UNITED STATES
SECURITIES AND EXCHANGE COMMISSION
Washington, D.C. 20549
FORM N-CSR
CERTIFIED SHAREHOLDER REPORT OF REGISTERED
MANAGEMENT INVESTMENT COMPANIES
Investment Company Act file number 811-05084
Mutual of America Investment Corporation
(Exact name of registrant as specified in charter)
320 Park Avenue, New York, N.Y. 10022
(Address of principal executive offices) (Zip code)
James J. Roth
Chairman of the Board, President and Chief Executive Officer
Mutual of America Investment Corporation
320 Park Avenue
New York, NY 10022
(Name and address of agent for service)
Registrant’s telephone number, including area code:
(212) 224-1600
Date of fiscal year end: December 31
Date of reporting period: December 31, 2017
| ITEM 1. | REPORTS TO STOCKHOLDERS. |
The Annual Report to Shareholders follows:
DECEMBER 31, 2017
Annual Reports of Investment Options Offered by Mutual of America Life Insurance Company
This report is not to be construed as an offering for sale of any Variable Policy. No offering is made except in conjunction with a prospectus which must precede or accompany this report.


320 PARK AVENUE
NEW YORK NY 10022-6839
February 2018
As a valued variable annuity owner, variable life insurance policyholder or participant in a group variable annuity, we are pleased to provide you with the annual fund reports for the investment options you have selected. Included in this booklet are the annual reports of the Mutual of America Investment Corporation Funds. If you have also selected other investments options, you will receive annual reports for those funds in a separate booklet or booklets. The reports provide an update on each portfolio’s performance as of December 31, 2017. Please note that portfolio performance does not take into account the fees charged by the annuity contract or life insurance policy. When viewed net of these contract fees, your performance will be lower. As always, past performance cannot predict or guarantee future returns.
Mutual of America has specialized in providing retirement products and related services to organizations and their employees, as well as individuals, for more than 70 years. As a mutual company, we do not have stockholders and are not publicly traded. We operate solely for the benefit of our customers, managing the Company for their long-term interest, rather than for the short-term demands of stockholders. Today, as in the past, Mutual of America remains financially strong and is rated among the strongest companies in the life insurance industry by the major independent rating agencies.*
Since 1945, Mutual of America has remained committed to offering plan sponsors, plan participants and individuals carefully selected, quality products and services at a competitive price and the personal attention they need to help build and preserve assets for a financially secure future. Integrity, prudence, and reliability are the values that have guided us since our inception and that continue to serve us well.
We hope you will find the enclosed information helpful. We appreciate and value your business and look forward to serving you in the future. If you have any questions, please call your local Mutual of America Regional Office or 1-800-468-3785.
Sincerely,
Mutual of America Life Insurance Company
| * | While these ratings do not apply to the safety or investment performance of the Separate Account investment funds available under Mutual of America’s products, they do reflect the Company’s ability to fulfill its General Account obligations, which include its obligations under the Interest Accumulation Account, annuity purchase rate guarantees and annuity benefit payouts, as well as life insurance and disability income payments. Third party ratings are subject to change. |
DECEMBER 31, 2017
Annual Reports of Mutual of America Investment Corporation
This report is not to be construed as an offering for sale of any Variable Policy. No offering is made except in conjunction with a prospectus which must precede or accompany this report.

CONTENTS
MUTUALOF AMERICA INVESTMENT CORPORATION
We are pleased to present the Mutual of America Investment Corporation (the “Investment Company”) Annual Report. This Report includes important information regarding the performance and financial position of the Investment Company’s funds for the year ended December 31, 2017.
The year 2017 was one for the U.S. stock market record books. According to The Wall Street Journal, The Dow Jones Industrial Average made 71 record-high closings, the most since the tech frenzy of the late 1990s. The S&P 500® Index (S&P 500) and NASDAQ also stood near record highs at year end. One of the more interesting statistics is that 2017 was the first time in which the S&P 500 posted positive total returns for every month of the year, part of a string of 14 consecutive months of increases. Also during 2017 there were no days in which the S&P 500 finished with a 2% or greater move, and very few with even a 1% move. In fact, the best performance day was a 1.38% advance. Such outcomes were not anticipated by any economists or strategists.
Globally, the same held true for most markets. All developed markets posted positive results, with all but two in double digits. In the U.S., the S&P 500 Index advanced more than 20% on a total return basis. The Japan Nikkei Index advanced about 20%. European markets generally finished up in the high single-digits to mid-teens in percentage terms. In U.S. dollar terms, foreign results were even better, given the weaker dollar versus last year. At the same time, most emerging markets also posted strong gains.
The sources of these spectacular results are threefold, in our opinion. First, 2017 was a year of truly synchronized global economic growth. Second, global monetary policy remained accommodative because, despite the scaling back of quantitative easing by the U.S. Federal Reserve, Europe and Japan continued to pump money into the global financial system. And third, markets were buoyed by high expectations for aggressive fiscal policy initiatives by the Trump administration, including tax cuts and infrastructure spending.
With regard to the global economy, we have previously commented on the steady acceleration in economic statistics during 2017. The U.S. produced two back-to-back quarters of 3.0%-plus Gross Domestic Product growth and while the fourth quarter result was slightly lower at 2.6%, the underlying fundamentals were strong and support the premise of continued economic growth. Both the ISM Manufacturing and ISM Non-Manufacturing surveys of purchasing managers stand near cycle and historical highs. The most important underlying components of these surveys — namely, orders, prices and deliveries — were among the strongest. Retail sales at the end of the year registered a 6% year-over-year run-rate following six straight monthly advances. Beyond the U.S., in an ascending trend, Japan posted seven positive GDP quarters in a row, while Europe has slowly expanded over the past three years and is currently growing at a rate approaching 2.0%. China, while expected to slow over the long term, continued to grow at a mid-to-high 6% range over the past few years. Combined on a weighted basis, global growth showed modest but consistent improvement for the past couple of years, as indicated by optimistic forecasts by such organizations as the International Monetary Fund.
All major global monetary authorities are at various stages in their quantitative easing cycles. The U.S. stopped buying new bonds two years ago, then began to gradually raise the Federal Funds rate. More recently, it allowed its balance sheet to begin slowly shrinking by not reinvesting the proceeds of maturing bonds. The Bank of England has pursued a parallel course. The European Central Bank began its withdrawal from quantitative easing by beginning to let its maturing bonds roll off without reinvestment, but at a very gradual pace. Given recent good news on the economy, it is expected to begin to raise interest rates sometime in 2018. The Bank of Japan will probably maintain its bond buying program until it becomes more confident in the sustainability of modest inflation. Plenty of liquidity remains in the global financial system and if economic conditions begin to deteriorate, central banks should be able to reinitiate some form of rate reduction/quantitative easing program. Of course, there are skeptics who fear that central banks will tighten monetary conditions too quickly and curtail expansion prematurely. The strength of the global economy and the deliberately slow pace at which the banks are moving suggests that won’t happen anytime soon. The major concern is how current policy may have to be modified to respond to the economic effects of the recently passed Tax Cuts and Job Act bill in the U.S.
There is no doubt that the bill will add fuel to the economic expansion. Analysts have already penciled in an additional $10 to $18 in S&P 500 earnings per share over the next two years. It appears that most Americans will see at least a modest increase in their paychecks. A number of corporations have already announced across-the-board wage increases and special bonuses. In addition, one key expectation is that corporations will use some of the proceeds from the tax cut and repatriation of foreign earnings to expand capital spending, which has been a missing component in this expansion. These expectations are backed up by surveys of corporate leaders. Unlike share buybacks, dividends or acquisitions, which are financial transactions whose proceeds tend to feed back into financial assets, capital spending injects money and liquidity into the real economy where it has a multiplier effect. As an
1
example, when Company A buys a machine from Company B and produces goods more efficiently and cheaply, it permits wage increases and/or lower consumer prices. In the meantime, Company B must hire workers to fulfill new demand, thus raising incomes which in turn are used by workers to buy food, furniture, or cars.
There are skeptics who raise the question of why companies would ramp up capital spending now when there has been more than enough cash to do so during most of this expansion. Instead, most cash went toward share repurchases, dividends and acquisitions, generally non-productive uses of capital except for the latter — if they work. Companies invest in projects if they determine that the returns on capital invested exceed the costs of that capital. Given the historically low interest rates that have prevailed over the past 10 years, the cost of debt capital has been extremely low, and therefore one would think there would be many viable investment alternatives for corporations to pursue. But corporations often took on debt for share repurchases instead, suggesting that such reduction in share count and thus higher earnings per share and returns on book value were deemed higher (and less risky) than capital projects. The question now is whether the tax law changes the calculus to incentivize capital spending as opposed to directly or indirectly returning capital to shareholders. Of course, the answer will be case specific, but the combination of reducing the amount of interest expense that can be used for tax purposes, the five-year provision allowing full expensing of capital purchases, and the lower taxes on profits derived from such capital projects, would seem to provide plenty of motivation for at least some corporations to change their capital allocation policies.
Increasing economic growth drives corporate sales and earnings, which in turn drive stock prices. Rising earnings drive rising earnings expectations, both in terms of magnitude and sustainability. These two components of expectations are important because they help to explain the relative contributions of actual earnings and the price/earnings (P/E) ratio to stock price changes. If earnings expectations rise and are then realized or exceeded, stock prices should advance by the same amount assuming the P/E multiple does not change. But P/E multiples do change and account for a wide range of differences between how much earnings affect relative stock price changes. P/E ratios depend on how much future growth markets are willing to discount into current stock prices. The more confidence investors have in the sustainability of earnings growth the more they are willing to pay per dollar of earnings (i.e., the P/E ratio). Conversely, if earnings growth is viewed as the result of a one-time event, such as a change in tax law, the P/E ratio is not likely to rise much, if at all. And if the markets begin to suspect that earnings are about to roll over and decline, the P/E ratio and, thus, stock prices will fall faster than actual earnings decline.
This admittedly arcane discussion of valuation is important to understanding what we believe is going on in the market today. The most strident complaint is that the markets are too expensive because the P/E ratio, even based on tax-cut adjusted corporate earnings, is currently 18.5 times versus a long-term historical average of 15.0 times. Based on the reasoning above, it would seem that the step-up in earnings from the recently passed tax cut has been fully taken into account by the markets. However, we believe the price per dollar of those earnings (P/E ratio) is not excessive for several reasons. First, the historical average is just that, an average over time that encompasses both up and down markets. Given the strengthening global economy and increase in sales and earnings over the past couple of years, it does not seem outlandish to pay more than average for those kinds of results. Furthermore, the current strength seems to have momentum that could persist, especially with the assist of large tax cuts for corporations and increased paychecks for most consumers.
The point is that investors are discounting the incremental growth effects expected to come from a pick-up in corporate capital spending due to the tax cut bill. More growth, higher earnings, and higher stock prices for longer periods of time are why we don’t believe stock valuations are too elevated and why we believe the current bull market rally has longer to run.
The total return performance (net of investment management and other operating expenses) for each of the Investment Company Funds is reflected below:
| | | | |
| Total Returns — Year Ended December 31, 2017 | |
| |
Equity Index Fund | | | +21.65% | |
All America Fund | | | +19.41% | |
Small Cap Value Fund | | | + 8.29% | |
Small Cap Growth Fund | | | +23.82% | |
Mid Cap Value Fund | | | +14.92% | |
Mid-Cap Equity Index Fund | | | +16.05% | |
International Fund | | | +24.47% | |
Composite Fund | | | +13.37% | |
Retirement Income Fund | | | + 7.35% | |
2010 Retirement Fund | | | + 9.06% | |
2
| | | | |
| Total Returns — Year Ended December 31, 2017 | |
| |
2015 Retirement Fund | | | +10.64% | |
2020 Retirement Fund | | | +12.52% | |
2025 Retirement Fund | | | +14.44% | |
2030 Retirement Fund | | | +16.01% | |
2035 Retirement Fund | | | +17.15% | |
2040 Retirement Fund | | | +17.40% | |
2045 Retirement Fund | | | +17.62% | |
2050 Retirement Fund | | | +17.86% | |
2055 Retirement Fund | | | +17.99% | |
Conservative Allocation Fund | | | + 8.92% | |
Moderate Allocation Fund | | | +13.72% | |
Aggressive Allocation Fund | | | +16.64% | |
Money Market Fund | | | + 0.70% | |
Mid-Term Bond Fund | | | + 2.32% | |
Bond Fund | | | + 3.62% | |
The above performance figures do not reflect the deduction of respective Separate Account fees and expenses imposed by Mutual of America Life Insurance Company. All Fund performances presented throughout this report are historical, reflect the full reinvestment of dividends paid, and should not be considered indicative of future results.
The pages that immediately follow include brief discussions of each Fund’s performance for the year ended December 31, 2017, compared with its relevant index. Also presented are graphs and tables for each Fund (except for the Money Market Fund) which illustrates each Fund’s respective:
| | ● | | Historical total return achieved over specific periods, expressed as an average annual rate and as a cumulative rate; |
| | ● | | Value in dollars of a $10,000 hypothetical investment at the beginning of each specified period; and |
| | ● | | Historical performance compared to an appropriate index. |
Following the discussions are the graphical representations of the asset allocations of each Fund and an illustration of each Fund’s operating expenses. The summarized portfolios of each Fund and financial statements are presented in the pages that follow.
Thank you for your continued investment in our Funds.
Sincerely,

James J. Roth
Chairman of the Board, President
and Chief Executive Officer
Mutual of America Investment Corporation
The views expressed in this Annual Report are subject to change at any time based on market and other conditions and should not be construed as a recommendation. This Report contains forward looking statements which speak only as of the date they were made and involve a number of risks and uncertainties that could cause actual results to differ materially from those expressed herein. Readers are cautioned not to place undue reliance on our forward-looking statements, as we assume no obligation to update these forward-looking statements. Readers assume any and all responsibility for any investment decision made as a result of the views expressed herein.
Standard & Poor’s®, S&P® and S&P 500® are trademarks of Standard & Poor’s Financial Services LLC, a subsidiary of The McGraw-Hill Companies, Inc.
3
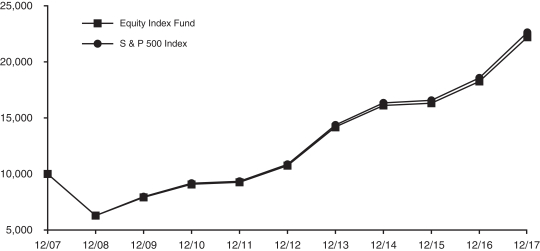
EQUITY INDEX FUND
The Equity Index Fund’s objective is to replicate the performance of the S&P 500® Index (S&P 500), which consists of 500 stocks chosen by Standard & Poor’s for market size, liquidity and industry group representation. The S&P 500 is a market-weighted index of 500 stocks traded on the New York Stock Exchange, American Stock Exchange and NASDAQ, with each stock’s weight in the index proportionate to its market value. The weightings make each company’s influence on the S&P 500’s performance directly proportional to that company’s market value.
The Equity Index Fund’s performance for the year ended December 31, 2017, was 21.81% before expenses and 21.65% after expenses, just below the benchmark return of 21.83%. Note that the Equity Index Fund’s performance includes expenses, such as transaction costs and management fees, which are not applicable to the benchmark.
GROWTH OF A $10,000 INVESTMENT
| | | | | | | | | | | | |
Equity Index Fund | |
Period
Ended
12/31/2017 | | Growth of $10,000 | | | Total Return | |
| | | Cumu-
lative | | | Average
Annual | |
1 Year | | | $12,164 | | | | 21.65% | | | | 21.65% | |
5 Years | | | $20,630 | | | | 106.30% | | | | 15.58% | |
10 Years | | | $22,177 | | | | 121.77% | | | | 8.29% | |
| | | | | | | | | | | | |
S & P 500 Index | |
Period
Ended
12/31/2017 | | Growth
of
$10,000 | | | Total Return | |
| | | Cumu-
lative | | | Average
Annual | |
1 Year | | | $12,183 | | | | 21.83% | | | | 21.83% | |
5 Years | | | $20,813 | | | | 108.13% | | | | 15.79% | |
10 Years | | | $22,598 | | | | 125.98% | | | | 8.50% | |
The line representing the performance return of the Equity Index Fund includes expenses, such as transaction costs and management fees that reduce returns, while the performance return line of the Index does not. Past performance is not indicative of future results.
4
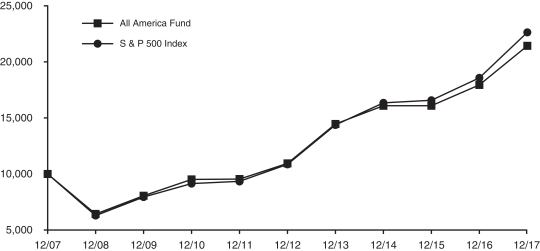
ALL AMERICA FUND
The investment objective of the All America Fund is to outperform the S&P 500® Index (S&P 500). The All America Fund has been approximately 60% passively invested in the 500 stocks that comprise the S&P 500, with the remaining 40% actively managed, comprised of 20% large capitalization stocks and 20% small cap stocks. Beginning July 1, 2016, the actively managed portfolio shifted to mid-cap stocks from large cap stocks, thus providing exposure to all levels of market capitalization among domestic stocks.
For the year ended December 31, 2017, the S&P 500 of large capitalization stocks increased by 21.83% on a total return basis, while the Russell® Midcap Core Index was up 18.52% and the Russell Midcap® Value Index was up 13.34%. The Russell 2000® Growth Index advanced 22.17% and the Russell 2000® Value Index was up 7.84%.
The All America Fund’s return for the year ended December 31, 2017, before expenses was 20.02% and 19.41% after expenses versus the benchmark return of 21.83% The underperformance of the Fund versus the S&P 500 during the year was due to the underperformance of the mid and small capitalization segments of the fund as compared to the large capitalization benchmark.
GROWTH OF A $10,000 INVESTMENT
| | | | | | | | | | | | |
All America Fund | |
Period
Ended
12/31/2017 | | Growth
of
$10,000 | | | Total Return | |
| | | Cumu-
lative | | | Average Annual | |
1 Year | | | $11,942 | | | | 19.41% | | | | 19.41% | |
5 Years | | | $19,544 | | | | 95.44% | | | | 14.33% | |
10 Years | | | $21,401 | | | | 114.01% | | | | 7.90% | |
| | | | | | | | | | | | |
S & P 500 Index | |
Period
Ended
12/31/2017 | | Growth
of
$10,000 | | | Total Return | |
| | | Cumu-
lative | | | Average Annual | |
1 Year | | | $12,183 | | | | 21.83% | | | | 21.83% | |
5 Years | | | $20,813 | | | | 108.13% | | | | 15.79% | |
10 Years | | | $22,598 | | | | 125.98% | | | | 8.50% | |
The line representing the performance return of the All America Fund includes expenses, such as transaction costs and management fees that reduce returns, while the performance return line of the Index does not. Past performance is not indicative of future results.
5
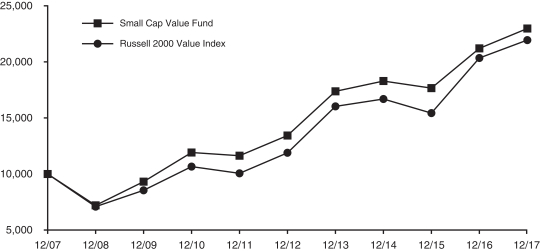
SMALL CAP VALUE FUND
The investment objective of the Small Cap Value Fund is capital appreciation. The Small Cap Value Fund generally invests in companies that are below $3 billion in market capitalization and have lower price-to-book characteristics than the overall market.
For the year ended December 31, 2017, the Small Cap Value Fund returned 9.16% before expenses and 8.29% after expenses versus a 7.84% return for the Russell 2000® Value Index. Within the benchmark, the best performing sectors were Health Care and Industrials while the worst performing sectors were Retail and Energy.
Stock selection was the primary driver of positive performance versus the benchmark. Sectors contributing to Fund performance included Technology and Basic Materials, while sectors detracting from Fund performance included Consumer Cyclicals and Industrials.
GROWTH OF A $10,000 INVESTMENT
| | | | | | | | | | | | |
Small Cap Value Fund | |
Period
Ended
12/31/2017 | | Growth
of
$10,000 | | | Total Return | |
| | | Cumu-
lative | | | Average Annual | |
1 Year | | | $10,830 | | | | 8.29% | | | | 8.29% | |
5 Years | | | $17,086 | | | | 70.86% | | | | 11.30% | |
10 Years | | | $22,952 | | | | 129.52% | | | | 8.65% | |
| | | | | | | | | | | | |
Russell 2000 Value Index | |
Period
Ended
12/31/2017 | | Growth
of
$10,000 | | | Total Return | |
| | | Cumu-
lative | | | Average Annual | |
1 Year | | | $10,784 | | | | 7.84% | | | | 7.84% | |
5 Years | | | $18,429 | | | | 84.29% | | | | 13.01% | |
10 Years | | | $21,938 | | | | 119.38% | | | | 8.17% | |
The line representing the performance return of the Small Cap Value Fund includes expenses, such as transaction costs and management fees that reduce returns, while the performance return line of the Index does not. Past performance is not indicative of future results.
6
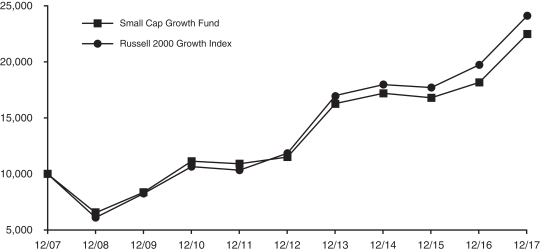
SMALL CAP GROWTH FUND
The investment objective of the Small Cap Growth Fund is capital appreciation. The Small Cap Growth Fund invests in growth stocks within the small capitalization marketplace. The Fund returned 24.81% before expenses and 23.82% after expenses during the year ended December 31, 2017. The Fund’s benchmark, the Russell 2000® Growth Index, returned 22.17% for the year.
The growth style showed attractive returns in the large, mid and small cap asset classes for the year 2017, outperforming the value style. Telecommunication Services and Health Care were the sectors with the top absolute returns in the Russell 2000® Growth Index. Both Energy and REITs had the lowest absolute returns in the Russell 2000® Growth Index for the 12-month period.
The Fund’s best outperformance came from the Information Technology, Industrials and Materials sectors which contributed meaningfully to our overall return. Consumer Staples and Financials underperformed the Russell 2000® Growth Index for the calendar year 2017.
Our underperformance in the Consumer Staples and Financials sectors was not enough to offset our strong performance in the Technology, Industrials and Materials sectors which provided investors with an attractive absolute and relative return of over 20%.
Our outperformance was driven by stock selection not sector allocation.
We expect macro events will continue to play an outsized role in the financial markets with reactions from investors happening in increasingly short periods of time.
GROWTH OF A $10,000 INVESTMENT
| | | | | | | | | | | | |
Small Cap Growth Fund | |
Period
Ended
12/31/2017 | | Growth
of
$10,000 | | | Total Return | |
| | | Cumu-
lative | | | Average Annual | |
1 Year | | | $12,383 | | | | 23.82% | | | | 23.82% | |
5 Years | | | $19,502 | | | | 95.02% | | | | 14.28% | |
10 Years | | | $22,476 | | | | 124.76% | | | | 8.42% | |
| | | | | | | | | | | | |
Russell 2000 Growth Index | |
Period
Ended
12/31/2017 | | Growth
of
$10,000 | | | Total Return | |
| | | Cumu-
lative | | | Average Annual | |
1 Year | | | $12,217 | | | | 22.17% | | | | 22.17% | |
5 Years | | | $20,295 | | | | 102.95% | | | | 15.21% | |
10 Years | | | $24,089 | | | | 140.89% | | | | 9.19% | |
The line representing the performance return of the Small Cap Growth Fund includes expenses, such as transaction costs and management fees that reduce returns, while the performance return line of the Index does not. Past performance is not indicative of future results.
7
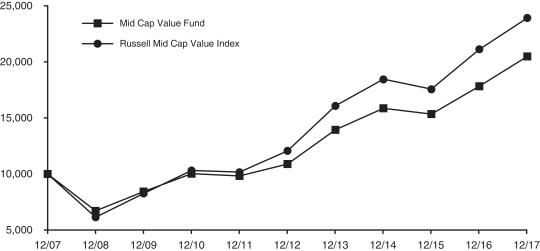
MID CAP VALUE FUND
The investment objective of the Mid Cap Value Fund is to outperform the Russell Midcap® Value Index. The Mid Cap Value Fund generally invests in companies that are between $1 billion and $20 billion in market capitalization and have lower price-to-book characteristics.
For the year ended December 31, 2017, the Mid Cap Value Fund returned 15.66% before expenses and 14.92% after expenses versus a 13.34% return for the Russell Midcap® Value Index. Within the benchmark, the best performing sectors were Basic Materials and Industrials while the worst performing sectors were Energy and REITs.
Stock selection was the primary driver of positive performance versus the benchmark. Sectors contributing to Mid Cap Value Fund performance included Health Care and Industrials, while sectors detracting from Fund performance included Energy and REITs.
GROWTH OF A $10,000 INVESTMENT
| | | | | | | | | | | | |
Mid Cap Value Fund | |
Period
Ended
12/31/2017 | | Growth
of
$10,000 | | | Total Return | |
| | | Cumu-
lative | | | Average
Annual | |
1 Year | | $ | 11,491 | | | | 14.92 | % | | | 14.92 | % |
5 Years | | $ | 18,767 | | | | 87.67 | % | | | 13.41 | % |
10 Years | | $ | 20,458 | | | | 104.58 | % | | | 7.41 | % |
| | | | | | | | | | | | |
Russell Mid Cap Value Index | |
Period
Ended
12/31/2017 | | Growth
of
$10,000 | | | Total Return | |
| | | Cumu-
lative | | | Average
Annual | |
1 Year | | $ | 11,334 | | | | 13.34 | % | | | 13.34 | % |
5 Years | | $ | 19,832 | | | | 98.32 | % | | | 14.68 | % |
10 Years | | $ | 23,890 | | | | 138.90 | % | | | 9.10 | % |
The line representing the performance return of the Mid Cap Value Fund includes expenses, such as transaction costs and management fees that reduce returns, while the performance return line of the Index does not. Past performance is not indicative of future results.
8
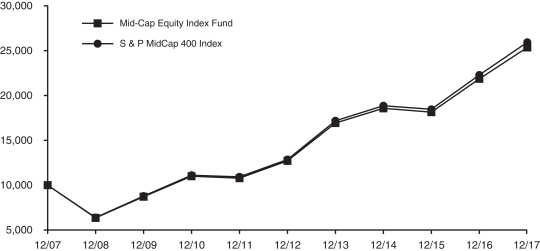
MID-CAP EQUITY INDEX FUND
The Mid-Cap Equity Index Fund invests in the 400 stocks that comprise the S&P MidCap 400® Index (S&P MidCap 400). The S&P MidCap 400 is a market-weighted index of 400 stocks traded on the New York Stock Exchange, American Stock Exchange and NASDAQ. The weightings make each company’s influence on the S&P MidCap 400’s performance directly proportional to that company’s market value. The companies included in the S&P MidCap 400 tend to be typical of this asset class, the medium-capitalized sector of the U.S. securities market.
The Mid-Cap Equity Index Fund’s performance for the year ended December 31, 2017, was 16.21% before expenses and 16.05% after expenses, finishing below the 16.24% return of the S&P MidCap 400. Note that the performance of the Mid-Cap Equity Index Fund includes expenses, such as transaction costs and management fees, which are not applicable to the benchmark.
GROWTH OF A $10,000 INVESTMENT
| | | | | | | | | | | | |
Mid-Cap Equity Index Fund | |
Period
Ended
12/31/2017 | | Growth
of
$10,000 | | | Total Return | |
| | | Cumu-
lative | | | Average
Annual | |
1 Year | | $ | 11,604 | | | | 16.05 | % | | | 16.05 | % |
5 Years | | $ | 19,939 | | | | 99.39 | % | | | 14.80 | % |
10 Years | | $ | 25,307 | | | | 153.07 | % | | | 9.72 | % |
| | | | | | | | | | | | |
S & P MidCap 400 Index | |
Period
Ended
12/31/2017 | | Growth
of
$10,000 | | | Total Return | |
| | | Cumu-
lative | | | Average
Annual | |
1 Year | | $ | 11,624 | | | | 16.24 | % | | | 16.24 | % |
5 Years | | $ | 20,118 | | | | 101.18 | % | | | 15.01 | % |
10 Years | | $ | 25,856 | | | | 158.56 | % | | | 9.97 | % |
The line representing the performance return of the Mid-Cap Equity Index Fund includes expenses, such as transaction costs and management fees that reduce returns, while the performance return line of the Index does not. Past performance is not indicative of future results.
9
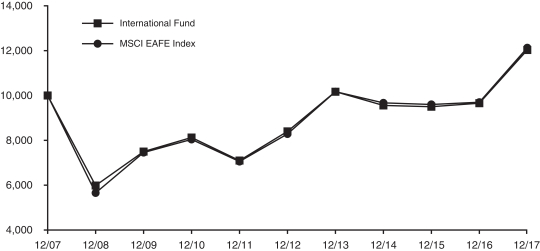
INTERNATIONAL FUND
The International Fund seeks capital appreciation by investing, directly or indirectly, mainly in exchange traded funds that invest in stocks of large and mid-cap companies in developed market countries located outside of the United States and Canada that are reflected or contained in the Morgan Stanley Capital International, Inc. Europe, Australasia and Far East® Index (MSCI EAFE® Index). Currently the International Fund is invested mainly in exchange traded funds that reflect, replicate or follow the country weightings of the MSCI EAFE® Index. The Fund also has invested a small percentage of assets in exchange traded funds that provide exposure to emerging markets and to companies with small market capitalizations in developed market countries.
For the year ended December 31, 2017, the International Fund returned 24.62% before expenses and 24.47% after expenses, finishing below the 25.03% return of the benchmark. The fund’s benchmark closes earlier in the day than the actual market for the fund’s investments. This time lag can result in both positive and negative performance differences.
GROWTH OF A $10,000 INVESTMENT
| | | | | | | | | | | | |
International Fund | |
Period
Ended
12/31/2017 | | Growth
of
$10,000 | | | Total Return | |
| | | Cumu-
lative | | | Average
Annual | |
1 Year | | $ | 12,446 | | | | 24.47 | % | | | 24.47 | % |
5 Years | | $ | 14,301 | | | | 43.01 | % | | | 7.42 | % |
10 Years | | $ | 12,016 | | | | 20.16 | % | | | 1.85 | % |
| | | | | | | | | | | | |
MSCI EAFE Index | |
Period
Ended
12/31/2017 | | Growth
of
$10,000 | | | Total Return | |
| | | Cumu-
lative | | | Average
Annual | |
1 Year | | $ | 12,503 | | | | 25.03 | % | | | 25.03 | % |
5 Years | | $ | 14,625 | | | | 46.25 | % | | | 7.90 | % |
10 Years | | $ | 12,119 | | | | 21.19 | % | | | 1.94 | % |
The line representing the performance return of the International Fund includes expenses, such as transaction costs and management fees that reduce returns, while the performance return line of the Index does not. Past performance is not indicative of future results.
10
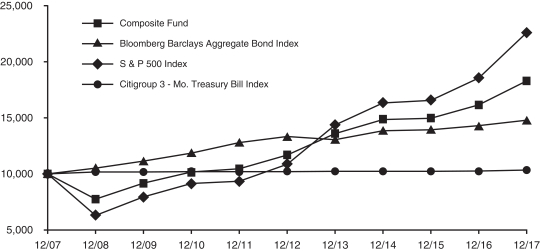
COMPOSITE FUND
The Composite Fund seeks capital appreciation and current income by investing in a diversified portfolio of common stocks, debt securities and money market instruments.
The primary investment objective of the fixed income portion of the fund is to provide a high level of current income, consistent with capital preservation, while minimizing volatility. It does this by investing primarily in investment grade publicly traded debt securities. The securities held include corporate, U.S. agency and mortgage-backed bonds, all of which normally yield more than U.S. Treasury issues.
For the year ended December 31, 2017, the fixed income portion of the Fund had a total return of 3.56% before expenses. This compares favorably to the Bloomberg Barclays Aggregate Bond Index (the Aggregate), which returned 3.54%. The fixed income portion of the Fund focused on income and capital preservation.
All asset classes represented in the Aggregate delivered positive results during the period. Investment grade corporate bonds had the strongest showing, 6.42%, while asset-backed securities had the weakest, 1.55%. Longer dated bonds, those set to mature in more than ten years, returned 10.47% and those with one to three years to maturity offered 0.86%.
The Federal Reserve (Fed) governors continue to withdraw some of the extraordinary measures put in place following the financial crisis in 2008. To that end, they raised the Fed Funds target range three times in 2017, in March, June and again in December, to 1.25%-1.50%. Further increases are expected in 2018.
The interest rate curve flattened as yields on short-dated U.S. Treasuries rose while those of long-dated U.S. Treasuries fell. Two-year U.S. Treasury Notes yielded 1.19% at the end of the 4th quarter of 2016 and 1.88% on December 31, 2017. Ten year yields fell 3 basis points or 0.03% to 2.41% during the year. This is not an uncommon effect during a Fed tightening cycle. The front end of the yield curve, generally considered to be up to five years in maturity, is more affected by Fed policy. As the Fed raises rates, short term rates move with them. The longer end of the yield curve, maturities of seven to thirty years, is driven more by inflation expectations. As Fed tightenings in theory slow the economy, inflation is presumed to fall and tends to pull longer term rates down.
High-grade corporate bond spreads tightened from 127 basis points at the end of 2016 to 96 basis points on December 29, 2017. This represents close to the lowest level in ten years and helped corporate bonds deliver the best return of the benchmark components for the second year in a row. Utilities aided by their exposure to the long end of the Treasury curve had the best overall return. Metals and mining, spurred by worldwide economic growth, repeated as the best performing individual sector with a double digit return.
The primary objective of the equity portion of the Composite Fund is to provide exposure to a diversified portfolio of primarily large capitalization, domestic equity securities that have the potential to outperform their peer group over the medium to long term. The portfolio has a focus on dividend income, and aims to continually earn a dividend yield that is higher than that of its benchmark without taking significant over or under weights in any sector.
For the year ended December 31, 2017, the equity portion of the Fund had a total return of 21.52% (before expenses), underperforming the S&P 500® Index (S&P 500) which gained 21.83%. The slight underperformance of the Fund was due to the fact that the income-oriented equities that are a focus of the fund’s strategy were not in favor during the year.
The Fund’s aggregate performance for the year ended December 31, 2017, was 13.94% before expenses and 13.37% after expenses, versus a 14.26% return in the weighted benchmark.
GROWTH OF A $10,000 INVESTMENT
| | | | | | | | | | | | |
Composite Fund | |
Period
Ended
12/31/2017 | | Growth
of
$10,000 | | | Total Return | |
| | | Cumu-
lative | | | Average
Annual | |
1 Year | | $ | 11,337 | | | | 13.37 | % | | | 13.37 | % |
5 Years | | $ | 15,657 | | | | 56.57 | % | | | 9.38 | % |
10 Years | | $ | 18,318 | | | | 83.18 | % | | | 6.24 | % |
| | | | | | | | | | | | |
S & P 500 Index | |
Period
Ended
12/31/2017 | | Growth
of
$10,000 | | | Total Return | |
| | | Cumu-
lative | | | Average
Annual | |
1 Year | | $ | 12,183 | | | | 21.83 | % | | | 21.83 | % |
5 Years | | $ | 20,813 | | | | 108.13 | % | | | 15.79 | % |
10 Years | | $ | 22,598 | | | | 125.98 | % | | | 8.50 | % |
| | | | | | | | | | | | |
Bloomberg Barclays Aggregate Bond Index | |
Period
Ended
12/31/2017 | | Growth
of
$10,000 | | | Total Return | |
| | | Cumu-
lative | | | Average
Annual | |
1 Year | | $ | 10,354 | | | | 3.54 | % | | | 3.54 | % |
5 Years | | $ | 11,095 | | | | 10.95 | % | | | 2.10 | % |
10 Years | | $ | 14,810 | | | | 48.10 | % | | | 4.01 | % |
| | | | | | | | | | | | |
Citigroup 3 - Month T-Bill Index | |
Period
Ended
12/31/2017 | | Growth
of
$10,000 | | | Total Return | |
| | | Cumu-
lative | | | Average
Annual | |
1 Year | | $ | 10,084 | | | | 0.84 | % | | | 0.84 | % |
5 Years | | $ | 10,122 | | | | 1.22 | % | | | 0.24 | % |
10 Years | | $ | 10,350 | | | | 3.50 | % | | | 0.34 | % |
The line representing the performance return of the Composite Fund includes expenses, such as transaction costs and management fees that reduce returns, while the performance return lines of the Indices do not. Past performance is not indicative of future results.
11
RETIREMENT INCOME FUND
The objective of the Retirement Income Fund is current income consistent with the preservation of capital and, to a lesser extent, capital appreciation. The Retirement Income Fund invests primarily in the fixed-income funds of the Investment Company and also invests in two equity funds of the Investment Company. The Fund’s current target allocation is approximately 75% of net assets in fixed-income funds (approximately 30% in the Bond, 35% in the Mid-Term Bond Funds and 10% in the Money Market Fund) and approximately 25% of net assets in equity funds (20% in the Equity Index Fund and 5% in the Mid-Cap Equity Index Fund) (See Note 1 in the Notes to Financial Statements for additional information on changes to Fund target allocations during 2017).
Performance for the Retirement Income Fund is compared to the Bloomberg Barclays Aggregate Bond Index (65% weighting), the Citigroup 3-Month Treasury Bill Index (10% weighting) and the S&P 500® Index (25% weighting). For the year ended December 31, 2017, the Fund returned 7.41% before expenses and 7.35% after expenses, versus a 7.64% return in the weighted benchmark.
GROWTH OF A $10,000 INVESTMENT

| | | | | | | | | | | | |
Retirement Income Fund | |
Period
Ended
12/31/2017 | | Growth of
$10,000 | | | Total Return | |
| | | Cumu-
lative | | | Average
Annual | |
1 Year | | | $10,732 | | | | 7.35% | | | | 7.35% | |
5 Years | | | $13,098 | | | | 30.98% | | | | 5.55% | |
10 Years | | | $16,846 | | | | 68.46% | | | | 5.35% | |
| | | | | | | | | | | | |
S & P 500 Index | |
Period
Ended
12/31/2017 | | Growth of
$10,000 | | | Total Return | |
| | | Cumu-
lative | | | Average
Annual | |
1 Year | | | $12,183 | | | | 21.83% | | | | 21.83% | |
5 Years | | | $20,813 | | | | 108.13% | | | | 15.79% | |
10 Years | | | $22,598 | | | | 125.98% | | | | 8.50% | |
| | | | | | | | | | | | |
Bloomberg Barclays Aggregate Bond Index | |
Period
Ended
12/31/2017 | | Growth of
$10,000 | | | Total Return | |
| | | Cumu-
lative | | | Average
Annual | |
1 Year | | | $10,354 | | | | 3.54% | | | | 3.54% | |
5 Years | | | $11,095 | | | | 10.95% | | | | 2.10% | |
10 Years | | | $14,810 | | | | 48.10% | | | | 4.01% | |
| | | | | | | | | | | | |
Citigroup 3 - Month T-Bill Index | |
Period
Ended
12/31/2017 | | Growth of
$10,000 | | | Total Return | |
| | | Cumu-
lative | | | Average
Annual | |
1 Year | | | $10,084 | | | | 0.84% | | | | 0.84% | |
5 Years | | | $10,122 | | | | 1.22% | | | | 0.24% | |
10 Years | | | $10,350 | | | | 3.50% | | | | 0.34% | |
The line representing the performance return of the Retirement Income Fund includes expenses, such as direct management fees and expenses of the underlying funds in which the Fund invests, that reduce returns while the performance return lines of the Indices do not. Past performance is not indicative of future results.
12
2010 RETIREMENT FUND
The objective of the 2010 Retirement Fund is current income and capital appreciation appropriate for the asset allocation associated with a retirement in 2010. The 2010 Retirement Fund invests in funds of the Investment Company. The Fund’s current target allocation is approximately 68% of net assets in fixed-income funds (approximately 27% in the Bond Fund, 35% in the Mid-Term Bond Fund and 6% in the Money Market Fund) and approximately 32% of net assets in equity funds (22% in the Equity Index Fund, 7% in the Mid-Cap Equity Index Fund and 3% in the International Fund) (See Note 1 in the Notes to Financial Statements for additional information on changes to Fund target allocations during 2017).
Performance for the 2010 Retirement Fund is compared to the Bloomberg Barclays Aggregate Bond Index (62% weighting), the Citigroup 3-Month Treasury Bill Index (6% weighting) and the S&P 500® Index (32% weighting). For the year ended December 31, 2017, the Fund returned 9.07% before expenses and 9.06% after expenses, versus a 9.00% return in the weighted benchmark.
GROWTH OF A $10,000 INVESTMENT

| | | | | | | | | | | | |
2010 Retirement Fund | |
Period
Ended
12/31/2017 | | Growth of
$10,000 | | | Total Return | |
| | | Cumu-
lative | | | Average
Annual | |
1 Year | | | $10,905 | | | | 9.06% | | | | 9.06% | |
5 Years | | | $13,982 | | | | 39.82% | | | | 6.94% | |
10 Years | | | $17,416 | | | | 74.16% | | | | 5.70% | |
| | | | | | | | | | | | |
S & P 500 Index | |
Period
Ended
12/31/2017 | | Growth of
$10,000 | | | Total Return | |
| | | Cumu-
lative | | | Average
Annual | |
1 Year | | | $12,183 | | | | 21.83% | | | | 21.83% | |
5 Years | | | $20,813 | | | | 108.13% | | | | 15.79% | |
10 Years | | | $22,598 | | | | 125.98% | | | | 8.50% | |
| | | | | | | | | | | | |
Bloomberg Barclays Aggregate Bond Index | |
Period
Ended
12/31/2017 | | Growth of
$10,000 | | | Total Return | |
| | | Cumu-
lative | | | Average
Annual | |
1 Year | | | $10,354 | | | | 3.54% | | | | 3.54% | |
5 Years | | | $11,095 | | | | 10.95% | | | | 2.10% | |
10 Years | | | $14,810 | | | | 48.10% | | | | 4.01% | |
| | | | | | | | | | | | |
Citigroup 3 - Month T-Bill Index | |
Period
Ended
12/31/2017 | | Growth of
$10,000 | | | Total Return | |
| | | Cumu-
lative | | | Average
Annual | |
1 Year | | | $10,084 | | | | 0.84% | | | | 0.84% | |
5 Years | | | $10,122 | | | | 1.22% | | | | 0.24% | |
10 Years | | | $10,350 | | | | 3.50% | | | | 0.34% | |
The line representing the performance return of the 2010 Retirement Fund includes expenses, such as direct management fees and expenses of the underlying funds in which the Fund invests, that reduce returns while the performance return lines of the Indices do not. Past performance is not indicative of future results.
13
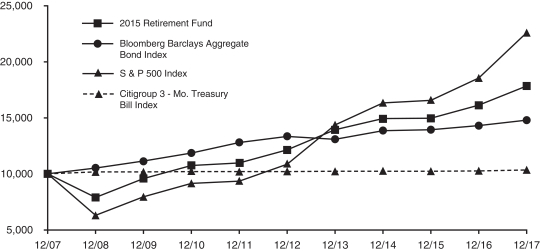
2015 RETIREMENT FUND
The objective of the 2015 Retirement Fund is current income and capital appreciation appropriate for the asset allocation associated with a retirement in 2015. The 2015 Retirement Fund invests in funds of the Investment Company. The Fund’s current target allocation is approximately 59% of net assets in fixed-income funds (26% in the Bond Fund, 30% in the Mid-Term Bond Fund and 3% in the Money Market Fund) and approximately 41% of net assets in equity funds (approximately 26% in the Equity Index Fund, 8% in the Mid-Cap Equity Index Fund, 5% in the International Fund and 1% each in the Small Cap Growth and Small Cap Value Funds) (See Note 1 in the Notes to Financial Statements for additional information on changes to Fund target allocations during 2017).
Performance for the 2015 Retirement Fund is compared to the Bloomberg Barclays Aggregate Bond Index (56% weighting), the Citigroup 3-Month Treasury Bill Index (3% weighting) and the S&P 500® Index (41% weighting). For the year ended December 31, 2017, the Fund returned 10.72% before expenses and 10.64% after expenses, versus a 10.70% return in the weighted benchmark.
GROWTH OF A $10,000 INVESTMENT
| | | | | | | | | | | | |
2015 Retirement Fund | |
Period
Ended
12/31/2017 | | Growth of
$10,000 | | | Total Return | |
| | | Cumu-
lative | | | Average
Annual | |
1 Year | | | $11,063 | | | | 10.64% | | | | 10.64% | |
5 Years | | | $14,693 | | | | 46.93% | | | | 8.01% | |
10 Years | | | $17,848 | | | | 78.48% | | | | 5.96% | |
| | | | | | | | | | | | |
S & P 500 Index | |
Period
Ended
12/31/2017 | | Growth of
$10,000 | | | Total Return | |
| | | Cumu-
lative | | | Average
Annual | |
1 Year | | | $12,183 | | | | 21.83% | | | | 21.83% | |
5 Years | | | $20,813 | | | | 108.13% | | | | 15.79% | |
10 Years | | | $22,598 | | | | 125.98% | | | | 8.50% | |
| | | | | | | | | | | | |
Bloomberg Barclays Aggregate Bond Index | |
Period
Ended
12/31/2017 | | Growth of
$10,000 | | | Total Return | |
| | | Cumu-
lative | | | Average
Annual | |
1 Year | | | $10,354 | | | | 3.54% | | | | 3.54% | |
5 Years | | | $11,095 | | | | 10.95% | | | | 2.10% | |
10 Years | | | $14,810 | | | | 48.10% | | | | 4.01% | |
| | | | | | | | | | | | |
Citigroup 3 - Month T-Bill Index | |
Period
Ended
12/31/2017 | | Growth of
$10,000 | | | Total Return | |
| | | Cumu-
lative | | | Average
Annual | |
1 Year | | | $10,084 | | | | 0.84% | | | | 0.84% | |
5 Years | | | $10,122 | | | | 1.22% | | | | 0.24% | |
10 Years | | | $10,350 | | | | 3.50% | | | | 0.34% | |
The line representing the performance return of the 2015 Retirement Fund includes expenses, such as direct management fees and expenses of the underlying funds in which the Fund invests, that reduce returns while the performance return lines of the Indices do not. Past performance is not indicative of future results
14
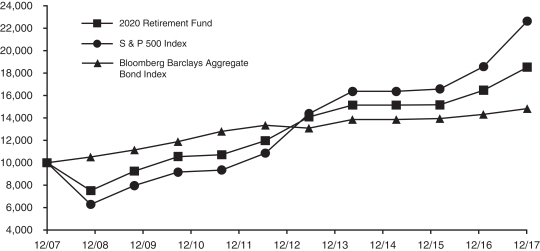
2020 RETIREMENT FUND
The objective of the 2020 Retirement Fund is current income and capital appreciation appropriate for the asset allocation associated with a target retirement in 2020. The 2020 Retirement Fund invests in funds of the Investment Company. The Fund’s current target allocation is approximately 51% of net assets in equity funds (approximately 29% in the Equity Index Fund, 10% in the Mid-Cap Equity Index Fund, 8% in the International Fund and 2% each in the Small Cap Growth and Small Cap Value Funds) and approximately 49% of net assets in fixed-income funds (26% in the Bond Fund and 23% in the Mid-Term Bond Fund) (See Note 1 in the Notes to Financial Statements for additional information on changes to Fund target allocations during 2017).
Performance for the 2020 Retirement Fund is compared to the S&P 500® Index (51% weighting) and the Bloomberg Barclays Aggregate Bond Index (49% weighting). For the year ended December 31, 2017, the Fund returned 12.60% before expenses and 12.52% after expenses, versus a 12.61% return in the weighted benchmark.
GROWTH OF A $10,000 INVESTMENT
| | | | | | | | | | | | |
2020 Retirement Fund | |
Period
Ended
12/31/2017 | | Growth of
$10,000 | | | Total Return | |
| | | Cumu-
lative | | | Average
Annual | |
1 Year | | | $11,250 | | | | 12.52% | | | | 12.52% | |
5 Years | | | $15,456 | | | | 54.56% | | | | 9.10% | |
10 Years | | | $18,501 | | | | 85.01% | | | | 6.34% | |
| | | | | | | | | | | | |
S & P 500 Index | |
Period
Ended
12/31/2017 | | Growth of
$10,000 | | | Total Return | |
| | | Cumu-
lative | | | Average
Annual | |
1 Year | | | $12,183 | | | | 21.83% | | | | 21.83% | |
5 Years | | | $20,813 | | | | 108.13% | | | | 15.79% | |
10 Years | | | $22,598 | | | | 125.98% | | | | 8.50% | |
| | | | | | | | | | | | |
Bloomberg Barclays Aggregate Bond Index | |
Period
Ended
12/31/2017 | | Growth of
$10,000 | | | Total Return | |
| | | Cumu-
lative | | | Average
Annual | |
1 Year | | | $10,354 | | | | 3.54% | | | | 3.54% | |
5 Years | | | $11,095 | | | | 10.95% | | | | 2.10% | |
10 Years | | | $14,810 | | | | 48.10% | | | | 4.01% | |
The line representing the performance return of the 2020 Retirement Fund includes expenses, such as direct management fees and expenses of the underlying funds in which the Fund invests, that reduce returns while the performance return lines of the Indices do not. Past performance is not indicative of future results.
15
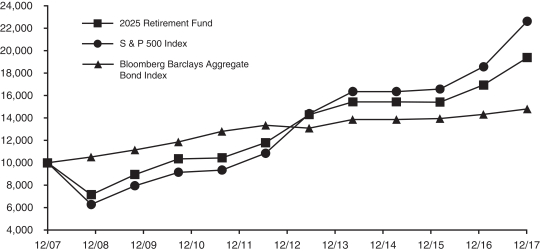
2025 RETIREMENT FUND
The objective of the 2025 Retirement Fund is current income and capital appreciation appropriate for the asset allocation associated with a target retirement in 2025. The 2025 Retirement Fund invests in funds of the Investment Company. The Fund’s current target allocation is approximately 62% of net assets in equity funds (approximately 32% in the Equity Index Fund, 12% in the Mid-Cap Equity Index Fund, 10% in the International Fund and 4% each in the Small Cap Growth and Small Cap Value Funds) and approximately 38% of net assets in fixed-income funds (25% in the Bond Fund and 13% in the Mid-Term Bond Fund) (See Note 1 in the Notes to Financial Statements for additional information on changes to Fund target allocations during 2017).
Performance for the 2025 Retirement Fund is compared to the S&P 500® Index (62% weighting) and the Bloomberg Barclays Aggregate Bond Index (38% weighting). For the year ended December 31, 2017, the Fund returned 14.52% before expenses and 14.44% after expenses, versus a 14.63% return in the weighted benchmark.
GROWTH OF A $10,000 INVESTMENT
| | | | | | | | | | | | |
2025 Retirement Fund | |
Period
Ended
12/31/2017 | | Growth of
$10,000 | | | Total Return | |
| | | Cumu-
lative | | | Average
Annual | |
1 Year | | | $11,442 | | | | 14.44% | | | | 14.44% | |
5 Years | | | $16,420 | | | | 64.20% | | | | 10.43% | |
10 Years | | | $19,366 | | | | 93.66% | | | | 6.83% | |
| | | | | | | | | | | | |
S & P 500 Index | |
Period
Ended
12/31/2017 | | Growth of
$10,000 | | | Total Return | |
| | | Cumu-
lative | | | Average
Annual | |
1 Year | | | $12,183 | | | | 21.83% | | | | 21.83% | |
5 Years | | | $20,813 | | | | 108.13% | | | | 15.79% | |
10 Years | | | $22,598 | | | | 125.98% | | | | 8.50% | |
| | | | | | | | | | | | |
Bloomberg Barclays Aggregate Bond Index | |
Period
Ended
12/31/2017 | | Growth of
$10,000 | | | Total Return | |
| | | Cumu-
lative | | | Average
Annual | |
1 Year | | | $10,354 | | | | 3.54% | | | | 3.54% | |
5 Years | | | $11,095 | | | | 10.95% | | | | 2.10% | |
10 Years | | | $14,810 | | | | 48.10% | | | | 4.01% | |
The line representing the performance return of the 2025 Retirement Fund includes expenses, such as direct management fees and expenses of the underlying funds in which the Fund invests, that reduce returns while the performance return lines of the Indices do not. Past performance is not indicative of future results.
16
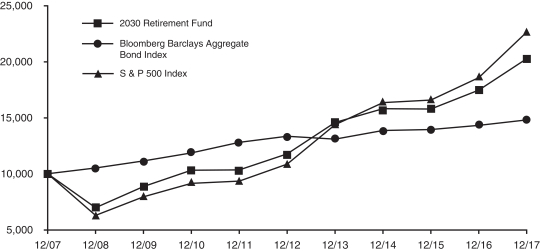
2030 RETIREMENT FUND
The objective of the 2030 Retirement Fund is current income and capital appreciation appropriate for the asset allocation associated with a target retirement in 2030. The 2030 Retirement Fund invests in funds of the Investment Company. The Fund’s current target allocation is approximately 73% of net assets in equity funds (approximately 34% in the Equity Index Fund, 17% in the Mid-Cap Equity Index Fund, 12% in the International Fund and 5% each in the Small Cap Growth and Small Cap Value Funds) and approximately 27% of net assets in fixed-income funds (22% in the Bond Fund and 5% in the Mid-Term Bond Fund) (See Note 1 in the Notes to Financial Statements for additional information on changes to Fund target allocations during 2017).
Performance for the 2030 Retirement Fund is compared to the S&P 500® Index (73% weighting) and the Bloomberg Barclays Aggregate Bond Index (27% weighting). For the year ended December 31, 2017, the Fund returned 16.09% before expenses and 16.01% after expenses, versus 16.68% a return in the weighted benchmark.
GROWTH OF A $10,000 INVESTMENT
| | | | | | | | | | | | |
2030 Retirement Fund | |
Period
Ended
12/31/2017 | | Growth of
$10,000 | | | Total Return | |
| | | Cumu-
lative | | | Average
Annual | |
1 Year | | | $11,600 | | | | 16.01% | | | | 16.01% | |
5 Years | | | $17,191 | | | | 71.91% | | | | 11.45% | |
10 Years | | | $20,238 | | | | 102.38% | | | | 7.30% | |
| | | | | | | | | | | | |
S & P 500 Index | |
Period
Ended
12/31/2017 | | Growth of
$10,000 | | | Total Return | |
| | | Cumu-
lative | | | Average
Annual | |
1 Year | | | $12,183 | | | | 21.83% | | | | 21.83% | |
5 Years | | | $20,813 | | | | 108.13% | | | | 15.79% | |
10 Years | | | $22,598 | | | | 125.98% | | | | 8.50% | |
| | | | | | | | | | | | |
Bloomberg Barclays Aggregate Bond Index | |
Period
Ended
12/31/2017 | | Growth of
$10,000 | | | Total Return | |
| | | Cumu-
lative | | | Average
Annual | |
1 Year | | | $10,354 | | | | 3.54% | | | | 3.54% | |
5 Years | | | $11,095 | | | | 10.95% | | | | 2.10% | |
10 Years | | | $14,810 | | | | 48.10% | | | | 4.01% | |
The line representing the performance return of the 2030 Retirement Fund includes expenses, such as direct management fees and expenses of the underlying funds in which the Fund invests, that reduce returns while the performance return lines of the Indices do not. Past performance is not indicative of future results.
17
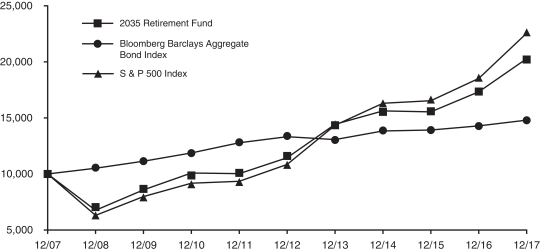
2035 RETIREMENT FUND
The objective of the 2035 Retirement Fund is current income and capital appreciation appropriate for the asset allocation associated with a target retirement in 2035. The 2035 Retirement Fund invests in funds of the Investment Company. The Fund’s current target allocation is approximately 82% of net assets in equity funds (approximately 36% in the Equity Index Fund, 21% in the Mid-Cap Equity Index Fund, 13% in the International Fund and 6% each in the Small Cap Growth and Small Cap Value Funds) and approximately 18% of net assets in the Bond Fund (See Note 1 in the Notes to Financial Statements for additional information on changes to Fund target allocations during 2017).
Performance for the 2035 Retirement Fund is compared to the S&P 500® Index (82% weighting) and the Bloomberg Barclays Aggregate Bond Index (18% weighting). For the year ended December 31, 2017, the Fund returned 17.23% before expenses and 17.15% after expenses, versus an 18.38% return in the weighted benchmark.
GROWTH OF A $10,000 INVESTMENT
| | | | | | | | | | | | |
2035 Retirement Fund | |
Period
Ended
12/31/2017 | | Growth of
$10,000 | | | Total Return | |
| | | Cumu-
lative | | | Average
Annual | |
1 Year | | | $11,713 | | | | 17.15% | | | | 17.15% | |
5 Years | | | $17,723 | | | | 77.23% | | | | 12.13% | |
10 Years | | | $20,325 | | | | 103.25% | | | | 7.35% | |
| | | | | | | | | | | | |
S & P 500 Index | |
Period
Ended
12/31/2017 | | Growth of
$10,000 | | | Total Return | |
| | | Cumu-
lative | | | Average
Annual | |
1 Year | | | $12,183 | | | | 21.83% | | | | 21.83% | |
5 Years | | | $20,813 | | | | 108.13% | | | | 15.79% | |
10 Years | | | $22,598 | | | | 125.98% | | | | 8.50% | |
| | | | | | | | | | | | |
Bloomberg Barclays Aggregate Bond Index | |
Period
Ended
12/31/2017 | | Growth of
$10,000 | | | Total Return | |
| | | Cumu-
lative | | | Average
Annual | |
1 Year | | | $10,354 | | | | 3.54% | | | | 3.54% | |
5 Years | | | $11,095 | | | | 10.95% | | | | 2.10% | |
10 Years | | | $14,810 | | | | 48.10% | | | | 4.01% | |
The line representing the performance return of the 2035 Retirement Fund includes expenses, such as direct management fees and expenses of the underlying funds in which the Fund invests, that reduce returns while the performance return lines of the Indices do not. Past performance is not indicative of future results.
18
2040 RETIREMENT FUND
The objective of the 2040 Retirement Fund is current income and capital appreciation appropriate for the asset allocation associated with a target retirement in 2040. The 2040 Retirement Fund invests in funds of the Investment Company. The Fund’s current target allocation is approximately 85% of net assets in equity funds (approximately 36% in the Equity Index Fund, 21% in the Mid-Cap Equity Index Fund, 14% in the International Fund and 7% each in the Small Cap Growth and Small Cap Value Funds) and approximately 15% of net assets in the Bond Fund (See Note 1 in the Notes to Financial Statements for additional information on changes to Fund target allocations during 2017).
Performance for the 2040 Retirement Fund is compared to the S&P 500® Index (85% weighting) and the Bloomberg Barclays Aggregate Bond Index (15% weighting). For the year ended December 31, 2017, the Fund returned 17.48% before expenses and 17.40% after expenses, versus an 18.95% return in the weighted benchmark.
GROWTH OF A $10,000 INVESTMENT

| | | | | | | | | | | | |
2040 Retirement Fund | |
Period
Ended
12/31/2017 | | Growth of
$10,000 | | | Total Return | |
| | | Cumu-
lative | | | Average
Annual | |
1 Year | | | $11,738 | | | | 17.40% | | | | 17.40% | |
5 Years | | | $17,839 | | | | 78.39% | | | | 12.28% | |
10 Years | | | $20,562 | | | | 105.62% | | | | 7.47% | |
| | | | | | | | | | | | |
S & P 500 Index | |
Period
Ended
12/31/2017 | | Growth of
$10,000 | | | Total Return | |
| | | Cumu-
lative | | | Average
Annual | |
1 Year | | | $12,183 | | | | 21.83% | | | | 21.83% | |
5 Years | | | $20,813 | | | | 108.13% | | | | 15.79% | |
10 Years | | | $22,598 | | | | 125.98% | | | | 8.50% | |
| | | | | | | | | | | | |
Bloomberg Barclays Aggregate Bond Index | |
Period
Ended
12/31/2017 | | Growth of
$10,000 | | | Total Return | |
| | | Cumu-
lative | | | Average
Annual | |
1 Year | | | $10,354 | | | | 3.54% | | | | 3.54% | |
5 Years | | | $11,095 | | | | 10.95% | | | | 2.10% | |
10 Years | | | $14,810 | | | | 48.10% | | | | 4.01% | |
The line representing the performance return of the 2040 Retirement Fund includes expenses, such as direct management fees and expenses of the underlying funds in which the Fund invests, that reduce returns while the performance return lines of the Indices do not. Past performance is not indicative of future results.
19
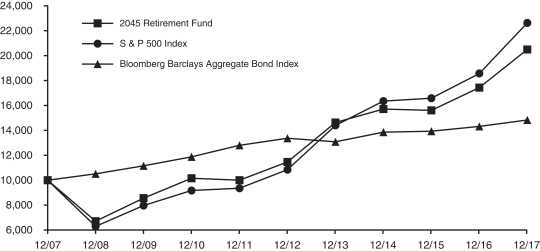
2045 RETIREMENT FUND
The objective of the 2045 Retirement Fund is current income and capital appreciation appropriate for the asset allocation associated with a target retirement in 2045. The 2045 Retirement Fund invests in funds of the Investment Company. The Fund’s current target allocation is approximately 88% of net assets in equity funds (approximately 35% in the Equity Index Fund, 22% in the Mid-Cap Equity Index Fund, 15% in the International Fund and 8% each in the Small Cap Growth and Small Cap Value Funds) and approximately 12% of net assets in the Bond Fund (See Note 1 in the Notes to Financial Statements for additional information on changes to Fund target allocations during 2017).
Performance for the 2045 Retirement Fund is compared to the S&P 500® Index (88% weighting) and the Bloomberg Barclays Aggregate Bond Index (12% weighting). For the year ended December 31, 2017, the Fund returned 17.70% before expenses and 17.62% after expenses, versus a 19.52% return in the weighted benchmark.
GROWTH OF A $10,000 INVESTMENT
| | | | | | | | | | | | |
2045 Retirement Fund | |
Period
Ended
12/31/2017 | | Growth of
$10,000 | | | Total Return | |
| | | Cumu-
lative | | | Average
Annual | |
1 Year | | | $11,760 | | | | 17.62% | | | | 17.62% | |
5 Years | | | $17,881 | | | | 78.81% | | | | 12.33% | |
10 Years | | | $20,476 | | | | 104.76% | | | | 7.43% | |
| | | | | | | | | | | | |
S & P 500 Index | |
Period
Ended
12/31/2017 | | Growth of
$10,000 | | | Total Return | |
| | | Cumu-
lative | | | Average
Annual | |
1 Year | | | $12,183 | | | | 21.83% | | | | 21.83% | |
5 Years | | | $20,813 | | | | 108.13% | | | | 15.79% | |
10 Years | | | $22,598 | | | | 125.98% | | | | 8.50% | |
| | | | | | | | | | | | |
Bloomberg Barclays Aggregate Bond Index | |
Period
Ended
12/31/2017 | | Growth of
$10,000 | | | Total Return | |
| | | Cumu-
lative | | | Average
Annual | |
1 Year | | | $10,354 | | | | 3.54% | | | | 3.54% | |
5 Years | | | $11,095 | | | | 10.95% | | | | 2.10% | |
10 Years | | | $14,810 | | | | 48.10% | | | | 4.01% | |
The line representing the performance return of the 2045 Retirement Fund includes expenses, such as direct management fees and expenses of the underlying funds in which the Fund invests, that reduce returns while the performance return lines of the Indices do not. Past performance is not indicative of future results.
20
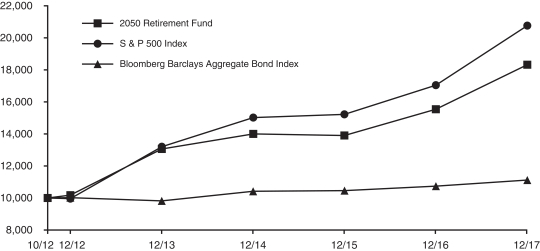
2050 RETIREMENT FUND
The objective of the 2050 Retirement Fund is current income and capital appreciation appropriate for the asset allocation associated with a target retirement in 2050. The 2050 Retirement Fund invests in funds of the Investment Company. The Fund’s current target allocation is approximately 90% of net assets in equity funds (approximately 34% in the Equity Index Fund, 22% in the Mid-Cap Equity Index Fund, 16% in the International Fund and 9% each in the Small Cap Growth and Small Cap Value Funds) and approximately 10% of net assets in the Bond Fund (See Note 1 in the Notes to Financial Statements for additional information on changes to Fund target allocations during 2017).
Performance for the 2050 Retirement Fund is compared to the S&P 500® Index (90% weighting) and the Bloomberg Barclays Aggregate Bond Index (10% weighting). For the year ended December 31, 2017, the Fund returned 17.94% before expenses and 17.86% after expenses, versus a 19.91% return in the weighted benchmark.
GROWTH OF A $10,000 INVESTMENT
| | | | | | | | | | | | |
2050 Retirement Fund | |
Period Ended
12/31/2017 | | Growth of
$10,000 | | | Total Return | |
| | | Cumu-
lative | | | Average
Annual | |
1 Year | | | $11,785 | | | | 17.86% | | | | 17.86% | |
5 Years | | | $17,957 | | | | 79.57% | | | | 12.42% | |
Since 10/1/12 (Inception) | | | $18,285 | | | | 82.85% | | | | 12.18% | |
| | | | | | | | | | | | |
S & P 500 Index | |
Period Ended
12/31/2017 | | Growth of
$10,000 | | | Total Return | |
| | | Cumu-
lative | | | Average
Annual | |
1 Year | | | $12,183 | | | | 21.83% | | | | 21.83% | |
5 Years | | | $20,813 | | | | 108.13% | | | | 15.79% | |
Since 10/1/12 (Inception) | | | $20,734 | | | | 107.34% | | | | 14.90% | |
| | | | | | | | | | | | |
Bloomberg Barclays Aggregate Bond Index | |
Period Ended
12/31/2017 | | Growth of
$10,000 | | | Total Return | |
| | | Cumu-
lative | | | Average
Annual | |
1 Year | | | $10,354 | | | | 3.54% | | | | 3.54% | |
5 Years | | | $11,095 | | | | 10.95% | | | | 2.10% | |
Since 10/1/12 (Inception) | | | $11,119 | | | | 11.19% | | | | 2.04% | |
The line representing the performance return of the 2050 Retirement Fund includes expenses, such as direct management fees and expenses of the underlying funds in which the Fund invests, that reduce returns while the performance return lines of the Indices do not. Past performance is not indicative of future results.
21
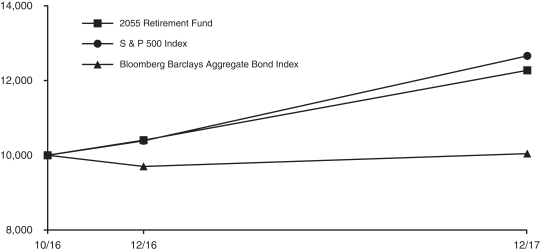
2055 RETIREMENT FUND
The objective of the 2055 Retirement Fund is current income and capital appreciation appropriate for the asset allocation associated with a target retirement in 2055. The 2055 Retirement Fund invests in funds of the Investment Company. The Fund’s current target allocation is approximately 91% of net assets in equity funds (approximately 32% in the Equity Index Fund, 22% in the Mid-Cap Equity Index Fund, 17% in the International Fund and 10% each in the Small Cap Growth and Small Cap Value Funds) and approximately 9% of net assets in the Bond Fund (See Note 1 in the Notes to Financial Statements for additional information on changes to Fund target allocations during 2017).
Performance for the 2055 Retirement Fund is compared to the S&P 500® Index (91% weighting) and the Bloomberg Barclays Aggregate Bond Index (9% weighting). For the year ended December 31, 2017, the Fund returned 18.05% before expenses and 17.99% after expenses, versus a 20.10% return in the weighted benchmark.
GROWTH OF A $10,000 INVESTMENT
| | | | | | | | | | | | |
2055 Retirement Fund | |
Period
Ended
12/31/2017 | | Growth of
$10,000 | | | Total Return | |
| | | Cumu-
lative | | | Average
Annual | |
1 Year | | | $11,797 | | | | 17.99% | | | | 17.99% | |
Since 10/1/16 (Inception) | | | $12,269 | | | | 22.69% | | | | 17.77% | |
| | | | | | | | | | | | |
S & P 500 Index | |
Period
Ended
12/31/2017 | | Growth of
$10,000 | | | Total Return | |
| | | Cumu-
lative | | | Average
Annual | |
1 Year | | | $12,183 | | | | 21.83% | | | | 21.83% | |
Since 10/1/16 (Inception) | | | $12,648 | | | | 26.48% | | | | 20.68% | |
| | | | | | | | | | | | |
Bloomberg Barclays Aggregate Bond Index | |
Period
Ended
12/31/2017 | | Growth of
$10,000 | | | Total Return | |
| | | Cumu-
lative | | | Average
Annual | |
1 Year | | | $10,354 | | | | 3.54% | | | | 3.54% | |
Since 10/1/16 (Inception) | | | $10,045 | | | | 0.45% | | | | 0.37% | |
The line representing the performance return of the 2055 Retirement Fund includes expenses, such as direct management fees and expenses of the underlying funds in which the Fund invests, that reduce returns while the performance return lines of the Indices do not. Past performance is not indicative of future results.
22
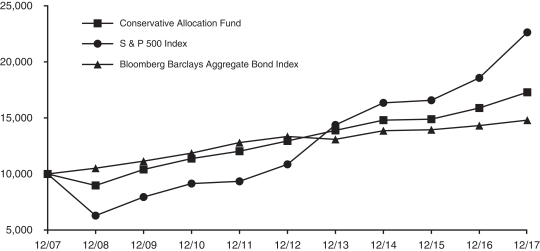
CONSERVATIVE ALLOCATION FUND
The objective of the Conservative Allocation Fund is current income and, to a lesser extent, capital appreciation. The Conservative Allocation Fund invests primarily in the fixed-income funds of the Investment Company and also invests in the equity funds of the Investment Company. The Conservative Allocation Fund’s target allocation is approximately 65% of net assets in fixed-income funds (approximately 30% in the Bond Fund and 35% in the Mid-Term Bond Fund) and approximately 35% of net assets in equity funds (approximately 25% in the Equity Index Fund, 5% in the Mid-Cap Equity Index Fund and 5% in the International Fund).
Performance for the Conservative Allocation Fund is compared to the Bloomberg Barclays Aggregate Bond Index (65% weighting) and the S&P 500® Index (35% weighting). For the year ended December 31, 2017, the Conservative Allocation Fund returned 8.94% before expenses and 8.92% after expenses, versus a 9.70% return in the weighted benchmark.
GROWTH OF A $10,000 INVESTMENT
| | | | | | | | | | | | |
Conservative Allocation Fund | |
Period
Ended
12/31/2017 | | Growth of
$10,000 | | | Total Return | |
| | | Cumu-
lative | | | Average
Annual | |
1 Year | | | $10,891 | | | | 8.92% | | | | 8.92% | |
5 Years | | | $13,359 | | | | 33.59% | | | | 5.97% | |
10 Years | | | $17,289 | | | | 72.89% | | | | 5.63% | |
| | | | | | | | | | | | |
S & P 500 Index | |
Period
Ended
12/31/2017 | | Growth of
$10,000 | | | Total Return | |
| | | Cumu-
lative | | | Average
Annual | |
1 Year | | | $12,183 | | | | 21.83% | | | | 21.83% | |
5 Years | | | $20,813 | | | | 108.13% | | | | 15.79% | |
10 Years | | | $22,598 | | | | 125.98% | | | | 8.50% | |
| | | | | | | | | | | | |
Bloomberg Barclays Aggregate Bond Index | |
Period
Ended
12/31/2017 | | Growth of
$10,000 | | | Total Return | |
| | | Cumu-
lative | | | Average
Annual | |
1 Year | | | $10,354 | | | | 3.54% | | | | 3.54% | |
5 Years | | | $11,095 | | | | 10.95% | | | | 2.10% | |
10 Years | | | $14,810 | | | | 48.10% | | | | 4.01% | |
The line representing the performance return of the Conservative Allocation Fund includes direct operating expenses and expenses in the underlying funds in which the Fund invests, that reduce returns while the performance return lines of the Indicies do not. Past performance is not indicative of future results.
23
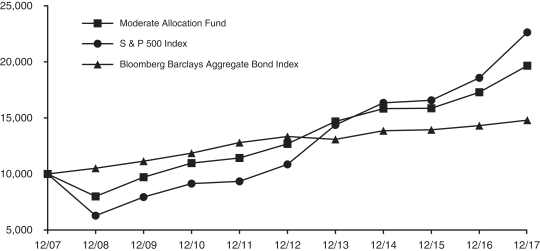
MODERATE ALLOCATION FUND
The objective of the Moderate Allocation Fund is capital appreciation and current income. The Moderate Allocation Fund invests in the equity and fixed-income funds of the Investment Company. The Moderate Allocation Fund’s target allocation is approximately 60% of net assets in equity funds (approximately 35% of its net assets in the Equity Index Fund, 15% in the Mid-Cap Equity Index Fund and 10% in the International Fund) and approximately 40% of net assets in fixed-income funds (approximately 25% of its net assets in the Bond Fund and approximately 15% of its net assets in the Mid-Term Bond Fund).
Performance for the Moderate Allocation Fund is compared to the S&P 500® Index (60% weighting) and the Bloomberg Barclays Aggregate Bond Index (40% weighting). For the year ended December 31, 2017, the Moderate Allocation Fund returned 13.74% before expenses and 13.72% after expenses, versus a 14.26% return for the weighted benchmark.
GROWTH OF A $10,000 INVESTMENT
| | | | | | | | | | | | |
Moderate Allocation Fund | |
Period
Ended
12/31/2017 | | Growth of
$10,000 | | | Total Return | |
| | | Cumu-
lative | | | Average
Annual | |
1 Year | | | $11,371 | | | | 13.72% | | | | 13.72% | |
5 Years | | | $15,475 | | | | 54.75% | | | | 9.13% | |
10 Years | | | $19,658 | | | | 96.58% | | | | 6.99% | |
| | | | | | | | | | | | |
S & P 500 Index | |
Period
Ended
12/31/2017 | | Growth of
$10,000 | | | Total Return | |
| | | Cumu-
lative | | | Average
Annual | |
1 Year | | | $12,183 | | | | 21.83% | | | | 21.83% | |
5 Years | | | $20,813 | | | | 108.13% | | | | 15.79% | |
10 Years | | | $22,598 | | | | 125.98% | | | | 8.50% | |
| | | | | | | | | | | | |
Bloomberg Barclays Aggregate Bond Index | |
Period
Ended
12/31/2017 | | Growth of
$10,000 | | | Total Return | |
| | | Cumu-
lative | | | Average
Annual | |
1 Year | | | $10,354 | | | | 3.54% | | | | 3.54% | |
5 Years | | | $11,095 | | | | 10.95% | | | | 2.10% | |
10 Years | | | $14,810 | | | | 48.10% | | | | 4.01% | |
The line representing the performance return of the Moderate Allocation Fund includes direct operating expenses and expenses in the underlying funds in which the Fund invests, that reduce returns while the performance return lines of the Indicies do not. Past performance is not indicative of future results.
24
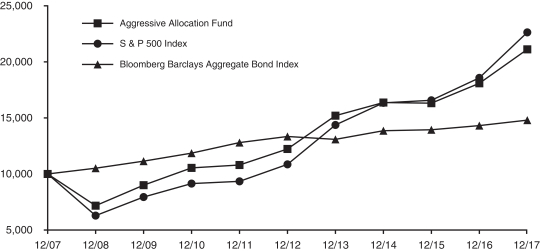
AGGRESSIVE ALLOCATION FUND
The objective of the Aggressive Allocation Fund is capital appreciation and, to a lesser extent, current income. The Aggressive Allocation Fund invests in the equity and fixed-income funds of the Investment Company. The Aggressive Allocation Fund’s target allocation is approximately 80% of net assets in equity funds (approximately 35% of its net assets in the Equity Index Fund, 20% in the Mid-Cap Equity Index Fund, 5% each in the Small Cap Value Fund and Small Cap Growth Funds, and 15% in the International Fund) and approximately 20% of net assets in the Bond Fund.
Performance for the Aggressive Allocation Fund is compared to the S&P 500® Index (80% weighting) and the Bloomberg Barclays Aggregate Bond Index (20% weighting). For the year ended December 31, 2017, the Aggressive Allocation Fund returned 16.66% before expenses and 16.64% after expenses, versus an 18.00% return for the weighted benchmark.
GROWTH OF A $10,000 INVESTMENT
| | | | | | | | | | | | |
Aggressive Allocation Fund | |
Period Ended 12/31/2017 | | Growth of
$10,000 | | | Total Return | |
| | | Cumu-
lative | | | Average
Annual | |
1 Year | | | $11,665 | | | | 16.64% | | | | 16.64% | |
5 Years | | | $17,223 | | | | 72.23% | | | | 11.48% | |
10 Years | | | $21,095 | | | | 110.95% | | | | 7.75% | |
| | | | | | | | | | | | |
S & P 500 Index | |
Period Ended 12/31/2017 | | Growth of
$10,000 | | | Total Return | |
| | | Cumu-
lative | | | Average
Annual | |
1 Year | | | $12,183 | | | | 21.83% | | | | 21.83% | |
5 Years | | | $20,813 | | | | 108.13% | | | | 15.79% | |
10 Years | | | $22,598 | | | | 125.98% | | | | 8.50% | |
| | | | | | | | | | | | |
Bloomberg Barclays Aggregate Bond Index | |
Period Ended 12/31/2017 | | Growth of
$10,000 | | | Total Return | |
| | | Cumu-
lative | | | Average
Annual | |
1 Year | | | $10,354 | | | | 3.54% | | | | 3.54% | |
5 Years | | | $11,095 | | | | 10.95% | | | | 2.10% | |
10 Years | | | $14,810 | | | | 48.10% | | | | 4.01% | |
The line representing the performance return of the Aggressive Allocation Fund includes direct operating expenses and expenses in the underlying funds in which the Fund invests, that reduce returns while the performance return lines of the Indicies do not. Past performance is not indicative of future results.
25
MONEY MARKET FUND
The Money Market Fund’s investment objective is to realize current income while maintaining liquidity, investment quality and stability of capital through investing in high-quality commercial paper issued by U.S. corporations and securities issued by the U.S. government and its agencies. For the year ended December 31, 2017, the Money Market Fund returned 0.94% before expenses and 0.70% after expenses, compared to a 0.84% return for the Citigroup 3-Month Treasury Bill Index. Note that the benchmark performance does not reflect any expenses.
The Federal Reserve (Fed) governors continue to withdraw some of the extraordinary measures put in place following the financial crisis in 2008. To that end, they raised the Fed Funds target range three times in 2017, in March, June and again in December, to 1.25%-1.50%. Further increases are expected in 2018. While the frequency of future rate increases is uncertain, the Fed’s commitment to unwinding more of the measures taken since the crisis is clear. At the June meeting, the Fed laid out a plan to start reducing its holdings of $4.5 trillion in U.S. Treasury and Mortgage-Backed securities. The Committee intends to slowly decrease its reinvestment of the principal payments it receives from securities it holds. These actions commenced in October when the Fed started reducing its purchases by $10 billion per month. This figure will rise in equal amounts until it reaches $50 billion per month later this year.
The Fund’s strategy will continue to focus on quality, liquidity, and maintaining a relatively short weighted average maturity in light of the uncertainty of the path of interest rates. On December 31 the fund held in 27% U.S. Treasury Bills, 12% in U.S. agency discount notes and the remainder in commercial paper. The average maturity was 21 days.
The seven-day effective yield as of February 13, 2018, was 1.21%. As with all performance reporting, this yield is not necessarily indicative of future annual yields. Neither the Federal Deposit Insurance Corporation nor any other U.S. government agency insures or guarantees investments in shares of the Money Market Fund.
26
MID-TERM BOND FUND
The Mid-Term Bond Fund seeks a high level of return consistent with the preservation of capital through investment in publicly traded debt securities. The portfolio continues to emphasize corporate issues, particularly BBB-rated bonds, in order to capture incremental income. The Fund will continue to focus on income, rather than market volatility, to achieve superior returns over market cycles. In addition, the Fund’s corporate positions will remain highly diversified in order to help shield the portfolio from unanticipated credit risks. The objective of the Fund is to maintain a maturity profile similar to the Bloomberg Barclays Intermediate Government/Credit Bond Index.
For the year ended December 31, 2017, the Mid-Term Bond Fund returned 2.78% before expenses and 2.32% after expenses versus a 2.14% return for the Bloomberg Barclays Intermediate Government/Credit Bond Index during the same period. The Fund’s continuing emphasis on higher-yielding corporate issues was a major contributor to its outperformance.
GROWTH OF A $10,000 INVESTMENT
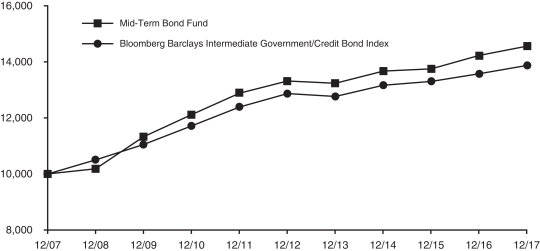
| | | | | | | | | | | | |
Mid-Term Bond Fund | |
Period
Ended
12/31/2017 | | Growth of
$10,000 | | | Total Return | |
| | | Cumu-
lative | | | Average
Annual | |
1 Year | | | $10,232 | | | | 2.32% | | | | 2.32% | |
5 Years | | | $10,939 | | | | 9.39% | | | | 1.81% | |
10 Years | | | $14,555 | | | | 45.55% | | | | 3.83% | |
| | | | | | | | | | | | |
Bloomberg Barclays Intermediate Government/Credit Bond Index | |
Period
Ended
12/31/2017 | | Growth of
$10,000 | | | Total Return | |
| | | Cumu-
lative | | | Average
Annual | |
1 Year | | | $10,214 | | | | 2.14% | | | | 2.14% | |
5 Years | | | $10,772 | | | | 7.72% | | | | 1.50% | |
10 Years | | | $13,865 | | | | 38.65% | | | | 3.32% | |
The line representing the performance return of the Mid-Term Bond Fund includes expenses, such as transaction costs and management fees that reduce returns, while the performance return line of the Index does not. Past performance is not indicative of future results.
27
BOND FUND
The Bond Fund’s primary investment objective is to provide as high a level of current income over time as is believed to be consistent with prudent investment risk. It does this by investing primarily in investment grade publicly traded debt securities. A secondary objective is preservation of capital. The securities held by the Bond Fund include corporate, U.S. agency and mortgage-backed bonds, all of which normally yield more than U.S. Treasury issues.
The Bond Fund’s strategy is to overweight corporate bonds, underweight U.S. Treasuries, and market weight mortgage-backed securities. The portfolio’s aim is to maintain a similar maturity profile to the benchmark, the Bloomberg Barclays U.S. Aggregate Bond Index (the Aggregate) with an overweighting of BBB issuers. To achieve the duration target of approximately 90% of the benchmark, intermediate corporate and longer U.S. Treasury maturities are emphasized. The Bond Fund also stresses diversification in order to protect the Fund from unexpected credit events, so few corporate holdings exceed one-half of one percent of the Fund’s value. This extreme diversification will be maintained going forward as part of our risk control.
For the year ended December 31, 2017, the Bond Fund returned 4.08% before expenses and 3.62% after expenses, versus a 3.54% return for the Aggregate. The Fund’s relative outperformance was driven primarily by its’ overweight position in corporate bonds, in particular, BBB-rated industrial bonds.
The Federal Reserve (Fed) governors continue to withdraw some of the extraordinary measures put in place following the financial crisis in 2008. To that end, they raised the Fed Funds target range three times in 2017, in March, June and again in December, to 1.25%-1.50%. Further increases are expected in 2018.
The interest rate curve flattened as yields on short-dated U.S. Treasuries rose while those of long-dated U.S. Treasuries fell. Two-year U.S. Treasury Notes yielded 1.19% at the end of the 4th quarter of 2016 and 1.88% on December 29, 2017. Ten year yields fell 3 basis points or 0.03% to 2.41% during the year. This is not an uncommon effect during a Fed tightening cycle. The front end of the yield curve, generally considered to be up to five years in maturity, is more affected by Fed policy. As the Fed raises rates, short term rates move with them. The longer end of the yield curve, maturities of seven to thirty years, is driven more by inflation expectations. As Fed tightenings in theory slow the economy, inflation is presumed to fall and tends to pull longer term rates down.
High-grade corporate bond spreads tightened from 127 basis points at the end of 2016 to 96 basis points on December 29, 2017. This represents close to the lowest level in ten years and helped corporate bonds deliver the best return of the benchmark components for the second year in a row. Utilities aided by their exposure to the long end of the Treasury curve had the best overall return. Metals and mining, spurred by worldwide economic growth, repeated as the best performing individual sector with a double digit return.
GROWTH OF A $10,000 INVESTMENT
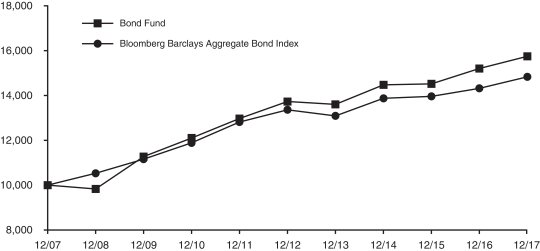
| | | | | | | | | | | | |
Bond Fund | |
Period
Ended
12/31/2017 | | Growth of
$10,000 | | | Total Return | |
| | | Cumu-
lative | | | Average
Annual | |
1 Year | | | $10,362 | | | | 3.62% | | | | 3.62% | |
5 Years | | | $11,468 | | | | 14.68% | | | | 2.77% | |
10 Years | | | $15,726 | | | | 57.26% | | | | 4.61% | |
| | | | | | | | | | | | |
Bloomberg Barclays Aggregate Bond Index | |
Period
Ended
12/31/2017 | | Growth of
$10,000 | | | Total Return | |
| | | Cumu-
lative | | | Average
Annual | |
1 Year | | | $10,354 | | | | 3.54% | | | | 3.54% | |
5 Years | | | $11,095 | | | | 10.95% | | | | 2.10% | |
10 Years | | | $14,810 | | | | 48.10% | | | | 4.01% | |
The line representing the performance return of the Bond Fund includes expenses, such as transaction costs and management fees that reduce returns, while the performance return line of the Index does not. Past performance is not indicative of future results.
28
MUTUAL OF AMERICA INVESTMENT CORPORATION
ASSET ALLOCATIONS AS OF DECEMBER 31, 2017 (Unaudited)
Equity Index Fund
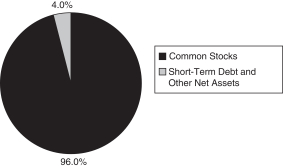
All America Fund
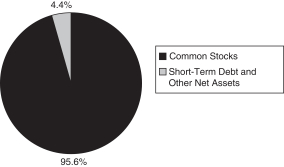
Small Cap Value Fund
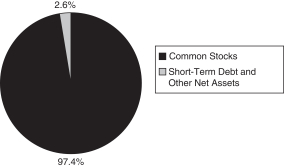
Small Cap Growth Fund

Mid Cap Value Fund
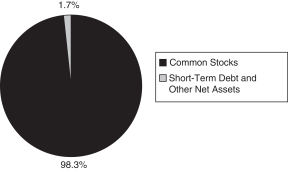
Mid-Cap Equity Index Fund
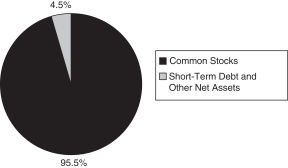
29
MUTUAL OF AMERICA INVESTMENT CORPORATION
ASSET ALLOCATIONS AS OF DECEMBER 31, 2017 (Unaudited) (Continued)
International Fund
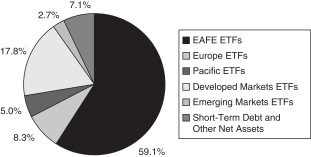
Composite Fund
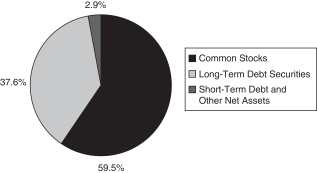
Retirement Income Fund
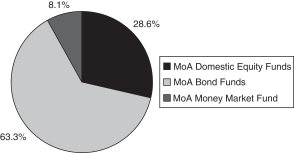
2010 Retirement Fund
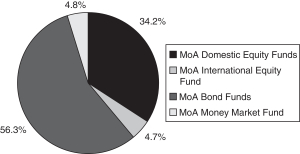
2015 Retirement Fund
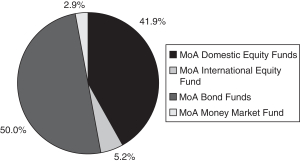
2020 Retirement Fund
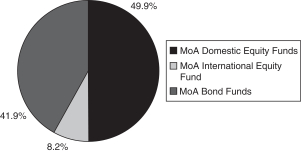
30
MUTUAL OF AMERICA INVESTMENT CORPORATION
ASSET ALLOCATIONS AS OF DECEMBER 31, 2017 (Unaudited) (Continued)
2025 Retirement Fund
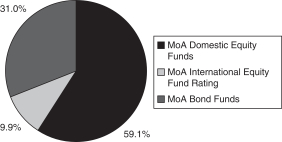
2030 Retirement Fund
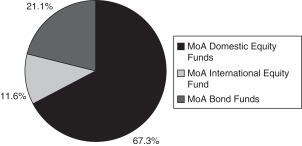
2035 Retirement Fund
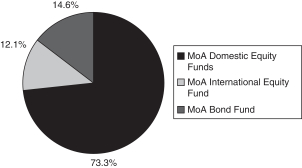
2040 Retirement Fund
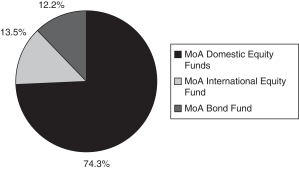
2045 Retirement Fund
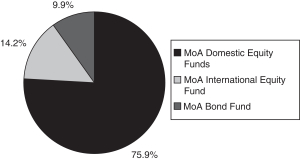
2050 Retirement Fund

31
MUTUAL OF AMERICA INVESTMENT CORPORATION
ASSET ALLOCATIONS AS OF DECEMBER 31, 2017 (Unaudited) (Continued)
2055 Retirement Fund

Conservative Allocation Fund
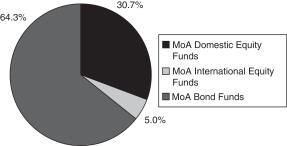
Moderate Allocation Fund
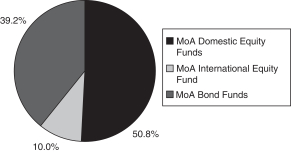
Aggressive Allocation Fund
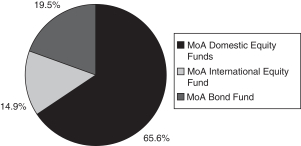
Money Market Fund
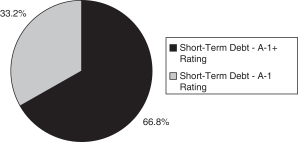
Mid-Term Bond Fund
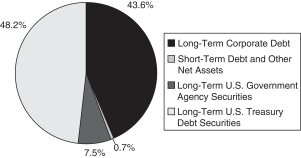
32
MUTUAL OF AMERICA INVESTMENT CORPORATION
ASSET ALLOCATIONS AS OF DECEMBER 31, 2017 (Unaudited) (Continued)
Bond Fund
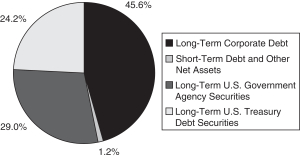
33
MUTUAL OF AMERICA INVESTMENT CORPORATION
EXPENSE EXAMPLE (Unaudited)
EXAMPLE
As a shareholder of one of the Mutual of America Investment Corporation Funds, you incur ongoing costs, including management fees and other Fund expenses. You do not incur transactional costs, such as sales charges (loads), redemption fees or exchange fees. Additionally, Mutual of America Capital Management LLC, the Funds’ Adviser, has contractually agreed to reimburse the direct non-advisory operating expenses of any Allocation or Retirement Fund (each a “Fund of Funds”) that has less than $50 million in average daily net assets for the prior calendar year. This contractual obligation remains in effect through April 30, 2018 and will continue for succeeding 12 month periods ending April 30th unless i) The Fund of Funds has at least $50 million in average daily net assets for the prior calendar year, ii) the Investment Company gives not less than 30 days written notice to the Adviser, or iii) the Adviser gives 45 days advance notice to the Investment Company before the next May 1 of a given year to terminate the agreement. In that case, the agreement will terminate on the next May 1 following the written notice.
This Example is intended to help you understand your ongoing costs (in dollars) of investing in a Fund and to compare these costs with the ongoing costs of investing in other mutual funds. The Example is based on an investment of $1,000 invested at July 1, 2017 and held for the entire period ending December 31, 2017 under the expense reimbursement agreement in effect during that period as described above.
The estimate of expenses does not include fees and charges associated with your variable annuity contract or variable life insurance policy. If those fees and charges were included, the estimate of expenses for the period would be higher and your ending account value would be lower.
ACTUAL EXPENSES
The first line of the tables below provides information about actual account values and actual expenses. You may use the information in this line, together with the amount you invested, to estimate the expenses that you paid over the period. Simply divide your account value by $1,000 (for example, an $8,600 account value divided by $1,000=8.6), then multiply the result by the number in the first line under the heading entitled “Expenses Paid During Period” to estimate the expenses you paid on your account during this period.
HYPOTHETICAL EXAMPLE FOR COMPARISON PURPOSES
The second line of the tables below provides information about hypothetical account values and hypothetical expenses based on each Fund’s actual expense ratio and an assumed rate of return of 5% per year before expenses, which is not the Fund’s actual return. The hypothetical account values and expenses may not be used to estimate the actual ending account balance or expenses you paid for the period. You may use this information to compare the ongoing costs of investing in the Fund with other funds. To do so, compare this 5% hypothetical example with the 5% hypothetical examples that appear in the shareholder reports of the other funds.
Please note that the second line of the table is useful in comparing ongoing costs only, and will not help you determine the relative total costs of owning other non-Mutual of America funds, which may also charge transactional costs, such as sales charges (loads), redemption fees or exchange fees, which the Mutual of America Investment Corporation does not charge.
| | | | | | | | | | | | | | | | | | |
| | | Equity Index Fund | | | | |
| | | | | Beginning
Account Value
July 1, 2017 | | | Ending
Account Value
December 31, 2017 | | | Expenses Paid
During Period*
July 1, 2017 to
December 31, 2017 | | | | |
| | | Actual | | | $1,000.00 | | | | $1,113.49 | | | | $0.75 | | | | | |
| | | Hypothetical
(5% return before expenses) | | | $1,000.00 | | | | $1,024.18 | | | | $0.71 | | | | | |
| | * | Expenses are equal to the Fund’s annual expense ratio (before any expense reimbursement) of 0.14%, multiplied by the average account value over the period, multiplied by 184/365 (to reflect the one-half year period). |
34
MUTUAL OF AMERICA INVESTMENT CORPORATION
EXPENSE EXAMPLE (Unaudited) (Continued)
| | | | | | | | | | | | | | | | | | |
| | | All America Fund | | | | |
| | | | | Beginning
Account Value
July 1, 2017 | | | Ending
Account Value
December 31, 2017 | | | Expenses Paid
During Period*
July 1, 2017 to
December 31, 2017 | | | | |
| | | Actual | | | $1,000.00 | | | | $1,106.21 | | | | $2.71 | | | | | |
| | | Hypothetical
(5% return before expenses) | | | $1,000.00 | | | | $1,022.27 | | | | $2.60 | | | | | |
| | * | Expenses are equal to the Fund’s annual expense ratio of 0.51%, multiplied by the average account value over the period, multiplied by 184/365 (to reflect the one-half year period). |
| | | | | | | | | | | | | | | | | | |
| | | Small Cap Value Fund | | | | |
| | | | | Beginning
Account Value
July 1, 2017 | | | Ending
Account Value
December 31, 2017 | | | Expenses Paid
During Period*
July 1, 2017 to
December 31, 2017 | | | | |
| | | Actual | | | $1,000.00 | | | | $1,063.17 | | | | $4.21 | | | | | |
| | | Hypothetical
(5% return before expenses) | | | $1,000.00 | | | | $1,020.72 | | | | $4.13 | | | | | |
| | * | Expenses are equal to the Fund’s annual expense ratio (before any expense reimbursement) of 0.81%, multiplied by the average account value over the period, multiplied by 184/365 (to reflect the one-half year period). |
| | | | | | | | | | | | | | | | | | |
| | | Small Cap Growth Fund | | | | |
| | | | | Beginning
Account Value
July 1, 2017 | | | Ending
Account Value
December 31, 2017 | | | Expenses Paid
During Period*
July 1, 2017 to
December 31, 2017 | | | | |
| | | Actual | | | $1,000.00 | | | | $1,113.99 | | | | $4.37 | | | | | |
| | | Hypothetical
(5% return before expenses) | | | $1,000.00 | | | | $1,020.67 | | | | $4.18 | | | | | |
| | * | Expenses are equal to the Fund’s annual expense ratio (before any expense reimbursement) of 0.82%, multiplied by the average account value over the period, multiplied by 184/365 (to reflect the one-half year period). |
| | | | | | | | | | | | | | | | | | |
| | | Mid Cap Value Fund | | | | |
| | | | | Beginning
Account Value
July 1, 2017 | | | Ending
Account Value
December 31, 2017 | | | Expenses Paid
During Period*
July 1, 2017 to
December 31, 2017 | | | | |
| | | Actual | | | $1,000.00 | | | | $1,104.16 | | | | $3.39 | | | | | |
| | | Hypothetical
(5% return before expenses) | | | $1,000.00 | | | | $1,021.60 | | | | $3.26 | | | | | |
| | * | Expenses are equal to the Fund’s annual expense ratio of 0.64%, multiplied by the average account value over the period, multiplied by 184/365 (to reflect the one-half year period). |
35
MUTUAL OF AMERICA INVESTMENT CORPORATION
EXPENSE EXAMPLE (Unaudited) (Continued)
| | | | | | | | | | | | | | | | | | |
| | | Mid-Cap Equity Index Fund | | | | |
| | | | | Beginning
Account Value
July 1, 2017 | | | Ending
Account Value
December 31, 2017 | | | Expenses Paid
During Period*
July 1, 2017 to
December 31, 2017 | | | | |
| | | Actual | | | $1,000.00 | | | | $1,095.85 | | | | $0.74 | | | | | |
| | | Hypothetical
(5% return before expenses) | | | $1,000.00 | | | | $1,024.18 | | | | $0.71 | | | | | |
| | * | Expenses are equal to the Fund’s annual expense ratio (before any expense reimbursement) of 0.14%, multiplied by the average account value over the period, multiplied by 184/365 (to reflect the one-half year period). |
| | | | | | | | | | | | | | | | | | |
| | | International Fund | | | | |
| | | | | Beginning
Account Value
July 1, 2017 | | | Ending
Account Value
December 31, 2017 | | | Expenses Paid
During Period*
July 1, 2017 to
December 31, 2017 | | | | |
| | | Actual | | | $1,000.00 | | | | $1,089.29 | | | | $1.84 | | | | | |
| | | Hypothetical
(5% return before expenses) | | | $1,000.00 | | | | $1,023.09 | | | | $1.78 | | | | | |
| | * | Expenses are equal to the Fund’s annual expense ratio (before any expense reimbursement) of 0.35% (reflecting direct expenses and the proportional expense ratios of the underlying funds in which the Fund invests), multiplied by the average account value over the period, multiplied by 184/365 (to reflect the one-half year period). |
| | | | | | | | | | | | | | | | | | |
| | | Composite Fund | | | | |
| | | | | Beginning
Account Value
July 1, 2017 | | | Ending Account Value
December 31, 2017 | | | Expenses Paid
During Period*
July 1, 2017 to
December 31, 2017 | | | | |
| | | Actual | | | $1,000.00 | | | | $1,077.36 | | | | $2.67 | | | | | |
| | | Hypothetical
(5% return before expenses) | | | $1,000.00 | | | | $1,022.27 | | | | $2.60 | | | | | |
| | * | Expenses are equal to the Fund’s annual expense ratio (before any expense reimbursement) of 0.51%, multiplied by the average account value over the period, multiplied by 184/365 (to reflect the one-half year period). |
| | | | | | | | | | | | | | | | | | |
| | | Retirement Income Fund | | | | |
| | | | | Beginning
Account Value
July 1, 2017 | | | Ending
Account Value
December 31, 2017 | | | Expenses Paid
During Period*
July 1, 2017 to
December 31, 2017 | | | | |
| | | Actual | | | $1,000.00 | | | | $1,034.45 | | | | $2.26 | | | | | |
| | | Hypothetical
(5% return before expenses) | | | $1,000.00 | | | | $1,022.63 | | | | $2.24 | | | | | |
| | * | Expenses are equal to the Fund’s annual expense ratio (before any expense reimbursement) of 0.44% (reflecting direct expenses and the proportional expense ratios of the underlying funds in which the Fund invests), multiplied by the average account value over the period, multiplied by 184/365 (to reflect the one-half year period). |
36
MUTUAL OF AMERICA INVESTMENT CORPORATION
EXPENSE EXAMPLE (Unaudited) (Continued)
| | | | | | | | | | | | | | | | | | |
| | | 2010 Retirement Fund | | | | |
| | | | | Beginning
Account Value
July 1, 2017 | | | Ending
Account Value
December 31, 2017 | | | Expenses Paid
During Period*
July 1, 2017 to
December 31, 2017 | | | | |
| | | Actual | | | $1,000.00 | | | | $1,043.63 | | | | $1.96 | | | | | |
| | | Hypothetical
(5% return before expenses) | | | $1,000.00 | | | | $1,022.94 | | | | $1.94 | | | | | |
| | * | Expenses are equal to the Fund’s annual expense ratio (before any expense reimbursement) of 0.38% (reflecting direct expenses and the proportional expense ratios of the underlying funds in which the Fund invests), multiplied by the average account value over the period, multiplied by 184/365 (to reflect the one-half year period). |
| | | | | | | | | | | | | | | | | | |
| | | 2015 Retirement Fund | | | | |
| | | | | Beginning
Account Value
July 1, 2017 | | | Ending
Account Value
December 31, 2017 | | | Expenses Paid
During Period*
July 1, 2017 to
December 31, 2017 | | | | |
| | | Actual | | | $1,000.00 | | | | $1,051.00 | | | | $2.02 | | | | | |
| | | Hypothetical
(5% return before expenses) | | | $1,000.00 | | | | $1,022.89 | | | | $1.99 | | | | | |
| | * | Expenses are equal to the Fund’s annual expense ratio of 0.39% (reflecting direct expenses and the proportional expense ratios of the underlying funds in which the Fund invests), multiplied by the average account value over the period, multiplied by 184/365 (to reflect the one-half year period). |
| | | | | | | | | | | | | | | | | | |
| | | 2020 Retirement Fund | | | | |
| | | | | Beginning
Account Value July 1, 2017 | | | Ending
Account Value
December 31, 2017 | | | Expenses Paid
During Period*
July 1, 2017 to
December 31, 2017 | | | | |
| | | Actual | | | $1,000.00 | | | | $1,061.46 | | | | $1.92 | | | | | |
| | | Hypothetical
(5% return before expenses) | | | $1,000.00 | | | | $1,022.99 | | | | $1.89 | | | | | |
| | * | Expenses are equal to the Fund’s annual expense ratio of 0.37% (reflecting direct expenses and the proportional expense ratios of the underlying funds in which the Fund invests), multiplied by the average account value over the period, multiplied by 184/365 (to reflect the one-half year period). |
| | | | | | | | | | | | | | | | | | |
| | | 2025 Retirement Fund | | | | |
| | | | | Beginning
Account Value
July 1, 2017 | | | Ending
Account Value
December 31, 2017 | | | Expenses Paid
During Period*
July 1, 2017 to
December 31, 2017 | | | | |
| | | Actual | | | $1,000.00 | | | | $1,071.87 | | | | $1.83 | | | | | |
| | | Hypothetical
(5% return before expenses) | | | $1,000.00 | | | | $1,023.09 | | | | $1.78 | | | | | |
| | * | Expenses are equal to the Fund’s annual expense ratio of 0.35% (reflecting direct expenses and the proportional expense ratios of the underlying funds in which the Fund invests), multiplied by the average account value over the period, multiplied by 184/365 (to reflect the one-half year period). |
37
MUTUAL OF AMERICA INVESTMENT CORPORATION
EXPENSE EXAMPLE (Unaudited) (Continued)
| | | | | | | | | | | | | | | | | | |
| | | 2030 Retirement Fund | | | | |
| | | | | Beginning
Account Value
July 1, 2017 | | | Ending
Account Value
December 31, 2017 | | | Expenses Paid During Period*
July 1, 2017 to
December 31, 2017 | | | | |
| | | Actual | | | $1,000.00 | | | | $1,081.15 | | | | $1.78 | | | | | |
| | | Hypothetical
(5% return before expenses) | | | $1,000.00 | | | | $1,023.15 | | | | $1.73 | | | | | |
| | * | Expenses are equal to the Fund’s annual expense ratio of 0.34% (reflecting direct expenses and the proportional expense ratios of the underlying funds in which the Fund invests), multiplied by the average account value over the period, multiplied by 184/365 (to reflect the one-half year period). |
| | | | | | | | | | | | | | | | | | |
| | | 2035 Retirement Fund | | | | |
| | | | | Beginning
Account Value
July 1, 2017 | | | Ending
Account Value
December 31, 2017 | | | Expenses Paid
During Period*
July 1, 2017 to
December 31, 2017 | | | | |
| | | Actual | | | $1,000.00 | | | | $1,087.34 | | | | $1.74 | | | | | |
| | | Hypothetical
(5% return before expenses) | | | $1,000.00 | | | | $1,023.20 | | | | $1.68 | | | | | |
| | * | Expenses are equal to the Fund’s annual expense ratio of 0.33% (reflecting direct expenses and the proportional expense ratios of the underlying funds in which the Fund invests), multiplied by the average account value over the period, multiplied by 184/365 (to reflect the one-half year period). |
| | | | | | | | | | | | | | | | | | |
| | | 2040 Retirement Fund | | | | |
| | | | | Beginning
Account Value
July 1, 2017 | | | Ending
Account Value
December 31, 2017 | | | Expenses Paid
During Period*
July 1, 2017 to
December 31, 2017 | | | | |
| | | Actual | | | $1,000.00 | | | | $1,089.01 | | | | $1.84 | | | | | |
| | | Hypothetical
(5% return before expenses) | | | $1,000.00 | | | | $1,023.09 | | | | $1.78 | | | | | |
| | * | Expenses are equal to the Fund’s annual expense ratio of 0.35% (reflecting direct expenses and the proportional expense ratios of the underlying funds in which the Fund invests), multiplied by the average account value over the period, multiplied by 184/365 (to reflect the one-half year period). |
| | | | | | | | | | | | | | | | | | |
| | | 2045 Retirement Fund | | | | |
| | | | | Beginning
Account Value
July 1, 2017 | | | Ending
Account Value
December 31, 2017 | | | Expenses Paid
During Period*
July 1, 2017 to
December 31, 2017 | | | | |
| | | Actual | | | $1,000.00 | | | | $1,090.54 | | | | $1.84 | | | | | |
| | | Hypothetical
(5% return before expenses) | | | $1,000.00 | | | | $1,023.09 | | | | $1.78 | | | | | |
| | * | Expenses are equal to the Fund’s annual expense ratio of 0.35% (reflecting direct expenses and the proportional expense ratios of the underlying funds in which the Fund invests), multiplied by the average account value over the period, multiplied by 184/365 (to reflect the one-half year period). |
38
MUTUAL OF AMERICA INVESTMENT CORPORATION
EXPENSE EXAMPLE (Unaudited) (Continued)
| | | | | | | | | | | | | | | | | | |
| | | 2050 Retirement Fund | | | | |
| | | | | Beginning
Account Value
July 1, 2017 | | | Ending
Account Value
December 31, 2017 | | | Expenses Paid
During Period*
July 1, 2017 to
December 31, 2017 | | | | |
| | | Actual | | | $1,000.00 | | | | $1,091.65 | | | | $1.90 | | | | | |
| | | Hypothetical
(5% return before expenses) | | | $1,000.00 | | | | $1,023.04 | | | | $1.84 | | | | | |
| | * | Expenses are equal to the Fund’s annual expense ratio (before any expense reimbursement) of 0.36% (reflecting direct expenses and the proportional expense ratios of the underlying funds in which the Fund invests), multiplied by the average account value over the period, multiplied by 184/365 (to reflect the one-half year period). |
| | | | | | | | | | | | | | | | | | |
| | | 2055 Retirement Fund | | | | |
| | | | | Beginning
Account Value
July 1, 2017 | | | Ending
Account Value
December 31, 2017 | | | Expenses Paid
During Period*
July 1, 2017 to
December 31, 2017 | | | | |
| | | Actual | | | $1,000.00 | | | | $1,091.47 | | | | $1.84 | | | | | |
| | | Hypothetical
(5% return before expenses) | | | $1,000.00 | | | | $1,023.09 | | | | $1.78 | | | | | |
| | * | Expenses are equal to the Fund’s annual expense ratio of 0.35% (reflecting direct expenses and the proportional expense ratios of the underlying funds in which the Fund invests), multiplied by the average account value over the period, multiplied by 184/365 (to reflect the one-half year period). |
| | | | | | | | | | | | | | | | | | |
| | | Conservative Allocation Fund | | | | |
| | | | | Beginning
Account Value
July 1, 2017 | | | Ending
Account Value
December 31, 2017 | | | Expenses Paid
During Period*
July 1, 2017 to
December 31, 2017 | | | | |
| | | Actual | | | $1,000.00 | | | | $1,038.05 | | | | $1.90 | | | | | |
| | | Hypothetical
(5% return before expenses) | | | $1,000.00 | | | | $1,022.99 | | | | $1.89 | | | | | |
| | * | Expenses are equal to the Fund’s annual expense ratio of 0.37% (reflecting direct operating expenses and the proportional expense ratios of the underlying funds in which the Fund invests), multiplied by the average account value over the period, multiplied by 184/365 (to reflect the one-half year period). |
| | | | | | | | | | | | | | | | | | |
| | | Moderate Allocation Fund | | | | |
| | | | | Beginning
Account Value
July 1, 2017 | | | Ending
Account Value
December 31, 2017 | | | Expenses Paid
During Period*
July 1, 2017 to
December 31, 2017 | | | | |
| | | Actual | | | $1,000.00 | | | | $1,067.01 | | | | $1.41 | | | | | |
| | | Hypothetical
(5% return before expenses) | | | $1,000.00 | | | | $1,023.51 | | | | $1.38 | | | | | |
| | * | Expenses are equal to the Fund’s annual expense ratio of 0.27% (reflecting direct operating expenses and the proportional expense ratios of the underlying funds in which the Fund invests), multiplied by the average account value over the period, multiplied by 184/365 (to reflect the one-half year period). |
39
MUTUAL OF AMERICA INVESTMENT CORPORATION
EXPENSE EXAMPLE (Unaudited) (Continued)
| | | | | | | | | | | | | | | | | | |
| | | Aggressive Allocation Fund | | | | |
| | | | | Beginning
Account Value
July 1, 2017 | | | Ending
Account Value
December 31, 2017 | | | Expenses Paid
During Period*
July 1, 2017 to
December 31, 2017 | | | | |
| | | Actual | | | $1,000.00 | | | | $1,082.74 | | | | $1.47 | | | | | |
| | | Hypothetical
(5% return before expenses) | | | $1,000.00 | | | | $1,023.45 | | | | $1.43 | | | | | |
| | * | Expenses are equal to the Fund’s annual expense ratio of 0.28% (reflecting direct operating expenses and the proportional expense ratios of the underlying funds in which the Fund invests), multiplied by the average account value over the period, multiplied by 184/365 (to reflect the one-half year period). |
| | | | | | | | | | | | | | | | | | |
| | | Money Market Fund | | | | |
| | | | | Beginning
Account Value
July 1, 2017 | | | Ending
Account Value
December 31, 2017 | | | Expenses Paid
During Period*
July 1, 2017 to
December 31, 2017 | | | | |
| | | Actual | | | $1,000.00 | | | | $1,004.53 | | | | $1.26 | | | | | |
| | | Hypothetical
(5% return before expenses) | | | $1,000.00 | | | | $1,023.61 | | | | $1.28 | | | | | |
| | * | Expenses are equal to the Fund’s annual expense ratio (before any expense reimbursement) of 0.25%, multiplied by the average account value over the period, multiplied by 184/365 (to reflect the one-half year period). |
| | | | | | | | | | | | | | | | | | |
| | | Mid-Term Bond Fund | | | | |
| | | | | Beginning
Account Value
July 1, 2017 | | | Ending
Account Value
December 31, 2017 | | | Expenses Paid
During Period*
July 1, 2017 to
December 31, 2017 | | | | |
| | | Actual | | | $1,000.00 | | | | $1,004.78 | | | | $2.38 | | | | | |
| | | Hypothetical
(5% return before expenses) | | | $1,000.00 | | | | $1,022.48 | | | | $2.40 | | | | | |
| | * | Expenses are equal to the Fund’s annual expense ratio (before any expense reimbursement) of 0.47%, multiplied by the average account value over the period, multiplied by 184/365 (to reflect the one-half year period). |
| | | | | | | | | | | | | | | | | | |
| | | Bond Fund | | | | |
| | | | | Beginning
Account Value
July 1, 2017 | | | Ending
Account Value
December 31, 2017 | | | Expenses Paid
During Period*
July 1, 2017 to
December 31, 2017 | | | | |
| | | Actual | | | $1,000.00 | | | | $1,009.93 | | | | $2.28 | | | | | |
| | | Hypothetical
(5% return before expenses) | | | $1,000.00 | | | | $1,022.58 | | | | $2.29 | | | | | |
| | * | Expenses are equal to the Fund’s annual expense ratio (before any expense reimbursement) of 0.45%, multiplied by the average account value over the period, multiplied by 184/365 (to reflect the one-half year period). |
40
MUTUAL OF AMERICA INVESTMENT CORPORATION — EQUITY INDEX FUND
SUMMARY PORTFOLIO OF INVESTMENTS IN SECURITIES
December 31, 2017
| | | | | | | | |
| | | Shares | | | Value | |
| | | | | | | | |
| INDEXED ASSETS: | | | | | |
COMMON STOCKS: | | | | | |
CONSUMER DISCRETIONARY (11.8%) | | | | | | | | |
Amazon.com, Inc.* | | | 45,604 | | | $ | 53,332,510 | |
Comcast Corp. Cl A | | | 537,130 | | | | 21,512,057 | |
Disney (Walt) Co. | | | 173,583 | | | | 18,661,908 | |
Home Depot, Inc. | | | 133,762 | | | | 25,351,912 | |
McDonald’s Corp. | | | 90,993 | | | | 15,661,715 | |
Other Securities | | | 3,017,758 | | | | 184,142,503 | |
| | | | | | | | |
| | | | | | | 318,662,605 | |
| | | | | | | | |
CONSUMER STAPLES (7.9%) | | | | | | | | |
Altria Group, Inc. | | | 216,692 | | | | 15,473,976 | |
Coca-Cola Co. | | | 439,981 | | | | 20,186,328 | |
PepsiCo, Inc. | | | 162,139 | | | | 19,443,709 | |
Philip Morris Int’l., Inc. | | | 178,307 | | | | 18,838,135 | |
Proctor & Gamble Co. | | | 291,416 | | | | 26,775,302 | |
Wal-Mart Stores, Inc. | | | 167,585 | | | | 16,549,019 | |
Other Securities | | | 1,377,118 | | | | 96,107,330 | |
| | | | | | | | |
| | | | | | | 213,373,799 | |
| | | | | | | | |
ENERGY (5.9%) | | | | | | | | |
Chevron Corp. | | | 216,895 | | | | 27,153,085 | |
Exxon Mobil Corp. | | | 485,758 | | | | 40,628,799 | |
Other Securities | | | 1,856,806 | | | | 91,422,515 | |
| | | | | | | | |
| | | | | | | 159,204,399 | |
| | | | | | | | |
FINANCIALS (15.0%) | | | | | | | | |
Bank of America Corp. | | | 1,100,802 | | | | 32,495,675 | |
Berkshire Hathaway, Inc. Cl B* | | | 220,061 | | | | 43,620,491 | |
Citigroup, Inc. | | | 302,166 | | | | 22,484,172 | |
JPMorgan Chase & Co. | | | 394,072 | | | | 42,142,060 | |
Visa, Inc. Cl A | | | 206,262 | | | | 23,517,993 | |
Wells Fargo & Co. | | | 504,476 | | | | 30,606,559 | |
Other Securities | | | 3,085,837 | | | | 213,039,864 | |
| | | | | | | | |
| | | | | | | 407,906,814 | |
| | | | | | | | |
HEALTH CARE (13.2%) | | | | | | | | |
Abbott Laboratories | | | 197,306 | | | | 11,260,253 | |
AbbVie, Inc. | | | 181,815 | | | | 17,583,329 | |
Amgen, Inc. | | | 82,799 | | | | 14,398,746 | |
Bristol-Myers Squibb Co. | | | 188,436 | | | | 11,547,358 | |
Johnson & Johnson | | | 307,745 | | | | 42,998,131 | |
Medtronic PLC | | | 155,814 | | | | 12,581,981 | |
Merck & Co., Inc. | | | 311,378 | | | | 17,521,240 | |
Pfizer, Inc. | | | 681,159 | | | | 24,671,579 | |
UnitedHealth Group, Inc. | | | 110,164 | | | | 24,286,755 | |
Other Securities | | | 1,725,288 | | | | 181,831,721 | |
| | | | | | | | |
| | | | | | | 358,681,093 | |
| | | | | | | | |
| | | | | | | | |
| | | Shares | | | Value | |
| | | | | | | | |
| INDEXED ASSETS (CONTINUED): | | | | | | | | |
COMMON STOCKS (CONTINUED): | | | | | | | | |
INDUSTRIALS (9.8%) | | | | | | | | |
3M Co. | | | 67,707 | | | $ | 15,936,197 | |
Boeing Co. | | | 63,445 | | | | 18,710,565 | |
General Electric Co. | | | 997,703 | | | | 17,409,917 | |
Honeywell International, Inc. | | | 87,766 | | | | 13,459,794 | |
Union Pacific Corp. | | | 89,512 | | | | 12,003,559 | |
United Technologies Corp. | | | 84,981 | | | | 10,841,026 | |
Other Securities | | | 1,812,272 | | | | 178,190,106 | |
| | | | | | | | |
| | | | | | | 266,551,164 | |
| | | | | | | | |
INFORMATION TECHNOLOGY (21.9%) | | | | | | | | |
Accenture PLC Cl A | | | 70,322 | | | | 10,765,595 | |
Alphabet, Inc. Cl A* | | | 33,856 | | | | 35,663,910 | |
Alphabet, Inc. Cl C* | | | 34,357 | | | | 35,950,914 | |
Apple, Inc. | | | 585,197 | | | | 99,032,887 | |
Broadcom Ltd. | | | 45,753 | | | | 11,753,946 | |
Cisco Systems, Inc. | | | 561,801 | | | | 21,516,978 | |
Facebook, Inc. Cl A* | | | 272,228 | | | | 48,037,353 | |
Intel Corp. | | | 532,732 | | | | 24,590,909 | |
Int’l. Business Machines Corp. | | | 98,971 | | | | 15,184,131 | |
Mastercard, Inc. Cl A | | | 105,749 | | | | 16,006,169 | |
Microsoft Corp. | | | 877,721 | | | | 75,080,254 | |
NVIDIA Corp. | | | 69,175 | | | | 13,385,363 | |
Oracle Corp. | | | 347,163 | | | | 16,413,867 | |
Texas Instruments, Inc. | | | 113,628 | | | | 11,867,308 | |
Other Securities | | | 2,603,321 | | | | 159,990,152 | |
| | | | | | | | |
| | | | | | | 595,239,736 | |
| | | | | | | | |
MATERIALS (2.9%) | | | | | | | | |
DowDuPont, Inc. | | | 266,843 | | | | 19,004,558 | |
Other Securities | | | 759,225 | | | | 58,644,300 | |
| | | | | | | | |
| | | | | | | 77,648,858 | |
| | | | | | | | |
REAL ESTATE (2.8%) | | | | | | | | |
Other Securities | | | 1,048,261 | | | | 75,348,154 | |
| | | | | | | | |
TELECOMMUNICATION SERVICES (2.0%) | | | | | | | | |
AT&T, Inc. | | | 703,269 | | | | 27,343,099 | |
Verizon Communications, Inc. | | | 465,721 | | | | 24,650,613 | |
Other Securities | | | 108,292 | | | | 1,806,311 | |
| | | | | | | | |
| | | | | | | 53,800,023 | |
| | | | | | | | |
UTILITIES (2.8%) | | | | | | | | |
Other Securities | | | 1,334,594 | | | | 76,617,705 | |
| | | | | | | | |
TOTAL INDEXED ASSETS-COMMON STOCKS | | | | | | | | |
(Cost: $1,472,096,212) 96.0% | | | | | | | 2,603,034,350 | |
| | | | | | | | |
The accompanying notes are an integral part of these portfolio schedules.
41
MUTUAL OF AMERICA INVESTMENT CORPORATION — EQUITY INDEX FUND
SUMMARY PORTFOLIO OF INVESTMENTS IN SECURITIES (Continued)
December 31, 2017
| | | | | | | | | | | | | | | | | | | | |
| | | Rating** | | | Rate(%) | | | Maturity | | | Face Amount | | | Value | |
| SHORT-TERM DEBT SECURITIES: | | | | | | | | | | | | | | | | | | | | |
U.S. GOVERNMENT (1.9%) | | | | | | | | | | | | | | | | | | | | |
U.S. Treasury Bill (1) | | | A-1+ | | | | 1.00 - 1.25 | | | | 01/02/18 - 03/01/18 | | | $ | 50,400,000 | | | $ | 50,342,108 | |
| | | | | | | | | | | | | | | | | | | | |
COMMERCIAL PAPER (2.0%) | | | | | | | | | | | | | | | | | | | | |
Exxon Mobil Corp. | | | A-1+ | | | | 1.39 | | | | 01/10/18 | | | | 1,000,000 | | | | 999,575 | |
J.P. Morgan Securities LLC | | | A-1 | | | | 1.55 | | | | 01/04/18 | | | | 10,000,000 | | | | 9,997,846 | |
Procter & Gamble Co.† | | | A-1+ | | | | 1.48 | | | | 01/17/18 | | | | 25,000,000 | | | | 24,981,498 | |
Toyota Motor Credit Corp. | | | A-1+ | | | | 1.26 | | | | 01/03/18 | | | | 20,000,000 | | | | 19,997,196 | |
| | | | | | | | | | | | | | | | | | | | |
| | | | | | | | | | | | | | | | | | | 55,976,115 | |
| | | | | | | | | | | | | | | | | | | | |
TOTAL SHORT-TERM DEBT SECURITIES
(Cost: $106,318,223) 3.9% | | | | 106,318,223 | |
| | | | | | | | | | | | | | | | | | | | |
TOTAL INVESTMENTS
(Cost: $1,578,414,435) 99.9% | | | | 2,709,352,573 | |
| | | | | | | | | | | | | | | | | | | | |
OTHER NET ASSETS 0.1% | | | | 2,232,378 | |
| | | | | | | | | | | | | | | | | | | | |
NET ASSETS 100.0% | | | $ | 2,711,584,951 | |
| | | | | | | | | | | | | | | | | | | | |
The accompanying notes are an integral part of these portfolio schedules.
42
MUTUAL OF AMERICA INVESTMENT CORPORATION — ALL AMERICA FUND
SUMMARY PORTFOLIO OF INVESTMENTS IN SECURITIES
December 31, 2017
| | | | | | | | |
| | | Shares | | | Value | |
| | | | | | | | |
| INDEXED ASSETS: | | | | | |
COMMON STOCKS: | | | | | |
CONSUMER DISCRETIONARY (6.7%) | | | | | | | | |
Amazon.com, Inc.* | | | 3,089 | | | $ | 3,612,493 | |
Comcast Corp. Cl A | | | 36,387 | | | | 1,457,299 | |
Disney (Walt) Co. | | | 11,760 | | | | 1,264,318 | |
Home Depot, Inc. | | | 9,062 | | | | 1,717,521 | |
McDonald’s Corp. | | | 6,165 | | | | 1,061,120 | |
Other Securities | | | 204,432 | | | | 12,474,376 | |
| | | | | | | | |
| | | | | | | 21,587,127 | |
| | | | | | | | |
CONSUMER STAPLES (4.5%) | | | | | | | | |
Altria Group, Inc. | | | 14,680 | | | | 1,048,299 | |
Coca-Cola Co. | | | 29,806 | | | | 1,367,499 | |
PepsiCo, Inc. | | | 10,984 | | | | 1,317,201 | |
Philip Morris Int’l., Inc. | | | 12,079 | | | | 1,276,146 | |
Proctor & Gamble Co. | | | 19,741 | | | | 1,813,803 | |
Wal-Mart Stores, Inc. | | | 11,352 | | | | 1,121,010 | |
Other Securities | | | 93,293 | | | | 6,510,605 | |
| | | | | | | | |
| | | | | | | 14,454,563 | |
| | | | | | | | |
ENERGY (3.3%) | | | | | | | | |
Chevron Corp. | | | 14,694 | | | | 1,839,542 | |
Exxon Mobil Corp. | | | 32,907 | | | | 2,752,341 | |
Other Securities | | | 125,787 | | | | 6,193,378 | |
| | | | | | | | |
| | | | | | | 10,785,261 | |
| | | | | | | | |
FINANCIALS (8.5%) | | | | | | | | |
Bank of America Corp. | | | 74,573 | | | | 2,201,395 | |
Berkshire Hathaway, Inc. Cl B* | | | 14,907 | | | | 2,954,866 | |
Citigroup, Inc. | | | 20,470 | | | | 1,523,173 | |
JPMorgan Chase & Co. | | | 26,696 | | | | 2,854,870 | |
Progressive Corp. | | | 4,438 | | | | 249,948 | |
Visa, Inc. Cl A | | | 13,973 | | | | 1,593,201 | |
Wells Fargo & Co. | | | 34,176 | | | | 2,073,458 | |
Other Securities | | | 204,724 | | | | 14,211,878 | |
| | | | | | | | |
| | | | | | | 27,662,789 | |
| | | | | | | | |
HEALTH CARE (7.4%) | | | | | | | | |
AbbVie, Inc. | | | 12,317 | | | | 1,191,177 | |
Amgen, Inc. | | | 5,609 | | | | 975,405 | |
Johnson & Johnson | | | 20,847 | | | | 2,912,743 | |
Merck & Co., Inc. | | | 21,094 | | | | 1,186,959 | |
Pfizer, Inc. | | | 46,144 | | | | 1,671,336 | |
UnitedHealth Group, Inc. | | | 7,462 | | | | 1,645,073 | |
Other Securities | | | 153,565 | | | | 14,716,032 | |
| | | | | | | | |
| | | | | | | 24,298,725 | |
| | | | | | | | |
| | | | | | | | |
| | | Shares | | | Value | |
| | | | | | | | |
| INDEXED ASSETS (CONTINUED): | | | | | | | | |
COMMON STOCKS (CONTINUED): | | | | | | | | |
INDUSTRIALS (5.6%) | | | | | | | | |
3M Co. | | | 4,586 | | | $ | 1,079,407 | |
Boeing Co. | | | 4,297 | | | | 1,267,228 | |
General Electric Co. | | | 67,588 | | | | 1,179,411 | |
L-3 Communications Corp. | | | 633 | | | | 125,239 | |
Rockwell Automation, Inc. | | | 1,015 | | | | 199,295 | |
Other Securities | | | 138,891 | | | | 14,206,125 | |
| | | | | | | | |
| | | | | | | 18,056,705 | |
| | | | | | | | |
INFORMATION TECHNOLOGY (12.4%) | | | | | | | | |
Alphabet, Inc. Cl A* | | | 2,293 | | | | 2,415,446 | |
Alphabet, Inc. Cl C* | | | 2,327 | | | | 2,434,983 | |
Apple, Inc. | | | 39,644 | | | | 6,708,949 | |
Cisco Systems, Inc. | | | 38,059 | | | | 1,457,660 | |
Facebook, Inc. Cl A* | | | 18,441 | | | | 3,254,099 | |
Intel Corp. | | | 36,090 | | | | 1,665,914 | |
Int’l. Business Machines Corp. | | | 6,705 | | | | 1,028,681 | |
Mastercard, Inc. Cl A | | | 7,163 | | | | 1,084,192 | |
Microsoft Corp. | | | 59,460 | | | | 5,086,208 | |
Oracle Corp. | | | 23,518 | | | | 1,111,931 | |
Other Securities | | | 196,598 | | | | 14,074,097 | |
| | | | | | | | |
| | | | | | | 40,322,160 | |
| | | | | | | | |
MATERIALS (1.6%) | | | | | | | | |
DowDuPont, Inc. | | | 18,077 | | | | 1,287,444 | |
Packaging Corp. of America | | | 761 | | | | 91,739 | |
Other Securities | | | 50,675 | | | | 3,881,051 | |
| | | | | | | | |
| | | | | | | 5,260,234 | |
| | | | | | | | |
REAL ESTATE (1.6%) | | | | | | | | |
Other Securities | | | 71,011 | | | | 5,103,860 | |
| | | | | | | | |
TELECOMMUNICATION SERVICES (1.1%) | | | | | | | | |
AT&T, Inc. | | | 47,642 | | | | 1,852,321 | |
Verizon Communications, Inc. | | | 31,549 | | | | 1,669,889 | |
Other Securities | | | 7,337 | | | | 122,381 | |
| | | | | | | | |
| | | | | | | 3,644,591 | |
| | | | | | | | |
UTILITIES (1.6%) | | | | | | | | |
Other Securities | | | 90,404 | | | | 5,189,859 | |
| | | | | | | | |
TOTAL INDEXED ASSETS-COMMON STOCKS | | | | | | | | |
(Cost: $101,957,136) 54.3% | | | | | | | 176,365,874 | |
| | | | | | | | |
| | | | | | | | | | | | | | | | | | | | |
| | | Rating** | | | Rate(%) | | | Maturity | | | Face Amount | | | Value | |
| INDEXED ASSETS: | | | | | | | | | | | | | | | | | | | | |
SHORT-TERM DEBT SECURITIES: | | | | | | | | | | | | |
U.S. GOVERNMENT (2.2%) | | | | | | | | | | | | |
U.S. Treasury Bill (1) | | | A-1+ | | | | 1.05 - 1.15 | | | | 01/04/18 | | | $ | 7,305,000 | | | $ | 7,303,867 | |
| | | | | | | | | | | | | | | | | | | | |
COMMERCIAL PAPER (1.2%) | | | | | | | | | | | | | | | | |
Estee Lauder Cos.† | | | A-1 | | | | 1.40 | | | | 01/02/18 | | | | 1,800,000 | | | | 1,799,790 | |
J.P. Morgan Securities LLC | | | A-1 | | | | 1.55 | | | | 01/04/18 | | | | 2,000,000 | | | | 1,999,569 | |
| | | | | | | | | | | | | | | | | | | | |
| | | | | | | | | | | | | | | | | | | 3,799,359 | |
| | | | | | | | | | | | | | | | | | | | |
TOTAL INDEXED ASSETS-SHORT-TERM DEBT SECURITIES
(Cost: $11,103,226) 3.4% | | | | | | | | | | | | | | | | | | | 11,103,226 | |
| | | | | | | | | | | | | | | | | | | | |
TOTAL INDEXED ASSETS
(Cost: $113,060,362) 57.7% | | | | | | | | | | | | | | | | | | $ | 187,469,100 | |
| | | | | | | | | | | | | | | | | | | | |
The accompanying notes are an integral part of these portfolio schedules.
43
MUTUAL OF AMERICA INVESTMENT CORPORATION — ALL AMERICA FUND
SUMMARY PORTFOLIO OF INVESTMENTS IN SECURITIES (Continued)
December 31, 2017
| | | | | | | | |
| | | Shares | | | Value | |
| | | | | | | |
| ACTIVE ASSETS: | | | | | |
COMMON STOCKS: | | | | | |
CONSUMER DISCRETIONARY (4.5%) | | | | | | | | |
Five Below, Inc.* | | | 14,968 | | | $ | 992,678 | |
Lions Gate Entertainment Corp. Cl A* | | | 16,474 | | | | 556,986 | |
Lions Gate Entertainment Corp. Cl B* | | | 16,474 | | | | 522,884 | |
Sleep Number Corp.* | | | 39,361 | | | | 1,479,580 | |
Other Securities | | | 290,277 | | | | 11,186,083 | |
| | | | | | | | |
| | | | | | | 14,738,211 | |
| | | | | | | | |
CONSUMER STAPLES (1.1%) | | | | | | | | |
Other Securities | | | 122,368 | | | | 3,667,582 | |
| | | | | | | | |
ENERGY (2.1%) | | | | | | | | |
PBF Energy, Inc. | | | 28,931 | | | | 1,025,604 | |
Other Securities | | | 300,089 | | | | 5,667,831 | |
| | | | | | | | |
| | | | | | | 6,693,435 | |
| | | | | | | | |
FINANCIALS (7.7%) | | | | | | | | |
Progressive Corp. | | | 13,155 | | | | 740,890 | |
SVB Financial Group* | | | 5,897 | | | | 1,378,542 | |
Other Securities | | | 628,957 | | | | 22,733,603 | |
| | | | | | | | |
| | | | | | | 24,853,035 | |
| | | | | | | | |
HEALTH CARE (4.4%) | | | | | | | | |
Other Securities†† | | | 296,930 | | | | 14,327,870 | |
| | | | | | | | |
| | | | | | | | |
| | | Shares | | | Value | |
| ACTIVE ASSETS (CONTINUED): | | | | | | | | |
COMMON STOCKS (CONTINUED): | | | | | | | | |
| | | | | | | |
INDUSTRIALS (6.8%) | | | | | | | | |
L-3 Communications Corp. | | | 4,498 | | | $ | 889,929 | |
Mueller Industries, Inc. | | | 29,136 | | | | 1,032,288 | |
Rockwell Automation, Inc. | | | 4,161 | | | | 817,012 | |
Other Securities | | | 371,804 | | | | 19,242,666 | |
| | | | | | | | |
| | | | | | | 21,981,895 | |
| | | | | | | | |
INFORMATION TECHNOLOGY (6.1%) | | | | | | | | |
Other Securities†† | | | 541,953 | | | | 19,816,398 | |
| | | | | | | | |
MATERIALS (2.7%) | | | | | | | | |
Packaging Corp. of America | | | 7,768 | | | | 936,433 | |
Other Securities†† | | | 209,158 | | | | 7,930,333 | |
| | | | | | | | |
| | | | | | | 8,866,766 | |
| | | | | | | | |
REAL ESTATE (3.5%) | | | | | | | | |
Other Securities | | | 371,219 | | | | 11,469,655 | |
| | | | | | | | |
TELECOMMUNICATION SERVICES (0.4%) | | | | | | | | |
Other Securities | | | 71,281 | | | | 1,170,470 | |
| | | | | | | | |
UTILITIES (2.0%) | | | | | | | | |
Other Securities | | | 139,841 | | | | 6,459,533 | |
| | | | | | | | |
TOTAL ACTIVE ASSETS-COMMON STOCKS | | | | | | | | |
(Cost: $107,525,247) 41.3% | | | | | | | 134,044,850 | |
| | | | | | | | |
| | | | | | | | | | | | | | | | | | | | |
| | | Rating** | | | Rate(%) | | | Maturity | | | Face Amount | | | Value | |
| ACTIVE ASSETS: | | | | | | | | | | | | | | | | | | | | |
SHORT-TERM DEBT SECURITIES: | | | | | | | | | | | | | | | | | | | | |
U.S. GOVERNMENT (0.4%) | | | | | | | | | | | | | | | | | | | | |
U.S. Treasury Bill | | | A-1+ | | | | 1.00 | | | | 01/02/18 | | | | 1,500,000 | | | $ | 1,499,875 | |
| | | | | | | | | | | | | | | | | | | | |
COMMERCIAL PAPER (0.2%) | | | | | | | | | | | | | | | | | | | | |
Home Depot, Inc.† | | | A-1 | | | | 1.44 | | | | 01/02/18 | | | | 500,000 | | | | 499,940 | |
| | | | | | | | | | | | | | | | | | | | |
TOTAL ACTIVE ASSETS-SHORT-TERM DEBT SECURITIES
(Cost: $1,999,815) 0.6% | | | | 1,999,815 | |
| | | | | | | | | | | | | | | | | | | | |
| | | | | |
| | | | | | | | | | | | Shares | | | Value | |
| ACTIVE ASSETS: | |
WARRANTS: | | | | | | | | | | | | | | | | | | | | |
FINANCIALS (0.0%) (2) | | | | | | | | | | | | | | | | | | | | |
Easterly Acquisition Corp. — expiring 07/29/2020* | | | | | | | | | | | | | | | 11,885 | | | $ | 7,073 | |
| | | | | | | | | | | | | | | | | | | | |
TOTAL ACTIVE ASSETS-WARRANTS
(Cost: $7,178) 0.0% (2) | | | | 7,073 | |
| | | | | | | | | | | | | | | | | | | | |
TOTAL ACTIVE ASSETS
(Cost: $109,532,240) 41.9% | | | | 136,051,738 | |
| | | | | | | | | | | | | | | | | | | | |
TOTAL INVESTMENTS
(Cost: $222,592,602) 99.6% | | | | 323,520,838 | |
| | | | | | | | | | | | | | | | | | | | |
OTHER NET ASSETS 0.4% | | | | 1,215,517 | |
| | | | | | | | | | | | | | | | | | | | |
NET ASSETS 100.0% | | | $ | 324,736,355 | |
| | | | | | | | | | | | | | | | | | | | |
The accompanying notes are an integral part of these portfolio schedules.
44
MUTUAL OF AMERICA INVESTMENT CORPORATION — SMALL CAP VALUE FUND
SUMMARY PORTFOLIO OF INVESTMENTS IN SECURITIES
December 31, 2017
| | | | | | | | |
| | | Shares | | | Value | |
| | | | | | | | |
| COMMON STOCKS: | | | | | | | | |
CONSUMER DISCRETIONARY (7.8%) | | | | | | | | |
Houghton Mifflin Harcourt Co.* | | | 581,642 | | | $ | 5,409,271 | |
Playa Hotels & Resorts NV* | | | 426,102 | | | | 4,597,641 | |
Sleep Number Corp.* | | | 257,966 | | | | 9,696,942 | |
Other Securities | | | 757,370 | | | | 19,768,778 | |
| | | | | | | | |
| | | | | | | 39,472,632 | |
| | | | | | | | |
CONSUMER STAPLES (2.5%) | | | | | | | | |
Crimson Wine Group Ltd.* | | | 493,977 | | | | 5,270,735 | |
Vector Group Ltd. | | | 181,478 | | | | 4,061,478 | |
Other Securities | | | 260,675 | | | | 3,336,640 | |
| | | | | | | | |
| | | | | | | 12,668,853 | |
| | | | | | | | |
ENERGY (5.4%) | | | | | | | | |
PBF Energy, Inc. | | | 252,833 | | | | 8,962,930 | |
Other Securities | | | 1,704,168 | | | | 18,246,306 | |
| | | | | | | | |
| | | | | | | 27,209,236 | |
| | | | | | | | |
FINANCIALS (30.1%) | | | | | | | | |
American Equity Investment Life Hldg. Co. | | | 174,359 | | | | 5,358,052 | |
Aspen Insurance Hldgs. Ltd. | | | 104,108 | | | | 4,226,785 | |
BancFirst Corp. | | | 127,923 | | | | 6,543,261 | |
Banner Corp. | | | 97,571 | | | | 5,378,114 | |
Brookline Bancorp, Inc. | | | 410,915 | | | | 6,451,366 | |
Bryn Mawr Bank Corp. | | | 115,255 | | | | 5,094,271 | |
Ellington Financial LLC | | | 340,468 | | | | 4,940,191 | |
Enterprise Financial Svcs. Corp. | | | 122,767 | | | | 5,542,930 | |
First Interstate BancSytem, Inc. | | | 144,811 | | | | 5,799,681 | |
Flushing Financial Corp. | | | 141,534 | | | | 3,892,185 | |
Glacier Bancorp, Inc. | | | 126,415 | | | | 4,979,487 | |
Marlin Business Svcs. Corp. | | | 210,988 | | | | 4,726,131 | |
NMI Hldgs., Inc. Cl A* | | | 475,449 | | | | 8,082,633 | |
Northfield Bancorp, Inc. | | | 288,402 | | | | 4,925,906 | |
Selective Insurance Group, Inc. | | | 126,320 | | | | 7,414,984 | |
Stock Yards Bancorp, Inc. | | | 233,782 | | | | 8,813,581 | |
SVB Financial Group* | | | 49,346 | | | | 11,535,614 | |
Other Securities | | | 1,689,969 | | | | 48,562,940 | |
| | | | | | | | |
| | | | | | | 152,268,112 | |
| | | | | | | | |
HEALTH CARE (4.2%) | | | | | | | | |
Supernus Pharmaceuticals, Inc.* | | | 189,497 | | | | 7,551,455 | |
Other Securities | | | 659,037 | | | | 13,443,135 | |
| | | | | | | | |
| | | | | | | 20,994,590 | |
| | | | | | | | |
INDUSTRIALS (15.4%) | | | | | | | | |
BMC Stock Hldgs., Inc.* | | | 171,832 | | | | 4,347,350 | |
Deluxe Corp. | | | 60,368 | | | | 4,638,677 | |
Encore Wire Corp. | | | 106,307 | | | | 5,171,836 | |
| | | | | | | | |
| | | Shares | | | Value | |
| | | | | | | | |
| COMMON STOCKS (Continued): | | | | | | | | |
INDUSTRIALS (CONTINUED) | | | | | | | | |
Hyster-Yale Materials Handling, Inc. Cl A | | | 49,472 | | | $ | 4,213,036 | |
Kirby Corp.* | | | 57,547 | | | | 3,844,140 | |
Landstar System, Inc. | | | 38,121 | | | | 3,968,396 | |
Miller Industries, Inc. | | | 285,727 | | | | 7,371,757 | |
Mueller Industries, Inc. | | | 363,229 | | | | 12,869,203 | |
Universal Forest Products, Inc. | | | 134,242 | | | | 5,050,184 | |
VSE Corp. | | | 108,029 | | | | 5,231,844 | |
Other Securities | | | 849,702 | | | | 21,274,053 | |
| | | | | | | | |
| | | | | | | 77,980,476 | |
| | | | | | | | |
INFORMATION TECHNOLOGY (10.6%) | | | | | | | | |
Proofpoint, Inc.* | | | 54,466 | | | | 4,837,125 | |
Stamps.com, Inc.* | | | 21,552 | | | | 4,051,776 | |
SYNNEX Corp. | | | 33,653 | | | | 4,575,125 | |
Other Securities†† | | | 2,776,013 | | | | 40,309,897 | |
| | | | | | | | |
| | | | | | | 53,773,923 | |
| | | | | | | | |
MATERIALS (4.9%) | |
Kaiser Aluminum Corp. | | | 50,222 | | | | 5,366,221 | |
Kraton Corp.* | | | 86,116 | | | | 4,148,208 | |
Other Securities | | | 573,503 | | | | 15,468,759 | |
| | | | | | | | |
| | | | 24,983,188 | |
| | | | | | | | |
REAL ESTATE (11.0%) | | | | | | | | |
Chesapeake Lodging Trust | | | 152,271 | | | | 4,125,021 | |
Colony NorthStar, Inc. Cl A | | | 349,308 | | | | 3,985,604 | |
Cousins Properties, Inc. | | | 433,934 | | | | 4,013,889 | |
Easterly Government Pptys. | | | 221,923 | | | | 4,735,837 | |
Forest City Realty Trust, Inc. Cl A | | | 289,862 | | | | 6,985,674 | |
Highwoods Properties, Inc. | | | 95,766 | | | | 4,875,447 | |
Terreno Realty Corp. | | | 115,490 | | | | 4,049,079 | |
The GEO Group, Inc. | | | 225,302 | | | | 5,317,127 | |
Other Securities | | | 842,331 | | | | 17,327,285 | |
| | | | | | | | |
| | | | 55,414,963 | |
| | | | | | | | |
TELECOMMUNICATION SERVICES (1.3%) | | | | | | | | |
ORBCOMM, Inc.* | | | 372,812 | | | | 3,795,226 | |
Other Securities | | | 77,199 | | | | 2,609,326 | |
| | | | | | | | |
| | | | 6,404,552 | |
| | | | | | | | |
UTILITIES (4.2%) | | | | | | | | |
Avista Corp. | | | 87,482 | | | | 4,504,448 | |
Idacorp, Inc. | | | 44,368 | | | | 4,053,460 | |
Other Securities | | | 260,590 | | | | 12,724,152 | |
| | | | | | | | |
| | | | 21,282,060 | |
| | | | | | | | |
TOTAL COMMON STOCKS | | | | | | | | |
(Cost: $383,367,674) 97.4% | | | | | | | 492,452,585 | |
| | | | | | | | |
The accompanying notes are an integral part of these portfolio schedules.
45
MUTUAL OF AMERICA INVESTMENT CORPORATION — SMALL CAP VALUE FUND
SUMMARY PORTFOLIO OF INVESTMENTS IN SECURITIES (Continued)
December 31, 2017
| | | | | | | | | | | | | | | | | | | | |
| | | Rating** | | | Rate(%) | | | Maturity | | | Face Amount | | | Value | |
SHORT-TERM DEBT SECURITIES: | | | | | | | | | | | | | | | | | | | | |
U.S. GOVERNMENT (1.5%) | | | | | | | | | | | | | | | | | | | | |
U.S. Treasury Bill | | | A-1+ | | | | 1.02 - 1.25 | | | | 01/02/18 - 02/15/18 | | | $ | 7,300,000 | | | $ | 7,294,264 | |
| | | | | | | | | | | | | | | | | | | | |
COMMERCIAL PAPER (1.2%) | | | | | | | | | | | | | | | | | | | | |
Estee Lauder Cos.† | | | A-1 | | | | 1.40 | | | | 01/02/18 | | | | 1,200,000 | | | | 1,199,860 | |
Toyota Motor Credit Corp. | | | A-1+ | | | | 1.26 | | | | 01/03/18 | | | | 5,000,000 | | | | 4,999,299 | |
| | | | | | | | | | | | | | | | | | | | |
| | | | | | | | | | | | | | | | | | | 6,199,159 | |
| | | | | | | | | | | | | | | | | | | | |
TOTAL SHORT-TERM DEBT SECURITIES
(Cost: $13,493,423) 2.7% | | | | 13,493,423 | |
| | | | | | | | | | | | | | | | | | | | |
| | | | | | | | |
| | | Shares | | | Value | |
WARRANTS: | | | | | | | | |
FINANCIALS (0.0%) (2) | | | | | | | | |
Easterly Acquisition Corp. — expiring 07/29/2020* | | | 146,691 | | | $ | 87,296 | |
| | | | | | | | |
TOTAL WARRANTS
(Cost: $88,598) (0.0%) (2) | | | | 87,296 | |
| | | | | | | | |
TOTAL INVESTMENTS
(Cost: $396,949,695) 100.1% | | | | 506,033,304 | |
| | | | | | | | |
OTHER NET ASSETS -0.1% | | | | (311,555 | ) |
| | | | | | | | |
NET ASSETS 100.0% | | | $ | 505,721,749 | |
| | | | | | | | |
The accompanying notes are an integral part of these portfolio schedules.
46
MUTUAL OF AMERICA INVESTMENT CORPORATION — SMALL CAP GROWTH FUND
SUMMARY PORTFOLIO OF INVESTMENTS IN SECURITIES
December 31, 2017
| | | | | | | | |
| | | Shares | | | Value | |
| | | | | | | | |
| COMMON STOCKS: | |
CONSUMER DISCRETIONARY (14.1%) | |
Bloomin’ Brands, Inc. | | | 261,074 | | | $ | 5,571,319 | |
Dave & Buster’s Entertainment, Inc.* | | | 73,880 | | | | 4,075,960 | |
Five Below, Inc.* | | | 156,567 | | | | 10,383,522 | |
Haverty Furniture Cos., Inc. | | | 259,596 | | | | 5,879,849 | |
Lions Gate Entertainment Corp. Cl A* | | | 112,275 | | | | 3,796,018 | |
Lions Gate Entertainment Corp. Cl B* | | | 112,275 | | | | 3,563,609 | |
Lithia Motors, Inc. Cl A | | | 48,987 | | | | 5,564,433 | |
Red Rock Resorts, Inc. Cl A | | | 184,539 | | | | 6,226,346 | |
Sleep Number Corp.* | | | 227,087 | | | | 8,536,200 | |
Steve Madden Ltd.* | | | 91,266 | | | | 4,262,122 | |
Thor Industries, Inc. | | | 41,461 | | | | 6,249,002 | |
Other Securities | | | 550,529 | | | | 14,239,113 | |
| | | | | | | | |
| | | | | | | 78,347,493 | |
| | | | | | | | |
CONSUMER STAPLES (2.0%) | | | | | | | | |
WD-40 Co. | | | 34,065 | | | | 4,019,670 | |
Other Securities | | | 338,359 | | | | 7,089,938 | |
| | | | | | | | |
| | | | | | | 11,109,608 | |
| | | | | | | | |
ENERGY (1.8%) | | | | | | | | |
Ring Energy, Inc.* | | | 298,264 | | | | 4,145,870 | |
Other Securities | | | 216,720 | | | | 5,906,774 | |
| | | | | | | | |
| | | | | | | 10,052,644 | |
| | | | | | | | |
FINANCIALS (6.5%) | | | | | | | | |
First Merchants Corp. | | | 96,605 | | | | 4,063,206 | |
Heritage Financial Corp. | | | 136,270 | | | | 4,197,116 | |
Moelis & Co. Cl A | | | 124,488 | | | | 6,037,668 | |
Other Securities | | | 694,792 | | | | 21,504,964 | |
| | | | | | | | |
| | | | | | | 35,802,954 | |
| | | | | | | | |
HEALTH CARE (22.8%) | | | | | | | | |
Abiomed, Inc.* | | | 22,751 | | | | 4,263,765 | |
Acadia Healthcare Co., Inc.* | | | 123,519 | | | | 4,030,425 | |
Chemed Corp. | | | 18,117 | | | | 4,402,793 | |
Exact Sciences Corp.* | | | 98,139 | | | | 5,156,223 | |
Neurocrine Biosciences, Inc.* | | | 54,319 | | | | 4,214,611 | |
Omnicell, Inc.* | | | 132,523 | | | | 6,427,366 | |
Pacira Pharmaceuticals, Inc.* | | | 94,038 | | | | 4,292,835 | |
Sage Therapeutics, Inc.* | | | 32,212 | | | | 5,305,639 | |
Supernus Pharmaceuticals, Inc.* | | | 127,970 | | | | 5,099,605 | |
WellCare Health Plans, Inc.* | | | 23,982 | | | | 4,823,020 | |
Other Securities†† | | | 2,075,497 | | | | 78,837,280 | |
| | | | | | | | |
| | | | | | | 126,853,562 | |
| | | | | | | | |
| | | | | | | | |
| | | Shares | | | Value | |
| | | | | | | | |
| COMMON STOCKS (CONTINUED): | |
INDUSTRIALS (17.9%) | | | | | | | | |
BMC Stock Hldgs., Inc.* | | | 186,594 | | | $ | 4,720,828 | |
EnPro Industries, Inc. | | | 103,414 | | | | 9,670,243 | |
Granite Construction, Inc. | | | 132,757 | | | | 8,420,777 | |
Healthcare Svcs. Group, Inc. | | | 115,290 | | | | 6,078,089 | |
John Bean Technologies Corp. | | | 36,087 | | | | 3,998,440 | |
Landstar System, Inc. | | | 44,715 | | | | 4,654,832 | |
Mueller Water Products, Inc. Cl A | | | 365,431 | | | | 4,578,850 | |
Sun Hydraulics Corp. | | | 109,534 | | | | 7,085,754 | |
Teledyne Technologies, Inc.* | | | 36,513 | | | | 6,614,330 | |
Trex Co., Inc.* | | | 55,033 | | | | 5,965,027 | |
Other Securities | | | 1,230,311 | | | | 37,579,938 | |
| | | | | | | | |
| | | | | | | 99,367,108 | |
| | | | | | | | |
INFORMATION TECHNOLOGY (22.4%) | | | | | | | | |
Callidus Software, Inc.* | | | 276,326 | | | | 7,916,740 | |
CommVault Systems, Inc.* | | | 81,906 | | | | 4,300,065 | |
EPAM Systems, Inc.* | | | 59,245 | | | | 6,364,690 | |
LogMeIn, Inc. | | | 34,686 | | | | 3,971,547 | |
New Relic, Inc.* | | | 92,620 | | | | 5,350,657 | |
Proofpoint, Inc.* | | | 75,391 | | | | 6,695,475 | |
Science Applications Int’l. Corp. | | | 59,663 | | | | 4,568,396 | |
Zendisk, Inc.* | | | 141,776 | | | | 4,797,700 | |
Other Securities | | | 2,623,212 | | | | 80,254,746 | |
| | | | | | | | |
| | | | | | | 124,220,016 | |
| | | | | | | | |
MATERIALS (5.5%) | | | | | | | | |
Ferro Corp.* | | | 367,341 | | | | 8,665,574 | |
Ferroglobe PLC | | | 314,981 | | | | 5,102,692 | |
Minerals Technologies, Inc. | | | 56,663 | | | | 3,901,248 | |
Orion Engineered Carbons S.A. | | | 166,734 | | | | 4,268,390 | |
U.S. Concrete, Inc.* | | | 57,312 | | | | 4,794,149 | |
Other Securities†† | | | 137,823 | | | | 3,841,594 | |
| | | | | | | | |
| | | | | | | 30,573,647 | |
| | | | | | | | |
REAL ESTATE (2.8%) | | | | | | | | |
QTS Realty Trust, Inc. | | | 93,441 | | | | 5,060,765 | |
Terreno Realty Corp. | | | 118,937 | | | | 4,169,931 | |
Other Securities | | | 229,743 | | | | 6,425,610 | |
| | | | | | | | |
| | | | | | | 15,656,306 | |
| | | | | | | | |
TELECOMMUNICATION SERVICES (1.4%) | | | | | | | | |
Other Securities | | | 490,433 | | | | 7,590,596 | |
| | | | | | | | |
UTILITIES (0.6%) | | | | | | | | |
Other Securities | | | 44,353 | | | | 3,483,928 | |
| | | | | | | | |
TOTAL COMMON STOCKS | | | | | | | | |
(Cost: $425,063,022) 97.8% | | | | | | | 543,057,862 | |
| | | | | | | | |
The accompanying notes are an integral part of these portfolio schedules.
47
MUTUAL OF AMERICA INVESTMENT CORPORATION — SMALL CAP GROWTH FUND
SUMMARY PORTFOLIO OF INVESTMENTS IN SECURITIES (Continued)
December 31, 2017
| | | | | | | | | | | | | | | | | | | | |
| | | Rating** | | | Rate(%) | | | Maturity | | | Face Amount | | | Value | |
| SHORT-TERM DEBT SECURITIES: | | | | | | | | | | | | | | | | | | | | |
U.S. GOVERNMENT (1.5%) | | | | | | | | | | | | | | | | | | | | |
U.S. Treasury Bill | | | A-1+ | | | | 1.00 - 1.04 | | | | 01/02/18 - 01/11/18 | | | $ | 8,200,000 | | | $ | 8,198,251 | |
| | | | | | | | | | | | | | | | | | | | |
TOTAL SHORT-TERM DEBT SECURITIES
(Cost: $8,198,251) 1.5% | | | | 8,198,251 | |
| | | | | | | | | | | | | | | | | | | | |
TOTAL INVESTMENTS
(Cost: $433,261,273) 99.3% | | | | 551,256,113 | |
| | | | | | | | | | | | | | | | | | | | |
OTHER NET ASSETS 0.7% | | | | 3,645,883 | |
| | | | | | | | | | | | | | | | | | | | |
NET ASSETS 100.0% | | | $ | 554,901,996 | |
| | | | | | | | | | | | | | | | | | | | |
The accompanying notes are an integral part of these portfolio schedules.
48
MUTUAL OF AMERICA INVESTMENT CORPORATION — MID CAP VALUE FUND
SUMMARY PORTFOLIO OF INVESTMENTS IN SECURITIES
December 31, 2017
| | | | | | | | |
| | | Shares | | | Value | |
| COMMON STOCKS: | | | | | | | | |
CONSUMER DISCRETIONARY (4.1%) | | | | | |
Sleep Number Corp.* | | | 30,170 | | | $ | 1,134,090 | |
Wiley (John) & Sons, Inc. Cl A | | | 14,076 | | | | 925,497 | |
Other Securities | | | 69,672 | | | | 2,166,231 | |
| | | | | | | | |
| | | | | | | 4,225,818 | |
| | | | | | | | |
CONSUMER STAPLES (2.6%) | | | | | |
Ingredion, Inc. | | | 8,421 | | | | 1,177,256 | |
Other Securities | | | 40,813 | | | | 1,549,260 | |
| | | | | | | | |
| | | | | | | 2,726,516 | |
| | | | | | | | |
ENERGY (7.3%) | | | | | |
PBF Energy, Inc. | | | 47,913 | | | | 1,698,516 | |
Other Securities | | | 276,213 | | | | 5,848,454 | |
| | | | | | | | |
| | | | | | | 7,546,970 | |
| | | | | | | | |
FINANCIALS (21.7%) | | | | | |
American Financial Group, Inc. | | | 12,849 | | | | 1,394,630 | |
Ameriprise Financial, Inc. | | | 11,272 | | | | 1,910,266 | |
Associated Banc-Corp. | | | 50,204 | | | | 1,275,182 | |
BankUnited, Inc. | | | 23,723 | | | | 966,001 | |
Discover Financial Svcs. | | | 12,401 | | | | 953,885 | |
Everest Re Group Ltd. | | | 4,106 | | | | 908,494 | |
Fifth Third Bancorp | | | 40,116 | | | | 1,217,119 | |
Hartford Financial Svcs. Group, Inc. | | | 21,415 | | | | 1,205,236 | |
KeyCorp | | | 103,272 | | | | 2,082,996 | |
Lincoln National Corp. | | | 15,429 | | | | 1,186,027 | |
Progressive Corp. | | | 23,743 | | | | 1,337,206 | |
Reinsurance Grp. of America, Inc. | | | 7,392 | | | | 1,152,635 | |
SVB Financial Group* | | | 9,919 | | | | 2,318,763 | |
Voya Financial, Inc. | | | 27,446 | | | | 1,357,754 | |
Zions Bancorporation | | | 20,230 | | | | 1,028,291 | |
Other Securities | | | 66,931 | | | | 2,114,683 | |
| | | | | | | | |
| | | | | | | 22,409,168 | |
| | | | | | | | |
HEALTH CARE (6.0%) | | | | | |
Agilent Technologies, Inc. | | | 16,100 | | | | 1,078,217 | |
Humana, Inc. | | | 3,554 | | | | 881,641 | |
Other Securities | | | 62,460 | | | | 4,188,027 | |
| | | | | | | | |
| | | | | | | 6,147,885 | |
| | | | | | | | |
INDUSTRIALS (17.2%) | | | | | |
Alaska Air Group, Inc. | | | 21,680 | | | | 1,593,697 | |
Carlisle Cos., Inc. | | | 11,438 | | | | 1,299,929 | |
Harris Corp. | | | 9,543 | | | | 1,351,766 | |
Kirby Corp.* | | | 17,344 | | | | 1,158,579 | |
| | | | | | | | |
| | | Shares | | | Value | |
| COMMON STOCKS (CONTINUED): | | | | | | | | |
INDUSTRIALS (CONTINUED) | | | | | |
L-3 Communications Corp. | | | 8,347 | | | $ | 1,651,454 | |
Old Dominion Freight Line, Inc. | | | 13,893 | | | | 1,827,624 | |
Oshkosh Corp. | | | 10,661 | | | | 968,978 | |
Rockwell Automation, Inc. | | | 5,020 | | | | 985,677 | |
Stanley Black & Decker, Inc. | | | 10,266 | | | | 1,742,038 | |
United Rentals, Inc.* | | | 12,402 | | | | 2,132,028 | |
Other Securities | | | 80,127 | | | | 3,117,996 | |
| | | | | | | | |
| | | | | | | 17,829,766 | |
| | | | | | | | |
INFORMATION TECHNOLOGY (6.8%) | | | | | |
DXC Technology Co. | | | 15,427 | | | | 1,464,022 | |
Other Securities | | | 119,867 | | | | 5,576,217 | |
| | | | | | | | |
| | | | | | | 7,040,239 | |
| | | | | | | | |
MATERIALS (10.3%) | | | | | |
Crown Hldgs., Inc.* | | | 34,085 | | | | 1,917,281 | |
Eastman Chemical Co. | | | 16,277 | | | | 1,507,901 | |
Freeport-McMoRan, Inc.* | | | 49,260 | | | | 933,970 | |
International Paper Co. | | | 17,549 | | | | 1,016,789 | |
Packaging Corp. of America | | | 21,659 | | | | 2,610,987 | |
Steel Dynamics, Inc. | | | 28,317 | | | | 1,221,312 | |
Other Securities | | | 30,522 | | | | 1,425,008 | |
| | | | | | | | |
| | | | | | | 10,633,248 | |
| | | | | | | | |
REAL ESTATE (12.8%) | | | | | | | | |
AvalonBay Communities, Inc. | | | 5,202 | | | | 928,089 | |
Duke Realty Corp. | | | 51,172 | | | | 1,392,390 | |
Host Hotels & Resorts, Inc. | | | 46,595 | | | | 924,911 | |
ProLogis, Inc. | | | 24,757 | | | | 1,597,074 | |
Vornado Realty Trust | | | 13,033 | | | | 1,018,920 | |
Welltower, Inc. | | | 13,332 | | | | 850,182 | |
Other Securities | | | 236,351 | | | | 6,515,516 | |
| | | | | | | | |
| | | | | | | 13,227,082 | |
| | | | | | | | |
UTILITIES (9.5%) | | | | | | | | |
Ameren Corp. | | | 18,208 | | | | 1,074,090 | |
Consolidated Edison, Inc. | | | 14,115 | | | | 1,199,069 | |
Entergy Corp. | | | 10,621 | | | | 864,443 | |
Great Plains Energy, Inc. | | | 35,098 | | | | 1,131,560 | |
PPL Corp. | | | 28,507 | | | | 882,292 | |
Public Svc. Enterprise Group, Inc. | | | 26,919 | | | | 1,386,329 | |
Other Securities | | | 103,711 | | | | 3,310,369 | |
| | | | | | | | |
| | | | | | | 9,848,152 | |
| | | | | | | | |
TOTAL COMMON STOCKS | | | | | | | | |
(Cost: $78,104,364) 98.3% | | | | | | | 101,634,844 | |
| | | | | | | | |
The accompanying notes are an integral part of these portfolio schedules.
49
MUTUAL OF AMERICA INVESTMENT CORPORATION — MID CAP VALUE FUND
SUMMARY PORTFOLIO OF INVESTMENTS IN SECURITIES (Continued)
December 31, 2017
| | | | | | | | | | | | | | | | | | | | |
| | | Rating** | | | Rate(%) | | | Maturity | | | Face Amount | | | Value | |
| SHORT-TERM DEBT SECURITIES: | | | | | | | | | | | | | | | | | |
U.S. GOVERNMENT (1.6%) | | | | | | | | | | | | | | | | | | | | |
U.S. Treasury Bill | | | A-1+ | | | | 1.00 - 1.05 | | | | 01/02/18 - 01/04/18 | | | $ | 1,600,000 | | | $ | 1,599,860 | |
| | | | | | | | | | | | | | | | | | | | |
TOTAL SHORT-TERM DEBT SECURITIES
(Cost: $1,599,860) 1.6% | | | | 1,599,860 | |
| | | | | | | | | | | | | | | | | | | | |
TOTAL INVESTMENTS
(Cost: $79,704,224) 99.9% | | | | 103,234,704 | |
| | | | | | | | | | | | | | | | | | | | |
OTHER NET ASSETS 0.1% | | | | 159,452 | |
| | | | | | | | | | | | | | | | | | | | |
NET ASSETS 100.0% | | | $ | 103,394,156 | |
| | | | | | | | | | | | | | | | | | | | |
The accompanying notes are an integral part of these portfolio schedules.
50
MUTUAL OF AMERICA INVESTMENT CORPORATION — MID-CAP EQUITY INDEX FUND
SUMMARY PORTFOLIO OF INVESTMENTS IN SECURITIES
December 31, 2017
| | | | | | | | |
| | | Shares | | | Value | |
| INDEXED ASSETS: | |
COMMON STOCKS: | |
CONSUMER DISCRETIONARY (11.6%) | |
Domino’s Pizza, Inc. | | | 33,771 | | | $ | 6,381,368 | |
NVR, Inc.* | | | 2,718 | | | | 9,535,337 | |
Polaris Industries, Inc. | | | 45,659 | | | | 5,661,259 | |
Thor Industries, Inc. | | | 37,769 | | | | 5,692,544 | |
Other Securities | | | 3,784,500 | | | | 140,707,597 | |
| | | | | | | | |
| | | | | | | 167,978,105 | |
| | | | | | | | |
CONSUMER STAPLES (3.6%) | | | | | | | | |
Ingredion, Inc. | | | 55,737 | | | | 7,792,033 | |
Lamb Weston Hldgs., Inc. | | | 114,209 | | | | 6,447,098 | |
Other Securities | | | 1,134,448 | | | | 38,322,620 | |
| | | | | | | | |
| | | | | | | 52,561,751 | |
| | | | | | | | |
ENERGY (4.1%) | | | | | | | | |
HollyFrontier Corp. | | | 137,159 | | | | 7,025,284 | |
Other Securities | | | 3,310,728 | | | | 52,476,161 | |
| | | | | | | | |
| | | | | | | 59,501,445 | |
| | | | | | | | |
FINANCIALS (16.5%) | | | | | | | | |
Alleghany Corp.* | | | 11,974 | | | | 7,137,582 | |
American Financial Group, Inc. | | | 54,005 | | | | 5,861,703 | |
East West Bancorp, Inc. | | | 111,239 | | | | 6,766,668 | |
FactSet Research Systems, Inc. | | | 30,330 | | | | 5,846,411 | |
MarketAxess Hldgs., Inc. | | | 29,364 | | | | 5,924,187 | |
MSCI, Inc. Cl A | | | 70,171 | | | | 8,879,437 | |
Reinsurance Grp. of America, Inc. | | | 49,714 | | | | 7,751,904 | |
SEI Investments Co. | | | 100,674 | | | | 7,234,434 | |
Signature Bank* | | | 41,487 | | | | 5,694,506 | |
SVB Financial Group* | | | 40,752 | | | | 9,526,590 | |
Other Securities | | | 5,191,317 | | | | 169,005,006 | |
| | | | | | | | |
| | | | | | | 239,628,428 | |
| | | | | | | | |
HEALTH CARE (7.2%) | | | | | | | | |
Abiomed, Inc.* | | | 32,621 | | | | 6,113,502 | |
STERIS PLC | | | 66,323 | | | | 5,801,273 | |
Teleflex, Inc. | | | 35,123 | | | | 8,739,305 | |
WellCare Health Plans, Inc.* | | | 34,434 | | | | 6,925,022 | |
West Pharmaceutical Svcs., Inc. | | | 58,022 | | | | 5,725,031 | |
Other Securities | | | 1,525,596 | | | | 71,699,464 | |
| | | | | | | | |
| | | | | | | 105,003,597 | |
| | | | | | | | |
INDUSTRIALS (15.2%) | | | | | | | | |
Copart, Inc.* | | | 156,181 | | | | 6,745,457 | |
Graco, Inc. | | | 128,715 | | | | 5,820,492 | |
Hubbell, Inc. | | | 42,693 | | | | 5,778,071 | |
Huntington Ingalls Industries, Inc. | | | 35,195 | | | | 8,295,462 | |
| | | | | | | | |
| | | Shares | | | Value | |
| INDEXED ASSETS (CONTINUED): | |
COMMON STOCKS (CONTINUED): | |
INDUSTRIALS (CONTINUED) | | | | | | | | |
IDEX Corp. | | | 59,507 | | | $ | 7,853,139 | |
JetBlue Airways Corp.* | | | 251,332 | | | | 5,614,757 | |
Lennox International, Inc. | | | 29,423 | | | | 6,127,634 | |
Manpowergroup, Inc. | | | 51,616 | | | | 6,509,294 | |
Nordson Corp. | | | 39,194 | | | | 5,738,002 | |
Old Dominion Freight Line, Inc. | | | 53,197 | | | | 6,998,065 | |
Orbital ATK, Inc. | | | 44,911 | | | | 5,905,797 | |
Other Securities | | | 2,447,868 | | | | 148,340,351 | |
| | | | | | | | |
| | | | | | | 219,726,521 | |
| | | | | | | | |
INFORMATION TECHNOLOGY (16.6%) | | | | | | | | |
Broadridge Financial Solutions, Inc. | | | 90,678 | | | | 8,213,613 | |
CDK Global, Inc. | | | 101,846 | | | | 7,259,583 | |
Cognex Corp. | | | 135,630 | | | | 8,295,131 | |
Henry (Jack) & Associates, Inc. | | | 59,871 | | | | 7,002,512 | |
IPG Photonics Corp.* | | | 29,176 | | | | 6,247,457 | |
Keysight Technologies, Inc.* | | | 145,202 | | | | 6,040,403 | |
Leidos Hldgs., Inc. | | | 111,079 | | | | 7,172,371 | |
Take-Two Interactive Software, Inc.* | | | 88,578 | | | | 9,724,088 | |
Teradyne, Inc. | | | 151,190 | | | | 6,330,325 | |
Trimble Navigation Ltd.* | | | 195,191 | | | | 7,932,562 | |
Other Securities | | | 3,556,042 | | | | 167,132,891 | |
| | | | | | | | |
| | | | | | | 241,350,936 | |
| | | | | | | | |
MATERIALS (6.8%) | | | | | | | | |
Steel Dynamics, Inc. | | | 183,287 | | | | 7,905,168 | |
The Chemours Co. | | | 143,351 | | | | 7,176,151 | |
Other Securities | | | 1,772,637 | | | | 83,899,463 | |
| | | | | | | | |
| | | | | | | 98,980,782 | |
| | | | | | | | |
REAL ESTATE (8.7%) | | | | | | | | |
Camden Property Trust | | | 72,628 | | | | 6,686,134 | |
Kilroy Realty Corp. | | | 77,070 | | | | 5,753,276 | |
Other Securities | | | 3,664,813 | | | | 114,229,927 | |
| | | | | | | | |
| | | | | | | 126,669,337 | |
| | | | | | | | |
TELECOMMUNICATION SERVICES (0.1%) | | | | | | | | |
Other Securities | | | 73,210 | | | | 2,035,238 | |
| | | | | | | | |
UTILITIES (5.1%) | | | | | | | | |
Atmos Energy Corp. | | | 86,838 | | | | 7,458,516 | |
UGI Corp. | | | 134,247 | | | | 6,302,897 | |
Westar Energy, Inc. | | | 111,405 | | | | 5,882,184 | |
Other Securities | | | 1,192,372 | | | | 53,840,320 | |
| | | | | | | | |
| | | | | | | 73,483,917 | |
| | | | | | | | |
TOTAL INDEXED ASSETS-COMMON STOCKS | | | | | | | | |
(Cost: $1,011,902,982) 95.5% | | | | | | | 1,386,920,057 | |
| | | | | | | | |
The accompanying notes are an integral part of these portfolio schedules.
51
MUTUAL OF AMERICA INVESTMENT CORPORATION — MID-CAP EQUITY INDEX FUND
SUMMARY PORTFOLIO OF INVESTMENTS IN SECURITIES (Continued)
December 31, 2017
| | | | | | | | | | | | | | | | | | | | |
| | | Rating** | | | Rate(%) | | | Maturity | | | Face Amount | | | Value | |
| SHORT-TERM DEBT SECURITIES: | | | | | | | | | | | | | | | | | | | | |
U.S. GOVERNMENT (2.6%) | | | | | | | | | | | | | | | | | | | | |
U.S. Treasury Bill (1) | | | A-1+ | | | | 1.05 - 1.25 | | | | 01/02/18 - 03/01/18 | | | $ | 38,400,000 | | | $ | 38,349,864 | |
| | | | | | | | | | | | | | | | | | | | |
COMMERCIAL PAPER (1.9%) | | | | | | | | | | | | | | | | | | | | |
New Jersey Natural Gas | | | A-1 | | | | 1.64 | | | | 01/04/18 | | | | 2,400,000 | | | | 2,399,453 | |
Procter & Gamble Co.† | | | A-1+ | | | | 1.48 | | | | 01/17/18 | | | | 15,000,000 | | | | 14,988,899 | |
Toyota Motor Credit Corp. | | | A-1+ | | | | 1.26 | | | | 01/03/18 | | | | 10,000,000 | | | | 9,998,597 | |
| | | | | | | | | | | | | | | | | | | | |
| | | | | | | | | | | | | | | | | | | 27,386,949 | |
| | | | | | | | | | | | | | | | | | | | |
TOTAL SHORT-TERM DEBT SECURITIES
(Cost: $65,736,813) 4.5% | | | | 65,736,813 | |
| | | | | | | | | | | | | | | | | | | | |
TOTAL INVESTMENTS
(Cost: $1,077,639,795) 100.0% | | | | 1,452,656,870 | |
| | | | | | | | | | | | | | | | | | | | |
OTHER NET ASSETS -0.0% (2) | | | | (623,763 | ) |
| | | | | | | | | | | | | | | | | | | | |
NET ASSETS 100.0% | | | $ | 1,452,033,107 | |
| | | | | | | | | | | | | | | | | | | | |
The accompanying notes are an integral part of these portfolio schedules.
52
MUTUAL OF AMERICA INVESTMENT CORPORATION — INTERNATIONAL FUND
PORTFOLIO OF INVESTMENTS IN SECURITIES
December 31, 2017
| | | | | | | | |
| | | Shares | | | Value | |
| COMMON STOCKS: | | | | | | | | |
FINANCIALS (92.9%) | | | | | | | | |
iShares Core MSCI EAFE ETF | | | 500,019 | | | $ | 33,046,256 | |
iShares Core MSCI Europe ETF | | | 393,284 | | | | 19,731,058 | |
iShares Core MSCI Pacific ETF | | | 177,010 | | | | 10,555,106 | |
iShares Edge MSCI Emerging Markets ETF | | | 239,149 | | | | 14,530,693 | |
iShares MSCI EAFE ETF | | | 2,780,851 | | | | 195,521,634 | |
iShares MSCI EAFE Growth ETF | | | 492,363 | | | | 39,753,389 | |
iShares MSCI EAFE Small-Cap ETF | | | 177,935 | | | | 11,471,469 | |
iShares MSCI EAFE Value ETF | | | 689,386 | | | | 38,057,554 | |
Vanguard FTSE Developed Markets ETF | | | 2,129,980 | | | | 95,550,903 | |
Vanguard FTSE Europe ETF | | | 424,630 | | | | 25,116,865 | |
Vanguard FTSE Pacific ETF | | | 220,480 | | | | 16,072,992 | |
| | | | | | | | |
| | | | | | | 499,407,919 | |
| | | | | | | | |
TOTAL COMMON STOCKS | | | | | | | | |
(Cost: $429,063,976) 92.9% | | | | | | | 499,407,919 | |
| | | | | | | | |
| | | | | | | | | | | | | | | | | | | | |
| | | Rating** | | | Rate(%) | | | Maturity | | | Face Amount | | | Value | |
| SHORT-TERM DEBT SECURITIES: | | | | | | | | | | | | | | | | | | | | |
U.S. GOVERNMENT (5.2%) | | | | | | | | | | | | | | | | | | | | |
U.S. Treasury Bill | | | A-1+ | | | | 1.00 - 1.25 | | | | 01/02/18 - 02/15/18 | | | $ | 28,000,000 | | | $ | 27,985,218 | |
| | | | | | | | | | | | | | | | | | | | |
COMMERCIAL PAPER (1.9%) | | | | | | | | | | | | | | | | | | | | |
New Jersey Natural Gas | | | A-1 | | | | 1.64 | | | | 01/04/18 | | | | 5,000,000 | | | | 4,998,861 | |
Toyota Motor Credit Corp. | | | A-1+ | | | | 1.26 | | | | 01/03/18 | | | | 5,000,000 | | | | 4,999,299 | |
| | | | | | | | | | | | | | | | | | | | |
| | | | | | | | | | | | | | | | | | | 9,998,160 | |
| | | | | | | | | | | | | | | | | | | | |
TOTAL SHORT-TERM DEBT SECURITIES
(Cost: $37,983,378) 7.1% | | | | 37,983,378 | |
| | | | | | | | | | | | | | | | | | | | |
TOTAL INVESTMENTS
(Cost: $467,047,354) 100.0% | | | | 537,391,297 | |
| | | | | | | | | | | | | | | | | | | | |
OTHER NET ASSETS 0.0% (2) | | | | 78,785 | |
| | | | | | | | | | | | | | | | | | | | |
NET ASSETS 100.0% | | | $ | 537,470,082 | |
| | | | | | | | | | | | | | | | | | | | |
The accompanying notes are an integral part of these portfolio schedules.
53
MUTUAL OF AMERICA INVESTMENT CORPORATION — COMPOSITE FUND
SUMMARY PORTFOLIO OF INVESTMENTS IN SECURITIES
December 31, 2017
| | | | | | | | |
| | | Shares | | | Value | |
| COMMON STOCKS: | | | | | | | | |
CONSUMER DISCRETIONARY (7.3%) | | | | | | | | |
Amazon.com, Inc.* | | | 1,384 | | | $ | 1,618,546 | |
Comcast Corp. Cl A | | | 59,006 | | | | 2,363,190 | |
Home Depot, Inc. | | | 18,404 | | | | 3,488,110 | |
Ross Stores, Inc. | | | 19,656 | | | | 1,577,394 | |
Viacom, Inc. Cl B | | | 30,790 | | | | 948,640 | |
Other Securities | | | 115,288 | | | | 3,958,589 | |
| | | | | | | | |
| | | | | | | 13,954,469 | |
| | | | | | | | |
CONSUMER STAPLES (2.6%) | | | | | | | | |
PepsiCo, Inc. | | | 17,146 | | | | 2,056,148 | |
Walgreens Boots Alliance, Inc. | | | 28,230 | | | | 2,050,063 | |
Other Securities | | | 6,739 | | | | 813,128 | |
| | | | | | | | |
| | | | | | | 4,919,339 | |
| | | | | | | | |
ENERGY (5.3%) | | | | | | | | |
Baker Hughes, a GE Co. | | | 55,307 | | | | 1,749,913 | |
Chevron Corp. | | | 13,719 | | | | 1,717,482 | |
Marathon Petroleum Corp. | | | 30,700 | | | | 2,025,586 | |
Other Securities | | | 107,646 | | | | 4,506,469 | |
| | | | | | | | |
| | | | | | | 9,999,450 | |
| | | | | | | | |
FINANCIALS (9.8%) | | | | | | | | |
Ameriprise Financial, Inc. | | | 7,686 | | | | 1,302,546 | |
Citigroup, Inc. | | | 30,385 | | | | 2,260,948 | |
CME Group, Inc. | | | 11,064 | | | | 1,615,897 | |
JPMorgan Chase & Co. | | | 28,544 | | | | 3,052,495 | |
KeyCorp | | | 76,720 | | | | 1,547,442 | |
Morgan Stanley | | | 28,862 | | | | 1,514,389 | |
PNC Financial Svcs. Grp., Inc. | | | 10,410 | | | | 1,502,059 | |
State Street Corp. | | | 12,892 | | | | 1,258,388 | |
Synchrony Financial | | | 38,962 | | | | 1,504,323 | |
Other Securities | | | 43,453 | | | | 3,083,624 | |
| | | | | | | | |
| | | | | | | 18,642,111 | |
| | | | | | | | |
HEALTH CARE (8.1%) | | | | | | | | |
AbbVie, Inc. | | | 33,388 | | | | 3,228,953 | |
Aetna, Inc. | | | 11,357 | | | | 2,048,689 | |
Amgen, Inc. | | | 8,182 | | | | 1,422,850 | |
Bristol-Myers Squibb Co. | | | 25,270 | | | | 1,548,546 | |
Gilead Sciences, Inc. | | | 17,443 | | | | 1,249,617 | |
Johnson & Johnson | | | 16,751 | | | | 2,340,450 | |
UnitedHealth Group, Inc. | | | 12,662 | | | | 2,791,465 | |
| | | | | | | | |
| | | Shares | | | Value | |
| COMMON STOCKS (CONTINUED): | | | | | | | | |
HEALTH CARE (CONTINUED) | | | | | | | | |
Other Securities | | | 2,837 | | | $ | 703,775 | |
| | | | | | | | |
| | | | | | | 15,334,345 | |
| | | | | | | | |
INDUSTRIALS (4.8%) | | | | | | | | |
Boeing Co. | | | 10,391 | | | | 3,064,410 | |
Delta Air Lines, Inc. | | | 32,906 | | | | 1,842,736 | |
FedEx Corp. | | | 8,438 | | | | 2,105,619 | |
Lockheed Martin Corp. | | | 4,633 | | | | 1,487,425 | |
Other Securities | | | 7,912 | | | | 705,671 | |
| | | | | | | | |
| | | | | | | 9,205,861 | |
| | | | | | | | |
INFORMATION TECHNOLOGY (15.9%) | | | | | | | | |
Alphabet, Inc. Cl A* | | | 3,410 | | | | 3,592,094 | |
Apple, Inc. | | | 35,431 | | | | 5,995,983 | |
Applied Materials, Inc. | | | 20,800 | | | | 1,063,296 | |
Broadcom Ltd. | | | 7,383 | | | | 1,896,693 | |
Cisco Systems, Inc. | | | 47,253 | | | | 1,809,790 | |
Corning, Inc. | | | 40,729 | | | | 1,302,921 | |
DXC Technology Co. | | | 13,749 | | | | 1,304,780 | |
Microsoft Corp. | | | 53,625 | | | | 4,587,079 | |
NVIDIA Corp. | | | 6,836 | | | | 1,322,766 | |
Oracle Corp. | | | 29,952 | | | | 1,416,131 | |
Total System Services, Inc. | | | 18,597 | | | | 1,470,837 | |
Other Securities | | | 69,930 | | | | 4,515,306 | |
| | | | | | | | |
| | | | | | | 30,277,676 | |
| | | | | | | | |
MATERIALS (1.6%) | | | | | | | | |
Other Securities | | | 46,531 | | | | 3,103,634 | |
| | | | | | | | |
REAL ESTATE (1.8%) | | | | | | | | |
American Tower Corp. | | | 13,731 | | | | 1,959,002 | |
Simon Property Group, Inc. | | | 8,648 | | | | 1,485,208 | |
| | | | | | | | |
| | | | | | | 3,444,210 | |
| | | | | | | | |
TELECOMMUNICATION SERVICES (0.5%) | | | | | | | | |
Other Securities | | | 57,491 | | | | 958,950 | |
| | | | | | | | |
UTILITIES (1.8%) | | | | | | | | |
NextEra Energy, Inc. | | | 10,950 | | | | 1,710,281 | |
Sempra Energy | | | 16,076 | | | | 1,718,846 | |
| | | | | | | | |
| | | | | | | 3,429,127 | |
| | | | | | | | |
TOTAL COMMON STOCKS | | | | | | | | |
(Cost: $88,093,747) 59.5% | | | | | | | 113,269,172 | |
| | | | | | | | |
The accompanying notes are an integral part of these portfolio schedules.
54
MUTUAL OF AMERICA INVESTMENT CORPORATION — COMPOSITE FUND
SUMMARY PORTFOLIO OF INVESTMENTS IN SECURITIES (Continued)
December 31, 2017
| | | | | | | | | | | | | | | | |
| | | Rating** | | | Rate(%) | | Maturity | | Face Amount | | | Value | |
| LONG-TERM DEBT SECURITIES: | | | | | | | | | | | | | | | | |
U.S. GOVERNMENT (12.0%) | | | | | | | | | | | | | | | | |
U.S. Treasury Note | | | AA+ | | | 1.50 - 2.38 | | 02/28/23 - 08/15/27 | | $ | 7,750,000 | | | $ | 7,600,786 | |
U.S. Treasury Strip | | | AA+ | | | 0.00 | | 11/15/21 -08/15/29 | | | 18,550,000 | | | | 15,153,775 | |
| | | | | | | | | | | | | | | | |
| | | | | | | | | | | | | | | 22,754,561 | |
| | | | | | | | | | | | | | | | |
U.S. GOVERNMENT AGENCIES (11.7%) | | | | | | | | | | | | | | | | |
MORTGAGE-BACKED OBLIGATIONS (11.4%) | | | | | | | | | | | | | | | | |
FHLMC | | | AA+ | | | 2.50 - 6.00 | | 02/01/25 - 09/01/47 | | | 5,359,142 | | | | 5,577,282 | |
FHLMC ARM | | | AA+ | | | 2.76 - 4.65 | | 02/01/36 - 09/01/39 | | | 107,249 | | | | 112,249 | |
FHLMC Strip | | | AA+ | | | 3.00 | | 01/15/43 | | | 291,334 | | | | 295,886 | |
FNMA | | | AA+ | | | 2.40 - 8.00 | | 04/01/18 - 12/25/49 | | | 12,177,812 | | | | 12,646,590 | |
FNMA Strip | | | AA+ | | | 3.00 | | 08/25/42 | | | 233,460 | | | | 233,540 | |
GNMA (3) | | | AA+ | | | 4.00 - 7.00 | | 04/15/31 - 10/20/43 | | | 1,456,242 | | | | 1,550,398 | |
Small Business Administration (3) | | | AA+ | | | 2.81 | | 06/01/37 | | | 1,323,294 | | | | 1,326,814 | |
Other Securities | | | | | | | | | | | 123,499 | | | | 128,909 | |
| | | | | | | | | | | | | | | | |
| | | | | | | | | | | | | | | 21,871,668 | |
| | | | | | | | | | | | | | | | |
NON-MORTGAGE-BACKED OBLIGATIONS (0.3%) | | | | | | | | | | | | | | | | |
FHLMC | | | AA+ | | | 0.00 | | 11/29/19 | | | 500,000 | | | | 478,864 | |
| | | | | | | | | | | | | | | | |
CORPORATE DEBT (13.9%) | | | | | | | | | | | | | | | | |
CONSUMER DISCRETIONARY (2.9%) | | | | | | | | | | | | | | | | |
Viacom, Inc. | | | BBB- | | | 3.25 | | 03/15/23 | | | 350,000 | | | | 340,180 | |
Other Securities | | | | | | | | | | | 5,061,000 | | | | 5,205,806 | |
| | | | | | | | | | | | | | | | |
| | | | | | | | | | | | | | | 5,545,986 | |
| | | | | | | | | | | | | | | | |
CONSUMER STAPLES (0.7%) | | | | | | | | | | | | | | | | |
Other Securities | | | | | | | | | | | 1,325,000 | | | | 1,359,289 | |
| | | | | | | | | | | | | | | | |
ENERGY (1.3%) | | | | | | | | | | | | | | | | |
Other Securities | | | | | | | | | | | 2,460,000 | | | | 2,495,228 | |
| | | | | | | | | | | | | | | | |
FINANCIALS (3.0%) | | | | | | | | | | | | | | | | |
Synchrony Financial | | | BBB- | | | 3.70 | | 08/04/26 | | | 400,000 | | | | 394,368 | |
Other Securities | | | | | | | | | | | 4,850,000 | | | | 5,061,105 | |
Other Securities† | | | | | | | | | | | 273,000 | | | | 284,986 | |
| | | | | | | | | | | | | | | | |
| | | | | | | | | | | | | | | 5,740,459 | |
| | | | | | | | | | | | | | | | |
HEALTH CARE (1.5%) | | | | | | | | | | | | | | | | |
Other Securities | | | | | | | | | | | 2,715,000 | | | | 2,826,606 | |
| | | | | | | | | | | | | | | | |
INDUSTRIALS (0.6%) | | | | | | | | | | | | | | | | |
Other Securities | | | | | | | | | | | 800,000 | | | | 817,173 | |
Other Securities† | | | | | | | | | | | 300,000 | | | | 300,895 | |
| | | | | | | | | | | | | | | | |
| | | | | | | | | | | | | | | 1,118,068 | |
| | | | | | | | | | | | | | | | |
INFORMATION TECHNOLOGY (1.2%) | | | | | | | | | | | | | | | | |
Applied Materials, Inc. | | | A- | | | 3.90 | | 10/01/25 | | | 350,000 | | | | 371,496 | |
Other Securities | | | | | | | | | | | 1,885,000 | | | | 1,951,233 | |
| | | | | | | | | | | | | | | | |
| | | | | | | | | | | | | | | 2,322,729 | |
| | | | | | | | | | | | | | | | |
MATERIALS (0.9%) | | | | | | | | | | | | | | | | |
Other Securities | | | | | | | | | | | 1,700,000 | | | | 1,750,351 | |
| | | | | | | | | | | | | | | | |
REAL ESTATE (0.9%) | | | | | | | | | | | | | | | | |
Other Securities | | | | | | | | | | | 1,650,000 | | | | 1,716,042 | |
| | | | | | | | | | | | | | | | |
TELECOMMUNICATION SERVICES (0.2%) | | | | | | | | | | | | | | | | |
Other Securities | | | | | | | | | | | 350,000 | | | | 350,622 | |
| | | | | | | | | | | | | | | | |
UTILITIES (0.7%) | | | | | | | | | | | | | | | | |
Other Securities | | | | | | | | | | | 1,240,000 | | | | 1,303,089 | |
| | | | | | | | | | | | | | | | |
TOTAL LONG-TERM DEBT SECURITIES
(Cost: $70,140,235) 37.6% | | | | | | | | | | | | | | | 71,633,562 | |
| | | | | | | | | | | | | | | | |
The accompanying notes are an integral part of these portfolio schedules.
55
MUTUAL OF AMERICA INVESTMENT CORPORATION — COMPOSITE FUND
SUMMARY PORTFOLIO OF INVESTMENTS IN SECURITIES (Continued)
December 31, 2017
| | | | | | | | | | | | | | | | | | | | |
| | | Rating** | | | Rate(%) | | | Maturity | | | Face Amount | | | Value | |
| SHORT-TERM DEBT SECURITIES: | | | | | | | | | | | | | | | | | | | | |
U.S. GOVERNMENT (1.3%) | | | | | | | | | | | | | | | | | | | | |
U.S. Treasury Bill | | | A-1+ | | | | 1.00 | | | | 01/02/18 | | | $ | 2,600,000 | | | $ | 2,599,783 | |
| | | | | | | | | | | | | | | | | | | | |
COMMERCIAL PAPER (1.1%) | | | | | | | | | | | | | | | | | | | | |
Estee Lauder Cos.† | | | A-1 | | | | 1.40 | | | | 01/02/18 | | | | 2,000,000 | | | | 1,999,767 | |
| | | | | | | | | | | | | | | | | | | | |
TOTAL SHORT-TERM DEBT SECURITIES
(Cost: $4,599,550) 2.4% | | | | 4,599,550 | |
| | | | | | | | | | | | | | | | | | | | |
TOTAL INVESTMENTS
(Cost: $162,833,532) 99.5% | | | | 189,502,284 | |
| | | | | | | | | | | | | | | | | | | | |
OTHER NET ASSETS 0.5% | | | | 868,631 | |
| | | | | | | | | | | | | | | | | | | | |
NET ASSETS 100.0% | | | $ | 190,370,915 | |
| | | | | | | | | | | | | | | | | | | | |
The accompanying notes are an integral part of these portfolio schedules.
56
MUTUAL OF AMERICA INVESTMENT CORPORATION — RETIREMENT INCOME FUND
PORTFOLIO OF INVESTMENTS IN SECURITIES
December 31, 2017
| | | | | | | | |
| | | Shares | | | Value | |
| COMMON STOCKS: | | | | |
DIVERSIFIED MUTUAL FUNDS (100.0%) | | | | |
Mutual of America Investment Corporation | | | | |
Bond Fund (30.1%) | | | 21,028,408 | | | $ | 30,339,830 | |
Equity Index Fund (22.8%) | | | 5,601,241 | | | | 22,985,867 | |
Mid-Cap Equity Index Fund (5.8%) | | | 2,488,936 | | | | 5,830,114 | |
Mid-Term Bond Fund (33.2%) | | | 32,156,863 | | | | 33,475,294 | |
Money Market Fund (8.1%) | | | 6,800,751 | | | | 8,188,254 | |
| | | | | | | | |
TOTAL INVESTMENTS
(Cost: $97,648,449) 100.0% | | | 100,819,359 | |
| | | | | | | | |
OTHER NET ASSETS -0.0% (2) | | | | | | | (697 | ) |
| | | | | | | | |
NET ASSETS 100.0% | | | | | | $ | 100,818,662 | |
| | | | | | | | |
MUTUAL OF AMERICA INVESTMENT CORPORATION — 2010 RETIREMENT FUND
PORTFOLIO OF INVESTMENTS IN SECURITIES
December 31, 2017
| | | | | | | | |
| | | Shares | | | Value | |
| COMMON STOCKS: | | | | | | | | |
DIVERSIFIED MUTUAL FUNDS (100.0%) | | | | | | | | |
Mutual of America Investment Corporation | | | | | | | | |
Bond Fund (24.6%) | | | 4,362,194 | | | $ | 6,293,782 | |
Equity Index Fund (25.7%) | | | 1,596,211 | | | | 6,550,388 | |
International Fund (4.7%) | | | 1,324,331 | | | | 1,197,602 | |
Mid-Cap Equity Index Fund (8.5%) | | | 926,995 | | | | 2,171,404 | |
Mid-Term Bond Fund (31.7%) | | | 7,784,829 | | | | 8,104,006 | |
Money Market Fund (4.8%) | | | 1,023,545 | | | | 1,232,370 | |
| | | | | | | | |
TOTAL INVESTMENTS
(Cost: $24,241,164) 100.0% | | | | | | | 25,549,552 | |
| | | | | | | | |
OTHER NET ASSETS 0.0% (2) | | | | | | | 415 | |
| | | | | | | | |
NET ASSETS 100.0% | | | | | | $ | 25,549,967 | |
| | | | | | | | |
MUTUAL OF AMERICA INVESTMENT CORPORATION — 2015 RETIREMENT FUND
PORTFOLIO OF INVESTMENTS IN SECURITIES
December 31, 2017
| | | | | | | | |
| | | Shares | | | Value | |
| COMMON STOCKS: | | | | | | | | |
DIVERSIFIED MUTUAL FUNDS (100.0%) | | | | | | | | |
Mutual of America Investment Corporation | | | | | | | | |
Bond Fund (23.9%) | | | 25,670,752 | | | $ | 37,037,812 | |
Equity Index Fund (29.8%) | | | 11,229,380 | | | | 46,082,119 | |
International Fund (5.2%) | | | 8,894,550 | | | | 8,043,404 | |
Mid-Cap Equity Index Fund (10.0%) | | | 6,644,139 | | | | 15,563,312 | |
Mid-Term Bond Fund (26.1%) | | | 38,918,195 | | | | 40,513,841 | |
Money Market Fund (2.9%) | | | 3,679,837 | | | | 4,430,605 | |
Small Cap Growth Fund (1.1%) | | | 1,102,740 | | | | 1,702,980 | |
Small Cap Value Fund (1.0%) | | | 930,010 | | | | 1,613,834 | |
| | | | | | | | |
TOTAL INVESTMENTS
(Cost: $140,319,928) 100.0% | | | | | | | 154,987,907 | |
| | | | | | | | |
OTHER NET ASSETS -0.0% (2) | | | | | | | (1,994 | ) |
| | | | | | | | |
NET ASSETS 100.0% | | | | | | $ | 154,985,913 | |
| | | | | | | | |
The accompanying notes are an integral part of these portfolio schedules.
57
MUTUAL OF AMERICA INVESTMENT CORPORATION — 2020 RETIREMENT FUND
PORTFOLIO OF INVESTMENTS IN SECURITIES
December 31, 2017
| | | | | | | | |
| | | Shares | | | Value | |
| COMMON STOCKS: | | | | | | | | |
DIVERSIFIED MUTUAL FUNDS (100.0%) | | | | | | | | |
Mutual of America Investment Corporation | | | | | | | | |
Bond Fund (22.6%) | | | 82,418,401 | | | $ | 118,913,434 | |
Equity Index Fund (33.5%) | | | 42,890,919 | | | | 176,011,895 | |
International Fund (8.2%) | | | 47,574,138 | | | | 43,021,626 | |
Mid-Cap Equity Index Fund (11.9%) | | | 26,604,901 | | | | 62,319,639 | |
Mid-Term Bond Fund (19.3%) | | | 97,214,071 | | | | 101,199,848 | |
Small Cap Growth Fund (2.2%) | | | 7,351,543 | | | | 11,353,121 | |
Small Cap Value Fund (2.3%) | | | 6,936,328 | | | | 12,036,520 | |
| | | | | | | | |
TOTAL INVESTMENTS
(Cost: $465,283,860) 100.0% | | | | | | | 524,856,083 | |
| | | | | | | | |
OTHER NET ASSETS -0.0% (2) | | | | | | | (3,510 | ) |
| | | | | | | | |
NET ASSETS 100.0% | | | | | | $ | 524,852,573 | |
| | | | | | | | |
MUTUAL OF AMERICA INVESTMENT CORPORATION — 2025 RETIREMENT FUND
PORTFOLIO OF INVESTMENTS IN SECURITIES
December 31, 2017
| | | | | | | | |
| | | Shares | | | Value | |
| COMMON STOCKS: | | | | | | | | |
DIVERSIFIED MUTUAL FUNDS (100.0%) | | | | | | | | |
Mutual of America Investment Corporation | | | | | | | | |
Bond Fund (21.3%) | | | 101,538,642 | | | $ | 146,500,156 | |
Equity Index Fund (36.3%) | | | 60,738,196 | | | | 249,251,940 | |
International Fund (9.9%) | | | 75,073,605 | | | | 67,889,586 | |
Mid-Cap Equity Index Fund (14.7%) | | | 42,896,732 | | | | 100,481,819 | |
Mid-Term Bond Fund (9.7%) | | | 63,565,556 | | | | 66,171,743 | |
Small Cap Growth Fund (4.0%) | | | 17,882,708 | | | | 27,616,588 | |
Small Cap Value Fund (4.1%) | | | 16,034,840 | | | | 27,825,050 | |
| | | | | | | | |
TOTAL INVESTMENTS
(Cost: $597,276,964) 100.0% | | | | | | | 685,736,882 | |
| | | | | | | | |
OTHER NET ASSETS -0.0% (2) | | | | (4,468 | ) |
| | | | | | | | |
NET ASSETS 100.0% | | | $ | 685,732,414 | |
| | | | | | | | |
MUTUAL OF AMERICA INVESTMENT CORPORATION — 2030 RETIREMENT FUND
PORTFOLIO OF INVESTMENTS IN SECURITIES
December 31, 2017
| | | | | | | | |
| | | Shares | | | Value | |
| COMMON STOCKS: | | | | | | | | |
DIVERSIFIED MUTUAL FUNDS (100.0%) | | | | | | | | |
Mutual of America Investment Corporation | | | | | | | | |
Bond Fund (18.9%) | | | 76,031,998 | | | $ | 109,699,118 | |
Equity Index Fund (38.0%) | | | 53,538,458 | | | | 219,706,306 | |
International Fund (11.6%) | | | 74,007,031 | | | | 66,925,076 | |
Mid-Cap Equity Index Fund (18.7%) | | | 46,112,192 | | | | 108,013,752 | |
Mid-Term Bond Fund (2.2%) | | | 12,037,438 | | | | 12,530,973 | |
Small Cap Growth Fund (5.3%) | | | 19,762,768 | | | | 30,519,999 | |
Small Cap Value Fund (5.3%) | | | 17,470,136 | | | | 30,315,700 | |
| | | | | | | | |
TOTAL INVESTMENTS
(Cost: $492,216,031) 100.0% | | | | | | | 577,710,924 | |
| | | | | | | | |
OTHER NET ASSETS -0.0% (2) | | | | | | | (3,764 | ) |
| | | | | | | | |
NET ASSETS 100.0% | | | | | | $ | 577,707,160 | |
| | | | | | | | |
The accompanying notes are an integral part of these portfolio schedules.
58
MUTUAL OF AMERICA INVESTMENT CORPORATION — 2035 RETIREMENT FUND
PORTFOLIO OF INVESTMENTS IN SECURITIES
December 31, 2017
| | | | | | | | |
| | | Shares | | | Value | |
| COMMON STOCKS: | | | | | | | | |
DIVERSIFIED MUTUAL FUNDS (100.0%) | | | | | | | | |
MUTUAL OF AMERICA INVESTMENT CORPORATION | | | | | | | | |
Bond Fund (14.6%) | | | 48,849,599 | | | $ | 70,480,300 | |
Equity Index Fund (39.8%) | | | 46,993,461 | | | | 192,847,537 | |
International Fund (12.1%) | | | 64,582,412 | | | | 58,402,327 | |
Mid-Cap Equity Index Fund (21.5%) | | | 44,436,252 | | | | 104,088,009 | |
Small Cap Growth Fund (6.0%) | | | 19,010,258 | | | | 29,357,883 | |
Small Cap Value Fund (6.0%) | | | 16,711,043 | | | | 28,998,455 | |
| | | | | | | | |
TOTAL INVESTMENTS
(Cost: $405,662,756) 100.0% | | | | | | | 484,174,511 | |
| | | | | | | | |
OTHER NET ASSETS -0.0% (2) | | | | | | | (3,148 | ) |
| | | | | | | | |
NET ASSETS 100.0% | | | | | | $ | 484,171,363 | |
| | | | | | | | |
MUTUAL OF AMERICA INVESTMENT CORPORATION — 2040 RETIREMENT FUND
PORTFOLIO OF INVESTMENTS IN SECURITIES
December 31, 2017
| | | | | | | | |
| | | Shares | | | Value | |
| COMMON STOCKS: | | | | |
DIVERSIFIED MUTUAL FUNDS (100.0%) | | | | |
Mutual of America Investment Corporation | | | | |
Bond Fund (12.2%) | | | 33,092,653 | | | $ | 47,746,145 | |
Equity Index Fund (38.6%) | | | 36,965,757 | | | | 151,696,748 | |
International Fund (13.5%) | | | 58,492,567 | | | | 52,895,238 | |
Mid-Cap Equity Index Fund (21.2%) | | | 35,593,198 | | | | 83,373,933 | |
Small Cap Growth Fund (7.3%) | | | 18,656,806 | | | | 28,812,042 | |
Small Cap Value Fund (7.2%) | | | 16,288,953 | | | | 28,266,008 | |
| | | | | | | | |
TOTAL INVESTMENTS
(Cost: $326,535,069) 100.0% | | | | | | | 392,790,114 | |
| | | | | | | | |
OTHER NET ASSETS -0.0% (2) | | | | | | | (2,591 | ) |
| | | | | | | | |
NET ASSETS 100.0% | | | | | | $ | 392,787,523 | |
| | | | | | | | |
MUTUAL OF AMERICA INVESTMENT CORPORATION — 2045 RETIREMENT FUND
PORTFOLIO OF INVESTMENTS IN SECURITIES
December 31, 2017
| | | | | | | | |
| | | Shares | | | Value | |
| COMMON STOCKS: | | | | |
DIVERSIFIED MUTUAL FUNDS (100.0%) | | | | |
Mutual of America Investment Corporation | | | | |
Bond Fund (9.9%) | | | 30,126,471 | | | $ | 43,466,532 | |
Equity Index Fund (36.9%) | | | 39,321,078 | | | | 161,362,300 | |
International Fund (14.2%) | | | 68,587,524 | | | | 62,024,178 | |
Mid-Cap Equity Index Fund (22.4%) | | | 41,866,235 | | | | 98,067,970 | |
Small Cap Growth Fund (8.4%) | | | 23,719,298 | | | | 36,630,139 | |
Small Cap Value Fund (8.2%) | | | 20,631,832 | | | | 35,802,149 | |
| | | | | | | | |
TOTAL INVESTMENTS
(Cost: $356,025,178) 100.0% | | | | | | | 437,353,268 | |
| | | | | | | | |
OTHER NET ASSETS -0.0% (2) | | | | | | | (2,892 | ) |
| | | | | | | | |
NET ASSETS 100.0% | | | | | | $ | 437,350,376 | |
| | | | | | | | |
The accompanying notes are an integral part of these portfolio schedules.
59
MUTUAL OF AMERICA INVESTMENT CORPORATION — 2050 RETIREMENT FUND
PORTFOLIO OF INVESTMENTS IN SECURITIES
December 31, 2017
| | | | | | | | |
| | | Shares | | | Value | |
| COMMON STOCKS: | | | | |
DIVERSIFIED MUTUAL FUNDS (100.0%) | | | | |
Mutual of America Investment Corporation | | | | |
Bond Fund (8.2%) | | | 14,621,592 | | | $ | 21,096,062 | |
Equity Index Fund (35.3%) | | | 22,037,429 | | | | 90,435,215 | |
International Fund (15.6%) | | | 44,349,573 | | | | 40,105,630 | |
Mid-Cap Equity Index Fund (22.4%) | | | 24,493,001 | | | | 57,372,700 | |
Small Cap Growth Fund (9.4%) | | | 15,575,392 | | | | 24,053,358 | |
Small Cap Value Fund (9.1%) | | | 13,505,767 | | | | 23,436,382 | |
| | | | | | | | |
TOTAL INVESTMENTS
(Cost: $228,116,484) 100.0% | | | | | | | 256,499,347 | |
| | | | | | | | |
OTHER NET ASSETS -0.0% (2) | | | | | | | (1,122 | ) |
| | | | | | | | |
NET ASSETS 100.0% | | | | | | $ | 256,498,225 | |
| | | | | | | | |
MUTUAL OF AMERICA INVESTMENT CORPORATION — 2055 RETIREMENT FUND
PORTFOLIO OF INVESTMENTS IN SECURITIES
December 31, 2017
| | | | | | | | |
| | | Shares | | | Value | |
| COMMON STOCKS: | | | | |
DIVERSIFIED MUTUAL FUNDS (100.0%) | | | | |
Mutual of America Investment Corporation | | | | |
Bond Fund (8.2%) | | | 1,942,909 | | | $ | 2,803,233 | |
Equity Index Fund (32.6%) | | | 2,731,965 | | | | 11,211,191 | |
International Fund (16.9%) | | | 6,408,644 | | | | 5,795,381 | |
Mid-Cap Equity Index Fund (22.3%) | | | 3,258,944 | | | | 7,633,789 | |
Small Cap Growth Fund (10.1%) | | | 2,249,265 | | | | 3,473,580 | |
Small Cap Value Fund (9.9%) | | | 1,954,964 | | | | 3,392,424 | |
| | | | | | | | |
TOTAL INVESTMENTS
(Cost: $32,726,349) 100.0% | | | | | | | 34,309,598 | |
| | | | | | | | |
OTHER NET ASSETS -0.0% (2) | | | | | | | (140 | ) |
| | | | | | | | |
NET ASSETS 100.0% | | | | | | $ | 34,309,458 | |
| | | | | | | | |
MUTUAL OF AMERICA INVESTMENT CORPORATION — CONSERVATIVE ALLOCATION FUND
PORTFOLIO OF INVESTMENTS IN SECURITIES
December 31, 2017
| | | | | | | | |
| | | Shares | | | Value | |
| COMMON STOCKS: | | | | |
DIVERSIFIED MUTUAL FUNDS (100.0%) | | | | |
Mutual of America Investment Corporation | | | | |
Bond Fund (29.7%) | | | 32,177,928 | | | $ | 46,426,379 | |
Equity Index Fund (25.6%) | | | 9,761,314 | | | | 40,057,603 | |
International Fund (5.0%) | | | 8,721,043 | | | | 7,886,500 | |
Mid-Cap Equity Index Fund (5.1%) | | | 3,433,638 | | | | 8,042,996 | |
Mid-Term Bond Fund (34.6%) | | | 51,973,692 | | | | 54,104,613 | |
| | | | | | | | |
TOTAL INVESTMENTS
(Cost: $148,348,099) 100.0% | | | | | | | 156,518,091 | |
| | | | | | | | |
OTHER NET ASSETS -0.0% (2) | | | | | | | (211 | ) |
| | | | | | | | |
NET ASSETS 100.0% | | | | | | $ | 156,517,880 | |
| | | | | | | | |
The accompanying notes are an integral part of these portfolio schedules.
60
MUTUAL OF AMERICA INVESTMENT CORPORATION — MODERATE ALLOCATION FUND
PORTFOLIO OF INVESTMENTS IN SECURITIES
December 31, 2017
| | | | | | | | |
| | | Shares | | | Value | |
| COMMON STOCKS: | | | | |
DIVERSIFIED MUTUAL FUNDS (100.0%) | | | | |
Mutual of America Investment Corporation | | | | |
Bond Fund (24.5%) | | | 67,471,627 | | | $ | 97,348,198 | |
Equity Index Fund (35.5%) | | | 34,383,276 | | | | 141,098,993 | |
International Fund (10.0%) | | | 43,883,861 | | | | 39,684,483 | |
Mid-Cap Equity Index Fund (15.3%) | | | 25,917,716 | | | | 60,709,968 | |
Mid-Term Bond Fund (14.7%) | | | 56,045,963 | | | | 58,343,848 | |
| | | | | | | | |
TOTAL INVESTMENTS
(Cost: $334,548,706) 100.0% | | | | | | | 397,185,490 | |
| | | | | | | | |
OTHER NET ASSETS -0.0% (2) | | | | | | | (551 | ) |
| | | | | | | | |
NET ASSETS 100.0% | | | | | | $ | 397,184,939 | |
| | | | | | | | |
MUTUAL OF AMERICA INVESTMENT CORPORATION — AGGRESSIVE ALLOCATION FUND
PORTFOLIO OF INVESTMENTS IN SECURITIES
December 31, 2017
| | | | | | | | |
| | | Shares | | | Value | |
| COMMON STOCKS: | | | | |
DIVERSIFIED MUTUAL FUNDS (100.0%) | | | | |
Mutual of America Investment Corporation | | | | |
Bond Fund (19.5%) | | | 41,106,085 | | | $ | 59,307,942 | |
Equity Index Fund (35.3%) | | | 26,188,134 | | | | 107,468,506 | |
International Fund (14.9%) | | | 50,129,203 | | | | 45,332,189 | |
Mid-Cap Equity Index Fund (20.3%) | | | 26,321,148 | | | | 61,654,972 | |
Small Cap Growth Fund (5.0%) | | | 9,950,630 | | | | 15,366,937 | |
Small Cap Value Fund (5.0%) | | | 8,828,590 | | | | 15,320,137 | |
| | | | | | | | |
TOTAL INVESTMENTS
(Cost: $237,221,918) 100.0% | | | | | | | 304,450,683 | |
| | | | | | | | |
OTHER NET ASSETS -0.0% (2) | | | | | | | (1,319 | ) |
| | | | | | | | |
NET ASSETS 100.0% | | | | | | $ | 304,449,364 | |
| | | | | | | | |
The accompanying notes are an integral part of these portfolio schedules.
61
MUTUAL OF AMERICA INVESTMENT CORPORATION — MONEY MARKET FUND
PORTFOLIO OF INVESTMENTS IN SECURITIES
December 31, 2017
| | | | | | | | | | | | | | | | | | | | |
| | | Rating** | | | Rate(%) | | | Maturity | | | Face Amount | | | Value | |
| SHORT-TERM DEBT SECURITIES: | | | | | | | | | | | | | | | | |
U.S. GOVERNMENT (26.7%) | | | | | | | | | | | | | | | | |
U.S. Treasury Bill | | | A-1+ | | | | 1.02 | | | | 01/11/18 | | | $ | 1,600,000 | | | $ | 1,599,453 | |
U.S. Treasury Bill | | | A-1+ | | | | 1.03 | | | | 01/02/18 | | | | 2,800,000 | | | | 2,799,759 | |
U.S. Treasury Bill | | | A-1+ | | | | 1.05 | | | | 01/04/18 | | | | 2,400,000 | | | | 2,399,649 | |
U.S. Treasury Bill | | | A-1+ | | | | 1.06 | | | | 01/18/18 | | | | 1,700,000 | | | | 1,699,047 | |
U.S. Treasury Bill | | | A-1+ | | | | 1.11 | | | | 01/18/18 | | | | 500,000 | | | | 499,707 | |
U.S. Treasury Bill | | | A-1+ | | | | 1.15 | | | | 01/18/18 | | | | 900,000 | | | | 899,453 | |
U.S. Treasury Bill | | | A-1+ | | | | 1.15 | | | | 01/25/18 | | | | 400,000 | | | | 399,666 | |
U.S. Treasury Bill | | | A-1+ | | | | 1.18 | | | | 01/25/18 | | | | 1,500,000 | | | | 1,498,720 | |
U.S. Treasury Bill | | | A-1+ | | | | 1.25 | | | | 02/15/18 | | | | 2,100,000 | | | | 2,096,567 | |
U.S. Treasury Bill | | | A-1+ | | | | 1.25 | | | | 03/01/18 | | | | 2,900,000 | | | | 2,894,249 | |
U.S. Treasury Bill | | | A-1+ | | | | 1.26 | | | | 02/15/18 | | | | 2,100,000 | | | | 2,096,555 | |
| | | | | | | | | | | | | | | | | | | | |
| | | | | | | | | | | | | | | 18,882,825 | |
| | | | | | | | | | | | | | | | | | | | |
U.S. GOVERNMENT AGENCIES (12.4%) | | | | | | | | | | | | | | | | |
FHLB | | | A-1+ | | | | 1.17 | | | | 01/22/18 | | | | 100,000 | | | | 99,925 | |
FHLB | | | A-1+ | | | | 1.18 | | | | 01/10/18 | | | | 1,100,000 | | | | 1,099,601 | |
FHLB | | | A-1+ | | | | 1.20 | | | | 01/09/18 | | | | 1,700,000 | | | | 1,699,433 | |
FHLB | | | A-1+ | | | | 1.21 | | | | 01/16/18 | | | | 1,100,000 | | | | 1,099,371 | |
FHLB | | | A-1+ | | | | 1.28 | | | | 02/01/18 | | | | 1,500,000 | | | | 1,498,232 | |
FHLB | | | A-1+ | | | | 1.30 | | | | 02/07/18 | | | | 2,100,000 | | | | 2,097,041 | |
FHLB | | | A-1+ | | | | 1.30 | | | | 02/16/18 | | | | 1,200,000 | | | | 1,197,919 | |
| | | | | | | | | | | | | | | | | | | | |
| | | | | | | | | | | | | | | 8,791,522 | |
| | | | | | | | | | | | | | | | | | | | |
COMMERCIAL PAPER (60.9%) | | | | | | | | | | | | | | | | |
Apple, Inc.† | | | A-1+ | | | | 1.20 | | | | 01/10/18 | | | | 2,100,000 | | | | 2,099,229 | |
Chevron Corp.† | | | A-1+ | | | | 1.20 | | | | 01/08/18 | | | | 2,700,000 | | | | 2,699,189 | |
Cisco Systems, Inc.† | | | A-1+ | | | | 1.30 | | | | 01/03/18 | | | | 600,000 | | | | 599,913 | |
Coca-Cola Co.† | | | A-1+ | | | | 1.23 | | | | 01/12/18 | | | | 1,800,000 | | | | 1,799,199 | |
Deere & Co.† | | | A-1 | | | | 1.36 | | | | 01/17/18 | | | | 2,100,000 | | | | 2,098,571 | |
Emerson Electric Co.† | | | A-1 | | | | 1.27 | | | | 01/26/18 | | | | 2,700,000 | | | | 2,697,426 | |
Estee Lauder Cos.† | | | A-1 | | | | 1.20 | | | | 01/04/18 | | | | 2,700,000 | | | | 2,699,550 | |
Exxon Mobil Corp. | | | A-1+ | | | | 1.39 | | | | 01/10/18 | | | | 1,700,000 | | | | 1,699,278 | |
Hershey Foods† | | | A-1 | | | | 1.45 | | | | 01/03/18 | | | | 2,000,000 | | | | 1,999,678 | |
Illinois Tool Works, Inc.† | | | A-1 | | | | 1.25 | | | | 01/16/18 | | | | 2,700,000 | | | | 2,698,404 | |
Intercontinental Exchange, Inc.† | | | A-1 | | | | 1.58 | | | | 01/30/18 | | | | 2,750,000 | | | | 2,746,258 | |
Microsoft Corp.† | | | A-1+ | | | | 1.23 | | | | 01/09/18 | | | | 1,700,000 | | | | 1,699,418 | |
New Jersey Natural Gas† | | | A-1 | | | | 1.64 | | | | 01/04/18 | | | | 2,600,000 | | | | 2,599,408 | |
NIKE, Inc.† | | | A-1+ | | | | 1.33 | | | | 01/11/18 | | | | 2,200,000 | | | | 2,199,024 | |
Procter & Gamble Co.† | | | A-1+ | | | | 1.31 | | | | 02/01/18 | | | | 2,400,000 | | | | 2,397,115 | |
QUALCOMM, Inc.† | | | A-1 | | | | 1.23 | | | | 01/03/18 | | | | 2,700,000 | | | | 2,699,630 | |
Simon Property Group LP† | | | A-1 | | | | 1.35 | | | | 01/23/18 | | | | 1,100,000 | | | | 1,099,009 | |
Simon Property Group LP† | | | A-1 | | | | 1.47 | | | | 01/29/18 | | | | 630,000 | | | | 629,228 | |
Toyota Motor Credit Corp. | | | A-1+ | | | | 1.36 | | | | 01/24/18 | | | | 2,500,000 | | | | 2,497,637 | |
Unilever Capital† | | | A-1 | | | | 1.22 | | | | 01/08/18 | | | | 650,000 | | | | 649,801 | |
Wal-Mart Stores, Inc.† | | | A-1+ | | | | 1.21 | | | | 01/05/18 | | | | 1,900,000 | | | | 1,899,616 | |
Washington Gas Light Co. | | | A-1 | | | | 1.75 | | | | 01/05/18 | | | | 900,000 | | | | 899,737 | |
| | | | | | | | | | | | | | | | | | | | |
| | | | | | | | | | | | | | | 43,106,318 | |
| | | | | | | | | | | | | | | | | | | | |
TOTAL SHORT-TERM DEBT SECURITIES
(Cost: $70,780,274) 100.0% | | | | 70,780,665 | |
| | | | | | | | | | | | | | | | | | | | |
TOTAL INVESTMENTS
(Cost: $70,780,274) 100.0% | | | | 70,780,665 | |
| | | | | | | | | | | | | | | | | | | | |
OTHER NET ASSETS 0.0% (2) | | | | 18,728 | |
| | | | | | | | | | | | | | | | | | | | |
NET ASSETS 100.0% | | | $ | 70,799,393 | |
| | | | | | | | | | | | | | | | | | | | |
The accompanying notes are an integral part of these portfolio schedules.
62
MUTUAL OF AMERICA INVESTMENT CORPORATION — MID-TERM BOND FUND
SUMMARY PORTFOLIO OF INVESTMENTS IN SECURITIES
December 31, 2017
| | | | | | | | | | | | | | | | | | | | |
| | | Rating** | | | Rate(%) | | | Maturity | | | Face Amount | | | Value | |
| LONG-TERM DEBT SECURITIES: | | | | | | | | | | | | | | | | | | | | |
U.S. GOVERNMENT (48.2%) | | | | | | | | | | | | | | | | | | | | |
U.S. Treasury Note | | | AA+ | | | | 0.75 - 2.00 | | | | 07/15/19 - 08/15/26 | | | $ | 231,800,000 | | | $ | 224,460,151 | |
U.S. Treasury Strip | | | AA+ | | | | 0.00 | | | | 08/15/18 | | | | 45,000,000 | | | | 44,545,135 | |
| | | | | | | | | | | | | | | | | | | | |
| | | | | | | | | | | | | | | | | | | 269,005,286 | |
| | | | | | | | | | | | | | | | | | | | |
U.S. GOVERNMENT AGENCIES (7.5%) | | | | | | | | | | | | | | | | |
MORTGAGE-BACKED OBLIGATIONS (1.1%) | | | | | | | | | | | | | | | | | | | | |
FHLMC | | | AA+ | | | | 7.50 | | | | 03/15/21 | | | | 1,798 | | | | 1,888 | |
Small Business Administration (3) | | | AA+ | | | | 2.88 | | | | 05/01/37 | | | | 5,861,895 | | | | 5,892,974 | |
| | | | | | | | | | | | | | | | | | | | |
| | | | | | | | | | | | | | | 5,894,862 | |
| | | | | | | | | | | | | | | | | | | | |
NON-MORTGAGE-BACKED OBLIGATIONS (6.4%) | | | | | | | | | | | | | | | | |
FHLMC | | | AA+ | | | | 0.00 | | | | 11/29/19 | | | | 13,500,000 | | | | 12,929,315 | |
FNMA | | | AA+ | | | | 0.00 | | | | 10/09/19 | | | | 23,000,000 | | | | 22,151,323 | |
Other Securities | | | | | | | | | | | | | | | 900,000 | | | | 842,112 | |
| | | | | | | | | | | | | | | | | | | | |
| | | | | | | | | | | | | | | 35,922,750 | |
| | | | | | | | | | | | | | | | | | | | |
CORPORATE DEBT (43.6%) | | | | | | | | | | | | | | | | |
CONSUMER DISCRETIONARY (7.5%) | | | | | | | | | | | | | | | | |
Advance Auto Parts, Inc. | | | BBB- | | | | 4.50 - 5.75 | | | | 05/01/20 - 12/01/23 | | | | 2,250,000 | | | | 2,385,226 | |
Coach, Inc. | | | BBB- | | | | 3.00 | | | | 07/15/22 | | | | 2,500,000 | | | | 2,491,168 | |
Expedia, Inc. | | | BBB- | | | | 5.95 | | | | 08/15/20 | | | | 2,000,000 | | | | 2,151,776 | |
Family Dollar Stores, Inc. | | | BBB- | | | | 5.00 | | | | 02/01/21 | | | | 2,000,000 | | | | 2,120,000 | |
Gap, Inc. | | | BB+ | | | | 5.95 | | | | 04/12/21 | | | | 2,000,000 | | | | 2,156,574 | |
Marriott International, Inc. | | | BBB | | | | 3.00 - 3.38 | | | | 03/01/19 - 02/15/23 | | | | 4,000,000 | | | | 4,018,073 | |
NVR, Inc. | | | BBB+ | | | | 3.95 | | | | 09/15/22 | | | | 2,000,000 | | | | 2,087,834 | |
Scripps Networks Interactive, Inc. | | | BBB | | | | 3.50 | | | | 06/15/22 | | | | 2,500,000 | | | | 2,525,200 | |
Tupperware Brands Corp. | | | BBB- | | | | 4.75 | | | | 06/01/21 | | | | 2,000,000 | | | | 2,108,424 | |
Viacom, Inc. | | | BBB- | | | | 3.25 | | | | 03/15/23 | | | | 2,500,000 | | | | 2,429,860 | |
Wyndham Worldwide Corp. | | | BBB- | | | | 4.15 | | | | 04/01/24 | | | | 2,500,000 | | | | 2,511,693 | |
Other Securities | | | | | | | | | | | | | | | 14,373,000 | | | | 14,631,146 | |
| | | | | | | | | | | | | | | | | | | | |
| | | | | | | | | | | | | | | 41,616,974 | |
| | | | | | | | | | | | | | | | | | | | |
CONSUMER STAPLES (3.3%) | | | | | | | | | | | | | | | | |
Flowers Foods, Inc. | | | BBB | | | | 4.38 | | | | 04/01/22 | | | | 2,000,000 | | | | 2,120,604 | |
Mead Johnson Nutrition Co. | | | A- | | | | 4.90 | | | | 11/01/19 | | | | 3,075,000 | | | | 3,220,555 | |
Other Securities | | | | | | | | | | | | | | | 12,790,000 | | | | 12,910,880 | |
| | | | | | | | | | | | | | | | | | | | |
| | | | | | | | | | | | | | | 18,252,039 | |
| | | | | | | | | | | | | | | | | | | | |
ENERGY (2.7%) | | | | | | | | | | | | | | | | |
SESI LLC | | | BB- | | | | 7.13 | | | | 12/15/21 | | | | 2,150,000 | | | | 2,203,750 | |
Other Securities | | | | | | | | | | | | | | | 12,964,000 | | | | 12,880,855 | |
| | | | | | | | | | | | | | | | | | | | |
| | | | | | | | | | | | | | | 15,084,605 | |
| | | | | | | | | | | | | | | | | | | | |
FINANCIALS (11.4%) | | | | | | | | | | | | | | | | | | | | |
Alleghany Corp. | | | BBB+ | | | | 4.95 | | | | 06/27/22 | | | | 2,000,000 | | | | 2,161,312 | |
American Int’l. Group, Inc. | | | BBB+ | | | | 4.13 | | | | 02/15/24 | | | | 2,000,000 | | | | 2,113,206 | |
Ares Capital Corp. | | | BBB | | | | 3.63 | | | | 01/19/22 | | | | 2,500,000 | | | | 2,510,338 | |
Barrick N.A. Finance LLC | | | BBB- | | | | 4.40 | | | | 05/30/21 | | | | 2,000,000 | | | | 2,117,022 | |
Berkley (W.R.) Corp. | | | BBB+ | | | | 4.63 | | | | 03/15/22 | | | | 2,000,000 | | | | 2,128,448 | |
Block Financial LLC | | | BBB | | | | 5.50 | | | | 11/01/22 | | | | 2,472,000 | | | | 2,656,228 | |
Capital One Financial Corp. | | | BBB | | | | 4.75 | | | | 07/15/21 | | | | 2,000,000 | | | | 2,136,958 | |
Fairfax Financial Hldgs.† | | | BBB- | | | | 5.80 | | | | 05/15/21 | | | | 1,274,000 | | | | 1,374,938 | |
Fairfax U.S., Inc.† | | | BBB- | | | | 4.88 | | | | 08/13/24 | | | | 750,000 | | | | 781,559 | |
Fifth Third Bancorp | | | BBB | | | | 4.30 | | | | 01/16/24 | | | | 2,500,000 | | | | 2,653,393 | |
First Tennessee Bank | | | BBB | | | | 2.95 | | | | 12/01/19 | | | | 2,200,000 | | | | 2,214,641 | |
FS Investment Corp. | | | BBB | | | | 4.75 | | | | 05/15/22 | | | | 2,675,000 | | | | 2,753,888 | |
Lincoln National Corp. | | | A- | | | | 4.00 | | | | 09/01/23 | | | | 2,000,000 | | | | 2,087,830 | |
Moody’s Corp. | | | BBB+ | | | | 5.50 | | | | 09/01/20 | | | | 2,000,000 | | | | 2,153,730 | |
Nasdaq, Inc. | | | BBB | | | | 5.55 | | | | 01/15/20 | | | | 2,150,000 | | | | 2,278,923 | |
Prospect Capital Corp. | | | BBB- | | | | 4.95 - 5.88 | | | | 07/15/22 - 03/15/23 | | | | 4,425,000 | | | | 4,477,174 | |
Other Securities | | | | | | | | | | | | | | | 25,920,000 | | | | 26,208,478 | |
Other Securities† | | | | | | | | | | | | | | | 1,000,000 | | | | 997,146 | |
| | | | | | | | | | | | | | | | | | | | |
| | | | | | | | | | | | | | | 63,805,212 | |
| | | | | | | | | | | | | | | | | | | | |
The accompanying notes are an integral part of these portfolio schedules.
63
MUTUAL OF AMERICA INVESTMENT CORPORATION — MID-TERM BOND FUND
SUMMARY PORTFOLIO OF INVESTMENTS IN SECURITIES (Continued)
December 31, 2017
| | | | | | | | | | | | | | | | | | | | |
| | | Rating** | | | Rate(%) | | | Maturity | | | Face Amount | | | Value | |
| LONG-TERM DEBT SECURITIES (CONTINUED): | | | | | | | | | | | | | | | | | | | | |
HEALTH CARE (4.3%) | | | | | | | | | | | | | | | | |
Agilent Technologies, Inc. | | | BBB+ | | | | 5.00 | | | | 07/15/20 | | | $ | 2,000,000 | | | $ | 2,123,684 | |
Bio-Rad Laboratories, Inc. | | | BBB | | | | 4.88 | | | | 12/15/20 | | | | 2,000,000 | | | | 2,116,706 | |
PerkinElmer, Inc. | | | BBB | | | | 5.00 | | | | 11/15/21 | | | | 2,000,000 | | | | 2,156,256 | |
Quest Diagnostics, Inc. | | | BBB+ | | | | 4.75 | | | | 01/30/20 | | | | 2,000,000 | | | | 2,089,978 | |
Thermo Fisher Scientific, Inc. | | | BBB | | | | 3.60 - 4.50 | | | | 03/01/21 - 08/15/21 | | | | 2,000,000 | | | | 2,113,451 | |
Other Securities | | | | | | | | | | | | | | | 13,000,000 | | | | 13,127,321 | |
| | | | | | | | | | | | | | | | | | | | |
| | | | | | | | | | | | | | | 23,727,396 | |
| | | | | | | | | | | | | | | | | | | | |
INDUSTRIALS (2.8%) | | | | | | | | | | | | | | | | |
L-3 Communications Corp. | | | BBB- | | | | 5.20 | | | | 10/15/19 | | | | 2,000,000 | | | | 2,094,832 | |
Valmont Industries, Inc. | | | BBB+ | | | | 6.63 | | | | 04/20/20 | | | | 2,000,000 | | | | 2,175,978 | |
Verisk Analytics, Inc. | | | BBB- | | | | 4.13 | | | | 09/12/22 | | | | 2,000,000 | | | | 2,087,972 | |
Other Securities | | | | | | | | | | | | | | | 8,000,000 | | | | 8,044,984 | |
Other Securities† | | | | | | | | | | | | | | | 1,300,000 | | | | 1,303,877 | |
| | | | | | | | | | | | | | | | | | | | |
| | | | | | | | | | | | | | | 15,707,643 | |
| | | | | | | | | | | | | | | | | | | | |
INFORMATION TECHNOLOGY (4.1%) | | | | | | | | | | | | | | | | |
Adobe Systems, Inc. | | | A | | | | 4.75 | | | | 02/01/20 | | | | 2,000,000 | | | | 2,100,234 | |
Avnet, Inc. | | | BBB- | | | | 3.75 - 5.88 | | | | 06/15/20 - 12/01/21 | | | | 2,080,000 | | | | 2,158,523 | |
eBay, Inc. | | | BBB+ | | | | 2.88 | | | | 08/01/21 | | | | 2,100,000 | | | | 2,120,849 | |
Juniper Networks, Inc. | | | BBB | | | | 4.50 - 4.60 | | | | 03/15/21 - 03/15/24 | | | | 2,100,000 | | | | 2,189,245 | |
Other Securities | | | | | | | | | | | | | | | 14,126,000 | | | | 14,509,274 | |
| | | | | | | | | | | | | | | | | | | | |
| | | | | | | | | | | | | | | 23,078,125 | |
| | | | | | | | | | | | | | | | | | | | |
MATERIALS (2.6%) | | | | | | | | | | | | | | | | |
Domtar Corp. | | | BBB- | | | | 4.40 | | | | 04/01/22 | | | | 2,000,000 | | | | 2,104,060 | |
Other Securities | | | | | | | | | | | | | | | 12,437,000 | | | | 12,626,984 | |
| | | | | | | | | | | | | | | | | | | | |
| | | | | | | | | | | | | | | 14,731,044 | |
| | | | | | | | | | | | | | | | | | | | |
REAL ESTATE (2.8%) | | | | | | | | | | | | | | | | |
CBRE Services, Inc. | | | BBB | | | | 5.25 | | | | 03/15/25 | | | | 2,000,000 | | | | 2,199,840 | |
Omega Healthcare Investors, Inc. | | | BBB- | | | | 4.38 - 4.50 | | | | 08/01/23 - 01/15/25 | | | | 2,500,000 | | | | 2,524,369 | |
Vornado Realty LP | | | BBB | | | | | | | | 01/15/22 | | | | 2,000,000 | | | | 2,145,434 | |
Other Securities | | | | | | | | | | | | | | | 8,660,000 | | | | 8,901,247 | |
| | | | | | | | | | | | | | | | | | | | |
| | | | | | | | | | | | | | | 15,770,890 | |
| | | | | | | | | | | | | | | | | | | | |
TELECOMMUNICATION SERVICES (0.4%) | | | | | | | | | | | | | | | | |
Other Securities | | | | | | | | | | | 2,000,000 | | | | 2,004,080 | |
| | | | | | | | | | | | | | | | | | | | |
UTILITIES (1.7%) | | | | | | | | | | | | | | | | |
National Fuel Gas Co. | | | BBB | | | | 4.90 | | | | 12/01/21 | | | | 2,000,000 | | | | 2,106,262 | |
Other Securities | | | | | | | | | | | | | | | 5,900,000 | | | | 6,199,499 | |
Other Securities† | | | | | | | | | | | | | | | 1,400,000 | | | | 1,113,000 | |
| | | | | | | | | | | | | | | | | | | | |
| | | | | | | | | | | | | | | | | | | 9,418,761 | |
| | | | | | | | | | | | | | | | | | | | |
TOTAL LONG-TERM DEBT SECURITIES
(Cost: $554,702,291) 99.3% | | | | | | | | | | | | | | | | | | | 554,019,667 | |
| | | | | | | | | | | | | | | | | | | | |
| | | | | |
| SHORT-TERM DEBT SECURITIES: | | | | | | | | | | | | | | | | | | | | |
COMMERCIAL PAPER (0.1%) | | | | | | | | | | | | | | | | | | | | |
Home Depot, Inc.† | | | A-1 | | | | 1.44 | | | | 01/02/18 | | | | 800,000 | | | | 799,904 | |
| | | | | | | | | | | | | | | | | | | | |
TOTAL SHORT-TERM DEBT SECURITIES
(Cost: $799,904) 0.1% | | | | 799,904 | |
| | | | | | | | | | | | | | | | | | | | |
TOTAL INVESTMENTS
(Cost: $555,502,195) 99.4% | | | | 554,819,571 | |
| | | | | | | | | | | | | | | | | | | | |
OTHER NET ASSETS 0.6% | | | | 3,383,446 | |
| | | | | | | | | | | | | | | | | | | | |
NET ASSETS 100.0% | | | $ | 558,203,017 | |
| | | | | | | | | | | | | | | | | | | | |
The accompanying notes are an integral part of these portfolio schedules.
64
MUTUAL OF AMERICA INVESTMENT CORPORATION — BOND FUND
SUMMARY PORTFOLIO OF INVESTMENTS IN SECURITIES
December 31, 2017
| | | | | | | | | | | | | | | | |
| | | Rating** | | | Rate(%) | | Maturity | | Face Amount | | | Value | |
| LONG-TERM DEBT SECURITIES: | | | | | | | | | | | | | | | | |
U.S. GOVERNMENT (24.2%) | | | | | | | | | | | | | | | | |
U.S. Treasury Note | | | AA+ | | | 0.75 - 2.38 | | 07/15/19 - 08/15/27 | | $ | 231,750,000 | | | $ | 226,126,155 | |
U.S. Treasury Strip | | | AA+ | | | 0.00 | | 08/15/25 - 08/15/37 | | | 110,000,000 | | | | 81,574,590 | |
| | | | | | | | | | | | | | | | |
| | | | | | | | | | | | | | | 307,700,745 | |
| | | | | | | | | | | | | | | | |
U.S. GOVERNMENT AGENCIES (29.0%) | | | | | | | | | | | | | | | | |
MORTGAGE-BACKED OBLIGATIONS (27.8%) | | | | | | | | | | | | | | | | |
FHLMC | | | AA+ | | | 2.50 - 6.00 | | 03/01/21 - 11/01/47 | | | 129,226,651 | | | | 132,914,918 | |
FHLMC ARM | | | AA+ | | | 2.76 - 4.65 | | 02/01/36 - 04/01/42 | | | 1,025,237 | | | | 1,064,181 | |
FHLMC Strip | | | AA+ | | | 3.00 | | 01/15/43 | | | 2,913,341 | | | | 2,958,856 | |
FNMA | | | AA+ | | | 2.25 - 8.00 | | 04/01/18 - 07/01/56 | | | 163,394,226 | | | | 169,436,907 | |
FNMA ARM | | | AA+ | | | 2.40 | | 05/01/43 | | | 1,708,644 | | | | 1,711,053 | |
FNMA Strip | | | AA+ | | | 3.00 | | 08/25/42 | | | 1,297,002 | | | | 1,297,447 | |
GNMA (3) | | | AA+ | | | 2.68 - 7.00 | | 04/15/24 - 10/16/47 | | | 24,764,344 | | | | 25,906,283 | |
Small Business Admin. Particip. (3) | | | AA+ | | | 2.80 - 2.88 | | 01/01/37 - 06/01/37 | | | 19,022,125 | | | | 19,082,126 | |
Other Securities | | | | | | | | | | | 679,246 | | | | 708,998 | |
| | | | | | | | | | | | | | | | |
| | | | | | | | | | | | | | | 355,080,769 | |
| | | | | | | | | | | | | | | | |
NON-MORTGAGE-BACKED OBLIGATIONS (1.2%) | | | | | | | | | | | | | | | | |
FHLMC | | | AA+ | | | 0.00 | | 11/29/19 | | | 11,000,000 | | | | 10,534,997 | |
FNMA | | | AA+ | | | 0.00 | | 10/09/19 | | | 5,050,000 | | | | 4,863,660 | |
| | | | | | | | | | | | | | | | |
| | | | | | | | | | | | | | | 15,398,657 | |
| | | | | | | | | | | | | | | | |
CORPORATE DEBT (45.6%) | | | | | | | | | | | | | | | | |
CONSUMER DISCRETIONARY (7.7%) | | | | | | | | | | | | | | | | |
Advance Auto Parts, Inc. | | | BBB- | | | 4.50 - 5.75 | | 05/01/20 - 12/01/23 | | | 5,000,000 | | | | 5,296,137 | |
Amazon.com, Inc. | | | AA- | | | 5.20 | | 12/03/25 | | | 5,000,000 | | | | 5,739,720 | |
AutoZone, Inc. | | | BBB | | | 3.25 - 4.00 | | 11/15/20 - 04/15/25 | | | 5,700,000 | | | | 5,828,128 | |
Gap, Inc. | | | BB+ | | | 5.95 | | 04/12/21 | | | 5,000,000 | | | | 5,391,435 | |
Harman Int’l. Industries, Inc. | | | BBB+ | | | 4.15 | | 05/15/25 | | | 5,000,000 | | | | 5,169,725 | |
Marriott International, Inc. | | | BBB | | | 3.00 - 3.38 | | 03/01/19 - 02/15/23 | | | 7,000,000 | | | | 7,059,061 | |
Scripps Networks Interactive, Inc. | | | BBB | | | 3.50 | | 06/15/22 | | | 5,000,000 | | | | 5,050,400 | |
Other Securities | | | | | | | | | | | 58,374,000 | | | | 59,579,126 | |
| | | | | | | | | | | | | | | | |
| | | | | | | | | | | | | | | 99,113,732 | |
| | | | | | | | | | | | | | | | |
CONSUMER STAPLES (2.1%) | | | | | | | | | | | | | | | | |
Other Securities | | | | | | | | | | | 25,195,000 | | | | 26,153,771 | |
| | | | | | | | | | | | | | | | |
ENERGY (3.7%) | | | | | | | | | | | | | | | | |
Kinder Morgan Energy Partners | | | BBB- | | | 4.30 | | 05/01/24 | | | 5,000,000 | | | | 5,205,790 | |
Other Securities | | | | | | | | | | | 40,600,000 | | | | 41,364,956 | |
| | | | | | | | | | | | | | | | |
| | | | | | | | | | | | | | | 46,570,746 | |
| | | | | | | | | | | | | | | | |
FINANCIALS (11.0%) | | | | | | | | | | | | | | | | |
Alleghany Corp. | | | BBB+ | | | 4.95 - 5.63 | | 09/15/20 - 06/27/22 | | | 5,000,000 | | | | 5,377,969 | |
American Express Co. | | | BBB | | | 3.63 | | 12/05/24 | | | 5,000,000 | | | | 5,144,730 | |
American Int’l. Group, Inc. | | | BBB+ | | | 3.75 | | 07/10/25 | | | 5,000,000 | | | | 5,155,120 | |
Bank of America Corp. | | | BBB+ | | | 3.95 | | 04/21/25 | | | 5,000,000 | | | | 5,170,590 | |
Block Financial LLC | | | BBB | | | 5.25 - 5.50 | | 11/01/22 - 10/01/25 | | | 5,250,000 | | | | 5,638,055 | |
Citigroup, Inc. | | | BBB | | | 3.88 | | 03/26/25 | | | 5,000,000 | | | | 5,118,245 | |
Citizens Financial Group, Inc. | | | BBB | | | 3.75 | | 07/01/24 | | | 5,000,000 | | | | 4,996,760 | |
Fairfax Financial Hldgs.† | | | BBB- | | | 5.80 | | 05/15/21 | | | 1,500,000 | | | | 1,618,844 | |
Fairfax U.S., Inc.† | | | BBB- | | | 4.88 | | 08/13/24 | | | 3,500,000 | | | | 3,647,277 | |
Fifth Third Bancorp | | | BBB | | | 4.30 | | 01/16/24 | | | 5,000,000 | | | | 5,306,785 | |
First Tennessee Bank | | | BBB | | | 2.95 | | 12/01/19 | | | 5,000,000 | | | | 5,033,275 | |
JPMorgan Chase & Co. | | | BBB+ | | | 3.88 | | 09/10/24 | | | 5,000,000 | | | | 5,215,615 | |
Lincoln National Corp. | | | A- | | | 4.00 - 4.85 | | 06/24/21 - 09/01/23 | | | 5,000,000 | | | | 5,243,097 | |
Old Republic Int’l. Corp. | | | BBB+ | | | 3.88 | | 08/26/26 | | | 5,000,000 | | | | 5,033,150 | |
Signet UK Finance PLC | | | BBB- | | | 4.70 | | 06/15/24 | | | 5,000,000 | | | | 4,923,090 | |
Synchrony Financial | | | BBB- | | | 2.70 - 3.70 | | 02/03/20 - 08/04/26 | | | 5,000,000 | | | | 4,966,906 | |
The accompanying notes are an integral part of these portfolio schedules.
65
MUTUAL OF AMERICA INVESTMENT CORPORATION — BOND FUND
SUMMARY PORTFOLIO OF INVESTMENTS IN SECURITIES (Continued)
December 31, 2017
| | | | | | | | | | | | | | | | | | | | |
| | | Rating** | | | Rate(%) | | | Maturity | | | Face Amount | | | Value | |
| LONG-TERM DEBT SECURITIES (CONTINUED): | | | | | | | | | | | | | | | | | | | | |
CORPORATE DEBT (CONTINUED) | | | | | | | | | | | | | | | | | | | | |
FINANCIALS (CONTINUED) | | | | | | | | | | | | | | | | | | | | |
Unum Group | | | BBB | | | | 4.00 | | | | 03/15/24 | | | $ | 5,000,000 | | | $ | 5,206,680 | |
Voya Financial, Inc. | | | BBB | | | | 3.65 | | | | 06/15/26 | | | | 5,000,000 | | | | 5,056,520 | |
Wells Fargo & Co. | | | A- | | | | 3.45 - 4.13 | | | | 02/13/23 - 08/15/23 | | | | 5,000,000 | | | | 5,130,736 | |
Other Securities | | | | | | | | | | | | | | | 44,750,000 | | | | 46,966,096 | |
Other Securities† | | | | | | | | | | | | | | | 710,000 | | | | 755,263 | |
| | | | | | | | | | | | | | | | | | | | |
| | | | | | | | | | | | | | | | | | | 140,704,803 | |
| | | | | | | | | | | | | | | | | | | | |
HEALTH CARE (4.4%) | | | | | | | | | | | | | |
Anthem, Inc. | | | A | | | | 3.30 - 4.35 | | | | 08/15/20 - 01/15/23 | | | | 5,539,000 | | | | 5,686,339 | |
Owens & Minor, Inc. | | | BBB- | | | | 3.88 - 4.38 | | | | 09/15/21 - 12/15/24 | | | | 5,000,000 | | | | 5,060,407 | |
Quest Diagnostics, Inc. | | | BBB+ | | | | 3.50 - 4.75 | | | | 01/30/20 - 03/30/25 | | | | 4,700,000 | | | | 4,888,020 | |
Zimmer Biomet Hldgs., Inc. | | | BBB | | | | 3.15 | | | | 04/01/22 | | | | 5,000,000 | | | | 5,012,245 | |
Other Securities | | | | | | | | | | | | | | | 34,000,000 | | | | 35,567,459 | |
| | | | | | | | | | | | | | | | | | | | |
| | | | | | | | | | | | | | | | | | | 56,214,470 | |
| | | | | | | | | | | | | | | | | | | | |
INDUSTRIALS (2.4%) | | | | | | | | | | | | | | | | | | | | |
Verisk Analytics, Inc. | | | BBB- | | | | 4.00 | | | | 06/15/25 | | | | 5,000,000 | | | | 5,170,455 | |
Other Securities | | | | | | | | | | | | | | | 21,650,000 | | | | 22,221,774 | |
Other Securities† | | | | | | | | | | | | | | | 3,000,000 | | | | 3,008,946 | |
| | | | | | | | | | | | | | | | | | | | |
| | | | | | | | | | | | | | | | | | | 30,401,175 | |
| | | | | | | | | | | | | | | | | | | | |
INFORMATION TECHNOLOGY (4.6%) | | | | | | | | | | | | | | | | | | | | |
Applied Materials, Inc. | | | A- | | | | 3.90 | | | | 10/01/25 | | | | 5,000,000 | | | | 5,307,080 | |
eBay, Inc. | | | BBB+ | | | | 2.88 | | | | 08/01/21 | | | | 5,000,000 | | | | 5,049,640 | |
Fidelity Nat’l. Information | | | BBB | | | | 3.88 | | | | 06/05/24 | | | | 5,000,000 | | | | 5,219,235 | |
Juniper Networks, Inc. | | | BBB | | | | 4.50 - 4.60 | | | | 03/15/21 - 03/15/24 | | | | 5,000,000 | | | | 5,216,326 | |
Keysight Technologies, Inc. | | | BBB- | | | | 4.55 | | | | 10/30/24 | | | | 5,000,000 | | | | 5,304,545 | |
Lam Research Corp. | | | BBB+ | | | | 2.75 | | | | 03/15/20 | | | | 5,000,000 | | | | 5,035,395 | |
Motorola Solutions, Inc. | | | BBB- | | | | 3.75 - 4.00 | | | | 05/15/22 - 09/01/24 | | | | 5,000,000 | | | | 5,134,245 | |
Other Securities | | | | | | | | | | | | | | | 21,020,000 | | | | 21,788,283 | |
| | | | | | | | | | | | | | | | | | | | |
| | | | | | | | | | | | | | | | | | | 58,054,749 | |
| | | | | | | | | | | | | | | | | | | | |
MATERIALS (4.4%) | | | | | | | | | | | | | | | | | | | | |
Domtar Corp. | | | BBB- | | | | 4.40 | | | | 04/01/22 | | | | 5,000,000 | | | | 5,260,150 | |
Dow Chemical Co. | | | BBB | | | | 3.50 | | | | 10/01/24 | | | | 4,800,000 | | | | 4,938,456 | |
Sherwin-Williams Co. | | | BBB | | | | 3.95 | | | | 01/15/26 | | | | 5,000,000 | | | | 5,214,160 | |
Other Securities | | | | | | | | | | | | | | | 40,100,000 | | | | 41,132,360 | |
| | | | | | | | | | | | | | | | | | | | |
| | | | | | | | | | | | | | | | | | | 56,545,126 | |
| | | | | | | | | | | | | | | | | | | | |
REAL ESTATE (3.2%) | | | | | | | | | | | | | | | | | | | | |
Mack-Cali Realty LP | | | BBB- | | | | 4.50 | | | | 04/18/22 | | | | 5,000,000 | | | | 5,009,770 | |
Other Securities | | | | | | | | | | | | | | | 34,050,000 | | | | 35,280,530 | |
| | | | | | | | | | | | | | | | | | | | |
| | | | | | | | | | | | | | | | | | | 40,290,300 | |
| | | | | | | | | | | | | | | | | | | | |
TELECOMMUNICATION SERVICES (0.4%) | | | | | | | | | | | | | | | | | | | | |
AT&T, Inc. | | | BBB+ | | | | 3.00 | | | | 02/15/22 - 06/30/22 | | | | 5,000,000 | | | | 5,009,936 | |
| | | | | | | | | | | | | | | | | | | | |
UTILITIES (1.7%) | | | | | | | | | | | | | | | | | | | | |
National Fuel Gas Co. | | | BBB | | | | 4.90 - 5.20 | | | | 12/01/21 - 07/15/25 | | | | 5,000,000 | | | | 5,304,597 | |
SCANA Corp. | | | BBB- | | | | 4.13 - 4.75 | | | | 05/15/21 - 02/01/22 | | | | 5,000,000 | | | | 5,122,015 | |
Other Securities | | | | | | | | | | | | | | | 9,225,000 | | | | 9,738,500 | |
Other Securities† | | | | | | | | | | | | | | | 2,000,000 | | | | 1,590,000 | |
| | | | | | | | | | | | | | | | | | | | |
| | | | | | | | | | | | | | | | | | | 21,755,112 | |
| | | | | | | | | | | | | | | | | | | | |
SOVEREIGN DEBT (0.3%) | | | | | | | | | | | | | | | | | | | | |
Sri Lanka AID | | | NR | | | | 6.59 | | | | 09/15/28 | | | | 2,806,886 | | | | 3,258,795 | |
| | | | | | | | | | | | | | | | | | | | |
TOTAL LONG-TERM DEBT SECURITIES
(Cost: $1,247,818,454) 99.1% | | | | | | | | | | | | | | | | | | | 1,262,252,886 | |
| | | | | | | | | | | | | | | | | | | | |
The accompanying notes are an integral part of these portfolio schedules.
66
MUTUAL OF AMERICA INVESTMENT CORPORATION — BOND FUND
SUMMARY PORTFOLIO OF INVESTMENTS IN SECURITIES (Continued)
December 31, 2017
| | | | | | | | | | | | | | | | |
| | | Rating** | | | Rate(%) | | Maturity | | Face Amount | | | Value | |
| SHORT-TERM DEBT SECURITIES: | | | | | | | | | | | | | | | | |
COMMERCIAL PAPER (0.7%) | | | | | | | | | | | | | | | | |
Home Depot, Inc.† | | | A-1 | | | 1.44 | | 01/02/18 | | $ | 8,700,000 | | | $ | 8,698,956 | |
| | | | | | | | | | | | | | | | |
TOTAL SHORT-TERM DEBT SECURITIES
(Cost: $8,698,956) 0.7% | | | | 8,698,956 | |
| | | | | | | | | | | | | | | | |
TOTAL INVESTMENTS
(Cost: $1,256,517,410) 99.8% | | | | 1,270,951,842 | |
| | | | | | | | | | | | | | | | |
OTHER NET ASSETS 0.2% | | | | 3,176,189 | |
| | | | | | | | | | | | | | | | |
NET ASSETS 100.0% | | | $ | 1,274,128,031 | |
| | | | | | | | | | | | | | | | |
The accompanying notes are an integral part of these portfolio schedules.
67
MUTUAL OF AMERICA INVESTMENT CORPORATION
FOOTNOTES TO SUMMARY PORTFOLIOS OF INVESTMENTS IN SECURITIES
December 31, 2017
| | |
| Abbreviations: | | ARM = Adjustable Rate Mortgage |
| | FHLB = Federal Home Loan Bank |
| | FHLMC = Federal Home Loan Mortgage Corporation |
| | FNMA = Federal National Mortgage Association |
| | GNMA = Government National Mortgage Association |
| | NR = Not Rated |
| | “Other Securities” represent securities in the respective category that individually, or in the aggregate by issuer, do not exceed 1% of net assets. |
| * | Non-income producing security. |
| ** | Ratings as per Standard & Poor’s Corporation (unaudited). |
| † | Security is exempt from registration under Rule 144A of the Securities Act of 1933. These securities may be resold in transactions exempt from registration, normally to qualified institutional buyers. At December 31, 2017, the aggregate values of these securities and their percentages of the respective Funds’ net assets were as follows: |
| | | | | | | | |
Fund | | Aggregate
Market
Value | | | Percentage
of
Net Assets | |
EQUITY INDEX FUND | | $ | 24,981,498 | | | | 0.9 | % |
ALL AMERICA FUND | | $ | 2,299,730 | | | | 0.7 | % |
SMALL CAP VALUE FUND | | $ | 1,199,860 | | | | 0.2 | % |
MID-CAP EQUITY INDEX FUND | | $ | 14,988,899 | | | | 1.0 | % |
COMPOSITE FUND | | $ | 2,585,648 | | | | 1.4 | % |
MONEY MARKET FUND | | $ | 38,009,666 | | | | 53.7 | % |
MID-TERM BOND FUND | | $ | 6,370,424 | | | | 1.1 | % |
BOND FUND | | $ | 19,319,286 | | | | 1.5 | % |
| †† | One security within the category is a Level 3 Security. |
| (1) | This security, or a portion thereof, has been segregated to cover initial margin requirements on open futures contracts. Information on futures contracts outstanding in the Funds as of December 31, 2017, was as follows: |
| | | | | | | | | | | | | | | | | | | | | | | | | | |
Fund | | Number of
Contracts | | | Contract Type | | Purchased (P)
or Sold (S) | | | Expiration
Date | | | Underlying
Face Amount
at Value | | | Unrealized
Gain(Loss)(a) | | | Face Value
of Futures
as a %
of Total
Investments | |
EQUITY INDEX FUND | | | 797 | | | E-mini S&P 500
Stock Index | | | P | | | | March 2018 | | | $ | 106,638,600 | | | $ | 517,095 | | | | 3.9 | % |
ALL AMERICA FUND | | | 84 | | | E-mini S&P 500
Stock Index | | | P | | | | March 2018 | | | $ | 11,239,200 | | | $ | 91,979 | | | | 3.5 | % |
MID-CAP EQUITY INDEX FUND | | | 343 | | | E-mini S&P MidCap
400 Stock Index | | | P | | | | March 2018 | | | $ | 65,252,320 | | | $ | 225,422 | | | | 4.5 | % |
| | (a) | Includes the cumulative appreciation(depreciation) of futures contracts, which is included in Net Unrealized Appreciation (Depreciation) of Investments and Futures Contracts in the Components of Net Assets section of the Statements of Assets and Liabilities. The Receivable or Payable for Daily Variation on Futures Contracts in the Statements of Assets and Liabilities only includes the current day’s variation margin payable or receivable. |
| (2) | Percentage is less than 0.05%. |
| (3) | U.S. Government guaranteed security. |
68
(This page has been left blank intentionally.)
MUTUAL OF AMERICA INVESTMENT CORPORATION
STATEMENTS OF ASSETS AND LIABILITIES
December 31, 2017
| | | | | | | | | | | | | | | | | | | | |
| | |
Equity Index
Fund | | | All America
Fund | | | Small Cap
Value Fund | | | Small Cap
Growth Fund | | | Mid Cap
Value Fund | |
ASSETS | | | | | | | | | | | | | | | | | | | | |
Investments at fair value | | | | | | | | | | | | | | | | | | | | |
(Cost: Equity Index Fund — $1,578,414,435 All America Fund — $222,592,602 Small Cap Value Fund — $396,949,695 Small Cap Growth Fund — $433,261,273 Mid Cap Value Fund — $79,704,224 Mid-Cap Equity Index Fund — $1,077,639,795 International Fund — $467,047,354 Composite Fund — $162,833,532 Retirement Income Fund — $97,648,449 2010 Retirement Fund — $24,241,164 2015 Retirement Fund — $140,319,928 2020 Retirement Fund — $465,283,860 2025 Retirement Fund — $597,276,964) | |
(Notes 1 and 3) | | $ | 2,709,352,573 | | | $ | 323,520,838 | | | $ | 506,033,304 | | | $ | 551,256,113 | | | $ | 103,234,704 | |
Cash | | | — | | | | 389,337 | | | | 139,065 | | | | 28,283 | | | | 6,642 | |
Interest and dividends receivable | | | 2,623,632 | | | | 317,896 | | | | 435,777 | | | | 251,720 | | | | 158,318 | |
Receivable for securities sold | | | 1,911,625 | | | | 730,933 | | | | 1,232,918 | | | | 3,970,457 | | | | — | |
Other receivables | | | — | | | | — | | | | 897 | | | | 3,447 | | | | — | |
| | | | | | | | | | | | | | | | | | | | |
TOTAL ASSETS | | | 2,713,887,830 | | | | 324,959,004 | | | | 507,841,961 | | | | 555,510,020 | | | | 103,399,664 | |
| | | | | | | | | | | | | | | | | | | | |
| | | | | |
LIABILITIES | | | | | | | | | | | | | | | | | | | | |
Due to custodian bank | | | 1,883,702 | | | | — | | | | — | | | | — | | | | — | |
Payable for securities purchased | | | — | | | | 168,761 | | | | 2,072,647 | | | | 526,557 | | | | — | |
Payable for daily variation on future contracts | | | 394,195 | | | | 40,740 | | | | — | | | | — | | | | — | |
Accrued expenses | | | 24,982 | | | | 13,148 | | | | 47,565 | | | | 81,467 | | | | 5,508 | |
| | | | | | | | | | | | | | | | | | | | |
TOTAL LIABILITIES: | | | 2,302,879 | | | | 222,649 | | | | 2,120,212 | | | | 608,024 | | | | 5,508 | |
| | | | | | | | | | | | | | | | | | | | |
NET ASSETS | | $ | 2,711,584,951 | | | $ | 324,736,355 | | | $ | 505,721,749 | | | $ | 554,901,996 | | | $ | 103,394,156 | |
| | | | | | | | | | | | | | | | | | | | |
NUMBEROF SHARES OUTSTANDING (Note 4) | | | 660,764,208 | | | | 136,259,701 | | | | 291,434,007 | | | | 359,318,522 | | | | 60,396,632 | |
| | | | | | | | | | | | | | | | | | | | |
NET ASSET VALUES, offering and redemption price per share | | | $4.10 | | | | $2.38 | | | | $1.74 | | | | $1.54 | | | | $1.71 | |
| | | | | | | | | | | | | | | | | | | | |
| | | | | |
COMPONENTSOF NET ASSETS | | | | | | | | | | | | | | | | | | | | |
Paid-in capital | | $ | 1,497,713,598 | | | $ | 208,088,865 | | | $ | 350,797,694 | | | $ | 397,874,817 | | | $ | 70,902,671 | |
Accumulated undistributed net investment income (loss) | | | 43,482,957 | | | | 3,999,110 | | | | 7,813,509 | | | | 182,432 | | | | 1,717,714 | |
Accumulated undistributed net realized gain (loss) on investments and futures contracts | | | 38,933,163 | | | | 11,628,165 | | | | 38,026,937 | | | | 38,849,907 | | | | 7,243,291 | |
Net unrealized appreciation (depreciation) of investments and futures contracts | | | 1,131,455,233 | | | | 101,020,215 | | | | 109,083,609 | | | | 117,994,840 | | | | 23,530,480 | |
| | | | | | | | | | | | | | | | | | | | |
NET ASSETS | | $ | 2,711,584,951 | | | $ | 324,736,355 | | | $ | 505,721,749 | | | $ | 554,901,996 | | | $ | 103,394,156 | |
| | | | | | | | | | | | | | | | | | | | |
| (a) | The Retirement and Allocation Funds are invested in affiliated investment companies of Mutual of America Investment Corp. |
The accompanying notes are an integral part of these financial statements.
70
| | | | | | | | | | | | | | | | | | | | | | | | | | | | | | | | |
Mid-Cap
Equity Index
Fund | | | International
Fund | | | Composite
Fund | | | Retirement
Income
Fund | | | 2010
Retirement
Fund | | | 2015
Retirement
Fund | | | 2020
Retirement
Fund | | | 2025
Retirement
Fund | | | |
| | | | | | | | | | | | | | | | | | | | | | | | | | | | | | | | |
| | | | | | | | | | | | | | | | | | | | | | | | | | | | | | | | |
| | | | | | | | |
| | | | | | | | | | | | | | | | | | | | | | | | | | | | | | | | |
| $ | 1,452,656,870 | | | $ | 537,391,297 | | | $ | 189,502,284 | | | $ | 100,819,359 | (a) | | $ | 25,549,552 | (a) | | $ | 154,987,907 | (a) | | $ | 524,856,083 | (a) | | $ | 685,736,882 | (a) | | |
| | 181,249 | | | | 85,342 | | | | 347,267 | | | | — | | | | — | | | | — | | | | — | | | | — | | | |
| | 1,966,499 | | | | — | | | | 525,708 | | | | — | | | | — | | | | — | | | | — | | | | — | | | |
| | 962,527 | | | | — | | | | 319 | | | | — | | | | — | | | | — | | | | — | | | | — | | | |
| | — | | | | — | | | | — | | | | 11,843 | | | | 8,652 | | | | — | | | | — | | | | — | | | |
| | | | | | | | | | | | | | | | | | | | | | | | | | | | | | | | |
| | 1,455,767,145 | | | | 537,476,639 | | | | 190,375,578 | | | | 100,831,202 | | | | 25,558,204 | | | | 154,987,907 | | | | 524,856,083 | | | | 685,736,882 | | | |
| | | | | | | | | | | | | | | | | | | | | | | | | | | | | | | | |
| | | | | | | | |
| | | | | | | | | | | | | | | | | | | | | | | | | | | | | | | | |
| | — | | | | — | | | | — | | | | — | | | | — | | | | — | | | | — | | | | — | | | |
| | 3,303,504 | | | | — | | | | — | | | | — | | | | — | | | | — | | | | — | | | | — | | | |
| | 416,290 | | | | — | | | | — | | | | — | | | | — | | | | — | | | | — | | | | — | | | |
| | 14,244 | | | | 6,557 | | | | 4,663 | | | | 12,540 | | | | 8,237 | | | | 1,994 | | | | 3,510 | | | | 4,468 | | | |
| | | | | | | | | | | | | | | | | | | | | | | | | | | | | | | | |
| | 3,734,038 | | | | 6,557 | | | | 4,663 | | | | 12,540 | | | | 8,237 | | | | 1,994 | | | | 3,510 | | | | 4,468 | | | |
| | | | | | | | | | | | | | | | | | | | | | | | | | | | | | | | |
| $ | 1,452,033,107 | | | $ | 537,470,082 | | | $ | 190,370,915 | | | $ | 100,818,662 | | | $ | 25,549,967 | | | $ | 154,985,913 | | | $ | 524,852,573 | | | $ | 685,732,414 | | | |
| | | | | | | | | | | | | | | | | | | | | | | | | | | | | | | | |
| | 619,888,133 | | | | 594,344,780 | | | | 99,760,702 | | | | 86,397,770 | | | | 25,359,862 | | | | 145,270,066 | | | | 428,449,681 | | | | 515,854,916 | | | |
| | | | | | | | | | | | | | | | | | | | | | | | | | | | | | | | |
| | $2.34 | | | | $0.90 | | | | $1.91 | | | | $1.17 | | | | $1.01 | | | | $1.07 | | | | $1.23 | | | | $1.33 | | | |
| | | | | | | | | | | | | | | | | | | | | | | | | | | | | | | | |
| | | | | | | | |
| | | | | | | | | | | | | | | | | | | | | | | | | | | | | | | | |
| $ | 973,601,635 | | | $ | 456,331,390 | | | $ | 146,047,799 | | | $ | 94,826,320 | | | $ | 22,807,031 | | | $ | 131,643,744 | | | $ | 441,847,089 | | | $ | 562,854,134 | | | |
| | 17,265,865 | | | | 12,148,232 | | | | 3,867,102 | | | | 1,751,326 | | | | 490,991 | | | | 2,885,420 | | | | 9,311,834 | | | | 11,340,011 | | | |
| | | | | | | | |
| | 85,923,110 | | | | (1,353,483 | ) | | | 13,787,262 | | | | 1,070,106 | | | | 943,557 | | | | 5,788,770 | | | | 14,121,427 | | | | 23,078,351 | | | |
| | | | | | | | |
| | 375,242,497 | | | | 70,343,943 | | | | 26,668,752 | | | | 3,170,910 | | | | 1,308,388 | | | | 14,667,979 | | | | 59,572,223 | | | | 88,459,918 | | | |
| | | | | | | | | | | | | | | | | | | | | | | | | | | | | | | | |
| $ | 1,452,033,107 | | | $ | 537,470,082 | | | $ | 190,370,915 | | | $ | 100,818,662 | | | $ | 25,549,967 | | | $ | 154,985,913 | | | $ | 524,852,573 | | | $ | 685,732,414 | | | |
| | | | | | | | | | | | | | | | | | | | | | | | | | | | | | | | |
The accompanying notes are an integral part of these financial statements.
71
MUTUAL OF AMERICA INVESTMENT CORPORATION
STATEMENTS OF ASSETS AND LIABILITIES (Continued)
December 31, 2017
| | | | | | | | | | | | | | | | | | | | |
| | | 2030
Retirement
Fund | | | 2035
Retirement
Fund | | | 2040
Retirement
Fund | | | 2045
Retirement
Fund | | | 2050
Retirement
Fund | |
ASSETS | | | | | | | | | | | | | | | | | | | | |
Investments at fair value | | | | | | | | | | | | | | | | | | | | |
(Cost: 2030 Retirement Fund — $492,216,031 2035 Retirement Fund — $405,662,756 2040 Retirement Fund — $326,535,069 2045 Retirement Fund — $356,025,178 2050 Retirement Fund — $228,116,484 2055 Retirement Fund — $32,726,349 Conservative Allocation Fund — $148,348,099 Moderate Allocation Fund — $334,548,706 Aggressive Allocation Fund — $237,221,918 Money Market Fund — $70,780,274 Mid-Term Bond Fund — $555,502,195 Bond Fund — $1,256,517,410) | |
(Notes 1 and 3) | | $ | 577,710,924 | (a) | | $ | 484,174,511 | (a) | | $ | 392,790,114 | (a) | | $ | 437,353,268 | (a) | | $ | 256,499,347 | (a) |
Cash | | | — | | | | — | | | | — | | | | — | | | | — | |
Interest and dividends receivable | | | — | | | | — | | | | — | | | | — | | | | — | |
Receivable for securities sold | | | — | | | | — | | | | — | | | | — | | | | — | |
Other receivables | | | — | | | | — | | | | — | | | | — | | | | — | |
| | | | | | | | | | | | | | | | | | | | |
TOTAL ASSETS | | | 577,710,924 | | | | 484,174,511 | | | | 392,790,114 | | | | 437,353,268 | | | | 256,499,347 | |
| | | | | | | | | | | | | | | | | | | | |
| | | | | |
LIABILITIES | | | | | | | | | | | | | | | | | | | | |
Due to custodian bank | | | — | | | | — | | | | — | | | | — | | | | — | |
Payable for securities purchased | | | — | | | | — | | | | — | | | | — | | | | — | |
Payable for daily variation on future contracts | | | — | | | | — | | | | — | | | | — | | | | — | |
Accrued expenses | | | 3,764 | | | | 3,148 | | | | 2,591 | | | | 2,892 | | | | 1,122 | |
| | | | | | | | | | | | | | | | | | | | |
TOTAL LIABILITIES | | | 3,764 | | | | 3,148 | | | | 2,591 | | | | 2,892 | | | | 1,122 | |
| | | | | | | | | | | | | | | | | | | | |
NET ASSETS | | $ | 577,707,160 | | | $ | 484,171,363 | | | $ | 392,787,523 | | | $ | 437,350,376 | | | $ | 256,498,225 | |
| | | | | | | | | | | | | | | | | | | | |
NUMBEROF SHARES OUTSTANDING (Note 4) | | | 417,986,579 | | | | 345,541,845 | | | | 283,386,019 | | | | 315,271,648 | | | | 154,619,686 | |
| | | | | | | | | | | | | | | | | | | | |
NET ASSET VALUES, offering and redemption price per share | | | $1.38 | | | | $1.40 | | | | $1.39 | | | | $1.39 | | | | $1.66 | |
| | | | | | | | | | | | | | | | | | | | |
| | | | | |
COMPONENTSOF NET ASSETS | | | | | | | | | | | | | | | | | | | | |
Paid-in capital | | $ | 463,694,853 | | | $ | 382,424,527 | | | $ | 308,126,413 | | | $ | 334,173,506 | | | $ | 218,091,875 | |
Accumulated undistributed net investment income (loss) | | | 9,022,072 | | | | 7,120,325 | | | | 5,677,938 | | | | 6,218,541 | | | | 3,442,823 | |
Accumulated undistributed net realized gain (loss)on investments and futures contracts | | | 19,495,342 | | | | 16,114,756 | | | | 12,728,127 | | | | 15,630,239 | | | | 6,580,664 | |
Net unrealized appreciation (depreciation)of investments and futures contracts | | | 85,494,893 | | | | 78,511,755 | | | | 66,255,045 | | | | 81,328,090 | | | | 28,382,863 | |
| | | | | | | | | | | | | | | | | | | | |
NET ASSETS | | $ | 577,707,160 | | | $ | 484,171,363 | | | $ | 392,787,523 | | | $ | 437,350,376 | | | $ | 256,498,225 | |
| | | | | | | | | | | | | | | | | | | | |
| (a) | The Retirement and Allocation Funds are invested in affiliated investment companies of Mutual of America Investment Corp. |
The accompanying notes are an integral part of these financial statements.
72
| | | | | | | | | | | | | | | | | | | | | | | | | | | | | | | | |
2055
Retirement
Fund | | | Conservative
Allocation
Fund | | | Moderate
Allocation
Fund | | | Aggressive
Allocation
Fund | | | Money
Market
Fund | | | Mid-Term
Bond Fund | | | Bond Fund | | | | | | |
| | | | | | | | | | | | | | | | | | | | | | | | | | | | | | | | |
| | | | | | | | | | | | | | | | | | | | | | | | | | | | | | | | |
| | | | | | | | | | | | | | | | | | | | | | | | | | | | | | | | |
| $ | 34,309,598 | (a) | | $ | 156,518,091 | (a) | | $ | 397,185,490 | (a) | | $ | 304,450,683 | (a) | | $ | 70,780,665 | | | $ | 554,819,571 | | | $ | 1,270,951,842 | | | | | | | |
| | — | | | | — | | | | — | | | | — | | | | 18,890 | | | | 42,035 | | | | 166,371 | | | | | | | |
| | — | | | | — | | | | — | | | | — | | | | — | | | | 3,380,959 | | | | 8,263,411 | | | | | | | |
| | — | | | | — | | | | — | | | | — | | | | — | | | | — | | | | 1,350,132 | | | | | | | |
| | — | | | | — | | | | — | | | | — | | | | — | | | | 3,010 | | | | 2,350 | | | | | | | |
| | | | | | | | | | | | | | | | | | | | | | | | | | | | | | | | |
| | 34,309,598 | | | | 156,518,091 | | | | 397,185,490 | | | | 304,450,683 | | | | 70,799,555 | | | | 558,245,575 | | | | 1,280,734,106 | | | | | | | |
| | | | | | | | | | | | | | | | | | | | | | | | | | | | | | | | |
| | | | | | | | |
| | | | | | | | | | | | | | | | | | | | | | | | | | | | | | | | |
| | — | | | | — | | | | — | | | | — | | | | — | | | | — | | | | — | | | | | | | |
| | — | | | | — | | | | — | | | | — | | | | — | | | | — | | | | 6,551,100 | | | | | | | |
| | — | | | | — | | | | — | | | | — | | | | — | | | | — | | | | — | | | | | | | |
| | 140 | | | | 211 | | | | 551 | | | | 1,319 | | | | 162 | | | | 42,558 | | | | 54,975 | | | | | | | |
| | | | | | | | | | | | | | | | | | | | | | | | | | | | | | | | |
| | 140 | | | | 211 | | | | 551 | | | | 1,319 | | | | 162 | | | | 42,558 | | | | 6,606,075 | | | | | | | |
| | | | | | | | | | | | | | | | | | | | | | | | | | | | | | | | |
| | $34,309,458 | | | | $156,517,880 | | | | $397,184,939 | | | | $304,449,364 | | | | $70,799,393 | | | | $558,203,017 | | | | $1,274,128,031 | | | | | | | |
| | | | | | | | | | | | | | | | | | | | | | | | | | | | | | | | |
| | 27,964,164 | | | | 123,302,016 | | | | 255,351,823 | | | | 171,830,878 | | | | 58,802,424 | | | | 536,217,943 | | | | 883,024,833 | | | | | | | |
| | | | | | | | | | | | | | | | | | | | | | | | | | | | | | | | |
| | $1.23 | | | | $1.27 | | | | $1.56 | | | | $1.77 | | | | $1.20 | | | | $1.04 | | | | $1.44 | | | | | | | |
| | | | | | | | | | | | | | | | | | | | | | | | | | | | | | | | |
| | | | | | | | |
| | | | | | | | | | | | | | | | | | | | | | | | | | | | | | | | |
| $ | 31,818,467 | | | $ | 138,811,410 | | | $ | 308,983,554 | | | $ | 217,921,220 | | | $ | 70,337,336 | | | $ | 546,322,335 | | | $ | 1,224,822,330 | | | | | | | |
| | 320,748 | | | | 3,300,750 | | | | 7,438,128 | | | | 5,093,663 | | | | 462,689 | | | | 12,308,917 | | | | 34,954,410 | | | | | | | |
| 586,994 | | | | 6,235,728 | | | | 18,126,473 | | | | 14,205,716 | | | | (1,023 | ) | | | 254,389 | | | | (83,141 | ) | | | | | | |
| 1,583,249 | | | | 8,169,992 | | | | 62,636,784 | | | | 67,228,765 | | | | 391 | | | | (682,624 | ) | | | 14,434,432 | | | | | | | |
| | | | | | | | | | | | | | | | | | | | | | | | | | | | | | | | |
| | $34,309,458 | | | | $156,517,880 | | | | $397,184,939 | | | | $304,449,364 | | | | $70,799,393 | | | | $558,203,017 | | | | $1,274,128,031 | | | | | | | |
| | | | | | | | | | | | | | | | | | | | | | | | | | | | | | | | |
The accompanying notes are an integral part of these financial statements.
73
MUTUAL OF AMERICA INVESTMENT CORPORATION
STATEMENTS OF OPERATIONS
For the Year Ended December 31, 2017
| | | | | | | | | | | | | | | | | | | | |
| | | | | |
| | | Equity Index
Fund | | | All America
Fund | | | Small Cap
Value Fund | | | Small Cap
Growth Fund | | | Mid Cap
Value Fund | |
INVESTMENT INCOMEAND EXPENSES | | | | | | | | | | | | | | | | | | | | |
INVESTMENT INCOME | | | | | | | | | | | | | | | | | | | | |
Dividends | | $ | 46,721,379 | | | $ | 5,599,728 | | | $ | 11,813,209 | | | $ | 4,061,240 | | | $ | 2,172,188 | |
Interest | | | 716,385 | | | | 94,535 | | | | 262,375 | | | | 103,482 | | | | 23,547 | |
| | | | | | | | | | | | | | | | | | | | |
Total investment income | | | 47,437,764 | | | | 5,694,263 | | | | 12,075,584 | | | | 4,164,722 | | | | 2,195,735 | |
| | | | | | | | | | | | | | | | | | | | |
| | | | | |
EXPENSES | | | | | | | | | | | | | | | | | | | | |
Investment advisory fees (Note 2) | | | 1,787,273 | | | | 1,231,378 | | | | 3,540,392 | | | | 3,608,217 | | | | 549,847 | |
Other operating expenses | | | | | | | | | | | | | | | | | | | | |
Accounting and recordkeeping expenses | | | 469,882 | | | | 125,282 | | | | 102,798 | | | | 113,980 | | | | 27,885 | |
Shareholders reports | | | 16,668 | | | | 17,685 | | | | 17,760 | | | | 19,257 | | | | 14,977 | |
Custodian expenses | | | 39,524 | | | | 59,933 | | | | 18,153 | | | | 22,581 | | | | 9,931 | |
Independent directors’ fees and expenses | | | 138,148 | | | | 18,138 | | | | 29,313 | | | | 32,421 | | | | 6,040 | |
Audit | | | 42,903 | | | | 13,490 | | | | 13,602 | | | | 15,468 | | | | 4,492 | |
Legal and Compliance | | | 109,876 | | | | 34,548 | | | | 34,837 | | | | 39,613 | | | | 11,505 | |
Administrative | | | 412,727 | | | | 54,189 | | | | 87,574 | | | | 96,860 | | | | 18,047 | |
Licenses | | | 177,862 | | | | 14,012 | | | | — | | | | — | | | | — | |
Other | | | 61,659 | | | | 8,096 | | | | 13,083 | | | | 14,470 | | | | 2,696 | |
| | | | | | | | | | | | | | | | | | | | |
Total operating expenses | | | 1,469,249 | | | | 345,373 | | | | 317,120 | | | | 354,650 | | | | 95,573 | |
| | | | | | | | | | | | | | | | | | | | |
Total expenses before reimbursement | | | 3,256,522 | | | | 1,576,751 | | | | 3,857,512 | | | | 3,962,867 | | | | 645,420 | |
Non-Advisory operating expense reimbursement (Note 2) | | | (34,543 | ) | | | — | | | | (52,774 | ) | | | (94,660 | ) | | | — | |
Fee waiver and expense reimbursement (Note 2) | | | — | | | | — | | | | — | | | | — | | | | — | |
| | | | | | | | | | | | | | | | | | | | |
Net expenses | | | 3,221,979 | | | | 1,576,751 | | | | 3,804,738 | | | | 3,868,207 | | | | 645,420 | |
| | | | | | | | | | | | | | | | | | | | |
Net Investment Income (LOSS) | | | 44,215,785 | | | | 4,117,512 | | | | 8,270,846 | | | | 296,515 | | | | 1,550,315 | |
| | | | | | | | | | | | | | | | | | | | |
NET REALIZEDAND UNREALIZED GAIN (LOSS)ON INVESTMENTSAND
FUTURES CONTRACTS (NOTE 1) | | | | | | | | | | | | | | | | | | | | |
Net realized gain (loss) on: | | | | | | | | | | | | | | | | | | | | |
Investment securities | | | 48,545,934 | | | | 15,659,746 | | | | 36,492,214 | | | | 38,804,225 | | | | 7,184,494 | |
Futures contracts | | | 13,946,910 | | | | 1,089,117 | | | | — | | | | — | | | | — | |
Gain distributions from Mutual of America Investment Corp. Funds | | | — | | | | — | | | | — | | | | — | | | | — | |
| | | | | | | | | | | | | | | | | | | | |
| | | 62,492,844 | | | | 16,748,863 | | | | 36,492,214 | | | | 38,804,225 | | | | 7,184,494 | |
| | | | | | | | | | | | | | | | | | | | |
Change in net unrealized appreciation (depreciation) of: | | | | | | | | | | | | | | | | | | | | |
Investment securities | | | 361,286,026 | | | | 33,771,687 | | | | (6,611,332 | ) | | | 64,349,468 | | | | 5,161,646 | |
Futures contracts | | | 1,216,902 | | | | 219,953 | | | | — | | | | — | | | | — | |
| | | | | | | | | | | | | | | | | | | | |
| | | 362,502,928 | | | | 33,991,640 | | | | (6,611,332 | ) | | | 64,349,468 | | | | 5,161,646 | |
| | | | | | | | | | | | | | | | | | | | |
NET REALIZEDAND UNREALIZED GAIN (LOSS)ON INVESTMENTSAND
FUTURES CONTRACTS | | | 424,995,772 | | | | 50,740,503 | | | | 29,880,882 | | | | 103,153,693 | | | | 12,346,140 | |
| | | | | | | | | | | | | | | | | | | | |
NET INCREASE (DECREASE)IN NET ASSETS RESULTINGFROM OPERATIONS | | $ | 469,211,557 | | | $ | 54,858,015 | | | $ | 38,151,728 | | | $ | 103,450,208 | | | $ | 13,896,455 | |
| | | | | | | | | | | | | | | | | | | | |
| (a) | The Retirement and Allocation Funds invest in affiliated funds of Mutual of America Investment Corporation and receive dividend income entirely from these affiliated funds. |
| (b) | The Retirement and Allocation Funds incur direct investment management expenses of .05% and .00%, respectively. Certain operating expenses that can be attributed only to the Retirement and Allocation Funds were charged directly to those Funds, subject to the Adviser’s agreement to reimburse direct non-advisory operating expenses of any such Fund whose average daily net assets for the prior calendar year was less than $50 million. The Retirement and Allocation Funds also bear their pro-rata share of the non-advisory operating expenses borne by each of the underlying Funds in which they invest. |
| (c) | Realized gains and losses for the Retirement and Allocation Funds resulted from the disposition of shares of the underlying funds. |
| (d) | Net of foreign taxes of $930,214. |
The accompanying notes are an integral part of these financial statements.
74
| | | | | | | | | | | | | | | | | | | | | | | | | | | | | | | | |
Mid-Cap
Equity Index
Fund | | | International
Fund | | | Composite
Fund | | | Retirement
Income
Fund | | | 2010
Retirement
Fund | | | 2015
Retirement
Fund | | | 2020
Retirement
Fund | | | 2025
Retirement
Fund | | | |
| | | | | | | | | | | | | | | | | | | | | | | | | | | | | | | | |
| | | | | | | | | | | | | | | | | | | | | | | | | | | | | | | | |
| $ | 20,765,859 | | | $ | 12,470,887 | (d) | | $ | 2,325,407 | | | $ | 1,748,100 | (a) | | $ | 477,285 | (a) | | $ | 2,864,268 | (a) | | $ | 9,105,896 | (a) | | $ | 10,909,200 | (a) | | |
| | 393,360 | | | | 218,815 | | | | 2,481,127 | | | | — | | | | — | | | | — | | | | — | | | | — | | | |
| | | | | | | | | | | | | | | | | | | | | | | | | | | | | | | | |
| | 21,159,219 | | | | 12,689,702 | | | | 4,806,534 | | | | 1,748,100 | | | | 477,285 | | | | 2,864,268 | | | | 9,105,896 | | | | 10,909,200 | | | |
| | | | | | | | | | | | | | | | | | | | | | | | | | | | | | | | |
| | | | | | | | |
| | | | | | | | | | | | | | | | | | | | | | | | | | | | | | | | |
| | 987,491 | | | | 340,296 | | | | 732,205 | | | | 41,896 | (b) | | | 12,299 | (b) | | | 74,334 | (b) | | | 231,566 | (b) | | | 289,898 | (b) | | |
| | | | | | | | | | | | | | | | | | | | | | | | | | | | | | | | |
| | 273,267 | | | | 80,881 | | | | 70,375 | | | | — | (b) | | | — | (b) | | | — | (b) | | | — | (b) | | | — | (b) | | |
| | 17,467 | | | | 14,251 | | | | 18,310 | | | | 14,764 | (b) | | | 13,958 | (b) | | | 16,049 | (b) | | | 16,530 | (b) | | | 16,456 | (b) | | |
| | 32,758 | | | | 7,477 | | | | 33,575 | | | | — | (b) | | | — | (b) | | | — | (b) | | | — | (b) | | | — | (b) | | |
| | 77,598 | | | | 25,612 | | | | 10,664 | | | | — | (b) | | | — | (b) | | | — | (b) | | | — | (b) | | | — | (b) | | |
| | 28,611 | | | | 1,370 | | | | 7,931 | | | | 3,995 | (b) | | | 1,061 | (b) | | | 7,374 | (b) | | | 23,660 | (b) | | | 29,500 | (b) | | |
| | 73,275 | | | | 3,508 | | | | 20,312 | | | | 6,892 | (b) | | | 1,830 | (b) | | | 12,719 | (b) | | | 40,812 | (b) | | | 50,885 | (b) | | |
| | 231,829 | | | | 76,518 | | | | 31,861 | | | | — | (b) | | | — | (b) | | | — | (b) | | | — | (b) | | | — | (b) | | |
| | 99,905 | | | | — | | | | — | | | | — | (b) | | | — | (b) | | | — | (b) | | | — | (b) | | | — | (b) | | |
| | 34,633 | | | | 11,431 | | | | 4,760 | | | | — | (b) | | | — | (b) | | | — | (b) | | | — | (b) | | | — | (b) | | |
| | | | | | | | | | | | | | | | | | | | | | | | | | | | | | | | |
| | 869,343 | | | | 221,048 | | | | 197,788 | | | | 25,651 | | | | 16,849 | | | | 36,142 | | | | 81,002 | | | | 96,841 | | | |
| | | | | | | | | | | | | | | | | | | | | | | | | | | | | | | | |
| | 1,856,834 | | | | 561,344 | | | | 929,993 | | | | 67,547 | | | | 29,148 | | | | 110,476 | | | | 312,568 | | | | 386,739 | | | |
| | (41,575 | ) | | | (19,874 | ) | | | (5,213 | ) | | | (14,371 | ) | | | (8,652 | ) | | | — | | | | — | | | | — | | | |
| | — | | | | — | | | | — | | | | — | | | | (16,849 | ) | | | — | | | | — | | | | — | | | |
| | | | | | | | | | | | | | | | | | | | | | | | | | | | | | | | |
| | 1,815,259 | | | | 541,470 | | | | 924,780 | | | | 53,176 | | | | 3,647 | | | | 110,476 | | | | 312,568 | | | | 386,739 | | | |
| | | | | | | | | | | | | | | | | | | | | | | | | | | | | | | | |
| | 19,343,960 | | | | 12,148,232 | | | | 3,881,754 | | | | 1,694,924 | | | | 473,638 | | | | 2,753,792 | | | | 8,793,328 | | | | 10,522,461 | | | |
| | | | | | | | | | | | | | | | | | | | | | | | | | | | | | | | |
| | | | | | | | |
| | | | | | | | | | | | | | | | | | | | | | | | | | | | | | | | |
| | | | | | | | | | | | | | | | | | | | | | | | | | | | | | | | |
| | 83,119,957 | | | | 70 | | | | 14,133,237 | | | | 707,080 | (c) | | | 792,065 | (c) | | | 4,182,441 | (c) | | | 7,563,945 | (c) | | | 12,373,310 | (c) | | |
| | 4,328,722 | | | | — | | | | — | | | | — | | | | — | | | | — | | | | — | | | | — | | | |
| | | | | | | | |
| | — | | | | — | | | | — | | | | 743,146 | | | | 253,373 | | | | 1,912,244 | | | | 7,540,341 | | | | 11,890,469 | | | |
| | | | | | | | | | | | | | | | | | | | | | | | | | | | | | | | |
| | 87,448,679 | | | | 70 | | | | 14,133,237 | | | | 1,450,226 | | | | 1,045,438 | | | | 6,094,685 | | | | 15,104,286 | | | | 24,263,779 | | | |
| | | | | | | | | | | | | | | | | | | | | | | | | | | | | | | | |
| | | | | | | | | | | | | | | | | | | | | | | | | | | | | | | | |
| | 90,415,734 | | | | 84,667,994 | | | | 5,080,238 | | | | 2,753,539 | | | | 619,430 | | | | 6,185,688 | | | | 30,791,307 | | | | 43,536,296 | | | |
| | 1,139,836 | | | | — | | | | — | | | | — | | | | — | | | | — | | | | — | | | | — | | | |
| | | | | | | | | | | | | | | | | | | | | | | | | | | | | | | | |
| | 91,555,570 | | | | 84,667,994 | | | | 5,080,238 | | | | 2,753,539 | | | | 619,430 | | | | 6,185,688 | | | | 30,791,307 | | | | 43,536,296 | | | |
| | | | | | | | | | | | | | | | | | | | | | | | | | | | | | | | |
| | | | | | | | |
| | 179,004,249 | | | | 84,668,064 | | | | 19,213,475 | | | | 4,203,765 | | | | 1,664,868 | | | | 12,280,373 | | | | 45,895,593 | | | | 67,800,075 | | | |
| | | | | | | | | | | | | | | | | | | | | | | | | | | | | | | | |
| $ | 198,348,209 | | | $ | 96,816,296 | | | $ | 23,095,229 | | | $ | 5,898,689 | | | $ | 2,138,506 | | | $ | 15,034,165 | | | $ | 54,688,921 | | | $ | 78,322,536 | | | |
| | | | | | | | | | | | | | | | | | | | | | | | | | | | | | | | |
The accompanying notes are an integral part of these financial statements.
75
MUTUAL OF AMERICA INVESTMENT CORPORATION
STATEMENTS OF OPERATIONS (Continued)
For the Year Ended December 31, 2017
| | | | | | | | | | | | | | | | | | | | |
| | | 2030
Retirement
Fund | | | 2035
Retirement
Fund | | | 2040
Retirement
Fund | | | 2045
Retirement
Fund | | | 2050
Retirement
Fund | |
INVESTMENT INCOMEAND EXPENSES | | | | | | | | | | | | | | | | | | | | |
INVESTMENT INCOME | | | | | | | | | | | | | | | | | | | | |
Dividends | | $ | 8,551,626 | (a) | | $ | 6,673,705 | (a) | | $ | 5,282,350 | (a) | | $ | 5,735,851 | (a) | | $ | 3,148,655 | (a) |
Interest | | | — | | | | — | | | | — | | | | — | | | | — | |
| | | | | | | | | | | | | | | | | | | | |
Total investment income | | | 8,551,626 | | | | 6,673,705 | | | | 5,282,350 | | | | 5,735,851 | | | | 3,148,655 | |
| | | | | | | | | | | | | | | | | | | | |
| | | | | |
EXPENSES | | | | | | | | | | | | | | | | | | | | |
Investment advisory fees (Note 2) | | | 241,717 | (b) | | | 202,358 | (b) | | | 164,861 | (b) | | | 188,196 | (b) | | | 101,829 | (b) |
Other operating expenses | | | | | | | | | | | | | | | | | | | | |
Accounting and recordkeeping expenses | | | — | (b) | | | — | (b) | | | — | (b) | | | — | (b) | | | — | (b) |
Shareholders reports | | | 16,332 | (b) | | | 16,263 | (b) | | | 16,158 | (b) | | | 16,327 | (b) | | | 15,691 | (b) |
Custodian expenses | | | — | (b) | | | — | (b) | | | — | (b) | | | — | (b) | | | — | (b) |
Independent directors’ fees and expenses | | | — | (b) | | | — | (b) | | | — | (b) | | | — | (b) | | | — | (b) |
Audit | | | 24,419 | (b) | | | 20,355 | (b) | | | 16,479 | (b) | | | 19,003 | (b) | | | 9,885 | (b) |
Legal and Compliance | | | 42,119 | (b) | | | 35,110 | (b) | | | 28,425 | (b) | | | 32,778 | (b) | | | 17,050 | (b) |
Administrative | | | — | (b) | | | — | (b) | | | — | (b) | | | — | (b) | | | — | (b) |
Licenses | | | — | (b) | | | — | (b) | | | — | (b) | | | — | (b) | | | — | (b) |
Other | | | — | (b) | | | — | (b) | | | — | (b) | | | — | (b) | | | — | (b) |
| | | | | | | | | | | | | | | | | | | | |
Total operating expenses | | | 82,870 | | | | 71,728 | | | | 61,062 | | | | 68,108 | | | | 42,626 | |
| | | | | | | | | | | | | | | | | | | | |
Total expenses before reimbursement | | | 324,587 | | | | 274,086 | | | | 225,923 | | | | 256,304 | | | | 144,455 | |
Non-Advisory operating expense reimbursement (Note 2) | | | — | | | | — | | | | — | | | | — | | | | (6,394 | ) |
Fee waiver and expense reimbursement (Note 2) | | | — | | | | — | | | | — | | | | — | | | | — | |
| | | | | | | | | | | | | | | | | | | | |
Net expenses | | | 324,587 | | | | 274,086 | | | | 225,923 | | | | 256,304 | | | | 138,061 | |
| | | | | | | | | | | | | | | | | | | | |
Net Investment Income (Loss) | | | 8,227,039 | | | | 6,399,619 | | | | 5,056,427 | | | | 5,479,547 | | | | 3,010,594 | |
| | | | | | | | | | | | | | | | | | | | |
NET REALIZEDAND UNREALIZED GAIN (LOSS)ON INVESTMENTSAND
FUTURES CONTRACTS (NOTE 1) | | | | | | | | | | | | | | | | | | | | |
Net realized gain (loss) on: | | | | | | | | | | | | | | | | | | | | |
Investment securities | | | 8,767,440 | (c) | | | 6,179,295 | (c) | | | 4,399,384 | (c) | | | 5,797,948 | (c) | | | 828,912 | (c) |
Futures contracts | | | — | | | | — | | | | — | | | | — | | | | — | |
Gain distributions from Mutual of America Investment Corp. Funds | | | 11,838,893 | | | | 10,885,013 | | | | 9,134,997 | | | | 10,763,917 | | | | 6,187,507 | |
| | | | | | | | | | | | | | | | | | | | |
| | | 20,606,333 | | | | 17,064,308 | | | | 13,534,381 | | | | 16,561,865 | | | | 7,016,419 | |
| | | | | | | | | | | | | | | | | | | | |
Change in net unrealized appreciation (depreciation) of: | | | | | | | | | | | | | | | | | | | | |
Investment securities | | | 43,362,960 | | | | 40,982,001 | | | | 34,637,708 | | | | 39,378,606 | | | | 23,769,184 | |
Futures contracts | | | — | | | | — | | | | — | | | | — | | | | — | |
| | | | | | | | | | | | | | | | | | | | |
| | | 43,362,960 | | | | 40,982,001 | | | | 34,637,708 | | | | 39,378,606 | | | | 23,769,184 | |
| | | | | | | | | | | | | | | | | | | | |
NET REALIZEDAND UNREALIZED GAIN (LOSS)ON INVESTMENTSAND
FUTURES CONTRACTS | | | 63,969,293 | | | | 58,046,309 | | | | 48,172,089 | | | | 55,940,471 | | | | 30,785,603 | |
| | | | | | | | | | | | | | | | | | | | |
NET INCREASE (DECREASE)IN NET ASSETS RESULTINGFROM OPERATIONS | | $ | 72,196,332 | | | $ | 64,445,928 | | | $ | 53,228,516 | | | $ | 61,420,018 | | | $ | 33,796,197 | |
| | | | | | | | | | | | | | | | | | | | |
| (a) | The Retirement and Allocation Funds invest in affiliated funds of Mutual of America Investment Corporation and receive dividend income entirely from these affiliated funds. |
| (b) | The Retirement and Allocation Funds incur direct investment management expenses of .05% and .00%, respectively. Certain operating expenses that can be attributed only to the Retirement and Allocation Funds were charged directly to those Funds, subject to the Adviser’s agreement to reimburse direct non-advisory operating expenses of any such Fund whose average daily net assets for the prior calendar year was less than $50 million. The Retirement and Allocation Funds also bear their pro-rata share of the non-advisory operating expenses borne by each of the underlying Funds in which they invest. |
| (c) | Realized gains and losses for the Retirement and Allocation Funds resulted from the disposition of shares of the underlying funds. |
The accompanying notes are an integral part of these financial statements.
76
| | | | | | | | | | | | | | | | | | | | | | | | | | | | |
2055
Retirement
Fund | | | Conservative
Allocation
Fund | | | Moderate
Allocation
Fund | | | Aggressive
Allocation
Fund | | | Money
Market
Fund | | | Mid-Term
Bond Fund | | | Bond Fund | | | |
| | | | | | | | | | | | | | | | | | | | | | | | | | | | |
| | | | | | | | | | | | | | | | | | | | | | | | | | | | |
| $ | 287,237 | (a) | | $ | 3,248,478 | (a) | | $ | 7,130,548 | (a) | | $ | 4,719,426 | (a) | | $ | — | | | $ | — | | | $ | — | | | |
| | — | | | | — | | | | — | | | | — | | | | 624,445 | | | | 14,646,578 | | | | 40,119,766 | | | |
| | | | | | | | | | | | | | | | | | | | | | | | | | | | |
| | 287,237 | | | | 3,248,478 | | | | 7,130,548 | | | | 4,719,426 | | | | 624,445 | | | | 14,646,578 | | | | 40,119,766 | | | |
| | | | | | | | | | | | | | | | | | | | | | | | | | | | |
| | | | | | | |
| | | | | | | | | | | | | | | | | | | | | | | | | | | | |
| | 7,240 | (b) | | | — | (b) | | | — | (b) | | | — | (b) | | | 98,589 | | | | 2,071,010 | | | | 4,559,829 | | | |
| | | | | | | | | | | | | | | | | | | | | | | | | | | | |
| | — | (b) | | | — | (b) | | | — | (b) | | | — | (b) | | | 17,582 | | | | 134,466 | | | | 288,580 | | | |
| | 11,236 | (b) | | | 14,691 | (b) | | | 16,101 | (b) | | | 15,909 | (b) | | | 15,337 | | | | 19,088 | | | | 24,564 | | | |
| | — | (b) | | | — | (b) | | | — | (b) | | | — | (b) | | | 8,326 | | | | 10,819 | | | | 28,743 | | | |
| | — | (b) | | | — | (b) | | | — | (b) | | | — | (b) | | | 3,954 | | | | 34,502 | | | | 72,314 | | | |
| | 632 | (b) | | | 7,204 | (b) | | | 18,998 | (b) | | | 14,292 | (b) | | | 2,555 | | | | 9,161 | | | | 19,434 | | | |
| | 1,089 | (b) | | | 12,426 | (b) | | | 32,770 | (b) | | | 24,653 | (b) | | | 6,543 | | | | 23,461 | | | | 49,771 | | | |
| | — | (b) | | | — | (b) | | | — | (b) | | | — | (b) | | | 11,813 | | | | 103,078 | | | | 216,042 | | | |
| | — | (b) | | | — | (b) | | | — | (b) | | | — | (b) | | | — | | | | — | | | | — | | | |
| | — | (b) | | | — | (b) | | | — | (b) | | | — | (b) | | | 1,765 | | | | 15,399 | | | | 32,275 | | | |
| | | | | | | | | | | | | | | | | | | | | | | | | | | | |
| | 12,957 | | | | 34,321 | | | | 67,869 | | | | 54,854 | | | | 67,875 | | | | 349,974 | | | | 731,723 | | | |
| | | | | | | | | | | | | | | | | | | | | | | | | | | | |
| | 20,197 | | | | 34,321 | | | | 67,869 | | | | 54,854 | | | | 166,464 | | | | 2,420,984 | | | | 5,291,552 | | | |
| | — | | | | — | | | | — | | | | — | | | | (4,708 | ) | | | (83,325 | ) | | | (126,196 | ) | | |
| | (12,957 | ) | | | — | | | | — | | | | — | | | | — | | | | — | | | | — | | | |
| | | | | | | | | | | | | | | | | | | | | | | | | | | | |
| | 7,240 | | | | 34,321 | | | | 67,869 | | | | 54,854 | | | | 161,756 | | | | 2,337,659 | | | | 5,165,356 | | | |
| | | | | | | | | | | | | | | | | | | | | | | | | | | | |
| | 279,997 | | | | 3,214,157 | | | | 7,062,679 | | | | 4,664,572 | | | | 462,689 | | | | 12,308,919 | | | | 34,954,410 | | | |
| | | | | | | | | | | | | | | | | | | | | | | | | | | | |
| | | | | | | | | | | | | | | | | | | | | | | | | | | | |
| | | | | | | | | | | | | | | | | | | | | | | | | | | | |
| | 68,906 | (c) | | | 5,588,712 | (c) | | | 15,398,638 | (c) | | | 11,978,629 | (c) | | | 445 | | | | 237,075 | | | | (77,618 | ) | | |
| | — | | | | — | | | | — | | | | — | | | | — | | | | — | | | | — | | | |
| | 575,178 | | | | 1,006,601 | | | | 6,431,377 | | | | 6,586,412 | | | | — | | | | — | | | | — | | | |
| | | | | | | | | | | | | | | | | | | | | | | | | | | | |
| | 644,084 | | | | 6,595,313 | | | | 21,830,015 | | | | 18,565,041 | | | | 445 | | | | 237,075 | | | | (77,618 | ) | | |
| | | | | | | | | | | | | | | | | | | | | | | | | | | | |
| | | | | | | | | | | | | | | | | | | | | | | | | | | | |
| | 1,552,376 | | | | 2,573,385 | | | | 18,562,193 | | | | 20,157,123 | | | | 306 | | | | (1,156,836 | ) | | | 5,518,377 | | | |
| | — | | | | — | | | | — | | | | — | | | | — | | | | — | | | | — | | | |
| | | | | | | | | | | | | | | | | | | | | | | | | | | | |
| | 1,552,376 | | | | 2,573,385 | | | | 18,562,193 | | | | 20,157,123 | | | | 306 | | | | (1,156,836 | ) | | | 5,518,377 | | | |
| | | | | | | | | | | | | | | | | | | | | | | | | | | | |
|
2,196,460 |
| | | 9,168,698 | | | | 40,392,208 | | | | 38,722,164 | | | | 751 | | | | (919,761 | ) | | | 5,440,759 | | | |
| | | | | | | | | | | | | | | | | | | | | | | | | | | | |
| $ | 2,476,457 | | | $ | 12,382,855 | | | $ | 47,454,887 | | | $ | 43,386,736 | | | $ | 463,440 | | | $ | 11,389,158 | | | $ | 40,395,169 | | | |
| | | | | | | | | | | | | | | | | | | | | | | | | | | | |
The accompanying notes are an integral part of these financial statements.
77
MUTUAL OF AMERICA INVESTMENT CORPORATION
STATEMENTS OF CHANGES IN NET ASSETS
For the Years Ended December 31,
| | | | | | | | | | | | | | | | |
| | | Equity Index Fund | | | All America Fund | |
| | | 2017 | | | 2016 | | | 2017 | | | 2016 | |
INCREASE (DECREASE) IN NET ASSETS | | | | | | | | | | | | | | | | |
FROM OPERATIONS | | | | | | | | | | | | | | | | |
Net investment income (loss) | | $ | 44,215,785 | | | $ | 39,427,977 | | | $ | 4,117,512 | | | $ | 4,099,059 | |
Net realized gain (loss) on investments and futures contracts | | | 62,492,844 | | | | 45,245,921 | | | | 16,748,863 | | | | 38,904,517 | |
Change in net unrealized appreciation (depreciation) of investments and futures contracts | | | 362,502,928 | | | | 136,834,177 | | | | 33,991,640 | | | | (11,645,937 | ) |
| | | | | | | | | | | | | | | | |
NET INCREASE (DECREASE) IN NET ASSETS RESULTING FROM OPERATIONS | | | 469,211,557 | | | | 221,508,075 | | | | 54,858,015 | | | | 31,357,639 | |
| | | | | | | | | | | | | | | | |
| | | | |
DISTRIBUTIONS (Notes 1 and 5) | | | | | | | | | | | | | | | | |
From net investment income | | | (38,919,706 | ) | | | (34,619,166 | ) | | | (3,802,012 | ) | | | (3,947,519 | ) |
From net realized gains | | | (45,861,843 | ) | | | (49,908,340 | ) | | | (36,980,385 | ) | | | (17,354,545 | ) |
| | | | | | | | | | | | | | | | |
Total distributions | | | (84,781,549 | ) | | | (84,527,506 | ) | | | (40,782,397 | ) | | | (21,302,064 | ) |
| | | | | | | | | | | | | | | | |
| | | | |
CAPITAL TRANSACTIONS (Note 4) | | | | | | | | | | | | | | | | |
Proceeds from sale of shares | | | 280,655,275 | | | | 209,534,199 | | | | 4,994,968 | | | | 3,905,224 | |
Dividends reinvested | | | 84,781,549 | | | | 84,527,506 | | | | 40,782,397 | | | | 21,302,064 | |
Cost of shares redeemed | | | (181,599,618 | ) | | | (141,946,780 | ) | | | (30,960,356 | ) | | | (34,216,260 | ) |
| | | | | | | | | | | | | | | | |
NET INCREASE (DECREASE) IN NET ASSETS FROM CAPITAL TRANSACTIONS | | | 183,837,206 | | | | 152,114,925 | | | | 14,817,009 | | | | (9,008,972 | ) |
| | | | | | | | | | | | | | | | |
INCREASE (DECREASE) IN NET ASSETS | | | 568,267,214 | | | | 289,095,494 | | | | 28,892,627 | | | | 1,046,603 | |
NET ASSETS, BEGINNING OF PERIOD | | | 2,143,317,737 | | | | 1,854,222,243 | | | | 295,843,728 | | | | 294,797,125 | |
| | | | | | | | | | | | | | | | |
NET ASSETS, END OF PERIOD | | $ | 2,711,584,951 | | | $ | 2,143,317,737 | | | $ | 324,736,355 | | | $ | 295,843,728 | |
| | | | | | | | | | | | | | | | |
ACCUMULATED UNDISTRIBUTED NET INVESTMENT INCOME (LOSS) | | $ | 43,482,957 | | | $ | 38,981,241 | | | $ | 3,999,110 | | | $ | 4,004,203 | |
| | | | | | | | | | | | | | | | |
| | | | |
OTHER INFORMATION: | | | | | | | | | | | | | | | | |
Shares outstanding at the beginning of period | | | 613,796,674 | | | | 568,528,724 | | | | 129,150,212 | | | | 132,899,216 | |
| | | | | | | | | | | | | | | | |
Shares sold | | | 72,758,083 | | | | 62,532,808 | | | | 2,084,026 | | | | 1,762,928 | |
Shares issued as reinvestment of dividends | | | 21,862,291 | | | | 25,622,727 | | | | 17,925,989 | | | | 9,891,307 | |
Shares redeemed | | | (47,652,840 | ) | | | (42,887,585 | ) | | | (12,900,526 | ) | | | (15,403,239 | ) |
| | | | | | | | | | | | | | | | |
Net increase (decrease) | | | 46,967,534 | | | | 45,267,950 | | | | 7,109,489 | | | | (3,749,004 | ) |
| | | | | | | | | | | | | | | | |
Shares outstanding at the end of period | | | 660,764,208 | | | | 613,796,674 | | | | 136,259,701 | | | | 129,150,212 | |
| | | | | | | | | | | | | | | | |
The accompanying notes are an integral part of these financial statements.
78
| | | | | | | | | | | | | | | | | | | | | | | | | | | | | | | | |
| Small Cap Value Fund | | | Small Cap Growth Fund | | | Mid Cap Value Fund | | | Mid-Cap Equity Index Fund | | | |
| 2017 | | | 2016 | | | 2017 | | | 2016 | | | 2017 | | | 2016 | | | 2017 | | | 2016 | | | |
| | | | | | | | | | | | | | | | | | | | | | | | | | | | | | | | |
| | | | | | | | | | | | | | | | | | | | | | | | | | | | | | | | |
| $ | 8,270,846 | | | $ | 4,582,828 | | | $ | 296,515 | | | $ | 233,258 | | | $ | 1,550,315 | | | $ | 1,243,933 | | | $ | 19,343,960 | | | $ | 17,040,188 | | | |
| | 36,492,214 | | | | 21,162,617 | | | | 38,804,225 | | | | 17,695,904 | | | | 7,184,494 | | | | 4,570,150 | | | | 87,448,679 | | | | 76,031,428 | | | |
| | | | | | | | |
| | (6,611,332 | ) | | | 49,990,802 | | | | 64,349,468 | | | | 14,374,516 | | | | 5,161,646 | | | | 7,222,550 | | | | 91,555,570 | | | | 111,173,821 | | | |
| | | | | | | | | | | | | | | | | | | | | | | | | | | | | | | | |
| | 38,151,728 | | | | 75,736,247 | | | | 103,450,208 | | | | 32,303,678 | | | | 13,896,455 | | | | 13,036,633 | | | | 198,348,209 | | | | 204,245,437 | | | |
| | | | | | | | | | | | | | | | | | | | | | | | | | | | | | | | |
| | | | | | | | |
| | | | | | | | | | | | | | | | | | | | | | | | | | | | | | | | |
| | (2,722,335 | ) | | | (3,473,986 | ) | | | (119,175 | ) | | | — | | | | (1,059,046 | ) | | | (1,115,504 | ) | | | (15,061,844 | ) | | | (13,403,568 | ) | | |
| | (22,418,108 | ) | | | (5,500,345 | ) | | | (17,468,310 | ) | | | (39,762,021 | ) | | | (4,282,390 | ) | | | (4,887,020 | ) | | | (78,333,904 | ) | | | (71,656,832 | ) | | |
| | | | | | | | | | | | | | | | | | | | | | | | | | | | | | | | |
| | (25,140,443 | ) | | | (8,974,331 | ) | | | (17,587,485 | ) | | | (39,762,021 | ) | | | (5,341,436 | ) | | | (6,002,524 | ) | | | (93,395,748 | ) | | | (85,060,400 | ) | | |
| | | | | | | | | | | | | | | | | | | | | | | | | | | | | | | | |
| | | | | | | | |
| | | | | | | | | | | | | | | | | | | | | | | | | | | | | | | | |
| | 50,530,295 | | | | 37,892,425 | | | | 56,136,417 | | | | 35,062,988 | | | | 7,799,776 | | | | 11,023,289 | | | | 139,275,450 | | | | 134,367,488 | | | |
| | 25,140,443 | | | | 8,974,331 | | | | 17,587,485 | | | | 39,762,021 | | | | 5,341,436 | | | | 6,002,524 | | | | 93,395,748 | | | | 85,060,400 | | | |
| | (47,802,151 | ) | | | (25,255,029 | ) | | | (37,490,815 | ) | | | (36,184,437 | ) | | | (16,319,390 | ) | | | (7,572,114 | ) | | | (130,627,727 | ) | | | (70,973,227 | ) | | |
| | | | | | | | | | | | | | | | | | | | | | | | | | | | | | | | |
| | 27,868,587 | | | | 21,611,727 | | | | 36,233,087 | | | | 38,640,572 | | | | (3,178,178 | ) | | | 9,453,699 | | | | 102,043,471 | | | | 148,454,661 | | | |
| | | | | | | | | | | | | | | | | | | | | | | | | | | | | | | | |
| | 40,879,872 | | | | 88,373,643 | | | | 122,095,810 | | | | 31,182,229 | | | | 5,376,841 | | | | 16,487,808 | | | | 206,995,932 | | | | 267,639,698 | | | |
| | 464,841,877 | | | | 376,468,234 | | | | 432,806,186 | | | | 401,623,957 | | | | 98,017,315 | | | | 81,529,507 | | | | 1,245,037,175 | | | | 977,397,477 | | | |
| | | | | | | | | | | | | | | | | | | | | | | | | | | | | | | | |
| $ | 505,721,749 | | | $ | 464,841,877 | | | $ | 554,901,996 | | | $ | 432,806,186 | | | $ | 103,394,156 | | | $ | 98,017,315 | | | $ | 1,452,033,107 | | | $ | 1,245,037,175 | | | |
| | | | | | | | | | | | | | | | | | | | | | | | | | | | | | | | |
| $ | 7,813,509 | | | $ | 4,275,125 | | | $ | 182,432 | | | $ | 125,500 | | | $ | 1,717,714 | | | $ | 1,068,227 | | | $ | 17,265,865 | | | $ | 16,421,998 | | | |
| | | | | | | | | | | | | | | | | | | | | | | | | | | | | | | | |
| | | | | | | | |
| | | | | | | | | | | | | | | | | | | | | | | | | | | | | | | | |
| | 275,365,315 | | | | 261,696,017 | | | | 335,357,612 | | | | 304,121,411 | | | | 62,318,941 | | | | 55,990,109 | | | | 574,306,144 | | | | 501,311,878 | | | |
| | | | | | | | | | | | | | | | | | | | | | | | | | | | | | | | |
| | 29,611,517 | | | | 24,832,010 | | | | 38,971,886 | | | | 27,646,314 | | | | 4,806,994 | | | | 7,281,442 | | | | 61,230,392 | | | | 65,449,391 | | | |
| | 14,598,450 | | | | 5,991,779 | | | | 11,783,010 | | | | 31,953,741 | | | | 3,270,674 | | | | 4,184,209 | | | | 41,917,027 | | | | 43,133,705 | | | |
| | (28,141,275 | ) | | | (17,154,491 | ) | | | (26,793,986 | ) | | | (28,363,854 | ) | | | (9,999,977 | ) | | | (5,136,819 | ) | | | (57,565,430 | ) | | | (35,588,830 | ) | | |
| | | | | | | | | | | | | | | | | | | | | | | | | | | | | | | | |
| | 16,068,692 | | | | 13,669,298 | | | | 23,960,910 | | | | 31,236,201 | | | | (1,922,309 | ) | | | 6,328,832 | | | | 45,581,989 | | | | 72,994,266 | | | |
| | | | | | | | | | | | | | | | | | | | | | | | | | | | | | | | |
| | 291,434,007 | | | | 275,365,315 | | | | 359,318,522 | | | | 335,357,612 | | | | 60,396,632 | | | | 62,318,941 | | | | 619,888,133 | | | | 574,306,144 | | | |
| | | | | | | | | | | | | | | | | | | | | | | | | | | | | | | | |
The accompanying notes are an integral part of these financial statements.
79
MUTUAL OF AMERICA INVESTMENT CORPORATION
STATEMENTS OF CHANGES IN NET ASSETS (Continued)
For the Years Ended December 31,
| | | | | | | | | | | | | | | | |
| | | International Fund | | | Composite Fund | |
| | | 2017 | | | 2016 | | | 2017 | | | 2016 | |
INCREASE (DECREASE)IN NET ASSETS | | | | | | | | | | | | | | | | |
FROM OPERATIONS | | | | | | | | | | | | | | | | |
Net investment income (loss) | | $ | 12,148,232 | | | $ | 9,884,641 | | | $ | 3,881,754 | | | $ | 3,753,358 | |
Net realized gain (loss) on investments and futures contracts | | | 70 | | | | 1,581,427 | | | | 14,133,237 | | | | 23,489,051 | |
Change in net unrealized appreciation (depreciation) of investments and futures contracts | | | 84,667,994 | | | | (5,032,541 | ) | | | 5,080,238 | | | | (13,674,781 | ) |
| | | | | | | | | | | | | | | | |
NET INCREASE (DECREASE)IN NET ASSETS RESULTINGFROM OPERATIONS | | | 96,816,296 | | | | 6,433,527 | | | | 23,095,229 | | | | 13,567,628 | |
| | | | | | | | | | | | | | | | |
| | | | |
DISTRIBUTIONS (Notes 1 and 5) | | | | | | | | | | | | | | | | |
From net investment income | | | (9,884,641 | ) | | | (7,642,431 | ) | | | (3,738,706 | ) | | | (3,658,442 | ) |
From net realized gains | | | (1,196,804 | ) | | | (507 | ) | | | (21,558,240 | ) | | | (10,434,654 | ) |
| | | | | | | | | | | | | | | | |
Total distributions | | | (11,081,445 | ) | | | (7,642,938 | ) | | | (25,296,946 | ) | | | (14,093,096 | ) |
| | | | | | | | | | | | | | | | |
| | | | |
CAPITAL TRANSACTIONS (Note 4) | | | | | | | | | | | | | | | | |
Proceeds from sale of shares | | | 93,050,146 | | | | 68,349,676 | | | | 5,856,506 | | | | 6,797,815 | |
Dividends reinvested | | | 11,081,445 | | | | 7,642,938 | | | | 25,296,946 | | | | 14,093,096 | |
Cost of shares redeemed | | | (29,124,853 | ) | | | (17,474,443 | ) | | | (19,724,207 | ) | | | (19,136,304 | ) |
| | | | | | | | | | | | | | | | |
NET INCREASE (DECREASE)IN NET ASSETSFROM CAPITAL TRANSACTIONS | | | 75,006,738 | | | | 58,518,171 | | | | 11,429,245 | | | | 1,754,607 | |
| | | | | | | | | | | | | | | | |
INCREASE (DECREASE)IN NET ASSETS | | | 160,741,589 | | | | 57,308,760 | | | | 9,227,528 | | | | 1,229,139 | |
NET ASSETS, BEGINNINGOF PERIOD | | | 376,728,493 | | | | 319,419,733 | | | | 181,143,387 | | | | 179,914,248 | |
| | | | | | | | | | | | | | | | |
NET ASSETS, ENDOF PERIOD | | $ | 537,470,082 | | | $ | 376,728,493 | | | $ | 190,370,915 | | | $ | 181,143,387 | |
| | | | | | | | | | | | | | | | |
ACCUMULATED UNDISTRIBUTED NET INVESTMENT INCOME (LOSS) | | $ | 12,148,232 | | | $ | 9,884,641 | | | $ | 3,867,102 | | | $ | 3,748,522 | |
| | | | | | | | | | | | | | | | |
| | | | |
OTHER INFORMATION: | | | | | | | | | | | | | | | | |
Shares outstanding at the beginning of period | | | 506,896,525 | | | | 427,541,926 | | | | 92,999,300 | | | | 91,853,422 | |
| | | | | | | | | | | | | | | | |
Shares sold | | | 109,396,814 | | | | 92,830,402 | | | | 2,942,783 | | | | 3,474,216 | |
Shares issued as reinvestment of dividends | | | 12,707,482 | | | | 10,348,096 | | | | 13,750,699 | | | | 7,481,435 | |
Shares redeemed | | | (34,656,041 | ) | | | (23,823,899 | ) | | | (9,932,080 | ) | | | (9,809,773 | ) |
| | | | | | | | | | | | | | | | |
Net increase (decrease) | | | 87,448,255 | | | | 79,354,599 | | | | 6,761,402 | | | | 1,145,878 | |
| | | | | | | | | | | | | | | | |
Shares outstanding at the end of period | | | 594,344,780 | | | | 506,896,525 | | | | 99,760,702 | | | | 92,999,300 | |
| | | | | | | | | | | | | | | | |
The accompanying notes are an integral part of these financial statements.
80
| | | | | | | | | | | | | | | | | | | | | | | | | | | | | | | | | | |
| Retirement Income Fund | | | 2010 Retirement Fund | | | 2015 Retirement Fund | | | 2020 Retirement Fund | | | | |
| 2017 | | | 2016 | | | 2017 | | | 2016 | | | 2017 | | | 2016 | | | 2017 | | | 2016 | | | | |
| | | | | | | | | | | | | | | | | | | | | | | | | | | | | | | | | | |
| | | | | | | | | | | | | | | | | | | | | | | | | | | | | | | | | | |
| $ | 1,694,924 | | | $ | 1,530,422 | | | $ | 473,638 | | | $ | 539,513 | | | $ | 2,753,792 | | | $ | 3,002,795 | | | $ | 8,793,328 | | | $ | 7,811,788 | | | | | |
| | 1,450,226 | | | | 1,280,342 | | | | 1,045,438 | | | | 1,107,665 | | | | 6,094,685 | | | | 6,424,739 | | | | 15,104,286 | | | | 15,151,238 | | | | | |
| | | | | | | | |
| | 2,753,539 | | | | 1,149,321 | | | | 619,430 | | | | 710 | | | | 6,185,688 | | | | 1,217,614 | | | | 30,791,307 | | | | 8,601,495 | | | | | |
| | | | | | | | | | | | | | | | | | | | | | | | | | | | | | | | | | |
| | 5,898,689 | | | | 3,960,085 | | | | 2,138,506 | | | | 1,647,888 | | | | 15,034,165 | | | | 10,645,148 | | | | 54,688,921 | | | | 31,564,521 | | | | | |
| | | | | | | | | | | | | | | | | | | | | | | | | | | | | | | | | | |
| | | | | | | | |
| | | | | | | | | | | | | | | | | | | | | | | | | | | | | | | | | | |
| | (1,539,981 | ) | | | (1,417,706 | ) | | | (543,546 | ) | | | (579,461 | ) | | | (3,028,463 | ) | | | (3,360,637 | ) | | | (7,891,832 | ) | | | (7,495,794 | ) | | | | |
| | (1,379,154 | ) | | | (2,334,883 | ) | | | (1,150,822 | ) | | | (1,449,643 | ) | | | (6,504,889 | ) | | | (8,964,100 | ) | | | (15,006,151 | ) | | | (15,116,286 | ) | | | | |
| | | | | | | | | | | | | | | | | | | | | | | | | | | | | | | | | | |
| | (2,919,135 | ) | | | (3,752,589 | ) | | | (1,694,368 | ) | | | (2,029,104 | ) | | | (9,533,352 | ) | | | (12,324,737 | ) | | | (22,897,983 | ) | | | (22,612,080 | ) | | | | |
| | | | | | | | | | | | | | | | | | | | | | | | | | | | | | | | | | |
| | | | | | | | |
| | | | | | | | | | | | | | | | | | | | | | | | | | | | | | | | | | |
| | 32,172,908 | | | | 19,963,945 | | | | 4,928,903 | | | | 4,860,985 | | | | 15,693,916 | | | | 12,428,714 | | | | 77,413,289 | | | | 60,741,136 | | | | | |
| | 2,919,135 | | | | 3,752,589 | | | | 1,694,368 | | | | 2,029,104 | | | | 9,533,352 | | | | 12,324,737 | | | | 22,897,983 | | | | 22,612,080 | | | | | |
| | (12,952,830 | ) | | | (11,713,859 | ) | | | (7,200,626 | ) | | | (6,387,715 | ) | | | (22,133,922 | ) | | | (25,443,200 | ) | | | (33,093,454 | ) | | | (30,060,119 | ) | | | | |
| | | | | | | | | | | | | | | | | | | | | | | | | | | | | | | | | | |
| | 22,139,213 | | | | 12,002,675 | | | | (577,355 | ) | | | 502,374 | | | | 3,093,346 | | | | (689,749 | ) | | | 67,217,818 | | | | 53,293,097 | | | | | |
| | | | | | | | | | | | | | | | | | | | | | | | | | | | | | | | | | |
| | 25,118,767 | | | | 12,210,171 | | | | (133,217 | ) | | | 121,158 | | | | 8,594,159 | | | | (2,369,338 | ) | | | 99,008,756 | | | | 62,245,538 | | | | | |
| | 75,699,895 | | | | 63,489,724 | | | | 25,683,184 | | | | 25,562,026 | | | | 146,391,754 | | | | 148,761,092 | | | | 425,843,817 | | | | 363,598,279 | | | | | |
| | | | | | | | | | | | | | | | | | | | | | | | | | | | | | | | | | |
| $ | 100,818,662 | | | $ | 75,699,895 | | | $ | 25,549,967 | | | $ | 25,683,184 | | | $ | 154,985,913 | | | $ | 146,391,754 | | | $ | 524,852,573 | | | $ | 425,843,817 | | | | | |
| | | | | | | | | | | | | | | | | | | | | | | | | | | | | | | | | | |
| $ | 1,751,326 | | | $ | 1,539,981 | | | $ | 490,991 | | | $ | 543,546 | | | $ | 2,885,420 | | | $ | 3,028,460 | | | $ | 9,311,834 | | | $ | 7,891,832 | | | | | |
| | | | | | | | | | | | | | | | | | | | | | | | | | | | | | | | | | |
| | | | | | | | |
| | | | | | | | | | | | | | | | | | | | | | | | | | | | | | | | | | |
| | 67,312,624 | | | | 56,717,917 | | | | 25,875,441 | | | | 25,303,663 | | | | 142,136,674 | | | | 142,339,770 | | | | 372,702,026 | | | | 325,767,231 | | | | | |
| | | | | | | | | | | | | | | | | | | | | | | | | | | | | | | | | | |
| | 27,753,913 | | | | 17,515,224 | | | | 4,824,578 | | | | 4,798,782 | | | | 14,745,583 | | | | 11,829,560 | | | | 64,222,463 | | | | 53,304,303 | | | | | |
| | 2,540,886 | | | | 3,360,539 | | | | 1,716,264 | | | | 2,071,565 | | | | 9,148,642 | | | | 12,201,031 | | | | 19,226,863 | | | | 20,334,111 | | | | | |
| | (11,209,653 | ) | | | (10,281,056 | ) | | | (7,056,421 | ) | | | (6,298,569 | ) | | | (20,760,833 | ) | | | (24,233,687 | ) | | | (27,701,671 | ) | | | (26,703,619 | ) | | | | |
| | | | | | | | | | | | | | | | | | | | | | | | | | | | | | | | | | |
| | 19,085,146 | | | | 10,594,707 | | | | (515,579 | ) | | | 571,778 | | | | 3,133,392 | | | | (203,096 | ) | | | 55,747,655 | | | | 46,934,795 | | | | | |
| | | | | | | | | | | | | | | | | | | | | | | | | | | | | | | | | | |
| | 86,397,770 | | | | 67,312,624 | | | | 25,359,862 | | | | 25,875,441 | | | | 145,270,066 | | | | 142,136,674 | | | | 428,449,681 | | | | 372,702,026 | | | | | |
| | | | | | | | | | | | | | | | | | | | | | | | | | | | | | | | | | |
The accompanying notes are an integral part of these financial statements.
81
MUTUAL OF AMERICA INVESTMENT CORPORATION
STATEMENTS OF CHANGES IN NET ASSETS (Continued)
For the Years Ended December 31,
| | | | | | | | | | | | | | | | |
| | | 2025 Retirement Fund | | | 2030 Retirement Fund | |
| | | 2017 | | | 2016 | | | 2017 | | | 2016 | |
INCREASE (DECREASE)IN NET ASSETS | | | | | | | | | | | | | | | | |
FROM OPERATIONS | | | | | | | | | | | | | | | | |
Net investment income (loss) | | $ | 10,522,461 | | | $ | 8,340,336 | | | $ | 8,227,039 | | | $ | 6,383,344 | |
Net realized gain (loss) on investments and futures contracts | | | 24,263,779 | | | | 17,975,841 | | | | 20,606,333 | | | | 16,642,471 | |
Change in net unrealized appreciation (depreciation) of investments and futures contracts | | | 43,536,296 | | | | 15,514,743 | | | | 43,362,960 | | | | 14,528,108 | |
| | | | | | | | | | | | | | | | |
NET INCREASE (DECREASE)IN NET ASSETS RESULTINGFROM OPERATIONS | | | 78,322,536 | | | | 41,830,920 | | | | 72,196,332 | | | | 37,553,923 | |
| | | | | | | | | | | | | | | | |
| | | | |
DISTRIBUTIONS (Notes 1 and 5) | | | | | | | | | | | | | | | | |
From net investment income | | | (8,443,812 | ) | | | (7,530,298 | ) | | | (6,471,545 | ) | | | (5,967,073 | ) |
From net realized gains | | | (17,549,626 | ) | | | (17,294,855 | ) | | | (16,402,087 | ) | | | (16,440,817 | ) |
| | | | | | | | | | | | | | | | |
Total distributions | | | (25,993,438 | ) | | | (24,825,153 | ) | | | (22,873,632 | ) | | | (22,407,890 | ) |
| | | | | | | | | | | | | | | | |
| | | | |
CAPITAL TRANSACTIONS (Note 4) | | | | | | | | | | | | | | | | |
Proceeds from sale of shares | | | 126,625,039 | | | | 83,094,922 | | | | 106,077,871 | | | | 65,836,378 | |
Dividends reinvested | | | 25,993,438 | | | | 24,825,153 | | | | 22,873,632 | | | | 22,407,890 | |
Cost of shares redeemed | | | (23,344,451 | ) | | | (16,754,823 | ) | | | (16,853,502 | ) | | | (15,151,173 | ) |
| | | | | | | | | | | | | | | | |
NET INCREASE (DECREASE)IN NET ASSETSFROM CAPITAL TRANSACTIONS | | | 129,274,026 | | | | 91,165,252 | | | | 112,098,001 | | | | 73,093,095 | |
| | | | | | | | | | | | | | | | |
INCREASE (DECREASE)IN NET ASSETS | | | 181,603,124 | | | | 108,171,019 | | | | 161,420,701 | | | | 88,239,128 | |
NET ASSETS, BEGINNINGOF PERIOD | | | 504,129,290 | | | | 395,958,271 | | | | 416,286,459 | | | | 328,047,331 | |
| | | | | | | | | | | | | | | | |
NET ASSETS, ENDOF PERIOD | | $ | 685,732,414 | | | $ | 504,129,290 | | | $ | 577,707,160 | | | $ | 416,286,459 | |
| | | | | | | | | | | | | | | | |
ACCUMULATED UNDISTRIBUTED NET INVESTMENT INCOME (LOSS) | | $ | 11,340,011 | | | $ | 8,443,812 | | | $ | 9,022,072 | | | $ | 6,471,545 | |
| | | | | | | | | | | | | | | | |
| | | | |
OTHER INFORMATION: | | | | | | | | | | | | | | | | |
Shares outstanding at the beginning of period | | | 415,825,169 | | | | 339,214,646 | | | | 334,109,962 | | | | 273,996,553 | |
| | | | | | | | | | | | | | | | |
Shares sold | | | 98,079,023 | | | | 69,668,887 | | | | 79,451,171 | | | | 53,895,949 | |
Shares issued as reinvestment of dividends | | | 20,203,892 | | | | 21,243,935 | | | | 17,170,566 | | | | 18,787,249 | |
Shares redeemed | | | (18,253,168 | ) | | | (14,302,299 | ) | | | (12,745,120 | ) | | | (12,569,789 | ) |
| | | | | | | | | | | | | | | | |
Net increase (decrease) | | | 100,029,747 | | | | 76,610,523 | | | | 83,876,617 | | | | 60,113,409 | |
| | | | | | | | | | | | | | | | |
Shares outstanding at the end of period | | | 515,854,916 | | | | 415,825,169 | | | | 417,986,579 | | | | 334,109,962 | |
| | | | | | | | | | | | | | | | |
The accompanying notes are an integral part of these financial statements.
82
| | | | | | | | | | | | | | | | | | | | | | | | | | | | | | |
| 2035 Retirement Fund | | | 2040 Retirement Fund | | | 2045 Retirement Fund | | | 2050 Retirement Fund | |
| 2017 | | | 2016 | | | 2017 | | | 2016 | | | 2017 | | | 2016 | | | 2017 | | | 2016 | |
| | | | | | | | | | | | | | | | | | | | | | | | | | | | | | |
| | | | | | | | | | | | | | | | | | | | | | | | | | | | | | |
| $ | 6,399,619 | | | $ | 5,014,634 | | | $ | 5,056,427 | | | $ | 3,878,789 | | | $ | 5,479,547 | | | $ | 4,429,055 | | | $ | 3,010,594 | | | $ | 1,924,825 | |
| | 17,064,308 | | | | 14,378,657 | | | | 13,534,381 | | | | 12,766,659 | | | | 16,561,865 | | | | 14,077,259 | | | | 7,016,419 | | | | 5,152,801 | |
| | | | | | | | | | | | | | | | | | | | | | | | | | | | | | |
| | 40,982,001 | | | | 14,207,037 | | | | 34,637,708 | | | | 11,424,558 | | | | 39,378,606 | | | | 14,717,213 | | | | 23,769,184 | | | | 8,103,703 | |
| | | | | | | | | | | | | | | | | | | | | | | | | | | | | | |
| | 64,445,928 | | | | 33,600,328 | | | | 53,228,516 | | | | 28,070,006 | | | | 61,420,018 | | | | 33,223,527 | | | | 33,796,197 | | | | 15,181,329 | |
| | | | | | | | | | | | | | | | | | | | | | | | | | | | | | |
| | | | | | | |
| | | | | | | | | | | | | | | | | | | | | | | | | | | | | | |
| | (5,090,035 | ) | | | (4,653,592 | ) | | | (3,936,958 | ) | | | (3,629,694 | ) | | | (4,492,530 | ) | | | (4,323,009 | ) | | | (1,952,198 | ) | | | (1,305,214 | ) |
| | (14,165,396 | ) | | | (15,229,224 | ) | | | (12,664,502 | ) | | | (13,528,794 | ) | | | (13,839,470 | ) | | | (16,121,366 | ) | | | (5,127,131 | ) | | | (3,752,852 | ) |
| | | | | | | | | | | | | | | | | | | | | | | | | | | | | | |
| | (19,255,431 | ) | | | (19,882,816 | ) | | | (16,601,460 | ) | | | (17,158,488 | ) | | | (18,332,000 | ) | | | (20,444,375 | ) | | | (7,079,329 | ) | | | (5,058,066 | ) |
| | | | | | | | | | | | | | | | | | | | | | | | | | | | | | |
| | | | | | | |
| | | | | | | | | | | | | | | | | | | | | | | | | | | | | | |
| | 82,835,500 | | | | 59,045,385 | | | | 66,867,713 | | | | 43,339,746 | | | | 60,429,606 | | | | 43,884,460 | | | | 65,362,608 | | | | 57,049,790 | |
| | 19,255,431 | | | | 19,882,816 | | | | 16,601,460 | | | | 17,158,488 | | | | 18,332,000 | | | | 20,444,375 | | | | 7,079,329 | | | | 5,058,066 | |
| | (14,947,422 | ) | | | (12,123,049 | ) | | | (13,006,066 | ) | | | (7,616,743 | ) | | | (16,905,936 | ) | | | (9,251,474 | ) | | | (6,709,097 | ) | | | (2,077,210 | ) |
| | | | | | | | | | | | | | | | | | | | | | | | | | | | | | |
| | 87,143,509 | | | | 66,805,152 | | | | 70,463,107 | | | | 52,881,491 | | | | 61,855,670 | | | | 55,077,361 | | | | 65,732,840 | | | | 60,030,646 | |
| | | | | | | | | | | | | | | | | | | | | | | | | | | | | | |
| | 132,334,006 | | | | 80,522,664 | | | | 107,090,163 | | | | 63,793,009 | | | | 104,943,688 | | | | 67,856,513 | | | | 92,449,708 | | | | 70,153,909 | |
| | 351,837,357 | | | | 271,314,693 | | | | 285,697,360 | | | | 221,904,351 | | | | 332,406,688 | | | | 264,550,175 | | | | 164,048,517 | | | | 93,894,608 | |
| | | | | | | | | | | | | | | | | | | | | | | | | | | | | | |
| $ | 484,171,363 | | | $ | 351,837,357 | | | $ | 392,787,523 | | | $ | 285,697,360 | | | $ | 437,350,376 | | | $ | 332,406,688 | | | $ | 256,498,225 | | | $ | 164,048,517 | |
| | | | | | | | | | | | | | | | | | | | | | | | | | | | | | |
| $ | 7,120,325 | | | $ | 5,090,035 | | | $ | 5,677,938 | | | $ | 3,936,958 | | | $ | 6,218,541 | | | $ | 4,492,530 | | | $ | 3,442,823 | | | $ | 1,952,198 | |
| | | | | | | | | | | | | | | | | | | | | | | | | | | | | | |
| | | | | | | |
| | | | | | | | | | | | | | | | | | | | | | | | | | | | | | |
| | 281,100,694 | | | | 226,218,710 | | | | 230,643,020 | | | | 186,547,652 | | | | 268,924,524 | | | | 222,683,482 | | | | 112,896,396 | | | | 69,495,056 | |
| | | | | | | | | | | | | | | | | | | | | | | | | | | | | | |
| | 61,396,950 | | | | 48,252,870 | | | | 50,159,660 | | | | 35,902,529 | | | | 45,393,704 | | | | 36,492,502 | | | | 41,635,209 | | | | 41,228,623 | |
| | 14,298,764 | | | | 16,701,779 | | | | 12,463,175 | | | | 14,602,732 | | | | 13,753,057 | | | | 17,462,750 | | | | 4,440,753 | | | | 3,680,293 | |
| | (11,254,563 | ) | | | (10,072,665 | ) | | | (9,879,836 | ) | | | (6,409,893 | ) | | | (12,799,637 | ) | | | (7,714,210 | ) | | | (4,352,672 | ) | | | (1,507,576 | ) |
| | | | | | | | | | | | | | | | | | | | | | | | | | | | | | |
| | 64,441,151 | | | | 54,881,984 | | | | 52,742,999 | | | | 44,095,368 | | | | 46,347,124 | | | | 46,241,042 | | | | 41,723,290 | | | | 43,401,340 | |
| | | | | | | | | | | | | | | | | | | | | | | | | | | | | | |
| | 345,541,845 | | | | 281,100,694 | | | | 283,386,019 | | | | 230,643,020 | | | | 315,271,648 | | | | 268,924,524 | | | | 154,619,686 | | | | 112,896,396 | |
| | | | | | | | | | | | | | | | | | | | | | | | | | | | | | |
The accompanying notes are an integral part of these financial statements.
83
MUTUAL OF AMERICA INVESTMENT CORPORATION
STATEMENTS OF CHANGES IN NET ASSETS (Continued)
For the Years Ended December 31,
| | | | | | | | | | | | | | | | |
| | | 2055 Retirement Fund | | | Conservative Allocation Fund | |
| | | 2017 | | | 2016† | | | 2017 | | | 2016 | |
INCREASE (DECREASE)IN NET ASSETS | | | | | | | | | | | | | | | | |
FROM OPERATIONS | | | | | | | | | | | | | | | | |
Net investment income (loss) | | $ | 279,997 | | | $ | (132 | ) | | $ | 3,214,157 | | | $ | 3,031,347 | |
Net realized gain (loss) on investments and futures contracts | | | 644,084 | | | | (16,339 | ) | | | 6,595,313 | | | | 2,568,490 | |
Change in net unrealized appreciation (depreciation) of investments and futures contracts | | | 1,552,376 | | | | 30,873 | | | | 2,573,385 | | | | 2,812,869 | |
| | | | | | | | | | | | | | | | |
NET INCREASE (DECREASE)IN NET ASSETS RESULTINGFROM OPERATIONS | | | 2,476,457 | | | | 14,402 | | | | 12,382,855 | | | | 8,412,706 | |
| | | | | | | | | | | | | | | | |
| | | | |
Distributions (Notes 1 and 5) | | | | | | | | | | | | | | | | |
From net investment income | | | — | | | | — | | | | (3,053,002 | ) | | | (3,062,118 | ) |
From net realized gains | | | — | | | | — | | | | (2,676,902 | ) | | | (3,660,743 | ) |
| | | | | | | | | | | | | | | | |
Total distributions | | | — | | | | — | | | | (5,729,904 | ) | | | (6,722,861 | ) |
| | | | | | | | | | | | | | | | |
| | | | |
CAPITAL TRANSACTIONS (Note 4) | | | | | | | | | | | | | | | | |
Proceeds from sale of shares | | | 29,317,575 | | | | 3,695,700 | | | | 20,472,615 | | | | 17,454,029 | |
Dividends reinvested | | | — | | | | — | | | | 5,729,904 | | | | 6,722,861 | |
Cost of shares redeemed | | | (803,993 | ) | | | (390,683 | ) | | | (15,859,329 | ) | | | (14,107,929 | ) |
| | | | | | | | | | | | | | | | |
NET INCREASE (DECREASE)IN NET ASSETSFROM CAPITAL TRANSACTIONS | | | 28,513,582 | | | | 3,305,017 | | | | 10,343,190 | | | | 10,068,961 | |
| | | | | | | | | | | | | | | | |
INCREASE (DECREASE)IN NET ASSETS | | | 30,990,039 | | | | 3,319,419 | | | | 16,996,141 | | | | 11,758,806 | |
NET ASSETS, BEGINNINGOF PERIOD | | | 3,319,419 | | | | — | | | | 139,521,739 | | | | 127,762,933 | |
| | | | | | | | | | | | | | | | |
NET ASSETS, ENDOF PERIOD | | $ | 34,309,458 | | | $ | 3,319,419 | | | $ | 156,517,880 | | | $ | 139,521,739 | |
| | | | | | | | | | | | | | | | |
ACCUMULATED UNDISTRIBUTED NET INVESTMENT INCOME (LOSS) | | $ | 320,748 | | | $ | — | | | $ | 3,300,750 | | | $ | 3,053,004 | |
| | | | | | | | | | | | | | | | |
| | | | |
OTHER INFORMATION: | | | | | | | | | | | | | | | | |
Shares outstanding at the beginning of period | | | 3,191,688 | | | | — | | | | 115,118,175 | | | | 106,833,345 | |
| | | | | | | | | | | | | | | | |
Shares sold | | | 25,479,233 | | | | 3,598,978 | | | | 16,225,324 | | | | 14,299,004 | |
Shares issued as reinvestment of dividends | | | — | | | | — | | | | 4,593,518 | | | | 5,611,058 | |
Shares redeemed | | | (706,757 | ) | | | (407,290 | ) | | | (12,635,001 | ) | | | (11,625,232 | ) |
| | | | | | | | | | | | | | | | |
Net Increase (decrease) | | | 24,772,476 | | | | 3,191,688 | | | | 8,183,841 | | | | 8,284,830 | |
| | | | | | | | | | | | | | | | |
Shares outstanding at the end of period | | | 27,964,164 | | | | 3,191,688 | | | | 123,302,016 | | | | 115,118,175 | |
| | | | | | | | | | | | | | | | |
| † | For the period October 1, 2016 (Commencement of Operations) to December 31, 2016. |
The accompanying notes are an integral part of these financial statements.
84
| | | | | | | | | | | | | | | | | | | | | | | | | | | | | | | | | | | | | | |
| Moderate Allocation Fund | | | Aggressive Allocation Fund | | | Money Market Fund | | | Mid-Term Bond Fund | | | Bond Fund | |
| 2017 | | | 2016 | | | 2017 | | | 2016 | | | 2017 | | | 2016 | | | 2017 | | | 2016 | | | 2017 | | | 2016 | |
| | | | | | | | | | | | | | | | | | | | | | | | | | | | | | | | | | | | | | |
| | | | | | | | | | | | | | | | | | | | | | | | | | | | | | | | | | | | | | |
| $ | 7,062,679 | | | $ | 6,815,738 | | | $ | 4,664,572 | | | $ | 4,379,900 | | | $ | 462,689 | | | $ | 83,111 | | | $ | 12,308,919 | | | $ | 11,551,692 | | | $ | 34,954,410 | | | $ | 32,730,237 | |
| | 21,830,015 | | | | 11,890,351 | | | | 18,565,041 | | | | 15,730,054 | | | | 445 | | | | (26 | ) | | | 237,075 | | | | 729,217 | | | | (77,618 | ) | | | 2,266,244 | |
| | | | | | | | | |
| | 18,562,193 | | | | 9,992,223 | | | | 20,157,123 | | | | 6,155,891 | | | | 306 | | | | (1,000 | ) | | | (1,156,836 | ) | | | 3,108,491 | | | | 5,518,377 | | | | 11,554,313 | |
| | | | | | | | | | | | | | | | | | | | | | | | | | | | | | | | | | | | | | |
| | 47,454,887 | | | | 28,698,312 | | | | 43,386,736 | | | | 26,265,845 | | | | 463,440 | | | | 82,085 | | | | 11,389,158 | | | | 15,389,400 | | | | 40,395,169 | | | | 46,550,794 | |
| | | | | | | | | | | | | | | | | | | | | | | | | | | | | | | | | | | | | | |
| | | | | | | | | |
| | | | | | | | | | | | | | | | | | | | | | | | | | | | | | | | | | | | | | |
| | (6,887,282 | ) | | | (7,136,729 | ) | | | (4,432,394 | ) | | | (5,034,207 | ) | | | (83,111 | ) | | | — | | | | (11,551,692 | ) | | | (12,125,546 | ) | | | (32,730,237 | ) | | | (29,240,973 | ) |
| | (10,932,002 | ) | | | (15,163,373 | ) | | | (15,484,011 | ) | | | (16,088,598 | ) | | | — | | | | — | | | | (711,903 | ) | | | (696,581 | ) | | | (2,242,695 | ) | | | (1,620,584 | ) |
| | | | | | | | | | | | | | | | | | | | | | | | | | | | | | | | | | | | | | |
| | (17,819,284 | ) | | | (22,300,102 | ) | | | (19,916,405 | ) | | | (21,122,805 | ) | | | (83,111 | ) | | | — | | | | (12,263,595 | ) | | | (12,822,127 | ) | | | (34,972,932 | ) | | | (30,861,557 | ) |
| | | | | | | | | | | | | | | | | | | | | | | | | | | | | | | | | | | | | | |
| | | | | | | | | |
| | | | | | | | | | | | | | | | | | | | | | | | | | | | | | | | | | | | | | |
| | 33,445,237 | | | | 24,930,266 | | | | 17,881,824 | | | | 10,983,920 | | | | 21,771,292 | | | | 10,516,506 | | | | 109,137,538 | | | | 69,654,159 | | | | 215,994,313 | | | | 135,038,720 | |
| | 17,819,284 | | | | 22,300,102 | | | | 19,916,405 | | | | 21,122,805 | | | | 83,111 | | | | — | | | | 12,263,595 | | | | 12,822,127 | | | | 34,972,932 | | | | 30,861,557 | |
| | (30,723,099 | ) | | | (22,771,198 | ) | | | (20,548,822 | ) | | | (22,242,770 | ) | | | (14,482,315 | ) | | | (14,232,032 | ) | | | (54,594,230 | ) | | | (44,859,350 | ) | | | (90,752,819 | ) | | | (79,735,048 | ) |
| | | | | | | | | | | | | | | | | | | | | | | | | | | | | | | | | | | | | | |
| | 20,541,422 | | | | 24,459,170 | | | | 17,249,407 | | | | 9,863,955 | | | | 7,372,088 | | | | (3,715,526 | ) | | | 66,806,903 | | | | 37,616,936 | | | | 160,214,426 | | | | 86,165,229 | |
| | | | | | | | | | | | | | | | | | | | | | | | | | | | | | | | | | | | | | |
| | 50,177,025 | | | | 30,857,380 | | | | 40,719,738 | | | | 15,006,995 | | | | 7,752,417 | | | | (3,633,441 | ) | | | 65,932,466 | | | | 40,184,209 | | | | 165,636,663 | | | | 101,854,466 | |
| | 347,007,914 | | | | 316,150,534 | | | | 263,729,626 | | | | 248,722,631 | | | | 63,046,976 | | | | 66,680,417 | | | | 492,270,551 | | | | 452,086,342 | | | | 1,108,491,368 | | | | 1,006,636,902 | |
| | | | | | | | | | | | | | | | | | | | | | | | | | | | | | | | | | | | | | |
| $ | 397,184,939 | | | $ | 347,007,914 | | | $ | 304,449,364 | | | $ | 263,729,626 | | | $ | 70,799,393 | | | $ | 63,046,976 | | | $ | 558,203,017 | | | $ | 492,270,551 | | | $ | 1,274,128,031 | | | $ | 1,108,491,368 | |
| | | | | | | | | | | | | | | | | | | | | | | | | | | | | | | | | | | | | | |
| $ | 7,438,128 | | | $ | 6,887,282 | | | $ | 5,093,663 | | | $ | 4,432,394 | | | $ | 462,689 | | | $ | 83,111 | | | $ | 12,308,917 | | | $ | 11,551,690 | | | $ | 34,954,410 | | | $ | 32,730,237 | |
| | | | | | | | | | | | | | | | | | | | | | | | | | | | | | | | | | | | | | |
| | | | | | | | | |
| | | | | | | | | | | | | | | | | | | | | | | | | | | | | | | | | | | | | | |
| | 241,781,963 | | | | 224,315,530 | | | | 161,691,427 | | | | 155,044,805 | | | | 52,661,579 | | | | 55,769,535 | | | | 472,826,923 | | | | 437,295,485 | | | | 772,998,898 | | | | 714,259,784 | |
| | | | | | | | | | | | | | | | | | | | | | | | | | | | | | | | | | | | | | |
| | 21,951,443 | | | | 17,451,268 | | | | 10,327,417 | | | | 6,822,801 | | | | 18,140,836 | | | | 8,789,794 | | | | 103,442,063 | | | | 65,868,017 | | | | 148,034,706 | | | | 92,453,682 | |
| | 11,825,574 | | | | 16,016,276 | | | | 11,668,789 | | | | 13,554,944 | | | | 69,182 | | | | — | | | | 11,754,947 | | | | 12,184,847 | | | | 24,255,513 | | | | 21,161,940 | |
| | (20,207,157 | ) | | | (16,001,111 | ) | | | (11,856,755 | ) | | | (13,731,123 | ) | | | (12,069,173 | ) | | | (11,897,750 | ) | | | (51,805,990 | ) | | | (42,521,426 | ) | | | (62,264,284 | ) | | | (54,876,508 | ) |
| | | | | | | | | | | | | | | | | | | | | | | | | | | | | | | | | | | | | | |
| | 13,569,860 | | | | 17,466,433 | | | | 10,139,451 | | | | 6,646,622 | | | | 6,140,845 | | | | (3,107,956 | ) | | | 63,391,020 | | | | 35,531,438 | | | | 110,025,935 | | | | 58,739,114 | |
| | | | | | | | | | | | | | | | | | | | | | | | | | | | | | | | | | | | | | |
| | 255,351,823 | | | | 241,781,963 | | | | 171,830,878 | | | | 161,691,427 | | | | 58,802,424 | | | | 52,661,579 | | | | 536,217,943 | | | | 472,826,923 | | | | 883,024,833 | | | | 772,998,898 | |
| | | | | | | | | | | | | | | | | | | | | | | | | | | | | | | | | | | | | | |
The accompanying notes are an integral part of these financial statements.
85
MUTUAL OF AMERICA INVESTMENT CORPORATION
FINANCIAL HIGHLIGHTS
Income from investment operations and distributions per share for a Fund share outstanding throughout the five years ended December 31, 2017 (or since the Fund’s inception date if in existence less than five years) and other supplementary data with respect to each Fund are presented below and in the pages following:
| | | | | | | | | | | | | | | | | | | | |
| | | Equity Index Fund | |
| | | Years Ended December 31, | |
| | | 2017 | | | 2016 | | | 2015 | | | 2014 | | | 2013 | |
Net Asset Value, Beginning of Period | | $ | 3.49 | | | $ | 3.26 | | | $ | 3.41 | | | $ | 3.09 | | | $ | 2.40 | |
| | | | | | | | | | | | | | | | | | | | |
| | | | | |
INCOME (LOSS)FROM INVESTMENT OPERATIONS | | | | | | | | | | | | | | | | | | | | |
Net Investment Income (Loss) | | | 0.07 | | | | 0.06 | | | | 0.06 | | | | 0.06 | | | | 0.05 | |
Net Realized and Unrealized Gains (Losses) on Investments and Futures Contracts | | | 0.67 | | | | 0.32 | | | | (0.03 | ) | | | 0.35 | | | | 0.70 | |
| | | | | | | | | | | | | | | | | | | | |
Total From Investment Operations | | | 0.74 | | | | 0.38 | | | | 0.03 | | | | 0.41 | | | | 0.75 | |
| | | | | | | | | | | | | | | | | | | | |
| | | | | |
Less Distributions | | | | | | | | | | | | | | | | | | | | |
From Net Investment Income | | | (0.06 | ) | | | (0.06 | ) | | | (0.06 | ) | | | (0.05 | ) | | | (0.04 | ) |
From Net Realized Gains | | | (0.07 | ) | | | (0.09 | ) | | | (0.12 | ) | | | (0.04 | ) | | | (0.02 | ) |
| | | | | | | | | | | | | | | | | | | | |
Total Distributions | | | (0.13 | ) | | | (0.15 | ) | | | (0.18 | ) | | | (0.09 | ) | | | (0.06 | ) |
| | | | | | | | | | | | | | | | | | | | |
Net Asset Value, End of Period | | $ | 4.10 | | | $ | 3.49 | | | $ | 3.26 | | | $ | 3.41 | | | $ | 3.09 | |
| | | | | | | | | | | | | | | | | | | | |
Total Return (%)(h) | | | 21.65 | | | | 11.80 | | | | 1.24 | | | | 13.49 | | | | 32.02 | |
Net Assets, End of Period ($ millions) | | | 2,712 | | | | 2,143 | | | | 1,854 | | | | 1,789 | | | | 1,556 | |
Ratio of Net Investment Income (Loss) to Average Net Assets (%) | | | 1.85 | | | | 2.03 | | | | 1.94 | | | | 1.82 | | | | 1.87 | |
Ratio of Expenses to Average Net Assets Before Expense Reimbursement (%) | | | 0.14 | | | | 0.14 | | | | 0.15 | | | | 0.17 | | | | 0.19 | |
Ratio of Expenses to Average Net Assets After Expense Reimbursement (%) | | | 0.13 | (e) | | | 0.14 | | | | 0.15 | | | | 0.17 | | | | 0.19 | |
Portfolio Turnover Rate (%)(a) | | | 5.23 | | | | 5.58 | | | | 4.74 | | | | 8.07 | | | | 3.90 | |
| (a) | Portfolio turnover rate excludes all short-term securities. |
| (d) | Allocation and Retirement Funds exclude expenses of the underlying funds. |
| (e) | Includes one time reimbursement from Adviser for non-advisory operating expenses (Note 2). |
| (f) | For the period October 1, 2016 (commencement of operations) through December 31, 2016. |
| (g) | Amount is less than $0.005 per share. |
| (h) | Total return is calculated assuming a purchase of a share on the first day and a sale on the last day of each year or period reported and includes reinvestment of distributions, if any, and does not reflect the effect of fees and charges associated with your variable annuity contract or variable life insurance policy. Total return does not reflect expenses associated with the separate account such as administrative fees and account charges which, if reflected, would reduce the total returns for all years and periods shown. The total return for 2017 for the Funds subject to the one time reimbursement from the Adviser (Note 2) includes the impact of this reimbursement which was determined not to be material. Past performance is no guarantee of future results. Total returns may reflect adjustments to conform to generally accepted accounting principles. Total returns for periods less than one full year are not annualized. |
NA = Not Applicable
The accompanying notes are an integral part of these financial statements.
86
| | | | | | | | | | | | | | | | | | | | | | | | | | | | | | | | | | | | | | | | |
| All America Fund | | | Small Cap Value Fund | | | |
| Years Ended December 31, | | | Years Ended December 31, | | | |
| 2017 | | | 2016 | | | 2015 | | | 2014 | | | 2013 | | | 2017 | | | 2016 | | | 2015 | | | 2014 | | | 2013 | | | |
| $ | 2.29 | | | $ | 2.22 | | | $ | 2.42 | | | $ | 2.38 | | | $ | 1.85 | | | $ | 1.69 | | | $ | 1.44 | | | $ | 1.61 | | | $ | 1.72 | | | $ | 1.35 | | | |
| | | | | | | | | | | | | | | | | | | | | | | | | | | | | | | | | | | | | | | | |
| | | | | | | | | | |
| | | | | | | | | | | | | | | | | | | | | | | | | | | | | | | | | | | | | | | | |
| | 0.03 | | | | 0.03 | | | | 0.03 | | | | 0.03 | | | | 0.03 | | | | 0.03 | | | | 0.02 | | | | 0.02 | | | | 0.02 | | | | 0.03 | | | |
| | 0.39 | | | | 0.21 | | | | (0.03 | ) | | | 0.23 | | | | 0.55 | | | | 0.11 | | | | 0.26 | | | | (0.08 | ) | | | 0.06 | | | | 0.36 | | | |
| | | | | | | | | | | | | | | | | | | | | | | | | | | | | | | | | | | | | | | | |
| | 0.42 | | | | 0.24 | | | | — | | | | 0.26 | | | | 0.58 | | | | 0.14 | | | | 0.28 | | | | (0.06 | ) | | | 0.08 | | | | 0.39 | | | |
| | | | | | | | | | | | | | | | | | | | | | | | | | | | | | | | | | | | | | | | |
| | | | | | | | | | |
| | | | | | | | | | | | | | | | | | | | | | | | | | | | | | | | | | | | | | | | |
| | (0.03 | ) | | | (0.03 | ) | | | (0.03 | ) | | | (0.03 | ) | | | (0.03 | ) | | | (0.01 | ) | | | (0.01 | ) | | | (0.01 | ) | | | (0.02 | ) | | | (0.02 | ) | | |
| | (0.30 | ) | | | (0.14 | ) | | | (0.15 | ) | | | (0.19 | ) | | | (0.02 | ) | | | (0.08 | ) | | | (0.02 | ) | | | (0.10 | ) | | | (0.17 | ) | | | — | | | |
| | | | | | | | | | | | | | | | | | | | | | | | | | | | | | | | | | | | | | | | |
| | (0.33 | ) | | | (0.17 | ) | | | (0.18 | ) | | | (0.22 | ) | | | (0.05 | ) | | | (0.09 | ) | | | (0.03 | ) | | | (0.11 | ) | | | (0.19 | ) | | | (0.02 | ) | | |
| | | | | | | | | | | | | | | | | | | | | | | | | | | | | | | | | | | | | | | | |
| $ | 2.38 | | | $ | 2.29 | | | $ | 2.22 | | | $ | 2.42 | | | $ | 2.38 | | | $ | 1.74 | | | $ | 1.69 | | | $ | 1.44 | | | $ | 1.61 | | | $ | 1.72 | | | |
| | | | | | | | | | | | | | | | | | | | | | | | | | | | | | | | | | | | | | | | |
| | 19.41 | | | | 11.49 | | | | (0.04 | ) | | | 11.16 | | | | 32.13 | | | | 8.29 | | | | 20.04 | | | | (3.40 | ) | | | 5.17 | | | | 29.35 | | | |
| | 325 | | | | 296 | | | | 295 | | | | 324 | | | | 318 | | | | 506 | | | | 465 | | | | 376 | | | | 393 | | | | 382 | | | |
| | 1.33 | | | | 1.42 | | | | 1.32 | | | | 1.35 | | | | 1.44 | | | | 1.75 | | | | 1.17 | | | | 1.14 | | | | 1.02 | | | | 1.70 | | | |
| | 0.51 | | | | 0.53 | | | | 0.55 | | | | 0.49 | | | | 0.51 | | | | 0.81 | | | | 0.82 | | | | 0.83 | | | | 0.84 | | | | 0.87 | | | |
| | 0.51 | | | | 0.53 | | | | 0.55 | | | | 0.49 | | | | 0.51 | | | | 0.80 | (e) | | | 0.82 | | | | 0.83 | | | | 0.84 | | | | 0.87 | | | |
| | 22.28 | | | | 40.10 | | | | 14.73 | | | | 15.38 | | | | 28.48 | | | | 34.36 | | | | 32.06 | | | | 19.03 | | | | 38.09 | | | | 41.36 | | | |
The accompanying notes are an integral part of these financial statements.
87
MUTUAL OF AMERICA INVESTMENT CORPORATION
FINANCIAL HIGHLIGHTS (Continued)
| | | | | | | | | | | | | | | | | | | | |
| | | Small Cap Growth Fund | |
| | | Years Ended December 31, | |
| | | 2017 | | | 2016 | | | 2015 | | | 2014 | | | 2013 | |
Net Asset Value, Beginning of Period | | $ | 1.29 | | | $ | 1.32 | | | $ | 1.54 | | | $ | 1.58 | | | $ | 1.22 | |
| | | | | | | | | | | | | | | | | | | | |
| | | | | |
INCOME (LOSS)FROM INVESTMENT OPERATIONS | | | | | | | | | | | | | | | | | | | | |
Net Investment Income (Loss) | | | — | (g) | | | — | (g) | | | — | (g) | | | — | (g) | | | — | (g) |
Net Realized and Unrealized Gains (Losses) on Investments and Futures Contracts | | | 0.30 | | | | 0.10 | | | | (0.03 | ) | | | 0.09 | | | | 0.47 | |
| | | | | | | | | | | | | | | | | | | | |
Total From Investment Operations | | | 0.30 | | | | 0.10 | | | | (0.03 | ) | | | 0.09 | | | | 0.47 | |
| | | | | | | | | | | | | | | | | | | | |
| | | | | |
Less Distributions | | | | | | | | | | | | | | | | | | | | |
From Net Investment Income | | | — | (g) | | | — | | | | — | | | | — | (g) | | | — | |
From Net Realized Gains | | | (0.05 | ) | | | (0.13 | ) | | | (0.19 | ) | | | (0.13 | ) | | | (0.11 | ) |
| | | | | | | | | | | | | | | | | | | | |
Total Distributions | | | (0.05 | ) | | | (0.13 | ) | | | (0.19 | ) | | | (0.13 | ) | | | (0.11 | ) |
| | | | | | | | | | | | | | | | | | | | |
Net Asset Value, End of Period | | $ | 1.54 | | | $ | 1.29 | | | $ | 1.32 | | | $ | 1.54 | | | $ | 1.58 | |
| | | | | | | | | | | | | | | | | | | | |
Total Return (%)(h) | | | 23.82 | | | | 8.10 | | | | (2.39 | ) | | | 5.70 | | | | 41.19 | |
Net Assets, End of Period ($ millions) | | | 555 | | | | 433 | | | | 402 | | | | 412 | | | | 424 | |
Ratio of Net Investment Income (Loss) to Average Net Assets (%) | | | 0.06 | | | | 0.06 | | | | (0.12 | ) | | | (0.09 | ) | | | 0.19 | |
Ratio of Expenses to Average Net Assets Before Expense Reimbursement (%) | | | 0.82 | | | | 0.82 | | | | 0.83 | | | | 0.84 | | | | 0.86 | |
Ratio of Expenses to Average Net Assets After Expense Reimbursement (%) | | | 0.80 | (e) | | | 0.82 | | | | 0.83 | | | | 0.84 | | | | 0.86 | |
Portfolio Turnover Rate (%)(a) | | | 62.33 | | | | 53.80 | | | | 67.83 | | | | 67.58 | | | | 53.36 | |
| (a) | Portfolio turnover rate excludes all short-term securities. |
| (d) | Allocation and Retirement Funds exclude expenses of the underlying funds. |
| (e) | Includes one time reimbursement from Adviser for non-advisory operating expenses (Note 2). |
| (f) | For the period October 1, 2016 (commencement of operations) through December 31, 2016. |
| (g) | Amount is less than $0.005 per share. |
| (h) | Total return is calculated assuming a purchase of a share on the first day and a sale on the last day of each year or period reported and includes reinvestment of distributions, if any, and does not reflect the effect of fees and charges associated with your variable annuity contract or variable life insurance policy. Total return does not reflect expenses associated with the separate account such as administrative fees and account charges which, if reflected, would reduce the total returns for all years and periods shown. The total return for 2017 for the Funds subject to the one time reimbursement from the Adviser (Note 2) includes the impact of this reimbursement which was determined not to be material. Past performance is no guarantee of future results. Total returns may reflect adjustments to conform to generally accepted accounting principles. Total returns for periods less than one full year are not annualized. |
NA = Not Applicable
The accompanying notes are an integral part of these financial statements.
88
| | | | | | | | | | | | | | | | | | | | | | | | | | | | | | | | | | | | | | | | |
| Mid Cap Value Fund | | | Mid-Cap Equity Index Fund | | | |
| Years Ended December 31, | | | Years Ended December 31, | | | |
| 2017 | | | 2016 | | | 2015 | | | 2014 | | | 2013 | | | 2017 | | | 2016 | | | 2015 | | | 2014 | | | 2013 | | | |
| $ | 1.57 | | | $ | 1.46 | | | $ | 1.63 | | | $ | 1.53 | | | $ | 1.23 | | | $ | 2.17 | | | $ | 1.95 | | | $ | 2.16 | | | $ | 2.08 | | | $ | 1.63 | | | |
| | | | | | | | | | | | | | | | | | | | | | | | | | | | | | | | | | | | | | | | |
| | | | | | | | | | |
| | | | | | | | | | | | | | | | | | | | | | | | | | | | | | | | | | | | | | | | |
| | 0.03 | | | | 0.02 | | | | 0.02 | | | | 0.02 | | | | 0.01 | | | | 0.03 | | | | 0.03 | | | | 0.03 | | | | 0.03 | | | | 0.02 | | | |
| | 0.20 | | | | 0.20 | | | | (0.08 | ) | | | 0.19 | | | | 0.33 | | | | 0.31 | | | | 0.36 | | | | (0.08 | ) | | | 0.17 | | | | 0.51 | | | |
| | | | | | | | | | | | | | | | | | | | | | | | | | | | | | | | | | | | | | | | |
| | 0.23 | | | | 0.22 | | | | (0.06 | ) | | | 0.21 | | | | 0.34 | | | | 0.34 | | | | 0.39 | | | | (0.05 | ) | | | 0.20 | | | | 0.53 | | | |
| | | | | | | | | | | | | | | | | | | | | | | | | | | | | | | | | | | | | | | | |
| | | | | | | | | | |
| | | | | | | | | | | | | | | | | | | | | | | | | | | | | | | | | | | | | | | | |
| | (0.02 | ) | | | (0.02 | ) | | | (0.02 | ) | | | (0.01 | ) | | | (0.01 | ) | | | (0.03 | ) | | | (0.03 | ) | | | (0.02 | ) | | | (0.02 | ) | | | (0.02 | ) | | |
| | (0.07 | ) | | | (0.09 | ) | | | (0.10 | ) | | | (0.10 | ) | | | (0.03 | ) | | | (0.14 | ) | | | (0.14 | ) | | | (0.14 | ) | | | (0.10 | ) | | | (0.06 | ) | | |
| | | | | | | | | | | | | | | | | | | | | | | | | | | | | | | | | | | | | | | | |
| | (0.09 | ) | | | (0.11 | ) | | | (0.12 | ) | | | (0.11 | ) | | | (0.04 | ) | | | (0.17 | ) | | | (0.17 | ) | | | (0.16 | ) | | | (0.12 | ) | | | (0.08 | ) | | |
| | | | | | | | | | | | | | | | | | | | | | | | | | | | | | | | | | | | | | | | |
| $ | 1.71 | | | $ | 1.57 | | | $ | 1.46 | | | $ | 1.63 | | | $ | 1.53 | | | $ | 2.34 | | | $ | 2.17 | | | $ | 1.95 | | | $ | 2.16 | | | $ | 2.08 | | | |
| | | | | | | | | | | | | | | | | | | | | | | | | | | | | | | | | | | | | | | | |
| | 14.92 | | | | 16.18 | | | | (3.34 | ) | | | 13.82 | | | | 27.78 | | | | 16.05 | | | | 20.51 | | | | (2.37 | ) | | | 9.63 | | | | 33.21 | | | |
| | 103 | | | | 98 | | | | 82 | | | | 92 | | | | 72 | | | | 1,452 | | | | 1,245 | | | | 977 | | | | 1,001 | | | | 902 | | | |
| | 1.55 | | | | 1.48 | | | | 1.45 | | | | 1.25 | | | | 1.08 | | | | 1.46 | | | | 1.60 | | | | 1.45 | | | | 1.31 | | | | 1.25 | | | |
| | 0.64 | | | | 0.66 | | | | 0.65 | | | | 0.64 | | | | 0.66 | | | | 0.14 | | | | 0.15 | | | | 0.16 | | | | 0.17 | | | | 0.19 | | | |
| | 0.64 | | | | 0.66 | | | | 0.65 | | | | 0.64 | | | | 0.66 | | | | 0.14 | (e) | | | 0.15 | | | | 0.16 | | | | 0.17 | | | | 0.19 | | | |
| | 24.09 | | | | 25.80 | | | | 15.86 | | | | 40.91 | | | | 36.42 | | | | 19.36 | | | | 21.75 | | | | 21.67 | | | | 16.29 | | | | 13.30 | | | |
The accompanying notes are an integral part of these financial statements.
89
MUTUAL OF AMERICA INVESTMENT CORPORATION
FINANCIAL HIGHLIGHTS (Continued)
| | | | | | | | | | | | | | | | | | | | |
| | | International Fund | |
| | | Years Ended December 31, | |
| | | 2017 | | | 2016 | | | 2015 | | | 2014 | | | 2013 | |
Net Asset Value, Beginning of Period | | $ | 0.74 | | | $ | 0.75 | | | $ | 0.77 | | | $ | 0.84 | | | $ | 0.71 | |
| | | | | | | | | | | | | | | | | | | | |
| | | | | |
INCOME (LOSS)FROM INVESTMENT OPERATIONS | | | | | | | | | | | | | | | | | | | | |
Net Investment Income (Loss) | | | 0.02 | | | | 0.02 | | | | 0.01 | | | | 0.02 | | | | 0.02 | |
Net Realized and Unrealized Gains (Losses) on Investments and Futures Contracts | | | 0.16 | | | | (0.01 | ) | | | (0.01 | ) | | | (0.08 | ) | | | 0.13 | |
| | | | | | | | | | | | | | | | | | | | |
Total From Investment Operations | | | 0.18 | | | | 0.01 | | | | — | | | | (0.06 | ) | | | 0.15 | |
| | | | | | | | | | | | | | | | | | | | |
| | | | | |
Less Distributions | | | | | | | | | | | | | | | | | | | | |
From Net Investment Income | | | (0.02 | ) | | | (0.02 | ) | | | (0.02 | ) | | | (0.01 | ) | | | (0.02 | ) |
From Net Realized Gains | | | — | (g) | | | — | (g) | | | — | (g) | | | — | (g) | | | — | |
| | | | | | | | | | | | | | | | | | | | |
Total Distributions | | | (0.02 | ) | | | (0.02 | ) | | | (0.02 | ) | | | (0.01 | ) | | | (0.02 | ) |
| | | | | | | | | | | | | | | | | | | | |
Net Asset Value, End of Period | | $ | 0.90 | | | $ | 0.74 | | | $ | 0.75 | | | $ | 0.77 | | | $ | 0.84 | |
| | | | | | | | | | | | | | | | | | | | |
Total Return (%)(h) | | | 24.47 | | | | 1.69 | | | | (0.63 | ) | | | (6.03 | ) | | | 21.00 | |
Net Assets, End of Period ($ millions) | | | 537 | | | | 377 | | | | 319 | | | | 264 | | | | 174 | |
Ratio of Net Investment Income (Loss) to Average Net Assets (%) | | | 2.67 | | | | 2.94 | | | | 2.47 | | | | 3.48 | | | | 2.76 | |
Ratio of Expenses to Average Net Assets Before Expense Reimbursement (%)(d) | | | 0.12 | | | | 0.13 | | | | 0.14 | | | | 0.17 | | | | 0.18 | |
Ratio of Expenses to Average Net Assets After Expense Reimbursement (%)(d) | | | 0.12 | (e) | | | 0.13 | | | | 0.14 | | | | 0.17 | | | | 0.18 | |
Portfolio Turnover Rate (%)(a) | | | — | | | | 3.08 | | | | — | | | | 0.61 | | | | 10.22 | |
| (a) | Portfolio turnover rate excludes all short-term securities. |
| (d) | Allocation and Retirement Funds exclude expenses of the underlying funds. |
| (e) | Includes one time reimbursement from Adviser for non-advisory operating expenses (Note 2). |
| (f) | For the period October 1, 2016 (commencement of operations) through December 31, 2016. |
| (g) | Amount is less than $0.005 per share. |
| (h) | Total return is calculated assuming a purchase of a share on the first day and a sale on the last day of each year or period reported and includes reinvestment of distributions, if any, and does not reflect the effect of fees and charges associated with your variable annuity contract or variable life insurance policy. Total return does not reflect expenses associated with the separate account such as administrative fees and account charges which, if reflected, would reduce the total returns for all years and periods shown. The total return for 2017 for the Funds subject to the one time reimbursement from the Adviser (Note 2) includes the impact of this reimbursement which was determined not to be material. Past performance is no guarantee of future results. Total returns may reflect adjustments to conform to generally accepted accounting principles. Total returns for periods less than one full year are not annualized. |
NA = Not Applicable
The accompanying notes are an integral part of these financial statements.
90
| | | | | | | | | | | | | | | | | | | | | | | | | | | | | | | | | | | | | | | | |
| Composite Fund | | | Retirement Income Fund | | | |
| Years Ended December 31, | | | Years Ended December 31, | | | |
| 2017 | | | 2016 | | | 2015 | | | 2014 | | | 2013 | | | 2017 | | | 2016 | | | 2015 | | | 2014 | | | 2013 | | | |
| $ | 1.95 | | | $ | 1.96 | | | $ | 2.00 | | | $ | 1.87 | | | $ | 1.64 | | | $ | 1.12 | | | $ | 1.12 | | | $ | 1.16 | | | $ | 1.13 | | | $ | 1.07 | | | |
| | | | | | | | | | | | | | | | | | | | | | | | | | | | | | | | | | | | | | | | |
| | | | | | | | | | |
| | | | | | | | | | | | | | | | | | | | | | | | | | | | | | | | | | | | | | | | |
| | 0.04 | | | | 0.04 | | | | 0.04 | | | | 0.04 | | | | 0.04 | | | | 0.02 | | | | 0.02 | | | | 0.02 | | | | 0.02 | | | | 0.02 | | | |
| | 0.21 | | | | 0.11 | | | | (0.02 | ) | | | 0.13 | | | | 0.23 | | | | 0.07 | | | | 0.04 | | | | (0.01 | ) | | | 0.05 | | | | 0.06 | | | |
| | | | | | | | | | | | | | | | | | | | | | | | | | | | | | | | | | | | | | | | |
| | 0.25 | | | | 0.15 | | | | 0.02 | | | | 0.17 | | | | 0.27 | | | | 0.09 | | | | 0.06 | | | | 0.01 | | | | 0.07 | | | | 0.08 | | | |
| | | | | | | | | | | | | | | | | | | | | | | | | | | | | | | | | | | | | | | | |
| | | | | | | | | | |
| | | | | | | | | | | | | | | | | | | | | | | | | | | | | | | | | | | | | | | | |
| | (0.04 | ) | | | (0.04 | ) | | | (0.04 | ) | | | (0.04 | ) | | | (0.04 | ) | | | (0.02 | ) | | | (0.02 | ) | | | (0.02 | ) | | | (0.02 | ) | | | — | (g) | | |
| | (0.25 | ) | | | (0.12 | ) | | | (0.02 | ) | | | — | | | | — | | | | (0.02 | ) | | | (0.04 | ) | | | (0.03 | ) | | | (0.02 | ) | | | (0.02 | ) | | |
| | | | | | | | | | | | | | | | | | | | | | | | | | | | | | | | | | | | | | | | |
| | (0.29 | ) | | | (0.16 | ) | | | (0.06 | ) | | | (0.04 | ) | | | (0.04 | ) | | | (0.04 | ) | | | (0.06 | ) | | | (0.05 | ) | | | (0.04 | ) | | | (0.02 | ) | | |
| | | | | | | | | | | | | | | | | | | | | | | | | | | | | | | | | | | | | | | | |
| $ | 1.91 | | | $ | 1.95 | | | $ | 1.96 | | | $ | 2.00 | | | $ | 1.87 | | | $ | 1.17 | | | $ | 1.12 | | | $ | 1.12 | | | $ | 1.16 | | | $ | 1.13 | | | |
| | | | | | | | | | | | | | | | | | | | | | | | | | | | | | | | | | | | | | | | |
| | 13.37 | | | | 7.92 | | | | 0.80 | | | | 9.10 | | | | 16.37 | | | | 7.35 | | | | 6.18 | | | | 0.49 | | | | 6.50 | | | | 7.40 | | | |
| | 190 | | | | 181 | | | | 180 | | | | 194 | | | | 186 | | | | 101 | | | | 76 | | | | 63 | | | | 54 | | | | 40 | | | |
| | 2.11 | | | | 2.10 | | | | 1.93 | | | | 2.09 | | | | 2.04 | | | | 2.01 | | | | 2.26 | | | | 2.35 | | | | 2.21 | | | | 2.18 | | | |
| | 0.51 | | | | 0.52 | | | | 0.53 | | | | 0.49 | | | | 0.51 | | | | 0.08 | | | | 0.09 | | | | 0.09 | | | | 0.05 | | | | 0.05 | | | |
| | 0.50 | (e) | | | 0.52 | | | | 0.53 | | | | 0.49 | | | | 0.51 | | | | 0.06 | (e) | | | 0.09 | | | | 0.05 | | | | 0.05 | | | | 0.05 | | | |
| | 60.13 | | | | 57.40 | | | | 13.13 | | | | 12.31 | | | | 20.98 | | | | 18.54 | | | | 16.88 | | | | 22.64 | | | | 17.63 | | | | 24.01 | | | |
The accompanying notes are an integral part of these financial statements.
91
MUTUAL OF AMERICA INVESTMENT CORPORATION
FINANCIAL HIGHLIGHTS (Continued)
| | | | | | | | | | | | | | | | | | | | |
| | | 2010 Retirement Fund | |
| | | Years Ended December 31, | |
| | | 2017 | | | 2016 | | | 2015 | | | 2014 | | | 2013 | |
Net Asset Value, Beginning of Period | | $ | 0.99 | | | $ | 1.01 | | | $ | 1.09 | | | $ | 1.06 | | | $ | 1.00 | |
| | | | | | | | | | | | | | | | | | | | |
| | | | | |
INCOME (LOSS)FROM INVESTMENT OPERATIONS | | | | | | | | | | | | | | | | | | | | |
Net Investment Income (Loss) | | | 0.03 | | | | 0.02 | | | | 0.02 | | | | 0.02 | | | | 0.02 | |
Net Realized and Unrealized Gains (Losses) on Investments and Futures Contracts | | | 0.06 | | | | 0.04 | | | | (0.02 | ) | | | 0.06 | | | | 0.09 | |
| | | | | | | | | | | | | | | | | | | | |
Total From Investment Operations | | | 0.09 | | | | 0.06 | | | | — | | | | 0.08 | | | | 0.11 | |
| | | | | | | | | | | | | | | | | | | | |
| | | | | |
Less Distributions | | | | | | | | | | | | | | | | | | | | |
From Net Investment Income | | | (0.02 | ) | | | (0.02 | ) | | | (0.02 | ) | | | (0.02 | ) | | | — | (g) |
From Net Realized Gains | | | (0.05 | ) | | | (0.06 | ) | | | (0.06 | ) | | | (0.03 | ) | | | (0.05 | ) |
| | | | | | | | | | | | | | | | | | | | |
Total Distributions | | | (0.07 | ) | | | (0.08 | ) | | | (0.08 | ) | | | (0.05 | ) | | | (0.05 | ) |
| | | | | | | | | | | | | | | | | | | | |
Net Asset Value, End of Period | | $ | 1.01 | | | $ | 0.99 | | | $ | 1.01 | | | $ | 1.09 | | | $ | 1.06 | |
| | | | | | | | | | | | | | | | | | | | |
Total Return (%)(h) | | | 9.06 | | | | 6.87 | | | | 0.40 | | | | 6.93 | | | | 11.78 | |
Net Assets, End of Period ($ millions) | | | 26 | | | | 26 | | | | 26 | | | | 27 | | | | 24 | |
Ratio of Net Investment Income (Loss) to Average Net Assets (%) | | | 1.92 | | | | 2.15 | | | | 2.10 | | | | 2.06 | | | | 2.09 | |
Ratio of Expenses to Average Net Assets Before Expense Reimbursement (%)(d) | | | 0.12 | | | | 0.12 | | | | 0.12 | | | | 0.05 | | | | 0.05 | |
Ratio of Expenses to Average Net Assets After Expense Reimbursement (%)(d) | | | 0.01 | (e) | | | 0.05 | | | | 0.05 | | | | 0.05 | | | | 0.05 | |
Portfolio Turnover Rate (%)(a) | | | 24.48 | | | | 24.58 | | | | 23.28 | | | | 20.45 | | | | 19.60 | |
| (a) | Portfolio turnover rate excludes all short-term securities. |
| (d) | Allocation and Retirement Funds exclude expenses of the underlying funds. |
| (e) | Includes one time reimbursement from Adviser for non-advisory operating expenses (Note 2). |
| (f) | For the period October 1, 2016 (commencement of operations) through December 31, 2016. |
| (g) | Amount is less than $0.005 per share. |
| (h) | Total return is calculated assuming a purchase of a share on the first day and a sale on the last day of each year or period reported and includes reinvestment of distributions, if any, and does not reflect the effect of fees and charges associated with your variable annuity contract or variable life insurance policy. Total return does not reflect expenses associated with the separate account such as administrative fees and account charges which, if reflected, would reduce the total returns for all years and periods shown. The total return for 2017 for the Funds subject to the one time reimbursement from the Adviser (Note 2) includes the impact of this reimbursement which was determined not to be material. Past performance is no guarantee of future results. Total returns may reflect adjustments to conform to generally accepted accounting principles. Total returns for periods less than one full year are not annualized. |
NA = Not Applicable
The accompanying notes are an integral part of these financial statements.
92
| | | | | | | | | | | | | | | | | | | | | | | | | | | | | | | | | | | | | | | | |
| 2015 Retirement Fund | | | 2020 Retirement Fund | | | |
| Years Ended December 31, | | | Years Ended December 31, | | | |
| 2017 | | | 2016 | | | 2015 | | | 2014 | | | 2013 | | | 2017 | | | 2016 | | | 2015 | | | 2014 | | | 2013 | | | |
| $ | 1.03 | | | $ | 1.05 | | | $ | 1.13 | | | $ | 1.10 | | | $ | 1.00 | | | $ | 1.14 | | | $ | 1.12 | | | $ | 1.18 | | | $ | 1.13 | | | $ | 0.99 | | | |
| | | | | | | | | | | | | | | | | | | | | | | | | | | | | | | | | | | | | | | | |
| | | | | | | | | | |
| | | | | | | | | | | | | | | | | | | | | | | | | | | | | | | | | | | | | | | | |
| | 0.02 | | | | 0.02 | | | | 0.02 | | | | 0.02 | | | | 0.02 | | | | 0.02 | | | | 0.02 | | | | 0.02 | | | | 0.02 | | | | 0.02 | | | |
| | 0.09 | | | | 0.05 | | | | (0.02 | ) | | | 0.06 | | | | 0.12 | | | | 0.13 | | | | 0.07 | | | | (0.01 | ) | | | 0.06 | | | | 0.14 | | | |
| | | | | | | | | | | | | | | | | | | | | | | | | | | | | | | | | | | | | | | | |
| | 0.11 | | | | 0.07 | | | | — | | | | 0.08 | | | | 0.14 | | | | 0.15 | | | | 0.09 | | | | 0.01 | | | | 0.08 | | | | 0.16 | | | |
| | | | | | | | | | | | | | | | | | | | | | | | | | | | | | | | | | | | | | | | |
| | | | | | | | | | |
| | | | | | | | | | | | | | | | | | | | | | | | | | | | | | | | | | | | | | | | |
| | (0.02 | ) | | | (0.02 | ) | | | (0.02 | ) | | | (0.02 | ) | | | — | (g) | | | (0.02 | ) | | | (0.02 | ) | | | (0.02 | ) | | | (0.02 | ) | | | — | (g) | | |
| | (0.05 | ) | | | (0.07 | ) | | | (0.06 | ) | | | (0.03 | ) | | | (0.04 | ) | | | (0.04 | ) | | | (0.05 | ) | | | (0.05 | ) | | | (0.01 | ) | | | (0.02 | ) | | |
| | | | | | | | | | | | | | | | | | | | | | | | | | | | | | | | | | | | | | | | |
| | (0.07 | ) | | | (0.09 | ) | | | (0.08 | ) | | | (0.05 | ) | | | (0.04 | ) | | | (0.06 | ) | | | (0.07 | ) | | | (0.07 | ) | | | (0.03 | ) | | | (0.02 | ) | | |
| | | | | | | | | | | | | | | | | | | | | | | | | | | | | | | | | | | | | | | | |
| $ | 1.07 | | | $ | 1.03 | | | $ | 1.05 | | | $ | 1.13 | | | $ | 1.10 | | | $ | 1.23 | | | $ | 1.14 | | | $ | 1.12 | | | $ | 1.18 | | | $ | 1.13 | | | |
| | | | | | | | | | | | | | | | | | | | | | | | | | | | | | | | | | | | | | | | |
| | 10.64 | | | | 7.72 | | | | 0.27 | | | | 7.16 | | | | 14.80 | | | | 12.52 | | | | 8.57 | | | | 0.13 | | | | 7.36 | | | | 17.72 | | | |
| | 155 | | | | 146 | | | | 149 | | | | 154 | | | | 138 | | | | 525 | | | | 426 | | | | 364 | | | | 320 | | | | 251 | | | |
| | 1.85 | | | | 2.07 | | | | 2.07 | | | | 2.00 | | | | 2.07 | | | | 1.89 | | | | 2.03 | | | | 2.06 | | | | 1.92 | | | | 1.85 | | | |
| | 0.07 | | | | 0.08 | | | | 0.07 | | | | 0.05 | | | | 0.05 | | | | 0.07 | | | | 0.07 | | | | 0.07 | | | | 0.05 | | | | 0.05 | | | |
| | 0.07 | | | | 0.08 | | | | 0.07 | | | | 0.05 | | | | 0.05 | | | | 0.07 | | | | 0.07 | | | | 0.07 | | | | 0.05 | | | | 0.05 | | | |
| | 14.98 | | | | 12.96 | | | | 17.75 | | | | 16.41 | | | | 11.83 | | | | 7.09 | | | | 7.99 | | | | 7.76 | | | | 9.54 | | | | 3.56 | | | |
The accompanying notes are an integral part of these financial statements.
93
MUTUAL OF AMERICA INVESTMENT CORPORATION
FINANCIAL HIGHLIGHTS (Continued)
| | | | | | | | | | | | | | | | | | | | |
| | | 2025 Retirement Fund | |
| | | Years Ended December 31, | |
| | | 2017 | | | 2016 | | | 2015 | | | 2014 | | | 2013 | |
Net Asset Value, Beginning of Period | | $ | 1.21 | | | $ | 1.17 | | | $ | 1.23 | | | $ | 1.16 | | | $ | 0.98 | |
| | | | | | | | | | | | | | | | | | | | |
| | | | | |
INCOME (LOSS)FROM INVESTMENT OPERATIONS | | | | | | | | | | | | | | | | | | | | |
Net Investment Income (Loss) | | | 0.02 | | | | 0.02 | | | | 0.02 | | | | 0.02 | | | | 0.02 | |
Net Realized and Unrealized Gains (Losses) on Investments and Futures Contracts | | | 0.16 | | | | 0.09 | | | | (0.02 | ) | | | 0.08 | | | | 0.18 | |
| | | | | | | | | | | | | | | | | | | | |
Total From Investment Operations | | | 0.18 | | | | 0.11 | | | | — | | | | 0.10 | | | | 0.20 | |
| | | | | | | | | | | | | | | | | | | | |
| | | | | |
Less Distributions | | | | | | | | | | | | | | | | | | | | |
From Net Investment Income | | | (0.02 | ) | | | (0.02 | ) | | | (0.02 | ) | | | (0.02 | ) | | | — | (g) |
From Net Realized Gains | | | (0.04 | ) | | | (0.05 | ) | | | (0.04 | ) | | | (0.01 | ) | | | (0.02 | ) |
| | | | | | | | | | | | | | | | | | | | |
Total Distributions | | | (0.06 | ) | | | (0.07 | ) | | | (0.06 | ) | | | (0.03 | ) | | | (0.02 | ) |
| | | | | | | | | | | | | | | | | | | | |
Net Asset Value, End of Period | | $ | 1.33 | | | $ | 1.21 | | | $ | 1.17 | | | $ | 1.23 | | | $ | 1.16 | |
| | | | | | | | | | | | | | | | | | | | |
Total Return (%)(h) | | | 14.44 | | | | 9.84 | | | | (0.10 | ) | | | 8.00 | | | | 21.11 | |
Net Assets, End of Period ($ millions) | | | 686 | | | | 504 | | | | 396 | | | | 331 | | | | 257 | |
Ratio of Net Investment Income (Loss) to Average Net Assets (%) | | | 1.81 | | | | 1.91 | | | | 1.91 | | | | 1.75 | | | | 1.67 | |
Ratio of Expenses to Average Net Assets Before Expense Reimbursement (%)(d) | | | 0.07 | | | | 0.07 | | | | 0.07 | | | | 0.05 | | | | 0.05 | |
Ratio of Expenses to Average Net Assets After Expense Reimbursement (%)(d) | | | 0.07 | | | | 0.07 | | | | 0.07 | | | | 0.05 | | | | 0.05 | |
Portfolio Turnover Rate (%)(a) | | | 5.78 | | | | 5.27 | | | | 4.36 | | | | 6.00 | | | | 1.49 | |
| (a) | Portfolio turnover rate excludes all short-term securities. |
| (d) | Allocation and Retirement Funds exclude expenses of the underlying funds. |
| (e) | Includes one time reimbursement from Adviser for non-advisory operating expenses (Note 2). |
| (f) | For the period October 1, 2016 (commencement of operations) through December 31, 2016. |
| (g) | Amount is less than $0.005 per share. |
| (h) | Total return is calculated assuming a purchase of a share on the first day and a sale on the last day of each year or period reported and includes reinvestment of distributions, if any, and does not reflect the effect of fees and charges associated with your variable annuity contract or variable life insurance policy. Total return does not reflect expenses associated with the separate account such as administrative fees and account charges which, if reflected, would reduce the total returns for all years and periods shown. The total return for 2017 for the Funds subject to the one time reimbursement from the Adviser (Note 2) includes the impact of this reimbursement which was determined not to be material. Past performance is no guarantee of future results. Total returns may reflect adjustments to conform to generally accepted accounting principles. Total returns for periods less than one full year are not annualized. |
NA = Not Applicable
The accompanying notes are an integral part of these financial statements.
94
| | | | | | | | | | | | | | | | | | | | | | | | | | | | | | | | | | | | | | | | |
| 2030 Retirement Fund | | | 2035 Retirement Fund | | | |
| Years Ended December 31, | | | Years Ended December 31, | | | |
| 2017 | | | 2016 | | | 2015 | | | 2014 | | | 2013 | | | 2017 | | | 2016 | | | 2015 | | | 2014 | | | 2013 | | | |
| $ | 1.25 | | | $ | 1.20 | | | $ | 1.27 | | | $ | 1.19 | | | $ | 0.98 | | | $ | 1.25 | | | $ | 1.20 | | | $ | 1.27 | | | $ | 1.20 | | | $ | 0.97 | | | |
| | | | | | | | | | | | | | | | | | | | | | | | | | | | | | | | | | | | | | | | |
| | | | | | | | | | |
| | | | | | | | | | | | | | | | | | | | | | | | | | | | | | | | | | | | | | | | |
| | 0.02 | | | | 0.02 | | | | 0.02 | | | | 0.02 | | | | 0.02 | | | | 0.02 | | | | 0.02 | | | | 0.02 | | | | 0.01 | | | | 0.01 | | | |
| | 0.17 | | | | 0.11 | | | | (0.02 | ) | | | 0.09 | | | | 0.21 | | | | 0.20 | | | | 0.11 | | | | (0.03 | ) | | | 0.08 | | | | 0.24 | | | |
| | | | | | | | | | | | | | | | | | | | | | | | | | | | | | | | | | | | | | | | |
| | 0.19 | | | | 0.13 | | | | — | | | | 0.11 | | | | 0.23 | | | | 0.22 | | | | 0.13 | | | | (0.01 | ) | | | 0.09 | | | | 0.25 | | | |
| | | | | | | | | | | | | | | | | | | | | | | | | | | | | | | | | | | | | | | | |
| | | | | | | | | | |
| | | | | | | | | | | | | | | | | | | | | | | | | | | | | | | | | | | | | | | | |
| | (0.02 | ) | | | (0.02 | ) | | | (0.02 | ) | | | (0.02 | ) | | | — | (g) | | | (0.02 | ) | | | (0.02 | ) | | | (0.02 | ) | | | (0.01 | ) | | | — | (g) | | |
| | (0.04 | ) | | | (0.06 | ) | | | (0.05 | ) | | | (0.01 | ) | | | (0.02 | ) | | | (0.05 | ) | | | (0.06 | ) | | | (0.04 | ) | | | (0.01 | ) | | | (0.02 | ) | | |
| | | | | | | | | | | | | | | | | | | | | | | | | | | | | | | | | | | | | | | | |
| | (0.06 | ) | | | (0.08 | ) | | | (0.07 | ) | | | (0.03 | ) | | | (0.02 | ) | | | (0.07 | ) | | | (0.08 | ) | | | (0.06 | ) | | | (0.02 | ) | | | (0.02 | ) | | |
| | | | | | | | | | | | | | | | | | | | | | | | | | | | | | | | | | | | | | | | |
| $ | 1.38 | | | $ | 1.25 | | | $ | 1.20 | | | $ | 1.27 | | | $ | 1.19 | | | $ | 1.40 | | | $ | 1.25 | | | $ | 1.20 | | | $ | 1.27 | | | $ | 1.20 | | | |
| | | | | | | | | | | | | | | | | | | | | | | | | | | | | | | | | | | | | | | | |
| | 16.01 | | | | 10.73 | | | | (0.22 | ) | | | 8.44 | | | | 23.72 | | | | 17.15 | | | | 11.43 | | | | (0.37 | ) | | | 8.26 | | | | 25.92 | | | |
| | 578 | | | | 416 | | | | 328 | | | | 277 | | | | 212 | | | | 484 | | | | 352 | | | | 271 | | | | 230 | | | | 173 | | | |
| | 1.69 | | | | 1.78 | | | | 1.81 | | | | 1.66 | | | | 1.60 | | | | 1.57 | | | | 1.67 | | | | 1.68 | | | | 1.52 | | | | 1.47 | | | |
| | 0.07 | | | | 0.07 | | | | 0.07 | | | | 0.05 | | | | 0.05 | | | | 0.07 | | | | 0.07 | | | | 0.07 | | | | 0.05 | | | | 0.05 | | | |
| | 0.07 | | | | 0.07 | | | | 0.07 | | | | 0.05 | | | | 0.05 | | | | 0.07 | | | | 0.07 | | | | 0.07 | | | | 0.05 | | | | 0.05 | | | |
| | 5.75 | | | | 5.12 | | | | 4.83 | | | | 5.52 | | | | 1.58 | | | | 4.02 | | | | 4.98 | | | | 5.16 | | | | 4.29 | | | | 1.76 | | | |
The accompanying notes are an integral part of these financial statements.
95
MUTUAL OF AMERICA INVESTMENT CORPORATION
FINANCIAL HIGHLIGHTS (Continued)
| | | | | | | | | | | | | | | | | | | | |
| | | 2040 Retirement Fund | |
| |
| | | Years Ended December 31, | |
| | | 2017 | | | 2016 | | | 2015 | | | 2014 | | | 2013 | |
Net Asset Value, Beginning of Period | | $ | 1.24 | | | $ | 1.19 | | | $ | 1.26 | | | $ | 1.20 | | | $ | 0.96 | |
| | | | | | | | | | | | | | | | | | | | |
| | | | | |
INCOME (LOSS)FROM INVESTMENT OPERATIONS | | | | | | | | | | | | | | | | | | | | |
Net Investment Income (Loss) | | | 0.01 | | | | 0.02 | | | | 0.02 | | | | 0.01 | | | | 0.01 | |
Net Realized and Unrealized Gains (Losses) on Investments and Futures Contracts | | | 0.20 | | | | 0.11 | | | | (0.03 | ) | | | 0.08 | | | | 0.25 | |
| | | | | | | | | | | | | | | | | | | | |
Total From Investment Operations | | | 0.21 | | | | 0.13 | | | | (0.01 | ) | | | 0.09 | | | | 0.26 | |
| | | | | | | | | | | | | | | | | | | | |
| | | | | |
Less Distributions | | | | | | | | | | | | | | | | | | | | |
From Net Investment Income | | | (0.01 | ) | | | (0.02 | ) | | | (0.02 | ) | | | (0.01 | ) | | | — | (g) |
From Net Realized Gains | | | (0.05 | ) | | | (0.06 | ) | | | (0.04 | ) | | | (0.02 | ) | | | (0.02 | ) |
| | | | | | | | | | | | | | | | | | | | |
Total Distributions | | | (0.06 | ) | | | (0.08 | ) | | | (0.06 | ) | | | (0.03 | ) | | | (0.02 | ) |
| | | | | | | | | | | | | | | | | | | | |
Net Asset Value, End of Period | | $ | 1.39 | | | $ | 1.24 | | | $ | 1.19 | | | $ | 1.26 | | | $ | 1.20 | |
| | | | | | | | | | | | | | | | | | | | |
Total Return (%)(h) | | | 17.40 | | | | 11.66 | | | | (0.64 | ) | | | 7.71 | | | | 27.20 | |
Net Assets, End of Period ($ millions) | | | 393 | | | | 286 | | | | 222 | | | | 189 | | | | 148 | |
Ratio of Net Investment Income (Loss) to Average Net Assets (%) | | | 1.53 | | | | 1.59 | | | | 1.58 | | | | 1.40 | | | | 1.39 | |
Ratio of Expenses to Average Net Assets Before Expense Reimbursement (%)(d) | | | 0.07 | | | | 0.07 | | | | 0.07 | | | | 0.05 | | | | 0.05 | |
Ratio of Expenses to Average Net Assets After Expense Reimbursement (%)(d) | | | 0.07 | | | | 0.07 | | | | 0.07 | | | | 0.05 | | | | 0.05 | |
Portfolio Turnover Rate (%)(a) | | | 4.07 | | | | 5.23 | | | | 5.17 | | | | 4.31 | | | | 1.37 | |
| (a) | Portfolio turnover rate excludes all short-term securities. |
| (d) | Allocation and Retirement Funds exclude expenses of the underlying funds. |
| (e) | Includes one time reimbursement from Adviser for non-advisory operating expenses (Note 2). |
| (f) | For the period October 1, 2016 (commencement of operations) through December 31, 2016. |
| (g) | Amount is less than $0.005 per share. |
| (h) | Total return is calculated assuming a purchase of a share on the first day and a sale on the last day of each year or period reported and includes reinvestment of distributions, if any, and does not reflect the effect of fees and charges associated with your variable annuity contract or variable life insurance policy. Total return does not reflect expenses associated with the separate account such as administrative fees and account charges which, if reflected, would reduce the total returns for all years and periods shown. The total return for 2017 for the Funds subject to the one time reimbursement from the Adviser (Note 2) includes the impact of this reimbursement which was determined not to be material. Past performance is no guarantee of future results. Total returns may reflect adjustments to conform to generally accepted accounting principles. Total returns for periods less than one full year are not annualized. |
The accompanying notes are an integral part of these financial statements.
96
| | | | | | | | | | | | | | | | | | | | | | | | | | | | | | | | | | | | | | | | | | | | | | |
| 2045 Retirement Fund | | | 2050 Retirement Fund | | | 2055 Retirement Fund | |
| Years Ended December 31, | | | Years Ended December 31, | | | Year Ended
December 31,
2017 | | | Period Ended
December 31,
2016(f) | |
| 2017 | | | 2016 | | | 2015 | | | 2014 | | | 2013 | | | 2017 | | | 2016 | | | 2015 | | | 2014 | | | 2013 | | | |
| $ | 1.24 | | | $ | 1.19 | | | $ | 1.26 | | | $ | 1.20 | | | $ | 0.96 | | | $ | 1.45 | | | $ | 1.35 | | | $ | 1.39 | | | $ | 1.30 | | | $ | 1.02 | | | $ | 1.04 | | | $ | 1.00 | |
| | | | | | | | | | | | | | | | | | | | | | | | | | | | | | | | | | | | | | | | | | | | | | |
| | | | | | | | | | | |
| | | | | | | | | | | | | | | | | | | | | | | | | | | | | | | | | | | | | | | | | | | | | | |
| | 0.01 | | | | 0.02 | | | | 0.02 | | | | 0.01 | | | | 0.01 | | | | 0.01 | | | | 0.01 | | | | 0.03 | | | | 0.01 | | | | — | (g) | | | — | (g) | | | — | (g) |
| | 0.20 | | | | 0.12 | | | | (0.03 | ) | | | 0.07 | | | | 0.25 | | | | 0.25 | | | | 0.14 | | | | (0.04 | ) | | | 0.08 | | | | 0.28 | | | | 0.19 | | | | 0.04 | |
| | | | | | | | | | | | | | | | | | | | | | | | | | | | | | | | | | | | | | | | | | | | | | |
| | 0.21 | | | | 0.14 | | | | (0.01 | ) | | | 0.08 | | | | 0.26 | | | | 0.26 | | | | 0.15 | | | | (0.01 | ) | | | 0.09 | | | | 0.28 | | | | 0.19 | | | | 0.04 | |
| | | | | | | | | | | | | | | | | | | | | | | | | | | | | | | | | | | | | | | | | | | | | | |
| | | | | | | | | | | |
| | | | | | | | | | | | | | | | | | | | | | | | | | | | | | | | | | | | | | | | | | | | | | |
| | (0.01 | ) | | | (0.02 | ) | | | (0.02 | ) | | | (0.01 | ) | | | — | (g) | | | (0.01 | ) | | | (0.01 | ) | | | (0.01 | ) | | | — | (g) | | | — | (g) | | | — | | | | — | |
| | (0.05 | ) | | | (0.07 | ) | | | (0.04 | ) | | | (0.01 | ) | | | (0.02 | ) | | | (0.04 | ) | | | (0.04 | ) | | | (0.02 | ) | | | — | (g) | | | — | (g) | | | — | | | | — | |
| | | | | | | | | | | | | | | | | | | | | | | | | | | | | | | | | | | | | | | | | | | | | | |
| | (0.06 | ) | | | (0.09 | ) | | | (0.06 | ) | | | (0.02 | ) | | | (0.02 | ) | | | (0.05 | ) | | | (0.05 | ) | | | (0.03 | ) | | | — | | | | — | | | | — | | | | — | |
| | | | | | | | | | | | | | | | | | | | | | | | | | | | | | | | | | | | | | | | | | | | | | |
| $ | 1.39 | | | $ | 1.24 | | | $ | 1.19 | | | $ | 1.26 | | | $ | 1.20 | | | $ | 1.66 | | | $ | 1.45 | | | $ | 1.35 | | | $ | 1.39 | | | $ | 1.30 | | | $ | 1.23 | | | $ | 1.04 | |
| | | | | | | | | | | | | | | | | | | | | | | | | | | | | | | | | | | | | | | | | | | | | | |
| | 17.62 | | | | 11.68 | | | | (0.69 | ) | | | 7.36 | | | | 27.68 | | | | 17.86 | | | | 11.78 | | | | (0.73 | ) | | | 7.15 | | | | 28.17 | | | | 17.99 | | | | 4.01 | (b) |
| | 437 | | | | 332 | | | | 265 | | | | 232 | | | | 186 | | | | 256 | | | | 164 | | | | 94 | | | | 50 | | | | 20 | | | | 34 | | | | 3 | |
| | 1.45 | | | | 1.54 | | | | 1.55 | | | | 1.37 | | | | 1.37 | | | | 1.47 | | | | 1.58 | | | | 1.65 | | | | 1.47 | | | | 0.54 | | | | 1.90 | | | | (0.05 | )(c) |
| | 0.07 | | | | 0.07 | | | | 0.07 | | | | 0.05 | | | | 0.05 | | | | 0.07 | | | | 0.08 | | | | 0.09 | | | | 0.05 | | | | 0.05 | | | | 0.14 | | | | 0.50 | (c) |
| | 0.07 | | | | 0.07 | | | | 0.07 | | | | 0.05 | | | | 0.05 | | | | 0.07 | (e) | | | 0.08 | | | | 0.05 | | | | 0.05 | | | | 0.05 | | | | 0.05 | | | | 0.05 | (c) |
| | 4.46 | | | | 3.91 | | | | 4.40 | | | | 3.48 | | | | 0.93 | | | | 3.75 | | | | 2.67 | | | | 2.67 | | | | 1.53 | | | | 1.22 | | | | 4.32 | | | | 22.25 | (b) |
The accompanying notes are an integral part of these financial statements.
97
MUTUAL OF AMERICA INVESTMENT CORPORATION
FINANCIAL HIGHLIGHTS (Continued)
| | | | | | | | | | | | | | | | | | | | |
| | | Conservative Allocation Fund | |
| | | Years Ended December 31, | |
| | | 2017 | | | 2016 | | | 2015 | | | 2014 | | | 2013 | |
Net Asset Value, Beginning of Period | | $ | 1.21 | | | $ | 1.20 | | | $ | 1.25 | | | $ | 1.22 | | | $ | 1.15 | |
| | | | | | | | | | | | | | | | | | | | |
| | | | | |
INCOME (LOSS)FROM INVESTMENT OPERATIONS | | | | | | | | | | | | | | | | | | | | |
Net Investment Income (Loss) | | | 0.03 | | | | 0.03 | | | | 0.02 | | | | 0.03 | | | | 0.03 | |
Net Realized and Unrealized Gains (Losses) on Investments and Futures Contracts | | | 0.08 | | | | 0.04 | | | | (0.01 | ) | | | 0.05 | | | | 0.05 | |
| | | | | | | | | | | | | | | | | | | | |
Total From Investment Operations | | | 0.11 | | | | 0.07 | | | | 0.01 | | | | 0.08 | | | | 0.08 | |
| | | | | | | | | | | | | | | | | | | | |
| | | | | |
Less Distributions | | | | | | | | | | | | | | | | | | | | |
From Net Investment Income | | | (0.03 | ) | | | (0.03 | ) | | | (0.03 | ) | | | (0.03 | ) | | | — | (g) |
From Net Realized Gains | | | (0.02 | ) | | | (0.03 | ) | | | (0.03 | ) | | | (0.02 | ) | | | (0.01 | ) |
| | | | | | | | | | | | | | | | | | | | |
Total Distributions | | | (0.05 | ) | | | (0.06 | ) | | | (0.06 | ) | | | (0.05 | ) | | | (0.01 | ) |
| | | | | | | | | | | | | | | | | | | | |
Net Asset Value, End of Period | | $ | 1.27 | | | $ | 1.21 | | | $ | 1.20 | | | $ | 1.25 | | | $ | 1.22 | |
| | | | | | | | | | | | | | | | | | | | |
Total Return (%)(h) | | | 8.92 | | | | 6.71 | | | | 0.44 | | | | 6.62 | | | | 7.34 | |
Net Assets, End of Period ($ millions) | | | 157 | | | | 140 | | | | 128 | | | | 123 | | | | 98 | |
Ratio of Net Investment Income (Loss) to Average Net Assets (%) | | | 2.20 | | | | 2.31 | | | | 2.32 | | | | 2.31 | | | | 2.45 | |
Ratio of Expenses to Average Net Assets Before Expense Reimbursement (%)(d) | | | 0.02 | | | | 0.03 | | | | 0.02 | | | | — | | | | — | |
Ratio of Expenses to Average Net Assets After Expense Reimbursement (%)(d) | | | 0.02 | | | | 0.03 | | | | 0.02 | | | | — | | | | — | |
Portfolio Turnover Rate (%)(a) | | | 23.64 | | | | 8.89 | | | | 10.58 | | | | 17.24 | | | | 10.16 | |
| (a) | Portfolio turnover rate excludes all short-term securities. |
| (d) | Allocation and Retirement Funds exclude expenses of the underlying funds. |
| (e) | Includes one time reimbursement from Adviser for non-advisory operating expenses (Note 2). |
| (f) | For the period October 1, 2016 (commencement of operations) through December 31, 2016. |
| (g) | Amount is less than $0.005 per share. |
| (h) | Total return is calculated assuming a purchase of a share on the first day and a sale on the last day of each year or period reported and includes reinvestment of distributions, if any, and does not reflect the effect of fees and charges associated with your variable annuity contract or variable life insurance policy. Total return does not reflect expenses associated with the separate account such as administrative fees and account charges which, if reflected, would reduce the total returns for all years and periods shown. The total return for 2017 for the Funds subject to the one time reimbursement from the Adviser (Note 2) includes the impact of this reimbursement which was determined not to be material. Past performance is no guarantee of future results. Total returns may reflect adjustments to conform to generally accepted accounting principles. Total returns for periods less than one full year are not annualized. |
NA = Not Applicable
The accompanying notes are an integral part of these financial statements.
98
| | | | | | | | | | | | | | | | | | | | | | | | | | | | | | | | | | | | | | |
| Moderate Allocation Fund | | | Aggressive Allocation Fund | |
| Years Ended December 31, | | | Years Ended December 31, | |
| 2017 | | | 2016 | | | 2015 | | | 2014 | | | 2013 | | | 2017 | | | 2016 | | | 2015 | | | 2014 | | | 2013 | |
| $ | 1.44 | | | $ | 1.41 | | | $ | 1.52 | | | $ | 1.45 | | | $ | 1.27 | | | $ | 1.63 | | | $ | 1.60 | | | $ | 1.77 | | | $ | 1.69 | | | $ | 1.38 | |
| | | | | | | | | | | | | | | | | | | | | | | | | | | | | | | | | | | | | | |
| | | | | | | | | |
| | | | | | | | | | | | | | | | | | | | | | | | | | | | | | | | | | | | | | |
| | 0.03 | | | | 0.03 | | | | 0.03 | | | | 0.03 | | | | 0.03 | | | | 0.03 | | | | 0.03 | | | | 0.03 | | | | 0.03 | | | | 0.03 | |
| | 0.17 | | | | 0.10 | | | | (0.03 | ) | | | 0.09 | | | | 0.16 | | | | 0.24 | | | | 0.14 | | | | (0.05 | ) | | | 0.11 | | | | 0.30 | |
| | | | | | | | | | | | | | | | | | | | | | | | | | | | | | | | | | | | | | |
| | 0.20 | | | | 0.13 | | | | — | | | | 0.12 | | | | 0.19 | | | | 0.27 | | | | 0.17 | | | | (0.02 | ) | | | 0.14 | | | | 0.33 | |
| | | | | | | | | | | | | | | | | | | | | | | | | | | | | | | | | | | | | | |
| | | | | | | | | |
| | | | | | | | | | | | | | | | | | | | | | | | | | | | | | | | | | | | | | |
| | (0.03 | ) | | | (0.03 | ) | | | (0.03 | ) | | | (0.03 | ) | | | — | (g) | | | (0.03 | ) | | | (0.03 | ) | | | (0.03 | ) | | | (0.03 | ) | | | — | (g) |
| | (0.05 | ) | | | (0.07 | ) | | | (0.08 | ) | | | (0.02 | ) | | | (0.01 | ) | | | (0.10 | ) | | | (0.11 | ) | | | (0.12 | ) | | | (0.03 | ) | | | (0.02 | ) |
| | | | | | | | | | | | | | | | | | | | | | | | | | | | | | | | | | | | | | |
| | (0.08 | ) | | | (0.10 | ) | | | (0.11 | ) | | | (0.05 | ) | | | (0.01 | ) | | | (0.13 | ) | | | (0.14 | ) | | | (0.15 | ) | | | (0.06 | ) | | | (0.02 | ) |
| | | | | | | | | | | | | | | | | | | | | | | | | | | | | | | | | | | | | | |
| $ | 1.56 | | | $ | 1.44 | | | $ | 1.41 | | | $ | 1.52 | | | $ | 1.45 | | | $ | 1.77 | | | $ | 1.63 | | | $ | 1.60 | | | $ | 1.77 | | | $ | 1.69 | |
| | | | | | | | | | | | | | | | | | | | | | | | | | | | | | | | | | | | | | |
| | 13.72 | | | | 9.08 | | | | 0.16 | | | | 7.71 | | | | 15.66 | | | | 16.64 | | | | 10.86 | | | | (0.38 | ) | | | 7.66 | | | | 24.19 | |
| | 397 | | | | 347 | | | | 316 | | | | 315 | | | | 281 | | | | 304 | | | | 264 | | | | 249 | | | | 255 | | | | 236 | |
| | 1.90 | | | | 2.08 | | | | 2.09 | | | | 1.95 | | | | 2.09 | | | | 1.65 | | | | 1.74 | | | | 1.81 | | | | 1.60 | | | | 1.75 | |
| | 0.02 | | | | 0.02 | | | | 0.02 | | | | — | | | | — | | | | 0.02 | | | | 0.02 | | | | 0.02 | | | | — | | | | — | |
| | 0.02 | | | | 0.02 | | | | 0.02 | | | | — | | | | — | | | | 0.02 | | | | 0.02 | | | | 0.02 | | | | — | | | | — | |
| | 12.05 | | | | 6.65 | | | | 8.10 | | | | 13.87 | | | | 4.71 | | | | 9.55 | | | | 9.51 | | | | 7.86 | | | | 19.61 | | | | 4.93 | |
The accompanying notes are an integral part of these financial statements.
99
MUTUAL OF AMERICA INVESTMENT CORPORATION
FINANCIAL HIGHLIGHTS (Continued)
| | | | | | | | | | | | | | | | | | | | |
| | | Money Market Fund | |
| | | Years Ended December 31, | |
| | | 2017 | | | 2016 | | | 2015 | | | 2014 | | | 2013 | |
Net Asset Value, Beginning of Period | | $ | 1.20 | | | $ | 1.20 | | | $ | 1.20 | | | $ | 1.20 | | | $ | 1.20 | |
| | | | | | | | | | | | | | | | | | | | |
| | | | | |
INCOME (LOSS)FROM INVESTMENT OPERATIONS | | | | | | | | | | | | | | | | | | | | |
Net Investment Income (Loss) | | | — | (g) | | | — | (g) | | | — | (g) | | | — | (g) | | | — | (g) |
Net Realized and Unrealized Gains (Losses) on Investments and Futures Contracts | | | — | (g) | | | — | (g) | | | — | (g) | | | — | (g) | | | — | (g) |
| | | | | | | | | | | | | | | | | | | | |
Total From Investment Operations | | | — | | | | — | | | | — | | | | — | | | | — | |
| | | | | | | | | | | | | | | | | | | | |
| | | | | |
Less Distributions | | | | | | | | | | | | | | | | | | | | |
From Net Investment Income | | | — | (g) | | | — | | | | — | | | | — | | | | — | |
From Net Realized Gains | | | — | | | | — | | | | — | | | | — | | | | — | |
| | | | | | | | | | | | | | | | | | | | |
Total Distributions | | | — | | | | — | | | | — | | | | — | | | | — | |
| | | | | | | | | | | | | | | | | | | | |
Net Asset Value, End of Period | | $ | 1.20 | | | $ | 1.20 | | | $ | 1.20 | | | $ | 1.20 | | | $ | 1.20 | |
| | | | | | | | | | | | | | | | | | | | |
Total Return (%)(h) | | | 0.70 | | | | 0.14 | | | | (0.11 | ) | | | (0.14 | ) | | | (0.16 | ) |
Net Assets, End of Period ($ millions) | | | 71 | | | | 63 | | | | 67 | | | | 77 | | | | 84 | |
Ratio of Net Investment Income (Loss) to Average Net Assets (%) | | | 0.70 | | | | 0.13 | | | | (0.11 | ) | | | (0.14 | ) | | | (0.16 | ) |
Ratio of Expenses to Average Net Assets Before Expense Reimbursement (%) | | | 0.25 | | | | 0.28 | | | | 0.26 | | | | 0.24 | | | | 0.27 | |
Ratio of Expenses to Average Net Assets After Expense Reimbursement (%) | | | 0.24 | (e) | | | 0.28 | | | | 0.26 | | | | 0.24 | | | | 0.27 | |
Portfolio Turnover Rate (%)(a) | | | NA | | | | NA | | | | NA | | | | NA | | | | NA | |
| (a) | Portfolio turnover rate excludes all short-term securities. |
| (d) | Allocation and Retirement Funds exclude expenses of the underlying funds. |
| (e) | Includes one time reimbursement from Adviser for non-advisory operating expenses (Note 2). |
| (f) | For the period October 1, 2016 (commencement of operations) through December 31, 2016. |
| (g) | Amount is less than $0.005 per share. |
| (h) | Total return is calculated assuming a purchase of a share on the first day and a sale on the last day of each year or period reported and includes reinvestment of distributions, if any, and does not reflect the effect of fees and charges associated with your variable annuity contract or variable life insurance policy. Total return does not reflect expenses associated with the separate account such as administrative fees and account charges which, if reflected, would reduce the total returns for all years and periods shown. The total return for 2017 for the Funds subject to the one time reimbursement from the Adviser (Note 2) includes the impact of this reimbursement which was determined not to be material. Past performance is no guarantee of future results. Total returns may reflect adjustments to conform to generally accepted accounting principles. Total returns for periods less than one full year are not annualized. |
NA = Not Applicable
The accompanying notes are an integral part of these financial statements.
100
| | | | | | | | | | | | | | | | | | | | | | | | | | | | | | | | | | | | | | | | |
| Mid-Term Bond Fund | | | Bond Fund | | | |
| Years Ended December 31, | | | Years Ended December 31, | | | |
| 2017 | | | 2016 | | | 2015 | | | 2014 | | | 2013 | | | 2017 | | | 2016 | | | 2015 | | | 2014 | | | 2013 | | | |
| $ | 1.04 | | | $ | 1.03 | | | $ | 1.06 | | | $ | 1.05 | | | $ | 1.09 | | | $ | 1.43 | | | $ | 1.41 | | | $ | 1.45 | | | $ | 1.41 | | | $ | 1.47 | | | |
| | | | | | | | | | | | | | | | | | | | | | | | | | | | | | | | | | | | | | | | |
| | | | | | | | | | |
| | | | | | | | | | | | | | | | | | | | | | | | | | | | | | | | | | | | | | | | |
| | 0.02 | | | | 0.03 | | | | 0.03 | | | | 0.03 | | | | 0.03 | | | | 0.04 | | | | 0.04 | | | | 0.04 | | | | 0.04 | | | | 0.05 | | | |
| | — | (g) | | | 0.01 | | | | (0.03 | ) | | | 0.02 | | | | (0.04 | ) | | | 0.01 | | | | 0.02 | | | | (0.03 | ) | | | 0.04 | | | | (0.06 | ) | | |
| | | | | | | | | | | | | | | | | | | | | | | | | | | | | | | | | | | | | | | | |
| | 0.02 | | | | 0.04 | | | | — | | | | 0.05 | | | | (0.01 | ) | | | 0.05 | | | | 0.06 | | | | 0.01 | | | | 0.08 | | | | (0.01 | ) | | |
| | | | | | | | | | | | | | | | | | | | | | | | | | | | | | | | | | | | | | | | |
| | | | | | | | | | |
| | | | | | | | | | | | | | | | | | | | | | | | | | | | | | | | | | | | | | | | |
| | (0.02 | ) | | | (0.03 | ) | | | (0.03 | ) | | | (0.03 | ) | | | (0.03 | ) | | | (0.04 | ) | | | (0.04 | ) | | | (0.05 | ) | | | (0.04 | ) | | | (0.05 | ) | | |
| | — | (g) | | | — | (g) | | | — | (g) | | | (0.01 | ) | | | — | (g) | | | — | (g) | | | — | (g) | | | — | (g) | | | — | | | | — | (g) | | |
| | | | | | | | | | | | | | | | | | | | | | | | | | | | | | | | | | | | | | | | |
| | (0.02 | ) | | | (0.03 | ) | | | (0.03 | ) | | | (0.04 | ) | | | (0.03 | ) | | | (0.04 | ) | | | (0.04 | ) | | | (0.05 | ) | | | (0.04 | ) | | | (0.05 | ) | | |
| | | | | | | | | | | | | | | | | | | | | | | | | | | | | | | | | | | | | | | | |
| $ | 1.04 | | | $ | 1.04 | | | $ | 1.03 | | | $ | 1.06 | | | $ | 1.05 | | | $ | 1.44 | | | $ | 1.43 | | | $ | 1.41 | | | $ | 1.45 | | | $ | 1.41 | | | |
| | | | | | | | | | | | | | | | | | | | | | | | | | | | | | | | | | | | | | | | |
| | 2.32 | | | | 3.51 | | | | 0.61 | | | | 3.22 | | | | (0.55 | ) | | | 3.62 | | | | 4.71 | | | | 0.33 | | | | 6.31 | | | | (0.91 | ) | | |
| | 558 | | | | 492 | | | | 452 | | | | 435 | | | | 392 | | | | 1,274 | | | | 1,108 | | | | 1,007 | | | | 956 | | | | 804 | | | |
| | 2.37 | | | | 2.45 | | | | 2.68 | | | | 2.57 | | | | 2.77 | | | | 2.98 | | | | 3.07 | | | | 2.93 | | | | 3.59 | | | | 3.35 | | | |
| | 0.47 | | | | 0.46 | | | | 0.46 | | | | 0.49 | | | | 0.51 | | | | 0.45 | | | | 0.45 | | | | 0.45 | | | | 0.48 | | | | 0.51 | | | |
| | 0.45 | (e) | | | 0.46 | | | | 0.46 | | | | 0.49 | | | | 0.51 | | | | 0.44 | (e) | | | 0.45 | | | | 0.45 | | | | 0.48 | | | | 0.51 | | | |
| | 14.18 | | | | 17.52 | | | | 19.07 | | | | 36.56 | | | | 23.94 | | | | 10.65 | | | | 13.54 | | | | 27.51 | | | | 15.00 | | | | 27.41 | | | |
The accompanying notes are an integral part of these financial statements.
101
MUTUAL OF AMERICA INVESTMENT CORPORATION
NOTES TO FINANCIAL STATEMENTS
December 31, 2017
| 1. | SIGNIFICANT ACCOUNTING POLICIESAND ORGANIZATION |
Mutual of America Investment Corporation (the “Investment Company”) is a diversified, open-end management investment company — a type of company commonly known as a “mutual fund”. It is registered as such under the Investment Company Act of 1940 (the “Investment Company Act”). The Investment Company was formed on February 21, 1986 as a Maryland corporation and principally offers its shares exclusively to separate accounts of Mutual of America Life Insurance Company (“Mutual of America Life”) and a former affiliate that offers the funds through its separate accounts. As a “series” type mutual fund, the Investment Company issues separate classes (or series) of capital stock, each of which represents a separate Fund of investments. At December 31, 2017, there were 25 active funds (collectively, “the Funds”): Equity Index Fund, All America Fund, Small Cap Value Fund, Small Cap Growth Fund, Mid Cap Value Fund, Mid-Cap Equity Index Fund, International Fund, Composite Fund, Money Market Fund, Mid-Term Bond Fund, Bond Fund; Retirement Income Fund, 2010 Retirement Fund, 2015 Retirement Fund, 2020 Retirement Fund, 2025 Retirement Fund, 2030 Retirement Fund, 2035 Retirement Fund, 2040 Retirement Fund, 2045 Retirement Fund, 2050 Retirement Fund and 2055 Retirement Fund (collectively, “Retirement Funds”); a Conservative Allocation Fund, a Moderate Allocation Fund and an Aggressive Allocation Fund (collectively, “Allocation Funds”). The 2050 Retirement Fund commenced operations on October 1, 2012. The 2055 Retirement Fund commenced operations on October 1, 2016.
Investment Company shares are issued to Mutual of America Life and, on a limited basis, to Wilton Reassurance Life Company of New York (formerly The American Life Insurance Company of New York), for allocation to their Separate Accounts as a funding medium for variable accumulation annuity contracts and variable life insurance policies. In addition, shares of selected equity and fixed income funds of the Investment Company are directly issued to one or more of the Investment Company’s Retirement Funds and Allocation Funds.
The Funds follow investment company accounting and reporting guidance of the Financial Accounting Standards Board (“FASB”) Accounting Codification Topic 946 Financial Services – Investment Companies. The preparation of financial statements in accordance with U.S. generally accepted accounting principles (“GAAP”) requires management to make estimates and assumptions that affect the reported amounts of assets, liabilities, income, expenses and related disclosures. Changes in the economic environment, financial markets and any other parameters used in determining these estimates could cause actual results to differ.
The following is a summary of the significant accounting policies consistently followed by the Investment Company, which are in conformity with GAAP:
Fair Value — The Investment Company values its investments at fair value. Fair value is an estimate of the price the Fund would receive upon selling a security in an orderly arms-length transaction. Investments are categorized based on a three-level valuation hierarchy for measurement and disclosure of fair value. The valuation hierarchy is based upon the transparency of inputs used to measure fair value. These inputs are summarized in the three broad levels listed below:
| | • | | Level 1 — quoted prices in active markets for identical securities. |
| | • | | Level 2 — other significant observable inputs (including yield, quality, coupon rate, maturity, issue type, quoted prices for similar securities, prepayment speeds, trading characteristics, etc.). |
| | • | | Level 3 — significant unobservable inputs (including the Fund’s own assumptions in determining the fair value of investments). |
As of December 31, 2017, management determined that the fair value inputs for all equity securities were considered Level 1, with the exception of three securities in the All America, Small Cap Value and Small Cap Growth Funds (see Note1 below) which were considered Level 3. In addition, non-registered securities under Rule 144A of the Securities Act of 1933 were considered Level 2. Furthermore, certain Rule 144A securities not actively traded are considered Level 3; however, there were no such 144A securities as of December 31, 2017. Fair value inputs for all debt securities were considered Level 2. The inputs or methodologies used for valuing securities are not necessarily an indication of the risk associated with investing in those securities. Transfers between levels are reflected based on the fair value at the beginning of a reporting period.
102
MUTUAL OF AMERICA INVESTMENT CORPORATION
NOTES TO FINANCIAL STATEMENTS (Continued)
December 31, 2017
| 1. | SIGNIFICANT ACCOUNTING POLICIESAND ORGANIZATION (CONTINUED) |
The following is a summary of the inputs used to value the Funds’ investments and other financial instruments as of December 31, 2017:
| | | | | | | | | | | | | | | | |
Fund | | Level 1 — Quoted
Prices | | | Level 2 — Significant
Observable Inputs | | | Level 3 — Significant
Unobservable Inputs | | | Total | |
Investments at Fair Value: | | | | | | | | | | | | | | | | |
(See Summary Portfolios or Portfolios of Investments for More Details) | | | | | | | | | |
Equity Index Fund | | | | | | | | | | | | | | | | |
Common Stock | | $ | 2,603,034,350 | | | | — | | | | — | | | $ | 2,603,034,350 | |
Short-Term Debt Securities | | | — | | | $ | 106,318,223 | | | | — | | | $ | 106,318,223 | |
| | | | | | | | | | | | | | | | |
| | $ | 2,603,034,350 | | | $ | 106,318,223 | | | | — | | | $ | 2,709,352,573 | |
All America Fund | | | | | | | | | | | | | | | | |
Common Stock-Indexed | | $ | 176,365,874 | | | | — | | | | — | | | $ | 176,365,874 | |
Common Stock-Active | | $ | 133,759,475 | | | | — | | | $ | 285,375 | (1) | | $ | 134,044,850 | |
Short-Term Debt Securities-Indexed | | | — | | | $ | 11,103,226 | | | | — | | | $ | 11,103,226 | |
Short-Term Debt Securities-Active | | | — | | | $ | 1,999,815 | | | | — | | | $ | 1,999,815 | |
Warrants-Active | | $ | 7,073 | | | | — | | | | — | | | $ | 7,073 | |
| | | | | | | | | | | | | | | | |
| | $ | 310,132,422 | | | $ | 13,103,041 | | | $ | 285,375 | | | $ | 323,520,838 | |
Small Cap Value Fund | | | | | | | | | | | | | | | | |
Common Stock | | $ | 489,246,460 | | | | — | | | $ | 3,206,125 | (1) | | $ | 492,452,585 | |
Short-Term Debt Securities | | | — | | | $ | 13,493,423 | | | | — | | | $ | 13,493,423 | |
Warrants | | $ | 87,296 | | | | — | | | | — | | | $ | 87,296 | |
| | | | | | | | | | | | | | | | |
| | $ | 489,333,756 | | | $ | 13,493,423 | | | $ | 3,206,125 | | | $ | 506,033,304 | |
Small Cap Growth Fund | | | | | | | | | | | | | | | | |
Common Stock | | $ | 543,057,862 | | | | — | | | | — | (1) | | $ | 543,057,862 | |
Short-Term Debt Securities | | | — | | | $ | 8,198,251 | | | | — | | | $ | 8,198,251 | |
| | | | | | | | | | | | | | | | |
| | $ | 543,057,862 | | | $ | 8,198,251 | | | | — | | | $ | 551,256,113 | |
Mid Cap Value Fund | | | | | | | | | | | | | | | | |
Common Stock | | $ | 101,634,844 | | | | — | | | | — | | | $ | 101,634,844 | |
Short-Term Debt Securities | | | — | | | $ | 1,599,860 | | | | — | | | $ | 1,599,860 | |
| | | | | | | | | | | | | | | | |
| | $ | 101,634,844 | | | $ | 1,599,860 | | | | — | | | $ | 103,234,704 | |
Mid-Cap Equity Index Fund | | | | | | | | | | | | | | | | |
Common Stock | | $ | 1,386,920,057 | | | | — | | | | — | | | $ | 1,386,920,057 | |
Short-Term Debt Securities | | | — | | | $ | 65,736,813 | | | | — | | | $ | 65,736,813 | |
| | | | | | | | | | | | | | | | |
| | $ | 1,386,920,057 | | | $ | 65,736,813 | | | | — | | | $ | 1,452,656,870 | |
International Fund | | | | | | | | | | | | | | | | |
Common Stock | | $ | 499,407,919 | | | | — | | | | — | | | $ | 499,407,919 | |
Short-Term Debt Securities | | | — | | | $ | 37,983,378 | | | | — | | | $ | 37,983,378 | |
| | | | | | | | | | | | | | | | |
| | $ | 499,407,919 | | | $ | 37,983,378 | | | | — | | | $ | 537,391,297 | |
Composite Fund | | | | | | | | | | | | | | | | |
Common Stock | | $ | 113,269,172 | | | | — | | | | — | | | $ | 113,269,172 | |
U.S. Government Debt | | | — | | | $ | 22,754,561 | | | | — | | | $ | 22,754,561 | |
U.S. Government Agency Residential Mortgage-Backed Obligations | | | — | | | $ | 21,871,668 | | | | — | | | $ | 21,871,668 | |
U.S. Government Agency
Non-Mortgage-Backed Obligations | | | — | | | $ | 478,864 | | | | — | | | $ | 478,864 | |
Long-Term Corporate Debt | | | — | | | $ | 26,528,469 | | | | — | | | $ | 26,528,469 | |
Short-Term Debt Securities | | | — | | | $ | 4,599,550 | | | | — | | | $ | 4,599,550 | |
| | | | | | | | | | | | | | | | |
| | $ | 113,269,172 | | | $ | 76,233,112 | | | | — | | | $ | 189,502,284 | |
103
MUTUAL OF AMERICA INVESTMENT CORPORATION
NOTES TO FINANCIAL STATEMENTS (Continued)
December 31, 2017
| 1. | SIGNIFICANT ACCOUNTING POLICIESAND ORGANIZATION (CONTINUED) |
| | | | | | | | | | | | | | | | |
Fund | | Level 1 — Quoted
Prices | | | Level 2 — Significant
Observable Inputs | | | Level 3 — Significant
Unobservable Inputs | | | Total | |
Retirement Income Fund | | | | | | | | | | | | | | | | |
Common Stock | | $ | 100,819,359 | | | | — | | | | — | | | $ | 100,819,359 | |
2010 Retirement Fund | | | | | | | | | | | | | | | | |
Common Stock | | $ | 25,549,552 | | | | — | | | | — | | | $ | 25,549,552 | |
2015 Retirement Fund | | | | | | | | | | | | | | | | |
Common Stock | | $ | 154,987,907 | | | | — | | | | — | | | $ | 154,987,907 | |
2020 Retirement Fund | | | | | | | | | | | | | | | | |
Common Stock | | $ | 524,856,083 | | | | — | | | | — | | | $ | 524,856,083 | |
2025 Retirement Fund | | | | | | | | | | | | | | | | |
Common Stock | | $ | 685,736,882 | | | | — | | | | — | | | $ | 685,736,882 | |
2030 Retirement Fund | | | | | | | | | | | | | | | | |
Common Stock | | $ | 577,710,924 | | | | — | | | | — | | | $ | 577,710,924 | |
2035 Retirement Fund | | | | | | | | | | | | | | | | |
Common Stock | | $ | 484,174,511 | | | | — | | | | — | | | $ | 484,174,511 | |
2040 Retirement Fund | | | | | | | | | | | | | | | | |
Common Stock | | $ | 392,790,114 | | | | — | | | | — | | | $ | 392,790,114 | |
2045 Retirement Fund | | | | | | | | | | | | | | | | |
Common Stock | | $ | 437,353,268 | | | | — | | | | — | | | $ | 437,353,268 | |
2050 Retirement Fund | | | | | | | | | | | | | | | | |
Common Stock | | $ | 256,499,347 | | | | — | | | | — | | | $ | 256,499,347 | |
2055 Retirement Fund | | | | | | | | | | | | | | | | |
Common Stock | | $ | 34,309,598 | | | | — | | | | — | | | $ | 34,309,598 | |
Conservative Allocation Fund | | | | | | | | | | | | | | | | |
Common Stock | | $ | 156,518,091 | | | | — | | | | — | | | $ | 156,518,091 | |
Moderate Allocation Fund | | | | | | | | | | | | | | | | |
Common Stock | | $ | 397,185,490 | | | | — | | | | — | | | $ | 397,185,490 | |
Aggressive Allocation Fund | | | | | | | | | | | | | | | | |
Common Stock | | $ | 304,450,683 | | | | — | | | | — | | | $ | 304,450,683 | |
Money Market Fund | | | | | | | | | | | | | | | | |
U.S. Government Debt | | | — | | | $ | 18,882,825 | | | | — | | | $ | 18,882,825 | |
U.S. Government Agency Short-Term Debt | | | — | | | $ | 8,791,522 | | | | — | | | $ | 8,791,522 | |
Commercial Paper | | | — | | | $ | 43,106,318 | | | | — | | | $ | 43,106,318 | |
| | | | | | | | | | | | | | | | |
| | | — | | | $ | 70,780,665 | | | | — | | | $ | 70,780,665 | |
Mid-Term Bond Fund | | | | | | | | | | | | | | | | |
U.S. Government Debt | | | — | | | $ | 269,005,286 | | | | — | | | $ | 269,005,286 | |
U.S. Government Agency Residential
Mortgage-Backed Obligations | | | — | | | $ | 5,894,862 | | | | — | | | $ | 5,894,862 | |
U.S. Government Agency
Non-Mortgage-Backed Obligations | | | — | | | $ | 35,922,750 | | | | — | | | $ | 35,922,750 | |
Long-Term Corporate Debt | | | — | | | $ | 243,196,769 | | | | — | | | $ | 243,196,769 | |
Short-Term Debt Securities | | | — | | | $ | 799,904 | | | | — | | | $ | 799,904 | |
| | | | | | | | | | | | | | | | |
| | | — | | | $ | 554,819,571 | | | | — | | | $ | 554,819,571 | |
Bond Fund | | | | | | | | | | | | | | | | |
U.S. Government Debt | | | — | | | $ | 307,700,745 | | | | — | | | $ | 307,700,745 | |
U.S. Government Agency Residential
Mortgage-Backed Obligations | | | — | | | $ | 355,080,769 | | | | — | | | $ | 355,080,769 | |
U.S. Government Agency
Non-Mortgage-Backed Obligations | | | — | | | $ | 15,398,657 | | | | — | | | $ | 15,398,657 | |
Long-Term Corporate Debt | | | — | | | $ | 580,813,920 | | | | — | | | $ | 580,813,920 | |
Sovereign Debt | | | — | | | $ | 3,258,795 | | | | — | | | $ | 3,258,795 | |
Short-Term Debt Securities | | | — | | | $ | 8,698,956 | | | | — | | | $ | 8,698,956 | |
| | | | | | | | | | | | | | | | |
| | | — | | | $ | 1,270,951,842 | | | | — | | | $ | 1,270,951,842 | |
104
MUTUAL OF AMERICA INVESTMENT CORPORATION
NOTES TO FINANCIAL STATEMENTS (Continued)
December 31, 2017
| 1. | SIGNIFICANT ACCOUNTING POLICIESAND ORGANIZATION (CONTINUED) |
| | | | | | | | | | | | | | | | |
Fund | | Level 1 — Quoted
Prices | | | Level 2 — Significant
Observable Inputs | | | Level 3 — Significant
Unobservable Inputs | | | Total | |
Other Financial Instruments:* | | | | | | | | | | | | | | | | |
Equity Index Fund | | $ | 517,095 | | | | — | | | | — | | | $ | 517,095 | |
All America Fund | | $ | 91,979 | | | | — | | | | — | | | $ | 91,979 | |
Mid-Cap Equity Index Fund | | $ | 225,422 | | | | — | | | | — | | | $ | 225,422 | |
| * | Other financial instruments are derivative instruments not reflected in the Portfolio of Investments, such as futures, which are valued at the unrealized appreciation/depreciation on the instrument. |
| (1) | Includes securities fair valued using methods determined in good faith by the Adviser and reviewed by the Investment Company Valuation Committee, in accordance with procedures adopted by the Board of Directors of the Investment Company. |
| | | | | | | | | | | | | | | | | | | | | | | | |
| | | Fair Value Measurement Using Significant Unobservable
Inputs (Level 3) for the Year Ended December 31, 2017 | |
| | | Balance
December 31,
2016(a) | | | Change in
Unrealized
Gains
(Losses) | | | Transfers
Into
Level 3 | | | Transfers
Out of
Level 3 | | | Balance
December 31,
2017(a) | | | Unrealized Gains/(Losses)
of Level 3 Assets Held as of
December 31, 2017 Included
in Statements of Operation | |
All America Fund | | $ | 285,375 | | | | — | | | | — | | | | — | | | $ | 285,375 | | | $ | 30,822 | |
Small Cap Value Fund | | $ | 3,206,125 | | | | — | | | | — | | | | — | | | $ | 3,206,125 | | | $ | 347,256 | |
Small Cap Growth Fund | | | — | | | | — | | | | — | | | | — | | | | — | | | | — | |
| (a) | Includes securities fair valued using methods determined in good faith by the Adviser and reviewed by the Investment Company Valuation Committee, in accordance with procedures adopted by the Board of Directors of the Investment Company. |
Security Valuation — Investment securities are carried at fair value as follows:
The Funds’ investments are fair valued as of the close of trading on the New York Stock Exchange (“Exchange”) on each day the Exchange is open for trading. The Exchange usually closes at 4:00 pm Eastern Time but sometimes closes earlier.
Exchange-traded equity securities are valued at the last reported sales price on the principal exchange on which the security is traded. If there is no trading volume for a particular valuation day, the last bid price is used. For equity securities traded in the over-the-counter market, the security is valued at the last sale price, or if no sale, at the latest bid price available.
Short-term debt securities with a maturity of 60 days or less are valued at amortized cost, which approximates fair value for such securities.
Debt securities, including short-term debt securities maturing in excess of 60 days, are valued on the basis of prices obtained from an independent pricing source. The pricing source may utilize various pricing methodologies that incorporate both models (which consider factors such as yield, quality, coupon rate, maturity, issue type, quoted prices for similar securities, prepayment speeds and trading characteristics) and dealer-supplied valuations to derive a valuation.
In the rare instance when a price is not available from an independent pricing source or when prices may not reflect fair value, such as when the price provided by the pricing source is not based on a recent trade, a calculated fair value is used, as determined in good faith by the Adviser and reviewed by a Valuation Committee, in accordance with procedures adopted by the Board of Directors of the Investment Company.
Mutual of America Capital Management LLC (“the Adviser”) uses a market approach to calculate fair value for equity securities which are categorized as Level 3. The Adviser’s valuation is primarily based on information regarding the specific equity issuer, such as the last trade price, financial statements, the relationship of per-share book value to the last trade price, operating information and any corporate
105
MUTUAL OF AMERICA INVESTMENT CORPORATION
NOTES TO FINANCIAL STATEMENTS (Continued)
December 31, 2017
| 1. | SIGNIFICANT ACCOUNTING POLICIESAND ORGANIZATION (CONTINUED) |
actions, such as dividends or returns of capital, that may have occurred since the last trade. The Adviser also considers industry-specific conditions and overall market conditions, to determine whether the last trade price reflects fair value or needs to be adjusted. Generally, absent any significant contrary indications, the last trade price will be used as the calculated fair value.
The Retirement Funds and the Allocation Funds value their investments in the underlying Funds of the Investment Company at their respective net asset values.
Investment Transactions — Investment transactions are accounted for as of the trade date. Realized gains and losses on the sale of short and long-term debt securities are computed on the basis of amortized cost at the time of sale. Realized gains and losses on the sale of equity securities are based on the identified cost basis of the security, determined on the first-in, first-out (“FIFO”) basis.
Futures Contracts — The Equity Index Fund, Mid-Cap Equity Index Fund and a portion of the All America Fund each maintain indexed asset portfolios which are subject to equity price risk. In order to remain more fully invested in the equity markets while minimizing transaction costs, the funds purchase stock index futures contracts. These purchases of futures contracts allow the funds to invest available cash to attempt to efficiently and cost effectively keep the funds fully invested on a daily basis in an attempt to minimize deviation from the performance of the indices. An initial cash margin deposit (represented by cash or Treasury bills) is made upon entering into a futures contract and serves as collateral for the contract. This initial margin, maintained in a segregated account, is equal to approximately 5%-6% of the contract amount, and does not involve the borrowing of funds to finance the transaction. During the period the futures contract is outstanding, changes in the value of the contract are recognized as unrealized appreciation or depreciation by “marking-to-market” on a daily basis to reflect the market value of the contract at the end of each trading day. The accumulated unrealized appreciation or depreciation on the contract is included in Net Unrealized Appreciation (Depreciation) of Investments and Futures Contracts in the Components of Net Assets section of the Statements of Assets and Liabilities. Futures contracts are valued at the settlement price established each day by the exchange on which traded. Depending upon whether unrealized appreciation or depreciation are incurred, variation margin payments are received or made daily. The net change in unrealized appreciation or depreciation of futures contracts is recorded in the Statements of Operations. When the contract is closed, a realized gain or loss from futures transactions is recorded in the Statements of Operations, equal to the net variation margin received or paid over the period the contract was outstanding.
The “Underlying Face Amount at Value” (appearing in the “Footnotes to Summary Portfolios of Investments in Securities”) representing the aggregate of outstanding contractual amounts under futures contracts reflects the extent of a Fund’s exposure to off-balance sheet risk. The use of futures transactions involves the risk of imperfect correlation in the price movements of the contract and the underlying securities. With futures contracts, there is minimal counterparty credit risk to the Fund since futures are exchange traded and the exchange’s clearinghouse, as counterparty to all exchange traded futures, guarantees the futures against default.
During the year ended December 31, 2017, the Equity Index Fund, Mid-Cap Equity Index Fund and the All America Fund purchased futures contracts with total principal amounts of $522,112,401, $302,971,576 and $51,916,830, respectively.
Warrants — A warrant is an option to purchase common stock of an issuer and is issued in conjunction with another security, such as a debt obligation. A warrant specifies the price at which the holder may purchase shares of common stock and usually expires after a period of time. A warrant holder generally may pay cash for the common stock to be purchased or may surrender the principal amount of the related debt security the warrant holder owns equal to the purchase price for the stock.
The common stock underlying a warrant may not increase in value after the date the warrant was issued, or may not increase up to the warrant exercise price. In this case, the warrant generally would have little value and could expire unexercised.
106
MUTUAL OF AMERICA INVESTMENT CORPORATION
NOTES TO FINANCIAL STATEMENTS (Continued)
December 31, 2017
| 1. | SIGNIFICANT ACCOUNTING POLICIESAND ORGANIZATION (CONTINUED) |
At December 31, 2017, warrants held by the Funds of the Investment Company were traded on active markets and are considered Level 1 securities.
Retirement Funds — Each of the Retirement Funds invests in equity (stock) funds and fixed income (bond) funds and targets different percentages to these asset classes. The targets reflect varying emphases on achieving capital appreciation and gains versus preserving capital and producing income, depending on the specific Fund’s time horizon.
The Retirement Funds target their investments in the following underlying funds of the Investment Company in accordance with the percentage allocations noted (unaudited):
| | | | | | | | | | | | | | | | | | | | | | | | | | | | | | | | |
| | | Equity
Index
Fund | | | Mid-Cap
Equity
Index
Fund | | | Small Cap
Growth
Fund | | | Small Cap
Value
Fund | | | International
Fund | | | Bond
Fund | | | Mid-Term
Bond
Fund | | | Money
Market
Fund | |
Retirement Income Fund | | | 20% | | | | 5% | | | | — | | | | — | | | | — | | | | 30% | | | | 35% | | | | 10% | |
2010 Retirement Fund | | | 22% | | | | 7% | | | | — | | | | — | | | | 3% | | | | 27% | | | | 35% | | | | 6% | |
2015 Retirement Fund | | | 26% | | | | 8% | | | | 1% | | | | 1% | | | | 5% | | | | 26% | | | | 30% | | | | 3% | |
2020 Retirement Fund | | | 29% | | | | 10% | | | | 2% | | | | 2% | | | | 8% | | | | 26% | | | | 23% | | | | — | |
2025 Retirement Fund | | | 32% | | | | 12% | | | | 4% | | | | 4% | | | | 10% | | | | 25% | | | | 13% | | | | — | |
2030 Retirement Fund | | | 34% | | | | 17% | | | | 5% | | | | 5% | | | | 12% | | | | 22% | | | | 5% | | | | — | |
2035 Retirement Fund | | | 36% | | | | 21% | | | | 6% | | | | 6% | | | | 13% | | | | 18% | | | | — | | | | — | |
2040 Retirement Fund | | | 36% | | | | 21% | | | | 7% | | | | 7% | | | | 14% | | | | 15% | | | | — | | | | — | |
2045 Retirement Fund | | | 35% | | | | 22% | | | | 8% | | | | 8% | | | | 15% | | | | 12% | | | | — | | | | — | |
2050 Retirement Fund | | | 34% | | | | 22% | | | | 9% | | | | 9% | | | | 16% | | | | 10% | | | | — | | | | — | |
2055 Retirement Fund | | | 32% | | | | 22% | | | | 10% | | | | 10% | | | | 17% | | | | 9% | | | | — | | | | — | |
Generally, rebalancing of the Retirement Funds’ holdings is performed on a periodic basis and the mix of underlying Funds is reviewed annually.
Allocation Funds — The Allocation Funds target their investments in the following underlying Funds of the Investment Company in accordance with the percentage allocations noted (unaudited):
| | | | | | | | | | | | | | | | | | | | | | | | | | | | |
| | | Equity
Index
Fund | | | Mid-Cap
Equity
Index
Fund | | | Small Cap
Growth
Fund | | | Small Cap
Value
Fund | | | International
Fund | | | Bond
Fund | | | Mid-Term
Bond
Fund | |
Conservative Allocation | | | 25% | | | | 5% | | | | — | | | | — | | | | 5% | | | | 30% | | | | 35% | |
Moderate Allocation | | | 35% | | | | 15% | | | | — | | | | — | | | | 10% | | | | 25% | | | | 15% | |
Aggressive Allocation | | | 35% | | | | 20% | | | | 5% | | | | 5% | | | | 15% | | | | 20% | | | | — | |
Generally, rebalancing of the Allocation Funds’ holdings is performed on a periodic basis.
Change in Target Investments — During the year, the Retirement Funds listed below had changes to their target investments. Overall increases (decreases) to the target percentages were as follows (unaudited):
| | | | | | | | | | | | | | | | | | | | | | | | | | | | | | | | |
| | | Equity
Index
Fund | | | Mid-Cap
Equity
Index
Fund | | | Small Cap
Growth
Fund | | | Small Cap
Value
Fund | | | International
Fund | | | Bond
Fund | | | Mid-Term
Bond
Fund | | | Money
Market
Fund | |
Retirement Income Fund | | | — | | | | — | | | | — | | | | — | | | | — | | | | — | | | | (5% | ) | | | 5% | |
2010 Retirement Fund | | | (1% | ) | | | — | | | | — | | | | — | | | | — | | | | 1% | | | | (1% | ) | | | 1% | |
2015 Retirement Fund | | | — | | | | (1% | ) | | | — | | | | — | | | | (1% | ) | | | — | | | | (1% | ) | | | 3% | |
2020 Retirement Fund | | | (1% | ) | | | (1% | ) | | | — | | | | — | | | | — | | | | — | | | | 2% | | | | — | |
2025 Retirement Fund | | | (3% | ) | | | (2% | ) | | | 1% | | | | 1% | | | | — | | | | — | | | | 3% | | | | — | |
2030 Retirement Fund | | | (3% | ) | | | — | | | | — | | | | — | | | | 1% | | | | (3% | ) | | | 5% | | | | — | |
2035 Retirement Fund | | | (2% | ) | | | 1% | | | | — | | | | — | | | | — | | | | 1% | | | | — | | | | — | |
2040 Retirement Fund | | | — | | | | 1% | | | | (1% | ) | | | (1% | ) | | | — | | | | 1% | | | | — | | | | — | |
2045 Retirement Fund | | | 2% | | | | — | | | | (1% | ) | | | (1% | ) | | | — | | | | — | | | | — | | | | — | |
2050 Retirement Fund | | | 2% | | | | — | | | | (1% | ) | | | (1% | ) | | | — | | | | — | | | | — | | | | — | |
2055 Retirement Fund | | | 2% | | | | (1% | ) | | | (1% | ) | | | (1% | ) | | | — | | | | 1% | | | | — | | | | — | |
107
MUTUAL OF AMERICA INVESTMENT CORPORATION
NOTES TO FINANCIAL STATEMENTS (Continued)
December 31, 2017
| 1. | SIGNIFICANT ACCOUNTING POLICIESAND ORGANIZATION (CONTINUED) |
Investment Income — Interest income, accretion of discount and amortization of premium are recorded daily on an accrual basis using the effective interest method. A debt obligation may cease accrual of income and result in a reduction to interest income when the collection of all or a portion of current and past due interest is in doubt. Dividend income is recorded on the ex-dividend date. Foreign source tax withheld from dividends is recorded as a reduction from dividend income. Should reclamation efforts succeed, such amounts are recorded as income upon collection.
Distributions to Shareholders (“Dividends”) — Distributions to shareholders are recorded on the ex-dividend date and are made at least annually. It is the Investment Company’s policy to make distributions of its net investment income and net realized gains, if any, in accordance with Federal income tax regulations, which may differ from U.S. generally accepted accounting principles. Accordingly, periodic reclassifications (which do not impact the funds’ net asset values) are made within the funds’ capital accounts to reflect income and gains available for distribution under Federal income tax regulations.
Federal Income Taxes — Each Fund in the Investment Company intends to comply with the requirements of the Internal Revenue Code applicable to regulated investment companies and to distribute substantially all of its taxable income to shareholders. Therefore, no federal income or excise tax provision is required.
GAAP requires the evaluation of tax positions taken in the course of preparing a fund’s tax return to determine whether it is “more-likely-than-not” that tax positions taken in the fund’s tax return will be ultimately sustained, and, if not, a tax liability and expense is recorded.
As of December 31, 2017, management has evaluated the tax positions taken on the Funds’ filed tax returns for all open tax years and has concluded that no tax provision is required in any of the Funds’ financial statements. Each Fund’s federal and state income, franchise and federal excise tax returns for tax years for which the applicable statutes of limitations have not expired are subject to examination by the Internal Revenue Service and state departments of revenue.
As of December 31, 2017, the Money Market and Bond Funds had a capital loss carry forward of $1,023 and $77,618, respectively, to offset any future net realized capital gains generated after December 31, 2017.
The Investment Company has an Investment Advisory Agreement with Mutual of America Capital Management LLC (“the Adviser”), an indirect wholly-owned subsidiary of Mutual of America Life. For providing investment management services to each of the Funds of the Investment Company, the Adviser receives a fee, calculated as a daily charge of the value of the net assets of each fund, at the following annual rates:
| | | | |
Fund | | Annual Investment
Management Fee | |
Retirement Funds | | | .05 | % |
Equity Index, Mid-Cap Equity Index, International Funds | | | .075 | % |
Money Market Fund | | | .15 | % |
Bond Fund | | | .39 | % |
All America, Composite, Mid-Term Bond Funds | | | .40 | % |
Mid Cap Value Fund | | | .55 | % |
Small Cap Value, Small Cap Growth Funds | | | .75 | % |
The Retirement and Allocation Funds incur direct investment management expenses of .05% and .00%, respectively. Shareholders in the Allocation and Retirement Funds indirectly bear their pro-rata share of the investment management fees incurred by the underlying funds in which they invest. Through December 31, 2014, they also did not incur operating expenses other than those included in each of the underlying funds in which they invest. Commencing January 1, 2015, the expense allocation methodology was modified such that certain non-advisory operating expenses that can be attributed only to the Retirement and Allocation Funds are now charged directly to those Funds. During 2017, Mutual of America reimbursed the applicable funds $492,285 to reflect the change in the operating expense
108
MUTUAL OF AMERICA INVESTMENT CORPORATION
NOTES TO FINANCIAL STATEMENTS (Continued)
December 31, 2017
allocation methodology. The one time reimbursement is accounted for on the Statements of Operations under the financial statement caption “Non-Advisory operating expense reimbursement.”
Effective January 1, 2015, the Investment Company and the Adviser entered into an agreement under which the Adviser agrees to reimburse the direct non-advisory operating expenses of any Allocation or Retirement Fund (each a “Fund of Funds”) that has less than $50 million in average daily net assets for the prior calendar year. This agreement remains in effect through April 30, 2018 and continues into successive 12 month periods ending April 30 unless i) The Fund of Funds has at least $50 million in average daily net assets for the prior calendar year, ii) the Investment Company gives not less than 30 days written notice to the Adviser, or iii) the Adviser gives 45 days advance notice to the Investment Company before the next May 1 of a given year to terminate the agreement. In that case, the agreement will terminate on the next May 1 following the written notice.
The cost of investment purchases and proceeds from sales of investments, excluding short-term securities and futures contracts, for the year ended December 31, 2017, were as follows:
| | | | | | | | | | | | | | | | | | | | |
| | | Equity Index
Fund | | | All America
Fund | | | Small Cap
Value Fund | | | Small Cap
Growth Fund | | | Mid Cap
Value Fund | |
Cost of investment purchases | | $ | 259,541,195 | | | $ | 66,374,961 | | | $ | 174,521,289 | | | $ | 314,147,578 | | | $ | 23,513,886 | |
| | | | | | | | | | | | | | | | | | | | |
Proceeds from sales of investments | | $ | 120,822,101 | | | $ | 83,763,752 | | | $ | 157,031,965 | | | $ | 295,668,788 | | | $ | 27,762,086 | |
| | | | | | | | | | | | | | | | | | | | |
| | | | | |
| | | Mid-Cap Equity
Index Fund | | | International
Fund | | | Composite
Fund | | | Retirement
Income Fund | | | 2010
Retirement
Fund | |
Cost of investment purchases | | $ | 274,521,002 | | | $ | 59,291,058 | | | $ | 106,449,194 | | | $ | 37,262,182 | | | $ | 6,075,947 | |
| | | | | | | | | | | | | | | | | | | | |
Proceeds from sales of investments | | $ | 247,465,415 | | | $ | — | | | $ | 116,901,189 | | | $ | 15,604,636 | | | $ | 7,621,172 | |
| | | | | | | | | | | | | | | | | | | | |
| | | | | |
| | | 2015
Retirement
Fund | | | 2020
Retirement
Fund | | | 2025
Retirement
Fund | | | 2030
Retirement
Fund | | | 2035
Retirement
Fund | |
Cost of investment purchases | | $ | 22,361,275 | | | $ | 93,665,727 | | | $ | 159,379,264 | | | $ | 137,203,776 | | | $ | 101,529,026 | |
| | | | | | | | | | | | | | | | | | | | |
Proceeds from sales of investments | | $ | 24,134,724 | | | $ | 33,010,159 | | | $ | 33,682,904 | | | $ | 27,911,040 | | | $ | 16,354,288 | |
| | | | | | | | | | | | | | | | | | | | |
| | | | | |
| | | 2040
Retirement
Fund | | | 2045
Retirement
Fund | | | 2050
Retirement
Fund | | | 2055
Retirement
Fund | | | Conservative
Allocation
Fund | |
Cost of investment purchases | | $ | 81,551,020 | | | $ | 76,649,724 | | | $ | 75,523,272 | | | $ | 30,007,199 | | | $ | 43,374,221 | |
| | | | | | | | | | | | | | | | | | | | |
Proceeds from sales of investments | | $ | 13,496,305 | | | $ | 16,880,781 | | | $ | 7,670,936 | | | $ | 638,305 | | | $ | 34,540,103 | |
| | | | | | | | | | | | | | | | | | | | |
| | | | | |
| | | Moderate
Allocation
Fund | | | Aggressive
Allocation
Fund | | | Money Market
Fund | | | Mid-Term
Bond Fund | | | Bond Fund | |
Cost of investment purchases | | $ | 60,894,774 | | | $ | 35,554,228 | | | $ | — | | | $ | 139,856,408 | | | $ | 284,462,553 | |
| | | | | | | | | | | | | | | | | | | | |
Proceeds from sales of investments | | $ | 44,678,232 | | | $ | 26,969,096 | | | $ | — | | | $ | 72,966,155 | | | $ | 123,839,588 | |
| | | | | | | | | | | | | | | | | | | | |
The cost of short-term security purchases for the Money Market Fund for the year ended December 31, 2017, was $607,654,542; net proceeds from sales for the same period were $600,540,975.
109
MUTUAL OF AMERICA INVESTMENT CORPORATION
NOTES TO FINANCIAL STATEMENTS (Continued)
December 31, 2017
| 3. | INVESTMENTS (CONTINUED) |
The components of net unrealized appreciation (depreciation) of investments for federal income tax purposes and the cost of investments for federal income tax purposes at December 31, 2017 for each of the funds were as follows:
| | | | | | | | | | | | | | | | | | | | |
| | | Equity Index
Fund | | | All America
Fund | | | Small Cap
Value Fund | | | Small Cap
Growth Fund | | | Mid Cap
Value Fund | |
Unrealized Appreciation | | $ | 1,158,932,496 | | | $ | 107,153,408 | | | $ | 130,502,649 | | | $ | 134,790,722 | | | $ | 27,681,358 | |
Unrealized Depreciation | | | (51,867,964 | ) | | | (10,997,642 | ) | | | (20,003,112 | ) | | | (17,610,110 | ) | | | (4,181,665 | ) |
| | | | | | | | | | | | | | | | | | | | |
Net | | $ | 1,107,064,532 | | | $ | 96,155,766 | | | $ | 110,499,537 | | | $ | 117,180,612 | | | $ | 23,499,693 | |
| | | | | | | | | | | | | | | | | | | | |
Tax Cost of Investments | | $ | 1,602,288,041 | | | $ | 227,365,072 | | | $ | 395,533,767 | | | $ | 434,075,501 | | | $ | 79,735,011 | |
| | | | | | | | | | | | | | | | | | | | |
| | | | | |
| | | Mid-Cap Equity
Index Fund | | | International
Fund | | | Composite Fund | | | Retirement
Income Fund | | | 2010
Retirement
Fund | |
Unrealized Appreciation | | $ | 429,793,564 | | | $ | 70,343,943 | | | $ | 28,116,868 | | | $ | 3,170,910 | | | $ | 1,308,388 | |
Unrealized Depreciation | | | (59,875,445 | ) | | | (1,353,553 | ) | | | (1,936,740 | ) | | | (269,136 | ) | | | (111,553 | ) |
| | | | | | | | | | | | | | | | | | | | |
Net | | $ | 369,918,119 | | | $ | 68,990,390 | | | $ | 26,180,128 | | | $ | 2,901,774 | | | $ | 1,196,835 | |
| | | | | | | | | | | | | | | | | | | | |
Tax Cost of Investments | | $ | 1,082,738,751 | | | $ | 468,400,907 | | | $ | 163,322,156 | | | $ | 97,917,585 | | | $ | 24,352,717 | |
| | | | | | | | | | | | | | | | | | | | |
| | | | | |
| | | 2015
Retirement
Fund | | | 2020
Retirement
Fund | | | 2025
Retirement
Fund | | | 2030
Retirement
Fund | | | 2035
Retirement
Fund | |
Unrealized Appreciation | | $ | 14,667,979 | | | $ | 59,572,223 | | | $ | 88,459,918 | | | $ | 85,494,893 | | | $ | 78,511,755 | |
Unrealized Depreciation | | | (310,519 | ) | | | (343,331 | ) | | | (295,164 | ) | | | (232,018 | ) | | | (152,056 | ) |
| | | | | | | | | | | | | | | | | | | | |
Net | | $ | 14,357,460 | | | $ | 59,228,892 | | | $ | 88,164,754 | | | $ | 85,262,875 | | | $ | 78,359,699 | |
| | | | | | | | | | | | | | | | | | | | |
Tax Cost of Investments | | $ | 140,630,447 | | | $ | 465,627,191 | | | $ | 597,572,128 | | | $ | 492,448,049 | | | $ | 405,814,812 | |
| | | | | | | | | | | | | | | | | | | | |
| | | | | |
| | | 2040
Retirement
Fund | | | 2045
Retirement
Fund | | | 2050
Retirement
Fund | | | 2055
Retirement
Fund | | | Conservative
Allocation
Fund | |
Unrealized Appreciation | | $ | 66,255,045 | | | $ | 81,328,090 | | | $ | 28,382,863 | | | $ | 1,583,249 | | | $ | 8,169,992 | |
Unrealized Depreciation | | | (163,432 | ) | | | (156,828 | ) | | | (53,718 | ) | | | (1,149 | ) | | | (441,881 | ) |
| | | | | | | | | | | | | | | | | | | | |
Net | | $ | 66,091,613 | | | $ | 81,171,262 | | | $ | 28,329,145 | | | $ | 1,582,100 | | | $ | 7,728,111 | |
| | | | | | | | | | | | | | | | | | | | |
Tax Cost of Investments | | $ | 326,698,501 | | | $ | 356,182,006 | | | $ | 228,170,202 | | | $ | 32,727,498 | | | $ | 148,789,980 | |
| | | | | | | | | | | | | | | | | | | | |
| | | | | |
| | | Moderate
Allocation
Fund | | | Aggressive
Allocation
Fund | | | Money Market
Fund | | | Mid-Term Bond
Fund | | | Bond Fund | |
Unrealized Appreciation | | $ | 62,636,784 | | | $ | 67,228,765 | | | $ | 391 | | | $ | 4,647,999 | | | $ | 24,051,646 | |
Unrealized Depreciation | | | (2,277,141 | ) | | | (2,491,208 | ) | | | 0 | | | | (5,314,347 | ) | | | (9,622,737 | ) |
| | | | | | | | | | | | | | | | | | | | |
Net | | $ | 60,359,643 | | | $ | 64,737,557 | | | $ | 391 | | | $ | (666,348 | ) | | $ | 14,428,909 | |
| | | | | | | | | | | | | | | | | | | | |
Tax Cost of Investments | | $ | 336,825,847 | | | $ | 239,713,126 | | | $ | 70,780,274 | | | $ | 555,485,919 | | | $ | 1,256,522,933 | |
| | | | | | | | | | | | | | | | | | | | |
Differences between amounts reflected in the Statements of Assets and Liabilities and those computed for federal income tax purposes arise primarily from federal income tax treatment of wash sales, REITs, partnerships, corporate actions and futures contracts.
110
MUTUAL OF AMERICA INVESTMENT CORPORATION
NOTES TO FINANCIAL STATEMENTS (Continued)
December 31, 2017
| 3. | INVESTMENTS (CONTINUED) |
Investments in affiliated investment companies during the year ended December 31, 2017 were as follows:
| | | | | | | | | | | | | | | | | | | | | | | | | | | | | | | | |
Affiliated Investment Company | | Value as of
December 31,
2016 | | | Purchases | | | Realized
Gain
(Loss) on
Investment
Securities | | | Change in
Unrealized
Appreciation
(Depreciation)
of Investment
Securities | | | Sales | | | Value as of
December 31,
2017 | | | Dividends | | | Realized
Gain,
Distributions | |
Retirement Income Fund | | | | | | | | | | | | | | | | | | | | | | | | | | | | | | | | |
Bond Fund | | $ | 22,590,894 | | | $ | 10,812,258 | | | $ | 105,931 | | | $ | (44,640 | ) | | $ | (3,124,613 | ) | | $ | 30,339,830 | | | $ | 735,242 | | | $ | 50,379 | |
Equity Index Fund | | | 16,078,959 | | | | 6,585,088 | | | | 602,342 | | | | 2,374,970 | | | | (2,655,492 | ) | | | 22,985,867 | | | | 306,997 | | | | 361,756 | |
Mid-Cap Equity Index Fund | | | 4,051,382 | | | | 1,932,844 | | | | 47,352 | | | | 319,305 | | | | (520,769 | ) | | | 5,830,114 | | | | 56,047 | | | | 291,490 | |
Mid-Term Bond Fund | | | 30,607,594 | | | | 11,374,589 | | | | (50,720 | ) | | | 74,371 | | | | (8,530,540 | ) | | | 33,475,294 | | | | 641,282 | | | | 39,521 | |
Money Market Fund | | | 2,372,365 | | | | 6,557,403 | | | | 2,175 | | | | 29,533 | | | | (773,222 | ) | | | 8,188,254 | | | | 8,532 | | | | — | |
| | | | | | | | | | | | | | | | | | | | | | | | | | | | | | | | |
Total | | $ | 75,701,194 | | | $ | 37,262,182 | | | $ | 707,080 | | | $ | 2,753,539 | | | $ | (15,604,636 | ) | | $ | 100,819,359 | | | $ | 1,748,100 | | | $ | 743,146 | |
| | | | | | | | | | | | | | | | | | | | | | | | | | | | | | | | |
2010 Retirement Fund | | | | | | | | | | | | | | | | | | | | | | | | | | | | | | | | |
Bond Fund | | $ | 6,633,679 | | | $ | 1,398,162 | | | $ | 39,633 | | | $ | 6,802 | | | $ | (1,784,494 | ) | | $ | 6,293,782 | | | $ | 165,956 | | | $ | 11,371 | |
Equity Index Fund | | | 6,369,884 | | | | 1,191,590 | | | | 662,582 | | | | 342,948 | | | | (2,016,616 | ) | | | 6,550,388 | | | | 94,609 | | | | 111,484 | |
International Fund | | | 753,943 | | | | 470,760 | | | | 35,874 | | | | 138,700 | | | | (201,675 | ) | | | 1,197,602 | | | | 22,769 | | | | 2,757 | |
Mid-Cap Equity Index Fund | | | 2,053,267 | | | | 451,102 | | | | 82,133 | | | | 79,804 | | | | (494,902 | ) | | | 2,171,404 | | | | 22,551 | | | | 117,286 | |
Mid-Term Bond Fund | | | 9,093,610 | | | | 1,744,003 | | | | (28,697 | ) | | | 45,810 | | | | (2,750,720 | ) | | | 8,104,006 | | | | 169,969 | | | | 10,475 | |
Money Market Fund | | | 778,899 | | | | 820,330 | | | | 540 | | | | 5,366 | | | | (372,765 | ) | | | 1,232,370 | | | | 1,431 | | | | — | |
| | | | | | | | | | | | | | | | | | | | | | | | | | | | | | | | |
Total | | $ | 25,683,282 | | | $ | 6,075,947 | | | $ | 792,065 | | | $ | 619,430 | | | $ | (7,621,172 | ) | | $ | 25,549,552 | | | $ | 477,285 | | | $ | 253,373 | |
| | | | | | | | | | | | | | | | | | | | | | | | | | | | | | | | |
2015 Retirement Fund | | | | | | | | | | | | | | | | | | | | | | | | | | | | | | | | |
Bond Fund | | $ | 36,215,289 | | | $ | 5,397,462 | | | $ | 155,647 | | | $ | 63,450 | | | $ | (4,794,036 | ) | | $ | 37,037,812 | | | $ | 993,567 | | | $ | 68,080 | |
Equity Index Fund | | | 40,768,318 | | | | 4,559,514 | | | | 2,777,141 | | | | 4,130,797 | | | | (6,153,651 | ) | | | 46,082,119 | | | | 674,112 | | | | 794,354 | |
International Fund | | | 8,552,145 | | | | 801,640 | | | | 708,150 | | | | 964,247 | | | | (2,982,778 | ) | | | 8,043,404 | | | | 154,204 | | | | 18,671 | |
Mid-Cap Equity Index Fund | | | 14,819,918 | | | | 2,000,203 | | | | 726,180 | | | | 458,169 | | | | (2,441,158 | ) | | | 15,563,312 | | | | 163,652 | | | | 851,125 | |
Mid-Term Bond Fund | | | 42,983,570 | | | | 4,518,547 | | | | (232,631 | ) | | | 282,351 | | | | (7,037,996 | ) | | | 40,513,841 | | | | 864,354 | | | | 53,268 | |
Money Market Fund | | | — | | | | 4,710,263 | | | | 483 | | | | 16,397 | | | | (296,538 | ) | | | 4,430,605 | | | | 5,251 | | | | — | |
Small Cap Growth Fund | | | 1,458,216 | | | | 173,905 | | | | 13,708 | | | | 262,581 | | | | (205,430 | ) | | | 1,702,980 | | | | 373 | | | | 54,646 | |
Small Cap Value Fund | | | 1,595,771 | | | | 199,741 | | | | 33,763 | | | | 7,696 | | | | (223,137 | ) | | | 1,613,834 | | | | 8,755 | | | | 72,100 | |
| | | | | | | | | | | | | | | | | | | | | | | | | | | | | | | | |
Total | | $ | 146,393,227 | | | $ | 22,361,275 | | | $ | 4,182,441 | | | $ | 6,185,688 | | | $ | (24,134,724 | ) | | $ | 154,987,907 | | | $ | 2,864,268 | | | $ | 1,912,244 | |
| | | | | | | | | | | | | | | | | | | | | | | | | | | | | | | | |
2020 Retirement Fund | | | | | | | | | | | | | | | | | | | | | | | | | | | | | | | | |
Bond Fund | | $ | 102,961,309 | | | $ | 22,021,991 | | | $ | 369,414 | | | $ | 112,244 | | | $ | (6,551,524 | ) | | $ | 118,913,434 | | | $ | 3,055,313 | | | $ | 209,352 | |
Equity Index Fund | | | 137,223,398 | | | | 25,629,060 | | | | 4,952,047 | | | | 19,607,066 | | | | (11,399,676 | ) | | | 176,011,895 | | | | 2,491,168 | | | | 2,935,519 | |
International Fund | | | 33,025,671 | | | | 6,427,530 | | | | 591,878 | | | | 6,603,794 | | | | (3,627,247 | ) | | | 43,021,626 | | | | 794,709 | | | | 96,221 | |
Mid-Cap Equity Index Fund | | | 51,732,914 | | | | 10,987,038 | | | | 1,499,933 | | | | 2,883,557 | | | | (4,783,803 | ) | | | 62,319,639 | | | | 634,447 | | | | 3,299,643 | |
Mid-Term Bond Fund | | | 82,121,310 | | | | 24,893,810 | | | | (65,092 | ) | | | (208,851 | ) | | | (5,541,329 | ) | | | 101,199,848 | | | | 2,064,630 | | | | 127,238 | |
Small Cap Growth Fund | | | 8,447,477 | | | | 1,738,226 | | | | 66,549 | | | | 1,641,971 | | | | (541,102 | ) | | | 11,353,121 | | | | 2,399 | | | | 351,676 | |
Small Cap Value Fund | | | 10,333,184 | | | | 1,968,072 | | | | 149,216 | | | | 151,526 | | | | (565,478 | ) | | | 12,036,520 | | | | 63,230 | | | | 520,692 | |
| | | | | | | | | | | | | | | | | | | | | | | | | | | | | | | | |
Total | | $ | 425,845,263 | | | $ | 93,665,727 | | | $ | 7,563,945 | | | $ | 30,791,307 | | | $ | (33,010,159 | ) | | $ | 524,856,083 | | | $ | 9,105,896 | | | $ | 7,540,341 | |
| | | | | | | | | | | | | | | | | | | | | | | | | | | | | | | | |
2025 Retirement Fund | | | | | | | | | | | | | | | | | | | | | | | | | | | | | | | | |
Bond Fund | | $ | 115,158,713 | | | $ | 34,273,080 | | | $ | 300,756 | | | $ | 125,430 | | | $ | (3,357,823 | ) | | $ | 146,500,156 | | | $ | 3,705,142 | | | $ | 253,879 | |
Equity Index Fund | | | 186,795,987 | | | | 45,788,402 | | | | 8,407,775 | | | | 25,707,247 | | | | (17,447,471 | ) | | | 249,251,940 | | | | 3,486,636 | | | | 4,108,550 | |
International Fund | | | 43,950,773 | | | | 14,950,020 | | | | 242,104 | | | | 10,089,818 | | | | (1,343,129 | ) | | | 67,889,586 | | | | 1,236,260 | | | | 149,683 | |
Mid-Cap Equity Index Fund | | | 81,646,960 | | | | 20,890,062 | | | | 3,194,021 | | | | 3,748,573 | | | | (8,997,797 | ) | | | 100,481,819 | | | | 1,013,608 | | | | 5,271,588 | |
Mid-Term Bond Fund | | | 44,145,872 | | | | 23,915,882 | | | | 10,812 | | | | (325,087 | ) | | | (1,575,736 | ) | | | 66,171,743 | | | | 1,318,127 | | | | 81,233 | |
Small Cap Growth Fund | | | 14,895,663 | | | | 9,506,399 | | | | 85,825 | | | | 3,609,175 | | | | (480,474 | ) | | | 27,616,588 | | | | 5,747 | | | | 842,349 | |
Small Cap Value Fund | | | 17,536,948 | | | | 10,055,419 | | | | 132,017 | | | | 581,140 | | | | (480,474 | ) | | | 27,825,050 | | | | 143,680 | | | | 1,183,187 | |
| | | | | | | | | | | | | | | | | | | | | | | | | | | | | | | | |
Total | | $ | 504,130,916 | | | $ | 159,379,264 | | | $ | 12,373,310 | | | $ | 43,536,296 | | | $ | (33,682,904 | ) | | $ | 685,736,882 | | | $ | 10,909,200 | | | $ | 11,890,469 | |
| | | | | | | | | | | | | | | | | | | | | | | | | | | | | | | | |
111
MUTUAL OF AMERICA INVESTMENT CORPORATION
NOTES TO FINANCIAL STATEMENTS (Continued)
December 31, 2017
| 3. | INVESTMENTS (CONTINUED) |
| | | | | | | | | | | | | | | | | | | | | | | | | | | | | | | | |
Affiliated Investment Company | | Value as of
December 31,
2016 | | | Purchases | | | Realized
Gain
(Loss) on
Investment
Securities | | | Change in
Unrealized
Appreciation
(Depreciation)
of Investment
Securities | | | Sales | | | Value as of
December 31,
2017 | | | Dividends | | | Realized
Gain,
Distributions | |
2030 Retirement Fund | | | | | | | | | | | | | | | | | | | | | | | | | | | | | | | | |
Bond Fund | | $ | 93,704,768 | | | $ | 25,178,683 | | | $ | 637,811 | | | $ | (105,097 | ) | | $ | (9,717,047 | ) | | $ | 109,699,118 | | | $ | 2,777,855 | | | $ | 190,340 | |
Equity Index Fund | | | 163,841,698 | | | | 40,588,853 | | | | 7,143,419 | | | | 22,866,387 | | | | (14,734,051 | ) | | | 219,706,306 | | | | 3,072,324 | | | | 3,620,337 | |
International Fund | | | 40,126,217 | | | | 18,049,118 | | | | 166,506 | | | | 9,555,562 | | | | (972,327 | ) | | | 66,925,076 | | | | 1,217,454 | | | | 147,406 | |
Mid-Cap Equity Index Fund | | | 75,972,240 | | | | 26,524,552 | | | | 561,172 | | | | 6,397,159 | | | | (1,441,371 | ) | | | 108,013,752 | | | | 1,084,507 | | | | 5,640,321 | |
Mid-Term Bond Fund | | | — | | | | 12,954,531 | | | | (41 | ) | | | (225,138 | ) | | | (198,379 | ) | | | 12,530,973 | | | | 236,210 | | | | 14,557 | |
Small Cap Growth Fund | | | 20,394,726 | | | | 6,161,785 | | | | 103,337 | | | | 4,284,083 | | | | (423,932 | ) | | | 30,519,999 | | | | 6,371 | | | | 933,837 | |
Small Cap Value Fund | | | 22,248,139 | | | | 7,746,254 | | | | 155,236 | | | | 590,004 | | | | (423,933 | ) | | | 30,315,700 | | | | 156,905 | | | | 1,292,095 | |
| | | | | | | | | | | | | | | | | | | | | | | | | | | | | | | | |
Total | | $ | 416,287,788 | | | $ | 137,203,776 | | | $ | 8,767,440 | | | $ | 43,362,960 | | | $ | (27,911,040 | ) | | $ | 577,710,924 | | | $ | 8,551,626 | | | $ | 11,838,893 | |
| | | | | | | | | | | | | | | | | | | | | | | | | | | | | | | | |
2035 Retirement Fund | | | | | | | | | | | | | | | | | | | | | | | | | | | | | | | | |
Bond Fund | | $ | 52,111,597 | | | $ | 19,934,582 | | | $ | 106,154 | | | $ | 14,079 | | | $ | (1,686,112 | ) | | $ | 70,480,300 | | | $ | 1,759,660 | | | $ | 120,573 | |
Equity Index Fund | | | 141,369,696 | | | | 33,992,003 | | | | 4,312,556 | | | | 21,758,615 | | | | (8,585,333 | ) | | | 192,847,537 | | | | 2,675,726 | | | | 3,152,996 | |
International Fund | | | 40,471,437 | | | | 11,216,112 | | | | 554,362 | | | | 8,664,132 | | | | (2,503,716 | ) | | | 58,402,327 | | | | 1,050,785 | | | | 127,226 | |
Mid-Cap Equity Index Fund | | | 74,858,776 | | | | 24,431,255 | | | | 798,666 | | | | 5,973,430 | | | | (1,974,118 | ) | | | 104,088,009 | | | | 1,032,966 | | | | 5,372,271 | |
Small Cap Growth Fund | | | 20,581,471 | | | | 5,528,076 | | | | 191,031 | | | | 4,086,305 | | | | (1,029,000 | ) | | | 29,357,883 | | | | 6,065 | | | | 889,040 | |
Small Cap Value Fund | | | 22,445,500 | | | | 6,426,998 | | | | 216,526 | | | | 485,440 | | | | (576,009 | ) | | | 28,998,455 | | | | 148,503 | | | | 1,222,907 | |
| | | | | | | | | | | | | | | | | | | | | | | | | | | | | | | | |
Total | | $ | 351,838,477 | | | $ | 101,529,026 | | | $ | 6,179,295 | | | $ | 40,982,001 | | | $ | (16,354,288 | ) | | $ | 484,174,511 | | | $ | 6,673,705 | | | $ | 10,885,013 | |
| | | | | | | | | | | | | | | | | | | | | | | | | | | | | | | | |
2040 Retirement Fund | | | | | | | | | | | | | | | | | | | | | | | | | | | | | | | | |
Bond Fund | | $ | 34,083,832 | | | $ | 14,846,695 | | | $ | 80,889 | | | $ | (47,511 | ) | | $ | (1,217,760 | ) | | $ | 47,746,145 | | | $ | 1,207,768 | | | $ | 82,757 | |
Equity Index Fund | | | 108,177,528 | | | | 26,922,229 | | | | 1,860,223 | | | | 18,423,773 | | | | (3,687,005 | ) | | | 151,696,748 | | | | 2,121,841 | | | | 2,500,316 | |
International Fund | | | 35,507,903 | | | | 10,331,799 | | | | 207,919 | | | | 8,010,636 | | | | (1,163,019 | ) | | | 52,895,238 | | | | 964,716 | | | | 116,805 | |
Mid-Cap Equity Index Fund | | | 61,404,654 | | | | 18,206,717 | | | | 572,089 | | | | 4,906,670 | | | | (1,716,197 | ) | | | 83,373,933 | | | | 835,489 | | | | 4,345,226 | |
Small Cap Growth Fund | | | 22,252,668 | | | | 5,390,015 | | | | 714,847 | | | | 3,654,596 | | | | (3,200,084 | ) | | | 28,812,042 | | | | 6,027 | | | | 883,412 | |
Small Cap Value Fund | | | 24,271,722 | | | | 5,853,565 | | | | 963,417 | | | | (310,456 | ) | | | (2,512,240 | ) | | | 28,266,008 | | | | 146,509 | | | | 1,206,481 | |
| | | | | | | | | | | | | | | | | | | | | | | | | | | | | | | | |
Total | | $ | 285,698,307 | | | $ | 81,551,020 | | | $ | 4,399,384 | | | $ | 34,637,708 | | | $ | (13,496,305 | ) | | $ | 392,790,114 | | | $ | 5,282,350 | | | $ | 9,134,997 | |
| | | | | | | | | | | | | | | | | | | | | | | | | | | | | | | | |
2045 Retirement Fund | | | | | | | | | | | | | | | | | | | | | | | | | | | | | | | | |
Bond Fund | | $ | 34,764,813 | | | $ | 9,989,190 | | | $ | 119,243 | | | $ | 3,417 | | | $ | (1,410,131 | ) | | $ | 43,466,532 | | | $ | 1,117,711 | | | $ | 76,586 | |
Equity Index Fund | | | 117,410,071 | | | | 26,117,998 | | | | 2,063,284 | | | | 19,817,047 | | | | (4,046,100 | ) | | | 161,362,300 | | | | 2,282,062 | | | | 2,689,115 | |
International Fund | | | 44,383,042 | | | | 9,536,884 | | | | 492,030 | | | | 9,550,747 | | | | (1,938,525 | ) | | | 62,024,178 | | | | 1,145,188 | | | | 138,656 | |
Mid-Cap Equity Index Fund | | | 75,010,914 | | | | 19,034,445 | | | | 1,130,371 | | | | 5,477,480 | | | | (2,585,240 | ) | | | 98,067,970 | | | | 995,362 | | | | 5,176,695 | |
Small Cap Growth Fund | | | 29,089,986 | | | | 5,690,727 | | | | 781,489 | | | | 4,888,088 | | | | (3,820,151 | ) | | | 36,630,139 | | | | 7,754 | | | | 1,136,566 | |
Small Cap Value Fund | | | 31,748,945 | | | | 6,280,480 | | | | 1,211,531 | | | | (358,173 | ) | | | (3,080,634 | ) | | | 35,802,149 | | | | 187,774 | | | | 1,546,299 | |
| | | | | | | | | | | | | | | | | | | | | | | | | | | | | | | | |
Total | | $ | 332,407,771 | | | $ | 76,649,724 | | | $ | 5,797,948 | | | $ | 39,378,606 | | | $ | (16,880,781 | ) | | $ | 437,353,268 | | | $ | 5,735,851 | | | $ | 10,763,917 | |
| | | | | | | | | | | | | | | | | | | | | | | | | | | | | | | | |
2050 Retirement Fund | | | | | | | | | | | | | | | | | | | | | | | | | | | | | | | | |
Bond Fund | | $ | 14,180,395 | | | $ | 7,417,162 | | | $ | 15,796 | | | $ | 2,149 | | | $ | (519,440 | ) | | $ | 21,096,062 | | | $ | 518,274 | | | $ | 35,512 | |
Equity Index Fund | | | 55,574,225 | | | | 25,311,926 | | | | 471,591 | | | | 10,797,421 | | | | (1,719,948 | ) | | | 90,435,215 | | | | 1,232,443 | | | | 1,452,276 | |
International Fund | | | 23,620,952 | | | | 11,498,100 | | | | 94,524 | | | | 5,723,157 | | | | (831,103 | ) | | | 40,105,630 | | | | 713,506 | | | | 86,389 | |
Mid-Cap Equity Index Fund | | | 37,342,081 | | | | 17,628,086 | | | | 241,339 | | | | 3,303,961 | | | | (1,142,767 | ) | | | 57,372,700 | | | | 561,044 | | | | 2,917,885 | |
Small Cap Growth Fund | | | 15,963,608 | | | | 6,649,291 | | | | (117,171 | ) | | | 3,532,788 | | | | (1,975,158 | ) | | | 24,053,358 | | | | 4,911 | | | | 719,798 | |
Small Cap Value Fund | | | 17,367,654 | | | | 7,018,707 | | | | 122,833 | | | | 409,708 | | | | (1,482,520 | ) | | | 23,436,382 | | | | 118,477 | | | | 975,647 | |
| | | | | | | | | | | | | | | | | | | | | | | | | | | | | | | | |
Total | | $ | 164,048,915 | | | $ | 75,523,272 | | | $ | 828,912 | | | $ | 23,769,184 | | | $ | (7,670,936 | ) | | $ | 256,499,347 | | | $ | 3,148,655 | | | $ | 6,187,507 | |
| | | | | | | | | | | | | | | | | | | | | | | | | | | | | | | | |
2055 Retirement Fund | | | | | | | | | | | | | | | | | | | | | | | | | | | | | | | | |
Bond Fund | | $ | 263,886 | | | $ | 2,592,141 | | | $ | (235 | ) | | $ | (21,137 | ) | | $ | (31,422 | ) | | $ | 2,803,233 | | | $ | 46,031 | | | $ | 3,154 | |
Equity Index Fund | | | 996,766 | | | | 9,614,567 | | | | 14,603 | | | | 699,329 | | | | (114,074 | ) | | | 11,211,191 | | | | 106,175 | | | | 125,115 | |
International Fund | | | 561,230 | | | | 4,987,913 | | | | 18,071 | | | | 377,710 | | | | (149,543 | ) | | | 5,795,381 | | | | 71,007 | | | | 8,597 | |
Mid-Cap Equity Index Fund | | | 766,985 | | | | 6,733,887 | | | | 12,863 | | | | 226,511 | | | | (106,457 | ) | | | 7,633,789 | | | | 51,716 | | | | 268,965 | |
Small Cap Growth Fund | | | 359,520 | | | | 3,021,048 | | | | 14,331 | | | | 235,796 | | | | (157,115 | ) | | | 3,473,580 | | | | 491 | | | | 72,039 | |
Small Cap Value Fund | | | 371,035 | | | | 3,057,643 | | | | 9,273 | | | | 34,167 | | | | (79,694 | ) | | | 3,392,424 | | | | 11,817 | | | | 97,308 | |
| | | | | | | | | | | | | | | | | | | | | | | | | | | | | | | | |
Total | | $ | 3,319,422 | | | $ | 30,007,199 | | | $ | 68,906 | | | $ | 1,552,376 | | | $ | (638,305 | ) | | $ | 34,309,598 | | | $ | 287,237 | | | $ | 575,178 | |
| | | | | | | | | | | | | | | | | | | | | | | | | | | | | | | | |
112
MUTUAL OF AMERICA INVESTMENT CORPORATION
NOTES TO FINANCIAL STATEMENTS (Continued)
December 31, 2017
| 3. | INVESTMENTS (CONTINUED) |
| | | | | | | | | | | | | | | | | | | | | | | | | | | | | | | | |
Affiliated Investment Company | | Value as of
December 31,
2016 | | | Purchases | | | Realized
Gain
(Loss) on
Investment
Securities | | | Change in
Unrealized
Appreciation
(Depreciation)
of Investment
Securities | | | Sales | | | Value as of
December 31,
2017 | | | Dividends | | | Realized
Gain,
Distributions | |
Conservative Allocation Fund | | | | | | | | | | | | | | | | | | | | | | | | | | | | | | | | |
Bond Fund | | $ | 40,462,596 | | | $ | 15,499,972 | | | $ | 335,496 | | | $ | (282,583 | ) | | $ | (9,589,102 | ) | | $ | 46,426,379 | | | $ | 1,380,394 | | | $ | 94,585 | |
Equity Index Fund | | | 37,108,138 | | | | 8,169,436 | | | | 4,957,638 | | | | 1,113,389 | | | | (11,290,998 | ) | | | 40,057,603 | | | | 529,867 | | | | 624,380 | |
International Fund | | | 6,965,165 | | | | 1,680,196 | | | | (16,697 | ) | | | 1,437,020 | | | | (2,179,184 | ) | | | 7,886,500 | | | | 134,282 | | | | 16,258 | |
Mid-Cap Equity Index Fund | | | 7,804,216 | | | | 5,117,496 | | | | 466,286 | | | | 286,622 | | | | (5,631,624 | ) | | | 8,042,996 | | | | 38,368 | | | | 199,547 | |
Mid-Term Bond Fund | | | 47,181,761 | | | | 12,907,121 | | | | (154,011 | ) | | | 18,937 | | | | (5,849,195 | ) | | | 54,104,613 | | | | 1,165,567 | | | | 71,831 | |
| | | | | | | | | | | | | | | | | | | | | | | | | | | | | | | | |
Total | | $ | 139,521,876 | | | $ | 43,374,221 | | | $ | 5,588,712 | | | $ | 2,573,385 | | | $ | (34,540,103 | ) | | $ | 156,518,091 | | | $ | 3,248,478 | | | $ | 1,006,601 | |
| | | | | | | | | | | | | | | | | | | | | | | | | | | | | | | | |
Moderate Allocation Fund | | | | | | | | | | | | | | | | | | | | | | | | | | | | | | | | |
Bond Fund | | $ | 81,623,898 | | | $ | 21,445,885 | | | $ | 569,313 | | | $ | (118,003 | ) | | $ | (6,172,895 | ) | | $ | 97,348,198 | | | $ | 2,338,821 | | | $ | 160,257 | |
Equity Index Fund | | | 125,924,853 | | | | 14,312,554 | | | | 11,002,021 | | | | 10,725,429 | | | | (20,865,864 | ) | | | 141,098,993 | | | | 2,176,573 | | | | 2,564,810 | |
International Fund | | | 33,741,948 | | | | 3,683,561 | | | | 70,679 | | | | 7,201,960 | | | | (5,013,665 | ) | | | 39,684,483 | | | | 794,157 | | | | 96,154 | |
Mid-Cap Equity Index Fund | | | 56,777,794 | | | | 8,264,941 | | | | 3,655,106 | | | | 934,198 | | | | (8,922,071 | ) | | | 60,709,968 | | | | 680,639 | | | | 3,539,878 | |
Mid-Term Bond Fund | | | 48,939,624 | | | | 13,187,833 | | | | 101,519 | | | | (181,391 | ) | | | (3,703,737 | ) | | | 58,343,848 | | | | 1,140,358 | | | | 70,278 | |
| | | | | | | | | | | | | | | | | | | | | | | | | | | | | | | | |
Total | | $ | 347,008,117 | | | $ | 60,894,774 | | | $ | 15,398,638 | | | $ | 18,562,193 | | | $ | (44,678,232 | ) | | $ | 397,185,490 | | | $ | 7,130,548 | | | $ | 6,431,377 | |
| | | | | | | | | | | | | | | | | | | | | | | | | | | | | | | | |
Aggressive Allocation Fund | | | | | | | | | | | | | | | | | | | | | | | | | | | | | | | | |
Bond Fund | | $ | 48,302,076 | | | $ | 14,125,866 | | | $ | 310,250 | | | $ | (152,979 | ) | | $ | (3,277,271 | ) | | $ | 59,307,942 | | | $ | 1,522,785 | | | $ | 104,342 | |
Equity Index Fund | | | 93,309,198 | | | | 8,255,305 | | | | 5,874,209 | | | | 10,288,570 | | | | (10,258,776 | ) | | | 107,468,506 | | | | 1,594,002 | | | | 1,878,325 | |
International Fund | | | 37,453,109 | | | | 3,041,773 | | | | (5,303 | ) | | | 8,077,631 | | | | (3,235,021 | ) | | | 45,332,189 | | | | 878,480 | | | | 106,364 | |
Mid-Cap Equity Index Fund | | | 56,148,183 | | | | 7,117,023 | | | | 3,789,930 | | | | 905,291 | | | | (6,305,455 | ) | | | 61,654,972 | | | | 640,237 | | | | 3,329,756 | |
Small Cap Growth Fund | | | 13,905,331 | | | | 1,191,631 | | | | 1,173,480 | | | | 1,451,045 | | | | (2,354,550 | ) | | | 15,366,937 | | | | 3,445 | | | | 504,903 | |
Small Cap Value Fund | | | 14,611,902 | | | | 1,822,630 | | | | 836,063 | | | | (412,435 | ) | | | (1,538,023 | ) | | | 15,320,137 | | | | 80,477 | | | | 662,722 | |
| | | | | | | | | | | | | | | | | | | | | | | | | | | | | | | | |
Total | | $ | 263,729,799 | | | $ | 35,554,228 | | | $ | 11,978,629 | | | $ | 20,157,123 | | | $ | (26,969,096 | ) | | $ | 304,450,683 | | | $ | 4,719,426 | | | $ | 6,586,412 | |
| | | | | | | | | | | | | | | | | | | | | | | | | | | | | | | | |
The Investment Company has registered an indefinite number of its capital shares pursuant to Rule 24f-2 under the Investment Company Act of 1940. On November 9, 2017, the Board of Directors of the Investment Company changed the number of authorized shares as indicated by the following table. As a result of these actions, there remained 1,115,000,000 unallocated shares as of December 31, 2017.
| | | | | | | | | | | | |
| | | Authorized No. of Shares | |
| | | Previous
Allocation | | | Allocation
Increase/
(Decrease) | | | Total Shares
Allocated | |
Equity Index Fund | | | 800,000,000 | | | | — | | | | 800,000,000 | |
All America Fund | | | 200,000,000 | | | | — | | | | 200,000,000 | |
Small Cap Value Fund | | | 325,000,000 | | | | — | | | | 325,000,000 | |
Small Cap Growth Fund | | | 470,000,000 | | | | — | | | | 470,000,000 | |
Small Cap Equity Index Fund** | | | — | | | | 100,000,000 | | | | 100,000,000 | |
Mid Cap Value Fund | | | 100,000,000 | | | | — | | | | 100,000,000 | |
Mid-Cap Equity Index Fund | | | 750,000,000 | | | | — | | | | 750,000,000 | |
International Fund | | | 725,000,000 | | | | — | | | | 725,000,000 | |
Composite Fund | | | 150,000,000 | | | | — | | | | 150,000,000 | |
Retirement Income Fund | | | 95,000,000 | | | | — | | | | 95,000,000 | |
2010 Retirement Fund | | | 50,000,000 | | | | — | | | | 50,000,000 | |
2015 Retirement Fund | | | 200,000,000 | | | | — | | | | 200,000,000 | |
2020 Retirement Fund | | | 515,000,000 | | | | — | | | | 515,000,000 | |
2025 Retirement Fund | | | 625,000,000 | | | | — | | | | 625,000,000 | |
2030 Retirement Fund | | | 515,000,000 | | | | — | | | | 515,000,000 | |
2035 Retirement Fund | | | 445,000,000 | | | | — | | | | 445,000,000 | |
2040 Retirement Fund | | | 385,000,000 | | | | — | | | | 385,000,000 | |
2045 Retirement Fund | | | 425,000,000 | | | | — | | | | 425,000,000 | |
113
MUTUAL OF AMERICA INVESTMENT CORPORATION
NOTES TO FINANCIAL STATEMENTS (Continued)
December 31, 2017
| 4. | CAPITAL SHARE ACTIVITY (CONTINUED) |
| | | | | | | | | | | | |
| | | Authorized No. of Shares | |
| | | Previous
Allocation | | | Allocation
Increase/
(Decrease) | | | Total Shares
Allocated | |
2050 Retirement Fund | | | 270,000,000 | | | | — | | | | 270,000,000 | |
2055 Retirement Fund | | | 100,000,000 | | | | — | | | | 100,000,000 | |
2060 Retirement Fund** | | | — | | | | 100,000,000 | | | | 100,000,000 | |
Conservative Allocation Fund | | | 165,000,000 | | | | — | | | | 165,000,000 | |
Moderate Allocation Fund | | | 320,000,000 | | | | — | | | | 320,000,000 | |
Aggressive Allocation Fund | | | 215,000,000 | | | | — | | | | 215,000,000 | |
Money Market Fund | | | 125,000,000 | | | | — | | | | 125,000,000 | |
Mid-Term Bond Fund | | | 540,000,000 | | | | — | | | | 540,000,000 | |
Bond Fund | | | 925,000,000 | | | | — | | | | 925,000,000 | |
| | | | | | | | | | | | |
Sub-Total | | | 9,435,000,000 | | | | 200,000,000 | | | | 9,635,000,000 | |
Shares to be allocated at the discretion of the Board of Directors | | | 1,315,000,000 | | | | (200,000,000 | ) | | | 1,115,000,000 | |
| | | | | | | | | | | | |
Total | | | 10,750,000,000 | | | | — | | | | 10,750,000,000 | |
| | | | | | | | | | | | |
| ** | Fund to commence operations on, or after, July 1, 2018. |
| 5. | DISTRIBUTIONSTO SHAREHOLDERSAND INCOME TAX INFORMATION |
On October 3, 2017 and October 4, 2017, required distributions of net investment income and, as applicable, net realized gains relating to 2016 were declared and paid for all applicable funds in accordance with Internal Revenue Code Section 855(a). No such distributions were required for the 2055 Retirement Fund.
The Funds of Mutual of America Investment Corporation intend to declare and pay their respective tax year 2017 investment company taxable income and capital gains in 2018 in accordance with Internal Revenue Section 855(a).
Pursuant to shareholders’ instructions, substantially all dividend distributions throughout 2017 and 2016 were immediately reinvested into their respective funds. The tax character of the distributions paid during 2017 and 2016 was as follows:
| | | | | | | | | | | | | | | | | | | | |
| | | Equity Index
Fund | | | All America
Fund | | | Small Cap
Value Fund | | | Small Cap
Growth Fund | | | Mid Cap
Value Fund | |
Ordinary Income (a) | | | | | | | | | | | | | | | | | | | | |
2017 | | $ | 42,045,361 | | | $ | 5,437,103 | | | $ | 6,398,744 | | | $ | 1,099,348 | | | $ | 1,059,046 | |
2016 | | $ | 35,794,376 | | | $ | 3,947,519 | | | $ | 3,473,986 | | | $ | 0 | | | $ | 1,115,504 | |
Long-Term Capital Gains | | | | | | | | | | | | | | | | | | | | |
2017 | | $ | 42,736,188 | | | $ | 35,345,294 | | | $ | 18,741,699 | | | $ | 16,488,137 | | | $ | 4,282,390 | |
2016 | | $ | 48,733,130 | | | $ | 17,354,545 | | | $ | 5,500,345 | | | $ | 39,762,021 | | | $ | 4,887,020 | |
| | | | | |
| | | Mid-Cap
Equity Index
Fund | | | International
Fund | | | Composite
Fund | | | Retirement
Fund | | | 2010
Retirement
Fund | |
Ordinary Income (a) | | | | | | | | | | | | | | | | | | | | |
2017 | | $ | 18,442,754 | | | $ | 9,884,641 | | | $ | 4,300,467 | | | $ | 1,539,981 | | | $ | 543,546 | |
2016 | | $ | 13,403,568 | | | $ | 7,642,938 | | | $ | 3,865,723 | | | $ | 1,417,706 | | | $ | 579,461 | |
Long-Term Capital Gains | | | | | | | | | | | | | | | | | | | | |
2017 | | $ | 74,952,994 | | | $ | 1,196,804 | | | $ | 20,996,479 | | | $ | 1,379,154 | | | $ | 1,150,822 | |
2016 | | $ | 71,656,832 | | | $ | 0 | | | $ | 10,227,373 | | | $ | 2,334,883 | | | $ | 1,449,643 | |
| | | | | |
| | | 2015
Retirement
Fund | | | 2020
Retirement
Fund | | | 2025
Retirement
Fund | | | 2030
Retirement
Fund | | | 2035
Retirement
Fund | |
Ordinary Income (a) | | | | | | | | | | | | | | | | | | | | |
2017 | | $ | 3,028,463 | | | $ | 7,891,832 | | | $ | 8,443,812 | | | $ | 6,471,545 | | | $ | 5,090,035 | |
2016 | | $ | 3,360,637 | | | $ | 7,495,794 | | | $ | 7,530,298 | | | $ | 5,967,073 | | | $ | 4,653,592 | |
Long-Term Capital Gains | | | | | | | | | | | | | | | | | | | | |
2017 | | $ | 6,504,889 | | | $ | 15,006,151 | | | $ | 17,549,626 | | | $ | 16,402,087 | | | $ | 14,165,396 | |
2016 | | $ | 8,964,100 | | | $ | 15,116,286 | | | $ | 17,294,855 | | | $ | 16,440,817 | | | $ | 15,229,224 | |
114
MUTUAL OF AMERICA INVESTMENT CORPORATION
NOTES TO FINANCIAL STATEMENTS (Continued)
December 31, 2017
| 5. | DISTRIBUTIONSTO SHAREHOLDERSAND INCOME TAX INFORMATION (CONTINUED) |
| | | | | | | | | | | | | | | | | | | | |
| | | 2040
Retirement
Fund | | | 2045
Retirement
Fund | | | 2050
Retirement
Fund | | | 2055
Retirement
Fund | | | Conservative
Allocation
Fund | |
Ordinary Income (a) | | | | | | | | | | | | | | | | | | | | |
2017 | | $ | 3,936,958 | | | $ | 4,492,530 | | | $ | 1,952,198 | | | $ | 0 | | | $ | 3,053,002 | |
2016 | | $ | 3,629,694 | | | $ | 4,323,009 | | | $ | 1,305,214 | | | $ | 0 | | | $ | 3,087,144 | |
Long-Term Capital Gains | | | | | | | | | | | | | | | | | | | | |
2017 | | $ | 12,664,502 | | | $ | 13,839,470 | | | $ | 5,127,131 | | | $ | 0 | | | $ | 2,676,902 | |
2016 | | $ | 13,528,794 | | | $ | 16,121,366 | | | $ | 3,752,852 | | | $ | 0 | | | $ | 3,635,717 | |
| | | | | |
| | | Moderate
Allocation
Fund | | | Aggressive
Allocation
Fund | | | Money
Market Fund | | | Mid-Term
Bond Fund | | | Bond Fund | |
Ordinary Income (a) | | | | | | | | | | | | | | | | | | | | |
2017 | | $ | 6,887,282 | | | $ | 4,432,394 | | | $ | 83,111 | | | $ | 11,719,948 | | | $ | 33,167,639 | |
2016 | | $ | 7,137,035 | | | $ | 5,034,614 | | | $ | 0 | | | $ | 12,142,285 | | | $ | 29,240,973 | |
Long-Term Capital Gains | | | | | | | | | | | | | | | | | | | | |
2017 | | $ | 10,932,002 | | | $ | 15,484,011 | | | $ | 0 | | | $ | 543,647 | | | $ | 1,805,293 | |
2016 | | $ | 15,163,067 | | | $ | 16,088,191 | | | $ | 0 | | | $ | 679,842 | | | $ | 1,620,584 | |
Notes:
| (a) | Includes distributions from Fund-level net short-term capital gains. |
Undistributed net income and gains (losses) — As of December 31, 2017, undistributed net income and undistributed accumulated gain (loss) for federal income tax purposes were as follows:
| | | | | | | | | | | | | | | | | | | | |
| | | Equity Index
Fund | | | All America
Fund | | | Small Cap
Value Fund | | | Small Cap
Growth Fund | | | Mid Cap
Value Fund | |
Accumulated undistributed net investment income | | $ | 50,361,259 | | | $ | 17,854,593 | | | $ | 8,076,774 | | | $ | 3,604,872 | | | $ | 2,311,441 | |
Accumulated undistributed net realized gain/(loss) on investments and futures contracts | | $ | 56,445,562 | | | $ | 2,637,131 | | | $ | 36,347,744 | | | $ | 36,241,695 | | | $ | 6,680,351 | |
Net unrealized appreciation (depreciation) of investments and futures contracts | | $ | 1,107,064,532 | | | $ | 96,155,766 | | | $ | 110,499,537 | | | $ | 117,180,612 | | | $ | 23,499,693 | |
| | | | | |
| | | Mid-Cap
Equity Index
Fund | | | International
Fund | | | Composite
Fund | | | Retirement
Income
Fund | | | 2010
Retirement
Fund | |
Accumulated undistributed net investment income | | $ | 23,037,787 | | | $ | 12,148,302 | | | $ | 7,720,570 | | | $ | 1,751,326 | | | $ | 490,991 | |
Accumulated undistributed net realized gain/(loss) on investments and futures contracts | | $ | 85,475,566 | | | $ | 0 | | | $ | 10,422,418 | | | $ | 1,339,242 | | | $ | 1,055,110 | |
Net unrealized appreciation (depreciation) of investments and futures contracts | | $ | 369,918,119 | | | $ | 68,990,390 | | | $ | 26,180,128 | | | $ | 2,901,774 | | | $ | 1,196,835 | |
| | | | | |
| | | 2015
Retirement
Fund | | | 2020
Retirement
Fund | | | 2025
Retirement
Fund | | | 2030
Retirement
Fund | | | 2035
Retirement
Fund | |
Accumulated undistributed net investment income | | $ | 2,885,898 | | | $ | 9,311,834 | | | $ | 11,340,011 | | | $ | 9,023,183 | | | $ | 7,120,325 | |
Accumulated undistributed net realized gain/(loss) on investments and futures contracts | | $ | 6,098,811 | | | $ | 14,464,758 | | | $ | 23,373,515 | | | $ | 19,726,249 | | | $ | 16,266,812 | |
Net unrealized appreciation (depreciation) of investments and futures contracts | | $ | 14,357,460 | | | $ | 59,228,892 | | | $ | 88,164,754 | | | $ | 85,262,875 | | | $ | 78,359,699 | |
115
MUTUAL OF AMERICA INVESTMENT CORPORATION
NOTES TO FINANCIAL STATEMENTS (Continued)
December 31, 2017
| 5. | DISTRIBUTIONSTO SHAREHOLDERSAND INCOME TAX INFORMATION (CONTINUED) |
| | | | | | | | | | | | | | | | | | | | |
| | | 2040
Retirement
Fund | | | 2045
Retirement
Fund | | | 2050
Retirement
Fund | | | 2055
Retirement
Fund | | | Conservative
Allocation
Fund | |
Accumulated undistributed net investment income | | $ | 5,677,938 | | | $ | 6,218,541 | | | $ | 3,442,823 | | | $ | 366,872 | | | $ | 3,300,748 | |
Accumulated undistributed net realized gain/(loss) on investments and futures contracts | | $ | 12,891,559 | | | $ | 15,787,067 | | | $ | 6,634,382 | | | $ | 542,019 | | | $ | 6,677,611 | |
Net unrealized appreciation (depreciation) of investments and futures contracts | | $ | 66,091,613 | | | $ | 81,171,262 | | | $ | 28,329,145 | | | $ | 1,582,100 | | | $ | 7,728,111 | |
| | | | | |
| | | Moderate
Allocation
Fund | | | Aggressive
Allocation
Fund | | | Money Market
Fund | | | Mid-Term
Bond Fund | | | Bond Fund | |
Accumulated undistributed net investment income | | $ | 7,438,128 | | | $ | 5,093,663 | | | $ | 462,689 | | | $ | 12,347,782 | | | $ | 34,954,410 | |
Accumulated undistributed net realized gain/(loss) on investments and futures contracts | | $ | 20,403,614 | | | $ | 16,696,924 | | | $ | (1,023 | ) | | $ | 199,248 | | | $ | (77,618 | ) |
Net unrealized appreciation (depreciation) of investments and futures contracts | | $ | 60,359,643 | | | $ | 64,737,557 | | | $ | 391 | | | $ | (666,348 | ) | | $ | 14,428,909 | |
The difference between the components of distributable earnings for income tax purposes and the amounts reflected in the statements of assets and liabilities arise primarily from federal income tax treatment of wash sales, REITs, partnerships, corporate actions and futures contracts.
Reclassifications — The Funds make adjustments to the components of net assets for book to tax differences that are considered permanent in nature. For the year ended December 31, 2017, the Funds reclassified amounts primarily relating to differences in the book to tax treatment of partnership investments, REITs, PFICs, corporate actions and the character of distributions. Each Fund’s net assets are not affected by these reclassifications.
During the year ended December 31, 2017, each Fund reclassified the following book to tax differences [increases (decreases)]:
| | | | | | | | | | | | | | | | | | | | |
| | | | | |
| | | Equity Index
Fund | | | All America
Fund | | | Small Cap
Value Fund | | | Small Cap
Growth Fund | | | Mid Cap
Value Fund | |
Accumulated undistributed net investment income | | $ | (794,363 | ) | | $ | (320,593 | ) | | $ | (2,010,127 | ) | | $ | (120,408 | ) | | $ | 158,218 | |
Accumulated undistributed net realized gains (loss) on investments and futures contracts | | $ | 794,363 | | | $ | 320,593 | | | $ | 2,010,127 | | | $ | 120,408 | | | $ | (158,218 | ) |
| | | | | | | | | | | | | | | | | | | | |
Paid in capital | | $ | 0 | | | $ | 0 | | | $ | 0 | | | $ | 0 | | | $ | 0 | |
| | | | | | | �� | | | | | | | | | | | | | |
| | | | | |
| | | Mid-Cap
Equity Index
Fund | | | International
Fund | | | Composite
Fund | | | Retirement
Income
Fund | | | 2010
Retirement
Fund | |
Accumulated undistributed net investment income | | $ | (3,438,249 | ) | | $ | 0 | | | $ | (24,468 | ) | | $ | 56,402 | | | $ | 17,353 | |
Accumulated undistributed net realized gains (loss) on investments and futures contracts | | $ | 4,025,665 | | | $ | 0 | | | $ | 24,468 | | | $ | (56,402 | ) | | $ | (17,353 | ) |
| | | | | | | | | | | | | | | | | | | | |
Paid in capital | | $ | (587,416 | ) | | $ | 0 | | | $ | 0 | | | $ | 0 | | | $ | 0 | |
| | | | | | | | | | | | | | | | | | | | |
| | | | | |
| | | 2015
Retirement
Fund | | | 2020
Retirement
Fund | | | 2025
Retirement
Fund | | | 2030
Retirement
Fund | | | 2035
Retirement
Fund | |
Accumulated undistributed net investment income | | $ | 131,631 | | | $ | 518,506 | | | $ | 817,550 | | | $ | 795,033 | | | $ | 720,706 | |
Accumulated undistributed net realized gains (loss) on investments and futures contracts | | $ | (131,631 | ) | | $ | (518,506 | ) | | $ | (817,550 | ) | | $ | (795,033 | ) | | $ | (720,706 | ) |
| | | | | | | | | | | | | | | | | | | | |
Paid in capital | | $ | 0 | | | $ | 0 | | | $ | 0 | | | $ | 0 | | | $ | 0 | |
| | | | | | | | | | | | | | | | | | | | |
116
MUTUAL OF AMERICA INVESTMENT CORPORATION
NOTES TO FINANCIAL STATEMENTS (Continued)
December 31, 2017
| 5. | DISTRIBUTIONSTO SHAREHOLDERSAND INCOME TAX INFORMATION (CONTINUED) |
| | | | | | | | | | | | | | | | | | | | |
| | | 2040
Retirement
Fund | | | 2045
Retirement
Fund | | | 2050
Retirement
Fund | | | 2055
Retirement
Fund | | | Conservative
Allocation
Fund | |
Accumulated undistributed net investment income | | $ | 621,511 | | | $ | 738,994 | | | $ | 432,229 | | | $ | 40,751 | | | $ | 86,591 | |
Accumulated undistributed net realized gains (loss) on investments and futures contracts | | $ | (621,511 | ) | | $ | (738,994 | ) | | $ | (432,229 | ) | | $ | (40,751 | ) | | $ | (86,591 | ) |
| | | | | | | | | | | | | | | | | | | | |
Paid in capital | | $ | 0 | | | $ | 0 | | | $ | 0 | | | $ | 0 | | | $ | 0 | |
| | | | | | | | | | | | | | | | | | | | |
| | | | | |
| | | Moderate
Allocation
Fund | | | Aggressive
Allocation
Fund | | | Money
Market Fund | | | Mid-Term
Bond Fund | | | Bond
Fund | |
Accumulated undistributed net investment income | | $ | 375,449 | | | $ | 429,091 | | | $ | 0 | | | $ | 0 | | | $ | 0 | |
Accumulated undistributed net realized gains (loss) on investments and futures contracts | | $ | (375,449 | ) | | $ | (429,091 | ) | | $ | 0 | | | $ | 0 | | | $ | 0 | |
| | | | | | | | | | | | | | | | | | | | |
Paid in capital | | $ | 0 | | | $ | 0 | | | $ | 0 | | | $ | 0 | | | $ | 0 | |
| | | | | | | | | | | | | | | | | | | | |
| 6. | RECENT ACCOUNTING PRONOUNCEMENTS |
On October 13, 2016, the Securities and Exchange Commission (the “SEC”) adopted new rules and forms and amended existing rules and forms which are intended to modernize and enhance the reporting and disclosure of information by registered investment companies and to improve the quality of information that funds provide to investors. In an effort to enhance monitoring and regulation, the new rules and forms will allow the SEC to more effectively collect and use data reported by funds. The new rules also promote effective liquidity risk management across the open-end fund industry and enhance disclosure regarding fund liquidity and redemption practices. The compliance date of these rules is generally December 1, 2018. Management is currently evaluating the impact and implications of the updates, which have not yet been determined.
On February 22, 2018, the Board of Directors of the Investment Company increased the number of authorized shares from 10.75 billion to 14.75 billion. Also on that date, the Board of Directors changed the number of authorized shares of the following Funds. As a result of these actions, there remained 2,290,000,000 unallocated shares on that date.
| | | | | | | | | | | | |
Fund | | Previous
Allocation | | | Allocation
Increase | | | Total Shares
Allocated | |
Equity Index Fund | | | 800,000,000 | | | | 100,000,000 | | | | 900,000,000 | |
Small Cap Growth Fund | | | 470,000,000 | | | | 100,000,000 | | | | 570,000,000 | |
Small Cap Value Fund | | | 325,000,000 | | | | 100,000,000 | | | | 425,000,000 | |
Mid-Cap Equity Index Fund | | | 750,000,000 | | | | 100,000,000 | | | | 850,000,000 | |
International Fund | | | 725,000,000 | | | | 250,000,000 | | | | 975,000,000 | |
Retirement Income Fund | | | 95,000,000 | | | | 125,000,000 | | | | 220,000,000 | |
2020 Retirement Fund | | | 515,000,000 | | | | 150,000,000 | | | | 665,000,000 | |
2025 Retirement Fund | | | 625,000,000 | | | | 300,000,000 | | | | 925,000,000 | |
2030 Retirement Fund | | | 515,000,000 | | | | 300,000,000 | | | | 815,000,000 | |
2035 Retirement Fund | | | 445,000,000 | | | | 300,000,000 | | | | 745,000,000 | |
2040 Retirement Fund | | | 385,000,000 | | | | 200,000,000 | | | | 585,000,000 | |
2045 Retirement Fund | | | 425,000,000 | | | | 100,000,000 | | | | 525,000,000 | |
2050 Retirement Fund | | | 270,000,000 | | | | 100,000,000 | | | | 370,000,000 | |
2055 Retirement Fund | | | 100,000,000 | | | | 100,000,000 | | | | 200,000,000 | |
Bond Fund | | | 925,000,000 | | | | 500,000,000 | | | | 1,425,000,000 | |
Management, on behalf of the Investment Company, has evaluated the need for disclosures and/or adjustments to the financial statements from subsequent events. As a result of this evaluation, except as noted above, no additional subsequent events require disclosure and/or adjustment to the financial statements.
117
REPORT OF INDEPENDENT REGISTERED PUBLIC ACCOUNTING FIRM
To the Shareholders and Board of Directors
Mutual of America Investment Corporation:
Opinion on the Financial Statements
We have audited the accompanying statements of assets and liabilities of Mutual of America Investment Corporation, comprised of Equity Index Fund, All America Fund, Small Cap Value Fund, Small Cap Growth Fund, Mid Cap Value Fund, Mid-Cap Equity Index Fund, International Fund, Composite Fund, Retirement Income Fund, 2010 Retirement Fund, 2015 Retirement Fund, 2020 Retirement Fund, 2025 Retirement Fund, 2030 Retirement Fund, 2035 Retirement Fund, 2040 Retirement Fund, 2045 Retirement Fund, 2050 Retirement Fund, 2055 Retirement Fund (commenced operations October 1, 2016), Conservative Allocation Fund, Moderate Allocation Fund, Aggressive Allocation Fund, Money Market Fund, Mid-Term Bond Fund and Bond Fund (collectively, the “Funds”), including the portfolios of investments in securities for the Conservative Allocation Fund, Moderate Allocation Fund, Aggressive Allocation Fund, Money Market Fund, International Fund, Retirement Income Fund, 2010 Retirement Fund, 2015 Retirement Fund, 2020 Retirement Fund, 2025 Retirement Fund, 2030 Retirement Fund, 2035 Retirement Fund, 2040 Retirement Fund, 2045 Retirement Fund, 2050 Retirement Fund, and 2055 Retirement Fund, and the summary portfolios of investments in securities for each of the remaining Funds, as of December 31, 2017, the related statements of operations for the year then ended, the statements of changes in net assets for each of the years or periods in the two-year period then ended, and the related notes (collectively, the “financial statements”) and the financial highlights for each of the years or periods in the five-year period then ended. In our opinion, the financial statements and financial highlights referred to above present fairly, in all material respects, the financial position of the Funds as of December 31, 2017, the results of their operations for the year then ended, the changes in their net assets for each of the years or periods in the two-year period then ended, and the financial highlights for each of the years or periods in the five-year period then ended, in conformity with U.S. generally accepted accounting principles.
Basis for Opinion
These financial statements and financial highlights are the responsibility of the Funds’ management. Our responsibility is to express an opinion on these financial statements and financial highlights based on our audits. We are a public accounting firm registered with the Public Company Accounting Oversight Board (United States) (“PCAOB”) and are required to be independent with respect to the Funds in accordance with the U.S. federal securities laws and the applicable rules and regulations of the Securities and Exchange Commission and the PCAOB.
We conducted our audits in accordance with the standards of the PCAOB. Those standards require that we plan and perform the audit to obtain reasonable assurance about whether the financial statements and financial highlights are free of material misstatement, whether due to error or fraud. Our audits included performing procedures to assess the risks of material misstatement of the financial statements and financial highlights, whether due to error or fraud, and performing procedures that respond to those risks. Such procedures included examining, on a test basis, evidence regarding the amounts and disclosures in the financial statements and financial highlights. Such procedures also included confirmation of securities owned as of December 31, 2017, by correspondence with the custodian and brokers or by other appropriate auditing procedures when replies from brokers were not received. Our audits also included evaluating the accounting principles used and significant estimates made by management, as well as evaluating the overall presentation of the financial statements and financial highlights. We believe that our audits provide a reasonable basis for our opinion.

KPMG has served as the auditor of Mutual of America Investment Corporation since 2002.
New York, New York
February 27, 2018
118
MUTUAL OF AMERICA INVESTMENT CORPORATION
ADDITIONAL INFORMATION
Directors and Officers — Unaudited
The tables below show information about the Directors and officers of the Investment Company. The address of each Director and officer is c/o Mutual of America Investment Corporation, 320 Park Avenue, New York, New York 10022. The Investment Company does not hold regular annual meetings of shareholders, and each Director has been elected by shareholders to serve until a successor is duly elected at a meeting of shareholders called for the purpose of electing directors. Each officer of the Investment Company has been elected by the Board of Directors to serve until a successor is duly elected. The Independent Directors do not serve as directors of any other investment companies advised by or affiliated with the Adviser or Mutual of America with the exception of serving on the Board of Directors of Mutual of America Institutional Funds, Inc., an affiliated registered management investment company, which also receives investment advice from the Adviser. The Interested Directors and officers of the Investment Company do not receive compensation from the Investment Company for their service. Mr. Roth serves as director of one other investment company advised by or affiliated with the Adviser, Mutual of America Institutional Funds, Inc.
The Investment Company’s Statement of Additional Information (“SAI”), filed with the Securities and Exchange Commission, contains additional information about the Investment Company’s Directors and Officers. A copy of the latest SAI can be obtained, without charge, by writing to Mutual of America Investment Corporation at 320 Park Avenue, New York, NY 10022-6839 or by calling 1-800-468-3785 or through the following websites: http://www.mutualofamerica.com or http://www.sec.gov.
| | | | | | |
| Independent Directors |
| Name and Age | | Length of
Time Served | | Principal Occupation(s)
in Past Five Years | | Other Directorships
Held by Director |
| | | | | | |
| | | |
Carolyn N. Dolan, age 70 | | Since
April 2011 | | Executive Vice President, Head of Direct Client Investments, Fiera Capital Inc.; prior thereto Founding Principal and Portfolio Manager, Samson Capital Advisors LLC | | Director, Market Street Trust Company; Trustee, Fordham University; Mutual of America Institutional Funds, Inc. |
| | | | | | |
Stanley E. Grayson, age 67 | | Since
November 2017 | | Vice Chairman and Chief Operating Officer, M.R. Beal & Company (Retired 2014) | | Director, TD Bank, N.A.; Director, YMCA of Greater New York; Trustee, College of the Holy Cross |
| | | | | | |
LaSalle D. Leffall, III, age 54 | | Since
April 2011 | | President and Founder, LDL Financial, LLC | | Director, Federal Home Loan Bank of Atlanta; Mutual of America Institutional Funds, Inc. |
| | | | | | |
John W. Sibal, age 65 | | Since
April 2011 | | President & Chief Executive Officer, Eustis Commercial Mortgage Corporation | | Director, Eustis Commercial Mortgage Corporation; Director, New Orleans Recreation Development Foundation; Treasurer and Director, Friends of Nord, Inc.; Mutual of America Institutional Funds, Inc. |
| | | | | | |
Margaret M. Smyth, age 54 | | Since
February 2007 | | U.S. Chief Financial Officer, National Grid; prior thereto Vice President of Finance, Con Edison; prior thereto Vice President, Chief Financial Officer, Hamilton Sundstrand, a United Technologies Company | | Director, Etsy, Inc.; Director, Concern Worldwide, USA; Director, BritishAmerican Business Association; Trustees Fellow, Fordham University; Director, National Grid USA; Mutual of America Institutional Funds, Inc. |
119
| | | | | | |
| Independent Directors |
| Name and Age | | Length of
Time Served | | Principal Occupation(s)
in Past Five Years | | Other Directorships
Held by Director |
| | | | | | |
Patrick J. Waide, Jr., age 80 | | Since
December 2003 | | Certified Public Accountant | | Trustee, John Simon Guggenheim Memorial Foundation; Emeritus Director, National Catholic Reporter; Mutual of America Institutional Funds, Inc. |
| | | | | | |
William E. Whiston, age 63 | | Since
February 2011 | | Chief Financial Officer, the Archdiocese of New York; Adjunct Professor in Finance, Fordham University Graduate School of Business; prior thereto Executive Vice President and member, United States Management Board at Allied Irish Bank | | Director, Sterling National Bank; Trustee and Treasurer, Trustees of St. Patrick’s Cathedral in New York City; Trustee, St. Joseph’s Seminary; Mutual of America Institutional Funds, Inc. |
| Interested Director | | | | | | |
| Name and Age | | Length of
Time Served | | Principal Occupation(s)
in Past Five Years | | Other Directorships
Held by Director |
| | | | | | |
| | | |
James J. Roth, Chairman, President and Chief Executive Officer, age 68 | | Since
August 2015 | | Senior Executive Vice President and General Counsel, Mutual of America Life Insurance Company since March 2013; prior thereto Executive Vice President and General Counsel, Mutual of America Life Insurance Company since April 2009; Chairman of the Board, President and Chief Executive Officer, Mutual of America Investment Corporation and Mutual of America Institutional Funds, Inc. since August 2015 | | Mutual of America Life Insurance Company; Mutual of America Institutional Funds, Inc.; Mutual of America Holding Company LLC; Mutual of America Foundation |
Mr. Roth is an “interested person” as an officer of the Adviser and of affiliates of the Adviser.
120
| | | | | | |
| Officers | | | | | | |
| Name, Position and Age | | Length of
Time Served | | Principal Occupation(s)
in Past Five Years | | Other Directorships
Held by Officer |
| | | | | | |
| | | |
Chris W. Festog, Senior Executive Vice President, Chief Financial Officer and Treasurer, age 56 | | Since
April 2013 | | Senior Executive Vice President and Chief Financial Officer, Mutual of America Life Insurance Company since March 2017; prior thereto Executive Vice President and Chief Financial Officer, Mutual of America Life Insurance Company since March 2015; prior thereto Executive Vice President and Deputy Treasurer, Mutual of America Life Insurance Company | | Mutual of America Holding Company LLC; Mutual of America Securities LLC |
| | | | | | |
Diana H. Glynn, Senior Vice President and Internal Auditor, age 53 | | Since
April 2017 | | Senior Vice President and Internal Auditor, Mutual of America Life Insurance Company since April 2017; Senior Vice President and Internal Auditor, Mutual of America Investment Corporation and Mutual of America Institutional Funds, Inc.; prior thereto Vice President, Internal Auditor, Mutual of America Life Insurance Company | | None |
| | | | | | |
Kathryn A. Lu, Executive Vice President and Chief Compliance Officer, age 57 | | Since
July 2008 | | Executive Vice President and Chief Compliance Officer, Mutual of America Life Insurance Company, prior thereto Senior Vice President and Chief Compliance Officer, Mutual of America Life Insurance Company; Executive Vice President and Chief Compliance Officer, Mutual of America Investment Corporation and Mutual of America Institutional Funds, Inc. | | None |
| | | | | | |
Christopher M. Miseo, Senior Vice President and Chief Accounting Officer, age 61 | | Since
March 2013 | | Senior Vice President and Director of Accounting and Financial Reporting, Mutual of America Life Insurance Company | | None |
| | | | | | |
Scott H. Rothstein, Executive Vice President, Deputy General Counsel and Corporate Secretary, age 52 | | Since
April 2013 | | Executive Vice President and Deputy General Counsel, Mutual of America Life Insurance Company, since January 2009; Executive Vice President, Deputy General Counsel and Corporate Secretary, Mutual of America Investment Corporation and Mutual of America Institutional Funds, Inc., since April 2013 | | None |
121
Quarterly Portfolio Schedules
Included in this Annual Report are summary schedules of Mutual of America Investment Corporation’s (“Investment Company”) Fund portfolio holdings as of December 31, 2017. The Investment Company files complete schedules of Fund portfolio holdings with the Securities and Exchange Commission (“SEC”) for the first and third quarters of each fiscal year on Form N-Q and for the second and fourth quarters of each fiscal year on Form N-CSR. The Forms N-Q and N-CSR are available on the SEC’s website at http://www.sec.gov. Additionally, the Forms N-Q and N-CSR may be reviewed and copied at the SEC’s Public Reference Room in Washington, DC. Information on the operation of the Public Reference Room may be obtained by calling 1-800-SEC-0330.
Proxy Voting Policies and Procedures
A copy of the Investment Company’s proxy voting policies and procedures can be obtained free of charge by calling 1-800-468-3785. It is also available on the SEC’s website at http://www.sec.gov.
Information regarding how the Investment Company voted proxies relating to portfolio securities during the 12-month period ended June 30, 2017 is available without charge by calling 1-800-468-3785. It is also available on the SEC website.
Code of Ethics
The Investment Company has adopted a Code of Ethics that complies with Rule 17j-1 of the Investment Company Act of 1940 and with the requirements of the Sarbanes-Oxley Act of 2002. A copy of the Code of Ethics is available free of charge, upon request. To obtain a free copy of the Code of Ethics, please call (212) 224-1568 or write to:
Ms. Kathryn A. Lu
Executive Vice President and Chief Compliance Officer
Mutual of America Investment Corporation
320 Park Avenue
New York, NY 10022-6839
Supplemental Dividend Information — Unaudited
Dividends from the International, Money Market, Mid-Term Bond and Bond Funds do not qualify for the corporate dividends received deduction. The 2055 Retirement Fund did not distribute any dividends during 2017. The following are the percentages of the ordinary dividends distributed in 2017 by the other Investment Corporation Funds that qualify for the corporate dividends received deduction:
| | | | | | | | | | | | | | | | | | | | |
| | | Equity
Index Fund | | | All
America
Fund | | | Small Cap
Value Fund | | | Small Cap
Growth Fund | | | Mid-Cap
Equity Index
Fund | |
Ordinary dividend
qualifying percentage | | | 90.01% | | | | 82.52% | | | | 57.23% | | | | 100.00% | | | | 65.13% | |
| | | | | |
| | | Mid Cap
Value
Fund | | | Composite
Fund | | | Retirement
Income
Fund | | | 2010
Retirement
Fund | | | 2015
Retirement
Fund | |
Ordinary dividend
qualifying percentage | | | 100.00% | | | | 47.73% | | | | 19.44% | | | | 24.86% | | | | 30.05% | |
| | | | | |
| | | 2020
Retirement
Fund | | | 2025
Retirement
Fund | | | 2030
Retirement
Fund | | | 2035
Retirement
Fund | | | 2040
Retirement
Fund | |
Ordinary dividend
qualifying percentage | | | 37.11% | | | | 47.58% | | | | 54.92% | | | | 61.98% | | | | 64.02% | |
| | | | | |
| | | 2045
Retirement
Fund | | | 2050
Retirement
Fund | | | Conservative
Allocation
Fund | | | Moderate
Allocation
Fund | | | Aggressive
Allocation
Fund | |
Ordinary dividend
qualifying percentage | | | 63.89% | | | | 64.93% | | | | 22.41% | | | | 38.94% | | | | 51.21% | |
122
Important tax information: The following amounts of 2017 Investment Corporation Fund long-term capital gains (if any) have been designated as capital gains dividends.
| | | | | | | | | | | | | | | | | | | | |
| | | Equity
Index Fund | | | All America
Fund | | | Small Cap
Value Fund | | | Small Cap
Growth Fund | | | Mid-Cap
Equity Index
Fund | |
Dividends qualifying for reduced
long-term capital gains tax rate | | $ | 42,736,188 | | | $ | 35,345,294 | | | $ | 18,741,699 | | | $ | 16,488,137 | | | $ | 74,952,994 | |
| | | | | |
| | | Mid Cap
Value
Fund | | | International
Fund | | | Composite
Fund | | | Retirement
Income Fund | | | 2010
Retirement
Fund | |
Dividends qualifying for reduced
long-term capital gains tax rate | | $ | 4,282,390 | | | $ | 1,196,804 | | | $ | 20,996,479 | | | $ | 1,379,154 | | | $ | 1,150,822 | |
| | | | | |
| | | 2015
Retirement
Fund | | | 2020
Retirement
Fund | | | 2025
Retirement
Fund | | | 2030
Retirement
Fund | | | 2035
Retirement
Fund | |
Dividends qualifying for reduced
long-term capital gains tax rate | | $ | 6,504,889 | | | $ | 15,006,151 | | | $ | 17,549,626 | | | $ | 16,402,087 | | | $ | 14,165,396 | |
| | | | | |
| | | 2040
Retirement
Fund | | | 2045
Retirement
Fund | | | 2050
Retirement
Fund | | | 2055
Retirement
Fund | | | Conservative
Allocation
Fund | |
Dividends qualifying for reduced
long-term capital gains tax rate | | $ | 12,664,502 | | | $ | 13,839,470 | | | $ | 5,127,131 | | | $ | 0 | | | $ | 2,676,902 | |
| | | | | |
| | | Moderate
Allocation
Fund | | | Aggressive
Allocation
Fund | | | Money
Market Fund | | | Mid-Term
Bond Fund | | | Bond Fund | |
Dividends qualifying for reduced
long-term capital gains tax rate | | $ | 10,932,002 | | | $ | 15,484,011 | | | $ | 0 | | | $ | 543,647 | | | $ | 1,805,293 | |
123
MUTUALOF AMERICA
LIFE INSURANCE COMPANY
320 PARK AVENUE
NEW YORK, NY 10022-6839
www.mutualofamerica.com
320 PARK AVENUE
NEW YORK NY 10022-6839
ADDRESS SERVICE REQUESTED
| | |
 | | You can receive these and other important documents electronically. Sign up for eDocuments and we’ll waive the monthly participant charge. Find out more at mutualofamerica.com or call 1-800-468-3785. |
Mutual of America Investment Corporation (the “Corporation”) has adopted a Code of Ethics that applies to its principal executive and financial officers, as well as all Access Persons as defined under Rule 17j-1 of the Investment Company Act of 1940. The Code of Ethics consists of two sections. The first section, designated as Section A, is the Code of Ethics required under Rule 17j-1. Section A requires those subject to it to submit periodic reports detailing their securities holdings and transactions (subject to several exemptions contained in the rules) and requires pre-approval for certain securities transactions by such persons, including purchases and sales of reportable securities, investments in initial public offerings and private placements. Section A was amended during the period covered by this report. These amendments were made to: (1) enhance the efficiency of the Code of Ethics by revising provisions that unnecessarily increased certain administrative burdens without advancing the overall goals of the Code of Ethics; (2) enhance and clarify certain provisions so that, overall, the Code of Ethics would operate and be administered more effectively; and (3) further serve the Code of Ethics’ objective of acting in the best interests of the Corporation’s shareholders at all times.
The second section, designated as Section B, is to assure compliance with the Code of Ethics requirements of Section 406 of the Sarbanes-Oxley Act of 2002. It applies specifically to the Corporation’s principal executive and financial officers. There have been no amendments to Section B during the period covered by this report.
The two sections are not mutually exclusive and must be observed independently by each person to whom they are intended to apply. Section A applies to all individuals while Section B applies to the individuals designated in Section B. Both Sections explicitly require those individuals subject to the provisions of the Code of Ethics to promptly report violations of the Code of Ethics to the Chief Compliance Officer.
The Annual Report to Shareholders includes information on how to obtain a copy of the Code of Ethics at no charge.
| ITEM 3. | AUDIT COMMITTEE FINANCIAL EXPERT. |
| | (a) | (1) Mutual of America Investment Corporation’s Board of Directors has determined that one audit committee financial expert serves on its Audit Committee. |
| | (a) | (2) The audit committee financial expert is Margaret M. Smyth. She is a Certified Public Accountant and has been U.S. Chief Financial Officer at National Grid since 2014. Her experience also includes previously held senior finance positions at Con Edison, Hamilton Sunstrand and United Technologies, and was a partner at Deloitte Touche and Arthur Andersen. Ms. Smyth is considered an independent director. |
| ITEM 4. | PRINCIPAL ACCOUNTANT FEES AND SERVICES. |
2017: $510,000
2016: $489,000
(b), (c), (d) There were no Audit-Related, Tax or Other Fees.
(e) All non-audit fees are pre-approved by the Audit Committee in advance.
(f), (g), (h) Not applicable.
| ITEM 5. | AUDIT COMMITTEE OF LISTED REGISTRANTS. |
Not applicable.
(a) Schedule I – Portfolios of Investments in Securities follows:
MUTUAL OF AMERICA INVESTMENT CORPORATION - EQUITY INDEX FUND
PORTFOLIO OF INVESTMENTS IN SECURITIES
December 31, 2017
| | | | | | | | |
| | | Shares | | | Value | |
INDEXED ASSETS: | | | | | | | | |
COMMON STOCKS: | | | | | | | | |
CONSUMER DISCRETIONARY (11.8%) | | | | | | | | |
Advance Auto Parts, Inc. | | | 7,778 | | | | 775,389 | |
Amazon.com, Inc.* | | | 45,604 | | | | 53,332,510 | |
Aptiv PLC | | | 30,992 | | | | 2,629,051 | |
AutoZone, Inc.* | | | 2,962 | | | | 2,107,078 | |
Best Buy Co., Inc. | | | 27,980 | | | | 1,915,791 | |
BorgWarner, Inc. | | | 20,227 | | | | 1,033,397 | |
CarMax, Inc.* | | | 19,193 | | | | 1,230,847 | |
Carnival Corp. | | | 47,555 | | | | 3,156,225 | |
CBS Corp. Cl B | | | 39,835 | | | | 2,350,265 | |
Charter Communications, Inc. Cl A* | | | 22,615 | | | | 7,597,735 | |
Chipotle Mexican Grill, Inc.* | | | 2,486 | | | | 718,529 | |
Comcast Corp. Cl A | | | 537,130 | | | | 21,512,057 | |
D.R. Horton, Inc. | | | 41,148 | | | | 2,101,428 | |
Darden Restaurants, Inc. | | | 14,681 | | | | 1,409,670 | |
Discovery Communications, Inc. Cl A* | | | 12,547 | | | | 280,802 | |
Discovery Communications, Inc. Cl C* | | | 26,701 | | | | 565,260 | |
DISH Network Corp.* | | | 26,622 | | | | 1,271,201 | |
Disney (Walt) Co. | | | 173,583 | | | | 18,661,908 | |
Dollar General Corp. | | | 28,303 | | | | 2,632,462 | |
Dollar Tree, Inc.* | | | 26,754 | | | | 2,870,972 | |
Expedia, Inc. | | | 15,078 | | | | 1,805,892 | |
Foot Locker, Inc. | | | 16,773 | | | | 786,318 | |
Ford Motor Co. | | | 454,876 | | | | 5,681,401 | |
Gap, Inc. | | | 23,028 | | | | 784,334 | |
Garmin Ltd. | | | 13,389 | | | | 797,583 | |
General Motors Co. | | | 145,759 | | | | 5,974,661 | |
Genuine Parts Co. | | | 16,793 | | | | 1,595,503 | |
Goodyear Tire & Rubber Co. | | | 24,759 | | | | 799,963 | |
H&R Block, Inc. | | | 28,542 | | | | 748,371 | |
Hanesbrands, Inc. | | | 36,041 | | | | 753,617 | |
Harley-Davidson, Inc. | | | 20,565 | | | | 1,046,347 | |
Hasbro, Inc. | | | 13,562 | | | | 1,232,650 | |
Hilton Worldwide Hldgs., Inc. | | | 23,729 | | | | 1,894,998 | |
Home Depot, Inc. | | | 133,762 | | | | 25,351,912 | |
Interpublic Group of Cos., Inc. | | | 38,267 | | | | 771,463 | |
Kohl’s Corp. | | | 20,198 | | | | 1,095,338 | |
L Brands, Inc. | | | 26,503 | | | | 1,596,011 | |
Leggett & Platt, Inc. | | | 16,591 | | | | 791,888 | |
Lennar Corp. Cl A | | | 25,435 | | | | 1,608,509 | |
LKQ Corp.* | | | 32,748 | | | | 1,331,861 | |
Lowe’s Cos., Inc. | | | 95,941 | | | | 8,916,757 | |
Macy’s, Inc. | | | 31,383 | | | | 790,538 | |
Marriott International, Inc. Cl A | | | 34,452 | | | | 4,676,197 | |
Mattel, Inc. | | | 33,361 | | | | 513,092 | |
McDonald’s Corp. | | | 90,993 | | | | 15,661,715 | |
MGM Resorts International | | | 55,720 | | | | 1,860,491 | |
Michael Kors Hldgs. Ltd.* | | | 16,826 | | | | 1,059,197 | |
Mohawk Industries, Inc.* | | | 7,573 | | | | 2,089,391 | |
Netflix, Inc.* | | | 49,258 | | | | 9,455,566 | |
Newell Brands, Inc. | | | 59,837 | | | | 1,848,963 | |
News Corp. Cl A | | | 48,216 | | | | 781,581 | |
News Corp. Cl B | | | 15,818 | | | | 262,579 | |
NIKE, Inc. Cl B | | | 148,600 | | | | 9,294,930 | |
Nordstrom, Inc. | | | 11,433 | | | | 541,696 | |
Norwegian Cruise Line Hldgs. Ltd.* | | | 19,525 | | | | 1,039,706 | |
Omnicom Group, Inc. | | | 28,058 | | | | 2,043,464 | |
| | | | | | | | |
O’Reilly Automotive, Inc.* | | | 9,696 | | | | 2,332,276 | |
Priceline Group Inc.* | | | 5,582 | | | | 9,700,065 | |
PulteGroup, Inc. | | | 31,257 | | | | 1,039,295 | |
PVH Corp. | | | 9,696 | | | | 1,330,388 | |
Ralph Lauren Corp. | | | 5,349 | | | | 554,638 | |
Ross Stores, Inc. | | | 44,486 | | | | 3,570,002 | |
Royal Caribbean Cruises Ltd. | | | 18,862 | | | | 2,249,859 | |
Scripps Networks Interactive, Inc. Cl A | | | 9,432 | | | | 805,304 | |
Signet Jewelers Ltd. | | | 4,793 | | | | 271,044 | |
Starbucks Corp. | | | 164,212 | | | | 9,430,695 | |
Tapestry, Inc. | | | 30,250 | | | | 1,337,958 | |
Target Corp. | | | 62,073 | | | | 4,050,263 | |
Tiffany & Co. | | | 12,840 | | | | 1,334,718 | |
Time Warner, Inc. | | | 89,488 | | | | 8,185,467 | |
TJX Cos., Inc. | | | 73,377 | | | | 5,610,405 | |
Tractor Supply Co. | | | 15,458 | | | | 1,155,486 | |
TripAdvisor, Inc.* | | | 14,971 | | | | 515,901 | |
Twenty-First Century Fox, Inc. Cl A | | | 124,537 | | | | 4,300,263 | |
Twenty-First Century Fox, Inc. Cl B | | | 52,086 | | | | 1,777,174 | |
Ulta Beauty, Inc.* | | | 7,194 | | | | 1,609,010 | |
Under Armour, Inc. Cl A* | | | 17,187 | | | | 248,008 | |
Under Armour, Inc. Cl C* | | | 19,022 | | | | 253,373 | |
V.F. Corp. | | | 38,591 | | | | 2,855,734 | |
Viacom, Inc. Cl B | | | 43,411 | | | | 1,337,493 | |
Whirlpool Corp. | | | 7,951 | | | | 1,340,857 | |
Wyndham Worldwide Corp. | | | 11,594 | | | | 1,343,397 | |
Wynn Resorts Ltd. | | | 9,456 | | | | 1,594,187 | |
Yum! Brands, Inc. | | | 37,891 | | | | 3,092,285 | |
| | | | | | | | |
| | | | | | | 318,662,605 | |
| | | | | | | | |
CONSUMER STAPLES (7.9%) | | | | | | | | |
Altria Group, Inc. | | | 216,692 | | | | 15,473,976 | |
Archer-Daniels-Midland Co. | | | 64,568 | | | | 2,587,885 | |
Brown-Forman Corp. Cl B | | | 23,616 | | | | 1,621,711 | |
Campbell Soup Co. | | | 21,199 | | | | 1,019,884 | |
Church & Dwight Co., Inc. | | | 26,450 | | | | 1,326,997 | |
Clorox Co. | | | 14,131 | | | | 2,101,845 | |
Coca-Cola Co. | | | 439,981 | | | | 20,186,328 | |
Colgate-Palmolive Co. | | | 101,630 | | | | 7,667,984 | |
Conagra Brands, Inc. | | | 48,689 | | | | 1,834,115 | |
Constellation Brands, Inc. Cl A | | | 19,889 | | | | 4,546,029 | |
Costco Wholesale Corp. | | | 49,700 | | | | 9,250,164 | |
Coty, Inc. Cl A | | | 52,728 | | | | 1,048,760 | |
CVS Health Corp. | | | 113,753 | | | | 8,247,093 | |
Dr. Pepper Snapple Group, Inc. | | | 19,525 | | | | 1,895,097 | |
Estee Lauder Cos., Inc. Cl A | | | 26,228 | | | | 3,337,251 | |
General Mills, Inc. | | | 64,329 | | | | 3,814,066 | |
Hershey Co. | | | 15,995 | | | | 1,815,592 | |
Hormel Foods Corp. | | | 28,323 | | | | 1,030,674 | |
J.M. Smucker Co. | | | 13,127 | | | | 1,630,898 | |
Kellogg Co. | | | 28,201 | | | | 1,917,104 | |
Kimberly-Clark Corp. | | | 39,636 | | | | 4,782,480 | |
Kraft Heinz Co. | | | 68,769 | | | | 5,347,477 | |
Kroger Co. | | | 98,996 | | | | 2,717,440 | |
McCormick & Co., Inc. | | | 12,901 | | | | 1,314,741 | |
Molson Coors Brewing Co. Cl B | | | 22,669 | | | | 1,860,445 | |
Mondelez International, Inc. Cl A | | | 168,538 | | | | 7,213,426 | |
Monster Beverage Corp.* | | | 45,041 | | | | 2,850,645 | |
PepsiCo, Inc. | | | 162,139 | | | | 19,443,709 | |
Philip Morris Int’l., Inc. | | | 178,307 | | | | 18,838,135 | |
Proctor & Gamble Co. | | | 291,416 | | | | 26,775,302 | |
Sysco Corp. | | | 55,536 | | | | 3,372,701 | |
Tyson Foods, Inc. Cl A | | | 35,494 | | | | 2,877,499 | |
Walgreens Boots Alliance, Inc. | | | 97,457 | | | | 7,077,327 | |
Wal-Mart Stores, Inc. | | | 167,585 | | | | 16,549,019 | |
| | | | | | | | |
| | | | | | | 213,373,799 | |
| | | | | | | | |
| | | | | | | | |
ENERGY (5.9%) | | | | | | | | |
Anadarko Petroleum Corp. | | | 59,844 | | | | 3,210,032 | |
Andeavor | | | 16,479 | | | | 1,884,209 | |
Apache Corp. | | | 45,857 | | | | 1,936,083 | |
Baker Hughes, a GE Co. | | | 51,306 | | | | 1,623,322 | |
Cabot Oil & Gas Corp. | | | 57,674 | | | | 1,649,476 | |
Chesapeake Energy Corp.* | | | 72,786 | | | | 288,233 | |
Chevron Corp. | | | 216,895 | | | | 27,153,085 | |
Cimarex Energy Co. | | | 11,508 | | | | 1,404,091 | |
Concho Resources, Inc.* | | | 17,130 | | | | 2,573,269 | |
ConocoPhillips | | | 138,884 | | | | 7,623,343 | |
Devon Energy Corp. | | | 62,127 | | | | 2,572,058 | |
EOG Resources, Inc. | | | 65,915 | | | | 7,112,888 | |
EQT Corp. | | | 28,222 | | | | 1,606,396 | |
Exxon Mobil Corp. | | | 485,758 | | �� | | 40,628,799 | |
Halliburton Co. | | | 98,302 | | | | 4,804,019 | |
Helmerich & Payne, Inc. | | | 13,371 | | | | 864,301 | |
Hess Corp. | | | 29,786 | | | | 1,413,941 | |
Kinder Morgan, Inc. | | | 216,782 | | | | 3,917,251 | |
Marathon Oil Corp. | | | 103,189 | | | | 1,746,990 | |
Marathon Petroleum Corp. | | | 55,230 | | | | 3,644,075 | |
National Oilwell Varco, Inc. | | | 39,462 | | | | 1,421,421 | |
Newfield Exploration Co.* | | | 27,486 | | | | 866,634 | |
Noble Energy, Inc. | | | 59,408 | | | | 1,731,149 | |
Occidental Petroleum Corp. | | | 88,156 | | | | 6,493,571 | |
ONEOK, Inc. | | | 44,718 | | | | 2,390,177 | |
Phillips 66 | | | 49,380 | | | | 4,994,787 | |
Pioneer Natural Resources Co. | | | 19,972 | | | | 3,452,160 | |
Range Resources Corp. | | | 32,854 | | | | 560,489 | |
Schlumberger Ltd. | | | 157,226 | | | | 10,595,490 | |
TechnipFMC PLC | | | 47,123 | | | | 1,475,421 | |
Valero Energy Corp. | | | 50,416 | | | | 4,633,735 | |
Williams Cos., Inc. | | | 96,212 | | | | 2,933,504 | |
| | | | | | | | |
| | | | | | | 159,204,399 | |
| | | | | | | | |
FINANCIALS (15.0%) | | | | | | | | |
Affiliated Managers Group, Inc. | | | 6,565 | | | | 1,347,466 | |
Aflac, Inc. | | | 43,891 | | | | 3,852,752 | |
Allstate Corp. | | | 40,141 | | | | 4,203,164 | |
American Express Co. | | | 82,061 | | | | 8,149,478 | |
American Int’l. Group, Inc. | | | 101,335 | | | | 6,037,539 | |
Ameriprise Financial, Inc. | | | 17,008 | | | | 2,882,346 | |
Aon PLC | | | 28,065 | | | | 3,760,710 | |
Assurant, Inc. | | | 5,242 | | | | 528,603 | |
Bank of America Corp. | | | 1,100,802 | | | | 32,495,675 | |
Bank of New York Mellon Corp. | | | 115,159 | | | | 6,202,464 | |
BB&T Corp. | | | 89,365 | | | | 4,443,228 | |
Berkshire Hathaway, Inc. Cl B* | | | 220,061 | | | | 43,620,491 | |
BlackRock, Inc. | | | 14,236 | | | | 7,313,176 | |
Brighthouse Financial, Inc.* | | | 8,936 | | | | 524,007 | |
Capital One Financial Corp. | | | 56,543 | | | | 5,630,552 | |
CBOE Holdings, Inc. | | | 12,337 | | | | 1,537,067 | |
Charles Schwab Corp. | | | 137,677 | | | | 7,072,467 | |
Chubb Ltd. | | | 52,519 | | | | 7,674,601 | |
Cincinnati Financial Corp. | | | 17,598 | | | | 1,319,322 | |
Citigroup, Inc. | | | 302,166 | | | | 22,484,172 | |
Citizens Financial Group, Inc. | | | 56,432 | | | | 2,369,015 | |
CME Group, Inc. | | | 39,482 | | | | 5,766,346 | |
Comerica, Inc. | | | 18,332 | | | | 1,591,401 | |
Discover Financial Svcs. | | | 41,869 | | | | 3,220,563 | |
E*Trade Financial Corp.* | | | 31,791 | | | | 1,575,880 | |
Everest Re Group Ltd. | | | 4,673 | | | | 1,033,948 | |
Fifth Third Bancorp | | | 78,089 | | | | 2,369,220 | |
Franklin Resources, Inc. | | | 35,695 | | | | 1,546,664 | |
Gallagher (Arthur J.) & Co. | | | 20,396 | | | | 1,290,659 | |
Goldman Sachs Group, Inc. | | | 40,324 | | | | 10,272,942 | |
| | | | | | | | |
Hartford Financial Svcs. Group, Inc. | | | 42,090 | | | | 2,368,825 | |
Huntington Bancshares, Inc. | | | 124,163 | | | | 1,807,813 | |
Intercontinental Exchange, Inc. | | | 66,343 | | | | 4,681,162 | |
Invesco Ltd. | | | 49,617 | | | | 1,813,005 | |
JPMorgan Chase & Co. | | | 394,072 | | | | 42,142,060 | |
KeyCorp | | | 118,457 | | | | 2,389,278 | |
Leucadia National Corp. | | | 40,841 | | | | 1,081,878 | |
Lincoln National Corp. | | | 23,848 | | | | 1,833,196 | |
Loews Corp. | | | 31,213 | | | | 1,561,586 | |
M&T Bank Corp. | | | 16,725 | | | | 2,859,808 | |
Marsh & McLennan Cos., Inc. | | | 59,046 | | | | 4,805,754 | |
MetLife, Inc. | | | 121,997 | | | | 6,168,168 | |
Moody’s Corp. | | | 19,052 | | | | 2,812,266 | |
Morgan Stanley | | | 156,547 | | | | 8,214,021 | |
Nasdaq, Inc. | | | 13,392 | | | | 1,028,907 | |
Navient Corp. | | | 39,605 | | | | 527,539 | |
Northern Trust Corp. | | | 24,010 | | | | 2,398,359 | |
People’s United Financial, Inc. | | | 41,500 | | | | 776,050 | |
PNC Financial Svcs. Grp., Inc. | | | 53,915 | | | | 7,779,395 | |
Principal Financial Grp., Inc. | | | 29,507 | | | | 2,082,014 | |
Progressive Corp. | | | 65,503 | | | | 3,689,129 | |
Prudential Financial, Inc. | | | 49,350 | | | | 5,674,263 | |
Raymond James Financial, Inc. | | | 14,801 | | | | 1,321,729 | |
Regions Financial Corp. | | | 136,872 | | | | 2,365,148 | |
S&P Global, Inc. | | | 29,260 | | | | 4,956,644 | |
State Street Corp. | | | 42,131 | | | | 4,112,407 | |
SunTrust Banks, Inc. | | | 56,010 | | | | 3,617,686 | |
Synchrony Financial | | | 83,580 | | | | 3,227,024 | |
T. Rowe Price Group, Inc. | | | 28,001 | | | | 2,938,145 | |
Torchmark Corp. | | | 11,592 | | | | 1,051,510 | |
Travelers Cos., Inc. | | | 30,950 | | | | 4,198,058 | |
U.S. Bancorp | | | 181,563 | | | | 9,728,146 | |
Unum Group | | | 23,908 | | | | 1,312,310 | |
Visa, Inc. Cl A | | | 206,262 | | | | 23,517,993 | |
Wells Fargo & Co. | | | 504,476 | | | | 30,606,559 | |
Willis Towers Watson PLC | | | 15,075 | | | | 2,271,717 | |
XL Group Ltd. | | | 28,745 | | | | 1,010,674 | |
Zions Bancorporation | | | 20,867 | | | | 1,060,670 | |
| | | | | | | | |
| | | | | | | 407,906,814 | |
| | | | | | | | |
HEALTH CARE (13.2%) | | | | | | | | |
Abbott Laboratories | | | 197,306 | | | | 11,260,253 | |
AbbVie, Inc. | | | 181,815 | | | | 17,583,329 | |
Aetna, Inc. | | | 37,509 | | | | 6,766,249 | |
Agilent Technologies, Inc. | | | 38,623 | | | | 2,586,582 | |
Alexion Pharmaceuticals, Inc.* | | | 24,988 | | | | 2,988,315 | |
Align Technology, Inc.* | | | 7,838 | | | | 1,741,525 | |
Allergan PLC | | | 37,688 | | | | 6,165,003 | |
AmerisourceBergen Corp. | | | 19,661 | | | | 1,805,273 | |
Amgen, Inc. | | | 82,799 | | | | 14,398,746 | |
Anthem, Inc. | | | 28,743 | | | | 6,467,462 | |
Baxter International, Inc. | | | 55,857 | | | | 3,610,596 | |
Becton, Dickinson & Co. | | | 30,213 | | | | 6,467,294 | |
BIOGEN, Inc.* | | | 23,901 | | | | 7,614,142 | |
Boston Scientific Corp.* | | | 160,933 | | | | 3,989,529 | |
Bristol-Myers Squibb Co. | | | 188,436 | | | | 11,547,358 | |
Cardinal Health, Inc. | | | 36,764 | | | | 2,252,530 | |
Celgene Corp.* | | | 90,565 | | | | 9,451,363 | |
Centene Corp.* | | | 18,817 | | | | 1,898,259 | |
Cerner Corp.* | | | 37,608 | | | | 2,534,403 | |
CIGNA Corp. | | | 28,054 | | | | 5,697,487 | |
Cooper Companies, Inc. | | | 5,678 | | | | 1,237,123 | |
Danaher Corp. | | | 69,051 | | | | 6,409,314 | |
DaVita Inc Inc.* | | | 18,605 | | | | 1,344,211 | |
DENTSPLY SIRONA, Inc. | | | 27,421 | | | | 1,805,124 | |
Edwards Lifesciences Corp.* | | | 24,943 | | | | 2,811,326 | |
| | | | | | | | |
Envision Healthcare Corp.* | | | 15,275 | | | | 527,904 | |
Express Scripts Hldg. Co.* | | | 65,867 | | | | 4,916,313 | |
Gilead Sciences, Inc. | | | 148,928 | | | | 10,669,202 | |
HCA Healthcare, Inc.* | | | 32,556 | | | | 2,859,719 | |
Hologic, Inc.* | | | 29,992 | | | | 1,282,158 | |
Humana, Inc. | | | 16,459 | | | | 4,082,984 | |
IDEXX Laboratories, Inc.* | | | 9,922 | | | | 1,551,602 | |
Illumina, Inc.* | | | 17,052 | | | | 3,725,691 | |
Incyte Corp.* | | | 19,148 | | | | 1,813,507 | |
Intuitive Surgical, Inc.* | | | 12,605 | | | | 4,600,069 | |
IQVIA Holdings, Inc.* | | | 17,885 | | | | 1,750,942 | |
Johnson & Johnson | | | 307,745 | | | | 42,998,131 | |
Laboratory Corp. of America Hldgs.* | | | 11,473 | | | | 1,830,058 | |
Lilly (Eli) & Co. | | | 110,804 | | | | 9,358,506 | |
McKesson Corp. | | | 23,972 | | | | 3,738,433 | |
Medtronic PLC | | | 155,814 | | | | 12,581,981 | |
Merck & Co., Inc. | | | 311,378 | | | | 17,521,240 | |
Mettler-Toledo Int’l., Inc.* | | | 2,873 | | | | 1,779,881 | |
Mylan NV* | | | 58,170 | | | | 2,461,173 | |
Patterson Cos., Inc. | | | 7,124 | | | | 257,390 | |
PerkinElmer, Inc. | | | 10,868 | | | | 794,668 | |
Perrigo Co. PLC | | | 15,111 | | | | 1,317,075 | |
Pfizer, Inc. | | | 681,159 | | | | 24,671,579 | |
Quest Diagnostics, Inc. | | | 15,936 | | | | 1,569,537 | |
Regeneron Pharmaceuticals, Inc.* | | | 8,811 | | | | 3,312,584 | |
ResMed, Inc. | | | 15,343 | | | | 1,299,399 | |
Schein (Henry), Inc.* | | | 18,418 | | | | 1,287,050 | |
Stryker Corp. | | | 37,226 | | | | 5,764,074 | |
Thermo Fisher Scientific, Inc. | | | 46,093 | | | | 8,752,139 | |
UnitedHealth Group, Inc. | | | 110,164 | | | | 24,286,755 | |
Universal Health Svcs., Inc. Cl B | | | 9,170 | | | | 1,039,420 | |
Varian Medical Systems, Inc.* | | | 9,351 | | | | 1,039,364 | |
Vertex Pharmaceuticals, Inc.* | | | 29,110 | | | | 4,362,425 | |
Waters Corp.* | | | 9,313 | | | | 1,799,178 | |
Zimmer Biomet Hldgs., Inc. | | | 22,641 | | | | 2,732,089 | |
Zoetis, Inc. | | | 54,332 | | | | 3,914,077 | |
| | | | | | | | |
| | | | | | | 358,681,093 | |
| | | | | | | | |
INDUSTRIALS (9.8%) | | | | | | | | |
3M Co. | | | 67,707 | | | | 15,936,197 | |
Acuity Brands, Inc. | | | 4,721 | | | | 830,896 | |
Alaska Air Group, Inc. | | | 14,563 | | | | 1,070,526 | |
Allegion PLC | | | 9,480 | | | | 754,229 | |
American Airlines Group, Inc. | | | 46,055 | | | | 2,396,242 | |
AMETEK, Inc. | | | 25,579 | | | | 1,853,710 | |
Arconic, Inc. | | | 51,711 | | | | 1,409,125 | |
Boeing Co. | | | 63,445 | | | | 18,710,565 | |
Caterpillar, Inc. | | | 67,088 | | | | 10,571,727 | |
Cintas Corp. | | | 9,855 | | | | 1,535,705 | |
CSX Corp. | | | 103,161 | | | | 5,674,887 | |
Cummins, Inc. | | | 18,368 | | | | 3,244,524 | |
Deere & Co. | | | 36,036 | | | | 5,639,994 | |
Delta Air Lines, Inc. | | | 74,827 | | | | 4,190,312 | |
Dover Corp. | | | 18,749 | | | | 1,893,462 | |
Eaton Corp. PLC | | | 50,559 | | | | 3,994,667 | |
Emerson Electric Co. | | | 73,834 | | | | 5,145,491 | |
Equifax, Inc. | | | 13,209 | | | | 1,557,605 | |
Expeditors Int’l. of Wash. | | | 20,200 | | | | 1,306,738 | |
Fastenal Co. | | | 34,205 | | | | 1,870,671 | |
FedEx Corp. | | | 28,079 | | | | 7,006,834 | |
Flowserve Corp. | | | 12,623 | | | | 531,807 | |
Fluor Corp. | | | 15,446 | | | | 797,786 | |
Fortive Corp. | | | 36,160 | | | | 2,616,176 | |
Fortune Brands Home & Security, Inc. | | | 19,485 | | | | 1,333,553 | |
General Dynamics Corp. | | | 31,379 | | | | 6,384,058 | |
General Electric Co. | | | 997,703 | | | | 17,409,917 | |
| | | | | | | | |
Grainger (W.W.), Inc. | | | 5,733 | | | | 1,354,421 | |
Harris Corp. | | | 12,679 | | | | 1,795,980 | |
Honeywell International, Inc. | | | 87,766 | | | | 13,459,794 | |
Hunt (J.B.) Transport Svcs., Inc. | | | 9,288 | | | | 1,067,934 | |
IHS Markit Ltd.* | | | 40,015 | | | | 1,806,677 | |
Illinois Tool Works, Inc. | | | 34,883 | | | | 5,820,229 | |
Ingersoll-Rand PLC | | | 27,037 | | | | 2,411,430 | |
Jacobs Engineering Group, Inc. | | | 11,681 | | | | 770,479 | |
Johnson Controls Int’l. PLC | | | 104,896 | | | | 3,997,587 | |
Kansas City Southern | | | 11,758 | | | | 1,237,177 | |
L-3 Communications Corp. | | | 9,351 | | | | 1,850,095 | |
Lockheed Martin Corp. | | | 28,378 | | | | 9,110,757 | |
Masco Corp. | | | 36,987 | | | | 1,625,209 | |
Nielsen Hldgs. PLC | | | 34,539 | | | | 1,257,220 | |
Norfolk Southern Corp. | | | 33,282 | | | | 4,822,562 | |
Northrop Grumman Corp. | | | 20,177 | | | | 6,192,523 | |
PACCAR, Inc. | | | 41,083 | | | | 2,920,180 | |
Parker Hannifin Corp. | | | 14,851 | | | | 2,963,963 | |
Pentair PLC | | | 18,927 | | | | 1,336,625 | |
Quanta Services, Inc.* | | | 20,424 | | | | 798,783 | |
Raytheon Co. | | | 32,676 | | | | 6,138,187 | |
Republic Services, Inc. | | | 27,610 | | | | 1,866,712 | |
Robert Half Int’l., Inc. | | | 14,306 | | | | 794,555 | |
Robinson (C.H.) Worldwide, Inc. | | | 15,127 | | | | 1,347,664 | |
Rockwell Automation, Inc. | | | 14,988 | | | | 2,942,894 | |
Rockwell Collins, Inc. | | | 19,356 | | | | 2,625,061 | |
Roper Technologies, Inc. | | | 11,284 | | | | 2,922,556 | |
Smith (A.O.) Corp. | | | 17,155 | | | | 1,051,258 | |
Snap-on, Inc. | | | 6,208 | | | | 1,082,054 | |
Southwest Airlines Co. | | | 61,006 | | | | 3,992,843 | |
Stanley Black & Decker, Inc. | | | 17,200 | | | | 2,918,668 | |
Stericycle, Inc.* | | | 11,561 | | | | 786,032 | |
Textron, Inc. | | | 28,310 | | | | 1,602,063 | |
TransDigm Group, Inc. | | | 5,624 | | | | 1,544,463 | |
Union Pacific Corp. | | | 89,512 | | | | 12,003,559 | |
United Continental Hldgs., Inc* | | | 28,474 | | | | 1,919,148 | |
United Parcel Service, Inc. Cl B | | | 79,278 | | | | 9,445,974 | |
United Rentals, Inc.* | | | 9,533 | | | | 1,638,818 | |
United Technologies Corp. | | | 84,981 | | | | 10,841,026 | |
Verisk Analytics, Inc. Cl A* | | | 16,424 | | | | 1,576,704 | |
Waste Management, Inc. | | | 45,513 | | | | 3,927,772 | |
Xylem, Inc. | | | 19,298 | | | | 1,316,124 | |
| | | | | | | | |
| | | | | | | 266,551,164 | |
| | | | | | | | |
INFORMATION TECHNOLOGY (21.9%) | | | | | | | | |
Accenture PLC Cl A | | | 70,322 | | | | 10,765,595 | |
Activision Blizzard, Inc. | | | 86,579 | | | | 5,482,182 | |
Adobe Systems, Inc.* | | | 56,038 | | | | 9,820,099 | |
Advanced Micro Devices, Inc.* | | | 102,748 | | | | 1,056,249 | |
Akamai Technologies, Inc.* | | | 18,254 | | | | 1,187,240 | |
Alliance Data Systems Corp. | | | 5,467 | | | | 1,385,775 | |
Alphabet, Inc. Cl A* | | | 33,856 | | | | 35,663,910 | |
Alphabet, Inc. Cl C* | | | 34,357 | | | | 35,950,914 | |
Amphenol Corp. Cl A | | | 35,041 | | | | 3,076,600 | |
Analog Devices, Inc. | | | 42,095 | | | | 3,747,718 | |
ANSYS, Inc.* | | | 8,837 | | | | 1,304,253 | |
Apple, Inc. | | | 585,197 | | | | 99,032,887 | |
Applied Materials, Inc. | | | 120,005 | | | | 6,134,656 | |
Autodesk, Inc.* | | | 24,016 | | | | 2,517,597 | |
Automatic Data Processing, Inc. | | | 50,839 | | | | 5,957,822 | |
Broadcom Ltd. | | | 45,753 | | | | 11,753,946 | |
CA, Inc. | | | 38,641 | | | | 1,285,972 | |
Cadence Design Systems, Inc.* | | | 30,041 | | | | 1,256,315 | |
Cisco Systems, Inc. | | | 561,801 | | | | 21,516,978 | |
Citrix Systems, Inc.* | | | 17,784 | | | | 1,564,992 | |
Cognizant Technology Solutions | | | 68,714 | | | | 4,880,068 | |
| | | | | | | | |
Corning, Inc. | | | 97,610 | | | | 3,122,544 | |
CSRA, Inc. | | | 17,279 | | | | 516,988 | |
DXC Technology Co. | | | 32,862 | | | | 3,118,557 | |
eBay, Inc.* | | | 109,649 | | | | 4,138,153 | |
Electronic Arts, Inc.* | | | 36,136 | | | | 3,796,448 | |
F5 Networks, Inc.* | | | 7,873 | | | | 1,033,095 | |
Facebook, Inc. Cl A* | | | 272,228 | | | | 48,037,353 | |
Fidelity Nat’l. Information Svcs., Inc. | | | 38,415 | | | | 3,614,467 | |
Fiserv, Inc.* | | | 23,820 | | | | 3,123,517 | |
FLIR Systems, Inc. | | | 16,413 | | | | 765,174 | |
Gartner, Inc.* | | | 10,713 | | | | 1,319,306 | |
Global Payments, Inc. | | | 18,158 | | | | 1,820,158 | |
Hewlett Packard Enterprise Co. | | | 180,326 | | | | 2,589,481 | |
HP, Inc. | | | 186,665 | | | | 3,921,832 | |
Intel Corp. | | | 532,732 | | | | 24,590,909 | |
Int’l. Business Machines Corp. | | | 98,971 | | | | 15,184,131 | |
Intuit, Inc. | | | 27,884 | | | | 4,399,538 | |
Juniper Networks, Inc. | | | 45,206 | | | | 1,288,371 | |
KLA-Tencor Corp. | | | 17,351 | | | | 1,823,070 | |
Lam Research Corp. | | | 18,302 | | | | 3,368,849 | |
Mastercard, Inc. Cl A | | | 105,749 | | | | 16,006,169 | |
Microchip Technology, Inc. | | | 26,912 | | | | 2,365,027 | |
Micron Technology, Inc.* | | | 129,151 | | | | 5,310,689 | |
Microsoft Corp. | | | 877,721 | | | | 75,080,254 | |
Motorola Solutions, Inc. | | | 19,655 | | | | 1,775,633 | |
NetApp, Inc. | | | 31,622 | | �� | | 1,749,329 | |
NVIDIA Corp. | | | 69,175 | | | | 13,385,363 | |
Oracle Corp. | | | 347,163 | | | | 16,413,867 | |
Paychex, Inc. | | | 37,456 | | | | 2,550,004 | |
PayPal Hldgs., Inc.* | | | 128,387 | | | | 9,451,851 | |
Qorvo, Inc.* | | | 15,876 | | | | 1,057,342 | |
QUALCOMM, Inc. | | | 167,722 | | | | 10,737,562 | |
Red Hat, Inc.* | | | 20,354 | | | | 2,444,515 | |
Salesforce.com, inc.* | | | 79,302 | | | | 8,107,043 | |
Seagate Technology PLC | | | 31,030 | | | | 1,298,295 | |
Skyworks Solutions, Inc. | | | 21,887 | | | | 2,078,171 | |
Symantec Corp. | | | 71,782 | | | | 2,014,203 | |
Synopsys, Inc.* | | | 17,731 | | | | 1,511,390 | |
TE Connectivity Ltd. | | | 40,632 | | | | 3,861,665 | |
Texas Instruments, Inc. | | | 113,628 | | | | 11,867,308 | |
Total System Services, Inc. | | | 20,236 | | | | 1,600,465 | |
VeriSign, Inc.* | | | 9,051 | | | | 1,035,796 | |
Western Digital Corp. | | | 35,219 | | | | 2,800,967 | |
Western Union Co. | | | 52,874 | | | | 1,005,135 | |
Xerox Corp. | | | 26,222 | | | | 764,371 | |
Xilinx, Inc. | | | 30,460 | | | | 2,053,613 | |
| | | | | | | | |
| | | | | | | 595,239,736 | |
| | | | | | | | |
MATERIALS (2.9%) | | | | | | | | |
Air Products & Chemicals, Inc. | | | 24,176 | | | | 3,966,798 | |
Albemarle Corp. | | | 11,892 | | | | 1,520,868 | |
Avery Dennison Corp. | | | 9,000 | | | | 1,033,740 | |
Ball Corp. | | | 39,982 | | | | 1,513,319 | |
CF Industries Hldgs., Inc. | | | 25,499 | | | | 1,084,727 | |
DowDuPont, Inc. | | | 266,843 | | | | 19,004,558 | |
Eastman Chemical Co. | | | 17,205 | | | | 1,593,871 | |
Ecolab, Inc. | | | 28,934 | | | | 3,882,364 | |
FMC Corp. | | | 14,141 | | | | 1,338,587 | |
Freeport-McMoRan, Inc.* | | | 155,441 | | | | 2,947,161 | |
International Paper Co. | | | 46,211 | | | | 2,677,465 | |
Int’l. Flavors & Fragrances, Inc. | | | 8,483 | | | | 1,294,591 | |
LyondellBasell Inds. NV Cl A | | | 36,812 | | | | 4,061,100 | |
Martin Marietta Materials, Inc. | | | 7,599 | | | | 1,679,683 | |
Monsanto Co. | | | 50,986 | | | | 5,954,145 | |
Newmont Mining Corp. | | | 57,697 | | | | 2,164,791 | |
Nucor Corp. | | | 34,765 | | | | 2,210,359 | |
| | | | | | | | |
Packaging Corp. of America | | | 11,243 | | | | 1,355,344 | |
PPG Industries, Inc. | | | 29,427 | | | | 3,437,662 | |
Praxair, Inc. | | | 33,028 | | | | 5,108,771 | |
Sealed Air Corp. | | | 21,285 | | | | 1,049,351 | |
Sherwin-Williams Co. | | | 9,643 | | | | 3,954,016 | |
The Mosaic Co. | | | 42,105 | | | | 1,080,414 | |
Vulcan Materials Co. | | | 14,959 | | | | 1,920,287 | |
WestRock Co. | | | 28,712 | | | | 1,814,886 | |
| | | | | | | | |
| | | | | | | 77,648,858 | |
| | | | | | | | |
REAL ESTATE (2.8%) | | | | | | | | |
Alexandria Real Estate Equities, Inc. | | | 11,823 | | | | 1,543,966 | |
American Tower Corp. | | | 49,168 | | | | 7,014,799 | |
Apartment Investment & Management Co. Cl A | | | 17,795 | | | | 777,819 | |
AvalonBay Communities, Inc. | | | 15,679 | | | | 2,797,290 | |
Boston Properties, Inc. | | | 18,281 | | | | 2,377,078 | |
CBRE Group, Inc.* | | | 36,367 | | | | 1,575,055 | |
Crown Castle Int’l. Corp. | | | 47,075 | | | | 5,225,796 | |
Digital Realty Trust, Inc. | | | 22,671 | | | | 2,582,227 | |
Duke Realty Corp. | | | 37,414 | | | | 1,018,035 | |
Equinix, Inc. | | | 9,087 | | | | 4,118,410 | |
Equity Residential | | | 43,612 | | | | 2,781,137 | |
Essex Property Trust, Inc. | | | 7,257 | | | | 1,751,622 | |
Extra Space Storage, Inc. | | | 15,025 | | | | 1,313,936 | |
Federal Realty Investment Trust | | | 7,886 | | | | 1,047,340 | |
GGP, Inc. | | | 66,721 | | | | 1,560,604 | |
HCP, Inc. | | | 57,462 | | | | 1,498,609 | |
Host Hotels & Resorts, Inc. | | | 77,947 | | | | 1,547,248 | |
Iron Mountain, Inc. | | | 31,937 | | | | 1,204,983 | |
Kimco Realty Corp. | | | 42,197 | | | | 765,876 | |
Mid-America Apt. Communities, Inc. | | | 12,595 | | | | 1,266,553 | |
ProLogis, Inc. | | | 59,436 | | | | 3,834,216 | |
Public Storage | | | 17,295 | | | | 3,614,655 | |
Realty Income Corp. | | | 31,716 | | | | 1,808,446 | |
Regency Centers Corp. | | | 18,597 | | | | 1,286,540 | |
SBA Communications Corp. Cl A* | | | 12,694 | | | | 2,073,692 | |
Simon Property Group, Inc. | | | 35,585 | | | | 6,111,368 | |
SL Green Realty Corp | | | 10,065 | | | | 1,015,860 | |
The Macerich Co. | | | 11,846 | | | | 778,045 | |
UDR, Inc. | | | 33,021 | | | | 1,271,969 | |
Ventas, Inc. | | | 40,543 | | | | 2,432,985 | |
Vornado Realty Trust | | | 20,108 | | | | 1,572,043 | |
Welltower, Inc. | | | 42,752 | | | | 2,726,295 | |
Weyerhaeuser Co. | | | 86,604 | | | | 3,053,657 | |
| | | | | | | | |
| | | | | | | 75,348,154 | |
| | | | | | | | |
TELECOMMUNICATION SERVICES (2.0%) | | | | | | | | |
AT&T, Inc. | | | 703,269 | | | | 27,343,099 | |
CenturyLink, Inc. | | | 108,292 | | | | 1,806,311 | |
Verizon Communications, Inc. | | | 465,721 | | | | 24,650,613 | |
| | | | | | | | |
| | | | | | | 53,800,023 | |
| | | | | | | | |
UTILITIES (2.8%) | | | | | | | | |
AES Corp. | | | 72,348 | | | | 783,529 | |
Alliant Energy Corp. | | | 23,565 | | | | 1,004,105 | |
Ameren Corp. | | | 29,777 | | | | 1,756,545 | |
American Electric Power Co., Inc. | | | 57,786 | | | | 4,251,316 | |
American Water Works Co., Inc. | | | 19,881 | | | | 1,818,913 | |
CenterPoint Energy, Inc. | | | 45,223 | | | | 1,282,524 | |
CMS Energy Corp. | | | 31,779 | | | | 1,503,147 | |
Consolidated Edison, Inc. | | | 35,471 | | | | 3,013,261 | |
Dominion Resources, Inc. | | | 73,844 | | | | 5,985,795 | |
DTE Energy Co. | | | 20,761 | | | | 2,272,499 | |
Duke Energy Corp. | | | 80,046 | | | | 6,732,669 | |
Edison International | | | 37,172 | | | | 2,350,757 | |
Entergy Corp. | | | 21,769 | | | | 1,771,779 | |
Eversource Energy | | | 36,364 | | | | 2,297,478 | |
Exelon Corp. | | | 108,342 | | | | 4,269,758 | |
| | | | | | | | |
FirstEnergy Corp. | | | 48,699 | | | | 1,491,163 | |
NextEra Energy, Inc. | | | 54,351 | | | | 8,489,083 | |
NiSource, Inc. | | | 39,276 | | | | 1,008,215 | |
NRG Energy, Inc. | | | 37,548 | | | | 1,069,367 | |
PG&E Corp. | | | 58,793 | | | | 2,635,690 | |
Pinnacle West Capital Corp. | | | 11,643 | | | | 991,751 | |
PPL Corp. | | | 77,008 | | | | 2,383,398 | |
Public Svc. Enterprise Group, Inc. | | | 59,944 | | | | 3,087,116 | |
SCANA Corp. | | | 17,405 | | | | 692,371 | |
Sempra Energy | | | 28,944 | | | | 3,094,692 | |
Southern Co. | | | 115,827 | | | | 5,570,120 | |
WEC Energy Group, Inc. | | | 34,460 | | | | 2,289,178 | |
Xcel Energy, Inc. | | | 56,568 | | | | 2,721,486 | |
| | | | | | | | |
| | | | | | | 76,617,705 | |
| | | | | | | | |
TOTAL INDEXED ASSETS - COMMON STOCKS
(Cost: $1,472,096,212) 96.0% | | | | | | | 2,603,034,350 | |
| | | | | | | | |
| | | | | | | | | | | | | | | | | | | | |
| | | Rating** | | | Rate(%) | | | Maturity | | | Face Amount | | | Value | |
SHORT-TERM DEBT SECURITIES: | | | | | | | | | | | | | | | | | | | | |
U.S. GOVERNMENT (1.9%) | | | | | | | | | | | | | | | | | | | | |
U.S. Treasury Bill (1) | | | A-1+ | | | | 1.00 | | | | 01/02/18 | | | | 4,000,000 | | | | 3,999,667 | |
U.S. Treasury Bill (1) | | | A-1+ | | | | 1.02 | | | | 01/02/18 | | | | 9,600,000 | | | | 9,599,179 | |
U.S. Treasury Bill (1) | | | A-1+ | | | | 1.05 | | | | 01/04/18 | | | | 6,000,000 | | | | 5,999,123 | |
U.S. Treasury Bill (1) | | | A-1+ | | | | 1.25 | | | | 02/15/18 | | | | 19,400,000 | | | | 19,368,286 | |
U.S. Treasury Bill (1) | | | A-1+ | | | | 1.25 | | | | 03/01/18 | | | | 11,400,000 | | | | 11,375,853 | |
| | | | | | | | | | | | | | | | | | | | |
| | | | | | | | | | | | | | | | | | | 50,342,108 | |
| | | | | | | | | | | | | | | | | | | | |
COMMERCIAL PAPER (2.0%) | | | | | | | | | | | | | | | | | | | | |
Exxon Mobil Corp. | | | A-1+ | | | | 1.39 | | | | 01/10/18 | | | | 1,000,000 | | | | 999,575 | |
J.P. Morgan Securities LLC | | | A-1 | | | | 1.55 | | | | 01/04/18 | | | | 10,000,000 | | | | 9,997,846 | |
Procter & Gamble Co.† | | | A-1+ | | | | 1.48 | | | | 01/17/18 | | | | 25,000,000 | | | | 24,981,498 | |
Toyota Motor Credit Corp. | | | A-1+ | | | | 1.26 | | | | 01/03/18 | | | | 20,000,000 | | | | 19,997,196 | |
| | | | | | | | | | | | | | | | | | | | |
| | | | | | | | | | | | | | | | | | | 55,976,115 | |
| | | | | | | | | | | | | | | | | | | | |
TOTAL SHORT-TERM DEBT SECURITIES
(Cost: $106,318,223) 3.9% | | | | | | | | | | | | | | | | | | | 106,318,223 | |
| | | | | | | | | | | | | | | | | | | | |
TOTAL INVESTMENTS
(Cost: $1,578,414,435) 99.9% | | | | | | | | | | | | | | | | | | | 2,709,352,573 | |
| | | | | | | | | | | | | | | | | | | | |
OTHER NET ASSETS 0.1% | | | | | | | | | | | | | | | | 2,232,378 | |
| | | | | | | | | | | | | | | | | | | | |
NET ASSETS 100.0% | | | | | | | | | | | | | | | $ | 2,711,584,951 | |
| | | | | | | | | | | | | | | | | | | | |
The disclosures regarding Fair Value and Security Valuation included in Section 1 of the Notes to Financial Statements (Significant Accounting Policies and Organization) are an integral part of these portfolio schedules.
MUTUAL OF AMERICA INVESTMENT CORPORATION - ALL AMERICA FUND
PORTFOLIO OF INVESTMENTS IN SECURITIES
December 31, 2017
| | | | | | | | |
| | | Shares | | | Value | |
INDEXED ASSETS: | | | | | | | | |
COMMON STOCKS: | | | | | | | | |
CONSUMER DISCRETIONARY (6.7%) | | | | | | | | |
Advance Auto Parts, Inc. | | | 526 | | | | 52,437 | |
Amazon.com, Inc.* | | | 3,089 | | | | 3,612,493 | |
Aptiv PLC | | | 2,099 | | | | 178,058 | |
AutoZone, Inc.* | | | 201 | | | | 142,985 | |
Best Buy Co., Inc. | | | 1,896 | | | | 129,819 | |
BorgWarner, Inc. | | | 1,370 | | | | 69,993 | |
CarMax, Inc.* | | | 1,301 | | | | 83,433 | |
Carnival Corp. | | | 3,222 | | | | 213,844 | |
CBS Corp. Cl B | | | 2,699 | | | | 159,241 | |
Charter Communications, Inc. Cl A* | | | 1,533 | | | | 515,027 | |
Chipotle Mexican Grill, Inc.* | | | 169 | | | | 48,846 | |
Comcast Corp. Cl A | | | 36,387 | | | | 1,457,299 | |
D.R. Horton, Inc. | | | 2,787 | | | | 142,332 | |
Darden Restaurants, Inc. | | | 994 | | | | 95,444 | |
Discovery Communications, Inc. Cl A* | | | 850 | | | | 19,023 | |
Discovery Communications, Inc. Cl C* | | | 1,808 | | | | 38,275 | |
DISH Network Corp.* | | | 1,804 | | | | 86,141 | |
Disney (Walt) Co. | | | 11,760 | | | | 1,264,318 | |
Dollar General Corp. | | | 1,917 | | | | 178,300 | |
Dollar Tree, Inc.* | | | 1,812 | | | | 194,446 | |
Expedia, Inc. | | | 1,021 | | | | 122,285 | |
Foot Locker, Inc. | | | 1,136 | | | | 53,256 | |
Ford Motor Co. | | | 30,815 | | | | 384,879 | |
Gap, Inc. | | | 1,560 | | | | 53,134 | |
Garmin Ltd. | | | 908 | | | | 54,090 | |
General Motors Co. | | | 9,875 | | | | 404,776 | |
Genuine Parts Co. | | | 1,138 | | | | 108,121 | |
Goodyear Tire & Rubber Co. | | | 1,678 | | | | 54,216 | |
H&R Block, Inc. | | | 1,933 | | | | 50,683 | |
Hanesbrands, Inc. | | | 2,442 | | | | 51,062 | |
Harley-Davidson, Inc. | | | 1,393 | | | | 70,876 | |
Hasbro, Inc. | | | 918 | | | | 83,437 | |
Hilton Worldwide Hldgs., Inc. | | | 1,607 | | | | 128,335 | |
Home Depot, Inc. | | | 9,062 | | | | 1,717,521 | |
Interpublic Group of Cos., Inc. | | | 2,593 | | | | 52,275 | |
Kohl’s Corp. | | | 1,369 | | | | 74,241 | |
L Brands, Inc. | | | 1,796 | | | | 108,155 | |
Leggett & Platt, Inc. | | | 1,123 | | | | 53,601 | |
Lennar Corp. Cl A | | | 1,723 | | | | 108,963 | |
LKQ Corp.* | | | 2,219 | | | | 90,247 | |
Lowe’s Cos., Inc. | | | 6,499 | | | | 604,017 | |
Macy’s, Inc. | | | 2,126 | | | | 53,554 | |
Marriott International, Inc. Cl A | | | 2,334 | | | | 316,794 | |
Mattel, Inc. | | | 2,260 | | | | 34,759 | |
McDonald’s Corp. | | | 6,165 | | | | 1,061,120 | |
MGM Resorts International | | | 3,775 | | | | 126,047 | |
Michael Kors Hldgs. Ltd.* | | | 1,139 | | | | 71,700 | |
Mohawk Industries, Inc.* | | | 513 | | | | 141,537 | |
Netflix, Inc.* | | | 3,336 | | | | 640,379 | |
Newell Brands, Inc. | | | 4,053 | | | | 125,238 | |
News Corp. Cl A | | | 3,266 | | | | 52,942 | |
News Corp. Cl B | | | 1,072 | | | | 17,795 | |
NIKE, Inc. Cl B | | | 10,067 | | | | 629,691 | |
Nordstrom, Inc. | | | 775 | | | | 36,720 | |
Norwegian Cruise Line Hldgs. Ltd.* | | | 1,323 | | | | 70,450 | |
Omnicom Group, Inc. | | | 1,900 | | | | 138,377 | |
O’Reilly Automotive, Inc.* | | | 657 | | | | 158,035 | |
Priceline Group Inc.* | | | 378 | | | | 656,866 | |
PulteGroup, Inc. | | | 2,117 | | | | 70,390 | |
PVH Corp. | | | 656 | | | | 90,010 | |
Ralph Lauren Corp. | | | 363 | | | | 37,639 | |
Ross Stores, Inc. | | | 3,013 | | | | 241,793 | |
MUTUAL OF AMERICA INVESTMENT CORPORATION - ALL AMERICA FUND
PORTFOLIO OF INVESTMENTS IN SECURITIES
December 31, 2017
| | | | | | | | |
Royal Caribbean Cruises Ltd. | | | 1,278 | | | | 152,440 | |
Scripps Networks Interactive, Inc. Cl A | | | 639 | | | | 54,558 | |
Signet Jewelers Ltd. | | | 325 | | | | 18,379 | |
Starbucks Corp. | | | 11,125 | | | | 638,909 | |
Tapestry, Inc. | | | 2,049 | | | | 90,627 | |
Target Corp. | | | 4,205 | | | | 274,376 | |
Tiffany & Co. | | | 869 | | | | 90,333 | |
Time Warner, Inc. | | | 6,062 | | | | 554,491 | |
TJX Cos., Inc. | | | 4,970 | | | | 380,006 | |
Tractor Supply Co. | | | 1,047 | | | | 78,263 | |
TripAdvisor, Inc.* | | | 1,014 | | | | 34,942 | |
Twenty-First Century Fox, Inc. Cl A | | | 8,436 | | | | 291,295 | |
Twenty-First Century Fox, Inc. Cl B | | | 3,528 | | | | 120,375 | |
Ulta Beauty, Inc.* | | | 487 | | | | 108,922 | |
Under Armour, Inc. Cl A* | | | 1,165 | | | | 16,811 | |
Under Armour, Inc. Cl C* | | | 1,288 | | | | 17,156 | |
V.F. Corp. | | | 2,615 | | | | 193,510 | |
Viacom, Inc. Cl B | | | 2,941 | | | | 90,612 | |
Whirlpool Corp. | | | 539 | | | | 90,897 | |
Wyndham Worldwide Corp. | | | 786 | | | | 91,074 | |
Wynn Resorts Ltd. | | | 640 | | | | 107,898 | |
Yum! Brands, Inc. | | | 2,567 | | | | 209,493 | |
| | | | | | | | |
| | | | | | | 21,587,127 | |
| | | | | | | | |
CONSUMER STAPLES (4.5%) | | | | | | | | |
Altria Group, Inc. | | | 14,680 | | | | 1,048,299 | |
Archer-Daniels-Midland Co. | | | 4,374 | | | | 175,310 | |
Brown-Forman Corp. Cl B | | | 1,599 | | | | 109,803 | |
Campbell Soup Co. | | | 1,436 | | | | 69,086 | |
Church & Dwight Co., Inc. | | | 1,792 | | | | 89,905 | |
Clorox Co. | | | 958 | | | | 142,493 | |
Coca-Cola Co. | | | 29,806 | | | | 1,367,499 | |
Colgate-Palmolive Co. | | | 6,884 | | | | 519,398 | |
Conagra Brands, Inc. | | | 3,299 | | | | 124,273 | |
Constellation Brands, Inc. Cl A | | | 1,347 | | | | 307,884 | |
Costco Wholesale Corp. | | | 3,366 | | | | 626,480 | |
Coty, Inc. Cl A | | | 3,572 | | | | 71,047 | |
CVS Health Corp. | | | 7,707 | | | | 558,758 | |
Dr. Pepper Snapple Group, Inc. | | | 1,323 | | | | 128,410 | |
Estee Lauder Cos., Inc. Cl A | | | 1,776 | | | | 225,978 | |
General Mills, Inc. | | | 4,358 | | | | 258,386 | |
Hershey Co. | | | 1,083 | | | | 122,931 | |
Hormel Foods Corp. | | | 1,919 | | | | 69,832 | |
J.M. Smucker Co. | | | 890 | | | | 110,574 | |
Kellogg Co. | | | 1,911 | | | | 129,910 | |
Kimberly-Clark Corp. | | | 2,686 | | | | 324,093 | |
Kraft Heinz Co. | | | 4,659 | | | | 362,284 | |
Kroger Co. | | | 6,707 | | | | 184,107 | |
McCormick & Co., Inc. | | | 873 | | | | 88,967 | |
Molson Coors Brewing Co. Cl B | | | 1,535 | | | | 125,977 | |
Mondelez International, Inc. Cl A | | | 11,418 | | | | 488,690 | |
Monster Beverage Corp.* | | | 3,052 | | | | 193,161 | |
PepsiCo, Inc. | | | 10,984 | | | | 1,317,201 | |
Philip Morris Int’l., Inc. | | | 12,079 | | | | 1,276,146 | |
Proctor & Gamble Co. | | | 19,741 | | | | 1,813,803 | |
Sysco Corp. | | | 3,762 | | | | 228,466 | |
Tyson Foods, Inc. Cl A | | | 2,404 | | | | 194,892 | |
Walgreens Boots Alliance, Inc. | | | 6,603 | | | | 479,510 | |
Wal-Mart Stores, Inc. | | | 11,352 | | | | 1,121,010 | |
| | | | | | | | |
| | | | | | | 14,454,563 | |
| | | | | | | | |
ENERGY (3.3%) | | | | | | | | |
Anadarko Petroleum Corp. | | | 4,055 | | | | 217,510 | |
Andeavor | | | 1,117 | | | | 127,718 | |
Apache Corp. | | | 3,107 | | | | 131,178 | |
Baker Hughes, a GE Co. | | | 3,475 | | | | 109,949 | |
Cabot Oil & Gas Corp. | | | 3,907 | | | | 111,740 | |
Chesapeake Energy Corp.* | | | 4,931 | | | | 19,527 | |
MUTUAL OF AMERICA INVESTMENT CORPORATION - ALL AMERICA FUND
PORTFOLIO OF INVESTMENTS IN SECURITIES
December 31, 2017
| | | | | | | | |
Chevron Corp. | | | 14,694 | | | | 1,839,542 | |
Cimarex Energy Co. | | | 779 | | | | 95,046 | |
Concho Resources, Inc.* | | | 1,160 | | | | 174,255 | |
ConocoPhillips | | | 9,408 | | | | 516,405 | |
Devon Energy Corp. | | | 4,208 | | | | 174,211 | |
EOG Resources, Inc. | | | 4,465 | | | | 481,818 | |
EQT Corp. | | | 1,911 | | | | 108,774 | |
Exxon Mobil Corp. | | | 32,907 | | | | 2,752,341 | |
Halliburton Co. | | | 6,660 | | | | 325,474 | |
Helmerich & Payne, Inc. | | | 906 | | | | 58,564 | |
Hess Corp. | | | 2,017 | | | | 95,747 | |
Kinder Morgan, Inc. | | | 14,685 | | | | 265,358 | |
Marathon Oil Corp. | | | 6,990 | | | | 118,341 | |
Marathon Petroleum Corp. | | | 3,742 | | | | 246,897 | |
National Oilwell Varco, Inc. | | | 2,674 | | | | 96,317 | |
Newfield Exploration Co.* | | | 1,862 | | | | 58,709 | |
Noble Energy, Inc. | | | 4,024 | | | | 117,259 | |
Occidental Petroleum Corp. | | | 5,972 | | | | 439,898 | |
ONEOK, Inc. | | | 3,029 | | | | 161,900 | |
Phillips 66 | | | 3,346 | | | | 338,448 | |
Pioneer Natural Resources Co. | | | 1,353 | | | | 233,866 | |
Range Resources Corp. | | | 2,225 | | | | 37,959 | |
Schlumberger Ltd. | | | 10,652 | | | | 717,838 | |
TechnipFMC PLC | | | 3,193 | | | | 99,973 | |
Valero Energy Corp. | | | 3,416 | | | | 313,965 | |
Williams Cos., Inc. | | | 6,518 | | | | 198,734 | |
| | | | | | | | |
| | | | | | | 10,785,261 | |
| | | | | | | | |
FINANCIALS (8.5%) | | | | | | | | |
Affiliated Managers Group, Inc. | | | 445 | | | | 91,336 | |
Aflac, Inc. | | | 2,974 | | | | 261,058 | |
Allstate Corp. | | | 2,720 | | | | 284,811 | |
American Express Co. | | | 5,560 | | | | 552,164 | |
American Int’l. Group, Inc. | | | 6,865 | | | | 409,017 | |
Ameriprise Financial, Inc. | | | 1,153 | | | | 195,399 | |
Aon PLC | | | 1,902 | | | | 254,868 | |
Assurant, Inc. | | | 355 | | | | 35,798 | |
Bank of America Corp. | | | 74,573 | | | | 2,201,395 | |
Bank of New York Mellon Corp. | | | 7,802 | | | | 420,216 | |
BB&T Corp. | | | 6,054 | | | | 301,005 | |
Berkshire Hathaway, Inc. Cl B* | | | 14,907 | | | | 2,954,866 | |
BlackRock, Inc. | | | 964 | | | | 495,216 | |
Brighthouse Financial, Inc.* | | | 605 | | | | 35,477 | |
Capital One Financial Corp. | | | 3,830 | | | | 381,391 | |
CBOE Holdings, Inc. | | | 836 | | | | 104,157 | |
Charles Schwab Corp. | | | 9,326 | | | | 479,077 | |
Chubb Ltd. | | | 3,558 | | | | 519,931 | |
Cincinnati Financial Corp. | | | 1,192 | | | | 89,364 | |
Citigroup, Inc. | | | 20,470 | | | | 1,523,173 | |
Citizens Financial Group, Inc. | | | 3,822 | | | | 160,448 | |
CME Group, Inc. | | | 2,674 | | | | 390,538 | |
Comerica, Inc. | | | 1,242 | | | | 107,818 | |
Discover Financial Svcs. | | | 2,836 | | | | 218,145 | |
E*Trade Financial Corp.* | | | 2,153 | | | | 106,724 | |
Everest Re Group Ltd. | | | 316 | | | | 69,918 | |
Fifth Third Bancorp | | | 5,291 | | | | 160,529 | |
Franklin Resources, Inc. | | | 2,419 | | | | 104,815 | |
Gallagher (Arthur J.) & Co. | | | 1,381 | | | | 87,390 | |
Goldman Sachs Group, Inc. | | | 2,732 | | | | 696,004 | |
Hartford Financial Svcs. Group, Inc. | | | 2,851 | | | | 160,454 | |
Huntington Bancshares, Inc. | | | 8,411 | | | | 122,464 | |
Intercontinental Exchange, Inc. | | | 4,495 | | | | 317,167 | |
Invesco Ltd. | | | 3,361 | | | | 122,811 | |
iShares Core S&P 500 ETF | | | 108 | | | | 29,036 | |
JPMorgan Chase & Co. | | | 26,696 | | | | 2,854,870 | |
KeyCorp | | | 8,025 | | | | 161,864 | |
Leucadia National Corp. | | | 2,766 | | | | 73,271 | |
MUTUAL OF AMERICA INVESTMENT CORPORATION - ALL AMERICA FUND
PORTFOLIO OF INVESTMENTS IN SECURITIES
December 31, 2017
| | | | | | | | |
Lincoln National Corp. | | | 1,616 | | | | 124,222 | |
Loews Corp. | | | 2,114 | | | | 105,763 | |
M&T Bank Corp. | | | 1,134 | | | | 193,903 | |
Marsh & McLennan Cos., Inc. | | | 4,000 | | | | 325,560 | |
MetLife, Inc. | | | 8,264 | | | | 417,828 | |
Moody’s Corp. | | | 1,291 | | | | 190,565 | |
Morgan Stanley | | | 10,606 | | | | 556,497 | |
Nasdaq, Inc. | | | 907 | | | | 69,685 | |
Navient Corp. | | | 2,683 | | | | 35,738 | |
Northern Trust Corp. | | | 1,627 | | | | 162,521 | |
People’s United Financial, Inc. | | | 2,812 | | | | 52,584 | |
PNC Financial Svcs. Grp., Inc. | | | 3,652 | | | | 526,947 | |
Principal Financial Grp., Inc. | | | 1,999 | | | | 141,049 | |
Progressive Corp. | | | 4,438 | | | | 249,948 | |
Prudential Financial, Inc. | | | 3,343 | | | | 384,378 | |
Raymond James Financial, Inc. | | | 1,003 | | | | 89,568 | |
Regions Financial Corp. | | | 9,273 | | | | 160,237 | |
S&P Global, Inc. | | | 1,982 | | | | 335,751 | |
State Street Corp. | | | 2,855 | | | | 278,677 | |
SunTrust Banks, Inc. | | | 3,794 | | | | 245,054 | |
Synchrony Financial | | | 5,662 | | | | 218,610 | |
T. Rowe Price Group, Inc. | | | 1,897 | | | | 199,052 | |
Torchmark Corp. | | | 786 | | | | 71,298 | |
Travelers Cos., Inc. | | | 2,097 | | | | 284,437 | |
U.S. Bancorp | | | 12,299 | | | | 658,980 | |
Unum Group | | | 1,620 | | | | 88,922 | |
Visa, Inc. Cl A | | | 13,973 | | | | 1,593,201 | |
Wells Fargo & Co. | | | 34,176 | | | | 2,073,458 | |
Willis Towers Watson PLC | | | 1,022 | | | | 154,005 | |
XL Group Ltd. | | | 1,948 | | | | 68,492 | |
Zions Bancorporation | | | 1,414 | | | | 71,874 | |
| | | | | | | | |
| | | | | | | 27,662,789 | |
| | | | | | | | |
HEALTH CARE (7.4%) | | | | | | | | |
Abbott Laboratories | | | 13,367 | | | | 762,855 | |
AbbVie, Inc. | | | 12,317 | | | | 1,191,177 | |
Aetna, Inc. | | | 2,540 | | | | 458,191 | |
Agilent Technologies, Inc. | | | 2,616 | | | | 175,194 | |
Alexion Pharmaceuticals, Inc.* | | | 1,693 | | | | 202,466 | |
Align Technology, Inc.* | | | 531 | | | | 117,983 | |
Allergan PLC | | | 2,554 | | | | 417,783 | |
AmerisourceBergen Corp. | | | 1,331 | | | | 122,212 | |
Amgen, Inc. | | | 5,609 | | | | 975,405 | |
Anthem, Inc. | | | 1,948 | | | | 438,319 | |
Baxter International, Inc. | | | 3,784 | | | | 244,598 | |
Becton, Dickinson & Co. | | | 2,047 | | | | 438,074 | |
BIOGEN, Inc.* | | | 1,620 | | | | 516,083 | |
Boston Scientific Corp.* | | | 10,902 | | | | 270,261 | |
Bristol-Myers Squibb Co. | | | 12,765 | | | | 782,239 | |
Cardinal Health, Inc. | | | 2,490 | | | | 152,562 | |
Celgene Corp.* | | | 6,135 | | | | 640,249 | |
Centene Corp.* | | | 1,275 | | | | 128,622 | |
Cerner Corp.* | | | 2,547 | | | | 171,642 | |
CIGNA Corp. | | | 1,901 | | | | 386,074 | |
Cooper Companies, Inc. | | | 385 | | | | 83,884 | |
Danaher Corp. | | | 4,678 | | | | 434,212 | |
DaVita Inc Inc.* | | | 1,260 | | | | 91,035 | |
DENTSPLY SIRONA, Inc. | | | 1,857 | | | | 122,246 | |
Edwards Lifesciences Corp.* | | | 1,689 | | | | 190,367 | |
Envision Healthcare Corp.* | | | 1,034 | | | | 35,735 | |
Express Scripts Hldg. Co.* | | | 4,463 | | | | 333,118 | |
Gilead Sciences, Inc. | | | 10,090 | | | | 722,848 | |
HCA Healthcare, Inc.* | | | 2,206 | | | | 193,775 | |
Hologic, Inc.* | | | 2,032 | | | | 86,868 | |
Humana, Inc. | | | 1,116 | | | | 276,846 | |
IDEXX Laboratories, Inc.* | | | 672 | | | | 105,087 | |
Illumina, Inc.* | | | 1,155 | | | | 252,356 | |
MUTUAL OF AMERICA INVESTMENT CORPORATION - ALL AMERICA FUND
PORTFOLIO OF INVESTMENTS IN SECURITIES
December 31, 2017
| | | | | | | | |
Incyte Corp.* | | | 1,297 | | | | 122,839 | |
Intuitive Surgical, Inc.* | | | 854 | | | | 311,659 | |
IQVIA Holdings, Inc.* | | | 1,212 | | | | 118,655 | |
Johnson & Johnson | | | 20,847 | | | | 2,912,743 | |
Laboratory Corp. of America Hldgs.* | | | 777 | | | | 123,939 | |
Lilly (Eli) & Co. | | | 7,506 | | | | 633,957 | |
McKesson Corp. | | | 1,624 | | | | 253,263 | |
Medtronic PLC | | | 10,555 | | | | 852,316 | |
Merck & Co., Inc. | | | 21,094 | | | | 1,186,959 | |
Mettler-Toledo Int’l., Inc.* | | | 195 | | | | 120,806 | |
Mylan NV* | | | 3,941 | | | | 166,744 | |
Patterson Cos., Inc. | | | 482 | | | | 17,415 | |
PerkinElmer, Inc. | | | 737 | | | | 53,889 | |
Perrigo Co. PLC | | | 1,023 | | | | 89,165 | |
Pfizer, Inc. | | | 46,144 | | | | 1,671,336 | |
Quest Diagnostics, Inc. | | | 1,080 | | | | 106,369 | |
Regeneron Pharmaceuticals, Inc.* | | | 597 | | | | 224,448 | |
ResMed, Inc. | | | 1,039 | | | | 87,993 | |
Schein (Henry), Inc.* | | | 1,247 | | | | 87,140 | |
Stryker Corp. | | | 2,521 | | | | 390,352 | |
Thermo Fisher Scientific, Inc. | | | 3,122 | | | | 592,805 | |
UnitedHealth Group, Inc. | | | 7,462 | | | | 1,645,073 | |
Universal Health Svcs., Inc. Cl B | | | 622 | | | | 70,504 | |
Varian Medical Systems, Inc.* | | | 634 | | | | 70,469 | |
Vertex Pharmaceuticals, Inc.* | | | 1,972 | | | | 295,524 | |
Waters Corp.* | | | 630 | | | | 121,710 | |
Zimmer Biomet Hldgs., Inc. | | | 1,534 | | | | 185,108 | |
Zoetis, Inc. | | | 3,681 | | | | 265,179 | |
| | | | | | | | |
| | | | | | | 24,298,725 | |
| | | | | | | | |
INDUSTRIALS (5.6%) | | | | | | | | |
3M Co. | | | 4,586 | | | | 1,079,407 | |
Acuity Brands, Inc. | | | 319 | | | | 56,144 | |
Alaska Air Group, Inc. | | | 986 | | | | 72,481 | |
Allegion PLC | | | 643 | | | | 51,157 | |
American Airlines Group, Inc. | | | 3,120 | | | | 162,334 | |
AMETEK, Inc. | | | 1,733 | | | | 125,591 | |
Arconic, Inc. | | | 3,503 | | | | 95,457 | |
Boeing Co. | | | 4,297 | | | | 1,267,228 | |
Caterpillar, Inc. | | | 4,544 | | | | 716,044 | |
Cintas Corp. | | | 667 | | | | 103,939 | |
CSX Corp. | | | 6,988 | | | | 384,410 | |
Cummins, Inc. | | | 1,244 | | | | 219,740 | |
Deere & Co. | | | 2,442 | | | | 382,197 | |
Delta Air Lines, Inc. | | | 5,070 | | | | 283,920 | |
Dover Corp. | | | 1,271 | | | | 128,358 | |
Eaton Corp. PLC | | | 3,426 | | | | 270,688 | |
Emerson Electric Co. | | | 5,002 | | | | 348,589 | |
Equifax, Inc. | | | 894 | | | | 105,420 | |
Expeditors Int’l. of Wash. | | | 1,369 | | | | 88,561 | |
Fastenal Co. | | | 2,317 | | | | 126,717 | |
FedEx Corp. | | | 1,903 | | | | 474,875 | |
Flowserve Corp. | | | 856 | | | | 36,063 | |
Fluor Corp. | | | 1,047 | | | | 54,078 | |
Fortive Corp. | | | 2,449 | | | | 177,185 | |
Fortune Brands Home & Security, Inc. | | | 1,320 | | | | 90,341 | |
General Dynamics Corp. | | | 2,126 | | | | 432,535 | |
General Electric Co. | | | 67,588 | | | | 1,179,411 | |
Grainger (W.W.), Inc. | | | 389 | | | | 91,901 | |
Harris Corp. | | | 859 | | | | 121,677 | |
Honeywell International, Inc. | | | 5,945 | | | | 911,725 | |
Hunt (J.B.) Transport Svcs., Inc. | | | 630 | | | | 72,437 | |
IHS Markit Ltd.* | | | 2,711 | | | | 122,402 | |
Illinois Tool Works, Inc. | | | 2,364 | | | | 394,433 | |
Ingersoll-Rand PLC | | | 1,832 | | | | 163,396 | |
Jacobs Engineering Group, Inc. | | | 792 | | | | 52,240 | |
Johnson Controls Int’l. PLC | | | 7,105 | | | | 270,772 | |
MUTUAL OF AMERICA INVESTMENT CORPORATION - ALL AMERICA FUND
PORTFOLIO OF INVESTMENTS IN SECURITIES
December 31, 2017
| | | | | | | | |
Kansas City Southern | | | 796 | | | | 83,755 | |
L-3 Communications Corp. | | | 633 | | | | 125,239 | |
Lockheed Martin Corp. | | | 1,922 | | | | 617,058 | |
Masco Corp. | | | 2,506 | | | | 110,114 | |
Nielsen Hldgs. PLC | | | 2,340 | | | | 85,176 | |
Norfolk Southern Corp. | | | 2,254 | | | | 326,605 | |
Northrop Grumman Corp. | | | 1,366 | | | | 419,239 | |
PACCAR, Inc. | | | 2,783 | | | | 197,816 | |
Parker Hannifin Corp. | | | 1,006 | | | | 200,777 | |
Pentair PLC | | | 1,282 | | | | 90,535 | |
Quanta Services, Inc.* | | | 1,383 | | | | 54,089 | |
Raytheon Co. | | | 2,214 | | | | 415,900 | |
Republic Services, Inc. | | | 1,870 | | | | 126,431 | |
Robert Half Int’l., Inc. | | | 970 | | | | 53,874 | |
Robinson (C.H.) Worldwide, Inc. | | | 1,025 | | | | 91,317 | |
Rockwell Automation, Inc. | | | 1,015 | | | | 199,295 | |
Rockwell Collins, Inc. | | | 1,311 | | | | 177,798 | |
Roper Technologies, Inc. | | | 765 | | | | 198,135 | |
Smith (A.O.) Corp. | | | 1,162 | | | | 71,207 | |
Snap-on, Inc. | | | 421 | | | | 73,380 | |
Southwest Airlines Co. | | | 4,133 | | | | 270,505 | |
Stanley Black & Decker, Inc. | | | 1,166 | | | | 197,859 | |
Stericycle, Inc.* | | | 783 | | | | 53,236 | |
Textron, Inc. | | | 1,918 | | | | 108,540 | |
TransDigm Group, Inc. | | | 381 | | | | 104,630 | |
Union Pacific Corp. | | | 6,064 | | | | 813,182 | |
United Continental Hldgs., Inc* | | | 1,929 | | | | 130,015 | |
United Parcel Service, Inc. Cl B | | | 5,370 | | | | 639,836 | |
United Rentals, Inc.* | | | 645 | | | | 110,882 | |
United Technologies Corp. | | | 5,756 | | | | 734,293 | |
Verisk Analytics, Inc. Cl A* | | | 1,113 | | | | 106,848 | |
Waste Management, Inc. | | | 3,084 | | | | 266,149 | |
Xylem, Inc. | | | 1,307 | | | | 89,137 | |
| | | | | | | | |
| | | | | | | 18,056,705 | |
| | | | | | | | |
INFORMATION TECHNOLOGY (12.4%) | | | | | | | | |
Accenture PLC Cl A | | | 4,764 | | | | 729,321 | |
Activision Blizzard, Inc. | | | 5,865 | | | | 371,372 | |
Adobe Systems, Inc.* | | | 3,797 | | | | 665,386 | |
Advanced Micro Devices, Inc.* | | | 6,960 | | | | 71,549 | |
Akamai Technologies, Inc.* | | | 1,237 | | | | 80,454 | |
Alliance Data Systems Corp. | | | 371 | | | | 94,041 | |
Alphabet, Inc. Cl A* | | | 2,293 | | | | 2,415,446 | |
Alphabet, Inc. Cl C* | | | 2,327 | | | | 2,434,983 | |
Amphenol Corp. Cl A | | | 2,374 | | | | 208,437 | |
Analog Devices, Inc. | | | 2,851 | | | | 253,825 | |
ANSYS, Inc.* | | | 599 | | | | 88,406 | |
Apple, Inc. | | | 39,644 | | | | 6,708,949 | |
Applied Materials, Inc. | | | 8,130 | | | | 415,606 | |
Autodesk, Inc.* | | | 1,627 | | | | 170,558 | |
Automatic Data Processing, Inc. | | | 3,444 | | | | 403,602 | |
Broadcom Ltd. | | | 3,100 | | | | 796,390 | |
CA, Inc. | | | 2,617 | | | | 87,094 | |
Cadence Design Systems, Inc.* | | | 2,036 | | | | 85,146 | |
Cisco Systems, Inc. | | | 38,059 | | | | 1,457,660 | |
Citrix Systems, Inc.* | | | 1,204 | | | | 105,952 | |
Cognizant Technology Solutions | | | 4,654 | | | | 330,527 | |
Corning, Inc. | | | 6,613 | | | | 211,550 | |
CSRA, Inc. | | | 1,170 | | | | 35,006 | |
DXC Technology Co. | | | 2,226 | | | | 211,247 | |
eBay, Inc.* | | | 7,429 | | | | 280,370 | |
Electronic Arts, Inc.* | | | 2,448 | | | | 257,187 | |
F5 Networks, Inc.* | | | 533 | | | | 69,940 | |
Facebook, Inc. Cl A* | | | 18,441 | | | | 3,254,099 | |
Fidelity Nat’l. Information Svcs., Inc. | | | 2,602 | | | | 244,822 | |
Fiserv, Inc.* | | | 1,613 | | | | 211,513 | |
FLIR Systems, Inc. | | | 1,112 | | | | 51,841 | |
MUTUAL OF AMERICA INVESTMENT CORPORATION - ALL AMERICA FUND
PORTFOLIO OF INVESTMENTS IN SECURITIES
December 31, 2017
| | | | | | | | |
Gartner, Inc.* | | | 725 | | | | 89,284 | |
Global Payments, Inc. | | | 1,230 | | | | 123,295 | |
Hewlett Packard Enterprise Co. | | | 12,216 | | | | 175,422 | |
HP, Inc. | | | 12,646 | | | | 265,692 | |
Intel Corp. | | | 36,090 | | | | 1,665,914 | |
Int’l. Business Machines Corp. | | | 6,705 | | | | 1,028,681 | |
Intuit, Inc. | | | 1,888 | | | | 297,889 | |
Juniper Networks, Inc. | | | 3,062 | | | | 87,267 | |
KLA-Tencor Corp. | | | 1,175 | | | | 123,457 | |
Lam Research Corp. | | | 1,239 | | | | 228,063 | |
Mastercard, Inc. Cl A | | | 7,163 | | | | 1,084,192 | |
Microchip Technology, Inc. | | | 1,824 | | | | 160,293 | |
Micron Technology, Inc.* | | | 8,749 | | | | 359,759 | |
Microsoft Corp. | | | 59,460 | | | | 5,086,208 | |
Motorola Solutions, Inc. | | | 1,331 | | | | 120,243 | |
NetApp, Inc. | | | 2,142 | | | | 118,495 | |
NVIDIA Corp. | | | 4,686 | | | | 906,741 | |
Oracle Corp. | | | 23,518 | | | | 1,111,931 | |
Paychex, Inc. | | | 2,538 | | | | 172,787 | |
PayPal Hldgs., Inc.* | | | 8,697 | | | | 640,273 | |
Qorvo, Inc.* | | | 1,075 | | | | 71,595 | |
QUALCOMM, Inc. | | | 11,362 | | | | 727,395 | |
Red Hat, Inc.* | | | 1,379 | | | | 165,618 | |
Salesforce.com, inc.* | | | 5,372 | | | | 549,180 | |
Seagate Technology PLC | | | 2,102 | | | | 87,948 | |
Skyworks Solutions, Inc. | | | 1,482 | | | | 140,716 | |
Symantec Corp. | | | 4,862 | | | | 136,428 | |
Synopsys, Inc.* | | | 1,202 | | | | 102,458 | |
TE Connectivity Ltd. | | | 2,752 | | | | 261,550 | |
Texas Instruments, Inc. | | | 7,697 | | | | 803,875 | |
Total System Services, Inc. | | | 1,370 | | | | 108,353 | |
VeriSign, Inc.* | | | 614 | | | | 70,266 | |
Western Digital Corp. | | | 2,385 | | | | 189,679 | |
Western Union Co. | | | 3,581 | | | | 68,075 | |
Xerox Corp. | | | 1,776 | | | | 51,772 | |
Xilinx, Inc. | | | 2,063 | | | | 139,087 | |
| | | | | | | | |
| | | | | | | 40,322,160 | |
| | | | | | | | |
MATERIALS (1.6%) | | | | | | | | |
Air Products & Chemicals, Inc. | | | 1,638 | | | | 268,763 | |
Albemarle Corp. | | | 806 | | | | 103,079 | |
Avery Dennison Corp. | | | 610 | | | | 70,065 | |
Ball Corp. | | | 2,709 | | | | 102,536 | |
CF Industries Hldgs., Inc. | | | 1,728 | | | | 73,509 | |
DowDuPont, Inc. | | | 18,077 | | | | 1,287,444 | |
Eastman Chemical Co. | | | 1,166 | | | | 108,018 | |
Ecolab, Inc. | | | 1,961 | | | | 263,127 | |
FMC Corp. | | | 958 | | | | 90,684 | |
Freeport-McMoRan, Inc.* | | | 10,531 | | | | 199,668 | |
International Paper Co. | | | 3,131 | | | | 181,410 | |
Int’l. Flavors & Fragrances, Inc. | | | 574 | | | | 87,598 | |
LyondellBasell Inds. NV Cl A | | | 2,493 | | | | 275,028 | |
Martin Marietta Materials, Inc. | | | 514 | | | | 113,615 | |
Monsanto Co. | | | 3,454 | | | | 403,358 | |
Newmont Mining Corp. | | | 3,909 | | | | 146,666 | |
Nucor Corp. | | | 2,356 | | | | 149,794 | |
Packaging Corp. of America | | | 761 | | | | 91,739 | |
PPG Industries, Inc. | | | 1,994 | | | | 232,939 | |
Praxair, Inc. | | | 2,237 | | | | 346,019 | |
Sealed Air Corp. | | | 1,441 | | | | 71,041 | |
Sherwin-Williams Co. | | | 653 | | | | 267,756 | |
The Mosaic Co. | | | 2,852 | | | | 73,182 | |
Vulcan Materials Co. | | | 1,014 | | | | 130,167 | |
WestRock Co. | | | 1,946 | | | | 123,029 | |
| | | | | | | | |
| | | | | | | 5,260,234 | |
| | | | | | | | |
REAL ESTATE (1.6%) | | | | | | | | |
Alexandria Real Estate Equities, Inc. | | | 800 | | | | 104,472 | |
MUTUAL OF AMERICA INVESTMENT CORPORATION - ALL AMERICA FUND
PORTFOLIO OF INVESTMENTS IN SECURITIES
December 31, 2017
| | | | | | | | |
American Tower Corp. | | | 3,330 | | | | 475,091 | |
Apartment Investment & Management Co. Cl A | | | 1,205 | | | | 52,671 | |
AvalonBay Communities, Inc. | | | 1,063 | | | | 189,650 | |
Boston Properties, Inc. | | | 1,238 | | | | 160,977 | |
CBRE Group, Inc.* | | | 2,463 | | | | 106,673 | |
Crown Castle Int’l. Corp. | | | 3,189 | | | | 354,011 | |
Digital Realty Trust, Inc. | | | 1,535 | | | | 174,837 | |
Duke Realty Corp. | | | 2,535 | | | | 68,977 | |
Equinix, Inc. | | | 615 | | | | 278,658 | |
Equity Residential | | | 2,954 | | | | 188,377 | |
Essex Property Trust, Inc. | | | 492 | | | | 118,754 | |
Extra Space Storage, Inc. | | | 1,018 | | | | 89,024 | |
Federal Realty Investment Trust | | | 534 | | | | 70,921 | |
GGP, Inc. | | | 4,520 | | | | 105,723 | |
HCP, Inc. | | | 3,892 | | | | 101,503 | |
Host Hotels & Resorts, Inc. | | | 5,281 | | | | 104,828 | |
Iron Mountain, Inc. | | | 2,163 | | | | 81,610 | |
Kimco Realty Corp. | | | 2,859 | | | | 51,891 | |
Mid-America Apt. Communities, Inc. | | | 854 | | | | 85,878 | |
ProLogis, Inc. | | | 4,027 | | | | 259,782 | |
Public Storage | | | 1,171 | | | | 244,739 | |
Realty Income Corp. | | | 2,149 | | | | 122,536 | |
Regency Centers Corp. | | | 1,259 | | | | 87,098 | |
SBA Communications Corp. Cl A* | | | 860 | | | | 140,490 | |
Simon Property Group, Inc. | | | 2,411 | | | | 414,065 | |
SL Green Realty Corp | | | 682 | | | | 68,834 | |
The Macerich Co. | | | 803 | | | | 52,741 | |
UDR, Inc. | | | 2,237 | | | | 86,169 | |
Ventas, Inc. | | | 2,746 | | | | 164,787 | |
Vornado Realty Trust | | | 1,362 | | | | 106,481 | |
Welltower, Inc. | | | 2,897 | | | | 184,742 | |
Weyerhaeuser Co. | | | 5,867 | | | | 206,870 | |
| | | | | | | | |
| | | | | | | 5,103,860 | |
| | | | | | | | |
TELECOMMUNICATION SERVICES (1.1%) | | | | | | | | |
AT&T, Inc. | | | 47,642 | | | | 1,852,321 | |
CenturyLink, Inc. | | | 7,337 | | | | 122,381 | |
Verizon Communications, Inc. | | | 31,549 | | | | 1,669,889 | |
| | | | | | | | |
| | | | | | | 3,644,591 | |
| | | | | | | | |
UTILITIES (1.6%) | | | | | | | | |
AES Corp. | | | 4,901 | | | | 53,078 | |
Alliant Energy Corp. | | | 1,597 | | | | 68,048 | |
Ameren Corp. | | | 2,017 | | | | 118,983 | |
American Electric Power Co., Inc. | | | 3,914 | | | | 287,953 | |
American Water Works Co., Inc. | | | 1,347 | | | | 123,237 | |
CenterPoint Energy, Inc. | | | 3,064 | | | | 86,895 | |
CMS Energy Corp. | | | 2,152 | | | | 101,790 | |
Consolidated Edison, Inc. | | | 2,402 | | | | 204,050 | |
Dominion Resources, Inc. | | | 5,002 | | | | 405,462 | |
DTE Energy Co. | | | 1,406 | | | | 153,901 | |
Duke Energy Corp. | | | 5,423 | | | | 456,129 | |
Edison International | | | 2,518 | | | | 159,238 | |
Entergy Corp. | | | 1,474 | | | | 119,969 | |
Eversource Energy | | | 2,463 | | | | 155,612 | |
Exelon Corp. | | | 7,340 | | | | 289,269 | |
FirstEnergy Corp. | | | 3,299 | | | | 101,015 | |
NextEra Energy, Inc. | | | 3,681 | | | | 574,935 | |
NiSource, Inc. | | | 2,660 | | | | 68,282 | |
NRG Energy, Inc. | | | 2,543 | | | | 72,425 | |
PG&E Corp. | | | 3,983 | | | | 178,558 | |
Pinnacle West Capital Corp. | | | 789 | | | | 67,207 | |
PPL Corp. | | | 5,216 | | | | 161,435 | |
Public Svc. Enterprise Group, Inc. | | | 4,060 | | | | 209,090 | |
SCANA Corp. | | | 1,179 | | | | 46,901 | |
Sempra Energy | | | 1,960 | | | | 209,563 | |
Southern Co. | | | 7,846 | | | | 377,314 | |
WEC Energy Group, Inc. | | | 2,335 | | | | 155,114 | |
MUTUAL OF AMERICA INVESTMENT CORPORATION - ALL AMERICA FUND
PORTFOLIO OF INVESTMENTS IN SECURITIES
December 31, 2017
| | | | | | | | |
Xcel Energy, Inc. | | | 3,833 | | | | 184,406 | |
| | | | | | | | |
| | | | | | | 5,189,859 | |
| | | | | | | | |
TOTAL INDEXED ASSETS - COMMON STOCKS
(Cost: $101,957,136) 54.3% | | | | | | | 176,365,874 | |
| | | | | |
| | | | | | | | | | | | | | | | | | | | |
| | | Rating** | | | Rate(%) | | | Maturity | | | Face Amount | | | Value | |
INDEXED ASSETS: | | | | | | | | | | | | | | | | | | | | |
SHORT-TERM DEBT SECURITIES: | | | | | | | | | | | | | | | | | | | | |
U.S. GOVERNMENT (2.2%) | | | | | | | | | | | | | | | | | | | | |
U.S. Treasury Bill (1) | | | A-1+ | | | | 1.05 | | | | 01/04/18 | | | | 300,000 | | | | 299,956 | |
U.S. Treasury Bill (1) | | | A-1+ | | | | 1.10 | | | | 01/04/18 | | | | 5,005,000 | | | | 5,004,232 | |
U.S. Treasury Bill (1) | | | A-1+ | | | | 1.15 | | | | 01/04/18 | | | | 2,000,000 | | | | 1,999,679 | |
| | | | | | | | | | | | | | | | | | | | |
| | | | | | | | | | | | | | | | | | | 7,303,867 | |
| | | | | | | | | | | | | | | | | | | | |
COMMERCIAL PAPER (1.2%) | | | | | | | | | | | | | | | | | | | | |
Estee Lauder Cos.† | | | A-1 | | | | 1.40 | | | | 01/02/18 | | | | 1,800,000 | | | | 1,799,790 | |
J.P. Morgan Securities LLC | | | A-1 | | | | 1.55 | | | | 01/04/18 | | | | 2,000,000 | | | | 1,999,569 | |
| | | | | | | | | | | | | | | | | | | | |
| | | | | | | | | | | | | | | | | | | 3,799,359 | |
| | | | | | | | | | | | | | | | | | | | |
TOTAL INDEXED ASSETS - SHORT-TERM DEBT SECURITIES (Cost: $11,103,226) 3.4% | | | | | | | | | | | | | | | | | | | 11,103,226 | |
| | | | | | | | |
TOTAL INDEXED ASSETS
(Cost: $113,060,362) 57.7% | | | | | | | | | | | | | | | | | | | 187,469,100 | |
| | | | | | | | | | | | | | | | | | | | |
| | | | | | | | |
| | | Shares | | | Value | |
ACTIVE ASSETS: | | | | | | | | |
COMMON STOCKS: | | | | | | | | |
CONSUMER DISCRETIONARY (4.5%) | | | | | | | | |
AMC Entertainment Hldgs., Inc. Cl A | | | 9,340 | | | | 141,034 | |
AMC Networks, Inc. Cl A* | | | 2,306 | | | | 124,708 | |
American Axle & Mfg. Hldgs., Inc.* | | | 12,277 | | | | 209,077 | |
AutoZone, Inc.* | | | 927 | | | | 659,440 | |
Bassett Furniture Industries, Inc. | | | 2,259 | | | | 84,938 | |
Belmond Ltd.* | | | 21,722 | | | | 266,095 | |
Bloomin’ Brands, Inc. | | | 13,895 | | | | 296,519 | |
BorgWarner, Inc. | | | 8,551 | | | | 436,871 | |
Bright Horizons Family Solutions, Inc.* | | | 4,161 | | | | 391,134 | |
Cooper Tire & Rubber Co. | | | 5,300 | | | | 187,355 | |
Dave & Buster’s Entertainment, Inc.* | | | 10,861 | | | | 599,202 | |
Expedia, Inc. | | | 1,178 | | | | 141,089 | |
Five Below, Inc.* | | | 14,968 | | | | 992,678 | |
Haverty Furniture Cos., Inc. | | | 15,779 | | | | 357,394 | |
Houghton Mifflin Harcourt Co.* | | | 43,747 | | | | 406,847 | |
ILG, Inc. | | | 8,452 | | | | 240,713 | |
Liberty Interactive Corp. Ser. A QVC Group* | | | 11,438 | | | | 279,316 | |
Lions Gate Entertainment Corp. Cl A* | | | 16,474 | | | | 556,986 | |
Lions Gate Entertainment Corp. Cl B* | | | 16,474 | | | | 522,884 | |
Lithia Motors, Inc. Cl A | | | 6,965 | | | | 791,154 | |
Marriott International, Inc. Cl A | | | 4,399 | | | | 597,076 | |
MSG Networks, Inc.* | | | 14,607 | | | | 295,792 | |
NVR, Inc.* | | | 110 | | | | 385,904 | |
Playa Hotels & Resorts NV* | | | 30,123 | | | | 325,027 | |
Ralph Lauren Corp. | | | 4,717 | | | | 489,106 | |
Red Rock Resorts, Inc. Cl A | | | 15,146 | | | | 511,026 | |
Scripps Networks Interactive, Inc. Cl A | | | 7,146 | | | | 610,125 | |
Signet Jewelers Ltd. | | | 3,675 | | | | 207,822 | |
Sleep Number Corp.* | | | 39,361 | | | | 1,479,580 | |
Steve Madden Ltd.* | | | 5,597 | | | | 261,380 | |
Taylor Morrison Home Corp. Cl A* | | | 3,067 | | | | 75,049 | |
Thor Industries, Inc. | | | 5,696 | | | | 858,501 | |
Tractor Supply Co. | | | 6,602 | | | | 493,500 | |
Unifi, Inc.* | | | 7,028 | | | | 252,094 | |
Wiley (John) & Sons, Inc. Cl A | | | 3,206 | | | | 210,795 | |
| | | | | | | | |
| | | | | | | 14,738,211 | |
| | | | | | | | |
MUTUAL OF AMERICA INVESTMENT CORPORATION - ALL AMERICA FUND
PORTFOLIO OF INVESTMENTS IN SECURITIES
December 31, 2017
| | | | | | | | |
CONSUMER STAPLES (1.1%) | | | | | | | | |
Cal-Maine Foods, Inc.* | | | 6,459 | | | | 287,102 | |
Church & Dwight Co., Inc. | | | 9,891 | | | | 496,231 | |
Constellation Brands, Inc. Cl A | | | 2,326 | | | | 531,654 | |
Crimson Wine Group Ltd.* | | | 40,194 | | | | 428,870 | |
Edgewell Personal Care Co.* | | | 1,800 | | | | 106,902 | |
Ingredion, Inc. | | | 1,985 | | | | 277,503 | |
J.M. Smucker Co. | | | 2,578 | | | | 320,291 | |
Orchids Paper Products Co. | | | 27,547 | | | | 352,602 | |
Vector Group Ltd. | | | 27,452 | | | | 614,379 | |
WD-40 Co. | | | 2,136 | | | | 252,048 | |
| | | | | | | | |
| | | | | | | 3,667,582 | |
| | | | | | | | |
ENERGY (2.1%) | | | | | | | | |
Abraxas Petroleum Corp.* | | | 44,432 | | | | 109,303 | |
Andeavor | | | 1,027 | | | | 117,427 | |
Baker Hughes, a GE Co. | | | 4,199 | | | | 132,856 | |
Carrizo Oil and Gas, Inc.* | | | 11,474 | | | | 244,167 | |
Centennial Resource Dev., Inc. Cl A* | | | 15,282 | | | | 302,584 | |
Cheniere Energy, Inc.* | | | 3,558 | | | | 191,563 | |
Concho Resources, Inc.* | | | 1,292 | | | | 194,084 | |
Continental Resources, Inc.* | | | 9,434 | | | | 499,719 | |
CrossAmerica Partners LP | | | 7,925 | | | | 188,219 | |
Devon Energy Corp. | | | 5,626 | | | | 232,916 | |
Ensco PLC Cl A | | | 21,028 | | | | 124,275 | |
Gulfport Energy Corp.* | | | 12,161 | | | | 155,174 | |
Hess Corp. | | | 1,838 | | | | 87,250 | |
Matador Resources Co.* | | | 4,062 | | | | 126,450 | |
Matrix Service Co.* | | | 4,269 | | | | 75,988 | |
MPLX LP | | | 3,872 | | | | 137,340 | |
Nabors Industries Ltd. | | | 28,195 | | | | 192,572 | |
Newfield Exploration Co.* | | | 6,966 | | | | 219,638 | |
Noble Energy, Inc. | | | 6,083 | | | | 177,259 | |
PBF Energy, Inc. | | | 28,931 | | | | 1,025,604 | |
PDC Energy, Inc.* | | | 4,443 | | | | 228,992 | |
Range Resources Corp. | | | 37,807 | | | | 644,987 | |
Ring Energy, Inc.* | | | 18,107 | | | | 251,687 | |
RPC, Inc. | | | 18,385 | | | | 469,369 | |
Weatherford Int’l. PLC* | | | 11,730 | | | | 48,914 | |
Williams Cos., Inc. | | | 16,894 | | | | 515,098 | |
| | | | | | | | |
| | | | | | | 6,693,435 | |
| | | | | | | | |
FINANCIALS (7.7%) | | | | | | | | |
American Equity Investment Life Hldg. Co. | | | 12,331 | | | | 378,932 | |
American Financial Group, Inc. | | | 2,947 | | | | 319,867 | |
Ameriprise Financial, Inc. | | | 4,284 | | | | 726,009 | |
AMERISAFE, Inc. | | | 2,027 | | | | 124,863 | |
Aspen Insurance Hldgs. Ltd. | | | 6,966 | | | | 282,820 | |
Associated Banc-Corp. | | | 25,875 | | | | 657,225 | |
BancFirst Corp. | | | 8,791 | | | | 449,660 | |
Bank of Marin Bancorp | | | 3,612 | | | | 245,616 | |
BankUnited, Inc. | | | 5,506 | | | | 224,204 | |
Banner Corp. | | | 7,101 | | | | 391,407 | |
Brookline Bancorp, Inc. | | | 27,256 | | | | 427,919 | |
Brown & Brown, Inc. | | | 3,167 | | | | 162,974 | |
Bryn Mawr Bank Corp. | | | 7,768 | | | | 343,346 | |
Cadence Bancorporation* | | | 6,464 | | | | 175,304 | |
CBOE Holdings, Inc. | | | 3,201 | | | | 398,813 | |
Charter Financial Corp. | | | 14,939 | | | | 262,030 | |
CIT Group, Inc. | | | 3,865 | | | | 190,274 | |
Citizens Financial Group, Inc. | | | 3,040 | | | | 127,619 | |
Customers Bancorp, Inc.* | | | 3,954 | | | | 102,764 | |
Dime Community Bancshares | | | 12,775 | | | | 267,636 | |
Discover Financial Svcs. | | | 6,169 | | | | 474,520 | |
East West Bancorp, Inc. | | | 4,925 | | | | 299,588 | |
Ellington Financial LLC | | | 23,909 | | | | 346,920 | |
Enterprise Financial Svcs. Corp. | | | 8,726 | | | | 393,979 | |
Everest Re Group Ltd. | | | 1,801 | | | | 398,490 | |
Fifth Third Bancorp | | | 18,569 | | | | 563,384 | |
MUTUAL OF AMERICA INVESTMENT CORPORATION - ALL AMERICA FUND
PORTFOLIO OF INVESTMENTS IN SECURITIES
December 31, 2017
| | | | | | | | |
First Connecticut Bancorp, Inc. | | | 6,481 | | | | 169,478 | |
First Interstate BancSytem, Inc. | | | 9,534 | | | | 381,837 | |
First Merchants Corp. | | | 5,945 | | | | 250,047 | |
First Republic Bank/CA | | | 3,596 | | | | 311,557 | |
Flushing Financial Corp. | | | 9,862 | | | | 271,205 | |
Glacier Bancorp, Inc. | | | 8,950 | | | | 352,541 | |
Great Southern Bancorp, Inc. | | | 3,403 | | | | 175,765 | |
Hanmi Financial Corp. | | | 4,576 | | | | 138,882 | |
Hartford Financial Svcs. Group, Inc. | | | 12,813 | | | | 721,115 | |
Heritage Financial Corp. | | | 8,200 | | | | 252,560 | |
IBERIABANK Corp. | | | 1,128 | | | | 87,420 | |
Investors Bancorp, Inc. | | | 19,275 | | | | 267,537 | |
iShares Russell Mid-Cap ETF | | | 1,000 | | | | 208,130 | |
iShares Russell Mid-Cap Value ETF | | | 2,820 | | | | 251,403 | |
KeyCorp | | | 39,797 | | | | 802,706 | |
Lincoln National Corp. | | | 3,761 | | | | 289,108 | |
Luther Burbank Corp.* | | | 7,170 | | | | 86,327 | |
Marlin Business Svcs. Corp. | | | 15,158 | | | | 339,539 | |
MB Financial, Inc. | | | 5,567 | | | | 247,843 | |
Moelis & Co. Cl A | | | 7,672 | | | | 372,092 | |
NMI Hldgs., Inc. Cl A* | | | 32,875 | | | | 558,875 | |
Northfield Bancorp, Inc. | | | 20,098 | | | | 343,274 | |
Pinnacle Financial Partners, Inc. | | | 3,142 | | | | 208,315 | |
PowerShares KBW Bank Portfolio | | | 4,370 | | | | 240,481 | |
Principal Financial Grp., Inc. | | | 3,725 | | | | 262,836 | |
Progressive Corp. | | | 13,155 | | | | 740,890 | |
Prosperity Bancshares, Inc. | | | 2,481 | | | | 173,844 | |
Raymond James Financial, Inc. | | | 4,584 | | | | 409,351 | |
Reinsurance Grp. of America, Inc. | | | 5,387 | | | | 839,995 | |
S&T Bancorp, Inc. | | | 5,559 | | | | 221,304 | |
SEI Investments Co. | | | 5,144 | | | | 369,648 | |
Selective Insurance Group, Inc. | | | 8,757 | | | | 514,036 | |
Starwood Property Trust, Inc. | | | 44,072 | | | | 940,937 | |
Sterling Bancorp | | | 4,908 | | | | 120,737 | |
Stock Yards Bancorp, Inc. | | | 16,019 | | | | 603,916 | |
SVB Financial Group* | | | 5,897 | | | | 1,378,542 | |
Synchrony Financial | | | 3,708 | | | | 143,166 | |
TriCo Bancshares | | | 5,319 | | | | 201,377 | |
TriState Capital Hldgs., Inc.* | | | 9,772 | | | | 224,756 | |
UMB Financial Corp. | | | 2,777 | | | | 199,722 | |
United Financial Bancorp, Inc. | | | 3,828 | | | | 67,526 | |
United Insurance Hldgs. Corp. | | | 10,029 | | | | 173,000 | |
Voya Financial, Inc. | | | 6,253 | | | | 309,336 | |
Waterstone Financial, Inc. | | | 5,714 | | | | 97,424 | |
Webster Financial Corp. | | | 6,904 | | | | 387,729 | |
Wintrust Financial Corp. | | | 1,911 | | | | 157,409 | |
Zions Bancorporation | | | 4,945 | | | | 251,354 | |
| | | | | | | | |
| | | | | | | 24,853,035 | |
| | | | | | | | |
HEALTH CARE (4.4%) | | | | | | | | |
Abiomed, Inc.* | | | 2,044 | | | | 383,066 | |
Acadia Healthcare Co., Inc.* | | | 16,985 | | | | 554,220 | |
ACADIA Pharmaceuticals, Inc.* | | | 4,794 | | | | 144,348 | |
Acceleron Pharma, Inc.* | | | 3,341 | | | | 141,792 | |
Agilent Technologies, Inc. | | | 5,417 | | | | 362,777 | |
Agios Pharmaceuticals, Inc.* | | | 1,735 | | | | 99,190 | |
Akebia Therapeutics, Inc.* | | | 6,206 | | | | 92,283 | |
Align Technology, Inc.* | | | 1,331 | | | | 295,735 | |
Amicus Therapeutics, Inc.* | | | 11,706 | | | | 168,449 | |
Anika Therapeutics, Inc.* | | | 2,958 | | | | 159,466 | |
Becton, Dickinson & Co. | | | 747 | | | | 159,866 | |
BioMarin Pharmaceutical, Inc.* | | | 1,232 | | | | 109,857 | |
BioSpecifics Technologies Corp.* | | | 3,132 | | | | 135,710 | |
bluebird bio, Inc.* | | | 2,171 | | | | 386,655 | |
Boston Scientific Corp.* | | | 11,746 | | | | 291,184 | |
Cambrex Corp.* | | | 1,434 | | | | 68,832 | |
Catalent, Inc.* | | | 4,813 | | | | 197,718 | |
MUTUAL OF AMERICA INVESTMENT CORPORATION - ALL AMERICA FUND
PORTFOLIO OF INVESTMENTS IN SECURITIES
December 31, 2017
| | | | | | | | |
Centene Corp.* | | | 4,424 | | | | 446,293 | |
Chemed Corp. | | | 1,092 | | | | 265,378 | |
Clovis Oncology, Inc.* | | | 2,236 | | | | 152,048 | |
Dyax Corp. - contingent value rights* | | | 6,315 | | | | 0 | †† |
Edwards Lifesciences Corp.* | | | 3,452 | | | | 389,075 | |
Emergent Biosolutions, Inc.* | | | 7,264 | | | | 337,558 | |
Envision Healthcare Corp.* | | | 12,743 | | | | 440,398 | |
Exact Sciences Corp.* | | | 6,037 | | | | 317,184 | |
Hill-Rom Hldgs., Inc. | | | 2,029 | | | | 171,024 | |
Humana, Inc. | | | 856 | | | | 212,348 | |
ICU Medical, Inc.* | | | 571 | | | | 123,336 | |
Incyte Corp.* | | | 1,024 | | | | 96,983 | |
Insulet Corp.* | | | 3,318 | | | | 228,942 | |
Intersect ENT, Inc.* | | | 4,617 | | | | 149,591 | |
Intuitive Surgical, Inc.* | | | 476 | | | | 173,711 | |
iRhythm Technologies, Inc.* | | | 2,378 | | | | 133,287 | |
Karyopharm Therapeutics, Inc.* | | | 8,856 | | | | 85,018 | |
Medicines Co.* | | | 3,363 | | | | 91,944 | |
Mettler-Toledo Int’l., Inc.* | | | 568 | | | | 351,887 | |
Nektar Therapeutics* | | | 3,489 | | | | 208,363 | |
Neogen Corp.* | | | 2,156 | | | | 177,245 | |
Neurocrine Biosciences, Inc.* | | | 9,004 | | | | 698,620 | |
Nevro Corp.* | | | 3,102 | | | | 214,162 | |
NuVasive, Inc.* | | | 2,183 | | | | 127,684 | |
Omeros Corp.* | | | 6,171 | | | | 119,903 | |
Omnicell, Inc.* | | | 8,149 | | | | 395,227 | |
OSI Pharmaceuticals, Inc. - rights* | | | 1,570 | | | | 16 | †† |
Pacific Biosciences of CA, Inc.* | | | 26,523 | | | | 70,021 | |
Pacira Pharmaceuticals, Inc.* | | | 8,387 | | | | 382,867 | |
Penumbra, Inc.* | | | 1,870 | | | | 175,967 | |
PRA Health Sciences, Inc.* | | | 1,667 | | | | 151,814 | |
Prestige Brands Hldgs., Inc.* | | | 2,767 | | | | 122,882 | |
Prothena Corp. PLC* | | | 2,994 | | | | 112,245 | |
Radius Health, Inc.* | | | 2,788 | | | | 88,575 | |
Repligen Corp.* | | | 4,761 | | | | 172,729 | |
Sage Therapeutics, Inc.* | | | 1,972 | | | | 324,808 | |
Spark Therapeutics, Inc.* | | | 1,973 | | | | 101,452 | |
Supernus Pharmaceuticals, Inc.* | | | 20,049 | | | | 798,953 | |
Ultragenyx Pharmaceutical, Inc.* | | | 2,088 | | | | 96,841 | |
United Therapeutics Corp.* | | | 622 | | | | 92,025 | |
WellCare Health Plans, Inc.* | | | 2,528 | | | | 508,406 | |
Wright Medical Group NV* | | | 15,330 | | | | 340,326 | |
Zimmer Biomet Hldgs., Inc. | | | 3,392 | | | | 409,313 | |
Zoetis, Inc. | | | 6,268 | | | | 451,547 | |
Zogenix, Inc.* | | | 1,716 | | | | 68,726 | |
| | | | | | | | |
| | | | | | | 14,327,870 | |
| | | | | | | | |
INDUSTRIALS (6.8%) | | | | | | | | |
AeroVironment, Inc.* | | | 2,055 | | | | 115,409 | |
Alaska Air Group, Inc. | | | 8,437 | | | | 620,204 | |
Altra Industrial Motion Corp. | | | 3,144 | | | | 158,458 | |
AMERCO | | | 506 | | | | 191,222 | |
Astronics Corp.* | | | 6,280 | | | | 260,430 | |
AZZ, Inc. | | | 2,113 | | | | 107,974 | |
BMC Stock Hldgs., Inc.* | | | 23,373 | | | | 591,337 | |
Builders FirstSource, Inc.* | | | 12,604 | | | | 274,641 | |
Carlisle Cos., Inc. | | | 6,787 | | | | 771,343 | |
Copart, Inc.* | | | 4,995 | | | | 215,734 | |
Daseke, Inc.* | | | 16,360 | | | | 233,784 | |
Deluxe Corp. | | | 7,083 | | | | 544,258 | |
Dover Corp. | | | 3,762 | | | | 379,924 | |
Echo Global Logistics, Inc.* | | | 7,263 | | | | 203,364 | |
EMCOR Group, Inc. | | | 2,536 | | | | 207,318 | |
Encore Wire Corp. | | | 7,586 | | | | 369,059 | |
EnPro Industries, Inc. | | | 6,336 | | | | 592,479 | |
Fortune Brands Home & Security, Inc. | | | 4,686 | | | | 320,710 | |
Generac Hldgs., Inc.* | | | 4,206 | | | | 208,281 | |
MUTUAL OF AMERICA INVESTMENT CORPORATION - ALL AMERICA FUND
PORTFOLIO OF INVESTMENTS IN SECURITIES
December 31, 2017
| | | | | | | | |
GMS, Inc.* | | | 5,102 | | | | 192,039 | |
Granite Construction, Inc. | | | 14,101 | | | | 894,427 | |
H&E Equipment Services | | | 4,995 | | | | 203,047 | |
Harris Corp. | | | 3,604 | | | | 510,507 | |
Healthcare Svcs. Group, Inc. | | | 7,016 | | | | 369,884 | |
Hyster-Yale Materials Handling, Inc. Cl A | | | 3,314 | | | | 282,220 | |
ICF International, Inc.* | | | 2,663 | | | | 139,808 | |
IHS Markit Ltd.* | | | 2,489 | | | | 112,378 | |
InnerWorkings, Inc.* | | | 16,153 | | | | 162,015 | |
John Bean Technologies Corp. | | | 2,218 | | | | 245,754 | |
Kirby Corp.* | | | 8,036 | | | | 536,804 | |
L-3 Communications Corp. | | | 4,498 | | | | 889,929 | |
Landstar System, Inc. | | | 6,528 | | | | 679,565 | |
Lennox International, Inc. | | | 1,585 | | | | 330,092 | |
Lincoln Electric Hldgs., Inc. | | | 3,318 | | | | 303,862 | |
LSC Communications, Inc. | | | 21,252 | | | | 321,968 | |
Miller Industries, Inc. | | | 20,191 | | | | 520,928 | |
Mueller Industries, Inc. | | | 29,136 | | | | 1,032,288 | |
Mueller Water Products, Inc. Cl A | | | 23,210 | | | | 290,821 | |
NCI Building Systems, Inc.* | | | 11,617 | | | | 224,208 | |
Nordson Corp. | | | 2,245 | | | | 328,668 | |
Old Dominion Freight Line, Inc. | | | 7,033 | | | | 925,191 | |
Orbital ATK, Inc. | | | 2,284 | | | | 300,346 | |
Oshkosh Corp. | | | 2,533 | | | | 230,224 | |
Quanex Building Products Corp. | | | 5,512 | | | | 128,981 | |
Republic Services, Inc. | | | 1,880 | | | | 127,107 | |
Rockwell Automation, Inc. | | | 4,161 | | | | 817,012 | |
Roper Technologies, Inc. | | | 807 | | | | 209,013 | |
Schneider National, Inc. Cl B | | | 5,021 | | | | 143,400 | |
Simpson Manufacturing Co., Inc. | | | 2,328 | | | | 133,650 | |
Smith (A.O.) Corp. | | | 3,165 | | | | 193,951 | |
Stanley Black & Decker, Inc. | | | 2,380 | | | | 403,862 | |
Sun Hydraulics Corp. | | | 6,729 | | | | 435,299 | |
Teledyne Technologies, Inc.* | | | 2,230 | | | | 403,965 | |
Trex Co., Inc.* | | | 3,233 | | | | 350,425 | |
Tutor Perini Corp.* | | | 6,047 | | | | 153,291 | |
United Rentals, Inc.* | | | 4,822 | | | | 828,950 | |
Universal Forest Products, Inc. | | | 14,349 | | | | 539,809 | |
VSE Corp. | | | 7,363 | | | | 356,590 | |
Wabtec Corp. | | | 3,319 | | | | 270,266 | |
XPO Logistics, Inc.* | | | 1,020 | | | | 93,422 | |
| | | | | | | | |
| | | | | | | 21,981,895 | |
| | | | | | | | |
INFORMATION TECHNOLOGY (6.1%) | | | | | | | | |
Acacia Communications, Inc.* | | | 2,784 | | | | 100,864 | |
Advanced Energy Industries, Inc.* | | | 1,781 | | | | 120,182 | |
Aerohive Networks, Inc.* | | | 20,020 | | | | 116,717 | |
Akamai Technologies, Inc.* | | | 3,230 | | | | 210,079 | |
Ambarella, Inc.* | | | 1,562 | | | | 91,768 | |
Amphenol Corp. Cl A | | | 4,928 | | | | 432,678 | |
Analog Devices, Inc. | | | 4,510 | | | | 401,525 | |
Anixter International, Inc.* | | | 2,650 | | | | 201,400 | |
ARRIS International PLC* | | | 8,188 | | | | 210,349 | |
Avnet, Inc. | | | 8,602 | | | | 340,811 | |
Belden, Inc. | | | 3,139 | | | | 242,237 | |
Cabot MicroElectronics Corp. | | | 910 | | | | 85,613 | |
Callidus Software, Inc.* | | | 16,838 | | | | 482,409 | |
Coherent, Inc.* | | | 841 | | | | 237,347 | |
CommVault Systems, Inc.* | | | 7,785 | | | | 408,713 | |
Comtech Telecommunications Corp. | | | 9,260 | | | | 204,831 | |
Cornerstone OnDemand, Inc.* | | | 3,019 | | | | 106,661 | |
Cray, Inc.* | | | 3,455 | | | | 83,611 | |
Cypress Semiconductor Corp. | | | 29,054 | | | | 442,782 | |
DXC Technology Co. | | | 7,693 | | | | 730,066 | |
Entegris, Inc. | | | 5,554 | | | | 169,119 | |
EPAM Systems, Inc.* | | | 3,635 | | | | 390,508 | |
Euronet Worldwide, Inc.* | | | 3,669 | | | | 309,187 | |
MUTUAL OF AMERICA INVESTMENT CORPORATION - ALL AMERICA FUND
PORTFOLIO OF INVESTMENTS IN SECURITIES
December 31, 2017
| | | | | | | | |
Everspin Technologies, Inc.* | | | 10,701 | | | | 80,258 | |
F5 Networks, Inc.* | | | 408 | | | | 53,538 | |
Fair Isaac Corp. | | | 1,210 | | | | 185,372 | |
Fidelity Nat’l. Information Svcs., Inc. | | | 4,512 | | | | 424,534 | |
Finisar Corp.* | | | 2,957 | | | | 60,175 | |
Five9, Inc.* | | | 6,748 | | | | 167,890 | |
Global Payments, Inc. | | | 3,968 | | | | 397,752 | |
Globant S.A.* | | | 3,307 | | | | 153,643 | |
Grubhub, Inc.* | | | 2,009 | | | | 144,246 | |
Guidewire Software, Inc.* | | | 2,832 | | | | 210,304 | |
II-VI, Inc.* | | | 7,668 | | | | 360,013 | |
Integrated Device Technology, Inc.* | | | 6,260 | | | | 186,110 | |
KLA-Tencor Corp. | | | 3,646 | | | | 383,085 | |
Littelfuse, Inc. | | | 998 | | | | 197,424 | |
LogMeIn, Inc. | | | 6,055 | | | | 693,298 | |
Lumentum Hldgs., Inc.* | | | 5,043 | | | | 246,603 | |
Match Group, Inc.* | | | 4,140 | | | | 129,623 | |
MAXIMUS, Inc. | | | 1,654 | | | | 118,393 | |
MaxLinear, Inc. Cl A* | | | 15,229 | | | | 402,350 | |
Microchip Technology, Inc. | | | 2,699 | | | | 237,188 | |
MKS Instruments, Inc. | | | 4,170 | | | | 394,066 | |
Monolithic Power Systems, Inc. | | | 2,111 | | | | 237,192 | |
New Relic, Inc.* | | | 5,582 | | | | 322,472 | |
Nutanix, Inc. Cl A* | | | 3,395 | | | | 119,776 | |
Oclaro, Inc.* | | | 13,141 | | | | 88,570 | |
Paycom Software, Inc.* | | | 2,401 | | | | 192,872 | |
Perficient, Inc.* | | | 9,507 | | | | 181,298 | |
Plexus Corp.* | | | 3,735 | | | | 226,789 | |
Proofpoint, Inc.* | | | 8,354 | | | | 741,918 | |
PTC, Inc.* | | | 7,153 | | | | 434,688 | |
Q2 Hldgs., Inc.* | | | 3,355 | | | | 123,632 | |
Rapid7, Inc.* | | | 6,928 | | | | 129,276 | |
Red Hat, Inc.* | | | 3,125 | | | | 375,313 | |
Richardson Electronics Ltd. | | | 41,267 | | | | 278,140 | |
Science Applications Int’l. Corp. | | | 3,668 | | | | 280,859 | |
Sequans Communications S.A. ADR* | | | 103,493 | | | | 197,671 | |
Skyworks Solutions, Inc. | | | 3,709 | | | | 352,170 | |
Splunk, Inc.* | | | 4,036 | | | | 334,342 | |
Stamps.com, Inc.* | | | 3,700 | | | | 695,600 | |
Symantec Corp. | | | 2,968 | | | | 83,282 | |
SYNNEX Corp. | | | 2,395 | | | | 325,600 | |
Synopsys, Inc.* | | | 2,337 | | | | 199,206 | |
Take-Two Interactive Software, Inc.* | | | 2,911 | | | | 319,570 | |
Vantiv, Inc. Cl A* | | | 4,347 | | | | 319,722 | |
ViaSat, Inc.* | | | 6,405 | | | | 479,414 | |
Western Digital Corp. | | | 1,622 | | | | 128,998 | |
Workday, Inc.* | | | 1,162 | | | | 118,222 | |
Xilinx, Inc. | | | 2,920 | | | | 196,866 | |
Xperi Corp. | | | 16,985 | | | | 414,434 | |
Xura, Inc.* | | | 11,415 | | | | 285,375 | †† |
Zendisk, Inc.* | | | 8,505 | | | | 287,809 | |
| | | | | | | | |
| | | | | | | 19,816,398 | |
| | | | | | | | |
MATERIALS (2.7%) | | | | | | | | |
Ashland Global Holdings, Inc. | | | 2,245 | | | | 159,844 | |
Axalta Coating Systems Ltd.* | | | 17,545 | | | | 567,756 | |
Berry Global Group, Inc.* | | | 4,044 | | | | 237,261 | |
Boise Cascade Co. | | | 6,225 | | | | 248,378 | |
Crown Hldgs., Inc.* | | | 13,630 | | | | 766,688 | |
Eastman Chemical Co. | | | 3,793 | | | | 351,384 | |
Ferro Corp.* | | | 30,631 | | | | 722,585 | |
Ferroglobe PLC | | | 27,523 | | | | 445,872 | |
Ferroglobe Representation & Warranty Insurance Trust* | | | 6,080 | | | | 0 | †† |
Freeport-McMoRan, Inc.* | | | 11,223 | | | | 212,788 | |
International Paper Co. | | | 4,253 | | | | 246,419 | |
Kaiser Aluminum Corp. | | | 3,436 | | | | 367,137 | |
Kraton Corp.* | | | 6,203 | | | | 298,799 | |
MUTUAL OF AMERICA INVESTMENT CORPORATION - ALL AMERICA FUND
PORTFOLIO OF INVESTMENTS IN SECURITIES
December 31, 2017
| | | | | | | | |
Minerals Technologies, Inc. | | | 3,444 | | | | 237,119 | |
Nucor Corp. | | | 2,273 | | | | 144,517 | |
Orion Engineered Carbons S.A. | | | 10,230 | | | | 261,888 | |
Packaging Corp. of America | | | 7,768 | | | | 936,433 | |
RPM International, Inc. | | | 2,331 | | | | 122,191 | |
Steel Dynamics, Inc. | | | 18,050 | | | | 778,497 | |
The Mosaic Co. | | | 2,582 | | | | 66,254 | |
TimkenSteel Corp.* | | | 9,993 | | | | 151,794 | |
U.S. Concrete, Inc.* | | | 5,228 | | | | 437,323 | |
United States Steel Corp. | | | 5,699 | | | | 200,548 | |
Valvoline, Inc. | | | 6,162 | | | | 154,420 | |
Vulcan Materials Co. | | | 3,480 | | | | 446,728 | |
Westlake Chemical Corp. | | | 2,855 | | | | 304,143 | |
| | | | | | | | |
| | | | | | | 8,866,766 | |
| | | | | | | | |
REAL ESTATE (3.5%) | | | | | | | | |
Alexander’s, Inc. | | | 650 | | | | 257,302 | |
Apartment Investment & Management Co. Cl A | | | 3,748 | | | | 163,825 | |
AvalonBay Communities, Inc. | | | 1,211 | | | | 216,055 | |
Brandywine Realty Trust | | | 10,572 | | | | 192,305 | |
Camden Property Trust | | | 3,287 | | | | 302,601 | |
Chatham Lodging Trust | | | 9,254 | | | | 210,621 | |
Chesapeake Lodging Trust | | | 10,711 | | | | 290,161 | |
Colony NorthStar, Inc. Cl A | | | 25,155 | | | | 287,019 | |
Cousins Properties, Inc. | | | 29,600 | | | | 273,800 | |
DDR Corp. | | | 13,181 | | | | 118,102 | |
Duke Realty Corp. | | | 30,062 | | | | 817,987 | |
Easterly Government Pptys. | | | 22,288 | | | | 475,626 | |
Equity Lifestyle Properties, Inc. | | | 967 | | | | 86,082 | |
Essex Property Trust, Inc. | | | 1,026 | | | | 247,646 | |
Extra Space Storage, Inc. | | | 2,188 | | | | 191,341 | |
Forest City Realty Trust, Inc. Cl A | | | 22,389 | | | | 539,575 | |
GGP, Inc. | | | 6,873 | | | | 160,759 | |
Highwoods Properties, Inc. | | | 6,650 | | | | 338,552 | |
Host Hotels & Resorts, Inc. | | | 22,325 | | | | 443,152 | |
Kilroy Realty Corp. | | | 9,160 | | | | 683,794 | |
Life Storage, Inc. | | | 953 | | | | 84,884 | |
Medical Properties Trust, Inc. | | | 16,032 | | | | 220,921 | |
Pebblebrook Hotel Trust | | | 5,944 | | | | 220,938 | |
Pennsylvania REIT | | | 11,824 | | | | 140,587 | |
ProLogis, Inc. | | | 5,734 | | | | 369,900 | |
QTS Realty Trust, Inc. | | | 5,739 | | | | 310,824 | |
Regency Centers Corp. | | | 5,744 | | | | 397,370 | |
RLJ Lodging Trust | | | 10,137 | | | | 222,709 | |
SBA Communications Corp. Cl A* | | | 2,858 | | | | 466,883 | |
Summit Hotel Pptys., Inc. | | | 5,600 | | | | 85,288 | |
Sun Communities, Inc. | | | 3,367 | | | | 312,390 | |
Terreno Realty Corp. | | | 19,570 | | | | 686,124 | |
The GEO Group, Inc. | | | 21,892 | | | | 516,652 | |
Urstadt Biddle Pptys., Inc. Cl A | | | 5,090 | | | | 110,657 | |
Vornado Realty Trust | | | 2,968 | | | | 232,038 | |
Welltower, Inc. | | | 7,522 | | | | 479,678 | |
Weyerhaeuser Co. | | | 8,948 | | | | 315,507 | |
| | | | | | | | |
| | | | | | | 11,469,655 | |
| | | | | | | | |
TELECOMMUNICATION SERVICES (0.4%) | | | | | | | | |
CenturyLink, Inc. | | | 6,090 | | | | 101,581 | |
ORBCOMM, Inc.* | | | 48,617 | | | | 494,921 | |
Shenandoah Telecommunications Co. | | | 11,985 | | | | 405,093 | |
Zayo Group Hldgs., Inc.* | | | 4,589 | | | | 168,875 | |
| | | | | | | | |
| | | | | | | 1,170,470 | |
| | | | | | | | |
UTILITIES (2.0%) | | | | | | | | |
AES Corp. | | | 10,071 | | | | 109,069 | |
Ameren Corp. | | | 4,310 | | | | 254,247 | |
Avista Corp. | | | 6,324 | | | | 325,623 | |
Chesapeake Utilities Corp. | | | 2,719 | | | | 213,577 | |
Consolidated Edison, Inc. | | | 3,341 | | | | 283,818 | |
Edison International | | | 6,972 | | | | 440,910 | |
MUTUAL OF AMERICA INVESTMENT CORPORATION - ALL AMERICA FUND
PORTFOLIO OF INVESTMENTS IN SECURITIES
December 31, 2017
| | | | | | | | | | | | | | | | | | | | |
Entergy Corp. | | | | | | | | | | | | | | | 2,661 | | | | 216,579 | |
Eversource Energy | | | | | | | | | | | | | | | 2,504 | | | | 158,203 | |
FirstEnergy Corp. | | | | | | | | | | | | | | | 5,754 | | | | 176,187 | |
Great Plains Energy, Inc. | | | | | | | | | | | | | | | 20,941 | | | | 675,138 | |
Idacorp, Inc. | | | | | | | | | | | | | | | 3,116 | | | | 284,678 | |
NiSource, Inc. | | | | | | | | | | | | | | | 16,249 | | | | 417,112 | |
Northwest Natural Gas Co. | | | | | | | | | | | | | | | 2,973 | | | | 177,339 | |
NorthWestern Corp. | | | | | | | | | | | | | | | 3,757 | | | | 224,293 | |
PG&E Corp. | | | | | | | | | | | | | | | 2,170 | | | | 97,281 | |
PNM Resources, Inc. | | | | | | | | | | | | | | | 6,569 | | | | 265,716 | |
Portland General Electric Co. | | | | | | | | | | | | | | | 5,201 | | | | 237,062 | |
PPL Corp. | | | | | | | | | | | | | | | 6,748 | | | | 208,851 | |
Public Svc. Enterprise Group, Inc. | | | | | | | | | | | | | | | 6,132 | | | | 315,798 | |
Sempra Energy | | | | | | | | | | | | | | | 6,000 | | | | 641,520 | |
UGI Corp. | | | | | | | | | | | | | | | 12,451 | | | | 584,574 | |
Westar Energy, Inc. | | | | | | | | | | | | | | | 2,878 | | | | 151,958 | |
| | | | | | | | | | | | | | | | | | | | |
| | | | | | | | | | | | | | | | | | | 6,459,533 | |
| | | | | | | | | | | | | | | | | | | | |
TOTAL ACTIVE ASSETS - COMMON STOCKS
(Cost: $107,525,247) 41.3% | | | | 134,044,850 | |
| | | | | |
| | | | | |
| | | Rating** | | | Rate(%) | | | Maturity | | | Face Amount | | | Value | |
ACTIVE ASSETS: | | | | | | | | | | | | | | | | | | | | |
SHORT-TERM DEBT SECURITIES: | | | | | | | | | | | | | | | | | | | | |
U.S. GOVERNMENT (0.4%) | | | | | | | | | | | | | | | | | �� | | | |
U.S. Treasury Bill | | | A-1+ | | | | 1.00 | | | | 01/02/18 | | | | 800,000 | | | | 799,933 | |
U.S. Treasury Bill | | | A-1+ | | | | 1.00 | | | | 01/02/18 | | | | 700,000 | | | | 699,942 | |
| | | | | | | | | | | | | | | | | | | | |
| | | | | | | | | | | | | | | | | | | 1,499,875 | |
| | | | | | | | | | | | | | | | | | | | |
COMMERCIAL PAPER (0.2%) | | | | | | | | | | | | | | | | | | | | |
Home Depot, Inc.† | | | A-1 | | | | 1.44 | | | | 01/02/18 | | | | 500,000 | | | | 499,940 | |
| | | | | | | | | | | | | | | | | | | | |
TOTAL ACTIVE ASSETS - SHORT-TERM DEBT SECURITIES
(Cost: $1,999,815) 0.6% | | | | | | | | | | | | | | | | | | | 1,999,815 | |
| | | | | | | | | | | | | | | | | | | | |
| | | | | |
| | | | | | | | | | | | Shares | | | Value | |
ACTIVE ASSETS: | | | | | | | | | | | | | | | | | | | | |
WARRANTS: | | | | | | | | | | | | | | | | | | | | |
FINANCIALS (0.0%) (2) | | | | | | | | | | | | | | | | | | | | |
Easterly Acquisition Corp. - expiring 07/29/2020* | | | | | | | | | | | | | | | 11,885 | | | | 7,073 | |
| | | | | | | | | | | | | | | | | | | | |
TOTAL ACTIVE ASSETS - WARRANTS
(Cost: $7,178) 0.0% (2) | | | | | | | | | | | | | | | | | | | 7,073 | |
| | | | | | | | | | | | | | | | | | | | |
TOTAL ACTIVE ASSETS
(Cost: $109,532,240) 41.9% | | | | | | | | | | | | | | | | | | | 136,051,738 | |
| | | | | | | | | | | | | | | | | | | | |
TOTAL INVESTMENTS
(Cost: $222,592,602) 99.6% | | | | | | | | | | | | | | | | | | | 323,520,838 | |
| | | | | | | | | | | | | | | | | | | | |
OTHER NET ASSETS 0.4% | | | | | | | | | | | | | | | | | | | 1,215,517 | |
| | | | | | | | | | | | | | | | | | | | |
NET ASSETS 100.0% | | | | | | | | | | | | | | | | | | $ | 324,736,355 | |
| | | | | | | | | | | | | | | | | | | | |
The disclosures regarding Fair Value and Security Valuation included in Section 1 of the Notes to Financial Statements (Significant Accounting Policies and Organization) are an integral part of these portfolio schedules.
MUTUAL OF AMERICA INVESTMENT CORPORATION - SMALL CAP VALUE FUND
PORTFOLIO OF INVESTMENTS IN SECURITIES
December 31, 2017
| | | | | | | | |
| | | Shares | | | Value | |
COMMON STOCKS: | | | | | | | | |
CONSUMER DISCRETIONARY (7.8%) | | | | | | | | |
AMC Entertainment Hldgs., Inc. Cl A | | | 139,624 | | | | 2,108,322 | |
Bassett Furniture Industries, Inc. | | | 32,413 | | | | 1,218,729 | |
Belmond Ltd.* | | | 127,728 | | | | 1,564,668 | |
Dave & Buster’s Entertainment, Inc.* | | | 31,162 | | | | 1,719,208 | |
Houghton Mifflin Harcourt Co.* | | | 581,642 | | | | 5,409,271 | |
ILG, Inc. | | | 92,848 | | | | 2,644,311 | |
MSG Networks, Inc.* | | | 139,533 | | | | 2,825,543 | |
Playa Hotels & Resorts NV* | | | 426,102 | | | | 4,597,641 | |
Red Rock Resorts, Inc. Cl A | | | 55,560 | | | | 1,874,594 | |
Signet Jewelers Ltd. | | | 40,877 | | | | 2,311,594 | |
Sleep Number Corp.* | | | 257,966 | | | | 9,696,942 | |
Unifi, Inc.* | | | 97,625 | | | | 3,501,809 | |
| | | | | | | | |
| | | | | | | 39,472,632 | |
| | | | | | | | |
CONSUMER STAPLES (2.5%) | | | | | | | | |
Crimson Wine Group Ltd.* | | | 493,977 | | | | 5,270,735 | |
Orchids Paper Products Co. | | | 260,675 | | | | 3,336,640 | |
Vector Group Ltd. | | | 181,478 | | | | 4,061,478 | |
| | | | | | | | |
| | | | | | | 12,668,853 | |
| | | | | | | | |
ENERGY (5.4%) | | | | | | | | |
Abraxas Petroleum Corp.* | | | 640,701 | | | | 1,576,124 | |
Carrizo Oil and Gas, Inc.* | | | 168,186 | | | | 3,578,998 | |
CrossAmerica Partners LP | | | 116,126 | | | | 2,757,993 | |
Ensco PLC Cl A | | | 318,761 | | | | 1,883,878 | |
Matrix Service Co.* | | | 61,655 | | | | 1,097,459 | |
Nabors Industries Ltd. | | | 166,438 | | | | 1,136,772 | |
PBF Energy, Inc. | | | 252,833 | | | | 8,962,930 | |
PDC Energy, Inc.* | | | 65,314 | | | | 3,366,284 | |
Range Resources Corp. | | | 166,987 | | | | 2,848,798 | |
| | | | | | | | |
| | | | | | | 27,209,236 | |
| | | | | | | | |
FINANCIALS (30.1%) | | | | | | | | |
American Equity Investment Life Hldg. Co. | | | 174,359 | | | | 5,358,052 | |
Aspen Insurance Hldgs. Ltd. | | | 104,108 | | | | 4,226,785 | |
BancFirst Corp. | | | 127,923 | | | | 6,543,261 | |
Bank of Marin Bancorp | | | 51,586 | | | | 3,507,848 | |
Banner Corp. | | | 97,571 | | | | 5,378,114 | |
Brookline Bancorp, Inc. | | | 410,915 | | | | 6,451,366 | |
Bryn Mawr Bank Corp. | | | 115,255 | | | | 5,094,271 | |
Cadence Bancorporation* | | | 94,532 | | | | 2,563,708 | |
Charter Financial Corp. | | | 207,689 | | | | 3,642,865 | |
Customers Bancorp, Inc.* | | | 56,825 | | | | 1,476,882 | |
Dime Community Bancshares | | | 171,897 | | | | 3,601,242 | |
Ellington Financial LLC | | | 340,468 | | | | 4,940,191 | |
Enterprise Financial Svcs. Corp. | | | 122,767 | | | | 5,542,930 | |
First Connecticut Bancorp, Inc. | | | 92,636 | | | | 2,422,431 | |
First Interstate BancSytem, Inc. | | | 144,811 | | | | 5,799,681 | |
Flushing Financial Corp. | | | 141,534 | | | | 3,892,185 | |
Glacier Bancorp, Inc. | | | 126,415 | | | | 4,979,487 | |
Great Southern Bancorp, Inc. | | | 50,831 | | | | 2,625,421 | |
Hanmi Financial Corp. | | | 63,626 | | | | 1,931,049 | |
IBERIABANK Corp. | | | 16,762 | | | | 1,299,055 | |
Investors Bancorp, Inc. | | | 269,663 | | | | 3,742,922 | |
Luther Burbank Corp.* | | | 103,521 | | | | 1,246,393 | |
Marlin Business Svcs. Corp. | | | 210,988 | | | | 4,726,131 | |
MB Financial, Inc. | | | 74,552 | | | | 3,319,055 | |
NMI Hldgs., Inc. Cl A* | | | 475,449 | | | | 8,082,633 | |
Northfield Bancorp, Inc. | | | 288,402 | | | | 4,925,906 | |
PowerShares KBW Bank Portfolio | | | 46,350 | | | | 2,550,641 | |
Prosperity Bancshares, Inc. | | | 36,694 | | | | 2,571,149 | |
MUTUAL OF AMERICA INVESTMENT CORPORATION - SMALL CAP VALUE FUND
PORTFOLIO OF INVESTMENTS IN SECURITIES
December 31, 2017
| | | | | | | | |
Selective Insurance Group, Inc. | | | 126,320 | | | | 7,414,984 | |
Sterling Bancorp | | | 72,545 | | | | 1,784,607 | |
Stock Yards Bancorp, Inc. | | | 233,782 | | | | 8,813,581 | |
SVB Financial Group* | | | 49,346 | | | | 11,535,614 | |
TriCo Bancshares | | | 78,876 | | | | 2,986,245 | |
UMB Financial Corp. | | | 36,115 | | | | 2,597,391 | |
United Financial Bancorp, Inc. | | | 54,936 | | | | 969,071 | |
Waterstone Financial, Inc. | | | 82,106 | | | | 1,399,907 | |
Wintrust Financial Corp. | | | 28,227 | | | | 2,325,058 | |
| | | | | | | | |
| | | | | | | 152,268,112 | |
| | | | | | | | |
HEALTH CARE (4.2%) | | | | | | | | |
bluebird bio, Inc.* | | | 15,692 | | | | 2,794,745 | |
Emergent Biosolutions, Inc.* | | | 37,317 | | | | 1,734,121 | |
Envision Healthcare Corp.* | | | 48,141 | | | | 1,663,753 | |
Neurocrine Biosciences, Inc.* | | | 25,893 | | | | 2,009,038 | |
Pacific Biosciences of CA, Inc.* | | | 382,561 | | | | 1,009,961 | |
Pacira Pharmaceuticals, Inc.* | | | 38,981 | | | | 1,779,483 | |
Supernus Pharmaceuticals, Inc.* | | | 189,497 | | | | 7,551,455 | |
Wright Medical Group NV* | | | 110,452 | | | | 2,452,034 | |
| | | | | | | | |
| | | | | | | 20,994,590 | |
| | | | | | | | |
INDUSTRIALS (15.4%) | | | | | | | | |
AZZ, Inc. | | | 30,260 | | | | 1,546,286 | |
BMC Stock Hldgs., Inc.* | | | 171,832 | | | | 4,347,350 | |
Builders FirstSource, Inc.* | | | 132,178 | | | | 2,880,159 | |
Daseke, Inc.* | | | 239,749 | | | | 3,426,013 | |
Deluxe Corp. | | | 60,368 | | | | 4,638,677 | |
EMCOR Group, Inc. | | | 37,819 | | | | 3,091,703 | |
Encore Wire Corp. | | | 106,307 | | | | 5,171,836 | |
GMS, Inc.* | | | 76,185 | | | | 2,867,603 | |
Hyster-Yale Materials Handling, Inc. Cl A | | | 49,472 | | | | 4,213,036 | |
ICF International, Inc.* | | | 39,783 | | | | 2,088,608 | |
Kirby Corp.* | | | 57,547 | | | | 3,844,140 | |
Landstar System, Inc. | | | 38,121 | | | | 3,968,396 | |
LSC Communications, Inc. | | | 203,169 | | | | 3,078,010 | |
Miller Industries, Inc. | | | 285,727 | | | | 7,371,757 | |
Mueller Industries, Inc. | | | 363,229 | | | | 12,869,203 | |
Tutor Perini Corp.* | | | 90,559 | | | | 2,295,671 | |
Universal Forest Products, Inc. | | | 134,242 | | | | 5,050,184 | |
VSE Corp. | | | 108,029 | | | | 5,231,844 | |
| | | | | | | | |
| | | | | | | 77,980,476 | |
| | | | | | | | |
INFORMATION TECHNOLOGY (10.6%) | | | | | | | | |
Aerohive Networks, Inc.* | | | 281,456 | | | | 1,640,888 | |
Anixter International, Inc.* | | | 38,936 | | | | 2,959,136 | |
Belden, Inc. | | | 16,475 | | | | 1,271,376 | |
CommVault Systems, Inc.* | | | 39,739 | | | | 2,086,298 | |
Comtech Telecommunications Corp. | | | 132,325 | | | | 2,927,029 | |
Cypress Semiconductor Corp. | | | 63,799 | | | | 972,297 | |
Everspin Technologies, Inc.* | | | 53,895 | | | | 404,213 | |
Finisar Corp.* | | | 43,689 | | | | 889,071 | |
II-VI, Inc.* | | | 42,762 | | | | 2,007,676 | |
Lumentum Hldgs., Inc.* | | | 25,392 | | | | 1,241,669 | |
MaxLinear, Inc. Cl A* | | | 113,024 | | | | 2,986,094 | |
MKS Instruments, Inc. | | | 28,716 | | | | 2,713,662 | |
Perficient, Inc.* | | | 66,506 | | | | 1,268,269 | |
Plexus Corp.* | | | 54,251 | | | | 3,294,121 | |
Proofpoint, Inc.* | | | 54,466 | | | | 4,837,125 | |
Richardson Electronics Ltd. | | | 556,918 | | | | 3,753,627 | |
Sequans Communications S.A. ADR* | | | 923,354 | | | | 1,763,606 | |
Stamps.com, Inc.* | | | 21,552 | | | | 4,051,776 | |
SYNNEX Corp. | | | 33,653 | | | | 4,575,125 | |
ViaSat, Inc.* | | | 17,074 | | | | 1,277,989 | |
MUTUAL OF AMERICA INVESTMENT CORPORATION - SMALL CAP VALUE FUND
PORTFOLIO OF INVESTMENTS IN SECURITIES
December 31, 2017
| | | | | | | | | | | | | | | | | | | | |
Xperi Corp. | | | | | | | | | | | | | | | 149,457 | | | | 3,646,751 | |
Xura, Inc.* | | | | | | | | | | | | | | | 128,245 | | | | 3,206,125 | †† |
| | | | | | | | | | | | | | | | | | | | |
| | | | | | | | | | | | | | | | | | | 53,773,923 | |
| | | | | | | | | | | | | | | | | | | | |
MATERIALS (4.9%) | | | | | | | | | | | | | | | | | | | | |
Boise Cascade Co. | | | | | | | | | | | | | | | 91,281 | | | | 3,642,112 | |
Ferro Corp.* | | | | | | | | | | | | | | | 110,058 | | | | 2,596,268 | |
Ferroglobe PLC | | | | | | | | | | | | | | | 117,799 | | | | 1,908,344 | |
Kaiser Aluminum Corp. | | | | | | | | | | | | | | | 50,222 | | | | 5,366,221 | |
Kraton Corp.* | | | | | | | | | | | | | | | 86,116 | | | | 4,148,208 | |
TimkenSteel Corp.* | | | | | | | | | | | | | | | 143,366 | | | | 2,177,730 | |
U.S. Concrete, Inc.* | | | | | | | | | | | | | | | 25,552 | | | | 2,137,425 | |
United States Steel Corp. | | | | | | | | | | | | | | | 85,447 | | | | 3,006,880 | |
| | | | | | | | | | | | | | | | | | | | |
| | | | | | | | | | | | | | | | | | | 24,983,188 | |
| | | | | | | | | | | | | | | | | | | | |
REAL ESTATE (11.0%) | | | | | | | | | | | | | | | | | | | | |
Alexander’s, Inc. | | | | | | | | | | | | | | | 5,544 | | | | 2,194,592 | |
Chatham Lodging Trust | | | | | | | | | | | | | | | 135,173 | | | | 3,076,537 | |
Chesapeake Lodging Trust | | | | | | | | | | | | | | | 152,271 | | | | 4,125,021 | |
Colony NorthStar, Inc. Cl A | | | | | | | | | | | | | | | 349,308 | | | | 3,985,604 | |
Cousins Properties, Inc. | | | | | | | | | | | | | | | 433,934 | | | | 4,013,889 | |
Easterly Government Pptys. | | | | | | | | | | | | | | | 221,923 | | | | 4,735,837 | |
Forest City Realty Trust, Inc. Cl A | | | | | | | | | | | | | | | 289,862 | | | | 6,985,674 | |
Highwoods Properties, Inc. | | | | | | | | | | | | | | | 95,766 | | | | 4,875,447 | |
Life Storage, Inc. | | | | | | | | | | | | | | | 13,630 | | | | 1,214,024 | |
Medical Properties Trust, Inc. | | | | | | | | | | | | | | | 239,188 | | | | 3,296,011 | |
Pennsylvania REIT | | | | | | | | | | | | | | | 171,887 | | | | 2,043,736 | |
RLJ Lodging Trust | | | | | | | | | | | | | | | 115,821 | | | | 2,544,587 | |
Summit Hotel Pptys., Inc. | | | | | | | | | | | | | | | 83,603 | | | | 1,273,274 | |
Terreno Realty Corp. | | | | | | | | | | | | | | | 115,490 | | | | 4,049,079 | |
The GEO Group, Inc. | | | | | | | | | | | | | | | 225,302 | | | | 5,317,127 | |
Urstadt Biddle Pptys., Inc. Cl A | | | | | | | | | | | | | | | 77,485 | | | | 1,684,524 | |
| | | | | | | | | | | | | | | | | | | | |
| | | | | | | | | | | | | | | | | | | 55,414,963 | |
| | | | | | | | | | | | | | | | | | | | |
TELECOMMUNICATION SERVICES (1.3%) | | | | | | | | | | | | | | | | | | | | |
ORBCOMM, Inc.* | | | | | | | | | | | | | | | 372,812 | | | | 3,795,226 | |
Shenandoah Telecommunications Co. | | | | | | | | | | | | | | | 77,199 | | | | 2,609,326 | |
| | | | | | | | | | | | | | | | | | | | |
| | | | | | | | | | | | | | | | | | | 6,404,552 | |
| | | | | | | | | | | | | | | | | | | | |
UTILITIES (4.2%) | | | | | | | | | | | | | | | | | | | | |
Avista Corp. | | | | | | | | | | | | | | | 87,482 | | | | 4,504,448 | |
Idacorp, Inc. | | | | | | | | | | | | | | | 44,368 | | | | 4,053,460 | |
Northwest Natural Gas Co. | | | | | | | | | | | | | | | 42,253 | | | | 2,520,391 | |
NorthWestern Corp. | | | | | | | | | | | | | | | 51,542 | | | | 3,077,057 | |
PNM Resources, Inc. | | | | | | | | | | | | | | | 92,751 | | | | 3,751,778 | |
Portland General Electric Co. | | | | | | | | | | | | | | | 74,044 | | | | 3,374,926 | |
| | | | | | | | | | | | | | | | | | | | |
| | | | | | | | | | | | | | | | | | | 21,282,060 | |
| | | | | | | | | | | | | | | | | | | | |
TOTAL COMMON STOCKS
(Cost: $383,367,674) 97.4% | | | | | | | | | | | | | | | | | | | 492,452,585 | |
| | | | | | | | | | | | | | | | | | | | |
| | | | | |
| | | Rating** | | | Rate(%) | | | Maturity | | | Face Amount | | | Value | |
SHORT-TERM DEBT SECURITIES: | | | | | | | | | | | | | | | | | | | | |
U.S. GOVERNMENT (1.5%) | | | | | | | | | | | | | | | | | | | | |
U.S. Treasury Bill | | | A-1+ | | | | 1.02 | | | | 01/02/18 | | | | 4,000,000 | | | | 3,999,659 | |
U.S. Treasury Bill | | | A-1+ | | | | 1.25 | | | | 02/15/18 | | | | 3,300,000 | | | | 3,294,605 | |
| | | | | | | | | | | | | | | | | | | | |
| | | | | | | | | | | | | | | | | | | 7,294,264 | |
| | | | | | | | | | | | | | | | | | | | |
COMMERCIAL PAPER (1.2%) | | | | | | | | | | | | | | | | | | | | |
Estee Lauder Cos.† | | | A-1 | | | | 1.40 | | | | 01/02/18 | | | | 1,200,000 | | | | 1,199,860 | |
Toyota Motor Credit Corp. | | | A-1+ | | | | 1.26 | | | | 01/03/18 | | | | 5,000,000 | | | | 4,999,299 | |
| | | | | | | | | | | | | | | | | | | | |
| | | | | | | | | | | | | | | | | | | 6,199,159 | |
| | | | | | | | | | | | | | | | | | | | |
TOTAL SHORT-TERM DEBT SECURITIES
(Cost: $13,493,423) 2.7% | | | | | | | | | | | | | | | | | | | 13,493,423 | |
| | | | | | | | | | | | | | | | | | | | |
MUTUAL OF AMERICA INVESTMENT CORPORATION - SMALL CAP VALUE FUND
PORTFOLIO OF INVESTMENTS IN SECURITIES
December 31, 2017
| | | | | | | | |
| | | Shares | | | Value | |
WARRANTS: | | | | | | | | |
FINANCIALS (0.0%) (2) | | | | | | | | |
Easterly Acquisition Corp. - expiring 07/29/2020* | | | 146,691 | | | | 87,296 | |
| | | | | | | | |
TOTAL WARRANTS
(Cost: $88,598) (0.0%) (2) | | | | | | | 87,296 | |
| | | | | |
TOTAL INVESTMENTS
(Cost: $396,949,695) 100.1% | | | | | | | 506,033,304 | |
| | | | | | | | |
OTHER NET ASSETS -0.1% | | | | | | | (311,555 | ) |
| | | | | | | | |
NET ASSETS 100.0% | | | | | | $ | 505,721,749 | |
| | | | | | | | |
The disclosures regarding Fair Value and Security Valuation included in Section 1 of the Notes to Financial Statements (Significant Accounting Policies and Organization) are an integral part of these portfolio schedules.
MUTUAL OF AMERICA INVESTMENT CORPORATION - SMALL CAP GROWTH FUND
PORTFOLIO OF INVESTMENTS IN SECURITIES
December 31, 2017
| | | | | | | | |
| | | Shares | | | Value | |
COMMON STOCKS: | | | | | | | | |
CONSUMER DISCRETIONARY (14.1%) | | | | | | | | |
AMC Networks, Inc. Cl A* | | | 37,291 | | | | 2,016,697 | |
American Axle & Mfg. Hldgs., Inc.* | | | 202,200 | | | | 3,443,466 | |
Belmond Ltd.* | | | 189,177 | | | | 2,317,418 | |
Bloomin’ Brands, Inc. | | | 261,074 | | | | 5,571,319 | |
Bright Horizons Family Solutions, Inc.* | | | 36,722 | | | | 3,451,868 | |
Cooper Tire & Rubber Co. | | | 85,139 | | | | 3,009,664 | |
Dave & Buster’s Entertainment, Inc.* | | | 73,880 | | | | 4,075,960 | |
Five Below, Inc.* | | | 156,567 | | | | 10,383,522 | |
Haverty Furniture Cos., Inc. | | | 259,596 | | | | 5,879,849 | |
Lions Gate Entertainment Corp. Cl A* | | | 112,275 | | | | 3,796,018 | |
Lions Gate Entertainment Corp. Cl B* | | | 112,275 | | | | 3,563,609 | |
Lithia Motors, Inc. Cl A | | | 48,987 | | | | 5,564,433 | |
Red Rock Resorts, Inc. Cl A | | | 184,539 | | | | 6,226,346 | |
Sleep Number Corp.* | | | 227,087 | | | | 8,536,200 | |
Steve Madden Ltd.* | | | 91,266 | | | | 4,262,122 | |
Thor Industries, Inc. | | | 41,461 | | | | 6,249,002 | |
| | | | | | | | |
| | | | | | | 78,347,493 | |
| | | | | | | | |
CONSUMER STAPLES (2.0%) | | | | | | | | |
Cal-Maine Foods, Inc.* | | | 48,354 | | | | 2,149,335 | |
Orchids Paper Products Co. | | | 161,765 | | | | 2,070,592 | |
Vector Group Ltd. | | | 128,240 | | | | 2,870,011 | |
WD-40 Co. | | | 34,065 | | | | 4,019,670 | |
| | | | | | | | |
| | | | | | | 11,109,608 | |
| | | | | | | | |
ENERGY (1.8%) | | | | | | | | |
Matador Resources Co.* | | | 66,770 | | | | 2,078,550 | |
Ring Energy, Inc.* | | | 298,264 | | | | 4,145,870 | |
RPC, Inc. | | | 149,950 | | | | 3,828,224 | |
| | | | | | | | |
| | | | | | | 10,052,644 | |
| | | | | | | | |
FINANCIALS (6.5%) | | | | | | | | |
AMERISAFE, Inc. | | | 33,085 | | | | 2,038,036 | |
First Merchants Corp. | | | 96,605 | | | | 4,063,206 | |
Heritage Financial Corp. | | | 136,270 | | | | 4,197,116 | |
Moelis & Co. Cl A | | | 124,488 | | | | 6,037,668 | |
Pinnacle Financial Partners, Inc. | | | 50,839 | | | | 3,370,626 | |
S&T Bancorp, Inc. | | | 92,481 | | | | 3,681,669 | |
Starwood Property Trust, Inc. | | | 144,874 | | | | 3,093,060 | |
TriState Capital Hldgs., Inc.* | | | 159,969 | | | | 3,679,287 | |
United Insurance Hldgs. Corp. | | | 163,206 | | | | 2,815,304 | |
Webster Financial Corp. | | | 50,338 | | | | 2,826,982 | |
| | | | | | | | |
| | | | | | | 35,802,954 | |
| | | | | | | | |
HEALTH CARE (22.8%) | | | | | | | | |
Abiomed, Inc.* | | | 22,751 | | | | 4,263,765 | |
Acadia Healthcare Co., Inc.* | | | 123,519 | | | | 4,030,425 | |
ACADIA Pharmaceuticals, Inc.* | | | 40,859 | | | | 1,230,264 | |
Acceleron Pharma, Inc.* | | | 54,328 | | | | 2,305,680 | |
Agios Pharmaceuticals, Inc.* | | | 28,320 | | | | 1,619,054 | |
Akebia Therapeutics, Inc.* | | | 122,149 | | | | 1,816,356 | |
Amicus Therapeutics, Inc.* | | | 192,814 | | | | 2,774,593 | |
Anika Therapeutics, Inc.* | | | 46,636 | | | | 2,514,147 | |
BioSpecifics Technologies Corp.* | | | 51,419 | | | | 2,227,985 | |
bluebird bio, Inc.* | | | 19,754 | | | | 3,518,187 | |
Cambrex Corp.* | | | 23,635 | | | | 1,134,480 | |
Catalent, Inc.* | | | 77,727 | | | | 3,193,025 | |
Chemed Corp. | | | 18,117 | | | | 4,402,793 | |
Clovis Oncology, Inc.* | | | 36,186 | | | | 2,460,648 | |
Dyax Corp. - contingent value rights* | | | 76,346 | | | | 0 | †† |
Emergent Biosolutions, Inc.* | | | 74,780 | | | | 3,475,027 | |
Envision Healthcare Corp.* | | | 68,355 | | | | 2,362,349 | |
MUTUAL OF AMERICA INVESTMENT CORPORATION - SMALL CAP GROWTH FUND
PORTFOLIO OF INVESTMENTS IN SECURITIES
December 31, 2017
| | | | | | | | |
Exact Sciences Corp.* | | | 98,139 | | | | 5,156,223 | |
ICU Medical, Inc.* | | | 9,313 | | | | 2,011,608 | |
Insulet Corp.* | | | 53,764 | | | | 3,709,716 | |
Intersect ENT, Inc.* | | | 76,551 | | | | 2,480,252 | |
iRhythm Technologies, Inc.* | | | 39,220 | | | | 2,198,281 | |
Karyopharm Therapeutics, Inc.* | | | 144,012 | | | | 1,382,515 | |
Medicines Co.* | | | 54,687 | | | | 1,495,143 | |
Nektar Therapeutics* | | | 57,430 | | | | 3,429,720 | |
Neogen Corp.* | | | 35,255 | | | | 2,898,314 | |
Neurocrine Biosciences, Inc.* | | | 54,319 | | | | 4,214,611 | |
Nevro Corp.* | | | 51,062 | | | | 3,525,320 | |
NuVasive, Inc.* | | | 36,060 | | | | 2,109,149 | |
Omeros Corp.* | | | 101,107 | | | | 1,964,509 | |
Omnicell, Inc.* | | | 132,523 | | | | 6,427,366 | |
Pacira Pharmaceuticals, Inc.* | | | 94,038 | | | | 4,292,835 | |
Penumbra, Inc.* | | | 30,206 | | | | 2,842,385 | |
PRA Health Sciences, Inc.* | | | 28,669 | | | | 2,610,886 | |
Prestige Brands Hldgs., Inc.* | | | 45,142 | | | | 2,004,756 | |
Prothena Corp. PLC* | | | 49,298 | | | | 1,848,182 | |
Radius Health, Inc.* | | | 46,024 | | | | 1,462,182 | |
Repligen Corp.* | | | 78,298 | | | | 2,840,651 | |
Sage Therapeutics, Inc.* | | | 32,212 | | | | 5,305,639 | |
Spark Therapeutics, Inc.* | | | 35,818 | | | | 1,841,762 | |
Supernus Pharmaceuticals, Inc.* | | | 127,970 | | | | 5,099,605 | |
Ultragenyx Pharmaceutical, Inc.* | | | 33,946 | | | | 1,574,415 | |
WellCare Health Plans, Inc.* | | | 23,982 | | | | 4,823,020 | |
Wright Medical Group NV* | | | 128,020 | | | | 2,842,044 | |
Zogenix, Inc.* | | | 28,307 | | | | 1,133,695 | |
| | | | | | | | |
| | | | | | | 126,853,562 | |
| | | | | | | | |
INDUSTRIALS (17.9%) | | | | | | | | |
AeroVironment, Inc.* | | | 33,950 | | | | 1,906,632 | |
Altra Industrial Motion Corp. | | | 51,399 | | | | 2,590,510 | |
Astronics Corp.* | | | 89,750 | | | | 3,721,932 | |
BMC Stock Hldgs., Inc.* | | | 186,594 | | | | 4,720,828 | |
Deluxe Corp. | | | 42,151 | | | | 3,238,883 | |
Echo Global Logistics, Inc.* | | | 118,904 | | | | 3,329,312 | |
EnPro Industries, Inc. | | | 103,414 | | | | 9,670,243 | |
Generac Hldgs., Inc.* | | | 68,217 | | | | 3,378,106 | |
Granite Construction, Inc. | �� | | 132,757 | | | | 8,420,777 | |
H&E Equipment Services | | | 81,633 | | | | 3,318,381 | |
Healthcare Svcs. Group, Inc. | | | 115,290 | | | | 6,078,089 | |
InnerWorkings, Inc.* | | | 263,335 | | | | 2,641,250 | |
John Bean Technologies Corp. | | | 36,087 | | | | 3,998,440 | |
Landstar System, Inc. | | | 44,715 | | | | 4,654,832 | |
Mueller Water Products, Inc. Cl A | | | 365,431 | | | | 4,578,850 | |
NCI Building Systems, Inc.* | | | 189,058 | | | | 3,648,819 | |
Quanex Building Products Corp. | | | 83,724 | | | | 1,959,142 | |
Schneider National, Inc. Cl B | | | 81,744 | | | | 2,334,609 | |
Simpson Manufacturing Co., Inc. | | | 38,174 | | | | 2,191,569 | |
Sun Hydraulics Corp. | | | 109,534 | | | | 7,085,754 | |
Teledyne Technologies, Inc.* | | | 36,513 | | | | 6,614,330 | |
Trex Co., Inc.* | | | 55,033 | | | | 5,965,027 | |
Universal Forest Products, Inc. | | | 88,272 | | | | 3,320,793 | |
| | | | | | | | |
| | | | | | | 99,367,108 | |
| | | | | | | | |
INFORMATION TECHNOLOGY (22.4%) | | | | | | | | |
Acacia Communications, Inc.* | | | 45,761 | | | | 1,657,921 | |
Advanced Energy Industries, Inc.* | | | 30,940 | | | | 2,087,831 | |
Ambarella, Inc.* | | | 26,085 | | | | 1,532,494 | |
Belden, Inc. | | | 32,749 | | | | 2,527,240 | |
Cabot MicroElectronics Corp. | | | 14,920 | | | | 1,403,674 | |
Callidus Software, Inc.* | | | 276,326 | | | | 7,916,740 | |
MUTUAL OF AMERICA INVESTMENT CORPORATION - SMALL CAP GROWTH FUND
PORTFOLIO OF INVESTMENTS IN SECURITIES
December 31, 2017
| | | | | | | | |
CommVault Systems, Inc.* | | | 81,906 | | | | 4,300,065 | |
Cornerstone OnDemand, Inc.* | | | 49,124 | | | | 1,735,551 | |
Cray, Inc.* | | | 56,835 | | | | 1,375,407 | |
Cypress Semiconductor Corp. | | | 130,010 | | | | 1,981,352 | |
Entegris, Inc. | | | 91,833 | | | | 2,796,315 | |
EPAM Systems, Inc.* | | | 59,245 | | | | 6,364,690 | |
Euronet Worldwide, Inc.* | | | 23,426 | | | | 1,974,109 | |
Everspin Technologies, Inc.* | | | 113,972 | | | | 854,790 | |
Fair Isaac Corp. | | | 19,641 | | | | 3,009,001 | |
Five9, Inc.* | | | 109,805 | | | | 2,731,948 | |
Globant S.A.* | | | 53,867 | | | | 2,502,661 | |
Grubhub, Inc.* | | | 33,157 | | | | 2,380,673 | |
II-VI, Inc.* | | | 76,915 | | | | 3,611,159 | |
Integrated Device Technology, Inc.* | | | 101,607 | | | | 3,020,776 | |
Littelfuse, Inc. | | | 16,156 | | | | 3,195,980 | |
LogMeIn, Inc. | | | 34,686 | | | | 3,971,547 | |
Lumentum Hldgs., Inc.* | | | 54,114 | | | | 2,646,175 | |
MAXIMUS, Inc. | | | 28,614 | | | | 2,048,190 | |
MaxLinear, Inc. Cl A* | | | 122,960 | | | | 3,248,603 | |
MKS Instruments, Inc. | | | 36,083 | | | | 3,409,844 | |
Monolithic Power Systems, Inc. | | | 34,337 | | | | 3,858,105 | |
New Relic, Inc.* | | | 92,620 | | | | 5,350,657 | |
Nutanix, Inc. Cl A* | | | 55,837 | | | | 1,969,929 | |
Oclaro, Inc.* | | | 215,935 | | | | 1,455,402 | |
Paycom Software, Inc.* | | | 39,034 | | | | 3,135,601 | |
Perficient, Inc.* | | | 82,930 | | | | 1,581,475 | |
Proofpoint, Inc.* | | | 75,391 | | | | 6,695,475 | |
Q2 Hldgs., Inc.* | | | 54,614 | | | | 2,012,526 | |
Rapid7, Inc.* | | | 111,802 | | | | 2,086,225 | |
Science Applications Int’l. Corp. | | | 59,663 | | | | 4,568,396 | |
Sequans Communications S.A. ADR* | | | 569,816 | | | | 1,088,349 | |
Stamps.com, Inc.* | | | 18,528 | | | | 3,483,264 | |
Take-Two Interactive Software, Inc.* | | | 20,844 | | | | 2,288,254 | |
ViaSat, Inc.* | | | 37,274 | | | | 2,789,959 | |
Xperi Corp. | | | 113,687 | | | | 2,773,963 | |
Zendisk, Inc.* | | | 141,776 | | | | 4,797,700 | |
| | | | | | | | |
| | | | | | | 124,220,016 | |
| | | | | | | | |
MATERIALS (5.5%) | | | | | | | | |
Berry Global Group, Inc.* | | | 65,478 | | | | 3,841,594 | |
Ferro Corp.* | | | 367,341 | | | | 8,665,574 | |
Ferroglobe PLC | | | 314,981 | | | | 5,102,692 | |
Ferroglobe Representation & Warranty Insurance Trust* | | | 72,345 | | | | 0 | †† |
Minerals Technologies, Inc. | | | 56,663 | | | | 3,901,248 | |
Orion Engineered Carbons S.A. | | | 166,734 | | | | 4,268,390 | |
U.S. Concrete, Inc.* | | | 57,312 | | | | 4,794,149 | |
| | | | | | | | |
| | | | | | | 30,573,647 | |
| | | | | | | | |
REAL ESTATE (2.8%) | | | | | | | | |
Easterly Government Pptys. | | | 133,540 | | | | 2,849,744 | |
Pebblebrook Hotel Trust | | | 96,203 | | | | 3,575,866 | |
QTS Realty Trust, Inc. | | | 93,441 | | | | 5,060,765 | |
Terreno Realty Corp. | | | 118,937 | | | | 4,169,931 | |
| | | | | | | | |
| | | | | | | 15,656,306 | |
| | | | | | | | |
TELECOMMUNICATION SERVICES (1.4%) | | | | | | | | |
ORBCOMM, Inc.* | | | 380,442 | | | | 3,872,900 | |
Shenandoah Telecommunications Co. | | | 109,991 | | | | 3,717,696 | |
| | | | | | | | |
| | | | | | | 7,590,596 | |
| | | | | | | | |
UTILITIES (0.6%) | | | | | | | | |
Chesapeake Utilities Corp. | | | 44,353 | | | | 3,483,928 | |
| | | | | | | | |
TOTAL COMMON STOCKS
(Cost: $425,063,022) 97.8% | | | | 543,057,862 | |
| | | | | |
MUTUAL OF AMERICA INVESTMENT CORPORATION - SMALL CAP GROWTH FUND
PORTFOLIO OF INVESTMENTS IN SECURITIES
December 31, 2017
| | | | | | | | | | | | | | | | | | | | |
| | | Rating** | | | Rate(%) | | | Maturity | | | Face Amount | | | Value | |
SHORT-TERM DEBT SECURITIES: | | | | | | | | | | | | | | | | | | | | |
U.S. GOVERNMENT (1.5%) | | | | | | | | | | | | | | | | | | | | |
U.S. Treasury Bill | | | A-1+ | | | | 1.00 | | | | 01/02/18 | | | | 2,000,000 | | | | 1,999,833 | |
U.S. Treasury Bill | | | A-1+ | | | | 1.02 | | | | 01/02/18 | | | | 2,200,000 | | | | 2,199,812 | |
U.S. Treasury Bill | | | A-1+ | | | | 1.04 | | | | 01/11/18 | | | | 4,000,000 | | | | 3,998,606 | |
| | | | | | | | | | | | | | | | | | | | |
| | | | | | | | | | | | | | | | | | | 8,198,251 | |
| | | | | | | | | | | | | | | | | | | | |
TOTAL SHORT-TERM DEBT SECURITIES
(Cost: $8,198,251) 1.5% | | | | | | | | | | | | | | | | | | | 8,198,251 | |
| | | | | | | | | | | | | | | | | | | | |
TOTAL INVESTMENTS
(Cost: $433,261,273) 99.3% | | | | | | | | | | | | | | | | | | | 551,256,113 | |
| | | | | | | | | | | | | | | | | | | | |
OTHER NET ASSETS 0.7% | | | | | | | | | | | | | | | | | | | 3,645,883 | |
| | | | | | | | | | | | | | | | | | | | |
NET ASSETS 100.0% | | | | | | | | | | | | | | | | | | $ | 554,901,996 | |
| | | | | | | | | | | | | | | | | | | | |
The disclosures regarding Fair Value and Security Valuation included in Section 1 of the Notes to Financial Statements (Significant Accounting Policies and Organization) are an integral part of these portfolio schedules.
MUTUAL OF AMERICA INVESTMENT CORPORATION - MID CAP VALUE FUND
PORTFOLIO OF INVESTMENTS IN SECURITIES
December 31, 2017
| | | | | | | | |
| | | Shares | | | Value | |
COMMON STOCKS: | | | | | | | | |
CONSUMER DISCRETIONARY (4.1%) | | | | | | | | |
ILG, Inc. | | | 8,810 | | | | 250,909 | |
Liberty Interactive Corp. Ser. A QVC Group* | | | 17,450 | | | | 426,129 | |
MSG Networks, Inc.* | | | 21,903 | | | | 443,536 | |
Ralph Lauren Corp. | | | 5,037 | | | | 522,287 | |
Signet Jewelers Ltd. | | | 3,750 | | | | 212,063 | |
Sleep Number Corp.* | | | 30,170 | | | | 1,134,090 | |
Taylor Morrison Home Corp. Cl A* | | | 12,722 | | | | 311,307 | |
Wiley (John) & Sons, Inc. Cl A | | | 14,076 | | | | 925,497 | |
| | | | | | | | |
| | | | | | | 4,225,818 | |
| | | | | | | | |
CONSUMER STAPLES (2.6%) | | | | | | | | |
Constellation Brands, Inc. Cl A | | | 1,719 | | | | 392,912 | |
Edgewell Personal Care Co.* | | | 7,604 | | | | 451,602 | |
Ingredion, Inc. | | | 8,421 | | | | 1,177,256 | |
Vector Group Ltd. | | | 31,490 | | | | 704,746 | |
| | | | | | | | |
| | | | | | | 2,726,516 | |
| | | | | | | | |
ENERGY (7.3%) | | | | | | | | |
Andeavor | | | 4,420 | | | | 505,383 | |
Baker Hughes, a GE Co. | | | 18,432 | | | | 583,188 | |
Cheniere Energy, Inc.* | | | 15,507 | | | | 834,897 | |
Hess Corp. | | | 7,538 | | | | 357,829 | |
MPLX LP | | | 16,998 | | | | 602,919 | |
Nabors Industries Ltd. | | | 69,463 | | | | 474,432 | |
Noble Energy, Inc. | | | 26,701 | | | | 778,067 | |
PBF Energy, Inc. | | | 47,913 | | | | 1,698,516 | |
Range Resources Corp. | | | 42,315 | | | | 721,894 | |
Weatherford Int’l. PLC* | | | 49,088 | | | | 204,697 | |
Williams Cos., Inc. | | | 25,751 | | | | 785,148 | |
| | | | | | | | |
| | | | | | | 7,546,970 | |
| | | | | | | | |
FINANCIALS (21.7%) | | | | | | | | |
American Financial Group, Inc. | | | 12,849 | | | | 1,394,630 | |
Ameriprise Financial, Inc. | | | 11,272 | | | | 1,910,266 | |
Associated Banc-Corp. | | | 50,204 | | | | 1,275,182 | |
BankUnited, Inc. | | | 23,723 | | | | 966,001 | |
Citizens Financial Group, Inc. | | | 12,450 | | | | 522,651 | |
Discover Financial Svcs. | | | 12,401 | | | | 953,885 | |
Everest Re Group Ltd. | | | 4,106 | | | | 908,494 | |
Fifth Third Bancorp | | | 40,116 | | | | 1,217,119 | |
Hartford Financial Svcs. Group, Inc. | | | 21,415 | | | | 1,205,236 | |
KeyCorp | | | 103,272 | | | | 2,082,996 | |
Lincoln National Corp. | | | 15,429 | | | | 1,186,027 | |
PowerShares KBW Bank Portfolio | | | 4,640 | | | | 255,339 | |
Progressive Corp. | | | 23,743 | | | | 1,337,206 | |
Reinsurance Grp. of America, Inc. | | | 7,392 | | | | 1,152,635 | |
Starwood Property Trust, Inc. | | | 34,048 | | | | 726,925 | |
SVB Financial Group* | | | 9,919 | | | | 2,318,763 | |
Synchrony Financial | | | 15,793 | | | | 609,768 | |
Voya Financial, Inc. | | | 27,446 | | | | 1,357,754 | |
Zions Bancorporation | | | 20,230 | | | | 1,028,291 | |
| | | | | | | | |
| | | | | | | 22,409,168 | |
| | | | | | | | |
HEALTH CARE (6.0%) | | | | | | | | |
Agilent Technologies, Inc. | | | 16,100 | | | | 1,078,217 | |
Boston Scientific Corp.* | | | 25,310 | | | | 627,435 | |
Centene Corp.* | | | 7,027 | | | | 708,884 | |
Edwards Lifesciences Corp.* | | | 4,860 | | | | 547,771 | |
Hill-Rom Hldgs., Inc. | | | 8,790 | | | | 740,909 | |
Humana, Inc. | | | 3,554 | | | | 881,641 | |
Neurocrine Biosciences, Inc.* | | | 9,860 | | | | 765,037 | |
Zimmer Biomet Hldgs., Inc. | | | 6,613 | | | | 797,991 | |
| | | | | | | | |
| | | | | | | 6,147,885 | |
| | | | | | | | |
MUTUAL OF AMERICA INVESTMENT CORPORATION - MID CAP VALUE FUND
PORTFOLIO OF INVESTMENTS IN SECURITIES
December 31, 2017
| | | | | | | | |
INDUSTRIALS (17.2%) | | | | | | | | |
Alaska Air Group, Inc. | | | 21,680 | | | | 1,593,697 | |
Builders FirstSource, Inc.* | | | 15,170 | | | | 330,554 | |
Carlisle Cos., Inc. | | | 11,438 | | | | 1,299,929 | |
Harris Corp. | | | 9,543 | | | | 1,351,766 | |
Kirby Corp.* | | | 17,344 | | | | 1,158,579 | |
L-3 Communications Corp. | | | 8,347 | | | | 1,651,454 | |
Landstar System, Inc. | | | 5,150 | | | | 536,115 | |
LSC Communications, Inc. | | | 29,860 | | | | 452,379 | |
Mueller Industries, Inc. | | | 15,200 | | | | 538,536 | |
Old Dominion Freight Line, Inc. | | | 13,893 | | | | 1,827,624 | |
Orbital ATK, Inc. | | | 2,497 | | | | 328,356 | |
Oshkosh Corp. | | | 10,661 | | | | 968,978 | |
Republic Services, Inc. | | | 7,920 | | | | 535,471 | |
Rockwell Automation, Inc. | | | 5,020 | | | | 985,677 | |
Stanley Black & Decker, Inc. | | | 10,266 | | | | 1,742,038 | |
United Rentals, Inc.* | | | 12,402 | | | | 2,132,028 | |
XPO Logistics, Inc.* | | | 4,330 | | | | 396,585 | |
| | | | | | | | |
| | | | | | | 17,829,766 | |
| | | | | | | | |
INFORMATION TECHNOLOGY (6.8%) | | | | | | | | |
Analog Devices, Inc. | | | 5,583 | | | | 497,054 | |
ARRIS International PLC* | | | 19,334 | | | | 496,690 | |
Avnet, Inc. | | | 18,235 | | | | 722,471 | |
Cypress Semiconductor Corp. | | | 35,470 | | | | 540,563 | |
DXC Technology Co. | | | 15,427 | | | | 1,464,022 | |
F5 Networks, Inc.* | | | 1,906 | | | | 250,105 | |
KLA-Tencor Corp. | | | 2,330 | | | | 244,813 | |
LogMeIn, Inc. | | | 3,520 | | | | 403,040 | |
PTC, Inc.* | | | 7,380 | | | | 448,483 | |
Skyworks Solutions, Inc. | | | 2,270 | | | | 215,537 | |
Stamps.com, Inc.* | | | 4,514 | | | | 848,632 | |
Symantec Corp. | | | 12,203 | | | | 342,416 | |
Western Digital Corp. | | | 7,122 | | | | 566,413 | |
| | | | | | | | |
| | | | | | | 7,040,239 | |
| | | | | | | | |
MATERIALS (10.3%) | | | | | | | | |
Crown Hldgs., Inc.* | | | 34,085 | | | | 1,917,281 | |
Eastman Chemical Co. | | | 16,277 | | | | 1,507,901 | |
Freeport-McMoRan, Inc.* | | | 49,260 | | | | 933,970 | |
International Paper Co. | | | 17,549 | | | | 1,016,789 | |
Nucor Corp. | | | 9,932 | | | | 631,477 | |
Packaging Corp. of America | | | 21,659 | | | | 2,610,987 | |
RPM International, Inc. | | | 9,910 | | | | 519,482 | |
Steel Dynamics, Inc. | | | 28,317 | | | | 1,221,312 | |
The Mosaic Co. | | | 10,680 | | | | 274,049 | |
| | | | | | | | |
| | | | | | | 10,633,248 | |
| | | | | | | | |
REAL ESTATE (12.8%) | | | | | | | | |
Alexander’s, Inc. | | | 1,137 | | | | 450,081 | |
Apartment Investment & Management Co. Cl A | | | 16,452 | | | | 719,117 | |
AvalonBay Communities, Inc. | | | 5,202 | | | | 928,089 | |
Brandywine Realty Trust | | | 46,401 | | | | 844,034 | |
DDR Corp. | | | 55,483 | | | | 497,128 | |
Duke Realty Corp. | | | 51,172 | | | | 1,392,390 | |
Equity Lifestyle Properties, Inc. | | | 4,221 | | | | 375,753 | |
Forest City Realty Trust, Inc. Cl A | | | 13,055 | | | | 314,626 | |
GGP, Inc. | | | 30,168 | | | | 705,630 | |
Host Hotels & Resorts, Inc. | | | 46,595 | | | | 924,911 | |
Kilroy Realty Corp. | | | 8,734 | | | | 651,993 | |
ProLogis, Inc. | | | 24,757 | | | | 1,597,074 | |
Regency Centers Corp. | | | 7,776 | | | | 537,944 | |
RLJ Lodging Trust | | | 8,525 | | | | 187,294 | |
The GEO Group, Inc. | | | 28,610 | | | | 675,196 | |
MUTUAL OF AMERICA INVESTMENT CORPORATION - MID CAP VALUE FUND
PORTFOLIO OF INVESTMENTS IN SECURITIES
December 31, 2017
| | | | | | | | | | | | | | | | | | | | |
Vornado Realty Trust | | | | | | | | | | | | | | | 13,033 | | | | 1,018,920 | |
Welltower, Inc. | | | | | | | | | | | | | | | 13,332 | | | | 850,182 | |
Weyerhaeuser Co. | | | | | | | | | | | | | | | 15,789 | | | | 556,720 | |
| | | | | | | | | | | | | | | | | | | | |
| | | | | | | | | | | | | | | | | | | 13,227,082 | |
| | | | | | | | | | | | | | | | | | | | |
UTILITIES (9.5%) | | | | | | | | | | | | | | | | | | | | |
AES Corp. | | | | | | | | | | | | | | | 41,460 | | | | 449,012 | |
Ameren Corp. | | | | | | | | | | | | | | | 18,208 | | | | 1,074,090 | |
Consolidated Edison, Inc. | | | | | | | | | | | | | | | 14,115 | | | | 1,199,069 | |
Edison International | | | | | | | | | | | | | | | 6,761 | | | | 427,566 | |
Entergy Corp. | | | | | | | | | | | | | | | 10,621 | | | | 864,443 | |
Eversource Energy | | | | | | | | | | | | | | | 10,994 | | | | 694,601 | |
FirstEnergy Corp. | | | | | | | | | | | | | | | 24,306 | | | | 744,250 | |
Great Plains Energy, Inc. | | | | | | | | | | | | | | | 35,098 | | | | 1,131,560 | |
PG&E Corp. | | | | | | | | | | | | | | | 8,920 | | | | 399,884 | |
PPL Corp. | | | | | | | | | | | | | | | 28,507 | | | | 882,292 | |
Public Svc. Enterprise Group, Inc. | | | | | | | | | | | | | | | 26,919 | | | | 1,386,329 | |
Westar Energy, Inc. | | | | | | | | | | | | | | | 11,270 | | | | 595,056 | |
| | | | | | | | | | | | | | | | | | | | |
| | | | | | | | | | | | | | | | | | | 9,848,152 | |
| | | | | | | | | | | | | | | | | | | | |
TOTAL COMMON STOCKS
(Cost: $78,104,364) 98.3% | | | | | | | | | | | | | | | | | | | 101,634,844 | |
| | | | | | | | | | | | | | | | | | | | |
| | | | | |
| | | Rating** | | | Rate(%) | | | Maturity | | | Face Amount | | | Value | |
SHORT-TERM DEBT SECURITIES: | | | | | | | | | | | | | | | | | | | | |
U.S. GOVERNMENT (1.6%) | | | | | | | | | | | | | | | | | | | | |
U.S. Treasury Bill | | | A-1+ | | | | 1.00 | | | | 01/02/18 | | | | 1,500,000 | | | | 1,499,875 | |
U.S. Treasury Bill | | | A-1+ | | | | 1.05 | | | | 01/04/18 | | | | 100,000 | | | | 99,985 | |
| | | | | | | | | | | | | | | | | | | | |
| | | | | | | | | | | | | | | | | | | 1,599,860 | |
| | | | | | | | | | | | | | | | | | | | |
TOTAL SHORT-TERM DEBT SECURITIES
(Cost: $1,599,860) 1.6% | | | | | | | | | | | | | | | | | | | 1,599,860 | |
| | | | | | | | | | | | | | | | | | | | |
TOTAL INVESTMENTS
(Cost: $79,704,224) 99.9% | | | | | | | | | | | | | | | | | | | 103,234,704 | |
| | | | | | | | | | | | | | | | | | | | |
OTHER NET ASSETS 0.1% | | | | | | | | | | | | | | | | | | | 159,452 | |
| | | | | | | | | | | | | | | | | | | | |
NET ASSETS 100.0% | | | | | | | | | | | | | | | | | | $ | 103,394,156 | |
| | | | | | | | | | | | | | | | | | | | |
The disclosures regarding Fair Value and Security Valuation included in Section 1 of the Notes to Financial Statements (Significant Accounting Policies and Organization) are an integral part of these portfolio schedules.
MUTUAL OF AMERICA INVESTMENT CORPORATION - MID-CAP EQUITY INDEX FUND
PORTFOLIO OF INVESTMENTS IN SECURITIES
December 31, 2017
| | | | | | | | |
| | | Shares | | | Value | |
INDEXED ASSETS: | | | | | | | | |
COMMON STOCKS: | | | | | | | | |
CONSUMER DISCRETIONARY (11.6%) | | | | | | | | |
Aaron’s, Inc. | | | 48,445 | | | | 1,930,533 | |
Adtalem Global Education, Inc. | | | 45,645 | | | | 1,919,372 | |
AMC Networks, Inc. Cl A* | | | 39,970 | | | | 2,161,578 | |
American Eagle Outfitters, Inc. | | | 132,170 | | | | 2,484,796 | |
AutoNation, Inc.* | | | 47,135 | | | | 2,419,440 | |
Bed Bath & Beyond, Inc. | | | 108,969 | | | | 2,396,228 | |
Big Lots, Inc. | | | 32,905 | | | | 1,847,616 | |
Brinker International, Inc. | | | 36,190 | | | | 1,405,620 | |
Brunswick Corp. | | | 67,254 | | | | 3,713,766 | |
Buffalo Wild Wings, Inc.* | | | 12,315 | | | | 1,925,450 | |
Cable One, Inc. | | | 3,634 | | | | 2,555,974 | |
CalAtlantic Group, Inc. | | | 60,326 | | | | 3,401,783 | |
Carter’s, Inc. | | | 36,474 | | | | 4,285,330 | |
Cheesecake Factory, Inc. | | | 31,929 | | | | 1,538,339 | |
Churchill Downs, Inc. | | | 9,853 | | | | 2,292,793 | |
Cinemark Hldgs., Inc. | | | 84,215 | | | | 2,932,366 | |
Cooper Tire & Rubber Co. | | | 40,014 | | | | 1,414,495 | |
Cracker Barrel Old Country Store, Inc. | | | 18,412 | | | | 2,925,483 | |
Dana Hldg. Corp. | | | 112,350 | | | | 3,596,324 | |
Deckers Outdoor Corp.* | | | 25,223 | | | | 2,024,146 | |
Delphi Technologies PLC* | | | 69,548 | | | | 3,649,184 | |
Dick’s Sporting Goods, Inc. | | | 65,663 | | | | 1,887,155 | |
Dillard’s, Inc. Cl A | | | 16,597 | | | | 996,650 | |
Domino’s Pizza, Inc. | | | 33,771 | | | | 6,381,368 | |
Dunkin’ Brands Group, Inc. | | | 69,574 | | | | 4,485,436 | |
GameStop Corp. Cl A | | | 74,835 | | | | 1,343,288 | |
Gentex Corp. | | | 222,005 | | | | 4,651,005 | |
Graham Hldgs. Co. Cl B | | | 3,659 | | | | 2,043,003 | |
Helen of Troy Ltd.* | | | 20,685 | | | | 1,993,000 | |
ILG, Inc. | | | 83,423 | | | | 2,375,887 | |
International Speedway Corp. Cl A | | | 20,184 | | | | 804,332 | |
Jack in the Box, Inc. | | | 23,433 | | | | 2,299,012 | |
KB Home | | | 66,742 | | | | 2,132,407 | |
Live Nation Entertainment, Inc.* | | | 105,862 | | | | 4,506,545 | |
Meredith Corp. | | | 31,373 | | | | 2,072,187 | |
Michaels Cos., Inc.* | | | 88,061 | | | | 2,130,196 | |
Murphy USA, Inc.* | | | 25,380 | | | | 2,039,537 | |
New York Times Co. Cl A | | | 96,604 | | | | 1,787,174 | |
NVR, Inc.* | | | 2,718 | | | | 9,535,337 | |
Office Depot, Inc. | | | 402,468 | | | | 1,424,737 | |
Papa John’s Int’l., Inc. | | | 19,317 | | | | 1,083,877 | |
Polaris Industries, Inc. | | | 45,659 | | | | 5,661,259 | |
Pool Corp. | | | 30,779 | | | | 3,990,497 | |
Sally Beauty Hldgs., Inc.* | | | 98,053 | | | | 1,839,474 | |
Service Corp. International | | | 146,205 | | | | 5,456,371 | |
Six Flags Entertainment Corp. | | | 59,808 | | | | 3,981,419 | |
Skechers U.S.A., Inc. Cl A* | | | 104,184 | | | | 3,942,323 | |
Sotheby’s* | | | 29,454 | | | | 1,519,826 | |
TEGNA, Inc. | | | 163,131 | | | | 2,296,884 | |
Tempur Sealy Int’l., Inc.* | | | 35,165 | | | | 2,204,494 | |
Texas Roadhouse, Inc. | | | 50,285 | | | | 2,649,014 | |
The Wendy’s Co. | | | 141,380 | | | | 2,321,460 | |
Thor Industries, Inc. | | | 37,769 | | | | 5,692,544 | |
Toll Brothers, Inc. | | | 114,896 | | | | 5,517,306 | |
TRI Pointe Group, Inc.* | | | 115,772 | | | | 2,074,634 | |
Tupperware Brands Corp. | | | 40,368 | | | | 2,531,074 | |
Urban Outfitters, Inc.* | | | 62,656 | | | | 2,196,719 | |
Wiley (John) & Sons, Inc. Cl A | | | 33,802 | | | | 2,222,482 | |
Williams-Sonoma, Inc. | | | 59,721 | | | | 3,087,576 | |
| | | | | | | | |
| | | | | | | 167,978,105 | |
| | | | | | | | |
MUTUAL OF AMERICA INVESTMENT CORPORATION - MID-CAP EQUITY INDEX FUND
PORTFOLIO OF INVESTMENTS IN SECURITIES
December 31, 2017
| | | | | | | | |
CONSUMER STAPLES (3.6%) | | | | | | | | |
Avon Products, Inc.* | | | 330,565 | | | | 710,715 | |
Boston Beer Co., Inc. Cl A* | | | 6,589 | | | | 1,259,158 | |
Casey’s General Stores, Inc. | | | 29,929 | | | | 3,350,252 | |
Dean Foods Co. | | | 71,237 | | | | 823,500 | |
Edgewell Personal Care Co.* | | | 43,006 | | | | 2,554,126 | |
Energizer Hldgs., Inc. | | | 46,016 | | | | 2,207,848 | |
Flowers Foods, Inc. | | | 142,109 | | | | 2,744,125 | |
Hain Celestial Group, Inc.* | | | 80,709 | | | | 3,421,255 | |
Ingredion, Inc. | | | 55,737 | | | | 7,792,033 | |
Lamb Weston Hldgs., Inc. | | | 114,209 | | | | 6,447,098 | |
Lancaster Colony Corp. | | | 14,773 | | | | 1,908,819 | |
Nu Skin Enterprises, Inc. Cl A | | | 38,630 | | | | 2,635,725 | |
Post Hldgs., Inc.* | | | 51,322 | | | | 4,066,242 | |
Sanderson Farms, Inc. | | | 15,813 | | | | 2,194,528 | |
Snyder’s-Lance, Inc. | | | 67,571 | | | | 3,383,956 | |
Sprouts Farmers Market, Inc.* | | | 97,095 | | | | 2,364,263 | |
Tootsie Roll Industries, Inc. | | | 14,922 | | | | 543,161 | |
TreeHouse Foods, Inc.* | | | 43,604 | | | | 2,156,654 | |
United Natural Foods, Inc.* | | | 40,558 | | | | 1,998,293 | |
| | | | | | | | |
| | | | | | | 52,561,751 | |
| | | | | | | | |
ENERGY (4.1%) | | | | | | | | |
Callon Petroleum Co.* | | | 155,174 | | | | 1,885,364 | |
CNX Resources Corp.* | | | 157,594 | | | | 2,305,600 | |
Core Laboratories N.V. | | | 34,320 | | | | 3,759,756 | |
Diamond Offshore Drilling, Inc.* | | | 49,259 | | | | 915,725 | |
Dril-Quip, Inc.* | | | 30,064 | | | | 1,434,053 | |
Energen Corp.* | | | 76,056 | | | | 4,378,544 | |
Ensco PLC Cl A | | | 351,370 | | | | 2,076,597 | |
Gulfport Energy Corp.* | | | 123,578 | | | | 1,576,855 | |
HollyFrontier Corp. | | | 137,159 | | | | 7,025,284 | |
Matador Resources Co.* | | | 76,779 | | | | 2,390,130 | |
Murphy Oil Corp. | | | 126,063 | | | | 3,914,256 | |
Nabors Industries Ltd. | | | 250,173 | | | | 1,708,682 | |
Oceaneering Int’l., Inc. | | | 73,912 | | | | 1,562,500 | |
Patterson-UTI Energy, Inc. | | | 172,888 | | | | 3,978,153 | |
PBF Energy, Inc. | | | 86,385 | | | | 3,062,348 | |
QEP Resources, Inc.* | | | 190,132 | | | | 1,819,563 | |
Rowan Companies PLC Cl A* | | | 91,021 | | | | 1,425,389 | |
SM Energy Co. | | | 76,970 | | | | 1,699,498 | |
Southwestern Energy Co.* | | | 391,236 | | | | 2,183,097 | |
Superior Energy Services, Inc.* | | | 125,599 | | | | 1,209,518 | |
Transocean Ltd.* | | | 304,071 | | | | 3,247,478 | |
World Fuel Services Corp. | | | 54,308 | | | | 1,528,227 | |
WPX Energy, Inc.* | | | 313,776 | | | | 4,414,828 | |
| | | | | | | | |
| | | | | | | 59,501,445 | |
| | | | | | | | |
FINANCIALS (16.5%) | | | | | | | | |
Alleghany Corp.* | | | 11,974 | | | | 7,137,582 | |
American Financial Group, Inc. | | | 54,005 | | | | 5,861,703 | |
Aspen Insurance Hldgs. Ltd. | | | 46,113 | | | | 1,872,188 | |
Associated Banc-Corp. | | | 118,229 | | | | 3,003,017 | |
BancorpSouth Bank | | | 63,426 | | | | 1,994,748 | |
Bank of Hawaii Corp. | | | 32,028 | | | | 2,744,800 | |
Bank of the Ozarks, Inc. | | | 92,748 | | | | 4,493,641 | |
Berkley (W.R.) Corp. | | | 75,167 | | | | 5,385,716 | |
Brown & Brown, Inc. | | | 90,635 | | | | 4,664,077 | |
Cathay General Bancorp | | | 57,463 | | | | 2,423,215 | |
Chemical Financial Corp. | | | 54,721 | | | | 2,925,932 | |
CNO Financial Group, Inc. | | | 128,255 | | | | 3,166,616 | |
Commerce Bancshares, Inc. | | | 71,500 | | | | 3,992,560 | |
Cullen/Frost Bankers, Inc. | | | 44,793 | | | | 4,239,657 | |
East West Bancorp, Inc. | | | 111,239 | | | | 6,766,668 | |
Eaton Vance Corp. | | | 90,768 | | | | 5,118,408 | |
FactSet Research Systems, Inc. | | | 30,330 | | | | 5,846,411 | |
MUTUAL OF AMERICA INVESTMENT CORPORATION - MID-CAP EQUITY INDEX FUND
PORTFOLIO OF INVESTMENTS IN SECURITIES
December 31, 2017
| | | | | | | | |
Federated Investors, Inc. Cl B | | | 73,548 | | | | 2,653,612 | |
First American Financial Corp. | | | 86,330 | | | | 4,837,933 | |
First Horizon National Corp. | | | 252,240 | | | | 5,042,278 | |
FNB Corp. | | | 247,568 | | | | 3,421,390 | |
Fulton Financial Corp. | | | 136,331 | | | | 2,440,325 | |
Genworth Financial, Inc.* | | | 370,331 | | | | 1,151,729 | |
Hancock Hldg. Co. | | | 65,903 | | | | 3,262,199 | |
Hanover Insurance Group, Inc. | | | 33,274 | | | | 3,596,254 | |
Home BancShares, Inc. | | | 125,043 | | | | 2,907,250 | |
Interactive Brokers Group, Inc. Cl A | | | 55,793 | | | | 3,303,504 | |
International Bancshares Corp. | | | 41,666 | | | | 1,654,140 | |
Janus Henderson Group PLC | | | 140,282 | | | | 5,367,189 | |
Kemper Corp. | | | 37,442 | | | | 2,579,754 | |
Legg Mason, Inc. | | | 67,406 | | | | 2,829,704 | |
MarketAxess Hldgs., Inc. | | | 29,364 | | | | 5,924,187 | |
MB Financial, Inc. | | | 64,905 | | | | 2,889,571 | |
Mercury General Corp. | | | 28,921 | | | | 1,545,538 | |
MSCI, Inc. Cl A | | | 70,171 | | | | 8,879,437 | |
New York Community Bancorp, Inc. | | | 376,513 | | | | 4,902,199 | |
Old Republic Int’l. Corp. | | | 191,268 | | | | 4,089,310 | |
PacWest Bancorp | | | 99,744 | | | | 5,027,098 | |
Pinnacle Financial Partners, Inc. | | | 56,094 | | | | 3,719,032 | |
Primerica, Inc. | | | 34,679 | | | | 3,521,652 | |
Prosperity Bancshares, Inc. | | | 54,362 | | | | 3,809,145 | |
Reinsurance Grp. of America, Inc. | | | 49,714 | | | | 7,751,904 | |
RenaissanceRe Hldgs. Ltd. | | | 31,461 | | | | 3,951,187 | |
SEI Investments Co. | | | 100,674 | | | | 7,234,434 | |
Signature Bank* | | | 41,487 | | | | 5,694,506 | |
SLM Corp.* | | | 340,960 | | | | 3,852,848 | |
Sterling Bancorp | | | 172,983 | | | | 4,255,382 | |
Stifel Financial Corp. | | | 53,581 | | | | 3,191,284 | |
SVB Financial Group* | | | 40,752 | | | | 9,526,590 | |
Synovus Financial Corp. | | | 93,580 | | | | 4,486,225 | |
TCF Financial Corp. | | | 133,378 | | | | 2,734,249 | |
Texas Capital Bancshares, Inc.* | | | 37,704 | | | | 3,351,886 | |
Trustmark Corp. | | | 54,040 | | | | 1,721,714 | |
UMB Financial Corp. | | | 33,639 | | | | 2,419,317 | |
Umpqua Hldgs. Corp. | | | 169,535 | | | | 3,526,328 | |
United Bankshares, Inc. | | | 81,542 | | | | 2,833,585 | |
Valley National Bancorp | | | 202,190 | | | | 2,268,572 | |
Washington Federal, Inc. | | | 67,436 | | | | 2,309,683 | |
Webster Financial Corp. | | | 70,441 | | | | 3,955,967 | |
Wintrust Financial Corp. | | | 43,358 | | | | 3,571,398 | |
| | | | | | | | |
| | | | | | | 239,628,428 | |
| | | | | | | | |
HEALTH CARE (7.2%) | | | | | | | | |
Abiomed, Inc.* | | | 32,621 | | | | 6,113,502 | |
Acadia Healthcare Co., Inc.* | | | 63,955 | | | | 2,086,852 | |
Akorn, Inc.* | | | 72,528 | | | | 2,337,577 | |
Allscripts Healthcare Solutions, Inc.* | | | 142,993 | | | | 2,080,548 | |
Bio-Rad Laboratories, Inc. Cl A* | | | 15,876 | | | | 3,789,125 | |
Bio-Techne Corp. | | | 28,928 | | | | 3,747,622 | |
Bioverative, Inc.* | | | 83,056 | | | | 4,478,380 | |
Catalent, Inc.* | | | 103,794 | | | | 4,263,858 | |
Charles River Laboratories Int’l., Inc.* | | | 35,985 | | | | 3,938,558 | |
Endo International PLC* | | | 155,660 | | | | 1,206,365 | |
Globus Medical, Inc. Cl A* | | | 56,063 | | | | 2,304,189 | |
Halyard Health, Inc.* | | | 37,567 | | | | 1,734,844 | |
HealthSouth Corp. | | | 77,100 | | | | 3,809,511 | |
Hill-Rom Hldgs., Inc. | | | 51,361 | | | | 4,329,219 | |
INC Research Hldgs., Inc. Cl A* | | | 44,466 | | | | 1,938,718 | |
LifePoint Health, Inc.* | | | 31,458 | | | | 1,566,608 | |
LivaNova PLC* | | | 34,061 | | | | 2,722,155 | |
Mallinckrodt PLC* | | | 75,011 | | | | 1,692,248 | |
Masimo Corp.* | | | 36,700 | | | | 3,112,160 | |
MUTUAL OF AMERICA INVESTMENT CORPORATION - MID-CAP EQUITY INDEX FUND
PORTFOLIO OF INVESTMENTS IN SECURITIES
December 31, 2017
| | | | | | | | |
Medidata Solutions, Inc.* | | | 46,144 | | | | 2,924,145 | |
MEDNAX, Inc.* | | | 72,199 | | | | 3,858,315 | |
Molina Healthcare, Inc.* | | | 34,366 | | | | 2,635,185 | |
NuVasive, Inc.* | | | 40,649 | | | | 2,377,560 | |
Owens & Minor, Inc. | | | 50,731 | | | | 957,801 | |
Prestige Brands Hldgs., Inc.* | | | 42,293 | | | | 1,878,232 | |
STERIS PLC | | | 66,323 | | | | 5,801,273 | |
Teleflex, Inc. | | | 35,123 | | | | 8,739,305 | |
Tenet Healthcare Corp.* | | | 58,575 | | | | 887,997 | |
United Therapeutics Corp.* | | | 34,077 | | | | 5,041,692 | |
WellCare Health Plans, Inc.* | | | 34,434 | | | | 6,925,022 | |
West Pharmaceutical Svcs., Inc. | | | 58,022 | | | | 5,725,031 | |
| | | | | | | | |
| | | | | | | 105,003,597 | |
| | | | | | | | |
INDUSTRIALS (15.2%) | | | | | | | | |
AECOM* | | | 120,565 | | | | 4,478,990 | |
AGCO Corp. | | | 51,870 | | | | 3,705,074 | |
Avis Budget Group, Inc.* | | | 57,040 | | | | 2,502,915 | |
Carlisle Cos., Inc. | | | 47,834 | | | | 5,436,334 | |
Clean Harbors, Inc.* | | | 39,131 | | | | 2,120,900 | |
Copart, Inc.* | | | 156,181 | | | | 6,745,457 | |
Crane Co. | | | 38,469 | | | | 3,432,204 | |
Curtiss-Wright Corp. | | | 34,727 | | | | 4,231,485 | |
Deluxe Corp. | | | 37,766 | | | | 2,901,939 | |
Donaldson Co., Inc. | | | 101,647 | | | | 4,975,621 | |
Dun & Bradstreet Corp. | | | 28,561 | | | | 3,381,908 | |
Dycom Industries, Inc.* | | | 23,591 | | | | 2,628,745 | |
EMCOR Group, Inc. | | | 45,593 | | | | 3,727,228 | |
EnerSys | | | 32,231 | | | | 2,244,245 | |
Esterline Technologies Corp.* | | | 20,547 | | | | 1,534,861 | |
GATX Corp. | | | 29,262 | | | | 1,818,926 | |
Genesee & Wyoming, Inc. Cl A* | | | 47,881 | | | | 3,769,671 | |
Graco, Inc. | | | 128,715 | | | | 5,820,492 | |
Granite Construction, Inc. | | | 30,541 | | | | 1,937,216 | |
HNI Corp. | | | 35,134 | | | | 1,355,118 | |
Hubbell, Inc. | | | 42,693 | | | | 5,778,071 | |
Huntington Ingalls Industries, Inc. | | | 35,195 | | | | 8,295,462 | |
IDEX Corp. | | | 59,507 | | | | 7,853,139 | |
ITT, Inc. | | | 67,738 | | | | 3,615,177 | |
JetBlue Airways Corp.* | | | 251,332 | | | | 5,614,757 | |
KBR, Inc. | | | 109,575 | | | | 2,172,872 | |
Kennametal, Inc. | | | 63,817 | | | | 3,089,381 | |
Kirby Corp.* | | | 42,809 | | | | 2,859,641 | |
KLX, Inc.* | | | 40,266 | | | | 2,748,155 | |
Knight-Swift Transportation Hldgs., Inc. | | | 100,594 | | | | 4,397,970 | |
Landstar System, Inc. | | | 32,977 | | | | 3,432,906 | |
Lennox International, Inc. | | | 29,423 | | | | 6,127,634 | |
Lincoln Electric Hldgs., Inc. | | | 48,082 | | | | 4,403,350 | |
Manpowergroup, Inc. | | | 51,616 | | | | 6,509,294 | |
Miller (Herman), Inc. | | | 47,060 | | | | 1,884,753 | |
MSA Safety, Inc. | | | 25,910 | | | | 2,008,543 | |
MSC Industrial Direct Co., Inc. Cl A | | | 34,194 | | | | 3,305,192 | |
Nordson Corp. | | | 39,194 | | | | 5,738,002 | |
NOW, Inc.* | | | 79,987 | | | | 882,257 | |
Old Dominion Freight Line, Inc. | | | 53,197 | | | | 6,998,065 | |
Orbital ATK, Inc. | | | 44,911 | | | | 5,905,797 | |
Oshkosh Corp. | | | 58,782 | | | | 5,342,696 | |
Pitney Bowes, Inc. | | | 151,756 | | | | 1,696,632 | |
Regal Beloit Corp. | | | 34,462 | | | | 2,639,789 | |
Rollins, Inc. | | | 73,463 | | | | 3,418,233 | |
Ryder System, Inc. | | | 41,832 | | | | 3,520,999 | |
Teledyne Technologies, Inc.* | | | 27,745 | | | | 5,026,007 | |
Terex Corp. | | | 62,092 | | | | 2,994,076 | |
The Brink’s Co. | | | 38,830 | | | | 3,055,921 | |
Timken Co. | | | 54,225 | | | | 2,665,159 | |
MUTUAL OF AMERICA INVESTMENT CORPORATION - MID-CAP EQUITY INDEX FUND
PORTFOLIO OF INVESTMENTS IN SECURITIES
December 31, 2017
| | | | | | | | |
Toro Co. | | | 84,827 | | | | 5,533,265 | |
Trinity Industries, Inc. | | | 118,896 | | | | 4,453,844 | |
Valmont Industries, Inc. | | | 17,770 | | | | 2,947,155 | |
Wabtec Corp. | | | 65,481 | | | | 5,332,118 | |
Watsco, Inc. | | | 24,081 | | | | 4,094,733 | |
Werner Enterprises, Inc. | | | 35,665 | | | | 1,378,452 | |
Woodward, Inc. | | | 42,562 | | | | 3,257,695 | |
| | | | | | | | |
| | | | | | | 219,726,521 | |
| | | | | | | | |
INFORMATION TECHNOLOGY (16.6%) | | | | | | | | |
3D Systems Corp.* | | | 94,599 | | | | 817,335 | |
ACI Worldwide, Inc.* | | | 91,248 | | | | 2,068,592 | |
Acxiom Corp.* | | | 59,889 | | | | 1,650,541 | |
ARRIS International PLC* | | | 137,159 | | | | 3,523,615 | |
Arrow Electronics, Inc.* | | | 68,449 | | | | 5,503,984 | |
Avnet, Inc. | | | 95,090 | | | | 3,767,466 | |
Belden, Inc. | | | 32,375 | | | | 2,498,379 | |
Blackbaud, Inc. | | | 36,964 | | | | 3,492,728 | |
Broadridge Financial Solutions, Inc. | | | 90,678 | | | | 8,213,613 | |
Cars.com, Inc.* | | | 55,119 | | | | 1,589,632 | |
CDK Global, Inc. | | | 101,846 | | | | 7,259,583 | |
Ciena Corp.* | | | 109,504 | | | | 2,291,919 | |
Cirrus Logic, Inc.* | | | 48,633 | | | | 2,522,107 | |
Cognex Corp. | | | 135,630 | | | | 8,295,131 | |
Coherent, Inc.* | | | 19,254 | | | | 5,433,864 | |
CommVault Systems, Inc.* | | | 33,185 | | | | 1,742,213 | |
Convergys Corp. | | | 69,096 | | | | 1,623,756 | |
CoreLogic, Inc.* | | | 62,971 | | | | 2,909,890 | |
Cree, Inc.* | | | 74,762 | | | | 2,776,661 | |
Cypress Semiconductor Corp. | | | 261,275 | | | | 3,981,831 | |
Diebold Nixdorf, Inc. | | | 57,608 | | | | 941,891 | |
DST Systems, Inc. | | | 47,934 | | | | 2,975,263 | |
Fair Isaac Corp. | | | 23,680 | | | | 3,627,776 | |
First Solar, Inc.* | | | 62,211 | | | | 4,200,487 | |
Fortinet, Inc.* | | | 117,463 | | | | 5,131,958 | |
Henry (Jack) & Associates, Inc. | | | 59,871 | | | | 7,002,512 | |
Integrated Device Technology, Inc.* | | | 104,600 | | | | 3,109,758 | |
InterDigital, Inc. | | | 27,478 | | | | 2,092,450 | |
IPG Photonics Corp.* | | | 29,176 | | | | 6,247,457 | |
j2 Global, Inc. | | | 37,854 | | | | 2,840,186 | |
Jabil, Inc. | | | 137,994 | | | | 3,622,343 | |
Keysight Technologies, Inc.* | | | 145,202 | | | | 6,040,403 | |
Knowles Corp.* | | | 65,463 | | | | 959,688 | |
Leidos Hldgs., Inc. | | | 111,079 | | | | 7,172,371 | |
Littelfuse, Inc. | | | 17,416 | | | | 3,445,233 | |
LogMeIn, Inc. | | | 41,544 | | | | 4,756,788 | |
Manhattan Associates, Inc.* | | | 53,029 | | | | 2,627,057 | |
MAXIMUS, Inc. | | | 49,854 | | | | 3,568,549 | |
Microsemi Corp.* | | | 92,230 | | | | 4,763,680 | |
MKS Instruments, Inc. | | | 42,413 | | | | 4,008,029 | |
Monolithic Power Systems, Inc. | | | 29,274 | | | | 3,289,227 | |
National Instruments Corp. | | | 81,721 | | | | 3,402,045 | |
NCR Corp.* | | | 95,957 | | | | 3,261,578 | |
NetScout Systems, Inc.* | | | 68,580 | | | | 2,088,261 | |
Plantronics, Inc. | | | 26,859 | | | | 1,353,156 | |
PTC, Inc.* | | | 91,107 | | | | 5,536,572 | |
Sabre Corp. | | | 162,809 | | | | 3,337,585 | |
Science Applications Int’l. Corp. | | | 33,630 | | | | 2,575,049 | |
Silicon Laboratories, Inc.* | | | 32,452 | | | | 2,865,512 | |
Synaptics, Inc.* | | | 26,747 | | | | 1,068,275 | |
SYNNEX Corp. | | | 22,711 | | | | 3,087,560 | |
Take-Two Interactive Software, Inc.* | | | 88,578 | | | | 9,724,088 | |
Tech Data Corp.* | | | 27,008 | | | | 2,645,974 | |
Teradata Corp.* | | | 92,970 | | | | 3,575,626 | |
Teradyne, Inc. | | | 151,190 | | | | 6,330,325 | |
MUTUAL OF AMERICA INVESTMENT CORPORATION - MID-CAP EQUITY INDEX FUND
PORTFOLIO OF INVESTMENTS IN SECURITIES
December 31, 2017
| | | | | | | | |
Trimble Navigation Ltd.* | | | 195,191 | | | | 7,932,562 | |
Tyler Technologies, Inc.* | | | 27,254 | | | | 4,825,321 | |
Ultimate Software Group, Inc.* | | | 22,025 | | | | 4,806,516 | |
VeriFone Systems, Inc.* | | | 90,242 | | | | 1,598,186 | |
Versum Materials, Inc. | | | 84,297 | | | | 3,190,641 | |
ViaSat, Inc.* | | | 40,910 | | | | 3,062,114 | |
Vishay Intertechnology, Inc. | | | 98,933 | | | | 2,052,860 | |
WEX, Inc.* | | | 30,710 | | | | 4,337,173 | |
Zebra Technologies Corp. Cl A* | | | 41,503 | | | | 4,308,011 | |
| | | | | | | | |
| | | | | | | 241,350,936 | |
| | | | | | | | |
MATERIALS (6.8%) | | | | | | | | |
Allegheny Technologies, Inc.* | | | 98,793 | | | | 2,384,863 | |
AptarGroup, Inc. | | | 49,005 | | | | 4,228,151 | |
Ashland Global Holdings, Inc. | | | 48,805 | | | | 3,474,916 | |
Bemis Co., Inc. | | | 69,914 | | | | 3,341,190 | |
Cabot Corp. | | | 47,804 | | | | 2,944,248 | |
Carpenter Technology Corp. | | | 35,457 | | | | 1,807,952 | |
Commercial Metals Co. | | | 86,696 | | | | 1,848,359 | |
Compass Minerals Int’l., Inc. | | | 25,673 | | | | 1,854,874 | |
Domtar Corp. | | | 47,961 | | | | 2,375,029 | |
Eagle Materials, Inc. | | | 37,496 | | | | 4,248,297 | |
Greif, Inc. Cl A | | | 20,013 | | | | 1,212,388 | |
Louisiana-Pacific Corp.* | | | 112,527 | | | | 2,954,959 | |
Minerals Technologies, Inc. | | | 28,526 | | | | 1,964,015 | |
NewMarket Corp. | | | 7,151 | | | | 2,841,736 | |
Olin Corp. | | | 130,814 | | | | 4,654,362 | |
Owens-Illinois, Inc.* | | | 128,655 | | | | 2,852,281 | |
PolyOne Corp. | | | 62,318 | | | | 2,710,833 | |
Reliance Steel & Aluminum Co. | | | 56,453 | | | | 4,843,103 | |
Royal Gold, Inc. | | | 50,475 | | | | 4,145,007 | |
RPM International, Inc. | | | 103,127 | | | | 5,405,917 | |
Scotts Miracle-Gro Co. Cl A | | | 32,225 | | | | 3,447,753 | |
Sensient Technologies Corp. | | | 32,930 | | | | 2,408,830 | |
Silgan Hldgs., Inc. | | | 56,494 | | | | 1,660,359 | |
Sonoco Products Co. | | | 76,299 | | | | 4,054,529 | |
Steel Dynamics, Inc. | | | 183,287 | | | | 7,905,168 | |
The Chemours Co. | | | 143,351 | | | | 7,176,151 | |
United States Steel Corp. | | | 133,998 | | | | 4,715,390 | |
Valvoline, Inc. | | | 157,089 | | | | 3,936,650 | |
Worthington Industries, Inc. | | | 35,939 | | | | 1,583,472 | |
| | | | | | | | |
| | | | | | | 98,980,782 | |
| | | | | | | | |
REAL ESTATE (8.7%) | | | | | | | | |
Alexander & Baldwin, Inc. | | | 33,505 | | | | 929,429 | |
American Campus Communities, Inc. | | | 106,208 | | | | 4,357,714 | |
Camden Property Trust | | | 72,628 | | | | 6,686,134 | |
CoreCivic, Inc. | | | 93,306 | | | | 2,099,385 | |
CoreSite Realty Corp. | | | 26,884 | | | | 3,062,088 | |
Corporate Office Pptys. Trust | | | 77,442 | | | | 2,261,306 | |
Cousins Properties, Inc. | | | 333,555 | | | | 3,085,384 | |
CyrusOne, Inc. | | | 72,365 | | | | 4,307,888 | |
DCT Industrial Trust, Inc. | | | 71,723 | | | | 4,215,878 | |
Douglas Emmett, Inc. | | | 123,493 | | | | 5,070,623 | |
Education Realty Trust, Inc. | | | 60,658 | | | | 2,118,177 | |
EPR Properties | | | 48,824 | | | | 3,196,019 | |
First Industrial Realty Trust, Inc. | | | 94,004 | | | | 2,958,306 | |
Healthcare Realty Trust, Inc. | | | 98,666 | | | | 3,169,152 | |
Highwoods Properties, Inc. | | | 79,665 | | | | 4,055,745 | |
Hospitality Properties Trust | | | 126,010 | | | | 3,761,399 | |
JBG SMITH Properties | | | 71,608 | | | | 2,486,946 | |
Jones Lang LaSalle, Inc. | | | 35,445 | | | | 5,278,824 | |
Kilroy Realty Corp. | | | 77,070 | | | | 5,753,276 | |
Lamar Advertising Co. Cl A | | | 65,313 | | | | 4,848,837 | |
LaSalle Hotel Pptys. | | | 86,696 | | | | 2,433,557 | |
Liberty Property Trust | | | 112,911 | | | | 4,856,302 | |
MUTUAL OF AMERICA INVESTMENT CORPORATION - MID-CAP EQUITY INDEX FUND
PORTFOLIO OF INVESTMENTS IN SECURITIES
December 31, 2017
| | | | | | | | |
Life Storage, Inc. | | | 36,816 | | | | 3,279,201 | |
Mack-Cali Realty Corp. | | | 68,736 | | | | 1,481,948 | |
Medical Properties Trust, Inc. | | | 284,318 | | | | 3,917,902 | |
National Retail Pptys., Inc. | | | 117,653 | | | | 5,074,374 | |
Omega Healthcare Investors, Inc. | | | 155,647 | | | | 4,286,518 | |
Potlatch Corp. | | | 32,244 | | | | 1,608,976 | |
Quality Care Properties, Inc.* | | | 75,273 | | | | 1,039,520 | |
Rayonier, Inc. | | | 100,362 | | | | 3,174,450 | |
Sabra Health Care REIT, Inc. | | | 139,308 | | | | 2,614,811 | |
Senior Housing Pptys. Trust | | | 182,021 | | | | 3,485,702 | |
Tanger Factory Outlet Centers, Inc. | | | 73,743 | | | | 1,954,927 | |
Taubman Centers, Inc. | | | 47,518 | | | | 3,109,103 | |
The GEO Group, Inc. | | | 98,295 | | | | 2,319,762 | |
Uniti Group, Inc.* | | | 124,396 | | | | 2,213,005 | |
Urban Edge Pptys. | | | 79,926 | | | | 2,037,314 | |
Washington Prime Group, Inc. | | | 135,523 | | | | 964,924 | |
Weingarten Realty Investors | | | 94,753 | | | | 3,114,531 | |
| | | | | | | | |
| | | | | | | 126,669,337 | |
| | | | | | | | |
TELECOMMUNICATION SERVICES (0.1%) | | | | | | | | |
Telephone & Data Systems, Inc. | | | 73,210 | | | | 2,035,238 | |
| | | | | | | | |
UTILITIES (5.1%) | | | | | | | | |
Aqua America, Inc. | | | 137,160 | | | | 5,380,787 | |
Atmos Energy Corp. | | | 86,838 | | | | 7,458,516 | |
Black Hills Corp. | | | 41,382 | | | | 2,487,472 | |
Great Plains Energy, Inc. | | | 166,962 | | | | 5,382,855 | |
Hawaiian Electric Industries, Inc. | | | 85,572 | | | | 3,093,428 | |
Idacorp, Inc. | | | 38,850 | | | | 3,549,336 | |
MDU Resources Group, Inc. | | | 151,979 | | | | 4,085,196 | |
National Fuel Gas Co. | | | 65,920 | | | | 3,619,667 | |
New Jersey Resources Corp. | | | 66,916 | | | | 2,690,023 | |
NorthWestern Corp. | | | 38,048 | | | | 2,271,466 | |
OGE Energy Corp. | | | 153,297 | | | | 5,045,004 | |
ONE Gas, Inc. | | | 41,411 | | | | 3,033,770 | |
PNM Resources, Inc. | | | 62,515 | | | | 2,528,732 | |
Southwest Gas Hldgs., Inc. | | | 37,648 | | | | 3,029,911 | |
UGI Corp. | | | 134,247 | | | | 6,302,897 | |
Vectren Corp. | | | 64,640 | | | | 4,202,893 | |
Westar Energy, Inc. | | | 111,405 | | | | 5,882,184 | |
WGL Hldgs., Inc. | | | 40,072 | | | | 3,439,780 | |
| | | | | | | | |
| | | | | | | 73,483,917 | |
| | | | | | | | |
TOTAL INDEXED ASSETS - COMMON STOCKS
(Cost: $1,011,902,982) 95.5% | | | | | | | 1,386,920,057 | |
| | | | | | | | |
| | | | | | | | | | | | | | | | | | | | |
| | | Rating** | | | Rate(%) | | | Maturity | | | Face Amount | | | Value | |
SHORT-TERM DEBT SECURITIES: | | | | | | | | | | | | | | | | | | | | |
U.S. GOVERNMENT (2.6%) | | | | | | | | | | | | | |
U.S. Treasury Bill (1) | | | A-1+ | | | | 1.05 | | | | 01/04/18 | | | | 5,000,000 | | | | 4,999,269 | |
U.S. Treasury Bill (1) | | | A-1+ | | | | 1.09 | | | | 01/02/18 | | | | 8,000,000 | | | | 7,999,271 | |
U.S. Treasury Bill (1) | | | A-1+ | | | | 1.25 | | | | 02/15/18 | | | | 10,600,000 | | | | 10,582,672 | |
U.S. Treasury Bill (1) | | | A-1+ | | | | 1.25 | | | | 03/01/18 | | | | 14,800,000 | | | | 14,768,652 | |
| | | | | | | | | | | | | | | | | | | | |
| | | | | | | | | | | | | | | | | | | 38,349,864 | |
| | | | | | | | | | | | | | | | | | | | |
COMMERCIAL PAPER (1.9%) | | | | | | | | | | | | | |
New Jersey Natural Gas | | | A-1 | | | | 1.64 | | | | 01/04/18 | | | | 2,400,000 | | | | 2,399,453 | |
Procter & Gamble Co.† | | | A-1+ | | | | 1.48 | | | | 01/17/18 | | | | 15,000,000 | | | | 14,988,899 | |
Toyota Motor Credit Corp. | | | A-1+ | | | | 1.26 | | | | 01/03/18 | | | | 10,000,000 | | | | 9,998,597 | |
| | | | | | | | | | | | | | | | | | | | |
| | | | | | | | | | | | | | | | | | | 27,386,949 | |
| | | | | | | | | | | | | | | | | | | | |
TOTAL SHORT-TERM DEBT SECURITIES
(Cost: $65,736,813) 4.5% | | | | | | | | | | | | | | | | | | | 65,736,813 | |
| | | | | | | | | | | | | | | | | | | | |
TOTAL INVESTMENTS
(Cost: $1,077,639,795) 100.0% | | | | | | | | | | | | | | | | | | | 1,452,656,870 | |
| | | | | | | | | | | | | | | | | | | | |
OTHER NET ASSETS -0.0% (2) | | | | | | | | | | | | | | | | | | | (623,763 | ) |
| | | | | | | | | | | | | | | | | | | | |
NET ASSETS 100.0% | | | | | | | | | | | | | | | | | | $ | 1,452,033,107 | |
| | | | | | | | | | | | | | | | | | | | |
The disclosures regarding Fair Value and Security Valuation included in Section 1 of the Notes to Financial Statements (Significant Accounting Policies and Organization) are an integral part of these portfolio schedules.
MUTUAL OF AMERICA INVESTMENT CORPORATION - INTERNATIONAL FUND
PORTFOLIO OF INVESTMENTS IN SECURITIES
December 31, 2017
| | | | | | | | |
| | | Shares | | | Value | |
COMMON STOCKS: | | | | | | | | |
FINANCIALS (92.9%) | | | | | | | | |
iShares Core MSCI EAFE ETF | | | 500,019 | | | | 33,046,256 | |
iShares Core MSCI Europe ETF | | | 393,284 | | | | 19,731,058 | |
iShares Core MSCI Pacific ETF | | | 177,010 | | | | 10,555,106 | |
iShares Edge MSCI Emerging Markets ETF | | | 239,149 | | | | 14,530,693 | |
iShares MSCI EAFE ETF | | | 2,780,851 | | | | 195,521,634 | |
iShares MSCI EAFE Growth ETF | | | 492,363 | | | | 39,753,389 | |
iShares MSCI EAFE Small-Cap ETF | | | 177,935 | | | | 11,471,469 | |
iShares MSCI EAFE Value ETF | | | 689,386 | | | | 38,057,554 | |
Vanguard FTSE Developed Markets ETF | | | 2,129,980 | | | | 95,550,903 | |
Vanguard FTSE Europe ETF | | | 424,630 | | | | 25,116,865 | |
Vanguard FTSE Pacific ETF | | | 220,480 | | | | 16,072,992 | |
| | | | | | | | |
| | | | | | | 499,407,919 | |
| | | | | | | | |
TOTAL COMMON STOCKS
(Cost: $429,063,976) 92.9% | | | | | | | 499,407,919 | |
| | | | | | | | |
| | | | | | | | | | | | | | | | | | | | |
| | | Rating** | | | Rate(%) | | | Maturity | | | Face Amount | | | Value | |
SHORT-TERM DEBT SECURITIES: | | | | | | | | | | | | | | | | | | | | |
U.S. GOVERNMENT (5.2%) | | | | | | | | | | | | | | | | | | | | |
U.S. Treasury Bill | | | A-1+ | | | | 1.00 | | | | 01/02/18 | | | | 6,000,000 | | | | 5,999,500 | |
U.S. Treasury Bill | | | A-1+ | | | | 1.02 | | | | 01/02/18 | | | | 6,000,000 | | | | 5,999,489 | |
U.S. Treasury Bill | | | A-1+ | | | | 1.04 | | | | 01/11/18 | | | | 5,000,000 | | | | 4,998,257 | |
U.S. Treasury Bill | | | A-1+ | | | | 1.05 | | | | 01/04/18 | | | | 4,000,000 | | | | 3,999,415 | |
U.S. Treasury Bill | | | A-1+ | | | | 1.25 | | | | 02/15/18 | | | | 7,000,000 | | | | 6,988,557 | |
| | | | | | | | | | | | | | | | | | | | |
| | | | | | | | | | | | | | | | | | | 27,985,218 | |
| | | | | | | | | | | | | | | | | | | | |
COMMERCIAL PAPER (1.9%) | | | | | | | | | | | | | |
New Jersey Natural Gas | | | A-1 | | | | 1.64 | | | | 01/04/18 | | | | 5,000,000 | | | | 4,998,861 | |
Toyota Motor Credit Corp. | | | A-1+ | | | | 1.26 | | | | 01/03/18 | | | | 5,000,000 | | | | 4,999,299 | |
| | | | | | | | | | | | | | | | | | | | |
| | | | | | | | | | | | | | | | | | | 9,998,160 | |
| | | | | | | | | | | | | | | | | | | | |
TOTAL SHORT-TERM DEBT SECURITIES
(Cost: $37,983,378) 7.1% | | | | | | | | | | | | | | | | | | | 37,983,378 | |
| | | | | | | | | | | | | | | | | | | | |
TOTAL INVESTMENTS
(Cost: $467,047,354) 100.0% | | | | | | | | | | | | | | | | | | | 537,391,297 | |
| | | | | | | | | | | | | | | | | | | | |
OTHER NET ASSETS 0.0% (2) | | | | | | | | | | | | | | | | | | | 78,785 | |
| | | | | | | | | | | | | | | | | | | | |
NET ASSETS 100.0% | | | | | | | | | | | | | | | | | | $ | 537,470,082 | |
| | | | | | | | | | | | | | | | | | | | |
The disclosures regarding Fair Value and Security Valuation included in Section 1 of the Notes to Financial Statements (Significant Accounting Policies and Organization) are an integral part of these portfolio schedules.
MUTUAL OF AMERICA INVESTMENT CORPORATION - COMPOSITE FUND
PORTFOLIO OF INVESTMENTS IN SECURITIES
December 31, 2017
| | | | | | | | |
| | | Shares | | | Value | |
COMMON STOCKS: | | | | | | | | |
CONSUMER DISCRETIONARY (7.3%) | | | | | | | | |
Amazon.com, Inc.* | | | 1,384 | | | | 1,618,546 | |
Comcast Corp. Cl A | | | 59,006 | | | | 2,363,190 | |
Foot Locker, Inc. | | | 15,330 | | | | 718,670 | |
Ford Motor Co. | | | 62,100 | | | | 775,629 | |
Home Depot, Inc. | | | 18,404 | | | | 3,488,110 | |
Ross Stores, Inc. | | | 19,656 | | | | 1,577,394 | |
Royal Caribbean Cruises Ltd. | | | 5,168 | | | | 616,439 | |
Tapestry, Inc. | | | 27,079 | | | | 1,197,704 | |
Viacom, Inc. Cl B | | | 30,790 | | | | 948,640 | |
Wyndham Worldwide Corp. | | | 5,611 | | | | 650,147 | |
| | | | | | | | |
| | | | | | | 13,954,469 | |
| | | | | | | | |
CONSUMER STAPLES (2.6%) | | | | | | | | |
Kimberly-Clark Corp. | | | 6,739 | | | | 813,128 | |
PepsiCo, Inc. | | | 17,146 | | | | 2,056,148 | |
Walgreens Boots Alliance, Inc. | | | 28,230 | | | | 2,050,063 | |
| | | | | | | | |
| | | | | | | 4,919,339 | |
| | | | | | | | |
ENERGY (5.3%) | | | | | | | | |
Anadarko Petroleum Corp. | | | 13,030 | | | | 698,929 | |
Baker Hughes, a GE Co. | | | 55,307 | | | | 1,749,913 | |
Chevron Corp. | | | 13,719 | | | | 1,717,482 | |
Cimarex Energy Co. | | | 5,225 | | | | 637,502 | |
Marathon Petroleum Corp. | | | 30,700 | | | | 2,025,586 | |
National Oilwell Varco, Inc. | | | 16,942 | | | | 610,251 | �� |
Noble Energy, Inc. | | | 12,301 | | | | 358,451 | |
Pioneer Natural Resources Co. | | | 5,486 | | | | 948,255 | |
Range Resources Corp. | | | 30,794 | | | | 525,346 | |
Williams Cos., Inc. | | | 23,868 | | | | 727,735 | |
| | | | | | | | |
| | | | | | | 9,999,450 | |
| | | | | | | | |
FINANCIALS (9.8%) | | | | | | | | |
American Int’l. Group, Inc. | | | 19,660 | | | | 1,171,343 | |
Ameriprise Financial, Inc. | | | 7,686 | | | | 1,302,546 | |
Citigroup, Inc. | | | 30,385 | | | | 2,260,948 | |
CME Group, Inc. | | | 11,064 | | | | 1,615,897 | |
Comerica, Inc. | | | 14,366 | | | | 1,247,112 | |
JPMorgan Chase & Co. | | | 28,544 | | | | 3,052,495 | |
KeyCorp | | | 76,720 | | | | 1,547,442 | |
Morgan Stanley | | | 28,862 | | | | 1,514,389 | |
PNC Financial Svcs. Grp., Inc. | | | 10,410 | | | | 1,502,059 | |
Principal Financial Grp., Inc. | | | 9,427 | | | | 665,169 | |
State Street Corp. | | | 12,892 | | | | 1,258,388 | |
Synchrony Financial | | | 38,962 | | | | 1,504,323 | |
| | | | | | | | |
| | | | | | | 18,642,111 | |
| | | | | | | | |
HEALTH CARE (8.1%) | | | | | | | | |
AbbVie, Inc. | | | 33,388 | | | | 3,228,953 | |
Aetna, Inc. | | | 11,357 | | | | 2,048,689 | |
Amgen, Inc. | | | 8,182 | | | | 1,422,850 | |
Bristol-Myers Squibb Co. | | | 25,270 | | | | 1,548,546 | |
Gilead Sciences, Inc. | | | 17,443 | | | | 1,249,617 | |
Humana, Inc. | | | 2,837 | | | | 703,775 | |
Johnson & Johnson | | | 16,751 | | | | 2,340,450 | |
UnitedHealth Group, Inc. | | | 12,662 | | | | 2,791,465 | |
| | | | | | | | |
| | | | | | | 15,334,345 | |
| | | | | | | | |
INDUSTRIALS (4.8%) | | | | | | | | |
Boeing Co. | | | 10,391 | | | | 3,064,410 | |
Delta Air Lines, Inc. | | | 32,906 | | | | 1,842,736 | |
FedEx Corp. | | | 8,438 | | | | 2,105,619 | |
Ingersoll-Rand PLC | | | 7,912 | | | | 705,671 | |
Lockheed Martin Corp. | | | 4,633 | | | | 1,487,425 | |
| | | | | | | | |
| | | | | | | 9,205,861 | |
| | | | | | | | |
MUTUAL OF AMERICA INVESTMENT CORPORATION - COMPOSITE FUND
PORTFOLIO OF INVESTMENTS IN SECURITIES
December 31, 2017
| | | | | | | | |
INFORMATION TECHNOLOGY (15.9%) | | | | | | | | |
Alphabet, Inc. Cl A* | | | 3,410 | | | | 3,592,094 | |
Apple, Inc. | | | 35,431 | | | | 5,995,983 | |
Applied Materials, Inc. | | | 20,800 | | | | 1,063,296 | |
Broadcom Ltd. | | | 7,383 | | | | 1,896,693 | |
Cisco Systems, Inc. | | | 47,253 | | | | 1,809,790 | |
Corning, Inc. | | | 40,729 | | | | 1,302,921 | |
DXC Technology Co. | | | 13,749 | | | | 1,304,780 | |
Intel Corp. | | | 12,861 | | | | 593,664 | |
Lam Research Corp. | | | 5,026 | | | | 925,136 | |
Micron Technology, Inc.* | | | 21,992 | | | | 904,311 | |
Microsoft Corp. | | | 53,625 | | | | 4,587,079 | |
NVIDIA Corp. | | | 6,836 | | | | 1,322,766 | |
Oracle Corp. | | | 29,952 | | | | 1,416,131 | |
QUALCOMM, Inc. | | | 19,198 | | | | 1,229,056 | |
Total System Services, Inc. | | | 18,597 | | | | 1,470,837 | |
Western Digital Corp. | | | 10,853 | | | | 863,139 | |
| | | | | | | | |
| | | | | | | 30,277,676 | |
| | | | | | | | |
MATERIALS (1.6%) | | | | | | | | |
Avery Dennison Corp. | | | 5,636 | | | | 647,351 | |
Eastman Chemical Co. | | | 12,774 | | | | 1,183,383 | |
International Paper Co. | | | 10,666 | | | | 617,988 | |
Newmont Mining Corp. | | | 17,455 | | | | 654,912 | |
| | | | | | | | |
| | | | | | | 3,103,634 | |
| | | | | | | | |
REAL ESTATE (1.8%) | | | | | | | | |
American Tower Corp. | | | 13,731 | | | | 1,959,002 | |
Simon Property Group, Inc. | | | 8,648 | | | | 1,485,208 | |
| | | | | | | | |
| | | | | | | 3,444,210 | |
| | | | | | | | |
TELECOMMUNICATION SERVICES (0.5%) | | | | | | | | |
CenturyLink, Inc. | | | 57,491 | | | | 958,950 | |
| | | | | | | | |
UTILITIES (1.8%) | | | | | | | | |
NextEra Energy, Inc. | | | 10,950 | | | | 1,710,281 | |
Sempra Energy | | | 16,076 | | | | 1,718,846 | |
| | | | | | | | |
| | | | | | | 3,429,127 | |
| | | | | | | | |
TOTAL COMMON STOCKS
(Cost: $88,093,747) 59.5% | | | | | | | 113,269,172 | |
| | | | | |
| | | | | | | | | | | | | | | | | | | | |
| | | Rating** | | | Rate(%) | | | Maturity | | | Face Amount | | | Value | |
LONG-TERM DEBT SECURITIES: | | | | | | | | | | | | | | | | | | | | |
U.S. GOVERNMENT (12.0%) | | | | | | | | | | | | | |
U.S. Treasury Note | | | AA+ | | | | 1.50 | | | | 02/28/23 | | | | 500,000 | | | | 482,481 | |
U.S. Treasury Note | | | AA+ | | | | 1.63 | | | | 02/15/26 | | | | 750,000 | | | | 708,281 | |
U.S. Treasury Note | | | AA+ | | | | 2.00 | | | | 02/15/25 | | | | 500,000 | | | | 488,770 | |
U.S. Treasury Note | | | AA+ | | | | 2.00 | | | | 11/15/26 | | | | 800,000 | | | | 774,218 | |
U.S. Treasury Note | | | AA+ | | | | 2.13 | | | | 05/15/25 | | | | 750,000 | | | | 738,545 | |
U.S. Treasury Note | | | AA+ | | | | 2.25 | | | | 02/15/27 | | | | 350,000 | | | | 345,406 | |
U.S. Treasury Note | | | AA+ | | | | 2.25 | | | | 08/15/27 | | | | 2,250,000 | | | | 2,218,361 | |
U.S. Treasury Note | | | AA+ | | | | 2.38 | | | | 05/15/27 | | | | 1,850,000 | | | | 1,844,724 | |
U.S. Treasury Strip | | | AA+ | | | | 0.00 | | | | 11/15/21 | | | | 7,050,000 | | | | 6,491,550 | |
U.S. Treasury Strip | | | AA+ | | | | 0.00 | | | | 08/15/28 | | | | 6,000,000 | | | | 4,577,958 | |
U.S. Treasury Strip | | | AA+ | | | | 0.00 | | | | 08/15/29 | | | | 5,500,000 | | | | 4,084,267 | |
| | | | | | | | | | | | | | | | | | | | |
| | | | | | | | | | | | | | | | | | | 22,754,561 | |
| | | | | | | | | | | | | | | | | | | | |
U.S. GOVERNMENT AGENCIES (11.7%) | | | | | | | | | | | | | | | | | | | | |
MORTGAGE-BACKED OBLIGATIONS (11.4%) | | | | | | | | | | | | | |
FHLMC | | | AA+ | | | | 2.50 | | | | 09/01/27 | | | | 229,566 | | | | 230,755 | |
FHLMC | | | AA+ | | | | 3.00 | | | | 06/01/27 | | | | 129,891 | | | | 132,331 | |
FHLMC | | | AA+ | | | | 3.00 | | | | 08/01/27 | | | | 135,809 | | | | 138,404 | |
FHLMC | | | AA+ | | | | 3.00 | | | | 10/15/37 | | | | 195,977 | | | | 198,509 | |
MUTUAL OF AMERICA INVESTMENT CORPORATION - COMPOSITE FUND
PORTFOLIO OF INVESTMENTS IN SECURITIES
December 31, 2017
| | | | | | | | | | | | | | | | | | |
FHLMC | | AA+ | | | 3.00 | | | | 11/01/42 | | | | 218,324 | | | | 219,696 | |
FHLMC | | AA+ | | | 3.00 | | | | 04/01/43 | | | | 267,789 | | | | 269,196 | |
FHLMC | | AA+ | | | 3.50 | | | | 01/01/43 | | | | 294,738 | | | | 304,164 | |
FHLMC | | AA+ | | | 3.50 | | | | 06/01/45 | | | | 344,782 | | | | 355,628 | |
FHLMC | | AA+ | | | 3.50 | | | | 07/01/45 | | | | 402,986 | | | | 416,985 | |
FHLMC | | AA+ | | | 3.50 | | | | 09/01/47 | | | | 584,620 | | | | 601,275 | |
FHLMC | | AA+ | | | 4.00 | | | | 02/01/25 | | | | 29,448 | | | | 30,558 | |
FHLMC | | AA+ | | | 4.00 | | | | 03/01/41 | | | | 132,664 | | | | 139,270 | |
FHLMC | | AA+ | | | 4.00 | | | | 07/01/41 | | | | 174,521 | | | | 184,925 | |
FHLMC | | AA+ | | | 4.00 | | | | 11/01/42 | | | | 125,242 | | | | 131,996 | |
FHLMC | | AA+ | | | 4.00 | | | | 01/01/43 | | | | 229,513 | | | | 242,315 | |
FHLMC | | AA+ | | | 4.00 | | | | 01/01/44 | | | | 229,957 | | | | 242,335 | |
FHLMC | | AA+ | | | 4.00 | | | | 10/01/44 | | | | 186,913 | | | | 195,527 | |
FHLMC | | AA+ | | | 4.00 | | | | 06/01/45 | | | | 330,262 | | | | 348,492 | |
FHLMC | | AA+ | | | 4.00 | | | | 05/01/47 | | | | 387,592 | | | | 405,354 | |
FHLMC | | AA+ | | | 4.50 | | | | 08/01/34 | | | | 28,783 | | | | 30,722 | |
FHLMC | | AA+ | | | 4.50 | | | | 08/15/35 | | | | 27,818 | | | | 28,985 | |
FHLMC | | AA+ | | | 4.50 | | | | 02/01/44 | | | | 213,223 | | | | 226,901 | |
FHLMC | | AA+ | | | 5.00 | | | | 02/01/26 | | | | 16,816 | | | | 18,070 | |
FHLMC | | AA+ | | | 5.00 | | | | 10/01/40 | | | | 234,062 | | | | 255,034 | |
FHLMC | | AA+ | | | 5.50 | | | | 07/01/32 | | | | 33,836 | | | | 37,315 | |
FHLMC | | AA+ | | | 5.50 | | | | 05/01/33 | | | | 42,543 | | | | 46,564 | |
FHLMC | | AA+ | | | 5.50 | | | | 06/01/37 | | | | 98,622 | | | | 109,635 | |
FHLMC | | AA+ | | | 6.00 | | | | 03/15/32 | | | | 32,845 | | | | 36,341 | |
FHLMC ARM | | AA+ | | | 2.76 | | | | 02/01/36 | | | | 28,439 | | | | 29,958 | |
FHLMC ARM | | AA+ | | | 2.93 | | | | 05/01/37 | | | | 20,980 | | | | 21,909 | |
FHLMC ARM | | AA+ | | | 3.40 | | | | 03/01/37 | | | | 6,282 | | | | 6,572 | |
FHLMC ARM | | AA+ | | | 3.61 | | | | 04/01/37 | | | | 30,808 | | | | 32,446 | |
FHLMC ARM | | AA+ | | | 4.65 | | | | 09/01/39 | | | | 20,740 | | | | 21,364 | |
FHLMC Strip | | AA+ | | | 3.00 | | | | 01/15/43 | | | | 291,334 | | | | 295,886 | |
FNMA | | AA+ | | | 2.40 | | | | 05/01/43 | | | | 331,132 | | | | 331,599 | |
FNMA | | AA+ | | | 2.68 | | | | 12/01/26 | | | | 300,000 | | | | 292,795 | |
FNMA | | AA+ | | | 2.91 | | | | 07/01/27 | | | | 297,853 | | | | 297,602 | |
FNMA | | AA+ | | | 3.00 | | | | 06/01/33 | | | | 281,881 | | | | 288,274 | |
FNMA | | AA+ | | | 3.00 | | | | 09/01/33 | | | | 242,899 | | | | 248,412 | |
FNMA | | AA+ | | | 3.00 | | | | 12/01/42 | | | | 286,228 | | | | 284,939 | |
FNMA | | AA+ | | | 3.00 | | | | 01/01/43 | | | | 602,926 | | | | 606,184 | |
FNMA | | AA+ | | | 3.00 | | | | 02/01/43 | | | | 162,609 | | | | 163,085 | |
FNMA | | AA+ | | | 3.00 | | | | 03/01/43 | | | | 334,022 | | | | 336,411 | |
FNMA | | AA+ | | | 3.00 | | | | 04/01/43 | | | | 292,636 | | | | 291,317 | |
FNMA | | AA+ | | | 3.00 | | | | 09/01/43 | | | | 341,003 | | | | 342,776 | |
FNMA | | AA+ | | | 3.50 | | | | 03/25/28 | | | | 260,586 | | | | 267,751 | |
FNMA | | AA+ | | | 3.50 | | | | 08/01/38 | | | | 219,832 | | | | 226,949 | |
FNMA | | AA+ | | | 3.50 | | | | 10/01/41 | | | | 134,716 | | | | 136,941 | |
FNMA | | AA+ | | | 3.50 | | | | 11/01/41 | | | | 257,562 | | | | 265,916 | |
FNMA | | AA+ | | | 3.50 | | | | 12/01/41 | | | | 241,584 | | | | 246,761 | |
FNMA | | AA+ | | | 3.50 | | | | 04/01/42 | | | | 273,925 | | | | 278,696 | |
FNMA | | AA+ | | | 3.50 | | | | 04/01/42 | | | | 407,398 | | | | 420,645 | |
FNMA | | AA+ | | | 3.50 | | | | 08/01/42 | | | | 200,316 | | | | 206,253 | |
FNMA | | AA+ | | | 3.50 | | | | 10/01/42 | | | | 215,217 | | | | 222,204 | |
FNMA | | AA+ | | | 3.50 | | | | 08/01/43 | | | | 438,848 | | | | 452,612 | |
FNMA | | AA+ | | | 3.50 | | | | 08/01/43 | | | | 363,969 | | | | 375,152 | |
FNMA | | AA+ | | | 3.50 | | | | 01/01/44 | | | | 92,543 | | | | 94,212 | |
FNMA | | AA+ | | | 3.50 | | | | 08/25/44 | | | | 100,000 | | | | 102,380 | |
FNMA | | AA+ | | | 3.50 | | | | 04/01/45 | | | | 312,396 | | | | 322,363 | |
FNMA | | AA+ | | | 3.50 | | | | 06/01/45 | | | | 871,901 | | | | 899,976 | |
FNMA | | AA+ | | | 4.00 | | | | 05/01/19 | | | | 9,149 | | | | 9,416 | |
FNMA | | AA+ | | | 4.00 | | | | 07/25/26 | | | | 356,029 | | | | 379,184 | |
FNMA | | AA+ | | | 4.00 | | | | 01/01/31 | | | | 156,171 | | | | 164,467 | |
FNMA | | AA+ | | | 4.00 | | | | 11/01/40 | | | | 141,987 | | | | 149,138 | |
FNMA | | AA+ | | | 4.00 | | | | 05/01/41 | | | | 158,062 | | | | 164,021 | |
MUTUAL OF AMERICA INVESTMENT CORPORATION - COMPOSITE FUND
PORTFOLIO OF INVESTMENTS IN SECURITIES
December 31, 2017
| | | | | | | | | | | | | | | | | | |
FNMA | | AA+ | | | 4.00 | | | | 11/01/45 | | | | 341,194 | | | | 357,966 | |
FNMA | | AA+ | | | 4.00 | | | | 02/01/47 | | | | 271,966 | | | | 285,820 | |
FNMA | | AA+ | | | 4.50 | | | | 05/01/18 | | | | 1,370 | | | | 1,391 | |
FNMA | | AA+ | | | 4.50 | | | | 05/01/30 | | | | 52,335 | | | | 55,852 | |
FNMA | | AA+ | | | 4.50 | | | | 04/01/31 | | | | 67,549 | | | | 72,091 | |
FNMA | | AA+ | | | 4.50 | | | | 08/01/33 | | | | 29,222 | | | | 31,216 | |
FNMA | | AA+ | | | 4.50 | | | | 09/01/33 | | | | 58,034 | | | | 62,000 | |
FNMA | | AA+ | | | 4.50 | | | | 06/01/34 | | | | 47,616 | | | | 50,870 | |
FNMA | | AA+ | | | 4.50 | | | | 08/01/35 | | | | 32,924 | | | | 35,193 | |
FNMA | | AA+ | | | 4.50 | | | | 12/01/35 | | | | 35,938 | | | | 38,400 | |
FNMA | | AA+ | | | 4.50 | | | | 05/01/39 | | | | 60,111 | | | | 64,852 | |
FNMA | | AA+ | | | 4.50 | | | | 05/01/39 | | | | 90,301 | | | | 97,573 | |
FNMA | | AA+ | | | 4.50 | | | | 05/01/40 | | | | 103,596 | | | | 110,452 | |
FNMA | | AA+ | | | 4.50 | | | | 10/01/40 | | | | 514,952 | | | | 552,046 | |
FNMA | | AA+ | | | 5.00 | | | | 04/01/18 | | | | 2,472 | | | | 2,516 | |
FNMA | | AA+ | | | 5.00 | | | | 06/01/33 | | | | 60,088 | | | | 65,269 | |
FNMA | | AA+ | | | 5.00 | | | | 10/01/33 | | | | 62,456 | | | | 68,181 | |
FNMA | | AA+ | | | 5.00 | | | | 11/01/33 | | | | 39,974 | | | | 43,422 | |
FNMA | | AA+ | | | 5.00 | | | | 11/01/33 | | | | 174,711 | | | | 189,784 | |
FNMA | | AA+ | | | 5.00 | | | | 03/01/34 | | | | 22,117 | | | | 24,026 | |
FNMA | | AA+ | | | 5.00 | | | | 04/01/34 | | | | 37,271 | | | | 40,683 | |
FNMA | | AA+ | | | 5.00 | | | | 09/01/35 | | | | 20,262 | | | | 22,000 | |
FNMA | | AA+ | | | 5.00 | | | | 11/25/35 | | | | 81,029 | | | | 86,453 | |
FNMA | | AA+ | | | 5.00 | | | | 08/01/37 | | | | 162,592 | | | | 175,869 | |
FNMA | | AA+ | | | 5.00 | | | | 05/01/39 | | | | 71,419 | | | | 76,527 | |
FNMA | | AA+ | | | 5.00 | | | | 06/01/40 | | | | 40,067 | | | | 43,246 | |
FNMA | | AA+ | | | 5.50 | | | | 03/01/34 | | | | 10,978 | | | | 12,026 | |
FNMA | | AA+ | | | 5.50 | | | | 05/01/34 | | | | 123,520 | | | | 136,962 | |
FNMA | | AA+ | | | 5.50 | | | | 07/01/34 | | | | 38,860 | | | | 42,968 | |
FNMA | | AA+ | | | 5.50 | | | | 09/01/34 | | | | 17,956 | | | | 19,896 | |
FNMA | | AA+ | | | 5.50 | | | | 09/01/34 | | | | 59,099 | | | | 65,276 | |
FNMA | | AA+ | | | 5.50 | | | | 10/01/34 | | | | 20,775 | | | | 23,007 | |
FNMA | | AA+ | | | 5.50 | | | | 02/01/35 | | | | 34,312 | | | | 38,038 | |
FNMA | | AA+ | | | 5.50 | | | | 02/01/35 | | | | 51,826 | | | | 57,622 | |
FNMA | | AA+ | | | 5.50 | | | | 08/01/35 | | | | 14,488 | | | | 16,058 | |
FNMA | | AA+ | | | 5.50 | | | | 08/01/37 | | | | 7,819 | | | | 8,590 | |
FNMA | | AA+ | | | 5.50 | | | | 11/01/38 | | | | 5,721 | | | | 6,002 | |
FNMA | | AA+ | | | 5.50 | | | | 06/01/48 | | | | 16,983 | | | | 18,055 | |
FNMA | | AA+ | | | 6.00 | | | | 12/25/49 | | | | 42,224 | | | | 47,479 | |
FNMA | | AA+ | | | 6.00 | | | | 05/01/23 | | | | 15,764 | | | | 17,611 | |
FNMA | | AA+ | | | 6.00 | | | | 04/01/32 | | | | 4,791 | | | | 5,353 | |
FNMA | | AA+ | | | 6.00 | | | | 05/01/32 | | | | 12,208 | | | | 13,814 | |
FNMA | | AA+ | | | 6.00 | | | | 04/01/33 | | | | 77,771 | | | | 87,641 | |
FNMA | | AA+ | | | 6.00 | | | | 05/01/33 | | | | 33,846 | | | | 37,810 | |
FNMA | | AA+ | | | 6.00 | | | | 06/01/34 | | | | 19,415 | | | | 21,964 | |
FNMA | | AA+ | | | 6.00 | | | | 09/01/34 | | | | 12,612 | | | | 14,197 | |
FNMA | | AA+ | | | 6.00 | | | | 10/01/34 | | | | 25,022 | | | | 27,977 | |
FNMA | | AA+ | | | 6.00 | | | | 12/01/36 | | | | 29,616 | | | | 33,354 | |
FNMA | | AA+ | | | 6.00 | | | | 01/01/37 | | | | 34,896 | | | | 39,474 | |
FNMA | | AA+ | | | 6.00 | | | | 04/01/37 | | | | 7,207 | | | | 7,538 | |
FNMA | | AA+ | | | 6.00 | | | | 05/01/37 | | | | 5,856 | | | | 6,255 | |
FNMA | | AA+ | | | 6.00 | | | | 06/01/37 | | | | 5,731 | | | | 5,979 | |
FNMA | | AA+ | | | 6.00 | | | | 10/25/44 | | | | 87,604 | | | | 98,539 | |
FNMA | | AA+ | | | 6.00 | | | | 02/25/47 | | | | 77,540 | | | | 87,220 | |
FNMA | | AA+ | | | 6.50 | | | | 05/01/32 | | | | 23,716 | | | | 26,288 | |
FNMA | | AA+ | | | 6.50 | | | | 05/01/32 | | | | 7,682 | | | | 8,516 | |
FNMA | | AA+ | | | 6.50 | | | | 07/01/32 | | | | 3,821 | | | | 4,236 | |
FNMA | | AA+ | | | 6.50 | | | | 07/01/34 | | | | 21,465 | | | | 23,793 | |
FNMA | | AA+ | | | 6.50 | | | | 05/01/37 | | | | 19,732 | | | | 20,634 | |
FNMA | | AA+ | | | 6.50 | | | | 09/01/37 | | | | 7,088 | | | | 7,856 | |
FNMA | | AA+ | | | 7.00 | | | | 09/01/31 | | | | 13,968 | | | | 15,251 | |
MUTUAL OF AMERICA INVESTMENT CORPORATION - COMPOSITE FUND
PORTFOLIO OF INVESTMENTS IN SECURITIES
December 31, 2017
| | | | | | | | | | | | | | | | | | |
FNMA | | AA+ | | | 7.00 | | | | 04/01/32 | | | | 4,001 | | | | 4,368 | |
FNMA | | AA+ | | | 7.50 | | | | 06/01/31 | | | | 4,775 | | | | 5,368 | |
FNMA | | AA+ | | | 7.50 | | | | 02/01/32 | | | | 4,485 | | | | 4,937 | |
FNMA | | AA+ | | | 7.50 | | | | 06/01/32 | | | | 4,185 | | | | 4,922 | |
FNMA | | AA+ | | | 8.00 | | | | 04/01/32 | | | | 1,508 | | | | 1,587 | |
FNMA Strip | | AA+ | | | 3.00 | | | | 08/25/42 | | | | 233,460 | | | | 233,540 | |
GNMA (3) | | AA+ | | | 4.00 | | | | 08/15/41 | | | | 168,218 | | | | 176,482 | |
GNMA (3) | | AA+ | | | 4.00 | | | | 01/15/42 | | | | 230,162 | | | | 241,515 | |
GNMA (3) | | AA+ | | | 4.00 | | | | 08/20/42 | | | | 157,706 | | | | 164,969 | |
GNMA (3) | | AA+ | | | 4.50 | | | | 04/20/31 | | | | 85,825 | | | | 91,095 | |
GNMA (3) | | AA+ | | | 4.50 | | | | 10/15/40 | | | | 149,748 | | | | 160,468 | |
GNMA (3) | | AA+ | | | 4.50 | | | | 10/20/43 | | | | 305,005 | | | | 325,362 | |
GNMA (3) | | AA+ | | | 5.00 | | | | 04/15/39 | | | | 124,495 | | | | 137,057 | |
GNMA (3) | | AA+ | | | 5.00 | | | | 06/20/39 | | | | 146,215 | | | | 156,678 | |
GNMA (3) | | AA+ | | | 5.00 | | | | 11/15/39 | | | | 72,487 | | | | 78,419 | |
GNMA (3) | | AA+ | | | 6.50 | | | | 04/15/31 | | | | 1,880 | | | | 2,085 | |
GNMA (3) | | AA+ | | | 6.50 | | | | 10/15/31 | | | | 2,796 | | | | 3,222 | |
GNMA (3) | | AA+ | | | 6.50 | | | | 12/15/31 | | | | 1,454 | | | | 1,613 | |
GNMA (3) | | AA+ | | | 6.50 | | | | 05/15/32 | | | | 6,970 | | | | 7,733 | |
GNMA (3) | | AA+ | | | 7.00 | | | | 05/15/31 | | | | 2,605 | | | | 3,007 | |
GNMA (3) | | AA+ | | | 7.00 | | | | 05/15/32 | | | | 676 | | | | 693 | |
Small Business Administration (3) | | AA+ | | | 2.81 | | | | 06/01/37 | | | | 1,323,294 | | | | 1,326,814 | |
Vendee Mortgage Trust (3) | | AA+ | | | 5.25 | | | | 01/15/32 | | | | 123,499 | | | | 128,909 | |
| | | | | | | | | | | | | | | | | | |
| | | | | | | | | | | | | | | | | 21,871,668 | |
| | | | | | | | | | | | | | | | | | |
NON-MORTGAGE-BACKED OBLIGATIONS (0.3%) | | | | | | | | | | | | | |
FHLMC | | AA+ | | | 0.00 | | | | 11/29/19 | | | | 500,000 | | | | 478,864 | |
| | | | | | | | | | | | | | | | | | |
CORPORATE DEBT (13.9%) | | | | | | | | | | | | | | | | | | |
CONSUMER DISCRETIONARY (2.9%) | | | | | | | | | | | | | |
Advance Auto Parts, Inc. | | BBB- | | | 4.50 | | | | 12/01/23 | | | | 100,000 | | | | 105,137 | |
Advance Auto Parts, Inc. | | BBB- | | | 5.75 | | | | 05/01/20 | | | | 270,000 | | | | 287,713 | |
Amazon.com, Inc. | | AA- | | | 5.20 | | | | 12/03/25 | | | | 300,000 | | | | 344,383 | |
AutoZone, Inc. | | BBB | | | 4.00 | | | | 11/15/20 | | | | 250,000 | | | | 259,467 | |
Coach, Inc. | | BBB- | | | 4.25 | | | | 04/01/25 | | | | 100,000 | | | | 102,700 | |
Dollar General Corp. | | BBB | | | 3.25 | | | | 04/15/23 | | | | 300,000 | | | | 304,046 | |
Expedia, Inc. | | BBB- | | | 5.95 | | | | 08/15/20 | | | | 250,000 | | | | 268,972 | |
Family Dollar Stores, Inc. | | BBB- | | | 5.00 | | | | 02/01/21 | | | | 300,000 | | | | 318,000 | |
Harman Int’l. Industries, Inc. | | BBB+ | | | 4.15 | | | | 05/15/25 | | | | 300,000 | | | | 310,184 | |
Kohl’s Corp. | | BBB- | | | 3.25 | | | | 02/01/23 | | | | 250,000 | | | | 247,152 | |
Kohl’s Corp. | | BBB- | | | 4.00 | | | | 11/01/21 | | | | 100,000 | | | | 102,867 | |
Lowe’s Cos., Inc. | | A- | | | 3.12 | | | | 04/15/22 | | | | 300,000 | | | | 306,085 | |
Macy’s Retail Hldgs., Inc. | | BBB- | | | 2.88 | | | | 02/15/23 | | | | 216,000 | | | | 202,771 | |
Marriott International, Inc. | | BBB | | | 3.13 | | | | 10/15/21 | | | | 25,000 | | | | 25,304 | |
Marriott International, Inc. | | BBB | | | 3.25 | | | | 09/15/22 | | | | 350,000 | | | | 356,426 | |
Mattel, Inc. | | BB- | | | 3.15 | | | | 03/15/23 | | | | 350,000 | | | | 301,354 | |
NVR, Inc. | | BBB+ | | | 3.95 | | | | 09/15/22 | | | | 300,000 | | | | 313,175 | |
Omnicom Group, Inc. | | BBB+ | | | 3.63 | | | | 05/01/22 | | | | 100,000 | | | | 103,236 | |
Omnicom Group, Inc. | | BBB+ | | | 4.45 | | | | 08/15/20 | | | | 250,000 | | | | 262,262 | |
O’Reilly Automotive, Inc. | | BBB+ | | | 3.80 | | | | 09/01/22 | | | | 300,000 | | | | 315,598 | |
Tupperware Brands Corp. | | BBB- | | | 4.75 | | | | 06/01/21 | | | | 350,000 | | | | 368,974 | |
Viacom, Inc. | | BBB- | | | 3.25 | | | | 03/15/23 | | | | 350,000 | | | | 340,180 | |
| | | | | | | | | | | | | | | | | | |
| | | | | | | | | | | | | | | | | 5,545,986 | |
| | | | | | | | | | | | | | | | | | |
CONSUMER STAPLES (0.7%) | | | | | | | | | | | | | |
Edgewell Personal Care Co. | | BB+ | | | 4.70 | | | | 05/19/21 | | | | 275,000 | | | | 283,938 | |
Ingredion, Inc. | | BBB | | | 4.63 | | | | 11/01/20 | | | | 250,000 | | | | 262,612 | |
Molson Coors Brewing Co. | | BBB- | | | 3.50 | | | | 05/01/22 | | | | 400,000 | | | | 410,842 | |
Sysco Corp. | | BBB+ | | | 2.60 | | | | 06/12/22 | | | | 300,000 | | | | 297,915 | |
Sysco Corp. | | BBB+ | | | 3.75 | | | | 10/01/25 | | | | 100,000 | | | | 103,982 | |
| | | | | | | | | | | | | | | | | | |
| | | | | | | | | | | | | | | | | 1,359,289 | |
| | | | | | | | | | | | | | | | | | |
MUTUAL OF AMERICA INVESTMENT CORPORATION - COMPOSITE FUND
PORTFOLIO OF INVESTMENTS IN SECURITIES
December 31, 2017
| | | | | | | | | | | | | | | | | | |
ENERGY (1.3%) | | | | | | | | | | | | | |
Cameron International Corp. | | AA- | | | 4.50 | | | | 06/01/21 | | | | 300,000 | | | | 311,738 | |
Energen Corp. | | BB | | | 4.63 | | | | 09/01/21 | | | | 250,000 | | | | 253,125 | |
EQT Corp. | | BBB | | | 4.88 | | | | 11/15/21 | | | | 210,000 | | | | 223,900 | |
Marathon Oil Corp. | | BBB- | | | 2.80 | | | | 11/01/22 | | | | 350,000 | | | | 346,590 | |
Noble Corp. | | B | | | 7.50 | | | | 03/15/19 | | | | 800,000 | | | | 819,000 | |
Rowan Companies PLC | | B+ | | | 4.88 | | | | 06/01/22 | | | | 300,000 | | | | 282,750 | |
Seacor Hldgs., Inc. | | NR | | | 7.38 | | | | 10/01/19 | | | | 250,000 | | | | 258,125 | |
| | | | | | | | | | | | | | | | | | |
| | | | | | | | | | | | | | | | | 2,495,228 | |
| | | | | | | | | | | | | | | | | | |
FINANCIALS (3.0%) | | | | | | | | | | | | | |
Aflac, Inc. | | A- | | | 4.00 | | | | 02/15/22 | | | | 300,000 | | | | 315,733 | |
Alleghany Corp. | | BBB+ | | | 5.63 | | | | 09/15/20 | | | | 300,000 | | | | 321,666 | |
American Express Co. | | BBB | | | 3.63 | | | | 12/05/24 | | | | 250,000 | | | | 257,237 | |
Bank of America Corp. | | BBB+ | | | 3.95 | | | | 04/21/25 | | | | 300,000 | | | | 310,235 | |
Barrick N.A. Finance LLC | | BBB- | | | 4.40 | | | | 05/30/21 | | | | 250,000 | | | | 264,628 | |
Berkley (W.R.) Corp. | | BBB+ | | | 7.38 | | | | 09/15/19 | | | | 250,000 | | | | 269,065 | |
Block Financial LLC | | BBB | | | 5.25 | | | | 10/01/25 | | | | 350,000 | | | | 375,710 | |
Capital One Financial Corp. | | BBB | | | 4.75 | | | | 07/15/21 | | | | 300,000 | | | | 320,544 | |
Citizens Financial Group, Inc. | | BBB | | | 3.75 | | | | 07/01/24 | | | | 250,000 | | | | 249,838 | |
Citizens Financial Group, Inc. | | BBB | | | 4.35 | | | | 08/01/25 | | | | 100,000 | | | | 104,015 | |
Fairfax U.S., Inc.† | | BBB- | | | 4.88 | | | | 08/13/24 | | | | 250,000 | | | | 260,520 | |
Fifth Third Bancorp | | BBB | | | 4.30 | | | | 01/16/24 | | | | 300,000 | | | | 318,407 | |
First Republic Bank | | A- | | | 2.38 | | | | 06/17/19 | | | | 150,000 | | | | 149,727 | |
First Tennessee Bank | | BBB | | | 2.95 | | | | 12/01/19 | | | | 350,000 | | | | 352,329 | |
Lincoln National Corp. | | A- | | | 4.00 | | | | 09/01/23 | | | | 250,000 | | | | 260,979 | |
Moody’s Corp. | | BBB+ | | | 4.50 | | | | 09/01/22 | | | | 250,000 | | | | 267,868 | |
Pacific LifeCorp.† | | A- | | | 6.00 | | | | 02/10/20 | | | | 23,000 | | | | 24,466 | |
Prudential Financial, Inc. | | A | | | 4.50 | | | | 11/16/21 | | | | 250,000 | | | | 267,943 | |
Signet UK Finance PLC | | BBB- | | | 4.70 | | | | 06/15/24 | | | | 250,000 | | | | 246,155 | |
Synchrony Financial | | BBB- | | | 3.70 | | | | 08/04/26 | | | | 400,000 | | | | 394,368 | |
Unum Group | | BBB | | | 4.00 | | | | 03/15/24 | | | | 150,000 | | | | 156,200 | |
Voya Financial, Inc. | | BBB | | | 3.65 | | | | 06/15/26 | | | | 250,000 | | | | 252,826 | |
| | | | | | | | | | | | | | | | | | |
| | | | | | | | | | | | | | | | | 5,740,459 | |
| | | | | | | | | | | | | | | | | | |
HEALTH CARE (1.5%) | | | | | | | | | | | | | |
Agilent Technologies, Inc. | | BBB+ | | | 5.00 | | | | 07/15/20 | | | | 290,000 | | | | 307,934 | |
Anthem, Inc. | | A | | | 4.35 | | | | 08/15/20 | | | | 250,000 | | | | 261,930 | |
Bio-Rad Laboratories, Inc. | | BBB | | | 4.88 | | | | 12/15/20 | | | | 200,000 | | | | 211,671 | |
Medco Health Solutions, Inc. | | BBB+ | | | 4.13 | | | | 09/15/20 | | | | 250,000 | | | | 259,428 | |
Owens & Minor, Inc. | | BBB- | | | 3.88 | | | | 09/15/21 | | | | 400,000 | | | | 404,667 | |
PerkinElmer, Inc. | | BBB | | | 5.00 | | | | 11/15/21 | | | | 300,000 | | | | 323,438 | |
Quest Diagnostics, Inc. | | BBB+ | | | 4.70 | | | | 04/01/21 | | | | 150,000 | | | | 158,596 | |
Quest Diagnostics, Inc. | | BBB+ | | | 4.75 | | | | 01/30/20 | | | | 250,000 | | | | 261,247 | |
Thermo Fisher Scientific, Inc. | | BBB | | | 3.60 | | | | 08/15/21 | | | | 375,000 | | | | 387,083 | |
Zimmer Biomet Hldgs., Inc. | | BBB | | | 3.15 | | | | 04/01/22 | | | | 250,000 | | | | 250,612 | |
| | | | | | | | | | | | | | | | | | |
| | | | | | | | | | | | | | | | | 2,826,606 | |
| | | | | | | | | | | | | | | | | | |
INDUSTRIALS (0.6%) | | | | | | | | | | | | | |
Crane Co. | | BBB | | | 2.75 | | | | 12/15/18 | | | | 350,000 | | | | 351,568 | |
Hunt (J.B.) Transport Svcs., | | BBB+ | | | 3.30 | | | | 08/15/22 | | | | 200,000 | | | | 202,596 | |
L-3 Communications Corp. | | BBB- | | | 4.75 | | | | 07/15/20 | | | | 250,000 | | | | 263,009 | |
Penske Truck Leasing Co. LP† | | BBB | | | 3.38 | | | | 03/15/18 | | | | 300,000 | | | | 300,895 | |
| | | | | | | | | | | | | | | | | | |
| | | | | | | | | | | | | | | | | 1,118,068 | |
| | | | | | | | | | | | | | | | | | |
INFORMATION TECHNOLOGY (1.2%) | | | | | | | | | | | | | |
Applied Materials, Inc. | | A- | | | 3.90 | | | | 10/01/25 | | | | 350,000 | | | | 371,496 | |
Arrow Electronics, Inc. | | BBB- | | | 4.50 | | | | 03/01/23 | | | | 300,000 | | | | 315,554 | |
eBay, Inc. | | BBB+ | | | 2.88 | | | | 08/01/21 | | | | 325,000 | | | | 328,227 | |
Fiserv, Inc. | | BBB | | | 4.75 | | | | 06/15/21 | | | | 360,000 | | | | 384,317 | |
Ingram Micro, Inc. | | NR | | | 5.00 | | | | 08/10/22 | | | | 200,000 | | | | 196,081 | |
Juniper Networks, Inc. | | BBB | | | 4.60 | | | | 03/15/21 | | | | 350,000 | | | | 366,554 | |
Symantec Corp. | | BB+ | | | 4.20 | | | | 09/15/20 | | | | 350,000 | | | | 360,500 | |
| | | | | | | | | | | | | | | | | | |
| | | | | | | | | | | | | | | | | 2,322,729 | |
| | | | | | | | | | | | | | | | | | |
MATERIALS (0.9%) | | | | | | | | | | | | | |
Freeport-McMoRan, Inc. | | BB- | | | 3.55 | | | | 03/01/22 | | | | 300,000 | | | | 296,625 | |
Methanex Corp. | | BB+ | | | 3.25 | | | | 12/15/19 | | | | 250,000 | | | | 251,116 | |
MUTUAL OF AMERICA INVESTMENT CORPORATION - COMPOSITE FUND
PORTFOLIO OF INVESTMENTS IN SECURITIES
December 31, 2017
| | | | | | | | | | | | | | | | | | |
Packaging Corp. of America | | BBB | | | 3.90 | | | | 06/15/22 | | | | 250,000 | | | | 260,398 | |
Packaging Corp. of America | | BBB | | | 4.50 | | | | 11/01/23 | | | | 150,000 | | | | 161,367 | |
Sherwin-Williams Co. | | BBB | | | 3.95 | | | | 01/15/26 | | | | 350,000 | | | | 364,991 | |
Southern Copper Corp. | | BBB | | | 3.50 | | | | 11/08/22 | | | | 100,000 | | | | 102,714 | |
Teck Resources Ltd. | | BB+ | | | 4.75 | | | | 01/15/22 | | | | 300,000 | | | | 313,140 | |
| | | | | | | | | | | | | | | | | | |
| | | | | | | | | | | | | | | | | 1,750,351 | |
| | | | | | | | | | | | | | | | | | |
REAL ESTATE (0.9%) | | | | | | | | | | | | | |
Government Pptys. Income Trust | | BBB- | | | 3.75 | | | | 08/15/19 | | | | 350,000 | | | | 352,941 | |
Healthcare Realty Trust, Inc. | | BBB | | | 3.75 | | | | 04/15/23 | | | | 250,000 | | | | 254,289 | |
Hospitality Properties Trust | | BBB- | | | 5.00 | | | | 08/15/22 | | | | 250,000 | | | | 266,780 | |
National Retail Pptys., Inc. | | BBB+ | | | 3.80 | | | | 10/15/22 | | | | 250,000 | | | | 258,242 | |
Ventas Realty LP/Capital Corp. | | BBB+ | | | 4.00 | | | | 04/30/19 | | | | 100,000 | | | | 101,819 | |
Ventas Realty LP/Capital Corp. | | BBB+ | | | 4.75 | | | | 06/01/21 | | | | 200,000 | | | | 211,939 | |
Welltower, Inc. | | BBB+ | | | 6.13 | | | | 04/15/20 | | | | 250,000 | | | | 270,032 | |
| | | | | | | | | | | | | | | | | | |
| | | | | | | | | | | | | | | | | 1,716,042 | |
| | | | | | | | | | | | | | | | | | |
TELECOMMUNICATION SERVICES (0.2%) | | | | | | | | | | | | | |
AT&T, Inc. | | BBB+ | | | 3.00 | | | | 06/30/22 | | | | 350,000 | | | | 350,622 | |
| | | | | | | | | | | | | | | | | | |
UTILITIES (0.7%) | | | | | | | | | | | | | |
Entergy Corp. | | BBB | | | 5.13 | | | | 09/15/20 | | | | 250,000 | | | | 264,120 | |
Exelon Corp. | | BBB- | | | 5.15 | | | | 12/01/20 | | | | 340,000 | | | | 362,043 | |
National Fuel Gas Co. | | BBB | | | 4.90 | | | | 12/01/21 | | | | 250,000 | | | | 263,283 | |
National Fuel Gas Co. | | BBB | | | 5.20 | | | | 07/15/25 | | | | 100,000 | | | | 107,260 | |
SCANA Corp. | | BBB- | | | 4.13 | | | | 02/01/22 | | | | 300,000 | | | | 306,383 | |
| | | | | | | | | | | | | | | | | | |
| | | | | | | | | | | | | | | | | 1,303,089 | |
| | | | | | | | | | | | | | | | | | |
TOTAL LONG-TERM DEBT SECURITIES
(Cost: $70,140,235) 37.6% | | | | | | | | | | | | | | | | | 71,633,562 | |
| | | | | | | | | |
| | | | | |
| | | Rating** | | Rate(%) | | | Maturity | | | Face Amount | | | Value | |
SHORT-TERM DEBT SECURITIES: | | | | | | | | | | | | | | | | | | |
U.S. GOVERNMENT (1.3%) | | | | | | | | | | | | | |
U.S. Treasury Bill | | A-1+ | | | 1.00 | | | | 01/02/18 | | | | 2,600,000 | | | | 2,599,783 | |
| | | | | | | | | | | | | | | | | | |
COMMERCIAL PAPER (1.1%) | | | | | | | | | | | | | |
Estee Lauder Cos.† | | A-1 | | | 1.40 | | | | 01/02/18 | | | | 2,000,000 | | | | 1,999,767 | |
| | | | | | | | | | | | | | | | | | |
TOTAL SHORT-TERM DEBT SECURITIES
(Cost: $4,599,550) 2.4% | | | | | | | | | | | | | | | | | 4,599,550 | |
| | | | | | | | | |
TOTAL INVESTMENTS
(Cost: $162,833,532) 99.5% | | | | | | | | | | | | | | | | | 189,502,284 | |
| | | | | | | | | | | | | | | | | | |
OTHER NET ASSETS 0.5% | | | | | | | | | | | | | | | | | 868,631 | |
| | | | | | | | | | | | | | | | | | |
NET ASSETS 100.0% | | | | | | | | | | | | | | | | $ | 190,370,915 | |
| | | | | | | | | | | | | | | | | | |
The disclosures regarding Fair Value and Security Valuation included in Section 1 of the Notes to Financial Statements (Significant Accounting Policies and Organization) are an integral part of these portfolio schedules.
MUTUAL OF AMERICA INVESTMENT CORPORATION - RETIREMENT INCOME FUND
PORTFOLIO OF INVESTMENTS IN SECURITIES
December 31, 2017
| | | | | | | | |
| | | Shares | | | Value | |
COMMON STOCKS: | | | | | | | | |
DIVERSIFIED MUTUAL FUNDS (100.0%) | | | | | | | | |
Mutual of America Investment Corporation | | | | | | | | |
Bond Fund (30.1%) | | | 21,028,408 | | | | 30,339,830 | |
Equity Index Fund (22.8%) | | | 5,601,241 | | | | 22,985,867 | |
Mid-Cap Equity Index Fund (5.8%) | | | 2,488,936 | | | | 5,830,114 | |
Mid-Term Bond Fund (33.2%) | | | 32,156,863 | | | | 33,475,294 | |
Money Market Fund (8.1%) | | | 6,800,751 | | | | 8,188,254 | |
| | | | | | | | |
TOTAL INVESTMENTS
(Cost: $97,648,449) 100.0% | | | | | | | 100,819,359 | |
| | | | | | | | |
OTHER NET ASSETS -0.0% (2) | | | | | | | (697 | ) |
| | | | | | | | |
NET ASSETS 100.0% | | | | | | $ | 100,818,662 | |
| | | | | | | | |
The disclosures regarding Fair Value and Security Valuation included in Section 1 of the Notes to Financial Statements (Significant Accounting Policies and Organization) are an integral part of these portfolio schedules.
MUTUAL OF AMERICA INVESTMENT CORPORATION - 2010 RETIREMENT FUND
PORTFOLIO OF INVESTMENTS IN SECURITIES
December 31, 2017
| | | | | | | | |
| | | Shares | | | Value | |
COMMON STOCKS: | | | | | | | | |
DIVERSIFIED MUTUAL FUNDS (100.0%) | | | | | | | | |
Mutual of America Investment Corporation | | | | | | | | |
Bond Fund (24.6%) | | | 4,362,194 | | | | 6,293,782 | |
Equity Index Fund (25.7%) | | | 1,596,211 | | | | 6,550,388 | |
International Fund (4.7%) | | | 1,324,331 | | | | 1,197,602 | |
Mid-Cap Equity Index Fund (8.5%) | | | 926,995 | | | | 2,171,404 | |
Mid-Term Bond Fund (31.7%) | | | 7,784,829 | | | | 8,104,006 | |
Money Market Fund (4.8%) | | | 1,023,545 | | | | 1,232,370 | |
| | | | | | | | |
TOTAL INVESTMENTS
(Cost: $24,241,164) 100.0% | | | | | | | 25,549,552 | |
| | | | | | | | |
OTHER NET ASSETS 0.0% (2) | | | | | | | 415 | |
| | | | | | | | |
NET ASSETS 100.0% | | | | | | $ | 25,549,967 | |
| | | | | | | | |
The disclosures regarding Fair Value and Security Valuation included in Section 1 of the Notes to Financial Statements (Significant Accounting Policies and Organization) are an integral part of these portfolio schedules.
MUTUAL OF AMERICA INVESTMENT CORPORATION - 2015 RETIREMENT FUND
PORTFOLIO OF INVESTMENTS IN SECURITIES
December 31, 2017
| | | | | | | | |
| | | Shares | | | Value | |
COMMON STOCKS: | | | | | | | | |
DIVERSIFIED MUTUAL FUNDS (100.0%) | | | | | | | | |
Mutual of America Investment Corporation | | | | | | | | |
Bond Fund (23.9%) | | | 25,670,752 | | | | 37,037,812 | |
Equity Index Fund (29.8%) | | | 11,229,380 | | | | 46,082,119 | |
International Fund (5.2%) | | | 8,894,550 | | | | 8,043,404 | |
Mid-Cap Equity Index Fund (10.0%) | | | 6,644,139 | | | | 15,563,312 | |
Mid-Term Bond Fund (26.1%) | | | 38,918,195 | | | | 40,513,841 | |
Money Market Fund (2.9%) | | | 3,679,837 | | | | 4,430,605 | |
Small Cap Growth Fund (1.1%) | | | 1,102,740 | | | | 1,702,980 | |
Small Cap Value Fund (1.0%) | | | 930,010 | | | | 1,613,834 | |
| | | | | | | | |
TOTAL INVESTMENTS
(Cost: $140,319,928) 100.0% | | | | 154,987,907 | |
| | | | | | | | |
OTHER NET ASSETS -0.0% (2) | | | | | | | (1,994 | ) |
| | | | | | | | |
NET ASSETS 100.0% | | | | | | $ | 154,985,913 | |
| | | | | | | | |
The disclosures regarding Fair Value and Security Valuation included in Section 1 of the Notes to Financial Statements (Significant Accounting Policies and Organization) are an integral part of these portfolio schedules.
MUTUAL OF AMERICA INVESTMENT CORPORATION - 2020 RETIREMENT FUND
PORTFOLIO OF INVESTMENTS IN SECURITIES
December 31, 2017
| | | | | | | | |
| | | Shares | | | Value | |
COMMON STOCKS: | | | | | | | | |
DIVERSIFIED MUTUAL FUNDS (100.0%) | | | | | | | | |
Mutual of America Investment Corporation | | | | | | | | |
Bond Fund (22.6%) | | | 82,418,401 | | | | 118,913,434 | |
Equity Index Fund (33.5%) | | | 42,890,919 | | | | 176,011,895 | |
International Fund (8.2%) | | | 47,574,138 | | | | 43,021,626 | |
Mid-Cap Equity Index Fund (11.9%) | | | 26,604,901 | | | | 62,319,639 | |
Mid-Term Bond Fund (19.3%) | | | 97,214,071 | | | | 101,199,848 | |
Small Cap Growth Fund (2.2%) | | | 7,351,543 | | | | 11,353,121 | |
Small Cap Value Fund (2.3%) | | | 6,936,328 | | | | 12,036,520 | |
| | | | | | | | |
TOTAL INVESTMENTS
(Cost: $465,283,860) 100.0% | | | | | | | 524,856,083 | |
| | | | | | | | |
OTHER NET ASSETS -0.0% (2) | | | | | | | (3,510 | ) |
| | | | | | | | |
NET ASSETS 100.0% | | | | | | $ | 524,852,573 | |
| | | | | | | | |
The disclosures regarding Fair Value and Security Valuation included in Section 1 of the Notes to Financial Statements (Significant Accounting Policies and Organization) are an integral part of these portfolio schedules.
MUTUAL OF AMERICA INVESTMENT CORPORATION - 2025 RETIREMENT FUND
PORTFOLIO OF INVESTMENTS IN SECURITIES
December 31, 2017
| | | | | | | | |
| | | Shares | | | Value | |
COMMON STOCKS: | | | | | | | | |
DIVERSIFIED MUTUAL FUNDS (100.0%) | | | | | | | | |
Mutual of America Investment Corporation | | | | | | | | |
Bond Fund (21.3%) | | | 101,538,642 | | | | 146,500,156 | |
Equity Index Fund (36.3%) | | | 60,738,196 | | | | 249,251,940 | |
International Fund (9.9%) | | | 75,073,605 | | | | 67,889,586 | |
Mid-Cap Equity Index Fund (14.7%) | | | 42,896,732 | | | | 100,481,819 | |
Mid-Term Bond Fund (9.7%) | | | 63,565,556 | | | | 66,171,743 | |
Small Cap Growth Fund (4.0%) | | | 17,882,708 | | | | 27,616,588 | |
Small Cap Value Fund (4.1%) | | | 16,034,840 | | | | 27,825,050 | |
| | | | | | | | |
TOTAL INVESTMENTS
(Cost: $597,276,964) 100.0% | | | | | | | 685,736,882 | |
| | | | | | | | |
OTHER NET ASSETS -0.0% (2) | | | | | | | (4,468 | ) |
| | | | | | | | |
NET ASSETS 100.0% | | | | | | $ | 685,732,414 | |
| | | | | | | | |
The disclosures regarding Fair Value and Security Valuation included in Section 1 of the Notes to Financial Statements (Significant Accounting Policies and Organization) are an integral part of these portfolio schedules.
MUTUAL OF AMERICA INVESTMENT CORPORATION - 2030 RETIREMENT FUND
PORTFOLIO OF INVESTMENTS IN SECURITIES
December 31, 2017
| | | | | | | | |
| | | Shares | | | Value | |
COMMON STOCKS: | | | | | | | | |
DIVERSIFIED MUTUAL FUNDS (100.0%) | | | | | | | | |
Mutual of America Investment Corporation | | | | | | | | |
Bond Fund (18.9%) | | | 76,031,998 | | | | 109,699,118 | |
Equity Index Fund (38.0%) | | | 53,538,458 | | | | 219,706,306 | |
International Fund (11.6%) | | | 74,007,031 | | | | 66,925,076 | |
Mid-Cap Equity Index Fund (18.7%) | | | 46,112,192 | | | | 108,013,752 | |
Mid-Term Bond Fund (2.2%) | | | 12,037,438 | | | | 12,530,973 | |
Small Cap Growth Fund (5.3%) | | | 19,762,768 | | | | 30,519,999 | |
Small Cap Value Fund (5.3%) | | | 17,470,136 | | | | 30,315,700 | |
| | | | | | | | |
TOTAL INVESTMENTS
(Cost: $492,216,031) 100.0% | | | | | | | 577,710,924 | |
| | | | | | | | |
OTHER NET ASSETS -0.0% (2) | | | | | | | (3,764 | ) |
| | | | | | | | |
NET ASSETS 100.0% | | | | | | $ | 577,707,160 | |
| | | | | | | | |
The disclosures regarding Fair Value and Security Valuation included in Section 1 of the Notes to Financial Statements (Significant Accounting Policies and Organization) are an integral part of these portfolio schedules.
MUTUAL OF AMERICA INVESTMENT CORPORATION - 2035 RETIREMENT FUND
PORTFOLIO OF INVESTMENTS IN SECURITIES
December 31, 2017
| | | | | | | | |
| | | Shares | | | Value | |
COMMON STOCKS: | | | | | | | | |
DIVERSIFIED MUTUAL FUNDS (100.0%) | | | | | | | | |
Mutual of America Investment Corporation | | | | | | | | |
Bond Fund (14.6%) | | | 48,849,599 | | | | 70,480,300 | |
Equity Index Fund (39.8%) | | | 46,993,461 | | | | 192,847,537 | |
International Fund (12.1%) | | | 64,582,412 | | | | 58,402,327 | |
Mid-Cap Equity Index Fund (21.5%) | | | 44,436,252 | | | | 104,088,009 | |
Small Cap Growth Fund (6.0%) | | | 19,010,258 | | | | 29,357,883 | |
Small Cap Value Fund (6.0%) | | | 16,711,043 | | | | 28,998,455 | |
| | | | | | | | |
TOTAL INVESTMENTS
(Cost: $405,662,756) 100.0% | | | | | | | 484,174,511 | |
| | | | | | | | |
OTHER NET ASSETS -0.0% (2) | | | | | | | (3,148 | ) |
| | | | | | | | |
NET ASSETS 100.0% | | | | | | $ | 484,171,363 | |
| | | | | | | | |
The disclosures regarding Fair Value and Security Valuation included in Section 1 of the Notes to Financial Statements (Significant Accounting Policies and Organization) are an integral part of these portfolio schedules.
MUTUAL OF AMERICA INVESTMENT CORPORATION - 2040 RETIREMENT FUND
PORTFOLIO OF INVESTMENTS IN SECURITIES
December 31, 2017
| | | | | | | | |
| | | Shares | | | Value | |
COMMON STOCKS: | | | | | | | | |
DIVERSIFIED MUTUAL FUNDS (100.0%) | | | | | | | | |
Mutual of America Investment Corporation | | | | | | | | |
Bond Fund (12.2%) | | | 33,092,653 | | | | 47,746,145 | |
Equity Index Fund (38.6%) | | | 36,965,757 | | | | 151,696,748 | |
International Fund (13.5%) | | | 58,492,567 | | | | 52,895,238 | |
Mid-Cap Equity Index Fund (21.2%) | | | 35,593,198 | | | | 83,373,933 | |
Small Cap Growth Fund (7.3%) | | | 18,656,806 | | | | 28,812,042 | |
Small Cap Value Fund (7.2%) | | | 16,288,953 | | | | 28,266,008 | |
| | | | | | | | |
TOTAL INVESTMENTS
(Cost: $326,535,069) 100.0% | | | | | | | 392,790,114 | |
| | | | | | | | |
OTHER NET ASSETS -0.0% (2) | | | | | | | (2,591 | ) |
| | | | | | | | |
NET ASSETS 100.0% | | | | | | $ | 392,787,523 | |
| | | | | | | | |
The disclosures regarding Fair Value and Security Valuation included in Section 1 of the Notes to Financial Statements (Significant Accounting Policies and Organization) are an integral part of these portfolio schedules.
MUTUAL OF AMERICA INVESTMENT CORPORATION - 2045 RETIREMENT FUND
PORTFOLIO OF INVESTMENTS IN SECURITIES
December 31, 2017
| | | | | | | | |
| | | Shares | | | Value | |
COMMON STOCKS: | | | | | | | | |
DIVERSIFIED MUTUAL FUNDS (100.0%) | | | | | | | | |
Mutual of America Investment Corporation | | | | | | | | |
Bond Fund (9.9%) | | | 30,126,471 | | | | 43,466,532 | |
Equity Index Fund (36.9%) | | | 39,321,078 | | | | 161,362,300 | |
International Fund (14.2%) | | | 68,587,524 | | | | 62,024,178 | |
Mid-Cap Equity Index Fund (22.4%) | | | 41,866,235 | | | | 98,067,970 | |
Small Cap Growth Fund (8.4%) | | | 23,719,298 | | | | 36,630,139 | |
Small Cap Value Fund (8.2%) | | | 20,631,832 | | | | 35,802,149 | |
| | | | | | | | |
TOTAL INVESTMENTS
(Cost: $356,025,178) 100.0% | | | | | | | 437,353,268 | |
| | | | | | | | |
OTHER NET ASSETS -0.0% (2) | | | | | | | (2,892 | ) |
| | | | | | | | |
NET ASSETS 100.0% | | | | | | $ | 437,350,376 | |
| | | | | | | | |
The disclosures regarding Fair Value and Security Valuation included in Section 1 of the Notes to Financial Statements (Significant Accounting Policies and Organization) are an integral part of these portfolio schedules.
MUTUAL OF AMERICA INVESTMENT CORPORATION - 2050 RETIREMENT FUND
PORTFOLIO OF INVESTMENTS IN SECURITIES
December 31, 2017
| | | | | | | | |
| | | Shares | | | Value | |
COMMON STOCKS: | | | | | | | | |
DIVERSIFIED MUTUAL FUNDS (100.0%) | | | | | | | | |
Mutual of America Investment Corporation | | | | | | | | |
Bond Fund (8.2%) | | | 14,621,592 | | | | 21,096,062 | |
Equity Index Fund (35.3%) | | | 22,037,429 | | | | 90,435,215 | |
International Fund (15.6%) | | | 44,349,573 | | | | 40,105,630 | |
Mid-Cap Equity Index Fund (22.4%) | | | 24,493,001 | | | | 57,372,700 | |
Small Cap Growth Fund (9.4%) | | | 15,575,392 | | | | 24,053,358 | |
Small Cap Value Fund (9.1%) | | | 13,505,767 | | | | 23,436,382 | |
| | | | | | | | |
TOTAL INVESTMENTS
(Cost: $228,116,484) 100.0% | | | | | | | 256,499,347 | |
| | | | | | | | |
OTHER NET ASSETS -0.0% (2) | | | | | | | (1,122 | ) |
| | | | | | | | |
NET ASSETS 100.0% | | | | | | $ | 256,498,225 | |
| | | | | | | | |
The disclosures regarding Fair Value and Security Valuation included in Section 1 of the Notes to Financial Statements (Significant Accounting Policies and Organization) are an integral part of these portfolio schedules.
MUTUAL OF AMERICA INVESTMENT CORPORATION - 2055 RETIREMENT FUND
PORTFOLIO OF INVESTMENTS IN SECURITIES
December 31, 2017
| | | | | | | | |
| | | Shares | | | Value | |
COMMON STOCKS: | | | | | | | | |
DIVERSIFIED MUTUAL FUNDS (100.0%) | | | | | | | | |
Mutual of America Investment Corporation | | | | | | | | |
Bond Fund (8.2%) | | | 1,942,909 | | | | 2,803,233 | |
Equity Index Fund (32.6%) | | | 2,731,965 | | | | 11,211,191 | |
International Fund (16.9%) | | | 6,408,644 | | | | 5,795,381 | |
Mid-Cap Equity Index Fund (22.3%) | | | 3,258,944 | | | | 7,633,789 | |
Small Cap Growth Fund (10.1%) | | | 2,249,265 | | | | 3,473,580 | |
Small Cap Value Fund (9.9%) | | | 1,954,964 | | | | 3,392,424 | |
| | | | | | | | |
TOTAL INVESTMENTS
(Cost: $32,726,349) 100.0% | | | | | | | 34,309,598 | |
| | | | | | | | |
OTHER NET ASSETS -0.0% (2) | | | | | | | (140 | ) |
| | | | | | | | |
NET ASSETS 100.0% | | | | | | $ | 34,309,458 | |
| | | | | | | | |
The disclosures regarding Fair Value and Security Valuation included in Section 1 of the Notes to Financial Statements (Significant Accounting Policies and Organization) are an integral part of these portfolio schedules.
MUTUAL OF AMERICA INVESTMENT CORPORATION - CONSERVATIVE ALLOCATION FUND
PORTFOLIO OF INVESTMENTS IN SECURITIES
December 31, 2017
| | | | | | | | |
| | | Shares | | | Value | |
COMMON STOCKS: | | | | | | | | |
DIVERSIFIED MUTUAL FUNDS (100.0%) | | | | | | | | |
Mutual of America Investment Corporation | | | | | | | | |
Bond Fund (29.7%) | | | 32,177,928 | | | | 46,426,379 | |
Equity Index Fund (25.6%) | | | 9,761,314 | | | | 40,057,603 | |
International Fund (5.0%) | | | 8,721,043 | | | | 7,886,500 | |
Mid-Cap Equity Index Fund (5.1%) | | | 3,433,638 | | | | 8,042,996 | |
Mid-Term Bond Fund (34.6%) | | | 51,973,692 | | | | 54,104,613 | |
| | | | | | | | |
TOTAL INVESTMENTS
(Cost: $148,348,099) 100.0% | | | | | | | 156,518,091 | |
| | | | | | | | |
OTHER NET ASSETS -0.0% (2) | | | | | | | (211 | ) |
| | | | | | | | |
NET ASSETS 100.0% | | | | | | $ | 156,517,880 | |
| | | | | | | | |
The disclosures regarding Fair Value and Security Valuation included in Section 1 of the Notes to Financial Statements (Significant Accounting Policies and Organization) are an integral part of these portfolio schedules.
MUTUAL OF AMERICA INVESTMENT CORPORATION - MODERATE ALLOCATION FUND
PORTFOLIO OF INVESTMENTS IN SECURITIES
December 31, 2017
| | | | | | | | |
| | | Shares | | | Value | |
COMMON STOCKS: | | | | | | | | |
DIVERSIFIED MUTUAL FUNDS (100.0%) | | | | | | | | |
Mutual of America Investment Corporation | | | | | | | | |
Bond Fund (24.5%) | | | 67,471,627 | | | | 97,348,198 | |
Equity Index Fund (35.5%) | | | 34,383,276 | | | | 141,098,993 | |
International Fund (10.0%) | | | 43,883,861 | | | | 39,684,483 | |
Mid-Cap Equity Index Fund (15.3%) | | | 25,917,716 | | | | 60,709,968 | |
Mid-Term Bond Fund (14.7%) | | | 56,045,963 | | | | 58,343,848 | |
| | | | | | | | |
TOTAL INVESTMENTS
(Cost: $334,548,706) 100.0% | | | | | | | 397,185,490 | |
| | | | | | | | |
OTHER NET ASSETS -0.0% (2) | | | | | | | (551 | ) |
| | | | | | | | |
NET ASSETS 100.0% | | | | | | $ | 397,184,939 | |
| | | | | | | | |
The disclosures regarding Fair Value and Security Valuation included in Section 1 of the Notes to Financial Statements (Significant Accounting Policies and Organization) are an integral part of these portfolio schedules.
MUTUAL OF AMERICA INVESTMENT CORPORATION - AGGRESSIVE ALLOCATION FUND
PORTFOLIO OF INVESTMENTS IN SECURITIES
December 31, 2017
| | | | | | | | |
| | | Shares | | | Value | |
COMMON STOCKS: | | | | | | | | |
DIVERSIFIED MUTUAL FUNDS (100.0%) | | | | | | | | |
Mutual of America Investment Corporation | | | | | | | | |
Bond Fund (19.5%) | | | 41,106,085 | | | | 59,307,942 | |
Equity Index Fund (35.3%) | | | 26,188,134 | | | | 107,468,506 | |
International Fund (14.9%) | | | 50,129,203 | | | | 45,332,189 | |
Mid-Cap Equity Index Fund (20.3%) | | | 26,321,148 | | | | 61,654,972 | |
Small Cap Growth Fund (5.0%) | | | 9,950,630 | | | | 15,366,937 | |
Small Cap Value Fund (5.0%) | | | 8,828,590 | | | | 15,320,137 | |
| | | | | | | | |
TOTAL INVESTMENTS
(Cost: $237,221,918) 100.0% | | | | | | | 304,450,683 | |
| | | | | | | | |
OTHER NET ASSETS -0.0% (2) | | | | | | | (1,319 | ) |
| | | | | | | | |
NET ASSETS 100.0% | | | | | | $ | 304,449,364 | |
| | | | | | | | |
The disclosures regarding Fair Value and Security Valuation included in Section 1 of the Notes to Financial Statements (Significant Accounting Policies and Organization) are an integral part of these portfolio schedules.
MUTUAL OF AMERICA INVESTMENT CORPORATION - MONEY MARKET FUND
PORTFOLIO OF INVESTMENTS IN SECURITIES
December 31, 2017
| | | | | | | | | | | | | | | | | | | | |
| | | Rating** | | | Rate(%) | | | Maturity | | | Face Amount | | | Value | |
SHORT-TERM DEBT SECURITIES: | | | | | | | | | | | | | | | | | | | | |
U.S. GOVERNMENT (26.7%) | | | | | | | | | | | | | |
U.S. Treasury Bill | | | A-1+ | | | | 1.02 | | | | 01/11/18 | | | | 1,600,000 | | | | 1,599,453 | |
U.S. Treasury Bill | | | A-1+ | | | | 1.03 | | | | 01/02/18 | | | | 2,800,000 | | | | 2,799,759 | |
U.S. Treasury Bill | | | A-1+ | | | | 1.05 | | | | 01/04/18 | | | | 2,400,000 | | | | 2,399,649 | |
U.S. Treasury Bill | | | A-1+ | | | | 1.06 | | | | 01/18/18 | | | | 1,700,000 | | | | 1,699,047 | |
U.S. Treasury Bill | | | A-1+ | | | | 1.11 | | | | 01/18/18 | | | | 500,000 | | | | 499,707 | |
U.S. Treasury Bill | | | A-1+ | | | | 1.15 | | | | 01/18/18 | | | | 900,000 | | | | 899,453 | |
U.S. Treasury Bill | | | A-1+ | | | | 1.15 | | | | 01/25/18 | | | | 400,000 | | | | 399,666 | |
U.S. Treasury Bill | | | A-1+ | | | | 1.18 | | | | 01/25/18 | | | | 1,500,000 | | | | 1,498,720 | |
U.S. Treasury Bill | | | A-1+ | | | | 1.25 | | | | 02/15/18 | | | | 2,100,000 | | | | 2,096,567 | |
U.S. Treasury Bill | | | A-1+ | | | | 1.25 | | | | 03/01/18 | | | | 2,900,000 | | | | 2,894,249 | |
U.S. Treasury Bill | | | A-1+ | | | | 1.26 | | | | 02/15/18 | | | | 2,100,000 | | | | 2,096,555 | |
| | | | | | | | | | | | | | | | | | | | |
| | | | | | | | | | | | | | | | | | | 18,882,825 | |
| | | | | | | | | | | | | | | | | | | | |
U.S. GOVERNMENT AGENCIES (12.4%) | | | | | | | | | | | | | |
FHLB | | | A-1+ | | | | 1.17 | | | | 01/22/18 | | | | 100,000 | | | | 99,925 | |
FHLB | | | A-1+ | | | | 1.18 | | | | 01/10/18 | | | | 1,100,000 | | | | 1,099,601 | |
FHLB | | | A-1+ | | | | 1.20 | | | | 01/09/18 | | | | 1,700,000 | | | | 1,699,433 | |
FHLB | | | A-1+ | | | | 1.21 | | | | 01/16/18 | | | | 1,100,000 | | | | 1,099,371 | |
FHLB | | | A-1+ | | | | 1.28 | | | | 02/01/18 | | | | 1,500,000 | | | | 1,498,232 | |
FHLB | | | A-1+ | | | | 1.30 | | | | 02/07/18 | | | | 2,100,000 | | | | 2,097,041 | |
FHLB | | | A-1+ | | | | 1.30 | | | | 02/16/18 | | | | 1,200,000 | | | | 1,197,919 | |
| | | | | | | | | | | | | | | | | | | | |
| | | | | | | | | | | | | | | | | | | 8,791,522 | |
| | | | | | | | | | | | | | | | | | | | |
COMMERCIAL PAPER (60.9%) | | | | | | | | | | | | | |
Apple, Inc.† | | | A-1+ | | | | 1.20 | | | | 01/10/18 | | | | 2,100,000 | | | | 2,099,229 | |
Chevron Corp.† | | | A-1+ | | | | 1.20 | | | | 01/08/18 | | | | 2,700,000 | | | | 2,699,189 | |
Cisco Systems, Inc.† | | | A-1+ | | | | 1.30 | | | | 01/03/18 | | | | 600,000 | | | | 599,913 | |
Coca-Cola Co.† | | | A-1+ | | | | 1.23 | | | | 01/12/18 | | | | 1,800,000 | | | | 1,799,199 | |
Deere & Co.† | | | A-1 | | | | 1.36 | | | | 01/17/18 | | | | 2,100,000 | | | | 2,098,571 | |
Emerson Electric Co.† | | | A-1 | | | | 1.27 | | | | 01/26/18 | | | | 2,700,000 | | | | 2,697,426 | |
Estee Lauder Cos.† | | | A-1 | | | | 1.20 | | | | 01/04/18 | | | | 2,700,000 | | | | 2,699,550 | |
Exxon Mobil Corp. | | | A-1+ | | | | 1.39 | | | | 01/10/18 | | | | 1,700,000 | | | | 1,699,278 | |
Hershey Foods† | | | A-1 | | | | 1.45 | | | | 01/03/18 | | | | 2,000,000 | | | | 1,999,678 | |
Illinois Tool Works, Inc.† | | | A-1 | | | | 1.25 | | | | 01/16/18 | | | | 2,700,000 | | | | 2,698,404 | |
Intercontinental Exchange, Inc.† | | | A-1 | | | | 1.58 | | | | 01/30/18 | | | | 2,750,000 | | | | 2,746,258 | |
Microsoft Corp.† | | | A-1+ | | | | 1.23 | | | | 01/09/18 | | | | 1,700,000 | | | | 1,699,418 | |
New Jersey Natural Gas† | | | A-1 | | | | 1.64 | | | | 01/04/18 | | | | 2,600,000 | | | | 2,599,408 | |
NIKE, Inc.† | | | A-1+ | | | | 1.33 | | | | 01/11/18 | | | | 2,200,000 | | | | 2,199,024 | |
Procter & Gamble Co.† | | | A-1+ | | | | 1.31 | | | | 02/01/18 | | | | 2,400,000 | | | | 2,397,115 | |
QUALCOMM, Inc.† | | | A-1 | | | | 1.23 | | | | 01/03/18 | | | | 2,700,000 | | | | 2,699,630 | |
Simon Property Group LP† | | | A-1 | | | | 1.35 | | | | 01/23/18 | | | | 1,100,000 | | | | 1,099,009 | |
Simon Property Group LP† | | | A-1 | | | | 1.47 | | | | 01/29/18 | | | | 630,000 | | | | 629,228 | |
Toyota Motor Credit Corp. | | | A-1+ | | | | 1.36 | | | | 01/24/18 | | | | 2,500,000 | | | | 2,497,637 | |
Unilever Capital† | | | A-1 | | | | 1.22 | | | | 01/08/18 | | | | 650,000 | | | | 649,801 | |
Wal-Mart Stores, Inc.† | | | A-1+ | | | | 1.21 | | | | 01/05/18 | | | | 1,900,000 | | | | 1,899,616 | |
Washington Gas Light Co. | | | A-1 | | | | 1.75 | | | | 01/05/18 | | | | 900,000 | | | | 899,737 | |
| | | | | | | | | | | | | | | | | | | | |
| | | | | | | | | | | | | | | | | | | 43,106,318 | |
| | | | | | | | | | | | | | | | | | | | |
TOTAL SHORT-TERM DEBT SECURITIES
(Cost: $70,780,274) 100.0% | | | | | | | | | | | | | | | | | | | 70,780,665 | |
| | | | | | | | | |
TOTAL INVESTMENTS
(Cost: $70,780,274) 100.0% | | | | | | | | | | | | | | | | | | | 70,780,665 | |
| | | | | | | | | | | | | | | | | | | | |
OTHER NET ASSETS 0.0% (2) | | | | | | | | | | | | | | | | | | | 18,728 | |
| | | | | | | | | | | | | | | | | | | | |
NET ASSETS 100.0% | | | | | | | | | | | | | | | | | | $ | 70,799,393 | |
| | | | | | | | | | | | | | | | | | | | |
The disclosures regarding Fair Value and Security Valuation included in Section 1 of the Notes to Financial Statements (Significant Accounting Policies and Organization) are an integral part of these portfolio schedules.
MUTUAL OF AMERICA INVESTMENT CORPORATION - MID-TERM BOND FUND
PORTFOLIO OF INVESTMENTS IN SECURITIES
December 31, 2017
| | | | | | | | | | | | | | | | | | | | |
| | | Rating** | | | Rate(%) | | | Maturity | | | Face Amount | | | Value | |
LONG-TERM DEBT SECURITIES: | | | | | | | | | | | | | | | | | | | | |
U.S. GOVERNMENT (48.2%) | | | | | | | | | | | | | |
U.S. Treasury Note | | | AA+ | | | | 0.75 | | | | 07/15/19 | | | | 3,500,000 | | | | 3,441,074 | |
U.S. Treasury Note | | | AA+ | | | | 1.38 | | | | 06/30/23 | | | | 18,000,000 | | | | 17,195,634 | |
U.S. Treasury Note | | | AA+ | | | | 1.38 | | | | 09/30/23 | | | | 23,500,000 | | | | 22,385,583 | |
U.S. Treasury Note | | | AA+ | | | | 1.50 | | | | 10/31/19 | | | | 3,000,000 | | | | 2,979,375 | |
U.S. Treasury Note | | | AA+ | | | | 1.50 | | | | 02/28/23 | | | | 35,500,000 | | | | 34,256,113 | |
U.S. Treasury Note | | | AA+ | | | | 1.50 | | | | 08/15/26 | | | | 22,000,000 | | | | 20,468,602 | |
U.S. Treasury Note | | | AA+ | | | | 1.63 | | | | 06/30/20 | | | | 5,500,000 | | | | 5,459,394 | |
U.S. Treasury Note | | | AA+ | | | | 1.63 | | | | 10/31/23 | | | | 9,900,000 | | | | 9,557,757 | |
U.S. Treasury Note | | | AA+ | | | | 1.63 | | | | 05/15/26 | | | | 13,000,000 | | | | 12,244,375 | |
U.S. Treasury Note | | | AA+ | | | | 1.75 | | | | 09/30/19 | | | | 3,000,000 | | | | 2,993,202 | |
U.S. Treasury Note | | | AA+ | | | | 1.75 | | | | 12/31/20 | | | | 3,500,000 | | | | 3,475,665 | |
U.S. Treasury Note | | | AA+ | | | | 1.75 | | | | 02/28/22 | | | | 15,000,000 | | | | 14,770,320 | |
U.S. Treasury Note | | | AA+ | | | | 1.88 | | | | 05/31/22 | | | | 16,900,000 | | | | 16,706,580 | |
U.S. Treasury Note | | | AA+ | | | | 2.00 | | | | 11/30/20 | | | | 7,500,000 | | | | 7,507,035 | |
U.S. Treasury Note | | | AA+ | | | | 2.00 | | | | 05/31/24 | | | | 31,500,000 | | | | 30,911,832 | |
U.S. Treasury Note | | | AA+ | | | | 2.00 | | | | 06/30/24 | | | | 20,500,000 | | | | 20,107,610 | |
U.S. Treasury Strip | | | AA+ | | | | 0.00 | | | | 08/15/18 | | | | 45,000,000 | | | | 44,545,135 | |
| | | | | | | | | | | | | | | | | | | | |
| | | | | | | | | | | | | | | | | | | 269,005,286 | |
| | | | | | | | | | | | | | | | | | | | |
U.S. GOVERNMENT AGENCIES (7.5%) | | | | | | | | | | | | | | | | | | | | |
MORTGAGE-BACKED OBLIGATIONS (1.1%) | | | | | | | | | | | | | |
FHLMC | | | AA+ | | | | 7.50 | | | | 03/15/21 | | | | 1,798 | | | | 1,888 | |
Small Business Administration (3) | | | AA+ | | | | 2.88 | | | | 05/01/37 | | | | 5,861,895 | | | | 5,892,974 | |
| | | | | | | | | | | | | | | | | | | | |
| | | | | | | | | | | | | | | | | | | 5,894,862 | |
| | | | | | | | | | | | | | | | | | | | |
NON-MORTGAGE-BACKED OBLIGATIONS (6.4%) | | | | | | | | | | | | | | | | | | | | |
FHLMC | | | AA+ | | | | 0.00 | | | | 11/29/19 | | | | 13,500,000 | | | | 12,929,315 | |
FNMA | | | AA+ | | | | 0.00 | | | | 10/09/19 | | | | 23,000,000 | | | | 22,151,323 | |
Tennessee Valley Auth. Strip | | | AA+ | | | | 0.00 | | | | 11/01/20 | | | | 900,000 | | | | 842,112 | |
| | | | | | | | | | | | | | | | | | | | |
| | | | | | | | | | | | | | | | | | | 35,922,750 | |
| | | | | | | | | | | | | | | | | | | | |
CORPORATE DEBT (43.6%) | | | | | | | | | | | | | | | | | | | | |
CONSUMER DISCRETIONARY (7.5%) | | | | | | | | | | | | | | | | | | | | |
Advance Auto Parts, Inc. | | | BBB- | | | | 4.50 | | | | 01/15/22 | | | | 500,000 | | | | 523,977 | |
Advance Auto Parts, Inc. | | | BBB- | | | | 4.50 | | | | 12/01/23 | | | | 250,000 | | | | 262,843 | |
Advance Auto Parts, Inc. | | | BBB- | | | | 5.75 | | | | 05/01/20 | | | | 1,500,000 | | | | 1,598,406 | |
AutoZone, Inc. | | | BBB | | | | 3.70 | | | | 04/15/22 | | | | 300,000 | | | | 309,499 | |
AutoZone, Inc. | | | BBB | | | | 4.00 | | | | 11/15/20 | | | | 700,000 | | | | 726,508 | |
Brinker International, Inc. | | | BB+ | | | | 2.60 | | | | 05/15/18 | | | | 2,000,000 | | | | 2,000,000 | |
Coach, Inc. | | | BBB- | | | | 3.00 | | | | 07/15/22 | | | | 2,500,000 | | | | 2,491,168 | |
Dollar General Corp. | | | BBB | | | | 3.25 | | | | 04/15/23 | | | | 1,047,000 | | | | 1,061,120 | |
Expedia, Inc. | | | BBB- | | | | 5.95 | | | | 08/15/20 | | | | 2,000,000 | | | | 2,151,776 | |
Family Dollar Stores, Inc. | | | BBB- | | | | 5.00 | | | | 02/01/21 | | | | 2,000,000 | | | | 2,120,000 | |
Gap, Inc. | | | BB+ | | | | 5.95 | | | | 04/12/21 | | | | 2,000,000 | | | | 2,156,574 | |
Harman Int’l. Industries, Inc. | | | BBB+ | | | | 4.15 | | | | 05/15/25 | | | | 2,000,000 | | | | 2,067,890 | |
Hyatt Hotels Corp. | | | BBB | | | | 5.38 | | | | 08/15/21 | | | | 50,000 | | | | 53,865 | |
Kohl’s Corp. | | | BBB- | | | | 3.25 | | | | 02/01/23 | | | | 700,000 | | | | 692,026 | |
Kohl’s Corp. | | | BBB- | | | | 4.00 | | | | 11/01/21 | | | | 1,325,000 | | | | 1,362,988 | |
Marriott International, Inc. | | | BBB | | | | 3.00 | | | | 03/01/19 | | | | 1,200,000 | | | | 1,208,183 | |
Marriott International, Inc. | | | BBB | | | | 3.13 | | | | 02/15/23 | | | | 2,000,000 | | | | 1,993,264 | |
Marriott International, Inc. | | | BBB | | | | 3.38 | | | | 10/15/20 | | | | 800,000 | | | | 816,626 | |
Mattel, Inc. | | | BB | | | | 1.70 | | | | 03/15/18 | | | | 2,000,000 | | | | 1,992,500 | |
Newell Brands, Inc. | | | BBB- | | | | 4.70 | | | | 08/15/20 | | | | 525,000 | | | | 551,999 | |
NVR, Inc. | | | BBB+ | | | | 3.95 | | | | 09/15/22 | | | | 2,000,000 | | | | 2,087,834 | |
Omnicom Group, Inc. | | | BBB+ | | | | 3.63 | | | | 05/01/22 | | | | 2,000,000 | | | | 2,064,718 | |
O’Reilly Automotive, Inc. | | | BBB+ | | | | 4.63 | | | | 09/15/21 | | | | 281,000 | | | | 298,572 | |
Scripps Networks Interactive, Inc. | | | BBB | | | | 3.50 | | | | 06/15/22 | | | | 2,500,000 | | | | 2,525,200 | |
Tupperware Brands Corp. | | | BBB- | | | | 4.75 | | | | 06/01/21 | | | | 2,000,000 | | | | 2,108,424 | |
Viacom, Inc. | | | BBB- | | | | 3.25 | | | | 03/15/23 | | | | 2,500,000 | | | | 2,429,860 | |
Whirlpool Corp. | | | BBB | | | | 2.40 | | | | 03/01/19 | | | | 1,445,000 | | | | 1,449,461 | |
Wyndham Worldwide Corp. | | | BBB- | | | | 4.15 | | | | 04/01/24 | | | | 2,500,000 | | | | 2,511,693 | |
| | | | | | | | | | | | | | | | | | | | |
| | | | | | | | | | | | | | | | | | | 41,616,974 | |
| | | | | | | | | | | | | | | | | | | | |
MUTUAL OF AMERICA INVESTMENT CORPORATION - MID-TERM BOND FUND
PORTFOLIO OF INVESTMENTS IN SECURITIES
December 31, 2017
| | | | | | | | | | | | | | | | | | |
CONSUMER STAPLES (3.3%) | | | | | | | | | | | | | | | | | | |
Beam Suntory, Inc. | | BBB | | | 1.75 | | | | 06/15/18 | | | | 2,000,000 | | | | 1,996,692 | |
CVS Health Corp. | | BBB+ | | | 3.38 | | | | 08/12/24 | | | | 590,000 | | | | 593,181 | |
Dr. Pepper Snapple Group, Inc. | | BBB+ | | | 2.60 | | | | 01/15/19 | | | | 150,000 | | | | 150,472 | |
Edgewell Personal Care Co. | | BB+ | | | 4.70 | | | | 05/19/21 | | | | 2,000,000 | | | | 2,065,000 | |
Flowers Foods, Inc. | | BBB | | | 4.38 | | | | 04/01/22 | | | | 2,000,000 | | | | 2,120,604 | |
General Mills, Inc. | | BBB+ | | | 2.20 | | | | 10/21/19 | | | | 775,000 | | | | 774,804 | |
Ingredion, Inc. | | BBB | | | 4.63 | | | | 11/01/20 | | | | 275,000 | | | | 288,873 | |
Kellogg Co. | | BBB | | | 2.65 | | | | 12/01/23 | | | | 2,000,000 | | | | 1,986,806 | |
Kroger Co. | | BBB | | | 2.95 | | | | 11/01/21 | | | | 2,000,000 | | | | 2,019,370 | |
Mead Johnson Nutrition Co. | | A- | | | 4.90 | | | | 11/01/19 | | | | 3,075,000 | | | | 3,220,555 | |
Molson Coors Brewing Co. | | BBB- | | | 3.50 | | | | 05/01/22 | | | | 1,000,000 | | | | 1,027,106 | |
Sysco Corp. | | BBB+ | | | 2.60 | | | | 10/01/20 | | | | 2,000,000 | | | | 2,008,576 | |
| | | | | | | | | | | | | | | | | | |
| | | | | | | | | | | | | | | | | 18,252,039 | |
| | | | | | | | | | | | | | | | | | |
ENERGY (2.7%) | | | | | | | | | | | | | | | | | | |
Cameron International Corp. | | AA- | | | 3.60 | | | | 04/30/22 | | | | 214,000 | | | | 217,291 | |
Diamond Offshore Drilling, Inc. | | B+ | | | 3.45 | | | | 11/01/23 | | | | 1,500,000 | | | | 1,338,750 | |
Energen Corp. | | BB | | | 4.63 | | | | 09/01/21 | | | | 2,000,000 | | | | 2,025,000 | |
EQT Corp. | | BBB | | | 4.88 | | | | 11/15/21 | | | | 1,250,000 | | | | 1,332,738 | |
Kinder Morgan, Inc. | | BBB- | | | 3.05 | | | | 12/01/19 | | | | 2,000,000 | | | | 2,017,520 | |
Marathon Oil Corp. | | BBB- | | | 2.80 | | | | 11/01/22 | | | | 2,000,000 | | | | 1,980,516 | |
Noble Energy, Inc. | | BBB | | | 4.15 | | | | 12/15/21 | | | | 2,000,000 | | | | 2,084,040 | |
Rowan Companies PLC | | B+ | | | 4.88 | | | | 06/01/22 | | | | 2,000,000 | | | | 1,885,000 | |
SESI LLC | | BB- | | | 7.13 | | | | 12/15/21 | | | | 2,150,000 | | | | 2,203,750 | |
| | | | | | | | | | | | | | | | | | |
| | | | | | | | | | | | | | | | | 15,084,605 | |
| | | | | | | | | | | | | | | | | | |
FINANCIALS (11.4%) | | | | | | | | | | | | | | | | | | |
Aflac, Inc. | | A- | | | 3.63 | | | | 06/15/23 | | | | 550,000 | | | | 571,155 | |
Alleghany Corp. | | BBB+ | | | 4.95 | | | | 06/27/22 | | | | 2,000,000 | | | | 2,161,312 | |
American Express Credit Corp. | | A- | | | 2.25 | | | | 08/15/19 | | | | 2,000,000 | | | | 2,004,178 | |
American Int’l. Group, Inc. | | BBB+ | | | 4.13 | | | | 02/15/24 | | | | 2,000,000 | | | | 2,113,206 | |
Ares Capital Corp. | | BBB | | | 3.63 | | | | 01/19/22 | | | | 2,500,000 | | | | 2,510,338 | |
Bank of America Corp. | | A- | | | 2.65 | | | | 04/01/19 | | | | 1,250,000 | | | | 1,257,096 | |
Barrick N.A. Finance LLC | | BBB- | | | 4.40 | | | | 05/30/21 | | | | 2,000,000 | | | | 2,117,022 | |
Berkley (W.R.) Corp. | | BBB+ | | | 4.63 | | | | 03/15/22 | | | | 2,000,000 | | | | 2,128,448 | |
Block Financial LLC | | BBB | | | 5.50 | | | | 11/01/22 | | | | 2,472,000 | | | | 2,656,228 | |
Capital One Financial Corp. | | BBB | | | 4.75 | | | | 07/15/21 | | | | 2,000,000 | | | | 2,136,958 | |
Citigroup, Inc. | | BBB+ | | | 2.55 | | | | 04/08/19 | | | | 1,850,000 | | | | 1,856,531 | |
Citizens Financial Group, Inc. | | BBB | | | 3.75 | | | | 07/01/24 | | | | 2,000,000 | | | | 1,998,704 | |
Erac USA Finance LLC† | | BBB+ | | | 2.35 | | | | 10/15/19 | | | | 1,000,000 | | | | 997,146 | |
Fairfax Financial Hldgs.† | | BBB- | | | 5.80 | | | | 05/15/21 | | | | 1,274,000 | | | | 1,374,938 | |
Fairfax U.S., Inc.† | | BBB- | | | 4.88 | | | | 08/13/24 | | | | 750,000 | | | | 781,559 | |
Fifth Third Bancorp | | BBB | | | 4.30 | | | | 01/16/24 | | | | 2,500,000 | | | | 2,653,393 | |
First Republic Bank | | A- | | | 2.38 | | | | 06/17/19 | | | | 2,000,000 | | | | 1,996,358 | |
First Tennessee Bank | | BBB | | | 2.95 | | | | 12/01/19 | | | | 2,200,000 | | | | 2,214,641 | |
FS Investment Corp. | | BBB | | | 4.75 | | | | 05/15/22 | | | | 2,675,000 | | | | 2,753,888 | |
JPMorgan Chase & Co. | | BBB+ | | | 3.88 | | | | 09/10/24 | | | | 1,520,000 | | | | 1,585,547 | |
Legg Mason, Inc. | | BBB | | | 3.95 | | | | 07/15/24 | | | | 2,000,000 | | | | 2,046,112 | |
Lincoln National Corp. | | A- | | | 4.00 | | | | 09/01/23 | | | | 2,000,000 | | | | 2,087,830 | |
Moody’s Corp. | | BBB+ | | | 5.50 | | | | 09/01/20 | | | | 2,000,000 | | | | 2,153,730 | |
Nasdaq, Inc. | | BBB | | | 5.55 | | | | 01/15/20 | | | | 2,150,000 | | | | 2,278,923 | |
Peoples United Bank | | BBB+ | | | 4.00 | | | | 07/15/24 | | | | 1,750,000 | | | | 1,767,458 | |
Prospect Capital Corp. | | BBB- | | | 4.95 | | | | 07/15/22 | | | | 2,500,000 | | | | 2,496,875 | |
Prospect Capital Corp. | | BBB- | | | 5.88 | | | | 03/15/23 | | | | 1,925,000 | | | | 1,980,299 | |
Signet UK Finance PLC | | BBB- | | | 4.70 | | | | 06/15/24 | | | | 2,000,000 | | | | 1,969,236 | |
Stifel Financial Corp. | | BBB- | | | 4.25 | | | | 07/18/24 | | | | 2,000,000 | | | | 2,048,638 | |
Synchrony Financial | | BBB- | | | 2.70 | | | | 02/03/20 | | | | 1,000,000 | | | | 1,002,499 | |
Unum Group | | BBB | | | 4.00 | | | | 03/15/24 | | | | 2,000,000 | | | | 2,082,672 | |
Voya Financial, Inc. | | BBB | | | 3.65 | | | | 06/15/26 | | | | 2,000,000 | | | | 2,022,608 | |
Wells Fargo & Co. | | A | | | 2.13 | | | | 04/22/19 | | | | 2,000,000 | | | | 1,999,686 | |
| | | | | | | | | | | | | | | | | | |
| | | | | | | | | | | | | | | | | 63,805,212 | |
| | | | | | | | | | | | | | | | | | |
MUTUAL OF AMERICA INVESTMENT CORPORATION - MID-TERM BOND FUND
PORTFOLIO OF INVESTMENTS IN SECURITIES
December 31, 2017
| | | | | | | | | | | | | | | | | | |
HEALTH CARE (4.3%) | | | | | | | | | | | | | |
Abbott Laboratories | | BBB | | | 3.25 | | | | 04/15/23 | | | | 2,000,000 | | | | 2,027,980 | |
Agilent Technologies, Inc. | | BBB+ | | | 5.00 | | | | 07/15/20 | | | | 2,000,000 | | | | 2,123,684 | |
Anthem, Inc. | | A | | | 3.13 | | | | 05/15/22 | | | | 2,000,000 | | | | 2,017,668 | |
Bio-Rad Laboratories, Inc. | | BBB | | | 4.88 | | | | 12/15/20 | | | | 2,000,000 | | | | 2,116,706 | |
Edwards Lifesciences Corp. | | BBB- | | | 2.88 | | | | 10/15/18 | | | | 2,000,000 | | | | 2,013,492 | |
Express Scripts Hldg. Co. | | BBB+ | | | 2.25 | | | | 06/15/19 | | | | 2,000,000 | | | | 1,996,768 | |
Laboratory Corp. of America | | BBB | | | 3.75 | | | | 08/23/22 | | | | 600,000 | | | | 622,258 | |
Laboratory Corp. of America | | BBB | | | 4.63 | | | | 11/15/20 | | | | 400,000 | | | | 420,923 | |
Owens & Minor, Inc. | | BBB- | | | 3.88 | | | | 09/15/21 | | | | 2,000,000 | | | | 2,023,334 | |
PerkinElmer, Inc. | | BBB | | | 5.00 | | | | 11/15/21 | | | | 2,000,000 | | | | 2,156,256 | |
Quest Diagnostics, Inc. | | BBB+ | | | 4.75 | | | | 01/30/20 | | | | 2,000,000 | | | | 2,089,978 | |
Thermo Fisher Scientific, Inc. | | BBB | | | 3.60 | | | | 08/15/21 | | | | 400,000 | | | | 412,888 | |
Thermo Fisher Scientific, Inc. | | BBB | | | 4.50 | | | | 03/01/21 | | | | 1,600,000 | | | | 1,700,563 | |
Zimmer Biomet Hldgs., Inc. | | BBB | | | 3.15 | | | | 04/01/22 | | | | 2,000,000 | | | | 2,004,898 | |
| | | | | | | | | | | | | | | | | | |
| | | | | | | | | | | | | | | | | 23,727,396 | |
| | | | | | | | | | | | | | | | | | |
INDUSTRIALS (2.8%) | | | | | | | | | | | | | |
Crane Co. | | BBB | | | 2.75 | | | | 12/15/18 | | | | 2,000,000 | | | | 2,008,960 | |
Flowserve Corp. | | BBB- | | | 3.50 | | | | 09/15/22 | | | | 2,000,000 | | | | 2,008,482 | |
Hunt (J.B.) Transport Svcs., Inc. | | BBB+ | | | 3.30 | | | | 08/15/22 | | | | 2,000,000 | | | | 2,025,958 | |
Kennametal, Inc. | | BBB- | | | 2.65 | | | | 11/01/19 | | | | 2,000,000 | | | | 2,001,584 | |
L-3 Communications Corp. | | BBB- | | | 5.20 | | | | 10/15/19 | | | | 2,000,000 | | | | 2,094,832 | |
Penske Truck Leasing Co. LP† | | BBB | | | 3.38 | | | | 03/15/18 | | | | 1,300,000 | | | | 1,303,877 | |
Valmont Industries, Inc. | | BBB+ | | | 6.63 | | | | 04/20/20 | | | | 2,000,000 | | | | 2,175,978 | |
Verisk Analytics, Inc. | | BBB- | | | 4.13 | | | | 09/12/22 | | | | 2,000,000 | | | | 2,087,972 | |
| | | | | | | | | | | | | | | | | | |
| | | | | | | | | | | | | | | | | 15,707,643 | |
| | | | | | | | | | | | | | | | | | |
INFORMATION TECHNOLOGY (4.1%) | | | | | | | | | | | | | |
Adobe Systems, Inc. | | A | | | 4.75 | | | | 02/01/20 | | | | 2,000,000 | | | | 2,100,234 | |
Amphenol Corp. | | BBB+ | | | 2.55 | | | | 01/30/19 | | | | 2,000,000 | | | | 2,006,808 | |
Arrow Electronics, Inc. | | BBB- | | | 3.00 | | | | 03/01/18 | | | | 1,250,000 | | | | 1,251,584 | |
Arrow Electronics, Inc. | | BBB- | | | 4.50 | | | | 03/01/23 | | | | 50,000 | | | | 52,592 | |
Avnet, Inc. | | BBB- | | | 3.75 | | | | 12/01/21 | | | | 1,130,000 | | | | 1,146,254 | |
Avnet, Inc. | | BBB- | | | 5.88 | | | | 06/15/20 | | | | 950,000 | | | | 1,012,269 | |
eBay, Inc. | | BBB+ | | | 2.88 | | | | 08/01/21 | | | | 2,100,000 | | | | 2,120,849 | |
Fiserv, Inc. | | BBB | | | 4.75 | | | | 06/15/21 | | | | 1,900,000 | | | | 2,028,341 | |
Jabil, Inc. | | BBB- | | | 4.70 | | | | 09/15/22 | | | | 1,976,000 | | | | 2,071,638 | |
Juniper Networks, Inc. | | BBB | | | 4.50 | | | | 03/15/24 | | | | 1,500,000 | | | | 1,560,867 | |
Juniper Networks, Inc. | | BBB | | | 4.60 | | | | 03/15/21 | | | | 600,000 | | | | 628,378 | |
Lam Research Corp. | | BBB+ | | | 2.75 | | | | 03/15/20 | | | | 2,000,000 | | | | 2,014,158 | |
Motorola Solutions, Inc. | | BBB- | | | 3.75 | | | | 05/15/22 | | | | 2,000,000 | | | | 2,054,292 | |
Symantec Corp. | | BB+ | | | 4.20 | | | | 09/15/20 | | | | 2,000,000 | | | | 2,060,000 | |
Total System Services, Inc. | | BBB- | | | 3.75 | | | | 06/01/23 | | | | 950,000 | | | | 969,861 | |
| | | | | | | | | | | | | | | | | | |
| | | | | | | | | | | | | | | | | 23,078,125 | |
| | | | | | | | | | | | | | | | | | |
MATERIALS (2.6%) | | | | | | | | | | | | | |
Albemarle Corp. | | BBB | | | 4.50 | | | | 12/15/20 | | | | 1,065,000 | | | | 1,120,067 | |
Domtar Corp. | | BBB- | | | 4.40 | | | | 04/01/22 | | | | 2,000,000 | | | | 2,104,060 | |
Freeport-McMoRan, Inc. | �� | BB- | | | 3.10 | | | | 03/15/20 | | | | 1,750,000 | | | | 1,739,063 | |
Freeport-McMoRan, Inc. | | BB- | | | 3.55 | | | | 03/01/22 | | | | 250,000 | | | | 247,188 | |
Goldcorp, Inc. | | BBB+ | | | 2.13 | | | | 03/15/18 | | | | 2,000,000 | | | | 2,001,032 | |
Kinross Gold Corp. | | BB+ | | | 5.13 | | | | 09/01/21 | | | | 750,000 | | | | 781,875 | |
Methanex Corp. | | BB+ | | | 3.25 | | | | 12/15/19 | | | | 2,000,000 | | | | 2,008,924 | |
Newmont Mining Corp. | | BBB | | | 3.50 | | | | 03/15/22 | | | | 2,000,000 | | | | 2,041,746 | |
Southern Copper Corp. | | BBB | | | 3.50 | | | | 11/08/22 | | | | 2,000,000 | | | | 2,054,280 | |
WestRock Co. | | BBB | | | 3.50 | | | | 03/01/20 | | | | 622,000 | | | | 632,809 | |
| | | | | | | | | | | | | | | | | | |
| | | | | | | | | | | | | | | | | 14,731,044 | |
| | | | | | | | | | | | | | | | | | |
REAL ESTATE (2.8%) | | | | | | | | | | | | | |
CBRE Services, Inc. | | BBB | | | 5.25 | | | | 03/15/25 | | | | 2,000,000 | | | | 2,199,840 | |
Government Pptys. Income Trust | | BBB- | | | 3.75 | | | | 08/15/19 | | | | 2,000,000 | | | | 2,016,808 | |
MUTUAL OF AMERICA INVESTMENT CORPORATION - MID-TERM BOND FUND
PORTFOLIO OF INVESTMENTS IN SECURITIES
December 31, 2017
| | | | | | | | | | | | | | | | | | | | |
HCP, Inc. | | | BBB | | | | 3.15 | | | | 08/01/22 | | | | 750,000 | | | | 757,082 | |
Hospitality Properties Trust | | | BBB- | | | | 5.00 | | | | 08/15/22 | | | | 1,300,000 | | | | 1,387,256 | |
Jones Lang LaSalle, Inc. | | | BBB | | | | 4.40 | | | | 11/15/22 | | | | 1,410,000 | | | | 1,485,524 | |
Mack-Cali Realty LP | | | BBB- | | | | 4.50 | | | | 04/18/22 | | | | 1,000,000 | | | | 1,001,954 | |
Omega Healthcare Investors, Inc. | | | BBB- | | | | 4.38 | | | | 08/01/23 | | | | 1,750,000 | | | | 1,774,899 | |
Omega Healthcare Investors, Inc. | | | BBB- | | | | 4.50 | | | | 01/15/25 | | | | 750,000 | | | | 749,470 | |
Senior Housing Pptys. Trust | | | BBB- | | | | 4.75 | | | | 05/01/24 | | | | 500,000 | | | | 521,698 | |
Ventas Realty LP/Capital Corp. | | | BBB+ | | | | 4.00 | | | | 04/30/19 | | | | 1,700,000 | | | | 1,730,925 | |
Vornado Realty LP | | | BBB | | | | | | | | 01/15/22 | | | | 2,000,000 | | | | 2,145,434 | |
| | | | | | | | | | | | | | | | | | | | |
| | | | | | | | | | | | | | | | | | | 15,770,890 | |
| | | | | | | | | | | | | | | | | | | | |
TELECOMMUNICATION SERVICES (0.4%) | | | | | | | | | | | | | |
AT&T, Inc. | | | BBB+ | | | | 3.00 | | | | 02/15/22 | | | | 2,000,000 | | | | 2,004,080 | |
| | | | | | | | | | | | | | | | | | | | |
UTILITIES (1.7%) | | | | | | | | | | | | | |
Entergy Corp. | | | BBB | | | | 5.13 | | | | 09/15/20 | | | | 1,400,000 | | | | 1,479,069 | |
Exelon Corp. | | | BBB- | | | | 5.15 | | | | 12/01/20 | | | | 1,500,000 | | | | 1,597,247 | |
Exelon Generation Co. LLC | | | BBB | | | | 4.25 | | | | 06/15/22 | | | | 1,000,000 | | | | 1,049,353 | |
National Fuel Gas Co. | | | BBB | | | | 4.90 | | | | 12/01/21 | | | | 2,000,000 | | | | 2,106,262 | |
SCANA Corp. | | | BBB- | | | | 4.75 | | | | 05/15/21 | | | | 2,000,000 | | | | 2,073,830 | |
Talen Energy Supply LLC† | | | B+ | | | | 6.50 | | | | 09/15/24 | | | | 1,400,000 | | | | 1,113,000 | |
| | | | | | | | | | | | | | | | | | | | |
| | | | | | | | | | | | | | | | | | | 9,418,761 | |
| | | | | | | | | | | | | | | | | | | | |
TOTAL LONG-TERM DEBT SECURITIES
(Cost: $554,702,291) 99.3% | | | | | | | | | | | | | | | | | | | 554,019,667 | |
| | | | | | | | | | | | | | | | | | | | |
| | | | | |
| | | Rating** | | | Rate(%) | | | Maturity | | | Face Amount | | | Value | |
SHORT-TERM DEBT SECURITIES: | | | | | | | | | | | | | | | | | | | | |
COMMERCIAL PAPER (0.1%) | | | | | | | | | | | | | |
Home Depot, Inc.† | | | A-1 | | | | 1.44 | | | | 01/02/18 | | | | 800,000 | | | | 799,904 | |
| | | | | | | | | | | | | | | | | | | | |
TOTAL SHORT-TERM DEBT SECURITIES
(Cost: $799,904) 0.1% | | | | | | | | | | | | | | | | | | | 799,904 | |
| | | | | | | | | | | | | | | | | | | | |
TOTAL INVESTMENTS
(Cost: $555,502,195) 99.4% | | | | | | | | | | | | | | | | | | | 554,819,571 | |
| | | | | | | | | | | | | | | | | | | | |
OTHER NET ASSETS 0.6% | | | | | | | | | | | | | | | | | | | 3,383,446 | |
| | | | | | | | | | | | | | | | | | | | |
NET ASSETS 100.0% | | | | | | | | | | | | | | | | | | $ | 558,203,017 | |
| | | | | | | | | | | | | | | | | | | | |
The disclosures regarding Fair Value and Security Valuation included in Section 1 of the Notes to Financial Statements (Significant Accounting Policies and Organization) are an integral part of these portfolio schedules.
MUTUAL OF AMERICA INVESTMENT CORPORATION - BOND FUND
PORTFOLIO OF INVESTMENTS IN SECURITIES
December 31, 2017
| | | | | | | | | | | | | | | | | | | | |
| | | Rating** | | | Rate(%) | | | Maturity | | | Face Amount | | | Value | |
LONG-TERM DEBT SECURITIES: | | | | | | | | | | | | | | | | | | | | |
U.S. GOVERNMENT (24.2%) | | | | | | | | | | | | | |
U.S. Treasury Note | | | AA+ | | | | 0.75 | | | | 07/15/19 | | | | 5,700,000 | | | | 5,604,035 | |
U.S. Treasury Note | | | AA+ | | | | 1.50 | | | | 08/15/26 | | | | 50,800,000 | | | | 47,263,863 | |
U.S. Treasury Note | | | AA+ | | | | 1.63 | | | | 05/15/26 | | | | 2,000,000 | | | | 1,883,750 | |
U.S. Treasury Note | | | AA+ | | | | 2.00 | | | | 11/15/26 | | | | 10,000,000 | | | | 9,677,730 | |
U.S. Treasury Note | | | AA+ | | | | 2.25 | | | | 11/15/25 | | | | 1,000,000 | | | | 991,211 | |
U.S. Treasury Note | | | AA+ | | | | 2.25 | | | | 02/15/27 | | | | 24,000,000 | | | | 23,685,000 | |
U.S. Treasury Note | | | AA+ | | | | 2.25 | | | | 08/15/27 | | | | 74,500,000 | | | | 73,452,381 | |
U.S. Treasury Note | | | AA+ | | | | 2.38 | | | | 05/15/27 | | | | 63,750,000 | | | | 63,568,185 | |
U.S. Treasury Strip | | | AA+ | | | | 0.00 | | | | 08/15/25 | | | | 20,000,000 | | | | 16,595,460 | |
U.S. Treasury Strip | | | AA+ | | | | 0.00 | | | | 08/15/26 | | | | 20,000,000 | | | | 16,152,080 | |
U.S. Treasury Strip | | | AA+ | | | | 0.00 | | | | 08/15/28 | | | | 20,000,000 | | | | 15,259,860 | |
U.S. Treasury Strip | | | AA+ | | | | 0.00 | | | | 08/15/29 | | | | 20,000,000 | | | | 14,851,880 | |
U.S. Treasury Strip | | | AA+ | | | | 0.00 | | | | 08/15/33 | | | | 10,000,000 | | | | 6,608,420 | |
U.S. Treasury Strip | | | AA+ | | | | 0.00 | | | | 08/15/35 | | | | 10,000,000 | | | | 6,236,950 | |
U.S. Treasury Strip | | | AA+ | | | | 0.00 | | | | 08/15/37 | | | | 10,000,000 | | | | 5,869,940 | |
| | | | | | | | | | | | | | | | | | | | |
| | | | | | | | | | | | | | | | | | | 307,700,745 | |
| | | | | | | | | | | | | | | | | | | | |
U.S. GOVERNMENT AGENCIES (29.0%) | | | | | | | | | | | | | | | | | | | | |
MORTGAGE-BACKED OBLIGATIONS (27.8%) | | | | | | | | | | | | | |
FHLMC | | | AA+ | | | | 2.50 | | | | 09/01/27 | | | | 1,377,395 | | | | 1,384,528 | |
FHLMC | | | AA+ | | | | 2.50 | | | | 12/01/27 | | | | 1,505,012 | | | | 1,512,522 | |
FHLMC | | | AA+ | | | | 2.50 | | | | 04/01/28 | | | | 1,653,856 | | | | 1,661,892 | |
FHLMC | | | AA+ | | | | 3.00 | | | | 06/01/27 | | | | 708,732 | | | | 722,045 | |
FHLMC | | | AA+ | | | | 3.00 | | | | 08/01/27 | | | | 442,709 | | | | 451,169 | |
FHLMC | | | AA+ | | | | 3.00 | | | | 10/15/37 | | | | 1,343,844 | | | | 1,361,207 | |
FHLMC | | | AA+ | | | | 3.00 | | | | 12/15/40 | | | | 1,338,203 | | | | 1,331,686 | |
FHLMC | | | AA+ | | | | 3.00 | | | | 07/01/42 | | | | 697,188 | | | | 708,624 | |
FHLMC | | | AA+ | | | | 3.00 | | | | 10/01/42 | | | | 2,165,016 | | | | 2,176,837 | |
FHLMC | | | AA+ | | | | 3.00 | | | | 11/01/42 | | | | 2,235,926 | | | | 2,248,362 | |
FHLMC | | | AA+ | | | | 3.00 | | | | 11/01/42 | | | | 857,229 | | | | 862,173 | |
FHLMC | | | AA+ | | | | 3.00 | | | | 11/01/42 | | | | 988,291 | | | | 994,297 | |
FHLMC | | | AA+ | | | | 3.00 | | | | 11/01/42 | | | | 3,625,484 | | | | 3,645,656 | |
FHLMC | | | AA+ | | | | 3.00 | | | | 02/01/43 | | | | 1,919,836 | | | | 1,930,913 | |
FHLMC | | | AA+ | | | | 3.00 | | | | 03/01/43 | | | | 1,561,069 | | | | 1,570,076 | |
FHLMC | | | AA+ | | | | 3.00 | | | | 04/01/43 | | | | 986,786 | | | | 991,962 | |
FHLMC | | | AA+ | | | | 3.00 | | | | 04/01/43 | | | | 2,248,338 | | | | 2,261,313 | |
FHLMC | | | AA+ | | | | 3.00 | | | | 04/01/43 | | | | 1,472,243 | | | | 1,479,978 | |
FHLMC | | | AA+ | | | | 3.00 | | | | 09/15/43 | | | | 3,723,857 | | | | 3,733,330 | |
FHLMC | | | AA+ | | | | 3.00 | | | | 04/15/44 | | | | 1,190,030 | | | | 1,180,421 | |
FHLMC | | | AA+ | | | | 3.00 | | | | 04/15/45 | | | | 2,949,744 | | | | 2,956,416 | |
FHLMC | | | AA+ | | | | 3.00 | | | | 09/01/46 | | | | 1,732,107 | | | | 1,735,852 | |
FHLMC | | | AA+ | | | | 3.00 | | | | 09/01/46 | | | | 4,687,760 | | | | 4,694,248 | |
FHLMC | | | AA+ | | | | 3.00 | | | | 11/01/46 | | | | 1,420,510 | | | | 1,412,785 | |
FHLMC | | | AA+ | | | | 3.50 | | | | 02/01/35 | | | | 3,122,777 | | | | 3,246,030 | |
FHLMC | | | AA+ | | | | 3.50 | | | | 02/01/35 | | | | 1,602,430 | | | | 1,666,570 | |
FHLMC | | | AA+ | | | | 3.50 | | | | 04/01/35 | | | | 1,309,307 | | | | 1,360,267 | |
FHLMC | | | AA+ | | | | 3.50 | | | | 01/01/41 | | | | 1,531,890 | | | | 1,580,826 | |
FHLMC | | | AA+ | | | | 3.50 | | | | 07/01/42 | | | | 1,954,439 | | | | 2,024,414 | |
FHLMC | | | AA+ | | | | 3.50 | | | | 10/01/42 | | | | 1,665,446 | | | | 1,718,700 | |
FHLMC | | | AA+ | | | | 3.50 | | | | 01/01/43 | | | | 1,591,583 | | | | 1,642,487 | |
FHLMC | | | AA+ | | | | 3.50 | | | | 01/01/43 | | | | 864,232 | | | | 891,863 | |
FHLMC | | | AA+ | | | | 3.50 | | | | 05/01/43 | | | | 2,267,413 | | | | 2,339,846 | |
FHLMC | | | AA+ | | | | 3.50 | | | | 06/01/43 | | | | 2,789,851 | | | | 2,874,620 | |
FHLMC | | | AA+ | | | | 3.50 | | | | 07/01/43 | | | | 789,495 | | | | 814,733 | |
FHLMC | | | AA+ | | | | 3.50 | | | | 11/01/43 | | | | 1,592,977 | | | | 1,643,866 | |
FHLMC | | | AA+ | | | | 3.50 | | | | 01/01/44 | | | | 2,629,703 | | | | 2,713,716 | |
FHLMC | | | AA+ | | | | 3.50 | | | | 04/01/45 | | | | 2,263,284 | | | | 2,334,471 | |
MUTUAL OF AMERICA INVESTMENT CORPORATION - BOND FUND
PORTFOLIO OF INVESTMENTS IN SECURITIES
December 31, 2017
| | | | | | | | | | | | | | | | | | |
FHLMC | | AA+ | | | 3.50 | | | | 07/01/45 | | | | 2,417,916 | | | | 2,501,912 | |
FHLMC | | AA+ | | | 3.50 | | | | 09/01/45 | | | | 1,949,848 | | | | 2,008,250 | |
FHLMC | | AA+ | | | 3.50 | | | | 05/01/46 | | | | 4,046,101 | | | | 4,161,265 | |
FHLMC | | AA+ | | | 3.50 | | | | 08/01/46 | | | | 2,964,193 | | | | 3,056,824 | |
FHLMC | | AA+ | | | 3.50 | | | | 04/01/47 | | | | 2,847,635 | | | | 2,928,465 | |
FHLMC | | AA+ | | | 3.50 | | | | 08/01/47 | | | | 4,327,665 | | | | 4,450,960 | |
FHLMC | | AA+ | | | 3.50 | | | | 09/01/47 | | | | 1,461,549 | | | | 1,503,187 | |
FHLMC | | AA+ | | | 3.50 | | | | 09/01/47 | | | | 5,913,649 | | | | 6,082,123 | |
FHLMC | | AA+ | | | 3.50 | | | | 11/01/47 | | | | 3,989,891 | | | | 4,103,559 | |
FHLMC | | AA+ | | | 4.00 | | | | 02/01/25 | | | | 217,837 | | | | 226,046 | |
FHLMC | | AA+ | | | 4.00 | | | | 05/01/25 | | | | 87,762 | | | | 91,156 | |
FHLMC | | AA+ | | | 4.00 | | | | 05/01/26 | | | | 290,071 | | | | 302,970 | |
FHLMC | | AA+ | | | 4.00 | | | | 12/01/33 | | | | 1,158,185 | | | | 1,216,193 | |
FHLMC | | AA+ | | | 4.00 | | | | 12/15/38 | | | | 497,166 | | | | 513,934 | |
FHLMC | | AA+ | | | 4.00 | | | | 07/01/41 | | | | 1,090,757 | | | | 1,155,779 | |
FHLMC | | AA+ | | | 4.00 | | | | 12/01/41 | | | | 649,102 | | | | 681,499 | |
FHLMC | | AA+ | | | 4.00 | | | | 07/01/42 | | | | 2,272,928 | | | | 2,410,180 | |
FHLMC | | AA+ | | | 4.00 | | | | 08/01/42 | | | | 1,675,175 | | | | 1,764,470 | |
FHLMC | | AA+ | | | 4.00 | | | | 08/01/42 | | | | 816,622 | | | | 857,254 | |
FHLMC | | AA+ | | | 4.00 | | | | 09/01/42 | | | | 983,778 | | | | 1,032,732 | |
FHLMC | | AA+ | | | 4.00 | | | | 11/01/42 | | | | 1,452,809 | | | | 1,531,153 | |
FHLMC | | AA+ | | | 4.00 | | | | 12/01/42 | | | | 1,072,553 | | | | 1,125,553 | |
FHLMC | | AA+ | | | 4.00 | | | | 01/01/43 | | | | 1,778,729 | | | | 1,877,940 | |
FHLMC | | AA+ | | | 4.00 | | | | 01/01/44 | | | | 1,773,952 | | | | 1,869,441 | |
FHLMC | | AA+ | | | 4.00 | | | | 10/01/44 | | | | 1,480,606 | | | | 1,548,555 | |
FHLMC | | AA+ | | | 4.00 | | | | 10/01/44 | | | | 1,869,135 | | | | 1,955,267 | |
FHLMC | | AA+ | | | 4.00 | | | | 10/01/44 | | | | 1,845,276 | | | | 1,930,590 | |
FHLMC | | AA+ | | | 4.00 | | | | 05/01/47 | | | | 3,875,922 | | | | 4,053,544 | |
FHLMC | | AA+ | | | 4.50 | | | | 03/01/34 | | | | 392,714 | | | | 419,211 | |
FHLMC | | AA+ | | | 4.50 | | | | 08/01/34 | | | | 215,870 | | | | 230,412 | |
FHLMC | | AA+ | | | 4.50 | | | | 08/15/35 | | | | 71,653 | | | | 74,657 | |
FHLMC | | AA+ | | | 4.50 | | | | 12/01/39 | | | | 197,473 | | | | 209,856 | |
FHLMC | | AA+ | | | 4.50 | | | | 03/01/41 | | | | 539,315 | | | | 583,601 | |
FHLMC | | AA+ | | | 5.00 | | | | 02/01/26 | | | | 63,059 | | | | 67,762 | |
FHLMC | | AA+ | | | 5.00 | | | | 08/01/35 | | | | 1,152,563 | | | | 1,255,916 | |
FHLMC | | AA+ | | | 5.00 | | | | 10/01/40 | | | | 1,053,278 | | | | 1,147,653 | |
FHLMC | | AA+ | | | 5.50 | | | | 03/01/21 | | | | 54,501 | | | | 56,163 | |
FHLMC | | AA+ | | | 5.50 | | | | 07/01/32 | | | | 169,178 | | | | 186,574 | |
FHLMC | | AA+ | | | 5.50 | | | | 01/15/33 | | | | 201,194 | | | | 217,976 | |
FHLMC | | AA+ | | | 5.50 | | | | 05/01/33 | | | | 251,452 | | | | 275,220 | |
FHLMC | | AA+ | | | 5.50 | | | | 06/01/37 | | | | 986,225 | | | | 1,096,348 | |
FHLMC | | AA+ | | | 6.00 | | | | 07/15/29 | | | | 120,852 | | | | 132,169 | |
FHLMC | | AA+ | | | 6.00 | | | | 03/15/32 | | | | 144,520 | | | | 159,898 | |
FHLMC ARM | | AA+ | | | 2.76 | | | | 02/01/36 | | | | 126,359 | | | | 133,110 | |
FHLMC ARM | | AA+ | | | 2.90 | | | | 04/01/37 | | | | 143,399 | | | | 150,155 | |
FHLMC ARM | | AA+ | | | 2.93 | | | | 05/01/37 | | | | 77,180 | | | | 80,595 | |
FHLMC ARM | | AA+ | | | 3.33 | | | | 04/01/42 | | | | 355,609 | | | | 364,538 | |
FHLMC ARM | | AA+ | | | 3.40 | | | | 03/01/37 | | | | 28,348 | | | | 29,655 | |
FHLMC ARM | | AA+ | | | 3.61 | | | | 04/01/37 | | | | 127,085 | | | | 133,838 | |
FHLMC ARM | | AA+ | | | 4.65 | | | | 09/01/39 | | | | 167,257 | | | | 172,290 | |
FHLMC Strip | | AA+ | | | 3.00 | | | | 01/15/43 | | | | 2,913,341 | | | | 2,958,856 | |
FNMA | | AA+ | | | 2.25 | | | | 01/01/28 | | | | 1,455,461 | | | | 1,413,652 | |
FNMA | | AA+ | | | 2.68 | | | | 12/01/26 | | | | 3,000,000 | | | | 2,927,949 | |
FNMA | | AA+ | | | 2.91 | | | | 07/01/27 | | | | 2,978,525 | | | | 2,976,020 | |
FNMA | | AA+ | | | 3.00 | | | | 09/01/29 | | | | 1,607,801 | | | | 1,642,336 | |
FNMA | | AA+ | | | 3.00 | | | | 06/01/33 | | | | 1,296,651 | | | | 1,326,061 | |
FNMA | | AA+ | | | 3.00 | | | | 07/01/33 | | | | 2,416,990 | | | | 2,471,819 | |
FNMA | | AA+ | | | 3.00 | | | | 09/01/33 | | | | 2,520,074 | | | | 2,577,277 | |
FNMA | | AA+ | | | 3.00 | | | | 04/25/42 | | | | 1,489,059 | | | | 1,501,971 | |
FNMA | | AA+ | | | 3.00 | | | | 10/01/42 | | | | 731,835 | | | | 734,878 | |
FNMA | | AA+ | | | 3.00 | | | | 12/01/42 | | | | 1,117,203 | | | | 1,120,338 | |
MUTUAL OF AMERICA INVESTMENT CORPORATION - BOND FUND
PORTFOLIO OF INVESTMENTS IN SECURITIES
December 31, 2017
| | | | | | | | | | | | | | | | | | |
FNMA | | AA+ | | | 3.00 | | | | 12/01/42 | | | | 1,717,370 | | | | 1,709,632 | |
FNMA | | AA+ | | | 3.00 | | | | 01/01/43 | | | | 3,798,435 | | | | 3,818,962 | |
FNMA | | AA+ | | | 3.00 | | | | 02/01/43 | | | | 1,626,093 | | | | 1,630,851 | |
FNMA | | AA+ | | | 3.00 | | | | 03/01/43 | | | | 2,171,142 | | | | 2,186,674 | |
FNMA | | AA+ | | | 3.00 | | | | 04/01/43 | | | | 2,048,451 | | | | 2,039,222 | |
FNMA | | AA+ | | | 3.00 | | | | 02/01/45 | | | | 2,002,492 | | | | 2,017,411 | |
FNMA | | AA+ | | | 3.00 | | | | 03/01/45 | | | | 2,097,055 | | | | 2,087,626 | |
FNMA | | AA+ | | | 3.00 | | | | 09/01/46 | | | | 2,830,201 | | | | 2,831,639 | |
FNMA | | AA+ | | | 3.00 | | | | 01/01/47 | | | | 1,289,609 | | | | 1,283,787 | |
FNMA | | AA+ | | | 3.50 | | | | 02/01/26 | | | | 174,949 | | | | 180,628 | |
FNMA | | AA+ | | | 3.50 | | | | 03/01/32 | | | | 960,909 | | | | 999,876 | |
FNMA | | AA+ | | | 3.50 | | | | 08/01/38 | | | | 1,884,275 | | | | 1,945,280 | |
FNMA | | AA+ | | | 3.50 | | | | 03/01/41 | | | | 1,605,780 | | | | 1,663,176 | |
FNMA | | AA+ | | | 3.50 | | | | 10/01/41 | | | | 943,014 | | | | 958,590 | |
FNMA | | AA+ | | | 3.50 | | | | 12/01/41 | | | | 1,159,605 | | | | 1,184,452 | |
FNMA | | AA+ | | | 3.50 | | | | 04/01/42 | | | | 1,357,994 | | | | 1,402,150 | |
FNMA | | AA+ | | | 3.50 | | | | 04/01/42 | | | | 1,205,270 | | | | 1,226,261 | |
FNMA | | AA+ | | | 3.50 | | | | 07/01/42 | | | | 1,934,485 | | | | 1,996,694 | |
FNMA | | AA+ | | | 3.50 | | | | 08/01/42 | | | | 1,198,148 | | | | 1,233,657 | |
FNMA | | AA+ | | | 3.50 | | | | 09/01/42 | | | | 1,503,429 | | | | 1,552,367 | |
FNMA | | AA+ | | | 3.50 | | | | 10/01/42 | | | | 1,614,124 | | | | 1,666,529 | |
FNMA | | AA+ | | | 3.50 | | | | 12/01/42 | | | | 2,740,446 | | | | 2,829,570 | |
FNMA | | AA+ | | | 3.50 | | | | 12/01/42 | | | | 1,326,040 | | | | 1,343,701 | |
FNMA | | AA+ | | | 3.50 | | | | 01/01/43 | | | | 1,499,467 | | | | 1,543,691 | |
FNMA | | AA+ | | | 3.50 | | | | 03/01/43 | | | | 1,839,461 | | | | 1,898,675 | |
FNMA | | AA+ | | | 3.50 | | | | 06/01/43 | | | | 3,320,135 | | | | 3,423,776 | |
FNMA | | AA+ | | | 3.50 | | | | 08/01/43 | | | | 2,227,996 | | | | 2,297,879 | |
FNMA | | AA+ | | | 3.50 | | | | 08/01/43 | | | | 4,767,989 | | | | 4,914,494 | |
FNMA | | AA+ | | | 3.50 | | | | 10/01/43 | | | | 1,203,659 | | | | 1,226,209 | |
FNMA | | AA+ | | | 3.50 | | | | 01/01/44 | | | | 1,028,257 | | | | 1,046,803 | |
FNMA | | AA+ | | | 3.50 | | | | 08/25/44 | | | | 4,100,000 | | | | 4,197,580 | |
FNMA | | AA+ | | | 3.50 | | | | 02/01/45 | | | | 2,288,994 | | | | 2,351,413 | |
FNMA | | AA+ | | | 3.50 | | | | 04/01/45 | | | | 3,781,003 | | | | 3,905,553 | |
FNMA | | AA+ | | | 3.50 | | | | 04/01/45 | | | | 2,342,971 | | | | 2,417,721 | |
FNMA | | AA+ | | | 3.50 | | | | 05/01/45 | | | | 4,240,352 | | | | 4,368,283 | |
FNMA | | AA+ | | | 3.50 | | | | 06/01/45 | | | | 5,231,405 | | | | 5,399,856 | |
FNMA | | AA+ | | | 3.50 | | | | 10/01/45 | | | | 4,180,814 | | | | 4,318,467 | |
FNMA | | AA+ | | | 3.50 | | | | 02/01/46 | | | | 4,545,925 | | | | 4,692,312 | |
FNMA | | AA+ | | | 3.50 | | | | 02/01/46 | | | | 2,595,218 | | | | 2,665,987 | |
FNMA | | AA+ | | | 3.50 | | | | 03/01/46 | | | | 2,381,904 | | | | 2,465,575 | |
FNMA | | AA+ | | | 4.00 | | | | 05/01/19 | | | | 75,022 | | | | 77,210 | |
FNMA | | AA+ | | | 4.00 | | | | 07/25/26 | | | | 1,780,145 | | | | 1,895,920 | |
FNMA | | AA+ | | | 4.00 | | | | 01/01/31 | | | | 110,831 | | | | 116,719 | |
FNMA | | AA+ | | | 4.00 | | | | 12/01/33 | | | | 1,266,957 | | | | 1,328,633 | |
FNMA | | AA+ | | | 4.00 | | | | 03/01/35 | | | | 359,510 | | | | 377,593 | |
FNMA | | AA+ | | | 4.00 | | | | 11/01/38 | | | | 1,563,761 | | | | 1,643,453 | |
FNMA | | AA+ | | | 4.00 | | | | 11/01/40 | | | | 785,104 | | | | 824,647 | |
FNMA | | AA+ | | | 4.00 | | | | 05/01/41 | | | | 1,003,905 | | | | 1,041,756 | |
FNMA | | AA+ | | | 4.00 | | | | 08/01/42 | | | | 2,099,151 | | | | 2,204,636 | |
FNMA | | AA+ | | | 4.00 | | | | 05/01/43 | | | | 1,251,746 | | | | 1,314,446 | |
FNMA | | AA+ | | | 4.00 | | | | 09/01/45 | | | | 1,354,021 | | | | 1,419,948 | |
FNMA | | AA+ | | | 4.00 | | | | 11/01/45 | | | | 2,047,163 | | | | 2,147,795 | |
FNMA | | AA+ | | | 4.00 | | | | 02/01/47 | | | | 4,532,768 | | | | 4,763,667 | |
FNMA | | AA+ | | | 4.00 | | | | 07/01/56 | | | | 2,254,612 | | | | 2,366,555 | |
FNMA | | AA+ | | | 4.50 | | | | 05/01/18 | | | | 6,508 | | | | 6,609 | |
FNMA | | AA+ | | | 4.50 | | | | 05/01/19 | | | | 7,344 | | | | 7,458 | |
FNMA | | AA+ | | | 4.50 | | | | 06/01/19 | | | | 31,554 | | | | 32,043 | |
FNMA | | AA+ | | | 4.50 | | | | 05/01/30 | | | | 290,752 | | | | 310,286 | |
FNMA | | AA+ | | | 4.50 | | | | 04/01/31 | | | | 453,542 | | | | 484,038 | |
FNMA | | AA+ | | | 4.50 | | | | 08/01/33 | | | | 110,844 | | | | 118,406 | |
FNMA | | AA+ | | | 4.50 | | | | 08/01/33 | | | | 146,912 | | | | 156,855 | |
MUTUAL OF AMERICA INVESTMENT CORPORATION - BOND FUND
PORTFOLIO OF INVESTMENTS IN SECURITIES
December 31, 2017
| | | | | | | | | | | | | | | | | | |
FNMA | | AA+ | | | 4.50 | | | | 09/01/33 | | | | 295,444 | | | | 315,635 | |
FNMA | | AA+ | | | 4.50 | | | | 10/01/33 | | | | 280,184 | | | | 299,366 | |
FNMA | | AA+ | | | 4.50 | | | | 10/01/33 | | | | 128,459 | | | | 137,222 | |
FNMA | | AA+ | | | 4.50 | | | | 05/01/34 | | | | 134,335 | | | | 143,541 | |
FNMA | | AA+ | | | 4.50 | | | | 06/01/34 | | | | 193,867 | | | | 207,115 | |
FNMA | | AA+ | | | 4.50 | | | | 07/01/34 | | | | 168,039 | | | | 179,626 | |
FNMA | | AA+ | | | 4.50 | | | | 01/01/35 | | | | 584,448 | | | | 624,649 | |
FNMA | | AA+ | | | 4.50 | | | | 08/01/35 | | | | 164,619 | | | | 175,963 | |
FNMA | | AA+ | | | 4.50 | | | | 12/01/35 | | | | 203,018 | | | | 216,930 | |
FNMA | | AA+ | | | 4.50 | | | | 05/01/39 | | | | 993,779 | | | | 1,072,159 | |
FNMA | | AA+ | | | 4.50 | | | | 05/01/39 | | | | 677,255 | | | | 731,794 | |
FNMA | | AA+ | | | 4.50 | | | | 05/01/40 | | | | 517,981 | | | | 552,262 | |
FNMA | | AA+ | | | 4.50 | | | | 07/01/40 | | | | 3,087,514 | | | | 3,297,113 | |
FNMA | | AA+ | | | 4.50 | | | | 10/01/40 | | | | 3,433,013 | | | | 3,680,306 | |
FNMA | | AA+ | | | 4.50 | | | | 11/01/40 | | | | 475,681 | | | | 510,753 | |
FNMA | | AA+ | | | 4.50 | | | | 06/01/41 | | | | 521,149 | | | | 558,738 | |
FNMA | | AA+ | | | 4.50 | | | | 10/01/41 | | | | 169,489 | | | | 180,465 | |
FNMA | | AA+ | | | 4.50 | | | | 11/01/41 | | | | 938,524 | | | | 1,006,343 | |
FNMA | | AA+ | | | 4.50 | | | | 01/01/42 | | | | 108,640 | | | | 116,208 | |
FNMA | | AA+ | | | 4.50 | | | | 07/01/42 | | | | 1,704,299 | | | | 1,839,278 | |
FNMA | | AA+ | | | 4.50 | | | | 03/01/44 | | | | 1,327,969 | | | | 1,415,442 | |
FNMA | | AA+ | | | 4.50 | | | | 04/01/44 | | | | 2,506,714 | | | | 2,709,885 | |
FNMA | | AA+ | | | 5.00 | | | | 04/01/18 | | | | 1,324 | | | | 1,348 | |
FNMA | | AA+ | | | 5.00 | | | | 09/01/18 | | | | 23,823 | | | | 24,252 | |
FNMA | | AA+ | | | 5.00 | | | | 09/01/20 | | | | 36,565 | | | | 37,236 | |
FNMA | | AA+ | | | 5.00 | | | | 10/01/20 | | | | 95,876 | | | | 97,790 | |
FNMA | | AA+ | | | 5.00 | | | | 10/01/25 | | | | 101,474 | | | | 108,997 | |
FNMA | | AA+ | | | 5.00 | | | | 09/01/33 | | | | 565,505 | | | | 614,277 | |
FNMA | | AA+ | | | 5.00 | | | | 10/01/33 | | | | 404,127 | | | | 441,172 | |
FNMA | | AA+ | | | 5.00 | | | | 11/01/33 | | | | 443,497 | | | | 481,759 | |
FNMA | | AA+ | | | 5.00 | | | | 03/01/34 | | | | 98,296 | | | | 106,782 | |
FNMA | | AA+ | | | 5.00 | | | | 04/01/34 | | | | 50,904 | | | | 55,290 | |
FNMA | | AA+ | | | 5.00 | | | | 04/01/34 | | | | 220,078 | | | | 240,225 | |
FNMA | | AA+ | | | 5.00 | | | | 04/01/35 | | | | 175,994 | | | | 192,054 | |
FNMA | | AA+ | | | 5.00 | | | | 06/01/35 | | | | 110,255 | | | | 119,703 | |
FNMA | | AA+ | | | 5.00 | | | | 09/01/35 | | | | 149,711 | | | | 160,738 | |
FNMA | | AA+ | | | 5.00 | | | | 09/01/35 | | | | 243,148 | | | | 263,996 | |
FNMA | | AA+ | | | 5.00 | | | | 11/25/35 | | | | 675,242 | | | | 720,442 | |
FNMA | | AA+ | | | 5.00 | | | | 08/01/37 | | | | 709,492 | | | | 767,429 | |
FNMA | | AA+ | | | 5.00 | | | | 05/01/39 | | | | 486,257 | | | | 521,034 | |
FNMA | | AA+ | | | 5.00 | | | | 09/25/40 | | | | 1,347,271 | | | | 1,428,834 | |
FNMA | | AA+ | | | 5.50 | | | | 01/01/24 | | | | 117,859 | | | | 129,007 | |
FNMA | | AA+ | | | 5.50 | | | | 03/01/24 | | | | 248,159 | | | | 271,634 | |
FNMA | | AA+ | | | 5.50 | | | | 09/01/25 | | | | 108,646 | | | | 119,619 | |
FNMA | | AA+ | | | 5.50 | | | | 11/01/26 | | | | 73,783 | | | | 80,762 | |
FNMA | | AA+ | | | 5.50 | | | | 01/01/27 | | | | 47,990 | | | | 52,529 | |
FNMA | | AA+ | | | 5.50 | | | | 03/01/33 | | | | 218,197 | | | | 234,592 | |
FNMA | | AA+ | | | 5.50 | | | | 09/01/33 | | | | 222,033 | | | | 247,621 | |
FNMA | | AA+ | | | 5.50 | | | | 10/01/33 | | | | 393,583 | | | | 438,864 | |
FNMA | | AA+ | | | 5.50 | | | | 03/01/34 | | | | 207,162 | | | | 230,529 | |
FNMA | | AA+ | | | 5.50 | | | | 03/01/34 | | | | 47,048 | | | | 51,538 | |
FNMA | | AA+ | | | 5.50 | | | | 07/01/34 | | | | 155,439 | | | | 171,871 | |
FNMA | | AA+ | | | 5.50 | | | | 09/01/34 | | | | 47,860 | | | | 52,410 | |
FNMA | | AA+ | | | 5.50 | | | | 09/01/34 | | | | 70,030 | | | | 77,594 | |
FNMA | | AA+ | | | 5.50 | | | | 09/01/34 | | | | 148,843 | | | | 164,399 | |
FNMA | | AA+ | | | 5.50 | | | | 10/01/34 | | | | 273,355 | | | | 302,730 | |
FNMA | | AA+ | | | 5.50 | | | | 02/01/35 | | | | 123,522 | | | | 136,937 | |
FNMA | | AA+ | | | 5.50 | | | | 02/01/35 | | | | 186,572 | | | | 207,440 | |
FNMA | | AA+ | | | 5.50 | | | | 04/01/35 | | | | 158,660 | | | | 174,431 | |
FNMA | | AA+ | | | 5.50 | | | | 08/01/35 | | | | 268,311 | | | | 297,403 | |
FNMA | | AA+ | | | 5.50 | | | | 02/25/37 | | | | 39,248 | | | | 41,106 | |
MUTUAL OF AMERICA INVESTMENT CORPORATION - BOND FUND
PORTFOLIO OF INVESTMENTS IN SECURITIES
December 31, 2017
| | | | | | | | | | | | | | | | | | |
FNMA | | AA+ | | | 5.50 | | | | 05/01/38 | | | | 357,173 | | | | 393,441 | |
FNMA | | AA+ | | | 5.50 | | | | 11/01/38 | | | | 31,685 | | | | 33,240 | |
FNMA | | AA+ | | | 5.50 | | | | 06/01/48 | | | | 96,236 | | | | 102,311 | |
FNMA | | AA+ | | | 6.00 | | | | 12/25/49 | | | | 422,244 | | | | 474,790 | |
FNMA | | AA+ | | | 6.00 | | | | 05/01/23 | | | | 155,140 | | | | 173,311 | |
FNMA | | AA+ | | | 6.00 | | | | 01/01/25 | | | | 104,306 | | | | 116,523 | |
FNMA | | AA+ | | | 6.00 | | | | 03/01/28 | | | | 138,512 | | | | 154,755 | |
FNMA | | AA+ | | | 6.00 | | | | 04/01/32 | | | | 18,782 | | | | 20,984 | |
FNMA | | AA+ | | | 6.00 | | | | 05/01/32 | | | | 163,587 | | | | 185,106 | |
FNMA | | AA+ | | | 6.00 | | | | 04/01/33 | | | | 444,194 | | | | 500,569 | |
FNMA | | AA+ | | | 6.00 | | | | 03/01/36 | | | | 32,706 | | | | 35,712 | |
FNMA | | AA+ | | | 6.00 | | | | 12/01/36 | | | | 114,483 | | | | 128,932 | |
FNMA | | AA+ | | | 6.00 | | | | 01/01/37 | | | | 169,442 | | | | 191,675 | |
FNMA | | AA+ | | | 6.00 | | | | 04/01/37 | | | | 36,036 | | | | 37,690 | |
FNMA | | AA+ | | | 6.00 | | | | 05/01/37 | | | | 26,321 | | | | 28,112 | |
FNMA | | AA+ | | | 6.00 | | | | 06/01/37 | | | | 24,070 | | | | 25,113 | |
FNMA | | AA+ | | | 6.00 | | | | 07/01/37 | | | | 58,816 | | | | 65,851 | |
FNMA | | AA+ | | | 6.00 | | | | 08/01/37 | | | | 94,516 | | | | 106,617 | |
FNMA | | AA+ | | | 6.00 | | | | 12/01/37 | | | | 42,171 | | | | 47,556 | |
FNMA | | AA+ | | | 6.00 | | | | 10/25/44 | | | | 444,760 | | | | 500,273 | |
FNMA | | AA+ | | | 6.00 | | | | 02/25/47 | | | | 938,542 | | | | 1,055,711 | |
FNMA | | AA+ | | | 6.50 | | | | 05/01/32 | | | | 104,482 | | | | 115,813 | |
FNMA | | AA+ | | | 6.50 | | | | 05/01/32 | | | | 92,990 | | | | 103,075 | |
FNMA | | AA+ | | | 6.50 | | | | 09/01/36 | | | | 20,636 | | | | 22,416 | |
FNMA | | AA+ | | | 6.50 | | | | 05/01/37 | | | | 88,792 | | | | 92,852 | |
FNMA | | AA+ | | | 6.50 | | | | 07/01/37 | | | | 19,174 | | | | 21,253 | |
FNMA | | AA+ | | | 6.50 | | | | 09/01/37 | | | | 27,038 | | | | 29,970 | |
FNMA | | AA+ | | | 6.50 | | | | 05/01/38 | | | | 38,868 | | | | 43,083 | |
FNMA | | AA+ | | | 7.00 | | | | 09/01/31 | | | | 50,386 | | | | 55,012 | |
FNMA | | AA+ | | | 7.00 | | | | 01/25/44 | | | | 338,927 | | | | 393,485 | |
FNMA | | AA+ | | | 7.50 | | | | 06/01/32 | | | | 59,430 | | | | 69,893 | |
FNMA | | AA+ | | | 8.00 | | | | 04/01/32 | | | | 19,605 | | | | 20,633 | |
FNMA ARM | | AA+ | | | 2.40 | | | | 05/01/43 | | | | 1,708,644 | | | | 1,711,053 | |
FNMA Strip | | AA+ | | | 3.00 | | | | 08/25/42 | | | | 1,297,002 | | | | 1,297,447 | |
GNMA (3) | | AA+ | | | 2.68 | | | | 10/16/47 | | | | 2,000,000 | | | | 1,993,836 | |
GNMA (3) | | AA+ | | | 3.00 | | | | 07/16/36 | | | | 1,758,595 | | | | 1,770,000 | |
GNMA (3) | | AA+ | | | 3.50 | | | | 07/15/42 | | | | 1,700,564 | | | | 1,763,490 | |
GNMA (3) | | AA+ | | | 3.50 | | | | 11/15/42 | | | | 1,138,538 | | | | 1,184,102 | |
GNMA (3) | | AA+ | | | 3.50 | | | | 05/20/45 | | | | 2,629,410 | | | | 2,735,149 | |
GNMA (3) | | AA+ | | | 3.70 | | | | 05/15/42 | | | | 857,907 | | | | 895,451 | |
GNMA (3) | | AA+ | | | 4.00 | | | | 04/15/24 | | | | 244,154 | | | | 257,932 | |
GNMA (3) | | AA+ | | | 4.00 | | | | 01/20/41 | | | | 1,437,976 | | | | 1,503,839 | |
GNMA (3) | | AA+ | | | 4.00 | | | | 03/15/41 | | | | 666,521 | | | | 700,025 | |
GNMA (3) | | AA+ | | | 4.00 | | | | 08/15/41 | | | | 1,088,471 | | | | 1,141,944 | |
GNMA (3) | | AA+ | | | 4.00 | | | | 11/15/41 | | | | 781,815 | | | | 828,249 | |
GNMA (3) | | AA+ | | | 4.00 | | | | 12/15/41 | | | | 1,649,316 | | | | 1,730,642 | |
GNMA (3) | | AA+ | | | 4.00 | | | | 08/20/42 | | | | 1,093,431 | | | | 1,143,785 | |
GNMA (3) | | AA+ | | | 4.25 | | | | 04/20/41 | | | | 900,837 | | | | 945,280 | |
GNMA (3) | | AA+ | | | 4.29 | | | | 04/15/41 | | | | 289,490 | | | | 303,880 | |
GNMA (3) | | AA+ | | | 4.50 | | | | 06/20/30 | | | | 59,417 | | | | 63,561 | |
GNMA (3) | | AA+ | | | 4.50 | | | | 09/15/30 | | | | 534,792 | | | | 568,162 | |
GNMA (3) | | AA+ | | | 4.50 | | | | 06/20/34 | | | | 356,905 | | | | 377,627 | |
GNMA (3) | | AA+ | | | 4.50 | | | | 09/15/40 | | | | 930,581 | | | | 985,891 | |
GNMA (3) | | AA+ | | | 4.50 | | | | 10/15/40 | | | | 1,216,704 | | | | 1,303,804 | |
GNMA (3) | | AA+ | | | 4.50 | | | | 10/15/40 | | | | 273,679 | | | | 288,425 | |
GNMA (3) | | AA+ | | | 5.00 | | | | 04/15/39 | | | | 1,003,284 | | | | 1,104,515 | |
GNMA (3) | | AA+ | | | 5.00 | | | | 06/20/39 | | | | 1,279,379 | | | | 1,370,937 | |
GNMA (3) | | AA+ | | | 5.00 | | | | 11/15/39 | | | | 414,210 | | | | 448,109 | |
GNMA (3) | | AA+ | | | 5.00 | | | | 05/15/40 | | | | 164,338 | | | | 178,595 | |
GNMA (3) | | AA+ | | | 5.00 | | | | 06/20/40 | | | | 147,883 | | | | 158,264 | |
GNMA (3) | | AA+ | | | 5.50 | | | | 01/15/36 | | | | 89,162 | | | | 97,791 | |
MUTUAL OF AMERICA INVESTMENT CORPORATION - BOND FUND
PORTFOLIO OF INVESTMENTS IN SECURITIES
December 31, 2017
| | | | | | | | | | | | | | | | | | | | |
GNMA (3) | | | AA+ | | | | 6.50 | | | | 04/15/31 | | | | 7,017 | | | | 7,785 | |
GNMA (3) | | | AA+ | | | | 6.50 | | | | 12/15/31 | | | | 20,725 | | | | 22,992 | |
GNMA (3) | | | AA+ | | | | 6.50 | | | | 05/15/32 | | | | 26,613 | | | | 29,525 | |
GNMA (3) | | | AA+ | | | | 7.00 | | | | 05/15/32 | | | | 2,630 | | | | 2,696 | |
Small Business Admin. Particip. (3) | | | AA+ | | | | 2.80 | | | | 01/01/37 | | | | 7,033,868 | | | | 7,046,494 | |
Small Business Admin. Particip. (3) | | | AA+ | | | | 2.81 | | | | 06/01/37 | | | | 6,126,362 | | | | 6,142,658 | |
Small Business Admin. Particip. (3) | | | AA+ | | | | 2.88 | | | | 05/01/37 | | | | 5,861,895 | | | | 5,892,974 | |
Vendee Mortgage Trust (3) | | | AA+ | | | | 5.25 | | | | 01/15/32 | | | | 679,246 | | | | 708,998 | |
| | | | | | | | | | | | | | | | | | | | |
| | | | | | | | | | | | | | | | | | | 355,080,769 | |
| | | | | | | | | | | | | | | | | | | | |
NON-MORTGAGE-BACKED OBLIGATIONS (1.2%) | | | | | | | | | | | | | |
FHLMC | | | AA+ | | | | 0.00 | | | | 11/29/19 | | | | 11,000,000 | | | | 10,534,997 | |
FNMA | | | AA+ | | | | 0.00 | | | | 10/09/19 | | | | 5,050,000 | | | | 4,863,660 | |
| | | | | | | | | | | | | | | | | | | | |
| | | | | | | | | | | | | | | | | | | 15,398,657 | |
| | | | | | | | | | | | | | | | | | | | |
CORPORATE DEBT (45.6%) | | | | | | | | | | | | | | | | | | | | |
CONSUMER DISCRETIONARY (7.7%) | | | | | | | | | | | | | |
Advance Auto Parts, Inc. | | | BBB- | | | | 4.50 | | | | 01/15/22 | | | | 1,000,000 | | | | 1,047,954 | |
Advance Auto Parts, Inc. | | | BBB- | | | | 4.50 | | | | 12/01/23 | | | | 1,000,000 | | | | 1,051,371 | |
Advance Auto Parts, Inc. | | | BBB- | | | | 5.75 | | | | 05/01/20 | | | | 3,000,000 | | | | 3,196,812 | |
Amazon.com, Inc. | | | AA- | | | | 5.20 | | | | 12/03/25 | | | | 5,000,000 | | | | 5,739,720 | |
AutoZone, Inc. | | | BBB | | | | 3.25 | | | | 04/15/25 | | | | 2,000,000 | | | | 1,992,358 | |
AutoZone, Inc. | | | BBB | | | | 3.70 | | | | 04/15/22 | | | | 700,000 | | | | 722,163 | |
AutoZone, Inc. | | | BBB | | | | 4.00 | | | | 11/15/20 | | | | 3,000,000 | | | | 3,113,607 | |
Brinker International, Inc. | | | BB+ | | | | 3.88 | | | | 05/15/23 | | | | 4,000,000 | | | | 3,880,000 | |
Coach, Inc. | | | BBB- | | | | 4.25 | | | | 04/01/25 | | | | 2,500,000 | | | | 2,567,505 | |
Dollar General Corp. | | | BBB | | | | 3.25 | | | | 04/15/23 | | | | 4,000,000 | | | | 4,053,944 | |
Expedia, Inc. | | | BBB- | | | | 5.95 | | | | 08/15/20 | | | | 4,000,000 | | | | 4,303,552 | |
Family Dollar Stores, Inc. | | | BBB- | | | | 5.00 | | | | 02/01/21 | | | | 4,000,000 | | | | 4,240,000 | |
Gap, Inc. | | | BB+ | | | | 5.95 | | | | 04/12/21 | | | | 5,000,000 | | | | 5,391,435 | |
Harman Int’l. Industries, Inc. | | | BBB+ | | | | 4.15 | | | | 05/15/25 | | | | 5,000,000 | | | | 5,169,725 | |
Hyatt Hotels Corp. | | | BBB | | | | 5.38 | | | | 08/15/21 | | | | 200,000 | | | | 215,461 | |
Kohl’s Corp. | | | BBB- | | | | 3.25 | | | | 02/01/23 | | | | 1,804,000 | | | | 1,783,449 | |
Kohl’s Corp. | | | BBB- | | | | 4.00 | | | | 11/01/21 | | | | 2,620,000 | | | | 2,695,115 | |
Lowe’s Cos., Inc. | | | A- | | | | 3.12 | | | | 04/15/22 | | | | 2,000,000 | | | | 2,040,564 | |
Marriott International, Inc. | | | BBB | | | | 3.00 | | | | 03/01/19 | | | | 1,000,000 | | | | 1,006,819 | |
Marriott International, Inc. | | | BBB | | | | 3.13 | | | | 02/15/23 | | | | 3,000,000 | | | | 2,989,896 | |
Marriott International, Inc. | | | BBB | | | | 3.38 | | | | 10/15/20 | | | | 3,000,000 | | | | 3,062,346 | |
Mattel, Inc. | | | BB- | | | | 3.15 | | | | 03/15/23 | | | | 2,000,000 | | | | 1,722,020 | |
Mattel, Inc. | | | BB- | | | | 4.35 | | | | 10/01/20 | | | | 1,000,000 | | | | 985,000 | |
Newell Brands, Inc. | | | BBB- | | | | 4.70 | | | | 08/15/20 | | | | 3,000,000 | | | | 3,154,278 | |
NVR, Inc. | | | BBB+ | | | | 3.95 | | | | 09/15/22 | | | | 4,000,000 | | | | 4,175,668 | |
Omnicom Group, Inc. | | | BBB+ | | | | 3.63 | | | | 05/01/22 | | | | 1,000,000 | | | | 1,032,359 | |
Omnicom Group, Inc. | | | BBB+ | | | | 4.45 | | | | 08/15/20 | | | | 3,000,000 | | | | 3,147,138 | |
O’Reilly Automotive, Inc. | | | BBB+ | | | | 3.80 | | | | 09/01/22 | | | | 3,250,000 | | | | 3,418,977 | |
Scripps Networks Interactive, Inc. | | | BBB | | | | 3.50 | | | | 06/15/22 | | | | 5,000,000 | | | | 5,050,400 | |
Tupperware Brands Corp. | | | BBB- | | | | 4.75 | | | | 06/01/21 | | | | 4,000,000 | | | | 4,216,848 | |
Viacom, Inc. | | | BBB- | | | | 3.25 | | | | 03/15/23 | | | | 5,000,000 | | | | 4,859,720 | |
Whirlpool Corp. | | | BBB | | | | 3.70 | | | | 05/01/25 | | | | 2,000,000 | | | | 2,060,522 | |
Whirlpool Corp. | | | BBB | | | | 4.85 | | | | 06/15/21 | | | | 1,000,000 | | | | 1,069,118 | |
Wyndham Worldwide Corp. | | | BBB- | | | | 3.90 | | | | 03/01/23 | | | | 4,000,000 | | | | 3,957,888 | |
| | | | | | | | | | | | | | | | | | | | |
| | | | | | | | | | | | | | | | | | | 99,113,732 | |
| | | | | | | | | | | | | | | | | | | | |
CONSUMER STAPLES (2.1%) | | | | | | | | | | | | | |
Conagra Brands, Inc. | | | BBB | | | | 4.95 | | | | 08/15/20 | | | | 645,000 | | | | 681,532 | |
Edgewell Personal Care Co. | | | BB+ | | | | 4.70 | | | | 05/19/21 | | | | 4,000,000 | | | | 4,130,000 | |
Flowers Foods, Inc. | | | BBB | | | | 4.38 | | | | 04/01/22 | | | | 4,000,000 | | | | 4,241,208 | |
Ingredion, Inc. | | | BBB | | | | 4.63 | | | | 11/01/20 | | | | 3,225,000 | | | | 3,387,695 | |
Kroger Co. | | | BBB | | | | 2.95 | | | | 11/01/21 | | | | 4,800,000 | | | | 4,846,488 | |
Mead Johnson Nutrition Co. | | | A- | | | | 4.13 | | | | 11/15/25 | | | | 1,950,000 | | | | 2,068,188 | |
Molson Coors Brewing Co. | | | BBB- | | | | 3.50 | | | | 05/01/22 | | | | 3,000,000 | | | | 3,081,318 | |
Sysco Corp. | | | BBB+ | | | | 3.75 | | | | 10/01/25 | | | | 3,575,000 | | | | 3,717,342 | |
| | | | | | | | | | | | | | | | | | | | |
| | | | | | | | | | | | | | | | | | | 26,153,771 | |
| | | | | | | | | | | | | | | | | | | | |
MUTUAL OF AMERICA INVESTMENT CORPORATION - BOND FUND
PORTFOLIO OF INVESTMENTS IN SECURITIES
December 31, 2017
| | | | | | | | | | | | | | | | | | | | |
ENERGY (3.7%) | | | | | | | | | | | | | |
Cameron International Corp. | | | AA- | | | | 4.50 | | | | 06/01/21 | | | | 3,000,000 | | | | 3,117,384 | |
Devon Energy | | | BBB | | | | 5.85 | | | | 12/15/25 | | | | 2,500,000 | | | | 2,919,188 | |
Diamond Offshore Drilling, Inc. | | | B+ | | | | 3.45 | | | | 11/01/23 | | | | 3,000,000 | | | | 2,677,500 | |
Energen Corp. | | | BB | | | | 4.63 | | | | 09/01/21 | | | | 4,000,000 | | | | 4,050,000 | |
EQT Corp. | | | BBB | | | | 4.88 | | | | 11/15/21 | | | | 4,000,000 | | | | 4,264,760 | |
Kinder Morgan Energy Partners | | | BBB- | | | | 4.30 | | | | 05/01/24 | | | | 5,000,000 | | | | 5,205,790 | |
Marathon Oil Corp. | | | BBB- | | | | 2.80 | | | | 11/01/22 | | | | 4,000,000 | | | | 3,961,032 | |
Marathon Petroleum Corp. | | | BBB | | | | 5.13 | | | | 03/01/21 | | | | 3,300,000 | | | | 3,541,685 | |
Murphy Oil Corp. | | | BBB- | | | | 4.70 | | | | 12/01/22 | | | | 3,525,000 | | | | 3,538,219 | |
Noble Corp. | | | B | | | | 7.50 | | | | 03/15/19 | �� | | | 2,000,000 | | | | 2,047,500 | |
Rowan Companies PLC | | | B+ | | | | 4.88 | | | | 06/01/22 | | | | 4,000,000 | | | | 3,770,000 | |
Seacor Hldgs., Inc. | | | NR | | | | 7.38 | | | | 10/01/19 | | | | 2,775,000 | | | | 2,865,188 | |
SESI LLC | | | BB- | | | | 7.13 | | | | 12/15/21 | | | | 4,500,000 | | | | 4,612,500 | |
| | | | | | | | | | | | | | | | | | | | |
| | | | | | | | | | | | | | | | | | | 46,570,746 | |
| | | | | | | | | | | | | | | | | | | | |
FINANCIALS (11.0%) | | | | | | | | | | | | | |
Aflac, Inc. | | | A- | | | | 4.00 | | | | 02/15/22 | | | | 3,000,000 | | | | 3,157,329 | |
Alleghany Corp. | | | BBB+ | | | | 4.95 | | | | 06/27/22 | | | | 2,000,000 | | | | 2,161,312 | |
Alleghany Corp. | | | BBB+ | | | | 5.63 | | | | 09/15/20 | | | | 3,000,000 | | | | 3,216,657 | |
American Express Co. | | | BBB | | | | 3.63 | | | | 12/05/24 | | | | 5,000,000 | | | | 5,144,730 | |
American Int’l. Group, Inc. | | | BBB+ | | | | 3.75 | | | | 07/10/25 | | | | 5,000,000 | | | | 5,155,120 | |
Bank of America Corp. | | | BBB+ | | | | 3.95 | | | | 04/21/25 | | | | 5,000,000 | | | | 5,170,590 | |
Barrick N.A. Finance LLC | | | BBB- | | | | 4.40 | | | | 05/30/21 | | | | 4,000,000 | | | | 4,234,044 | |
Berkley (W.R.) Corp. | | | BBB+ | | | | 4.63 | | | | 03/15/22 | | | | 2,000,000 | | | | 2,128,448 | |
Berkley (W.R.) Corp. | | | BBB+ | | | | 7.38 | | | | 09/15/19 | | | | 2,000,000 | | | | 2,152,516 | |
Block Financial LLC | | | BBB | | | | 5.25 | | | | 10/01/25 | | | | 3,000,000 | | | | 3,220,371 | |
Block Financial LLC | | | BBB | | | | 5.50 | | | | 11/01/22 | | | | 2,250,000 | | | | 2,417,684 | |
Capital One Financial Corp. | | | BBB | | | | 4.75 | | | | 07/15/21 | | | | 4,000,000 | | | | 4,273,916 | |
Citigroup, Inc. | | | BBB | | | | 3.88 | | | | 03/26/25 | | | | 5,000,000 | | | | 5,118,245 | |
Citizens Financial Group, Inc. | | | BBB | | | | 3.75 | | | | 07/01/24 | | | | 5,000,000 | | | | 4,996,760 | |
Fairfax Financial Hldgs.† | | | BBB- | | | | 5.80 | | | | 05/15/21 | | | | 1,500,000 | | | | 1,618,844 | |
Fairfax U.S., Inc.† | | | BBB- | | | | 4.88 | | | | 08/13/24 | | | | 3,500,000 | | | | 3,647,277 | |
Fifth Third Bancorp | | | BBB | | | | 4.30 | | | | 01/16/24 | | | | 5,000,000 | | | | 5,306,785 | |
First Republic Bank | | | A- | | | | 2.38 | | | | 06/17/19 | | | | 2,000,000 | | | | 1,996,358 | |
First Tennessee Bank | | | BBB | | | | 2.95 | | | | 12/01/19 | | | | 5,000,000 | | | | 5,033,275 | |
Genworth Financial, Inc. | | | B | | | | 7.20 | | | | 02/15/21 | | | | 1,750,000 | | | | 1,706,250 | |
Genworth Financial, Inc. | | | B | | | | 7.63 | | | | 09/24/21 | | | | 1,300,000 | | | | 1,270,750 | |
Hartford Financial Svcs. | | | BBB+ | | | | 5.50 | | | | 03/30/20 | | | | 1,000,000 | | | | 1,065,813 | |
JPMorgan Chase & Co. | | | BBB+ | | | | 3.88 | | | | 09/10/24 | | | | 5,000,000 | | | | 5,215,615 | |
Kemper Corp. | | | BBB- | | | | 4.35 | | | | 02/15/25 | | | | 2,000,000 | | | | 2,036,004 | |
Lincoln National Corp. | | | A- | | | | 4.00 | | | | 09/01/23 | | | | 4,000,000 | | | | 4,175,660 | |
Lincoln National Corp. | | | A- | | | | 4.85 | | | | 06/24/21 | | | | 1,000,000 | | | | 1,067,437 | |
Markel Corp. | | | BBB | | | | 5.35 | | | | 06/01/21 | | | | 1,200,000 | | | | 1,292,921 | |
Marsh & McLennan Cos., Inc. | | | A- | | | | 4.80 | | | | 07/15/21 | | | | 3,000,000 | | | | 3,207,318 | |
Moody’s Corp. | | | BBB+ | | | | 4.50 | | | | 09/01/22 | | | | 4,000,000 | | | | 4,285,880 | |
Nasdaq, Inc. | | | BBB | | | | 5.55 | | | | 01/15/20 | | | | 2,500,000 | | | | 2,649,910 | |
Old Republic Int’l. Corp. | | | BBB+ | | | | 3.88 | | | | 08/26/26 | | | | 5,000,000 | | | | 5,033,150 | |
Pacific LifeCorp.† | | | A- | | | | 6.00 | | | | 02/10/20 | | | | 710,000 | | | | 755,263 | |
Peoples United Bank | | | BBB+ | | | | 4.00 | | | | 07/15/24 | | | | 2,000,000 | | | | 2,019,952 | |
Prudential Financial, Inc. | | | A | | | | 4.50 | | | | 11/16/21 | | | | 1,000,000 | | | | 1,071,771 | |
Reinsurance Grp. of America, Inc. | | | A- | | | | 4.70 | | | | 09/15/23 | | | | 1,000,000 | | | | 1,072,704 | |
Reinsurance Grp. of America, Inc. | | | A- | | | | 5.00 | | | | 06/01/21 | | | | 3,000,000 | | | | 3,207,903 | |
Signet UK Finance PLC | | | BBB- | | | | 4.70 | | | | 06/15/24 | | | | 5,000,000 | | | | 4,923,090 | |
Stifel Financial Corp. | | | BBB- | | | | 4.25 | | | | 07/18/24 | | | | 1,500,000 | | | | 1,536,479 | |
Synchrony Financial | | | BBB- | | | | 2.70 | | | | 02/03/20 | | | | 2,250,000 | | | | 2,255,623 | |
Synchrony Financial | | | BBB- | | | | 3.70 | | | | 08/04/26 | | | | 2,750,000 | | | | 2,711,283 | |
Travelers Cos., Inc. | | | A | | | | 3.90 | | | | 11/01/20 | | | | 2,500,000 | | | | 2,599,830 | |
Unum Group | | | BBB | | | | 4.00 | | | | 03/15/24 | | | | 5,000,000 | | | | 5,206,680 | |
Voya Financial, Inc. | | | BBB | | | | 3.65 | | | | 06/15/26 | | | | 5,000,000 | | | | 5,056,520 | |
Wells Fargo & Co. | | | A- | | | | 3.45 | | | | 02/13/23 | | | | 4,000,000 | | | | 4,076,184 | |
Wells Fargo & Co. | | | A- | | | | 4.13 | | | | 08/15/23 | | | | 1,000,000 | | | | 1,054,552 | |
| | | | | | | | | | | | | | | | | | | | |
| | | | | | | | | | | | | | | | | | | 140,704,803 | |
| | | | | | | | | | | | | | | | | | | | |
MUTUAL OF AMERICA INVESTMENT CORPORATION - BOND FUND
PORTFOLIO OF INVESTMENTS IN SECURITIES
December 31, 2017
| | | | | | | | | | | | | | | | | | | | |
HEALTH CARE (4.4%) | | | | | | | | | | | | | |
Agilent Technologies, Inc. | | | BBB+ | | | | 5.00 | | | | 07/15/20 | | | | 4,000,000 | | | | 4,247,368 | |
Anthem, Inc. | | | A | | | | 3.30 | | | | 01/15/23 | | | | 3,539,000 | | | | 3,590,903 | |
Anthem, Inc. | | | A | | | | 4.35 | | | | 08/15/20 | | | | 2,000,000 | | | | 2,095,436 | |
Biogen Idec, Inc. | | | A- | | | | 4.05 | | | | 09/15/25 | | | | 2,500,000 | | | | 2,645,498 | |
Bio-Rad Laboratories, Inc. | | | BBB | | | | 4.88 | | | | 12/15/20 | | | | 4,000,000 | | | | 4,233,412 | |
Edwards Lifesciences Corp. | | | BBB- | | | | 2.88 | | | | 10/15/18 | | | | 4,500,000 | | | | 4,530,357 | |
Express Scripts Hldg. Co. | | | BBB+ | | | | 3.50 | | | | 06/15/24 | | | | 2,000,000 | | | | 2,017,690 | |
Humana, Inc. | | | BBB+ | | | | 3.85 | | | | 10/01/24 | | | | 3,000,000 | | | | 3,120,207 | |
Laboratory Corp. of America | | | BBB | | | | 3.75 | | | | 08/23/22 | | | | 2,000,000 | | | | 2,074,192 | |
Laboratory Corp. of America | | | BBB | | | | 4.63 | | | | 11/15/20 | | | | 1,000,000 | | | | 1,052,307 | |
Medco Health Solutions, Inc. | | | BBB+ | | | | 4.13 | | | | 09/15/20 | | | | 3,000,000 | | | | 3,113,139 | |
Owens & Minor, Inc. | | | BBB- | | | | 3.88 | | | | 09/15/21 | | | | 2,200,000 | | | | 2,225,667 | |
Owens & Minor, Inc. | | | BBB- | | | | 4.38 | | | | 12/15/24 | | | | 2,800,000 | | | | 2,834,740 | |
PerkinElmer, Inc. | | | BBB | | | | 5.00 | | | | 11/15/21 | | | | 4,000,000 | | | | 4,312,512 | |
Quest Diagnostics, Inc. | | | BBB+ | | | | 3.50 | | | | 03/30/25 | | | | 700,000 | | | | 708,064 | |
Quest Diagnostics, Inc. | | | BBB+ | | | | 4.75 | | | | 01/30/20 | | | | 4,000,000 | | | | 4,179,956 | |
Thermo Fisher Scientific, Inc. | | | BBB | | | | 3.60 | | | | 08/15/21 | | | | 1,000,000 | | | | 1,032,221 | |
Thermo Fisher Scientific, Inc. | | | BBB | | | | 4.50 | | | | 03/01/21 | | | | 3,000,000 | | | | 3,188,556 | |
Zimmer Biomet Hldgs., Inc. | | | BBB | | | | 3.15 | | | | 04/01/22 | | | | 5,000,000 | | | | 5,012,245 | |
| | | | | | | | | | | | | | | | | | | | |
| | | | | | | | | | | | | | | | | | | 56,214,470 | |
| | | | | | | | | | | | | | | | | | | | |
INDUSTRIALS (2.4%) | | | | | | | | | | | | | |
Crane Co. | | | BBB | | | | 2.75 | | | | 12/15/18 | | | | 4,000,000 | | | | 4,017,920 | |
Dun & Bradstreet Corp. | | | BB+ | | | | 4.63 | | | | 12/01/22 | | | | 1,000,000 | | | | 1,014,183 | |
Flowserve Corp. | | | BBB- | | | | 3.50 | | | | 09/15/22 | | | | 4,000,000 | | | | 4,016,964 | |
Hexcel Corp. | | | BBB | | | | 4.70 | | | | 08/15/25 | | | | 3,900,000 | | | | 4,150,029 | |
Kennametal, Inc. | | | BBB- | | | | 2.65 | | | | 11/01/19 | | | | 4,000,000 | | | | 4,003,168 | |
L-3 Communications Corp. | | | BBB- | | | | 4.75 | | | | 07/15/20 | | | | 3,000,000 | | | | 3,156,102 | |
L-3 Communications Corp. | | | BBB- | | | | 5.20 | | | | 10/15/19 | | | | 1,000,000 | | | | 1,047,416 | |
Penske Truck Leasing Co. LP† | | | BBB | | | | 3.38 | | | | 03/15/18 | | | | 3,000,000 | | | | 3,008,946 | |
Valmont Industries, Inc. | | | BBB+ | | | | 6.63 | | | | 04/20/20 | | | | 750,000 | | | | 815,992 | |
Verisk Analytics, Inc. | | | BBB- | | | | 4.00 | | | | 06/15/25 | | | | 5,000,000 | | | | 5,170,455 | |
| | | | | | | | | | | | | | | | | | | | |
| | | | | | | | | | | | | | | | | | | 30,401,175 | |
| | | | | | | | | | | | | | | | | | | | |
INFORMATION TECHNOLOGY (4.6%) | | | | | | | | | | | | | |
Adobe Systems, Inc. | | | A | | | | 4.75 | | | | 02/01/20 | | | | 4,000,000 | | | | 4,200,468 | |
Applied Materials, Inc. | | | A- | | | | 3.90 | | | | 10/01/25 | | | | 5,000,000 | | | | 5,307,080 | |
Arrow Electronics, Inc. | | | BBB- | | | | 4.00 | | | | 04/01/25 | | | | 1,000,000 | | | | 1,020,415 | |
Arrow Electronics, Inc. | | | BBB- | | | | 4.50 | | | | 03/01/23 | | | | 1,100,000 | | | | 1,157,030 | |
Avnet, Inc. | | | BBB- | | | | 4.88 | | | | 12/01/22 | | | | 270,000 | | | | 287,031 | |
Avnet, Inc. | | | BBB- | | | | 5.88 | | | | 06/15/20 | | | | 1,100,000 | | | | 1,172,101 | |
eBay, Inc. | | | BBB+ | | | | 2.88 | | | | 08/01/21 | | | | 5,000,000 | | | | 5,049,640 | |
Fidelity Nat’l. Information | | | BBB | | | | 3.88 | | | | 06/05/24 | | | | 5,000,000 | | | | 5,219,235 | |
Fiserv, Inc. | | | BBB | | | | 4.63 | | | | 10/01/20 | | | | 2,800,000 | | | | 2,954,773 | |
Fiserv, Inc. | | | BBB | | | | 4.75 | | | | 06/15/21 | | | | 1,000,000 | | | | 1,067,548 | |
Ingram Micro, Inc. | | | NR | | | | 5.00 | | | | 08/10/22 | | | | 1,000,000 | | | | 980,404 | |
Ingram Micro, Inc. | | | NR | | | | 5.45 | | | | 12/15/24 | | | | 750,000 | | | | 744,889 | |
Juniper Networks, Inc. | | | BBB | | | | 4.50 | | | | 03/15/24 | | | | 3,000,000 | | | | 3,121,734 | |
Juniper Networks, Inc. | | | BBB | | | | 4.60 | | | | 03/15/21 | | | | 2,000,000 | | | | 2,094,592 | |
Keysight Technologies, Inc. | | | BBB- | | | | 4.55 | | | | 10/30/24 | | | | 5,000,000 | | | | 5,304,545 | |
Lam Research Corp. | | | BBB+ | | | | 2.75 | | | | 03/15/20 | | | | 5,000,000 | | | | 5,035,395 | |
Motorola Solutions, Inc. | | | BBB- | | | | 3.75 | | | | 05/15/22 | | | | 4,000,000 | | | | 4,108,584 | |
Motorola Solutions, Inc. | | | BBB- | | | | 4.00 | | | | 09/01/24 | | | | 1,000,000 | | | | 1,025,661 | |
Symantec Corp. | | | BB+ | | | | 4.20 | | | | 09/15/20 | | | | 4,000,000 | | | | 4,120,000 | |
Total System Services, Inc. | | | BBB- | | | | 3.75 | | | | 06/01/23 | | | | 4,000,000 | | | | 4,083,624 | |
| | | | | | | | | | | | | | | | | | | | |
| | | | | | | | | | | | | | | | | | | 58,054,749 | |
| | | | | | | | | | | | | | | | | | | | |
MATERIALS (4.4%) | | | | | | | | | | | | | |
Albemarle Corp. | | | BBB | | | | 4.50 | | | | 12/15/20 | | | | 2,000,000 | | | | 2,103,412 | |
Carpenter Technology Corp. | | | BBB- | | | | 4.45 | | | | 03/01/23 | | | | 3,600,000 | | | | 3,670,229 | |
Domtar Corp. | | | BBB- | | | | 4.40 | | | | 04/01/22 | | | | 5,000,000 | | | | 5,260,150 | |
Dow Chemical Co. | | | BBB | | | | 3.50 | | | | 10/01/24 | | | | 4,800,000 | | | | 4,938,456 | |
Eastman Chemical Co. | | | BBB | | | | 4.50 | | | | 01/15/21 | | | | 2,500,000 | | | | 2,619,300 | |
MUTUAL OF AMERICA INVESTMENT CORPORATION - BOND FUND
PORTFOLIO OF INVESTMENTS IN SECURITIES
December 31, 2017
| | | | | | | | | | | | | | | | | | | | |
Freeport-McMoRan, Inc. | | | BB- | | | | 3.55 | | | | 03/01/22 | | | | 4,000,000 | | | | 3,955,000 | |
Goldcorp, Inc. | | | BBB+ | | | | 2.13 | | | | 03/15/18 | | | | 4,000,000 | | | | 4,002,064 | |
Kinross Gold Corp. | | | BB+ | | | | 5.13 | | | | 09/01/21 | | | | 4,000,000 | | | | 4,170,000 | |
Methanex Corp. | | | BB+ | | | | 3.25 | | | | 12/15/19 | | | | 3,400,000 | | | | 3,415,171 | |
Methanex Corp. | | | BB+ | | | | 5.25 | | | | 03/01/22 | | | | 600,000 | | | | 636,494 | |
Newmont Mining Corp. | | | BBB | | | | 3.50 | | | | 03/15/22 | | | | 4,000,000 | | | | 4,083,492 | |
Packaging Corp. of America | | | BBB | | | | 3.90 | | | | 06/15/22 | | | | 2,000,000 | | | | 2,083,182 | |
Packaging Corp. of America | | | BBB | | | | 4.50 | | | | 11/01/23 | | | | 2,000,000 | | | | 2,151,556 | |
Sherwin-Williams Co. | | | BBB | | | | 3.95 | | | | 01/15/26 | | | | 5,000,000 | | | | 5,214,160 | |
Southern Copper Corp. | | | BBB | | | | 3.50 | | | | 11/08/22 | | | | 4,000,000 | | | | 4,108,560 | |
Teck Resources Ltd. | | | BB+ | | | | 3.75 | | | | 02/01/23 | | | | 1,000,000 | | | | 1,002,500 | |
Teck Resources Ltd. | | | BB+ | | | | 4.75 | | | | 01/15/22 | | | | 3,000,000 | | | | 3,131,400 | |
| | | | | | | | | | | | | | | | | | | | |
| | | | | | | | | | | | | | | | | | | 56,545,126 | |
| | | | | | | | | | | | | | | | | | | | |
REAL ESTATE (3.2%) | | | | | | | | | | | | | |
Boston Properties LP | | | A- | | | | 3.85 | | | | 02/01/23 | | | | 3,000,000 | | | | 3,125,316 | |
Government Pptys. Income Trust | | | BBB- | | | | 3.75 | | | | 08/15/19 | | | | 4,000,000 | | | | 4,033,616 | |
HCP, Inc. | | | BBB | | | | 3.40 | | | | 02/01/25 | | | | 3,750,000 | | | | 3,716,899 | |
Healthcare Realty Trust, Inc. | | | BBB | | | | 3.75 | | | | 04/15/23 | | | | 4,000,000 | | | | 4,068,620 | |
Hospitality Properties Trust | | | BBB- | | | | 5.00 | | | | 08/15/22 | | | | 4,550,000 | | | | 4,855,396 | |
Jones Lang LaSalle, Inc. | | | BBB | | | | 4.40 | | | | 11/15/22 | | | | 4,000,000 | | | | 4,214,252 | |
Mack-Cali Realty LP | | | BBB- | | | | 4.50 | | | | 04/18/22 | | | | 5,000,000 | | | | 5,009,770 | |
National Retail Pptys., Inc. | | | BBB+ | | | | 3.30 | | | | 04/15/23 | | | | 1,000,000 | | | | 1,004,978 | |
National Retail Pptys., Inc. | | | BBB+ | | | | 3.80 | | | | 10/15/22 | | | | 3,000,000 | | | | 3,098,898 | |
Ventas Realty LP/Capital Corp. | | | BBB+ | | | | 3.25 | | | | 08/15/22 | | | | 500,000 | | | | 505,956 | |
Ventas Realty LP/Capital Corp. | | | BBB+ | | | | 4.75 | | | | 06/01/21 | | | | 3,000,000 | | | | 3,179,088 | |
Welltower, Inc. | | | BBB+ | | | | 3.75 | | | | 03/15/23 | | | | 750,000 | | | | 777,193 | |
Welltower, Inc. | | | BBB+ | | | | 6.13 | | | | 04/15/20 | | | | 2,500,000 | | | | 2,700,318 | |
| | | | | | | | | | | | | | | | | | | | |
| | | | | | | | | | | | | | | | | | | 40,290,300 | |
| | | | | | | | | | | | | | | | | | | | |
TELECOMMUNICATION SERVICES (0.4%) | | | | | | | | | | | | | |
AT&T, Inc. | | | BBB+ | | | | 3.00 | | | | 02/15/22 | | | | 4,000,000 | | | | 4,008,160 | |
AT&T, Inc. | | | BBB+ | | | | 3.00 | | | | 06/30/22 | | | | 1,000,000 | | | | 1,001,776 | |
| | | | | | | | | | | | | | | | | | | | |
| | | | | | | | | | | | | | | | | | | 5,009,936 | |
| | | | | | | | | | | | | | | | | | | | |
UTILITIES (1.7%) | | | | | | | | | | | | | |
Entergy Corp. | | | BBB | | | | 5.13 | | | | 09/15/20 | | | | 2,500,000 | | | | 2,641,195 | |
Exelon Corp. | | | BBB- | | | | 5.15 | | | | 12/01/20 | | | | 3,000,000 | | | | 3,194,493 | |
Exelon Generation Co. LLC | | | BBB | | | | 4.25 | | | | 06/15/22 | | | | 1,000,000 | | | | 1,049,353 | |
National Fuel Gas Co. | | | BBB | | | | 4.90 | | | | 12/01/21 | | | | 3,000,000 | | | | 3,159,393 | |
National Fuel Gas Co. | | | BBB | | | | 5.20 | | | | 07/15/25 | | | | 2,000,000 | | | | 2,145,204 | |
SCANA Corp. | | | BBB- | | | | 4.13 | | | | 02/01/22 | | | | 4,000,000 | | | | 4,085,100 | |
SCANA Corp. | | | BBB- | | | | 4.75 | | | | 05/15/21 | | | | 1,000,000 | | | | 1,036,915 | |
Talen Energy Supply LLC† | | | B+ | | | | 6.50 | | | | 09/15/24 | | | | 2,000,000 | | | | 1,590,000 | |
UIL Hldgs. Corp. | | | BBB | | | | 4.63 | | | | 10/01/20 | | | | 2,725,000 | | | | 2,853,459 | |
| | | | | | | | | | | | | | | | | | | | |
| | | | | | | | | | | | | | | | | | | 21,755,112 | |
| | | | | | | | | | | | | | | | | | | | |
SOVEREIGN DEBT (0.3%) | | | | | | | | | | | | | |
Sri Lanka AID | | | NR | | | | 6.59 | | | | 09/15/28 | | | | 2,806,886 | | | | 3,258,795 | |
| | | | | | | | | | | | | | | | | | | | |
TOTAL LONG-TERM DEBT SECURITIES
(Cost: $1,247,818,454) 99.1% | | | | | | | | 1,262,252,886 | |
| | | | | | | | | | | | | | | | | | | | |
| | | | | |
| | | Rating** | | | Rate(%) | | | Maturity | | | Face Amount | | | Value | |
SHORT-TERM DEBT SECURITIES: | | | | | | | | | | | | | | | | | | | | |
COMMERCIAL PAPER (0.7%) | | | | | | | | | | | | | |
Home Depot, Inc.† | | | A-1 | | | | 1.44 | | | | 01/02/18 | | | | 8,700,000 | | | | 8,698,956 | |
| | | | | | | | | | | | | | | | | | | | |
TOTAL SHORT-TERM DEBT SECURITIES
(Cost: $8,698,956) 0.7% | | | | | | | | | | | | | | | | | | | 8,698,956 | |
| | | | | | | | | | | | | | | | | | | | |
TOTAL INVESTMENTS
(Cost: $1,256,517,410) 99.8% | | | | | | | | | | | | | | | | | | | 1,270,951,842 | |
| | | | | | | | | | | | | | | | | | | | |
OTHER NET ASSETS 0.2% | | | | | | | | | | | | | | | | | | | 3,176,189 | |
| | | | | | | | | | | | | | | | | | | | |
NET ASSETS 100.0% | | | | | | | | | | | | | | | | | | $ | 1,274,128,031 | |
| | | | | | | | | | | | | | | | | | | | |
The disclosures regarding Fair Value and Security Valuation included in Section 1 of the Notes to Financial Statements (Significant Accounting Policies and Organization) are an integral part of these portfolio schedules.
MUTUAL OF AMERICA INVESTMENT CORPORATION
FOOTNOTES TO PORTFOLIOS OF INVESTMENTS IN SECURITIES
December 31, 2017
| | |
| Abbreviations: | | ARM = Adjustable Rate Mortgage |
| | FHLB = Federal Home Loan Bank |
| | FHLMC = Federal Home Loan Mortgage Corporation |
| | FNMA = Federal National Mortgage Association |
| | GNMA = Government National Mortgage Association |
| | NR = Not Rated |
| * | Non-income producing security. |
| ** | Ratings as per Standard & Poor’s Corporation (unaudited). |
| † | Security is exempt from registration under Rule 144A of the Securities Act of 1933. These securities may be resold in transactions exempt from registration, normally to qualified institutional buyers. At December 31, 2017, the aggregate values of these securities and their percentages of the respective Funds’ net assets were as follows: |
| | | | | | | | |
Fund | | Aggregate
Market
Value | | | Percentage
of
Net Assets | |
EQUITY INDEX FUND | | $ | 24,981,498 | | | | 0.9 | % |
ALL AMERICA FUND | | $ | 2,299,730 | | | | 0.7 | % |
SMALL CAP VALUE FUND | | $ | 1,199,860 | | | | 0.2 | % |
MID-CAP EQUITY INDEX FUND | | $ | 14,988,899 | | | | 1.0 | % |
COMPOSITE FUND | | $ | 2,585,648 | | | | 1.4 | % |
MONEY MARKET FUND | | $ | 38,009,666 | | | | 53.7 | % |
MID-TERM BOND FUND | | $ | 6,370,424 | | | | 1.1 | % |
BOND FUND | | $ | 19,319,286 | | | | 1.5 | % |
| (1) | This security, or a portion thereof, has been segregated to cover initial margin requirements on open futures contracts. |
| | Information on futures contracts outstanding in the Funds as of December 31, 2017, was as follows: |
| | | | | | | | | | | | | | | | | | | | | | |
Fund | | Number of
Contracts | | Contract Type | | Purchased (P)
or Sold (S) | | Expiration
Date | | | Underlying
Face Amount
at Value | | | Unrealized
Gain(Loss)(a) | | | Face Value
of Futures
as a % of
Total
Investments | |
EQUITY INDEX FUND | | 797 | | E-mini S&P 500
Stock Index | | P | | | March 2018 | | | $ | 106,638,600 | | | $ | 517,095 | | | | 3.9 | % |
ALL AMERICA FUND | | 84 | | E-mini S&P 500
Stock Index | | P | | | March 2018 | | | $ | 11,239,200 | | | $ | 91,979 | | | | 3.5 | % |
MID-CAP EQUITY INDEX FUND | | 343 | | E-mini S&P
MidCap 400
Stock Index | | P | | | March 2018 | | | $ | 65,252,320 | | | $ | 225,422 | | | | 4.5 | % |
| (a) | Includes the cumulative appreciation(depreciation) of futures contracts. |
| (2) | Percentage is less than 0.05%. |
| (3) | U.S. Government guaranteed security. |
(b) Not applicable.
| ITEM 7. | DISCLOSURE OF PROXY VOTING POLICIES AND PROCEDURES FOR CLOSED-END MANAGEMENT INVESTMENT COMPANIES. |
Not applicable.
| ITEM 8. | PORTFOLIO MANAGERS OF CLOSED-END MANAGEMENT INVESTMENT COMPANIES. |
Not applicable.
| ITEM 9. | PURCHASES OF EQUITY SECURITES BY CLOSED-END MANAGEMENT INVESTMENT COMPANY AND AFFILIATED PURCHASERS. |
Not applicable.
| ITEM 10. | SUBMISSION OF MATTERS TO A VOTE OF SECURITY HOLDERS. |
Not applicable.
| ITEM 11. | CONTROLS AND PROCEDURES. |
| | (a) | The registrant’s principal executive officer and principal financial officer have evaluated the registrant’s disclosure controls and procedures within 90 days of this filing and have concluded that the registrant’s disclosure controls and procedures were effective, as of that date, in ensuring that information required to be disclosed by the registrant in this Form N-CSR was recorded, processed, summarized, and reported in a timely and accurate manner. |
| | (b) | The registrant’s principal executive officer and principal financial officer are aware of no changes in the registrant’s internal control over financial reporting that occurred during the second fiscal quarter of the period covered by this report that has materially affected, or is likely to materially affect, the registrant’s internal control over financial reporting. |
| | | | |
Attached hereto: |
| | |
(a) | | (1) Not applicable. | | |
| | |
| | (2) Exhibit 99.CERT | | Certifications by the registrant’s principal executive officer and principal financial officer, pursuant to Section 302 of the Sarbanes-Oxley Act of 2002 and required by Rule 30a-2(a) under the Investment Company Act of 1940. |
| | |
| | (3) Not applicable. | | |
| | |
(b) | | Exhibit 99.906CERT | | Certifications pursuant to Section 906 of the Sarbanes-Oxley Act of 2002 and required by Rule 30a-2(b) under the Investment Company Act of 1940. |
| | |
| | Exhibit 99.REPT | | Report of Independent Registered Public Accounting Firm |
SIGNATURES
Pursuant to the requirements of the Securities Exchange Act of 1934 and the Investment Company Act of 1940, the registrant has duly caused this report to be signed on its behalf by the undersigned, thereunto duly authorized.
| | |
| | Mutual of America Investment Corporation |
| |
| By: | | /s/ JAMES J. ROTH |
| | James J. Roth |
| | Chairman of the Board, |
| | President and Chief Executive Officer of |
| | Mutual of America Investment Corporation |
Date: March 9, 2018
Pursuant to the requirements of the Securities Exchange Act of 1934 and the Investment Company Act of 1940, this report has been signed below by the following persons on behalf of the registrant and in the capacities and on the dates indicated.
| | |
| By: | | /s/ JAMES J. ROTH |
| | James J. Roth |
| | Chairman of the Board, |
| | President and Chief Executive Officer of |
| | Mutual of America Investment Corporation |
Date: March 9, 2018
| | |
| By: | | /s/ CHRIS W. FESTOG |
| | Chris W. Festog |
| | Senior Executive Vice President, |
| | Chief Financial Officer and Treasurer of |
| | Mutual of America Investment Corporation |
Date: March 9, 2018