UNITED STATES
SECURITIES AND EXCHANGE COMMISSION
Washington, D.C. 20549
FORM N-CSR
CERTIFIED SHAREHOLDER REPORT OF REGISTERED
MANAGEMENT INVESTMENT COMPANIES
Investment Company Act file number 811-05084
Mutual of America Investment Corporation
(Exact name of registrant as specified in charter)
320 Park Avenue, New York, N.Y. 10022
(Address of principal executive offices) (Zip code)
James J. Roth
Chairman of the Board, President and Chief Executive Officer
Mutual of America Investment Corporation
320 Park Avenue
New York, NY 10022
(Name and address of agent for service)
Registrant’s telephone number, including area code:
(212) 224-1600
Date of fiscal year end: December 31
Date of reporting period: December 31, 2016
| ITEM 1. | REPORTS TO STOCKHOLDERS. |
The Annual Report to Shareholders follows:
DECEMBER 31, 2016
Annual Reports of Investment Options Offered by Mutual of America Life Insurance Company
This report is not to be construed as an offering for sale of any Variable Policy. No offering is made except in conjunction with a prospectus which must precede or accompany this report.


320 PARK AVENUE
NEW YORK NY 10022-6839
February 2017
As a valued variable annuity owner, variable life insurance policyholder or participant in a group variable annuity, we are pleased to provide you with the annual fund reports for the investment options you have selected. Included in this booklet are the annual reports of the Mutual of America Investment Corporation Funds. If you have also selected other investments options, you will receive annual reports for those funds in a separate booklet or booklets. The reports provide an update on each portfolio’s performance as of December 31, 2016. Please note that portfolio performance does not take into account the fees charged by the annuity contract or life insurance policy. When viewed net of these contract fees, your performance will be lower. As always, past performance cannot predict or guarantee future returns.
Mutual of America has specialized in providing retirement products and related services to organizations and their employees, as well as individuals, for more than 70 years. As a mutual company, we do not have stockholders and are not publicly traded. We operate solely for the benefit of our customers, managing the Company for their long-term interest, rather than for the short-term demands of stockholders. Today, as in the past, Mutual of America remains financially strong and is rated among the strongest companies in the life insurance industry by the major independent rating agencies.*
Since 1945, Mutual of America has remained committed to offering plan sponsors, plan participants and individuals carefully selected, quality products and services at a competitive price and the personal attention they need to help build and preserve assets for a financially secure future. Integrity, prudence, and reliability are the values that have guided us since our inception and that continue to serve us well.
We hope you will find the enclosed information helpful. We appreciate and value your business and look forward to serving you in the future. If you have any questions, please call your local Mutual of America Regional Office or 1-800-468-3785.
Sincerely,
Mutual of America Life Insurance Company
| * | While these ratings do not apply to the safety or investment performance of the Separate Account investment funds available under Mutual of America’s products, they do reflect the Company’s ability to fulfill its General Account obligations, which include its obligations under the Interest Accumulation Account, annuity purchase rate guarantees and annuity benefit payouts, as well as life insurance and disability income payments. Third party ratings are subject to change. |
DECEMBER 31, 2016
Annual Reports of Mutual of America Investment Corporation
This report is not to be construed as an offering for sale of any Variable Policy. No offering is made except in conjunction with a prospectus which must precede or accompany this report.

CONTENTS
MUTUALOF AMERICA INVESTMENT CORPORATION
We are pleased to present the Mutual of America Investment Corporation (the “Investment Company”) Annual Report. This Report includes important information regarding the performance and financial position of the Investment Company’s funds for the year ended December 31, 2016.
Over the last few months, markets have gone through rapid and dramatic changes. The 10-Year U.S. Treasury bond yield has jumped over 120 basis points since its 2016 low of 1.37% on July 6th, with 75 basis points of that move since the election on November 8th. The U.S. dollar has advanced 11% since its 2016 low on May 3rd, 5% of which came after the election. Crude oil prices are up 39% since the year low on January 21st, 15% of which came since the election. The CRB Index, which tracks oil and natural gas, metals, and agricultural commodities, is up 24% since its low in early September, and 9% since the election. And the S&P 500® Index is up 24% since closing at a year low on February 11th, 9% since the election. The Russell Small Cap and Mid-Cap Indexes have done even better. Few foreign markets have fared as well except those with high commodity exposure that have recovered after severe collapses, such as Russia, Brazil, Peru and Canada. All statistics are as of December 31, 2016.
In short, all asset classes have advanced substantially over the course of the year and accelerated following the election. There are two explanations. The first is that investors correctly anticipated improving economic conditions over the past several months, and have gone on to interpret President Trump’s agenda to be very beneficial to future economic growth and corporate profits. The improvement in the economic data is fact, as documented below. However, most of the key proposals of the Trump administration on which investors have focused, namely tax cuts and reform, infrastructure spending and deregulation, especially of the financial and environmentally sensitive sectors, will require legislation, which, even with Republican majorities in both houses of Congress, will take time and will likely require compromise. At the same time, President Trump’s protectionist promises are considered by most commentators to be negative for the economy. During the first few days in office, the President withdrew the U.S. from the Trans Pacific Partnership agreement, has plans to meet with the president of Mexico and Prime Minister of Canada to discuss renegotiating the North Atlantic Free Trade Agreement (NAFTA), and has stated that re-importation of any U.S. manufactured goods abroad will face high tariffs.
The improvement in the domestic economic fundamentals is indisputable. Gross Domestic Product (GDP) registered 3.5% at an annualized rate for the third quarter, up from 1.4% in the second quarter and 0.8% in the first. The initial report on fourth quarter GDP came in at 1.9%, a bit below consensus of 2.2%, but in line with the average over the last seven years. The unemployment rate as of December was 4.7%, down from the 5.0% level through most of 2016, and approaching the lows of the last two expansions. Unemployment claims have been running at historical lows, job cuts are down, and voluntary job quits, a measure of worker confidence, are up. Auto sales and new home sales have plateaued at cycle highs, but housing starts and permits, as well as existing home sales have improved recently. Retail sales have been firming over the past few months, supported by improving wages and personal income increases. And the savings rate, as well as lower gas and oil prices versus last year, provide some incremental spending power to the consumer. Consumer confidence has also showed strong recent improvement.
Even the manufacturing front, which has been the weak link during most of this extended recovery, has firmed substantially both domestically and globally. Small business confidence is up. This is important because most jobs are generated by small businesses in this country. Almost all domestic regional manufacturing surveys have registered strong improvement. The Institute of Supply Management (ISM) Purchasing Managers Surveys (PMI) are showing acceleration in most economies across the globe. The same is true for most Leading Indicators, a measure of future growth. The Economic Cycle Research Institute’s Weekly Leading Index has reached a cycle high, indicating a positive economic outlook. The Citi Economic Surprise Index, a measure of how economic data compare with expectations, has shown acceleration since mid-year. This series has a very strong historical correlation with S&P® Index price moves. Even Non-Farm Productivity registered a positive 3.1% advance after several negative quarters.
On the inflation front, inflation expectations have been rising as indicated by the recent increasing spread between Treasury bonds and Treasury Inflation Protected bonds (TIPs). The most recent reading of the Consumer Price Index (CPI) exclusive of food and energy, referred to as Core CPI, was 2.1%, in line with the Federal Reserve’s target goal. Similarly, the Producer Price Index (PPI), also exclusive of food, energy, as well as trade, an index of inflation within the manufacturing sectors and a driver of ultimate consumer prices, most recently registered 1.8%, up from 1.6% in the prior period.
In response, The Federal Reserve (Fed) just raised the Fed Funds Rate 25 basis points to a range of 0.50% to 0.75%, the first increase since December 2015. Recall that the reason for the stock market’s meltdown and the bond market’s dramatic yield drop at the beginning of the year was the Fed’s signaling in early January three to four additional 25 basis point increases for 2016. The markets’ reaction expressed the belief by investors that if the Fed
1
were to do so, the result would be recession. Subsequent economic data soon made it apparent that the economy was already deteriorating. As mentioned, first quarter GDP came in at a very weak 0.8%, well below the 2.0% average maintained over the prior four years. In late January and early February, the Fed began to aggressively back away from its hawkish bent, and markets began to reverse immediately. However, it took until the second half for the economic data to show signs of improvement before markets recovered to beginning of year levels, and to move on to new highs following the November election for the reasons discussed earlier.
It is our belief that the market’s positive response to the tax, infrastructure and deregulatory components of the President’s campaign proposals is premature. It also ignores the potential negative consequences of his protectionist policies, especially threats to raise tariff rates on imports of products manufactured abroad where labor costs are much lower, with particular focus on American products manufactured outside the United States. Such an action would almost assuredly lead to retaliation in kind which in turn would undermine global trade and thus global growth.
Let’s take a look at the tax proposal. First, President Trump’s plan, so far as we can tell at this time given the limited information provided to date, is different in many ways from the other Republican proposals already being advanced within Congress, most particularly Paul Ryan’s. This means compromise will be required, as well as the likelihood that any final plan will differ, perhaps substantially, from either Paul Ryan’s or the President’s plan to which investors seem to be so enthusiastically responding. Second, investors do not seem to be totally clear as to whether the plan that ends up being sponsored will propose only tax cuts, or will involve wholesale tax reform. A pure tax cut proposal may be more difficult to pass because it would not be deficit neutral and therefore would require sixty votes to break a likely Democratic filibuster and allow a vote on the bill. Senate rules allow tax issues to pass with a majority vote through a process called “budget reconciliation” only when the law is deficit neutral, which tax cuts by definition would not be. Tax reform that is deficit neutral would qualify under this budget resolution rule, but would take much longer to negotiate and implement. Stock prices seem to reflect a belief by investors that tax reduction, whether through tax cuts or reform would be quickly forthcoming after President Trump assumed office, which is by no means a certainty.
With regard to infrastructure spending, during the campaign, President Trump pledged a program to spend $1 trillion over ten years. Given U.S. debt currently running at nearly 80% of GDP, it may be difficult to get the support of many Republicans, who have been staunchly fiscally conservative, consistently resisting or blocking Democratic spending proposals and tax increases to pay for them. This means that the President may very well have to negotiate, or “make a deal” with his own party despite its control of both houses of Congress. The same goes for many of the President’s other proposals. In addition, infrastructure spending requires specific “shovel ready” projects and a sufficient labor pool to implement them. There are few such projects, and there are already too few workers to fill existing job openings, to say nothing about the availability of people willing to do that kind of work. Stagnation and even reversal in immigration growth, especially from Mexico and other Central and South American countries where the manual labor pool has come from over the past thirty years, exacerbates the situation.
Deregulation, as is the case with tax reform, will take time, except perhaps for environmental regulations, many of which have been implemented by executive orders issued by President Obama. These can be eliminated by President Trump with the stroke of a pen. But financial deregulation will require overhauling the Dodd-Frank law, a lengthy, complex piece of legislation with an already entrenched bureaucracy. In addition, many Dodd-Frank regulations should probably remain intact. After all, it is evident with hindsight that financial deregulation during the Clinton and Bush administrations had no small part in leading to the housing market collapse that spawned the Great Recession. The repeal of the Glass-Steagall Act of 1933, which separated commercial from investment banking because of implicit conflict of interest, is now generally thought to have been one of the leading causes of excessive bank leverage and reckless lending, to say nothing of the profligate creation and marketing of increasingly exotic and risky investment vehicles such as collateralized debt obligations (CDO’s), especially the class of CDO’s called collateralized mortgage obligations (CMO’s). The so-called Volker Rule incorporated into Dodd-Frank essentially reestablished constraints on the investment banks of today. Unravelling parts of Dodd-Frank without eliminating those that serve as necessary constraints on bad acting will be a tedious, difficult, and drawn out process.
The robust market rally at the end of last year, characterized by almost daily all-time highs, has stretched stock valuations toward historic upper bounds. Analysts and strategists are beginning to raise earnings estimates, some extremely aggressively, which will make valuations seem more reasonable. However, the point of these comments is to point out that, in our opinion, a large part of the recent market ebullience is based on expectations regarding proposed policy changes of a Presidential administration that has only recently been installed. Moreover, as discussed, policy proposals are just that — proposals, not legislative fact.
2
Finally, this entire economic expansion since 2009 has been characterized by oscillations in economic growth prospects and a sub-par, sub-optimal average economic growth rate of 2%. If the pattern holds, the recent strength will recede and fears of a recession will reassert themselves. Markets would almost assuredly retrench in response. The recent rise in the dollar and interest rates are both potential restraints on economic growth and earnings and could derail the recovery if the increases continue.
We would like to be less cautious and more confident in the sustainability of the recent acceleration in economic growth, as well as prospects for quick implementation of growth enhancing policy proposals. We hope we are being overly conservative. But years of experience, and a solid knowledge of the history of economics and markets counsels skepticism that this time is different. GDP growth of 2% with sequential up and down periods looking ahead remains our base case. In the long run, an extended cycle without excesses is, after all, not necessarily a bad thing. We’d rather have sustained compounded low growth than a short-lived dramatic blow-off followed by a collapse. We’d rather continue to accrue wealth for a long period of time than to become wealthy then poor in quick succession.
The total return performance (net of investment management and other operating expenses) for each of the Investment Company Funds is reflected below:
| | | | |
| Total Returns — Year Ended December 31, 2016 | |
| |
Equity Index Fund | | | +11.80% | |
All America Fund | | | +11.49% | |
Small Cap Value Fund | | | +20.04% | |
Small Cap Growth Fund | | | + 8.10% | |
Mid Cap Value Fund | | | +16.18% | |
Mid-Cap Equity Index Fund | | | +20.51% | |
International Fund | | | + 1.69% | |
Composite Fund | | | + 7.92% | |
Retirement Income Fund | | | + 6.18% | |
2010 Retirement Fund | | | + 6.87% | |
2015 Retirement Fund | | | + 7.72% | |
2020 Retirement Fund | | | + 8.57% | |
2025 Retirement Fund | | | + 9.84% | |
2030 Retirement Fund | | | +10.73% | |
2035 Retirement Fund | | | +11.43% | |
2040 Retirement Fund | | | +11.66% | |
2045 Retirement Fund | | | +11.68% | |
2050 Retirement Fund | | | +11.78% | |
2055 Retirement Fund† | | | + 4.01% | |
Conservative Allocation Fund | | | + 6.71% | |
Moderate Allocation Fund | | | + 9.08% | |
Aggressive Allocation Fund | | | +10.86% | |
Money Market Fund | | | + 0.14% | |
Mid-Term Bond Fund | | | + 3.51% | |
Bond Fund | | | + 4.71% | |
| † | For the period October 1, 2016 (commencement of operations) through December 31, 2016. |
The above performance figures do not reflect the deduction of respective Separate Account fees and expenses imposed by Mutual of America Life Insurance Company. All Fund performances presented throughout this report are historical, reflect the full reinvestment of dividends paid, and should not be considered indicative of future results.
The pages that immediately follow include brief discussions of each Fund’s performance for the year ended December 31, 2016, compared with its relevant index. Also presented are graphs and tables for each Fund (except for the Money Market Fund and the 2055 Retirement Fund) which illustrates each Fund’s respective:
| | ● | | Historical total return achieved over specific periods, expressed as an average annual rate and as a cumulative rate; |
| | ● | | Value in dollars of a $10,000 hypothetical investment at the beginning of each specified period; and |
| | ● | | Historical performance compared to an appropriate index. |
3
Following the discussions are the graphical representations of the asset allocations of each Fund and an illustration of each Fund’s operating expenses. The summarized portfolios of each Fund and financial statements are presented in the pages that follow.
Thank you for your continued investment in our Funds.
Sincerely,

James J. Roth
Chairman of the Board, President
and Chief Executive Officer
Mutual of America Investment Corporation
The views expressed in this Annual Report are subject to change at any time based on market and other conditions and should not be construed as a recommendation. This Report contains forward looking statements which speak only as of the date they were made and involve a number of risks and uncertainties that could cause actual results to differ materially from those expressed herein. Readers are cautioned not to place undue reliance on our forward-looking statements, as we assume no obligation to update these forward-looking statements. Readers assume any and all responsibility for any investment decision made as a result of the views expressed herein.
Standard & Poor’s®, S&P® and S&P 500® are trademarks of Standard & Poor’s Financial Services LLC, a subsidiary of The McGraw-Hill Companies, Inc.
4
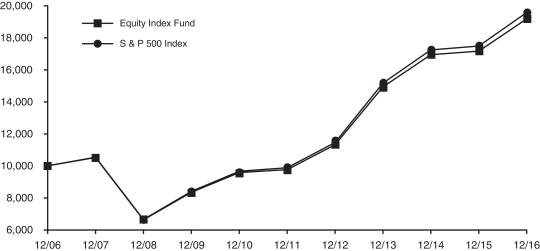
EQUITY INDEX FUND
The Equity Index Fund’s objective is to replicate the performance of the S&P 500® Index (S&P 500), which consists of 500 stocks chosen by Standard & Poor’s for market size, liquidity and industry group representation. The S&P 500 is a market-weighted index of 500 stocks traded on the New York Stock Exchange, American Stock Exchange and NASDAQ, with each stock’s weight in the index proportionate to its market value. The weightings make each company’s influence on the S&P 500’s performance directly proportional to that company’s market value.
The Equity Index Fund’s performance for the year ended December 31, 2016, was 11.96% before expenses and 11.80% after expenses, in line with the benchmark return of 11.96%. Note that the Equity Index Fund’s performance includes expenses, such as transaction costs and management fees, which are not applicable to the benchmark.
GROWTH OF A $10,000 INVESTMENT
| | | | | | | | | | | | |
Equity Index Fund | |
Period
Ended
12/31/2016 | | Growth
of
$10,000 | | | Total Return | |
| | | Cumu-
lative | | | Average
Annual | |
1 Year | | | $11,179 | | | | 11.80% | | | | 11.80% | |
5 Years | | | $19,662 | | | | 96.62% | | | | 14.50% | |
10 Years | | | $19,183 | | | | 91.83% | | | | 6.74% | |
| | | | | | | | | | | | |
S & P 500 Index | |
Period
Ended
12/31/2016 | | Growth of
$10,000 | | | Total Return | |
| | | Cumu-
lative | | | Average
Annual | |
1 Year | | | $11,196 | | | | 11.96% | | | | 11.96% | |
5 Years | | | $19,817 | | | | 98.17% | | | | 14.66% | |
10 Years | | | $19,567 | | | | 95.67% | | | | 6.95% | |
The line representing the performance return of the Equity Index Fund includes expenses, such as transaction costs and management fees that reduce returns, while the performance return line of the Index does not. Past performance is not indicative of future results.
5
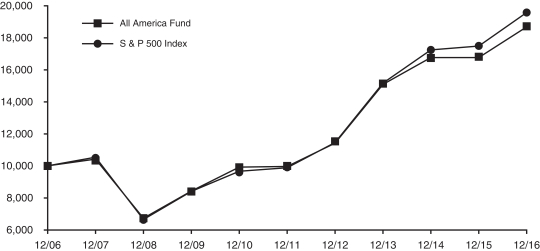
ALL AMERICA FUND
The investment objective of the All America Fund is to outperform the S&P 500® Index (S&P 500). The All America Fund has been approximately 60% passively invested in the 500 stocks that comprise the S&P 500, with the remaining 40% actively managed, comprised of 20% large capitalization stocks and 20% small cap stocks. Beginning July 1, 2016, the actively managed portfolio shifted to mid-cap stocks from large cap stocks, thus providing exposure to all levels of market capitalization among domestic stocks.
For the year ended December 31, 2016, the S&P 500 of large capitalization stocks increased by 11.96% on a total return basis, while the Russell® Midcap Core Index was up 13.80% and the Russell Midcap Value Index was up 20.00%. The Russell 2000® Growth Index advanced 11.32% and the Russell 2000® Value Index was up 31.74%.
The All America Fund’s return for the year ended December 31, 2016, before expenses was 12.08% and 11.49% after expenses versus the benchmark return of 11.96% The modest outperformance of the Fund was the result of the outperformance of the benchmark by the Midcap and Small Cap Value components of the Fund.
GROWTH OF A $10,000 INVESTMENT
| | | | | | | | | | | | |
All America Fund | |
Period
Ended
12/31/2016 | | Growth
of
$10,000 | | | Total Return | |
| | | Cumu-
lative | | | Average
Annual | |
1 Year | | | $11,150 | | | | 11.49% | | | | 11.49% | |
5 Years | | | $18,779 | | | | 87.79% | | | | 13.45% | |
10 Years | | | $18,688 | | | | 86.88% | | | | 6.46% | |
| | | | | | | | | | | | |
S & P 500 Index | |
Period
Ended
12/31/2016 | | Growth of
$10,000 | | | Total Return | |
| | | Cumu-
lative | | | Average
Annual | |
1 Year | | | $11,196 | | | | 11.96% | | | | 11.96% | |
5 Years | | | $19,817 | | | | 98.17% | | | | 14.66% | |
10 Years | | | $19,567 | | | | 95.67% | | | | 6.95% | |
The line representing the performance return of the All America Fund includes expenses, such as transaction costs and management fees that reduce returns, while the performance return line of the Index does not. Past performance is not indicative of future results.
6
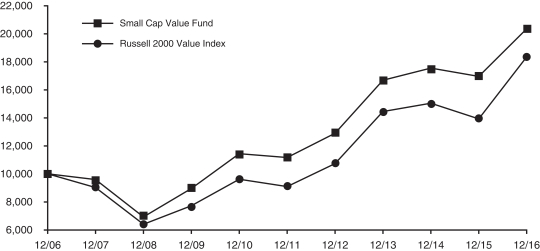
SMALL CAP VALUE FUND
The investment objective of the Small Cap Value Fund is capital appreciation. The Small Cap Value Fund generally invests in companies that are below $3 billion in market capitalization and have lower price-to-book characteristics than the overall market.
For the year ended December 31, 2016, the Small Cap Value Fund returned 21.03% before expenses and 20.04% after expenses versus a 31.74% return for the Russell 2000® Value Index. Within the benchmark, the best performing sectors were Basic Materials and Utilities while the worst performing sectors were Retail and Health Care.
Stock selection was the primary driver of negative performance versus the benchmark. Sectors contributing to Fund performance included Retail and Insurance, while sectors detracting from Fund performance included Industrials and Basic Materials.
GROWTH OF A $10,000 INVESTMENT
| | | | | | | | | | | | |
Small Cap Value Fund | |
Period
Ended
12/31/2016 | | Growth
of
$10,000 | | | Total Return | |
| | | Cumu-
lative | | | Average
Annual | |
1 Year | | | $12,004 | | | | 20.04% | | | | 20.04% | |
5 Years | | | $18,218 | | | | 82.18% | | | | 12.76% | |
10 Years | | | $20,350 | | | | 103.50% | | | | 7.37% | |
| | | | | | | | | | | | |
Russell 2000 Value Index | |
Period Ended
12/31/2016 | | Growth of
$10,000 | | | Total Return | |
| | | Cumu-
lative | | | Average
Annual | |
1 Year | | | $13,174 | | | | 31.74% | | | | 31.74% | |
5 Years | | | $20,174 | | | | 101.74% | | | | 15.07% | |
10 Years | | | $18,353 | | | | 83.53% | | | | 6.26% | |
The line representing the performance return of the Small Cap Value Fund includes expenses, such as transaction costs and management fees that reduce returns, while the performance return line of the Index does not. Past performance is not indicative of future results.
7
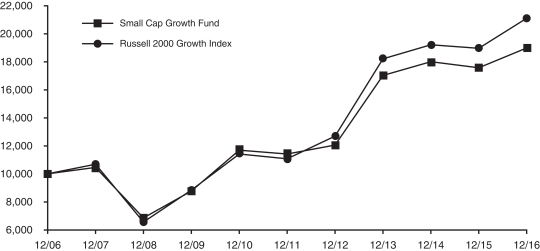
SMALL CAP GROWTH FUND
The investment objective of the Small Cap Growth Fund is capital appreciation. The Small Cap Growth Fund invests in growth stocks within the small capitalization marketplace. The Fund returned 8.99% before expenses and 8.10% after expenses during the year ended December 31, 2016 The Fund’s benchmark, the Russell 2000® Growth Index, returned 11.32% for the period.
The domestic small company growth sector outperformed the domestic large and mid-cap growth equity classes. Health Care, which has been one of the best drivers of performance over the last several years in small cap growth as well as many other asset classes, declined almost 10% for the year in the Russell 2000 Growth Index. This negative return was mostly due to the biotechnology and pharmaceutical industries. Health Care was the economic sector that had a negative return for the year.
The growth style of investing struggled with its large exposure to Health Care, Information Technology and Consumer Discretionary sectors. In addition, the small cap growth equity class has little representation in Energy and Materials, which were two of the best performing sectors during calendar year 2016.
Investors in the small company fund benefitted from strong performance in Telecommunications Services, Financials and the Utility sectors. The Information Technology sector detracted from the overall return of the Fund. Poor stock selection in Software was the main drag.
With higher short-term interest rates and the expectation of rising domestic economic growth following the Presidential election, investors drove the prices of stocks in the economically sensitive areas including Materials, Energy and Financials. We expect macro events will continue to play an outsized role in the financial markets with reactions from investors happening in increasing short periods of time.
GROWTH OF A $10,000 INVESTMENT
| | | | | | | | | | | | |
Small Cap Growth Fund | |
Period
Ended
12/31/2016 | | Growth
of
$10,000 | | | Total Return | |
| | | Cumu-
lative | | | Average
Annual | |
1 Year | | | $10,811 | | | | 8.10% | | | | 8.10% | |
5 Years | | | $16,635 | | | | 66.35% | | | | 10.71% | |
10 Years | | | $19,001 | | | | 90.01% | | | | 6.63% | |
| | | | | | | | | | | | |
Russell 2000 Growth Index | |
Period Ended
12/31/2016 | | Growth of
$10,000 | | | Total Return | |
| | | Cumu-
lative | | | Average
Annual | |
1 Year | | | $11,132 | | | | 11.32% | | | | 11.32% | |
5 Years | | | $19,036 | | | | 90.36% | | | | 13.74% | |
10 Years | | | $21,108 | | | | 111.08% | | | | 7.76% | |
The line representing the performance return of the Small Cap Growth Fund includes expenses, such as transaction costs and management fees that reduce returns, while the performance return line of the Index does not. Past performance is not indicative of future results.
8
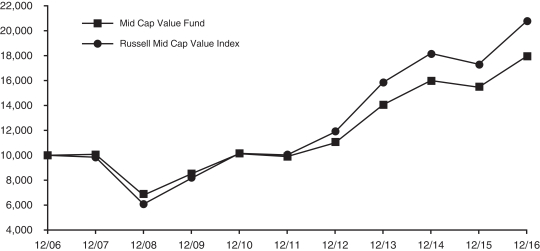
MID CAP VALUE FUND
The investment objective of the Mid Cap Value Fund is to outperform the Russell Midcap® Value Index. The Mid Cap Value Fund generally invests in companies that are between $1 billion and $20 billion in market capitalization and have lower price-to-book characteristics.
For the year ended December 31, 2016, the Mid Cap Value Fund returned 16.95% before expenses and 16.18% after expenses versus a 20.00% return for the Russell Midcap® Value Index. Within the benchmark, the best performing sectors were Basic Materials and Utilities while the worst performing sectors were Finance and Retail.
Stock selection was the primary driver of negative performance versus the benchmark. Sectors contributing to Mid Cap Value Fund performance included Consumer Cyclical and Consumer Staples, while sectors detracting from Fund performance included Energy and Basic Materials.
GROWTH OF A $10,000 INVESTMENT
| | | | | | | | | | | | |
Mid Cap Value Fund | |
Period
Ended
12/31/2016 | | Growth
of
$10,000 | | | Total Return | |
| | | Cumu-
lative | | | Average
Annual | |
1 Year | | | $11,617 | | | | 16.18% | | | | 16.18% | |
5 Years | | | $18,130 | | | | 81.30% | | | | 12.64% | |
10 Years | | | $17,960 | | | | 79.60% | | | | 6.03% | |
| | | | | | | | | | | | |
Russell Mid Cap Value Index | |
Period Ended
12/31/2016 | | Growth of
$10,000 | | | Total Return | |
| | | Cumu-
lative | | | Average
Annual | |
1 Year | | | $12,000 | | | | 20.00% | | | | 20.00% | |
5 Years | | | $20,737 | | | | 107.37% | | | | 15.70% | |
10 Years | | | $20,779 | | | | 107.79% | | | | 7.59% | |
The line representing the performance return of the Mid Cap Value Fund includes expenses, such as transaction costs and management fees that reduce returns, while the performance return line of the Index does not. Past performance is not indicative of future results.
9
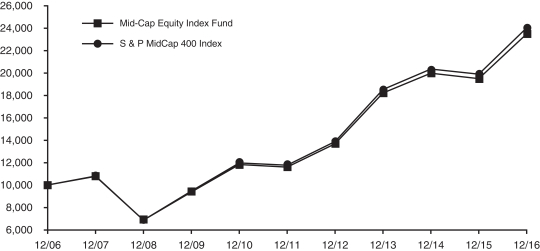
MID-CAP EQUITY INDEX FUND
The Mid-Cap Equity Index Fund invests in the 400 stocks that comprise the S&P MidCap 400® Index (S&P MidCap 400). The S&P MidCap 400 is a market-weighted index of 400 stocks traded on the New York Stock Exchange, American Stock Exchange and NASDAQ. The weightings make each company’s influence on the S&P MidCap 400’s performance directly proportional to that company’s market value. The companies included in the S&P MidCap 400 tend to be typical of this asset class, the medium-capitalized sector of the U.S. securities market.
The Mid-Cap Equity Index Fund’s performance for the year ended December 31, 2016, was 20.69% before expenses and 20.51% after expenses, finishing slightly below the 20.74% return of the S&P MidCap 400. Note that the performance of the Mid-Cap Equity Index Fund includes expenses, such as transaction costs and management fees, which are not applicable to the benchmark.
GROWTH OF A $10,000 INVESTMENT
| | | | | | | | | | | | |
Mid-Cap Equity Index Fund | |
Period
Ended
12/31/2016 | | Growth
of
$10,000 | | | Total Return | |
| | | Cumu-
lative | | | Average
Annual | |
1 Year | | | $12,050 | | | | 20.51% | | | | 20.51% | |
5 Years | | | $20,243 | | | | 102.43% | | | | 15.17% | |
10 Years | | | $23,499 | | | | 134.99% | | | | 8.93% | |
| | | | | | | | | | | | |
S & P MidCap 400 Index | |
Period Ended
12/31/2016 | | Growth of
$10,000 | | | Total Return | |
| | | Cumu-
lative | | | Average
Annual | |
1 Year | | | $12,074 | | | | 20.74% | | | | 20.74% | |
5 Years | | | $20,402 | | | | 104.02% | | | | 15.33% | |
10 Years | | | $24,019 | | | | 140.19% | | | | 9.16% | |
The line representing the performance return of the Mid-Cap Equity Index Fund includes expenses, such as transaction costs and management fees that reduce returns, while the performance return line of the Index does not. Past performance is not indicative of future results.
10
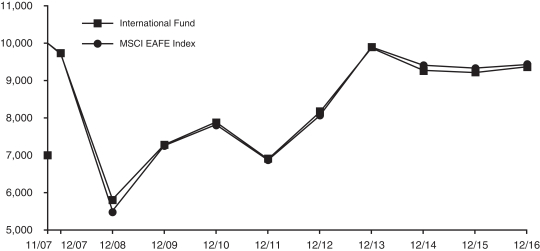
INTERNATIONAL FUND
The International Fund seeks capital appreciation by investing, directly or indirectly, mainly in exchange traded funds that invest in stocks of large and mid-cap companies in developed market countries located outside of the United States and Canada that are reflected or contained in the Morgan Stanley Capital International, Inc. Europe, Australasia and Far East® Index (MSCI EAFE® Index). Currently the International Fund is invested mainly in exchange traded funds that reflect, replicate or follow the country weightings of the MSCI EAFE® Index. The Fund also has invested a small percentage of assets in exchange traded funds that provide exposure to emerging markets and to companies with small market capitalizations in developed market countries.
For the year ended December 31 2016, the International Fund returned 1.82% before expenses and 1.69% after expenses, outperforming the 1.0% return of the benchmark. The fund’s benchmark closes earlier in the day than the actual market for the fund’s investments. This time lag can result in both positive and negative performance differences.
GROWTH OF A $10,000 INVESTMENT
| | | | | | | | | | | | |
International Fund | |
Period
Ended
12/31/2016 | | Growth
of
$10,000 | | | Total Return | |
| | | Cumu-
lative | | | Average
Annual | |
1 Year | | | $10,169 | | | | 1.69% | | | | 1.69% | |
5 Years | | | $13,586 | | | | 35.86% | | | | 6.33% | |
Since 11/5/07 (Inception) | | | $9,372 | | | | -6.28% | | | | -0.71% | |
| | | | | | | | | | | | |
MSCI EAFE Index | |
Period Ended
12/31/2016 | | Growth of
$10,000 | | | Total Return | |
| | | Cumu-
lative | | | Average
Annual | |
1 Year | | | $10,100 | | | | 1.00% | | | | 1.00% | |
5 Years | | | $13,723 | | | | 37.23% | | | | 6.53% | |
Since 11/5/07 (Inception) | | | $9,431 | | | | -5.69% | | | | -0.64% | |
The line representing the performance return of the International Fund includes expenses, such as transaction costs and management fees that reduce returns, while the performance return line of the Index does not. Past performance is not indicative of future results.
11
COMPOSITE FUND
The Composite Fund seeks capital appreciation and current income by investing in a diversified portfolio of common stocks, debt securities and money market instruments.
The primary investment objective of the fixed income portion of the fund is to provide a high level of current income, consistent with capital preservation, while minimizing volatility. It does this by investing primarily in investment grade publicly traded debt securities. The securities held include corporate, U.S. agency and mortgage-backed bonds, all of which normally yield more than U.S. Treasury issues.
For the year ended December 31, 2016, the fixed income portion of the Fund had a total return of 3.94% before expenses. This compares favorably to the Bloomberg Barclays Aggregate Bond Index, which returned 2.65%. The fixed income portion of the Fund focused on income and capital preservation
The fixed income markets produced positive returns in 2016. U.S. Treasury rates, which fell for much of the first six months of the year before reversing course, finished 2016 slightly higher than where they began. The yield curve steepened as yields on long-dated U.S. Treasuries rose a little more than those of short-dated U.S. Treasuries. Two-year U.S. Treasury Notes yielded 1.19% on December 30, 2016, up from 1.05% at the end of 2015. Yields on ten-year Notes rose from 2.27% at 2015 year-end to 2.44% on December 31.
High-grade corporate bond spreads tightened from 172 basis points at the end of 2015 to 127 on December 31. This action helped corporates deliver a return more than double that of the benchmark and the strongest return for the sector relative to U.S. Treasuries since 2012. BBB-rated corporates bested higher rated corporates with a better than 8% return versus the 4.65% return of A-rated corporates. Our decision to maintain our exposure in Energy, Metals and Mining securities was rewarded as those sectors produced double-digit returns in 2016.
The fixed income portion of the Fund’s strategy is to overweight corporates, underweight U.S. Treasuries, and market weight mortgage-backed securities. The portfolio’s objective is to maintain a similar maturity profile to the Bloomberg Barclays Aggregate Bond Index with an overweighting of BBB issuers. To achieve the duration target, intermediate corporate maturities and longer U.S. Treasury maturities are emphasized. The Fund also stresses diversification in order to protect the Fund from unexpected credit events, so few holdings exceed one-half of one percent of the Fund’s value. This extreme diversification will be maintained going forward as part of our risk control.
For the year ended December 31, 2016, the equity portion of the Fund had a total return of 11.84% (before expenses), underperforming the S&P 500® Index (S&P 500) by 0.12%. The positive performance of the S&P 500 for 2016 obscures the volatility of the year. For the six weeks of 2016, the S&P 500 rapidly declined 11% as concerns about U.S. and global growth, a slowing Chinese economy, questions about the direction of oil prices and the U.S. dollar, worries about when and at what pace the Federal Reserve would continue to raise policy rates, a spreading Middle Eastern war spearheaded by the avowed terrorist group ISIS, and anxiety over the June 23rd vote in the United Kingdom to stay in or leave the European Union, with a leave vote portending a potential breakup of the European Union. The majority of the growth in the S&P 500 came subsequent to the Presidential election in November 2016.
The equity portion of the Composite Fund maintains sector weights within plus or minus 100 basis points of the S&P 500 and does not take positions in individual stocks with over-weights of more than 200 basis points. This structural discipline produces a relatively low-risk portfolio that emphasizes stock selection based on strong fundamental analysis.
The full year 2016 was characterized by a wide dispersion in sector performance (28 percentage points between the top and bottom sector) such that outperformance required over-weights in sectors outperforming the benchmark and underweights in underperforming sectors. Our investment style precludes such an investment posture.
GROWTH OF A $10,000 INVESTMENT

| | | | | | | | | | | | |
Composite Fund | |
Period
Ended
12/31/2016 | | Growth
of
$10,000 | | | Total Return | |
| | | Cumu-
lative | | | Average
Annual | |
1 Year | | | $10,793 | | | | 7.92% | | | | 7.92% | |
5 Years | | | $15,421 | | | | 54.21% | | | | 9.06% | |
10 Years | | | $17,239 | | | | 72.39% | | | | 5.60% | |
| | | | | | | | | | | | |
S & P 500 Index | |
Period Ended
12/31/2016 | | Growth of
$10,000 | | | Total Return | |
| | | Cumu-
lative | | | Average
Annual | |
1 Year | | | $11,196 | | | | 11.96% | | | | 11.96% | |
5 Years | | | $19,817 | | | | 98.17% | | | | 14.66% | |
10 Years | | | $19,567 | | | | 95.67% | | | | 6.95% | |
| | | | | | | | | | | | |
Bloomberg Barclays Aggregate Bond Index | |
Period
Ended
12/31/2016 | | Growth
of
$10,000 | | | Total Return | |
| | | Cumu-
lative | | | Average
Annual | |
1 Year | | | $10,265 | | | | 2.65% | | | | 2.65% | |
5 Years | | | $11,167 | | | | 11.67% | | | | 2.23% | |
10 Years | | | $15,299 | | | | 52.99% | | | | 4.34% | |
| | | | | | | | | | | | |
Citigroup 3 - Month T-Bill Index | |
Period Ended
12/31/2016 | | Growth of
$10,000 | | | Total Return | |
| | | Cumu-
lative | | | Average
Annual | |
1 Year | | | $10,027 | | | | 0.27% | | | | 0.27% | |
5 Years | | | $10,045 | | | | 0.45% | | | | 0.09% | |
10 Years | | | $10,750 | | | | 7.50% | | | | 0.73% | |
The line representing the performance return of the Composite Fund includes expenses, such as transaction costs and management fees that reduce returns, while the performance return lines of the Indices do not. Past performance is not indicative of future results.
12
RETIREMENT INCOME FUND
The objective of the Retirement Income Fund is current income consistent with the preservation of capital and, to a lesser extent, capital appreciation. The Retirement Income Fund invests primarily in the fixed-income funds of the Investment Company and also invests in two equity funds of the Investment Company. The Fund’s current target allocation is approximately 75% of net assets in fixed-income funds (approximately 30% in the Bond, 40% in the Mid-Term Bond Funds and 5% in the Money Market Fund) and approximately 25% of net assets in equity funds (20% in the Equity Index Fund and 5% in the Mid-Cap Equity Index Fund).
Performance for the Retirement Income Fund is compared to the Bloomberg Barclays Aggregate Bond Index (70% weighting), the Citigroup 3-Month Treasury Bill Index (5% weighting) and the S&P 500® Index (25% weighting). For the year ended December 31, 2016, the Fund returned 6.28% before expenses and 6.18% after expenses, versus a 4.84% return in the weighted benchmark.
GROWTH OF A $10,000 INVESTMENT

| | | | | | | | | | | | |
Retirement Income Fund | |
Period
Ended
12/31/2016 | | Growth of
$10,000 | | | Total Return | |
| | | Cumu- lative | | | Average Annual | |
1 Year | | | $10,616 | | | | 6.18% | | | | 6.18% | |
5 Years | | | $13,077 | | | | 30.77% | | | | 5.52% | |
Since 11/5/07 (Inception) | | | $15,707 | | | | 57.07% | | | | 5.06% | |
| | | | | | | | | | | | |
S & P 500 Index | |
Period
Ended
12/31/2016 | | Growth of
$10,000 | | | Total Return | |
| | | Cumu- lative | | | Average Annual | |
1 Year | | | $11,196 | | | | 11.96% | | | | 11.96% | |
5 Years | | | $19,817 | | | | 98.17% | | | | 14.66% | |
Since 11/5/07 (Inception) | | | $18,199 | | | | 81.99% | | | | 6.76% | |
| | | | | | | | | | | | |
Bloomberg Barclays Aggregate Bond Index | |
Period
Ended
12/31/2016 | | Growth
of
$10,000 | | | Total Return | |
| | | Cumu-
lative | | | Average
Annual | |
1 Year | | | $10,265 | | | | 2.65% | | | | 2.65% | |
5 Years | | | $11,167 | | | | 11.67% | | | | 2.23% | |
Since 11/5/07 (Inception) | | | $14,507 | | | | 45.07% | | | | 4.15% | |
| | | | | | | | | | | | |
Citigroup 3 - Month T-Bill Index | |
Period
Ended
12/31/2016 | | Growth of
$10,000 | | | Total Return | |
| | | Cumu-
lative | | | Average
Annual | |
1 Year | | | $10,027 | | | | 0.27% | | | | 0.27% | |
5 Years | | | $10,045 | | | | 0.45% | | | | 0.09% | |
Since 11/5/07 (Inception) | | | $10,329 | | | | 3.29% | | | | 0.36% | |
The line representing the performance return of the Retirement Income Fund includes expenses, such as direct management fees and expenses of the underlying funds in which the Fund invests, that reduce returns while the performance return lines of the Indices do not. Past performance is not indicative of future results.
13
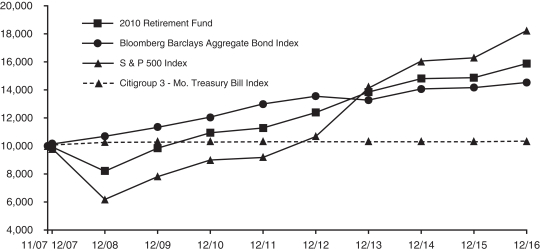
2010 RETIREMENT FUND
The objective of the 2010 Retirement Fund is current income and capital appreciation appropriate for the asset allocation associated with a retirement in 2010. The 2010 Retirement Fund invests in funds of the Investment Company. The Fund’s current target allocation is approximately 67% of net assets in fixed-income funds (approximately 26% in the Bond Fund, 36% in the Mid-Term Bond Fund and 5% in the Money Market Fund) and approximately 33% of net assets in equity funds (23% in the Equity Index Fund, 7% in the Mid-Cap Equity Index Fund and 3% in the International Fund) (See Note 1 in the Notes to Financial Statements for additional information on changes to Fund target allocations during 2016).
Performance for the 2010 Retirement Fund is compared to the Bloomberg Barclays Aggregate Bond Index (62% weighting), the Citigroup 3-Month Treasury Bill Index (5% weighting) and the S&P 500® Index (33% weighting). For the year ended December 31, 2016, the Fund returned 6.92% before expenses and 6.87% after expenses, versus a 5.58% return in the weighted benchmark.
GROWTH OF A $10,000 INVESTMENT
| | | | | | | | | | | | |
2010 Retirement Fund | |
Period
Ended
12/31/2016 | | Growth
of
$10,000 | | | Total Return | |
| | | Cumu-
lative | | | Average
Annual | |
1 Year | | | $10,687 | | | | 6.87% | | | | 6.87% | |
5 Years | | | $14,067 | | | | 40.67% | | | | 7.08% | |
Since 11/5/07 (Inception) | | | $15,864 | | | | 58.64% | | | | 5.17% | |
| | | | | | | | | | | | |
S & P 500 Index | |
Period
Ended
12/31/2016 | | Growth of
$10,000 | | | Total Return | |
| | | Cumu-
lative | | | Average
Annual | |
1 Year | | | $11,196 | | | | 11.96% | | | | 11.96% | |
5 Years | | | $19,817 | | | | 98.17% | | | | 14.66% | |
Since 11/5/07 (Inception) | | | $18,199 | | | | 81.99% | | | | 6.76% | |
| | | | | | | | | | | | |
Bloomberg Barclays Aggregate Bond Index | |
Period
Ended
12/31/2016 | | Growth
of
$10,000 | | | Total Return | |
| | | Cumu-
lative | | | Average
Annual | |
1 Year | | | $10,265 | | | | 2.65% | | | | 2.65% | |
5 Years | | | $11,167 | | | | 11.67% | | | | 2.23% | |
Since 11/5/07 (Inception) | | | $14,507 | | | | 45.07% | | | | 4.15% | |
| | | | | | | | | | | | |
Citigroup 3 - Month T-Bill Index | |
Period
Ended
12/31/2016 | | Growth of
$10,000 | | | Total Return | |
| | | Cumu-
lative | | | Average
Annual | |
1 Year | | | $10,027 | | | | 0.27% | | | | 0.27% | |
5 Years | | | $10,045 | | | | 0.45% | | | | 0.09% | |
Since 11/5/07 (Inception) | | | $10,329 | | | | 3.29% | | | | 0.36% | |
The line representing the performance return of the 2010 Retirement Fund includes expenses, such as direct management fees and expenses of the underlying funds in which the Fund invests, that reduce returns while the performance return lines of the Indices do not. Past performance is not indicative of future results.
14
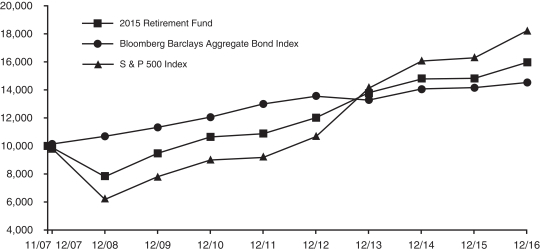
2015 RETIREMENT FUND
The objective of the 2015 Retirement Fund is current income and capital appreciation appropriate for the asset allocation associated with a retirement in 2015. The 2015 Retirement Fund invests in funds of the Investment Company. The Fund’s current target allocation is approximately 57% of net assets in fixed-income funds (26% in the Bond Fund and 31% in the Mid-Term Bond Fund) and approximately 43% of net assets in equity funds (approximately 26% in the Equity Index Fund, 9% in the Mid-Cap Equity Index Fund, 6% in the International Fund and 1% each in the Small Cap Growth and Small Cap Value Funds) (See Note 1 in the Notes to Financial Statements for additional information on changes to Fund target allocations during 2016).
Performance for the 2015 Retirement Fund is compared to the S&P 500® Index (43% weighting) and the Bloomberg Barclays Aggregate Bond Index (57% weighting). For the year ended December 31, 2016, the Fund returned 7.81% before expenses and 7.72% after expenses, versus a 6.63% return in the weighted benchmark.
GROWTH OF A $10,000 INVESTMENT
| | | | | | | | | | | | |
2015 Retirement Fund | |
Period
Ended
12/31/2016 | | Growth
of
$10,000 | | | Total Return | |
| | | Cumu-
lative | | | Average
Annual | |
1 Year | | | $10,772 | | | | 7.72% | | | | 7.72% | |
5 Years | | | $14,691 | | | | 46.91% | | | | 8.01% | |
Since 11/5/07 (Inception) | | | $15,945 | | | | 59.45% | | | | 5.23% | |
| | | | | | | | | | | | |
S & P 500 Index | |
Period
Ended
12/31/2016 | | Growth of
$10,000 | | | Total Return | |
| | | Cumu-
lative | | | Average
Annual | |
1 Year | | | $11,196 | | | | 11.96% | | | | 11.96% | |
5 Years | | | $19,817 | | | | 98.17% | | | | 14.66% | |
Since 11/5/07 (Inception) | | | $18,199 | | | | 81.99% | | | | 6.76% | |
| | | | | | | | | | | | |
Bloomberg Barclays Aggregate Bond Index | |
Period
Ended
12/31/2016 | | Growth
of
$10,000 | | | Total Return | |
| | | Cumu-
lative | | | Average
Annual | |
1 Year | | | $10,265 | | | | 2.65% | | | | 2.65% | |
5 Years | | | $11,167 | | | | 11.67% | | | | 2.23% | |
Since 11/5/07 (Inception) | | | $14,507 | | | | 45.07% | | | | 4.15% | |
The line representing the performance return of the 2015 Retirement Fund includes expenses, such as direct management fees and expenses of the underlying funds in which the Fund invests, that reduce returns while the performance return lines of the Indices do not. Past performance is not indicative of future results.
15
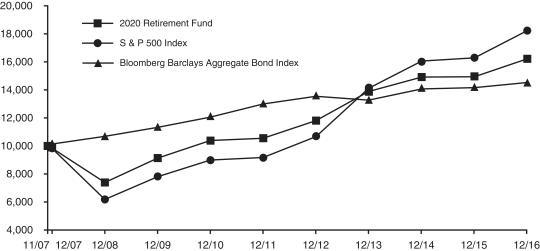
2020 RETIREMENT FUND
The objective of the 2020 Retirement Fund is current income and capital appreciation appropriate for the asset allocation associated with a target retirement in 2020. The 2020 Retirement Fund invests in funds of the Investment Company. The Fund’s current target allocation is approximately 53% of net assets in equity funds (approximately 30% in the Equity Index Fund, 11% in the Mid-Cap Equity Index Fund, 8% in the International Fund and 2% each in the Small Cap Growth and Small Cap Value Funds) and approximately 47% of net assets in fixed-income funds (26% in the Bond Fund and 21% in the Mid-Term Bond Fund) (See Note 1 in the Notes to Financial Statements for additional information on changes to Fund target allocations during 2016).
Performance for the 2020 Retirement Fund is compared to the S&P 500® Index (53% weighting) and the Bloomberg Barclays Aggregate Bond Index (47% weighting). For the year ended December 31, 2016 the Fund returned 8.65% before expenses and 8.57% after expenses, versus a 7.56% return in the weighted benchmark.
GROWTH OF A $10,000 INVESTMENT
| | | | | | | | | | | | |
2020 Retirement Fund | |
Period
Ended
12/31/2016 | | Growth
of
$10,000 | | | Total Return | |
| | | Cumu-
lative | | | Average
Annual | |
1 Year | | | $10,856 | | | | 8.57% | | | | 8.57% | |
5 Years | | | $15,345 | | | | 53.45% | | | | 8.96% | |
Since 11/5/07 (Inception) | | | $16,192 | | | | 61.92% | | | | 5.41% | |
| | | | | | | | | | | | |
S & P 500 Index | |
Period
Ended
12/31/2016 | | Growth of
$10,000 | | | Total Return | |
| | | Cumu-
lative | | | Average
Annual | |
1 Year | | | $11,196 | | | | 11.96% | | | | 11.96% | |
5 Years | | | $19,817 | | | | 98.17% | | | | 14.66% | |
Since 11/5/07 (Inception) | | | $18,199 | | | | 81.99% | | | | 6.76% | |
| | | | | | | | | | | | |
Bloomberg Barclays Aggregate Bond Index | |
Period
Ended
12/31/2016 | | Growth
of
$10,000 | | | Total Return | |
| | | Cumu-
lative | | | Average
Annual | |
1 Year | | | $10,265 | | | | 2.65% | | | | 2.65% | |
5 Years | | | $11,167 | | | | 11.67% | | | | 2.23% | |
Since 11/5/07 (Inception) | | | $14,507 | | | | 45.07% | | | | 4.15% | |
The line representing the performance return of the 2020 Retirement Fund includes expenses, such as direct management fees and expenses of the underlying funds in which the Fund invests, that reduce returns while the performance return lines of the Indices do not. Past performance is not indicative of future results.
16
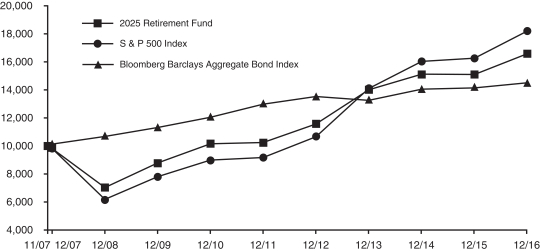
2025 RETIREMENT FUND
The objective of the 2025 Retirement Fund is current income and capital appreciation appropriate for the asset allocation associated with a target retirement in 2025. The 2025 Retirement Fund invests in funds of the Investment Company. The Fund’s current target allocation is approximately 65% of net assets in equity funds (approximately 35% in the Equity Index Fund, 14% in the Mid-Cap Equity Index Fund, 10% in the International Fund and 3% each in the Small Cap Growth and Small Cap Value Funds) and approximately 35% of net assets in fixed-income funds (25% in the Bond Fund and 10% in the Mid-Term Bond Fund) (See Note 1 in the Notes to Financial Statements for additional information on changes to Fund target allocations during 2016).
Performance for the 2025 Retirement Fund is compared to the S&P 500® Index (65% weighting) and the Bloomberg Barclays Aggregate Bond Index (35% weighting). For the year ended December 31, 2016 the Fund returned 9.92% before expenses and 9.84% after expenses, versus an 8.68% return in the weighted benchmark.
GROWTH OF A $10,000 INVESTMENT
| | | | | | | | | | | | |
2025 Retirement Fund | |
Period
Ended
12/31/2016 | | Growth
of
$10,000 | | | Total Return | |
| | | Cumu-
lative | | | Average
Annual | |
1 Year | | | $10,983 | | | | 9.84% | | | | 9.84% | |
5 Years | | | $16,202 | | | | 62.02% | | | | 10.15% | |
Since 11/5/07 (Inception) | | | $16,594 | | | | 65.94% | | | | 5.69% | |
| | | | | | | | | | | | |
S & P 500 Index | |
Period Ended
12/31/2016 | | Growth of
$10,000 | | | Total Return | |
| | | Cumu-
lative | | | Average
Annual | |
1 Year | | | $11,196 | | | | 11.96% | | | | 11.96% | |
5 Years | | | $19,817 | | | | 98.17% | | | | 14.66% | |
Since 11/5/07 (Inception) | | | $18,199 | | | | 81.99% | | | | 6.76% | |
| | | | | | | | | | | | |
Bloomberg Barclays Aggregate Bond Index | |
Period
Ended
12/31/2016 | | Growth
of
$10,000 | | | Total Return | |
| | | Cumu-
lative | | | Average
Annual | |
1 Year | | | $10,265 | | | | 2.65% | | | | 2.65% | |
5 Years | | | $11,167 | | | | 11.67% | | | | 2.23% | |
Since 11/5/07 (Inception) | | | $14,507 | | | | 45.07% | | | | 4.15% | |
The line representing the performance return of the 2025 Retirement Fund includes expenses, such as direct management fees and expenses of the underlying funds in which the Fund invests, that reduce returns while the performance return lines of the Indices do not. Past performance is not indicative of future results.
17
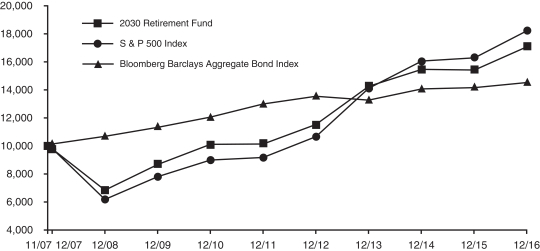
2030 RETIREMENT FUND
The objective of the 2030 Retirement Fund is current income and capital appreciation appropriate for the asset allocation associated with a target retirement in 2030. The 2030 Retirement Fund invests in funds of the Investment Company. The Fund’s current target allocation is approximately 75% of net assets in equity funds (approximately 37% in the Equity Index Fund, 17% in the Mid-Cap Equity Index Fund, 11% in the International Fund and 5% each in the Small Cap Growth and Small Cap Value Funds) and approximately 25% of net assets in the Bond Fund (See Note 1 in the Notes to Financial Statements for additional information on changes to Fund target allocations during 2016).
Performance for the 2030 Retirement Fund is compared to the S&P 500® Index (75% weighting) and the Bloomberg Barclays Aggregate Bond Index (25% weighting). For the year ended December 31, 2016, the Fund returned 10.81% before expenses and 10.73% after expenses, versus a 9.62% return in the weighted benchmark.
GROWTH OF A $10,000 INVESTMENT
| | | | | | | | | | | | |
2030 Retirement Fund | |
Period
Ended
12/31/2016 | | Growth
of
$10,000 | | | Total Return | |
| | | Cumu-
lative | | | Average
Annual | |
1 Year | | | $11,071 | | | | 10.73% | | | | 10.73% | |
5 Years | | | $16,851 | | | | 68.51% | | | | 11.02% | |
Since 11/5/07 (Inception) | | | $17,060 | | | | 70.60% | | | | 6.01% | |
| | | | | | | | | | | | |
S & P 500 Index | |
Period
Ended
12/31/2016 | | Growth of
$10,000 | | | Total Return | |
| | | Cumu-
lative | | | Average
Annual | |
1 Year | | | $11,196 | | | | 11.96% | | | | 11.96% | |
5 Years | | | $19,817 | | | | 98.17% | | | | 14.66% | |
Since 11/5/07 (Inception) | | | $18,199 | | | | 81.99% | | | | 6.76% | |
| | | | | | | | | | | | |
Bloomberg Barclays Aggregate Bond Index | |
Period
Ended
12/31/2016 | | Growth
of
$10,000 | | | Total Return | |
| | | Cumu-
lative | | | Average
Annual | |
1 Year | | | $10,265 | | | | 2.65% | | | | 2.65% | |
5 Years | | | $11,167 | | | | 11.67% | | | | 2.23% | |
Since 11/5/07 (Inception) | | | $14,507 | | | | 45.07% | | | | 4.15% | |
The line representing the performance return of the 2030 Retirement Fund includes expenses, such as direct management fees and expenses of the underlying funds in which the Fund invests, that reduce returns while the performance return lines of the Indices do not. Past performance is not indicative of future results.
18
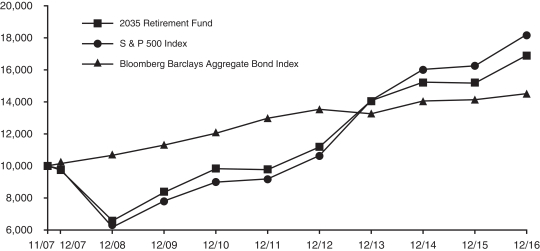
2035 RETIREMENT FUND
The objective of the 2035 Retirement Fund is current income and capital appreciation appropriate for the asset allocation associated with a target retirement in 2035. The 2035 Retirement Fund invests in funds of the Investment Company. The Fund’s current target allocation is approximately 83% of net assets in equity funds (approximately 38% in the Equity Index Fund, 20% in the Mid-Cap Equity Index Fund, 13% in the International Fund and 6% each in the Small Cap Growth and Small Cap Value Funds) and approximately 17% of net assets in the Bond Fund (See Note 1 in the Notes to Financial Statements for additional information on changes to Fund target allocations during 2016).
Performance for the 2035 Retirement Fund is compared to the S&P 500® Index (83% weighting) and the Bloomberg Barclays Aggregate Bond Index (17% weighting). For the year ended December 31, 2016, the Fund returned 11.51% before expenses and 11.43% after expenses, versus a 10.37% return in the weighted benchmark.
GROWTH OF A $10,000 INVESTMENT
| | | | | | | | | | | | |
2035 Retirement Fund | |
Period
Ended
12/31/2016 | | Growth
of
$10,000 | | | Total Return | |
| | | Cumu-
lative | | | Average
Annual | |
1 Year | | | $11,142 | | | | 11.43% | | | | 11.43% | |
5 Years | | | $17,309 | | | | 73.09% | | | | 11.62% | |
Since 11/5/07 (Inception) | | | $16,912 | | | | 69.12% | | | | 5.91% | |
| | | | | | | | | | | | |
S & P 500 Index | |
Period
Ended
12/31/2016 | | Growth of
$10,000 | | | Total Return | |
| | | Cumu-
lative | | | Average
Annual | |
1 Year | | | $11,196 | | | | 11.96% | | | | 11.96% | |
5 Years | | | $19,817 | | | | 98.17% | | | | 14.66% | |
Since 11/5/07 (Inception) | | | $18,199 | | | | 81.99% | | | | 6.76% | |
| | | | | | | | | | | | |
Bloomberg Barclays Aggregate Bond Index | |
Period
Ended
12/31/2016 | | Growth
of
$10,000 | | | Total Return | |
| | | Cumu-
lative | | | Average
Annual | |
1 Year | | | $10,265 | | | | 2.65% | | | | 2.65% | |
5 Years | | | $11,167 | | | | 11.67% | | | | 2.23% | |
Since 11/5/07 (Inception) | | | $14,507 | | | | 45.07% | | | | 4.15% | |
The line representing the performance return of the 2035 Retirement Fund includes expenses, such as direct management fees and expenses of the underlying funds in which the Fund invests, that reduce returns while the performance return lines of the Indices do not. Past performance is not indicative of future results.
19
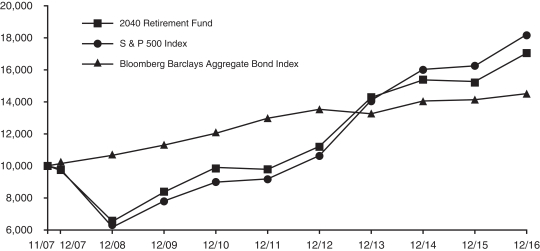
2040 RETIREMENT FUND
The objective of the 2040 Retirement Fund is current income and capital appreciation appropriate for the asset allocation associated with a target retirement in 2040. The 2040 Retirement Fund invests in funds of the Investment Company. The Fund’s current target allocation is approximately 86% of net assets in equity funds (approximately 36% in the Equity Index Fund, 20% in the Mid-Cap Equity Index Fund, 14% in the International Fund and 8% each in the Small Cap Growth and Small Cap Value Funds) and approximately 14% of net assets in the Bond Fund (See Note 1 in the Notes to Financial Statements for additional information on changes to Fund target allocations during 2016).
Performance for the 2040 Retirement Fund is compared to the S&P 500® Index (86% weighting) and the Bloomberg Barclays Aggregate Bond Index (14% weighting). For the year ended December 31, 2016, the Fund returned 11.74% before expenses and 11.66% after expenses, versus a 10.65% return in the weighted benchmark.
GROWTH OF A $10,000 INVESTMENT
| | | | | | | | | | | | |
2040 Retirement Fund | |
Period
Ended
12/31/2016 | | Growth
of
$10,000 | | | Total Return | |
| | | Cumu-
lative | | | Average
Annual | |
1 Year | | | $11,165 | | | | 11.66% | | | | 11.66% | |
5 Years | | | $17,424 | | | | 74.24% | | | | 11.77% | |
Since 11/5/07 (Inception) | | | $17,048 | | | | 70.48% | | | | 6.01% | |
| | | | | | | | | | | | |
S & P 500 Index | |
Period
Ended
12/31/2016 | | Growth of
$10,000 | | | Total Return | |
| | | Cumu-
lative | | | Average
Annual | |
1 Year | | | $11,196 | | | | 11.96% | | | | 11.96% | |
5 Years | | | $19,817 | | | | 98.17% | | | | 14.66% | |
Since 11/5/07 (Inception) | | | $18,199 | | | | 81.99% | | | | 6.76% | |
| | | | | | | | | | | | |
Bloomberg Barclays Aggregate Bond Index | |
Period
Ended
12/31/2016 | | Growth
of
$10,000 | | | Total Return | |
| | | Cumu-
lative | | | Average
Annual | |
1 Year | | | $10,265 | | | | 2.65% | | | | 2.65% | |
5 Years | | | $11,167 | | | | 11.67% | | | | 2.23% | |
Since 11/5/07 (Inception) | | | $14,507 | | | | 45.07% | | | | 4.15% | |
The line representing the performance return of the 2040 Retirement Fund includes expenses, such as direct management fees and expenses of the underlying funds in which the Fund invests, that reduce returns while the performance return lines of the Indices do not. Past performance is not indicative of future results.
20
2045 RETIREMENT FUND
The objective of the 2045 Retirement Fund is current income and capital appreciation appropriate for the asset allocation associated with a target retirement in 2045. The 2045 Retirement Fund invests in funds of the Investment Company. The Fund’s current target allocation is approximately 88% of net assets in equity funds (approximately 33% in the Equity Index Fund, 22% in the Mid-Cap Equity Index Fund, 15% in the International Fund and 9% each in the Small Cap Growth and Small Cap Value Funds) and approximately 12% of net assets in the Bond Fund (See Note 1 in the Notes to Financial Statements for additional information on changes to Fund target allocations during 2016).
Performance for the 2045 Retirement Fund is compared to the S&P 500® Index (88% weighting) and the Bloomberg Barclays Aggregate Bond Index (12% weighting). For the year ended December 31, 2016, the Fund returned 11.76% before expenses and 11.68% after expenses, versus a 10.83% return in the weighted benchmark.
GROWTH OF A $10,000 INVESTMENT

| | | | | | | | | | | | |
2045 Retirement Fund | |
Period
Ended
12/31/2016 | | Growth
of
$10,000 | | | Total Return | |
| | | Cumu-
lative | | | Average
Annual | |
1 Year | | | $11,167 | | | | 11.68% | | | | 11.68% | |
5 Years | | | $17,404 | | | | 74.04% | | | | 11.74% | |
Since 11/5/07 (Inception) | | | $16,925 | | | | 69.25% | | | | 5.92% | |
| | | | | | | | | | | | |
S & P 500 Index | |
Period
Ended
12/31/2016 | | Growth of
$10,000 | | | Total Return | |
| | | Cumu-
lative | | | Average
Annual | |
1 Year | | | $11,196 | | | | 11.96% | | | | 11.96% | |
5 Years | | | $19,817 | | | | 98.17% | | | | 14.66% | |
Since 11/5/07 (Inception) | | | $18,199 | | | | 81.99% | | | | 6.76% | |
| | | | | | | | | | | | |
Bloomberg Barclays Aggregate Bond Index | |
Period
Ended
12/31/2016 | | Growth
of
$10,000 | | | Total Return | |
| | | Cumu-
lative | | | Average
Annual | |
1 Year | | | $10,265 | | | | 2.65% | | | | 2.65% | |
5 Years | | | $11,167 | | | | 11.67% | | | | 2.23% | |
Since 11/5/07 (Inception) | | | $14,507 | | | | 45.07% | | | | 4.15% | |
The line representing the performance return of the 2045 Retirement Fund includes expenses, such as direct management fees and expenses of the underlying funds in which the Fund invests, that reduce returns while the performance return lines of the Indices do not. Past performance is not indicative of future results.
21
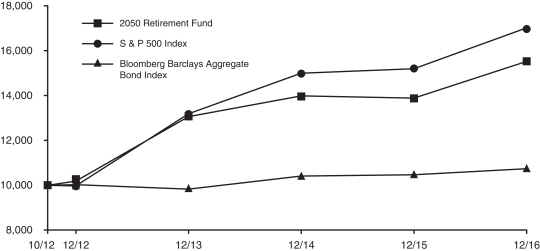
2050 RETIREMENT FUND
The objective of the 2050 Retirement Fund is current income and capital appreciation appropriate for the asset allocation associated with a target retirement in 2050. The 2050 Retirement Fund invests in funds of the Investment Company. The Fund’s current target allocation is approximately 90% of net assets in equity funds (approximately 32% in the Equity Index Fund, 22% in the Mid-Cap Equity Index Fund, 16% in the International Fund and 10% each in the Small Cap Growth and Small Cap Value Funds) and approximately 10% of net assets in the Bond Fund (See Note 1 in the Notes to Financial Statements for additional information on changes to Fund target allocations during 2016).
Performance for the 2050 Retirement Fund is compared to the S&P 500® Index (90% weighting) and the Bloomberg Barclays Aggregate Bond Index (10% weighting). For the year ended December 31, 2016, the Fund returned 11.87% before expenses and 11.78% after expenses, versus an 11.02% return in the weighted benchmark.
GROWTH OF A $10,000 INVESTMENT
| | | | | | | | | | | | |
2050 Retirement Fund | |
Period
Ended
12/31/2016 | | Growth of $10,000 | | | Total Return | |
| | | Cumu-
lative | | | Average
Annual | |
1 Year | | | $11,177 | | | | 11.78% | | | | 11.78% | |
Since 10/1/12
(Inception) | | | $15,516 | | | | 55.16% | | | | 10.91% | |
| | | | | | | | | | | | |
S & P 500 Index | |
Period
Ended
12/31/2016 | | Growth of $10,000 | | | Total Return | |
| | | Cumu-
lative | | | Average
Annual | |
1 Year | | | $11,196 | | | | 11.96% | | | | 11.96% | |
Since 10/1/12
(Inception) | | | $17,019 | | | | 70.19% | | | | 13.32% | |
| | | | | | | | | | | | |
Bloomberg Barclays Aggregate Bond Index | |
Period
Ended
12/31/2016 | | Growth of $10,000 | | | Total Return | |
| | | Cumu-
lative | | | Average
Annual | |
1 Year | | | $10,265 | | | | 2.65% | | | | 2.65% | |
Since 10/1/12
(Inception) | | | $10,739 | | | | 7.39% | | | | 1.69% | |
The line representing the performance return of the 2050 Retirement Fund includes expenses, such as direct management fees and expenses of the underlying funds in which the Fund invests, that reduce returns while the performance return lines of the Indices do not. Past performance is not indicative of future results.
22
2055 RETIREMENT FUND
The objective of the 2055 Retirement Fund is current income and capital appreciation appropriate for the asset allocation associated with a target retirement in 2055. The 2055 Retirement Fund invests in funds of the Investment Company. The Fund’s current target allocation is approximately 92% of net assets in equity funds (approximately 30% in the Equity Index Fund, 23% in the Mid-Cap Equity Index Fund, 17% in the International Fund and 11% each in the Small Cap Growth and Small Cap Value Funds) and approximately 8% of net assets in the Bond Fund.
Performance for the 2055 Retirement Fund is compared to the S&P 500® Index (92% weighting) and the Bloomberg Barclays Aggregate Bond Index (8% weighting). For the period October 1, 2016 (commencement of operations) through December 31, 2016, the Fund returned 4.02% before expenses and 4.01% after expenses, versus a 3.28% return in the weighted benchmark.
Since the Fund has been in operation for less than six months, no graphical depiction of performance is being presented at this time.
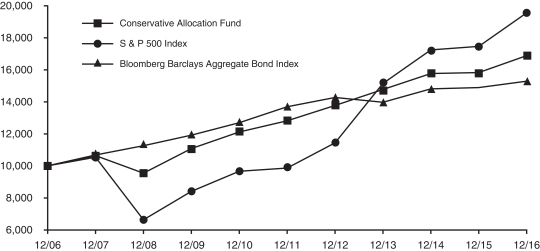
CONSERVATIVE ALLOCATION FUND
The objective of the Conservative Allocation Fund is current income and, to a lesser extent, capital appreciation. The Conservative Allocation Fund invests primarily in the fixed-income funds of the Investment Company and also invests in the equity funds of the Investment Company. The Conservative Allocation Fund’s target allocation is approximately 65% of net assets in fixed-income funds (approximately 30% in the Bond Fund and 35% in the Mid-Term Bond Fund) and approximately 35% of net assets in equity funds (approximately 25% in the Equity Index Fund, 5% in the Mid-Cap Equity Index Fund and 5% in the International Fund).
Performance for the Conservative Allocation Fund is compared to the Bloomberg Barclays Aggregate Bond Index (65% weighting) and the S&P 500® Index (35% weighting). For the year ended December 31, 2016, the Conservative Allocation Fund returned 6.74% before expenses and 6.71% after expenses, versus a 5.89% return in the weighted benchmark.
GROWTH OF A $10,000 INVESTMENT
| | | | | | | | | | | | |
Conservative Allocation Fund | |
Period
Ended
12/31/2016 | | Growth
of
$10,000 | | | Total Return | |
| | | Cumu- lative | | | Average Annual | |
1 Year | | | $10,671 | | | | 6.71% | | | | 6.71% | |
5 Years | | | $13,179 | | | | 31.79% | | | | 5.69% | |
10 Years | | | $16,896 | | | | 68.96% | | | | 5.39% | |
| | | | | | | | | | | | |
S & P 500 Index | |
Period
Ended
12/31/2016 | | Growth of $10,000 | | | Total Return | |
| | | Cumu- lative | | | Average Annual | |
1 Year | | | $11,196 | | | | 11.96% | | | | 11.96% | |
5 Years | | | $19,817 | | | | 98.17% | | | | 14.66% | |
10 Years | | | $19,567 | | | | 95.67% | | | | 6.95% | |
| | | | | | | | | | | | |
Bloomberg Barclays Aggregate Bond Index | |
Period
Ended
12/31/2016 | | Growth of $10,000 | | | Total Return | |
| | | Cumu- lative | | | Average Annual | |
1 Year | | | $10,265 | | | | 2.65% | | | | 2.65% | |
5 Years | | | $11,167 | | | | 11.67% | | | | 2.23% | |
10 Years | | | $15,299 | | | | 52.99% | | | | 4.34% | |
The line representing the performance return of the Conservative Allocation Fund includes direct operating expenses and expenses in the underlying funds in which the Fund invests, that reduce returns while the performance return lines of the Indicies do not. Past performance is not indicative of future results.
23
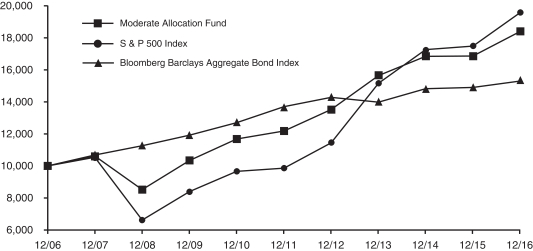
MODERATE ALLOCATION FUND
The objective of the Moderate Allocation Fund is capital appreciation and current income. The Moderate Allocation Fund invests in the equity and fixed-income funds of the Investment Company. The Moderate Allocation Fund’s target allocation is approximately 60% of net assets in equity funds (approximately 35% of its net assets in the Equity Index Fund, 15% in the Mid-Cap Equity Index Fund and 10% in the International Fund) and approximately 40% of net assets in fixed-income funds (approximately 25% of its net assets in the Bond Fund and approximately 15% of its net assets in the Mid-Term Bond Fund).
Performance for the Moderate Allocation Fund is compared to the S&P 500® Index (60% weighting) and the Bloomberg Barclays Aggregate Bond Index (40% weighting). For the year ended December 31, 2016, the Moderate Allocation Fund returned 9.10% before expenses and 9.08% after expenses, versus an 8.21% return for the weighted benchmark.
GROWTH OF A $10,000 INVESTMENT
| | | | | | | | | | | | |
Moderate Allocation Fund | |
Period
Ended
12/31/2016 | | Growth of $10,000 | | | Total Return | |
| | | Cumu- lative | | | Average Annual | |
1 Year | | | $10,908 | | | | 9.08% | | | | 9.08% | |
5 Years | | | $15,094 | | | | 50.94% | | | | 8.60% | |
10 Years | | | $18,387 | | | | 83.87% | | | | 6.29% | |
| | | | | | | | | | | | |
S & P 500 Index | |
Period
Ended
12/31/2016 | | Growth
of
$10,000 | | | Total Return | |
| | | Cumu- lative | | | Average Annual | |
1 Year | | | $11,196 | | | | 11.96% | | | | 11.96% | |
5 Years | | | $19,817 | | | | 98.17% | | | | 14.66% | |
10 Years | | | $19,567 | | | | 95.67% | | | | 6.95% | |
| | | | | | | | | | | | |
Bloomberg Barclays Aggregate Bond Index | |
Period
Ended
12/31/2016 | | Growth of $10,000 | | | Total Return | |
| | | Cumu- lative | | | Average Annual | |
1 Year | | | $10,265 | | | | 2.65% | | | | 2.65% | |
5 Years | | | $11,167 | | | | 11.67% | | | | 2.23% | |
10 Years | | | $15,299 | | | | 52.99% | | | | 4.34% | |
The line representing the performance return of the Moderate Allocation Fund includes direct operating expenses and expenses in the underlying funds in which the Fund invests, that reduce returns while the performance return lines of the Indicies do not. Past performance is not indicative of future results.
24
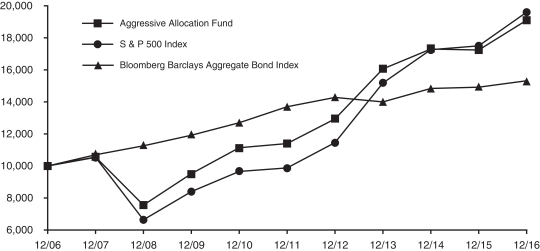
AGGRESSIVE ALLOCATION FUND
The objective of the Aggressive Allocation Fund is capital appreciation and, to a lesser extent, current income. The Aggressive Allocation Fund invests in the equity and fixed-income funds of the Investment Company. The Aggressive Allocation Fund’s target allocation is approximately 80% of net assets in equity funds (approximately 35% of its net assets in the Equity Index Fund, 20% in the Mid-Cap Equity Index Fund, 5% in the Small Cap Value Fund, 5% in the Small Cap Growth Fund and 15% in the International Fund) and approximately 20% of net assets in the Bond Fund.
Performance for the Aggressive Allocation Fund is compared to the S&P 500® Index (80% weighting) and the Bloomberg Barclays Aggregate Bond Index (20% weighting). For the year ended December 31, 2016, the Aggressive Allocation Fund returned 10.88% before expenses and 10.86% after expenses, versus a 10.08% return for the weighted benchmark.
GROWTH OF A $10,000 INVESTMENT
| | | | | | | | | | | | |
Aggressive Allocation Fund | |
Period
Ended
12/31/2016 | | Growth of
$10,000 | | | Total Return | |
| | | Cumu- lative | | | Average
Annual | |
1 Year | | | $11,088 | | | | 10.86% | | | | 10.86% | |
5 Years | | | $16,749 | | | | 67.49% | | | | 10.88% | |
10 Years | | | $19,087 | | | | 90.87% | | | | 6.69% | |
| | | | | | | | | | | | |
S & P 500 Index | |
Period
Ended
12/31/2016 | | Growth
of
$10,000 | | | Total Return | |
| | | Cumu- lative | | | Average
Annual | |
1 Year | | | $11,196 | | | | 11.96% | | | | 11.96% | |
5 Years | | | $19,817 | | | | 98.17% | | | | 14.66% | |
10 Years | | | $19,567 | | | | 95.67% | | | | 6.95% | |
| | | | | | | | | | | | |
Bloomberg Barclays Aggregate Bond Index | |
Period
Ended
12/31/2016 | | Growth
of
$10,000 | | | Total Return | |
| | | Cumu- lative | | | Average
Annual | |
1 Year | | | $10,265 | | | | 2.65% | | | | 2.65% | |
5 Years | | | $11,167 | | | | 11.67% | | | | 2.23% | |
10 Years | | | $15,299 | | | | 52.99% | | | | 4.34% | |
The line representing the performance return of the Aggressive Allocation Fund includes direct operating expenses and expenses in the underlying funds in which the Fund invests, that reduce returns while the performance return lines of the Indicies do not. Past performance is not indicative of future results.
25
MONEY MARKET FUND
The Money Market Fund’s investment objective is to realize current income while maintaining liquidity, investment quality and stability of capital through investing in high-quality commercial paper issued by U.S. corporations and securities issued by the U.S. government and its agencies. For the year ended December 31, 2016, the Money Market Fund returned 0.42% before expenses and 0.14% after expenses, compared to a 0.27% return for the Citigroup 3-Month Treasury Bill Index. Note that the benchmark performance does not reflect any expenses.
The Federal Reserve (“Fed”) governors raised the Fed Funds target range to 0.50%-0.75%, an increase of 25 basis points, at the December 2016 meeting. This was the first change in the target since December of last year. Following the meeting, the Fed released its summary of its economic projections. One of those projections includes the expectations by the Fed governors of where the Fed Funds rate will be at the end of each of the next three years. The 2017 “dot-plot” suggests three increases this year to the 1.25%-1.50% area. The market, per the Fed Funds futures contracts, is pricing in only two increases.
The Fund’s strategy will continue to focus on quality, liquidity, and maintaining a relatively short weighted average maturity in light of the uncertainty of the path of interest rates. At year-end, the fund held 24% U.S. Treasury bills, 15% U.S. agency discount notes and the remainder in commercial paper. The average maturity was 24.7 days.
The seven-day effective yield as of February 14, 2017, was 0.37%. As with all performance reporting, this yield is not necessarily indicative of future annual yields. Neither the Federal Deposit Insurance Corporation nor any other U.S. government agency insures or guarantees investments in shares of the Money Market Fund.
MID-TERM BOND FUND
The Mid-Term Bond Fund seeks a high level of return consistent with the preservation of capital through investment in publicly traded debt securities. The Mid-Term Bond Fund primarily invests in corporate and U.S. government agency securities, which typically yield more than U.S. Treasury issues.
During 2016, the Mid-Term Bond Fund emphasized corporate issues, particularly BBB-rated bonds, in order to capture incremental income. The Fund will continue to focus on income, rather than market volatility, to achieve superior returns over market cycles. In addition, the Fund’s corporate positions will remain highly diversified in order to shield the portfolio from any credit risks. The objective of the Fund is to maintain a maturity profile similar to the Bloomberg Barclays Intermediate Government/Credit Bond Index.
For the year ended December 31, 2016, the Mid-Term Bond Fund returned 3.99% before expenses and 3.51% after expenses versus a 2.08% return of the Bloomberg Barclays Intermediate Government/Credit Bond Index during the same period. The Fund’s continuing emphasis on higher-yielding corporate issues was a major contributor to its outperformance.
GROWTH OF A $10,000 INVESTMENT
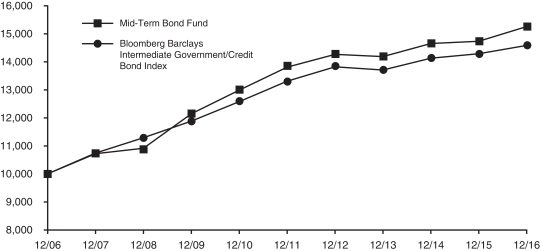
| | | | | | | | | | | | |
Mid-Term Bond Fund | |
Period
Ended
12/31/2016 | | Growth
of
$10,000 | | | Total Return | |
| | | Cumu-
lative | | | Average
Annual | |
1 Year | | | $10,351 | | | | 3.51% | | | | 3.51% | |
5 Years | | | $11,047 | | | | 10.47% | | | | 2.01% | |
10 Years | | | $15,254 | | | | 52.54% | | | | 4.32% | |
| | | | | | | | | | | | |
Bloomberg Barclays Intermediate Government/Credit Bond Index | |
Period
Ended
12/31/2016 | | Growth
of
$10,000 | | | Total Return | |
| | | Cumu-
lative | | | Average
Annual | |
1 Year | | | $10,208 | | | | 2.08% | | | | 2.08% | |
5 Years | | | $10,957 | | | | 9.57% | | | | 1.85% | |
10 Years | | | $14,580 | | | | 45.80% | | | | 3.84% | |
The line representing the performance return of the Mid-Term Bond Fund includes expenses, such as transaction costs and management fees that reduce returns, while the performance return line of the Index does not. Past performance is not indicative of future results.
26
BOND FUND
The Bond Fund’s primary investment objective is to provide as high a level of current income over time as is believed to be consistent with prudent investment risk. It does this by investing primarily in investment grade publicly traded debt securities. A secondary objective is preservation of capital. The securities held by the Bond Fund include corporate, U.S. agency and mortgage-backed bonds, all of which normally yield more than U.S. Treasury issues.
The Bond Fund’s strategy is to overweight corporate bonds, underweight U.S. Treasuries, and market weight mortgage-backed securities. The portfolio’s aim is to maintain a similar maturity profile to the benchmark, the Bloomberg Barclays Aggregate Bond Index (the Aggregate) with an overweighting of BBB issuers. To achieve the duration target of approximately 90% of the benchmark, intermediate corporate and longer U.S. Treasury maturities are emphasized. The Bond Fund also stresses diversification in order to protect the Fund from unexpected credit events, so few corporate holdings exceed one-half of one percent of the Fund’s value. This extreme diversification will be maintained going forward as part of our risk control.
The fixed income markets produced positive returns in 2016. The Aggregate returned 2.65% for the year. U.S. Treasury rates, which fell for much of the first six months of the year before reversing course, finished 2016 slightly higher than where they began. The yield curve steepened as yields on long-dated U.S. Treasuries rose a little more than those of short-dated U.S. Treasuries. Two-year U.S. Treasury Notes yielded 1.19% on December 31, 2016, up from 1.05% at the end of 2015. Yields on ten-year Notes rose from 2.27% at 2015 year-end to 2.44% on December 31.
High-grade corporate bond spreads tightened from 172 basis points at the end of 2015 to 127 on December 31. This action helped corporates deliver a return more than double that of the benchmark and the strongest return for the sector relative to U.S. Treasuries since 2012. BBB-rated corporates bested higher rated corporates with a better than 8% return versus the 4.65% return of A-rated corporates. Our decision to maintain our exposure in Energy, Metals and Mining securities was rewarded as those sectors produced double-digit returns in 2016.
For 2016, the Bond Fund returned 5.18% before expenses and 4.71% after expenses, versus a 2.65% return of the Bloomberg Barclays Aggregate Bond Index. The Fund’s relative outperformance was driven primarily by its’ overweight position in corporate bonds in particular, BBB-rated industrial bonds.
GROWTH OF A $10,000 INVESTMENT
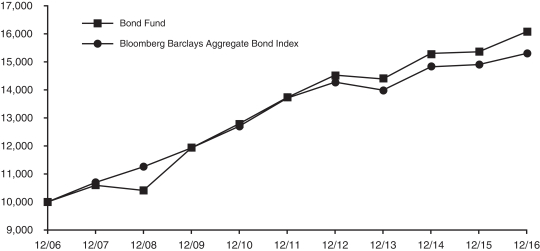
| | | | | | | | | | | | |
Bond Fund | |
Period
Ended
12/31/2016 | | Growth
of
$10,000 | | | Total Return | |
| | | Cumu-
lative | | | Average
Annual | |
1 Year | | | $10,472 | | | | 4.71% | | | | 4.71% | |
5 Years | | | $11,709 | | | | 17.09% | | | | 3.23% | |
10 Years | | | $16,124 | | | | 61.24% | | | | 4.88% | |
| | | | | | | | | | | | |
Bloomberg Barclays Aggregate Bond Index | |
Period
Ended
12/31/2016 | | Growth
of
$10,000 | | | Total Return | |
| | | Cumu-
lative | | | Average
Annual | |
1 Year | | | $10,265 | | | | 2.65% | | | | 2.65% | |
5 Years | | | $11,167 | | | | 11.67% | | | | 2.23% | |
10 Years | | | $15,299 | | | | 52.99% | | | | 4.34% | |
The line representing the performance return of the Bond Fund includes expenses, such as transaction costs and management fees that reduce returns, while the performance return line of the Index does not. Past performance is not indicative of future results.
27
MUTUAL OF AMERICA INVESTMENT CORPORATION
ASSET ALLOCATIONS AS OF DECEMBER 31, 2016 (Unaudited)
Equity Index Fund
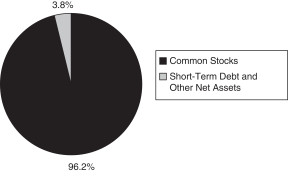
All America Fund
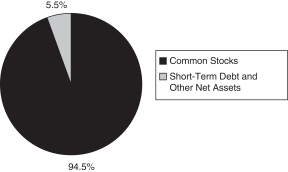
Small Cap Value Fund
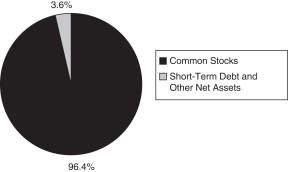
Small Cap Growth Fund
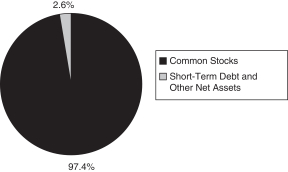
Mid Cap Value Fund
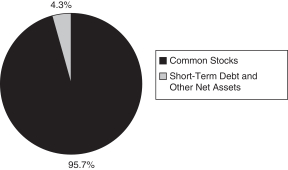
Mid-Cap Equity Index Fund

28
MUTUAL OF AMERICA INVESTMENT CORPORATION
ASSET ALLOCATIONS AS OF DECEMBER 31, 2016 (Unaudited) (Continued)
International Fund
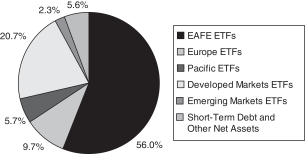
Composite Fund
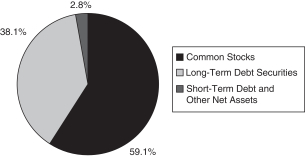
Retirement Income Fund
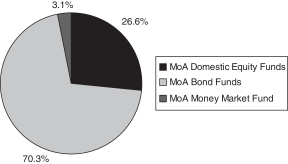
2010 Retirement Fund
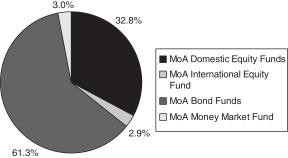
2015 Retirement Fund
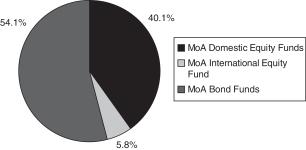
2020 Retirement Fund
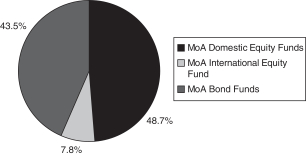
29
MUTUAL OF AMERICA INVESTMENT CORPORATION
ASSET ALLOCATIONS AS OF DECEMBER 31, 2016 (Unaudited) (Continued)
2025 Retirement Fund
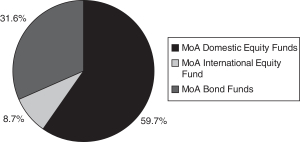
2030 Retirement Fund
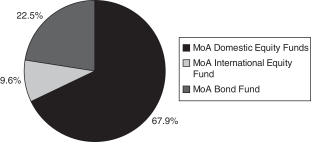
2035 Retirement Fund
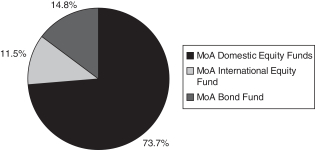
2040 Retirement Fund
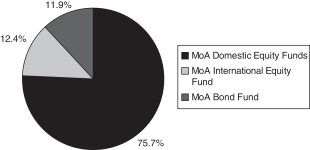
2045 Retirement Fund

2050 Retirement Fund

30
MUTUAL OF AMERICA INVESTMENT CORPORATION
ASSET ALLOCATIONS AS OF DECEMBER 31, 2016 (Unaudited) (Continued)
2055 Retirement Fund
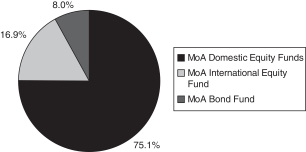
Conservative Allocation Fund
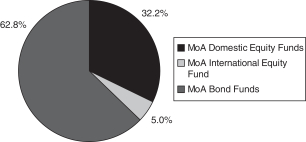
Moderate Allocation Fund
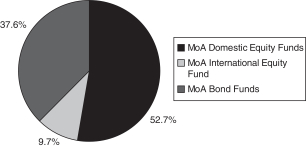
Aggressive Allocation Fund

Money Market Fund
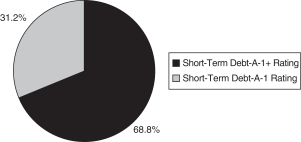
Mid-Term Bond Fund
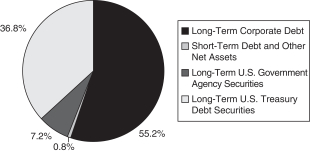
31
MUTUAL OF AMERICA INVESTMENT CORPORATION
ASSET ALLOCATIONS AS OF DECEMBER 31, 2016 (Unaudited) (Continued)
Bond Fund
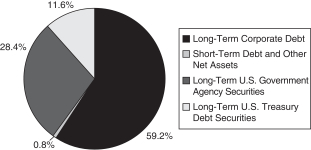
32
MUTUAL OF AMERICA INVESTMENT CORPORATION
EXPENSE EXAMPLE (Unaudited)
EXAMPLE
As a shareholder of one of the Mutual of America Investment Corporation Funds, you incur ongoing costs, including management fees and other Fund expenses. You do not incur transactional costs, such as sales charges (loads), redemption fees or exchange fees. Additionally, Mutual of America Capital Management LLC, the Funds’ Adviser, has contractually agreed to reimburse the direct non-advisory operating expenses of any Allocation or Retirement Fund (each a “Fund of Funds”) that has less than $50 million in average daily net assets for the prior calendar year. This contractual obligation remains in effect through April 30, 2017 and will continue for succeeding 12 month periods ending April 30th unless i) The Fund of Funds has at least $50 million in average daily net assets for the prior calendar year, ii) the Investment Company gives not less than 30 days written notice to the Adviser, or iii) the Adviser gives 45 days advance notice to the Investment Company before the next May 1 of a given year to terminate the agreement. In that case, the agreement will terminate on the next May 1 following the written notice.
This Example is intended to help you understand your ongoing costs (in dollars) of investing in a Fund and to compare these costs with the ongoing costs of investing in other mutual funds. The Example is based on an investment of $1,000 invested at July 1, 2016 and held for the entire period ending December 31, 2016 under the expense reimbursement agreement in effect during that period as described above.
The estimate of expenses does not include fees and charges associated with your variable annuity contract or variable life insurance policy. If those fees and charges were included, the estimate of expenses for the period would be higher and your ending account value would be lower.
ACTUAL EXPENSES
The first line of the tables below provides information about actual account values and actual expenses. You may use the information in this line, together with the amount you invested, to estimate the expenses that you paid over the period. Simply divide your account value by $1,000 (for example, an $8,600 account value divided by $1,000=8.6), then multiply the result by the number in the first line under the heading entitled “Expenses Paid During Period” to estimate the expenses you paid on your account during this period.
HYPOTHETICAL EXAMPLE FOR COMPARISON PURPOSES
The second line of the tables below provides information about hypothetical account values and hypothetical expenses based on each Fund’s actual expense ratio and an assumed rate of return of 5% per year before expenses, which is not the Fund’s actual return. The hypothetical account values and expenses may not be used to estimate the actual ending account balance or expenses you paid for the period. You may use this information to compare the ongoing costs of investing in the Fund with other funds. To do so, compare this 5% hypothetical example with the 5% hypothetical examples that appear in the shareholder reports of the other funds.
Please note that the second line of the table is useful in comparing ongoing costs only, and will not help you determine the relative total costs of owning other non-Mutual of America funds, which may also charge transactional costs, such as sales charges (loads), redemption fees or exchange fees, which the Mutual of America Investment Corporation does not charge.
| | | | | | | | | | | | | | | | | | |
| | | Equity Index Fund | | | | |
| | | | | Beginning
Account Value
July 1, 2016 | | | Ending
Account Value
December 31, 2016 | | | Expenses Paid
During Period*
July 1, 2016 to
December 31, 2016 | | | | |
| | | Actual | | | $1,000.00 | | | | $1,078.26 | | | | $0.73 | | | | | |
| | | Hypothetical
(5% return before expenses) | | | $1,000.00 | | | | $1,024.11 | | | | $0.71 | | | | | |
| | * | Expenses are equal to the Fund’s annual expense ratio of 0.14%, multiplied by the average account value over the period, multiplied by 184/366 (to reflect the one-half year period). |
33
MUTUAL OF AMERICA INVESTMENT CORPORATION
EXPENSE EXAMPLE (Unaudited) (Continued)
| | | | | | | | | | | | | | | | | | |
| | | All America Fund | | | | |
| | | | | Beginning
Account Value
July 1, 2016 | | | Ending
Account Value
December 31, 2016 | | | Expenses Paid
During Period*
July 1, 2016 to
December 31, 2016 | | | | |
| | | Actual | | | $1,000.00 | | | | $1,088.34 | | | | $2.78 | | | | | |
| | | Hypothetical
(5% return before expenses) | | | $1,000.00 | | | | $1,022.10 | | | | $2.69 | | | | | |
| | * | Expenses are equal to the Fund’s annual expense ratio of 0.53%, multiplied by the average account value over the period, multiplied by 184/366 (to reflect the one-half year period). |
| | | | | | | | | | | | | | | | | | |
| | | Small Cap Value Fund | | | | |
| | | | | Beginning
Account Value
July 1, 2016 | | | Ending
Account Value
December 31, 2016 | | | Expenses Paid
During Period*
July 1, 2016 to
December 31, 2016 | | | | |
| | | Actual | | | $1,000.00 | | | | $1,162.71 | | | | $4.45 | | | | | |
| | | Hypothetical
(5% return before expenses) | | | $1,000.00 | | | | $1,020.62 | | | | $4.17 | | | | | |
| | * | Expenses are equal to the Fund’s annual expense ratio of 0.82%, multiplied by the average account value over the period, multiplied by 184/366 (to reflect the one-half year period). |
| | | | | | | | | | | | | | | | | | |
| | | Small Cap Growth Fund | | | | |
| | | | | Beginning
Account Value
July 1, 2016 | | | Ending
Account Value
December 31, 2016 | | | Expenses Paid
During Period*
July 1, 2016 to
December 31, 2016 | | | | |
| | | Actual | | | $1,000.00 | | | | $1,095.35 | | | | $4.32 | | | | | |
| | | Hypothetical
(5% return before expenses) | | | $1,000.00 | | | | $1,020.62 | | | | $4.17 | | | | | |
| | * | Expenses are equal to the Fund’s annual expense ratio of 0.82%, multiplied by the average account value over the period, multiplied by 184/366 (to reflect the one-half year period). |
| | | | | | | | | | | | | | | | | | |
| | | Mid Cap Value Fund | | | | |
| | | | | Beginning
Account Value
July 1, 2016 | | | Ending
Account Value
December 31, 2016 | | | Expenses Paid
During Period*
July 1, 2016 to
December 31, 2016 | | | | |
| | | Actual | | | $1,000.00 | | | | $1,113.03 | | | | $3.50 | | | | | |
| | | Hypothetical
(5% return before expenses) | | | $1,000.00 | | | | $1,021.44 | | | | $3.35 | | | | | |
| | * | Expenses are equal to the Fund’s annual expense ratio of 0.66%, multiplied by the average account value over the period, multiplied by 184/366 (to reflect the one-half year period). |
34
MUTUAL OF AMERICA INVESTMENT CORPORATION
EXPENSE EXAMPLE (Unaudited) (Continued)
| | | | | | | | | | | | | | | | | | |
| | | Mid-Cap Equity Index Fund | | | | |
| | | | | Beginning
Account Value
July 1, 2016 | | | Ending
Account Value
December 31, 2016 | | | Expenses Paid
During Period*
July 1, 2016 to
December 31, 2016 | | | | |
| | | Actual | | | $1,000.00 | | | | $1,118.94 | | | | $0.80 | | | | | |
| | | Hypothetical
(5% return before expenses) | | | $1,000.00 | | | | $1,024.06 | | | | $0.76 | | | | | |
| | * | Expenses are equal to the Fund’s annual expense ratio of 0.15%, multiplied by the average account value over the period, multiplied by 184/366 (to reflect the one-half year period). |
| | | | | | | | | | | | | | | | | | |
| | | International Fund | | | | |
| | | | | Beginning
Account Value
July 1, 2016 | | | Ending
Account Value
December 31, 2016 | | | Expenses Paid
During Period*
July 1, 2016 to
December 31, 2016 | | | | |
| | | Actual | | | $1,000.00 | | | | $1,042.01 | | | | $1.80 | | | | | |
| | | Hypothetical
(5% return before expenses) | | | $1,000.00 | | | | $1,023.03 | | | | $1.78 | | | | | |
| | * | Expenses are equal to the Fund’s annual expense ratio of 0.35% (reflecting direct expenses and the proportional expense ratios of the underlying funds in which the Fund invests), multiplied by the average account value over the period, multiplied by 184/366 (to reflect the one-half year period). |
| | | | | | | | | | | | | | | | | | |
| | | Composite Fund | | | | |
| | | | | Beginning
Account Value
July 1, 2016 | | | Ending Account Value
December 31, 2016 | | | Expenses Paid
During Period*
July 1, 2016 to
December 31, 2016 | | | | |
| | | Actual | | | $1,000.00 | | | | $1,045.82 | | | | $2.67 | | | | | |
| | | Hypothetical
(5% return before expenses) | | | $1,000.00 | | | | $1,022.16 | | | | $2.64 | | | | | |
| | * | Expenses are equal to the Fund’s annual expense ratio of 0.52%, multiplied by the average account value over the period, multiplied by 184/366 (to reflect the one-half year period). |
| | | | | | | | | | | | | | | | | | |
| | | Retirement Income Fund | | | | |
| | | | | Beginning
Account Value
July 1, 2016 | | | Ending
Account Value
December 31, 2016 | | | Expenses Paid
During Period*
July 1, 2016 to
December 31, 2016 | | | | |
| | | Actual | | | $1,000.00 | | | | $1,013.58 | | | | $2.33 | | | | | |
| | | Hypothetical
(5% return before expenses) | | | $1,000.00 | | | | $1,022.46 | | | | $2.34 | | | | | |
| | * | Expenses are equal to the Fund’s annual expense ratio of 0.46% (reflecting direct expenses and the proportional expense ratios of the underlying funds in which the Fund invests), multiplied by the average account value over the period, multiplied by 184/366 (to reflect the one-half year period). |
35
MUTUAL OF AMERICA INVESTMENT CORPORATION
EXPENSE EXAMPLE (Unaudited) (Continued)
| | | | | | | | | | | | | | | | | | |
| | | 2010 Retirement Fund | | | | |
| | | | | Beginning
Account Value
July 1, 2016 | | | Ending
Account Value
December 31, 2016 | | | Expenses Paid
During Period*
July 1, 2016 to
December 31, 2016 | | | | |
| | | Actual | | | $1,000.00 | | | | $1,022.08 | | | | $1.98 | | | | | |
| | | Hypothetical
(5% return before expenses) | | | $1,000.00 | | | | $1,022.82 | | | | $1.98 | | | | | |
| | * | Expenses are equal to the Fund’s annual expense ratio of 0.39% (reflecting direct expenses and the proportional expense ratios of the underlying funds in which the Fund invests), multiplied by the average account value over the period, multiplied by 184/366 (to reflect the one-half year period). |
| | | | | | | | | | | | | | | | | | |
| | | 2015 Retirement Fund | | | | |
| | | | | Beginning
Account Value
July 1, 2016 | | | Ending
Account Value
December 31, 2016 | | | Expenses Paid
During Period*
July 1, 2016 to
December 31, 2016 | | | | |
| | | Actual | | | $1,000.00 | | | | $1,030.95 | | | | $2.09 | | | | | |
| | | Hypothetical
(5% return before expenses) | | | $1,000.00 | | | | $1,022.72 | | | | $2.08 | | | | | |
| | * | Expenses are equal to the Fund’s annual expense ratio of 0.41% (reflecting direct expenses and the proportional expense ratios of the underlying funds in which the Fund invests), multiplied by the average account value over the period, multiplied by 184/366 (to reflect the one-half year period). |
| | | | | | | | | | | | | | | | | | |
| | | 2020 Retirement Fund | | | | |
| | | | | Beginning
Account Value July 1, 2016 | | | Ending
Account Value
December 31, 2016 | | | Expenses Paid
During Period*
July 1, 2016 to
December 31, 2016 | | | | |
| | | Actual | | | $1,000.00 | | | | $1,041.82 | | | | $1.95 | | | | | |
| | | Hypothetical
(5% return before expenses) | | | $1,000.00 | | | | $1,022.88 | | | | $1.93 | | | | | |
| | * | Expenses are equal to the Fund’s annual expense ratio of 0.38% (reflecting direct expenses and the proportional expense ratios of the underlying funds in which the Fund invests), multiplied by the average account value over the period, multiplied by 184/366 (to reflect the one-half year period). |
| | | | | | | | | | | | | | | | | | |
| | | 2025 Retirement Fund | | | | |
| | | | | Beginning
Account Value
July 1, 2016 | | | Ending
Account Value
December 31, 2016 | | | Expenses Paid
During Period*
July 1, 2016 to
December 31, 2016 | | | | |
| | | Actual | | | $1,000.00 | | | | $1,054.77 | | | | $1.81 | | | | | |
| | | Hypothetical
(5% return before expenses) | | | $1,000.00 | | | | $1,023.03 | | | | $1.78 | | | | | |
| | * | Expenses are equal to the Fund’s annual expense ratio of 0.35% (reflecting direct expenses and the proportional expense ratios of the underlying funds in which the Fund invests), multiplied by the average account value over the period, multiplied by 184/366 (to reflect the one-half year period). |
36
MUTUAL OF AMERICA INVESTMENT CORPORATION
EXPENSE EXAMPLE (Unaudited) (Continued)
| | | | | | | | | | | | | | | | | | |
| | | 2030 Retirement Fund | | | | |
| | | | | Beginning
Account Value
July 1, 2016 | | | Ending
Account Value
December 31, 2016 | | | Expenses Paid During Period*
July 1, 2016 to
December 31, 2016 | | | | |
| | | Actual | | | $1,000.00 | | | | $1,064.27 | | | | $1.82 | | | | | |
| | | Hypothetical
(5% return before expenses) | | | $1,000.00 | | | | $1,023.03 | | | | $1.78 | | | | | |
| | * | Expenses are equal to the Fund’s annual expense ratio of 0.35% (reflecting direct expenses and the proportional expense ratios of the underlying funds in which the Fund invests), multiplied by the average account value over the period, multiplied by 184/366 (to reflect the one-half year period). |
| | | | | | | | | | | | | | | | | | |
| | | 2035 Retirement Fund | | | | |
| | | | | Beginning
Account Value
July 1, 2016 | | | Ending
Account Value
December 31, 2016 | | | Expenses Paid
During Period*
July 1, 2016 to December 31, 2016 | | | | |
| | | Actual | | | $1,000.00 | | | | $1,073.35 | | | | $1.77 | | | | | |
| | | Hypothetical
(5% return before expenses) | | | $1,000.00 | | | | $1,023.08 | | | | $1.73 | | | | | |
| | * | Expenses are equal to the Fund’s annual expense ratio of 0.34% (reflecting direct expenses and the proportional expense ratios of the underlying funds in which the Fund invests), multiplied by the average account value over the period, multiplied by 184/366 (to reflect the one-half year period). |
| | | | | | | | | | | | | | | | | | |
| | | 2040 Retirement Fund | | | | |
| | | | | Beginning
Account Value
July 1, 2016 | | | Ending
Account Value
December 31, 2016 | | | Expenses Paid
During Period*
July 1, 2016 to
December 31, 2016 | | | | |
| | | Actual | | | $1,000.00 | | | | $1,077.84 | | | | $1.88 | | | | | |
| | | Hypothetical
(5% return before expenses) | | | $1,000.00 | | | | $1,022.98 | | | | $1.83 | | | | | |
| | * | Expenses are equal to the Fund’s annual expense ratio of 0.36% (reflecting direct expenses and the proportional expense ratios of the underlying funds in which the Fund invests), multiplied by the average account value over the period, multiplied by 184/366 (to reflect the one-half year period). |
| | | | | | | | | | | | | | | | | | |
| | | 2045 Retirement Fund | | | | |
| | | | | Beginning
Account Value
July 1, 2016 | | | Ending
Account Value
December 31, 2016 | | | Expenses Paid
During Period*
July 1, 2016 to
December 31, 2016 | | | | |
| | | Actual | | | $1,000.00 | | | | $1,080.59 | | | | $1.88 | | | | | |
| | | Hypothetical
(5% return before expenses) | | | $1,000.00 | | | | $1,022.98 | | | | $1.83 | | | | | |
| | * | Expenses are equal to the Fund’s annual expense ratio of 0.36% (reflecting direct expenses and the proportional expense ratios of the underlying funds in which the Fund invests), multiplied by the average account value over the period, multiplied by 184/366 (to reflect the one-half year period). |
37
MUTUAL OF AMERICA INVESTMENT CORPORATION
EXPENSE EXAMPLE (Unaudited) (Continued)
| | | | | | | | | | | | | | | | | | |
| | | 2050 Retirement Fund | | | | |
| | | | | Beginning
Account Value
July 1, 2016 | | | Ending
Account Value
December 31, 2016 | | | Expenses Paid
During Period*
July 1, 2016 to
December 31, 2016 | | | | |
| | | Actual | | | $1,000.00 | | | | $1,083.10 | | | | $1.99 | | | | | |
| | | Hypothetical
(5% return before expenses) | | | $1,000.00 | | | | $1,022.88 | | | | $1.93 | | | | | |
| | * | Expenses are equal to the Fund’s annual expense ratio of 0.38% (reflecting direct expenses and the proportional expense ratios of the underlying funds in which the Fund invests), multiplied by the average account value over the period, multiplied by 184/366 (to reflect the one-half year period). |
| | | | | | | | | | | | | | | | | | |
| | | 2055 Retirement Fund | | | | |
| | | | | Beginning
Account Value
July 1, 2016 | | | Ending
Account Value
December 31, 2016 | | | Expenses Paid
During Period*
July 1, 2016 to
December 31, 2016 | | | | |
| | | Actual | | | $1,000.00 | | | | $1,019.91 | | | | $1.83 | | | | | |
| | | Hypothetical
(5% return before expenses) | | | $1,000.00 | | | | $1,022.98 | | | | $1.83 | | | | | |
| | * | The Fund was not in operation during the entire period from July 1, 2016 through December 31, 2016. Expenses are equal to the Fund’s annual expense ratio of 0.36% (reflecting direct expenses and the proportional expense ratios of the underlying funds in which the Fund invests), multiplied by the average account value over the period, multiplied by 184/366 (to reflect the one-half year period). |
| | | | | | | | | | | | | | | | | | |
| | | Conservative Allocation Fund | | | | |
| | | | | Beginning
Account Value
July 1, 2016 | | | Ending
Account Value
December 31, 2016 | | | Expenses Paid
During Period*
July 1, 2016 to
December 31, 2016 | | | | |
| | | Actual | | | $1,000.00 | | | | $1,020.70 | | | | $1.88 | | | | | |
| | | Hypothetical
(5% return before expenses) | | | $1,000.00 | | | | $1,022.93 | | | | $1.88 | | | | | |
| | * | Expenses are equal to the Fund’s annual expense ratio of 0.37% (reflecting direct operating expenses and the proportional expense ratios of the underlying funds in which the Fund invests), multiplied by the average account value over the period, multiplied by 184/366 (to reflect the one-half year period). |
| | | | | | | | | | | | | | | | | | |
| | | Moderate Allocation Fund | | | | |
| | | | | Beginning
Account Value
July 1, 2016 | | | Ending
Account Value
December 31, 2016 | | | Expenses Paid
During Period*
July 1, 2016 to
December 31, 2016 | | | | |
| | | Actual | | | $1,000.00 | | | | $1,045.14 | | | | $1.49 | | | | | |
| | | Hypothetical
(5% return before expenses) | | | $1,000.00 | | | | $1,023.34 | | | | $1.47 | | | | | |
| | * | Expenses are equal to the Fund’s annual expense ratio of 0.29% (reflecting direct operating expenses and the proportional expense ratios of the underlying funds in which the Fund invests), multiplied by the average account value over the period, multiplied by 184/366 (to reflect the one-half year period). |
38
MUTUAL OF AMERICA INVESTMENT CORPORATION
EXPENSE EXAMPLE (Unaudited) (Continued)
| | | | | | | | | | | | | | | | | | |
| | | Aggressive Allocation Fund | | | | |
| | | | | Beginning
Account Value
July 1, 2016 | | | Ending
Account Value
December 31, 2016 | | | Expenses Paid
During Period*
July 1, 2016 to
December 31, 2016 | | | | |
| | | Actual | | | $1,000.00 | | | | $1,068.18 | | | | $1.51 | | | | | |
| | | Hypothetical
(5% return before expenses) | | | $1,000.00 | | | | $1,023.34 | | | | $1.47 | | | | | |
| | * | Expenses are equal to the Fund’s annual expense ratio of 0.29% (reflecting direct operating expenses and the proportional expense ratios of the underlying funds in which the Fund invests), multiplied by the average account value over the period, multiplied by 184/366 (to reflect the one-half year period). |
| | | | | | | | | | | | | | | | | | |
| | | Money Market Fund | | | | |
| | | | | Beginning
Account Value
July 1, 2016 | | | Ending
Account Value
December 31, 2016 | | | Expenses Paid
During Period*
July 1, 2016 to
December 31, 2016 | | | | |
| | | Actual | | | $1,000.00 | | | | $1,000.75 | | | | $1.41 | | | | | |
| | | Hypothetical
(5% return before expenses) | | | $1,000.00 | | | | $1,023.39 | | | | $1.42 | | | | | |
| | * | Expenses are equal to the Fund’s annual expense ratio of 0.28%, multiplied by the average account value over the period, multiplied by 184/366 (to reflect the one-half year period). |
| | | | | | | | | | | | | | | | | | |
| | | Mid-Term Bond Fund | | | | |
| | | | | Beginning
Account Value
July 1, 2016 | | | Ending
Account Value
December 31, 2016 | | | Expenses Paid
During Period*
July 1, 2016 to
December 31, 2016 | | | | |
| | | Actual | | | $1,000.00 | | | | $991.06 | | | | $2.30 | | | | | |
| | | Hypothetical
(5% return before expenses) | | | $1,000.00 | | | | $1,022.46 | | | | $2.34 | | | | | |
| | * | Expenses are equal to the Fund’s annual expense ratio of 0.46%, multiplied by the average account value over the period, multiplied by 184/366 (to reflect the one-half year period). |
| | | | | | | | | | | | | | | | | | |
| | | Bond Fund | | | | |
| | | | | Beginning
Account Value
July 1, 2016 | | | Ending
Account Value
December 31, 2016 | | | Expenses Paid
During Period*
July 1, 2016 to
December 31, 2016 | | | | |
| | | Actual | | | $1,000.00 | | | | $987.00 | | | | $2.25 | | | | | |
| | | Hypothetical
(5% return before expenses) | | | $1,000.00 | | | | $1,022.52 | | | | $2.29 | | | | | |
| | * | Expenses are equal to the Fund’s annual expense ratio of 0.45%, multiplied by the average account value over the period, multiplied by 184/366 (to reflect the one-half year period). |
39
MUTUAL OF AMERICA INVESTMENT CORPORATION — EQUITY INDEX FUND
SUMMARY PORTFOLIO OF INVESTMENTS IN SECURITIES
December 31, 2016
| | | | | | | | |
| | | Shares | | | Value | |
| | | | | | | | |
| | | | | | | | |
| INDEXED ASSETS: | |
COMMON STOCKS: | |
CONSUMER DISCRETIONARY (11.5%) | |
Amazon.com, Inc.* | | | 42,190 | | | $ | 31,637,015 | |
Comcast Corp. Cl A | | | 255,968 | | | | 17,674,590 | |
Disney (Walt) Co. | | | 156,094 | | | | 16,268,117 | |
Home Depot, Inc. | | | 129,984 | | | | 17,428,255 | |
McDonald’s Corp. | | | 89,598 | | | | 10,905,869 | |
Other Securities | | | 2,859,319 | | | | 153,353,089 | |
| | | | | | | | |
| | | | | | | 247,266,935 | |
| | | | | | | | |
CONSUMER STAPLES (9.0%) | |
Altria Group, Inc. | | | 208,462 | | | | 14,096,200 | |
Coca-Cola Co. | | | 416,848 | | | | 17,282,518 | |
CVS Health Corp. | | | 112,944 | | | | 8,912,411 | |
PepsiCo, Inc. | | | 153,921 | | | | 16,104,754 | |
Philip Morris Int’l., Inc. | | | 164,878 | | | | 15,084,688 | |
Proctor & Gamble Co. | | | 286,496 | | | | 24,088,584 | |
Wal-Mart Stores, Inc. | | | 160,247 | | | | 11,076,273 | |
Other Securities | | | 1,352,833 | | | | 86,278,300 | |
| | | | | | | | |
| | | | | | | 192,923,728 | |
| | | | | | | | |
ENERGY (7.3%) | |
Chevron Corp. | | | 201,746 | | | | 23,745,504 | |
Exxon Mobil Corp. | | | 445,036 | | | | 40,168,949 | |
Schlumberger Ltd. | | | 149,154 | | | | 12,521,515 | |
Other Securities | | | 1,715,242 | | | | 79,854,762 | |
| | | | | | | | |
| | | | | | | 156,290,730 | |
| | | | | | | | |
FINANCIALS (14.3%) | |
Bank of America Corp. | | | 1,084,547 | | | | 23,968,489 | |
Berkshire Hathaway, Inc. Cl B* | | | 203,075 | | | | 33,097,164 | |
Citigroup, Inc. | | | 305,837 | | | | 18,175,893 | |
Goldman Sachs Group, Inc. | | | 39,809 | | | | 9,532,265 | |
JPMorgan Chase & Co. | | | 385,253 | | | | 33,243,481 | |
Wells Fargo & Co. | | | 482,923 | | | | 26,613,887 | |
Other Securities | | | 2,891,502 | | | | 161,647,129 | |
| | | | | | | | |
| | | | | | | 306,278,308 | |
| | | | | | | | |
HEALTH CARE (13.1%) | |
AbbVie, Inc. | | | 174,329 | | | | 10,916,482 | |
Amgen, Inc. | | | 79,521 | | | | 11,626,765 | |
Bristol-Myers Squibb Co. | | | 178,074 | | | | 10,406,645 | |
Celgene Corp.* | | | 83,881 | | | | 9,709,226 | |
Gilead Sciences, Inc. | | | 139,912 | | | | 10,019,098 | |
Johnson & Johnson | | | 291,643 | | | | 33,600,190 | |
Medtronic PLC | | | 147,068 | | | | 10,475,654 | |
Merck & Co., Inc. | | | 293,884 | | | | 17,300,951 | |
Pfizer, Inc. | | | 651,839 | | | | 21,171,731 | |
| | | | | | | | |
| | | Shares | | | Value | |
| | | | | | | | |
| INDEXED ASSETS (CONTINUED): | |
COMMON STOCKS (CONTINUED): | |
HEALTH CARE (CONTINUED) | |
UnitedHealth Group, Inc. | | | 101,687 | | | $ | 16,273,987 | |
Other Securities | | | 1,551,388 | | | | 129,990,218 | |
| | | | | | | | |
| | | | | | | 281,490,947 | |
| | | | | | | | |
INDUSTRIALS (9.9%) | |
3M Co. | | | 64,299 | | | | 11,481,872 | |
Boeing Co. | | | 61,647 | | | | 9,597,205 | |
General Electric Co. | | | 945,006 | | | | 29,862,190 | |
Honeywell International, Inc. | | | 81,739 | | | | 9,469,463 | |
Union Pacific Corp. | | | 88,265 | | | | 9,151,315 | |
United Technologies Corp. | | | 82,346 | | | | 9,026,769 | |
Other Securities | | | 1,696,659 | | | | 133,173,333 | |
| | | | | | | | |
| | | | | | | 211,762,147 | |
| | | | | | | | |
INFORMATION TECHNOLOGY (20.0%) | |
Alphabet, Inc. Cl A* | | | 31,616 | | | | 25,054,099 | |
Alphabet, Inc. Cl C* | | | 31,791 | | | | 24,536,744 | |
Apple, Inc. | | | 571,104 | | | | 66,145,262 | |
Cisco Systems, Inc. | | | 534,679 | | | | 16,157,999 | |
Facebook, Inc. Cl A* | | | 250,563 | | | | 28,827,273 | |
Intel Corp. | | | 505,585 | | | | 18,337,568 | |
Int’l. Business Machines Corp. | | | 92,517 | | | | 15,356,897 | |
MasterCard, Inc. Cl A | | | 102,643 | | | | 10,597,890 | |
Microsoft Corp. | | | 833,295 | | | | 51,780,951 | |
Oracle Corp. | | | 319,987 | | | | 12,303,500 | |
QUALCOMM, Inc. | | | 158,692 | | | | 10,346,718 | |
Visa, Inc. Cl A | | | 199,228 | | | | 15,543,769 | |
Other Securities | | | 2,538,838 | | | | 133,380,983 | |
| | | | | | | | |
| | | | | | | 428,369,653 | |
| | | | | | | | |
MATERIALS (2.7%) | |
Other Securities | | | 888,440 | | | | 58,369,374 | |
| | | | | | | | |
REAL ESTATE (2.8%) | |
Other Securities | | | 898,765 | | | | 59,881,373 | |
| | | | | | | | |
TELECOMMUNICATION SERVICES (2.6%) | |
AT&T, Inc. | | | 656,968 | | | | 27,940,849 | |
Verizon Communications, Inc. | | | 436,847 | | | | 23,318,893 | |
Other Securities | | | 210,528 | | | | 3,530,466 | |
| | | | | | | | |
| | | | | | | 54,790,208 | |
| | | | | | | | |
UTILITIES (3.0%) | |
Other Securities | | | 1,234,008 | | | | 65,154,284 | |
| | | | | | | | |
TOTAL INDEXED ASSETS-COMMON STOCKS | |
(Cost: $1,292,925,575) 96.2% | | | | | | | 2,062,577,687 | |
| | | | | | | | |
The accompanying notes are an integral part of these portfolio schedules.
40
MUTUAL OF AMERICA INVESTMENT CORPORATION — EQUITY INDEX FUND
SUMMARY PORTFOLIO OF INVESTMENTS IN SECURITIES (Continued)
December 31, 2016
| | | | | | | | | | | | | | | | | | | | |
| | | Rating** | | | Rate(%) | | | Maturity | | | Face Amount | | | Value | |
| SHORT-TERM DEBT SECURITIES: | | | | | | | | | | | | | | | | | | | | |
U.S. GOVERNMENT (1.2%) | | | | | | | | | | | | | | | | | | | | |
U.S. Treasury Bill (1) | | | A-1+ | | | | 0.31 - 0.46 | | | | 01/12/17 - 02/23/17 | | | $ | 24,900,000 | | | $ | 24,891,018 | |
| | | | | | | | | | | | | | | | | | | | |
U.S. GOVERNMENT AGENCIES (0.5%) | | | | | | | | | | | | | | | | | | | | |
FHLB | | | A-1+ | | | | 0.49 | | | | 02/07/17 | | | | 10,500,000 | | | | 10,494,625 | |
| | | | | | | | | | | | | | | | | | | | |
COMMERCIAL PAPER (2.0%) | | | | | | | | | | | | | | | | | | | | |
Cargill, Inc.† | | | A-1 | | | | 0.64 - 0.71 | | | | 01/03/17 - 01/06/17 | | | | 7,400,000 | | | | 7,399,448 | |
Danaher Corp.† | | | A-1 | | | | 0.70 | | | | 01/06/17 | | | | 4,000,000 | | | | 3,999,533 | |
GE Capital Treasury LLC | | | A-1+ | | | | 0.56 | | | | 02/06/17 | | | | 10,000,000 | | | | 9,994,242 | |
Intercontinental Exchange, Inc.† | | | A-1 | | | | 0.68 | | | | 01/03/17 | | | | 4,249,000 | | | | 4,248,759 | |
Southern California Gas Co.† | | | A-1 | | | | 0.70 | | | | 01/03/17 | | | | 6,000,000 | | | | 5,999,650 | |
Toyota Motor Credit Corp. | | | A-1+ | | | | 0.58 - 0.78 | | | | 01/04/17 - 02/01/17 | | | | 11,400,000 | | | | 11,395,053 | |
| | | | | | | | | | | | | | | | | | | | |
| | | | | | | | | | | | | | | | | | | 43,036,685 | |
| | | | | | | | | | | | | | | | | | | | |
TOTAL SHORT-TERM DEBT SECURITIES
(Cost: $78,422,328) 3.7% | | | | 78,422,328 | |
| | | | | | | | | | | | | | | | | | | | |
TOTAL INVESTMENTS
(Cost: $1,371,347,903) 99.9% | | | | 2,141,000,015 | |
| | | | | | | | | | | | | | | | | | | | |
OTHER NET ASSETS 0.1% | | | | 2,317,722 | |
| | | | | | | | | | | | | | | | | | | | |
NET ASSETS 100.0% | | | $ | 2,143,317,737 | |
| | | | | | | | | | | | | | | | | | | | |
The accompanying notes are an integral part of these portfolio schedules.
41
MUTUAL OF AMERICA INVESTMENT CORPORATION — ALL AMERICA FUND
SUMMARY PORTFOLIO OF INVESTMENTS IN SECURITIES
December 31, 2016
| | | | | | | | |
| | | Shares | | | Value | |
| | | | | | | | |
| INDEXED ASSETS: | | | | | | | | |
COMMON STOCKS: | | | | | | | | |
CONSUMER DISCRETIONARY (6.1%) | | | | | | | | |
Amazon.com, Inc.* | | | 3,065 | | | $ | 2,298,352 | |
Comcast Corp. Cl A | | | 18,599 | | | | 1,284,261 | |
Disney (Walt) Co. | | | 11,342 | | | | 1,182,063 | |
Home Depot, Inc. | | | 9,445 | | | | 1,266,386 | |
Other Securities | | | 214,280 | | | | 11,934,362 | |
| | | | | | | | |
| | | | | | | 17,965,424 | |
| | | | | | | | |
CONSUMER STAPLES (4.7%) | | | | | | | | |
Altria Group, Inc. | | | 15,147 | | | | 1,024,240 | |
Coca-Cola Co. | | | 30,288 | | | | 1,255,740 | |
PepsiCo, Inc. | | | 11,184 | | | | 1,170,182 | |
Philip Morris Int’l., Inc. | | | 11,981 | | | | 1,096,142 | |
Proctor & Gamble Co. | | | 20,817 | | | | 1,750,293 | |
Other Securities | | | 118,150 | | | | 7,721,703 | |
| | | | | | | | |
| | | | | | | 14,018,300 | |
| | | | | | | | |
ENERGY (3.8%) | | | | | | | | |
Chevron Corp. | | | 14,659 | | | | 1,725,364 | |
Exxon Mobil Corp. | | | 32,336 | | | | 2,918,643 | |
Range Resources Corp. | | | 1,326 | | | | 45,561 | |
Schlumberger Ltd. | | | 10,837 | | | | 909,766 | |
Other Securities | | | 123,302 | | | | 5,756,646 | |
| | | | | | | | |
| | | | | | | 11,355,980 | |
| | | | | | | | |
FINANCIALS (7.6%) | | | | | | | | |
Bank of America Corp. | | | 78,805 | | | | 1,741,591 | |
Berkshire Hathaway, Inc. Cl B* | | | 14,755 | | | | 2,404,770 | |
Citigroup, Inc. | | | 22,223 | | | | 1,320,713 | |
JPMorgan Chase & Co. | | | 27,992 | | | | 2,415,430 | |
Wells Fargo & Co. | | | 35,090 | | | | 1,933,810 | |
Other Securities | | | 213,343 | | | | 12,516,604 | |
| | | | | | | | |
| | | | | | | 22,332,918 | |
| | | | | | | | |
HEALTH CARE (6.9%) | | | | | | | | |
Johnson & Johnson | | | 21,192 | | | | 2,441,530 | |
Merck & Co., Inc. | | | 21,354 | | | | 1,257,110 | |
Pfizer, Inc. | | | 47,363 | | | | 1,538,350 | |
UnitedHealth Group, Inc. | | | 7,388 | | | | 1,182,376 | |
Other Securities | | | 171,050 | | | | 14,032,909 | |
| | | | | | | | |
| | | | | | | 20,452,275 | |
| | | | | | | | |
| | | | | | | | |
| | | Shares | | | Value | |
| | | | | | | | |
| INDEXED ASSETS (CONTINUED): | |
COMMON STOCKS (CONTINUED): | |
INDUSTRIALS (5.2%) | | | | | | | | |
Alaska Air Group, Inc. | | | 1,012 | | | $ | 89,795 | |
General Electric Co. | | | 68,666 | | | | 2,169,846 | |
Other Securities | | | 149,762 | | | | 13,127,251 | |
| | | | | | | | |
| | | | | | | 15,386,892 | |
| | | | | | | | |
INFORMATION TECHNOLOGY (10.5%) | | | | | | | | |
Alphabet, Inc. Cl A* | | | 2,297 | | | | 1,820,253 | |
Alphabet, Inc. Cl C* | | | 2,310 | | | | 1,782,912 | |
Apple, Inc. | | | 41,498 | | | | 4,806,293 | |
Broadcom Ltd. | | | 3,131 | | | | 553,467 | |
Cisco Systems, Inc. | | | 38,851 | | | | 1,174,077 | |
Facebook, Inc. Cl A* | | | 18,206 | | | | 2,094,600 | |
Intel Corp. | | | 36,736 | | | | 1,332,415 | |
Int’l. Business Machines Corp. | | | 6,723 | | | | 1,115,951 | |
Microsoft Corp. | | | 60,548 | | | | 3,762,448 | |
Oracle Corp. | | | 23,251 | | | | 894,001 | |
Visa, Inc. Cl A | | | 14,477 | | | | 1,129,496 | |
Other Securities | | | 203,599 | | | | 10,659,600 | |
| | | | | | | | |
| | | | | | | 31,125,513 | |
| | | | | | | | |
MATERIALS (1.4%) | | | | | | | | |
Other Securities | | | 64,552 | | | | 4,241,100 | |
| | | | | | | | |
REAL ESTATE (1.5%) | | | | | | | | |
Other Securities | | | 65,301 | | | | 4,350,496 | |
| | | | | | | | |
TELECOMMUNICATION SERVICES (1.4%) | | | | | | | | |
AT&T, Inc. | | | 47,736 | | | | 2,030,212 | |
Verizon Communications, Inc. | | | 31,741 | | | | 1,694,335 | |
Other Securities | | | 15,297 | | | | 256,508 | |
| | | | | | | | |
| | | | | | | 3,981,055 | |
| | | | | | | | |
UTILITIES (1.6%) | | | | | | | | |
Sempra Energy | | | 1,932 | | | | 194,436 | |
Other Securities | | | 87,735 | | | | 4,539,904 | |
| | | | | | | | |
| | | | | | | 4,734,340 | |
| | | | | | | | |
TOTAL INDEXED ASSETS-COMMON STOCKS | | | | | | | | |
(Cost: $100,287,712) 50.7% | | | | | | | 149,944,293 | |
| | | | | | | | |
| | | | | | | | | | | | | | | | | | | | |
| | | Rating** | | | Rate(%) | | | Maturity | | | Face Amount | | | Value | |
| INDEXED ASSETS: | | | | | | | | | | | | | | | | | | | | |
SHORT-TERM DEBT SECURITIES: | | | | | | | | | | | | | | | | | | | | |
U.S. GOVERNMENT (0.7%) | | | | | | | | | | | | | | | | | | | | |
U.S. Treasury Bill (1) | | | A-1+ | | | | 0.34 - 0.47 | | | | 02/09/17 | | | $ | 2,200,000 | | | $ | 2,198,879 | |
| | | | | | | | | | | | | | | | | | | | |
COMMERCIAL PAPER (3.5%) | | | | | | | | | | | | | | | | | | | | |
Cargill, Inc.† | | | A-1 | | | | 0.64 | | | | 01/06/17 | | | | 5,000,000 | | | | 4,999,467 | |
Novartis Finance Corp.† | | | A-1+ | | | | 0.50 | | | | 01/03/17 | | | | 5,200,000 | | | | 5,199,783 | |
| | | | | | | | | | | | | | | | | | | | |
| | | | | | | | | | | | | | | | | | | 10,199,250 | |
| | | | | | | | | | | | | | | | | | | | |
TOTAL INDEXED ASSETS-SHORT-TERM DEBT SECURITIES
(Cost: $12,398,129) 4.2% | | | | 12,398,129 | |
| | | | | | | | | | | | | | | | | | | | |
TOTAL INDEXED ASSETS
(Cost: $112,685,841) 54.9% | | | $ | 162,342,422 | |
| | | | | | | | | | | | | | | | | | | | |
The accompanying notes are an integral part of these portfolio schedules.
42
MUTUAL OF AMERICA INVESTMENT CORPORATION — ALL AMERICA FUND
SUMMARY PORTFOLIO OF INVESTMENTS IN SECURITIES (Continued)
December 31, 2016
| | | | | | | | |
| | | Shares | | | Value | |
| | | | | | | | |
| ACTIVE ASSETS: | | | | | | | | |
COMMON STOCKS: | | | | | | | | |
CONSUMER DISCRETIONARY (5.3%) | | | | | | | | |
CST Brands, Inc. | | | 32,328 | | | $ | 1,556,592 | |
Panera Bread Co. Cl A* | | | 6,276 | | | | 1,287,145 | |
Select Comfort Corp.* | | | 39,509 | | | | 893,694 | |
Other Securities | | | 354,750 | | | | 11,811,625 | |
| | | | | | | | |
| | | | | | | 15,549,056 | |
| | | | | | | | |
CONSUMER STAPLES (1.6%) | | | | | | | | |
Other Securities | | | 132,192 | | | | 4,837,758 | |
| | | | | | | | |
ENERGY (2.5%) | | | | | | | | |
PBF Energy, Inc. | | | 34,484 | | | | 961,414 | |
Range Resources Corp. | | | 25,385 | | | | 872,228 | |
Other Securities | | | 239,591 | | | | 5,509,943 | |
| | | | | | | | |
| | | | | | | 7,343,585 | |
| | | | | | | | |
FINANCIALS (8.7%) | | | | | | | | |
Starwood Property Trust, Inc. | | | 51,954 | | | | 1,140,391 | |
SVB Financial Group* | | | 7,212 | | | | 1,238,012 | |
Other Securities | | | 684,336 | | | | 23,573,909 | |
| | | | | | | | |
| | | | | | | 25,952,312 | |
| | | | | | | | |
HEALTH CARE (4.2%) | | | | | | | | |
Acadia Healthcare Co., Inc.* | | | 35,736 | | | | 1,182,862 | |
Other Securities | | | 307,864 | | | | 11,166,796 | |
| | | | | | | | |
| | | | | | | 12,349,658 | |
| | | | | | | | |
INDUSTRIALS (6.0%) | | | | | | | | |
Alaska Air Group, Inc. | | | 12,118 | | | | 1,075,230 | |
Astronics Corp.* | | | 27,210 | | | | 920,786 | |
| | | | | | | | |
| | | Shares | | | Value | |
| | | | | | | | |
| ACTIVE ASSETS (CONTINUED): | |
COMMON STOCKS (CONTINUED): | |
INDUSTRIALS (CONTINUED) | |
AZZ, Inc. | | | 20,004 | | | $ | 1,278,255 | |
Mueller Industries, Inc. | | | 26,260 | | | | 1,049,350 | |
Other Securities | | | 267,971 | | | | 13,409,235 | |
| | | | | | | | |
| | | | | | | 17,732,856 | |
| | | | | | | | |
INFORMATION TECHNOLOGY (7.1%) | | | | | | | | |
Broadcom Ltd. | | | 2,090 | | | | 369,449 | |
Cavium, Inc.* | | | 17,439 | | | | 1,088,892 | |
Stamps.com, Inc.* | | | 8,010 | | | | 918,346 | |
Other Securities | | | 675,725 | | | | 18,757,477 | |
| | | | | | | | |
| | | | | | | 21,134,164 | |
| | | | | | | | |
MATERIALS (2.3%) | | | | | | | | |
Other Securities | | | 201,993 | | | | 6,696,822 | |
| | | | | | | | |
REAL ESTATE (3.5%) | | | | | | | | |
Other Securities | | | 346,313 | | | | 10,211,283 | |
| | | | | | | | |
TELECOMMUNICATION SERVICES (0.4%) | | | | | | | | |
Other Securities | | | 73,461 | | | | 1,232,144 | |
| | | | | | | | |
UTILITIES (2.2%) | | | | | | | | |
Sempra Energy | | | 7,245 | | | | 729,137 | |
Other Securities | | | 126,744 | | | | 5,877,118 | |
| | | | | | | | |
| | | | | | | 6,606,255 | |
| | | | | | | | |
TOTAL ACTIVE ASSETS-COMMON STOCKS
(Cost: $112,150,206) 43.8% | | | | | | | 129,645,893 | |
| | | | | | | | |
| | | | | | | | | | | | | | | | | | | | |
| | | Rating** | | | Rate(%) | | | Maturity | | | Face Amount | | | Value | |
ACTIVE ASSETS: | | | | | | | | | | | | | | | | | | | | |
SHORT-TERM DEBT SECURITIES: | | | | | | | | | | | | | | | | | | | | |
COMMERCIAL PAPER (1.1%) | | | | | | | | | | | | | | | | | | | | |
Novartis Finance Corp.† | | | A-1+ | | | | 0.50 | | | | 01/03/17 | | | $ | 3,300,000 | | | $ | 3,299,863 | |
| | | | | | | | | | | | | | | | | | | | |
TOTAL ACTIVE ASSETS-SHORT-TERM DEBT SECURITIES
(Cost: $3,299,863) 1.1% | | | | 3,299,863 | |
| | | | | | | | | | | | | | | | | | | | |
| | | | | |
| ACTIVE ASSETS: | | | | | | | | | | | | | | | | | | | | |
WARRANTS: | | | | | | | | | | | | | | | | | | | | |
FINANCIALS (0.0%) (2) | | | | | | | | | | | | | | | | | | | | |
Easterly Acquisition Corp. — expiring 07/29/2020* | | | | | | | | | | | | | | | 13,042 | | | | 4,826 | |
Pace Hldgs. Corp. — expiring 10/29/2020* | | | | | | | | | | | | | | | 24,200 | | | | 14,520 | |
| | | | | | | | | | | | | | | | | | | | |
| | | | | | | | | | | | | | | | | | | 19,346 | |
| | | | | | | | | | | | | | | | | | | | |
TOTAL ACTIVE ASSETS-WARRANTS
(Cost: $15,065) 0.0% (2) | | | | 19,346 | |
| | | | | | | | | | | | | | | | | | | | |
TOTAL ACTIVE ASSETS
(Cost: $115,465,134) 44.9% | | | | 132,965,102 | |
| | | | | | | | | | | | | | | | | | | | |
TOTAL INVESTMENTS
(Cost: $228,150,975) 99.8% | | | | 295,307,524 | |
| | | | | | | | | | | | | | | | | | | | |
OTHER NET ASSETS 0.2% | | | | 536,204 | |
| | | | | | | | | | | | | | | | | | | | |
NET ASSETS 100.0% | | | $ | 295,843,728 | |
| | | | | | | | | | | | | | | | | | | | |
The accompanying notes are an integral part of these portfolio schedules.
43
MUTUAL OF AMERICA INVESTMENT CORPORATION — SMALL CAP VALUE FUND
SUMMARY PORTFOLIO OF INVESTMENTS IN SECURITIES
December 31, 2016
| | | | | | | | |
| | | Shares | | | Value | |
| | | | | | | | |
| COMMON STOCKS: | | | | | | | | |
CONSUMER DISCRETIONARY (7.3%) | | | | | | | | |
Bassett Furniture Industries, Inc. | | | 142,628 | | | $ | 4,335,891 | |
CST Brands, Inc. | | | 90,217 | | | | 4,343,949 | |
Houghton Mifflin Harcourt Co.* | | | 502,623 | | | | 5,453,460 | |
Select Comfort Corp.* | | | 235,124 | | | | 5,318,505 | |
Unifi, Inc.* | | | 125,675 | | | | 4,100,775 | |
Other Securities | | | 573,813 | | | | 10,450,580 | |
| | | | | | | | |
| | | | | | | 34,003,160 | |
| | | | | | | | |
CONSUMER STAPLES (2.3%) | | | | | | | | |
Crimson Wine Group Ltd.* | | | 476,811 | | | | 4,467,719 | |
Vector Group Ltd. | | | 157,533 | | | | 3,582,300 | |
Other Securities | | | 82,449 | | | | 2,832,584 | |
| | | | | | | | |
| | | | | | | 10,882,603 | |
| | | | | | | | |
ENERGY (6.4%) | | | | | | | | |
PBF Energy, Inc. | | | 281,879 | | | | 7,858,787 | |
Other Securities | | | 1,380,993 | | | | 21,807,902 | |
| | | | | | | | |
| | | | | | | 29,666,689 | |
| | | | | | | | |
FINANCIALS (35.7%) | | | | | | | | |
Allied World Assurance Co. Hldgs. AG | | | 72,807 | | | | 3,910,464 | |
American Equity Investment Life Hldg. Co. | | | 158,921 | | | | 3,582,079 | |
Aspen Insurance Hldgs. Ltd. | | | 79,149 | | | | 4,353,195 | |
BancFirst Corp. | | | 58,298 | | | | 5,424,629 | |
Banner Corp. | | | 95,264 | | | | 5,316,684 | |
Brookline Bancorp, Inc. | | | 374,530 | | | | 6,142,292 | |
Bryn Mawr Bank Corp. | | | 105,050 | | | | 4,427,858 | |
Colony Capital, Inc. Cl A | | | 246,654 | | | | 4,994,744 | |
Customers Bancorp, Inc.* | | | 141,303 | | | | 5,061,473 | |
Eagle Bancorp, Inc.* | | | 58,402 | | | | 3,559,602 | |
Ellington Financial LLC | | | 310,321 | | | | 4,816,182 | |
Enterprise Financial Svcs. Corp. | | | 111,896 | | | | 4,811,528 | |
First Interstate BancSytem, Inc. | | | 131,988 | | | | 5,616,089 | |
Glacier Bancorp, Inc. | | | 115,222 | | | | 4,174,493 | |
Investors Bancorp, Inc. | | | 331,616 | | | | 4,626,043 | |
iShares Russell 2000 Value ETF | | | 60,870 | | | | 7,239,878 | |
NMI Hldgs., Inc. Cl A* | | | 371,990 | | | | 3,961,694 | |
Northfield Bancorp, Inc. | | | 244,977 | | | | 4,892,191 | |
PrivateBancorp, Inc. | | | 110,602 | | | | 5,993,522 | |
Selective Insurance Group, Inc. | | | 115,135 | | | | 4,956,562 | |
SPDR S&P Bank ETF | | | 109,560 | | | | 4,762,573 | |
Stock Yards Bancorp, Inc. | | | 204,975 | | | | 9,623,576 | |
SVB Financial Group* | | | 58,666 | | | | 10,070,606 | |
Other Securities | | | 1,902,277 | | | | 43,861,706 | |
| | | | | | | | |
| | | | | | | 166,179,663 | |
| | | | | | | | |
| | | | | | | | |
| | | Shares | | | Value | |
| | | | | | | | |
| COMMON STOCKS (CONTINUED): | | | | | | | | |
HEALTH CARE (3.4%) | | | | | | | | |
Supernus Pharmaceuticals, Inc.* | | | 189,158 | | | $ | 4,776,240 | |
Other Securities | | | 775,660 | | | | 10,913,716 | |
| | | | | | | | |
| | | | | | | 15,689,956 | |
| | | | | | | | |
INDUSTRIALS (13.5%) | | | | | | | | |
Alaska Air Group, Inc. | | | 40,240 | | | | 3,570,495 | |
AZZ, Inc. | | | 116,120 | | | | 7,420,068 | |
Deluxe Corp. | | | 57,509 | | | | 4,118,219 | |
Encore Wire Corp. | | | 96,894 | | | | 4,200,355 | |
Miller Industries, Inc. | | | 260,428 | | | | 6,888,321 | |
Mueller Industries, Inc. | | | 331,066 | | | | 13,229,395 | |
Orbital ATK, Inc. | | | 67,032 | | | | 5,880,717 | |
Other Securities | | | 547,074 | | | | 17,747,315 | |
| | | | | | | | |
| | | | | | | 63,054,885 | |
| | | | | | | | |
INFORMATION TECHNOLOGY (10.5%) | | | | | | | | |
MKS Instruments, Inc. | | | 65,107 | | | | 3,867,356 | |
Proofpoint, Inc.* | | | 54,213 | | | | 3,830,148 | |
Stamps.com, Inc.* | | | 50,245 | | | | 5,760,589 | |
SYNNEX Corp. | | | 30,673 | | | | 3,712,046 | |
Other Securities | | | 2,516,321 | | | | 31,572,112 | |
| | | | | | | | |
| | | | | | | 48,742,251 | |
| | | | | | | | |
MATERIALS (3.4%) | |
Kaiser Aluminum Corp. | | | 62,845 | | | | 4,882,428 | |
Kraton Corporation Inc.* | | | 156,136 | | | | 4,446,753 | |
Other Securities | | | 391,335 | | | | 6,245,177 | |
| | | | | | | | |
| | | | | | | 15,574,358 | |
| | | | | | | | |
REAL ESTATE (9.1%) | |
Chesapeake Lodging Trust | | | 138,787 | | | | 3,589,032 | |
Easterly Government Pptys. | | | 202,273 | | | | 4,049,505 | |
FelCor Lodging Trust, Inc. | | | 574,412 | | | | 4,601,040 | |
Forest City Realty Trust, Inc. Cl A | | | 277,128 | | | | 5,775,348 | |
Highwoods Properties, Inc. | | | 87,286 | | | | 4,452,459 | |
Other Securities | | | 805,343 | | | | 19,684,359 | |
| | | | | | | | |
| | | | | | | 42,151,743 | |
| | | | | | | | |
TELECOMMUNICATION SERVICES (1.0%) | |
Other Securities | | | 391,345 | | | | 4,575,450 | |
| | | | | | | | |
UTILITIES (3.8%) | |
Other Securities | | | 365,437 | | | | 17,554,344 | |
| | | | | | | | |
TOTAL COMMON STOCKS
(Cost: $332,428,801) 96.4% | | | | | | | 448,075,102 | |
| | | | | | | | |
The accompanying notes are an integral part of these portfolio schedules.
44
MUTUAL OF AMERICA INVESTMENT CORPORATION — SMALL CAP VALUE FUND
SUMMARY PORTFOLIO OF INVESTMENTS IN SECURITIES (Continued)
December 31, 2016
| | | | | | | | | | | | | | | | | | | | |
| | | Rating** | | | Rate(%) | | | Maturity | | | Face Amount | | | Value | |
| SHORT-TERM DEBT SECURITIES: | | | | | | | | | | | | | | | | | | | | |
U.S. GOVERNMENT (2.7%) | | | | | | | | | | | | | | | | | | | | |
U.S. Treasury Bill | | | A-1+ | | | | 0.41 - 0.47 | | | | 01/26/17 - 02/09/17 | | | $ | 12,500,000 | | | $ | 12,493,963 | |
| | | | | | | | | | | | | | | | | | | | |
COMMERCIAL PAPER (1.5%) | | | | | | | | | | | | | | | | | | | | |
Cargill, Inc.† | | | A-1 | | | | 0.64 | | | | 01/06/17 | | | | 1,000,000 | | | | 999,893 | |
Novartis Finance Corp.† | | | A-1+ | | | | 0.50 | | | | 01/03/17 | | | | 6,000,000 | | | | 5,999,750 | |
| | | | | | | | | | | | | | | | | | | | |
| | | | | | | | | | | | | | | | | | | 6,999,643 | |
| | | | | | | | | | | | | | | | | | | | |
TOTAL SHORT-TERM DEBT SECURITIES
(Cost: $19,493,606) 4.2% | | | | 19,493,606 | |
| | | | | | | | | | | | | | | | | | | | |
| | | | | | | | |
| | | Shares | | | Value | |
WARRANTS: | | | | | | | | |
FINANCIALS (0.0%) (2) | |
Easterly Acquisition Corp. — expiring 07/29/2020* | | | 146,691 | | | $ | 54,276 | |
Pace Hldgs. Corp. — expiring 10/29/2020* | | | 273,830 | | | | 164,298 | |
| | | | | | | | |
| | | | | | | 218,574 | |
| | | | | | | | |
TOTAL WARRANTS | | | | | | | | |
(Cost: $169,934) 0.0% (2) | | | | | | | 218,574 | |
| | | | | | | | |
TOTAL INVESTMENTS | | | | | | | | |
(Cost: $352,092,341) 100.6% | | | | | | | 467,787,282 | |
| | | | | | | | |
OTHER NET ASSETS -0.6% | | | | | | | (2,945,405 | ) |
| | | | | | | | |
NET ASSETS 100.0% | | | | | | $ | 464,841,877 | |
| | | | | | | | |
The accompanying notes are an integral part of these portfolio schedules.
45
MUTUAL OF AMERICA INVESTMENT CORPORATION — SMALL CAP GROWTH FUND
SUMMARY PORTFOLIO OF INVESTMENTS IN SECURITIES
December 31, 2016
| | | | | | | | |
| | | Shares | | | Value | |
| | | | | | | | |
| COMMON STOCKS: | | | | | | | | |
CONSUMER DISCRETIONARY (16.8%) | |
Bloomin’ Brands, Inc. | | | 222,912 | | | $ | 4,019,103 | |
Cooper Tire & Rubber Co. | | | 88,085 | | | | 3,422,102 | |
CST Brands, Inc. | | | 129,588 | | | | 6,239,662 | |
Five Below, Inc.* | | | 120,057 | | | | 4,797,478 | |
Haverty Furniture Cos., Inc. | | | 245,929 | | | | 5,828,517 | |
Lions Gate Entertainment Corp. Cl A | | | 110,555 | | | | 2,973,930 | |
Lions Gate Entertainment Corp. Cl B* | | | 110,555 | | | | 2,713,020 | |
Lithia Motors, Inc. Cl A | | | 37,770 | | | | 3,657,269 | |
Red Robin Gourmet Burgers, Inc.* | | | 79,491 | | | | 4,483,292 | |
Select Comfort Corp.* | | | 269,483 | | | | 6,095,705 | |
Steve Madden Ltd.* | | | 94,424 | | | | 3,375,658 | |
Thor Industries, Inc. | | | 42,896 | | | | 4,291,745 | |
Vista Outdoor, Inc.* | | | 99,530 | | | | 3,672,657 | |
Other Securities | | | 589,282 | | | | 16,991,202 | |
| | | | | | | | |
| | | | | | | 72,561,340 | |
| | | | | | | | |
CONSUMER STAPLES (3.4%) | |
WD-40 Co. | | | 55,663 | | | | 6,507,005 | |
Other Securities | | | 290,431 | | | | 8,402,355 | |
| | | | | | | | |
| | | | | | | 14,909,360 | |
| | | | | | | | |
ENERGY (1.4%) | |
Other Securities | | | 250,978 | | | | 5,951,310 | |
| | | | | | | | |
FINANCIALS (7.8%) | |
FBL Financial Group, Inc. Cl A | | | 51,971 | | | | 4,061,534 | |
Investors Bancorp, Inc. | | | 350,144 | | | | 4,884,509 | |
iShares Russell 2000 ETF | | | 39,941 | | | | 5,386,044 | |
Pinnacle Financial Partners, Inc. | | | 55,887 | | | | 3,872,969 | |
Safety Insurance Group, Inc. | | | 61,226 | | | | 4,512,356 | |
Other Securities | | | 357,092 | | | | 10,828,569 | |
| | | | | | | | |
| | | | | | | 33,545,981 | |
| | | | | | | | |
HEALTH CARE (18.5%) | |
Abiomed, Inc.* | | | 30,134 | | | | 3,395,499 | |
Acadia Healthcare Co., Inc.* | | | 186,878 | | | | 6,185,662 | |
Emergent Biosolutions, Inc.* | | | 126,488 | | | | 4,153,866 | |
Omnicell, Inc.* | | | 137,107 | | | | 4,647,927 | |
PAREXEL International Corp.* | | | 58,143 | | | | 3,821,158 | |
Supernus Pharmaceuticals, Inc.* | | | 179,870 | | | | 4,541,718 | |
TESARO, Inc.* | | | 35,629 | | | | 4,791,388 | |
WellCare Health Plans, Inc.* | | | 27,611 | | | | 3,784,916 | |
Other Securities | | | 1,561,907 | | | | 45,015,893 | |
| | | | | | | | |
| | | | | | | 80,338,027 | |
| | | | | | | | |
INDUSTRIALS (13.5%) | |
Astronics Corp.* | | | 275,898 | | | | 9,336,383 | |
AZZ, Inc. | | | 112,762 | | | | 7,205,490 | |
| | | | | | | | |
| | | Shares | | | Value | |
| | | | | | | | |
| COMMON STOCKS (CONTINUED): | | | | | | | | |
INDUSTRIALS (CONTINUED) | | | | | | | | |
Covenant Transportation Group Cl A* | | | 230,319 | | | $ | 4,454,369 | |
EnPro Industries, Inc. | | | 91,366 | | | | 6,154,414 | |
Healthcare Svcs. Group, Inc. | | | 141,445 | | | | 5,540,401 | |
Mueller Water Products, Inc. Cl A | | | 378,072 | | | | 5,032,138 | |
Sun Hydraulics Corp. | | | 91,470 | | | | 3,656,056 | |
Teledyne Technologies, Inc.* | | | 37,777 | | | | 4,646,571 | |
Trex Co., Inc.* | | | 73,035 | | | | 4,703,454 | |
Other Securities | | | 226,953 | | | | 7,563,949 | |
| | | | | | | | |
| | | | | | | 58,293,225 | |
| | | | | | | | |
INFORMATION TECHNOLOGY (24.1%) | |
Ambarella, Inc.* | | | 64,793 | | | | 3,507,245 | |
Cavium, Inc.* | | | 93,081 | | | | 5,811,978 | |
LogMeIn, Inc. | | | 72,057 | | | | 6,957,103 | |
MaxLinear, Inc. Cl A* | | | 207,669 | | | | 4,527,184 | |
Monolithic Power Systems, Inc. | | | 52,927 | | | | 4,336,309 | |
Proofpoint, Inc.* | | | 83,061 | | | | 5,868,260 | |
Other Securities | | | 3,445,115 | | | | 73,465,873 | |
| | | | | | | | |
| | | | | | | 104,473,952 | |
| | | | | | | | |
MATERIALS (4.5%) | |
Berry Plastics Group, Inc.* | | | 71,672 | | | | 3,492,577 | |
Ferro Corp.* | | | 395,488 | | | | 5,667,343 | |
U.S. Concrete, Inc.* | | | 81,485 | | | | 5,337,268 | |
Other Securities | | | 327,043 | | | | 5,069,380 | |
| | | | | | | | |
| | | | | | | 19,566,568 | |
| | | | | | | | |
REAL ESTATE (3.6%) | |
Easterly Government Pptys. | | | 218,327 | | | | 4,370,907 | |
QTS Realty Trust, Inc. | | | 86,558 | | | | 4,297,605 | |
Terreno Realty Corp. | | | 123,865 | | | | 3,528,914 | |
Other Securities | | | 122,617 | | | | 3,282,457 | |
| | | | | | | | |
| | | | | | | 15,479,883 | |
| | | | | | | | |
TELECOMMUNICATION SERVICES (1.5%) | |
Shenandoah Telecommunications Co. | | | 126,215 | | | | 3,445,670 | |
Other Securities | | | 369,987 | | | | 3,059,792 | |
| | | | | | | | |
| | | | | | | 6,505,462 | |
| | | | | | | | |
UTILITIES (2.3%) | |
Chesapeake Utilities Corp. | | | 75,755 | | | | 5,071,797 | |
Northwest Natural Gas Co. | | | 79,071 | | | | 4,728,446 | |
| | | | | | | | |
| | | | | | | 9,800,243 | |
| | | | | | | | |
TOTAL COMMON STOCKS
(Cost: $367,779,979) 97.4% | | | | | | | 421,425,351 | |
| | | | | | | | |
The accompanying notes are an integral part of these portfolio schedules.
46
MUTUAL OF AMERICA INVESTMENT CORPORATION — SMALL CAP GROWTH FUND
SUMMARY PORTFOLIO OF INVESTMENTS IN SECURITIES (Continued)
December 31, 2016
| | | | | | | | | | | | | | | | | | | | |
| | | Rating** | | | Rate(%) | | | Maturity | | | Face Amount | | | Value | |
| SHORT-TERM DEBT SECURITIES: | | | | | | | | | | | | | | | | | | | | |
U.S. GOVERNMENT (0.8%) | | | | | | | | | | | | | | | | | | | | |
U.S. Treasury Bill | | | A-1+ | | | | 0.31 - 0.46 | | | | 01/05/17 - 02/23/17 | | | $ | 3,600,000 | | | $ | 3,598,422 | |
| | | | | | | | | | | | | | | | | | | | |
COMMERCIAL PAPER (1.9%) | | | | | | | | | | | | | | | | | | | | |
Cargill, Inc.† | | | A-1 | | | | 0.71 | | | | 01/03/17 | | | | 2,000,000 | | | | 1,999,882 | |
Danaher Corp.† | | | A-1 | | | | 0.70 | | | | 01/06/17 | | | | 1,100,000 | | | | 1,099,872 | |
Novartis Finance Corp.† | | | A-1+ | | | | 0.50 | | | | 01/03/17 | | | | 2,300,000 | | | | 2,299,904 | |
Southern California Gas Co.† | | | A-1 | | | | 0.70 | | | | 01/03/17 | | | | 1,250,000 | | | | 1,249,927 | |
Toyota Motor Credit Corp. | | | A-1+ | | | | 0.78 | | | | 01/04/17 | | | | 1,500,000 | | | | 1,499,870 | |
| | | | | | | | | | | | | | | | | | | | |
| | | | | | | | | | | | | | | | | | | 8,149,455 | |
| | | | | | | | | | | | | | | | | | | | |
TOTAL SHORT-TERM DEBT SECURITIES
(Cost: $11,747,877) 2.7% | | | | 11,747,877 | |
| | | | | | | | | | | | | | | | | | | | |
TOTAL INVESTMENTS
(Cost: $379,527,856) 100.1% | | | | 433,173,228 | |
| | | | | | | | | | | | | | | | | | | | |
OTHER NET ASSETS -0.1% | | | | (367,042 | ) |
| | | | | | | | | | | | | | | | | | | | |
NET ASSETS 100.0% | | | $ | 432,806,186 | |
| | | | | | | | | | | | | | | | | | | | |
The accompanying notes are an integral part of these portfolio schedules.
47
MUTUAL OF AMERICA INVESTMENT CORPORATION — MID CAP VALUE FUND
SUMMARY PORTFOLIO OF INVESTMENTS IN SECURITIES
December 31, 2016
| | | | | | | | |
| | | Shares | | | Value | |
| | | | | | | | |
| COMMON STOCKS: | | | | | | | | |
CONSUMER DISCRETIONARY (3.7%) | |
CST Brands, Inc. | | | 21,146 | | | $ | 1,018,180 | |
Other Securities | | | 73,600 | | | | 2,581,556 | |
| | | | | | | | |
| | | | | | | 3,599,736 | |
| | | | | | | | |
CONSUMER STAPLES (3.0%) | |
Ingredion, Inc. | | | 7,957 | | | | 994,307 | |
Other Securities | | | 46,167 | | | | 1,989,246 | |
| | | | | | | | |
| | | | | | | 2,983,553 | |
| | | | | | | | |
ENERGY (10.2%) | |
Baker Hughes, Inc. | | | 17,416 | | | | 1,131,518 | |
Continental Resources, Inc.* | | | 18,819 | | | | 969,931 | |
Hess Corp. | | | 14,143 | | | | 880,967 | |
Nabors Industries Ltd. | | | 65,633 | | | | 1,076,381 | |
Noble Energy, Inc. | | | 25,229 | | | | 960,216 | |
PBF Energy, Inc. | | | 51,271 | | | | 1,429,435 | |
Range Resources Corp. | | | 32,848 | | | | 1,128,657 | |
Other Securities | | | 140,188 | | | | 2,463,494 | |
| | | | | | | | |
| | | | | | | 10,040,599 | |
| | | | | | | | |
FINANCIALS (23.2%) | |
American Financial Group, Inc. | | | 12,141 | | | | 1,069,865 | |
Ameriprise Financial, Inc. | | | 16,235 | | | | 1,801,111 | |
Associated Banc-Corp. | | | 47,436 | | | | 1,171,669 | |
BankUnited, Inc. | | | 22,415 | | | | 844,821 | |
Discover Financial Svcs. | | | 11,717 | | | | 844,679 | |
Everest Re Group Ltd. | | | 5,873 | | | | 1,270,917 | |
Fifth Third Bancorp | | | 52,483 | | | | 1,415,467 | |
Hartford Financial Svcs. Group, Inc. | | | 20,234 | | | | 964,150 | |
iShares Russell Mid-Cap Value ETF | | | 36,640 | | | | 2,946,956 | |
KeyCorp | | | 97,578 | | | | 1,782,750 | |
Lincoln National Corp. | | | 19,917 | | | | 1,319,900 | |
Reinsurance Grp. of America, Inc. | | | 11,699 | | | | 1,472,085 | |
SVB Financial Group* | | | 10,997 | | | | 1,887,745 | |
Voya Financial, Inc. | | | 25,933 | | | | 1,017,092 | |
Other Securities | | | 112,788 | | | | 2,997,406 | |
| | | | | | | | |
| | | | | | | 22,806,613 | |
| | | | | | | | |
HEALTH CARE (4.9%) | |
Boston Scientific Corp.* | | | 43,464 | | | | 940,126 | |
Other Securities | | | 55,007 | | | | 3,862,111 | |
| | | | | | | | |
| | | | | | | 4,802,237 | |
| | | | | | | | |
INDUSTRIALS (11.5%) | |
Alaska Air Group, Inc. | | | 20,485 | | | | 1,817,634 | |
Carlisle Cos., Inc. | | | 8,729 | | | | 962,721 | |
| | | | | | | | |
| | | Shares | | | Value | |
| | | | | | | | |
| COMMON STOCKS (CONTINUED): | | | | | | | | |
INDUSTRIALS (CONTINUED) | | | | | | | | |
| | | | | | | | |
Kirby Corp.* | | | 16,388 | | | $ | 1,089,802 | |
L3 Technologies, Inc. Inc. | | | 10,636 | | | | 1,617,842 | |
Old Dominion Freight Line, Inc.* | | | 13,127 | | | | 1,126,165 | |
Orbital ATK, Inc. | | | 14,973 | | | | 1,313,581 | |
United Rentals, Inc.* | | | 11,718 | | | | 1,237,186 | |
Other Securities | | | 63,012 | | | | 2,103,403 | |
| | | | | | | | |
| | | | | | | 11,268,334 | |
| | | | | | | | |
INFORMATION TECHNOLOGY (11.6%) | |
ARRIS International PLC* | | | 36,381 | | | | 1,096,160 | |
Avnet, Inc. | | | 17,230 | | | | 820,320 | |
Broadcom Ltd. | | | 8,864 | | | | 1,566,889 | |
Fidelity Nat’l. Information Svcs., Inc. | | | 11,895 | | | | 899,738 | |
Harris Corp. | | | 9,017 | | | | 923,972 | |
Stamps.com, Inc.* | | | 10,728 | | | | 1,229,965 | |
Other Securities | | | 126,472 | | | | 4,796,262 | |
| | | | | | | | |
| | | | | | | 11,333,306 | |
| | | | | | | | |
MATERIALS (7.8%) | | | | | | | | |
Crown Hldgs., Inc.* | | | 29,844 | | | | 1,568,899 | |
Eastman Chemical Co. | | | 14,246 | | | | 1,071,442 | |
International Paper Co. | | | 20,087 | | | | 1,065,816 | |
Packaging Corp. of America | | | 19,662 | | | | 1,667,731 | |
Other Securities | | | 77,225 | | | | 2,275,547 | |
| | | | | | | | |
| | | | | | | 7,649,435 | |
| | | | | | | | |
REAL ESTATE (11.6%) | | | | | | | | |
AvalonBay Communities, Inc. | | | 4,915 | | | | 870,692 | |
Duke Realty Corp. | | | 48,351 | | | | 1,284,203 | |
ProLogis, Inc. | | | 18,583 | | | | 980,997 | |
Vornado Realty Trust | | | 12,314 | | | | 1,285,212 | |
Other Securities | | | 235,604 | | | | 6,925,087 | |
| | | | | | | | |
| | | | | | | 11,346,191 | |
| | | | | | | | |
UTILITIES (8.2%) | | | | | | | | |
Ameren Corp. | | | 17,204 | | | | 902,522 | |
Consolidated Edison, Inc. | | | 13,337 | | | | 982,670 | |
Great Plains Energy, Inc. | | | 33,163 | | | | 907,008 | |
PPL Corp. | | | 26,935 | | | | 917,137 | |
Public Svc. Enterprise Group, Inc. | | | 25,435 | | | | 1,116,088 | |
Other Securities | | | 61,633 | | | | 3,160,248 | |
| | | | | | | | |
| | | | | | | 7,985,673 | |
| | | | | | | | |
TOTAL COMMON STOCKS | | | | | | | | |
(Cost: $75,446,843) 95.7% | | | | | | | 93,815,677 | |
| | | | | | | | |
| | | | | | | | | | | | | | | | | | | | |
| | | Rating** | | | Rate(%) | | | Maturity | | | Face Amount | | | Value | |
| SHORT-TERM DEBT SECURITIES: | | | | | | | | | | | | | | | | | | | | |
U.S. GOVERNMENT (1.1%) | | | | | | | | | | | | | | | | | | | | |
U.S. Treasury Bill | | | A-1+ | | | | 0.31 - 0.46 | | | | 01/05/17 - 02/23/17 | | | $ | 1,100,000 | | | $ | 1,099,823 | |
| | | | | | | | | | | | | | | | | | | | |
COMMERCIAL PAPER (4.1%) | | | | | | | | | | | | | | | | | | | | |
Cargill, Inc.† | | | A-1 | | | | 0.64 | | | | 01/06/17 | | | | 1,000,000 | | | | 999,893 | |
Novartis Finance Corp.† | | | A-1+ | | | | 0.50 | | | | 01/03/17 | | | | 1,500,000 | | | | 1,499,938 | |
Toyota Motor Credit Corp. | | | A-1+ | | | | 0.78 | | | | 01/04/17 | | | | 1,500,000 | | | | 1,499,870 | |
| | | | | | | | | | | | | | | | | | | | |
| | | | | | | | | | | | | | | | | | | 3,999,701 | |
| | | | | | | | | | | | | | | | | | | | |
TOTAL SHORT-TERM DEBT SECURITIES
(Cost: $5,099,524) 5.2% | | | | 5,099,524 | |
| | | | | | | | | | | | | | | | | | | | |
TOTAL INVESTMENTS
(Cost: $80,546,367) 100.9% | | | | 98,915,201 | |
| | | | | | | | | | | | | | | | | | | | |
OTHER NET ASSETS -0.9% | | | | (897,886 | ) |
| | | | | | | | | | | | | | | | | | | | |
NET ASSETS 100.0% | | | $ | 98,017,315 | |
| | | | | | | | | | | | | | | | | | | | |
The accompanying notes are an integral part of these portfolio schedules.
48
MUTUAL OF AMERICA INVESTMENT CORPORATION — MID-CAP EQUITY INDEX FUND
SUMMARY PORTFOLIO OF INVESTMENTS IN SECURITIES
December 31, 2016
| | | | | | | | |
| | | Shares | | | Value | |
| | | | | | | | |
| INDEXED ASSETS: | | | | | | | | |
COMMON STOCKS: | | | | | | | | |
CONSUMER DISCRETIONARY (10.8%) | | | | | | | | |
Domino’s Pizza, Inc. | | | 35,250 | | | $ | 5,613,210 | |
Other Securities | | | 3,753,615 | | | | 128,636,868 | |
| | | | | | | | |
| | | | | | | 134,250,078 | |
| | | | | | | | |
CONSUMER STAPLES (4.1%) | | | | | | | | |
Ingredion, Inc. | | | 53,433 | | | | 6,676,988 | |
WhiteWave Foods Co. Cl A* | | | 129,889 | | | | 7,221,827 | |
Other Securities | | | 1,124,119 | | | | 37,389,387 | |
| | | | | | | | |
| | | | | | | 51,288,202 | |
| | | | | | | | |
ENERGY (3.8%) | | | | | | | | |
Other Securities | | | 2,429,750 | | | | 47,176,505 | |
| | | | | | | | |
FINANCIALS (16.4%) | | | | | | | | |
Alleghany Corp.* | | | 11,373 | | | | 6,916,149 | |
East West Bancorp, Inc. | | | 106,309 | | | | 5,403,686 | |
Everest Re Group Ltd. | | | 30,272 | | | | 6,550,861 | |
FactSet Research Systems, Inc. | | | 29,654 | | | | 4,846,353 | |
MSCI, Inc. Cl A | | | 68,712 | | | | 5,413,131 | |
New York Community Bancorp, Inc. | | | 357,094 | | | | 5,681,366 | |
Raymond James Financial, Inc. | | | 93,422 | | | | 6,471,342 | |
Reinsurance Grp. of America, Inc. | | | 47,560 | | | | 5,984,475 | |
SEI Investments Co. | | | 98,287 | | | | 4,851,446 | |
Signature Bank* | | | 39,346 | | | | 5,909,769 | |
SVB Financial Group* | | | 38,215 | | | | 6,559,987 | |
Other Securities | | | 4,209,891 | | | | 139,519,478 | |
| | | | | | | | |
| | | | | | | 204,108,043 | |
| | | | | | | | |
HEALTH CARE (7.2%) | | | | | | | | |
Align Technology, Inc.* | | | 54,707 | | | | 5,258,984 | |
IDEXX Laboratories, Inc.* | | | 66,155 | | | | 7,757,992 | |
ResMed, Inc. | | | 103,272 | | | | 6,408,028 | |
Teleflex, Inc. | | | 31,998 | | | | 5,156,478 | |
Other Securities | | | 1,205,861 | | | | 64,969,800 | |
| | | | | | | | |
| | | | | | | 89,551,282 | |
| | | | | | | | |
INDUSTRIALS (14.2%) | | | | | | | | |
Carlisle Cos., Inc. | | | 47,292 | | | | 5,215,835 | |
Huntington Ingalls Industries, Inc. | | | 34,189 | | | | 6,297,272 | |
IDEX Corp. | | | 56,161 | | | | 5,057,860 | |
JetBlue Airways Corp* | | | 236,509 | | | | 5,302,532 | |
Smith (A.O.) Corp. | | | 108,160 | | | | 5,121,376 | |
Wabtec Corp. | | | 64,512 | | | | 5,355,786 | |
Other Securities | | | 2,533,023 | | | | 144,643,497 | |
| | | | | | | | |
| | | | | | | 176,994,158 | |
| | | | | | | | |
| | | | | | | | |
| | | Shares | | | Value | |
| | | | | | | | |
| INDEXED ASSETS (CONTINUED): | | | | | | | | |
COMMON STOCKS (CONTINUED): | | | | | | | | |
INFORMATION TECHNOLOGY (16.8%) | | | | | | | | |
Advanced Micro Devices, Inc.* | | | 552,353 | | | $ | 6,263,683 | |
ANSYS, Inc.* | | | 63,261 | | | | 5,851,010 | |
Broadridge Financial Solutions, Inc. | | | 87,770 | | | | 5,819,151 | |
Cadence Design Systems, Inc.* | | | 210,178 | | | | 5,300,689 | |
CDK Global, Inc. | | | 110,313 | | | | 6,584,583 | |
Computer Sciences Corp. | | | 103,006 | | | | 6,120,617 | |
Gartner, Inc.* | | | 61,078 | | | | 6,173,153 | |
Henry (Jack) & Associates, Inc. | | | 57,392 | | | | 5,095,262 | |
Leidos Hldgs., Inc. | | | 105,581 | | | | 5,399,412 | |
Synopsys, Inc.* | | | 111,352 | | | | 6,554,179 | |
Trimble Navigation Ltd.* | | | 184,318 | | | | 5,557,188 | |
Other Securities | | | 3,795,725 | | | | 145,087,552 | |
| | | | | | | | |
| | | | | | | 209,806,479 | |
| | | | | | | | |
MATERIALS (7.0%) | | | | | | | | |
Ashland Global Holdings, Inc. | | | 45,452 | | | | 4,967,449 | |
Packaging Corp. of America | | | 67,781 | | | | 5,749,184 | |
RPM International, Inc. | | | 98,171 | | | | 5,284,545 | |
Steel Dynamics, Inc. | | | 177,971 | | | | 6,332,208 | |
Valspar Corp. | | | 53,007 | | | | 5,492,055 | |
Other Securities | | | 1,346,166 | | | | 59,303,596 | |
| | | | | | | | |
| | | | | | | 87,129,037 | |
| | | | | | | | |
REAL ESTATE (10.0%) | | | | | | | | |
Alexandria Real Estate Equities, Inc. | | | 58,830 | | | | 6,537,778 | |
American Campus Communities, Inc. | | | 96,980 | | | | 4,826,695 | |
Camden Property Trust | | | 64,457 | | | | 5,418,900 | |
Duke Realty Corp. | | | 261,545 | | | | 6,946,635 | |
Kilroy Realty Corp. | | | 67,489 | | | | 4,941,545 | |
Regency Centers Corp. | | | 77,585 | | | | 5,349,486 | |
Other Securities | | | 2,950,971 | | | | 90,709,092 | |
| | | | | | | | |
| | | | | | | 124,730,131 | |
| | | | | | | | |
TELECOMMUNICATION SERVICES (0.2%) | | | | | | | | |
Other Securities | | | 69,434 | | | | 2,004,560 | |
| | | | | | | | |
UTILITIES (5.1%) | | | | | | | | |
Atmos Energy Corp. | | | 76,185 | | | | 5,649,118 | |
OGE Energy Corp. | | | 146,051 | | | | 4,885,406 | |
UGI Corp. | | | 127,182 | | | | 5,860,547 | |
Westar Energy, Inc. | | | 104,801 | | | | 5,905,536 | |
Other Securities | | | 975,872 | | | | 41,268,625 | |
| | | | | | | | |
| | | | | | | 63,569,232 | |
| | | | | | | | |
TOTAL INDEXED ASSETS-COMMON STOCKS | | | | | | | | |
(Cost: $906,006,366) 95.6% | | | | | | | 1,190,607,707 | |
| | | | | | | | |
The accompanying notes are an integral part of these portfolio schedules.
49
MUTUAL OF AMERICA INVESTMENT CORPORATION — MID-CAP EQUITY INDEX FUND
SUMMARY PORTFOLIO OF INVESTMENTS IN SECURITIES (Continued)
December 31, 2016
| | | | | | | | | | | | | | | | | | | | |
| | | Rating** | | | Rate(%) | | | Maturity | | | Face Amount | | | Value | |
| SHORT-TERM DEBT SECURITIES: | | | | | | | | | | | | | | | | | | | | |
U.S. GOVERNMENT (1.2%) | | | | | | | | | | | | | | | | | | | | |
U.S. Treasury Bill (1) | | | A-1+ | | | | 0.31 - 0.44 | | | | 01/12/17 - 02/16/17 | | | $ | 14,500,000 | | | $ | 14,495,608 | |
| | | | | | | | | | | | | | | | | | | | |
U.S. GOVERNMENT AGENCIES (0.4%) | | | | | | | | | | | | | | | | | | | | |
FHLB | | | A-1+ | | | | 0.49 | | | | 02/07/17 | | | | 5,400,000 | | | | 5,397,235 | |
| | | | | | | | | | | | | | | | | | | | |
COMMERCIAL PAPER (2.7%) | | | | | | | | | | | | | | | | | | | | |
Cargill, Inc.† | | | A-1 | | | | 0.64 - 0.71 | | | | 01/03/17 - 01/06/17 | | | | 9,750,000 | | | | 9,749,197 | |
Danaher Corp.† | | | A-1 | | | | 0.70 | | | | 01/06/17 | | | | 2,500,000 | | | | 2,499,708 | |
GE Capital Treasury LLC | | | A-1+ | | | | 0.61 | | | | 01/26/17 | | | | 5,000,000 | | | | 4,997,797 | |
Novartis Finance Corp.† | | | A-1+ | | | | 0.50 | | | | 01/03/17 | | | | 6,000,000 | | | | 5,999,751 | |
Southern California Gas Co.† | | | A-1 | | | | 0.70 | | | | 01/03/17 | | | | 5,000,000 | | | | 4,999,708 | |
Toyota Motor Credit Corp. | | | A-1+ | | | | 0.65 | | | | 02/01/17 | | | | 5,000,000 | | | | 4,997,109 | |
| | | | | | | | | | | | | | | | | | | | |
| | | | | | | | | | | | | | | | | | | 33,243,270 | |
| | | | | | | | | | | | | | | | | | | | |
TOTAL SHORT-TERM DEBT SECURITIES
(Cost: $53,136,113) 4.3% | | | | 53,136,113 | |
| | | | | | | | | | | | | | | | | | | | |
TOTAL INVESTMENTS
(Cost: $959,142,479) 99.9% | | | | 1,243,743,820 | |
| | | | | | | | | | | | | | | | | | | | |
OTHER NET ASSETS 0.1% | | | | 1,293,355 | |
| | | | | | | | | | | | | | | | | | | | |
NET ASSETS 100.0% | | | $ | 1,245,037,175 | |
| | | | | | | | | | | | | | | | | | | | |
The accompanying notes are an integral part of these portfolio schedules.
50
MUTUAL OF AMERICA INVESTMENT CORPORATION — INTERNATIONAL FUND
PORTFOLIO OF INVESTMENTS IN SECURITIES
December 31, 2016
| | | | | | | | |
| | | Shares | | | Value | |
| COMMON STOCKS: | | | | | | | | |
FINANCIALS (94.4%) | | | | | | | | |
iShares Core MSCI EAFE ETF | | | 138,481 | | | $ | 7,426,736 | |
iShares Core MSCI Europe ETF | | | 393,284 | | | | 16,002,726 | |
iShares Core MSCI Pacific ETF | | | 177,010 | | | | 8,639,858 | |
iShares Edge MSCI Emerging Markets ETF | | | 179,014 | | | | 8,755,575 | |
iShares MSCI EAFE ETF | | | 2,388,293 | | | | 137,876,155 | |
iShares MSCI EAFE Growth ETF | | | 443,228 | | | | 28,229,191 | |
iShares MSCI EAFE Small-Cap ETF | | | 177,935 | | | | 8,866,501 | |
iShares MSCI EAFE Value ETF | | | 606,383 | | | | 28,651,597 | |
Vanguard FTSE Developed Markets ETF | | | 2,129,980 | | | | 77,829,469 | |
Vanguard FTSE Europe ETF | | | 424,630 | | | | 20,356,762 | |
Vanguard FTSE Pacific ETF | | | 220,480 | | | | 12,814,298 | |
| | | | | | | | |
| | | | | | | 355,448,868 | |
| | | | | | | | |
TOTAL COMMON STOCKS
(Cost: $369,772,919) 94.4% | | | | | | | 355,448,868 | |
| | | | | | | | |
| | | | | | | | | | | | | | | | | | | | |
| | | Rating** | | | Rate(%) | | | Maturity | | | Face Amount | | | Value | |
| SHORT-TERM DEBT SECURITIES: | | | | | | | | | | | | | | | | | | | | |
U.S. GOVERNMENT (2.0%) | | | | | | | | | | | | | | | | | | | | |
U.S. Treasury Bill | | | A-1+ | | | | 0.41 - 0.46 | | | | 01/12/17 - 02/23/17 | | | $ | 7,500,000 | | | $ | 7,497,044 | |
| | | | | | | | | | | | | | | | | | | | |
COMMERCIAL PAPER (3.6%) | | | | | | | | | | | | | | | | | | | | |
Cargill, Inc.† | | | A-1 | | | | 0.64 - 0.71 | | | | 01/03/17 - 01/06/17 | | | | 3,000,000 | | | | 2,999,775 | |
Novartis Finance Corp.† | | | A-1+ | | | | 0.50 | | | | 01/03/17 | | | | 4,700,000 | | | | 4,699,804 | |
Toyota Motor Credit Corp. | | | A-1+ | | | | 0.62 | | | | 01/18/17 | | | | 6,000,000 | | | | 5,998,139 | |
| | | | | | | | | | | | | | | | | | | | |
| | | | | | | | | | | | | | | | | | | 13,697,718 | |
| | | | | | | | | | | | | | | | | | | | |
TOTAL SHORT-TERM DEBT SECURITIES
(Cost: $21,194,762) 5.6% | | | | 21,194,762 | |
| | | | | | | | | | | | | | | | | | | | |
TOTAL INVESTMENTS
(Cost: $390,967,681) 100.0% | | | | 376,643,630 | |
| | | | | | | | | | | | | | | | | | | | |
OTHER NET ASSETS 0.0% (2) | | | | 84,863 | |
| | | | | | | | | | | | | | | | | | | | |
NET ASSETS 100.0% | | | $ | 376,728,493 | |
| | | | | | | | | | | | | | | | | | | | |
The accompanying notes are an integral part of these portfolio schedules.
51
MUTUAL OF AMERICA INVESTMENT CORPORATION — COMPOSITE FUND
SUMMARY PORTFOLIO OF INVESTMENTS IN SECURITIES
December 31, 2016
| | | | | | | | |
| | | Shares | | | Value | |
| | | | | | | | |
| COMMON STOCKS: | |
CONSUMER DISCRETIONARY (5.8%) | |
Amazon.com, Inc.* | | | 2,548 | | | $ | 1,910,669 | |
CBS Corp. Cl B | | | 21,963 | | | | 1,397,286 | |
Home Depot, Inc. | | | 12,824 | | | | 1,719,442 | |
Whirlpool Corp. | | | 8,364 | | | | 1,520,324 | |
Other Securities | | | 126,345 | | | | 3,947,880 | |
| | | | | | | | |
| | | | | | | 10,495,601 | |
| | | | | | | | |
CONSUMER STAPLES (4.4%) | |
Dr. Pepper Snapple Group, Inc. | | | 13,198 | | | | 1,196,663 | |
PepsiCo, Inc. | | | 15,412 | | | | 1,612,558 | |
Sysco Corp. | | | 19,604 | | | | 1,085,473 | |
Walgreens Boots Alliance, Inc. | | | 20,869 | | | | 1,727,118 | |
Other Securities | | | 32,618 | | | | 2,388,326 | |
| | | | | | | | |
| | | | | | | 8,010,138 | |
| | | | | | | | |
ENERGY (6.0%) | |
Chevron Corp. | | | 18,743 | | | | 2,206,051 | |
Schlumberger Ltd. | | | 19,009 | | | | 1,595,806 | |
Other Securities | | | 151,454 | | | | 6,993,796 | |
| | | | | | | | |
| | | | | | | 10,795,653 | |
| | | | | | | | |
FINANCIALS (9.2%) | |
American Int’l. Group, Inc. | | | 25,771 | | | | 1,683,104 | |
Citigroup, Inc. | | | 27,266 | | | | 1,620,418 | |
Discover Financial Svcs. | | | 22,618 | | | | 1,630,532 | |
JPMorgan Chase & Co. | | | 33,027 | | | | 2,849,900 | |
MetLife, Inc. | | | 30,604 | | | | 1,649,250 | |
Northern Trust Corp. | | | 14,609 | | | | 1,300,931 | |
PNC Financial Svcs. Grp., Inc. | | | 10,133 | | | | 1,185,156 | |
Other Securities | | | 143,643 | | | | 4,790,891 | |
| | | | | | | | |
| | | | | | | 16,710,182 | |
| | | | | | | | |
HEALTH CARE (9.1%) | |
AbbVie, Inc. | | | 26,462 | | | | 1,657,050 | |
Amgen, Inc. | | | 11,855 | | | | 1,733,320 | |
Becton, Dickinson & Co. | | | 8,401 | | | | 1,390,786 | |
Gilead Sciences, Inc. | | | 20,158 | | | | 1,443,514 | |
McKesson Corp. | | | 8,790 | | | | 1,234,556 | |
Merck & Co., Inc. | | | 25,965 | | | | 1,528,560 | |
Pfizer, Inc. | | | 71,437 | | | | 2,320,274 | |
Quest Diagnostics, Inc. | | | 12,038 | | | | 1,106,292 | |
UnitedHealth Group, Inc. | | | 13,651 | | | | 2,184,706 | |
Other Securities | | | 29,193 | | | | 1,924,368 | |
| | | | | | | | |
| | | | | | | 16,523,426 | |
| | | | | | | | |
| | | | | | | | |
| | | Shares | | | Value | |
| | | | | | | | |
| Common Stocks (CONTINUED): | | | | | | | | |
INDUSTRIALS (5.0%) | |
Boeing Co. | | | 12,023 | | | $ | 1,871,741 | |
Delta Air Lines, Inc. | | | 23,557 | | | | 1,158,769 | |
Eaton Corp. PLC | | | 17,158 | | | | 1,151,130 | |
FedEx Corp. | | | 7,819 | | | | 1,455,898 | |
Ingersoll-Rand PLC | | | 17,665 | | | | 1,325,582 | |
L3 Technologies, Inc. Inc. | | | 7,728 | | | | 1,175,506 | |
Other Securities | | | 3,513 | | | | 878,039 | |
| | | | | | | | |
| | | | | | | 9,016,665 | |
| | | | | | | | |
INFORMATION TECHNOLOGY (13.7%) | |
Accenture Ltd. Cl A | | | 12,874 | | | | 1,507,932 | |
Alphabet, Inc. Cl A* | | | 2,868 | | | | 2,272,747 | |
Apple, Inc. | | | 39,059 | | | | 4,523,811 | |
Applied Materials, Inc. | | | 39,804 | | | | 1,284,475 | |
Cisco Systems, Inc. | | | 65,492 | | | | 1,979,168 | |
Intel Corp. | | | 52,319 | | | | 1,897,610 | |
Lam Research Corp. | | | 12,929 | | | | 1,366,983 | |
Microsoft Corp. | | | 64,157 | | | | 3,986,716 | |
Oracle Corp. | | | 50,923 | | | | 1,957,989 | |
QUALCOMM, Inc. | | | 21,210 | | | | 1,382,892 | |
Other Securities | | | 93,331 | | | | 2,708,871 | |
| | | | | | | | |
| | | | | | | 24,869,194 | |
| | | | | | | | |
MATERIALS (1.8%) | | | | | | | | |
International Paper Co. | | | 22,879 | | | | 1,213,960 | |
Other Securities | | | 54,306 | | | | 1,992,593 | |
| | | | | | | | |
| | | | | | | 3,206,553 | |
| | | | | | | | |
REAL ESTATE (1.5%) | | | | | | | | |
American Tower Corp. | | | 10,309 | | | | 1,089,455 | |
Other Securities | | | 33,309 | | | | 1,656,248 | |
| | | | | | | | |
| | | | | | | 2,745,703 | |
| | | | | | | | |
TELECOMMUNICATION SERVICES (1.4%) | | | | | | | | |
Verizon Communications, Inc. | | | 31,287 | | | | 1,670,100 | |
Other Securities | | | 32,493 | | | | 772,684 | |
| | | | | | | | |
| | | | | | | 2,442,784 | |
| | | | | | | | |
UTILITIES (1.2%) | | | | | | | | |
Other Securities | | | 35,792 | | | | 2,218,297 | |
| | | | | | | | |
TOTAL COMMON STOCKS | | | | | | | | |
(Cost: $86,916,341) 59.1% | | | | | | | 107,034,196 | |
| | | | | | | | |
| | | | | | | | | | | | | | | | | | | | |
| | | Rating** | | | Rate(%) | | | Maturity | | | Face Amount | | | Value | |
| LONG-TERM DEBT SECURITIES: | | | | | | | | | | | | | | | | | | | | |
U.S. GOVERNMENT (10.3%) | | | | | | | | | | | | | | | | | | | | |
U.S. Treasury Note | | | AA+ | | | | 1.50 - 2.13 | | | | 02/28/23 - 11/15/26 | | | $ | 4,150,000 | | | $ | 3,942,315 | |
U.S. Treasury Strip | | | AA+ | | | | 0.00 | | | | 11/15/21 - 08/15/29 | | | | 18,550,000 | | | | 14,619,948 | |
| | | | | | | | | | | | | | | | | | | | |
| | | | | | | | | | | | | | | | | | | 18,562,263 | |
| | | | | | | | | | | | | | | | | | | | |
U.S. GOVERNMENT AGENCIES (11.2%) | | | | | | | | | | | | | | | | | | | | |
MORTGAGE-BACKED OBLIGATIONS (10.9%) | | | | | | | | | | | | | | | | | | | | |
FHLMC | | | AA+ | | | | 2.50 - 6.00 | | | | 02/01/25 - 07/01/45 | | | | 4,855,845 | | | | 5,064,513 | |
FHLMC ARM | | | AA+ | | | | 2.76 - 5.89 | | | | 02/01/36 - 09/01/39 | | | | 144,845 | | | | 152,944 | |
FHLMC Strip | | | AA+ | | | | 3.00 | | | | 01/15/43 | | | | 338,392 | | | | 336,609 | |
FNMA | | | AA+ | | | | 3.00 - 8.00 | | | | 03/01/17 - 12/25/49 | | | | 10,656,995 | | | | 11,167,572 | |
FNMA ARM | | | AA+ | | | | 2.41 | | | | 05/01/43 | | | | 370,050 | | | | 374,386 | |
The accompanying notes are an integral part of these portfolio schedules.
52
MUTUAL OF AMERICA INVESTMENT CORPORATION — COMPOSITE FUND
SUMMARY PORTFOLIO OF INVESTMENTS IN SECURITIES (Continued)
December 31, 2016
| | | | | | | | | | | | | | | | | | | | |
| | | Rating** | | | Rate(%) | | | Maturity | | | Face Amount | | | Value | |
| LONG-TERM DEBT SECURITIES (CONTINUED): | | | | | | | | | | | | | | | | | | | | |
U.S. GOVERNMENT AGENCIES (CONTINUED) | | | | | | | | | | | | | | | | | | | | |
MORTGAGE-BACKED OBLIGATIONS (CONTINUED) | | | | | | | | | | | | | | | | | | | | |
FNMA Strip | | | AA+ | | | | 3.00 | | | | 08/25/42 | | | $ | 289,082 | | | $ | 287,290 | |
GNMA (3) | | | AA+ | | | | 3.50 - 7.00 | | | | 10/15/24 - 10/20/43 | | | | 2,124,489 | | | | 2,307,253 | |
Other Securities | | | | | | | | | | | | | | | 161,915 | | | | 172,493 | |
| | | | | | | | | | | | | | | | | | | | |
| | | | | | | | | | | | | | | | | | | 19,863,060 | |
| | | | | | | | | | | | | | | | | | | | |
NON-MORTGAGE-BACKED OBLIGATIONS (0.3%) | | | | | | | | | | | | | | | | | | | | |
FHLMC | | | AA+ | | | | 0.00 | | | | 11/29/19 | | | | 500,000 | | | | 474,527 | |
| | | | | | | | | | | | | | | | | | | | |
CORPORATE DEBT (16.6%) | | | | | | | | | | | | | | | | | | | | |
CONSUMER DISCRETIONARY (3.2%) | | | | | | | | | | | | | | | | | | | | |
Other Securities | | | | | | | | | | | | | | | 5,686,000 | | | | 5,821,715 | |
| | | | | | | | | | | | | | | | | | | | |
CONSUMER STAPLES (0.9%) | | | | | | | | | | | | | | | | | | | | |
Sysco Corp. | | | BBB+ | | | | 2.60 - 3.75 | | | | 06/12/22 - 10/01/25 | | | | 400,000 | | | | 396,560 | |
Other Securities | | | | | | | | | | | | | | | 1,225,000 | | | | 1,286,801 | |
| | | | | | | | | | | | | | | | | | | | |
| | | | | | | | | | | | | | | | | | | 1,683,361 | |
| | | | | | | | | | | | | | | | | | | | |
ENERGY (1.6%) | | | | | | | | | | | | | | | | | | | | |
Other Securities | | | | | | | | | | | | | | | 2,910,000 | | | | 2,945,557 | |
| | | | | | | | | | | | | | | | | | | | |
FINANCIALS (3.2%) | | | | | | | | | | | | | | | | | | | | |
Fifth Third Bancorp | | | BBB | | | | 4.30 | | | | 01/16/24 | | | | 300,000 | | | | 308,148 | |
Other Securities | | | | | | | | | | | | | | | 4,650,000 | | | | 4,775,144 | |
Other Securities† | | | | | | | | | | | | | | | 650,000 | | | | 657,826 | |
| | | | | | | | | | | | | | | | | | | | |
| | | | | | | | | | | | | | | | | | | 5,741,118 | |
| | | | | | | | | | | | | | | | | | | | |
HEALTH CARE (1.7%) | | | | | | | | | | | | | | | | | | | | |
Pfizer, Inc. | | | AA | | | | 6.05 | | | | 03/30/17 | | | | 300,000 | | | | 303,632 | |
Quest Diagnostics, Inc. | | | BBB+ | | | | 4.70 - 4.75 | | | | 01/30/20 - 04/01/21 | | | | 400,000 | | | | 427,850 | |
Other Securities | | | | | | | | | | | | | | | 2,315,000 | | | | 2,414,709 | |
| | | | | | | | | | | | | | | | | | | | |
| | | | | | | | | | | | | | | | | | | 3,146,191 | |
| | | | | | | | | | | | | | | | | | | | |
INDUSTRIALS (1.3%) | | | | | | | | | | | | | | | | | | | | |
Other Securities | | | | | | | | | | | | | | | 2,250,000 | | | | 2,308,699 | |
| | | | | | | | | | | | | | | | | | | | |
INFORMATION TECHNOLOGY (1.4%) | | | | | | | | | | | | | | | | | | | | |
Applied Materials, Inc. | | | A- | | | | 3.90 | | | | 10/01/25 | | | | 350,000 | | | | 369,038 | |
Other Securities | | | | | | | | | | | | | | | 2,085,000 | | | | 2,150,375 | |
| | | | | | | | | | | | | | | | | | | | |
| | | | | | | | | | | | | | | | | | | 2,519,413 | |
| | | | | | | | | | | | | | | | | | | | |
MATERIALS (1.1%) | | | | | | | | | | | | | | | | | | | | |
Other Securities | | | | | | | | | | | | | | | 1,950,000 | | | | 1,958,859 | |
| | | | | | | | | | | | | | | | | | | | |
REAL ESTATE (1.1%) | | | | | | | | | | | | | | | | | | | | |
American Tower Corp. | | | BBB- | | | | 4.50 | | | | 01/15/18 | | | | 250,000 | | | | 256,598 | |
Other Securities | | | | | | | | | | | | | | | 1,650,000 | | | | 1,721,151 | |
| | | | | | | | | | | | | | | | | | | | |
| | | | | | | | | | | | | | | | | | | 1,977,749 | |
| | | | | | | | | | | | | | | | | | | | |
TELECOMMUNICATION SERVICES (0.4%) | | | | | | | | | | | | | | | | | | | | |
Verizon Communications, Inc. | | | BBB+ | | | | 4.50 | | | | 09/15/20 | | | | 325,000 | | | | 347,787 | |
Other Securities | | | | | | | | | | | | | | | 350,000 | | | | 343,564 | |
| | | | | | | | | | | | | | | | | | | | |
| | | | | | | | | | | | | | | | | | | 691,351 | |
| | | | | | | | | | | | | | | | | | | | |
UTILITIES (0.7%) | | | | | | | | | | | | | | | | | | | | |
Other Securities | | | | | | | | | | | | | | | 1,240,000 | | | | 1,308,597 | |
| | | | | | | | | | | | | | | | | | | | |
TOTAL LONG-TERM DEBT SECURITIES
(Cost: $67,531,801) 38.1% | | | | 69,002,460 | |
| | | | | | | | | | | | | | | | | | | | |
| | | | | |
| SHORT-TERM DEBT SECURITIES: | | | | | | | | | | | | | | | | | | | | |
COMMERCIAL PAPER (3.0%) | | | | | | | | | | | | | | | | | | | | |
Novartis Finance Corp.† | | | A-1+ | | | | 0.50 | | | | 01/03/17 | | | $ | 3,400,000 | | | $ | 3,399,859 | |
Toyota Motor Credit Corp. | | | A-1+ | | | | 0.62 | | | | 01/18/17 | | | | 2,000,000 | | | | 1,999,379 | |
| | | | | | | | | | | | | | | | | | | | |
| | | | | | | | | | | | | | | | | | | 5,399,238 | |
| | | | | | | | | | | | | | | | | | | | |
TOTAL SHORT-TERM DEBT SECURITIES
(Cost: $5,399,238) 3.0% | | | | 5,399,238 | |
| | | | | | | | | | | | | | | | | | | | |
TOTAL INVESTMENTS
(Cost: $159,847,380) 100.2% | | | | 181,435,894 | |
| | | | | | | | | | | | | | | | | | | | |
OTHER NET ASSETS -0.2% | | | | (292,507 | ) |
| | | | | | | | | | | | | | | | | | | | |
NET ASSETS 100.0% | | | $ | 181,143,387 | |
| | | | | | | | | | | | | | | | | | | | |
The accompanying notes are an integral part of these portfolio schedules.
53
MUTUAL OF AMERICA INVESTMENT CORPORATION — RETIREMENT INCOME FUND
PORTFOLIO OF INVESTMENTS IN SECURITIES
December 31, 2016
| | | | | | | | |
| | | Shares | | | Value | |
| COMMON STOCKS: | | | | | | | | |
DIVERSIFIED MUTUAL FUNDS (100.0%) | | | | | | | | |
Mutual of America Investment Corporation | | | | | | | | |
Bond Fund (29.8%) | | | 15,754,695 | | | $ | 22,590,894 | |
Equity Index Fund (21.2%) | | | 4,604,642 | | | | 16,078,959 | |
Mid-Cap Equity Index Fund (5.4%) | | | 1,868,807 | | | | 4,051,382 | |
Mid-Term Bond Fund (40.5%) | | | 29,398,662 | | | | 30,607,594 | |
Money Market Fund (3.1%) | | | 1,981,578 | | | | 2,372,365 | |
| | | | | | | | |
TOTAL INVESTMENTS
(Cost: $75,283,823) 100.0% | | | | | | | 75,701,194 | |
| | | | | | | | |
OTHER NET ASSETS -0.0% (2) | | | | | | | (1,299 | ) |
| | | | | | | | |
NET ASSETS 100.0% | | | | | | $ | 75,699,895 | |
| | | | | | | | |
MUTUAL OF AMERICA INVESTMENT CORPORATION — 2010 RETIREMENT FUND
PORTFOLIO OF INVESTMENTS IN SECURITIES
December 31, 2016
| | | | | | | | |
| | | Shares | | | Value | |
| COMMON STOCKS: | | | | | | | | |
DIVERSIFIED MUTUAL FUNDS (100.0%) | | | | | | | | |
Mutual of America Investment Corporation | | | | | | | | |
Bond Fund (25.8%) | | | 4,626,271 | | | $ | 6,633,679 | |
Equity Index Fund (24.8%) | | | 1,824,188 | | | | 6,369,884 | |
International Fund (2.9%) | | | 1,014,446 | | | | 753,943 | |
Mid-Cap Equity Index Fund (8.0%) | | | 947,124 | | | | 2,053,267 | |
Mid-Term Bond Fund (35.5%) | | | 8,734,432 | | | | 9,093,610 | |
Money Market Fund (3.0%) | | | 650,595 | | | | 778,899 | |
| | | | | | | | |
TOTAL INVESTMENTS
(Cost: $24,994,324) 100.0% | | | | | | | 25,683,282 | |
| | | | | | | | |
OTHER NET ASSETS -0.0% (2) | | | | | | | (98 | ) |
| | | | | | | | |
NET ASSETS 100.0% | | | | | | $ | 25,683,184 | |
| | | | | | | | |
MUTUAL OF AMERICA INVESTMENT CORPORATION — 2015 RETIREMENT FUND
PORTFOLIO OF INVESTMENTS IN SECURITIES
December 31, 2016
| | | | | | | | |
| | | Shares | | | Value | |
| COMMON STOCKS: | | | | | | | | |
DIVERSIFIED MUTUAL FUNDS (100.0%) | | | | | | | | |
Mutual of America Investment Corporation | | | | | | | | |
Bond Fund (24.7%) | | | 25,256,232 | | | $ | 36,215,289 | |
Equity Index Fund (27.9%) | | | 11,675,104 | | | | 40,768,318 | |
International Fund (5.8%) | | | 11,507,099 | | | | 8,552,145 | |
Mid-Cap Equity Index Fund (10.1%) | | | 6,836,077 | | | | 14,819,918 | |
Mid-Term Bond Fund (29.4%) | | | 41,285,814 | | | | 42,983,570 | |
Small Cap Growth Fund (1.0%) | | | 1,129,891 | | | | 1,458,216 | |
Small Cap Value Fund (1.1%) | | | 945,317 | | | | 1,595,771 | |
| | | | | | | | |
TOTAL INVESTMENTS
(Cost: $137,910,936) 100.0% | | | | | | | 146,393,227 | |
| | | | | | | | |
OTHER NET ASSETS -0.0% (2) | | | | | | | (1,473 | ) |
| | | | | | | | |
NET ASSETS 100.0% | | | | | | $ | 146,391,754 | |
| | | | | | | | |
The accompanying notes are an integral part of these portfolio schedules.
54
MUTUAL OF AMERICA INVESTMENT CORPORATION — 2020 RETIREMENT FUND
PORTFOLIO OF INVESTMENTS IN SECURITIES
December 31, 2016
| | | | | | | | |
| | | Shares | | | Value | |
| COMMON STOCKS: | | | | | | | | |
DIVERSIFIED MUTUAL FUNDS (100.0%) | | | | | | | | |
Mutual of America Investment Corporation | | | | | | | | |
Bond Fund (24.2%) | | | 71,804,333 | | | $ | 102,961,309 | |
Equity Index Fund (32.1%) | | | 39,297,609 | | | | 137,223,398 | |
International Fund (7.8%) | | | 44,436,766 | | | | 33,025,671 | |
Mid-Cap Equity Index Fund (12.2%) | | | 23,863,168 | | | | 51,732,914 | |
Mid-Term Bond Fund (19.3%) | | | 78,877,701 | | | | 82,121,310 | |
Small Cap Growth Fund (2.0%) | | | 6,545,483 | | | | 8,447,477 | |
Small Cap Value Fund (2.4%) | | | 6,121,264 | | | | 10,333,184 | |
| | | | | | | | |
TOTAL INVESTMENTS
(Cost: $397,064,347) 100.0% | | | | | | | 425,845,263 | |
| | | | | | | | |
OTHER NET ASSETS -0.0% (2) | | | | | | | (1,446 | ) |
| | | | | | | | |
NET ASSETS 100.0% | | | | | | $ | 425,843,817 | |
| | | | | | | | |
MUTUAL OF AMERICA INVESTMENT CORPORATION — 2025 RETIREMENT FUND
PORTFOLIO OF INVESTMENTS IN SECURITIES
December 31, 2016
| | | | | | | | |
| | | Shares | | | Value | |
| COMMON STOCKS: | | | | | | | | |
DIVERSIFIED MUTUAL FUNDS (100.0%) | | | | | | | | |
Mutual of America Investment Corporation | | | | | | | | |
Bond Fund (22.8%) | | | 80,310,697 | | | $ | 115,158,713 | |
Equity Index Fund (37.0%) | | | 53,494,052 | | | | 186,795,987 | |
International Fund (8.7%) | | | 59,136,730 | | | | 43,950,773 | |
Mid-Cap Equity Index Fund (16.2%) | | | 37,661,809 | | | | 81,646,960 | |
Mid-Term Bond Fund (8.8%) | | | 42,402,208 | | | | 44,145,872 | |
Small Cap Growth Fund (3.0%) | | | 11,541,827 | | | | 14,895,663 | |
Small Cap Value Fund (3.5%) | | | 10,388,695 | | | | 17,536,948 | |
| | | | | | | | |
TOTAL INVESTMENTS
(Cost: $459,207,294) 100.0% | | | | | | | 504,130,916 | |
| | | | | | | | |
OTHER NET ASSETS -0.0% (2) | | | | | | | (1,626 | ) |
| | | | | | | | |
NET ASSETS 100.0% | | | | | | $ | 504,129,290 | |
| | | | | | | | |
MUTUAL OF AMERICA INVESTMENT CORPORATION — 2030 RETIREMENT FUND
PORTFOLIO OF INVESTMENTS IN SECURITIES
December 31, 2016
| | | | | | | | |
| | | Shares | | | Value | |
| COMMON STOCKS: | | | | | | | | |
DIVERSIFIED MUTUAL FUNDS (100.0%) | | | | | | | | |
Mutual of America Investment Corporation | | | | | | | | |
Bond Fund (22.5%) | | | 65,348,900 | | | $ | 93,704,768 | |
Equity Index Fund (39.4%) | | | 46,920,475 | | | | 163,841,698 | |
International Fund (9.6%) | | | 53,990,706 | | | | 40,126,217 | |
Mid-Cap Equity Index Fund (18.3%) | | | 35,044,195 | | | | 75,972,240 | |
Small Cap Growth Fund (4.9%) | | | 15,802,747 | | | | 20,394,726 | |
Small Cap Value Fund (5.3%) | | | 13,179,553 | | | | 22,248,139 | |
| | | | | | | | |
TOTAL INVESTMENTS
(Cost: $374,155,855) 100.0% | | | | | | | 416,287,788 | |
| | | | | | | | |
OTHER NET ASSETS -0.0% (2) | | | | | | | (1,329 | ) |
| | | | | | | | |
NET ASSETS 100.0% | | | | | | $ | 416,286,459 | |
| | | | | | | | |
The accompanying notes are an integral part of these portfolio schedules.
55
MUTUAL OF AMERICA INVESTMENT CORPORATION — 2035 RETIREMENT FUND
PORTFOLIO OF INVESTMENTS IN SECURITIES
December 31, 2016
| | | | | | | | |
| | | Shares | | | Value | |
| COMMON STOCKS: | | | | | | | | |
DIVERSIFIED MUTUAL FUNDS (100.0%) | | | | | | | | |
Mutual of America Investment Corporation | | | | | | | | |
Bond Fund (14.8%) | | | 36,342,180 | | | $ | 52,111,597 | |
Equity Index Fund (40.1%) | | | 40,485,013 | | | | 141,369,696 | |
International Fund (11.5%) | | | 54,455,207 | | | | 40,471,437 | |
Mid-Cap Equity Index Fund (21.3%) | | | 34,530,580 | | | | 74,858,776 | |
Small Cap Growth Fund (5.9%) | | | 15,947,446 | | | | 20,581,471 | |
Small Cap Value Fund (6.4%) | | | 13,296,467 | | | | 22,445,500 | |
| | | | | | | | |
TOTAL INVESTMENTS
(Cost: $314,308,723) 100.0% | | | | | | | 351,838,477 | |
| | | | | | | | |
OTHER NET ASSETS -0.0% (2) | | | | | | | (1,120 | ) |
| | | | | | | | |
NET ASSETS 100.0% | | | | | | $ | 351,837,357 | |
| | | | | | | | |
MUTUAL OF AMERICA INVESTMENT CORPORATION — 2040 RETIREMENT FUND
PORTFOLIO OF INVESTMENTS IN SECURITIES
December 31, 2016
| | | | | | | | |
| | | Shares | | | Value | |
| COMMON STOCKS: | | | | | | | | |
DIVERSIFIED MUTUAL FUNDS (100.0%) | | | | | | | | |
Mutual of America Investment Corporation | | | | | | | | |
Bond Fund (11.9%) | | | 23,769,772 | | | $ | 34,083,832 | |
Equity Index Fund (37.9%) | | | 30,979,543 | | | | 108,177,528 | |
International Fund (12.4%) | | | 47,776,663 | | | | 35,507,903 | |
Mid-Cap Equity Index Fund (21.5%) | | | 28,324,513 | | | | 61,404,654 | |
Small Cap Growth Fund (7.8%) | | | 17,242,365 | | | | 22,252,668 | |
Small Cap Value Fund (8.5%) | | | 14,378,301 | | | | 24,271,722 | |
| | | | | | | | |
TOTAL INVESTMENTS
(Cost: $254,080,970) 100.0% | | | | | | | 285,698,307 | |
| | | | | | | | |
OTHER NET ASSETS -0.0% (2) | | | | | | | (947 | ) |
| | | | | | | | |
NET ASSETS 100.0% | | | | | | $ | 285,697,360 | |
| | | | | | | | |
MUTUAL OF AMERICA INVESTMENT CORPORATION — 2045 RETIREMENT FUND
PORTFOLIO OF INVESTMENTS IN SECURITIES
December 31, 2016
| | | | | | | | |
| | | Shares | | | Value | |
| COMMON STOCKS: | | | | | | | | |
DIVERSIFIED MUTUAL FUNDS (100.0%) | | | | | | | | |
Mutual of America Investment Corporation | | | | | | | | |
Bond Fund (10.5%) | | | 24,244,682 | | | $ | 34,764,813 | |
Equity Index Fund (35.2%) | | | 33,623,530 | | | | 117,410,071 | |
International Fund (13.4%) | | | 59,718,358 | | | | 44,383,042 | |
Mid-Cap Equity Index Fund (22.5%) | | | 34,600,758 | | | | 75,010,914 | |
Small Cap Growth Fund (8.8%) | | | 22,540,225 | | | | 29,089,986 | |
Small Cap Value Fund (9.6%) | | | 18,807,725 | | | | 31,748,945 | |
| | | | | | | | |
TOTAL INVESTMENTS
(Cost: $290,458,287) 100.0% | | | | | | | 332,407,771 | |
| | | | | | | | |
OTHER NET ASSETS -0.0% (2) | | | | | | | (1,083 | ) |
| | | | | | | | |
NET ASSETS 100.0% | | | | | | $ | 332,406,688 | |
| | | | | | | | |
The accompanying notes are an integral part of these portfolio schedules.
56
MUTUAL OF AMERICA INVESTMENT CORPORATION — 2050 RETIREMENT FUND
PORTFOLIO OF INVESTMENTS IN SECURITIES
December 31, 2016
| | | | | | | | |
| | | Shares | | | Value | |
| COMMON STOCKS: | | | | | | | | |
DIVERSIFIED MUTUAL FUNDS (100.0%) | | | | | | | | |
Mutual of America Investment Corporation | | | | | | | | |
Bond Fund (8.6%) | | | 9,889,286 | | | $ | 14,180,395 | |
Equity Index Fund (33.9%) | | | 15,915,173 | | | | 55,574,225 | |
International Fund (14.4%) | | | 31,782,510 | | | | 23,620,952 | |
Mid-Cap Equity Index Fund (22.8%) | | | 17,225,018 | | | | 37,342,081 | |
Small Cap Growth Fund (9.7%) | | | 12,369,319 | | | | 15,963,608 | |
Small Cap Value Fund (10.6%) | | | 10,288,407 | | | | 17,367,654 | |
| | | | | | | | |
TOTAL INVESTMENTS
(Cost: $159,435,236) 100.0% | | | | | | | 164,048,915 | |
| | | | | | | | |
OTHER NET ASSETS -0.0% (2) | | | | | | | (398 | ) |
| | | | | | | | |
NET ASSETS 100.0% | | | | | | $ | 164,048,517 | |
| | | | | | | | |
MUTUAL OF AMERICA INVESTMENT CORPORATION — 2055 RETIREMENT FUND
PORTFOLIO OF INVESTMENTS IN SECURITIES
December 31, 2016
| | | | | | | | |
| | | Shares | | | Value | |
| COMMON STOCKS: | | | | | | | | |
DIVERSIFIED MUTUAL FUNDS (100.0%) | | | | | | | | |
Mutual of America Investment Corporation | | | | | | | | |
Bond Fund (8.0%) | | | 184,032 | | | $ | 263,886 | |
Equity Index Fund (30.0%) | | | 285,451 | | | | 996,766 | |
International Fund (16.9%) | | | 755,147 | | | | 561,230 | |
Mid-Cap Equity Index Fund (23.1%) | | | 353,792 | | | | 766,985 | |
Small Cap Growth Fund (10.8%) | | | 278,572 | | | | 359,520 | |
Small Cap Value Fund (11.2%) | | | 219,797 | | | | 371,035 | |
| | | | | | | | |
TOTAL INVESTMENTS
(Cost: $3,288,549) 100.0% | | | | | | | 3,319,422 | |
| | | | | | | | |
OTHER NET ASSETS -0.0% (2) | | | | | | | (3 | ) |
| | | | | | | | |
NET ASSETS 100.0% | | | | | | $ | 3,319,419 | |
| | | | | | | | |
MUTUAL OF AMERICA INVESTMENT CORPORATION — CONSERVATIVE ALLOCATION FUND
PORTFOLIO OF INVESTMENTS IN SECURITIES
December 31, 2016
| | | | | | | | |
| | | Shares | | | Value | |
| COMMON STOCKS: | | | | | | | | |
DIVERSIFIED MUTUAL FUNDS (100.0%) | | | | | | | | |
Mutual of America Investment Corporation | | | | | | | | |
Bond Fund (29.0%) | | | 28,218,267 | | | $ | 40,462,596 | |
Equity Index Fund (26.6%) | | | 10,626,913 | | | | 37,108,138 | |
International Fund (5.0%) | | | 9,371,782 | | | | 6,965,165 | |
Mid-Cap Equity Index Fund (5.6%) | | | 3,599,900 | | | | 7,804,216 | |
Mid-Term Bond Fund (33.8%) | | | 45,318,187 | | | | 47,181,761 | |
| | | | | | | | |
TOTAL INVESTMENTS
(Cost: $133,925,269) 100.0% | | | | | | | 139,521,876 | |
| | | | | | | | |
OTHER NET ASSETS -0.0% (2) | | | | | | | (137 | ) |
| | | | | | | | |
NET ASSETS 100.0% | | | | | | $ | 139,521,739 | |
| | | | | | | | |
The accompanying notes are an integral part of these portfolio schedules.
57
MUTUAL OF AMERICA INVESTMENT CORPORATION — MODERATE ALLOCATION FUND
PORTFOLIO OF INVESTMENTS IN SECURITIES
December 31, 2016
| | | | | | | | |
| | | Shares | | | Value | |
| COMMON STOCKS: | | | | | | | | |
DIVERSIFIED MUTUAL FUNDS (100.0%) | | | | | | | | |
Mutual of America Investment Corporation | | | | | | | | |
Bond Fund (23.5%) | | | 56,923,805 | | | $ | 81,623,898 | |
Equity Index Fund (36.3%) | | | 36,061,967 | | | | 125,924,853 | |
International Fund (9.7%) | | | 45,400,532 | | | | 33,741,948 | |
Mid-Cap Equity Index Fund (16.4%) | | | 26,190,252 | | | | 56,777,794 | |
Mid-Term Bond Fund (14.1%) | | | 47,006,618 | | | | 48,939,624 | |
| | | | | | | | |
TOTAL INVESTMENTS
(Cost: $302,933,526) 100.0% | | | | | | | 347,008,117 | |
| | | | | | | | |
OTHER NET ASSETS -0.0% (2) | | | | | | | (203 | ) |
| | | | | | | | |
NET ASSETS 100.0% | | | | | | $ | 347,007,914 | |
| | | | | | | | |
MUTUAL OF AMERICA INVESTMENT CORPORATION — AGGRESSIVE ALLOCATION FUND
PORTFOLIO OF INVESTMENTS IN SECURITIES
December 31, 2016
| | | | | | | | |
| | | Shares | | | Value | |
| COMMON STOCKS: | | | | | | | | |
DIVERSIFIED MUTUAL FUNDS (100.0%) | | | | | | | | |
Mutual of America Investment Corporation | | | | | | | | |
Bond Fund (18.3%) | | | 33,685,453 | | | $ | 48,302,076 | |
Equity Index Fund (35.4%) | | | 26,721,597 | | | | 93,309,198 | |
International Fund (14.2%) | | | 50,393,981 | | | | 37,453,109 | |
Mid-Cap Equity Index Fund (21.3%) | | | 25,899,827 | | | | 56,148,183 | |
Small Cap Growth Fund (5.3%) | | | 10,774,473 | | | | 13,905,331 | |
Small Cap Value Fund (5.5%) | | | 8,655,930 | | | | 14,611,902 | |
| | | | | | | | |
TOTAL INVESTMENTS
(Cost: $216,658,157) 100.0% | | | | | | | 263,729,799 | |
| | | | | | | | |
OTHER NET ASSETS -0.0% (2) | | | | | | | (173 | ) |
| | | | | | | | |
NET ASSETS 100.0% | | | | | | $ | 263,729,626 | |
| | | | | | | | |
The accompanying notes are an integral part of these portfolio schedules.
58
MUTUAL OF AMERICA INVESTMENT CORPORATION — MONEY MARKET FUND
PORTFOLIO OF INVESTMENTS IN SECURITIES
December 31, 2016
| | | | | | | | | | | | | | | | | | | | |
| | | Rating** | | | Rate(%) | | | Maturity | | | Face Amount | | | Value | |
| | | | | | | | | | | | | | | | | | | | |
| SHORT-TERM DEBT SECURITIES: | | | | | | | | | | | | | | | | | | | | |
U.S. GOVERNMENT (24.1%) | | | | | | | | | | | | | |
U.S. Treasury Bill | | | A-1+ | | | | 0.18 | | | | 01/05/17 | | | $ | 900,000 | | | $ | 899,978 | |
U.S. Treasury Bill | | | A-1+ | | | | 0.27 | | | | 01/12/17 | | | | 1,000,000 | | | | 999,909 | |
U.S. Treasury Bill | | | A-1+ | | | | 0.29 | | | | 01/05/17 | | | | 1,000,000 | | | | 999,959 | |
U.S. Treasury Bill | | | A-1+ | | | | 0.31 | | | | 01/19/17 | | | | 1,800,000 | | | | 1,799,701 | |
U.S. Treasury Bill | | | A-1+ | | | | 0.32 | | | | 01/26/17 | | | | 700,000 | | | | 699,838 | |
U.S. Treasury Bill | | | A-1+ | | | | 0.35 | | | | 01/12/17 | | | | 1,500,000 | | | | 1,499,824 | |
U.S. Treasury Bill | | | A-1+ | | | | 0.40 | | | | 02/02/17 | | | | 1,200,000 | | | | 1,199,565 | |
U.S. Treasury Bill | | | A-1+ | | | | 0.42 | | | | 02/09/17 | | | | 2,000,000 | | | | 1,999,066 | |
U.S. Treasury Bill | | | A-1+ | | | | 0.42 | | | | 02/16/17 | | | | 1,800,000 | | | | 1,799,013 | |
U.S. Treasury Bill | | | A-1+ | | | | 0.44 | | | | 01/12/17 | | | | 1,300,000 | | | | 1,299,811 | |
U.S. Treasury Bill | | | A-1+ | | | | 0.46 | | | | 03/02/17 | | | | 2,000,000 | | | | 1,998,542 | |
| | | | | | | | | | | | | | | | | | | | |
| | | | | | | | | | | | | | | | | | | 15,195,206 | |
| | | | | | | | | | | | | | | | | | | | |
U.S. GOVERNMENT AGENCIES (14.7%) | | | | | | | | | | | | | |
FHLB | | | A-1+ | | | | 0.38 | | | | 01/13/17 | | | | 1,000,000 | | | | 999,865 | |
FHLB | | | A-1+ | | | | 0.40 | | | | 01/13/17 | | | | 500,000 | | | | 499,928 | |
FHLB | | | A-1+ | | | | 0.41 | | | | 01/17/17 | | | | 1,800,000 | | | | 1,799,651 | |
FHLB | | | A-1+ | | | | 0.43 | | | | 01/12/17 | | | | 100,000 | | | | 99,986 | |
FHLB | | | A-1+ | | | | 0.45 | | | | 01/12/17 | | | | 200,000 | | | | 199,970 | |
FHLB | | | A-1+ | | | | 0.45 | | | | 01/18/17 | | | | 1,000,000 | | | | 999,776 | |
FHLB | | | A-1+ | | | | 0.46 | | | | 01/25/17 | | | | 700,000 | | | | 699,779 | |
FHLB | | | A-1+ | | | | 0.46 | | | | 02/09/17 | | | | 800,000 | | | | 799,591 | |
FHLB | | | A-1+ | | | | 0.50 | | | | 01/25/17 | | | | 1,000,000 | | | | 999,653 | |
FHLB | | | A-1+ | | | | 0.51 | | | | 02/24/17 | | | | 1,800,000 | | | | 1,798,584 | |
FNMA | | | A-1+ | | | | 0.32 | | | | 01/17/17 | | | | 400,000 | | | | 399,940 | |
| | | | | | | | | | | | | | | | | | | | |
| | | | | | | | | | | | | | | | | | | 9,296,723 | |
| | | | | | | | | | | | | | | | | | | | |
COMMERCIAL PAPER (61.2%) | | | | | | | | | | | | | |
Apple, Inc.† | | | A-1+ | | | | 0.53 | | | | 01/10/17 | | | | 1,600,000 | | | | 1,599,764 | |
Apple, Inc.† | | | A-1+ | | | | 0.60 | | | | 01/30/17 | | | | 400,000 | | | | 399,800 | |
Apple, Inc.† | | | A-1+ | | | | 0.68 | | | | 02/07/17 | | | | 450,000 | | | | 449,677 | |
Cargill, Inc.† | | | A-1 | | | | 0.72 | | | | 01/09/17 | | | | 2,000,000 | | | | 1,999,640 | |
Chevron Corp.† | | | A-1+ | | | | 0.55 | | | | 01/04/17 | | | | 385,000 | | | | 384,976 | |
Chevron Corp.† | | | A-1+ | | | | 0.60 | | | | 02/13/17 | | | | 600,000 | | | | 599,560 | |
Chevron Corp.† | | | A-1+ | | | | 0.61 | | | | 02/01/17 | | | | 750,000 | | | | 749,593 | |
Cisco Systems, Inc.† | | | A-1+ | | | | 0.65 | | | | 01/20/17 | | | | 1,500,000 | | | | 1,499,458 | |
Coca-Cola Co.† | | | A-1+ | | | | 0.52 | | | | 01/19/17 | | | | 1,300,000 | | | | 1,299,643 | |
Coca-Cola Co.† | | | A-1 | | | | 0.60 | | | | 01/23/17 | | | | 500,000 | | | | 499,808 | |
Coca-Cola Co.† | | | A-1+ | | | | 0.65 | | | | 01/03/17 | | | | 640,000 | | | | 639,965 | |
Danaher Corp.† | | | A-1 | | | | 0.66 | | | | 01/05/17 | | | | 1,150,000 | | | | 1,149,895 | |
Danaher Corp.† | | | A-1 | | | | 0.70 | | | | 01/06/17 | | | | 1,000,000 | | | | 999,883 | |
Grainger (W.W.), Inc. | | | A-1+ | | | | 0.63 | | | | 02/13/17 | | | | 700,000 | | | | 699,461 | |
Intercontinental Exchange, Inc.† | | | A-1 | | | | 0.68 | | | | 01/03/17 | | | | 750,000 | | | | 749,958 | |
Intercontinental Exchange, Inc.† | | | A-1 | | | | 0.82 | | | | 02/17/17 | | | | 1,750,000 | | | | 1,748,086 | |
J.P. Morgan Securities LLC | | | A-1 | | | | 0.75 | | | | 01/17/17 | | | | 500,000 | | | | 499,823 | |
J.P. Morgan Securities LLC† | | | A-1 | | | | 0.80 | | | | 02/01/17 | | | | 1,500,000 | | | | 1,498,933 | |
Estee Lauder Cos.† | | | A-1 | | | | 0.68 | | | | 01/30/17 | | | | 1,000,000 | | | | 999,433 | |
Eli Lilly & Co.† | | | A-1+ | | | | 0.55 | | | | 01/13/17 | | | | 2,000,000 | | | | 1,999,603 | |
Microsoft Corp.† | | | A-1+ | | | | 0.61 | | | | 01/30/17 | | | | 400,000 | | | | 399,797 | |
Microsoft Corp.† | | | A-1+ | | | | 0.73 | | | | 02/07/17 | | | | 290,000 | | | | 289,776 | |
Nestle Capital Corp.† | | | A-1+ | | | | 0.68 | | | | 02/06/17 | | | | 2,000,000 | | | | 1,998,602 | |
PepsiCo, Inc.† | | | A-1 | | | | 0.54 | | | | 01/27/17 | | | | 2,000,000 | | | | 1,999,190 | |
Pfizer, Inc.† | | | A-1+ | | | | 0.67 | | | | 02/07/17 | | | | 2,000,000 | | | | 1,998,585 | |
Procter & Gamble Co.† | | | A-1+ | | | | 0.50 | | | | 01/10/17 | | | | 1,900,000 | | | | 1,899,736 | |
Simon Ppty. Group LP† | | | A-1 | | | | 0.72 | | | | 01/03/17 | | | | 1,500,000 | | | | 1,499,910 | |
Southern Califonia Gas Co.† | | | A-1 | | | | 0.70 | | | | 01/03/17 | | | | 2,000,000 | | | | 1,999,881 | |
Toyota Motor Credit Corp. | | | A-1+ | | | | 0.57 | | | | 01/11/17 | | | | 2,000,000 | | | | 1,999,651 | |
The accompanying notes are an integral part of these portfolio schedules.
59
MUTUAL OF AMERICA INVESTMENT CORPORATION — MONEY MARKET FUND
PORTFOLIO OF INVESTMENTS IN SECURITIES (Continued)
December 31, 2016
| | | | | | | | | | | | | | | | | | | | |
| | | Rating** | | | Rate(%) | | | Maturity | | | Face Amount | | | Value | |
| SHORT-TERM DEBT SECURITIES (CONTINUED) | | | | | | | | | | | | | | | | | | | | |
COMMERCIAL PAPER (CONTINUED) | | | | | | | | | | | | | |
Unilever Capital Corp.† | | | A-1 | | | | 0.64 | | | | 02/17/17 | | | $ | 1,000,000 | | | $ | 999,146 | |
Unilever Capital Corp.† | | | A-1 | | | | 0.78 | | | | 02/21/17 | | | | 1,000,000 | | | | 998,873 | |
Washington Gas Light Co. | | | A-1 | | | | 0.60 | | | | 01/04/17 | | | | 2,000,000 | | | | 1,999,867 | |
| | | | | | | | | | | | | | | | | | | | |
| | | | | | | | | | | | | | | | | | | 38,549,973 | |
| | | | | | | | | | | | | | | | | | | | |
TOTAL SHORT-TERM DEBT SECURITIES
(Cost: $63,041,817) 100.0% | | | | 63,041,902 | |
| | | | | | | | | | | | | | | | | | | | |
TOTAL INVESTMENTS
(Cost: $63,041,817) 100.0% | | | | 63,041,902 | |
| | | | | | | | | | | | | | | | | | | | |
OTHER NET ASSETS 0.0% (2) | | | | 5,074 | |
| | | | | | | | | | | | | | | | | | | | |
NET ASSETS 100.0% | | | $ | 63,046,976 | |
| | | | | | | | | | | | | | | | | | | | |
The accompanying notes are an integral part of these portfolio schedules.
60
MUTUAL OF AMERICA INVESTMENT CORPORATION — MID-TERM BOND FUND
SUMMARY PORTFOLIO OF INVESTMENTS IN SECURITIES
December 31, 2016
| | | | | | | | | | | | | | | | | | | | |
| | | Rating** | | | Rate(%) | | | Maturity | | | Face Amount | | | Value | |
| LONG-TERM DEBT SECURITIES: | | | | | | | | | | | | | | | | | | | | |
U.S. GOVERNMENT (36.8%) | | | | | | | | | | | | | | | | | | | | |
U.S. Treasury Note | | | AA+ | | | | 1.38 - 2.13 | | | | 09/30/19 - 08/15/26 | | | $ | 136,900,000 | | | $ | 132,134,368 | |
U.S. Treasury Strip | | | AA+ | | | | 0.00 | | | | 08/15/18 | | | | 50,000,000 | | | | 49,091,295 | |
| | | | | | | | | | | | | | | | | | | | |
| | | | | | | | | | | | | | | | | | | 181,225,663 | |
| | | | | | | | | | | | | | | | | | | | |
U.S. GOVERNMENT AGENCIES (7.2%) | | | | | | | | | | | | | | | | | | | | |
MORTGAGE-BACKED OBLIGATIONS (0.0%) (2) | | | | | | | | | | | | | | | | | | | | |
FHLMC | | | AA+ | | | | 7.50 - 8.00 | | | | 09/01/18 - 03/15/21 | | | | 2,602 | | | | 2,798 | |
| | | | | | | | | | | | | | | | | | | | |
NON-MORTGAGE-BACKED OBLIGATIONS (7.2%) | | | | | | | | | | | | | | | | | | | | |
FHLMC | | | AA+ | | | | 0.00 | | | | 11/29/19 | | | | 13,500,000 | | | | 12,812,216 | |
FNMA | | | AA+ | | | | 0.00 | | | | 10/09/19 | | | | 23,000,000 | | | | 21,810,969 | |
Other Securities | | | | | | | | | | | | | | | 900,000 | | | | 824,170 | |
| | | | | | | | | | | | | | | | | | | | |
| | | | | | | | | | | | | | | | | | | 35,447,355 | |
| | | | | | | | | | | | | | | | | | | | |
CORPORATE DEBT (55.2%) | | | | | | | | | | | | | | | | | | | | |
CONSUMER DISCRETIONARY (9.1%) | | | | | | | | | | | | | | | | | | | | |
Advance Auto Parts, Inc. | | | BBB- | | | | 4.50 - 5.75 | | | | 05/01/20 - 12/01/23 | | | | 2,250,000 | | | | 2,394,516 | |
Expedia, Inc. | | | BBB- | | | | 5.95 | | | | 08/15/20 | | | | 2,000,000 | | | | 2,186,142 | |
Family Dollar Stores, Inc. | | | BBB- | | | | 5.00 | | | | 02/01/21 | | | | 2,000,000 | | | | 2,135,000 | |
Gap, Inc. | | | BB+ | | | | 5.95 | | | | 04/12/21 | | | | 2,000,000 | | | | 2,104,680 | |
Harman Int’l. Industries, Inc. | | | BBB- | | | | 4.15 | | | | 05/15/25 | | | | 2,000,000 | | | | 2,064,860 | |
Kohl’s Corp. | | | BBB | | | | 3.25 - 4.00 | | | | 11/01/21 - 02/01/23 | | | | 2,025,000 | | | | 2,081,535 | |
Marriott International, Inc. | | | BBB | | | | 3.00 - 3.38 | | | | 03/01/19 - 02/15/23 | | | | 4,000,000 | | | | 3,991,685 | |
Tupperware Brands Corp. | | | BBB- | | | | 4.75 | | | | 06/01/21 | | | | 2,000,000 | | | | 2,138,794 | |
Wyndham Worldwide Corp. | | | BBB- | | | | 2.95 | | | | 03/01/17 | | | | 2,160,000 | | | | 2,162,173 | |
Other Securities | | | | | | | | | | | | | | | 23,310,000 | | | | 23,517,618 | |
| | | | | | | | | | | | | | | | | | | | |
| | | | | | | | | | | | | | | | | | | 44,777,003 | |
| | | | | | | | | | | | | | | | | | | | |
CONSUMER STAPLES (3.2%) | | | | | | | | | | | | | | | | | | | | |
Edgewell Personal Care Co. | | | BB+ | | | | 4.70 | | | | 05/19/21 | | | | 2,000,000 | | | | 2,105,172 | |
Flowers Foods, Inc. | | | BBB | | | | 4.38 | | | | 04/01/22 | | | | 2,000,000 | | | | 2,101,768 | |
Mead Johnson Nutrition Co. | | | BBB- | | | | 4.90 | | | | 11/01/19 | | | | 3,075,000 | | | | 3,295,951 | |
Other Securities | | | | | | | | | | | | | | | 8,200,000 | | | | 8,279,686 | |
| | | | | | | | | | | | | | | | | | | | |
| | | | | | | | | | | | | | | | | | | 15,782,577 | |
| | | | | | | | | | | | | | | | | | | | |
ENERGY (4.3%) | | | | | | | | | | | | | | | | | | | | |
Noble Energy, Inc. | | | BBB | | | | 4.15 | | | | 12/15/21 | | | | 2,000,000 | | | | 2,081,374 | |
SESI LLC | | | BB- | | | | 7.13 | | | | 12/15/21 | | | | 2,150,000 | | | | 2,187,625 | |
Other Securities | | | | | | | | | | | | | | | 17,254,000 | | | | 16,996,885 | |
| | | | | | | | | | | | | | | | | | | | |
| | | | | | | | | | | | | | | | | | | 21,265,884 | |
| | | | | | | | | | | | | | | | | | | | |
FINANCIALS (12.5%) | | | | | | | | | | | | | | | | | | | | |
Aflac, Inc. | | | A- | | | | 2.65 - 3.63 | | | | 02/15/17 - 06/15/23 | | | | 2,050,000 | | | | 2,071,610 | |
Alleghany Corp. | | | BBB+ | | | | 4.95 | | | | 06/27/22 | | | | 2,000,000 | | | | 2,168,098 | |
Ares Capital Corp. | | | BBB | | | | 3.63 | | | | 01/19/22 | | | | 2,500,000 | | | | 2,423,580 | |
Barrick N.A. Finance LLC | | | BBB- | | | | 4.40 | | | | 05/30/21 | | | | 2,000,000 | | | | 2,101,710 | |
Berkley (W.R.) Corp. | | | BBB+ | | | | 4.63 | | | | 03/15/22 | | | | 2,000,000 | | | | 2,139,284 | |
Block Financial LLC | | | BBB | | | | 5.50 | | | | 11/01/22 | | | | 2,472,000 | | | | 2,604,222 | |
Capital One Financial Corp. | | | BBB | | | | 4.75 | | | | 07/15/21 | | | | 2,000,000 | | | | 2,163,150 | |
Fairfax Financial Hldgs.† | | | BBB- | | | | 5.80 | | | | 05/15/21 | | | | 1,274,000 | | | | 1,362,770 | |
Fairfax U.S., Inc.† | | | BBB- | | | | 4.88 | | | | 08/13/24 | | | | 750,000 | | | | 733,571 | |
First Tennessee Bank | | | BBB | | | | 2.95 | | | | 12/01/19 | | | | 2,200,000 | | | | 2,205,456 | |
Lincoln National Corp. | | | A- | | | | 4.00 | | | | 09/01/23 | | | | 2,000,000 | | | | 2,084,944 | |
Moody’s Corp. | | | BBB+ | | | | 5.50 | | | | 09/01/20 | | | | 2,000,000 | | | | 2,196,548 | |
Nasdaq, Inc. | | | BBB | | | | 5.55 | | | | 01/15/20 | | | | 2,150,000 | | | | 2,323,468 | |
Other Securities | | | | | | | | | | | | | | | 31,250,000 | | | | 31,163,699 | |
Other Securities† | | | | | | | | | | | | | | | 3,790,000 | | | | 3,818,366 | |
| | | | | | | | | | | | | | | | | | | | |
| | | | | | | | | | | | | | | | | | | 61,560,476 | |
| | | | | | | | | | | | | | | | | | | | |
HEALTH CARE (5.6%) | | | | | | | | | | | | | | | | | | | | |
Agilent Technologies, Inc. | | | BBB+ | | | | 5.00 | | | | 07/15/20 | | | | 2,000,000 | | | | 2,158,174 | |
Bio-Rad Laboratories, Inc. | | | BBB | | | | 4.88 | | | | 12/15/20 | | | | 2,000,000 | | | | 2,137,332 | |
The accompanying notes are an integral part of these portfolio schedules.
61
MUTUAL OF AMERICA INVESTMENT CORPORATION — MID-TERM BOND FUND
SUMMARY PORTFOLIO OF INVESTMENTS IN SECURITIES (Continued)
December 31, 2016
| | | | | | | | | | | | | | | | | | | | |
| | | Rating** | | | Rate(%) | | | Maturity | | | Face Amount | | | Value | |
| LONG-TERM DEBT SECURITIES (CONTINUED) | | | | | | | | | | | | | | | | | | | | |
CORPORATE DEBT (CONTINUED) | | | | | | | | | | | | | | | | | | | | |
HEALTH CARE (CONTINUED) | | | | | | | | | | | | | | | | | | | | |
PerkinElmer, Inc. | | | BBB | | | | 5.00 | | | | 11/15/21 | | | $ | 2,000,000 | | | $ | 2,160,544 | |
Quest Diagnostics, Inc. | | | BBB+ | | | | 4.75 | | | | 01/30/20 | | | | 2,000,000 | | | | 2,134,812 | |
Thermo Fisher Scientific, Inc. | | | BBB | | | | 3.60 - 4.50 | | | | 03/01/21 - 08/15/21 | | | | 2,000,000 | | | | 2,123,855 | |
Other Securities | | | | | | | | | | | | | | | 16,750,000 | | | | 16,926,029 | |
| | | | | | | | | | | | | | | | | | | | |
| | | | | | | | | | | | | | | | | | | 27,640,746 | |
| | | | | | | | | | | | | | | | | | | | |
INDUSTRIALS (5.0%) | | | | | | | | | | | | | | | | | | | | |
Arconic, Inc. | | | BBB- | | | | 6.75 | | | | 07/15/18 | | | | 2,000,000 | | | | 2,127,500 | |
GATX Corp. | | | BBB | | | | 6.00 | | | | 02/15/18 | | | | 2,050,000 | | | | 2,133,136 | |
L-3 Communications Corp. | | | BBB- | | | | 5.20 | | | | 10/15/19 | | | | 2,000,000 | | | | 2,151,132 | |
Valmont Industries, Inc. | | | BBB+ | | | | 6.63 | | | | 04/20/20 | | | | 2,000,000 | | | | 2,214,924 | |
Verisk Analytics, Inc. | | | BBB- | | | | 4.13 | | | | 09/12/22 | | | | 2,000,000 | | | | 2,083,788 | |
Other Securities | | | | | | | | | | | | | | | 13,500,000 | | | | 13,579,325 | |
| | | | | | | | | | | | | | | | | | | | |
| | | | | | | | | | | | | | | | | | | 24,289,805 | |
| | | | | | | | | | | | | | | | | | | | |
INFORMATION TECHNOLOGY (6.0%) | | | | | | | | | | | | | | | | | | | | |
Adobe Systems, Inc. | | | A- | | | | 4.75 | | | | 02/01/20 | | | | 2,000,000 | | | | 2,148,888 | |
Arrow Electronics, Inc. | | | BBB- | | | | 3.00 - 6.88 | | | | 03/01/18 - 03/01/23 | | | | 2,000,000 | | | | 2,059,121 | |
eBay, Inc. | | | BBB+ | | | | 2.88 | | | | 08/01/21 | | | | 2,100,000 | | | | 2,104,038 | |
Juniper Networks, Inc. | | | BBB | | | | 4.50 - 4.60 | | | | 03/15/21 - 03/15/24 | | | | 2,100,000 | | | | 2,176,258 | |
Other Securities | | | | | | | | | | | | | | | 20,587,000 | | | | 21,053,855 | |
| | | | | | | | | | | | | | | | | | | | |
| | | | | | | | | | | | | | | | | | | 29,542,160 | |
| | | | | | | | | | | | | | | | | | | | |
MATERIALS (3.0%) | | | | | | | | | | | | | | | | | | | | |
Domtar Corp. | | | BBB- | | | | 4.40 | | | | 04/01/22 | | | | 2,000,000 | | | | 2,057,728 | |
Other Securities | | | | | | | | | | | | | | | 12,437,000 | | | | 12,459,410 | |
| | | | | | | | | | | | | | | | | | | | |
| | | | | | | | | | | | | | | | | | | 14,517,138 | |
| | | | | | | | | | | | | | | | | | | | |
REAL ESTATE (3.8%) | | | | | | | | | | | | | | | | | | | | |
CBRE Services, Inc. | | | BBB | | | | 5.25 | | | | 03/15/25 | | | | 2,000,000 | | | | 2,062,320 | |
Healthcare Realty Trust | | | BBB | | | | 5.75 | | | | 01/15/21 | | | | 2,000,000 | | | | 2,198,108 | |
Vornado Realty LP | | | BBB | | | | 2.50 - 5.00 | | | | 06/30/19 - 01/15/22 | | | | 2,000,000 | | | | 2,124,027 | |
Other Securities | | | | | | | | | | | | | | | 12,130,000 | | | | 12,439,358 | |
| | | | | | | | | | | | | | | | | | | | |
| | | | | | | | | | | | | | | | | | | 18,823,813 | |
| | | | | | | | | | | | | | | | | | | | |
TELECOMMUNICATION SERVICES (0.8%) | | | | | | | | | | | | | | | | | | | | |
Verizon Communications, Inc. | | | BBB+ | | | | 4.50 | | | | 09/15/20 | | | | 2,000,000 | | | | 2,140,226 | |
Other Securities | | | | | | | | | | | | | | | 2,000,000 | | | | 1,980,478 | |
| | | | | | | | | | | | | | | | | | | | |
| | | | | | | | | | | | | | | | | | | 4,120,704 | |
| | | | | | | | | | | | | | | | | | | | |
UTILITIES (1.9%) | | | | | | | | | | | | | | | | | | | | |
National Fuel Gas Co. | | | BBB | | | | 4.90 | | | | 12/01/21 | | | | 2,000,000 | | | | 2,116,548 | |
SCANA Corp. | | | BBB | | | | 4.75 | | | | 05/15/21 | | | | 2,000,000 | | | | 2,091,406 | |
Other Securities | | | | | | | | | | | | | | | 5,300,000 | | | | 5,275,295 | |
| | | | | | | | | | | | | | | | | | | | |
| | | | | | | | | | | | | | | | | | | 9,483,249 | |
| | | | | | | | | | | | | | | | | | | | |
TOTAL LONG-TERM DEBT SECURITIES
(Cost: $488,005,159) 99.2% | | | | | | | | | | | | | | | | | | | 488,479,371 | |
| | | | | | | | | | | | | | | | | | | | |
| | | | | |
| SHORT-TERM DEBT SECURITIES: | | | | | | | | | | | | | | | | | | | | |
COMMERCIAL PAPER (0.1%) | | | | | | | | | | | | | | | | | | | | |
Novartis Finance Corp.† | | | A-1+ | | | | 0.50 | | | | 01/03/17 | | | | 600,000 | | | | 599,975 | |
| | | | | | | | | | | | | | | | | | | | |
TOTAL SHORT-TERM DEBT SECURITIES
(Cost: $599,975) 0.1% | | | | 599,975 | |
| | | | | | | | | | | | | | | | | | | | |
TOTAL INVESTMENTS
(Cost: $488,605,134) 99.3% | | | | 489,079,346 | |
| | | | | | | | | | | | | | | | | | | | |
OTHER NET ASSETS 0.7% | | | | 3,191,205 | |
| | | | | | | | | | | | | | | | | | | | |
NET ASSETS 100.0% | | | $ | 492,270,551 | |
| | | | | | | | | | | | | | | | | | | | |
The accompanying notes are an integral part of these portfolio schedules.
62
MUTUAL OF AMERICA INVESTMENT CORPORATION — BOND FUND
SUMMARY PORTFOLIO OF INVESTMENTS IN SECURITIES
December 31, 2016
| | | | | | | | | | | | | | | | | | | | |
| | | Rating** | | | Rate(%) | | | Maturity | | | Face Amount | | | Value | |
| | | | | | | | | | | | | | | | | | | | |
| LONG-TERM DEBT SECURITIES: | | | | | | | | | | | | | | | | | | | | |
U.S. GOVERNMENT (11.6%) | | | | | | | | | | | | | | | | | | | | |
U.S. Treasury Note | | | AA+ | | | | 1.50 - 2.25 | | | | 11/15/25 - 11/15/26 | | | $ | 55,800,000 | | | $ | 51,498,611 | |
U.S. Treasury Strip | | | AA+ | | | | 0.00 | | | | 08/15/25 - 08/15/37 | | | | 110,000,000 | | | | 77,444,430 | |
| | | | | | | | | | | | | | | | | | | | |
| | | | | | | | | | | | | | | | | | | 128,943,041 | |
| | | | | | | | | | | | | | | | | | | | |
U.S. GOVERNMENT AGENCIES (28.4%) | | | | | | | | | | | | | | | | | | | | |
MORTGAGE-BACKED OBLIGATIONS (27.0%) | | | | | | | | | | | | | | | | | | | | |
FHLMC | | | AA+ | | | | 2.50 - 6.00 | | | | 03/01/21 - 09/01/46 | | | | 100,217,493 | | | | 103,237,987 | |
FHLMC ARM | | | AA+ | | | | 2.76 - 5.89 | | | | 02/01/36 - 04/01/42 | | | | 1,433,879 | | | | 1,500,173 | |
FHLMC Strip | | | AA+ | | | | 3.00 | | | | 01/15/43 | | | | 3,383,918 | | | | 3,366,088 | |
FNMA | | | AA+ | | | | 2.25 - 8.00 | | | | 03/01/17 - 12/25/49 | | | | 144,365,978 | | | | 150,585,150 | |
FNMA ARM | | | AA+ | | | | 2.41 - 4.00 | | | | 05/01/43 | | | | 3,454,145 | | | | 3,555,649 | |
FNMA Strip | | | AA+ | | | | 3.00 | | | | 08/25/42 | | | | 1,606,012 | | | | 1,596,054 | |
GNMA (3) | | | AA+ | | | | 2.68 - 7.00 | | | | 04/15/24 - 10/16/47 | | | | 32,837,994 | | | | 34,881,960 | |
Other Securities | | | | | | | | | | | | | | | 890,533 | | | | 948,714 | |
| | | | | | | | | | | | | | | | | | | | |
| | | | | | | | | | | | | | | | | | | 299,671,775 | |
| | | | | | | | | | | | | | | | | | | | |
NON-MORTGAGE-BACKED OBLIGATIONS(1.4%) | | | | | | | | | | | | | | | | | | | | |
FHLMC | | | AA+ | | | | 0.00 | | | | 11/29/19 | | | | 11,000,000 | | | | 10,439,583 | |
FNMA | | | AA+ | | | | 0.00 | | | | 10/09/19 | | | | 5,050,000 | | | | 4,788,930 | |
| | | | | | | | | | | | | | | | | | | | |
| | | | | | | | | | | | | | | | | | | 15,228,513 | |
| | | | | | | | | | | | | | | | | | | | |
CORPORATE DEBT (58.9%) | | | | | | | | | | | | | | | | | | | | |
CONSUMER DISCRETIONARY (9.1%) | | | | | | | | | | | | | | | | | | | | |
Advance Auto Parts, Inc. | | | BBB- | | | | 4.50 - 5.75 | | | | 05/01/20 - 12/01/23 | | | | 5,000,000 | | | | 5,306,053 | |
AutoZone, Inc. | | | BBB | | | | 3.25 - 4.00 | | | | 11/15/20 - 04/15/25 | | | | 5,700,000 | | | | 5,834,743 | |
Gap, Inc. | | | BB+ | | | | 5.95 | | | | 04/12/21 | | | | 5,000,000 | | | | 5,261,700 | |
Harman Int’l. Industries, Inc. | | | BBB- | | | | 4.15 | | | | 05/15/25 | | | | 5,000,000 | | | | 5,162,150 | |
Marriott International, Inc. | | | BBB | | | | 3.00 - 3.38 | | | | 03/01/19 - 02/15/23 | | | | 7,000,000 | | | | 7,020,098 | |
Scripps Networks Interactive, Inc. | | | BBB | | | | 3.50 | | | | 06/15/22 | | | | 5,000,000 | | | | 5,052,830 | |
Other Securities | | | | | | | | | | | | | | | 66,074,000 | | | | 67,539,334 | |
| | | | | | | | | | | | | | | | | | | | |
| | | | | | | | | | | | | | | | | | | 101,176,908 | |
| | | | | | | | | | | | | | | | | | | | |
CONSUMER STAPLES (2.8%) | | | | | | | | | | | | | | | | | | | | |
Whole Foods Market, Inc. | | | BBB- | | | | 5.20 | | | | 12/03/25 | | | | 5,000,000 | | | | 5,294,125 | |
Other Securities | | | | | | | | | | | | | | | 25,195,000 | | | | 26,086,041 | |
| | | | | | | | | | | | | | | | | | | | |
| | | | | | | | | | | | | | | | | | | 31,380,166 | |
| | | | | | | | | | | | | | | | | | | | |
ENERGY (4.9%) | | | | | | | | | | | | | | | | | | | | |
Kinder Morgan Energy Partners | | | BBB- | | | | 4.30 | | | | 05/01/24 | | | | 5,000,000 | | | | 5,116,015 | |
Other Securities | | | | | | | | | | | | | | | 48,350,000 | | | | 48,647,721 | |
| | | | | | | | | | | | | | | | | | | | |
| | | | | | | | | | | | | | | | | | | 53,763,736 | |
| | | | | | | | | | | | | | | | | | | | |
FINANCIALS (13.3%) | | | | | | | | | | | | | | | | | | | | |
Alleghany Corp. | | | BBB+ | | | | 4.95 - 5.63 | | | | 09/15/20 - 06/27/22 | | | | 5,000,000 | | | | 5,415,199 | |
American Express Co. | | | BBB | | | | 3.63 | | | | 12/05/24 | | | | 5,000,000 | | | | 5,020,725 | |
American Int’l. Group, Inc. | | | A- | | | | 3.75 | | | | 07/10/25 | | | | 5,000,000 | | | | 5,032,270 | |
Bank of America Corp. | | | BBB | | | | 3.95 | | | | 04/21/25 | | | | 5,000,000 | | | | 4,977,445 | |
Block Financial LLC | | | BBB | | | | 5.25 - 5.50 | | | | 11/01/22 - 10/01/25 | | | | 5,250,000 | | | | 5,404,296 | |
Citigroup, Inc. | | | BBB | | | | 3.88 | | | | 03/26/25 | | | | 5,000,000 | | | | 4,966,995 | |
Fairfax Financial Hldgs.† | | | BBB- | | | | 5.80 | | | | 05/15/21 | | | | 1,500,000 | | | | 1,604,517 | |
Fairfax U.S., Inc.† | | | BBB- | | | | 4.88 | | | | 08/13/24 | | | | 3,500,000 | | | | 3,423,333 | |
Fifth Third Bancorp | | | BBB | | | | 4.30 | | | | 01/16/24 | | | | 5,000,000 | | | | 5,135,800 | |
First Tennessee Bank | | | BBB | | | | 2.95 | | | | 12/01/19 | | | | 5,000,000 | | | | 5,012,400 | |
JPMorgan Chase & Co. | | | BBB+ | | | | 3.88 | | | | 09/10/24 | | | | 5,000,000 | | | | 5,059,185 | |
JPMorgan Chase Bank NA | | | A- | | | | 6.00 | | | | 10/01/17 | | | | 2,000,000 | | | | 2,063,968 | |
The accompanying notes are an integral part of these portfolio schedules.
63
MUTUAL OF AMERICA INVESTMENT CORPORATION — BOND FUND
SUMMARY PORTFOLIO OF INVESTMENTS IN SECURITIES (Continued)
December 31, 2016
| | | | | | | | | | | | | | | | | | | | |
| | | Rating** | | | Rate(%) | | | Maturity | | | Face Amount | | | Value | |
| | | | | | | | | | | | | | | | | | | | |
| LONG-TERM DEBT SECURITIES (CONTINUED): | | | | | | | | | | | | | | | | | | | | |
CORPORATE DEBT (CONTINUED) | | | | | | | | | | | | | | | | | | | | |
FINANCIALS (CONTINUED) | | | | | | | | | | | | | | | | | | | | |
Lincoln National Corp. | | | A- | | | | 4.00 - 4.85 | | | | 06/24/21 - 09/01/23 | | | $ | 5,000,000 | | | $ | 5,253,080 | |
Synchrony Financial | | | BBB- | | | | 2.70 - 3.70 | | | | 02/03/20 - 08/04/26 | | | | 5,000,000 | | | | 4,886,824 | |
Unum Group | | | BBB | | | | 4.00 | | | | 03/15/24 | | | | 5,000,000 | | | | 5,020,335 | |
Voya Financial, Inc. | | | BBB | | | | 3.65 | | | | 06/15/26 | | | | 5,000,000 | | | | 4,888,875 | |
Wells Fargo & Co. | | | A- | | | | 3.45 - 4.13 | | | | 02/13/23 - 08/15/23 | | | | 5,000,000 | | | | 5,049,115 | |
Other Securities | | | | | | | | | | | | | | | 61,841,000 | | | | 63,497,344 | |
Other Securities† | | | | | | | | | | | | | | | 6,000,000 | | | | 6,294,015 | |
| | | | | | | | | | | | | | | | | | | | |
| | | | | | | | | | | | | | | | | | | 148,005,721 | |
| | | | | | | | | | | | | | | | | | | | |
HEALTH CARE (6.3%) | | | | | | | | | | | | | |
Anthem, Inc. | | | A | | | | 3.30 - 4.35 | | | | 08/15/20 - 01/15/23 | | | | 5,539,000 | | | | 5,643,790 | |
Biogen Idec, Inc. | | | A- | | | | 4.05 - 6.88 | | | | 03/01/18 - 09/15/25 | | | | 5,000,000 | | | | 5,217,733 | |
Humana, Inc. | | | A- | | | | 3.85 - 7.20 | | | | 06/15/18 - 10/01/24 | | | | 5,000,000 | | | | 5,220,966 | |
Owens & Minor, Inc. | | | BBB | | | | 3.88 - 4.38 | | | | 09/15/21 - 12/15/24 | | | | 5,000,000 | | | | 4,959,503 | |
Quest Diagnostics, Inc. | | | BBB+ | | | | 3.50 - 4.75 | | | | 01/30/20 - 03/30/25 | | | | 4,700,000 | | | | 4,961,296 | |
Zimmer Biomet Hldgs., Inc. | | | BBB | | | | 3.15 | | | | 04/01/22 | | | | 5,000,000 | | | | 4,986,330 | |
Other Securities | | | | | | | | | | | | | | | 37,000,000 | | | | 38,713,167 | |
| | | | | | | | | | | | | | | | | | | | |
| | | | | | | | | | | | | | | | | | | 69,702,785 | |
| | | | | | | | | | | | | | | | | | | | |
INDUSTRIALS (4.0%) | | | | | | | | | | | | | |
Verisk Analytics, Inc. | | | BBB- | | | | 4.00 | | | | 06/15/25 | | | | 5,000,000 | | | | 5,070,195 | |
Other Securities | | | | | | | | | | | | | | | 38,650,000 | | | | 39,651,664 | |
| | | | | | | | | | | | | | | | | | | | |
| | | | | | | | | | | | | | | | | | | 44,721,859 | |
| | | | | | | | | | | | | | | | | | | | |
INFORMATION TECHNOLOGY (6.4%) | | | | | | | | | | | | | |
Applied Materials, Inc. | | | A- | | | | 3.90 | | | | 10/01/25 | | | | 5,000,000 | | | | 5,271,965 | |
Arrow Electronics, Inc. | | | BBB- | | | | 4.00 - 6.88 | | | | 06/01/18 - 04/01/25 | | | | 5,000,000 | | | | 5,177,233 | |
eBay, Inc. | | | BBB+ | | | | 2.88 | | | | 08/01/21 | | | | 5,000,000 | | | | 5,009,615 | |
Fidelity Nat’l. Information | | | BBB | | | | 3.88 | | | | 06/05/24 | | | | 5,000,000 | | | | 5,101,300 | |
Juniper Networks, Inc. | | | BBB | | | | 4.50 - 4.60 | | | | 03/15/21 - 03/15/24 | | | | 5,000,000 | | | | 5,209,021 | |
Keysight Technologies, Inc. | | | BBB- | | | | 4.55 | | | | 10/30/24 | | | | 5,000,000 | | | | 4,949,865 | |
Lam Research Corp. | | | BBB | | | | 2.75 | | | | 03/15/20 | | | | 5,000,000 | | | | 5,010,350 | |
Motorola Solutions, Inc. | | | BBB- | | | | 3.75 - 4.00 | | | | 05/15/22 - 09/01/24 | | | | 5,000,000 | | | | 5,044,241 | |
Other Securities | | | | | | | | | | | | | | | 28,868,000 | | | | 29,774,605 | |
| | | | | | | | | | | | | | | | | | | | |
| | | | | | | | | | | | | | | | | | | 70,548,195 | |
| | | | | | | | | | | | | | | | | | | | |
MATERIALS (5.2%) | | | | | | | | | | | | | |
Domtar Corp. | | | BBB- | | | | 4.40 | | | | 04/01/22 | | | | 5,000,000 | | | | 5,144,320 | |
Dow Chemical Co. | | | BBB | | | | 3.50 | | | | 10/01/24 | | | | 4,800,000 | | | | 4,841,890 | |
Valspar Corp. | | | BBB | | | | 3.95 | | | | 01/15/26 | | | | 5,000,000 | | | | 4,998,520 | |
Other Securities | | | | | | | | | | | | | | | 42,100,000 | | | | 42,268,905 | |
| | | | | | | | | | | | | | | | | | | | |
| | | | | | | | | | | | | | | | | | | 57,253,635 | |
| | | | | | | | | | | | | | | | | | | | |
REAL ESTATE (4.3%) | | | | | | | | | | | | | |
American Tower Corp. | | | BBB- | | | | 4.50 | | | | 01/15/18 | | | | 5,000,000 | | | | 5,131,965 | |
Mack-Cali Realty LP | | | BBB- | | | | 4.50 | | | | 04/18/22 | | | | 5,000,000 | | | | 5,031,315 | |
Other Securities | | | | | | | | | | | | | | | 36,050,000 | | | | 37,018,633 | |
| | | | | | | | | | | | | | | | | | | | |
| | | | | | | | | | | | | | | | | | | 47,181,913 | |
| | | | | | | | | | | | | | | | | | | | |
TELECOMMUNICATION SERVICES (0.6%) | | | | | | | | | | | | | |
AT&T, Inc. | | | BBB+ | | | | 3.00 | | | | 02/15/22 - 06/30/22 | | | | 5,000,000 | | | | 4,942,566 | |
Other Securities | | | | | | | | | | | | | | | 2,000,000 | | | | 2,140,226 | |
| | | | | | | | | | | | | | | | | | | | |
| | | | | | | | | | | | | | | | | | | 7,082,792 | |
| | | | | | | | | | | | | | | | | | | | |
The accompanying notes are an integral part of these portfolio schedules.
64
MUTUAL OF AMERICA INVESTMENT CORPORATION — BOND FUND
SUMMARY PORTFOLIO OF INVESTMENTS IN SECURITIES (Continued)
December 31, 2016
| | | | | | | | | | | | | | | | | | | | |
| | | Rating** | | | Rate(%) | | | Maturity | | | Face Amount | | | Value | |
| | | | | | | | | | | | | | | | | | | | |
| LONG-TERM DEBT SECURITIES (CONTINUED): | | | | | | | | | | | | | | | | | | | | |
CORPORATE DEBT (CONTINUED) | | | | | | | | | | | | | | | | | | | | |
UTILITIES (2.0%) | | | | | | | | | | | | | |
National Fuel Gas Co. | | | BBB | | | | 4.90 - 5.20 | | | | 12/01/21 - 07/15/25 | | | $ | 5,000,000 | | | $ | 5,252,016 | |
SCANA Corp. | | | BBB | | | | 4.13 - 4.75 | | | | 05/15/21 - 02/01/22 | | | | 5,000,000 | | | | 5,087,263 | |
Other Securities | | | | | | | | | | | | | | | 11,225,000 | | | | 11,403,345 | |
| | | | | | | | | | | | | | | | | | | | |
| | | | | | | | | | | | | | | | | | | 21,742,624 | |
| | | | | | | | | | | | | | | | | | | | |
SOVEREIGN DEBT (0.3%) | | | | | | | | | | | | | |
Sri Lanka AID | | | NR | | | | 6.59 | | | | 09/15/28 | | | | 2,976,293 | | | | 3,558,307 | |
| | | | | | | | | | | | | | | | | | | | |
TOTAL LONG-TERM DEBT SECURITIES
(Cost: $1,091,045,915) 99.2% | | | | | | | | | | | | | | | | | | | 1,099,961,970 | |
| | | | | | | | | | | | | | | | | | | | |
| | | | | |
| SHORT-TERM DEBT SECURITIES: | | | | | | | | | | | | | | | | | | | | |
COMMERCIAL PAPER (0.6%) | | | | | | | | | | | | | | | | | | | | |
Novartis Finance Corp.† | | | A-1+ | | | | 0.50 | | | | 01/03/17 | | | | 6,200,000 | | | | 6,199,742 | |
| | | | | | | | | | | | | | | | | | | | |
TOTAL SHORT-TERM DEBT SECURITIES
(Cost: $6,199,742) 0.6% | | | | 6,199,742 | |
| | | | | | | | | | | | | | | | | | | | |
TOTAL INVESTMENTS
(Cost: $1,097,245,657) 99.8% | | | | 1,106,161,712 | |
| | | | | | | | | | | | | | | | | | | | |
OTHER NET ASSETS 0.2% | | | | 2,329,656 | |
| | | | | | | | | | | | | | | | | | | | |
NET ASSETS 100.0% | | | $ | 1,108,491,368 | |
| | | | | | | | | | | | | | | | | | | | |
The accompanying notes are an integral part of these portfolio schedules.
65
MUTUAL OF AMERICA INVESTMENT CORPORATION
SUMMARY FOOTNOTES TO PORTFOLIOS OF INVESTMENTS IN SECURITIES
December 31, 2016
| | |
| Abbreviations: | | ARM = Adjustable Rate Mortgage |
| | FHLB = Federal Home Loan Bank |
| | FHLMC = Federal Home Loan Mortgage Corporation |
| | FNMA = Federal National Mortgage Association |
| | GNMA = Government National Mortgage Association |
| | NR = Not Rated |
| | “ Other Securities” represent securities in the respective category that individually, or in the aggregate by issuer, do not exceed 1% of net assets. |
| * | Non-income producing security. |
| ** | Ratings as per Standard & Poor’s Corporation (unaudited). |
| † | Security is exempt from registration under Rule 144A of the Securities Act of 1933. These securities may be resold in transactions exempt from registration, normally to qualified institutional buyers. At December 31, 2016, the aggregate values of these securities and their percentages of the respective Funds’ net assets were as follows: |
| | | | | | | | |
Fund | | Aggregate
Market
Value | | | Percentage
of
Net Assets | |
EQUITY INDEX FUND | | $ | 21,647,390 | | | | 1.0 | % |
ALL AMERICA FUND | | $ | 13,499,113 | | | | 4.6 | % |
SMALL CAP VALUE FUND | | $ | 6,999,643 | | | | 1.5 | % |
SMALL CAP GROWTH FUND | | $ | 6,649,585 | | | | 1.5 | % |
MID CAP VALUE FUND | | $ | 2,499,831 | | | | 2.6 | % |
MID-CAP EQUITY INDEX FUND | | $ | 23,248,364 | | | | 1.9 | % |
INTERNATIONAL FUND | | $ | 7,699,579 | | | | 2.0 | % |
COMPOSITE FUND | | $ | 4,057,685 | | | | 2.2 | % |
MONEY MARKET FUND | | $ | 33,351,171 | | | | 52.9 | % |
MID-TERM BOND FUND | | $ | 6,514,682 | | | | 1.3 | % |
BOND FUND | | $ | 17,521,607 | | | | 1.6 | % |
| (1) | This security, or a portion thereof, has been segregated to cover initial margin requirements on open futures contracts. Information on futures contracts outstanding in the Funds as of December 31, 2016, was as follows: |
| | | | | | | | | | | | | | | | | | | | | | | | | | |
Fund | | Number of
Contracts | | | Contract Type | | Purchased (P)
or Sold (S) | | | Expiration
Date | | | Underlying
Face Amount
at Value(a) | | | Unrealized
Gain(Loss) | | | Face Value
of Futures
as a %
of Total
Investments | |
EQUITY INDEX FUND | | | 722 | | | E-mini S&P 500
Stock Index | | | P | | | | March 2017 | | | $ | 80,726,820 | | | ($ | 699,807 | ) | | | 3.7 | % |
ALL AMERICA FUND | | | 113 | | | E-mini S&P 500
Stock Index | | | P | | | | March 2017 | | | $ | 12,634,530 | | | ($ | 127,974 | ) | | | 4.3 | % |
MID-CAP EQUITY INDEX FUND | | | 328 | | | E-mini S&P MidCap
400 Stock Index | | | P | | | | March 2017 | | | $ | 54,418,480 | | | ($ | 914,414 | ) | | | 4.4 | % |
| | (a) | Includes the cumulative appreciation(depreciation) of futures contracts, which is included in Net Unrealized Appreciation (Depreciation) of Investments and Futures Contracts in the Components of Net Assets section of the Statements of Assets and Liabilities. The Receivable or Payable for Daily Variation on Futures Contracts in the Statements of Assets and Liabilities only includes the current day’s variation margin payable or receivable. |
| (2) | Percentage is less than 0.05%. |
| (3) | U.S. Government guaranteed security. |
66
(This page has been left blank intentionally.)
MUTUAL OF AMERICA INVESTMENT CORPORATION
STATEMENTS OF ASSETS AND LIABILITIES
December 31, 2016
| | | | | | | | | | | | | | | | | | | | |
| | |
Equity Index
Fund | | |
All America
Fund | | |
Small Cap
Value Fund | | |
Small Cap
Growth Fund | | |
Mid Cap
Value Fund | |
ASSETS: | | | | | | | | | | | | | | | | | | | | |
Investments at fair value | | | | | | | | | | | | | | | | | | | | |
(Cost: Equity Index Fund — $1,371,347,903 All America Fund — $228,150,975 Small Cap Value Fund — $352,092,341 Small Cap Growth Fund — $379,527,856 Mid Cap Value Fund — $80,546,367 Mid-Cap Equity Index Fund — $959,142,479 International Fund — $390,967,681 Composite Fund — $159,847,380 Retirement Income Fund — $75,283,823 2010 Retirement Fund — $24,994,324 2015 Retirement Fund — $137,910,936 2020 Retirement Fund — $397,064,347 2025 Retirement Fund — $459,207,294) | |
(Notes 1 and 3) | | $ | 2,141,000,015 | | | $ | 295,307,524 | | | $ | 467,787,282 | | | $ | 433,173,228 | | | $ | 98,915,201 | |
Cash | | | 32,756 | | | | 227,526 | | | | 84,277 | | | | 10,306 | | | | 39,051 | |
Interest and dividends receivable | | | 2,622,381 | | | | 350,365 | | | | 337,895 | | | | 221,457 | | | | 165,780 | |
Receivable for securities sold | | | — | | | | 238,354 | | | | 454,925 | | | | — | | | | — | |
Other receivables | | | — | | | | — | | | | — | | | | — | | | | — | |
| | | | | | | | | | | | | | | | | | | | |
TOTAL ASSETS | | | 2,143,655,152 | | | | 296,123,769 | | | | 468,664,379 | | | | 433,404,991 | | | | 99,120,032 | |
| | | | | | | | | | | | | | | | | | | | |
| | | | | |
LIABILITIES: | | | | | | | | | | | | | | | | | | | | |
Due to custodian bank | | | — | | | | — | | | | — | | | | — | | | | — | |
Payable for securities purchased | | | — | | | | 225,192 | | | | 3,811,730 | | | | 590,582 | | | | 1,100,831 | |
Payable for daily variation on future contracts | | | 330,530 | | | | 50,285 | | | | — | | | | — | | | | — | |
Accrued expenses | | | 6,885 | | | | 4,564 | | | | 10,772 | | | | 8,223 | | | | 1,886 | |
| | | | | | | | | | | | | | | | | | | | |
TOTAL LIABILITIES: | | | 337,415 | | | | 280,041 | | | | 3,822,502 | | | | 598,805 | | | | 1,102,717 | |
| | | | | | | | | | | | | | | | | | | | |
NET ASSETS | | $ | 2,143,317,737 | | | $ | 295,843,728 | | | $ | 464,841,877 | | | $ | 432,806,186 | | | $ | 98,017,315 | |
| | | | | | | | | | | | | | | | | | | | |
NUMBEROF SHARES OUTSTANDING (Note 4) | | | 613,796,674 | | | | 129,150,212 | | | | 275,365,315 | | | | 335,357,612 | | | | 62,318,941 | |
| | | | | | | | | | | | | | | | | | | | |
NET ASSET VALUES, offering and redemption price per share | | | $3.49 | | | | $2.29 | | | | $1.69 | | | | $1.29 | | | | $1.57 | |
| | | | | | | | | | | | | | | | | | | | |
| | | | | |
COMPONENTSOF NET ASSETS: | | | | | | | | | | | | | | | | | | | | |
Paid-in capital | | $ | 1,313,876,392 | | | $ | 193,271,856 | | | $ | 322,929,107 | | | $ | 361,641,730 | | | $ | 74,080,849 | |
Accumulated undistributed net investment income (loss) | | | 38,981,241 | | | | 4,004,203 | | | | 4,275,125 | | | | 125,500 | | | | 1,068,227 | |
Accumulated undistributed net realized gain (loss) on investments and futures contracts | | | 21,507,799 | | | | 31,539,094 | | | | 21,942,704 | | | | 17,393,584 | | | | 4,499,405 | |
Net unrealized appreciation (depreciation) of investments and futures contracts | | | 768,952,305 | | | | 67,028,575 | | | | 115,694,941 | | | | 53,645,372 | | | | 18,368,834 | |
| | | | | | | | | | | | | | | | | | | | |
NET ASSETS | | $ | 2,143,317,737 | | | $ | 295,843,728 | | | $ | 464,841,877 | | | $ | 432,806,186 | | | $ | 98,017,315 | |
| | | | | | | | | | | | | | | | | | | | |
| (a) | The Retirement and Allocation Funds are invested in affiliated investment companies of Mutual of America Investment Corp. |
The accompanying notes are an integral part of these financial statements.
68
| | | | | | | | | | | | | | | | | | | | | | | | | | | | | | | | |
Mid-Cap
Equity Index
Fund | | | International
Fund | | | Composite
Fund | | | Retirement
Income
Fund | | | 2010
Retirement
Fund | | | 2015
Retirement
Fund | | | 2020
Retirement
Fund | | | 2025
Retirement
Fund | | | |
| | | | | | | | | | | | | | | | | | | | | | | | | | | | | | | | |
| | | | | | | | | | | | | | | | | | | | | | | | | | | | | | | | |
| | | | | | | | |
| | | | | | | | | | | | | | | | | | | | | | | | | | | | | | | | |
| $ | 1,243,743,820 | | | $ | 376,643,630 | | | $ | 181,435,894 | | | $ | 75,701,194 | (a) | | $ | 25,683,282 | (a) | | $ | 146,393,227 | (a) | | $ | 425,845,263 | (a) | | $ | 504,130,916 | (a) | | |
| | 96,312 | | | | 87,158 | | | | 136,892 | | | | — | | | | — | | | | — | | | | — | | | | — | | | |
| | 1,434,184 | | | | — | | | | 525,615 | | | | — | | | | — | | | | — | | | | — | | | | — | | | |
| | — | | | | — | | | | 818 | | | | — | | | | — | | | | — | | | | — | | | | — | | | |
| | — | | | | — | | | | 181 | | | | — | | | | — | | | | — | | | | — | | | | — | | | |
| | | | | | | | | | | | | | | | | | | | | | | | | | | | | | | | |
| | 1,245,274,316 | | | | 376,730,788 | | | | 182,099,400 | | | | 75,701,194 | | | | 25,683,282 | | | | 146,393,227 | | | | 425,845,263 | | | | 504,130,916 | | | |
| | | | | | | | | | | | | | | | | | | | | | | | | | | | | | | | |
| | | | | | | | |
| | | | | | | | | | | | | | | | | | | | | | | | | | | | | | | | |
| | — | | | | — | | | | — | | | | — | | | | — | | | | — | | | | — | | | | — | | | |
| | — | | | | — | | | | 956,013 | | | | — | | | | — | | | | — | | | | — | | | | — | | | |
| | 231,420 | | | | — | | | | — | | | | — | | | | — | | | | — | | | | — | | | | — | | | |
| | 5,721 | | | | 2,295 | | | | — | | | | 1,299 | | | | 98 | | | | 1,473 | | | | 1,446 | | | | 1,626 | | | |
| | | | | | | | | | | | | | | | | | | | | | | | | | | | | | | | |
| | 237,141 | | | | 2,295 | | | | 956,013 | | | | 1,299 | | | | 98 | | | | 1,473 | | | | 1,446 | | | | 1,626 | | | |
| | | | | | | | | | | | | | | | | | | | | | | | | | | | | | | | |
| $ | 1,245,037,175 | | | $ | 376,728,493 | | | $ | 181,143,387 | | | $ | 75,699,895 | | | $ | 25,683,184 | | | $ | 146,391,754 | | | $ | 425,843,817 | | | $ | 504,129,290 | | | |
| | | | | | | | | | | | | | | | | | | | | | | | | | | | | | | | |
| | 574,306,144 | | | | 506,896,525 | | | | 92,999,300 | | | | 67,312,624 | | | | 25,875,441 | | | | 142,136,674 | | | | 372,702,026 | | | | 415,825,169 | | | |
| | | | | | | | | | | | | | | | | | | | | | | | | | | | | | | | |
| | $2.17 | | | | $0.74 | | | | $1.95 | | | | $1.12 | | | | $0.99 | | | | $1.03 | | | | $1.14 | | | | $1.21 | | | |
| | | | | | | | | | | | | | | | | | | | | | | | | | | | | | | | |
| | | | | | | | |
| | | | | | | | | | | | | | | | | | | | | | | | | | | | | | | | |
| $ | 872,145,580 | | | $ | 381,324,652 | | | $ | 134,618,554 | | | $ | 72,687,107 | | | $ | 23,384,386 | | | $ | 128,550,398 | | | $ | 374,629,271 | | | $ | 433,580,108 | | | |
| | 16,421,998 | | | | 9,884,641 | | | | 3,748,522 | | | | 1,539,981 | | | | 543,546 | | | | 3,028,460 | | | | 7,891,832 | | | | 8,443,812 | | | |
| | | | | | | | |
| | 72,782,670 | | | | (156,749 | ) | | | 21,187,797 | | | | 1,055,436 | | | | 1,066,294 | | | | 6,330,605 | | | | 14,541,798 | | | | 17,181,748 | | | |
| | | | | | | | |
| | 283,686,927 | | | | (14,324,051 | ) | | | 21,588,514 | | | | 417,371 | | | | 688,958 | | | | 8,482,291 | | | | 28,780,916 | | | | 44,923,622 | | | |
| | | | | | | | | | | | | | | | | | | | | | | | | | | | | | | | |
| $ | 1,245,037,175 | | | $ | 376,728,493 | | | $ | 181,143,387 | | | $ | 75,699,895 | | | $ | 25,683,184 | | | $ | 146,391,754 | | | $ | 425,843,817 | | | $ | 504,129,290 | | | |
| | | | | | | | | | | | | | | | | | | | | | | | | | | | | | | | |
The accompanying notes are an integral part of these financial statements.
69
MUTUAL OF AMERICA INVESTMENT CORPORATION
STATEMENTS OF ASSETS AND LIABILITIES (Continued)
December 31, 2016
| | | | | | | | | | | | | | | | | | | | |
| | | 2030
Retirement
Fund | | | 2035
Retirement
Fund | | | 2040
Retirement
Fund | | | 2045
Retirement
Fund | | | 2050
Retirement
Fund | |
ASSETS: | | | | | | | | | | | | | | | | | | | | |
Investments at fair value | | | | | | | | | | | | | | | | | | | | |
(Cost: 2030 Retirement Fund — $374,155,855 2035 Retirement Fund — $314,308,723 2040 Retirement Fund — $254,080,970 2045 Retirement Fund — $290,458,287 2050 Retirement Fund — $159,435,236 2055 Retirement Fund — $3,288,549 Conservative Allocation Fund — $133,925,269 Moderate Allocation Fund — $302,933,526 Aggressive Allocation Fund — $216,658,157 Money Market Fund — $63,041,817 Mid-Term Bond Fund — $488,605,134 Bond Fund — $1,097,245,657) (Notes 1 and 3) | | $ | 416,287,788 | (a) | | $ | 351,838,477 | (a) | | $ | 285,698,307 | (a) | | $ | 332,407,771 | (a) | | $ | 164,048,915 | (a) |
Cash | | | — | | | | — | | | | — | | | | — | | | | — | |
Interest and dividends receivable | | | — | | | | — | | | | — | | | | — | | | | — | |
Receivable for securities sold | | | — | | | | — | | | | — | | | | — | | | | — | |
Other receivables | | | — | | | | — | | | | — | | | | — | | | | — | |
| | | | | | | | | | | | | | | | | | | | |
TOTAL ASSETS | | | 416,287,788 | | | | 351,838,477 | | | | 285,698,307 | | | | 332,407,771 | | | | 164,048,915 | |
| | | | | | | | | | | | | | | | | | | | |
| | | | | |
LIABILITIES: | | | | | | | | | | | | | | | | | | | | |
Due to custodian bank | | | — | | | | — | | | | — | | | | — | | | | — | |
Payable for securities purchased | | | — | | | | — | | | | — | | | | — | | | | — | |
Payable for daily variation on future contracts | | | — | | | | — | | | | — | | | | — | | | | — | |
Accrued expenses | | | 1,329 | | | | 1,120 | | | | 947 | | | | 1,083 | | | | 398 | |
| | | | | | | | | | | | | | | | | | | | |
TOTAL LIABILITIES | | | 1,329 | | | | 1,120 | | | | 947 | | | | 1,083 | | | | 398 | |
| | | | | | | | | | | | | | | | | | | | |
NET ASSETS | | $ | 416,286,459 | | | $ | 351,837,357 | | | $ | 285,697,360 | | | $ | 332,406,688 | | | $ | 164,048,517 | |
| | | | | | | | | | | | | | | | | | | | |
NUMBEROF SHARES OUTSTANDING (Note 4) | | | 334,109,962 | | | | 281,100,694 | | | | 230,643,020 | | | | 268,924,524 | | | | 112,896,396 | |
| | | | | | | | | | | | | | | | | | | | |
NET ASSET VALUES, offering and redemption price per share | | | $1.25 | | | | $1.25 | | | | $1.24 | | | | $1.24 | | | | $1.45 | |
| | | | | | | | | | | | | | | | | | | | |
| | | | | |
COMPONENTSOF NET ASSETS: | | | | | | | | | | | | | | | | | | | | |
Paid-in capital | | $ | 351,596,852 | | | $ | 295,281,018 | | | $ | 237,663,306 | | | $ | 272,317,836 | | | $ | 152,359,035 | |
Accumulated undistributed net investment income (loss) | | | 6,471,545 | | | | 5,090,035 | | | | 3,936,958 | | | | 4,492,530 | | | | 1,952,198 | |
Accumulated undistributed net realized gain (loss) on investments and futures contracts | | | 16,086,129 | | | | 13,936,550 | | | | 12,479,759 | | | | 13,646,838 | | | | 5,123,605 | |
Net unrealized appreciation (depreciation) of investments and futures contracts | | | 42,131,933 | | | | 37,529,754 | | | | 31,617,337 | | | | 41,949,484 | | | | 4,613,679 | |
| | | | | | | | | | | | | | | | | | | | |
NET ASSETS | | $ | 416,286,459 | | | $ | 351,837,357 | | | $ | 285,697,360 | | | $ | 332,406,688 | | | $ | 164,048,517 | |
| | | | | | | | | | | | | | | | | | | | |
| † | Fund commenced operations on October 1, 2016. |
| (a) | The Retirement and Allocation Funds are invested in affiliated investment companies of Mutual of America Investment Corp. |
The accompanying notes are an integral part of these financial statements.
70
| | | | | | | | | | | | | | | | | | | | | | | | | | | | |
2055
Retirement
Fund† | | | Conservative
Allocation
Fund | | | Moderate
Allocation
Fund | | | Aggressive
Allocation
Fund | | | Money
Market
Fund | | | Mid-Term
Bond Fund | | | Bond Fund | | | |
| | | | | | | | | | | | | | | | | | | | | | | | | | | | |
| | | | | | | | | | | | | | | | | | | | | | | | | | | | |
| | | | | | | |
| | | | | | | | | | | | | | | | | | | | | | | | | | | | |
| $ | 3,319,422 | (a) | | $ | 139,521,876 | (a) | | $ | 347,008,117 | (a) | | $ | 263,729,799 | (a) | | $ | 63,041,902 | | | $ | 489,079,346 | | | $ | 1,106,161,712 | | | |
| | — | | | | — | | | | — | | | | — | | | | 5,560 | | | | — | | | | 4,121 | | | |
| | — | | | | — | | | | — | | | | — | | | | — | | | | 3,204,920 | | | | 8,073,219 | | | |
| | — | | | | — | | | | — | | | | — | | | | — | | | | — | | | | 3,116 | | | |
| | — | | | | — | | | | — | | | | — | | | | — | | | | 11,033 | | | | — | | | |
| | | | | | | | | | | | | | | | | | | | | | | | | | | | |
| | 3,319,422 | | | | 139,521,876 | | | | 347,008,117 | | | | 263,729,799 | | | | 63,047,462 | | | | 492,295,299 | | | | 1,114,242,168 | | | |
| | | | | | | | | | | | | | | | | | | | | | | | | | | | |
| | | | | | | |
| | | | | | | | | | | | | | | | | | | | | | | | | | | | |
| | — | | | | — | | | | — | | | | — | | | | — | | | | 24,748 | | | | — | | | |
| | — | | | | — | | | | — | | | | — | | | | — | | | | — | | | | 5,736,481 | | | |
| | — | | | | — | | | | — | | | | — | | | | — | | | | — | | | | — | | | |
| | 3 | | | | 137 | | | | 203 | | | | 173 | | | | 486 | | | | — | | | | 14,319 | | | |
| | | | | | | | | | | | | | | | | | | | | | | | | | | | |
| | 3 | | | | 137 | | | | 203 | | | | 173 | | | | 486 | | | | 24,748 | | | | 5,750,800 | | | |
| | | | | | | | | | | | | | | | | | | | | | | | | | | | |
| $ | 3,319,419 | | | $ | 139,521,739 | | | $ | 347,007,914 | | | $ | 263,729,626 | | | $ | 63,046,976 | | | $ | 492,270,551 | | | $ | 1,108,491,368 | | | |
| | | | | | | | | | | | | | | | | | | | | | | | | | | | |
| | 3,191,688 | | | | 115,118,175 | | | | 241,781,963 | | | | 161,691,427 | | | | 52,661,579 | | | | 472,826,923 | | | | 772,998,898 | | | |
| | | | | | | | | | | | | | | | | | | | | | | | | | | | |
| | $1.04 | | | | $1.21 | | | | $1.44 | | | | $1.63 | | | | $1.20 | | | | $1.04 | | | | $1.43 | | | |
| | | | | | | | | | | | | | | | | | | | | | | | | | | | |
| | | | | | | |
| | | | | | | | | | | | | | | | | | | | | | | | | | | | |
| $ | 3,304,885 | | | $ | 128,468,220 | | | $ | 288,442,132 | | | $ | 200,671,813 | | | $ | 62,965,248 | | | $ | 479,515,432 | | | $ | 1,064,607,904 | | | |
| | — | | | | 3,053,004 | | | | 6,887,282 | | | | 4,432,394 | | | | 83,111 | | | | 11,551,690 | | | | 32,730,237 | | | |
| | | | | | | |
| | (16,339 | ) | | | 2,403,908 | | | | 7,603,909 | | | | 11,553,777 | | | | (1,468 | ) | | | 729,217 | | | | 2,237,172 | | | |
| | | | | | | |
| | 30,873 | | | | 5,596,607 | | | | 44,074,591 | | | | 47,071,642 | | | | 85 | | | | 474,212 | | | | 8,916,055 | | | |
| | | | | | | | | | | | | | | | | | | | | | | | | | | | |
| $ | 3,319,419 | | | $ | 139,521,739 | | | $ | 347,007,914 | | | $ | 263,729,626 | | | $ | 63,046,976 | | | $ | 492,270,551 | | | $ | 1,108,491,368 | | | |
| | | | | | | | | | | | | | | | | | | | | | | | | | | | |
The accompanying notes are an integral part of these financial statements.
71
MUTUAL OF AMERICA INVESTMENT CORPORATION
STATEMENTS OF OPERATIONS
For the Year Ended December 31, 2016
| | | | | | | | | | | | | | | | | | | | |
| | | | | |
| | | Equity Index
Fund | | | All America
Fund | | | Small Cap
Value Fund | | | Small Cap
Growth Fund | | | Mid Cap
Value Fund | |
INVESTMENT INCOMEAND EXPENSES: | | | | | | | | | | | | | | | | | | | | |
INCOME: | | | | | | | | | | | | | | | | | | | | |
Dividends | | $ | 41,974,578 | | | $ | 5,591,673 | | | $ | 7,726,113 | | | $ | 3,416,729 | | | $ | 1,788,150 | |
Interest | | | 223,815 | | | | 22,203 | | | | 65,848 | | | | 59,681 | | | | 11,751 | |
| | | | | | | | | | | | | | | | | | | | |
Total income | | | 42,198,393 | | | | 5,613,876 | | | | 7,791,961 | | | | 3,476,410 | | | | 1,799,901 | |
| | | | | | | | | | | | | | | | | | | | |
| | | | | |
EXPENSES: | | | | | | | | | | | | | | | | | | | | |
Investment advisory fees (Note 2) | | | 1,450,654 | | | | 1,144,136 | | | | 2,929,353 | | | | 2,963,049 | | | | 462,084 | |
Other operating expenses: | | | | | | | | | | | | | | | | | | | | |
Accounting and recordkeeping expenses | | | 394,991 | | | | 117,553 | | | | 82,378 | | | | 84,119 | | | | 25,322 | |
Shareholders reports | | | 18,288 | | | | 22,820 | | | | 18,578 | | | | 18,395 | | | | 16,575 | |
Custodian expenses | | | 48,543 | | | | 77,181 | | | | 20,654 | | | | 15,334 | | | | 9,561 | |
Independent directors’ fees and expenses | | | 136,548 | | | | 20,986 | | | | 27,642 | | | | 28,133 | | | | 6,441 | |
Audit | | | 57,927 | | | | 20,511 | | | | 18,126 | | | | 18,923 | | | | 6,296 | |
Legal and Compliance | | | 97,789 | | | | 34,625 | | | | 30,600 | | | | 31,944 | | | | 10,628 | |
Administrative | | | 347,190 | | | | 53,359 | | | | 70,284 | | | | 71,532 | | | | 16,377 | |
Licenses | | | 161,587 | | | | 14,901 | | | | — | | | | — | | | | — | |
Other | | | 56,899 | | | | 8,745 | | | | 11,518 | | | | 11,723 | | | | 2,684 | |
| | | | | | | | | | | | | | | | | | | | |
Total operating expenses | | | 1,319,762 | | | | 370,681 | | | | 279,780 | | | | 280,103 | | | | 93,884 | |
| | | | | | | | | | | | | | | | | | | | |
Total expenses before reimbursement | | | 2,770,416 | | | | 1,514,817 | | | | 3,209,133 | | | | 3,243,152 | | | | 555,968 | |
Fee waiver and expense reimbursement (Note 2) | | | — | | | | — | | | | — | | | | — | | | | — | |
| | | | | | | | | | | | | | | | | | | | |
Net Expenses | | | 2,770,416 | | | | 1,514,817 | | | | 3,209,133 | | | | 3,243,152 | | | | 555,968 | |
| | | | | | | | | | | | | | | | | | | | |
Net Investment Income (Loss) | | | 39,427,977 | | | | 4,099,059 | | | | 4,582,828 | | | | 233,258 | | | | 1,243,933 | |
| | | | | | | | | | | | | | | | | | | | |
NET REALIZEDAND UNREALIZED GAIN (LOSS) oN INVESTMENTSAND
FUTURES CONTRACTS (Note 1): | | | | | | | | | | | | | | | | | | | | |
Net realized gain (loss) on: | | | | | | | | | | | | | | | | | | | | |
Investment securities | | | 39,029,085 | | | | 38,761,892 | | | | 21,162,617 | | | | 17,695,904 | | | | 4,570,150 | |
Futures contracts | | | 6,216,836 | | | | 142,625 | | | | — | | | | — | | | | — | |
Gain distributions from Mutual of America Investment Corp. Funds | | | — | | | | — | | | | — | | | | — | | | | — | |
| | | | | | | | | | | | | | | | | | | | |
| | | 45,245,921 | | | | 38,904,517 | | | | 21,162,617 | | | | 17,695,904 | | | | 4,570,150 | |
| | | | | | | | | | | | | | | | | | | | |
Change in net unrealized appreciation (depreciation) of: | | | | | | | | | | | | | | | | | | | | |
Investment securities | | | 137,355,218 | | | | (11,550,557 | ) | | | 49,990,802 | | | | 14,374,516 | | | | 7,222,550 | |
Futures contracts | | | (521,041 | ) | | | (95,380 | ) | | | — | | | | — | | | | — | |
| | | | | | | | | | | | | | | | | | | | |
| | | 136,834,177 | | | | (11,645,937 | ) | | | 49,990,802 | | | | 14,374,516 | | | | 7,222,550 | |
| | | | | | | | | | | | | | | | | | | | |
NET REALIZEDAND UNREALIZED GAIN (LOSS)ON INVESTMENTSAND
FUTURES CONTRACTS | | | 182,080,098 | | | | 27,258,580 | | | | 71,153,419 | | | | 32,070,420 | | | | 11,792,700 | |
| | | | | | | | | | | | | | | | | | | | |
NET INCREASE (DECREASE)IN NET ASSETS RESULTINGFROM OPERATIONS | | $ | 221,508,075 | | | $ | 31,357,639 | | | $ | 75,736,247 | | | $ | 32,303,678 | | | $ | 13,036,633 | |
| | | | | | | | | | | | | | | | | | | | |
| (a) | The Retirement and Allocation Funds invest in affiliated funds of Mutual of America Investment Corporation and receive dividend income entirely from these affiliated funds. |
| (b) | The Retirement and Allocation Funds incur direct investment management expenses of .05% and .00%, respectively. Certain operating expenses that can be attributed only to the Retirement and Allocation Funds were charged directly to those Funds, subject to the Adviser’s agreement to reimburse direct non-advisory operating expenses of any such Fund whose average daily net assets for the prior calendar year was less than $50 million. The Retirement and Allocation Funds also bear their pro-rata share of the non-advisory operating expenses borne by each of the underlying Funds in which they invest. |
| (c) | Realized gains and losses for the Retirement and Allocation Funds resulted from the disposition of shares of the underlying funds. |
| (d) | Net of foreign taxes of $737,270. |
The accompanying notes are an integral part of these financial statements.
72
| | | | | | | | | | | | | | | | | | | | | | | | | | | | | | | | |
Mid-Cap
Equity Index
Fund | | | International
Fund | | | Composite
Fund | | | Retirement
Income
Fund | | | 2010
Retirement
Fund | | | 2015
Retirement
Fund | | | 2020
Retirement
Fund | | | 2025
Retirement
Fund | | | |
| | | | | | | | | | | | | | | | | | | | | | | | | | | | | | | | |
| | | | | | | | | | | | | | | | | | | | | | | | | | | | | | | | |
| $ | 18,478,748 | | | $ | 10,262,567 | (d) | | $ | 2,250,031 | | | $ | 1,590,936 | (a) | | $ | 552,012 | (a) | | $ | 3,118,498 | (a) | | $ | 8,086,666 | (a) | | $ | 8,649,545 | (a) | | |
| | 149,528 | | | | 43,284 | | | | 2,425,546 | | | | — | | | | — | | | | — | | | | — | | | | — | | | |
| | | | | | | | | | | | | | | | | | | | | | | | | | | | | | | | |
| | 18,628,276 | | | | 10,305,851 | | | | 4,675,577 | | | | 1,590,936 | | | | 552,012 | | | | 3,118,498 | | | | 8,086,666 | | | | 8,649,545 | | | |
| | | | | | | | | | | | | | | | | | | | | | | | | | | | | | | | |
| | | | | | | | |
| | | | | | | | | | | | | | | | | | | | | | | | | | | | | | | | |
| | 795,892 | | | | 250,457 | | | | 712,107 | | | | 33,726 | (b) | | | 12,499 | (b) | | | 72,199 | (b) | | | 191,375 | (b) | | | 217,548 | (b) | | |
| | | | | | | | | | | | | | | | | | | | | | | | | | | | | | | | |
| | 226,044 | | | | 58,893 | | | | 69,540 | | | | — | (b) | | | — | (b) | | | — | (b) | | | — | (b) | | | — | (b) | | |
| | 18,385 | | | | 14,380 | | | | 21,162 | | | | 15,489 | (b) | | | 14,113 | (b) | | | 17,226 | (b) | | | 16,538 | (b) | | | 16,357 | (b) | | |
| | 56,653 | | | | 5,870 | | | | 28,551 | | | | — | (b) | | | — | (b) | | | — | (b) | | | — | (b) | | | — | (b) | | |
| | 75,274 | | | | 21,999 | | | | 13,794 | | | | — | (b) | | | — | (b) | | | — | (b) | | | — | (b) | | | — | (b) | | |
| | 38,689 | | | | 1,677 | | | | 13,483 | | | | 5,145 | (b) | | | 1,697 | (b) | | | 11,966 | (b) | | | 30,494 | (b) | | | 34,291 | (b) | | |
| | 65,313 | | | | 2,830 | | | | 22,760 | | | | 6,154 | (b) | | | 2,031 | (b) | | | 14,312 | (b) | | | 36,471 | (b) | | | 41,013 | (b) | | |
| | 191,394 | | | | 55,936 | | | | 35,074 | | | | — | (b) | | | — | (b) | | | — | (b) | | | — | (b) | | | — | (b) | | |
| | 89,077 | | | | — | | | | — | | | | — | (b) | | | — | (b) | | | — | (b) | | | — | (b) | | | — | (b) | | |
| | 31,367 | | | | 9,168 | | | | 5,748 | | | | — | (b) | | | — | (b) | | | — | (b) | | | — | (b) | | | — | (b) | | |
| | | | | | | | | | | | | | | | | | | | | | | | | | | | | | | | |
| | 792,196 | | | | 170,753 | | | | 210,112 | | | | 26,788 | | | | 17,841 | | | | 43,504 | | | | 83,503 | | | | 91,661 | | | |
| | | | | | | | | | | | | | | | | | | | | | | | | | | | | | | | |
| | 1,588,088 | | | | 421,210 | | | | 922,219 | | | | 60,514 | | | | 30,340 | | | | 115,703 | | | | 274,878 | | | | 309,209 | | | |
| | — | | | | — | | | | — | | | | — | | | | (17,841 | ) | | | — | | | | — | | | | — | | | |
| | | | | | | | | | | | | | | | | | | | | | | | | | | | | | | | |
| | 1,588,088 | | | | 421,210 | | | | 922,219 | | | | 60,514 | | | | 12,499 | | | | 115,703 | | | | 274,878 | | | | 309,209 | | | |
| | | | | | | | | | | | | | | | | | | | | | | | | | | | | | | | |
| | 17,040,188 | | | | 9,884,641 | | | | 3,753,358 | | | | 1,530,422 | | | | 539,513 | | | | 3,002,795 | | | | 7,811,788 | | | | 8,340,336 | | | |
| | | | | | | | | | | | | | | | | | | | | | | | | | | | | | | | |
|
|
| | | | | | | | | | | | | | | | | | | | | | | | | | | | | | |
| | | | | | | | | | | | | | | | | | | | | | | | | | | | | | | | |
| | 67,460,637 | | | | 1,581,427 | | | | 23,489,051 | | | | 610,474 | (c) | | | 796,287 | (c) | | | 4,149,665 | (c) | | | 7,730,648 | (c) | | | 7,189,083 | (c) | | |
| | 8,570,791 | | | | — | | | | — | | | | — | | | | — | | | | — | | | | — | | | | — | | | |
|
— |
| | | — | | | | — | | | | 669,868 | | | | 311,378 | | | | 2,275,074 | | | | 7,420,590 | | | | 10,786,758 | | | |
| | | | | | | | | | | | | | | | | | | | | | | | | | | | | | | | |
| | 76,031,428 | | | | 1,581,427 | | | | 23,489,051 | | | | 1,280,342 | | | | 1,107,665 | | | | 6,424,739 | | | | 15,151,238 | | | | 17,975,841 | | | |
| | | | | | | | | | | | | | | | | | | | | | | | | | | | | | | | |
| | | | | | | | | | | | | | | | | | | | | | | | | | | | | | | | |
| | 111,761,308 | | | | (5,032,541 | ) | | | (13,674,781 | ) | | | 1,149,321 | | | | 710 | | | | 1,217,614 | | | | 8,601,495 | | | | 15,514,743 | | | |
| | (587,487 | ) | | | — | | | | — | | | | — | | | | — | | | | — | | | | — | | | | — | | | |
| | | | | | | | | | | | | | | | | | | | | | | | | | | | | | | | |
| | 111,173,821 | | | | (5,032,541 | ) | | | (13,674,781 | ) | | | 1,149,321 | | | | 710 | | | | 1,217,614 | | | | 8,601,495 | | | | 15,514,743 | | | |
| | | | | | | | | | | | | | | | | | | | | | | | | | | | | | | | |
|
187,205,249 |
| | | (3,451,114 | ) | | | 9,814,270 | | | | 2,429,663 | | | | 1,108,375 | | | | 7,642,353 | | | | 23,752,733 | | | | 33,490,584 | | | |
| | | | | | | | | | | | | | | | | | | | | | | | | | | | | | | | |
| $ | 204,245,437 | | | $ | 6,433,527 | | | $ | 13,567,628 | | | $ | 3,960,085 | | | $ | 1,647,888 | | | $ | 10,645,148 | | | $ | 31,564,521 | | | $ | 41,830,920 | | | |
| | | | | | | | | | | | | | | | | | | | | | | | | | | | | | | | |
The accompanying notes are an integral part of these financial statements.
73
MUTUAL OF AMERICA INVESTMENT CORPORATION
STATEMENTS OF OPERATIONS (Continued)
For the Year Ended December 31, 2016
| | | | | | | | | | | | | | | | | | | | |
| | | 2030
Retirement
Fund | | | 2035
Retirement
Fund | | | 2040
Retirement
Fund | | | 2045
Retirement
Fund | | | 2050
Retirement
Fund | |
INVESTMENT INCOMEAND EXPENSES: | | | | | | | | | | | | | | | | | | | | |
INCOME: | | | | | | | | | | | | | | | | | | | | |
Dividends | | $ | 6,640,185 | (a) | | $ | 5,231,928 | (a) | | $ | 4,059,018 | (a) | | $ | 4,638,545 | (a) | | $ | 2,019,178 | (a) |
Interest | | | — | | | | — | | | | — | | | | — | | | | — | |
| | | | | | | | | | | | | | | | | | | | |
Total income | | | 6,640,185 | | | | 5,231,928 | | | | 4,059,018 | | | | 4,638,545 | | | | 2,019,178 | |
| | | | | | | | | | | | | | | | | | | | |
| | | | | |
EXPENSES: | | | | | | | | | | | | | | | | | | | | |
Investment advisory fees (Note 2) | | | 178,730 | (b) | | | 149,246 | (b) | | | 121,502 | (b) | | | 143,290 | (b) | | | 60,792 | (b) |
Other operating expenses: | | | | | | | | | | | | | | | | | | | | |
Accounting and recordkeeping expenses | | | — | (b) | | | — | (b) | | | — | (b) | | | — | (b) | | | — | (b) |
Shareholders reports | | | 16,358 | (b) | | | 16,381 | (b) | | | 16,457 | (b) | | | 16,428 | (b) | | | 14,758 | (b) |
Custodian expenses | | | — | (b) | | | — | (b) | | | — | (b) | | | — | (b) | | | — | (b) |
Independent directors’ fees and expenses | | | — | (b) | | | — | (b) | | | — | (b) | | | — | (b) | | | — | (b) |
Audit | | | 28,120 | (b) | | | 23,527 | (b) | | | 19,248 | (b) | | | 22,665 | (b) | | | 8,562 | (b) |
Legal and Compliance | | | 33,633 | (b) | | | 28,140 | (b) | | | 23,022 | (b) | | | 27,107 | (b) | | | 10,241 | (b) |
Administrative | | | — | (b) | | | — | (b) | | | — | (b) | | | — | (b) | | | — | (b) |
Licenses | | | — | (b) | | | — | (b) | | | — | (b) | | | — | (b) | | | — | (b) |
Other | | | — | (b) | | | — | (b) | | | — | (b) | | | — | (b) | | | — | (b) |
| | | | | | | | | | | | | | | | | | | | |
Total operating expenses | | | 78,111 | | | | 68,048 | | | | 58,727 | | | | 66,200 | | | | 33,561 | |
| | | | | | | | | | | | | | | | | | | | |
Total expenses before reimbursement | | | 256,841 | | | | 217,294 | | | | 180,229 | | | | 209,490 | | | | 94,353 | |
Fee waiver and expense reimbursement (Note 2) | | | — | | | | — | | | | — | | | | — | | | | — | |
| | | | | | | | | | | | | | | | | | | | |
Net Expenses | | | 256,841 | | | | 217,294 | | | | 180,229 | | | | 209,490 | | | | 94,353 | |
| | | | | | | | | | | | | | | | | | | | |
Net investment Income (Loss) | | | 6,383,344 | | | | 5,014,634 | | | | 3,878,789 | | | | 4,429,055 | | | | 1,924,825 | |
| | | | | | | | | | | | | | | | | | | | |
NET REALIZEDAND UNREALIZED GAIN (LOSS)ON INVESTMENTSAND
FUTURES CONTRACTS (Note 1): | | | | | | | | | | | | | | | | | | | | |
Net realized gain (loss) on: | | | | | | | | | | | | | | | | | | | | |
Investment securities | | | 6,546,328 | (c) | | | 4,834,304 | (c) | | | 4,575,913 | (c) | | | 4,172,059 | (c) | | | 597,598 | (c) |
Futures contracts | | | — | | | | — | | | | — | | | | — | | | | — | |
Gain distributions from Mutual of America Investment Corp. Funds | | | 10,096,143 | | | | 9,544,353 | | | | 8,190,746 | | | | 9,905,200 | | | | 4,555,203 | |
| | | | | | | | | | | | | | | | | | | | |
| | | 16,642,471 | | | | 14,378,657 | | | | 12,766,659 | | | | 14,077,259 | | | | 5,152,801 | |
| | | | | | | | | | | | | | | | | | | | |
Change in net unrealized appreciation (depreciation) of: | | | | | | | | | | | | | | | | | | | | |
Investment securities | | | 14,528,108 | | | | 14,207,037 | | | | 11,424,558 | | | | 14,717,213 | | | | 8,103,703 | |
Futures contracts | | | — | | | | — | | | | — | | | | — | | | | — | |
| | | | | | | | | | | | | | | | | | | | |
| | | 14,528,108 | | | | 14,207,037 | | | | 11,424,558 | | | | 14,717,213 | | | | 8,103,703 | |
| | | | | | | | | | | | | | | | | | | | |
NET REALIZEDAND UNREALIZED GAIN (LOSS)ON INVESTMENTSAND FUTURES CONTRACTS | | | 31,170,579 | | | | 28,585,694 | | | | 24,191,217 | | | | 28,794,472 | | | | 13,256,504 | |
| | | | | | | | | | | | | | | | | | | | |
NET INCREASE (DECREASE)IN NET ASSETS RESULTINGFROM OPERATIONS | | $ | 37,553,923 | | | $ | 33,600,328 | | | $ | 28,070,006 | | | $ | 33,223,527 | | | $ | 15,181,329 | |
| | | | | | | | | | | | | | | | | | | | |
| † | For the period October 1, 2016 (Commencement of Operations) to December 31, 2016. |
| (a) | The Retirement and Allocation Funds invest in affiliated funds of Mutual of America Investment Corporation and receive dividend income entirely from these affiliated funds. |
| (b) | The Retirement and Allocation Funds incur direct investment management expenses of .05% and .00%, respectively. Certain operating expenses that can be attributed only to the Retirement and Allocation Funds were charged directly to those Funds, subject to the Adviser’s agreement to reimburse direct non-advisory operating expenses of any such Fund whose average daily net assets for the prior calendar year was less than $50 million. The Retirement and Allocation Funds also bear their pro-rata share of the non-advisory operating expenses borne by each of the underlying Funds in which they invest. |
| (c) | Realized gains and losses for the Retirement and Allocation Funds resulted from the disposition of shares of the underlying funds. |
The accompanying notes are an integral part of these financial statements.
74
| | | | | | | | | | | | | | | | | | | | | | | | | | | | |
2055
Retirement
Fund† | | | Conservative
Allocation
Fund | | | Moderate
Allocation
Fund | | | Aggressive
Allocation
Fund | | | Money
Market
Fund | | | Mid-Term
Bond Fund | | | Bond Fund | | | |
| | | | | | | | | | | | | | | | | | | | | | | | | | | | |
| | | | | | | | | | | | | | | | | | | | | | | | | | | | |
| $ | — | | | $ | 3,071,655 | (a) | | $ | 6,889,754 | (a) | | $ | 4,441,093 | (a) | | $ | — | | | $ | — | | | $ | — | | | |
| | — | | | | — | | | | — | | | | — | | | | 257,737 | | | | 13,732,099 | | | | 37,534,502 | | | |
| | | | | | | | | | | | | | | | | | | | | | | | | | | | |
| | — | | | | 3,071,655 | | | | 6,889,754 | | | | 4,441,093 | | | | 257,737 | | | | 13,732,099 | | | | 37,534,502 | | | |
| | | | | | | | | | | | | | | | | | | | | | | | | | | | |
| | | | | | | |
| | | | | | | | | | | | | | | | | | | | | | | | | | | | | |
| | 132 | (b) | | | — | (b) | | | — | (b) | | | — | (b) | | | 93,945 | | | | 1,876,855 | | | | 4,130,121 | | | |
| | | | | | | | | | | | | | | | | | | | | | | | | | | | |
| | — | (b) | | | — | (b) | | | — | (b) | | | — | (b) | | | 18,154 | | | | 107,153 | | | | 247,083 | | | |
| | 1,273 | (b) | | | 16,814 | (b) | | | 16,509 | (b) | | | 16,653 | (b) | | | 15,789 | | | | 18,984 | | | | 19,229 | | | |
| | — | (b) | | | — | (b) | | | — | (b) | | | — | (b) | | | 13,793 | | | | 9,060 | | | | 27,999 | | | |
| | — | (b) | | | — | (b) | | | — | (b) | | | — | (b) | | | 5,106 | | | | 33,469 | | | | 75,619 | | | |
| | — | (b) | | | 10,699 | (b) | | | 26,187 | (b) | | | 20,282 | (b) | | | 4,736 | | | | 13,333 | | | | 29,922 | | | |
| | 2 | (b) | | | 12,795 | (b) | | | 31,320 | (b) | | | 24,258 | (b) | | | 7,995 | | | | 22,506 | | | | 50,512 | | | |
| | — | (b) | | | — | (b) | | | — | (b) | | | — | (b) | | | 12,981 | | | | 85,100 | | | | 192,270 | | | |
| | — | (b) | | | — | (b) | | | — | (b) | | | — | (b) | | | — | | | | — | | | | — | | | |
| | — | (b) | | | — | (b) | | | — | (b) | | | — | (b) | | | 2,127 | | | | 13,947 | | | | 31,510 | | | |
| | | | | | | | | | | | | | | | | | | | | | | | | | | | |
| | 1,275 | | | | 40,308 | | | | 74,016 | | | | 61,193 | | | | 80,681 | | | | 303,552 | | | | 674,144 | | | |
| | | | | | | | | | | | | | | | | | | | | | | | | | | | |
| | 1,407 | | | | 40,308 | | | | 74,016 | | | | 61,193 | | | | 174,626 | | | | 2,180,407 | | | | 4,804,265 | | | |
| | (1,275 | ) | | | — | | | | — | | | | — | | | | — | | | | — | | | | — | | | |
| | | | | | | | | | | | | | | | | | | | | | | | | | | | |
| | 132 | | | | 40,308 | | | | 74,016 | | | | 61,193 | | | | 174,626 | | | | 2,180,407 | | | | 4,804,265 | | | |
| | | | | | | | | | | | | | | | | | | | | | | | | | | | |
| | (132 | ) | | | 3,031,347 | | | | 6,815,738 | | | | 4,379,900 | | | | 83,111 | | | | 11,551,692 | | | | 32,730,237 | | | |
| | | | | | | | | | | | | | | | | | | | | | | | | | | | |
|
|
| | | | | | | | | | | | | | | | | | | | | | | | | | |
| | | | | | | | | | | | | | | | | | | | | | | | | | | | |
| | (16,339 | )(c) | | | 1,142,223 | (c) | | | 5,378,085 | (c) | | | 8,583,928 | (c) | | | (26 | ) | | | 729,217 | | | | 2,266,244 | | | |
| | — | | | | — | | | | — | | | | — | | | | — | | | | — | | | | — | | | |
| | — | | | | 1,426,267 | | | | 6,512,266 | | | | 7,146,126 | | | | — | | | | — | | | | — | | | |
| | | | | | | | | | | | | | | | | | | | | | | | | | | | |
| | (16,339 | ) | | | 2,568,490 | | | | 11,890,351 | | | | 15,730,054 | | | | (26 | ) | | | 729,217 | | | | 2,266,244 | | | |
| | | | | | | | | | | | | | | | | | | | | | | | | | | | |
| | | | | | | | | | | | | | | | | | | | | | | | | | | | |
| | 30,873 | | | | 2,812,869 | | | | 9,992,223 | | | | 6,155,891 | | | | (1,000 | ) | | | 3,108,491 | | | | 11,554,313 | | | |
| | — | | | | — | | | | — | | | | — | | | | — | | | | — | | | | — | | | |
| | | | | | | | | | | | | | | | | | | | | | | | | | | | |
| | 30,873 | | | | 2,812,869 | | | | 9,992,223 | | | | 6,155,891 | | | | (1,000 | ) | | | 3,108,491 | | | | 11,554,313 | | | |
| | | | | | | | | | | | | | | | | | | | | | | | | | | | |
|
14,534 |
| | | 5,381,359 | | | | 21,882,574 | | | | 21,885,945 | | | | (1,026 | ) | | | 3,837,708 | | | | 13,820,557 | | | |
| | | | | | | | | | | | | | | | | | | | | | | | | | | | |
| $ | 14,402 | | | $ | 8,412,706 | | | $ | 28,698,312 | | | $ | 26,265,845 | | | $ | 82,085 | | | $ | 15,389,400 | | | $ | 46,550,794 | | | |
| | | | | | | | | | | | | | | | | | | | | | | | | | | | |
The accompanying notes are an integral part of these financial statements.
75
MUTUAL OF AMERICA INVESTMENT CORPORATION
STATEMENTS OF CHANGES IN NET ASSETS
For the Years Ended December 31,
| | | | | | | | | | | | | | | | |
| | | Equity Index Fund | | | All America Fund | |
| | | 2016 | | | 2015 | | | 2016 | | | 2015 | |
INCREASE (DECREASE) IN NET ASSETS: | | | | | | | | | | | | | | | | |
FROM OPERATIONS: | | | | | | | | | | | | | | | | |
Net investment income (loss) | | $ | 39,427,977 | | | $ | 35,259,619 | | | $ | 4,099,059 | | | $ | 4,112,031 | |
Net realized gain (loss) on investments and futures contracts | | | 45,245,921 | | | | 37,927,338 | | | | 38,904,517 | | | | 16,404,603 | |
Change in net unrealized appreciation (depreciation) of investments and futures contracts | | | 136,834,177 | | | | (50,421,811 | ) | | | (11,645,937 | ) | | | (20,193,366 | ) |
| | | | | | | | | | | | | | | | |
NET INCREASE (DECREASE) IN NET ASSETS RESULTING FROM OPERATIONS | | | 221,508,075 | | | | 22,765,146 | | | | 31,357,639 | | | | 323,268 | |
| | | | | | | | | | | | | | | | |
| | | | |
DISTRIBUTIONS (Notes 1 and 5) | | | | | | | | | | | | | | | | |
From net investment income | | | (34,619,166 | ) | | | (29,188,647 | ) | | | (3,947,519 | ) | | | (4,193,905 | ) |
From net realized gains | | | (49,908,340 | ) | | | (65,074,652 | ) | | | (17,354,545 | ) | | | (19,549,735 | ) |
| | | | | | | | | | | | | | | | |
Total distributions | | | (84,527,506 | ) | | | (94,263,299 | ) | | | (21,302,064 | ) | | | (23,743,640 | ) |
| | | | | | | | | | | | | | | | |
| | | | |
CAPITAL SHARE TRANSACTIONS (Note 4): | | | | | | | | | | | | | | | | |
Net proceeds from sale of shares | | | 209,534,199 | | | | 204,460,581 | | | | 3,905,224 | | | | 4,787,618 | |
Dividends reinvested | | | 84,527,506 | | | | 94,263,299 | | | | 21,302,064 | | | | 23,743,640 | |
Cost of shares redeemed | | | (141,946,780 | ) | | | (162,113,848 | ) | | | (34,216,260 | ) | | | (34,496,884 | ) |
| | | | | | | | | | | | | | | | |
NET INCREASE (DECREASE) IN NET ASSETS FROM CAPITAL SHARE TRANSACTIONS | | | 152,114,925 | | | | 136,610,032 | | | | (9,008,972 | ) | | | (5,965,626 | ) |
| | | | | | | | | | | | | | | | |
INCREASE (DECREASE) IN NET ASSETS | | | 289,095,494 | | | | 65,111,879 | | | | 1,046,603 | | | | (29,385,998 | ) |
NET ASSETS, BEGINNING OF PERIOD | | | 1,854,222,243 | | | | 1,789,110,364 | | | | 294,797,125 | | | | 324,183,123 | |
| | | | | | | | | | | | | | | | |
NET ASSETS, END OF PERIOD | | $ | 2,143,317,737 | | | $ | 1,854,222,243 | | | $ | 295,843,728 | | | $ | 294,797,125 | |
| | | | | | | | | | | | | | | | |
ACCUMULATED UNDISTRIBUTED NET INVESTMENT INCOME (LOSS) | | $ | 38,981,241 | | | $ | 34,349,119 | | | $ | 4,004,203 | | | $ | 3,873,755 | |
| | | | | | | | | | | | | | | | |
| | | | |
OTHER INFORMATION: | | | | | | | | | | | | | | | | |
Shares outstanding at the beginning of period | | | 568,528,724 | | | | 524,974,834 | | | | 132,899,216 | | | | 134,209,249 | |
| | | | | | | | | | | | | | | | |
Shares sold | | | 62,532,808 | | | | 60,445,948 | | | | 1,762,928 | | | | 1,997,801 | |
Shares issued as reinvestment of dividends | | | 25,622,727 | | | | 30,604,709 | | | | 9,891,307 | | | | 11,136,977 | |
Shares redeemed | | | (42,887,585 | ) | | | (47,496,767 | ) | | | (15,403,239 | ) | | | (14,444,811 | ) |
| | | | | | | | | | | | | | | | |
Net increase (decrease) | | | 45,267,950 | | | | 43,553,890 | | | | (3,749,004 | ) | | | (1,310,033 | ) |
| | | | | | | | | | | | | | | | |
Shares outstanding at the end of period | | | 613,796,674 | | | | 568,528,724 | | | | 129,150,212 | | | | 132,899,216 | |
| | | | | | | | | | | | | | | | |
The accompanying notes are an integral part of these financial statements.
76
| | | | | | | | | | | | | | | | | | | | | | | | | | | | | | | | |
| Small Cap Value Fund | | | Small Cap Growth Fund | | | Mid Cap Value Fund | | | Mid-Cap Equity Index Fund | | | |
| 2016 | | | 2015 | | | 2016 | | | 2015 | | | 2016 | | | 2015 | | | 2016 | | | 2015 | | | |
| | | | | | | | | | | | | | | | | | | | | | | | | | | | | | | | |
| | | | | | | | | | | | | | | | | | | | | | | | | | | | | | | | |
| $ | 4,582,828 | | | $ | 4,461,545 | | | $ | 233,258 | | | $ | (496,788 | ) | | $ | 1,243,933 | | | $ | 1,301,152 | | | $ | 17,040,188 | | | $ | 14,666,361 | | | |
| | 21,162,617 | | | | 6,017,598 | | | | 17,695,904 | | | | 39,518,825 | | | | 4,570,150 | | | | 4,517,447 | | | | 76,031,428 | | | | 71,340,246 | | | |
| | | | | | | | |
| | 49,990,802 | | | | (23,441,857 | ) | | | 14,374,516 | | | | (49,504,619 | ) | | | 7,222,550 | | | | (8,503,711 | ) | | | 111,173,821 | | | | (109,187,366 | ) | | |
| | | | | | | | | | | | | | | | | | | | | | | | | | | | | | | | |
| | 75,736,247 | | | | (12,962,714 | ) | | | 32,303,678 | | | | (10,482,582 | ) | | | 13,036,633 | | | | (2,685,112 | ) | | | 204,245,437 | | | | (23,180,759 | ) | | |
| | | | | | | | | | | | | | | | | | | | | | | | | | | | | | | | |
| | | | | | | | |
| | | | | | | | | | | | | | | | | | | | | | | | | | | | | | | | |
| | (3,473,986 | ) | | | (3,251,696 | ) | | | — | | | | — | | | | (1,115,504 | ) | | | (944,993 | ) | | | (13,403,568 | ) | | | (11,340,680 | ) | | |
| | (5,500,345 | ) | | | (23,962,528 | ) | | | (39,762,021 | ) | | | (50,286,630 | ) | | | (4,887,020 | ) | | | (5,149,406 | ) | | | (71,656,832 | ) | | | (62,570,149 | ) | | |
| | | | | | | | | | | | | | | | | | | | | | | | | | | | | | | | |
| | (8,974,331 | ) | | | (27,214,224 | ) | | | (39,762,021 | ) | | | (50,286,630 | ) | | | (6,002,524 | ) | | | (6,094,399 | ) | | | (85,060,400 | ) | | | (73,910,829 | ) | | |
| | | | | | | | | | | | | | | | | | | | | | | | | | | | | | | | |
| | | | | | | | |
| | | | | | | | | | | | | | | | | | | | | | | | | | | | | | | | |
| | 37,892,425 | | | | 27,883,451 | | | | 35,062,988 | | | | 44,124,233 | | | | 11,023,289 | | | | 7,424,648 | | | | 134,367,488 | | | | 98,724,678 | | | |
| | 8,974,331 | | | | 27,214,224 | | | | 39,762,021 | | | | 50,286,630 | | | | 6,002,524 | | | | 6,094,399 | | | | 85,060,400 | | | | 73,910,829 | | | |
| | (25,255,029 | ) | | | (31,909,045 | ) | | | (36,184,437 | ) | | | (44,366,736 | ) | | | (7,572,114 | ) | | | (15,537,986 | ) | | | (70,973,227 | ) | | | (98,775,032 | ) | | |
| | | | | | | | | | | | | | | | | | | | | | | | | | | | | | | | |
| | 21,611,727 | | | | 23,188,630 | | | | 38,640,572 | | | | 50,044,127 | | | | 9,453,699 | | | | (2,018,939 | ) | | | 148,454,661 | | | | 73,860,475 | | | |
| | | | | | | | | | | | | | | | | | | | | | | | | | | | | | | | |
| | 88,373,643 | | | | (16,988,308 | ) | | | 31,182,229 | | | | (10,725,085 | ) | | | 16,487,808 | | | | (10,798,450 | ) | | | 267,639,698 | | | | (23,231,113 | ) | | |
| | 376,468,234 | | | | 393,456,542 | | | | 401,623,957 | | | | 412,349,042 | | | | 81,529,507 | | | | 92,327,957 | | | | 977,397,477 | | | | 1,000,628,590 | | | |
| | | | | | | | | | | | | | | | | | | | | | | | | | | | | | | | |
| $ | 464,841,877 | | | $ | 376,468,234 | | | $ | 432,806,186 | | | $ | 401,623,957 | | | $ | 98,017,315 | | | $ | 81,529,507 | | | $ | 1,245,037,175 | | | $ | 977,397,477 | | | |
| | | | | | | | | | | | | | | | | | | | | | | | | | | | | | | | |
| $ | 4,275,125 | | | $ | 4,084,760 | | | $ | 125,500 | | | $ | — | | | $ | 1,068,227 | | | $ | 1,149,851 | | | $ | 16,421,998 | | | $ | 13,506,294 | | | |
| | | | | | | | | | | | | | | | | | | | | | | | | | | | | | | | |
| | | | | | | | |
| | | | | | | | | | | | | | | | | | | | | | | | | | | | | | | | |
| | 261,696,017 | | | | 244,764,120 | | | | 304,121,411 | | | | 268,125,197 | | | | 55,990,109 | | | | 56,753,645 | | | | 501,311,878 | | | | 462,801,870 | | | |
| | | | | | | | | | | | | | | | | | | | | | | | | | | | | | | | |
| | 24,832,010 | | | | 17,874,943 | | | | 27,646,314 | | | | 28,422,542 | | | | 7,281,442 | | | | 4,647,065 | | | | 65,449,391 | | | | 46,010,863 | | | |
| | 5,991,779 | | | | 19,225,751 | | | | 31,953,741 | | | | 36,898,275 | | | | 4,184,209 | | | | 4,252,622 | | | | 43,133,705 | | | | 37,933,784 | | | |
| | (17,154,491 | ) | | | (20,168,797 | ) | | | (28,363,854 | ) | | | (29,324,603 | ) | | | (5,136,819 | ) | | | (9,663,223 | ) | | | (35,588,830 | ) | | | (45,434,639 | ) | | |
| | | | | | | | | | | | | | | | | | | | | | | | | | | | | | | | |
| | 13,669,298 | | | | 16,931,897 | | | | 31,236,201 | | | | 35,996,214 | | | | 6,328,832 | | | | (763,536 | ) | | | 72,994,266 | | | | 38,510,008 | | | |
| | | | | | | | | | | | | | | | | | | | | | | | | | | | | | | | |
| | 275,365,315 | | | | 261,696,017 | | | | 335,357,612 | | | | 304,121,411 | | | | 62,318,941 | | | | 55,990,109 | | | | 574,306,144 | | | | 501,311,878 | | | |
| | | | | | | | | | | | | | | | | | | | | | | | | | | | | | | | |
The accompanying notes are an integral part of these financial statements.
77
MUTUAL OF AMERICA INVESTMENT CORPORATION
STATEMENTS OF CHANGES IN NET ASSETS (Continued)
For the Years Ended December 31,
| | | | | | | | | | | | | | | | |
| | | International Fund | | | Composite Fund | |
| | | 2016 | | | 2015 | | | 2016 | | | 2015 | |
INCREASE (DECREASE)IN NET ASSETS: | | | | | | | | | | | | | | | | |
FROM OPERATIONS: | | | | | | | | | | | | | | | | |
Net investment income (loss) | | $ | 9,884,641 | | | $ | 7,642,431 | | | $ | 3,753,358 | | | $ | 3,663,278 | |
Net realized gain (loss) on investments and futures contracts | | | 1,581,427 | | | | 507 | | | | 23,489,051 | | | | 8,731,574 | |
Change in net unrealized appreciation (depreciation) of investments and futures contracts | | | (5,032,541 | ) | | | (12,251,849 | ) | | | (13,674,781 | ) | | | (10,775,925 | ) |
| | | | | | | | | | | | | | | | |
NET INCREASE (DECREASE)IN NET ASSETS RESULTINGFROM OPERATIONS | | | 6,433,527 | | | | (4,608,911 | ) | | | 13,567,628 | | | | 1,618,927 | |
| | | | | | | | | | | | | | | | |
| | | | |
DISTRIBUTIONS (Notes 1 and 5) | | | | | | | | | | | | | | | | |
From net investment income | | | (7,642,431 | ) | | | (8,132,055 | ) | | | (3,658,442 | ) | | | (3,937,658 | ) |
From net realized gains | | | (507 | ) | | | (101,057 | ) | | | (10,434,654 | ) | | | (1,373,297 | ) |
| | | | | | | | | | | | | | | | |
Total distributions | | | (7,642,938 | ) | | | (8,233,112 | ) | | | (14,093,096 | ) | | | (5,310,955 | ) |
| | | | | | | | | | | | | | | | |
| | | | |
CAPITAL SHARE TRANSACTIONS (Note 4): | | | | | | | | | | | | | | | | |
Net proceeds from sale of shares | | | 68,349,676 | | | | 75,820,430 | | | | 6,797,815 | | | | 6,788,566 | |
Dividends reinvested | | | 7,642,938 | | | | 8,233,112 | | | | 14,093,096 | | | | 5,310,955 | |
Cost of shares redeemed | | | (17,474,443 | ) | | | (15,625,361 | ) | | | (19,136,304 | ) | | | (22,318,528 | ) |
| | | | | | | | | | | | | | | | |
NET INCREASE (DECREASE)IN NET ASSETSFROM CAPITAL SHARE TRANSACTIONS | | | 58,518,171 | | | | 68,428,181 | | | | 1,754,607 | | | | (10,219,007 | ) |
| | | | | | | | | | | | | | | | |
INCREASE (DECREASE)IN NET ASSETS | | | 57,308,760 | | | | 55,586,158 | | | | 1,229,139 | | | | (13,911,035 | ) |
NET ASSETS, BEGINNINGOF PERIOD | | | 319,419,733 | | | | 263,833,575 | | | | 179,914,248 | | | | 193,825,283 | |
| | | | | | | | | | | | | | | | |
NET ASSETS, ENDOF PERIOD | | $ | 376,728,493 | | | $ | 319,419,733 | | | $ | 181,143,387 | | | $ | 179,914,248 | |
| | | | | | | | | | | | | | | | |
ACCUMULATED UNDISTRIBUTED NET INVESTMENT INCOME (LOSS) | | $ | 9,884,641 | | | $ | 7,642,431 | | | $ | 3,748,522 | | | $ | 3,658,946 | |
| | | | | | | | | | | | | | | | |
| | | | |
OTHER INFORMATION: | | | | | | | | | | | | | | | | |
Shares outstanding at the beginning of period | | | 427,541,926 | | | | 341,369,894 | | | | 91,853,422 | | | | 96,812,141 | |
| | | | | | | | | | | | | | | | |
Shares sold | | | 92,830,402 | | | | 94,702,675 | | | | 3,474,216 | | | | 3,377,546 | |
Shares issued as reinvestment of dividends | | | 10,348,096 | | | | 11,091,742 | | | | 7,481,435 | | | | 2,786,254 | |
Shares redeemed | | | (23,823,899 | ) | | | (19,622,385 | ) | | | (9,809,773 | ) | | | (11,122,519 | ) |
| | | | | | | | | | | | | | | | |
Net increase (decrease) | | | 79,354,599 | | | | 86,172,032 | | | | 1,145,878 | | | | (4,958,719 | ) |
| | | | | | | | | | | | | | | | |
Shares outstanding at the end of period | | | 506,896,525 | | | | 427,541,926 | | | | 92,999,300 | | | | 91,853,422 | |
| | | | | | | | | | | | | | | | |
The accompanying notes are an integral part of these financial statements.
78
| | | | | | | | | | | | | | | | | | | | | | | | | | | | | | | | |
| Retirement Income Fund | | | 2010 Retirement Fund | | | 2015 Retirement Fund | | | 2020 Retirement Fund | | | |
| 2016 | | | 2015 | | | 2016 | | | 2015 | | | 2016 | | | 2015 | | | 2016 | | | 2015 | | | |
| | | | | | | | | | | | | | | | | | | | | | | | | | | | | | | | |
| | | | | | | | | | | | | | | | | | | | | | | | | | | | | | | | |
| $ | 1,530,422 | | | $ | 1,376,527 | | | $ | 539,513 | | | $ | 556,007 | | | $ | 3,002,795 | | | $ | 3,205,193 | | | $ | 7,811,788 | | | $ | 7,109,898 | | | |
| | 1,280,342 | | | | 2,259,915 | | | | 1,107,665 | | | | 1,450,104 | | | | 6,424,739 | | | | 9,360,361 | | | | 15,151,238 | | | | 15,854,789 | | | |
| | | | | | | | |
| | 1,149,321 | | | | (3,452,698 | ) | | | 710 | | | | (1,915,105 | ) | | | 1,217,614 | | | | (12,144,914 | ) | | | 8,601,495 | | | | (23,312,046 | ) | | |
| | | | | | | | | | | | | | | | | | | | | | | | | | | | | | | | |
| | 3,960,085 | | | | 183,744 | | | | 1,647,888 | | | | 91,006 | | | | 10,645,148 | | | | 420,640 | | | | 31,564,521 | | | | (347,359 | ) | | |
| | | | | | | | | | | | | | | | | | | | | | | | | | | | | | | | |
| | | | | | | | |
| | | | | | | | | | | | | | | | | | | | | | | | | | | | | | | | |
| | (1,417,706 | ) | | | (1,043,642 | ) | | | (579,461 | ) | | | (553,391 | ) | | | (3,360,637 | ) | | | (3,145,220 | ) | | | (7,495,794 | ) | | | (5,971,939 | ) | | |
| | (2,334,883 | ) | | | (1,507,057 | ) | | | (1,449,643 | ) | | | (1,342,011 | ) | | | (8,964,100 | ) | | | (8,330,888 | ) | | | (15,116,286 | ) | | | (14,219,639 | ) | | |
| | | | | | | | | | | | | | | | | | | | | | | | | | | | | | | | |
| | (3,752,589 | ) | | | (2,550,699 | ) | | | (2,029,104 | ) | | | (1,895,402 | ) | | | (12,324,737 | ) | | | (11,476,108 | ) | | | (22,612,080 | ) | | | (20,191,578 | ) | | |
| | | | | | | | | | | | | | | | | | | | | | | | | | | | | | | | |
| | | | | | | | |
| | | | | | | | | | | | | | | | | | | | | | | | | | | | | | | | |
| | 19,963,945 | | | | 24,013,651 | | | | 4,860,985 | | | | 4,789,683 | | | | 12,428,714 | | | | 21,012,564 | | | | 60,741,136 | | | | 70,945,700 | | | |
| | 3,752,589 | | | | 2,550,699 | | | | 2,029,104 | | | | 1,895,402 | | | | 12,324,737 | | | | 11,476,108 | | | | 22,612,080 | | | | 20,191,578 | | | |
| | (11,713,859 | ) | | | (14,242,810 | ) | | | (6,387,715 | ) | | | (5,876,669 | ) | | | (25,443,200 | ) | | | (26,833,644 | ) | | | (30,060,119 | ) | | | (27,041,015 | ) | | |
| | | | | | | | | | | | | | | | | | | | | | | | | | | | | | | | |
| | 12,002,675 | | | | 12,321,540 | | | | 502,374 | | | | 808,416 | | | | (689,749 | ) | | | 5,655,028 | | | | 53,293,097 | | | | 64,096,263 | | | |
| | | | | | | | | | | | | | | | | | | | | | | | | | | | | | | | |
| | 12,210,171 | | | | 9,954,585 | | | | 121,158 | | | | (995,980 | ) | | | (2,369,338 | ) | | | (5,400,440 | ) | | | 62,245,538 | | | | 43,557,326 | | | |
| | 63,489,724 | | | | 53,535,139 | | | | 25,562,026 | | | | 26,558,006 | | | | 148,761,092 | | | | 154,161,532 | | | | 363,598,279 | | | | 320,040,953 | | | |
| | | | | | | | | | | | | | | | | | | | | | | | | | | | | | | | |
| $ | 75,699,895 | | | $ | 63,489,724 | | | $ | 25,683,184 | | | $ | 25,562,026 | | | $ | 146,391,754 | | | $ | 148,761,092 | | | $ | 425,843,817 | | | $ | 363,598,279 | | | |
| | | | | | | | | | | | | | | | | | | | | | | | | | | | | | | | |
| $ | 1,539,981 | | | $ | 1,417,706 | | | $ | 543,546 | | | $ | 579,461 | | | $ | 3,028,460 | | | $ | 3,360,634 | | | $ | 7,891,832 | | | $ | 7,495,794 | | | |
| | | | | | | | | | | | | | | | | | | | | | | | | | | | | | | | |
| | | | | | | | |
| | | | | | | | | | | | | | | | | | | | | | | | | | | | | | | | |
| | 56,717,917 | | | | 46,045,385 | | | | 25,303,663 | | | | 24,456,165 | | | | 142,339,770 | | | | 136,513,695 | | | | 325,767,231 | | | | 270,183,637 | | | |
| | | | | | | | | | | | | | | | | | | | | | | | | | | | | | | | |
| | 17,515,224 | | | | 20,666,143 | | | | 4,798,782 | | | | 4,464,838 | | | | 11,829,560 | | | | 18,812,865 | | | | 53,304,303 | | | | 60,145,525 | | | |
| | 3,360,539 | | | | 2,293,417 | | | | 2,071,565 | | | | 1,895,626 | | | | 12,201,031 | | | | 11,117,706 | | | | 20,334,111 | | | | 18,386,686 | | | |
| | (10,281,056 | ) | | | (12,287,028 | ) | | | (6,298,569 | ) | | | (5,512,966 | ) | | | (24,233,687 | ) | | | (24,104,496 | ) | | | (26,703,619 | ) | | | (22,948,617 | ) | | |
| | | | | | | | | | | | | | | | | | | | | | | | | | | | | | | | |
| | 10,594,707 | | | | 10,672,532 | | | | 571,778 | | | | 847,498 | | | | (203,096 | ) | | | 5,826,075 | | | | 46,934,795 | | | | 55,583,594 | | | |
| | | | | | | | | | | | | | | | | | | | | | | | | | | | | | | | |
| | 67,312,624 | | | | 56,717,917 | | | | 25,875,441 | | | | 25,303,663 | | | | 142,136,674 | | | | 142,339,770 | | | | 372,702,026 | | | | 325,767,231 | | | |
| | | | | | | | | | | | | | | | | | | | | | | | | | | | | | | | |
The accompanying notes are an integral part of these financial statements.
79
MUTUAL OF AMERICA INVESTMENT CORPORATION
STATEMENTS OF CHANGES IN NET ASSETS (Continued)
For the Years Ended December 31, 2016
| | | | | | | | | | | | | | | | |
| | |
2025 Retirement Fund | | | 2030 Retirement Fund | |
| | | 2016 | | | 2015 | | | 2016 | | | 2015 | |
INCREASE (DECREASE)IN NET ASSETS: | | | | | | | | | | | | | | | | |
FROM OPERATIONS: | | | | | | | | | | | | | | | | |
Net investment income (loss) | | $ | 8,340,336 | | | $ | 7,016,193 | | | $ | 6,383,344 | | | $ | 5,515,774 | |
Net realized gain (loss) on investments and futures contracts | | | 17,975,841 | | | | 18,034,836 | | | | 16,642,471 | | | | 17,057,812 | |
Change in net unrealized appreciation (depreciation) of investments and futures contracts | | | 15,514,743 | | | | (26,452,633 | ) | | | 14,528,108 | | | | (23,904,450 | ) |
| | | | | | | | | | | | | | | | |
NET INCREASE (DECREASE)IN NET ASSETS RESULTINGFROM OPERATIONS | | | 41,830,920 | | | | (1,401,604 | ) | | | 37,553,923 | | | | (1,330,864 | ) |
| | | | | | | | | | | | | | | | |
| | | | |
DISTRIBUTIONS (Notes 1 and 5) | | | | | | | | | | | | | | | | |
From net investment income | | | (7,530,298 | ) | | | (5,804,497 | ) | | | (5,967,073 | ) | | | (4,662,610 | ) |
From net realized gains | | | (17,294,855 | ) | | | (12,670,849 | ) | | | (16,440,817 | ) | | | (11,054,574 | ) |
| | | | | | | | | | | | | | | | |
Total distributions | | | (24,825,153 | ) | | | (18,475,346 | ) | | | (22,407,890 | ) | | | (15,717,184 | ) |
| | | | | | | | | | | | | | | | |
| | | | |
CAPITAL SHARE TRANSACTIONS (Note 4): | | | | | | | | | | | | | | | | |
Net proceeds from sale of shares | | | 83,094,922 | | | | 82,443,284 | | | | 65,836,378 | | | | 68,504,048 | |
Dividends reinvested | | | 24,825,153 | | | | 18,475,346 | | | | 22,407,890 | | | | 15,717,184 | |
Cost of shares redeemed | | | (16,754,823 | ) | | | (16,173,335 | ) | | | (15,151,173 | ) | | | (16,185,115 | ) |
| | | | | | | | | | | | | | | | |
NET INCREASE (DECREASE)IN NET ASSETSFROM CAPITAL SHARE TRANSACTIONS | | | 91,165,252 | | | | 84,745,295 | | | | 73,093,095 | | | | 68,036,117 | |
| | | | | | | | | | | | | | | | |
INCREASE (DECREASE)IN NET ASSETS | | | 108,171,019 | | | | 64,868,345 | | | | 88,239,128 | | | | 50,988,069 | |
NET ASSETS, BEGINNINGOF PERIOD | | | 395,958,271 | | | | 331,089,926 | | | | 328,047,331 | | | | 277,059,262 | |
| | | | | | | | | | | | | | | | |
NET ASSETS, ENDOF PERIOD | | $ | 504,129,290 | | | $ | 395,958,271 | | | $ | 416,286,459 | | | $ | 328,047,331 | |
| | | | | | | | | | | | | | | | |
ACCUMULATED UNDISTRIBUTED NET INVESTMENT INCOME (LOSS) | | $ | 8,443,812 | | | $ | 7,530,298 | | | $ | 6,471,545 | | | $ | 5,967,073 | |
| | | | | | | | | | | | | | | | |
| | | | |
OTHER INFORMATION: | | | | | | | | | | | | | | | | |
Shares outstanding at the beginning of period | | | 339,214,646 | | | | 268,929,635 | | | | 273,996,553 | | | | 218,780,055 | |
| | | | | | | | | | | | | | | | |
Shares sold | | | 69,668,887 | | | | 67,229,996 | | | | 53,895,949 | | | | 54,499,347 | |
Shares issued as reinvestment of dividends | | | 21,243,935 | | | | 16,139,959 | | | | 18,787,249 | | | | 13,413,210 | |
Shares redeemed | | | (14,302,299 | ) | | | (13,084,944 | ) | | | (12,569,789 | ) | | | (12,696,059 | ) |
| | | | | | | | | | | | | | | | |
Net increase (decrease) | | | 76,610,523 | | | | 70,285,011 | | | | 60,113,409 | | | | 55,216,498 | |
| | | | | | | | | | | | | | | | |
Shares outstanding at the end of period | | | 415,825,169 | | | | 339,214,646 | | | | 334,109,962 | | | | 273,996,553 | |
| | | | | | | | | | | | | | | | |
| † | For the period October 1, 2016 (Commencement of Operations) to December 31, 2016. |
The accompanying notes are an integral part of these financial statements.
80
| | | | | | | | | | | | | | | | | | | | | | | | | | | | | | | | | | |
| 2035 Retirement Fund | | | 2040 Retirement Fund | | | 2045 Retirement Fund | | | 2050 Retirement Fund | | | 2055
Retirement
Fund† | |
| 2016 | | | 2015 | | | 2016 | | | 2015 | | | 2016 | | | 2015 | | | 2016 | | | 2015 | | | 2016 | |
| | | | | | | | | | | | | | | | | | | | | | | | | | | | | | | | | | |
| | | | | | | | | | | | | | | | | | | | | | | | | | | | | | | | | | |
| $ | 5,014,634 | | | $ | 4,252,445 | | | $ | 3,878,789 | | | $ | 3,284,944 | | | $ | 4,429,055 | | | $ | 3,928,537 | | | $ | 1,924,825 | | | $ | 1,187,955 | | | $ | (132 | ) |
| | 14,378,657 | | | | 15,875,085 | | | | 12,766,659 | | | | 13,971,726 | | | | 14,077,259 | | | | 16,640,145 | | | | 5,152,801 | | | | 3,869,216 | | | | (16,339 | ) |
|
14,207,037 |
| | | (21,741,597 | ) | | | 11,424,558 | | | | (19,277,737 | ) | | | 14,717,213 | | | | (23,075,308 | ) | | | 8,103,703 | | | | (6,445,213 | ) | | | 30,873 | |
| | | | | | | | | | | | | | | | | | | | | | | | | | | | | | | | | | |
| | 33,600,328 | | | | (1,614,067 | ) | | | 28,070,006 | | | | (2,021,067 | ) | | | 33,223,527 | | | | (2,506,626 | ) | | | 15,181,329 | | | | (1,388,042 | ) | | | 14,402 | |
| | | | | | | | | | | | | | | | | | | | | | | | | | | | | | | | | | |
| | | | | | | | |
| | | | | | | | | | | | | | | | | | | | | | | | | | | | | | | | | | |
| | (4,653,592 | ) | | | (3,637,561 | ) | | | (3,629,694 | ) | | | (2,857,782 | ) | | | (4,323,009 | ) | | | (3,540,101 | ) | | | (1,305,214 | ) | | | (592,908 | ) | | | — | |
| | (15,229,224 | ) | | | (8,709,705 | ) | | | (13,528,794 | ) | | | (7,858,679 | ) | | | (16,121,366 | ) | | | (9,449,171 | ) | | | (3,752,852 | ) | | | (1,150,118 | ) | | | — | |
| | | | | | | | | | | | | | | | | | | | | | | | | | | | | | | | | | |
| | (19,882,816 | ) | | | (12,347,266 | ) | | | (17,158,488 | ) | | | (10,716,461 | ) | | | (20,444,375 | ) | | | (12,989,272 | ) | | | (5,058,066 | ) | | | (1,743,026 | ) | | | — | |
| | | | | | | | | | | | | | | | | | | | | | | | | | | | | | | | | | |
| | | | | | | | |
| | | | | | | | | | | | | | | | | | | | | | | | | | | | | | | | | | | |
| | 59,045,385 | | | | 55,367,374 | | | | 43,339,746 | | | | 45,547,857 | | | | 43,884,460 | | | | 43,558,908 | | | | 57,049,790 | | | | 47,515,756 | | | | 3,695,700 | |
| | 19,882,816 | | | | 12,347,266 | | | | 17,158,488 | | | | 10,716,461 | | | | 20,444,375 | | | | 12,989,272 | | | | 5,058,066 | | | | 1,743,026 | | | | — | |
| | (12,123,049 | ) | | | (12,291,501 | ) | | | (7,616,743 | ) | | | (10,232,468 | ) | | | (9,251,474 | ) | | | (8,607,985 | ) | | | (2,077,210 | ) | | | (2,444,022 | ) | | | (390,683 | ) |
| | | | | | | | | | | | | | | | | | | | | | | | | | | | | | | | | | |
| | 66,805,152 | | | | 55,423,139 | | | | 52,881,491 | | | | 46,031,850 | | | | 55,077,361 | | | | 47,940,195 | | | | 60,030,646 | | | | 46,814,760 | | | | 3,305,017 | |
| | | | | | | | | | | | | | | | | | | | | | | | | | | | | | | | | | |
| | 80,522,664 | | | | 41,461,806 | | | | 63,793,009 | | | | 33,294,322 | | | | 67,856,513 | | | | 32,444,297 | | | | 70,153,909 | | | | 43,683,692 | | | | 3,319,419 | |
| | 271,314,693 | | | | 229,852,887 | | | | 221,904,351 | | | | 188,610,029 | | | | 264,550,175 | | | | 232,105,878 | | | | 93,894,608 | | | | 50,210,916 | | | | — | |
| | | | | | | | | | | | | | | | | | | | | | | | | | | | | | | | | | |
| $ | 351,837,357 | | | $ | 271,314,693 | | | $ | 285,697,360 | | | $ | 221,904,351 | | | $ | 332,406,688 | | | $ | 264,550,175 | | | $ | 164,048,517 | | | $ | 93,894,608 | | | $ | 3,319,419 | |
| | | | | | | | | | | | | | | | | | | | | | | | | | | | | | | | | | |
| $ | 5,090,035 | | | $ | 4,653,592 | | | $ | 3,936,958 | | | $ | 3,629,694 | | | $ | 4,492,530 | | | $ | 4,323,009 | | | $ | 1,952,198 | | | $ | 1,305,214 | | | $ | — | |
| | | | | | | | | | | | | | | | | | | | | | | | | | | | | | | | | | |
| | | | | | | | |
| | | | | | | | | | | | | | | | | | | | | | | | | | | | | | | | | | | |
| | 226,218,710 | | | | 181,398,047 | | | | 186,547,652 | | | | 149,253,147 | | | | 222,683,482 | | | | 183,851,790 | | | | 69,495,056 | | | | 36,041,942 | | | | — | |
| | | | | | | | | | | | | | | | | | | | | | | | | | | | | | | | | | |
| | 48,252,870 | | | | 43,936,915 | | | | 35,902,529 | | | | 36,160,229 | | | | 36,492,502 | | | | 34,477,445 | | | | 41,228,623 | | | | 33,863,211 | | | | 3,598,978 | |
| | 16,701,779 | | | | 10,525,529 | | | | 14,602,732 | | | | 9,186,890 | | | | 17,462,750 | | | | 11,149,772 | | | | 3,680,293 | | | | 1,315,493 | | | | — | |
| | (10,072,665 | ) | | | (9,641,781 | ) | | | (6,409,893 | ) | | | (8,052,614 | ) | | | (7,714,210 | ) | | | (6,795,525 | ) | | | (1,507,576 | ) | | | (1,725,590 | ) | | | (407,290 | ) |
| | | | | | | | | | | | | | | | | | | | | | | | | | | | | | | | | | |
| | 54,881,984 | | | | 44,820,663 | | | | 44,095,368 | | | | 37,294,505 | | | | 46,241,042 | | | | 38,831,692 | | | | 43,401,340 | | | | 33,453,114 | | | | 3,191,688 | |
| | | | | | | | | | | | | | | | | | | | | | | | | | | | | | | | | | |
| | 281,100,694 | | | | 226,218,710 | | | | 230,643,020 | | | | 186,547,652 | | | | 268,924,524 | | | | 222,683,482 | | | | 112,896,396 | | | | 69,495,056 | | | | 3,191,688 | |
| | | | | | | | | | | | | | | | | | | | | | | | | | | | | | | | | | |
The accompanying notes are an integral part of these financial statements.
81
MUTUAL OF AMERICA INVESTMENT CORPORATION
STATEMENTS OF CHANGES IN NET ASSETS (Continued)
For the Years Ended December 31, 2016
| | | | | | | | | | | | | | | | |
| | |
| | | Conservative Allocation Fund | | | Moderate Allocation Fund | |
| | | 2016 | | | 2015 | | | 2016 | | | 2015 | |
INCREASE (DECREASE)IN NET ASSETS: | | | | | | | | | | | | | | | | |
FROM OPERATIONS: | | | | | | | | | | | | | | | | |
Net investment income (loss) | | $ | 3,031,347 | | | $ | 2,969,049 | | | $ | 6,815,738 | | | $ | 6,722,983 | |
Net realized gain (loss) on investments and futures contracts | | | 2,568,490 | | | | 3,665,869 | | | | 11,890,351 | | | | 17,367,764 | |
Change in net unrealized appreciation (depreciation) of investments and futures contracts | | | 2,812,869 | | | | (6,166,634 | ) | | | 9,992,223 | | | | (23,664,759 | ) |
| | | | | | | | | | | | | | | | |
NET INCREASE (DECREASE)IN NET ASSETS RESULTINGFROM OPERATIONS | | | 8,412,706 | | | | 468,284 | | | | 28,698,312 | | | | 425,988 | |
| | | | | | | | | | | | | | | | |
| | | | |
DISTRIBUTIONS (Notes 1 and 5) | | | | | | | | | | | | | | | | |
From net investment income | | | (3,062,118 | ) | | | (2,608,918 | ) | | | (7,136,729 | ) | | | (6,514,098 | ) |
From net realized gains | | | (3,660,743 | ) | | | (3,800,636 | ) | | | (15,163,373 | ) | | | (15,635,475 | ) |
| | | | | | | | | | | | | | | | |
Total distributions | | | (6,722,861 | ) | | | (6,409,554 | ) | | | (22,300,102 | ) | | | (22,149,573 | ) |
| | | | | | | | | | | | | | | | |
| | | | |
CAPITAL SHARE TRANSACTIONS (Note 4): | | | | | | | | | | | | | | | | |
Net proceeds from sale of shares | | | 17,454,029 | | | | 19,677,859 | | | | 24,930,266 | | | | 24,101,254 | |
Dividends reinvested | | | 6,722,861 | | | | 6,409,554 | | | | 22,300,102 | | | | 22,149,573 | |
Cost of shares redeemed | | | (14,107,929 | ) | | | (14,906,335 | ) | | | (22,771,198 | ) | | | (23,584,888 | ) |
| | | | | | | | | | | | | | | | |
NET INCREASE (DECREASE)IN NET ASSETSFROM CAPITAL SHARE TRANSACTIONS | | | 10,068,961 | | | | 11,181,078 | | | | 24,459,170 | | | | 22,665,939 | |
| | | | | | | | | | | | | | | | |
INCREASE (DECREASE)IN NET ASSETS | | | 11,758,806 | | | | 5,239,808 | | | | 30,857,380 | | | | 942,354 | |
NET ASSETS, BEGINNINGOF PERIOD | | | 127,762,933 | | | | 122,523,125 | | | | 316,150,534 | | | | 315,208,180 | |
| | | | | | | | | | | | | | | | |
NET ASSETS, END OF PERIOD | | $ | 139,521,739 | | | $ | 127,762,933 | | | $ | 347,007,914 | | | $ | 316,150,534 | |
| | | | | | | | | | | | | | | | |
ACCUMULATED UNDISTRIBUTED NET INVESTMENT INCOME (LOSS) | | $ | 3,053,004 | | | $ | 3,062,120 | | | $ | 6,887,282 | | | $ | 7,136,729 | |
| | | | | | | | | | | | | | | | |
| | | | |
OTHER INFORMATION: | | | | | | | | | | | | | | | | |
Shares outstanding at the beginning of period | | | 106,833,345 | | | | 97,670,821 | | | | 224,315,530 | | | | 208,049,805 | |
| | | | | | | | | | | | | | | | |
Shares sold | | | 14,299,004 | | | | 15,752,829 | | | | 17,451,268 | | | | 16,033,248 | |
Shares issued as reinvestment of dividends | | | 5,611,058 | | | | 5,414,572 | | | | 16,016,276 | | | | 16,001,333 | |
Shares redeemed | | | (11,625,232 | ) | | | (12,004,877 | ) | | | (16,001,111 | ) | | | (15,768,856 | ) |
| | | | | | | | | | | | | | | | |
Net increase (decrease) | | | 8,284,830 | | | | 9,162,524 | | | | 17,466,433 | | | | 16,265,725 | |
| | | | | | | | | | | | | | | | |
Shares outstanding at the end of period | | | 115,118,175 | | | | 106,833,345 | | | | 241,781,963 | | | | 224,315,530 | |
| | | | | | | | | | | | | | | | |
The accompanying notes are an integral part of these financial statements.
82
| | | | | | | | | | | | | | | | | | | | | | | | | | | | | | | | |
| | | | |
| Aggressive Allocation Fund | | | Money Market Fund | | | Mid-Term Bond Fund | | | Bond Fund | | | |
| 2016 | | | 2015 | | | 2016 | | | 2015 | | | 2016 | | | 2015 | | | 2016 | | | 2015 | | | |
| | | | | | | | | | | | | | | | | | | | | | | | | | | | | | | | |
| | | | | | | | | | | | | | | | | | | | | | | | | | | | | | | | |
| $ | 4,379,900 | | | $ | 4,650,678 | | | $ | 83,111 | | | $ | (80,292 | ) | | $ | 11,551,692 | | | $ | 12,125,546 | | | $ | 32,730,237 | | | $ | 29,240,973 | | | |
| | 15,730,054 | | | | 16,729,039 | | | | (26 | ) | | | (1,442 | ) | | | 729,217 | | | | 696,581 | | | | 2,266,244 | | | | 1,591,512 | | | |
| | | | | | | | |
| | 6,155,891 | | | | (22,197,912 | ) | | | (1,000 | ) | | | (3,287 | ) | | | 3,108,491 | | | | (10,264,191 | ) | | | 11,554,313 | | | | (28,238,502 | ) | | |
| | | | | | | | | | | | | | | | | | | | | | | | | | | | | | | | |
| | 26,265,845 | | | | (818,195 | ) | | | 82,085 | | | | (85,021 | ) | | | 15,389,400 | | | | 2,557,936 | | | | 46,550,794 | | | | 2,593,983 | | | |
| | | | | | | | | | | | | | | | | | | | | | | | | | | | | | | | |
| | | | | | | | |
| | | | | | | | | | | | | | | | | | | | | | | | | | | | | | | | |
| | (5,034,207 | ) | | | (4,669,780 | ) | | | — | | | | — | | | | (12,125,546 | ) | | | (10,593,944 | ) | | | (29,240,973 | ) | | | (31,506,309 | ) | | |
| | (16,088,598 | ) | | | (16,880,272 | ) | | | — | | | | — | | | | (696,581 | ) | | | (1,564,411 | ) | | | (1,620,584 | ) | | | (1,601,325 | ) | | |
| | | | | | | | | | | | | | | | | | | | | | | | | | | | | | | | |
| | (21,122,805 | ) | | | (21,550,052 | ) | | | — | | | | — | | | | (12,822,127 | ) | | | (12,158,355 | ) | | | (30,861,557 | ) | | | (33,107,634 | ) | | |
| | | | | | | | | | | | | | | | | | | | | | | | | | | | | | | | |
| | | | | | | | |
| | | | | | | | | | | | | | | | | | | | | | | | | | | | | | | | |
| | 10,983,920 | | | | 11,577,351 | | | | 10,516,506 | | | | 8,953,288 | | | | 69,654,159 | | | | 64,053,401 | | | | 135,038,720 | | | | 130,055,610 | | | |
| | 21,122,805 | | | | 21,550,052 | | | | — | | | | — | | | | 12,822,127 | | | | 12,158,355 | | | | 30,861,557 | | | | 33,107,634 | | | |
| | (22,242,770 | ) | | | (16,836,727 | ) | | | (14,232,032 | ) | | | (19,666,616 | ) | | | (44,859,350 | ) | | | (49,758,493 | ) | | | (79,735,048 | ) | | | (81,894,490 | ) | | |
| | | | | | | | | | | | | | | | | | | | | | | | | | | | | | | | |
| | 9,863,955 | | | | 16,290,676 | | | | (3,715,526 | ) | | | (10,713,328 | ) | | | 37,616,936 | | | | 26,453,263 | | | | 86,165,229 | | | | 81,268,754 | | | |
| | | | | | | | | | | | | | | | | | | | | | | | | | | | | | | | |
| | 15,006,995 | | | | (6,077,571 | ) | | | (3,633,441 | ) | | | (10,798,349 | ) | | | 40,184,209 | | | | 16,852,844 | | | | 101,854,466 | | | | 50,755,103 | | | |
| | 248,722,631 | | | | 254,800,202 | | | | 66,680,417 | | | | 77,478,766 | | | | 452,086,342 | | | | 435,233,498 | | | | 1,006,636,902 | | | | 955,881,799 | | | |
| | | | | | | | | | | | | | | | | | | | | | | | | | | | | | | | |
| $ | 263,729,626 | | | $ | 248,722,631 | | | $ | 63,046,976 | | | $ | 66,680,417 | | | $ | 492,270,551 | | | $ | 452,086,342 | | | $ | 1,108,491,368 | | | $ | 1,006,636,902 | | | |
| | | | | | | | | | | | | | | | | | | | | | | | | | | | | | | | |
| $ | 4,432,394 | | | $ | 5,034,207 | | | $ | 83,111 | | | $ | — | | | $ | 11,551,690 | | | $ | 12,125,544 | | | $ | 32,730,237 | | | $ | 29,240,973 | | | |
| | | | | | | | | | | | | | | | | | | | | | | | | | | | | | | | |
| | | | | | | | |
| | | | | | | | | | | | | | | | | | | | | | | | | | | | | | | | |
| | 155,044,805 | | | | 144,356,850 | | | | 55,769,535 | | | | 64,724,065 | | | | 437,295,485 | | | | 412,252,911 | | | | 714,259,784 | | | | 658,106,501 | | | |
| | | | | | | | | | | | | | | | | | | | | | | | | | | | | | | | |
| | 6,822,801 | | | | 6,683,214 | | | | 8,789,794 | | | | 7,484,706 | | | | 65,868,017 | | | | 60,357,557 | | | | 92,453,682 | | | | 89,271,323 | | | |
| | 13,554,944 | | | | 13,692,231 | | | | — | | | | — | | | | 12,184,847 | | | | 11,691,052 | | | | 21,161,940 | | | | 23,327,458 | | | |
| | (13,731,123 | ) | | | (9,687,490 | ) | | | (11,897,750 | ) | | | (16,439,236 | ) | | | (42,521,426 | ) | | | (47,006,035 | ) | | | (54,876,508 | ) | | | (56,445,498 | ) | | |
| | | | | | | | | | | | | | | | | | | | | | | | | | | | | | | | |
| | 6,646,622 | | | | 10,687,955 | | | | (3,107,956 | ) | | | (8,954,530 | ) | | | 35,531,438 | | | | 25,042,574 | | | | 58,739,114 | | | | 56,153,283 | | | |
| | | | | | | | | | | | | | | | | | | | | | | | | | | | | | | | |
| | 161,691,427 | | | | 155,044,805 | | | | 52,661,579 | | | | 55,769,535 | | | | 472,826,923 | | | | 437,295,485 | | | | 772,998,898 | | | | 714,259,784 | | | |
| | | | | | | | | | | | | | | | | | | | | | | | | | | | | | | | |
The accompanying notes are an integral part of these financial statements.
83
MUTUAL OF AMERICA INVESTMENT CORPORATION
FINANCIAL HIGHLIGHTS
Income from investment operations and distributions per share for a Fund share outstanding throughout the five years ended December 31, 2016 (or since the Fund’s inception date if in existence less than five years) and other supplementary data with respect to each Fund are presented below and in the pages following:
| | | | | | | | | | | | | | | | | | | | |
| | | Equity Index Fund | |
| | | Years Ended December 31, | |
| | | 2016 | | | 2015 | | | 2014 | | | 2013 | | | 2012 | |
Net Asset Value, Beginning of Period | | $ | 3.26 | | | $ | 3.41 | | | $ | 3.09 | | | $ | 2.40 | | | $ | 2.07 | |
| | | | | | | | | | | | | | | | | | | | |
| | | | | |
INCOME (LOSS)FROM INVESTMENT OPERATIONS: | | | | | | | | | | | | | | | | | | | | |
Net Investment Income (Loss) | | | 0.06 | | | | 0.06 | | | | 0.06 | | | | 0.05 | | | | 0.05 | |
Net Realized and Unrealized Gains (Losses) on Investments and Futures Contracts | | | 0.32 | | | | (0.03 | ) | | | 0.35 | | | | 0.70 | | | | 0.28 | |
| | | | | | | | | | | | | | | | | | | | |
Total From Investment Operations | | | 0.38 | | | | 0.03 | | | | 0.41 | | | | 0.75 | | | | 0.33 | |
| | | | | | | | | | | | | | | | | | | | |
| | | | | |
Less: Distributions | | | | | | | | | | | | | | | | | | | | |
From Net Investment Income | | | (0.06 | ) | | | (0.06 | ) | | | (0.05 | ) | | | (0.04 | ) | | | — | (g) |
From Net Realized Gains | | | (0.09 | ) | | | (0.12 | ) | | | (0.04 | ) | | | (0.02 | ) | | | — | |
| | | | | | | | | | | | | | | | | | | | |
Total Distributions | | | (0.15 | ) | | | (0.18 | ) | | | (0.09 | ) | | | (0.06 | ) | | | — | |
| | | | | | | | | | | | | | | | | | | | |
Net Asset Value, End of Period | | $ | 3.49 | | | $ | 3.26 | | | $ | 3.41 | | | $ | 3.09 | | | $ | 2.40 | |
| | | | | | | | | | | | | | | | | | | | |
Total Return (%)(h) | | | 11.80 | | | | 1.24 | | | | 13.49 | | | | 32.02 | | | | 15.94 | |
Net Assets, End of Period ($ millions) | | | 2,143 | | | | 1,854 | | | | 1,789 | | | | 1,556 | | | | 1,109 | |
Ratio of Net Investment Income (Loss) to Average Net Assets (%) | | | 2.03 | | | | 1.94 | | | | 1.82 | | | | 1.87 | | | | 2.03 | |
Ratio of Expenses to Average Net Assets Before Expense Reimbursement (%) | | | 0.14 | | | | 0.15 | | | | 0.17 | | | | 0.19 | | | | 0.22 | |
Ratio of Expenses to Average Net Assets After Expense Reimbursement (%) | | | 0.14 | | | | 0.15 | | | | 0.17 | | | | 0.19 | | | | 0.22 | |
Portfolio Turnover Rate (%)(a) | | | 5.58 | | | | 4.74 | | | | 8.07 | | | | 3.90 | | | | 6.45 | |
| (a) | Portfolio turnover rate excludes all short-term securities. |
| (d) | Allocation and Retirement Funds exclude expenses of the underlying funds. |
| (e) | For the period October 1, 2012 (commencement of operations) through December 31, 2012. |
| (f) | For the period October 1, 2016 (commencement of operations) through December 31, 2016. |
| (g) | Amount is less than $0.005 per share. |
| (h) | Total return does not reflect fees and charges associated with your variable annuity contract or variable life insurance policy. Inclusion of those fees and charges would reduce the total return shown. |
NA = Not Applicable
The accompanying notes are an integral part of these financial statements.
84
| | | | | | | | | | | | | | | | | | | | | | | | | | | | | | | | | | | | | | | | |
| All America Fund | | | Small Cap Value Fund | | | |
| Years Ended December 31, | | | Years Ended December 31, | | | |
| 2016 | | | 2015 | | | 2014 | | | 2013 | | | 2012 | | | 2016 | | | 2015 | | | 2014 | | | 2013 | | | 2012 | | | |
| $ | 2.22 | | | $ | 2.42 | | | $ | 2.38 | | | $ | 1.85 | | | $ | 1.61 | | | $ | 1.44 | | | $ | 1.61 | | | $ | 1.72 | | | $ | 1.35 | | | $ | 1.17 | | | |
| | | | | | | | | | | | | | | | | | | | | | | | | | | | | | | | | | | | | | | | |
| | | | | | | | | | |
| | | | | | | | | | | | | | | | | | | | | | | | | | | | | | | | | | | | | | | | |
| | 0.03 | | | | 0.03 | | | | 0.03 | | | | 0.03 | | | | 0.03 | | | | 0.02 | | | | 0.02 | | | | 0.02 | | | | 0.03 | | | | 0.02 | | | |
| | 0.21 | | | | (0.03 | ) | | | 0.23 | | | | 0.55 | | | | 0.21 | | | | 0.26 | | | | (0.08 | ) | | | 0.06 | | | | 0.36 | | | | 0.16 | | | |
| | | | | | | | | | | | | | | | | | | | | | | | | | | | | | | | | | | | | | | | |
| | 0.24 | | | | — | | | | 0.26 | | | | 0.58 | | | | 0.24 | | | | 0.28 | | | | (0.06 | ) | | | 0.08 | | | | 0.39 | | | | 0.18 | | | |
| | | | | | | | | | | | | | | | | | | | | | | | | | | | | | | | | | | | | | | | |
| | | | | | | | | | |
| | | | | | | | | | | | | | | | | | | | | | | | | | | | | | | | | | | | | | | | |
| | (0.03 | ) | | | (0.03 | ) | | | (0.03 | ) | | | (0.03 | ) | | | — | | | | (0.01 | ) | | | (0.01 | ) | | | (0.02 | ) | | | (0.02 | ) | | | — | | | |
| | (0.14 | ) | | | (0.15 | ) | | | (0.19 | ) | | | (0.02 | ) | | | — | | | | (0.02 | ) | | | (0.10 | ) | | | (0.17 | ) | | | — | | | | — | | | |
| | | | | | | | | | | | | | | | | | | | | | | | | | | | | | | | | | | | | | | | |
| | (0.17 | ) | | | (0.18 | ) | | | (0.22 | ) | | | (0.05 | ) | | | — | | | | (0.03 | ) | | | (0.11 | ) | | | (0.19 | ) | | | (0.02 | ) | | | — | | | |
| | | | | | | | | | | | | | | | | | | | | | | | | | | | | | | | | | | | | | | | |
| $ | 2.29 | | | $ | 2.22 | | | $ | 2.42 | | | $ | 2.38 | | | $ | 1.85 | | | $ | 1.69 | | | $ | 1.44 | | | $ | 1.61 | | | $ | 1.72 | | | $ | 1.35 | | | |
| | | | | | | | | | | | | | | | | | | | | | | | | | | | | | | | | | | | | | | | |
| | 11.49 | | | | (0.04 | ) | | | 11.16 | | | | 32.13 | | | | 14.73 | | | | 20.04 | | | | (3.40 | ) | | | 5.17 | | | | 29.35 | | | | 15.46 | | | |
| | 296 | | | | 295 | | | | 324 | | | | 318 | | | | 256 | | | | 465 | | | | 376 | | | | 393 | | | | 382 | | | | 290 | | | |
| | 1.42 | | | | 1.32 | | | | 1.35 | | | | 1.44 | | | | 1.52 | | | | 1.17 | | | | 1.14 | | | | 1.02 | | | | 1.70 | | | | 1.67 | | | |
| | 0.53 | | | | 0.55 | | | | 0.49 | | | | 0.51 | | | | 0.55 | | | | 0.82 | | | | 0.83 | | | | 0.84 | | | | 0.87 | | | | 0.90 | | | |
| | 0.53 | | | | 0.55 | | | | 0.49 | | | | 0.51 | | | | 0.55 | | | | 0.82 | | | | 0.83 | | | | 0.84 | | | | 0.87 | | | | 0.90 | | | |
| | 40.10 | | | | 14.73 | | | | 15.38 | | | | 28.48 | | | | 17.37 | | | | 32.06 | | | | 19.03 | | | | 38.09 | | | | 41.36 | | | | 24.71 | | | |
The accompanying notes are an integral part of these financial statements.
85
MUTUAL OF AMERICA INVESTMENT CORPORATION
FINANCIAL HIGHLIGHTS (Continued)
| | | | | | | | | | | | | | | | | | | | |
| | | Small Cap Growth Fund | |
| | | Years Ended December 31, | |
| | | 2016 | | | 2015 | | | 2014 | | | 2013 | | | 2012 | |
Net Asset Value, Beginning of Period | | $ | 1.32 | | | $ | 1.54 | | | $ | 1.58 | | | $ | 1.22 | | | $ | 1.16 | |
| | | | | | | | | | | | | | | | | | | | |
| | | | | |
INCOME (LOSS)FROM INVESTMENT OPERATIONS: | | | | | | | | | | | | | | | | | | | | |
Net Investment Income (Loss) | | | — | (g) | | | — | (g) | | | — | (g) | | | — | (g) | | | — | (g) |
Net Realized and Unrealized Gains (Losses) on Investments and Futures Contracts | | | 0.10 | | | | (0.03 | ) | | | 0.09 | | | | 0.47 | | | | 0.07 | |
| | | | | | | | | | | | | | | | | | | | |
| | | | | |
Total From Investment Operations | | | 0.10 | | | | (0.03 | ) | | | 0.09 | | | | 0.47 | | | | 0.07 | |
| | | | | | | | | | | | | | | | | | | | |
| | | | | |
Less: Distributions | | | | | | | | | | | | | | | | | | | | |
From Net Investment Income | | | — | | | | — | | | | — | (g) | | | — | | | | — | |
From Net Realized Gains | | | (0.13 | ) | | | (0.19 | ) | | | (0.13 | ) | | | (0.11 | ) | | | (0.01 | ) |
| | | | | | | | | | | | | | | | | | | | |
Total Distributions | | | (0.13 | ) | | | (0.19 | ) | | | (0.13 | ) | | | (0.11 | ) | | | (0.01 | ) |
| | | | | | | | | | | | | | | | | | | | |
Net Asset Value, End of Period | | $ | 1.29 | | | $ | 1.32 | | | $ | 1.54 | | | $ | 1.58 | | | $ | 1.22 | |
| | | | | | | | | | | | | | | | | | | | |
Total Return (%)(h) | | | 8.10 | | | | (2.39 | ) | | | 5.70 | | | | 41.19 | | | | 5.62 | |
Net Assets, End of Period ($ millions) | | | 433 | | | | 402 | | | | 412 | | | | 424 | | | | 272 | |
Ratio of Net Investment Income (Loss) to Average Net Assets (%) | | | 0.06 | | | | (0.12 | ) | | | (0.09 | ) | | | 0.19 | | | | (0.08 | ) |
Ratio of Expenses to Average Net Assets Before Expense Reimbursement (%) | | | 0.82 | | | | 0.83 | | | | 0.84 | | | | 0.86 | | | | 0.90 | |
Ratio of Expenses to Average Net Assets After Expense Reimbursement (%) | | | 0.82 | | | | 0.83 | | | | 0.84 | | | | 0.86 | | | | 0.90 | |
Portfolio Turnover Rate (%)(a) | | | 53.80 | | | | 67.83 | | | | 67.58 | | | | 53.36 | | | | 66.69 | |
| (a) | Portfolio turnover rate excludes all short-term securities. |
| (d) | Allocation and Retirement Funds exclude expenses of the underlying funds. |
| (e) | For the period October 1, 2012 (commencement of operations) through December 31, 2012. |
| (f) | For the period October 1, 2016 (commencement of operations) through December 31, 2016. |
| (g) | Amount is less than $0.005 per share. |
| (h) | Total return does not reflect fees and charges associated with your variable annuity contract or variable life insurance policy. Inclusion of those fees and charges would reduce the total return shown. |
The accompanying notes are an integral part of these financial statements.
86
| | | | | | | | | | | | | | | | | | | | | | | | | | | | | | | | | | | | | | | | |
| Mid Cap Value Fund | | | Mid-Cap Equity Index Fund | | | |
| Years Ended December 31, | | | Years Ended December 31, | | | |
| 2016 | | | 2015 | | | 2014 | | | 2013 | | | 2012 | | | 2016 | | | 2015 | | | 2014 | | | 2013 | | | 2012 | | | |
| $ | 1.46 | | | $ | 1.63 | | | $ | 1.53 | | | $ | 1.23 | | | $ | 1.11 | | | $ | 1.95 | | | $ | 2.16 | | | $ | 2.08 | | | $ | 1.63 | | | $ | 1.43 | | | |
| | | | | | | | | | | | | | | | | | | | | | | | | | | | | | | | | | | | | | | | |
| | | | | | | | | | |
| | | | | | | | | | | | | | | | | | | | | | | | | | | | | | | | | | | | | | | | |
| | | | | | | | | | |
| | 0.02 | | | | 0.02 | | | | 0.02 | | | | 0.01 | | | | 0.02 | | | | 0.03 | | | | 0.03 | | | | 0.03 | | | | 0.02 | | | | 0.02 | | | |
| | 0.20 | | | | (0.08 | ) | | | 0.19 | | | | 0.33 | | | | 0.10 | | | | 0.36 | | | | (0.08 | ) | | | 0.17 | | | | 0.51 | | | | 0.24 | | | |
| | | | | | | | | | | | | | | | | | | | | | | | | | | | | | | | | | | | | | | | |
| | 0.22 | | | | (0.06 | ) | | | 0.21 | | | | 0.34 | | | | 0.12 | | | | 0.39 | | | | (0.05 | ) | | | 0.20 | | | | 0.53 | | | | 0.26 | | | |
| | | | | | | | | | | | | | | | | | | | | | | | | | | | | | | | | | | | | | | | |
| | | | | | | | | | |
| | | | | | | | | | | | | | | | | | | | | | | | | | | | | | | | | | | | | | | | |
| | (0.02 | ) | | | (0.02 | ) | | | (0.01 | ) | | | (0.01 | ) | | | — | | | | (0.03 | ) | | | (0.02 | ) | | | (0.02 | ) | | | (0.02 | ) | | | — | | | |
| | (0.09 | ) | | | (0.10 | ) | | | (0.10 | ) | | | (0.03 | ) | | | — | | | | (0.14 | ) | | | (0.14 | ) | | | (0.10 | ) | | | (0.06 | ) | | | (0.06 | ) | | |
| | | | | | | | | | | | | | | | | | | | | | | | | | | | | | | | | | | | | | | | |
| | (0.11 | ) | | | (0.12 | ) | | | (0.11 | ) | | | (0.04 | ) | | | — | | | | (0.17 | ) | | | (0.16 | ) | | | (0.12 | ) | | | (0.08 | ) | | | (0.06 | ) | | |
| | | | | | | | | | | | | | | | | | | | | | | | | | | | | | | | | | | | | | | | |
| $ | 1.57 | | | $ | 1.46 | | | $ | 1.63 | | | $ | 1.53 | | | $ | 1.23 | | | $ | 2.17 | | | $ | 1.95 | | | $ | 2.16 | | | $ | 2.08 | | | $ | 1.63 | | | |
| | | | | | | | | | | | | | | | | | | | | | | | | | | | | | | | | | | | | | | | |
| | 16.18 | | | | (3.34 | ) | | | 13.82 | | | | 27.78 | | | | 11.01 | | | | 20.51 | | | | (2.37 | ) | | | 9.63 | | | | 33.21 | | | | 17.80 | | | |
| | 98 | | | | 82 | | | | 92 | | | | 72 | | | | 53 | | | | 1,245 | | | | 977 | | | | 1,001 | | | | 902 | | | | 610 | | | |
| | 1.48 | | | | 1.45 | | | | 1.25 | | | | 1.08 | | | | 1.36 | | | | 1.60 | | | | 1.45 | | | | 1.31 | | | | 1.25 | | | | 1.50 | | | |
| | 0.66 | | | | 0.65 | | | | 0.64 | | | | 0.66 | | | | 0.70 | | | | 0.15 | | | | 0.16 | | | | 0.17 | | | | 0.19 | | | | 0.22 | | | |
| | 0.66 | | | | 0.65 | | | | 0.64 | | | | 0.66 | | | | 0.70 | | | | 0.15 | | | | 0.16 | | | | 0.17 | | | | 0.19 | | | | 0.22 | | | |
| | 25.80 | | | | 15.86 | | | | 40.91 | | | | 36.42 | | | | 29.05 | | | | 21.75 | | | | 21.67 | | | | 16.29 | | | | 13.30 | | | | 12.98 | | | |
The accompanying notes are an integral part of these financial statements.
87
MUTUAL OF AMERICA INVESTMENT CORPORATION
FINANCIAL HIGHLIGHTS (Continued)
| | | | | | | | | | | | | | | | | | | | |
| | | International Fund | |
| | | Years Ended December 31, | |
| | | 2016 | | | 2015 | | | 2014 | | | 2013 | | | 2012 | |
Net Asset Value, Beginning of Period | | $ | 0.75 | | | $ | 0.77 | | | $ | 0.84 | | | $ | 0.71 | | | $ | 0.60 | |
| | | | | | | | | | | | | | | | | | | | |
| | | | | |
INCOME (LOSS)FROM INVESTMENT OPERATIONS: | | | | | | | | | | | | | | | | | | | | |
Net Investment Income (Loss) | | | 0.02 | | | | 0.01 | | | | 0.02 | | | | 0.02 | | | | 0.02 | |
Net Realized and Unrealized Gains (Losses) on Investments and Futures Contracts | | | (0.01 | ) | | | (0.01 | ) | | | (0.08 | ) | | | 0.13 | | | | 0.09 | |
| | | | | | | | | | | | | | | | | | | | |
Total From Investment Operations | | | 0.01 | | | | — | | | | (0.06 | ) | | | 0.15 | | | | 0.11 | |
| | | | | | | | | | | | | | | | | | | | |
| | | | | |
Less: Distributions | | | | | | | | | | | | | | | | | | | | |
From Net Investment Income | | | (0.02 | ) | | | (0.02 | ) | | | (0.01 | ) | | | (0.02 | ) | | | — | (g) |
From Net Realized Gains | | | — | (g) | | | — | (g) | | | — | (g) | | | — | | | | — | (g) |
| | | | | | | | | | | | | | | | | | | | |
Total Distributions | | | (0.02 | ) | | | (0.02 | ) | | | (0.01 | ) | | | (0.02 | ) | | | — | |
| | | | | | | | | | | | | | | | | | | | |
Net Asset Value, End of Period | | $ | 0.74 | | | $ | 0.75 | | | $ | 0.77 | | | $ | 0.84 | | | $ | 0.71 | |
| | | | | | | | | | | | | | | | | | | | |
Total Return (%)(h) | | | 1.69 | | | | (0.63 | ) | | | (6.03 | ) | | | 21.00 | | | | 18.24 | |
Net Assets, End of Period ($ millions) | | | 377 | | | | 319 | | | | 264 | | | | 174 | | | | 115 | |
Ratio of Net Investment Income (Loss) to Average Net Assets (%) | | | 2.94 | | | | 2.47 | | | | 3.48 | | | | 2.76 | | | | 3.20 | |
Ratio of Expenses to Average Net Assets Before Expense Reimbursement (%)(d) | | | 0.13 | | | | 0.14 | | | | 0.17 | | | | 0.18 | | | | 0.21 | |
Ratio of Expenses to Average Net Assets After Expense Reimbursement (%)(d) | | | 0.13 | | | | 0.14 | | | | 0.17 | | | | 0.18 | | | | 0.21 | |
Portfolio Turnover Rate (%)(a) | | | 3.08 | | | | — | | | | 0.61 | | | | 10.22 | | | | 0.28 | |
| (a) | Portfolio turnover rate excludes all short-term securities. |
| (d) | Allocation and Retirement Funds exclude expenses of the underlying funds. |
| (e) | For the period October 1, 2012 (commencement of operations) through December 31, 2012. |
| (f) | For the period October 1, 2016 (commencement of operations) through December 31, 2016. |
| (g) | Amount is less than $0.005 per share. |
| (h) | Total return does not reflect fees and charges associated with your variable annuity contract or variable life insurance policy. Inclusion of those fees and charges would reduce the total return shown. |
NA = Not Applicable
The accompanying notes are an integral part of these financial statements.
88
| | | | | | | | | | | | | | | | | | | | | | | | | | | | | | | | | | | | | | | | |
| Composite Fund | | | Retirement Income Fund | | | |
| Years Ended December 31, | | | Years Ended December 31, | | | |
| 2016 | | | 2015 | | | 2014 | | | 2013 | | | 2012 | | | 2016 | | | 2015 | | | 2014 | | | 2013 | | | 2012 | | | |
| $ | 1.96 | | | $ | 2.00 | | | $ | 1.87 | | | $ | 1.64 | | | $ | 1.47 | | | $ | 1.12 | | | $ | 1.16 | | | $ | 1.13 | | | $ | 1.07 | | | $ | 1.05 | | | |
| | | | | | | | | | | | | | | | | | | | | | | | | | | | | | | | | | | | | | | | |
| | | | | | | | | | |
| | | | | | | | | | | | | | | | | | | | | | | | | | | | | | | | | | | | | | | | |
| | 0.04 | | | | 0.04 | | | | 0.04 | | | | 0.04 | | | | 0.04 | | | | 0.02 | | | | 0.02 | | | | 0.02 | | | | 0.02 | | | | — | (g) | | |
| | 0.11 | | | | (0.02 | ) | | | 0.13 | | | | 0.23 | | | | 0.13 | | | | 0.04 | | | | (0.01 | ) | | | 0.05 | | | | 0.06 | | | | 0.07 | | | |
| | | | | | | | | | | | | | | | | | | | | | | | | | | | | | | | | | | | | | | | |
| | 0.15 | | | | 0.02 | | | | 0.17 | | | | 0.27 | | | | 0.17 | | | | 0.06 | | | | 0.01 | | | | 0.07 | | | | 0.08 | | | | 0.07 | | | |
| | | | | | | | | | | | | | | | | | | | | | | | | | | | | | | | | | | | | | | | |
| | | | | | | | | | |
| | | | | | | | | | | | | | | | | | | | | | | | | | | | | | | | | | | | | | | | |
| | (0.04 | ) | | | (0.04 | ) | | | (0.04 | ) | | | (0.04 | ) | | | — | (g) | | | (0.02 | ) | | | (0.02 | ) | | | (0.02 | ) | | | — | (g) | | | (0.03 | ) | | |
| | (0.12 | ) | | | (0.02 | ) | | | — | | | | — | | | | — | | | | (0.04 | ) | | | (0.03 | ) | | | (0.02 | ) | | | (0.02 | ) | | | (0.02 | ) | | |
| | | | | | | | | | | | | | | | | | | | | | | | | | | | | | | | | | | | | | | | |
| | (0.16 | ) | | | (0.06 | ) | | | (0.04 | ) | | | (0.04 | ) | | | — | | | | (0.06 | ) | | | (0.05 | ) | | | (0.04 | ) | | | (0.02 | ) | | | (0.05 | ) | | |
| | | | | | | | | | | | | | | | | | | | | | | | | | | | | | | | | | | | | | | | |
| $ | 1.95 | | | $ | 1.96 | | | $ | 2.00 | | | $ | 1.87 | | | $ | 1.64 | | | $ | 1.12 | | | $ | 1.12 | | | $ | 1.16 | | | $ | 1.13 | | | $ | 1.07 | | | |
| | | | | | | | | | | | | | | | | | | | | | | | | | | | | | | | | | | | | | | | |
| | 7.92 | | | | 0.80 | | | | 9.10 | | | | 16.37 | | | | 11.65 | | | | 6.18 | | | | 0.49 | | | | 6.50 | | | | 7.40 | | | | 7.15 | | | |
| | 181 | | | | 180 | | | | 194 | | | | 186 | | | | 170 | | | | 76 | | | | 63 | | | | 54 | | | | 40 | | | | 31 | | | |
| | 2.10 | | | | 1.93 | | | | 2.09 | | | | 2.04 | | | | 2.17 | | | | 2.26 | | | | 2.35 | | | | 2.21 | | | | 2.18 | | | | (0.03 | ) | | |
| | 0.52 | | | | 0.53 | | | | 0.49 | | | | 0.51 | | | | 0.55 | | | | 0.09 | | | | 0.09 | | | | 0.05 | | | | 0.05 | | | | 0.05 | | | |
| | 0.52 | | | | 0.53 | | | | 0.49 | | | | 0.51 | | | | 0.55 | | | | 0.09 | | | | 0.05 | | | | 0.05 | | | | 0.05 | | | | 0.05 | | | |
| | 57.40 | | | | 13.13 | | | | 12.31 | | | | 20.98 | | | | 25.42 | | | | 16.88 | | | | 22.64 | | | | 17.63 | | | | 24.01 | | | | 18.07 | | | |
The accompanying notes are an integral part of these financial statements.
89
MUTUAL OF AMERICA INVESTMENT CORPORATION
FINANCIAL HIGHLIGHTS (Continued)
| | | | | | | | | | | | | | | | | | | | |
| | | 2010 Retirement Fund | |
| | | Years Ended December 31, | |
| | | 2016 | | | 2015 | | | 2014 | | | 2013 | | | 2012 | |
Net Asset Value, Beginning of Period | | $ | 1.01 | | | $ | 1.09 | | | $ | 1.06 | | | $ | 1.00 | | | $ | 0.97 | |
| | | | | | | | | | | | | | | | | | | | |
| | | | | |
INCOME (LOSS)FROM INVESTMENT OPERATIONS: | | | | | | | | | | | | | | | | | | | | |
Net Investment Income (Loss) | | | 0.02 | | | | 0.02 | | | | 0.02 | | | | 0.02 | | | | — | (g) |
Net Realized and Unrealized Gains (Losses) on Investments and Futures Contracts | | | 0.04 | | | | (0.02 | ) | | | 0.06 | | | | 0.09 | | | | 0.09 | |
| | | | | | | | | | | | | | | | | | | | |
Total From Investment Operations | | | 0.06 | | | | — | | | | 0.08 | | | | 0.11 | | | | 0.09 | |
| | | | | | | | | | | | | | | | | | | | |
| | | | | |
Less: Distributions | | | | | | | | | | | | | | | | | | | | |
From Net Investment Income | | | (0.02 | ) | | | (0.02 | ) | | | (0.02 | ) | | | — | (g) | | | (0.02 | ) |
From Net Realized Gains | | | (0.06 | ) | | | (0.06 | ) | | | (0.03 | ) | | | (0.05 | ) | | | (0.04 | ) |
| | | | | | | | | | | | | | | | | | | | |
Total Distributions | | | (0.08 | ) | | | (0.08 | ) | | | (0.05 | ) | | | (0.05 | ) | | | (0.06 | ) |
| | | | | | | | | | | | | | | | | | | | |
Net Asset Value, End of Period | | $ | 0.99 | | | $ | 1.01 | | | $ | 1.09 | | | $ | 1.06 | | | $ | 1.00 | |
| | | | | | | | | | | | | | | | | | | | |
Total Return (%)(h) | | | 6.87 | | | | 0.40 | | | | 6.93 | | | | 11.78 | | | | 9.69 | |
Net Assets, End of Period ($ millions) | | | 26 | | | | 26 | | | | 27 | | | | 24 | | | | 21 | |
Ratio of Net Investment Income (Loss) to Average Net Assets (%) | | | 2.15 | | | | 2.10 | | | | 2.06 | | | | 2.09 | | | | (0.03 | ) |
Ratio of Expenses to Average Net Assets Before Expense Reimbursement (%)(d) | | | 0.12 | | | | 0.12 | | | | 0.05 | | | | 0.05 | | | | 0.05 | |
Ratio of Expenses to Average Net Assets After Expense Reimbursement (%)(d) | | | 0.05 | | | | 0.05 | | | | 0.05 | | | | 0.05 | | | | 0.05 | |
Portfolio Turnover Rate (%)(a) | | | 24.58 | | | | 23.28 | | | | 20.45 | | | | 19.60 | | | | 26.61 | |
| (a) | Portfolio turnover rate excludes all short-term securities. |
| (d) | Allocation and Retirement Funds exclude expenses of the underlying funds. |
| (e) | For the period October 1, 2012 (commencement of operations) through December 31, 2012. |
| (f) | For the period October 1, 2016 (commencement of operations) through December 31, 2016. |
| (g) | Amount is less than $0.005 per share. |
| (h) | Total return does not reflect fees and charges associated with your variable annuity contract or variable life insurance policy. Inclusion of those fees and charges would reduce the total return shown. |
NA = Not Applicable
The accompanying notes are an integral part of these financial statements.
90
| | | | | | | | | | | | | | | | | | | | | | | | | | | | | | | | | | | | | | | | |
| 2015 Retirement Fund | | | 2020 Retirement Fund | | | |
| Years Ended December 31, | | | Years Ended December 31, | | | |
| 2016 | | | 2015 | | | 2014 | | | 2013 | | | 2012 | | | 2016 | | | 2015 | | | 2014 | | | 2013 | | | 2012 | | | |
| $ | 1.05 | | | $ | 1.13 | | | $ | 1.10 | | | $ | 1.00 | | | $ | 0.93 | | | $ | 1.12 | | | $ | 1.18 | | | $ | 1.13 | | | $ | 0.99 | | | $ | 0.90 | | | |
| | | | | | | | | | | | | | | | | | | | | | | | | | | | | | | | | | | | | | | | |
| | | | | | | | | | |
| | | | | | | | | | | | | | | | | | | | | | | | | | | | | | | | | | | | | | | | |
| | 0.02 | | | | 0.02 | | | | 0.02 | | | | 0.02 | | | | — | (g) | | | 0.02 | | | | 0.02 | | | | 0.02 | | | | 0.02 | | | | — | (g) | | |
| | 0.05 | | | | (0.02 | ) | | | 0.06 | | | | 0.12 | | | | 0.10 | | | | 0.07 | | | | (0.01 | ) | | | 0.06 | | | | 0.14 | | | | 0.11 | | | |
| | | | | | | | | | | | | | | | | | | | | | | | | | | | | | | | | | | | | | | | |
| | 0.07 | | | | — | | | | 0.08 | | | | 0.14 | | | | 0.10 | | | | 0.09 | | | | 0.01 | | | | 0.08 | | | | 0.16 | | | | 0.11 | | | |
| | | | | | | | | | | | | | | | | | | | | | | | | | | | | | | | | | | | | | | | |
| | | | | | | | | | |
| | | | | | | | | | | | | | | | | | | | | | | | | | | | | | | | | | | | | | | | |
| | (0.02 | ) | | | (0.02 | ) | | | (0.02 | ) | | | — | (g) | | | (0.02 | ) | | | (0.02 | ) | | | (0.02 | ) | | | (0.02 | ) | | | — | (g) | | | (0.02 | ) | | |
| | (0.07 | ) | | | (0.06 | ) | | | (0.03 | ) | | | (0.04 | ) | | | (0.01 | ) | | | (0.05 | ) | | | (0.05 | ) | | | (0.01 | ) | | | (0.02 | ) | | | — | (g) | | |
| | | | | | | | | | | | | | | | | | | | | | | | | | | | | | | | | | | | | | | | |
| | (0.09 | ) | | | (0.08 | ) | | | (0.05 | ) | | | (0.04 | ) | | | (0.03 | ) | | | (0.07 | ) | | | (0.07 | ) | | | (0.03 | ) | | | (0.02 | ) | | | (0.02 | ) | | |
| | | | | | | | | | | | | | | | | | | | | | | | | | | | | | | | | | | | | | | | |
| $ | 1.03 | | | $ | 1.05 | | | $ | 1.13 | | | $ | 1.10 | | | $ | 1.00 | | | $ | 1.14 | | | $ | 1.12 | | | $ | 1.18 | | | $ | 1.13 | | | $ | 0.99 | | | |
| | | | | | | | | | | | | | | | | | | | | | | | | | | | | | | | | | | | | | | | |
| | 7.72 | | | | 0.27 | | | | 7.16 | | | | 14.80 | | | | 10.59 | | | | 8.57 | | | | 0.13 | | | | 7.36 | | | | 17.72 | | | | 11.69 | | | |
| | 146 | | | | 149 | | | | 154 | | | | 138 | | | | 112 | | | | 426 | | | | 364 | | | | 320 | | | | 251 | | | | 169 | | | |
| | 2.07 | | | | 2.07 | | | | 2.00 | | | | 2.07 | | | | (0.03 | ) | | | 2.03 | | | | 2.06 | | | | 1.92 | | | | 1.85 | | | | (0.03 | ) | | |
| | 0.08 | | | | 0.07 | | | | 0.05 | | | | 0.05 | | | | 0.05 | | | | 0.07 | | | | 0.07 | | | | 0.05 | | | | 0.05 | | | | 0.05 | | | |
| | 0.08 | | | | 0.07 | | | | 0.05 | | | | 0.05 | | | | 0.05 | | | | 0.07 | | | | 0.07 | | | | 0.05 | | | | 0.05 | | | | 0.05 | | | |
| | 12.96 | | | | 17.75 | | | | 16.41 | | | | 11.83 | | | | 19.59 | | | | 7.99 | | | | 7.76 | | | | 9.54 | | | | 3.56 | | | | 9.89 | | | |
The accompanying notes are an integral part of these financial statements.
91
MUTUAL OF AMERICA INVESTMENT CORPORATION
FINANCIAL HIGHLIGHTS (Continued)
| | | | | | | | | | | | | | | | | | | | |
| | | 2025 Retirement Fund | |
| | | Years Ended December 31, | |
| | | 2016 | | | 2015 | | | 2014 | | | 2013 | | | 2012 | |
Net Asset Value, Beginning of Period | | $ | 1.17 | | | $ | 1.23 | | | $ | 1.16 | | | $ | 0.98 | | | $ | 0.89 | |
| | | | | | | | | | | | | | | | | | | | |
| | | | | |
INCOME (LOSS)FROM INVESTMENT OPERATIONS: | | | | | | | | | | | | | | | | | | | | |
Net Investment Income (Loss) | | | 0.02 | | | | 0.02 | | | | 0.02 | | | | 0.02 | | | | — | (g) |
Net Realized and Unrealized Gains (Losses) on Investments and Futures Contracts | | | 0.09 | | | | (0.02 | ) | | | 0.08 | | | | 0.18 | | | | 0.11 | |
| | | | | | | | | | | | | | | | | | | | |
Total From Investment Operations | | | 0.11 | | | | — | | | | 0.10 | | | | 0.20 | | | | 0.11 | |
| | | | | | | | | | | | | | | | | | | | |
| | | | | |
Less: Distributions | | | | | | | | | | | | | | | | | | | | |
From Net Investment Income | | | (0.02 | ) | | | (0.02 | ) | | | (0.02 | ) | | | — | (g) | | | (0.02 | ) |
From Net Realized Gains | | | (0.05 | ) | | | (0.04 | ) | | | (0.01 | ) | | | (0.02 | ) | | | — | (g) |
| | | | | | | | | | | | | | | | | | | | |
Total Distributions | | | (0.07 | ) | | | (0.06 | ) | | | (0.03 | ) | | | (0.02 | ) | | | (0.02 | ) |
| | | | | | | | | | | | | | | | | | | | |
Net Asset Value, End of Period | | $ | 1.21 | | | $ | 1.17 | | | $ | 1.23 | | | $ | 1.16 | | | $ | 0.98 | |
| | | | | | | | | | | | | | | | | | | | |
Total Return (%)(h) | | | 9.84 | | | | (0.10 | ) | | | 8.00 | | | | 21.11 | | | | 12.90 | |
Net Assets, End of Period ($ millions) | | | 504 | | | | 396 | | | | 331 | | | | 257 | | | | 162 | |
Ratio of Net Investment Income (Loss) to Average Net Assets (%) | | | 1.91 | | | | 1.91 | | | | 1.75 | | | | 1.67 | | | | (0.04 | ) |
Ratio of Expenses to Average Net Assets Before Expense Reimbursement (%)(d) | | | 0.07 | | | | 0.07 | | | | 0.05 | | | | 0.05 | | | | 0.05 | |
Ratio of Expenses to Average Net Assets After Expense Reimbursement (%)(d) | | | 0.07 | | | | 0.07 | | | | 0.05 | | | | 0.05 | | | | 0.05 | |
Portfolio Turnover Rate (%)(a) | | | 5.27 | | | | 4.36 | | | | 6.00 | | | | 1.49 | | | | 8.59 | |
| (a) | Portfolio turnover rate excludes all short-term securities. |
| (d) | Allocation and Retirement Funds exclude expenses of the underlying funds. |
| (e) | For the period October 1, 2012 (commencement of operations) through December 31, 2012. |
| (f) | For the period October 1, 2016 (commencement of operations) through December 31, 2016. |
| (g) | Amount is less than $0.005 per share. |
| (h) | Total return does not reflect fees and charges associated with your variable annuity contract or variable life insurance policy. Inclusion of those fees and charges would reduce the total return shown. |
The accompanying notes are an integral part of these financial statements.
92
| | | | | | | | | | | | | | | | | | | | | | | | | | | | | | | | | | | | | | | | |
| 2030 Retirement Fund | | | 2035 Retirement Fund | | | |
| Years Ended December 31, | | | Years Ended December 31, | | | |
| 2016 | | | 2015 | | | 2014 | | | 2013 | | | 2012 | | | 2016 | | | 2015 | | | 2014 | | | 2013 | | | 2012 | | | |
| $ | 1.20 | | | $ | 1.27 | | | $ | 1.19 | | | $ | 0.98 | | | $ | 0.88 | | | $ | 1.20 | | | $ | 1.27 | | | $ | 1.20 | | | $ | 0.97 | | | $ | 0.86 | | | |
| | | | | | | | | | | | | | | | | | | | | | | | | | | | | | | | | | | | | | | | |
| | | | | | | | | | |
| | | | | | | | | | | | | | | | | | | | | | | | | | | | | | | | | | | | | | | | |
| | 0.02 | | | | 0.02 | | | | 0.02 | | | | 0.02 | | | | — | (g) | | | 0.02 | | | | 0.02 | | | | 0.01 | | | | 0.01 | | | | — | (g) | | |
| | 0.11 | | | | (0.02 | ) | | | 0.09 | | | | 0.21 | | | | 0.12 | | | | 0.11 | | | | (0.03 | ) | | | 0.08 | | | | 0.24 | | | | 0.13 | | | |
| | | | | | | | | | | | | | | | | | | | | | | | | | | | | | | | | | | | | | | | |
| | 0.13 | | | | — | | | | 0.11 | | | | 0.23 | | | | 0.12 | | | | 0.13 | | | | (0.01 | ) | | | 0.09 | | | | 0.25 | | | | 0.13 | | | |
| | | | | | | | | | | | | | | | | | | | | | | | | | | | | | | | | | | | | | | | |
| | | | | | | | | | |
| | | | | | | | | | | | | | | | | | | | | | | | | | | | | | | | | | | | | | | | |
| | (0.02 | ) | | | (0.02 | ) | | | (0.02 | ) | | | — | (g) | | | (0.02 | ) | | | (0.02 | ) | | | (0.02 | ) | | | (0.01 | ) | | | — | (g) | | | (0.02 | ) | | |
| | (0.06 | ) | | | (0.05 | ) | | | (0.01 | ) | | | (0.02 | ) | | | — | (g) | | | (0.06 | ) | | | (0.04 | ) | | | (0.01 | ) | | | (0.02 | ) | | | — | (g) | | |
| | | | | | | | | | | | | | | | | | | | | | | | | | | | | | | | | | | | | | | | |
| | (0.08 | ) | | | (0.07 | ) | | | (0.03 | ) | | | (0.02 | ) | | | (0.02 | ) | | | (0.08 | ) | | | (0.06 | ) | | | (0.02 | ) | | | (0.02 | ) | | | (0.02 | ) | | |
| | | | | | | | | | | | | | | | | | | | | | | | | | | | | | | | | | | | | | | | |
| $ | 1.25 | | | $ | 1.20 | | | $ | 1.27 | | | $ | 1.19 | | | $ | 0.98 | | | $ | 1.25 | | | $ | 1.20 | | | $ | 1.27 | | | $ | 1.20 | | | $ | 0.97 | | | |
| | | | | | | | | | | | | | | | | | | | | | | | | | | | | | | | | | | | | | | | |
| | 10.73 | | | | (0.22 | ) | | | 8.44 | | | | 23.72 | | | | 13.69 | | | | 11.43 | | | | (0.37 | ) | | | 8.26 | | | | 25.92 | | | | 14.39 | | | |
| | 416 | | | | 328 | | | | 277 | | | | 212 | | | | 133 | | | | 352 | | | | 271 | | | | 230 | | | | 173 | | | | 107 | | | |
| | 1.78 | | | | 1.81 | | | | 1.66 | | | | 1.60 | | | | (0.04 | ) | | | 1.67 | | | | 1.68 | | | | 1.52 | | | | 1.47 | | | | (0.04 | ) | | |
| | 0.07 | | | | 0.07 | | | | 0.05 | | | | 0.05 | | | | 0.05 | | | | 0.07 | | | | 0.07 | | | | 0.05 | | | | 0.05 | | | | 0.05 | | | |
| | 0.07 | | | | 0.07 | | | | 0.05 | | | | 0.05 | | | | 0.05 | | | | 0.07 | | | | 0.07 | | | | 0.05 | | | | 0.05 | | | | 0.05 | | | |
| | 5.12 | | | | 4.83 | | | | 5.52 | | | | 1.58 | | | | 7.61 | | | | 4.98 | | | | 5.16 | | | | 4.29 | | | | 1.76 | | | | 6.51 | | | |
The accompanying notes are an integral part of these financial statements.
93
MUTUAL OF AMERICA INVESTMENT CORPORATION
FINANCIAL HIGHLIGHTS (Continued)
| | | | | | | | | | | | | | | | | | | | |
| | | 2040 Retirement Fund | |
| |
| | | Years Ended December 31, | |
| | | 2016 | | | 2015 | | | 2014 | | | 2013 | | | 2012 | |
Net Asset Value, Beginning of Period | | $ | 1.19 | | | $ | 1.26 | | | $ | 1.20 | | | $ | 0.96 | | | $ | 0.85 | |
| | | | | | | | | | | | | | | | | | | | |
| | | | | |
INCOME (LOSS)FROM INVESTMENT OPERATIONS: | | | | | | | | | | | | | | | | | | | | |
Net Investment Income (Loss) | | | 0.02 | | | | 0.02 | | | | 0.01 | | | | 0.01 | | | | — | (g) |
Net Realized and Unrealized Gains (Losses) on Investments and Futures Contracts | | | 0.11 | | | | (0.03 | ) | | | 0.08 | | | | 0.25 | | | | 0.13 | |
| | | | | | | | | | | | | | | | | | | | |
Total From Investment Operations | | | 0.13 | | | | (0.01 | ) | | | 0.09 | | | | 0.26 | | | | 0.13 | |
| | | | | | | | | | | | | | | | | | | | |
| | | | | |
Less: Distributions | | | | | | | | | | | | | | | | | | | | |
From Net Investment Income | | | (0.02 | ) | | | (0.02 | ) | | | (0.01 | ) | | | — | (g) | | | (0.02 | ) |
From Net Realized Gains | | | (0.06 | ) | | | (0.04 | ) | | | (0.02 | ) | | | (0.02 | ) | | | — | (g) |
| | | | | | | | | | | | | | | | | | | | |
Total Distributions | | | (0.08 | ) | | | (0.06 | ) | | | (0.03 | ) | | | (0.02 | ) | | | (0.02 | ) |
| | | | | | | | | | | | | | | | | | | | |
Net Asset Value, End of Period | | $ | 1.24 | | | $ | 1.19 | | | $ | 1.26 | | | $ | 1.20 | | | $ | 0.96 | |
| | | | | | | | | | | | | | | | | | | | |
Total Return (%)(h) | | | 11.66 | | | | (0.64 | ) | | | 7.71 | | | | 27.20 | | | | 14.63 | |
Net Assets, End of Period ($ millions) | | | 286 | | | | 222 | | | | 189 | | | | 148 | | | | 94 | |
Ratio of Net Investment Income (Loss) to Average Net Assets (%) | | | 1.59 | | | | 1.58 | | | | 1.40 | | | | 1.39 | | | | (0.04 | ) |
Ratio of Expenses to Average Net Assets Before Expense Reimbursement (%)(d) | | | 0.07 | | | | 0.07 | | | | 0.05 | | | | 0.05 | | | | 0.05 | |
Ratio of Expenses to Average Net Assets After Expense Reimbursement (%)(d) | | | 0.07 | | | | 0.07 | | | | 0.05 | | | | 0.05 | | | | 0.05 | |
Portfolio Turnover Rate (%)(a) | | | 5.23 | | | | 5.17 | | | | 4.31 | | | | 1.37 | | | | 4.99 | |
| (a) | Portfolio turnover rate excludes all short-term securities. |
| (d) | Allocation and Retirement Funds exclude expenses of the underlying funds. |
| (e) | For the period October 1, 2012 (commencement of operations) through December 31, 2012. |
| (f) | For the period October 1, 2016 (commencement of operations) through December 31, 2016. |
| (g) | Amount is less than $0.005 per share. |
| (h) | Total return does not reflect fees and charges associated with your variable annuity contract or variable life insurance policy. Inclusion of those fees and charges would reduce the total return shown. |
NA = Not Applicable
The accompanying notes are an integral part of these financial statements.
94
| | | | | | | | | | | | | | | | | | | | | | | | | | | | | | | | | | | | | | | | | | | | |
| 2045 Retirement Fund | | | 2050 Retirement Fund | | | 2055 Retirement Fund | | | |
| Years Ended December 31, | | | Years Ended December 31, | | | Period Ended
December 31,
2012(e) | | | Period Ended
December 31,
2016(f) | | | |
2016 | | | 2015 | | | 2014 | | | 2013 | | | 2012 | | | 2016 | | | 2015 | | | 2014 | | | 2013 | | | | |
| $ | 1.19 | | | $ | 1.26 | | | $ | 1.20 | | | $ | 0.96 | | | $ | 0.85 | | | $ | 1.35 | | | $ | 1.39 | | | $ | 1.30 | | | $ | 1.02 | | | $ | 1.00 | | | $ | 1.00 | | | |
| | | | | | | | | | | | | | | | | | | | | | | | | | | | | | | | | | | | | | | | | | | | |
| | | | | | | | | | | |
| | | | | | | | | | | | | | | | | | | | | | | | | | | | | | | | | | | | | | | | | | | | |
| | 0.02 | | | | 0.02 | | | | 0.01 | | | | 0.01 | | | | — | (g) | | | 0.01 | | | | 0.03 | | | | 0.01 | | | | — | (g) | | | — | (g) | | | — | (g) | | |
| | 0.12 | | | | (0.03 | ) | | | 0.07 | | | | 0.25 | | | | 0.13 | | | | 0.14 | | | | (0.04 | ) | | | 0.08 | | | | 0.28 | | | | 0.02 | | | | 0.04 | | | |
| | | | | | | | | | | | | | | | | | | | | | | | | | | | | | | | | | | | | | | | | | | | |
| | 0.14 | | | | (0.01 | ) | | | 0.08 | | | | 0.26 | | | | 0.13 | | | | 0.15 | | | | (0.01 | ) | | | 0.09 | | | | 0.28 | | | | 0.02 | | | | 0.04 | | | |
| | | | | | | | | | | | | | | | | | | | | | | | | | | | | | | | | | | | | | | | | | | | |
| | | | | | | | | | | |
| | | | | | | | | | | | | | | | | | | | | | | | | | | | | | | | | | | | | | | | | | | | |
| | (0.02 | ) | | | (0.02 | ) | | | (0.01 | ) | | | — | (g) | | | (0.02 | ) | | | (0.01 | ) | | | (0.01 | ) | | | — | (g) | | | — | (g) | | | — | | | | — | | | |
| | (0.07 | ) | | | (0.04 | ) | | | (0.01 | ) | | | (0.13 | ) | | | — | (g) | | | (0.04 | ) | | | (0.02 | ) | | | — | (g) | | | — | (g) | | | — | | | | — | | | |
| | | | | | | | | | | | | | | | | | | | | | | | | | | | | | | | | | | | | | | | | | | | |
| | (0.09 | ) | | | (0.06 | ) | | | (0.02 | ) | | | (0.13 | ) | | | (0.02 | ) | | | (0.05 | ) | | | (0.03 | ) | | | — | | | | — | | | | — | | | | — | | | |
| | | | | | | | | | | | | | | | | | | | | | | | | | | | | | | | | | | | | | | | | | | | |
| $ | 1.24 | | | $ | 1.19 | | | $ | 1.26 | | | $ | 1.20 | | | $ | 0.96 | | | $ | 1.45 | | | $ | 1.35 | | | $ | 1.39 | | | $ | 1.30 | | | $ | 1.02 | | | $ | 1.04 | | | |
| | | | | | | | | | | | | | | | | | | | | | | | | | | | | | | | | | | | | | | | | | | | |
| | 11.68 | | | | (0.69 | ) | | | 7.36 | | | | 27.68 | | | | 14.45 | | | | 11.78 | | | | (0.73 | ) | | | 7.15 | | | | 28.17 | | | | 1.83 | (b) | | | 4.01 | (b) | | |
| | 332 | | | | 265 | | | | 232 | | | | 186 | | | | 118 | | | | 164 | | | | 94 | | | | 50 | | | | 20 | | | | 2 | | | | 3 | | | |
| | 1.54 | | | | 1.55 | | | | 1.37 | | | | 1.37 | | | | (0.04 | ) | | | 1.58 | | | | 1.65 | | | | 1.47 | | | | 0.54 | | | | (0.01 | )(b) | | | (0.05 | )(c) | | |
| | 0.07 | | | | 0.07 | | | | 0.05 | | | | 0.05 | | | | 0.05 | | | | 0.08 | | | | 0.09 | | | | 0.05 | | | | 0.05 | | | | 0.05 | (c) | | | 0.50 | (c) | | |
| | 0.07 | | | | 0.07 | | | | 0.05 | | | | 0.05 | | | | 0.05 | | | | 0.08 | | | | 0.05 | | | | 0.05 | | | | 0.05 | | | | 0.05 | (c) | | | 0.05 | (c) | | |
| | 3.91 | | | | 4.40 | | | | 3.48 | | | | 0.93 | | | | 4.03 | | | | 2.67 | | | | 2.67 | | | | 1.53 | | | | 1.22 | | | | 0.76 | (b) | | | 22.25 | (b) | | |
The accompanying notes are an integral part of these financial statements.
95
MUTUAL OF AMERICA INVESTMENT CORPORATION
FINANCIAL HIGHLIGHTS (Continued)
| | | | | | | | | | | | | | | | | | | | |
| | | Conservative Allocation Fund | |
| | | Years Ended December 31, | |
| | | 2016 | | | 2015 | | | 2014 | | | 2013 | | | 2012 | |
Net Asset Value, Beginning of Period | | $ | 1.20 | | | $ | 1.25 | | | $ | 1.22 | | | $ | 1.15 | | | $ | 1.11 | |
| | | | | | | | | | | | | | | | | | | | |
| | | | | |
INCOME (LOSS)FROM INVESTMENT OPERATIONS: | | | | | | | | | | | | | | | | | | | | |
Net Investment Income (Loss) | | | 0.03 | | | | 0.02 | | | | 0.03 | | | | 0.03 | | | | — | (g) |
Net Realized and Unrealized Gains (Losses) on Investments and Futures Contracts | | | 0.04 | | | | (0.01 | ) | | | 0.05 | | | | 0.05 | | | | 0.08 | |
| | | | | | | | | | | | | | | | | | | | |
Total From Investment Operations | | | 0.07 | | | | 0.01 | | | | 0.08 | | | | 0.08 | | | | 0.08 | |
| | | | | | | | | | | | | | | | | | | | |
| | | | | |
Less: Distributions | | | | | | | | | | | | | | | | | | | | |
From Net Investment Income | | | (0.03 | ) | | | (0.03 | ) | | | (0.03 | ) | | | — | (g) | | | (0.03 | ) |
From Net Realized Gains | | | (0.03 | ) | | | (0.03 | ) | | | (0.02 | ) | | | (0.01 | ) | | | (0.01 | ) |
| | | | | | | | | | | | | | | | | | | | |
Total Distributions | | | (0.06 | ) | | | (0.06 | ) | | | (0.05 | ) | | | (0.01 | ) | | | (0.04 | ) |
| | | | | | | | | | | | | | | | | | | | |
Net Asset Value, End of Period | | $ | 1.21 | | | $ | 1.20 | | | $ | 1.25 | | | $ | 1.22 | | | $ | 1.15 | |
| | | | | | | | | | | | | | | | | | | | |
Total Return (%)(h) | | | 6.71 | | | | 0.44 | | | | 6.62 | | | | 7.34 | | | | 7.44 | |
Net Assets, End of Period ($ millions) | | | 140 | | | | 128 | | | | 123 | | | | 98 | | | | 86 | |
Ratio of Net Investment Income (Loss) to Average Net Assets (%) | | | 2.31 | | | | 2.32 | | | | 2.31 | | | | 2.45 | | | | 0.03 | |
Ratio of Expenses to Average Net Assets Before Expense Reimbursement (%)(d) | | | 0.03 | | | | 0.02 | | | | — | | | | — | | | | — | |
Ratio of Expenses to Average Net Assets After Expense Reimbursement (%)(d) | | | 0.03 | | | | 0.02 | | | | — | | | | — | | | | — | |
Portfolio Turnover Rate (%)(a) | | | 8.89 | | | | 10.58 | | | | 17.24 | | | | 10.16 | | | | 10.14 | |
| (a) | Portfolio turnover rate excludes all short-term securities. |
| (d) | Allocation and Retirement Funds exclude expenses of the underlying funds. |
| (e) | For the period October 1, 2012 (commencement of operations) through December 31, 2012. |
| (f) | For the period October 1, 2016 (commencement of operations) through December 31, 2016. |
| (g) | Amount is less than $0.005 per share. |
| (h) | Total return does not reflect fees and charges associated with your variable annuity contract or variable life insurance policy. Inclusion of those fees and charges would reduce the total return shown. |
NA = Not Applicable
The accompanying notes are an integral part of these financial statements.
96
| | | | | | | | | | | | | | | | | | | | | | | | | | | | | | | | | | | | | | | | |
| Moderate Allocation Fund | | | Aggressive Allocation Fund | | | |
| Years Ended December 31, | | | Years Ended December 31, | | | |
| 2016 | | | 2015 | | | 2014 | | | 2013 | | | 2012 | | | 2016 | | | 2015 | | | 2014 | | | 2013 | | | 2012 | | | |
| $ | 1.41 | | | $ | 1.52 | | | $ | 1.45 | | | $ | 1.27 | | | $ | 1.18 | | | $ | 1.60 | | | $ | 1.77 | | | $ | 1.69 | | | $ | 1.38 | | | $ | 1.24 | | | |
| | | | | | | | | | | | | | | | | | | | | | | | | | | | | | | | | | | | | | | | |
| | | | | | | | | | |
| | | | | | | | | | | | | | | | | | | | | | | | | | | | | | | | | | | | | | | | |
| | 0.03 | | | | 0.03 | | | | 0.03 | | | | 0.03 | | | | — | (g) | | | 0.03 | | | | 0.03 | | | | 0.03 | | | | 0.03 | | | | — | (g) | | |
| | 0.10 | | | | (0.03 | ) | | | 0.09 | | | | 0.16 | | | | 0.13 | | | | 0.14 | | | | (0.05 | ) | | | 0.11 | | | | 0.30 | | | | 0.17 | | | |
| | | | | | | | | | | | | | | | | | | | | | | | | | | | | | | | | | | | | | | | |
| | 0.13 | | | | — | | | | 0.12 | | | | 0.19 | | | | 0.13 | | | | 0.17 | | | | (0.02 | ) | | | 0.14 | | | | 0.33 | | | | 0.17 | | | |
| | | | | | | | | | | | | | | | | | | | | | | | | | | | | | | | | | | | | | | | |
| | | | | | | | | | |
| | | | | | | | | | | | | | | | | | | | | | | | | | | | | | | | | | | | | | | | |
| | (0.03 | ) | | | (0.03 | ) | | | (0.03 | ) | | | — | (g) | | | (0.03 | ) | | | (0.03 | ) | | | (0.03 | ) | | | (0.03 | ) | | | — | (g) | | | (0.03 | ) | | |
| | (0.07 | ) | | | (0.08 | ) | | | (0.02 | ) | | | (0.01 | ) | | | (0.01 | ) | | | (0.11 | ) | | | (0.12 | ) | | | (0.03 | ) | | | (0.02 | ) | | | — | (g) | | |
| | | | | | | | | | | | | | | | | | | | | | | | | | | | | | | | | | | | | | | | |
| | (0.10 | ) | | | (0.11 | ) | | | (0.05 | ) | | | (0.01 | ) | | | (0.04 | ) | | | (0.14 | ) | | | (0.15 | ) | | | (0.06 | ) | | | (0.02 | ) | | | (0.03 | ) | | |
| | | | | | | | | | | | | | | | | | | | | | | | | | | | | | | | | | | | | | | | |
| $ | 1.44 | | | $ | 1.41 | | | $ | 1.52 | | | $ | 1.45 | | | $ | 1.27 | | | $ | 1.63 | | | $ | 1.60 | | | $ | 1.77 | | | $ | 1.69 | | | $ | 1.38 | | | |
| | | | | | | | | | | | | | | | | | | | | | | | | | | | | | | | | | | | | | | | |
| | 9.08 | | | | 0.16 | | | | 7.71 | | | | 15.66 | | | | 10.90 | | | | 10.86 | | | | (0.38 | ) | | | 7.66 | | | | 24.19 | | | | 13.41 | | | |
| | 347 | | | | 316 | | | | 315 | | | | 281 | | | | 225 | | | | 264 | | | | 249 | | | | 255 | | | | 236 | | | | 187 | | | |
| | 2.08 | | | | 2.09 | | | | 1.95 | | | | 2.09 | | | | 0.02 | | | | 1.74 | | | | 1.81 | | | | 1.60 | | | | 1.75 | | | | 0.01 | | | |
| | 0.02 | | | | 0.02 | | | | — | | | | — | | | | — | | | | 0.02 | | | | 0.02 | | | | — | | | | — | | | | — | | | |
| | 0.02 | | | | 0.02 | | | | — | | | | — | | | | — | | | | 0.02 | | | | 0.02 | | | | — | | | | — | | | | — | | | |
| | 6.65 | | | | 8.10 | | | | 13.87 | | | | 4.71 | | | | 8.11 | | | | 9.51 | | | | 7.86 | | | | 19.61 | | | | 4.93 | | | | 7.82 | | | |
The accompanying notes are an integral part of these financial statements.
97
MUTUAL OF AMERICA INVESTMENT CORPORATION
FINANCIAL HIGHLIGHTS (Continued)
| | | | | | | | | | | | | | | | | | | | |
| | | Money Market Fund | |
| | | Years Ended December 31, | |
| | | 2016 | | | 2015 | | | 2014 | | | 2013 | | | 2012 | |
Net Asset Value, Beginning of Period | | $ | 1.20 | | | $ | 1.20 | | | $ | 1.20 | | | $ | 1.20 | | | $ | 1.20 | |
| | | | | | | | | | | | | | | | | | | | |
| | | | | |
INCOME (LOSS)FROM INVESTMENT OPERATIONS: | | | | | | | | | | | | | | | | | | | | |
Net Investment Income (Loss) | | | — | (g) | | | — | (g) | | | — | (g) | | | — | (g) | | | — | (g) |
Net Realized and Unrealized Gains (Losses) on Investments and Futures Contracts | | | — | (g) | | | — | (g) | | | — | (g) | | | — | (g) | | | — | (g) |
| | | | | | | | | | | | | | | | | | | | |
Total From Investment Operations | | | — | | | | — | | | | — | | | | — | | | | — | |
| | | | | | | | | | | | | | | | | | | | |
| | | | | |
Less: Distributions | | | | | | | | | | | | | | | | | | | | |
From Net Investment Income | | | — | | | | — | | | | — | | | | — | | | | — | |
From Net Realized Gains | | | — | | | | — | | | | — | | | | — | | | | — | |
| | | | | | | | | | | | | | | | | | | | |
Total Distributions | | | — | | | | — | | | | — | | | | — | | | | — | |
| | | | | | | | | | | | | | | | | | | | |
Net Asset Value, End of Period | | $ | 1.20 | | | $ | 1.20 | | | $ | 1.20 | | | $ | 1.20 | | | $ | 1.20 | |
| | | | | | | | | | | | | | | | | | | | |
Total Return (%)(h) | | | 0.14 | | | | (0.11 | ) | | | (0.14 | ) | | | (0.16 | ) | | | (0.17 | ) |
Net Assets, End of Period ($ millions) | | | 63 | | | | 67 | | | | 77 | | | | 84 | | | | 90 | |
Ratio of Net Investment Income (Loss) to Average Net Assets (%) | | | 0.13 | | | | (0.11 | ) | | | (0.14 | ) | | | (0.16 | ) | | | (0.18 | ) |
Ratio of Expenses to Average Net Assets Before Expense Reimbursement (%) | | | 0.28 | | | | 0.26 | | | | 0.24 | | | | 0.27 | | | | 0.30 | |
Ratio of Expenses to Average Net Assets After Expense Reimbursement (%) | | | 0.28 | | | | 0.26 | | | | 0.24 | | | | 0.27 | | | | 0.30 | |
Portfolio Turnover Rate (%)(a) | | | NA | | | | NA | | | | NA | | | | NA | | | | NA | |
| (a) | Portfolio turnover rate excludes all short-term securities. |
| (d) | Allocation and Retirement Funds exclude expenses of the underlying funds. |
| (e) | For the period October 1, 2012 (commencement of operations) through December 31, 2012. |
| (f) | For the period October 1, 2016 (commencement of operations) through December 31, 2016. |
| (g) | Amount is less than $0.005 per share. |
| (h) | Total return does not reflect fees and charges associated with your variable annuity contract or variable life insurance policy. Inclusion of those fees and charges would reduce the total return shown. |
NA = Not Applicable
The accompanying notes are an integral part of these financial statements.
98
| | | | | | | | | | | | | | | | | | | | | | | | | | | | | | | | | | | | | | | | |
| Mid-Term Bond Fund | | | Bond Fund | | | |
| Years Ended December 31, | | | Years Ended December 31, | | | |
| 2016 | | | 2015 | | | 2014 | | | 2013 | | | 2012 | | | 2016 | | | 2015 | | | 2014 | | | 2013 | | | 2012 | | | |
| $ | 1.03 | | | $ | 1.06 | | | $ | 1.05 | | | $ | 1.09 | | | $ | 1.06 | | | $ | 1.41 | | | $ | 1.45 | | | $ | 1.41 | | | $ | 1.47 | | | $ | 1.39 | | | |
| | | | | | | | | | | | | | | | | | | | | | | | | | | | | | | | | | | | | | | | |
| | | | | | | | | | |
| | | | | | | | | | | | | | | | | | | | | | | | | | | | | | | | | | | | | | | | |
| | 0.03 | | | | 0.03 | | | | 0.03 | | | | 0.03 | | | | 0.03 | | | | 0.04 | | | | 0.04 | | | | 0.04 | | | | 0.05 | | | | 0.05 | | | |
| | 0.01 | | | | (0.03 | ) | | | 0.02 | | | | (0.04 | ) | | | — | (g) | | | 0.02 | | | | (0.03 | ) | | | 0.04 | | | | (0.06 | ) | | | 0.03 | | | |
| | | | | | | | | | | | | | | | | | | | | | | | | | | | | | | | | | | | | | | | |
| | 0.04 | | | | — | | | | 0.05 | | | | (0.01 | ) | | | 0.03 | | | | 0.06 | | | | 0.01 | | | | 0.08 | | | | (0.01 | ) | | | 0.08 | | | |
| | | | | | | | | | | | | | | | | | | | | | | | | | | | | | | | | | | | | | | | |
| | | | | | | | | | |
| | | | | | | | | | | | | | | | | | | | | | | | | | | | | | | | | | | | | | | | |
| | (0.03 | ) | | | (0.03 | ) | | | (0.03 | ) | | | (0.03 | ) | | | — | (g) | | | (0.04 | ) | | | (0.05 | ) | | | (0.04 | ) | | | (0.05 | ) | | | — | (g) | | |
| | — | (g) | | | — | (g) | | | (0.01 | ) | | | — | (g) | | | — | (g) | | | — | (g) | | | — | (g) | | | — | | | | — | (g) | | | — | | | |
| | | | | | | | | | | | | | | | | | | | | | | | | | | | | | | | | | | | | | | | |
| | (0.03 | ) | | | (0.03 | ) | | | (0.04 | ) | | | (0.03 | ) | | | — | | | | (0.04 | ) | | | (0.05 | ) | | | (0.04 | ) | | | (0.05 | ) | | | — | | | |
| | | | | | | | | | | | | | | | | | | | | | | | | | | | | | | | | | | | | | | | |
| $ | 1.04 | | | $ | 1.03 | | | $ | 1.06 | | | $ | 1.05 | | | $ | 1.09 | | | $ | 1.43 | | | $ | 1.41 | | | $ | 1.45 | | | $ | 1.41 | | | $ | 1.47 | | | |
| | | | | | | | | | | | | | | | | | | | | | | | | | | | | | | | | | | | | | | | |
| | 3.51 | | | | 0.61 | | | | 3.22 | | | | (0.55 | ) | | | 3.33 | | | | 4.71 | | | | 0.33 | | | | 6.31 | | | | (0.91 | ) | | | 5.79 | | | |
| | 492 | | | | 452 | | | | 435 | | | | 392 | | | | 387 | | | | 1,108 | | | | 1,007 | | | | 956 | | | | 804 | | | | 753 | | | |
| | 2.45 | | | | 2.68 | | | | 2.57 | | | | 2.77 | | | | 2.94 | | | | 3.07 | | | | 2.93 | | | | 3.59 | | | | 3.35 | | | | 3.55 | | | |
| | 0.46 | | | | 0.46 | | | | 0.49 | | | | 0.51 | | | | 0.55 | | | | 0.45 | | | | 0.45 | | | | 0.48 | | | | 0.51 | | | | 0.55 | | | |
| | 0.46 | | | | 0.46 | | | | 0.49 | | | | 0.51 | | | | 0.55 | | | | 0.45 | | | | 0.45 | | | | 0.48 | | | | 0.51 | | | | 0.55 | | | |
| | 17.52 | | | | 19.07 | | | | 36.56 | | | | 23.94 | | | | 14.30 | | | | 13.54 | | | | 27.51 | | | | 15.00 | | | | 27.41 | | | | 28.89 | | | |
The accompanying notes are an integral part of these financial statements.
99
MUTUAL OF AMERICA INVESTMENT CORPORATION
NOTES TO FINANCIAL STATEMENTS
December 31, 2016
| 1. | SIGNIFICANT ACCOUNTING POLICIESAND ORGANIZATION |
Mutual of America Investment Corporation (the “Investment Company”) is a diversified, open-end management investment company — a type of company commonly known as a “mutual fund”. It is registered as such under the Investment Company Act of 1940 (the “Investment Company Act”). The Investment Company was formed on February 21, 1986 as a Maryland corporation and principally offers its shares exclusively to separate accounts of Mutual of America Life Insurance Company (“Mutual of America Life”) and a former affiliate that offers the Funds through its separate accounts. As a “series” type mutual fund, the Investment Company issues separate classes (or series) of capital stock, each of which represents a separate Fund of investments. At December 31, 2016, there were 25 active Funds (collectively, “the Funds”): Equity Index Fund, All America Fund, Small Cap Value Fund, Small Cap Growth Fund, Mid Cap Value Fund, Mid-Cap Equity Index Fund, International Fund, Composite Fund, Money Market Fund, Mid-Term Bond Fund, Bond Fund; Retirement Income Fund, 2010 Retirement Fund, 2015 Retirement Fund, 2020 Retirement Fund, 2025 Retirement Fund, 2030 Retirement Fund, 2035 Retirement Fund, 2040 Retirement Fund, 2045 Retirement Fund, 2050 Retirement Fund and 2055 Retirement Fund (collectively, “Retirement Funds”); a Conservative Allocation Fund, a Moderate Allocation Fund and an Aggressive Allocation Fund (collectively, “Allocation Funds”). The 2050 Retirement Fund commenced operations on October 1, 2012. The 2055 Retirement Fund commenced operations on October 1, 2016.
Investment Company shares are issued to Mutual of America Life and, on a limited basis, to Wilton Reassurance Life Company of New York (formerly The American Life Insurance Company of New York), for allocation to their Separate Accounts as a funding medium for variable accumulation annuity contracts and variable life insurance policies. In addition, shares of selected equity and fixed income funds of the Investment Company are directly issued to one or more of the Investment Company’s Retirement Funds and Allocation Funds.
The preparation of financial statements in accordance with U.S. generally accepted accounting principles (“GAAP”) requires management to make estimates and assumptions that affect the reported amounts of assets, liabilities, income, expenses and related disclosures. Changes in the economic environment, financial markets and any other parameters used in determining these estimates could cause actual results to differ.
The following is a summary of the significant accounting policies consistently followed by the Investment Company, which are in conformity with GAAP:
Fair Value — The Investment Company values its investments at fair value. Fair value is an estimate of the price the Fund would receive upon selling a security in an orderly arms-length transaction. Investments are categorized based on a three-level valuation hierarchy for measurement and disclosure of fair value. The valuation hierarchy is based upon the transparency of inputs used to measure fair value. These inputs are summarized in the three broad levels listed below:
| | • | | Level 1 — quoted prices in active markets for identical securities. |
| | • | | Level 2 — other significant observable inputs (including yield, quality, coupon rate, maturity, issue type, quoted prices for similar securities, prepayment speeds, trading characteristics, etc.). |
| | • | | Level 3 — significant unobservable inputs (including the Fund’s own assumptions in determining the fair value of investments). |
As of December 31, 2016, management determined that the fair value inputs for all equity securities were considered Level 1, with the exception of one security in the All America and Small Cap Value Funds (see Note 1 below) which was considered Level 3. In addition, non-registered securities under Rule 144A of the Securities Act of 1933 were considered Level 2. Furthermore, certain Rule 144A securities not actively traded are considered Level 3; however, there were no such 144A securities as of December 31, 2016. Fair value inputs for all debt securities were considered Level 2. The inputs or methodologies used for valuing securities are not necessarily an indication of the risk associated with investing in those securities. Transfers between levels are reflected based on the fair value at the beginning of a reporting period.
100
MUTUAL OF AMERICA INVESTMENT CORPORATION
NOTES TO FINANCIAL STATEMENTS (Continued)
December 31, 2016
| 1. | SIGNIFICANT ACCOUNTING POLICIESAND ORGANIZATION (CONTINUED) |
The following is a summary of the inputs used to value the Funds’ investments and other financial instruments as of December 31, 2016:
| | | | | | | | | | | | | | | | |
Fund | | Level 1 — Quoted
Prices | | | Level 2 — Significant
Observable Inputs | | | Level 3 — Significant
Unobservable Inputs | | | Total | |
Investments at Fair Value: | | | | | | | | | | | | | | | | |
(See Summary Portfolios or Portfolios of Investments for More Details) | | | | | | | | | |
Equity Index Fund | | | | | | | | | | | | | | | | |
Common Stock | | $ | 2,062,577,687 | | | | — | | | | — | | | $ | 2,062,577,687 | |
Short-Term Debt Securities | | | — | | | $ | 78,422,328 | | | | — | | | $ | 78,422,328 | |
| | | | | | | | | | | | | | | | |
| | $ | 2,062,577,687 | | | $ | 78,422,328 | | | | — | | | $ | 2,141,000,015 | |
All America Fund | | | | | | | | | | | | | | | | |
Common Stock-Indexed | | $ | 149,944,293 | | | | — | | | | — | | | $ | 149,944,293 | |
Common Stock-Active | | $ | 129,360,518 | | | | — | | | $ | 285,375 | (1) | | $ | 129,645,893 | |
Short-Term Debt Securities-Indexed | | | — | | | $ | 12,398,129 | | | | — | | | $ | 12,398,129 | |
Short-Term Debt Securities-Active | | | — | | | $ | 3,299,863 | | | | — | | | $ | 3,299,863 | |
Warrants-Active | | $ | 19,346 | | | | — | | | | — | | | $ | 19,346 | |
| | | | | | | | | | | | | | | | |
| | $ | 279,324,157 | | | $ | 15,697,992 | | | $ | 285,375 | | | $ | 295,307,524 | |
Small Cap Value Fund | | | | | | | | | | | | | | | | |
Common Stock | | $ | 444,868,977 | | | | — | | | $ | 3,206,125 | (1) | | $ | 448,075,102 | |
Short-Term Debt Securities | | | — | | | $ | 19,493,606 | | | | — | | | $ | 19,493,606 | |
Warrants | | $ | 218,574 | | | | — | | | | — | | | $ | 218,574 | |
| | | | | | | | | | | | | | | | |
| | $ | 445,087,551 | | | $ | 19,493,606 | | | $ | 3,206,125 | | | $ | 467,787,282 | |
Small Cap Growth Fund | | | | | | | | | | | | | | | | |
Common Stock | | $ | 421,425,351 | | | | — | | | | — | | | $ | 421,425,351 | |
Short-Term Debt Securities | | | — | | | $ | 11,747,877 | | | | — | | | $ | 11,747,877 | |
| | | | | | | | | | | | | | | | |
| | $ | 421,425,351 | | | $ | 11,747,877 | | | | — | | | $ | 433,173,228 | |
Mid Cap Value Fund | | | | | | | | | | | | | | | | |
Common Stock | | $ | 93,815,677 | | | | — | | | | — | | | $ | 93,815,677 | |
Short-Term Debt Securities | | | — | | | $ | 5,099,524 | | | | — | | | $ | 5,099,524 | |
| | | | | | | | | | | | | | | | |
| | $ | 93,815,677 | | | $ | 5,099,524 | | | | — | | | $ | 98,915,201 | |
Mid-Cap Equity Index Fund | | | | | | | | | | | | | | | | |
Common Stock | | $ | 1,190,607,707 | | | | — | | | | — | | | $ | 1,190,607,707 | |
Short-Term Debt Securities | | | — | | | $ | 53,136,113 | | | | — | | | $ | 53,136,113 | |
| | | | | | | | | | | | | | | | |
| | $ | 1,190,607,707 | | | $ | 53,136,113 | | | | — | | | $ | 1,243,743,820 | |
International Fund | | | | | | | | | | | | | | | | |
Common Stock | | $ | 355,448,868 | | | | — | | | | — | | | $ | 355,448,868 | |
Short-Term Debt Securities | | | — | | | $ | 21,194,762 | | | | — | | | $ | 21,194,762 | |
| | | | | | | | | | | | | | | | |
| | $ | 355,448,868 | | | $ | 21,194,762 | | | | — | | | $ | 376,643,630 | |
Composite Fund | | | | | | | | | | | | | | | | |
Common Stock | | $ | 107,034,196 | | | | — | | | | — | | | $ | 107,034,196 | |
U.S. Government Debt | | | — | | | $ | 18,562,263 | | | | — | | | $ | 18,562,263 | |
U.S. Government Agency Residential
Mortgage-Backed Obligations | | | — | | | $ | 19,863,060 | | | | — | | | $ | 19,863,060 | |
U.S. Government Agency
Non-Mortgage-Backed Obligations | | | — | | | $ | 474,527 | | | | — | | | $ | 474,527 | |
Long-Term Corporate Debt | | | — | | | $ | 30,102,610 | | | | — | | | $ | 30,102,610 | |
Short-Term Debt Securities | | | — | | | $ | 5,399,238 | | | | — | | | $ | 5,399,238 | |
| | | | | | | | | | | | | | | | |
| | $ | 107,034,196 | | | $ | 74,401,698 | | | | — | | | $ | 181,435,894 | |
101
MUTUAL OF AMERICA INVESTMENT CORPORATION
NOTES TO FINANCIAL STATEMENTS (Continued)
December 31, 2016
| 1. | SIGNIFICANT ACCOUNTING POLICIESAND ORGANIZATION (CONTINUED) |
| | | | | | | | | | | | | | | | |
Fund | | Level 1 — Quoted
Prices | | | Level 2 — Significant
Observable Inputs | | | Level 3 — Significant
Unobservable Inputs | | | Total | |
Retirement Income Fund | | | | | | | | | | | | | | | | |
Common Stock | | $ | 75,701,194 | | | | — | | | | — | | | $ | 75,701,194 | |
2010 Retirement Fund | | | | | | | | | | | | | | | | |
Common Stock | | $ | 25,683,282 | | | | — | | | | — | | | $ | 25,683,282 | |
2015 Retirement Fund | | | | | | | | | | | | | | | | |
Common Stock | | $ | 146,393,227 | | | | — | | | | — | | | $ | 146,393,227 | |
2020 Retirement Fund | | | | | | | | | | | | | | | | |
Common Stock | | $ | 425,845,263 | | | | — | | | | — | | | $ | 425,845,263 | |
2025 Retirement Fund | | | | | | | | | | | | | | | | |
Common Stock | | $ | 504,130,916 | | | | — | | | | — | | | $ | 504,130,916 | |
2030 Retirement Fund | | | | | | | | | | | | | | | | |
Common Stock | | $ | 416,287,788 | | | | — | | | | — | | | $ | 416,287,788 | |
2035 Retirement Fund | | | | | | | | | | | | | | | | |
Common Stock | | $ | 351,838,477 | | | | — | | | | — | | | $ | 351,838,477 | |
2040 Retirement Fund | | | | | | | | | | | | | | | | |
Common Stock | | $ | 285,698,307 | | | | — | | | | — | | | $ | 285,698,307 | |
2045 Retirement Fund | | | | | | | | | | | | | | | | |
Common Stock | | $ | 332,407,771 | | | | — | | | | — | | | $ | 332,407,771 | |
2050 Retirement Fund | | | | | | | | | | | | | | | | |
Common Stock | | $ | 164,048,915 | | | | — | | | | — | | | $ | 164,048,915 | |
2055 Retirement Fund | | | | | | | | | | | | | | | | |
Common Stock | | $ | 3,319,422 | | | | — | | | | — | | | $ | 3,319,422 | |
Conservative Allocation Fund | | | | | | | | | | | | | | | | |
Common Stock | | $ | 139,521,876 | | | | — | | | | — | | | $ | 139,521,876 | |
Moderate Allocation Fund | | | | | | | | | | | | | | | | |
Common Stock | | $ | 347,008,117 | | | | — | | | | — | | | $ | 347,008,117 | |
Aggressive Allocation Fund | | | | | | | | | | | | | | | | |
Common Stock | | $ | 263,729,799 | | | | — | | | | — | | | $ | 263,729,799 | |
Money Market Fund | | | | | | | | | | | | | | | | |
U.S. Government Debt | | | — | | | $ | 15,195,206 | | | | — | | | $ | 15,195,206 | |
U.S. Government Agency Short-Term Debt | | | — | | | $ | 9,296,723 | | | | — | | | $ | 9,296,723 | |
Commercial Paper | | | — | | | $ | 38,549,973 | | | | — | | | $ | 38,549,973 | |
| | | | | | | | | | | | | | | | |
| | | — | | | $ | 63,041,902 | | | | — | | | $ | 63,041,902 | |
Mid-Term Bond Fund | | | | | | | | | | | | | | | | |
U.S. Government Debt | | | — | | | $ | 181,225,663 | | | | — | | | $ | 181,225,663 | |
U.S. Government Agency Residential
Mortgage-Backed Obligations | | | — | | | $ | 2,798 | | | | — | | | $ | 2,798 | |
U.S. Government Agency
Non-Mortgage-Backed Obligations | | | — | | | $ | 35,447,355 | | | | — | | | $ | 35,447,355 | |
Long-Term Corporate Debt | | | — | | | $ | 271,803,555 | | | | — | | | $ | 271,803,555 | |
Short-Term Debt Securities | | | — | | | $ | 599,975 | | | | — | | | $ | 599,975 | |
| | | | | | | | | | | | | | | | |
| | | — | | | $ | 489,079,346 | | | | — | | | $ | 489,079,346 | |
Bond Fund | | | | | | | | | | | | | | | | |
U.S. Government Debt | | | — | | | $ | 128,943,041 | | | | — | | | $ | 128,943,041 | |
U.S. Government Agency Residential
Mortgage-Backed Obligations | | | — | | | $ | 299,671,775 | | | | — | | | $ | 299,671,775 | |
U.S. Government Agency
Non-Mortgage-Backed Obligations | | | — | | | $ | 15,228,513 | | | | — | | | $ | 15,228,513 | |
Long-Term Corporate Debt | | | — | | | $ | 652,560,334 | | | | — | | | $ | 652,560,334 | |
Sovereign Debt | | | — | | | $ | 3,558,307 | | | | — | | | $ | 3,558,307 | |
Short-Term Debt Securities | | | — | | | $ | 6,199,742 | | | | — | | | $ | 6,199,742 | |
| | | | | | | | | | | | | | | | |
| | | — | | | $ | 1,106,161,712 | | | | — | | | $ | 1,106,161,712 | |
102
MUTUAL OF AMERICA INVESTMENT CORPORATION
NOTES TO FINANCIAL STATEMENTS (Continued)
December 31, 2016
| 1. | SIGNIFICANT ACCOUNTING POLICIESAND ORGANIZATION (CONTINUED) |
| | | | | | | | | | | | | | | | |
Fund | | Level 1 — Quoted
Prices | | | Level 2 — Significant
Observable Inputs | | | Level 3 — Significant
Unobservable Inputs | | | Total | |
Other Financial Instruments:* | | | | | | | | | | | | | | | | |
| | | | |
Equity Index Fund | | $ | (699,807 | ) | | | — | | | | — | | | $ | (699,807 | ) |
All America Fund | | $ | (127,974 | ) | | | — | | | | — | | | $ | (127,974 | ) |
Mid-Cap Equity Index Fund | | $ | (914,414 | ) | | | — | | | | — | | | $ | (914,414 | ) |
| * | Other financial instruments are derivative instruments not reflected in the Portfolio of Investments, such as futures, which are valued at the unrealized appreciation/depreciation on the instrument. |
| (1) | Includes security issued by Xura, Inc. included in “Other Securities” in the Information Technology section of the active asset segment of the All America Fund portfolio and in a similar section of the Small Cap Value Fund portfolio. The security is fair valued at its last trade price. |
| | | | | | | | | | | | | | | | | | | | | | | | |
| | | Fair Value Measurement Using Significant Unobservable
Inputs (Level 3) for the Year Ended December 31, 2016 | |
| | | Balance
December 31,
2015 | | | Change in
Unrealized
Gains
(Losses) | | | Transfers
Into
Level 3(a) | | | Transfers
Out of
Level 3 | | | Balance
December 31,
2016 | | | Unrealized Gains/(Losses)
of Level 3 Assets Held as of
December 31, 2016 Included
in Statements of Operation | |
All America Fund | | | — | | | | — | | | $ | 285,375 | | | | — | | | $ | 285,375 | | | $ | 30,822 | |
Small Cap Value Fund | | | — | | | | — | | | $ | 3,206,125 | | | | — | | | $ | 3,206,125 | | | $ | 347,256 | |
| (a) | Reflects transfers into Level 3 from Level 1 as a result of a security being carried at a calculated fair value due to the absence of recent trading activity in the security, as described in Security Valuation below. |
Security Valuation — Investment securities are carried at fair value as follows:
Exchange-traded equity securities are valued at the last reported sales price on the principal exchange on which the security is traded. If there is no trading volume for a particular valuation day, the last bid price is used. For equity securities traded in the over-the-counter market, the security is valued at the last sale price, or if no sale, at the latest bid price available.
Short-term debt securities with a maturity of 60 days or less are valued at amortized cost, which approximates fair value for such securities.
Debt securities, including short-term debt securities maturing in excess of 60 days, are valued on the basis of prices obtained from an independent pricing source. The pricing source may utilize various pricing methodologies that incorporate both models (which consider factors such as yield, quality, coupon rate, maturity, issue type, quoted prices for similar securities, prepayment speeds and trading characteristics) and dealer-supplied valuations to derive a valuation.
In the rare instance when a price is not available from an independent pricing source or when prices may not reflect fair value, such as when the price provided by the pricing source is not based on a recent trade, a calculated fair value is used, as determined in good faith by the Adviser and reviewed by a Valuation Committee, in accordance with procedures adopted by the Board of Directors of the Investment Company.
Mutual of America Capital Management LLC (“the Adviser”) uses a market approach to calculate fair value for equity securities which are categorized as Level 3. The Adviser’s valuation is primarily based on information regarding the specific equity issuer, such as the last trade price, financial statements, the relationship of per-share book value to the last trade price, operating information and any corporate actions, such as dividends or returns of capital, that may have occurred since the last trade. The Adviser also considers industry-specific conditions and overall market conditions, to determine whether the last trade price reflects fair value or needs to be adjusted. Generally, absent any significant contrary indications, the last trade price will be used as the calculated fair value.
103
MUTUAL OF AMERICA INVESTMENT CORPORATION
NOTES TO FINANCIAL STATEMENTS (Continued)
December 31, 2016
| 1. | SIGNIFICANT ACCOUNTING POLICIESAND ORGANIZATION (CONTINUED) |
The Retirement Funds and the Allocation Funds value their investments in the underlying Funds of the Investment Company at their respective net asset values.
Investment Transactions — Investment transactions are accounted for as of the trade date. Realized gains and losses on the sale of short and long-term debt securities are computed on the basis of amortized cost at the time of sale. Realized gains and losses on the sale of equity securities are based on the identified cost basis of the security, determined on the first-in, first-out (“FIFO”) basis.
Futures Contracts — The Equity Index Fund, Mid-Cap Equity Index Fund and a portion of the All America Fund each maintain indexed asset portfolios which are subject to equity price risk. In order to remain more fully invested in the equity markets while minimizing transaction costs, the funds purchase stock index futures contracts. An initial cash margin deposit (represented by cash or Treasury bills) is made upon entering into a futures contract and serves as collateral for the contract. This initial margin, maintained in a segregated account, is equal to approximately 5%-6% of the contract amount, and does not involve the borrowing of funds to finance the transaction. During the period the futures contract is outstanding, changes in the value of the contract are recognized as unrealized appreciation or depreciation by “marking-to-market” on a daily basis to reflect the market value of the contract at the end of each trading day. The accumulated unrealized appreciation or depreciation on the contract is included in Net Unrealized Appreciation (Depreciation) of Investments and Futures Contracts in the Components of Net Assets section of the Statements of Assets and Liabilities. Futures contracts are valued at the settlement price established each day by the exchange on which traded. Depending upon whether unrealized appreciation or depreciation are incurred, variation margin payments are received or made daily. The net change in unrealized appreciation or depreciation of futures contracts is recorded in the Statements of Operations. When the contract is closed, a realized gain or loss from futures transactions is recorded in the Statements of Operations, equal to the net variation margin received or paid over the period the contract was outstanding.
The “Underlying Face Amount at Value” (appearing in the “Footnotes to Summary Portfolios of Investments in Securities”) representing the aggregate of outstanding contractual amounts under futures contracts reflects the extent of a Fund’s exposure to off-balance sheet risk. The use of futures transactions involves the risk of imperfect correlation in the price movements of the contract and the underlying securities. With futures contracts, there is minimal counterparty credit risk to the Fund since futures are exchange traded and the exchange’s clearinghouse, as counterparty to all exchange traded futures, guarantees the futures against default.
During the year ended December 31, 2016, the Equity Index Fund, Mid-Cap Equity Index Fund and the All America Fund purchased futures contracts with total principal amounts of $403,664,998, $332,968,621 and $51,974,965, respectively.
Warrants — A warrant is an option to purchase common stock of an issuer and is issued in conjunction with another security, such as a debt obligation. A warrant specifies the price at which the holder may purchase shares of common stock and usually expires after a period of time. A warrant holder generally may pay cash for the common stock to be purchased or may surrender the principal amount of the related debt security the warrant holder owns equal to the purchase price for the stock.
The common stock underlying a warrant may not increase in value after the date the warrant was issued, or may not increase up to the warrant exercise price. In this case, the warrant generally would have little value and could expire unexercised.
At December 31, 2016, warrants held by the Funds of the Investment Company were traded on active markets and are considered Level 1 securities.
Retirement Funds — Each of the Retirement Funds invests in equity (stock) funds and fixed income (bond) funds and targets different percentages to these asset classes. The targets reflect varying emphases on achieving capital appreciation and gains versus preserving capital and producing income, depending on the specific Fund’s time horizon.
104
MUTUAL OF AMERICA INVESTMENT CORPORATION
NOTES TO FINANCIAL STATEMENTS (Continued)
December 31, 2016
| 1. | SIGNIFICANT ACCOUNTING POLICIESAND ORGANIZATION (CONTINUED) |
The Retirement Funds target their investments in the following underlying funds of the Investment Company in accordance with the percentage allocations noted:
| | | | | | | | | | | | | | | | | | | | | | | | | | | | | | | | |
| | | Equity
Index
Fund | | | Mid-Cap
Equity
Index
Fund | | | Small Cap
Growth
Fund | | | Small Cap
Value
Fund | | | International
Fund | | | Bond
Fund | | | Mid-Term
Bond
Fund | | | Money
Market
Fund | |
Retirement Income Fund | | | 20% | | | | 5% | | | | — | | | | — | | | | — | | | | 30% | | | | 40% | | | | 5% | |
2010 Retirement Fund | | | 23% | | | | 7% | | | | — | | | | — | | | | 3% | | | | 26% | | | | 36% | | | | 5% | |
2015 Retirement Fund | | | 26% | | | | 9% | | | | 1% | | | | 1% | | | | 6% | | | | 26% | | | | 31% | | | | — | |
2020 Retirement Fund | | | 30% | | | | 11% | | | | 2% | | | | 2% | | | | 8% | | | | 26% | | | | 21% | | | | — | |
2025 Retirement Fund | | | 35% | | | | 14% | | | | 3% | | | | 3% | | | | 10% | | | | 25% | | | | 10% | | | | — | |
2030 Retirement Fund | | | 37% | | | | 17% | | | | 5% | | | | 5% | | | | 11% | | | | 25% | | | | — | | | | — | |
2035 Retirement Fund | | | 38% | | | | 20% | | | | 6% | | | | 6% | | | | 13% | | | | 17% | | | | — | | | | — | |
2040 Retirement Fund | | | 36% | | | | 20% | | | | 8% | | | | 8% | | | | 14% | | | | 14% | | | | — | | | | — | |
2045 Retirement Fund | | | 33% | | | | 22% | | | | 9% | | | | 9% | | | | 15% | | | | 12% | | | | — | | | | — | |
2050 Retirement Fund | | | 32% | | | | 22% | | | | 10% | | | | 10% | | | | 16% | | | | 10% | | | | — | | | | — | |
2055 Retirement Fund | | | 30% | | | | 23% | | | | 11% | | | | 11% | | | | 17% | | | | 8% | | | | — | | | | — | |
Generally, rebalancing of the Retirement Funds’ holdings is performed on a periodic basis and the mix of underlying Funds is reviewed annually.
Allocation Funds — The Allocation Funds target their investments in the following underlying Funds of the Investment Company in accordance with the percentage allocations noted:
| | | | | | | | | | | | | | | | | | | | | | | | | | | | |
| | | Equity
Index
Fund | | | Mid-Cap
Equity
Index
Fund | | | Small Cap
Growth
Fund | | | Small Cap
Value
Fund | | | International
Fund | | | Bond
Fund | | | Mid-Term
Bond
Fund | |
Conservative Allocation | | | 25% | | | | 5% | | | | — | | | | — | | | | 5% | | | | 30% | | | | 35% | |
Moderate Allocation | | | 35% | | | | 15% | | | | — | | | | — | | | | 10% | | | | 25% | | | | 15% | |
Aggressive Allocation | | | 35% | | | | 20% | | | | 5% | | | | 5% | | | | 15% | | | | 20% | | | | — | |
Generally, rebalancing of the Allocation Funds’ holdings is performed on a periodic basis.
Change in Target Investments — During the year, the Retirement Funds listed below had changes to their target investments. Overall increases (decreases) to the target percentages were as follows:
| | | | | | | | | | | | | | | | | | | | | | | | | | | | | | | | |
| | | Equity
Index
Fund | | | Mid-Cap
Equity
Index
Fund | | | Small Cap
Growth
Fund | | | Small Cap
Value
Fund | | | International
Fund | | | Bond
Fund | | | Mid-Term
Bond
Fund | | | Money
Market
Fund | |
2010 Retirement Fund | | | (1% | ) | | | (1% | ) | | | — | | | | — | | | | — | | | | 1% | | | | 1% | | | | — | |
2015 Retirement Fund | | | (1% | ) | | | (1% | ) | | | — | | | | — | | | | — | | | | 1% | | | | 1% | | | | — | |
2020 Retirement Fund | | | (1% | ) | | | (1% | ) | | | — | | | | — | | | | — | | | | 1% | | | | 1% | | | | — | |
2025 Retirement Fund | | | (2% | ) | | | (1% | ) | | | — | | | | — | | | | — | | | | 3% | | | | — | | | | — | |
2030 Retirement Fund | | | (2% | ) | | | (1% | ) | | | — | | | | — | | | | — | | | | 3% | | | | — | | | | — | |
2035 Retirement Fund | | | (2% | ) | | | — | | | | — | | | | — | | | | — | | | | 2% | | | | — | | | | — | |
2040 Retirement Fund | | | (1% | ) | | | — | | | | — | | | | — | | | | — | | | | 1% | | | | — | | | | — | |
2045 Retirement Fund | | | (1% | ) | | | — | | | | — | | | | — | | | | — | | | | 1% | | | | — | | | | — | |
2050 Retirement Fund | | | (2% | ) | | | — | | | | — | | | | — | | | | 1% | | | | 1% | | | | — | | | | — | |
Investment Income — Interest income, accretion of discount and amortization of premium are recorded daily on an accrual basis using the effective interest method. A debt obligation may cease accrual of income and result in a reduction to interest income when the collection of all or a portion of current and past due interest is in doubt. Dividend income is recorded on the ex-dividend date. Foreign source tax withheld from dividends is recorded as a reduction from dividend income. Should reclamation efforts succeed, such amounts are recorded as income upon collection.
105
MUTUAL OF AMERICA INVESTMENT CORPORATION
NOTES TO FINANCIAL STATEMENTS (Continued)
December 31, 2016
| 1. | SIGNIFICANT ACCOUNTING POLICIESAND ORGANIZATION (CONTINUED) |
Distributions to Shareholders (“Dividends”) — Distributions to shareholders are recorded on the ex-dividend date and are made at least annually. It is the Investment Company’s policy to make distributions of its net investment income and net realized gains, if any, in accordance with Federal income tax regulations, which may differ from U.S. generally accepted accounting principles. Accordingly, periodic reclassifications (which do not impact the funds’ net asset values) are made within the funds’ capital accounts to reflect income and gains available for distribution under Federal income tax regulations.
Federal Income Taxes — Each Fund in the Investment Company intends to comply with the requirements of the Internal Revenue Code applicable to regulated investment companies and to distribute substantially all of its taxable income to shareholders. Therefore, no federal income or excise tax provision is required.
GAAP requires the evaluation of tax positions taken in the course of preparing a fund’s tax return to determine whether it is “more-likely-than-not” that tax positions taken in the fund’s tax return will be ultimately sustained, and, if not, a tax liability and expense is recorded.
As of December 31, 2016, management has evaluated the tax positions taken on the Funds’ tax returns for all open tax years and has concluded that no tax provision is required in any of the Funds’ financial statements. Each Fund’s federal and state income, franchise and federal excise tax returns for tax years for which the applicable statutes of limitations have not expired are subject to examination by the Internal Revenue Service and state departments of revenue.
As of December 31, 2016, the Money Market and 2055 Retirement Funds had a capital loss carry forward of $1,468 and $107, respectively, to offset any future net realized capital gains generated after December 31, 2016.
The Investment Company has an Investment Advisory Agreement with Mutual of America Capital Management LLC (“the Adviser”), an indirect wholly-owned subsidiary of Mutual of America Life. For providing investment management services to each of the Funds of the Investment Company, the Adviser receives a fee, calculated as a daily charge of the value of the net assets of each fund, at the following annual rates:
| | | | |
Fund | | Annual Investment
Management Fee | |
Retirement Funds | | | .05 | % |
Equity Index, Mid-Cap Equity Index, International Funds | | | .075 | % |
Money Market Fund | | | .15 | % |
Bond Fund | | | .39 | % |
All America, Composite, Mid-Term Bond Funds | | | .40 | % |
Mid Cap Value Fund | | | .55 | % |
Small Cap Value, Small Cap Growth Funds | | | .75 | % |
The Adviser does not assess a fee for investment management to the Allocation Funds. However, shareholders in the Allocation Funds (and the Retirement and International Funds) will indirectly bear their pro-rata share of the investment management fees incurred by the underlying Funds in which they invest.
The Retirement and Allocation Funds incur direct investment management expenses of .05% and .00%, respectively. The Funds also bore their pro-rata share of the investment management fees charged to each of the underlying funds in which they invest. Through December 31, 2014, they also did not incur operating expenses other than those included in each of the underlying funds in which they invest. Commencing January 1, 2015, the expense allocation methodology was modified such that certain non-advisory operating expenses that can be attributed only to the Retirement and Allocation Funds are now charged directly to those Funds. Effective January 1, 2015, the Investment Company and the Adviser entered into an agreement under which the Adviser agrees to reimburse the direct non-advisory operating expenses of any Allocation or Retirement Fund (each a “Fund of Funds”) that has less than $50 million in average daily net assets for the prior calendar year. This agreement remains in effect through April 30, 2017 and continues into successive 12 month periods ending April 30 unless i) The Fund of Funds has at
106
MUTUAL OF AMERICA INVESTMENT CORPORATION
NOTES TO FINANCIAL STATEMENTS (Continued)
December 31, 2016
least $50 million in average daily net assets for the prior calendar year, ii) the Investment Company gives not less than 30 days written notice to the Adviser, or iii) the Adviser gives 45 days advance notice to the Investment Company before the next May 1 of a given year to terminate the agreement. In that case, the agreement will terminate on the next May 1 following the written notice.
The cost of investment purchases and proceeds from sales of investments, excluding short-term securities and futures contracts, for the year ended December 31, 2016, were as follows:
| | | | | | | | | | | | | | | | | | | | |
| | | Equity Index
Fund | | | All America
Fund | | | Small Cap
Value Fund | | | Small Cap
Growth Fund | | | Mid Cap
Value Fund | |
Cost of investment purchases | | $ | 217,794,858 | | | $ | 112,647,980 | | | $ | 138,613,478 | | | $ | 206,584,864 | | | $ | 26,515,318 | |
| | | | | | | | | | | | | | | | | | | | |
Proceeds from sales of investments | | $ | 105,147,384 | | | $ | 147,356,064 | | | $ | 121,186,640 | | | $ | 207,612,143 | | | $ | 21,040,737 | |
| | | | | | | | | | | | | | | | | | | | |
| | | | | |
| | | Mid-Cap Equity
Index Fund | | | International
Fund | | | Composite
Fund | | | Retirement
Income Fund | | | 2010
Retirement
Fund | |
Cost of investment purchases | | $ | 307,638,260 | | | $ | 64,536,980 | | | $ | 99,423,438 | | | $ | 21,936,625 | | | $ | 6,192,806 | |
| | | | | | | | | | | | | | | | | | | | |
Proceeds from sales of investments | | $ | 223,800,178 | | | $ | 10,001,367 | | | $ | 108,387,964 | | | $ | 11,471,236 | | | $ | 6,868,645 | |
| | | | | | | | | | | | | | | | | | | | |
| | | | | |
| | | 2015
Retirement
Fund | | | 2020
Retirement
Fund | | | 2025
Retirement
Fund | | | 2030
Retirement
Fund | | | 2035
Retirement
Fund | |
Cost of investment purchases | | $ | 18,842,180 | | | $ | 76,726,217 | | | $ | 108,573,080 | | | $ | 85,626,275 | | | $ | 76,477,153 | |
| | | | | | | | | | | | | | | | | | | | |
Proceeds from sales of investments | | $ | 26,578,612 | | | $ | 30,812,599 | | | $ | 23,105,603 | | | $ | 18,461,336 | | | $ | 14,995,602 | |
| | | | | | | | | | | | | | | | | | | | |
| | | | | |
| | | 2040
Retirement
Fund | | | 2045
Retirement
Fund | | | 2050
Retirement
Fund | | | 2055
Retirement
Fund | | | Conservative
Allocation
Fund | |
Cost of investment purchases | | $ | 60,619,020 | | | $ | 60 270,907 | | | $ | 64,748,506 | | | $ | 3,684,260 | | | $ | 19,528,438 | |
| | | | | | | | | | | | | | | | | | | | |
Proceeds from sales of investments | | $ | 12,826,292 | | | $ | 11,303,442 | | | $ | 3,280,771 | | | $ | 379,372 | | | $ | 11,724,602 | |
| | | | | | | | | | | | | | | | | | | | |
| | | | | |
| | | Moderate
Allocation
Fund | | | Aggressive
Allocation
Fund | | | Money
Market Fund | | | Mid-Term
Bond Fund | | | Bond Fund | |
Cost of investment purchases | | $ | 37,352,697 | | | $ | 24,305,219 | | | | — | | | $ | 116,612,033 | | | $ | 231,016,306 | |
| | | | | | | | | | | | | | | | | | | | |
Proceeds from sales of investments | | $ | 21,865,228 | | | $ | 24,037,538 | | | | — | | | $ | 81,878,123 | | | $ | 142,926,551 | |
| | | | | | | | | | | | | | | | | | | | |
The cost of short-term security purchases for the Money Market Fund for the year ended December 31, 2016, was $915,507,887; net proceeds from sales for the year were $919,389,467.
The components of net unrealized appreciation (depreciation) of investments for federal income tax purposes and the cost of investments for federal income tax purposes at December 31, 2016 for each of the funds were as follows:
| | | | | | | | | | | | | | | | | | | | |
| | | Equity Index
Fund | | | All America
Fund | | | Small Cap
Value Fund | | | Small Cap
Growth Fund | | | Mid Cap
Value Fund | |
Unrealized Appreciation | | $ | 791,221,919 | | | $ | 74,360,535 | | | $ | 130,969,382 | | | $ | 78,792,146 | | | $ | 21,816,742 | |
Unrealized Depreciation | | | (46,759,390 | ) | | | (12,586,911 | ) | | | (14,652,334 | ) | | | (25,233,233 | ) | | | (3,267,675 | ) |
| | | | | | | | | | | | | | | | | | | | |
Net | | $ | 744,462,529 | | | $ | 61,773,624 | | | $ | 116,317,048 | | | $ | 53,558,913 | | | $ | 18,549,067 | |
| | | | | | | | | | | | | | | | | | | | |
Tax Cost of Investments | | $ | 1,396,537,486 | | | $ | 233,533,900 | | | $ | 351,470,234 | | | $ | 379,614,315 | | | $ | 80,366,134 | |
| | | | | | | | | | | | | | | | | | | | |
107
MUTUAL OF AMERICA INVESTMENT CORPORATION
NOTES TO FINANCIAL STATEMENTS (Continued)
December 31, 2016
| 3. | INVESTMENTS (CONTINUED) |
| | | | | | | | | | | | | | | | | | | | |
| | | Mid-Cap Equity
Index Fund | | | International
Fund | | | Composite
Fund | | | Retirement
Income Fund | | | 2010
Retirement
Fund | |
Unrealized Appreciation | | $ | 328,360,757 | | | $ | 1,963,334 | | | $ | 23,241,191 | | | $ | 1,199,426 | | | $ | 938,354 | |
Unrealized Depreciation | | | (49,839,785 | ) | | | (17,640,938 | ) | | | (2,017,899 | ) | | | (1,105,773 | ) | | | (333,924 | ) |
| | | | | | | | | | | | | | | | | | | | |
Net | | $ | 278,520,972 | | | $ | (15,677,604 | ) | | $ | 21,223,292 | | | $ | 93,653 | | | $ | 604,430 | |
| | | | | | | | | | | | | | | | | | | | |
Tax Cost of Investments | | $ | 965,222,848 | | | $ | 392,321,234 | | | $ | 160,212,602 | | | $ | 75,607,541 | | | $ | 25,078,852 | |
| | | | | | | | | | | | | | | | | | | | |
| | | | | |
| | | 2015
Retirement
Fund | | | 2020
Retirement
Fund | | | 2025
Retirement
Fund | | | 2030
Retirement
Fund | | | 2035
Retirement
Fund | |
Unrealized Appreciation | | $ | 9,952,795 | | | $ | 31,665,439 | | | $ | 47,055,064 | | | $ | 43,209,588 | | | $ | 38,653,094 | |
Unrealized Depreciation | | | (1,630,668 | ) | | | (3,348,876 | ) | | | (2,499,320 | ) | | | (1,393,613 | ) | | | (1,352,186 | ) |
| | | | | | | | | | | | | | | | | | | | |
Net | | $ | 8,322,127 | | | $ | 28,316,563 | | | $ | 44,555,744 | | | $ | 41,815,975 | | | $ | 37,300,908 | |
| | | | | | | | | | | | | | | | | | | | |
Tax Cost of Investments | | $ | 138,071,100 | | | $ | 397,528,700 | | | $ | 459,575,172 | | | $ | 374,471,813 | | | $ | 314,537,569 | |
| | | | | | | | | | | | | | | | | | | | |
| | | | | |
| | | 2040
Retirement
Fund | | | 2045
Retirement
Fund | | | 2050
Retirement
Fund | | | 2055
Retirement
Fund | | | Conservative
Allocation
Fund | |
Unrealized Appreciation | | $ | 32,164,942 | | | $ | 42,440,673 | | | $ | 6,864,465 | | | $ | 31,356 | | | $ | 7,458,303 | |
Unrealized Depreciation | | | (732,348 | ) | | | (683,821 | ) | | | (2,254,312 | ) | | | (16,715 | ) | | | (2,134,688 | ) |
| | | | | | | | | | | | | | | | | | | | |
Net | | $ | 31,432,594 | | | $ | 41,756,852 | | | $ | 4,610,153 | | | $ | 14,641 | | | $ | 5,323,615 | |
| | | | | | | | | | | | | | | | | | | | |
Tax Cost of Investments | | $ | 254,265,713 | | | $ | 290,650,919 | | | $ | 159,438,762 | | | $ | 3,304,781 | | | $ | 134,198,261 | |
| | | | | | | | | | | | | | | | | | | | |
| | | | | |
| | | Moderate
Allocation
Fund | | | Aggressive
Allocation
Fund | | | Money
Market Fund | | | Mid-Term
Bond Fund | | | Bond Fund | |
Unrealized Appreciation | | $ | 48,555,130 | | | $ | 51,268,723 | | | $ | 85 | | | $ | 5,818,511 | | | $ | 21,596,295 | |
Unrealized Depreciation | | | (7,808,632 | ) | | | (8,120,201 | ) | | | 0 | | | | (5,326,987 | ) | | | (12,685,763 | ) |
| | | | | | | | | | | | | | | | | | | | |
Net | | $ | 40,746,498 | | | $ | 43,148,522 | | | $ | 85 | | | $ | 491,524 | | | $ | 8,910,532 | |
| | | | | | | | | | | | | | | | | | | | |
Tax Cost of Investments | | $ | 306,261,619 | | | $ | 220,581,277 | | | $ | 63,041,817 | | | $ | 488,587,822 | | | $ | 1,097,251,180 | |
| | | | | | | | | | | | | | | | | | | | |
Differences between amounts reflected in the Statements of Assets and Liabilities and those computed for federal income tax purposes arise primarily from federal income tax treatment of wash sales, REITs, partnerships, corporate actions and futures contracts.
Investments in affiliated investment companies during the year or period ended December 31, 2016 were as follows:
| | | | | | | | | | | | | | | | | | | | | | | | | | | | | | | | |
Affiliated Investment Company | | Value as of
December 31,
2015 | | | Purchases | | | Realized
Gain
(Loss) on
Investment
Securities | | | Change in
Unrealized
Appreciation
(Depreciation)
of Investment
Securities | | | Sales | | | Value as of
December 31,
2016 | | | Dividends | | | Realized
Gain,
Distributions | |
Retirement Income Fund | |
Bond Fund | | $ | 19,608,496 | | | $ | 6,090,258 | | | $ | 29,156 | | | $ | 271,461 | | | $ | (3,408,477 | ) | | $ | 22,590,894 | | | $ | 570,171 | | | $ | 31,600 | |
Equity Index Fund | | | 12,702,069 | | | | 4,749,460 | | | | 581,434 | | | | 392,061 | | | | (2,346,065 | ) | | | 16,078,959 | | | | 252,093 | | | | 363,428 | |
Mid-Cap Equity Index Fund | | | 2,972,761 | | | | 1,345,849 | | | | 82,579 | | | | 287,162 | | | | (636,969 | ) | | | 4,051,382 | | | | 43,618 | | | | 233,188 | |
Mid-Term Bond Fund | | | 25,553,991 | | | | 8,837,922 | | | | (80,157 | ) | | | 193,059 | | | | (3,897,221 | ) | | | 30,607,594 | | | | 725,054 | | | | 41,652 | |
Money Market Fund | | | 2,638,693 | | | | 913,136 | | | | (2,538 | ) | | | 5,578 | | | | (1,182,504 | ) | | | 2,372,365 | | | | — | | | | — | |
| | | | | | | | | | | | | | | | | | | | | | | | | | | | | | | | |
Total | | $ | 63,476,010 | | | $ | 21,936,625 | | | $ | 610,474 | | | $ | 1,149,321 | | | $ | (11,471,236 | ) | | $ | 75,701,194 | | | $ | 1,590,936 | | | $ | 669,868 | |
| | | | | | | | | | | | | | | | | | | | | | | | | | | | | | | | |
108
MUTUAL OF AMERICA INVESTMENT CORPORATION
NOTES TO FINANCIAL STATEMENTS (Continued)
December 31, 2016
| 3. | INVESTMENTS (CONTINUED) |
| | | | | | | | | | | | | | | | | | | | | | | | | | | | | | | | |
Affiliated Investment Company | | Value as of
December 31,
2015 | | | Purchases | | | Realized
Gain
(Loss) on
Investment
Securities | | | Change in
Unrealized
Appreciation
(Depreciation)
of Investment
Securities | | | Sales | | | Value as of
December 31,
2016 | | | Dividends | | | Realized
Gain,
Distributions | |
2010 Retirement Fund | |
Bond Fund | | $ | 6,692,883 | | | $ | 1,351,790 | | | $ | 49,377 | | | $ | 70,799 | | | $ | (1,531,170 | ) | | $ | 6,633,679 | | | $ | 178,522 | | | $ | 9,894 | |
Equity Index Fund | | | 6,425,681 | | | | 1,279,266 | | | | 611,850 | | | | (198,726 | ) | | | (1,748,187 | ) | | | 6,369,884 | | | | 109,712 | | | | 158,164 | |
International Fund | | | 717,952 | | | | 230,521 | | | | 42,033 | | | | (45,625 | ) | | | (190,938 | ) | | | 753,943 | | | | 16,489 | | | | 1 | |
Mid-Cap Equity Index Fund | | | 2,163,416 | | | | 472,744 | | | | 148,606 | | | | 64,084 | | | | (795,583 | ) | | | 2,053,267 | | | | 24,413 | | | | 130,515 | |
Mid-Term Bond Fund | | | 8,529,463 | | | | 2,597,968 | | | | (53,657 | ) | | | 107,163 | | | | (2,087,327 | ) | | | 9,093,610 | | | | 222,876 | | | | 12,804 | |
Money Market Fund | | | 1,032,729 | | | | 260,517 | | | | (1,922 | ) | | | 3,015 | | | | (515,440 | ) | | | 778,899 | | | | — | | | | — | |
| | | | | | | | | | | | | | | | | | | | | | | | | | | | | | | | |
Total | | $ | 25,562,124 | | | $ | 6,192,806 | | | $ | 796,287 | | | $ | 710 | | | $ | (6,868,645 | ) | | $ | 25,683,282 | | | $ | 552,012 | | | $ | 311,378 | |
| | | | | | | | | | | | | | | | | | | | | | | | | | | | | | | | |
2015 Retirement Fund | |
Bond Fund | | $ | 37,588,943 | | | $ | 4,043,666 | | | $ | 315,870 | | | $ | 343,849 | | | $ | (6,077,039 | ) | | $ | 36,215,289 | | | $ | 973,410 | | | $ | 53,948 | |
Equity Index Fund | | | 42,183,693 | | | | 3,867,793 | | | | 2,906,492 | | | | (176,503 | ) | | | (8,013,157 | ) | | | 40,768,318 | | | | 712,429 | | | | 1,027,065 | |
International Fund | | | 8,414,559 | | | | 1,486,104 | | | | 7,270 | | | | (80,741 | ) | | | (1,275,047 | ) | | | 8,552,145 | | | | 173,042 | | | | 11 | |
Mid-Cap Equity Index Fund | | | 15,488,169 | | | | 1,893,602 | | | | 1,038,940 | | | | 526,772 | | | | (4,127,565 | ) | | | 14,819,918 | | | | 180,557 | | | | 965,277 | |
Mid-Term Bond Fund | | | 42,281,260 | | | | 6,904,515 | | | | (164,347 | ) | | | 438,981 | | | | (6,476,839 | ) | | | 42,983,570 | | | | 1,066,072 | | | | 61,243 | |
Small Cap Growth Fund | | | 1,391,647 | | | | 421,260 | | | | 12,970 | | | | (40,120 | ) | | | (327,541 | ) | | | 1,458,216 | | | | — | | | | 146,967 | |
Small Cap Value Fund | | | 1,414,109 | | | | 225,240 | | | | 32,470 | | | | 205,376 | | | | (281,424 | ) | | | 1,595,771 | | | | 12,988 | | | | 20,563 | |
| | | | | | | | | | | | | | | | | | | | | | | | | | | | | | | | |
Total | | $ | 148,762,380 | | | $ | 18,842,180 | | | $ | 4,149,665 | | | $ | 1,217,614 | | | $ | (26,578,612 | ) | | $ | 146,393,227 | | | $ | 3,118,498 | | | $ | 2,275,074 | |
| | | | | | | | | | | | | | | | | | | | | | | | | | | | | | | | |
2020 Retirement Fund | |
Bond Fund | | $ | 90,525,095 | | | $ | 17,325,833 | | | $ | 481,982 | | | $ | 833,772 | | | $ | (6,205,373 | ) | | $ | 102,961,309 | | | $ | 2,635,427 | | | $ | 146,060 | |
Equity Index Fund | | | 122,942,523 | | | | 20,471,559 | | | | 6,150,706 | | | | 2,618,514 | | | | (14,959,904 | ) | | | 137,223,398 | | | | 2,281,337 | | | | 3,288,864 | |
International Fund | | | 30,025,615 | | | | 4,925,082 | | | | 162,732 | | | | (310,071 | ) | | | (1,777,687 | ) | | | 33,025,671 | | | | 688,030 | | | | 46 | |
Mid-Cap Equity Index Fund | | | 39,832,348 | | | | 9,349,595 | | | | 745,777 | | | | 4,143,011 | | | | (2,337,817 | ) | | | 51,732,914 | | | | 552,374 | | | | 2,953,047 | |
Mid-Term Bond Fund | | | 64,883,901 | | | | 20,957,140 | | | | (12,408 | ) | | | 171,276 | | | | (3,878,599 | ) | | | 82,121,310 | | | | 1,850,090 | | | | 106,283 | |
Small Cap Growth Fund | | | 7,629,541 | | | | 1,909,351 | | | | 35,332 | | | | (181,448 | ) | | | (945,299 | ) | | | 8,447,477 | | | | — | | | | 800,564 | |
Small Cap Value Fund | | | 7,760,479 | | | | 1,787,657 | | | | 166,527 | | | | 1,326,441 | | | | (707,920 | ) | | | 10,333,184 | | | | 79,408 | | | | 125,726 | |
| | | | | | | | | | | | | | | | | | | | | | | | | | | | | | | | |
Total | | $ | 363,599,502 | | | $ | 76,726,217 | | | $ | 7,730,648 | | | $ | 8,601,495 | | | $ | (30,812,599 | ) | | $ | 425,845,263 | | | $ | 8,086,666 | | | $ | 7,420,590 | |
| | | | | | | | | | | | | | | | | | | | | | | | | | | | | | | | |
2025 Retirement Fund | |
Bond Fund | | $ | 89,759,030 | | | $ | 26,519,724 | | | $ | 147,414 | | | $ | 955,165 | | | $ | (2,222,620 | ) | | $ | 115,158,713 | | | $ | 2,875,650 | | | $ | 159,373 | |
Equity Index Fund | | | 152,280,291 | | | | 34,214,450 | | | | 4,966,665 | | | | 6,741,357 | | | | (11,406,776 | ) | | | 186,795,987 | | | | 3,011,106 | | | | 4,340,927 | |
International Fund | | | 36,226,349 | | | | 9,089,261 | | | | 150,353 | | | | (257,954 | ) | | | (1,257,236 | ) | | | 43,950,773 | | | | 892,100 | | | | 59 | |
Mid-Cap Equity Index Fund | | | 61,818,449 | | | | 16,311,915 | | | | 1,630,610 | | | | 6,107,742 | | | | (4,221,756 | ) | | | 81,646,960 | | | | 870,035 | | | | 4,651,298 | |
Mid-Term Bond Fund | | | 29,833,695 | | | | 16,170,901 | | | | 34,932 | | | | (43,256 | ) | | | (1,850,400 | ) | | | 44,145,872 | | | | 869,116 | | | | 49,928 | |
Small Cap Growth Fund | | | 12,909,656 | | | | 3,640,304 | | | | 84,648 | | | | (317,966 | ) | | | (1,420,979 | ) | | | 14,895,663 | | | | — | | | | 1,376,909 | |
Small Cap Value Fund | | | 13,132,143 | | | | 2,626,525 | | | | 174,461 | | | | 2,329,655 | | | | (725,836 | ) | | | 17,536,948 | | | | 131,538 | | | | 208,264 | |
| | | | | | | | | | | | | | | | | | | | | | | | | | | | | | | | |
Total | | $ | 395,959,613 | | | $ | 108,573,080 | | | $ | 7,189,083 | | | $ | 15,514,743 | | | $ | (23,105,603 | ) | | $ | 504,130,916 | | | $ | 8,649,545 | | | $ | 10,786,758 | |
| | | | | | | | | | | | | | | | | | | | | | | | | | | | | | | | |
2030 Retirement Fund | |
Bond Fund | | $ | 74,567,584 | | | $ | 20,400,405 | | | $ | 166,426 | | | $ | 805,940 | | | $ | (2,235,587 | ) | | $ | 93,704,768 | | | $ | 2,316,733 | | | $ | 128,397 | |
Equity Index Fund | | | 136,327,089 | | | | 28,810,599 | | | | 5,098,002 | | | | 5,187,253 | | | | (11,581,245 | ) | | | 163,841,698 | | | | 2,596,721 | | | | 3,743,532 | |
International Fund | | | 30,442,091 | | | | 10,843,828 | | | | 71,608 | | | | (188,909 | ) | | | (1,042,401 | ) | | | 40,126,217 | | | | 767,581 | | | | 51 | |
Mid-Cap Equity Index Fund | | | 55,223,617 | | | | 16,232,599 | | | | 928,951 | | | | 6,177,853 | | | | (2,590,780 | ) | | | 75,972,240 | | | | 801,876 | | | | 4,286,911 | |
Small Cap Growth Fund | | | 15,609,140 | | | | 5,531,445 | | | | 114,805 | | | | (386,845 | ) | | | (473,819 | ) | | | 20,394,726 | | | | — | | | | 1,688,240 | |
Small Cap Value Fund | | | 15,878,892 | | | | 3,807,399 | | | | 166,536 | | | | 2,932,816 | | | | (537,504 | ) | | | 22,248,139 | | | | 157,274 | | | | 249,012 | |
| | | | | | | | | | | | | | | | | | | | | | | | | | | | | | | | |
Total | | $ | 328,048,413 | | | $ | 85,626,275 | | | $ | 6,546,328 | | | $ | 14,528,108 | | | $ | (18,461,336 | ) | | $ | 416,287,788 | | | $ | 6,640,185 | | | $ | 10,096,143 | |
| | | | | | | | | | | | | | | | | | | | | | | | | | | | | | | | |
2035 Retirement Fund | |
Bond Fund | | $ | 43,054,008 | | | $ | 11,746,200 | | | $ | 230,730 | | | $ | 382,831 | | | $ | (3,302,172 | ) | | $ | 52,111,597 | | | $ | 1,284,705 | | | $ | 71,201 | |
Equity Index Fund | | | 113,496,377 | | | | 26,399,949 | | | | 3,368,744 | | | | 5,394,055 | | | | (7,289,429 | ) | | | 141,369,696 | | | | 2,219,622 | | | | 3,199,892 | |
International Fund | | | 30,519,614 | | | | 11,056,467 | | | | 88,240 | | | | (189,978 | ) | | | (1,002,906 | ) | | | 40,471,437 | | | | 779,583 | | | | 52 | |
Mid-Cap Equity Index Fund | | | 52,857,418 | | | | 17,310,433 | | | | 802,453 | | | | 6,098,738 | | | | (2,210,266 | ) | | | 74,858,776 | | | | 788,274 | | | | 4,214,194 | |
Small Cap Growth Fund | | | 15,560,698 | | | | 5,965,496 | | | | 166,962 | | | | (419,390 | ) | | | (692,295 | ) | | | 20,581,471 | | | | — | | | | 1,806,092 | |
Small Cap Value Fund | | | 15,827,470 | | | | 3,998,608 | | | | 177,175 | | | | 2,940,781 | | | | (498,534 | ) | | | 22,445,500 | | | | 159,744 | | | | 252,922 | |
| | | | | | | | | | | | | | | | | | | | | | | | | | | | | | | | |
Total | | $ | 271,315,585 | | | $ | 76,477,153 | | | $ | 4,834,304 | | | $ | 14,207,037 | | | $ | (14,995,602 | ) | | $ | 351,838,477 | | | $ | 5,231,928 | | | $ | 9,544,353 | |
| | | | | | | | | | | | | | | | | | | | | | | | | | | | | | | | |
109
MUTUAL OF AMERICA INVESTMENT CORPORATION
NOTES TO FINANCIAL STATEMENTS (Continued)
December 31, 2016
| 3. | INVESTMENTS (CONTINUED) |
| | | | | | | | | | | | | | | | | | | | | | | | | | | | | | | | |
Affiliated Investment Company | | Value as of
December 31,
2015 | | | Purchases | | | Realized
Gain
(Loss) on
Investment
Securities | | | Change in
Unrealized
Appreciation
(Depreciation)
of Investment
Securities | | | Sales | | | Value as of
December 31,
2016 | | | Dividends | | | Realized
Gain,
Distributions | |
2040 Retirement Fund | |
Bond Fund | | $ | 26,755,253 | | | $ | 7,958,791 | | | $ | 75,270 | | | $ | 266,876 | | | $ | (972,358 | ) | | $ | 34,083,832 | | | $ | 824,190 | | | $ | 45,678 | |
Equity Index Fund | | | 82,389,895 | | | | 23,135,155 | | | | 1,926,373 | | | | 4,804,197 | | | | (4,078,092 | ) | | | 108,177,528 | | | | 1,712,170 | | | | 2,468,330 | |
International Fund | | | 29,166,549 | | | | 7,104,551 | | | | 64,879 | | | | (180,134 | ) | | | (647,942 | ) | | | 35,507,903 | | | | 699,352 | | | | 46 | |
Mid-Cap Equity Index Fund | | | 49,177,993 | | | | 12,139,218 | | | | 2,023,102 | | | | 3,926,178 | | | | (5,861,837 | ) | | | 61,404,654 | | | | 654,255 | | | | 3,497,716 | |
Small Cap Growth Fund | | | 17,057,928 | | | | 5,819,914 | | | | 110,072 | | | | (383,784 | ) | | | (351,462 | ) | | | 22,252,668 | | | | — | | | | 1,911,319 | |
Small Cap Value Fund | | | 17,357,490 | | | | 4,461,391 | | | | 376,217 | | | | 2,991,225 | | | | (914,601 | ) | | | 24,271,722 | | | | 169,051 | | | | 267,657 | |
| | | | | | | | | | | | | | | | | | | | | | | | | | | | | | | | |
Total | | $ | 221,905,108 | | | $ | 60,619,020 | | | $ | 4,575,913 | | | $ | 11,424,558 | | | $ | (12,826,292 | ) | | $ | 285,698,307 | | | $ | 4,059,018 | | | $ | 8,190,746 | |
| | | | | | | | | | | | | | | | | | | | | | | | | | | | | | | | |
2045 Retirement Fund | |
Bond Fund | | $ | 26,387,858 | | | $ | 8,752,896 | | | $ | 61,957 | | | $ | 246,154 | | | $ | (684,052 | ) | | $ | 34,764,813 | | | $ | 827,604 | | | $ | 45,867 | |
Equity Index Fund | | | 97,604,785 | | | | 17,973,303 | | | | 2,744,003 | | | | 4,727,206 | | | | (5,639,226 | ) | | | 117,410,071 | | | | 1,868,043 | | | | 2,693,043 | |
International Fund | | | 39,676,479 | | | | 6,956,818 | | | | 250,644 | | | | (391,797 | ) | | | (2,109,102 | ) | | | 44,383,042 | | | | 914,979 | | | | 61 | |
Mid-Cap Equity Index Fund | | | 54,684,199 | | | | 15,040,270 | | | | 771,302 | | | | 6,332,339 | | | | (1,817,196 | ) | | | 75,010,914 | | | | 796,848 | | | | 4,260,032 | |
Small Cap Growth Fund | | | 22,898,412 | | | | 7,078,837 | | | | 141,120 | | | | (501,450 | ) | | | (526,933 | ) | | | 29,089,986 | | | | — | | | | 2,540,344 | |
Small Cap Value Fund | | | 23,299,301 | | | | 4,468,783 | | | | 203,033 | | | | 4,304,761 | | | | (526,933 | ) | | | 31,748,945 | | | | 231,071 | | | | 365,853 | |
| | | | | | | | | | | | | | | | | | | | | | | | | | | | | | | | |
Total | | $ | 264,551,034 | | | $ | 60,270,907 | | | $ | 4,172,059 | | | $ | 14,717,213 | | | $ | (11,303,442 | ) | | $ | 332,407,771 | | | $ | 4,638,545 | | | $ | 9,905,200 | |
| | | | | | | | | | | | | | | | | | | | | | | | | | | | | | | | |
2050 Retirement Fund | |
Bond Fund | | $ | 7,595,596 | | | $ | 6,680,010 | | | $ | 2,239 | | | $ | 11,452 | | | $ | (108,902 | ) | | $ | 14,180,395 | | | $ | 304,876 | | | $ | 16,897 | |
Equity Index Fund | | | 34,134,263 | | | | 20,256,572 | | | | 504,906 | | | | 2,746,333 | | | | (2,067,849 | ) | | | 55,574,225 | | | | 805,497 | | | | 1,161,237 | |
International Fund | | | 14,791,061 | | | | 9,236,695 | | | | 12,024 | | | | 6,368 | | | | (425,196 | ) | | | 23,620,952 | | | | 433,868 | | | | 29 | |
Mid-Cap Equity Index Fund | | | 19,059,314 | | | | 15,522,985 | | | | 63,246 | | | | 3,095,582 | | | | (399,046 | ) | | | 37,342,081 | | | | 359,738 | | | | 1,923,194 | |
Small Cap Growth Fund | | | 9,059,531 | | | | 7,090,535 | | | | 4,755 | | | | (79,903 | ) | | | (111,310 | ) | | | 15,963,608 | | | | — | | | | 1,271,452 | |
Small Cap Value Fund | | | 9,240,114 | | | | 5,961,709 | | | | 10,428 | | | | 2,323,871 | | | | (168,468 | ) | | | 17,367,654 | | | | 115,199 | | | | 182,394 | |
| | | | | | | | | | | | | | | | | | | | | | | | | | | | | | | | |
Total | | $ | 93,879,879 | | | $ | 64,748,506 | | | $ | 597,598 | | | $ | 8,103,703 | | | $ | (3,280,771 | ) | | $ | 164,048,915 | | | $ | 2,019,178 | | | $ | 4,555,203 | |
| | | | | | | | | | | | | | | | | | | | | | | | | | | | | | | | |
2055 Retirement Fund† | |
Bond Fund | | $ | — | | | $ | 294,741 | | | $ | (22 | ) | | $ | (483 | ) | | $ | (30,350 | ) | | $ | 263,886 | | | $ | — | | | $ | — | |
Equity Index Fund | | | — | | | | 1,105,277 | | | | (3,757 | ) | | | 9,057 | | | | (113,811 | ) | | | 996,766 | | | | — | | | | — | |
International Fund | | | — | | | | 626,324 | | | | (2,206 | ) | | | 1,605 | | | | (64,493 | ) | | | 561,230 | | | | — | | | | — | |
Mid-Cap Equity Index Fund | | | — | | | | 847,380 | | | | (3,773 | ) | | | 10,634 | | | | (87,256 | ) | | | 766,985 | | | | — | | | | — | |
Small Cap Growth Fund | | | — | | | | 405,269 | | | | (4,258 | ) | | | 240 | | | | (41,731 | ) | | | 359,520 | | | | — | | | | — | |
Small Cap Value Fund | | | — | | | | 405,269 | | | | (2,323 | ) | | | 9,820 | | | | (41,731 | ) | | | 371,035 | | | | — | | | | — | |
| | | | | | | | | | | | | | | | | | | | | | | | | | | | | | | | |
Total | | $ | — | | | $ | 3,684,260 | | | $ | (16,339 | ) | | $ | 30,873 | | | $ | (379,372 | ) | | $ | 3,319,422 | | | $ | — | | | $ | — | |
| | | | | | | | | | | | | | | | | | | | | | | | | | | | | | | | |
Conservative Allocation Fund | |
Bond Fund | | $ | 38,252,389 | | | $ | 5,376,688 | | | $ | 165,346 | | | $ | 455,858 | | | $ | (3,787,685 | ) | | $ | 40,462,596 | | | $ | 1,070,416 | | | $ | 59,324 | |
Equity Index Fund | | | 32,422,641 | | | | 5,060,524 | | | | 1,040,579 | | | | 1,297,039 | | | | (2,712,645 | ) | | | 37,108,138 | | | | 589,559 | | | | 849,931 | |
International Fund | | | 6,166,398 | | | | 1,370,958 | | | | (92,024 | ) | | | 62,362 | | | | (542,529 | ) | | | 6,965,165 | | | | 145,923 | | | | 10 | |
Mid-Cap Equity Index Fund | | | 6,085,687 | | | | 1,515,858 | | | | (34,800 | ) | | | 780,000 | | | | (542,529 | ) | | | 7,804,216 | | | | 84,008 | | | | 449,114 | |
Mid-Term Bond Fund | | | 44,835,833 | | | | 6,204,410 | | | | 63,122 | | | | 217,610 | | | | (4,139,214 | ) | | | 47,181,761 | | | | 1,181,749 | | | | 67,888 | |
| | | | | | | | | | | | | | | | | | | | | | | | | | | | | | | | |
Total | | $ | 127,762,948 | | | $ | 19,528,438 | | | $ | 1,142,223 | | | $ | 2,812,869 | | | $ | (11,724,602 | ) | | $ | 139,521,876 | | | $ | 3,071,655 | | | $ | 1,426,267 | |
| | | | | | | | | | | | | | | | | | | | | | | | | | | | | | | | |
Moderate Allocation Fund | |
Bond Fund | | $ | 79,269,726 | | | $ | 7,405,023 | | | $ | 762,366 | | | $ | 606,228 | | | $ | (6,419,445 | ) | | $ | 81,623,898 | | | $ | 2,220,306 | | | $ | 123,053 | |
Equity Index Fund | | | 112,965,487 | | | | 12,103,503 | | | | 3,765,984 | | | | 4,443,929 | | | | (7,354,050 | ) | | | 125,924,853 | | | | 2,054,837 | | | | 2,962,335 | |
International Fund | | | 30,701,048 | | | | 4,972,889 | | | | (292,322 | ) | | | 176,453 | | | | (1,816,120 | ) | | | 33,741,948 | | | | 726,530 | | | | 48 | |
Mid-Cap Equity Index Fund | | | 45,426,051 | | | | 8,501,233 | | | | 1,026,132 | | | | 4,548,559 | | | | (2,724,181 | ) | | | 56,777,794 | | | | 627,450 | | | | 3,354,410 | |
Mid-Term Bond Fund | | | 47,788,028 | | | | 4,370,049 | | | | 115,925 | | | | 217,054 | | | | (3,551,432 | ) | | | 48,939,624 | | | | 1,260,631 | | | | 72,420 | |
| | | | | | | | | | | | | | | | | | | | | | | | | | | | | | | | |
Total | | $ | 316,150,340 | | | $ | 37,352,697 | | | $ | 5,378,085 | | | $ | 9,992,223 | | | $ | (21,865,228 | ) | | $ | 347,008,117 | | | $ | 6,889,754 | | | $ | 6,512,266 | |
| | | | | | | | | | | | | | | | | | | | | | | | | | | | | | | | |
110
MUTUAL OF AMERICA INVESTMENT CORPORATION
NOTES TO FINANCIAL STATEMENTS (Continued)
December 31, 2016
| 3. | INVESTMENTS (CONTINUED) |
| | | | | | | | | | | | | | | | | | | | | | | | | | | | | | | | |
Affiliated Investment Company | | Value as of
December 31,
2015 | | | Purchases | | | Realized
Gain
(Loss) on
Investment
Securities | | | Change in
Unrealized
Appreciation
(Depreciation)
of Investment
Securities | | | Sales | | | Value as of
December 31,
2016 | | | Dividends | | | Realized
Gain,
Distributions | |
Aggressive Allocation Fund | |
Bond Fund | | $ | 50,339,115 | | | $ | 3,027,684 | | | $ | 644,131 | | | $ | 305,861 | | | $ | (6,014,715 | ) | | $ | 48,302,076 | | | $ | 1,334,561 | | | $ | 73,964 | |
Equity Index Fund | | | 89,739,728 | | | | 6,605,243 | | | | 5,461,256 | | | | 788,890 | | | | (9,285,919 | ) | | | 93,309,198 | | | | 1,544,746 | | | | 2,226,965 | |
International Fund | | | 36,583,779 | | | | 3,951,185 | | | | (456,815 | ) | | | 287,262 | | | | (2,912,302 | ) | | | 37,453,109 | | | | 818,820 | | | | 54 | |
Mid-Cap Equity Index Fund | | | 48,095,351 | | | | 6,237,989 | | | | 2,158,845 | | | | 3,539,066 | | | | (3,883,068 | ) | | | 56,148,183 | | | | 629,186 | | | | 3,363,694 | |
Small Cap Growth Fund | | | 11,876,597 | | | | 3,161,031 | | | | 455,202 | | | | (616,732 | ) | | | (970,767 | ) | | | 13,905,331 | | | | — | | | | 1,301,302 | |
Small Cap Value Fund | | | 12,087,729 | | | | 1,322,087 | | | | 321,309 | | | | 1,851,544 | | | | (970,767 | ) | | | 14,611,902 | | | | 113,780 | | | | 180,147 | |
| | | | | | | | | | | | | | | | | | | | | | | | | | | | | | | | |
Total | | $ | 248,722,299 | | | $ | 24,305,219 | | | $ | 8,583,928 | | | $ | 6,155,891 | | | $ | (24,037,538 | ) | | $ | 263,729,799 | | | $ | 4,441,093 | | | $ | 7,146,126 | |
| | | | | | | | | | | | | | | | | | | | | | | | | | | | | | | | |
| † | Fund commenced operations on October 1, 2016. |
The Investment Company has registered an indefinite number of its capital shares pursuant to Rule 24f-2 under the Investment Company Act of 1940. On February 25, 2016, the Board of Directors of the Investment Company increased the number of authorized shares from 8.25 billion to 9.25 billion. On November 10, 2016, the Board of Directors of the Investment Company further increased the number of authorized shares from 9.25 billion to 10.75 billion. Also on February 25, 2016 and November 10, 2016, the Board of Directors changed the number of authorized shares as indicated by the following table. As a result of these actions, there remained 1,315,000,000 unallocated shares as of December 31, 2016.
| | | | | | | | | | | | |
| | | Authorized Number of Shares | |
| | | Previous
Allocation | | | Allocation
Increase/
(Decrease) | | | Total Shares
Allocated | |
Equity Index Fund | | | 700,000,000 | | | | 100,000,000 | | | | 800,000,000 | |
All America Fund | | | 200,000,000 | | | | — | | | | 200,000,000 | |
Small Cap Value Fund | | | 325,000,000 | | | | — | | | | 325,000,000 | |
Small Cap Growth Fund | | | 395,000,000 | | | | 75,000,000 | | | | 470,000,000 | |
Mid Cap Value Fund | | | 100,000,000 | | | | — | | | | 100,000,000 | |
Mid-Cap Equity Index Fund | | | 600,000,000 | | | | 150,000,000 | | | | 750,000,000 | |
International Fund | | | 525,000,000 | | | | 200,000,000 | | | | 725,000,000 | |
Composite Fund | | | 150,000,000 | | | | — | | | | 150,000,000 | |
Retirement Income Fund | | | 80,000,000 | | | | 15,000,000 | | | | 95,000,000 | |
2010 Retirement Fund | | | 50,000,000 | | | | — | | | | 50,000,000 | |
2015 Retirement Fund | | | 200,000,000 | | | | — | | | | 200,000,000 | |
2020 Retirement Fund | | | 425,000,000 | | | | 90,000,000 | | | | 515,000,000 | |
2025 Retirement Fund | | | 425,000,000 | | | | 200,000,000 | | | | 625,000,000 | |
2030 Retirement Fund | | | 365,000,000 | | | | 150,000,000 | | | | 515,000,000 | |
2035 Retirement Fund | | | 295,000,000 | | | | 150,000,000 | | | | 445,000,000 | |
2040 Retirement Fund | | | 225,000,000 | | | | 160,000,000 | | | | 385,000,000 | |
2045 Retirement Fund | | | 275,000,000 | | | | 150,000,000 | | | | 425,000,000 | |
2050 Retirement Fund | | | 110,000,000 | | | | 160,000,000 | | | | 270,000,000 | |
2055 Retirement Fund** | | | 100,000,000 | | | | — | | | | 100,000,000 | |
Conservative Allocation Fund | | | 150,000,000 | | | | 15,000,000 | | | | 165,000,000 | |
Moderate Allocation Fund | | | 255,000,000 | | | | 65,000,000 | | | | 320,000,000 | |
Aggressive Allocation Fund | | | 200,000,000 | | | | 15,000,000 | | | | 215,000,000 | |
Money Market Fund | | | 125,000,000 | | | | — | | | | 125,000,000 | |
111
MUTUAL OF AMERICA INVESTMENT CORPORATION
NOTES TO FINANCIAL STATEMENTS (Continued)
December 31, 2016
| 4. | CAPITAL SHARE ACTIVITY (CONTINUED) |
| | | | | | | | | | | | |
| | | Authorized Number of Shares | |
| | | Previous
Allocation | | | Allocation
Increase/
(Decrease) | | | Total Shares
Allocated | |
Mid-Term Bond Fund | | | 540,000,000 | | | | — | | | | 540,000,000 | |
Bond Fund | | | 925,000,000 | | | | — | | | | 925,000,000 | |
| | | | | | | | | | | | |
Sub-Total | | | 7,740,000,000 | | | | 1,695,000,000 | | | | 9,435,000,000 | |
Shares to be allocated at the discretion of the Board of Directors | | | 510,000,000 | | | | 805,000,000 | | | | 1,315,000,000 | |
| | | | | | | | | | | | |
Total | | | 8,250,000,000 | | | | 2,500,000,000 | | | | 10,750,000,000 | |
| | | | | | | | | | | | |
| ** | The 2055 Retirement Fund commenced operations on October 1, 2016. |
| 5. | DISTRIBUTIONS TO SHAREHOLDERS AND INCOME TAX INFORMATION |
On September 13, 2016, required distributions of net investment income and, as applicable, net realized gains relating to 2015 were declared and paid for all applicable funds in accordance with Internal Revenue Section 855(a). No such distributions were required for the Money Market Fund and the 2055 Retirement Fund.
The Funds of Mutual of America Investment Corporation intend to declare and pay their respective tax year 2016 investment company taxable income and capital gains in 2017 in accordance with Internal Revenue Section 855(a).
Pursuant to shareholders’ instructions, substantially all dividend distributions throughout 2016 and 2015 were immediately reinvested into their respective funds. The tax character of the distributions paid during 2016 and 2015 was as follows:
| | | | | | | | | | | | | | | | | | | | |
| | | Equity Index
Fund | | | All America
Fund | | | Small Cap
Value Fund | | | Small Cap
Growth | | | Mid Cap
Value Fund | |
Ordinary Income (a) | | | | | | | | | | | | | | | | | | | | |
2016 | | $ | 35,794,376 | | | $ | 3,947,519 | | | $ | 3,473,986 | | | $ | 0 | | | $ | 1,115,504 | |
2015 | | $ | 31,336,864 | | | $ | 4,193,905 | | | $ | 3,251,696 | | | $ | 0 | | | $ | 1,088,832 | |
Long-Term Capital Gains | | | | | | | | | | | | | | | | | | | | |
2016 | | $ | 48,733,130 | | | $ | 17,354,545 | | | $ | 5,500,345 | | | $ | 39,762,021 | | | $ | 4,887,020 | |
2015 | | $ | 62,926,435 | | | $ | 19,549,735 | | | $ | 23,962,528 | | | $ | 50,286,630 | | | $ | 5,005,567 | |
| | | | | |
| | | Mid-Cap
Equity Index
Fund | | | International
Fund | | | Composite
Fund | | | Retirement
Fund | | | 2010
Retirement
Fund | |
Ordinary Income (a) | | | | | | | | | | | | | | | | | | | | |
2016 | | $ | 13,403,568 | | | $ | 7,642,938 | | | $ | 3,865,723 | | | $ | 1,417,706 | | | $ | 579,461 | |
2015 | | $ | 16,367,543 | | | $ | 8,147,328 | | | $ | 3,937,658 | | | $ | 1,043,642 | | | $ | 553,391 | |
Long-Term Capital Gains | | | | | | | | | | | | | | | | | | | | |
2016 | | $ | 71,656,832 | | | $ | 0 | | | $ | 10,227,373 | | | $ | 2,334,883 | | | $ | 1,449,643 | |
2015 | | $ | 57,543,286 | | | $ | 85,784 | | | $ | 1,373,297 | | | $ | 1,507,057 | | | $ | 1,342,011 | |
112
MUTUAL OF AMERICA INVESTMENT CORPORATION
NOTES TO FINANCIAL STATEMENTS (Continued)
December 31, 2016
| 5. | DISTRIBUTIONS TO SHAREHOLDERS AND INCOME TAX INFORMATION (CONTINUED) |
| | | | | | | | | | | | | | | | | | | | |
| | | 2015
Retirement
Fund | | | 2020
Retirement
Fund | | | 2025
Retirement
Fund | | | 2030
Retirement
Fund | | | 2035
Retirement
Fund | |
Ordinary Income (a) | | | | | | | | | | | | | | | | | | | | |
2016 | | $ | 3,360,637 | | | $ | 7,495,794 | | | $ | 7,530,298 | | | $ | 5,967,073 | | | $ | 4,653,592 | |
2015 | | $ | 3,145,220 | | | $ | 5,971,939 | | | $ | 5,804,497 | | | $ | 4,662,610 | | | $ | 3,637,561 | |
Long-Term Capital Gains | | | | | | | | | | | | | | | | | | | | |
2016 | | $ | 8,964,100 | | | $ | 15,116,286 | | | $ | 17,294,855 | | | $ | 16,440,817 | | | $ | 15,229,224 | |
2015 | | $ | 8,330,888 | | | $ | 14,219,639 | | | $ | 12,670,849 | | | $ | 11,054,574 | | | $ | 8,709,705 | |
| | | | | |
| | | 2040
Retirement
Fund | | | 2045
Retirement
Fund | | | 2050
Retirement
Fund | | | 2055
Retirement
Fund | | | Conservative
Allocation
Fund | |
Ordinary Income (a) | | | | | | | | | | | | | | | | | | | | |
2016 | | $ | 3,629,694 | | | $ | 4,323,009 | | | $ | 1,305,214 | | | $ | 0 | | | $ | 3,087,144 | |
2015 | | $ | 2,857,782 | | | $ | 3,540,101 | | | $ | 592,908 | | | $ | NA | | | $ | 2,610,734 | |
Long-Term Capital Gains | | | | | | | | | | | | | | | | | | | | |
2016 | | $ | 13,528,794 | | | $ | 16,121,366 | | | $ | 3,752,852 | | | $ | 0 | | | $ | 3,635,717 | |
2015 | | $ | 7,858,679 | | | $ | 9,449,171 | | | $ | 1,150,118 | | | $ | NA | | | $ | 3,798,820 | |
| | | | | |
| | | Moderate
Allocation
Fund | | | Aggressive
Allocation
Fund | | | Money
Market Fund | | | Mid-Term
Bond Fund | | | Bond Fund | |
Ordinary Income (a) | | | | | | | | | | | | | | | | | | | | |
2016 | | $ | 7,137,035 | | | $ | 5,034,614 | | | $ | 0 | | | $ | 12,142,285 | | | $ | 29,240,973 | |
2015 | | $ | 6,538,841 | | | $ | 4,687,286 | | | $ | 0 | | | $ | 10,648,630 | | | $ | 31,972,350 | |
Long-Term Capital Gains | | | | | | | | | | | | | | | | | | | | |
2016 | | $ | 15,163,067 | | | $ | 16,088,191 | | | $ | 0 | | | $ | 679,842 | | | $ | 1,620,584 | |
2015 | | $ | 15,610,732 | | | $ | 16,862,766 | | | $ | 0 | | | $ | 1,509,725 | | | $ | 1,135,284 | |
Notes:
| (a) | Includes distributions from Fund-level net short-term capital gains. |
NA = Not applicable.
Undistributed net income and gains (losses) — As of December 31, 2016, undistributed net income and undistributed accumulated gain (loss) for federal income tax purposes were as follows:
| | | | | | | | | | | | | | | | | | | | |
| | | Equity Index
Fund | | | All America
Fund | | | Small Cap
Value Fund | | | Small Cap
Growth Fund | | | Mid Cap
Value Fund | |
Accumulated undistributed net investment income | | $ | 42,510,742 | | | $ | 5,667,008 | | | $ | 7,920,566 | | | $ | 1,102,441 | | | $ | 1,075,365 | |
Accumulated undistributed net realized gain/(loss) on investments and futures contracts | | $ | 42,468,074 | | | $ | 35,131,240 | | | $ | 17,675,156 | | | $ | 16,503,102 | | | $ | 4,312,034 | |
Net unrealized appreciation (depreciation) of investments and futures contracts | | $ | 744,462,529 | | | $ | 61,773,624 | | | $ | 116,317,048 | | | $ | 53,558,913 | | | $ | 18,549,067 | |
| | | | | |
| | | Mid-Cap
Equity Index
Fund | | | International
Fund | | | Composite
Fund | | | Retirement
Income
Fund | | | 2010
Retirement
Fund | |
Accumulated undistributed net investment income | | $ | 19,793,056 | | | $ | 9,884,641 | | | $ | 4,309,874 | | | $ | 1,539,981 | | | $ | 543,546 | |
Accumulated undistributed net realized gain/(loss) on investments and futures contracts | | $ | 74,577,567 | | | $ | 1,196,804 | | | $ | 20,991,667 | | | $ | 1,379,154 | | | $ | 1,150,822 | |
Net unrealized appreciation (depreciation) of investments and futures contracts | | $ | 278,520,972 | | | $ | (15,677,604 | ) | | $ | 21,223,292 | | | $ | 93,653 | | | $ | 604,430 | |
113
MUTUAL OF AMERICA INVESTMENT CORPORATION
NOTES TO FINANCIAL STATEMENTS (Continued)
December 31, 2016
| 5. | DISTRIBUTIONS TO SHAREHOLDERS AND INCOME TAX INFORMATION (CONTINUED) |
| | | | | | | | | | | | | | | | | | | | |
| ,, | | 2015
Retirement
Fund | | | 2020
Retirement
Fund | | | 2025
Retirement
Fund | | | 2030
Retirement
Fund | | | 2035
Retirement
Fund | |
Accumulated undistributed net investment income | | $ | 3,028,463 | | | $ | 7,891,832 | | | $ | 8,443,812 | | | $ | 6,471,545 | | | $ | 5,090,035 | |
Accumulated undistributed net realized gain/(loss) on investments and futures contracts | | $ | 6,490,766 | | | $ | 15,006,151 | | | $ | 17,549,626 | | | $ | 16,402,087 | | | $ | 14,165,396 | |
Net unrealized appreciation (depreciation) of investments and futures contracts | | $ | 8,322,127 | | | $ | 28,316,563 | | | $ | 44,555,744 | | | $ | 41,815,975 | | | $ | 37,300,908 | |
| | | | | |
| | | 2040
Retirement
Fund | | | 2045
Retirement
Fund | | | 2050
Retirement
Fund | | | 2055
Retirement
Fund | | | Conservative
Allocation
Fund | |
Accumulated undistributed net investment income | | $ | 3,936,958 | | | $ | 4,492,530 | | | $ | 1,952,198 | | | $ | 0 | | | $ | 3,053,002 | |
Accumulated undistributed net realized gain/(loss) on investments and futures contracts | | $ | 12,664,502 | | | $ | 13,839,470 | | | $ | 5,127,131 | | | $ | (107 | ) | | $ | 2,676,902 | |
Net unrealized appreciation (depreciation) of investments and futures contracts | | $ | 31,432,594 | | | $ | 41,756,852 | | | $ | 4,610,153 | | | $ | 14,641 | | | $ | 5,323,615 | |
| | | | | |
| | | Moderate
Allocation
Fund | | | Aggressive
Allocation
Fund | | | Money Market
Fund | | | Mid-Term
Bond Fund | | | Bond Fund | |
Accumulated undistributed net investment income | | $ | 6,887,282 | | | $ | 4,432,394 | | | $ | 83,111 | | | $ | 11,719,948 | | | $ | 33,167,639 | |
Accumulated undistributed net realized gain/(loss) on investments and futures contracts | | $ | 10,932,002 | | | $ | 15,476,897 | | | $ | (1,468 | ) | | $ | 543,647 | | | $ | 1,805,293 | |
Net unrealized appreciation (depreciation) of investments and futures contracts | | $ | 40,746,498 | | | $ | 43,148,522 | | | $ | 85 | | | $ | 491,524 | | | $ | 8,910,532 | |
The difference between the components of distributable earnings for income tax purposes and the amounts reflected in the statements of assets and liabilities arise primarily from federal income tax treatment of wash sales, REITs, partnerships, corporate actions and futures contracts.
Reclassifications — The Funds make adjustments to the components of net assets for book to tax differences that are considered permanent in nature. For the year ended December 31, 2016, the Funds reclassified amounts primarily relating to differences in the book to tax treatment of partnership investments, REITs, net operating losses, corporate actions and the character of distributions. Each Fund’s net assets are not affected by these reclassifications.
During the year ended December 31, 2016, each Fund reclassified the following book to tax differences [increases (decreases)]:
| | | | | | | | | | | | | | | | | | | | |
| | | Equity Index
Fund | | | All America
Fund | | | Small Cap
Value Fund | | | Small Cap
Growth Fund | | | Mid Cap
Value Fund | |
Accumulated undistributed net investment income | | $ | (176,689 | ) | | $ | (21,092 | ) | | $ | (918,477 | ) | | $ | (107,758 | ) | | $ | (210,053 | ) |
Accumulated undistributed net realized gains (loss) on investments and futures contracts | | $ | 176,689 | | | $ | 21,092 | | | $ | 918,477 | | | $ | (424,159 | ) | | $ | 210,053 | |
| | | | | | | | | | | | | | | | | | | | |
Paid in capital | | $ | 0 | | | $ | 0 | | | $ | 0 | | | $ | 531,917 | | | $ | 0 | |
| | | | | | | | | | | | | | | | | | | | |
| | | | | |
| | | Mid-Cap
Equity Index
Fund | | | International
Fund | | | Composite
Fund | | | Retirement
Income
Fund | | | 2010
Retirement
Fund | |
Accumulated undistributed net investment income | | $ | (720,916 | ) | | $ | 0 | | | $ | (5,340 | ) | | $ | 9,559 | | | $ | 4,033 | |
Accumulated undistributed net realized gains (loss) on investments and futures contracts | | $ | 720,916 | | | $ | 0 | | | $ | 5,340 | | | $ | (9,559 | ) | | $ | (4,033 | ) |
| | | | | | | | | | | | | | | | | | | | |
Paid in capital | | $ | 0 | | | $ | 0 | | | $ | 0 | | | $ | 0 | | | $ | 0 | |
| | | | | | | | | | | | | | | | | | | | |
114
MUTUAL OF AMERICA INVESTMENT CORPORATION
NOTES TO FINANCIAL STATEMENTS (Continued)
December 31, 2016
| 5. | DISTRIBUTIONS TO SHAREHOLDERS AND INCOME TAX INFORMATION (CONTINUED) |
| | | | | | | | | | | | | | | | | | | | |
| | | 2015
Retirement
Fund | | | 2020
Retirement
Fund | | | 2025
Retirement
Fund | | | 2030
Retirement
Fund | | | 2035
Retirement
Fund | |
Accumulated undistributed net investment income | | $ | 25,668 | | | $ | 80,044 | | | $ | 103,476 | | | $ | 88,201 | | | $ | 75,401 | |
Accumulated undistributed net realized gains (loss) on investments and futures contracts | | $ | (25,668 | ) | | $ | (80,044 | ) | | $ | (103,476 | ) | | $ | (88,201 | ) | | $ | (75,401 | ) |
| | | | | | | | | | | | | | | | | | | | |
Paid in capital | | $ | 0 | | | $ | 0 | | | $ | 0 | | | $ | 0 | | | $ | 0 | |
| | | | | | | | | | | | | | | | | | | | |
| | | | | |
| | | 2040
Retirement
Fund | | | 2045
Retirement
Fund | | | 2050
Retirement
Fund | | | 2055
Retirement
Fund | | | Conservative
Allocation
Fund | |
Accumulated undistributed net investment income | | $ | 58,169 | | | $ | 63,475 | | | $ | 27,373 | | | $ | 132 | | | $ | 21,655 | |
Accumulated undistributed net realized gains (loss) on investments and futures contracts | | $ | (58,169 | ) | | $ | (63,475 | ) | | $ | (27,373 | ) | | $ | 0 | | | $ | (21,655 | ) |
| | | | | | | | | | | | | | | | | | | | |
Paid in capital | | $ | 0 | | | $ | 0 | | | $ | 0 | | | $ | (132 | ) | | $ | 0 | |
| | | | | | | | | | | | | | | | | | | | |
| | | | | |
| | | Moderate
Allocation
Fund | | | Aggressive
Allocation
Fund | | | Money
Market Fund | | | Mid-Term
Bond Fund | | | Bond
Fund | |
Accumulated undistributed net investment income | | $ | 71,544 | | | $ | 52,494 | | | $ | 0 | | | $ | 0 | | | $ | 0 | |
Accumulated undistributed net realized gains (loss) on investments and futures contracts | | $ | (71,544 | ) | | $ | (52,494 | ) | | $ | 0 | | | $ | 0 | | | $ | 0 | |
| | | | | | | | | | | | | | | | | | | | |
Paid in capital | | $ | 0 | | | $ | 0 | | | $ | 0 | | | $ | 0 | | | $ | 0 | |
| | | | | | | | | | | | | | | | | | | | |
| 6. | RECENT ACCOUNTING PRONOUNCEMENTS |
On October 13, 2016, the Securities and Exchange Commission (the “SEC”) adopted new rules and forms and amended existing rules and forms which are intended to modernize and enhance the reporting and disclosure of information by registered investment companies and to improve the quality of information that funds provide to investors. In an effort to enhance monitoring and regulation, the new rules and forms will allow the SEC to more effectively collect and use data reported by funds. The new rules also promote effective liquidity risk management across the open-end fund industry and enhance disclosure regarding fund liquidity and redemption practices. The compliance date of these rules is generally December 1, 2018. Management is currently evaluating the impact and implications of the updates, which have not yet been determined.
In December 2016, the Financial Accounting Standards Board released an Accounting Standards Update (“ASU”) that makes technical changes to various sections of the Accounting Standards Codification (“ASC”), including Topic 820, Fair Value Measurement. The changes to Topic 820 are intended to clarify the difference between a valuation approach and a valuation technique. The changes to ASC 820-10-50-2 require a reporting entity to disclose, for Level 2 and Level 3 fair value measurements, a change in either or both a valuation approach and a valuation technique and the reason(s) for the change. The changes to Topic 820 are effective for fiscal years, and interim periods within those fiscal years, beginning after December 15, 2016. At this time, management is evaluating the implications of the ASU and its impact on the financial statements and the related disclosures. At this point, the impact on the financial statements and related disclosures has not yet been determined.
Management, on behalf of the Investment Company, has evaluated the need for disclosures and/or adjustments to the financial statements from subsequent events. As a result of this evaluation, no additional subsequent events require disclosure and/or adjustment to the financial statements.
115
REPORT OF INDEPENDENT REGISTERED PUBLIC ACCOUNTING FIRM
The Shareholders and Board of Directors
of Mutual of America Investment Corporation:
We have audited the accompanying statement of assets and liabilities of Mutual of America Investment Corporation, comprising the Equity Index Fund, All America Fund, Small Cap Value Fund, Small Cap Growth Fund, Mid Cap Value Fund, Mid-Cap Equity Index Fund, International Fund, Composite Fund, Retirement Income Fund, 2010 Retirement Fund, 2015 Retirement Fund, 2020 Retirement Fund, 2025 Retirement Fund, 2030 Retirement Fund, 2035 Retirement Fund, 2040 Retirement Fund, 2045 Retirement Fund, 2050 Retirement Fund, 2055 Retirement Fund, Conservative Allocation Fund, Moderate Allocation Fund, Aggressive Allocation Fund, Money Market Fund, Mid-Term Bond Fund and Bond Fund (collectively, the “Funds”), including the portfolios of investments in securities for the Conservative Allocation Fund, Moderate Allocation Fund, Aggressive Allocation Fund, Money Market Fund, International Fund, Retirement Income Fund, 2010 Retirement Fund, 2015 Retirement Fund, 2020 Retirement Fund, 2025 Retirement Fund, 2030 Retirement Fund, 2035 Retirement Fund, 2040 Retirement Fund, 2045 Retirement Fund, 2050 Retirement Fund and 2055 Retirement Fund, and the summary portfolios of investments in securities for each of the remaining Funds as of December 31, 2016, and the related statements of operations for the year or period then ended, the statements of changes in net assets for each of the years or period in the two-year period then ended, and the financial highlights for each of the years or periods in the five-year period then ended. These financial statements and financial highlights are the responsibility of the Funds’ management. Our responsibility is to express an opinion on these financial statements and financial highlights based on our audits.
We conducted our audits in accordance with the standards of the Public Company Accounting Oversight Board (United States). Those standards require that we plan and perform the audit to obtain reasonable assurance about whether the financial statements and financial highlights are free of material misstatement. An audit includes examining, on a test basis, evidence supporting the amounts and disclosures in the financial statements. Our procedures included confirmation of securities owned as of December 31, 2016, by correspondence with the custodian and brokers. An audit also includes assessing the accounting principles used and significant estimates made by management, as well as evaluating the overall financial statement presentation. We believe that our audits provide a reasonable basis for our opinion.
In our opinion, the financial statements and financial highlights referred to above present fairly, in all material respects, the financial position of each of the aforementioned Funds of Mutual of America Investment Corporation as of December 31, 2016, the results of their operations for the year or period then ended, the changes in their net assets for each of the years or period in the two-year period then ended, and the financial highlights for each of the years or periods in the five-year period then ended, in conformity with U.S. generally accepted accounting principles.

New York, New York
February 27, 2017
116
MUTUAL OF AMERICA INVESTMENT CORPORATION
ADDITIONAL INFORMATION
Directors and Officers — Unaudited
The tables below show information about the Directors and officers of the Investment Company. The address of each Director and officer is c/o Mutual of America Investment Corporation, 320 Park Avenue, New York, New York 10022. The Investment Company does not hold regular annual meetings of shareholders, and each Director has been elected by shareholders to serve until a successor is duly elected at a meeting of shareholders called for the purpose of electing directors. Each officer of the Investment Company has been elected by the Board of Directors to serve until a successor is duly elected. The Independent Directors do not serve as directors of any other investment companies advised by or affiliated with the Adviser or Mutual of America with the exception of serving on the Board of Directors of Mutual of America Institutional Funds, Inc., an affiliated registered management investment company, which also receives investment advice from the Adviser. The Interested Directors and officers of the Investment Company do not receive compensation from the Investment Company for their service. Mr. Roth serves as director of one other investment company advised by or affiliated with the Adviser, Mutual of America Institutional Funds, Inc.
The Investment Company’s Statement of Additional Information (“SAI”), filed with the Securities and Exchange Commission, contains additional information about the Investment Company’s Directors and Officers. A copy of the latest SAI can be obtained, without charge, by writing to Mutual of America Investment Corporation at 320 Park Avenue, New York, NY 10022-6839 or by calling 1-800-468-3785 or through the following websites: http://www.mutualofamerica.com or http://www.sec.gov.
| | | | | | |
| Independent Directors |
| Name and Age | | Length of
Time Served | | Principal Occupation(s)
in Past Five Years | | Other Directorships
Held by Director |
| | | | | | |
| | | |
Carolyn N. Dolan, age 69 | | Since
April 2011 | | Executive Vice President, Head of Direct Client Investments, Fiera Capital Inc.; prior thereto Founding Principal and Portfolio Manager, Samson Capital Advisors LLC | | Director, Market Street Trust Company; Trustee, Fordham University; Mutual of America Institutional Funds, Inc. |
| | | | | | |
| | | |
LaSalle D. Leffall, III, age 53 | | Since
April 2011 | | President and Founder, LDL Financial, LLC | | Director, Federal Home Loan Bank of Atlanta; Mutual of America Institutional Funds, Inc. |
| | | | | | |
| | | |
John W. Sibal, age 64 | | Since
April 2011 | | President & Chief Executive Officer, Eustis Commercial Mortgage Corporation | | Director, Eustis Commercial Mortgage Corporation; Director, New Orleans Recreation Development Foundation; Treasurer and Director, Friends of Nord, Inc.; Mutual of America Institutional Funds, Inc. |
| | | | | | |
| | | |
Margaret M. Smyth, age 53 | | Since
February 2007 | | U.S. Chief Financial Officer, National Grid; prior thereto Vice President of Finance, Con Edison; prior thereto Vice President, Chief Financial Officer, Hamilton Sundstrand, a United Technologies Company | | Director, Etsy, Inc.; Director, Concern Worldwide, USA; Director, BritishAmerican Business Association; Trustees Fellow, Fordham University; Director, National Grid USA; Mutual of America Institutional Funds, Inc. |
117
| | | | | | |
| Independent Directors |
| Name and Age | | Length of
Time Served | | Principal Occupation(s)
in Past Five Years | | Other Directorships
Held by Director |
| | | | | | |
| | | |
Patrick J. Waide, Jr., age 79 | | Since
December 2003 | | Certified Public Accountant | | Trustee, John Simon Guggenheim Memorial Foundation; Emeritus Director, National Catholic Reporter; Mutual of America Institutional Funds, Inc. |
| | | | | | |
| | | |
William E. Whiston, age 62 | | Since
February 2011 | | Chief Financial Officer, the Archdiocese of New York; Adjunct Professor in Finance, Fordham University Graduate School of Business; prior thereto Executive Vice President and member, United States Management Board at Allied Irish Bank | | Director, Sterling National Bank; Trustee and Treasurer, Trustees of St. Patrick’s Cathedral in New York City; Trustee, St. Joseph’s Seminary; Mutual of America Institutional Funds, Inc. |
| | | |
| Interested Director | | | | | | |
| Name and Age | | Length of
Time Served | | Principal Occupation(s)
in Past Five Years | | Other Directorships
Held by Director |
| | | | | | |
| | | |
James J. Roth,
Chairman, President and
Chief Executive Officer,
age 67 | | Since
August 2015 | | Senior Executive Vice President and General Counsel, Mutual of America Life Insurance Company since March 2013; prior thereto Executive Vice President and General Counsel, Mutual of America Life Insurance Company since April 2009; Chairman of the Board, President and Chief Executive Officer, Mutual of America Investment Corporation and Mutual of America Institutional Funds, Inc. since August 2015 | | Mutual of America Life Insurance Company; Mutual of America Institutional Funds, Inc.; Mutual of America Holding Company LLC; Mutual of America Foundation |
Mr. Roth is an “interested person” as an officer of the Adviser and of affiliates of the Adviser.
118
| | | | | | |
| Officers | | | | | | |
| Name, Position and Age | | Length of
Time Served | | Principal Occupation(s)
in Past Five Years | | Other Directorships
Held by Officer |
| | | | | | |
| | | |
Chris W. Festog, Executive Vice President, Chief Financial Officer and Treasurer, age 55 | | Since
April 2013 | | Executive Vice President and Chief Financial Officer, Mutual of America Life Insurance Company since March 2015; prior thereto Executive Vice President and Deputy Treasurer, Mutual of America Life Insurance Company | | Mutual of America Holding Company LLC; Mutual of America Securities LLC |
| | | | | | |
| | | |
Scott H. Rothstein, Executive Vice President, Deputy General Counsel and Corporate Secretary, age 51 | | Since
April 2013 | | Executive Vice President and Deputy General Counsel, Mutual of America Life Insurance Company, since January 2009; Executive Vice President, Deputy General Counsel and Corporate Secretary, Mutual of America Investment Corporation and Mutual of America Institutional Funds, Inc., since April 2013 | | None |
| | | | | | |
| | | |
Kathryn A. Lu, Executive Vice President and Chief Compliance Officer, age 56 | | Since
July 2008 | | Executive Vice President and Chief Compliance Officer, Mutual of America Life Insurance Company, prior thereto Senior Vice President and Chief Compliance Officer, Mutual of America Life Insurance Company; Executive Vice President and Chief Compliance Officer, Mutual of America Investment Corporation and Mutual of America Institutional Funds, Inc. | | None |
| | | | | | |
| | | |
John J. Corrigan, Executive Vice President and Internal Auditor, age 57 | | Since
February 2008 | | Executive Vice President and Internal Auditor, Mutual of America Life Insurance Company, prior thereto Senior Vice President and Internal Auditor, Mutual of America; Executive Vice President and Internal Auditor, Mutual of America Investment Corporation and Mutual of America Institutional Funds, Inc. | | None |
119
| | | | | | |
| Officers | | | | | | |
| Name, Position and Age | | Length of
Time Served | | Principal Occupation(s)
in Past Five Years | | Other Directorships
Held by Officer |
| | | | | | |
| | | |
Christopher M. Miseo, Senior Vice President and Chief Accounting Officer, age 60 | | Since
March 2013 | | Senior Vice President and Director of Accounting and Financial Reporting, Mutual of America Life Insurance Company | | None |
120
Quarterly Portfolio Schedules
Included in this Annual Report are summary schedules of Mutual of America Investment Corporation’s (“Investment Company”) Fund portfolio holdings as of December 31, 2016. The Investment Company files complete schedules of Fund portfolio holdings with the Securities and Exchange Commission (“SEC”) for the first and third quarters of each fiscal year on Form N-Q and for the second and fourth quarters of each fiscal year on Form N-CSR. The Forms N-Q and N-CSR are available on the SEC’s website at http://www.sec.gov. Additionally, the Forms N-Q and N-CSR may be reviewed and copied at the SEC’s Public Reference Room in Washington, DC. Information on the operation of the Public Reference Room may be obtained by calling 1-800-SEC-0330.
Proxy Voting Policies and Procedures
A copy of the Investment Company’s proxy voting policies and procedures can be obtained free of charge by calling 1-800-468-3785. It is also available on the SEC’s website at http://www.sec.gov.
Information regarding how the Investment Company voted proxies relating to portfolio securities during the 12-month period ended June 30, 2016 is available without charge by calling 1-800-468-3785. It is also available on the SEC website.
Code of Ethics
The Investment Company has adopted a Code of Ethics that complies with Rule 17j-1 of the Investment Company Act of 1940 and with the requirements of the Sarbanes-Oxley Act of 2002. A copy of the Code of Ethics is available free of charge, upon request. To obtain a free copy of the Code of Ethics, please call (212) 224-1568 or write to:
Ms. Kathryn A. Lu
Executive Vice President and Chief Compliance Officer
Mutual of America Investment Corporation
320 Park Avenue
New York, NY 10022-6839
Supplemental Dividend Information — Unaudited
Dividends from the International, Mid-Term Bond and Bond Funds do not qualify for the corporate dividends received deduction. The Money Market Fund and 2055 Retirement Fund did not distribute any dividends during 2016. The following are the percentages of the ordinary dividends distributed in 2016 by the other Investment Corporation Funds that qualify for the corporate dividends received deduction:
| | | | | | | | | | | | | | | | | | | | |
| | | Equity
Index Fund | | | All
America
Fund | | | Small Cap
Value Fund | | | Small Cap
Growth Fund | | | Mid-Cap
Equity Index
Fund | |
Ordinary dividend
qualifying percentage | | | 100% | | | | 100% | | | | 100% | | | | 0% | | | | 88.80% | |
| | | | | |
| | | Mid Cap
Value
Fund | | | Composite
Fund | | | Retirement
Income Fund | | | 2010
Retirement
Fund | | | 2015
Retirement
Fund | |
Ordinary dividend
qualifying percentage | | | 100% | | | | 52.70% | | | | 16.50% | | | | 22.79% | | | | 26.42% | |
| | | | | |
| | | 2020
Retirement
Fund | | | 2025
Retirement
Fund | | | 2030
Retirement
Fund | | | 2035
Retirement
Fund | | | 2040
Retirement
Fund | |
Ordinary dividend
qualifying percentage | | | 32.35% | | | | 41.00% | | | | 46.73% | | | | 51.71% | | | | 52.53% | |
| | | | | |
| | | 2045
Retirement
Fund | | | 2050
Retirement
Fund | | | Conservative
Allocation
Fund | | | Moderate
Allocation
Fund | | | Aggressive
Allocation
Fund | |
Ordinary dividend
qualifying percentage | | | 53.01% | | | | 53.61% | | | | 19.46% | | | | 32.99% | | | | 41.97% | |
121
Important tax information: The following amounts of 2016 Investment Corporation Fund long-term capital gains (if any) have been designated as capital gains dividends.
| | | | | | | | | | | | | | | | | | | | |
| | | Equity
Index Fund | | | All America
Fund | | | Small Cap
Value Fund | | | Small Cap
Growth Fund | | | Mid-Cap
Equity Index
Fund | |
Dividends qualifying for reduced
long-term capital gains tax rate | | $ | 48,733,130 | | | $ | 17,354,545 | | | $ | 5,500,345 | | | $ | 39,762,021 | | | $ | 71,656,832 | |
| | | | | |
| | | Mid Cap
Value Fund | | | International
Fund | | | Composite
Fund | | | Retirement
Income Fund | | | 2010
Retirement
Fund | |
Dividends qualifying for reduced
long-term capital gains tax rate | | $ | 4,887,020 | | | $ | 0 | | | $ | 10,227,373 | | | $ | 2,334,883 | | | $ | 1,449,643 | |
| | | | | |
| | | 2015
Retirement
Fund | | | 2020
Retirement
Fund | | | 2025
Retirement
Fund | | | 2030
Retirement
Fund | | | 2035
Retirement
Fund | |
Dividends qualifying for reduced
long-term capital gains tax rate | | $ | 8,964,100 | | | $ | 15,116,286 | | | $ | 17,294,855 | | | $ | 16,440,817 | | | $ | 15,229,224 | |
| | | | | |
| | | 2040
Retirement
Fund | | | 2045
Retirement
Fund | | | 2050
Retirement
Fund | | | 2055
Retirement
Fund | | | Conservative
Allocation
Fund | |
Dividends qualifying for reduced
long-term capital gains tax rate | | $ | 13,528,794 | | | $ | 16,121,366 | | | $ | 3,752,852 | | | $ | 0 | | | $ | 3,635,717 | |
| | | | | |
| | | Moderate
Allocation
Fund | | | Aggressive
Allocation
Fund | | | Money
Market Fund | | | Mid-Term
Bond Fund | | | Bond Fund | |
Dividends qualifying for reduced
long-term capital gains tax rate | | $ | 15,163,067 | | | $ | 16,088,191 | | | $ | 0 | | | $ | 679,842 | | | $ | 1,620,584 | |
122
MUTUALOF AMERICA
LIFE INSURANCE COMPANY
320 PARK AVENUE
NEW YORK, NY 10022-6839
www.mutualofamerica.com
320 PARK AVENUE
NEW YORK NY 10022-6839
ADDRESS SERVICE REQUESTED
| | |
 | | You can receive these and other important documents electronically. Sign up for eDocuments and we’ll waive the monthly participant charge. Find out more at mutualofamerica.com or call 1-800-468-3785. |
Mutual of America Investment Corporation has adopted a Code of Ethics that applies to its principal executive and financial officers, as well as all Access Persons as defined under Rule 17j-1 of the Investment Company Act of 1940. The Code of Ethics consists of two sections. The first section, designated as Section A, is the Code of Ethics required under Rule 17j-1. Section A requires those subject to it to submit periodic reports detailing their securities holdings and transactions (subject to several exemptions contained in the rules) and requires pre-approval for certain securities transactions by such persons, including purchases and sales of reportable securities, investments in initial public offerings and private placements.
The second section, designated as Section B, is to assure compliance with the Code of Ethics requirements of Section 406 of the Sarbanes-Oxley Act of 2002. It applies specifically to the Corporation’s principal executive and financial officers.
The two sections are not mutually exclusive and must be observed independently by each person to whom they are intended to apply. Section A applies to all individuals while Section B applies to the individuals designated in Section B. Both Sections explicitly require those individuals subject to the provisions of the Code of Ethics to promptly report violations of the Code of Ethics to the Chief Compliance Officer.
There have been no amendments to Section A or B during the period covered by this report.
The Annual Report to Shareholders includes information on how to obtain a copy of the Code of Ethics at no charge.
| ITEM 3. | AUDIT COMMITTEE FINANCIAL EXPERT. |
| | (a) | (1) Mutual of America Investment Corporation’s Board of Directors has determined that one audit committee financial expert serves on its Audit Committee. |
| | (a) | (2) The audit committee financial expert is Margaret M. Smyth. She is a Certified Public Accountant and has been U.S. Chief Financial Officer at National Grid since 2014. Her experience also includes previously held senior finance positions at Con Edison, Hamilton Sunstrand and United Technologies, and was a partner at Deloitte Touche and Arthur Andersen. Ms. Smyth is considered an independent director. |
| ITEM 4. | PRINCIPAL ACCOUNTANT FEES AND SERVICES. |
2016: $466,506
2015: $466,511
(b), (c), (d) There were no Audit-Related, Tax or Other Fees.
| | (e) | All non-audit fees are pre-approved by the Audit Committee in advance. |
(f), (g), (h) Not applicable.
| ITEM 5. | AUDIT COMMITTEE OF LISTED REGISTRANTS. |
Not applicable.
(a) Schedule I – Portfolios of Investments in Securities follows:
MUTUAL OF AMERICA INVESTMENT CORPORATION - EQUITY INDEX FUND
PORTFOLIO OF INVESTMENTS IN SECURITIES
December 31, 2016
| | | | | | | | |
| | | Shares | | | Value | |
INDEXED ASSETS: | | | | | | | | |
COMMON STOCKS: | | | | | | | | |
CONSUMER DISCRETIONARY (11.5%) | | | | | | | | |
Advance Auto Parts, Inc. | | | 8,465 | | | | 1,431,601 | |
Amazon.com, Inc.* | | | 42,190 | | | | 31,637,015 | |
AutoNation, Inc.* | | | 8,665 | | | | 421,552 | |
AutoZone, Inc.* | | | 3,148 | | | | 2,486,259 | |
Bed Bath & Beyond, Inc. | | | 17,567 | | | | 713,923 | |
Best Buy Co., Inc. | | | 30,422 | | | | 1,298,107 | |
BorgWarner, Inc. | | | 20,995 | | | | 828,043 | |
CarMax, Inc.* | | | 19,857 | | | | 1,278,592 | |
Carnival Corp. | | | 43,964 | | | | 2,288,766 | |
CBS Corp. Cl B | | | 41,931 | | | | 2,667,650 | |
Charter Communications, Inc. Cl A* | | | 22,999 | | | | 6,621,872 | |
Chipotle Mexican Grill, Inc.* | | | 3,199 | | | | 1,207,047 | |
Coach, Inc. | | | 29,100 | | | | 1,019,082 | |
Comcast Corp. Cl A | | | 255,968 | | | | 17,674,590 | |
D.R. Horton, Inc. | | | 37,011 | | | | 1,011,511 | |
Darden Restaurants, Inc. | | | 13,872 | | | | 1,008,772 | |
Delphi Automotive PLC | | | 30,441 | | | | 2,050,201 | |
Discovery Communications, Inc. Cl A* | | | 14,424 | | | | 395,362 | |
Discovery Communications, Inc. Cl C* | | | 22,374 | | | | 599,176 | |
Disney (Walt) Co. | | | 156,094 | | | | 16,268,117 | |
Dollar General Corp. | | | 26,897 | | | | 1,992,261 | |
Dollar Tree, Inc.* | | | 24,495 | | | | 1,890,524 | |
Expedia, Inc. | | | 12,493 | | | | 1,415,207 | |
Foot Locker, Inc. | | | 13,703 | | | | 971,406 | |
Ford Motor Co. | | | 412,594 | | | | 5,004,765 | |
Gap, Inc. | | | 25,419 | | | | 570,402 | |
Garmin Ltd. | | | 12,730 | | | | 617,278 | |
General Motors Co. | | | 149,275 | | | | 5,200,741 | |
Genuine Parts Co. | | | 16,896 | | | | 1,614,244 | |
Goodyear Tire & Rubber Co. | | | 25,353 | | | | 782,647 | |
H&R Block, Inc. | | | 22,220 | | | | 510,838 | |
Hanesbrands, Inc. | | | 38,262 | | | | 825,311 | |
Harley-Davidson, Inc. | | | 17,395 | | | | 1,014,824 | |
Harman Int’l. Industries, Inc. | | | 7,538 | | | | 837,924 | |
Hasbro, Inc. | | | 12,668 | | | | 985,444 | |
Home Depot, Inc. | | | 129,984 | | | | 17,428,255 | |
Interpublic Group of Cos., Inc. | | | 43,533 | | | | 1,019,108 | |
Kohl’s Corp. | | | 19,517 | | | | 963,749 | |
L Brands, Inc. | | | 26,852 | | | | 1,767,936 | |
Leggett & Platt, Inc. | | | 12,480 | | | | 610,022 | |
Lennar Corp. Cl A | | | 19,109 | | | | 820,349 | |
LKQ Corp.* | | | 31,846 | | | | 976,080 | |
Lowe’s Cos., Inc. | | | 93,726 | | | | 6,665,793 | |
Macy’s, Inc. | | | 32,213 | | | | 1,153,548 | |
Marriott International, Inc. Cl A | | | 34,475 | | | | 2,850,410 | |
Mattel, Inc. | | | 36,040 | | | | 992,902 | |
McDonald’s Corp. | | | 89,598 | | | | 10,905,869 | |
Michael Kors Hldgs. Ltd.* | | | 18,160 | | | | 780,517 | |
Mohawk Industries, Inc.* | | | 6,304 | | | | 1,258,783 | |
Netflix, Inc.* | | | 45,226 | | | | 5,598,979 | |
Newell Brands, Inc. | | | 49,644 | | | | 2,216,605 | |
News Corp. Cl A | | | 35,631 | | | | 408,331 | |
News Corp. Cl B | | | 17,304 | | | | 204,187 | |
NIKE, Inc. Cl B | | | 142,575 | | | | 7,247,087 | |
Nordstrom, Inc. | | | 12,212 | | | | 585,321 | |
Omnicom Group, Inc. | | | 24,124 | | | | 2,053,194 | |
| | | | | | | | |
O’Reilly Automotive, Inc.* | | | 10,433 | | | | 2,904,652 | |
Priceline Group Inc.* | | | 5,345 | | | | 7,836,091 | |
PulteGroup, Inc. | | | 33,116 | | | | 608,672 | |
PVH Corp. | | | 8,922 | | | | 805,121 | |
Ralph Lauren Corp. | | | 6,470 | | | | 584,370 | |
Ross Stores, Inc. | | | 42,605 | | | | 2,794,888 | |
Royal Caribbean Cruises Ltd. | | | 17,189 | | | | 1,410,186 | |
Scripps Networks Interactive, Inc. Cl A | | | 8,814 | | | | 629,055 | |
Signet Jewelers Ltd. | | | 6,603 | | | | 622,399 | |
Staples, Inc. | | | 62,652 | | | | 567,001 | |
Starbucks Corp. | | | 155,427 | | | | 8,629,307 | |
Target Corp. | | | 59,042 | | | | 4,264,604 | |
TEGNA, Inc. | | | 18,623 | | | | 398,346 | |
Tiffany & Co. | | | 10,327 | | | | 799,620 | |
Time Warner, Inc. | | | 83,409 | | | | 8,051,471 | |
TJX Cos., Inc. | | | 69,939 | | | | 5,254,517 | |
Tractor Supply Co. | | | 13,631 | | | | 1,033,366 | |
TripAdvisor, Inc.* | | | 13,139 | | | | 609,255 | |
Twenty-First Century Fox, Inc. Cl A | | | 110,487 | | | | 3,098,055 | |
Twenty-First Century Fox, Inc. Cl B | | | 52,355 | | | | 1,426,674 | |
Ulta Salon, Cosmetics & Fragrances, Inc.* | | | 6,343 | | | | 1,617,084 | |
Under Armour, Inc. Cl A* | | | 20,410 | | | | 592,911 | |
Under Armour, Inc. Cl C* | | | 16,260 | | | | 409,264 | |
Urban Outfitters, Inc.* | | | 6,764 | | | | 192,639 | |
V.F. Corp. | | | 34,851 | | | | 1,859,301 | |
Viacom, Inc. Cl B | | | 34,856 | | | | 1,223,446 | |
Whirlpool Corp. | | | 8,399 | | | | 1,526,686 | |
Wyndham Worldwide Corp. | | | 10,774 | | | | 822,810 | |
Wynn Resorts Ltd. | | | 9,079 | | | | 785,424 | |
Yum! Brands, Inc. | | | 35,712 | | | | 2,261,641 | |
| | | | | | | | |
| | | | | | | 247,266,935 | |
| | | | | | | | |
CONSUMER STAPLES (9.0%) | | | | | | | | |
Altria Group, Inc. | | | 208,462 | | | | 14,096,200 | |
Archer-Daniels-Midland Co. | | | 63,093 | | | | 2,880,195 | |
Brown-Forman Corp. Cl B | | | 18,336 | | | | 823,653 | |
Campbell Soup Co. | | | 20,992 | | | | 1,269,386 | |
Church & Dwight Co., Inc. | | | 27,933 | | | | 1,234,359 | |
Clorox Co. | | | 14,053 | | | | 1,686,641 | |
Coca-Cola Co. | | | 416,848 | | | | 17,282,518 | |
Colgate-Palmolive Co. | | | 94,655 | | | | 6,194,223 | |
Conagra Brands, Inc. | | | 43,488 | | | | 1,719,950 | |
Constellation Brands, Inc. Cl A | | | 18,493 | | | | 2,835,162 | |
Costco Wholesale Corp. | | | 46,705 | | | | 7,477,938 | |
Coty, Inc. Cl A | | | 55,606 | | | | 1,018,146 | |
CVS Health Corp. | | | 112,944 | | | | 8,912,411 | |
Dr. Pepper Snapple Group, Inc. | | | 20,659 | | | | 1,873,152 | |
Estee Lauder Cos., Inc. Cl A | | | 24,392 | | | | 1,865,744 | |
General Mills, Inc. | | | 62,512 | | | | 3,861,366 | |
Hershey Co. | | | 14,440 | | | | 1,493,529 | |
Hormel Foods Corp. | | | 29,934 | | | | 1,042,003 | |
J.M. Smucker Co. | | | 12,937 | | | | 1,656,712 | |
Kellogg Co. | | | 28,444 | | | | 2,096,607 | |
Kimberly-Clark Corp. | | | 37,686 | | | | 4,300,726 | |
Kraft Heinz Co. | | | 63,138 | | | | 5,513,210 | |
Kroger Co. | | | 98,993 | | | | 3,416,248 | |
McCormick & Co., Inc. | | | 11,254 | | | | 1,050,336 | |
Mead Johnson Nutrition Co. | | | 20,281 | | | | 1,435,084 | |
Molson Coors Brewing Co. Cl B | | | 19,096 | | | | 1,858,232 | |
Mondelez International, Inc. Cl A | | | 164,378 | | | | 7,286,877 | |
Monster Beverage Corp.* | | | 42,127 | | | | 1,867,911 | |
PepsiCo, Inc. | | | 153,921 | | | | 16,104,754 | |
Philip Morris Int’l., Inc. | | | 164,878 | | | | 15,084,688 | |
Proctor & Gamble Co. | | | 286,496 | | | | 24,088,584 | |
Reynolds American, Inc. | | | 90,043 | | | | 5,046,010 | |
Sysco Corp. | | | 55,165 | | | | 3,054,486 | |
| | | | | | | | |
Tyson Foods, Inc. Cl A | | | 29,928 | | | | 1,845,959 | |
Walgreens Boots Alliance, Inc. | | | 91,500 | | | | 7,572,540 | |
Wal-Mart Stores, Inc. | | | 160,247 | | | | 11,076,273 | |
Whole Foods Market, Inc. | | | 32,572 | | | | 1,001,915 | |
| | | | | | | | |
| | | | | | | 192,923,728 | |
| | | | | | | | |
ENERGY (7.3%) | | | | | | | | |
Anadarko Petroleum Corp. | | | 58,830 | | | | 4,102,216 | |
Apache Corp. | | | 40,764 | | | | 2,587,291 | |
Baker Hughes, Inc. | | | 44,408 | | | | 2,885,188 | |
Cabot Oil & Gas Corp. | | | 47,587 | | | | 1,111,632 | |
Chesapeake Energy Corp.* | | | 87,006 | | | | 610,782 | |
Chevron Corp. | | | 201,746 | | | | 23,745,504 | |
Cimarex Energy Co. | | | 10,625 | | | | 1,443,938 | |
Concho Resources, Inc.* | | | 15,065 | | | | 1,997,619 | |
ConocoPhillips | | | 132,818 | | | | 6,659,495 | |
Devon Energy Corp. | | | 57,093 | | | | 2,607,437 | |
EOG Resources, Inc. | | | 62,589 | | | | 6,327,748 | |
EQT Corp. | | | 19,334 | | | | 1,264,444 | |
Exxon Mobil Corp. | | | 445,036 | | | | 40,168,949 | |
FMC Technologies, Inc.* | | | 23,948 | | | | 850,872 | |
Halliburton Co. | | | 92,369 | | | | 4,996,239 | |
Helmerich & Payne, Inc. | | | 10,548 | | | | 816,415 | |
Hess Corp. | | | 30,027 | | | | 1,870,382 | |
Kinder Morgan, Inc. | | | 205,780 | | | | 4,261,704 | |
Marathon Oil Corp. | | | 88,358 | | | | 1,529,477 | |
Marathon Petroleum Corp. | | | 57,889 | | | | 2,914,711 | |
Murphy Oil Corp. | | | 18,718 | | | | 582,691 | |
National Oilwell Varco, Inc. | | | 42,653 | | | | 1,596,928 | |
Newfield Exploration Co.* | | | 23,087 | | | | 935,024 | |
Noble Energy, Inc. | | | 45,442 | | | | 1,729,523 | |
Occidental Petroleum Corp. | | | 83,123 | | | | 5,920,851 | |
ONEOK, Inc. | | | 21,384 | | | | 1,227,655 | |
Phillips 66 | | | 47,700 | | | | 4,121,757 | |
Pioneer Natural Resources Co. | | | 17,940 | | | | 3,230,456 | |
Range Resources Corp. | | | 18,239 | | | | 626,692 | |
Schlumberger Ltd. | | | 149,154 | | | | 12,521,515 | |
Southwestern Energy Co.* | | | 59,408 | | | | 642,795 | |
Spectra Energy Corp. | | | 74,775 | | | | 3,072,505 | |
Tesoro Corp. | | | 11,535 | | | | 1,008,736 | |
Transocean Ltd.* | | | 41,373 | | | | 609,838 | |
Valero Energy Corp. | | | 49,075 | | | | 3,352,804 | |
Williams Cos., Inc. | | | 75,752 | | | | 2,358,917 | |
| | | | | | | | |
| | | | | | | 156,290,730 | |
| | | | | | | | |
FINANCIALS (14.3%) | | | | | | | | |
Affiliated Managers Group, Inc.* | | | 5,504 | | | | 799,731 | |
Aflac, Inc. | | | 45,089 | | | | 3,138,194 | |
Allstate Corp. | | | 39,494 | | | | 2,927,295 | |
American Express Co. | | | 83,287 | | | | 6,169,901 | |
American Int’l. Group, Inc. | | | 103,494 | | | | 6,759,193 | |
Ameriprise Financial, Inc. | | | 16,480 | | | | 1,828,291 | |
Aon PLC | | | 27,856 | | | | 3,106,780 | |
Assurant, Inc. | | | 6,818 | | | | 633,119 | |
Bank of America Corp. | | | 1,084,547 | | | | 23,968,489 | |
Bank of New York Mellon Corp. | | | 112,975 | | | | 5,352,755 | |
BB&T Corp. | | | 88,866 | | | | 4,178,479 | |
Berkshire Hathaway, Inc. Cl B* | | | 203,075 | | | | 33,097,164 | |
BlackRock, Inc. | | | 13,226 | | | | 5,033,022 | |
Capital One Financial Corp. | | | 51,144 | | | | 4,461,803 | |
Charles Schwab Corp. | | | 127,392 | | | | 5,028,162 | |
Chubb Ltd. | | | 50,360 | | | | 6,653,563 | |
Cincinnati Financial Corp. | | | 16,382 | | | | 1,240,937 | |
Citigroup, Inc. | | | 305,837 | | | | 18,175,893 | |
Citizens Financial Group, Inc. | | | 52,599 | | | | 1,874,102 | |
CME Group, Inc. | | | 35,721 | | | | 4,120,417 | |
Comerica, Inc. | | | 18,268 | | | | 1,244,233 | |
| | | | | | | | |
Discover Financial Svcs. | | | 43,490 | | | | 3,135,194 | |
E*Trade Financial Corp.* | | | 29,874 | | | | 1,035,134 | |
Fifth Third Bancorp | | | 84,641 | | | | 2,282,768 | |
Franklin Resources, Inc. | | | 36,768 | | | | 1,455,277 | |
Gallagher (Arthur J.) & Co. | | | 20,296 | | | | 1,054,580 | |
Goldman Sachs Group, Inc. | | | 39,809 | | | | 9,532,265 | |
Hartford Financial Svcs. Group, Inc. | | | 39,189 | | | | 1,867,356 | |
Huntington Bancshares, Inc. | | | 110,582 | | | | 1,461,894 | |
Intercontinental Exchange, Inc. | | | 64,293 | | | | 3,627,411 | |
Invesco Ltd. | | | 45,643 | | | | 1,384,809 | |
JPMorgan Chase & Co. | | | 385,253 | | | | 33,243,481 | |
KeyCorp | | | 114,198 | | | | 2,086,397 | |
Leucadia National Corp. | | | 35,343 | | | | 821,725 | |
Lincoln National Corp. | | | 25,010 | | | | 1,657,413 | |
Loews Corp. | | | 30,742 | | | | 1,439,648 | |
M&T Bank Corp. | | | 16,318 | | | | 2,552,625 | |
Marsh & McLennan Cos., Inc. | | | 54,652 | | | | 3,693,929 | |
MetLife, Inc. | | | 117,982 | | | | 6,358,050 | |
Moody’s Corp. | | | 17,223 | | | | 1,623,612 | |
Morgan Stanley | | | 155,507 | | | | 6,570,171 | |
Nasdaq, Inc. | | | 12,208 | | | | 819,401 | |
Navient Corp. | | | 32,524 | | | | 534,369 | |
Northern Trust Corp. | | | 23,280 | | | | 2,073,084 | |
People’s United Financial, Inc. | | | 32,515 | | | | 629,490 | |
PNC Financial Svcs. Grp., Inc. | | | 52,402 | | | | 6,128,938 | |
Principal Financial Grp., Inc. | | | 28,628 | | | | 1,656,416 | |
Progressive Corp. | | | 64,000 | | | | 2,272,000 | |
Prudential Financial, Inc. | | | 46,982 | | | | 4,888,947 | |
Regions Financial Corp. | | | 130,238 | | | | 1,870,218 | |
S&P Global, Inc. | | | 27,412 | | | | 2,947,886 | |
State Street Corp. | | | 39,304 | | | | 3,054,707 | |
SunTrust Banks, Inc. | | | 52,469 | | | | 2,877,925 | |
Synchrony Financial | | | 85,204 | | | | 3,090,349 | |
T. Rowe Price Group, Inc. | | | 27,172 | | | | 2,044,965 | |
Torchmark Corp. | | | 11,355 | | | | 837,545 | |
Travelers Cos., Inc. | | | 30,831 | | | | 3,774,331 | |
U.S. Bancorp | | | 172,666 | | | | 8,869,852 | |
Unum Group | | | 23,788 | | | | 1,045,007 | |
Wells Fargo & Co. | | | 482,923 | | | | 26,613,887 | |
Willis Towers Watson PLC | | | 13,610 | | | | 1,664,283 | |
XL Group Ltd. | | | 28,613 | | | | 1,066,120 | |
Zions Bancorporation | | | 19,594 | | | | 843,326 | |
| | | | | | | | |
| | | | | | | 306,278,308 | |
| | | | | | | | |
HEALTH CARE (13.1%) | | | | | | | | |
Abbott Laboratories | | | 156,988 | | | | 6,029,909 | |
AbbVie, Inc. | | | 174,329 | | | | 10,916,482 | |
Aetna, Inc. | | | 38,012 | | | | 4,713,868 | |
Agilent Technologies, Inc. | | | 36,037 | | | | 1,641,846 | |
Alexion Pharmaceuticals, Inc.* | | | 24,346 | | | | 2,978,733 | |
Allergan PLC* | | | 40,130 | | | | 8,427,701 | |
AmerisourceBergen Corp. | | | 18,895 | | | | 1,477,400 | |
Amgen, Inc. | | | 79,521 | | | | 11,626,765 | |
Anthem, Inc. | | | 27,495 | | | | 3,952,956 | |
Bard (C.R.), Inc. | | | 7,518 | | | | 1,688,994 | |
Baxter International, Inc. | | | 51,241 | | | | 2,272,026 | |
Becton, Dickinson & Co. | | | 22,296 | | | | 3,691,103 | |
BIOGEN, Inc.* | | | 23,167 | | | | 6,569,698 | |
Boston Scientific Corp.* | | | 146,298 | | | | 3,164,426 | |
Bristol-Myers Squibb Co. | | | 178,074 | | | | 10,406,645 | |
Cardinal Health, Inc. | | | 34,123 | | | | 2,455,832 | |
Celgene Corp.* | | | 83,881 | | | | 9,709,226 | |
Centene Corp.* | | | 18,658 | | | | 1,054,364 | |
Cerner Corp.* | | | 34,100 | | | | 1,615,317 | |
CIGNA Corp. | | | 27,606 | | | | 3,682,364 | |
Cooper Companies, Inc. | | | 4,747 | | | | 830,393 | |
| | | | | | | | |
Danaher Corp. | | | 65,450 | | | | 5,094,628 | |
DaVita Inc Inc.* | | | 16,188 | | | | 1,039,270 | |
DENTSPLY SIRONA, Inc. | | | 24,244 | | | | 1,399,606 | |
Edwards Lifesciences Corp.* | | | 22,857 | | | | 2,141,701 | |
Endo International PLC* | | | 26,033 | | | | 428,764 | |
Envision Healthcare Corp.* | | | 12,546 | | | | 794,036 | |
Express Scripts Hldg. Co.* | | | 65,895 | | | | 4,532,917 | |
Gilead Sciences, Inc. | | | 139,912 | | | | 10,019,098 | |
HCA Hldgs., Inc.* | | | 31,094 | | | | 2,301,578 | |
Hologic, Inc.* | | | 30,984 | | | | 1,243,078 | |
Humana, Inc. | | | 16,378 | | | | 3,341,603 | |
Illumina, Inc.* | | | 16,100 | | | | 2,061,444 | |
Intuitive Surgical, Inc.* | | | 4,236 | | | | 2,686,344 | |
Johnson & Johnson | | | 291,643 | | | | 33,600,190 | |
Laboratory Corp. of America Hldgs.* | | | 11,489 | | | | 1,474,958 | |
Lilly (Eli) & Co. | | | 104,146 | | | | 7,659,938 | |
Mallinckrodt PLC* | | | 11,754 | | | | 585,584 | |
McKesson Corp. | | | 23,475 | | | | 3,297,064 | |
Medtronic PLC | | | 147,068 | | | | 10,475,654 | |
Merck & Co., Inc. | | | 293,884 | | | | 17,300,951 | |
Mettler-Toledo Int’l., Inc.* | | | 2,940 | | | | 1,230,566 | |
Mylan NV* | | | 49,207 | | | | 1,877,247 | |
Patterson Cos., Inc. | | | 10,259 | | | | 420,927 | |
PerkinElmer, Inc. | | | 11,581 | | | | 603,949 | |
Perrigo Co. PLC | | | 15,062 | | | | 1,253,610 | |
Pfizer, Inc. | | | 651,839 | | | | 21,171,731 | |
Quest Diagnostics, Inc. | | | 15,780 | | | | 1,450,182 | |
Regeneron Pharmaceuticals, Inc.* | | | 8,196 | | | | 3,008,670 | |
Schein (Henry), Inc.* | | | 8,125 | | | | 1,232,644 | |
St. Jude Medical, Inc. | | | 31,463 | | | | 2,523,018 | |
Stryker Corp. | | | 33,327 | | | | 3,992,908 | |
Thermo Fisher Scientific, Inc. | | | 42,133 | | | | 5,944,966 | |
UnitedHealth Group, Inc. | | | 101,687 | | | | 16,273,987 | |
Universal Health Svcs., Inc. Cl B | | | 9,704 | | | | 1,032,312 | |
Varian Medical Systems, Inc.* | | | 9,103 | | | | 817,267 | |
Vertex Pharmaceuticals, Inc.* | | | 27,088 | | | | 1,995,573 | |
Waters Corp.* | | | 9,077 | | | | 1,219,858 | |
Zimmer Biomet Hldgs., Inc. | | | 22,260 | | | | 2,297,232 | |
Zoetis, Inc. | | | 51,557 | | | | 2,759,846 | |
| | | | | | | | |
| | | | | | | 281,490,947 | |
| | | | | | | | |
INDUSTRIALS (9.9%) | | | | | | | | |
3M Co. | | | 64,299 | | | | 11,481,872 | |
Acuity Brands, Inc. | | | 5,016 | | | | 1,157,994 | |
Alaska Air Group, Inc. | | | 13,932 | | | | 1,236,186 | |
Allegion PLC | | | 9,683 | | | | 619,712 | |
American Airlines Group, Inc. | | | 56,242 | | | | 2,625,939 | |
AMETEK, Inc. | | | 25,275 | | | | 1,228,365 | |
Arconic, Inc. | | | 50,600 | | | | 938,124 | |
Boeing Co. | | | 61,647 | | | | 9,597,205 | |
Caterpillar, Inc. | | | 62,412 | | | | 5,788,089 | |
Cintas Corp. | | | 8,662 | | | | 1,000,981 | |
CSX Corp. | | | 97,981 | | | | 3,520,457 | |
Cummins, Inc. | | | 16,622 | | | | 2,271,729 | |
Deere & Co. | | | 30,732 | | | | 3,166,625 | |
Delta Air Lines, Inc. | | | 78,038 | | | | 3,838,689 | |
Dover Corp. | | | 16,394 | | | | 1,228,402 | |
Dun & Bradstreet Corp. | | | 3,447 | | | | 418,190 | |
Eaton Corp. PLC | | | 48,849 | | | | 3,277,279 | |
Emerson Electric Co. | | | 70,098 | | | | 3,907,964 | |
Equifax, Inc. | | | 12,383 | | | | 1,464,042 | |
Expeditors Int’l. of Wash. | | | 19,255 | | | | 1,019,745 | |
Fastenal Co. | | | 30,109 | | | | 1,414,521 | |
FedEx Corp. | | | 26,585 | | | | 4,950,127 | |
Flowserve Corp. | | | 12,872 | | | | 618,500 | |
Fluor Corp. | | | 15,091 | | | | 792,579 | |
| | | | | | | | |
Fortive Corp. | | | 30,342 | | | | 1,627,242 | |
Fortune Brands Home & Security, Inc. | | | 15,075 | | | | 805,910 | |
General Dynamics Corp. | | | 30,796 | | | | 5,317,237 | |
General Electric Co. | | | 945,006 | | | | 29,862,190 | |
Grainger (W.W.), Inc. | | | 6,170 | | | | 1,432,983 | |
Honeywell International, Inc. | | | 81,739 | | | | 9,469,463 | |
Hunt (J.B.) Transport Svcs., Inc. | | | 8,577 | | | | 832,569 | |
Illinois Tool Works, Inc. | | | 33,176 | | | | 4,062,733 | |
Ingersoll-Rand PLC | | | 26,872 | | | | 2,016,475 | |
Jacobs Engineering Group, Inc.* | | | 14,053 | | | | 801,021 | |
Johnson Controls Int’l. PLC | | | 98,968 | | | | 4,076,492 | |
Kansas City Southern | | | 11,989 | | | | 1,017,267 | |
L3 Technologies, Inc. Inc. | | | 7,923 | | | | 1,205,168 | |
Lockheed Martin Corp. | | | 27,303 | | | | 6,824,112 | |
Masco Corp. | | | 32,891 | | | | 1,040,013 | |
Nielsen Hldgs. PLC | | | 33,844 | | | | 1,419,756 | |
Norfolk Southern Corp. | | | 31,124 | | | | 3,363,571 | |
Northrop Grumman Corp. | | | 18,719 | | | | 4,353,665 | |
PACCAR, Inc. | | | 38,208 | | | | 2,441,491 | |
Parker Hannifin Corp. | | | 14,559 | | | | 2,038,260 | |
Pentair PLC | | | 18,320 | | | | 1,027,202 | |
Pitney Bowes, Inc. | | | 13,282 | | | | 201,754 | |
Quanta Services, Inc.* | | | 17,474 | | | | 608,969 | |
Raytheon Co. | | | 31,964 | | | | 4,538,888 | |
Republic Services, Inc. | | | 25,712 | | | | 1,466,870 | |
Robert Half Int’l., Inc. | | | 12,841 | | | | 626,384 | |
Robinson (C.H.) Worldwide, Inc. | | | 14,291 | | | | 1,046,959 | |
Rockwell Automation, Inc. | | | 13,776 | | | | 1,851,494 | |
Rockwell Collins, Inc. | | | 13,298 | | | | 1,233,522 | |
Roper Technologies, Inc. | | | 11,148 | | | | 2,040,976 | |
Ryder System, Inc. | | | 5,386 | | | | 400,934 | |
Snap-on, Inc. | | | 6,015 | | | | 1,030,189 | |
Southwest Airlines Co. | | | 66,107 | | | | 3,294,773 | |
Stanley Black & Decker, Inc. | | | 15,881 | | | | 1,821,392 | |
Stericycle, Inc.* | | | 8,176 | | | | 629,879 | |
Textron, Inc. | | | 29,506 | | | | 1,432,811 | |
TransDigm Group, Inc. | | | 5,779 | | | | 1,438,740 | |
Union Pacific Corp. | | | 88,265 | | | | 9,151,315 | |
United Continental Hldgs., Inc* | | | 30,535 | | | | 2,225,391 | |
United Parcel Service, Inc. Cl B | | | 73,753 | | | | 8,455,044 | |
United Rentals, Inc.* | | | 9,752 | | | | 1,029,616 | |
United Technologies Corp. | | | 82,346 | | | | 9,026,769 | |
Verisk Analytics, Inc. Cl A* | | | 17,787 | | | | 1,443,771 | |
Waste Management, Inc. | | | 44,335 | | | | 3,143,795 | |
Xylem, Inc. | | | 20,674 | | | | 1,023,776 | |
| | | | | | | | |
| | | | | | | 211,762,147 | |
| | | | | | | | |
INFORMATION TECHNOLOGY (20.0%) | | | | | | | | |
Accenture Ltd. Cl A | | | 66,005 | | | | 7,731,166 | |
Activision Blizzard, Inc. | | | 73,563 | | | | 2,656,360 | |
Adobe Systems, Inc.* | | | 52,556 | | | | 5,410,640 | |
Akamai Technologies, Inc.* | | | 18,724 | | | | 1,248,516 | |
Alliance Data Systems Corp. | | | 6,370 | | | | 1,455,545 | |
Alphabet, Inc. Cl A* | | | 31,616 | | | | 25,054,099 | |
Alphabet, Inc. Cl C* | | | 31,791 | | | | 24,536,744 | |
Amphenol Corp. Cl A | | | 33,966 | | | | 2,282,515 | |
Analog Devices, Inc. | | | 31,621 | | | | 2,296,317 | |
Apple, Inc. | | | 571,104 | | | | 66,145,262 | |
Applied Materials, Inc. | | | 114,575 | | | | 3,697,335 | |
Autodesk, Inc.* | | | 21,453 | | | | 1,587,737 | |
Automatic Data Processing, Inc. | | | 47,661 | | | | 4,898,598 | |
Broadcom Ltd. | | | 43,093 | | | | 7,617,550 | |
CA, Inc. | | | 32,285 | | | | 1,025,694 | |
Cisco Systems, Inc. | | | 534,679 | | | | 16,157,999 | |
Citrix Systems, Inc.* | | | 16,000 | | | | 1,428,960 | |
Cognizant Technology Solutions* | | | 66,870 | | | | 3,746,726 | |
| | | | | | | | |
Corning, Inc. | | | 102,469 | | | | 2,486,923 | |
CSRA, Inc. | | | 13,165 | | | | 419,174 | |
eBay, Inc.* | | | 112,167 | | | | 3,330,238 | |
Electronic Arts, Inc.* | | | 31,238 | | | | 2,460,305 | |
F5 Networks, Inc.* | | | 7,228 | | | | 1,046,036 | |
Facebook, Inc. Cl A* | | | 250,563 | | | | 28,827,273 | |
Fidelity Nat’l. Information Svcs., Inc. | | | 35,078 | | | | 2,653,300 | |
First Solar, Inc.* | | | 6,062 | | | | 194,530 | |
Fiserv, Inc.* | | | 23,341 | | | | 2,480,681 | |
FLIR Systems, Inc. | | | 17,129 | | | | 619,899 | |
Global Payments, Inc. | | | 17,789 | | | | 1,234,734 | |
Harris Corp. | | | 13,926 | | | | 1,426,997 | |
Hewlett Packard Enterprise Co. | | | 177,016 | | | | 4,096,150 | |
HP, Inc. | | | 177,178 | | | | 2,629,322 | |
Intel Corp. | | | 505,585 | | | | 18,337,568 | |
Int’l. Business Machines Corp. | | | 92,517 | | | | 15,356,897 | |
Intuit, Inc. | | | 26,658 | | | | 3,055,273 | |
Juniper Networks, Inc. | | | 44,296 | | | | 1,251,805 | |
KLA-Tencor Corp. | | | 15,736 | | | | 1,238,108 | |
Lam Research Corp. | | | 17,837 | | | | 1,885,906 | |
Linear Technology Corp. | | | 26,785 | | | | 1,670,045 | |
MasterCard, Inc. Cl A | | | 102,643 | | | | 10,597,890 | |
Microchip Technology, Inc. | | | 22,412 | | | | 1,437,730 | |
Micron Technology, Inc.* | | | 112,082 | | | | 2,456,837 | |
Microsoft Corp. | | | 833,295 | | | | 51,780,951 | |
Motorola Solutions, Inc. | | | 17,475 | | | | 1,448,503 | |
NetApp, Inc. | | | 28,387 | | | | 1,001,209 | |
NVIDIA Corp. | | | 57,090 | | | | 6,093,787 | |
Oracle Corp. | | | 319,987 | | | | 12,303,500 | |
Paychex, Inc. | | | 34,101 | | | | 2,076,069 | |
PayPal Hldgs., Inc.* | | | 121,388 | | | | 4,791,184 | |
Qorvo, Inc.* | | | 15,105 | | | | 796,487 | |
QUALCOMM, Inc. | | | 158,692 | | | | 10,346,718 | |
Red Hat, Inc.* | | | 18,290 | | | | 1,274,813 | |
Salesforce.com, inc.* | | | 68,545 | | | | 4,692,591 | |
Seagate Technology PLC | | | 31,452 | | | | 1,200,523 | |
Skyworks Solutions, Inc. | | | 18,845 | | | | 1,406,968 | |
Symantec Corp. | | | 68,720 | | | | 1,641,721 | |
TE Connectivity Ltd. | | | 38,582 | | | | 2,672,961 | |
Teradata Corp.* | | | 14,638 | | | | 397,714 | |
Texas Instruments, Inc. | | | 108,354 | | | | 7,906,591 | |
Total System Services, Inc. | | | 16,636 | | | | 815,663 | |
VeriSign, Inc.* | | | 10,634 | | | | 808,928 | |
Visa, Inc. Cl A | | | 199,228 | | | | 15,543,769 | |
Western Digital Corp. | | | 30,719 | | | | 2,087,356 | |
Western Union Co. | | | 48,630 | | | | 1,056,244 | |
Xerox Corp. | | | 91,911 | | | | 802,383 | |
Xilinx, Inc. | | | 28,164 | | | | 1,700,261 | |
Yahoo!, Inc.* | | | 91,838 | | | | 3,551,375 | |
| | | | | | | | |
| | | | | | | 428,369,653 | |
| | | | | | | | |
MATERIALS (2.7%) | | | | | | | | |
Air Products & Chemicals, Inc. | | | 23,903 | | | | 3,437,729 | |
Albemarle Corp. | | | 11,711 | | | | 1,008,083 | |
Avery Dennison Corp. | | | 8,620 | | | | 605,296 | |
Ball Corp. | | | 19,055 | | | | 1,430,459 | |
CF Industries Hldgs., Inc. | | | 21,358 | | | | 672,350 | |
Dow Chemical Co. | | | 121,463 | | | | 6,950,113 | |
Du Pont (E.I.) de Nemours & Co. | | | 92,132 | | | | 6,762,489 | |
Eastman Chemical Co. | | | 16,417 | | | | 1,234,723 | |
Ecolab, Inc. | | | 27,647 | | | | 3,240,781 | |
FMC Corp. | | | 14,475 | | | | 818,706 | |
Freeport-McMoRan Copper & Gold, Inc.* | | | 132,349 | | | | 1,745,683 | |
International Paper Co. | | | 42,525 | | | | 2,256,377 | |
Int’l. Flavors & Fragrances, Inc. | | | 8,814 | | | | 1,038,554 | |
LyondellBasell Inds. NV Cl A | | | 35,316 | | | | 3,029,406 | |
| | | | | | | | |
Martin Marietta Materials, Inc. | | | 6,537 | | | | 1,448,142 | |
Monsanto Co. | | | 47,603 | | | | 5,008,312 | |
Newmont Mining Corp. | | | 59,109 | | | | 2,013,844 | |
Nucor Corp. | | | 33,796 | | | | 2,011,538 | |
PPG Industries, Inc. | | | 28,063 | | | | 2,659,250 | |
Praxair, Inc. | | | 30,535 | | | | 3,578,397 | |
Sealed Air Corp. | | | 22,084 | | | | 1,001,289 | |
Sherwin-Williams Co. | | | 8,527 | | | | 2,291,546 | |
The Mosaic Co. | | | 35,117 | | | | 1,029,982 | |
Vulcan Materials Co. | | | 13,449 | | | | 1,683,142 | |
WestRock Co. | | | 27,835 | | | | 1,413,183 | |
| | | | | | | | |
| | | | | | | 58,369,374 | |
| | | | | | | | |
REAL ESTATE (2.8%) | | | | | | | | |
American Tower Corp. | | | 45,187 | | | | 4,775,362 | |
Apartment Investment & Management Co. Cl A | | | 18,905 | | | | 859,232 | |
AvalonBay Communities, Inc. | | | 14,542 | | | | 2,576,115 | |
Boston Properties, Inc. | | | 16,826 | | | | 2,116,374 | |
CBRE Group, Inc.* | | | 32,694 | | | | 1,029,534 | |
Crown Castle Int’l. Corp. | | | 39,008 | | | | 3,384,724 | |
Digital Realty Trust, Inc. | | | 17,395 | | | | 1,709,233 | |
Equinix, Inc. | | | 7,739 | | | | 2,765,996 | |
Equity Residential | | | 39,202 | | | | 2,523,041 | |
Essex Property Trust, Inc. | | | 7,348 | | | | 1,708,410 | |
Extra Space Storage, Inc. | | | 14,034 | | | | 1,083,986 | |
Federal Realty Investment Trust | | | 7,395 | | | | 1,050,903 | |
General Growth Pptys., Inc. | | | 63,381 | | | | 1,583,257 | |
HCP, Inc. | | | 50,091 | | | | 1,488,705 | |
Host Hotels & Resorts, Inc. | | | 76,785 | | | | 1,446,629 | |
Iron Mountain, Inc. | | | 26,042 | | | | 845,844 | |
Kimco Realty Corp. | | | 49,006 | | | | 1,232,991 | |
Mid-America Apt. Communities, Inc. | | | 12,977 | | | | 1,270,708 | |
ProLogis, Inc. | | | 55,554 | | | | 2,932,696 | |
Public Storage | | | 16,223 | | | | 3,625,841 | |
Realty Income Corp. | | | 26,263 | | | | 1,509,597 | |
Simon Property Group, Inc. | | | 33,396 | | | | 5,933,467 | |
SL Green Realty Corp | | | 11,412 | | | | 1,227,361 | |
The Macerich Co. | | | 11,906 | | | | 843,421 | |
UDR, Inc. | | | 29,712 | | | | 1,083,894 | |
Ventas, Inc. | | | 37,505 | | | | 2,344,813 | |
Vornado Realty Trust | | | 18,209 | | | | 1,900,473 | |
Welltower, Inc. | | | 38,467 | | | | 2,574,596 | |
Weyerhaeuser Co. | | | 81,561 | | | | 2,454,170 | |
| | | | | | | | |
| | | | | | | 59,881,373 | |
| | | | | | | | |
TELECOMMUNICATION SERVICES (2.6%) | | | | | | | | |
AT&T, Inc. | | | 656,968 | | | | 27,940,849 | |
CenturyLink, Inc. | | | 61,227 | | | | 1,455,978 | |
Frontier Communications Corp. | | | 119,670 | | | | 404,485 | |
Level 3 Communications, Inc.* | | | 29,631 | | | | 1,670,003 | |
Verizon Communications, Inc. | | | 436,847 | | | | 23,318,893 | |
| | | | | | | | |
| | | | | | | 54,790,208 | |
| | | | | | | | |
UTILITIES (3.0%) | | | | | | | | |
AES Corp. | | | 70,328 | | | | 817,211 | |
Alliant Energy Corp. | | | 22,202 | | | | 841,234 | |
Ameren Corp. | | | 24,219 | | | | 1,270,529 | |
American Electric Power Co., Inc. | | | 53,254 | | | | 3,352,872 | |
American Water Works Co., Inc. | | | 20,022 | | | | 1,448,792 | |
CenterPoint Energy, Inc. | | | 42,748 | | | | 1,053,311 | |
CMS Energy Corp. | | | 30,140 | | | | 1,254,427 | |
Consolidated Edison, Inc. | | | 31,319 | | | | 2,307,584 | |
Dominion Resources, Inc. | | | 65,972 | | | | 5,052,795 | |
DTE Energy Co. | | | 19,121 | | | | 1,883,610 | |
Duke Energy Corp. | | | 73,472 | | | | 5,702,897 | |
Edison International | | | 35,189 | | | | 2,533,256 | |
Entergy Corp. | | | 19,979 | | | | 1,467,857 | |
Eversource Energy | | | 34,435 | | | | 1,901,845 | |
| | | | | | | | |
Exelon Corp. | | | 97,954 | | | | 3,476,387 | |
FirstEnergy Corp. | | | 45,887 | | | | 1,421,120 | |
NextEra Energy, Inc. | | | 50,825 | | | | 6,071,555 | |
NiSource, Inc. | | | 37,784 | | | | 836,538 | |
NRG Energy, Inc. | | | 33,298 | | | | 408,233 | |
PG&E Corp. | | | 54,695 | | | | 3,323,815 | |
Pinnacle West Capital Corp. | | | 10,810 | | | | 843,504 | |
PPL Corp. | | | 72,530 | | | | 2,469,647 | |
Public Svc. Enterprise Group, Inc. | | | 51,919 | | | | 2,278,206 | |
SCANA Corp. | | | 14,052 | | | | 1,029,731 | |
Sempra Energy | | | 26,576 | | | | 2,674,609 | |
Southern Co. | | | 106,629 | | | | 5,245,081 | |
WEC Energy Group, Inc. | | | 32,291 | | | | 1,893,867 | |
Xcel Energy, Inc. | | | 56,358 | | | | 2,293,771 | |
| | | | | | | | |
| | | | | | | 65,154,284 | |
| | | | | | | | |
TOTAL INDEXED ASSETS - COMMON STOCKS
(Cost: $1,292,925,575) 96.2% | | | | | | | 2,062,577,687 | |
| | | | | | | | |
| | | | | | | | | | | | | | | | | | | | |
| | | Rating** | | | Rate(%) | | | Maturity | | | Face Amount | | | Value | |
SHORT-TERM DEBT SECURITIES: | | | | | | | | | | | | | | | | | | | | |
U.S. GOVERNMENT (1.2%) | | | | | | | | | | | | | | | | | | | | |
U.S. Treasury Bill (1) | | | A-1+ | | | | 0.31 | | | | 01/19/17 | | | | 3,900,000 | | | | 3,899,372 | |
U.S. Treasury Bill (1) | | | A-1+ | | | | 0.41 | | | | 01/26/17 | | | | 6,000,000 | | | | 5,998,201 | |
U.S. Treasury Bill (1) | | | A-1+ | | | | 0.42 | | | | 02/09/17 | | | | 1,000,000 | | | | 999,533 | |
U.S. Treasury Bill (1) | | | A-1+ | | | | 0.43 | | | | 02/09/17 | | | | 4,000,000 | | | | 3,998,088 | |
U.S. Treasury Bill (1) | | | A-1+ | | | | 0.44 | | | | 01/12/17 | | | | 5,000,000 | | | | 4,999,275 | |
U.S. Treasury Bill (1) | | | A-1+ | | | | 0.46 | | | | 02/23/17 | | | | 5,000,000 | | | | 4,996,549 | |
| | | | | | | | | | | | | | | | | | | | |
| | | | | | | | | | | | | | | | | | | 24,891,018 | |
| | | | | | | | | | | | | | | | | | | | |
U.S. GOVERNMENT AGENCIES (0.5%) | | | | | | | | | | | | | | | | | | | | |
FHLB | | | A-1+ | | | | 0.49 | | | | 02/07/17 | | | | 10,500,000 | | | | 10,494,625 | |
| | | | | | | | | | | | | | | | | | | | |
COMMERCIAL PAPER (2.0%) | | | | | | | | | | | | | | | | | | | | |
Cargill, Inc.† | | | A-1 | | | | 0.64 | | | | 01/06/17 | | | | 2,400,000 | | | | 2,399,744 | |
Cargill, Inc.† | | | A-1 | | | | 0.71 | | | | 01/03/17 | | | | 5,000,000 | | | | 4,999,704 | |
Danaher Corp.† | | | A-1 | | | | 0.70 | | | | 01/06/17 | | | | 4,000,000 | | | | 3,999,533 | |
GE Capital Treasury LLC | | | A-1+ | | | | 0.56 | | | | 02/06/17 | | | | 10,000,000 | | | | 9,994,242 | |
Intercontinental Exchange, Inc.† | | | A-1 | | | | 0.68 | | | | 01/03/17 | | | | 4,249,000 | | | | 4,248,759 | |
Southern California Gas Co.† | | | A-1 | | | | 0.70 | | | | 01/03/17 | | | | 6,000,000 | | | | 5,999,650 | |
Toyota Motor Credit Corp. | | | A-1+ | | | | 0.58 | | | | 01/24/17 | | | | 5,000,000 | | | | 4,998,066 | |
Toyota Motor Credit Corp. | | | A-1+ | | | | 0.65 | | | | 02/01/17 | | | | 5,000,000 | | | | 4,997,109 | |
Toyota Motor Credit Corp. | | | A-1+ | | | | 0.78 | | | | 01/04/17 | | | | 1,400,000 | | | | 1,399,878 | |
| | | | | | | | | | | | | | | | | | | | |
| | | | | | | | | | | | | | | | | | | 43,036,685 | |
| | | | | | | | | | | | | | | | | | | | |
TOTAL SHORT-TERM DEBT SECURITIES
(Cost: $78,422,328) 3.7% | | | | | | | | | | | | | | | | | | | 78,422,328 | |
| | | | | | | | | | | | | | | | | | | | |
TOTAL INVESTMENTS
(Cost: $1,371,347,903) 99.9% | | | | | | | | | | | | | | | | | | | 2,141,000,015 | |
| | | | | | | | | | | | | | | | | | | | |
OTHER NET ASSETS 0.1% | | | | | | | | | | | | | | | | | | | 2,317,722 | |
| | | | | | | | | | | | | | | | | | | | |
NET ASSETS 100.0% | | | | | | | | | | | | | | | | | | $ | 2,143,317,737 | |
| | | | | | | | | | | | | | | | | | | | |
The accompanying notes are an integral part of these portfolio schedules.
MUTUAL OF AMERICA INVESTMENT CORPORATION - ALL AMERICA FUND
PORTFOLIO OF INVESTMENTS IN SECURITIES
December 31, 2016
| | | | | | | | |
| | | Shares | | | Value | |
INDEXED ASSETS: | | | | | | | | |
COMMON STOCKS: | | | | | | | | |
CONSUMER DISCRETIONARY (6.1%) | | | | | | | | |
Advance Auto Parts, Inc. | | | 615 | | | | 104,009 | |
Amazon.com, Inc.* | | | 3,065 | | | | 2,298,352 | |
AutoNation, Inc.* | | | 629 | | | | 30,601 | |
AutoZone, Inc.* | | | 228 | | | | 180,072 | |
Bed Bath & Beyond, Inc. | | | 1,276 | | | | 51,857 | |
Best Buy Co., Inc. | | | 2,210 | | | | 94,301 | |
BorgWarner, Inc. | | | 1,526 | | | | 60,185 | |
CarMax, Inc.* | | | 1,443 | | | | 92,915 | |
Carnival Corp. | | | 3,195 | | | | 166,332 | |
CBS Corp. Cl B | | | 3,047 | | | | 193,850 | |
Charter Communications, Inc. Cl A* | | | 1,672 | | | | 481,402 | |
Chipotle Mexican Grill, Inc.* | | | 232 | | | | 87,538 | |
Coach, Inc. | | | 2,115 | | | | 74,067 | |
Comcast Corp. Cl A | | | 18,599 | | | | 1,284,261 | |
D.R. Horton, Inc. | | | 2,689 | | | | 73,490 | |
Darden Restaurants, Inc. | | | 1,007 | | | | 73,229 | |
Delphi Automotive PLC | | | 2,211 | | | | 148,911 | |
Discovery Communications, Inc. Cl A* | | | 1,049 | | | | 28,753 | |
Discovery Communications, Inc. Cl C* | | | 1,626 | | | | 43,544 | |
Disney (Walt) Co. | | | 11,342 | | | | 1,182,063 | |
Dollar General Corp. | | | 1,955 | | | | 144,807 | |
Dollar Tree, Inc.* | | | 1,780 | | | | 137,380 | |
Expedia, Inc. | | | 908 | | | | 102,858 | |
Foot Locker, Inc. | | | 996 | | | | 70,606 | |
Ford Motor Co. | | | 29,980 | | | | 363,657 | |
Gap, Inc. | | | 1,847 | | | | 41,447 | |
Garmin Ltd. | | | 925 | | | | 44,853 | |
General Motors Co. | | | 10,847 | | | | 377,909 | |
Genuine Parts Co. | | | 1,227 | | | | 117,228 | |
Goodyear Tire & Rubber Co. | | | 1,843 | | | | 56,893 | |
H&R Block, Inc. | | | 1,615 | | | | 37,129 | |
Hanesbrands, Inc. | | | 2,781 | | | | 59,986 | |
Harley-Davidson, Inc. | | | 1,264 | | | | 73,742 | |
Harman Int’l. Industries, Inc. | | | 547 | | | | 60,805 | |
Hasbro, Inc. | | | 920 | | | | 71,567 | |
Home Depot, Inc. | | | 9,445 | | | | 1,266,386 | |
Interpublic Group of Cos., Inc. | | | 3,163 | | | | 74,046 | |
Kohl’s Corp. | | | 1,418 | | | | 70,021 | |
L Brands, Inc. | | | 1,951 | | | | 128,454 | |
Leggett & Platt, Inc. | | | 907 | | | | 44,334 | |
Lennar Corp. Cl A | | | 1,389 | | | | 59,630 | |
LKQ Corp.* | | | 2,314 | | | | 70,924 | |
Lowe’s Cos., Inc. | | | 6,810 | | | | 484,327 | |
Macy’s, Inc. | | | 2,341 | | | | 83,831 | |
Marriott International, Inc. Cl A | | | 2,504 | | | | 207,031 | |
Mattel, Inc. | | | 2,619 | | | | 72,153 | |
McDonald’s Corp. | | | 6,511 | | | | 792,519 | |
Michael Kors Hldgs. Ltd.* | | | 1,319 | | | | 56,691 | |
Mohawk Industries, Inc.* | | | 459 | | | | 91,653 | |
Netflix, Inc.* | | | 3,287 | | | | 406,931 | |
Newell Brands, Inc. | | | 3,608 | | | | 161,097 | |
News Corp. Cl A | | | 2,589 | | | | 29,670 | |
News Corp. Cl B | | | 1,257 | | | | 14,833 | |
NIKE, Inc. Cl B | | | 10,360 | | | | 526,599 | |
Nordstrom, Inc. | | | 888 | | | | 42,562 | |
Omnicom Group, Inc. | | | 1,753 | | | | 149,198 | |
O’Reilly Automotive, Inc.* | | | 758 | | | | 211,035 | |
MUTUAL OF AMERICA INVESTMENT CORPORATION - ALL AMERICA FUND
PORTFOLIO OF INVESTMENTS IN SECURITIES
December 31, 2016
| | | | | | | | |
Priceline Group Inc.* | | | 388 | | | | 568,831 | |
PulteGroup, Inc. | | | 2,406 | | | | 44,222 | |
PVH Corp. | | | 648 | | | | 58,476 | |
Ralph Lauren Corp. | | | 470 | | | | 42,450 | |
Ross Stores, Inc. | | | 3,095 | | | | 203,032 | |
Royal Caribbean Cruises Ltd. | | | 1,249 | | | | 102,468 | |
Scripps Networks Interactive, Inc. Cl A | | | 641 | | | | 45,748 | |
Signet Jewelers Ltd. | | | 480 | | | | 45,245 | |
Staples, Inc. | | | 4,553 | | | | 41,205 | |
Starbucks Corp. | | | 11,294 | | | | 627,043 | |
Target Corp. | | | 4,291 | | | | 309,939 | |
TEGNA, Inc. | | | 1,354 | | | | 28,962 | |
Tiffany & Co. | | | 751 | | | | 58,150 | |
Time Warner, Inc. | | | 6,060 | | | | 584,972 | |
TJX Cos., Inc. | | | 5,082 | | | | 381,811 | |
Tractor Supply Co. | | | 991 | | | | 75,128 | |
TripAdvisor, Inc.* | | | 954 | | | | 44,237 | |
Twenty-First Century Fox, Inc. Cl A | | | 8,029 | | | | 225,133 | |
Twenty-First Century Fox, Inc. Cl B | | | 3,804 | | | | 103,659 | |
Ulta Salon, Cosmetics & Fragrances, Inc.* | | | 460 | | | | 117,272 | |
Under Armour, Inc. Cl A* | | | 1,483 | | | | 43,081 | |
Under Armour, Inc. Cl C* | | | 1,182 | | | | 29,751 | |
Urban Outfitters, Inc.* | | | 492 | | | | 14,012 | |
V.F. Corp. | | | 2,533 | | | | 135,136 | |
Viacom, Inc. Cl B | | | 2,533 | | | | 88,908 | |
Whirlpool Corp. | | | 610 | | | | 110,880 | |
Wyndham Worldwide Corp. | | | 783 | | | | 59,798 | |
Wynn Resorts Ltd. | | | 659 | | | | 57,010 | |
Yum! Brands, Inc. | | | 2,595 | | | | 164,341 | |
| | | | | | | | |
| | | | | | | 17,965,424 | |
| | | | | | | | |
CONSUMER STAPLES (4.7%) | | | | | | | | |
Altria Group, Inc. | | | 15,147 | | | | 1,024,240 | |
Archer-Daniels-Midland Co. | | | 4,584 | | | | 209,260 | |
Brown-Forman Corp. Cl B | | | 1,333 | | | | 59,878 | |
Campbell Soup Co. | | | 1,525 | | | | 92,217 | |
Church & Dwight Co., Inc. | | | 2,029 | | | | 89,662 | |
Clorox Co. | | | 1,021 | | | | 122,540 | |
Coca-Cola Co. | | | 30,288 | | | | 1,255,740 | |
Colgate-Palmolive Co. | | | 6,878 | | | | 450,096 | |
Conagra Brands, Inc. | | | 3,160 | | | | 124,978 | |
Constellation Brands, Inc. Cl A | | | 1,344 | | | | 206,049 | |
Costco Wholesale Corp. | | | 3,394 | | | | 543,413 | |
Coty, Inc. Cl A | | | 4,040 | | | | 73,972 | |
CVS Health Corp. | | | 8,207 | | | | 647,614 | |
Dr. Pepper Snapple Group, Inc. | | | 1,501 | | | | 136,096 | |
Estee Lauder Cos., Inc. Cl A | | | 1,772 | | | | 135,540 | |
General Mills, Inc. | | | 4,543 | | | | 280,621 | |
Hershey Co. | | | 1,050 | | | | 108,602 | |
Hormel Foods Corp. | | | 2,175 | | | | 75,712 | |
J.M. Smucker Co. | | | 940 | | | | 120,376 | |
Kellogg Co. | | | 2,066 | | | | 152,285 | |
Kimberly-Clark Corp. | | | 2,739 | | | | 312,575 | |
Kraft Heinz Co. | | | 4,588 | | | | 400,624 | |
Kroger Co. | | | 7,193 | | | | 248,230 | |
McCormick & Co., Inc. | | | 818 | | | | 76,344 | |
Mead Johnson Nutrition Co. | | | 1,473 | | | | 104,229 | |
Molson Coors Brewing Co. Cl B | | | 1,388 | | | | 135,066 | |
Mondelez International, Inc. Cl A | | | 11,944 | | | | 529,478 | |
Monster Beverage Corp.* | | | 3,061 | | | | 135,725 | |
PepsiCo, Inc. | | | 11,184 | | | | 1,170,182 | |
Philip Morris Int’l., Inc. | | | 11,981 | | | | 1,096,142 | |
MUTUAL OF AMERICA INVESTMENT CORPORATION - ALL AMERICA FUND
PORTFOLIO OF INVESTMENTS IN SECURITIES
December 31, 2016
| | | | | | | | |
Proctor & Gamble Co. | | | 20,817 | | | | 1,750,293 | |
Reynolds American, Inc. | | | 6,542 | | | | 366,614 | |
Sysco Corp. | | | 4,008 | | | | 221,923 | |
Tyson Foods, Inc. Cl A | | | 2,175 | | | | 134,154 | |
Walgreens Boots Alliance, Inc. | | | 6,648 | | | | 550,188 | |
Wal-Mart Stores, Inc. | | | 11,644 | | | | 804,833 | |
Whole Foods Market, Inc. | | | 2,367 | | | | 72,809 | |
| | | | | | | | |
| | | | | | | 14,018,300 | |
| | | | | | | | |
ENERGY (3.8%) | | | | | | | | |
Anadarko Petroleum Corp. | | | 4,274 | | | | 298,026 | |
Apache Corp. | | | 2,961 | | | | 187,935 | |
Baker Hughes, Inc. | | | 3,227 | | | | 209,658 | |
Cabot Oil & Gas Corp. | | | 3,458 | | | | 80,779 | |
Chesapeake Energy Corp.* | | | 6,321 | | | | 44,373 | |
Chevron Corp. | | | 14,659 | | | | 1,725,364 | |
Cimarex Energy Co. | | | 772 | | | | 104,915 | |
Concho Resources, Inc.* | | | 1,095 | | | | 145,197 | |
ConocoPhillips | | | 9,650 | | | | 483,851 | |
Devon Energy Corp. | | | 4,148 | | | | 189,439 | |
EOG Resources, Inc. | | | 4,547 | | | | 459,702 | |
EQT Corp. | | | 1,404 | | | | 91,822 | |
Exxon Mobil Corp. | | | 32,336 | | | | 2,918,643 | |
FMC Technologies, Inc.* | | | 1,741 | | | | 61,858 | |
Halliburton Co. | | | 6,711 | | | | 362,998 | |
Helmerich & Payne, Inc. | | | 767 | | | | 59,366 | |
Hess Corp. | | | 2,181 | | | | 135,854 | |
Kinder Morgan, Inc. | | | 14,952 | | | | 309,656 | |
Marathon Oil Corp. | | | 6,421 | | | | 111,148 | |
Marathon Petroleum Corp. | | | 4,206 | | | | 211,772 | |
Murphy Oil Corp. | | | 1,360 | | | | 42,337 | |
National Oilwell Varco, Inc. | | | 3,099 | | | | 116,027 | |
Newfield Exploration Co.* | | | 1,677 | | | | 67,919 | |
Noble Energy, Inc. | | | 3,302 | | | | 125,674 | |
Occidental Petroleum Corp. | | | 6,039 | | | | 430,158 | |
ONEOK, Inc. | | | 1,554 | | | | 89,215 | |
Phillips 66 | | | 3,466 | | | | 299,497 | |
Pioneer Natural Resources Co. | | | 1,304 | | | | 234,811 | |
Range Resources Corp. | | | 1,326 | | | | 45,561 | |
Schlumberger Ltd. | | | 10,837 | | | | 909,766 | |
Southwestern Energy Co.* | | | 4,316 | | | | 46,699 | |
Spectra Energy Corp. | | | 5,433 | | | | 223,242 | |
Tesoro Corp. | | | 839 | | | | 73,371 | |
Transocean Ltd.* | | | 3,007 | | | | 44,323 | |
Valero Energy Corp. | | | 3,566 | | | | 243,629 | |
Williams Cos., Inc. | | | 5,504 | | | | 171,395 | |
| | | | | | | | |
| | | | | | | 11,355,980 | |
| | | | | | | | |
FINANCIALS (7.6%) | | | | | | | | |
Affiliated Managers Group, Inc.* | | | 400 | | | | 58,120 | |
Aflac, Inc. | | | 3,276 | | | | 228,010 | |
Allstate Corp. | | | 2,870 | | | | 212,724 | |
American Express Co. | | | 6,051 | | | | 448,258 | |
American Int’l. Group, Inc. | | | 7,520 | | | | 491,131 | |
Ameriprise Financial, Inc. | | | 1,198 | | | | 132,906 | |
Aon PLC | | | 2,024 | | | | 225,737 | |
Assurant, Inc. | | | 495 | | | | 45,966 | |
Bank of America Corp. | | | 78,805 | | | | 1,741,591 | |
Bank of New York Mellon Corp. | | | 8,209 | | | | 388,942 | |
BB&T Corp. | | | 6,457 | | | | 303,608 | |
Berkshire Hathaway, Inc. Cl B* | | | 14,755 | | | | 2,404,770 | |
BlackRock, Inc. | | | 961 | | | | 365,699 | |
Capital One Financial Corp. | | | 3,717 | | | | 324,271 | |
MUTUAL OF AMERICA INVESTMENT CORPORATION - ALL AMERICA FUND
PORTFOLIO OF INVESTMENTS IN SECURITIES
December 31, 2016
| | | | | | | | |
Charles Schwab Corp. | | | 9,257 | | | | 365,374 | |
Chubb Ltd. | | | 3,659 | | | | 483,427 | |
Cincinnati Financial Corp. | | | 1,190 | | | | 90,143 | |
Citigroup, Inc. | | | 22,223 | | | | 1,320,713 | |
Citizens Financial Group, Inc. | | | 3,822 | | | | 136,178 | |
CME Group, Inc. | | | 2,596 | | | | 299,449 | |
Comerica, Inc. | | | 1,328 | | | | 90,450 | |
Discover Financial Svcs. | | | 3,160 | | | | 227,804 | |
E*Trade Financial Corp.* | | | 2,170 | | | | 75,191 | |
Fifth Third Bancorp | | | 6,150 | | | | 165,866 | |
Franklin Resources, Inc. | | | 2,672 | | | | 105,758 | |
Gallagher (Arthur J.) & Co. | | | 1,474 | | | | 76,589 | |
Goldman Sachs Group, Inc. | | | 2,893 | | | | 692,729 | |
Hartford Financial Svcs. Group, Inc. | | | 2,848 | | | | 135,707 | |
Huntington Bancshares, Inc. | | | 8,035 | | | | 106,223 | |
Intercontinental Exchange, Inc. | | | 4,671 | | | | 263,538 | |
Invesco Ltd. | | | 3,316 | | | | 100,607 | |
iShares Core S&P 500 ETF | | | 348 | | | | 78,297 | |
JPMorgan Chase & Co. | | | 27,992 | | | | 2,415,430 | |
KeyCorp | | | 8,298 | | | | 151,604 | |
Leucadia National Corp. | | | 2,568 | | | | 59,706 | |
Lincoln National Corp. | | | 1,817 | | | | 120,413 | |
Loews Corp. | | | 2,233 | | | | 104,571 | |
M&T Bank Corp. | | | 1,186 | | | | 185,526 | |
Marsh & McLennan Cos., Inc. | | | 3,972 | | | | 268,467 | |
MetLife, Inc. | | | 8,572 | | | | 461,945 | |
Moody’s Corp. | | | 1,252 | | | | 118,026 | |
Morgan Stanley | | | 11,300 | | | | 477,425 | |
Nasdaq, Inc. | | | 887 | | | | 59,535 | |
Navient Corp. | | | 2,364 | | | | 38,841 | |
Northern Trust Corp. | | | 1,691 | | | | 150,584 | |
People’s United Financial, Inc. | | | 2,363 | | | | 45,748 | |
PNC Financial Svcs. Grp., Inc. | | | 3,808 | | | | 445,384 | |
Principal Financial Grp., Inc. | | | 2,080 | | | | 120,349 | |
Progressive Corp. | | | 4,650 | | | | 165,075 | |
Prudential Financial, Inc. | | | 3,413 | | | | 355,157 | |
Regions Financial Corp. | | | 9,464 | | | | 135,903 | |
S&P Global, Inc. | | | 1,992 | | | | 214,220 | |
State Street Corp. | | | 2,855 | | | | 221,891 | |
SunTrust Banks, Inc. | | | 3,813 | | | | 209,143 | |
Synchrony Financial | | | 6,191 | | | | 224,548 | |
T. Rowe Price Group, Inc. | | | 1,974 | | | | 148,563 | |
Torchmark Corp. | | | 826 | | | | 60,926 | |
Travelers Cos., Inc. | | | 2,240 | | | | 274,221 | |
U.S. Bancorp | | | 12,546 | | | | 644,488 | |
Unum Group | | | 1,729 | | | | 75,955 | |
Wells Fargo & Co. | | | 35,090 | | | | 1,933,810 | |
Willis Towers Watson PLC | | | 989 | | | | 120,935 | |
XL Group Ltd. | | | 2,079 | | | | 77,464 | |
Zions Bancorporation | | | 1,424 | | | | 61,289 | |
| | | | | | | | |
| | | | | | | 22,332,918 | |
| | | | | | | | |
HEALTH CARE (6.9%) | | | | | | | | |
Abbott Laboratories | | | 11,406 | | | | 438,104 | |
AbbVie, Inc. | | | 12,666 | | | | 793,145 | |
Aetna, Inc. | | | 2,762 | | | | 342,516 | |
Agilent Technologies, Inc. | | | 2,618 | | | | 119,276 | |
Alexion Pharmaceuticals, Inc.* | | | 1,769 | | | | 216,437 | |
Allergan PLC* | | | 2,915 | | | | 612,179 | |
AmerisourceBergen Corp. | | | 1,372 | | | | 107,277 | |
Amgen, Inc. | | | 5,779 | | | | 844,948 | |
Anthem, Inc. | | | 1,998 | | | | 287,252 | |
MUTUAL OF AMERICA INVESTMENT CORPORATION - ALL AMERICA FUND
PORTFOLIO OF INVESTMENTS IN SECURITIES
December 31, 2016
| | | | | | | | |
Bard (C.R.), Inc. | | | 547 | | | | 122,889 | |
Baxter International, Inc. | | | 3,724 | | | | 165,122 | |
Becton, Dickinson & Co. | | | 1,621 | | | | 268,362 | |
BIOGEN, Inc.* | | | 1,684 | | | | 477,549 | |
Boston Scientific Corp.* | | | 10,630 | | | | 229,927 | |
Bristol-Myers Squibb Co. | | | 12,940 | | | | 756,214 | |
Cardinal Health, Inc. | | | 2,479 | | | | 178,414 | |
Celgene Corp.* | | | 6,094 | | | | 705,381 | |
Centene Corp.* | | | 1,355 | | | | 76,571 | |
Cerner Corp.* | | | 2,477 | | | | 117,335 | |
CIGNA Corp. | | | 2,005 | | | | 267,447 | |
Cooper Companies, Inc. | | | 345 | | | | 60,351 | |
Danaher Corp. | | | 4,755 | | | | 370,129 | |
DaVita Inc Inc.* | | | 1,177 | | | | 75,563 | |
DENTSPLY SIRONA, Inc. | | | 1,762 | | | | 101,720 | |
Edwards Lifesciences Corp.* | | | 1,660 | | | | 155,542 | |
Endo International PLC* | | | 1,891 | | | | 31,145 | |
Envision Healthcare Corp.* | | | 911 | | | | 57,657 | |
Express Scripts Hldg. Co.* | | | 4,788 | | | | 329,367 | |
Gilead Sciences, Inc. | | | 10,167 | | | | 728,059 | |
HCA Hldgs., Inc.* | | | 2,260 | | | | 167,285 | |
Hologic, Inc.* | | | 2,251 | | | | 90,310 | |
Humana, Inc. | | | 1,190 | | | | 242,796 | |
Illumina, Inc.* | | | 1,169 | | | | 149,679 | |
Intuitive Surgical, Inc.* | | | 307 | | | | 194,690 | |
Johnson & Johnson | | | 21,192 | | | | 2,441,530 | |
Laboratory Corp. of America Hldgs.* | | | 834 | | | | 107,069 | |
Lilly (Eli) & Co. | | | 7,567 | | | | 556,553 | |
Mallinckrodt PLC* | | | 854 | | | | 42,546 | |
McKesson Corp. | | | 1,706 | | | | 239,608 | |
Medtronic PLC | | | 10,687 | | | | 761,235 | |
Merck & Co., Inc. | | | 21,354 | | | | 1,257,110 | |
Mettler-Toledo Int’l., Inc.* | | | 213 | | | | 89,153 | |
Mylan NV* | | | 3,575 | | | | 136,386 | |
Patterson Cos., Inc. | | | 745 | | | | 30,567 | |
PerkinElmer, Inc. | | | 842 | | | | 43,910 | |
Perrigo Co. PLC | | | 1,095 | | | | 91,137 | |
Pfizer, Inc. | | | 47,363 | | | | 1,538,350 | |
Quest Diagnostics, Inc. | | | 1,146 | | | | 105,317 | |
Regeneron Pharmaceuticals, Inc.* | | | 595 | | | | 218,419 | |
Schein (Henry), Inc.* | | | 591 | | | | 89,661 | |
St. Jude Medical, Inc. | | | 2,286 | | | | 183,314 | |
Stryker Corp. | | | 2,421 | | | | 290,060 | |
Thermo Fisher Scientific, Inc. | | | 3,061 | | | | 431,907 | |
UnitedHealth Group, Inc. | | | 7,388 | | | | 1,182,376 | |
Universal Health Svcs., Inc. Cl B | | | 705 | | | | 74,998 | |
Varian Medical Systems, Inc.* | | | 662 | | | | 59,434 | |
Vertex Pharmaceuticals, Inc.* | | | 1,968 | | | | 144,983 | |
Waters Corp.* | | | 659 | | | | 88,563 | |
Zimmer Biomet Hldgs., Inc. | | | 1,617 | | | | 166,874 | |
Zoetis, Inc. | | | 3,747 | | | | 200,577 | |
| | | | | | | | |
| | | | | | | 20,452,275 | |
| | | | | | | | |
INDUSTRIALS (5.2%) | | | | | | | | |
3M Co. | | | 4,672 | | | | 834,279 | |
Acuity Brands, Inc. | | | 364 | | | | 84,033 | |
Alaska Air Group, Inc. | | | 1,012 | | | | 89,795 | |
Allegion PLC | | | 704 | | | | 45,056 | |
American Airlines Group, Inc. | | | 4,087 | | | | 190,822 | |
AMETEK, Inc. | | | 1,836 | | | | 89,230 | |
Arconic, Inc. | | | 3,676 | | | | 68,153 | |
Boeing Co. | | | 4,480 | | | | 697,446 | |
MUTUAL OF AMERICA INVESTMENT CORPORATION - ALL AMERICA FUND
PORTFOLIO OF INVESTMENTS IN SECURITIES
December 31, 2016
| | | | | | | | |
Caterpillar, Inc. | | | 4,534 | | | | 420,483 | |
Cintas Corp. | | | 630 | | | | 72,803 | |
CSX Corp. | | | 7,120 | | | | 255,822 | |
Cummins, Inc. | | | 1,207 | | | | 164,961 | |
Deere & Co. | | | 2,233 | | | | 230,088 | |
Delta Air Lines, Inc. | | | 5,671 | | | | 278,956 | |
Dover Corp. | | | 1,192 | | | | 89,317 | |
Dun & Bradstreet Corp. | | | 251 | | | | 30,451 | |
Eaton Corp. PLC | | | 3,549 | | | | 238,102 | |
Emerson Electric Co. | | | 5,093 | | | | 283,935 | |
Equifax, Inc. | | | 900 | | | | 106,407 | |
Expeditors Int’l. of Wash. | | | 1,400 | | | | 74,144 | |
Fastenal Co. | | | 2,188 | | | | 102,792 | |
FedEx Corp. | | | 1,931 | | | | 359,552 | |
Flowserve Corp. | | | 936 | | | | 44,975 | |
Fluor Corp. | | | 1,096 | | | | 57,562 | |
Fortive Corp. | | | 2,205 | | | | 118,254 | |
Fortune Brands Home & Security, Inc. | | | 1,096 | | | | 58,592 | |
General Dynamics Corp. | | | 2,237 | | | | 386,240 | |
General Electric Co. | | | 68,666 | | | | 2,169,846 | |
Grainger (W.W.), Inc. | | | 448 | | | | 104,048 | |
Honeywell International, Inc. | | | 5,939 | | | | 688,033 | |
Hunt (J.B.) Transport Svcs., Inc. | | | 624 | | | | 60,572 | |
Illinois Tool Works, Inc. | | | 2,411 | | | | 295,251 | |
Ingersoll-Rand PLC | | | 1,953 | | | | 146,553 | |
Jacobs Engineering Group, Inc.* | | | 1,021 | | | | 58,197 | |
Johnson Controls Int’l. PLC | | | 7,192 | | | | 296,238 | |
Kansas City Southern | | | 871 | | | | 73,904 | |
L3 Technologies, Inc. Inc. | | | 576 | | | | 87,615 | |
Lockheed Martin Corp. | | | 1,983 | | | | 495,631 | |
Masco Corp. | | | 2,390 | | | | 75,572 | |
Nielsen Hldgs. PLC | | | 2,460 | | | | 103,197 | |
Norfolk Southern Corp. | | | 2,262 | | | | 244,454 | |
Northrop Grumman Corp. | | | 1,361 | | | | 316,541 | |
PACCAR, Inc. | | | 2,776 | | | | 177,386 | |
Parker Hannifin Corp. | | | 1,057 | | | | 147,980 | |
Pentair PLC | | | 1,331 | | | | 74,629 | |
Pitney Bowes, Inc. | | | 966 | | | | 14,674 | |
Quanta Services, Inc.* | | | 1,269 | | | | 44,225 | |
Raytheon Co. | | | 2,322 | | | | 329,724 | |
Republic Services, Inc. | | | 1,868 | | | | 106,569 | |
Robert Half Int’l., Inc. | | | 933 | | | | 45,512 | |
Robinson (C.H.) Worldwide, Inc. | | | 1,039 | | | | 76,117 | |
Rockwell Automation, Inc. | | | 1,001 | | | | 134,534 | |
Rockwell Collins, Inc. | | | 967 | | | | 89,699 | |
Roper Technologies, Inc. | | | 810 | | | | 148,295 | |
Ryder System, Inc. | | | 392 | | | | 29,180 | |
Snap-on, Inc. | | | 438 | | | | 75,016 | |
Southwest Airlines Co. | | | 4,804 | | | | 239,431 | |
Stanley Black & Decker, Inc. | | | 1,154 | | | | 132,352 | |
Stericycle, Inc.* | | | 595 | | | | 45,839 | |
Textron, Inc. | | | 2,143 | | | | 104,064 | |
TransDigm Group, Inc. | | | 419 | | | | 104,314 | |
Union Pacific Corp. | | | 6,414 | | | | 665,004 | |
United Continental Hldgs., Inc* | | | 2,219 | | | | 161,721 | |
United Parcel Service, Inc. Cl B | | | 5,359 | | | | 614,356 | |
United Rentals, Inc.* | | | 708 | | | | 74,751 | |
United Technologies Corp. | | | 5,984 | | | | 655,966 | |
Verisk Analytics, Inc. Cl A* | | | 1,292 | | | | 104,872 | |
Waste Management, Inc. | | | 3,221 | | | | 228,401 | |
Xylem, Inc. | | | 1,502 | | | | 74,379 | |
| | | | | | | | |
| | | | | | | 15,386,892 | |
| | | | | | | | |
MUTUAL OF AMERICA INVESTMENT CORPORATION - ALL AMERICA FUND
PORTFOLIO OF INVESTMENTS IN SECURITIES
December 31, 2016
| | | | | | | | |
INFORMATION TECHNOLOGY (10.5%) | | | | | | | | |
Accenture Ltd. Cl A | | | 4,796 | | | | 561,755 | |
Activision Blizzard, Inc. | | | 5,345 | | | | 193,008 | |
Adobe Systems, Inc.* | | | 3,819 | | | | 393,166 | |
Akamai Technologies, Inc.* | | | 1,360 | | | | 90,685 | |
Alliance Data Systems Corp. | | | 462 | | | | 105,567 | |
Alphabet, Inc. Cl A* | | | 2,297 | | | | 1,820,253 | |
Alphabet, Inc. Cl C* | | | 2,310 | | | | 1,782,912 | |
Amphenol Corp. Cl A | | | 2,468 | | | | 165,850 | |
Analog Devices, Inc. | | | 2,298 | | | | 166,881 | |
Apple, Inc. | | | 41,498 | | | | 4,806,293 | |
Applied Materials, Inc. | | | 8,326 | | | | 268,680 | |
Autodesk, Inc.* | | | 1,558 | | | | 115,308 | |
Automatic Data Processing, Inc. | | | 3,464 | | | | 356,030 | |
Broadcom Ltd. | | | 3,131 | | | | 553,467 | |
CA, Inc. | | | 2,346 | | | | 74,532 | |
Cisco Systems, Inc. | | | 38,851 | | | | 1,174,077 | |
Citrix Systems, Inc.* | | | 1,163 | | | | 103,868 | |
Cognizant Technology Solutions* | | | 4,858 | | | | 272,194 | |
Corning, Inc. | | | 7,445 | | | | 180,690 | |
CSRA, Inc. | | | 957 | | | | 30,471 | |
eBay, Inc.* | | | 8,150 | | | | 241,974 | |
Electronic Arts, Inc.* | | | 2,270 | | | | 178,785 | |
F5 Networks, Inc.* | | | 525 | | | | 75,978 | |
Facebook, Inc. Cl A* | | | 18,206 | | | | 2,094,600 | |
Fidelity Nat’l. Information Svcs., Inc. | | | 2,548 | | | | 192,731 | |
First Solar, Inc.* | | | 441 | | | | 14,152 | |
Fiserv, Inc.* | | | 1,696 | | | | 180,251 | |
FLIR Systems, Inc. | | | 1,244 | | | | 45,020 | |
Global Payments, Inc. | | | 1,292 | | | | 89,678 | |
Harris Corp. | | | 1,011 | | | | 103,597 | |
Hewlett Packard Enterprise Co. | | | 12,863 | | | | 297,650 | |
HP, Inc. | | | 12,874 | | | | 191,050 | |
Intel Corp. | | | 36,736 | | | | 1,332,415 | |
Int’l. Business Machines Corp. | | | 6,723 | | | | 1,115,951 | |
Intuit, Inc. | | | 1,937 | | | | 222,000 | |
Juniper Networks, Inc. | | | 3,218 | | | | 90,941 | |
KLA-Tencor Corp. | | | 1,144 | | | | 90,010 | |
Lam Research Corp. | | | 1,296 | | | | 137,026 | |
Linear Technology Corp. | | | 1,946 | | | | 121,333 | |
MasterCard, Inc. Cl A | | | 7,458 | | | | 770,039 | |
Microchip Technology, Inc. | | | 1,629 | | | | 104,500 | |
Micron Technology, Inc.* | | | 8,144 | | | | 178,516 | |
Microsoft Corp. | | | 60,548 | | | | 3,762,448 | |
Motorola Solutions, Inc. | | | 1,270 | | | | 105,270 | |
NetApp, Inc. | | | 2,063 | | | | 72,762 | |
NVIDIA Corp. | | | 4,148 | | | | 442,758 | |
Oracle Corp. | | | 23,251 | | | | 894,001 | |
Paychex, Inc. | | | 2,478 | | | | 150,861 | |
PayPal Hldgs., Inc.* | | | 8,820 | | | | 348,125 | |
Qorvo, Inc.* | | | 1,097 | | | | 57,845 | |
QUALCOMM, Inc. | | | 11,530 | | | | 751,756 | |
Red Hat, Inc.* | | | 1,329 | | | | 92,631 | |
Salesforce.com, inc.* | | | 4,981 | | | | 340,999 | |
Seagate Technology PLC | | | 2,286 | | | | 87,257 | |
Skyworks Solutions, Inc. | | | 1,370 | | | | 102,284 | |
Symantec Corp. | | | 4,993 | | | | 119,283 | |
TE Connectivity Ltd. | | | 2,803 | | | | 194,192 | |
Teradata Corp.* | | | 1,063 | | | | 28,882 | |
Texas Instruments, Inc. | | | 7,873 | | | | 574,493 | |
MUTUAL OF AMERICA INVESTMENT CORPORATION - ALL AMERICA FUND
PORTFOLIO OF INVESTMENTS IN SECURITIES
December 31, 2016
| | | | | | | | |
Total System Services, Inc. | | | 1,209 | | | | 59,277 | |
VeriSign, Inc.* | | | 772 | | | | 58,726 | |
Visa, Inc. Cl A | | | 14,477 | | | | 1,129,496 | |
Western Digital Corp. | | | 2,232 | | | | 151,664 | |
Western Union Co. | | | 3,534 | | | | 76,758 | |
Xerox Corp. | | | 6,678 | | | | 58,299 | |
Xilinx, Inc. | | | 2,046 | | | | 123,517 | |
Yahoo!, Inc.* | | | 6,673 | | | | 258,045 | |
| | | | | | | | |
| | | | | | | 31,125,513 | |
| | | | | | | | |
MATERIALS (1.4%) | | | | | | | | |
Air Products & Chemicals, Inc. | | | 1,736 | | | | 249,672 | |
Albemarle Corp. | | | 851 | | | | 73,254 | |
Avery Dennison Corp. | | | 627 | | | | 44,028 | |
Ball Corp. | | | 1,384 | | | | 103,897 | |
CF Industries Hldgs., Inc. | | | 1,552 | | | | 48,857 | |
Dow Chemical Co. | | | 8,825 | | | | 504,967 | |
Du Pont (E.I.) de Nemours & Co. | | | 6,695 | | | | 491,413 | |
Eastman Chemical Co. | | | 1,192 | | | | 89,650 | |
Ecolab, Inc. | | | 2,009 | | | | 235,495 | |
FMC Corp. | | | 1,051 | | | | 59,445 | |
Freeport-McMoRan Copper & Gold, Inc.* | | | 9,616 | | | | 126,835 | |
International Paper Co. | | | 3,090 | | | | 163,955 | |
Int’l. Flavors & Fragrances, Inc. | | | 640 | | | | 75,411 | |
LyondellBasell Inds. NV Cl A | | | 2,567 | | | | 220,197 | |
Martin Marietta Materials, Inc. | | | 475 | | | | 105,227 | |
Monsanto Co. | | | 3,458 | | | | 363,816 | |
Newmont Mining Corp. | | | 4,294 | | | | 146,297 | |
Nucor Corp. | | | 2,456 | | | | 146,181 | |
PPG Industries, Inc. | | | 2,040 | | | | 193,310 | |
Praxair, Inc. | | | 2,218 | | | | 259,927 | |
Sealed Air Corp. | | | 1,604 | | | | 72,725 | |
Sherwin-Williams Co. | | | 620 | | | | 166,619 | |
The Mosaic Co. | | | 2,552 | | | | 74,850 | |
Vulcan Materials Co. | | | 978 | | | | 122,397 | |
WestRock Co. | | | 2,022 | | | | 102,675 | |
| | | | | | | | |
| | | | | | | 4,241,100 | |
| | | | | | | | |
REAL ESTATE (1.5%) | | | | | | | | |
American Tower Corp. | | | 3,284 | | | | 347,053 | |
Apartment Investment & Management Co. Cl A | | | 1,373 | | | | 62,403 | |
AvalonBay Communities, Inc. | | | 1,057 | | | | 187,248 | |
Boston Properties, Inc. | | | 1,222 | | | | 153,703 | |
CBRE Group, Inc.* | | | 2,375 | | | | 74,789 | |
Crown Castle Int’l. Corp. | | | 2,834 | | | | 245,906 | |
Digital Realty Trust, Inc. | | | 1,263 | | | | 124,102 | |
Equinix, Inc. | | | 562 | | | | 200,807 | |
Equity Residential | | | 2,848 | | | | 183,297 | |
Essex Property Trust, Inc. | | | 533 | | | | 123,923 | |
Extra Space Storage, Inc. | | | 1,019 | | | | 78,708 | |
Federal Realty Investment Trust | | | 538 | | | | 76,455 | |
General Growth Pptys., Inc. | | | 4,605 | | | | 115,033 | |
HCP, Inc. | | | 3,639 | | | | 108,151 | |
Host Hotels & Resorts, Inc. | | | 5,580 | | | | 105,127 | |
Iron Mountain, Inc. | | | 1,893 | | | | 61,485 | |
Kimco Realty Corp. | | | 3,560 | | | | 89,570 | |
Mid-America Apt. Communities, Inc. | | | 942 | | | | 92,241 | |
ProLogis, Inc. | | | 4,037 | | | | 213,113 | |
Public Storage | | | 1,178 | | | | 263,283 | |
Realty Income Corp. | | | 1,909 | | | | 109,729 | |
Simon Property Group, Inc. | | | 2,427 | | | | 431,205 | |
SL Green Realty Corp | | | 829 | | | | 89,159 | |
The Macerich Co. | | | 866 | | | | 61,347 | |
MUTUAL OF AMERICA INVESTMENT CORPORATION - ALL AMERICA FUND
PORTFOLIO OF INVESTMENTS IN SECURITIES
December 31, 2016
| | | | | | | | |
UDR, Inc. | | | 2,158 | | | | 78,724 | |
Ventas, Inc. | | | 2,725 | | | | 170,367 | |
Vornado Realty Trust | | | 1,324 | | | | 138,186 | |
Welltower, Inc. | | | 2,795 | | | | 187,069 | |
Weyerhaeuser Co. | | | 5,926 | | | | 178,313 | |
| | | | | | | | |
| | | | | | | 4,350,496 | |
| | | | | | | | |
TELECOMMUNICATION SERVICES (1.4%) | | | | | | | | |
AT&T, Inc. | | | 47,736 | | | | 2,030,212 | |
CenturyLink, Inc. | | | 4,448 | | | | 105,773 | |
Frontier Communications Corp. | | | 8,696 | | | | 29,392 | |
Level 3 Communications, Inc.* | | | 2,153 | | | | 121,343 | |
Verizon Communications, Inc. | | | 31,741 | | | | 1,694,335 | |
| | | | | | | | |
| | | | | | | 3,981,055 | |
| | | | | | | | |
UTILITIES (1.6%) | | | | | | | | |
AES Corp. | | | 5,110 | | | | 59,378 | |
Alliant Energy Corp. | | | 1,614 | | | | 61,154 | |
Ameren Corp. | | | 1,760 | | | | 92,330 | |
American Electric Power Co., Inc. | | | 3,869 | | | | 243,592 | |
American Water Works Co., Inc. | | | 1,454 | | | | 105,211 | |
CenterPoint Energy, Inc. | | | 3,107 | | | | 76,556 | |
CMS Energy Corp. | | | 2,190 | | | | 91,148 | |
Consolidated Edison, Inc. | | | 2,276 | | | | 167,696 | |
Dominion Resources, Inc. | | | 4,794 | | | | 367,172 | |
DTE Energy Co. | | | 1,390 | | | | 136,929 | |
Duke Energy Corp. | | | 5,339 | | | | 414,413 | |
Edison International | | | 2,556 | | | | 184,006 | |
Entergy Corp. | | | 1,451 | | | | 106,605 | |
Eversource Energy | | | 2,502 | | | | 138,185 | |
Exelon Corp. | | | 7,118 | | | | 252,618 | |
FirstEnergy Corp. | | | 3,334 | | | | 103,254 | |
NextEra Energy, Inc. | | | 3,693 | | | | 441,166 | |
NiSource, Inc. | | | 2,745 | | | | 60,774 | |
NRG Energy, Inc. | | | 2,420 | | | | 29,669 | |
PG&E Corp. | | | 3,974 | | | | 241,500 | |
Pinnacle West Capital Corp. | | | 786 | | | | 61,332 | |
PPL Corp. | | | 5,270 | | | | 179,444 | |
Public Svc. Enterprise Group, Inc. | | | 3,773 | | | | 165,559 | |
SCANA Corp. | | | 1,021 | | | | 74,819 | |
Sempra Energy | | | 1,932 | | | | 194,436 | |
Southern Co. | | | 7,747 | | | | 381,075 | |
WEC Energy Group, Inc. | | | 2,347 | | | | 137,652 | |
Xcel Energy, Inc. | | | 4,095 | | | | 166,667 | |
| | | | | | | | |
| | | | | | | 4,734,340 | |
| | | | | | | | |
TOTAL INDEXED ASSETS - COMMON STOCKS
(Cost: $100,287,712) 50.7% | | | | | | | 149,944,293 | |
| | | | | | | | |
| | | | | | | | | | | | | | | | | | | | |
| | | Rating** | | | Rate(%) | | | Maturity | | | Face Amount | | | Value | |
INDEXED ASSETS: | | | | | | | | | | | | | | | | | | | | |
SHORT-TERM DEBT SECURITIES: | | | | | | | | | | | | | | | | | | | | |
U.S. GOVERNMENT (0.7%) | | | | | | | | | | | | | | | | | | | | |
U.S. Treasury Bill (1) | | | A-1+ | | | | 0.34 | | | | 02/09/17 | | | | 200,000 | | | | 199,924 | |
U.S. Treasury Bill (1) | | | A-1+ | | | | 0.47 | | | | 02/09/17 | | | | 2,000,000 | | | | 1,998,955 | |
| | | | | | | | | | | | | | | | | | | | |
| | | | | | | | | | | | | | | | | | | 2,198,879 | |
| | | | | | | | | | | | | | | | | | | | |
COMMERCIAL PAPER (3.5%) | | | | | | | | | | | | | | | | | | | | |
Cargill, Inc.† | | | A-1 | | | | 0.64 | | | | 01/06/17 | | | | 5,000,000 | | | | 4,999,467 | |
Novartis Finance Corp.† | | | A-1+ | | | | 0.50 | | | | 01/03/17 | | | | 5,200,000 | | | | 5,199,783 | |
| | | | | | | | | | | | | | | | | | | | |
| | | | | | | | | | | | | | | | | | | 10,199,250 | |
| | | | | | | | | | | | | | | | | | | | |
TOTAL INDEXED ASSETS - SHORT-TERM DEBT SECURITIES
(Cost: $12,398,129) 4.2% | | | | | | | | | | | | | | | | | | | 12,398,129 | |
| | | | | | | | | | | | | | | | | | | | |
TOTAL INDEXED ASSETS
(Cost: $112,685,841) 54.9% | | | | | | | | | | | | | | | | | | | 162,342,422 | |
| | | | | | | | | | | | | | | | | | | | |
MUTUAL OF AMERICA INVESTMENT CORPORATION - ALL AMERICA FUND
PORTFOLIO OF INVESTMENTS IN SECURITIES
December 31, 2016
| | | | | | | | |
| | | Shares | | | Value | |
ACTIVE ASSETS: | | | | | | | | |
COMMON STOCKS: | | | | | | | | |
CONSUMER DISCRETIONARY (5.3%) | | | | | | | | |
AutoZone, Inc.* | | | 776 | | | | 612,877 | |
Bassett Furniture Industries, Inc. | | | 11,284 | | | | 343,034 | |
Belmond Ltd.* | | | 25,823 | | | | 344,737 | |
Bloomin’ Brands, Inc. | | | 17,879 | | | | 322,358 | |
BorgWarner, Inc. | | | 11,943 | | | | 471,032 | |
Bright Horizons Family Solutions, Inc.* | | | 1,595 | | | | 111,682 | |
Cooper Tire & Rubber Co. | | | 7,051 | | | | 273,931 | |
CST Brands, Inc. | | | 32,328 | | | | 1,556,592 | |
Dick’s Sporting Goods, Inc. | | | 3,800 | | | | 201,780 | |
Dillard’s, Inc. Cl A | | | 595 | | | | 37,301 | |
Dollar Tree, Inc.* | | | 2,718 | | | | 209,775 | |
Drew Industries, Inc. | | | 2,048 | | | | 220,672 | |
Eros International PLC* | | | 14,290 | | | | 186,485 | |
Five Below, Inc.* | | | 9,612 | | | | 384,096 | |
Haverty Furniture Cos., Inc. | | | 19,650 | | | | 465,705 | |
Houghton Mifflin Harcourt Co.* | | | 54,679 | | | | 593,267 | |
HSN, Inc. | | | 5,390 | | | | 184,877 | |
Intrawest Resorts Hldgs., Inc.* | | | 16,857 | | | | 300,897 | |
Liberty Interactive Corp. Ser. A QVC Group* | | | 12,754 | | | | 254,825 | |
Lions Gate Entertainment Corp. Cl A | | | 19,964 | | | | 537,032 | |
Lions Gate Entertainment Corp. Cl B* | | | 19,964 | | | | 489,917 | |
Lithia Motors, Inc. Cl A | | | 6,585 | | | | 637,626 | |
Macy’s, Inc. | | | 2,891 | | | | 103,527 | |
MSG Networks, Inc.* | | | 9,671 | | | | 207,927 | |
NVR, Inc.* | | | 148 | | | | 247,012 | |
Panera Bread Co. Cl A* | | | 6,276 | | | | 1,287,145 | |
Popeyes Louisiana Kitchen, Inc.* | | | 1,873 | | | | 113,279 | |
Ralph Lauren Corp. | | | 5,385 | | | | 486,373 | |
Red Robin Gourmet Burgers, Inc.* | | | 6,273 | | | | 353,797 | |
Scripps Networks Interactive, Inc. Cl A | | | 3,527 | | | | 251,722 | |
Select Comfort Corp.* | | | 39,509 | | | | 893,694 | |
Steve Madden Ltd.* | | | 7,526 | | | | 269,055 | |
Taylor Morrison Home Corp. Cl A* | | | 2,887 | | | | 55,604 | |
Thor Industries, Inc. | | | 7,194 | | | | 719,760 | |
Tractor Supply Co. | | | 6,154 | | | | 466,535 | |
TripAdvisor, Inc.* | | | 1,693 | | | | 78,504 | |
Unifi, Inc.* | | | 10,092 | | | | 329,302 | |
Vista Outdoor, Inc.* | | | 21,161 | | | | 780,841 | |
Wiley (John) & Sons, Inc. Cl A | | | 3,018 | | | | 164,481 | |
| | | | | | | | |
| | | | | | | 15,549,056 | |
| | | | | | | | |
CONSUMER STAPLES (1.6%) | | | | | | | | |
Cal-Maine Foods, Inc. | | | 7,484 | | | | 330,606 | |
Church & Dwight Co., Inc. | | | 11,944 | | | | 527,805 | |
Constellation Brands, Inc. Cl A | | | 3,073 | | | | 471,121 | |
Crimson Wine Group Ltd.* | | | 38,233 | | | | 358,243 | |
Edgewell Personal Care Co.* | | | 1,694 | | | | 123,645 | |
Energizer Hldgs., Inc. | | | 1,694 | | | | 75,569 | |
Farmer Brothers Co.* | | | 5,082 | | | | 186,509 | |
Ingredion, Inc. | | | 1,868 | | | | 233,425 | |
J.M. Smucker Co. | | | 5,262 | | | | 673,852 | |
Orchids Paper Products Co. | | | 1,589 | | | | 41,600 | |
Vector Group Ltd. | | | 29,677 | | | | 674,855 | |
MUTUAL OF AMERICA INVESTMENT CORPORATION - ALL AMERICA FUND
PORTFOLIO OF INVESTMENTS IN SECURITIES
December 31, 2016
| | | | | | | | |
Village Super Market, Inc. Cl A | | | 20,166 | | | | 623,129 | |
WD-40 Co. | | | 4,426 | | | | 517,399 | |
| | | | | | | | |
| | | | | | | 4,837,758 | |
| | | | | | | | |
ENERGY (2.5%) | | | | | | | | |
Abraxas Petroleum Corp.* | | | 45,639 | | | | 117,292 | |
Atwood Oceanics, Inc. | | | 14,193 | | | | 186,354 | |
Baker Hughes, Inc. | | | 3,952 | | | | 256,761 | |
Carrizo Oil and Gas, Inc.* | | | 5,021 | | | | 187,534 | |
Cheniere Energy, Inc.* | | | 7,850 | | | | 325,225 | |
Continental Resources, Inc.* | | | 12,749 | | | | 657,083 | |
CrossAmerica Partners LP | | | 5,967 | | | | 150,309 | |
FMC Technologies, Inc.* | | | 8,756 | | | | 311,101 | |
Gulfport Energy Corp.* | | | 34,957 | | | | 756,470 | |
Hess Corp. | | | 3,210 | | | | 199,951 | |
Matador Resources Co.* | | | 10,081 | | | | 259,687 | |
Matrix Service Co.* | | | 4,385 | | | | 99,540 | |
MPLX LP | | | 3,645 | | | | 126,190 | |
Nabors Industries Ltd. | | | 27,791 | | | | 455,772 | |
Newfield Exploration Co.* | | | 6,608 | | | | 267,624 | |
Noble Energy, Inc. | | | 5,726 | | | | 217,932 | |
PBF Energy, Inc. | | | 34,484 | | | | 961,414 | |
PDC Energy, Inc.* | | | 3,550 | | | | 257,659 | |
Range Resources Corp. | | | 25,385 | | | | 872,228 | |
RSP Permian, Inc.* | | | 3,333 | | | | 148,718 | |
Tesoro Corp. | | | 967 | | | | 84,564 | |
Weatherford Int’l. PLC* | | | 20,181 | | | | 100,703 | |
Williams Cos., Inc. | | | 11,030 | | | | 343,474 | |
| | | | | | | | |
| | | | | | | 7,343,585 | |
| | | | | | | | |
FINANCIALS (8.7%) | | | | | | | | |
Allied World Assurance Co. Hldgs. AG | | | 13,000 | | | | 698,230 | |
American Equity Investment Life Hldg. Co. | | | 12,666 | | | | 285,492 | |
American Financial Group, Inc. | | | 2,774 | | | | 244,445 | |
Ameriprise Financial, Inc. | | | 5,542 | | | | 614,830 | |
Aon PLC | | | 3,171 | | | | 353,662 | |
Aspen Insurance Hldgs. Ltd. | | | 6,122 | | | | 336,710 | |
Associated Banc-Corp. | | | 10,766 | | | | 265,920 | |
Assurant, Inc. | | | 1,087 | | | | 100,939 | |
BancFirst Corp. | | | 4,515 | | | | 420,121 | |
Bank of Marin Bancorp | | | 3,710 | | | | 258,773 | |
Bank of the Ozarks, Inc. | | | 4,588 | | | | 241,283 | |
BankUnited, Inc. | | | 5,183 | | | | 195,347 | |
Banner Corp. | | | 7,413 | | | | 413,720 | |
Brookline Bancorp, Inc. | | | 27,996 | | | | 459,134 | |
Bryn Mawr Bank Corp. | | | 7,979 | | | | 336,315 | |
Charter Financial Corp. | | | 14,227 | | | | 237,164 | |
Colony Capital, Inc. Cl A | | | 19,814 | | | | 401,234 | |
Columbia Banking System, Inc. | | | 2,053 | | | | 91,728 | |
Commerce Bancshares, Inc. | | | 5,646 | | | | 326,395 | |
Customers Bancorp, Inc.* | | | 11,393 | | | | 408,097 | |
Dime Community Bancshares | | | 13,122 | | | | 263,752 | |
Discover Financial Svcs. | | | 2,742 | | | | 197,671 | |
Eagle Bancorp, Inc.* | | | 4,516 | | | | 275,250 | |
East West Bancorp, Inc. | | | 5,947 | | | | 302,286 | |
Easterly Acquisition Corp.* | | | 26,084 | | | | 256,927 | |
Ellington Financial LLC | | | 24,558 | | | | 381,140 | |
Enterprise Financial Svcs. Corp. | | | 8,964 | | | | 385,452 | |
Everest Re Group Ltd. | | | 2,762 | | | | 597,697 | |
FBL Financial Group, Inc. Cl A | | | 4,135 | | | | 323,150 | |
Fifth Third Bancorp | | | 24,014 | | | | 647,658 | |
First Connecticut Bancorp, Inc. | | | 6,657 | | | | 150,781 | |
First Interstate BancSytem, Inc. | | | 10,296 | | | | 438,095 | |
MUTUAL OF AMERICA INVESTMENT CORPORATION - ALL AMERICA FUND
PORTFOLIO OF INVESTMENTS IN SECURITIES
December 31, 2016
| | | | | | | | |
First Republic Bank/CA | | | 6,443 | | | | 593,658 | |
Flushing Financial Corp. | | | 8,877 | | | | 260,895 | |
Gallagher (Arthur J.) & Co. | | | 3,362 | | | | 174,690 | |
Glacier Bancorp, Inc. | | | 9,193 | | | | 333,062 | |
Hanmi Financial Corp. | | | 7,637 | | | | 266,531 | |
Hartford Financial Svcs. Group, Inc. | | | 13,857 | | | | 660,286 | |
Heritage Financial Corp. | | | 10,333 | | | | 266,075 | |
Huntington Bancshares, Inc. | | | 8,731 | | | | 115,424 | |
Investors Bancorp, Inc. | | | 55,291 | | | | 771,310 | |
iShares Russell 2000 Value ETF | | | 1,910 | | | | 227,175 | |
iShares Russell Mid-Cap Value ETF | | | 1,350 | | | | 108,581 | |
Janus Capital Group, Inc. | | | 11,963 | | | | 158,749 | |
KeyCorp | | | 22,146 | | | | 404,607 | |
Lincoln National Corp. | | | 4,520 | | | | 299,540 | |
Marlin Business Svcs. Corp. | | | 13,023 | | | | 272,181 | |
MB Financial, Inc. | | | 5,718 | | | | 270,061 | |
NMI Hldgs., Inc. Cl A* | | | 29,038 | | | | 309,255 | |
Northfield Bancorp, Inc. | | | 19,632 | | | | 392,051 | |
Pace Hldgs. Corp.* | | | 24,200 | | | | 244,904 | |
Pinnacle Financial Partners, Inc. | | | 4,408 | | | | 305,474 | |
Principal Financial Grp., Inc. | | | 1,524 | | | | 88,179 | |
PrivateBancorp, Inc. | | | 9,046 | | | | 490,203 | |
Progressive Corp. | | | 11,459 | | | | 406,795 | |
Prosperity Bancshares, Inc. | | | 3,379 | | | | 242,545 | |
Raymond James Financial, Inc. | | | 5,535 | | | | 383,409 | |
Reinsurance Grp. of America, Inc. | | | 7,033 | | | | 884,963 | |
Safety Insurance Group, Inc. | | | 4,865 | | | | 358,551 | |
SEI Investments Co. | | | 6,212 | | | | 306,624 | |
Selective Insurance Group, Inc. | | | 8,995 | | | | 387,235 | |
SPDR S&P Bank ETF | | | 8,738 | | | | 379,841 | |
Starwood Property Trust, Inc. | | | 51,954 | | | | 1,140,391 | |
Stock Yards Bancorp, Inc. | | | 15,818 | | | | 742,655 | |
Stonegate Bank | | | 2,365 | | | | 98,691 | |
SunTrust Banks, Inc. | | | 6,898 | | | | 378,355 | |
SVB Financial Group* | | | 7,212 | | | | 1,238,012 | |
Synchrony Financial | | | 3,490 | | | | 126,582 | |
TriCo Bancshares | | | 5,025 | | | | 171,755 | |
UMB Financial Corp. | | | 2,853 | | | | 220,023 | |
United Financial Bancorp, Inc. | | | 1,742 | | | | 31,635 | |
Voya Financial, Inc. | | | 5,886 | | | | 230,849 | |
Waterstone Financial, Inc. | | | 4,314 | | | | 79,378 | |
Webster Financial Corp. | | | 4,085 | | | | 221,734 | |
| | | | | | | | |
| | | | | | | 25,952,312 | |
| | | | | | | | |
HEALTH CARE (4.2%) | | | | | | | | |
Abiomed, Inc.* | | | 2,381 | | | | 268,291 | |
Acadia Healthcare Co., Inc.* | | | 35,736 | | | | 1,182,862 | |
ACADIA Pharmaceuticals, Inc.* | | | 7,399 | | | | 213,387 | |
Acceleron Pharma, Inc.* | | | 3,208 | | | | 81,868 | |
Acorda Therapeutics, Inc.* | | | 4,838 | | | | 90,954 | |
Agilent Technologies, Inc. | | | 3,452 | | | | 157,273 | |
Agios Pharmaceuticals, Inc.* | | | 1,237 | | | | 51,620 | |
Albany Molecular Research, Inc.* | | | 7,846 | | | | 147,191 | |
Align Technology, Inc.* | | | 4,190 | | | | 402,785 | |
Anika Therapeutics, Inc.* | | | 3,936 | | | | 192,707 | |
Bard (C.R.), Inc. | | | 1,776 | | | | 398,996 | |
BioMarin Pharmaceutical, Inc.* | | | 1,487 | | | | 123,183 | |
BioSpecifics Technologies Corp.* | | | 4,167 | | | | 232,102 | |
Boston Scientific Corp.* | | | 18,904 | | | | 408,894 | |
Catalent, Inc.* | | | 4,886 | | | | 131,727 | |
Centene Corp.* | | | 7,293 | | | | 412,127 | |
Chemed Corp. | | | 748 | | | | 119,987 | |
MUTUAL OF AMERICA INVESTMENT CORPORATION - ALL AMERICA FUND
PORTFOLIO OF INVESTMENTS IN SECURITIES
December 31, 2016
| | | | | | | | |
CIGNA Corp. | | | 1,081 | | | | 144,195 | |
DENTSPLY SIRONA, Inc. | | | 2,488 | | | | 143,632 | |
DexCom, Inc.* | | | 3,537 | | | | 211,159 | |
Edwards Lifesciences Corp.* | | | 1,123 | | | | 105,225 | |
Emergent Biosolutions, Inc.* | | | 12,760 | | | | 419,039 | |
Ensign Group, Inc. | | | 3,517 | | | | 78,113 | |
Envision Healthcare Corp.* | | | 3,544 | | | | 224,300 | |
Hill-Rom Hldgs., Inc. | | | 1,110 | | | | 62,315 | |
Humana, Inc. | | | 1,822 | | | | 371,742 | |
Insulet Corp.* | | | 2,260 | | | | 85,157 | |
Integra LifeSciences Hldgs. Corp.* | | | 1,838 | | | | 157,682 | |
Intersect ENT, Inc.* | | | 8,062 | | | | 97,550 | |
Intuitive Surgical, Inc.* | | | 193 | | | | 122,395 | |
Karyopharm Therapeutics, Inc.* | | | 6,288 | | | | 59,107 | |
Kindred Healthcare, Inc. | | | 9,754 | | | | 76,569 | |
Kite Pharma, Inc.* | | | 2,092 | | | | 93,805 | |
Medicines Co.* | | | 3,207 | | | | 108,846 | |
Mettler-Toledo Int’l., Inc.* | | | 685 | | | | 286,714 | |
Neogen Corp.* | | | 3,388 | | | | 223,608 | |
Neurocrine Biosciences, Inc.* | | | 5,951 | | | | 230,304 | |
NuVasive, Inc.* | | | 2,663 | | | | 179,380 | |
Omeros Corp.* | | | 8,212 | | | | 81,463 | |
Omnicell, Inc.* | | | 10,842 | | | | 367,544 | |
OSI Pharmaceuticals, Inc. - rights* | | | 1,570 | | | | 16 | |
Pacific Biosciences of CA, Inc.* | | | 40,516 | | | | 153,961 | |
Pacira Pharmaceuticals, Inc.* | | | 2,312 | | | | 74,678 | |
PAREXEL International Corp.* | | | 4,674 | | | | 307,175 | |
Penumbra, Inc.* | | | 1,618 | | | | 103,228 | |
Prestige Brands Hldgs., Inc.* | | | 2,857 | | | | 148,850 | |
Prothena Corp. PLC* | | | 1,955 | | | | 96,166 | |
Radius Health, Inc.* | | | 2,597 | | | | 98,764 | |
Repligen Corp.* | | | 3,446 | | | | 106,206 | |
Sorrento Therapeutics, Inc.* | | | 10,948 | | | | 53,645 | |
Supernus Pharmaceuticals, Inc.* | | | 28,865 | | | | 728,841 | |
TESARO, Inc.* | | | 2,815 | | | | 378,561 | |
Ultragenyx Pharmaceutical, Inc.* | | | 2,367 | | | | 166,424 | |
United Therapeutics Corp.* | | | 751 | | | | 107,716 | |
WellCare Health Plans, Inc.* | | | 2,217 | | | | 303,906 | |
Wright Medical Group NV* | | | 15,556 | | | | 357,477 | |
Zimmer Biomet Hldgs., Inc. | | | 3,141 | | | | 324,152 | |
Zoetis, Inc. | | | 5,494 | | | | 294,094 | |
| | | | | | | | |
| | | | | | | 12,349,658 | |
| | | | | | | | |
INDUSTRIALS (6.0%) | | | | | | | | |
Alaska Air Group, Inc. | | | 12,118 | | | | 1,075,230 | |
AMERCO | | | 611 | | | | 225,819 | |
Astronics Corp.* | | | 27,210 | | | | 920,786 | |
AZZ, Inc. | | | 20,004 | | | | 1,278,255 | |
BMC Stock Hldgs., Inc.* | | | 13,678 | | | | 266,722 | |
Carlisle Cos., Inc. | | | 5,408 | | | | 596,448 | |
Covenant Transportation Group Cl A* | | | 28,725 | | | | 555,542 | |
Deluxe Corp. | | | 4,621 | | | | 330,910 | |
Dover Corp. | | | 4,543 | | | | 340,407 | |
Encore Wire Corp. | | | 7,793 | | | | 337,827 | |
EnPro Industries, Inc. | | | 7,218 | | | | 486,204 | |
Equifax, Inc. | | | 3,608 | | | | 426,574 | |
Flowserve Corp. | | | 5,221 | | | | 250,869 | |
Fortune Brands Home & Security, Inc. | | | 5,658 | | | | 302,477 | |
Generac Hldgs., Inc.* | | | 4,654 | | | | 189,604 | |
Healthcare Svcs. Group, Inc. | | | 11,086 | | | | 434,239 | |
IHS Markit Ltd.* | | | 3,005 | | | | 106,407 | |
John Bean Technologies Corp. | | | 1,674 | | | | 143,880 | |
MUTUAL OF AMERICA INVESTMENT CORPORATION - ALL AMERICA FUND
PORTFOLIO OF INVESTMENTS IN SECURITIES
December 31, 2016
| | | | | | | | |
Johnson Controls Int’l. PLC | | | 5,125 | | | | 211,099 | |
Kansas City Southern | | | 1,693 | | | | 143,651 | |
Kirby Corp.* | | | 7,906 | | | | 525,749 | |
L3 Technologies, Inc. Inc. | | | 3,167 | | | | 481,733 | |
Lincoln Electric Hldgs., Inc. | | | 4,006 | | | | 307,140 | |
LSC Communications, Inc. | | | 2,571 | | | | 76,307 | |
Miller Industries, Inc. | | | 20,739 | | | | 548,547 | |
Mueller Industries, Inc. | | | 26,260 | | | | 1,049,350 | |
Mueller Water Products, Inc. Cl A | | | 30,882 | | | | 411,039 | |
Old Dominion Freight Line, Inc.* | | | 7,650 | | | | 656,293 | |
Orbital ATK, Inc. | | | 8,849 | | | | 776,323 | |
Oshkosh Corp. | | | 2,614 | | | | 168,891 | |
Pitney Bowes, Inc. | | | 6,902 | | | | 104,841 | |
Quanex Building Products Corp. | | | 7,275 | | | | 147,683 | |
Rockwell Automation, Inc. | | | 3,552 | | | | 477,389 | |
Rockwell Collins, Inc. | | | 3,687 | | | | 342,006 | |
Roper Technologies, Inc. | | | 974 | | | | 178,320 | |
Smith (A.O.) Corp. | | | 3,821 | | | | 180,924 | |
Sun Hydraulics Corp. | | | 7,236 | | | | 289,223 | |
Teledyne Technologies, Inc.* | | | 2,967 | | | | 364,941 | |
TransDigm Group, Inc. | | | 1,751 | | | | 435,929 | |
Trex Co., Inc.* | | | 5,766 | | | | 371,330 | |
Triumph Group, Inc. | | | 5,978 | | | | 158,417 | |
United Rentals, Inc.* | | | 2,675 | | | | 282,427 | |
Universal Forest Products, Inc. | | | 1,665 | | | | 170,130 | |
VSE Corp. | | | 7,009 | | | | 272,230 | |
Wabtec Corp. | | | 4,008 | | | | 332,744 | |
| | | | | | | | |
| | | | | | | 17,732,856 | |
| | | | | | | | |
INFORMATION TECHNOLOGY (7.1%) | | | | | | | | |
Acacia Communications, Inc.* | | | 2,090 | | | | 129,058 | |
Advanced Micro Devices, Inc.* | | | 10,295 | | | | 116,745 | |
Aerohive Networks, Inc.* | | | 40,982 | | | | 233,598 | |
Akamai Technologies, Inc.* | | | 4,832 | | | | 322,198 | |
Ambarella, Inc.* | | | 6,345 | | | | 343,455 | |
Amphenol Corp. Cl A | | | 5,774 | | | | 388,013 | |
Analog Devices, Inc. | | | 4,335 | | | | 314,808 | |
Anixter International, Inc.* | | | 1,459 | | | | 118,252 | |
ARRIS International PLC* | | | 24,199 | | | | 729,115 | |
Aspen Technology, Inc.* | | | 1,370 | | | | 74,912 | |
Avnet, Inc. | | | 9,280 | | | | 441,821 | |
Belden, Inc. | | | 1,880 | | | | 140,568 | |
Broadcom Ltd. | | | 2,090 | | | | 369,449 | |
CA, Inc. | | | 5,206 | | | | 165,395 | |
CalAmp Corp.* | | | 19,407 | | | | 281,402 | |
Callidus Software, Inc.* | | | 11,396 | | | | 191,453 | |
Cavium, Inc.* | | | 17,439 | | | | 1,088,892 | |
Cirrus Logic, Inc.* | | | 1,679 | | | | 94,931 | |
Computer Sciences Corp. | | | 7,574 | | | | 450,047 | |
Comtech Telecommunications Corp. | | | 12,981 | | | | 153,825 | |
Cornerstone OnDemand, Inc.* | | | 4,018 | | | | 170,002 | |
Ellie Mae, Inc.* | | | 1,655 | | | | 138,490 | |
EPAM Systems, Inc.* | | | 2,464 | | | | 158,460 | |
Euronet Worldwide, Inc.* | | | 2,569 | | | | 186,073 | |
Everspin Technologies, Inc.* | | | 18,439 | | | | 152,859 | |
ExlService Hldgs., Inc.* | | | 1,534 | | | | 77,375 | |
F5 Networks, Inc.* | | | 408 | | | | 59,046 | |
Fair Isaac Corp. | | | 1,188 | | | | 141,633 | |
FARO Technologies, Inc.* | | | 4,483 | | | | 161,388 | |
Fidelity Nat’l. Information Svcs., Inc. | | | 8,147 | | | | 616,239 | |
Genpact Ltd.* | | | 11,358 | | | | 276,454 | |
Global Payments, Inc. | | | 4,791 | | | | 332,543 | |
MUTUAL OF AMERICA INVESTMENT CORPORATION - ALL AMERICA FUND
PORTFOLIO OF INVESTMENTS IN SECURITIES
December 31, 2016
| | | | | | | | |
Globant S.A.* | | | 6,189 | | | | 206,403 | |
Guidewire Software, Inc.* | | | 3,420 | | | | 168,709 | |
Harris Corp. | | | 2,046 | | | | 209,654 | |
Imperva, Inc.* | | | 1,851 | | | | 71,078 | |
Integrated Device Technology, Inc.* | | | 3,250 | | | | 76,570 | |
j2 Global, Inc. | | | 2,471 | | | | 202,128 | |
LogMeIn, Inc. | | | 7,963 | | | | 768,828 | |
Lumentum Hldgs., Inc.* | | | 5,466 | | | | 211,261 | |
Match Group, Inc.* | | | 5,000 | | | | 85,500 | |
MAXIMUS, Inc. | | | 2,478 | | | | 138,248 | |
MaxLinear, Inc. Cl A* | | | 26,148 | | | | 570,026 | |
Microchip Technology, Inc. | | | 4,130 | | | | 264,940 | |
Microsemi Corp.* | | | 4,372 | | | | 235,957 | |
MKS Instruments, Inc. | | | 5,243 | | | | 311,434 | |
Monolithic Power Systems, Inc. | | | 4,233 | | | | 346,810 | |
New Relic, Inc.* | | | 8,876 | | | | 250,747 | |
Nimble Storage, Inc.* | | | 15,233 | | | | 120,645 | |
Nutanix, Inc. Cl A* | | | 2,395 | | | | 63,611 | |
NVIDIA Corp. | | | 3,365 | | | | 359,180 | |
NXP Semiconductors NV* | | | 4,080 | | | | 399,881 | |
Palo Alto Networks, Inc.* | | | 1,734 | | | | 216,837 | |
Paycom Software, Inc.* | | | 4,312 | | | | 196,153 | |
Perficient, Inc.* | | | 4,130 | | | | 72,234 | |
Plexus Corp.* | | | 3,276 | | | | 177,035 | |
Proofpoint, Inc.* | | | 11,049 | | | | 780,612 | |
PTC, Inc.* | | | 6,443 | | | | 298,118 | |
Rapid7, Inc.* | | | 9,217 | | | | 112,171 | |
Red Hat, Inc.* | | | 3,773 | | | | 262,978 | |
Richardson Electronics Ltd. | | | 43,077 | | | | 271,385 | |
Rogers Corp.* | | | 3,997 | | | | 307,010 | |
Science Applications Int’l. Corp. | | | 2,676 | | | | 226,925 | |
Sequans Communications S.A. ADR* | | | 143,100 | | | | 267,597 | |
Skyworks Solutions, Inc. | | | 3,824 | | | | 285,500 | |
Splunk, Inc.* | | | 4,874 | | | | 249,305 | |
SPS Commerce, Inc.* | | | 902 | | | | 63,041 | |
SS&C Technologies Hldgs., Inc. | | | 2,518 | | | | 72,015 | |
Stamps.com, Inc.* | | | 8,010 | | | | 918,346 | |
Symantec Corp. | | | 3,820 | | | | 91,260 | |
SYNNEX Corp. | | | 2,460 | | | | 297,709 | |
Synopsys, Inc.* | | | 1,720 | | | | 101,239 | |
Take-Two Interactive Software, Inc.* | | | 3,975 | | | | 195,928 | |
Talend S.A. ADR* | | | 6,579 | | | | 146,054 | |
Vantiv, Inc. Cl A* | | | 4,316 | | | | 257,320 | |
ViaSat, Inc.* | | | 3,936 | | | | 260,642 | |
Virtusa Corp.* | | | 12,297 | | | | 308,900 | |
Western Digital Corp. | | | 1,527 | | | | 103,760 | |
Workday, Inc.* | | | 1,404 | | | | 92,790 | |
Xerox Corp. | | | 7,255 | | | | 63,336 | |
Xilinx, Inc. | | | 3,526 | | | | 212,865 | |
Xura, Inc.* | | | 11,415 | | | | 285,375 | |
Zendisk, Inc.* | | | 12,246 | | | | 259,615 | |
| | | | | | | | |
| | | | | | | 21,134,164 | |
| | | | | | | | |
MATERIALS (2.3%) | | | | | | | | |
Ashland Global Holdings, Inc. | | | 4,474 | | | | 488,963 | |
Axalta Coating Systems Ltd.* | | | 21,000 | | | | 571,200 | |
Berry Plastics Group, Inc.* | | | 5,694 | | | | 277,469 | |
Boise Cascade Co.* | | | 8,680 | | | | 195,300 | |
Crown Hldgs., Inc.* | | | 13,228 | | | | 695,396 | |
Eastman Chemical Co. | | | 3,233 | | | | 243,154 | |
Ferro Corp.* | | | 37,409 | | | | 536,071 | |
Ferroglobe PLC | | | 15,626 | | | | 169,230 | |
MUTUAL OF AMERICA INVESTMENT CORPORATION - ALL AMERICA FUND
PORTFOLIO OF INVESTMENTS IN SECURITIES
December 31, 2016
| | | | | | | | |
Freeport-McMoRan Copper & Gold, Inc.* | | | 10,564 | | | | 139,339 | |
Huntsman Corp. | | | 11,029 | | | | 210,433 | |
International Paper Co. | | | 4,559 | | | | 241,901 | |
Kaiser Aluminum Corp. | | | 5,005 | | | | 388,838 | |
Kraton Corporation Inc.* | | | 12,193 | | | | 347,257 | |
LSB Industries, Inc.* | | | 5,577 | | | | 46,958 | |
Nucor Corp. | | | 2,140 | | | | 127,373 | |
Orion Engineered Carbons S.A. | | | 7,063 | | | | 133,138 | |
Packaging Corp. of America | | | 7,502 | | | | 636,320 | |
PolyOne Corp. | | | 2,951 | | | | 94,550 | |
RPM International, Inc. | | | 1,005 | | | | 54,099 | |
Steel Dynamics, Inc. | | | 3,010 | | | | 107,096 | |
TimkenSteel Corp.* | | | 10,284 | | | | 159,196 | |
U.S. Concrete, Inc.* | | | 6,518 | | | | 426,929 | |
Vulcan Materials Co. | | | 3,249 | | | | 406,612 | |
| | | | | | | | |
| | | | | | | 6,696,822 | |
| | | | | | | | |
REAL ESTATE (3.5%) | | | | | | | | |
Alexander’s, Inc. | | | 646 | | | | 275,758 | |
Apartment Investment & Management Co. Cl A | | | 3,528 | | | | 160,348 | |
AvalonBay Communities, Inc. | | | 1,140 | | | | 201,951 | |
Brandywine Realty Trust | | | 9,951 | | | | 164,291 | |
Camden Property Trust | | | 2,849 | | | | 239,515 | |
CBRE Group, Inc.* | | | 5,782 | | | | 182,075 | |
Chatham Lodging Trust | | | 11,907 | | | | 244,689 | |
Chesapeake Lodging Trust | | | 11,002 | | | | 284,512 | |
Cousins Properties, Inc. | | | 16,688 | | | | 142,015 | |
Crown Castle Int’l. Corp. | | | 2,915 | | | | 252,935 | |
CubeSmart | | | 9,736 | | | | 260,633 | |
DDR Corp. | | | 8,307 | | | �� | 126,848 | |
Duke Realty Corp. | | | 33,196 | | | | 881,685 | |
Easterly Government Pptys. | | | 33,675 | | | | 674,173 | |
Equity Lifestyle Properties, Inc. | | | 910 | | | | 65,611 | |
Essex Property Trust, Inc. | | | 1,239 | | | | 288,068 | |
Extra Space Storage, Inc. | | | 2,643 | | | | 204,145 | |
FelCor Lodging Trust, Inc. | | | 44,112 | | | | 353,337 | |
Forest City Realty Trust, Inc. Cl A | | | 24,110 | | | | 502,453 | |
General Growth Pptys., Inc. | | | 6,469 | | | | 161,596 | |
Highwoods Properties, Inc. | | | 6,831 | | | | 348,449 | |
Host Hotels & Resorts, Inc. | | | 19,166 | | | | 361,087 | |
Kilroy Realty Corp. | | | 10,531 | | | | 771,080 | |
Life Storage, Inc. | | | 1,663 | | | | 141,787 | |
Pennsylvania REIT | | | 12,145 | | | | 230,269 | |
ProLogis, Inc. | | | 4,217 | | | | 222,615 | |
QTS Realty Trust, Inc. | | | 6,969 | | | | 346,011 | |
Regency Centers Corp. | | | 1,667 | | | | 114,940 | |
RLJ Lodging Trust | | | 1,953 | | | | 47,829 | |
Terreno Realty Corp. | | | 23,265 | | | | 662,819 | |
The GEO Group, Inc. | | | 6,750 | | | | 242,528 | |
Urstadt Biddle Pptys., Inc. Cl A | | | 6,697 | | | | 161,465 | |
Vornado Realty Trust | | | 2,794 | | | | 291,610 | |
Welltower, Inc. | | | 7,475 | | | | 500,301 | |
Weyerhaeuser Co. | | | 3,385 | | | | 101,855 | |
| | | | | | | | |
| | | | | | | 10,211,283 | |
| | | | | | | | |
TELECOMMUNICATION SERVICES (0.4%) | | | | | | | | |
ORBCOMM, Inc.* | | | 54,417 | | | | 450,028 | |
SBA Communications Corp. Cl A* | | | 3,452 | | | | 356,454 | |
Shenandoah Telecommunications Co. | | | 15,592 | | | | 425,662 | |
| | | | | | | | |
| | | | | | | 1,232,144 | |
| | | | | | | | |
UTILITIES (2.2%) | | | | | | | | |
Ameren Corp. | | | 4,057 | | | | 212,830 | |
Avista Corp. | | | 6,940 | | | | 277,531 | |
MUTUAL OF AMERICA INVESTMENT CORPORATION - ALL AMERICA FUND
PORTFOLIO OF INVESTMENTS IN SECURITIES
December 31, 2016
| | | | | | | | |
Chesapeake Utilities Corp. | | | 6,108 | | | | 408,931 | |
Consolidated Edison, Inc. | | | 3,145 | | | | 231,724 | |
Edison International | | | 6,696 | | | | 482,045 | |
Entergy Corp. | | | 2,505 | | | | 184,042 | |
Eversource Energy | | | 9,544 | | | | 527,115 | |
FirstEnergy Corp. | | | 5,416 | | | | 167,734 | |
Great Plains Energy, Inc. | | | 7,821 | | | | 213,904 | |
Idacorp, Inc. | | | 3,200 | | | | 257,760 | |
NiSource, Inc. | | | 16,158 | | | | 357,738 | |
Northwest Natural Gas Co. | | | 9,337 | | | | 558,352 | |
NorthWestern Corp. | | | 3,859 | | | | 219,461 | |
PNM Resources, Inc. | | | 6,748 | | | | 231,456 | |
Portland General Electric Co. | | | 5,342 | | | | 231,469 | |
PPL Corp. | | | 6,352 | | | | 216,286 | |
Public Svc. Enterprise Group, Inc. | | | 5,772 | | | | 253,275 | |
Sempra Energy | | | 7,245 | | | | 729,137 | |
UGI Corp. | | | 15,035 | | | | 692,813 | |
Westar Energy, Inc. | | | 2,709 | | | | 152,652 | |
| | | | | | | | |
| | | | | | | 6,606,255 | |
| | | | | | | | |
TOTAL ACTIVE ASSETS - COMMON STOCKS
(Cost: $112,150,206) 43.8% | | | | | | | 129,645,893 | |
| | | | | | | | |
| | | | | | | | | | | | | | | | | | | | |
| | | Rating** | | | Rate(%) | | | Maturity | | | Face Amount | | | Value | |
ACTIVE ASSETS: | | | | | | | | | | | | | | | | | | | | |
SHORT-TERM DEBT SECURITIES: | | | | | | | | | | | | | | | | | | | | |
COMMERCIAL PAPER (1.1%) | | | | | | | | | | | | | | | | | | | | |
Novartis Finance Corp.† | | | A-1+ | | | | 0.50 | | | | 01/03/17 | | | | 1,000,000 | | | | 999,958 | |
Novartis Finance Corp.† | | | A-1+ | | | | 0.50 | | | | 01/03/17 | | | | 900,000 | | | | 899,963 | |
Novartis Finance Corp.† | | | A-1+ | | | | 0.50 | | | | 01/03/17 | | | | 700,000 | | | | 699,971 | |
Novartis Finance Corp.† | | | A-1+ | | | | 0.50 | | | | 01/03/17 | | | | 700,000 | | | | 699,971 | |
| | | | | | | | | | | | | | | | | | | | |
| | | | | | | | | | | | | | | | | | | 3,299,863 | |
| | | | | | | | | | | | | | | | | | | | |
TOTAL ACTIVE ASSETS - SHORT-TERM DEBT SECURITIES
(Cost: $3,299,863) 1.1% | | | | | | | | | | | | | | | | | | | 3,299,863 | |
| | | | | | | | | | | | | | | | | | | | |
ACTIVE ASSETS: | | | | | | | | | | | | | | | | | | | | |
WARRANTS: | | | | | | | | | | | | | | | | | | | | |
FINANCIALS (0.0%) (2) | | | | | | | | | | | | | | | | | | | | |
Easterly Acquisition Corp. - expiring 07/29/2020* | | | | | | | | | | | | | | | 13,042 | | | | 4,826 | |
Pace Hldgs. Corp. - expiring 10/29/2020* | | | | | | | | | | | | | | | 24,200 | | | | 14,520 | |
| | | | | | | | | | | | | | | | | | | | |
| | | | | | | | | | | | | | | | | | | 19,346 | |
| | | | | | | | | | | | | | | | | | | | |
TOTAL ACTIVE ASSETS - WARRANTS
(Cost: $15,065) 0.0% (2) | | | | | | | | | | | | | | | | | | | 19,346 | |
| | | | | | | | | | | | | | | | | | | | |
TOTAL ACTIVE ASSETS
(Cost: $115,465,134) 44.9% | | | | | | | | | | | | | | | | | | | 132,965,102 | |
| | | | | | | | | | | | | | | | | | | | |
TOTAL INVESTMENTS
(Cost: $228,150,975) 99.8% | | | | | | | | | | | | | | | | | | | 295,307,524 | |
| | | | | | | | | | | | | | | | | | | | |
OTHER NET ASSETS 0.2% | | | | | | | | | | | | | | | | | | | 536,204 | |
| | | | | | | | | | | | | | | | | | | | |
NET ASSETS 100.0% | | | | | | | | | | | | | | | | | | $ | 295,843,728 | |
| | | | | | | | | | | | | | | | | | | | |
The accompanying notes are an integral part of these portfolio schedules.
MUTUAL OF AMERICA INVESTMENT CORPORATION - SMALL CAP VALUE FUND
PORTFOLIO OF INVESTMENTS IN SECURITIES
December 31, 2016
| | | | | | | | |
| | | Shares | | | Value | |
COMMON STOCKS: | | | | | | | | |
CONSUMER DISCRETIONARY (7.3%) | | | | | | | | |
Bassett Furniture Industries, Inc. | | | 142,628 | | | | 4,335,891 | |
Belmond Ltd.* | | | 116,419 | | | | 1,554,194 | |
CST Brands, Inc. | | | 90,217 | | | | 4,343,949 | |
Eros International PLC* | | | 185,851 | | | | 2,425,356 | |
Houghton Mifflin Harcourt Co.* | | | 502,623 | | | | 5,453,460 | |
Intrawest Resorts Hldgs., Inc.* | | | 111,722 | | | | 1,994,238 | |
MSG Networks, Inc.* | | | 92,247 | | | | 1,983,311 | |
Select Comfort Corp.* | | | 235,124 | | | | 5,318,505 | |
Unifi, Inc.* | | | 125,675 | | | | 4,100,775 | |
Vista Outdoor, Inc.* | | | 67,574 | | | | 2,493,481 | |
| | | | | | | | |
| | | | | | | 34,003,160 | |
| | | | | | | | |
CONSUMER STAPLES (2.3%) | | | | | | | | |
Crimson Wine Group Ltd.* | | | 476,811 | | | | 4,467,719 | |
Farmer Brothers Co.* | | | 64,075 | | | | 2,351,553 | |
Orchids Paper Products Co. | | | 18,374 | | | | 481,031 | |
Vector Group Ltd. | | | 157,533 | | | | 3,582,300 | |
| | | | | | | | |
| | | | | | | 10,882,603 | |
| | | | | | | | |
ENERGY (6.4%) | | | | | | | | |
Abraxas Petroleum Corp.* | | | 583,968 | | | | 1,500,798 | |
Atwood Oceanics, Inc. | | | 181,585 | | | | 2,384,211 | |
Carrizo Oil and Gas, Inc.* | | | 62,517 | | | | 2,335,010 | |
CrossAmerica Partners LP | | | 76,452 | | | | 1,925,826 | |
Gulfport Energy Corp.* | | | 104,921 | | | | 2,270,490 | |
Matrix Service Co.* | | | 56,196 | | | | 1,275,649 | |
Nabors Industries Ltd. | | | 159,126 | | | | 2,609,666 | |
PBF Energy, Inc. | | | 281,879 | | | | 7,858,787 | |
PDC Energy, Inc.* | | | 44,299 | | | | 3,215,221 | |
Range Resources Corp. | | | 68,542 | | | | 2,355,103 | |
RSP Permian, Inc.* | | | 43,387 | | | | 1,935,928 | |
| | | | | | | | |
| | | | | | | 29,666,689 | |
| | | | | | | | |
FINANCIALS (35.7%) | | | | | | | | |
Allied World Assurance Co. Hldgs. AG | | | 72,807 | | | | 3,910,464 | |
American Equity Investment Life Hldg. Co. | | | 158,921 | | | | 3,582,079 | |
Aspen Insurance Hldgs. Ltd. | | | 79,149 | | | | 4,353,195 | |
BancFirst Corp. | | | 58,298 | | | | 5,424,629 | |
Bank of Marin Bancorp | | | 47,018 | | | | 3,279,506 | |
Banner Corp. | | | 95,264 | | | | 5,316,684 | |
Brookline Bancorp, Inc. | | | 374,530 | | | | 6,142,292 | |
Bryn Mawr Bank Corp. | | | 105,050 | | | | 4,427,858 | |
Charter Financial Corp. | | | 182,142 | | | | 3,036,307 | |
Colony Capital, Inc. Cl A | | | 246,654 | | | | 4,994,744 | |
Columbia Banking System, Inc. | | | 25,915 | | | | 1,157,882 | |
Customers Bancorp, Inc.* | | | 141,303 | | | | 5,061,473 | |
Dime Community Bancshares | | | 163,876 | | | | 3,293,908 | |
Eagle Bancorp, Inc.* | | | 58,402 | | | | 3,559,602 | |
Easterly Acquisition Corp.* | | | 293,383 | | | | 2,889,823 | |
Ellington Financial LLC | | | 310,321 | | | | 4,816,182 | |
Enterprise Financial Svcs. Corp. | | | 111,896 | | | | 4,811,528 | |
First Connecticut Bancorp, Inc. | | | 84,433 | | | | 1,912,407 | |
First Interstate BancSytem, Inc. | | | 131,988 | | | | 5,616,089 | |
Flushing Financial Corp. | | | 113,686 | | | | 3,341,232 | |
Glacier Bancorp, Inc. | | | 115,222 | | | | 4,174,493 | |
Hanmi Financial Corp. | | | 95,086 | | | | 3,318,501 | |
Investors Bancorp, Inc. | | | 331,616 | | | | 4,626,043 | |
iShares Russell 2000 Value ETF | | | 60,870 | | | | 7,239,878 | |
Janus Capital Group, Inc. | | | 150,157 | | | | 1,992,583 | |
Marlin Business Svcs. Corp. | | | 166,824 | | | | 3,486,622 | |
MB Financial, Inc. | | | 67,951 | | | | 3,209,326 | |
MUTUAL OF AMERICA INVESTMENT CORPORATION - SMALL CAP VALUE FUND
PORTFOLIO OF INVESTMENTS IN SECURITIES
December 31, 2016
| | | | | | | | |
NMI Hldgs., Inc. Cl A* | | | 371,990 | | | | 3,961,694 | |
Northfield Bancorp, Inc. | | | 244,977 | | | | 4,892,191 | |
Pace Hldgs. Corp.* | | | 273,830 | | | | 2,771,160 | |
PrivateBancorp, Inc. | | | 110,602 | | | | 5,993,522 | |
Prosperity Bancshares, Inc. | | | 40,965 | | | | 2,940,468 | |
Selective Insurance Group, Inc. | | | 115,135 | | | | 4,956,562 | |
SPDR S&P Bank ETF | | | 109,560 | | | | 4,762,573 | |
Stock Yards Bancorp, Inc. | | | 204,975 | | | | 9,623,576 | |
Stonegate Bank | | | 29,541 | | | | 1,232,746 | |
SVB Financial Group* | | | 58,666 | | | | 10,070,606 | |
TriCo Bancshares | | | 62,751 | | | | 2,144,829 | |
UMB Financial Corp. | | | 32,918 | | | | 2,538,636 | |
United Financial Bancorp, Inc. | | | 22,369 | | | | 406,221 | |
Waterstone Financial, Inc. | | | 49,432 | | | | 909,549 | |
| | | | | | | | |
| | | | | | | 166,179,663 | |
| | | | | | | | |
HEALTH CARE (3.4%) | | | | | | | | |
Albany Molecular Research, Inc.* | | | 100,069 | | | | 1,877,294 | |
Emergent Biosolutions, Inc.* | | | 34,013 | | | | 1,116,987 | |
Ensign Group, Inc. | | | 42,872 | | | | 952,187 | |
Envision Healthcare Corp.* | | | 44,487 | | | | 2,815,582 | |
Kindred Healthcare, Inc. | | | 125,345 | | | | 983,958 | |
Pacific Biosciences of CA, Inc.* | | | 348,687 | | | | 1,325,011 | |
Supernus Pharmaceuticals, Inc.* | | | 189,158 | | | | 4,776,240 | |
Wright Medical Group NV* | | | 80,187 | | | | 1,842,697 | |
| | | | | | | | |
| | | | | | | 15,689,956 | |
| | | | | | | | |
INDUSTRIALS (13.5%) | | | | | | | | |
Alaska Air Group, Inc. | | | 40,240 | | | | 3,570,495 | |
Astronics Corp.* | | | 67,567 | | | | 2,286,467 | |
AZZ, Inc. | | | 116,120 | | | | 7,420,068 | |
BMC Stock Hldgs., Inc.* | | | 117,737 | | | | 2,295,872 | |
Covenant Transportation Group Cl A* | | | 129,226 | | | | 2,499,231 | |
Deluxe Corp. | | | 57,509 | | | | 4,118,219 | |
Encore Wire Corp. | | | 96,894 | | | | 4,200,355 | |
Kirby Corp.* | | | 52,452 | | | | 3,488,058 | |
LSC Communications, Inc. | | | 33,240 | | | | 986,564 | |
Miller Industries, Inc. | | | 260,428 | | | | 6,888,321 | |
Mueller Industries, Inc. | | | 331,066 | | | | 13,229,395 | |
Orbital ATK, Inc. | | | 67,032 | | | | 5,880,717 | |
Triumph Group, Inc. | | | 41,372 | | | | 1,096,358 | |
Universal Forest Products, Inc. | | | 15,755 | | | | 1,609,846 | |
VSE Corp. | | | 89,725 | | | | 3,484,919 | |
| | | | | | | | |
| | | | | | | 63,054,885 | |
| | | | | | | | |
INFORMATION TECHNOLOGY (10.5%) | | | | | | | | |
Aerohive Networks, Inc.* | | | 256,534 | | | | 1,462,244 | |
Ambarella, Inc.* | | | 15,313 | | | | 828,893 | |
Anixter International, Inc.* | | | 18,139 | | | | 1,470,166 | |
CalAmp Corp.* | | | 73,850 | | | | 1,070,825 | |
Cavium, Inc.* | | | 54,228 | | | | 3,385,996 | |
Cirrus Logic, Inc.* | | | 20,822 | | | | 1,177,276 | |
Comtech Telecommunications Corp. | | | 161,666 | | | | 1,915,742 | |
Everspin Technologies, Inc.* | | | 71,185 | | | | 590,124 | |
LogMeIn, Inc. | | | 27,939 | | | | 2,697,510 | |
MaxLinear, Inc. Cl A* | | | 119,839 | | | | 2,612,490 | |
MKS Instruments, Inc. | | | 65,107 | | | | 3,867,356 | |
Plexus Corp.* | | | 39,298 | | | | 2,123,664 | |
Proofpoint, Inc.* | | | 54,213 | | | | 3,830,148 | |
Richardson Electronics Ltd. | | | 533,438 | | | | 3,360,659 | |
Rogers Corp.* | | | 32,446 | | | | 2,492,177 | |
Sequans Communications S.A. ADR* | | | 904,166 | | | | 1,690,790 | |
Stamps.com, Inc.* | | | 50,245 | | | | 5,760,589 | |
SYNNEX Corp. | | | 30,673 | | | | 3,712,046 | |
MUTUAL OF AMERICA INVESTMENT CORPORATION - SMALL CAP VALUE FUND
PORTFOLIO OF INVESTMENTS IN SECURITIES
December 31, 2016
| | | | | | | | |
Virtusa Corp.* | | | 59,213 | | | | 1,487,431 | |
Xura, Inc.* | | | 128,245 | | | | 3,206,125 | |
| | | | | | | | |
| | | | | | | 48,742,251 | |
| | | | | | | | |
MATERIALS (3.4%) | | | | | | | | |
Boise Cascade Co.* | | | 110,970 | | | | 2,496,825 | |
Ferro Corp.* | | | 76,426 | | | | 1,095,185 | |
Kaiser Aluminum Corp. | | | 62,845 | | | | 4,882,428 | |
Kraton Corporation Inc.* | | | 156,136 | | | | 4,446,753 | |
LSB Industries, Inc.* | | | 71,361 | | | | 600,860 | |
TimkenSteel Corp.* | | | 132,578 | | | | 2,052,307 | |
| | | | | | | | |
| | | | | | | 15,574,358 | |
| | | | | | | | |
REAL ESTATE (9.1%) | | | | | | | | |
Alexander’s, Inc. | | | 5,053 | | | | 2,156,974 | |
Chatham Lodging Trust | | | 142,287 | | | | 2,923,998 | |
Chesapeake Lodging Trust | | | 138,787 | | | | 3,589,032 | |
Cousins Properties, Inc. | | | 207,220 | | | | 1,763,442 | |
Easterly Government Pptys. | | | 202,273 | | | | 4,049,505 | |
FelCor Lodging Trust, Inc. | | | 574,412 | | | | 4,601,040 | |
Forest City Realty Trust, Inc. Cl A | | | 277,128 | | | | 5,775,348 | |
Highwoods Properties, Inc. | | | 87,286 | | | | 4,452,459 | |
Life Storage, Inc. | | | 21,674 | | | | 1,847,925 | |
Pennsylvania REIT | | | 156,667 | | | | 2,970,406 | |
Terreno Realty Corp. | | | 105,264 | | | | 2,998,971 | |
The GEO Group, Inc. | | | 83,924 | | | | 3,015,389 | |
Urstadt Biddle Pptys., Inc. Cl A | | | 83,254 | | | | 2,007,254 | |
| | | | | | | | |
| | | | | | | 42,151,743 | |
| | | | | | | | |
TELECOMMUNICATION SERVICES (1.0%) | | | | | | | | |
ORBCOMM, Inc.* | | | 320,981 | | | | 2,654,513 | |
Shenandoah Telecommunications Co. | | | 70,364 | | | | 1,920,937 | |
| | | | | | | | |
| | | | | | | 4,575,450 | |
| | | | | | | | |
UTILITIES (3.8%) | | | | | | | | |
Avista Corp. | | | 87,482 | | | | 3,498,405 | |
Idacorp, Inc. | | | 40,440 | | | | 3,257,442 | |
Northwest Natural Gas Co. | | | 38,511 | | | | 2,302,958 | |
NorthWestern Corp. | | | 46,978 | | | | 2,671,639 | |
PNM Resources, Inc. | | | 84,539 | | | | 2,899,688 | |
Portland General Electric Co. | | | 67,487 | | | | 2,924,212 | |
| | | | | | | | |
| | | | | | | 17,554,344 | |
| | | | | | | | |
TOTAL COMMON STOCKS
(Cost: $332,428,801) 96.4% | | | | | | | 448,075,102 | |
| | | | | | | | |
| | | | | | | | | | | | | | | | | | | | |
| | | Rating** | | | Rate(%) | | | Maturity | | | Face Amount | | | Value | |
SHORT-TERM DEBT SECURITIES: | | | | | | | | | | | | | | | | | | | | |
U.S. GOVERNMENT (2.7%) | | | | | | | | | | | | | | | | | | | | |
U.S. Treasury Bill | | | A-1+ | | | | 0.41 | | | | 01/26/17 | | | | 3,000,000 | | | | 2,999,100 | |
U.S. Treasury Bill | | | A-1+ | | | | 0.42 | | | | 02/16/17 | | | | 5,000,000 | | | | 4,997,258 | |
U.S. Treasury Bill | | | A-1+ | | | | 0.42 | | | | 02/16/17 | | | | 1,500,000 | | | | 1,499,172 | |
U.S. Treasury Bill | | | A-1+ | | | | 0.47 | | | | 02/09/17 | | | | 3,000,000 | | | | 2,998,433 | |
| | | | | | | | | | | | | | | | | | | | |
| | | | | | | | | | | | | | | | | | | 12,493,963 | |
| | | | | | | | | | | | | | | | | | | | |
COMMERCIAL PAPER (1.5%) | | | | | | | | | | | | | | | | | | | | |
Cargill, Inc.† | | | A-1 | | | | 0.64 | | | | 01/06/17 | | | | 1,000,000 | | | | 999,893 | |
Novartis Finance Corp.† | | | A-1+ | | | | 0.50 | | | | 01/03/17 | | | | 6,000,000 | | | | 5,999,750 | |
| | | | | | | | | | | | | | | | | | | | |
| | | | | | | | | | | | | | | | | | | 6,999,643 | |
| | | | | | | | | | | | | | | | | | | | |
TOTAL SHORT-TERM DEBT SECURITIES
(Cost: $19,493,606) 4.2% | | | | | | | | | | | | | | | | | | | 19,493,606 | |
| | | | | | | | | | | | | | | | | | | | |
MUTUAL OF AMERICA INVESTMENT CORPORATION - SMALL CAP VALUE FUND
PORTFOLIO OF INVESTMENTS IN SECURITIES
December 31, 2016
| | | | | | | | |
| | | Shares | | | Value | |
WARRANTS: | | | | | | | | |
FINANCIALS (0.0%) (2) | | | | | | | | |
Easterly Acquisition Corp. - expiring 07/29/2020* | | | 146,691 | | | | 54,276 | |
Pace Hldgs. Corp. - expiring 10/29/2020* | | | 273,830 | | | | 164,298 | |
| | | | | | | | |
| | | | | | | 218,574 | |
| | | | | | | | |
TOTAL WARRANTS
(Cost: $169,934) 0.0% (2) | | | | | | | 218,574 | |
| | | | | | | | |
TOTAL INVESTMENTS
(Cost: $352,092,341) 100.6% | | | | | | | 467,787,282 | |
| | | | | | | | |
OTHER NET ASSETS -0.6% | | | | | | | (2,945,405 | ) |
| | | | | | | | |
NET ASSETS 100.0% | | | | | | $ | 464,841,877 | |
| | | | | | | | |
The accompanying notes are an integral part of these portfolio schedules.
MUTUAL OF AMERICA INVESTMENT CORPORATION - SMALL CAP GROWTH FUND
PORTFOLIO OF INVESTMENTS IN SECURITIES
December 31, 2016
| | | | | | | | |
| | | Shares | | | Value | |
COMMON STOCKS: | | | | | | | | |
CONSUMER DISCRETIONARY (16.8%) | | | | | | | | |
Belmond Ltd.* | | | 192,575 | | | | 2,570,876 | |
Bloomin’ Brands, Inc. | | | 222,912 | | | | 4,019,103 | |
Bright Horizons Family Solutions, Inc.* | | | 18,045 | | | | 1,263,511 | |
Cooper Tire & Rubber Co. | | | 88,085 | | | | 3,422,102 | |
CST Brands, Inc. | | | 129,588 | | | | 6,239,662 | |
Drew Industries, Inc. | | | 25,213 | | | | 2,716,701 | |
Five Below, Inc.* | | | 120,057 | | | | 4,797,478 | |
Haverty Furniture Cos., Inc. | | | 245,929 | | | | 5,828,517 | |
Houghton Mifflin Harcourt Co.* | | | 146,701 | | | | 1,591,706 | |
HSN, Inc. | | | 68,462 | | | | 2,348,247 | |
Intrawest Resorts Hldgs., Inc.* | | | 98,437 | | | | 1,757,100 | |
Lions Gate Entertainment Corp. Cl A | | | 110,555 | | | | 2,973,930 | |
Lions Gate Entertainment Corp. Cl B* | | | 110,555 | | | | 2,713,020 | |
Lithia Motors, Inc. Cl A | | | 37,770 | | | | 3,657,269 | |
Panera Bread Co. Cl A* | | | 16,133 | | | | 3,308,717 | |
Popeyes Louisiana Kitchen, Inc.* | | | 23,716 | | | | 1,434,344 | |
Red Robin Gourmet Burgers, Inc.* | | | 79,491 | | | | 4,483,292 | |
Select Comfort Corp.* | | | 269,483 | | | | 6,095,705 | |
Steve Madden Ltd.* | | | 94,424 | | | | 3,375,658 | |
Thor Industries, Inc. | | | 42,896 | | | | 4,291,745 | |
Vista Outdoor, Inc.* | | | 99,530 | | | | 3,672,657 | |
| | | | | | | | |
| | | | | | | 72,561,340 | |
| | | | | | | | |
CONSUMER STAPLES (3.4%) | | | | | | | | |
Cal-Maine Foods, Inc. | | | 42,964 | | | | 1,897,935 | |
Vector Group Ltd. | | | 139,989 | | | | 3,183,350 | |
Village Super Market, Inc. Cl A | | | 107,478 | | | | 3,321,070 | |
WD-40 Co. | | | 55,663 | | | | 6,507,005 | |
| | | | | | | | |
| | | | | | | 14,909,360 | |
| | | | | | | | |
ENERGY (1.4%) | | | | | | | | |
Gulfport Energy Corp.* | | | 124,729 | | | | 2,699,136 | |
Matador Resources Co.* | | | 126,249 | | | | 3,252,174 | |
| | | | | | | | |
| | | | | | | 5,951,310 | |
| | | | | | | | |
FINANCIALS (7.8%) | | | | | | | | |
Bank of the Ozarks, Inc. | | | 58,571 | | | | 3,080,249 | |
FBL Financial Group, Inc. Cl A | | | 51,971 | | | | 4,061,534 | |
Heritage Financial Corp. | | | 131,037 | | | | 3,374,203 | |
Investors Bancorp, Inc. | | | 350,144 | | | | 4,884,509 | |
iShares Russell 2000 ETF | | | 39,941 | | | | 5,386,044 | |
Pinnacle Financial Partners, Inc. | | | 55,887 | | | | 3,872,969 | |
Safety Insurance Group, Inc. | | | 61,226 | | | | 4,512,356 | |
Starwood Property Trust, Inc. | | | 145,899 | | | | 3,202,483 | |
Webster Financial Corp. | | | 21,585 | | | | 1,171,634 | |
| | | | | | | | |
| | | | | | | 33,545,981 | |
| | | | | | | | |
HEALTH CARE (18.5%) | | | | | | | | |
Abiomed, Inc.* | | | 30,134 | | | | 3,395,499 | |
Acadia Healthcare Co., Inc.* | | | 186,878 | | | | 6,185,662 | |
ACADIA Pharmaceuticals, Inc.* | | | 70,013 | | | | 2,019,175 | |
Acceleron Pharma, Inc.* | | | 39,245 | | | | 1,001,532 | |
Acorda Therapeutics, Inc.* | | | 59,170 | | | | 1,112,396 | |
Agios Pharmaceuticals, Inc.* | | | 15,573 | | | | 649,861 | |
Anika Therapeutics, Inc.* | | | 48,250 | | | | 2,362,320 | |
BioSpecifics Technologies Corp.* | | | 50,850 | | | | 2,832,345 | |
Catalent, Inc.* | | | 61,107 | | | | 1,647,445 | |
Chemed Corp. | | | 9,520 | | | | 1,527,103 | |
DexCom, Inc.* | | | 25,150 | | | | 1,501,455 | |
Emergent Biosolutions, Inc.* | | | 126,488 | | | | 4,153,866 | |
Insulet Corp.* | | | 28,298 | | | | 1,066,269 | |
Integra LifeSciences Hldgs. Corp.* | | | 24,575 | | | | 2,108,289 | |
MUTUAL OF AMERICA INVESTMENT CORPORATION - SMALL CAP GROWTH FUND
PORTFOLIO OF INVESTMENTS IN SECURITIES
December 31, 2016
| | | | | | | | |
Intersect ENT, Inc.* | | | 100,775 | | | | 1,219,378 | |
Karyopharm Therapeutics, Inc.* | | | 79,236 | | | | 744,818 | |
Kite Pharma, Inc.* | | | 26,490 | | | | 1,187,812 | |
Medicines Co.* | | | 40,844 | | | | 1,386,245 | |
Neogen Corp.* | | | 43,495 | | | | 2,870,670 | |
Neurocrine Biosciences, Inc.* | | | 64,455 | | | | 2,494,409 | |
NuVasive, Inc.* | | | 33,625 | | | | 2,264,980 | |
Omeros Corp.* | | | 104,606 | | | | 1,037,692 | |
Omnicell, Inc.* | | | 137,107 | | | | 4,647,927 | |
Pacific Biosciences of CA, Inc.* | | | 168,161 | | | | 639,012 | |
Pacira Pharmaceuticals, Inc.* | | | 29,073 | | | | 939,058 | |
PAREXEL International Corp.* | | | 58,143 | | | | 3,821,158 | |
Penumbra, Inc.* | | | 20,585 | | | | 1,313,323 | |
Prestige Brands Hldgs., Inc.* | | | 36,070 | | | | 1,879,247 | |
Prothena Corp. PLC* | | | 24,835 | | | | 1,221,634 | |
Radius Health, Inc.* | | | 32,884 | | | | 1,250,579 | |
Repligen Corp.* | | | 43,875 | | | | 1,352,228 | |
Sorrento Therapeutics, Inc.* | | | 137,696 | | | | 674,710 | |
Supernus Pharmaceuticals, Inc.* | | | 179,870 | | | | 4,541,718 | |
TESARO, Inc.* | | | 35,629 | | | | 4,791,388 | |
Ultragenyx Pharmaceutical, Inc.* | | | 29,905 | | | | 2,102,621 | |
WellCare Health Plans, Inc.* | | | 27,611 | | | | 3,784,916 | |
Wright Medical Group NV* | | | 113,546 | | | | 2,609,287 | |
| | | | | | | | |
| | | | | | | 80,338,027 | |
| | | | | | | | |
INDUSTRIALS (13.5%) | | | | | | | | |
Astronics Corp.* | | | 275,898 | | | | 9,336,383 | |
AZZ, Inc. | | | 112,762 | | | | 7,205,490 | |
BMC Stock Hldgs., Inc.* | | | 55,989 | | | | 1,091,786 | |
Covenant Transportation Group Cl A* | | | 230,319 | | | | 4,454,369 | |
EnPro Industries, Inc. | | | 91,366 | | | | 6,154,414 | |
Generac Hldgs., Inc.* | | | 58,718 | | | | 2,392,171 | |
Healthcare Svcs. Group, Inc. | | | 141,445 | | | | 5,540,401 | |
John Bean Technologies Corp. | | | 21,015 | | | | 1,806,239 | |
Mueller Water Products, Inc. Cl A | | | 378,072 | | | | 5,032,138 | |
Quanex Building Products Corp. | | | 86,080 | | | | 1,747,424 | |
Sun Hydraulics Corp. | | | 91,470 | | | | 3,656,056 | |
Teledyne Technologies, Inc.* | | | 37,777 | | | | 4,646,571 | |
Trex Co., Inc.* | | | 73,035 | | | | 4,703,454 | |
Universal Forest Products, Inc. | | | 5,151 | | | | 526,329 | |
| | | | | | | | |
| | | | | | | 58,293,225 | |
| | | | | | | | |
INFORMATION TECHNOLOGY (24.1%) | | | | | | | | |
Acacia Communications, Inc.* | | | 24,840 | | | | 1,533,870 | |
Advanced Micro Devices, Inc.* | | | 132,025 | | | | 1,497,164 | |
Aerohive Networks, Inc.* | | | 260,149 | | | | 1,482,849 | |
Ambarella, Inc.* | | | 64,793 | | | | 3,507,245 | |
ARRIS International PLC* | | | 93,220 | | | | 2,808,719 | |
Aspen Technology, Inc.* | | | 17,401 | | | | 951,487 | |
Belden, Inc. | | | 23,440 | | | | 1,752,609 | |
CalAmp Corp.* | | | 173,252 | | | | 2,512,154 | |
Callidus Software, Inc.* | | | 145,134 | | | | 2,438,251 | |
Cavium, Inc.* | | | 93,081 | | | | 5,811,978 | |
Cornerstone OnDemand, Inc.* | | | 50,824 | | | | 2,150,363 | |
Ellie Mae, Inc.* | | | 20,935 | | | | 1,751,841 | |
EPAM Systems, Inc.* | | | 31,755 | | | | 2,042,164 | |
Euronet Worldwide, Inc.* | | | 32,746 | | | | 2,371,793 | |
Everspin Technologies, Inc.* | | | 164,029 | | | | 1,359,800 | |
ExlService Hldgs., Inc.* | | | 18,990 | | | | 957,856 | |
Fair Isaac Corp. | | | 14,395 | | | | 1,716,172 | |
FARO Technologies, Inc.* | | | 56,662 | | | | 2,039,832 | |
Globant S.A.* | | | 78,390 | | | | 2,614,307 | |
Imperva, Inc.* | | | 21,775 | | | | 836,160 | |
MUTUAL OF AMERICA INVESTMENT CORPORATION - SMALL CAP GROWTH FUND
PORTFOLIO OF INVESTMENTS IN SECURITIES
December 31, 2016
| | | | | | | | |
Integrated Device Technology, Inc.* | | | 41,370 | | | | 974,677 | |
j2 Global, Inc. | | | 31,386 | | | | 2,567,375 | |
LogMeIn, Inc. | | | 72,057 | | | | 6,957,103 | |
Lumentum Hldgs., Inc.* | | | 71,695 | | | | 2,771,012 | |
MAXIMUS, Inc. | | | 31,374 | | | | 1,750,355 | |
MaxLinear, Inc. Cl A* | | | 207,669 | | | | 4,527,184 | |
Microsemi Corp.* | | | 54,575 | | | | 2,945,413 | |
Monolithic Power Systems, Inc. | | | 52,927 | | | | 4,336,309 | |
New Relic, Inc.* | | | 113,514 | | | | 3,206,771 | |
Nimble Storage, Inc.* | | | 192,545 | | | | 1,524,956 | |
Nutanix, Inc. Cl A* | | | 29,240 | | | | 776,614 | |
Paycom Software, Inc.* | | | 54,172 | | | | 2,464,284 | |
Perficient, Inc.* | | | 52,495 | | | | 918,138 | |
Proofpoint, Inc.* | | | 83,061 | | | | 5,868,260 | |
Rapid7, Inc.* | | | 115,670 | | | | 1,407,704 | |
Rogers Corp.* | | | 17,582 | | | | 1,350,473 | |
Science Applications Int’l. Corp. | | | 33,866 | | | | 2,871,837 | |
Sequans Communications S.A. ADR* | | | 880,597 | | | | 1,646,716 | |
SPS Commerce, Inc.* | | | 11,420 | | | | 798,144 | |
Stamps.com, Inc.* | | | 20,940 | | | | 2,400,771 | |
Take-Two Interactive Software, Inc.* | | | 49,600 | | | | 2,444,784 | |
Talend S.A. ADR* | | | 82,300 | | | | 1,827,060 | |
ViaSat, Inc.* | | | 30,906 | | | | 2,046,595 | |
Virtusa Corp.* | | | 89,999 | | | | 2,260,775 | |
Zendisk, Inc.* | | | 79,907 | | | | 1,694,028 | |
| | | | | | | | |
| | | | | | | 104,473,952 | |
| | | | | | | | |
MATERIALS (4.5%) | | | | | | | | |
Berry Plastics Group, Inc.* | | | 71,672 | | | | 3,492,577 | |
Ferro Corp.* | | | 395,488 | | | | 5,667,343 | |
Ferroglobe PLC | | | 199,130 | | | | 2,156,578 | |
Orion Engineered Carbons S.A. | | | 89,881 | | | | 1,694,257 | |
PolyOne Corp. | | | 38,032 | | | | 1,218,545 | |
U.S. Concrete, Inc.* | | | 81,485 | | | | 5,337,268 | |
| | | | | | | | |
| | | | | | | 19,566,568 | |
| | | | | | | | |
REAL ESTATE (3.6%) | | | | | | | | |
CubeSmart | | | 122,617 | | | | 3,282,457 | |
Easterly Government Pptys. | | | 218,327 | | | | 4,370,907 | |
QTS Realty Trust, Inc. | | | 86,558 | | | | 4,297,605 | |
Terreno Realty Corp. | | | 123,865 | | | | 3,528,914 | |
| | | | | | | | |
| | | | | | | 15,479,883 | |
| | | | | | | | |
TELECOMMUNICATION SERVICES (1.5%) | | | | | | | | |
ORBCOMM, Inc.* | | | 369,987 | | | | 3,059,792 | |
Shenandoah Telecommunications Co. | | | 126,215 | | | | 3,445,670 | |
| | | | | | | | |
| | | | | | | 6,505,462 | |
| | | | | | | | |
UTILITIES (2.3%) | | | | | | | | |
Chesapeake Utilities Corp. | | | 75,755 | | | | 5,071,797 | |
Northwest Natural Gas Co. | | | 79,071 | | | | 4,728,446 | |
| | | | | | | | |
| | | | | | | 9,800,243 | |
| | | | | | | | |
TOTAL COMMON STOCKS
(Cost: $367,779,979) 97.4% | | | | | | | 421,425,351 | |
| | | | | | | | |
| | | | | | | | | | | | | | | | | | | | |
| | | Rating** | | | Rate(%) | | | Maturity | | | Face Amount | | | Value | |
SHORT-TERM DEBT SECURITIES: | | | | | | | | | | | | | | | | | | | | |
U.S. GOVERNMENT (0.8%) | | | | | | | | | | | | | | | | | | | | |
U.S. Treasury Bill | | | A-1+ | | | | 0.31 | | | | 01/05/17 | | | | 1,100,000 | | | | 1,099,952 | |
U.S. Treasury Bill | | | A-1+ | | | | 0.41 | | | | 01/26/17 | | | | 500,000 | | | | 499,850 | |
U.S. Treasury Bill | | | A-1+ | | | | 0.46 | | | | 02/23/17 | | | | 2,000,000 | | | | 1,998,620 | |
| | | | | | | | | | | | | | | | | | | | |
| | | | | | | | | | | | | | | | | | | 3,598,422 | |
| | | | | | | | | | | | | | | | | | | | |
COMMERCIAL PAPER (1.9%) | | | | | | | | | | | | | | | | | | | | |
Cargill, Inc.† | | | A-1 | | | | 0.71 | | | | 01/03/17 | | | | 2,000,000 | | | | 1,999,882 | |
MUTUAL OF AMERICA INVESTMENT CORPORATION - SMALL CAP GROWTH FUND
PORTFOLIO OF INVESTMENTS IN SECURITIES
December 31, 2016
| | | | | | | | | | | | | | | | | | | | |
Danaher Corp.† | | | A-1 | | | | 0.70 | | | | 01/06/17 | | | | 1,100,000 | | | | 1,099,872 | |
Novartis Finance Corp.† | | | A-1+ | | | | 0.50 | | | | 01/03/17 | | | | 2,300,000 | | | | 2,299,904 | |
Southern California Gas Co.† | | | A-1 | | | | 0.70 | | | | 01/03/17 | | | | 1,250,000 | | | | 1,249,927 | |
Toyota Motor Credit Corp. | | | A-1+ | | | | 0.78 | | | | 01/04/17 | | | | 1,500,000 | | | | 1,499,870 | |
| | | | | | | | | | | | | | | | | | | | |
| | | | | | | | | | | | | | | | | | | 8,149,455 | |
| | | | | | | | | | | | | | | | | | | | |
TOTAL SHORT-TERM DEBT SECURITIES
(Cost: $11,747,877) 2.7% | | | | | | | | | | | | | | | | | | | 11,747,877 | |
| | | | | | | | | | | | | | | | | | | | |
TOTAL INVESTMENTS
(Cost: $379,527,856) 100.1% | | | | | | | | | | | | | | | | | | | 433,173,228 | |
| | | | | | | | | | | | | | | | | | | | |
OTHER NET ASSETS -0.1% | | | | | | | | | | | | | | | | | | | (367,042 | ) |
| | | | | | | | | | | | | | | | | | | | |
NET ASSETS 100.0% | | | | | | | | | | | | | | | | | | $ | 432,806,186 | |
| | | | | | | | | | | | | | | | | | | | |
The accompanying notes are an integral part of these portfolio schedules.
MUTUAL OF AMERICA INVESTMENT CORPORATION - MID CAP VALUE FUND
PORTFOLIO OF INVESTMENTS IN SECURITIES
December 31, 2016
| | | | | | | | |
| | | Shares | | | Value | |
COMMON STOCKS: | | | | | | | | |
CONSUMER DISCRETIONARY (3.7%) | | | | | | | | |
CST Brands, Inc. | | | 21,146 | | | | 1,018,180 | |
Dillard’s, Inc. Cl A | | | 2,525 | | | | 158,292 | |
Liberty Interactive Corp. Ser. A QVC Group* | | | 16,488 | | | | 329,430 | |
Macy’s, Inc. | | | 12,739 | | | | 456,184 | |
MSG Networks, Inc.* | | | 11,067 | | | | 237,941 | |
Ralph Lauren Corp. | | | 4,759 | | | | 429,833 | |
Taylor Morrison Home Corp. Cl A* | | | 12,722 | | | | 245,026 | |
Wiley (John) & Sons, Inc. Cl A | | | 13,300 | | | | 724,850 | |
| | | | | | | | |
| | | | | | | 3,599,736 | |
| | | | | | | | |
CONSUMER STAPLES (3.0%) | | | | | | | | |
Constellation Brands, Inc. Cl A | | | 3,179 | | | | 487,372 | |
Edgewell Personal Care Co.* | | | 7,185 | | | | 524,433 | |
Energizer Hldgs., Inc. | | | 7,466 | | | | 333,058 | |
Ingredion, Inc. | | | 7,957 | | | | 994,307 | |
Vector Group Ltd. | | | 28,337 | | | | 644,383 | |
| | | | | | | | |
| | | | | | | 2,983,553 | |
| | | | | | | | |
ENERGY (10.2%) | | | | | | | | |
Baker Hughes, Inc. | | | 17,416 | | | | 1,131,518 | |
Cheniere Energy, Inc.* | | | 14,652 | | | | 607,032 | |
Continental Resources, Inc.* | | | 18,819 | | | | 969,931 | |
Hess Corp. | | | 14,143 | | | | 880,967 | |
MPLX LP | | | 16,061 | | | | 556,032 | |
Nabors Industries Ltd. | | | 65,633 | | | | 1,076,381 | |
Noble Energy, Inc. | | | 25,229 | | | | 960,216 | |
PBF Energy, Inc. | | | 51,271 | | | | 1,429,435 | |
Range Resources Corp. | | | 32,848 | | | | 1,128,657 | |
Tesoro Corp. | | | 4,176 | | | | 365,191 | |
Weatherford Int’l. PLC* | | | 89,628 | | | | 447,244 | |
Williams Cos., Inc. | | | 15,671 | | | | 487,995 | |
| | | | | | | | |
| | | | | | | 10,040,599 | |
| | | | | | | | |
FINANCIALS (23.2%) | | | | | | | | |
American Financial Group, Inc. | | | 12,141 | | | | 1,069,865 | |
Ameriprise Financial, Inc. | | | 16,235 | | | | 1,801,111 | |
Associated Banc-Corp. | | | 47,436 | | | | 1,171,669 | |
Assurant, Inc. | | | 4,793 | | | | 445,078 | |
BankUnited, Inc. | | | 22,415 | | | | 844,821 | |
Discover Financial Svcs. | | | 11,717 | | | | 844,679 | |
Everest Re Group Ltd. | | | 5,873 | | | | 1,270,917 | |
Fifth Third Bancorp | | | 52,483 | | | | 1,415,467 | |
Hartford Financial Svcs. Group, Inc. | | | 20,234 | | | | 964,150 | |
Huntington Bancshares, Inc. | | | 38,468 | | | | 508,547 | |
iShares Russell Mid-Cap Value ETF | | | 36,640 | | | | 2,946,956 | |
KeyCorp | | | 97,578 | | | | 1,782,750 | |
Lincoln National Corp. | | | 19,917 | | | | 1,319,900 | |
Progressive Corp. | | | 22,434 | | | | 796,407 | |
Reinsurance Grp. of America, Inc. | | | 11,699 | | | | 1,472,085 | |
Starwood Property Trust, Inc. | | | 32,171 | | | | 706,153 | |
SVB Financial Group* | | | 10,997 | | | | 1,887,745 | |
Synchrony Financial | | | 14,922 | | | | 541,221 | |
Voya Financial, Inc. | | | 25,933 | | | | 1,017,092 | |
| | | | | | | | |
| | | | | | | 22,806,613 | |
| | | | | | | | |
HEALTH CARE (4.9%) | | | | | | | | |
Acadia Healthcare Co., Inc.* | | | 12,834 | | | | 424,805 | |
Agilent Technologies, Inc. | | | 15,212 | | | | 693,059 | |
Boston Scientific Corp.* | | | 43,464 | | | | 940,126 | |
Centene Corp.* | | | 6,640 | | | | 375,226 | |
CIGNA Corp. | | | 4,765 | | | | 635,603 | |
Hill-Rom Hldgs., Inc. | | | 4,894 | | | | 274,749 | |
MUTUAL OF AMERICA INVESTMENT CORPORATION - MID CAP VALUE FUND
PORTFOLIO OF INVESTMENTS IN SECURITIES
December 31, 2016
| | | | | | | | |
Humana, Inc. | | | 3,554 | | | | 725,123 | |
Zimmer Biomet Hldgs., Inc. | | | 7,108 | | | | 733,546 | |
| | | | | | | | |
| | | | | | | 4,802,237 | |
| | | | | | | | |
INDUSTRIALS (11.5%) | | | | | | | | |
Alaska Air Group, Inc. | | | 20,485 | | | | 1,817,634 | |
AZZ, Inc. | | | 9,016 | | | | 576,122 | |
Carlisle Cos., Inc. | | | 8,729 | | | | 962,721 | |
Kirby Corp.* | | | 16,388 | | | | 1,089,802 | |
L3 Technologies, Inc. Inc. | | | 10,636 | | | | 1,617,842 | |
Old Dominion Freight Line, Inc.* | | | 13,127 | | | | 1,126,165 | |
Orbital ATK, Inc. | | | 14,973 | | | | 1,313,581 | |
Oshkosh Corp. | | | 11,519 | | | | 744,243 | |
Pitney Bowes, Inc. | | | 30,292 | | | | 460,135 | |
Triumph Group, Inc. | | | 12,185 | | | | 322,903 | |
United Rentals, Inc.* | | | 11,718 | | | | 1,237,186 | |
| | | | | | | | |
| | | | | | | 11,268,334 | |
| | | | | | | | |
INFORMATION TECHNOLOGY (11.6%) | | | | | | | | |
Analog Devices, Inc. | | | 9,716 | | | | 705,576 | |
ARRIS International PLC* | | | 36,381 | | | | 1,096,160 | |
Avnet, Inc. | | | 17,230 | | | | 820,320 | |
Broadcom Ltd. | | | 8,864 | | | | 1,566,889 | |
CA, Inc. | | | 22,939 | | | | 728,772 | |
Cavium, Inc.* | | | 11,587 | | | | 723,492 | |
Computer Sciences Corp. | | | 11,421 | | | | 678,636 | |
F5 Networks, Inc.* | | | 1,801 | | | | 260,641 | |
Fidelity Nat’l. Information Svcs., Inc. | | | 11,895 | | | | 899,738 | |
Harris Corp. | | | 9,017 | | | | 923,972 | |
NXP Semiconductors NV* | | | 2,515 | | | | 246,495 | |
SS&C Technologies Hldgs., Inc. | | | 11,098 | | | | 317,403 | |
Stamps.com, Inc.* | | | 10,728 | | | | 1,229,965 | |
Symantec Corp. | | | 16,699 | | | | 398,939 | |
Western Digital Corp. | | | 6,729 | | | | 457,236 | |
Xerox Corp. | | | 31,967 | | | | 279,072 | |
| | | | | | | | |
| | | | | | | 11,333,306 | |
| | | | | | | | |
MATERIALS (7.8%) | | | | | | | | |
Ashland Global Holdings, Inc. | | | 3,630 | | | | 396,723 | |
Crown Hldgs., Inc.* | | | 29,844 | | | | 1,568,899 | |
Eastman Chemical Co. | | | 14,246 | | | | 1,071,442 | |
Freeport-McMoRan Copper & Gold, Inc.* | | | 46,544 | | | | 613,915 | |
International Paper Co. | | | 20,087 | | | | 1,065,816 | |
Nucor Corp. | | | 9,384 | | | | 558,536 | |
Packaging Corp. of America | | | 19,662 | | | | 1,667,731 | |
RPM International, Inc. | | | 4,262 | | | | 229,423 | |
Steel Dynamics, Inc. | | | 13,405 | | | | 476,950 | |
| | | | | | | | |
| | | | | | | 7,649,435 | |
| | | | | | | | |
REAL ESTATE (11.6%) | | | | | | | | |
Alexander’s, Inc. | | | 1,074 | | | | 458,458 | |
Apartment Investment & Management Co. Cl A | | | 15,545 | | | | 706,520 | |
AvalonBay Communities, Inc. | | | 4,915 | | | | 870,692 | |
Brandywine Realty Trust | | | 43,843 | | | | 723,848 | |
DDR Corp. | | | 35,945 | | | | 548,880 | |
Duke Realty Corp. | | | 48,351 | | | | 1,284,203 | |
Equity Lifestyle Properties, Inc. | | | 3,988 | | | | 287,535 | |
Forest City Realty Trust, Inc. Cl A | | | 12,335 | | | | 257,061 | |
General Growth Pptys., Inc. | | | 28,505 | | | | 712,055 | |
Host Hotels & Resorts, Inc. | | | 46,595 | | | | 877,850 | |
Kilroy Realty Corp. | | | 8,252 | | | | 604,211 | |
ProLogis, Inc. | | | 18,583 | | | | 980,997 | |
Regency Centers Corp. | | | 7,347 | | | | 506,576 | |
RLJ Lodging Trust | | | 8,525 | | | | 208,777 | |
Vornado Realty Trust | | | 12,314 | | | | 1,285,212 | |
Welltower, Inc. | | | 8,732 | | | | 584,433 | |
Weyerhaeuser Co. | | | 14,918 | | | | 448,883 | |
| | | | | | | | |
| | | | | | | 11,346,191 | |
| | | | | | | | |
MUTUAL OF AMERICA INVESTMENT CORPORATION - MID CAP VALUE FUND
PORTFOLIO OF INVESTMENTS IN SECURITIES
December 31, 2016
| | | | | | | | |
UTILITIES (8.2%) | | | | | | | | |
Ameren Corp. | | | 17,204 | | | | 902,522 | |
Consolidated Edison, Inc. | | | 13,337 | | | | 982,670 | |
Edison International | | | 6,388 | | | | 459,872 | |
Entergy Corp. | | | 10,621 | | | | 780,325 | |
Eversource Energy | | | 10,388 | | | | 573,729 | |
FirstEnergy Corp. | | | 22,966 | | | | 711,257 | |
Great Plains Energy, Inc. | | | 33,163 | | | | 907,008 | |
PPL Corp. | | | 26,935 | | | | 917,137 | |
Public Svc. Enterprise Group, Inc. | | | 25,435 | | | | 1,116,088 | |
Westar Energy, Inc. | | | 11,270 | | | | 635,065 | |
| | | | | | | | |
| | | | | | | 7,985,673 | |
| | | | | | | | |
TOTAL COMMON STOCKS
(Cost: $75,446,843) 95.7% | | | | | | | 93,815,677 | |
| | | | | | | | |
| | | | | | | | | | | | | | | | | | | | |
| | | Rating** | | | Rate(%) | | | Maturity | | | Face Amount | | | Value | |
SHORT-TERM DEBT SECURITIES: | | | | | | | | | | | | | | | | | | | | |
U.S. GOVERNMENT (1.1%) | | | | | | | | | | | | | | | | | | | | |
U.S. Treasury Bill | | | A-1+ | | | | 0.31 | | | | 01/05/17 | | | | 900,000 | | | | 899,961 | |
U.S. Treasury Bill | | | A-1+ | | | | 0.46 | | | | 02/23/17 | | | | 200,000 | | | | 199,862 | |
| | | | | | | | | | | | | | | | | | | | |
| | | | | | | | | | | | | | | | | | | 1,099,823 | |
| | | | | | | | | | | | | | | | | | | | |
COMMERCIAL PAPER (4.1%) | | | | | | | | | | | | | | | | | | | | |
Cargill, Inc.† | | | A-1 | | | | 0.64 | | | | 01/06/17 | | | | 1,000,000 | | | | 999,893 | |
Novartis Finance Corp.† | | | A-1+ | | | | 0.50 | | | | 01/03/17 | | | | 1,500,000 | | | | 1,499,938 | |
Toyota Motor Credit Corp. | | | A-1+ | | | | 0.78 | | | | 01/04/17 | | | | 1,500,000 | | | | 1,499,870 | |
| | | | | | | | | | | | | | | | | | | | |
| | | | | | | | | | | | | | | | | | | 3,999,701 | |
| | | | | | | | | | | | | | | | | | | | |
TOTAL SHORT-TERM DEBT SECURITIES
(Cost: $5,099,524) 5.2% | | | | | | | | | | | | | | | | | | | 5,099,524 | |
| | | | | | | | | | | | | | | | | | | | |
TOTAL INVESTMENTS
(Cost: $80,546,367) 100.9% | | | | | | | | | | | | | | | | | | | 98,915,201 | |
| | | | | | | | | | | | | | | | | | | | |
OTHER NET ASSETS -0.9% | | | | | | | | | | | | | | | | | | | (897,886 | ) |
| | | | | | | | | | | | | | | | | | | | |
NET ASSETS 100.0% | | | | | | | | | | | | | | | | | | $ | 98,017,315 | |
| | | | | | | | | | | | | | | | | | | | |
The accompanying notes are an integral part of these portfolio schedules.
MUTUAL OF AMERICA INVESTMENT CORPORATION - MID-CAP EQUITY INDEX FUND
PORTFOLIO OF INVESTMENTS IN SECURITIES
December 31, 2016
| | | | | | | | |
| | | Shares | | | Value | |
INDEXED ASSETS: | | | | | | | | |
COMMON STOCKS: | | | | | | | | |
CONSUMER DISCRETIONARY (10.8%) | | | | | | | | |
Aaron’s, Inc. | | | 47,134 | | | | 1,507,817 | |
AMC Networks, Inc. Cl A* | | | 44,173 | | | | 2,312,015 | |
American Eagle Outfitters, Inc. | | | 122,386 | | | | 1,856,596 | |
Big Lots, Inc. | | | 32,413 | | | | 1,627,457 | |
Brinker International, Inc. | | | 37,445 | | | | 1,854,651 | |
Brunswick Corp. | | | 65,751 | | | | 3,586,060 | |
Buffalo Wild Wings, Inc.* | | | 13,661 | | | | 2,109,258 | |
Cabela’s, Inc.* | | | 38,254 | | | | 2,239,772 | |
Cable One, Inc. | | | 3,446 | | | | 2,142,482 | |
CalAtlantic Group, Inc. | | | 52,853 | | | | 1,797,531 | |
Carter’s, Inc. | | | 36,627 | | | | 3,164,207 | |
Cheesecake Factory, Inc. | | | 32,652 | | | | 1,955,202 | |
Chico’s FAS, Inc. | | | 96,961 | | | | 1,395,269 | |
Churchill Downs, Inc. | | | 9,408 | | | | 1,415,434 | |
Cinemark Hldgs., Inc. | | | 77,114 | | | | 2,958,093 | |
Cracker Barrel Old Country Store, Inc. | | | 17,532 | | | | 2,927,493 | |
CST Brands, Inc. | | | 54,702 | | | | 2,633,901 | |
Dana Hldg. Corp. | | | 107,554 | | | | 2,041,375 | |
Deckers Outdoor Corp.* | | | 23,487 | | | | 1,300,945 | |
Devry Education Group Inc. | | | 41,279 | | | | 1,287,905 | |
Dick’s Sporting Goods, Inc. | | | 64,237 | | | | 3,410,985 | |
Domino’s Pizza, Inc. | | | 35,250 | | | | 5,613,210 | |
Dunkin’ Brands Group, Inc. | | | 67,743 | | | | 3,552,443 | |
Fossil Group, Inc.* | | | 31,704 | | | | 819,865 | |
GameStop Corp. Cl A | | | 74,949 | | | | 1,893,212 | |
Gentex Corp. | | | 208,476 | | | | 4,104,892 | |
Graham Hldgs. Co. Cl B | | | 3,391 | | | | 1,736,022 | |
Helen of Troy Ltd.* | | | 20,255 | | | | 1,710,535 | |
HSN, Inc. | | | 23,221 | | | | 796,480 | |
International Speedway Corp. Cl A | | | 18,812 | | | | 692,282 | |
Jack in the Box, Inc. | | | 23,582 | | | | 2,632,694 | |
Kate Spade & Co.* | | | 89,553 | | | | 1,671,955 | |
KB Home | | | 58,151 | | | | 919,367 | |
Live Nation Entertainment, Inc.* | | | 98,025 | | | | 2,607,465 | |
Meredith Corp. | | | 26,754 | | | | 1,582,499 | |
Murphy USA, Inc.* | | | 26,961 | | | | 1,657,293 | |
New York Times Co. Cl A | | | 87,972 | | | | 1,170,028 | |
NVR, Inc.* | | | 2,570 | | | | 4,289,330 | |
Office Depot, Inc. | | | 394,519 | | | | 1,783,226 | |
Panera Bread Co. Cl A* | | | 15,840 | | | | 3,248,626 | |
Papa John’s Int’l., Inc. | | | 20,107 | | | | 1,720,757 | |
Penney (J.C.) Co., Inc.* | | | 230,535 | | | | 1,915,746 | |
Polaris Industries, Inc. | | | 43,693 | | | | 3,599,866 | |
Pool Corp. | | | 30,253 | | | | 3,156,598 | |
Restoration Hardware Hldgs., Inc.* | | | 29,796 | | | | 914,737 | |
Sally Beauty Hldgs., Inc.* | | | 106,760 | | | | 2,820,599 | |
Service Corp. International | | | 137,704 | | | | 3,910,794 | |
Skechers U.S.A., Inc. Cl A* | | | 99,299 | | | | 2,440,769 | |
Sotheby’s | | | 34,277 | | | | 1,366,281 | |
Tempur Sealy Int’l., Inc.* | | | 37,314 | | | | 2,547,800 | |
Texas Roadhouse, Inc. | | | 46,430 | | | | 2,239,783 | |
The Wendy’s Co. | | | 148,142 | | | | 2,002,880 | |
Thor Industries, Inc. | | | 35,520 | | | | 3,553,776 | |
Time, Inc. | | | 75,479 | | | | 1,347,300 | |
Toll Brothers, Inc.* | | | 107,525 | | | | 3,333,275 | |
TRI Pointe Group, Inc.* | | | 108,537 | | | | 1,246,005 | |
Tupperware Brands Corp. | | | 36,176 | | | | 1,903,581 | |
Vista Outdoor, Inc.* | | | 42,010 | | | | 1,550,169 | |
Wiley (John) & Sons, Inc. Cl A | | | 32,223 | | | | 1,756,154 | |
Williams-Sonoma, Inc. | | | 60,288 | | | | 2,917,336 | |
| | | | | | | | |
| | | | | | | 134,250,078 | |
| | | | | | | | |
MUTUAL OF AMERICA INVESTMENT CORPORATION - MID-CAP EQUITY INDEX FUND
PORTFOLIO OF INVESTMENTS IN SECURITIES
December 31, 2016
| | | | | | | | |
CONSUMER STAPLES (4.1%) | | | | | | | | |
Avon Products, Inc. | | | 310,748 | | | | 1,566,170 | |
Boston Beer Co., Inc. Cl A* | | | 6,397 | | | | 1,086,530 | |
Casey’s General Stores, Inc. | | | 28,843 | | | | 3,428,856 | |
Dean Foods Co. | | | 65,724 | | | | 1,431,469 | |
Edgewell Personal Care Co.* | | | 43,092 | | | | 3,145,285 | |
Energizer Hldgs., Inc. | | | 44,047 | | | | 1,964,937 | |
Flowers Foods, Inc. | | | 136,069 | | | | 2,717,298 | |
Hain Celestial Group, Inc.* | | | 75,848 | | | | 2,960,347 | |
Ingredion, Inc. | | | 53,433 | | | | 6,676,988 | |
Lamb Weston Hldgs., Inc.* | | | 100,126 | | | | 3,789,769 | |
Lancaster Colony Corp. | | | 13,914 | | | | 1,967,300 | |
Post Hldgs., Inc.* | | | 47,872 | | | | 3,848,430 | |
Snyder’s-Lance, Inc. | | | 62,689 | | | | 2,403,496 | |
Sprouts Farmers Market, Inc.* | | | 98,476 | | | | 1,863,166 | |
Tootsie Roll Industries, Inc. | | | 11,589 | | | | 460,663 | |
TreeHouse Foods, Inc.* | | | 40,900 | | | | 2,952,571 | |
United Natural Foods, Inc.* | | | 37,785 | | | | 1,803,100 | |
WhiteWave Foods Co. Cl A* | | | 129,889 | | | | 7,221,827 | |
| | | | | | | | |
| | | | | | | 51,288,202 | |
| | | | | | | | |
ENERGY (3.8%) | | | | | | | | |
CONSOL Energy, Inc. | | | 129,851 | | | | 2,367,184 | |
Denbury Resources, Inc.* | | | 281,809 | | | | 1,037,057 | |
Diamond Offshore Drilling, Inc. | | | 49,416 | | | | 874,663 | |
Dril-Quip, Inc.* | | | 26,770 | | | | 1,607,539 | |
Energen Corp. | | | 71,477 | | | | 4,122,079 | |
Ensco PLC Cl A | | | 216,467 | | | | 2,104,059 | |
Gulfport Energy Corp.* | | | 113,657 | | | | 2,459,537 | |
HollyFrontier Corp. | | | 128,510 | | | | 4,209,988 | |
Nabors Industries Ltd. | | | 205,268 | | | | 3,366,395 | |
Noble Corp. PLC | | | 178,162 | | | | 1,054,719 | |
Oceaneering Int’l., Inc. | | | 73,669 | | | | 2,078,202 | |
Oil States International, Inc.* | | | 37,722 | | | | 1,471,158 | |
Patterson-UTI Energy, Inc. | | | 107,016 | | | | 2,880,871 | |
QEP Resources, Inc. | | | 173,380 | | | | 3,191,926 | |
Rowan Companies PLC Cl A | | | 89,303 | | | | 1,686,934 | |
SM Energy Co. | | | 71,598 | | | | 2,468,699 | |
Superior Energy Services, Inc. | | | 112,422 | | | | 1,897,683 | |
Western Refining, Inc. | | | 58,606 | | | | 2,218,237 | |
World Fuel Services Corp. | | | 52,357 | | | | 2,403,710 | |
WPX Energy, Inc.* | | | 252,290 | | | | 3,675,865 | |
| | | | | | | | |
| | | | | | | 47,176,505 | |
| | | | | | | | |
FINANCIALS (16.4%) | | | | | | | | |
Alleghany Corp.* | | | 11,373 | | | | 6,916,149 | |
American Financial Group, Inc. | | | 52,845 | | | | 4,656,701 | |
Aspen Insurance Hldgs. Ltd. | | | 44,598 | | | | 2,452,890 | |
Associated Banc-Corp. | | | 110,918 | | | | 2,739,675 | |
BancorpSouth, Inc. | | | 60,546 | | | | 1,879,953 | |
Bank of Hawaii Corp. | | | 31,346 | | | | 2,780,077 | |
Bank of the Ozarks, Inc. | | | 66,395 | | | | 3,491,713 | |
Berkley (W.R.) Corp. | | | 70,467 | | | | 4,686,760 | |
Brown & Brown, Inc. | | | 85,032 | | | | 3,814,536 | |
Cathay General Bancorp | | | 54,480 | | | | 2,071,874 | |
CBOE Holdings, Inc. | | | 60,422 | | | | 4,464,582 | |
Chemical Financial Corp. | | | 51,460 | | | | 2,787,588 | |
CNO Financial Group, Inc. | | | 130,186 | | | | 2,493,062 | |
Commerce Bancshares, Inc. | | | 64,192 | | | | 3,710,940 | |
Cullen/Frost Bankers, Inc. | | | 40,796 | | | | 3,599,431 | |
East West Bancorp, Inc. | | | 106,309 | | | | 5,403,686 | |
Eaton Vance Corp. | | | 83,210 | | | | 3,484,835 | |
Endurance Specialty Hldgs. Ltd. | | | 46,811 | | | | 4,325,336 | |
Everest Re Group Ltd. | | | 30,272 | | | | 6,550,861 | |
FactSet Research Systems, Inc. | | | 29,654 | | | | 4,846,353 | |
MUTUAL OF AMERICA INVESTMENT CORPORATION - MID-CAP EQUITY INDEX FUND
PORTFOLIO OF INVESTMENTS IN SECURITIES
December 31, 2016
| | | | | | | | |
Federated Investors, Inc. Cl B | | | 69,637 | | | | 1,969,334 | |
First American Financial Corp. | | | 80,635 | | | | 2,953,660 | |
First Horizon National Corp. | | | 169,300 | | | | 3,387,693 | |
FNB Corp. | | | 152,534 | | | | 2,445,120 | |
Fulton Financial Corp. | | | 125,740 | | | | 2,363,912 | |
Genworth Financial, Inc.* | | | 370,431 | | | | 1,411,342 | |
Hancock Hldg. Co. | | | 61,189 | | | | 2,637,246 | |
Hanover Insurance Group, Inc. | | | 30,794 | | | | 2,802,562 | |
International Bancshares Corp. | | | 43,403 | | | | 1,770,842 | |
Janus Capital Group, Inc. | | | 105,876 | | | | 1,404,975 | |
Kemper Corp. | | | 36,746 | | | | 1,627,848 | |
Legg Mason, Inc. | | | 67,174 | | | | 2,009,174 | |
MarketAxess Hldgs., Inc. | | | 27,869 | | | | 4,094,513 | |
MB Financial, Inc. | | | 51,296 | | | | 2,422,710 | |
Mercury General Corp. | | | 26,254 | | | | 1,580,753 | |
MSCI, Inc. Cl A | | | 68,712 | | | | 5,413,131 | |
New York Community Bancorp, Inc. | | | 357,094 | | | | 5,681,366 | |
Old Republic Int’l. Corp. | | | 180,090 | | | | 3,421,710 | |
PacWest Bancorp | | | 88,262 | | | | 4,804,983 | |
Primerica, Inc. | | | 32,805 | | | | 2,268,466 | |
PrivateBancorp, Inc. | | | 58,852 | | | | 3,189,190 | |
Prosperity Bancshares, Inc. | | | 51,005 | | | | 3,661,139 | |
Raymond James Financial, Inc. | | | 93,422 | | | | 6,471,342 | |
Reinsurance Grp. of America, Inc. | | | 47,560 | | | | 5,984,475 | |
RenaissanceRe Hldgs. Ltd. | | | 30,440 | | | | 4,146,537 | |
SEI Investments Co. | | | 98,287 | | | | 4,851,446 | |
Signature Bank* | | | 39,346 | | | | 5,909,769 | |
SLM Corp.* | | | 316,578 | | | | 3,488,690 | |
Stifel Financial Corp.* | | | 49,406 | | | | 2,467,830 | |
SVB Financial Group* | | | 38,215 | | | | 6,559,987 | |
Synovus Financial Corp. | | | 91,037 | | | | 3,739,800 | |
TCF Financial Corp. | | | 125,412 | | | | 2,456,821 | |
Trustmark Corp. | | | 50,496 | | | | 1,800,182 | |
UMB Financial Corp. | | | 32,635 | | | | 2,516,811 | |
Umpqua Hldgs. Corp. | | | 159,981 | | | | 3,004,443 | |
Valley National Bancorp | | | 191,280 | | | | 2,226,499 | |
Waddell & Reed Financial, Inc. Cl A | | | 58,264 | | | | 1,136,731 | |
Washington Federal, Inc. | | | 64,910 | | | | 2,229,659 | |
Webster Financial Corp. | | | 67,272 | | | | 3,651,524 | |
WisdomTree Investments, Inc. | | | 88,584 | | | | 986,826 | |
| | | | | | | | |
| | | | | | | 204,108,043 | |
| | | | | | | | |
HEALTH CARE (7.2%) | | | | | | | | |
Abiomed, Inc.* | | | 29,474 | | | | 3,321,130 | |
Akorn, Inc.* | | | 62,930 | | | | 1,373,762 | |
Align Technology, Inc.* | | | 54,707 | | | | 5,258,984 | |
Allscripts Healthcare Solutions, Inc.* | | | 135,367 | | | | 1,382,097 | |
Bio-Rad Laboratories, Inc. Cl A* | | | 15,166 | | | | 2,764,458 | |
Bio-Techne Corp. | | | 27,155 | | | | 2,792,349 | |
Catalent, Inc.* | | | 89,347 | | | | 2,408,795 | |
Charles River Laboratories Int’l., Inc.* | | | 34,935 | | | | 2,661,698 | |
Globus Medical, Inc. Cl A* | | | 54,470 | | | | 1,351,401 | |
Halyard Health, Inc.* | | | 34,497 | | | | 1,275,699 | |
HealthSouth Corp. | | | 65,324 | | | | 2,693,962 | |
Hill-Rom Hldgs., Inc. | | | 43,618 | | | | 2,448,715 | |
IDEXX Laboratories, Inc.* | | | 66,155 | | | | 7,757,992 | |
LifePoint Health, Inc.* | | | 29,011 | | | | 1,647,825 | |
LivaNova PLC* | | | 31,123 | | | | 1,399,601 | |
MEDNAX, Inc.* | | | 67,575 | | | | 4,504,550 | |
Molina Healthcare, Inc.* | | | 31,636 | | | | 1,716,569 | |
NuVasive, Inc.* | | | 37,492 | | | | 2,525,461 | |
Owens & Minor, Inc. | | | 44,450 | | | | 1,568,641 | |
PAREXEL International Corp.* | | | 38,546 | | | | 2,533,243 | |
Prestige Brands Hldgs., Inc.* | | | 38,039 | | | | 1,981,832 | |
ResMed, Inc. | | | 103,272 | | | | 6,408,028 | |
MUTUAL OF AMERICA INVESTMENT CORPORATION - MID-CAP EQUITY INDEX FUND
PORTFOLIO OF INVESTMENTS IN SECURITIES
December 31, 2016
| | | | | | | | |
STERIS PLC | | | 62,219 | | | | 4,192,938 | |
Teleflex, Inc. | | | 31,998 | | | | 5,156,478 | |
Tenet Healthcare Corp.* | | | 56,415 | | | | 837,199 | |
United Therapeutics Corp.* | | | 31,461 | | | | 4,512,451 | |
VCA Inc.* | | | 59,742 | | | | 4,101,288 | |
WellCare Health Plans, Inc.* | | | 32,342 | | | | 4,433,441 | |
West Pharmaceutical Svcs., Inc. | | | 53,527 | | | | 4,540,695 | |
| | | | | | | | |
| | | | | | | 89,551,282 | |
| | | | | | | | |
INDUSTRIALS (14.2%) | | | | | | | | |
AECOM* | | | 113,019 | | | | 4,109,371 | |
AGCO Corp. | | | 49,400 | | | | 2,858,284 | |
Avis Budget Group, Inc.* | | | 66,065 | | | | 2,423,264 | |
B/E Aerospace, Inc. | | | 74,100 | | | | 4,460,079 | |
Carlisle Cos., Inc. | | | 47,292 | | | | 5,215,835 | |
CEB, Inc. | | | 23,778 | | | | 1,440,947 | |
CLARCOR, Inc. | | | 34,933 | | | | 2,880,925 | |
Clean Harbors, Inc.* | | | 37,644 | | | | 2,094,889 | |
Copart, Inc.* | | | 74,984 | | | | 4,154,863 | |
Crane Co. | | | 37,202 | | | | 2,683,008 | |
Curtiss-Wright Corp. | | | 32,950 | | | | 3,240,962 | |
Deluxe Corp. | | | 34,942 | | | | 2,502,197 | |
Donaldson Co., Inc. | | | 97,042 | | | | 4,083,527 | |
Dycom Industries, Inc.* | | | 22,669 | | | | 1,820,094 | |
EMCOR Group, Inc. | | | 44,670 | | | | 3,160,849 | |
EnerSys | | | 32,074 | | | | 2,504,979 | |
Esterline Technologies Corp.* | | | 22,322 | | | | 1,991,122 | |
FTI Consulting, Inc.* | | | 31,781 | | | | 1,432,687 | |
GATX Corp. | | | 29,151 | | | | 1,795,119 | |
Genesee & Wyoming, Inc. Cl A* | | | 44,939 | | | | 3,119,216 | |
Graco, Inc. | | | 41,417 | | | | 3,441,339 | |
Granite Construction, Inc. | | | 29,171 | | | | 1,604,405 | |
HNI Corp. | | | 32,437 | | | | 1,813,877 | |
Hubbell, Inc. | | | 38,020 | | | | 4,436,934 | |
Huntington Ingalls Industries, Inc. | | | 34,189 | | | | 6,297,272 | |
IDEX Corp. | | | 56,161 | | | | 5,057,860 | |
ITT, Inc. | | | 63,998 | | | | 2,468,403 | |
JetBlue Airways Corp* | | | 236,509 | | | | 5,302,532 | |
Joy Global, Inc. | | | 72,737 | | | | 2,036,636 | |
KBR, Inc. | | | 103,341 | | | | 1,724,761 | |
Kennametal, Inc. | | | 59,135 | | | | 1,848,560 | |
Kirby Corp.* | | | 39,460 | | | | 2,624,090 | |
KLX, Inc.* | | | 39,046 | | | | 1,761,365 | |
Landstar System, Inc. | | | 31,263 | | | | 2,666,734 | |
Lennox International, Inc. | | | 28,149 | | | | 4,311,582 | |
Lincoln Electric Hldgs., Inc. | | | 45,469 | | | | 3,486,108 | |
Manpowergroup, Inc. | | | 48,922 | | | | 4,347,698 | |
Miller (Herman), Inc. | | | 43,303 | | | | 1,480,963 | |
MSA Safety, Inc. | | | 22,510 | | | | 1,560,618 | |
MSC Industrial Direct Co., Inc. Cl A | | | 32,557 | | | | 3,007,941 | |
Nordson Corp. | | | 39,019 | | | | 4,372,079 | |
NOW, Inc.* | | | 80,681 | | | | 1,651,540 | |
Old Dominion Freight Line, Inc.* | | | 50,755 | | | | 4,354,271 | |
Orbital ATK, Inc. | | | 42,690 | | | | 3,745,194 | |
Oshkosh Corp. | | | 54,654 | | | | 3,531,195 | |
Regal Beloit Corp. | | | 33,194 | | | | 2,298,685 | |
Rollins, Inc. | | | 68,577 | | | | 2,316,531 | |
Smith (A.O.) Corp. | | | 108,160 | | | | 5,121,376 | |
Teledyne Technologies, Inc.* | | | 25,956 | | | | 3,192,588 | |
Terex Corp. | | | 76,340 | | | | 2,407,000 | |
Timken Co. | | | 51,486 | | | | 2,043,994 | |
Toro Co. | | | 79,940 | | | | 4,472,643 | |
Trinity Industries, Inc. | | | 111,744 | | | | 3,102,013 | |
Triumph Group, Inc. | | | 35,646 | | | | 944,619 | |
Valmont Industries, Inc. | | | 16,595 | | | | 2,338,236 | |
MUTUAL OF AMERICA INVESTMENT CORPORATION - MID-CAP EQUITY INDEX FUND
PORTFOLIO OF INVESTMENTS IN SECURITIES
December 31, 2016
| | | | | | | | |
Wabtec Corp. | | | 64,512 | | | | 5,355,786 | |
Watsco, Inc. | | | 19,117 | | | | 2,831,610 | |
Werner Enterprises, Inc. | | | 31,133 | | | | 839,034 | |
Woodward, Inc. | | | 40,896 | | | | 2,823,869 | |
| | | | | | | | |
| | | | | | | 176,994,158 | |
| | | | | | | | |
INFORMATION TECHNOLOGY (16.8%) | | | | | | | | |
3D Systems Corp.* | | | 78,510 | | | | 1,043,398 | |
ACI Worldwide, Inc.* | | | 84,565 | | | | 1,534,855 | |
Acxiom Corp.* | | | 57,688 | | | | 1,546,038 | |
Advanced Micro Devices, Inc.* | | | 552,353 | | | | 6,263,683 | |
ANSYS, Inc.* | | | 63,261 | | | | 5,851,010 | |
ARRIS International PLC* | | | 139,113 | | | | 4,191,475 | |
Arrow Electronics, Inc.* | | | 64,820 | | | | 4,621,666 | |
Avnet, Inc. | | | 94,591 | | | | 4,503,478 | |
Belden, Inc. | | | 30,885 | | | | 2,309,271 | |
Broadridge Financial Solutions, Inc. | | | 87,770 | | | | 5,819,151 | |
Brocade Communications Systems, Inc. | | | 290,404 | | | | 3,627,146 | |
Cadence Design Systems, Inc.* | | | 210,178 | | | | 5,300,689 | |
CDK Global, Inc. | | | 110,313 | | | | 6,584,583 | |
Ciena Corp.* | | | 102,590 | | | | 2,504,222 | |
Cirrus Logic, Inc.* | | | 47,635 | | | | 2,693,283 | |
Cognex Corp | | | 63,083 | | | | 4,013,340 | |
CommVault Systems, Inc.* | | | 31,219 | | | | 1,604,657 | |
Computer Sciences Corp. | | | 103,006 | | | | 6,120,617 | |
comScore, Inc.* | | | 32,602 | | | | 1,029,571 | |
Convergys Corp. | | | 72,251 | | | | 1,774,485 | |
CoreLogic, Inc.* | | | 61,465 | | | | 2,263,756 | |
Cree, Inc.* | | | 75,439 | | | | 1,990,835 | |
Cypress Semiconductor Corp. | | | 237,999 | | | | 2,722,709 | |
Diebold Nixdorf, Inc. | | | 53,915 | | | | 1,355,962 | |
DST Systems, Inc. | | | 23,287 | | | | 2,495,202 | |
Fair Isaac Corp. | | | 22,692 | | | | 2,705,340 | |
Fortinet, Inc.* | | | 108,507 | | | | 3,268,231 | |
Gartner, Inc.* | | | 61,078 | | | | 6,173,153 | |
Henry (Jack) & Associates, Inc. | | | 57,392 | | | | 5,095,262 | |
Integrated Device Technology, Inc.* | | | 96,374 | | | | 2,270,571 | |
InterDigital, Inc. | | | 25,211 | | | | 2,303,025 | |
Intersil Corp. Cl A | | | 102,541 | | | | 2,286,664 | |
IPG Photonics Corp.* | | | 26,922 | | | | 2,657,471 | |
j2 Global, Inc. | | | 35,202 | | | | 2,879,524 | |
Jabil Circuit, Inc. | | | 135,086 | | | | 3,197,486 | |
Keysight Technologies, Inc.* | | | 124,880 | | | | 4,566,862 | |
Knowles Corp.* | | | 64,025 | | | | 1,069,858 | |
Leidos Hldgs., Inc. | | | 105,581 | | | | 5,399,412 | |
Littelfuse, Inc. | | | 16,519 | | | | 2,507,089 | |
Manhattan Associates, Inc.* | | | 53,114 | | | | 2,816,635 | |
MAXIMUS, Inc. | | | 48,164 | | | | 2,687,070 | |
Mentor Graphics Corp. | | | 78,646 | | | | 2,901,251 | |
Microsemi Corp.* | | | 84,998 | | | | 4,587,342 | |
Monolithic Power Systems, Inc. | | | 27,033 | | | | 2,214,814 | |
National Instruments Corp. | | | 79,314 | | | | 2,444,458 | |
NCR Corp.* | | | 90,683 | | | | 3,678,102 | |
NetScout Systems, Inc.* | | | 66,303 | | | | 2,088,545 | |
NeuStar, Inc. Cl A* | | | 39,877 | | | | 1,331,892 | |
Plantronics, Inc. | | | 23,995 | | | | 1,313,966 | |
PTC, Inc.* | | | 83,408 | | | | 3,859,288 | |
Science Applications Int’l. Corp. | | | 32,497 | | | | 2,755,746 | |
Silicon Laboratories, Inc.* | | | 30,514 | | | | 1,983,410 | |
Synaptics, Inc.* | | | 25,472 | | | | 1,364,790 | |
SYNNEX Corp. | | | 21,123 | | | | 2,556,305 | |
Synopsys, Inc.* | | | 111,352 | | | | 6,554,179 | |
Tech Data Corp.* | | | 25,909 | | | | 2,193,974 | |
Teradyne, Inc. | | | 149,343 | | | | 3,793,312 | |
Trimble Navigation Ltd.* | | | 184,318 | | | | 5,557,188 | |
MUTUAL OF AMERICA INVESTMENT CORPORATION - MID-CAP EQUITY INDEX FUND
PORTFOLIO OF INVESTMENTS IN SECURITIES
December 31, 2016
| | | | | | | | |
Tyler Technologies, Inc.* | | | 24,667 | | | | 3,521,708 | |
Ultimate Software Group, Inc.* | | | 21,341 | | | | 3,891,531 | |
VeriFone Systems, Inc.* | | | 78,743 | | | | 1,396,113 | |
Versum Materials, Inc.* | | | 81,280 | | | | 2,281,530 | |
ViaSat, Inc.* | | | 38,170 | | | | 2,527,617 | |
Vishay Intertechnology, Inc. | | | 97,567 | | | | 1,580,585 | |
WebMD Health Corp.* | | | 26,957 | | | | 1,336,258 | |
WEX, Inc.* | | | 28,380 | | | | 3,167,208 | |
Zebra Technologies Corp. Cl A* | | | 38,207 | | | | 3,276,632 | |
| | | | | | | | |
| | | | | | | 209,806,479 | |
| | | | | | | | |
MATERIALS (7.0%) | | | | | | | | |
Allegheny Technologies, Inc. | | | 80,493 | | | | 1,282,253 | |
AptarGroup, Inc. | | | 46,166 | | | | 3,390,893 | |
Ashland Global Holdings, Inc. | | | 45,452 | | | | 4,967,449 | |
Bemis Co., Inc. | | | 68,857 | | | | 3,292,742 | |
Cabot Corp. | | | 45,383 | | | | 2,293,657 | |
Carpenter Technology Corp. | | | 34,168 | | | | 1,235,857 | |
Commercial Metals Co. | | | 83,974 | | | | 1,828,954 | |
Compass Minerals Int’l., Inc. | | | 24,198 | | | | 1,895,913 | |
Domtar Corp. | | | 45,578 | | | | 1,778,909 | |
Eagle Materials, Inc. | | | 34,925 | | | | 3,441,160 | |
Greif, Inc. Cl A | | | 19,925 | | | | 1,022,352 | |
Louisiana-Pacific Corp.* | | | 102,712 | | | | 1,944,338 | |
Minerals Technologies, Inc. | | | 25,033 | | | | 1,933,799 | |
NewMarket Corp. | | | 6,763 | | | | 2,866,430 | |
Olin Corp. | | | 117,774 | | | | 3,016,192 | |
Owens-Illinois, Inc.* | | | 121,226 | | | | 2,110,545 | |
Packaging Corp. of America | | | 67,781 | | | | 5,749,184 | |
PolyOne Corp. | | | 62,760 | | | | 2,010,830 | |
Reliance Steel & Aluminum Co. | | | 52,565 | | | | 4,181,020 | |
Royal Gold, Inc. | | | 47,682 | | | | 3,020,655 | |
RPM International, Inc. | | | 98,171 | | | | 5,284,545 | |
Scotts Miracle-Gro Co. Cl A | | | 32,861 | | | | 3,139,869 | |
Sensient Technologies Corp. | | | 33,138 | | | | 2,603,984 | |
Silgan Hldgs., Inc. | | | 28,321 | | | | 1,449,469 | |
Sonoco Products Co. | | | 73,628 | | | | 3,880,196 | |
Steel Dynamics, Inc. | | | 177,971 | | | | 6,332,208 | |
United States Steel Corp. | | | 125,686 | | | | 4,148,895 | |
Valspar Corp. | | | 53,007 | | | | 5,492,055 | |
Worthington Industries, Inc. | | | 32,350 | | | | 1,534,684 | |
| | | | | | | | |
| | | | | | | 87,129,037 | |
| | | | | | | | |
REAL ESTATE (10.0%) | | | | | | | | |
Alexander & Baldwin, Inc. | | | 34,806 | | | | 1,561,745 | |
Alexandria Real Estate Equities, Inc. | | | 58,830 | | | | 6,537,778 | |
American Campus Communities, Inc. | | | 96,980 | | | | 4,826,695 | |
Camden Property Trust | | | 64,457 | | | | 5,418,900 | |
Care Capital Pptys., Inc. | | | 59,570 | | | | 1,489,250 | |
Communications Sales & Leasing* | | | 101,412 | | | | 2,576,879 | |
CoreCivic, Inc. | | | 89,243 | | | | 2,182,884 | |
Corporate Office Pptys. Trust | | | 71,335 | | | | 2,227,079 | |
Cousins Properties, Inc. | | | 247,742 | | | | 2,108,284 | |
DCT Industrial Trust, Inc. | | | 66,555 | | | | 3,186,653 | |
Douglas Emmett, Inc. | | | 104,334 | | | | 3,814,451 | |
Duke Realty Corp. | | | 261,545 | | | | 6,946,635 | |
Education Realty Trust, Inc. | | | 52,706 | | | | 2,229,464 | |
EPR Properties | | | 46,338 | | | | 3,325,678 | |
Equity One, Inc. | | | 67,306 | | | | 2,065,621 | |
First Industrial Realty Trust, Inc. | | | 87,015 | | | | 2,440,771 | |
Healthcare Realty Trust | | | 84,650 | | | | 2,566,588 | |
Highwoods Properties, Inc. | | | 74,391 | | | | 3,794,685 | |
Hospitality Properties Trust | | | 121,413 | | | | 3,853,649 | |
Jones Lang LaSalle, Inc. | | | 33,488 | | | | 3,383,628 | |
Kilroy Realty Corp. | | | 67,489 | | | | 4,941,545 | |
Lamar Advertising Co. Cl A | | | 61,284 | | | | 4,120,736 | |
MUTUAL OF AMERICA INVESTMENT CORPORATION - MID-CAP EQUITY INDEX FUND
PORTFOLIO OF INVESTMENTS IN SECURITIES
December 31, 2016
| | | | | | | | |
LaSalle Hotel Pptys. | | | 82,463 | | | | 2,512,648 | |
Liberty Property Trust | | | 106,187 | | | | 4,194,387 | |
Life Storage, Inc. | | | 34,247 | | | | 2,919,899 | |
Mack-Cali Realty Corp. | | | 64,010 | | | | 1,857,570 | |
Medical Properties Trust, Inc. | | | 237,198 | | | | 2,917,535 | |
National Retail Pptys., Inc. | | | 107,393 | | | | 4,746,771 | |
Omega Healthcare Investors, Inc. | | | 142,907 | | | | 4,467,273 | |
Potlatch Corp. | | | 29,076 | | | | 1,211,015 | |
Quality Care Properties, Inc.* | | | 70,268 | | | | 1,089,154 | |
Rayonier, Inc. | | | 89,949 | | | | 2,392,643 | |
Regency Centers Corp. | | | 77,585 | | | | 5,349,486 | |
Senior Housing Pptys. Trust | | | 176,991 | | | | 3,350,440 | |
Tanger Factory Outlet Centers, Inc. | | | 71,659 | | | | 2,563,959 | |
Taubman Centers, Inc. | | | 43,790 | | | | 3,237,395 | |
Urban Edge Pptys. | | | 65,907 | | | | 1,813,102 | |
Washington Prime Group, Inc. | | | 140,173 | | | | 1,459,201 | |
Weingarten Realty Investors | | | 85,165 | | | | 3,048,055 | |
| | | | | | | | |
| | | | | | | 124,730,131 | |
| | | | | | | | |
TELECOMMUNICATION SERVICES (0.2%) | | | | | | | | |
Telephone & Data Systems, Inc. | | | 69,434 | | | | 2,004,560 | |
| | | | | | | | |
UTILITIES (5.1%) | | | | | | | | |
Aqua America, Inc. | | | 131,302 | | | | 3,944,312 | |
Atmos Energy Corp. | | | 76,185 | | | | 5,649,118 | |
Black Hills Corp. | | | 39,500 | | | | 2,422,930 | |
Great Plains Energy, Inc. | | | 156,119 | | | | 4,269,855 | |
Hawaiian Electric Industries, Inc. | | | 79,096 | | | | 2,615,705 | |
Idacorp, Inc. | | | 37,140 | | | | 2,991,627 | |
MDU Resources Group, Inc. | | | 143,295 | | | | 4,122,597 | |
National Fuel Gas Co. | | | 61,951 | | | | 3,508,905 | |
New Jersey Resources Corp. | | | 62,509 | | | | 2,219,070 | |
NorthWestern Corp. | | | 35,738 | | | | 2,032,420 | |
OGE Energy Corp. | | | 146,051 | | | | 4,885,406 | |
ONE Gas, Inc. | | | 37,905 | | | | 2,424,404 | |
PNM Resources, Inc. | | | 57,097 | | | | 1,958,427 | |
Southwest Gas Corp. | | | 34,318 | | | | 2,629,445 | |
UGI Corp. | | | 127,182 | | | | 5,860,547 | |
Vectren Corp. | | | 61,815 | | | | 3,223,652 | |
Westar Energy, Inc. | | | 104,801 | | | | 5,905,536 | |
WGL Hldgs., Inc. | | | 38,087 | | | | 2,905,276 | |
| | | | | | | | |
| | | | | | | 63,569,232 | |
| | | | | | | | |
TOTAL INDEXED ASSETS - COMMON STOCKS
(Cost: $906,006,366) 95.6% | | | | | | | 1,190,607,707 | |
| | | | | | | | |
| | | | | | | | | | | | | | | | | | | | |
| | | Rating** | | | Rate(%) | | | Maturity | | | Face Amount | | | Value | |
SHORT-TERM DEBT SECURITIES: | | | | | | | | | | | | | | | | | | | | |
U.S. GOVERNMENT (1.2%) | | | | | | | | | | | | | | | | | | | | |
U.S. Treasury Bill (1) | | | A-1+ | | | | 0.31 | | | | 01/19/17 | | | | 500,000 | | | | 499,919 | |
U.S. Treasury Bill (1) | | | A-1+ | | | | 0.33 | | | | 01/19/17 | | | | 2,000,000 | | | | 1,999,651 | |
U.S. Treasury Bill (1) | | | A-1+ | | | | 0.41 | | | | 01/26/17 | | | | 1,000,000 | | | | 999,700 | |
U.S. Treasury Bill (1) | | | A-1+ | | | | 0.42 | | | | 02/16/17 | | | | 1,000,000 | | | | 999,452 | |
U.S. Treasury Bill (1) | | | A-1+ | | | | 0.43 | | | | 02/09/17 | | | | 5,000,000 | | | | 4,997,611 | |
U.S. Treasury Bill (1) | | | A-1+ | | | | 0.44 | | | | 01/12/17 | | | | 5,000,000 | | | | 4,999,275 | |
| | | | | | | | | | | | | | | | | | | | |
| | | | | | | | | | | | | | | | | | | 14,495,608 | |
| | | | | | | | | | | | | | | | | | | | |
U.S. GOVERNMENT AGENCIES (0.4%) | | | | | | | | | | | | | | | | | | | | |
FHLB | | | A-1+ | | | | 0.49 | | | | 02/07/17 | | | | 5,400,000 | | | | 5,397,235 | |
| | | | | | | | | | | | | | | | | | | | |
COMMERCIAL PAPER (2.7%) | | | | | | | | | | | | | | | | | | | | |
Cargill, Inc.† | | | A-1 | | | | 0.71 | | | | 01/03/17 | | | | 5,000,000 | | | | 4,999,704 | |
Cargill, Inc.† | | | A-1 | | | | 0.64 | | | | 01/06/17 | | | | 4,750,000 | | | | 4,749,493 | |
Danaher Corp.† | | | A-1 | | | | 0.70 | | | | 01/06/17 | | | | 2,500,000 | | | | 2,499,708 | |
GE Capital Treasury LLC | | | A-1+ | | | | 0.61 | | | | 01/26/17 | | | | 5,000,000 | | | | 4,997,797 | |
Novartis Finance Corp.† | | | A-1+ | | | | 0.50 | | | | 01/03/17 | | | | 6,000,000 | | | | 5,999,751 | |
Southern California Gas Co.† | | | A-1 | | | | 0.70 | | | | 01/03/17 | | | | 5,000,000 | | | | 4,999,708 | |
MUTUAL OF AMERICA INVESTMENT CORPORATION - MID-CAP EQUITY INDEX FUND
PORTFOLIO OF INVESTMENTS IN SECURITIES
December 31, 2016
| | | | | | | | | | | | | | | | | | | | |
Toyota Motor Credit Corp. | | | A-1+ | | | | 0.65 | | | | 02/01/17 | | | | 5,000,000 | | | | 4,997,109 | |
| | | | | | | | | | | | | | | | | | | | |
| | | | | | | | | | | | | | | | | | | 33,243,270 | |
| | | | | | | | | | | | | | | | | | | | |
TOTAL SHORT-TERM DEBT SECURITIES
(Cost: $53,136,113) 4.3% | | | | | | | | | | | | | | | | | | | 53,136,113 | |
| | | | | | | | | | | | | | | | | | | | |
TOTAL INVESTMENTS
(Cost: $959,142,479) 99.9% | | | | | | | | | | | | | | | | | | | 1,243,743,820 | |
| | | | | | | | | | | | | | | | | | | | |
OTHER NET ASSETS 0.1% | | | | | | | | | | | | | | | | | | | 1,293,355 | |
| | | | | | | | | | | | | | | | | | | | |
NET ASSETS 100.0% | | | | | | | | | | | | | | | | | | $ | 1,245,037,175 | |
| | | | | | | | | | | | | | | | | | | | |
The accompanying notes are an integral part of these portfolio schedules.
MUTUAL OF AMERICA INVESTMENT CORPORATION - INTERNATIONAL FUND
PORTFOLIO OF INVESTMENTS IN SECURITIES
December 31, 2016
| | | | | | | | |
| | | Shares | | | Value | |
COMMON STOCKS: | | | | | | | | |
FINANCIALS (94.4%) | | | | | | | | |
iShares Core MSCI EAFE ETF | | | 138,481 | | | | 7,426,736 | |
iShares Core MSCI Europe ETF | | | 393,284 | | | | 16,002,726 | |
iShares Core MSCI Pacific ETF | | | 177,010 | | | | 8,639,858 | |
iShares Edge MSCI Emerging Markets ETF | | | 179,014 | | | | 8,755,575 | |
iShares MSCI EAFE ETF | | | 2,388,293 | | | | 137,876,155 | |
iShares MSCI EAFE Growth ETF | | | 443,228 | | | | 28,229,191 | |
iShares MSCI EAFE Small-Cap ETF | | | 177,935 | | | | 8,866,501 | |
iShares MSCI EAFE Value ETF | | | 606,383 | | | | 28,651,597 | |
Vanguard FTSE Developed Markets ETF | | | 2,129,980 | | | | 77,829,469 | |
Vanguard FTSE Europe ETF | | | 424,630 | | | | 20,356,762 | |
Vanguard FTSE Pacific ETF | | | 220,480 | | | | 12,814,298 | |
| | | | | | | | |
| | | | | | | 355,448,868 | |
| | | | | | | | |
TOTAL COMMON STOCKS
(Cost: $369,772,919) 94.4% | | | | | | | 355,448,868 | |
| | | | | | | | |
| | | | | | | | | | | | | | | | | | | | |
| | | Rating** | | | Rate(%) | | | Maturity | | | Face Amount | | | Value | |
SHORT-TERM DEBT SECURITIES: | | | | | | | | | | | | | | | | | | | | |
U.S. GOVERNMENT (2.0%) | | | | | | | | | | | | | | | | | | | | |
U.S. Treasury Bill | | | A-1+ | | | | 0.41 | | | | 01/26/17 | | | | 1,500,000 | | | | 1,499,550 | |
U.S. Treasury Bill | | | A-1+ | | | | 0.44 | | | | 01/12/17 | | | | 3,000,000 | | | | 2,999,565 | |
U.S. Treasury Bill | | | A-1+ | | | | 0.46 | | | | 02/23/17 | | | | 3,000,000 | | | | 2,997,929 | |
| | | | | | | | | | | | | | | | | | | | |
| | | | | | | | | | | | | | | | | | | 7,497,044 | |
| | | | | | | | | | | | | | | | | | | | |
COMMERCIAL PAPER (3.6%) | | | | | | | | | | | | | | | | | | | | |
Cargill, Inc.† | | | A-1 | | | | 0.64 | | | | 01/06/17 | | | | 1,000,000 | | | | 999,893 | |
Cargill, Inc.† | | | A-1 | | | | 0.71 | | | | 01/03/17 | | | | 2,000,000 | | | | 1,999,882 | |
Novartis Finance Corp.† | | | A-1+ | | | | 0.50 | | | | 01/03/17 | | | | 4,700,000 | | | | 4,699,804 | |
Toyota Motor Credit Corp. | | | A-1+ | | | | 0.62 | | | | 01/18/17 | | | | 6,000,000 | | | | 5,998,139 | |
| | | | | | | | | | | | | | | | | | | | |
| | | | | | | | | | | | | | | | | | | 13,697,718 | |
| | | | | | | | | | | | | | | | | | | | |
TOTAL SHORT-TERM DEBT SECURITIES
(Cost: $21,194,762) 5.6% | | | | | | | | | | | | | | | | | | | 21,194,762 | |
| | | | | | | | | | | | | | | | | | | | |
TOTAL INVESTMENTS
(Cost: $390,967,681) 100.0% | | | | | | | | | | | | | | | | | | | 376,643,630 | |
| | | | | | | | | | | | | | | | | | | | |
OTHER NET ASSETS 0.0% (2) | | | | | | | | | | | | | | | | | | | 84,863 | |
| | | | | | | | | | | | | | | | | | | | |
NET ASSETS 100.0% | | | | | | | | | | | | | | | | | | $ | 376,728,493 | |
| | | | | | | | | | | | | | | | | | | | |
The accompanying notes are an integral part of these portfolio schedules.
MUTUAL OF AMERICA INVESTMENT CORPORATION - COMPOSITE FUND
PORTFOLIO OF INVESTMENTS IN SECURITIES
December 31, 2016
| | | | | | | | |
| | | Shares | | | Value | |
COMMON STOCKS: | | | | | | | | |
CONSUMER DISCRETIONARY (5.8%) | | | | | | | | |
Amazon.com, Inc.* | | | 2,548 | | | | 1,910,669 | |
CBS Corp. Cl B | | | 21,963 | | | | 1,397,286 | |
D.R. Horton, Inc. | | | 22,628 | | | | 618,423 | |
Ford Motor Co. | | | 65,385 | | | | 793,120 | |
Home Depot, Inc. | | | 12,824 | | | | 1,719,442 | |
PVH Corp. | | | 7,849 | | | | 708,294 | |
Ross Stores, Inc. | | | 13,455 | | | | 882,648 | |
Starbucks Corp. | | | 17,028 | | | | 945,395 | |
Whirlpool Corp. | | | 8,364 | | | | 1,520,324 | |
| | | | | | | | |
| | | | | | | 10,495,601 | |
| | | | | | | | |
CONSUMER STAPLES (4.4%) | | | | | | | | |
Dr. Pepper Snapple Group, Inc. | | | 13,198 | | | | 1,196,663 | |
J.M. Smucker Co. | | | 6,963 | | | | 891,682 | |
PepsiCo, Inc. | | | 15,412 | | | | 1,612,558 | |
Reynolds American, Inc. | | | 15,205 | | | | 852,088 | |
Sysco Corp. | | | 19,604 | | | | 1,085,473 | |
Tyson Foods, Inc. Cl A | | | 10,450 | | | | 644,556 | |
Walgreens Boots Alliance, Inc. | | | 20,869 | | | | 1,727,118 | |
| | | | | | | | |
| | | | | | | 8,010,138 | |
| | | | | | | | |
ENERGY (6.0%) | | | | | | | | |
Chevron Corp. | | | 18,743 | | | | 2,206,051 | |
Cimarex Energy Co. | | | 7,501 | | | | 1,019,386 | |
Devon Energy Corp. | | | 17,388 | | | | 794,110 | |
Marathon Petroleum Corp. | | | 22,734 | | | | 1,144,657 | |
National Oilwell Varco, Inc. | | | 20,423 | | | | 764,637 | |
Noble Energy, Inc. | | | 17,451 | | | | 664,185 | |
Occidental Petroleum Corp. | | | 12,275 | | | | 874,348 | |
Range Resources Corp. | | | 18,887 | | | | 648,957 | |
Schlumberger Ltd. | | | 19,009 | | | | 1,595,806 | |
Williams Cos., Inc. | | | 34,795 | | | | 1,083,516 | |
| | | | | | | | |
| | | | | | | 10,795,653 | |
| | | | | | | | |
FINANCIALS (9.2%) | | | | | | | | |
American Int’l. Group, Inc. | | | 25,771 | | | | 1,683,104 | |
Citigroup, Inc. | | | 27,266 | | | | 1,620,418 | |
Discover Financial Svcs. | | | 22,618 | | | | 1,630,532 | |
Fifth Third Bancorp | | | 32,369 | | | | 872,992 | |
JPMorgan Chase & Co. | | | 33,027 | | | | 2,849,900 | |
KeyCorp | | | 48,655 | | | | 888,927 | |
MetLife, Inc. | | | 30,604 | | | | 1,649,250 | |
Morgan Stanley | | | 26,224 | | | | 1,107,964 | |
Northern Trust Corp. | | | 14,609 | | | | 1,300,931 | |
PNC Financial Svcs. Grp., Inc. | | | 10,133 | | | | 1,185,156 | |
SunTrust Banks, Inc. | | | 14,769 | | | | 810,080 | |
U.S. Bancorp | | | 21,626 | | | | 1,110,928 | |
| | | | | | | | |
| | | | | | | 16,710,182 | |
| | | | | | | | |
HEALTH CARE (9.1%) | | | | | | | | |
AbbVie, Inc. | | | 26,462 | | | | 1,657,050 | |
Aetna, Inc. | | | 7,907 | | | | 980,547 | |
Amgen, Inc. | | | 11,855 | | | | 1,733,320 | |
Baxter International, Inc. | | | 21,286 | | | | 943,821 | |
Becton, Dickinson & Co. | | | 8,401 | | | | 1,390,786 | |
Gilead Sciences, Inc. | | | 20,158 | | | | 1,443,514 | |
McKesson Corp. | | | 8,790 | | | | 1,234,556 | |
Merck & Co., Inc. | | | 25,965 | | | | 1,528,560 | |
Pfizer, Inc. | | | 71,437 | | | | 2,320,274 | |
Quest Diagnostics, Inc. | | | 12,038 | | | | 1,106,292 | |
UnitedHealth Group, Inc. | | | 13,651 | | | | 2,184,706 | |
| | | | | | | | |
| | | | | | | 16,523,426 | |
| | | | | | | | |
MUTUAL OF AMERICA INVESTMENT CORPORATION - COMPOSITE FUND
PORTFOLIO OF INVESTMENTS IN SECURITIES
December 31, 2016
| | | | | | | | |
INDUSTRIALS (5.0%) | | | | | | | | |
Boeing Co. | | | 12,023 | | | | 1,871,741 | |
Delta Air Lines, Inc. | | | 23,557 | | | | 1,158,769 | |
Eaton Corp. PLC | | | 17,158 | | | | 1,151,130 | |
FedEx Corp. | | | 7,819 | | | | 1,455,898 | |
Ingersoll-Rand PLC | | | 17,665 | | | | 1,325,582 | |
L3 Technologies, Inc. Inc. | | | 7,728 | | | | 1,175,506 | |
Lockheed Martin Corp. | | | 3,513 | | | | 878,039 | |
| | | | | | | | |
| | | | | | | 9,016,665 | |
| | | | | | | | |
INFORMATION TECHNOLOGY (13.7%) | | | | | | | | |
Accenture Ltd. Cl A | | | 12,874 | | | | 1,507,932 | |
Alphabet, Inc. Cl A* | | | 2,868 | | | | 2,272,747 | |
Apple, Inc. | | | 39,059 | | | | 4,523,811 | |
Applied Materials, Inc. | | | 39,804 | | | | 1,284,475 | |
CA, Inc. | | | 17,883 | | | | 568,143 | |
Cisco Systems, Inc. | | | 65,492 | | | | 1,979,168 | |
Citrix Systems, Inc.* | | | 6,975 | | | | 622,937 | |
HP, Inc. | | | 57,577 | | | | 854,443 | |
Intel Corp. | | | 52,319 | | | | 1,897,610 | |
Lam Research Corp. | | | 12,929 | | | | 1,366,983 | |
Microsoft Corp. | | | 64,157 | | | | 3,986,716 | |
Oracle Corp. | | | 50,923 | | | | 1,957,989 | |
Paychex, Inc. | | | 10,896 | | | | 663,348 | |
QUALCOMM, Inc. | | | 21,210 | | | | 1,382,892 | |
| | | | | | | | |
| | | | | | | 24,869,194 | |
| | | | | | | | |
MATERIALS (1.8%) | | | | | | | | |
Eastman Chemical Co. | | | 9,029 | | | | 679,071 | |
Freeport-McMoRan Copper & Gold, Inc.* | | | 35,409 | | | | 467,045 | |
International Paper Co. | | | 22,879 | | | | 1,213,960 | |
LyondellBasell Inds. NV Cl A | | | 9,868 | | | | 846,477 | |
| | | | | | | | |
| | | | | | | 3,206,553 | |
| | | | | | | | |
REAL ESTATE (1.5%) | | | | | | | | |
American Tower Corp. | | | 10,309 | | | | 1,089,455 | |
Iron Mountain, Inc. | | | 16,555 | | | | 537,706 | |
ProLogis, Inc. | | | 12,479 | | | | 658,766 | |
SL Green Realty Corp | | | 4,275 | | | | 459,776 | |
| | | | | | | | |
| | | | | | | 2,745,703 | |
| | | | | | | | |
TELECOMMUNICATION SERVICES (1.4%) | | | | | | | | |
CenturyLink, Inc. | | | 32,493 | | | | 772,684 | |
Verizon Communications, Inc. | | | 31,287 | | | | 1,670,100 | |
| | | | | | | | |
| | | | | | | 2,442,784 | |
| | | | | | | | |
UTILITIES (1.2%) | | | | | | | | |
CenterPoint Energy, Inc. | | | 20,381 | | | | 502,188 | |
NextEra Energy, Inc. | | | 8,775 | | | | 1,048,262 | |
Sempra Energy | | | 6,636 | | | | 667,847 | |
| | | | | | | | |
| | | | | | | 2,218,297 | |
| | | | | | | | |
TOTAL COMMON STOCKS
(Cost: $86,916,341) 59.1% | | | | | | | 107,034,196 | |
| | | | | | | | |
| | | | | | | | | | | | | | | | | | | | |
| | | Rating** | | | Rate(%) | | | Maturity | | | Face Amount | | | Value | |
LONG-TERM DEBT SECURITIES: | | | | | | | | | | | | | | | | | | | | |
U.S. GOVERNMENT (10.3%) | | | | | | | | | | | | | | | | | | | | |
U.S. Treasury Note | | | AA+ | | | | 1.50 | | | | 02/28/23 | | | | 500,000 | | | | 480,899 | |
U.S. Treasury Note | | | AA+ | | | | 1.50 | | | | 08/15/26 | | | | 1,150,000 | | | | 1,057,686 | |
U.S. Treasury Note | | | AA+ | | | | 1.63 | | | | 02/15/26 | | | | 750,000 | | | | 700,781 | |
U.S. Treasury Note | | | AA+ | | | | 2.00 | | | | 02/15/25 | | | | 500,000 | | | | 486,641 | |
U.S. Treasury Note | | | AA+ | | | | 2.00 | | | | 11/15/26 | | | | 500,000 | | | | 481,074 | |
U.S. Treasury Note | | | AA+ | | | | 2.13 | | | | 05/15/25 | | | | 750,000 | | | | 735,234 | |
U.S. Treasury Strip | | | AA+ | | | | 0.00 | | | | 11/15/21 | | | | 7,050,000 | | | | 6,386,907 | |
MUTUAL OF AMERICA INVESTMENT CORPORATION - COMPOSITE FUND
PORTFOLIO OF INVESTMENTS IN SECURITIES
December 31, 2016
| | | | | | | | | | | | | | | | | | |
U.S. Treasury Strip | | AA+ | | | 0.00 | | | | 08/15/28 | | | | 6,000,000 | | | | 4,362,850 | |
U.S. Treasury Strip | | AA+ | | | 0.00 | | | | 08/15/29 | | | | 5,500,000 | | | | 3,870,191 | |
| | | | | | | | | | | | | | | | | | |
| | | | | | | | | | | | | | | | | 18,562,263 | |
| | | | | | | | | | | | | | | | | | |
U.S. GOVERNMENT AGENCIES (11.2%) | | | | | | | | | | | | | | | | | | |
MORTGAGE-BACKED OBLIGATIONS (10.9%) | | | | | | | | | | | | | | | | | | |
FHLMC | | AA+ | | | 2.50 | | | | 09/01/27 | | | | 266,041 | | | | 266,914 | |
FHLMC | | AA+ | | | 3.00 | | | | 06/01/27 | | | | 165,356 | | | | 169,959 | |
FHLMC | | AA+ | | | 3.00 | | | | 08/01/27 | | | | 176,658 | | | | 181,522 | |
FHLMC | | AA+ | | | 3.00 | | | | 10/15/37 | | | | 233,245 | | | | 237,465 | |
FHLMC | | AA+ | | | 3.00 | | | | 11/01/42 | | | | 246,525 | | | | 246,196 | |
FHLMC | | AA+ | | | 3.00 | | | | 04/01/43 | | | | 275,946 | | | | 275,833 | |
FHLMC | | AA+ | | | 3.50 | | | | 01/01/43 | | | | 340,672 | | | | 349,167 | |
FHLMC | | AA+ | | | 3.50 | | | | 06/01/45 | | | | 374,353 | | | | 384,482 | |
FHLMC | | AA+ | | | 3.50 | | | | 07/01/45 | | | | 444,207 | | | | 456,816 | |
FHLMC | | AA+ | | | 4.00 | | | | 02/01/25 | | | | 39,980 | | | | 42,114 | |
FHLMC | | AA+ | | | 4.00 | | | | 03/01/41 | | | | 168,940 | | | | 177,668 | |
FHLMC | | AA+ | | | 4.00 | | | | 07/01/41 | | | | 216,104 | | | | 228,767 | |
FHLMC | | AA+ | | | 4.00 | | | | 11/01/42 | | | | 138,935 | | | | 147,379 | |
FHLMC | | AA+ | | | 4.00 | | | | 01/01/43 | | | | 278,100 | | | | 295,175 | |
FHLMC | | AA+ | | | 4.00 | | | | 01/01/44 | | | | 262,581 | | | | 277,558 | |
FHLMC | | AA+ | | | 4.00 | | | | 06/01/45 | | | | 375,630 | | | | 396,824 | |
FHLMC | | AA+ | | | 4.50 | | | | 08/01/34 | | | | 38,146 | | | | 41,112 | |
FHLMC | | AA+ | | | 4.50 | | | | 08/15/35 | | | | 43,185 | | | | 45,437 | |
FHLMC | | AA+ | | | 4.50 | | | | 02/01/44 | | | | 241,825 | | | | 259,835 | |
FHLMC | | AA+ | | | 5.00 | | | | 02/01/26 | | | | 22,280 | | | | 24,244 | |
FHLMC | | AA+ | | | 5.00 | | | | 10/01/40 | | | | 266,141 | | | | 291,005 | |
FHLMC | | AA+ | | | 5.50 | | | | 07/01/32 | | | | 44,108 | | | | 49,342 | |
FHLMC | | AA+ | | | 5.50 | | | | 05/01/33 | | | | 45,858 | | | | 50,837 | |
FHLMC | | AA+ | | | 5.50 | | | | 06/01/37 | | | | 108,837 | | | | 122,687 | |
FHLMC | | AA+ | | | 6.00 | | | | 03/15/32 | | | | 42,192 | | | | 46,175 | |
FHLMC ARM | | AA+ | | | 2.76 | | | | 02/01/36 | | | | 29,409 | | | | 31,089 | |
FHLMC ARM | | AA+ | | | 2.90 | | | | 04/01/37 | | | | 45,653 | | | | 48,676 | |
FHLMC ARM | | AA+ | | | 2.93 | | | | 05/01/37 | | | | 30,765 | | | | 32,200 | |
FHLMC ARM | | AA+ | | | 4.54 | | | | 09/01/39 | | | | 31,843 | | | | 33,452 | |
FHLMC ARM | | AA+ | | | 5.89 | | | | 03/01/37 | | | | 7,175 | | | | 7,527 | |
FHLMC Strip | | AA+ | | | 3.00 | | | | 01/15/43 | | | | 338,392 | | | | 336,609 | |
FNMA | | AA+ | | | 3.00 | | | | 06/01/33 | | | | 331,290 | | | | 338,043 | |
FNMA | | AA+ | | | 3.00 | | | | 09/01/33 | | | | 280,469 | | | | 286,169 | |
FNMA | | AA+ | | | 3.00 | | | | 12/01/42 | | | | 319,916 | | | | 315,785 | |
FNMA | | AA+ | | | 3.00 | | | | 01/01/43 | | | | 713,832 | | | | 713,628 | |
FNMA | | AA+ | | | 3.00 | | | | 02/01/43 | | | | 197,329 | | | | 196,698 | |
FNMA | | AA+ | | | 3.00 | | | | 03/01/43 | | | | 375,242 | | | | 374,090 | |
FNMA | | AA+ | | | 3.00 | | | | 09/01/43 | | | | 380,770 | | | | 380,662 | |
FNMA | | AA+ | | | 3.50 | | | | 03/25/28 | | | | 281,688 | | | | 289,632 | |
FNMA | | AA+ | | | 3.50 | | | | 08/01/38 | | | | 238,245 | | | | 244,773 | |
FNMA | | AA+ | | | 3.50 | | | | 10/01/41 | | | | 155,671 | | | | 159,834 | |
FNMA | | AA+ | | | 3.50 | | | | 11/01/41 | | | | 290,103 | | | | 299,165 | |
FNMA | | AA+ | | | 3.50 | | | | 12/01/41 | | | | 272,868 | | | | 280,163 | |
FNMA | | AA+ | | | 3.50 | | | | 04/01/42 | | | | 332,276 | | | | 340,888 | |
FNMA | | AA+ | | | 3.50 | | | | 04/01/42 | | | | 417,797 | | | | 430,877 | |
FNMA | | AA+ | | | 3.50 | | | | 08/01/42 | | | | 304,071 | | | | 313,425 | |
FNMA | | AA+ | | | 3.50 | | | | 10/01/42 | | | | 281,786 | | | | 290,546 | |
FNMA | | AA+ | | | 3.50 | | | | 01/01/44 | | | | 104,999 | | | | 106,648 | |
FNMA | | AA+ | | | 3.50 | | | | 06/01/45 | | | | 932,472 | | | | 958,899 | |
FNMA | | AA+ | | | 4.00 | | | | 05/01/19 | | | | 16,445 | | | | 16,934 | |
FNMA | | AA+ | | | 4.00 | | | | 07/25/26 | | | | 390,885 | | | | 423,712 | |
FNMA | | AA+ | | | 4.00 | | | | 01/01/31 | | | | 192,177 | | | | 203,837 | |
FNMA | | AA+ | | | 4.00 | | | | 11/01/40 | | | | 180,316 | | | | 189,618 | |
FNMA | | AA+ | | | 4.00 | | | | 05/01/41 | | | | 191,521 | | | | 200,838 | |
FNMA | | AA+ | | | 4.00 | | | | 11/01/45 | | | | 452,543 | | | | 477,288 | |
FNMA | | AA+ | | | 4.50 | | | | 05/01/18 | | | | 8,624 | | | | 8,864 | |
MUTUAL OF AMERICA INVESTMENT CORPORATION - COMPOSITE FUND
PORTFOLIO OF INVESTMENTS IN SECURITIES
December 31, 2016
| | | | | | | | | | | | | | | | | | |
FNMA | | AA+ | | | 4.50 | | | | 05/01/30 | | | | 66,430 | | | | 71,509 | |
FNMA | | AA+ | | | 4.50 | | | | 04/01/31 | | | | 87,810 | | | | 94,547 | |
FNMA | | AA+ | | | 4.50 | | | | 08/01/33 | | | | 31,553 | | | | 34,074 | |
FNMA | | AA+ | | | 4.50 | | | | 09/01/33 | | | | 72,669 | | | | 78,479 | |
FNMA | | AA+ | | | 4.50 | | | | 06/01/34 | | | | 60,069 | | | | 64,911 | |
FNMA | | AA+ | | | 4.50 | | | | 08/01/35 | | | | 47,059 | | | | 50,899 | |
FNMA | | AA+ | | | 4.50 | | | | 12/01/35 | | | | 45,724 | | | | 49,282 | |
FNMA | | AA+ | | | 4.50 | | | | 05/01/39 | | | | 70,047 | | | | 75,946 | |
FNMA | | AA+ | | | 4.50 | | | | 05/01/39 | | | | 107,293 | | | | 116,033 | |
FNMA | | AA+ | | | 4.50 | | | | 05/01/40 | | | | 106,111 | | | | 113,912 | |
FNMA | | AA+ | | | 5.00 | | | | 04/01/18 | | | | 21,687 | | | | 22,195 | |
FNMA | | AA+ | | | 5.00 | | | | 06/01/33 | | | | 74,532 | | | | 81,640 | |
FNMA | | AA+ | | | 5.00 | | | | 10/01/33 | | | | 76,742 | | | | 84,781 | |
FNMA | | AA+ | | | 5.00 | | | | 11/01/33 | | | | 50,222 | | | | 55,167 | |
FNMA | | AA+ | | | 5.00 | | | | 11/01/33 | | | | 196,752 | | | | 215,455 | |
FNMA | | AA+ | | | 5.00 | | | | 03/01/34 | | | | 27,935 | | | | 30,585 | |
FNMA | | AA+ | | | 5.00 | | | | 04/01/34 | | | | 44,631 | | | | 49,239 | |
FNMA | | AA+ | | | 5.00 | | | | 09/01/35 | | | | 27,974 | | | | 30,558 | |
FNMA | | AA+ | | | 5.00 | | | | 11/25/35 | | | | 102,187 | | | | 110,643 | |
FNMA | | AA+ | | | 5.00 | | | | 08/01/37 | | | | 222,531 | | | | 242,724 | |
FNMA | | AA+ | | | 5.00 | | | | 05/01/39 | | | | 98,064 | | | | 107,051 | |
FNMA | | AA+ | | | 5.00 | | | | 06/01/40 | | | | 49,860 | | | | 54,389 | |
FNMA | | AA+ | | | 5.50 | | | | 04/01/17 | | | | 379 | | | | 381 | |
FNMA | | AA+ | | | 5.50 | | | | 05/01/17 | | | | 90 | | | | 90 | |
FNMA | | AA+ | | | 5.50 | | | | 03/01/34 | | | | 14,334 | | | | 16,004 | |
FNMA | | AA+ | | | 5.50 | | | | 05/01/34 | | | | 170,549 | | | | 190,774 | |
FNMA | | AA+ | | | 5.50 | | | | 07/01/34 | | | | 47,505 | | | | 53,237 | |
FNMA | | AA+ | | | 5.50 | | | | 09/01/34 | | | | 25,581 | | | | 28,712 | |
FNMA | | AA+ | | | 5.50 | | | | 09/01/34 | | | | 75,055 | | | | 83,871 | |
FNMA | | AA+ | | | 5.50 | | | | 10/01/34 | | | | 30,882 | | | | 34,578 | |
FNMA | | AA+ | | | 5.50 | | | | 02/01/35 | | | | 39,693 | | | | 44,562 | |
FNMA | | AA+ | | | 5.50 | | | | 02/01/35 | | | | 63,398 | | | | 71,662 | |
FNMA | | AA+ | | | 5.50 | | | | 08/01/35 | | | | 22,627 | | | | 25,310 | |
FNMA | | AA+ | | | 5.50 | | | | 08/01/37 | | | | 11,596 | | | | 12,917 | |
FNMA | | AA+ | | | 5.50 | | | | 11/01/38 | | | | 11,522 | | | | 12,265 | |
FNMA | | AA+ | | | 5.50 | | | | 06/01/48 | | | | 19,237 | | | | 20,767 | |
FNMA | | AA+ | | | 6.00 | | | | 03/01/17 | | | | 65 | | | | 65 | |
FNMA | | AA+ | | | 6.00 | | | | 05/01/23 | | | | 21,736 | | | | 24,591 | |
FNMA | | AA+ | | | 6.00 | | | | 04/01/32 | | | | 8,510 | | | | 9,629 | |
FNMA | | AA+ | | | 6.00 | | | | 05/01/32 | | | | 14,622 | | | | 16,760 | |
FNMA | | AA+ | | | 6.00 | | | | 04/01/33 | | | | 105,155 | | | | 121,848 | |
FNMA | | AA+ | | | 6.00 | | | | 05/01/33 | | | | 50,202 | | | | 56,884 | |
FNMA | | AA+ | | | 6.00 | | | | 06/01/34 | | | | 22,478 | | | | 25,736 | |
FNMA | | AA+ | | | 6.00 | | | | 09/01/34 | | | | 15,246 | | | | 17,466 | |
FNMA | | AA+ | | | 6.00 | | | | 10/01/34 | | | | 31,600 | | | | 35,804 | |
FNMA | | AA+ | | | 6.00 | | | | 11/01/34 | | | | 13,377 | | | | 15,139 | |
FNMA | | AA+ | | | 6.00 | | | | 12/01/36 | | | | 40,428 | | | | 46,390 | |
FNMA | | AA+ | | | 6.00 | | | | 01/01/37 | | | | 43,223 | | | | 49,565 | |
FNMA | | AA+ | | | 6.00 | | | | 04/01/37 | | | | 13,701 | | | | 14,737 | |
FNMA | | AA+ | | | 6.00 | | | | 05/01/37 | | | | 8,496 | | | | 9,003 | |
FNMA | | AA+ | | | 6.00 | | | | 06/01/37 | | | | 15,262 | | | | 16,304 | |
FNMA | | AA+ | | | 6.00 | | | | 10/25/44 | | | | 97,433 | | | | 111,820 | |
FNMA | | AA+ | | | 6.00 | | | | 02/25/47 | | | | 88,607 | | | | 98,652 | |
FNMA | | AA+ | | | 6.00 | | | | 12/25/49 | | | | 52,882 | | | | 59,942 | |
FNMA | | AA+ | | | 6.50 | | | | 03/01/17 | | | | 94 | | | | 94 | |
FNMA | | AA+ | | | 6.50 | | | | 05/01/17 | | | | 112 | | | | 112 | |
FNMA | | AA+ | | | 6.50 | | | | 06/01/17 | | | | 821 | | | | 823 | |
FNMA | | AA+ | | | 6.50 | | | | 05/01/32 | | | | 24,697 | | | | 27,941 | |
FNMA | | AA+ | | | 6.50 | | | | 05/01/32 | | | | 7,990 | | | | 9,040 | |
FNMA | | AA+ | | | 6.50 | | | | 07/01/32 | | | | 3,988 | | | | 4,512 | |
FNMA | | AA+ | | | 6.50 | | | | 07/01/34 | | | | 26,756 | | | | 30,271 | |
MUTUAL OF AMERICA INVESTMENT CORPORATION - COMPOSITE FUND
PORTFOLIO OF INVESTMENTS IN SECURITIES
December 31, 2016
| | | | | | | | | | | | | | | | | | |
FNMA | | AA+ | | | 6.50 | | | | 05/01/37 | | | | 30,137 | | | | 31,283 | |
FNMA | | AA+ | | | 6.50 | | | | 09/01/37 | | | | 14,638 | | | | 16,561 | |
FNMA | | AA+ | | | 7.00 | | | | 09/01/31 | | | | 15,765 | | | | 17,487 | |
FNMA | | AA+ | | | 7.00 | | | | 04/01/32 | | | | 6,683 | | | | 7,332 | |
FNMA | | AA+ | | | 7.50 | | | | 06/01/31 | | | | 5,890 | | | | 6,807 | |
FNMA | | AA+ | | | 7.50 | | | | 02/01/32 | | | | 6,112 | | | | 7,128 | |
FNMA | | AA+ | | | 7.50 | | | | 06/01/32 | | | | 5,064 | | | | 6,023 | |
FNMA | | AA+ | | | 8.00 | | | | 04/01/32 | | | | 1,560 | | | | 1,658 | |
FNMA ARM | | AA+ | | | 2.41 | | | | 05/01/43 | | | | 370,050 | | | | 374,386 | |
FNMA Strip | | AA+ | | | 3.00 | | | | 08/25/42 | | | | 289,082 | | | | 287,290 | |
GNMA (3) | | AA+ | | | 3.50 | | | | 09/20/33 | | | | 9,008 | | | | 9,021 | |
GNMA (3) | | AA+ | | | 4.00 | | | | 08/15/41 | | | | 211,884 | | | | 226,862 | |
GNMA (3) | | AA+ | | | 4.00 | | | | 01/15/42 | | | | 260,635 | | | | 278,245 | |
GNMA (3) | | AA+ | | | 4.00 | | | | 03/20/42 | | | | 150,782 | | | | 162,408 | |
GNMA (3) | | AA+ | | | 4.00 | | | | 08/20/42 | | | | 184,538 | | | | 196,682 | |
GNMA (3) | | AA+ | | | 4.50 | | | | 04/20/31 | | | | 101,019 | | | | 109,087 | |
GNMA (3) | | AA+ | | | 4.50 | | | | 10/15/40 | | | | 183,165 | | | | 203,013 | |
GNMA (3) | | AA+ | | | 4.50 | | | | 10/20/43 | | | | 359,070 | | | | 391,314 | |
GNMA (3) | | AA+ | | | 5.00 | | | | 10/15/24 | | | | 205,709 | | | | 224,846 | |
GNMA (3) | | AA+ | | | 5.00 | | | | 04/15/39 | | | | 151,911 | | | | 170,102 | |
GNMA (3) | | AA+ | | | 5.00 | | | | 06/20/39 | | | | 189,647 | | | | 205,928 | |
GNMA (3) | | AA+ | | | 5.00 | | | | 11/15/39 | | | | 98,215 | | | | 108,058 | |
GNMA (3) | | AA+ | | | 6.50 | | | | 04/15/31 | | | | 2,795 | | | | 3,192 | |
GNMA (3) | | AA+ | | | 6.50 | | | | 10/15/31 | | | | 3,437 | | | | 4,004 | |
GNMA (3) | | AA+ | | | 6.50 | | | | 12/15/31 | | | | 1,542 | | | | 1,761 | |
GNMA (3) | | AA+ | | | 6.50 | | | | 05/15/32 | | | | 7,381 | | | | 8,431 | |
GNMA (3) | | AA+ | | | 7.00 | | | | 05/15/31 | | | | 3,049 | | | | 3,574 | |
GNMA (3) | | AA+ | | | 7.00 | | | | 05/15/32 | | | | 702 | | | | 725 | |
Vendee Mortgage Trust (3) | | AA+ | | | 5.25 | | | | 01/15/32 | | | | 161,915 | | | | 172,493 | |
| | | | | | | | | | | | | | | | | | |
| | | | | | | | | | | | | | | | | 19,863,060 | |
| | | | | | | | | | | | | | | | | | |
NON-MORTGAGE-BACKED OBLIGATIONS (0.3%) | | | | | | | | | | | | | | | | | | |
FHLMC | | AA+ | | | 0.00 | | | | 11/29/19 | | | | 500,000 | | | | 474,527 | |
| | | | | | | | | | | | | | | | | | |
CORPORATE DEBT (16.6%) | | | | | | | | | | | | | | | | | | |
CONSUMER DISCRETIONARY (3.2%) | | | | | | | | | | | | | | | | | | |
Advance Auto Parts, Inc. | | BBB- | | | 4.50 | | | | 12/01/23 | | | | 100,000 | | | | 103,404 | |
Advance Auto Parts, Inc. | | BBB- | | | 5.75 | | | | 05/01/20 | | | | 270,000 | | | | 290,552 | |
AutoZone, Inc. | | BBB | | | 4.00 | | | | 11/15/20 | | | | 250,000 | | | | 262,374 | |
Coach, Inc. | | BBB- | | | 4.25 | | | | 04/01/25 | | | | 100,000 | | | | 100,555 | |
Dollar General Corp. | | BBB | | | 3.25 | | | | 04/15/23 | | | | 300,000 | | | | 296,048 | |
Expedia, Inc. | | BBB- | | | 5.95 | | | | 08/15/20 | | | | 250,000 | | | | 273,268 | |
Family Dollar Stores, Inc. | | BBB- | | | 5.00 | | | | 02/01/21 | | | | 300,000 | | | | 320,250 | |
Harman Int’l. Industries, Inc. | | BBB- | | | 4.15 | | | | 05/15/25 | | | | 300,000 | | | | 309,729 | |
Kohl’s Corp. | | BBB | | | 3.25 | | | | 02/01/23 | | | | 250,000 | | | | 247,141 | |
Kohl’s Corp. | | BBB | | | 4.00 | | | | 11/01/21 | | | | 100,000 | | | | 104,871 | |
Lowe’s Cos., Inc. | | A- | | | 3.12 | | | | 04/15/22 | | | | 300,000 | | | | 307,356 | |
Macy’s Retail Hldgs., Inc. | | BBB | | | 2.88 | | | | 02/15/23 | | | | 216,000 | | | | 205,567 | |
Marriott International, Inc. | | BBB | | | 3.13 | | | | 10/15/21 | | | | 25,000 | | | | 25,276 | |
Marriott International, Inc. | | BBB | | | 3.25 | | | | 09/15/22 | | | | 350,000 | | | | 352,931 | |
Mattel, Inc. | | BBB | | | 3.15 | | | | 03/15/23 | | | | 350,000 | | | | 344,598 | |
NVR, Inc. | | BBB+ | | | 3.95 | | | | 09/15/22 | | | | 300,000 | | | | 305,745 | |
Omnicom Group, Inc. | | BBB+ | | | 3.63 | | | | 05/01/22 | | | | 100,000 | | | | 102,701 | |
Omnicom Group, Inc. | | BBB+ | | | 4.45 | | | | 08/15/20 | | | | 250,000 | | | | 265,928 | |
O’Reilly Automotive, Inc. | | BBB+ | | | 3.80 | | | | 09/01/22 | | | | 300,000 | | | | 310,410 | |
Staples, Inc. | | BBB- | | | 4.38 | | | | 01/12/23 | | | | 275,000 | | | | 275,519 | |
Tupperware Brands Corp. | | BBB- | | | 4.75 | | | | 06/01/21 | | | | 350,000 | | | | 374,289 | |
Viacom, Inc. | | BBB- | | | 3.25 | | | | 03/15/23 | | | | 350,000 | | | | 335,703 | |
Wynn Las Vegas LLC | | BB | | | 5.38 | | | | 03/15/22 | | | | 300,000 | | | | 307,500 | |
| | | | | | | | | | | | | | | | | | |
| | | | | | | | | | | | | | | | | 5,821,715 | |
| | | | | | | | | | | | | | | | | | |
CONSUMER STAPLES (0.9%) | | | | | | | | | | | | | | | | | | |
Edgewell Personal Care Co. | | BB+ | | | 4.70 | | | | 05/19/21 | | | | 275,000 | | | | 289,461 | |
MUTUAL OF AMERICA INVESTMENT CORPORATION - COMPOSITE FUND
PORTFOLIO OF INVESTMENTS IN SECURITIES
December 31, 2016
| | | | | | | | | | | | | | | | | | |
Ingredion, Inc. | | BBB | | | 4.63 | | | | 11/01/20 | | | | 250,000 | | | | 267,944 | |
Molson Coors Brewing Co. | | BBB- | | | 3.50 | | | | 05/01/22 | | | | 400,000 | | | | 411,748 | |
Sysco Corp. | | BBB+ | | | 2.60 | | | | 06/12/22 | | | | 300,000 | | | | 295,354 | |
Sysco Corp. | | BBB+ | | | 3.75 | | | | 10/01/25 | | | | 100,000 | | | | 101,206 | |
Whole Foods Market, Inc. | | BBB- | | | 5.20 | | | | 12/03/25 | | | | 300,000 | | | | 317,648 | |
| | | | | | | | | | | | | | | | | | |
| | | | | | | | | | | | | | | | | 1,683,361 | |
| | | | | | | | | | | | | | | | | | |
ENERGY (1.6%) | | | | | | | | | | | | | | | | | | |
Cameron International Corp. | | AA- | | | 4.50 | | | | 06/01/21 | | | | 300,000 | | | | 310,160 | |
Energen Corp. | | BB | | | 4.63 | | | | 09/01/21 | | | | 250,000 | | | | 250,625 | |
EQT Corp. | | BBB | | | 4.88 | | | | 11/15/21 | | | | 210,000 | | | | 224,152 | |
FMC Technologies, Inc. | | BBB | | | 2.00 | | | | 10/01/17 | | | | 250,000 | | | | 250,179 | |
Marathon Oil Corp. | | BBB- | | | 2.80 | | | | 11/01/22 | | | | 350,000 | | | | 334,691 | |
Murphy Oil Corp. | | BBB- | | | 3.50 | | | | 12/01/17 | | | | 200,000 | | | | 201,000 | |
Noble Corp. | | BB- | | | 7.50 | | | | 03/15/19 | | | | 800,000 | | | | 840,000 | |
Rowan Companies PLC | | B+ | | | 4.88 | | | | 06/01/22 | | | | 300,000 | | | | 283,500 | |
Seacor Hldgs., Inc. | | B | | | 7.38 | | | | 10/01/19 | | | | 250,000 | | | | 251,250 | |
| | | | | | | | | | | | | | | | | | |
| | | | | | | | | | | | | | | | | 2,945,557 | |
| | | | | | | | | | | | | | | | | | |
FINANCIALS (3.2%) | | | | | | | | | | | | | | | | | | |
Aflac, Inc. | | A- | | | 4.00 | | | | 02/15/22 | | | | 300,000 | | | | 317,268 | |
Alleghany Corp. | | BBB+ | | | 5.63 | | | | 09/15/20 | | | | 300,000 | | | | 324,710 | |
American Express Co. | | BBB | | | 3.63 | | | | 12/05/24 | | | | 250,000 | | | | 251,036 | |
Barrick N.A. Finance LLC | | BBB- | | | 4.40 | | | | 05/30/21 | | | | 250,000 | | | | 262,714 | |
Berkley (W.R.) Corp. | | BBB+ | | | 7.38 | | | | 09/15/19 | | | | 250,000 | | | | 280,405 | |
Block Financial LLC | | BBB | | | 5.25 | | | | 10/01/25 | | | | 350,000 | | | | 353,961 | |
Capital One Financial Corp. | | BBB | | | 4.75 | | | | 07/15/21 | | | | 300,000 | | | | 324,473 | |
Citizens Financial Group, Inc. | | BBB | | | 3.75 | | | | 07/01/24 | | | | 250,000 | | | | 241,994 | |
Citizens Financial Group, Inc. | | BBB | | | 4.35 | | | | 08/01/25 | | | | 100,000 | | | | 100,467 | |
Fairfax U.S., Inc.† | | BBB- | | | 4.88 | | | | 08/13/24 | | | | 250,000 | | | | 244,524 | |
Fifth Third Bancorp | | BBB | | | 4.30 | | | | 01/16/24 | | | | 300,000 | | | | 308,148 | |
First Republic Bank | | A- | | | 2.38 | | | | 06/17/19 | | | | 150,000 | | | | 149,748 | |
First Tennessee Bank | | BBB | | | 2.95 | | | | 12/01/19 | | | | 350,000 | | | | 350,868 | |
Lincoln National Corp. | | A- | | | 4.00 | | | | 09/01/23 | | | | 250,000 | | | | 260,618 | |
Moody’s Corp. | | BBB+ | | | 4.50 | | | | 09/01/22 | | | | 250,000 | | | | 267,949 | |
Pacific LifeCorp.† | | A- | | | 6.00 | | | | 02/10/20 | | | | 100,000 | | | | 108,049 | |
Penske Truck Leasing Co. LP† | | BBB | | | 3.38 | | | | 03/15/18 | | | | 300,000 | | | | 305,253 | |
Prudential Financial, Inc. | | A | | | 4.50 | | | | 11/16/21 | | | | 250,000 | | | | 270,347 | |
Signet UK Finance PLC | | BBB- | | | 4.70 | | | | 06/15/24 | | | | 250,000 | | | | 239,024 | |
Synchrony Financial | | BBB- | | | 3.70 | | | | 08/04/26 | | | | 400,000 | | | | 384,508 | |
Unum Group | | BBB | | | 4.00 | | | | 03/15/24 | | | | 150,000 | | | | 150,610 | |
Voya Financial, Inc. | | BBB | | | 3.65 | | | | 06/15/26 | | | | 250,000 | | | | 244,444 | |
| | | | | | | | | | | | | | | | | | |
| | | | | | | | | | | | | | | | | 5,741,118 | |
| | | | | | | | | | | | | | | | | | |
HEALTH CARE (1.7%) | | | | | | | | | | | | | | | | | | |
Agilent Technologies, Inc. | | BBB+ | | | 5.00 | | | | 07/15/20 | | | | 290,000 | | | | 312,935 | |
Anthem, Inc. | | A | | | 4.35 | | | | 08/15/20 | | | | 250,000 | | | | 263,845 | |
Bio-Rad Laboratories, Inc. | | BBB | | | 4.88 | | | | 12/15/20 | | | | 200,000 | | | | 213,733 | |
Medco Health Solutions, Inc. | | BBB+ | | | 4.13 | | | | 09/15/20 | | | | 250,000 | | | | 262,326 | |
Owens & Minor, Inc. | | BBB | | | 3.88 | | | | 09/15/21 | | | | 400,000 | | | | 400,904 | |
PerkinElmer, Inc. | | BBB | | | 5.00 | | | | 11/15/21 | | | | 300,000 | | | | 324,082 | |
Pfizer, Inc. | | AA | | | 6.05 | | | | 03/30/17 | | | | 300,000 | | | | 303,632 | |
Quest Diagnostics, Inc. | | BBB+ | | | 4.70 | | | | 04/01/21 | | | | 150,000 | | | | 160,998 | |
Quest Diagnostics, Inc. | | BBB+ | | | 4.75 | | | | 01/30/20 | | | | 250,000 | | | | 266,852 | |
Thermo Fisher Scientific, Inc. | | BBB | | | 3.60 | | | | 08/15/21 | | | | 375,000 | | | | 387,567 | |
Zimmer Biomet Hldgs., Inc. | | BBB | | | 3.15 | | | | 04/01/22 | | | | 250,000 | | | | 249,317 | |
| | | | | | | | | | | | | | | | | | |
| | | | | | | | | | | | | | | | | 3,146,191 | |
| | | | | | | | | | | | | | | | | | |
INDUSTRIALS (1.3%) | | | | | | | | | | | | | | | | | | |
Arconic, Inc. | | BBB- | | | 6.75 | | | | 07/15/18 | | | | 250,000 | | | | 265,938 | |
Crane Co. | | BBB | | | 2.75 | | | | 12/15/18 | | | | 350,000 | | | | 354,375 | |
Dun & Bradstreet Corp. | | BBB- | | | 3.25 | | | | 12/01/17 | | | | 400,000 | | | | 403,884 | |
Equifax, Inc. | | BBB+ | | | 3.30 | | | | 12/15/22 | | | | 300,000 | | | | 305,006 | |
Hunt (J.B.) Transport Svcs., Inc. | | BBB+ | | | 3.30 | | | | 08/15/22 | | | | 200,000 | | | | 200,795 | |
L-3 Communications Corp. | | BBB- | | | 4.75 | | | | 07/15/20 | | | | 250,000 | | | | 265,769 | |
MUTUAL OF AMERICA INVESTMENT CORPORATION - COMPOSITE FUND
PORTFOLIO OF INVESTMENTS IN SECURITIES
December 31, 2016
| | | | | | | | | | | | | | | | | | | | |
Pentair PLC | | | BBB- | | | | 5.00 | | | | 05/15/21 | | | | 250,000 | | | | 262,974 | |
Pitney Bowes, Inc. | | | BBB- | | | | 5.25 | | | | 01/15/37 | | | | 250,000 | | | | 249,958 | |
| | | | | | | | | | | | | | | | | | | | |
| | | | | | | | | | | | | | | | | | | 2,308,699 | |
| | | | | | | | | | | | | | | | | | | | |
INFORMATION TECHNOLOGY (1.4%) | | | | | | | | | | | | | | | | | | | | |
Applied Materials, Inc. | | | A- | | | | 3.90 | | | | 10/01/25 | | | | 350,000 | | | | 369,038 | |
Arrow Electronics, Inc. | | | BBB- | | | | 4.50 | | | | 03/01/23 | | | | 300,000 | | | | 305,703 | |
eBay, Inc. | | | BBB+ | | | | 2.88 | | | | 08/01/21 | | | | 325,000 | | | | 325,625 | |
Fiserv, Inc. | | | BBB | | | | 4.75 | | | | 06/15/21 | | | | 360,000 | | | | 387,408 | |
Ingram Micro, Inc. | | | NR | | | | 5.00 | | | | 08/10/22 | | | | 200,000 | | | | 195,166 | |
Ingram Micro, Inc. | | | NR | | | | 5.25 | | | | 09/01/17 | | | | 100,000 | | | | 101,471 | |
Juniper Networks, Inc. | | | BBB | | | | 4.60 | | | | 03/15/21 | | | | 350,000 | | | | 374,722 | |
Symantec Corp. | | | BBB- | | | | 4.20 | | | | 09/15/20 | | | | 350,000 | | | | 359,049 | |
Tech Data Corp. | | | BBB- | | | | 3.75 | | | | 09/21/17 | | | | 100,000 | | | | 101,231 | |
| | | | | | | | | | | | | | | | | | | | |
| | | | | | | | | | | | | | | | | | | 2,519,413 | |
| | | | | | | | | | | | | | | | | | | | |
MATERIALS (1.1%) | | | | | | | | | | | | | | | | | | | | |
Freeport-McMoRan Copper & Gold | | | BB- | | | | 3.55 | | | | 03/01/22 | | | | 300,000 | | | | 279,000 | |
Methanex Corp. | | | BB+ | | | | 3.25 | | | | 12/15/19 | | | | 250,000 | | | | 246,147 | |
Packaging Corp. of America | | | BBB | | | | 3.90 | | | | 06/15/22 | | | | 250,000 | | | | 257,836 | |
Packaging Corp. of America | | | BBB | | | | 4.50 | | | | 11/01/23 | | | | 150,000 | | | | 158,884 | |
Southern Copper Corp. | | | BBB | | | | 3.50 | | | | 11/08/22 | | | | 100,000 | | | | 99,471 | |
Teck Resources Ltd. | | | BB | | | | 4.75 | | | | 01/15/22 | | | | 300,000 | | | | 300,750 | |
Valspar Corp. | | | BBB | | | | 3.95 | | | | 01/15/26 | | | | 350,000 | | | | 349,896 | |
Vulcan Materials Co. | | | BBB | | | | 7.00 | | | | 06/15/18 | | | | 250,000 | | | | 266,875 | |
| | | | | | | | | | | | | | | | | | | | |
| | | | | | | | | | | | | | | | | | | 1,958,859 | |
| | | | | | | | | | | | | | | | | | | | |
REAL ESTATE (1.1%) | | | | | | | | | | | | | | | | | | | | |
American Tower Corp. | | | BBB- | | | | 4.50 | | | | 01/15/18 | | | | 250,000 | | | | 256,598 | |
Government Pptys. Income Trust | | | BBB- | | | | 3.75 | | | | 08/15/19 | | | | 350,000 | | | | 353,845 | |
Healthcare Realty Trust | | | BBB | | | | 3.75 | | | | 04/15/23 | | | | 250,000 | | | | 249,106 | |
Hospitality Properties Trust | | | BBB- | | | | 5.00 | | | | 08/15/22 | | | | 250,000 | | | | 263,928 | |
National Retail Pptys., Inc. | | | BBB+ | | | | 3.80 | | | | 10/15/22 | | | | 250,000 | | | | 258,057 | |
Ventas Realty LP/Capital Corp. | | | BBB+ | | | | 4.00 | | | | 04/30/19 | | | | 100,000 | | | | 103,668 | |
Ventas Realty LP/Capital Corp. | | | BBB+ | | | | 4.75 | | | | 06/01/21 | | | | 200,000 | | | | 215,040 | |
Welltower, Inc. | | | BBB+ | | | | 6.13 | | | | 04/15/20 | | | | 250,000 | | | | 277,507 | |
| | | | | | | | | | | | | | | | | | | | |
| | | | | | | | | | | | | | | | | | | 1,977,749 | |
| | | | | | | | | | | | | | | | | | | | |
TELECOMMUNICATION SERVICES (0.4%) | | | | | | | | | | | | | | | | | | | | |
AT&T, Inc. | | | BBB+ | | | | 3.00 | | | | 06/30/22 | | | | 350,000 | | | | 343,564 | |
Verizon Communications, Inc. | | | BBB+ | | | | 4.50 | | | | 09/15/20 | | | | 325,000 | | | | 347,787 | |
| | | | | | | | | | | | | | | | | | | | |
| | | | | | | | | | | | | | | | | | | 691,351 | |
| | | | | | | | | | | | | | | | | | | | |
UTILITIES (0.7%) | | | | | | | | | | | | | | | | | | | | |
Constellation Energy | | | BBB- | | | | 5.15 | | | | 12/01/20 | | | | 340,000 | | | | 367,562 | |
Entergy Corp. | | | BBB | | | | 5.13 | | | | 09/15/20 | | | | 250,000 | | | | 269,489 | |
National Fuel Gas Co. | | | BBB | | | | 4.90 | | | | 12/01/21 | | | | 250,000 | | | | 264,569 | |
National Fuel Gas Co. | | | BBB | | | | 5.20 | | | | 07/15/25 | | | | 100,000 | | | | 103,860 | |
SCANA Corp. | | | BBB | | | | 4.13 | | | | 02/01/22 | | | | 300,000 | | | | 303,117 | |
| | | | | | | | | | | | | | | | | | | | |
| | | | | | | | | | | | | | | | | | | 1,308,597 | |
| | | | | | | | | | | | | | | | | | | | |
TOTAL LONG-TERM DEBT SECURITIES
(Cost: $67,531,801) 38.1% | | | | | | | | | | | | | | | | | | | 69,002,460 | |
| | | | | | | | | | | | | | | | | | | | |
| | | | | |
| | | Rating** | | | Rate(%) | | | Maturity | | | Face Amount | | | Value | |
SHORT-TERM DEBT SECURITIES: | | | | | | | | | | | | | | | | | | | | |
COMMERCIAL PAPER (3.0%) | | | | | | | | | | | | | | | | | | | | |
Novartis Finance Corp.† | | | A-1+ | | | | 0.50 | | | | 01/03/17 | | | | 1,300,000 | | | | 1,299,946 | |
Novartis Finance Corp.† | | | A-1+ | | | | 0.50 | | | | 01/03/17 | | | | 1,200,000 | | | | 1,199,950 | |
Novartis Finance Corp.† | | | A-1+ | | | | 0.50 | | | | 01/03/17 | | | | 900,000 | | | | 899,963 | |
Toyota Motor Credit Corp. | | | A-1+ | | | | 0.62 | | | | 01/18/17 | | | | 2,000,000 | | | | 1,999,379 | |
| | | | | | | | | | | | | | | | | | | | |
| | | | | | | | | | | | | | | | | | | 5,399,238 | |
| | | | | | | | | | | | | | | | | | | | |
TOTAL SHORT-TERM DEBT SECURITIES
(Cost: $5,399,238) 3.0% | | | | | | | | | | | | | | | | | | | 5,399,238 | |
| | | | | | | | | | | | | | | | | | | | |
MUTUAL OF AMERICA INVESTMENT CORPORATION - COMPOSITE FUND
PORTFOLIO OF INVESTMENTS IN SECURITIES
December 31, 2016
| | | | | | | | | | | | |
TOTAL INVESTMENTS
(Cost: $159,847,380) 100.2% | | | | | | | | | | | 181,435,894 | |
| | | | | | | | | | | | |
OTHER NET ASSETS -0.2% | | | | | | | | | | | (292,507 | ) |
| | | | | | | | | | | | |
NET ASSETS 100.0% | | | | | | | | | | $ | 181,143,387 | |
| | | | | | | | | | | | |
The accompanying notes are an integral part of these portfolio schedules.
MUTUAL OF AMERICA INVESTMENT CORPORATION - RETIREMENT INCOME FUND
PORTFOLIO OF INVESTMENTS IN SECURITIES
December 31, 2016
| | | | | | | | |
| | | Shares | | | Value | |
COMMON STOCKS: | | | | | | | | |
DIVERSIFIED MUTUAL FUNDS (100.0%) | | | | | | | | |
Mutual of America Investment Corporation | | | | | | | | |
Bond Fund (29.8%) | | | 15,754,695 | | | | 22,590,894 | |
Equity Index Fund (21.2%) | | | 4,604,642 | | | | 16,078,959 | |
Mid-Cap Equity Index Fund (5.4%) | | | 1,868,807 | | | | 4,051,382 | |
Mid-Term Bond Fund (40.5%) | | | 29,398,662 | | | | 30,607,594 | |
Money Market Fund (3.1%) | | | 1,981,578 | | | | 2,372,365 | |
| | | | | | | | |
TOTAL INVESTMENTS
(Cost: $75,283,823) 100.0% | | | | | | | 75,701,194 | |
| | | | | | | | |
OTHER NET ASSETS -0.0% (2) | | | | | | | (1,299 | ) |
| | | | | | | | |
NET ASSETS 100.0% | | | | | | $ | 75,699,895 | |
| | | | | | | | |
The accompanying notes are an integral part of these portfolio schedules.
MUTUAL OF AMERICA INVESTMENT CORPORATION - 2010 RETIREMENT FUND
PORTFOLIO OF INVESTMENTS IN SECURITIES
December 31, 2016
| | | | | | | | |
| | | Shares | | | Value | |
COMMON STOCKS: | | | | | | | | |
DIVERSIFIED MUTUAL FUNDS (100.0%) | | | | | | | | |
Mutual of America Investment Corporation | | | | | | | | |
Bond Fund (25.8%) | | | 4,626,271 | | | | 6,633,679 | |
Equity Index Fund (24.8%) | | | 1,824,188 | | | | 6,369,884 | |
International Fund (2.9%) | | | 1,014,446 | | | | 753,943 | |
Mid-Cap Equity Index Fund (8.0%) | | | 947,124 | | | | 2,053,267 | |
Mid-Term Bond Fund (35.5%) | | | 8,734,432 | | | | 9,093,610 | |
Money Market Fund (3.0%) | | | 650,595 | | | | 778,899 | |
| | | | | | | | |
TOTAL INVESTMENTS
(Cost: $24,994,324) 100.0% | | | | | | | 25,683,282 | |
| | | | | | | | |
OTHER NET ASSETS -0.0% (2) | | | | | | | (98 | ) |
| | | | | | | | |
NET ASSETS 100.0% | | | | | | $ | 25,683,184 | |
| | | | | | | | |
The accompanying notes are an integral part of these portfolio schedules.
MUTUAL OF AMERICA INVESTMENT CORPORATION - 2015 RETIREMENT FUND
PORTFOLIO OF INVESTMENTS IN SECURITIES
December 31, 2016
| | | | | | | | |
| | | Shares | | | Value | |
COMMON STOCKS: | | | | | | | | |
DIVERSIFIED MUTUAL FUNDS (100.0%) | | | | | | | | |
Mutual of America Investment Corporation | | | | | | | | |
Bond Fund (24.7%) | | | 25,256,232 | | | | 36,215,289 | |
Equity Index Fund (27.9%) | | | 11,675,104 | | | | 40,768,318 | |
International Fund (5.8%) | | | 11,507,099 | | | | 8,552,145 | |
Mid-Cap Equity Index Fund (10.1%) | | | 6,836,077 | | | | 14,819,918 | |
Mid-Term Bond Fund (29.4%) | | | 41,285,814 | | | | 42,983,570 | |
Small Cap Growth Fund (1.0%) | | | 1,129,891 | | | | 1,458,216 | |
Small Cap Value Fund (1.1%) | | | 945,317 | | | | 1,595,771 | |
| | | | | | | | |
TOTAL INVESTMENTS
(Cost: $137,910,936) 100.0% | | | | | | | 146,393,227 | |
| | | | | | | | |
OTHER NET ASSETS -0.0% (2) | | | | | | | (1,473 | ) |
| | | | | | | | |
NET ASSETS 100.0% | | | | | | $ | 146,391,754 | |
| | | | | | | | |
The accompanying notes are an integral part of these portfolio schedules.
MUTUAL OF AMERICA INVESTMENT CORPORATION - 2020 RETIREMENT FUND
PORTFOLIO OF INVESTMENTS IN SECURITIES
December 31, 2016
| | | | | | | | |
| | | Shares | | | Value | |
COMMON STOCKS: | | | | | | | | |
DIVERSIFIED MUTUAL FUNDS (100.0%) | | | | | | | | |
Mutual of America Investment Corporation | | | | | | | | |
Bond Fund (24.2%) | | | 71,804,333 | | | | 102,961,309 | |
Equity Index Fund (32.1%) | | | 39,297,609 | | | | 137,223,398 | |
International Fund (7.8%) | | | 44,436,766 | | | | 33,025,671 | |
Mid-Cap Equity Index Fund (12.2%) | | | 23,863,168 | | | | 51,732,914 | |
Mid-Term Bond Fund (19.3%) | | | 78,877,701 | | | | 82,121,310 | |
Small Cap Growth Fund (2.0%) | | | 6,545,483 | | | | 8,447,477 | |
Small Cap Value Fund (2.4%) | | | 6,121,264 | | | | 10,333,184 | |
| | | | | | | | |
TOTAL INVESTMENTS
(Cost: $397,064,347) 100.0% | | | | | | | 425,845,263 | |
| | | | | | | | |
OTHER NET ASSETS -0.0% (2) | | | | | | | (1,446 | ) |
| | | | | | | | |
NET ASSETS 100.0% | | | | | | $ | 425,843,817 | |
| | | | | | | | |
The accompanying notes are an integral part of these portfolio schedules.
MUTUAL OF AMERICA INVESTMENT CORPORATION - 2025 RETIREMENT FUND
PORTFOLIO OF INVESTMENTS IN SECURITIES
December 31, 2016
| | | | | | | | |
| | | Shares | | | Value | |
COMMON STOCKS: | | | | | | | | |
DIVERSIFIED MUTUAL FUNDS (100.0%) | | | | | | | | |
Mutual of America Investment Corporation | | | | | | | | |
Bond Fund (22.8%) | | | 80,310,697 | | | | 115,158,713 | |
Equity Index Fund (37.0%) | | | 53,494,052 | | | | 186,795,987 | |
International Fund (8.7%) | | | 59,136,730 | | | | 43,950,773 | |
Mid-Cap Equity Index Fund (16.2%) | | | 37,661,809 | | | | 81,646,960 | |
Mid-Term Bond Fund (8.8%) | | | 42,402,208 | | | | 44,145,872 | |
Small Cap Growth Fund (3.0%) | | | 11,541,827 | | | | 14,895,663 | |
Small Cap Value Fund (3.5%) | | | 10,388,695 | | | | 17,536,948 | |
| | | | | | | | |
TOTAL INVESTMENTS
(Cost: $459,207,294) 100.0% | | | | | | | 504,130,916 | |
| | | | | | | | |
OTHER NET ASSETS -0.0% (2) | | | | | | | (1,626 | ) |
| | | | | | | | |
NET ASSETS 100.0% | | | | | | $ | 504,129,290 | |
| | | | | | | | |
The accompanying notes are an integral part of these portfolio schedules.
MUTUAL OF AMERICA INVESTMENT CORPORATION - 2030 RETIREMENT FUND
PORTFOLIO OF INVESTMENTS IN SECURITIES
December 31, 2016
| | | | | | | | |
| | | Shares | | | Value | |
COMMON STOCKS: | | | | | | | | |
DIVERSIFIED MUTUAL FUNDS (100.0%) | | | | | | | | |
Mutual of America Investment Corporation | | | | | | | | |
Bond Fund (22.5%) | | | 65,348,900 | | | | 93,704,768 | |
Equity Index Fund (39.4%) | | | 46,920,475 | | | | 163,841,698 | |
International Fund (9.6%) | | | 53,990,706 | | | | 40,126,217 | |
Mid-Cap Equity Index Fund (18.3%) | | | 35,044,195 | | | | 75,972,240 | |
Small Cap Growth Fund (4.9%) | | | 15,802,747 | | | | 20,394,726 | |
Small Cap Value Fund (5.3%) | | | 13,179,553 | | | | 22,248,139 | |
| | | | | | | | |
TOTAL INVESTMENTS
(Cost: $374,155,855) 100.0% | | | | | | | 416,287,788 | |
| | | | | | | | |
OTHER NET ASSETS -0.0% (2) | | | | | | | (1,329 | ) |
| | | | | | | | |
NET ASSETS 100.0% | | | | | | $ | 416,286,459 | |
| | | | | | | | |
The accompanying notes are an integral part of these portfolio schedules.
MUTUAL OF AMERICA INVESTMENT CORPORATION - 2035 RETIREMENT FUND
PORTFOLIO OF INVESTMENTS IN SECURITIES
December 31, 2016
| | | | | | | | |
| | | Shares | | | Value | |
COMMON STOCKS: | | | | | | | | |
DIVERSIFIED MUTUAL FUNDS (100.0%) | | | | | | | | |
Mutual of America Investment Corporation | | | | | | | | |
Bond Fund (14.8%) | | | 36,342,180 | | | | 52,111,597 | |
Equity Index Fund (40.1%) | | | 40,485,013 | | | | 141,369,696 | |
International Fund (11.5%) | | | 54,455,207 | | | | 40,471,437 | |
Mid-Cap Equity Index Fund (21.3%) | | | 34,530,580 | | | | 74,858,776 | |
Small Cap Growth Fund (5.9%) | | | 15,947,446 | | | | 20,581,471 | |
Small Cap Value Fund (6.4%) | | | 13,296,467 | | | | 22,445,500 | |
| | | | | | | | |
TOTAL INVESTMENTS
(Cost: $314,308,723) 100.0% | | | | | | | 351,838,477 | |
| | | | | | | | |
OTHER NET ASSETS -0.0% (2) | | | | | | | (1,120 | ) |
| | | | | | | | |
NET ASSETS 100.0% | | | | | | $ | 351,837,357 | |
| | | | | | | | |
The accompanying notes are an integral part of these portfolio schedules.
MUTUAL OF AMERICA INVESTMENT CORPORATION - 2040 RETIREMENT FUND
PORTFOLIO OF INVESTMENTS IN SECURITIES
December 31, 2016
| | | | | | | | |
| | | Shares | | | Value | |
COMMON STOCKS: | | | | | | | | |
DIVERSIFIED MUTUAL FUNDS (100.0%) | | | | | | | | |
Mutual of America Investment Corporation | | | | | | | | |
Bond Fund (11.9%) | | | 23,769,772 | | | | 34,083,832 | |
Equity Index Fund (37.9%) | | | 30,979,543 | | | | 108,177,528 | |
International Fund (12.4%) | | | 47,776,663 | | | | 35,507,903 | |
Mid-Cap Equity Index Fund (21.5%) | | | 28,324,513 | | | | 61,404,654 | |
Small Cap Growth Fund (7.8%) | | | 17,242,365 | | | | 22,252,668 | |
Small Cap Value Fund (8.5%) | | | 14,378,301 | | | | 24,271,722 | |
| | | | | | | | |
TOTAL INVESTMENTS
(Cost: $254,080,970) 100.0% | | | | | | | 285,698,307 | |
| | | | | | | | |
OTHER NET ASSETS -0.0% (2) | | | | | | | (947 | ) |
| | | | | | | | |
NET ASSETS 100.0% | | | | | | $ | 285,697,360 | |
| | | | | | | | |
The accompanying notes are an integral part of these portfolio schedules.
MUTUAL OF AMERICA INVESTMENT CORPORATION - 2045 RETIREMENT FUND
PORTFOLIO OF INVESTMENTS IN SECURITIES
December 31, 2016
| | | | | | | | |
| | | Shares | | | Value | |
COMMON STOCKS: | | | | | | | | |
DIVERSIFIED MUTUAL FUNDS (100.0%) | | | | | | | | |
Mutual of America Investment Corporation | | | | | | | | |
Bond Fund (10.5%) | | | 24,244,682 | | | | 34,764,813 | |
Equity Index Fund (35.2%) | | | 33,623,530 | | | | 117,410,071 | |
International Fund (13.4%) | | | 59,718,358 | | | | 44,383,042 | |
Mid-Cap Equity Index Fund (22.5%) | | | 34,600,758 | | | | 75,010,914 | |
Small Cap Growth Fund (8.8%) | | | 22,540,225 | | | | 29,089,986 | |
Small Cap Value Fund (9.6%) | | | 18,807,725 | | | | 31,748,945 | |
| | | | | | | | |
TOTAL INVESTMENTS
(Cost: $290,458,287) 100.0% | | | | | | | 332,407,771 | |
| | | | | | | | |
OTHER NET ASSETS -0.0% (2) | | | | | | | (1,083 | ) |
| | | | | | | | |
NET ASSETS 100.0% | | | | | | $ | 332,406,688 | |
| | | | | | | | |
The accompanying notes are an integral part of these portfolio schedules.
MUTUAL OF AMERICA INVESTMENT CORPORATION - 2050 RETIREMENT FUND
PORTFOLIO OF INVESTMENTS IN SECURITIES
December 31, 2016
| | | | | | | | |
| | | Shares | | | Value | |
COMMON STOCKS: | | | | | | | | |
DIVERSIFIED MUTUAL FUNDS (100.0%) | | | | | | | | |
Mutual of America Investment Corporation | | | | | | | | |
Bond Fund (8.6%) | | | 9,889,286 | | | | 14,180,395 | |
Equity Index Fund (33.9%) | | | 15,915,173 | | | | 55,574,225 | |
International Fund (14.4%) | | | 31,782,510 | | | | 23,620,952 | |
Mid-Cap Equity Index Fund (22.8%) | | | 17,225,018 | | | | 37,342,081 | |
Small Cap Growth Fund (9.7%) | | | 12,369,319 | | | | 15,963,608 | |
Small Cap Value Fund (10.6%) | | | 10,288,407 | | | | 17,367,654 | |
| | | | | | | | |
TOTAL INVESTMENTS
(Cost: $159,435,236) 100.0% | | | | | | | 164,048,915 | |
| | | | | | | | |
OTHER NET ASSETS -0.0% (2) | | | | | | | (398 | ) |
| | | | | | | | |
NET ASSETS 100.0% | | | | | | $ | 164,048,517 | |
| | | | | | | | |
The accompanying notes are an integral part of these portfolio schedules.
MUTUAL OF AMERICA INVESTMENT CORPORATION - 2055 RETIREMENT FUND
PORTFOLIO OF INVESTMENTS IN SECURITIES
December 31, 2016
| | | | | | | | |
| | | Shares | | | Value | |
COMMON STOCKS: | | | | | | | | |
DIVERSIFIED MUTUAL FUNDS (100.0%) | | | | | | | | |
Mutual of America Investment Corporation | | | | | | | | |
Bond Fund (8.0%) | | | 184,032 | | | | 263,886 | |
Equity Index Fund (30.0%) | | | 285,451 | | | | 996,766 | |
International Fund (16.9%) | | | 755,147 | | | | 561,230 | |
Mid-Cap Equity Index Fund (23.1%) | | | 353,792 | | | | 766,985 | |
Small Cap Growth Fund (10.8%) | | | 278,572 | | | | 359,520 | |
Small Cap Value Fund (11.2%) | | | 219,797 | | | | 371,035 | |
| | | | | | | | |
TOTAL INVESTMENTS
(Cost: $3,288,549) 100.0% | | | | | | | 3,319,422 | |
| | | | | | | | |
OTHER NET ASSETS -0.0% (2) | | | | | | | (3 | ) |
| | | | | | | | |
NET ASSETS 100.0% | | | | | | $ | 3,319,419 | |
| | | | | | | | |
The accompanying notes are an integral part of these portfolio schedules.
MUTUAL OF AMERICA INVESTMENT CORPORATION - CONSERVATIVE ALLOCATION FUND
PORTFOLIO OF INVESTMENTS IN SECURITIES
December 31, 2016
| | | | | | | | |
| | | Shares | | | Value | |
COMMON STOCKS: | | | | | | | | |
DIVERSIFIED MUTUAL FUNDS (100.0%) | | | | | | | | |
Mutual of America Investment Corporation | | | | | | | | |
Bond Fund (29.0%) | | | 28,218,267 | | | | 40,462,596 | |
Equity Index Fund (26.6%) | | | 10,626,913 | | | | 37,108,138 | |
International Fund (5.0%) | | | 9,371,782 | | | | 6,965,165 | |
Mid-Cap Equity Index Fund (5.6%) | | | 3,599,900 | | | | 7,804,216 | |
Mid-Term Bond Fund (33.8%) | | | 45,318,187 | | | | 47,181,761 | |
| | | | | | | | |
TOTAL INVESTMENTS
(Cost: $133,925,269) 100.0% | | | | | | | 139,521,876 | |
| | | | | | | | |
OTHER NET ASSETS -0.0% (2) | | | | | | | (137 | ) |
| | | | | | | | |
NET ASSETS 100.0% | | | | | | $ | 139,521,739 | |
| | | | | | | | |
The accompanying notes are an integral part of these portfolio schedules.
MUTUAL OF AMERICA INVESTMENT CORPORATION - MODERATE ALLOCATION FUND
PORTFOLIO OF INVESTMENTS IN SECURITIES
December 31, 2016
| | | | | | | | |
| | | Shares | | | Value | |
COMMON STOCKS: | | | | | | | | |
DIVERSIFIED MUTUAL FUNDS (100.0%) | | | | | | | | |
Mutual of America Investment Corporation | | | | | | | | |
Bond Fund (23.5%) | | | 56,923,805 | | | | 81,623,898 | |
Equity Index Fund (36.3%) | | | 36,061,967 | | | | 125,924,853 | |
International Fund (9.7%) | | | 45,400,532 | | | | 33,741,948 | |
Mid-Cap Equity Index Fund (16.4%) | | | 26,190,252 | | | | 56,777,794 | |
Mid-Term Bond Fund (14.1%) | | | 47,006,618 | | | | 48,939,624 | |
| | | | | | | | |
TOTAL INVESTMENTS
(Cost: $302,933,526) 100.0% | | | | | | | 347,008,117 | |
| | | | | | | | |
OTHER NET ASSETS -0.0% (2) | | | | | | | (203 | ) |
| | | | | | | | |
NET ASSETS 100.0% | | | | | | $ | 347,007,914 | |
| | | | | | | | |
The accompanying notes are an integral part of these portfolio schedules.
MUTUAL OF AMERICA INVESTMENT CORPORATION - AGGRESSIVE ALLOCATION FUND
PORTFOLIO OF INVESTMENTS IN SECURITIES
December 31, 2016
| | | | | | | | |
| | | Shares | | | Value | |
COMMON STOCKS: | | | | | | | | |
DIVERSIFIED MUTUAL FUNDS (100.0%) | | | | | | | | |
Mutual of America Investment Corporation | | | | | | | | |
Bond Fund (18.3%) | | | 33,685,453 | | | | 48,302,076 | |
Equity Index Fund (35.4%) | | | 26,721,597 | | | | 93,309,198 | |
International Fund (14.2%) | | | 50,393,981 | | | | 37,453,109 | |
Mid-Cap Equity Index Fund (21.3%) | | | 25,899,827 | | | | 56,148,183 | |
Small Cap Growth Fund (5.3%) | | | 10,774,473 | | | | 13,905,331 | |
Small Cap Value Fund (5.5%) | | | 8,655,930 | | | | 14,611,902 | |
| | | | | | | | |
TOTAL INVESTMENTS
(Cost: $216,658,157) 100.0% | | | | | | | 263,729,799 | |
| | | | | | | | |
OTHER NET ASSETS -0.0% (2) | | | | | | | (173 | ) |
| | | | | | | | |
NET ASSETS 100.0% | | | | | | $ | 263,729,626 | |
| | | | | | | | |
The accompanying notes are an integral part of these portfolio schedules.
MUTUAL OF AMERICA INVESTMENT CORPORATION - MONEY MARKET FUND
PORTFOLIO OF INVESTMENTS IN SECURITIES
December 31, 2016
| | | | | | | | | | | | | | | | | | |
| | | Rating** | | Rate(%) | | | Maturity | | | Face Amount | | | Value | |
SHORT-TERM DEBT SECURITIES: | | | | | | | | | | | | | | | | | | |
U.S. GOVERNMENT (24.1%) | | | | | | | | | | | | | |
U.S. Treasury Bill | | A-1+ | | | 0.18 | | | | 01/05/17 | | | | 900,000 | | | | 899,978 | |
U.S. Treasury Bill | | A-1+ | | | 0.27 | | | | 01/12/17 | | | | 1,000,000 | | | | 999,909 | |
U.S. Treasury Bill | | A-1+ | | | 0.29 | | | | 01/05/17 | | | | 1,000,000 | | | | 999,959 | |
U.S. Treasury Bill | | A-1+ | | | 0.31 | | | | 01/19/17 | | | | 1,800,000 | | | | 1,799,701 | |
U.S. Treasury Bill | | A-1+ | | | 0.32 | | | | 01/26/17 | | | | 700,000 | | | | 699,838 | |
U.S. Treasury Bill | | A-1+ | | | 0.35 | | | | 01/12/17 | | | | 1,500,000 | | | | 1,499,824 | |
U.S. Treasury Bill | | A-1+ | | | 0.40 | | | | 02/02/17 | | | | 1,200,000 | | | | 1,199,565 | |
U.S. Treasury Bill | | A-1+ | | | 0.42 | | | | 02/09/17 | | | | 2,000,000 | | | | 1,999,066 | |
U.S. Treasury Bill | | A-1+ | | | 0.42 | | | | 02/16/17 | | | | 1,800,000 | | | | 1,799,013 | |
U.S. Treasury Bill | | A-1+ | | | 0.44 | | | | 01/12/17 | | | | 1,300,000 | | | | 1,299,811 | |
U.S. Treasury Bill | | A-1+ | | | 0.46 | | | | 03/02/17 | | | | 2,000,000 | | | | 1,998,542 | |
| | | | | | | | | | | | | | | | | | |
| | | | | | | | | | | | | | | | | 15,195,206 | |
| | | | | | | | | | | | | | | | | | |
U.S. GOVERNMENT AGENCIES (14.7%) | | | | | | | | | | | | | |
FHLB | | A-1+ | | | 0.38 | | | | 01/13/17 | | | | 1,000,000 | | | | 999,865 | |
FHLB | | A-1+ | | | 0.40 | | | | 01/13/17 | | | | 500,000 | | | | 499,928 | |
FHLB | | A-1+ | | | 0.41 | | | | 01/17/17 | | | | 1,800,000 | | | | 1,799,651 | |
FHLB | | A-1+ | | | 0.43 | | | | 01/12/17 | | | | 100,000 | | | | 99,986 | |
FHLB | | A-1+ | | | 0.45 | | | | 01/12/17 | | | | 200,000 | | | | 199,970 | |
FHLB | | A-1+ | | | 0.45 | | | | 01/18/17 | | | | 1,000,000 | | | | 999,776 | |
FHLB | | A-1+ | | | 0.46 | | | | 01/25/17 | | | | 700,000 | | | | 699,779 | |
FHLB | | A-1+ | | | 0.46 | | | | 02/09/17 | | | | 800,000 | | | | 799,591 | |
FHLB | | A-1+ | | | 0.50 | | | | 01/25/17 | | | | 1,000,000 | | | | 999,653 | |
FHLB | | A-1+ | | | 0.51 | | | | 02/24/17 | | | | 1,800,000 | | | | 1,798,584 | |
FNMA | | A-1+ | | | 0.32 | | | | 01/17/17 | | | | 400,000 | | | | 399,940 | |
| | | | | | | | | | | | | | | | | | |
| | | | | | | | | | | | | | | | | 9,296,723 | |
| | | | | | | | | | | | | | | | | | |
COMMERCIAL PAPER (61.2%) | | | | | | | | | | | | | |
Apple, Inc.† | | A-1+ | | | 0.53 | | | | 01/10/17 | | | | 1,600,000 | | | | 1,599,764 | |
Apple, Inc.† | | A-1+ | | | 0.60 | | | | 01/30/17 | | | | 400,000 | | | | 399,800 | |
Apple, Inc.† | | A-1+ | | | 0.68 | | | | 02/07/17 | | | | 450,000 | | | | 449,677 | |
Cargill, Inc.† | | A-1 | | | 0.72 | | | | 01/09/17 | | | | 2,000,000 | | | | 1,999,640 | |
Chevron Corp.† | | A-1+ | | | 0.55 | | | | 01/04/17 | | | | 385,000 | | | | 384,976 | |
Chevron Corp.† | | A-1+ | | | 0.60 | | | | 02/13/17 | | | | 600,000 | | | | 599,560 | |
Chevron Corp.† | | A-1+ | | | 0.61 | | | | 02/01/17 | | | | 750,000 | | | | 749,593 | |
Cisco Systems, Inc.† | | A-1+ | | | 0.65 | | | | 01/20/17 | | | | 1,500,000 | | | | 1,499,458 | |
Coca-Cola Co.† | | A-1+ | | | 0.52 | | | | 01/19/17 | | | | 1,300,000 | | | | 1,299,643 | |
Coca-Cola Co.† | | A-1 | | | 0.60 | | | | 01/23/17 | | | | 500,000 | | | | 499,808 | |
Coca-Cola Co.† | | A-1+ | | | 0.65 | | | | 01/03/17 | | | | 640,000 | | | | 639,965 | |
Danaher Corp.† | | A-1 | | | 0.66 | | | | 01/05/17 | | | | 1,150,000 | | | | 1,149,895 | |
Danaher Corp.† | | A-1 | | | 0.70 | | | | 01/06/17 | | | | 1,000,000 | | | | 999,883 | |
Grainger (W.W.), Inc. | | A-1+ | | | 0.63 | | | | 02/13/17 | | | | 700,000 | | | | 699,461 | |
Intercontinental Exchange, Inc.† | | A-1 | | | 0.68 | | | | 01/03/17 | | | | 750,000 | | | | 749,958 | |
Intercontinental Exchange, Inc.† | | A-1 | | | 0.82 | | | | 02/17/17 | | | | 1,750,000 | | | | 1,748,086 | |
J.P. Morgan Securities LLC | | A-1 | | | 0.75 | | | | 01/17/17 | | | | 500,000 | | | | 499,823 | |
J.P. Morgan Securities LLC† | | A-1 | | | 0.80 | | | | 02/01/17 | | | | 1,500,000 | | | | 1,498,933 | |
Estee Lauder Cos.† | | A-1 | | | 0.68 | | | | 01/30/17 | | | | 1,000,000 | | | | 999,433 | |
Eli Lilly & Co.† | | A-1+ | | | 0.55 | | | | 01/13/17 | | | | 2,000,000 | | | | 1,999,603 | |
Microsoft Corp.† | | A-1+ | | | 0.61 | | | | 01/30/17 | | | | 400,000 | | | | 399,797 | |
Microsoft Corp.† | | A-1+ | | | 0.73 | | | | 02/07/17 | | | | 290,000 | | | | 289,776 | |
Nestle Capital Corp.† | | A-1+ | | | 0.68 | | | | 02/06/17 | | | | 2,000,000 | | | | 1,998,602 | |
PepsiCo, Inc.† | | A-1 | | | 0.54 | | | | 01/27/17 | | | | 2,000,000 | | | | 1,999,190 | |
Pfizer, Inc.† | | A-1+ | | | 0.67 | | | | 02/07/17 | | | | 2,000,000 | | | | 1,998,585 | |
Procter & Gamble Co.† | | A-1+ | | | 0.50 | | | | 01/10/17 | | | | 1,900,000 | | | | 1,899,736 | |
Simon Ppty. Group LP† | | A-1 | | | 0.72 | | | | 01/03/17 | | | | 1,500,000 | | | | 1,499,910 | |
Southern Califonia Gas Co.† | | A-1 | | | 0.70 | | | | 01/03/17 | | | | 2,000,000 | | | | 1,999,881 | |
Toyota Motor Credit Corp. | | A-1+ | | | 0.57 | | | | 01/11/17 | | | | 2,000,000 | | | | 1,999,651 | |
Unilever Capital Corp.† | | A-1 | | | 0.64 | | | | 02/17/17 | | | | 1,000,000 | | | | 999,146 | |
Unilever Capital Corp.† | | A-1 | | | 0.78 | | | | 02/21/17 | | | | 1,000,000 | | | | 998,873 | |
Washington Gas Light Co. | | A-1 | | | 0.60 | | | | 01/04/17 | | | | 2,000,000 | | | | 1,999,867 | |
| | | | | | | | | | | | | | | | | | |
| | | | | | | | | | | | | | | | | 38,549,973 | |
| | | | | | | | | | | | | | | | | | |
TOTAL SHORT-TERM DEBT SECURITIES
(Cost: $63,041,817) 100.0% | | | | | | | | 63,041,902 | |
| | | | | | | | | | | | | | | | | | |
TOTAL INVESTMENTS
(Cost: $63,041,817) 100.0% | | | | | | | | | | | | 63,041,902 | |
| | | | | | | | | | | | | | | | | | |
OTHER NET ASSETS 0.0% (2) | | | | | | | | | | | | 5,074 | |
| | | | | | | | | | | | | | | | | | |
NET ASSETS 100.0% | | | | | | | | | | | $ | 63,046,976 | |
| | | | | | | | | | | | | | | | | | |
The accompanying notes are an integral part of these portfolio schedules.
MUTUAL OF AMERICA INVESTMENT CORPORATION - MID-TERM BOND FUND
PORTFOLIO OF INVESTMENTS IN SECURITIES
December 31, 2016
| | | | | | | | | | | | | | | | | | | | |
| | | Rating** | | | Rate(%) | | | Maturity | | | Face Amount | | | Value | |
LONG-TERM DEBT SECURITIES: | | | | | | | | | | | | | | | | | | | | |
U.S. GOVERNMENT (36.8%) | | | | | | | | | | | | | |
U.S. Treasury Note | | | AA+ | | | | 1.38 | | | | 06/30/23 | | | | 18,000,000 | | | | 17,098,596 | |
U.S. Treasury Note | | | AA+ | | | | 1.38 | | | | 09/30/23 | | | | 23,500,000 | | | | 22,254,310 | |
U.S. Treasury Note | | | AA+ | | | | 1.50 | | | | 10/31/19 | | | | 3,000,000 | | | | 3,007,266 | |
U.S. Treasury Note | | | AA+ | | | | 1.50 | | | | 02/28/23 | | | | 13,000,000 | | | | 12,503,361 | |
U.S. Treasury Note | | | AA+ | | | | 1.50 | | | | 08/15/26 | | | | 12,500,000 | | | | 11,496,588 | |
U.S. Treasury Note | | | AA+ | | | | 1.63 | | | | 06/30/20 | | | | 5,500,000 | | | | 5,502,580 | |
U.S. Treasury Note | | | AA+ | | | | 1.63 | | | | 10/31/23 | | | | 6,900,000 | | | | 6,638,283 | |
U.S. Treasury Note | | | AA+ | | | | 1.63 | | | | 05/15/26 | | | | 10,000,000 | | | | 9,325,000 | |
U.S. Treasury Note | | | AA+ | | | | 1.75 | | | | 09/30/19 | | | | 3,000,000 | | | | 3,029,532 | |
U.S. Treasury Note | | | AA+ | | | | 1.75 | | | | 12/31/20 | | | | 3,500,000 | | | | 3,498,908 | |
U.S. Treasury Note | | | AA+ | | | | 1.75 | | | | 02/28/22 | | | | 15,000,000 | | | | 14,820,705 | |
U.S. Treasury Note | | | AA+ | | | | 1.88 | | | | 05/31/22 | | | | 11,000,000 | | | | 10,911,483 | |
U.S. Treasury Note | | | AA+ | | | | 2.00 | | | | 11/30/20 | | | | 7,500,000 | | | | 7,577,640 | |
U.S. Treasury Note | | | AA+ | | | | 2.13 | | | | 11/30/23 | | | | 4,500,000 | | | | 4,470,116 | |
U.S. Treasury Strip | | | AA+ | | | | 0.00 | | | | 08/15/18 | | | | 50,000,000 | | | | 49,091,295 | |
| | | | | | | | | | | | | | | | | | | | |
| | | | | | | | | | | | | | | | | | | 181,225,663 | |
| | | | | | | | | | | | | | | | | | | | |
U.S. GOVERNMENT AGENCIES (7.2%) | | | | | | | | | | | | | | | | | | | | |
MORTGAGE-BACKED OBLIGATIONS (0.0%) (2) | | | | | | | | | | | | | |
FHLMC | | | AA+ | | | | 7.50 | | | | 03/15/21 | | | | 2,599 | | | | 2,795 | |
FHLMC | | | AA+ | | | | 8.00 | | | | 09/01/18 | | | | 3 | | | | 3 | |
| | | | | | | | | | | | | | | | | | | | |
| | | | | | | | | | | | | | | | | | | 2,798 | |
| | | | | | | | | | | | | | | | | | | | |
NON-MORTGAGE-BACKED OBLIGATIONS (7.2%) | | | | | | | | | | �� | | | |
FHLMC | | | AA+ | | | | 0.00 | | | | 11/29/19 | | | | 13,500,000 | | | | 12,812,216 | |
FNMA | | | AA+ | | | | 0.00 | | | | 10/09/19 | | | | 23,000,000 | | | | 21,810,969 | |
Tennessee Valley Auth. Strip | | | AA+ | | | | 0.00 | | | | 11/01/20 | | | | 900,000 | | | | 824,170 | |
| | | | | | | | | | | | | | | | | | | | |
| | | | | | | | | | | | | | | | | | | 35,447,355 | |
| | | | | | | | | | | | | | | | | | | | |
CORPORATE DEBT (55.2%) | | | | | | | | | | | | | | | | | | | | |
CONSUMER DISCRETIONARY (9.1%) | | | | | | | | | | | | | |
Advance Auto Parts, Inc. | | | BBB- | | | | 4.50 | | | | 01/15/22 | | | | 500,000 | | | | 521,826 | |
Advance Auto Parts, Inc. | | | BBB- | | | | 4.50 | | | | 12/01/23 | | | | 250,000 | | | | 258,511 | |
Advance Auto Parts, Inc. | | | BBB- | | | | 5.75 | | | | 05/01/20 | | | | 1,500,000 | | | | 1,614,179 | |
AutoZone, Inc. | | | BBB | | | | 3.70 | | | | 04/15/22 | | | | 300,000 | | | | 310,017 | |
AutoZone, Inc. | | | BBB | | | | 4.00 | | | | 11/15/20 | | | | 700,000 | | | | 734,647 | |
Brinker International, Inc. | | | BB+ | | | | 2.60 | | | | 05/15/18 | | | | 2,000,000 | | | | 2,004,500 | |
Carnival Corp. | | | A- | | | | 1.88 | | | | 12/15/17 | | | | 2,000,000 | | | | 2,008,028 | |
Dollar General Corp. | | | BBB | | | | 3.25 | | | | 04/15/23 | | | | 1,047,000 | | | | 1,033,206 | |
Dollar General Corp. | | | BBB | | | | 4.13 | | | | 07/15/17 | | | | 962,000 | | | | 975,959 | |
Expedia, Inc. | | | BBB- | | | | 5.95 | | | | 08/15/20 | | | | 2,000,000 | | | | 2,186,142 | |
Family Dollar Stores, Inc. | | | BBB- | | | | 5.00 | | | | 02/01/21 | | | | 2,000,000 | | | | 2,135,000 | |
Gap, Inc. | | | BB+ | | | | 5.95 | | | | 04/12/21 | | | | 2,000,000 | | | | 2,104,680 | |
Harman Int’l. Industries, Inc. | | | BBB- | | | | 4.15 | | | | 05/15/25 | | | | 2,000,000 | | | | 2,064,860 | |
Hyatt Hotels Corp. | | | BBB | | | | 5.38 | | | | 08/15/21 | | | | 50,000 | | | | 54,693 | |
Kohl’s Corp. | | | BBB | | | | 3.25 | | | | 02/01/23 | | | | 700,000 | | | | 691,996 | |
Kohl’s Corp. | | | BBB | | | | 4.00 | | | | 11/01/21 | | | | 1,325,000 | | | | 1,389,539 | |
Marriott International, Inc. | | | BBB | | | | 3.00 | | | | 03/01/19 | | | | 1,200,000 | | | | 1,220,996 | |
Marriott International, Inc. | | | BBB | | | | 3.13 | | | | 02/15/23 | | | | 2,000,000 | | | | 1,949,992 | |
Marriott International, Inc. | | | BBB | | | | 3.38 | | | | 10/15/20 | | | | 800,000 | | | | 820,697 | |
Mattel, Inc. | | | BBB | | | | 1.70 | | | | 03/15/18 | | | | 2,000,000 | | | | 1,995,508 | |
Newell Brands, Inc. | | | BBB- | | | | 4.70 | | | | 08/15/20 | | | | 525,000 | | | | 557,906 | |
NVR, Inc. | | | BBB+ | | | | 3.95 | | | | 09/15/22 | | | | 2,000,000 | | | | 2,038,298 | |
Omnicom Group, Inc. | | | BBB+ | | | | 3.63 | | | | 05/01/22 | | | | 2,000,000 | | | | 2,054,022 | |
O’Reilly Automotive, Inc. | | | BBB+ | | | | 4.63 | | | | 09/15/21 | | | | 281,000 | | | | 301,577 | |
Scripps Networks Interactive, Inc. | | | BBB | | | | 3.50 | | | | 06/15/22 | | | | 2,000,000 | | | | 2,021,132 | |
Staples, Inc. | | | BBB- | | | | 2.75 | | | | 01/12/18 | | | | 2,000,000 | | | | 2,009,248 | |
Tupperware Brands Corp. | | | BBB- | | | | 4.75 | | | | 06/01/21 | | | | 2,000,000 | | | | 2,138,794 | |
Viacom, Inc. | | | BBB- | | | | 3.25 | | | | 03/15/23 | | | | 2,000,000 | | | | 1,918,302 | |
Whirlpool Corp. | | | BBB | | | | 2.40 | | | | 03/01/19 | | | | 1,445,000 | | | | 1,450,575 | |
MUTUAL OF AMERICA INVESTMENT CORPORATION - MID-TERM BOND FUND
PORTFOLIO OF INVESTMENTS IN SECURITIES
December 31, 2016
| | | | | | | | | | | | | | | | | | |
Wyndham Worldwide Corp. | | BBB- | | | 2.95 | | | | 03/01/17 | | | | 2,160,000 | | | | 2,162,173 | |
Wynn Las Vegas LLC | | BB | | | 5.38 | | | | 03/15/22 | | | | 2,000,000 | | | | 2,050,000 | |
| | | | | | | | | | | | | | | | | | |
| | | | | | | | | | | | | | | | | 44,777,003 | |
| | | | | | | | | | | | | | | | | | |
CONSUMER STAPLES (3.2%) | | | | | | | | | | | | | |
Beam Suntory, Inc. | | BBB | | | 1.75 | | | | 06/15/18 | | | | 2,000,000 | | | | 1,994,918 | |
Dr. Pepper Snapple Group, Inc. | | BBB+ | | | 2.60 | | | | 01/15/19 | | | | 150,000 | | | | 152,196 | |
Edgewell Personal Care Co. | | BB+ | | | 4.70 | | | | 05/19/21 | | | | 2,000,000 | | | | 2,105,172 | |
Flowers Foods, Inc. | | BBB | | | 4.38 | | | | 04/01/22 | | | | 2,000,000 | | | | 2,101,768 | |
General Mills, Inc. | | BBB+ | | | 2.20 | | | | 10/21/19 | | | | 775,000 | | | | 778,772 | |
Ingredion, Inc. | | BBB | | | 4.63 | | | | 11/01/20 | | | | 275,000 | | | | 294,739 | |
Kroger Co. | | BBB | | | 2.95 | | | | 11/01/21 | | | | 2,000,000 | | | | 2,012,418 | |
Mead Johnson Nutrition Co. | | BBB- | | | 4.90 | | | | 11/01/19 | | | | 3,075,000 | | | | 3,295,951 | |
Molson Coors Brewing Co. | | BBB- | | | 3.50 | | | | 05/01/22 | | | | 1,000,000 | | | | 1,029,371 | |
Sysco Corp. | | BBB+ | | | 2.60 | | | | 10/01/20 | | | | 2,000,000 | | | | 2,017,272 | |
| | | | | | | | | | | | | | | | | | |
| | | | | | | | | | | | | | | | | 15,782,577 | |
| | | | | | | | | | | | | | | | | | |
ENERGY (4.3%) | | | | | | | | | | | | | |
Cameron International Corp. | | AA- | | | 3.60 | | | | 04/30/22 | | | | 214,000 | | | | 214,254 | |
Diamond Offshore Drilling, Inc. | | BB+ | | | 3.45 | | | | 11/01/23 | | | | 1,500,000 | | | | 1,290,000 | |
Energen Corp. | | BB | | | 4.63 | | | | 09/01/21 | | | | 2,000,000 | | | | 2,005,000 | |
EQT Corp. | | BBB | | | 4.88 | | | | 11/15/21 | | | | 1,250,000 | | | | 1,334,239 | |
FMC Technologies, Inc. | | BBB | | | 2.00 | | | | 10/01/17 | | | | 2,000,000 | | | | 2,001,432 | |
Kinder Morgan, Inc. | | BBB- | | | 3.05 | | | | 12/01/19 | | | | 2,000,000 | | | | 2,028,712 | |
Marathon Oil Corp. | | BBB- | | | 2.80 | | | | 11/01/22 | | | | 2,000,000 | | | | 1,912,522 | |
Murphy Oil Corp. | | BBB- | | | 3.50 | | | | 12/01/17 | | | | 2,000,000 | | | | 2,010,000 | |
Noble Energy, Inc. | | BBB | | | 4.15 | | | | 12/15/21 | | | | 2,000,000 | | | | 2,081,374 | |
Pioneer Natural Resources Co. | | BBB- | | | 6.65 | | | | 03/15/17 | | | | 2,000,000 | | | | 2,020,402 | |
Rowan Companies PLC | | B+ | | | 4.88 | | | | 06/01/22 | | | | 2,000,000 | | | | 1,890,000 | |
SESI LLC | | BB- | | | 7.13 | | | | 12/15/21 | | | | 2,150,000 | | | | 2,187,625 | |
Sunoco, Inc. | | BBB- | | | 5.75 | | | | 01/15/17 | | | | 290,000 | | | | 290,324 | |
| | | | | | | | | | | | | | | | | | |
| | | | | | | | | | | | | | | | | 21,265,884 | |
| | | | | | | | | | | | | | | | | | |
FINANCIALS (12.5%) | | | | | | | | | | | | | |
Aflac, Inc. | | A- | | | 2.65 | | | | 02/15/17 | | | | 1,500,000 | | | | 1,502,262 | |
Aflac, Inc. | | A- | | | 3.63 | | | | 06/15/23 | | | | 550,000 | | | | 569,348 | |
Alleghany Corp. | | BBB+ | | | 4.95 | | | | 06/27/22 | | | | 2,000,000 | | | | 2,168,098 | |
American Express Credit Corp. | | A- | | | 2.25 | | | | 08/15/19 | | | | 2,000,000 | | | | 2,011,130 | |
Ares Capital Corp. | | BBB | | | 3.63 | | | | 01/19/22 | | | | 2,500,000 | | | | 2,423,580 | |
Bank of America Corp. | | BBB+ | | | 2.65 | | | | 04/01/19 | | | | 1,250,000 | | | | 1,263,205 | |
Barrick N.A. Finance LLC | | BBB- | | | 4.40 | | | | 05/30/21 | | | | 2,000,000 | | | | 2,101,710 | |
Berkley (W.R.) Corp. | | BBB+ | | | 4.63 | | | | 03/15/22 | | | | 2,000,000 | | | | 2,139,284 | |
Block Financial LLC | | BBB | | | 5.50 | | | | 11/01/22 | | | | 2,472,000 | | | | 2,604,222 | |
Capital One Financial Corp. | | BBB | | | 4.75 | | | | 07/15/21 | | | | 2,000,000 | | | | 2,163,150 | |
Citigroup, Inc. | | BBB+ | | | 2.55 | | | | 04/08/19 | | | | 1,850,000 | | | | 1,865,063 | |
Citizens Financial Group, Inc. | | BBB | | | 3.75 | | | | 07/01/24 | | | | 2,000,000 | | | | 1,935,948 | |
Erac USA Finance Co.† | | BBB+ | | | 2.75 | | | | 03/15/17 | | | | 1,000,000 | | | | 1,002,680 | |
Erac USA Finance LLC† | | BBB+ | | | 2.35 | | | | 10/15/19 | | | | 1,000,000 | | | | 999,112 | |
Fairfax Financial Hldgs.† | | BBB- | | | 5.80 | | | | 05/15/21 | | | | 1,274,000 | | | | 1,362,770 | |
Fairfax U.S., Inc.† | | BBB- | | | 4.88 | | | | 08/13/24 | | | | 750,000 | | | | 733,571 | |
Fifth Third Bancorp | | BBB | | | 4.30 | | | | 01/16/24 | | | | 2,000,000 | | | | 2,054,320 | |
First Republic Bank | | A- | | | 2.38 | | | | 06/17/19 | | | | 2,000,000 | | | | 1,996,644 | |
First Tennessee Bank | | BBB | | | 2.95 | | | | 12/01/19 | | | | 2,200,000 | | | | 2,205,456 | |
Ford Motor Credit Co. LLC | | BBB | | | 3.00 | | | | 06/12/17 | | | | 2,000,000 | | | | 2,011,642 | |
JPMorgan Chase & Co. | | A- | | | 2.00 | | | | 08/15/17 | | | | 2,000,000 | | | | 2,007,412 | |
Kemper Corp. | | BBB- | | | 6.00 | | | | 05/15/17 | | | | 500,000 | | | | 507,394 | |
Lincoln National Corp. | | A- | | | 4.00 | | | | 09/01/23 | | | | 2,000,000 | | | | 2,084,944 | |
Moody’s Corp. | | BBB+ | | | 5.50 | | | | 09/01/20 | | | | 2,000,000 | | | | 2,196,548 | |
Morgan Stanley | | BBB+ | | | 4.75 | | | | 03/22/17 | | | | 1,000,000 | | | | 1,007,532 | |
Nasdaq, Inc. | | BBB | | | 5.55 | | | | 01/15/20 | | | | 2,150,000 | | | | 2,323,468 | |
Penske Truck Leasing Co. LP† | | BBB | | | 3.38 | | | | 03/15/18 | | | | 1,300,000 | | | | 1,322,764 | |
Penske Truck Leasing Co. LP† | | BBB | | | 3.75 | | | | 05/11/17 | | | | 490,000 | | | | 493,810 | |
Peoples United Bank | | BBB+ | | | 4.00 | | | | 07/15/24 | | | | 1,750,000 | | | | 1,723,841 | |
Reinsurance Grp. of America, Inc. | | A- | | | 5.63 | | | | 03/15/17 | | | | 1,500,000 | | | | 1,512,201 | |
MUTUAL OF AMERICA INVESTMENT CORPORATION - MID-TERM BOND FUND
PORTFOLIO OF INVESTMENTS IN SECURITIES
December 31, 2016
| | | | | | | | | | | | | | | | | | |
Signet UK Finance PLC | | BBB- | | | 4.70 | | | | 06/15/24 | | | | 2,000,000 | | | | 1,912,190 | |
Stifel Financial Corp. | | BBB- | | | 4.25 | | | | 07/18/24 | | | | 2,000,000 | | | | 1,986,264 | |
Synchrony Financial | | BBB- | | | 2.70 | | | | 02/03/20 | | | | 1,000,000 | | | | 997,035 | |
Unum Group | | BBB | | | 4.00 | | | | 03/15/24 | | | | 2,000,000 | | | | 2,008,134 | |
Voya Financial, Inc. | | BBB | | | 3.65 | | | | 06/15/26 | | | | 2,000,000 | | | | 1,955,550 | |
Wells Fargo & Co. | | A | | | 2.13 | | | | 04/22/19 | | | | 2,000,000 | | | | 2,006,472 | |
Zions Bancorporation | | BBB- | | | 4.50 | | | | 03/27/17 | | | | 400,000 | | | | 401,722 | |
| | | | | | | | | | | | | | | | | | |
| | | | | | | | | | | | | | | | | 61,560,476 | |
| | | | | | | | | | | | | | | | | | |
HEALTH CARE (5.6%) | | | | | | | | | | | | | |
Agilent Technologies, Inc. | | BBB+ | | | 5.00 | | | | 07/15/20 | | | | 2,000,000 | | | | 2,158,174 | |
Anthem, Inc. | | A | | | 3.13 | | | | 05/15/22 | | | | 2,000,000 | | | | 2,001,014 | |
Becton, Dickinson & Co. | | BBB+ | | | 1.45 | | | | 05/15/17 | | | | 2,000,000 | | | | 2,001,428 | |
Biogen Idec, Inc. | | A- | | | 6.88 | | | | 03/01/18 | | | | 1,250,000 | | | | 1,321,911 | |
Bio-Rad Laboratories, Inc. | | BBB | | | 4.88 | | | | 12/15/20 | | | | 2,000,000 | | | | 2,137,332 | |
Edwards Lifesciences Corp. | | BBB- | | | 2.88 | | | | 10/15/18 | | | | 2,000,000 | | | | 2,030,040 | |
Express Scripts Hldg. Co. | | BBB+ | | | 2.25 | | | | 06/15/19 | | | | 2,000,000 | | | | 1,999,774 | |
Laboratory Corp. of America | | BBB | | | 3.75 | | | | 08/23/22 | | | | 600,000 | | | | 615,705 | |
Laboratory Corp. of America | | BBB | | | 4.63 | | | | 11/15/20 | | | | 400,000 | | | | 428,826 | |
Lilly (Eli) & Co. | | AA- | | | 5.20 | | | | 03/15/17 | | | | 500,000 | | | | 504,063 | |
Owens & Minor, Inc. | | BBB | | | 3.88 | | | | 09/15/21 | | | | 2,000,000 | | | | 2,004,520 | |
PerkinElmer, Inc. | | BBB | | | 5.00 | | | | 11/15/21 | | | | 2,000,000 | | | | 2,160,544 | |
Pfizer, Inc. | | AA | | | 6.05 | | | | 03/30/17 | | | | 2,000,000 | | | | 2,024,216 | |
Quest Diagnostics, Inc. | | BBB+ | | | 4.75 | | | | 01/30/20 | | | | 2,000,000 | | | | 2,134,812 | |
Thermo Fisher Scientific, Inc. | | BBB | | | 3.60 | | | | 08/15/21 | | | | 400,000 | | | | 413,405 | |
Thermo Fisher Scientific, Inc. | | BBB | | | 4.50 | | | | 03/01/21 | | | | 1,600,000 | | | | 1,710,450 | |
Zimmer Biomet Hldgs., Inc. | | BBB | | | 3.15 | | | | 04/01/22 | | | | 2,000,000 | | | | 1,994,532 | |
| | | | | | | | | | | | | | | | | | |
| | | | | | | | | | | | | | | | | 27,640,746 | |
| | | | | | | | | | | | | | | | | | |
INDUSTRIALS (5.0%) | | | | | | | | | | | | | |
Arconic, Inc. | | BBB- | | | 6.75 | | | | 07/15/18 | | | | 2,000,000 | | | | 2,127,500 | |
Crane Co. | | BBB | | | 2.75 | | | | 12/15/18 | | | | 2,000,000 | | | | 2,025,000 | |
Dun & Bradstreet Corp. | | BBB- | | | 3.25 | | | | 12/01/17 | | | | 2,000,000 | | | | 2,019,420 | |
Equifax, Inc. | | BBB+ | | | 3.30 | | | | 12/15/22 | | | | 2,000,000 | | | | 2,033,372 | |
Flowserve Corp. | | BBB | | | 3.50 | | | | 09/15/22 | | | | 2,000,000 | | | | 2,004,826 | |
GATX Corp. | | BBB | | | 6.00 | | | | 02/15/18 | | | | 2,050,000 | | | | 2,133,136 | |
Hunt (J.B.) Transport Svcs., Inc. | | BBB+ | | | 3.30 | | | | 08/15/22 | | | | 2,000,000 | | | | 2,007,948 | |
Kennametal, Inc. | | BBB- | | | 2.65 | | | | 11/01/19 | | | | 2,000,000 | | | | 1,989,014 | |
L-3 Communications Corp. | | BBB- | | | 5.20 | | | | 10/15/19 | | | | 2,000,000 | | | | 2,151,132 | |
Pitney Bowes, Inc. | | BBB- | | | 5.25 | | | | 01/15/37 | | | | 1,500,000 | | | | 1,499,745 | |
Valmont Industries, Inc. | | BBB+ | | | 6.63 | | | | 04/20/20 | | | | 2,000,000 | | | | 2,214,924 | |
Verisk Analytics, Inc. | | BBB- | | | 4.13 | | | | 09/12/22 | | | | 2,000,000 | | | | 2,083,788 | |
| | | | | | | | | | | | | | | | | | |
| | | | | | | | | | | | | | | | | 24,289,805 | |
| | | | | | | | | | | | | | | | | | |
INFORMATION TECHNOLOGY (6.0%) | | | | | | | | | | | | | |
Adobe Systems, Inc. | | A- | | | 4.75 | | | | 02/01/20 | | | | 2,000,000 | | | | 2,148,888 | |
Amphenol Corp. | | BBB+ | | | 2.55 | | | | 01/30/19 | | | | 2,000,000 | | | | 2,024,006 | |
Arrow Electronics, Inc. | | BBB- | | | 3.00 | | | | 03/01/18 | | | | 1,250,000 | | | | 1,264,239 | |
Arrow Electronics, Inc. | | BBB- | | | 4.50 | | | | 03/01/23 | | | | 50,000 | | | | 50,951 | |
Arrow Electronics, Inc. | | BBB- | | | 6.88 | | | | 06/01/18 | | | | 700,000 | | | | 743,931 | |
Avnet, Inc. | | BBB- | | | 5.88 | | | | 06/15/20 | | | | 950,000 | | | | 1,028,016 | |
Black Knight InfoServ LLC | | BBB | | | 5.75 | | | | 04/15/23 | | | | 1,311,000 | | | | 1,373,273 | |
eBay, Inc. | | BBB+ | | | 2.88 | | | | 08/01/21 | | | | 2,100,000 | | | | 2,104,038 | |
Fidelity Nat’l. Information | | BBB | | | 1.45 | | | | 06/05/17 | | | | 2,000,000 | | | | 2,000,792 | |
Fiserv, Inc. | | BBB | | | 4.75 | | | | 06/15/21 | | | | 1,900,000 | | | | 2,044,655 | |
Ingram Micro, Inc. | | NR | | | 5.25 | | | | 09/01/17 | | | | 1,500,000 | | | | 1,522,058 | |
Jabil Circuit, Inc. | | BBB- | | | 4.70 | | | | 09/15/22 | | | | 1,976,000 | | | | 2,015,520 | |
Juniper Networks, Inc. | | BBB | | | 4.50 | | | | 03/15/24 | | | | 1,500,000 | | | | 1,533,878 | |
Juniper Networks, Inc. | | BBB | | | 4.60 | | | | 03/15/21 | | | | 600,000 | | | | 642,380 | |
Lam Research Corp. | | BBB | | | 2.75 | | | | 03/15/20 | | | | 2,000,000 | | | | 2,004,140 | |
Motorola Solutions, Inc. | | BBB- | | | 3.75 | | | | 05/15/22 | | | | 2,000,000 | | | | 2,021,538 | |
Symantec Corp. | | BBB- | | | 4.20 | | | | 09/15/20 | | | | 2,000,000 | | | | 2,051,708 | |
Tech Data Corp. | | BBB- | | | 3.75 | | | | 09/21/17 | | | | 2,000,000 | | | | 2,024,614 | |
Total System Services, Inc. | | BBB- | | | 3.75 | | | | 06/01/23 | | | | 950,000 | | | | 943,535 | |
| | | | | | | | | | | | | | | | | | |
| | | | | | | | | | | | | | | | | 29,542,160 | |
| | | | | | | | | | | | | | | | | | |
MUTUAL OF AMERICA INVESTMENT CORPORATION - MID-TERM BOND FUND
PORTFOLIO OF INVESTMENTS IN SECURITIES
December 31, 2016
| | | | | | | | | | | | | | | | | | | | |
MATERIALS (3.0%) | | | | | | | | | | | | | |
Albemarle Corp. | | | BBB- | | | | 4.50 | | | | 12/15/20 | | | | 1,065,000 | | | | 1,130,836 | |
Domtar Corp. | | | BBB- | | | | 4.40 | | | | 04/01/22 | | | | 2,000,000 | | | | 2,057,728 | |
Freeport-McMoRan Copper & Gold | | | BB- | | | | 3.10 | | | | 03/15/20 | | | | 1,750,000 | | | | 1,706,250 | |
Freeport-McMoRan Copper & Gold | | | BB- | | | | 3.55 | | | | 03/01/22 | | | | 250,000 | | | | 232,500 | |
Goldcorp, Inc. | | | BBB+ | | | | 2.13 | | | | 03/15/18 | | | | 2,000,000 | | | | 1,999,066 | |
Kinross Gold Corp. | | | BB+ | | | | 5.13 | | | | 09/01/21 | | | | 750,000 | | | | 761,715 | |
Methanex Corp. | | | BB+ | | | | 3.25 | | | | 12/15/19 | | | | 2,000,000 | | | | 1,969,172 | |
Newmont Mining Corp. | | | BBB | | | | 3.50 | | | | 03/15/22 | | | | 2,000,000 | | | | 2,032,742 | |
Southern Copper Corp. | | | BBB | | | | 3.50 | | | | 11/08/22 | | | | 2,000,000 | | | | 1,989,428 | |
WestRock Co. | | | BBB | | | | 3.50 | | | | 03/01/20 | | | | 622,000 | | | | 637,701 | |
| | | | | | | | | | | | | | | | | | | | |
| | | | | | | | | | | | | | | | | | | 14,517,138 | |
| | | | | | | | | | | | | | | | | | | | |
REAL ESTATE (3.8%) | | | | | | | | | | | | | |
American Tower Corp. | | | BBB- | | | | 4.50 | | | | 01/15/18 | | | | 2,000,000 | | | | 2,052,786 | |
Boston Properties LP | | | A- | | | | 3.70 | | | | 11/15/18 | | | | 1,970,000 | | | | 2,029,175 | |
CBRE Services, Inc. | | | BBB | | | | 5.25 | | | | 03/15/25 | | | | 2,000,000 | | | | 2,062,320 | |
Government Pptys. Income Trust | | | BBB- | | | | 3.75 | | | | 08/15/19 | | | | 2,000,000 | | | | 2,021,972 | |
HCP, Inc. | | | BBB | | | | 3.15 | | | | 08/01/22 | | | | 750,000 | | | | 740,547 | |
Healthcare Realty Trust | | | BBB | | | | 5.75 | | | | 01/15/21 | | | | 2,000,000 | | | | 2,198,108 | |
Hospitality Properties Trust | | | BBB- | | | | 5.00 | | | | 08/15/22 | | | | 1,300,000 | | | | 1,372,424 | |
Jones Lang LaSalle, Inc. | | | BBB+ | | | | 4.40 | | | | 11/15/22 | | | | 1,410,000 | | | | 1,453,838 | |
Mack-Cali Realty LP | | | BBB- | | | | 4.50 | | | | 04/18/22 | | | | 1,000,000 | | | | 1,006,263 | |
Ventas Realty LP/Capital Corp. | | | BBB+ | | | | 4.00 | | | | 04/30/19 | | | | 1,700,000 | | | | 1,762,353 | |
Vornado Realty LP | | | BBB | | | | 2.50 | | | | 06/30/19 | | | | 500,000 | | | | 501,772 | |
Vornado Realty LP | | | BBB | | | | 5.00 | | | | 01/15/22 | | | | 1,500,000 | | | | 1,622,255 | |
| | | | | | | | | | | | | | | | | | | | |
| | | | | | | | | | | | | | | | | | | 18,823,813 | |
| | | | | | | | | | | | | | | | | | | | |
TELECOMMUNICATION SERVICES (0.8%) | | | | | | | | | | | | | |
AT&T, Inc. | | | BBB+ | | | | 3.00 | | | | 02/15/22 | | | | 2,000,000 | | | | 1,980,478 | |
Verizon Communications, Inc. | | | BBB+ | | | | 4.50 | | | | 09/15/20 | | | | 2,000,000 | | | | 2,140,226 | |
| | | | | | | | | | | | | | | | | | | | |
| | | | | | | | | | | | | | | | | | | 4,120,704 | |
| | | | | | | | | | | | | | | | | | | | |
UTILITIES (1.9%) | | | | | | | | | | | | | |
Constellation Energy | | | BBB- | | | | 5.15 | | | | 12/01/20 | | | | 1,500,000 | | | | 1,621,599 | |
Entergy Corp. | | | BBB | | | | 5.13 | | | | 09/15/20 | | | | 1,400,000 | | | | 1,509,136 | |
Exelon Generation Co. LLC | | | BBB | | | | 4.25 | | | | 06/15/22 | | | | 1,000,000 | | | | 1,035,060 | |
National Fuel Gas Co. | | | BBB | | | | 4.90 | | | | 12/01/21 | | | | 2,000,000 | | | | 2,116,548 | |
SCANA Corp. | | | BBB | | | | 4.75 | | | | 05/15/21 | | | | 2,000,000 | | | | 2,091,406 | |
Talen Energy Supply LLC | | | B+ | | | | 4.60 | | | | 12/15/21 | | | | 1,400,000 | | | | 1,109,500 | |
| | | | | | | | | | | | | | | | | | | | |
| | | | | | | | | | | | | | | | | | | 9,483,249 | |
| | | | | | | | | | | | | | | | | | | | |
TOTAL LONG-TERM DEBT SECURITIES
(Cost: $488,005,159) 99.2% | | | | | | | | 488,479,371 | |
| | | | | | | | | | | | | | | | | | | | |
| | | | | |
| | | Rating** | | | Rate(%) | | | Maturity | | | Face Amount | | | Value | |
SHORT-TERM DEBT SECURITIES: | | | | | | | | | | | | | | | | | | | | |
COMMERCIAL PAPER (0.1%) | | | | | | | | | | | | | |
Novartis Finance Corp.† | | | A-1+ | | | | 0.50 | | | | 01/03/17 | | | | 600,000 | | | | 599,975 | |
| | | | | | | | | | | | | | | | | | | | |
TOTAL SHORT-TERM DEBT SECURITIES
(Cost: $599,975) 0.1% | | | | | | | | 599,975 | |
| | | | | | | | | | | | | | | | | | | | |
TOTAL INVESTMENTS
(Cost: $488,605,134) 99.3% | | | | | | | | | | | | | | | | | | | 489,079,346 | |
| | | | | | | | | | | | | | | | | | | | |
OTHER NET ASSETS 0.7% | | | | | | | | | | | | | | | | | | | 3,191,205 | |
| | | | | | | | | | | | | | | | | | | | |
NET ASSETS 100.0% | | | | | | | | | | | | | | | | | | $ | 492,270,551 | |
| | | | | | | | | | | | | | | | | | | | |
The accompanying notes are an integral part of these portfolio schedules.
MUTUAL OF AMERICA INVESTMENT CORPORATION - BOND FUND
PORTFOLIO OF INVESTMENTS IN SECURITIES
December 31, 2016
| | | | | | | | | | | | | | | | | | | | |
| | | Rating** | | | Rate(%) | | | Maturity | | | Face Amount | | | Value | |
LONG-TERM DEBT SECURITIES: | | | | | | | | | | | | | | | | | | | | |
U.S. GOVERNMENT (11.6%) | | | | | | | | | | | | | |
U.S. Treasury Note | | | AA+ | | | | 1.50 | | | | 08/15/26 | | | | 50,800,000 | | | | 46,722,127 | |
U.S. Treasury Note | | | AA+ | | | | 1.63 | | | | 05/15/26 | | | | 2,000,000 | | | | 1,865,000 | |
U.S. Treasury Note | | | AA+ | | | | 2.00 | | | | 11/15/26 | | | | 2,000,000 | | | | 1,924,296 | |
U.S. Treasury Note | | | AA+ | | | | 2.25 | | | | 11/15/25 | | | | 1,000,000 | | | | 987,188 | |
U.S. Treasury Strip | | | AA+ | | | | 0.00 | | | | 08/15/25 | | | | 20,000,000 | | | | 16,098,220 | |
U.S. Treasury Strip | | | AA+ | | | | 0.00 | | | | 08/15/26 | | | | 20,000,000 | | | | 15,558,060 | |
U.S. Treasury Strip | | | AA+ | | | | 0.00 | | | | 08/15/28 | | | | 20,000,000 | | | | 14,542,840 | |
U.S. Treasury Strip | | | AA+ | | | | 0.00 | | | | 08/15/29 | | | | 20,000,000 | | | | 14,073,420 | |
U.S. Treasury Strip | | | AA+ | | | | 0.00 | | | | 08/15/33 | | | | 10,000,000 | | | | 6,139,590 | |
U.S. Treasury Strip | | | AA+ | | | | 0.00 | | | | 08/15/35 | | | | 10,000,000 | | | | 5,719,430 | |
U.S. Treasury Strip | | | AA+ | | | | 0.00 | | | | 08/15/37 | | | | 10,000,000 | | | | 5,312,870 | |
| | | | | | | | | | | | | | | | | | | | |
| | | | | | | | | | | | | | | | | | | 128,943,041 | |
| | | | | | | | | | | | | | | | | | | | |
U.S. GOVERNMENT AGENCIES (28.4%) | | | | | | | | | | | | | | | | | | | | |
MORTGAGE-BACKED OBLIGATIONS (27.0%) | | | | | | | | | | | | | |
FHLMC | | | AA+ | | | | 2.50 | | | | 09/01/27 | | | | 1,596,243 | | | | 1,601,485 | |
FHLMC | | | AA+ | | | | 2.50 | | | | 12/01/27 | | | | 1,759,836 | | | | 1,765,622 | |
FHLMC | | | AA+ | | | | 2.50 | | | | 04/01/28 | | | | 2,062,567 | | | | 2,068,910 | |
FHLMC | | | AA+ | | | | 3.00 | | | | 06/01/27 | | | | 902,242 | | | | 927,360 | |
FHLMC | | | AA+ | | | | 3.00 | | | | 08/01/27 | | | | 575,867 | | | | 591,724 | |
FHLMC | | | AA+ | | | | 3.00 | | | | 10/15/37 | | | | 1,599,394 | | | | 1,628,334 | |
FHLMC | | | AA+ | | | | 3.00 | | | | 12/15/40 | | | | 1,593,121 | | | | 1,603,396 | |
FHLMC | | | AA+ | | | | 3.00 | | | | 07/01/42 | | | | 834,557 | | | | 843,028 | |
FHLMC | | | AA+ | | | | 3.00 | | | | 10/01/42 | | | | 2,395,716 | | | | 2,394,739 | |
FHLMC | | | AA+ | | | | 3.00 | | | | 11/01/42 | | | | 2,551,980 | | | | 2,550,413 | |
FHLMC | | | AA+ | | | | 3.00 | | | | 11/01/42 | | | | 987,960 | | | | 987,149 | |
FHLMC | | | AA+ | | | | 3.00 | | | | 11/01/42 | | | | 1,118,114 | | | | 1,116,851 | |
FHLMC | | | AA+ | | | | 3.00 | | | | 11/01/42 | | | | 4,118,640 | | | | 4,116,963 | |
FHLMC | | | AA+ | | | | 3.00 | | | | 02/01/43 | | | | 2,212,376 | | | | 2,211,475 | |
FHLMC | | | AA+ | | | | 3.00 | | | | 03/01/43 | | | | 1,660,052 | | | | 1,659,375 | |
FHLMC | | | AA+ | | | | 3.00 | | | | 04/01/43 | | | | 1,116,685 | | | | 1,116,229 | |
FHLMC | | | AA+ | | | | 3.00 | | | | 04/01/43 | | | | 2,448,418 | | | | 2,447,419 | |
FHLMC | | | AA+ | | | | 3.00 | | | | 04/01/43 | | | | 1,517,087 | | | | 1,516,468 | |
FHLMC | | | AA+ | | | | 3.00 | | | | 09/01/46 | | | | 4,927,704 | | | | 4,898,196 | |
FHLMC | | | AA+ | | | | 3.50 | | | | 02/01/35 | | | | 3,696,971 | | | | 3,816,586 | |
FHLMC | | | AA+ | | | | 3.50 | | | | 02/01/35 | | | | 1,924,387 | | | | 1,990,026 | |
FHLMC | | | AA+ | | | | 3.50 | | | | 04/01/35 | | | | 1,572,591 | | | | 1,625,052 | |
FHLMC | | | AA+ | | | | 3.50 | | | | 01/01/41 | | | | 1,792,365 | | | | 1,846,177 | |
FHLMC | | | AA+ | | | | 3.50 | | | | 07/01/42 | | | | 2,286,417 | | | | 2,355,446 | |
FHLMC | | | AA+ | | | | 3.50 | | | | 10/01/42 | | | | 1,951,276 | | | | 2,008,957 | |
FHLMC | | | AA+ | | | | 3.50 | | | | 01/01/43 | | | | 1,839,631 | | | | 1,885,504 | |
FHLMC | | | AA+ | | | | 3.50 | | | | 01/01/43 | | | | 987,958 | | | | 1,012,592 | |
FHLMC | | | AA+ | | | | 3.50 | | | | 05/01/43 | | | | 2,605,082 | | | | 2,683,489 | |
FHLMC | | | AA+ | | | | 3.50 | | | | 07/01/43 | | | | 911,619 | | | | 938,481 | |
FHLMC | | | AA+ | | | | 3.50 | | | | 11/01/43 | | | | 1,782,046 | | | | 1,835,650 | |
FHLMC | | | AA+ | | | | 3.50 | | | | 01/01/44 | | | | 3,035,244 | | | | 3,125,370 | |
FHLMC | | | AA+ | | | | 3.50 | | | | 04/01/45 | | | | 2,537,259 | | | | 2,606,780 | |
FHLMC | | | AA+ | | | | 3.50 | | | | 07/01/45 | | | | 2,665,244 | | | | 2,740,897 | |
FHLMC | | | AA+ | | | | 3.50 | | | | 09/01/45 | | | | 2,198,743 | | | | 2,255,765 | |
FHLMC | | | AA+ | | | | 3.50 | | | | 05/01/46 | | | | 4,641,717 | | | | 4,757,170 | |
FHLMC | | | AA+ | | | | 4.00 | | | | 02/01/25 | | | | 295,745 | | | | 311,532 | |
FHLMC | | | AA+ | | | | 4.00 | | | | 05/01/25 | | | | 114,328 | | | | 119,824 | |
FHLMC | | | AA+ | | | | 4.00 | | | | 05/01/26 | | | | 387,041 | | | | 407,411 | |
FHLMC | | | AA+ | | | | 4.00 | | | | 12/01/33 | | | | 1,359,795 | | | | 1,435,108 | |
FHLMC | | | AA+ | | | | 4.00 | | | | 12/15/38 | | | | 500,000 | | | | 518,321 | |
FHLMC | | | AA+ | | | | 4.00 | | | | 07/01/41 | | | | 1,350,652 | | | | 1,429,796 | |
FHLMC | | | AA+ | | | | 4.00 | | | | 12/01/41 | | | | 719,728 | | | | 760,064 | |
FHLMC | | | AA+ | | | | 4.00 | | | | 07/01/42 | | | | 2,701,341 | | | | 2,881,394 | |
MUTUAL OF AMERICA INVESTMENT CORPORATION - BOND FUND
PORTFOLIO OF INVESTMENTS IN SECURITIES
December 31, 2016
| | | | | | | | | | | | | | | | | | |
FHLMC | | AA+ | | | 4.00 | | | | 08/01/42 | | | | 1,000,202 | | | | 1,055,534 | |
FHLMC | | AA+ | | | 4.00 | | | | 08/01/42 | | | | 1,895,548 | | | | 2,009,582 | |
FHLMC | | AA+ | | | 4.00 | | | | 09/01/42 | | | | 1,240,998 | | | | 1,304,539 | |
FHLMC | | AA+ | | | 4.00 | | | | 11/01/42 | | | | 1,611,641 | | | | 1,709,594 | |
FHLMC | | AA+ | | | 4.00 | | | | 12/01/42 | | | | 1,322,974 | | | | 1,414,951 | |
FHLMC | | AA+ | | | 4.00 | | | | 01/01/43 | | | | 2,155,277 | | | | 2,287,605 | |
FHLMC | | AA+ | | | 4.00 | | | | 01/01/44 | | | | 2,025,623 | | | | 2,141,162 | |
FHLMC | | AA+ | | | 4.00 | | | | 10/01/44 | | | | 2,300,521 | | | | 2,422,349 | |
FHLMC | | AA+ | | | 4.50 | | | | 03/01/34 | | | | 516,065 | | | | 556,254 | |
FHLMC | | AA+ | | | 4.50 | | | | 08/01/34 | | | | 286,097 | | | | 308,339 | |
FHLMC | | AA+ | | | 4.50 | | | | 08/15/35 | | | | 111,233 | | | | 117,034 | |
FHLMC | | AA+ | | | 4.50 | | | | 12/01/39 | | | | 413,625 | | | | 443,850 | |
FHLMC | | AA+ | | | 4.50 | | | | 03/01/41 | | | | 673,176 | | | | 735,753 | |
FHLMC | | AA+ | | | 5.00 | | | | 02/01/26 | | | | 83,549 | | | | 90,915 | |
FHLMC | | AA+ | | | 5.00 | | | | 08/01/35 | | | | 1,254,934 | | | | 1,381,360 | |
FHLMC | | AA+ | | | 5.00 | | | | 10/01/40 | | | | 1,197,634 | | | | 1,309,524 | |
FHLMC | | AA+ | | | 5.50 | | | | 03/01/21 | | | | 88,768 | | | | 93,288 | |
FHLMC | | AA+ | | | 5.50 | | | | 07/01/32 | | | | 220,541 | | | | 246,709 | |
FHLMC | | AA+ | | | 5.50 | | | | 01/15/33 | | | | 248,296 | | | | 273,327 | |
FHLMC | | AA+ | | | 5.50 | | | | 05/01/33 | | | | 271,048 | | | | 300,474 | |
FHLMC | | AA+ | | | 5.50 | | | | 01/15/35 | | | | 34,239 | | | | 34,719 | |
FHLMC | | AA+ | | | 5.50 | | | | 06/01/37 | | | | 1,088,371 | | | | 1,226,870 | |
FHLMC | | AA+ | | | 6.00 | | | | 07/15/29 | | | | 155,750 | | | | 178,558 | |
FHLMC | | AA+ | | | 6.00 | | | | 03/15/32 | | | | 185,644 | | | | 203,169 | |
FHLMC ARM | | AA+ | | | 2.76 | | | | 02/01/36 | | | | 130,077 | | | | 137,511 | |
FHLMC ARM | | AA+ | | | 2.90 | | | | 04/01/37 | | | | 188,317 | | | | 200,788 | |
FHLMC ARM | | AA+ | | | 2.90 | | | | 04/01/37 | | | | 275,127 | | | | 289,532 | |
FHLMC ARM | | AA+ | | | 2.93 | | | | 05/01/37 | | | | 113,208 | | | | 118,489 | |
FHLMC ARM | | AA+ | | | 3.33 | | | | 04/01/42 | | | | 438,089 | | | | 450,236 | |
FHLMC ARM | | AA+ | | | 4.54 | | | | 09/01/39 | | | | 256,798 | | | | 269,771 | |
FHLMC ARM | | AA+ | | | 5.89 | | | | 03/01/37 | | | | 32,263 | | | | 33,846 | |
FHLMC Strip | | AA+ | | | 3.00 | | | | 01/15/43 | | | | 3,383,918 | | | | 3,366,088 | |
FNMA | | AA+ | | | 2.25 | | | | 01/01/28 | | | | 1,573,645 | | | | 1,532,220 | |
FNMA | | AA+ | | | 3.00 | | | | 09/01/29 | | | | 1,805,705 | | | | 1,856,705 | |
FNMA | | AA+ | | | 3.00 | | | | 06/01/33 | | | | 1,523,935 | | | | 1,554,999 | |
FNMA | | AA+ | | | 3.00 | | | | 07/01/33 | | | | 2,820,027 | | | | 2,877,442 | |
FNMA | | AA+ | | | 3.00 | | | | 09/01/33 | | | | 2,909,865 | | | | 2,969,007 | |
FNMA | | AA+ | | | 3.00 | | | | 04/25/42 | | | | 1,737,723 | | | | 1,770,152 | |
FNMA | | AA+ | | | 3.00 | | | | 10/01/42 | | | | 861,782 | | | | 860,471 | |
FNMA | | AA+ | | | 3.00 | | | | 12/01/42 | | | | 1,305,500 | | | | 1,299,226 | |
FNMA | | AA+ | | | 3.00 | | | | 12/01/42 | | | | 1,919,497 | | | | 1,894,712 | |
FNMA | | AA+ | | | 3.00 | | | | 01/01/43 | | | | 4,497,139 | | | | 4,495,857 | |
FNMA | | AA+ | | | 3.00 | | | | 02/01/43 | | | | 1,973,292 | | | | 1,966,977 | |
FNMA | | AA+ | | | 3.00 | | | | 03/01/43 | | | | 2,439,073 | | | | 2,431,582 | |
FNMA | | AA+ | | | 3.00 | | | | 02/01/45 | | | | 2,288,548 | | | | 2,284,144 | |
FNMA | | AA+ | | | 3.00 | | | | 09/01/46 | | | | 2,979,844 | | | | 2,963,496 | |
FNMA | | AA+ | | | 3.50 | | | | 02/01/26 | | | | 227,233 | | | | 237,037 | |
FNMA | | AA+ | | | 3.50 | | | | 03/01/32 | | | | 1,152,802 | | | | 1,199,057 | |
FNMA | | AA+ | | | 3.50 | | | | 08/01/38 | | | | 2,042,097 | | | | 2,098,058 | |
FNMA | | AA+ | | | 3.50 | | | | 03/01/41 | | | | 1,911,242 | | | | 1,971,181 | |
FNMA | | AA+ | | | 3.50 | | | | 10/01/41 | | | | 1,089,695 | | | | 1,118,835 | |
FNMA | | AA+ | | | 3.50 | | | | 12/01/41 | | | | 1,309,764 | | | | 1,344,782 | |
FNMA | | AA+ | | | 3.50 | | | | 04/01/42 | | | | 1,462,012 | | | | 1,499,909 | |
FNMA | | AA+ | | | 3.50 | | | | 04/01/42 | | | | 1,392,656 | | | | 1,436,255 | |
FNMA | | AA+ | | | 3.50 | | | | 07/01/42 | | | | 2,320,408 | | | | 2,392,510 | |
FNMA | | AA+ | | | 3.50 | | | | 08/01/42 | | | | 1,818,737 | | | | 1,874,685 | |
FNMA | | AA+ | | | 3.50 | | | | 09/01/42 | | | | 1,751,408 | | | | 1,805,946 | |
FNMA | | AA+ | | | 3.50 | | | | 10/01/42 | | | | 2,113,397 | | | | 2,179,092 | |
FNMA | | AA+ | | | 3.50 | | | | 12/01/42 | | | | 3,220,478 | | | | 3,321,221 | |
FNMA | | AA+ | | | 3.50 | | | | 12/01/42 | | | | 1,856,495 | | | | 1,919,848 | |
FNMA | | AA+ | | | 3.50 | | | | 03/01/43 | | | | 2,067,125 | | | | 2,130,945 | |
MUTUAL OF AMERICA INVESTMENT CORPORATION - BOND FUND
PORTFOLIO OF INVESTMENTS IN SECURITIES
December 31, 2016
| | | | | | | | | | | | | | | | | | |
FNMA | | AA+ | | | 3.50 | | | | 06/01/43 | | | | 3,883,665 | | | | 4,002,664 | |
FNMA | | AA+ | | | 3.50 | | | | 10/01/43 | | | | 1,403,436 | | | | 1,447,465 | |
FNMA | | AA+ | | | 3.50 | | | | 01/01/44 | | | | 1,166,652 | | | | 1,184,979 | |
FNMA | | AA+ | | | 3.50 | | | | 02/01/45 | | | | 2,717,197 | | | | 2,787,059 | |
FNMA | | AA+ | | | 3.50 | | | | 04/01/45 | | | | 4,271,839 | | | | 4,395,483 | |
FNMA | | AA+ | | | 3.50 | | | | 05/01/45 | | | | 4,922,198 | | | | 5,054,954 | |
FNMA | | AA+ | | | 3.50 | | | | 06/01/45 | | | | 5,594,829 | | | | 5,753,403 | |
FNMA | | AA+ | | | 3.50 | | | | 10/01/45 | | | | 4,774,902 | | | | 4,913,268 | |
FNMA | | AA+ | | | 3.50 | | | | 02/01/46 | | | | 4,909,680 | | | | 5,048,879 | |
FNMA | | AA+ | | | 3.50 | | | | 03/01/46 | | | | 2,852,063 | | | | 2,938,968 | |
FNMA | | AA+ | | | 4.00 | | | | 05/01/19 | | | | 134,852 | | | | 138,855 | |
FNMA | | AA+ | | | 4.00 | | | | 07/25/26 | | | | 1,954,424 | | | | 2,118,560 | |
FNMA | | AA+ | | | 4.00 | | | | 01/01/31 | | | | 136,383 | | | | 144,658 | |
FNMA | | AA+ | | | 4.00 | | | | 12/01/33 | | | | 1,597,816 | | | | 1,688,693 | |
FNMA | | AA+ | | | 4.00 | | | | 03/01/35 | | | | 438,390 | | | | 463,014 | |
FNMA | | AA+ | | | 4.00 | | | | 11/01/38 | | | | 1,967,024 | | | | 2,070,169 | |
FNMA | | AA+ | | | 4.00 | | | | 11/01/40 | | | | 997,043 | | | | 1,048,473 | |
FNMA | | AA+ | | | 4.00 | | | | 05/01/41 | | | | 1,216,416 | | | | 1,275,593 | |
FNMA | | AA+ | | | 4.00 | | | | 08/01/42 | | | | 2,489,180 | | | | 2,625,951 | |
FNMA | | AA+ | | | 4.00 | | | | 09/01/45 | | | | 1,716,114 | | | | 1,811,492 | |
FNMA | | AA+ | | | 4.00 | | | | 11/01/45 | | | | 2,715,256 | | | | 2,863,726 | |
FNMA | | AA+ | | | 4.50 | | | | 05/01/18 | | | | 40,966 | | | | 42,103 | |
FNMA | | AA+ | | | 4.50 | | | | 05/01/19 | | | | 17,440 | | | | 17,923 | |
FNMA | | AA+ | | | 4.50 | | | | 06/01/19 | | | | 66,624 | | | | 68,472 | |
FNMA | | AA+ | | | 4.50 | | | | 05/01/30 | | | | 369,056 | | | | 397,272 | |
FNMA | | AA+ | | | 4.50 | | | | 04/01/31 | | | | 589,578 | | | | 634,818 | |
FNMA | | AA+ | | | 4.50 | | | | 08/01/33 | | | | 178,789 | | | | 193,009 | |
FNMA | | AA+ | | | 4.50 | | | | 08/01/33 | | | | 119,685 | | | | 129,245 | |
FNMA | | AA+ | | | 4.50 | | | | 09/01/33 | | | | 369,950 | | | | 399,528 | |
FNMA | | AA+ | | | 4.50 | | | | 10/01/33 | | | | 161,437 | | | | 174,406 | |
FNMA | | AA+ | | | 4.50 | | | | 10/01/33 | | | | 359,463 | | | | 387,966 | |
FNMA | | AA+ | | | 4.50 | | | | 05/01/34 | | | | 139,379 | | | | 150,671 | |
FNMA | | AA+ | | | 4.50 | | | | 06/01/34 | | | | 244,565 | | | | 264,282 | |
FNMA | | AA+ | | | 4.50 | | | | 07/01/34 | | | | 194,812 | | | | 210,062 | |
FNMA | | AA+ | | | 4.50 | | | | 01/01/35 | | | | 705,700 | | | | 762,610 | |
FNMA | | AA+ | | | 4.50 | | | | 08/01/35 | | | | 235,295 | | | | 254,496 | |
FNMA | | AA+ | | | 4.50 | | | | 09/01/35 | | | | 51,638 | | | | 53,729 | |
FNMA | | AA+ | | | 4.50 | | | | 12/01/35 | | | | 258,301 | | | | 278,402 | |
FNMA | | AA+ | | | 4.50 | | | | 05/01/39 | | | | 804,694 | | | | 870,246 | |
FNMA | | AA+ | | | 4.50 | | | | 05/01/39 | | | | 1,158,047 | | | | 1,255,576 | |
FNMA | | AA+ | | | 4.50 | | | | 05/01/40 | | | | 530,555 | | | | 569,557 | |
FNMA | | AA+ | | | 4.50 | | | | 07/01/40 | | | | 3,821,459 | | | | 4,109,963 | |
FNMA | | AA+ | | | 4.50 | | | | 11/01/40 | | | | 563,349 | | | | 606,093 | |
FNMA | | AA+ | | | 4.50 | | | | 06/01/41 | | | | 558,325 | | | | 602,827 | |
FNMA | | AA+ | | | 4.50 | | | | 10/01/41 | | | | 353,436 | | | | 380,335 | |
FNMA | | AA+ | | | 4.50 | | | | 11/01/41 | | | | 1,033,985 | | | | 1,117,069 | |
FNMA | | AA+ | | | 4.50 | | | | 01/01/42 | | | | 135,553 | | | | 146,454 | |
FNMA | | AA+ | | | 4.50 | | | | 07/01/42 | | | | 2,008,356 | | | | 2,181,233 | |
FNMA | | AA+ | | | 4.50 | | | | 03/01/44 | | | | 1,560,186 | | | | 1,678,881 | |
FNMA | | AA+ | | | 4.50 | | | | 05/01/44 | | | | 1,821,736 | | | | 1,960,445 | |
FNMA | | AA+ | | | 5.00 | | | | 04/01/18 | | | | 11,618 | | | | 11,890 | |
FNMA | | AA+ | | | 5.00 | | | | 09/01/18 | | | | 82,349 | | | | 84,276 | |
FNMA | | AA+ | | | 5.00 | | | | 09/01/20 | | | | 64,363 | | | | 66,054 | |
FNMA | | AA+ | | | 5.00 | | | | 10/01/20 | | | | 133,441 | | | | 139,216 | |
FNMA | | AA+ | | | 5.00 | | | | 10/01/25 | | | | 130,821 | | | | 142,483 | |
FNMA | | AA+ | | | 5.00 | | | | 09/01/33 | | | | 729,824 | | | | 799,464 | |
FNMA | | AA+ | | | 5.00 | | | | 10/01/33 | | | | 496,563 | | | | 548,585 | |
FNMA | | AA+ | | | 5.00 | | | | 11/01/33 | | | | 499,447 | | | | 546,925 | |
FNMA | | AA+ | | | 5.00 | | | | 03/01/34 | | | | 124,154 | | | | 135,932 | |
FNMA | | AA+ | | | 5.00 | | | | 04/01/34 | | | | 64,315 | | | | 70,270 | |
FNMA | | AA+ | | | 5.00 | | | | 04/01/34 | | | | 263,533 | | | | 290,744 | |
MUTUAL OF AMERICA INVESTMENT CORPORATION - BOND FUND
PORTFOLIO OF INVESTMENTS IN SECURITIES
December 31, 2016
| | | | | | | | | | | | | | | | | | |
FNMA | | AA+ | | | 5.00 | | | | 04/01/35 | | | | 209,992 | | | | 230,937 | |
FNMA | | AA+ | | | 5.00 | | | | 06/01/35 | | | | 133,644 | | | | 145,958 | |
FNMA | | AA+ | | | 5.00 | | | | 09/01/35 | | | | 335,690 | | | | 366,693 | |
FNMA | | AA+ | | | 5.00 | | | | 09/01/35 | | | | 154,618 | | | | 168,342 | |
FNMA | | AA+ | | | 5.00 | | | | 11/25/35 | | | | 851,558 | | | | 922,026 | |
FNMA | | AA+ | | | 5.00 | | | | 08/01/37 | | | | 971,044 | | | | 1,059,159 | |
FNMA | | AA+ | | | 5.00 | | | | 05/01/39 | | | | 667,672 | | | | 728,856 | |
FNMA | | AA+ | | | 5.00 | | | | 09/25/40 | | | | 1,414,431 | | | | 1,528,583 | |
FNMA | | AA+ | | | 5.50 | | | | 04/01/17 | | | | 1,391 | | | | 1,396 | |
FNMA | | AA+ | | | 5.50 | | | | 05/01/17 | | | | 1,210 | | | | 1,212 | |
FNMA | | AA+ | | | 5.50 | | | | 01/01/24 | | | | 154,970 | | | | 172,139 | |
FNMA | | AA+ | | | 5.50 | | | | 03/01/24 | | | | 326,294 | | | | 362,520 | |
FNMA | | AA+ | | | 5.50 | | | | 09/01/25 | | | | 139,254 | | | | 155,674 | |
FNMA | | AA+ | | | 5.50 | | | | 11/01/26 | | | | 101,582 | | | | 112,815 | |
FNMA | | AA+ | | | 5.50 | | | | 01/01/27 | | | | 59,600 | | | | 66,234 | |
FNMA | | AA+ | | | 5.50 | | | | 03/01/33 | | | | 244,466 | | | | 266,215 | |
FNMA | | AA+ | | | 5.50 | | | | 09/01/33 | | | | 266,336 | | | | 301,992 | |
FNMA | | AA+ | | | 5.50 | | | | 10/01/33 | | | | 470,616 | | | | 533,450 | |
FNMA | | AA+ | | | 5.50 | | | | 03/01/34 | | | | 61,433 | | | | 68,587 | |
FNMA | | AA+ | | | 5.50 | | | | 03/01/34 | | | | 279,552 | | | | 317,137 | |
FNMA | | AA+ | | | 5.50 | | | | 07/01/34 | | | | 190,022 | | | | 212,947 | |
FNMA | | AA+ | | | 5.50 | | | | 09/01/34 | | | | 49,839 | | | | 55,591 | |
FNMA | | AA+ | | | 5.50 | | | | 09/01/34 | | | | 99,766 | | | | 111,977 | |
FNMA | | AA+ | | | 5.50 | | | | 09/01/34 | | | | 189,027 | | | | 211,231 | |
FNMA | | AA+ | | | 5.50 | | | | 10/01/34 | | | | 406,339 | | | | 454,970 | |
FNMA | | AA+ | | | 5.50 | | | | 02/01/35 | | | | 142,895 | | | | 160,423 | |
FNMA | | AA+ | | | 5.50 | | | | 02/01/35 | | | | 228,234 | | | | 257,985 | |
FNMA | | AA+ | | | 5.50 | | | | 04/01/35 | | | | 208,884 | | | | 233,825 | |
FNMA | | AA+ | | | 5.50 | | | | 08/01/35 | | | | 419,047 | | | | 468,744 | |
FNMA | | AA+ | | | 5.50 | | | | 02/25/37 | | | | 76,696 | | | | 81,482 | |
FNMA | | AA+ | | | 5.50 | | | | 05/01/38 | | | | 472,620 | | | | 528,500 | |
FNMA | | AA+ | | | 5.50 | | | | 11/01/38 | | | | 63,813 | | | | 67,928 | |
FNMA | | AA+ | | | 5.50 | | | | 06/01/48 | | | | 109,011 | | | | 117,682 | |
FNMA | | AA+ | | | 6.00 | | | | 03/01/17 | | | | 826 | | | | 827 | |
FNMA | | AA+ | | | 6.00 | | | | 05/01/23 | | | | 213,907 | | | | 241,999 | |
FNMA | | AA+ | | | 6.00 | | | | 01/01/25 | | | | 127,200 | | | | 143,905 | |
FNMA | | AA+ | | | 6.00 | | | | 03/01/28 | | | | 171,086 | | | | 193,645 | |
FNMA | | AA+ | | | 6.00 | | | | 04/01/32 | | | | 33,361 | | | | 37,745 | |
FNMA | | AA+ | | | 6.00 | | | | 05/01/32 | | | | 195,937 | | | | 224,578 | |
FNMA | | AA+ | | | 6.00 | | | | 04/01/33 | | | | 600,599 | | | | 695,944 | |
FNMA | | AA+ | | | 6.00 | | | | 11/01/34 | | | | 66,119 | | | | 74,828 | |
FNMA | | AA+ | | | 6.00 | | | | 03/01/36 | | | | 43,297 | | | | 47,688 | |
FNMA | | AA+ | | | 6.00 | | | | 12/01/36 | | | | 156,275 | | | | 179,322 | |
FNMA | | AA+ | | | 6.00 | | | | 01/01/37 | | | | 209,878 | | | | 240,674 | |
FNMA | | AA+ | | | 6.00 | | | | 03/01/37 | | | | 129,185 | | | | 137,112 | |
FNMA | | AA+ | | | 6.00 | | | | 04/01/37 | | | | 68,504 | | | | 73,683 | |
FNMA | | AA+ | | | 6.00 | | | | 05/01/37 | | | | 38,183 | | | | 40,462 | |
FNMA | | AA+ | | | 6.00 | | | | 06/01/37 | | | | 64,100 | | | | 68,477 | |
FNMA | | AA+ | | | 6.00 | | | | 07/01/37 | | | | 86,032 | | | | 97,368 | |
FNMA | | AA+ | | | 6.00 | | | | 08/01/37 | | | | 124,681 | | | | 141,150 | |
FNMA | | AA+ | | | 6.00 | | | | 12/01/37 | | | | 48,055 | | | | 54,367 | |
FNMA | | AA+ | | | 6.00 | | | | 10/25/44 | | | | 494,658 | | | | 567,701 | |
FNMA | | AA+ | | | 6.00 | | | | 02/25/47 | | | | 1,072,495 | | | | 1,194,086 | |
FNMA | | AA+ | | | 6.00 | | | | 12/25/49 | | | | 528,822 | | | | 599,421 | |
FNMA | | AA+ | | | 6.50 | | | | 03/01/17 | | | | 1,248 | | | | 1,248 | |
FNMA | | AA+ | | | 6.50 | | | | 05/01/17 | | | | 465 | | | | 465 | |
FNMA | | AA+ | | | 6.50 | | | | 05/01/32 | | | | 108,668 | | | | 122,943 | |
FNMA | | AA+ | | | 6.50 | | | | 05/01/32 | | | | 96,838 | | | | 109,560 | |
FNMA | | AA+ | | | 6.50 | | | | 09/01/36 | | | | 37,610 | | | | 41,518 | |
FNMA | | AA+ | | | 6.50 | | | | 05/01/37 | | | | 135,618 | | | | 140,773 | |
FNMA | | AA+ | | | 6.50 | | | | 07/01/37 | | | | 25,770 | | | | 29,155 | |
MUTUAL OF AMERICA INVESTMENT CORPORATION - BOND FUND
PORTFOLIO OF INVESTMENTS IN SECURITIES
December 31, 2016
| | | | | | | | | | | | | | | | | | |
FNMA | | AA+ | | | 6.50 | | | | 09/01/37 | | | | 55,843 | | | | 63,179 | |
FNMA | | AA+ | | | 6.50 | | | | 05/01/38 | | | | 92,493 | | | | 104,643 | |
FNMA | | AA+ | | | 7.00 | | | | 09/01/31 | | | | 56,868 | | | | 63,077 | |
FNMA | | AA+ | | | 7.00 | | | | 01/25/44 | | | | 404,346 | | | | 477,135 | |
FNMA | | AA+ | | | 7.50 | | | | 06/01/32 | | | | 71,911 | | | | 85,533 | |
FNMA | | AA+ | | | 8.00 | | | | 04/01/32 | | | | 20,284 | | | | 21,560 | |
FNMA ARM | | AA+ | | | 2.41 | | | | 05/01/43 | | | | 1,909,460 | | | | 1,931,835 | |
FNMA ARM | | AA+ | | | 4.00 | | | | 05/01/43 | | | | 1,544,685 | | | | 1,623,814 | |
FNMA Strip | | AA+ | | | 3.00 | | | | 08/25/42 | | | | 1,606,012 | | | | 1,596,054 | |
GNMA (3) | | AA+ | | | 2.68 | | | | 10/16/47 | | | | 2,000,000 | | | | 1,994,146 | |
GNMA (3) | | AA+ | | | 3.00 | | | | 07/16/36 | | | | 1,835,458 | | | | 1,869,348 | |
GNMA (3) | | AA+ | | | 3.50 | | | | 11/20/32 | | | | 2,332,480 | | | | 2,427,641 | |
GNMA (3) | | AA+ | | | 3.50 | | | | 09/20/33 | | | | 54,048 | | | | 54,125 | |
GNMA (3) | | AA+ | | | 3.50 | | | | 07/15/42 | | | | 1,744,000 | | | | 1,819,417 | |
GNMA (3) | | AA+ | | | 3.50 | | | | 11/15/42 | | | | 1,165,514 | | | | 1,216,186 | |
GNMA (3) | | AA+ | | | 3.50 | | | | 05/20/45 | | | | 2,690,576 | | | | 2,813,667 | |
GNMA (3) | | AA+ | | | 3.70 | | | | 05/15/42 | | | | 943,983 | | | | 993,072 | |
GNMA (3) | | AA+ | | | 4.00 | | | | 04/15/24 | | | | 283,402 | | | | 295,801 | |
GNMA (3) | | AA+ | | | 4.00 | | | | 01/20/41 | | | | 1,982,297 | | | | 2,112,544 | |
GNMA (3) | | AA+ | | | 4.00 | | | | 03/15/41 | | | | 852,366 | | | | 911,911 | |
GNMA (3) | | AA+ | | | 4.00 | | | | 08/15/41 | | | | 1,371,016 | | | | 1,467,933 | |
GNMA (3) | | AA+ | | | 4.00 | | | | 11/15/41 | | | | 911,545 | | | | 984,458 | |
GNMA (3) | | AA+ | | | 4.00 | | | | 12/15/41 | | | | 1,690,115 | | | | 1,800,295 | |
GNMA (3) | | AA+ | | | 4.00 | | | | 01/15/42 | | | | 472,630 | | | | 503,633 | |
GNMA (3) | | AA+ | | | 4.00 | | | | 03/20/42 | | | | 695,917 | | | | 749,573 | |
GNMA (3) | | AA+ | | | 4.00 | | | | 08/20/42 | | | | 1,279,462 | | | | 1,363,664 | |
GNMA (3) | | AA+ | | | 4.25 | | | | 06/20/36 | | | | 674,749 | | | | 727,066 | |
GNMA (3) | | AA+ | | | 4.25 | | | | 04/20/41 | | | | 947,781 | | | | 1,014,977 | |
GNMA (3) | | AA+ | | | 4.29 | | | | 04/15/41 | | | | 299,403 | | | | 321,468 | |
GNMA (3) | | AA+ | | | 4.50 | | | | 06/20/30 | | | | 73,178 | | | | 79,639 | |
GNMA (3) | | AA+ | | | 4.50 | | | | 09/15/30 | | | | 567,230 | | | | 618,874 | |
GNMA (3) | | AA+ | | | 4.50 | | | | 06/20/34 | | | | 463,997 | | | | 499,767 | |
GNMA (3) | | AA+ | | | 4.50 | | | | 09/15/40 | | | | 1,171,928 | | | | 1,272,202 | |
GNMA (3) | | AA+ | | | 4.50 | | | | 10/15/40 | | | | 1,488,214 | | | | 1,649,485 | |
GNMA (3) | | AA+ | | | 4.50 | | | | 10/15/40 | | | | 426,310 | | | | 462,179 | |
GNMA (3) | | AA+ | | | 5.00 | | | | 04/15/39 | | | | 1,224,224 | | | | 1,370,823 | |
GNMA (3) | | AA+ | | | 5.00 | | | | 06/20/39 | | | | 1,659,410 | | | | 1,801,867 | |
GNMA (3) | | AA+ | | | 5.00 | | | | 11/15/39 | | | | 561,231 | | | | 617,476 | |
GNMA (3) | | AA+ | | | 5.00 | | | | 05/15/40 | | | | 233,420 | | | | 258,453 | |
GNMA (3) | | AA+ | | | 5.00 | | | | 06/20/40 | | | | 290,596 | | | | 313,018 | |
GNMA (3) | | AA+ | | | 5.00 | | | | 06/20/40 | | | | 266,000 | | | | 288,604 | |
GNMA (3) | | AA+ | | | 5.50 | | | | 01/15/36 | | | | 122,199 | | | | 136,623 | |
GNMA (3) | | AA+ | | | 6.50 | | | | 04/15/31 | | | | 10,433 | | | | 11,917 | |
GNMA (3) | | AA+ | | | 6.50 | | | | 12/15/31 | | | | 21,970 | | | | 25,096 | |
GNMA (3) | | AA+ | | | 6.50 | | | | 05/15/32 | | | | 28,183 | | | | 32,193 | |
GNMA (3) | | AA+ | | | 7.00 | | | | 05/15/32 | | | | 2,729 | | | | 2,819 | |
Vendee Mortgage Trust (3) | | AA+ | | | 5.25 | | | | 01/15/32 | | | | 890,533 | | | | 948,714 | |
| | | | | | | | | | | | | | | | | | |
| | | | | | | | | | | | | | | | | 299,671,775 | |
| | | | | | | | | | | | | | | | | | |
NON-MORTGAGE-BACKED OBLIGATIONS (1.4%) | | | | | | | | | | | | | |
FHLMC | | AA+ | | | 0.00 | | | | 11/29/19 | | | | 11,000,000 | | | | 10,439,583 | |
FNMA | | AA+ | | | 0.00 | | | | 10/09/19 | | | | 5,050,000 | | | | 4,788,930 | |
| | | | | | | | | | | | | | | | | | |
| | | | | | | | | | | | | | | | | 15,228,513 | |
| | | | | | | | | | | | | | | | | | |
CORPORATE DEBT (58.9%) | | | | | | | | | | | | | | | | | | |
CONSUMER DISCRETIONARY (9.1%) | | | | | | | | | | | | | |
Advance Auto Parts, Inc. | | BBB- | | | 4.50 | | | | 01/15/22 | | | | 1,000,000 | | | | 1,043,652 | |
Advance Auto Parts, Inc. | | BBB- | | | 4.50 | | | | 12/01/23 | | | | 1,000,000 | | | | 1,034,044 | |
Advance Auto Parts, Inc. | | BBB- | | | 5.75 | | | | 05/01/20 | | | | 3,000,000 | | | | 3,228,357 | |
AutoZone, Inc. | | BBB | | | 3.25 | | | | 04/15/25 | | | | 2,000,000 | | | | 1,962,882 | |
AutoZone, Inc. | | BBB | | | 3.70 | | | | 04/15/22 | | | | 700,000 | | | | 723,373 | |
AutoZone, Inc. | | BBB | | | 4.00 | | | | 11/15/20 | | | | 3,000,000 | | | | 3,148,488 | |
Brinker International, Inc. | | BB+ | | | 3.88 | | | | 05/15/23 | | | | 4,000,000 | | | | 3,785,000 | |
MUTUAL OF AMERICA INVESTMENT CORPORATION - BOND FUND
PORTFOLIO OF INVESTMENTS IN SECURITIES
December 31, 2016
| | | | | | | | | | | | | | | | | | |
Coach, Inc. | | BBB- | | | 4.25 | | | | 04/01/25 | | | | 2,500,000 | | | | 2,513,885 | |
Dollar General Corp. | | BBB | | | 3.25 | | | | 04/15/23 | | | | 4,000,000 | | | | 3,947,300 | |
Expedia, Inc. | | BBB- | | | 5.95 | | | | 08/15/20 | | | | 4,000,000 | | | | 4,372,284 | |
Family Dollar Stores, Inc. | | BBB- | | | 5.00 | | | | 02/01/21 | | | | 4,000,000 | | | | 4,270,000 | |
Gap, Inc. | | BB+ | | | 5.95 | | | | 04/12/21 | | | | 5,000,000 | | | | 5,261,700 | |
Harman Int’l. Industries, Inc. | | BBB- | | | 4.15 | | | | 05/15/25 | | | | 5,000,000 | | | | 5,162,150 | |
Hyatt Hotels Corp. | | BBB | | | 5.38 | | | | 08/15/21 | | | | 200,000 | | | | 218,772 | |
Kohl’s Corp. | | BBB | | | 3.25 | | | | 02/01/23 | | | | 1,804,000 | | | | 1,783,371 | |
Kohl’s Corp. | | BBB | | | 4.00 | | | | 11/01/21 | | | | 2,620,000 | | | | 2,747,618 | |
Lowe’s Cos., Inc. | | A- | | | 3.12 | | | | 04/15/22 | | | | 2,000,000 | | | | 2,049,042 | |
Marriott International, Inc. | | BBB | | | 3.00 | | | | 03/01/19 | | | | 1,000,000 | | | | 1,017,497 | |
Marriott International, Inc. | | BBB | | | 3.13 | | | | 02/15/23 | | | | 3,000,000 | | | | 2,924,988 | |
Marriott International, Inc. | | BBB | | | 3.38 | | | | 10/15/20 | | | | 3,000,000 | | | | 3,077,613 | |
Mattel, Inc. | | BBB | | | 3.15 | | | | 03/15/23 | | | | 2,000,000 | | | | 1,969,134 | |
Mattel, Inc. | | BBB | | | 4.35 | | | | 10/01/20 | | | | 1,000,000 | | | | 1,057,179 | |
Newell Brands, Inc. | | BBB- | | | 4.70 | | | | 08/15/20 | | | | 3,000,000 | | | | 3,188,037 | |
NVR, Inc. | | BBB+ | | | 3.95 | | | | 09/15/22 | | | | 4,000,000 | | | | 4,076,596 | |
Omnicom Group, Inc. | | BBB+ | | | 3.63 | | | | 05/01/22 | | | | 1,000,000 | | | | 1,027,011 | |
Omnicom Group, Inc. | | BBB+ | | | 4.45 | | | | 08/15/20 | | | | 3,000,000 | | | | 3,191,133 | |
O’Reilly Automotive, Inc. | | BBB+ | | | 3.80 | | | | 09/01/22 | | | | 3,250,000 | | | | 3,362,772 | |
Scripps Networks Interactive, Inc. | | BBB | | | 3.50 | | | | 06/15/22 | | | | 5,000,000 | | | | 5,052,830 | |
Staples, Inc. | | BBB- | | | 4.38 | | | | 01/12/23 | | | | 3,700,000 | | | | 3,706,986 | |
Tupperware Brands Corp. | | BBB- | | | 4.75 | | | | 06/01/21 | | | | 4,000,000 | | | | 4,277,588 | |
Viacom, Inc. | | BBB- | | | 3.25 | | | | 03/15/23 | | | | 5,000,000 | | | | 4,795,755 | |
Whirlpool Corp. | | BBB | | | 3.70 | | | | 05/01/25 | | | | 2,000,000 | | | | 2,017,958 | |
Whirlpool Corp. | | BBB | | | 4.85 | | | | 06/15/21 | | | | 1,000,000 | | | | 1,089,049 | |
Wyndham Worldwide Corp. | | BBB- | | | 3.90 | | | | 03/01/23 | | | | 4,000,000 | | | | 3,992,864 | |
Wynn Las Vegas LLC | | BB | | | 5.38 | | | | 03/15/22 | | | | 4,000,000 | | | | 4,100,000 | |
| | | | | | | | | | | | | | | | | | |
| | | | | | | | | | | | | | | | | 101,176,908 | |
| | | | | | | | | | | | | | | | | | |
CONSUMER STAPLES (2.8%) | | | | | | | | | | | | | |
Conagra Brands, Inc. | | BBB | | | 4.95 | | | | 08/15/20 | | | | 645,000 | | | | 685,981 | |
Edgewell Personal Care Co. | | BB+ | | | 4.70 | | | | 05/19/21 | | | | 4,000,000 | | | | 4,210,344 | |
Flowers Foods, Inc. | | BBB | | | 4.38 | | | | 04/01/22 | | | | 4,000,000 | | | | 4,203,536 | |
Ingredion, Inc. | | BBB | | | 4.63 | | | | 11/01/20 | | | | 3,225,000 | | | | 3,456,481 | |
Kroger Co. | | BBB | | | 2.95 | | | | 11/01/21 | | | | 4,800,000 | | | | 4,829,803 | |
Mead Johnson Nutrition Co. | | BBB- | | | 4.13 | | | | 11/15/25 | | | | 1,950,000 | | | | 1,993,661 | |
Molson Coors Brewing Co. | | BBB- | | | 3.50 | | | | 05/01/22 | | | | 3,000,000 | | | | 3,088,113 | |
Sysco Corp. | | BBB+ | | | 3.75 | | | | 10/01/25 | | | | 3,575,000 | | | | 3,618,122 | |
Whole Foods Market, Inc. | | BBB- | | | 5.20 | | | | 12/03/25 | | | | 5,000,000 | | | | 5,294,125 | |
| | | | | | | | | | | | | | | | | | |
| | | | | | | | | | | | | | | | | 31,380,166 | |
| | | | | | | | | | | | | | | | | | |
ENERGY (4.9%) | | | | | | | | | | | | | |
Cameron International Corp. | | AA- | | | 4.50 | | | | 06/01/21 | | | | 3,000,000 | | | | 3,101,598 | |
Devon Energy | | BBB | | | 5.85 | | | | 12/15/25 | | | | 2,500,000 | | | | 2,840,343 | |
Diamond Offshore Drilling, Inc. | | BB+ | | | 3.45 | | | | 11/01/23 | | | | 3,000,000 | | | | 2,580,000 | |
Energen Corp. | | BB | | | 4.63 | | | | 09/01/21 | | | | 4,000,000 | | | | 4,010,000 | |
EQT Corp. | | BBB | | | 4.88 | | | | 11/15/21 | | | | 4,000,000 | | | | 4,269,564 | |
FMC Technologies, Inc. | | BBB | | | 2.00 | | | | 10/01/17 | | | | 4,500,000 | | | | 4,503,222 | |
Kinder Morgan Energy Partners | | BBB- | | | 4.30 | | | | 05/01/24 | | | | 5,000,000 | | | | 5,116,015 | |
Marathon Oil Corp. | | BBB- | | | 2.80 | | | | 11/01/22 | | | | 4,000,000 | | | | 3,825,044 | |
Marathon Petroleum Corp. | | BBB | | | 5.13 | | | | 03/01/21 | | | | 3,300,000 | | | | 3,602,498 | |
Murphy Oil Corp. | | BBB- | | | 3.50 | | | | 12/01/17 | | | | 1,250,000 | | | | 1,256,250 | |
Murphy Oil Corp. | | BBB- | | | 3.70 | | | | 12/01/22 | | | | 3,525,000 | | | | 3,409,345 | |
Noble Corp. | | BB- | | | 7.50 | | | | 03/15/19 | | | | 2,000,000 | | | | 2,100,000 | |
Rowan Companies PLC | | B+ | | | 4.88 | | | | 06/01/22 | | | | 4,000,000 | | | | 3,780,000 | |
Seacor Hldgs., Inc. | | B | | | 7.38 | | | | 10/01/19 | | | | 2,775,000 | | | | 2,788,875 | |
SESI LLC | | BB- | | | 7.13 | | | | 12/15/21 | | | | 4,500,000 | | | | 4,578,750 | |
Sunoco, Inc. | | BBB- | | | 5.75 | | | | 01/15/17 | | | | 2,000,000 | | | | 2,002,232 | |
| | | | | | | | | | | | | | | | | | |
| | | | | | | | | | | | | | | | | 53,763,736 | |
| | | | | | | | | | | | | | | | | | |
FINANCIALS (13.3%) | | | | | | | | | | | | | |
Aflac, Inc. | | A- | | | 4.00 | | | | 02/15/22 | | | | 3,000,000 | | | | 3,172,677 | |
Alleghany Corp. | | BBB+ | | | 4.95 | | | | 06/27/22 | | | | 2,000,000 | | | | 2,168,098 | |
MUTUAL OF AMERICA INVESTMENT CORPORATION - BOND FUND
PORTFOLIO OF INVESTMENTS IN SECURITIES
December 31, 2016
| | | | | | | | | | | | | | | | | | |
Alleghany Corp. | | BBB+ | | | 5.63 | | | | 09/15/20 | | | | 3,000,000 | | | | 3,247,101 | |
American Express Co. | | BBB | | | 3.63 | | | | 12/05/24 | | | | 5,000,000 | | | | 5,020,725 | |
American Int’l. Group, Inc. | | A- | | | 3.75 | | | | 07/10/25 | | | | 5,000,000 | | | | 5,032,270 | |
Bank of America Corp. | | BBB | | | 3.95 | | | | 04/21/25 | | | | 5,000,000 | | | | 4,977,445 | |
Barrick N.A. Finance LLC | | BBB- | | | 4.40 | | | | 05/30/21 | | | | 4,000,000 | | | | 4,203,420 | |
Berkley (W.R.) Corp. | | BBB+ | | | 4.63 | | | | 03/15/22 | | | | 2,000,000 | | | | 2,139,284 | |
Berkley (W.R.) Corp. | | BBB+ | | | 7.38 | | | | 09/15/19 | | | | 2,000,000 | | | | 2,243,240 | |
Block Financial LLC | | BBB | | | 5.25 | | | | 10/01/25 | | | | 3,000,000 | | | | 3,033,948 | |
Block Financial LLC | | BBB | | | 5.50 | | | | 11/01/22 | | | | 2,250,000 | | | | 2,370,348 | |
Capital One Financial Corp. | | BBB | | | 4.75 | | | | 07/15/21 | | | | 4,000,000 | | | | 4,326,300 | |
Citigroup, Inc. | | BBB | | | 3.88 | | | | 03/26/25 | | | | 5,000,000 | | | | 4,966,995 | |
Citizens Financial Group, Inc. | | BBB | | | 3.75 | | | | 07/01/24 | | | | 5,000,000 | | | | 4,839,870 | |
Fairfax Financial Hldgs.† | | BBB- | | | 5.80 | | | | 05/15/21 | | | | 1,500,000 | | | | 1,604,517 | |
Fairfax U.S., Inc.† | | BBB- | | | 4.88 | | | | 08/13/24 | | | | 3,500,000 | | | | 3,423,333 | |
Fifth Third Bancorp | | BBB | | | 4.30 | | | | 01/16/24 | | | | 5,000,000 | | | | 5,135,800 | |
First Republic Bank | | A- | | | 2.38 | | | | 06/17/19 | | | | 2,000,000 | | | | 1,996,644 | |
First Tennessee Bank | | BBB | | | 2.95 | | | | 12/01/19 | | | | 5,000,000 | | | | 5,012,400 | |
Genworth Financial, Inc. | | B | | | 7.20 | | | | 02/15/21 | | | | 1,750,000 | | | | 1,597,596 | |
Genworth Financial, Inc. | | B | | | 7.63 | | | | 09/24/21 | | | | 1,300,000 | | | | 1,199,250 | |
Hartford Financial Svcs. | | BBB+ | | | 5.50 | | | | 03/30/20 | | | | 1,000,000 | | | | 1,091,927 | |
JPMorgan Chase & Co. | | BBB+ | | | 3.88 | | | | 09/10/24 | | | | 5,000,000 | | | | 5,059,185 | |
JPMorgan Chase Bank NA | | A- | | | 6.00 | | | | 10/01/17 | | | | 2,000,000 | | | | 2,063,968 | |
Kemper Corp. | | BBB- | | | 4.35 | | | | 02/15/25 | | | | 2,000,000 | | | | 1,988,348 | |
Kemper Corp. | | BBB- | | | 6.00 | | | | 05/15/17 | | | | 1,091,000 | | | | 1,107,133 | |
Lincoln National Corp. | | A- | | | 4.00 | | | | 09/01/23 | | | | 4,000,000 | | | | 4,169,888 | |
Lincoln National Corp. | | A- | | | 4.85 | | | | 06/24/21 | | | | 1,000,000 | | | | 1,083,192 | |
Markel Corp. | | BBB+ | | | 5.35 | | | | 06/01/21 | | | | 1,200,000 | | | | 1,309,840 | |
Marsh & McLennan Cos., Inc. | | A- | | | 4.80 | | | | 07/15/21 | | | | 3,000,000 | | | | 3,260,958 | |
Moody’s Corp. | | BBB+ | | | 4.50 | | | | 09/01/22 | | | | 4,000,000 | | | | 4,287,188 | |
Nasdaq, Inc. | | BBB | | | 5.55 | | | | 01/15/20 | | | | 2,500,000 | | | | 2,701,708 | |
Old Republic Int’l. Corp. | | BBB+ | | | 3.88 | | | | 08/26/26 | | | | 5,000,000 | | | | 4,756,075 | |
Pacific LifeCorp.† | | A- | | | 6.00 | | | | 02/10/20 | | | | 3,000,000 | | | | 3,241,482 | |
Penske Truck Leasing Co. LP† | | BBB | | | 3.38 | | | | 03/15/18 | | | | 3,000,000 | | | | 3,052,533 | |
Peoples United Bank | | BBB+ | | | 4.00 | | | | 07/15/24 | | | | 2,000,000 | | | | 1,970,104 | |
Prudential Financial, Inc. | | A | | | 4.50 | | | | 11/16/21 | | | | 1,000,000 | | | | 1,081,388 | |
Reinsurance Grp. of America, Inc. | | A- | | | 4.70 | | | | 09/15/23 | | | | 1,000,000 | | | | 1,060,348 | |
Reinsurance Grp. of America, Inc. | | A- | | | 5.00 | | | | 06/01/21 | | | | 3,000,000 | | | | 3,241,959 | |
Signet UK Finance PLC | | BBB- | | | 4.70 | | | | 06/15/24 | | | | 5,000,000 | | | | 4,780,475 | |
Stifel Financial Corp. | | BBB- | | | 4.25 | | | | 07/18/24 | | | | 1,500,000 | | | | 1,489,698 | |
Synchrony Financial | | BBB- | | | 2.70 | | | | 02/03/20 | | | | 2,250,000 | | | | 2,243,329 | |
Synchrony Financial | | BBB- | | | 3.70 | | | | 08/04/26 | | | | 2,750,000 | | | | 2,643,495 | |
Travelers Cos., Inc. | | A | | | 3.90 | | | | 11/01/20 | | | | 2,500,000 | | | | 2,647,608 | |
Unum Group | | BBB | | | 4.00 | | | | 03/15/24 | | | | 5,000,000 | | | | 5,020,335 | |
Voya Financial, Inc. | | BBB | | | 3.65 | | | | 06/15/26 | | | | 5,000,000 | | | | 4,888,875 | |
Wells Fargo & Co. | | A- | | | 3.45 | | | | 02/13/23 | | | | 4,000,000 | | | | 4,014,396 | |
Wells Fargo & Co. | | A- | | | 4.13 | | | | 08/15/23 | | | | 1,000,000 | | | | 1,034,719 | |
Zions Bancorporation | | BBB- | | | 4.50 | | | | 03/27/17 | | | | 1,000,000 | | | | 1,004,306 | |
| | | | | | | | | | | | | | | | | | |
| | | | | | | | | | | | | | | | | 148,005,721 | |
| | | | | | | | | | | | | | | | | | |
HEALTH CARE (6.3%) | | | | | | | | | | | | | |
Agilent Technologies, Inc. | | BBB+ | | | 5.00 | | | | 07/15/20 | | | | 4,000,000 | | | | 4,316,348 | |
AmerisourceBergen Corp. | | A- | | | 4.88 | | | | 11/15/19 | | | | 2,500,000 | | | | 2,680,448 | |
Anthem, Inc. | | A | | | 3.30 | | | | 01/15/23 | | | | 3,539,000 | | | | 3,533,030 | |
Anthem, Inc. | | A | | | 4.35 | | | | 08/15/20 | | | | 2,000,000 | | | | 2,110,760 | |
Biogen Idec, Inc. | | A- | | | 4.05 | | | | 09/15/25 | | | | 2,500,000 | | | | 2,573,910 | |
Biogen Idec, Inc. | | A- | | | 6.88 | | | | 03/01/18 | | | | 2,500,000 | | | | 2,643,823 | |
Bio-Rad Laboratories, Inc. | | BBB | | | 4.88 | | | | 12/15/20 | | | | 4,000,000 | | | | 4,274,664 | |
CIGNA Corp. | | A | | | 5.38 | | | | 03/15/17 | | | | 2,000,000 | | | | 2,015,250 | |
Edwards Lifesciences Corp. | | BBB- | | | 2.88 | | | | 10/15/18 | | | | 4,500,000 | | | | 4,567,590 | |
Express Scripts Hldg. Co. | | BBB+ | | | 3.50 | | | | 06/15/24 | | | | 2,000,000 | | | | 1,976,414 | |
Humana, Inc. | | A- | | | 3.85 | | | | 10/01/24 | | | | 3,000,000 | | | | 3,071,100 | |
Humana, Inc. | | A- | | | 7.20 | | | | 06/15/18 | | | | 2,000,000 | | | | 2,149,866 | |
MUTUAL OF AMERICA INVESTMENT CORPORATION - BOND FUND
PORTFOLIO OF INVESTMENTS IN SECURITIES
December 31, 2016
| | | | | | | | | | | | | | | | | | |
Laboratory Corp. of America | | BBB | | | 3.75 | | | | 08/23/22 | | | | 2,000,000 | | | | 2,052,350 | |
Laboratory Corp. of America | | BBB | | | 4.63 | | | | 11/15/20 | | | | 1,000,000 | | | | 1,072,065 | |
Medco Health Solutions, Inc. | | BBB+ | | | 4.13 | | | | 09/15/20 | | | | 3,000,000 | | | | 3,147,912 | |
Owens & Minor, Inc. | | BBB | | | 3.88 | | | | 09/15/21 | | | | 2,200,000 | | | | 2,204,972 | |
Owens & Minor, Inc. | | BBB | | | 4.38 | | | | 12/15/24 | | | | 2,800,000 | | | | 2,754,531 | |
PerkinElmer, Inc. | | BBB | | | 5.00 | | | | 11/15/21 | | | | 4,000,000 | | | | 4,321,088 | |
Pfizer, Inc. | | AA | | | 6.05 | | | | 03/30/17 | | | | 4,000,000 | | | | 4,048,432 | |
Quest Diagnostics, Inc. | | BBB+ | | | 3.50 | | | | 03/30/25 | | | | 700,000 | | | | 691,672 | |
Quest Diagnostics, Inc. | | BBB+ | | | 4.75 | | | | 01/30/20 | | | | 4,000,000 | | | | 4,269,624 | |
Thermo Fisher Scientific, Inc. | | BBB | | | 3.60 | | | | 08/15/21 | | | | 1,000,000 | | | | 1,033,513 | |
Thermo Fisher Scientific, Inc. | | BBB | | | 4.50 | | | | 03/01/21 | | | | 3,000,000 | | | | 3,207,093 | |
Zimmer Biomet Hldgs., Inc. | | BBB | | | 3.15 | | | | 04/01/22 | | | | 5,000,000 | | | | 4,986,330 | |
| | | | | | | | | | | | | | | | | | |
| | | | | | | | | | | | | | | | | 69,702,785 | |
| | | | | | | | | | | | | | | | | | |
INDUSTRIALS (4.0%) | | | | | | | | | | | | | |
Arconic, Inc. | | BBB- | | | 6.75 | | | | 07/15/18 | | | | 4,000,000 | | | | 4,255,000 | |
Crane Co. | | BBB | | | 2.75 | | | | 12/15/18 | | | | 4,000,000 | | | | 4,050,000 | |
Dun & Bradstreet Corp. | | BBB- | | | 3.25 | | | | 12/01/17 | | | | 3,000,000 | | | | 3,029,130 | |
Dun & Bradstreet Corp. | | BBB- | | | 4.38 | | | | 12/01/22 | | | | 1,000,000 | | | | 1,013,268 | |
Equifax, Inc. | | BBB+ | | | 3.30 | | | | 12/15/22 | | | | 4,000,000 | | | | 4,066,744 | |
Flowserve Corp. | | BBB | | | 3.50 | | | | 09/15/22 | | | | 4,000,000 | | | | 4,009,652 | |
Hexcel Corp. | | BBB- | | | 4.70 | | | | 08/15/25 | | | | 3,900,000 | | | | 3,999,282 | |
Kennametal, Inc. | | BBB- | | | 2.65 | | | | 11/01/19 | | | | 4,000,000 | | | | 3,978,028 | |
L-3 Communications Corp. | | BBB- | | | 4.75 | | | | 07/15/20 | | | | 3,000,000 | | | | 3,189,225 | |
L-3 Communications Corp. | | BBB- | | | 5.20 | | | | 10/15/19 | | | | 1,000,000 | | | | 1,075,566 | |
Pentair PLC | | BBB- | | | 5.00 | | | | 05/15/21 | | | | 3,000,000 | | | | 3,155,682 | |
Pitney Bowes, Inc. | | BBB- | | | 5.25 | | | | 01/15/37 | | | | 3,000,000 | | | | 2,999,490 | |
Valmont Industries, Inc. | | BBB+ | | | 6.63 | | | | 04/20/20 | | | | 750,000 | | | | 830,597 | |
Verisk Analytics, Inc. | | BBB- | | | 4.00 | | | | 06/15/25 | | | | 5,000,000 | | | | 5,070,195 | |
| | | | | | | | | | | | | | | | | | |
| | | | | | | | | | | | | | | | | 44,721,859 | |
| | | | | | | | | | | | | | | | | | |
INFORMATION TECHNOLOGY (6.4%) | | | | | | | | | | | | | |
Adobe Systems, Inc. | | A- | | | 4.75 | | | | 02/01/20 | | | | 4,000,000 | | | | 4,297,776 | |
Applied Materials, Inc. | | A- | | | 3.90 | | | | 10/01/25 | | | | 5,000,000 | | | | 5,271,965 | |
Arrow Electronics, Inc. | | BBB- | | | 4.00 | | | | 04/01/25 | | | | 1,000,000 | | | | 974,320 | |
Arrow Electronics, Inc. | | BBB- | | | 4.50 | | | | 03/01/23 | | | | 1,100,000 | | | | 1,120,912 | |
Arrow Electronics, Inc. | | BBB- | | | 6.88 | | | | 06/01/18 | | | | 2,900,000 | | | | 3,082,001 | |
Avnet, Inc. | | BBB- | | | 4.88 | | | | 12/01/22 | | | | 270,000 | | | | 280,725 | |
Avnet, Inc. | | BBB- | | | 5.88 | | | | 06/15/20 | | | | 1,100,000 | | | | 1,190,334 | |
Black Knight InfoServ LLC | | BBB | | | 5.75 | | | | 04/15/23 | | | | 2,948,000 | | | | 3,088,030 | |
eBay, Inc. | | BBB+ | | | 2.88 | | | | 08/01/21 | | | | 5,000,000 | | | | 5,009,615 | |
Fidelity Nat’l. Information | | BBB | | | 3.88 | | | | 06/05/24 | | | | 5,000,000 | | | | 5,101,300 | |
Fiserv, Inc. | | BBB | | | 4.63 | | | | 10/01/20 | | | | 2,800,000 | | | | 2,990,498 | |
Fiserv, Inc. | | BBB | | | 4.75 | | | | 06/15/21 | | | | 1,000,000 | | | | 1,076,134 | |
Ingram Micro, Inc. | | NR | | | 5.00 | | | | 08/10/22 | | | | 1,000,000 | | | | 975,829 | |
Ingram Micro, Inc. | | NR | | | 5.25 | | | | 09/01/17 | | | | 3,000,000 | | | | 3,044,115 | |
Ingram Micro, Inc. | | NR | | | 5.45 | | | | 12/15/24 | | | | 750,000 | | | | 705,740 | |
Juniper Networks, Inc. | | BBB | | | 4.50 | | | | 03/15/24 | | | | 3,000,000 | | | | 3,067,755 | |
Juniper Networks, Inc. | | BBB | | | 4.60 | | | | 03/15/21 | | | | 2,000,000 | | | | 2,141,266 | |
Keysight Technologies, Inc. | | BBB- | | | 4.55 | | | | 10/30/24 | | | | 5,000,000 | | | | 4,949,865 | |
Lam Research Corp. | | BBB | | | 2.75 | | | | 03/15/20 | | | | 5,000,000 | | | | 5,010,350 | |
Motorola Solutions, Inc. | | BBB- | | | 3.75 | | | | 05/15/22 | | | | 4,000,000 | | | | 4,043,076 | |
Motorola Solutions, Inc. | | BBB- | | | 4.00 | | | | 09/01/24 | | | | 1,000,000 | | | | 1,001,165 | |
Symantec Corp. | | BBB- | | | 4.20 | | | | 09/15/20 | | | | 4,000,000 | | | | 4,103,416 | |
Tech Data Corp. | | BBB- | | | 3.75 | | | | 09/21/17 | | | | 4,000,000 | | | | 4,049,228 | |
Total System Services, Inc. | | BBB- | | | 3.75 | | | | 06/01/23 | | | | 4,000,000 | | | | 3,972,780 | |
| | | | | | | | | | | | | | | | | | |
| | | | | | | | | | | | | | | | | 70,548,195 | |
| | | | | | | | | | | | | | | | | | |
MATERIALS (5.2%) | | | | | | | | | | | | | |
Albemarle Corp. | | BBB- | | | 4.50 | | | | 12/15/20 | | | | 2,000,000 | | | | 2,123,636 | |
Carpenter Technology Corp. | | BBB- | | | 4.45 | | | | 03/01/23 | | | | 3,600,000 | | | | 3,444,988 | |
Domtar Corp. | | BBB- | | | 4.40 | | | | 04/01/22 | | | | 5,000,000 | | | | 5,144,320 | |
Dow Chemical Co. | | BBB | | | 3.50 | | | | 10/01/24 | | | | 4,800,000 | | | | 4,841,890 | |
Eastman Chemical Co. | | BBB | | | 4.50 | | | | 01/15/21 | | | | 2,500,000 | | | | 2,640,295 | |
MUTUAL OF AMERICA INVESTMENT CORPORATION - BOND FUND
PORTFOLIO OF INVESTMENTS IN SECURITIES
December 31, 2016
| | | | | | | | | | | | | | | | | | |
Freeport-McMoRan Copper & Gold | | BB- | | | 3.55 | | | | 03/01/22 | | | | 4,000,000 | | | | 3,720,000 | |
Goldcorp, Inc. | | BBB+ | | | 2.13 | | | | 03/15/18 | | | | 4,000,000 | | | | 3,998,132 | |
Kinross Gold Corp. | | BB+ | | | 5.13 | | | | 09/01/21 | | | | 4,000,000 | | | | 4,062,480 | |
Methanex Corp. | | BB+ | | | 3.25 | | | | 12/15/19 | | | | 3,400,000 | | | | 3,347,592 | |
Methanex Corp. | | BB+ | | | 5.25 | | | | 03/01/22 | | | | 600,000 | | | | 618,796 | |
Newmont Mining Corp. | | BBB | | | 3.50 | | | | 03/15/22 | | | | 4,000,000 | | | | 4,065,484 | |
Packaging Corp. of America | | BBB | | | 3.90 | | | | 06/15/22 | | | | 2,000,000 | | | | 2,062,688 | |
Packaging Corp. of America | | BBB | | | 4.50 | | | | 11/01/23 | | | | 2,000,000 | | | | 2,118,458 | |
Southern Copper Corp. | | BBB | | | 3.50 | | | | 11/08/22 | | | | 4,000,000 | | | | 3,978,856 | |
Teck Resources Ltd. | | BB | | | 3.75 | | | | 02/01/23 | | | | 1,000,000 | | | | 945,000 | |
Teck Resources Ltd. | | BB | | | 4.75 | | | | 01/15/22 | | | | 3,000,000 | | | | 3,007,500 | |
Valspar Corp. | | BBB | | | 3.95 | | | | 01/15/26 | | | | 5,000,000 | | | | 4,998,520 | |
Vulcan Materials Co. | | BBB | | | 7.00 | | | | 06/15/18 | | | | 2,000,000 | | | | 2,135,000 | |
| | | | | | | | | | | | | | | | | | |
| | | | | | | | | | | | | | | | | 57,253,635 | |
| | | | | | | | | | | | | | | | | | |
REAL ESTATE (4.3%) | | | | | | | | | | | | | |
American Tower Corp. | | BBB- | | | 4.50 | | | | 01/15/18 | | | | 5,000,000 | | | | 5,131,965 | |
Boston Properties LP | | A- | | | 3.70 | | | | 11/15/18 | | | | 1,000,000 | | | | 1,030,038 | |
Boston Properties LP | | A- | | | 3.85 | | | | 02/01/23 | | | | 3,000,000 | | | | 3,078,180 | |
Government Pptys. Income Trust | | BBB- | | | 3.75 | | | | 08/15/19 | | | | 4,000,000 | | | | 4,043,944 | |
HCP, Inc. | | BBB | | | 3.40 | | | | 02/01/25 | | | | 3,750,000 | | | | 3,588,086 | |
Healthcare Realty Trust | | BBB | | | 3.75 | | | | 04/15/23 | | | | 4,000,000 | | | | 3,985,696 | |
Hospitality Properties Trust | | BBB- | | | 5.00 | | | | 08/15/22 | | | | 4,550,000 | | | | 4,803,485 | |
Jones Lang LaSalle, Inc. | | BBB+ | | | 4.40 | | | | 11/15/22 | | | | 4,000,000 | | | | 4,124,364 | |
Mack-Cali Realty LP | | BBB- | | | 4.50 | | | | 04/18/22 | | | | 5,000,000 | | | | 5,031,315 | |
National Retail Pptys., Inc. | | BBB+ | | | 3.30 | | | | 04/15/23 | | | | 1,000,000 | | | | 994,143 | |
National Retail Pptys., Inc. | | BBB+ | | | 3.80 | | | | 10/15/22 | | | | 3,000,000 | | | | 3,096,684 | |
Ventas Realty LP/Capital Corp. | | BBB+ | | | 3.25 | | | | 08/15/22 | | | | 500,000 | | | | 504,728 | |
Ventas Realty LP/Capital Corp. | | BBB+ | | | 4.75 | | | | 06/01/21 | | | | 3,000,000 | | | | 3,225,597 | |
Vornado Realty LP | | BBB | | | 2.50 | | | | 06/30/19 | | | | 1,000,000 | | | | 1,003,543 | |
Welltower, Inc. | | BBB+ | | | 3.75 | | | | 03/15/23 | | | | 750,000 | | | | 765,080 | |
Welltower, Inc. | | BBB+ | | | 6.13 | | | | 04/15/20 | | | | 2,500,000 | | | | 2,775,065 | |
| | | | | | | | | | | | | | | | | | |
| | | | | | | | | | | | | | | | | 47,181,913 | |
| | | | | | | | | | | | | | | | | | |
TELECOMMUNICATION SERVICES (0.6%) | | | | | | | | | | | | | |
AT&T, Inc. | | BBB+ | | | 3.00 | | | | 02/15/22 | | | | 4,000,000 | | | | 3,960,956 | |
AT&T, Inc. | | BBB+ | | | 3.00 | | | | 06/30/22 | | | | 1,000,000 | | | | 981,610 | |
Verizon Communications, Inc. | | BBB+ | | | 4.50 | | | | 09/15/20 | | | | 2,000,000 | | | | 2,140,226 | |
| | | | | | | | | | | | | | | | | | |
| | | | | | | | | | | | | | | | | 7,082,792 | |
| | | | | | | | | | | | | | | | | | |
UTILITIES (2.0%) | | | | | | | | | | | | | |
Constellation Energy | | BBB- | | | 5.15 | | | | 12/01/20 | | | | 3,000,000 | | | | 3,243,198 | |
Entergy Corp. | | BBB | | | 5.13 | | | | 09/15/20 | | | | 2,500,000 | | | | 2,694,885 | |
Exelon Generation Co. LLC | | BBB | | | 4.25 | | | | 06/15/22 | | | | 1,000,000 | | | | 1,035,060 | |
National Fuel Gas Co. | | BBB | | | 4.90 | | | | 12/01/21 | | | | 3,000,000 | | | | 3,174,822 | |
National Fuel Gas Co. | | BBB | | | 5.20 | | | | 07/15/25 | | | | 2,000,000 | | | | 2,077,194 | |
SCANA Corp. | | BBB | | | 4.13 | | | | 02/01/22 | | | | 4,000,000 | | | | 4,041,560 | |
SCANA Corp. | | BBB | | | 4.75 | | | | 05/15/21 | | | | 1,000,000 | | | | 1,045,703 | |
Talen Energy Supply LLC | | B+ | | | 4.60 | | | | 12/15/21 | | | | 2,000,000 | | | | 1,585,000 | |
UIL Hldgs. Corp. | | BBB+ | | | 4.63 | | | | 10/01/20 | | | | 2,725,000 | | | | 2,845,202 | |
| | | | | | | | | | | | | | | | | | |
| | | | | | | | | | | | | | | | | 21,742,624 | |
| | | | | | | | | | | | | | | | | | |
SOVEREIGN DEBT (0.3%) | | | | | | | | | | | | | |
Sri Lanka AID | | NR | | | 6.59 | | | | 09/15/28 | | | | 2,976,293 | | | | 3,558,307 | |
| | | | | | | | | | | | | | | | | | |
TOTAL LONG-TERM DEBT SECURITIES
(Cost: $1,091,045,915) 99.2% | | | | | | | | 1,099,961,970 | |
| | | | | | | | | | | | | | | | | | |
| | | | | | | | | | | | | | | | | | | | |
| | | Rating** | | | Rate(%) | | | Maturity | | | Face Amount | | | Value | |
SHORT-TERM DEBT SECURITIES: | | | | | | | | | | | | | | | | | | | | |
COMMERCIAL PAPER (0.6%) | | | | | | | | | | | | | |
Novartis Finance Corp.† | | | A-1+ | | | | 0.50 | | | | 01/03/17 | | | | 6,200,000 | | | | 6,199,742 | |
| | | | | | | | | | | | | | | | | | | | |
TOTAL SHORT-TERM DEBT SECURITIES
(Cost: $6,199,742) 0.6% | | | | | | | | | | | | | | | | | | | 6,199,742 | |
| | | | | | | | | | | | | | | | | | | | |
MUTUAL OF AMERICA INVESTMENT CORPORATION - BOND FUND
PORTFOLIO OF INVESTMENTS IN SECURITIES
December 31, 2016
| | | | |
TOTAL INVESTMENTS
(Cost: $1,097,245,657) 99.8% | | | 1,106,161,712 | |
| | | | |
OTHER NET ASSETS 0.2% | | | 2,329,656 | |
| | | | |
NET ASSETS 100.0% | | $ | 1,108,491,368 | |
| | | | |
The accompanying notes are an integral part of these portfolio schedules.
MUTUAL OF AMERICA INVESTMENT CORPORATION
FOOTNOTES TO PORTFOLIOS OF INVESTMENTS IN SECURITIES
December 31, 2016
| | |
| Abbreviations: | | ARM = Adjustable Rate Mortgage |
| | FHLB = Federal Home Loan Bank |
| | FHLMC = Federal Home Loan Mortgage Corporation |
| | FNMA = Federal National Mortgage Association |
| | GNMA = Government National Mortgage Association |
| | NR = Not Rated |
| * | Non-income producing security. |
| ** | Ratings as per Standard & Poor’s Corporation (unaudited). |
| † | Security is exempt from registration under Rule 144A of the Securities Act of 1933. These securities may be resold in transactions exempt from registration, normally to qualified institutional buyers. At December 31, 2016, the aggregate values of these securities and their percentages of the respective Funds’ net assets were as follows: |
| | | | | | | | |
Fund | | Aggregate
Market
Value | | | Percentage
of
Net Assets | |
EQUITY INDEX FUND | | $ | 21,647,390 | | | | 1.0 | % |
ALL AMERICA FUND | | $ | 13,499,113 | | | | 4.6 | % |
SMALL CAP VALUE FUND | | $ | 6,999,643 | | | | 1.5 | % |
SMALL CAP GROWTH FUND | | $ | 6,649,585 | | | | 1.5 | % |
MID CAP VALUE FUND | | $ | 2,499,831 | | | | 2.6 | % |
MID-CAP EQUITY INDEX FUND | | $ | 23,248,364 | | | | 1.9 | % |
INTERNATIONAL FUND | | $ | 7,699,579 | | | | 2.0 | % |
COMPOSITE FUND | | $ | 4,057,685 | | | | 2.2 | % |
MONEY MARKET FUND | | $ | 33,351,171 | | | | 52.9 | % |
MID-TERM BOND FUND | | $ | 6,514,682 | | | | 1.3 | % |
BOND FUND | | $ | 17,521,607 | | | | 1.6 | % |
| (1) | This security, or a portion thereof, has been segregated to cover initial margin requirements on open futures contracts. |
| | Information on futures contracts outstanding in the Funds as of December 31, 2016, was as follows: |
| | | | | | | | | | | | | | | | | | | | | | |
Fund | | Number of
Contracts | | Contract Type | | Purchased (P)
or Sold (S) | | Expiration
Date | | | Underlying
Face Amount
at Value(a) | | | Unrealized
Gain(Loss) | | | Face Value
of Futures
as a % of
Total
Investments | |
EQUITY INDEX FUND | | 722 | | E-mini S&P 500
Stock Index | | P | | | March 2017 | | | $ | 80,726,820 | | | ($ | 699,807 | ) | | | 3.7 | % |
ALL AMERICA FUND | | 113 | | E-mini S&P 500
Stock Index | | P | | | March 2017 | | | $ | 12,634,530 | | | ($ | 127,974 | ) | | | 4.3 | % |
MID-CAP EQUITY INDEX FUND | | 328 | | E-mini S&P
MidCap 400
Stock Index | | P | | | March 2017 | | | $ | 54,418,480 | | | ($ | 914,414 | ) | | | 4.4 | % |
| (a) | Includes the cumulative appreciation(depreciation) of futures contracts. |
| (2) | Percentage is less than 0.05%. |
| (3) | U.S. Government guaranteed security. |
MUTUAL OF AMERICA INVESTMENT CORPORATION
FOOTNOTES TO PORTFOLIOS OF INVESTMENTS IN SECURITIES
December 31, 2016
Fair Value—The Investment Company values its investments at fair value. Fair value is an estimate of the price the Fund would receive upon selling a security in an orderly arms-length transaction. Investments are categorized based on a three-level valuation hierarchy for measurement and disclosure of fair value. The valuation hierarchy is based upon the transparency of inputs used to measure fair value. These inputs are summarized in the three broad levels listed below:
| • | | Level 1 – quoted prices in active markets for identical securities. |
| • | | Level 2 – other significant observable inputs (including yield, quality, coupon rate, maturity, issue type, quoted prices for similar securities, prepayment speeds, trading characteristics, etc.). |
| • | | Level 3 – significant unobservable inputs (including the Fund’s own assumptions in determining the fair value of investments). |
As of December 31, 2016, management determined that the fair value inputs for all equity securities were considered Level 1, with the exception of one security in the All America and Small Cap Value Funds (see Note b below) which was considered Level 3. In addition, non-registered securities under Rule 144A of the Securities Act of 1933 were considered Level 2. Furthermore, certain Rule 144A securities not actively traded were considered Level 3; however, there were no such 144A securities as of December 31, 2016. Fair value inputs for all debt securities were considered Level 2. The inputs used for valuing securities are not necessarily an indication of the risk associated with investing in those securities. Transfers between levels are reflected based on the fair value at the beginning of a reporting period.
The following is a summary of the inputs used to value the Funds’ investments and other financial instruments as of December 31, 2016:
| | | | | | | | | | | | | | | | |
Fund | | Level 1 – Quoted
Prices | | | Level 2 – Significant
Observable Inputs | | | Level 3 – Significant
Unobservable Inputs | | | Total | |
Investments at Fair Value: | | | | | | | | | | | | | | | | |
(See Portfolios of Investments for More Details) | |
Equity Index Fund | | | | | | | | | | | | | | | | |
Common Stock | | $ | 2,062,577,687 | | | | — | | | | — | | | $ | 2,062,577,687 | |
Short-Term Debt Securities | | | — | | | $ | 78,422,328 | | | | — | | | $ | 78,422,328 | |
| | | | | | | | | | | | | | | | |
| | $ | 2,062,577,687 | | | $ | 78,422,328 | | | | — | | | $ | 2,141,000,015 | |
| | | | |
All America Fund | | | | | | | | | | | | | | | | |
Common Stock - Indexed | | $ | 149,944,293 | | | | — | | | | — | | | $ | 149,944,293 | |
Common Stock - Active | | $ | 129,360,518 | | | | — | | | $ | 285,375 | (b) | | $ | 129,645,893 | |
Short-Term Debt Securities - Indexed | | | — | | | $ | 12,398,129 | | | | — | | | $ | 12,398,129 | |
Short-Term Debt Securities - Active | | | — | | | $ | 3,299,863 | | | | — | | | $ | 3,299,863 | |
Warrants - Active | | $ | 19,346 | | | | — | | | | — | | | $ | 19,346 | |
| | | | | | | | | | | | | | | | |
| | $ | 279,324,157 | | | $ | 15,697,992 | | | $ | 285,375 | | | $ | 295,307,524 | |
| | | | |
Small Cap Value Fund | | | | | | | | | | | | | | | | |
Common Stock | | $ | 444,868,977 | | | | — | | | $ | 3,206,125 | (b) | | $ | 448,075,102 | |
Short-Term Debt Securities | | | — | | | $ | 19,493,606 | | | | — | | | $ | 19,493,606 | |
Warrants | | $ | 218,574 | | | | — | | | | — | | | $ | 218,574 | |
| | | | | | | | | | | | | | | | |
| | $ | 445,087,551 | | | $ | 19,493,606 | | | $ | 3,206,125 | | | $ | 467,787,282 | |
| | | | |
Small Cap Growth Fund | | | | | | | | | | | | | | | | |
Common Stock | | $ | 421,425,351 | | | | — | | | | — | | | $ | 421,425,351 | |
Short-Term Debt Securities | | | — | | | $ | 11,747,877 | | | | — | | | $ | 11,747,877 | |
| | | | | | | | | | | | | | | | |
| | $ | 421,425,351 | | | $ | 11,747,877 | | | | — | | | $ | 433,173,228 | |
| | | | |
Mid Cap Value Fund | | | | | | | | | | | | | | | | |
Common Stock | | $ | 93,815,677 | | | | — | | | | — | | | $ | 93,815,677 | |
Short-Term Debt Securities | | | — | | | $ | 5,099,524 | | | | — | | | $ | 5,099,524 | |
| | | | | | | | | | | | | | | | |
| | $ | 93,815,677 | | | $ | 5,099,524 | | | | — | | | $ | 98,915,201 | |
| | | | |
Mid-Cap Equity Index Fund | | | | | | | | | | | | | | | | |
Common Stock | | $ | 1,190,607,707 | | | | — | | | | — | | | $ | 1,190,607,707 | |
Short-Term Debt Securities | | | — | | | $ | 53,136,113 | | | | — | | | $ | 53,136,113 | |
| | | | | | | | | | | | | | | | |
| | $ | 1,190,607,707 | | | $ | 53,136,113 | | | | — | | | $ | 1,243,743,820 | |
| | | | |
International Fund | | | | | | | | | | | | | | | | |
Common Stock | | $ | 355,448,868 | | | | — | | | | — | | | $ | 355,448,868 | |
Short-Term Debt Securities | | | — | | | $ | 21,194,762 | | | | — | | | $ | 21,194,762 | |
| | | | | | | | | | | | | | | | |
| | $ | 355,448,868 | | | $ | 21,194,762 | | | | — | | | $ | 376,643,630 | |
| | | | |
Composite Fund | | | | | | | | | | | | | | | | |
Common Stock | | $ | 107,034,196 | | | | — | | | | — | | | $ | 107,034,196 | |
U.S. Government Debt | | | — | | | $ | 18,562,263 | | | | — | | | $ | 18,562,263 | |
U.S. Government Agency Residential Mortgage-Backed Obligations | | | — | | | $ | 19,863,060 | | | | — | | | $ | 19,863,060 | |
U.S. Government Agency Non-Mortgage-Backed Obligations | | | — | | | $ | 474,527 | | | | — | | | $ | 474,527 | |
Long-Term Corporate Debt | | | — | | | $ | 30,102,610 | | | | — | | | $ | 30,102,610 | |
Short-Term Debt Securities | | | — | | | $ | 5,399,238 | | | | — | | | $ | 5,399,238 | |
| | | | | | | | | | | | | | | | |
| | $ | 107,034,196 | | | $ | 74,401,698 | | | | — | | | $ | 181,435,894 | |
| | | | |
Retirement Income Fund | | | | | | | | | | | | | | | | |
Common Stock | | $ | 75,701,194 | | | | — | | | | — | | | $ | 75,701,194 | |
MUTUAL OF AMERICA INVESTMENT CORPORATION
FOOTNOTES TO PORTFOLIOS OF INVESTMENTS IN SECURITIES
December 31, 2016
| | | | | | | | | | | | | | | | |
2010 Retirement Fund | | | | | | | | | | | | | | | | |
Common Stock | | $ | 25,683,282 | | | | — | | | | — | | | $ | 25,683,282 | |
| | | | |
2015 Retirement Fund | | | | | | | | | | | | | | | | |
Common Stock | | $ | 146,393,227 | | | | — | | | | — | | | $ | 146,393,227 | |
| | | | |
2020 Retirement Fund | | | | | | | | | | | | | | | | |
Common Stock | | $ | 425,845,263 | | | | — | | | | — | | | $ | 425,845,263 | |
| | | | |
2025 Retirement Fund | | | | | | | | | | | | | | | | |
Common Stock | | $ | 504,130,916 | | | | — | | | | — | | | $ | 504,130,916 | |
| | | | |
2030 Retirement Fund | | | | | | | | | | | | | | | | |
Common Stock | | $ | 416,287,788 | | | | — | | | | — | | | $ | 416,287,788 | |
| | | | |
2035 Retirement Fund | | | | | | | | | | | | | | | | |
Common Stock | | $ | 351,838,477 | | | | — | | | | — | | | $ | 351,838,477 | |
| | | | |
2040 Retirement Fund | | | | | | | | | | | | | | | | |
Common Stock | | $ | 285,698,307 | | | | — | | | | — | | | $ | 285,698,307 | |
| | | | |
2045 Retirement Fund | | | | | | | | | | | | | | | | |
Common Stock | | $ | 332,407,771 | | | | — | | | | — | | | $ | 332,407,771 | |
| | | | |
2050 Retirement Fund | | | | | | | | | | | | | | | | |
Common Stock | | $ | 164,048,915 | | | | — | | | | — | | | $ | 164,048,915 | |
| | | | |
2055 Retirement Fund | | | | | | | | | | | | | | | | |
Common Stock | | $ | 3,319,422 | | | | — | | | | — | | | $ | 3,319,422 | |
| | | | |
Conservative Allocation Fund | | | | | | | | | | | | | | | | |
Common Stock | | $ | 139,521,876 | | | | — | | | | — | | | $ | 139,521,876 | |
| | | | |
Moderate Allocation Fund | | | | | | | | | | | | | | | | |
Common Stock | | $ | 347,008,117 | | | | — | | | | — | | | $ | 347,008,117 | |
| | | | |
Aggressive Allocation Fund | | | | | | | | | | | | | | | | |
Common Stock | | $ | 263,729,799 | | | | — | | | | — | | | $ | 263,729,799 | |
| | | | |
Money Market Fund | | | | | | | | | | | | | | | | |
U.S. Government Debt | | | — | | | $ | 15,195,206 | | | | — | | | $ | 15,195,206 | |
U.S. Government Agency Short-Term Debt | | | — | | | $ | 9,296,723 | | | | — | | | $ | 9,296,723 | |
Commercial Paper | | | — | | | $ | 38,549,973 | | | | — | | | $ | 38,549,973 | |
| | | | | | | | | | | | | | | | |
| | | — | | | $ | 63,041,902 | | | | — | | | $ | 63,041,902 | |
| | | | |
Mid-Term Bond Fund | | | | | | | | | | | | | | | | |
U.S. Government Debt | | | — | | | $ | 181,225,663 | | | | — | | | $ | 181,225,663 | |
U.S. Government Agency Residential Mortgage-Backed Obligations | | | — | | | $ | 2,798 | | | | — | | | $ | 2,798 | |
U.S. Government Agency Non-Mortgage-Backed Obligations | | | — | | | $ | 35,447,355 | | | | — | | | $ | 35,447,355 | |
Long-Term Corporate Debt | | | — | | | $ | 271,803,555 | | | | — | | | $ | 271,803,555 | |
Short-Term Debt Securities | | | — | | | $ | 599,975 | | | | — | | | $ | 599,975 | |
| | | | | | | | | | | | | | | | |
| | | — | | | $ | 489,079,346 | | | | — | | | $ | 489,079,346 | |
| | | | |
Bond Fund | | | | | | | | | | | | | | | | |
U.S. Government Debt | | | — | | | $ | 128,943,041 | | | | — | | | $ | 128,943,041 | |
U.S. Government Agency Residential Mortgage-Backed Obligations | | | — | | | $ | 299,671,775 | | | | — | | | $ | 299,671,775 | |
U.S. Government Agency Non-Mortgage-Backed Obligations | | | — | | | $ | 15,228,513 | | | | — | | | $ | 15,228,513 | |
Long-Term Corporate Debt | | | — | | | $ | 652,560,334 | | | | — | | | $ | 652,560,334 | |
Sovereign Debt | | | — | | | $ | 3,558,307 | | | | — | | | $ | 3,558,307 | |
Short-Term Debt Securities | | | — | | | $ | 6,199,742 | | | | — | | | $ | 6,199,742 | |
| | | | | | | | | | | | | | | | |
| | | — | | | $ | 1,106,161,712 | | | | — | | | $ | 1,106,161,712 | |
| | | | |
Other Financial Instruments:* | | | | | | | | | | | | | | | | |
Equity Index Fund | | ($ | 699,807 | ) | | | — | | | | — | | | ($ | 699,807 | ) |
All America Fund | | ($ | 127,974 | ) | | | — | | | | — | | | ($ | 127,974 | ) |
Mid-Cap Equity Index Fund | | ($ | 914,414 | ) | | | — | | | | — | | | ($ | 914,414 | ) |
| * | Other financial instruments are derivative instruments not reflected in the Portfolio of Investments, such as futures, which are valued at the unrealized appreciation/depreciation on the instrument. |
MUTUAL OF AMERICA INVESTMENT CORPORATION
FOOTNOTES TO PORTFOLIOS OF INVESTMENTS IN SECURITIES
December 31, 2016
| (b) | Reflects security issued by Xura, Inc. included in the Information Technology section of the active asset segment of the All America Fund portfolio and in the Small Cap Value Fund portfolio. The security is fair valued at its last trade price. |
MUTUAL OF AMERICA INVESTMENT CORPORATION
FOOTNOTES TO PORTFOLIOS OF INVESTMENTS IN SECURITIES
December 31, 2016
| | | | | | | | | | | | | | | | | | | | | | | | |
| | | Fair Value Measurement Using Significant Unobservable Inputs (Level 3)
for the Year Ended December 31, 2016 | |
| | | Balance
December 31,
2015 | | | Change in
Unrealized
Gains
(Losses) | | | Transfers
Into
Level 3 (c) | | | Transfers
Out of
Level 3 | | | Balance
December 31,
2016 | | | Net Change in
Unrealized Gains/(Losses)
of Level 3 Assets Held as of
December 31, 2016 | |
All America Fund - Active Common Stock | | | — | | | | — | | | $ | 285,375 | | | | — | | | $ | 285,375 | | | $ | 30,822 | |
Small Cap Value Fund - Common Stock | | | — | | | | — | | | $ | 3,206,125 | | | | — | | | $ | 3,206,125 | | | $ | 347,256 | |
| (c) | Reflects transfers into Level 3 from Level 1 as a result of a security being carried at a calculated fair value due to the absence of recent trading activity in the security, as described in Security Valuation below. |
Security Valuation — Investment securities are carried at fair value as follows:
Exchange-traded equity securities are valued at the last reported sales price on the principal exchange on which the security is traded. If there is no trading volume for a particular valuation day, the last bid price is used. For equity securities traded in the over-the-counter market, the security is valued at the last sale price, or if no sale, at the latest bid price available.
Short-term debt securities with a maturity of 60 days or less are valued at amortized cost, which approximates fair value for such securities.
Debt securities, including short-term debt securities maturing in excess of 60 days, are valued on the basis of prices obtained from an independent pricing source. The pricing source may utilize various pricing methodologies that incorporate both models (which consider factors such as yield, quality, coupon rate, maturity, issue type, quoted prices for similar securities, prepayment speeds and trading characteristics) and dealer supplied valuations to derive a valuation.
In the rare instance when a price is not available from an independent pricing source or when prices may not reflect fair value, such as when the price provided by the pricing source is not based on a recent trade, a calculated fair value is used, as determined in good faith by the Adviser and reviewed by a Valuation Committee, in accordance with procedures adopted by the Board of Directors of the Investment Company.
The Advisor uses a market approach to calculate fair value for equity securities which are categorized as Level 3. The Adviser’s valuation is primarily based on information regarding the specific equity issuer, such as the last trade price, financial statements, the relationship of per-share book value to the last trade price, operating information and any corporate actions, such as dividends or returns of capital, that may have occurred since the last trade. The Adviser also considers industry-specific conditions and overall market conditions, to determine whether the last trade price reflects fair value or needs to be adjusted. Generally, absent any significant contrary indications, the last trade price will be used to calculate fair value.
Retirement Funds and the Allocation Funds value their investments in the underlying Funds of the Investment Company at their respective net asset values.
Investment Transactions — Investment transactions are accounted for as of the trade date. Realized gain and loss on the sale of short and long-term debt securities are computed on the basis of amortized cost at the time of sale. Realized gains and losses on the sale of equity securities are based on the identified cost basis of the security, determined on the first-in, first-out (“FIFO”) basis.
Futures Contracts - The Equity Index Fund, Mid-Cap Equity Index Fund and a portion of the All America Fund each maintain indexed asset portfolios which are subject to equity price risk. In order to remain more fully invested in the equity markets while minimizing transaction costs, the funds purchase stock index futures contracts. An initial cash margin deposit (represented by cash or Treasury bills) is made upon entering into a futures contract and serves as collateral for the contract. This initial margin, maintained in a segregated account, is equal to approximately 5%-6% of the contract amount, and does not involve the borrowing of funds to finance the transaction. During the period the futures contract is outstanding, changes in the value of the contract are recognized as unrealized appreciation or depreciation by “marking-to-market” on a daily basis to reflect the market value of the contract at the end of each trading day. The accumulated unrealized appreciation or depreciation on the contract is included in Net Unrealized Appreciation (Depreciation) of Investments and Futures Contracts in the Components of Net Assets section of the Statements of Assets and Liabilities.
Futures contracts are valued at the settlement price established each day by the exchange on which traded. Depending upon whether unrealized appreciation or depreciation are incurred, variation margin payments are received or made daily. The net change in unrealized appreciation or depreciation of futures contracts is recorded in the Statements of Operations. When the contract is closed, a realized gain or loss from futures transactions is recorded in the Statements of Operations, equal to the net variation margin received or paid over the period the contract was outstanding. The “Underlying Face Amount at Value” (appearing in the “Notes to the Portfolios of Investments in Securities”), representing the aggregate of outstanding contractual amounts under futures contracts, reflects the extent of a Fund’s exposure to off-balance sheet risk. The use of futures transactions involves the risk of imperfect correlation in the price movements of the contract and the underlying securities. With futures contracts, there is minimal counterparty credit risk to the Fund since futures are exchange traded and the exchange’s clearinghouse, as counterparty to all exchange traded futures, guarantees the futures against default.
Warrants — A warrant is an option to purchase common stock of an issuer and is issued in conjunction with another security, such as a debt obligation. A warrant specifies the price at which the holder may purchase shares of common stock and usually expires after a period of time. A warrant holder generally may pay cash for the common stock to be purchased or may surrender the principal amount of the related debt security the warrant holder owns equal to the purchase price for the stock. The common stock underlying a warrant may not increase in value after the date the warrant was issued, or may not increase up to the warrant exercise price. In this case, the warrant generally would have little value and could expire unexercised.
At December 31, 2016, warrants held by the Funds of the Investment Company were traded on active markets and are considered Level 1 securities.
MUTUAL OF AMERICA INVESTMENT CORPORATION
FOOTNOTES TO PORTFOLIOS OF INVESTMENTS IN SECURITIES
December 31, 2016
Tax Information - The components of net unrealized appreciation (depreciation) of investments for federal income tax purposes and the cost of investments for federal income tax purposes at December 31, 2016 for each of the funds were as follows.
| | | | | | | | | | | | | | | | | | | | |
| | | Equity Index
Fund | | | All America
Fund | | | Small Cap
Value Fund | | | Small Cap
Growth Fund | | | Mid Cap
Value Fund | |
Unrealized Appreciation | | $ | 791,221,919 | | | $ | 74,360,535 | | | $ | 130,969,382 | | | $ | 78,792,146 | | | $ | 21,816,742 | |
Unrealized Depreciation | | | (46,759,390 | ) | | | (12,586,911 | ) | | | (14,652,334 | ) | | | (25,233,233 | ) | | | (3,267,675 | ) |
| | | | | | | | | | | | | | | | | | | | |
Net | | $ | 744,462,529 | | | $ | 61,773,624 | | | $ | 116,317,048 | | | $ | 53,558,913 | | | | 18,549,067 | |
| | | | | | | | | | | | | | | | | | | | |
Cost of Investments | | $ | 1,396,537,486 | | | $ | 233,533,900 | | | $ | 351,470,234 | | | $ | 379,614,315 | | | $ | 80,366,134 | |
| | | | | | | | | | | | | | | | | | | | |
| | | | | |
| | | Mid-Cap
Equity Index
Fund | | | International
Fund | | | Composite
Fund | | | Retirement
Income
Fund | | | 2010
Retirement
Fund | |
Unrealized Appreciation | | $ | 328,360,757 | | | $ | 1,963,334 | | | $ | 23,241,191 | | | $ | 1,199,426 | | | $ | 938,354 | |
Unrealized Depreciation | | | (49,839,785 | ) | | | (17,640,938 | ) | | | (2,017,899 | ) | | | (1,105,773 | ) | | | (333,924 | ) |
| | | | | | | | | | | | | | | | | | | | |
Net | | $ | 278,520,972 | | | $ | (15,677,604 | ) | | $ | 21,223,292 | | | $ | 93,653 | | | | 604,430 | |
| | | | | | | | | | | | | | | | | | | | |
Cost of Investments | | $ | 965,222,848 | | | $ | 392,321,234 | | | $ | 160,212,602 | | | $ | 75,607,541 | | | $ | 25,078,852 | |
| | | | | | | | | | | | | | | | | | | | |
| | | | | |
| | | 2015
Retirement
Fund | | | 2020
Retirement
Fund | | | 2025
Retirement
Fund | | | 2030
Retirement
Fund | | | 2035
Retirement
Fund | |
Unrealized Appreciation | | $ | 9,952,795 | | | $ | 31,665,439 | | | $ | 47,055,064 | | | $ | 43,209,588 | | | $ | 38,653,094 | |
Unrealized Depreciation | | | (1,630,668 | ) | | | (3,348,876 | ) | | | (2,499,320 | ) | | | (1,393,613 | ) | | | (1,352,186 | ) |
| | | | | | | | | | | | | | | | | | | | |
Net | | $ | 8,322,127 | | | $ | 28,316,563 | | | $ | 44,555,744 | | | $ | 41,815,975 | | | $ | 37,300,908 | |
| | | | | | | | | | | | | | | | | | | | |
Cost of Investments | | $ | 138,071,100 | | | $ | 397,528,700 | | | $ | 459,575,172 | | | $ | 374,471,813 | | | $ | 314,537,569 | |
| | | | | | | | | | | | | | | | | | | | |
| | | | | |
| | | 2040
Retirement
Fund | | | 2045
Retirement
Fund | | | 2050
Retirement
Fund | | | 2055
Retirement
Fund | | | Conservative
Allocation
Fund | |
Unrealized Appreciation | | $ | 32,164,942 | | | $ | 42,440,673 | | | $ | 6,864,465 | | | $ | 31,356 | | | $ | 7,458,303 | |
Unrealized Depreciation | | | (732,348 | ) | | | (683,821 | ) | | | (2,254,312 | ) | | | (16,715 | ) | | | (2,134,688 | ) |
| | | | | | | | | | | | | | | | | | | | |
Net | | $ | 31,432,594 | | | $ | 41,756,852 | | | $ | 4,610,153 | | | $ | 14,641 | | | $ | 5,323,615 | |
| | | | | | | | | | | | | | | | | | | | |
Cost of Investments | | $ | 254,265,713 | | | $ | 290,650,919 | | | $ | 159,438,762 | | | $ | 3,304,781 | | | $ | 134,198,261 | |
| | | | | | | | | | | | | | | | | | | | |
| | | | | |
| | | Moderate
Allocation
Fund | | | Aggressive
Allocation
Fund | | | Money
Market
Fund | | | Mid-Term
Bond Fund | | | Bond
Fund | |
Unrealized Appreciation | | $ | 48,555,130 | | | $ | 51,268,723 | | | $ | 85 | | | $ | 5,818,511 | | | $ | 21,596,295 | |
Unrealized Depreciation | | | (7,808,632 | ) | | | (8,120,201 | ) | | | — | | | | (5,326,987 | ) | | | (12,685,763 | ) |
| | | | | | | | | | | | | | | | | | | | |
Net | | $ | 40,746,498 | | | $ | 43,148,522 | | | $ | 85 | | | $ | 491,524 | | | $ | 8,910,532 | |
| | | | | | | | | | | | | | | | | | | | |
Cost of Investments | | $ | 306,261,619 | | | $ | 220,581,277 | | | $ | 63,041,817 | | | $ | 488,587,822 | | | $ | 1,097,251,180 | |
| | | | | | | | | | | | | | | | | | | | |
Differences in basis between amounts reflected in the Portfolios of Investments in Securities and those computed for federal income tax purposes arise primarily from the federal income tax treatment of wash sales, REITs, partnerships, corporate actions and futures contracts.
(b) Not applicable.
| ITEM 7. | DISCLOSURE OF PROXY VOTING POLICIES AND PROCEDURES FOR CLOSED-END MANAGEMENT INVESTMENT COMPANIES. |
Not applicable.
| ITEM 8. | PORTFOLIO MANAGERS OF CLOSED-END MANAGEMENT INVESTMENT COMPANIES. |
Not applicable.
| ITEM 9. | PURCHASES OF EQUITY SECURITES BY CLOSED-END MANAGEMENT INVESTMENT COMPANY AND AFFILIATED PURCHASERS. |
Not applicable.
| ITEM 10. | SUBMISSION OF MATTERS TO A VOTE OF SECURITY HOLDERS. |
Not applicable.
| ITEM 11. | CONTROLS AND PROCEDURES. |
| | (a) | The registrant’s principal executive officer and principal financial officer have evaluated the registrant’s disclosure controls and procedures within 90 days of this filing and have concluded that the registrant’s disclosure controls and procedures were effective, as of that date, in ensuring that information required to be disclosed by the registrant in this Form N-CSR was recorded, processed, summarized, and reported in a timely and accurate manner. |
| | (b) | The registrant’s principal executive officer and principal financial officer are aware of no changes in the registrant’s internal control over financial reporting that occurred during the second fiscal quarter of the period covered by this report that has materially affected, or is likely to materially affect, the registrant’s internal control over financial reporting. |
| | | | |
Attached hereto: |
| | |
(a) | | (1) Not applicable. | | |
| | |
| | (2) Exhibit 99.CERT | | Certifications by the registrant’s principal executive officer and principal financial officer, pursuant to Section 302 of the Sarbanes-Oxley Act of 2002 and required by Rule 30a-2(a) under the Investment Company Act of 1940. |
| | |
| | (3) Not applicable. | | |
| | |
(b) | | Exhibit 99.906CERT | | Certifications pursuant to Section 906 of the Sarbanes-Oxley Act of 2002 and required by Rule 30a-2(b) under the Investment Company Act of 1940. |
| | |
| | Exhibit 99.REPT | | Report of Independent Registered Public Accounting Firm |
SIGNATURES
Pursuant to the requirements of the Securities Exchange Act of 1934 and the Investment Company Act of 1940, the registrant has duly caused this report to be signed on its behalf by the undersigned, thereunto duly authorized.
| | |
| | Mutual of America Investment Corporation |
| |
| By: | | /s/ JAMES J. ROTH |
| | James J. Roth |
| | Chairman of the Board, |
| | President and Chief Executive Officer of |
| | Mutual of America Investment Corporation |
Date: March 10, 2017
Pursuant to the requirements of the Securities Exchange Act of 1934 and the Investment Company Act of 1940, this report has been signed below by the following persons on behalf of the registrant and in the capacities and on the dates indicated.
| | |
| By: | | /s/ JAMES J. ROTH |
| | James J. Roth |
| | Chairman of the Board, |
| | President and Chief Executive Officer of |
| | Mutual of America Investment Corporation |
|
| Date: March 10, 2017 |
| |
| By: | | /s/ CHRIS W. FESTOG |
| | Chris W. Festog |
| | Executive Vice President, |
| | Chief Financial Officer and Treasurer of |
| | Mutual of America Investment Corporation |
|
| Date: March 10, 2017 |