UNITED STATES
SECURITIES AND EXCHANGE COMMISSION
Washington, D.C. 20549
FORMN-CSR
CERTIFIED SHAREHOLDER REPORT OF REGISTERED
MANAGEMENT INVESTMENT COMPANIES
Investment Company Act file number811-05084
Mutual of America Investment Corporation
(Exact name of registrant as specified in charter)
320 Park Avenue, New York, N.Y. 10022
(Address of principal executive offices) (Zip code)
James J. Roth
Chairman of the Board, President and Chief Executive Officer
Mutual of America Investment Corporation
320 Park Avenue
New York, NY 10022
(Name and address of agent for service)
Registrant’s telephone number, including area code: (212)224-1600
Date of fiscal year end: December 31
Date of reporting period: December 31, 2018
| ITEM 1. | REPORTS TO STOCKHOLDERS. |
DECEMBER 31, 2018
Annual Reports of Investment Options Offered by Mutual of America Life Insurance Company
This report is not to be construed as an offering for sale of any Variable Policy. No offering is made except in conjunction with a prospectus, which must precede or accompany this report.


320 PARK AVENUE
NEW YORK NY 10022-6839
February 2019
As a valued variable annuity owner, variable life insurance policyholder or participant in a group variable annuity, we are pleased to provide you with the annual fund reports for the investment options you have selected. Included in this booklet are the annual reports of the Mutual of America Investment Corporation Funds. If you have also selected other investments options, you will receive annual reports for those funds in a separate booklet or booklets. The reports provide an update on each portfolio’s performance as of December 31, 2018. Please note that portfolio performance does not take into account the fees charged by the annuity contract or life insurance policy. When viewed net of these contract fees, your performance will be lower. As always, past performance cannot predict or guarantee future returns.
Mutual of America has specialized in providing retirement products and related services to organizations and their employees, as well as individuals, for more than 70 years. As a mutual company, we do not have stockholders and are not publicly traded. We operate solely for the benefit of our customers, managing the Company for their long-term interest, rather than for the short-term demands of stockholders. Today, as in the past, Mutual of America remains financially strong and is rated among the strongest companies in the life insurance industry by the major independent rating agencies.*
Since 1945, Mutual of America has remained committed to offering plan sponsors, plan participants and individuals carefully selected, quality products and services at a competitive price and the personal attention they need to help build and preserve assets for a financially secure future. Integrity, prudence, and reliability are the values that have guided us since our inception and that continue to serve us well.
We hope you will find the enclosed information helpful. We appreciate and value your business and look forward to serving you in the future. If you have any questions, please call your local Mutual of America Regional Office or1-800-468-3785.
Sincerely,
Mutual of America Life Insurance Company
| * | While these ratings do not apply to the safety or investment performance of the Separate Account investment funds available under Mutual of America’s products, they do reflect the Company’s ability to fulfill its General Account obligations, which include its obligations under the Interest Accumulation Account, annuity purchase rate guarantees and annuity benefit payouts, as well as life insurance and disability income payments. Third party ratings are subject to change. |
DECEMBER 31, 2018
Annual Reports of Mutual of America Investment Corporation
This report is not to be construed as an offering for sale of any Variable Policy. No offering is made except in conjunction with a prospectus, which must precede or accompany this report.

Beginning on January 1, 2021, as permitted by regulations adopted by the Securities and Exchange Commission, paper copies of the Funds’ shareholder reports like this one will no longer be sent by mail, unless you specifically request paper copies of the reports from the Mutual of America. Instead, the reports will be made available on a website, and you will be notified by mail each time a report is posted and provided with a website link to access the report.
If you already elected to receive shareholder reports electronically, you will not be affected by this change and you need not take any action. You may elect to receive shareholder reports and other communications from mutual of America electronically by signing up for the eDocuments program. You can sign up for eDocuments by completing the Consent Agreement located on the Mutual of America website and indicating your consent to receive documents through the Mutual of America website.
You may elect to receive all future reports in paper free of charge. You can inform us that you wish to continue receiving paper copies of your shareholder reports by writing to us at 320 Park Avenue, New York, New York 10022, by calling 1-800-574-9267, or by sending an email to mutualofamerica@dfinsolutions.com. Your election to receive reports in paper will apply to all of the Funds.
CONTENTS
MUTUALOF AMERICA INVESTMENT CORPORATION
We are pleased to present the Mutual of America Investment Corporation (the “Investment Company”) Annual Report. This Report includes important information regarding the performance and financial position of the Investment Company’s funds for the year ended December 31, 2018.
For the year 2018, the S&P 500® Index declined 4.4%, its worst performance since 2008. After beginning the year with a 7% race to new, all-time highs, the market settled into a range around 0% until mid-July, when it began a steady advance to another all-time high, before sliding 19.3% from the end of September through December, including a 9% decline in December alone. This latter period was characterized by substantial volatility, with the market reacting primarily to concerns regarding global growth. U.S. stock markets were not the only ones to suffer, as all but a few stock markets across the globe declined for the year.
U.S. bond markets fared no better during 2018: long-term Treasury bonds fell 1.7%; U.S. corporate bonds declined 2.2%; and below-investment-grade U.S. corporate bonds declined 2.1%. Spreads widened in December, most dramatically among below-investment-grade (junk) bonds. Globally, the Bloomberg Barclays Global Aggregate Bond Index declined 1.2%. On the commodity front, gold declined 0.9% and oil prices plummeted 25%. Cash instruments (e.g., short-term Treasury notes and commercial paper) was the only major asset class to post positive returns, up 1.9% for the year.
The primary reasons for the volatile and declining markets in 2018 were rising concerns among investors that global growth was slowing and the prospect of an earlier-than-expected recession on the horizon. First, China’s growth is slowing due to internal policies to restrain lending, as well as some disruption caused by U.S. tariffs on more than $200 billion worth of Chinese goods. Further, Chinese consumer spending is slowing significantly. Consumers in China constituted three-quarters of that country’s economic growth last year, but that percentage is likely to fall to only two-thirds this year. Despite recent stimulatory efforts, including tax cuts, lower interest rates and encouragement of lending (after a year of discouraging such lending), China’s high and rising debt is a restraint.
As the second-largest economy in the world, a precipitous slowdown in China could have a serious negative impact on the health of the global economy. Markets likely will react poorly if current U.S. negotiations with China over issues such as trade, technology transfer, and patent and copyright protection, as well as aggressive actions by China to expand its territory and influence, prove unsuccessful. If the U.S. moves forward on contemplated trade measures by raising tariffs on Chinese imports, and placing tariffs on automobiles and auto imports from Europe, Japan, Canada and South Korea, then global tariff rates could reach levels not seen since the 1940s. The era of globalization will have passed, almost assuredly reducing growth prospects for the world.
Few other major economies are showing signs of strength. Statistics from Europe and Japan remain lackluster and deteriorated slowly over the last year. Japan has failed to generate Gross Domestic Product (GDP) growth in excess of 2.0% since 2010, and except for 2014 and 2008, Japan’s inflation rate has not exceeded 1.0% in 20 years. Despite Prime Minister Abe’s efforts and the most expansive quantitative easing (QE) program in the world, Japan has not been, and in all likelihood, will not be, an engine of global growth in the foreseeable future.
In Europe, among the Big Four countries of Germany, Spain, Italy and France, only Germany and Spain generated GDP growth above 2.0% over the past year, with Italy and France barely crawling along at 1.0% or less. Beyond the economic data, Europe has a number of serious problems that are existential in nature. French President Emmanuel Macron essentially abandoned his business-oriented reform program in the face of protests. The United Kingdom’s decision to exit the European Union (EU) represents a significant rupture in the fabric of the collection of the 28 nations that joined together in a single market, fostering the free movement of people, goods, services and capital across their borders. Besides severing important commercial and financial interrelationships, the exit of Britain, often referred to as Brexit, creates a precedent for other members to leave the EU. As for Italy, it is struggling to carry its huge debt load. The EU and Italy are sparring over Italy’s budget, with the EU demanding less spending and lower deficits — in short, austerity — a formula that worked in Spain and Portugal, and to an extent, Greece. The difference in the case of Italy is the magnitude of its debt load and the exhaustion of the EU’s capacity to bail out its faltering constituents.
The EU is on the verge of ending its quantitative easing (QE) program because it purchased European bonds up to the legal limit over the past few years. The vision of Europe as a single economic unit on par with the U.S. and China has become tarnished. The essential flaw, identified at inception, is that while the EU is largely united (19 of 28 members) under a single monetary system (the Euro), the bloc has no centralized taxing authority and, therefore, no ability to regulate debt levels or allocate funds where they are most needed. The disintegration of the EU would have profound effects on global economic growth, as well as on international political relations, which are already in flux.
1
In addition, the U.S. Federal Reserve Board reversed its QE program over the past three years by discontinuing the purchase of Treasury and mortgage securities, thus reducing the size of its balance sheet and, as a consequence, the amount of liquidity available to the global market which could contribute to a deterioration in the rate of future growth. Of greater consequence, the Fed has been raising the Federal Funds rate, the benchmark level for short-term rates. Beginning in December 2015, the Fed raised this rate in 25-basis-point increments nine times, from 0% — 0.25% to a current range of 2.25% — 2.50%. The frequency of these rate increases accelerated over time, with only one rate increase each in 2015 and 2016, three in 2017 and four in 2018. The current Federal Funds level is approaching the recent level of 10-year rates, and comparisons among a number of shorter maturity rates have inverted, such that the Fed Funds rate is higher than some rates between two- and five-year maturities. Lenders cannot make profits when the rate at which they borrow is higher than the rate at which they lend. And borrowers cannot borrow if lenders keep raising their lending rates to attempt to maintain profit margins.
The debate among investors over the last half of 2018 was whether the Fed raised the Fed Funds rate too high and/or too quickly, such that the expansion will be cut off and precipitate a recession. The Fed is trying to engineer a so-called “soft landing,” slowing growth enough to preclude an inflationary spike without damaging the labor market. While the most recent hike in December was well telegraphed by the Fed, investors were clearly hoping that the Fed might defer, or at least suggest a pause in, future rate hikes. In fact, one explanation for the volatile decline in stock prices at the end of 2018 was the market’s fear that the December rate hike was a mistake. Comments by the Chair of the Federal Reserve, Jerome Powell, immediately following the rates meeting in December, did nothing to alleviate investors’ concerns that the Fed was pushing the economy into recession — and not just the U.S. economy. The international trading and financial system is fueled by the U.S. dollar, which means that Fed policy affects every individual economy in the world, because it is the only institution that can increase or decrease world U.S. dollar supply. The Fed’s current program is officially designed to reduce the amount of dollars in the domestic economy to curb inflation and reestablish a “normalized,” self-regulating demand/supply economy. But the centrality of the U.S. dollar to the global economy makes Fed policy de facto global.
Comments by Fed officials since the last meeting, and after the markets’ freefall reaction, have been a bit more dovish without explicitly acknowledging that the last increase was a mistake. More recently, Chairman Powell has gone so far as to say that the Fed’s current policy stance “is appropriate” and language relating to future gradual rate hikes has been dropped. This has brought the Fed more in line with market participants, who had not been forecasting any further rate hikes for the remainder of the year.
Specifically, the first round of manufacturing data for December was surprisingly weak. The first hint of trouble came on December 17, with the release of the New York Fed Empire State Manufacturing Survey, which showed a month-over-month decline from 23.3 to 10.9, versus an expectation of 20. Later that week, the Philadelphia Fed Manufacturing Business Outlook Survey reported a decline from 12.9 to 9.4, versus a consensus estimate of 15. The following week, the Kansas City Fed Manufacturing Survey reported a decline from 15 in November to 3 in December, versus an expectation of 13. A few days later, the Richmond Fed Fifth District Survey of Manufacturing Activity came in at -8, compared with November’s reading of 14, versus an expectation of 15. Finally, the Dallas Fed Texas Manufacturing Outlook Survey registered -5.1, down from 17.6, versus an expectation of 15. The only Regional Federal Reserve Bank survey that showed some stability was the Chicago Fed National Activity Index, down from 0.24 to 0.22, versus an expectation of 0.20. Each Regional Fed Survey uses its own scale for comparing month-to-month economic activity in its region. The economic significance of each is represented by the direction and magnitude of change.
The implication of these regional surveys was confirmed in early January with the release of the United States Institute of Supply Management (ISM) Series Indexes: the Purchasing Managers’ Index (PMI) dropped from 59.3 in November to 54.1 in December; the Employment Index fell from 58.4 to 56.2; the Prices Index declined from 60.7 to 54.9; and, most worrisome, the New Orders Index declined from 62.1 to 51.1. All of the current numbers remain in expansion territory, but the slowdown was greater and more rapid than expected. These results may be seasonal, in that after ramping up for the holiday season, companies slowed production to realign inventories. In a similar vein, strong retail sales from November to December may obscure excess inventories that had to be reduced by heavy markdowns, thus pinching retail margins.
The same seasonal explanation may account for the extremely strong jobs report (e.g., the change in total nonfarm payroll employment) that came out the day after the ISM data, showing that 312,000 new jobs were created in December versus 155,000 in November, versus an expectation of 184,000. However, other data on employment was strong, as well. While the unemployment rate rose from 3.7% to 3.9%, that was largely a function of an increase in the labor participation rate, meaning more people found jobs or are looking for them. Additionally, average hourly earnings on both a month-over-month and year-over-year basis advanced ahead of expectations, with the year-over-year rate registering 3.2%, the highest for the cycle.
2
It is not unusual to be faced with seemingly contradictory data over short periods of time, and subsequent data will be necessary to discern actual trends in the underlying economy. Despite the negative result from the manufacturing surveys, many current indicators suggest the U.S. economy remains healthy. These include strong consumer spending, inflation levels well within Fed targets, and low unemployment. However, a number of recent corporate reports suggest tariffs are beginning to bite. Capital expenditures started to decelerate. Also, the government shutdown that began on December 22, which was the longest shutdown in U.S. history, with an estimated 800,000 federal workers across the country furloughed or required to work without pay, will impact GDP growth. The continuation of stalemates such as these may sap business and consumer confidence in the government’s ability to function, adding more uncertainty to the list of worries.
ISM data is also a leading indicator that is highly correlated with the direction of change in the future, while employment data is lagging or coincident with indicators correlated with what is happening now. Despite the strength of GDP and corporate earnings in 2018, and given the waning positive impact of last year’s tax cut, both GDP and corporate earnings most likely will be much less robust in 2019. Analyst earnings estimates for 2019 are declining, although growth rates remain positive. The key issue is whether the Federal Reserve will be able to maintain the expansion at a positive, though slower, rate of growth, or raise rates too high and risk throwing the economy into recession.
Markets will continue to be volatile as they react to a number of key issues, including tariffs, Chinese growth, how Europe deals with the threats to its existence as a single economic bloc, and most importantly going forward, in our judgment, the actions of the Federal Reserve.
The total return performance (net of investment management and other operating expenses) for each of the Investment Company Funds is reflected below:
| | | | |
| Total Returns — Year Ended December 31, 2018 | |
| |
Equity Index Fund | | | - 4.56% | |
All America Fund | | | - 8.27% | |
Small Cap Value Fund | | | -14.57% | |
Small Cap Growth Fund | | | -12.53% | |
Small Cap Equity Index Fund† | | | -16.54% | |
Mid Cap Value Fund | | | -14.08% | |
Mid-Cap Equity Index Fund | | | -11.26% | |
International Fund | | | -13.36% | |
Composite Fund | | | - 3.20% | |
Retirement Income Fund | | | - 1.21% | |
2010 Retirement Fund | | | - 1.93% | |
2015 Retirement Fund | | | - 3.01% | |
2020 Retirement Fund | | | - 4.04% | |
2025 Retirement Fund | | | - 5.22% | |
2030 Retirement Fund | | | - 6.49% | |
2035 Retirement Fund | | | - 7.36% | |
2040 Retirement Fund | | | - 7.94% | |
2045 Retirement Fund | | | - 8.29% | |
2050 Retirement Fund | | | - 8.74% | |
2055 Retirement Fund | | | - 8.88% | |
2060 Retirement Fund† | | | -10.54% | |
Conservative Allocation Fund | | | - 2.04% | |
Moderate Allocation Fund | | | - 4.41% | |
Aggressive Allocation Fund | | | - 7.13% | |
Money Market Fund | | | + 1.71% | |
Mid-Term Bond Fund | | | + 0.57% | |
Bond Fund | | | + 0.17% | |
| † | For the period July 2, 2018 (commencement of operations) through December 31, 2018. |
The above performance figures do not reflect the deduction of respective Separate Account fees and expenses imposed by Mutual of America Life Insurance Company. All Fund performances presented throughout this report are historical, reflect the full reinvestment of dividends paid, and should not be considered indicative of future results.
3
The pages that immediately follow include brief discussions of each Fund’s performance for the year ended December 31, 2018, compared to its relevant index. Also presented are graphs and tables for each Fund (except for the Money Market Fund) which illustrates each Fund’s respective:
| | ● | | Historical total return achieved over specific periods, expressed as an average annual rate and as a cumulative rate; |
| | ● | | Value in dollars of a $10,000 hypothetical investment at the beginning of each specified period; and |
| | ● | | Historical performance compared to an appropriate index. |
Following the discussions are the graphical representations of the asset allocations of each Fund and an illustration of each Fund’s operating expenses. The portfolios of each Fund and financial statements are presented in the pages that follow.
Thank you for your continued investment in our Funds.
Sincerely,

James J. Roth
Chairman of the Board,
President and Chief Executive Officer
Mutual of America Investment Corporation
The views expressed in this Annual Report are subject to change at any time based on market and other conditions and should not be construed as a recommendation. This Report contains forward-looking statements which speak only as of the date they were made and involve a number of risks and uncertainties that could cause actual results to differ materially from those expressed herein. Readers are cautioned not to place undue reliance on our forward-looking statements, as we assume no obligation to update these forward-looking statements. Readers assume any and all responsibility for any investment decision made as a result of the views expressed herein.
S&P® and S&P 500® are trademarks of Standard & Poor’s Financial Services LLC.
4
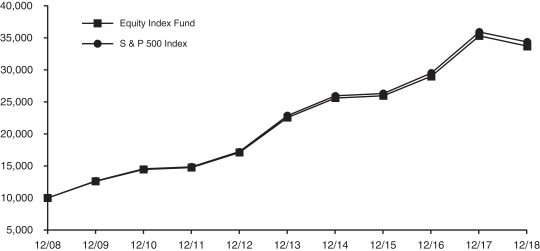
EQUITY INDEX FUND (Unaudited)
The Equity Index Fund’s objective is to replicate the performance of the S&P 500® Index (S&P 500), which consists of 500 stocks chosen by Standard & Poor’s for market size, liquidity and industry group representation. The S&P 500 is a market-weighted index of 500 stocks traded on the New York Stock Exchange, American Stock Exchange and NASDAQ, with each stock’s weight in the index proportionate to its market value. The weightings make each company’s influence on the S&P 500’s performance directly proportional to that company’s market value.
The Equity Index Fund’s performance for the year ended December 31, 2018, was -4.44% before expenses and -4.56% after expenses, finishing below the benchmark return of -4.38%. Note that the Equity Index Fund’s performance includes expenses, such as transaction costs and management fees, which are not applicable to the benchmark.
GROWTH OF A $10,000 INVESTMENT
| | | | | | | | | | | | |
Equity Index Fund | |
Period
Ended
12/31/2018 | | Growth of $10,000 | | | Total Return | |
| | Cumu-
lative | | | Average
Annual | |
1 Year | | | $9,544 | | | | -4.56% | | | | -4.56% | |
5 Years | | | $14,913 | | | | 49.13% | | | | 8.32% | |
10 Years | | | $33,637 | | | | 236.37% | | | | 12.89% | |
| | | | | | | | | | | | |
S & P 500 Index | |
Period
Ended
12/31/2018 | | Growth
of
$10,000 | | | Total Return | |
| | Cumu-
lative | | | Average
Annual | |
1 Year | | | $9,562 | | | | -4.38% | | | | -4.38% | |
5 Years | | | $15,032 | | | | 50.32% | | | | 8.49% | |
10 Years | | | $34,300 | | | | 243.00% | | | | 13.12% | |
The line representing the performance return of the Equity Index Fund includes expenses, such as transaction costs and management fees that reduce returns, while the performance return line of the Index does not. Past performance is not indicative of future results.
5
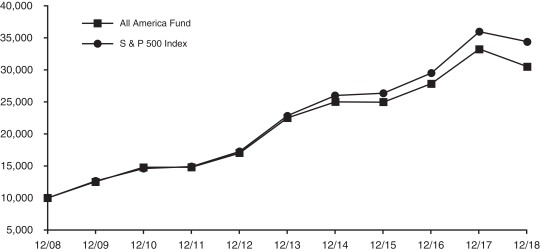
ALL AMERICA FUND (Unaudited)
The investment objective of the All America Fund is to outperform the S&P 500® Index (S&P 500). The All America Fund is approximately 60% passively invested in the 500 stocks that comprise the S&P 500, with the remaining 40% actively managed, comprised of 20% mid-cap capitalization stocks and 20% small cap stocks, thus providing exposure to all levels of market capitalization among domestic stocks.
For the year ended December 31, 2018, the S&P 500 of large capitalization stocks decreased by 4.38% on a total return basis, while the Russell® Midcap Core Index was down 9.06% and the Russell Midcap® Value Index was down 12.29%. The Russell 2000® Growth Index declined 9.31% and the Russell 2000® Value Index declined 12.86%.
The All America Fund’s return for the year ended December 31, 2018, before expenses was -7.79% and -8.27% after expenses versus the benchmark return of -4.38% The underperformance of the Fund versus the S&P 500 during the year was due to the underperformance of the mid and small capitalization segments of the fund as compared to the large capitalization benchmark.
GROWTH OF A $10,000 INVESTMENT
| | | | | | | | | | | | |
All America Fund | |
Period
Ended
12/31/2018 | | Growth of $10,000 | | | Total Return | |
| | Cumu-
lative | | | Average
Annual | |
1 Year | | | $9,174 | | | | -8.27% | | | | -8.27% | |
5 Years | | | $13,569 | | | | 35.69% | | | | 6.29% | |
10 Years | | | $30,431 | | | | 204.31% | | | | 11.77% | |
| | | | | | | | | | | | |
S & P 500 Index | |
Period
Ended
12/31/2018 | | Growth
of
$10,000 | | | Total Return | |
| | Cumu-
lative | | | Average
Annual | |
1 Year | | | $9,562 | | | | -4.38% | | | | -4.38% | |
5 Years | | | $15,032 | | | | 50.32% | | | | 8.49% | |
10 Years | | | $34,300 | | | | 243.00% | | | | 13.12% | |
The line representing the performance return of the All America Fund includes expenses, such as transaction costs and management fees that reduce returns, while the performance return line of the Index does not. Past performance is not indicative of future results.
6
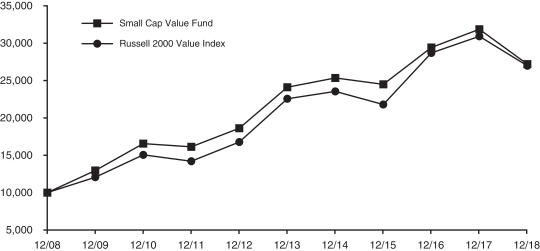
SMALL CAP VALUE FUND (Unaudited)
The investment objective of the Small Cap Value Fund is capital appreciation. The Small Cap Value Fund generally invests in companies that are below $3 billion in market capitalization and have lower price-to-book characteristics than the overall market.
For the year ended December 31, 2018, the Small Cap Value Fund returned -13.87% before expenses and -14.57% after expenses versus a -12.86% return for the Russell 2000® Value Index. Within the benchmark, the best performing sectors were Health Care and Technology while the worst performing sectors were Consumer Staples and Basic Materials.
Stock selection was the primary driver of negative performance versus the benchmark. Sectors contributing to Fund performance included Finance and Health Care, while sectors detracting from Fund performance included Consumer Staples and Industrials.
GROWTH OF A $10,000 INVESTMENT
| | | | | | | | | | | | |
Small Cap Value Fund | |
Period
Ended
12/31/2018 | | Growth of $10,000 | | | Total Return | |
| | Cumu-
lative | | | Average
Annual | |
1 Year | | | $8,544 | | | | -14.57% | | | | -14.57% | |
5 Years | | | $11,284 | | | | 12.84% | | | | 2.44% | |
10 Years | | | $27,142 | | | | 171.42% | | | | 10.49% | |
| | | | | | | | | | | | |
Russell 2000 Value Index | |
Period
Ended
12/31/2018 | | Growth
of
$10,000 | | | Total Return | |
| | Cumu-
lative | | | Average
Annual | |
1 Year | | | $8,714 | | | | -12.86% | | | | -12.86% | |
5 Years | | | $11,937 | | | | 19.37% | | | | 3.61% | |
10 Years | | | $26,894 | | | | 168.94% | | | | 10.40% | |
The line representing the performance return of the Small Cap Value Fund includes expenses, such as transaction costs and management fees that reduce returns, while the performance return line of the Index does not. Past performance is not indicative of future results.
7
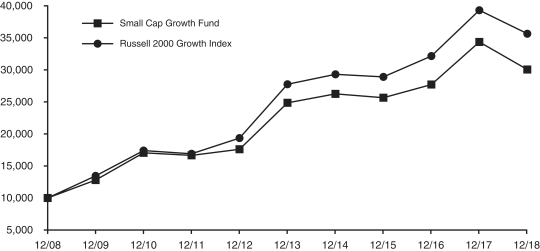
SMALL CAP GROWTH FUND (Unaudited)
The investment objective of the Small Cap Growth Fund is capital appreciation. The Small Cap Growth Fund invests in growth stocks within the small capitalization marketplace. The Fund returned -11.82% before expenses and -12.53% after expenses during the year ended December 31, 2018. The Fund’s benchmark, the Russell 2000® Growth Index, returned -9.31% for the comparable period.
The small cap market peaked August 31 after returning over 18.5%. By December 24th, it had declined 29% from this peak before rallying 7.5% in the last several days of December to finish the year. High volatility returned to the equity marketplace on interest rate and trade fears.
For calendar year 2018, high earnings growth companies dominated small cap equity returns. Any type of valuation discipline or sell discipline did not seem to matter during this period. Given our concern for elevated valuations in the equity market in the second quarter, we struggled to keep up with the market rally in the first part of the calendar year.
Given our philosophy that performance should be driven by stock selection not macro-economic bets, our portfolio was exposed to the negative performance in the Energy and Material sectors. Our exposure to the Utility sector which had positive returns for the year was beneficial to the portfolio. Technology remained the best performing sector for the year and in which we nicely outperformed.
GROWTH OF A $10,000 INVESTMENT
| | | | | | | | | | | | |
Small Cap Growth Fund | |
Period
Ended
12/31/2018 | | Growth of $10,000 | | | Total Return | |
| | Cumu-
lative | | | Average
Annual | |
1 Year | | | $8,748 | | | | -12.53% | | | | -12.53% | |
5 Years | | | $12,082 | | | | 20.82% | | | | 3.85% | |
10 Years | | | $29,958 | | | | 199.58% | | | | 11.58% | |
| | | | | | | | | | | | |
Russell 2000 Growth Index | |
Period
Ended
12/31/2018 | | Growth
of
$10,000 | | | Total Return | |
| | Cumu-
lative | | | Average
Annual | |
1 Year | | | $9,069 | | | | -9.31% | | | | -9.31% | |
5 Years | | | $12,844 | | | | 28.44% | | | | 5.13% | |
10 Years | | | $35,547 | | | | 255.47% | | | | 13.52% | |
The line representing the performance return of the Small Cap Growth Fund includes expenses, such as transaction costs and management fees that reduce returns, while the performance return line of the Index does not. Past performance is not indicative of future results.
8
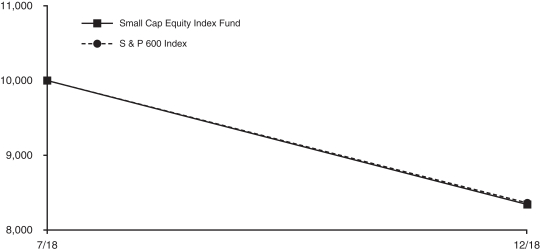
SMALL CAP EQUITY INDEX FUND (Unaudited)
The Small-Cap Equity Index Fund invests in the 600 stocks that comprise the S&P SmallCap 600® Index (S&P SmallCap 600). The S&P SmallCap 600 is a market-weighted index of 600 stocks traded on the New York Stock Exchange, American Stock Exchange and NASDAQ. The weightings make each company’s influence on the S&P SmallCap 600’s performance directly proportional to that company’s market value.
The Small-Cap Equity Index Fund launched at the end of June 2018 with an investment by Mutual of America and became available as an investment to shareholders on July 2, 2018. The 6-month performance for the year ended December 31, 2018, was -16.48% before expenses and -16.54% after expenses, finishing below the -16.34% return of the S&P SmallCap 600. Note that the performance of the Small-Cap Equity Index Fund includes expenses, such as transaction costs and management fees, which are not applicable to the benchmark.
GROWTH OF A $10,000 INVESTMENT
| | | | | | | | |
Small Cap Equity Index Fund | |
Period
Ended
12/31/2018 | | Growth of
$10,000 | | | Total Return | |
| | Cumu-
lative | |
Since 7/2/18 (Inception) | | | $8,346 | | | | -16.54% | |
| | | | | | | | |
S & P 600 Index | |
Period
Ended
12/31/2018 | | Growth of
$10,000 | | | Total Return | |
| | Cumu-
lative | |
Since 7/2/18 (Inception) | | | $9,315 | | | | -16.34% | |
Performance is for the half-year period from July 2 (Commencement of Operations) to December 31, 2018. The line representing the performance return of the Small Cap Equity Index Fund includes expenses, such as transaction costs and management fees that reduce returns, while the performance return line of the Index does not. Past performance is not indicative of future results.
9
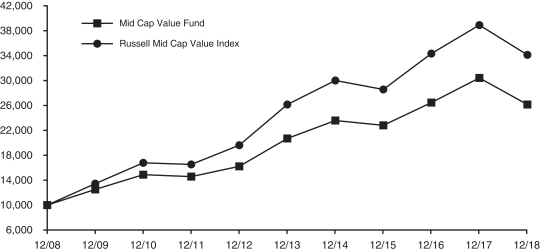
MID CAP VALUE FUND (Unaudited)
The investment objective of the Mid Cap Value Fund is to outperform the Russell Midcap® Value Index. The Mid Cap Value Fund generally invests in companies that are between $1 billion and $20 billion in market capitalization and have lower price-to-book characteristics.
For the year ended December 31, 2018, the Mid Cap Value Fund returned -13.52% before expenses and -14.08% after expenses versus a -12.29% return for the Russell Midcap® Value Index. Within the benchmark, the best performing sectors were Technology and Energy while the worst performing sectors were Industrials and Consumer Staples.
Stock selection was the primary driver of positive performance versus the benchmark. Sectors contributing to Mid Cap Value Fund performance included Health Care and Utilities, while sectors detracting from Fund performance included REITs and Technology.
GROWTH OF A $10,000 INVESTMENT
| | | | | | | | | | | | |
Mid Cap Value Fund | |
Period Ended
12/31/2018 | | Growth of
$10,000 | | | Total Return | |
| | Cumu-
lative | | | Average
Annual | |
1 Year | | | $8,592 | | | | -14.08% | | | | -14.08% | |
5 Years | | | $12,619 | | | | 26.19% | | | | 4.76% | |
10 Years | | | $26,095 | | | | 160.95% | | | | 10.05% | |
| | | | | | | | | | | | |
Russell Mid Cap Value Index | |
Period Ended
12/31/2018 | | Growth of
$10,000 | | | Total Return | |
| | Cumu-
lative | | | Average
Annual | |
1 Year | | | $8,771 | | | | -12.29% | | | | -12.29% | |
5 Years | | | $13,034 | | | | 30.34% | | | | 5.44% | |
10 Years | | | $34,039 | | | | 240.39% | | | | 13.03% | |
The line representing the performance return of the Mid Cap Value Fund includes expenses, such as transaction costs and management fees that reduce returns, while the performance return line of the Index does not. Past performance is not indicative of future results.
10
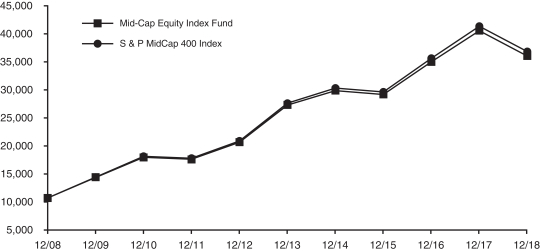
MID-CAP EQUITY INDEX FUND (Unaudited)
The Mid-Cap Equity Index Fund invests in the 400 stocks that comprise the S&P MidCap 400® Index (S&P MidCap 400). The S&P MidCap 400 is a market-weighted index of 400 stocks traded on the New York Stock Exchange, American Stock Exchange and NASDAQ. The weightings make each company’s influence on the S&P MidCap 400’s performance directly proportional to that company’s market value. The companies included in the S&P MidCap 400 tend to be typical of this asset class, the medium-capitalized sector of the U.S. securities market.
The Mid-Cap Equity Index Fund’s performance for the year ended December 31, 2018, was -11.14% before expenses and -11.26% after expenses, finishing below the -11.08% return of the S&P MidCap 400. Note that the performance of the Mid-Cap Equity Index Fund includes expenses, such as transaction costs and management fees, which are not applicable to the benchmark.
GROWTH OF A $10,000 INVESTMENT
| | | | | | | | | | | | |
Mid-Cap Equity Index Fund | |
Period
Ended
12/31/2018 | | Growth of $10,000 | | | Total Return | |
| | Cumu-
lative | | | Average
Annual | |
1 Year | | | $8,874 | | | | -11.26% | | | | -11.26% | |
5 Years | | | $13,282 | | | | 32.82% | | | | 5.84% | |
10 Years | | | $35,264 | | | | 252.64% | | | | 13.42% | |
| | | | | | | | | | | | |
S & P MidCap 400 Index | |
Period
Ended
12/31/2018 | | Growth of $10,000 | | | Total Return | |
| | Cumu-
lative | | | Average
Annual | |
1 Year | | | $8,892 | | | | -11.08% | | | | -11.08% | |
5 Years | | | $13,399 | | | | 33.99% | | | | 6.03% | |
10 Years | | | $36,053 | | | | 260.53% | | | | 13.68% | |
The line representing the performance return of the Mid-Cap Equity Index Fund includes expenses, such as transaction costs and management fees that reduce returns, while the performance return line of the Index does not. Past performance is not indicative of future results.
11
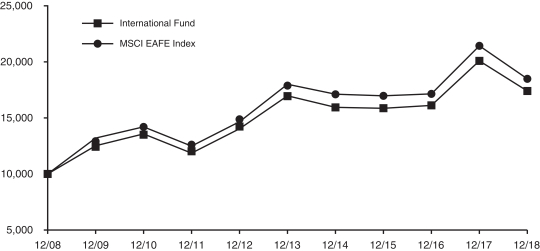
INTERNATIONAL FUND (Unaudited)
The International Fund seeks capital appreciation by investing, directly or indirectly, mainly in exchange traded funds that invest in stocks of large and mid-cap companies in developed market countries located outside of the United States and Canada that are reflected or contained in the Morgan Stanley Capital International, Inc. Europe, Australasia and Far East® Index (MSCI EAFE® Index). Currently the International Fund is invested mainly in exchange traded funds that reflect, replicate or follow the country weightings of the MSCI EAFE® Index. The Fund also has invested a small percentage of assets in exchange traded funds that provide exposure to emerging markets and to companies with small market capitalizations in developed market countries.
For the year ended December 31, 2018, the International Fund returned -13.26% before expenses and -13.36% after expenses, finishing ahead of the -13.79% return of the benchmark. The fund’s benchmark closes earlier in the day than the actual market for the fund’s investments. This time lag can result in both positive and negative performance differences.
GROWTH OF A $10,000 INVESTMENT
| | | | | | | | | | | | |
International Fund | |
Period Ended
12/31/2018 | | Growth of
$10,000 | | | Total Return | |
| | Cumu-
lative | | | Average
Annual | |
1 Year | | | $8,664 | | | | -13.36% | | | | -13.36% | |
5 Years | | | $10,240 | | | | 2.40% | | | | 0.48% | |
10 Years | | | $17,370 | | | | 73.70% | | | | 5.68% | |
| | | | | | | | | | | | |
MSCI EAFE Index | |
Period Ended 12/31/2018 | | Growth of $10,000 | | | Total Return | |
| | Cumu-
lative | | | Average
Annual | |
1 Year | | | $8,621 | | | | -13.79% | | | | -13.79% | |
5 Years | | | $10,268 | | | | 2.68% | | | | 0.53% | |
10 Years | | | $18,453 | | | | 84.53% | | | | 6.32% | |
The line representing the performance return of the International Fund includes expenses, such as transaction costs and management fees that reduce returns, while the performance return line of the Index does not. Past performance is not indicative of future results.
12
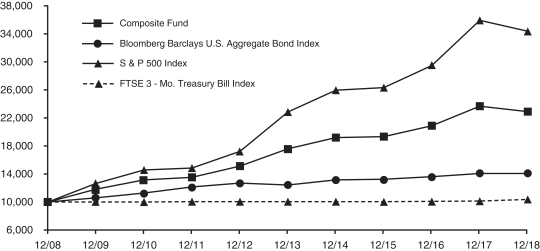
COMPOSITE FUND (Unaudited)
The Composite Fund seeks capital appreciation and current income by investing in a diversified portfolio of common stocks, debt securities and money market instruments.
The primary investment objective of the fixed income portion of the fund is to provide a high level of current income, consistent with capital preservation, while minimizing volatility. It does this by investing primarily in investment grade publicly traded debt securities. The securities held include corporate, U.S. agency and mortgage-backed securities, all of which normally yield more than U.S. Treasury issues.
For the year ended December 31, 2018, the fixed income portion of the Fund had a total return of 0.92% before expenses. This compares favorably to the Bloomberg Barclays U.S. Aggregate Bond Index, which returned 0.01%. All but one of the asset classes represented in the Index delivered positive results during the period. Investment grade corporate bonds were the outlier with a -2.5% return. In general, higher quality bonds outperformed lower and those with shorter maturities outperformed longer.
The Federal Reserve (Fed) governors continue to remove some of the monetary accommodation put in place following the financial crisis in 2008. To that end, they raised the Fed Funds target range four times in 2018 to 2.25% — 2.50%. These moves were, for the most part, expected by the financial markets as communication from the Fed has become more transparent in recent years. Further increases are expected in 2019. In addition to raising the Fed Funds target, the Fed is removing monetary stimulus by slowly winding down its’ $4.0 trillion portfolio. Presently, the Fed reinvests a combined $50 billion fewer Treasuries and mortgage-backed securities each month than it receives via maturities and coupon payments. The intended effect is to shrink the portfolio to close to $1 trillion without having to resort to sales which might drive interest rates higher than desired.
The interest rate curve flattened as yields on short-dated Treasuries rose more than did the yields of long-dated Treasuries. Two-year Treasury Notes yielded 1.88% at the end of the 4th quarter of 2017 and 2.49% on December 31, 2018. Ten-year yields rose 28 basis points or 0.28% to 2.68%. While on the surface these increases might seem small, they do not reflect the path interest rates took during the course of 2018. The trend to higher yields that started in September 2017 peaked in early November 2018. This trend saw the Two-year yield reach 2.97%, a level not seen in a decade. Similarly, the Ten-year yield topped out at 3.24% before falling back to 2.68% at year end. Slowing inflation, lower oil prices and concerns about growth both here and abroad contributed to the fall in interest rates through the end of the year.
Despite a strong start to the year that saw investment grade spreads collapse to pre-crisis tights in early February, high-grade corporate bond spreads widened for much of the year tracing a path from 96 basis points at the end of 2017 to 154 on December 31, 2018. Concerns about a flattening yield curve which can affect bank profitability, fewer foreign buyers of U.S. corporates and less demand for short dated corporates from companies freed to repatriate cash under the new tax law all contributed to the widening. In a reversal of the theme of the last two years, lower-rated credit underperformed higher-rated. For the year, AAA-rated corporate spreads widened 23 basis points, while BBB-rated bond spreads widened 69.
The primary objective of the equity portion of the Composite Fund is to provide exposure to a diversified portfolio of primarily large capitalization, domestic equity securities that have the potential to outperform their peer group over the medium to long term. The portfolio has a focus on dividend income, and aims to continually earn a dividend yield that is higher than that of its benchmark without taking significant over or under weights in any sector.
For the year ended December 31, 2018, the equity portion of the Fund had a total return of -5.71% (before expenses), underperforming the S&P 500® Index (S&P 500) which lost -4.38%. The underperformance of the Fund was due to less favorable stock selection, as the dividend paying stocks favored by the Fund’s strategy was generally not in favor during the year.
The Fund’s aggregate performance for the year ended December 31, 2018, was -2.71% before expenses and -3.20% after expenses, versus a -2.26% return in the weighted benchmark.
GROWTH OF A $10,000 INVESTMENT
| | | | | | | | | | | | |
Composite Fund | |
Period
Ended
12/31/2018 | | Growth of
$10,000 | | | Total Return | |
| | Cumu-
lative | | | Average
Annual | |
1 Year | | $ | 9,681 | | | | -3.20 | % | | | -3.20 | % |
5 Years | | $ | 13,024 | | | | 30.24 | % | | | 5.42 | % |
10 Years | | $ | 22,883 | | | | 128.83 | % | | | 8.63 | % |
| | | | | | | | | | | | |
S & P 500 Index | |
Period
Ended
12/31/2018 | | Growth of
$10,000 | | | Total Return | |
| | Cumu-
lative | | | Average
Annual | |
1 Year | | $ | 9,562 | | | | -4.38 | % | | | -4.38 | % |
5 Years | | $ | 15,032 | | | | 50.32 | % | | | 8.49 | % |
10 Years | | $ | 34,300 | | | | 243.00 | % | | | 13.12 | % |
| | | | | | | | | | | | |
Bloomberg Barclays U.S. Aggregate Bond Index | |
Period Ended
12/31/2018 | | Growth of
$10,000 | | | Total Return | |
| | Cumu-
lative | | | Average
Annual | |
1 Year | | $ | 10,001 | | | | 0.01 | % | | | 0.01 | % |
5 Years | | $ | 11,325 | | | | 13.25 | % | | | 2.52 | % |
10 Years | | $ | 14,074 | | | | 40.74 | % | | | 3.48 | % |
| | | | | | | | | | | | |
FTSE 3 - Month T-Bill Index | |
Period
Ended
12/31/2018 | | Growth of
$10,000 | | | Total Return | |
| | Cumu-
lative | | | Average
Annual | |
1 Year | | $ | 10,186 | | | | 1.86 | % | | | 1.86 | % |
5 Years | | $ | 10,306 | | | | 3.06 | % | | | 0.60 | % |
10 Years | | $ | 10,356 | | | | 3.56 | % | | | 0.35 | % |
The line representing the performance return of the Composite Fund includes expenses, such as transaction costs and management fees that reduce returns, while the performance return lines of the Indices do not. Past performance is not indicative of future results.
13
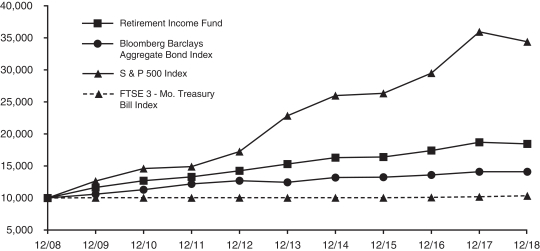
RETIREMENT INCOME FUND (Unaudited)
The objective of the Retirement Income Fund is current income consistent with the preservation of capital and, to a lesser extent, capital appreciation. The Retirement Income Fund invests primarily in the fixed-income funds of the Investment Company and also invests in two equity funds of the Investment Company. The Fund’s current target allocation is approximately 75% of net assets in fixed-income funds (approximately 30% in the Bond, 30% in the Mid-Term Bond Funds and 15% in the Money Market Fund) and approximately 25% of net assets in equity funds (20% in the Equity Index Fund and 5% in the Mid-Cap Equity Index Fund) (See Note 1 in the Notes to Financial Statements for additional information on changes to Fund target allocations during 2018).
Performance for the Retirement Income Fund is compared to the Bloomberg Barclays U.S. Aggregate Bond Index (60% weighting), the FTSE 3-Month Treasury Bill Index (15% weighting) and the S&P 500® Index (25% weighting). For the year ended December 31, 2018, the Fund returned -1.13% before expenses and -1.21% after expenses, versus a -0.54% return in the weighted benchmark.
GROWTH OF A $10,000 INVESTMENT
| | | | | | | | | | | | |
Retirement Income Fund | |
Period
Ended
12/31/2018 | | Growth of
$10,000 | | | Total Return | |
| | Cumu-
lative | | | Average
Annual | |
1 Year | | | $9,878 | | | | -1.21% | | | | -1.21% | |
5 Years | | | $12,049 | | | | 20.49% | | | | 3.80% | |
10 Years | | | $18,412 | | | | 84.12% | | | | 6.29% | |
| | | | | | | | | | | | |
S & P 500 Index | |
Period
Ended
12/31/2018 | | Growth of
$10,000 | | | Total Return | |
| | Cumu-
lative | | | Average
Annual | |
1 Year | | | $9,562 | | | | -4.38% | | | | -4.38% | |
5 Years | | | $15,032 | | | | 50.32% | | | | 8.49% | |
10 Years | | | $34,300 | | | | 243.00% | | | | 13.12% | |
| | | | | | | | | | | | |
Bloomberg Barclays U.S. Aggregate Bond Index | |
Period
Ended
12/31/2018 | | Growth of
$10,000 | | | Total Return | |
| | Cumu-
lative | | | Average
Annual | |
1 Year | | | $10,001 | | | | 0.01% | | | | 0.01% | |
5 Years | | | $11,325 | | | | 13.25% | | | | 2.52% | |
10 Years | | | $14,074 | | | | 40.74% | | | | 3.48% | |
| | | | | | | | | | | | |
FTSE 3 - Month T-Bill Index | |
Period
Ended
12/31/2018 | | Growth of
$10,000 | | | Total Return | |
| | Cumu-
lative | | | Average
Annual | |
1 Year | | | $10,186 | | | | 1.86% | | | | 1.86% | |
5 Years | | | $10,306 | | | | 3.06% | | | | 0.60% | |
10 Years | | | $10,356 | | | | 3.56% | | | | 0.35% | |
The line representing the performance return of the Retirement Income Fund includes expenses, such as direct management fees and expenses of the underlying funds in which the Fund invests, that reduce returns while the performance return lines of the Indices do not. Past performance is not indicative of future results.
14
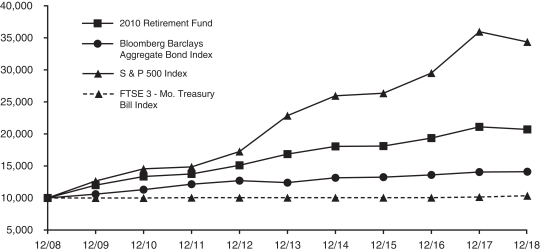
2010 RETIREMENT FUND (Unaudited)
The objective of the 2010 Retirement Fund is current income and capital appreciation appropriate for the asset allocation associated with a retirement in 2010. The 2010 Retirement Fund invests in funds of the Investment Company. The Fund’s current target allocation is approximately 70% of net assets in fixed-income funds (approximately 30% in the Bond Fund, 30% in the Mid-Term Bond Fund and 10% in the Money Market Fund) and approximately 30% of net assets in equity funds (20% in the Equity Index Fund, 7% in the Mid-Cap Equity Index Fund and 3% in the International Fund) (See Note 1 in the Notes to Financial Statements for additional information on changes to Fund target allocations during 2018).
Performance for the 2010 Retirement Fund is compared to the Bloomberg Barclays U.S. Aggregate Bond Index (60% weighting), the FTSE 3-Month Treasury Bill Index (10% weighting) and the S&P 500® Index (30% weighting). For the year ended December 31, 2018, the Fund returned -1.88% before expenses and -1.93% after expenses, versus a -0.82% return in the weighted benchmark.
GROWTH OF A $10,000 INVESTMENT
| | | | | | | | | | | | |
2010 Retirement Fund | |
Period Ended
12/31/2018 | | Growth of
$10,000 | | | Total Return | |
| | Cumu-
lative | | | Average
Annual | |
1 Year | | | $9,808 | | | | -1.93% | | | | -1.93% | |
5 Years | | | $12,267 | | | | 22.67% | | | | 4.18% | |
10 Years | | | $20,687 | | | | 106.87% | | | | 7.54% | |
| | | | | | | | | | | | |
S & P 500 Index | |
Period Ended
12/31/2018 | | Growth of
$10,000 | | | Total Return | |
| | Cumu-
lative | | | Average
Annual | |
1 Year | | | $9,562 | | | | -4.38% | | | | -4.38% | |
5 Years | | | $15,032 | | | | 50.32% | | | | 8.49% | |
10 Years | | | $34,300 | | | | 243.00% | | | | 13.12% | |
| | | | | | | | | | | | |
Bloomberg Barclays U.S. Aggregate Bond Index | |
Period Ended
12/31/2018 | | Growth of $10,000 | | | Total Return | |
| | Cumu-
lative | | | Average
Annual | |
1 Year | | | $10,001 | | | | 0.01% | | | | 0.01% | |
5 Years | | | $11,325 | | | | 13.25% | | | | 2.52% | |
10 Years | | | $14,074 | | | | 40.74% | | | | 3.48% | |
| | | | | | | | | | | | |
FTSE 3 - Month T-Bill Index | |
Period Ended
12/31/2018 | | Growth of
$10,000 | | | Total Return | |
| | Cumu-
lative | | | Average
Annual | |
1 Year | | | $10,186 | | | | 1.86% | | | | 1.86% | |
5 Years | | | $10,306 | | | | 3.06% | | | | 0.60% | |
10 Years | | | $10,356 | | | | 3.56% | | | | 0.35% | |
The line representing the performance return of the 2010 Retirement Fund includes expenses, such as direct management fees and expenses of the underlying funds in which the Fund invests, that reduce returns while the performance return lines of the Indices do not. Past performance is not indicative of future results.
15
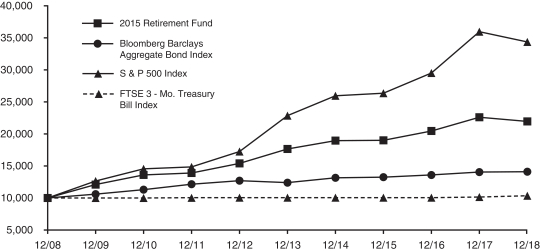
2015 RETIREMENT FUND (Unaudited)
The objective of the 2015 Retirement Fund is current income and capital appreciation appropriate for the asset allocation associated with a retirement in 2015. The 2015 Retirement Fund invests in funds of the Investment Company. The Fund’s current target allocation is approximately 60% of net assets in fixed-income funds (30% in the Bond Fund, 25% in the Mid-Term Bond Fund and 5% in the Money Market Fund) and approximately 40% of net assets in equity funds (approximately 25% in the Equity Index Fund, 8% in the Mid-Cap Equity Index Fund, 5% in the International Fund and 1% each in the Small Cap Growth and Small Cap Value Funds) (See Note 1 in the Notes to Financial Statements for additional information on changes to Fund target allocations during 2018).
Performance for the 2015 Retirement Fund is compared to the Bloomberg Barclays U.S. Aggregate Bond Index (55% weighting), the FTSE 3-Month Treasury Bill Index (5% weighting) and the S&P 500® Index (40% weighting). For the year ended December 31, 2018, the Fund returned -2.94% before expenses and -3.01% after expenses, versus a -1.30% return in the weighted benchmark.
GROWTH OF A $10,000 INVESTMENT
| | | | | | | | | | | | |
2015 Retirement Fund | |
Period
Ended
12/31/2018 | | Growth
of
$10,000 | | | Total Return | |
| | Cumu-
lative | | | Average Annual | |
1 Year | | | $9,700 | | | | -3.01% | | | | -3.01% | |
5 Years | | | $12,414 | | | | 24.14% | | | | 4.43% | |
10 Years | | | $21,912 | | | | 119.12% | | | | 8.16% | |
| | | | | | | | | | | | |
S & P 500 Index | |
Period
Ended
12/31/2018 | | Growth of $10,000 | | | Total Return | |
| | Cumu-
lative | | | Average
Annual | |
1 Year | | | $9,562 | | | | -4.38% | | | | -4.38% | |
5 Years | | | $15,032 | | | | 50.32% | | | | 8.49% | |
10 Years | | | $34,300 | | | | 243.00% | | | | 13.12% | |
| | | | | | | | | | | | |
Bloomberg Barclays U.S. Aggregate Bond Index | |
Period
Ended
12/31/2018 | | Growth of $10,000 | | | Total Return | |
| | Cumu-
lative | | | Average
Annual | |
1 Year | | | $10,001 | | | | 0.01% | | | | 0.01% | |
5 Years | | | $11,325 | | | | 13.25% | | | | 2.52% | |
10 Years | | | $14,074 | | | | 40.74% | | | | 3.48% | |
| | | | | | | | | | | | |
FTSE 3 - Month T-Bill Index | |
Period
Ended
12/31/2018 | | Growth of $10,000 | | | Total Return | |
| | Cumu-
lative | | | Average
Annual | |
1 Year | | | $10,186 | | | | 1.86% | | | | 1.86% | |
5 Years | | | $10,306 | | | | 3.06% | | | | 0.60% | |
10 Years | | | $10,356 | | | | 3.56% | | | | 0.35% | |
The line representing the performance return of the 2015 Retirement Fund includes expenses, such as direct management fees and expenses of the underlying funds in which the Fund invests, that reduce returns while the performance return lines of the Indices do not. Past performance is not indicative of future results.
16
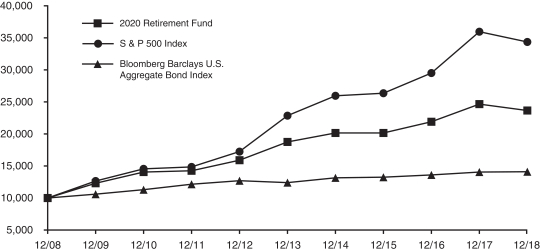
2020 RETIREMENT FUND (Unaudited)
The objective of the 2020 Retirement Fund is current income and capital appreciation appropriate for the asset allocation associated with a target retirement in 2020. The 2020 Retirement Fund invests in funds of the Investment Company. The Fund’s current target allocation is approximately 50% of net assets in equity funds (approximately 28% in the Equity Index Fund, 10% in the Mid-Cap Equity Index Fund, 8% in the International Fund and 2% each in the Small Cap Growth and Small Cap Value Funds) and approximately 50% of net assets in fixed-income funds (28% in the Bond Fund and 22% in the Mid-Term Bond Fund) (See Note 1 in the Notes to Financial Statements for additional information on changes to Fund target allocations during 2018).
Performance for the 2020 Retirement Fund is compared to the S&P 500® Index (50% weighting) and the Bloomberg Barclays U.S. Aggregate Bond Index (50% weighting). For the year ended December 31, 2018, the Fund returned -3.97% before expenses and -4.04% after expenses, versus a -1.81% return in the weighted benchmark.
GROWTH OF A $10,000 INVESTMENT
| | | | | | | | | | | | |
2020 Retirement Fund | |
Period
Ended
12/31/2018 | | Growth of $10,000 | | | Total Return | |
| | Cumu-
lative | | | Average
Annual | |
1 Year | | | $9,596 | | | | -4.04% | | | | -4.04% | |
5 Years | | | $12,599 | | | | 25.99% | | | | 4.73% | |
10 Years | | | $23,609 | | | | 136.09% | | | | 8.97% | |
| | | | | | | | | | | | |
S & P 500 Index | |
Period
Ended
12/31/2018 | | Growth of $10,000 | | | Total Return | |
| | Cumu-
lative | | | Average
Annual | |
1 Year | | | $9,562 | | | | -4.38% | | | | -4.38% | |
5 Years | | | $15,032 | | | | 50.32% | | | | 8.49% | |
10 Years | | | $34,300 | | | | 243.00% | | | | 13.12% | |
| | | | | | | | | | | | |
Bloomberg Barclays U.S. Aggregate Bond Index | |
Period
Ended
12/31/2018 | | Growth of $10,000 | | | Total Return | |
| | Cumu-
lative | | | Average
Annual | |
1 Year | | | $10,001 | | | | 0.01% | | | | 0.01% | |
5 Years | | | $11,325 | | | | 13.25% | | | | 2.52% | |
10 Years | | | $14,074 | | | | 40.74% | | | | 3.48% | |
The line representing the performance return of the 2020 Retirement Fund includes expenses, such as direct management fees and expenses of the underlying funds in which the Fund invests, that reduce returns while the performance return lines of the Indices do not. Past performance is not indicative of future results.
17
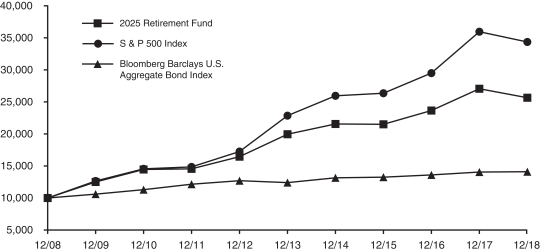
2025 RETIREMENT FUND (Unaudited)
The objective of the 2025 Retirement Fund is current income and capital appreciation appropriate for the asset allocation associated with a target retirement in 2025. The 2025 Retirement Fund invests in funds of the Investment Company. The Fund’s current target allocation is approximately 61% of net assets in equity funds (approximately 31% in the Equity Index Fund, 12% in the Mid-Cap Equity Index Fund, 10% in the International Fund and 4% each in the Small Cap Growth and Small Cap Value Funds) and approximately 39% of net assets in fixed-income funds (25% in the Bond Fund and 14% in the Mid-Term Bond Fund) (See Note 1 in the Notes to Financial Statements for additional information on changes to Fund target allocations during 2018).
Performance for the 2025 Retirement Fund is compared to the S&P 500® Index (61% weighting) and the Bloomberg Barclays U.S. Aggregate Bond Index (39% weighting). For the year ended December 31, 2018, the Fund returned -5.16% before expenses and -5.22% after expenses, versus a -2.31% return in the weighted benchmark.
GROWTH OF A $10,000 INVESTMENT
| | | | | | | | | | | | |
2025 Retirement Fund | |
Period
Ended
12/31/2018 | | Growth of $10,000 | | | Total Return | |
| | Cumu-
lative | | | Average
Annual | |
1 Year | | | $9,478 | | | | -5.22% | | | | -5.22% | |
5 Years | | | $12,849 | | | | 28.49% | | | | 5.15% | |
10 Years | | | $25,603 | | | | 156.03% | | | | 9.85% | |
| | | | | | | | | | | | |
S & P 500 Index | |
Period
Ended
12/31/2018 | | Growth of $10,000 | | | Total Return | |
| | Cumu-
lative | | | Average
Annual | |
1 Year | | | $9,562 | | | | -4.38% | | | | -4.38% | |
5 Years | | | $15,032 | | | | 50.32% | | | | 8.49% | |
10 Years | | | $34,300 | | | | 243.00% | | | | 13.12% | |
| | | | | | | | | | | | |
Bloomberg Barclays U.S. Aggregate Bond Index | |
Period
Ended
12/31/2018 | | Growth of $10,000 | | | Total Return | |
| | Cumu-
lative | | | Average
Annual | |
1 Year | | | $10,001 | | | | 0.01% | | | | 0.01% | |
5 Years | | | $11,325 | | | | 13.25% | | | | 2.52% | |
10 Years | | | $14,074 | | | | 40.74% | | | | 3.48% | |
The line representing the performance return of the 2025 Retirement Fund includes expenses, such as direct management fees and expenses of the underlying funds in which the Fund invests, that reduce returns while the performance return lines of the Indices do not. Past performance is not indicative of future results.
18
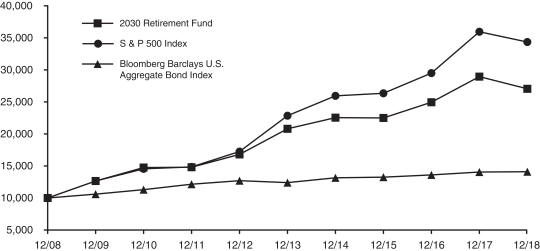
2030 RETIREMENT FUND (Unaudited)
The objective of the 2030 Retirement Fund is current income and capital appreciation appropriate for the asset allocation associated with a target retirement in 2030. The 2030 Retirement Fund invests in funds of the Investment Company. The Fund’s current target allocation is approximately 72% of net assets in equity funds (approximately 33% in the Equity Index Fund, 17% in the Mid-Cap Equity Index Fund, 12% in the International Fund and 5% each in the Small Cap Growth and Small Cap Value Funds) and approximately 28% of net assets in fixed-income funds (22% in the Bond Fund and 6% in the Mid-Term Bond Fund) (See Note 1 in the Notes to Financial Statements for additional information on changes to Fund target allocations during 2018).
Performance for the 2030 Retirement Fund is compared to the S&P 500® Index (72% weighting) and the Bloomberg Barclays U.S. Aggregate Bond Index (28% weighting). For the year ended December 31, 2018, the Fund returned -6.42% before expenses and -6.49% after expenses, versus a -2.85% return in the weighted benchmark.
GROWTH OF A $10,000 INVESTMENT
| | | | | | | | | | | | |
2030 Retirement Fund | |
Period
Ended
12/31/2018 | | Growth of $10,000 | | | Total Return | |
| | Cumu-
lative | | | Average
Annual | |
1 Year | | | $9,351 | | | | -6.49% | | | | -6.49% | |
5 Years | | | $12,993 | | | | 29.93% | | | | 5.38% | |
10 Years | | | $27,012 | | | | 170.12% | | | | 10.44% | |
| | | | | | | | | | | | |
S & P 500 Index | |
Period
Ended
12/31/2018 | | Growth of $10,000 | | | Total Return | |
| | Cumu-
lative | | | Average
Annual | |
1 Year | | | $9,562 | | | | -4.38% | | | | -4.38% | |
5 Years | | | $15,032 | | | | 50.32% | | | | 8.49% | |
10 Years | | | $34,300 | | | | 243.00% | | | | 13.12% | |
| | | | | | | | | | | | |
Bloomberg Barclays U.S. Aggregate Bond Index | |
Period
Ended
12/31/2018 | | Growth of $10,000 | | | Total Return | |
| | Cumu-
lative | | | Average
Annual | |
1 Year | | | $10,001 | | | | 0.01% | | | | 0.01% | |
5 Years | | | $11,325 | | | | 13.25% | | | | 2.52% | |
10 Years | | | $14,074 | | | | 40.74% | | | | 3.48% | |
The line representing the performance return of the 2030 Retirement Fund includes expenses, such as direct management fees and expenses of the underlying funds in which the Fund invests, that reduce returns while the performance return lines of the Indices do not. Past performance is not indicative of future results.
19
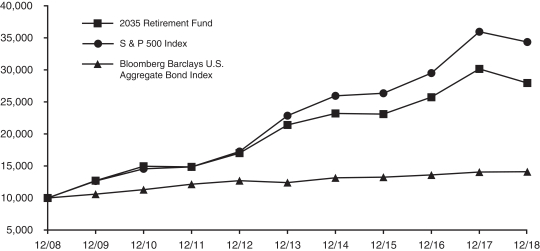
2035 RETIREMENT FUND (Unaudited)
The objective of the 2035 Retirement Fund is current income and capital appreciation appropriate for the asset allocation associated with a target retirement in 2035. The 2035 Retirement Fund invests in funds of the Investment Company. The Fund’s current target allocation is approximately 81% of net assets in equity funds (approximately 35% in the Equity Index Fund, 20% in the Mid-Cap Equity Index Fund, 14% in the International Fund and 6% each in the Small Cap Growth and Small Cap Value Funds) and approximately 19% of net assets in the Bond Fund (See Note 1 in the Notes to Financial Statements for additional information on changes to Fund target allocations during 2018).
Performance for the 2035 Retirement Fund is compared to the S&P 500® Index (81% weighting) and the Bloomberg Barclays U.S. Aggregate Bond Index (19% weighting). For the year ended December 31, 2018, the Fund returned -7.30% before expenses and -7.36% after expenses, versus a -3.31% return in the weighted benchmark.
GROWTH OF A $10,000 INVESTMENT
| | | | | | | | | | | | |
2035 Retirement Fund | |
Period
Ended
12/31/2018 | | Growth of
$10,000 | | | Total Return | |
| | Cumu-
lative | | | Average
Annual | |
1 Year | | | $9,264 | | | | -7.36% | | | | -7.36% | |
5 Years | | | $13,039 | | | | 30.39% | | | | 5.45% | |
10 Years | | | $27,904 | | | | 179.04% | | | | 10.80% | |
| | | | | | | | | | | | |
S & P 500 Index | |
Period
Ended
12/31/2018 | | Growth of
$10,000 | | | Total Return | |
| | Cumu-
lative | | | Average
Annual | |
1 Year | | | $9,562 | | | | -4.38% | | | | -4.38% | |
5 Years | | | $15,032 | | | | 50.32% | | | | 8.49% | |
10 Years | | | $34,300 | | | | 243.00% | | | | 13.12% | |
| | | | | | | | | | | | |
Bloomberg Barclays U.S. Aggregate Bond Index | |
Period
Ended
12/31/2018 | | Growth of
$10,000 | | | Total Return | |
| | Cumu-
lative | | | Average
Annual | |
1 Year | | | $10,001 | | | | 0.01% | | | | 0.01% | |
5 Years | | | $11,325 | | | | 13.25% | | | | 2.52% | |
10 Years | | | $14,074 | | | | 40.74% | | | | 3.48% | |
The line representing the performance return of the 2035 Retirement Fund includes expenses, such as direct management fees and expenses of the underlying funds in which the Fund invests, that reduce returns while the performance return lines of the Indices do not. Past performance is not indicative of future results.
20
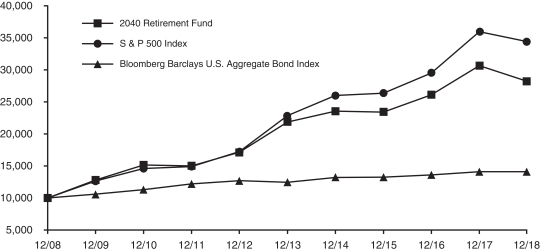
2040 RETIREMENT FUND (Unaudited)
The objective of the 2040 Retirement Fund is current income and capital appreciation appropriate for the asset allocation associated with a target retirement in 2040. The 2040 Retirement Fund invests in funds of the Investment Company. The Fund’s current target allocation is approximately 85% of net assets in equity funds (approximately 35% in the Equity Index Fund, 20% in the Mid-Cap Equity Index Fund, 16% in the International Fund and 7% each in the Small Cap Growth and Small Cap Value Funds) and approximately 15% of net assets in the Bond Fund (See Note 1 in the Notes to Financial Statements for additional information on changes to Fund target allocations during 2018).
Performance for the 2040 Retirement Fund is compared to the S&P 500® Index (85% weighting) and the Bloomberg Barclays U.S. Aggregate Bond Index (15% weighting). For the year ended December 31, 2018, the Fund returned -7.88% before expenses and -7.94% after expenses, versus a -3.53% return in the weighted benchmark.
GROWTH OF A $10,000 INVESTMENT
| | | | | | | | | | | | |
2040 Retirement Fund | |
Period Ended
12/31/2018 | | Growth of
$10,000 | | | Total Return | |
| | Cumu-
lative | | | Average
Annual | |
1 Year | | | $9,206 | | | | -7.94% | | | | -7.94% | |
5 Years | | | $12,912 | | | | 29.12% | | | | 5.25% | |
10 Years | | | $28,146 | | | | 181.46% | | | | 10.90% | |
| | | | | | | | | | | | |
S & P 500 Index | |
Period Ended
12/31/2018 | | Growth of
$10,000 | | | Total Return | |
| | Cumu-
lative | | | Average
Annual | |
1 Year | | | $9,562 | | | | -4.38% | | | | -4.38% | |
5 Years | | | $15,032 | | | | 50.32% | | | | 8.49% | |
10 Years | | | $34,300 | | | | 243.00% | | | | 13.12% | |
| | | | | | | | | | | | |
Bloomberg Barclays U.S. Aggregate Bond Index | |
Period Ended
12/31/2018 | | Growth of
$10,000 | | | Total Return | |
| | Cumu-
lative | | | Average
Annual | |
1 Year | | | $10,001 | | | | 0.01% | | | | 0.01% | |
5 Years | | | $11,325 | | | | 13.25% | | | | 2.52% | |
10 Years | | | $14,074 | | | | 40.74% | | | | 3.48% | |
The line representing the performance return of the 2040 Retirement Fund includes expenses, such as direct management fees and expenses of the underlying funds in which the Fund invests, that reduce returns while the performance return lines of the Indices do not. Past performance is not indicative of future results.
21
2045 RETIREMENT FUND (Unaudited)
The objective of the 2045 Retirement Fund is current income and capital appreciation appropriate for the asset allocation associated with a target retirement in 2045. The 2045 Retirement Fund invests in funds of the Investment Company. The Fund’s current target allocation is approximately 87% of net assets in equity funds (approximately 34% in the Equity Index Fund, 21% in the Mid-Cap Equity Index Fund, 16% in the International Fund and 8% each in the Small Cap Growth and Small Cap Value Funds) and approximately 13% of net assets in the Bond Fund (See Note 1 in the Notes to Financial Statements for additional information on changes to Fund target allocations during 2018).
Performance for the 2045 Retirement Fund is compared to the S&P 500® Index (87% weighting) and the Bloomberg Barclays U.S. Aggregate Bond Index (13% weighting). For the year ended December 31, 2018, the Fund returned -8.23% before expenses and -8.29% after expenses, versus a -3.64% return in the weighted benchmark.
GROWTH OF A $10,000 INVESTMENT

| | | | | | | | | | | | |
2045 Retirement Fund | |
Period
Ended
12/31/2018 | | Growth of
$10,000 | | | Total Return | |
| | Cumu-
lative | | | Average
Annual | |
1 Year | | | $9,171 | | | | -8.29% | | | | -8.29% | |
5 Years | | | $12,843 | | | | 28.43% | | | | 5.13% | |
10 Years | | | $27,984 | | | | 179.84% | | | | 10.83% | |
| | | | | | | | | | | | |
S & P 500 Index | |
Period
Ended
12/31/2018 | | Growth of
$10,000 | | | Total Return | |
| | Cumu-
lative | | | Average
Annual | |
1 Year | | | $9,562 | | | | -4.38% | | | | -4.38% | |
5 Years | | | $15,032 | | | | 50.32% | | | | 8.49% | |
10 Years | | | $34,300 | | | | 243.00% | | | | 13.12% | |
| | | | | | | | | | | | |
Bloomberg Barclays U.S. Aggregate Bond Index | |
Period
Ended
12/31/2018 | | Growth of
$10,000 | | | Total Return | |
| | Cumu-
lative | | | Average
Annual | |
1 Year | | | $10,001 | | | | 0.01% | | | | 0.01% | |
5 Years | | | $11,325 | | | | 13.25% | | | | 2.52% | |
10 Years | | | $14,074 | | | | 40.74% | | | | 3.48% | |
The line representing the performance return of the 2045 Retirement Fund includes expenses, such as direct management fees and expenses of the underlying funds in which the Fund invests, that reduce returns while the performance return lines of the Indices do not. Past performance is not indicative of future results.
22
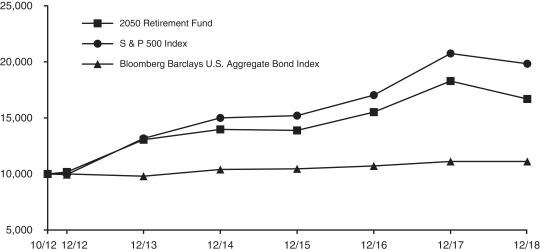
2050 RETIREMENT FUND (Unaudited)
The objective of the 2050 Retirement Fund is current income and capital appreciation appropriate for the asset allocation associated with a target retirement in 2050. The 2050 Retirement Fund invests in funds of the Investment Company. The Fund’s current target allocation is approximately 89% of net assets in equity funds (approximately 32% in the Equity Index Fund, 21% in the Mid-Cap Equity Index Fund, 18% in the International Fund and 9% each in the Small Cap Growth and Small Cap Value Funds) and approximately 11% of net assets in the Bond Fund (See Note 1 in the Notes to Financial Statements for additional information on changes to Fund target allocations during 2018).
Performance for the 2050 Retirement Fund is compared to the S&P 500® Index (89% weighting) and the Bloomberg Barclays U.S. Aggregate Bond Index (11% weighting). For the year ended December 31, 2018, the Fund returned -8.68% before expenses and -8.74% after expenses, versus a -3.75% return in the weighted benchmark.
GROWTH OF A $10,000 INVESTMENT
| | | | | | | | | | | | |
2050 Retirement Fund | |
Period
Ended
12/31/2018 | | Growth of
$10,000 | | | Total Return | |
| | Cumu-
lative | | | Average
Annual | |
1 Year | | | $9,126 | | | | -8.74% | | | | -8.74% | |
5 Years | | | $12,786 | | | | 27.86% | | | | 5.04% | |
Since 10/1/12 (Inception) | | | $16,688 | | | | 66.88% | | | | 8.54% | |
| | | | | | | | | | | | |
S & P 500 Index | |
Period
Ended
12/31/2018 | | Growth of
$10,000 | | | Total Return | |
| | Cumu-
lative | | | Average
Annual | |
1 Year | | | $9,562 | | | | -4.38% | | | | -4.38% | |
5 Years | | | $15,032 | | | | 50.32% | | | | 8.49% | |
Since 10/1/12 (Inception) | | | $19,826 | | | | 98.26% | | | | 11.58% | |
| | | | | | | | | | | | |
Bloomberg Barclays U.S. Aggregate Bond Index | |
Period
Ended
12/31/2018 | | Growth of
$10,000 | | | Total Return | |
| | Cumu-
lative | | | Average
Annual | |
1 Year | | | $10,001 | | | | 0.01% | | | | 0.01% | |
5 Years | | | $11,325 | | | | 13.25% | | | | 2.52% | |
Since 10/1/12 (Inception) | | | $11,120 | | | | 11.20% | | | | 1.71% | |
The line representing the performance return of the 2050 Retirement Fund includes expenses, such as direct management fees and expenses of the underlying funds in which the Fund invests, that reduce returns while the performance return lines of the Indices do not. Past performance is not indicative of future results.
23
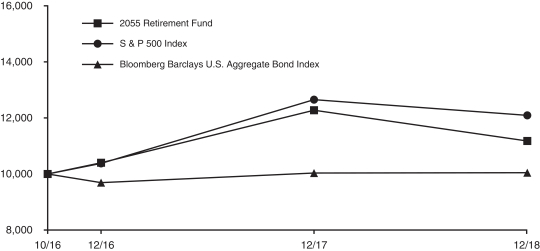
2055 RETIREMENT FUND (Unaudited)
The objective of the 2055 Retirement Fund is current income and capital appreciation appropriate for the asset allocation associated with a target retirement in 2055. The 2055 Retirement Fund invests in funds of the Investment Company. The Fund’s current target allocation is approximately 91% of net assets in equity funds (approximately 31% in the Equity Index Fund, 22% in the Mid-Cap Equity Index Fund, 18% in the International Fund and 10% each in the Small Cap Growth and Small Cap Value Funds) and approximately 9% of net assets in the Bond Fund (See Note 1 in the Notes to Financial Statements for additional information on changes to Fund target allocations during 2018).
Performance for the 2055 Retirement Fund is compared to the S&P 500® Index (91% weighting) and the Bloomberg Barclays U.S. Aggregate Bond Index (9% weighting). For the year ended December 31, 2018, the Fund returned -8.83% before expenses and -8.88% after expenses, versus a -3.86% return in the weighted benchmark.
GROWTH OF A $10,000 INVESTMENT
| | | | | | | | | | | | |
2055 Retirement Fund | |
Period
Ended
12/31/2018 | | Growth of
$10,000 | | | Total Return | |
| | Cumu-
lative | | | Average
Annual | |
1 Year | | | $9,112 | | | | -8.88% | | | | -8.88% | |
Since 10/1/16 (Inception) | | | $11,180 | | | | 11.80% | | | | 5.08% | |
| | | | | | | | | | | | |
S & P 500 Index | |
Period
Ended
12/31/2018 | | Growth of
$10,000 | | | Total Return | |
| | Cumu-
lative | | | Average
Annual | |
1 Year | | | $9,562 | | | | -4.38% | | | | -4.38% | |
Since 10/1/16 (Inception) | | | $12,094 | | | | 20.94% | | | | 8.83% | |
| | | | | | | | | | | | |
Bloomberg Barclays U.S. Aggregate Bond Index | |
Period
Ended
12/31/2018 | | Growth of
$10,000 | | | Total Return | |
| | Cumu-
lative | | | Average
Annual | |
1 Year | | | $10,001 | | | | 0.01% | | | | 0.01% | |
Since 10/1/16 (Inception) | | | $10,046 | | | | 0.46% | | | | 0.21% | |
The line representing the performance return of the 2055 Retirement Fund includes expenses, such as direct management fees and expenses of the underlying funds in which the Fund invests, that reduce returns while the performance return lines of the Indices do not. Past performance is not indicative of future results.
24
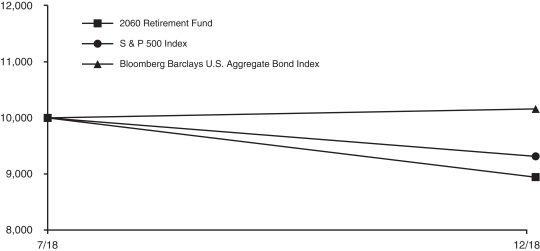
2060 RETIREMENT FUND (Unaudited)
The objective of the 2060 Retirement Fund is current income and capital appreciation appropriate for the asset allocation associated with a target retirement in 2060. The 2060 Retirement Fund invests in funds of the Investment Company. The Fund’s current target allocation is approximately 93% of net assets in equity funds (approximately 30% in the Equity Index Fund, 23% in the Mid-Cap Equity Index Fund, 20% in the International Fund and 10% each in the Small Cap Growth and Small Cap Value Funds) and approximately 7% of net assets in the Bond.
Performance for the 2060 Retirement Fund is compared to the S&P 500® Index (93% weighting) and the Bloomberg Barclays U.S. Aggregate Bond Index (7% weighting). For the period July 2, 2018 (commencement of operations) through December 31, 2018, the Fund returned -10.52% before expenses and -10.54% after expenses, versus a -6.18% return in the weighted benchmark.
GROWTH OF A $10,000 INVESTMENT
| | | | | | | | |
2060 Retirement Fund | |
Period
Ended
12/31/2018 | | Growth of $10,000 | | | Total Return | |
| | Cumu-
lative | |
Since 7/2/18 (Inception) | | | $8,946 | | | | -10.54% | |
| | | | | | | | |
S & P 500 Index | |
Period
Ended
12/31/2018 | | Growth of $10,000 | | | Total Return | |
| | Cumu-
lative | |
Since 7/2/18 (Inception) | | | $9,315 | | | | -6.85% | |
| | | | | | | | |
Bloomberg Barclays U.S. Aggregate Bond Index | |
Period
Ended
12/31/2018 | | Growth of $10,000 | | | Total Return | |
| | Cumu-
lative | |
Since 7/2/18 (Inception) | | | $10,162 | | | | 1.66% | |
Performance is for the half-year period from July 2 (Commencement of Operations) to December 31, 2018. The line representing the performance return of the 2060 Retirement Fund includes expenses, such as direct management fees and expenses of the underlying funds in which the Fund invests, that reduce returns while the performance return lines of the Indices do not. Past performance is not indicative of future results.
25
CONSERVATIVE ALLOCATION FUND (Unaudited)
The objective of the Conservative Allocation Fund is current income and, to a lesser extent, capital appreciation. The Conservative Allocation Fund invests primarily in the fixed-income funds of the Investment Company and also invests in the equity funds of the Investment Company. The Conservative Allocation Fund’s target allocation is approximately 65% of net assets in fixed-income funds (approximately 30% in the Bond Fund and 35% in the Mid-Term Bond Fund) and approximately 35% of net assets in equity funds (approximately 25% in the Equity Index Fund, 5% in the Mid-Cap Equity Index Fund and 5% in the International Fund).
Performance for the Conservative Allocation Fund is compared to the Bloomberg Barclays U.S. Aggregate Bond Index (65% weighting) and the S&P 500® Index (35% weighting). For the year ended December 31, 2018, the Conservative Allocation Fund returned -2.02% before expenses and -2.04% after expenses, versus a -1.19% return in the weighted benchmark.
GROWTH OF A $10,000 INVESTMENT
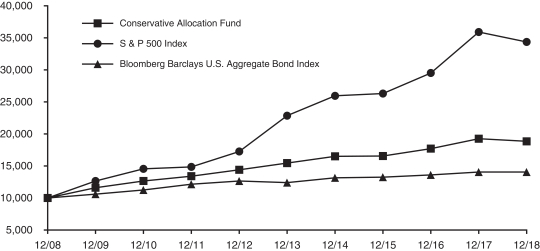
| | | | | | | | | | | | |
Conservative Allocation Fund | |
Period
Ended
12/31/2018 | | Growth of $10,000 | | | Total Return | |
| | Cumu-
lative | | | Average
Annual | |
1 Year | | | $9,796 | | | | -2.04% | | | | -2.04% | |
5 Years | | | $12,192 | | | | 21.92% | | | | 4.04% | |
10 Years | | | $18,857 | | | | 88.57% | | | | 6.55% | |
| | | | | | | | | | | | |
S & P 500 Index | |
Period
Ended
12/31/2018 | | Growth of $10,000 | | | Total Return | |
| | Cumu-
lative | | | Average
Annual | |
1 Year | | | $9,562 | | | | -4.38% | | | | -4.38% | |
5 Years | | | $15,032 | | | | 50.32% | | | | 8.49% | |
10 Years | | | $34,300 | | | | 243.00% | | | | 13.12% | |
| | | | | | | | | | | | |
Bloomberg Barclays U.S. Aggregate Bond Index | |
Period Ended
12/31/2018 | | Growth of
$10,000 | | | Total Return | |
| | Cumu-
lative | | | Average
Annual | |
1 Year | | | $10,001 | | | | 0.01% | | | | 0.01% | |
5 Years | | | $11,325 | | | | 13.25% | | | | 2.52% | |
10 Years | | | $14,074 | | | | 40.74% | | | | 3.48% | |
The line representing the performance return of the Conservative Allocation Fund includes direct operating expenses and expenses in the underlying funds in which the Fund invests, that reduce returns while the performance return lines of the Indicies do not. Past performance is not indicative of future results.
26
MODERATE ALLOCATION FUND (Unaudited)
The objective of the Moderate Allocation Fund is capital appreciation and current income. The Moderate Allocation Fund invests in the equity and fixed-income funds of the Investment Company. The Moderate Allocation Fund’s target allocation is approximately 60% of net assets in equity funds (approximately 35% of its net assets in the Equity Index Fund, 15% in the Mid-Cap Equity Index Fund and 10% in the International Fund) and approximately 40% of net assets in fixed-income funds (approximately 25% of its net assets in the Bond Fund and approximately 15% of its net assets in the Mid-Term Bond Fund).
Performance for the Moderate Allocation Fund is compared to the S&P 500® Index (60% weighting) and the Bloomberg Barclays U.S. Aggregate Bond Index (40% weighting). For the year ended December 31, 2018, the Moderate Allocation Fund returned -4.39% before expenses and -4.41% after expenses, versus a -2.26% return for the weighted benchmark.
GROWTH OF A $10,000 INVESTMENT
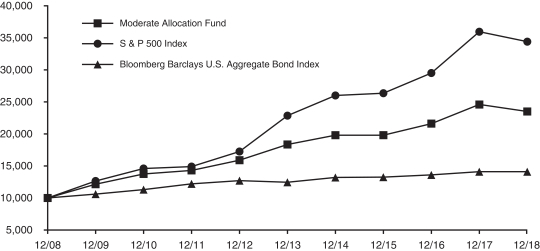
| | | | | | | | | | | | |
Moderate Allocation Fund | |
Period
Ended
12/31/2018 | | Growth of $10,000 | | | Total Return | |
| | Cumu-
lative | | | Average
Annual | |
1 Year | | | $9,559 | | | | -4.41% | | | | -4.41% | |
5 Years | | | $12,790 | | | | 27.90% | | | | 5.05% | |
10 Years | | | $23,445 | | | | 134.45% | | | | 8.89% | |
| | | | | | | | | | | | |
S & P 500 Index | |
Period
Ended
12/31/2018 | | Growth of $10,000 | | | Total Return | |
| | Cumu-
lative | | | Average
Annual | |
1 Year | | | $9,562 | | | | -4.38% | | | | -4.38% | |
5 Years | | | $15,032 | | | | 50.32% | | | | 8.49% | |
10 Years | | | $34,300 | | | | 243.00% | | | | 13.12% | |
| | | | | | | | | | | | |
Bloomberg Barclays U.S. Aggregate Bond Index | |
Period
Ended
12/31/2018 | | Growth of
$10,000 | | | Total Return | |
| | Cumu-
lative | | | Average
Annual | |
1 Year | | | $10,001 | | | | 0.01% | | | | 0.01% | |
5 Years | | | $11,325 | | | | 13.25% | | | | 2.52% | |
10 Years | | | $14,074 | | | | 40.74% | | | | 3.48% | |
The line representing the performance return of the Moderate Allocation Fund includes direct operating expenses and expenses in the underlying funds in which the Fund invests, that reduce returns while the performance return lines of the Indicies do not. Past performance is not indicative of future results.
27
AGGRESSIVE ALLOCATION FUND (Unaudited)
The objective of the Aggressive Allocation Fund is capital appreciation and, to a lesser extent, current income. The Aggressive Allocation Fund invests in the equity and fixed-income funds of the Investment Company. The Aggressive Allocation Fund’s target allocation is approximately 80% of net assets in equity funds (approximately 35% of its net assets in the Equity Index Fund, 20% in the Mid-Cap Equity Index Fund, 5% each in the Small Cap Value Fund and Small Cap Growth Funds, and 15% in the International Fund) and approximately 20% of net assets in the Bond Fund.
Performance for the Aggressive Allocation Fund is compared to the S&P 500® Index (80% weighting) and the Bloomberg Barclays U.S. Aggregate Bond Index (20% weighting). For the year ended December 31, 2018, the Aggressive Allocation Fund returned -7.11% before expenses and -7.13% after expenses, versus an -3.26% return for the weighted benchmark.
GROWTH OF A $10,000 INVESTMENT
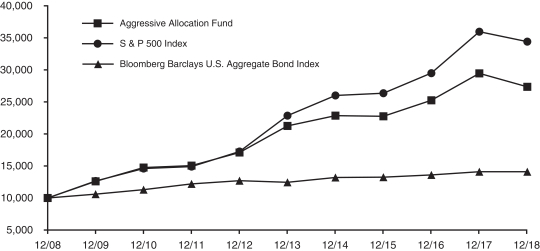
| | | | | | | | | | | | |
Aggressive Allocation Fund | |
Period
Ended
12/31/2018 | | Growth of $10,000 | | | Total Return | |
| | Cumu-
lative | | | Average
Annual | |
1 Year | | | $9,289 | | | | -7.13% | | | | -7.13% | |
5 Years | | | $12,879 | | | | 28.79% | | | | 5.19% | |
10 Years | | | $27,286 | | | | 172.86% | | | | 10.55% | |
| | | | | | | | | | | | |
S & P 500 Index | |
Period
Ended
12/31/2018 | | Growth of $10,000 | | | Total Return | |
| | Cumu-
lative | | | Average
Annual | |
1 Year | | | $9,562 | | | | -4.38% | | | | -4.38% | |
5 Years | | | $15,032 | | | | 50.32% | | | | 8.49% | |
10 Years | | | $34,300 | | | | 243.00% | | | | 13.12% | |
| | | | | | | | | | | | |
Bloomberg Barclays U.S. Aggregate Bond Index | |
Period
Ended
12/31/2018 | | Growth of $10,000 | | | Total Return | |
| | Cumu-
lative | | | Average
Annual | |
1 Year | | | $10,001 | | | | 0.01% | | | | 0.01% | |
5 Years | | | $11,325 | | | | 13.25% | | | | 2.52% | |
10 Years | | | $14,074 | | | | 40.74% | | | | 3.48% | |
The line representing the performance return of the Aggressive Allocation Fund includes direct operating expenses and expenses in the underlying funds in which the Fund invests, that reduce returns while the performance return lines of the Indicies do not. Past performance is not indicative of future results.
28
MONEY MARKET FUND (Unaudited)
The Money Market Fund’s investment objective is to realize current income while maintaining liquidity, investment quality and stability of capital through investing in high-quality commercial paper issued by U.S. corporations and securities issued by the U.S. government and its agencies. For the year ended December 31, 2018, the Money Market Fund returned 1.91% before expenses and 1.71% after expenses, compared to a 1.86% return for the FTSE 3-Month Treasury Bill Index. Note that the benchmark performance does not reflect any expenses.
The Federal Reserve (Fed) governors continue to remove some of the monetary accommodation put in place following the financial crisis in 2008. To that end, they raised the Fed Funds target range four times in 2018 to 2.25% — 2.50%. These moves were, for the most part, expected by the financial markets as communication from the Fed has become more transparent in recent years. Further increases are expected in 2019. In addition to raising the Fed Funds target, the Fed is removing monetary stimulus by slowly winding down its’ $4.0 trillion portfolio. Presently, the Fed reinvests a combined $50 billion fewer Treasuries and mortgage-backed securities each month than it receives via maturities and coupon payments. The intended effect is to shrink the portfolio to close to $1 trillion without having to resort to sales which might drive interest rates higher than desired.
The Fund’s strategy will continue to focus on quality, liquidity, and maintaining a relatively short weighted average maturity. On December 31, 2018, the fund held 22% U.S. Treasury Bills, 17% U.S. agency discount notes and the remainder in commercial paper. The average maturity was 25 days.
The seven-day effective yield as of February 12, 2019, was 2.30%. As with all performance reporting, this yield is not necessarily indicative of future annual yields. Neither the Federal Deposit Insurance Corporation nor any other U.S. government agency insures or guarantees investments in shares of the Money Market Fund.
29
MID-TERM BOND FUND (Unaudited)
The Mid-Term Bond Fund seeks a high level of return consistent with the preservation of capital through investment in publicly traded debt securities. The portfolio continues to emphasize corporate issues, particularly BBB-rated bonds, in order to capture incremental income. The Fund will continue to focus on income, rather than market volatility, to achieve superior returns over market cycles. To achieve the duration target of approximately 90% of the benchmark, intermediate corporate and longer U.S. Treasury maturities are emphasized. In addition, the Fund’s corporate positions will remain highly diversified in order to help shield the portfolio from any credit risks. The objective of the Fund is to maintain a maturity profile similar to the Bloomberg Barclays U.S. Intermediate Government/Credit Bond Index.
For the year ended December 31, 2018, the Mid-Term Bond Fund returned 1.02% before expenses and 0.57% after expenses versus a 0.88% return of the Bloomberg Barclays Intermediate U.S. Government/Credit Bond Index during the same period. The Fund’s emphasis on higher-yielding, short-dated corporate issues was a major contributor to its outperformance.
GROWTH OF A $10,000 INVESTMENT
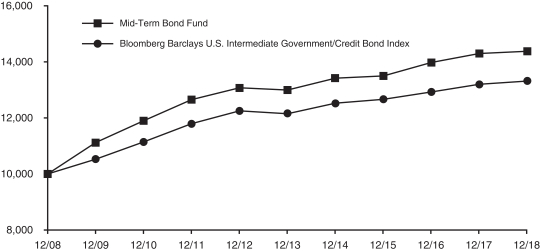
| | | | | | | | | | | | |
Mid-Term Bond Fund | |
Period Ended
12/31/2018 | | Growth of
$10,000 | | | Total Return | |
| | Cumu-
lative | | | Average
Annual | |
1 Year | | | $10,057 | | | | 0.57% | | | | 0.57% | |
5 Years | | | $11,062 | | | | 10.62% | | | | 2.04% | |
10 Years | | | $14,375 | | | | 43.75% | | | | 3.70% | |
| | | | | | | | | | | | |
Bloomberg Barclays U.S. Intermediate
Government/Credit Bond Index | |
Period Ended
12/31/2018 | | Growth of
$10,000 | | | Total Return | |
| | Cumu-
lative | | | Average
Annual | |
1 Year | | | $10,088 | | | | 0.88% | | | | 0.88% | |
5 Years | | | $10,961 | | | | 9.61% | | | | 1.86% | |
10 Years | | | $13,311 | | | | 33.11% | | | | 2.90% | |
The line representing the performance return of the Mid-Term Bond Fund includes expenses, such as transaction costs and management fees that reduce returns, while the performance return line of the Index does not. Past performance is not indicative of future results.
30
BOND FUND (Unaudited)
The Bond Fund’s primary investment objective is to provide as high a level of current income over time as is believed to be consistent with prudent investment risk. It does this by investing primarily in investment grade publicly traded debt securities. A secondary objective is preservation of capital. The securities held by the Bond Fund include corporate, U.S. agency and mortgage-backed securities, all of which normally yield more than U.S. Treasury issues.
Over the long term, the Bond Fund’s strategy is to overweight corporate bonds, underweight U.S. Treasuries, and market weight mortgage-backed securities. The portfolio’s aim is to maintain a similar maturity profile to the benchmark, the Bloomberg Barclays U.S. Aggregate Bond Index (the Aggregate) with an overweighting of BBB issuers. To achieve the duration target of approximately 90% of the benchmark, intermediate corporate and longer U.S. Treasury maturities are emphasized. The Bond Fund also stresses diversification in order to protect the Fund from unexpected credit events, so few corporate holdings exceed one-half of one percent of the Fund’s value. This extreme diversification will be maintained going forward as part of our risk control.
The fixed income market posted marginally positive returns for 2018. The Bloomberg Barclays U.S. Aggregate Bond Index returned 0.01% for the year. All but one of the asset classes represented in the Index delivered positive results during the period. Investment grade corporate bonds were the outlier with a -2.5% return. In general, higher quality bonds outperformed lower and those with shorter maturities outperformed longer.
The Federal Reserve (Fed) governors continue to remove some of the monetary accommodation put in place following the financial crisis in 2008. To that end, they raised the Fed Funds target range four times in 2018 to 2.25% — 2.50%. These moves were, for the most part, expected by the financial markets as communication from the Fed has become more transparent in recent years. Further increases are expected in 2019. In addition to raising the Fed Funds target, the Fed is removing monetary stimulus by slowly winding down its’ $4.0 trillion portfolio. Presently, the Fed reinvests a combined $50 billion fewer Treasuries and mortgage-backed securities each month than it receives via maturities and coupon payments. The intended effect is to shrink the portfolio to close to $1 trillion without having to resort to sales which might drive interest rates higher than desired.
The interest rate curve flattened as yields on short-dated Treasuries rose more than did the yields of long-dated Treasuries. Two-year Treasury Notes yielded 1.88% at the end of the 4th quarter of 2017 and 2.49% on December 31, 2018. Ten-year yields rose 28 basis points or 0.28% to 2.68%. While on the surface these increases might seem small, they do not reflect the path interest rates took during the course of 2018. The trend to higher yields that started in September 2017 peaked in early November 2018. This trend saw the Two-year yield reach 2.97%, a level not seen in a decade. Similarly, the Ten-year yield topped out at 3.24% before falling back to 2.68% at year end. Slowing inflation, lower oil prices and concerns about growth both here and abroad contributed to the fall in interest rates through the end of the year.
Despite a strong start to the year that saw investment grade spreads collapse to pre-crisis tights in early February, high-grade corporate bond spreads widened for much of the year tracing a path from 96 basis points at the end of 2017 to 154 on December 31. Concerns about a flattening yield curve which can affect bank profitability, fewer foreign buyers of U.S. corporates and less demand for short dated corporates from companies freed to repatriate cash under the new tax law all contributed to the widening. In a reversal of the theme of the last two years, lower-rated credit underperformed higher-rated. For the year, AAA-rated corporate spreads widened 23 basis points, while BBB-rated bond spreads widened 69.
For the year ended December 31, 2018, the Bond Fund returned 0.62% before expenses and 0.17% after expenses versus the 0.01% return of the Bloomberg Barclays U.S. Aggregate Bond Index. The Fund’s relative outperformance was driven primarily by its underweight position in long-dated securities which, as noted above, performed poorly relative to the remainder of the market.
GROWTH OF A $10,000 INVESTMENT
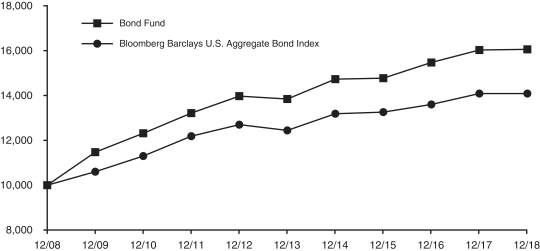
| | | | | | | | | | | | |
Bond Fund | |
Period
Ended
12/31/2018 | | Growth of $10,000 | | | Total Return | |
| | Cumu-
lative | | | Average
Annual | |
1 Year | | | $10,018 | | | | 0.17% | | | | 0.17% | |
5 Years | | | $11,592 | | | | 15.92% | | | | 3.00% | |
10 Years | | | $16,032 | | | | 60.32% | | | | 4.85% | |
| | | | | | | | | | | | |
Bloomberg Barclays U.S. Aggregate Bond Index | |
Period
Ended
12/31/2018 | | Growth of $10,000 | | | Total Return | |
| | Cumu-
lative | | | Average
Annual | |
1 Year | | | $10,001 | | | | 0.01% | | | | 0.01% | |
5 Years | | | $11,325 | | | | 13.25% | | | | 2.52% | |
10 Years | | | $14,074 | | | | 40.74% | | | | 3.48% | |
|
| The line representing the performance return of the Bond Fund includes expenses, such as transaction costs and management fees that reduce returns, while the performance return line of the Index does not. Past performance is not indicative of future results. |
31
MUTUAL OF AMERICA INVESTMENT CORPORATION
ASSET ALLOCATIONS AS OF DECEMBER 31, 2018 (Unaudited)
Equity Index Fund

All America Fund
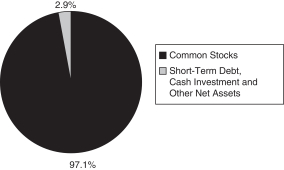
Small Cap Value Fund
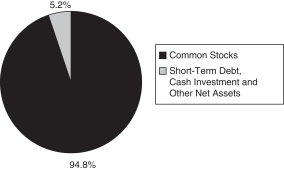
Small Cap Growth Fund

Small Cap Equity Index Fund
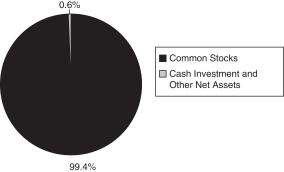
Mid Cap Value Fund
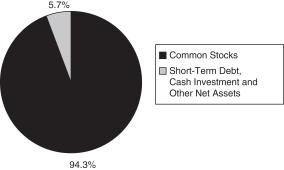
32
MUTUAL OF AMERICA INVESTMENT CORPORATION
ASSET ALLOCATIONS AS OF DECEMBER 31, 2018 (Unaudited) (Continued)
Mid-Cap Equity Index Fund

International Fund
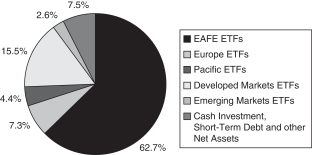
Composite Fund
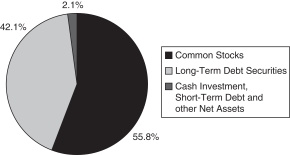
Retirement Income Fund
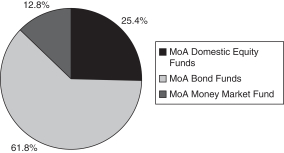
2010 Retirement Fund
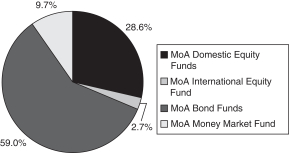
2015 Retirement Fund
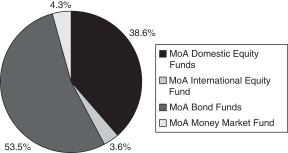
33
MUTUAL OF AMERICA INVESTMENT CORPORATION
ASSET ALLOCATIONS AS OF DECEMBER 31, 2018 (Unaudited) (Continued)
2020 Retirement Fund
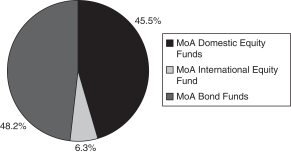
2025 Retirement Fund
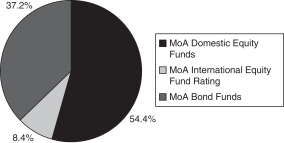
2030 Retirement Fund
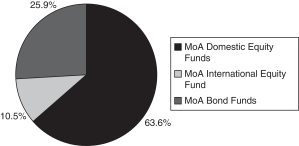
2035 Retirement Fund
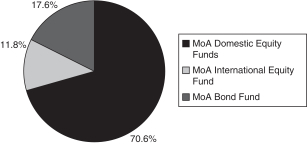
2040 Retirement Fund
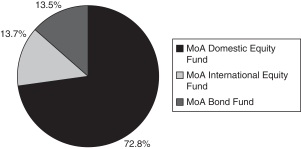
2045 Retirement Fund
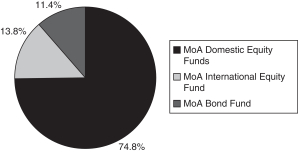
34
MUTUAL OF AMERICA INVESTMENT CORPORATION
ASSET ALLOCATIONS AS OF DECEMBER 31, 2018 (Unaudited) (Continued)
2050 Retirement Fund
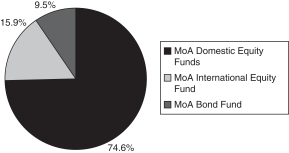
2055 Retirement Fund
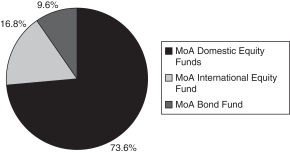
2060 Retirement Fund
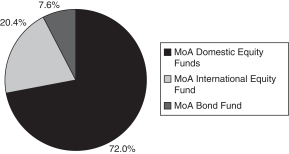
Conservative Allocation Fund
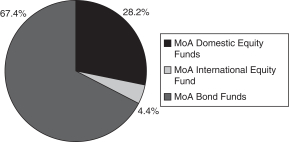
Moderate Allocation Fund
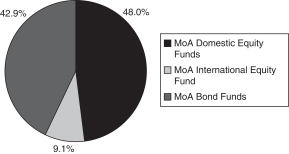
Aggressive Allocation Fund
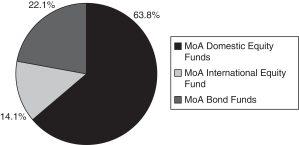
35
MUTUAL OF AMERICA INVESTMENT CORPORATION
ASSET ALLOCATIONS AS OF DECEMBER 31, 2018 (Unaudited) (Continued)
Money Market Fund
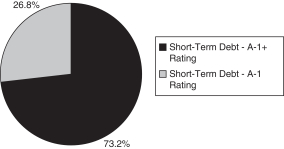
Mid-Term Bond Fund
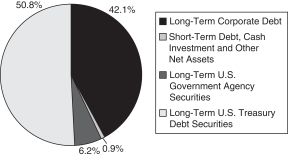
Bond Fund
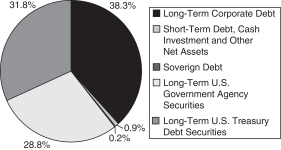
36
MUTUAL OF AMERICA INVESTMENT CORPORATION
EXPENSE EXAMPLE (Unaudited)
EXAMPLE
As a shareholder of one of the Mutual of America Investment Corporation Funds, you incur ongoing costs, including management fees and other Fund expenses. You do not incur transactional costs, such as sales charges (loads), redemption fees or exchange fees. Additionally, Mutual of America Capital Management LLC, the Funds’ Adviser, has contractually agreed to reimburse the direct non-advisory operating expenses of any Allocation or Retirement Fund (each a “Fund of Funds”) that has less than $50 million in average daily net assets for the prior calendar year. This contractual obligation remains in effect through April 30, 2019 and will continue for succeeding 12 month periods ending April 30th unless i) The Fund of Funds has at least $50 million in average daily net assets for the prior calendar year, ii) the Investment Company gives not less than 30 days written notice to the Adviser, or iii) the Adviser gives 45 days advance notice to the Investment Company before the next May 1 of a given year to terminate the agreement. In that case, the agreement will terminate on the next May 1 following the written notice.
This Example is intended to help you understand your ongoing costs (in dollars) of investing in a Fund and to compare these costs with the ongoing costs of investing in other mutual funds. The Example is based on an investment of $1,000 invested at July 1, 2018 and held for the entire period ending December 31, 2018 under the expense reimbursement agreement in effect during that period as described above.
The estimate of expenses does not include fees and charges associated with your variable annuity contract or variable life insurance policy. If those fees and charges were included, the estimate of expenses for the period would be higher and your ending account value would be lower.
ACTUAL EXPENSES
The first line of the tables below provides information about actual account values and actual expenses. You may use the information in this line, together with the amount you invested, to estimate the expenses that you paid over the period. Simply divide your account value by $1,000 (for example, an $8,600 account value divided by $1,000=8.6), then multiply the result by the number in the first line under the heading entitled “Expenses Paid During Period” to estimate the expenses you paid on your account during this period.
HYPOTHETICAL EXAMPLE FOR COMPARISON PURPOSES
The second line of the tables below provides information about hypothetical account values and hypothetical expenses based on each Fund’s actual expense ratio and an assumed rate of return of 5% per year before expenses, which is not the Fund’s actual return. The hypothetical account values and expenses may not be used to estimate the actual ending account balance or expenses you paid for the period. You may use this information to compare the ongoing costs of investing in the Fund with other funds. To do so, compare this 5% hypothetical example with the 5% hypothetical examples that appear in the shareholder reports of the other funds.
Please note that the second line of the table is useful in comparing ongoing costs only, and will not help you determine the relative total costs of owning other non-Mutual of America funds, which may also charge transactional costs, such as sales charges (loads), redemption fees or exchange fees, which the Mutual of America Investment Corporation does not charge.
| | | | | | | | | | | | | | | | | | |
| | | Equity Index Fund | | | | |
| | | | | Beginning
Account Value
July 1, 2018 | | | Ending
Account Value
December 31, 2018 | | | Expenses Paid
During Period*
July 1, 2018 to
December 31, 2018 | | | | |
| | | Actual | | | $1,000.00 | | | | $930.74 | | | | $0.63 | | | | | |
| | | Hypothetical
(5% return before expenses) | | | $1,000.00 | | | �� | $1,024.23 | | | | $0.66 | | | | | |
| | * | Expenses are equal to the Fund’s annual expense ratio of 0.13%, multiplied by the average account value over the period, multiplied by 184/365 (to reflect the one-half year period). |
37
MUTUAL OF AMERICA INVESTMENT CORPORATION
EXPENSE EXAMPLE (Unaudited) (Continued)
| | | | | | | | | | | | | | | | | | |
| | | All America Fund | | | | |
| | | | | Beginning
Account Value
July 1, 2018 | | | Ending
Account Value
December 31, 2018 | | | Expenses Paid
During Period*
July 1, 2018 to
December 31, 2018 | | | | |
| | | Actual | | | $1,000.00 | | | | $899.33 | | | | $2.49 | | | | | |
| | | Hypothetical
(5% return before expenses) | | | $1,000.00 | | | | $1,022.22 | | | | $2.65 | | | | | |
| | * | Expenses are equal to the Fund’s annual expense ratio of 0.52%, multiplied by the average account value over the period, multiplied by 184/365 (to reflect the one-half year period). |
| | | | | | | | | | | | | | | | | | |
| | | Small Cap Value Fund | | | | |
| | | | | Beginning
Account Value
July 1, 2018 | | | Ending
Account Value
December 31, 2018 | | | Expenses Paid During Period* July 1, 2018 to December 31, 2018 | | | | |
| | | Actual | | | $1,000.00 | | | | $843.76 | | | | $3.75 | | | | | |
| | | Hypothetical
(5% return before expenses) | | | $1,000.00 | | | | $1,020.72 | | | | $4.13 | | | | | |
| | * | Expenses are equal to the Fund’s annual expense ratio of 0.81%, multiplied by the average account value over the period, multiplied by 184/365 (to reflect the one-half year period). |
| | | | | | | | | | | | | | | | | | |
| | | Small Cap Growth Fund | | | | |
| | | | | Beginning
Account Value
July 1, 2018 | | | Ending
Account Value
December 31, 2018 | | | Expenses Paid During Period* July 1, 2018 to December 31, 2018 | | | | |
| | | Actual | | | $1,000.00 | | | | $845.01 | | | | $3.76 | | | | | |
| | | Hypothetical
(5% return before expenses) | | | $1,000.00 | | | | $1,020.72 | | | | $4.13 | | | | | |
| | * | Expenses are equal to the Fund’s annual expense ratio of 0.81%, multiplied by the average account value over the period, multiplied by 184/365 (to reflect the one-half year period). |
| | | | | | | | | | | | | | | | | | |
| | | Small Cap Equity Index Fund | | | | |
| | | | | Beginning
Account Value
July 1, 2018 | | | Ending
Account Value
December 31, 2018 | | | Expenses Paid During Period* July 1, 2018 to December 31, 2018 | | | | |
| | | Actual | | | $1,000.00 | | | | $834.59 | | | | $0.65 | | | | | |
| | | Hypothetical
(5% return before expenses) | | | $1,000.00 | | | | $1,024.18 | | | | $0.71 | | | | | |
| | * | The Fund commenced operations on July 2, 2018. Expenses are equal to the Fund’s annualized expense ratio of 0.14%, multiplied by the average account value over the period, multiplied by 184/365 (to reflect the one-half year period). |
38
MUTUAL OF AMERICA INVESTMENT CORPORATION
EXPENSE EXAMPLE (Unaudited) (Continued)
| | | | | | | | | | | | | | | | | | |
| | | Mid Cap Value Fund | | | | |
| | | | | Beginning
Account Value
July 1, 2018 | | | Ending
Account Value
December 31, 2018 | | | Expenses Paid During Period* July 1, 2018 to December 31, 2018 | | | | |
| | | Actual | | | $1,000.00 | | | | $859.99 | | | | $3.04 | | | | | |
| | | Hypothetical
(5% return before expenses) | | | $1,000.00 | | | | $1,021.55 | | | | $3.31 | | | | | |
| | * | Expenses are equal to the Fund’s annual expense ratio of 0.65%, multiplied by the average account value over the period, multiplied by 184/365 (to reflect the one-half year period). |
| | | | | | | | | | | | | | | | | | |
| | | Mid-Cap Equity Index Fund | | | | |
| | | | | Beginning
Account Value
July 1, 2018 | | | Ending
Account Value
December 31, 2018 | | | Expenses Paid During Period* July 1, 2018 to December 31, 2018 | | | | |
| | | Actual | | | $1,000.00 | | | | $858.53 | | | | $0.65 | | | | | |
| | | Hypothetical
(5% return before expenses) | | | $1,000.00 | | | | $1,024.18 | | | | $0.71 | | | | | |
| | * | Expenses are equal to the Fund’s annual expense ratio of 0.14%, multiplied by the average account value over the period, multiplied by 184/365 (to reflect the one-half year period). |
| | | | | | | | | | | | | | | | | | |
| | | International Fund | | | | |
| | | | | Beginning
Account Value
July 1, 2018 | | | Ending
Account Value
December 31, 2018 | | | Expenses Paid During Period* July 1, 2018 to December 31, 2018 | | | | |
| | | Actual | | | $1,000.00 | | | | $891.01 | | | | $1.62 | | | | | |
| | | Hypothetical
(5% return before expenses) | | | $1,000.00 | | | | $1,023.15 | | | | $1.73 | | | | | |
| | * | Expenses are equal to the Fund’s annual expense ratio of 0.34% (reflecting direct expenses and the proportional expense ratios of the underlying funds in which the Fund invests), multiplied by the average account value over the period, multiplied by 184/365 (to reflect the one-half year period). |
| | | | | | | | | | | | | | | | | | |
| | | Composite Fund | | | | |
| | | | | Beginning
Account Value
July 1, 2018 | | | Ending Account Value
December 31, 2018 | | | Expenses Paid During Period* July 1, 2018 to December 31, 2018 | | | | |
| | | Actual | | | $1,000.00 | | | | $962.35 | | | | $2.52 | | | | | |
| | | Hypothetical
(5% return before expenses) | | | $1,000.00 | | | | $1,022.27 | | | | $2.60 | | | | | |
| | * | Expenses are equal to the Fund’s annual expense ratio of 0.51%, multiplied by the average account value over the period, multiplied by 184/365 (to reflect the one-half year period). |
39
MUTUAL OF AMERICA INVESTMENT CORPORATION
EXPENSE EXAMPLE (Unaudited) (Continued)
| | | | | | | | | | | | | | | | | | |
| | | Retirement Income Fund | | | | |
| | | | | Beginning
Account Value
July 1, 2018 | | | Ending
Account Value
December 31, 2018 | | | Expenses Paid During Period* July 1, 2018 to December 31, 2018 | | | | |
| | | Actual | | | $1,000.00 | | | | $987.52 | | | | $2.05 | | | | | |
| | | Hypothetical
(5% return before expenses) | | | $1,000.00 | | | | $1,022.78 | | | | $2.09 | | | | | |
| | * | Expenses are equal to the Fund’s annual expense ratio of 0.41% (reflecting direct expenses and the proportional expense ratios of the underlying funds in which the Fund invests), multiplied by the average account value over the period, multiplied by 184/365 (to reflect the one-half year period). |
| | | | | | | | | | | | | | | | | | |
| | | 2010 Retirement Fund | | | | |
| | | | | Beginning
Account Value
July 1, 2018 | | | Ending
Account Value
December 31, 2018 | | | Expenses Paid During Period* July 1, 2018 to December 31, 2018 | | | | |
| | | Actual | | | $1,000.00 | | | | $979.01 | | | | $1.85 | | | | | |
| | | Hypothetical
(5% return before expenses) | | | $1,000.00 | | | | $1,022.99 | | | | $1.89 | | | | | |
| | * | Expenses are equal to the Fund’s annual expense ratio of 0.37% (reflecting direct expenses and the proportional expense ratios of the underlying funds in which the Fund invests), multiplied by the average account value over the period, multiplied by 184/365 (to reflect the one-half year period). |
| | | | | | | | | | | | | | | | | | |
| | | 2015 Retirement Fund | | | | |
| | | | | Beginning
Account Value
July 1, 2018 | | | Ending
Account Value
December 31, 2018 | | | Expenses Paid During Period* July 1, 2018 to December 31, 2018 | | | | |
| | | Actual | | | $1,000.00 | | | | $966.01 | | | | $1.88 | | | | | |
| | | Hypothetical
(5% return before expenses) | | | $1,000.00 | | | | $1,022.94 | | | | $1.94 | | | | | |
| | * | Expenses are equal to the Fund’s annual expense ratio of 0.38% (reflecting direct expenses and the proportional expense ratios of the underlying funds in which the Fund invests), multiplied by the average account value over the period, multiplied by 184/365 (to reflect the one-half year period). |
| | | | | | | | | | | | | | | | | | |
| | | 2020 Retirement Fund | | | | |
| | | | | Beginning
Account Value July 1, 2018 | | | Ending
Account Value
December 31, 2018 | | | Expenses Paid During Period* July 1, 2018 to December 31, 2018 | | | | |
| | | Actual | | | $1,000.00 | | | | $953.99 | | | | $1.77 | | | | | |
| | | Hypothetical
(5% return before expenses) | | | $1,000.00 | | | | $1,023.04 | | | | $1.84 | | | | | |
| | * | Expenses are equal to the Fund’s annual expense ratio of 0.36% (reflecting direct expenses and the proportional expense ratios of the underlying funds in which the Fund invests), multiplied by the average account value over the period, multiplied by 184/365 (to reflect the one-half year period). |
40
MUTUAL OF AMERICA INVESTMENT CORPORATION
EXPENSE EXAMPLE (Unaudited) (Continued)
| | | | | | | | | | | | | | | | | | |
| | | 2025 Retirement Fund | | | | |
| | | | | Beginning
Account Value
July 1, 2018 | | | Ending
Account Value
December 31, 2018 | | | Expenses Paid During Period* July 1, 2018 to December 31, 2018 | | | | |
| | | Actual | | | $1,000.00 | | | | $939.31 | | | | $1.71 | | | | | |
| | | Hypothetical
(5% return before expenses) | | | $1,000.00 | | | | $1,023.09 | | | | $1.78 | | | | | |
| | * | Expenses are equal to the Fund’s annual expense ratio of 0.35% (reflecting direct expenses and the proportional expense ratios of the underlying funds in which the Fund invests), multiplied by the average account value over the period, multiplied by 184/365 (to reflect the one-half year period). |
| | | | | | | | | | | | | | | | | | |
| | | 2030 Retirement Fund | | | | |
| | | | | Beginning
Account Value
July 1, 2018 | | | Ending
Account Value
December 31, 2018 | | | Expenses Paid During Period* July 1, 2018 to December 31, 2018 | | | | |
| | | Actual | | | $1,000.00 | | | | $924.07 | | | | $1.65 | | | | | |
| | | Hypothetical
(5% return before expenses) | | | $1,000.00 | | | | $1,023.15 | | | | $1.73 | | | | | |
| | * | Expenses are equal to the Fund’s annual expense ratio of 0.34% (reflecting direct expenses and the proportional expense ratios of the underlying funds in which the Fund invests), multiplied by the average account value over the period, multiplied by 184/365 (to reflect the one-half year period). |
| | | | | | | | | | | | | | | | | | |
| | | 2035 Retirement Fund | | | | |
| | | | | Beginning
Account Value
July 1, 2018 | | | Ending
Account Value
December 31, 2018 | | | Expenses Paid During Period* July 1, 2018 to December 31, 2018 | | | | |
| | | Actual | | | $1,000.00 | | | | $913.27 | | | | $1.54 | | | | | |
| | | Hypothetical
(5% return before expenses) | | | $1,000.00 | | | | $1,023.25 | | | | $1.63 | | | | | |
| | * | Expenses are equal to the Fund’s annual expense ratio of 0.32% (reflecting direct expenses and the proportional expense ratios of the underlying funds in which the Fund invests), multiplied by the average account value over the period, multiplied by 184/365 (to reflect the one-half year period). |
| | | | | | | | | | | | | | | | | | |
| | | 2040 Retirement Fund | | | | |
| | | | | Beginning
Account Value
July 1, 2018 | | | Ending
Account Value
December 31, 2018 | | | Expenses Paid During Period* July 1, 2018 to December 31, 2018 | | | | |
| | | Actual | | | $1,000.00 | | | | $907.47 | | | | $1.58 | | | | | |
| | | Hypothetical
(5% return before expenses) | | | $1,000.00 | | | | $1,023.20 | | | | $1.68 | | | | | |
| | * | Expenses are equal to the Fund’s annual expense ratio of 0.33% (reflecting direct expenses and the proportional expense ratios of the underlying funds in which the Fund invests), multiplied by the average account value over the period, multiplied by 184/365 (to reflect the one-half year period). |
41
MUTUAL OF AMERICA INVESTMENT CORPORATION
EXPENSE EXAMPLE (Unaudited) (Continued)
| | | | | | | | | | | | | | | | | | |
| | | 2045 Retirement Fund | | | | |
| | | | | Beginning
Account Value
July 1, 2018 | | | Ending
Account Value
December 31, 2018 | | | Expenses Paid During Period* July 1, 2018 to December 31, 2018 | | | | |
| | | Actual | | | $1,000.00 | | | | $903.41 | | | | $1.63 | | | | | |
| | | Hypothetical
(5% return before expenses) | | | $1,000.00 | | | | $1,023.15 | | | | $1.73 | | | | | |
| | * | Expenses are equal to the Fund’s annual expense ratio of 0.34% (reflecting direct expenses and the proportional expense ratios of the underlying funds in which the Fund invests), multiplied by the average account value over the period, multiplied by 184/365 (to reflect the one-half year period). |
| | | | | | | | | | | | | | | | | | |
| | | 2050 Retirement Fund | | | | |
| | | | | Beginning
Account Value
July 1, 2018 | | | Ending
Account Value
December 31, 2018 | | | Expenses Paid During Period* July 1, 2018 to December 31, 2018 | | | | |
| | | Actual | | | $1,000.00 | | | | $899.17 | | | | $1.67 | | | | | |
| | | Hypothetical
(5% return before expenses) | | | $1,000.00 | | | | $1,023.09 | | | | $1.78 | | | | | |
| | * | Expenses are equal to the Fund’s annual expense ratio of 0.35% (reflecting direct expenses and the proportional expense ratios of the underlying funds in which the Fund invests), multiplied by the average account value over the period, multiplied by 184/365 (to reflect the one-half year period). |
| | | | | | | | | | | | | | | | | | |
| | | 2055 Retirement Fund | | | | |
| | | | | Beginning
Account Value
July 1, 2018 | | | Ending
Account Value
December 31, 2018 | | | Expenses Paid During Period* July 1, 2018 to December 31, 2018 | | | | |
| | | Actual | | | $1,000.00 | | | | $898.21 | | | | $1.62 | | | | | |
| | | Hypothetical
(5% return before expenses) | | | $1,000.00 | | | | $1,023.15 | | | | $1.73 | | | | | |
| | * | Expenses are equal to the Fund’s annual expense ratio of 0.34% (reflecting direct expenses and the proportional expense ratios of the underlying funds in which the Fund invests), multiplied by the average account value over the period, multiplied by 184/365 (to reflect the one-half year period). |
| | | | | | | | | | | | | | | | | | |
| | | 2060 Retirement Fund | | | | |
| | | | | Beginning
Account Value
July 1, 2018 | | | Ending
Account Value
December 31, 2018 | | | Expenses Paid During Period* July 1, 2018 to December 31, 2018 | | | | |
| | | Actual | | | $1,000.00 | | | | $894.57 | | | | $1.62 | | | | | |
| | | Hypothetical
(5% return before expenses) | | | $1,000.00 | | | | $1,023.15 | | | | $1.73 | | | | | |
| | * | The Fund commenced operations on July 2, 2018. Expenses are equal to the Fund’s annualized expense ratio of 0.34% (reflecting direct expenses and the proportional expense ratios of the underlying funds in which the Fund invests), multiplied by the average account value over the period, multiplied by 184/365 (to reflect the one-half year period). |
42
MUTUAL OF AMERICA INVESTMENT CORPORATION
EXPENSE EXAMPLE (Unaudited) (Continued)
| | | | | | | | | | | | | | | | | | |
| | | Conservative Allocation Fund | | | | |
| | | | | Beginning
Account Value
July 1, 2018 | | | Ending
Account Value
December 31, 2018 | | | Expenses Paid During Period* July 1, 2018 to December 31, 2018 | | | | |
| | | Actual | | | $1,000.00 | | | | $980.45 | | | | $1.80 | | | | | |
| | | Hypothetical
(5% return before expenses) | | | $1,000.00 | | | | $1,023.04 | | | | $1.84 | | | | | |
| | * | Expenses are equal to the Fund’s annual expense ratio of 0.36% (reflecting direct operating expenses and the proportional expense ratios of the underlying funds in which the Fund invests), multiplied by the average account value over the period, multiplied by 184/365 (to reflect the one-half year period). |
| | | | | | | | | | | | | | | | | | |
| | | Moderate Allocation Fund | | | | |
| | | | | Beginning
Account Value
July 1, 2018 | | | Ending
Account Value
December 31, 2018 | | | Expenses Paid During Period* July 1, 2018 to December 31, 2018 | | | | |
| | | Actual | | | $1,000.00 | | | | $950.02 | | | | $1.33 | | | | | |
| | | Hypothetical
(5% return before expenses) | | | $1,000.00 | | | | $1,023.51 | | | | $1.38 | | | | | |
| | * | Expenses are equal to the Fund’s annual expense ratio of 0.27% (reflecting direct operating expenses and the proportional expense ratios of the underlying funds in which the Fund invests), multiplied by the average account value over the period, multiplied by 184/365 (to reflect the one-half year period). |
| | | | | | | | | | | | | | | | | | |
| | | Aggressive Allocation Fund | | | | |
| | | | | Beginning
Account Value
July 1, 2018 | | | Ending
Account Value
December 31, 2018 | | | Expenses Paid During Period* July 1, 2018 to December 31, 2018 | | | | |
| | | Actual | | | $1,000.00 | | | | $918.66 | | | | $1.35 | | | | | |
| | | Hypothetical
(5% return before expenses) | | | $1,000.00 | | | | $1,023.45 | | | | $1.43 | | | | | |
| | * | Expenses are equal to the Fund’s annual expense ratio of 0.28% (reflecting direct operating expenses and the proportional expense ratios of the underlying funds in which the Fund invests), multiplied by the average account value over the period, multiplied by 184/365 (to reflect the one-half year period). |
| | | | | | | | | | | | | | | | | | |
| | | Money Market Fund | | | | |
| | | | | Beginning
Account Value
July 1, 2018 | | | Ending
Account Value
December 31, 2018 | | | Expenses Paid During Period* July 1, 2018 to December 31, 2018 | | | | |
| | | Actual | | | $1,000.00 | | | | $1,009.88 | | | | $1.01 | | | | | |
| | | Hypothetical
(5% return before expenses) | | | $1,000.00 | | | | $1,023.87 | | | | $1.02 | | | | | |
| | * | Expenses are equal to the Fund’s annual expense ratio of 0.20%, multiplied by the average account value over the period, multiplied by 184/365 (to reflect the one-half year period). |
43
MUTUAL OF AMERICA INVESTMENT CORPORATION
EXPENSE EXAMPLE (Unaudited) (Continued)
| | | | | | | | | | | | | | | | | | |
| | | Mid-Term Bond Fund | | | | |
| | | | | Beginning
Account Value
July 1, 2018 | | | Ending
Account Value
December 31, 2018 | | | Expenses Paid During Period* July 1, 2018 to December 31, 2018 | | | | |
| | | Actual | | | $1,000.00 | | | | $1,014.66 | | | | $2.29 | | | | | |
| | | Hypothetical
(5% return before expenses) | | | $1,000.00 | | | | $1,022.58 | | | | $2.29 | | | | | |
| | * | Expenses are equal to the Fund’s annual expense ratio of 0.45%, multiplied by the average account value over the period, multiplied by 184/365 (to reflect the one-half year period). |
| | | | | | | | | | | | | | | | | | |
| | | Bond Fund | | | | |
| | | | | Beginning
Account Value
July 1, 2018 | | | Ending
Account Value
December 31, 2018 | | | Expenses Paid During Period* July 1, 2018 to December 31, 2018 | | | | |
| | | Actual | | | $1,000.00 | | | | $1,017.39 | | | | $2.29 | | | | | |
| | | Hypothetical
(5% return before expenses) | | | $1,000.00 | | | | $1,022.58 | | | | $2.29 | | | | | |
| | * | Expenses are equal to the Fund’s annual expense ratio of 0.45%, multiplied by the average account value over the period, multiplied by 184/365 (to reflect the one-half year period). |
44
MUTUAL OF AMERICA INVESTMENT CORPORATION — EQUITY INDEX FUND
PORTFOLIO OF INVESTMENTS IN SECURITIES
December 31, 2018
| | | | | | | | |
| | | Shares | | | Value | |
| | | | | | | | |
| INDEXED ASSETS: | | | | | | | | |
COMMON STOCKS: | | | | | | | | |
COMMUNICATION SERVICES (9.8%) | | | | | | | | |
Activision Blizzard, Inc. | | | 93,025 | | | $ | 4,332,174 | |
Alphabet, Inc. Cl A* | | | 36,501 | | | | 38,142,085 | |
Alphabet, Inc. Cl C* | | | 37,474 | | | | 38,808,449 | |
AT&T, Inc. | | | 879,824 | | | | 25,110,177 | |
CBS Corp. Cl B | | | 40,847 | | | | 1,785,831 | |
CenturyLink, Inc. | | | 115,289 | | | | 1,746,628 | |
Charter Communications, Inc. Cl A* | | | 21,577 | | | | 6,148,798 | |
Comcast Corp. Cl A | | | 552,013 | | | | 18,796,043 | |
Discovery, Inc. Cl A* | | | 19,052 | | | | 471,346 | |
Discovery, Inc. Cl C* | | | 43,916 | | | | 1,013,581 | |
DISH Network Corp. Cl A* | | | 27,865 | | | | 695,789 | |
Electronic Arts, Inc.* | | | 36,692 | | | | 2,895,366 | |
Facebook, Inc. Cl A* | | | 290,669 | | | | 38,103,799 | |
Interpublic Group of Cos., Inc. | | | 46,377 | | | | 956,758 | |
Netflix, Inc.* | | | 53,627 | | | | 14,353,803 | |
News Corp. Cl A | | | 46,805 | | | | 531,237 | |
News Corp. Cl B | | | 14,935 | | | | 172,499 | |
Omnicom Group, Inc. | | | 27,045 | | | | 1,980,776 | |
Take-Two Interactive Software, Inc.* | | | 13,908 | | | | 1,431,690 | |
TripAdvisor, Inc.* | | | 12,535 | | | | 676,138 | |
Twenty-First Century Fox, Inc. Cl A | | | 127,503 | | | | 6,135,444 | |
Twenty-First Century Fox, Inc. Cl B | | | 58,805 | | | | 2,809,703 | |
Twitter, Inc.* | | | 88,562 | | | | 2,545,272 | |
Verizon Communications, Inc. | | | 496,575 | | | | 27,917,446 | |
Viacom, Inc. Cl B | | | 42,791 | | | | 1,099,729 | |
Walt Disney Co. | | | 180,868 | | | | 19,832,176 | |
| | | | | | | | |
| | | | | | | 258,492,737 | |
| | | | | | | | |
CONSUMER DISCRETIONARY (9.6%) | | | | | | | | |
Advance Auto Parts, Inc. | | | 8,888 | | | | 1,399,504 | |
Amazon.com, Inc.* | | | 49,445 | | | | 74,264,907 | |
Aptiv PLC | | | 31,847 | | | | 1,960,820 | |
AutoZone, Inc.* | | | 3,047 | | | | 2,554,422 | |
Best Buy Co., Inc. | | | 28,473 | | | | 1,507,930 | |
Booking Hldgs., Inc.* | | | 5,581 | | | | 9,612,826 | |
BorgWarner, Inc. | | | 25,312 | | | | 879,339 | |
CarMax, Inc.* | | | 21,002 | | | | 1,317,455 | |
Carnival Corp. | | | 48,349 | | | | 2,383,606 | |
Chipotle Mexican Grill, Inc. Cl A* | | | 2,928 | | | | 1,264,281 | |
Darden Restaurants, Inc. | | | 14,927 | | | | 1,490,610 | |
Dollar General Corp. | | | 31,925 | | | | 3,450,454 | |
Dollar Tree, Inc.* | | | 28,808 | | | | 2,601,939 | |
DR Horton, Inc. | | | 41,508 | | | | 1,438,667 | |
eBay, Inc.* | | | 109,752 | | | | 3,080,739 | |
Expedia Group, Inc. | | | 14,338 | | | | 1,615,176 | |
Foot Locker, Inc. | | | 13,954 | | | | 742,353 | |
Ford Motor Co. | | | 472,741 | | | | 3,616,469 | |
Gap, Inc. | | | 25,923 | | | | 667,776 | |
Garmin Ltd. | | | 14,566 | | | | 922,319 | |
General Motors Co. | | | 158,975 | | | | 5,317,714 | |
Genuine Parts Co. | | | 17,712 | | | | 1,700,706 | |
Goodyear Tire & Rubber Co. | | | 28,201 | | | | 575,582 | |
| | | | | | | | |
| | | Shares | | | Value | |
| | | | | | | | |
| INDEXED ASSETS (CONTINUED): | | | | | | | | |
COMMON STOCKS (CONTINUED): | | | | | | | | |
CONSUMER DISCRETIONARY (CONTINUED) | | | | | | | | |
H&R Block, Inc. | | | 24,796 | | | $ | 629,074 | |
Hanesbrands, Inc. | | | 43,944 | | | | 550,618 | |
Harley-Davidson, Inc. | | | 19,460 | | | | 663,975 | |
Hasbro, Inc. | | | 14,093 | | | | 1,145,056 | |
Hilton Worldwide Hldgs., Inc. | | | 35,933 | | | | 2,579,989 | |
Home Depot, Inc. | | | 136,290 | | | | 23,417,348 | |
Kohl’s Corp. | | | 20,103 | | | | 1,333,633 | |
L Brands, Inc. | | | 28,033 | | | | 719,607 | |
Leggett & Platt, Inc. | | | 15,829 | | | | 567,311 | |
Lennar Corp. Cl A | | | 35,537 | | | | 1,391,274 | |
LKQ Corp.* | | | 38,163 | | | | 905,608 | |
Lowe’s Cos., Inc. | | | 97,306 | | | | 8,987,182 | |
Macy’s, Inc. | | | 37,506 | | | | 1,116,929 | |
Marriott International, Inc. Cl A | | | 34,512 | | | | 3,746,623 | |
Mattel, Inc.* | | | 41,313 | | | | 412,717 | |
McDonald’s Corp. | | | 92,737 | | | | 16,467,309 | |
MGM Resorts International | | | 61,183 | | | | 1,484,300 | |
Michael Kors Hldgs. Ltd.* | | | 18,121 | | | | 687,148 | |
Mohawk Industries, Inc.* | | | 7,645 | | | | 894,159 | |
Newell Brands, Inc. | | | 52,416 | | | | 974,413 | |
NIKE, Inc. Cl B | | | 155,348 | | | | 11,517,501 | |
Nordstrom, Inc. | | | 13,747 | | | | 640,748 | |
Norwegian Cruise Line Hldgs. Ltd.* | | | 26,771 | | | | 1,134,823 | |
O’Reilly Automotive, Inc.* | | | 9,698 | | | | 3,339,312 | |
PulteGroup, Inc. | | | 31,202 | | | | 810,940 | |
PVH Corp. | | | 9,229 | | | | 857,836 | |
Ralph Lauren Corp. Cl A | | | 6,653 | | | | 688,319 | |
Ross Stores, Inc. | | | 45,188 | | | | 3,759,642 | |
Royal Caribbean Cruises Ltd. | | | 20,845 | | | | 2,038,433 | |
Starbucks Corp. | | | 149,928 | | | | 9,655,363 | |
Tapestry, Inc. | | | 35,092 | | | | 1,184,355 | |
Target Corp. | | | 63,179 | | | | 4,175,500 | |
Tiffany & Co. | | | 13,164 | | | | 1,059,834 | |
TJX Cos., Inc. | | | 149,776 | | | | 6,700,978 | |
Tractor Supply Co. | | | 14,819 | | | | 1,236,497 | |
Ulta Beauty, Inc.* | | | 6,803 | | | | 1,665,647 | |
Under Armour, Inc. Cl A* | | | 22,660 | | | | 400,402 | |
Under Armour, Inc. Cl C* | | | 23,348 | | | | 377,537 | |
VF Corp. | | | 39,479 | | | | 2,816,432 | |
Whirlpool Corp. | | | 7,860 | | | | 839,998 | |
Wynn Resorts Ltd. | | | 11,836 | | | | 1,170,699 | |
Yum! Brands, Inc. | | | 37,392 | | | | 3,437,073 | |
| | | | | | | | |
| | | | | | | 252,547,736 | |
| | | | | | | | |
CONSUMER STAPLES (7.2%) | | | | | | | | |
Altria Group, Inc. | | | 224,712 | | | | 11,098,526 | |
Archer-Daniels-Midland Co. | | | 67,609 | | | | 2,769,941 | |
Brown-Forman Corp. Cl B | | | 19,947 | | | | 949,078 | |
Campbell Soup Co. | | | 23,167 | | | | 764,279 | |
Church & Dwight Co., Inc. | | | 29,357 | | | | 1,930,516 | |
Clorox Co. | | | 15,313 | | | | 2,360,346 | |
Coca-Cola Co. | | | 460,887 | | | | 21,822,999 | |
Colgate-Palmolive Co. | | | 104,867 | | | | 6,241,684 | |
Conagra Brands, Inc. | | | 58,899 | | | | 1,258,083 | |
Constellation Brands, Inc. Cl A | | | 20,134 | | | | 3,237,950 | |
The accompanying notes are an integral part of these portfolio schedules.
45
MUTUAL OF AMERICA INVESTMENT CORPORATION — EQUITY INDEX FUND
PORTFOLIO OF INVESTMENTS IN SECURITIES (Continued)
December 31, 2018
| | | | | | | | |
| | | Shares | | | Value | |
| | | | | | | | |
| INDEXED ASSETS (CONTINUED): | | | | | | | | |
COMMON STOCKS (CONTINUED): | | | | | | | | |
CONSUMER STAPLES (CONTINUED) | | | | | | | | |
Costco Wholesale Corp. | | | 52,943 | | | $ | 10,785,019 | |
Coty, Inc. Cl A | | | 54,603 | | | | 358,196 | |
Estee Lauder Cos., Inc. Cl A | | | 26,506 | | | | 3,448,431 | |
General Mills, Inc. | | | 72,132 | | | | 2,808,820 | |
Hershey Co. | | | 16,866 | | | | 1,807,698 | |
Hormel Foods Corp. | | | 32,852 | | | | 1,402,123 | |
JM Smucker Co. | | | 13,671 | | | | 1,278,102 | |
Kellogg Co. | | | 30,545 | | | | 1,741,370 | |
Kimberly-Clark Corp. | | | 41,502 | | | | 4,728,738 | |
Kraft Heinz Co. | | | 75,500 | | | | 3,249,520 | |
Kroger Co. | | | 96,290 | | | | 2,647,975 | |
Lamb Weston Hldgs., Inc. | | | 17,652 | | | | 1,298,481 | |
McCormick & Co., Inc. | | | 14,677 | | | | 2,043,625 | |
Molson Coors Brewing Co. Cl B | | | 22,741 | | | | 1,277,135 | |
Mondelez International, Inc. Cl A | | | 175,570 | | | | 7,028,067 | |
Monster Beverage Corp.* | | | 48,254 | | | | 2,375,062 | |
PepsiCo, Inc. | | | 170,824 | | | | 18,872,636 | |
Philip Morris International, Inc. | | | 187,876 | | | | 12,542,602 | |
Procter & Gamble Co. | | | 299,244 | | | | 27,506,508 | |
Sysco Corp. | | | 57,540 | | | | 3,605,456 | |
Tyson Foods, Inc. Cl A | | | 35,667 | | | | 1,904,618 | |
Walgreens Boots Alliance, Inc. | | | 97,495 | | | | 6,661,833 | |
Walmart, Inc. | | | 171,636 | | | | 15,987,893 | |
| | | | | | | | |
| | | | | | | 187,793,310 | |
| | | | | | | | |
ENERGY (5.1%) | | | | | | | | |
Anadarko Petroleum Corp. | | | 60,784 | | | | 2,664,771 | |
Apache Corp. | | | 46,015 | | | | 1,207,894 | |
Baker Hughes, a GE Co. Cl A | | | 62,185 | | | | 1,336,977 | |
Cabot Oil & Gas Corp. | | | 51,640 | | | | 1,154,154 | |
Chevron Corp. | | | 231,284 | | | | 25,161,386 | |
Cimarex Energy Co. | | | 11,647 | | | | 718,037 | |
Concho Resources, Inc.* | | | 24,216 | | | | 2,489,163 | |
ConocoPhillips | | | 138,840 | | | | 8,656,674 | |
Devon Energy Corp. | | | 56,705 | | | | 1,278,131 | |
Diamondback Energy, Inc. | | | 18,688 | | | | 1,732,378 | |
EOG Resources, Inc. | | | 70,547 | | | | 6,152,404 | |
Exxon Mobil Corp. | | | 509,908 | | | | 34,770,626 | |
Halliburton Co. | | | 106,266 | | | | 2,824,550 | |
Helmerich & Payne, Inc. | | | 13,194 | | | | 632,520 | |
Hess Corp. | | | 29,939 | | | | 1,212,529 | |
HollyFrontier Corp. | | | 19,416 | | | | 992,546 | |
Kinder Morgan, Inc. | | | 229,070 | | | | 3,523,097 | |
Marathon Oil Corp. | | | 100,663 | | | | 1,443,507 | |
Marathon Petroleum Corp. | | | 82,970 | | | | 4,896,060 | |
National Oilwell Varco, Inc. | | | 46,061 | | | | 1,183,768 | |
Newfield Exploration Co.* | | | 24,230 | | | | 355,212 | |
Noble Energy, Inc. | | | 58,241 | | | | 1,092,601 | |
Occidental Petroleum Corp. | | | 91,162 | | | | 5,595,524 | |
ONEOK, Inc. | | | 49,781 | | | | 2,685,685 | |
Phillips 66 | | | 51,052 | | | | 4,398,130 | |
Pioneer Natural Resources Co. | | | 20,459 | | | | 2,690,768 | |
Schlumberger Ltd. | | | 165,442 | | | | 5,969,147 | |
TechnipFMC PLC | | | 50,814 | | | | 994,938 | |
Valero Energy Corp. | | | 50,785 | | | | 3,807,351 | |
| | | | | | | | |
| | | Shares | | | Value | |
| | | | | | | | |
| INDEXED ASSETS (CONTINUED): | | | | | | | | |
COMMON STOCKS (CONTINUED): | | | | | | | | |
ENERGY (CONTINUED) | | | | | | | | |
Williams Cos., Inc. | | | 145,819 | | | $ | 3,215,309 | |
| | | | | | | | |
| | | | | | | 134,835,837 | |
| | | | | | | | |
FINANCIALS (12.9%) | | | | | | | | |
Affiliated Managers Group, Inc. | | | 6,288 | | | | 612,703 | |
Aflac, Inc. | | | 91,520 | | | | 4,169,651 | |
Allstate Corp. | | | 41,367 | | | | 3,418,155 | |
American Express Co. | | | 84,448 | | | | 8,049,583 | |
American International Group, Inc. | | | 106,964 | | | | 4,215,451 | |
Ameriprise Financial, Inc. | | | 16,855 | | | | 1,759,156 | |
Aon PLC | | | 28,948 | | | | 4,207,881 | |
Arthur J. Gallagher & Co. | | | 22,085 | | | | 1,627,664 | |
Assurant, Inc. | | | 6,283 | | | | 561,951 | |
Bank of America Corp. | | | 1,102,201 | | | | 27,158,233 | |
Bank of New York Mellon Corp. | | | 109,504 | | | | 5,154,353 | |
BB&T Corp. | | | 92,588 | | | | 4,010,912 | |
Berkshire Hathaway, Inc. Cl B* | | | 234,114 | | | | 47,801,397 | |
BlackRock, Inc. Cl A | | | 14,625 | | | | 5,744,992 | |
Brighthouse Financial, Inc.* | | | 14,325 | | | | 436,626 | |
Capital One Financial Corp. | | | 57,188 | | | | 4,322,841 | |
Cboe Global Markets, Inc. | | | 12,890 | | | | 1,261,029 | |
Charles Schwab Corp. | | | 144,890 | | | | 6,017,282 | |
Chubb Ltd. | | | 55,231 | | | | 7,134,741 | |
Cincinnati Financial Corp. | | | 18,194 | | | | 1,408,579 | |
Citigroup, Inc. | | | 295,728 | | | | 15,395,600 | |
Citizens Financial Group, Inc. | | | 56,412 | | | | 1,677,129 | |
CME Group, Inc. Cl A | | | 43,132 | | | | 8,113,992 | |
Comerica, Inc. | | | 19,477 | | | | 1,337,875 | |
Discover Financial Svcs. | | | 40,634 | | | | 2,396,593 | |
E*TRADE Financial Corp. | | | 30,738 | | | | 1,348,783 | |
Everest Re Group Ltd. | | | 4,892 | | | | 1,065,282 | |
Fifth Third Bancorp | | | 78,837 | | | | 1,855,035 | |
First Republic Bank | | | 19,723 | | | | 1,713,929 | |
Franklin Resources, Inc. | | | 35,770 | | | | 1,060,938 | |
Goldman Sachs Group, Inc. | | | 41,760 | | | | 6,976,008 | |
Hartford Financial Svcs. Group, Inc. | | | 43,106 | | | | 1,916,062 | |
Huntington Bancshares, Inc. | | | 127,354 | | | | 1,518,060 | |
Intercontinental Exchange, Inc. | | | 68,432 | | | | 5,154,983 | |
Invesco Ltd. | | | 49,563 | | | | 829,685 | |
Jefferies Financial Group, Inc. | | | 34,041 | | | | 590,952 | |
JPMorgan Chase & Co. | | | 400,986 | | | | 39,144,253 | |
KeyCorp | | | 123,916 | | | | 1,831,478 | |
Lincoln National Corp. | | | 25,717 | | | | 1,319,539 | |
Loews Corp. | | | 33,313 | | | | 1,516,408 | |
M&T Bank Corp. | | | 16,910 | | | | 2,420,328 | |
Marsh & McLennan Cos., Inc. | | | 60,509 | | | | 4,825,593 | |
MetLife, Inc. | | | 118,269 | | | | 4,856,125 | |
Moody’s Corp. | | | 20,056 | | | | 2,808,642 | |
Morgan Stanley | | | 157,723 | | | | 6,253,717 | |
MSCI, Inc. Cl A | | | 10,681 | | | | 1,574,700 | |
Nasdaq, Inc. | | | 13,764 | | | | 1,122,729 | |
The accompanying notes are an integral part of these portfolio schedules.
46
MUTUAL OF AMERICA INVESTMENT CORPORATION — EQUITY INDEX FUND
PORTFOLIO OF INVESTMENTS IN SECURITIES (Continued)
December 31, 2018
| | | | | | | | |
| | | Shares | | | Value | |
| | | | | | | | |
| INDEXED ASSETS (CONTINUED): | | | | | | | | |
COMMON STOCKS (CONTINUED): | | | | | | | | |
FINANCIALS (CONTINUED) | | | | | | | | |
Northern Trust Corp. | | | 26,631 | | | $ | 2,226,085 | |
People’s United Financial, Inc. | | | 45,628 | | | | 658,412 | |
PNC Financial Svcs. Group Inc | | | 55,471 | | | | 6,485,115 | |
Principal Financial Group, Inc. | | | 31,516 | | | | 1,392,062 | |
Progressive Corp. | | | 70,412 | | | | 4,247,956 | |
Prudential Financial, Inc. | | | 49,734 | | | | 4,055,808 | |
Raymond James Financial, Inc. | | | 15,533 | | | | 1,155,811 | |
Regions Financial Corp. | | | 124,422 | | | | 1,664,766 | |
S&P Global, Inc. | | | 30,155 | | | | 5,124,541 | |
State Street Corp. | | | 45,486 | | | | 2,868,802 | |
SunTrust Banks, Inc. | | | 53,889 | | | | 2,718,161 | |
SVB Financial Group* | | | 6,450 | | | | 1,224,984 | |
Synchrony Financial | | | 79,671 | | | | 1,869,082 | |
T. Rowe Price Group, Inc. | | | 29,055 | | | | 2,682,358 | |
Torchmark Corp. | | | 12,308 | | | | 917,315 | |
Travelers Cos., Inc. | | | 31,857 | | | | 3,814,876 | |
U.S. Bancorp | | | 182,635 | | | | 8,346,419 | |
Unum Group | | | 26,313 | | | | 773,076 | |
Wells Fargo & Co. | | | 509,671 | | | | 23,485,640 | |
Willis Towers Watson PLC | | | 15,593 | | | | 2,367,953 | |
Zions Bancorporation | | | 23,135 | | | | 942,520 | |
| | | | | | | | |
| | | | | | | 338,719,340 | |
| | | | | | | | |
HEALTH CARE (15.0%) | | | | | | | | |
Abbott Laboratories | | | 212,133 | | | | 15,343,580 | |
AbbVie, Inc. | | | 184,416 | | | | 17,001,311 | |
ABIOMED, Inc.* | | | 5,453 | | | | 1,772,443 | |
Agilent Technologies, Inc. | | | 38,509 | | | | 2,597,817 | |
Alexion Pharmaceuticals, Inc.* | | | 27,328 | | | | 2,660,654 | |
Align Technology, Inc.* | | | 8,762 | | | | 1,835,026 | |
Allergan PLC | | | 38,407 | | | | 5,133,480 | |
AmerisourceBergen Corp. Cl A | | | 19,022 | | | | 1,415,237 | |
Amgen, Inc. | | | 76,852 | | | | 14,960,779 | |
Anthem, Inc. | | | 30,961 | | | | 8,131,287 | |
Baxter International, Inc. | | | 59,720 | | | | 3,930,770 | |
Becton Dickinson & Co. | | | 32,353 | | | | 7,289,778 | |
Biogen, Inc.* | | | 24,569 | | | | 7,393,304 | |
Boston Scientific Corp.* | | | 167,694 | | | | 5,926,306 | |
Bristol-Myers Squibb Co. | | | 197,044 | | | | 10,242,347 | |
Cardinal Health, Inc. | | | 36,039 | | | | 1,607,339 | |
Celgene Corp.* | | | 85,341 | | | | 5,469,505 | |
Centene Corp.* | | | 24,879 | | | | 2,868,549 | |
Cerner Corp.* | | | 40,091 | | | | 2,102,372 | |
Cigna Corp. | | | 45,814 | | | | 8,700,995 | |
Cooper Cos., Inc. | | | 5,906 | | | | 1,503,077 | |
CVS Health Corp. | | | 155,705 | | | | 10,201,792 | |
Danaher Corp. | | | 74,297 | | | | 7,661,507 | |
DaVita, Inc.* | | | 15,268 | | | | 785,691 | |
DENTSPLY SIRONA, Inc. | | | 26,764 | | | | 995,888 | |
Edwards Lifesciences Corp.* | | | 25,292 | | | | 3,873,976 | |
Eli Lilly & Co. | | | 113,552 | | | | 13,140,237 | |
Gilead Sciences, Inc. | | | 157,185 | | | | 9,831,922 | |
HCA Healthcare, Inc. | | | 32,432 | | | | 4,036,162 | |
Henry Schein, Inc.* | | | 18,461 | | | | 1,449,558 | |
Hologic, Inc.* | | | 32,478 | | | | 1,334,846 | |
Humana, Inc. | | | 16,458 | | | | 4,714,888 | |
| | | | | | | | |
| | | Shares | | | Value | |
| | | | | | | | |
| INDEXED ASSETS (CONTINUED): | | | | | | | | |
COMMON STOCKS (CONTINUED): | | | | | | | | |
HEALTH CARE (CONTINUED) | | | | | | | | |
IDEXX Laboratories, Inc.* | | | 10,498 | | | $ | 1,952,838 | |
Illumina, Inc.* | | | 17,952 | | | | 5,384,343 | |
Incyte Corp.* | | | 21,731 | | | | 1,381,874 | |
Intuitive Surgical, Inc.* | | | 13,844 | | | | 6,630,169 | |
IQVIA Hldgs., Inc.* | | | 19,024 | | | | 2,210,018 | |
Johnson & Johnson | | | 323,664 | | | | 41,768,839 | |
Laboratory Corp. of America Hldgs.* | | | 12,208 | | | | 1,542,603 | |
McKesson Corp. | | | 23,554 | | | | 2,602,010 | |
Medtronic PLC | | | 161,992 | | | | 14,734,792 | |
Merck & Co., Inc. | | | 313,780 | | | | 23,975,930 | |
Mettler-Toledo International, Inc.* | | | 3,018 | | | | 1,706,920 | |
Mylan NV* | | | 62,703 | | | | 1,718,062 | |
Nektar Therapeutics Cl A* | | | 21,291 | | | | 699,835 | |
PerkinElmer, Inc. | | | 13,489 | | | | 1,059,561 | |
Perrigo Co. PLC | | | 15,236 | | | | 590,395 | |
Pfizer, Inc. | | | 698,143 | | | | 30,473,942 | |
Quest Diagnostics, Inc. | | | 16,461 | | | | 1,370,708 | |
Regeneron Pharmaceuticals, Inc.* | | | 9,437 | | | | 3,524,720 | |
ResMed, Inc. | | | 17,268 | | | | 1,966,307 | |
Stryker Corp. | | | 37,407 | | | | 5,863,547 | |
Thermo Fisher Scientific, Inc. | | | 48,562 | | | | 10,867,690 | |
UnitedHealth Group, Inc. | | | 116,443 | | | | 29,008,280 | |
Universal Health Svcs., Inc. Cl B | | | 10,228 | | | | 1,192,176 | |
Varian Medical Systems, Inc.* | | | 11,085 | | | | 1,256,041 | |
Vertex Pharmaceuticals, Inc.* | | | 31,155 | | | | 5,162,695 | |
Waters Corp.* | | | 9,131 | | | | 1,722,563 | |
WellCare Health Plans, Inc.* | | | 6,010 | | | | 1,418,901 | |
Zimmer Biomet Hldgs., Inc. | | | 24,650 | | | | 2,556,698 | |
Zoetis, Inc. Cl A | | | 58,099 | | | | 4,969,788 | |
| | | | | | | | |
| | | | | | | 395,224,668 | |
| | | | | | | | |
INDUSTRIALS (8.9%) | | | | | | | | |
3M Co. | | | 70,635 | | | | 13,458,793 | |
Alaska Air Group, Inc. | | | 14,896 | | | | 906,422 | |
Allegion PLC | | | 11,473 | | | | 914,513 | |
American Airlines Group, Inc. | | | 49,747 | | | | 1,597,376 | |
AMETEK, Inc. | | | 27,992 | | | | 1,895,058 | |
AO Smith Corp. | | | 17,382 | | | | 742,211 | |
Arconic, Inc. | | | 52,229 | | | | 880,581 | |
Boeing Co. | | | 63,948 | | | | 20,623,230 | |
Caterpillar, Inc. | | | 71,138 | | | | 9,039,506 | |
CH Robinson Worldwide, Inc. | | | 16,511 | | | | 1,388,410 | |
Cintas Corp. | | | 10,351 | | | | 1,738,865 | |
Copart, Inc.* | | | 24,751 | | | | 1,182,603 | |
CSX Corp. | | | 96,840 | | | | 6,016,669 | |
Cummins, Inc. | | | 17,763 | | | | 2,373,847 | |
Deere & Co. | | | 38,936 | | | | 5,808,083 | |
Delta Air Lines, Inc. | | | 75,281 | | | | 3,756,522 | |
Dover Corp. | | | 17,723 | | | | 1,257,447 | |
Eaton Corp. PLC | | | 52,260 | | | | 3,588,172 | |
Emerson Electric Co. | | | 75,472 | | | | 4,509,452 | |
Equifax, Inc. | | | 14,523 | | | | 1,352,527 | |
Expeditors International of Washington, Inc. | | | 20,837 | | | | 1,418,791 | |
The accompanying notes are an integral part of these portfolio schedules.
47
MUTUAL OF AMERICA INVESTMENT CORPORATION — EQUITY INDEX FUND
PORTFOLIO OF INVESTMENTS IN SECURITIES (Continued)
December 31, 2018
| | | | | | | | |
| | | Shares | | | Value | |
| | | | | | | | |
| INDEXED ASSETS (CONTINUED): | | | | | | | | |
COMMON STOCKS (CONTINUED): | | | | | | | | |
INDUSTRIALS (CONTINUED) | | | | | | | | |
Fastenal Co. | | | 34,754 | | | $ | 1,817,287 | |
FedEx Corp. | | | 29,047 | | | | 4,686,153 | |
Flowserve Corp. | | | 15,819 | | | | 601,438 | |
Fluor Corp. | | | 17,055 | | | | 549,171 | |
Fortive Corp. | | | 35,614 | | | | 2,409,643 | |
Fortune Brands Home & Security, Inc. | | | 17,195 | | | | 653,238 | |
General Dynamics Corp. | | | 33,481 | | | | 5,263,548 | |
General Electric Co. | | | 1,051,132 | | | | 7,957,069 | |
Harris Corp. | | | 14,166 | | | | 1,907,452 | |
Honeywell International, Inc. | | | 89,071 | | | | 11,768,061 | |
Huntington Ingalls Industries, Inc. | | | 5,179 | | | | 985,616 | |
IHS Markit Ltd.* | | | 43,330 | | | | 2,078,540 | |
Illinois Tool Works, Inc. | | | 37,023 | | | | 4,690,444 | |
Ingersoll-Rand PLC | | | 29,802 | | | | 2,718,836 | |
Jacobs Engineering Group, Inc. | | | 14,449 | | | | 844,689 | |
JB Hunt Transport Svcs., Inc. | | | 10,538 | | | | 980,456 | |
Johnson Controls International PLC | | | 112,082 | | | | 3,323,231 | |
Kansas City Southern | | | 12,232 | | | | 1,167,544 | |
L-3 Technologies, Inc. | | | 9,490 | | | | 1,648,033 | |
Lockheed Martin Corp. | | | 29,697 | | | | 7,775,863 | |
Masco Corp. | | | 37,120 | | | | 1,085,389 | |
Nielsen Hldgs. PLC | | | 43,024 | | | | 1,003,750 | |
Norfolk Southern Corp. | | | 32,843 | | | | 4,911,342 | |
Northrop Grumman Corp. | | | 20,750 | | | | 5,081,675 | |
PACCAR, Inc. | | | 42,190 | | | | 2,410,737 | |
Parker-Hannifin Corp. | | | 15,909 | | | | 2,372,668 | |
Pentair PLC | | | 19,257 | | | | 727,529 | |
Quanta Svcs., Inc. | | | 17,683 | | | | 532,258 | |
Raytheon Co. | | | 34,242 | | | | 5,251,011 | |
Republic Svcs., Inc. Cl A | | | 26,062 | | | | 1,878,810 | |
Robert Half International, Inc. | | | 14,683 | | | | 839,868 | |
Rockwell Automation, Inc. | | | 14,573 | | | | 2,192,945 | |
Rollins, Inc. | | | 17,784 | | | | 642,002 | |
Roper Technologies, Inc. | | | 12,509 | | | | 3,333,899 | |
Snap-on, Inc. | | | 6,745 | | | | 979,981 | |
Southwest Airlines Co. | | | 61,044 | | | | 2,837,325 | |
Stanley Black & Decker, Inc. | | | 18,337 | | | | 2,195,672 | |
Textron, Inc. | | | 29,311 | | | | 1,348,013 | |
TransDigm Group, Inc.* | | | 5,863 | | | | 1,993,772 | |
Union Pacific Corp. | | | 88,708 | | | | 12,262,107 | |
United Continental Hldgs., Inc.* | | | 27,582 | | | | 2,309,441 | |
United Parcel Svcs., Inc. Cl B | | | 83,476 | | | | 8,141,414 | |
United Rentals, Inc.* | | | 9,927 | | | | 1,017,815 | |
United Technologies Corp. | | | 97,765 | | | | 10,410,017 | |
Verisk Analytics, Inc. Cl A* | | | 19,887 | | | | 2,168,478 | |
Waste Management, Inc. | | | 47,156 | | | | 4,196,412 | |
WW Grainger, Inc. | | | 5,528 | | | | 1,560,886 | |
Xylem, Inc. | | | 21,658 | | | | 1,445,022 | |
| | | | | | | | |
| | | | | | | 233,405,628 | |
| | | | | | | | |
| | | | | | | | |
| | | Shares | | | Value | |
| | | | | | | | |
| INDEXED ASSETS (CONTINUED): | | | | | | | | |
COMMON STOCKS (CONTINUED): | | | | | | | | |
INFORMATION TECHNOLOGY (19.5%) | | | | | | | | |
Accenture PLC Cl A | | | 76,848 | | | $ | 10,836,336 | |
Adobe, Inc.* | | | 59,617 | | | | 13,487,750 | |
Advanced Micro Devices, Inc.* | | | 107,529 | | | | 1,984,985 | |
Akamai Technologies, Inc.* | | | 19,713 | | | | 1,204,070 | |
Alliance Data Systems Corp. | | | 5,657 | | | | 849,003 | |
Amphenol Corp. Cl A | | | 36,350 | | | | 2,945,077 | |
Analog Devices, Inc. | | | 44,880 | | | | 3,852,050 | |
ANSYS, Inc.* | | | 10,085 | | | | 1,441,550 | |
Apple, Inc. | | | 548,010 | | | | 86,443,098 | |
Applied Materials, Inc. | | | 118,960 | | | | 3,894,750 | |
Arista Networks, Inc.* | | | 6,367 | | | | 1,341,527 | |
Autodesk, Inc.* | | | 26,623 | | | | 3,423,984 | |
Automatic Data Processing, Inc. | | | 53,082 | | | | 6,960,112 | |
Broadcom, Inc. | | | 50,012 | | | | 12,717,051 | |
Broadridge Financial Solutions, Inc. | | | 14,215 | | | | 1,368,194 | |
Cadence Design Systems, Inc.* | | | 34,139 | | | | 1,484,364 | |
Cisco Systems, Inc. | | | 543,196 | | | | 23,536,683 | |
Citrix Systems, Inc. | | | 15,524 | | | | 1,590,589 | |
Cognizant Technology Solutions Corp. Cl A | | | 70,163 | | | | 4,453,947 | |
Corning, Inc. | | | 96,905 | | | | 2,927,500 | |
DXC Technology Co. | | | 33,924 | | | | 1,803,739 | |
F5 Networks, Inc.* | | | 7,337 | | | | 1,188,814 | |
Fidelity National Information Svcs., Inc. | | | 39,308 | | | | 4,031,035 | |
Fiserv, Inc.* | | | 48,338 | | | | 3,552,360 | |
FleetCor Technologies, Inc.* | | | 10,731 | | | | 1,992,961 | |
FLIR Systems, Inc. | | | 16,453 | | | | 716,364 | |
Fortinet, Inc.* | | | 17,720 | | | | 1,248,020 | |
Gartner, Inc.* | | | 10,965 | | | | 1,401,766 | |
Global Payments, Inc. | | | 19,180 | | | | 1,978,033 | |
Hewlett Packard Enterprise Co. | | | 171,614 | | | | 2,267,021 | |
HP, Inc. | | | 190,438 | | | | 3,896,362 | |
Intel Corp. | | | 551,889 | | | | 25,900,151 | |
International Business Machines Corp. | | | 109,844 | | | | 12,485,968 | |
Intuit, Inc. | | | 31,411 | | | | 6,183,255 | |
IPG Photonics Corp.* | | | 4,338 | | | | 491,452 | |
Jack Henry & Associates, Inc. | | | 9,343 | | | | 1,182,076 | |
Juniper Networks, Inc. | | | 41,687 | | | | 1,121,797 | |
Keysight Technologies, Inc.* | | | 22,655 | | | | 1,406,422 | |
KLA-Tencor Corp. | | | 18,374 | | | | 1,644,289 | |
Lam Research Corp. | | | 18,821 | | | | 2,562,856 | |
Mastercard, Inc. Cl A | | | 110,322 | | | | 20,812,245 | |
Maxim Integrated Products, Inc. | | | 33,584 | | | | 1,707,746 | |
Microchip Technology, Inc. | | | 28,776 | | | | 2,069,570 | |
Micron Technology, Inc.* | | | 135,784 | | | | 4,308,426 | |
Microsoft Corp. | | | 940,810 | | | | 95,558,072 | |
Motorola Solutions, Inc. | | | 19,673 | | | | 2,263,182 | |
NetApp, Inc. | | | 30,446 | | | | 1,816,713 | |
NVIDIA Corp. | | | 74,134 | | | | 9,896,889 | |
Oracle Corp. | | | 307,908 | | | | 13,902,046 | |
Paychex, Inc. | | | 38,708 | | | | 2,521,826 | |
PayPal Hldgs. Inc.* | | | 143,511 | | | | 12,067,840 | |
The accompanying notes are an integral part of these portfolio schedules.
48
MUTUAL OF AMERICA INVESTMENT CORPORATION — EQUITY INDEX FUND
PORTFOLIO OF INVESTMENTS IN SECURITIES (Continued)
December 31, 2018
| | | | | | | | |
| | | Shares | | | Value | |
| | | | | | | | |
| INDEXED ASSETS (CONTINUED): | | | | | | | | |
COMMON STOCKS (CONTINUED): | | | | | | | | |
INFORMATION TECHNOLOGY (CONTINUED) | | | | | | | | |
Qorvo, Inc.* | | | 15,107 | | | $ | 917,448 | |
QUALCOMM, Inc. | | | 146,704 | | | | 8,348,925 | |
Red Hat, Inc.* | | | 21,256 | | | | 3,733,404 | |
Salesforce.com, Inc.* | | | 93,167 | | | | 12,761,084 | |
Seagate Technology PLC | | | 31,474 | | | | 1,214,582 | |
Skyworks Solutions, Inc. | | | 21,506 | | | | 1,441,332 | |
Symantec Corp. | | | 77,913 | | | | 1,472,166 | |
Synopsys, Inc.* | | | 18,098 | | | | 1,524,576 | |
TE Connectivity Ltd. | | | 41,177 | | | | 3,114,217 | |
Texas Instruments, Inc. | | | 116,094 | | | | 10,970,883 | |
Total System Svcs., Inc. | | | 20,302 | | | | 1,650,350 | |
VeriSign, Inc.* | | | 12,904 | | | | 1,913,534 | |
Visa, Inc. Cl A | | | 212,476 | | | | 28,034,083 | |
Western Digital Corp. | | | 35,253 | | | | 1,303,303 | |
Western Union Co. | | | 53,631 | | | | 914,945 | |
Xerox Corp. | | | 25,146 | | | | 496,885 | |
Xilinx, Inc. | | | 30,670 | | | | 2,612,164 | |
| | | | | | | | |
| | | | | | | 513,145,797 | |
| | | | | | | | |
MATERIALS (2.6%) | | | | | | | | |
Air Products & Chemicals, Inc. | | | 26,430 | | | | 4,230,122 | |
Albemarle Corp. | | | 12,807 | | | | 987,036 | |
Avery Dennison Corp. | | | 10,458 | | | | 939,442 | |
Ball Corp. | | | 40,767 | �� | | | 1,874,467 | |
Celanese Corp. Cl A | | | 16,014 | | | | 1,440,780 | |
CF Industries Hldgs., Inc. | | | 27,816 | | | | 1,210,274 | |
DowDuPont, Inc. | | | 276,624 | | | | 14,793,852 | |
Eastman Chemical Co. | | | 16,917 | | | | 1,236,802 | |
Ecolab, Inc. | | | 30,643 | | | | 4,515,246 | |
FMC Corp. | | | 16,396 | | | | 1,212,648 | |
Freeport-McMoRan, Inc. | | | 175,915 | | | | 1,813,684 | |
International Flavors & Fragrances, Inc. | | | 12,193 | | | | 1,637,154 | |
International Paper Co. | | | 48,823 | | | | 1,970,496 | |
Linde PLC | | | 66,730 | | | | 10,412,549 | |
LyondellBasell Industries NV Cl A | | | 37,821 | | | | 3,145,194 | |
Martin Marietta Materials, Inc. | | | 7,612 | | | | 1,308,274 | |
Mosaic Co. | | | 42,801 | | | | 1,250,217 | |
Newmont Mining Corp. | | | 64,010 | | | | 2,217,947 | |
Nucor Corp. | | | 37,662 | | | | 1,951,268 | |
Packaging Corp. of America | | | 11,415 | | | | 952,696 | |
PPG Industries, Inc. | | | 28,892 | | | | 2,953,629 | |
Sealed Air Corp. | | | 18,881 | | | | 657,814 | |
Sherwin-Williams Co. | | | 9,937 | | | | 3,909,812 | |
Vulcan Materials Co. | | | 16,134 | | | | 1,594,039 | |
WestRock Co. | | | 30,678 | | | | 1,158,401 | |
| | | | | | | | |
| | | | | | | 69,373,843 | |
| | | | | | | | |
REAL ESTATE (2.9%) | | | | | | | | |
Alexandria Real Estate Equities, Inc. | | | 12,959 | | | | 1,493,395 | |
American Tower Corp. | | | 53,132 | | | | 8,404,951 | |
Apartment Investment & Management Co. Cl A | | | 18,684 | | | | 819,854 | |
AvalonBay Communities, Inc. | | | 16,652 | | | | 2,898,281 | |
| | | | | | | | |
| | | Shares | | | Value | |
| | | | | | | | |
| INDEXED ASSETS (CONTINUED): | | | | | | | | |
COMMON STOCKS (CONTINUED): | | | | | | | | |
REAL ESTATE (CONTINUED) | | | | | | | | |
Boston Properties, Inc. | | | 18,611 | | | $ | 2,094,668 | |
CBRE Group, Inc. Cl A* | | | 38,276 | | | | 1,532,571 | |
Crown Castle International Corp. | | | 50,125 | | | | 5,445,079 | |
Digital Realty Trust, Inc. | | | 24,882 | | | | 2,651,177 | |
Duke Realty Corp. | | | 43,125 | | | | 1,116,937 | |
Equinix, Inc. | | | 9,737 | | | | 3,432,877 | |
Equity Residential | | | 44,428 | | | | 2,932,692 | |
Essex Property Trust, Inc. | | | 7,918 | | | | 1,941,573 | |
Extra Space Storage, Inc. | | | 15,114 | | | | 1,367,515 | |
Federal Realty Investment Trust | | | 8,884 | | | | 1,048,667 | |
HCP, Inc. | | | 57,424 | | | | 1,603,852 | |
Host Hotels & Resorts, Inc. | | | 89,309 | | | | 1,488,781 | |
Iron Mountain, Inc. | | | 34,163 | | | | 1,107,223 | |
Kimco Realty Corp. | | | 50,845 | | | | 744,879 | |
Macerich Co. | | | 12,745 | | | | 551,604 | |
Mid-America Apartment Communities, Inc. | | | 13,645 | | | | 1,305,827 | |
Prologis, Inc. | | | 75,921 | | | | 4,458,081 | |
Public Storage | | | 17,932 | | | | 3,629,616 | |
Realty Income Corp. | | | 35,362 | | | | 2,229,220 | |
Regency Centers Corp. | | | 20,411 | | | | 1,197,717 | |
SBA Communications Corp. Cl A* | | | 13,679 | | | | 2,214,493 | |
Simon Property Group, Inc. | | | 37,250 | | | | 6,257,628 | |
SL Green Realty Corp. | | | 10,253 | | | | 810,807 | |
UDR, Inc. | | | 33,190 | | | | 1,314,988 | |
Ventas, Inc. | | | 42,864 | | | | 2,511,402 | |
Vornado Realty Trust | | | 20,949 | | | | 1,299,466 | |
Welltower, Inc. | | | 45,448 | | | | 3,154,546 | |
Weyerhaeuser Co. | | | 90,887 | | | | 1,986,790 | |
| | | | | | | | |
| | | | | | | 75,047,157 | |
| | | | | | | | |
UTILITIES (3.2%) | | | | | | | | |
AES Corp. | | | 79,787 | | | | 1,153,720 | |
Alliant Energy Corp. | | | 28,330 | | | | 1,196,943 | |
Ameren Corp. | | | 29,291 | | | | 1,910,652 | |
American Electric Power Co., Inc. | | | 59,249 | | | | 4,428,270 | |
American Water Works Co., Inc. | | | 21,738 | | | | 1,973,158 | |
CenterPoint Energy, Inc. | | | 60,188 | | | | 1,699,107 | |
CMS Energy Corp. | | | 34,013 | | | | 1,688,745 | |
Consolidated Edison, Inc. | | | 37,397 | | | | 2,859,375 | |
Dominion Energy, Inc. | | | 78,709 | | | | 5,624,545 | |
DTE Energy Co. | | | 21,862 | | | | 2,411,379 | |
Duke Energy Corp. | | | 85,605 | | | | 7,387,712 | |
Edison International | | | 39,100 | | | | 2,219,707 | |
Entergy Corp. | | | 21,756 | | | | 1,872,539 | |
Evergy, Inc. | | | 31,549 | | | | 1,791,037 | |
Eversource Energy | | | 38,085 | | | | 2,477,048 | |
Exelon Corp. | | | 116,381 | | | | 5,248,783 | |
FirstEnergy Corp. | | | 58,543 | | | | 2,198,290 | |
NextEra Energy, Inc. | | | 57,436 | | | | 9,983,526 | |
NiSource, Inc. | | | 43,509 | | | | 1,102,953 | |
NRG Energy, Inc. | | | 35,109 | | | | 1,390,316 | |
PG&E Corp.* | | | 62,148 | | | | 1,476,015 | |
Pinnacle West Capital Corp. | | | 13,506 | | | | 1,150,711 | |
The accompanying notes are an integral part of these portfolio schedules.
49
MUTUAL OF AMERICA INVESTMENT CORPORATION — EQUITY INDEX FUND
PORTFOLIO OF INVESTMENTS IN SECURITIES (Continued)
December 31, 2018
| | | | | | | | |
| | | Shares | | | Value | |
| | | | | | | | |
| INDEXED ASSETS (CONTINUED): | | | | | | | | |
COMMON STOCKS (CONTINUED): | | | | | | | | |
UTILITIES (CONTINUED) | | | | | | | | |
PPL Corp. | | | 86,716 | | | $ | 2,456,664 | |
Public Svc. Enterprise Group, Inc. | | | 60,603 | | | | 3,154,386 | |
SCANA Corp. | | | 17,192 | | | | 821,434 | |
Sempra Energy | | | 32,879 | | | | 3,557,179 | |
Southern Co. | | | 123,700 | | | | 5,432,904 | |
WEC Energy Group, Inc. | | | 37,854 | | | | 2,621,768 | |
Xcel Energy, Inc. | | | 61,912 | | | | 3,050,404 | |
| | | | | | | | |
| | | | | | | 84,339,270 | |
| | | | | | | | |
TOTAL INDEXED ASSETS-COMMON STOCKS | | | | | | | | |
(Cost: $1,646,680,615) 96.7% | | | | | | | 2,542,925,323 | |
| | | | | | | | |
| | | | | | | | | | | | | | | | | | | | |
| | | Rating** | | | Rate(%) | | | Maturity | | | Face Amount | | | Value | |
| SHORT-TERM DEBT SECURITIES: | | | | | | | | | | | | | | | | | | | | |
U.S. GOVERNMENT (2.1%) | | | | | | | | | | | | | | | | | | | | |
U.S. Treasury Bill | | | A-1+ | | | | 2.29 | | | | 01/17/19 | | | $ | 5,000,000 | | | $ | 4,994,936 | |
U.S. Treasury Bill | | | A-1+ | | | | 2.36 | | | | 02/14/19 | | | | 20,000,000 | | | | 19,942,531 | |
U.S. Treasury Bill (1) | | | A-1+ | | | | 2.36 | | | | 02/21/19 | | | | 13,000,000 | | | | 12,956,691 | |
U.S. Treasury Bill | | | A-1+ | | | | 2.36 | | | | 02/28/19 | | | | 11,000,000 | | | | 10,958,353 | |
U.S. Treasury Bill (1) | | | A-1+ | | | | 2.37 | | | | 02/21/19 | | | | 6,000,000 | | | | 5,980,011 | |
| | | | | | | | | | | | | | | | | | | | |
| | | | | | | | | | | | | | | | | | | 54,832,522 | |
| | | | | | | | | | | | | | | | | | | | |
COMMERCIAL PAPER (1.0%) | | | | | | | | | | | | | | | | | | | | |
Cargill, Inc.† | | | A-1 | | | | 2.39 | | | | 01/02/19 | | | | 25,200,000 | | | | 25,198,327 | |
| | | | | | | | | | | | | | | | | | | | |
TOTAL SHORT-TERM DEBT SECURITIES
(Cost: $80,030,849) 3.1% | | | | 80,030,849 | |
| | | | | | | | | | | | | | | | | | | | |
| | | | | |
| | | | | | Rate(%) | | | Maturity | | | Face Amount | | | Value | |
| TEMPORARY CASH INVESTMENT (0.0%) (2) | | | | | | | | | | | | | | | | | | | | |
Citibank, New York Time Deposit | | | | | | | 1.67 | | | | 01/02/19 | | | $ | 138,594 | | | $ | 138,594 | |
| | | | | | | | | | | | | | | | | | | | |
TOTAL TEMPORARY CASH INVESTMENT
(Cost: $138,594) 0.0% (2) | | | | 138,594 | |
| | | | | | | | | | | | | | | | | | | | |
TOTAL INVESTMENTS
(Cost: $1,726,850,058) 99.8% | | | | 2,623,094,766 | |
| | | | | | | | | | | | | | | | | | | | |
OTHER NET ASSETS 0.2% | | | | 5,514,746 | |
| | | | | | | | | | | | | | | | | | | | |
NET ASSETS 100.0% | | | $ | 2,628,609,512 | |
| | | | | | | | | | | | | | | | | | | | |
The accompanying notes are an integral part of these portfolio schedules.
50
MUTUAL OF AMERICA INVESTMENT CORPORATION — ALL AMERICA FUND
PORTFOLIO OF INVESTMENTS IN SECURITIES
December 31, 2018
| | | | | | | | |
| | | Shares | | | Value | |
| | | | | | | | |
| INDEXED ASSETS: | | | | | | | | |
COMMON STOCKS: | | | | | | | | |
COMMUNICATION SERVICES (5.7%) | | | | | | | | |
Activision Blizzard, Inc. | | | 5,463 | | | $ | 254,412 | |
Alphabet, Inc. Cl A* | | | 2,144 | | | | 2,240,394 | |
Alphabet, Inc. Cl C* | | | 2,201 | | | | 2,279,378 | |
AT&T, Inc. | | | 51,673 | | | | 1,474,748 | |
CBS Corp. Cl B | | | 2,399 | | | | 104,884 | |
CenturyLink, Inc. | | | 6,771 | | | | 102,581 | |
Charter Communications, Inc. Cl A* | | | 1,267 | | | | 361,057 | |
Comcast Corp. Cl A | | | 32,421 | | | | 1,103,935 | |
Discovery, Inc. Cl A* | | | 1,119 | | | | 27,684 | |
Discovery, Inc. Cl C* | | | 2,579 | | | | 59,523 | |
DISH Network Corp. Cl A* | | | 1,637 | | | | 40,876 | |
Electronic Arts, Inc.* | | | 2,155 | | | | 170,051 | |
Facebook, Inc. Cl A* | | | 17,071 | | | | 2,237,837 | |
Interpublic Group of Cos., Inc. | | | 2,724 | | | | 56,196 | |
Netflix, Inc.* | | | 3,150 | | | | 843,129 | |
News Corp. Cl A | | | 2,749 | | | | 31,201 | |
News Corp. Cl B | | | 877 | | | | 10,129 | |
Omnicom Group, Inc. | | | 1,588 | | | | 116,305 | |
Take-Two Interactive Software, Inc.* | | | 817 | | | | 84,102 | |
TripAdvisor, Inc.* | | | 736 | | | | 39,700 | |
Twenty-First Century Fox, Inc. Cl A | | | 7,488 | | | | 360,323 | |
Twenty-First Century Fox, Inc. Cl B | | | 3,454 | | | | 165,032 | |
Twitter, Inc.* | | | 5,201 | | | | 149,477 | |
Verizon Communications, Inc. | | | 29,165 | | | | 1,639,656 | |
Viacom, Inc. Cl B | | | 2,513 | | | | 64,584 | |
Walt Disney Co. | | | 10,623 | | | | 1,164,812 | |
| | | | | | | | |
| | | | | | | 15,182,006 | |
| | | | | | | | |
CONSUMER DISCRETIONARY (5.5%) | | | | | | | | |
Advance Auto Parts, Inc. | | | 522 | | | | 82,194 | |
Amazon.com, Inc.* | | | 2,904 | | | | 4,361,721 | |
Aptiv PLC | | | 1,870 | | | | 115,136 | |
AutoZone, Inc.* | | | 179 | | | | 150,063 | |
Best Buy Co., Inc. | | | 1,672 | | | | 88,549 | |
Booking Hldgs., Inc.* | | | 328 | | | | 564,954 | |
BorgWarner, Inc. | | | 1,487 | | | | 51,658 | |
CarMax, Inc.* | | | 1,233 | | | | 77,346 | |
Carnival Corp. | | | 2,840 | | | | 140,012 | |
Chipotle Mexican Grill, Inc. Cl A* | | | 172 | | | | 74,268 | |
Darden Restaurants, Inc. | | | 877 | | | | 87,577 | |
Dollar General Corp. | | | 1,875 | | | | 202,650 | |
Dollar Tree, Inc.* | | | 1,692 | | | | 152,821 | |
DR Horton, Inc. | | | 2,438 | | | | 84,501 | |
eBay, Inc.* | | | 6,446 | | | | 180,939 | |
Expedia Group, Inc. | | | 842 | | | | 94,851 | |
Foot Locker, Inc. | | | 820 | | | | 43,624 | |
Ford Motor Co. | | | 27,765 | | | | 212,402 | |
Gap, Inc. | | | 1,523 | | | | 39,233 | |
Garmin Ltd. | | | 855 | | | | 54,139 | |
General Motors Co. | | | 9,337 | | | | 312,323 | |
Genuine Parts Co. | | | 1,040 | | | | 99,861 | |
Goodyear Tire & Rubber Co. | | | 1,656 | | | | 33,799 | |
H&R Block, Inc. | | | 1,456 | | | | 36,939 | |
Hanesbrands, Inc. | | | 2,581 | | | | 32,340 | |
Harley-Davidson, Inc. | | | 1,143 | | | | 38,999 | |
| | | | | | | | |
| | | Shares | | | Value | |
| | | | | | | | |
| INDEXED ASSETS (CONTINUED): | | | | | | | | |
COMMON STOCKS (CONTINUED): | | | | | | | | |
CONSUMER DISCRETIONARY (CONTINUED) | | | | | | | | |
Hasbro, Inc. | | | 828 | | | $ | 67,275 | |
Hilton Worldwide Hldgs., Inc. | | | 2,110 | | | | 151,498 | |
Home Depot, Inc. | | | 8,005 | | | | 1,375,419 | |
Kohl’s Corp. | | | 1,181 | | | | 78,348 | |
L Brands, Inc. | | | 1,646 | | | | 42,253 | |
Leggett & Platt, Inc. | | | 930 | | | | 33,331 | |
Lennar Corp. Cl A | | | 2,087 | | | | 81,706 | |
LKQ Corp.* | | | 2,241 | | | | 53,179 | |
Lowe’s Cos., Inc. | | | 5,715 | | | | 527,837 | |
Macy’s, Inc. | | | 2,203 | | | | 65,605 | |
Marriott International, Inc. Cl A | | | 2,027 | | | | 220,051 | |
Mattel, Inc.* | | | 2,427 | | | | 24,246 | |
McDonald’s Corp. | | | 5,447 | | | | 967,224 | |
MGM Resorts International | | | 3,593 | | | | 87,166 | |
Michael Kors Hldgs. Ltd.* | | | 1,064 | | | | 40,347 | |
Mohawk Industries, Inc.* | | | 448 | | | | 52,398 | |
Newell Brands, Inc. | | | 3,078 | | | | 57,220 | |
NIKE, Inc. Cl B | | | 9,124 | | | | 676,453 | |
Nordstrom, Inc. | | | 807 | | | | 37,614 | |
Norwegian Cruise Line Hldgs. Ltd.* | | | 1,572 | | | | 66,637 | |
O’Reilly Automotive, Inc.* | | | 569 | | | | 195,924 | |
PulteGroup, Inc. | | | 1,833 | | | | 47,640 | |
PVH Corp. | | | 542 | | | | 50,379 | |
Ralph Lauren Corp. Cl A | | | 391 | | | | 40,453 | |
Ross Stores, Inc. | | | 2,654 | | | | 220,813 | |
Royal Caribbean Cruises Ltd. | | | 1,224 | | | | 119,695 | |
Starbucks Corp. | | | 8,805 | | | | 567,042 | |
Tapestry, Inc. | | | 2,061 | | | | 69,559 | |
Target Corp. | | | 3,711 | | | | 245,260 | |
Tiffany & Co. | | | 773 | | | | 62,234 | |
TJX Cos., Inc. | | | 8,797 | | | | 393,578 | |
Tractor Supply Co. | | | 870 | | | | 72,593 | |
Ulta Beauty, Inc.* | | | 400 | | | | 97,936 | |
Under Armour, Inc. Cl A* | | | 1,331 | | | | 23,519 | |
Under Armour, Inc. Cl C* | | | 1,371 | | | | 22,169 | |
VF Corp. | | | 2,319 | | | | 165,437 | |
Whirlpool Corp. | | | 462 | | | | 49,374 | |
Wynn Resorts Ltd. | | | 695 | | | | 68,742 | |
Yum! Brands, Inc. | | | 2,196 | | | | 201,856 | |
| | | | | | | | |
| | | | | | | 14,832,909 | |
| | | | | | | | |
CONSUMER STAPLES (4.1%) | | | | | | | | |
Altria Group, Inc. | | | 13,198 | | | | 651,849 | |
Archer-Daniels-Midland Co. | | | 3,971 | | | | 162,692 | |
Brown-Forman Corp. Cl B | | | 1,172 | | | | 55,764 | |
Campbell Soup Co. | | | 1,361 | | | | 44,899 | |
Church & Dwight Co., Inc. | | | 1,724 | | | | 113,370 | |
Clorox Co. | | | 899 | | | | 138,572 | |
Coca-Cola Co. | | | 27,069 | | | | 1,281,717 | |
Colgate-Palmolive Co. | | | 6,159 | | | | 366,584 | |
Conagra Brands, Inc. | | | 3,459 | | | | 73,884 | |
Constellation Brands, Inc. Cl A | | | 1,182 | | | | 190,089 | |
Costco Wholesale Corp. | | | 3,109 | | | | 633,334 | |
Coty, Inc. Cl A | | | 3,207 | | | | 21,038 | |
Estee Lauder Cos., Inc. Cl A | | | 1,557 | | | | 202,566 | |
General Mills, Inc. | | | 4,236 | | | | 164,950 | |
The accompanying notes are an integral part of these portfolio schedules.
51
MUTUAL OF AMERICA INVESTMENT CORPORATION — ALL AMERICA FUND
PORTFOLIO OF INVESTMENTS IN SECURITIES (Continued)
December 31, 2018
| | | | | | | | |
| | | Shares | | | Value | |
| | | | | | | | |
| INDEXED ASSETS (CONTINUED): | | | | | | | | |
COMMON STOCKS (CONTINUED): | | | | | | | | |
CONSUMER STAPLES (CONTINUED) | | | | | | | | |
Hershey Co. | | | 991 | | | $ | 106,215 | |
Hormel Foods Corp. | | | 1,929 | | | | 82,330 | |
JM Smucker Co. | | | 802 | | | | 74,979 | |
Kellogg Co. | | | 1,794 | | | | 102,276 | |
Kimberly-Clark Corp. | | | 2,437 | | | | 277,672 | |
Kraft Heinz Co. | | | 4,434 | | | | 190,839 | |
Kroger Co. | | | 5,655 | | | | 155,513 | |
Lamb Weston Hldgs., Inc. | | | 1,037 | | | | 76,282 | |
McCormick & Co., Inc. | | | 862 | | | | 120,025 | |
Molson Coors Brewing Co. Cl B | | | 1,336 | | | | 75,030 | |
Mondelez International, Inc. Cl A | | | 10,311 | | | | 412,749 | |
Monster Beverage Corp.* | | | 2,834 | | | | 139,489 | |
PepsiCo, Inc. | | | 10,033 | | | | 1,108,446 | |
Philip Morris International, Inc. | | | 11,034 | | | | 736,630 | |
Procter & Gamble Co. | | | 17,575 | | | | 1,615,494 | |
Sysco Corp. | | | 3,379 | | | | 211,728 | |
Tyson Foods, Inc. Cl A | | | 2,095 | | | | 111,873 | |
Walgreens Boots Alliance, Inc. | | | 5,726 | | | | 391,258 | |
Walmart, Inc. | | | 10,080 | | | | 938,952 | |
| | | | | | | | |
| | | | | | | 11,029,088 | |
| | | | | | | | |
ENERGY (3.0%) | | | | | | | | |
Anadarko Petroleum Corp. | | | 3,570 | | | | 156,509 | |
Apache Corp. | | | 2,703 | | | | 70,954 | |
Baker Hughes, a GE Co. Cl A | | | 3,652 | | | | 78,518 | |
Cabot Oil & Gas Corp. | | | 3,033 | | | | 67,788 | |
Chevron Corp. | | | 13,584 | | | | 1,477,803 | |
Cimarex Energy Co. | | | 684 | | | | 42,169 | |
Concho Resources, Inc.* | | | 1,422 | | | | 146,167 | |
ConocoPhillips | | | 8,154 | | | | 508,402 | |
Devon Energy Corp. | | | 3,330 | | | | 75,058 | |
Diamondback Energy, Inc. | | | 1,098 | | | | 101,784 | |
EOG Resources, Inc. | | | 4,143 | | | | 361,311 | |
Exxon Mobil Corp. | | | 29,948 | | | | 2,042,154 | |
Halliburton Co. | | | 6,241 | | | | 165,886 | |
Helmerich & Payne, Inc. | | | 775 | | | | 37,153 | |
Hess Corp. | | | 1,758 | | | | 71,199 | |
HollyFrontier Corp. | | | 1,140 | | | | 58,277 | |
Kinder Morgan, Inc. | | | 13,454 | | | | 206,923 | |
Marathon Oil Corp. | | | 5,912 | | | | 84,778 | |
Marathon Petroleum Corp. | | | 4,873 | | | | 287,556 | |
National Oilwell Varco, Inc. | | | 2,705 | | | | 69,518 | |
Newfield Exploration Co.* | | | 1,423 | | | | 20,861 | |
Noble Energy, Inc. | | | 3,421 | | | | 64,178 | |
Occidental Petroleum Corp. | | | 5,354 | | | | 328,629 | |
ONEOK, Inc. | | | 2,924 | | | | 157,750 | |
Phillips 66 | | | 2,998 | | | | 258,278 | |
Pioneer Natural Resources Co. | | | 1,202 | | | | 158,087 | |
Schlumberger Ltd. | | | 9,717 | | | | 350,589 | |
TechnipFMC PLC | | | 2,984 | | | | 58,427 | |
Valero Energy Corp. | | | 2,983 | | | | 223,635 | |
Williams Cos., Inc. | | | 8,564 | | | | 188,836 | |
| | | | | | | | |
| | | | | | | 7,919,177 | |
| | | | | | | | |
| | | | | | | | |
| | | Shares | | | Value | |
| | | | | | | | |
| INDEXED ASSETS (CONTINUED): | | | | | | | | |
COMMON STOCKS (CONTINUED): | | | | | | | | |
FINANCIALS (7.4%) | | | | | | | | |
Affiliated Managers Group, Inc. | | | 369 | | | $ | 35,955 | |
Aflac, Inc. | | | 5,375 | | | | 244,885 | |
Allstate Corp. | | | 2,430 | | | | 200,791 | |
American Express Co. | | | 4,960 | | | | 472,787 | |
American International Group, Inc. | | | 6,282 | | | | 247,574 | |
Ameriprise Financial, Inc. | | | 990 | | | | 103,326 | |
Aon PLC | | | 1,700 | | | | 247,112 | |
Arthur J. Gallagher & Co. | | | 1,297 | | | | 95,589 | |
Assurant, Inc. | | | 369 | | | | 33,003 | |
Bank of America Corp. | | | 64,734 | | | | 1,595,046 | |
Bank of New York Mellon Corp. | | | 6,431 | | | | 302,707 | |
BB&T Corp. | | | 5,438 | | | | 235,574 | |
Berkshire Hathaway, Inc. Cl B* | | | 13,750 | | | | 2,807,475 | |
BlackRock, Inc. Cl A | | | 859 | | | | 337,432 | |
Brighthouse Financial, Inc.* | | | 841 | | | | 25,634 | |
Capital One Financial Corp. | | | 3,359 | | | | 253,907 | |
Cboe Global Markets, Inc. | | | 757 | | | | 74,057 | |
Charles Schwab Corp. | | | 8,510 | | | | 353,420 | |
Chubb Ltd. | | | 3,244 | | | | 419,060 | |
Cincinnati Financial Corp. | | | 1,069 | | | | 82,762 | |
Citigroup, Inc. | | | 17,369 | | | | 904,230 | |
Citizens Financial Group, Inc. | | | 3,313 | | | | 98,495 | |
CME Group, Inc. Cl A | | | 2,533 | | | | 476,508 | |
Comerica, Inc. | | | 1,144 | | | | 78,581 | |
Discover Financial Svcs. | | | 2,386 | | | | 140,726 | |
E*TRADE Financial Corp. | | | 1,805 | | | | 79,203 | |
Everest Re Group Ltd. | | | 287 | | | | 62,497 | |
Fifth Third Bancorp | | | 4,630 | | | | 108,944 | |
First Republic Bank | | | 1,158 | | | | 100,630 | |
Franklin Resources, Inc. | | | 2,101 | | | | 62,316 | |
Goldman Sachs Group, Inc. | | | 2,453 | | | | 409,774 | |
Hartford Financial Svcs. Group, Inc. | | | 2,532 | | | | 112,547 | |
Huntington Bancshares, Inc. | | | 7,480 | | | | 89,162 | |
Intercontinental Exchange, Inc. | | | 4,019 | | | | 302,751 | |
Invesco Ltd. | | | 2,911 | | | | 48,730 | |
Jefferies Financial Group, Inc. | | | 1,999 | | | | 34,703 | |
JPMorgan Chase & Co. | | | 23,551 | | | | 2,299,049 | |
KeyCorp | | | 7,278 | | | | 107,569 | |
Lincoln National Corp. | | | 1,510 | | | | 77,478 | |
Loews Corp. | | | 1,957 | | | | 89,083 | |
M&T Bank Corp. | | | 993 | | | | 142,128 | |
Marsh & McLennan Cos., Inc. | | | 3,554 | | | | 283,431 | |
MetLife, Inc. | | | 6,946 | | | | 285,203 | |
Moody’s Corp. | | | 1,178 | | | | 164,967 | |
Morgan Stanley | | | 9,263 | | | | 367,278 | |
MSCI, Inc. Cl A | | | 627 | | | | 92,439 | |
Nasdaq, Inc. | | | 808 | | | | 65,909 | |
Northern Trust Corp. | | | 1,564 | | | | 130,735 | |
People’s United Financial, Inc. | | | 2,680 | | | | 38,672 | |
PNC Financial Svcs. Group, Inc. | | | 3,258 | | | | 380,893 | |
Principal Financial Group, Inc. | | | 1,851 | | | | 81,759 | |
Progressive Corp. | | | 4,135 | | | | 249,464 | |
Prudential Financial, Inc. | | | 2,921 | | | | 238,208 | |
Raymond James Financial, Inc. | | | 912 | | | | 67,862 | |
Regions Financial Corp. | | | 7,307 | | | | 97,768 | |
The accompanying notes are an integral part of these portfolio schedules.
52
MUTUAL OF AMERICA INVESTMENT CORPORATION — ALL AMERICA FUND
PORTFOLIO OF INVESTMENTS IN SECURITIES (Continued)
December 31, 2018
| | | | | | | | |
| | | Shares | | | Value | |
| | | | | | | | |
| INDEXED ASSETS (CONTINUED): | | | | | | | | |
COMMON STOCKS (CONTINUED): | | | | | | | | |
FINANCIALS (CONTINUED) | | | | | | | | |
S&P Global, Inc. | | | 1,771 | | | $ | 300,964 | |
State Street Corp. | | | 2,671 | | | | 168,460 | |
SunTrust Banks, Inc. | | | 3,165 | | | | 159,643 | |
SVB Financial Group* | | | 379 | | | | 71,980 | |
Synchrony Financial | | | 4,679 | | | | 109,769 | |
T Rowe Price Group, Inc. | | | 1,706 | | | | 157,498 | |
Torchmark Corp. | | | 723 | | | | 53,885 | |
Travelers Cos., Inc. | | | 1,871 | | | | 224,052 | |
U.S. Bancorp | | | 10,726 | | | | 490,178 | |
Unum Group | | | 1,546 | | | | 45,421 | |
Wells Fargo & Co. | | | 29,934 | | | | 1,379,359 | |
Willis Towers Watson PLC | | | 916 | | | | 139,104 | |
Zions Bancorporation | | | 1,359 | | | | 55,366 | |
| | | | | | | | |
| | | | | | | 19,893,467 | |
| | | | | | | | |
HEALTH CARE (8.7%) | | | | | | | | |
Abbott Laboratories | | | 12,459 | | | | 901,159 | |
AbbVie, Inc. | | | 10,831 | | | | 998,510 | |
ABIOMED, Inc.* | | | 320 | | | | 104,013 | |
Agilent Technologies, Inc. | | | 2,262 | | | | 152,595 | |
Alexion Pharmaceuticals, Inc.* | | | 1,605 | | | | 156,263 | |
Align Technology, Inc.* | | | 514 | | | | 107,647 | |
Allergan PLC | | | 2,256 | | | | 301,537 | |
AmerisourceBergen Corp. Cl A | | | 1,117 | | | | 83,105 | |
Amgen, Inc. | | | 4,514 | | | | 878,740 | |
Anthem, Inc. | | | 1,818 | | | | 477,461 | |
Baxter International, Inc. | | | 3,507 | | | | 230,831 | |
Becton Dickinson & Co. | | | 1,900 | | | | 428,108 | |
Biogen, Inc.* | | | 1,443 | | | | 434,228 | |
Boston Scientific Corp.* | | | 9,849 | | | | 348,064 | |
Bristol-Myers Squibb Co. | | | 11,573 | | | | 601,565 | |
Cardinal Health, Inc. | | | 2,117 | | | | 94,418 | |
Celgene Corp.* | | | 5,012 | | | | 321,219 | |
Centene Corp.* | | | 1,461 | | | | 168,453 | |
Cerner Corp.* | | | 2,355 | | | | 123,496 | |
Cigna Corp. | | | 2,691 | | | | 511,075 | |
Cooper Cos., Inc. | | | 346 | | | | 88,057 | |
CVS Health Corp. | | | 9,145 | | | | 599,180 | |
Danaher Corp. | | | 4,364 | | | | 450,016 | |
DaVita, Inc.* | | | 897 | | | | 46,160 | |
DENTSPLY SIRONA, Inc. | | | 1,572 | | | | 58,494 | |
Edwards Lifesciences Corp.* | | | 1,485 | | | | 227,457 | |
Eli Lilly & Co. | | | 6,669 | | | | 771,737 | |
Gilead Sciences, Inc. | | | 9,232 | | | | 577,462 | |
HCA Healthcare, Inc. | | | 1,905 | | | | 237,077 | |
Henry Schein, Inc.* | | | 1,084 | | | | 85,116 | |
Hologic, Inc.* | | | 1,907 | | | | 78,378 | |
Humana, Inc. | | | 967 | | | | 277,026 | |
IDEXX Laboratories, Inc.* | | | 617 | | | | 114,774 | |
Illumina, Inc.* | | | 1,054 | | | | 316,126 | |
Incyte Corp.* | | | 1,276 | | | | 81,141 | |
Intuitive Surgical, Inc.* | | | 813 | | | | 389,362 | |
IQVIA Hldgs., Inc.* | | | 1,117 | | | | 129,762 | |
Johnson & Johnson | | | 19,009 | | | | 2,453,111 | |
Laboratory Corp. of America Hldgs.* | | | 717 | | | | 90,600 | |
| | | | | | | | |
| | | Shares | | | Value | |
| | | | | | | | |
| INDEXED ASSETS (CONTINUED): | | | | | | | | |
COMMON STOCKS (CONTINUED): | | | | | | | | |
HEALTH CARE (CONTINUED) | | | | | | | | |
McKesson Corp. | | | 1,383 | | | $ | 152,780 | |
Medtronic PLC | | | 9,514 | | | | 865,393 | |
Merck & Co., Inc. | | | 18,429 | | | | 1,408,160 | |
Mettler-Toledo International, Inc.* | | | 178 | | | | 100,673 | |
Mylan NV* | | | 3,683 | | | | 100,914 | |
Nektar Therapeutics Cl A* | | | 1,250 | | | | 41,087 | |
PerkinElmer, Inc. | | | 792 | | | | 62,212 | |
Perrigo Co. PLC | | | 895 | | | | 34,681 | |
Pfizer, Inc. | | | 41,003 | | | | 1,789,781 | |
Quest Diagnostics, Inc. | | | 966 | | | | 80,439 | |
Regeneron Pharmaceuticals, Inc.* | | | 554 | | | | 206,919 | |
ResMed, Inc. | | | 1,014 | | | | 115,464 | |
Stryker Corp. | | | 2,197 | | | | 344,380 | |
Thermo Fisher Scientific, Inc. | | | 2,852 | | | | 638,249 | |
UnitedHealth Group, Inc. | | | 6,839 | | | | 1,703,732 | |
Universal Health Svcs., Inc. Cl B | | | 601 | | | | 70,053 | |
Varian Medical Systems, Inc.* | | | 651 | | | | 73,765 | |
Vertex Pharmaceuticals, Inc.* | | | 1,830 | | | | 303,249 | |
Waters Corp.* | | | 536 | | | | 101,116 | |
WellCare Health Plans, Inc.* | | | 352 | | | | 83,103 | |
Zimmer Biomet Hldgs., Inc. | | | 1,448 | | | | 150,187 | |
Zoetis, Inc. Cl A | | | 3,412 | | | | 291,862 | |
| | | | | | | | |
| | | | | | | 23,211,722 | |
| | | | | | | | |
INDUSTRIALS (5.1%) | | | | | | | | |
3M Co. | | | 4,149 | | | | 790,550 | |
Alaska Air Group, Inc. | | | 875 | | | | 53,244 | |
Allegion PLC | | | 674 | | | | 53,724 | |
American Airlines Group, Inc. | | | 2,922 | | | | 93,825 | |
AMETEK, Inc. | | | 1,644 | | | | 111,299 | |
AO Smith Corp. | | | 1,021 | | | | 43,597 | |
Arconic, Inc. | | | 3,067 | | | | 51,710 | |
Boeing Co. | | | 3,756 | | | | 1,211,310 | |
Caterpillar, Inc. | | | 4,178 | | | | 530,898 | |
CH Robinson Worldwide, Inc. | | | 970 | | | | 81,567 | |
Cintas Corp. | | | 607 | | | | 101,970 | |
Copart, Inc.* | | | 1,454 | | | | 69,472 | |
CSX Corp. | | | 5,688 | | | | 353,395 | |
Cummins, Inc. | | | 1,043 | | | | 139,386 | |
Deere & Co. | | | 2,287 | | | | 341,152 | |
Delta Air Lines, Inc. | | | 4,421 | | | | 220,608 | |
Dover Corp. | | | 1,041 | | | | 73,859 | |
Eaton Corp. PLC | | | 3,069 | | | | 210,717 | |
Emerson Electric Co. | | | 4,433 | | | | 264,872 | |
Equifax, Inc. | | | 853 | | | | 79,440 | |
Expeditors International of Washington, Inc. | | | 1,224 | | | | 83,342 | |
Fastenal Co. | | | 2,041 | | | | 106,724 | |
FedEx Corp. | | | 1,706 | | | | 275,229 | |
Flowserve Corp. | | | 929 | | | | 35,321 | |
Fluor Corp. | | | 1,002 | | | | 32,264 | |
Fortive Corp. | | | 2,092 | | | | 141,545 | |
Fortune Brands Home & Security, Inc. | | | 1,009 | | | | 38,332 | |
General Dynamics Corp. | | | 1,966 | | | | 309,075 | |
General Electric Co. | | | 61,735 | | | | 467,334 | |
The accompanying notes are an integral part of these portfolio schedules.
53
MUTUAL OF AMERICA INVESTMENT CORPORATION — ALL AMERICA FUND
PORTFOLIO OF INVESTMENTS IN SECURITIES (Continued)
December 31, 2018
| | | | | | | | |
| | | Shares | | | Value | |
| | | | | | | | |
| INDEXED ASSETS (CONTINUED): | | | | | | | | |
COMMON STOCKS (CONTINUED): | | | | | | | | |
INDUSTRIALS (CONTINUED) | | | | | | | | |
Harris Corp. | | | 831 | | | $ | 111,894 | |
Honeywell International, Inc. | | | 5,231 | | | | 691,120 | |
Huntington Ingalls Industries, Inc. | | | 304 | | | | 57,854 | |
IHS Markit Ltd.* | | | 2,545 | | | | 122,084 | |
Illinois Tool Works, Inc. | | | 2,174 | | | | 275,424 | |
Ingersoll-Rand PLC | | | 1,750 | | | | 159,652 | |
Jacobs Engineering Group, Inc. | | | 849 | | | | 49,632 | |
JB Hunt Transport Svcs., Inc. | | | 618 | | | | 57,499 | |
Johnson Controls International PLC | | | 6,583 | | | | 195,186 | |
Kansas City Southern | | | 718 | | | | 68,533 | |
L-3 Technologies, Inc. | | | 557 | | | | 96,729 | |
Lockheed Martin Corp. | | | 1,744 | | | | 456,649 | |
Masco Corp. | | | 2,180 | | | | 63,743 | |
Nielsen Hldgs. PLC | | | 2,527 | | | | 58,955 | |
Norfolk Southern Corp. | | | 1,929 | | | | 288,463 | |
Northrop Grumman Corp. | | | 1,219 | | | | 298,533 | |
PACCAR, Inc. | | | 2,477 | | | | 141,536 | |
Parker-Hannifin Corp. | | | 935 | | | | 139,446 | |
Pentair PLC | | | 1,131 | | | | 42,729 | |
Quanta Svcs., Inc. | | | 1,039 | | | | 31,274 | |
Raytheon Co. | | | 2,011 | | | | 308,387 | |
Republic Svcs., Inc. Cl A | | | 1,531 | | | | 110,370 | |
Robert Half International, Inc. | | | 862 | | | | 49,306 | |
Rockwell Automation, Inc. | | | 856 | | | | 128,811 | |
Rollins, Inc. | | | 1,044 | | | | 37,689 | |
Roper Technologies, Inc. | | | 735 | | | | 195,892 | |
Snap-on, Inc. | | | 396 | | | | 57,535 | |
Southwest Airlines Co. | | | 3,585 | | | | 166,631 | |
Stanley Black & Decker, Inc. | | | 1,077 | | | | 128,960 | |
Textron, Inc. | | | 1,721 | | | | 79,149 | |
TransDigm Group, Inc.* | | | 344 | | | | 116,981 | |
Union Pacific Corp. | | | 5,210 | | | | 720,178 | |
United Continental Hldgs., Inc.* | | | 1,620 | | | | 135,643 | |
United Parcel Svcs., Inc. Cl B | | | 4,903 | | | | 478,190 | |
United Rentals, Inc.* | | | 583 | | | | 59,775 | |
United Technologies Corp. | | | 5,742 | | | | 611,408 | |
Verisk Analytics, Inc. Cl A* | | | 1,168 | | | | 127,359 | |
Waste Management, Inc. | | | 2,770 | | | | 246,502 | |
WW Grainger, Inc. | | | 325 | | | | 91,767 | |
Xylem, Inc. | | | 1,272 | | | | 84,868 | |
| | | | | | | | |
| | | | | | | 13,708,097 | |
| | | | | | | | |
INFORMATION TECHNOLOGY (11.2%) | | | | | | | | |
Accenture PLC Cl A | | | 4,513 | | | | 636,378 | |
Adobe, Inc.* | | | 3,501 | | | | 792,066 | |
Advanced Micro Devices, Inc.* | | | 6,315 | | | | 116,575 | |
Akamai Technologies, Inc.* | | | 1,158 | | | | 70,731 | |
Alliance Data Systems Corp. | | | 332 | | | | 49,827 | |
Amphenol Corp. Cl A | | | 2,135 | | | | 172,978 | |
Analog Devices, Inc. | | | 2,636 | | | | 226,248 | |
ANSYS, Inc.* | | | 592 | | | | 84,620 | |
Apple, Inc. | | | 32,185 | | | | 5,076,862 | |
Applied Materials, Inc. | | | 6,987 | | | | 228,754 | |
Arista Networks, Inc.* | | | 374 | | | | 78,802 | |
Autodesk, Inc.* | | | 1,564 | | | | 201,146 | |
| | | | | | | | |
| | | Shares | | | Value | |
| | | | | | | | |
| INDEXED ASSETS (CONTINUED): | | | | | | | | |
COMMON STOCKS (CONTINUED): | | | | | | | | |
INFORMATION TECHNOLOGY (CONTINUED) | | | | | | | | |
Automatic Data Processing, Inc. | | | 3,118 | | | $ | 408,832 | |
Broadcom, Inc. | | | 2,937 | | | | 746,820 | |
Broadridge Financial Solutions, Inc. | | | 835 | | | | 80,369 | |
Cadence Design Systems, Inc.* | | | 2,005 | | | | 87,177 | |
Cisco Systems, Inc. | | | 31,903 | | | | 1,382,357 | |
Citrix Systems, Inc. | | | 912 | | | | 93,443 | |
Cognizant Technology Solutions Corp. Cl A | | | 4,121 | | | | 261,601 | |
Corning, Inc. | | | 5,691 | | | | 171,925 | |
DXC Technology Co. | | | 1,992 | | | | 105,915 | |
F5 Networks, Inc.* | | | 431 | | | | 69,835 | |
Fidelity National Information Svcs., Inc. | | | 2,309 | | | | 236,788 | |
Fiserv, Inc.* | | | 2,839 | | | | 208,638 | |
FleetCor Technologies, Inc.* | | | 630 | | | | 117,003 | |
FLIR Systems, Inc. | | | 966 | | | | 42,060 | |
Fortinet, Inc.* | | | 1,041 | | | | 73,318 | |
Gartner, Inc.* | | | 643 | | | | 82,201 | |
Global Payments, Inc. | | | 1,126 | | | | 116,124 | |
Hewlett Packard Enterprise Co. | | | 10,079 | | | | 133,144 | |
HP, Inc. | | | 11,185 | | | | 228,845 | |
Intel Corp. | | | 32,413 | | | | 1,521,142 | |
International Business Machines Corp. | | | 6,451 | | | | 733,285 | |
Intuit, Inc. | | | 1,845 | | | | 363,188 | |
IPG Photonics Corp.* | | | 254 | | | | 28,776 | |
Jack Henry & Associates, Inc. | | | 549 | | | | 69,459 | |
Juniper Networks, Inc. | | | 2,448 | | | | 65,876 | |
Keysight Technologies, Inc.* | | | 1,331 | | | | 82,628 | |
KLA-Tencor Corp. | | | 1,079 | | | | 96,560 | |
Lam Research Corp. | | | 1,105 | | | | 150,468 | |
Mastercard, Inc. Cl A | | | 6,479 | | | | 1,222,263 | |
Maxim Integrated Products, Inc. | | | 1,972 | | | | 100,276 | |
Microchip Technology, Inc. | | | 1,690 | | | | 121,545 | |
Micron Technology, Inc.* | | | 7,975 | | | | 253,047 | |
Microsoft Corp. | | | 55,255 | | | | 5,612,250 | |
Motorola Solutions, Inc. | | | 1,155 | | | | 132,871 | |
NetApp, Inc. | | | 1,788 | | | | 106,690 | |
NVIDIA Corp. | | | 4,354 | | | | 581,259 | |
Oracle Corp. | | | 18,084 | | | | 816,493 | |
Paychex, Inc. | | | 2,273 | | | | 148,086 | |
PayPal Hldgs., Inc.* | | | 8,429 | | | | 708,795 | |
Qorvo, Inc.* | | | 887 | | | | 53,867 | |
QUALCOMM, Inc. | | | 8,616 | | | | 490,337 | |
Red Hat, Inc.* | | | 1,248 | | | | 219,199 | |
Salesforce.com, Inc.* | | | 5,472 | | | | 749,500 | |
Seagate Technology PLC | | | 1,849 | | | | 71,353 | |
Skyworks Solutions, Inc. | | | 1,263 | | | | 84,646 | |
Symantec Corp. | | | 4,576 | | | | 86,463 | |
Synopsys, Inc.* | | | 1,063 | | | | 89,547 | |
TE Connectivity Ltd. | | | 2,418 | | | | 182,873 | |
Texas Instruments, Inc. | | | 6,818 | | | | 644,301 | |
Total System Svcs., Inc. | | | 1,192 | | | | 96,898 | |
VeriSign, Inc.* | | | 758 | | | | 112,404 | |
Visa, Inc. Cl A | | | 12,479 | | | | 1,646,479 | |
Western Digital Corp. | | | 2,070 | | | | 76,528 | |
The accompanying notes are an integral part of these portfolio schedules.
54
MUTUAL OF AMERICA INVESTMENT CORPORATION — ALL AMERICA FUND
PORTFOLIO OF INVESTMENTS IN SECURITIES (Continued)
December 31, 2018
| | | | | | | | |
| | | Shares | | | Value | |
| | | | | | | | |
| INDEXED ASSETS (CONTINUED): | | | | | | | | |
COMMON STOCKS (CONTINUED): | | | | | | | | |
INFORMATION TECHNOLOGY (CONTINUED) | | | | | | | | |
Western Union Co. | | | 3,150 | | | $ | 53,739 | |
Xerox Corp. | | | 1,477 | | | | 29,186 | |
Xilinx, Inc. | | | 1,801 | | | | 153,391 | |
| | | | | | | | |
| | | | | | | 30,137,050 | |
| | | | | | | | |
MATERIALS (1.5%) | | | | | | | | |
Air Products & Chemicals, Inc. | | | 1,552 | | | | 248,398 | |
Albemarle Corp. | | | 752 | | | | 57,957 | |
Avery Dennison Corp. | | | 614 | | | | 55,156 | |
Ball Corp. | | | 2,394 | | | | 110,076 | |
Celanese Corp. Cl A | | | 941 | | | | 84,662 | |
CF Industries Hldgs., Inc. | | | 1,634 | | | | 71,095 | |
DowDuPont, Inc. | | | 16,247 | | | | 868,890 | |
Eastman Chemical Co. | | | 994 | | | | 72,671 | |
Ecolab, Inc. | | | 1,800 | | | | 265,230 | |
FMC Corp. | | | 963 | | | | 71,223 | |
Freeport-McMoRan, Inc. | | | 10,332 | | | | 106,523 | |
International Flavors & Fragrances, Inc. | | | 716 | | | | 96,137 | |
International Paper Co. | | | 2,867 | | | | 115,712 | |
Linde PLC | | | 3,919 | | | | 611,521 | |
LyondellBasell Industries NV Cl A | | | 2,221 | | | | 184,698 | |
Martin Marietta Materials, Inc. | | | 447 | | | | 76,826 | |
Mosaic Co. | | | 2,514 | | | | 73,434 | |
Newmont Mining Corp. | | | 3,759 | | | | 130,249 | |
Nucor Corp. | | | 2,212 | | | | 114,604 | |
Packaging Corp. of America | | | 670 | | | | 55,918 | |
PPG Industries, Inc. | | | 1,697 | | | | 173,484 | |
Sealed Air Corp. | | | 1,109 | | | | 38,638 | |
Sherwin-Williams Co. | | | 584 | | | | 229,781 | |
Vulcan Materials Co. | | | 948 | | | | 93,662 | |
WestRock Co. | | | 1,801 | | | | 68,006 | |
| | | | | | | | |
| | | | | | | 4,074,551 | |
| | | | | | | | |
REAL ESTATE (1.6%) | | | | | | | | |
Alexandria Real Estate Equities, Inc. | | | 761 | | | | 87,698 | |
American Tower Corp. | | | 3,120 | | | | 493,553 | |
Apartment Investment & Management Co. Cl A | | | 1,097 | | | | 48,136 | |
AvalonBay Communities, Inc. | | | 978 | | | | 170,221 | |
Boston Properties, Inc. | | | 1,093 | | | | 123,017 | |
CBRE Group, Inc. Cl A* | | | 2,248 | | | | 90,010 | |
Crown Castle International Corp. | | | 2,944 | | | | 319,807 | |
Digital Realty Trust, Inc. | | | 1,461 | | | | 155,670 | |
Duke Realty Corp. | | | 2,533 | | | | 65,605 | |
Equinix, Inc. | | | 572 | | | | 201,664 | |
Equity Residential | | | 2,609 | | | | 172,220 | |
Essex Property Trust, Inc. | | | 465 | | | | 114,023 | |
Extra Space Storage, Inc. | | | 888 | | | | 80,346 | |
Federal Realty Investment Trust | | | 522 | | | | 61,617 | |
HCP, Inc. | | | 3,373 | | | | 94,208 | |
Host Hotels & Resorts, Inc. | | | 5,245 | | | | 87,434 | |
Iron Mountain, Inc. | | | 2,006 | | | | 65,014 | |
| | | | | | | | |
| | | Shares | | | Value | |
| | | | | | | | |
| INDEXED ASSETS (CONTINUED): | | | | | | | | |
COMMON STOCKS (CONTINUED): | | | | | | | | |
REAL ESTATE (CONTINUED) | | | | | | | | |
Kimco Realty Corp. | | | 2,986 | | | $ | 43,745 | |
Macerich Co. | | | 748 | | | | 32,373 | |
Mid-America Apartment Communities, Inc. | | | 802 | | | | 76,751 | |
Prologis, Inc. | | | 4,459 | | | | 261,833 | |
Public Storage | | | 1,053 | | | | 213,138 | |
Realty Income Corp. | | | 2,077 | | | | 130,934 | |
Regency Centers Corp. | | | 1,199 | | | | 70,357 | |
SBA Communications Corp. Cl A* | | | 803 | | | | 129,998 | |
Simon Property Group, Inc. | | | 2,188 | | | | 367,562 | |
SL Green Realty Corp. | | | 602 | | | | 47,606 | |
UDR, Inc. | | | 1,949 | | | | 77,219 | |
Ventas, Inc. | | | 2,517 | | | | 147,471 | |
Vornado Realty Trust | | | 1,230 | | | | 76,297 | |
Welltower, Inc. | | | 2,669 | | | | 185,255 | |
Weyerhaeuser Co. | | | 5,338 | | | | 116,689 | |
| | | | | | | | |
| | | | | | | 4,407,471 | |
| | | | | | | | |
UTILITIES (1.9%) | | | | | | | | |
AES Corp. | | | 4,686 | | | | 67,760 | |
Alliant Energy Corp. | | | 1,664 | | | | 70,304 | |
Ameren Corp. | | | 1,720 | | | | 112,196 | |
American Electric Power Co., Inc. | | | 3,480 | | | | 260,095 | |
American Water Works Co., Inc. | | | 1,277 | | | | 115,913 | |
CenterPoint Energy, Inc. | | | 3,535 | | | | 99,793 | |
CMS Energy Corp. | | | 1,998 | | | | 99,201 | |
Consolidated Edison, Inc. | | | 2,196 | | | | 167,906 | |
Dominion Energy, Inc. | | | 4,623 | | | | 330,360 | |
DTE Energy Co. | | | 1,283 | | | | 141,515 | |
Duke Energy Corp. | | | 5,028 | | | | 433,916 | |
Edison International | | | 2,296 | | | | 130,344 | |
Entergy Corp. | | | 1,277 | | | | 109,911 | |
Evergy, Inc. | | | 1,853 | | | | 105,195 | |
Eversource Energy | | | 2,237 | | | | 145,494 | |
Exelon Corp. | | | 6,835 | | | | 308,258 | |
FirstEnergy Corp. | | | 3,438 | | | | 129,097 | |
NextEra Energy, Inc. | | | 3,373 | | | | 586,295 | |
NiSource, Inc. | | | 2,555 | | | | 64,769 | |
NRG Energy, Inc. | | | 2,062 | | | | 81,655 | |
PG&E Corp.* | | | 3,650 | | | | 86,687 | |
Pinnacle West Capital Corp. | | | 793 | | | | 67,564 | |
PPL Corp. | | | 5,093 | | | | 144,285 | |
Public Svc. Enterprise Group, Inc. | | | 3,559 | | | | 185,246 | |
SCANA Corp. | | | 1,010 | | | | 48,258 | |
Sempra Energy | | | 1,931 | | | | 208,915 | |
Southern Co. | | | 7,265 | | | | 319,079 | |
WEC Energy Group, Inc. | | | 2,223 | | | | 153,965 | |
Xcel Energy, Inc. | | | 3,636 | | | | 179,146 | |
| | | | | | | | |
| | | | | | | 4,953,122 | |
| | | | | | | | |
TOTAL INDEX ASSETS-COMMON STOCKS | | | | | | | | |
(Cost: $97,941,226 ) 55.7% | | | | | | | 149,348,660 | |
| | | | | | | | |
The accompanying notes are an integral part of these portfolio schedules.
55
MUTUAL OF AMERICA INVESTMENT CORPORATION — ALL AMERICA FUND
PORTFOLIO OF INVESTMENTS IN SECURITIES (Continued)
December 31, 2018
| | | | | | | | | | | | | | | | | | | | |
| | | Rating** | | | Rate(%) | | | Maturity | | | Face Amount | | | Value | |
| INDEXED ASSETS: | | | | | | | | | | | | | | | | | | | | |
SHORT-TERM DEBT SECURITIES: | | | | | | | | | | | | | | | | | | | | |
U.S. GOVERNMENT (0.2%) | | | | | | | | | | | | | | | | | | | | |
U.S. Treasury Bill (1) | | | A-1+ | | | | 2.37 | | | | 02/21/2019 | | | $ | 500,000 | | | $ | 498,334 | |
| | | | | | | | | | | | | | | | | | | | |
U.S. GOVERNMENT AGENCIES (0.5%) | | | | | | | | | | | | | | | | | | | | |
FHLB | | | A-1+ | | | | 2.15 | | | | 01/02/2019 | | | | 1,400,000 | | | | 1,399,916 | |
| | | | | | | | | | | | | | | | | | | | |
TOTAL INDEXED ASSETS-SHORT-TERM DEBT (0.7%)
(Cost: $1,898,250) 0.7% | | | | 1,898,250 | |
| | | | | | | | | | | | | | | | | | | | |
TOTAL INDEXED ASSETS
(Cost: $99,839,476) 56.4% | | | | 151,246,910 | |
| | | | | | | | | | | | | | | | | | | | |
The accompanying notes are an integral part of these portfolio schedules.
56
MUTUAL OF AMERICA INVESTMENT CORPORATION — ALL AMERICA FUND
PORTFOLIO OF INVESTMENTS IN SECURITIES (Continued)
December 31, 2018
| | | | | | | | |
| | | Shares | | | Value | |
| | | | | | | | |
| ACTIVE ASSETS: | | | | | | | | |
COMMON STOCKS: | | | | | | | | |
COMMUNICATION SERVICES (1.2%) | | | | | | | | |
CenturyLink, Inc. | | | 5,951 | | | $ | 90,157 | |
Discovery, Inc. Cl A* | | | 4,509 | | | | 111,553 | |
Discovery, Inc. Cl C* | | | 19,855 | | | | 458,254 | |
Lions Gate Entertainment Corp. Cl A | | | 18,625 | | | | 299,862 | |
Lions Gate Entertainment Corp. Cl B | | | 17,243 | | | | 256,576 | |
MSG Networks, Inc. Cl A* | | | 15,199 | | | | 358,088 | |
Nexstar Media Group, Inc. Cl A | | | 1,360 | | | | 106,950 | |
ORBCOMM, Inc.* | | | 46,632 | | | | 385,180 | |
Shenandoah Telecommunications Co. | | | 8,862 | | | | 392,144 | |
Take-Two Interactive Software, Inc.* | | | 3,869 | | | | 398,275 | |
World Wrestling Entertainment, Inc. Cl A | | | 2,656 | | | | 198,456 | |
Zayo Group Hldgs., Inc.* | | | 4,484 | | | | 102,415 | |
| | | | | | | | |
| | | | | | | 3,157,910 | |
| | | | | | | | |
CONSUMER DISCRETIONARY (4.0%) | | | | | | | | |
American Axle & Manufacturing Hldgs., Inc.* | | | 14,543 | | | | 161,427 | |
AutoZone, Inc.* | | | 906 | | | | 759,536 | |
Belmond Ltd. Cl A* | | | 30,706 | | | | 768,571 | |
Bloomin’ Brands, Inc. | | | 27,768 | | | | 496,770 | |
BorgWarner, Inc. | | | 8,356 | | | | 290,288 | |
Bright Horizons Family Solutions, Inc.* | | | 1,968 | | | | 219,334 | |
Dave & Buster’s Entertainment, Inc. | | | 14,911 | | | | 664,434 | |
Etsy, Inc.* | | | 5,934 | | | | 282,280 | |
Expedia Group, Inc. | | | 1,151 | | | | 129,660 | |
Five Below, Inc.* | | | 8,625 | | | | 882,510 | |
Haverty Furniture Cos., Inc. | | | 14,513 | | | | 272,554 | |
Houghton Mifflin Harcourt Co.* | | | 21,199 | | | | 187,823 | |
Lithia Motors, Inc. Cl A | | | 12,132 | | | | 926,036 | |
Marriott International, Inc. Cl A | | | 2,882 | | | | 312,870 | |
Marriott Vacations Worldwide Corp. | | | 2,580 | | | | 181,916 | |
NVR, Inc.* | | | 107 | | | | 260,758 | |
Playa Hotels & Resorts NV* | | | 34,774 | | | | 250,025 | |
Qurate Retail, Inc.* | | | 11,611 | | | | 226,647 | |
Ralph Lauren Corp. Cl A | | | 4,737 | | | | 490,090 | |
Red Rock Resorts, Inc. Cl A | | | 18,893 | | | | 383,717 | |
Shutterfly, Inc.* | | | 2,035 | | | | 81,929 | |
Sleep Number Corp.* | | | 21,500 | | | | 682,195 | |
Stamps.com, Inc.* | | | 4,171 | | | | 649,174 | |
Steven Madden Ltd. | | | 11,947 | | | | 361,516 | |
Taylor Morrison Home Corp. Cl A* | | | 3,067 | | | | 48,765 | |
Tractor Supply Co. | | | 6,451 | | | | 538,271 | |
Unifi, Inc.* | | | 7,410 | | | | 169,244 | |
Weight Watchers International, Inc.* | | | 3,572 | | | | 137,701 | |
| | | | | | | | |
| | | | | | | 10,816,041 | |
| | | | | | | | |
CONSUMER STAPLES (0.9%) | | | | | | | | |
Cal-Maine Foods, Inc. | | | 4,711 | | | | 199,275 | |
Church & Dwight Co., Inc. | | | 9,665 | | | | 635,571 | |
Constellation Brands, Inc. Cl A | | | 2,316 | | | | 372,459 | |
Crimson Wine Group Ltd.* | | | 40,852 | | | | 319,667 | |
| | | | | | | | |
| | | Shares | | | Value | |
| | | | | | | | |
| ACTIVE ASSETS (CONTINUED): | | | | | | | | |
COMMON STOCKS (CONTINUED): | | | | | | | | |
CONSUMER STAPLES (CONTINUED) | | | | | | | | |
Ingredion, Inc. | | | 1,961 | | | $ | 179,235 | |
JM Smucker Co. | | | 3,154 | | | | 294,867 | |
Orchids Paper Products Co.* | | | 18,068 | | | | 16,984 | |
Vector Group Ltd. | | | 39,080 | | | | 380,248 | |
| | | | | | | | |
| | | | | | | 2,398,306 | |
| | | | | | | | |
ENERGY (1.7%) | | | | | | | | |
Abraxas Petroleum Corp.* | | | 45,160 | | | | 49,224 | |
Baker Hughes, a GE Co. Cl A | | | 4,562 | | | | 98,083 | |
C&J Energy Svcs., Inc.* | | | 5,255 | | | | 70,942 | |
Callon Petroleum Co.* | | | 20,268 | | | | 131,539 | |
Carrizo Oil & Gas, Inc.* | | | 10,312 | | | | 116,422 | |
Centennial Resource Development, Inc. Cl A* | | | 13,084 | | | | 144,186 | |
Cheniere Energy, Inc.* | | | 3,865 | | | | 228,769 | |
Continental Resources, Inc.* | | | 7,874 | | | | 316,456 | |
CrossAmerica Partners LP | | | 9,081 | | | | 128,587 | |
Devon Energy Corp. | | | 8,496 | | | | 191,500 | |
Hess Corp. | | | 1,997 | | | | 80,879 | |
Kosmos Energy Ltd.* | | | 15,131 | | | | 61,583 | |
Matrix Svcs. Co.* | | | 5,894 | | | | 105,738 | |
MPLX LP | | | 4,207 | | | | 127,472 | |
Newfield Exploration Co.* | | | 7,541 | | | | 110,551 | |
Noble Energy, Inc. | | | 6,609 | | | | 123,985 | |
PBF Energy, Inc. Cl A | | | 27,069 | | | | 884,344 | |
PDC Energy, Inc.* | | | 5,576 | | | | 165,942 | |
Penn Virginia Corp.* | | | 1,285 | | | | 69,467 | |
ProPetro Hldgs. Corp.* | | | 12,912 | | | | 159,076 | |
Range Resources Corp. | | | 28,743 | | | | 275,071 | |
RPC, Inc. | | | 20,714 | | | | 204,447 | |
Whiting Petroleum Corp.* | | | 16,475 | | | | 373,818 | |
Williams Cos., Inc. | | | 17,128 | | | | 377,673 | |
| | | | | | | | |
| | | | | | | 4,595,754 | |
| | | | | | | | |
FINANCIALS (7.7%) | | | | | | | | |
American Equity Investment Life Hldgs. Co. | | | 11,740 | | | | 328,016 | |
American Financial Group, Inc. | | | 3,202 | | | | 289,877 | |
Ameriprise Financial, Inc. | | | 4,486 | | | | 468,204 | |
AMERISAFE, Inc. | | | 3,175 | | | | 179,991 | |
Aspen Insurance Hldgs. Ltd. | | | 8,166 | | | | 342,890 | |
Associated Banc-Corp. | | | 12,426 | | | | 245,911 | |
BancFirst Corp. | | | 8,935 | | | | 445,856 | |
Bank of Marin Bancorp | | | 7,642 | | | | 315,156 | |
BankUnited, Inc. | | | 5,982 | | | | 179,101 | |
Banner Corp. | | | 7,217 | | | | 385,965 | |
Brookline Bancorp, Inc. | | | 27,702 | | | | 382,842 | |
Brown & Brown, Inc. | | | 10,450 | | | | 288,002 | |
Bryn Mawr Bank Corp. | | | 7,895 | | | | 271,588 | |
Cadence BanCorporation Cl A | | | 10,224 | | | | 171,559 | |
Cboe Global Markets, Inc. | | | 3,128 | | | | 306,013 | |
CenterState Bank Corp. | | | 11,206 | | | | 235,774 | |
Citizens Financial Group, Inc. | | | 3,303 | | | | 98,199 | |
Columbia Banking System, Inc. | | | 4,111 | | | | 149,188 | |
Dime Community Bancshares, Inc. | | | 12,396 | | | | 210,484 | |
Discover Financial Svcs. | | | 6,347 | | | | 374,346 | |
The accompanying notes are an integral part of these portfolio schedules.
57
MUTUAL OF AMERICA INVESTMENT CORPORATION — ALL AMERICA FUND
PORTFOLIO OF INVESTMENTS IN SECURITIES (Continued)
December 31, 2018
| | | | | | | | |
| | | Shares | | | Value | |
| | | | | | | | |
| ACTIVE ASSETS (CONTINUED): | | | | | | | | |
COMMON STOCKS (CONTINUED): | | | | | | | | |
FINANCIALS (CONTINUED) | | | | | | | | |
East West Bancorp, Inc. | | | 6,593 | | | $ | 286,993 | |
Ellington Financial LLC* | | | 24,301 | | | | 372,534 | |
Enterprise Financial Svcs. Corp. | | | 8,869 | | | | 333,740 | |
Everest Re Group Ltd. | | | 1,866 | | | | 406,340 | |
Fifth Third Bancorp | | | 22,919 | | | | 539,284 | |
First Interstate BancSystem, Inc. Cl A | | | 9,690 | | | | 354,266 | |
First Merchants Corp. | | | 7,027 | | | | 240,815 | |
First Republic Bank | | | 3,514 | | | | 305,367 | |
Flushing Financial Corp. | | | 9,569 | | | | 206,021 | |
Glacier Bancorp, Inc. | | | 6,629 | | | | 262,641 | |
Great Southern Bancorp, Inc. | | | 3,459 | | | | 159,218 | |
Hartford Financial Svcs. Group, Inc. | | | 13,064 | | | | 580,695 | |
Heritage Financial Corp. | | | 10,020 | | | | 297,794 | |
IBERIABANK Corp. | | | 1,535 | | | | 98,670 | |
Investors Bancorp, Inc. | | | 12,663 | | | | 131,695 | |
iShares Micro-Cap ETF | | | 3,106 | | | | 256,090 | |
iShares Russell 2000 Value ETF | | | 1,826 | | | | 196,368 | |
iShares Russell Mid-Cap ETF | | | 12,680 | | | | 589,366 | |
KeyCorp | | | 32,723 | | | | 483,646 | |
Lincoln National Corp. | | | 4,086 | | | | 209,653 | |
Marlin Business Svcs. Corp. | | | 14,708 | | | | 328,430 | |
MB Financial, Inc. | | | 6,586 | | | | 261,003 | |
Moelis & Co. Cl A | | | 8,125 | | | | 279,338 | |
NMI Hldgs., Inc. Cl A* | | | 32,777 | | | | 585,069 | |
Northfield Bancorp, Inc. | | | 20,428 | | | | 276,799 | |
Pinnacle Financial Partners, Inc. | | | 10,678 | | | | 492,256 | |
Primerica, Inc. | | | 1,575 | | | | 153,893 | |
Principal Financial Group, Inc. | | | 4,617 | | | | 203,933 | |
Progressive Corp. | | | 10,935 | | | | 659,708 | |
Raymond James Financial, Inc. | | | 4,479 | | | | 333,282 | |
Reinsurance Group of America, Inc. Cl A | | | 5,456 | | | | 765,095 | |
S&T Bancorp, Inc. | | | 7,019 | | | | 265,599 | |
SEI Investments Co. | | | 5,750 | | | | 265,650 | |
Selective Insurance Group, Inc. | | | 8,900 | | | | 542,366 | |
Starwood Property Trust, Inc. | | | 36,278 | | | | 715,039 | |
Sterling Bancorp | | | 6,444 | | | | 106,390 | |
Stock Yards Bancorp, Inc. | | | 16,282 | | | | 534,050 | |
SVB Financial Group* | | | 1,624 | | | | 308,430 | |
Synchrony Financial | | | 4,028 | | | | 94,497 | |
TriCo Bancshares | | | 5,406 | | | | 182,669 | |
TriState Capital Hldgs., Inc.* | | | 10,694 | | | | 208,105 | |
UMB Financial Corp. | | | 3,011 | | | | 183,581 | |
United Financial Bancorp, Inc. | | | 5,232 | | | | 76,910 | |
United Insurance Hldgs., Corp. | | | 9,523 | | | | 158,272 | |
Voya Financial, Inc. | | | 6,793 | | | | 272,671 | |
Wintrust Financial Corp. | | | 1,942 | | | | 129,124 | |
Zions Bancorporation | | | 5,372 | | | | 218,855 | |
| | | | | | | | |
| | | | | | | 20,581,172 | |
| | | | | | | | |
HEALTH CARE (5.2%) | | | | | | | | |
ABIOMED, Inc.* | | | 252 | | | | 81,910 | |
ACADIA Pharmaceuticals, Inc.* | | | 5,883 | | | | 95,128 | |
Acceleron Pharma, Inc.* | | | 3,172 | | | | 138,141 | |
Agilent Technologies, Inc. | | | 5,694 | | | | 384,117 | |
| | | | | | | | |
| | | Shares | | | Value | |
| | | | | | | | |
| ACTIVE ASSETS (CONTINUED): | | | | | | | | |
COMMON STOCKS (CONTINUED): | | | | | | | | |
HEALTH CARE (CONTINUED) | | | | | | | | |
Agios Pharmaceuticals, Inc.* | | | 2,256 | | | $ | 104,024 | |
Akebia Therapeutics, Inc.* | | | 5,893 | | | | 32,588 | |
Alder Biopharmaceuticals, Inc.* | | | 5,955 | | | | 61,039 | |
Align Technology, Inc.* | | | 618 | | | | 129,428 | |
Alnylam Pharmaceuticals, Inc.* | | | 1,220 | | | | 88,950 | |
Amicus Therapeutics, Inc.* | | | 11,116 | | | | 106,491 | |
AMN Healthcare Svcs., Inc.* | | | 2,099 | | | | 118,929 | |
Aptinyx, Inc.* | | | 3,505 | | | | 57,973 | |
Array BioPharma, Inc.* | | | 7,943 | | | | 113,188 | |
Avanos Medical, Inc.* | | | 2,761 | | | | 123,665 | |
AxoGen, Inc.* | | | 4,714 | | | | 96,307 | |
BioMarin Pharmaceutical, Inc.* | | | 1,204 | | | | 102,521 | |
Blueprint Medicines Corp.* | | | 2,362 | | | | 127,335 | |
Boston Scientific Corp.* | | | 12,148 | | | | 429,310 | |
Cambrex Corp.* | | | 2,682 | | | | 101,272 | |
Centene Corp.* | | | 4,509 | | | | 519,888 | |
Editas Medicine, Inc.* | | | 3,635 | | | | 82,696 | |
Edwards Lifesciences Corp.* | | | 3,749 | | | | 574,235 | |
Emergent BioSolutions, Inc.* | | | 7,848 | | | | 465,229 | |
Evolent Health, Inc. Cl A* | | | 11,680 | | | | 233,016 | |
Exact Sciences Corp.* | | | 7,792 | | | | 491,675 | |
FibroGen, Inc.* | | | 1,971 | | | | 91,218 | |
Flexion Therapeutics, Inc.* | | | 4,930 | | | | 55,808 | |
Globus Medical, Inc. Cl A* | | | 3,629 | | | | 157,063 | |
Hill-Rom Hldgs., Inc. | | | 4,254 | | | | 376,692 | |
Horizon Pharma PLC* | | | 8,624 | | | | 168,513 | |
Humana, Inc. | | | 843 | | | | 241,503 | |
ICU Medical, Inc.* | | | 686 | | | | 157,526 | |
Incyte Corp.* | | | 1,001 | | | | 63,653 | |
Inogen, Inc.* | | | 1,106 | | | | 137,332 | |
Insulet Corp.* | | | 1,628 | | | | 129,133 | |
Intersect ENT, Inc.* | | | 4,384 | | | | 123,541 | |
iRhythm Technologies, Inc.* | | | 2,258 | | | | 156,886 | |
Karyopharm Therapeutics, Inc.* | | | 7,361 | | | | 68,973 | |
LivaNova PLC* | | | 2,665 | | | | 243,768 | |
Loxo Oncology, Inc.* | | | 1,265 | | | | 177,189 | |
Madrigal Pharmaceuticals, Inc.* | | | 240 | | | | 27,053 | |
Masimo Corp.* | | | 1,060 | | | | 113,812 | |
Medicines Co.* | | | 4,784 | | | | 91,566 | |
Medidata Solutions, Inc.* | | | 2,819 | | | | 190,057 | |
Mettler-Toledo International, Inc.* | | | 555 | | | | 313,897 | |
MyoKardia, Inc.* | | | 1,737 | | | | 84,870 | |
Neogen Corp.* | | | 2,729 | | | | 155,553 | |
Neurocrine Biosciences, Inc.* | | | 5,125 | | | | 365,976 | |
Omnicell, Inc.* | | | 2,845 | | | | 174,228 | |
Pacific Biosciences of California, Inc.* | | | 17,117 | | | | 126,666 | |
Pacira Pharmaceuticals, Inc.* | | | 7,277 | | | | 313,057 | |
Penumbra, Inc.* | | | 765 | | | | 93,483 | |
Portola Pharmaceuticals, Inc.* | | | 4,364 | | | | 85,185 | |
PRA Health Sciences, Inc.* | | | 1,475 | | | | 135,641 | |
Quidel Corp.* | | | 3,875 | | | | 189,178 | |
Repligen Corp.* | | | 4,521 | | | | 238,438 | |
Sage Therapeutics, Inc.* | | | 844 | | | | 80,847 | |
Sientra, Inc.* | | | 7,130 | | | | 90,622 | |
Spark Therapeutics, Inc.* | | | 1,873 | | | | 73,309 | |
The accompanying notes are an integral part of these portfolio schedules.
58
MUTUAL OF AMERICA INVESTMENT CORPORATION — ALL AMERICA FUND
PORTFOLIO OF INVESTMENTS IN SECURITIES (Continued)
December 31, 2018
| | | | | | | | |
| | | Shares | | | Value | |
| | | | | | | | |
| ACTIVE ASSETS (CONTINUED): | | | | | | | | |
COMMON STOCKS (CONTINUED): | | | | | | | | |
HEALTH CARE (CONTINUED) | | | | | | | | |
STAAR Surgical Co.* | | | 4,225 | | | $ | 134,820 | |
Supernus Pharmaceuticals, Inc.* | | | 22,204 | | | | 737,617 | |
Tabula Rasa HealthCare, Inc.* | | | 2,205 | | | | 140,591 | |
Tactile Systems Technology, Inc.* | | | 3,647 | | | | 166,121 | |
Ultragenyx Pharmaceutical, Inc.* | | | 1,983 | | | | 86,221 | |
United Therapeutics Corp.* | | | 608 | | | | 66,211 | |
Veeva Systems, Inc. Cl A* | | | 2,885 | | | | 257,688 | |
Vericel Corp.* | | | 21,584 | | | | 375,562 | |
WellCare Health Plans, Inc.* | | | 2,430 | | | | 573,698 | |
Wright Medical Group NV* | | | 15,060 | | | | 409,933 | |
Xencor, Inc.* | | | 4,911 | | | | 177,582 | |
Zimmer Biomet Hldgs., Inc. | | | 3,553 | | | | 368,517 | |
Zoetis, Inc. Cl A | | | 3,745 | | | | 320,348 | |
Zogenix, Inc.* | | | 2,791 | | | | 101,760 | |
| | | | | | | | |
| | | | | | | 14,067,960 | |
| | | | | | | | |
INDUSTRIALS (6.3%) | | | | | | | | |
AAR Corp. | | | 11,190 | | | | 417,835 | |
Advanced Disposal Svcs., Inc.* | | | 6,343 | | | | 151,851 | |
Aerovironment, Inc.* | | | 2,867 | | | | 194,813 | |
Alaska Air Group, Inc. | | | 8,799 | | | | 535,419 | |
AMERCO | | | 494 | | | | 162,086 | |
ASGN, Inc.* | | | 3,168 | | | | 172,656 | |
BG Staffing, Inc. | | | 4,971 | | | | 102,651 | |
Brink’s Co. | | | 6,427 | | | | 415,506 | |
Builders FirstSource, Inc.* | | | 8,696 | | | | 94,873 | |
Carlisle Cos., Inc. | | | 5,974 | | | | 600,506 | |
CH Robinson Worldwide, Inc. | | | 2,330 | | | | 195,930 | |
Copart, Inc.* | | | 3,001 | | | | 143,388 | |
Daseke, Inc.* | | | 30,873 | | | | 113,613 | |
Dover Corp. | | | 3,676 | | | | 260,812 | |
Echo Global Logistics, Inc.* | | | 11,064 | | | | 224,931 | |
EMCOR Group, Inc. | | | 4,911 | | | | 293,138 | |
Encore Wire Corp. | | | 8,322 | | | | 417,598 | |
EnPro Industries, Inc. | | | 3,199 | | | | 192,260 | |
Exponent, Inc. | | | 3,916 | | | | 198,580 | |
Fortive Corp. | | | 2,210 | | | | 149,528 | |
Generac Hldgs., Inc.* | | | 3,666 | | | | 182,200 | |
Gorman-Rupp Co. | | | 8,675 | | | | 281,157 | |
Granite Construction, Inc. | | | 11,007 | | | | 443,362 | |
Harris Corp. | | | 3,227 | | | | 434,516 | |
HD Supply Hldgs., Inc.* | | | 5,005 | | | | 187,788 | |
Heidrick & Struggles International, Inc. | | | 4,628 | | | | 144,347 | |
Hyster-Yale Materials Handling, Inc. | | | 3,216 | | | | 199,263 | |
ICF International, Inc. | | | 3,004 | | | | 194,599 | |
John Bean Technologies Corp. | | | 1,876 | | | | 134,716 | |
Kirby Corp.* | | | 4,398 | | | | 296,249 | |
Knoll, Inc. | | | 8,253 | | | | 136,009 | |
Kratos Defense & Security Solutions, Inc.* | | | 14,024 | | | | 197,598 | |
L-3 Technologies, Inc. | | | 4,610 | | | | 800,572 | |
Landstar System, Inc. | | | 2,589 | | | | 247,690 | |
Lennox International, Inc. | | | 2,094 | | | | 458,293 | |
Lincoln Electric Hldgs., Inc. | | | 3,242 | | | | 255,632 | |
LSC Communications, Inc. | | | 20,831 | | | | 145,817 | |
| | | | | | | | |
| | | Shares | | | Value | |
| | | | | | | | |
| ACTIVE ASSETS (CONTINUED): | | | | | | | | |
COMMON STOCKS (CONTINUED): | | | | | | | | |
INDUSTRIALS (CONTINUED) | | | | | | | | |
Miller Industries, Inc. | | | 19,592 | | | $ | 528,984 | |
Mueller Industries, Inc. | | | 43,284 | | | | 1,011,114 | |
Old Dominion Freight Line, Inc. | | | 6,333 | | | | 782,062 | |
Oshkosh Corp. | | | 2,752 | | | | 168,725 | |
Republic Svcs., Inc. Cl A | | | 1,130 | | | | 81,461 | |
Robert Half International, Inc. | | | 6,156 | | | | 352,124 | |
Rockwell Automation, Inc. | | | 2,874 | | | | 432,479 | |
Roper Technologies, Inc. | | | 789 | | | | 210,284 | |
Simpson Manufacturing Co., Inc. | | | 5,686 | | | | 307,783 | |
Spirit Airlines, Inc.* | | | 5,745 | | | | 332,750 | |
Stanley Black & Decker, Inc. | | | 4,091 | | | | 489,856 | |
Sun Hydraulics Corp. | | | 4,946 | | | | 164,158 | |
Teledyne Technologies, Inc.* | | | 1,329 | | | | 275,196 | |
Trex Co., Inc.* | | | 9,363 | | | | 555,788 | |
United Rentals, Inc.* | | | 4,642 | | | | 475,944 | |
Universal Forest Products, Inc. | | | 7,378 | | | | 191,533 | |
VSE Corp. | | | 10,094 | | | | 301,912 | |
Wabtec Corp. | | | 3,243 | | | | 227,821 | |
XPO Logistics, Inc.* | | | 1,554 | | | | 88,640 | |
| | | | | | | | |
| | | | | | | 16,756,396 | |
| | | | | | | | |
INFORMATION TECHNOLOGY (6.4%) | | | | | | | | |
Aerohive Networks, Inc.* | | | 20,348 | | | | 66,334 | |
Altair Engineering, Inc. Cl A* | | | 3,934 | | | | 108,500 | |
Amphenol Corp. Cl A | | | 4,815 | | | | 390,111 | |
Analog Devices, Inc. | | | 4,630 | | | | 397,393 | |
Anixter International, Inc.* | | | 2,666 | | | | 144,790 | |
Apptio, Inc. Cl A* | | | 9,770 | | | | 370,869 | |
Avnet, Inc. | | | 7,279 | | | | 262,772 | |
Ciena Corp.* | | | 5,730 | | | | 194,304 | |
Coherent, Inc.* | | | 1,144 | | | | 120,932 | |
Comtech Telecommunications Corp. | | | 2,558 | | | | 62,262 | |
Conduent, Inc.* | | | 10,665 | | | | 113,369 | |
Cornerstone OnDemand, Inc.* | | | 2,867 | | | | 144,583 | |
Cray, Inc.* | | | 13,554 | | | | 292,631 | |
Cypress Semiconductor Corp. | | | 26,235 | | | | 333,709 | |
DXC Technology Co. | | | 6,719 | | | | 357,249 | |
Entegris, Inc. | | | 6,249 | | | | 174,316 | |
EPAM Systems, Inc.* | | | 3,676 | | | | 426,453 | |
Euronet Worldwide, Inc.* | | | 3,000 | | | | 307,140 | |
Everspin Technologies, Inc.* | | | 22,197 | | | | 124,525 | |
F5 Networks, Inc.* | | | 443 | | | | 71,779 | |
Fidelity National Information Svcs., Inc. | | | 2,009 | | | | 206,023 | |
Five9, Inc.* | | | 11,772 | | | | 514,672 | |
Global Payments, Inc. | | | 3,877 | | | | 399,835 | |
Globant S.A.* | | | 3,140 | | | | 176,845 | |
Guidewire Software, Inc.* | | | 2,767 | | | | 221,996 | |
HubSpot, Inc.* | | | 1,450 | | | | 182,308 | |
II-VI, Inc.* | | | 8,174 | | | | 265,328 | |
Integrated Device Technology, Inc.* | | | 4,011 | | | | 194,253 | |
Itron, Inc.* | | | 2,284 | | | | 108,010 | |
KLA-Tencor Corp. | | | 2,740 | | | | 245,202 | |
LogMeIn, Inc. | | | 7,511 | | | | 612,672 | |
Lumentum Hldgs., Inc.* | | | 5,454 | | | | 229,123 | |
The accompanying notes are an integral part of these portfolio schedules.
59
MUTUAL OF AMERICA INVESTMENT CORPORATION — ALL AMERICA FUND
PORTFOLIO OF INVESTMENTS IN SECURITIES (Continued)
December 31, 2018
| | | | | | | | |
| | | Shares | | | Value | |
| | | | | | | | |
| ACTIVE ASSETS (CONTINUED): | | | | | | | | |
COMMON STOCKS (CONTINUED): | | | | | | | | |
INFORMATION TECHNOLOGY (CONTINUED) | | | | | | | | |
MaxLinear, Inc. Cl A* | | | 14,973 | | | $ | 263,525 | |
Microchip Technology, Inc. | | | 3,252 | | | | 233,884 | |
MINDBODY, Inc. Cl A* | | | 2,144 | | | | 78,042 | |
MKS Instruments, Inc. | | | 5,959 | | | | 385,011 | |
Motorola Solutions, Inc. | | | 1,385 | | | | 159,331 | |
New Relic, Inc.* | | | 5,190 | | | | 420,234 | |
Nutanix, Inc. Cl A* | | | 4,445 | | | | 184,868 | |
Palo Alto Networks, Inc.* | | | 963 | | | | 181,381 | |
Perficient, Inc.* | | | 11,039 | | | | 245,728 | |
Perspecta, Inc. | | | 9,913 | | | | 170,702 | |
Plexus Corp.* | | | 2,371 | | | | 121,111 | |
Proofpoint, Inc.* | | | 7,613 | | | | 638,046 | |
PTC, Inc.* | | | 6,632 | | | | 549,793 | |
Pure Storage, Inc. Cl A* | | | 10,185 | | | | 163,775 | |
Q2 Hldgs., Inc.* | | | 3,980 | | | | 197,209 | |
Qorvo, Inc.* | | | 1,651 | | | | 100,265 | |
Rapid7, Inc.* | | | 12,561 | | | | 391,401 | |
RealPage, Inc.* | | | 4,300 | | | | 207,217 | |
Red Hat, Inc.* | | | 2,564 | | | | 450,341 | |
Richardson Electronics Ltd.* | | | 41,267 | | | | 358,610 | |
Rogers Corp.* | | | 1,801 | | | | 178,407 | |
Science Applications International Corp. | | | 1,285 | | | | 81,854 | |
Sequans Communications S.A. ADR* | | | 67,510 | | | | 52,658 | |
Splunk, Inc.* | | | 3,944 | | | | 413,528 | |
SYNNEX Corp. | | | 5,531 | | | | 447,126 | |
Synopsys, Inc.* | | | 2,284 | | | | 192,404 | |
ViaSat, Inc.* | | | 12,735 | | | | 750,728 | |
Western Digital Corp. | | | 1,762 | | | | 65,141 | |
Worldpay, Inc. Cl A* | | | 6,377 | | | | 487,394 | |
Xilinx, Inc. | | | 2,853 | | | | 242,990 | |
Xperi Corp. | | | 17,697 | | | | 325,448 | |
Xura, Inc.* | | | 11,415 | | | | 285,375 | †† |
Zendesk, Inc.* | | | 6,726 | | | | 392,597 | |
| | | | | | | | |
| | | | | | | 17,236,412 | |
| | | | | | | | |
MATERIALS (2.0%) | | | | | | | | |
Ashland Global Hldgs., Inc. | | | 4,212 | | | | 298,884 | |
Berry Global Group, Inc.* | | | 6,645 | | | | 315,837 | |
Boise Cascade Co. | | | 5,060 | | | | 120,681 | |
Century Aluminum Co.* | | | 8,141 | | | | 59,511 | |
Crown Hldgs., Inc.* | | | 15,624 | | | | 649,490 | |
Eastman Chemical Co. | | | 1,274 | | | | 93,142 | |
Ferro Corp.* | | | 31,948 | | | | 500,945 | |
Ferroglobe PLC | | | 10,886 | | | | 17,309 | |
Ferroglobe Representation & Warranty Insurance Trust* | | | 6,080 | | | | 0 | †† |
FMC Corp. | | | 1,586 | | | | 117,301 | |
Freeport-McMoRan, Inc. | | | 10,487 | | | | 108,121 | |
Ingevity Corp.* | | | 1,705 | | | | 142,691 | |
International Paper Co. | | | 4,253 | | | | 171,651 | |
Kaiser Aluminum Corp. | | | 2,491 | | | | 222,421 | |
Minerals Technologies, Inc. | | | 2,174 | | | | 111,613 | |
Mosaic Co. | | | 1,882 | | | | 54,973 | |
Nucor Corp. | | | 2,469 | | | | 127,919 | |
| | | | | | | | |
| | | Shares | | | Value | |
| | | | | | | | |
| ACTIVE ASSETS (CONTINUED): | | | | | | | | |
COMMON STOCKS (CONTINUED): | | | | | | | | |
MATERIALS (CONTINUED) | | | | | | | | |
Olin Corp. | | | 17,184 | | | $ | 345,570 | |
Packaging Corp. of America | | | 8,168 | | | | 681,702 | |
Steel Dynamics, Inc. | | | 18,350 | | | | 551,234 | |
TimkenSteel Corp.* | | | 4,876 | | | | 42,616 | |
U.S. Concrete, Inc.* | | | 7,672 | | | | 270,668 | |
Vulcan Materials Co. | | | 3,436 | | | | 339,477 | |
| | | | | | | | |
| | | | | | | 5,343,756 | |
| | | | | | | | |
REAL ESTATE (3.4%) | | | | | | | | |
Alexander’s, Inc. | | | 678 | | | | 206,614 | |
Apartment Investment & Management Co. Cl A | | | 4,072 | | | | 178,680 | |
AvalonBay Communities, Inc. | | | 1,316 | | | | 229,050 | |
Brandywine Realty Trust | | | 42,415 | | | | 545,881 | |
Camden Property Trust | | | 3,212 | | | | 282,817 | |
Chatham Lodging Trust | | | 8,125 | | | | 143,650 | |
Chesapeake Lodging Trust | | | 10,886 | | | | 265,074 | |
Cousins Properties, Inc. | | | 30,085 | | | | 237,672 | |
Duke Realty Corp. | | | 30,649 | | | | 793,809 | |
Easterly Government Properties, Inc. | | | 23,189 | | | | 363,604 | |
Equity LifeStyle Properties, Inc. | | | 1,051 | | | | 102,084 | |
Essex Property Trust, Inc. | | | 563 | | | | 138,053 | |
Extra Space Storage, Inc. | | | 2,138 | | | | 193,446 | |
GEO Group, Inc. | | | 23,555 | | | | 464,034 | |
Highwoods Properties, Inc. | | | 6,759 | | | | 261,506 | |
Host Hotels & Resorts, Inc. | | | 26,588 | | | | 443,222 | |
JBG SMITH Properties | | | 5,957 | | | | 207,363 | |
Kilroy Realty Corp. | | | 9,168 | | | | 576,484 | |
Macerich Co. | | | 2,368 | | | | 102,487 | |
Medical Properties Trust, Inc. | | | 19,832 | | | | 318,899 | |
Pebblebrook Hotel Trust | | | 7,458 | | | | 211,136 | |
Pennsylvania REIT | | | 12,018 | | | | 71,387 | |
Prologis, Inc. | | | 4,165 | | | | 244,569 | |
QTS Realty Trust, Inc. Cl A | | | 3,093 | | | | 114,596 | |
Regency Centers Corp. | | | 1,098 | | | | 64,431 | |
RLJ Lodging Trust | | | 7,068 | | | | 115,915 | |
Sabra Health Care REIT, Inc. | | | 10,739 | | | | 176,979 | |
SBA Communications Corp. Cl A* | | | 2,793 | | | | 452,158 | |
Summit Hotel Properties, Inc. | | | 5,692 | | | | 55,383 | |
Sun Communities, Inc. | | | 3,290 | | | | 334,626 | |
Terreno Realty Corp. | | | 19,243 | | | | 676,776 | |
Urstadt Biddle Properties, Inc. Cl A | | | 4,411 | | | | 84,779 | |
Vornado Realty Trust | | | 1,997 | | | | 123,874 | |
Welltower, Inc. | | | 3,510 | | | | 243,629 | |
Weyerhaeuser Co. | | | 9,137 | | | | 199,735 | |
| | | | | | | | |
| | | | | | | 9,224,402 | |
| | | | | | | | |
UTILITIES (2.6%) | | | | | | | | |
AES Corp. | | | 10,941 | | | | 158,206 | |
Ameren Corp. | | | 4,682 | | | | 305,406 | |
Avista Corp. | | | 5,417 | | | | 230,114 | |
Black Hills Corp. | | | 2,570 | | | | 161,345 | |
Chesapeake Utilities Corp. | | | 2,582 | | | | 209,917 | |
Consolidated Edison, Inc. | | | 3,630 | | | | 277,550 | |
Edison International | | | 6,989 | | | | 396,765 | |
The accompanying notes are an integral part of these portfolio schedules.
60
MUTUAL OF AMERICA INVESTMENT CORPORATION — ALL AMERICA FUND
PORTFOLIO OF INVESTMENTS IN SECURITIES (Continued)
December 31, 2018
| | | | | | | | |
| | | Shares | | | Value | |
| | | | | | | | |
| ACTIVE ASSETS (CONTINUED): | | | | | | | | |
COMMON STOCKS (CONTINUED): | | | | | | | | |
UTILITIES (CONTINUED) | | | | | | | | |
Entergy Corp. | | | 2,891 | | | $ | 248,830 | |
Evergy, Inc. | | | 11,533 | | | | 654,728 | |
Eversource Energy | | | 2,720 | | | | 176,909 | |
FirstEnergy Corp. | | | 6,251 | | | | 234,725 | |
IDACORP, Inc. | | | 3,168 | | | | 294,814 | |
NiSource, Inc. | | | 23,823 | | | | 603,913 | |
Northwest Natural Hldg. Co. | | | 3,022 | | | | 182,710 | |
NorthWestern Corp. | | | 3,819 | | | | 227,001 | |
PNM Resources, Inc. | | | 6,677 | | | | 274,358 | |
Portland General Electric Co. | | | 6,447 | | | | 295,595 | |
PPL Corp. | | | 7,331 | | | | 207,687 | |
Public Svc. Enterprise Group, Inc. | | | 6,662 | | | | 346,757 | |
Sempra Energy | | | 5,863 | | | | 634,318 | |
UGI Corp. | | | 10,422 | | | | 556,014 | |
| | | | | | | | |
| | | | | | | 6,677,662 | |
| | | | | | | | |
TOTAL ACTIVE ASSETS-COMMON STOCKS | | | | | | | | |
(Cost: $109,053,966) 41.4% | | | | | | | 110,855,771 | |
| | | | | | | | |
| | | | | | | | | | | | | | | | | | | | |
| | | Rating** | | | Rate(%) | | | Maturity | | | Face Amount | | | Value | |
| ACTIVE ASSETS: | | | | | | | | | | | | | | | | | | | | |
SHORT-TERM DEBT SECURITIES: | | | | | | | | | | | | | | | | | | | | |
U.S. GOVERNMENT AGENCIES (1.9%) | | | | | | | | | | | | | | | | | | | | |
FHLB | | | A-1+ | | | | 2.15 | | | | 01/02/2019 | | | $ | 5,200,000 | | | $ | 5,199,689 | |
| | | | | | | | | | | | | | | | | | | | |
COMMERCIAL PAPER (0.3%) | | | | | | | | | | | | | | | | | | | | |
Cargill, Inc.† | | | A-1 | | | | 2.39 | | | | 01/02/2019 | | | | 800,000 | | | | 799,947 | |
| | | | | | | | | | | | | | | | | | | | |
TOTAL ACTIVE ASSETS-SHORT-TERM DEBT SECURITIES
(Cost: $5,999,636) 2.2% | | | | 5,999,636 | |
| | | | | | | | | | | | | | | | | | | | |
TOTAL ACTIVE ASSETS
(Cost: $115,053,602) 43.6% | | | | 116,855,407 | |
| | | | | | | | | | | | | | | | | | | | |
| | | | | |
| | | | | | Rate(%) | | | Maturity | | | Face Amount | | | Value | |
| TEMPORARY CASH INVESTMENT (0.1%) | | | | | | | | | | | | | | | | | | | | |
Citibank, New York Time Deposit | | | | | | | 1.67 | | | | 01/02/19 | | | $ | 291,756 | | | $ | 291,756 | |
| | | | | | | | | | | | | | | | | | | | |
TOTAL TEMPORARY CASH INVESTMENT
(Cost: $291,756) 0.1% | | | | 291,756 | |
| | | | | | | | | | | | | | | | | | | | |
TOTAL INVESTMENTS
(Cost: $215,184,834) 100.1% | | | | 268,394,073 | |
| | | | | | | | | | | | | | | | | | | | |
OTHER NET ASSETS -0.1% | | | | (319,966 | ) |
| | | | | | | | | | | | | | | | | | | | |
NET ASSETS 100.0% | | | $ | 268,074,107 | |
| | | | | | | | | | | | | | | | | | | | |
The accompanying notes are an integral part of these portfolio schedules.
61
MUTUAL OF AMERICA INVESTMENT CORPORATION — SMALL CAP VALUE FUND
PORTFOLIO OF INVESTMENTS IN SECURITIES
December 31, 2018
| | | | | | | | |
| | | Shares | | | Value | |
| | | | | | | | |
| COMMON STOCKS: | | | | | | | | |
COMMUNICATION SERVICES (2.0%) | | | | | | | | |
MSG Networks, Inc. Cl A* | | | 144,347 | | | $ | 3,400,815 | |
ORBCOMM, Inc.* | | | 385,675 | | | | 3,185,676 | |
Shenandoah Telecommunications Co. | | | 45,563 | | | | 2,016,163 | |
| | | | | | | | |
| | | | | | | 8,602,654 | |
| | | | | | | | |
CONSUMER DISCRETIONARY (7.8%) | | | | | | | | |
Belmond Ltd. Cl A* | | | 249,150 | | | | 6,236,225 | |
Dave & Buster’s Entertainment, Inc. | | | 76,273 | | | | 3,398,725 | |
Houghton Mifflin Harcourt Co.* | | | 307,072 | | | | 2,720,658 | |
Lithia Motors, Inc. Cl A | | | 78,428 | | | | 5,986,409 | |
Marriott Vacations Worldwide Corp. | | | 15,848 | | | | 1,117,443 | |
Playa Hotels & Resorts NV* | | | 507,975 | | | | 3,652,340 | |
Red Rock Resorts, Inc. Cl A | | | 43,220 | | | | 877,798 | |
Sleep Number Corp.* | | | 80,498 | | | | 2,554,202 | |
Stamps.com, Inc.* | | | 27,330 | | | | 4,253,641 | |
Unifi, Inc.* | | | 104,883 | | | | 2,395,528 | |
| | | | | | | | |
| | | | | | | 33,192,969 | |
| | | | | | | | |
CONSUMER STAPLES (1.7%) | | | | | | | | |
Crimson Wine Group Ltd.* | | | 592,228 | | | | 4,634,184 | |
Orchids Paper Products Co.* | | | 269,669 | | | | 253,489 | |
Vector Group Ltd. | | | 267,191 | | | | 2,599,768 | |
| | | | | | | | |
| | | | | | | 7,487,441 | |
| | | | | | | | |
ENERGY (5.5%) | | | | | | | | |
Abraxas Petroleum Corp.* | | | 662,808 | | | | 722,461 | |
C&J Energy Svcs., Inc.* | | | 76,108 | | | | 1,027,458 | |
Callon Petroleum Co.* | | | 292,216 | | | | 1,896,482 | |
Carrizo Oil & Gas, Inc.* | | | 149,399 | | | | 1,686,715 | |
CrossAmerica Partners LP | | | 129,778 | | | | 1,837,656 | |
Matrix Svcs. Co.* | | | 85,362 | | | | 1,531,394 | |
PBF Energy, Inc. Cl A | | | 223,763 | | | | 7,310,337 | |
PDC Energy, Inc.* | | | 80,854 | | | | 2,406,215 | |
ProPetro Hldgs. Corp.* | | | 185,869 | | | | 2,289,906 | |
Range Resources Corp. | | | 132,569 | | | | 1,268,685 | |
Whiting Petroleum Corp.* | | | 66,974 | | | | 1,519,640 | |
| | | | | | | | |
| | | | | | | 23,496,949 | |
| | | | | | | | |
FINANCIALS (29.3%) | | | | | | | | |
American Equity Investment Life Hldg. Co. | | | 169,916 | | | | 4,747,453 | |
Aspen Insurance Hldgs. Ltd. | | | 121,028 | | | | 5,081,966 | |
BancFirst Corp. | | | 132,337 | | | | 6,603,616 | |
Bank of Marin Bancorp | | | 110,842 | | | | 4,571,124 | |
Banner Corp. | | | 100,938 | | | | 5,398,164 | |
Brookline Bancorp, Inc. | | | 425,093 | | | | 5,874,785 | |
Bryn Mawr Bank Corp. | | | 119,232 | | | | 4,101,581 | |
Cadence Bancorporation Cl A | | | 148,149 | | | | 2,485,940 | |
CenterState Bank Corp. | | | 158,563 | | | | 3,336,166 | |
Columbia Banking System, Inc. | | | 58,967 | | | | 2,139,912 | |
Dime Community Bancshares, Inc. | | | 171,897 | | | | 2,918,811 | |
Ellington Financial LLC* | | | 348,115 | | | | 5,336,603 | |
Enterprise Financial Svcs. Corp. | | | 127,003 | | | | 4,779,123 | |
First Interstate BancSystem, Inc. Cl A | | | 149,808 | | | | 5,476,981 | |
Flushing Financial Corp. | | | 141,534 | | | | 3,047,227 | |
Glacier Bancorp, Inc. | | | 95,926 | | | | 3,800,588 | |
| | | | | | | | |
| | | Shares | | | Value | |
| | | | | | | | |
| COMMON STOCKS (CONTINUED): | | | | | | | | |
FINANCIALS (CONTINUED) | | | | | | | | |
Great Southern Bancorp, Inc. | | | 52,585 | | | $ | 2,420,488 | |
IBERIABANK Corp. | | | 22,027 | | | | 1,415,896 | |
Investors Bancorp, Inc. | | | 183,813 | | | | 1,911,655 | |
iShares Russell 2000 Value ETF | | | 26,436 | | | | 2,842,927 | |
Marlin Business Svcs. Corp. | | | 213,838 | | | | 4,775,003 | |
MB Financial, Inc. | | | 96,462 | | | | 3,822,789 | |
NMI Hldgs., Inc. Cl A* | | | 478,189 | | | | 8,535,674 | |
Northfield Bancorp, Inc. | | | 293,253 | | | | 3,973,578 | |
Selective Insurance Group, Inc. | | | 130,679 | | | | 7,963,578 | |
Sterling Bancorp | | | 92,479 | | | | 1,526,828 | |
Stock Yards Bancorp, Inc. | | | 241,848 | | | | 7,932,614 | |
TriCo Bancshares | | | 81,598 | | | | 2,757,196 | |
UMB Financial Corp. | | | 43,537 | | | | 2,654,451 | |
United Financial Bancorp, Inc. | | | 76,611 | | | | 1,126,182 | |
Wintrust Financial Corp. | | | 29,201 | | | | 1,941,574 | |
| | | | | | | | |
| | | | | | | 125,300,473 | |
| | | | | | | | |
HEALTH CARE (5.5%) | | | | | | | | |
Avanos Medical, Inc.* | | | 40,046 | | | | 1,793,660 | |
Emergent BioSolutions, Inc.* | | | 38,605 | | | | 2,288,504 | |
Exact Sciences Corp.* | | | 18,638 | | | | 1,176,058 | |
LivaNova PLC* | | | 11,840 | | | | 1,083,005 | |
Pacific Biosciences of California, Inc.* | | | 247,947 | | | | 1,834,808 | |
Pacira Pharmaceuticals, Inc.* | | | 40,326 | | | | 1,734,825 | |
Sientra, Inc.* | | | 66,102 | | | | 840,156 | |
Supernus Pharmaceuticals, Inc.* | | | 193,672 | | | | 6,433,784 | |
Vericel Corp.* | | | 169,168 | | | | 2,943,523 | |
Wright Medical Group NV* | | | 114,263 | | | | 3,110,239 | |
| | | | | | | | |
| | | | | | | 23,238,562 | |
| | | | | | | | |
INDUSTRIALS (13.1%) | | | | | | | | |
AAR Corp. | | | 102,710 | | | | 3,835,191 | |
Builders FirstSource, Inc.* | | | 125,888 | | | | 1,373,438 | |
Daseke, Inc.* | | | 447,024 | | | | 1,645,048 | |
EMCOR Group, Inc. | | | 37,819 | | | | 2,257,416 | |
Encore Wire Corp. | | | 120,757 | | | | 6,059,586 | |
Hyster-Yale Materials Handling, Inc. | | | 49,472 | | | | 3,065,285 | |
ICF International, Inc. | | | 43,287 | | | | 2,804,132 | |
Kratos Defense & Security Solutions, Inc.* | | | 126,520 | | | | 1,782,667 | |
LSC Communications, Inc. | | | 215,518 | | | | 1,508,626 | |
Miller Industries, Inc. | | | 285,727 | | | | 7,714,629 | |
Mueller Industries, Inc. | | | 479,757 | | | | 11,207,123 | |
Spirit Airlines, Inc.* | | | 47,180 | | | | 2,732,666 | |
Trex Co., Inc.* | | | 47,510 | | | | 2,820,194 | |
Universal Forest Products, Inc. | | | 106,812 | | | | 2,772,840 | |
VSE Corp. | | | 146,796 | | | | 4,390,668 | |
| | | | | | | | |
| | | | | | | 55,969,509 | |
| | | | | | | | |
INFORMATION TECHNOLOGY (10.8%) | | | | | | | | |
Aerohive Networks, Inc.* | | | 291,167 | | | | 949,205 | |
Anixter International, Inc.* | | | 38,200 | | | | 2,074,642 | |
Apptio, Inc. Cl A* | | | 46,110 | | | | 1,750,336 | |
Ciena Corp.* | | | 83,070 | | | | 2,816,904 | |
Comtech Telecommunications Corp. | | | 37,033 | | | | 901,383 | |
Cray, Inc.* | | | 98,968 | | | | 2,136,719 | |
The accompanying notes are an integral part of these portfolio schedules.
62
MUTUAL OF AMERICA INVESTMENT CORPORATION — SMALL CAP VALUE FUND
PORTFOLIO OF INVESTMENTS IN SECURITIES (Continued)
December 31, 2018
| | | | | | | | |
| | | Shares | | | Value | |
| | | | | | | | |
| COMMON STOCKS (CONTINUED): | | | | | | | | |
INFORMATION TECHNOLOGY (CONTINUED) | | | | | | | | |
Everspin Technologies, Inc.* | | | 122,444 | | | $ | 686,911 | |
Five9, Inc.* | | | 24,680 | | | | 1,079,010 | |
II-VI, Inc.* | | | 44,237 | | | | 1,435,933 | |
Lumentum Hldgs., Inc.* | | | 33,768 | | | | 1,418,594 | |
MaxLinear, Inc. Cl A* | | | 116,924 | | | | 2,057,862 | |
MKS Instruments, Inc. | | | 17,955 | | | | 1,160,072 | |
Perficient, Inc.* | | | 72,763 | | | | 1,619,704 | |
Perspecta, Inc. | | | 92,392 | | | | 1,590,990 | |
Plexus Corp.* | | | 34,078 | | | | 1,740,704 | |
Proofpoint, Inc.* | | | 24,106 | | | | 2,020,324 | |
Rapid7, Inc.* | | | 20,330 | | | | 633,483 | |
Richardson Electronics Ltd.* | | | 566,918 | | | | 4,926,518 | |
Rogers Corp.* | | | 7,540 | | | | 746,912 | |
Sequans Communications S.A. ADR* | | | 923,354 | | | | 720,216 | |
SYNNEX Corp. | | | 52,152 | | | | 4,215,968 | |
ViaSat, Inc.* | | | 57,121 | | | | 3,367,283 | |
Xperi Corp. | | | 163,754 | | | | 3,011,436 | |
Xura, Inc.* | | | 128,245 | | | | 3,206,125 | †† |
| | | | | | | | |
| | | | | | | 46,267,234 | |
| | | | | | | | |
MATERIALS (3.5%) | | | | | | | | |
Berry Global Group, Inc.* | | | 46,912 | | | | 2,229,727 | |
Boise Cascade Co. | | | 73,311 | | | | 1,748,467 | |
Ferro Corp.* | | | 174,925 | | | | 2,742,824 | |
Ferroglobe PLC | | | 160,016 | | | | 254,426 | |
Kaiser Aluminum Corp. | | | 35,848 | | | | 3,200,868 | |
Olin Corp. | | | 127,060 | | | | 2,555,177 | |
TimkenSteel Corp.* | | | 70,933 | | | | 619,954 | |
U.S. Concrete, Inc.* | | | 50,242 | | | | 1,772,538 | |
| | | | | | | | |
| | | | | | | 15,123,981 | |
| | | | | | | | |
| | | | | | | | |
| | | Shares | | | Value | |
| | | | | | | | |
| COMMON STOCKS (CONTINUED): | | | | | | | | |
REAL ESTATE (10.0%) | | | | | | | | |
Alexander’s, Inc. | | | 5,735 | | | $ | 1,747,684 | |
Chatham Lodging Trust | | | 118,537 | | | | 2,095,734 | |
Chesapeake Lodging Trust | | | 157,525 | | | | 3,835,734 | |
Cousins Properties, Inc. | | | 448,906 | | | | 3,546,357 | |
Easterly Government Properties, Inc. | | | 247,322 | | | | 3,878,009 | |
GEO Group, Inc. | | | 240,170 | | | | 4,731,349 | |
Highwoods Properties, Inc. | | | 99,070 | | | | 3,833,018 | |
JBG SMITH Properties | | | 86,387 | | | | 3,007,132 | |
Medical Properties Trust, Inc. | | | 288,149 | | | | 4,633,436 | |
Pennsylvania REIT | | | 177,818 | | | | 1,056,239 | |
RLJ Lodging Trust | | | 103,048 | | | | 1,689,987 | |
Sabra Health Care REIT, Inc. | | | 156,691 | | | | 2,582,268 | |
Summit Hotel Properties, Inc. | | | 86,488 | | | | 841,528 | |
Terreno Realty Corp. | | | 119,475 | | | | 4,201,936 | |
Urstadt Biddle Properties, Inc. Cl A | | | 64,310 | | | | 1,236,038 | |
| | | | | | | | |
| | | | | | | 42,916,449 | |
| | | | | | | | |
UTILITIES (5.6%) | | | | | | | | |
Avista Corp. | | | 78,330 | | | | 3,327,459 | |
Black Hills Corp. | | | 37,550 | | | | 2,357,389 | |
IDACORP, Inc. | | | 45,899 | | | | 4,271,361 | |
Northwest Natural Hldg. Co. | | | 43,711 | | | | 2,642,767 | |
NorthWestern Corp. | | | 53,320 | | | | 3,169,341 | |
PNM Resources, Inc. | | | 95,951 | | | | 3,942,626 | |
Portland General Electric Co. | | | 93,459 | | | | 4,285,095 | |
| | | | | | | | |
| | | | | | | 23,996,038 | |
| | | | | | | | |
TOTAL COMMON STOCKS | | | | | | | | |
(Cost: $400,424,593) 94.8% | | | | | | | 405,592,259 | |
| | | | | | | | |
| | | | | | | | | | | | | | | | | | | | |
| | | Rating** | | | Rate(%) | | | Maturity | | | Face Amount | | | Value | |
| SHORT-TERM DEBT SECURITIES: | | | | | | | | | | | | | | | | | | | | |
U.S. GOVERNMENT (2.4%) | | | | | | | | | | | | | | | | | | | | |
U.S. Treasury Bill | | | A-1+ | | | | 2.36 | | | | 02/14/19 | | | $ | 10,000,000 | | | $ | 9,971,266 | |
| | | | | | | | | | | | | | | | | | | | |
U.S. GOVERNMENT AGENCIES (1.2%) | | | | | | | | | | | | | | | | | | | | |
FHLB | | | A-1+ | | | | 2.15 | | | | 01/02/19 | | | | 5,200,000 | | | | 5,199,689 | |
| | | | | | | | | | | | | | | | | | | | |
COMMERCIAL PAPER (2.5%) | | | | | | | | | | | | | | | | | | | | |
Cargill, Inc.† | | | A-1 | | | | 2.39 | | | | 01/02/19 | | | | 10,900,000 | | | | 10,899,276 | |
| | | | | | | | | | | | | | | | | | | | |
TOTAL SHORT-TERM DEBT SECURITIES
(Cost: $26,070,231) 6.1% | | | | 26,070,231 | |
| | | | | | | | | | | | | | | | | | | | |
| | | | | |
| | | | | | Rate(%) | | | Maturity | | | Face Amount | | | Value | |
| TEMPORARY CASH INVESTMENT (0.0%) (2) | | | | | | | | | | | | | | | | | | | | |
Citibank, New York Time Deposit | | | | 1.67 | | | | 01/02/19 | | | $ | 52,184 | | | $ | 52,184 | |
| | | | | | | | | | | | | | | | | | | | |
TOTAL TEMPORARY CASH INVESTMENT
(Cost: $52,184) 0.0% (2) | | | | 52,184 | |
| | | | | | | | | | | | | | | | | | | | |
TOTAL INVESTMENTS
(Cost: $426,547,008) 100.9% | | | | 431,714,674 | |
| | | | | | | | | | | | | | | | | | | | |
OTHER NET ASSETS -0.9% | | | | (3,712,589 | ) |
| | | | | | | | | | | | | | | | | | | | |
NET ASSETS 100.0% | | | $ | 428,002,085 | |
| | | | | | | | | | | | | | | | | | | | |
The accompanying notes are an integral part of these portfolio schedules.
63
MUTUAL OF AMERICA INVESTMENT CORPORATION — SMALL CAP GROWTH FUND
PORTFOLIO OF INVESTMENTS IN SECURITIES
December 31, 2018
| | | | | | | | |
| | | Shares | | | Value | |
| | | | | | | | |
| COMMON STOCKS: | | | | | | | | |
COMMUNICATION SERVICES (3.9%) | | | | | | | | |
Lions Gate Entertainment Corp. Cl A | | | 112,275 | | | $ | 1,807,628 | |
Lions Gate Entertainment Corp. Cl B | | | 124,228 | | | | 1,848,513 | |
Nexstar Media Group, Inc. Cl A | | | 22,244 | | | | 1,749,268 | |
ORBCOMM, Inc.* | | | 350,835 | | | | 2,897,897 | |
Shenandoah Telecommunications Co. | | | 96,521 | | | | 4,271,054 | |
Take-Two Interactive Software, Inc.* | | | 28,300 | | | | 2,913,202 | |
World Wrestling Entertainment, Inc. Cl A | | | 44,276 | | | | 3,308,302 | |
| | | | | | | | |
| | | | | | | 18,795,864 | |
| | | | | | | | |
CONSUMER DISCRETIONARY (14.3%) | | | | | | | | |
American Axle & Manufacturing Hldgs., Inc.* | | | 245,950 | | | | 2,730,045 | |
Belmond Ltd. Cl A* | | | 228,354 | | | | 5,715,701 | |
Bloomin’ Brands, Inc. | | | 474,798 | | | | 8,494,136 | |
Dave & Buster’s Entertainment, Inc. | | | 94,330 | | | | 4,203,345 | |
Etsy, Inc.* | | | 100,648 | | | | 4,787,825 | |
Five Below, Inc.* | | | 90,054 | | | | 9,214,325 | |
Haverty Furniture Cos., Inc. | | | 247,026 | | | | 4,639,148 | |
Lithia Motors, Inc. Cl A | | | 48,987 | | | | 3,739,178 | |
Red Rock Resorts, Inc. Cl A | | | 269,549 | | | | 5,474,540 | |
Shutterfly, Inc.* | | | 33,175 | | | | 1,335,626 | |
Sleep Number Corp.* | | | 238,930 | | | | 7,581,249 | |
Stamps.com, Inc.* | | | 16,794 | | | | 2,613,818 | |
Steven Madden Ltd. | | | 201,590 | | | | 6,100,113 | |
Weight Watchers International, Inc.* | | | 60,378 | | | | 2,327,572 | |
| | | | | | | | |
| | | | | | | 68,956,621 | |
| | | | | | | | |
CONSUMER STAPLES (0.5%) | | | | | | | | |
Cal-Maine Foods, Inc. | | | 21,572 | | | | 912,496 | |
Vector Group Ltd. | | | 134,009 | | | | 1,303,907 | |
| | | | | | | | |
| | | | | | | 2,216,403 | |
| | | | | | | | |
ENERGY (0.9%) | | | | | | | | |
Kosmos Energy Ltd.* | | | 257,888 | | | | 1,049,604 | |
Penn Virginia Corp.* | | | 22,325 | | | | 1,206,890 | |
Whiting Petroleum Corp.* | | | 87,140 | | | | 1,977,207 | |
| | | | | | | | |
| | | | | | | 4,233,701 | |
| | | | | | | | |
FINANCIALS (8.0%) | | | | | | | | |
AMERISAFE, Inc. | | | 54,331 | | | | 3,080,024 | |
First Merchants Corp. | | | 119,974 | | | | 4,111,509 | |
Heritage Financial Corp. | | | 163,360 | | | | 4,855,059 | |
iShares Micro-Cap ETF | | | 52,669 | | | | 4,342,559 | |
Moelis & Co. Cl A | | | 137,459 | | | | 4,725,840 | |
Pinnacle Financial Partners, Inc. | | | 54,586 | | | | 2,516,414 | |
Primerica, Inc. | | | 20,922 | | | | 2,044,289 | |
S&T Bancorp, Inc. | | | 114,321 | | | | 4,325,907 | |
Starwood Property Trust, Inc. | | | 144,182 | | | | 2,841,827 | |
TriState Capital Hldgs., Inc.* | | | 180,925 | | | | 3,520,801 | |
United Insurance Hldgs. Corp. | | | 162,427 | | | | 2,699,537 | |
| | | | | | | | |
| | | | | | | 39,063,766 | |
| | | | | | | | |
HEALTH CARE (25.3%) | | | | | | | | |
ACADIA Pharmaceuticals, Inc.* | | | 99,250 | | | | 1,604,873 | |
Acceleron Pharma, Inc.* | | | 54,069 | | | | 2,354,705 | |
| | | | | | | | |
| | | Shares | | | Value | |
| | | | | | | | |
| COMMON STOCKS (CONTINUED): | |
HEALTH CARE (CONTINUED) | | | | | | | | |
Agios Pharmaceuticals, Inc.* | | | 21,142 | | | $ | 974,858 | |
Akebia Therapeutics, Inc.* | | | 121,566 | | | | 672,260 | |
Alder Biopharmaceuticals, Inc.* | | | 100,645 | | | | 1,031,611 | |
Amicus Therapeutics, Inc.* | | | 191,893 | | | | 1,838,335 | |
AMN Healthcare Svcs., Inc.* | | | 35,681 | | | | 2,021,685 | |
Aptinyx, Inc.* | | | 59,512 | | | | 984,328 | |
Array BioPharma, Inc.* | | | 135,550 | | | | 1,931,588 | |
AxoGen, Inc.* | | | 79,659 | | | | 1,627,433 | |
Blueprint Medicines Corp.* | | | 40,126 | | | | 2,163,193 | |
Cambrex Corp.* | | | 45,297 | | | | 1,710,415 | |
Editas Medicine, Inc.* | | | 61,504 | | | | 1,399,216 | |
Emergent BioSolutions, Inc.* | | | 87,236 | | | | 5,171,350 | |
Evolent Health, Inc. Cl A* | | | 196,945 | | | | 3,929,053 | |
Exact Sciences Corp.* | | | 52,934 | | | | 3,340,135 | |
FibroGen, Inc.* | | | 33,749 | | | | 1,561,904 | |
Flexion Therapeutics, Inc.* | | | 81,860 | | | | 926,655 | |
Globus Medical, Inc. Cl A* | | | 59,251 | | | | 2,564,383 | |
Horizon Pharma PLC* | | | 145,765 | | | | 2,848,248 | |
ICU Medical, Inc.* | | | 11,605 | | | | 2,664,856 | |
Inogen, Inc.* | | | 18,680 | | | | 2,319,496 | |
Insulet Corp.* | | | 27,508 | | | | 2,181,935 | |
Intersect ENT, Inc.* | | | 76,185 | | | | 2,146,893 | |
iRhythm Technologies, Inc.* | | | 39,033 | | | | 2,712,013 | |
Karyopharm Therapeutics, Inc.* | | | 125,614 | | | | 1,177,003 | |
LivaNova PLC* | | | 31,521 | | | | 2,883,226 | |
Loxo Oncology, Inc.* | | | 20,617 | | | | 2,887,823 | |
Madrigal Pharmaceuticals, Inc.* | | | 3,890 | | | | 438,481 | |
Masimo Corp.* | | | 18,032 | | | | 1,936,096 | |
Medicines Co.* | | | 81,257 | | | | 1,555,259 | |
Medidata Solutions, Inc.* | | | 47,574 | | | | 3,207,439 | |
MyoKardia, Inc.* | | | 29,410 | | | | 1,436,973 | |
Neogen Corp.* | | | 46,782 | | | | 2,666,574 | |
Neurocrine Biosciences, Inc.* | | | 34,988 | | | | 2,498,493 | |
Omnicell, Inc.* | | | 48,321 | | | | 2,959,178 | |
Pacira Pharmaceuticals, Inc.* | | | 78,258 | | | | 3,366,659 | |
Portola Pharmaceuticals, Inc.* | | | 74,398 | | | | 1,452,249 | |
Quidel Corp.* | | | 65,405 | | | | 3,193,072 | |
Repligen Corp.* | | | 77,924 | | | | 4,109,712 | |
Sage Therapeutics, Inc.* | | | 14,432 | | | | 1,382,441 | |
Sientra, Inc.* | | | 42,338 | | | | 538,116 | |
Spark Therapeutics, Inc.* | | | 35,647 | | | | 1,395,224 | |
STAAR Surgical Co.* | | | 70,840 | | | | 2,260,504 | |
Supernus Pharmaceuticals, Inc.* | | | 151,140 | | | | 5,020,871 | |
Tabula Rasa HealthCare, Inc.* | | | 37,325 | | | | 2,379,842 | |
Tactile Systems Technology, Inc.* | | | 61,710 | | | | 2,810,891 | |
Ultragenyx Pharmaceutical, Inc.* | | | 33,784 | | | | 1,468,928 | |
Vericel Corp.* | | | 169,101 | | | | 2,942,357 | |
WellCare Health Plans, Inc.* | | | 23,867 | | | | 5,634,760 | |
Wright Medical Group NV* | | | 127,409 | | | | 3,468,073 | |
Xencor, Inc.* | | | 87,021 | | | | 3,146,679 | |
Zogenix, Inc.* | | | 45,817 | | | | 1,670,488 | |
| | | | | | | | |
| | | | | | | 122,568,832 | |
| | | | | | | | |
INDUSTRIALS (16.4%) | | | | | | | | |
AAR Corp. | | | 68,240 | | | | 2,548,082 | |
Advanced Disposal Svcs., Inc.* | | | 107,547 | | | | 2,574,675 | |
Aerovironment, Inc.* | | | 48,453 | | | | 3,292,381 | |
The accompanying notes are an integral part of these portfolio schedules.
64
MUTUAL OF AMERICA INVESTMENT CORPORATION — SMALL CAP GROWTH FUND
PORTFOLIO OF INVESTMENTS IN SECURITIES (Continued)
December 31, 2018
| | | | | | | | |
| | | Shares | | | Value | |
| | | | | | | | |
| COMMON STOCKS (CONTINUED): | |
INDUSTRIALS (CONTINUED) | | | | | | | | |
ASGN, Inc.* | | | 54,422 | | | $ | 2,965,999 | |
BG Staffing, Inc. | | | 84,336 | | | | 1,741,538 | |
Brink’s Co. | | | 108,710 | | | | 7,028,101 | |
Echo Global Logistics, Inc.* | | | 186,903 | | | | 3,799,738 | |
EMCOR Group, Inc. | | | 41,420 | | | | 2,472,360 | |
EnPro Industries, Inc. | | | 54,714 | | | | 3,288,311 | |
Exponent, Inc. | | | 66,251 | | | | 3,359,588 | |
Generac Hldgs., Inc.* | | | 62,478 | | | | 3,105,157 | |
Gorman-Rupp Co. | | | 147,210 | | | | 4,771,076 | |
Granite Construction, Inc. | | | 105,228 | | | | 4,238,584 | |
Heidrick & Struggles International, Inc. | | | 78,877 | | | | 2,460,174 | |
John Bean Technologies Corp. | | | 31,888 | | | | 2,289,877 | |
Knoll, Inc. | | | 140,042 | | | | 2,307,892 | |
Kratos Defense & Security Solutions, Inc.* | | | 90,344 | | | | 1,272,947 | |
Landstar System, Inc. | | | 44,501 | | | | 4,257,411 | |
Simpson Manufacturing Co., Inc. | | | 96,402 | | | | 5,218,240 | |
Spirit Airlines, Inc.* | | | 42,730 | | | | 2,474,922 | |
Sun Hydraulics Corp. | | | 84,339 | | | | 2,799,212 | |
Teledyne Technologies, Inc.* | | | 22,957 | | | | 4,753,706 | |
Trex Co., Inc.* | | | 103,188 | | | | 6,125,240 | |
| | | | | | | | |
| | | | | | | 79,145,211 | |
| | | | | | | | |
INFORMATION TECHNOLOGY (19.1%) | | | | | | | | |
Altair Engineering, Inc. Cl A* | | | 66,855 | | | | 1,843,861 | |
Apptio, Inc. Cl A* | | | 113,434 | | | | 4,305,955 | |
Cornerstone OnDemand, Inc.* | | | 48,889 | | | | 2,465,472 | |
Cray, Inc.* | | | 114,834 | | | | 2,479,266 | |
Cypress Semiconductor Corp. | | | 183,689 | | | | 2,336,524 | |
Entegris, Inc. | | | 105,595 | | | | 2,945,573 | |
EPAM Systems, Inc.* | | | 34,105 | | | | 3,956,521 | |
Everspin Technologies, Inc.* | | | 237,866 | | | | 1,334,428 | |
Five9, Inc.* | | | 170,118 | | | | 7,437,560 | |
Globant S.A.* | | | 53,610 | | | | 3,019,315 | |
HubSpot, Inc.* | | | 24,665 | | | | 3,101,130 | |
II-VI, Inc.* | | | 86,998 | | | | 2,823,955 | |
Integrated Device Technology, Inc.* | | | 67,720 | | | | 3,279,680 | |
Itron, Inc.* | | | 38,650 | | | | 1,827,758 | |
LogMeIn, Inc. | | | 30,017 | | | | 2,448,487 | |
Lumentum Hldgs., Inc.* | | | 53,856 | | | | 2,262,490 | |
| | | | | | | | |
| | | Shares | | | Value | |
| | | | | | | | |
| COMMON STOCKS (CONTINUED): | |
INFORMATION TECHNOLOGY (CONTINUED) | | | | | | | | |
MaxLinear, Inc. Cl A* | | | 122,373 | | | $ | 2,153,765 | |
MINDBODY, Inc. Cl A* | | | 36,163 | | | | 1,316,333 | |
MKS Instruments, Inc. | | | 32,960 | | | | 2,129,546 | |
New Relic, Inc.* | | | 87,575 | | | | 7,090,948 | |
Perficient, Inc.* | | | 104,220 | | | | 2,319,937 | |
Proofpoint, Inc.* | | | 40,692 | | | | 3,410,397 | |
Pure Storage, Inc. Cl A* | | | 73,795 | | | | 1,186,624 | |
Q2 Hldgs., Inc.* | | | 68,021 | | | | 3,370,441 | |
Rapid7, Inc.* | | | 188,110 | | | | 5,861,508 | |
Rogers Corp.* | | | 21,758 | | | | 2,155,347 | |
Science Applications International Corp. | | | 22,052 | | | | 1,404,712 | |
SYNNEX Corp. | | | 33,204 | | | | 2,684,211 | |
ViaSat, Inc.* | | | 52,547 | | | | 3,097,646 | |
Xperi Corp. | | | 113,144 | | | | 2,080,718 | |
Zendesk, Inc.* | | | 67,973 | | | | 3,967,584 | |
| | | | | | | | |
| | | | | | | 92,097,692 | |
| | | | | | | | |
MATERIALS (3.4%) | | | | | | | | |
Berry Global Group, Inc.* | | | 58,487 | | | | 2,779,888 | |
Century Aluminum Co.* | | | 138,864 | | | | 1,015,097 | |
Ferro Corp.* | | | 332,812 | | | | 5,218,493 | |
Ferroglobe Representation & Warranty Insurance Trust* | | | 72,345 | | | | 0 | †† |
Ingevity Corp.* | | | 28,190 | | | | 2,359,222 | |
Minerals Technologies, Inc. | | | 44,615 | | | | 2,290,535 | |
U.S. Concrete, Inc.* | | | 72,778 | | | | 2,567,609 | |
| | | | | | | | |
| | | | | | | 16,230,844 | |
| | | | | | | | |
REAL ESTATE (2.4%) | | | | | | | | |
Easterly Government Properties, Inc. | | | 132,902 | | | | 2,083,903 | |
Pebblebrook Hotel Trust | | | 128,133 | | | | 3,627,445 | |
QTS Realty Trust, Inc. Cl A | | | 52,971 | | | | 1,962,576 | |
Terreno Realty Corp. | | | 118,369 | | | | 4,163,038 | |
| | | | | | | | |
| | | | | | | 11,836,962 | |
| | | | | | | | |
UTILITIES (0.7%) | | | | | | | | |
Chesapeake Utilities Corp. | | | 44,141 | | | | 3,588,663 | |
| | | | | | | | |
TOTAL COMMON STOCKS | | | | | | | | |
(Cost: $456,659,862) 94.9% | | | | | | | 458,734,559 | |
| | | | | | | | |
| | | | | | | | | | | | | | | | | | | | |
| | | Rating** | | | Rate(%) | | | Maturity | | | Face Amount | | | Value | |
| SHORT-TERM DEBT SECURITIES: | | | | | | | | | | | | | | | | | | | | |
U.S. GOVERNMENT AGENCIES (2.7%) | | | | | | | | | | | | | | | | | | | | |
FHLB | | | A-1+ | | | | 2.10 | | | | 01/01/19 | | | $ | 8,000,000.00 | | | $ | 7,999,529 | |
FHLB | | | A-1+ | | | | 2.15 | | | | 01/02/19 | | | | 4,900,000.00 | | | | 4,899,712 | |
| | | | | | | | | | | | | | | | | | | | |
| | | | | | | | | | | | | | | | | | | 12,899,241 | |
| | | | | | | | | | | | | | | | | | | | |
COMMERCIAL PAPER (3.1%) | | | | | | | | | | | | | | | | | | | | |
Cargill, Inc.† | | | A-1 | | | | 2.39 | | | | 01/02/19 | | | | 14,800,000 | | | | 14,799,017 | |
| | | | | | | | | | | | | | | | | | | | |
TOTAL SHORT-TERM DEBT SECURITIES
(Cost: $27,698,258) 5.8% | | | | 27,698,258 | |
| | | | | | | | | | | | | | | | | | | | |
The accompanying notes are an integral part of these portfolio schedules.
65
MUTUAL OF AMERICA INVESTMENT CORPORATION — SMALL CAP GROWTH FUND
PORTFOLIO OF INVESTMENTS IN SECURITIES (Continued)
December 31, 2018
| | | | | | | | | | | | | | | | | | | | |
| | | | | | Rate(%) | | | Maturity | | | Face Amount | | | Value | |
| TEMPORARY CASH INVESTMENT (0.0%) (2) | | | | | | | | | | | | | | | | | | | | |
Citibank, New York Time Deposit | | | | 1.67 | | | | 01/02/19 | | | $ | 61,703 | | | $ | 61,703 | |
| | | | | | | | | | | | | | | | | | | | |
TOTAL TEMPORARY CASH INVESTMENT
(Cost: $61,703) 0.0% (2) | | | | 61,703 | |
| | | | | | | | | | | | | | | | | | | | |
TOTAL INVESTMENTS
(Cost: $484,419,823) 100.7% | | | | 486,494,520 | |
| | | | | | | | | | | | | | | | | | | | |
OTHER NET ASSETS -0.7% | | | | (3,162,183 | ) |
| | | | | | | | | | | | | | | | | | | | |
NET ASSETS 100.0% | | | $ | 483,332,337 | |
| | | | | | | | | | | | | | | | | | | | |
The accompanying notes are an integral part of these portfolio schedules.
66
MUTUAL OF AMERICA INVESTMENT CORPORATION — SMALL CAP EQUITY INDEX FUND
PORTFOLIO OF INVESTMENTS IN SECURITIES
December 31, 2018
| | | | | | | | |
| | | Shares | | | Value | |
| | | | | | | | |
| INDEXED ASSETS: | | | | | | | | |
COMMON STOCKS: | | | | | | | | |
COMMUNICATION SERVICES (1.9%) | | | | | | | | |
ATN International, Inc. | | | 269 | | | $ | 19,241 | |
Cincinnati Bell, Inc.* | | | 1,297 | | | | 10,091 | |
Cogent Communications Hldgs., Inc. | | | 1,037 | | | | 46,883 | |
Consolidated Communications Hldgs., Inc. | | | 1,796 | | | | 17,744 | |
EW Scripps Co. Cl A | | | 1,420 | | | | 22,337 | |
Frontier Communications Corp.* | | | 2,704 | | | | 6,435 | |
Gannett Co., Inc. | | | 2,827 | | | | 24,114 | |
Iridium Communications, Inc.* | | | 2,444 | | | | 45,092 | |
Marcus Corp. | | | 501 | | | | 19,789 | |
New Media Investment Group, Inc. | | | 1,352 | | | | 15,643 | |
QuinStreet, Inc.* | | | 951 | | | | 15,435 | |
Scholastic Corp. | | | 699 | | | | 28,142 | |
Spok Hldgs., Inc. | | | 454 | | | | 6,020 | |
TechTarget, Inc.* | | | 547 | | | | 6,679 | |
Vonage Hldgs. Corp.* | | | 5,510 | | | | 48,102 | |
| | | | | | | | |
| | | | | | | 331,747 | |
| | | | | | | | |
CONSUMER DISCRETIONARY (13.4%) | | | | | | | | |
Abercrombie & Fitch Co. Cl A | | | 1,677 | | | | 33,624 | |
American Axle & Manufacturing Hldgs., Inc.* | | | 2,780 | | | | 30,858 | |
American Public Education, Inc.* | | | 404 | | | | 11,498 | |
Asbury Automotive Group, Inc.* | | | 490 | | | | 32,663 | |
Ascena Retail Group, Inc.* | | | 4,353 | | | | 10,926 | |
Barnes & Noble Education, Inc.* | | | 899 | | | | 3,605 | |
Barnes & Noble, Inc. | | | 1,439 | | | | 10,202 | |
Belmond Ltd. Cl A* | | | 2,207 | | | | 55,241 | |
BJ’s Restaurants, Inc. | | | 524 | | | | 26,499 | |
Buckle, Inc. | | | 706 | | | | 13,654 | |
Caleres, Inc. | | | 1,078 | | | | 30,001 | |
Callaway Golf Co. | | | 2,180 | | | | 33,354 | |
Career Education Corp.* | | | 1,726 | | | | 19,711 | |
Cato Corp. Cl A | | | 568 | | | | 8,105 | |
Cavco Industries, Inc.* | | | 215 | | | | 28,032 | |
Chico’s FAS, Inc. | | | 3,135 | | | | 17,619 | |
Children’s Place, Inc. | | | 404 | | | | 36,396 | |
Chuy’s Hldgs., Inc.* | | | 426 | | | | 7,557 | |
Cooper Tire & Rubber Co. | | | 1,236 | | | | 39,960 | |
Cooper-Standard Hldgs., Inc.* | | | 409 | | | | 25,407 | |
Core-Mark Hldg. Co, Inc. | | | 1,136 | | | | 26,412 | |
Crocs, Inc.* | | | 1,667 | | | | 43,309 | |
Dave & Buster’s Entertainment, Inc. | | | 961 | | | | 42,822 | |
Dine Brands Global, Inc. | | | 436 | | | | 29,360 | |
Dorman Products, Inc.* | | | 718 | | | | 64,634 | |
DSW, Inc. Cl A | | | 1,686 | | | | 41,644 | |
El Pollo Loco Hldgs., Inc.* | | | 559 | | | | 8,480 | |
Ethan Allen Interiors, Inc. | | | 611 | | | | 10,747 | |
Express, Inc.* | | | 1,703 | | | | 8,702 | |
Fiesta Restaurant Group, Inc.* | | | 600 | | | | 9,306 | |
Fossil Group, Inc.* | | | 1,127 | | | | 17,728 | |
Fox Factory Hldg. Corp.* | | | 933 | | | | 54,926 | |
Francesca’s Hldgs. Corp.* | | | 873 | | | | 848 | |
GameStop Corp. Cl A | | | 2,540 | | | | 32,055 | |
Garrett Motion, Inc.* | | | 1,823 | | | | 22,496 | |
| | | | | | | | |
| | | Shares | | | Value | |
| | | | | | | | |
| INDEXED ASSETS (CONTINUED): | |
COMMON STOCKS (CONTINUED): | |
CONSUMER DISCRETIONARY (CONTINUED) | | | | | | | | |
Genesco, Inc.* | | | 502 | | | $ | 22,239 | |
Gentherm, Inc.* | | | 866 | | | | 34,623 | |
G-III Apparel Group Ltd.* | | | 1,055 | | | | 29,424 | |
Group 1 Automotive, Inc. | | | 452 | | | | 23,829 | |
Guess?, Inc. | | | 1,423 | | | | 29,556 | |
Haverty Furniture Cos., Inc. | | | 474 | | | | 8,902 | |
Hibbett Sports, Inc.* | | | 462 | | | | 6,607 | |
Installed Building Products, Inc.* | | | 542 | | | | 18,260 | |
iRobot Corp.* | | | 694 | | | | 58,116 | |
JC Penney Co., Inc.* | | | 7,694 | | | | 8,002 | |
Kirkland’s, Inc.* | | | 375 | | | | 3,574 | |
La-Z-Boy, Inc. | | | 1,157 | | | | 32,060 | |
LCI Industries | | | 630 | | | | 42,084 | |
LGI Homes, Inc.* | | | 456 | | | | 20,620 | |
Liquidity Svcs., Inc.* | | | 650 | | | | 4,010 | |
Lithia Motors, Inc. Cl A | | | 566 | | | | 43,203 | |
Lumber Liquidators Hldgs., Inc.* | | | 704 | | | | 6,702 | |
M/I Homes, Inc.* | | | 696 | | | | 14,630 | |
MarineMax, Inc.* | | | 573 | | | | 10,492 | |
MDC Hldgs., Inc. | | | 1,125 | | | | 31,624 | |
Meritage Homes Corp.* | | | 935 | | | | 34,333 | |
Monarch Casino & Resort, Inc.* | | | 291 | | | | 11,099 | |
Monro, Inc. | | | 829 | | | | 56,994 | |
Motorcar Parts of America, Inc.* | | | 467 | | | | 7,771 | |
Movado Group, Inc. | | | 411 | | | | 12,996 | |
Nautilus, Inc.* | | | 740 | | | | 8,066 | |
Nutrisystem, Inc. | | | 725 | | | | 31,813 | |
Office Depot, Inc. | | | 14,461 | | | | 37,309 | |
Oxford Industries, Inc. | | | 422 | | | | 29,979 | |
PetMed Express, Inc. | | | 509 | | | | 11,839 | |
Red Robin Gourmet Burgers, Inc.* | | | 324 | | | | 8,657 | |
Regis Corp.* | | | 828 | | | | 14,035 | |
Rent-A-Center, Inc.* | | | 1,096 | | | | 17,744 | |
RH* | | | 472 | | | | 56,555 | |
Ruth’s Hospitality Group, Inc. | | | 707 | | | | 16,070 | |
Shake Shack, Inc. Cl A* | | | 639 | | | | 29,023 | |
Shoe Carnival, Inc. | | | 253 | | | | 8,478 | |
Shutterfly, Inc.* | | | 839 | | | | 33,778 | |
Shutterstock, Inc. | | | 464 | | | | 16,709 | |
Sleep Number Corp.* | | | 818 | | | | 25,955 | |
Sonic Automotive, Inc. Cl A | | | 588 | | | | 8,091 | |
Stamps.com, Inc.* | | | 425 | | | | 66,147 | |
Standard Motor Products, Inc. | | | 497 | | | | 24,070 | |
Steven Madden Ltd. | | | 1,964 | | | | 59,431 | |
Strategic Education, Inc. | | | 536 | | | | 60,793 | |
Sturm Ruger & Co., Inc. | | | 434 | | | | 23,097 | |
Superior Industries International, Inc. | | | 573 | | | | 2,756 | |
Tailored Brands, Inc. | | | 1,246 | | | | 16,995 | |
Tile Shop Hldgs., Inc. | | | 962 | | | | 5,272 | |
TopBuild Corp.* | | | 878 | | | | 39,510 | |
Unifi, Inc.* | | | 368 | | | | 8,405 | |
Universal Electronics, Inc.* | | | 344 | | | | 8,696 | |
Vera Bradley, Inc.* | | | 542 | | | | 4,645 | |
Vista Outdoor, Inc.* | | | 1,412 | | | | 16,026 | |
Vitamin Shoppe, Inc.* | | | 384 | | | | 1,820 | |
The accompanying notes are an integral part of these portfolio schedules.
67
MUTUAL OF AMERICA INVESTMENT CORPORATION — SMALL CAP EQUITY INDEX FUND
PORTFOLIO OF INVESTMENTS IN SECURITIES (Continued)
December 31, 2018
| | | | | | | | |
| | | Shares | | | Value | |
| | | | | | | | |
| INDEXED ASSETS (CONTINUED): | |
COMMON STOCKS (CONTINUED): | |
CONSUMER DISCRETIONARY (CONTINUED) | | | | | | | | |
William Lyon Homes Cl A* | | | 816 | | | $ | 8,723 | |
Wingstop, Inc. | | | 726 | | | | 46,602 | |
Winnebago Industries, Inc. | | | 716 | | | | 17,334 | |
Wolverine World Wide, Inc. | | | 2,366 | | | | 75,452 | |
Zumiez, Inc.* | | | 469 | | | | 8,991 | |
| | | | | | | | |
| | | | | | | 2,308,997 | |
| | | | | | | | |
CONSUMER STAPLES (3.4%) | | | | | | | | |
Andersons, Inc. | | | 655 | | | | 19,578 | |
Avon Products, Inc.* | | | 11,003 | | | | 16,725 | |
B&G Foods, Inc. | | | 1,661 | | | | 48,019 | |
Calavo Growers, Inc. | | | 384 | | | | 28,017 | |
Cal-Maine Foods, Inc. | | | 742 | | | | 31,387 | |
Central Garden & Pet Co.* | | | 259 | | | | 8,922 | |
Central Garden & Pet Co. Cl A* | | | 1,030 | | | | 32,187 | |
Chefs’ Warehouse, Inc.* | | | 573 | | | | 18,324 | |
Coca-Cola Bottling Co. Consolidated | | | 116 | | | | 20,576 | |
Darling Ingredients, Inc.* | | | 4,104 | | | | 78,961 | |
Dean Foods Co. | | | 2,268 | | | | 8,641 | |
Inter Parfums, Inc. | | | 424 | | | | 27,802 | |
J&J Snack Foods Corp. | | | 374 | | | | 54,077 | |
John B Sanfilippo & Son, Inc. | | | 214 | | | | 11,911 | |
Medifast, Inc. | | | 296 | | | | 37,006 | |
MGP Ingredients, Inc. | | | 311 | | | | 17,743 | |
Seneca Foods Corp. Cl A* | | | 160 | | | | 4,515 | |
SpartanNash Co. | | | 896 | | | | 15,393 | |
United Natural Foods, Inc.* | | | 1,272 | | | | 13,470 | |
Universal Corp. | | | 618 | | | | 33,465 | |
WD-40 Co. | | | 341 | | | | 62,492 | |
| | | | | | | | |
| | | | | | | 589,211 | |
| | | | | | | | |
ENERGY (3.3%) | | | | | | | | |
Archrock, Inc. | | | 3,235 | | | | 24,230 | |
Bonanza Creek Energy, Inc.* | | | 463 | | | | 9,570 | |
Bristow Group, Inc.* | | | 902 | | | | 2,192 | |
C&J Energy Svcs., Inc.* | | | 1,568 | | | | 21,168 | |
CARBO Ceramics, Inc.* | | | 515 | | | | 1,792 | |
Carrizo Oil & Gas, Inc.* | | | 2,124 | | | | 23,980 | |
Cloud Peak Energy, Inc.* | | | 1,878 | | | | 688 | |
CONSOL Energy, Inc.* | | | 689 | | | | 21,848 | |
Denbury Resources, Inc.* | | | 11,482 | | | | 19,634 | |
Era Group, Inc.* | | | 514 | | | | 4,492 | |
Exterran Corp.* | | | 787 | | | | 13,930 | |
Geospace Technologies Corp.* | | | 342 | | | | 3,526 | |
Green Plains, Inc. | | | 967 | | | | 12,677 | |
Gulf Island Fabrication, Inc.* | | | 335 | | | | 2,419 | |
Gulfport Energy Corp.* | | | 3,961 | | | | 25,945 | |
Helix Energy Solutions Group, Inc.* | | | 3,466 | | | | 18,751 | |
HighPoint Resources Corp.* | | | 2,829 | | | | 7,044 | |
KLX Energy Svcs. Hldgs., Inc.* | | | 573 | | | | 13,437 | |
Laredo Petroleum, Inc.* | | | 3,844 | | | | 13,915 | |
Matrix Service Co.* | | | 679 | | | | 12,181 | |
Nabors Industries Ltd. | | | 8,115 | | | | 16,230 | |
Newpark Resources, Inc.* | | | 2,246 | | | | 15,430 | |
Noble Corp. PLC* | | | 6,112 | | | | 16,013 | |
Oil States International, Inc.* | | | 1,489 | | | | 21,263 | |
| | | | | | | | |
| | | Shares | | | Value | |
| | | | | | | | |
| INDEXED ASSETS (CONTINUED): | |
COMMON STOCKS (CONTINUED): | |
ENERGY (CONTINUED) | | | | | | | | |
Par Pacific Hldgs., Inc.* | | | 695 | | | $ | 9,855 | |
PDC Energy, Inc.* | | | 1,656 | | | | 49,283 | |
Penn Virginia Corp.* | | | 334 | | | | 18,056 | |
Pioneer Energy Svcs. Corp.* | | | 1,914 | | | | 2,354 | |
ProPetro Hldg. Corp.* | | | 1,840 | | | | 22,669 | |
Renewable Energy Group, Inc.* | | | 931 | | | | 23,927 | |
REX American Resources Corp.* | | | 141 | | | | 9,604 | |
Ring Energy, Inc.* | | | 1,433 | | | | 7,280 | |
SEACOR Hldgs., Inc.* | | | 429 | | | | 15,873 | |
SRC Energy, Inc.* | | | 6,047 | | | | 28,421 | |
Superior Energy Svcs., Inc.* | | | 3,972 | | | | 13,306 | |
TETRA Technologies, Inc.* | | | 3,086 | | | | 5,185 | |
Unit Corp.* | | | 1,369 | | | | 19,549 | |
US Silica Hldgs., Inc. | | | 1,958 | | | | 19,933 | |
| | | | | | | | |
| | | | | | | 567,650 | |
| | | | | | | | |
FINANCIALS (21.7%) | | | | | | | | |
Ambac Financial Group, Inc.* | | | 1,128 | | | | 19,447 | |
American Equity Investment Life Hldg. Co. | | | 2,247 | | | | 62,781 | |
Ameris Bancorp | | | 984 | | | | 31,163 | |
AMERISAFE, Inc. | | | 479 | | | | 27,155 | |
Apollo Commercial Real Estate Finance, Inc. | | | 2,790 | | | | 46,481 | |
ARMOUR Residential REIT, Inc. | | | 1,051 | | | | 21,545 | |
Axos Financial, Inc.* | | | 1,011 | | | | 25,457 | |
Banc of California, Inc. | | | 1,060 | | | | 14,109 | |
Banner Corp. | | | 785 | | | | 41,982 | |
Berkshire Hills Bancorp, Inc. | | | 999 | | | | 26,943 | |
Blucora, Inc.* | | | 1,199 | | | | 31,941 | |
Boston Private Financial Hldgs., Inc. | | | 2,085 | | | | 22,038 | |
Brookline Bancorp, Inc. | | | 1,997 | | | | 27,599 | |
Capstead Mortgage Corp. | | | 2,260 | | | | 15,074 | |
Central Pacific Financial Corp. | | | 722 | | | | 17,581 | |
City Hldg. Co. | | | 409 | | | | 27,644 | |
Columbia Banking System, Inc. | | | 1,815 | | | | 65,866 | |
Community Bank System, Inc. | | | 1,266 | | | | 73,808 | |
Customers Bancorp, Inc.* | | | 726 | | | | 13,213 | |
CVB Financial Corp. | | | 2,543 | | | | 51,445 | |
Dime Community Bancshares, Inc. | | | 772 | | | | 13,109 | |
Donnelley Financial Solutions, Inc.* | | | 853 | | | | 11,968 | |
Eagle Bancorp, Inc.* | | | 789 | | | | 38,432 | |
eHealth, Inc.* | | | 403 | | | | 15,483 | |
Employers Hldgs., Inc. | | | 814 | | | | 34,164 | |
Encore Capital Group, Inc.* | | | 634 | | | | 14,899 | |
Enova International, Inc.* | | | 842 | | | | 16,385 | |
EZCORP, Inc. Cl A* | | | 1,291 | | | | 9,979 | |
Fidelity Southern Corp. | | | 548 | | | | 14,259 | |
First BanCorp. | | | 5,391 | | | | 46,363 | |
First Commonwealth Financial Corp. | | | 2,469 | | | | 29,826 | |
First Financial Bancorp | | | 2,463 | | | | 58,422 | |
First Financial Bankshares, Inc. | | | 1,679 | | | | 96,862 | |
First Midwest Bancorp, Inc. | | | 2,653 | | | | 52,556 | |
FirstCash, Inc. | | | 1,075 | | | | 77,776 | |
Flagstar Bancorp, Inc.* | | | 732 | | | | 19,325 | |
Franklin Financial Network, Inc.* | | | 302 | | | | 7,964 | |
The accompanying notes are an integral part of these portfolio schedules.
68
MUTUAL OF AMERICA INVESTMENT CORPORATION — SMALL CAP EQUITY INDEX FUND
PORTFOLIO OF INVESTMENTS IN SECURITIES (Continued)
December 31, 2018
| | | | | | | | |
| | | Shares | | | Value | |
| | | | | | | | |
| INDEXED ASSETS (CONTINUED): | |
COMMON STOCKS (CONTINUED): | |
FINANCIALS (CONTINUED) | | | | | | | | |
Glacier Bancorp, Inc. | | | 2,115 | | | $ | 83,796 | |
Granite Point Mortgage Trust, Inc. | | | 1,079 | | | | 19,454 | |
Great Western Bancorp, Inc. | | | 1,446 | | | | 45,187 | |
Green Bancorp, Inc. | | | 655 | | | | 11,227 | |
Green Dot Corp. Cl A* | | | 1,175 | | | | 93,436 | |
Greenhill & Co., Inc. | | | 433 | | | | 10,565 | |
Hanmi Financial Corp. | | | 796 | | | | 15,681 | |
HCI Group, Inc. | | | 179 | | | | 9,095 | |
Heritage Financial Corp. | | | 827 | | | | 24,578 | |
HomeStreet, Inc.* | | | 673 | | | | 14,288 | |
Hope Bancorp, Inc. | | | 3,050 | | | | 36,173 | |
Horace Mann Educators Corp. | | | 1,020 | | | | 38,199 | |
Independent Bank Corp. | | | 702 | | | | 49,358 | |
INTL. FCStone, Inc.* | | | 394 | | | | 14,413 | |
Invesco Mortgage Capital, Inc. | | | 2,777 | | | | 40,211 | |
Investment Technology Group, Inc. | | | 815 | | | | 24,646 | |
iShares Core S&P Small-Cap ETF | | | 8,713 | | | | 603,985 | |
James River Group Hldgs. Ltd. | | | 747 | | | | 27,295 | |
LegacyTexas Financial Group, Inc. | | | 1,125 | | | | 36,101 | |
Maiden Hldgs. Ltd. | | | 1,803 | | | | 2,975 | |
Meta Financial Group, Inc. | | | 693 | | | | 13,437 | |
National Bank Hldgs. Corp. Cl A | | | 641 | | | | 19,788 | |
Navigators Group, Inc. | | | 571 | | | | 39,679 | |
NBT Bancorp, Inc. | | | 1,082 | | | | 37,426 | |
New York Mortgage Trust, Inc. | | | 3,871 | | | | 22,800 | |
NMI Hldgs., Inc. Cl A* | | | 1,646 | | | | 29,381 | |
Northfield Bancorp, Inc. | | | 1,163 | | | | 15,759 | |
Northwest Bancshares, Inc. | | | 2,559 | | | | 43,349 | |
OFG Bancorp | | | 1,071 | | | | 17,629 | |
Old National Bancorp. | | | 3,745 | | | | 57,673 | |
Opus Bank | | | 541 | | | | 10,598 | |
Oritani Financial Corp. | | | 960 | | | | 14,160 | |
Pacific Premier Bancorp, Inc.* | | | 1,123 | | | | 28,659 | |
PennyMac Mortgage Investment Trust | | | 1,517 | | | | 28,247 | |
Piper Jaffray Cos. | | | 371 | | | | 24,427 | |
PRA Group, Inc.* | | | 1,120 | | | | 27,294 | |
Preferred Bank | | | 347 | | | | 15,042 | |
ProAssurance Corp. | | | 1,333 | | | | 54,066 | |
Provident Financial Svcs., Inc. | | | 1,527 | | | | 36,847 | |
Redwood Trust, Inc. | | | 2,049 | | | | 30,878 | |
RLI Corp. | | | 972 | | | | 67,058 | |
S&T Bancorp, Inc. | | | 873 | | | | 33,034 | |
Safety Insurance Group, Inc. | | | 359 | | | | 29,370 | |
Seacoast Banking Corp. of Florida* | | | 1,269 | | | | 33,019 | |
Selective Insurance Group, Inc. | | | 1,470 | | | | 89,582 | |
ServisFirst Bancshares, Inc. | | | 1,148 | | | | 36,587 | |
Simmons First National Corp. Cl A | | | 2,289 | | | | 55,234 | |
Southside Bancshares, Inc. | | | 820 | | | | 26,035 | |
Stewart Information Svcs. Corp. | | | 584 | | | | 24,178 | |
Third Point Reinsurance Ltd.* | | | 1,859 | | | | 17,921 | |
Tompkins Financial Corp. | | | 309 | | | | 23,178 | |
Triumph Bancorp, Inc.* | | | 597 | | | | 17,731 | |
TrustCo Bank Corp. | | | 2,412 | | | | 16,546 | |
United Community Banks, Inc. | | | 1,981 | | | | 42,512 | |
United Fire Group, Inc. | | | 524 | | | | 29,056 | |
| | | | | | | | |
| | | Shares | | | Value | |
| | | | | | | | |
| INDEXED ASSETS (CONTINUED): | |
COMMON STOCKS (CONTINUED): | |
FINANCIALS (CONTINUED) | | | | | | | | |
United Insurance Hldgs. Corp. | | | 527 | | | $ | 8,759 | |
Universal Insurance Hldgs., Inc. | | | 798 | | | | 30,260 | |
Veritex Hldgs., Inc.* | | | 603 | | | | 12,892 | |
Virtus Investment Partners, Inc. | | | 176 | | | | 13,980 | |
Waddell & Reed Financial, Inc. Cl A | | | 1,954 | | | | 35,328 | |
Walker & Dunlop, Inc. | | | 718 | | | | 31,054 | |
Westamerica Bancorporation | | | 660 | | | | 36,749 | |
WisdomTree Investments, Inc. | | | 2,895 | | | | 19,252 | |
World Acceptance Corp.* | | | 166 | | | | 16,975 | |
| | | | | | | | |
| | | | | | | 3,735,136 | |
| | | | | | | | |
HEALTH CARE (11.2%) | | | | | | | | |
Acorda Therapeutics, Inc.* | | | 981 | | | | 15,284 | |
Addus Homecare Corp.* | | | 248 | | | | 16,834 | |
Akorn, Inc.* | | | 2,289 | | | | 7,760 | |
AMAG Pharmaceuticals, Inc.* | | | 857 | | | | 13,018 | |
Amedisys, Inc.* | | | 726 | | | | 85,022 | |
AMN Healthcare Svcs., Inc.* | | | 1,178 | | | | 66,746 | |
Amphastar Pharmaceuticals, Inc.* | | | 863 | | | | 17,174 | |
AngioDynamics, Inc.* | | | 914 | | | | 18,399 | |
ANI Pharmaceuticals, Inc.* | | | 208 | | | | 9,364 | |
Anika Therapeutics, Inc.* | | | 351 | | | | 11,797 | |
Assertio Therapeutics, Inc.* | | | 1,617 | | | | 5,837 | |
BioTelemetry, Inc.* | | | 834 | | | | 49,807 | |
Cambrex Corp.* | | | 833 | | | | 31,454 | |
Community Health Systems, Inc.* | | | 2,912 | | | | 8,212 | |
Computer Programs & Systems, Inc. | | | 292 | | | | 7,329 | |
CONMED Corp. | | | 642 | | | | 41,216 | |
Corcept Therapeutics, Inc.* | | | 2,639 | | | | 35,257 | |
CorVel Corp.* | | | 227 | | | | 14,010 | |
Cross Country Healthcare, Inc.* | | | 900 | | | | 6,597 | |
CryoLife, Inc.* | | | 853 | | | | 24,208 | |
Cutera, Inc.* | | | 346 | | | | 5,889 | |
Cytokinetics, Inc.* | | | 1,370 | | | | 8,658 | |
Diplomat Pharmacy, Inc.* | | | 1,401 | | | | 18,858 | |
Eagle Pharmaceuticals, Inc.* | | | 275 | | | | 11,080 | |
Emergent BioSolutions, Inc.* | | | 1,127 | | | | 66,809 | |
Enanta Pharmaceuticals, Inc.* | | | 390 | | | | 27,624 | |
Endo International PLC* | | | 4,941 | | | | 36,069 | |
Ensign Group, Inc. | | | 1,228 | | | | 47,634 | |
HealthStream, Inc. | | | 641 | | | | 15,480 | |
Heska Corp.* | | | 169 | | | | 14,551 | |
HMS Hldgs. Corp.* | | | 2,093 | | | | 58,876 | |
Innoviva, Inc.* | | | 1,682 | | | | 29,351 | |
Integer Hldgs. Corp.* | | | 744 | | | | 56,737 | |
Invacare Corp. | | | 833 | | | | 3,582 | |
Lannett Co, Inc.* | | | 840 | | | | 4,166 | |
Lantheus Hldgs., Inc.* | | | 962 | | | | 15,055 | |
LeMaitre Vascular, Inc. | | | 391 | | | | 9,243 | |
LHC Group, Inc.* | | | 724 | | | | 67,969 | |
Luminex Corp. | | | 1,037 | | | | 23,965 | |
Magellan Health, Inc.* | | | 608 | | | | 34,589 | |
Medicines Co.* | | | 1,639 | | | | 31,370 | |
Medpace Hldgs., Inc.* | | | 645 | | | | 34,140 | |
Meridian Bioscience, Inc. | | | 1,056 | | | | 18,332 | |
Merit Medical Systems, Inc.* | | | 1,346 | | | | 75,120 | |
The accompanying notes are an integral part of these portfolio schedules.
69
MUTUAL OF AMERICA INVESTMENT CORPORATION — SMALL CAP EQUITY INDEX FUND
PORTFOLIO OF INVESTMENTS IN SECURITIES (Continued)
December 31, 2018
| | | | | | | | |
| | | Shares | | | Value | |
| | | | | | | | |
| INDEXED ASSETS (CONTINUED): | |
COMMON STOCKS (CONTINUED): | |
HEALTH CARE (CONTINUED) | | | | | | | | |
Momenta Pharmaceuticals, Inc.* | | | 2,370 | | | $ | 26,165 | |
Myriad Genetics, Inc.* | | | 1,824 | | | | 53,024 | |
Natus Medical, Inc.* | | | 860 | | | | 29,266 | |
Neogen Corp.* | | | 1,293 | | | | 73,701 | |
NextGen Healthcare, Inc.* | | | 1,200 | | | | 18,180 | |
Omnicell, Inc.* | | | 979 | | | | 59,954 | |
OraSure Technologies, Inc.* | | | 1,523 | | | | 17,789 | |
Orthofix Medical, Inc.* | | | 472 | | | | 24,775 | |
Owens & Minor, Inc. | | | 1,524 | | | | 9,647 | |
Phibro Animal Health Corp. Cl A | | | 502 | | | | 16,144 | |
Progenics Pharmaceuticals, Inc.* | | | 2,130 | | | | 8,946 | |
Providence Service Corp.* | | | 274 | | | | 16,446 | |
Quorum Health Corp.* | | | 635 | | | | 1,835 | |
REGENXBIO, Inc.* | | | 734 | | | | 30,791 | |
Repligen Corp.* | | | 965 | | | | 50,894 | |
Select Medical Hldgs. Corp.* | | | 2,729 | | | | 41,890 | |
Spectrum Pharmaceuticals, Inc.* | | | 2,481 | | | | 21,709 | |
Supernus Pharmaceuticals, Inc.* | | | 1,312 | | | | 43,585 | |
Surmodics, Inc.* | | | 332 | | | | 15,690 | |
Tabula Rasa HealthCare, Inc.* | | | 426 | | | | 27,162 | |
Tactile Systems Technology, Inc.* | | | 417 | | | | 18,994 | |
Tivity Health, Inc.* | | | 1,013 | | | | 25,133 | |
US Physical Therapy, Inc. | | | 313 | | | | 32,036 | |
Vanda Pharmaceuticals, Inc.* | | | 1,302 | | | | 34,021 | |
Varex Imaging Corp.* | | | 951 | | | | 22,520 | |
| | | | | | | | |
| | | | | | | 1,920,769 | |
| | | | | | | | |
INDUSTRIALS (17.8%) | | | | | | | | |
AAON, Inc. | | | 1,008 | | | | 35,340 | |
AAR Corp. | | | 815 | | | | 30,432 | |
ABM Industries, Inc. | | | 1,616 | | | | 51,890 | |
Actuant Corp. Cl A | | | 1,508 | | | | 31,653 | |
Aegion Corp.* | | | 796 | | | | 12,991 | |
Aerojet Rocketdyne Hldgs., Inc.* | | | 1,784 | | | | 62,850 | |
Aerovironment, Inc.* | | | 527 | | | | 35,810 | |
Alamo Group, Inc. | | | 238 | | | | 18,402 | |
Albany International Corp. Cl A | | | 715 | | | | 44,637 | |
Allegiant Travel Co. | | | 319 | | | | 31,970 | |
American Woodmark Corp.* | | | 385 | | | | 21,437 | |
Apogee Enterprises, Inc. | | | 707 | | | | 21,104 | |
Applied Industrial Technologies, Inc. | | | 960 | | | | 51,782 | |
ArcBest Corp. | | | 635 | | | | 21,755 | |
Arcosa, Inc.* | | | 1,197 | | | | 33,145 | |
Astec Industries, Inc. | | | 565 | | | | 17,057 | |
Atlas Air Worldwide Hldgs., Inc.* | | | 632 | | | | 26,664 | |
Axon Enterprise, Inc.* | | | 1,449 | | | | 63,394 | |
AZZ, Inc. | | | 648 | | | | 26,153 | |
Barnes Group, Inc. | | | 1,174 | | | | 62,950 | |
Brady Corp. Cl A | | | 1,210 | | | | 52,587 | |
Briggs & Stratton Corp. | | | 1,044 | | | | 13,656 | |
Chart Industries, Inc.* | | | 773 | | | | 50,268 | |
CIRCOR International, Inc.* | | | 492 | | | | 10,480 | |
Comfort Systems USA, Inc. | | | 927 | | | | 40,491 | |
Cubic Corp. | | | 703 | | | | 37,779 | |
DXP Enterprises, Inc.* | | | 390 | | | | 10,858 | |
Echo Global Logistics, Inc.* | | | 702 | | | | 14,272 | |
| | | | | | | | |
| | | Shares | | | Value | |
| | | | | | | | |
| INDEXED ASSETS (CONTINUED): | |
COMMON STOCKS (CONTINUED): | |
INDUSTRIALS (CONTINUED) | | | | | | | | |
Encore Wire Corp. | | | 518 | | | $ | 25,993 | |
Engility Hldgs., Inc.* | | | 449 | | | | 12,779 | |
EnPro Industries, Inc. | | | 515 | | | | 30,952 | |
ESCO Technologies, Inc. | | | 636 | | | | 41,944 | |
Essendant, Inc. | | | 815 | | | | 10,253 | |
Exponent, Inc. | | | 1,296 | | | | 65,720 | |
Federal Signal Corp. | | | 1,483 | | | | 29,512 | |
Forrester Research, Inc. | | | 255 | | | | 11,399 | |
Forward Air Corp. | | | 723 | | | | 39,657 | |
Franklin Electric Co., Inc. | | | 976 | | | | 41,851 | |
FTI Consulting, Inc.* | | | 948 | | | | 63,175 | |
Gibraltar Industries, Inc.* | | | 800 | | | | 28,472 | |
Greenbrier Cos., Inc. | | | 795 | | | | 31,434 | |
Griffon Corp. | | | 840 | | | | 8,778 | |
Harsco Corp.* | | | 1,995 | | | | 39,621 | |
Hawaiian Hldgs., Inc. | | | 1,217 | | | | 32,141 | |
Heartland Express, Inc. | | | 1,182 | | | | 21,631 | |
Heidrick & Struggles International, Inc. | | | 474 | | | | 14,784 | |
Hillenbrand, Inc. | | | 1,552 | | | | 58,867 | |
Hub Group, Inc. Cl A* | | | 831 | | | | 30,805 | |
Insteel Industries, Inc. | | | 456 | | | | 11,072 | |
Interface, Inc. | | | 1,489 | | | | 21,218 | |
John Bean Technologies Corp. | | | 782 | | | | 56,155 | |
Kaman Corp. | | | 692 | | | | 38,814 | |
Kelly Svcs., Inc. Cl A | | | 775 | | | | 15,872 | |
Korn/Ferry International | | | 1,410 | | | | 55,751 | |
Lindsay Corp. | | | 269 | | | | 25,891 | |
LSC Communications, Inc. | | | 836 | | | | 5,852 | |
Lydall, Inc.* | | | 418 | | | | 8,490 | |
Marten Transport Ltd. | | | 956 | | | | 15,478 | |
Matson, Inc. | | | 1,069 | | | | 34,229 | |
Matthews International Corp. Cl A | | | 797 | | | | 32,374 | |
Mercury Systems, Inc.* | | | 1,200 | | | | 56,748 | |
Mobile Mini, Inc. | | | 1,104 | | | | 35,052 | |
Moog, Inc. Cl A | | | 805 | | | | 62,371 | |
Mueller Industries, Inc. | | | 1,442 | | | | 33,685 | |
Multi-Color Corp. | | | 352 | | | | 12,352 | |
MYR Group, Inc.* | | | 409 | | | | 11,522 | |
National Presto Industries, Inc. | | | 124 | | | | 14,498 | |
Navigant Consulting, Inc. | | | 1,060 | | | | 25,493 | |
Orion Group Hldgs., Inc.* | | | 711 | | | | 3,050 | |
Patrick Industries, Inc.* | | | 566 | | | | 16,759 | |
PGT Innovations, Inc.* | | | 1,452 | | | | 23,014 | |
Powell Industries, Inc. | | | 213 | | | | 5,327 | |
Proto Labs, Inc.* | | | 677 | | | | 76,359 | |
Quanex Building Products Corp. | | | 871 | | | | 11,837 | |
Raven Industries, Inc. | | | 891 | | | | 32,245 | |
Resources Connection, Inc. | | | 737 | | | | 10,465 | |
RR Donnelley & Sons Co. | | | 1,785 | | | | 7,069 | |
Saia, Inc.* | | | 637 | | | | 35,557 | |
Simpson Manufacturing Co., Inc. | | | 1,024 | | | | 55,429 | |
SkyWest, Inc. | | | 1,306 | | | | 58,078 | |
SPX Corp.* | | | 1,059 | | | | 29,663 | |
SPX FLOW, Inc.* | | | 1,051 | | | | 31,971 | |
Standex International Corp. | | | 319 | | | | 21,430 | |
The accompanying notes are an integral part of these portfolio schedules.
70
MUTUAL OF AMERICA INVESTMENT CORPORATION — SMALL CAP EQUITY INDEX FUND
PORTFOLIO OF INVESTMENTS IN SECURITIES (Continued)
December 31, 2018
| | | | | | | | |
| | | Shares | | | Value | |
| | | | | | | | |
| INDEXED ASSETS (CONTINUED): | |
COMMON STOCKS (CONTINUED): | |
INDUSTRIALS (CONTINUED) | | | | | | | | |
Team, Inc.* | | | 745 | | | $ | 10,914 | |
Tennant Co. | | | 447 | | | | 23,293 | |
Tetra Tech, Inc. | | | 1,380 | | | | 71,443 | |
Titan International, Inc. | | | 1,249 | | | | 5,820 | |
Trex Co, Inc.* | | | 1,471 | | | | 87,319 | |
Triumph Group, Inc. | | | 1,229 | | | | 14,134 | |
TrueBlue, Inc.* | | | 1,006 | | | | 22,384 | |
UniFirst Corp. | | | 383 | | | | 54,796 | |
Universal Forest Products, Inc. | | | 1,518 | | | | 39,407 | |
US Ecology, Inc. | | | 548 | | | | 34,513 | |
Veritiv Corp.* | | | 314 | | | | 7,841 | |
Viad Corp. | | | 502 | | | | 25,145 | |
Vicor Corp.* | | | 412 | | | | 15,569 | |
Wabash National Corp. | | | 1,380 | | | | 18,050 | |
WageWorks, Inc.* | | | 977 | | | | 26,535 | |
Watts Water Technologies, Inc. Cl A | | | 688 | | | | 44,397 | |
| | | | | | | | |
| | | | | | | 3,064,305 | |
| | | | | | | | |
INFORMATION TECHNOLOGY (13.8%) | | | | | | | | |
3D Systems Corp.* | | | 2,818 | | | | 28,659 | |
8x8, Inc.* | | | 2,366 | | | | 42,683 | |
ADTRAN, Inc. | | | 1,187 | | | | 12,748 | |
Advanced Energy Industries, Inc.* | | | 952 | | | | 40,869 | |
Agilysys, Inc.* | | | 437 | | | | 6,267 | |
Alarm.com Hldgs., Inc.* | | | 886 | | | | 45,957 | |
Anixter International, Inc.* | | | 717 | | | | 38,940 | |
Applied Optoelectronics, Inc.* | | | 477 | | | | 7,360 | |
Axcelis Technologies, Inc.* | | | 808 | | | | 14,382 | |
Badger Meter, Inc. | | | 731 | | | | 35,972 | |
Bel Fuse, Inc. Cl B | | | 251 | | | | 4,623 | |
Benchmark Electronics, Inc. | | | 1,088 | | | | 23,044 | |
Bottomline Technologies DE, Inc.* | | | 903 | | | | 43,344 | |
Brooks Automation, Inc. | | | 1,792 | | | | 46,915 | |
Cabot Microelectronics Corp. | | | 711 | | | | 67,794 | |
CalAmp Corp.* | | | 851 | | | | 11,071 | |
Cardtronics PLC Cl A* | | | 908 | | | | 23,608 | |
CEVA, Inc.* | | | 548 | | | | 12,105 | |
Cohu, Inc. | | | 1,016 | | | | 16,327 | |
Comtech Telecommunications Corp. | | | 600 | | | | 14,604 | |
Control4 Corp.* | | | 672 | | | | 11,827 | |
Cray, Inc.* | | | 1,025 | | | | 22,130 | |
CSG Systems International, Inc. | | | 830 | | | | 26,369 | |
CTS Corp. | | | 819 | | | | 21,204 | |
Daktronics, Inc. | | | 975 | | | | 7,215 | |
Diebold Nixdorf, Inc. | | | 1,883 | | | | 4,689 | |
Digi International, Inc.* | | | 679 | | | | 6,851 | |
Diodes, Inc.* | | | 982 | | | | 31,679 | |
DSP Group, Inc.* | | | 474 | | | | 5,309 | |
Ebix, Inc. | | | 574 | | | | 24,429 | |
Electro Scientific Industries, Inc.* | | | 845 | | | | 25,316 | |
Electronics For Imaging, Inc.* | | | 1,089 | | | | 27,007 | |
ePlus, Inc.* | | | 336 | | | | 23,913 | |
EVERTEC, Inc. | | | 1,506 | | | | 43,222 | |
ExlService Hldgs., Inc.* | | | 853 | | | | 44,885 | |
Extreme Networks, Inc.* | | | 2,968 | | | | 18,105 | |
| | | | | | | | |
| | | Shares | | | Value | |
| | | | | | | | |
| INDEXED ASSETS (CONTINUED): | |
COMMON STOCKS (CONTINUED): | |
INFORMATION TECHNOLOGY (CONTINUED) | | | | | | | | |
Fabrinet* | | | 921 | | | $ | 47,257 | |
FARO Technologies, Inc.* | | | 426 | | | | 17,313 | |
Finisar Corp.* | | | 2,913 | | | | 62,921 | |
FormFactor, Inc.* | | | 1,832 | | | | 25,813 | |
Harmonic, Inc.* | | | 2,173 | | | | 10,257 | |
Ichor Hldgs. Ltd.* | | | 573 | | | | 9,340 | |
II-VI, Inc.* | | | 1,469 | | | | 47,684 | |
Insight Enterprises, Inc.* | | | 877 | | | | 35,738 | |
Itron, Inc.* | | | 834 | | | | 39,440 | |
KEMET Corp. | | | 1,456 | | | | 25,538 | |
Knowles Corp.* | | | 2,234 | | | | 29,735 | |
Kopin Corp.* | | | 1,535 | | | | 1,533 | |
Kulicke & Soffa Industries, Inc. | | | 1,668 | | | | 33,810 | |
LivePerson, Inc.* | | | 1,453 | | | | 27,404 | |
ManTech International Corp. Cl A | | | 663 | | | | 34,672 | |
MaxLinear, Inc.* | | | 1,561 | | | | 27,474 | |
Methode Electronics, Inc. | | | 917 | | | | 21,357 | |
MicroStrategy, Inc. Cl A* | | | 234 | | | | 29,893 | |
Monotype Imaging Hldgs., Inc. | | | 1,032 | | | | 16,017 | |
MTS Systems Corp. | | | 445 | | | | 17,858 | |
Nanometrics, Inc.* | | | 596 | | | | 16,289 | |
NETGEAR, Inc.* | | | 781 | | | | 40,635 | |
NIC, Inc. | | | 1,647 | | | | 20,555 | |
OneSpan, Inc.* | | | 777 | | | | 10,062 | |
OSI Systems, Inc.* | | | 420 | | | | 30,786 | |
Park Electrochemical Corp. | | | 475 | | | | 8,583 | |
PDF Solutions, Inc.* | | | 692 | | | | 5,834 | |
Perficient, Inc.* | | | 820 | | | | 18,253 | |
Photronics, Inc.* | | | 1,710 | | | | 16,553 | |
Plexus Corp.* | | | 780 | | | | 39,842 | |
Power Integrations, Inc. | | | 730 | | | | 44,515 | |
Progress Software Corp. | | | 1,115 | | | | 39,571 | |
Qualys, Inc.* | | | 831 | | | | 62,109 | |
Rambus, Inc.* | | | 2,696 | | | | 20,678 | |
Rogers Corp.* | | | 453 | | | | 44,874 | |
Rudolph Technologies, Inc.* | | | 787 | | | | 16,110 | |
Sanmina Corp.* | | | 1,696 | | | | 40,806 | |
ScanSource, Inc.* | | | 639 | | | | 21,969 | |
Semtech Corp.* | | | 1,640 | | | | 75,227 | |
SMART Global Hldgs., Inc.* | | | 307 | | | | 9,118 | |
SolarEdge Technologies, Inc.* | | | 1,073 | | | | 37,662 | |
SPS Commerce, Inc.* | | | 441 | | | | 36,330 | |
Sykes Enterprises, Inc.* | | | 995 | | | | 24,606 | |
TiVo Corp. | | | 3,159 | | | | 29,726 | |
Travelport Worldwide Ltd. | | | 3,226 | | | | 50,390 | |
TTEC Hldgs., Inc. | | | 344 | | | | 9,828 | |
TTM Technologies, Inc.* | | | 2,296 | | | | 22,340 | |
Ultra Clean Hldgs., Inc.* | | | 965 | | | | 8,174 | |
Unisys Corp.* | | | 1,260 | | | | 14,654 | |
Veeco Instruments, Inc.* | | | 1,187 | | | | 8,796 | |
Viavi Solutions, Inc.* | | | 5,677 | | | | 57,054 | |
Virtusa Corp.* | | | 685 | | | | 29,174 | |
Xperi Corp. | | | 1,211 | | | | 22,270 | |
| | | | | | | | |
| | | | | | | 2,375,849 | |
| | | | | | | | |
The accompanying notes are an integral part of these portfolio schedules.
71
MUTUAL OF AMERICA INVESTMENT CORPORATION — SMALL CAP EQUITY INDEX FUND
PORTFOLIO OF INVESTMENTS IN SECURITIES (Continued)
December 31, 2018
| | | | | | | | |
| | | Shares | | | Value | |
| | | | | | | | |
| INDEXED ASSETS (CONTINUED): | |
COMMON STOCKS (CONTINUED): | |
MATERIALS (4.0%) | | | | | | | | |
AdvanSix, Inc.* | | | 740 | | | $ | 18,012 | |
AK Steel Hldg. Corp.* | | | 7,839 | | | | 17,638 | |
American Vanguard Corp. | | | 659 | | | | 10,010 | |
Balchem Corp. | | | 801 | | | | 62,758 | |
Boise Cascade Co. | | | 969 | | | | 23,111 | |
Century Aluminum Co.* | | | 1,206 | | | | 8,816 | |
Clearwater Paper Corp.* | | | 407 | | | | 9,919 | |
FutureFuel Corp. | | | 646 | | | | 10,246 | |
Hawkins, Inc. | | | 237 | | | | 9,705 | |
Haynes International, Inc. | | | 307 | | | | 8,105 | |
HB Fuller Co. | | | 1,243 | | | | 53,039 | |
Ingevity Corp.* | | | 1,048 | | | | 87,707 | |
Innophos Hldgs., Inc. | | | 484 | | | | 11,872 | |
Innospec, Inc. | | | 602 | | | | 37,179 | |
Kaiser Aluminum Corp. | | | 408 | | | | 36,430 | |
Koppers Hldgs., Inc.* | | | 515 | | | | 8,776 | |
Kraton Corp.* | | | 794 | | | | 17,341 | |
LSB Industries, Inc.* | | | 508 | | | | 2,804 | |
Lyondell Bassell Industries — contingent value rights* | | | 448 | | | | 0 | †† |
Materion Corp. | | | 504 | | | | 22,675 | |
Myers Industries, Inc. | | | 875 | | | | 13,221 | |
Neenah, Inc. | | | 415 | | | | 24,452 | |
Olympic Steel, Inc. | | | 231 | | | | 3,296 | |
PH Glatfelter Co. | | | 1,087 | | | | 10,609 | |
Quaker Chemical Corp. | | | 337 | | | | 59,888 | |
Rayonier Advanced Materials, Inc. | | | 1,269 | | | | 13,515 | |
Schweitzer-Mauduit International, Inc. | | | 763 | | | | 19,113 | |
Stepan Co. | | | 506 | | | | 37,444 | |
SunCoke Energy, Inc.* | | | 1,616 | | | | 13,817 | |
TimkenSteel Corp.* | | | 984 | | | | 8,600 | |
Tredegar Corp. | | | 635 | | | | 10,071 | |
US Concrete, Inc.* | | | 404 | | | | 14,253 | |
| | | | | | | | |
| | | | | | | 684,422 | |
| | | | | | | | |
REAL ESTATE (6.4%) | | | | | | | | |
Acadia Realty Trust | | | 2,023 | | | | 48,066 | |
Agree Realty Corp. | | | 847 | | | | 50,075 | |
American Assets Trust, Inc. | | | 933 | | | | 37,479 | |
Armada Hoffler Properties, Inc. | | | 1,230 | | | | 17,294 | |
CareTrust REIT, Inc. | | | 2,094 | | | | 38,655 | |
CBL & Associates Properties, Inc. | | | 4,166 | | | | 7,999 | |
Cedar Realty Trust, Inc. | | | 2,171 | | | | 6,817 | |
Chatham Lodging Trust | | | 1,148 | | | | 20,297 | |
Chesapeake Lodging Trust | | | 1,498 | | | | 36,476 | |
Community Healthcare Trust, Inc. | | | 437 | | | | 12,599 | |
DiamondRock Hospitality Co. | | | 5,146 | | | | 46,726 | |
| | | | | | | | |
| | | Shares | | | Value | |
| | | | | | | | |
| INDEXED ASSETS (CONTINUED): | |
COMMON STOCKS (CONTINUED): | |
REAL ESTATE (CONTINUED) | | | | | | | | |
Easterly Government Properties, Inc. | | | 1,515 | | | $ | 23,755 | |
EastGroup Properties, Inc. | | | 894 | | | | 82,007 | |
Four Corners Property Trust, Inc. | | | 1,680 | | | | 44,016 | |
Franklin Street Properties Corp. Cl C | | | 2,663 | | | | 16,590 | |
Getty Realty Corp. | | | 834 | | | | 24,528 | |
Global Net Lease, Inc. | | | 1,885 | | | | 33,214 | |
Government Properties Income Trust | | | 4,719 | | | | 32,419 | |
Hersha Hospitality Trust | | | 898 | | | | 15,751 | |
HFF, Inc. Cl A | | | 969 | | | | 32,132 | |
Independence Realty Trust, Inc. | | | 2,205 | | | | 20,242 | |
iStar, Inc. | | | 1,689 | | | | 15,488 | |
Kite Realty Group Trust | | | 2,084 | | | | 29,363 | |
Lexington Realty Trust | | | 5,222 | | | | 42,873 | |
LTC Properties, Inc. | | | 988 | | | | 41,180 | |
Marcus & Millichap, Inc.* | | | 523 | | | | 17,955 | |
MAX Hldgs., Inc. Cl A | | | 437 | | | | 13,438 | |
National Storage Affiliates Trust | | | 1,391 | | | | 36,806 | |
Pennsylvania Real Estate Investment Trust | | | 1,575 | | | | 9,355 | |
PS Business Parks, Inc. | | | 492 | | | | 64,452 | |
Retail Opportunity Investments Corp. | | | 2,825 | | | | 44,861 | |
RPT Realty | | | 1,993 | | | | 23,816 | |
Saul Centers, Inc. | | | 285 | | | | 13,458 | |
Summit Hotel Properties, Inc. | | | 2,592 | | | | 25,220 | |
Universal Health Realty Income Trust | | | 319 | | | | 19,577 | |
Urstadt Biddle Properties, Inc. Cl A | | | 734 | | | | 14,107 | |
Washington Prime Group, Inc. | | | 4,625 | | | | 22,477 | |
Whitestone REIT | | | 987 | | | | 12,101 | |
| | | | | | | | |
| | | | | | | 1,093,664 | |
| | | | | | | | |
UTILITIES (2.5%) | | | | | | | | |
American States Water Co. | | | 907 | | | | 60,805 | |
Avista Corp. | | | 1,623 | | | | 68,945 | |
California Water Service Group | | | 1,199 | | | | 57,144 | |
El Paso Electric Co. | | | 1,003 | | | | 50,280 | |
Northwest Natural Hldg. Co. | | | 714 | | | | 43,169 | |
South Jersey Industries, Inc. | | | 2,124 | | | | 59,047 | |
Spire, Inc. | | | 1,256 | | | | 93,045 | |
| | | | | | | | |
| | | | | | | 432,435 | |
| | | | | | | | |
TOTAL INDEXED ASSETS-COMMON STOCKS | | | | | | | | |
(Cost: $20,575,127) 99.4% | | | | | | | 17,104,185 | |
| | | | | | | | |
TOTAL INDEXED ASSETS | | | | | | | | |
(Cost: $20,575,127) 99.4% | | | | | | | 17,104,185 | |
| | | | | | | | |
| | | | | | | | | | | | | | | | |
| | | Rate(%) | | | Maturity | | | Face Amount | | | Value | |
| TEMPORARY CASH INVESTMENT (0.4%) | | | | | | | | | | | | | | | | |
Citibank, New York Time Deposit | | | 1.67 | | | | 01/02/19 | | | $ | 69,144 | | | $ | 69,144 | |
| | | | | | | | | | | | | | | | |
TOTAL TEMPORARY CASH INVESTMENT
(Cost: $69,144) 0.4% | | | | 69,144 | |
| | | | | | | | | | | | | | | | |
TOTAL INVESTMENTS
(Cost: $20,644,271) 99.8% | | | | 17,173,329 | |
| | | | | | | | | | | | | | | | |
OTHER NET ASSETS 0.2% | | | | 34,773 | |
| | | | | | | | | | | | | | | | |
NET ASSETS 100.0% | | | $ | 17,208,102 | |
| | | | | | | | | | | | | | | | |
The accompanying notes are an integral part of these portfolio schedules.
72
MUTUAL OF AMERICA INVESTMENT CORPORATION — MID CAP VALUE FUND
PORTFOLIO OF INVESTMENTS IN SECURITIES
December 31, 2018
| | | | | | | | |
| | | Shares | | | Value | |
| | | | | | | | |
| COMMON STOCKS: | | | | | | | | |
COMMUNICATION SERVICES (1.8%) | | | | | | | | |
Discovery, Inc. Cl A* | | | 16,930 | | | $ | 418,848 | |
Discovery, Inc. Cl C* | | | 17,770 | | | | 410,132 | |
Lions Gate Entertainment Corp. Cl A | | | 8,840 | | | | 142,324 | |
MSG Networks, Inc. Cl A* | | | 21,903 | | | | 516,034 | |
| | | | | | | | |
| | | | | | | 1,487,338 | |
| | | | | | | | |
CONSUMER DISCRETIONARY (3.1%) | | | | | | | | |
Marriott Vacations Worldwide Corp. | | | 5,813 | | | | 409,875 | |
Qurate Retail, Inc.* | | | 17,450 | | | | 340,624 | |
Ralph Lauren Corp. Cl A | | | 5,037 | | | | 521,128 | |
Sleep Number Corp.* | | | 7,150 | | | | 226,869 | |
Stamps.com, Inc.* | | | 4,940 | | | | 768,862 | |
Taylor Morrison Home Corp. Cl A* | | | 12,722 | | | | 202,280 | |
| | | | | | | | |
| | | | | | | 2,469,638 | |
| | | | | | | | |
CONSUMER STAPLES (1.8%) | | | | | | | | |
Constellation Brands, Inc. Cl A | | | 1,719 | | | | 276,450 | |
Ingredion, Inc. | | | 7,341 | | | | 670,967 | |
Vector Group Ltd. | | | 49,264 | | | | 479,339 | |
| | | | | | | | |
| | | | | | | 1,426,756 | |
| | | | | | | | |
ENERGY (6.5%) | | | | | | | | |
Baker Hughes, a GE Co. Cl A | | | 18,432 | | | | 396,288 | |
Cheniere Energy, Inc.* | | | 15,507 | | | | 917,859 | |
Devon Energy Corp. | | | 11,220 | | | | 252,899 | |
Hess Corp. | | | 7,538 | | | | 305,289 | |
MPLX LP | | | 16,998 | | | | 515,040 | |
Noble Energy, Inc. | | | 26,701 | | | | 500,911 | |
PBF Energy, Inc. Cl A | | | 45,343 | | | | 1,481,356 | |
Range Resources Corp. | | | 25,585 | | | | 244,848 | |
Williams Cos., Inc. | | | 25,751 | | | | 567,809 | |
| | | | | | | | |
| | | | | | | 5,182,299 | |
| | | | | | | | |
FINANCIALS (20.3%) | | | | | | | | |
American Financial Group, Inc. | | | 12,849 | | | | 1,163,220 | |
Ameriprise Financial, Inc. | | | 11,272 | | | | 1,176,459 | |
Associated Banc-Corp. | | | 50,204 | | | | 993,537 | |
BankUnited, Inc. | | | 23,723 | | | | 710,267 | |
Citizens Financial Group, Inc. | | | 12,450 | | | | 370,138 | |
Discover Financial Svcs. | | | 12,401 | | | | 731,411 | |
Everest Re Group Ltd. | | | 4,106 | | | | 894,123 | |
Fifth Third Bancorp | | | 40,116 | | | | 943,929 | |
Hartford Financial Svcs. Group, Inc. | | | 21,415 | | | | 951,897 | |
KeyCorp | | | 62,392 | | | | 922,154 | |
Lincoln National Corp. | | | 15,429 | | | | 791,662 | |
Progressive Corp. | | | 23,743 | | | | 1,432,415 | |
Reinsurance Group of America, Inc. Cl A | | | 7,392 | | | | 1,036,580 | |
Starwood Property Trust, Inc. | | | 34,048 | | | | 671,086 | |
SVB Financial Group* | | | 6,309 | | | | 1,198,205 | |
Synchrony Financial | | | 15,793 | | | | 370,504 | |
Voya Financial, Inc. | | | 27,446 | | | | 1,101,682 | |
Zions Bancorporation | | | 20,230 | | | | 824,170 | |
| | | | | | | | |
| | | | | | | 16,283,439 | |
| | | | | | | | |
HEALTH CARE (7.5%) | | | | | | | | |
Agilent Technologies, Inc. | | | 16,100 | | | | 1,086,106 | |
Boston Scientific Corp.* | | | 25,310 | | | | 894,455 | |
| | | | | | | | |
| | | Shares | | | Value | |
| | | | | | | | |
| COMMON STOCKS (CONTINUED): | | | | | | | | |
HEALTH CARE (CONTINUED) | | | | | | | | |
Centene Corp.* | | | 7,027 | | | $ | 810,213 | |
Edwards Lifesciences Corp.* | | | 2,970 | | | | 454,915 | |
Hill-Rom Hldgs., Inc. | | | 8,790 | | | | 778,355 | |
Humana, Inc. | | | 3,104 | | | | 889,234 | |
Neurocrine Biosciences, Inc.* | | | 6,180 | | | | 441,314 | |
Zimmer Biomet Hldgs., Inc. | | | 6,613 | | | | 685,900 | |
| | | | | | | | |
| | | | | | | 6,040,492 | |
| | | | | | | | |
INDUSTRIALS (14.0%) | | | | | | | | |
Alaska Air Group, Inc. | | | 21,680 | | | | 1,319,228 | |
Carlisle Cos., Inc. | | | 4,528 | | | | 455,155 | |
Harris Corp. | | | 6,793 | | | | 914,677 | |
Kirby Corp.* | | | 12,124 | | | | 816,673 | |
L-3 Technologies, Inc. | | | 8,347 | | | | 1,449,540 | |
LSC Communications, Inc. | | | 23,110 | | | | 161,770 | |
Mueller Industries, Inc. | | | 36,510 | | | | 852,873 | |
Old Dominion Freight Line, Inc. | | | 13,893 | | | | 1,715,647 | |
Oshkosh Corp. | | | 10,661 | | | | 653,626 | |
Republic Svcs., Inc. Cl A | | | 4,060 | | | | 292,685 | |
Stanley Black & Decker, Inc. | | | 10,266 | | | | 1,229,252 | |
United Rentals, Inc.* | | | 9,772 | | | | 1,001,923 | |
XPO Logistics, Inc.* | | | 5,650 | | | | 322,276 | |
| | | | | | | | |
| | | | | | | 11,185,325 | |
| | | | | | | | |
INFORMATION TECHNOLOGY (6.7%) | | | | | | | | |
Analog Devices, Inc. | | | 5,583 | | | | 479,189 | |
Avnet, Inc. | | | 11,425 | | | | 412,442 | |
DXC Technology Co. | | | 10,227 | | | | 543,770 | |
F5 Networks, Inc.* | | | 1,906 | | | | 308,829 | |
KLA-Tencor Corp. | | | 2,330 | | | | 208,512 | |
LogMeIn, Inc. | | | 5,250 | | | | 428,242 | |
Perspecta, Inc. | | | 13,053 | | | | 224,773 | |
Proofpoint, Inc.* | | | 6,510 | | | | 545,603 | |
PTC, Inc.* | | | 7,380 | | | | 611,802 | |
Qorvo, Inc.* | | | 5,940 | | | | 360,736 | |
ViaSat, Inc.* | | | 6,490 | | | | 382,586 | |
Western Digital Corp. | | | 7,122 | | | | 263,300 | |
Worldpay, Inc. Cl A* | | | 7,860 | | | | 600,740 | |
| | | | | | | | |
| | | | | | | 5,370,524 | |
| | | | | | | | |
MATERIALS (9.2%) | | | | | | | | |
Crown Hldgs., Inc.* | | | 34,085 | | | | 1,416,913 | |
Eastman Chemical Co. | | | 4,717 | | | | 344,860 | |
FMC Corp. | | | 5,810 | | | | 429,708 | |
Freeport-McMoRan, Inc. | | | 39,550 | | | | 407,760 | |
International Paper Co. | | | 17,549 | | | | 708,278 | |
Mosaic Co. | | | 7,050 | | | | 205,930 | |
Nucor Corp. | | | 9,932 | | | | 514,577 | |
Olin Corp. | | | 32,960 | | | | 662,826 | |
Packaging Corp. of America | | | 21,659 | | | | 1,807,660 | |
Steel Dynamics, Inc. | | | 28,317 | | | | 850,643 | |
| | | | | | | | |
| | | | | | | 7,349,155 | |
| | | | | | | | |
REAL ESTATE (11.8%) | | | | | | | | |
Alexander’s, Inc. | | | 1,137 | | | | 346,489 | |
Apartment Investment & Management Co. Cl A | | | 16,452 | | | | 721,914 | |
AvalonBay Communities, Inc. | | | 5,202 | | | | 905,408 | |
The accompanying notes are an integral part of these portfolio schedules.
73
MUTUAL OF AMERICA INVESTMENT CORPORATION — MID CAP VALUE FUND
PORTFOLIO OF INVESTMENTS IN SECURITIES (Continued)
December 31, 2018
| | | | | | | | |
| | | Shares | | | Value | |
| | | | | | | | |
| COMMON STOCKS (CONTINUED): | | | | | | | | |
REAL ESTATE (CONTINUED) | | | | | | | | |
Brandywine Realty Trust | | | 46,401 | | | $ | 597,181 | |
Duke Realty Corp. | | | 51,172 | | | | 1,325,355 | |
Equity LifeStyle Properties, Inc. | | | 4,221 | | | | 409,986 | |
GEO Group, Inc. | | | 28,610 | | | | 563,617 | |
Host Hotels & Resorts, Inc. | | | 46,595 | | | | 776,739 | |
Kilroy Realty Corp. | | | 8,734 | | | | 549,194 | |
Macerich Co. | | | 8,560 | | | | 370,477 | |
Prologis, Inc. | | | 14,987 | | | | 880,036 | |
Regency Centers Corp. | | | 3,926 | | | | 230,378 | |
Vornado Realty Trust | | | 7,493 | | | | 464,791 | |
Welltower, Inc. | | | 13,332 | | | | 925,374 | |
Weyerhaeuser Co. | | | 15,789 | | | | 345,147 | |
| | | | | | | | |
| | | | | | | 9,412,086 | |
| | | | | | | | |
| | | | | | | | |
| | | Shares | | | Value | |
| | | | | | | | |
| COMMON STOCKS (CONTINUED): | | | | | | | | |
UTILITIES (11.6%) | | | | | | | | |
AES Corp. | | | 41,460 | | | $ | 599,512 | |
Ameren Corp. | | | 18,208 | | | | 1,187,708 | |
Consolidated Edison, Inc. | | | 14,115 | | | | 1,079,233 | |
Edison International | | | 6,761 | | | | 383,822 | |
Entergy Corp. | | | 10,621 | | | | 914,149 | |
Evergy, Inc. | | | 22,442 | | | | 1,274,032 | |
Eversource Energy | | | 10,994 | | | | 715,050 | |
FirstEnergy Corp. | | | 24,306 | | | | 912,690 | |
PPL Corp. | | | 28,507 | | | | 807,603 | |
Public Svc. Enterprise Group, Inc. | | | 26,919 | | | | 1,401,134 | |
| | | | | | | | |
| | | | | | | 9,274,933 | |
| | | | | | | | |
TOTAL COMMON STOCKS | | | | | | | | |
(Cost: $68,526,222) 94.3% | | | | | | | 75,481,985 | |
| | | | | | | | |
| | | | | | | | | | | | | | | | | | | | |
| | | Rating** | | | Rate(%) | | | Maturity | | | Face Amount | | | Value | |
| SHORT-TERM DEBT SECURITIES: | | | | | | | | | | | | | | | | | | | | |
U.S. GOVERNMENT (3.3%) | | | | | | | | | | | | | | | | | | | | |
U.S. Treasury Bill | | | A-1+ | | | | 2.36 | | | | 02/28/19 | | | $ | 2,600,000 | | | $ | 2,590,156 | |
| | | | | | | | | | | | | | | | | | | | |
U.S. GOVERNMENT AGENCIES (1.6%) | | | | | | | | | | | | | | | | | | | | |
FHLB | | | A-1+ | | | | 2.15 | | | | 01/02/19 | | | | 1,300,000 | | | | 1,299,923 | |
| | | | | | | | | | | | | | | | | | | | |
COMMERCIAL PAPER (0.7%) | | | | | | | | | | | | | | | | | | | | |
Cargill, Inc.† | | | A-1 | | | | 2.39 | | | | 01/02/19 | | | | 600,000 | | | | 599,960 | |
| | | | | | | | | | | | | | | | | | | | |
TOTAL SHORT-TERM DEBT SECURITIES
(Cost: $4,490,039) 5.6% | | | | 4,490,039 | |
| | | | | | | | | | | | | | | | | | | | |
| | | | | |
| | | | | | Rate(%) | | | Maturity | | | Face Amount | | | Value | |
| TEMPORARY CASH INVESTMENT (0.1%) | | | | | | | | | | | | | | | | | | | | |
Citibank, New York Time Deposit | | | | 1.67 | | | | 01/02/19 | | | $ | 85,179 | | | $ | 85,179 | |
| | | | | | | | | | | | | | | | | | | | |
TOTAL TEMPORARY CASH INVESTMENT
(Cost: $85,179) 0.1% | | | | 85,179 | |
| | | | | | | | | | | | | | | | | | | | |
TOTAL INVESTMENTS
(Cost: $73,101,440) 100.0% | | | | 80,057,203 | |
| | | | | | | | | | | | | | | | | | | | |
OTHER NET ASSETS -0.0% (2) | | | | (15,426 | ) |
| | | | | | | | | | | | | | | | | | | | |
NET ASSETS 100.0% | | | $ | 80,041,777 | |
| | | | | | | | | | | | | | | | | | | | |
The accompanying notes are an integral part of these portfolio schedules.
74
MUTUAL OF AMERICA INVESTMENT CORPORATION — MID-CAP EQUITY INDEX FUND
PORTFOLIO OF INVESTMENTS IN SECURITIES
December 31, 2018
| | | | | | | | |
| | | Shares | | | Value | |
| | | | | | | | |
| INDEXED ASSETS: | | | | | | | | |
COMMON STOCKS: | | | | | | | | |
COMMUNICATION SERVICES (2.4%) | | | | | | | | |
AMC Networks, Inc. Cl A* | | | 38,060 | | | $ | 2,088,733 | |
Cable One, Inc. | | | 4,103 | | | | 3,364,870 | |
Cars.com, Inc.* | | | 53,751 | | | | 1,155,646 | |
Cinemark Hldgs., Inc. | | | 88,207 | | | | 3,157,811 | |
John Wiley & Sons, Inc. Cl A | | | 38,086 | | | | 1,788,899 | |
Live Nation Entertainment, Inc.* | | | 117,119 | | | | 5,768,111 | |
Meredith Corp. | | | 33,562 | | | | 1,743,210 | |
New York Times Co. Cl A | | | 118,918 | | | | 2,650,682 | |
TEGNA, Inc. | | | 182,582 | | | | 1,984,666 | |
Telephone & Data Systems, Inc. | | | 78,061 | | | | 2,540,105 | |
World Wrestling Entertainment, Inc. Cl A | | | 36,930 | | | | 2,759,410 | |
Yelp, Inc.* | | | 64,717 | | | | 2,264,448 | |
| | | | | | | | |
| | | | | | | 31,266,591 | |
| | | | | | | | |
CONSUMER DISCRETIONARY (11.4%) | | | | | | | | |
Aaron’s, Inc. | | | 57,422 | | | | 2,414,595 | |
Adient PLC | | | 72,836 | | | | 1,096,910 | |
Adtalem Global Education, Inc.* | | | 49,255 | | | | 2,330,747 | |
American Eagle Outfitters, Inc. | | | 143,314 | | | | 2,770,260 | |
AutoNation, Inc.* | | | 48,276 | | | | 1,723,453 | |
Bed Bath & Beyond, Inc. | | | 115,633 | | | | 1,308,966 | |
Big Lots, Inc. | | | 33,662 | | | | 973,505 | |
Boyd Gaming Corp. | | | 69,006 | | | | 1,433,945 | |
Brinker International, Inc. | | | 32,336 | | | | 1,422,137 | |
Brunswick Corp. | | | 72,762 | | | | 3,379,795 | |
Carter’s, Inc. | | | 38,528 | | | | 3,144,655 | |
Cheesecake Factory, Inc. | | | 34,640 | | | | 1,507,186 | |
Churchill Downs, Inc. | | | 10,060 | | | | 2,454,036 | |
Cracker Barrel Old Country Store, Inc. | | | 19,926 | | | | 3,185,370 | |
Dana, Inc. | | | 122,481 | | | | 1,669,416 | |
Deckers Outdoor Corp.* | | | 24,371 | | | | 3,118,269 | |
Delphi Technologies PLC | | | 74,714 | | | | 1,069,905 | |
Dick’s Sporting Goods, Inc. | | | 62,130 | | | | 1,938,456 | |
Dillard’s, Inc. Cl A | | | 15,463 | | | | 932,574 | |
Domino’s Pizza, Inc. | | | 34,516 | | | | 8,559,623 | |
Dunkin’ Brands Group, Inc. | | | 68,609 | | | | 4,399,209 | |
Eldorado Resorts, Inc.* | | | 54,401 | | | | 1,969,860 | |
Five Below, Inc.* | | | 47,801 | | | | 4,890,998 | |
Gentex Corp. | | | 219,692 | | | | 4,439,975 | |
Graham Hldgs. Co. Cl B | | | 3,583 | | | | 2,295,198 | |
Helen of Troy Ltd.* | | | 22,174 | | | | 2,908,785 | |
International Speedway Corp. Cl A | | | 20,193 | | | | 885,665 | |
Jack in the Box, Inc. | | | 21,339 | | | | 1,656,547 | |
KB Home | | | 72,471 | | | | 1,384,196 | |
Marriott Vacations Worldwide Corp. | | | 34,507 | | | | 2,433,089 | |
Michaels Cos., Inc.* | | | 75,635 | | | | 1,024,098 | |
Murphy USA, Inc.* | | | 25,102 | | | | 1,923,817 | |
NVR, Inc.* | | | 2,848 | | | | 6,940,548 | |
Ollie’s Bargain Outlet Hldgs., Inc.* | | | 44,087 | | | | 2,932,226 | |
Papa John’s International, Inc. | | | 18,661 | | | | 742,894 | |
Penn National Gaming, Inc.* | | | 90,018 | | | | 1,695,039 | |
Polaris Industries, Inc. | | | 48,981 | | | | 3,755,863 | |
Pool Corp. | | | 33,480 | | | | 4,976,802 | |
| | | | | | | | |
| | | Shares | | | Value | |
| | | | | | | | |
| INDEXED ASSETS (CONTINUED): | |
COMMON STOCKS (CONTINUED): | |
CONSUMER DISCRETIONARY (CONTINUED) | | | | | | | | |
Sally Beauty Hldgs., Inc.* | | | 100,562 | | | $ | 1,714,582 | |
Scientific Games Corp.Cl A* | | | 47,221 | | | | 844,312 | |
Service Corp. International | | | 151,221 | | | | 6,088,157 | |
Signet Jewelers Ltd. | | | 44,021 | | | | 1,398,547 | |
Six Flags Entertainment Corp. | | | 60,107 | | | | 3,343,752 | |
Skechers U.S.A., Inc. Cl A* | | | 112,185 | | | | 2,567,915 | |
Sotheby’s* | | | 28,858 | | | | 1,146,817 | |
Tempur Sealy International, Inc.* | | | 38,838 | | | | 1,607,893 | |
Texas Roadhouse, Inc. Cl A | | | 55,341 | | | | 3,303,858 | |
Thor Industries, Inc. | | | 41,707 | | | | 2,168,764 | |
Toll Brothers, Inc. | | | 113,106 | | | | 3,724,581 | |
TRI Pointe Group, Inc.* | | | 119,904 | | | | 1,310,551 | |
Tupperware Brands Corp. | | | 40,704 | | | | 1,285,025 | |
Urban Outfitters, Inc.* | | | 63,808 | | | | 2,118,426 | |
Visteon Corp.* | | | 24,183 | | | | 1,457,751 | |
Weight Watchers International, Inc.* | | | 32,285 | | | | 1,244,587 | |
Wendy’s Co. | | | 155,930 | | | | 2,434,067 | |
Williams-Sonoma, Inc. | | | 67,419 | | | | 3,401,289 | |
Wyndham Destinations, Inc. | | | 81,158 | | | | 2,908,703 | |
Wyndham Hotels & Resorts, Inc. | | | 82,756 | | | | 3,754,640 | |
| | | | | | | | |
| | | | | | | 145,512,829 | |
| | | | | | | | |
CONSUMER STAPLES (2.9%) | | | | | | | | |
Boston Beer Co., Inc. Cl A* | | | 7,168 | | | | 1,726,341 | |
Casey’s General Stores, Inc. | | | 30,526 | | | | 3,911,602 | |
Edgewell Personal Care Co.* | | | 44,973 | | | | 1,679,742 | |
Energizer Hldgs., Inc. | | | 49,431 | | | | 2,231,810 | |
Flowers Foods, Inc. | | | 152,599 | | | | 2,818,503 | |
Hain Celestial Group, Inc.* | | | 75,793 | | | | 1,202,077 | |
Ingredion, Inc. | | | 58,599 | | | | 5,355,949 | |
Lancaster Colony Corp. | | | 16,336 | | | | 2,889,185 | |
Nu Skin Enterprises, Inc. Cl A | | | 46,892 | | | | 2,875,886 | |
Post Hldgs., Inc.* | | | 56,015 | | | | 4,992,617 | |
Sanderson Farms, Inc. | | | 16,932 | | | | 1,681,178 | |
Sprouts Farmers Market, Inc.* | | | 106,738 | | | | 2,509,410 | |
Tootsie Roll Industries, Inc. | | | 15,420 | | | | 515,028 | |
TreeHouse Foods, Inc.* | | | 46,890 | | | | 2,377,792 | |
| | | | | | | | |
| | | | | | | 36,767,120 | |
| | | | | | | | |
ENERGY (3.6%) | | | | | | | | |
Apergy Corp.* | | | 65,072 | | | | 1,762,150 | |
Callon Petroleum Co.* | | | 191,476 | | | | 1,242,679 | |
Chesapeake Energy Corp.* | | | 767,315 | | | | 1,611,361 | |
CNX Resources Corp.* | | | 170,288 | | | | 1,944,689 | |
Core Laboratories N.V. | | | 36,453 | | | | 2,174,786 | |
Diamond Offshore Drilling, Inc.* | | | 53,754 | | | | 507,438 | |
Dril-Quip, Inc.* | | | 30,082 | | | | 903,362 | |
Ensco PLC Cl A | | | 367,226 | | | | 1,307,325 | |
EQT Corp. | | | 212,639 | | | | 4,016,751 | |
Equitrans Midstream Corp.* | | | 169,156 | | | | 3,386,503 | |
Matador Resources Co.* | | | 88,058 | | | | 1,367,541 | |
McDermott International, Inc.* | | | 153,178 | | | | 1,001,784 | |
Murphy Oil Corp. | | | 137,014 | | | | 3,204,757 | |
Oasis Petroleum, Inc.* | | | 225,566 | | | | 1,247,380 | |
Oceaneering International, Inc.* | | | 82,963 | | | | 1,003,852 | |
The accompanying notes are an integral part of these portfolio schedules.
75
MUTUAL OF AMERICA INVESTMENT CORPORATION — MID-CAP EQUITY INDEX FUND
PORTFOLIO OF INVESTMENTS IN SECURITIES (Continued)
December 31, 2018
| | | | | | | | |
| | | Shares | | | Value | |
| | | | | | | | |
| INDEXED ASSETS (CONTINUED): | |
COMMON STOCKS (CONTINUED): | |
ENERGY (CONTINUED) | | | | | | | | |
Patterson-UTI Energy, Inc. | | | 183,528 | | | $ | 1,899,515 | |
PBF Energy, Inc. Cl A | | | 100,665 | | | | 3,288,726 | |
QEP Resources, Inc.* | | | 201,491 | | | | 1,134,394 | |
Range Resources Corp. | | | 172,604 | | | | 1,651,820 | |
Rowan Cos. PLC Cl A* | | | 104,802 | | | | 879,289 | |
SM Energy Co. | | | 88,361 | | | | 1,367,828 | |
Southwestern Energy Co.* | | | 486,873 | | | | 1,660,237 | |
Transocean Ltd.* | | | 426,870 | | | | 2,962,478 | |
World Fuel Svcs. Corp. | | | 56,939 | | | | 1,219,064 | |
WPX Energy, Inc.* | | | 332,313 | | | | 3,771,753 | |
| | | | | | | | |
| | | | | | | 46,517,462 | |
| | | | | | | | |
FINANCIALS (15.9%) | | | | | | | | |
Alleghany Corp. | | | 12,366 | | | | 7,707,975 | |
American Financial Group, Inc. | | | 58,591 | | | | 5,304,243 | |
Aspen Insurance Hldgs. Ltd. | | | 49,430 | | | | 2,075,566 | |
Associated Banc-Corp. | | | 138,351 | | | | 2,737,966 | |
BancorpSouth Bank | | | 75,906 | | | | 1,984,183 | |
Bank of Hawaii Corp. | | | 34,705 | | | | 2,336,341 | |
Bank OZK | | | 99,902 | | | | 2,280,763 | |
Brown & Brown, Inc. | | | 196,308 | | | | 5,410,248 | |
Cathay General Bancorp | | | 64,648 | | | | 2,167,647 | |
Chemical Financial Corp. | | | 60,014 | | | | 2,197,113 | |
CNO Financial Group, Inc. | | | 137,878 | | | | 2,051,625 | |
Commerce Bancshares, Inc. | | | 82,993 | | | | 4,678,315 | |
Cullen/Frost Bankers, Inc. | | | 53,132 | | | | 4,672,428 | |
East West Bancorp, Inc. | | | 120,942 | | | | 5,264,605 | |
Eaton Vance Corp. | | | 97,788 | | | | 3,440,182 | |
Evercore, Inc. Cl A | | | 34,044 | | | | 2,436,189 | |
FactSet Research Systems, Inc. | | | 31,930 | | | | 6,390,151 | |
Federated Investors, Inc. Cl B | | | 79,370 | | | | 2,107,273 | |
First American Financial Corp. | | | 92,890 | | | | 4,146,610 | |
First Horizon National Corp. | | | 268,877 | | | | 3,538,421 | |
FNB Corp. | | | 272,246 | | | | 2,678,901 | |
Fulton Financial Corp. | | | 146,758 | | | | 2,271,814 | |
Genworth Financial, Inc. Cl A* | | | 415,041 | | | | 1,934,091 | |
Hancock Whitney Corp. | | | 71,071 | | | | 2,462,610 | |
Hanover Insurance Group, Inc. | | | 35,069 | | | | 4,095,007 | |
Home BancShares, Inc. | | | 132,754 | | | | 2,169,200 | |
Interactive Brokers Group, Inc. Cl A | | | 62,470 | | | | 3,413,985 | |
International Bancshares Corp. | | | 45,693 | | | | 1,571,839 | |
Janus Henderson Group PLC | | | 138,229 | | | | 2,864,105 | |
Kemper Corp. | | | 50,485 | | | | 3,351,194 | |
Legg Mason, Inc. | | | 71,411 | | | | 1,821,695 | |
LendingTree, Inc.* | | | 6,339 | | | | 1,391,854 | |
MarketAxess Hldgs., Inc. | | | 31,523 | | | | 6,661,125 | |
MB Financial, Inc. | | | 70,011 | | | | 2,774,536 | |
Mercury General Corp. | | | 22,572 | | | | 1,167,198 | |
Navient Corp. | | | 190,692 | | | | 1,679,997 | |
New York Community Bancorp, Inc. | | | 411,611 | | | | 3,873,260 | |
Old Republic International Corp. | | | 236,926 | | | | 4,873,568 | |
PacWest Bancorp | | | 101,275 | | | | 3,370,432 | |
Pinnacle Financial Partners, Inc. | | | 61,334 | | | | 2,827,497 | |
Primerica, Inc. | | | 35,842 | | | | 3,502,122 | |
Prosperity Bancshares, Inc. | | | 55,432 | | | | 3,453,414 | |
Reinsurance Group of America, Inc. Cl A | | | 52,487 | | | | 7,360,252 | |
| | | | | | | | |
| | | Shares | | | Value | |
| | | | | | | | |
| INDEXED ASSETS (CONTINUED): | |
COMMON STOCKS (CONTINUED): | |
FINANCIALS (CONTINUED) | | | | | | | | |
RenaissanceRe Hldgs. Ltd. | | | 33,528 | | | $ | 4,482,694 | |
SEI Investments Co. | | | 109,915 | | | | 5,078,073 | |
Signature Bank | | | 44,867 | | | | 4,612,776 | |
SLM Corp.* | | | 364,352 | | | | 3,027,765 | |
Sterling Bancorp | | | 186,811 | | | | 3,084,250 | |
Stifel Financial Corp. | | | 59,795 | | | | 2,476,709 | |
Synovus Financial Corp. | | | 138,686 | | | | 4,436,565 | |
TCF Financial Corp. | | | 139,737 | | | | 2,723,474 | |
Texas Capital Bancshares, Inc.* | | | 41,775 | | | | 2,134,285 | |
Trustmark Corp. | | | 55,927 | | | | 1,590,005 | |
UMB Financial Corp. | | | 37,507 | | | | 2,286,802 | |
Umpqua Hldgs. Corp. | | | 183,418 | | | | 2,916,346 | |
United Bankshares, Inc. | | | 86,454 | | | | 2,689,584 | |
Valley National Bancorp | | | 277,034 | | | | 2,460,062 | |
Washington Federal, Inc. | | | 68,316 | | | | 1,824,720 | |
Webster Financial Corp. | | | 76,979 | | | | 3,794,295 | |
Wintrust Financial Corp. | | | 46,954 | | | | 3,121,971 | |
WR Berkley Corp. | | | 80,410 | | | | 5,943,103 | |
| | | | | | | | |
| | | | | | | 203,181,019 | |
| | | | | | | | |
HEALTH CARE (9.7%) | | | | | | | | |
Acadia Healthcare Co., Inc.* | | | 74,038 | | | | 1,903,517 | |
Allscripts Healthcare Solutions, Inc.* | | | 147,432 | | | | 1,421,245 | |
Avanos Medical, Inc.* | | | 39,939 | | | | 1,788,868 | |
Bio-Rad Laboratories, Inc. Cl A* | | | 16,887 | | | | 3,921,499 | |
Bio-Techne Corp. | | | 31,917 | | | | 4,619,028 | |
Cantel Medical Corp. | | | 30,340 | | | | 2,258,813 | |
Catalent, Inc.* | | | 122,144 | | | | 3,808,450 | |
Charles River Laboratories International, Inc.* | | | 40,390 | | | | 4,571,340 | |
Chemed Corp. | | | 13,162 | | | | 3,728,531 | |
Encompass Health Corp. | | | 82,761 | | | | 5,106,354 | |
Exelixis, Inc.* | | | 254,888 | | | | 5,013,647 | |
Globus Medical, Inc. Cl A* | | | 64,122 | | | | 2,775,200 | |
Haemonetics Corp.* | | | 43,422 | | | | 4,344,371 | |
HealthEquity, Inc.* | | | 46,571 | | | | 2,777,960 | |
Hill-Rom Hldgs., Inc. | | | 56,670 | | | | 5,018,129 | |
ICU Medical, Inc.* | | | 13,940 | | | | 3,201,042 | |
Inogen, Inc.* | | | 14,951 | | | | 1,856,466 | |
Integra LifeSciences Hldgs. Corp.* | | | 59,751 | | | | 2,694,770 | |
Ligand Pharmaceuticals, Inc.* | | | 17,923 | | | | 2,432,151 | |
LivaNova PLC* | | | 40,791 | | | | 3,731,153 | |
Mallinckrodt PLC* | | | 69,403 | | | | 1,096,567 | |
Masimo Corp.* | | | 40,924 | | | | 4,394,010 | |
Medidata Solutions, Inc.* | | | 52,215 | | | | 3,520,335 | |
MEDNAX, Inc.* | | | 74,578 | | | | 2,461,074 | |
Molina Healthcare, Inc.* | | | 52,996 | | | | 6,159,195 | |
NuVasive, Inc.* | | | 43,301 | | | | 2,145,998 | |
Patterson Cos., Inc. | | | 69,161 | | | | 1,359,705 | |
PRA Health Sciences, Inc.* | | | 49,618 | | | | 4,562,871 | |
Prestige Consumer Healthcare, Inc.* | | | 43,567 | | | | 1,345,349 | |
STERIS PLC | | | 70,869 | | | | 7,572,353 | |
Syneos Health, Inc. Cl A* | | | 51,700 | | | | 2,034,395 | |
Teleflex, Inc. | | | 38,215 | | | | 9,877,813 | |
The accompanying notes are an integral part of these portfolio schedules.
76
MUTUAL OF AMERICA INVESTMENT CORPORATION — MID-CAP EQUITY INDEX FUND
PORTFOLIO OF INVESTMENTS IN SECURITIES (Continued)
December 31, 2018
| | | | | | | | |
| | | Shares | | | Value | |
| | | | | | | | |
| INDEXED ASSETS (CONTINUED): | |
COMMON STOCKS (CONTINUED): | |
HEALTH CARE (CONTINUED) | | | | | | | | |
Tenet Healthcare Corp.* | | | 70,285 | | | $ | 1,204,685 | |
United Therapeutics Corp.* | | | 36,682 | | | | 3,994,670 | |
West Pharmaceutical Svcs., Inc. | | | 62,579 | | | | 6,134,619 | |
| | | | | | | | |
| | | | | | | 124,836,173 | |
| | | | | | | | |
INDUSTRIALS (14.9%) | | | | | | | | |
Acuity Brands, Inc. | | | 33,455 | | | | 3,845,652 | |
AECOM* | | | 131,347 | | | | 3,480,695 | |
AGCO Corp. | | | 54,850 | | | | 3,053,499 | |
ASGN, Inc.* | | | 44,135 | | | | 2,405,357 | |
Avis Budget Group, Inc.* | | | 54,516 | | | | 1,225,520 | |
Brink’s Co. | | | 42,639 | | | | 2,756,611 | |
Carlisle Cos., Inc. | | | 49,670 | | | | 4,992,828 | |
Clean Harbors, Inc.* | | | 42,736 | | | | 2,109,022 | |
Crane Co. | | | 42,403 | | | | 3,060,649 | |
Curtiss-Wright Corp. | | | 36,544 | | | | 3,731,873 | |
Deluxe Corp. | | | 38,867 | | | | 1,494,047 | |
Donaldson Co., Inc. | | | 107,010 | | | | 4,643,164 | |
Dun & Bradstreet Corp. | | | 30,762 | | | | 4,390,968 | |
Dycom Industries, Inc.* | | | 26,259 | | | | 1,419,036 | |
EMCOR Group, Inc. | | | 48,575 | | | | 2,899,442 | |
EnerSys | | | 35,176 | | | | 2,730,009 | |
Esterline Technologies Corp.* | | | 21,998 | | | | 2,671,657 | |
GATX Corp. | | | 31,585 | | | | 2,236,534 | |
Genesee & Wyoming, Inc. Cl A* | | | 49,002 | | | | 3,627,128 | |
Graco, Inc. | | | 139,169 | | | | 5,824,223 | |
Granite Construction, Inc. | | | 39,564 | | | | 1,593,638 | |
Healthcare Svcs. Group, Inc. | | | 62,240 | | | | 2,500,803 | |
Herman Miller, Inc. | | | 49,864 | | | | 1,508,386 | |
HNI Corp. | | | 36,641 | | | | 1,298,191 | |
Hubbell, Inc. Cl B | | | 45,840 | | | | 4,553,746 | |
IDEX Corp. | | | 64,101 | | | | 8,093,392 | |
Insperity, Inc. | | | 32,021 | | | | 2,989,481 | |
ITT, Inc. | | | 73,485 | | | | 3,547,121 | |
JetBlue Airways Corp.* | | | 254,315 | | | | 4,084,299 | |
KBR, Inc. | | | 119,315 | | | | 1,811,202 | |
Kennametal, Inc. | | | 69,373 | | | | 2,308,733 | |
Kirby Corp.* | | | 45,207 | | | | 3,045,144 | |
Knight-Swift Transportation Hldgs., Inc. Cl A | | | 106,112 | | | | 2,660,228 | |
Landstar System, Inc. | | | 34,464 | | | | 3,297,171 | |
Lennox International, Inc. | | | 30,252 | | | | 6,620,953 | |
Lincoln Electric Hldgs., Inc. | | | 53,992 | | | | 4,257,269 | |
ManpowerGroup, Inc. | | | 51,726 | | | | 3,351,845 | |
MasTec, Inc.* | | | 53,599 | | | | 2,173,975 | |
MSA Safety, Inc. | | | 29,460 | | | | 2,777,194 | |
MSC Industrial Direct Co., Inc. Cl A | | | 38,214 | | | | 2,939,421 | |
Nordson Corp. | | | 43,724 | | | | 5,218,459 | |
NOW, Inc.* | | | 89,728 | | | | 1,044,434 | |
nVent Electric PLC | | | 132,545 | | | | 2,976,961 | |
Old Dominion Freight Line, Inc. | | | 54,837 | | | | 6,771,821 | |
Oshkosh Corp. | | | 59,979 | | | | 3,677,312 | |
Pitney Bowes, Inc. | | | 157,906 | | | | 933,224 | |
Regal Beloit Corp. | | | 36,016 | | | | 2,522,921 | |
Resideo Technologies, Inc.* | | | 102,303 | | | | 2,102,327 | |
| | | | | | | | |
| | | Shares | | | Value | |
| | | | | | | | |
| INDEXED ASSETS (CONTINUED): | |
COMMON STOCKS (CONTINUED): | |
INDUSTRIALS (CONTINUED) | | | | | | | | |
Ryder System, Inc. | | | 44,552 | | | $ | 2,145,179 | |
Stericycle, Inc.* | | | 72,056 | | | | 2,643,735 | |
Teledyne Technologies, Inc.* | | | 30,033 | | | | 6,218,933 | |
Terex Corp. | | | 54,220 | | | | 1,494,845 | |
Timken Co. | | | 57,688 | | | | 2,152,916 | |
Toro Co. | | | 87,938 | | | | 4,913,975 | |
Trinity Industries, Inc. | | | 122,728 | | | | 2,526,970 | |
Valmont Industries, Inc. | | | 18,645 | | | | 2,068,663 | |
Wabtec Corp. | | | 72,842 | | | | 5,117,151 | |
Watsco, Inc. | | | 26,742 | | | | 3,720,882 | |
Werner Enterprises, Inc. | | | 36,993 | | | | 1,092,773 | |
Woodward, Inc. | | | 46,537 | | | | 3,457,234 | |
| | | | | | | | |
| | | | | | | 190,810,821 | |
| | | | | | | | |
INFORMATION TECHNOLOGY (14.8%) | | | | | | | | |
ACI Worldwide, Inc.* | | | 97,248 | | | | 2,690,852 | |
ARRIS International PLC* | | | 135,827 | | | | 4,152,231 | |
Arrow Electronics, Inc.* | | | 72,825 | | | | 5,021,284 | |
Avnet, Inc. | | | 93,145 | | | | 3,362,534 | |
Belden, Inc. | | | 33,929 | | | | 1,417,214 | |
Blackbaud, Inc. | | | 41,580 | | | | 2,615,382 | |
CACI International, Inc. Cl A* | | | 20,827 | | | | 2,999,713 | |
CDK Global, Inc. | | | 107,094 | | | | 5,127,661 | |
Ciena Corp.* | | | 118,649 | | | | 4,023,388 | |
Cirrus Logic, Inc.* | | | 50,462 | | | | 1,674,329 | |
Cognex Corp. | | | 144,208 | | | | 5,576,523 | |
Coherent, Inc.* | | | 20,690 | | | | 2,187,140 | |
CommVault Systems, Inc.* | | | 32,758 | | | | 1,935,670 | |
CoreLogic, Inc.* | | | 67,928 | | | | 2,270,154 | |
Cree, Inc.* | | | 86,479 | | | | 3,699,139 | |
Cypress Semiconductor Corp. | | | 303,450 | | | | 3,859,884 | |
Fair Isaac Corp.* | | | 24,111 | | | | 4,508,757 | |
First Solar, Inc.* | | | 63,656 | | | | 2,702,515 | |
Integrated Device Technology, Inc.* | | | 106,676 | | | | 5,166,319 | |
InterDigital, Inc. | | | 28,440 | | | | 1,889,269 | |
j2 Global, Inc. | | | 39,288 | | | | 2,725,801 | |
Jabil, Inc. | | | 119,842 | | | | 2,970,883 | |
Leidos Hldgs., Inc. | | | 125,893 | | | | 6,637,079 | |
Littelfuse, Inc. | | | 20,740 | | | | 3,556,495 | |
LiveRamp Hldgs., Inc.* | | | 45,292 | | | | 1,749,630 | |
LogMeIn, Inc. | | | 42,372 | | | | 3,456,284 | |
Lumentum Hldgs., Inc.* | | | 63,558 | | | | 2,670,072 | |
Manhattan Associates, Inc.* | | | 55,752 | | | | 2,362,212 | |
MAXIMUS, Inc. | | | 54,062 | | | | 3,518,896 | |
MKS Instruments, Inc. | | | 45,901 | | | | 2,965,664 | |
Monolithic Power Systems, Inc. | | | 32,854 | | | | 3,819,278 | |
National Instruments Corp. | | | 94,671 | | | | 4,296,170 | |
NCR Corp.* | | | 97,213 | | | | 2,243,676 | |
NetScout Systems, Inc.* | | | 58,718 | | | | 1,387,506 | |
Perspecta, Inc. | | | 119,494 | | | | 2,057,687 | |
Plantronics, Inc. | | | 28,006 | | | | 926,999 | |
PTC, Inc.* | | | 90,108 | | | | 7,469,953 | |
Sabre Corp. | | | 232,425 | | | | 5,029,677 | |
Science Applications International Corp. | | | 35,736 | | | | 2,276,383 | |
Silicon Laboratories, Inc.* | | | 36,259 | | | | 2,857,572 | |
The accompanying notes are an integral part of these portfolio schedules.
77
MUTUAL OF AMERICA INVESTMENT CORPORATION — MID-CAP EQUITY INDEX FUND
PORTFOLIO OF INVESTMENTS IN SECURITIES (Continued)
December 31, 2018
| | | | | | | | |
| | | Shares | | | Value | |
| | | | | | | | |
| INDEXED ASSETS (CONTINUED): | |
COMMON STOCKS (CONTINUED): | |
INFORMATION TECHNOLOGY (CONTINUED) | | | | | | | | |
Synaptics, Inc.* | | | 29,243 | | | $ | 1,088,132 | |
SYNNEX Corp. | | | 35,067 | | | | 2,834,816 | |
Tech Data Corp.* | | | 31,265 | | | | 2,557,790 | |
Teradata Corp.* | | | 99,504 | | | | 3,816,973 | |
Teradyne, Inc. | | | 148,157 | | | | 4,649,167 | |
Trimble, Inc.* | | | 211,729 | | | | 6,968,001 | |
Tyler Technologies, Inc.* | | | 32,616 | | | | 6,060,705 | |
Ultimate Software Group, Inc.* | | | 26,485 | | | | 6,485,382 | |
Universal Display Corp. | | | 35,988 | | | | 3,367,397 | |
Versum Materials, Inc. | | | 90,504 | | | | 2,508,771 | |
ViaSat, Inc.* | | | 47,776 | | | | 2,816,395 | |
Vishay Intertechnology, Inc. | | | 111,175 | | | | 2,002,262 | |
WEX, Inc.* | | | 36,061 | | | | 5,050,704 | |
Zebra Technologies Corp. Cl A* | | | 44,865 | | | | 7,143,854 | |
| | | | | | | | |
| | | | | | | 189,208,224 | |
| | | | | | | | |
MATERIALS (6.4%) | | | | | | | | |
Allegheny Technologies, Inc.* | | | 105,484 | | | | 2,296,387 | |
AptarGroup, Inc. | | | 52,131 | | | | 4,903,963 | |
Ashland Global Hldgs., Inc. | | | 52,321 | | | | 3,712,698 | |
Bemis Co., Inc. | | | 76,087 | | | | 3,492,393 | |
Cabot Corp. | | | 49,903 | | | | 2,142,835 | |
Carpenter Technology Corp. | | | 39,595 | | | | 1,409,978 | |
Chemours Co. | | | 143,430 | | | | 4,047,595 | |
Commercial Metals Co. | | | 98,405 | | | | 1,576,448 | |
Compass Minerals International, Inc. | | | 28,019 | | | | 1,168,112 | |
Domtar Corp. | | | 52,419 | | | | 1,841,479 | |
Eagle Materials, Inc. | | | 39,580 | | | | 2,415,567 | |
Greif, Inc. Cl A | | | 21,324 | | | | 791,334 | |
Louisiana-Pacific Corp. | | | 116,836 | | | | 2,596,096 | |
Minerals Technologies, Inc. | | | 29,272 | | | | 1,502,824 | |
NewMarket Corp. | | | 7,426 | | | | 3,060,180 | |
Olin Corp. | | | 139,440 | | | | 2,804,138 | |
Owens-Illinois, Inc.* | | | 132,110 | | | | 2,277,576 | |
PolyOne Corp. | | | 67,021 | | | | 1,916,801 | |
Reliance Steel & Aluminum Co. | | | 58,599 | | | | 4,170,491 | |
Royal Gold, Inc. | | | 54,124 | | | | 4,635,721 | |
RPM International, Inc. | | | 110,792 | | | | 6,512,354 | |
Scotts Miracle-Gro Co. | | | 32,609 | | | | 2,004,149 | |
Sensient Technologies Corp. | | | 35,419 | | | | 1,978,151 | |
Silgan Hldgs., Inc. | | | 64,714 | | | | 1,528,545 | |
Sonoco Products Co. | | | 82,994 | | | | 4,409,471 | |
Steel Dynamics, Inc. | | | 191,617 | | | | 5,756,175 | |
United States Steel Corp. | | | 147,767 | | | | 2,695,270 | |
Valvoline, Inc. | | | 155,820 | | | | 3,015,117 | |
Worthington Industries, Inc. | | | 33,339 | | | | 1,161,531 | |
| | | | | | | | |
| | | | | | | 81,823,379 | |
| | | | | | | | |
REAL ESTATE (9.3%) | | | | | | | | |
Alexander & Baldwin, Inc.* | | | 56,530 | | | | 1,039,021 | |
American Campus Communities, Inc. | | | 114,011 | | | | 4,718,915 | |
Camden Property Trust | | | 77,757 | | | | 6,846,504 | |
CoreCivic, Inc. | | | 99,699 | | | | 1,777,633 | |
CoreSite Realty Corp. | | | 30,739 | | | | 2,681,363 | |
| | | | | | | | |
| | | Shares | | | Value | |
| | | | | | | | |
| INDEXED ASSETS (CONTINUED): | |
COMMON STOCKS (CONTINUED): | |
REAL ESTATE (CONTINUED) | | | | | | | | |
Corporate Office Properties Trust | | | 90,172 | | | $ | 1,896,317 | |
Cousins Properties, Inc. | | | 349,072 | | | | 2,757,669 | |
CyrusOne, Inc. | | | 87,311 | | | | 4,617,006 | |
Douglas Emmett, Inc. | | | 134,104 | | | | 4,576,970 | |
EPR Properties | | | 62,094 | | | | 3,975,879 | |
First Industrial Realty Trust, Inc. | | | 105,310 | | | | 3,039,247 | |
GEO Group, Inc. | | | 102,759 | | | | 2,024,352 | |
Healthcare Realty Trust, Inc. | | | 104,593 | | | | 2,974,625 | |
Highwoods Properties, Inc. | | | 86,060 | | | | 3,329,661 | |
Hospitality Properties Trust | | | 136,878 | | | | 3,268,647 | |
JBG SMITH Properties | | | 90,899 | | | | 3,164,194 | |
Jones Lang LaSalle, Inc. | | | 38,121 | | | | 4,826,119 | |
Kilroy Realty Corp. | | | 83,934 | | | | 5,277,771 | |
Lamar Advertising Co. Cl A | | | 70,682 | | | | 4,889,781 | |
Liberty Property Trust | | | 122,879 | | | | 5,146,173 | |
Life Storage, Inc. | | | 38,574 | | | | 3,586,996 | |
Mack-Cali Realty Corp. | | | 75,173 | | | | 1,472,639 | |
Medical Properties Trust, Inc. | | | 304,859 | | | | 4,902,133 | |
National Retail Properties, Inc. | | | 132,005 | | | | 6,403,563 | |
Omega Healthcare Investors, Inc. | | | 167,660 | | | | 5,893,249 | |
Pebblebrook Hotel Trust | | | 107,171 | | | | 3,034,011 | |
PotlatchDeltic Corp. | | | 56,855 | | | | 1,798,892 | |
Rayonier, Inc. | | | 108,551 | | | | 3,005,777 | |
Realogy Hldgs. Corp. | | | 99,167 | | | | 1,455,772 | |
Sabra Health Care REIT, Inc. | | | 149,715 | | | | 2,467,303 | |
Senior Housing Properties Trust | | | 199,820 | | | | 2,341,890 | |
Tanger Factory Outlet Centers, Inc. | | | 78,582 | | | | 1,588,928 | |
Taubman Centers, Inc. | | | 51,313 | | | | 2,334,228 | |
Uniti Group, Inc. | | | 148,741 | | | | 2,315,897 | |
Urban Edge Properties | | | 95,281 | | | | 1,583,570 | |
Weingarten Realty Investors | | | 99,221 | | | | 2,461,673 | |
| | | | | | | | |
| | | | | | | 119,474,368 | |
| | | | | | | | |
UTILITIES (5.4%) | | | | | | | | |
ALLETE, Inc. | | | 42,862 | | | | 3,266,942 | |
Aqua America, Inc. | | | 147,332 | | | | 5,037,281 | |
Atmos Energy Corp. | | | 96,920 | | | | 8,986,422 | |
Black Hills Corp. | | | 44,842 | | | | 2,815,181 | |
Hawaiian Electric Industries, Inc. | | | 89,869 | | | | 3,291,003 | |
IDACORP, Inc. | | | 41,946 | | | | 3,903,495 | |
MDU Resources Group, Inc. | | | 162,329 | | | | 3,869,923 | |
National Fuel Gas Co. | | | 71,620 | | | | 3,665,512 | |
New Jersey Resources Corp. | | | 73,448 | | | | 3,354,370 | |
NorthWestern Corp. | | | 41,773 | | | | 2,482,987 | |
OGE Energy Corp. | | | 165,424 | | | | 6,482,967 | |
ONE Gas, Inc. | | | 43,798 | | | | 3,486,321 | |
PNM Resources, Inc. | | | 66,478 | | | | 2,731,581 | |
Southwest Gas Hldgs., Inc. | | | 44,031 | | | | 3,368,371 | |
UGI Corp. | | | 144,525 | | | | 7,710,409 | |
Vectren Corp. | | | 68,778 | | | | 4,950,640 | |
| | | | | | | | |
| | | | | | | 69,403,405 | |
| | | | | | | | |
TOTAL INDEXED ASSETS-COMMON STOCKS | | | | | | | | |
(Cost: $1,146,076,465) 96.7% | | | | | | | 1,238,801,391 | |
| | | | | | | | |
The accompanying notes are an integral part of these portfolio schedules.
78
MUTUAL OF AMERICA INVESTMENT CORPORATION — MID-CAP EQUITY INDEX FUND
PORTFOLIO OF INVESTMENTS IN SECURITIES (Continued)
December 31, 2018
| | | | | | | | | | | | | | | | | | | | |
| | | Rating** | | | Rate(%) | | | Maturity | | | Face Amount | | | Value | |
| INDEXED ASSETS: | | | | | | | | | | | | | | | | | | | | |
SHORT-TERM DEBT SECURITIES: | | | | | | | | | | | | | | | | | | | | |
U.S. GOVERNMENT (2.2%) | | | | | | | | | | | | | | | | | | | | |
U.S. Treasury Bill | | | A-1+ | | | | 2.29 | | | | 01/17/19 | | | $ | 3,000,000 | | | $ | 2,996,961 | |
U.S. Treasury Bill | | | A-1+ | | | | 2.36 | | | | 02/14/19 | | | | 15,000,000 | | | | 14,956,899 | |
U.S. Treasury Bill | | | A-1+ | | | | 2.36 | | | | 02/28/19 | | | | 5,200,000 | | | | 5,180,312 | |
U.S. Treasury Bill (1) | | | A-1+ | | | | 2.37 | | | | 02/21/19 | | | | 5,000,000 | | | | 4,983,326 | |
| | | | | | | | | | | | | | | | | | | | |
| | | | | | | | | | | | | | | | | | | 28,117,498 | |
| | | | | | | | | | | | | | | | | | | | |
COMMERCIAL PAPER (1.0%) | | | | | | | | | | | | | | | | | | | | |
Cargill, Inc.† | | | A-1 | | | | 2.39 | | | | 01/02/19 | | | | 12,700,000 | | | | 12,699,157 | |
| | | | | | | | | | | | | | | | | | | | |
TOTAL INDEXED ASSETS-SHORT-TERM DEBT SECURITIES
(Cost: $40,816,655) 3.2% | | | | 40,816,655 | |
| | | | | | | | | | | | | | | | | | | | |
TOTAL INDEXED ASSETS
(Cost: $1,186,893,120) 99.9% | | | | 1,279,618,046 | |
| | | | | | | | | | | | | | | | | | | | |
| | | | | |
| | | | | | Rate(%) | | | Maturity | | | Face Amount | | | Value | |
| TEMPORARY CASH INVESTMENT (0.0%) (2) | | | | | | | | | | | | | | | | | | | | |
Citibank, New York Time Deposit | | | | | | | 1.67 | | | | 1/02/19 | | | $ | 106,816 | | | $ | 106,816 | |
| | | | | | | | | | | | | | | | | | | | |
TOTAL TEMPORARY CASH INVESTMENT
(Cost: $106,816) 0.0% (2) | | | | 106,816 | |
| | | | | | | | | | | | | | | | | | | | |
TOTAL INVESTMENTS
(Cost: $1,186,999,936) 99.9% | | | | 1,279,724,862 | |
| | | | | | | | | | | | | | | | | | | | |
OTHER NET ASSETS 0.1% | | | | 1,642,729 | |
| | | | | | | | | | | | | | | | | | | | |
NET ASSETS 100.0% | | | $ | 1,281,367,591 | |
| | | | | | | | | | | | | | | | | | | | |
The accompanying notes are an integral part of these portfolio schedules.
79
MUTUAL OF AMERICA INVESTMENT CORPORATION — INTERNATIONAL FUND
PORTFOLIO OF INVESTMENTS IN SECURITIES
December 31, 2018
| | | | | | | | |
| | | Shares | | | Value | |
| COMMON STOCKS: | | | | | | | | |
FINANCIALS (92.5%) | | | | | | | | |
iShares Core MSCI EAFE ETF | | | 964,519 | | | $ | 53,048,545 | |
iShares Core MSCI Europe ETF | | | 393,284 | | | | 16,254,428 | |
iShares Core MSCI Pacific ETF | | | 177,010 | | | | 8,960,246 | |
iShares Edge MSCI Min Vol Emerging Markets ETF | | | 239,149 | | | | 13,361,254 | |
iShares MSCI EAFE ETF | | | 3,094,851 | | | | 181,915,343 | |
iShares MSCI EAFE Growth ETF | | | 548,713 | | | | 37,899,607 | |
iShares MSCI EAFE Small-Cap ETF | | | 177,935 | | | | 9,220,592 | |
iShares MSCI EAFE Value ETF | | | 812,063 | | | | 36,721,489 | |
Vanguard FTSE Developed Markets ETF | | | 2,129,980 | | | | 79,022,258 | |
Vanguard FTSE Europe ETF | | | 424,630 | | | | 20,645,510 | |
Vanguard FTSE Pacific ETF | | | 220,480 | | | | 13,367,702 | |
| | | | | | | | |
| | | | | | | 470,416,974 | |
| | | | | | | | |
| TOTAL COMMON STOCKS | | | | | | | | |
(Cost: $490,224,455) 92.5% | | | | | | | 470,416,974 | |
| | | | | | | | |
| | | | | | | | | | | | | | | | | | | | |
| | | Rating** | | | Rate(%) | | | Maturity | | | Face Amount | | | Value | |
| SHORT-TERM DEBT SECURITIES: | | | | | | | | | | | | | | | | | | | | |
U.S. GOVERNMENT (3.0%) | | | | | | | | | | | | | | | | | | | | |
U.S. Treasury Bill | | | A-1+ | | | | 2.36 | | | | 02/14/19 | | | $ | 15,000,000 | | | $ | 14,956,899 | |
| | | | | | | | | | | | | | | | | | | | |
U.S. GOVERNMENT AGENCIES (2.8%) | | | | | | | | | | | | | | | | | | | | |
FHLB | | | A-1+ | | | | 2.10 | | | | 01/2/19 | | | | 14,400,000 | | | | 14,399,160 | |
| | | | | | | | | | | | | | | | | | | | |
COMMERCIAL PAPER (2.0%) | | | | | | | | | | | | | | | | | | | | |
Cargill Global Funding PLC† | | | A-1 | | | | 2.39 | | | | 01/2/19 | | | | 10,300,000 | | | | 10,299,316 | |
| | | | | | | | | | | | | | | | | | | | |
TOTAL SHORT-TERM DEBT SECURITIES
(Cost: $39,655,375) 7.8% | | | | 39,655,375 | |
| | | | | | | | | | | | | | | | | | | | |
| | | | | |
| | | | | | Rate(%) | | | Maturity | | | Face Amount | | | Value | |
| TEMPORARY CASH INVESTMENT (0.1%) | | | | | | | | | | | | | | | | | | | | |
Citibank, New York Time Deposit | | | | | | | 1.67 | | | | 01/2/19 | | | $ | 541,896 | | | $ | 541,896 | |
| | | | | | | | | | | | | | | | | | | | |
TOTAL TEMPORARY CASH INVESTMENT
(Cost: $541,896) 0.1% | | | | 541,896 | |
| | | | | | | | | | | | | | | | | | | | |
TOTAL INVESTMENTS
(Cost: $530,421,726) 100.4% | | | | 510,614,245 | |
| | | | | | | | | | | | | | | | | | | | |
OTHER NET ASSETS -0.4% | | | | (2,096,812 | ) |
| | | | | | | | | | | | | | | | | | | | |
NET ASSETS 100.0% | | | $ | 508,517,433 | |
| | | | | | | | | | | | | | | | | | | | |
The accompanying notes are an integral part of these portfolio schedules.
80
MUTUAL OF AMERICA INVESTMENT CORPORATION — COMPOSITE FUND
PORTFOLIO OF INVESTMENTS IN SECURITIES
December 31, 2018
| | | | | | | | |
| | | Shares | | | Value | |
| | | | | | | | |
| COMMON STOCKS: | | | | | | | | |
COMMUNICATION SERVICES (2.5%) | | | | | | | | |
CenturyLink, Inc. | | | 51,772 | | | $ | 784,346 | |
Comcast Corp. Cl A | | | 72,580 | | | | 2,471,349 | |
Viacom, Inc. Cl B | | | 36,354 | | | | 934,298 | |
| | | | | | | | |
| | | | | | | 4,189,993 | |
| | | | | | | | |
CONSUMER DISCRETIONARY (6.1%) | | | | | | | | |
Amazon.com, Inc.* | | | 987 | | | | 1,482,444 | |
Foot Locker, Inc. | | | 17,020 | | | | 905,464 | |
Home Depot, Inc. | | | 16,573 | | | | 2,847,573 | |
Kohl’s Corp. | | | 19,673 | | | | 1,305,107 | |
Macy’s, Inc. | | | 22,340 | | | | 665,285 | |
PulteGroup, Inc. | | | 22,611 | | | | 587,660 | |
PVH Corp. | | | 7,450 | | | | 692,478 | |
Ross Stores, Inc. | | | 17,701 | | | | 1,472,723 | |
Tapestry, Inc. | | | 16,624 | | | | 561,060 | |
| | | | | | | | |
| | | | | | | 10,519,794 | |
| | | | | | | | |
CONSUMER STAPLES (2.3%) | | | | | | | | |
General Mills, Inc. | | | 26,863 | | | | 1,046,045 | |
Kroger Co. | | | 23,497 | | | | 646,168 | |
PepsiCo, Inc. | | | 14,405 | | | | 1,591,464 | |
Walgreens Boots Alliance, Inc. | | | 10,697 | | | | 730,926 | |
| | | | | | | | |
| | | | | | | 4,014,603 | |
| | | | | | | | |
ENERGY (4.5%) | | | | | | | | |
Anadarko Petroleum Corp. | | | 11,531 | | | | 505,519 | |
Baker Hughes, a GE Co. Cl A | | | 31,473 | | | | 676,669 | |
Chevron Corp. | | | 17,305 | | | | 1,882,611 | |
ConocoPhillips | | | 16,082 | | | | 1,002,713 | |
Marathon Petroleum Corp. | | | 32,880 | | | | 1,940,249 | |
Pioneer Natural Resources Co. | | | 4,721 | | | | 620,906 | |
Williams Cos., Inc. | | | 53,308 | | | | 1,175,441 | |
| | | | | | | | |
| | | | | | | 7,804,108 | |
| | | | | | | | |
FINANCIALS (7.6%) | | | | | | | | |
American International Group, Inc. | | | 19,324 | | | | 761,559 | |
Bank of America Corp. | | | 76,309 | | | | 1,880,254 | |
Citigroup, Inc. | | | 30,775 | | | | 1,602,146 | |
CME Group, Inc. Cl A | | | 8,317 | | | | 1,564,594 | |
Comerica, Inc. | | | 12,936 | | | | 888,574 | |
Fifth Third Bancorp | | | 39,034 | | | | 918,470 | |
JPMorgan Chase & Co. | | | 25,705 | | | | 2,509,322 | |
Morgan Stanley | | | 29,437 | | | | 1,167,177 | |
Progressive Corp. | | | 10,629 | | | | 641,247 | |
Synchrony Financial | | | 45,769 | | | | 1,073,741 | |
| | | | | | | | |
| | | | | | | 13,007,084 | |
| | | | | | | | |
HEALTH CARE (8.5%) | | | | | | | | |
AbbVie, Inc. | | | 25,734 | | | | 2,372,418 | |
Amgen, Inc. | | | 7,368 | | | | 1,434,329 | |
Celgene Corp.* | | | 14,413 | | | | 923,729 | |
CVS Health Corp. | | | 23,470 | | | | 1,537,755 | |
Gilead Sciences, Inc. | | | 19,233 | | | | 1,203,024 | |
Humana, Inc. | | | 3,465 | | | | 992,653 | |
Medtronic PLC | | | 14,515 | | | | 1,320,284 | |
Merck & Co., Inc. | | | 25,490 | | | | 1,947,691 | |
UnitedHealth Group, Inc. | | | 11,403 | | | | 2,840,715 | |
| | | | | | | | |
| | | | | | | 14,572,598 | |
| | | | | | | | |
| | | | | | | | |
| | | Shares | | | Value | |
| | | | | | | | |
| COMMON STOCKS (Continued): | | | | | | | | |
INDUSTRIALS (5.2%) | | | | | | | | |
Boeing Co. | | | 7,731 | | | $ | 2,493,248 | |
Delta Air Lines, Inc. | | | 29,011 | | | | 1,447,649 | |
FedEx Corp. | | | 5,234 | | | | 844,401 | |
Ingersoll-Rand PLC | | | 9,370 | | | | 854,825 | |
Lockheed Martin Corp. | | | 4,962 | | | | 1,299,250 | |
PACCAR, Inc. | | | 10,286 | | | | 587,742 | |
Parker-Hannifin Corp. | | | 4,464 | | | | 665,761 | |
Robert Half International, Inc. | | | 13,416 | | | | 767,395 | |
| | | | | | | | |
| | | | | | | 8,960,271 | |
| | | | | | | | |
INFORMATION TECHNOLOGY (13.6%) | | | | | | | | |
Analog Devices, Inc. | | | 8,017 | | | | 688,099 | |
Apple, Inc. | | | 29,419 | | | | 4,640,553 | |
Broadcom, Inc. | | | 7,312 | | | | 1,859,295 | |
Cisco Systems, Inc. | | | 51,231 | | | | 2,219,839 | |
Citrix Systems, Inc. | | | 8,722 | | | | 893,656 | |
Corning, Inc. | | | 53,036 | | | | 1,602,218 | |
DXC Technology Co. | | | 18,829 | | | | 1,001,138 | |
Lam Research Corp. | | | 6,568 | | | | 894,365 | |
Micron Technology, Inc.* | | | 23,448 | | | | 744,005 | |
Microsoft Corp. | | | 51,193 | | | | 5,199,673 | |
Texas Instruments, Inc. | | | 10,744 | | | | 1,015,308 | |
Total System Svcs., Inc. | | | 13,074 | | | | 1,062,786 | |
Visa, Inc. Cl A | | | 12,194 | | | | 1,608,876 | |
| | | | | | | | |
| | | | | | | 23,429,811 | |
| | | | | | | | |
MATERIALS (1.8%) | | | | | | | | |
Eastman Chemical Co. | | | 11,503 | | | | 840,984 | |
LyondellBasell Industries NV Cl A | | | 13,463 | | | | 1,119,583 | |
Nucor Corp. | | | 10,135 | | | | 525,094 | |
WestRock Co. | | | 17,047 | | | | 643,695 | |
| | | | | | | | |
| | | | | | | 3,129,356 | |
| | | | | | | | |
REAL ESTATE (2.1%) | | | | | | | | |
American Tower Corp. | | | 11,010 | | | | 1,741,672 | |
Equinix, Inc. | | | 1,732 | | | | 610,634 | |
Simon Property Group, Inc. | | | 7,788 | | | | 1,308,306 | |
| | | | | | | | |
| | | | | | | 3,660,612 | |
| | | | | | | | |
UTILITIES (1.6%) | | | | | | | | |
NextEra Energy, Inc. | | | 8,998 | | | | 1,564,033 | |
Sempra Energy | | | 11,475 | | | | 1,241,480 | |
| | | | | | | | |
| | | | | | | 2,805,513 | |
| | | | | | | | |
TOTAL COMMON STOCKS | | | | | | | | |
(Cost: $86,762,789) 55.8% | | | | | | | 96,093,743 | |
| | | | | | | | |
The accompanying notes are an integral part of these portfolio schedules.
81
MUTUAL OF AMERICA INVESTMENT CORPORATION — COMPOSITE FUND
PORTFOLIO OF INVESTMENTS IN SECURITIES (Continued)
December 31, 2018
| | | | | | | | | | | | | | | | | | | | |
| | | Rating** | | | Rate(%) | | | Maturity | | | Face Amount | | | Value | |
| | | | | | | | | | | | | | | | | | | | |
| LONG-TERM DEBT SECURITIES: | | | | | | | | | | | | | | | | | | | | |
U.S. GOVERNMENT (16.2%) | | | | | | | | | | | | | | | | | | | | |
U.S. Treasury Note | | | AA+ | | | | 1.50 | | | | 02/28/23 | | | $ | 500,000 | | | $ | 480,386 | |
U.S. Treasury Note | | | AA+ | | | | 1.63 | | | | 02/15/26 | | | | 750,000 | | | | 702,450 | |
U.S. Treasury Note | | | AA+ | | | | 2.00 | | | | 02/15/25 | | | | 500,000 | | | | 483,727 | |
U.S. Treasury Note | | | AA+ | | | | 2.00 | | | | 11/15/26 | | | | 800,000 | | | | 764,204 | |
U.S. Treasury Note | | | AA+ | | | | 2.13 | | | | 05/15/25 | | | | 750,000 | | | | 730,022 | |
U.S. Treasury Note | | | AA+ | | | | 2.25 | | | | 02/15/27 | | | | 1,650,000 | | | | 1,603,372 | |
U.S. Treasury Note | | | AA+ | | | | 2.25 | | | | 08/15/27 | | | | 2,250,000 | | | | 2,179,146 | |
U.S. Treasury Note | | | AA+ | | | | 2.25 | | | | 11/15/27 | | | | 2,150,000 | | | | 2,078,439 | |
U.S. Treasury Note | | | AA+ | | | | 2.38 | | | | 05/15/27 | | | | 1,850,000 | | | | 1,812,625 | |
U.S. Treasury Note | | | AA+ | | | | 2.75 | | | | 05/31/23 | | | | 1,000,000 | | | | 1,010,902 | |
U.S. Treasury Note | | | AA+ | | | | 2.88 | | | | 05/15/28 | | | | 7,250,000 | | | | 7,366,595 | |
U.S. Treasury Strip | | | AA+ | | | | 0.00 | | | | 08/15/28 | | | | 6,000,000 | | | | 4,589,471 | |
U.S. Treasury Strip | | | AA+ | | | | 0.00 | | | | 08/15/29 | | | | 5,500,000 | | | | 4,078,337 | |
| | | | | | | | | | | | | | | | | | | | |
| | | | | | | | | | | | | | | | | | | 27,879,676 | |
| | | | | | | | | | | | | | | | | | | | |
U.S. GOVERNMENT AGENCIES (12.5%) | | | | | | | | | | | | | | | | | | | | |
MORTGAGE-BACKED OBLIGATIONS (12.2%) | | | | | | | | | | | | | | | | | | | | |
FHLMC | | | AA+ | | | | 2.50 | | | | 09/01/27 | | | | 194,938 | | | | 192,649 | |
FHLMC | | | AA+ | | | | 2.62 | | | | 01/25/23 | | | | 50,000 | | | | 49,263 | |
FHLMC | | | AA+ | | | | 3.00 | | | | 06/01/27 | | | | 117,687 | | | | 118,081 | |
FHLMC | | | AA+ | | | | 3.00 | | | | 08/01/27 | | | | 122,658 | | | | 122,886 | |
FHLMC | | | AA+ | | | | 3.00 | | | | 02/01/32 | | | | 296,240 | | | | 295,181 | |
FHLMC | | | AA+ | | | | 3.00 | | | | 10/15/37 | | | | 165,360 | | | | 165,070 | |
FHLMC | | | AA+ | | | | 3.00 | | | | 11/01/42 | | | | 185,741 | | | | 182,472 | |
FHLMC | | | AA+ | | | | 3.00 | | | | 04/01/43 | | | | 233,760 | | | | 229,826 | |
FHLMC | | | AA+ | | | | 3.50 | | | | 02/01/32 | | | | 130,463 | | | | 132,871 | |
FHLMC | | | AA+ | | | | 3.50 | | | | 01/01/43 | | | | 230,339 | | | | 231,822 | |
FHLMC | | | AA+ | | | | 3.50 | | | | 06/01/45 | | | | 316,337 | | | | 317,492 | |
FHLMC | | | AA+ | | | | 3.50 | | | | 07/01/45 | | | | 340,578 | | | | 342,218 | |
FHLMC | | | AA+ | | | | 4.00 | | | | 02/01/25 | | | | 21,781 | | | | 22,340 | |
FHLMC | | | AA+ | | | | 4.00 | | | | 11/01/33 | | | | 245,865 | | | | 251,704 | |
FHLMC | | | AA+ | | | | 4.00 | | | | 01/01/38 | | | | 186,934 | | | | 193,258 | |
FHLMC | | | AA+ | | | | 4.00 | | | | 03/01/41 | | | | 110,627 | | | | 113,826 | |
FHLMC | | | AA+ | | | | 4.00 | | | | 07/01/41 | | | | 150,374 | | | | 154,725 | |
FHLMC | | | AA+ | | | | 4.00 | | | | 11/01/42 | | | | 107,171 | | | | 110,139 | |
FHLMC | | | AA+ | | | | 4.00 | | | | 01/01/43 | | | | 178,536 | | | | 183,813 | |
FHLMC | | | AA+ | | | | 4.00 | | | | 01/01/44 | | | | 195,288 | | | | 200,697 | |
FHLMC | | | AA+ | | | | 4.00 | | | | 10/01/44 | | | | 156,282 | | | | 159,740 | |
FHLMC | | | AA+ | | | | 4.00 | | | | 06/01/45 | | | | 296,867 | | | | 304,368 | |
FHLMC | | | AA+ | | | | 4.00 | | | | 05/01/47 | | | | 356,662 | | | | 363,922 | |
FHLMC | | | AA+ | | | | 4.50 | | | | 08/01/34 | | | | 22,632 | | | | 23,539 | |
FHLMC | | | AA+ | | | | 4.50 | | | | 08/15/35 | | | | 21,028 | | | | 21,310 | |
FHLMC | | | AA+ | | | | 4.50 | | | | 02/01/44 | | | | 138,448 | | | | 143,499 | |
FHLMC | | | AA+ | | | | 4.50 | | | | 05/01/48 | | | | 479,886 | | �� | | 497,093 | |
FHLMC | | | AA+ | | | | 5.00 | | | | 02/01/26 | | | | 13,232 | | | | 13,849 | |
FHLMC | | | AA+ | | | | 5.00 | | | | 10/01/40 | | | | 147,898 | | | | 155,444 | |
FHLMC | | | AA+ | | | | 5.50 | | | | 07/01/32 | | | | 26,674 | | | | 28,543 | |
FHLMC | | | AA+ | | | | 5.50 | | | | 05/01/33 | | | | 28,897 | | | | 30,576 | |
FHLMC | | | AA+ | | | | 5.50 | | | | 06/01/37 | | | | 94,575 | | | | 102,131 | |
FHLMC | | | AA+ | | | | 6.00 | | | | 03/15/32 | | | | 26,712 | | | | 29,185 | |
FHLMC ARM | | | AA+ | | | | 3.70 | | | | 02/01/36 | | | | 27,108 | | | | 28,441 | |
FHLMC ARM | | | AA+ | | | | 3.90 | | | | 03/01/37 | | | | 3,650 | | | | 3,805 | |
FHLMC ARM | | | AA+ | | | | 4.14 | | | | 04/01/37 | | | | 19,614 | | | | 20,512 | |
FHLMC ARM | | | AA+ | | | | 4.18 | | | | 05/01/37 | | | | 20,278 | | | | 21,092 | |
FHLMC Strip | | | AA+ | | | | 3.00 | | | | 01/15/43 | | | | 248,722 | | | | 247,791 | |
FNMA | | | AA+ | | | | 2.68 | | | | 12/01/26 | | | | 300,000 | | | | 291,193 | |
FNMA | | | AA+ | | | | 2.92 | | | | 07/01/27 | | | | 292,483 | | | | 288,582 | |
The accompanying notes are an integral part of these portfolio schedules.
82
MUTUAL OF AMERICA INVESTMENT CORPORATION — COMPOSITE FUND
PORTFOLIO OF INVESTMENTS IN SECURITIES (Continued)
December 31, 2018
| | | | | | | | | | | | | | | | | | | | |
| | | Rating** | | | Rate(%) | | | Maturity | | | Face Amount | | | Value | |
| | | | | | | | | | | | | | | | | | | | |
| LONG-TERM DEBT SECURITIES (CONTINUED): | | | | | | | | | | | | | | | | | | | | |
U.S. GOVERNMENT AGENCIES (CONTINUED) | | | | | | | | | | | | | | | | | | | | |
MORTGAGE-BACKED OBLIGATIONS (CONTINUED) | | | | | | | | | | | | | | | | | | | | |
FNMA | | | AA+ | | | | 3.00 | | | | 06/01/33 | | | $ | 241,787 | | | $ | 240,800 | |
FNMA | | | AA+ | | | | 3.00 | | | | 09/01/33 | | | | 211,352 | | | | 210,489 | |
FNMA | | | AA+ | | | | 3.00 | | | | 12/01/42 | | | | 262,460 | | | | 255,037 | |
FNMA | | | AA+ | | | | 3.00 | | | | 01/01/43 | | | | 553,880 | | | | 545,544 | |
FNMA | | | AA+ | | | | 3.00 | | | | 02/01/43 | | | | 156,817 | | | | 154,330 | |
FNMA | | | AA+ | | | | 3.00 | | | | 03/01/43 | | | | 302,940 | | | | 298,136 | |
FNMA | | | AA+ | | | | 3.00 | | | | 04/01/43 | | | | 264,386 | | | | 256,914 | |
FNMA | | | AA+ | | | | 3.00 | | | | 09/01/43 | | | | 301,389 | | | | 296,491 | |
FNMA | | | AA+ | | | | 3.50 | | | | 03/25/28 | | | | 238,733 | | | | 242,415 | |
FNMA | | | AA+ | | | | 3.50 | | | | 08/01/38 | | | | 197,475 | | | | 198,669 | |
FNMA | | | AA+ | | | | 3.50 | | | | 10/01/41 | | | | 120,560 | | | | 121,261 | |
FNMA | | | AA+ | | | | 3.50 | | | | 11/01/41 | | | | 224,394 | | | | 226,207 | |
FNMA | | | AA+ | | | | 3.50 | | | | 12/01/41 | | | | 217,444 | | | | 218,718 | |
FNMA | | | AA+ | | | | 3.50 | | | | 04/01/42 | | | | 351,241 | | | | 354,092 | |
FNMA | | | AA+ | | | | 3.50 | | | | 04/01/42 | | | | 234,100 | | | | 235,483 | |
FNMA | | | AA+ | | | | 3.50 | | | | 08/01/42 | | | | 170,220 | | | | 171,602 | |
FNMA | | | AA+ | | | | 3.50 | | | | 10/01/42 | | | | 178,546 | | | | 179,996 | |
FNMA | | | AA+ | | | | 3.50 | | | | 11/25/42 | | | | 476,068 | | | | 481,496 | |
FNMA | | | AA+ | | | | 3.50 | | | | 08/01/43 | | | | 381,256 | | | | 384,107 | |
FNMA | | | AA+ | | | | 3.50 | | | | 08/01/43 | | | | 316,986 | | | | 318,965 | |
FNMA | | | AA+ | | | | 3.50 | | | | 01/01/44 | | | | 81,076 | | | | 80,604 | |
FNMA | | | AA+ | | | | 3.50 | | | | 08/25/44 | | | | 93,875 | | | | 95,161 | |
FNMA | | | AA+ | | | | 3.50 | | | | 04/01/45 | | | | 270,415 | | | | 271,521 | |
FNMA | | | AA+ | | | | 3.50 | | | | 11/01/46 | | | | 369,005 | | | | 370,110 | |
FNMA | | | AA+ | | | | 3.50 | | | | 09/01/47 | | | | 174,743 | | | | 175,314 | |
FNMA | | | AA+ | | | | 3.50 | | | | 08/01/48 | | | | 477,900 | | | | 478,100 | |
FNMA | | | AA+ | | | | 3.53 | | | | 01/01/26 | | | | 200,000 | | | | 205,400 | |
FNMA | | | AA+ | | | | 4.00 | | | | 05/01/19 | | | | 1,424 | | | | 1,457 | |
FNMA | | | AA+ | | | | 4.00 | | | | 07/25/26 | | | | 319,753 | | | | 334,887 | |
FNMA | | | AA+ | | | | 4.00 | | | | 01/01/31 | | | | 130,445 | | | | 134,000 | |
FNMA | | | AA+ | | | | 4.00 | | | | 07/01/40 | | | | 217,543 | | | | 223,727 | |
FNMA | | | AA+ | | | | 4.00 | | | | 11/01/40 | | | | 126,359 | | | | 129,971 | |
FNMA | | | AA+ | | | | 4.00 | | | | 05/01/41 | | | | 115,238 | | | | 117,412 | |
FNMA | | | AA+ | | | | 4.00 | | | | 11/01/45 | | | | 288,967 | | | | 297,310 | |
FNMA | | | AA+ | | | | 4.00 | | | | 02/01/47 | | | | 227,811 | | | | 232,970 | |
FNMA | | | AA+ | | | | 4.00 | | | | 05/01/48 | | | | 587,569 | | | | 599,273 | |
FNMA | | | AA+ | | | | 4.00 | | | | 07/01/56 | | | | 629,108 | | | | 642,026 | |
FNMA | | | AA+ | | | | 4.50 | | | | 05/01/30 | | | | 41,748 | | | | 43,664 | |
FNMA | | | AA+ | | | | 4.50 | | | | 04/01/31 | | | | 55,821 | | | | 58,385 | |
FNMA | | | AA+ | | | | 4.50 | | | | 08/01/33 | | | | 25,406 | | | | 26,439 | |
FNMA | | | AA+ | | | | 4.50 | | | | 09/01/33 | | | | 51,658 | | | | 53,769 | |
FNMA | | | AA+ | | | | 4.50 | | | | 06/01/34 | | | | 45,465 | | | | 47,267 | |
FNMA | | | AA+ | | | | 4.50 | | | | 08/01/35 | | | | 29,093 | | | | 30,297 | |
FNMA | | | AA+ | | | | 4.50 | | | | 12/01/35 | | | | 28,988 | | | | 30,190 | |
FNMA | | | AA+ | | | | 4.50 | | | | 05/01/39 | | | | 50,971 | | | | 53,394 | |
FNMA | | | AA+ | | | | 4.50 | | | | 05/01/39 | | | | 80,438 | | | | 84,247 | |
FNMA | | | AA+ | | | | 4.50 | | | | 05/01/40 | | | | 100,978 | | | | 106,124 | |
FNMA | | | AA+ | | | | 4.50 | | | | 10/01/40 | | | | 442,802 | | | | 464,029 | |
FNMA | | | AA+ | | | | 4.50 | | | | 11/01/47 | | | | 236,686 | | | | 245,389 | |
FNMA | | | AA+ | | | | 4.50 | | | | 11/01/47 | | | | 113,534 | | | | 118,332 | |
FNMA | | | AA+ | | | | 5.00 | | | | 06/01/33 | | | | 49,442 | | | | 52,512 | |
FNMA | | | AA+ | | | | 5.00 | | | | 10/01/33 | | | | 51,944 | | | | 55,252 | |
FNMA | | | AA+ | | | | 5.00 | | | | 11/01/33 | | | | 146,070 | | | | 155,161 | |
FNMA | | | AA+ | | | | 5.00 | | | | 11/01/33 | | | | 33,176 | | | | 35,347 | |
FNMA | | | AA+ | | | | 5.00 | | | | 03/01/34 | | | | 17,125 | | | | 18,189 | |
FNMA | | | AA+ | | | | 5.00 | | | | 04/01/34 | | | | 24,266 | | | | 25,580 | |
The accompanying notes are an integral part of these portfolio schedules.
83
MUTUAL OF AMERICA INVESTMENT CORPORATION — COMPOSITE FUND
PORTFOLIO OF INVESTMENTS IN SECURITIES (Continued)
December 31, 2018
| | | | | | | | | | | | | | | | | | | | |
| | | Rating** | | | Rate(%) | | | Maturity | | | Face Amount | | | Value | |
| | | | | | | | | | | | | | | | | | | | |
| LONG-TERM DEBT SECURITIES (CONTINUED): | | | | | | | | | | | | | | | | | | | | |
U.S. GOVERNMENT AGENCIES (CONTINUED) | | | | | | | | | | | | | | | | | | | | |
MORTGAGE-BACKED OBLIGATIONS (CONTINUED) | | | | | | | | | | | | | | | | | | | | |
FNMA | | | AA+ | | | | 5.00 | | | | 09/01/35 | | | $ | 17,826 | | | $ | 18,926 | |
FNMA | | | AA+ | | | | 5.00 | | | | 11/25/35 | | | | 66,754 | | | | 71,997 | |
FNMA | | | AA+ | | | | 5.00 | | | | 08/01/37 | | | | 143,214 | | | | 152,013 | |
FNMA | | | AA+ | | | | 5.00 | | | | 05/01/39 | | | | 59,186 | | | | 63,144 | |
FNMA | | | AA+ | | | | 5.00 | | | | 06/01/40 | | | | 32,123 | | | | 34,102 | |
FNMA | | | AA+ | | | | 5.50 | | | | 03/01/34 | | | | 8,179 | | | | 8,659 | |
FNMA | | | AA+ | | | | 5.50 | | | | 05/01/34 | | | | 105,523 | | | | 113,631 | |
FNMA | | | AA+ | | | | 5.50 | | | | 07/01/34 | | | | 33,938 | | | | 36,286 | |
FNMA | | | AA+ | | | | 5.50 | | | | 09/01/34 | | | | 15,111 | | | | 16,251 | |
FNMA | | | AA+ | | | | 5.50 | | | | 09/01/34 | | | | 47,203 | | | | 50,530 | |
FNMA | | | AA+ | | | | 5.50 | | | | 10/01/34 | | | | 19,962 | | | | 21,486 | |
FNMA | | | AA+ | | | | 5.50 | | | | 02/01/35 | | | | 35,272 | | | | 37,845 | |
FNMA | | | AA+ | | | | 5.50 | | | | 02/01/35 | | | | 28,456 | | | | 30,634 | |
FNMA | | | AA+ | | | | 5.50 | | | | 08/01/35 | | | | 11,839 | | | | 12,673 | |
FNMA | | | AA+ | | | | 5.50 | | | | 08/01/37 | | | | 6,846 | | | | 7,367 | |
FNMA | | | AA+ | | | | 5.50 | | | | 11/01/38 | | | | 4,522 | | | | 4,767 | |
FNMA | | | AA+ | | | | 5.50 | | | | 06/01/48 | | | | 12,134 | | | | 12,463 | |
FNMA | | | AA+ | | | | 6.00 | | | | 05/01/23 | | | | 11,288 | | | | 12,115 | |
FNMA | | | AA+ | | | | 6.00 | | | | 04/01/32 | | | | 1,747 | | | | 1,875 | |
FNMA | | | AA+ | | | | 6.00 | | | | 05/01/32 | | | | 10,196 | | | | 11,124 | |
FNMA | | | AA+ | | | | 6.00 | | | | 04/01/33 | | | | 56,916 | | | | 61,134 | |
FNMA | | | AA+ | | | | 6.00 | | | | 05/01/33 | | | | 31,170 | | | | 33,454 | |
FNMA | | | AA+ | | | | 6.00 | | | | 06/01/34 | | | | 14,188 | | | | 15,321 | |
FNMA | | | AA+ | | | | 6.00 | | | | 09/01/34 | | | | 9,788 | | | | 10,513 | |
FNMA | | | AA+ | | | | 6.00 | | | | 10/01/34 | | | | 24,139 | | | | 25,939 | |
FNMA | | | AA+ | | | | 6.00 | | | | 12/01/36 | | | | 24,909 | | | | 27,117 | |
FNMA | | | AA+ | | | | 6.00 | | | | 01/01/37 | | | | 26,910 | | | | 29,361 | |
FNMA | | | AA+ | | | | 6.00 | | | | 04/01/37 | | | | 4,595 | | | | 4,808 | |
FNMA | | | AA+ | | | | 6.00 | | | | 05/01/37 | | | | 4,597 | | | | 4,827 | |
FNMA | | | AA+ | | | | 6.00 | | | | 06/01/37 | | | | 1,710 | | | | 1,757 | |
FNMA | | | AA+ | | | | 6.00 | | | | 10/25/44 | | | | 79,579 | | | | 88,125 | |
FNMA | | | AA+ | | | | 6.00 | | | | 02/25/47 | | | | 69,186 | | | | 76,941 | |
FNMA | | | AA+ | | | | 6.00 | | | | 12/25/49 | | | | 33,078 | | | | 36,754 | |
FNMA | | | AA+ | | | | 6.50 | | | | 05/01/32 | | | | 22,671 | | | | 24,332 | |
FNMA | | | AA+ | | | | 6.50 | | | | 05/01/32 | | | | 4,237 | | | | 4,547 | |
FNMA | | | AA+ | | | | 6.50 | | | | 07/01/32 | | | | 3,647 | | | | 3,914 | |
FNMA | | | AA+ | | | | 6.50 | | | | 07/01/34 | | | | 16,296 | | | | 17,737 | |
FNMA | | | AA+ | | | | 6.50 | | | | 05/01/37 | | | | 19,218 | | | | 19,873 | |
FNMA | | | AA+ | | | | 6.50 | | | | 09/01/37 | | | | 6,922 | | | | 7,430 | |
FNMA | | | AA+ | | | | 7.00 | | | | 04/01/32 | | | | 3,768 | | | | 4,178 | |
FNMA | | | AA+ | | | | 7.50 | | | | 06/01/31 | | | | 4,132 | | | | 4,623 | |
FNMA | | | AA+ | | | | 7.50 | | | | 02/01/32 | | | | 4,184 | | | | 4,764 | |
FNMA | | | AA+ | | | | 7.50 | | | | 06/01/32 | | | | 3,205 | | | | 3,737 | |
FNMA | | | AA+ | | | | 8.00 | | | | 04/01/32 | | | | 1,451 | | | | 1,512 | |
FNMA Strip | | | AA+ | | | | 3.00 | | | | 08/25/42 | | | | 193,776 | | | | 190,441 | |
FRESB Multifamily Mortgage | | | AA+ | | | | 3.16 | | | | 11/25/27 | | | | 198,810 | | | | 195,548 | |
FRESB Multifamily Mortgage | | | AA+ | | | | 3.30 | | | | 12/25/27 | | | | 99,406 | | | | 98,547 | |
GNMA (3) | | | AA+ | | | | 3.50 | | | | 05/20/31 | | | | 96,413 | | | | 98,898 | |
GNMA (3) | | | AA+ | | | | 4.00 | | | | 08/15/41 | | | | 144,244 | | | | 148,633 | |
GNMA (3) | | | AA+ | | | | 4.00 | | | | 01/15/42 | | | | 209,492 | | | | 215,906 | |
GNMA (3) | | | AA+ | | | | 4.00 | | | | 08/20/42 | | | | 134,660 | | | | 138,256 | |
GNMA (3) | | | AA+ | | | | 4.50 | | | | 04/20/31 | | | | 72,399 | | | | 75,723 | |
GNMA (3) | | | AA+ | | | | 4.50 | | | | 10/15/40 | | | | 133,311 | | | | 140,787 | |
GNMA (3) | | | AA+ | | | | 4.50 | | | | 10/20/43 | | | | 267,760 | | | | 279,352 | |
GNMA (3) | | | AA+ | | | | 5.00 | | | | 04/15/39 | | | | 106,938 | | | | 113,982 | |
The accompanying notes are an integral part of these portfolio schedules.
84
MUTUAL OF AMERICA INVESTMENT CORPORATION — COMPOSITE FUND
PORTFOLIO OF INVESTMENTS IN SECURITIES (Continued)
December 31, 2018
| | | | | | | | | | | | | | | | | | | | |
| | | Rating** | | | Rate(%) | | | Maturity | | | Face Amount | | | Value | |
| | | | | | | | | | | | | | | | | | | | |
| LONG-TERM DEBT SECURITIES (CONTINUED): | | | | | | | | | | | | | | | | | | | | |
U.S. GOVERNMENT AGENCIES (CONTINUED) | | | | | | | | | | | | | | | | | | | | |
MORTGAGE-BACKED OBLIGATIONS (CONTINUED) | | | | | | | | | | | | | | | | | | | | |
GNMA (3) | | | AA+ | | | | 5.00 | | | | 06/20/39 | | | $ | 120,418 | | | $ | 127,847 | |
GNMA (3) | | | AA+ | | | | 5.00 | | | | 11/15/39 | | | | 59,506 | | | | 63,072 | |
GNMA (3) | | | AA+ | | | | 6.50 | | | | 04/15/31 | | | | 1,791 | | | | 1,928 | |
GNMA (3) | | | AA+ | | | | 6.50 | | | | 10/15/31 | | | | 2,291 | | | | 2,596 | |
GNMA (3) | | | AA+ | | | | 6.50 | | | | 12/15/31 | | | | 1,363 | | | | 1,467 | |
GNMA (3) | | | AA+ | | | | 6.50 | | | | 05/15/32 | | | | 6,529 | | | | 7,030 | |
GNMA (3) | | | AA+ | | | | 7.00 | | | | 05/15/31 | | | | 2,224 | | | | 2,522 | |
GNMA (3) | | | AA+ | | | | 7.00 | | | | 05/15/32 | | | | 649 | | | | 660 | |
Vendee Mortgage Trust (3) | | | AA+ | | | | 5.25 | | | | 01/15/32 | | | | 88,680 | | | | 90,773 | |
| | | | | | | | | | | | | | | | | | | | |
| | | | | | | | | | | | | | | | | | | 21,093,064 | |
| | | | | | | | | | | | | | | | | | | | |
NON-MORTGAGE-BACKED OBLIGATIONS (0.3%) | | | | | | | | | | | | | | | | | | | | |
FHLMC | | | AA+ | | | | 0.00 | | | | 11/29/19 | | | | 500,000 | | | | 487,039 | |
| | | | | | | | | | | | | | | | | | | | |
CORPORATE DEBT (13.4%) | | | | | | | | | | | | | | | | | | | | |
COMMUNICATION SERVICES (0.6%) | | | | | | | | | | | | | | | | | | | | |
AT&T, Inc. | | | BBB | | | | 3.00 | | | | 06/30/22 | | | | 350,000 | | | | 341,321 | |
Omnicom Group, Inc. | | | BBB+ | | | | 3.63 | | | | 05/01/22 | | | | 100,000 | | | | 98,612 | |
Omnicom Group, Inc. | | | BBB+ | | | | 4.45 | | | | 08/15/20 | | | | 250,000 | | | | 254,226 | |
Viacom, Inc. | | | BBB- | | | | 3.25 | | | | 03/15/23 | | | | 350,000 | | | | 336,708 | |
| | | | | | | | | | | | | | | | | | | | |
| | | | | | | | | | | | | | | | | | | 1,030,867 | |
| | | | | | | | | | | | | | | | | | | | |
CONSUMER DISCRETIONARY (2.9%) | | | | | | | | | | | | | | | | | | | | |
Advance Auto Parts, Inc. | | | BBB- | | | | 4.50 | | | | 12/01/23 | | | | 100,000 | | | | 102,344 | |
Advance Auto Parts, Inc. | | | BBB- | | | | 5.75 | | | | 05/01/20 | | | | 270,000 | | | | 276,501 | |
Amazon.com, Inc. | | | AA- | | | | 5.20 | | | | 12/03/25 | | | | 300,000 | | | | 329,693 | |
AutoZone, Inc. | | | BBB | | | | 4.00 | | | | 11/15/20 | | | | 250,000 | | | | 251,896 | |
Dollar General Corp. | | | BBB | | | | 3.25 | | | | 04/15/23 | | | | 300,000 | | | | 293,297 | |
eBay, Inc. | | | BBB+ | | | | 2.88 | | | | 08/01/21 | | | | 325,000 | | | | 320,452 | |
Expedia Group, Inc. | | | BBB | | | | 5.95 | | | | 08/15/20 | | | | 250,000 | | | | 258,254 | |
Family Dollar Stores, Inc. | | | BBB- | | | | 5.00 | | | | 02/01/21 | | | | 300,000 | | | | 305,250 | |
Harman International Industries, Inc. | | | BBB+ | | | | 4.15 | | | | 05/15/25 | | | | 300,000 | | | | 300,734 | |
Kohl’s Corp. | | | BBB- | | | | 3.25 | | | | 02/01/23 | | | | 250,000 | | | | 244,517 | |
Kohl’s Corp. | | | BBB- | | | | 4.00 | | | | 11/01/21 | | | | 100,000 | | | | 103,046 | |
Lowe’s Cos., Inc. | | | BBB+ | | | | 3.12 | | | | 04/15/22 | | | | 300,000 | | | | 294,823 | |
Macy’s Retail Hldgs., Inc. | | | BBB- | | | | 2.88 | | | | 02/15/23 | | | | 216,000 | | | | 199,987 | |
Marriott International, Inc. | | | BBB | | | | 3.13 | | | | 10/15/21 | | | | 25,000 | | | | 24,800 | |
Marriott International, Inc. | | | BBB | | | | 3.25 | | | | 09/15/22 | | | | 350,000 | | | | 342,744 | |
Mattel, Inc. | | | B+ | | | | 3.15 | | | | 03/15/23 | | | | 350,000 | | | | 287,000 | |
NVR, Inc. | | | BBB+ | | | | 3.95 | | | | 09/15/22 | | | | 300,000 | | | | 294,951 | |
O’Reilly Automotive, Inc. | | | BBB | | | | 3.80 | | | | 09/01/22 | | | | 300,000 | | | | 303,215 | |
Tapestry, Inc. | | | BBB- | | | | 4.25 | | | | 04/01/25 | | | | 100,000 | | | | 97,461 | |
Tupperware Brands Corp. | | | BBB- | | | | 4.75 | | | | 06/01/21 | | | | 350,000 | | | | 358,561 | |
| | | | | | | | | | | | | | | | | | | | |
| | | | | | | | | | | | | | | | | | | 4,989,526 | |
| | | | | | | | | | | | | | | | | | | | |
CONSUMER STAPLES (0.8%) | | | | | | | | | | | | | | | | | | | | |
Edgewell Personal Care Co. | | | BB | | | | 4.70 | | | | 05/19/21 | | | | 275,000 | | | | 270,875 | |
Ingredion, Inc. | | | BBB | | | | 4.63 | | | | 11/01/20 | | | | 250,000 | | | | 254,425 | |
Molson Coors Brewing Co. | | | BBB- | | | | 3.50 | | | | 05/01/22 | | | | 400,000 | | | | 397,587 | |
Sysco Corp. | | | BBB+ | | | | 2.60 | | | | 06/12/22 | | | | 300,000 | | | | 289,283 | |
Sysco Corp. | | | BBB+ | | | | 3.75 | | | | 10/01/25 | | | | 100,000 | | | | 97,557 | |
| | | | | | | | | | | | | | | | | | | | |
| | | | | | | | | | | | | | | | | | | 1,309,727 | |
| | | | | | | | | | | | | | | | | | | | |
ENERGY (0.8%) | | | | | | | | | | | | | | | | | | | | |
Cameron International Corp. | | | AA- | | | | 4.50 | | | | 06/01/21 | | | | 300,000 | | | | 303,592 | |
Energen Corp. | | | NR | | | | 4.63 | | | | 09/01/21 | | | | 250,000 | | | | 247,500 | |
EQT Corp. | | | BBB | | | | 4.88 | | | | 11/15/21 | | | | 210,000 | | | | 214,005 | |
Marathon Oil Corp. | | | BBB- | | | | 2.80 | | | | 11/01/22 | | | | 350,000 | | | | 328,715 | |
Rowan Cos., Inc. | | | B- | | | | 4.88 | | | | 06/01/22 | | | | 300,000 | | | | 247,500 | |
| | | | | | | | | | | | | | | | | | | | |
| | | | | | | | | | | | | | | | | | | 1,341,312 | |
| | | | | | | | | | | | | | | | | | | | |
The accompanying notes are an integral part of these portfolio schedules.
85
MUTUAL OF AMERICA INVESTMENT CORPORATION — COMPOSITE FUND
PORTFOLIO OF INVESTMENTS IN SECURITIES (Continued)
December 31, 2018
| | | | | | | | | | | | | | | | | | | | |
| | | Rating** | | | Rate(%) | | | Maturity | | | Face Amount | | | Value | |
| | | | | | | | | | | | | | | | | | | | |
| LONG-TERM DEBT SECURITIES (CONTINUED): | | | | | | | | | | | | | | | | | | | | |
CORPORATE DEBT (CONTINUED) | | | | | | | | | | | | | | | | | | | | |
FINANCIALS (3.0%) | | | | | | | | | | | | | | | | | | | | |
Aflac, Inc. | | | A- | | | | 4.00 | | | | 02/15/22 | | | $ | 300,000 | | | $ | 306,122 | |
Alleghany Corp. | | | BBB+ | | | | 5.63 | | | | 09/15/20 | | | | 300,000 | | | | 310,148 | |
American Express Co. | | | BBB | | | | 3.63 | | | | 12/05/24 | | | | 250,000 | | | | 244,375 | |
Bank of America Corp. | | | BBB+ | | | | 3.95 | | | | 04/21/25 | | | | 300,000 | | | | 290,806 | |
Block Financial LLC | | | BBB | | | | 5.25 | | | | 10/01/25 | | | | 350,000 | | | | 354,604 | |
Capital One Financial Corp. | | | BBB | | | | 4.75 | | | | 07/15/21 | | | | 300,000 | | | | 307,786 | |
Citizens Financial Group, Inc. | | | BBB | | | | 3.75 | | | | 07/01/24 | | | | 250,000 | | | | 243,390 | |
Citizens Financial Group, Inc. | | | BBB | | | | 4.35 | | | | 08/01/25 | | | | 100,000 | | | | 98,232 | |
Fairfax U.S., Inc.† | | | BBB- | | | | 4.88 | | | | 08/13/24 | | | | 250,000 | | | | 255,515 | |
Fifth Third Bancorp | | | BBB | | | | 4.30 | | | | 01/16/24 | | | | 300,000 | | | | 303,480 | |
First Republic Bank | | | A- | | | | 2.38 | | | | 06/17/19 | | | | 150,000 | | | | 149,356 | |
First Tennessee Bank | | | BBBu | | | | 2.95 | | | | 12/01/19 | | | | 350,000 | | | | 347,292 | |
Lincoln National Corp. | | | A- | | | | 4.00 | | | | 09/01/23 | | | | 250,000 | | | | 254,840 | |
Moody’s Corp. | | | BBB+ | | | | 4.50 | | | | 09/01/22 | | | | 250,000 | | | | 257,144 | |
Pacific LifeCorp.† | | | A- | | | | 6.00 | | | | 02/10/20 | | | | 23,000 | | | | 23,607 | |
Prudential Financial, Inc. | | | A | | | | 4.50 | | | | 11/16/21 | | | | 250,000 | | | | 258,008 | |
Signet UK Finance PLC | | | BB+ | | | | 4.70 | | | | 06/15/24 | | | | 250,000 | | | | 221,250 | |
Synchrony Financial | | | BBB- | | | | 3.70 | | | | 08/04/26 | | | | 400,000 | | | | 339,466 | |
Unum Group | | | BBB | | | | 4.00 | | | | 03/15/24 | | | | 150,000 | | | | 148,874 | |
Voya Financial, Inc. | | | BBB | | | | 3.65 | | | | 06/15/26 | | | | 250,000 | | | | 236,452 | |
WR Berkley Corp. | | | BBB+ | | | | 7.38 | | | | 09/15/19 | | | | 250,000 | | | | 257,297 | |
| | | | | | | | | | | | | | | | | | | | |
| | | | | | | | | | | | | | | | | | | 5,208,044 | |
| | | | | | | | | | | | | | | | | | | | |
HEALTH CARE (1.5%) | | | | | | | | | | | | | | | | | | | | |
Agilent Technologies, Inc. | | | BBB+ | | | | 5.00 | | | | 07/15/20 | | | | 290,000 | | | | 297,690 | |
Anthem, Inc. | | | A | | | | 4.35 | | | | 08/15/20 | | | | 250,000 | | | | 254,358 | |
Bio-Rad Laboratories, Inc. | | | BBB | | | | 4.88 | | | | 12/15/20 | | | | 200,000 | | | | 205,032 | |
Medco Health Solutions, Inc. | | | A- | | | | 4.13 | | | | 09/15/20 | | | | 250,000 | | | | 252,651 | |
Owens & Minor, Inc. | | | BB | | | | 3.88 | | | | 09/15/21 | | | | 400,000 | | | | 296,000 | |
PerkinElmer, Inc. | | | BBB | | | | 5.00 | | | | 11/15/21 | | | | 300,000 | | | | 309,511 | |
Quest Diagnostics, Inc. | | | BBB+ | | | | 4.70 | | | | 04/01/21 | | | | 150,000 | | | | 154,174 | |
Quest Diagnostics, Inc. | | | BBB+ | | | | 4.75 | | | | 01/30/20 | | | | 250,000 | | | | 253,995 | |
Thermo Fisher Scientific, Inc. | | | BBB+ | | | | 3.60 | | | | 08/15/21 | | | | 375,000 | | | | 376,089 | |
Zimmer Biomet Hldgs., Inc. | | | BBB | | | | 3.15 | | | | 04/01/22 | | | | 250,000 | | | | 244,417 | |
| | | | | | | | | | | | | | | | | | | | |
| | | | | | | | | | | | | | | | | | | 2,643,917 | |
| | | | | | | | | | | | | | | | | | | | |
INDUSTRIALS (0.1%) | | | | | | | | | |
JB Hunt Transport Svsc., Inc. | | | BBB+ | | | | 3.30 | | | | 08/15/22 | | | | 200,000 | | | | 198,364 | |
| | | | | | | | | | | | | | | | | | | | |
INFORMATION TECHNOLOGY (1.1%) | | | | | | | | | | | | | | | | | | | | |
Applied Materials, Inc. | | | A- | | | | 3.90 | | | | 10/01/25 | | | | 350,000 | | | | 352,365 | |
Arrow Electronics, Inc. | | | BBB- | | | | 4.50 | | | | 03/01/23 | | | | 300,000 | | | | 303,810 | |
Fiserv, Inc. | | | BBB | | | | 4.75 | | | | 06/15/21 | | | | 360,000 | | | | 370,785 | |
Ingram Micro, Inc. | | | NR | | | | 5.00 | | | | 08/10/22 | | | | 200,000 | | | | 195,484 | |
Juniper Networks, Inc. | | | BBB | | | | 4.60 | | | | 03/15/21 | | | | 350,000 | | | | 357,683 | |
Symantec Corp. | | | BB+ | | | | 4.20 | | | | 09/15/20 | | | | 350,000 | | | | 346,063 | |
| | | | | | | | | | | | | | | | | | | | |
| | | | | | | | | | | | | | | | | | | 1,926,190 | |
| | | | | | | | | | | | | | | | | | | | |
MATERIALS (1.0%) | | | | | | | | | | | | | | | | | | | | |
Freeport-McMoRan, Inc. | | | BB | | | | 3.55 | | | | 03/01/22 | | | | 300,000 | | | | 283,875 | |
Methanex Corp. | | | BB+ | | | | 3.25 | | | | 12/15/19 | | | | 250,000 | | | | 248,126 | |
Packaging Corp. of America | | | BBB | | | | 3.90 | | | | 06/15/22 | | | | 250,000 | | | | 252,401 | |
Packaging Corp. of America | | | BBB | | | | 4.50 | | | | 11/01/23 | | | | 150,000 | | | | 153,751 | |
Sherwin-Williams Co. | | | BBB | | | | 3.95 | | | | 01/15/26 | | | | 350,000 | | | | 342,383 | |
Southern Copper Corp. | | | BBB+ | | | | 3.50 | | | | 11/08/22 | | | | 100,000 | | | | 97,553 | |
Teck Resources Ltd. | | | BB+ | | | | 4.75 | | | | 01/15/22 | | | | 300,000 | | | | 298,500 | |
| | | | | | | | | | | | | | | | | | | | |
| | | | | | | | | | | | | | | | | | | 1,676,589 | |
| | | | | | | | | | | | | | | | | | | | |
The accompanying notes are an integral part of these portfolio schedules.
86
MUTUAL OF AMERICA INVESTMENT CORPORATION — COMPOSITE FUND
PORTFOLIO OF INVESTMENTS IN SECURITIES (Continued)
December 31, 2018
| | | | | | | | | | | | | | | | | | | | |
| | | Rating** | | | Rate(%) | | | Maturity | | | Face Amount | | | Value | |
| | | | | | | | | | | | | | | | | | | | |
| LONG-TERM DEBT SECURITIES (CONTINUED): | | | | | | | | | | | | | | | | | | | | |
CORPORATE DEBT (CONTINUED) | | | | | | | | | | | | | | | | | | | | |
REAL ESTATE (0.8%) | | | | | | | | | | | | | | | | | | | | |
Government Properties Income Trust | | | BBB- | | | | 3.75 | | | | 08/15/19 | | | $ | 350,000 | | | $ | 350,347 | |
Healthcare Realty Trust, Inc. | | | BBB | | | | 3.75 | | | | 04/15/23 | | | | 250,000 | | | | 246,146 | |
Hospitality Properties Trust | | | BBB- | | | | 5.00 | | | | 08/15/22 | | | | 250,000 | | | | 255,349 | |
National Retail Properties, Inc. | | | BBB+ | | | | 3.80 | | | | 10/15/22 | | | | 250,000 | | | | 251,273 | |
Welltower, Inc. | | | BBB+ | | | | 6.13 | | | | 04/15/20 | | | | 250,000 | | | | 257,854 | |
| | | | | | | | | | | | | | | | | | | | |
| | | | | | | | | | | | | | | | | | | 1,360,969 | |
| | | | | | | | | | | | | | | | | | | | |
UTILITIES (0.8%) | | | | | | | | | | | | | | | | | | | | |
Entergy Corp. | | | BBB | | | | 5.13 | | | | 09/15/20 | | | | 250,000 | | | | 255,114 | |
Exelon Corp. | | | BBB- | | | | 5.15 | | | | 12/01/20 | | | | 340,000 | | | | 347,441 | |
National Fuel Gas Co. | | | BBB | | | | 4.90 | | | | 12/01/21 | | | | 250,000 | | | | 254,572 | |
National Fuel Gas Co. | | | BBB | | | | 5.20 | | | | 07/15/25 | | | | 100,000 | | | | 101,532 | |
SCANA Corp. | | | BBB | | | | 4.13 | | | | 02/01/22 | | | | 300,000 | | | | 300,083 | |
Southern Co. | | | BBB+ | | | | 3.25 | | | | 07/01/26 | | | | 50,000 | | | | 46,862 | |
| | | | | | | | | | | | | | | | | | | | |
| | | | | | | | | | | | | | | | | | | 1,305,604 | |
| | | | | | | | | | | | | | | | | | | | |
TOTAL CORPORATE DEBT | | | | 22,991,109 | |
| | | | | | | | | | | | | | | | | | | | |
TOTAL LONG-TERM DEBT SECURITIES
(Cost: $72,847,616) 42.1% | | | | 72,450,888 | |
| | | | | | | | | | | | | | | | | | | | |
| | | | | |
| | | Rating** | | | Rate(%) | | | Maturity | | | Face Amount | | | Value | |
| SHORT-TERM DEBT SECURITIES: | | | | | | | | | | | | | | | | | | | | |
U.S. GOVERNMENT AGENCIES (1.5%) | | | | | | | | | | | | | | | | | | | | |
FHLB | | | A-1+ | | | | 2.15 | | | | 01/02/19 | | | $ | 2,600,000 | | | $ | 2,599,845 | |
| | | | | | | | | | | | | | | | | | | | |
TOTAL SHORT-TERM DEBT SECURITIES
(Cost: $2,599,845) 1.5% | | | | | | | | | | | | | | | | | | | 2,599,845 | |
| | | | | | | | | | | | | | | | | | | | |
| | | | | |
| | | | | | Rate(%) | | | Maturity | | | Face Amount | | | Value | |
| TEMPORARY CASH INVESTMENT (0.4%) | | | | | | | | | | | | | | | | | | | | |
Citibank, New York Time Deposit | | | | | | | 1.67 | | | | 01/02/19 | | | $ | 593,560 | | | $ | 593,560 | |
| | | | | | | | | | | | | | | | | | | | |
TOTAL TEMPORARY CASH INVESTMENT
(Cost: $593,560) 0.4% | | | | 593,560 | |
| | | | | | | | | | | | | | | | | | | | |
TOTAL INVESTMENTS
(Cost: $162,803,810) 99.8% | | | | 171,738,036 | |
| | | | | | | | | | | | | | | | | | | | |
OTHER NET ASSETS 0.2% | | | | 384,677 | |
| | | | | | | | | | | | | | | | | | | | |
NET ASSETS 100.0% | | | $ | 172,122,713 | |
| | | | | | | | | | | | | | | | | | | | |
The accompanying notes are an integral part of these portfolio schedules.
87
MUTUAL OF AMERICA INVESTMENT CORPORATION — RETIREMENT INCOME FUND
PORTFOLIO OF INVESTMENTS IN SECURITIES
December 31, 2018
| | | | | | | | |
| | | Shares | | | Value | |
| COMMON STOCKS: | | | | | | | | |
DIVERSIFIED MUTUAL FUNDS (100.0%) | | | | | | | | |
Mutual of America Investment Corporation | | | | | | | | |
Bond Fund (30.8%) | | | 22,288,833 | | | $ | 31,350,358 | |
Equity Index Fund (20.6%) | | | 5,530,638 | | | | 20,880,576 | |
Mid-Cap Equity Index Fund (4.8%) | | | 2,499,030 | | | | 4,826,371 | |
Mid-Term Bond Fund (31.0%) | | | 30,647,607 | | | | 31,395,838 | |
Money Market Fund (12.8%) | | | 10,625,002 | | | | 12,978,408 | |
| | | | | | | | |
TOTAL INVESTMENTS
(Cost: $102,865,400) 100.0% | | | | | | | 101,431,551 | |
| | | | | | | | |
OTHER NET ASSETS -0.0% (2) | | | | | | | (1,690 | ) |
| | | | | | | | |
NET ASSETS 100.0% | | | | | | $ | 101,429,861 | |
| | | | | | | | |
The accompanying notes are an integral part of these portfolio schedules.
88
MUTUAL OF AMERICA INVESTMENT CORPORATION — 2010 RETIREMENT FUND
PORTFOLIO OF INVESTMENTS IN SECURITIES
December 31, 2018
| | | | | | | | |
| | | Shares | | | Value | |
| COMMON STOCKS: | | | | | | | | |
DIVERSIFIED MUTUAL FUNDS (100.0%) | | | | | | | | |
Mutual of America Investment Corporation | | | | | | | | |
Bond Fund (29.0%) | | | 4,952,227 | | | $ | 6,965,555 | |
Equity Index Fund (21.6%) | | | 1,369,661 | | | | 5,171,070 | |
International Fund (2.7%) | | | 856,964 | | | | 656,485 | |
Mid-Cap Equity Index Fund (7.0%) | | | 871,720 | | | | 1,683,552 | |
Mid-Term Bond Fund (30.0%) | | | 7,028,067 | | | | 7,199,651 | |
Money Market Fund (9.7%) | | | 1,897,271 | | | | 2,317,511 | |
| | | | | | | | |
TOTAL INVESTMENTS
(Cost: $24,290,216) 100.0% | | | | | | | 23,993,824 | |
| | | | | | | | |
OTHER NET ASSETS -0.0% (2) | | | | | | | (747 | ) |
| | | | | | | | |
NET ASSETS 100.0% | | | | | | $ | 23,993,077 | |
| | | | | | | | |
The accompanying notes are an integral part of these portfolio schedules.
89
MUTUAL OF AMERICA INVESTMENT CORPORATION — 2015 RETIREMENT FUND
PORTFOLIO OF INVESTMENTS IN SECURITIES
December 31, 2018
| | | | | | | | |
| | | Shares | | | Value | |
| COMMON STOCKS: | | | | | | | | |
DIVERSIFIED MUTUAL FUNDS (100.0%) | | | | | | | | |
Mutual of America Investment Corporation | | | | | | | | |
Bond Fund (28.3%) | | | 27,891,932 | | | $ | 39,231,397 | |
Equity Index Fund (27.5%) | | | 10,070,477 | | | | 38,020,450 | |
International Fund (3.6%) | | | 6,588,407 | | | | 5,047,115 | |
Mid-Cap Equity Index Fund (9.4%) | | | 6,721,163 | | | | 12,980,568 | |
Mid-Term Bond Fund (25.2%) | | | 34,039,471 | | | | 34,870,510 | |
Money Market Fund (4.3%) | | | 4,851,117 | | | | 5,925,624 | |
Small Cap Growth Fund (0.9%) | | | 945,592 | | | | 1,193,714 | |
Small Cap Value Fund (0.8%) | | | 875,925 | | | | 1,189,654 | |
| | | | | | | | |
TOTAL INVESTMENTS
(Cost: $137,133,345) 100.0% | | | | | | | 138,459,032 | |
| | | | | | | | |
OTHER NET ASSETS -0.0% (2) | | | | | | | (2,016 | ) |
| | | | | | | | |
NET ASSETS 100.0% | | | | | | $ | 138,457,016 | |
| | | | | | | | |
The accompanying notes are an integral part of these portfolio schedules.
90
MUTUAL OF AMERICA INVESTMENT CORPORATION — 2020 RETIREMENT FUND
PORTFOLIO OF INVESTMENTS IN SECURITIES
December 31, 2018
| | | | | | | | |
| | | Shares | | | Value | |
| COMMON STOCKS: | | | | | | | | |
DIVERSIFIED MUTUAL FUNDS (100.0%) | | | | | | | | |
Mutual of America Investment Corporation | | | | | | | | |
Bond Fund (27.0%) | | | 98,712,871 | | | $ | 138,844,588 | |
Equity Index Fund (31.3%) | | | 42,753,064 | | | | 161,411,500 | |
International Fund (6.3%) | | | 42,659,799 | | | | 32,679,965 | |
Mid-Cap Equity Index Fund (10.3%) | | | 27,434,667 | | | | 52,984,517 | |
Mid-Term Bond Fund (21.2%) | | | 106,430,500 | | | | 109,028,894 | |
Small Cap Growth Fund (2.0%) | | | 8,028,868 | | | | 10,135,635 | |
Small Cap Value Fund (1.9%) | | | 7,441,346 | | | | 10,106,598 | |
| | | | | | | | |
TOTAL INVESTMENTS
(Cost: $511,451,394) 100.0% | | | | | | | 515,191,697 | |
| | | | | | | | |
OTHER NET ASSETS -0.0% (2) | | | | | | | (3,547 | ) |
| | | | | | | | |
NET ASSETS 100.0% | | | | | | $ | 515,188,150 | |
| | | | | | | | |
The accompanying notes are an integral part of these portfolio schedules.
91
MUTUAL OF AMERICA INVESTMENT CORPORATION — 2025 RETIREMENT FUND
PORTFOLIO OF INVESTMENTS IN SECURITIES
December 31, 2018
| | | | | | | | |
| | | Shares | | | Value | |
| COMMON STOCKS: | | | | | | | | |
DIVERSIFIED MUTUAL FUNDS (100.0%) | | | | | | | | |
Mutual of America Investment Corporation | | | | | | | | |
Bond Fund (24.2%) | | | 122,082,089 | | | $ | 171,714,563 | |
Equity Index Fund (34.6%) | | | 65,137,684 | | | | 245,923,223 | |
International Fund (8.4%) | | | 77,838,126 | | | | 59,628,675 | |
Mid-Cap Equity Index Fund (12.4%) | | | 45,757,888 | | | | 88,372,118 | |
Mid-Term Bond Fund (13.0%) | | | 89,936,771 | | | | 92,132,487 | |
Small Cap Growth Fund (3.8%) | | | 21,237,758 | | | | 26,810,524 | |
Small Cap Value Fund (3.6%) | | | 18,599,990 | | | | 25,261,912 | |
| | | | | | | | |
TOTAL INVESTMENTS
(Cost: $705,192,058) 100.0% | | | | | | | 709,843,502 | |
| | | | | | | | |
OTHER NET ASSETS -0.0% (2) | | | | | | | (4,585 | ) |
| | | | | | | | |
NET ASSETS 100.0% | | | | | | $ | 709,838,917 | |
| | | | | | | | |
The accompanying notes are an integral part of these portfolio schedules.
92
MUTUAL OF AMERICA INVESTMENT CORPORATION — 2030 RETIREMENT FUND
PORTFOLIO OF INVESTMENTS IN SECURITIES
December 31, 2018
| | | | | | | | |
| | | Shares | | | Value | |
| COMMON STOCKS: | | | | | | | | |
DIVERSIFIED MUTUAL FUNDS (100.0%) | | | | | | | | |
Mutual of America Investment Corporation | | | | | | | | |
Bond Fund (21.7%) | | | 95,359,013 | | | $ | 134,127,220 | |
Equity Index Fund (37.1%) | | | 60,575,270 | | | | 228,698,115 | |
International Fund (10.5%) | | | 84,753,814 | | | | 64,926,507 | |
Mid-Cap Equity Index Fund (17.3%) | | | 55,156,420 | | | | 106,523,484 | |
Mid-Term Bond Fund (4.2%) | | | 24,970,323 | | | | 25,579,948 | |
Small Cap Growth Fund (4.7%) | | | 23,206,701 | | | | 29,296,116 | |
Small Cap Value Fund (4.5%) | | | 20,588,456 | | | | 27,962,582 | |
| | | | | | | | |
TOTAL INVESTMENTS
(Cost: $612,396,623) 100.0% | | | | | | | 617,113,972 | |
| | | | | | | | |
OTHER NET ASSETS -0.0% (2) | | | | | | | (3,919 | ) |
| | | | | | | | |
NET ASSETS 100.0% | | | | | | $ | 617,110,053 | |
| | | | | | | | |
The accompanying notes are an integral part of these portfolio schedules.
93
MUTUAL OF AMERICA INVESTMENT CORPORATION — 2035 RETIREMENT FUND
PORTFOLIO OF INVESTMENTS IN SECURITIES
December 31, 2018
| | | | | | | | |
| | | Shares | | | Value | |
| COMMON STOCKS: | | | | | | | | |
DIVERSIFIED MUTUAL FUNDS (100.0%) | | | | | | | | |
Mutual of America Investment Corporation | | | | | | | | |
Bond Fund (17.6%) | | | 63,519,055 | | | $ | 89,342,727 | |
Equity Index Fund (39.3%) | | | 53,077,559 | | | | 200,390,982 | |
International Fund (11.8%) | | | 78,701,118 | | | | 60,289,779 | |
Mid-Cap Equity Index Fund (20.1%) | | | 52,928,909 | | | | 102,221,496 | |
Small Cap Growth Fund (5.7%) | | | 23,096,299 | | | | 29,156,744 | |
Small Cap Value Fund (5.5%) | | | 20,650,760 | | | | 28,047,202 | |
| | | | | | | | |
TOTAL INVESTMENTS
(Cost: $503,287,698) 100.0% | | | | | | | 509,448,930 | |
| | | | | | | | |
OTHER NET ASSETS -0.0% (2) | | | | | | | (2,820 | ) |
| | | | | | | | |
NET ASSETS 100.0% | | | | | | $ | 509,446,110 | |
| | | | | | | | |
The accompanying notes are an integral part of these portfolio schedules.
94
MUTUAL OF AMERICA INVESTMENT CORPORATION — 2040 RETIREMENT FUND
PORTFOLIO OF INVESTMENTS IN SECURITIES
December 31, 2018
| | | | | | | | |
| | | Shares | | | Value | |
| COMMON STOCKS: | | | | | | | | |
DIVERSIFIED MUTUAL FUNDS (100.0%) | | | | | | | | |
Mutual of America Investment Corporation | | | | | | | | |
Bond Fund (13.5%) | | | 39,952,608 | | | $ | 56,195,340 | |
Equity Index Fund (39.0%) | | | 42,576,594 | | | | 160,745,248 | |
International Fund (13.7%) | | | 73,578,796 | | | | 56,365,772 | |
Mid-Cap Equity Index Fund (20.0%) | | | 42,712,029 | | | | 82,489,656 | |
Small Cap Growth Fund (6.9%) | | | 22,544,155 | | | | 28,459,719 | |
Small Cap Value Fund (6.9%) | | | 20,914,665 | | | | 28,405,629 | |
| | | | | | | | |
TOTAL INVESTMENTS
(Cost: $406,264,366) 100.0% | | | | | | | 412,661,364 | |
| | | | | | | | |
OTHER NET ASSETS -0.0% (2) | | | | | | | (2,713 | ) |
| | | | | | | | |
NET ASSETS 100.0% | | | | | | $ | 412,658,651 | |
| | | | | | | | |
The accompanying notes are an integral part of these portfolio schedules.
95
MUTUAL OF AMERICA INVESTMENT CORPORATION — 2045 RETIREMENT FUND
PORTFOLIO OF INVESTMENTS IN SECURITIES
December 31, 2018
| | | | | | | | |
| | | Shares | | | Value | |
| COMMON STOCKS: | | | | | | | | |
DIVERSIFIED MUTUAL FUNDS (100.0%) | | | | | | | | |
Mutual of America Investment Corporation | | | | | | | | |
Bond Fund (11.4%) | | | 35,822,142 | | | $ | 50,385,633 | |
Equity Index Fund (38.0%) | | | 44,052,607 | | | | 166,317,843 | |
International Fund (13.8%) | | | 78,784,961 | | | | 60,354,007 | |
Mid-Cap Equity Index Fund (21.3%) | | | 48,251,081 | | | | 93,187,217 | |
Small Cap Growth Fund (7.9%) | | | 27,285,999 | | | | 34,445,818 | |
Small Cap Value Fund (7.6%) | | | 24,609,945 | | | | 33,424,440 | |
| | | | | | | | |
TOTAL INVESTMENTS
(Cost: $425,063,563) 100.0% | | | | | | | 438,114,958 | |
| | | | | | | | |
OTHER NET ASSETS -0.0% (2) | | | | | | | (2,972 | ) |
| | | | | | | | |
NET ASSETS 100.0% | | | | | | $ | 438,111,986 | |
| | | | | | | | |
The accompanying notes are an integral part of these portfolio schedules.
96
MUTUAL OF AMERICA INVESTMENT CORPORATION — 2050 RETIREMENT FUND
PORTFOLIO OF INVESTMENTS IN SECURITIES
December 31, 2018
| | | | | | | | |
| | | Shares | | | Value | |
| COMMON STOCKS: | | | | | | | | |
DIVERSIFIED MUTUAL FUNDS (100.0%) | | | | | | | | |
Mutual of America Investment Corporation | | | | | | | | |
Bond Fund (9.5%) | | | 19,121,379 | | | $ | 26,895,175 | |
Equity Index Fund (35.7%) | | | 26,986,176 | | | | 101,884,607 | |
International Fund (15.9%) | | | 59,223,472 | | | | 45,368,733 | |
Mid-Cap Equity Index Fund (21.3%) | | | 31,499,400 | | | | 60,834,727 | |
Small Cap Growth Fund (9.0%) | | | 20,408,818 | | | | 25,764,072 | |
Small Cap Value Fund (8.6%) | | | 18,071,092 | | | | 24,543,579 | |
| | | | | | | | |
TOTAL INVESTMENTS
(Cost: $300,228,805) 100.0% | | | | | | | 285,290,893 | |
| | | | | | | | |
OTHER NET ASSETS -0.0% (2) | | | | | | | (1,520 | ) |
| | | | | | | | |
NET ASSETS 100.0% | | | | | | $ | 285,289,373 | |
| | | | | | | | |
The accompanying notes are an integral part of these portfolio schedules.
97
MUTUAL OF AMERICA INVESTMENT CORPORATION — 2055 RETIREMENT FUND
PORTFOLIO OF INVESTMENTS IN SECURITIES
December 31, 2018
| | | | | | | | |
| | | Shares | | | Value | |
| COMMON STOCKS: | | | | | | | | |
DIVERSIFIED MUTUAL FUNDS (100.0%) | | | | | | | | |
Mutual of America Investment Corporation | | | | | | | | |
Bond Fund (9.6%) | | | 4,794,682 | | | $ | 6,743,960 | |
Equity Index Fund (33.3%) | | | 6,193,219 | | | | 23,382,110 | |
International Fund (16.8%) | | | 15,380,745 | | | | 11,782,573 | |
Mid-Cap Equity Index Fund (21.5%) | | | 7,840,756 | | | | 15,142,836 | |
Small Cap Growth Fund (9.4%) | | | 5,242,439 | | | | 6,618,049 | |
Small Cap Value Fund (9.4%) | | | 4,879,202 | | | | 6,626,777 | |
| | | | | | | | |
TOTAL INVESTMENTS
(Cost: $79,173,702) 100.0% | | | | | | | 70,296,305 | |
| | | | | | | | |
OTHER NET ASSETS -0.0% (2) | | | | | | | (226 | ) |
| | | | | | | | |
NET ASSETS 100.0% | | | | | | $ | 70,296,079 | |
| | | | | | | | |
The accompanying notes are an integral part of these portfolio schedules.
98
MUTUAL OF AMERICA INVESTMENT CORPORATION — 2060 RETIREMENT FUND
PORTFOLIO OF INVESTMENTS IN SECURITIES
December 31, 2018
| | | | | | | | |
| | | Shares | | | Value | |
| COMMON STOCKS: | | | | | | | | |
DIVERSIFIED MUTUAL FUNDS (100.0%) | | | | | | | | |
Mutual of America Investment Corporation | | | | | | | | |
Bond Fund (7.6%) | | | 220,312 | | | $ | 309,880 | |
Equity Index Fund (30.1%) | | | 322,226 | | | | 1,216,545 | |
International Fund (20.4%) | | | 1,074,797 | | | | 823,359 | |
Mid-Cap Equity Index Fund (22.4%) | | | 469,308 | | | | 906,374 | |
Small Cap Growth Fund (9.7%) | | | 310,859 | | | | 392,428 | |
Small Cap Value Fund (9.8%) | | | 292,160 | | | | 396,802 | |
| | | | | | | | |
TOTAL INVESTMENTS
(Cost: $4,398,334) 100.0% | | | | | | | 4,045,388 | |
| | | | | | | | |
OTHER NET ASSETS -0.0% (2) | | | | | | | (3 | ) |
| | | | | | | | |
NET ASSETS 100.0% | | | | | | $ | 4,045,385 | |
| | | | | | | | |
The accompanying notes are an integral part of these portfolio schedules.
99
MUTUAL OF AMERICA INVESTMENT CORPORATION — CONSERVATIVE ALLOCATION FUND
PORTFOLIO OF INVESTMENTS IN SECURITIES
December 31, 2018
| | | | | | | | |
| | | Shares | | | Value | |
| COMMON STOCKS: | | | | | | | | |
DIVERSIFIED MUTUAL FUNDS (100.0%) | | | | | | | | |
Mutual of America Investment Corporation | | | | | | | | |
Bond Fund (31.2%) | | | 33,261,256 | | | $ | 46,783,620 | |
Equity Index Fund (23.7%) | | | 9,414,364 | | | | 35,543,339 | |
International Fund (4.4%) | | | 8,626,245 | | | | 6,608,221 | |
Mid-Cap Equity Index Fund (4.5%) | | | 3,466,176 | | | | 6,694,219 | |
Mid-Term Bond Fund (36.2%) | | | 53,016,875 | | | | 54,311,229 | |
| | | | | | | | |
TOTAL INVESTMENTS
(Cost: $151,739,976) 100.0% | | | | | | | 149,940,628 | |
| | | | | | | | |
OTHER NET ASSETS -0.0% (2) | | | | | | | (258 | ) |
| | | | | | | | |
NET ASSETS 100.0% | | | | | | $ | 149,940,370 | |
| | | | | | | | |
The accompanying notes are an integral part of these portfolio schedules.
100
MUTUAL OF AMERICA INVESTMENT CORPORATION — MODERATE ALLOCATION FUND
PORTFOLIO OF INVESTMENTS IN SECURITIES
December 31, 2018
| | | | | | | | |
| | | Shares | | | Value | |
| COMMON STOCKS: | | | | | | | | |
DIVERSIFIED MUTUAL FUNDS (100.0%) | | | | | | | | |
Mutual of America Investment Corporation | | | | | | | | |
Bond Fund (26.9%) | | | 70,796,195 | | | $ | 99,578,388 | |
Equity Index Fund (34.2%) | | | 33,660,481 | | | | 127,083,025 | |
International Fund (9.1%) | | | 44,065,078 | | | | 33,756,494 | |
Mid-Cap Equity Index Fund (13.8%) | | | 26,547,720 | | | | 51,271,559 | |
Mid-Term Bond Fund (16.0%) | | | 58,031,903 | | | | 59,448,693 | |
| | | | | | | | |
TOTAL INVESTMENTS
(Cost: $350,807,778) 100.0% | | | | | | | 371,138,159 | |
| | | | | | | | |
OTHER NET ASSETS -0.0% (2) | | | | | | | (543 | ) |
| | | | | | | | |
NET ASSETS 100.0% | | | | | | $ | 371,137,616 | |
| | | | | | | | |
The accompanying notes are an integral part of these portfolio schedules.
101
MUTUAL OF AMERICA INVESTMENT CORPORATION — AGGRESSIVE ALLOCATION FUND
PORTFOLIO OF INVESTMENTS IN SECURITIES
December 31, 2018
| | | | | | | | |
| | | Shares | | | Value | |
| COMMON STOCKS: | | | | | | | | |
DIVERSIFIED MUTUAL FUNDS (100.0%) | | | | | | | | |
Mutual of America Investment Corporation | | | | | | | | |
Bond Fund (22.1%) | | | 42,724,799 | | | $ | 60,094,565 | |
Equity Index Fund (35.4%) | | | 25,416,639 | | | | 95,958,921 | |
International Fund (14.1%) | | | 49,892,938 | | | | 38,220,984 | |
Mid-Cap Equity Index Fund (19.0%) | | | 26,735,946 | | | | 51,635,080 | |
Small Cap Growth Fund (4.7%) | | | 10,010,693 | | | | 12,637,489 | |
Small Cap Value Fund (4.7%) | | | 9,446,665 | | | | 12,830,158 | |
| | | | | | | | |
TOTAL INVESTMENTS
(Cost: $248,586,785) 100.0% | | | | | | | 271,377,197 | |
| | | | | | | | |
OTHER NET ASSETS -0.0% (2) | | | | | | | (1,330 | ) |
| | | | | | | | |
NET ASSETS 100.0% | | | | | | $ | 271,375,867 | |
| | | | | | | | |
The accompanying notes are an integral part of these portfolio schedules.
102
MUTUAL OF AMERICA INVESTMENT CORPORATION — MONEY MARKET FUND
PORTFOLIO OF INVESTMENTS IN SECURITIES
December 31, 2018
| | | | | | | | | | | | | | | | | | | | |
| | | Rating** | | | Rate(%) | | | Maturity | | | Face Amount | | | Value | |
| SHORT-TERM DEBT SECURITIES: | | | | | | | | | | | | | | | | | | | | |
U.S. GOVERNMENT (22.1%) | | | | | | | | | | | | | | | | | | | | |
U.S. Treasury Bill | | | A-1+ | | | | 2.29 | | | | 01/15/19 | | | $ | 7,900,000 | | | $ | 7,892,996 | |
U.S. Treasury Bill | | | A-1+ | | | | 2.29 | | | | 01/17/19 | | | | 500,000 | | | | 499,494 | |
U.S. Treasury Bill | | | A-1+ | | | | 2.30 | | | | 01/22/19 | | | | 6,400,000 | | | | 6,391,432 | |
U.S. Treasury Bill | | | A-1+ | | | | 2.33 | | | | 02/07/19 | | | | 3,000,000 | | | | 2,992,836 | |
U.S. Treasury Bill | | | A-1+ | | | | 2.34 | | | | 02/14/19 | | | | 3,200,000 | | | | 3,190,894 | |
U.S. Treasury Bill | | | A-1+ | | | | 2.37 | | | | 01/29/19 | | | | 6,400,000 | | | | 6,388,264 | |
U.S. Treasury Bill | | | A-1+ | | | | 2.37 | | | | 02/21/19 | | | | 7,000,000 | | | | 6,976,571 | |
U.S. Treasury Bill | | | A-1+ | | | | 2.38 | | | | 02/28/19 | | | | 7,000,000 | | | | 6,973,291 | |
U.S. Treasury Bill | | | A-1+ | | | | 2.39 | | | | 02/19/19 | | | | 5,000,000 | | | | 4,983,820 | |
| | | | | | | | | | | | | | | | | | | | |
| | | | | | | | | | | | | | | | | | | 46,289,598 | |
| | | | | | | | | | | | | | | | | | | | |
U.S. GOVERNMENT AGENCIES (16.5%) | | | | | | | | | | | | | | | | | | | | |
FHLB | | | A-1+ | | | | 2.26 | | | | 01/02/19 | | | | 7,000,000 | | | | 6,999,562 | |
FHLB | | | A-1+ | | | | 2.26 | | | | 01/08/19 | | | | 700,000 | | | | 699,694 | |
FHLB | | | A-1+ | | | | 2.30 | | | | 01/09/19 | | | | 900,000 | | | | 899,540 | |
FHLB | | | A-1+ | | | | 2.38 | | | | 02/05/19 | | | | 5,400,000 | | | | 5,387,558 | |
FHLB | | | A-1+ | | | | 2.38 | | | | 02/07/19 | | | | 2,800,000 | | | | 2,793,180 | |
FHLB | | | A-1+ | | | | 2.38 | | | | 02/12/19 | | | | 3,300,000 | | | | 3,290,856 | |
FHLB | | | A-1+ | | | | 2.39 | | | | 02/13/19 | | | | 1,200,000 | | | | 1,196,589 | |
FHLB | | | A-1+ | | | | 2.40 | | | | 02/08/19 | | | | 4,000,000 | | | | 3,989,909 | |
FHLB | | | A-1+ | | | | 2.41 | | | | 02/20/19 | | | | 4,000,000 | | | | 3,986,667 | |
FHLB | | | A-1+ | | | | 2.43 | | | | 03/01/19 | | | | 700,000 | | | | 697,224 | |
FHLB | | | A-1+ | | | | 2.43 | | | | 03/05/19 | | | | 750,000 | | | | 746,874 | |
FNMA | | | A-1+ | | | | 2.22 | | | | 01/02/19 | | | | 4,000,000 | | | | 3,999,754 | |
| | | | | | | | | | | | | | | | | | | | |
| | | | | | | | | | | | | | | | | | | 34,687,407 | |
| | | | | | | | | | | | | | | | | | | | |
COMMERCIAL PAPER (61.3%) | | | | | | | | | | | | | | | | | | | | |
3M Co.† | | | A-1+ | | | | 2.45 | | | | 01/23/19 | | | | 5,000,000 | | | | 4,992,514 | |
Apple, Inc.† | | | A-1+ | | | | 2.31 | | | | 01/03/19 | | | | 4,000,000 | | | | 3,999,489 | |
Apple, Inc.† | | | A-1+ | | | | 2.31 | | | | 01/11/19 | | | | 3,000,000 | | | | 2,998,083 | |
Apple, Inc.† | | | A-1+ | | | | 2.49 | | | | 02/11/19 | | | | 600,000 | | | | 598,305 | |
Boeing Co.† | | | A-1 | | | | 2.39 | | | | 01/02/19 | | | | 600,000 | | | | 599,960 | |
Boeing Co.† | | | A-1 | | | | 2.53 | | | | 02/06/19 | | | | 1,300,000 | | | | 1,296,707 | |
Boeing Co.† | | | A-1 | | | | 2.59 | | | | 02/20/19 | | | | 5,200,000 | | | | 5,181,367 | |
Boeing Co.† | | | A-1 | | | | 2.61 | | | | 02/06/19 | | | | 250,000 | | | | 249,367 | |
Chevron Corp.† | | | A-1+ | | | | 2.30 | | | | 01/10/19 | | | | 6,600,000 | | | | 6,596,221 | |
Chevron Corp.† | | | A-1+ | | | | 2.41 | | | | 02/12/19 | | | | 900,000 | | | | 897,480 | |
CME Group, Inc.† | | | A-1+ | | | | 2.55 | | | | 01/08/19 | | | | 7,000,000 | | | | 6,996,529 | |
Coca-Cola Co.† | | | A-1 | | | | 2.31 | | | | 01/09/19 | | | | 2,298,000 | | | | 2,296,825 | |
Coca-Cola Co.† | | | A-1 | | | | 2.34 | | | | 01/08/19 | | | | 3,150,000 | | | | 3,148,573 | |
Coca-Cola Co.† | | | A-1 | | | | 2.41 | | | | 01/15/19 | | | | 1,400,000 | | | | 1,398,693 | |
Coca-Cola Co.† | | | A-1 | | | | 2.51 | | | | 02/15/19 | | | | 435,000 | | | | 433,641 | |
Coca-Cola Co.† | | | A-1 | | | | 2.56 | | | | 02/06/19 | | | | 750,000 | | | | 748,088 | |
Emerson Electric Co.† | | | A-1 | | | | 2.37 | | | | 01/04/19 | | | | 5,000,000 | | | | 4,999,013 | |
Emerson Electric Co.† | | | A-1 | | | | 2.50 | | | | 01/24/19 | | | | 2,500,000 | | | | 2,496,007 | |
Exxon Mobil Corp. | | | A-1+ | | | | 2.33 | | | | 01/11/19 | | | | 2,000,000 | | | | 1,998,711 | |
Exxon Mobil Corp. | | | A-1+ | | | | 2.35 | | | | 01/23/19 | | | | 2,000,000 | | | | 1,997,140 | |
Exxon Mobil Corp. | | | A-1+ | | | | 2.40 | | | | 01/25/19 | | | | 2,000,000 | | | | 1,996,813 | |
Intercontinental Exchange, Inc.† | | | A-1 | | | | 2.56 | | | | 02/04/19 | | | | 3,190,000 | | | | 3,182,317 | |
J.P. Morgan Securities LLC | | | A-1 | | | | 2.56 | | | | 01/17/19 | | | | 260,000 | | | | 259,706 | |
J.P. Morgan Securities LLC | | | A-1 | | | | 2.56 | | | | 01/28/19 | | | | 400,000 | | | | 399,235 | |
J.P. Morgan Securities LLC† | | | A-1 | | | | 2.56 | | | | 01/31/19 | | | | 250,000 | | | | 249,452 | |
J.P. Morgan Securities LLC | | | A-1 | | | | 2.61 | | | | 01/17/19 | | | | 500,000 | | | | 499,422 | |
J.P. Morgan Securities LLC | | | A-1 | | | | 2.61 | | | | 01/22/19 | | | | 250,000 | | | | 249,621 | |
J.P. Morgan Securities LLC† | | | A-1 | | | | 2.61 | | | | 01/28/19 | | | | 1,500,000 | | | | 1,497,075 | |
J.P. Morgan Securities LLC† | | | A-1 | | | | 2.66 | | | | 01/31/19 | | | | 1,200,000 | | | | 1,197,367 | |
J.P. Morgan Securities LLC | | | A-1 | | | | 2.71 | | | | 02/22/19 | | | | 250,000 | | | | 249,025 | |
The accompanying notes are an integral part of these portfolio schedules.
103
MUTUAL OF AMERICA INVESTMENT CORPORATION — MONEY MARKET FUND
PORTFOLIO OF INVESTMENTS IN SECURITIES (Continued)
December 31, 2018
| | | | | | | | | | | | | | | | | | | | |
| | | Rating** | | | Rate(%) | | | Maturity | | | Face Amount | | | Value | |
| SHORT-TERM DEBT SECURITIES (CONTINUED): | | | | | | | | | | | | | | | | | | | | |
COMMERCIAL PAPER (CONTINUED) | | | | | | | | | | | | | | | | | | | | |
Kimberly-Clark Corp.† | | | A-1 | | | | 2.45 | | | | 01/14/19 | | | $ | 900,000 | | | $ | 899,204 | |
Madison Gas & Electric | | | A-1+ | | | | 2.50 | | | | 01/15/19 | | | | 2,100,000 | | | | 2,097,958 | |
Natural Rural Utilities | | | A-1 | | | | 2.40 | | | | 01/04/19 | | | | 5,200,000 | | | | 5,198,960 | |
Natural Rural Utilities | | | A-1 | | | | 2.40 | | | | 01/07/19 | | | | 1,300,000 | | | | 1,299,480 | |
Natural Rural Utilities | | | A-1 | | | | 2.58 | | | | 02/05/19 | | | | 950,000 | | | | 947,626 | |
Nestle Capital Corp.† | | | A-1+ | | | | 2.34 | | | | 01/07/19 | | | | 4,000,000 | | | | 3,998,447 | |
Nestle Capital Corp.† | | | A-1+ | | | | 2.34 | | | | 01/28/19 | | | | 3,000,000 | | | | 2,994,757 | |
Novartis Finance Corp.† | | | A-1+ | | | | 2.35 | | | | 01/02/19 | | | | 3,500,000 | | | | 3,499,772 | |
Novartis Finance Corp.† | | | A-1+ | | | | 2.45 | | | | 01/25/19 | | | | 500,000 | | | | 499,183 | |
Novartis Finance Corp.† | | | A-1+ | | | | 2.56 | | | | 02/22/19 | | | | 4,000,000 | | | | 3,985,267 | |
ONE Gas, Inc.† | | | A-1 | | | | 2.46 | | | | 01/11/19 | | | | 3,300,000 | | | | 3,297,754 | |
ONE Gas, Inc.† | | | A-1 | | | | 2.49 | | | | 01/16/19 | | | | 4,000,000 | | | | 3,995,867 | |
Pfizer, Inc.† | | | A-1+ | | | | 2.44 | | | | 02/11/19 | | | | 7,500,000 | | | | 7,479,244 | |
Proctor & Gamble Co.† | | | A-1+ | | | | 2.44 | | | | 01/29/19 | | | | 7,000,000 | | | | 6,986,770 | |
Simon Property Group LP† | | | A-1 | | | | 2.33 | | | | 01/09/19 | | | | 2,600,000 | | | | 2,598,660 | |
Simon Property Group LP† | | | A-1 | | | | 2.33 | | | | 01/14/19 | | | | 3,500,000 | | | | 3,497,068 | |
Simon Property Group LP† | | | A-1 | | | | 2.41 | | | | 01/07/19 | | | | 1,000,000 | | | | 999,593 | |
Simon Property Group LP† | | | A-1 | | | | 2.50 | | | | 01/07/19 | | | | 800,000 | | | | 799,674 | |
Toyota Motor Credit Corp. | | | A-1+ | | | | 2.38 | | | | 01/04/19 | | | | 3,000,000 | | | | 2,999,407 | |
Unilever Capital Corp.† | | | A-1 | | | | 2.38 | | | | 01/22/19 | | | | 2,000,000 | | | | 1,997,235 | |
Wal-Mart Stores, Inc.† | | | A-1+ | | | | 2.51 | | | | 01/30/19 | | | | 5,000,000 | | | | 4,989,931 | |
| | | | | | | | | | | | | | | | | | | | |
| | | | | | | | | | | | | | | | | | | 128,764,603 | |
| | | | | | | | | | | | | | | | | | | | |
TOTAL SHORT-TERM DEBT SECURITIES
(Cost: $209,741,558) 99.9% | | | | 209,741,608 | |
| | | | | | | | | | | | | | | | | | | | |
TOTAL INVESTMENTS
(Cost: $209,741,558) 99.9% | | | | 209,741,608 | |
| | | | | | | | | | | | | | | | | | | | |
OTHER NET ASSETS 0.1% | | | | 171,311 | |
| | | | | | | | | | | | | | | | | | | | |
NET ASSETS 100.0% | | | $ | 209,912,919 | |
| | | | | | | | | | | | | | | | | | | | |
The accompanying notes are an integral part of these portfolio schedules.
104
MUTUAL OF AMERICA INVESTMENT CORPORATION — MID-TERM BOND FUND
PORTFOLIO OF INVESTMENTS IN SECURITIES
December 31, 2018
| | | | | | | | | | | | | | | | | | |
| | | Rating** | | Rate(%) | | | Maturity | | | Face Amount | | | Value | |
| LONG-TERM DEBT SECURITIES: | | | | | | | | | | | | | | | | | | |
U.S. GOVERNMENT (50.8%) | | | | | | | | | | | | | | | | | | |
U.S. Treasury Note | | AA+ | | | 0.75 | | | | 07/15/19 | | | $ | 3,000,000 | | | $ | 2,971,289 | |
U.S. Treasury Note | | AA+ | | | 1.13 | | | | 01/31/19 | | | | 13,000,000 | | | | 12,987,565 | |
U.S. Treasury Note | | AA+ | | | 1.38 | | | | 06/30/23 | | | | 18,000,000 | | | | 17,137,859 | |
U.S. Treasury Note | | AA+ | | | 1.38 | | | | 09/30/23 | | | | 23,500,000 | | | | 22,310,367 | |
U.S. Treasury Note | | AA+ | | | 1.50 | | | | 10/31/19 | | | | 3,000,000 | | | | 2,971,980 | |
U.S. Treasury Note | | AA+ | | | 1.50 | | | | 02/28/23 | | | | 21,000,000 | | | | 20,176,217 | |
U.S. Treasury Note | | AA+ | | | 1.50 | | | | 08/15/26 | | | | 22,000,000 | | | | 20,308,490 | |
U.S. Treasury Note | | AA+ | | | 1.63 | | | | 07/31/19 | | | | 13,500,000 | | | | 13,427,754 | |
U.S. Treasury Note | | AA+ | | | 1.63 | | | | 06/30/20 | | | | 5,500,000 | | | | 5,425,223 | |
U.S. Treasury Note | | AA+ | | | 1.63 | | | | 10/31/23 | | | | 9,900,000 | | | | 9,501,591 | |
U.S. Treasury Note | | AA+ | | | 1.63 | | | | 05/15/26 | | | | 26,000,000 | | | | 24,294,085 | |
U.S. Treasury Note | | AA+ | | | 1.75 | | | | 12/31/20 | | | | 3,500,000 | | | | 3,449,366 | |
U.S. Treasury Note | | AA+ | | | 1.75 | | | | 02/28/22 | | | | 15,000,000 | | | | 14,672,651 | |
U.S. Treasury Note | | AA+ | | | 1.88 | | | | 05/31/22 | | | | 16,900,000 | | | | 16,567,154 | |
U.S. Treasury Note | | AA+ | | | 2.00 | | | | 11/30/20 | | | | 7,500,000 | | | | 7,429,165 | |
U.S. Treasury Note | | AA+ | | | 2.00 | | | | 05/31/24 | | | | 25,000,000 | | | | 24,324,119 | |
U.S. Treasury Note | | AA+ | | | 2.00 | | | | 06/30/24 | | | | 23,500,000 | | | | 22,852,151 | |
U.S. Treasury Note | | AA+ | | | 2.13 | | | | 05/15/25 | | | | 10,200,000 | | | | 9,928,298 | |
U.S. Treasury Note | | AA+ | | | 2.75 | | | | 09/30/20 | | | | 2,000,000 | | | | 2,007,218 | |
U.S. Treasury Note | | AA+ | | | 2.75 | | | | 05/31/23 | | | | 8,000,000 | | | | 8,087,215 | |
U.S. Treasury Note | | AA+ | | | 2.88 | | | | 05/31/25 | | | | 36,500,000 | | | | 37,138,274 | |
| | | | | | | | | | | | | | | | | | |
| | | | | | | | | | | | | | | | | 297,968,031 | |
| | | | | | | | | | | | | | | | | | |
U.S. GOVERNMENT AGENCIES (6.2%) | | | | | | | | | | | | | | | | | | |
MORTGAGE-BACKED OBLIGATIONS (0.0%) (2) | | | | | | | | | | | | | | | | | | |
FHLMC | | AA+ | | | 7.50 | | | | 03/15/21 | | | | 920 | | | | 943 | |
| | | | | | | | | | | | | | | | | | |
NON-MORTGAGE-BACKED OBLIGATIONS (6.2%) | | | | | | | | | | | | | | | | | | |
FNMA | | AA+ | | | 0.00 | | | | 10/09/19 | | | | 23,000,000 | | | | 22,506,438 | |
FHLMC | | AA+ | | | 0.00 | | | | 11/29/19 | | | | 13,500,000 | | | | 13,150,064 | |
Tennessee Valley Authority Strip | | AA+ | | | 0.00 | | | | 11/01/20 | | | | 900,000 | | | | 854,481 | |
| | | | | | | | | | | | | | | | | | |
| | | | | | | | | | | | | | | | | 36,510,983 | |
| | | | | | | | | | | | | | | | | | |
CORPORATE DEBT (42.1%) | | | | | | | | | | | | | | | | | | |
COMMUNICATION SERVICES (1.5%) | | | | | | | | | | | | | | | | | | |
AT&T, Inc. | | BBB | | | 3.00 | | | | 02/15/22 | | | | 2,000,000 | | | | 1,962,112 | |
Discovery Communications LLC† | | BBB- | | | 3.50 | | | | 06/15/22 | | | | 2,500,000 | | | | 2,468,339 | |
Omnicom Group, Inc. | | BBB+ | | | 3.63 | | | | 05/01/22 | | | | 2,000,000 | | | | 1,972,228 | |
Viacom, Inc. | | BBB- | | | 3.25 | | | | 03/15/23 | | | | 2,500,000 | | | | 2,405,059 | |
| | | | | | | | | | | | | | | | | | |
| | | | | | | | | | | | | | | | | 8,807,738 | |
| | | | | | | | | | | | | | | | | | |
CONSUMER DISCRETIONARY (5.4%) | | | | | | | | | | | | | | | | | | |
Advance Auto Parts, Inc. | | BBB- | | | 4.50 | | | | 01/15/22 | | | | 500,000 | | | | 507,617 | |
Advance Auto Parts, Inc. | | BBB- | | | 4.50 | | | | 12/01/23 | | | | 250,000 | | | | 255,861 | |
Advance Auto Parts, Inc. | | BBB- | | | 5.75 | | | | 05/01/20 | | | | 1,500,000 | | | | 1,536,115 | |
AutoZone, Inc. | | BBB | | | 3.70 | | | | 04/15/22 | | | | 300,000 | | | | 302,320 | |
AutoZone, Inc. | | BBB | | | 4.00 | | | | 11/15/20 | | | | 700,000 | | | | 705,309 | |
Dollar General Corp. | | BBB | | | 3.25 | | | | 04/15/23 | | | | 1,047,000 | | | | 1,023,606 | |
eBay, Inc. | | BBB+ | | | 2.88 | | | | 08/01/21 | | | | 2,100,000 | | | | 2,070,616 | |
Expedia Group, Inc. | | BBB | | | 5.95 | | | | 08/15/20 | | | | 2,000,000 | | | | 2,066,031 | |
Family Dollar Stores, Inc. | | BBB- | | | 5.00 | | | | 02/01/21 | | | | 2,000,000 | | | | 2,035,000 | |
Gap, Inc. | | BB+ | | | 5.95 | | | | 04/12/21 | | | | 2,000,000 | | | | 2,042,126 | |
Harman International Industries, Inc. | | BBB+ | | | 4.15 | | | | 05/15/25 | | | | 2,000,000 | | | | 2,004,892 | |
Hyatt Hotels Corp. | | BBB | | | 5.38 | | | | 08/15/21 | | | | 50,000 | | | | 51,983 | |
Kohl’s Corp. | | BBB- | | | 3.25 | | | | 02/01/23 | | | | 700,000 | | | | 684,649 | |
Kohl’s Corp. | | BBB- | | | 4.00 | | | | 11/01/21 | | | | 1,325,000 | | | | 1,365,359 | |
Marriott International, Inc. | | BBB | | | 3.00 | | | | 03/01/19 | | | | 1,200,000 | | | | 1,198,468 | |
Marriott International, Inc. | | BBB | | | 3.13 | | | | 02/15/23 | | | | 2,000,000 | | | | 1,923,405 | |
The accompanying notes are an integral part of these portfolio schedules.
105
MUTUAL OF AMERICA INVESTMENT CORPORATION — MID-TERM BOND FUND
PORTFOLIO OF INVESTMENTS IN SECURITIES (Continued)
December 31, 2018
| | | | | | | | | | | | | | | | | | | | |
| | | Rating** | | | Rate(%) | | | Maturity | | | Face Amount | | | Value | |
| LONG-TERM DEBT SECURITIES (CONTINUED): | | | | | | | | | | | | | | | | | | | | |
CORPORATE DEBT (CONTINUED) | | | | | | | | | | | | | | | | | | | | |
CONSUMER DISCRETIONARY (CONTINUED) | | | | | | | | | | | | | | | | | | | | |
Marriott International, Inc. | | | BBB | | | | 3.38 | | | | 10/15/20 | | | $ | 800,000 | | | $ | 795,950 | |
Newell Brands, Inc. | | | BBB- | | | | 4.70 | | | | 08/15/20 | | | | 525,000 | | | | 533,821 | |
NVR, Inc. | | | BBB+ | | | | 3.95 | | | | 09/15/22 | | | | 2,000,000 | | | | 1,966,343 | |
O’Reilly Automotive, Inc. | | | BBB | | | | 4.63 | | | | 09/15/21 | | | | 281,000 | | | | 288,439 | |
Tapestry, Inc. | | | BBB- | | | | 3.00 | | | | 07/15/22 | | | | 2,500,000 | | | | 2,409,230 | |
Tupperware Brands Corp. | | | BBB- | | | | 4.75 | | | | 06/01/21 | | | | 2,000,000 | | | | 2,048,919 | |
Whirlpool Corp. | | | BBB | | | | 2.40 | | | | 03/01/19 | | | | 1,445,000 | | | | 1,443,013 | |
Wyndham Destinations, Inc. | | | BB- | | | | 5.40 | | | | 04/01/24 | | | | 2,500,000 | | | | 2,381,250 | |
| | | | | | | | | | | | | | | | | | | | |
| | | | | | | | | | | | | | | | | | | 31,640,322 | |
| | | | | | | | | | | | | | | | | | | | |
CONSUMER STAPLES (3.1%) | | | | | | | | | | | | | | | | | | | | |
Edgewell Personal Care Co. | | | BB | | | | 4.70 | | | | 05/19/21 | | | | 2,000,000 | | | | 1,970,000 | |
Flowers Foods, Inc. | | | BBB | | | | 4.38 | | | | 04/01/22 | | | | 2,000,000 | | | | 2,016,363 | |
General Mills, Inc. | | | BBB | | | | 2.20 | | | | 10/21/19 | | | | 775,000 | | | | 769,117 | |
Ingredion, Inc. | | | BBB | | | | 4.63 | | | | 11/01/20 | | | | 275,000 | | | | 279,868 | |
Kellogg Co. | | | BBB | | | | 2.65 | | | | 12/01/23 | | | | 2,000,000 | | | | 1,890,960 | |
Keurig Dr Pepper, Inc. | | | BBB | | | | 2.60 | | | | 01/15/19 | | | | 150,000 | | | | 149,961 | |
Keurig Dr Pepper, Inc. | | | BBB | | | | 3.13 | | | | 12/15/23 | | | | 2,990,000 | | | | 2,855,313 | |
Kroger Co. | | | BBB | | | | 2.95 | | | | 11/01/21 | | | | 2,000,000 | | | | 1,964,354 | |
Mead Johnson Nutrition Co. | | | A- | | | | 4.90 | | | | 11/01/19 | | | | 3,075,000 | | | | 3,116,472 | |
Molson Coors Brewing Co. | | | BBB- | | | | 3.50 | | | | 05/01/22 | | | | 1,000,000 | | | | 993,968 | |
Sysco Corp. | | | BBB+ | | | | 2.60 | | | | 10/01/20 | | | | 2,000,000 | | | | 1,978,080 | |
| | | | | | | | | | | | | | | | | | | | |
| | | | | | | | | | | | | | | | | | | 17,984,456 | |
| | | | | | | | | | | | | | | | | | | | |
ENERGY (2.4%) | | | | | | | | | | | | | | | | | | | | |
Cameron International Corp. | | | AA- | | | | 3.60 | | | | 04/30/22 | | | | 214,000 | | | | 211,075 | |
Diamond Offshore Drilling, Inc. | | | B | | | | 3.45 | | | | 11/01/23 | | | | 1,500,000 | | | | 1,110,000 | |
Energen Corp. | | | NR | | | | 4.63 | | | | 09/01/21 | | | | 2,000,000 | | | | 1,980,000 | |
EQT Corp. | | | BBB- | | | | 4.88 | | | | 11/15/21 | | | | 1,250,000 | | | | 1,273,840 | |
Kinder Morgan, Inc. | | | BBB- | | | | 3.05 | | | | 12/01/19 | | | | 2,000,000 | | | | 1,988,500 | |
Marathon Oil Corp. | | | BBB- | | | | 2.80 | | | | 11/01/22 | | | | 2,000,000 | | | | 1,878,367 | |
Noble Energy, Inc. | | | BBB | | | | 4.15 | | | | 12/15/21 | | | | 2,000,000 | | | | 2,009,499 | |
Rowan Companies PLC | | | B- | | | | 4.88 | | | | 06/01/22 | | | | 2,000,000 | | | | 1,650,000 | |
SESI LLC | | | BB- | | | | 7.13 | | | | 12/15/21 | | | | 2,150,000 | | | | 1,827,500 | |
| | | | | | | | | | | | | | | | | | | | |
| | | | | | | | | | | | | | | | | | | 13,928,781 | |
| | | | | | | | | | | | | | | | | | | | |
FINANCIALS (13.0%) | | | | | | | | | | | | | | | | | | | | |
Aflac, Inc. | | | A- | | | | 3.63 | | | | 06/15/23 | | | | 550,000 | | | | 551,792 | |
Alleghany Corp. | | | BBB+ | | | | 4.95 | | | | 06/27/22 | | | | 2,000,000 | | | | 2,091,316 | |
American Express Credit Corp. | | | A- | | | | 2.25 | | | | 08/15/19 | | | | 2,000,000 | | | | 1,990,945 | |
American International Group, Inc. | | | BBB+ | | | | 4.13 | | | | 02/15/24 | | | | 2,000,000 | | | | 2,008,050 | |
Ares Capital Corp. | | | BBB- | | | | 3.63 | | | | 01/19/22 | | | | 2,500,000 | | | | 2,426,985 | |
Assurant, Inc. | | | BBB | | | | 4.00 | | | | 03/15/23 | | | | 2,000,000 | | | | 2,015,690 | |
Bank of America Corp. | | | A- | | | | 2.65 | | | | 04/01/19 | | | | 1,250,000 | | | | 1,248,693 | |
Block Financial LLC | | | BBB | | | | 5.50 | | | | 11/01/22 | | | | 2,472,000 | | | | 2,541,685 | |
Capital One Financial Corp. | | | BBB | | | | 4.75 | | | | 07/15/21 | | | | 2,000,000 | | | | 2,051,907 | |
Citigroup, Inc. | | | BBB+ | | | | 2.55 | | | | 04/08/19 | | | | 1,850,000 | | | | 1,847,351 | |
Citizens Financial Group, Inc. | | | BBB | | | | 3.75 | | | | 07/01/24 | | | | 2,000,000 | | | | 1,947,118 | |
ERAC USA Finance LLC† | | | A- | | | | 2.35 | | | | 10/15/19 | | | | 1,000,000 | | | | 993,169 | |
Fairfax U.S., Inc.† | | | BBB- | | | | 4.88 | | | | 08/13/24 | | | | 750,000 | | | | 766,545 | |
Fifth Third Bancorp | | | BBB | | | | 4.30 | | | | 01/16/24 | | | | 2,500,000 | | | | 2,528,997 | |
First Republic Bank | | | A- | | | | 2.38 | | | | 06/17/19 | | | | 2,000,000 | | | | 1,991,409 | |
First Tennessee Bank | | | BBBu | | | | 2.95 | | | | 12/01/19 | | | | 2,200,000 | | | | 2,182,979 | |
FS Investment Corp. | | | BBB- | | | | 4.75 | | | | 05/15/22 | | | | 2,675,000 | | | | 2,648,348 | |
Goldman Sachs Group, Inc. | | | BBB+ | | | | 3.20 | | | | 02/23/23 | | | | 2,500,000 | | | | 2,424,771 | |
Huntington Bancshares, Inc. | | | BBB+ | | | | 2.30 | | | | 01/14/22 | | | | 2,750,000 | | | | 2,655,037 | |
Infinity Property & Casualty Corp. | | | BBB- | | | | 5.00 | | | | 09/19/22 | | | | 2,000,000 | | | | 2,049,682 | |
The accompanying notes are an integral part of these portfolio schedules.
106
MUTUAL OF AMERICA INVESTMENT CORPORATION — MID-TERM BOND FUND
PORTFOLIO OF INVESTMENTS IN SECURITIES (Continued)
December 31, 2018
| | | | | | | | | | | | | | | | | | |
| | | Rating** | | Rate(%) | | | Maturity | | | Face Amount | | | Value | |
| LONG-TERM DEBT SECURITIES (CONTINUED): | | | | | | | | | | | | | | | | | | |
CORPORATE DEBT (CONTINUED) | | | | | | | | | | | | | | | | | | |
FINANCIALS (CONTINUED) | | | | | | | | | | | | | | | | | | |
JPMorgan Chase & Co. | | BBB+ | | | 3.88 | | | | 09/10/24 | | | $ | 1,520,000 | | | $ | 1,498,480 | |
Legg Mason, Inc. | | BBB | | | 3.95 | | | | 07/15/24 | | | | 2,000,000 | | | | 1,971,124 | |
Lincoln National Corp. | | A- | | | 4.00 | | | | 09/01/23 | | | | 2,000,000 | | | | 2,038,716 | |
Moody’s Corp. | | BBB+ | | | 5.50 | | | | 09/01/20 | | | | 2,000,000 | | | | 2,073,727 | |
Morgan Stanley | | BBB+ | | | 3.13 | | | | 01/23/23 | | | | 2,500,000 | | | | 2,440,428 | |
Nasdaq, Inc. | | BBB | | | 5.55 | | | | 01/15/20 | | | | 2,150,000 | | | | 2,196,515 | |
People’s United Bank | | BBB+ | | | 4.00 | | | | 07/15/24 | | | | 1,750,000 | | | | 1,754,540 | |
PNC Bank NA | | A- | | | 3.80 | | | | 07/25/23 | | | | 2,500,000 | | | | 2,508,667 | |
Prospect Capital Corp. | | BBB- | | | 4.95 | | | | 07/15/22 | | | | 2,500,000 | | | | 2,390,818 | |
Prospect Capital Corp. | | BBB- | | | 5.88 | | | | 03/15/23 | | | | 1,925,000 | | | | 1,934,807 | |
Regions Financial Corp. | | BBB+ | | | 2.75 | | | | 08/14/22 | | | | 2,750,000 | | | | 2,653,010 | |
Signet UK Finance PLC | | BB+ | | | 4.70 | | | | 06/15/24 | | | | 2,000,000 | | | | 1,770,000 | |
Stifel Financial Corp. | | BBB- | | | 4.25 | | | | 07/18/24 | | | | 2,000,000 | | | | 2,022,407 | |
Synchrony Financial | | BBB- | | | 2.70 | | | | 02/03/20 | | | | 1,000,000 | | | | 982,900 | |
Synchrony Financial | | BBB- | | | 3.70 | | | | 08/04/26 | | | | 1,500,000 | | | | 1,272,999 | |
Unum Group | | BBB | | | 4.00 | | | | 03/15/24 | | | | 2,000,000 | | | | 1,984,988 | |
Voya Financial, Inc. | | BBB | | | 3.65 | | | | 06/15/26 | | | | 2,000,000 | | | | 1,891,618 | |
Wells Fargo & Co. | | A- | | | 2.13 | | | | 04/22/19 | | | | 2,000,000 | | | | 1,994,100 | |
WR Berkley Corp. | | BBB+ | | | 4.63 | | | | 03/15/22 | | | | 2,000,000 | | | | 2,055,597 | |
| | | | | | | | | | | | | | | | | | |
| | | | | | | | | | | | | | | | | 76,397,910 | |
| | | | | | | | | | | | | | | | | | |
HEALTH CARE (4.8%) | | | | | | | | | | | | | | | | | | |
AbbVie, Inc. | | A- | | | 2.85 | | | | 05/14/23 | | | | 2,500,000 | | | | 2,408,805 | |
Aetna, Inc. | | BBB | | | 2.80 | | | | 06/15/23 | | | | 2,500,000 | | | | 2,377,373 | |
Agilent Technologies, Inc. | | BBB+ | | | 5.00 | | | | 07/15/20 | | | | 2,000,000 | | | | 2,053,038 | |
Anthem, Inc. | | A | | | 3.13 | | | | 05/15/22 | | | | 2,000,000 | | | | 1,970,516 | |
Bio-Rad Laboratories, Inc. | | BBB | | | 4.88 | | | | 12/15/20 | | | | 2,000,000 | | | | 2,050,323 | |
CVS Health Corp. | | BBB | | | 3.38 | | | | 08/12/24 | | | | 590,000 | | | | 572,148 | |
CVS Health Corp. | | BBB | | | 3.88 | | | | 07/20/25 | | | | 1,500,000 | | | | 1,462,404 | |
Express Scripts Hldg. Co. | | A- | | | 2.25 | | | | 06/15/19 | | | | 2,000,000 | | | | 1,991,494 | |
Humana, Inc. | | BBB+ | | | 3.85 | | | | 10/01/24 | | | | 2,500,000 | | | | 2,497,781 | |
Laboratory Corp. of America Hldgs. | | BBB | | | 3.75 | | | | 08/23/22 | | | | 600,000 | | | | 603,314 | |
Laboratory Corp. of America Hldgs. | | BBB | | | 4.63 | | | | 11/15/20 | | | | 400,000 | | | | 408,275 | |
Owens & Minor, Inc. | | BB | | | 3.88 | | | | 09/15/21 | | | | 2,000,000 | | | | 1,480,000 | |
PerkinElmer, Inc. | | BBB | | | 5.00 | | | | 11/15/21 | | | | 2,000,000 | | | | 2,063,407 | |
Quest Diagnostics, Inc. | | BBB+ | | | 4.75 | | | | 01/30/20 | | | | 2,000,000 | | | | 2,031,959 | |
Thermo Fisher Scientific, Inc. | | BBB+ | | | 3.60 | | | | 08/15/21 | | | | 400,000 | | | | 401,162 | |
Thermo Fisher Scientific, Inc. | | BBB+ | | | 4.50 | | | | 03/01/21 | | | | 1,600,000 | | | | 1,635,210 | |
Zimmer Biomet Hldgs., Inc. | | BBB | | | 3.15 | | | | 04/01/22 | | | | 2,000,000 | | | | 1,955,332 | |
| | | | | | | | | | | | | | | | | | |
| | | | | | | | | | | | | | | | | 27,962,541 | |
| | | | | | | | | | | | | | | | | | |
INDUSTRIALS (1.0%) | | | | | | | | | | | | | | | | | | |
Flowserve Corp. | | BBB- | | | 3.50 | | | | 09/15/22 | | | | 2,000,000 | | | | 1,959,491 | |
JB Hunt Transport Svcs., Inc. | | BBB+ | | | 3.30 | | | | 08/15/22 | | | | 2,000,000 | | | | 1,983,641 | |
Verisk Analytics, Inc. | | BBB- | | | 4.13 | | | | 09/12/22 | | | | 2,000,000 | | | | 2,025,897 | |
| | | | | | | | | | | | | | | | | | |
| | | | | | | | | | | | | | | | | 5,969,029 | |
| | | | | | | | | | | | | | | | | | |
INFORMATION TECHNOLOGY (3.3%) | | | | | | | | | | | | | | | | | | |
Adobe Systems, Inc. | | A | | | 4.75 | | | | 02/01/20 | | | | 2,000,000 | | | | 2,039,673 | |
Amphenol Corp. | | BBB+ | | | 2.55 | | | | 01/30/19 | | | | 2,000,000 | | | | 1,998,686 | |
Arrow Electronics, Inc. | | BBB- | | | 4.50 | | | | 03/01/23 | | | | 50,000 | | | | 50,635 | |
Avnet, Inc. | | BBB- | | | 3.75 | | | | 12/01/21 | | | | 1,130,000 | | | | 1,136,528 | |
Avnet, Inc. | | BBB- | | | 5.88 | | | | 06/15/20 | | | | 950,000 | | | | 979,340 | |
Fiserv, Inc. | | BBB | | | 4.75 | | | | 06/15/21 | | | | 1,900,000 | | | | 1,956,923 | |
Jabil, Inc. | | BBB- | | | 4.70 | | | | 09/15/22 | | | | 1,976,000 | | | | 1,956,240 | |
Juniper Networks, Inc. | | BBB | | | 4.50 | | | | 03/15/24 | | | | 1,500,000 | | | | 1,511,045 | |
Juniper Networks, Inc. | | BBB | | | 4.60 | | | | 03/15/21 | | | | 600,000 | | | | 613,171 | |
The accompanying notes are an integral part of these portfolio schedules.
107
MUTUAL OF AMERICA INVESTMENT CORPORATION — MID-TERM BOND FUND
PORTFOLIO OF INVESTMENTS IN SECURITIES (Continued)
December 31, 2018
| | | | | | | | | | | | | | | | | | | | |
| | | Rating** | | | Rate(%) | | | Maturity | | | Face Amount | | | Value | |
| LONG-TERM DEBT SECURITIES (CONTINUED): | | | | | | | | | | | | | | | | | | | | |
CORPORATE DEBT (CONTINUED) | | | | | | | | | | | | | | | | | | | | |
INFORMATION TECHNOLOGY (CONTINUED) | | | | | | | | | | | | | | | | | | | | |
Lam Research Corp. | | | BBB+ | | | | 2.75 | | | | 03/15/20 | | | $ | 2,000,000 | | | $ | 1,980,955 | |
Motorola Solutions, Inc. | | | BBB- | | | | 3.75 | | | | 05/15/22 | | | | 2,000,000 | | | | 1,984,509 | |
Symantec Corp. | | | BB+ | | | | 4.20 | | | | 09/15/20 | | | | 2,000,000 | | | | 1,977,504 | |
Total System Svcs., Inc. | | | BBB- | | | | 3.75 | | | | 06/01/23 | | | | 950,000 | | | | 942,214 | |
| | | | | | | | | | | | | | | | | | | | |
| | | | | | | | | | | | | | | | | | | 19,127,423 | |
| | | | | | | | | | | | | | | | | | | | |
MATERIALS (2.1%) | | | | | | | | | | | | | | | | | | | | |
Albemarle Corp. | | | BBB | | | | 4.50 | | | | 12/15/20 | | | | 1,065,000 | | | | 1,083,615 | |
Domtar Corp. | | | BBB- | | | | 4.40 | | | | 04/01/22 | | | | 2,000,000 | | | | 2,010,019 | |
Freeport-McMoRan, Inc. | | | BB | | | | 3.10 | | | | 03/15/20 | | | | 1,750,000 | | | | 1,710,625 | |
Freeport-McMoRan, Inc. | | | BB | | | | 3.55 | | | | 03/01/22 | | | | 250,000 | | | | 236,563 | |
Kinross Gold Corp. | | | BBB- | | | | 5.13 | | | | 09/01/21 | | | | 750,000 | | | | 748,125 | |
Methanex Corp. | | | BB+ | | | | 3.25 | | | | 12/15/19 | | | | 2,000,000 | | | | 1,985,012 | |
Newmont Mining Corp. | | | BBB | | | | 3.50 | | | | 03/15/22 | | | | 2,000,000 | | | | 1,979,038 | |
Sherwin-Williams Co. | | | BBB | | | | 2.25 | | | | 05/15/20 | | | | 200,000 | | | | 196,909 | |
Southern Copper Corp. | | | BBB+ | | | | 3.50 | | | | 11/08/22 | | | | 2,000,000 | | | | 1,951,058 | |
WestRock RKT Co. | | | BBB | | | | 3.50 | | | | 03/01/20 | | | | 622,000 | | | | 621,366 | |
| | | | | | | | | | | | | | | | | | | | |
| | | | | | | | | | | | | | | | | | | 12,522,330 | |
| | | | | | | | | | | | | | | | | | | | |
REAL ESTATE (3.6%) | | | | | | | | | | | | | | | | | | | | |
Boston Properties LP | | | A- | | | | 3.80 | | | | 02/01/24 | | | | 3,000,000 | | | | 2,988,792 | |
CBRE Svcs., Inc. | | | BBB+ | | | | 5.25 | | | | 03/15/25 | | | | 2,000,000 | | | | 2,084,271 | |
Crown Castle International Corp. | | | BBB- | | | | 3.15 | | | | 07/15/23 | | | | 2,500,000 | | | | 2,403,061 | |
Government Properties Income Trust | | | BBB- | | | | 3.75 | | | | 08/15/19 | | | | 2,000,000 | | | | 2,001,985 | |
HCP, Inc. | | | BBB+ | | | | 3.15 | | | | 08/01/22 | | | | 750,000 | | | | 731,475 | |
HCP, Inc. | | | BBB+ | | | | 4.00 | | | | 12/01/22 | | | | 2,000,000 | | | | 1,996,979 | |
Hospitality Properties Trust | | | BBB- | | | | 5.00 | | | | 08/15/22 | | | | 1,300,000 | | | | 1,327,816 | |
Jones Lang LaSalle, Inc. | | | BBB+ | | | | 4.40 | | | | 11/15/22 | | | | 1,410,000 | | | | 1,424,226 | |
Mack-Cali Realty LP | | | BB+ | | | | 4.50 | | | | 04/18/22 | | | | 1,000,000 | | | | 964,939 | |
Omega Healthcare Investors, Inc. | | | BBB- | | | | 4.38 | | | | 08/01/23 | | | | 1,750,000 | | | | 1,757,265 | |
Omega Healthcare Investors, Inc. | | | BBB- | | | | 4.50 | | | | 01/15/25 | | | | 750,000 | | | | 738,924 | |
Senior Housing Properties Trust | | | BBB- | | | | 4.75 | | | | 05/01/24 | | | | 500,000 | | | | 496,033 | |
Vornado Realty LP | | | BBB | | | | 5.00 | | | | 01/15/22 | | | | 2,000,000 | | | | 2,063,792 | |
| | | | | | | | | | | | | | | | | | | | |
| | | | | | | | | | | | | | | | | | | 20,979,558 | |
| | | | | | | | | | | | | | | | | | | | |
UTILITIES (1.9%) | | | | | | | | | | | | | | | | | | | | |
Entergy Corp. | | | BBB | | | | 5.13 | | | | 09/15/20 | | | | 1,400,000 | | | | 1,428,641 | |
Exelon Corp. | | | BBB- | | | | 5.15 | | | | 12/01/20 | | | | 1,500,000 | | | | 1,532,827 | |
Exelon Generation Co. LLC | | | BBB | | | | 4.25 | | | | 06/15/22 | | | | 1,000,000 | | | | 1,013,705 | |
National Fuel Gas Co. | | | BBB | | | | 4.90 | | | | 12/01/21 | | | | 2,000,000 | | | | 2,036,576 | |
SCANA Corp. | | | BBB | | | | 4.75 | | | | 05/15/21 | | | | 2,000,000 | | | | 2,024,531 | |
Southern Co. | | | BBB+ | | | | 3.25 | | | | 07/01/26 | | | | 2,500,000 | | | | 2,343,083 | |
Talen Energy Supply LLC† | | | B+ | | | | 6.50 | | | | 09/15/24 | | | | 1,400,000 | | | | 855,750 | |
| | | | | | | | | | | | | | | | | | | | |
| | | | | | | | | | | | | | | | | | | 11,235,113 | |
| | | | | | | | | | | | | | | | | | | | |
TOTAL CORPORATE DEBT | | | | | | | | | | | | | | | | | | | 246,555,201 | |
| | | | | | | | | | | | | | | | | | | | |
TOTAL LONG-TERM DEBT SECURITIES
(Cost: $590,845,338) 99.1% | | | | | | | | | | | | | | | | | | | 581,035,158 | |
| | | | | | | | | | | | | | | | | | | | |
| | | | | |
| SHORT-TERM DEBT SECURITIES: | | | | | | | | | | | | | | | | | | | | |
U.S. GOVERNMENT AGENCIES (0.3%) | | | | | | | | | | | | | | | | | | | | |
FHLB | | | A-1+ | | | | 2.15 | | | | 01/02/19 | | | | 2,000,000 | | | | 1,999,881 | |
| | | | | | | | | | | | | | | | | | | | |
TOTAL SHORT-TERM DEBT SECURITIES
(Cost: $1,999,881) 0.3% | | | | 1,999,881 | |
| | | | | | | | | | | | | | | | | | | | |
The accompanying notes are an integral part of these portfolio schedules.
108
MUTUAL OF AMERICA INVESTMENT CORPORATION — MID-TERM BOND FUND
PORTFOLIO OF INVESTMENTS IN SECURITIES (Continued)
December 31, 2018
| | | | | | | | | | | | | | | | | | | | |
| | | | | | Rate(%) | | | Maturity | | | Face Amount | | | Value | |
TEMPORARY CASH INVESTMENT (0.0%) (2)
| | | | | | | | | | | | | | | | | | | | |
Citibank, New York Time Deposit | | | | | | | 1.67 | | | | 01/02/19 | | | $ | 32,852 | | | $ | 32,852 | |
| | | | | | | | | | | | | | | | | | | | |
TOTAL TEMPORARY CASH INVESTMENT
(Cost: $32,852) 0.0% (2) | | | | 32,852 | |
| | | | | | | | | | | | | | | | | | | | |
TOTAL INVESTMENTS
(Cost: $592,878,071) 99.4% | | | | 583,067,891 | |
| | | | | | | | | | | | | | | | | | | | |
OTHER NET ASSETS 0.6% | | | | 3,654,363 | |
| | | | | | | | | | | | | | | | | | | | |
NET ASSETS 100.0% | | | $ | 586,722,254 | |
| | | | | | | | | | | | | | | | | | | | |
The accompanying notes are an integral part of these portfolio schedules.
109
MUTUAL OF AMERICA INVESTMENT CORPORATION — BOND FUND
PORTFOLIO OF INVESTMENTS IN SECURITIES
December 31, 2018
| | | | | | | | | | | | | | | | | | | | |
| | | Rating** | | | Rate(%) | | | Maturity | | | Face Amount | | | Value | |
| LONG-TERM DEBT SECURITIES: | | | | | | | | | | | | | | | | | | | | |
U.S. GOVERNMENT (31.8%) | | | | | | | | | | | | | | | | | | | | |
U.S. Treasury Note | | | AA+ | | | | 1.50 | | | | 08/15/26 | | | $ | 50,800,000 | | | $ | 46,894,150 | |
U.S. Treasury Note | | | AA+ | | | | 1.63 | | | | 05/15/26 | | | | 2,000,000 | | | | 1,868,776 | |
U.S. Treasury Note | | | AA+ | | | | 2.00 | | | | 11/15/26 | | | | 15,000,000 | | | | 14,328,828 | |
U.S. Treasury Note | | | AA+ | | | | 2.25 | | | | 02/15/27 | | | | 44,000,000 | | | | 42,756,577 | |
U.S. Treasury Note | | | AA+ | | | | 2.25 | | | | 08/15/27 | | | | 74,500,000 | | | | 72,153,936 | |
U.S. Treasury Note | | | AA+ | | | | 2.25 | | | | 11/15/27 | | | | 51,100,000 | | | | 49,399,191 | |
U.S. Treasury Note | | | AA+ | | | | 2.38 | | | | 05/15/27 | | | | 63,750,000 | | | | 62,462,087 | |
U.S. Treasury Note | | | AA+ | | | | 2.75 | | | | 05/31/23 | | | | 16,000,000 | | | | 16,174,429 | |
U.S. Treasury Note | | | AA+ | | | | 2.88 | | | | 05/15/28 | | | | 39,000,000 | | | | 39,627,203 | |
U.S. Treasury Strip | | | AA+ | | | | 0.00 | | | | 08/15/25 | | | | 20,000,000 | | | | 16,811,320 | |
U.S. Treasury Strip | | | AA+ | | | | 0.00 | | | | 08/15/26 | | | | 20,000,000 | | | | 16,323,380 | |
U.S. Treasury Strip | | | AA+ | | | | 0.00 | | | | 08/15/28 | | | | 20,000,000 | | | | 15,298,236 | |
U.S. Treasury Strip | | | AA+ | | | | 0.00 | | | | 08/15/29 | | | | 20,000,000 | | | | 14,830,316 | |
U.S. Treasury Strip | | | AA+ | | | | 0.00 | | | | 08/15/33 | | | | 10,000,000 | | | | 6,549,480 | |
U.S. Treasury Strip | | | AA+ | | | | 0.00 | | | | 08/15/35 | | | | 10,000,000 | | | | 6,162,120 | |
U.S. Treasury Strip | | | AA+ | | | | 0.00 | | | | 08/15/37 | | | | 10,000,000 | | | | 5,774,529 | |
| | | | | | | | | | | | | | | | | | | | |
| | | | | | | | | | | | | | | | | | | 427,414,558 | |
| | | | | | | | | | | | | | | | | | | | |
U.S. GOVERNMENT AGENCIES (28.8%) | | | | | | | | | | | | | | | | | | | | |
MORTGAGE-BACKED OBLIGATIONS (27.7%) | | | | | | | | | | | | | | | | | | | | |
FHLMC | | | AA+ | | | | 2.50 | | | | 09/01/27 | | | | 1,169,631 | | | | 1,155,894 | |
FHLMC | | | AA+ | | | | 2.50 | | | | 12/01/27 | | | | 1,312,954 | | | | 1,297,518 | |
FHLMC | | | AA+ | | | | 3.00 | | | | 06/01/27 | | | | 642,144 | | | | 644,291 | |
FHLMC | | | AA+ | | | | 3.00 | | | | 08/01/27 | | | | 399,838 | | | | 400,583 | |
FHLMC | | | AA+ | | | | 3.00 | | | | 02/01/32 | | | | 4,739,832 | | | | 4,722,894 | |
FHLMC | | | AA+ | | | | 3.00 | | | | 10/15/37 | | | | 1,133,894 | | | | 1,131,912 | |
FHLMC | | | AA+ | | | | 3.00 | | | | 12/15/40 | | | | 1,137,298 | | | | 1,116,584 | |
FHLMC | | | AA+ | | | | 3.00 | | | | 07/01/42 | | | | 631,369 | | | | 630,499 | |
FHLMC | | | AA+ | | | | 3.00 | | | | 10/01/42 | | | | 1,972,702 | | | | 1,940,337 | |
FHLMC | | | AA+ | | | | 3.00 | | | | 11/01/42 | | | | 783,651 | | | | 769,857 | |
FHLMC | | | AA+ | | | | 3.00 | | | | 11/01/42 | | | | 1,939,885 | | | | 1,905,814 | |
FHLMC | | | AA+ | | | | 3.00 | | | | 11/01/42 | | | | 867,683 | | | | 852,426 | |
FHLMC | | | AA+ | | | | 3.00 | | | | 11/01/42 | | | | 3,227,990 | | | | 3,174,302 | |
FHLMC | | | AA+ | | | | 3.00 | | | | 02/01/43 | | | | 1,680,346 | | | | 1,651,418 | |
FHLMC | | | AA+ | | | | 3.00 | | | | 03/01/43 | | | | 1,490,525 | | | | 1,465,031 | |
FHLMC | | | AA+ | | | | 3.00 | | | | 04/01/43 | | | | 872,644 | | | | 857,417 | |
FHLMC | | | AA+ | | | | 3.00 | | | | 04/01/43 | | | | 1,285,160 | | | | 1,263,530 | |
FHLMC | | | AA+ | | | | 3.00 | | | | 04/01/43 | | | | 2,059,593 | | | | 2,024,604 | |
FHLMC | | | AA+ | | | | 3.00 | | | | 09/15/43 | | | | 3,272,468 | | | | 3,236,066 | |
FHLMC | | | AA+ | | | | 3.00 | | | | 04/15/44 | | | | 1,032,128 | | | | 1,010,001 | |
FHLMC | | | AA+ | | | | 3.00 | | | | 04/15/45 | | | | 2,708,788 | | | | 2,681,987 | |
FHLMC | | | AA+ | | | | 3.00 | | | | 09/01/46 | | | | 4,349,294 | | | | 4,245,058 | |
FHLMC | | | AA+ | | | | 3.00 | | | | 09/01/46 | | | | 1,684,240 | | | | 1,645,208 | |
FHLMC | | | AA+ | | | | 3.00 | | | | 11/01/46 | | | | 1,338,632 | | | | 1,295,505 | |
FHLMC | | | AA+ | | | | 3.50 | | | | 02/01/35 | | | | 1,375,628 | | | | 1,401,048 | |
FHLMC | | | AA+ | | | | 3.50 | | | | 02/01/35 | | | | 2,675,844 | | | | 2,710,408 | |
FHLMC | | | AA+ | | | | 3.50 | | | | 04/01/35 | | | | 1,131,560 | | | | 1,146,178 | |
FHLMC | | | AA+ | | | | 3.50 | | | | 02/01/36 | | | | 1,289,007 | | | | 1,305,662 | |
FHLMC | | | AA+ | | | | 3.50 | | | | 01/01/41 | | | | 1,346,769 | | | | 1,357,108 | |
FHLMC | | | AA+ | | | | 3.50 | | | | 07/01/42 | | | | 1,738,768 | | | | 1,752,114 | |
FHLMC | | | AA+ | | | | 3.50 | | | | 10/01/42 | | | | 1,471,004 | | | | 1,482,286 | |
FHLMC | | | AA+ | | | | 3.50 | | | | 01/01/43 | | | | 1,243,832 | | | | 1,251,839 | |
FHLMC | | | AA+ | | | | 3.50 | | | | 01/01/43 | | | | 662,713 | | | | 667,800 | |
FHLMC | | | AA+ | | | | 3.50 | | | | 05/01/43 | | | | 1,978,518 | | | | 1,993,635 | |
FHLMC | | | AA+ | | | | 3.50 | | | | 06/01/43 | | | | 2,519,962 | | | | 2,534,605 | |
FHLMC | | | AA+ | | | | 3.50 | | | | 07/01/43 | | | | 694,624 | | | | 699,884 | |
FHLMC | | | AA+ | | | | 3.50 | | | | 11/01/43 | | | | 1,367,555 | | | | 1,378,049 | |
The accompanying notes are an integral part of these portfolio schedules.
110
MUTUAL OF AMERICA INVESTMENT CORPORATION — BOND FUND
PORTFOLIO OF INVESTMENTS IN SECURITIES (Continued)
December 31, 2018
| | | | | | | | | | | | | | | | | | | | |
| | | Rating** | | | Rate(%) | | | Maturity | | | Face Amount | | | Value | |
| LONG-TERM DEBT SECURITIES (CONTINUED): | | | | | | | | | | | | | | | | | | | | |
U.S. GOVERNMENT AGENCIES (CONTINUED) | | | | | | | | | | | | | | | | | | | | |
MORTGAGE-BACKED OBLIGATIONS (CONTINUED) | | | | | | | | | | | | | | | | | | | | |
FHLMC | | | AA+ | | | | 3.50 | | | | 01/01/44 | | | $ | 2,339,631 | | | $ | 2,357,588 | |
FHLMC | | | AA+ | | | | 3.50 | | | | 05/15/44 | | | | 2,609,711 | | | | 2,642,861 | |
FHLMC | | | AA+ | | | | 3.50 | | | | 04/01/45 | | | | 1,994,493 | | | | 2,006,305 | |
FHLMC | | | AA+ | | | | 3.50 | | | | 07/01/45 | | | | 2,043,470 | | | | 2,053,306 | |
FHLMC | | | AA+ | | | | 3.50 | | | | 09/01/45 | | | | 1,743,312 | | | | 1,749,678 | |
FHLMC | | | AA+ | | | | 3.50 | | | | 11/01/45 | | | | 5,642,497 | | | | 5,671,496 | |
FHLMC | | | AA+ | | | | 3.50 | | | | 05/01/46 | | | | 3,639,094 | | | | 3,650,881 | |
FHLMC | | | AA+ | | | | 3.50 | | | | 08/01/46 | | | | 2,600,454 | | | | 2,608,608 | |
FHLMC | | | AA+ | | | | 3.50 | | | | 09/01/47 | | | | 5,544,714 | | | | 5,547,361 | |
FHLMC | | | AA+ | | | | 3.50 | | | | 11/01/47 | | | | 3,714,253 | | | | 3,714,588 | |
FHLMC | | | AA+ | | | | 4.00 | | | | 02/01/25 | | | | 161,117 | | | | 165,254 | |
FHLMC | | | AA+ | | | | 4.00 | | | | 05/01/25 | | | | 62,947 | | | | 64,563 | |
FHLMC | | | AA+ | | | | 4.00 | | | | 05/01/26 | | | | 215,031 | | | | 220,373 | |
FHLMC | | | AA+ | | | | 4.00 | | | | 11/01/33 | | | | 7,090,302 | | | | 7,258,666 | |
FHLMC | | | AA+ | | | | 4.00 | | | | 12/01/33 | | | | 1,018,939 | | | | 1,043,111 | |
FHLMC | | | AA+ | | | | 4.00 | | | | 01/01/38 | | | | 2,547,210 | | | | 2,633,369 | |
FHLMC | | | AA+ | | | | 4.00 | | | | 12/15/38 | | | | 368,344 | | | | 377,206 | |
FHLMC | | | AA+ | | | | 4.00 | | | | 07/01/41 | | | | 939,839 | | | | 967,029 | |
FHLMC | | | AA+ | | | | 4.00 | | | | 12/01/41 | | | | 564,004 | | | | 580,326 | |
FHLMC | | | AA+ | | | | 4.00 | | | | 07/01/42 | | | | 2,031,303 | | | | 2,109,373 | |
FHLMC | | | AA+ | | | | 4.00 | | | | 08/01/42 | | | | 701,306 | | | | 721,582 | |
FHLMC | | | AA+ | | | | 4.00 | | | | 08/01/42 | | | | 1,416,815 | | | | 1,457,811 | |
FHLMC | | | AA+ | | | | 4.00 | | | | 09/01/42 | | | | 740,351 | | | | 760,107 | |
FHLMC | | | AA+ | | | | 4.00 | | | | 11/01/42 | | | | 1,243,179 | | | | 1,277,615 | |
FHLMC | | | AA+ | | | | 4.00 | | | | 12/01/42 | | | | 930,855 | | | | 957,790 | |
FHLMC | | | AA+ | | | | 4.00 | | | | 01/01/43 | | | | 1,383,655 | | | | 1,424,549 | |
FHLMC | | | AA+ | | | | 4.00 | | | | 01/01/44 | | | | 1,506,511 | | | | 1,548,235 | |
FHLMC | | | AA+ | | | | 4.00 | | | | 10/01/44 | | | | 1,252,175 | | | | 1,279,877 | |
FHLMC | | | AA+ | | | | 4.00 | | | | 10/01/44 | | | | 1,562,816 | | | | 1,597,402 | |
FHLMC | | | AA+ | | | | 4.00 | | | | 10/01/44 | | | | 1,682,345 | | | | 1,719,575 | |
FHLMC | | | AA+ | | | | 4.00 | | | | 05/01/47 | | | | 3,566,618 | | | | 3,639,219 | |
FHLMC | | | AA+ | | | | 4.00 | | | | 05/01/48 | | | | 2,926,780 | | | | 2,984,330 | |
FHLMC | | | AA+ | | | | 4.50 | | | | 03/01/34 | | | | 340,562 | | | | 354,213 | |
FHLMC | | | AA+ | | | | 4.50 | | | | 08/01/34 | | | | 169,740 | | | | 176,544 | |
FHLMC | | | AA+ | | | | 4.50 | | | | 08/15/35 | | | | 54,163 | | | | 54,890 | |
FHLMC | | | AA+ | | | | 4.50 | | | | 06/01/37 | | | | 832,870 | | | | 868,267 | |
FHLMC | | | AA+ | | | | 4.50 | | | | 12/01/39 | | | | 107,214 | | | | 111,003 | |
FHLMC | | | AA+ | | | | 4.50 | | | | 03/01/41 | | | | 434,619 | | | | 455,879 | |
FHLMC | | | AA+ | | | | 4.50 | | | | 05/01/48 | | | | 4,712,809 | | | | 4,881,793 | |
FHLMC | | | AA+ | | | | 4.50 | | | | 05/01/48 | | | | 3,839,085 | | | | 3,976,742 | |
FHLMC | | | AA+ | | | | 5.00 | | | | 02/01/26 | | | | 49,620 | | | | 51,935 | |
FHLMC | | | AA+ | | | | 5.00 | | | | 08/01/35 | | | | 966,511 | | | | 1,025,584 | |
FHLMC | | | AA+ | | | | 5.00 | | | | 10/01/40 | | | | 665,540 | | | | 699,497 | |
FHLMC | | | AA+ | | | | 5.50 | | | | 03/01/21 | | | | 25,526 | | | | 25,829 | |
FHLMC | | | AA+ | | | | 5.50 | | | | 07/01/32 | | | | 133,371 | | | | 142,717 | |
FHLMC | | | AA+ | | | | 5.50 | | | | 01/15/33 | | | | 167,320 | | | | 178,960 | |
FHLMC | | | AA+ | | | | 5.50 | | | | 05/01/33 | | | | 170,795 | | | | 180,722 | |
FHLMC | | | AA+ | | | | 5.50 | | | | 06/01/37 | | | | 945,748 | | | | 1,021,306 | |
FHLMC | | | AA+ | | | | 6.00 | | | | 07/15/29 | | | | 100,813 | | | | 108,494 | |
FHLMC | | | AA+ | | | | 6.00 | | | | 03/15/32 | | | | 117,534 | | | | 128,413 | |
FHLMC ARM | | | AA+ | | | | 3.70 | | | | 02/01/36 | | | | 119,903 | | | | 125,797 | |
FHLMC ARM | | | AA+ | | | | 3.90 | | | | 03/01/37 | | | | 16,426 | | | | 17,121 | |
FHLMC ARM | | | AA+ | | | | 4.05 | | | | 04/01/37 | | | | 79,671 | | | | 83,061 | |
FHLMC ARM | | | AA+ | | | | 4.14 | | | | 04/01/37 | | | | 80,906 | | | | 84,611 | |
FHLMC ARM | | | AA+ | | | | 4.18 | | | | 05/01/37 | | | | 74,352 | | | | 77,336 | |
The accompanying notes are an integral part of these portfolio schedules.
111
MUTUAL OF AMERICA INVESTMENT CORPORATION — BOND FUND
PORTFOLIO OF INVESTMENTS IN SECURITIES (Continued)
December 31, 2018
| | | | | | | | | | | | | | | | | | | | |
| | | Rating** | | | Rate(%) | | | Maturity | | | Face Amount | | | Value | |
| LONG-TERM DEBT SECURITIES (CONTINUED): | | | | | | | | | | | | | | | | | | | | |
U.S. GOVERNMENT AGENCIES (CONTINUED) | | | | | | | | | | | | | | | | | | | | |
MORTGAGE-BACKED OBLIGATIONS (CONTINUED) | | | | | | | | | | | | | | | | | | | | |
FHLMC Strip | | | AA+ | | | | 3.00 | | | | 01/15/43 | | | $ | 2,487,216 | | | $ | 2,477,908 | |
FHLMC Strip | | | AA+ | | | | 3.50 | | | | 10/15/47 | | | | 2,423,488 | | | | 2,453,206 | |
FNMA | | | AA+ | | | | 2.25 | | | | 01/01/28 | | | | 1,333,435 | | | | 1,294,089 | |
FNMA | | | AA+ | | | | 2.68 | | | | 12/01/26 | | | | 3,000,000 | | | | 2,911,933 | |
FNMA | | | AA+ | | | | 2.92 | | | | 07/01/27 | | | | 2,924,827 | | | | 2,885,819 | |
FNMA | | | AA+ | | | | 3.00 | | | | 06/01/33 | | | | 1,112,222 | | | | 1,107,679 | |
FNMA | | | AA+ | | | | 3.00 | | | | 07/01/33 | | | | 2,082,277 | | | | 2,073,771 | |
FNMA | | | AA+ | | | | 3.00 | | | | 09/01/33 | | | | 2,192,777 | | | | 2,183,819 | |
FNMA | | | AA+ | | | | 3.00 | | | | 04/25/42 | | | | 1,246,891 | | | | 1,240,000 | |
FNMA | | | AA+ | | | | 3.00 | | | | 10/01/42 | | | | 690,897 | | | | 676,961 | |
FNMA | | | AA+ | | | | 3.00 | | | | 12/01/42 | | | | 988,068 | | | | 967,774 | |
FNMA | | | AA+ | | | | 3.00 | | | | 12/01/42 | | | | 1,574,759 | | | | 1,530,219 | |
FNMA | | | AA+ | | | | 3.00 | | | | 01/01/43 | | | | 3,489,442 | | | | 3,436,924 | |
FNMA | | | AA+ | | | | 3.00 | | | | 02/01/43 | | | | 1,568,166 | | | | 1,543,296 | |
FNMA | | | AA+ | | | | 3.00 | | | | 03/01/43 | | | | 1,969,112 | | | | 1,937,883 | |
FNMA | | | AA+ | | | | 3.00 | | | | 04/01/43 | | | | 1,850,700 | | | | 1,798,401 | |
FNMA | | | AA+ | | | | 3.00 | | | | 02/01/45 | | | | 1,496,899 | | | | 1,473,671 | |
FNMA | | | AA+ | | | | 3.00 | | | | 03/01/45 | | | | 1,911,266 | | | | 1,857,189 | |
FNMA | | | AA+ | | | | 3.00 | | | | 09/01/46 | | | | 2,663,777 | | | | 2,600,868 | |
FNMA | | | AA+ | | | | 3.00 | | | | 01/01/47 | | | | 1,214,435 | | | | 1,182,896 | |
FNMA | | | AA+ | | | | 3.50 | | | | 03/01/32 | | | | 821,097 | | | | 836,612 | |
FNMA | | | AA+ | | | | 3.50 | | | | 08/01/38 | | | | 1,692,644 | | | | 1,702,878 | |
FNMA | | | AA+ | | | | 3.50 | | | | 03/01/41 | | | | 1,450,575 | | | | 1,461,413 | |
FNMA | | | AA+ | | | | 3.50 | | | | 10/01/41 | | | | 843,922 | | | | 848,826 | |
FNMA | | | AA+ | | | | 3.50 | | | | 12/01/41 | | | | 1,043,730 | | | | 1,049,848 | |
FNMA | | | AA+ | | | | 3.50 | | | | 04/01/42 | | | | 1,170,803 | | | | 1,180,307 | |
FNMA | | | AA+ | | | | 3.50 | | | | 04/01/42 | | | | 1,030,039 | | | | 1,036,126 | |
FNMA | | | AA+ | | | | 3.50 | | | | 07/01/42 | | | | 1,628,954 | | | | 1,642,178 | |
FNMA | | | AA+ | | | | 3.50 | | | | 08/01/42 | | | | 1,018,136 | | | | 1,026,402 | |
FNMA | | | AA+ | | | | 3.50 | | | | 09/01/42 | | | | 1,268,465 | | | | 1,278,762 | |
FNMA | | | AA+ | | | | 3.50 | | | | 10/01/42 | | | | 1,339,097 | | | | 1,349,968 | |
FNMA | | | AA+ | | | | 3.50 | | | | 11/25/42 | | | | 1,904,273 | | | | 1,925,984 | |
FNMA | | | AA+ | | | | 3.50 | | | | 12/01/42 | | | | 2,437,349 | | | | 2,457,071 | |
FNMA | | | AA+ | | | | 3.50 | | | | 12/01/42 | | | | 1,289,483 | | | | 1,307,089 | |
FNMA | | | AA+ | | | | 3.50 | | | | 01/01/43 | | | | 1,287,669 | | | | 1,294,104 | |
FNMA | | | AA+ | | | | 3.50 | | | | 03/01/43 | | | | 1,558,642 | | | | 1,571,292 | |
FNMA | | | AA+ | | | | 3.50 | | | | 06/01/43 | | | | 2,984,469 | | | | 3,007,663 | |
FNMA | | | AA+ | | | | 3.50 | | | | 07/25/43 | | | | 2,278,870 | | | | 2,299,933 | |
FNMA | | | AA+ | | | | 3.50 | | | | 08/01/43 | | | | 4,152,521 | | | | 4,178,445 | |
FNMA | | | AA+ | | | | 3.50 | | | | 08/01/43 | | | | 1,935,606 | | | | 1,950,079 | |
FNMA | | | AA+ | | | | 3.50 | | | | 10/01/43 | | | | 1,139,381 | | | | 1,154,960 | |
FNMA | | | AA+ | | | | 3.50 | | | | 01/01/44 | | | | 900,845 | | | | 895,599 | |
FNMA | | | AA+ | | | | 3.50 | | | | 08/25/44 | | | | 3,848,860 | | | | 3,901,607 | |
FNMA | | | AA+ | | | | 3.50 | | | | 02/01/45 | | | | 1,959,220 | | | | 1,967,139 | |
FNMA | | | AA+ | | | | 3.50 | | | | 04/01/45 | | | | 3,331,830 | | | | 3,348,564 | |
FNMA | | | AA+ | | | | 3.50 | | | | 04/01/45 | | | | 2,028,110 | | | | 2,036,411 | |
FNMA | | | AA+ | | | | 3.50 | | | | 05/01/45 | | | | 3,691,771 | | | | 3,706,311 | |
FNMA | | | AA+ | | | | 3.50 | | | | 10/01/45 | | | | 3,633,041 | | | | 3,651,284 | |
FNMA | | | AA+ | | | | 3.50 | | | | 02/01/46 | | | | 2,339,679 | | | | 2,348,047 | |
FNMA | | | AA+ | | | | 3.50 | | | | 02/01/46 | | | | 4,105,503 | | | | 4,119,551 | |
FNMA | | | AA+ | | | | 3.50 | | | | 03/01/46 | | | | 2,123,688 | | | | 2,137,117 | |
FNMA | | | AA+ | | | | 3.50 | | | | 08/01/46 | | | | 3,371,971 | | | | 3,379,381 | |
FNMA | | | AA+ | | | | 3.50 | | | | 11/01/46 | | | | 2,952,041 | | | | 2,960,881 | |
FNMA | | | AA+ | | | | 3.50 | | | | 09/01/47 | | | | 4,019,090 | | | | 4,032,228 | |
FNMA | | | AA+ | | | | 3.50 | | | | 04/01/48 | | | | 1,829,860 | | | | 1,833,901 | |
FNMA | | | AA+ | | | | 3.50 | | | | 08/01/48 | | | | 4,779,003 | | | | 4,780,998 | |
The accompanying notes are an integral part of these portfolio schedules.
112
MUTUAL OF AMERICA INVESTMENT CORPORATION — BOND FUND
PORTFOLIO OF INVESTMENTS IN SECURITIES (Continued)
December 31, 2018
| | | | | | | | | | | | | | | | | | | | |
| | | Rating** | | | Rate(%) | | | Maturity | | | Face Amount | | | Value | |
| LONG-TERM DEBT SECURITIES (CONTINUED): | | | | | | | | | | | | | | | | | | | | |
U.S. GOVERNMENT AGENCIES (CONTINUED) | | | | | | | | | | | | | | | | | | | | |
MORTGAGE-BACKED OBLIGATIONS (CONTINUED) | | | | | | | | | | | | | | | | | | | | |
FNMA | | | AA+ | | | | 3.53 | | | | 01/01/26 | | | $ | 5,000,000 | | | $ | 5,134,992 | |
FNMA | | | AA+ | | | | 4.00 | | | | 05/01/19 | | | | 11,673 | | | | 11,949 | |
FNMA | | | AA+ | | | | 4.00 | | | | 07/25/26 | | | | 1,598,766 | | | | 1,674,434 | |
FNMA | | | AA+ | | | | 4.00 | | | | 05/25/29 | | | | 1,891,087 | | | | 1,968,659 | |
FNMA | | | AA+ | | | | 4.00 | | | | 01/01/31 | | | | 92,574 | | | | 95,097 | |
FNMA | | | AA+ | | | | 4.00 | | | | 12/01/33 | | | | 1,099,341 | | | | 1,127,072 | |
FNMA | | | AA+ | | | | 4.00 | | | | 03/01/35 | | | | 336,356 | | | | 344,629 | |
FNMA | | | AA+ | | | | 4.00 | | | | 06/01/36 | | | | 897,719 | | | | 927,216 | |
FNMA | | | AA+ | | | | 4.00 | | | | 11/01/38 | | | | 1,263,833 | | | | 1,299,931 | |
FNMA | | | AA+ | | | | 4.00 | | | | 10/01/40 | | | | 910,013 | | | | 937,706 | |
FNMA | | | AA+ | | | | 4.00 | | | | 11/01/40 | | | | 698,693 | | | | 718,663 | |
FNMA | | | AA+ | | | | 4.00 | | | | 01/01/41 | | | | 2,566,786 | | | | 2,639,666 | |
FNMA | | | AA+ | | | | 4.00 | | | | 02/01/41 | | | | 974,792 | | | | 1,002,657 | |
FNMA | | | AA+ | | | | 4.00 | | | | 05/01/41 | | | | 731,917 | | | | 745,722 | |
FNMA | | | AA+ | | | | 4.00 | | | | 08/01/42 | | | | 1,788,680 | | | | 1,839,808 | |
FNMA | | | AA+ | | | | 4.00 | | | | 05/01/43 | | | | 1,043,746 | | | | 1,073,567 | |
FNMA | | | AA+ | | | | 4.00 | | | | 09/01/45 | | | | 1,103,809 | | | | 1,129,417 | |
FNMA | | | AA+ | | | | 4.00 | | | | 11/01/45 | | | | 1,733,799 | | | | 1,783,863 | |
FNMA | | | AA+ | | | | 4.00 | | | | 02/01/47 | | | | 3,796,846 | | | | 3,882,835 | |
FNMA | | | AA+ | | | | 4.00 | | | | 05/01/48 | | | | 6,267,407 | | | | 6,392,244 | |
FNMA | | | AA+ | | | | 4.00 | | | | 07/01/56 | | | | 1,990,848 | | | | 2,031,729 | |
FNMA | | | AA+ | | | | 4.50 | | | | 05/01/19 | | | | 1,293 | | | | 1,316 | |
FNMA | | | AA+ | | | | 4.50 | | | | 06/01/19 | | | | 7,675 | | | | 7,813 | |
FNMA | | | AA+ | | | | 4.50 | | | | 05/01/30 | | | | 231,933 | | | | 242,580 | |
FNMA | | | AA+ | | | | 4.50 | | | | 04/01/31 | | | | 374,799 | | | | 392,014 | |
FNMA | | | AA+ | | | | 4.50 | | | | 08/01/33 | | | | 139,912 | | | | 145,614 | |
FNMA | | | AA+ | | | | 4.50 | | | | 08/01/33 | | | | 96,368 | | | | 100,284 | |
FNMA | | | AA+ | | | | 4.50 | | | | 09/01/33 | | | | 262,987 | | | | 273,735 | |
FNMA | | | AA+ | | | | 4.50 | | | | 10/01/33 | | | | 109,284 | | | | 113,737 | |
FNMA | | | AA+ | | | | 4.50 | | | | 10/01/33 | | | | 233,224 | | | | 242,954 | |
FNMA | | | AA+ | | | | 4.50 | | | | 05/01/34 | | | | 129,020 | | | | 134,318 | |
FNMA | | | AA+ | | | | 4.50 | | | | 06/01/34 | | | | 185,106 | | | | 192,446 | |
FNMA | | | AA+ | | | | 4.50 | | | | 07/01/34 | | | | 125,137 | | | | 130,300 | |
FNMA | | | AA+ | | | | 4.50 | | | | 01/01/35 | | | | 498,087 | | | | 518,517 | |
FNMA | | | AA+ | | | | 4.50 | | | | 08/01/35 | | | | 145,463 | | | | 151,484 | |
FNMA | | | AA+ | | | | 4.50 | | | | 12/01/35 | | | | 163,760 | | | | 170,550 | |
FNMA | | | AA+ | | | | 4.50 | | | | 05/01/39 | | | | 842,676 | | | | 882,739 | |
FNMA | | | AA+ | | | | 4.50 | | | | 05/01/39 | | | | 603,286 | | | | 631,855 | |
FNMA | | | AA+ | | | | 4.50 | | | | 05/01/40 | | | | 504,889 | | | | 530,620 | |
FNMA | | | AA+ | | | | 4.50 | | | | 07/01/40 | | | | 2,545,252 | | | | 2,684,412 | |
FNMA | | | AA+ | | | | 4.50 | | | | 10/01/40 | | | | 2,952,012 | | | | 3,093,528 | |
FNMA | | | AA+ | | | | 4.50 | | | | 11/01/40 | | | | 462,968 | | | | 485,157 | |
FNMA | | | AA+ | | | | 4.50 | | | | 03/01/41 | | | | 1,542,010 | | | | 1,615,851 | |
FNMA | | | AA+ | | | | 4.50 | | | | 06/01/41 | | | | 469,546 | | | | 492,054 | |
FNMA | | | AA+ | | | | 4.50 | | | | 08/01/41 | | | | 1,358,132 | | | | 1,423,228 | |
FNMA | | | AA+ | | | | 4.50 | | | | 10/01/41 | | | | 164,668 | | | | 170,628 | |
FNMA | | | AA+ | | | | 4.50 | | | | 11/01/41 | | | | 907,538 | | | | 951,040 | |
FNMA | | | AA+ | | | | 4.50 | | | | 01/01/42 | | | | 88,704 | | | | 92,669 | |
FNMA | | | AA+ | | | | 4.50 | | | | 07/01/42 | | | | 1,195,877 | | | | 1,253,024 | |
FNMA | | | AA+ | | | | 4.50 | | | | 03/01/44 | | | | 1,302,106 | | | | 1,356,464 | |
FNMA | | | AA+ | | | | 4.50 | | | | 04/01/44 | | | | 2,083,586 | | | | 2,171,460 | |
FNMA | | | AA+ | | | | 4.50 | | | | 11/01/47 | | | | 3,633,092 | | | | 3,786,639 | |
FNMA | | | AA+ | | | | 4.50 | | | | 11/01/47 | | | | 4,303,387 | | | | 4,461,612 | |
FNMA | | | AA+ | | | | 5.00 | | | | 09/01/20 | | | | 13,857 | | | | 14,086 | |
FNMA | | | AA+ | | | | 5.00 | | | | 10/01/20 | | | | 53,898 | | | | 54,788 | |
FNMA | | | AA+ | | | | 5.00 | | | | 10/01/25 | | | | 79,581 | | | | 83,392 | |
The accompanying notes are an integral part of these portfolio schedules.
113
MUTUAL OF AMERICA INVESTMENT CORPORATION — BOND FUND
PORTFOLIO OF INVESTMENTS IN SECURITIES (Continued)
December 31, 2018
| | | | | | | | | | | | | | | | | | | | |
| | | Rating** | | | Rate(%) | | | Maturity | | | Face Amount | | | Value | |
| LONG-TERM DEBT SECURITIES (CONTINUED): | | | | | | | | | | | | | | | | | | | | |
U.S. GOVERNMENT AGENCIES (CONTINUED) | | | | | | | | | | | | | | | | | | | | |
MORTGAGE-BACKED OBLIGATIONS (CONTINUED) | | | | | | | | | | | | | | | | | | | | |
FNMA | | | AA+ | | | | 5.00 | | | | 09/01/33 | | | $ | 468,749 | | | $ | 497,911 | |
FNMA | | | AA+ | | | | 5.00 | | | | 10/01/33 | | | | 336,109 | | | | 357,514 | |
FNMA | | | AA+ | | | | 5.00 | | | | 11/01/33 | | | | 370,792 | | | | 393,870 | |
FNMA | | | AA+ | | | | 5.00 | | | | 03/01/34 | | | | 76,113 | | | | 80,842 | |
FNMA | | | AA+ | | | | 5.00 | | | | 04/01/34 | | | | 42,194 | | | | 44,813 | |
FNMA | | | AA+ | | | | 5.00 | | | | 04/01/34 | | | | 143,282 | | | | 151,042 | |
FNMA | | | AA+ | | | | 5.00 | | | | 04/01/35 | | | | 140,627 | | | | 149,311 | |
FNMA | | | AA+ | | | | 5.00 | | | | 06/01/35 | | | | 88,256 | | | | 93,695 | |
FNMA | | | AA+ | | | | 5.00 | | | | 09/01/35 | | | | 143,501 | | | | 150,373 | |
FNMA | | | AA+ | | | | 5.00 | | | | 09/01/35 | | | | 213,914 | | | | 227,113 | |
FNMA | | | AA+ | | | | 5.00 | | | | 11/25/35 | | | | 556,283 | | | | 599,979 | |
FNMA | | | AA+ | | | | 5.00 | | | | 08/01/37 | | | | 624,932 | | | | 663,329 | |
FNMA | | | AA+ | | | | 5.00 | | | | 05/01/39 | | | | 402,966 | | | | 429,918 | |
FNMA | | | AA+ | | | | 5.00 | | | | 09/25/40 | | | | 1,276,674 | | | | 1,329,364 | |
FNMA | | | AA+ | | | | 5.50 | | | | 01/01/24 | | | | 86,840 | | | | 91,942 | |
FNMA | | | AA+ | | | | 5.50 | | | | 03/01/24 | | | | 185,613 | | | | 196,517 | |
FNMA | | | AA+ | | | | 5.50 | | | | 09/01/25 | | | | 87,713 | | | | 93,437 | |
FNMA | | | AA+ | | | | 5.50 | | | | 11/01/26 | | | | 57,047 | | | | 60,399 | |
FNMA | | | AA+ | | | | 5.50 | | | | 01/01/27 | | | | 40,353 | | | | 42,724 | |
FNMA | | | AA+ | | | | 5.50 | | | | 03/01/33 | | | | 176,672 | | | | 186,588 | |
FNMA | | | AA+ | | | | 5.50 | | | | 09/01/33 | | | | 210,189 | | | | 226,631 | |
FNMA | | | AA+ | | | | 5.50 | | | | 10/01/33 | | | | 320,806 | | | | 345,917 | |
FNMA | | | AA+ | | | | 5.50 | | | | 03/01/34 | | | | 160,029 | | | | 172,621 | |
FNMA | | | AA+ | | | | 5.50 | | | | 03/01/34 | | | | 35,051 | | | | 37,110 | |
FNMA | | | AA+ | | | | 5.50 | | | | 07/01/34 | | | | 135,753 | | | | 145,145 | |
FNMA | | | AA+ | | | | 5.50 | | | | 09/01/34 | | | | 58,934 | | | | 63,378 | |
FNMA | | | AA+ | | | | 5.50 | | | | 09/01/34 | | | | 118,882 | | | | 127,260 | |
FNMA | | | AA+ | | | | 5.50 | | | | 09/01/34 | | | | 36,241 | | | | 38,370 | |
FNMA | | | AA+ | | | | 5.50 | | | | 10/01/34 | | | | 262,660 | | | | 282,716 | |
FNMA | | | AA+ | | | | 5.50 | | | | 02/01/35 | | | | 126,979 | | | | 136,243 | |
FNMA | | | AA+ | | | | 5.50 | | | | 02/01/35 | | | | 102,440 | | | | 110,281 | |
FNMA | | | AA+ | | | | 5.50 | | | | 04/01/35 | | | | 126,447 | | | | 135,080 | |
FNMA | | | AA+ | | | | 5.50 | | | | 08/01/35 | | | | 219,260 | | | | 234,713 | |
FNMA | | | AA+ | | | | 5.50 | | | | 02/25/37 | | | | 28,120 | | | | 29,270 | |
FNMA | | | AA+ | | | | 5.50 | | | | 05/01/38 | | | | 325,160 | | | | 346,216 | |
FNMA | | | AA+ | | | | 5.50 | | | | 11/01/38 | | | | 25,046 | | | | 26,404 | |
FNMA | | | AA+ | | | | 5.50 | | | | 06/01/48 | | | | 68,757 | | | | 70,622 | |
FNMA | | | AA+ | | | | 6.00 | | | | 05/01/23 | | | | 111,086 | | | | 119,225 | |
FNMA | | | AA+ | | | | 6.00 | | | | 01/01/25 | | | | 78,641 | | | | 84,403 | |
FNMA | | | AA+ | | | | 6.00 | | | | 03/01/28 | | | | 102,622 | | | | 110,141 | |
FNMA | | | AA+ | | | | 6.00 | | | | 04/01/32 | | | | 6,847 | | | | 7,349 | |
FNMA | | | AA+ | | | | 6.00 | | | | 05/01/32 | | | | 136,623 | | | | 149,066 | |
FNMA | | | AA+ | | | | 6.00 | | | | 04/01/33 | | | | 325,080 | | | | 349,173 | |
FNMA | | | AA+ | | | | 6.00 | | | | 03/01/36 | | | | 26,296 | | | | 28,126 | |
FNMA | | | AA+ | | | | 6.00 | | | | 12/01/36 | | | | 96,285 | | | | 104,821 | |
FNMA | | | AA+ | | | | 6.00 | | | | 01/01/37 | | | | 130,667 | | | | 142,567 | |
FNMA | | | AA+ | | | | 6.00 | | | | 04/01/37 | | | | 22,977 | | | | 24,041 | |
FNMA | | | AA+ | | | | 6.00 | | | | 05/01/37 | | | | 20,662 | | | | 21,696 | |
FNMA | | | AA+ | | | | 6.00 | | | | 06/01/37 | | | | 7,183 | | | | 7,379 | |
FNMA | | | AA+ | | | | 6.00 | | | | 07/01/37 | | | | 56,947 | | | | 62,044 | |
FNMA | | | AA+ | | | | 6.00 | | | | 08/01/37 | | | | 70,942 | | | | 76,541 | |
FNMA | | | AA+ | | | | 6.00 | | | | 12/01/37 | | | | 40,877 | | | | 44,541 | |
FNMA | | | AA+ | | | | 6.00 | | | | 10/25/44 | | | | 404,016 | | | | 447,403 | |
FNMA | | | AA+ | | | | 6.00 | | | | 02/25/47 | | | | 837,423 | | | | 931,288 | |
FNMA | | | AA+ | | | | 6.00 | | | | 12/25/49 | | | | 330,783 | | | | 367,540 | |
The accompanying notes are an integral part of these portfolio schedules.
114
MUTUAL OF AMERICA INVESTMENT CORPORATION — BOND FUND
PORTFOLIO OF INVESTMENTS IN SECURITIES (Continued)
December 31, 2018
| | | | | | | | | | | | | | | | | | | | |
| | | Rating** | | | Rate(%) | | | Maturity | | | Face Amount | | | Value | |
| LONG-TERM DEBT SECURITIES (CONTINUED): | | | | | | | | | | | | | | | | | | | | |
U.S. GOVERNMENT AGENCIES (CONTINUED) | | | | | | | | | | | | | | | | | | | | |
MORTGAGE-BACKED OBLIGATIONS (CONTINUED) | | | | | | | | | | | | | | | | | | | | |
FNMA | | | AA+ | | | | 6.50 | | | | 05/01/32 | | | $ | 57,618 | | | $ | 61,840 | |
FNMA | | | AA+ | | | | 6.50 | | | | 05/01/32 | | | | 88,893 | | | | 95,405 | |
FNMA | | | AA+ | | | | 6.50 | | | | 09/01/36 | | | | 20,120 | | | | 21,941 | |
FNMA | | | AA+ | | | | 6.50 | | | | 05/01/37 | | | | 86,480 | | | | 89,430 | |
FNMA | | | AA+ | | | | 6.50 | | | | 07/01/37 | | | | 14,074 | | | | 15,148 | |
FNMA | | | AA+ | | | | 6.50 | | | | 09/01/37 | | | | 26,408 | | | | 28,342 | |
FNMA | | | AA+ | | | | 6.50 | | | | 05/01/38 | | | | 37,997 | | | | 41,430 | |
FNMA | | | AA+ | | | | 7.00 | | | | 01/25/44 | | | | 298,654 | | | | 340,817 | |
FNMA | | | AA+ | | | | 7.50 | | | | 06/01/32 | | | | 45,505 | | | | 53,069 | |
FNMA | | | AA+ | | | | 8.00 | | | | 04/01/32 | | | | 18,861 | | | | 19,658 | |
FNMA Strip | | | AA+ | | | | 3.00 | | | | 08/25/42 | | | | 1,076,532 | | | | 1,058,005 | |
FRESB Multifamily Mortgage | | | AA+ | | | | 3.16 | | | | 11/25/27 | | | | 1,988,099 | | | | 1,955,484 | |
FRESB Multifamily Mortgage | | | AA+ | | | | 3.30 | | | | 12/25/27 | | | | 1,988,129 | | | | 1,970,948 | |
GNMA (3) | | | AA+ | | | | 2.68 | | | | 10/16/47 | | | | 2,000,000 | | | | 1,973,923 | |
GNMA (3) | | | AA+ | | | | 3.00 | | | | 07/16/36 | | | | 1,679,024 | | | | 1,653,520 | |
GNMA (3) | | | AA+ | | | | 3.50 | | | | 05/20/31 | | | | 2,410,314 | | | | 2,472,450 | |
GNMA (3) | | | AA+ | | | | 3.50 | | | | 07/15/42 | | | | 1,601,381 | | | | 1,619,798 | |
GNMA (3) | | | AA+ | | | | 3.50 | | | | 11/15/42 | | | | 990,655 | | | | 1,002,100 | |
GNMA (3) | | | AA+ | | | | 3.50 | | | | 03/20/45 | | | | 4,021,709 | | | | 4,051,897 | |
GNMA (3) | | | AA+ | | | | 3.50 | | | | 05/20/45 | | | | 2,417,221 | | | | 2,441,653 | |
GNMA (3) | | | AA+ | | | | 3.70 | | | | 05/15/42 | | | | 778,914 | | | | 793,546 | |
GNMA (3) | | | AA+ | | | | 4.00 | | | | 04/15/24 | | | | 159,762 | | | | 163,425 | |
GNMA (3) | | | AA+ | | | | 4.00 | | | | 01/20/41 | | | | 1,398,611 | | | | 1,436,422 | |
GNMA (3) | | | AA+ | | | | 4.00 | | | | 03/15/41 | | | | 536,903 | | | | 553,642 | |
GNMA (3) | | | AA+ | | | | 4.00 | | | | 08/15/41 | | | | 933,346 | | | | 961,741 | |
GNMA (3) | | | AA+ | | | | 4.00 | | | | 11/15/41 | | | | 636,101 | | | | 657,239 | |
GNMA (3) | | | AA+ | | | | 4.00 | | | | 12/15/41 | | | | 1,398,879 | | | | 1,437,303 | |
GNMA (3) | | | AA+ | | | | 4.00 | | | | 08/20/42 | | | | 933,642 | | | | 958,573 | |
GNMA (3) | | | AA+ | | | | 4.25 | | | | 04/20/41 | | | | 726,494 | | | | 749,416 | |
GNMA (3) | | | AA+ | | | | 4.29 | | | | 04/15/41 | | | | 277,538 | | | | 286,163 | |
GNMA (3) | | | AA+ | | | | 4.50 | | | | 06/20/30 | | | | 39,798 | | | | 41,984 | |
GNMA (3) | | | AA+ | | | | 4.50 | | | | 09/15/30 | | | | 500,051 | | | | 522,391 | |
GNMA (3) | | | AA+ | | | | 4.50 | | | | 06/20/34 | | | | 299,185 | | | | 312,238 | |
GNMA (3) | | | AA+ | | | | 4.50 | | | | 09/15/40 | | | | 764,681 | | | | 798,498 | |
GNMA (3) | | | AA+ | | | | 4.50 | | | | 10/15/40 | | | | 1,083,155 | | | | 1,143,894 | |
GNMA (3) | | | AA+ | | | | 4.50 | | | | 10/15/40 | | | | 266,507 | | | | 278,314 | |
GNMA (3) | | | AA+ | | | | 5.00 | | | | 04/15/39 | | | | 861,794 | | | | 918,557 | |
GNMA (3) | | | AA+ | | | | 5.00 | | | | 06/20/39 | | | | 1,053,657 | | | | 1,118,664 | |
GNMA (3) | | | AA+ | | | | 5.00 | | | | 11/15/39 | | | | 340,035 | | | | 360,413 | |
GNMA (3) | | | AA+ | | | | 5.00 | | | | 05/15/40 | | | | 133,083 | | | | 140,252 | |
GNMA (3) | | | AA+ | | | | 5.00 | | | | 06/20/40 | | | | 97,494 | | | | 102,365 | |
GNMA (3) | | | AA+ | | | | 5.50 | | | | 01/15/36 | | | | 66,578 | | | | 70,712 | |
GNMA (3) | | | AA+ | | | | 6.50 | | | | 04/15/31 | | | | 6,687 | | | | 7,199 | |
GNMA (3) | | | AA+ | | | | 6.50 | | | | 12/15/31 | | | | 19,421 | | | | 20,909 | |
GNMA (3) | | | AA+ | | | | 6.50 | | | | 05/15/32 | | | | 24,930 | | | | 26,841 | |
GNMA (3) | | | AA+ | | | | 7.00 | | | | 05/15/32 | | | | 2,523 | | | | 2,568 | |
Vendee Mortgage Trust (3) | | | AA+ | | | | 5.25 | | | | 01/15/32 | | | | 487,741 | | | | 499,253 | |
| | | | | | | | | | | | | | | | | | | | |
| | | | | | | | | | | | | | | | | | | 372,303,511 | |
| | | | | | | | | | | | | | | | | | | | |
NON-MORTGAGE-BACKED OBLIGATIONS (1.1%) | | | | | | | | | | | | | | | | | | | | |
FNMA | | | AA+ | | | | 0.00 | | | | 10/09/19 | | | | 5,050,000 | | | | 4,941,631 | |
FHLMC | | | AA+ | | | | 0.00 | | | | 11/29/19 | | | | 11,000,000 | | | | 10,714,867 | |
| | | | | | | | | | | | | | | | | | | | |
| | | | | | | | | | | | | | | | | | | 15,656,498 | |
| | | | | | | | | | | | | | | | | | | | |
The accompanying notes are an integral part of these portfolio schedules.
115
MUTUAL OF AMERICA INVESTMENT CORPORATION — BOND FUND
PORTFOLIO OF INVESTMENTS IN SECURITIES (Continued)
December 31, 2018
| | | | | | | | | | | | | | | | | | | | |
| | | Rating** | | | Rate(%) | | | Maturity | | | Face Amount | | | Value | |
| LONG-TERM DEBT SECURITIES (CONTINUED): | | | | | | | | | | | | | | | | | | | | |
CORPORATE DEBT (38.3%) | | | | | |
COMMUNICATION SERVICES (1.4%) | | | | | | | | | | | | | | | | | | | | |
AT&T, Inc. | | | BBB | | | | 3.00 | | | | 02/15/22 | | | $ | 4,000,000 | | | $ | 3,924,224 | |
AT&T, Inc. | | | BBB | | | | 3.00 | | | | 06/30/22 | | | | 1,000,000 | | | | 975,203 | |
Discovery Communications LLC† | | | BBB- | | | | 3.50 | | | | 06/15/22 | | | | 5,000,000 | | | | 4,936,677 | |
Omnicom Group, Inc. | | | BBB+ | | | | 3.63 | | | | 05/01/22 | | | | 1,000,000 | | | | 986,114 | |
Omnicom Group, Inc. | | | BBB+ | | | | 4.45 | | | | 08/15/20 | | | | 3,000,000 | | | | 3,050,712 | |
Viacom, Inc. | | | BBB- | | | | 3.25 | | | | 03/15/23 | | | | 5,000,000 | | | | 4,810,119 | |
| | | | | | | | | | | | | | | | | | | | |
| | | | | | | | | | | | | | | | | | | 18,683,049 | |
| | | | | | | | | | | | | | | | | | | | |
CONSUMER DISCRETIONARY (6.4%) | | | | | | | | | | | | | | | | | | | | |
Advance Auto Parts, Inc. | | | BBB- | | | | 4.50 | | | | 01/15/22 | | | | 1,000,000 | | | | 1,015,234 | |
Advance Auto Parts, Inc. | | | BBB- | | | | 4.50 | | | | 12/01/23 | | | | 1,000,000 | | | | 1,023,443 | |
Advance Auto Parts, Inc. | | | BBB- | | | | 5.75 | | | | 05/01/20 | | | | 3,000,000 | | | | 3,072,230 | |
Amazon.com, Inc. | | | AA- | | | | 5.20 | | | | 12/03/25 | | | | 5,000,000 | | | | 5,494,883 | |
AutoZone, Inc. | | | BBB | | | | 3.25 | | | | 04/15/25 | | | | 2,000,000 | | | | 1,905,004 | |
AutoZone, Inc. | | | BBB | | | | 3.70 | | | | 04/15/22 | | | | 700,000 | | | | 705,413 | |
AutoZone, Inc. | | | BBB | | | | 4.00 | | | | 11/15/20 | | | | 3,000,000 | | | | 3,022,755 | |
Brinker International, Inc. | | | BB+ | | | | 3.88 | | | | 05/15/23 | | | | 4,000,000 | | | | 3,700,000 | |
Dollar General Corp. | | | BBB | | | | 3.25 | | | | 04/15/23 | | | | 4,000,000 | | | | 3,910,624 | |
eBay, Inc. | | | BBB+ | | | | 2.88 | | | | 08/01/21 | | | | 5,000,000 | | | | 4,930,039 | |
Expedia Group, Inc. | | | BBB | | | | 5.95 | | | | 08/15/20 | | | | 4,000,000 | | | | 4,132,062 | |
Family Dollar Stores, Inc. | | | BBB- | | | | 5.00 | | | | 02/01/21 | | | | 4,000,000 | | | | 4,070,000 | |
Gap, Inc. | | | BB+ | | | | 5.95 | | | | 04/12/21 | | | | 5,000,000 | | | | 5,105,315 | |
Harman International Industries, Inc. | | | BBB+ | | | | 4.15 | | | | 05/15/25 | | | | 5,000,000 | | | | 5,012,231 | |
Hyatt Hotels Corp. | | | BBB | | | | 5.38 | | | | 08/15/21 | | | | 200,000 | | | | 207,932 | |
Kohl’s Corp. | | | BBB- | | | | 3.25 | | | | 02/01/23 | | | | 1,804,000 | | | | 1,764,438 | |
Kohl’s Corp. | | | BBB- | | | | 4.00 | | | | 11/01/21 | | | | 2,620,000 | | | | 2,699,804 | |
Lowe’s Cos., Inc. | | | BBB+ | | | | 3.12 | | | | 04/15/22 | | | | 2,000,000 | | | | 1,965,489 | |
Marriott International, Inc. | | | BBB | | | | 3.00 | | | | 03/01/19 | | | | 1,000,000 | | | | 998,723 | |
Marriott International, Inc. | | | BBB | | | | 3.13 | | | | 02/15/23 | | | | 3,000,000 | | | | 2,885,107 | |
Marriott International, Inc. | | | BBB | | | | 3.38 | | | | 10/15/20 | | | | 3,000,000 | | | | 2,984,812 | |
Mattel, Inc. | | | B+ | | | | 3.15 | | | | 03/15/23 | | | | 2,000,000 | | | | 1,640,000 | |
Mattel, Inc. | | | B+ | | | | 4.35 | | | | 10/01/20 | | | | 1,000,000 | | | | 975,000 | |
Newell Brands, Inc. | | | BBB- | | | | 4.70 | | | | 08/15/20 | | | | 3,000,000 | | | | 3,050,409 | |
NVR, Inc. | | | BBB+ | | | | 3.95 | | | | 09/15/22 | | | | 4,000,000 | | | | 3,932,686 | |
O’Reilly Automotive, Inc. | | | BBB | | | | 3.80 | | | | 09/01/22 | | | | 3,250,000 | | | | 3,284,826 | |
Tapestry, Inc. | | | BBB- | | | | 4.25 | | | | 04/01/25 | | | | 2,500,000 | | | | 2,436,516 | |
Tupperware Brands Corp. | | | BBB- | | | | 4.75 | | | | 06/01/21 | | | | 4,000,000 | | | | 4,097,837 | |
Whirlpool Corp. | | | BBB | | | | 3.70 | | | | 05/01/25 | | | | 2,000,000 | | | | 1,937,616 | |
Whirlpool Corp. | | | BBB | | | | 4.85 | | | | 06/15/21 | | | | 1,000,000 | | | | 1,024,173 | |
Wyndham Destinations, Inc. | | | BB- | | | | 3.90 | | | | 03/01/23 | | | | 4,000,000 | | | | 3,680,000 | |
| | | | | | | | | | | | | | | | | | | | |
| | | | | | | | | | | | | | | | | | | 86,664,601 | |
| | | | | | | | | | | | | | | | | | | | |
CONSUMER STAPLES (1.9%) | | | | | | | | | | | | | | | | | | | | |
Conagra Brands, Inc. | | | BBB | | | | 4.95 | | | | 08/15/20 | | | | 645,000 | | | | 659,294 | |
Edgewell Personal Care Co. | | | BB | | | | 4.70 | | | | 05/19/21 | | | | 4,000,000 | | | | 3,940,000 | |
Flowers Foods, Inc. | | | BBB | | | | 4.38 | | | | 04/01/22 | | | | 4,000,000 | | | | 4,032,725 | |
Ingredion, Inc. | | | BBB | | | | 4.63 | | | | 11/01/20 | | | | 3,225,000 | | | | 3,282,084 | |
Kroger Co. | | | BBB | | | | 2.95 | | | | 11/01/21 | | | | 4,800,000 | | | | 4,714,451 | |
Mead Johnson Nutrition Co. | | | A- | | | | 4.13 | | | | 11/15/25 | | | | 1,950,000 | | | | 2,001,398 | |
Molson Coors Brewing Co. | | | BBB- | | | | 3.50 | | | | 05/01/22 | | | | 3,000,000 | | | | 2,981,904 | |
Sysco Corp. | | | BBB+ | | | | 3.75 | | | | 10/01/25 | | | | 3,575,000 | | | | 3,487,660 | |
| | | | | | | | | | | | | | | | | | | | |
| | | | | | | | | | | | | | | | | | | 25,099,516 | |
| | | | | | | | | | | | | | | | | | | | |
ENERGY (2.9%) | | | | | | | | | | | | | | | | | | | | |
Cameron International Corp. | | | AA- | | | | 4.50 | | | | 06/01/21 | | | | 3,000,000 | | | | 3,035,923 | |
Devon Energy Corp. | | | BBB | | | | 5.85 | | | | 12/15/25 | | | | 2,500,000 | | | | 2,652,734 | |
Diamond Offshore Drilling, Inc. | | | B | | | | 3.45 | | | | 11/01/23 | | | | 3,000,000 | | | | 2,220,000 | |
The accompanying notes are an integral part of these portfolio schedules.
116
MUTUAL OF AMERICA INVESTMENT CORPORATION — BOND FUND
PORTFOLIO OF INVESTMENTS IN SECURITIES (Continued)
December 31, 2018
| | | | | | | | | | | | | | | | | | | | |
| | | Rating** | | | Rate(%) | | | Maturity | | | Face Amount | | | Value | |
| LONG-TERM DEBT SECURITIES (CONTINUED): | | | | | | | | | | | | | | | | | | | | |
CORPORATE DEBT (CONTINUED) | | | | | |
ENERGY (CONTINUED) | | | | | | | | | | | | | | | | | | | | |
Energen Corp. | | | NR | | | | 4.63 | | | | 09/01/21 | | | $ | 4,000,000 | | | $ | 3,960,000 | |
EQT Corp. | | | BBB | | | | 4.88 | | | | 11/15/21 | | | | 4,000,000 | | | | 4,076,289 | |
Kinder Morgan Energy Partners LP | | | BBB- | | | | 4.30 | | | | 05/01/24 | | | | 5,000,000 | | | | 4,999,936 | |
Marathon Oil Corp. | | | BBB- | | | | 2.80 | | | | 11/01/22 | | | | 4,000,000 | | | | 3,756,735 | |
Marathon Petroleum Corp. | | | BBB | | | | 5.13 | | | | 03/01/21 | | | | 3,300,000 | | | | 3,395,695 | |
Murphy Oil Corp. | | | BBB- | | | | 4.45 | | | | 12/01/22 | | | | 3,525,000 | | | | 3,318,681 | |
Rowan Cos., Inc. | | | B- | | | | 4.88 | | | | 06/01/22 | | | | 4,000,000 | | | | 3,300,000 | |
SESI LLC | | | BB- | | | | 7.13 | | | | 12/15/21 | | | | 4,500,000 | | | | 3,825,000 | |
| | | | | | | | | | | | | | | | | | | | |
| | | | | | | | | | | | | | | | | | | 38,540,993 | |
| | | | | | | | | | | | | | | | | | | | |
FINANCIALS (9.6%) | | | | | | | | | |
Aflac, Inc. | | | A- | | | | 4.00 | | | | 02/15/22 | | | | 3,000,000 | | | | 3,061,220 | |
Alleghany Corp. | | | BBB+ | | | | 4.95 | | | | 06/27/22 | | | | 2,000,000 | | | | 2,091,316 | |
Alleghany Corp. | | | BBB+ | | | | 5.63 | | | | 09/15/20 | | | | 3,000,000 | | | | 3,101,480 | |
American Express Co. | | | BBB | | | | 3.63 | | | | 12/05/24 | | | | 5,000,000 | | | | 4,887,490 | |
American International Group, Inc. | | | BBB+ | | | | 3.75 | | | | 07/10/25 | | | | 5,000,000 | | | | 4,789,552 | |
Bank of America Corp. | | | BBB+ | | | | 3.95 | | | | 04/21/25 | | | | 5,000,000 | | | | 4,846,762 | |
Block Financial LLC | | | BBB | | | | 5.25 | | | | 10/01/25 | | | | 3,000,000 | | | | 3,039,466 | |
Block Financial LLC | | | BBB | | | | 5.50 | | | | 11/01/22 | | | | 2,250,000 | | | | 2,313,427 | |
Capital One Financial Corp. | | | BBB | | | | 4.75 | | | | 07/15/21 | | | | 4,000,000 | | | | 4,103,814 | |
Citigroup, Inc. | | | BBB | | | | 3.88 | | | | 03/26/25 | | | | 5,000,000 | | | | 4,835,699 | |
Citizens Financial Group, Inc. | | | BBB | | | | 3.75 | | | | 07/01/24 | | | | 5,000,000 | | | | 4,867,795 | |
Fairfax U.S., Inc.† | | | BBB- | | | | 4.88 | | | | 08/13/24 | | | | 3,500,000 | | | | 3,577,212 | |
Fifth Third Bancorp | | | BBB | | | | 4.30 | | | | 01/16/24 | | | | 5,000,000 | | | | 5,057,994 | |
First Republic Bank | | | A- | | | | 2.38 | | | | 06/17/19 | | | | 2,000,000 | | | | 1,991,409 | |
First Tennessee Bank | | | BBBu | | | | 2.95 | | | | 12/01/19 | | | | 5,000,000 | | | | 4,961,315 | |
Genworth Hldgs., Inc. | | | B | | | | 7.20 | | | | 02/15/21 | | | | 1,750,000 | | | | 1,723,750 | |
Genworth Hldgs., Inc. | | | B | | | | 7.63 | | | | 09/24/21 | | | | 1,300,000 | | | | 1,283,750 | |
Hartford Financial Svcs. | | | BBB+ | | | | 5.50 | | | | 03/30/20 | | | | 1,000,000 | | | | 1,025,997 | |
JPMorgan Chase & Co. | | | BBB+ | | | | 3.88 | | | | 09/10/24 | | | | 5,000,000 | | | | 4,929,210 | |
Kemper Corp. | | | BBB- | | | | 4.35 | | | | 02/15/25 | | | | 2,000,000 | | | | 1,975,154 | |
Lincoln National Corp. | | | A- | | | | 4.00 | | | | 09/01/23 | | | | 4,000,000 | | | | 4,077,433 | |
Lincoln National Corp. | | | A- | | | | 4.85 | | | | 06/24/21 | | | | 1,000,000 | | | | 1,032,309 | |
Markel Corp. | | | BBB | | | | 5.35 | | | | 06/01/21 | | | | 1,200,000 | | | | 1,248,956 | |
Marsh & McLennan Cos., Inc. | | | A- | | | | 4.80 | | | | 07/15/21 | | | | 3,000,000 | | | | 3,091,608 | |
Moody’s Corp. | | | BBB+ | | | | 4.50 | | | | 09/01/22 | | | | 4,000,000 | | | | 4,114,311 | |
Nasdaq, Inc. | | | BBB | | | | 5.55 | | | | 01/15/20 | | | | 2,500,000 | | | | 2,554,088 | |
Old Republic International Corp. | | | BBB+ | | | | 3.88 | | | | 08/26/26 | | | | 5,000,000 | | | | 4,776,832 | |
Pacific LifeCorp.† | | | A- | | | | 6.00 | | | | 02/10/20 | | | | 710,000 | | | | 728,742 | |
People’s United Bank | | | BBB+ | | | | 4.00 | | | | 07/15/24 | | | | 2,000,000 | | | | 2,005,188 | |
Prudential Financial, Inc. | | | A | | | | 4.50 | | | | 11/16/21 | | | | 1,000,000 | | | | 1,032,033 | |
Reinsurance Group of America, Inc. | | | A | | | | 4.70 | | | | 09/15/23 | | | | 1,000,000 | | | | 1,043,419 | |
Reinsurance Group of America, Inc. | | | A | | | | 5.00 | | | | 06/01/21 | | | | 3,000,000 | | | | 3,114,528 | |
Signet UK Finance PLC | | | BB+ | | | | 4.70 | | | | 06/15/24 | | | | 5,000,000 | | | | 4,425,000 | |
Stifel Financial Corp. | | | BBB- | | | | 4.25 | | | | 07/18/24 | | | | 1,500,000 | | | | 1,516,805 | |
Synchrony Financial | | | BBB- | | | | 2.70 | | | | 02/03/20 | | | | 2,250,000 | | | | 2,211,525 | |
Synchrony Financial | | | BBB- | | | | 3.70 | | | | 08/04/26 | | | | 2,750,000 | | | | 2,333,832 | |
Travelers Cos., Inc. | | | A | | | | 3.90 | | | | 11/01/20 | | | | 2,500,000 | | | | 2,538,074 | |
Unum Group | | | BBB | | | | 4.00 | | | | 03/15/24 | | | | 5,000,000 | | | | 4,962,470 | |
Voya Financial, Inc. | | | BBB | | | | 3.65 | | | | 06/15/26 | | | | 5,000,000 | | | | 4,729,045 | |
Wells Fargo & Co. | | | BBB+ | | | | 3.45 | | | | 02/13/23 | | | | 4,000,000 | | | | 3,915,848 | |
Wells Fargo & Co. | | | BBB+ | | | | 4.13 | | | | 08/15/23 | | | | 1,000,000 | | | | 1,005,843 | |
WR Berkley Corp. | | | BBB+ | | | | 4.63 | | | | 03/15/22 | | | | 2,000,000 | | | | 2,055,597 | |
WR Berkley Corp. | | | BBB+ | | | | 7.38 | | | | 09/15/19 | | | | 2,000,000 | | | | 2,058,377 | |
| | | | | | | | | | | | | | | | | | | | |
| | | | | | | | | | | | | | | | | | | 129,035,675 | |
| | | | | | | | | | | | | | | | | | | | |
The accompanying notes are an integral part of these portfolio schedules.
117
MUTUAL OF AMERICA INVESTMENT CORPORATION — BOND FUND
PORTFOLIO OF INVESTMENTS IN SECURITIES (Continued)
December 31, 2018
| | | | | | | | | | | | | | | | | | | | |
| | | Rating** | | | Rate(%) | | | Maturity | | | Face Amount | | | Value | |
| LONG-TERM DEBT SECURITIES (CONTINUED): | | | | | | | | | | | | | | | | | | | | |
CORPORATE DEBT (CONTINUED) | | | | | |
HEALTH CARE (3.6%) | | | | | | | | | | | | | | | | | | | | |
Agilent Technologies, Inc. | | | BBB+ | | | | 5.00 | | | | 07/15/20 | | | $ | 4,000,000 | | | $ | 4,106,075 | |
Anthem, Inc. | | | A | | | | 3.30 | | | | 01/15/23 | | | | 3,539,000 | | | | 3,482,082 | |
Anthem, Inc. | | | A | | | | 4.35 | | | | 08/15/20 | | | | 2,000,000 | | | | 2,034,861 | |
Biogen, Inc. | | | A- | | | | 4.05 | | | | 09/15/25 | | | | 2,500,000 | | | | 2,489,730 | |
Bio-Rad Laboratories, Inc. | | | BBB | | | | 4.88 | | | | 12/15/20 | | | | 4,000,000 | | | | 4,100,645 | |
Express Scripts Hldg. Co. | | | A- | | | | 3.50 | | | | 06/15/24 | | | | 2,000,000 | | | | 1,942,095 | |
Humana, Inc. | | | BBB+ | | | | 3.85 | | | | 10/01/24 | | | | 3,000,000 | | | | 2,997,337 | |
Laboratory Corp. of America Hldgs. | | | BBB | | | | 3.75 | | | | 08/23/22 | | | | 2,000,000 | | | | 2,011,047 | |
Laboratory Corp. of America Hldgs. | | | BBB | | | | 4.63 | | | | 11/15/20 | | | | 1,000,000 | | | | 1,020,687 | |
Medco Health Solutions, Inc. | | | A- | | | | 4.13 | | | | 09/15/20 | | | | 3,000,000 | | | | 3,031,811 | |
Owens & Minor, Inc. | | | BB | | | | 3.88 | | | | 09/15/21 | | | | 2,200,000 | | | | 1,628,000 | |
Owens & Minor, Inc. | | | BB | | | | 4.38 | | | | 12/15/24 | | | | 2,800,000 | | | | 1,792,000 | |
PerkinElmer, Inc. | | | BBB | | | | 5.00 | | | | 11/15/21 | | | | 4,000,000 | | | | 4,126,815 | |
Quest Diagnostics, Inc. | | | BBB+ | | | | 3.50 | | | | 03/30/25 | | | | 700,000 | | | | 682,908 | |
Quest Diagnostics, Inc. | | | BBB+ | | | | 4.75 | | | | 01/30/20 | | | | 4,000,000 | | | | 4,063,918 | |
Thermo Fisher Scientific, Inc. | | | BBB+ | | | | 3.60 | | | | 08/15/21 | | | | 1,000,000 | | | | 1,002,904 | |
Thermo Fisher Scientific, Inc. | | | BBB+ | | | | 4.50 | | | | 03/01/21 | | | | 3,000,000 | | | | 3,066,019 | |
Zimmer Biomet Hldgs., Inc. | | | BBB | | | | 3.15 | | | | 04/01/22 | | | | 5,000,000 | | | | 4,888,329 | |
| | | | | | | | | | | | | | | | | | | | |
| | | | | | | | | | | | | | | | | | | 48,467,263 | |
| | | | | | | | | | | | | | | | | | | | |
INDUSTRIALS (1.0%) | | | | | | | | | |
Dun & Bradstreet Corp. | | | BB+ | | | | 4.63 | | | | 12/01/22 | | | | 1,000,000 | | | | 1,012,500 | |
Flowserve Corp. | | | BBB- | | | | 3.50 | | | | 09/15/22 | | | | 4,000,000 | | | | 3,918,983 | |
Hexcel Corp. | | | BBB | | | | 4.70 | | | | 08/15/25 | | | | 3,900,000 | | | | 4,004,812 | |
Verisk Analytics, Inc. | | | BBB- | | | | 4.00 | | | | 06/15/25 | | | | 5,000,000 | | | | 5,021,804 | |
| | | | | | | | | | | | | | | | | | | | |
| | | | | | | | | | | | | | | | | | | 13,958,099 | |
| | | | | | | | | | | | | | | | | | | | |
INFORMATION TECHNOLOGY (3.6%) | | | | | | | | | | | | | | | | | | | | |
Adobe, Inc. | | | A | | | | 4.75 | | | | 02/01/20 | | | | 4,000,000 | | | | 4,079,346 | |
Applied Materials, Inc. | | | A- | | | | 3.90 | | | | 10/01/25 | | | | 5,000,000 | | | | 5,033,788 | |
Arrow Electronics, Inc. | | | BBB- | | | | 4.00 | | | | 04/01/25 | | | | 1,000,000 | | | | 974,455 | |
Arrow Electronics, Inc. | | | BBB- | | | | 4.50 | | | | 03/01/23 | | | | 1,100,000 | | | | 1,113,969 | |
Avnet, Inc. | | | BBB- | | | | 4.88 | | | | 12/01/22 | | | | 270,000 | | | | 275,757 | |
Avnet, Inc. | | | BBB- | | | | 5.88 | | | | 06/15/20 | | | | 1,100,000 | | | | 1,133,973 | |
Fidelity National Information Svcs., Inc. | | | BBB | | | | 3.88 | | | | 06/05/24 | | | | 5,000,000 | | | | 4,994,087 | |
Fiserv, Inc. | | | BBB | | | | 4.75 | | | | 06/15/21 | | | | 1,000,000 | | | | 1,029,959 | |
Ingram Micro, Inc. | | | NR | | | | 5.00 | | | | 08/10/22 | | | | 1,000,000 | | | | 977,418 | |
Ingram Micro, Inc. | | | NR | | | | 5.45 | | | | 12/15/24 | | | | 750,000 | | | | 708,201 | |
Juniper Networks, Inc. | | | BBB | | | | 4.50 | | | | 03/15/24 | | | | 3,000,000 | | | | 3,022,091 | |
Juniper Networks, Inc. | | | BBB | | | | 4.60 | | | | 03/15/21 | | | | 2,000,000 | | | | 2,043,902 | |
Keysight Technologies, Inc. | | | BBB- | | | | 4.55 | | | | 10/30/24 | | | | 5,000,000 | | | | 5,099,828 | |
Lam Research Corp. | | | BBB+ | | | | 2.75 | | | | 03/15/20 | | | | 5,000,000 | | | | 4,952,388 | |
Motorola Solutions, Inc. | | | BBB- | | | | 3.75 | | | | 05/15/22 | | | | 4,000,000 | | | | 3,969,018 | |
Motorola Solutions, Inc. | | | BBB- | | | | 4.00 | | | | 09/01/24 | | | | 1,000,000 | | | | 973,068 | |
Symantec Corp. | | | BB+ | | | | 4.20 | | | | 09/15/20 | | | | 4,000,000 | | | | 3,955,008 | |
Total System Svcs., Inc. | | | BBB- | | | | 3.75 | | | | 06/01/23 | | | | 4,000,000 | | | | 3,967,219 | |
| | | | | | | | | | | | | | | | | | | | |
| | | | | | | | | | | | | | | | | | | 48,303,475 | |
| | | | | | | | | | | | | | | | | | | | |
MATERIALS (3.7%) | | | | | | | | | | | | | | | | | | | | |
Albemarle Corp. | | | BBB | | | | 4.50 | | | | 12/15/20 | | | | 2,000,000 | | | | 2,034,958 | |
Carpenter Technology Corp. | | | BBB- | | | | 4.45 | | | | 03/01/23 | | | | 3,600,000 | | | | 3,497,705 | |
Domtar Corp. | | | BBB- | | | | 4.40 | | | | 04/01/22 | | | | 5,000,000 | | | | 5,025,046 | |
Dow Chemical Co. | | | BBB | | | | 3.50 | | | | 10/01/24 | | | | 4,800,000 | | | | 4,631,301 | |
Eastman Chemical Co. | | | BBB | | | | 4.50 | | | | 01/15/21 | | | | 2,500,000 | | | | 2,538,783 | |
Freeport-McMoRan, Inc. | | | BB | | | | 3.55 | | | | 03/01/22 | | | | 4,000,000 | | | | 3,785,000 | |
Kinross Gold Corp. | | | BBB- | | | | 5.13 | | | | 09/01/21 | | | | 4,000,000 | | | | 3,990,000 | |
Methanex Corp. | | | BB+ | | | | 3.25 | | | | 12/15/19 | | | | 3,400,000 | | | | 3,374,520 | |
The accompanying notes are an integral part of these portfolio schedules.
118
MUTUAL OF AMERICA INVESTMENT CORPORATION — BOND FUND
PORTFOLIO OF INVESTMENTS IN SECURITIES (Continued)
December 31, 2018
| | | | | | | | | | | | | | | | | | | | |
| | | Rating** | | | Rate(%) | | | Maturity | | | Face Amount | | | Value | |
| LONG-TERM DEBT SECURITIES (CONTINUED): | | | | | | | | | | | | | | | | | | | | |
CORPORATE DEBT (CONTINUED) | | | | | |
MATERIALS (CONTINUED) | | | | | | | | | | | | | | | | | | | | |
Methanex Corp. | | | BB+ | | | | 5.25 | | | | 03/01/22 | | | $ | 600,000 | | | $ | 605,030 | |
Newmont Mining Corp. | | | BBB | | | | 3.50 | | | | 03/15/22 | | | | 4,000,000 | | | | 3,958,077 | |
Packaging Corp. of America | | | BBB | | | | 3.90 | | | | 06/15/22 | | | | 2,000,000 | | | | 2,019,207 | |
Packaging Corp. of America | | | BBB | | | | 4.50 | | | | 11/01/23 | | | | 2,000,000 | | | | 2,050,011 | |
Sherwin-Williams Co. | | | BBB | | | | 3.95 | | | | 01/15/26 | | | | 5,000,000 | | | | 4,891,192 | |
Southern Copper Corp. | | | BBB+ | | | | 3.50 | | | | 11/08/22 | | | | 4,000,000 | | | | 3,902,115 | |
Teck Resources Ltd. | | | BB+ | | | | 3.75 | | | | 02/01/23 | | | | 1,000,000 | | | | 952,500 | |
Teck Resources Ltd. | | | BB+ | | | | 4.75 | | | | 01/15/22 | | | | 3,000,000 | | | | 2,985,000 | |
| | | | | | | | | | | | | | | | | | | | |
| | | | | | | | | | | | | | | | | | | 50,240,445 | |
| | | | | | | | | | | | | | | | | | | | |
REAL ESTATE (2.7%) | | | | | | | | | | | | | | | | | | | | |
Boston Properties LP | | | A- | | | | 3.85 | | | | 02/01/23 | | | | 3,000,000 | | | | 3,005,183 | |
Government Properties Income Trust | | | BBB- | | | | 3.75 | | | | 08/15/19 | | | | 4,000,000 | | | | 4,003,971 | |
HCP, Inc. | | | BBB+ | | | | 3.40 | | | | 02/01/25 | | | | 3,750,000 | | | | 3,550,315 | |
Healthcare Realty Trust, Inc. | | | BBB | | | | 3.75 | | | | 04/15/23 | | | | 4,000,000 | | | | 3,938,329 | |
Hospitality Properties Trust | | | BBB- | | | | 5.00 | | | | 08/15/22 | | | | 4,550,000 | | | | 4,647,356 | |
Jones Lang LaSalle, Inc. | | | BBB+ | | | | 4.40 | | | | 11/15/22 | | | | 4,000,000 | | | | 4,040,357 | |
Mack-Cali Realty LP | | | BB+ | | | | 4.50 | | | | 04/18/22 | | | | 5,000,000 | | | | 4,824,697 | |
National Retail Properties, Inc. | �� | | BBB+ | | | | 3.30 | | | | 04/15/23 | | | | 1,000,000 | | | | 978,234 | |
National Retail Properties, Inc. | | | BBB+ | | | | 3.80 | | | | 10/15/22 | | | | 3,000,000 | | | | 3,015,273 | |
Ventas Realty LP / Ventas Capital Corp. | | | BBB+ | | | | 3.25 | | | | 08/15/22 | | | | 500,000 | | | | 494,064 | |
Welltower, Inc. | | | BBB+ | | | | 3.75 | | | | 03/15/23 | | | | 750,000 | | | | 748,598 | |
Welltower, Inc. | | | BBB+ | | | | 6.13 | | | | 04/15/20 | | | | 2,500,000 | | | | 2,578,538 | |
| | | | | | | | | | | | | | | | | | | | |
| | | | | | | | | | | | | | | | | | | 35,824,915 | |
| | | | | | | | | | | | | | | | | | | | |
UTILITIES (1.5%) | | | | | | | | | |
Entergy Corp. | | | BBB | | | | 5.13 | | | | 09/15/20 | | | | 2,500,000 | | | | 2,551,145 | |
Exelon Corp. | | | BBB- | | | | 5.15 | | | | 12/01/20 | | | | 3,000,000 | | | | 3,065,654 | |
Exelon Generation Co. LLC | | | BBB | | | | 4.25 | | | | 06/15/22 | | | | 1,000,000 | | | | 1,013,705 | |
National Fuel Gas Co. | | | BBB | | | | 4.90 | | | | 12/01/21 | | | | 3,000,000 | | | | 3,054,864 | |
National Fuel Gas Co. | | | BBB | | | | 5.20 | | | | 07/15/25 | | | | 2,000,000 | | | | 2,030,639 | |
SCANA Corp. | | | BBB | | | | 4.13 | | | | 02/01/22 | | | | 4,000,000 | | | | 4,001,114 | |
SCANA Corp. | | | BBB | | | | 4.75 | | | | 05/15/21 | | | | 1,000,000 | | | | 1,012,265 | |
Talen Energy Supply LLC† | | | B+ | | | | 6.50 | | | | 09/15/24 | | | | 2,000,000 | | | | 1,222,500 | |
UIL Hldgs. Corp. | | | BBB | | | | 4.63 | | | | 10/01/20 | | | | 2,725,000 | | | | 2,790,330 | |
| | | | | | | | | | | | | | | | | | | | |
| | | | | | | | | | | | | | | | | | | 20,742,216 | |
| | | | | | | | | | | | | | | | | | | | |
TOTAL CORPORATE DEBT | | | | | | | | | | | | | | | | | | | 515,560,247 | |
| | | | | | | | | | | | | | | | | | | | |
SOVEREIGN DEBT (0.2%) | | | | | | | | | | | | | | | | | | | | |
Sri Lanka AID | | | NR | | | | 6.59 | | | | 09/15/28 | | | | 2,626,139 | | | | 2,960,966 | |
| | | | | | | | | | | | | | | | | | | | |
TOTAL LONG-TERM DEBT SECURITIES
(Cost: $1,352,839,474) 99.1% | | | | | | | | | | | | | | | | | | | 1,333,895,780 | |
| | | | | | | | | | | | | | | | | | | | |
| | | | | |
| SHORT-TERM DEBT SECURITIES: | | | | | | | | | | | | | | | | | | | | |
U.S. GOVERNMENT AGENCIES (0.2%) | | | | | | | | | | | | | | | | | | | | |
FHLB | | | A-1+ | | | | 2.15 | | | | 01/02/19 | | | | 2,400,000 | | | | 2,399,857 | |
| | | | | | | | | | | | | | | | | | | | |
TOTAL SHORT-TERM DEBT SECURITIES
(Cost: $2,399,857) 0.2% | | | | | | | | | | | | | | | | | | | 2,399,857 | |
| | | | | | | | | | | | | | | | | | | | |
| | | | | |
| | | | | | Rate(%) | | | Maturity | | | Face Amount | | | Value | |
| TEMPORARY CASH INVESTMENT (0.0%) (2) | | | | | | | | | | | | | | | | | | | | |
Citibank, New York Time Deposit | | | | 1.67 | | | | 01/02/19 | | | $ | 26,132 | | | $ | 26,132 | |
| | | | | | | | | | | | | | | | | | | | |
TOTAL TEMPORARY CASH INVESTMENT
(COST: $26,132) 0.0% (2) | | | | 26,132 | |
| | | | | | | | | | | | | | | | | | | | |
TOTAL INVESTMENTS
(COST: $1,355,265,463) 99.3% | | | | 1,336,321,769 | |
| | | | | | | | | | | | | | | | | | | | |
OTHER NET ASSETS 0.7% | | | | 9,272,774 | |
| | | | | | | | | | | | | | | | | | | | |
NET ASSETS 100.0% | | | $ | 1,345,594,543 | |
| | | | | | | | | | | | | | | | | | | | |
The accompanying notes are an integral part of these portfolio schedules.
119
MUTUAL OF AMERICA INVESTMENT CORPORATION
FOOTNOTES TO PORTFOLIOS OF INVESTMENTS IN SECURITIES
December 31, 2018
| | |
| Abbreviations: | | ARM = Adjustable Rate Mortgage |
| | FHLB = Federal Home Loan Bank |
| | FHLMC = Federal Home Loan Mortgage Corporation |
| | FNMA = Federal National Mortgage Association |
| | FRESB = Federal Home Loan Mortgage Corporation Multifamily Securitization Small Loan Balance |
| | GNMA = Government National Mortgage Association |
| | NR = Not Rated |
| * | Non-income producing security. |
| ** | Ratings as per Standard & Poor’s Corporation (unaudited). |
| † | Security is exempt from registration under Rule 144A of the Securities Act of 1933. These securities may be resold in transactions exempt from registration, normally to qualified institutional buyers. At December 31, 2018, the aggregate values of these securities and their percentages of the respective Funds’ net assets were as follows: |
| | | | | | | | |
Fund | | Aggregate
Market
Value | | | Percentage
of
Net Assets | |
EQUITY INDEX FUND | | $ | 25,198,327 | | | | 1.0 | % |
ALL AMERICA FUND | | $ | 799,947 | | | | 0.3 | % |
SMALL CAP VALUE FUND | | $ | 10,899,276 | | | | 2.5 | % |
SMALL CAP GROWTH FUND | | $ | 14,799,017 | | | | 3.1 | % |
MID CAP VALUE FUND | | $ | 599,960 | | | | 0.7 | % |
MID-CAP EQUITY INDEX FUND | | $ | 12,699,157 | | | | 1.0 | % |
INTERNATIONAL FUND | | $ | 10,299,316 | | | | 2.0 | % |
COMPOSITE FUND | | $ | 279,122 | | | | 0.2 | % |
MONEY MARKET FUND | | $ | 108,571,499 | | | | 51.7 | % |
MID-TERM BOND FUND | | $ | 5,083,803 | | | | 0.9 | % |
BOND FUND | | $ | 10,465,131 | | | | 0.8 | % |
| (1) | This security, or a portion thereof, has been segregated to cover initial margin requirements on open futures contracts. Information on futures contracts outstanding in the Funds as of December 31, 2018, was as follows: |
| | | | | | | | | | | | | | | | | | | | | | | | | | | | | | |
Fund | | Number of
Contracts | | | Contract Type | | Purchased (P)
or Sold (S) | | | Expiration
Date | | | Notional
Amount | | | Underlying
Face Amount
at Value | | | Unrealized
Gain(Loss)(a) | | | Face Value
of Futures
as a %
of Total
Investments | |
EQUITY INDEX FUND | | | 672 | | | E-mini S&P 500
Stock Index | | | P | | | | March 2019 | | | $ | 87,337,050 | | | $ | 84,174,720 | | | $ | (3,162,330 | ) | | | 3.2 | % |
ALL AMERICA FUND | | | 17 | | | E-mini S&P 500
Stock Index | | | P | | | | March 2019 | | | $ | 2,228,713 | | | $ | 2,129,420 | | | $ | (99,293 | ) | | | 0.8 | % |
MID-CAP EQUITY INDEX FUND | | | 252 | | | E-mini S&P
MidCap 400
Stock Index | | | P | | | | March 2019 | | | $ | 43,703,210 | | | $ | 41,887,440 | | | $ | (1,815,770 | ) | | | 3.3 | % |
| | (a) | Includes the cumulative appreciation (depreciation) of futures contracts, which is included in Total Distributable Earnings (Loss) in the Components of Net Assets section of the Statements of Assets and Liabilities. The Receivable or Payable for Daily Variation on Futures Contracts in the Statements of Assets and Liabilities only includes the current day’s variation margin payable or receivable. |
| (2) | Percentage is less than 0.05%. |
| (3) | U.S. Government guaranteed security. |
120
(This page has been left blank intentionally.)
MUTUAL OF AMERICA INVESTMENT CORPORATION
STATEMENTS OF ASSETS AND LIABILITIES
December 31, 2018
| | | | | | | | | | | | | | | | | | | | |
| | | Equity Index
Fund | | | All America
Fund | | | Small Cap
Value Fund | | | Small Cap
Growth Fund | | | Small Cap
Equity Index
Fund† | |
ASSETS | | | | | | | | | | | | | | | | | | | | |
Investments at fair value | | | | | | | | | | | | | | | | | | | | |
(Cost: Equity Index Fund — $1,726,850,058 All America Fund — $215,184,834 Small Cap Value Fund — $426,547,008 Small Cap Growth Fund — $484,419,823 Small Cap Equity Index Fund — $20,644,271 Mid Cap Value Fund — $73,101,440 Mid-Cap Equity Index Fund — $1,186,999,936 International Fund — $530,421,726 Composite Fund — $162,803,810 Retirement Income Fund — $102,865,400 2010 Retirement Fund — $24,290,216 2015 Retirement Fund — $137,133,345 2020 Retirement Fund — $511,451,394 2025 Retirement Fund — $705,192,058) | |
(Notes 1 and 3) | | $ | 2,623,094,766 | | | $ | 268,394,073 | | | $ | 431,714,674 | | | $ | 486,494,520 | | | $ | 17,173,329 | |
Cash | | | 1,273 | | | | 3,046 | | | | 656 | | | | 508 | | | | 166 | |
Interest and dividends receivable | | | 2,931,821 | | | | 304,052 | | | | 384,025 | | | | 259,346 | | | | 21,632 | |
Receivable for securities sold | | | 2,124,057 | | | | 173,759 | | | | — | | | | 831,273 | | | | 69,265 | |
Receivable for daily variation on future contracts | | | 650,103 | | | | 22,958 | | | | — | | | | — | | | | — | |
Shareholder subscriptions receivable | | | 1,563,463 | | | | — | | | | 22,375 | | | | 151,314 | | | | 43,789 | |
Other receivables | | | — | | | | — | | | | — | | | | — | | | | — | |
| | | | | | | | | | | | | | | | | | | | |
| | | | | |
TOTAL ASSETS | | | 2,630,365,483 | | | | 268,897,888 | | | | 432,121,730 | | | | 487,736,961 | | | | 17,308,181 | |
| | | | | | | | | | | | | | | | | | | | |
| | | | | |
LIABILITIES | | | | | | | | | | | | | | | | | | | | |
Payable for securities purchased | | | 1,713,929 | | | | 664,383 | | | | 4,079,240 | | | | 4,357,903 | | | | 99,843 | |
Shareholder redemptions payable | | | — | | | | 142,721 | | | | — | | | | — | | | | — | |
Accrued expenses | | | 42,042 | | | | 16,677 | | | | 40,405 | | | | 46,721 | | | | 236 | |
| | | | | | | | | | | | | | | | | | | | |
| | | | | |
TOTAL LIABILITIES: | | | 1,755,971 | | | | 823,781 | | | | 4,119,645 | | | | 4,404,624 | | | | 100,079 | |
| | | | | | | | | | | | | | | | | | | | |
| | | | | |
NET ASSETS | | $ | 2,628,609,512 | | | $ | 268,074,107 | | | $ | 428,002,085 | | | $ | 483,332,337 | | | $ | 17,208,102 | |
| | | | | | | | | | | | | | | | | | | | |
| | | | | |
NUMBEROF SHARES OUTSTANDING (Note 4) | | | 696,239,527 | | | | 130,791,956 | | | | 315,131,497 | | | | 382,867,811 | | | | 20,786,591 | |
| | | | | | | | | | | | | | | | | | | | |
| | | | | |
NET ASSET VALUES, offering and redemption price per share | | | $3.78 | | | | $2.05 | | | | $1.36 | | | | $1.26 | | | | $0.83 | |
| | | | | | | | | | | | | | | | | | | | |
| | | | | |
COMPONENTSOF NET ASSETS | | | | | | | | | | | | | | | | | | | | |
Paid-in capital | | $ | 1,648,947,536 | | | $ | 195,467,685 | | | $ | 389,300,899 | | | $ | 434,932,094 | | | $ | 20,905,666 | |
Total Distributable Earnings (Loss) (Notes 1, 5 and 6) | | | 979,661,976 | | | | 72,606,422 | | | | 38,701,186 | | | | 48,400,243 | | | | (3,697,564 | ) |
| | | | | | | | | | | | | | | | | | | | |
| | | | | |
NET ASSETS | | $ | 2,628,609,512 | | | $ | 268,074,107 | | | $ | 428,002,085 | | | $ | 483,332,337 | | | $ | 17,208,102 | |
| | | | | | | | | | | | | | | | | | | | |
| † | Fund commenced operations on July 2, 2018. |
| (a) | The Retirement and Allocation Funds are invested in affiliated investment companies of Mutual of America Investment Corp. |
The accompanying notes are an integral part of these financial statements.
122
| | | | | | | | | | | | | | | | | | | | | | | | | | | | | | | | | | | | |
Mid Cap Value Fund | | | Mid-Cap
Equity Index
Fund | | | International
Fund | | | Composite
Fund | | | Retirement
Income
Fund | | | 2010
Retirement
Fund | | | 2015
Retirement
Fund | | | 2020
Retirement
Fund | | | 2025
Retirement
Fund | | | |
| | | | | | | | | | | | | | | | | | | | | | | | | | | | | | | | | | | | |
| | | | | | | | | | | | | | | | | | | | | | | | | | | | | | | | | | | | |
| | | | | | | | | |
| | | | | | | | | | | | | | | | | | | | | | | | | | | | | | | | | | | | |
| $ | 80,057,203 | | | $ | 1,279,724,862 | | | $ | 510,614,245 | | | $ | 171,738,036 | | | $ | 101,431,551 | (a) | | $ | 23,993,824 | (a) | | $ | 138,459,032 | (a) | | $ | 515,191,697 | (a) | | $ | 709,843,502 | (a) | | |
| | 165 | | | | 771 | | | | 714 | | | | 2,064 | | | | — | | | | — | | | | — | | | | — | | | | — | | | |
| | 128,465 | | | | 1,445,082 | | | | — | | | | 563,233 | | | | — | | | | — | | | | — | | | | — | | | | — | | | |
| | — | | | | 388,193 | | | | — | | | | 245,056 | | | | — | | | | — | | | | — | | | | — | | | | — | | | |
| | — | | | | 423,300 | | | | — | | | | — | | | | — | | | | — | | | | — | | | | — | | | | — | | | |
| | 19,573 | | | | 736,514 | | | | 545,715 | | | | — | | | | — | | | | — | | | | — | | | | — | | | | — | | | |
| | — | | | | — | | | | — | | | | — | | | | 11,843 | | | | 8,652 | | | | — | | | | — | | | | — | | | |
| | | | | | | | | | | | | | | | | | | | | | | | | | | | | | | | | | | | |
| | | | | | | | | |
| | 80,205,406 | | | | 1,282,718,722 | | | | 511,160,674 | | | | 172,548,389 | | | | 101,443,394 | | | | 24,002,476 | | | | 138,459,032 | | | | 515,191,697 | | | | 709,843,502 | | | |
| | | | | | | | | | | | | | | | | | | | | | | | | | | | | | | | | | | | |
| | | | | | | | | |
| | | | | | | | | | | | | | | | | | | | | | | | | | | | | | | | | | | | |
| | 157,522 | | | | 1,329,792 | | | | 2,635,806 | | | | 373,335 | | | | — | | | | — | | | | — | | | | — | | | | — | | | |
| | — | | | | — | | | | — | | | | 42,483 | | | | — | | | | — | | | | — | | | | — | | | | — | | | |
| | 6,107 | | | | 21,339 | | | | 7,435 | | | | 9,858 | | | | 13,533 | | | | 9,399 | | | | 2,016 | | | | 3,547 | | | | 4,585 | | | |
| | | | | | | | | | | | | | | | | | | | | | | | | | | | | | | | | | | | |
| | | | | | | | | |
| | 163,629 | | | | 1,351,131 | | | | 2,643,241 | | | | 425,676 | | | | 13,533 | | | | 9,399 | | | | 2,016 | | | | 3,547 | | | | 4,585 | | | |
| | | | | | | | | | | | | | | | | | | | | | | | | | | | | | | | | | | | |
| | | | | | | | | |
| $ | 80,041,777 | | | $ | 1,281,367,591 | | | $ | 508,517,433 | | | $ | 172,122,713 | | | $ | 101,429,861 | | | $ | 23,993,077 | | | $ | 138,457,016 | | | $ | 515,188,150 | | | $ | 709,838,917 | | | |
| | | | | | | | | | | | | | | | | | | | | | | | | | | | | | | | | | | | |
| | | | | | | | | |
| | 59,766,695 | | | | 663,474,534 | | | | 663,808,196 | | | | 102,773,411 | | | | 90,717,399 | | | | 25,901,047 | | | | 142,345,025 | | | | 458,042,143 | | | | 590,617,736 | | | |
| | | | | | | | | | | | | | | | | | | | | | | | | | | | | | | | | | | | |
| | | | | | | | | |
| | $1.34 | | | | $1.93 | | | | $0.77 | | | | $1.67 | | | | $1.12 | | | | $0.93 | | | | $0.97 | | | | $1.12 | | | | $1.20 | | | |
| | | | | | | | | | | | | | | | | | | | | | | | | | | | | | | | | | | | |
| | | | | | | | | |
| | | | | | | | | | | | | | | | | | | | | | | | | | | | | | | | | | | | |
| $ | 69,654,854 | | | $ | 1,073,152,251 | | | $ | 514,858,629 | | | $ | 151,425,498 | | | $ | 99,730,848 | | | $ | 23,239,285 | | | $ | 128,363,562 | | | $ | 477,218,468 | | | $ | 660,844,635 | | | |
| | 10,386,923 | | | | 208,215,340 | | | | (6,341,196 | ) | | | 20,697,215 | | | | 1,699,013 | | | | 753,792 | | | | 10,093,454 | | | | 37,969,682 | | | | 48,994,282 | | | |
| | | | | | | | | | | | | | | | | | | | | | | | | | | | | | | | | | | | |
| | | | | | | | | |
| $ | 80,041,777 | | | $ | 1,281,367,591 | | | $ | 508,517,433 | | | $ | 172,122,713 | | | $ | 101,429,861 | | | $ | 23,993,077 | | | $ | 138,457,016 | | | $ | 515,188,150 | | | $ | 709,838,917 | | | |
| | | | | | | | | | | | | | | | | | | | | | | | | | | | | | | | | | | | |
The accompanying notes are an integral part of these financial statements.
123
MUTUAL OF AMERICA INVESTMENT CORPORATION
STATEMENTS OF ASSETS AND LIABILITIES (Continued)
December 31, 2018
| | | | | | | | | | | | | | | | | | | | |
| | | 2030
Retirement
Fund | | | 2035
Retirement
Fund | | | 2040
Retirement
Fund | | | 2045
Retirement
Fund | | | 2050
Retirement
Fund | |
ASSETS | | | | | | | | | | | | | | | | | | | | |
Investments at fair value | | | | | | | | | | | | | | | | | | | | |
(Cost: 2030 Retirement Fund — $612,396,623 2035 Retirement Fund — $503,287,698 2040 Retirement Fund — $406,264,366 2045 Retirement Fund — $425,063,563 2050 Retirement Fund — $300,228,805 2055 Retirement Fund — $79,173,702 2060 Retirement Fund — $4,398,334 Conservative Allocation Fund — $151,739,976 Moderate Allocation Fund — $350,807,778 Aggressive Allocation Fund — $248,586,785 Money Market Fund — $209,741,558 Mid-Term Bond Fund — $592,878,071 Bond Fund — $1,355,265,463) | |
(Notes 1 and 3) | | $ | 617,113,972 | (a) | | $ | 509,448,930 | (a) | | $ | 412,661,364 | (a) | | $ | 438,114,958 | (a) | | $ | 285,290,893 | (a) |
Cash | | | — | | | | — | | | | — | | | | — | | | | — | |
Interest and dividends receivable | | | — | | | | — | | | | — | | | | — | | | | — | |
Receivable for securities sold | | | — | | | | — | | | | — | | | | — | | | | — | |
Receivable for daily variation on future contracts | | | — | | | | — | | | | — | | | | — | | | | — | |
Shareholder subscriptions receivable | | | — | | | | — | | | | — | | | | — | | | | — | |
Other receivables | | | — | | | | — | | | | — | | | | — | | | | — | |
| | | | | | | | | | | | | | | | | | | | |
| | | | | |
TOTAL ASSETS | | | 617,113,972 | | | | 509,448,930 | | | | 412,661,364 | | | | 438,114,958 | | | | 285,290,893 | |
| | | | | | | | | | | | | | | | | | | | |
| | | | | |
LIABILITIES | | | | | | | | | | | | | | | | | | | | |
Payable for securities purchased | | | — | | | | — | | | | — | | | | — | | | | — | |
Shareholder redemptions payable | | | — | | | | — | | | | — | | | | — | | | | — | |
Accrued expenses | | | 3,919 | | | | 2,820 | | | | 2,713 | | | | 2,972 | | | | 1,520 | |
| | | | | | | | | | | | | | | | | | | | |
| | | | | |
TOTAL LIABILITIES | | | 3,919 | | | | 2,820 | | | | 2,713 | | | | 2,972 | | | | 1,520 | |
| | | | | | | | | | | | | | | | | | | | |
| | | | | |
NET ASSETS | | $ | 617,110,053 | | | $ | 509,446,110 | | | $ | 412,658,651 | | | $ | 438,111,986 | | | $ | 285,289,373 | |
| | | | | | | | | | | | | | | | | | | | |
| | | | | |
NUMBEROF SHARES OUTSTANDING (Note 4) | | | 499,279,402 | | | | 410,004,672 | | | | 337,385,671 | | | | 360,758,050 | | | | 194,840,021 | |
| | | | | | | | | | | | | | | | | | | | |
| | | | | |
NET ASSET VALUES, offering and redemption price per share | | | $1.24 | | | | $1.24 | | | | $1.22 | | | | $1.21 | | | | $1.46 | |
| | | | | | | | | | | | | | | | | | | | |
| | | | | |
COMPONENTSOF NET ASSETS | | | | | | | | | | | | | | | | | | | | |
Paid-in capital | | $ | 574,537,635 | | | $ | 471,358,054 | | | $ | 381,964,481 | | | $ | 396,234,052 | | | $ | 284,414,321 | |
Total Distributable Earnings (Loss) (Notes 1, 5 and 6) | | | 42,572,418 | | | | 38,088,056 | | | | 30,694,170 | | | | 41,877,934 | | | | 875,052 | |
| | | | | | | | | | | | | | | | | | | | |
| | | | | |
NET ASSETS | | $ | 617,110,053 | | | $ | 509,446,110 | | | $ | 412,658,651 | | | $ | 438,111,986 | | | $ | 285,289,373 | |
| | | | | | | | | | | | | | | | | | | | |
| † | Fund commenced operations on July 2, 2018. |
| (a) | The Retirement and Allocation Funds are invested in affiliated investment companies of Mutual of America Investment Corp. |
The accompanying notes are an integral part of these financial statements.
124
| | | | | | | | | | | | | | | | | | | | | | | | | | | | | | |
2055
Retirement
Fund | | | 2060
Retirement
Fund† | | | Conservative
Allocation
Fund | | | Moderate
Allocation
Fund | | | Aggressive
Allocation
Fund | | | Money
Market
Fund | | | Mid-Term
Bond Fund | | | Bond Fund | |
| | | | | | | | | | | | | | | | | | | | | | | | | | | | | | |
| | | | | | | | | | | | | | | | | | | | | | | | | | | | | | |
| | | | | | | |
| | | | | | | | | | | | | | | | | | | | | | | | | | | | | | |
| $ | 70,296,305 | (a) | | $ | 4,045,388 | (a) | | $ | 149,940,628 | (a) | | $ | 371,138,159 | (a) | | $ | 271,377,197 | (a) | | $ | 209,741,608 | | | $ | 583,067,891 | | | $ | 1,336,321,769 | |
| | — | | | | — | | | | — | | | | — | | | | — | | | | 13,453 | | | | 182 | | | | 378 | |
| | — | | | | — | | | | — | | | | — | | | | — | | | | — | | | | 3,497,224 | | | | 8,560,794 | |
| | — | | | | — | | | | — | | | | — | | | | — | | | | — | | | | — | | | | 8,763 | |
| | — | | | | — | | | | — | | | | — | | | | — | | | | — | | | | — | | | | — | |
| | — | | | | — | | | | — | | | | — | | | | — | | | | 162,372 | | | | 185,473 | | | | 767,979 | |
| | — | | | | — | | | | — | | | | — | | | | — | | | | — | | | | — | | | | — | |
| | | | | | | | | | | | | | | | | | | | | | | | | | | | | | |
| | | | | | | |
| | 70,296,305 | | | | 4,045,388 | | | | 149,940,628 | | | | 371,138,159 | | | | 271,377,197 | | | | 209,917,433 | | | | 586,750,770 | | | | 1,345,659,683 | |
| | | | | | | | | | | | | | | | | | | | | | | | | | | | | | |
| | | | | | | |
| | | | | | | | | | | | | | | | | | | | | | | | | | | | | | |
| | — | | | | — | | | | — | | | | — | | | | — | | | | — | | | | — | | | | — | |
| | — | | | | — | | | | — | | | | — | | | | — | | | | — | | | | — | | | | — | |
| | 226 | | | | 3 | | | | 258 | | | | 543 | | | | 1,330 | | | | 4,514 | | | | 28,516 | | | | 65,140 | |
| | | | | | | | | | | | | | | | | | | | | | | | | | | | | | |
| | | | | | | |
| | 226 | | | | 3 | | | | 258 | | | | 543 | | | | 1,330 | | | | 4,514 | | | | 28,516 | | | | 65,140 | |
| | | | | | | | | | | | | | | | | | | | | | | | | | | | | | |
| | | | | | | |
| $ | 70,296,079 | | | $ | 4,045,385 | | | $ | 149,940,370 | | | $ | 371,137,616 | | | $ | 271,375,867 | | | $ | 209,912,919 | | | $ | 586,722,254 | | | $ | 1,345,594,543 | |
| | | | | | | | | | | | | | | | | | | | | | | | | | | | | | |
| | | | | | | |
| | 63,777,224 | | | | 4,522,127 | | | | 128,699,580 | | | | 267,950,109 | | | | 177,406,835 | | | | 171,848,668 | | | | 572,739,290 | | | | 956,663,157 | |
| | | | | | | | | | | | | | | | | | | | | | | | | | | | | | |
| | | | | | | |
| | $1.10 | | | | $0.89 | | | | $1.17 | | | | $1.39 | | | | $1.53 | | | | $1.2215 | | | | $1.02 | | | | $1.41 | |
| | | | | | | | | | | | | | | | | | | | | | | | | | | | | | |
| | | | | | | |
| | | | | | | | | | | | | | | | | | | | | | | | | | | | | | |
| $ | 75,825,700 | | | $ | 4,364,120 | | | $ | 145,364,441 | | | $ | 327,938,945 | | | $ | 227,266,982 | | | $ | 207,691,655 | | | $ | 583,772,310 | | | $ | 1,328,191,317 | |
| | (5,529,621 | ) | | | (318,735 | ) | | | 4,575,929 | | | | 43,198,671 | | | | 44,108,885 | | | | 2,221,264 | | | | 2,949,944 | | | | 17,403,226 | |
| | | | | | | | | | | | | | | | | | | | | | | | | | | | | | |
| | | | | | | |
| $ | 70,296,079 | | | $ | 4,045,385 | | | $ | 149,940,370 | | | $ | 371,137,616 | | | $ | 271,375,867 | | | $ | 209,912,919 | | | $ | 586,722,254 | | | $ | 1,345,594,543 | |
| | | | | | | | | | | | | | | | | | | | | | | | | | | | | | |
The accompanying notes are an integral part of these financial statements.
125
MUTUAL OF AMERICA INVESTMENT CORPORATION
STATEMENTS OF OPERATIONS
For the Year Ended December 31, 2018
| | | | | | | | | | | | | | | | | | | | |
| | | Equity Index
Fund | | | All America
Fund | | | Small Cap
Value Fund | | | Small Cap
Growth Fund | | | Small Cap
Equity Index
Fund† | |
INVESTMENT INCOMEAND EXPENSES | | | | | | | | | | | | | | | | | | | | |
INVESTMENT INCOME | | | | | | | | | | | | | | | | | | | | |
Dividends | | $ | 53,537,747 | | | $ | 5,422,151 | | | $ | 9,063,700 | | | $ | 4,949,761 | | | $ | 123,247 | |
Interest | | | 1,528,757 | | | | 157,594 | | | | 369,559 | | | | 335,521 | | | | 335 | |
| | | | | | | | | | | | | | | | | | | | |
| | | | | |
Total investment income | | | 55,066,504 | | | | 5,579,745 | | | | 9,433,259 | | | | 5,285,282 | | | | 123,582 | |
| | | | | | | | | | | | | | | | | | | | |
| | | | | |
EXPENSES | | | | | | | | | | | | | | | | | | | | |
Investment advisory fees (Note 2) | | | 2,119,857 | | | | 1,264,089 | | | | 3,717,632 | | | | 4,225,839 | | | | 5,564 | |
| | | | | |
Other operating expenses | | | | | | | | | | | | | | | | | | | | |
Accounting and recordkeeping expenses | | | 512,580 | | | | 129,847 | | | | 101,482 | | | | 115,090 | | | | 45,185 | |
Shareholders reports | | | 17,284 | | | | 17,524 | | | | 17,283 | | | | 17,283 | | | | 1,193 | |
Custodian expenses | | | 38,455 | | | | 67,752 | | | | 12,344 | | | | 16,184 | | | | 67,851 | |
Independent directors’ fees and expenses | | | 190,928 | | | | 21,646 | | | | 33,949 | | | | 38,543 | | | | 106 | |
Audit | | | 77,806 | | | | 22,189 | | | | 19,878 | | | | 24,008 | | | | 111 | |
Legal and Compliance | | | 115,693 | | | | 33,006 | | | | 29,576 | | | | 35,718 | | | | 162 | |
Administrative | | | 380,593 | | | | 43,246 | | | | 67,822 | | | | 76,986 | | | | 190 | |
Licenses | | | 240,568 | | | | 16,312 | | | | — | | | | — | | | | 153 | |
Other (including year-end accrual) | | | 69,223 | | | | 18,717 | | | | 15,616 | | | | 14,071 | | | | (62 | ) |
| | | | | | | | | | | | | | | | | | | | |
| | | | | |
Total operating expenses | | | 1,643,130 | | | | 370,239 | | | | 297,950 | | | | 337,883 | | | | 114,889 | |
| | | | | | | | | | | | | | | | | | | | |
| | | | | |
Total expenses before reimbursement | | | 3,762,987 | | | | 1,634,328 | | | | 4,015,582 | | | | 4,563,722 | | | | 120,453 | |
Non-Advisory operating expense reimbursement (Note 2) | | | — | | | | — | | | | — | | | | — | | | | — | |
Fee waiver and expense reimbursement (Note 2) | | | — | | | | — | | | | — | | | | — | | | | (109,696 | ) |
| | | | | | | | | | | | | | | | | | | | |
| | | | | |
Net expenses | | | 3,762,987 | | | | 1,634,328 | | | | 4,015,582 | | | | 4,563,722 | | | | 10,757 | |
| | | | | | | | | | | | | | | | | | | | |
| | | | | |
Net Investment Income (Loss) | | | 51,303,517 | | | | 3,945,417 | | | | 5,417,677 | | | | 721,560 | | | | 112,825 | |
| | | | | | | | | | | | | | | | | | | | |
| | | | | |
NET REALIZEDAND UNREALIZED GAIN (LOSS)ON INVESTMENTSAND
FUTURES CONTRACTS (Note 1) | | | | | | | | | | | | | | | | | | | | |
Net realized gain (loss) on: | | | | | | | | | | | | | | | | | | | | |
Investment securities | | | 63,935,051 | | | | 20,453,902 | | | | 26,004,396 | | | | 46,288,828 | | | | (203,024 | ) |
Futures contracts (Note 1) | | | (4,062,277 | ) | | | (93,710 | ) | | | — | | | | — | | | | — | |
Gain distributions from Mutual of America Investment Corp. Funds | | | — | | | | — | | | | — | | | | — | | | | — | |
| | | | | | | | | | | | | | | | | | | | |
| | | | | |
| | | 59,872,774 | | | | 20,360,192 | | | | 26,004,396 | | | | 46,288,828 | | | | (203,024 | ) |
| | | | | | | | | | | | | | | | | | | | |
| | | | | |
Change in net unrealized appreciation (depreciation) of: | | | | | | | | | | | | | | | | | | | | |
Investment securities | | | (234,693,430 | ) | | | (47,718,997 | ) | | | (103,915,943 | ) | | | (115,920,143 | ) | | | (3,470,942 | ) |
Futures contracts (Note 1) | | | (3,679,425 | ) | | | (191,272 | ) | | | — | | | | — | | | | — | |
| | | | | | | | | | | | | | | | | | | | |
| | | | | |
| | | (238,372,855 | ) | | | (47,910,269 | ) | | | (103,915,943 | ) | | | (115,920,143 | ) | | | (3,470,942 | ) |
| | | | | | | | | | | | | | | | | | | | |
| | | | | |
NET REALIZEDAND UNREALIZED GAIN (LOSS)ON INVESTMENTSAND
FUTURES CONTRACTS | | | (178,500,081 | ) | | | (27,550,077 | ) | | | (77,911,547 | ) | | | (69,631,315 | ) | | | (3,673,966 | ) |
| | | | | | | | | | | | | | | | | | | | |
| | | | | |
NET INCREASE (DECREASE)IN NET ASSETS RESULTINGFROM OPERATIONS | | $ | (127,196,564 | ) | | $ | (23,604,660 | ) | | $ | (72,493,870 | ) | | $ | (68,909,755 | ) | | $ | (3,561,141 | ) |
| | | | | | | | | | | | | | | | | | | | |
| † | For the period July 2, 2018 (Commencement of Operations) to December 31, 2018. |
| (a) | The Retirement and Allocation Funds are invested in affiliated funds of Mutual of America Investment Corp. and receive dividend income entirely from these affiliated funds. |
| (b) | The Retirement and Allocation Funds incur direct investment management expenses of .05% and .00%, respectively. Certain operating expenses that can be attributed only to the Retirement and Allocation Funds were charged directly to those Funds, subject to the Adviser’s agreement to reimburse direct non-advisory operating expenses of any such Fund whose average daily net assets for the prior calendar year was less than $50 million. The Retirement and Allocation Funds will also continue to bear their pro-rata share of the non-advisory operating expenses borne by each of the underlying Funds in which they invest. |
| (c) | Realized gains and losses for the Retirement and Allocation Funds result from the disposition of shares of the underlying funds. |
| (d) | Net of foreign taxes of $1,248,463. |
The accompanying notes are an integral part of these financial statements.
126
| | | | | | | | | | | | | | | | | | | | | | | | | | | | | | | | | | | | |
Mid Cap
Value Fund | | | Mid-Cap
Equity Index
Fund | | | International
Fund | | | Composite
Fund | | | Retirement
Income
Fund | | | 2010
Retirement
Fund | | | 2015
Retirement
Fund | | | 2020
Retirement
Fund | | | 2025
Retirement
Fund | | | |
| | | | | | | | | | | | | | | | | | | | | | | | | | | | | | | | | | | | | |
| | | | | | | | | | | | | | | | | | | | | | | | | | | | | | | | | | | | | |
| $ | 2,056,704 | | | $ | 23,121,335 | | | $ | 14,959,025 | (d) | | $ | 2,469,438 | | | $ | 1,917,349 | (a) | | $ | 469,473 | (a) | | $ | 2,849,252 | (a) | | $ | 10,417,865 | (a) | | $ | 13,447,741 | (a) | | |
| | 47,681 | | | | 1,031,491 | | | | 529,623 | | | | 2,530,552 | | | | — | | | | — | | | | — | | | | — | | | | — | | | |
| | | | | | | | | | | | | | | | | | | | | | | | | | | | | | | | | | | | |
| | | | | | | | | |
| | 2,104,385 | | | | 24,152,826 | | | | 15,488,648 | | | | 4,999,990 | | | | 1,917,349 | | | | 469,473 | | | | 2,849,252 | | | | 10,417,865 | | | | 13,447,741 | | | |
| | | | | | | | | | | | | | | | | | | | | | | | | | | | | | | | | | | | |
| | | | | | | | | |
| | | | | | | | | | | | | | | | | | | | | | | | | | | | | | | | | | | | | |
| | 537,943 | | | | 1,100,882 | | | | 405,926 | | | | 755,522 | | | | 50,691 | (b) | | | 12,584 | (b) | | | 75,115 | (b) | | | 267,328 | (b) | | | 361,262 | (b) | | |
| | | | | | | | | |
| | | | | | | | | | | | | | | | | | | | | | | | | | | | | | | | | | | | | |
| | 32,412 | | | | 281,639 | | | | 99,406 | | | | 70,798 | | | | 9,269 | (b) | | | 8,897 | (b) | | | 9,506 | (b) | | | 11,376 | (b) | | | 12,290 | (b) | | |
| | 17,156 | | | | 17,284 | | | | 14,749 | | | | 20,866 | | | | 13,517 | (b) | | | 13,995 | (b) | | | 13,988 | (b) | | | 13,989 | (b) | | | 13,989 | (b) | | |
| | 9,058 | | | | 35,103 | | | | 7,642 | | | | 26,027 | | | | — | (b) | | | — | (b) | | | — | (b) | | | — | (b) | | | — | (b) | | |
| | 6,731 | | | | 100,110 | | | | 36,863 | | | | 12,828 | | | | — | (b) | | | — | (b) | | | — | (b) | | | — | (b) | | | — | (b) | | |
| | 6,899 | | | | 46,455 | | | | 2,589 | | | | 13,153 | | | | 7,026 | (b) | | | 1,757 | (b) | | | 10,490 | (b) | | | 37,095 | (b) | | | 49,898 | (b) | | |
| | 10,264 | | | | 69,104 | | | | 3,851 | | | | 19,559 | | | | 6,346 | (b) | | | 1,589 | (b) | | | 9,483 | (b) | | | 33,514 | (b) | | | 45,059 | (b) | | |
| | 13,459 | | | | 199,867 | | | | 73,579 | | | | 25,593 | | | | — | (b) | | | — | (b) | | | — | (b) | | | — | (b) | | | — | (b) | | |
| | — | | | | 125,864 | | | | — | | | | — | | | | — | (b) | | | — | (b) | | | — | (b) | | | — | (b) | | | — | (b) | | |
| | (1,241 | ) | | | 33,992 | | | | 24,205 | | | | 5,118 | | | | (8,398 | )(b) | | | 1,277 | (b) | | | (8,285 | )(b) | | | (12,631 | )(b) | | | (15,838 | )(b) | | |
| | | | | | | | | | | | | | | | | | | | | | | | | | | | | | | | | | | | |
| | | | | | | | | |
| | 94,738 | | | | 909,418 | | | | 262,884 | | | | 193,942 | | | | 27,760 | | | | 27,515 | | | | 35,182 | | | | 83,343 | | | | 105,398 | | | |
| | | | | | | | | | | | | | | | | | | | | | | | | | | | | | | | | | | | |
| | | | | | | | | |
| | 632,681 | | | | 2,010,300 | | | | 668,810 | | | | 949,464 | | | | 78,451 | | | | 40,099 | | | | 110,297 | | | | 350,671 | | | | 466,660 | | | |
| | — | | | | — | | | | — | | | | — | | | | — | | | | — | | | | — | | | | — | | | | — | | | |
| | — | | | | — | | | | — | | | | — | | | | — | | | | (27,515 | ) | | | — | | | | — | | | | — | | | |
| | | | | | | | | | | | | | | | | | | | | | | | | | | | | | | | | | | | |
| | | | | | | | | |
| | 632,681 | | | | 2,010,300 | | | | 668,810 | | | | 949,464 | | | | 78,451 | | | | 12,584 | | | | 110,297 | | | | 350,671 | | | | 466,660 | | | |
| | | | | | | | | | | | | | | | | | | | | | | | | | | | | | | | | | | | |
| | | | | | | | | |
| | 1,471,704 | | | | 22,142,526 | | | | 14,819,838 | | | | 4,050,526 | | | | 1,838,898 | | | | 456,889 | | | | 2,738,955 | | | | 10,067,194 | | | | 12,981,081 | | | |
| | | | | | | | | | | | | | | | | | | | | | | | | | | | | | | | | | | | |
| | | | | | | | | | | | | | | | | | | | | | | | | | | | | | | | | | | | |
| | | | | | | | | |
| | | | | | | | | | | | | | | | | | | | | | | | | | | | | | | | | | | | | |
| | 1,922,983 | | | | 105,479,810 | | | | — | | | | 8,205,586 | | | | 725,755 | (c) | | | 459,478 | (c) | | | 4,252,682 | (c) | | | 15,194,500 | (c) | | | 15,590,248 | (c) | | |
| | — | | | | (4,074,125 | ) | | | — | | | | — | | | | — | | | | — | | | | — | | | | — | | | | — | | | |
|
— |
| | | | | | | — | | | | — | | | | 837,345 | | | | 245,370 | | | | 2,086,649 | | | | 9,311,016 | | | | 16,066,673 | | | |
| | | | | | | | | | | | | | | | | | | | | | | | | | | | | | | | | | | | |
| | | | | | | | | |
| | 1,922,983 | | | | 101,405,685 | | | | — | | | | 8,205,586 | | | | 1,563,100 | | | | 704,848 | | | | 6,339,331 | | | | 24,505,516 | | | | 31,656,921 | | | |
| | | | | | | | | | | | | | | | | | | | | | | | | | | | | | | | | | | | |
| | | | | | | | | |
| | | | | | | | | | | | | | | | | | | | | | | | | | | | | | | | | | | | | |
| | (16,574,717 | ) | | | (282,292,149 | ) | | | (90,151,424 | ) | | | (17,734,526 | ) | | | (4,604,759 | ) | | | (1,604,780 | ) | | | (13,342,292 | ) | | | (55,831,920 | ) | | | (83,808,474 | ) | | |
| | — | | | | (2,041,192 | ) | | | — | | | | — | | | | — | | | | — | | | | — | | | | — | | | | — | | | |
| | | | | | | | | | | | | | | | | | | | | | | | | | | | | | | | | | | | |
| | | | | | | | | |
| | (16,574,717 | ) | | | (284,333,341 | ) | | | (90,151,424 | ) | | | (17,734,526 | ) | | | (4,604,759 | ) | | | (1,604,780 | ) | | | (13,342,292 | ) | | | (55,831,920 | ) | | | (83,808,474 | ) | | |
| | | | | | | | | | | | | | | | | | | | | | | | | | | | | | | | | | | | |
| | | | | | | | | |
| (14,651,734 | ) | | | (182,927,656 | ) | | | (90,151,424 | ) | | | (9,528,940 | ) | | | (3,041,659 | ) | | | (899,932 | ) | | | (7,002,961 | ) | | | (31,326,404 | ) | | | (52,151,553 | ) | | |
| | | | | | | | | | | | | | | | | | | | | | | | | | | | | | | | | | | | |
| | | | | | | | | |
$ | (13,180,030 | ) | | $ | (160,785,130 | ) | | $ | (75,331,586 | ) | | $ | (5,478,414 | ) | | $ | (1,202,761 | ) | | $ | (443,043 | ) | | $ | (4,264,006 | ) | | $ | (21,259,210 | ) | | $ | (39,170,472 | ) | | |
| | | | | | | | | | | | | | | | | | | | | | | | | | | | | | | | | | | | |
The accompanying notes are an integral part of these financial statements.
127
MUTUAL OF AMERICA INVESTMENT CORPORATION
STATEMENTS OF OPERATIONS (Continued)
For the Year Ended December 31, 2018
| | | | | | | | | | | | | | | | | | | | |
| | | 2030
Retirement
Fund | | | 2035
Retirement
Fund | | | 2040
Retirement
Fund | | | 2045
Retirement
Fund | | | 2050
Retirement
Fund | |
INVESTMENT INCOMEAND EXPENSES | | | | | | | | | | | | | | | | | | | | |
INVESTMENT INCOME | | | | | | | | | | | | | | | | | | | | |
Dividends | | $ | 11,147,433 | (a) | | $ | 8,775,101 | (a) | | $ | 6,978,924 | (a) | | $ | 7,354,825 | (a) | | $ | 4,578,173 | (a) |
Interest | | | — | | | | — | | | | — | | | | — | | | | — | |
| | | | | | | | | | | | | | | | | | | | |
| | | | | |
Total investment income | | | 11,147,433 | | | | 8,775,101 | | | | 6,978,924 | | | | 7,354,825 | | | | 4,578,173 | |
| | | | | | | | | | | | | | | | | | | | |
| | | | | |
EXPENSES | | | | | | | | | | | | | | | | | | | | |
Investment advisory fees (Note 2) | | | 310,056 | (b) | | | 257,852 | (b) | | | 210,500 | (b) | | | 229,077 | (b) | | | 142,530 | (b) |
| | | | | |
Other operating expenses | | | | | | | | | | | | | | | | | | | | |
Accounting and recordkeeping expenses | | | 11,793 | (b) | | | 11,284 | (b) | | | 10,823 | (b) | | | 11,004 | (b) | | | 10,162 | (b) |
Shareholders reports | | | 13,989 | (b) | | | 13,989 | (b) | | | 13,497 | (b) | | | 13,497 | (b) | | | 13,498 | (b) |
Custodian expenses | | | — | (b) | | | — | (b) | | | — | (b) | | | — | (b) | | | — | (b) |
Independent directors’ fees and expenses | | | — | (b) | | | — | (b) | | | — | (b) | | | — | (b) | | | — | (b) |
Audit | | | 42,704 | (b) | | | 35,541 | (b) | | | 29,024 | (b) | | | 31,713 | (b) | | | 19,568 | (b) |
Legal and Compliance | | | 38,551 | (b) | | | 32,087 | (b) | | | 26,204 | (b) | | | 28,645 | (b) | | | 17,659 | (b) |
Administrative | | | — | (b) | | | — | (b) | | | — | (b) | | | — | (b) | | | — | (b) |
Licenses | | | — | (b) | | | — | (b) | | | — | (b) | | | — | (b) | | | — | (b) |
Other (including year-end accrual) | | | (15,906 | )(b) | | | (14,178 | )(b) | | | (12,823 | )(b) | | | (12,497 | )(b) | | | (11,587 | )(b) |
| | | | | | | | | | | | | | | | | | | | |
| | | | | |
Total operating expenses | | | 91,131 | | | | 78,723 | | | | 66,725 | | | | 72,362 | | | | 49,300 | |
| | | | | | | | | | | | | | | | | | | | |
Total expenses before reimbursement | | | 401,187 | | | | 336,575 | | | | 277,225 | | | | 301,439 | | | | 191,830 | |
Non-Advisory operating expense reimbursement (Note 2) | | | — | | | | — | | | | — | | | | — | | | | — | |
Fee waiver and expense reimbursement (Note 2) | | | — | | | | — | | | | — | | | | — | | | | — | |
| | | | | | | | | | | | | | | | | | | | |
| | | | | |
Net expenses | | | 401,187 | | | | 336,575 | | | | 277,225 | | | | 301,439 | | | | 191,830 | |
| | | | | | | | | | | | | | | | | | | | |
| | | | | |
Net Investment Income (Loss) | | | 10,746,246 | | | | 8,438,526 | | | | 6,701,699 | | | | 7,053,386 | | | | 4,386,343 | |
| | | | | | | | | | | | | | | | | | | | |
| | | | | |
NET REALIZEDAND UNREALIZED GAIN (LOSS)ON INVESTMENTSAND
FUTURES CONTRACTS (Note 1) | | | | | | | | | | | | | | | | | | | | |
Net realized gain (loss) on: | | | | | | | | | | | | | | | | | | | | |
Investment securities | | | 10,272,348 | (c) | | | 7,667,517 | (c) | | | 4,012,436 | (c) | | | 6,274,437 | (c) | | | 1,243,234 | (c) |
Futures contracts (Note 1) | | | — | | | | — | | | | — | | | | — | | | | — | |
Gain distributions from Mutual of America Investment Corp. Funds | | | 17,068,493 | | | | 15,972,837 | | | | 13,746,469 | | | | 15,655,544 | | | | 10,237,105 | |
| | | | | | | | | | | | | | | | | | | | |
| | | | | |
| | | 27,340,841 | | | | 23,640,354 | | | | 17,758,905 | | | | 21,929,981 | | | | 11,480,339 | |
| | | | | | | | | | | | | | | | | | | | |
| | | | | |
Change in net unrealized appreciation (depreciation) of: | | | | | | | | | | | | | | | | | | | | |
Investment securities | | | (80,777,544 | ) | | | (72,350,523 | ) | | | (59,858,047 | ) | | | (68,276,695 | ) | | | (43,320,775 | ) |
Futures contracts (Note 1) | | | — | | | | — | | | | — | | | | — | | | | — | |
| | | | | | | | | | | | | | | | | | | | |
| | | | | |
| | | (80,777,544 | ) | | | (72,350,523 | ) | | | (59,858,047 | ) | | | (68,276,695 | ) | | | (43,320,775 | ) |
| | | | | | | | | | | | | | | | | | | | |
| | | | | |
NET REALIZEDAND UNREALIZED GAIN (LOSS)ON INVESTMENTSAND FUTURES CONTRACTS | | | (53,436,703 | ) | | | (48,710,169 | ) | | | (42,099,142 | ) | | | (46,346,714 | ) | | | (31,840,436 | ) |
| | | | | | | | | | | | | | | | | | | | |
| | | | | |
NET INCREASE (DECREASE)IN NET ASSETS RESULTINGFROM OPERATIONS | | $ | (42,690,457 | ) | | $ | (40,271,643 | ) | | $ | (35,397,443 | ) | | $ | (39,293,328 | ) | | $ | (27,454,093 | ) |
| | | | | | | | | | | | | | | | | | | | |
| † | For the period July 2, 2018 (Commencement of Operations) to December 31, 2018. |
| (a) | The Retirement and Allocation Funds are invested in affiliated funds of Mutual of America Investment Corp. and receive dividend income entirely from these affiliated funds. |
| (b) | The Retirement and Allocation Funds incur direct investment management expenses of .05% and .00%, respectively. Certain operating expenses that can be attributed only to the Retirement and Allocation Funds were charged directly to those Funds, subject to the Adviser’s agreement to reimburse direct non-advisory operating expenses of any such Fund whose average daily net assets for the prior calendar year was less than $50 million. The Retirement and Allocation Funds will also continue to bear their pro-rata share of the non-advisory operating expenses borne by each of the underlying Funds in which they invest. |
| (c) | Realized gains and losses for the Retirement and Allocation Funds result from the disposition of shares of the underlying funds. |
The accompanying notes are an integral part of these financial statements.
128
| | | | | | | | | | | | | | | | | | | | | | | | | | | | | | | | |
2055
Retirement
Fund | | | 2060
Retirement
Fund† | | | Conservative
Allocation
Fund | | | Moderate
Allocation
Fund | | | Aggressive
Allocation
Fund | | | Money
Market
Fund | | | Mid-Term
Bond Fund | | | Bond Fund | | | |
| | | | | | | | | | | | | | | | | | | | | | | | | | | | | | | | | |
| | | | | | | | | | | | | | | | | | | | | | | | | | | | | | | | | |
| $ | 964,037 | (a) | | $ | 11,263 | (a) | | $ | 3,302,279 | (a) | | $ | 7,770,185 | (a) | | $ | 5,255,486 | (a) | | $ | — | | | $ | — | | | $ | — | | | |
| | — | | | | — | | | | — | | | | — | | | | — | | | | 2,471,508 | | | | 16,333,814 | | | | 43,341,347 | | | |
| | | | | | | | | | | | | | | | | | | | | | | | | | | | | | | | |
| | | | | | | | |
| | 964,037 | | | | 11,263 | | | | 3,302,279 | | | | 7,770,185 | | | | 5,255,486 | | | | 2,471,508 | | | | 16,333,814 | | | | 43,341,347 | | | |
| | | | | | | | | | | | | | | | | | | | | | | | | | | | | | | | |
| | | | | | | | |
| | | | | | | | | | | | | | | | | | | | | | | | | | | | | | | | | |
| | 27,081 | (b) | | | 363 | (b) | | | — | (b) | | | — | (b) | | | — | (b) | | | 183,717 | | | | 2,269,800 | | | | 5,031,457 | | | |
| | | | | | | | |
| | | | | | | | | | | | | | | | | | | | | | | | | | | | | | | | | |
| | 9,039 | (b) | | | 8,779 | (b) | | | 9,533 | (b) | | | 10,710 | (b) | | | 10,237 | (b) | | | 31,068 | | | | 119,946 | | | | 272,198 | | | |
| | 13,497 | (b) | | | 2,047 | (b) | | | 13,699 | (b) | | | 13,699 | (b) | | | 13,699 | (b) | | | 14,562 | | | | 17,522 | | | | 20,518 | | | |
| | — | (b) | | | — | (b) | | | — | (b) | | | — | (b) | | | — | (b) | | | 8,261 | | | | 9,449 | | | | 32,413 | | | |
| | — | (b) | | | — | (b) | | | — | (b) | | | — | (b) | | | — | (b) | | | 7,183 | | | | 38,110 | | | | 86,615 | | | |
| | 3,532 | (b) | | | 26 | (b) | | | 10,824 | (b) | | | 27,692 | (b) | | | 20,996 | (b) | | | 6,249 | | | | 12,373 | | | | 28,634 | | | |
| | 3,170 | (b) | | | 21 | (b) | | | 9,780 | (b) | | | 25,027 | (b) | | | 18,982 | (b) | | | 9,237 | | | | 18,398 | | | | 42,587 | | | |
| | — | (b) | | | — | (b) | | | — | (b) | | | — | (b) | | | — | (b) | | | 13,966 | | | | 75,896 | | | | 172,484 | | | |
| | — | (b) | | | — | (b) | | | — | (b) | | | — | (b) | | | — | (b) | | | — | | | | — | | | | — | | | |
| | 2,760 | (b) | | | 41 | (b) | | | (9,692 | )(b) | | | (11,062 | )(b) | | | (10,095 | )(b) | | | (23,938 | ) | | | (1,671 | ) | | | 61,520 | | | |
| | | | | | | | | | | | | | | | | | | | | | | | | | | | | | | | |
| | | | | | | | |
| | 31,998 | | | | 10,914 | | | | 34,144 | | | | 66,066 | | | | 53,819 | | | | 66,588 | | | | 290,023 | | | | 716,969 | | | |
| | | | | | | | | | | | | | | | | | | | | | | | | | | | | | | | |
| | 59,079 | | | | 11,277 | | | | 34,144 | | | | 66,066 | | | | 53,819 | | | | 250,305 | | | | 2,559,823 | | | | 5,748,426 | | | |
| | — | | | | — | | | | — | | | | — | | | | — | | | | — | | | | — | | | | — | | | |
| | (31,998 | ) | | | (10,914 | ) | | | — | | | | — | | | | — | | | | — | | | | — | | | | — | | | |
| | | | | | | | | | | | | | | | | | | | | | | | | | | | | | | | |
| | | | | | | | |
| | 27,081 | | | | 363 | | | | 34,144 | | | | 66,066 | | | | 53,819 | | | | 250,305 | | | | 2,559,823 | | | | 5,748,426 | | | |
| | | | | | | | | | | | | | | | | | | | | | | | | | | | | | | | |
| | | | | | | | |
| | 936,956 | | | | 10,900 | | | | 3,268,135 | | | | 7,704,119 | | | | 5,201,667 | | | | 2,221,203 | | | | 13,773,991 | | | | 37,592,921 | | | |
| | | | | | | | | | | | | | | | | | | | | | | | | | | | | | | | |
| | | | | | | | |
| | | | | | | | | | | | | | | | | | | | | | | | | | | | | | | | |
| | | | | | | | | | | | | | | | | | | | | | | | | | | | | | | | | |
| | 232,473 | (c) | | | (1,669 | )(c) | | | 2,188,364 | (c) | | | 10,675,873 | (c) | | | 10,427,323 | (c) | | | 1,034 | | | | (1,152,125 | ) | | | (1,162,860 | ) | | |
| | — | | | | — | | | | — | | | | — | | | | — | | | | — | | | | — | | | | — | | | |
|
2,179,496 |
| | | 24,980 | | | | 1,360,659 | | | | 6,765,439 | | | | 8,180,691 | | | | — | | | | — | | | | — | | | |
| | | | | | | | | | | | | | | | | | | | | | | | | | | | | | | | |
| | | | | | | | |
| | 2,411,969 | | | | 23,311 | | | | 3,549,023 | | | | 17,441,312 | | | | 18,608,014 | | | | 1,034 | | | | (1,152,125 | ) | | | (1,162,860 | ) | | |
| | | | | | | | | | | | | | | | | | | | | | | | | | | | | | | | |
| | | | | | | | |
| | | | | | | | | | | | | | | | | | | | | | | | | | | | | | | | | |
| | (10,460,646 | ) | | | (352,946 | ) | | | (9,969,340 | ) | | | (42,306,403 | ) | | | (44,438,353 | ) | | | (341 | ) | | | (9,127,556 | ) | | | (33,378,126 | ) | | |
| | — | | | | — | | | | — | | | | — | | | | — | | | | — | | | | — | | | | — | | | |
| | | | | | | | | | | | | | | | | | | | | | | | | | | | | | | | |
| | | | | | | | |
| | (10,460,646 | ) | | | (352,946 | ) | | | (9,969,340 | ) | | | (42,306,403 | ) | | | (44,438,353 | ) | | | (341 | ) | | | (9,127,556 | ) | | | (33,378,126 | ) | | |
| | | | | | | | | | | | | | | | | | | | | | | | | | | | | | | | |
| | | | | | | | |
| | (8,048,677 | ) | |
|
(329,635 |
) | | | (6,420,317 | ) | | | (24,865,091 | ) | | | (25,830,339 | ) | | | 693 | | | | (10,279,681 | ) | | | (34,540,986 | ) | | |
| | | | | | | | | | | | | | | | | | | | | | | | | | | | | | | | |
| | | | | | | | |
| $ | (7,111,721 | ) | |
$ |
(318,735 |
) | | $ | (3,152,182 | ) | | $ | (17,160,972 | ) | | $ | (20,628,672 | ) | | $ | 2,221,896 | | | $ | 3,494,310 | | | $ | 3,051,935 | | | |
| | | | | | | | | | | | | | | | | | | | | | | | | | | | | | | | |
The accompanying notes are an integral part of these financial statements.
129
MUTUAL OF AMERICA INVESTMENT CORPORATION
STATEMENTS OF CHANGES IN NET ASSETS
For the Years Ended December 31,
| | | | | | | | | | | | | | | | |
| | | Equity Index Fund | | |
All America Fund | |
| | | 2018 | | | 2017 | | | 2018 | | | 2017 | |
INCREASE (DECREASE)IN NET ASSETS | | | | | | | | | | | | | | | | |
FROM OPERATIONS | | | | | | | | | | | | | | | | |
Net investment income (loss) | | $ | 51,303,517 | | | $ | 44,215,785 | | | $ | 3,945,417 | | | $ | 4,117,512 | |
Net realized gain (loss) on investments and futures contracts | | | 59,872,774 | | | | 62,492,844 | | | | 20,360,192 | | | | 16,748,863 | |
Change in net unrealized appreciation (depreciation) of investments and futures contracts | | | (238,372,855 | ) | | | 362,502,928 | | | | (47,910,269 | ) | | | 33,991,640 | |
| | | | | | | | | | | | | | | | |
| | | | |
NET INCREASE (DECREASE)IN NET ASSETS RESULTINGFROM OPERATIONS | | | (127,196,564 | ) | | | 469,211,557 | | | | (23,604,660 | ) | | | 54,858,015 | |
| | | | | | | | | | | | | | | | |
| | | | |
DISTRIBUTIONS (Notes 1 and 5)(a) | | | | | | | | | | | | | | | | |
From Distributable Earnings | | | (107,012,813 | ) | | | (84,781,549 | ) | | | (20,436,408 | ) | | | (40,782,397 | ) |
Return of Capital | | | — | | | | — | | | | — | | | | — | |
| | | | | | | | | | | | | | | | |
| | | | |
Total distributions | | | (107,012,813 | ) | | | (84,781,549 | ) | | | (20,436,408 | ) | | | (40,782,397 | ) |
| | | | | | | | | | | | | | | | |
| | | | |
CAPITAL TRANSACTIONS (Note 4) | | | | | | | | | | | | | | | | |
Proceeds from sale of shares | | | 251,921,033 | | | | 280,655,275 | | | | 5,132,192 | | | | 4,994,968 | |
Dividends reinvested | | | 107,012,813 | | | | 84,781,549 | | | | 20,436,408 | | | | 40,782,397 | |
Cost of shares redeemed | | | (207,699,908 | ) | | | (181,599,618 | ) | | | (38,189,780 | ) | | | (30,960,356 | ) |
| | | | | | | | | | | | | | | | |
| | | | |
NET INCREASE (DECREASE)IN NET ASSETSFROM CAPITAL TRANSACTIONS | | | 151,233,938 | | | | 183,837,206 | | | | (12,621,180 | ) | | | 14,817,009 | |
| | | | | | | | | | | | | | | | |
INCREASE (DECREASE)IN NET ASSETS | | | (82,975,439 | ) | | | 568,267,214 | | | | (56,662,248 | ) | | | 28,892,627 | |
NET ASSETS, BEGINNINGOF YEAR | | | 2,711,584,951 | | | | 2,143,317,737 | | | | 324,736,355 | | | | 295,843,728 | |
| | | | | | | | | | | | | | | | |
| | | | |
NET ASSETS, ENDOF YEAR | | $ | 2,628,609,512 | | | $ | 2,711,584,951 | | | $ | 268,074,107 | | | $ | 324,736,355 | |
| | | | | | | | | | | | | | | | |
| | | | |
ACCUMULATED UNDISTRIBUTED NET INVESTMENT INCOME (LOSS) (Notes 5 and 6)(b) | | $ | — | | | $ | 43,482,957 | | | $ | — | | | $ | 3,999,110 | |
| | | | | | | | | | | | | | | | |
| | | | |
OTHER INFORMATION: | | | | | | | | | | | | | | | | |
Shares outstanding at the beginning of year | | | 660,764,208 | | | | 613,796,674 | | | | 136,259,701 | | | | 129,150,212 | |
| | | | | | | | | | | | | | | | |
Shares sold | | | 60,734,671 | | | | 72,758,083 | | | | 2,200,603 | | | | 2,084,026 | |
Shares issued as reinvestment of dividends | | | 24,643,816 | | | | 21,862,291 | | | | 8,455,221 | | | | 17,925,989 | |
Shares redeemed | | | (49,903,168 | ) | | | (47,652,840 | ) | | | (16,123,569 | ) | | | (12,900,526 | ) |
| | | | | | | | | | | | | | | | |
| | | | |
Net increase (decrease) | | | 35,475,319 | | | | 46,967,534 | | | | (5,467,745 | ) | | | 7,109,489 | |
| | | | | | | | | | | | | | | | |
| | | | |
Shares outstanding at the end of year | | | 696,239,527 | | | | 660,764,208 | | | | 130,791,956 | | | | 136,259,701 | |
| | | | | | | | | | | | | | | | |
| † | For the period July 2, 2018 (Commencement of Operations) to December 31, 2018. |
| (a) | Prior Year Distributions have been modified to conform to the 2018 presentation. See Note 6, Recent Accounting Pronouncements for additional details. |
| (b) | Not presented for 2018 as a result of adoption of SEC’s Disclosure Update and Simplification Rule. |
The accompanying notes are an integral part of these financial statements.
130
| | | | | | | | | | | | | | | | | | | | | | | | | | | | | | | | | | | | |
| Small Cap Value Fund | | | Small Cap Growth Fund | | | Small Cap
Equity Index
Fund† | | | Mid Cap Value Fund | | | Mid-Cap Equity Index Fund | | | |
| 2018 | | | 2017 | | | 2018 | | | 2017 | | | 2018 | | | 2018 | | | 2017 | | | 2018 | | | 2017 | | | |
| | | | | | | | | | | | | | | | | | | | | | | | | | | | | | | | | | | | |
| | | | | | | | | | | | | | | | | | | | | | | | | | | | | | | | | | | | |
| $ | 5,417,677 | | | $ | 8,270,846 | | | $ | 721,560 | | | $ | 296,515 | | | $ | 112,825 | | | $ | 1,471,704 | | | $ | 1,550,315 | | | $ | 22,142,526 | | | $ | 19,343,960 | | | |
| | 26,004,396 | | | | 36,492,214 | | | | 46,288,828 | | | | 38,804,225 | | | | (203,024 | ) | | | 1,922,983 | | | | 7,184,494 | | | | 101,405,685 | | | | 87,448,679 | | | |
| | | | | | | | | |
| | (103,915,943 | ) | | | (6,611,332 | ) | | | (115,920,143 | ) | | | 64,349,468 | | | | (3,470,942 | ) | | | (16,574,717 | ) | | | 5,161,646 | | | | (284,333,341 | ) | | | 91,555,570 | | | |
| | | | | | | | | | | | | | | | | | | | | | | | | | | | | | | | | | | | |
| | | | | | | | | |
| | (72,493,870 | ) | | | 38,151,728 | | | | (68,909,755 | ) | | | 103,450,208 | | | | (3,561,141 | ) | | | (13,180,030 | ) | | | 13,896,455 | | | | (160,785,130 | ) | | | 198,348,209 | | | |
| | | | | | | | | | | | | | | | | | | | | | | | | | | | | | | | | | | | |
| | | | | | | | | |
| | | | | | | | | | | | | | | | | | | | | | | | | | | | | | | | | | | | |
| | (43,728,999 | ) | | | (25,140,443 | ) | | | (39,717,181 | ) | | | (17,587,485 | ) | | | (136,423 | ) | | | (8,924,532 | ) | | | (5,341,436 | ) | | | (109,431,002 | ) | | | (93,395,748 | ) | | |
| | — | | | | — | | | | — | | | | — | | | | (965 | ) | | | — | | | | — | | | | — | | | | — | | | |
| | | | | | | | | | | | | | | | | | | | | | | | | | | | | | | | | | | | |
| | | | | | | | | |
| | (43,728,999 | ) | | | (25,140,443 | ) | | | (39,717,181 | ) | | | (17,587,485 | ) | | | (137,388 | ) | | | (8,924,532 | ) | | | (5,341,436 | ) | | | (109,431,002 | ) | | | (93,395,748 | ) | | |
| | | | | | | | | | | | | | | | | | | | | | | | | | | | | | | | | | | | |
| | | | | | | | | |
| | | | | | | | | | | | | | | | | | | | | | | | | | | | | | | | | | | | |
| | 38,386,795 | | | | 50,530,295 | | | | 43,996,025 | | | | 56,136,417 | | | | 21,675,638 | | | | 5,341,000 | | | | 7,799,776 | | | | 119,784,786 | | | | 139,275,450 | | | |
| | 43,728,999 | | | | 25,140,443 | | | | 39,717,181 | | | | 17,587,485 | | | | 137,388 | | | | 8,924,532 | | | | 5,341,436 | | | | 109,431,002 | | | | 93,395,748 | | | |
| | (43,612,589 | ) | | | (47,802,151 | ) | | | (46,655,929 | ) | | | (37,490,815 | ) | | | (906,395 | ) | | | (15,513,349 | ) | | | (16,319,390 | ) | | | (129,665,172 | ) | | | (130,627,727 | ) | | |
| | | | | | | | | | | | | | | | | | | | | | | | | | | | | | | | | | | | |
| | | | | | | | | |
| | 38,503,205 | | | | 27,868,587 | | | | 37,057,277 | | | | 36,233,087 | | | | 20,906,631 | | | | (1,247,817 | ) | | | (3,178,178 | ) | | | 99,550,616 | | | | 102,043,471 | | | |
| | | | | | | | | | | | | | | | | | | | | | | | | | | | | | | | | | | | |
| | (77,719,664 | ) | | | 40,879,872 | | | | (71,569,659 | ) | | | 122,095,810 | | | | 17,208,102 | | | | (23,352,379 | ) | | | 5,376,841 | | | | (170,665,516 | ) | | | 206,995,932 | | | |
| | 505,721,749 | | | | 464,841,877 | | | | 554,901,996 | | | | 432,806,186 | | | | — | | | | 103,394,156 | | | | 98,017,315 | | | | 1,452,033,107 | | | | 1,245,037,175 | | | |
| | | | | | | | | | | | | | | | | | | | | | | | | | | | | | | | | | | | |
| | | | | | | | | |
| $ | 428,002,085 | | | $ | 505,721,749 | | | $ | 483,332,337 | | | $ | 554,901,996 | | | $ | 17,208,102 | | | $ | 80,041,777 | | | $ | 103,394,156 | | | $ | 1,281,367,591 | | | $ | 1,452,033,107 | | | |
| | | | | | | | | | | | | | | | | | | | | | | | | | | | | | | | | | | | |
| | | | | | | | | |
| $ | — | | | $ | 7,813,509 | | | $ | — | | | $ | 182,432 | | | $ | — | | | $ | — | | | $ | 1,717,714 | | | $ | — | | | $ | 17,265,865 | | | |
| | | | | | | | | | | | | | | | | | | | | | | | | | | | | | | | | | | | |
| | | | | | | | | |
| | | | | | | | | | | | | | | | | | | | | | | | | | | | | | | | | | | | |
| | 291,434,007 | | | | 275,365,315 | | | | 359,318,522 | | | | 335,357,612 | | | | — | | | | 60,396,632 | | | | 62,318,941 | | | | 619,888,133 | | | | 574,306,144 | | | |
| | | | | | | | | | | | | | | | | | | | | | | | | | | | | | | | | | | | |
| | 23,639,432 | | | | 29,611,517 | | | | 29,169,976 | | | | 38,971,886 | | | | 21,543,303 | | | | 3,234,055 | | | | 4,806,994 | | | | 52,594,103 | | | | 61,230,392 | | | |
| | 26,270,022 | | | | 14,598,450 | | | | 24,913,550 | | | | 11,783,010 | | | | 167,927 | | | | 5,513,245 | | | | 3,270,674 | | | | 46,453,117 | | | | 41,917,027 | | | |
| | (26,211,964 | ) | | | (28,141,275 | ) | | | (30,534,237 | ) | | | (26,793,986 | ) | | | (924,639 | ) | | | (9,377,237 | ) | | | (9,999,977 | ) | | | (55,460,819 | ) | | | (57,565,430 | ) | | |
| | | | | | | | | | | | | | | | | | | | | | | | | | | | | | | | | | | | |
| | | | | | | | | |
| | 23,697,490 | | | | 16,068,692 | | | | 23,549,289 | | | | 23,960,910 | | | | 20,786,591 | | | | (629,937 | ) | | | (1,922,309 | ) | | | 43,586,401 | | | | 45,581,989 | | | |
| | | | | | | | | | | | | | | | | | | | | | | | | | | | | | | | | | | | |
| | | | | | | | | |
| | 315,131,497 | | | | 291,434,007 | | | | 382,867,811 | | | | 359,318,522 | | | | 20,786,591 | | | | 59,766,695 | | | | 60,396,632 | | | | 663,474,534 | | | | 619,888,133 | | | |
| | | | | | | | | | | | | | | | | | | | | | | | | | | | | | | | | | | | |
The accompanying notes are an integral part of these financial statements.
131
MUTUAL OF AMERICA INVESTMENT CORPORATION
STATEMENTS OF CHANGES IN NET ASSETS (Continued)
For the Years Ended December 31,
| | | | | | | | | | | | | | | | |
| | | International Fund | | | Composite Fund | |
| | | 2018 | | | 2017 | | | 2018 | | | 2017 | |
INCREASE (DECREASE)IN NET ASSETS | | | | | | | | | | | | | | | | |
FROM OPERATIONS | | | | | | | | | | | | | | | | |
Net investment income (loss) | | $ | 14,819,838 | | | $ | 12,148,232 | | | $ | 4,050,526 | | | $ | 3,881,754 | |
Net realized gain (loss) on investments and futures contracts | | | — | | | | 70 | | | | 8,205,586 | | | | 14,133,237 | |
Change in net unrealized appreciation (depreciation) of investments and futures contracts | | | (90,151,424 | ) | | | 84,667,994 | | | | (17,734,526 | ) | | | 5,080,238 | |
| | | | | | | | | | | | | | | | |
| | | | |
NET INCREASE (DECREASE)IN NET ASSETS RESULTINGFROM OPERATIONS | | | (75,331,586 | ) | | | 96,816,296 | | | | (5,478,414 | ) | | | 23,095,229 | |
| | | | | | | | | | | | | | | | |
| | | | |
DISTRIBUTIONS (Notes 1 and 5)(a) | | | | | | | | | | | | | | | | |
From Distributable Earnings | | | (12,148,302 | ) | | | (11,081,445 | ) | | | (18,147,487 | ) | | | (25,296,946 | ) |
| | | | | | | | | | | | | | | | |
| | | | |
Total distributions | | | (12,148,302 | ) | | | (11,081,445 | ) | | | (18,147,487 | ) | | | (25,296,946 | ) |
| | | | | | | | | | | | | | | | |
| | | | |
CAPITAL TRANSACTIONS (Note 4) | | | | | | | | | | | | | | | | |
Proceeds from sale of shares | | | 88,808,391 | | | | 93,050,146 | | | | 8,858,290 | | | | 5,856,506 | |
Dividends reinvested | | | 12,148,302 | | | | 11,081,445 | | | | 18,147,487 | | | | 25,296,946 | |
Cost of shares redeemed | | | (42,429,454 | ) | | | (29,124,853 | ) | | | (21,628,078 | ) | | | (19,724,207 | ) |
| | | | | | | | | | | | | | | | |
| | | | |
NET INCREASE (DECREASE)IN NET ASSETSFROM CAPITAL TRANSACTIONS | | | 58,527,239 | | | | 75,006,738 | | | | 5,377,699 | | | | 11,429,245 | |
| | | | | | | | | | | | | | | | |
INCREASE (DECREASE)IN NET ASSETS | | | (28,952,649 | ) | | | 160,741,589 | | | | (18,248,202 | ) | | | 9,227,528 | |
NET ASSETS, BEGINNINGOF YEAR | | | 537,470,082 | | | | 376,728,493 | | | | 190,370,915 | | | | 181,143,387 | |
| | | | | | | | | | | | | | | | |
| | | | |
NET ASSETS, ENDOF YEAR | | $ | 508,517,433 | | | $ | 537,470,082 | | | $ | 172,122,713 | | | $ | 190,370,915 | |
| | | | | | | | | | | | | | | | |
| | | | |
ACCUMULATED UNDISTRIBUTED NET INVESTMENT INCOME (LOSS) (Notes 5 and 6)(b) | | $ | — | | | $ | 12,148,232 | | | $ | — | | | $ | 3,867,102 | |
| | | | | | | | | | | | | | | | |
| | | | |
OTHER INFORMATION: | | | | | | | | | | | | | | | | |
Shares outstanding at the beginning of year | | | 594,344,780 | | | | 506,896,525 | | | | 99,760,702 | | | | 92,999,300 | |
| | | | | | | | | | | | | | | | |
Shares sold | | | 103,838,007 | | | | 109,396,814 | | | | 4,789,234 | | | | 2,942,783 | |
Shares issued as reinvestment of dividends | | | 13,966,487 | | | | 12,707,482 | | | | 9,946,383 | | | | 13,750,699 | |
Shares redeemed | | | (48,341,078 | ) | | | (34,656,041 | ) | | | (11,722,908 | ) | | | (9,932,080 | ) |
| | | | | | | | | | | | | | | | |
| | | | |
Net increase (decrease) | | | 69,463,416 | | | | 87,448,255 | | | | 3,012,709 | | | | 6,761,402 | |
| | | | | | | | | | | | | | | | |
| | | | |
Shares outstanding at the end of year | | | 663,808,196 | | | | 594,344,780 | | | | 102,773,411 | | | | 99,760,702 | |
| | | | | | | | | | | | | | | | |
| (a) | Prior Year Distributions have been modified to conform to the 2018 presentation. See Note 6, Recent Accounting Pronouncements for additional details. |
| (b) | Not presented for 2018 as a result of adoption of SEC’s Disclosure Update and Simplification Rule. |
The accompanying notes are an integral part of these financial statements.
132
| | | | | | | | | | | | | | | | | | | | | | | | | | | | | | | | |
| Retirement Income Fund | | | 2010 Retirement Fund | | | 2015 Retirement Fund | | | 2020 Retirement Fund | | | |
| 2018 | | | 2017 | | | 2018 | | | 2017 | | | 2018 | | | 2017 | | | 2018 | | | 2017 | | | |
| | | | | | | | | | | | | | | | | | | | | | | | | | | | | | | | |
| | | | | | | | | | | | | | | | | | | | | | | | | | | | | | | | |
| $ | 1,838,898 | | | $ | 1,694,924 | | | $ | 456,889 | | | $ | 473,638 | | | $ | 2,738,955 | | | $ | 2,753,792 | | | $ | 10,067,194 | | | $ | 8,793,328 | | | |
| | 1,563,100 | | | | 1,450,226 | | | | 704,848 | | | | 1,045,438 | | | | 6,339,331 | | | | 6,094,685 | | | | 24,505,516 | | | | 15,104,286 | | | |
| | | | | | | | |
| | (4,604,759 | ) | | | 2,753,539 | | | | (1,604,780 | ) | | | 619,430 | | | | (13,342,292 | ) | | | 6,185,688 | | | | (55,831,920 | ) | | | 30,791,307 | | | |
| | | | | | | | | | | | | | | | | | | | | | | | | | | | | | | | |
| | | | | | | | |
| | (1,202,761 | ) | | | 5,898,689 | | | | (443,043 | ) | | | 2,138,506 | | | | (4,264,006 | ) | | | 15,034,165 | | | | (21,259,210 | ) | | | 54,688,921 | | | |
| | | | | | | | | | | | | | | | | | | | | | | | | | | | | | | | |
| | | | | | | | |
| | | | | | | | | | | | | | | | | | | | | | | | | | | | | | | | |
| | (3,090,568 | ) | | | (2,919,135 | ) | | | (1,546,101 | ) | | | (1,694,368 | ) | | | (8,984,709 | ) | | | (9,533,352 | ) | | | (23,776,592 | ) | | | (22,897,983 | ) | | |
| | | | | | | | | | | | | | | | | | | | | | | | | | | | | | | | |
| | | | | | | | |
| | (3,090,568 | ) | | | (2,919,135 | ) | | | (1,546,101 | ) | | | (1,694,368 | ) | | | (8,984,709 | ) | | | (9,533,352 | ) | | | (23,776,592 | ) | | | (22,897,983 | ) | | |
| | | | | | | | | | | | | | | | | | | | | | | | | | | | | | | | |
| | | | | | | | |
| | | | | | | | | | | | | | | | | | | | | | | | | | | | | | | | |
| | 23,573,287 | | | | 32,172,908 | | | | 3,296,291 | | | | 4,928,903 | | | | 13,089,181 | | | | 15,693,916 | | | | 60,347,677 | | | | 77,413,289 | | | |
| | 3,090,568 | | | | 2,919,135 | | | | 1,546,101 | | | | 1,694,368 | | | | 8,984,709 | | | | 9,533,352 | | | | 23,776,592 | | | | 22,897,983 | | | |
| | (21,759,327 | ) | | | (12,952,830 | ) | | | (4,410,138 | ) | | | (7,200,626 | ) | | | (25,354,072 | ) | | | (22,133,922 | ) | | | (48,752,890 | ) | | | (33,093,454 | ) | | |
| | | | | | | | | | | | | | | | | | | | | | | | | | | | | | | | |
| | | | | | | | |
| | 4,904,528 | | | | 22,139,213 | | | | 432,254 | | | | (577,355 | ) | | | (3,280,182 | ) | | | 3,093,346 | | | | 35,371,379 | | | | 67,217,818 | | | |
| | | | | | | | | | | | | | | | | | | | | | | | | | | | | | | | |
| | 611,199 | | | | 25,118,767 | | | | (1,556,890 | ) | | | (133,217 | ) | | | (16,528,897 | ) | | | 8,594,159 | | | | (9,664,423 | ) | | | 99,008,756 | | | |
| | 100,818,662 | | | | 75,699,895 | | | | 25,549,967 | | | | 25,683,184 | ) | | | 154,985,913 | | | | 146,391,754 | | | | 524,852,573 | | | | 425,843,817 | | | |
| | | | | | | | | | | | | | | | | | | | | | | | | | | | | | | | |
| | | | | | | | |
| $ | 101,429,861 | | | $ | 100,818,662 | | | $ | 23,993,077 | | | $ | 25,549,967 | | | $ | 138,457,016 | | | $ | 154,985,913 | | | $ | 515,188,150 | | | $ | 524,852,573 | | | |
| | | | | | | | | | | | | | | | | | | | | | | | | | | | | | | | |
| | | | | | | | |
| $ | — | | | $ | 1,751,326 | | | $ | — | | | $ | 490,991 | | | $ | — | | | $ | 2,885,420 | | | $ | — | | | $ | 9,311,834 | | | |
| | | | | | | | | | | | | | | | | | | | | | | | | | | | | | | | |
| | | | | | | | |
| | | | | | | | | | | | | | | | | | | | | | | | | | | | | | | | |
| | 86,397,770 | | | | 67,312,624 | | | | 25,359,862 | | | | 25,875,441 | | | | 145,270,066 | | | | 142,136,674 | | | | 428,449,681 | | | | 372,702,026 | | | |
| | | | | | | | | | | | | | | | | | | | | | | | | | | | | | | | |
| | 20,479,659 | | | | 27,753,913 | | | | 3,369,969 | | | | 4,824,578 | | | | 12,616,643 | | | | 14,745,583 | | | | 50,253,586 | | | | 64,222,463 | | | |
| | 2,673,992 | | | | 2,540,886 | | | | 1,597,232 | | | | 1,716,264 | | | | 8,673,847 | | | | 9,148,642 | | | | 19,519,809 | | | | 19,226,863 | | | |
| | (18,834,022 | ) | | | (11,209,653 | ) | | | (4,426,016 | ) | | | (7,056,421 | ) | | | (24,215,531 | ) | | | (20,760,833 | ) | | | (40,180,933 | ) | | | (27,701,671 | ) | | |
| | | | | | | | | | | | | | | | | | | | | | | | | | | | | | | | |
| | | | | | | | |
| | 4,319,629 | | | | 19,085,146 | | | | 541,185 | | | | (515,579 | ) | | | (2,925,041 | ) | | | 3,133,392 | | | | 29,592,462 | | | | 55,747,655 | | | |
| | | | | | | | | | | | | | | | | | | | | | | | | | | | | | | | |
| | | | | | | | |
| | 90,717,399 | | | | 86,397,770 | | | | 25,901,047 | | | | 25,359,862 | | | | 142,345,025 | | | | 145,270,066 | | | | 458,042,143 | | | | 428,449,681 | | | |
| | | | | | | | | | | | | | | | | | | | | | | | | | | | | | | | |
The accompanying notes are an integral part of these financial statements.
133
MUTUAL OF AMERICA INVESTMENT CORPORATION
STATEMENTS OF CHANGES IN NET ASSETS (Continued)
For the Years Ended December 31,
| | | | | | | | | | | | | | | | |
| | | 2025 Retirement Fund | | | 2030 Retirement Fund | |
| | | 2018 | | | 2017 | | | 2018 | | | 2017 | |
INCREASE (DECREASE)IN NET ASSETS | | | | | | | | | | | | | | | | |
FROM OPERATIONS | | | | | | | | | | | | | | | | |
Net investment income (loss) | | $ | 12,981,081 | | | $ | 10,522,461 | | | $ | 10,746,246 | | | $ | 8,227,039 | |
Net realized gain (loss) on investments and futures contracts | | | 31,656,921 | | | | 24,263,779 | | | | 27,340,841 | | | | 20,606,333 | |
Change in net unrealized appreciation (depreciation) of investments and futures contracts | | | (83,808,474 | ) | | | 43,536,296 | | | | (80,777,544 | ) | | | 43,362,960 | |
| | | | | | | | | | | | | | | | |
| | | | |
NET INCREASE (DECREASE)IN NET ASSETS RESULTINGFROM OPERATIONS | | | (39,170,472 | ) | | | 78,322,536 | | | | (42,690,457 | ) | | | 72,196,332 | |
| | | | | | | | | | | | | | | | |
| | | | |
DISTRIBUTIONS (Notes 1 and 5)(a) | | | | | | | | | | | | | | | | |
From Distributable Earnings | | | (34,713,526 | ) | | | (25,993,438 | ) | | | (28,749,432 | ) | | | (22,873,632 | ) |
| | | | | | | | | | | | | | | | |
| | | | |
Total distributions | | | (34,713,526 | ) | | | (25,993,438 | ) | | | (28,749,432 | ) | | | (22,873,632 | ) |
| | | | | | | | | | | | | | | | |
| | | | |
CAPITAL TRANSACTIONS (Note 4) | | | | | | | | | | | | | | | | |
Proceeds from sale of shares | | | 100,541,513 | | | | 126,625,039 | | | | 110,358,460 | | | | 106,077,871 | |
Dividends reinvested | | | 34,713,526 | | | | 25,993,438 | | | | 28,749,432 | | | | 22,873,632 | |
Cost of shares redeemed | | | (37,264,538 | ) | | | (23,344,451 | ) | | | (28,265,110 | ) | | | (16,853,502 | ) |
| | | | | | | | | | | | | | | | |
| | | | |
NET INCREASE (DECREASE)IN NET ASSETSFROM CAPITAL TRANSACTIONS | | | 97,990,501 | | | | 129,274,026 | | | | 110,842,782 | | | | 112,098,001 | |
| | | | | | | | | | | | | | | | |
| | | | |
INCREASE (DECREASE)IN NET ASSETS | | | 24,106,503 | | | | 181,603,124 | | | | 39,402,893 | | | | 161,420,701 | |
NET ASSETS, BEGINNINGOF YEAR | | | 685,732,414 | | | | 504,129,290 | | | | 577,707,160 | | | | 416,286,459 | |
| | | | | | | | | | | | | | | | |
| | | | |
NET ASSETS, ENDOF YEAR | | $ | 709,838,917 | | | $ | 685,732,414 | | | $ | 617,110,053 | | | $ | 577,707,160 | |
| | | | | | | | | | | | | | | | |
| | | | |
Accumulated Undistributed Net Investment Income (Loss) (Notes 5 and 6)(b) | | $ | — | | | $ | 11,340,011 | | | $ | — | | | $ | 9,022,072 | |
| | | | | | | | | | | | | | | | |
| | | | |
OTHER INFORMATION: | | | | | | | | | | | | | | | | |
Shares outstanding at the beginning of year | | | 515,854,916 | | | | 415,825,169 | | | | 417,986,579 | | | | 334,109,962 | |
| | | | | | | | | | | | | | | | |
Shares sold | | | 77,021,501 | | | | 98,079,023 | | | | 81,176,275 | | | | 79,451,171 | |
Shares issued as reinvestment of dividends | | | 26,138,522 | | | | 20,203,892 | | | | 20,616,212 | | | | 17,170,566 | |
Shares redeemed | | | (28,397,203 | ) | | | (18,253,168 | ) | | | (20,499,664 | ) | | | (12,745,120 | ) |
| | | | | | | | | | | | | | | | |
| | | | |
Net increase (decrease) | | | 74,762,820 | | | | 100,029,747 | | | | 81,292,823 | | | | 83,876,617 | |
| | | | | | | | | | | | | | | | |
| | | | |
Shares outstanding at the end of year | | | 590,617,736 | | | | 515,854,916 | | | | 499,279,402 | | | | 417,986,579 | |
| | | | | | | | | | | | | | | | |
| (a) | Prior Year Distributions have been modified to conform to the 2018 presentation. See Note 6, Recent Accounting Pronouncements for additional details. |
| (b) | Not presented for 2018 as a result of adoption of SEC’s Disclosure Update and Simplification Rule. |
The accompanying notes are an integral part of these financial statements.
134
| | | | | | | | | | | | | | | | | | | | | | | | | | | | | | |
| 2035 Retirement Fund | | | 2040 Retirement Fund | | | 2045 Retirement Fund | | | 2050 Retirement Fund | |
| 2018 | | | 2017 | | | 2018 | | | 2017 | | | 2018 | | | 2017 | | | 2018 | | | 2017 | |
| | | | | | | | | | | | | | | | | | | | | | | | | | | | | | |
| | | | | | | | | | | | | | | | | | | | | | | | | | | | | | |
| $ | 8,438,526 | | | $ | 6,399,619 | | | $ | 6,701,699 | | | $ | 5,056,427 | | | $ | 7,053,386 | | | $ | 5,479,547 | | | $ | 4,386,343 | | | $ | 3,010,594 | |
| | 23,640,354 | | | | 17,064,308 | | | | 17,758,905 | | | | 13,534,381 | | | | 21,929,981 | | | | 16,561,865 | | | | 11,480,339 | | | | 7,016,419 | |
| | | | | | | |
| | (72,350,523 | ) | | | 40,982,001 | | | | (59,858,047 | ) | | | 34,637,708 | | | | (68,276,695 | ) | | | 39,378,606 | | | | (43,320,775 | ) | | | 23,769,184 | |
| | | | | | | | | | | | | | | | | | | | | | | | | | | | | | |
| | | | | | | |
| | (40,271,643 | ) | | | 64,445,928 | | | | (35,397,443 | ) | | | 53,228,516 | | | | (39,293,328 | ) | | | 61,420,018 | | | | (27,454,093 | ) | | | 33,796,197 | |
| | | | | | | | | | | | | | | | | | | | | | | | | | | | | | |
| | | | | | | |
| | | | | | | | | | | | | | | | | | | | | | | | | | | | | | |
| | (23,387,137 | ) | | | (19,255,431 | ) | | | (18,569,497 | ) | | | (16,601,460 | ) | | | (22,005,608 | ) | | | (18,332,000 | ) | | | (10,077,205 | ) | | | (7,079,329 | ) |
| | | | | | | | | | | | | | | | | | | | | | | | | | | | | | |
| | | | | | | |
| | (23,387,137 | ) | | | (19,255,431 | ) | | | (18,569,497 | ) | | | (16,601,460 | ) | | | (22,005,608 | ) | | | (18,332,000 | ) | | | (10,077,205 | ) | | | (7,079,329 | ) |
| | | | | | | | | | | | | | | | | | | | | | | | | | | | | | |
| | | | | | | |
| | | | | | | | | | | | | | | | | | | | | | | | | | | | | | |
| | 87,912,910 | | | | 82,835,500 | | | | 67,075,551 | | | | 66,867,713 | | | | 59,427,642 | | | | 60,429,606 | | | | 63,234,612 | | | | 65,362,608 | |
| | 23,387,137 | | | | 19,255,431 | | | | 18,569,497 | | | | 16,601,460 | | | | 22,005,608 | | | | 18,332,000 | | | | 10,077,205 | | | | 7,079,329 | |
| | (22,366,520 | ) | | | (14,947,422 | ) | | | (11,806,980 | ) | | | (13,006,066 | ) | | | (19,372,704 | ) | | | (16,905,936 | ) | | | (6,989,371 | ) | | | (6,709,097 | ) |
| | | | | | | | | | | | | | | | | | | | | | | | | | | | | | |
| | | | | | | |
| | 88,933,527 | | | | 87,143,509 | | | | 73,838,068 | | | | 70,463,107 | | | | 62,060,546 | | | | 61,855,670 | | | | 66,322,446 | | | | 65,732,840 | |
| | | | | | | | | | | | | | | | | | | | | | | | | | | | | | |
| | | | | | | |
| | 25,274,747 | | | | 132,334,006 | | | | 19,871,128 | | | | 107,090,163 | | | | 761,610 | | | | 104,943,688 | | | | 28,791,148 | | | | 92,449,708 | |
| | 484,171,363 | | | | 351,837,357 | | | | 392,787,523 | | | | 285,697,360 | | | | 437,350,376 | | | | 332,406,688 | | | | 256,498,225 | | | | 164,048,517 | |
| | | | | | | | | | | | | | | | | | | | | | | | | | | | | | |
| | | | | | | |
| $ | 509,446,110 | | | $ | 484,171,363 | | | $ | 412,658,651 | | | $ | 392,787,523 | | | $ | 438,111,986 | | | $ | 437,350,376 | | | $ | 285,289,373 | | | $ | 256,498,225 | |
| | | | | | | | | | | | | | | | | | | | | | | | | | | | | | |
| | | | | | | |
| $ | — | | | $ | 7,120,325 | | | $ | — | | | $ | 5,677,938 | | | $ | — | | | $ | 6,218,541 | | | $ | — | | | $ | 3,442,823 | |
| | | | | | | | | | | | | | | | | | | | | | | | | | | | | | |
| | | | | | | |
| | | | | | | | | | | | | | | | | | | | | | | | | | | | | | |
| | 345,541,845 | | | | 281,100,694 | | | | 283,386,019 | | | | 230,643,020 | | | | 315,271,648 | | | | 268,924,524 | | | | 154,619,686 | | | | 112,896,396 | |
| | | | | | | | | | | | | | | | | | | | | | | | | | | | | | |
| | 64,050,159 | | | | 61,396,950 | | | | 49,388,270 | | | | 50,159,660 | | | | 43,877,177 | | | | 45,393,704 | | | | 38,536,206 | | | | 41,635,209 | |
| | 16,432,749 | | | | 14,298,764 | | | | 13,163,191 | | | | 12,463,175 | | | | 15,632,425 | | | | 13,753,057 | | | | 5,910,720 | | | | 4,440,753 | |
| | (16,020,081 | ) | | | (11,254,563 | ) | | | (8,551,809 | ) | | | (9,879,836 | ) | | | (14,023,200 | ) | | | (12,799,637 | ) | | | (4,226,591 | ) | | | (4,352,672 | ) |
| | | | | | | | | | | | | | | | | | | | | | | | | | | | | | |
| | | | | | | |
| | 64,462,827 | | | | 64,441,151 | | | | 53,999,652 | | | | 52,742,999 | | | | 45,486,402 | | | | 46,347,124 | | | | 40,220,335 | | | | 41,723,290 | |
| | | | | | | | | | | | | | | | | | | | | | | | | | | | | | |
| | | | | | | |
| | 410,004,672 | | | | 345,541,845 | | | | 337,385,671 | | | | 283,386,019 | | | | 360,758,050 | | | | 315,271,648 | | | | 194,840,021 | | | | 154,619,686 | |
| | | | | | | | | | | | | | | | | | | | | | | | | | | | | | |
The accompanying notes are an integral part of these financial statements.
135
MUTUAL OF AMERICA INVESTMENT CORPORATION
STATEMENTS OF CHANGES IN NET ASSETS (Continued)
For the Years Ended December 31,
| | | | | | | | | | | | | | | | | | | | |
| | | 2055 Retirement Fund | | | 2060 Retirement Fund† | | | Conservative Allocation Fund | |
| | | 2018 | | | 2017 | | | 2018 | | | 2018 | | | 2017 | |
INCREASE (DECREASE)IN NET ASSETS | | | | | | | | | | | | | | | | | | | | |
FROM OPERATIONS | | | | | | | | | | | | | | | | | | | | |
Net investment income (loss) | | $ | 936,956 | | | $ | 279,997 | | | $ | 10,900 | | | $ | 3,268,135 | | | $ | 3,214,157 | |
Net realized gain (loss) on investments and futures contracts | | | 2,411,969 | | | | 644,084 | | | | 23,311 | | | | 3,549,023 | | | | 6,595,313 | |
Change in net unrealized appreciation (depreciation) of investments and futures contracts | | | (10,460,646 | ) | | | 1,552,376 | | | | (352,946 | ) | | | (9,969,340 | ) | | | 2,573,385 | |
| | | | | | | | | | | | | | | | | | | | |
| | | | | |
NET INCREASE (DECREASE)IN NET ASSETS RESULTINGFROM OPERATIONS | | | (7,111,721 | ) | | | 2,476,457 | | | | (318,735 | ) | | | (3,152,182 | ) | | | 12,382,855 | |
| | | | | | | | | | | | | | | | | | | | |
| | | | | |
DISTRIBUTIONS (Notes 1 and 5)(a) | | | | | | | | | | | | | | | | | | | | |
From Distributable Earnings | | | (908,891 | ) | | | — | | | | — | | | | (9,978,359 | ) | | | (5,729,904 | ) |
| | | | | | | | | | | | | | | | | | | | |
| | | | | |
Total distributions | | | (908,891 | ) | | | — | | | | — | | | | (9,978,359 | ) | | | (5,729,904 | ) |
| | | | | | | | | | | | | | | | | | | | |
| | | | | |
CAPITAL TRANSACTIONS (Note 4) | | | | | | | | | | | | | | | | | | | | |
Proceeds from sale of shares | | | 44,845,628 | | | | 29,317,575 | | | | 4,526,850 | | | | 15,703,357 | | | | 20,472,615 | |
Dividends reinvested | | | 908,891 | | | | — | | | | — | | | | 9,978,359 | | | | 5,729,904 | |
Cost of shares redeemed | | | (1,747,286 | ) | | | (803,993 | ) | | | (162,730 | ) | | | (19,128,685 | ) | | | (15,859,329 | ) |
| | | | | | | | | | | | | | | | | | | | |
| | | | | |
NET INCREASE (DECREASE)IN NET ASSETSFROM CAPITAL TRANSACTIONS | | | 44,007,233 | | | | 28,513,582 | | | | 4,364,120 | | | | 6,553,031 | | | | 10,343,190 | |
| | | | | | | | | | | | | | | | | | | | |
INCREASE (DECREASE)IN NET ASSETS | | | 35,986,621 | | | | 30,990,039 | | | | 4,045,385 | | | | (6,577,510 | ) | | | 16,996,141 | |
NET ASSETS, BEGINNINGOF YEAR | | | 34,309,458 | | | | 3,319,419 | | | | — | | | | 156,517,880 | | | | 139,521,739 | |
| | | | | | | | | | | | | | | | | | | | |
| | | | | |
NET ASSETS, ENDOF YEAR | | $ | 70,296,079 | | | $ | 34,309,458 | | | $ | 4,045,385 | | | $ | 149,940,370 | | | $ | 156,517,880 | |
| | | | | | | | | | | | | | | | | | | | |
| | | | | |
ACCUMULATED UNDISTRIBUTED NET INVESTMENT INCOME (LOSS) (Notes 5 and 6)(b) | | $ | — | | | $ | 320,748 | | | $ | — | | | $ | — | | | $ | 3,300,750 | |
| | | | | | | | | | | | | | | | | | | | |
| | | | | |
OTHER INFORMATION: | | | | | | | | | | | | | | | | | | | | |
Shares outstanding at the beginning of year | | | 27,964,164 | | | | 3,191,688 | | | | — | | | | 123,302,016 | | | | 115,118,175 | |
| | | | | | | | | | | | | | | | | | | | |
Shares sold | | | 36,533,527 | | | | 25,479,233 | | | | 4,678,627 | | | | 12,641,849 | | | | 16,225,324 | |
Shares issued as reinvestment of dividends | | | 707,938 | | | | — | | | | — | | | | 8,205,267 | | | | 4,593,518 | |
Shares redeemed | | | (1,428,405 | ) | | | (706,757 | ) | | | (156,500 | ) | | | (15,449,552 | ) | | | (12,635,001 | ) |
| | | | | | | | | | | | | | | | | | | | |
| | | | | |
Net Increase (decrease) | | | 35,813,060 | | | | 24,772,476 | | | | 4,522,127 | | | | 5,397,564 | | | | 8,183,841 | |
| | | | | | | | | | | | | | | | | | | | |
| | | | | |
Shares outstanding at the end of year | | | 63,777,224 | | | | 27,964,164 | | | | 4,522,127 | | | | 128,699,580 | | | | 123,302,016 | |
| | | | | | | | | | | | | | | | | | | | |
| † | For the period July 2, 2018 (Commencement of Operations) to December 31, 2018. |
| (a) | Prior Year Distributions have been modified to conform to the 2018 presentation. See Note 6, Recent Accounting Pronouncements for additional details. |
| (b) | Not presented for 2018 as a result of adoption of SEC’s Disclosure Update and Simplification Rule. |
The accompanying notes are an integral part of these financial statements.
136
| | | | | | | | | | | | | | | | | | | | | | | | | | | | | | | | | | | | | | | | |
| Moderate Allocation Fund | | | Aggressive Allocation Fund | | | Money Market Fund | | | Mid-Term Bond Fund | | | Bond Fund | | | |
| 2018 | | | 2017 | | | 2018 | | | 2017 | | | 2018 | | | 2017 | | | 2018 | | | 2017 | | | 2018 | | | 2017 | | | |
| | | | | | | | | | | | | | | | | | | | | | | | | | | | | | | | | | | | | | | | |
| | | | | | | | | | | | | | | | | | | | | | | | | | | | | | | | | | | | | | | | |
| $ | 7,704,119 | | | $ | 7,062,679 | | | $ | 5,201,667 | | | $ | 4,664,572 | | | $ | 2,221,203 | | | $ | 462,689 | | | $ | 13,773,991 | | | $ | 12,308,919 | | | $ | 37,592,921 | | | $ | 34,954,410 | | | |
| | | | | | | | | | |
| | 17,441,312 | | | | 21,830,015 | | | | 18,608,014 | | | | 18,565,041 | | | | 1,034 | | | | 445 | | | | (1,152,125 | ) | | | 237,075 | | | | (1,162,860 | ) | | | (77,618 | ) | | |
| | | | | | | | | | |
| | (42,306,403 | ) | | | 18,562,193 | | | | (44,438,353 | ) | | | 20,157,123 | | | | (341 | ) | | | 306 | | | | (9,127,556 | ) | | | (1,156,836 | ) | | | (33,378,126 | ) | | | 5,518,377 | | | |
| | | | | | | | | | | | | | | | | | | | | | | | | | | | | | | | | | | | | | | | |
| | | | | | | | | | |
| | (17,160,972 | ) | | | 47,454,887 | | | | (20,628,672 | ) | | | 43,386,736 | | | | 2,221,896 | | | | 463,440 | | | | 3,494,310 | | | | 11,389,158 | | | | 3,051,935 | | | | 40,395,169 | | | |
| | | | | | | | | | | | | | | | | | | | | | | | | | | | | | | | | | | | | | | | |
| | | | | | | | | | |
| | | | | | | | | | | | | | | | | | | | | | | | | | | | | | | | | | | | | | | | |
| | (27,841,742 | ) | | | (17,819,284 | ) | | | (21,790,587 | ) | | | (19,916,405 | ) | | | (462,689 | ) | | | (83,111 | ) | | | (12,425,048 | ) | | | (12,263,595 | ) | | | (34,954,410 | ) | | | (34,972,932 | ) | | |
| | | | | | | | | | | | | | | | | | | | | | | | | | | | | | | | | | | | | | | | |
| | | | | | | | | | |
| | | | | | | | | | | | | | | | | | | | | | | | | | | | | | | | | | | | | | | | |
| | 28,953,969 | | | | 33,445,237 | | | | 13,617,276 | | | | 17,881,824 | | | | 169,828,569 | | | | 21,771,292 | | | | 86,963,104 | | | | 109,137,538 | | | | 181,636,262 | | | | 215,994,313 | | | |
| | 27,841,742 | | | | 17,819,284 | | | | 21,790,587 | | | | 19,916,405 | | | | 462,689 | | | | 83,111 | | | | 12,425,048 | | | | 12,263,595 | | | | 34,954,410 | | | | 34,972,932 | | | |
| | (37,840,320 | ) | | | (30,723,099 | ) | | | (26,062,101 | ) | | | (20,548,822 | ) | | | (32,936,939 | ) | | | (14,482,315 | ) | | | (61,938,177 | ) | | | (54,594,230 | ) | | | (113,221,685 | ) | | | (90,752,819 | ) | | |
| | | | | | | | | | | | | | | | | | | | | | | | | | | | | | | | | | | | | | | | |
| | | | | | | | | | |
| | 18,955,391 | | | | 20,541,422 | | | | 9,345,762 | | | | 17,249,407 | | | | 137,354,319 | | | | 7,372,088 | | | | 37,449,975 | | | | 66,806,903 | | | | 103,368,987 | | | | 160,214,426 | | | |
| | | | | | | | | | | | | | | | | | | | | | | | | | | | | | | | | | | | | | | | |
| | (26,047,323 | ) | | | 50,177,025 | | | | (33,073,497 | ) | | | 40,719,738 | | | | 139,113,526 | | | | 7,752,417 | | | | 28,519,237 | | | | 65,932,466 | | | | 71,466,512 | | | | 165,636,663 | | | |
| | 397,184,939 | | | | 347,007,914 | | | | 304,449,364 | | | | 263,729,626 | | | | 70,799,393 | | | | 63,046,976 | | | | 558,203,017 | | | | 492,270,551 | | | | 1,274,128,031 | | | | 1,108,491,368 | | | |
| | | | | | | | | | | | | | | | | | | | | | | | | | | | | | | | | | | | | | | | |
| | | | | | | | | | |
| $ | 371,137,616 | | | $ | 397,184,939 | | | $ | 271,375,867 | | | $ | 304,449,364 | | | $ | 209,912,919 | | | $ | 70,799,393 | | | $ | 586,722,254 | | | $ | 558,203,017 | | | $ | 1,345,594,543 | | | $ | 1,274,128,031 | | | |
| | | | | | | | | | | | | | | | | | | | | | | | | | | | | | | | | | | | | | | | |
| | | | | | | | | | |
| $ | — | | | $ | 7,438,128 | | | $ | — | | | $ | 5,093,663 | | | $ | — | | | $ | 462,689 | | | $ | — | | | $ | 12,308,917 | | | $ | — | | | $ | 34,954,410 | | | |
| | | | | | | | | | | | | | | | | | | | | | | | | | | | | | | | | | | | | | | | |
| | | | | | | | | | |
| | | | | | | | | | | | | | | | | | | | | | | | | | | | | | | | | | | | | | | | |
| | 255,351,823 | | | | 241,781,963 | | | | 171,830,878 | | | | 161,691,427 | | | | 58,802,424 | | | | 52,661,579 | | | | 536,217,943 | | | | 472,826,923 | | | | 883,024,833 | | | | 772,998,898 | | | |
| | | | | | | | | | | | | | | | | | | | | | | | | | | | | | | | | | | | | | | | |
| | 19,152,826 | | | | 21,951,443 | | | | 7,916,032 | | | | 10,327,417 | | | | 139,821,287 | | | | 18,140,836 | | | | 84,686,753 | | | | 103,442,063 | | | | 128,863,445 | | | | 148,034,706 | | | |
| | 18,451,265 | | | | 11,825,574 | | | | 12,557,686 | | | | 11,668,789 | | | | 381,374 | | | | 69,182 | | | | 12,244,949 | | | | 11,754,947 | | | | 25,134,852 | | | | 24,255,513 | | | |
| | (25,005,805 | ) | | | (20,207,157 | ) | | | (14,897,761 | ) | | | (11,856,755 | ) | | | (27,156,417 | ) | | | (12,069,173 | ) | | | (60,410,355 | ) | | | (51,805,990 | ) | | | (80,359,973 | ) | | | (62,264,284 | ) | | |
| | | | | | | | | | | | | | | | | | | | | | | | | | | | | | | | | | | | | | | | |
| | | | | | | | | | |
| | 12,598,286 | | | | 13,569,860 | | | | 5,575,957 | | | | 10,139,451 | | | | 113,046,244 | | | | 6,140,845 | | | | 36,521,347 | | | | 63,391,020 | | | | 73,638,324 | | | | 110,025,935 | | | |
| | | | | | | | | | | | | | | | | | | | | | | | | | | | | | | | | | | | | | | | |
| | | | | | | | | | |
| | 267,950,109 | | | | 255,351,823 | | | | 177,406,835 | | | | 171,830,878 | | | | 171,848,668 | | | | 58,802,424 | | | | 572,739,290 | | | | 536,217,943 | | | | 956,663,157 | | | | 883,024,833 | | | |
| | | | | | | | | | | | | | | | | | | | | | | | | | | | | | | | | | | | | | | | |
The accompanying notes are an integral part of these financial statements.
137
MUTUAL OF AMERICA INVESTMENT CORPORATION
FINANCIAL HIGHLIGHTS
Income from investment operations and distributions per share for a Fund share outstanding throughout the five years ended December 31, 2018 (or since the Fund’s inception date if in existence less than five years) and other supplementary data with respect to each Fund are presented below and in the pages following:
| | | | | | | | | | | | | | | | | | | | |
| | | Equity Index Fund | |
| | | Years Ended December 31, | |
| | | 2018 | | | 2017 | | | 2016 | | | 2015 | | | 2014 | |
| | | | | |
Net Asset Value, Beginning of Year | | $ | 4.10 | | | $ | 3.49 | | | $ | 3.26 | | | $ | 3.41 | | | $ | 3.09 | |
| | | | | | | | | | | | | | | | | | | | |
| | | | | |
INCOME (LOSS)FROM INVESTMENT OPERATIONS | | | | | | | | | | | | | | | | | | | | |
Net Investment Income (Loss) | | | 0.07 | | | | 0.07 | | | | 0.06 | | | | 0.06 | | | | 0.06 | |
Net Realized and Unrealized Gains (Losses) on Investments and Futures Contracts | | | (0.23 | ) | | | 0.67 | | | | 0.32 | | | | (0.03 | ) | | | 0.35 | |
| | | | | | | | | | | | | | | | | | | | |
| | | | | |
Total From Investment Operations | | | (0.16 | ) | | | 0.74 | | | | 0.38 | | | | 0.03 | | | | 0.41 | |
| | | | | | | | | | | | | | | | | | | | |
| | | | | |
Less Distributions | | | | | | | | | | | | | | | | | | | | |
From Net Investment Income | | | (0.07 | ) | | | (0.06 | ) | | | (0.06 | ) | | | (0.06 | ) | | | (0.05 | ) |
From Net Realized Gains | | | (0.09 | ) | | | (0.07 | ) | | | (0.09 | ) | | | (0.12 | ) | | | (0.04 | ) |
| | | | | | | | | | | | | | | | | | | | |
| | | | | |
Total Distributions | | | (0.16 | ) | | | (0.13 | ) | | | (0.15 | ) | | | (0.18 | ) | | | (0.09 | ) |
| | | | | | | | | | | | | | | | | | | | |
| | | | | |
Net Asset Value, End of Year | | $ | 3.78 | | | $ | 4.10 | | | $ | 3.49 | | | $ | 3.26 | | | $ | 3.41 | |
| | | | | | | | | | | | | | | | | | | | |
| | | | | |
Total Return (%)(i) | | | (4.56 | ) | | | 21.65 | | | | 11.80 | | | | 1.24 | | | | 13.49 | |
Net Assets, End of Year ($ millions) | | | 2,629 | | | | 2,712 | | | | 2,143 | | | | 1,854 | | | | 1,789 | |
Ratio of Net Investment Income (Loss) to Average Net Assets (%) | | | 1.83 | | | | 1.85 | | | | 2.03 | | | | 1.94 | | | | 1.82 | |
Ratio of Expenses to Average Net Assets Before Expense Reimbursement (%) | | | 0.13 | | | | 0.14 | | | | 0.14 | | | | 0.15 | | | | 0.17 | |
Ratio of Expenses to Average Net Assets After Expense Reimbursement (%) | | | 0.13 | | | | 0.13 | (e) | | | 0.14 | | | | 0.15 | | | | 0.17 | |
Portfolio Turnover Rate (%)(a) | | | 3.48 | | | | 5.23 | | | | 5.58 | | | | 4.74 | | | | 8.07 | |
| (a) | Portfolio turnover rate excludes all short-term securities. |
| (d) | Allocation and Retirement Funds exclude expenses of the underlying funds. |
| (e) | Includes one time reimbursement from Adviser fornon-advisory operating expenses (Note 2). |
| (f) | For the period October 1, 2016 (commencement of operations) through December 31, 2016. |
| (g) | For the period July 2, 2018 (commencement of operations) through December 31, 2018. |
| (h) | Amount is less than $0.005 per share. |
| (i) | Total return is calculated assuming a purchase of a share on the first day and a sale on the last day of each year or period reported and includes reinvestment of distributions, if any, and does not reflect the effect of fees and charges associated with your variable annuity contract or variable life insurance policy. Total return does not reflect expenses associated with the separate account such as administrative fees and account charges which, if reflected, would reduce the total returns for all years and periods shown. The total return for 2017 for the Funds subject to the one time reimbursement from the Adviser (Note 2) includes the impact of this reimbursement which was determined not to be material. Past performance is no guarantee of future results. Total returns may reflect adjustments to conform to generally accepted accounting principles. Total returns for periods less than one full year are not annualized. |
NA = Not Applicable
The accompanying notes are an integral part of these financial statements.
138
| | | | | | | | | | | | | | | | | | | | | | | | | | | | | | | | | | | | | | | | |
| All America Fund | | | Small Cap Value Fund | | | |
| Years Ended December 31, | | | Years Ended December 31, | | | |
| 2018 | | | 2017 | | | 2016 | | | 2015 | | | 2014 | | | 2018 | | | 2017 | | | 2016 | | | 2015 | | | 2014 | | | |
| | | | | | | | | | |
| $ | 2.38 | | | $ | 2.29 | | | $ | 2.22 | | | $ | 2.42 | | | $ | 2.38 | | | $ | 1.74 | | | $ | 1.69 | | | $ | 1.44 | | | $ | 1.61 | | | $ | 1.72 | | | |
| | | | | | | | | | | | | | | | | | | | | | | | | | | | | | | | | | | | | | | | |
| | | | | | | | | | |
| | | | | | | | | | | | | | | | | | | | | | | | | | | | | | | | | | | | | | | | |
| | 0.03 | | | | 0.03 | | | | 0.03 | | | | 0.03 | | | | 0.03 | | | | 0.01 | | | | 0.03 | | | | 0.02 | | | | 0.02 | | | | 0.02 | | | |
| | (0.20 | ) | | | 0.39 | | | | 0.21 | | | | (0.03 | ) | | | 0.23 | | | | (0.24 | ) | | | 0.11 | | | | 0.26 | | | | (0.08 | ) | | | 0.06 | | | |
| | | | | | | | | | | | | | | | | | | | | | | | | | | | | | | | | | | | | | | | |
| | | | | | | | | | |
| | (0.17 | ) | | | 0.42 | | | | 0.24 | | | | — | | | | 0.26 | | | | (0.23 | ) | | | 0.14 | | | | 0.28 | | | | (0.06 | ) | | | 0.08 | | | |
| | | | | | | | | | | | | | | | | | | | | | | | | | | | | | | | | | | | | | | | |
| | | | | | | | | | |
| | | | | | | | | | | | | | | | | | | | | | | | | | | | | | | | | | | | | | | | |
| | (0.03 | ) | | | (0.03 | ) | | | (0.03 | ) | | | (0.03 | ) | | | (0.03 | ) | | | (0.02 | ) | | | (0.01 | ) | | | (0.01 | ) | | | (0.01 | ) | | | (0.02 | ) | | |
| | (0.13 | ) | | | (0.30 | ) | | | (0.14 | ) | | | (0.15 | ) | | | (0.19 | ) | | | (0.13 | ) | | | (0.08 | ) | | | (0.02 | ) | | | (0.10 | ) | | | (0.17 | ) | | |
| | | | | | | | | | | | | | | | | | | | | | | | | | | | | | | | | | | | | | | | |
| | | | | | | | | | |
| | (0.16 | ) | | | (0.33 | ) | | | (0.17 | ) | | | (0.18 | ) | | | (0.22 | ) | | | (0.15 | ) | | | (0.09 | ) | | | (0.03 | ) | | | (0.11 | ) | | | (0.19 | ) | | |
| | | | | | | | | | | | | | | | | | | | | | | | | | | | | | | | | | | | | | | | |
| | | | | | | | | | |
| $ | 2.05 | | | $ | 2.38 | | | $ | 2.29 | | | $ | 2.22 | | | $ | 2.42 | | | $ | 1.36 | | | $ | 1.74 | | | $ | 1.69 | | | $ | 1.44 | | | $ | 1.61 | | | |
| | | | | | | | | | | | | | | | | | | | | | | | | | | | | | | | | | | | | | | | |
| | | | | | | | | | |
| | (8.27 | ) | | | 19.41 | | | | 11.49 | | | | (0.04 | ) | | | 11.16 | | | | (14.57 | ) | | | 8.29 | | | | 20.04 | | | | (3.40 | ) | | | 5.17 | | | |
| | 268 | | | | 325 | | | | 296 | | | | 295 | | | | 324 | | | | 428 | | | | 506 | | | | 465 | | | | 376 | | | | 393 | | | |
| | 1.26 | | | | 1.33 | | | | 1.42 | | | | 1.32 | | | | 1.35 | | | | 1.10 | | | | 1.75 | | | | 1.17 | | | | 1.14 | | | | 1.02 | | | |
| | 0.52 | | | | 0.51 | | | | 0.53 | | | | 0.55 | | | | 0.49 | | | | 0.81 | | | | 0.81 | | | | 0.82 | | | | 0.83 | | | | 0.84 | | | |
| | 0.52 | | | | 0.51 | | | | 0.53 | | | | 0.55 | | | | 0.49 | | | | 0.81 | | | | 0.80 | (e) | | | 0.82 | | | | 0.83 | | | | 0.84 | | | |
| | 17.60 | | | | 22.28 | | | | 40.10 | | | | 14.73 | | | | 15.38 | | | | 29.58 | | | | 34.36 | | | | 32.06 | | | | 19.03 | | | | 38.09 | | | |
The accompanying notes are an integral part of these financial statements.
139
MUTUAL OF AMERICA INVESTMENT CORPORATION
FINANCIAL HIGHLIGHTS (Continued)
| | | | | | | | | | | | | | | | | | | | |
| | | Small Cap Growth Fund | |
| | | Years Ended December 31, | |
| | | 2018 | | | 2017 | | | 2016 | | | 2015 | | | 2014 | |
| | | | | |
Net Asset Value, Beginning of Year | | $ | 1.54 | | | $ | 1.29 | | | $ | 1.32 | | | $ | 1.54 | | | $ | 1.58 | |
| | | | | | | | | | | | | | | | | | | | |
| | | | | |
INCOME (LOSS)FROM INVESTMENT OPERATIONS | | | | | | | | | | | | | | | | | | | | |
Net Investment Income (Loss) | | | — | (h) | | | — | (h) | | | — | (h) | | | — | (h) | | | — | (h) |
Net Realized and Unrealized Gains (Losses) on Investments and Futures Contracts | | | (0.17 | ) | | | 0.30 | | | | 0.10 | | | | (0.03 | ) | | | 0.09 | |
| | | | | | | | | | | | | | | | | | | | |
| | | | | |
Total From Investment Operations | | | (0.17 | ) | | | 0.30 | | | | 0.10 | | | | (0.03 | ) | | | 0.09 | |
| | | | | | | | | | | | | | | | | | | | |
| | | | | |
Less Distributions | | | | | | | | | | | | | | | | | | | | |
From Net Investment Income | | | — | (h) | | | — | (h) | | | — | | | | — | | | | — | (h) |
From Net Realized Gains | | | (0.11 | ) | | | (0.05 | ) | | | (0.13 | ) | | | (0.19 | ) | | | (0.13 | ) |
Return of Capital | | | — | | | | — | | | | — | | | | — | | | | — | |
| | | | | | | | | | | | | | | | | | | | |
| | | | | |
Total Distributions | | | (0.11 | ) | | | (0.05 | ) | | | (0.13 | ) | | | (0.19 | ) | | | (0.13 | ) |
| | | | | | | | | | | | | | | | | | | | |
| | | | | |
Net Asset Value, End of Year | | $ | 1.26 | | | $ | 1.54 | | | $ | 1.29 | | | $ | 1.32 | | | $ | 1.54 | |
| | | | | | | | | | | | | | | | | | | | |
| | | | | |
Total Return (%)(i) | | | (12.53 | ) | | | 23.82 | | | | 8.10 | | | | (2.39 | ) | | | 5.70 | |
Net Assets, End of Year ($ millions) | | | 483 | | | | 555 | | | | 433 | | | | 402 | | | | 412 | |
Ratio of Net Investment Income (Loss) to Average Net Assets (%) | | | 0.13 | | | | 0.06 | | | | 0.06 | | | | (0.12 | ) | | | (0.09 | ) |
Ratio of Expenses to Average Net Assets Before Expense Reimbursement (%) | | | 0.81 | | | | 0.82 | | | | 0.82 | | | | 0.83 | | | | 0.84 | |
Ratio of Expenses to Average Net Assets After Expense Reimbursement (%) | | | 0.81 | | | | 0.80 | (e) | | | 0.82 | | | | 0.83 | | | | 0.84 | |
Portfolio Turnover Rate (%)(a) | | | 60.57 | | | | 62.33 | | | | 53.80 | | | | 67.83 | | | | 67.58 | |
| (a) | Portfolio turnover rate excludes all short-term securities. |
| (d) | Allocation and Retirement Funds exclude expenses of the underlying funds. |
| (e) | Includes one time reimbursement from Adviser fornon-advisory operating expenses (Note 2). |
| (f) | For the period October 1, 2016 (commencement of operations) through December 31, 2016. |
| (g) | For the period July 2, 2018 (commencement of operations) through December 31, 2018. |
| (h) | Amount is less than $0.005 per share. |
| (i) | Total return is calculated assuming a purchase of a share on the first day and a sale on the last day of each year or period reported and includes reinvestment of distributions, if any, and does not reflect the effect of fees and charges associated with your variable annuity contract or variable life insurance policy. Total return does not reflect expenses associated with the separate account such as administrative fees and account charges which, if reflected, would reduce the total returns for all years and periods shown. The total return for 2017 for the Funds subject to the one time reimbursement from the Adviser (Note 2) includes the impact of this reimbursement which was determined not to be material. Past performance is no guarantee of future results. Total returns may reflect adjustments to conform to generally accepted accounting principles. Total returns for periods less than one full year are not annualized. |
NA = Not Applicable
The accompanying notes are an integral part of these financial statements.
140
| | | | | | | | | | | | | | | | | | | | | | | | | | | | | | | | | | | | | | |
Small Cap Equity
Index Fund | | | Mid Cap Value Fund | | | Mid-Cap Equity Index Fund | | |
Period Ended
December 31,
2018(g) | | | Years Ended December 31, | | | Years Ended December 31, | | |
| | 2018 | | | 2017 | | | 2016 | | | 2015 | | | 2014 | | | 2018 | | | 2017 | | | 2016 | | 2015 | | 2014 | | |
| | | | | | | | | | | |
| $ | 1.00 | | | $ | 1.71 | | | $ | 1.57 | | | $ | 1.46 | | | $ | 1.63 | | | $ | 1.53 | | | $ | 2.34 | | | $ | 2.17 | | | $1.95 | | $2.16 | | $2.08 | | |
| | | | | | | | | | | | | | | | | | | | | | | | | | | | | | | | | | | | | | |
| | | | | | | | | | | |
| | | | | | | | | | | | | | | | | | | | | | | | | | | | | | | | | | | | | | |
| | 0.01 | | | | 0.03 | | | | 0.03 | | | | 0.02 | | | | 0.02 | | | | 0.02 | | | | 0.03 | | | | 0.03 | | | 0.03 | | 0.03 | | 0.03 | | |
| | (0.17 | ) | | | (0.24 | ) | | | 0.20 | | | | 0.20 | | | | (0.08 | ) | | | 0.19 | | | | (0.26 | ) | | | 0.31 | | | 0.36 | | (0.08) | | 0.17 | | |
| | | | | | | | | | | | | | | | | | | | | | | | | | | | | | | | | | | | | | |
| | | | | | | | | | | |
| | (0.16 | ) | | | (0.21 | ) | | | 0.23 | | | | 0.22 | | | | (0.06 | ) | | | 0.21 | | | | (0.23 | ) | | | 0.34 | | | 0.39 | | (0.05) | | 0.20 | | |
| | | | | | | | | | | | | | | | | | | | | | | | | | | | | | | | | | | | | | |
| | | | | | | | | | | |
| | | | | | | | | | | | | | | | | | | | | | | | | | | | | | | | | | | | | | |
| | (0.01 | ) | | | (0.03 | ) | | | (0.02 | ) | | | (0.02 | ) | | | (0.02 | ) | | | (0.01 | ) | | | (0.03 | ) | | | (0.03 | ) | | (0.03) | | (0.02) | | (0.02) | | |
| | — | (h) | | | (0.13 | ) | | | (0.07 | ) | | | (0.09 | ) | | | (0.10 | ) | | | (0.10 | ) | | | (0.15 | ) | | | (0.14 | ) | | (0.14) | | (0.14) | | (0.10) | | |
| | — | (h) | | | — | | | | — | | | | — | | | | — | | | | — | | | | — | | | | — | | | — | | — | | — | | |
| | | | | | | | | | | | | | | | | | | | | | | | | | | | | | | | | | | | | | |
| | | | | | | | | | | |
| | (0.01 | ) | | | (0.16 | ) | | | (0.09 | ) | | | (0.11 | ) | | | (0.12 | ) | | | (0.11 | ) | | | (0.18 | ) | | | (0.17 | ) | | (0.17) | | (0.16) | | (0.12) | | |
| | | | | | | | | | | | | | | | | | | | | | | | | | | | | | | | | | | | | | |
| | | | | | | | | | | |
| $ | 0.83 | | | $ | 1.34 | | | $ | 1.71 | | | $ | 1.57 | | | $ | 1.46 | | | $ | 1.63 | | | $ | 1.93 | | | $ | 2.34 | | | $2.17 | | $1.95 | | $2.16 | | |
| | | | | | | | | | | | | | | | | | | | | | | | | | | | | | | | | | | | | | |
| | | | | | | | | | | |
| | (16.54 | )(b) | | | (14.08 | ) | | | 14.92 | | | | 16.18 | | | | (3.34 | ) | | | 13.82 | | | | (11.26 | ) | | | 16.05 | | | 20.51 | | (2.37) | | 9.63 | | |
| | 17 | | | | 80 | | | | 103 | | | | 98 | | | | 82 | | | | 92 | | | | 1,281 | | | | 1,452 | | | 1,245 | | 977 | | 1,001 | | |
| | 1.51 | (c) | | | 1.51 | | | | 1.55 | | | | 1.48 | | | | 1.45 | | | | 1.25 | | | | 1.52 | | | | 1.46 | | | 1.60 | | 1.45 | | 1.31 | | |
| | 1.61 | (c) | | | 0.65 | | | | 0.64 | | | | 0.66 | | | | 0.65 | | | | 0.64 | | | | 0.14 | | | | 0.14 | | | 0.15 | | 0.16 | | 0.17 | | |
| | 0.14 | (c) | | | 0.65 | | | | 0.64 | | | | 0.66 | | | | 0.65 | | | | 0.64 | | | | 0.14 | | | | 0.14 | (e) | | 0.15 | | 0.16 | | 0.17 | | |
| | 81.79 | | | | 10.75 | | | | 24.09 | | | | 25.80 | | | | 15.86 | | | | 40.91 | | | | 20.26 | | | | 19.36 | | | 21.75 | | 21.67 | | 16.29 | | |
The accompanying notes are an integral part of these financial statements.
141
MUTUAL OF AMERICA INVESTMENT CORPORATION
FINANCIAL HIGHLIGHTS (Continued)
| | | | | | | | | | | | | | | | | | | | |
| | | International Fund | |
| | | Years Ended December 31, | |
| | | 2018 | | | 2017 | | | 2016 | | | 2015 | | | 2014 | |
| | | | | |
Net Asset Value, Beginning of Year | | $ | 0.90 | | | $ | 0.74 | | | $ | 0.75 | | | $ | 0.77 | | | $ | 0.84 | |
| | | | | | | | | | | | | | | | | | | | |
| | | | | |
INCOME (LOSS)FROM INVESTMENT OPERATIONS | | | | | | | | | | | | | | | | | | | | |
Net Investment Income (Loss) | | | 0.02 | | | | 0.02 | | | | 0.02 | | | | 0.01 | | | | 0.02 | |
Net Realized and Unrealized Gains (Losses) on Investments and Futures Contracts | | | (0.13 | ) | | | 0.16 | | | | (0.01 | ) | | | (0.01 | ) | | | (0.08 | ) |
| | | | | | | | | | | | | | | | | | | | |
| | | | | |
Total From Investment Operations | | | (0.11 | ) | | | 0.18 | | | | 0.01 | | | | — | | | | (0.06 | ) |
| | | | | | | | | | | | | | | | | | | | |
| | | | | |
Less Distributions | | | | | | | | | | | | | | | | | | | | |
From Net Investment Income | | | (0.02 | ) | | | (0.02 | ) | | | (0.02 | ) | | | (0.02 | ) | | | (0.01 | ) |
From Net Realized Gains | | | — | (h) | | | — | (h) | | | — | (h) | | | — | (h) | | | — | (h) |
| | | | | | | | | | | | | | | | | | | | |
| | | | | |
Total Distributions | | | (0.02 | ) | | | (0.02 | ) | | | (0.02 | ) | | | (0.02 | ) | | | (0.01 | ) |
| | | | | | | | | | | | | | | | | | | | |
| | | | | |
Net Asset Value, End of Year | | $ | 0.77 | | | $ | 0.90 | | | $ | 0.74 | | | $ | 0.75 | | | $ | 0.77 | |
| | | | | | | | | | | | | | | | | | | | |
| | | | | |
Total Return (%)(i) | | | (13.36 | ) | | | 24.47 | | | | 1.69 | | | | (0.63 | ) | | | (6.03 | ) |
Net Assets, End of Year ($ millions) | | | 509 | | | | 537 | | | | 377 | | | | 319 | | | | 264 | |
Ratio of Net Investment Income (Loss) to Average Net Assets (%) | | | 2.75 | | | | 2.67 | | | | 2.94 | | | | 2.47 | | | | 3.48 | |
Ratio of Expenses to Average Net Assets Before Expense Reimbursement (%)(d)(j) | | | 0.12 | | | | 0.12 | | | | 0.13 | | | | 0.14 | | | | 0.17 | |
Ratio of Expenses to Average Net Assets After Expense Reimbursement (%)(d)(j) | | | 0.12 | | | | 0.12 | (e) | | | 0.13 | | | | 0.14 | | | | 0.17 | |
Portfolio Turnover Rate (%)(a) | | | — | | | | — | | | | 3.08 | | | | — | | | | 0.61 | |
| (a) | Portfolio turnover rate excludes all short-term securities. |
| (d) | Allocation and Retirement Funds exclude expenses of the underlying funds. |
| (e) | Includes one time reimbursement from Adviser fornon-advisory operating expenses (Note 2). |
| (f) | For the period October 1, 2016 (commencement of operations) through December 31, 2016. |
| (g) | For the period July 2, 2018 (commencement of operations) through December 31, 2018. |
| (h) | Amount is less than $0.005 per share. |
| (i) | Total return is calculated assuming a purchase of a share on the first day and a sale on the last day of each year or period reported and includes reinvestment of distributions, if any, and does not reflect the effect of fees and charges associated with your variable annuity contract or variable life insurance policy. Total return does not reflect expenses associated with the separate account such as administrative fees and account charges which, if reflected, would reduce the total returns for all years and periods shown. The total return for 2017 for the Funds subject to the one time reimbursement from the Adviser (Note 2) includes the impact of this reimbursement which was determined not to be material. Past performance is no guarantee of future results. Total returns may reflect adjustments to conform to generally accepted accounting principles. Total returns for periods less than one full year are not annualized. |
| (j) | International Fund excludes the expenses of its ETF investments. |
NA = Not Applicable
The accompanying notes are an integral part of these financial statements.
142
| | | | | | | | | | | | | | | | | | | | | | | | | | | | | | | | | | | | | | | | |
| Composite Fund | | | Retirement Income Fund | | | |
| Years Ended December 31, | | | Years Ended December 31, | | | |
| 2018 | | | 2017 | | | 2016 | | | 2015 | | | 2014 | | | 2018 | | | 2017 | | | 2016 | | | 2015 | | | 2014 | | | |
| | | | | | | | | | |
| $ | 1.91 | | | $ | 1.95 | | | $ | 1.96 | | | $ | 2.00 | | | $ | 1.87 | | | $ | 1.17 | | | $ | 1.12 | | | $ | 1.12 | | | $ | 1.16 | | | $ | 1.13 | | | |
| | | | | | | | | | | | | | | | | | | | | | | | | | | | | | | | | | | | | | | | |
| | | | | | | | | | |
| | | | | | | | | | | | | | | | | | | | | | | | | | | | | | | | | | | | | | | | |
| | 0.04 | | | | 0.04 | | | | 0.04 | | | | 0.04 | | | | 0.04 | | | | 0.02 | | | | 0.02 | | | | 0.02 | | | | 0.02 | | | | 0.02 | | | |
| | (0.09 | ) | | | 0.21 | | | | 0.11 | | | | (0.02 | ) | | | 0.13 | | | | (0.03 | ) | | | 0.07 | | | | 0.04 | | | | (0.01 | ) | | | 0.05 | | | |
| | | | | | | | | | | | | | | | | | | | | | | | | | | | | | | | | | | | | | | | |
| | | | | | | | | | |
| | (0.05 | ) | | | 0.25 | | | | 0.15 | | | | 0.02 | | | | 0.17 | | | | (0.01 | ) | | | 0.09 | | | | 0.06 | | | | 0.01 | | | | 0.07 | | | |
| | | | | | | | | | | | | | | | | | | | | | | | | | | | | | | | | | | | | | | | |
| | | | | | | | | | |
| | | | | | | | | | | | | | | | | | | | | | | | | | | | | | | | | | | | | | | | |
| | (0.04 | ) | | | (0.04 | ) | | | (0.04 | ) | | | (0.04 | ) | | | (0.04 | ) | | | (0.02 | ) | | | (0.02 | ) | | | (0.02 | ) | | | (0.02 | ) | | | (0.02 | ) | | |
| | (0.15 | ) | | | (0.25 | ) | | | (0.12 | ) | | | (0.02 | ) | | | — | | | | (0.02 | ) | | | (0.02 | ) | | | (0.04 | ) | | | (0.03 | ) | | | (0.02 | ) | | |
| | | | | | | | | | | | | | | | | | | | | | | | | | | | | | | | | | | | | | | | |
| | | | | | | | | | |
| | (0.19 | ) | | | (0.29 | ) | | | (0.16 | ) | | | (0.06 | ) | | | (0.04 | ) | | | (0.04 | ) | | | (0.04 | ) | | | (0.06 | ) | | | (0.05 | ) | | | (0.04 | ) | | |
| | | | | | | | | | | | | | | | | | | | | | | | | | | | | | | | | | | | | | | | |
| | | | | | | | | | |
| $ | 1.67 | | | $ | 1.91 | | | $ | 1.95 | | | $ | 1.96 | | | $ | 2.00 | | | $ | 1.12 | | | $ | 1.17 | | | $ | 1.12 | | | $ | 1.12 | | | $ | 1.16 | | | |
| | | | | | | | | | | | | | | | | | | | | | | | | | | | | | | | | | | | | | | | |
| | | | | | | | | | |
| | (3.20 | ) | | | 13.37 | | | | 7.92 | | | | 0.80 | | | | 9.10 | | | | (1.21 | ) | | | 7.35 | | | | 6.18 | | | | 0.49 | | | | 6.50 | | | |
| | 172 | | | | 190 | | | | 181 | | | | 180 | | | | 194 | | | | 101 | | | | 101 | | | | 76 | | | | 63 | | | | 54 | | | |
| | 2.16 | | | | 2.11 | | | | 2.10 | | | | 1.93 | | | | 2.09 | | | | 1.82 | | | | 2.01 | | | | 2.26 | | | | 2.35 | | | | 2.21 | | | |
| | 0.51 | | | | 0.51 | | | | 0.52 | | | | 0.53 | | | | 0.49 | | | | 0.08 | | | | 0.08 | | | | 0.09 | | | | 0.09 | | | | 0.05 | | | |
| | 0.51 | | | | 0.50 | (e) | | | 0.52 | | | | 0.53 | | | | 0.49 | | | | 0.08 | | | | 0.06 | (e) | | | 0.09 | | | | 0.05 | | | | 0.05 | | | |
| | 37.37 | | | | 60.13 | | | | 57.40 | | | | 13.13 | | | | 12.31 | | | | 21.90 | | | | 18.54 | | | | 16.88 | | | | 22.64 | | | | 17.63 | | | |
The accompanying notes are an integral part of these financial statements.
143
MUTUAL OF AMERICA INVESTMENT CORPORATION
FINANCIAL HIGHLIGHTS (Continued)
| | | | | | | | | | | | | | | | | | | | |
| | | 2010 Retirement Fund | |
| | | Years Ended December 31, | |
| | | 2018 | | | 2017 | | | 2016 | | | 2015 | | | 2014 | |
| | | | | |
Net Asset Value, Beginning of Year | | $ | 1.01 | | | $ | 0.99 | | | $ | 1.01 | | | $ | 1.09 | | | $ | 1.06 | |
| | | | | | | | | | | | | | | | | | | | |
| | | | | |
INCOME (LOSS)FROM INVESTMENT OPERATIONS | | | | | | | | | | | | | | | | | | | | |
Net Investment Income (Loss) | | | 0.02 | | | | 0.03 | | | | 0.02 | | | | 0.02 | | | | 0.02 | |
Net Realized and Unrealized Gains (Losses) on Investments and Futures Contracts | | | (0.04 | ) | | | 0.06 | | | | 0.04 | | | | (0.02 | ) | | | 0.06 | |
| | | | | | | | | | | | | | | | | | | | |
| | | | | |
Total From Investment Operations | | | (0.02 | ) | | | 0.09 | | | | 0.06 | | | | — | | | | 0.08 | |
| | | | | | | | | | | | | | | | | | | | |
| | | | | |
Less Distributions | | | | | | | | | | | | | | | | | | | | |
From Net Investment Income | | | (0.02 | ) | | | (0.02 | ) | | | (0.02 | ) | | | (0.02 | ) | | | (0.02 | ) |
From Net Realized Gains | | | (0.04 | ) | | | (0.05 | ) | | | (0.06 | ) | | | (0.06 | ) | | | (0.03 | ) |
| | | | | | | | | | | | | | | | | | | | |
| | | | | |
Total Distributions | | | (0.06 | ) | | | (0.07 | ) | | | (0.08 | ) | | | (0.08 | ) | | | (0.05 | ) |
| | | | | | | | | | | | | | | | | | | | |
| | | | | |
Net Asset Value, End of Year | | $ | 0.93 | | | $ | 1.01 | | | $ | 0.99 | | | $ | 1.01 | | | $ | 1.09 | |
| | | | | | | | | | | | | | | | | | | | |
| | | | | |
Total Return (%)(i) | | | (1.93 | ) | | | 9.06 | | | | 6.87 | | | | 0.40 | | | | 6.93 | |
Net Assets, End of Year ($ millions) | | | 24 | | | | 26 | | | | 26 | | | | 26 | | | | 27 | |
Ratio of Net Investment Income (Loss) to Average Net Assets (%) | | | 1.83 | | | | 1.92 | | | | 2.15 | | | | 2.10 | | | | 2.06 | |
Ratio of Expenses to Average Net Assets Before Expense Reimbursement (%)(d) | | | 0.16 | | | | 0.12 | | | | 0.12 | | | | 0.12 | | | | 0.05 | |
Ratio of Expenses to Average Net Assets After Expense Reimbursement (%)(d) | | | 0.05 | | | | 0.01 | (e) | | | 0.05 | | | | 0.05 | | | | 0.05 | |
Portfolio Turnover Rate (%)(a) | | | 22.75 | | | | 24.48 | | | | 24.58 | | | | 23.28 | | | | 20.45 | |
| (a) | Portfolio turnover rate excludes all short-term securities. |
| (d) | Allocation and Retirement Funds exclude expenses of the underlying funds. |
| (e) | Includes one time reimbursement from Adviser fornon-advisory operating expenses (Note 2). |
| (f) | For the period October 1, 2016 (commencement of operations) through December 31, 2016. |
| (g) | For the period July 2, 2018 (commencement of operations) through December 31, 2018. |
| (h) | Amount is less than $0.005 per share. |
| (i) | Total return is calculated assuming a purchase of a share on the first day and a sale on the last day of each year or period reported and includes reinvestment of distributions, if any, and does not reflect the effect of fees and charges associated with your variable annuity contract or variable life insurance policy. Total return does not reflect expenses associated with the separate account such as administrative fees and account charges which, if reflected, would reduce the total returns for all years and periods shown. The total return for 2017 for the Funds subject to the one time reimbursement from the Adviser (Note 2) includes the impact of this reimbursement which was determined not to be material. Past performance is no guarantee of future results. Total returns may reflect adjustments to conform to generally accepted accounting principles. Total returns for periods less than one full year are not annualized. |
NA = Not Applicable
The accompanying notes are an integral part of these financial statements.
144
| | | | | | | | | | | | | | | | | | | | | | | | | | | | | | | | | | | | | | | | |
| 2015 Retirement Fund | | | 2020 Retirement Fund | | | |
| Years Ended December 31, | | | Years Ended December 31, | | | |
| 2018 | | | 2017 | | | 2016 | | | 2015 | | | 2014 | | | 2018 | | | 2017 | | | 2016 | | | 2015 | | | 2014 | | | |
| | | | | | | | | | |
| $ | 1.07 | | | $ | 1.03 | | | $ | 1.05 | | | $ | 1.13 | | | $ | 1.10 | | | $ | 1.23 | | | $ | 1.14 | | | $ | 1.12 | | | $ | 1.18 | | | $ | 1.13 | | | |
| | | | | | | | | | | | | | | | | | | | | | | | | | | | | | | | | | | | | | | | |
| | | | | | | | | | |
| | | | | | | | | | | | | | | | | | | | | | | | | | | | | | | | | | | | | | | | |
| | 0.02 | | | | 0.02 | | | | 0.02 | | | | 0.02 | | | | 0.02 | | | | 0.02 | | | | 0.02 | | | | 0.02 | | | | 0.02 | | | | 0.02 | | | |
| | (0.06 | ) | | | 0.09 | | | | 0.05 | | | | (0.02 | ) | | | 0.06 | | | | (0.08 | ) | | | 0.13 | | | | 0.07 | | | | (0.01 | ) | | | 0.06 | | | |
| | | | | | | | | | | | | | | | | | | | | | | | | | | | | | | | | | | | | | | | |
| | | | | | | | | | |
| | (0.04 | ) | | | 0.11 | | | | 0.07 | | | | — | | | | 0.08 | | | | (0.06 | ) | | | 0.15 | | | | 0.09 | | | | 0.01 | | | | 0.08 | | | |
| | | | | | | | | | | | | | | | | | | | | | | | | | | | | | | | | | | | | | | | |
| | | | | | | | | | |
| | | | | | | | | | | | | | | | | | | | | | | | | | | | | | | | | | | | | | | | |
| | (0.02 | ) | | | (0.02 | ) | | | (0.02 | ) | | | (0.02 | ) | | | (0.02 | ) | | | (0.02 | ) | | | (0.02 | ) | | | (0.02 | ) | | | (0.02 | ) | | | (0.02 | ) | | |
| | (0.04 | ) | | | (0.05 | ) | | | (0.07 | ) | | | (0.06 | ) | | | (0.03 | ) | | | (0.03 | ) | | | (0.04 | ) | | | (0.05 | ) | | | (0.05 | ) | | | (0.01 | ) | | |
| | | | | | | | | | | | | | | | | | | | | | | | | | | | | | | | | | | | | | | | |
| | | | | | | | | | |
| | (0.06 | ) | | | (0.07 | ) | | | (0.09 | ) | | | (0.08 | ) | | | (0.05 | ) | | | (0.05 | ) | | | (0.06 | ) | | | (0.07 | ) | | | (0.07 | ) | | | (0.03 | ) | | |
| | | | | | | | | | | | | | | | | | | | | | | | | | | | | | | | | | | | | | | | |
| | | | | | | | | | |
| $ | 0.97 | | | $ | 1.07 | | | $ | 1.03 | | | $ | 1.05 | | | $ | 1.13 | | | $ | 1.12 | | | $ | 1.23 | | | $ | 1.14 | | | $ | 1.12 | | | $ | 1.18 | | | |
| | | | | | | | | | | | | | | | | | | | | | | | | | | | | | | | | | | | | | | | |
| | | | | | | | | | |
| | (3.01 | ) | | | 10.64 | | | | 7.72 | | | | 0.27 | | | | 7.16 | | | | (4.04 | ) | | | 12.52 | | | | 8.57 | | | | 0.13 | | | | 7.36 | | | |
| | 138 | | | | 155 | | | | 146 | | | | 149 | | | | 154 | | | | 515 | | | | 525 | | | | 426 | | | | 364 | | | | 320 | | | |
| | 1.83 | | | | 1.85 | | | | 2.07 | | | | 2.07 | | | | 2.00 | | | | 1.89 | | | | 1.89 | | | | 2.03 | | | | 2.06 | | | | 1.92 | | | |
| | 0.07 | | | | 0.07 | | | | 0.08 | | | | 0.07 | | | | 0.05 | | | | 0.07 | | | | 0.07 | | | | 0.07 | | | | 0.07 | | | | 0.05 | | | |
| | 0.07 | | | | 0.07 | | | | 0.08 | | | | 0.07 | | | | 0.05 | | | | 0.07 | | | | 0.07 | | | | 0.07 | | | | 0.07 | | | | 0.05 | | | |
| | 14.75 | | | | 14.98 | | | | 12.96 | | | | 17.75 | | | | 16.41 | | | | 10.84 | | | | 7.09 | | | | 7.99 | | | | 7.76 | | | | 9.54 | | | |
The accompanying notes are an integral part of these financial statements.
145
MUTUAL OF AMERICA INVESTMENT CORPORATION
FINANCIAL HIGHLIGHTS (Continued)
| | | | | | | | | | | | | | | | | | | | |
| | | 2025 Retirement Fund | |
| | | Years Ended December 31, | |
| | | 2018 | | | 2017 | | | 2016 | | | 2015 | | | 2014 | |
| | | | | |
Net Asset Value, Beginning of Year | | $ | 1.33 | | | $ | 1.21 | | | $ | 1.17 | | | $ | 1.23 | | | $ | 1.16 | |
| | | | | | | | | | | | | | | | | | | | |
| | | | | |
INCOME (LOSS)FROM INVESTMENT OPERATIONS | | | | | | | | | | | | | | | | | | | | |
Net Investment Income (Loss) | | | 0.02 | | | | 0.02 | | | | 0.02 | | | | 0.02 | | | | 0.02 | |
Net Realized and Unrealized Gains (Losses) on Investments and Futures Contracts | | | (0.09 | ) | | | 0.16 | | | | 0.09 | | | | (0.02 | ) | | | 0.08 | |
| | | | | | | | | | | | | | | | | | | | |
| | | | | |
Total From Investment Operations | | | (0.07 | ) | | | 0.18 | | | | 0.11 | | | | — | | | | 0.10 | |
| | | | | | | | | | | | | | | | | | | | |
| | | | | |
Less Distributions | | | | | | | | | | | | | | | | | | | | |
From Net Investment Income | | | (0.02 | ) | | | (0.02 | ) | | | (0.02 | ) | | | (0.02 | ) | | | (0.02 | ) |
From Net Realized Gains | | | (0.04 | ) | | | (0.04 | ) | | | (0.05 | ) | | | (0.04 | ) | | | (0.01 | ) |
| | | | | | | | | | | | | | | | | | | | |
| | | | | |
Total Distributions | | | (0.06 | ) | | | (0.06 | ) | | | (0.07 | ) | | | (0.06 | ) | | | (0.03 | ) |
| | | | | | | | | | | | | | | | | | | | |
| | | | | |
Net Asset Value, End of Year | | $ | 1.20 | | | $ | 1.33 | | | $ | 1.21 | | | $ | 1.17 | | | $ | 1.23 | |
| | | | | | | | | | | | | | | | | | | | |
| | | | | |
Total Return (%)(i) | | | (5.22 | ) | | | 14.44 | | | | 9.84 | | | | (0.10 | ) | | | 8.00 | |
Net Assets, End of Year ($ millions) | | | 710 | | | | 686 | | | | 504 | | | | 396 | | | | 331 | |
Ratio of Net Investment Income (Loss) to Average Net Assets (%) | | | 1.81 | | | | 1.81 | | | | 1.91 | | | | 1.91 | | | | 1.75 | |
Ratio of Expenses to Average Net Assets Before Expense Reimbursement (%)(d) | | | 0.06 | | | | 0.07 | | | | 0.07 | | | | 0.07 | | | | 0.05 | |
Ratio of Expenses to Average Net Assets After Expense Reimbursement (%)(d) | | | 0.06 | | | | 0.07 | | | | 0.07 | | | | 0.07 | | | | 0.05 | |
Portfolio Turnover Rate (%)(a) | | | 6.74 | | | | 5.78 | | | | 5.27 | | | | 4.36 | | | | 6.00 | |
| (a) | Portfolio turnover rate excludes all short-term securities. |
| (d) | Allocation and Retirement Funds exclude expenses of the underlying funds. |
| (e) | Includes one time reimbursement from Adviser fornon-advisory operating expenses (Note 2). |
| (f) | For the period October 1, 2016 (commencement of operations) through December 31, 2016. |
| (g) | For the period July 2, 2018 (commencement of operations) through December 31, 2018. |
| (h) | Amount is less than $0.005 per share. |
| (i) | Total return is calculated assuming a purchase of a share on the first day and a sale on the last day of each year or period reported and includes reinvestment of distributions, if any, and does not reflect the effect of fees and charges associated with your variable annuity contract or variable life insurance policy. Total return does not reflect expenses associated with the separate account such as administrative fees and account charges which, if reflected, would reduce the total returns for all years and periods shown. The total return for 2017 for the Funds subject to the one time reimbursement from the Adviser (Note 2) includes the impact of this reimbursement which was determined not to be material. Past performance is no guarantee of future results. Total returns may reflect adjustments to conform to generally accepted accounting principles. Total returns for periods less than one full year are not annualized. |
NA = Not Applicable
The accompanying notes are an integral part of these financial statements.
146
| | | | | | | | | | | | | | | | | | | | | | | | | | | | | | | | | | | | | | | | |
| 2030 Retirement Fund | | | 2035 Retirement Fund | | | |
| Years Ended December 31, | | | Years Ended December 31, | | | |
| 2018 | | | 2017 | | | 2016 | | | 2015 | | | 2014 | | | 2018 | | | 2017 | | | 2016 | | | 2015 | | | 2014 | | | |
| | | | | | | | | | |
| $ | 1.38 | | | $ | 1.25 | | | $ | 1.20 | | | $ | 1.27 | | | $ | 1.19 | | | $ | 1.40 | | | $ | 1.25 | | | $ | 1.20 | | | $ | 1.27 | | | $ | 1.20 | | | |
| | | | | | | | | | | | | | | | | | | | | | | | | | | | | | | | | | | | | | | | |
| | | | | | | | | | |
| | | | | | | | | | | | | | | | | | | | | | | | | | | | | | | | | | | | | | | | |
| | 0.02 | | | | 0.02 | | | | 0.02 | | | | 0.02 | | | | 0.02 | | | | 0.02 | | | | 0.02 | | | | 0.02 | | | | 0.02 | | | | 0.01 | | | |
| | (0.10 | ) | | | 0.17 | | | | 0.11 | | | | (0.02 | ) | | | 0.09 | | | | (0.12 | ) | | | 0.20 | | | | 0.11 | | | | (0.03 | ) | | | 0.08 | | | |
| | | | | | | | | | | | | | | | | | | | | | | | | | | | | | | | | | | | | | | | |
| | | | | | | | | | |
| | (0.08 | ) | | | 0.19 | | | | 0.13 | | | | — | | | | 0.11 | | | | (0.10 | ) | | | 0.22 | | | | 0.13 | | | | (0.01 | ) | | | 0.09 | | | |
| | | | | | | | | | | | | | | | | | | | | | | | | | | | | | | | | | | | | | | | |
| | | | | | | | | | |
| | | | | | | | | | | | | | | | | | | | | | | | | | | | | | | | | | | | | | | | |
| | (0.02 | ) | | | (0.02 | ) | | | (0.02 | ) | | | (0.02 | ) | | | (0.02 | ) | | | (0.02 | ) | | | (0.02 | ) | | | (0.02 | ) | | | (0.02 | ) | | | (0.01 | ) | | |
| | (0.04 | ) | | | (0.04 | ) | | | (0.06 | ) | | | (0.05 | ) | | | (0.01 | ) | | | (0.04 | ) | | | (0.05 | ) | | | (0.06 | ) | | | (0.04 | ) | | | (0.01 | ) | | |
| | | | | | | | | | | | | | | | | | | | | | | | | | | | | | | | | | | | | | | | |
| | | | | | | | | | |
| | (0.06 | ) | | | (0.06 | ) | | | (0.08 | ) | | | (0.07 | ) | | | (0.03 | ) | | | (0.06 | ) | | | (0.07 | ) | | | (0.08 | ) | | | (0.06 | ) | | | (0.02 | ) | | |
| | | | | | | | | | | | | | | | | | | | | | | | | | | | | | | | | | | | | | | | |
| | | | | | | | | | |
| $ | 1.24 | | | $ | 1.38 | | | $ | 1.25 | | | $ | 1.20 | | | $ | 1.27 | | | $ | 1.24 | | | $ | 1.40 | | | $ | 1.25 | | | $ | 1.20 | | | $ | 1.27 | | | |
| | | | | | | | | | | | | | | | | | | | | | | | | | | | | | | | | | | | | | | | |
| | | | | | | | | | |
| | (6.49 | ) | | | 16.01 | | | | 10.73 | | | | (0.22 | ) | | | 8.44 | | | | (7.36 | ) | | | 17.15 | | | | 11.43 | | | | (0.37 | ) | | | 8.26 | | | |
| | 617 | | | | 578 | | | | 416 | | | | 328 | | | | 277 | | | | 509 | | | | 484 | | | | 352 | | | | 271 | | | | 230 | | | |
| | 1.74 | | | | 1.69 | | | | 1.78 | | | | 1.81 | | | | 1.66 | | | | 1.64 | | | | 1.57 | | | | 1.67 | | | | 1.68 | | | | 1.52 | | | |
| | 0.07 | | | | 0.07 | | | | 0.07 | | | | 0.07 | | | | 0.05 | | | | 0.07 | | | | 0.07 | | | | 0.07 | | | | 0.07 | | | | 0.05 | | | |
| | 0.07 | | | | 0.07 | | | | 0.07 | | | | 0.07 | | | | 0.05 | | | | 0.07 | | | | 0.07 | | | | 0.07 | | | | 0.07 | | | | 0.05 | | | |
| | 5.01 | | | | 5.75 | | | | 5.12 | | | | 4.83 | | | | 5.52 | | | | 4.00 | | | | 4.02 | | | | 4.98 | | | | 5.16 | | | | 4.29 | | | |
The accompanying notes are an integral part of these financial statements.
147
MUTUAL OF AMERICA INVESTMENT CORPORATION
FINANCIAL HIGHLIGHTS (Continued)
| | | | | | | | | | | | | | | | | | | | |
| | |
2040 Retirement Fund | |
| | |
Years Ended December 31, | |
| | | 2018 | | | 2017 | | | 2016 | | | 2015 | | | 2014 | |
| | | | | |
Net Asset Value, Beginning of Year | | $ | 1.39 | | | $ | 1.24 | | | $ | 1.19 | | | $ | 1.26 | | | $ | 1.20 | |
| | | | | | | | | | | | | | | | | | | | |
| | | | | |
INCOME (LOSS) FROM INVESTMENT OPERATIONS | | | | | | | | | | | | | | | | | | | | |
Net Investment Income (Loss) | | | 0.02 | | | | 0.01 | | | | 0.02 | | | | 0.02 | | | | 0.01 | |
Net Realized and Unrealized Gains (Losses) on Investments and Futures Contracts | | | (0.13 | ) | | | 0.20 | | | | 0.11 | | | | (0.03 | ) | | | 0.08 | |
| | | | | | | | | | | | | | | | | | | | |
| | | | | |
Total From Investment Operations | | | (0.11 | ) | | | 0.21 | | | | 0.13 | | | | (0.01 | ) | | | 0.09 | |
| | | | | | | | | | | | | | | | | | | | |
| | | | | |
Less Distributions | | | | | | | | | | | | | | | | | | | | |
From Net Investment Income | | | (0.02 | ) | | | (0.01 | ) | | | (0.02 | ) | | | (0.02 | ) | | | (0.01 | ) |
From Net Realized Gains | | | (0.04 | ) | | | (0.05 | ) | | | (0.06 | ) | | | (0.04 | ) | | | (0.02 | ) |
| | | | | | | | | | | | | | | | | | | | |
| | | | | |
Total Distributions | | | (0.06 | ) | | | (0.06 | ) | | | (0.08 | ) | | | (0.06 | ) | | | (0.03 | ) |
| | | | | | | | | | | | | | | | | | | | |
| | | | | |
Net Asset Value, End of Year | | $ | 1.22 | | | $ | 1.39 | | | $ | 1.24 | | | $ | 1.19 | | | $ | 1.26 | |
| | | | | | | | | | | | | | | | | | | | |
| | | | | |
Total Return (%)(i) | | | (7.94 | ) | | | 17.40 | | | | 11.66 | | | | (0.64 | ) | | | 7.71 | |
Net Assets, End of Year ($ millions) | | | 413 | | | | 393 | | | | 286 | | | | 222 | | | | 189 | |
Ratio of Net Investment Income (Loss) to Average Net Assets (%) | | | 1.60 | | | | 1.53 | | | | 1.59 | | | | 1.58 | | | | 1.40 | |
Ratio of Expenses to Average Net Assets Before Expense Reimbursement (%)(d) | | | 0.07 | | | | 0.07 | | | | 0.07 | | | | 0.07 | | | | 0.05 | |
Ratio of Expenses to Average Net Assets After Expense Reimbursement (%)(d) | | | 0.07 | | | | 0.07 | | | | 0.07 | | | | 0.07 | | | | 0.05 | |
Portfolio Turnover Rate (%)(a) | | | 2.65 | | | | 4.07 | | | | 5.23 | | | | 5.17 | | | | 4.31 | |
| (a) | Portfolio turnover rate excludes all short-term securities. |
| (d) | Allocation and Retirement Funds exclude expenses of the underlying funds. |
| (e) | Includes one time reimbursement from Adviser fornon-advisory operating expenses (Note 2). |
| (f) | For the period October 1, 2016 (commencement of operations) through December 31, 2016. |
| (g) | For the period July 2, 2018 (commencement of operations) through December 31, 2018. |
| (h) | Amount is less than $0.005 per share. |
| (i) | Total return is calculated assuming a purchase of a share on the first day and a sale on the last day of each year or period reported and includes reinvestment of distributions, if any, and does not reflect the effect of fees and charges associated with your variable annuity contract or variable life insurance policy. Total return does not reflect expenses associated with the separate account such as administrative fees and account charges which, if reflected, would reduce the total returns for all years and periods shown. The total return for 2017 for the Funds subject to the one time reimbursement from the Adviser (Note 2) includes the impact of this reimbursement which was determined not to be material. Past performance is no guarantee of future results. Total returns may reflect adjustments to conform to generally accepted accounting principles. Total returns for periods less than one full year are not annualized. |
NA = Not Applicable
The accompanying notes are an integral part of these financial statements.
148
| | | | | | | | | | | | | | | | | | | | | | | | | | | | | | | | | | | | | | | | | | | | | | | | | | | | | | |
| 2045 Retirement Fund | | | 2050 Retirement Fund | | | 2055 Retirement Fund | | | 2060
Retirement
Fund | |
| Years Ended December 31, | | | Years Ended December 31, | | | Years Ended
December 31, | | | Period Ended
December 31,
2016(f) | | | Period Ended
December 31,
2018(g) | |
| 2018 | | | 2017 | | | 2016 | | | 2015 | | | 2014 | | | 2018 | | | 2017 | | | 2016 | | | 2015 | | | 2014 | | | 2018 | | | 2017 | |
| | | | | | | | | | | | | |
| $ | 1.39 | | | $ | 1.24 | | | $ | 1.19 | | | $ | 1.26 | | | $ | 1.00 | | | $ | 1.66 | | | $ | 1.45 | | | $ | 1.35 | | | $ | 1.39 | | | $ | 1.30 | | | $ | 1.23 | | | $ | 1.04 | | | $ | 1.00 | | | $ | 1.00 | |
| | | | | | | | | | | | | | | | | | | | | | | | | | | | | | | | | | | | | | | | | | | | | | | | | | | | | | |
| | | | | | | | | | | | | |
| | | | | | | | | | | | | | | | | | | | | | | | | | | | | | | | | | | | | | | | | | | | | | | | | | | | | | |
| | 0.02 | | | | 0.01 | | | | 0.02 | | | | 0.02 | | | | — | (h) | | | 0.02 | | | | 0.01 | | | | 0.01 | | | | 0.03 | | | | 0.01 | | | | 0.01 | | | | — | (h) | | | — | (h) | | | — | (h) |
| | (0.13 | ) | | | 0.20 | | | | 0.12 | | | | (0.03 | ) | | | 0.04 | | | | (0.16 | ) | | | 0.25 | | | | 0.14 | | | | (0.04 | ) | | | 0.08 | | | | (0.12 | ) | | | 0.19 | | | | 0.04 | | | | (0.11 | ) |
| | | | | | | | | | | | | | | | | | | | | | | | | | | | | | | | | | | | | | | | | | | | | | | | | | | | | | |
| | | | | | | | | | | | | |
| | (0.11 | ) | | | 0.21 | | | | 0.14 | | | | (0.01 | ) | | | 0.04 | | | | (0.14 | ) | | | 0.26 | | | | 0.15 | | | | (0.01 | ) | | | 0.09 | | | | (0.11 | ) | | | 0.19 | | | | 0.04 | | | | (0.11 | ) |
| | | | | | | | | | | | | | | | | | | | | | | | | | | | | | | | | | | | | | | | | | | | | | | | | | | | | | |
| | | | | | | | | | | | | |
| | | | | | | | | | | | | | | | | | | | | | | | | | | | | | | | | | | | | | | | | | | | | | | | | | | | | | |
| | (0.02 | ) | | | (0.01 | ) | | | (0.02 | ) | | | (0.02 | ) | | | — | | | | (0.02 | ) | | | (0.01 | ) | | | (0.01 | ) | | | (0.01 | ) | | | — | (h) | | | (0.01 | ) | | | — | | | | — | | | | — | |
| | (0.05 | ) | | | (0.05 | ) | | | (0.07 | ) | | | (0.04 | ) | | | — | | | | (0.04 | ) | | | (0.04 | ) | | | (0.04 | ) | | | (0.02 | ) | | | — | (h) | | | (0.01 | ) | | | — | | | | — | | | | — | |
| | | | | | | | | | | | | | | | | | | | | | | | | | | | | | | | | | | | | | | | | | | | | | | | | | | | | | |
| | | | | | | | | | | | | |
| | (0.07 | ) | | | (0.06 | ) | | | (0.09 | ) | | | (0.06 | ) | | | — | | | | (0.06 | ) | | | (0.05 | ) | | | (0.05 | ) | | | (0.03 | ) | | | — | | | | (0.02 | ) | | | — | | | | — | | | | — | |
| | | | | | | | | | | | | | | | | | | | | | | | | | | | | | | | | | | | | | | | | | | | | | | | | | | | | | |
| | | | | | | | | | | | | |
| $ | 1.21 | | | $ | 1.39 | | | $ | 1.24 | | | $ | 1.19 | | | $ | 1.04 | | | $ | 1.46 | | | $ | 1.66 | | | $ | 1.45 | | | $ | 1.35 | | | $ | 1.39 | | | $ | 1.10 | | | $ | 1.23 | | | $ | 1.04 | | | $ | 0.89 | |
| | | | | | | | | | | | | | | | | | | | | | | | | | | | | | | | | | | | | | | | | | | | | | | | | | | | | | |
| | | | | | | | | | | | | |
| | (8.29 | ) | | | 17.62 | | | | 11.68 | | | | (0.69 | ) | | | 4.01 | (b) | | | (8.74 | ) | | | 17.86 | | | | 11.78 | | | | (0.73 | ) | | | 7.15 | | | | (8.88 | ) | | | 17.99 | | | | 4.01 | (b) | | | (10.54 | )(b) |
| | 438 | | | | 437 | | | | 332 | | | | 265 | | | | 3 | | | | 285 | | | | 256 | | | | 164 | | | | 94 | | | | 50 | | | | 70 | | | | 34 | | | | 3 | | | | 4 | |
| | 1.55 | | | | 1.45 | | | | 1.54 | | | | 1.55 | | | | (0.05 | )(c) | | | 1.55 | | | | 1.47 | | | | 1.58 | | | | 1.65 | | | | 1.47 | | | | 1.73 | | | | 1.90 | | | | (0.05 | )(c) | | | 0.74 | (b) |
| | 0.07 | | | | 0.07 | | | | 0.07 | | | | 0.07 | | | | 0.50 | (c) | | | 0.07 | | | | 0.07 | | | | 0.08 | | | | 0.09 | | | | 0.05 | | | | 0.11 | | | | 0.14 | | | | 0.50 | (c) | | | 1.54 | (c) |
| | 0.07 | | | | 0.07 | | | | 0.07 | | | | 0.07 | | | | 0.05 | (c) | | | 0.07 | | | | 0.07 | (e) | | | 0.08 | | | | 0.05 | | | | 0.05 | | | | 0.05 | | | | 0.05 | | | | 0.05 | (c) | | | 0.05 | (c) |
| | 3.67 | | | | 4.46 | | | | 3.91 | | | | 4.40 | | | | 22.25 | (b) | | | 2.26 | | | | 3.75 | | | | 2.67 | | | | 2.67 | | | | 1.53 | | | | 3.42 | | | | 4.32 | | | | 22.25 | (b) | | | 6.10 | |
The accompanying notes are an integral part of these financial statements.
149
MUTUAL OF AMERICA INVESTMENT CORPORATION
FINANCIAL HIGHLIGHTS (Continued)
December 31, 2018
| | | | | | | | | | | | | | | | | | | | |
| | | Conservative Allocation Fund | |
| | | Years Ended December 31, | |
| | | 2018 | | | 2017 | | | 2016 | | | 2015 | | | 2014 | |
| | | | | |
Net Asset Value, Beginning of Year | | $ | 1.27 | | | $ | 1.21 | | | $ | 1.20 | | | $ | 1.25 | | | $ | 1.22 | |
| | | | | | | | | | | | | | | | | | | | |
| | | | | |
INCOME (LOSS)FROM INVESTMENT OPERATIONS | | | | | | | | | | | | | | | | | | | | |
Net Investment Income (Loss) | | | 0.03 | | | | 0.03 | | | | 0.03 | | | | 0.02 | | | | 0.03 | |
Net Realized and Unrealized Gains (Losses) on Investments and Futures Contracts | | | (0.05 | ) | | | 0.08 | | | | 0.04 | | | | (0.01 | ) | | | 0.05 | |
| | | | | | | | | | | | | | | | | | | | |
| | | | | |
Total From Investment Operations | | | (0.02 | ) | | | 0.11 | | | | 0.07 | | | | 0.01 | | | | 0.08 | |
| | | | | | | | | | | | | | | | | | | | |
| | | | | |
Less Distributions | | | | | | | | | | | | | | | | | | | | |
From Net Investment Income | | | (0.03 | ) | | | (0.03 | ) | | | (0.03 | ) | | | (0.03 | ) | | | (0.03 | ) |
From Net Realized Gains | | | (0.05 | ) | | | (0.02 | ) | | | (0.03 | ) | | | (0.03 | ) | | | (0.02 | ) |
| | | | | | | | | | | | | | | | | | | | |
| | | | | |
Total Distributions | | | (0.08 | ) | | | (0.05 | ) | | | (0.06 | ) | | | (0.06 | ) | | | (0.05 | ) |
| | | | | | | | | | | | | | | | | | | | |
| | | | | |
Net Asset Value, End of Year | | $ | 1.17 | | | $ | 1.27 | | | $ | 1.21 | | | $ | 1.20 | | | $ | 1.25 | |
| | | | | | | | | | | | | | | | | | | | |
| | | | | |
Total Return (%)(i) | | | (2.04 | ) | | | 8.92 | | | | 6.71 | | | | 0.44 | | | | 6.62 | |
Net Assets, End of Year ($ millions) | | | 150 | | | | 157 | | | | 140 | | | | 128 | | | | 123 | |
Ratio of Net Investment Income (Loss) to Average Net Assets (%) | | | 2.11 | | | | 2.20 | | | | 2.31 | | | | 2.32 | | | | 2.31 | |
Ratio of Expenses to Average Net Assets Before Expense Reimbursement (%)(d) | | | 0.02 | | | | 0.02 | | | | 0.03 | | | | 0.02 | | | | — | |
Ratio of Expenses to Average Net Assets After Expense Reimbursement (%)(d) | | | 0.02 | | | | 0.02 | | | | 0.03 | | | | 0.02 | | | | — | |
Portfolio Turnover Rate (%)(a) | | | 11.70 | | | | 23.64 | | | | 8.89 | | | | 10.58 | | | | 17.24 | |
| (a) | Portfolio turnover rate excludes all short-term securities. |
| (d) | Allocation and Retirement Funds exclude expenses of the underlying funds. |
| (e) | Includes one time reimbursement from Adviser fornon-advisory operating expenses (Note 2). |
| (f) | For the period October 1, 2016 (commencement of operations) through December 31, 2016. |
| (g) | For the period July 2, 2018 (commencement of operations) through December 31, 2018. |
| (h) | Amount is less than $0.005 per share. |
| (i) | Total return is calculated assuming a purchase of a share on the first day and a sale on the last day of each year or period reported and includes reinvestment of distributions, if any, and does not reflect the effect of fees and charges associated with your variable annuity contract or variable life insurance policy. Total return does not reflect expenses associated with the separate account such as administrative fees and account charges which, if reflected, would reduce the total returns for all years and periods shown. The total return for 2017 for the Funds subject to the one time reimbursement from the Adviser (Note 2) includes the impact of this reimbursement which was determined not to be material. Past performance is no guarantee of future results. Total returns may reflect adjustments to conform to generally accepted accounting principles. Total returns for periods less than one full year are not annualized. |
NA = Not Applicable
The accompanying notes are an integral part of these financial statements.
150
| | | | | | | | | | | | | | | | | | | | | | | | | | | | | | | | | | | | | | | | |
| Moderate Allocation Fund | | | Aggressive Allocation Fund | | | |
| Years Ended December 31, | | | Years Ended December 31, | | | |
| 2018 | | | 2017 | | | 2016 | | | 2015 | | | 2014 | | | 2018 | | | 2017 | | | 2016 | | | 2015 | | | 2014 | | | |
| | | | | | | | | | |
| $ | 1.56 | | | $ | 1.44 | | | $ | 1.41 | | | $ | 1.52 | | | $ | 1.45 | | | $ | 1.77 | | | $ | 1.63 | | | $ | 1.60 | | | $ | 1.77 | | | $ | 1.69 | | | |
| | | | | | | | | | | | | | | | | | | | | | | | | | | | | | | | | | | | | | | | |
| | | | | | | | | | |
| | | | | | | | | | | | | | | | | | | | | | | | | | | | | | | | | | | | | | | | |
| | 0.03 | | | | 0.03 | | | | 0.03 | | | | 0.03 | | | | 0.03 | | | | 0.03 | | | | 0.03 | | | | 0.03 | | | | 0.03 | | | | 0.03 | | | |
| | (0.09 | ) | | | 0.17 | | | | 0.10 | | | | (0.03 | ) | | | 0.09 | | | | (0.14 | ) | | | 0.24 | | | | 0.14 | | | | (0.05 | ) | | | 0.11 | | | |
| | | | | | | | | | | | | | | | | | | | | | | | | | | | | | | | | | | | | | | | |
| | | | | | | | | | |
| | (0.06 | ) | | | 0.20 | | | | 0.13 | | | | — | | | | 0.12 | | | | (0.11 | ) | | | 0.27 | | | | 0.17 | | | | (0.02 | ) | | | 0.14 | | | |
| | | | | | | | | | | | | | | | | | | | | | | | | | | | | | | | | | | | | | | | |
| | | | | | | | | | |
| | | | | | | | | | | | | | | | | | | | | | | | | | | | | | | | | | | | | | | | |
| | (0.03 | ) | | | (0.03 | ) | | | (0.03 | ) | | | (0.03 | ) | | | (0.03 | ) | | | (0.03 | ) | | | (0.03 | ) | | | (0.03 | ) | | | (0.03 | ) | | | (0.03 | ) | | |
| | (0.08 | ) | | | (0.05 | ) | | | (0.07 | ) | | | (0.08 | ) | | | (0.02 | ) | | | (0.10 | ) | | | (0.10 | ) | | | (0.11 | ) | | | (0.12 | ) | | | (0.03 | ) | | |
| | | | | | | | | | | | | | | | | | | | | | | | | | | | | | | | | | | | | | | | |
| | | | | | | | | | |
| | (0.11 | ) | | | (0.08 | ) | | | (0.10 | ) | | | (0.11 | ) | | | (0.05 | ) | | | (0.13 | ) | | | (0.13 | ) | | | (0.14 | ) | | | (0.15 | ) | | | (0.06 | ) | | |
| | | | | | | | | | | | | | | | | | | | | | | | | | | | | | | | | | | | | | | | |
| | | | | | | | | | |
| $ | 1.39 | | | $ | 1.56 | | | $ | 1.44 | | | $ | 1.41 | | | $ | 1.52 | | | $ | 1.53 | | | $ | 1.77 | | | $ | 1.63 | | | $ | 1.60 | | | $ | 1.77 | | | |
| | | | | | | | | | | | | | | | | | | | | | | | | | | | | | | | | | | | | | | | |
| | | | | | | | | | |
| | (4.41 | ) | | | 13.72 | | | | 9.08 | | | | 0.16 | | | | 7.71 | | | | (7.13 | ) | | | 16.64 | | | | 10.86 | | | | (0.38 | ) | | | 7.66 | | | |
| | 371 | | | | 397 | | | | 347 | | | | 316 | | | | 315 | | | | 271 | | | | 304 | | | | 264 | | | | 249 | | | | 255 | | | |
| | 1.95 | | | | 1.90 | | | | 2.08 | | | | 2.09 | | | | 1.95 | | | | 1.74 | | | | 1.65 | | | | 1.74 | | | | 1.81 | | | | 1.60 | | | |
| | 0.02 | | | | 0.02 | | | | 0.02 | | | | 0.02 | | | | — | | | | 0.02 | | | | 0.02 | | | | 0.02 | | | | 0.02 | | | | — | | | |
| | 0.02 | | | | 0.02 | | | | 0.02 | | | | 0.02 | | | | — | | | | 0.02 | | | | 0.02 | | | | 0.02 | | | | 0.02 | | | | — | | | |
| | 9.50 | | | | 12.05 | | | | 6.65 | | | | 8.10 | | | | 13.87 | | | | 9.13 | | | | 9.55 | | | | 9.51 | | | | 7.86 | | | | 19.61 | | | |
The accompanying notes are an integral part of these financial statements.
151
MUTUAL OF AMERICA INVESTMENT CORPORATION
FINANCIAL HIGHLIGHTS (Continued)
| | | | | | | | | | | | | | | | | | | | |
| | | Money Market Fund | |
| | | Years Ended December 31, | |
| | | 2018 | | | 2017 | | | 2016 | | | 2015 | | | 2014 | |
| | | | | |
Net Asset Value, Beginning of Year | | $ | 1.2040 | | | $ | 1.1972 | | | $ | 1.20 | | | $ | 1.20 | | | $ | 1.20 | |
| | | | | | | | | | | | | | | | | | | | |
| | | | | |
INCOME (LOSS)FROM INVESTMENT OPERATIONS | | | | | | | | | | | | | | | | | | | | |
Net Investment Income (Loss) | | | 0.0081 | | | | 0.0077 | | | | — | (h) | | | — | (h) | | | — | (h) |
Net Realized and Unrealized Gains (Losses) on Investments and Futures Contracts | | | 0.0124 | | | | 0.0005 | | | | — | (h) | | | — | (h) | | | — | (h) |
| | | | | | | | | | | | | | | | | | | | |
| | | | | |
Total From Investment Operations | | | 0.0205 | | | | 0.0082 | | | | — | | | | — | | | | — | |
| | | | | | | | | | | | | | | | | | | | |
| | | | | |
Less Distributions | | | | | | | | | | | | | | | | | | | | |
From Net Investment Income | | | (0.0030 | ) | | | (0.0014 | ) | | | — | | | | — | | | | — | |
From Net Realized Gains | | | — | | | | — | | | | — | | | | — | | | | — | |
| | | | | | | | | | | | | | | | | | | | |
| | | | | |
Total Distributions | | | (0.0030 | ) | | | (0.0014 | ) | | | — | | | | — | | | | — | |
| | | | | | | | | | | | | | | | | | | | |
| | | | | |
Net Asset Value, End of Year | | | 1.2215 | | | $ | 1.2040 | | | $ | 1.20 | | | $ | 1.20 | | | $ | 1.20 | |
| | | | | | | | | | | | | | | | | | | | |
| | | | | |
Total Return (%)(i) | | | 1.71 | | | | 0.70 | | | | 0.14 | | | | (0.11 | ) | | | (0.14 | ) |
Net Assets, End of Year ($ millions) | | | 210 | | | | 71 | | | | 63 | | | | 67 | | | | 77 | |
Ratio of Net Investment Income (Loss) to Average Net Assets (%) | | | 1.82 | | | | 0.70 | | | | 0.13 | | | | (0.11 | ) | | | (0.14 | ) |
Ratio of Expenses to Average Net Assets Before Expense Reimbursement (%) | | | 0.20 | | | | 0.25 | | | | 0.28 | | | | 0.26 | | | | 0.24 | |
Ratio of Expenses to Average Net Assets After Expense Reimbursement (%) | | | 0.20 | | | | 0.24 | (e) | | | 0.28 | | | | 0.26 | | | | 0.24 | |
Portfolio Turnover Rate (%)(a) | | | NA | | | | NA | | | | NA | | | | NA | | | | NA | |
| (a) | Portfolio turnover rate excludes all short-term securities. |
| (d) | Allocation and Retirement Funds exclude expenses of the underlying funds. |
| (e) | Includes one time reimbursement from Adviser fornon-advisory operating expenses (Note 2). |
| (f) | For the period October 1, 2016 (commencement of operations) through December 31, 2016. |
| (g) | For the period July 2, 2018 (commencement of operations) through December 31, 2018. |
| (h) | Amount is less than $0.005 per share. |
| (i) | Total return is calculated assuming a purchase of a share on the first day and a sale on the last day of each year or period reported and includes reinvestment of distributions, if any, and does not reflect the effect of fees and charges associated with your variable annuity contract or variable life insurance policy. Total return does not reflect expenses associated with the separate account such as administrative fees and account charges which, if reflected, would reduce the total returns for all years and periods shown. The total return for 2017 for the Funds subject to the one time reimbursement from the Adviser (Note 2) includes the impact of this reimbursement which was determined not to be material. Past performance is no guarantee of future results. Total returns may reflect adjustments to conform to generally accepted accounting principles. Total returns for periods less than one full year are not annualized. |
NA = Not Applicable
The accompanying notes are an integral part of these financial statements.
152
| | | | | | | | | | | | | | | | | | | | | | | | | | | | | | | | | | | | | | | | |
| Mid-Term Bond Fund | | | Bond Fund | | | |
| Years Ended December 31, | | | Years Ended December 31, | | | |
| 2018 | | | 2017 | | | 2016 | | | 2015 | | | 2014 | | | 2018 | | | 2017 | | | 2016 | | | 2015 | | | 2014 | | | |
| | | | | | | | | | |
| $ | 1.04 | | | $ | 1.04 | | | $ | 1.03 | | | $ | 1.06 | | | $ | 1.05 | | | $ | 1.44 | | | $ | 1.43 | | | $ | 1.41 | | | $ | 1.45 | | | $ | 1.41 | | | |
| | | | | | | | | | | | | | | | | | | | | | | | | | | | | | | | | | | | | | | | |
| | | | | | | | | | |
| | | | | | | | | | | | | | | | | | | | | | | | | | | | | | | | | | | | | | | | |
| | 0.02 | | | | 0.02 | | | | 0.03 | | | | 0.03 | | | | 0.03 | | | | 0.04 | | | | 0.04 | | | | 0.04 | | | | 0.04 | | | | 0.04 | | | |
| | (0.02 | ) | | | — | (h) | | | 0.01 | | | | (0.03 | ) | | | 0.02 | | | | (0.03 | ) | | | 0.01 | | | | 0.02 | | | | (0.03 | ) | | | 0.04 | | | |
| | | | | | | | | | | | | | | | | | | | | | | | | | | | | | | | | | | | | | | | |
| | | | | | | | | | |
| | 0.00 | | | | 0.02 | | | | 0.04 | | | | — | | | | 0.05 | | | | 0.01 | | | | 0.05 | | | | 0.06 | | | | 0.01 | | | | 0.08 | | | |
| | | | | | | | | | | | | | | | | | | | | | | | | | | | | | | | | | | | | | | | |
| | | | | | | | | | |
| | | | | | | | | | | | | | | | | | | | | | | | | | | | | | | | | | | | | | | | |
| | (0.02 | ) | | | (0.02 | ) | | | (0.03 | ) | | | (0.03 | ) | | | (0.03 | ) | | | (0.04 | ) | | | (0.04 | ) | | | (0.04 | ) | | | (0.05 | ) | | | (0.04 | ) | | |
| | — | (h) | | | — | (h) | | | — | (h) | | | — | (h) | | | (0.01 | ) | | | — | | | | — | (h) | | | — | (h) | | | — | (h) | | | — | | | |
| | | | | | | | | | | | | | | | | | | | | | | | | | | | | | | | | | | | | | | | |
| | | | | | | | | | |
| | (0.02 | ) | | | (0.02 | ) | | | (0.03 | ) | | | (0.03 | ) | | | (0.04 | ) | | | (0.04 | ) | | | (0.04 | ) | | | (0.04 | ) | | | (0.05 | ) | | | (0.04 | ) | | |
| | | | | | | | | | | | | | | | | | | | | | | | | | | | | | | | | | | | | | | | |
| | | | | | | | | | |
| $ | 1.02 | | | $ | 1.04 | | | $ | 1.04 | | | $ | 1.03 | | | $ | 1.06 | | | $ | 1.41 | | | $ | 1.44 | | | $ | 1.43 | | | $ | 1.41 | | | $ | 1.45 | | | |
| | | | | | | | | | | | | | | | | | | | | | | | | | | | | | | | | | | | | | | | |
| | | | | | | | | | |
| | 0.57 | | | | 2.32 | | | | 3.51 | | | | 0.61 | | | | 3.22 | | | | 0.17 | | | | 3.62 | | | | 4.71 | | | | 0.33 | | | | 6.31 | | | |
| | 587 | | | | 558 | | | | 492 | | | | 452 | | | | 435 | | | | 1,346 | | | | 1,274 | | | | 1,108 | | | | 1,007 | | | | 956 | | | |
| | 2.44 | | | | 2.37 | | | | 2.45 | | | | 2.68 | | | | 2.57 | | | | 2.93 | | | | 2.98 | | | | 3.07 | | | | 2.93 | | | | 3.59 | | | |
| | 0.45 | | | | 0.47 | | | | 0.46 | | | | 0.46 | | | | 0.49 | | | | 0.45 | | | | 0.45 | | | | 0.45 | | | | 0.45 | | | | 0.48 | | | |
| | 0.45 | | | | 0.45 | (e) | | | 0.46 | | | | 0.46 | | | | 0.49 | | | | 0.45 | | | | 0.44 | (e) | | | 0.45 | | | | 0.45 | | | | 0.48 | | | |
| | 20.12 | | | | 14.18 | | | | 17.52 | | | | 19.07 | | | | 36.56 | | | | 10.71 | | | | 10.65 | | | | 13.54 | | | | 27.51 | | | | 15.00 | | | |
The accompanying notes are an integral part of these financial statements.
153
MUTUAL OF AMERICA INVESTMENT CORPORATION
NOTES TO FINANCIAL STATEMENTS
December 31, 2018
| 1. | SIGNIFICANT ACCOUNTING POLICIESAND ORGANIZATION |
Mutual of America Investment Corporation (the “Investment Company”) is a diversified,open-end management investment company — a type of company commonly known as a “mutual fund”. It is registered as such under the Investment Company Act of 1940 (the “Investment Company Act”). The Investment Company was formed on February 21, 1986 as a Maryland corporation and principally offers its shares exclusively to separate accounts of Mutual of America Life Insurance Company (“Mutual of America Life”) and a former affiliate that offers the funds through its separate accounts. As a “series” type mutual fund, the Investment Company issues separate classes (or series) of capital stock, each of which represents a separate Fund of investments. At December 31, 2018, there were 27 active funds (collectively, “the Funds”): Equity Index Fund, All America Fund, Small Cap Value Fund, Small Cap Growth Fund, Small Cap Equity Index Fund, Mid Cap Value Fund,Mid-Cap Equity Index Fund, International Fund, Composite Fund, Money Market Fund,Mid-Term Bond Fund, Bond Fund; Retirement Income Fund, 2010 Retirement Fund, 2015 Retirement Fund, 2020 Retirement Fund, 2025 Retirement Fund, 2030 Retirement Fund, 2035 Retirement Fund, 2040 Retirement Fund, 2045 Retirement Fund, 2050 Retirement Fund, 2055 Retirement Fund and 2060 Retirement Fund (collectively, “Retirement Funds”); a Conservative Allocation Fund, a Moderate Allocation Fund and an Aggressive Allocation Fund (collectively, “Allocation Funds”). The 2055 Retirement Fund commenced operations on October 1, 2016. The Small Cap Equity Index Fund and the 2060 Retirement Fund commenced operations on July 2, 2018.
Investment Company shares are issued to Mutual of America Life and, on a limited basis, to Wilton Reassurance Life Company of New York (formerly The American Life Insurance Company of New York), for allocation to their Separate Accounts as a funding medium for variable accumulation annuity contracts and variable life insurance policies. In addition, shares of selected equity and fixed income funds of the Investment Company are directly issued to one or more of the Investment Company’s Retirement Funds and Allocation Funds.
The Funds follow investment company accounting and reporting guidance of the Financial Accounting Standards Board (“FASB”) Accounting Codification Topic 946 Financial Services — Investment Companies. The preparation of financial statements in accordance with U.S. generally accepted accounting principles (“GAAP”) requires management to make estimates and assumptions that affect the reported amounts of assets, liabilities, income, expenses and related disclosures. Changes in the economic environment, financial markets and any other parameters used in determining these estimates could cause actual results to differ.
The following is a summary of the significant accounting policies consistently followed by the Investment Company, which are in conformity with GAAP:
Fair Value— The Investment Company values its investments at fair value. Fair value is an estimate of the price the Fund would receive upon selling a security in an orderly arms-length transaction. Investments are categorized based on a three-level valuation hierarchy for measurement and disclosure of fair value. The valuation hierarchy is based upon the transparency of inputs used to measure fair value. These inputs are summarized in the three broad levels listed below:
| | • | | Level 1 — quoted prices in active markets for identical securities. |
| | • | | Level 2 — other significant observable inputs (including yield, quality, coupon rate, maturity, issue type, quoted prices for similar securities, prepayment speeds, trading characteristics, etc.). |
| | • | | Level 3 — significant unobservable inputs (including the Fund’s own assumptions in determining the fair value of investments). |
As of December 31, 2018, management determined that the fair value inputs for all equity securities were considered Level 1, with the exception of three securities in the All America, Small Cap Value and Small Cap Growth Funds (see Note 1 below) which were considered Level 3. In addition,non-registered securities under Rule 144A of the Securities Act of 1933 were considered Level 2. Furthermore, certain Rule 144A securities not actively traded are considered Level 3; however, there were no such 144A securities as of December 31, 2018. Fair value inputs for all debt securities and temporary cash investments were considered Level 2. The inputs or methodologies used for valuing securities are not necessarily an indication of the risk associated with investing in those securities. Transfers between levels are reflected based on the fair value at the beginning of a reporting period.
154
MUTUAL OF AMERICA INVESTMENT CORPORATION
NOTES TO FINANCIAL STATEMENTS (Continued)
December 31, 2018
| 1. | SIGNIFICANT ACCOUNTING POLICIESAND ORGANIZATION (CONTINUED) |
The following is a summary of the inputs used to value the Funds’ investments and other financial instruments as of December 31, 2018:
| | | | | | | | | | | | | | | | |
Fund | | Level 1 — Quoted
Prices | | | Level 2 — Significant
Observable Inputs | | | Level 3 — Significant
Unobservable Inputs | | | Total | |
| | | | |
Investments at Fair Value: | | | | | | | | | | | | | | | | |
| | |
(See Portfolios of Investments for More Details) | | | | | | | | | |
Equity Index Fund | | | | | | | | | | | | | | | | |
Common Stock-Indexed | | $ | 2,542,925,323 | | | | — | | | | — | | | $ | 2,542,925,323 | |
Short-Term Debt Securities | | | — | | | $ | 80,030,849 | | | | — | | | $ | 80,030,849 | |
Temporary Cash Investment | | | — | | | $ | 138,594 | | | | — | | | $ | 138,594 | |
| | | | | | | | | | | | | | | | |
| | $ | 2,542,925,323 | | | $ | 80,169,443 | | | | — | | | $ | 2,623,094,766 | |
All America Fund | | | | | | | | | | | | | | | | |
Common Stock-Indexed | | $ | 149,348,660 | | | | — | | | | — | | | $ | 149,348,660 | |
Common Stock-Active | | $ | 110,570,396 | | | | — | | | $ | 285,375 | (1) | | $ | 110,855,771 | |
Short-Term Debt Securities-Indexed | | | — | | | $ | 1,898,250 | | | | — | | | $ | 1,898,250 | |
Short-Term Debt Securities-Active | | | — | | | $ | 5,999,636 | | | | — | | | $ | 5,999,636 | |
Temporary Cash Investment | | | — | | | $ | 291,756 | | | | — | | | $ | 291,756 | |
| | | | | | | | | | | | | | | | |
| | $ | 259,919,056 | | | $ | 8,189,642 | | | $ | 285,375 | | | $ | 268,394,073 | |
Small Cap Value Fund | | | | | | | | | | | | | | | | |
Common Stock | | $ | 402,386,134 | | | | — | | | $ | 3,206,125 | (1) | | $ | 405,592,259 | |
Short-Term Debt Securities | | | — | | | $ | 26,070,231 | | | | — | | | $ | 26,070,231 | |
Temporary Cash Investment | | | — | | | $ | 52,184 | | | | — | | | $ | 52,184 | |
| | | | | | | | | | | | | | | | |
| | $ | 402,386,134 | | | $ | 26,122,415 | | | $ | 3,206,125 | | | $ | 431,714,674 | |
Small Cap Growth Fund | | | | | | | | | | | | | | | | |
Common Stock | | $ | 458,734,559 | | | | — | | | | — | (1) | | $ | 458,734,559 | |
Short-Term Debt Securities | | | — | | | $ | 27,698,258 | | | | — | | | $ | 27,698,258 | |
Temporary Cash Investment | | | — | | | $ | 61,703 | | | | — | | | $ | 61,703 | |
| | | | | | | | | | | | | | | | |
| | $ | 458,734,559 | | | $ | 27,759,961 | | | | — | | | $ | 486,494,520 | |
Small Cap Equity Index Fund | | | | | | | | | | | | | | | | |
Common Stock-Indexed | | $ | 17,104,185 | | | | — | | | | — | (1) | | $ | 17,104,185 | |
Temporary Cash Investment | | | | | | $ | 69,144 | | | | — | | | $ | 69,144 | |
| | | | | | | | | | | | | | | | |
| | $ | 17,104,185 | | | $ | 69,144 | | | | — | | | $ | 17,173,329 | |
Mid Cap Value Fund | | | | | | | | | | | | | | | | |
Common Stock | | $ | 75,481,985 | | | | — | | | | — | | | $ | 75,481,985 | |
Short-Term Debt Securities | | | | | | $ | 4,490,039 | | | | — | | | $ | 4,490,039 | |
Temporary Cash Investment | | | | | | $ | 85,179 | | | | — | | | $ | 85,179 | |
| | | | | | | | | | | | | | | | |
| | $ | 75,481,985 | | | $ | 4,575,218 | | | | — | | | $ | 80,057,203 | |
Mid-Cap Equity Index Fund | | | | | | | | | | | | | | | | |
Common Stock-Indexed | | $ | 1,238,801,391 | | | | — | | | | — | | | $ | 1,238,801,391 | |
Short-Term Debt Securities | | | | | | $ | 40,816,655 | | | | — | | | $ | 40,816,655 | |
Temporary Cash Investment | | | | | | $ | 106,816 | | | | — | | | $ | 106,816 | |
| | | | | | | | | | | | | | | | |
| | $ | 1,238,801,391 | | | $ | 40,923,471 | | | | — | | | $ | 1,279,724,862 | |
International Fund | | | | | | | | | | | | | | | | |
Common Stock | | $ | 470,416,974 | | | | — | | | | — | | | $ | 470,416,974 | |
Short-Term Debt Securities | | | — | | | $ | 39,655,375 | | | | — | | | $ | 39,655,375 | |
Temporary Cash Investment | | | | | | $ | 541,896 | | | | — | | | $ | 541,896 | |
| | | | | | | | | | | | | | | | |
| | $ | 470,416,974 | | | $ | 40,197,271 | | | | — | | | $ | 510,614,245 | |
Composite Fund | | | | | | | | | | | | | | | | |
Common Stock | | $ | 96,093,743 | | | | — | | | | — | | | $ | 96,093,743 | |
U.S. Government Debt | | | — | | | $ | 27,879,676 | | | | — | | | $ | 27,879,676 | |
U.S. Government Agency Residential
Mortgage-Backed Obligations | | | — | | | $ | 21,093,064 | | | | — | | | $ | 21,093,064 | |
155
MUTUAL OF AMERICA INVESTMENT CORPORATION
NOTES TO FINANCIAL STATEMENTS (Continued)
December 31, 2018
| 1. | SIGNIFICANT ACCOUNTING POLICIESAND ORGANIZATION (CONTINUED) |
| | | | | | | | | | | | | | | | |
Fund | | Level 1 — Quoted
Prices | | | Level 2 — Significant
Observable Inputs | | | Level 3 — Significant
Unobservable Inputs | | | Total | |
U.S. Government Agency
Non-Mortgage-Backed Obligations | | | — | | | $ | 487,039 | | | | — | | | $ | 487,039 | |
Long-Term Corporate Debt | | | — | | | $ | 22,991,109 | | | | — | | | $ | 22,991,109 | |
Short-Term Debt Securities | | | — | | | $ | 2,599,845 | | | | — | | | $ | 2,599,845 | |
Temporary Cash Investment | | | | | | $ | 593,560 | | | | — | | | $ | 593,560 | |
| | | | | | | | | | | | | | | | |
| | $ | 96,093,743 | | | $ | 75,644,293 | | | | — | | | $ | 171,738,036 | |
Retirement Income Fund | | | | | | | | | | | | | | | | |
Common Stock | | $ | 101,431,551 | | | | — | | | | — | | | $ | 101,431,551 | |
2010 Retirement Fund | | | | | | | | | | | | | | | | |
Common Stock | | $ | 23,993,824 | | | | — | | | | — | | | $ | 23,993,824 | |
2015 Retirement Fund | | | | | | | | | | | | | | | | |
Common Stock | | $ | 138,459,032 | | | | — | | | | — | | | $ | 138,459,032 | |
2020 Retirement Fund | | | | | | | | | | | | | | | | |
Common Stock | | $ | 515,191,697 | | | | — | | | | — | | | $ | 515,191,697 | |
2025 Retirement Fund | | | | | | | | | | | | | | | | |
Common Stock | | $ | 709,843,502 | | | | — | | | | — | | | $ | 709,843,502 | |
2030 Retirement Fund | | | | | | | | | | | | | | | | |
Common Stock | | $ | 617,113,972 | | | | — | | | | — | | | $ | 617,113,972 | |
2035 Retirement Fund | | | | | | | | | | | | | | | | |
Common Stock | | $ | 509,448,930 | | | | — | | | | — | | | $ | 509,448,930 | |
2040 Retirement Fund | | | | | | | | | | | | | | | | |
Common Stock | | $ | 412,661,364 | | | | — | | | | — | | | $ | 412,661,364 | |
2045 Retirement Fund | | | | | | | | | | | | | | | | |
Common Stock | | $ | 438,114,958 | | | | — | | | | — | | | $ | 438,114,958 | |
2050 Retirement Fund | | | | | | | | | | | | | | | | |
Common Stock | | $ | 285,290,893 | | | | — | | | | — | | | $ | 285,290,893 | |
2055 Retirement Fund | | | | | | | | | | | | | | | | |
Common Stock | | $ | 70,296,305 | | | | — | | | | — | | | $ | 70,296,305 | |
2060 Retirement Fund | | | | | | | | | | | | | | | | |
Common Stock | | $ | 4,045,388 | | | | — | | | | — | | | $ | 4,045,388 | |
Conservative Allocation Fund | | | | | | | | | | | | | | | | |
Common Stock | | $ | 149,940,628 | | | | — | | | | — | | | $ | 149,940,628 | |
Moderate Allocation Fund | | | | | | | | | | | | | | | | |
Common Stock | | $ | 371,138,159 | | | | — | | | | — | | | $ | 371,138,159 | |
Aggressive Allocation Fund | | | | | | | | | | | | | | | | |
Common Stock | | $ | 271,377,197 | | | | — | | | | — | | | $ | 271,377,197 | |
Money Market Fund | | | | | | | | | | | | | | | | |
U.S. Government Debt | | | — | | | $ | 46,289,598 | | | | — | | | $ | 46,289,598 | |
U.S. Government Agency Short-Term Debt | | | — | | | $ | 34,687,407 | | | | — | | | $ | 34,687,407 | |
Commercial Paper | | | — | | | $ | 128,764,603 | | | | — | | | $ | 128,764,603 | |
| | | | | | | | | | | | | | | | |
| | | — | | | $ | 209,741,608 | | | | — | | | $ | 209,741,608 | |
Mid-Term Bond Fund | | | | | | | | | | | | | | | | |
U.S. Government Debt | | | — | | | $ | 297,968,031 | | | | — | | | $ | 297,968,031 | |
U.S. Government Agency Residential
Mortgage-Backed Obligations | | | — | | | $ | 943 | | | | — | | | $ | 943 | |
U.S. Government Agency
Non-Mortgage-Backed Obligations | | | — | | | $ | 36,510,983 | | | | — | | | $ | 36,510,983 | |
Long-Term Corporate Debt | | | — | | | $ | 246,555,201 | | | | — | | | $ | 246,555,201 | |
Short-Term Debt Securities | | | — | | | $ | 1,999,881 | | | | — | | | $ | 1,999,881 | |
Temporary Cash Investment | | | | | | $ | 32,852 | | | | — | | | $ | 32,852 | |
| | | | | | | | | | | | | | | | |
| | | — | | | $ | 583,067,891 | | | | — | | | $ | 583,067,891 | |
156
MUTUAL OF AMERICA INVESTMENT CORPORATION
NOTES TO FINANCIAL STATEMENTS (Continued)
December 31, 2018
| 1. | SIGNIFICANT ACCOUNTING POLICIESAND ORGANIZATION (CONTINUED) |
| | | | | | | | | | | | | | | | |
Fund | | Level 1 — Quoted
Prices | | | Level 2 — Significant
Observable Inputs | | | Level 3 — Significant
Unobservable Inputs | | | Total | |
Bond Fund | | | | | | | | | | | | | | | | |
U.S. Government Debt | | | — | | | $ | 427,414,558 | | | | — | | | $ | 427,414,558 | |
U.S. Government Agency Residential
Mortgage-Backed Obligations | | | — | | | $ | 372,303,511 | | | | — | | | $ | 372,303,511 | |
U.S. Government Agency
Non-Mortgage-Backed Obligations | | | — | | | $ | 15,656,498 | | | | — | | | $ | 15,656,498 | |
Long-Term Corporate Debt | | | — | | | $ | 515,560,247 | | | | — | | | $ | 515,560,247 | |
Sovereign Debt | | | — | | | $ | 2,960,966 | | | | — | | | $ | 2,960,966 | |
Short-Term Debt Securities | | | — | | | $ | 2,399,857 | | | | — | | | $ | 2,399,857 | |
Temporary Cash Investment | | | | | | $ | 26,132 | | | | — | | | $ | 26,132 | |
| | | | | | | | | | | | | | | | |
| | | — | | | $ | 1,336,321,769 | | | | — | | | $ | 1,336,321,769 | |
| | | | |
Other Financial Instruments:* | | | | | | | | | | | | | | | | |
| | | | |
Equity Index Fund | | $ | (3,162,330 | ) | | | — | | | | — | | | $ | (3,162,330 | ) |
All America Fund | | $ | (99,293 | ) | | | — | | | | — | | | $ | (99,293 | ) |
Mid-Cap Equity Index Fund | | $ | (1,815,770 | ) | | | — | | | | — | | | $ | (1,815,770 | ) |
| * | Other financial instruments are derivative instruments not reflected in the Portfolio of Investments, such as futures, which are valued at the unrealized appreciation/depreciation on the instrument. |
| (1) | Includes securities fair valued using methods determined in good faith by the Adviser and reviewed by the Investment Company Valuation Committee, in accordance with procedures adopted by the Board of Directors of the Investment Company. |
| | | | | | | | | | | | | | | | | | | | | | | | | | | | |
| | | Fair Value Measurement Using Significant Unobservable
Inputs (Level 3) for the Year Ended December 31, 2018 | |
| | | Balance
December 31,
2017(a) | | | Change in
Unrealized
Gains
(Losses) | | | Transfers
Into
Level 3 | | | Transfers
Out of
Level 3 | | | Sales
2018(a) | | | Balance
December 31,
2018(a) | | | Unrealized Gains/(Losses)
of Level 3 Assets Held as of
December 31, 2018 Included
in Statements of Operations | |
All America Fund | | $ | 285,375 | | | | — | | | | — | | | | — | | | | — | (b) | | $ | 285,375 | | | $ | 30,822 | |
Small Cap Value Fund | | $ | 3,206,125 | | | | — | | | | — | | | | — | | | | — | | | $ | 3,206,125 | | | $ | 347,256 | |
Small Cap Growth Fund | | | — | | | | — | | | | — | | | | — | | | | — | (b) | | | — | | | | — | |
Small Cap Equity Index Fund | | | — | | | | — | | | | — | (c) | | | — | | | | — | | | | — | | | | — | |
| (a) | Includes securities fair valued using methods determined in good faith by the Adviser and reviewed by the Investment Company Valuation Committee, in accordance with procedures adopted by the Board of Directors of the Investment Company. |
| (b) | Level 3 security, Dyax Corp. — contingent value rights, with $0 fair value and unrealized gain (loss). |
| (c) | Lyondell Basell Industries — contingent value rights, with $0 fair value and unrealized gain (loss). |
Security Valuation — Investment securities are carried at fair value as follows:
The Funds’ investments are fair valued as of the close of trading on the New York Stock Exchange (“Exchange”) on each day the Exchange is open for trading. The Exchange usually closes at 4:00 pm Eastern Time but sometimes closes earlier. The Board of Directors of the Investment Company (the “Board”) has adopted valuation procedures for security valuation under which fair valuation responsibilities have been delegated to the Adviser. Pursuant to the Board’s delegation, the Adviser has established a Valuation Committee responsible for supervising the fair valuation of portfolio securities. The valuation procedures permit the Funds to utilize independent pricing vendor services, quotations from market makers and alternative valuation methods when market quotations are either not readily available or not deemed representative of fair value. A record of the Valuation Committee’s actions is subject to the Board’s review, approval and ratification at its next regularly scheduled quarterly meeting. For fiscal reporting year-end, securities were fair valued at the close of the last business day.
Exchange-traded equity securities are valued at the last reported sales price on the principal exchange on which the security is traded. If there is no trading volume for a particular valuation day, the last bid
157
MUTUAL OF AMERICA INVESTMENT CORPORATION
NOTES TO FINANCIAL STATEMENTS (Continued)
December 31, 2018
| 1. | SIGNIFICANT ACCOUNTING POLICIESAND ORGANIZATION (CONTINUED) |
price is used. For equity securities traded in theover-the-counter market, the security is valued at the last sale price, or if no sale, at the latest bid price available.
Short-term debt securities with a maturity of 60 days or less are valued at amortized cost, which approximates fair value for such securities.
Debt securities, including short-term debt securities maturing in excess of 60 days, are valued on the basis of prices obtained from an independent pricing source. The pricing source may utilize various pricing methodologies that incorporate both models (which consider factors such as yield, quality, coupon rate, maturity, issue type, quoted prices for similar securities, prepayment speeds and trading characteristics) and dealer-supplied valuations to derive a valuation.
Temporary cash investments are amounts on deposit with financial institutions that are swept daily into an overnight investment and returned the next business day. Cash equivalents such as short-term temporary cash investments are valued at amortized cost.
In the rare instance when a price is not available from an independent pricing source or when prices may not reflect fair value, such as when the price provided by the pricing source is not based on a recent trade, a calculated fair value is used, as determined in good faith by the Adviser and reviewed by a Valuation Committee, in accordance with procedures adopted by the Board of Directors of the Investment Company.
Mutual of America Capital Management LLC (“the Adviser”) uses a market approach to calculate fair value for equity securities which are categorized as Level 3. The Adviser’s valuation is primarily based on information regarding the specific equity issuer, such as the last trade price, financial statements, the relationship ofper-share book value to the last trade price, operating information and any corporate actions, such as dividends or returns of capital, that may have occurred since the last trade. The Adviser also considers industry-specific conditions and overall market conditions, to determine whether the last trade price reflects fair value or needs to be adjusted. Generally, absent any significant contrary indications, the last trade price will be used as the calculated fair value.
The Retirement Funds and the Allocation Funds value their investments in the underlying Funds of the Investment Company at their respective net asset values.
Investment Transactions — Investment transactions are accounted for as of the trade date. Realized gains and losses on the sale of short and long-term debt securities are computed on the basis of amortized cost at the time of sale. Realized gains and losses on the sale of equity securities are based on the identified cost basis of the security, determined on thefirst-in,first-out (“FIFO”) basis.
Futures Contracts— The Equity Index Fund,Mid-Cap Equity Index Fund and a portion of the All America Fund each maintain indexed asset portfolios which are subject to equity price risk. In order to remain more fully invested in the equity markets while minimizing transaction costs, the funds purchase stock index futures contracts. These purchases of futures contracts allow the funds to invest available cash to attempt to efficiently and cost effectively keep the funds fully invested on a daily basis in an attempt to minimize deviation from the performance of the indices. An initial cash margin deposit (represented by cash or Treasury bills) is made upon entering into a futures contract and serves as collateral for the contract. This initial margin, maintained in a segregated account, is equal to approximately5%-6% of the contract amount, and does not involve the borrowing of funds to finance the transaction. During the period the futures contract is outstanding, changes in the value of the contract are recognized as unrealized appreciation or depreciation by“marking-to-market” on a daily basis to reflect the market value of the contract at the end of each trading day. The accumulated unrealized appreciation or depreciation on the contract is included in Total Distributable Earnings (Loss) in the Components of Net Assets section of the Statements of Assets and Liabilities. Futures contracts are valued at the settlement price established each day by the exchange on which traded. Depending upon whether unrealized appreciation or depreciation are incurred, variation margin payments are received or made daily. The net change in unrealized appreciation or depreciation of futures contracts is recorded in the Statements of Operations. When the contract is closed, a realized gain or loss from futures transactions is recorded in the Statements of Operations, equal to the net variation margin received or paid over the period the contract was outstanding.
158
MUTUAL OF AMERICA INVESTMENT CORPORATION
NOTES TO FINANCIAL STATEMENTS (Continued)
December 31, 2018
| 1. | SIGNIFICANT ACCOUNTING POLICIESAND ORGANIZATION (CONTINUED) |
The “Underlying Face Amount at Value” (appearing in the “Footnotes to Portfolios of Investments in Securities”) representing the aggregate of outstanding contractual amounts under futures contracts reflects the extent of a Fund’s exposure tooff-balance sheet risk. The use of futures transactions involves the risk of imperfect correlation in the price movements of the contract and the underlying securities. With futures contracts, there is minimal counterparty credit risk to the Fund since futures are exchange traded and the exchange’s clearinghouse, as counterparty to all exchange traded futures, guarantees the futures against default.
The following table presents the financial statement impacts resulting from the funds’ use of futures contracts at their fair values as of December 31, 2018 and for the year ended December 31, 2018:
| | | | | | | | | | | | | | | | | | |
Derivatives not accounted
for as hedging instruments | | Risk
Type | | | Location on Statements of Assets and Liabilities | | Equity Index
Fund | | | All America
Fund | | | Mid-Cap Equity
Index Fund | |
Futures Contracts | | | Equity | | | Total Distributable Earnings (Loss) | | $ | (3,162,330 | ) | | $ | (99,293 | ) | | $ | (1,815,770 | ) |
| | | | | | | | | | | | | | | | | | |
| | | | | |
Derivatives not accounted
for as hedging instruments | | Risk
Type | | | Location on Statements of Operations | | All America
Fund | | | Equity Index
Fund | | | Mid-Cap Equity
Index Fund | |
Futures Contracts | | | Equity | | | Net realized gain (loss) on Futures contracts | | $ | (4,062,277 | ) | | $ | (93,710 | ) | | $ | (4,074,125 | ) |
| | | | | | | | | | | | | | | | | | |
Futures Contracts | | | Equity | | | Change in net unrealized appreciation (depreciation) of Futures contracts | | $ | (3,679,425 | ) | | $ | (191,272 | ) | | $ | (2,041,192 | ) |
| | | | | | | | | | | | | | | | | | |
During the year ended December 31, 2018, the Equity Index Fund,Mid-Cap Equity Index Fund and the All America Fund held futures contracts with average notional amounts of $89,587,957, $59,328,288 and $4,853,246, respectively.
Warrants — A warrant is an option to purchase common stock of an issuer and is issued in conjunction with another security, such as a debt obligation. A warrant specifies the price at which the holder may purchase shares of common stock and usually expires after a period of time. A warrant holder generally may pay cash for the common stock to be purchased or may surrender the principal amount of the related debt security the warrant holder owns equal to the purchase price for the stock.
The common stock underlying a warrant may not increase in value after the date the warrant was issued, or may not increase up to the warrant exercise price. In this case, the warrant generally would have little value and could expire unexercised.
Retirement Funds — Each of the Retirement Funds invests in equity (stock) funds and fixed income (bond) funds and targets different percentages to these asset classes. The targets reflect varying emphases on achieving capital appreciation and gains versus preserving capital and producing income, depending on the specific Fund’s time horizon.
The Retirement Funds target their investments in the following underlying funds of the Investment Company in accordance with the percentage allocations noted (unaudited):
| | | | | | | | | | | | | | | | | | | | | | | | | | | | | | | | |
| | | Equity
Index
Fund | | | Mid-Cap
Equity
Index
Fund | | | Small Cap
Growth
Fund | | | Small Cap
Value
Fund | | | International
Fund | | | Bond
Fund | | | Mid-Term
Bond
Fund | | | Money
Market
Fund | |
Retirement Income Fund | | | 20% | | | | 5% | | | | — | | | | — | | | | — | | | | 30% | | | | 30% | | | | 15% | |
2010 Retirement Fund | | | 20% | | | | 7% | | | | — | | | | — | | | | 3% | | | | 30% | | | | 30% | | | | 10% | |
2015 Retirement Fund | | | 25% | | | | 8% | | | | 1% | | | | 1% | | | | 5% | | | | 30% | | | | 25% | | | | 5% | |
2020 Retirement Fund | | | 28% | | | | 10% | | | | 2% | | | | 2% | | | | 8% | | | | 28% | | | | 22% | | | | — | |
2025 Retirement Fund | | | 31% | | | | 12% | | | | 4% | | | | 4% | | | | 10% | | | | 25% | | | | 14% | | | | — | |
2030 Retirement Fund | | | 33% | | | | 17% | | | | 5% | | | | 5% | | | | 12% | | | | 22% | | | | 6% | | | | — | |
2035 Retirement Fund | | | 35% | | | | 20% | | | | 6% | | | | 6% | | | | 14% | | | | 19% | | | | — | | | | — | |
2040 Retirement Fund | | | 35% | | | | 20% | | | | 7% | | | | 7% | | | | 16% | | | | 15% | | | | — | | | | — | |
2045 Retirement Fund | | | 34% | | | | 21% | | | | 8% | | | | 8% | | | | 16% | | | | 13% | | | | — | | | | — | |
2050 Retirement Fund | | | 32% | | | | 21% | | | | 9% | | | | 9% | | | | 18% | | | | 11% | | | | — | | | | — | |
2055 Retirement Fund | | | 31% | | | | 22% | | | | 10% | | | | 10% | | | | 18% | | | | 9% | | | | — | | | | — | |
159
MUTUAL OF AMERICA INVESTMENT CORPORATION
NOTES TO FINANCIAL STATEMENTS (Continued)
December 31, 2018
| 1. | SIGNIFICANT ACCOUNTING POLICIESAND ORGANIZATION (CONTINUED) |
Generally, rebalancing of the Retirement Funds’ holdings is performed on a periodic basis and the mix of underlying Funds is reviewed annually.
Allocation Funds — The Allocation Funds target their investments in the following underlying Funds of the Investment Company in accordance with the percentage allocations noted (unaudited):
| | | | | | | | | | | | | | | | | | | | | | | | | | | | |
| | | Equity
Index
Fund | | | Mid-Cap
Equity
Index
Fund | | | Small Cap
Growth
Fund | | | Small Cap
Value
Fund | | | International
Fund | | | Bond
Fund | | | Mid-Term
Bond
Fund | |
Conservative Allocation | | | 25% | | | | 5% | | | | — | | | | — | | | | 5% | | | | 30% | | | | 35% | |
Moderate Allocation | | | 35% | | | | 15% | | | | — | | | | — | | | | 10% | | | | 25% | | | | 15% | |
Aggressive Allocation | | | 35% | | | | 20% | | | | 5% | | | | 5% | | | | 15% | | | | 20% | | | | — | |
Generally, rebalancing of the Allocation Funds’ holdings is performed on a periodic basis.
Change in Target Investments — During the year, the Retirement Funds listed below had changes to their target investments. Overall increases (decreases) to the target percentages were as follows (unaudited):
| | | | | | | | | | | | | | | | | | | | | | | | | | | | | | | | |
| | | Equity
Index
Fund | | | Mid-Cap
Equity
Index
Fund | | | Small Cap
Growth
Fund | | | Small Cap
Value
Fund | | | International
Fund | | | Bond
Fund | | | Mid-Term
Bond
Fund | | | Money
Market
Fund | |
Retirement Income Fund | | | — | | | | — | | | | — | | | | — | | | | — | | | | — | | | | (5% | ) | | | 5% | |
2010 Retirement Fund | | | (2% | ) | | | — | | | | — | | | | — | | | | — | | | | 3% | | | | (5% | ) | | | 4% | |
2015 Retirement Fund | | | (1% | ) | | | — | | | | — | | | | — | | | | — | | | | 4% | | | | (5% | ) | | | 2% | |
2020 Retirement Fund | | | (1% | ) | | | — | | | | — | | | | — | | | | — | | | | 2% | | | | (1% | ) | | | — | |
2025 Retirement Fund | | | (1% | ) | | | — | | | | — | | | | — | | | | — | | | | — | | | | 1% | | | | — | |
2030 Retirement Fund | | | (1% | ) | | | — | | | | — | | | | — | | | | — | | | | — | | | | 1% | | | | — | |
2035 Retirement Fund | | | (1% | ) | | | (1% | ) | | | — | | | | — | | | | 1% | | | | 1% | | | | — | | | | — | |
2040 Retirement Fund | | | (1% | ) | | | (1% | ) | | | — | | | | — | | | | 2% | | | | — | | | | — | | | | — | |
2045 Retirement Fund | | | (1% | ) | | | (1% | ) | | | — | | | | — | | | | 1% | | | | 1% | | | | — | | | | — | |
2050 Retirement Fund | | | (2% | ) | | | (1% | ) | | | — | | | | — | | | | 2% | | | | 1% | | | | — | | | | — | |
2055 Retirement Fund | | | (1% | ) | | | — | | | | — | | | | — | | | | 1% | | | | — | | | | — | | | | — | |
Investment Income — Interest income, accretion of discount and amortization of premium are recorded daily on an accrual basis using the effective interest method. A debt obligation may cease accrual of income and result in a reduction to interest income when the collection of all or a portion of current and past due interest is in doubt. Dividend income is recorded on theex-dividend date. Foreign source tax withheld from dividends is recorded as a reduction from dividend income. Should reclamation efforts succeed, such amounts are recorded as income upon collection.
Distributions to Shareholders (“Dividends”) — Distributions to shareholders are recorded on theex-dividend date and are made at least annually. It is the Investment Company’s policy to make distributions of its net investment income and net realized gains, if any, in accordance with Federal income tax regulations, which may differ from U.S. generally accepted accounting principles. Accordingly, periodic reclassifications (which do not impact the funds’ net asset values) are made within the funds’ capital accounts to reflect income and gains available for distribution under Federal income tax regulations.
Federal Income Taxes — Each Fund in the Investment Company intends to comply with the requirements of the Internal Revenue Code applicable to regulated investment companies and to distribute substantially all of its taxable income to shareholders. Therefore, no federal income or excise tax provision is required.
GAAP requires the evaluation of tax positions taken in the course of preparing a fund’s tax return to determine whether it is“more-likely-than-not” that tax positions taken in the fund’s tax return will be ultimately sustained, and, if not, a tax liability and expense is recorded.
As of December 31, 2018, management has evaluated the tax positions taken on the Funds’ filed tax returns for all open tax years and has concluded that no tax provision is required in any of the Funds’ financial statements. Each Fund’s federal and state income, franchise and federal excise tax returns for tax years for which the applicable statutes of limitations have not expired are subject to examination by the Internal Revenue Service and state departments of revenue.
As of December 31, 2018, the Bond and Mid-Term Bond Funds had a capital loss carry forward of $1,414,738 and $1,155,406, respectively, to offset any future net realized capital gains generated after December 31, 2018.
160
MUTUAL OF AMERICA INVESTMENT CORPORATION
NOTES TO FINANCIAL STATEMENTS (Continued)
December 31, 2018
The Small Cap Equity Index Fund recognized post-October 2018 capital losses of $40,668, which were deferred for income tax purposes to the first day of the following year.
The Investment Company has an Investment Advisory Agreement with Mutual of America Capital Management LLC (“the Adviser”), an indirect wholly-owned subsidiary of Mutual of America Life. For providing investment management services to each of the Funds of the Investment Company, the Adviser receives a fee, calculated as a daily charge of the value of the net assets of each fund, at the following annual rates:
| | | | |
Fund | | Annual Investment
Management Fee | |
Retirement Funds | | | .05 | % |
Equity Index,Mid-Cap Equity Index, Small Cap Equity Index, International Funds | | | .075 | % |
Money Market Fund | | | .15 | % |
Bond Fund | | | .39 | % |
All America, Composite,Mid-Term Bond Funds | | | .40 | % |
Mid Cap Value Fund | | | .55 | % |
Small Cap Value, Small Cap Growth Funds | | | .75 | % |
The Retirement and Allocation Funds incur direct investment management expenses of .05% and .00%, respectively. Shareholders in the Allocation and Retirement Funds indirectly bear theirpro-rata share of the investment management fees incurred by the underlying funds in which they invest. Through December 31, 2014, they also did not incur operating expenses other than those included in each of the underlying funds in which they invest. Commencing January 1, 2015, the expense allocation methodology was modified such that certainnon-advisory operating expenses that can be attributed only to the Retirement and Allocation Funds are now charged directly to those Funds. During 2017, Mutual of America reimbursed the applicable funds $492,285 to reflect the change in the operating expense allocation methodology.
Effective January 1, 2015, the Investment Company and the Adviser entered into an agreement under which the Adviser agrees to reimburse the directnon-advisory operating expenses of any Allocation or Retirement Fund (each a “Fund of Funds”) that has less than $50 million in average daily net assets for the prior calendar year. This agreement remains in effect through April 30, 2019 and continues into successive 12 month periods ending April 30 unless i) The Fund of Funds has at least $50 million in average daily net assets for the prior calendar year, ii) the Investment Company gives not less than 30 days written notice to the Adviser, or iii) the Adviser gives 45 days advance notice to the Investment Company before the next May 1 of a given year to terminate the agreement. In that case, the agreement will terminate on the next May 1 following the written notice.
Effective July 2, 2018, the Investment Company and the Adviser entered into an agreement under which the Adviser agrees to reimburse the non-advisory operating expenses of the Small Cap Equity Index Fund to the extent that such operating expenses exceed 0.07% of net assets. This agreement remains in effect through April 30, 2021 and continues into successive 12 month periods ending April 30 unless i) the Investment Company gives not less than 30 days written notice to the Adviser, or ii) the Adviser gives 45 days advance notice to the Investment Company before the next May 1 of a given year to terminate the agreement. In that case, the agreement will terminate on the next May 1 following the written notice.
The cost of investment purchases and proceeds from sales of investments, excluding short-term securities and futures contracts, for the year ended December 31, 2018, were as follows:
| | | | | | | | | | | | | | | | | | | | |
| | | Equity Index
Fund | | | All America
Fund | | | Small Cap
Value Fund | | | Small Cap
Growth Fund | | | Small Cap
Equity Index
Fund | |
Cost of investment purchases | | $ | 223,011,762 | | | $ | 53,298,162 | | | $ | 142,630,390 | | | $ | 326,285,428 | | | $ | 32,433,234 | |
| | | | | | | | | | | | | | | | | | | | |
Proceeds from sales of investments | | $ | 94,435,137 | | | $ | 73,229,357 | | | $ | 139,028,093 | | | $ | 340,971,258 | | | $ | 11,543,591 | |
| | | | | | | | | | | | | | | | | | | | |
161
MUTUAL OF AMERICA INVESTMENT CORPORATION
NOTES TO FINANCIAL STATEMENTS (Continued)
December 31, 2018
| 3. | INVESTMENTS (CONTINUED) |
| | | | | | | | | | | | | | | | | | | | |
| | | Mid Cap
Value Fund | | | Mid-Cap Equity
Index Fund | | | International
Fund | | | Composite
Fund | | | Retirement
Income Fund | |
Cost of investment purchases | | $ | 10,121,848 | | | $ | 313,138,706 | | | $ | 61,160,479 | | | $ | 68,164,221 | | | $ | 26,627,559 | |
| | | | | | | | | | | | | | | | | | | | |
Proceeds from sales of investments | | $ | 20,199,528 | | | $ | 282,065,283 | | | $ | — | | | $ | 73,277,293 | | | $ | 22,136,363 | |
| | | | | | | | | | | | | | | | | | | | |
| | | | | |
| | | 2010
Retirement
Fund | | | 2015
Retirement
Fund | | | 2020
Retirement
Fund | | | 2025
Retirement
Fund | | | 2030
Retirement
Fund | |
Cost of investment purchases | | $ | 5,693,536 | | | $ | 22,018,832 | | | $ | 88,529,552 | | | $ | 140,673,455 | | | $ | 140,766,514 | |
| | | | | | | | | | | | | | | | | | | | |
Proceeds from sales of investments | | $ | 6,103,962 | | | $ | 29,458,097 | | | $ | 57,556,518 | | | $ | 48,348,609 | | | $ | 30,858,270 | |
| | | | | | | | | | | | | | | | | | | | |
| | | | | |
| | | 2035
Retirement
Fund | | | 2040
Retirement
Fund | | | 2045
Retirement
Fund | | | 2050
Retirement
Fund | | | 2055
Retirement
Fund | |
Cost of investment purchases | | $ | 110,461,188 | | | $ | 86,789,540 | | | $ | 79,428,848 | | | $ | 77,248,641 | | | $ | 48,056,868 | |
| | | | | | | | | | | | | | | | | | | | |
Proceeds from sales of investments | | $ | 20,503,763 | | | $ | 11,072,679 | | | $ | 16,664,900 | | | $ | 6,379,554 | | | $ | 1,841,988 | |
| | | | | | | | | | | | | | | | | | | | |
| | | | | |
| | | 2060
Retirement
Fund | | | Conservative
Allocation
Fund | | | Moderate
Allocation
Fund | | | Aggressive
Allocation Fund | | | Money Market
Fund | |
Cost of investment purchases | | $ | 4,511,391 | | | $ | 19,350,541 | | | $ | 43,119,284 | | | $ | 28,196,875 | | | $ | — | |
| | | | | | | | | | | | | | | | | | | | |
Proceeds from sales of investments | | $ | 111,388 | | | $ | 18,147,028 | | | $ | 37,536,085 | | | $ | 27,259,331 | | | $ | — | |
| | | | | | | | | | | | | | | | | | | | |
| | | | | |
| | | Mid-Term
Bond Fund | | | Bond Fund | | | | | | | | | | |
Cost of investment purchases | | $ | 150,684,502 | | | $ | 248,032,407 | | | | | | | | | | | | | |
| | | | | | | | | | | | | | | | | | | | |
Proceeds from sales of investments | | $ | 113,014,371 | | | $ | 136,772,690 | | | | | | | | | | | | | |
| | | | | | | | | | | | | | | | | | | | |
The cost of short-term security purchases for the Money Market Fund for the year ended December 31, 2018, was $1,085,196,906; proceeds from sales for the same period were $948,708,703.
The components of net unrealized appreciation (depreciation) of investments for federal income tax purposes and the cost of investments for federal income tax purposes at December 31, 2018 for each of the funds were as follows:
| | | | | | | | | | | | | | | | | | | | |
| | | Equity Index
Fund | | | All America
Fund | | | Small Cap
Value Fund | | | Small Cap
Growth Fund | | | Small Cap
Equity Index
Fund | |
Unrealized Appreciation | | $ | 980,243,857 | | | $ | 72,119,426 | | | $ | 63,470,587 | | | $ | 68,299,313 | | | $ | 282,391 | |
Unrealized Depreciation | | | (107,700,820 | ) | | | (22,999,417 | ) | | | (56,899,261 | ) | | | (67,213,255 | ) | | | (3,939,287 | ) |
| | | | | | | | | | | | | | | | | | | | |
Net | | $ | 872,543,037 | | | $ | 49,120,009 | | | $ | 6,571,326 | | | $ | 1,086,058 | | | $ | (3,656,896 | ) |
| | | | | | | | | | | | | | | | | | | | |
Tax Cost of Investments | | $ | 1,750,551,729 | | | $ | 219,274,064 | | | $ | 425,143,348 | | | $ | 485,408,462 | | | $ | 20,830,225 | |
| | | | | | | | | | | | | | | | | | | | |
| | | | | |
| | | Mid Cap
Value Fund | | | Mid-Cap Equity
Index Fund | | | International
Fund | | | Composite
Fund | | | Retirement
Income Fund | |
Unrealized Appreciation | | $ | 14,293,400 | | | $ | 239,343,394 | | | $ | 5,600,474 | | | $ | 16,913,137 | | | $ | 696,921 | |
Unrealized Depreciation | | | (7,358,833 | ) | | | (150,302,106 | ) | | | (26,761,508 | ) | | | (8,441,811 | ) | | | (2,832,356 | ) |
| | | | | | | | | | | | | | | | | | | | |
Net | | $ | 6,934,567 | | | $ | 89,041,288 | | | $ | (21,161,034 | ) | | $ | 8,471,326 | | | $ | (2,135,435 | ) |
| | | | | | | | | | | | | | | | | | | | |
Tax Cost of Investments | | $ | 73,122,636 | | | $ | 1,190,683,574 | | | $ | 531,775,279 | | | $ | 163,266,710 | | | $ | 103,566,986 | |
| | | | | | | | | | | | | | | | | | | | |
162
MUTUAL OF AMERICA INVESTMENT CORPORATION
NOTES TO FINANCIAL STATEMENTS (Continued)
December 31, 2018
| 3. | INVESTMENTS (CONTINUED) |
| | | | | | | | | | | | | | | | | | | | |
| | | 2010
Retirement
Fund | | | 2015
Retirement
Fund | | | 2020
Retirement
Fund | | | 2025
Retirement
Fund | | | 2030
Retirement
Fund | |
Unrealized Appreciation | | $ | 307,398 | | | $ | 5,020,625 | | | $ | 19,175,980 | | | $ | 28,637,851 | | | $ | 26,057,025 | |
Unrealized Depreciation | | | (779,261 | ) | | | (4,332,547 | ) | | | (16,186,509 | ) | | | (24,240,939 | ) | | | (21,540,007 | ) |
| | | | | | | | | | | | | | | | | | | | |
Net | | $ | (471,863 | ) | | $ | 688,078 | | | $ | 2,989,471 | | | $ | 4,396,912 | | | $ | 4,517,018 | |
| | | | | | | | | | | | | | | | | | | | |
Tax Cost of Investments | | $ | 24,465,687 | | | $ | 137,770,954 | | | $ | 512,202,226 | | | $ | 705,446,590 | | | $ | 612,596,954 | |
| | | | | | | | | | | | | | | | | | | | |
| | | | | |
| | | 2035
Retirement
Fund | | | 2040
Retirement
Fund | | | 2045
Retirement
Fund | | | 2050
Retirement
Fund | | | 2055
Retirement
Fund | |
Unrealized Appreciation | | $ | 24,479,609 | | | $ | 21,925,291 | | | $ | 27,096,893 | | | $ | 4,042,605 | | | $ | 0 | |
Unrealized Depreciation | | | (18,465,536 | ) | | | (15,684,616 | ) | | | (14,189,496 | ) | | | (19,067,645 | ) | | | (8,883,692 | ) |
| | | | | | | | | | | | | | | | | | | | |
Net | | $ | 6,014,073 | | | $ | 6,240,675 | | | $ | 12,907,397 | | | $ | (15,025,040 | ) | | $ | (8,883,692 | ) |
| | | | | | | | | | | | | | | | | | | | |
Tax Cost of Investments | | $ | 503,434,857 | | | $ | 406,420,689 | | | $ | 425,207,561 | | | $ | 300,315,933 | | | $ | 79,179,997 | |
| | | | | | | | | | | | | | | | | | | | |
| | | | | |
| | | 2060
Retirement
Fund | | | Conservative
Allocation
Fund | | | Moderate
Allocation
Fund | | | Aggressive
Allocation
Fund | | | Money Market
Fund | |
Unrealized Appreciation | | $ | 3,260 | | | $ | 2,682,576 | | | $ | 27,006,030 | | | $ | 27,885,274 | | | $ | 50 | |
Unrealized Depreciation | | | (358,911 | ) | | | (5,389,868 | ) | | | (8,746,396 | ) | | | (6,793,857 | ) | | | 0 | |
| | | | | | | | | | | | | | | | | | | | |
Net | | $ | (355,651 | ) | | $ | (2,707,292 | ) | | $ | 18,259,634 | | | $ | 21,091,417 | | | $ | 50 | |
| | | | | | | | | | | | | | | | | | | | |
Tax Cost of Investments | | $ | 4,401,039 | | | $ | 152,647,920 | | | $ | 352,878,525 | | | $ | 250,285,780 | | | $ | 209,741,558 | |
| | | | | | | | | | | | | | | | | | | | |
| | | | | |
| | | Mid-Term Bond
Fund | | | Bond Fund | | | | | | | | | | |
Unrealized Appreciation | | $ | 1,142,594 | | | $ | 9,013,722 | | | | | | | | | | | | | |
Unrealized Depreciation | | | (10,811,235 | ) | | | (27,788,679 | ) | | | | | | | | | | | | |
| | | | | | | | | | | | | | | | | | | | |
Net | | $ | (9,668,641 | ) | | $ | (18,774,957 | ) | | | | | | | | | | | | |
| | | | | | | | | | | | | | | | | | | | |
Tax Cost of Investments | | $ | 592,736,532 | | | $ | 1,355,096,726 | | | | | | | | | | | | | |
| | | | | | | | | | | | | | | | | | | | |
Differences between amounts reflected in the Statements of Assets and Liabilities and those computed for federal income tax purposes arise primarily from federal income tax treatment of wash sales, REITs, partnerships, corporate actions and futures contracts.
Investments in affiliated investment companies during the year or period ended December 31, 2018 were as follows:
| | | | | | | | | | | | | | | | | | | | | | | | | | | | | | | | |
Affiliated Investment Company | | Value as of
December 31,
2017 | | | Purchases | | | Realized
Gain
(Loss) on
Investment
Securities | | | Change in
Unrealized
Appreciation
(Depreciation)
of Investment
Securities | | | Sales | | | Value as of
December 31,
2018 | | | Dividends | | | Realized
Gain,
Distributions | |
Retirement Income Fund | | | | | | | | | | | | | | | | | | | | | | | | | | | | | | | | |
Bond Fund | | $ | 30,339,830 | | | $ | 6,950,246 | | | $ | (181,095 | ) | | $ | (579,890 | ) | | $ | (5,178,733 | ) | | $ | 31,350,358 | | | $ | 811,595 | | | $ | — | |
Equity Index Fund | | | 22,985,867 | | | | 4,650,289 | | | | 1,091,553 | | | | (2,869,403 | ) | | | (4,977,730 | ) | | | 20,880,576 | | | | 353,109 | | | | 497,391 | |
Mid-Cap Equity Index Fund | | | 5,830,114 | | | | 1,357,192 | | | | 124,874 | | | | (1,105,955 | ) | | | (1,379,854 | ) | | | 4,826,371 | | | | 73,403 | | | | 333,842 | |
Mid-Term Bond Fund | | | 33,475,294 | | | | 7,303,522 | | | | (331,526 | ) | | | (178,823 | ) | | | (8,872,629 | ) | | | 31,395,838 | | | | 647,780 | | | | 6,112 | |
Money Market Fund | | | 8,188,254 | | | | 6,366,310 | | | | 21,949 | | | | 129,312 | | | | (1,727,417 | ) | | | 12,978,408 | | | | 31,462 | | | | — | |
| | | | | | | | | | | | | | | | | | | | | | | | | | | | | | | | |
Total | | $ | 100,819,359 | | | $ | 26,627,559 | | | $ | 725,755 | | | $ | (4,604,759 | ) | | $ | (22,136,363 | ) | | $ | 101,431,551 | | | $ | 1,917,349 | | | $ | 837,345 | |
| | | | | | | | | | | | | | | | | | | | | | | | | | | | | | | | |
163
MUTUAL OF AMERICA INVESTMENT CORPORATION
NOTES TO FINANCIAL STATEMENTS (Continued)
December 31, 2018
| 3. | INVESTMENTS (CONTINUED) |
| | | | | | | | | | | | | | | | | | | | | | | | | | | | | | | | |
Affiliated Investment Company | | Value as of
December 31,
2017 | | | Purchases | | | Realized
Gain
(Loss) on
Investment
Securities | | | Change in
Unrealized
Appreciation
(Depreciation)
of Investment
Securities | | | Sales | | | Value as of
December 31,
2018 | | | Dividends | | | Realized
Gain,
Distributions | |
2010 Retirement Fund | | | | | | | | | | | | | | | | | | | | | | | | | | | | | | | | |
Bond Fund | | $ | 6,293,782 | | | $ | 1,981,340 | | | $ | (36,546 | ) | | $ | (125,353 | ) | | $ | (1,147,668 | ) | | $ | 6,965,555 | | | $ | 181,823 | | | $ | — | |
Equity Index Fund | | | 6,550,388 | | | | 806,401 | | | | 448,823 | | | | (869,869 | ) | | | (1,764,673 | ) | | | 5,171,070 | | | | 89,599 | | | | 126,210 | |
International Fund | | | 1,197,602 | | | | 101,497 | | | | 56,338 | | | | (183,922 | ) | | | (515,030 | ) | | | 656,485 | | | | 16,361 | | | | — | |
Mid-Cap Equity Index Fund | | | 2,171,404 | | | | 342,279 | | | | 57,498 | | | | (395,701 | ) | | | (491,928 | ) | | | 1,683,552 | | | | 25,888 | | | | 117,741 | |
Mid-Term Bond Fund | | | 8,104,006 | | | | 1,060,695 | | | | (71,428 | ) | | | (50,245 | ) | | | (1,843,377 | ) | | | 7,199,651 | | | | 150,366 | | | | 1,419 | |
Money Market Fund | | | 1,232,370 | | | | 1,401,324 | | | | 4,793 | | | | 20,310 | | | | (341,286 | ) | | | 2,317,511 | | | | 5,436 | | | | — | |
| | | | | | | | | | | | | | | | | | | | | | | | | | | | | | | | |
Total | | $ | 25,549,552 | | | $ | 5,693,536 | | | $ | 459,478 | | | $ | (1,604,780 | ) | | $ | (6,103,962 | ) | | $ | 23,993,824 | | | $ | 469,473 | | | $ | 245,370 | |
| | | | | | | | | | | | | | | | | | | | | | | | | | | | | | | | |
| | | | | | | | |
2015 Retirement Fund | | | | | | | | | | | | | | | | | | | | | | | | | | | | | | | | |
Bond Fund | | $ | 37,037,812 | | | $ | 9,379,078 | | | $ | (183,370 | ) | | $ | (776,829 | ) | | $ | (6,225,294 | ) | | $ | 39,231,397 | | | $ | 1,058,729 | | | $ | — | |
Equity Index Fund | | | 46,082,119 | | | | 4,027,196 | | | | 3,923,947 | | | | (7,187,219 | ) | | | (8,825,593 | ) | | | 38,020,450 | | | | 668,105 | | | | 941,097 | |
International Fund | | | 8,043,404 | | | | 607,918 | | | | 275,339 | | | | (1,243,944 | ) | | | (2,635,602 | ) | | | 5,047,115 | | | | 130,781 | | | | 1 | |
Mid-Cap Equity Index Fund | | | 15,563,312 | | | | 1,940,434 | | | | 490,848 | | | | (3,260,594 | ) | | | (1,753,432 | ) | | | 12,980,568 | | | | 205,230 | | | | 933,402 | |
Mid-Term Bond Fund | | | 40,513,841 | | | | 3,305,945 | | | | (302,389 | ) | | | (314,238 | ) | | | (8,332,649 | ) | | | 34,870,510 | | | | 751,616 | | | | 7,091 | |
Money Market Fund | | | 4,430,605 | | | | 2,342,116 | | | | 10,399 | | | | 63,362 | | | | (920,858 | ) | | | 5,925,624 | | | | 14,559 | | | | — | |
Small Cap Growth Fund | | | 1,702,980 | | | | 196,099 | | | | 18,948 | | | | (277,475 | ) | | | (446,838 | ) | | | 1,193,714 | | | | 149 | | | | 100,522 | |
Small Cap Value Fund | | | 1,613,834 | | | | 220,046 | | | | 18,960 | | | | (345,355 | ) | | | (317,831 | ) | | | 1,189,654 | | | | 20,083 | | | | 104,536 | |
| | | | | | | | | | | | | | | | | | | | | | | | | | | | | | | | |
Total | | $ | 154,987,907 | | | $ | 22,018,832 | | | $ | 4,252,682 | | | $ | (13,342,292 | ) | | $ | (29,458,097 | ) | | $ | 138,459,032 | | | $ | 2,849,252 | | | $ | 2,086,649 | |
| | | | | | | | | | | | | | | | | | | | | | | | | | | | | | | | |
| | | | | | | | |
2020 Retirement Fund | | | | | | | | | | | | | | | | | | | | | | | | | | | | | | | | |
Bond Fund | | $ | 118,913,434 | | | $ | 32,949,432 | | | $ | (7,470 | ) | | $ | (3,073,424 | ) | | $ | (9,937,384 | ) | | $ | 138,844,588 | | | $ | 3,593,193 | | | $ | — | |
Equity Index Fund | | | 176,011,895 | | | | 20,224,469 | | | | 10,128,631 | | | | (24,213,870 | ) | | | (20,739,625 | ) | | | 161,411,500 | | | | 2,768,944 | | | | 3,900,352 | |
International Fund | | | 43,021,626 | | | | 4,638,369 | | | | 2,314,420 | | | | (8,229,033 | ) | | | (9,065,417 | ) | | | 32,679,965 | | | | 812,026 | | | | 5 | |
Mid-Cap Equity Index Fund | | | 62,319,639 | | | | 9,303,196 | | | | 2,811,780 | | | | (13,791,786 | ) | | | (7,658,312 | ) | | | 52,984,517 | | | | 814,746 | | | | 3,705,525 | |
Mid-Term Bond Fund | | | 101,199,848 | | | | 17,650,982 | | | | (502,455 | ) | | | (1,117,543 | ) | | | (8,201,938 | ) | | | 109,028,894 | | | | 2,262,806 | | | | 21,349 | |
Small Cap Growth Fund | | | 11,353,121 | | | | 1,783,143 | | | | 149,612 | | | | (2,402,236 | ) | | | (748,005 | ) | | | 10,135,635 | | | | 1,227 | | | | 825,332 | |
Small Cap Value Fund | | | 12,036,520 | | | | 1,979,961 | | | | 299,982 | | | | (3,004,028 | ) | | | (1,205,837 | ) | | | 10,106,598 | | | | 164,923 | | | | 858,453 | |
| | | | | | | | | | | | | | | | | | | | | | | | | | | | | | | | |
Total | | $ | 524,856,083 | | | $ | 88,529,552 | | | $ | 15,194,500 | | | $ | (55,831,920 | ) | | $ | (57,556,518 | ) | | $ | 515,191,697 | | | $ | 10,417,865 | | | $ | 9,311,016 | |
| | | | | | | | | | | | | | | | | | | | | | | | | | | | | | | | |
| | | | | | | | |
2025 Retirement Fund | | | | | | | | | | | | | | | | | | | | | | | | | | | | | | | | |
Bond Fund | | $ | 146,500,156 | | | $ | 34,473,569 | | | $ | 127,310 | | | $ | (3,809,214 | ) | | $ | (5,577,258 | ) | | $ | 171,714,563 | | | $ | 4,319,136 | | | $ | — | |
Equity Index Fund | | | 249,251,940 | | | | 36,629,310 | | | | 8,805,708 | | | | (30,861,469 | ) | | | (17,902,266 | ) | | | 245,923,223 | | | | 4,120,123 | | | | 5,803,632 | |
International Fund | | | 67,889,586 | | | | 9,949,372 | | | | 1,868,905 | | | | (12,351,860 | ) | | | (7,727,328 | ) | | | 59,628,675 | | | | 1,437,418 | | | | 8 | |
Mid-Cap Equity Index Fund | | | 100,481,819 | | | | 17,577,905 | | | | 4,243,942 | | | | (22,461,173 | ) | | | (11,470,375 | ) | | | 88,372,118 | | | | 1,327,230 | | | | 6,036,340 | |
Mid-Term Bond Fund | | | 66,171,743 | | | | 30,092,416 | | | | (149,814 | ) | | | (979,416 | ) | | | (3,002,442 | ) | | | 92,132,487 | | | | 1,840,439 | | | | 17,364 | |
Small Cap Growth Fund | | | 27,616,588 | | | | 6,062,567 | | | | 164,324 | | | | (6,140,594 | ) | | | (892,361 | ) | | | 26,810,524 | | | | 3,160 | | | | 2,126,027 | |
Small Cap Value Fund | | | 27,825,050 | | | | 5,888,316 | | | | 529,873 | | | | (7,204,748 | ) | | | (1,776,579 | ) | | | 25,261,912 | | | | 400,235 | | | | 2,083,302 | |
| | | | | | | | | | | | | | | | | | | | | | | | | | | | | | | | |
Total | | $ | 685,736,882 | | | $ | 140,673,455 | | | $ | 15,590,248 | | | $ | (83,808,474 | ) | | $ | (48,348,609 | ) | | $ | 709,843,502 | | | $ | 13,447,741 | | | $ | 16,066,673 | |
| | | | | | | | | | | | | | | | | | | | | | | | | | | | | | | | |
| | | | | | | | |
2030 Retirement Fund | | | | | | | | | | | | | | | | | | | | | | | | | | | | | | | | |
Bond Fund | | $ | 109,699,118 | | | $ | 30,894,247 | | | $ | 269 | | | $ | (2,759,133 | ) | | $ | (3,707,281 | ) | | $ | 134,127,220 | | | $ | 3,346,679 | | | $ | — | |
Equity Index Fund | | | 219,706,306 | | | | 41,954,202 | | | | 6,011,151 | | | | (26,620,639 | ) | | | (12,352,905 | ) | | | 228,698,115 | | | | 3,786,659 | | | | 5,333,912 | |
International Fund | | | 66,925,076 | | | | 13,367,898 | | | | 920,663 | | | | (12,054,503 | ) | | | (4,232,627 | ) | | | 64,926,507 | | | | 1,542,658 | | | | 9 | |
Mid-Cap Equity Index Fund | | | 108,013,752 | | | | 25,498,587 | | | | 1,963,058 | | | | (24,084,042 | ) | | | (4,867,871 | ) | | | 106,523,484 | | | | 1,576,435 | | | | 7,169,741 | |
Mid-Term Bond Fund | | | 12,530,973 | | | | 14,196,862 | | | | (32,458 | ) | | | (193,037 | ) | | | (922,392 | ) | | | 25,579,948 | | | | 455,180 | | | | 4,294 | |
Small Cap Growth Fund | | | 30,519,999 | | | | 7,219,469 | | | | 516,551 | | | | (6,906,487 | ) | | | (2,053,416 | ) | | | 29,296,116 | | | | 3,402 | | | | 2,288,888 | |
Small Cap Value Fund | | | 30,315,700 | | | | 7,635,249 | | | | 893,114 | | | | (8,159,703 | ) | | | (2,721,778 | ) | | | 27,962,582 | | | | 436,420 | | | | 2,271,649 | |
| | | | | | | | | | | | | | | | | | | | | | | | | | | | | | | | |
Total | | $ | 577,710,924 | | | $ | 140,766,514 | | | $ | 10,272,348 | | | $ | (80,777,544 | ) | | $ | (30,858,270 | ) | | $ | 617,113,972 | | | $ | 11,147,433 | | | $ | 17,068,493 | |
| | | | | | | | | | | | | | | | | | | | | | | | | | | | | | | | |
| | | | | | | | |
2035 Retirement Fund | | | | | | | | | | | | | | | | | | | | | | | | | | | | | | | | |
Bond Fund | | $ | 70,480,300 | | | $ | 22,942,556 | | | $ | 3,559 | | | $ | (1,749,660 | ) | | $ | (2,334,028 | ) | | $ | 89,342,727 | | | $ | 2,140,159 | | | $ | — | |
Equity Index Fund | | | 192,847,537 | | | | 35,456,866 | | | | 4,835,116 | | | | (22,950,011 | ) | | | (9,798,526 | ) | | | 200,390,982 | | | | 3,301,848 | | | | 4,651,006 | |
International Fund | | | 58,402,327 | | | | 13,628,050 | | | | 329,444 | | | | (10,373,091 | ) | | | (1,696,951 | ) | | | 60,289,779 | | | | 1,399,010 | | | | 8 | |
Mid-Cap Equity Index Fund | | | 104,088,009 | | | | 24,118,300 | | | | 1,918,998 | | | | (23,019,545 | ) | | | (4,884,266 | ) | | | 102,221,496 | | | | 1,497,278 | | | | 6,809,728 | |
Small Cap Growth Fund | | | 29,357,883 | | | | 6,948,673 | | | | 183,444 | | | | (6,568,765 | ) | | | (764,491 | ) | | | 29,156,744 | | | | 3,353 | | | | 2,255,891 | |
Small Cap Value Fund | | | 28,998,455 | | | | 7,366,743 | | | | 396,956 | | | | (7,689,451 | ) | | | (1,025,501 | ) | | | 28,047,202 | | | | 433,453 | | | | 2,256,204 | |
| | | | | | | | | | | | | | | | | | | | | | | | | | | | | | | | |
Total | | $ | 484,174,511 | | | $ | 110,461,188 | | | $ | 7,667,517 | | | $ | (72,350,523 | ) | | $ | (20,503,763 | ) | | $ | 509,448,930 | | | $ | 8,775,101 | | | $ | 15,972,837 | |
| | | | | | | | | | | | | | | | | | | | | | | | | | | | | | | | |
164
MUTUAL OF AMERICA INVESTMENT CORPORATION
NOTES TO FINANCIAL STATEMENTS (Continued)
December 31, 2018
| 3. | INVESTMENTS (CONTINUED) |
| | | | | | | | | | | | | | | | | | | | | | | | | | | | | | | | |
Affiliated Investment Company | | Value as of
December 31,
2017 | | | Purchases | | | Realized
Gain
(Loss) on
Investment
Securities | | | Change in
Unrealized
Appreciation
(Depreciation)
of Investment
Securities | | | Sales | | | Value as of
December 31,
2018 | | | Dividends | | | Realized
Gain,
Distributions | |
2040 Retirement Fund | | | | | | | | | | | | | | | | | | | | | | | | | | | | | | | | |
Bond Fund | | $ | 47,746,145 | | | $ | 11,094,960 | | | $ | 46,764 | | | $ | (1,206,124 | ) | | $ | (1,486,405 | ) | | $ | 56,195,340 | | | $ | 1,369,676 | | | $ | — | |
Equity Index Fund | | | 151,696,748 | | | | 28,077,155 | | | | 2,446,799 | | | | (16,940,063 | ) | | | (4,535,391 | ) | | | 160,745,248 | | | | 2,637,811 | | | | 3,715,639 | |
International Fund | | | 52,895,238 | | | | 13,809,034 | | | | 242,764 | | | | (9,636,496 | ) | | | (944,768 | ) | | | 56,365,772 | | | | 1,313,485 | | | | 8 | |
Mid-Cap Equity Index Fund | | | 83,373,933 | | | | 19,223,015 | | | | 994,542 | | | | (18,074,013 | ) | | | (3,027,821 | ) | | | 82,489,656 | | | | 1,212,060 | | | | 5,512,535 | |
Small Cap Growth Fund | | | 28,812,042 | | | | 6,522,888 | | | | 158,033 | | | | (6,410,680 | ) | | | (622,564 | ) | | | 28,459,719 | | | | 3,291 | | | | 2,214,465 | |
Small Cap Value Fund | | | 28,266,008 | | | | 8,062,488 | | | | 123,534 | | | | (7,590,671 | ) | | | (455,730 | ) | | | 28,405,629 | | | | 442,601 | | | | 2,303,822 | |
| | | | | | | | | | | | | | | | | | | | | | | | | | | | | | | | |
Total | | $ | 392,790,114 | | | $ | 86,789,540 | | | $ | 4,012,436 | | | $ | (59,858,047 | ) | | $ | (11,072,679 | ) | | $ | 412,661,364 | | | $ | 6,978,924 | | | $ | 13,746,469 | |
| | | | | | | | | | | | | | | | | | | | | | | | | | | | | | | | |
| | | | | | | | |
2045 Retirement Fund | | | | | | | | | | | | | | | | | | | | | | | | | | | | | | | | |
Bond Fund | | $ | 43,466,532 | | | $ | 9,635,822 | | | $ | 30,987 | | | $ | (1,106,508 | ) | | $ | (1,641,200 | ) | | $ | 50,385,633 | | | $ | 1,257,968 | | | $ | — | |
Equity Index Fund | | | 161,362,300 | | | | 25,551,569 | | | | 3,048,333 | | | | (18,016,756 | ) | | | (5,627,603 | ) | | | 166,317,843 | | | | 2,760,690 | | | | 3,888,727 | |
International Fund | | | 62,024,178 | | | | 10,751,471 | | | | 492,249 | | | | (10,664,068 | ) | | | (2,249,823 | ) | | | 60,354,007 | | | | 1,417,830 | | | | 8 | |
Mid-Cap Equity Index Fund | | | 98,067,970 | | | | 19,008,206 | | | | 1,949,892 | | | | (21,333,036 | ) | | | (4,505,815 | ) | | | 93,187,217 | | | | 1,387,509 | | | | 6,310,490 | |
Small Cap Growth Fund | | | 36,630,139 | | | | 6,965,605 | | | | 444,241 | | | | (8,026,628 | ) | | | (1,567,539 | ) | | | 34,445,818 | | | | 4,034 | | | | 2,714,255 | |
Small Cap Value Fund | | | 35,802,149 | | | | 7,516,175 | | | | 308,735 | | | | (9,129,699 | ) | | | (1,072,920 | ) | | | 33,424,440 | | | | 526,794 | | | | 2,742,064 | |
| | | | | | | | | | | | | | | | | | | | | | | | | | | | | | | | |
Total | | $ | 437,353,268 | | | $ | 79,428,848 | | | $ | 6,274,437 | | | $ | (68,276,695 | ) | | $ | (16,664,900 | ) | | $ | 438,114,958 | | | $ | 7,354,825 | | | $ | 15,655,544 | |
| | | | | | | | | | | | | | | | | | | | | | | | | | | | | | | | |
| | | | | | | | |
2050 Retirement Fund | | | | | | | | | | | | | | | | | | | | | | | | | | | | | | | | |
Bond Fund | | $ | 21,096,062 | | | $ | 7,024,104 | | | $ | 5,179 | | | $ | (516,403 | ) | | $ | (713,767 | ) | | $ | 26,895,175 | | | $ | 643,034 | | | $ | — | |
Equity Index Fund | | | 90,435,215 | | | | 23,550,173 | | | | 865,432 | | | | (10,214,802 | ) | | | (2,751,411 | ) | | | 101,884,607 | | | | 1,643,251 | | | | 2,314,692 | |
International Fund | | | 40,105,630 | | | | 13,416,804 | | | | 89,293 | | | | (7,593,594 | ) | | | (649,400 | ) | | | 45,368,733 | | | | 1,034,855 | | | | 6 | |
Mid-Cap Equity Index Fund | | | 57,372,700 | | | | 17,670,956 | | | | 302,601 | | | | (12,941,658 | ) | | | (1,569,872 | ) | | | 60,834,727 | | | | 879,416 | | | | 3,999,650 | |
Small Cap Growth Fund | | | 24,053,358 | | | | 7,757,192 | | | | (12,428 | ) | | | (5,686,498 | ) | | | (347,552 | ) | | | 25,764,072 | | | | 2,931 | | | | 1,972,446 | |
Small Cap Value Fund | | | 23,436,382 | | | | 7,829,412 | | | | (6,843 | ) | | | (6,367,820 | ) | | | (347,552 | ) | | | 24,543,579 | | | | 374,686 | | | | 1,950,311 | |
| | | | | | | | | | | | | | | | | | | | | | | | | | | | | | | | |
Total | | $ | 256,499,347 | | | $ | 77,248,641 | | | $ | 1,243,234 | | | $ | (43,320,775 | ) | | $ | (6,379,554 | ) | | $ | 285,290,893 | | | $ | 4,578,173 | | | $ | 10,237,105 | |
| | | | | | | | | | | | | | | | | | | | | | | | | | | | | | | | |
| | | | | | | | |
2055 Retirement Fund | | | | | | | | | | | | | | | | | | | | | | | | | | | | | | | | |
Bond Fund | | $ | 2,803,233 | | | $ | 4,135,870 | | | $ | (1,584 | ) | | $ | (65,557 | ) | | $ | (128,002 | ) | | $ | 6,743,960 | | | $ | 139,632 | | | $ | — | |
Equity Index Fund | | | 11,211,191 | | | | 15,044,506 | | | | 80,326 | | | | (2,429,063 | ) | | | (524,850 | ) | | | 23,382,110 | | | | 325,082 | | | | 457,912 | |
International Fund | | | 5,795,381 | | | | 8,162,697 | | | | 69,634 | | | | (1,828,626 | ) | | | (416,513 | ) | | | 11,782,573 | | | | 226,611 | | | | 1 | |
Mid-Cap Equity Index Fund | | | 7,633,789 | | | | 10,873,738 | | | | 26,217 | | | | (3,098,022 | ) | | | (292,886 | ) | | | 15,142,836 | | | | 186,509 | | | | 848,259 | |
Small Cap Growth Fund | | | 3,473,580 | | | | 4,868,833 | | | | 54,848 | | | | (1,465,890 | ) | | | (313,322 | ) | | | 6,618,049 | | | | 636 | | | | 427,932 | |
Small Cap Value Fund | | | 3,392,424 | | | | 4,971,224 | | | | 3,032 | | | | (1,573,488 | ) | | | (166,415 | ) | | | 6,626,777 | | | | 85,567 | | | | 445,392 | |
| | | | | | | | | | | | | | | | | | | | | | | | | | | | | | | | |
Total | | $ | 34,309,598 | | | $ | 48,056,868 | | | $ | 232,473 | | | $ | (10,460,646 | ) | | $ | (1,841,988 | ) | | $ | 70,296,305 | | | $ | 964,037 | | | $ | 2,179,496 | |
| | | | | | | | | | | | | | | | | | | | | | | | | | | | | | | | |
| | | | | | | | |
2060 Retirement Fund† | | | | | | | | | | | | | | | | | | | | | | | | | | | | | | | | |
Bond Fund | | $ | — | | | $ | 314,637 | | | $ | (220 | ) | | $ | 3,260 | | | $ | (7,797 | ) | | $ | 309,880 | | | $ | 1,377 | | | $ | — | |
Equity Index Fund | | | — | | | | 1,350,687 | | | | 898 | | | | (101,623 | ) | | | (33,417 | ) | | | 1,216,545 | | | | 3,380 | | | | 4,762 | |
International Fund | | | — | | | | 898,324 | | | | (144 | ) | | | (52,543 | ) | | | (22,278 | ) | | | 823,359 | | | | 3,295 | | | | — | |
Mid-Cap Equity Index Fund | | | — | | | | 1,041,471 | | | | (1,069 | ) | | | (108,409 | ) | | | (25,619 | ) | | | 906,374 | | | | 2,197 | | | | 9,991 | |
Small Cap Growth Fund | | | — | | | | 452,507 | | | | (279 | ) | | | (48,662 | ) | | | (11,138 | ) | | | 392,428 | | | | 7 | | | | 4,984 | |
Small Cap Value Fund | | | — | | | | 453,765 | | | | (855 | ) | | | (44,969 | ) | | | (11,139 | ) | | | 396,802 | | | | 1,007 | | | | 5,243 | |
| | | | | | | | | | | | | | | | | | | | | | | | | | | | | | | | |
Total | | $ | — | | | $ | 4,511,391 | | | $ | (1,669 | ) | | $ | (352,946 | ) | | $ | (111,388 | ) | | $ | 4,045,388 | | | $ | 11,263 | | | $ | 24,980 | |
| | | | | | | | | | | | | | | | | | | | | | | | | | | | | | | | |
| | | | | | | | |
Conservative Allocation Fund | | | | | | | | | | | | | | | | | | | | | | | | | | | | | | | | |
Bond Fund | | $ | 46,426,379 | | | $ | 6,240,585 | | | $ | (172,078 | ) | | $ | (991,675 | ) | | $ | (4,719,591 | ) | | $ | 46,783,620 | | | $ | 1,249,700 | | | $ | — | |
Equity Index Fund | | | 40,057,603 | | | | 4,556,263 | | | | 2,461,402 | | | | (5,592,952 | ) | | | (5,938,977 | ) | | | 35,543,339 | | | | 617,837 | | | | 870,290 | |
International Fund | | | 7,886,500 | | | | 782,601 | | | | 19,383 | | | | (1,215,537 | ) | | | (864,726 | ) | | | 6,608,221 | | | | 168,973 | | | | 1 | |
Mid-Cap Equity Index Fund | | | 8,042,996 | | | | 1,198,460 | | | | 163,086 | | | | (1,592,778 | ) | | | (1,117,545 | ) | | | 6,694,219 | | | | 105,412 | | | | 479,421 | |
Mid-Term Bond Fund | | | 54,104,613 | | | | 6,572,632 | | | | (283,429 | ) | | | (576,398 | ) | | | (5,506,189 | ) | | | 54,311,229 | | | | 1,160,357 | | | | 10,947 | |
| | | | | | | | | | | | | | | | | | | | | | | | | | | | | | | | |
Total | | $ | 156,518,091 | | | $ | 19,350,541 | | | $ | 2,188,364 | | | $ | (9,969,340 | ) | | $ | (18,147,028 | ) | | $ | 149,940,628 | | | $ | 3,302,279 | | | $ | 1,360,659 | |
| | | | | | | | | | | | | | | | | | | | | | | | | | | | | | | | |
165
MUTUAL OF AMERICA INVESTMENT CORPORATION
NOTES TO FINANCIAL STATEMENTS (Continued)
December 31, 2018
| 3. | INVESTMENTS (CONTINUED) |
| | | | | | | | | | | | | | | | | | | | | | | | | | | | | | | | |
Affiliated Investment Company | | Value as of
December 31,
2017 | | | Purchases | | | Realized
Gain
(Loss) on
Investment
Securities | | | Change in
Unrealized
Appreciation
(Depreciation)
of Investment
Securities | | | Sales | | | Value as of
December 31,
2018 | | | Dividends | | | Realized
Gain,
Distributions | |
Moderate Allocation Fund | | | | | | | | | | | | | | | | | | | | | | | | | | | | | | | | |
Bond Fund | | $ | 97,348,198 | | | $ | 12,398,134 | | | $ | 236,873 | | | $ | (2,657,158 | ) | | $ | (7,747,659 | ) | | $ | 99,578,388 | | | $ | 2,645,625 | | | $ | — | |
Equity Index Fund | | | 141,098,993 | | | | 13,009,879 | | | | 8,453,475 | | | | (19,679,738 | ) | | | (15,799,584 | ) | | | 127,083,025 | | | | 2,198,991 | | | | 3,097,513 | |
International Fund | | | 39,684,483 | | | | 3,271,950 | | | | 37,743 | | | | (6,138,619 | ) | | | (3,099,063 | ) | | | 33,756,494 | | | | 858,405 | | | | 5 | |
Mid-Cap Equity Index Fund | | | 60,709,968 | | | | 7,765,591 | | | | 2,165,788 | | | | (13,128,605 | ) | | | (6,241,183 | ) | | | 51,271,559 | | | | 803,857 | | | | 3,656,002 | |
Mid-Term Bond Fund | | | 58,343,848 | | | | 6,673,730 | | | | (218,006 | ) | | | (702,283 | ) | | | (4,648,596 | ) | | | 59,448,693 | | | | 1,263,307 | | | | 11,919 | |
| | | | | | | | | | | | | | | | | | | | | | | | | | | | | | | | |
Total | | $ | 397,185,490 | | | $ | 43,119,284 | | | $ | 10,675,873 | | | $ | (42,306,403 | ) | | $ | (37,536,085 | ) | | $ | 371,138,159 | | | $ | 7,770,185 | | | $ | 6,765,439 | |
| | | | | | | | | | | | | | | | | | | | | | | | | | | | | | | | |
| | | | | | | | |
Aggressive Allocation Fund | | | | | | | | | | | | | | | | | | | | | | | | | | | | | | | | |
Bond Fund | | $ | 59,307,942 | | | $ | 6,883,199 | | | $ | 235,775 | | | $ | (1,708,085 | ) | | $ | (4,624,266 | ) | | $ | 60,094,565 | | | $ | 1,598,389 | | | $ | — | |
Equity Index Fund | | | 107,468,506 | | | | 7,716,850 | | | | 6,044,232 | | | | (14,401,859 | ) | | | (10,868,808 | ) | | | 95,958,921 | | | | 1,660,258 | | | | 2,338,651 | |
International Fund | | | 45,332,189 | | | | 3,227,278 | | | | 125,703 | | | | (6,995,989 | ) | | | (3,468,197 | ) | | | 38,220,984 | | | | 972,436 | | | | 6 | |
Mid-Cap Equity Index Fund | | | 61,654,972 | | | | 6,614,442 | | | | 2,775,287 | | | | (13,739,691 | ) | | | (5,669,930 | ) | | | 51,635,080 | | | | 809,273 | | | | 3,680,631 | |
Small Cap Growth Fund | | | 15,366,937 | | | | 1,582,424 | | | | 587,173 | | | | (3,426,981 | ) | | | (1,472,064 | ) | | | 12,637,489 | | | | 1,560 | | | | 1,049,730 | |
Small Cap Value Fund | | | 15,320,137 | | | | 2,172,682 | | | | 659,153 | | | | (4,165,748 | ) | | | (1,156,066 | ) | | | 12,830,158 | | | | 213,570 | | | | 1,111,673 | |
| | | | | | | | | | | | | | | | | | | | | | | | | | | | | | | | |
Total | | $ | 304,450,683 | | | $ | 28,196,875 | | | $ | 10,427,323 | | | $ | (44,438,353 | ) | | $ | (27,259,331 | ) | | $ | 271,377,197 | | | $ | 5,255,486 | | | $ | 8,180,691 | |
| | | | | | | | | | | | | | | | | | | | | | | | | | | | | | | | |
| † | Fund commenced operations on July 2, 2018. |
The Investment Company has registered an indefinite number of its capital shares pursuant to Rule 24f-2 under the Investment Company Act of 1940. On February 22, 2018, the Board of Directors increased the number of authorized shares from 10.75 billion to 14.75 billion. Also, on January 16, 2018, February 22, 2018 and November 8, 2018, the Board of Directors of the Investment Company changed the number of authorized shares for the Funds as indicated by the following table. As a result of these actions, there remained 1,640,000,000 unallocated shares as of December 31, 2018.
| | | | | | | | | | | | |
| | | Authorized No. of Shares | |
| | | Previous
Allocation | | | Allocation
Increase/
(Decrease) | | | Total Shares
Allocated | |
Equity Index Fund | | | 800,000,000 | | | | 100,000,000 | | | | 900,000,000 | |
All America Fund | | | 200,000,000 | | | | — | | | | 200,000,000 | |
Small Cap Value Fund | | | 325,000,000 | | | | 100,000,000 | | | | 425,000,000 | |
Small Cap Growth Fund | | | 470,000,000 | | | | 100,000,000 | | | | 570,000,000 | |
Small Cap Equity Index Fund** | | | 100,000,000 | | | | 100,000,000 | | | | 200,000,000 | |
Mid Cap Value Fund | | | 100,000,000 | | | | — | | | | 100,000,000 | |
Mid-Cap Equity Index Fund | | | 750,000,000 | | | | 100,000,000 | | | | 850,000,000 | |
International Fund | | | 725,000,000 | | | | 250,000,000 | | | | 975,000,000 | |
Composite Fund | | | 150,000,000 | | | | — | | | | 150,000,000 | |
Retirement Income Fund | | | 95,000,000 | | | | 125,000,000 | | | | 220,000,000 | |
2010 Retirement Fund | | | 50,000,000 | | | | — | | | | 50,000,000 | |
2015 Retirement Fund | | | 200,000,000 | | | | — | | | | 200,000,000 | |
2020 Retirement Fund | | | 515,000,000 | | | | 150,000,000 | | | | 665,000,000 | |
2025 Retirement Fund | | | 625,000,000 | | | | 300,000,000 | | | | 925,000,000 | |
2030 Retirement Fund | | | 515,000,000 | | | | 300,000,000 | | | | 815,000,000 | |
2035 Retirement Fund | | | 445,000,000 | | | | 300,000,000 | | | | 745,000,000 | |
2040 Retirement Fund | | | 385,000,000 | | | | 200,000,000 | | | | 585,000,000 | |
2045 Retirement Fund | | | 425,000,000 | | | | 100,000,000 | | | | 525,000,000 | |
2050 Retirement Fund | | | 270,000,000 | | | | 100,000,000 | | | | 370,000,000 | |
2055 Retirement Fund | | | 100,000,000 | | | | 100,000,000 | | | | 200,000,000 | |
2060 Retirement Fund** | | | 100,000,000 | | | | — | | | | 100,000,000 | |
166
MUTUAL OF AMERICA INVESTMENT CORPORATION
NOTES TO FINANCIAL STATEMENTS (Continued)
December 31, 2018
| 4. | CAPITAL SHARE ACTIVITY (CONTINUED) |
| | | | | | | | | | | | |
| | | Authorized No. of Shares | |
| | | Previous
Allocation | | | Allocation
Increase/
(Decrease) | | | Total Shares
Allocated | |
Conservative Allocation Fund | | | 165,000,000 | | | | — | | | | 165,000,000 | |
Moderate Allocation Fund | | | 320,000,000 | | | | — | | | | 320,000,000 | |
Aggressive Allocation Fund | | | 215,000,000 | | | | — | | | | 215,000,000 | |
Money Market Fund | | | 125,000,000 | | | | 300,000,000 | | | | 425,000,000 | |
Mid-Term Bond Fund | | | 540,000,000 | | | | 250,000,000 | | | | 790,000,000 | |
Bond Fund | | | 925,000,000 | | | | 500,000,000 | | | | 1,425,000,000 | |
| | | | | | | | | | | | |
Sub-Total | | | 9,635,000,000 | | | | 3,475,000,000 | | | | 13,110,000,000 | |
Shares to be allocated at the discretion of the Board of Directors | | | 1,115,000,000 | | | | 525,000,000 | | | | 1,640,000,000 | |
| | | | | | | | | | | | |
Total | | | 10,750,000,000 | | | | 4,000,000,000 | | | | 14,750,000,000 | |
| | | | | | | | | | | | |
| ** | Fund commenced operations on July 2, 2018. |
| 5. | DISTRIBUTIONSTO SHAREHOLDERSAND INCOME TAX INFORMATION |
On August 28, 2018 and August 30, 2018, required distributions of net investment income and, as applicable, net realized gains relating to 2017 were declared and paid for all applicable funds in accordance with Internal Revenue Code Section 855(a). No such distributions were required for the Small Cap Equity Index Fund and the 2060 Retirement Fund.
On December 27, 2018, required dividend distribution from net investment income was declared and paid for the Small Cap Equity Index Fund.
The Funds of Mutual of America Investment Corporation intend to declare and pay their respective tax year 2018 investment company taxable income and capital gains in 2019 in accordance with Internal Revenue Section 855(a).
Pursuant to shareholders’ instructions, substantially all dividend distributions throughout 2018 and 2017 were immediately reinvested into their respective funds. The tax character of the distributions paid during 2018 and 2017 were as follows:
| | | | | | | | | | | | | | | | | | | | |
| | | Equity Index
Fund | | | All America
Fund | | | Small Cap
Value Fund | | | Small Cap
Growth Fund | | | Small Cap
Equity Index
Fund | |
Ordinary Income (a) | | | | | | | | | | | | | | | | | | | | |
2018 | | $ | 50,954,024 | | | $ | 6,759,221 | | | $ | 7,840,591 | | | $ | 3,494,643 | | | $ | 136,423 | |
2017 | | $ | 42,045,361 | | | $ | 5,437,103 | | | $ | 6,398,744 | | | $ | 1,099,348 | | | $ | 0 | |
Long-Term Capital Gains | | | | | | | | | | | | | | | | | | | | |
2018 | | $ | 56,058,789 | | | $ | 13,677,187 | | | $ | 35,888,408 | | | $ | 36,222,538 | | | $ | 0 | |
2017 | | $ | 42,736,188 | | | $ | 35,345,294 | | | $ | 18,741,699 | | | $ | 16,488,137 | | | $ | 0 | |
Return of Capital | | | | | | | | | | | | | | | | | | | | |
2018 | | $ | 0 | | | $ | 0 | | | $ | 0 | | | $ | 0 | | | $ | 965 | |
2017 | | $ | 0 | | | $ | 0 | | | $ | 0 | | | $ | 0 | | | $ | 0 | |
| | | | | |
| | | Mid Cap
Value Fund | | | Mid-Cap
Equity Index
Fund | | | International
Fund | | | Composite
Fund | | | Retirement
Fund | |
Ordinary Income (a) | | | | | | | | | | | | | | | | | | | | |
2018 | | $ | 2,211,470 | | | $ | 23,927,995 | | | $ | 12,148,302 | | | $ | 7,731,743 | | | $ | 1,751,326 | |
2017 | | $ | 1,059,046 | | | $ | 18,442,754 | | | $ | 9,884,641 | | | $ | 4,300,467 | | | $ | 1,539,981 | |
Long-Term Capital Gains | | | | | | | | | | | | | | | | | | | | |
2018 | | $ | 6,713,062 | | | $ | 85,503,007 | | | $ | 0 | | | $ | 10,415,744 | | | $ | 1,339,242 | |
2017 | | $ | 4,282,390 | | | $ | 74,952,994 | | | $ | 1,196,804 | | | $ | 20,996,479 | | | $ | 1,379,154 | |
167
MUTUAL OF AMERICA INVESTMENT CORPORATION
NOTES TO FINANCIAL STATEMENTS (Continued)
December 31, 2018
| 5. | DISTRIBUTIONSTO SHAREHOLDERSAND INCOME TAX INFORMATION (CONTINUED) |
| | | | | | | | | | | | | | | | | | | | |
| | | 2010
Retirement
Fund | | | 2015
Retirement
Fund | | | 2020 Retirement
Fund | | | 2025
Retirement
Fund | | | 2030
Retirement
Fund | |
Ordinary Income (a) | | | | | | | | | | | | | | | | | | | | |
2018 | | $ | 490,991 | | | $ | 2,885,898 | | | $ | 9,311,834 | | | $ | 11,340,011 | | | $ | 9,023,183 | |
2017 | | $ | 543,546 | | | $ | 3,028,463 | | | $ | 7,891,832 | | | $ | 8,443,812 | | | $ | 6,471,545 | |
Long-Term Capital Gains | | | | | | | | | | | | | | | | | | | | |
2018 | | $ | 1,055,110 | | | $ | 6,098,811 | | | $ | 14,464,758 | | | $ | 23,373,515 | | | $ | 19,726,249 | |
2017 | | $ | 1,150,822 | | | $ | 6,504,889 | | | $ | 15,006,151 | | | $ | 17,549,626 | | | $ | 16,402,087 | |
| | | | | |
| | | 2035
Retirement
Fund | | | 2040
Retirement
Fund | | | 2045 Retirement
Fund | | | 2050
Retirement
Fund | | | 2055
Retirement
Fund | |
Ordinary Income (a) | | | | | | | | | | | | | | | | | | | | |
2018 | | $ | 7,120,325 | | | $ | 5,677,938 | | | $ | 6,218,541 | | | $ | 3,442,823 | | | $ | 366,872 | |
2017 | | $ | 5,090,035 | | | $ | 3,936,958 | | | $ | 4,492,530 | | | $ | 1,952,198 | | | $ | 0 | |
Long-Term Capital Gains | | | | | | | | | | | | | | | | | | | | |
2018 | | $ | 16,266,812 | | | $ | 12,891,559 | | | $ | 15,787,067 | | | $ | 6,634,382 | | | $ | 542,019 | |
2017 | | $ | 14,165,396 | | | $ | 12,664,502 | | | $ | 13,839,470 | | | $ | 5,127,131 | | | $ | 0 | |
| | | | | |
| | | 2060
Retirement
Fund | | | Conservative
Allocation
Fund | | | Moderate
Allocation Fund | | | Aggressive
Allocation Fund | | | Money
Market Fund | |
Ordinary Income (a) | | | | | | | | | | | | | | | | | | | | |
2018 | | $ | 0 | | | $ | 3,300,748 | | | $ | 7,438,128 | | | $ | 5,093,663 | | | $ | 462,689 | |
2017 | | $ | 0 | | | $ | 3,053,002 | | | $ | 6,887,282 | | | $ | 4,432,394 | | | $ | 83,111 | |
Long-Term Capital Gains | | | | | | | | | | | | | | | | | | | | |
2018 | | $ | 0 | | | $ | 6,677,611 | | | $ | 20,403,614 | | | $ | 16,696,924 | | | $ | 0 | |
2017 | | $ | 0 | | | $ | 2,676,902 | | | $ | 10,932,002 | | | $ | 15,484,011 | | | $ | 0 | |
| | | | | |
| | | Mid-Term
Bond Fund | | | Bond Fund | | | | | | | | | | |
Ordinary Income (a) | | | | | | | | | | | | | | | | | | | | |
2018 | | $ | 12,347,782 | | | $ | 34,954,410 | | | | | | | | | | | | | |
2017 | | $ | 11,719,948 | | | $ | 33,167,639 | | | | | | | | | | | | | |
Long-Term Capital Gains | | | | | | | | | | | | | | | | | | | | |
2018 | | $ | 77,266 | | | $ | 0 | | | | | | | | | | | | | |
2017 | | $ | 543,647 | | | $ | 1,805,293 | | | | | | | | | | | | | |
Notes:
| (a) | Includes distributions from Fund-level net short-term capital gains. |
Undistributed net income and gains (losses) — As of December 31, 2018, undistributed net income and undistributed accumulated gain (loss) for federal income tax purposes were as follows:
| | | | | | | | | | | | | | | | | | | | |
| | | Equity Index
Fund | | | All America
Fund | | | Small Cap
Value Fund | | | Small Cap
Growth Fund | | | Small Cap
Equity Index
Fund | |
Accumulated undistributed net investment income | | $ | 50,850,232 | | | $ | 3,657,100 | | | $ | 3,820,412 | | | $ | 481,365 | | | $ | 0 | |
Accumulated undistributed net realized gain/(loss) on investments and futures contracts | | $ | 56,268,707 | | | $ | 19,829,313 | | | $ | 28,309,448 | | | $ | 46,832,820 | | | $ | 0 | |
Net unrealized appreciation (depreciation) of investments and futures contracts | | $ | 872,543,037 | | | $ | 49,120,009 | | | $ | 6,571,326 | | | $ | 1,086,058 | | | $ | (3,656,896 | ) |
168
MUTUAL OF AMERICA INVESTMENT CORPORATION
NOTES TO FINANCIAL STATEMENTS (Continued)
December 31, 2018
| 5. | DISTRIBUTIONSTO SHAREHOLDERSAND INCOME TAX INFORMATION (CONTINUED) |
| | | | | | | | | | | | | | | | | | | | |
| | | Mid Cap
Value Fund | | | Mid-Cap
Equity Index
Fund | | | International
Fund | | | Composite
Fund | | | Retirement
Income
Fund | |
Accumulated undistributed net investment income | | $ | 1,254,159 | | | $ | 23,217,928 | | | $ | 14,819,838 | | | $ | 4,065,113 | | | $ | 1,908,444 | |
Accumulated undistributed net realized gain/(loss) on investments and futures contracts | | $ | 2,198,197 | | | $ | 95,956,124 | | | $ | 0 | | | $ | 8,160,776 | | | $ | 1,926,004 | |
Net unrealized appreciation (depreciation) of investments and futures contracts | | $ | 6,934,567 | | | $ | 89,041,288 | | | $ | (21,161,034 | ) | | $ | 8,471,326 | | | $ | (2,135,435 | ) |
| | | | | |
| | | 2010
Retirement
Fund | | | 2015
Retirement
Fund | | | 2020
Retirement
Fund | | | 2025
Retirement
Fund | | | 2030
Retirement
Fund | |
Accumulated undistributed net investment income | | $ | 476,056 | | | $ | 2,895,917 | | | $ | 10,744,694 | | | $ | 14,104,082 | | | $ | 11,887,199 | |
Accumulated undistributed net realized gain/(loss) on investments and futures contracts | | $ | 749,599 | | | $ | 6,509,459 | | | $ | 24,235,517 | | | $ | 30,493,288 | | | $ | 26,168,201 | |
Net unrealized appreciation (depreciation) of investments and futures contracts | | $ | (471,863 | ) | | $ | 688,078 | | | $ | 2,989,471 | | | $ | 4,396,912 | | | $ | 4,517,018 | |
| | | | | |
| | | 2035
Retirement
Fund | | | 2040
Retirement
Fund | | | 2045
Retirement
Fund | | | 2050
Retirement
Fund | | | 2055
Retirement
Fund | |
Accumulated undistributed net investment income | | $ | 9,486,781 | | | $ | 7,589,088 | | | $ | 8,048,993 | | | $ | 5,028,164 | | | $ | 1,071,155 | |
Accumulated undistributed net realized gain/(loss) on investments and futures contracts | | $ | 22,587,202 | | | $ | 16,864,407 | | | $ | 20,921,544 | | | $ | 10,871,928 | | | $ | 2,282,916 | |
Net unrealized appreciation (depreciation) of investments and futures contracts | | $ | 6,014,073 | | | $ | 6,240,675 | | | $ | 12,907,397 | | | $ | (15,025,040 | ) | | $ | (8,883,692 | ) |
| | | | | |
| | | 2060
Retirement
Fund | | | Conservative
Allocation
Fund | | | Moderate
Allocation
Fund | | | Aggressive
Allocation
Fund | | | Money
Market Fund | |
Accumulated undistributed net investment income | | $ | 13,446 | | | $ | 3,384,999 | | | $ | 8,202,249 | | | $ | 5,732,958 | | | $ | 2,221,214 | |
Accumulated undistributed net realized gain/(loss) on investments and futures contracts | | $ | 23,470 | | | $ | 3,898,222 | | | $ | 16,736,788 | | | $ | 17,284,510 | | | $ | 0 | |
Net unrealized appreciation (depreciation) of investments and futures contracts | | $ | (355,651 | ) | | $ | (2,707,292 | ) | | $ | 18,259,634 | | | $ | 21,091,417 | | | $ | 50 | |
| | | | | |
| | | Mid-Term
Bond Fund | | | Bond Fund | | | | | | | | | | |
Accumulated undistributed net investment income | | $ | 13,773,991 | | | $ | 37,592,921 | | | | | | | | | | | | | |
Accumulated undistributed net realized gain/(loss) on investments and futures contracts | | $ | (1,155,406 | ) | | $ | (1,414,738 | ) | | | | | | | | | | | | |
Net unrealized appreciation (depreciation) of investments and futures contracts | | $ | (9,668,641 | ) | | $ | (18,774,957 | ) | | | | | | | | | | | | |
The difference between the components of distributable earnings for income tax purposes and the amounts reflected in the statements of assets and liabilities arise primarily from federal income tax treatment of wash sales, REITs, partnerships, corporate actions and futures contracts.
| 6. | RECENT ACCOUNTING PRONOUNCEMENTS |
In March 2017, the FASB issued Accounting Standards Update 2017-08, Receivables – Nonrefundable Fees and Other Costs (Subtopic 310-20): Premium Amortization On Purchased Callable Debt Securities (“ASU 2017-08”). The update shortens the amortization period for the premium on certain purchased callable debt securities to the earliest
169
MUTUAL OF AMERICA INVESTMENT CORPORATION
NOTES TO FINANCIAL STATEMENTS (Continued)
December 31, 2018
| 6. | RECENT ACCOUNTING PRONOUNCEMENTS (CONTINUED) |
call date. ASU 2017-08 will be effective for annual periods beginning after December 15, 2018. Management has evaluated the impact of this change on the financial statements and determined that there is no material impact.
In August 2018, the Securities and Exchange Commission (the “SEC”) adopted amendments to RegulationS-X to update and simplify the disclosure requirements for registered investment companies by eliminating requirements that are redundant or duplicative of GAAP requirements or other SEC disclosure requirements. The new amendments require the presentation of the total, rather than the components, of distributable earnings on the Statement of Assets and Liabilities and the total, rather than the components, of dividends from net investment income and distributions from net realized gains on the Statement of Changes in Net Assets. The amendments also removed the requirement for the parenthetical disclosure of undistributed net investment income on the Statement of Changes in Net Assets and certain tax adjustments that were reflected in the Notes to Financial Statements. All of these have been reflected in the Funds’ financial statements.
The sources of distributions made in 2017 were as follows:
| | | | | | | | | | | | | | | | | | | | | | | | | | | | |
| | | Equity Index
Fund | | | All America
Fund | | | Small Cap
Value Fund | | | Small Cap
Growth Fund | | | Mid Cap
Value Fund | | | Mid-Cap Equity
Index Fund | | | International
Fund | |
From net investment income | | | (38,919,706 | ) | | | (3,802,012 | ) | | | (2,722,335 | ) | | | (119,175 | ) | | | (1,059,046 | ) | | | (15,061,844 | ) | | | (9,884,641 | ) |
From net realized gains | | | (45,861,843 | ) | | | (36,980,385 | ) | | | (22,418,108 | ) | | | (17,468,310 | ) | | | (4,282,390 | ) | | | (78,333,904 | ) | | | (1,196,804 | ) |
| | | | | | | | | | | | | | | | | | | | | | | | | | | | |
Total distributions | | | (84,781,549 | ) | | | (40,782,397 | ) | | | (25,140,443 | ) | | | (17,587,485 | ) | | | (5,341,436 | ) | | | (93,395,748 | ) | | | (11,081,445 | ) |
| | | | | | | |
| | | Composite
Fund | | | Retirement
Income Fund | | | 2010
Retirement
Fund | | | 2015
Retirement
Fund | | | 2020
Retirement
Fund | | | 2025
Retirement
Fund | | | 2030
Retirement
Fund | |
From net investment income | | | (3,738,706 | ) | | | (1,539,981 | ) | | | (543,546 | ) | | | (3,028,463 | ) | | | (7,891,832 | ) | | | (8,443,812 | ) | | | (6,471,545 | ) |
From net realized gains | | | (21,558,240 | ) | | | (1,379,154 | ) | | | (1,150,822 | ) | | | (6,504,889 | ) | | | (15,006,151 | ) | | | (17,549,626 | ) | | | (16,402,087 | ) |
| | | | | | | | | | | | | | | | | | | | | | | | | | | | |
Total distributions | | | (25,296,946 | ) | | | (2,919,135 | ) | | | (1,694,368 | ) | | | (9,533,352 | ) | | | (22,897,983 | ) | | | (25,993,438 | ) | | | (22,873,632 | ) |
| | | | | | | |
| | | 2035
Retirement
Fund | | | 2040
Retirement
Fund | | | 2045
Retirement
Fund | | | 2050
Retirement
Fund | | | 2055
Retirement
Fund | | | Conservative
Allocation
Fund | | | Moderate
Allocation
Fund | |
From net investment income | | | (5,090,035 | ) | | | (3,936,958 | ) | | | (4,492,530 | ) | | | (1,952,198 | ) | | | — | | | | (3,053,002 | ) | | | (6,887,282 | ) |
From net realized gains | | | (14,165,396 | ) | | | (12,664,502 | ) | | | (13,839,470 | ) | | | (5,127,131 | ) | | | — | | | | (2,676,902 | ) | | | (10,932,002 | ) |
| | | | | | | | | | | | | | | | | | | | | | | | | | | | |
Total distributions | | | (19,255,431 | ) | | | (16,601,460 | ) | | | (18,332,000 | ) | | | (7,079,329 | ) | | | — | | | | (5,729,904 | ) | | | (17,819,284 | ) |
| | | | | | | |
| | | Aggressive
Allocation
Fund | | | Money Market
Fund | | | Mid-Term
Bond Fund | | | Bond Fund | | | | | | | | | | |
From net investment income | | | (4,432,394 | ) | | | (83,111 | ) | | | (11,551,692 | ) | | | (32,730,237 | ) | | | | | | | | | | | | |
From net realized gains | | | (15,484,011 | ) | | | — | | | | (711,903 | ) | | | (2,242,695 | ) | | | | | | | | | | | | |
| | | | | | | | | | | | | | | | | | | | | | | | | | | | |
Total distributions | | | (19,916,405 | ) | | | (83,111 | ) | | | (12,263,595 | ) | | | (34,972,932 | ) | | | | | | | | | | | | |
Also in August 2018, the FASB issued Accounting Standards Update (“ASU”)No. 2018-13, which changes certain fair value measurement disclosure requirements. The new ASU, in addition to other modifications and additions, removes the requirement to disclose the amount and reasons for transfers between Level 1 and Level 2 of the fair value hierarchy, and the Funds’ policy for the timing of transfers between levels. The amendments are effective for financial statements issued for fiscal years beginning after December 15, 2019, and interim periods within those fiscal years. Management is currently evaluating the impact and implications of the provisions of the ASU to the Funds, which have not yet been determined.
Management, on behalf of the Investment Company, has evaluated the need for disclosures and/or adjustments to the financial statements from subsequent events. As a result of this evaluation, no subsequent events require disclosure and/or adjustment to the financial statements.
170
REPORT OF INDEPENDENT REGISTERED PUBLIC ACCOUNTING FIRM
To the Shareholders of the Funds and Board of Directors
Mutual of America Investment Corporation:
Opinion on the Financial Statements
We have audited the accompanying statements of assets and liabilities of Mutual of America Investment Corporation, comprised of the funds listed in the Appendix (the “Funds”), including the portfolios of investments in securities, as of December 31, 2018, the related statements of operations for the year or period then ended listed in the Appendix, the statements of changes in net assets for each of the years or periods in the two-year period then ended listed in the Appendix, and the related notes (collectively, the “financial statements”), and the financial highlights for the years or periods indicated therein. In our opinion, the financial statements and financial highlights present fairly, in all material respects, the financial position of each of the Funds as of December 31, 2018, the results of its operations for the year or period then ended listed in the Appendix, changes in its net assets for each of the years or periods in the two-year period then ended listed in the Appendix, and the financial highlights for each of the years or periods indicated therein, in conformity with U.S. generally accepted accounting principles.
Basis for Opinion
These financial statements and financial highlights are the responsibility of the Funds’ management. Our responsibility is to express an opinion on these financial statements and financial highlights based on our audits. We are a public accounting firm registered with the Public Company Accounting Oversight Board (United States) (“PCAOB”) and are required to be independent with respect to the Funds in accordance with the U.S. federal securities laws and the applicable rules and regulations of the Securities and Exchange Commission and the PCAOB.
We conducted our audits in accordance with the standards of the PCAOB. Those standards require that we plan and perform the audit to obtain reasonable assurance about whether the financial statements and financial highlights are free of material misstatement, whether due to error or fraud. Our audits included performing procedures to assess the risks of material misstatement of the financial statements and financial highlights, whether due to error or fraud, and performing procedures that respond to those risks. Such procedures included examining, on a test basis, evidence regarding the amounts and disclosures in the financial statements and financial highlights. Such procedures also included confirmation of securities owned as of December 31, 2018, by correspondence with the custodian and brokers or by other appropriate auditing procedures when replies from brokers were not received. Our audits also included evaluating the accounting principles used and significant estimates made by management, as well as evaluating the overall presentation of the financial statements and financial highlights. We believe that our audits provide a reasonable basis for our opinion.

KPMG has served as the auditor of one or more Mutual of America investment companies since 2002.
New York, New York
February 28, 2019
171
Appendix
Existing funds
Equity Index Fund
All America Fund
Small Cap Value Fund
Small Cap Growth Fund
Mid Cap Value Fund
Mid-Cap Equity Index Fund
International Fund
Composite Fund
Retirement Income Fund
2010 Retirement Fund
2015 Retirement Fund
2020 Retirement Fund
2025 Retirement Fund
2030 Retirement Fund
2035 Retirement Fund
2040 Retirement Fund
2045 Retirement Fund
2050 Retirement Fund
2055 Retirement Fund
Conservative Allocation Fund
Moderate Allocation Fund
Aggressive Allocation Fund
Money Market Fund
Mid-Term Bond Fund
Bond Fund
Statement of operations for the year ended December 31, 2018
Statements of changes in net assets for each of the years in the two-year period ended December 31, 2018
Funds launched in 2018:
Small Cap Equity Index Fund
Statements of operations and changes in net assets for the period from July 2, 2018 (commencement of operations) through December 31, 2018
2060 Retirement Fund
Statements of operations and changes in net assets for the period from July 2, 2018 (commencement of operations) through December 31, 2018
172
MUTUAL OF AMERICA INVESTMENT CORPORATION
ADDITIONAL INFORMATION
Directors and Officers — Unaudited
The tables below show information about the Directors and officers of the Investment Company. The address of each Director and officer is c/o Mutual of America Investment Corporation, 320 Park Avenue, New York, New York 10022. The Investment Company does not hold regular annual meetings of shareholders, and each Director has been elected by shareholders to serve until a successor is duly elected at a meeting of shareholders called for the purpose of electing directors. Each officer of the Investment Company has been elected by the Board of Directors to serve until a successor is duly elected. The Independent Directors do not serve as directors of any other investment companies advised by or affiliated with the Adviser or Mutual of America with the exception of serving on the Board of Directors of Mutual of America Institutional Funds, Inc., an affiliated registered management investment company, which also receives investment advice from the Adviser. The Interested Directors and officers of the Investment Company do not receive compensation from the Investment Company for their service. Mr. Roth serves as director of one other investment company advised by or affiliated with the Adviser, Mutual of America Institutional Funds, Inc.
The Investment Company’s Statement of Additional Information (“SAI”), filed with the Securities and Exchange Commission, contains additional information about the Investment Company’s Directors and Officers. A copy of the latest SAI can be obtained, without charge, by writing to Mutual of America Investment Corporation at 320 Park Avenue, New York, NY 10022-6839 or by calling1-800-468-3785 or through the following websites: http://www.mutualofamerica.com or http://www.sec.gov.
| | | | | | |
| Independent Directors |
| Name and Age | | Length of
Time Served | | Principal Occupation(s)
in Past Five Years | | Other Directorships
Held by Director |
| | | | | | |
| | | |
Carolyn N. Dolan, age 71 | | Since
April 2011 | | Executive Vice President, Head of Direct Client Investments, Fiera Capital Inc.; prior thereto Founding Principal and Portfolio Manager, Samson Capital Advisors LLC | | Director, Market Street Trust Company; Trustee, Fordham University; Mutual of America Institutional Funds, Inc. |
| | | | | | |
Stanley E. Grayson, age 68 | | Since
November 2017 | | Vice Chairman and Chief Operating Officer, M.R. Beal & Company (Retired 2014) | | Director, TD Bank, N.A.; Director, YMCA of Greater New York; Trustee, College of the Holy Cross; Director, Mother Cabrini Health Foundation |
| | | | | | |
LaSalle D. Leffall, III, age 55 | | Since
April 2011 | | President and Founder, LDL Financial, LLC | | Director, Federal Home Loan Bank of Atlanta; Mutual of America Institutional Funds, Inc. |
| | | | | | |
John W. Sibal, age 66 | | Since
April 2011 | | President & Chief Executive Officer, Eustis Commercial Mortgage Corporation | | Director, Eustis Commercial Mortgage Corporation; Director, New Orleans Recreation Development Foundation; Treasurer and Director, Friends of Nord, Inc.; Mutual of America Institutional Funds, Inc. |
173
| | | | | | |
| Independent Directors |
| Name and Age | | Length of
Time Served | | Principal Occupation(s)
in Past Five Years | | Other Directorships
Held by Director |
| | | | | | |
| | | |
Margaret M. Smyth, age 55 | | Since
February 2007 | | U.S. Chief Financial Officer, National Grid; prior thereto Vice President of Finance, Con Edison; prior thereto Vice President, Chief Financial Officer, Hamilton Sundstrand, a United Technologies Company | | Director, Etsy, Inc.; Director, Concern Worldwide, USA; Director, BritishAmerican Business Association; Trustees Fellow, Fordham University; Director, National Grid USA; Mutual of America Institutional Funds, Inc. |
| | | | | | |
Patrick J. Waide, Jr., age 81 | | Since
December 2003 | | Certified Public Accountant | | Trustee, John Simon Guggenheim Memorial Foundation; Emeritus Director, National Catholic Reporter; Mutual of America Institutional Funds, Inc. |
| | | | | | |
William E. Whiston, age 64 | | Since
February 2011 | | Chief Financial Officer, the Archdiocese of New York; Adjunct Professor in Finance, Fordham University Graduate School of Business; prior thereto Executive Vice President and member, United States Management Board at Allied Irish Bank | | Director, Sterling National Bank; Trustee and Treasurer, Trustees of St. Patrick’s Cathedral in New York City; Trustee, St. Joseph’s Seminary; Mutual of America Institutional Funds, Inc. |
| | | |
| Interested Director | | | | | | |
| Name and Age | | Length of
Time Served | | Principal Occupation(s)
in Past Five Years | | Other Directorships
Held by Director |
| | | | | | |
| | | |
James J. Roth, Chairman, President and Chief Executive Officer, age 69 | | Since
August 2015 | | Senior Executive Vice President and General Counsel, Mutual of America Life Insurance Company since March 2013; prior thereto Executive Vice President and General Counsel, Mutual of America Life Insurance Company since April 2009; Chairman of the Board, President and Chief Executive Officer, Mutual of America Investment Corporation and Mutual of America Institutional Funds, Inc. since August 2015 | | Mutual of America Life Insurance Company; Mutual of America Institutional Funds, Inc.; Mutual of America Holding Company LLC; Mutual of America Foundation |
Mr. Roth is an “interested person” as an officer of the Adviser and of affiliates of the Adviser.
174
| | | | | | |
| Officers | | | | | | |
| Name, Position and Age | | Length of
Time Served | | Principal Occupation(s)
in Past Five Years | | Other Directorships
Held by Officer |
| | | | | | |
| | | |
Chris W. Festog, Senior Executive Vice President, Chief Financial Officer and Treasurer, age 57 | | Since
April 2013 | | Senior Executive Vice President and Chief Financial Officer, Mutual of America Life Insurance Company since March 2017; prior thereto Executive Vice President and Chief Financial Officer, Mutual of America Life Insurance Company since March 2015; prior thereto Executive Vice President and Deputy Treasurer, Mutual of America Life Insurance Company | | Mutual of America Holding Company LLC; Mutual of America Securities LLC |
| | | | | | |
Diana H. Glynn, Senior Vice President and Internal Auditor, age 54 | | Since
April 2017 | | Senior Vice President and Internal Auditor, Mutual of America Life Insurance Company since April 2017; Senior Vice President and Internal Auditor, Mutual of America Investment Corporation and Mutual of America Institutional Funds, Inc.; prior thereto Vice President, Internal Auditor, Mutual of America Life Insurance Company | | None |
| | | | | | |
Kathryn A. Lu, Executive Vice President and Chief Compliance Officer, age 58 | | Since
July 2008 | | Executive Vice President and Chief Compliance Officer, Mutual of America Life Insurance Company, prior thereto Senior Vice President and Chief Compliance Officer, Mutual of America Life Insurance Company; Executive Vice President and Chief Compliance Officer, Mutual of America Investment Corporation and Mutual of America Institutional Funds, Inc. | | None |
| | | | | | |
Christopher M. Miseo, Senior Vice President and Chief Accounting Officer, age 62 | | Since
March 2013 | | Senior Vice President and Director of Accounting and Financial Reporting, Mutual of America Life Insurance Company | | None |
175
| | | | | | |
| Officers | | | | | | |
| Name, Position and Age | | Length of
Time Served | | Principal Occupation(s)
in Past Five Years | | Other Directorships
Held by Officer |
| | | | | | |
| | | |
Scott H. Rothstein, Executive Vice President, Deputy General Counsel and Corporate Secretary, age 53 | | Since
April 2013 | | Executive Vice President and Deputy General Counsel, Mutual of America Life Insurance Company, since January 2009; Executive Vice President, Deputy General Counsel and Corporate Secretary, Mutual of America Investment Corporation and Mutual of America Institutional Funds, Inc., since April 2013 | | None |
| | | | | | |
Michelle A. Rozich, Senior Vice President and Internal Auditor, age 45 | | Since
March 2018 | | Senior Vice President, Internal Auditor as of March 2018; formerly Audit Senior Manager, KPMG LLP | | None |
176
Quarterly Portfolio Schedules
Included in this Annual Report are schedules of Mutual of America Investment Corporation’s (“Investment Company”) Fund portfolio holdings as of December 31, 2018. The Investment Company files complete schedules of Fund portfolio holdings with the Securities and Exchange Commission (“SEC”) for the first and third quarters of each fiscal year onForm N-Q and for the second and fourth quarters of each fiscal year onForm N-CSR. TheForms N-Q andN-CSR are available on the SEC’s website at http://www.sec.gov.
Proxy Voting Policies and Procedures
A copy of the Investment Company’s proxy voting policies and procedures can be obtained free of charge by calling1-800-468-3785. It is also available on the SEC’s website at http://www.sec.gov.
Information regarding how the Investment Company voted proxies relating to portfolio securities during the12-month period ended June 30, 2018 is available without charge by calling1-800-468-3785. It is also available on the SEC website.
Code of Ethics
The Investment Company has adopted a Code of Ethics that complies with Rule17j-1 of the Investment Company Act of 1940 and with the requirements of the Sarbanes-Oxley Act of 2002. A copy of the Code of Ethics is available free of charge, upon request. To obtain a free copy of the Code of Ethics, please call(212) 224-1568 or write to:
Ms. Kathryn A. Lu
Executive Vice President and Chief Compliance Officer
Mutual of America Investment Corporation
320 Park Avenue
New York, NY 10022-6839
Supplemental Dividend Information — Unaudited
Dividends from the International, Money Market,Mid-Term Bond and Bond Funds do not qualify for the corporate dividends received deduction. The 2060 Retirement Fund did not distribute any dividends during 2018. The following are the percentages of the ordinary dividends distributed in 2018 by the other Investment Corporation Funds that qualify for the corporate dividends received deduction:
| | | | | | | | | | | | | | | | | | | | |
| | | Equity Index
Fund | | | All
America
Fund | | | Small Cap
Value Fund | | | Small Cap
Growth Fund | | | Small Cap
Equity Index
Fund | |
Ordinary dividend
qualifying percentage | | | 84.48% | | | | 25.43% | | | | 93.11% | | | | 79.07% | | | | 100.00% | |
| | | | | |
| | | Mid-Cap
Equity Index
Fund | | | Mid Cap
Value
Fund | | | Composite
Fund | | | Retirement
Income Fund | | | 2010
Retirement
Fund | |
Ordinary dividend
qualifying percentage | | | 61.61% | | | | 64.41% | | | | 27.34% | | | | 19.60% | | | | 22.40% | |
| | | | | |
| | | 2015
Retirement
Fund | | | 2020
Retirement
Fund | | | 2025
Retirement
Fund | | | 2030
Retirement
Fund | | | 2035
Retirement
Fund | |
Ordinary dividend
qualifying percentage | | | 27.76% | | | | 32.60% | | | | 39.20% | | | | 45.68% | | | | 51.70% | |
| | | | | |
| | | 2040
Retirement
Fund | | | 2045
Retirement
Fund | | | 2050
Retirement
Fund | | | 2055
Retirement
Fund | | | Conservative
Allocation
Fund | |
Ordinary dividend
qualifying percentage | | | 52.52% | | | | 53.66% | | | | 53.75% | | | | 44.95% | | | | 16.54% | |
| | | | | |
| | | Moderate
Allocation
Fund | | | Aggressive
Allocation
Fund | | | | | | | | | | |
Ordinary dividend
qualifying percentage | | | 35.75% | | | | 43.20% | | | | | | | | | | | | | |
177
Important tax information:The following amounts of 2018 Investment Corporation Fund long-term capital gains (if any) have been designated as capital gains dividends.
| | | | | | | | | | | | | | | | | | | | |
| | | Equity
Index Fund | | | All America
Fund | | | Small Cap
Value Fund | | | Small Cap
Growth Fund | | | Small-Cap
Equity Index
Fund | |
Dividends qualifying for reduced
long-term capital gains tax rate | | $ | 56,058,789 | | | $ | 13,677,187 | | | $ | 35,888,408 | | | $ | 36,222,538 | | | $ | 0 | |
| | | | | |
| | | Mid-Cap
Equity Index
Fund | | | Mid Cap
Value
Fund | | | International
Fund | | | Composite
Fund | | | Retirement
Income Fund | |
Dividends qualifying for reduced
long-term capital gains tax rate | | $ | 85,503,007 | | | $ | 6,713,062 | | | $ | 0 | | | $ | 10,415,744 | | | $ | 1,339,242 | |
| | | | | |
| | | 2010
Retirement
Fund | | | 2015
Retirement
Fund | | | 2020
Retirement
Fund | | | 2025
Retirement
Fund | | | 2030
Retirement
Fund | |
Dividends qualifying for reduced
long-term capital gains tax rate | | $ | 1,055,110 | | | $ | 6,098,811 | | | $ | 14,464,758 | | | $ | 23,373,515 | | | $ | 19,726,249 | |
| | | | | |
| | | 2035
Retirement
Fund | | | 2040
Retirement
Fund | | | 2045
Retirement
Fund | | | 2050
Retirement
Fund | | | 2055
Retirement
Fund | |
Dividends qualifying for reduced
long-term capital gains tax rate | | $ | 16,266,812 | | | $ | 12,891,559 | | | $ | 15,787,067 | | | $ | 6,634,382 | | | $ | 542,019 | |
| | | | | |
| | | 2060
Retirement
Fund | | | Conservative
Allocation
Fund | | | Moderate
Allocation
Fund | | | Aggressive
Allocation
Fund | | | Money
Market Fund | |
Dividends qualifying for reduced
long-term capital gains tax rate | | $ | 0 | | | $ | 6,677,611 | | | $ | 20,403,614 | | | $ | 16,696,924 | | | $ | 0 | |
| | | | | |
| | | Mid-Term
Bond Fund | | | Bond Fund | | | | | | | | | | |
Dividends qualifying for reduced
long-term capital gains tax rate | | $ | 77,266 | | | $ | 0 | | | | | | | | | | | | | |
178
MUTUALOF AMERICA
LIFE INSURANCE COMPANY
320 PARK AVENUE
NEW YORK, NY 10022-6839
www.mutualofamerica.com
320 PARK AVENUE
NEW YORK NY 10022-6839
ADDRESS SERVICE REQUESTED
| | |
 | | You can receive these and other important documents electronically. Sign up for eDocuments and we’ll waive the monthly participant charge. Find out more at mutualofamerica.com or call1-800-468-3785. |
Mutual of America Investment Corporation (the “Corporation”) has adopted a Code of Ethics that applies to its principal executive and financial officers, as well as all Access Persons as defined underRule 17j-1 of the Investment Company Act of 1940. The Code of Ethics consists of two sections. The first section, designated as Section A, is the Code of Ethics required underRule 17j-1. Section A requires those subject to it to submit periodic reports detailing their securities holdings and transactions (subject to several exemptions contained in the rules) and requirespre-approval for certain securities transactions by such persons, including purchases and sales of reportable securities, investments in initial public offerings and private placements.
The second section, designated as Section B, is to assure compliance with the Code of Ethics requirements of Section 406 of the Sarbanes-Oxley Act of 2002. It applies specifically to the Corporation’s principal executive and financial officers.
The two sections are not mutually exclusive and must be observed independently by each person to whom they are intended to apply. Section A applies to all individuals while Section B applies to the individuals designated in Section B. Both Sections explicitly require those individuals subject to the provisions of the Code of Ethics to promptly report violations of the Code of Ethics to the Chief Compliance Officer.
There have been no amendments to Section A or B during the period covered by this report.
The Annual Report to Shareholders includes information on how to obtain a copy of the Code of Ethics at no charge.
| ITEM 3. | AUDIT COMMITTEE FINANCIAL EXPERT. |
| | | | |
| (a) | | (1) | | Mutual of America Investment Corporation’s Board of Directors has determined that one audit committee financial expert serves on its Audit Committee. |
| | |
| (a) | | (2) | | The audit committee financial expert is Margaret M. Smyth. She is a Certified Public Accountant and has been U.S. Chief Financial Officer at National Grid since 2014. Her experience also includes previously held senior finance positions at Con Edison, Hamilton Sunstrand and United Technologies, and was a partner at Deloitte Touche and Arthur Andersen. Ms. Smyth is considered an independent director. |
| | |
(a) | | (3) | | Not applicable. |
| ITEM 4. | PRINCIPAL ACCOUNTANT FEES AND SERVICES. |
(a) Aggregate Audit Fees:
2018: $588,230
2017: $510,000
(b), (c), (d) There were no Audit-Related, Tax or Other Fees.
(e) Allnon-audit fees arepre-approved by the Audit Committee in advance.
(f), (g), (h) Not applicable.
| ITEM 5. | AUDIT COMMITTEE OF LISTED REGISTRANTS. |
Not applicable.
Not applicable.
| ITEM 7. | DISCLOSURE OF PROXY VOTING POLICIES AND PROCEDURES FORCLOSED-END MANAGEMENT INVESTMENT COMPANIES. |
Not applicable.
| ITEM 8. | PORTFOLIO MANAGERS OFCLOSED-END MANAGEMENT INVESTMENT COMPANIES. |
Not applicable.
| ITEM 9. | PURCHASES OF EQUITY SECURITES BYCLOSED-END MANAGEMENT INVESTMENT COMPANY AND AFFILIATED PURCHASERS. |
Not applicable.
| ITEM 10. | SUBMISSION OF MATTERS TO A VOTE OF SECURITY HOLDERS. |
Not applicable.
| ITEM 11. | CONTROLS AND PROCEDURES. |
| | (a) | The registrant’s principal executive officer and principal financial officer have evaluated the registrant’s disclosure controls and procedures within 90 days of this filing and have concluded that the registrant’s disclosure controls and procedures were effective, as of that date, in ensuring that information required to be disclosed by the registrant in this FormN-CSR was recorded, processed, summarized, and reported in a timely and accurate manner. |
| | (b) | The registrant’s principal executive officer and principal financial officer are aware of no changes in the registrant’s internal control over financial reporting that occurred during the second fiscal quarter of the period covered by this report that has materially affected, or is likely to materially affect, the registrant’s internal control over financial reporting. |
Attached hereto:
| | |
(a) (1) Not applicable. |
| |
(2) Exhibit 99.CERT | | Certifications by the registrant’s principal executive officer and principal financial officer, pursuant to Section 302 of the Sarbanes-Oxley Act of 2002 and required by Rule30a-2(a) under the Investment Company Act of 1940. |
| |
(3) Not applicable. | | |
| |
(b) Exhibit99.906CERT | | Certifications pursuant to Section 906 of the Sarbanes-Oxley Act of 2002 and required byRule 30a-2(b) under the Investment Company Act of 1940. |
SIGNATURES
Pursuant to the requirements of the Securities Exchange Act of 1934 and the Investment Company Act of 1940, the registrant has duly caused this report to be signed on its behalf by the undersigned, thereunto duly authorized.
Mutual of America Investment Corporation
| | |
| By: | | /s/ JAMES J. ROTH |
| | James J. Roth |
| | Chairman of the Board, |
| | President and Chief Executive Officer of |
| | Mutual of America Investment Corporation |
|
| Date: March 8, 2019 |
Pursuant to the requirements of the Securities Exchange Act of 1934 and the Investment Company Act of 1940, this report has been signed below by the following persons on behalf of the registrant and in the capacities and on the dates indicated.
| | |
| By: | | /s/ JAMES J. ROTH |
| | James J. Roth |
| | Chairman of the Board, |
| | President and Chief Executive Officer of |
| | Mutual of America Investment Corporation |
|
| Date: March 8, 2019 |
| | |
| By: | | /s/ CHRIS W. FESTOG |
| | Chris W. Festog |
| | Senior Executive Vice President, |
| | Chief Financial Officer and Treasurer of Mutual of America Investment Corporation |
|
| Date: March 8, 2019 |