UNITED STATES
SECURITIES AND EXCHANGE COMMISSION
Washington, D.C. 20549
FORM N-CSR
CERTIFIED SHAREHOLDER REPORT OF REGISTERED
MANAGEMENT INVESTMENT COMPANIES
Investment Company Act file number | 811-05084 |
|
Mutual of America Investment Corporation |
(Exact name of registrant as specified in charter) |
|
320 Park Avenue, New York, N.Y. | | 10022 |
(Address of principal executive offices) | | (Zip code) |
|
John R. Greed Senior Executive Vice President and Chief Financial Officer Mutual of America Life Insurance Company 320 Park Avenue New York, NY 10022 |
(Name and address of agent for service) |
|
Registrant’s telephone number, including area code: | (212) 224-1600 | |
|
Date of fiscal year end: | December 31 | |
|
Date of reporting period: | December 31, 2010 | |
| | | | | | | | |
ITEM 1. REPORTS TO STOCKHOLDERS.
The Annual Report to Shareholders follows:
DECEMBER 31, 2010
Annual Reports of Investment Options Offered by
Mutual of America Life Insurance Company
This report is not to be construed as an offering for sale of any Variable Policy. No offering is made except in conjunction with a prospectus which must precede or accompany this report.


320 PARK AVENUE
NEW YORK NY 10022-6839
February 2011
Dear Contract Owner,
As a valued variable accumulation annuity contract owner, we are pleased to provide you with the annual fund reports for the investment options offered by your contract. Included in this booklet are the annual reports of the Mutual of America Investment Corporation Funds. If you have also selected other investment options, you will receive annual reports for those funds in a separate booklet or booklets. The reports provide an update on each portfolio's performance as of December 31, 2010. Please note that portfolio performance does not take into account the fees charged by the contract. If these fees had been included, the fund's performance would have been lower. As always, past performance cannot predict or guarantee future returns.
Mutual of America has specialized in providing retirement products and related services to organizations and their employees, as well as individuals, for over 65 years. As a mutual company, we do not have stockholders and are not publicly traded. We operate solely for the benefit of our customers, managing the Company for their long-term interest, rather than for the short-term demands of stockholders. Today, as in the past, Mutual of America remains financially strong and is rated among the strongest companies in the life insurance industry by the major independent rating agencies.*
Since 1945, Mutual of America has remained committed to its Mission to offer plan sponsors, plan participants and individuals carefully selected, quality products and services at a competitive price and the personal attention they need to help build and preserve assets for a financially secure future. Integrity, prudence, and reliability are the values that have guided us since our inception and that continue to serve us well.
We hope you find the enclosed information helpful. We appreciate and value your business and look forward to serving you in the future. If you have any questions, please call your local Mutual of America Regional Office or 1-800-468-3785.
Sincerely,
Mutual of America Life Insurance Company
* While these ratings do not apply to the safety or investment performance of the Separate Account investment alternatives available under Mutual of America's products, they do reflect the Company's ability to fulfill its General Account obligations, which include its obligations under the Interest Accumulation Account, annuity purchase rate guarantees and annuity benefit payouts, as well as life insurance and disability income payments. Third party ratings are subject to change.
DECEMBER 31, 2010
Annual Reports of Mutual of America
Investment Corporation
This report is not to be construed as an offering for sale of any Variable Policy. No offering is made except in conjunction with a prospectus which must precede or accompany this report.


(This page has been left blank intentionally.)
CONTENTS
| | Page | |
| Annual Report of Mutual of America Investment Corporation | | | |
|
| President's Message | | | 1 | | |
|
| Portfolio Management Discussions | | | 5 | | |
|
| Asset Allocations | | | 27 | | |
|
| Expense Example | | | 31 | | |
|
| Summary Portfolios of Investments in Securities: | | | |
|
| Equity Index Fund | | | 38 | | |
|
| All America Fund | | | 39 | | |
|
| Small Cap Value Fund | | | 41 | | |
|
| Small Cap Growth Fund | | | 42 | | |
|
| Mid Cap Value Fund | | | 43 | | |
|
| Mid-Cap Equity Index Fund | | | 44 | | |
|
| International Fund | | | 45 | | |
|
| Composite Fund | | | 46 | | |
|
| Retirement Income Fund | | | 49 | | |
|
| 2010 Retirement Fund | | | 49 | | |
|
| 2015 Retirement Fund | | | 49 | | |
|
| 2020 Retirement Fund | | | 50 | | |
|
| 2025 Retirement Fund | | | 50 | | |
|
| 2030 Retirement Fund | | | 50 | | |
|
| 2035 Retirement Fund | | | 51 | | |
|
| 2040 Retirement Fund | | | 51 | | |
|
| 2045 Retirement Fund | | | 51 | | |
|
| Conservative Allocation Fund | | | 52 | | |
|
| Moderate Allocation Fund | | | 52 | | |
|
| Aggressive Allocation Fund | | | 52 | | |
|
| Money Market Fund | | | 53 | | |
|
| Mid-Term Bond Fund | | | 55 | | |
|
| Bond Fund | | | 57 | | |
|
| Statements of Assets and Liabilities | | | 60 | | |
|
| Statements of Operations | | | 64 | | |
|
| Statements of Changes in Net Assets | | | 68 | | |
|
| Financial Highlights | | | 76 | | |
|
| Notes to Financial Statements | | | 88 | | |
|
| Additional Information | | | 106 | | |
|
(This page has been left blank intentionally.)
MUTUAL OF AMERICA INVESTMENT CORPORATION
We are pleased to present the Mutual of America Investment Corporation (the "Investment Company") Annual Report. This Report includes important information regarding the performance and financial position of the Investment Company's funds for the year ended December 31, 2010.
Stocks and Bonds Generally Up in 2010
The S&P 500® Index advanced 15% on a total return basis (including dividends), while domestic small and mid-cap stock markets moved ahead between 20% and 30% on a price basis. The MSCI World Index was up a respectable 12%; however, the range of price returns across national stock markets in dollar terms was quite wide, running from an advance of 51% for Thailand to a decline of 10% for Hungary.
U.S. Bonds also performed fairly well in 2010. The Barclays U.S. Aggregate Index delivered a total return of 6.54%, and the Barclays Global Aggregate Index returned 5.54% on a dollar denominated basis, in line with U.S. returns. Advances were achieved elsewhere, including increases with U.S. Treasuries: 5.52%; High Grade Corporate Bonds: 9.00%; and High Yield Corporate Bonds: 15.12%.
Three Global Issues Remain Unresolved
Despite the strong asset returns in 2010, there are serious concerns regarding three global issues for which only stop-gap measures have been implemented to date.
For instance, in response to the European sovereign debt crisis, the European Union, along with the International Monetary Fund and the individual sovereign nations constituting the eurozone, agreed to create a nearly $1 trillion rescue fund last May. The key condition for such support was the promise to reduce budget deficits to some agreed-upon designated level within a certain timeframe.
Another matter of market concern during the past year was the prospect of monetary tightening by China in response to clear signs of a property bubble and the expectation that generalized inflation, especially among food products, was in the process of accelerating. Since April 2010, China has been tightening monetary policy. So far, the desired positive effects on inflation have not been realized, but neither have any feared negative effects on growth. The consensus outlook is that the Chinese government will control inflation without reducing overall growth by more than a couple of percentage points to a still strong 8% rate. This pace is believed sufficient to help sustain global growth.
The third major issue that roiled markets during the summer was a growing fear of a "double-dip" in U.S. economic growth. Following strong annualized Gross Domestic Product (GDP) numbers in the fourth quarter of 2009 and first quarter of 2010 of 5.0% and 3.7%, respectively, second quarter 2010 GDP came in at only 1.7%, and the sluggishness persisted into the first two months of the third quarter of 2010. Thus, the concern that the U.S. economy was slumping back into recession. Worry over the issues facing Europe and China exacerbated this concern.
The third quarter final GDP report came in at 2.6%. This number was slightly below expectations of 2.8%, and still slow by post-recession recovery standards, but firm enough to buoy markets, especially since the flow of economic data had begun to improve at the beginning of the fourth quarter.
Mid-term Elections Bring Change
Besides the firmer economic statistics, two other significant events occurred during the fourth quarter. In the mid-term election the Republican Party recaptured control of the House of Representatives and reduced the Democratic majority in the Senate. As President Obama acknowledged, the Republican victory was a true "shellacking." The market's interpretation of this outcome was that the Democrats would no longer be in a position to push through any more of their agenda beyond what they had already achieved with the Health Care Reform Act of 2010 and the Financial Reform Act of 2010 (Dodd-Frank Bill). Furthermore, the odds now favored a Congress that would be unable to do harm because of a bipartisan stalemate, a commonly held market belief thought to be favorable for stock markets.
To the surprise of most observers, astonishing bipartisan progress occurred on a number of fronts in the period between the election and the seating of the newly elected Congress in early January 2011. First and foremost, the Administration agreed, and was able to enforce Democratic Congressional approval, to extend the Bush-era tax cuts for all income brackets for two years, as well as accept the Republicans' preferred 35% estate tax rate rather than the Democrats' goal of 45%. In return, it appears the Republicans will help the President get congressional ratification for his revised free-trade agreement with South Korea, the centerpiece of his push for a doubling in U.S. exports over
1
the next five years. This represents the largest and most significant trade deal since the North American Free Trade Agreement between the United States, Canada and Mexico was implemented in 1994. In addition, the change in the balance of power within Congress helped the Administration secure Senate ratification in December 2010 of its April 8, 2010, New Strategic Arms Reduction Treaty with Russia, under the terms of which each nation's stockpile of strategic nuclear weapons will be reduced incrementally, among other things.
The Administration also signaled a move toward the political center, especially in its willingness to listen to, and work with, business. The recent appointment of William Daley as the new White House Chief of Staff was greeted warmly by the business community.
Debating Quantitative Easing 2.0
The second event, which had been widely anticipated, was the announcement by the Federal Reserve that it would implement a program to purchase $600 billion of long-term Treasuries over eight months, in addition to reinvesting in Treasuries' $300 million of proceeds of maturing securities already held on its balance sheet. This program, dubbed Quantitative Easing 2.0 (QE2 for short), follows the roughly $1.7 trillion QE1 program that was implemented during 2009. The Fed's explanation for implementing QE2 was the need to preclude a double-dip recession as well as a deflationary spiral. It also implied that the stimulus of these bond purchases, which would flow directly into the money supply and provide more liquidity to the domestic and global markets, would prompt banks to lend, encourage businesses to expand and hire, and thereby reduce unemployment. Moreover, it suggested that the program would raise asset prices, promoting a greater sense of wealth, and thereby spur consumer spending. One more implication was that the program would keep mid- to longer-term interest rates, especially mortgage rates, low.
Declining Dollar Weighs Heavy
Despite bipartisan progress on some fronts, the Republicans' mid-term election success in recapturing the House and reducing the power of Democrats in the Senate makes new fiscal stimulus unlikely. At the same time, the implications of QE2 on the global economy are potentially destabilizing. Investors have already been borrowing dollars at historically low interest rates to invest in higher yielding emerging markets around the world. The result has been to push up the value of emerging market currencies, making their exports less competitive against U.S. export goods priced in dollars — the value of which is declining because of the downward pressure on U.S. dollar rates caused by the Fed's QE2.
The temptation is for emerging market nations to establish capital controls or begin to erect specific trade barriers to protect their exporters. Brazil, for example, has already raised taxes on foreign investment. Furthermore, as the only international reserve currency, the dollar's declining value reduces the value of dollar surpluses in other nations, such as Japan and China, potentially leading to an attempt to reduce dollar holdings, and thus further reducing the value of the dollar.
To QE2 or Not?
The bottom line is that no one knows if QE2 will succeed in its stated goals, while some of the potential risks are fairly apparent. Critics of QE2 argue that the combination of currently accelerating economic domestic growth, the implementation of QE2 and the already high and rising U.S. national debt significantly raise the risks that inflation will become a much greater threat than recession/deflation. The counter argument is that the economic recovery remains unsteady, and any premature effort to remove the various forms of stimulus supporting it could plunge the domestic and even global economy back into recession.
Recently released notes on the Federal Reserve meeting in December 2010 make it clear the Fed has no intention of curtailing its incremental planned purchases of $600 million through this June. Federal Reserve chairman Ben Bernanke's recent comments to the Congressional Budget Committee reaffirm his belief that the program remains necessary despite recent improvements in the economic data and modestly rising inflation expectations.
The one glaring anomaly between the implied goal of keeping interest rates low is the rise in rates across the board, most especially in the 2-year to 10-year range. The 10-year rate is especially important to mortgage rates, which have risen by more than one-half percent in the last two months, further stymying any housing recovery.
Inching Toward Economic Stabilization and Growth
The bottom line is that the domestic and most major global economies seem to have settled into a slow growth trajectory that has a chance of sustainability. In the U.S., the key variable to watch is job creation and the unemployment rate; if these improve, the odds of a continued expansion increase over time. Improvement in the housing market, and state and local government finances, depend on job and income growth.
2
Globally, the sovereign debt issue in Europe, the growth issue in China and the consequences of QE2 are the key potentially destabilizing factors going forward. The common thread of each of these macro issues is the use of continued government involvement as a means to spur economic growth. The implication is that, despite over two years of ad hoc governmental responses to the fallout from the global financial crisis following Lehman Brothers' default in September 2008, the mechanisms of self-governing economic activity are not fully reactivated. The global economy has not reestablished its balance, but it seems to be staggering less and at least moving in the direction of a more stable and upward path.
If such a scenario of muddling through on the global economic front comes to pass, stock and some commodities markets should have another positive year, although not as robust as in 2010. Bond markets, however, seem set to generate lower returns as interest rates continue to rise in the face of economic improvement and increasing inflation expectations.
The total return performance (net of investment management and other operating expenses) for each of the Investment Company Funds is reflected below:
Total Returns — Year Ended December 31, 2010
| Equity Index Fund | | +14.68% | |
| All America Fund | | +17.78% | |
| Small Cap Value Fund | | +27.72% | |
| Small Cap Growth Fund | | +33.27% | |
| Mid Cap Value Fund | | +18.94% | |
| Mid-Cap Equity Index Fund | | +26.28% | |
| International Fund | | + 8.32% | |
| Composite Fund | | +11.02% | |
| Retirement Income Fund | | + 9.04% | |
| 2010 Retirement Fund | | +11.36% | |
| 2015 Retirement Fund | | +12.27% | |
| 2020 Retirement Fund | | +13.90% | |
| 2025 Retirement Fund | | +15.49% | |
| 2030 Retirement Fund | | +16.59% | |
| 2035 Retirement Fund | | +17.66% | |
| 2040 Retirement Fund | | +18.38% | |
| 2045 Retirement Fund | | +18.57% | |
| Conservative Allocation Fund | | + 9.34% | |
| Moderate Allocation Fund | | +13.11% | |
| Aggressive Allocation Fund | | +17.02% | |
| Money Market Fund | | - 0.14% | |
| Mid-Term Bond Fund | | + 6.93% | |
| Bond Fund | | + 7.29% | |
The above performance figures do not reflect the deduction of respective Separate Account fees and expenses imposed by Mutual of America Life Insurance Company. All Fund performances presented throughout this report are historical, reflect the full reinvestment of dividends paid, and should not be considered indicative of future results.
On the pages immediately following are brief presentations and graphs for each Fund (except the Money Market Fund), which illustrate each Fund's respective:
• Historical total return achieved over specified periods, expressed as an average annual rate and as a cumulative rate;
• Equivalent in dollars of a $10,000 hypothetical investment at the beginning of each specified period; and
• Historical performance compared to an appropriate index.
3
Following those are graphical representations of the asset allocations of each Fund and an illustration of each Fund's operating expenses. The summarized portfolios of each Fund and financial statements are presented in the pages which then follow.
Thank you for your continued investment in our Funds.
Sincerely,

John R. Greed
Chairman of the Board, President
and Chief Executive Officer
Mutual of America Investment Corporation
The views expressed in this Annual Report are subject to change at any time based on market and other conditions and should not be construed as a recommendation. This Report contains forward-looking statements, which speak only as of the date they were made and involve a number of risks and uncertainties that could cause actual results to differ materially from those expressed herein. Readers are cautioned not to place undue reliance on our forward-looking statements, as we assume no obligation to update these forward-looking statements. Readers assume any and all responsibility for any investment decision made as a result of the views expressed herein.
4
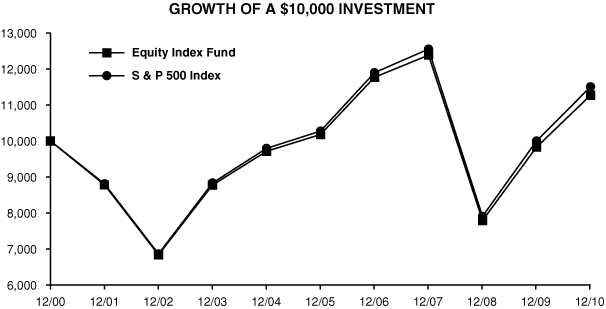
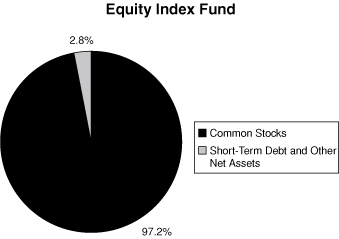
EQUITY INDEX FUND
The Equity Index Fund's objective is to replicate the performance of the S&P 500® Index (the "S&P 500"), which consists of 500 stocks chosen by Standard & Poor's for market size, liquidity and industry group representation. The S&P 500 is a market-weighted index of 500 stocks traded on the New York Stock Exchange, American Stock Exchange and NASDAQ, with each stock's weight in the index proportionate to its market value. The weightings make each company's influence on the S&P 500's performance directly proportional to that company's market value.
Equity markets declined in late June and early July of 2010 due to concerns regarding the potential sovereign debt defaults in Europe, coupled with a slower than expected economic recovery and sustained high unemployment. The S&P 500 closed at its lowest level of the year on July 1st at 1,010. However, in the second half of the year, driven by improved corporate earnings and quantitative easing by the U.S. Federal Reserve, the S&P 500 rallied, closing on December 31st at 1,257, 25% higher than its low for the year and just five points below the year's high, which occurred two days earlier. Consumer Discretionary, Industrials and Materials were the best performing sectors for 2010 returning 25%, 24% and 20% respectively. The Utilities and Health Care sectors lagged the market, with modest gains of under 1%.
The Equity Index Fund's performance for the year ended December 31, 2010, was 14.68%, in line with the benchmark return of 15.06%. Note that the Equity Index Fund's performance includes expenses, such as transaction costs and management fees, which are not applicable to the benchmark.
Equity Index Fund
| Period | | Growth | | Total Return | |
Ended
12/31/10 | | of
$10,000 | | Cumu-
lative | | Average
Annual | |
| 1 Year | | $ | 11,468 | | | | 14.68 | % | | | 14.68 | % | |
| 5 Years | | $ | 11,070 | | | | 10.70 | % | | | 2.05 | % | |
| 10 Years | | $ | 11,271 | | | | 12.71 | % | | | 1.20 | % | |
S & P 500 Index
| Period | | Growth | | Total Return | |
Ended
12/31/10 | | of
$10,000 | | Cumu-
lative | | Average
Annual | |
| 1 Year | | $ | 11,506 | | | | 15.06 | % | | | 15.06 | % | |
| 5 Years | | $ | 11,196 | | | | 11.96 | % | | | 2.29 | % | |
| 10 Years | | $ | 11,505 | | | | 15.05 | % | | | 1.41 | % | |
The line representing the performance return of the Equity Index Fund includes expenses, such as transaction costs and management fees that reduce returns, while the performance return line of the Index does not.
5
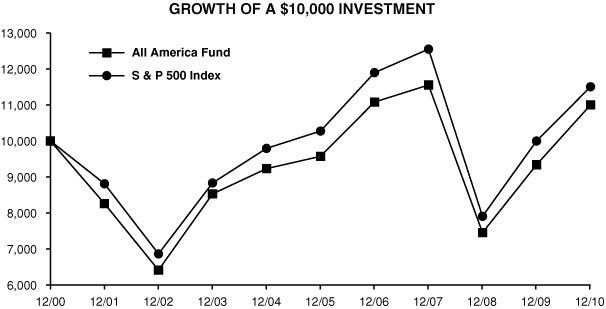
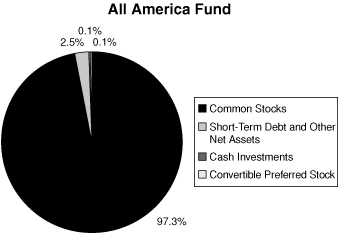
ALL AMERICA FUND
The investment objective of the All America Fund is to outperform the S&P 500® Index (the "S&P 500"). The All America Fund is approximately 60% invested in the 500 stocks that comprise the S&P 500, with the remaining 40% actively managed, using three different investment approaches. The actively managed portion of the All America Fund is close to being equally distributed between large cap stocks and small cap stocks, with the small cap stocks in turn equally distributed between small cap value and small cap growth stocks.
For the year ended December 31, 2010, the S&P 500 of large capitalization stocks increased by 15.06% on a total return basis, while the Russell 2000® Growth Index was up 29.09% and the Russell 2000® Value Index was up 24.50%.
The All America Fund's return for the year ended December 31, 2010, was 17.78% versus the benchmark return of 15.06%. The outperformance was attributable largely to the significant outperformance of both the Small Cap Growth and Small Cap Value components of the Fund relative to the S&P 500. These two components of the Fund represent 20% of the overall portfolio. The indexed portion of the Fund, representing 60% of the portfolio, exactly matched the performance of the S&P 500, while the large cap portion of the Fund, representing 20% of total assets, underperformed the S&P 500 for the period.
All America Fund
| Period | | Growth | | Total Return | |
Ended
12/31/10 | | of
$10,000 | | Cumu-
lative | | Average
Annual | |
| 1 Year | | $ | 11,778 | | | | 17.78 | % | | | 17.78 | % | |
| 5 Years | | $ | 11,492 | | | | 14.92 | % | | | 2.82 | % | |
| 10 Years | | $ | 11,002 | | | | 10.02 | % | | | 0.96 | % | |
S & P 500 Index
| Period | | Growth | | Total Return | |
Ended
12/31/10 | | of
$10,000 | | Cumu-
lative | | Average
Annual | |
| 1 Year | | $ | 11,506 | | | | 15.06 | % | | | 15.06 | % | |
| 5 Years | | $ | 11,196 | | | | 11.96 | % | | | 2.29 | % | |
| 10 Years | | $ | 11,505 | | | | 15.05 | % | | | 1.41 | % | |
The line representing the performance return of the All America Fund includes expenses, such as transaction costs and management fees that reduce returns, while the performance return line of the Index does not.
6
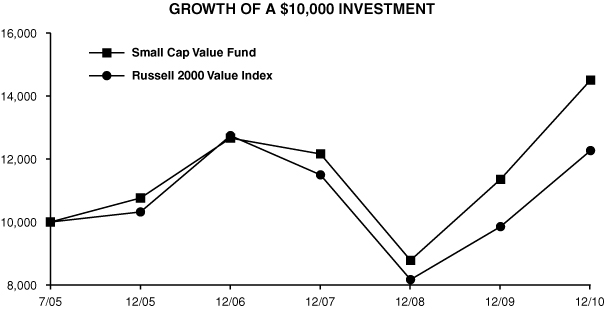
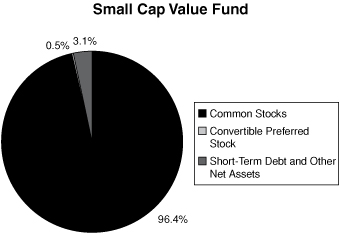
SMALL CAP VALUE FUND
The investment objective of the Small Cap Value Fund is to outperform the Russell 2000® Value Index. The Small Cap Value Fund generally invests in companies that are below $3 billion in market capitalization and have lower price-to-book characteristics than the overall market.
For the year ended December 31, 2010, the Small Cap Value Fund returned 27.72% versus a 24.50% return for the Russell 2000 Value Index. Stock selection was the primary driver of positive performance versus the benchmark. Sectors contributing to Fund performance included Consumer Staples, Energy and Technology, while sectors detracting from Fund performance included Healthcare and Finance.
Small Cap Value Fund
| Period | | Growth | | Total Return | |
Ended
12/31/10 | | of
$10,000 | | Cumu-
lative | | Average
Annual | |
| 1 Year | | $ | 12,772 | | | | 27.72 | % | | | 27.72 | % | |
| 5 Years | | $ | 13,478 | | | | 34.78 | % | | | 6.15 | % | |
Since 7/1/05
(Inception) | | $ | 14,505 | | | | 45.05 | % | | | 7.00 | % | |
Russell 2000 Value Index
| Period | | Growth | | Total Return | |
Ended
12/31/10 | | of
$10,000 | | Cumu-
lative | | Average
Annual | |
| 1 Year | | $ | 12,450 | | | | 24.50 | % | | | 24.50 | % | |
| 5 Years | | $ | 11,887 | | | | 18.87 | % | | | 3.52 | % | |
Since 7/1/05
(Inception) | | $ | 12,267 | | | | 22.67 | % | | | 3.78 | % | |
The line representing the performance return of the Small Cap Value Fund includes expenses, such as transaction costs and management fees that reduce returns, while the performance return line of the Index does not.
7
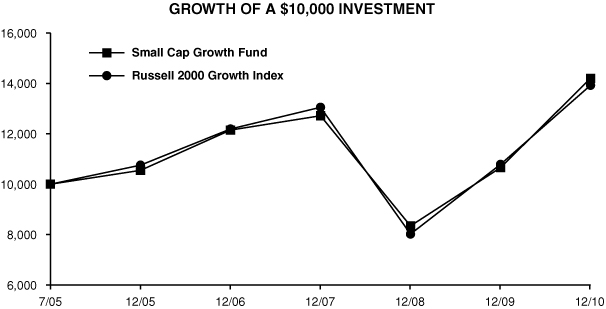
SMALL CAP GROWTH FUND
The investment objective of the Small Cap Growth Fund is capital appreciation. The Small Cap Growth Fund invests in growth stocks within the small capitalization marketplace. The Fund returned 33.27% during the year ended December 31, 2010. The Fund's benchmark, the Russell 2000® Growth Index, returned 29.09% for the period.
The Small Cap Growth Fund's outperformance against its benchmark was partially due to its lack of exposure to the micro-cap sector of the small capitalization marketplace. Sectors that contributed the most to Fund performance were Energy and Materials (largely due to our gold stocks). Utilities and Technology were not areas where we outperformed the benchmark although their underperformance was minimal. Cash equivalents were an overall drag on performance for the calendar year; however, within the year, the volatility of performance month-to-month continues to have us believe this was a prudent decision.
Macroeconomic factors continued to dominate the financial marketplace in 2010 as they did in 2009. Balance sheet recessions with secular deleveraging (such as the current one) cause consumer and state and local governments to reduce spending as they undergo a budgetary adjustment process. With our bottom-up stock selection approach, we remain focused on companies that have sustainable top line growth as opposed to companies with earnings growth that is derived from operating expense reduction.
Small Cap Growth Fund
| Period | | Growth | | Total Return | |
Ended
12/31/10 | | of
$10,000 | | Cumu-
lative | | Average
Annual | |
| 1 Year | | $ | 13,327 | | | | 33.27 | % | | | 33.27 | % | |
| 5 Years | | $ | 13,460 | | | | 34.60 | % | | | 6.12 | % | |
Since 7/1/05
(Inception) | | $ | 14,201 | | | | 42.01 | % | | | 6.58 | % | |
Russell 2000 Growth Index
| Period | | Growth | | Total Return | |
Ended
12/31/10 | | of
$10,000 | | Cumu-
lative | | Average
Annual | |
| 1 Year | | $ | 12,909 | | | | 29.09 | % | | | 29.09 | % | |
| 5 Years | | $ | 12,944 | | | | 29.44 | % | | | 5.30 | % | |
Since 7/1/05
(Inception) | | $ | 13,925 | | | | 39.25 | % | | | 6.20 | % | |
The line representing the performance return of the Small Cap Growth Fund includes expenses, such as transaction costs and management fees that reduce returns, while the performance return line of the Index does not.
8
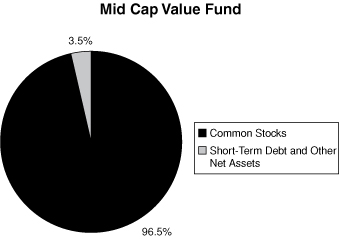
MID CAP VALUE FUND
The investment objective of the Mid Cap Value Fund is to outperform the Russell Midcap® Value Index. The Mid Cap Value Fund generally invests in companies that are between $1 billion and $20 billion in market capitalization and have lower price-to-book characteristics.
For the year ended December 31, 2010, the Mid Cap Value Fund returned 18.94% versus a 24.75% return for the Russell Midcap Value Index. Adverse stock selection was the primary driver of negative performance versus the benchmark. Sectors contributing to Mid Cap Value Fund performance included Healthcare and Technology while sectors detracting from Mid Cap Value Fund performance included Finance and Consumer Cyclical.
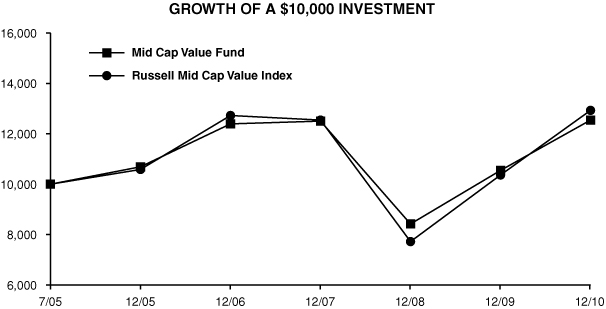
Mid Cap Value Fund
| Period | | Growth | | Total Return | |
Ended
12/31/10 | | of
$10,000 | | Cumu-
lative | | Average
Annual | |
| 1 Year | | $ | 11,894 | | | | 18.94 | % | | | 18.94 | % | |
| 5 Years | | $ | 11,733 | | | | 17.33 | % | | | 3.25 | % | |
Since 7/1/05
(Inception) | | $ | 12,544 | | | | 25.44 | % | | | 4.20 | % | |
Russell Mid Cap Value Index
| Period | | Growth | | Total Return | |
Ended
12/31/10 | | of
$10,000 | | Cumu-
lative | | Average
Annual | |
| 1 Year | | $ | 12,475 | | | | 24.75 | % | | | 24.75 | % | |
| 5 Years | | $ | 12,214 | | | | 22.14 | % | | | 4.08 | % | |
Since 7/1/05
(Inception) | | $ | 12,930 | | | | 29.30 | % | | | 4.78 | % | |
The line representing the performance return of the Mid Cap Value Fund includes expenses, such as transaction costs and management fees that reduce returns, while the performance return line of the Index does not.
9
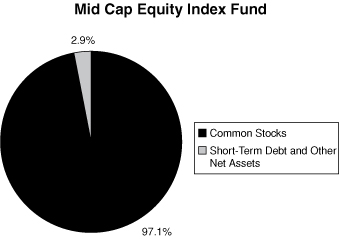
MID-CAP EQUITY INDEX FUND
The Mid-Cap Equity Index Fund invests in the 400 stocks that comprise the S&P MidCap 400® Index (the "S&P MidCap 400"). The S&P MidCap 400 is a market-weighted index of 400 stocks traded on the New York Stock Exchange, American Stock Exchange and NASDAQ. The weightings make each company's influence on the S&P MidCap 400's performance directly proportional to that company's market value. The companies included in the S&P MidCap 400 tend to be typical of this asset class, the medium-capitalized sector of the U.S. securities market.
The S&P MidCap 400 outperformed the S&P 500® Index for the year ended December 31, 2010. As was the case in 2009 small- and mid-cap companies were again preferred by investors and significantly outperformed their large-cap counterparts. Within the S&P MidCap 400, the Information Technology, Consumer Discretionary, Energy and Industrials sectors were all up at least 30%. Telecom and Utilities were the worst performing sectors but were still up 13% and 9%, respectively.
The Mid-Cap Equity Index Fund's performance for the year ended December 31, 2010, was 26.28%, in line with the 26.64% return of the S&P MidCap 400. Note that the performance of the Mid-Cap Equity Index Fund includes expenses, such as transaction costs and management fees, which are not applicable to the benchmark.

Mid-Cap Equity Index Fund
| Period | | Growth | | Total Return | |
Ended
12/31/10 | | of
$10,000 | | Cumu-
lative | | Average
Annual | |
| 1 Year | | $ | 12,628 | | | | 26.28 | % | | | 26.28 | % | |
| 5 Years | | $ | 13,042 | | | | 30.42 | % | | | 5.45 | % | |
| 10 Years | | $ | 19,347 | | | | 93.47 | % | | | 6.82 | % | |
S & P MidCap 400 Index
| Period | | Growth | | Total Return | |
Ended
12/31/10 | | of
$10,000 | | Cumu-
lative | | Average
Annual | |
| 1 Year | | $ | 12,664 | | | | 26.64 | % | | | 26.64 | % | |
| 5 Years | | $ | 13,215 | | | | 32.15 | % | | | 5.73 | % | |
| 10 Years | | $ | 19,968 | | | | 99.68 | % | | | 7.16 | % | |
The line representing the performance return of the Mid-Cap Equity Index Fund includes expenses, such as transaction costs and management fees that reduce returns, while the performance return line of the Index does not.
10
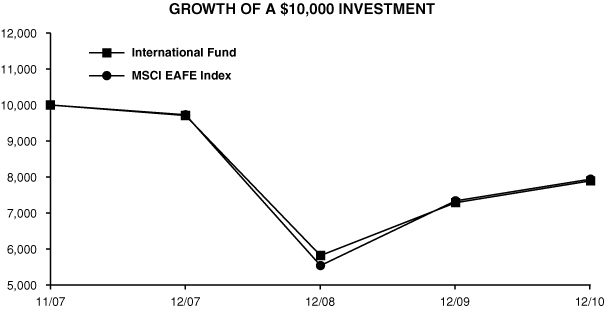
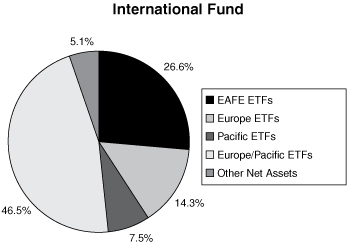
INTERNATIONAL FUND
The International Fund seeks capital appreciation by investing, directly or indirectly, in stocks of companies located outside of the United States that are reflected or contained in the Morgan Stanley Capital International, Inc. Europe, Australasia and Far East® Index ("MSCI EAFE® Index"). Currently the International Fund is invested exclusively in exchange traded funds that reflect or closely match the holdings in the MSCI EAFE Index.
For the year ended December 31, 2010, the International Fund returned 8.32%, outperforming the 8.21% return of the benchmark. Market volatility during the year caused a number of the International Fund's exchange traded fund holdings to experience positive tracking error relative to their benchmarks.
International Fund
| Period | | Growth | | Total Return | |
Ended
12/31/10 | | of
$10,000 | | Cumu-
lative | | Average
Annual | |
| 1 Year | | $ | 10,832 | | | | 8.32 | % | | | 8.32 | % | |
Since 11/5/07
(Inception) | | $ | 7,893 | | | | -21.07 | % | | | -7.22 | % | |
MSCI EAFE Index
| Period | | Growth | | Total Return | |
Ended
12/31/10 | | of
$10,000 | | Cumu-
lative | | Average
Annual | |
| 1 Year | | $ | 10,821 | | | | 8.21 | % | | | 8.21 | % | |
Since 11/5/07
(Inception) | | $ | 7,940 | | | | -20.60 | % | | | -7.05 | % | |
The line representing the performance return of the International Fund includes expenses, such as transaction costs and management fees that reduce returns, while the performance return line of the Index does not.
11
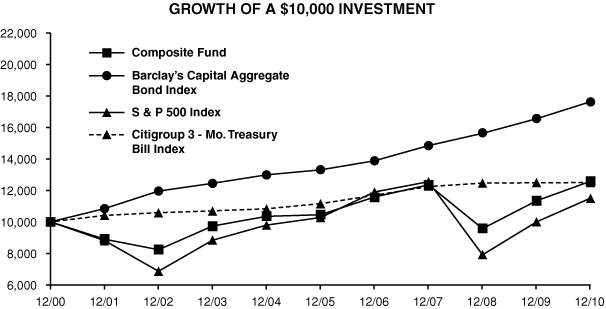
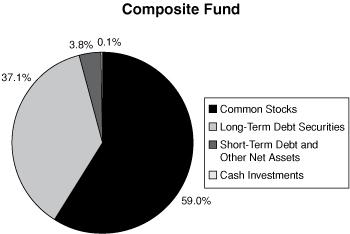
COMPOSITE FUND
The Composite Fund invests in a diversified portfolio of common stocks and fixed-income securities, seeking appreciation and current income. The equity portion of the Composite Fund invests in stocks within the S&P 500® Index (the "S&P 500").
For the year ended December 31, 2010, the equity portion of the Fund had a total return of 13.84% (before expenses), underperforming the S&P 500 Index by 122 basis points. The primary reason for underperformance of this portion of the Fund was poor stock selection within the Financial Services sector, which alone underperformed the index by 150 basis points.
The equity portion of the Composite Fund maintains sector weights within plus or minus 100 basis points of the S&P 500 Index and does not take positions in individual stocks with overweights of more than 200 basis points. This structural discipline produces a relatively low-risk portfolio that emphasizes stock selection based on strong fundamental analysis.
Fixed income portfolio managers remained focused on income as the Federal Reserve continued its low interest rate policy, especially in the money markets. As a result, higher yielding corporate bonds were in great demand. This enthusiasm for corporate credits is expected to continue as long as there is investor enthusiasm about economic prospects and a light new-issue calendar.
The Fund's fixed income strategy is to maintain a diversified portfolio of higher yielding corporate bonds while keeping the duration slightly short in order to guard against incipient inflation. All of the corporate bonds have relatively short maturities and each represents only a small percentage of the entire portfolio. This focus on income, rather than market volatility, will enable the Fund to provide favorable compounded rates of return over meaningful time periods.
For the year ended December 31, 2010, the Composite Fund returned 11.02% (after expenses) compared to the weighted benchmark return of 11.65%, 40% of which is based on the Barclays Capital Aggregate Bond Index and 60% of which is based on the S&P 500. Note that the performance of the Composite Fund includes expenses, such as transaction costs and management fees, which are not applicable to the benchmarks.
Composite Fund
| Period | | Growth | | Total Return | |
Ended
12/31/10 | | of
$10,000 | | Cumu-
lative | | Average
Annual | |
| 1 Year | | $ | 11,102 | | | | 11.02 | % | | | 11.02 | % | |
| 5 Years | | $ | 12,036 | | | | 20.36 | % | | | 3.78 | % | |
| 10 Years | | $ | 12,579 | | | | 25.79 | % | | | 2.32 | % | |
S & P 500 Index
| Period | | Growth | | Total Return | |
Ended
12/31/10 | | of
$10,000 | | Cumu-
lative | | Average
Annual | |
| 1 Year | | $ | 11,506 | | | | 15.06 | % | | | 15.06 | % | |
| 5 Years | | $ | 11,196 | | | | 11.96 | % | | | 2.29 | % | |
| 10 Years | | $ | 11,505 | | | | 15.05 | % | | | 1.41 | % | |
Barclay's Capital Aggregate Bond Index
| Period | | Growth | | Total Return | |
Ended
12/31/10 | | of
$10,000 | | Cumu-
lative | | Average
Annual | |
| 1 Year | | $ | 10,654 | | | | 6.54 | % | | | 6.54 | % | |
| 5 Years | | $ | 13,253 | | | | 32.53 | % | | | 5.79 | % | |
| 10 Years | | $ | 17,630 | | | | 76.30 | % | | | 5.83 | % | |
Citigroup 3 - Month T-Bill Index
| Period | | Growth | | Total Return | |
Ended
12/31/10 | | of
$10,000 | | Cumu-
lative | | Average
Annual | |
| 1 Year | | $ | 10,013 | | | | 0.13 | % | | | 0.13 | % | |
| 5 Years | | $ | 11,201 | | | | 12.01 | % | | | 2.30 | % | |
| 10 Years | | $ | 12,497 | | | | 24.97 | % | | | 2.26 | % | |
The line representing the performance return of the Composite Fund includes expenses, such as transaction costs and management fees that reduce returns, while the performance return line of the Indices do not.
12
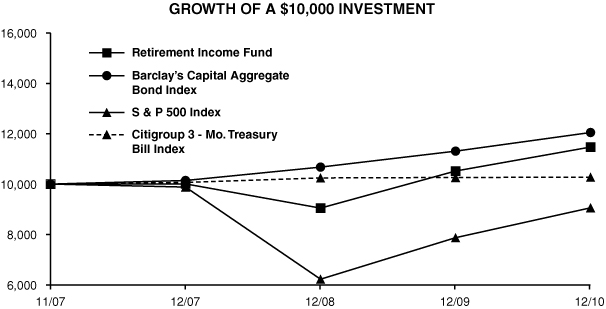
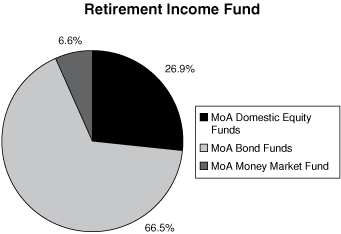
RETIREMENT INCOME FUND
The objective of the Retirement Income Fund is current income consistent with the preservation of capital and, to a lesser extent, capital appreciation. The Retirement Income Fund invests primarily in the fixed-income funds of the Investment Company and also invests in two equity funds of the Investment Company. The Fund's target allocation is approximately 75% of net assets in fixed-income funds (approximately 30% each in the Bond and Mid-Term Bond Funds and 15% in the Money Market Fund) and approximately 25% of net assets in equity funds (20% in the Equity Index Fund and 5% in the Mid-Cap Equity Index Fund).
Performance for the Retirement Income Fund is compared to the Barclays Capital Aggregate Bond Index (60% weighting), the Citigroup 3-Month Treasury Bill Index (15% weighting) and the S&P 500® Index (25% weighting). For the year ended December 31, 2010, the Fund returned 9.04% versus a 7.71% return in the weighted benchmark. The outperformance of the Fund is mainly attributable to the reduced allocation to the Money Market Fund, outperformance of the Bond Fund and Mid-Term Bond Fund relative to the Barclays Capital Aggregate Bond Index, as well as the Mid-Cap Equity Index Fund outperforming the S&P 500 Index.
Retirement Income Fund
| Period | | Growth | | Total Return | |
Ended
12/31/10 | | of
$10,000 | | Cumu-
lative | | Average
Annual | |
| 1 Year | | $ | 10,904 | | | | 9.04 | % | | | 9.04 | % | |
Since 11/5/07
(Inception) | | $ | 11,469 | | | | 14.69 | % | | | 4.44 | % | |
S & P 500 Index
| Period | | Growth | | Total Return | |
Ended
12/31/10 | | of
$10,000 | | Cumu-
lative | | Average
Annual | |
| 1 Year | | $ | 11,506 | | | | 15.06 | % | | | 15.06 | % | |
Since 11/5/07
(Inception) | | $ | 9,058 | | | | -9.42 | % | | | -3.09 | % | |
Barclay's Capital Aggregate Bond Index
| Period | | Growth | | Total Return | |
Ended
12/31/10 | | of
$10,000 | | Cumu-
lative | | Average
Annual | |
| 1 Year | | $ | 10,654 | | | | 6.54 | % | | | 6.54 | % | |
Since 11/5/07
(Inception) | | $ | 12,046 | | | | 20.46 | % | | | 6.08 | % | |
Citigroup 3 - Month T-Bill Index
| Period | | Growth | | Total Return | |
Ended
12/31/10 | | of
$10,000 | | Cumu-
lative | | Average
Annual | |
| 1 Year | | $ | 10,013 | | | | 0.13 | % | | | 0.13 | % | |
Since 11/5/07
(Inception) | | $ | 10,274 | | | | 2.74 | % | | | 0.86 | % | |
The line representing the performance return of the Retirement Income Fund includes expenses, such as transaction costs and management fees that reduce returns, while the performance return line of the Indices do not.
13
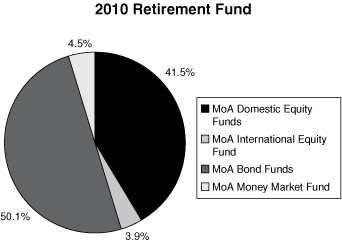
2010 RETIREMENT FUND
The objective of the 2010 Retirement Fund is current income and capital appreciation appropriate for the asset allocation associated with a target retirement in 2010. The 2010 Retirement Fund invests in funds of the Investment Company. The Fund's target allocation is approximately 57% of net assets in fixed-income funds (approximately 25% in the Bond Fund, 22% in the Mid-Term Bond Fund and 10% in the Money Market Fund) and approximately 43% of net assets in equity funds (25% in the Equity Index Fund, 14% in the Mid-Cap Equity Index Fund and 4% in the International Fund).
Performance for the 2010 Retirement Fund is compared to the Barclays Capital Aggregate Bond Index (47% weighting), the Citigroup 3-Month Treasury Bill Index (10% weighting) and the S&P 500® Index (43% weighting). For the year ended December 31, 2010, the Fund returned 11.36% versus a 9.56% return in the weighted benchmark. The outperformance of the Fund is mainly attributable to the reduced allocation to the Money Market Fund, outperformance of the Bond Fund and Mid-Term Bond Fund relative to the Barclays Capital Aggregate Bond Index, as well as the Mid-Cap Equity Index Fund outperforming the S&P 500 Index.

2010 Retirement Fund
| Period | | Growth | | Total Return | |
Ended
12/31/10 | | of
$10,000 | | Cumu-
lative | | Average
Annual | |
| 1 Year | | $ | 11,136 | | | | 11.36 | % | | | 11.36 | % | |
Since 11/5/07
(Inception) | | $ | 10,940 | | | | 9.40 | % | | | 2.89 | % | |
S & P 500 Index
| Period | | Growth | | Total Return | |
Ended
12/31/10 | | of
$10,000 | | Cumu-
lative | | Average
Annual | |
| 1 Year | | $ | 11,506 | | | | 15.06 | % | | | 15.06 | % | |
Since 11/5/07
(Inception) | | $ | 9,058 | | | | -9.42 | % | | | -3.09 | % | |
Barclay's Capital Aggregate Bond Index
| Period | | Growth | | Total Return | |
Ended
12/31/10 | | of
$10,000 | | Cumu-
lative | | Average
Annual | |
| 1 Year | | $ | 10,654 | | | | 6.54 | % | | | 6.54 | % | |
Since 11/5/07
(Inception) | | $ | 12,046 | | | | 20.46 | % | | | 6.08 | % | |
Citigroup 3 - Month T-Bill Index
| Period | | Growth | | Total Return | |
Ended
12/31/10 | | of
$10,000 | | Cumu-
lative | | Average
Annual | |
| 1 Year | | $ | 10,013 | | | | 0.13 | % | | | 0.13 | % | |
Since 11/5/07
(Inception) | | $ | 10,274 | | | | 2.74 | % | | | 0.86 | % | |
The line representing the performance return of the 2010 Retirement Fund includes expenses, such as transaction costs and management fees that reduce returns, while the performance return line of the Indices do not.
14
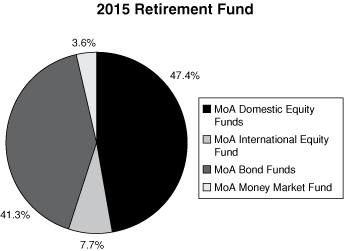
2015 RETIREMENT FUND
The objective of the 2015 Retirement Fund is current income and capital appreciation appropriate for the asset allocation associated with a target retirement in 2015. The 2015 Retirement Fund invests in funds of the Investment Company. The Fund's target allocation is approximately 53% of net assets in equity funds (approximately 30% in the Equity Index Fund, 11% in the Mid-Cap Equity Index Fund, 8% in the International Fund and 2% each in the Small Cap Growth and Small Cap Value Funds) and approximately 47% of net assets in fixed-income funds (25% in the Bond Fund, 13% in the Mid-Term Bond Fund and 9% in the Money Market Fund).
Performance for the 2015 Retirement Fund is compared to the S&P 500® Index (53% weighting), the Barclays Capital Aggregate Bond Index (38% weighting) and the Citigroup 3-Month Treasury Bill Index (9% weighting). For the year ended December 31, 2010, the Fund returned 12.27% versus a 10.48% return in the weighted benchmark. The outperformance of the Fund is mainly attributable to the reduced allocation to the Money Market Fund, outperformance of the Bond Fund and Mid-Term Bond Fund relative to the Barclays Capital Aggregate Bond Index, as well as the Mid-Cap Equity Index Fund, Small Cap Growth Fund and Small Cap Value Fund outperforming the S&P 500 Index.

2015 Retirement Fund
| Period | | Growth | | Total Return | |
Ended
12/31/10 | | of
$10,000 | | Cumu-
lative | | Average
Annual | |
| 1 Year | | $ | 11,227 | | | | 12.27 | % | | | 12.27 | % | |
Since 11/5/07
(Inception) | | $ | 10,631 | | | | 6.31 | % | | | 1.96 | % | |
S & P 500 Index
| Period | | Growth | | Total Return | |
Ended
12/31/10 | | of
$10,000 | | Cumu-
lative | | Average
Annual | |
| 1 Year | | $ | 11,506 | | | | 15.06 | % | | | 15.06 | % | |
Since 11/5/07
(Inception) | | $ | 9,058 | | | | -9.42 | % | | | -3.09 | % | |
Barclay's Capital Aggregate Bond Index
| Period | | Growth | | Total Return | |
Ended
12/31/10 | | of
$10,000 | | Cumu-
lative | | Average
Annual | |
| 1 Year | | $ | 10,654 | | | | 6.54 | % | | | 6.54 | % | |
Since 11/5/07
(Inception) | | $ | 12,046 | | | | 20.46 | % | | | 6.08 | % | |
Citigroup 3 - Month T-Bill Index
| Period | | Growth | | Total Return | |
Ended
12/31/10 | | of
$10,000 | | Cumu-
lative | | Average
Annual | |
| 1 Year | | $ | 10,013 | | | | 0.13 | % | | | 0.13 | % | |
Since 11/5/07
(Inception) | | $ | 10,274 | | | | 2.74 | % | | | 0.86 | % | |
The line representing the performance return of the 2015 Retirement Fund includes expenses, such as transaction costs and management fees that reduce returns, while the performance return line of the Indices do not.
15
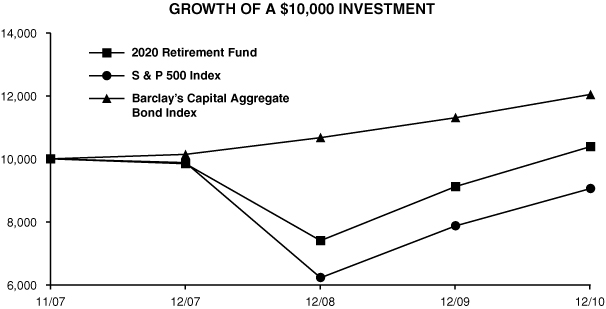
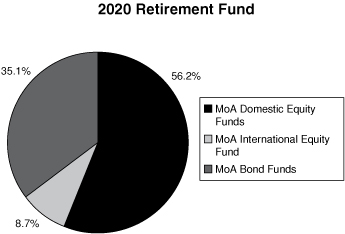
2020 RETIREMENT FUND
The objective of the 2020 Retirement Fund is current income and capital appreciation appropriate for the asset allocation associated with a target retirement in 2020. The 2020 Retirement Fund invests in funds of the Investment Company. The Fund's target allocation is approximately 63% of net assets in equity funds (approximately 35% in the Equity Index Fund, 11% in the Mid-Cap Equity Index Fund, 9% in the International Fund and 4% each in the Small Cap Growth and Small Cap Value Funds) and approximately 37% of net assets in fixed-income funds (24% in the Bond Fund and 13% in the Mid-Term Bond Fund).
Performance for the 2020 Retirement Fund is compared to the S&P 500® Index (63% weighting) and the Barclays Capital Aggregate Bond Index (37% weighting). For the year ended December 31, 2010, the Fund returned 13.90% versus an 11.91% return in the weighted benchmark. The outperformance of the Fund is mainly attributable to the Mid-Cap Equity Index, Small Cap Value and Small Cap Growth Funds outperforming the S&P 500 Index as well as the Bond Fund and the Mid-Term Bond Fund outperforming the Barclays Capital Aggregate Bond Index.
2020 Retirement Fund
| Period | | Growth | | Total Return | |
Ended
12/31/10 | | of
$10,000 | | Cumu-
lative | | Average
Annual | |
| 1 Year | | $ | 11,390 | | | | 13.90 | % | | | 13.90 | % | |
Since 11/5/07
(Inception) | | $ | 10,390 | | | | 3.90 | % | | | 1.22 | % | |
S & P 500 Index
| Period | | Growth | | Total Return | |
Ended
12/31/10 | | of
$10,000 | | Cumu-
lative | | Average
Annual | |
| 1 Year | | $ | 11,506 | | | | 15.06 | % | | | 15.06 | % | |
Since 11/5/07
(Inception) | | $ | 9,058 | | | | -9.42 | % | | | -3.09 | % | |
Barclay's Capital Aggregate Bond Index
| Period | | Growth | | Total Return | |
Ended
12/31/10 | | of
$10,000 | | Cumu-
lative | | Average
Annual | |
| 1 Year | | $ | 10,654 | | | | 6.54 | % | | | 6.54 | % | |
Since 11/5/07
(Inception) | | $ | 12,046 | | | | 20.46 | % | | | 6.08 | % | |
The line representing the performance return of the 2020 Retirement Fund includes expenses, such as transaction costs and management fees that reduce returns, while the performance return line of the Indices do not.
16
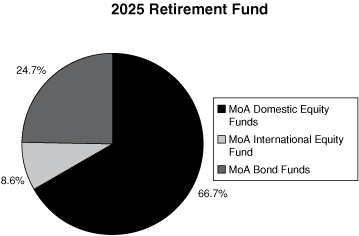
2025 RETIREMENT FUND
The objective of the 2025 Retirement Fund is current income and capital appreciation appropriate for the asset allocation associated with a target retirement in 2025. The 2025 Retirement Fund invests in funds of the Investment Company. The Fund's target allocation is approximately 74% of net assets in equity funds (approximately 40% in the Equity Index Fund, 15% in the Mid-Cap Equity Index Fund, 9% in the International Fund and 5% each in the Small Cap Growth and Small Cap Value Funds) and approximately 26% of net assets in fixed-income funds (20% in the Bond Fund and 6% in the Mid-Term Bond Fund).
Performance for the 2025 Retirement Fund is compared to the S&P 500® Index (74% weighting) and the Barclays Capital Aggregate Bond Index (26% weighting). For the year ended December 31, 2010, the Fund returned 15.49% versus a 12.84% return in the weighted benchmark. The outperformance of the Fund is mainly attributable to the Mid-Cap Equity Index, Small Cap Value and Small Cap Growth Funds outperforming the S&P 500 Index, as well as the Bond Fund and the Mid-Term Bond Fund outperforming the Barclays Capital Aggregate Bond Index.

2025 Retirement Fund
| Period | | Growth | | Total Return | |
Ended
12/31/10 | | of
$10,000 | | Cumu-
lative | | Average
Annual | |
| 1 Year | | $ | 11,549 | | | | 15.49 | % | | | 15.49 | % | |
Since 11/5/07
(Inception) | | $ | 10,157 | | | | 1.57 | % | | | 0.50 | % | |
S & P 500 Index
| Period | | Growth | | Total Return | |
Ended
12/31/10 | | of
$10,000 | | Cumu-
lative | | Average
Annual | |
| 1 Year | | $ | 11,506 | | | | 15.06 | % | | | 15.06 | % | |
Since 11/5/07
(Inception) | | $ | 9,058 | | | | -9.42 | % | | | -3.09 | % | |
Barclay's Capital Aggregate Bond Index
| Period | | Growth | | Total Return | |
Ended
12/31/10 | | of
$10,000 | | Cumu-
lative | | Average
Annual | |
| 1 Year | | $ | 10,654 | | | | 6.54 | % | | | 6.54 | % | |
Since 11/5/07
(Inception) | | $ | 12,046 | | | | 20.46 | % | | | 6.08 | % | |
The line representing the performance return of the 2025 Retirement Fund includes expenses, such as transaction costs and management fees that reduce returns, while the performance return line of the Indices do not.
17
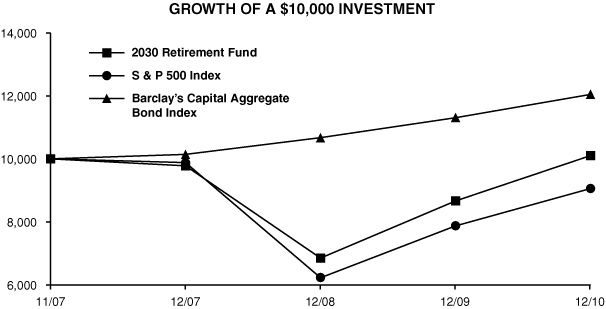
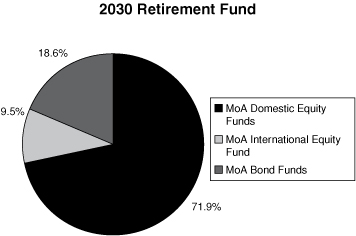
2030 RETIREMENT FUND
The objective of the 2030 Retirement Fund is current income and capital appreciation appropriate for the asset allocation associated with a target retirement in 2030. The 2030 Retirement Fund invests in funds of the Investment Company. The Fund's target allocation is approximately 80% of net assets in equity funds (approximately 40% in the Equity Index Fund, 18% in the Mid-Cap Equity Index Fund, 10% in the International Fund and 6% each in the Small Cap Growth and Small Cap Value Funds) and approximately 20% of net assets in the Bond Fund.
Performance for the 2030 Retirement Fund is compared to the S&P 500® Index (80% weighting) and the Barclays Capital Aggregate Bond Index (20% weighting). For the year ended December 31, 2010, the Fund returned 16.59% versus a 13.36% return in the weighted benchmark. The outperformance of the Fund is mainly attributable to the Mid-Cap Equity Index, Small Cap Value and Small Cap Growth Funds outperforming the S&P 500 Index, as well as the Bond Fund outperforming the Barclays Capital Aggregate Bond Index.
2030 Retirement Fund
| Period | | Growth | | Total Return | |
Ended
12/31/10 | | of
$10,000 | | Cumu-
lative | | Average
Annual | |
| 1 Year | | $ | 11,659 | | | | 16.59 | % | | | 16.59 | % | |
Since 11/5/07
(Inception) | | $ | 10,103 | | | | 1.03 | % | | | 0.32 | % | |
S & P 500 Index
| Period | | Growth | | Total Return | |
Ended
12/31/10 | | of
$10,000 | | Cumu-
lative | | Average
Annual | |
| 1 Year | | $ | 11,506 | | | | 15.06 | % | | | 15.06 | % | |
Since 11/5/07
(Inception) | | $ | 9,058 | | | | -9.42 | % | | | -3.09 | % | |
Barclay's Capital Aggregate Bond Index
| Period | | Growth | | Total Return | |
Ended
12/31/10 | | of
$10,000 | | Cumu-
lative | | Average
Annual | |
| 1 Year | | $ | 10,654 | | | | 6.54 | % | | | 6.54 | % | |
Since 11/5/07
(Inception) | | $ | 12,046 | | | | 20.46 | % | | | 6.08 | % | |
The line representing the performance return of the 2030 Retirement Fund includes expenses, such as transaction costs and management fees that reduce returns, while the performance return line of the Indices do not.
18
2035 RETIREMENT FUND
The objective of the 2035 Retirement Fund is current income and capital appreciation appropriate for the asset allocation associated with a target retirement in 2035. The 2035 Retirement Fund invests in funds of the Investment Company. The Fund's target allocation is approximately 87% of net assets in equity funds (approximately 40% in the Equity Index Fund, 21% in the Mid-Cap Equity Index Fund, 12% in the International Fund and 7% each in the Small Cap Growth and Small Cap Value Funds) and approximately 13% of net assets in the Bond Fund.
Performance for the 2035 Retirement Fund is compared to the S&P 500® Index (87% weighting) and the Barclays Capital Aggregate Bond Index (13% weighting). For the year ended December 31, 2010, the Fund returned 17.66% versus a 13.95% return in the weighted benchmark. The outperformance of the Fund is mainly attributable to the Mid-Cap Equity Index, Small Cap Value and Small Cap Growth Funds outperforming the S&P 500 Index, as well as the Bond Fund outperforming the Barclays Capital Aggregate Bond Index.

2035 Retirement Fund
| Period | | Growth | | Total Return | |
Ended
12/31/10 | | of
$10,000 | | Cumu-
lative | | Average
Annual | |
| 1 Year | | $ | 11,766 | | | | 17.66 | % | | | 17.66 | % | |
Since 11/5/07
(Inception) | | $ | 9,832 | | | | -1.68 | % | | | -0.53 | % | |
S & P 500 Index
| Period | | Growth | | Total Return | |
Ended
12/31/10 | | of
$10,000 | | Cumu-
lative | | Average
Annual | |
| 1 Year | | $ | 11,506 | | | | 15.06 | % | | | 15.06 | % | |
Since 11/5/07
(Inception) | | $ | 9,058 | | | | -9.42 | % | | | -3.09 | % | |
Barclay's Capital Aggregate Bond Index
| Period | | Growth | | Total Return | |
Ended
12/31/10 | | of
$10,000 | | Cumu-
lative | | Average
Annual | |
| 1 Year | | $ | 10,654 | | | | 6.54 | % | | | 6.54 | % | |
Since 11/5/07
(Inception) | | $ | 12,046 | | | | 20.46 | % | | | 6.08 | % | |
The line representing the performance return of the 2035 Retirement Fund includes expenses, such as transaction costs and management fees that reduce returns, while the performance return line of the Indices do not.
19
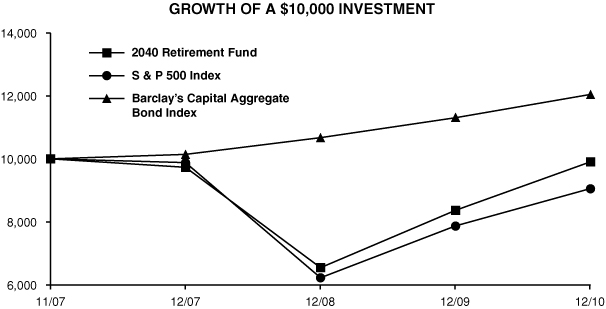
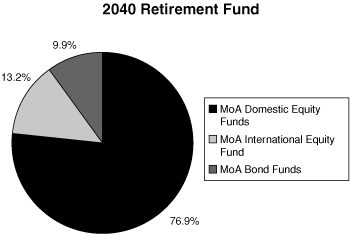
2040 RETIREMENT FUND
The objective of the 2040 Retirement Fund is current income and capital appreciation appropriate for the asset allocation associated with a target retirement in 2040. The 2040 Retirement Fund invests in funds of the Investment Company. The Fund's target allocation is approximately 89% of net assets in equity funds (approximately 35% in the Equity Index Fund, 24% in the Mid-Cap Equity Index Fund, 14% in the International Fund and 8% each in the Small Cap Growth and Small Cap Value Funds) and approximately 11% of net assets in the Bond Fund.
Performance for the 2040 Retirement Fund is compared to the S&P 500® Index (89% weighting) and the Barclays Capital Aggregate Bond Index (11% weighting). For the year ended December 31, 2010, the Fund returned 18.38% versus a 14.12% return in the weighted benchmark. The outperformance of the Fund is mainly attributable to the Mid-Cap Equity Index, Small Cap Value and Small Cap Growth Funds outperforming the S&P 500 Index, as well as the Bond Fund outperforming the Barclays Capital Aggregate Bond Index.
2040 Retirement Fund
| Period | | Growth | | Total Return | |
Ended
12/31/10 | | of
$10,000 | | Cumu-
lative | | Average
Annual | |
| 1 Year | | $ | 11,838 | | | | 18.38 | % | | | 18.38 | % | |
Since 11/5/07
(Inception) | | $ | 9,907 | | | | -0.93 | % | | | -0.30 | % | |
S & P 500 Index
| Period | | Growth | | Total Return | |
Ended
12/31/10 | | of
$10,000 | | Cumu-
lative | | Average
Annual | |
| 1 Year | | $ | 11,506 | | | | 15.06 | % | | | 15.06 | % | |
Since 11/5/07
(Inception) | | $ | 9,058 | | | | -9.42 | % | | | -3.09 | % | |
Barclay's Capital Aggregate Bond Index
| Period | | Growth | | Total Return | |
Ended
12/31/10 | | of
$10,000 | | Cumu-
lative | | Average
Annual | |
| 1 Year | | $ | 10,654 | | | | 6.54 | % | | | 6.54 | % | |
Since 11/5/07
(Inception) | | $ | 12,046 | | | | 20.46 | % | | | 6.08 | % | |
The line representing the performance return of the 2040 Retirement Fund includes expenses, such as transaction costs and management fees that reduce returns, while the performance return line of the Indices do not.
20
2045 RETIREMENT FUND
The objective of the 2045 Retirement Fund is current income and capital appreciation appropriate for the asset allocation associated with a target retirement in 2045. The 2045 Retirement Fund invests in funds of the Investment Company. The Fund's target allocation is approximately 90% of net assets in equity funds (approximately 35% in the Equity Index Fund, 20% in the Mid-Cap Equity Index Fund, 15% in the International Fund and 10% each in the Small Cap Growth and Small Cap Value Funds) and approximately 10% of net assets in the Bond Fund.
Performance for the 2045 Retirement Fund is compared to the S&P 500® Index (90% weighting) and the Barclays Capital Aggregate Bond Index (10% weighting). For the year ended December 31, 2010, the Fund returned 18.57% versus a 14.21% return in the weighted benchmark. The outperformance of the Fund is mainly attributable to the Mid-Cap Equity Index, Small Cap Value and Small Cap Growth Funds outperforming the S&P 500 Index, as well as the Bond Fund outperforming the Barclays Capital Aggregate Bond Index.

2045 Retirement Fund
| Period | | Growth | | Total Return | |
Ended
12/31/10 | | of
$10,000 | | Cumu-
lative | | Average
Annual | |
| 1 Year | | $ | 11,857 | | | | 18.57 | % | | | 18.57 | % | |
Since 11/5/07
(Inception) | | $ | 9,867 | | | | -1.33 | % | | | -0.42 | % | |
S & P 500 Index
| Period | | Growth | | Total Return | |
Ended
12/31/10 | | of
$10,000 | | Cumu-
lative | | Average
Annual | |
| 1 Year | | $ | 11,506 | | | | 15.06 | % | | | 15.06 | % | |
Since 11/5/07
(Inception) | | $ | 9,058 | | | | -9.42 | % | | | -3.09 | % | |
Barclay's Capital Aggregate Bond Index
| Period | | Growth | | Total Return | |
Ended
12/31/10 | | of
$10,000 | | Cumu-
lative | | Average
Annual | |
| 1 Year | | $ | 10,654 | | | | 6.54 | % | | | 6.54 | % | |
Since 11/5/07
(Inception) | | $ | 12,046 | | | | 20.46 | % | | | 6.08 | % | |
The line representing the performance return of the 2045 Retirement Fund includes expenses, such as transaction costs and management fees that reduce returns, while the performance return line of the Indices do not.
21
CONSERVATIVE ALLOCATION FUND
The objective of the Conservative Allocation Fund is current income and, to a lesser extent, capital appreciation. The Conservative Allocation Fund invests primarily in the fixed-income funds of the Investment Company and also invests in an equity fund of the Investment Company. The Conservative Allocation Fund's target allocation is approximately 75% of net assets in fixed-income funds (approximately 30% in the Bond Fund and approximately 45% in the Mid-Term Bond Fund) and approximately 25% of net assets in equity funds (the Equity Index Fund).
Performance for the Conservative Allocation Fund is compared to the Barclays Capital Aggregate Bond Index (75% weighting) and the S&P 500® Index (25% weighting). For the year ended December 31, 2010, the Conservative Allocation Fund returned 9.34% versus an 8.67% return in the weighted benchmark. The outperformance of the Fund is mainly attributable to the Bond Fund and the Mid-Term Bond Fund outperforming the Barclays Capital Aggregate Bond Index.

Conservative Allocation Fund
| Period | | Growth | | Total Return | |
Ended
12/31/10 | | of
$10,000 | | Cumu-
lative | | Average
Annual | |
| 1 Year | | $ | 10,934 | | | | 9.34 | % | | | 9.34 | % | |
| 5 Years | | $ | 12,962 | | | | 29.62 | % | | | 5.33 | % | |
Since 5/20/03
(Inception) | | $ | 14,625 | | | | 46.25 | % | | | 5.12 | % | |
S & P 500 Index
| Period | | Growth | | Total Return | |
Ended
12/31/10 | | of
$10,000 | | Cumu-
lative | | Average
Annual | |
| 1 Year | | $ | 11,506 | | | | 15.06 | % | | | 15.06 | % | |
| 5 Years | | $ | 11,196 | | | | 11.96 | % | | | 2.29 | % | |
Since 5/20/03
(Inception) | | $ | 15,919 | | | | 59.19 | % | | | 6.30 | % | |
Barclay's Capital Aggregate Bond Index
| Period | | Growth | | Total Return | |
Ended
12/31/10 | | of
$10,000 | | Cumu-
lative | | Average
Annual | |
| 1 Year | | $ | 10,654 | | | | 6.54 | % | | | 6.54 | % | |
| 5 Years | | $ | 13,253 | | | | 32.53 | % | | | 5.79 | % | |
Since 5/20/03
(Inception) | | $ | 14,218 | | | | 42.18 | % | | | 4.73 | % | |
The line representing the performance return of the Conservative Allocation Fund includes expenses, such as transaction costs and management fees that reduce returns, while the performance return line of the Indices do not.
22
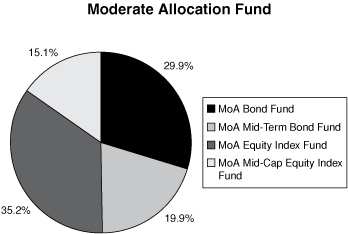
MODERATE ALLOCATION FUND
The objective of the Moderate Allocation Fund is capital appreciation and current income. The Moderate Allocation Fund invests in the equity and fixed-income funds of the Investment Company. The Moderate Allocation Fund's target allocation is approximately 50% of net assets in equity funds (approximately 35% of its net assets in the Equity Index Fund and approximately 15% of its net assets in the Mid-Cap Equity Index Fund) and approximately 50% of net assets in fixed-income funds (approximately 30% of its net assets in the Bond Fund and approximately 20% of its net assets in the Mid-Term Bond Fund).
Performance for the Moderate Allocation Fund is compared to the S&P 500® Index (50% weighting) and the Barclays Capital Aggregate Bond Index (50% weighting). For the year ended December 31, 2010, the Moderate Allocation Fund returned 13.11% versus a 10.80% return for the weighted benchmark. The outperformance of the Fund is mainly attributable to the Mid-Cap Equity Index Fund outperforming the S&P 500 Index, as well as the Bond Fund and the Mid-Term Bond Fund outperforming the Barclays Capital Aggregate Bond Index.

Moderate Allocation Fund
| Period | | Growth | | Total Return | |
Ended
12/31/10 | | of
$10,000 | | Cumu-
lative | | Average
Annual | |
| 1 Year | | $ | 11,311 | | | | 13.11 | % | | | 13.11 | % | |
| 5 Years | | $ | 12,768 | | | | 27.68 | % | | | 5.01 | % | |
Since 5/20/03
(Inception) | | $ | 16,119 | | | | 61.19 | % | | | 6.47 | % | |
S & P 500 Index
| Period | | Growth | | Total Return | |
Ended
12/31/10 | | of
$10,000 | | Cumu-
lative | | Average
Annual | |
| 1 Year | | $ | 11,506 | | | | 15.06 | % | | | 15.06 | % | |
| 5 Years | | $ | 11,196 | | | | 11.96 | % | | | 2.29 | % | |
Since 5/20/03
(Inception) | | $ | 15,919 | | | | 59.19 | % | | | 6.30 | % | |
Barclay's Capital Aggregate Bond Index
| Period | | Growth | | Total Return | |
Ended
12/31/10 | | of
$10,000 | | Cumu-
lative | | Average
Annual | |
| 1 Year | | $ | 10,654 | | | | 6.54 | % | | | 6.54 | % | |
| 5 Years | | $ | 13,253 | | | | 32.53 | % | | | 5.79 | % | |
Since 5/20/03
(Inception) | | $ | 14,218 | | | | 42.18 | % | | | 4.73 | % | |
The line representing the performance return of the Moderate Allocation Fund includes expenses, such as transaction costs and management fees that reduce returns, while the performance return line of the Indices do not.
23
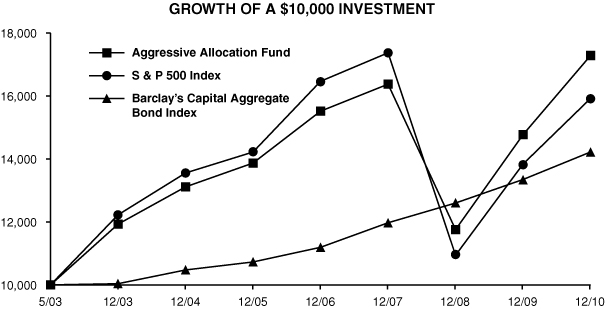
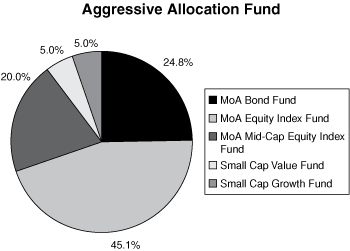
AGGRESSIVE ALLOCATION FUND
The objective of the Aggressive Allocation Fund is capital appreciation and, to a lesser extent, current income. The Aggressive Allocation Fund invests in the equity and fixed-income funds of the Investment Company. The Aggressive Allocation Fund's target allocation is approximately 75% of net assets in equity funds (approximately 45% of its net assets in the Equity Index Fund, approximately 20% of its net assets in the Mid-Cap Equity Index Fund, approximately 5% of its net assets in the Small Cap Value Fund and approximately 5% of its net assets in the Small Cap Growth Fund) and approximately 25% of net assets in the Bond Fund.
Performance for the Aggressive Allocation Fund is compared to the S&P 500® Index (75% weighting) and the Barclays Capital Aggregate Bond Index (25% weighting). For the year ended December 31, 2010, the Aggressive Allocation Fund returned 17.02% versus a 12.93% return for the weighted benchmark. The outperformance of the Fund is mainly attributable to the Mid-Cap Equity Index, Small Cap Value and Small Cap Growth Funds outperforming the S&P 500 Index, as well as the Bond Fund outperforming the Barclays Capital Aggregate Bond Index.
Aggressive Allocation Fund
| Period | | Growth | | Total Return | |
Ended
12/31/10 | | of
$10,000 | | Cumu-
lative | | Average
Annual | |
| 1 Year | | $ | 11,702 | | | | 17.02 | % | | | 17.02 | % | |
| 5 Years | | $ | 12,462 | | | | 24.62 | % | | | 4.50 | % | |
Since 5/20/03
(Inception) | | $ | 17,281 | | | | 72.81 | % | | | 7.45 | % | |
S & P 500 Index
| Period | | Growth | | Total Return | |
Ended
12/31/10 | | of
$10,000 | | Cumu-
lative | | Average
Annual | |
| 1 Year | | $ | 11,506 | | | | 15.06 | % | | | 15.06 | % | |
| 5 Years | | $ | 11,196 | | | | 11.96 | % | | | 2.29 | % | |
Since 5/20/03
(Inception) | | $ | 15,919 | | | | 59.19 | % | | | 6.30 | % | |
Barclay's Capital Aggregate Bond Index
| Period | | Growth | | Total Return | |
Ended
12/31/10 | | of
$10,000 | | Cumu-
lative | | Average
Annual | |
| 1 Year | | $ | 10,654 | | | | 6.54 | % | | | 6.54 | % | |
| 5 Years | | $ | 13,253 | | | | 32.53 | % | | | 5.79 | % | |
Since 5/20/03
(Inception) | | $ | 14,218 | | | | 42.18 | % | | | 4.73 | % | |
The line representing the performance return of the Aggressive Allocation Fund includes expenses, such as transaction costs and management fees that reduce returns, while the performance return line of the Indices do not.
24
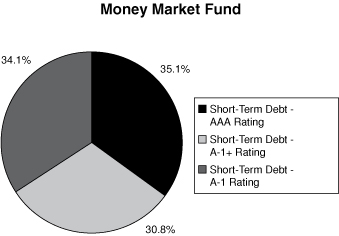
MONEY MARKET FUND
The Money Market Fund's investment objective is to realize current income while maintaining liquidity, investment quality and stability of capital through investing in high-quality commercial paper issued by U.S. corporations and securities issued by the U.S. government and its agencies. The Money Market Fund returned -0.14% for the year ended December 31, 2010, compared to a 0.13% return for the Citigroup 3-Month Treasury Bill Index. Note that the performance of the Money Market Fund includes expenses, such as transaction costs and management fees, which are not applicable to the benchmark.
The money market sector continued to experience historically low yields and a shrinking supply of eligible investments during 2010. The Federal Reserve remained committed to a near-zero interest rate policy, as it has kept its Fed Funds target rate unchanged at a range of 0 to 25 basis points since 2008. The Fed has stated that economic conditions "are likely to warrant exceptionally low levels for the Federal Funds rate for an extended period." The Money Market Fund will continue to focus on quality and a high degree of liquidity by maintaining a relatively short weighted average maturity.
The seven-day effective yield as of February 15, 2011, was -0.12%. As with all performance reporting, this yield is not necessarily indicative of future annual yields. Neither the Federal Deposit Insurance Corporation nor any other U.S. government agency insures or guarantees the Separate Account's investments in shares of the Money Market Fund.
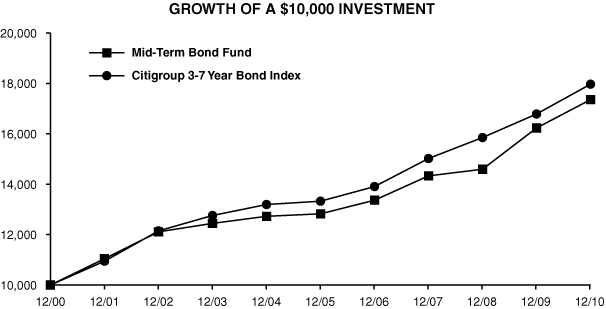
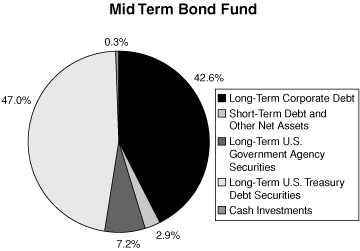
MID-TERM BOND FUND
The Mid-Term Bond Fund seeks a high level of return consistent with the preservation of capital through investment in publicly traded debt securities. The Mid-Term Bond Fund primarily invests in corporate and U.S. government agency securities, which normally yield more than U.S. Treasury issues.
During 2010 the Mid-Term Bond Fund continued to overweight corporate issues and underweight Agencies and Treasuries. This focus will continue for the near future since it provides a greater income benefit than other available investment sectors. The Mid-Term Bond Fund also maintains extreme diversification in its credit exposure in order to minimize event risk.
The Fund's duration is around 90% of its market benchmark. This serves to dampen price volatility and protect against the effects of prospective inflation. While inflation is still relatively benign, the government's economic stimulus and debt monetization policies are expected to cause an eventual rise in rates.
For the year ended December 31, 2010, the Mid-Term Bond Fund returned 6.93% versus a 7.05% return for the Citigroup Government/Corporate 3-7 Year Bond Index. Note that the performance of the Mid-Term Bond Fund includes expenses, such as transaction costs and management fees, which are not applicable to the benchmark.
Mid-Term Bond Fund
| Period | | Growth | | Total Return | |
Ended
12/31/10 | | of
$10,000 | | Cumu-
lative | | Average
Annual | |
| 1 Year | | $ | 10,693 | | | | 6.93 | % | | | 6.93 | % | |
| 5 Years | | $ | 13,533 | | | | 35.33 | % | | | 6.24 | % | |
| 10 Years | | $ | 17,356 | | | | 73.56 | % | | | 5.67 | % | |
Citigroup 3-7 Year Bond Index
| Period | | Growth | | Total Return | |
Ended
12/31/10 | | of
$10,000 | | Cumu-
lative | | Average
Annual | |
| 1 Year | | $ | 10,705 | | | | 7.05 | % | | | 7.05 | % | |
| 5 Years | | $ | 13,483 | | | | 34.83 | % | | | 6.16 | % | |
| 10 Years | | $ | 17,968 | | | | 79.68 | % | | | 6.03 | % | |
The line representing the performance return of the Mid-Term Bond Fund includes expenses, such as transaction costs and management fees that reduce returns, while the performance return line of the Index does not.
25
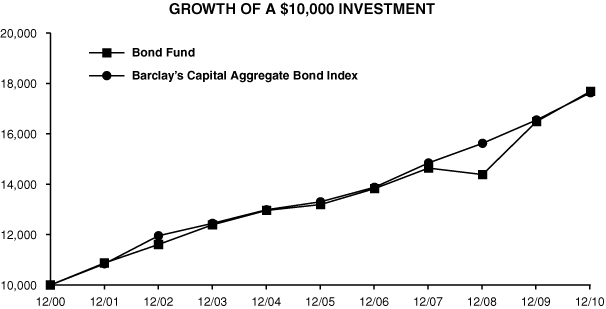
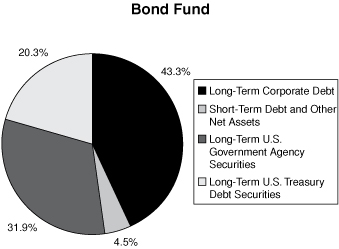
BOND FUND
The Bond Fund's primary investment objective is to provide as high a level of current income over time as is believed to be consistent with prudent investment risk by investing primarily in investment grade, publicly traded debt securities. A secondary objective is preservation of capital. The Bond Fund primarily invests in corporate, U.S. government agency and mortgage-backed securities, all of which normally yield more than U.S. Treasury issues.
During 2010, the Federal Reserve remained committed to keeping short-term rates low in an effort to stimulate the economy, re-liquefy the banking system and support the mortgage market. Longer-term rates also declined while the yield curve remained relative steep.
The corporate bond market also performed well as yield spreads between government and corporate bonds continued to tighten aggressively. This tightening was partially a result of a decrease in supply and an increase in demand by individual and institutional investors desperately searching for income. It was also helped by positive economic expectations on the part of many investors.
The Bond Fund's strategy was to maintain a slightly shorter duration than its benchmark, emphasize relatively short corporate bonds with high yields, establish extreme credit diversification and take a market weight in mortgage-related securities.
The Bond Fund's return for the year ended December 31, 2010, was 7.29%, compared to 6.54% for the Barclays Capital U.S. Aggregate Bond Index. The Fund's emphasis on higher-yielding corporate issues was a major contributor to outperformance.
Bond Fund
| Period | | Growth | | Total Return | |
Ended
12/31/10 | | of
$10,000 | | Cumu-
lative | | Average
Annual | |
| 1 Year | | $ | 10,729 | | | | 7.29 | % | | | 7.29 | % | |
| 5 Years | | $ | 13,407 | | | | 34.07 | % | | | 6.04 | % | |
| 10 Years | | $ | 17,737 | | | | 77.37 | % | | | 5.87 | % | |
Barclay's Capital Aggregate Bond Index
| Period | | Growth | | Total Return | |
Ended
12/31/10 | | of
$10,000 | | Cumu-
lative | | Average
Annual | |
| 1 Year | | $ | 10,654 | | | | 6.54 | % | | | 6.54 | % | |
| 5 Years | | $ | 13,253 | | | | 32.53 | % | | | 5.79 | % | |
| 10 Years | | $ | 17,630 | | | | 76.30 | % | | | 5.83 | % | |
The line representing the performance return of the Bond Fund includes expenses, such as transaction costs and management fees that reduce returns, while the performance return line of the Index does not.
26
MUTUAL OF AMERICA INVESTMENT CORPORATION
ASSET ALLOCATIONS AS OF DECEMBER 31, 2010 (Unaudited)

27
MUTUAL OF AMERICA INVESTMENT CORPORATION
ASSET ALLOCATIONS AS OF DECEMBER 31, 2010 (Unaudited) (Continued)
28
MUTUAL OF AMERICA INVESTMENT CORPORATION
ASSET ALLOCATIONS AS OF DECEMBER 31, 2010 (Unaudited) (Continued)


29
MUTUAL OF AMERICA INVESTMENT CORPORATION
ASSET ALLOCATIONS AS OF DECEMBER 31, 2010 (Unaudited) (Continued)
30
MUTUAL OF AMERICA INVESTMENT CORPORATION
EXPENSE EXAMPLE (Unaudited)
EXAMPLE
As a shareholder of one of the Mutual of America Investment Corporation Funds, you incur ongoing costs, including management fees and other Fund expenses. You do not incur transactional costs, such as sales charges (loads), redemption fees or exchange fees.
This Example is intended to help you understand your ongoing costs (in dollars) of investing in a Fund and to compare these costs with the ongoing costs of investing in other mutual funds. The Example is based on an investment of $1,000 invested at July 1, 2010 and held for the entire period ending December 31, 2010.
ACTUAL EXPENSES
The first line of the tables below provides information about actual account values and actual expenses. You may use the information in this line, together with the amount you invested, to estimate the expenses that you paid over the period. Simply divide your account value by $1,000 (for example, an $8,600 account value divided by $1,000=8.6), then multiply the result by the number in the first line under the heading entitled "Expenses Paid During Period" to estimate the expenses you paid on your account during this period.
HYPOTHETICAL EXAMPLE FOR COMPARISON PURPOSES
The second line of the tables below provides information about hypothetical account values and hypothetical expenses based on each Fund's actual expense ratio and an assumed rate of return of 5% per year before expenses, which is not the Fund's actual return. The hypothetical account values and expenses may not be used to estimate the actual ending account balance or expenses you paid for the period. You may use this information to compare the ongoing costs of investing in the Fund with other funds. To do so, compare this 5% hypothetical example with the 5% hypothetical examples that appear in the shareholder reports of the other funds.
Please note that the second line of the table is useful in comparing ongoing costs only, and will not help you determine the relative total costs of owning other funds, which may also charge transactional costs, such as sales charges (loads), redemption fees or exchange fees.
Equity Index Fund
| | | Beginning
Account Value
July 1, 2010 | | Ending
Account Value
December 31, 2010 | | Expenses Paid
During Period*
July 1 to
December 31, 2010 | |
| Actual | | $ | 1,000.00 | | | $ | 1,071.45 | | | $ | 1.28 | | |
Hypothetical
(5% return before expenses) | | $ | 1,000.00 | | | $ | 1,023.61 | | | $ | 1.25 | | |
* Expenses are equal to the Fund's annual expense ratio of 0.25%, multiplied by the average account value over the period, multiplied by 184/365 (to reflect the one-half year period).
All America Fund
| | | Beginning
Account Value
July 1, 2010 | | Ending
Account Value
December 31, 2010 | | Expenses Paid
During Period*
July 1 to
December 31, 2010 | |
| Actual | | $ | 1,000.00 | | | $ | 1,085.98 | | | $ | 2.95 | | |
Hypothetical
(5% return before expenses) | | $ | 1,000.00 | | | $ | 1,021.96 | | | $ | 2.86 | | |
* Expenses are equal to the Fund's annual expense ratio of 0.57%, multiplied by the average account value over the period, multiplied by 184/365 (to reflect the one-half year period).
31
MUTUAL OF AMERICA INVESTMENT CORPORATION
EXPENSE EXAMPLE (Unaudited) (Continued)
Small Cap Value Fund
| | | Beginning
Account Value
July 1, 2010 | | Ending
Account Value
December 31, 2010 | | Expenses Paid
During Period*
July 1 to
December 31, 2010 | |
| Actual | | $ | 1,000.00 | | | $ | 1,131.29 | | | $ | 4.85 | | |
Hypothetical
(5% return before expenses) | | $ | 1,000.00 | | | $ | 1,020.16 | | | $ | 4.61 | | |
* Expenses are equal to the Fund's annual expense ratio of 0.92%, multiplied by the average account value over the period, multiplied by 184/365 (to reflect the one-half year period).
Small Cap Growth Fund
| | | Beginning
Account Value
July 1, 2010 | | Ending
Account Value
December 31, 2010 | | Expenses Paid
During Period*
July 1 to
December 31, 2010 | |
| Actual | | $ | 1,000.00 | | | $ | 1,155.77 | | | $ | 4.91 | | |
Hypothetical
(5% return before expenses) | | $ | 1,000.00 | | | $ | 1,020.16 | | | $ | 4.61 | | |
* Expenses are equal to the Fund's annual expense ratio of 0.92%, multiplied by the average account value over the period, multiplied by 184/365 (to reflect the one-half year period).
Mid Cap Value Fund
| | | Beginning
Account Value
July 1, 2010 | | Ending
Account Value
December 31, 2010 | | Expenses Paid
During Period*
July 1 to
December 31, 2010 | |
| Actual | | $ | 1,000.00 | | | $ | 1,091.34 | | | $ | 3.73 | | |
Hypothetical
(5% return before expenses) | | $ | 1,000.00 | | | $ | 1,021.19 | | | $ | 3.61 | | |
* Expenses are equal to the Fund's annual expense ratio of 0.72%, multiplied by the average account value over the period, multiplied by 184/365 (to reflect the one-half year period).
Mid-Cap Equity Index Fund
| | | Beginning
Account Value
July 1, 2010 | | Ending
Account Value
December 31, 2010 | | Expenses Paid
During Period*
July 1 to
December 31, 2010 | |
| Actual | | $ | 1,000.00 | | | $ | 1,124.79 | | | $ | 1.31 | | |
Hypothetical
(5% return before expenses) | | $ | 1,000.00 | | | $ | 1,023.61 | | | $ | 1.25 | | |
* Expenses are equal to the Fund's annual expense ratio of 0.25%, multiplied by the average account value over the period, multiplied by 184/365 (to reflect the one-half year period).
32
MUTUAL OF AMERICA INVESTMENT CORPORATION
EXPENSE EXAMPLE (Unaudited) (Continued)
International Fund
| | | Beginning
Account Value
July 1, 2010 | | Ending
Account Value
December 31, 2010 | | Expenses Paid
During Period*
July 1 to
December 31, 2010 | |
| Actual | | $ | 1,000.00 | | | $ | 1,041.10 | | | $ | 2.38 | | |
Hypothetical
(5% return before expenses) | | $ | 1,000.00 | | | $ | 1,022.48 | | | $ | 2.36 | | |
* Expenses are equal to the Fund's annual expense ratio of 0.47% (reflecting direct expenses and the proportional expense ratios of the underlying funds in which the Fund invests ), multiplied by the average account value over the period, multiplied by 184/365 (to reflect the one-half year period).
Composite Fund
| | | Beginning
Account Value
July 1, 2010 | | Ending
Account Value
December 31, 2010 | | Expenses Paid
During Period*
July 1 to
December 31, 2010 | |
| Actual | | $ | 1,000.00 | | | $ | 1,054.07 | | | $ | 2.90 | | |
Hypothetical
(5% return before expenses) | | $ | 1,000.00 | | | $ | 1,021.96 | | | $ | 2.86 | | |
* Expenses are equal to the Fund's annual expense ratio of 0.57%, multiplied by the average account value over the period, multiplied by 184/365 (to reflect the one-half year period).
Retirement Income Fund
| | | Beginning
Account Value
July 1, 2010 | | Ending
Account Value
December 31, 2010 | | Expenses Paid
During Period*
July 1 to
December 31, 2010 | |
| Actual | | $ | 1,000.00 | | | $ | 1,044.62 | | | $ | 2.64 | | |
Hypothetical
(5% return before expenses) | | $ | 1,000.00 | | | $ | 1,022.11 | | | $ | 2.71 | | |
* Expenses are equal to the Fund's annual expense ratio of 0.52% (reflecting direct investment management fees and the proportional expense ratios of the underlying funds in which the Fund invests), multiplied by the average account value over the period, multiplied by 184/365 (to reflect the one-half year period).
2010 Retirement Fund
| | | Beginning
Account Value
July 1, 2010 | | Ending
Account Value
December 31, 2010 | | Expenses Paid
During Period*
July 1 to
December 31, 2010 | |
| Actual | | $ | 1,000.00 | | | $ | 1,055.74 | | | $ | 2.39 | | |
Hypothetical
(5% return before expenses) | | $ | 1,000.00 | | | $ | 1,022.48 | | | $ | 2.36 | | |
* Expenses are equal to the Fund's annual expense ratio of 0.47% (reflecting direct investment management fees and the proportional expense ratios of the underlying funds in which the Fund invests), multiplied by the average account value over the period, multiplied by 184/365 (to reflect the one-half year period).
33
MUTUAL OF AMERICA INVESTMENT CORPORATION
EXPENSE EXAMPLE (Unaudited) (Continued)
2015 Retirement Fund
| | | Beginning
Account Value
July 1, 2010 | | Ending
Account Value
December 31, 2010 | | Expenses Paid
During Period*
July 1 to
December 31, 2010 | |
| Actual | | $ | 1,000.00 | | | $ | 1,060.09 | | | $ | 2.40 | | |
Hypothetical
(5% return before expenses) | | $ | 1,000.00 | | | $ | 1,022.48 | | | $ | 2.36 | | |
* Expenses are equal to the Fund's annual expense ratio of 0.47% (reflecting direct investment management fees and the proportional expense ratios of the underlying funds in which the Fund invests), multiplied by the average account value over the period, multiplied by 184/365 (to reflect the one-half year period).
2020 Retirement Fund
| | | Beginning
Account Value
July 1, 2010 | | Ending
Account Value
December 31, 2010 | | Expenses Paid
During Period*
July 1 to
December 31, 2010 | |
| Actual | | $ | 1,000.00 | | | $ | 1,067.84 | | | $ | 2.46 | | |
Hypothetical
(5% return before expenses) | | $ | 1,000.00 | | | $ | 1,022.42 | | | $ | 2.41 | | |
* Expenses are equal to the Fund's annual expense ratio of 0.48% (reflecting direct investment management fees and the proportional expense ratios of the underlying funds in which the Fund invests), multiplied by the average account value over the period, multiplied by 184/365 (to reflect the one-half year period).
2025 Retirement Fund
| | | Beginning
Account Value
July 1, 2010 | | Ending
Account Value
December 31, 2010 | | Expenses Paid
During Period*
July 1 to
December 31, 2010 | |
| Actual | | $ | 1,000.00 | | | $ | 1,075.33 | | | $ | 2.31 | | |
Hypothetical
(5% return before expenses) | | $ | 1,000.00 | | | $ | 1,022.58 | | | $ | 2.26 | | |
* Expenses are equal to the Fund's annual expense ratio of 0.45% (reflecting direct investment management fees and the proportional expense ratios of the underlying funds in which the Fund invests), multiplied by the average account value over the period, multiplied by 184/365 (to reflect the one-half year period).
2030 Retirement Fund
| | | Beginning
Account Value
July 1, 2010 | | Ending
Account Value
December 31, 2010 | | Expenses Paid
During Period*
July 1 to
December 31, 2010 | |
| Actual | | $ | 1,000.00 | | | $ | 1,080.47 | | | $ | 2.32 | | |
Hypothetical
(5% return before expenses) | | $ | 1,000.00 | | | $ | 1,022.58 | | | $ | 2.26 | | |
* Expenses are equal to the Fund's annual expense ratio of 0.45% (reflecting direct investment management fees and the proportional expense ratios of the underlying funds in which the Fund invests), multiplied by the average account value over the period, multiplied by 184/365 (to reflect the one-half year period).
34
MUTUAL OF AMERICA INVESTMENT CORPORATION
EXPENSE EXAMPLE (Unaudited) (Continued)
2035 Retirement Fund
| | | Beginning
Account Value
July 1, 2010 | | Ending
Account Value
December 31, 2010 | | Expenses Paid
During Period*
July 1 to
December 31, 2010 | |
| Actual | | $ | 1,000.00 | | | $ | 1,085.44 | | | $ | 2.27 | | |
Hypothetical
(5% return before expenses) | | $ | 1,000.00 | | | $ | 1,022.63 | | | $ | 2.21 | | |
* Expenses are equal to the Fund's annual expense ratio of 0.44% (reflecting direct investment management fees and the proportional expense ratios of the underlying funds in which the Fund invests), multiplied by the average account value over the period, multiplied by 184/365 (to reflect the one-half year period).
2040 Retirement Fund
| | | Beginning
Account Value
July 1, 2010 | | Ending
Account Value
December 31, 2010 | | Expenses Paid
During Period*
July 1 to
December 31, 2010 | |
| Actual | | $ | 1,000.00 | | | $ | 1,088.82 | | | $ | 2.33 | | |
Hypothetical
(5% return before expenses) | | $ | 1,000.00 | | | $ | 1,022.58 | | | $ | 2.26 | | |
* Expenses are equal to the Fund's annual expense ratio of 0.45% (reflecting direct investment management fees and the proportional expense ratios of the underlying funds in which the Fund invests), multiplied by the average account value over the period, multiplied by 184/365 (to reflect the one-half year period).
2045 Retirement Fund
| | | Beginning
Account Value
July 1, 2010 | | Ending
Account Value
December 31, 2010 | | Expenses Paid
During Period*
July 1 to
December 31, 2010 | |
| Actual | | $ | 1,000.00 | | | $ | 1,089.69 | | | $ | 2.43 | | |
Hypothetical
(5% return before expenses) | | $ | 1,000.00 | | | $ | 1,022.48 | | | $ | 2.36 | | |
* Expenses are equal to the Fund's annual expense ratio of 0.47% (reflecting direct investment management fees and the proportional expense ratios of the underlying funds in which the Fund invests), multiplied by the average account value over the period, multiplied by 184/365 (to reflect the one-half year period).
Conservative Allocation Fund
| | | Beginning
Account Value
July 1, 2010 | | Ending
Account Value
December 31, 2010 | | Expenses Paid
During Period*
July 1 to
December 31, 2010 | |
| Actual | | $ | 1,000.00 | | | $ | 1,046.02 | | | $ | 2.69 | | |
Hypothetical
(5% return before expenses) | | $ | 1,000.00 | | | $ | 1,022.17 | | | $ | 2.66 | | |
* Expenses are equal to the Fund's annual expense ratio of 0.49% (reflecting the proportional expense ratios of the underlying funds in which the Fund invests), multiplied by the average account value over the period, multiplied by 184/365 (to reflect the one-half year period).
35
MUTUAL OF AMERICA INVESTMENT CORPORATION
EXPENSE EXAMPLE (Unaudited) (Continued)
Moderate Allocation Fund
| | | Beginning
Account Value
July 1, 2010 | | Ending
Account Value
December 31, 2010 | | Expenses Paid
During Period*
July 1 to
December 31, 2010 | |
| Actual | | $ | 1,000.00 | | | $ | 1,064.02 | | | $ | 2.20 | | |
Hypothetical
(5% return before expenses) | | $ | 1,000.00 | | | $ | 1,022.68 | | | $ | 2.16 | | |
* Expenses are equal to the Fund's annual expense ratio of 0.41% (reflecting the proportional expense ratios of the underlying funds in which the Fund invests), multiplied by the average account value over the period, multiplied by 184/365 (to reflect the one-half year period).
Aggressive Allocation Fund
| | | Beginning
Account Value
July 1, 2010 | | Ending
Account Value
December 31, 2010 | | Expenses Paid
During Period*
July 1 to
December 31, 2010 | |
| Actual | | $ | 1,000.00 | | | $ | 1,082.41 | | | $ | 2.11 | | |
Hypothetical
(5% return before expenses) | | $ | 1,000.00 | | | $ | 1,022.78 | | | $ | 2.06 | | |
* Expenses are equal to the Fund's annual expense ratio of 0.40% (reflecting the proportional expense ratios of the underlying funds in which the Fund invests), multiplied by the average account value over the period, multiplied by 184/365 (to reflect the one-half year period).
Money Market Fund
| | | Beginning
Account Value
July 1, 2010 | | Ending
Account Value
December 31, 2010 | | Expenses Paid
During Period*
July 1 to
December 31, 2010 | |
| Actual | | $ | 1,000.00 | | | $ | 999.23 | | | $ | 1.59 | | |
Hypothetical
(5% return before expenses) | | $ | 1,000.00 | | | $ | 1,023.25 | | | $ | 1.61 | | |
* Expenses are equal to the Fund's annual expense ratio of 0.32%, multiplied by the average account value over the period, multiplied by 184/365 (to reflect the one-half year period).
Mid Term Bond Fund
| | | Beginning
Account Value
July 1, 2010 | | Ending
Account Value
December 31, 2010 | | Expenses Paid
During Period*
July 1 to
December 31, 2010 | |
| Actual | | $ | 1,000.00 | | | $ | 1,034.32 | | | $ | 2.87 | | |
Hypothetical
(5% return before expenses) | | $ | 1,000.00 | | | $ | 1,021.96 | | | $ | 2.86 | | |
* Expenses are equal to the Fund's annual expense ratio of 0.57%, multiplied by the average account value over the period, multiplied by 184/365 (to reflect the one-half year period).
36
MUTUAL OF AMERICA INVESTMENT CORPORATION
EXPENSE EXAMPLE (Unaudited) (Continued)
Bond Fund
| | | Beginning
Account Value
July 1, 2010 | | Ending
Account Value
December 31, 2010 | | Expenses Paid
During Period*
July 1 to
December 31, 2010 | |
| Actual | | $ | 1,000.00 | | | $ | 1,036.04 | | | $ | 2.88 | | |
Hypothetical
(5% return before expenses) | | $ | 1,000.00 | | | $ | 1,021.96 | | | $ | 2.86 | | |
* Expenses are equal to the Fund's annual expense ratio of 0.57%, multiplied by the average account value over the period, multiplied by 184/365 (to reflect the one-half year period).
37
MUTUAL OF AMERICA INVESTMENT CORPORATION (EQUITY INDEX FUND)
SUMMARY PORTFOLIO OF INVESTMENTS IN SECURITIES
December 31, 2010
| | | Shares | | Value | |
| INDEXED ASSETS: | |
| COMMON STOCKS | |
| CONSUMER DISCRETIONARY (10.3%) | |
| Amazon.com, Inc.* | | | 27,379 | | | $ | 4,928,220 | | |
| Comcast Corp. Cl A | | | 216,807 | | | | 4,763,250 | | |
| Disney (Walt) Co. | | | 145,991 | | | | 5,476,122 | | |
| Ford Motor Co.* | | | 290,179 | | | | 4,872,105 | | |
| Home Depot, Inc. | | | 126,260 | | | | 4,426,676 | | |
| McDonald's Corp. | | | 81,244 | | | | 6,236,289 | | |
| Other Securities | | | 1,753,977 | | | | 62,867,518 | | |
| | | | 93,570,180 | | |
| CONSUMER STAPLES (10.3%) | |
| Altria Group, Inc. | | | 161,166 | | | | 3,967,907 | | |
| Coca-Cola Co. | | | 178,755 | | | | 11,756,716 | | |
| Kraft Foods, Inc. Cl A | | | 133,857 | | | | 4,217,834 | | |
| PepsiCo, Inc. | | | 121,795 | | | | 7,956,867 | | |
| Philip Morris Int'l., Inc. | | | 139,630 | | | | 8,172,544 | | |
| Proctor & Gamble Co. | | | 214,421 | | | | 13,793,703 | | |
| Wal-Mart Stores, Inc. | | | 151,273 | | | | 8,158,153 | | |
| Other Securities | | | 927,004 | | | | 35,528,154 | | |
| | | | 93,551,878 | | |
| ENERGY (11.7%) | |
| Chevron Corp. | | | 156,124 | | | | 14,246,315 | | |
| ConocoPhillips | | | 114,234 | | | | 7,779,335 | | |
| Exxon Mobil Corp. | | | 389,217 | | | | 28,459,542 | | |
| Occidental Petroleum Corp. | | | 62,414 | | | | 6,122,813 | | |
| Schlumberger Ltd. | | | 104,774 | | | | 8,748,629 | | |
| Other Securities | | | 865,366 | | | | 40,575,741 | | |
| | | | 105,932,375 | | |
| FINANCIALS (15.6%) | |
| Bank of America Corp. | | | 773,554 | | | | 10,319,210 | | |
| Berkshire Hathaway, Inc. Cl B* | | | 133,301 | | | | 10,678,743 | | |
| Citigroup, Inc.* | | | 2,211,968 | | | | 10,462,609 | | |
| Goldman Sachs Group, Inc. | | | 39,484 | | | | 6,639,629 | | |
| JPMorgan Chase & Co. | | | 302,131 | | | | 12,816,397 | | |
| U.S. Bancorp | | | 147,850 | | | | 3,987,515 | | |
| Wells Fargo & Co. | | | 402,829 | | | | 12,483,671 | | |
| Other Securities | | | 2,272,683 | | | | 73,402,554 | | |
| | | | 140,790,328 | | |
| HEALTH CARE (10.7%) | |
| Abbott Laboratories | | | 119,928 | | | | 5,745,750 | | |
| Johnson & Johnson | | | 212,434 | | | | 13,139,043 | | |
| Merck & Co., Inc. | | | 240,519 | | | | 8,668,305 | | |
| | | Shares | | Value | |
| INDEXED ASSETS (CONTINUED): | |
| COMMON STOCKS (CONTINUED) | |
| HEALTH CARE (CONTINUED) | |
| Pfizer, Inc. | | | 622,877 | | | $ | 10,906,576 | | |
| Other Securities | | | 1,413,799 | | | | 57,938,230 | | |
| | | | 96,397,904 | | |
| INDUSTRIALS (10.7%) | |
| 3M Co. | | | 55,121 | | | | 4,756,942 | | |
| Caterpillar, Inc. | | | 49,382 | | | | 4,625,118 | | |
| General Electric Co. | | | 826,966 | | | | 15,125,208 | | |
| United Parcel Service, Inc. Cl B | | | 76,990 | | | | 5,587,934 | | |
| United Technologies Corp. | | | 71,261 | | | | 5,609,666 | | |
| Other Securities | | | 1,098,388 | | | | 61,068,657 | | |
| | | | 96,773,525 | | |
| INFORMATION TECHNOLOGY (18.1%) | |
| Apple, Inc.* | | | 70,723 | | | | 22,812,407 | | |
| Cisco Systems, Inc.* | | | 431,471 | | | | 8,728,658 | | |
| Google, Inc.* | | | 19,250 | | | | 11,433,923 | | |
| Hewlett-Packard Co. | | | 174,835 | | | | 7,360,554 | | |
| Int'l. Business Machines Corp. | | | 95,410 | | | | 14,002,372 | | |
| Intel Corp. | | | 427,033 | | | | 8,980,504 | | |
| Microsoft Corp. | | | 580,089 | | | | 16,196,085 | | |
| Oracle Corp. | | | 283,574 | | | | 8,875,866 | | |
| QUALCOMM, Inc. | | | 124,775 | | | | 6,175,115 | | |
| Other Securities | | | 2,323,407 | | | | 59,008,587 | | |
| | | | 163,574,071 | | |
| MATERIALS (3.6%) | |
Freeport-McMoRan Copper &
Gold, Inc. | | | 35,607 | | | | 4,276,045 | | |
| Other Securities | | | 595,352 | | | | 28,424,070 | | |
| | | | 32,700,115 | | |
| TELECOMMUNICATION SERVICES (3.0%) | |
| AT&T, Inc. | | | 457,740 | | | | 13,448,401 | | |
| Verizon Communications, Inc. | | | 219,938 | | | | 7,869,382 | | |
| Other Securities | | | 556,040 | | | | 6,222,155 | | |
| | | | 27,539,938 | | |
| UTILITIES (3.2%) | |
| Other Securities | | | 893,893 | | | | 29,060,521 | | |
TOTAL INDEXED ASSETS-COMMON STOCKS
(Cost: $754,095,669) 97.2% | | $ | 879,890,835 | | |
| | | Rating** | | Rate | | Maturity | | Face
Amount | | Value | |
| SHORT-TERM DEBT SECURITIES: | |
| U.S. GOVERNMENT (0.5%) | |
| U.S. Treasury Bill (1) | | AAA | | | 0.12 | % | | 02/03/11 | | $ | 1,000,000 | | | $ | 999,890 | | |
| U.S. Treasury Bill (1) | | AAA | | | 0.14 | | | 03/31/11 | | | 2,000,000 | | | | 1,999,343 | | |
| U.S. Treasury Bill (1) | | AAA | | | 0.16 | | | 03/03/11 | | | 700,000 | | | | 699,855 | | |
| U.S. Treasury Bill (1) | | AAA | | | 0.16 | | | 03/03/11 | | | 500,000 | | | | 499,896 | | |
| | | | 4,198,984 | | |
| U.S. GOVERNMENT AGENCIES (0.6%) | |
| FHLMC | | AAA | | | 0.09 | | | 02/14/11 | | | 4,385,000 | | | | 4,384,518 | | |
| FHLMC | | AAA | | | 0.17 | | | 02/22/11 | | | 1,231,000 | | | | 1,230,698 | | |
| | | | 5,615,216 | | |
| COMMERCIAL PAPER (1.6%) | |
| General Electric Capital Corp. | | A-1+ | | | 0.15 | | | 01/31/11 | | | 4,500,000 | | | | 4,499,438 | | |
| NetJets, Inc.† | | A-1+ | | | 0.12 | | | 01/03/11 | | | 10,000,000 | | | | 9,999,933 | | |
| | | | 14,499,371 | | |
TOTAL SHORT-TERM DEBT SECURITIES
(Cost: $24,313,465) 2.7% | | | 24,313,571 | | |
TEMPORARY CASH INVESTMENTS (2)
(Cost: $151,300) 0.0% (3) | | | 151,300 | | |
TOTAL INVESTMENTS
(Cost: $778,560,434) 99.9% | | | 904,355,706 | | |
| OTHER NET ASSETS 0.1% | | | 1,021,282 | | |
| NET ASSETS 100.0% | | $ | 905,376,988 | | |
The accompanying notes are an integral part of these portfolio schedules.
38
MUTUAL OF AMERICA INVESTMENT CORPORATION (ALL AMERICA FUND)
SUMMARY PORTFOLIO OF INVESTMENTS IN SECURITIES
December 31, 2010
| | | Shares | | Value | |
| INDEXED ASSETS: | |
| COMMON STOCKS | |
| CONSUMER DISCRETIONARY (5.4%) | |
| Amazon.com, Inc.* | | | 4,279 | | | $ | 770,220 | | |
| Disney (Walt) Co. | | | 22,820 | | | | 855,978 | | |
| Ford Motor Co.* | | | 45,357 | | | | 761,544 | | |
| McDonald's Corp. | | | 12,699 | | | | 974,775 | | |
| Starbucks Corp. | | | 8,841 | | | | 284,061 | | |
| Other Securities | | | 318,956 | | | | 10,979,922 | | |
| | | | 14,626,500 | | |
| CONSUMER STAPLES (5.4%) | |
| Coca-Cola Co. | | | 27,940 | | | | 1,837,614 | | |
| Kraft Foods, Inc. Cl A | | | 20,923 | | | | 659,284 | | |
| PepsiCo, Inc. | | | 19,038 | | | | 1,243,753 | | |
| Philip Morris Int'l., Inc. | | | 21,826 | | | | 1,277,476 | | |
| Proctor & Gamble Co. | | | 33,516 | | | | 2,156,084 | | |
| Wal-Mart Stores, Inc. | | | 23,645 | | | | 1,275,175 | | |
| Other Securities | | | 170,215 | | | | 6,178,002 | | |
| | | | 14,627,388 | | |
| ENERGY (6.1%) | |
| Apache Corp. | | | 4,414 | | | | 526,281 | | |
| Chevron Corp. | | | 24,403 | | | | 2,226,774 | | |
| ConocoPhillips | | | 17,856 | | | | 1,215,994 | | |
| Exxon Mobil Corp. | | | 60,838 | | | | 4,448,470 | | |
| Halliburton Co. | | | 10,999 | | | | 449,089 | | |
| Occidental Petroleum Corp. | | | 9,756 | | | | 957,064 | | |
| Schlumberger Ltd. | | | 16,377 | | | | 1,367,480 | | |
| Other Securities | | | 119,848 | | | | 5,366,941 | | |
| | | | 16,558,093 | | |
| FINANCIALS (8.1%) | |
| Bank of America Corp. | | | 120,912 | | | | 1,612,966 | | |
| Berkshire Hathaway, Inc. Cl B* | | | 20,836 | | | | 1,669,172 | | |
| Citigroup, Inc.* | | | 345,745 | | | | 1,635,374 | | |
| Goldman Sachs Group, Inc. | | | 6,172 | | | | 1,037,884 | | |
| JPMorgan Chase & Co. | | | 47,226 | | | | 2,003,327 | | |
| MetLife, Inc. | | | 10,860 | | | | 482,618 | | |
| Wells Fargo & Co. | | | 62,965 | | | | 1,951,285 | | |
| Other Securities | | | 367,496 | | | | 11,614,096 | | |
| | | | 22,006,722 | | |
| HEALTH CARE (5.6%) | |
| Abbott Laboratories | | | 18,745 | | | | 898,073 | | |
| Johnson & Johnson | | | 33,205 | | | | 2,053,729 | | |
| | | Shares | | Value | |
| INDEXED ASSETS (CONTINUED): | |
| COMMON STOCKS (CONTINUED) | |
| HEALTH CARE (CONTINUED) | |
| Merck & Co., Inc. | | | 37,594 | | | $ | 1,354,888 | | |
| Pfizer, Inc. | | | 97,359 | | | | 1,704,756 | | |
| Other Securities | | | 220,935 | | | | 9,055,999 | | |
| | | | 15,067,445 | | |
| INDUSTRIALS (5.6%) | |
| Boeing Co. | | | 8,741 | | | | 570,438 | | |
| General Electric Co. | | | 129,260 | | | | 2,364,163 | | |
| Union Pacific Corp. | | | 6,025 | | | | 558,277 | | |
| Other Securities | | | 196,434 | | | | 11,633,743 | | |
| | | | 15,126,621 | | |
| INFORMATION TECHNOLOGY (9.4%) | |
| Apple, Inc.* | | | 11,054 | | | | 3,565,573 | | |
| Cisco Systems, Inc.* | | | 67,442 | | | | 1,364,352 | | |
| Google, Inc.* | | | 3,008 | | | | 1,786,662 | | |
| Hewlett-Packard Co. | | | 27,328 | | | | 1,150,509 | | |
| Int'l. Business Machines Corp. | | | 14,914 | | | | 2,188,779 | | |
| Intel Corp. | | | 66,749 | | | | 1,403,731 | | |
| Microsoft Corp. | | | 90,672 | | | | 2,531,557 | | |
| Oracle Corp. | | | 44,325 | | | | 1,387,373 | | |
| QUALCOMM, Inc. | | | 19,503 | | | | 965,203 | | |
| Texas Instruments, Inc. | | | 14,079 | | | | 457,568 | | |
| Other Securities | | | 349,095 | | | | 8,766,039 | | |
| | | | 25,567,346 | | |
| MATERIALS (1.9%) | |
Freeport-McMoRan Copper &
Gold, Inc. | | | 5,566 | | | | 668,421 | | |
| Other Securities | | | 93,052 | | | | 4,442,464 | | |
| | | | 5,110,885 | | |
| TELECOMMUNICATION SERVICES (1.6%) | |
| AT&T, Inc. | | | 71,547 | | | | 2,102,051 | | |
| Verizon Communications, Inc. | | | 34,377 | | | | 1,230,009 | | |
| Other Securities | | | 86,909 | | | | 972,512 | | |
| | | | 4,304,572 | | |
| UTILITIES (1.7%) | |
| Other Securities | | | 139,714 | | | | 4,542,065 | | |
TOTAL INDEXED ASSETS-COMMON STOCKS
(Cost: $130,702,241) 50.8% | | $ | 137,537,637 | | |
| | | Rating** | | Rate | | Maturity | | Face
Amount | | Value | |
| INDEXED ASSETS: | |
| SHORT-TERM DEBT SECURITIES: | |
| U.S. GOVERNMENT (0.3%) | |
| U.S. Treasury Bill (1) | | AAA | | | 0.12 | % | | 02/03/11 | | $ | 400,000 | | | $ | 399,956 | | |
| U.S. Treasury Bill (1) | | AAA | | | 0.14 | | | 03/31/11 | | | 500,000 | | | | 499,835 | | |
| | | | 899,791 | | |
| U.S. GOVERNMENT AGENCIES (0.7%) | |
| Farmer Mac | | AAA | | | 0.01 | | | 01/03/11 | | | 1,800,000 | | | | 1,799,999 | | |
| COMMERCIAL PAPER (0.4%) | |
| General Electric Capital Corp. | | A-1+ | | | 0.15 | | | 01/31/11 | | | 1,100,000 | | | | 1,099,863 | | |
TOTAL INDEXED ASSETS-SHORT-TERM DEBT SECURITIES
(Cost: $3,799,645) 1.4% | | | 3,799,653 | | |
TOTAL INDEXED ASSETS
(Cost: $134,501,886) 52.2% | | $ | 141,337,290 | | |
The accompanying notes are an integral part of these portfolio schedules.
39
MUTUAL OF AMERICA INVESTMENT CORPORATION (ALL AMERICA FUND)
SUMMARY PORTFOLIO OF INVESTMENTS IN SECURITIES (Continued)
December 31, 2010
| | | Shares | | Value | |
| ACTIVE ASSETS: | |
| COMMON STOCKS | |
| CONSUMER DISCRETIONARY (5.4%) | |
| Amazon.com, Inc.* | | | 3,875 | | | $ | 697,500 | | |
| Disney (Walt) Co. | | | 15,420 | | | | 578,404 | | |
| Ford Motor Co.* | | | 38,038 | | | | 638,658 | | |
| Starbucks Corp. | | | 22,773 | | | | 731,696 | | |
| Other Securities | | | 491,116 | | | | 12,035,576 | | |
| | | | 14,681,834 | | |
| CONSUMER STAPLES (2.4%) | |
| Kraft Foods, Inc. Cl A | | | 16,969 | | | | 534,693 | | |
| PepsiCo, Inc. | | | 14,156 | | | | 924,811 | | |
| Proctor & Gamble Co. | | | 18,072 | | | | 1,162,572 | | |
| Wal-Mart Stores, Inc. | | | 18,945 | | | | 1,021,704 | | |
| Other Securities | | | 99,057 | | | | 2,808,349 | | |
| | | | 6,452,129 | | |
| ENERGY (4.3%) | |
| Apache Corp. | | | 5,088 | | | | 606,642 | | |
| Brigham Exploration Co.* | | | 47,372 | | | | 1,290,413 | | |
| ConocoPhillips | | | 14,355 | | | | 977,576 | | |
| Exxon Mobil Corp. | | | 27,470 | | | | 2,008,606 | | |
| Halliburton Co. | | | 16,927 | | | | 691,129 | | |
| McMoRan Exploration Co.* | | | 85,766 | | | | 1,470,029 | | |
| Occidental Petroleum Corp. | | | 8,012 | | | | 785,977 | | |
| Other Securities | | | 90,012 | | | | 3,741,766 | | |
| | | | 11,572,138 | | |
| FINANCIALS (8.5%) | |
| Bank of America Corp. | | | 56,706 | | | | 756,458 | | |
| Berkshire Hathaway, Inc. Cl B* | | | 9,460 | | | | 757,841 | | |
| Citigroup, Inc.* | | | 149,236 | | | | 705,886 | | |
| Goldman Sachs Group, Inc. | | | 5,238 | | | | 880,822 | | |
| JPMorgan Chase & Co. | | | 33,775 | | | | 1,432,736 | | |
| MetLife, Inc. | | | 12,531 | | | | 556,878 | | |
| Wells Fargo & Co. | | | 41,694 | | | | 1,292,097 | | |
| Other Securities*** | | | 876,086 | | | | 16,645,133 | | |
| | | | 23,027,851 | | |
| HEALTH CARE (5.1%) | |
| Abbott Laboratories | | | 17,263 | | | | 827,070 | | |
| Johnson & Johnson | | | 18,173 | | | | 1,124,000 | | |
| Merck & Co., Inc. | | | 23,663 | | | | 852,815 | | |
| Other Securities | | | 619,050 | | | | 10,962,658 | | |
| | | | 13,766,543 | | |
| INDUSTRIALS (6.3%) | |
| Boeing Co. | | | 11,365 | | | | 741,680 | | |
| General Electric Co. | | | 66,845 | | | | 1,222,595 | | |
| | | Shares | | Value | |
| ACTIVE ASSETS (CONTINUED): | |
| COMMON STOCKS (CONTINUED) | |
| INDUSTRIALS (CONTINUED) | |
| Union Pacific Corp. | | | 4,042 | | | $ | 374,532 | | |
| Other Securities | | | 566,092 | | | | 14,713,250 | | |
| | | | 17,052,057 | | |
| INFORMATION TECHNOLOGY (9.0%) | |
| Apple, Inc.* | | | 6,171 | | | | 1,990,518 | | |
| Cisco Systems, Inc.* | | | 35,630 | | | | 720,795 | | |
| Google, Inc.* | | | 1,814 | | | | 1,077,462 | | |
| Hewlett-Packard Co. | | | 16,767 | | | | 705,891 | | |
| Int'l. Business Machines Corp. | | | 6,802 | | | | 998,262 | | |
| Microsoft Corp. | | | 35,092 | | | | 979,769 | | |
| Oracle Corp. | | | 22,854 | | | | 715,330 | | |
| QUALCOMM, Inc. | | | 12,487 | | | | 617,982 | | |
| Texas Instruments, Inc. | | | 14,347 | | | | 466,278 | | |
| Other Securities | | | 759,647 | | | | 16,321,141 | | |
| | | | 24,593,428 | | |
| MATERIALS (3.0%) | |
Freeport-McMoRan Copper &
Gold, Inc. | | | 6,275 | | | | 753,565 | | |
| Other Securities | | | 337,149 | | | | 7,385,707 | | |
| | | | 8,139,272 | | |
| TELECOMMUNICATION SERVICES (1.1%) | |
| AT&T, Inc. | | | 29,713 | | | | 872,968 | | |
| Other Securities | | | 201,251 | | | | 2,092,665 | | |
| | | | 2,965,633 | | |
| UTILITIES (1.3%) | |
| Other Securities | | | 108,350 | | | | 3,463,487 | | |
TOTAL ACTIVE ASSETS-COMMON STOCKS
(Cost: $100,906,113) 46.4% | | | 125,714,372 | | |
| ACTIVE ASSETS: | |
| CONVERTIBLE PREFERRED STOCKS | |
| ENERGY (0.1%) (3) | |
Energy XXI (Bermuda)
Ltd., 7.25% | | | 556 | | | | 164,993 | | |
TOTAL ACTIVE ASSETS-CONVERTIBLE
PREFERRED STOCKS
(Cost: $55,600) 0.1% | | $ | 164,993 | | |
| | | Rating** | | Rate | | Maturity | | Face
Amount | | Value | |
| ACTIVE ASSETS: | |
| SHORT-TERM DEBT SECURITIES: | |
| U.S. GOVERNMENT AGENCIES (0.4%) | |
| Farmer Mac | | AAA | | | 0.01 | % | | 01/03/11 | | $ | 1,000,000 | | | $ | 999,999 | | |
| COMMERCIAL PAPER (0.7%) | |
| General Electric Capital Corp. | | A-1+ | | | 0.15 | | | 01/31/11 | | | 800,000 | | | | 799,900 | | |
| NetJets, Inc.† | | A-1+ | | | 0.10 | | | 01/03/11 | | | 1,100,000 | | | | 1,099,994 | | |
| | | | 1,899,894 | | |
TOTAL SHORT-TERM DEBT SECURITIES
(Cost: $2,899,893) 1.1% | | | 2,899,893 | | |
TOTAL ACTIVE ASSETS
(Cost: $103,861,606) 47.6% | | | 128,779,258 | | |
TEMPORARY CASH INVESTMENTS (2)
(Cost: $152,600) 0.1% | | | 152,600 | | |
TOTAL INVESTMENTS
(Cost: $238,516,092) 99.9% | | | 270,269,148 | | |
| OTHER NET ASSETS 0.1% | | | 241,147 | | |
| NET ASSETS 100.0% | | $ | 270,510,295 | | |
The accompanying notes are an integral part of these portfolio schedules.
40
MUTUAL OF AMERICA INVESTMENT CORPORATION (SMALL CAP VALUE FUND)
SUMMARY PORTFOLIO OF INVESTMENTS IN SECURITIES
December 31, 2010
| | | Shares | | Value | |
| COMMON STOCKS: | |
| CONSUMER DISCRETIONARY (7.9%) | |
| CPI Corp. | | | 131,346 | | | $ | 2,961,852 | | |
| Dillard's, Inc. Cl A | | | 139,995 | | | | 5,311,410 | | |
| Pep Boys - Manny, Moe & Jack | | | 166,501 | | | | 2,236,108 | | |
| Rent-A-Center, Inc.* | | | 130,928 | | | | 4,226,356 | | |
| Wolverine World Wide, Inc. | | | 80,484 | | | | 2,565,830 | | |
| Other Securities | | | 285,402 | | | | 4,565,373 | | |
| | | | 21,866,929 | | |
| CONSUMER STAPLES (0.4%) | |
| Other Securities | | | 56,116 | | | | 971,929 | | |
| ENERGY (7.4%) | |
| Brigham Exploration Co.* | | | 177,057 | | | | 4,823,033 | | |
| Hornbeck Offshore Svcs., Inc.* | | | 119,970 | | | | 2,504,974 | | |
| MarkWest Energy Partners LP | | | 87,066 | | | | 3,770,828 | | |
| McMoRan Exploration Co.* | | | 371,483 | | | | 6,367,219 | | |
| Other Securities | | | 128,679 | | | | 2,996,334 | | |
| | | | 20,462,388 | | |
| FINANCIALS (35.4%) | |
| Ashford Hospitality Trust, Inc.* | | | 428,207 | | | | 4,132,198 | | |
| Aspen Insurance Hldgs. Ltd. | | | 95,723 | | | | 2,739,592 | | |
| Brookline Bancorp, Inc. | | | 254,994 | | | | 2,766,685 | | |
| Colonial Properties Trust | | | 133,963 | | | | 2,418,032 | | |
| Ellington Financial LLC* | | | 176,181 | | | | 3,918,265 | | |
| FelCor Lodging Trust, Inc.* | | | 331,367 | | | | 2,332,824 | | |
| Forest City Enterprises, Inc. Cl A* | | | 185,447 | | | | 3,095,110 | | |
| Highwoods Properties, Inc. | | | 82,762 | | | | 2,635,970 | | |
Meadowbrook Insurance
Group, Inc. | | | 284,977 | | | | 2,921,014 | | |
| NewAlliance Bancshares, Inc. | | | 209,969 | | | | 3,145,336 | | |
| Pennsylvania REIT | | | 183,503 | | | | 2,666,299 | | |
| PHH Corp.* | | | 100,371 | | | | 2,323,589 | | |
| ProAssurance Corp.* | | | 47,058 | | | | 2,851,715 | | |
| Senior Housing Pptys. Trust | | | 103,372 | | | | 2,267,982 | | |
| Signature Bank* | | | 48,822 | | | | 2,441,100 | | |
| SVB Financial Group* | | | 57,998 | | | | 3,076,794 | | |
| Westamerica Bancorporation | | | 50,335 | | | | 2,792,082 | | |
| Other Securities*** | | | 3,231,575 | | | | 49,667,489 | | |
| | | | 98,192,076 | | |
| HEALTH CARE (4.4%) | |
| Enzon Pharmaceuticals, Inc.* | | | 371,642 | | | | 4,522,883 | | |
| Other Securities | | | 1,093,378 | | | | 7,624,612 | | |
| | | | 12,147,495 | | |
| INDUSTRIALS (16.1%) | |
| Actuant Corp. Cl A | | | 111,596 | | | | 2,970,686 | | |
| Ameron International Corp. | | | 52,613 | | | | 4,018,055 | | |
| | | Shares | | Value | |
| COMMON STOCKS (CONTINUED): | |
| INDUSTRIALS (CONTINUED) | |
| AZZ, Inc. | | | 56,450 | | | $ | 2,258,565 | | |
| Encore Wire Corp. | | | 112,400 | | | | 2,818,992 | | |
| Genesee & Wyoming, Inc. Cl A* | | | 75,690 | | | | 4,007,786 | | |
| Kaydon Corp. | | | 77,208 | | | | 3,143,910 | | |
| Miller Industries, Inc. | | | 173,800 | | | | 2,473,174 | | |
| Mueller Industries, Inc. | | | 112,072 | | | | 3,664,754 | | |
| Old Dominion Freight Line, Inc.* | | | 124,405 | | | | 3,979,716 | | |
| Tutor Perini Corp.* | | | 129,053 | | | | 2,763,025 | | |
| Other Securities | | | 1,011,068 | | | | 12,634,648 | | |
| | | | 44,733,311 | | |
| INFORMATION TECHNOLOGY (8.6%) | |
| Tibco Software, Inc.* | | | 209,373 | | | | 4,126,742 | | |
| Other Securities | | | 1,327,635 | | | | 19,878,618 | | |
| | | | 24,005,360 | | |
| MATERIALS (9.5%) | |
| Crown Hldgs., Inc.* | | | 192,373 | | | | 6,421,408 | | |
| Cytec Industries, Inc. | | | 54,889 | | | | 2,912,410 | | |
| Kaiser Aluminum Corp. | | | 75,892 | | | | 3,801,430 | | |
| Silgan Hldgs., Inc. | | | 149,949 | | | | 5,369,674 | | |
| Other Securities | | | 825,472 | | | | 7,876,611 | | |
| | | | 26,381,533 | | |
| TELECOMMUNICATION SERVICES (2.0%) | |
Consolidated Comms.
Hldgs., Inc. | | | 121,107 | | | | 2,337,365 | | |
| Syniverse Hldgs., Inc.* | | | 72,082 | | | | 2,223,730 | | |
| Other Securities | | | 75,057 | | | | 833,133 | | |
| | | | 5,394,228 | | |
| UTILITIES (4.7%) | |
| Avista Corp. | | | 127,493 | | | | 2,871,142 | | |
| Idacorp, Inc. | | | 67,739 | | | | 2,504,988 | | |
| Unisource Energy Corp. | | | 81,661 | | | | 2,926,730 | | |
| Other Securities | | | 217,575 | | | | 4,832,789 | | |
| | | | 13,135,649 | | |
TOTAL COMMON STOCKS
(Cost: $211,266,137) 96.4% | | | 267,290,898 | | |
| CONVERTIBLE PREFERRED STOCKS: | |
| ENERGY (0.5%) | |
Energy XXI (Bermuda)
Ltd., 7.25% | | | 4,255 | | | | 1,262,671 | | |
TOTAL CONVERTIBLE PREFERRED STOCKS
(Cost: $425,500) 0.5% | | $ | 1,262,671 | | |
| | | Rating** | | Rate | | Maturity | | Face
Amount | | Value | |
| SHORT-TERM DEBT SECURITIES: | |
| U.S. GOVERNMENT AGENCIES (2.5%) | |
| Farmer Mac | | AAA | | | 0.01 | % | | 01/03/11 | | $ | 6,900,000 | | | $ | 6,899,996 | | |
| COMMERCIAL PAPER (3.4%) | |
| General Electric Capital Corp. | | A-1+ | | | 0.15 | | | 01/31/11 | | | 5,500,000 | | | | 5,499,312 | | |
| NetJets, Inc.† | | A-1+ | | | 0.10 | | | 01/03/11 | | | 4,000,000 | | | | 3,999,978 | | |
| | | | 9,499,290 | | |
TOTAL SHORT-TERM DEBT SECURITIES
(Cost: $16,399,286) 5.9% | | | 16,399,286 | | |
TOTAL INVESTMENTS
(Cost: $228,090,923) 102.8% | | | 284,952,855 | | |
| OTHER NET ASSETS -2.8% | | | (7,763,020 | ) | |
| NET ASSETS 100.0% | | $ | 277,189,835 | | |
The accompanying notes are an integral part of these portfolio schedules.
41
MUTUAL OF AMERICA INVESTMENT CORPORATION (SMALL CAP GROWTH FUND)
SUMMARY PORTFOLIO OF INVESTMENTS IN SECURITIES
December 31, 2010
| | | Shares | | Value | |
| COMMON STOCKS: | |
| CONSUMER DISCRETIONARY (15.1%) | |
| California Pizza Kitchen, Inc.* | | | 167,597 | | | $ | 2,896,076 | | |
| Carter's, Inc.* | | | 91,846 | | | | 2,710,375 | | |
| Deckers Outdoor Corp.* | | | 45,897 | | | | 3,659,827 | | |
| Fossil, Inc.* | | | 31,613 | | | | 2,228,084 | | |
| OfficeMax, Inc.* | | | 245,688 | | | | 4,348,678 | | |
| Pinnacle Entertainment, Inc.* | | | 267,932 | | | | 3,756,407 | | |
| Shutterfly, Inc.* | | | 106,198 | | | | 3,720,116 | | |
| Steve Madden Ltd.* | | | 50,782 | | | | 2,118,625 | | |
| Other Securities | | | 1,193,600 | | | | 17,042,744 | | |
| | | | 42,480,932 | | |
| CONSUMER STAPLES (2.7%) | |
| Pantry, Inc.* | | | 123,823 | | | | 2,459,125 | | |
| Other Securities | | | 141,556 | | | | 5,038,152 | | |
| | | | 7,497,277 | | |
| ENERGY (5.9%) | |
| Brigham Exploration Co.* | | | 199,283 | | | | 5,428,467 | | |
| Energy XXI (Bermuda) Ltd.* | | | 98,436 | | | | 2,723,724 | | |
| Lufkin Industries, Inc. | | | 34,209 | | | | 2,134,300 | | |
| McMoRan Exploration Co.* | | | 283,038 | | | | 4,851,271 | | |
| Other Securities | | | 33,268 | | | | 1,440,837 | | |
| | | | 16,578,599 | | |
| FINANCIALS (4.2%) | |
| Signature Bank* | | | 47,137 | | | | 2,356,850 | | |
| Stifel Financial Corp.* | | | 33,997 | | | | 2,109,174 | | |
| Other Securities | | | 250,272 | | | | 7,198,557 | | |
| | | | 11,664,581 | | |
| HEALTH CARE (16.8%) | |
| Cyberonics, Inc.* | | | 77,511 | | | | 2,404,391 | | |
| Enzon Pharmaceuticals, Inc.* | | | 179,966 | | | | 2,190,186 | | |
| HMS Hldgs. Corp.* | | | 39,108 | | | | 2,533,025 | | |
| IPC The Hospitalist Co.* | | | 61,650 | | | | 2,404,967 | | |
| Neogen Corp.* | | | 59,849 | | | | 2,455,604 | | |
| Salix Pharmaceuticals Ltd.* | | | 67,041 | | | | 3,148,245 | | |
| Steris Corp. | | | 78,839 | | | | 2,874,470 | | |
| Other Securities | | | 2,168,225 | | | | 29,064,115 | | |
| | | | 47,075,003 | | |
| INDUSTRIALS (15.2%) | |
| Genesee & Wyoming, Inc. Cl A* | | | 50,613 | | | | 2,679,958 | | |
| Old Dominion Freight Line, Inc.* | | | 76,189 | | | | 2,437,286 | | |
| | | Shares | | Value | |
| COMMON STOCKS (CONTINUED): | |
| INDUSTRIALS (CONTINUED) | |
| RBC Bearings, Inc.* | | | 57,125 | | | $ | 2,232,445 | | |
| Robbins & Myers, Inc. | | | 82,682 | | | | 2,958,362 | | |
| Sun Hydraulics Corp. | | | 74,184 | | | | 2,804,155 | | |
| Teledyne Technologies, Inc.* | | | 52,422 | | | | 2,304,995 | | |
| Other Securities | | | 1,501,517 | | | | 27,268,778 | | |
| | | | 42,685,979 | | |
| INFORMATION TECHNOLOGY (28.9%) | |
| Adtran, Inc. | | | 75,241 | | | | 2,724,477 | | |
| CommVault Systems, Inc.* | | | 90,430 | | | | 2,588,107 | | |
| comScore, Inc.* | | | 101,516 | | | | 2,264,822 | | |
| Forrester Research, Inc.* | | | 74,830 | | | | 2,640,751 | | |
| Informatica Corp.* | | | 105,536 | | | | 4,646,750 | | |
| LogMeIn, Inc.* | | | 88,076 | | | | 3,905,290 | | |
| Mercury Computer Systems, Inc.* | | | 138,344 | | | | 2,542,763 | | |
| Microsemi Corp.* | | | 99,129 | | | | 2,270,054 | | |
| Parametric Technology Corp.* | | | 161,282 | | | | 3,633,683 | | |
| Plexus Corp.* | | | 97,593 | | | | 3,019,527 | | |
| Rackspace Hosting, Inc.* | | | 66,861 | | | | 2,100,104 | | |
| RightNow Technologies, Inc.* | | | 90,924 | | | | 2,152,171 | | |
| Riverbed Technology, Inc.* | | | 113,777 | | | | 4,001,537 | | |
| Rogers Corp.* | | | 57,017 | | | | 2,180,900 | | |
| Sourcefire, Inc.* | | | 88,237 | | | | 2,287,985 | | |
| Tibco Software, Inc.* | | | 124,561 | | | | 2,455,097 | | |
| Other Securities | | | 2,271,224 | | | | 35,826,347 | | |
| | | | 81,240,365 | | |
| MATERIALS (6.3%) | |
| Innophos Hldgs., Inc. | | | 77,471 | | | | 2,795,154 | | |
| US Gold Corp.* | | | 636,404 | | | | 5,135,780 | | |
| Other Securities | | | 385,132 | | | | 9,870,178 | | |
| | | | 17,801,112 | | |
| TELECOMMUNICATION SERVICES (1.8%) | |
Consolidated Comms.
Hldgs., Inc. | | | 118,601 | | | | 2,288,999 | | |
| Syniverse Hldgs., Inc.* | | | 85,451 | | | | 2,636,163 | | |
| | | | 4,925,162 | | |
| UTILITIES (0.4%) | |
| Other Securities | | | 25,662 | | | | 1,192,513 | | |
TOTAL COMMON STOCKS
(Cost: $192,379,310) 97.3% | | $ | 273,141,523 | | |
| | | Rating** | | Rate | | Maturity | | Face
Amount | | Value | |
| SHORT-TERM DEBT SECURITIES: | |
| U.S. GOVERNMENT AGENCIES (1.3%) | |
| Farmer Mac | | AAA | | | 0.01 | % | | 01/03/11 | | $ | 3,700,000 | | | $ | 3,699,998 | | |
| COMMERCIAL PAPER (1.4%) | |
| NetJets, Inc.† | | A-1+ | | | 0.10 | | | 01/03/11 | | | 3,800,000 | | | | 3,799,979 | | |
TOTAL SHORT-TERM DEBT SECURITIES
(Cost: $7,499,977) 2.7% | | | 7,499,977 | | |
TOTAL INVESTMENTS
(Cost: $199,879,287) 100.0% | | | 280,641,500 | | |
| OTHER NET ASSETS 0.0% (3) | | | 126,382 | | |
| NET ASSETS 100.0% | | $ | 280,767,882 | | |
The accompanying notes are an integral part of these portfolio schedules.
42
MUTUAL OF AMERICA INVESTMENT CORPORATION (MID CAP VALUE FUND)
SUMMARY PORTFOLIO OF INVESTMENTS IN SECURITIES
December 31, 2010
| | | Shares | | Value | |
| COMMON STOCKS: | |
| CONSUMER DISCRETIONARY (9.6%) | |
| V.F. Corp. | | | 10,322 | | | $ | 889,550 | | |
| Whirlpool Corp. | | | 6,068 | | | | 539,020 | | |
| Other Securities | | | 135,759 | | | | 3,833,258 | | |
| | | | 5,261,828 | | |
| CONSUMER STAPLES (6.4%) | |
| ConAgra Foods, Inc. | | | 32,633 | | | | 736,853 | | |
| Dr. Pepper Snapple Group, Inc. | | | 18,290 | | | | 643,076 | | |
| Vector Group Ltd. | | | 43,771 | | | | 758,114 | | |
| Other Securities | | | 34,779 | | | | 1,351,835 | | |
| | | | 3,489,878 | | |
| ENERGY (10.8%) | |
| Arch Coal, Inc. | | | 18,731 | | | | 656,709 | | |
| Atwood Oceanics, Inc.* | | | 16,190 | | | | 605,020 | | |
| Noble Energy, Inc. | | | 8,725 | | | | 751,048 | | |
| Pride International, Inc.* | | | 16,064 | | | | 530,112 | | |
| Range Resources Corp. | | | 14,921 | | | | 671,147 | | |
| Unit Corp.* | | | 13,292 | | | | 617,812 | | |
| Other Securities | | | 90,153 | | | | 2,080,530 | | |
| | | | 5,912,378 | | |
| FINANCIALS (25.9%) | |
| American Financial Group, Inc. | | | 23,401 | | | | 755,618 | | |
| Ameriprise Financial, Inc. | | | 16,144 | | | | 929,087 | | |
| Aon Corp. | | | 13,623 | | | | 626,794 | | |
| Associated Banc-Corp. | | | 36,404 | | | | 551,521 | | |
| BOK Financial Corp. | | | 12,306 | | | | 657,140 | | |
| Equity Residential | | | 17,622 | | | | 915,463 | | |
| Host Hotels & Resorts, Inc. | | | 35,760 | | | | 639,031 | | |
| Legg Mason, Inc. | | | 15,970 | | | | 579,232 | | |
| People's United Financial, Inc. | | | 42,023 | | | | 588,742 | | |
| Public Storage | | | 5,302 | | | | 537,729 | | |
| SPDR KBW Regional Banking ETF | | | 20,968 | | | | 554,604 | | |
| StanCorp Financial Group, Inc. | | | 13,389 | | | | 604,379 | | |
| Vornado Realty Trust | | | 10,209 | | | | 850,716 | | |
| Other Securities | | | 272,569 | | | | 5,386,766 | | |
| | | | 14,176,822 | | |
| HEALTH CARE (6.0%) | |
| AmerisourceBergen Corp. | | | 18,305 | | | | 624,567 | | |
| Hospira, Inc.* | | | 9,674 | | | | 538,745 | | |
| Mettler-Toledo Int'l., Inc.* | | | 5,191 | | | | 784,931 | | |
| Other Securities | | | 29,717 | | | | 1,306,900 | | |
| | | | 3,255,143 | | |
| | | Shares | | Value | |
| COMMON STOCKS (CONTINUED): | |
| INDUSTRIALS (10.6%) | |
| Joy Global, Inc. | | | 8,515 | | | $ | 738,676 | | |
| Kirby Corp.* | | | 14,332 | | | | 631,325 | | |
| Oshkosh Corp.* | | | 15,991 | | | | 563,523 | | |
| Precision Castparts Corp. | | | 6,080 | | | | 846,397 | | |
| Other Securities | | | 70,381 | | | | 3,036,644 | | |
| | | | 5,816,565 | | |
| INFORMATION TECHNOLOGY (4.2%) | |
| Teradata Corp.* | | | 13,026 | | | | 536,150 | | |
| Other Securities | | | 88,668 | | | | 1,745,881 | | |
| | | | 2,282,031 | | |
| MATERIALS (8.8%) | |
| Agnico-Eagle Mines Ltd. | | | 7,619 | | | | 584,377 | | |
| Crown Hldgs., Inc.* | | | 53,946 | | | | 1,800,718 | | |
| Cytec Industries, Inc. | | | 13,998 | | | | 742,734 | | |
| Eastman Chemical Co. | | | 7,613 | | | | 640,101 | | |
| Sonoco Products Co. | | | 22,460 | | | | 756,228 | | |
| Other Securities | | | 14,364 | | | | 262,861 | | |
| | | | 4,787,019 | | |
| TELECOMMUNICATION SERVICES (2.2%) | |
| CenturyLink, Inc. | | | 14,595 | | | | 673,851 | | |
| Other Securities | | | 36,802 | | | | 513,020 | | |
| | | | 1,186,871 | | |
| UTILITIES (12.0%) | |
| Ameren Corp. | | | 22,774 | | | | 641,999 | | |
| Atmos Energy Corp. | | | 18,857 | | | | 588,338 | | |
| Constellation Energy Group, Inc. | | | 19,151 | | | | 586,595 | | |
| Edison International | | | 19,188 | | | | 740,657 | | |
| FirstEnergy Corp. | | | 20,317 | | | | 752,135 | | |
| Great Plains Energy, Inc. | | | 28,570 | | | | 553,972 | | |
| Integrys Energy Group, Inc. | | | 11,119 | | | | 539,383 | | |
| ITC Hldgs. Corp. | | | 10,037 | | | | 622,093 | | |
| NV Energy, Inc. | | | 41,978 | | | | 589,791 | | |
| Other Securities | | | 141,431 | | | | 975,689 | | |
| | | | 6,590,652 | | |
TOTAL COMMON STOCKS
(Cost: $47,581,808) 96.5% | | $ | 52,759,187 | | |
| | | Rating** | | Rate | | Maturity | | Face
Amount | | Value | |
| SHORT-TERM DEBT SECURITIES: | |
| U.S. GOVERNMENT AGENCIES (2.2%) | |
| Farmer Mac | | AAA | | | 0.01 | % | | 01/03/11 | | $ | 1,200,000 | | | $ | 1,199,999 | | |
| COMMERCIAL PAPER (3.8%) | |
| Hewlett-Packard Co.† | | A-1 | | | 0.18 | | | 01/07/11 | | | 1,000,000 | | | | 999,970 | | |
| NetJets, Inc.† | | A-1+ | | | 0.10 | | | 01/03/11 | | | 1,100,000 | | | | 1,099,994 | | |
| | | | 2,099,964 | | |
TOTAL SHORT-TERM DEBT SECURITIES
(Cost: $3,299,963) 6.0% | | | 3,299,963 | | |
TOTAL INVESTMENTS
(Cost: $50,881,771) 102.5% | | | 56,059,150 | | |
| OTHER NET ASSETS -2.5% | | | (1,369,297 | ) | |
| NET ASSETS 100.0% | | $ | 54,689,853 | | |
The accompanying notes are an integral part of these portfolio schedules.
43
MUTUAL OF AMERICA INVESTMENT CORPORATION (MID-CAP EQUITY INDEX FUND)
SUMMARY PORTFOLIO OF INVESTMENTS IN SECURITIES
December 31, 2010
| | | Shares | | Value | |
| INDEXED ASSETS: | |
| COMMON STOCKS | |
| CONSUMER DISCRETIONARY (13.9%) | |
| Advance Auto Parts, Inc. | | | 37,149 | | | $ | 2,457,406 | | |
| BorgWarner, Inc.* | | | 49,277 | | | | 3,565,684 | | |
| Chipotle Mexican Grill, Inc. Cl A* | | | 13,179 | | | | 2,802,646 | | |
| Dollar Tree, Inc.* | | | 54,831 | | | | 3,074,922 | | |
| PetSmart, Inc. | | | 50,702 | | | | 2,018,954 | | |
| Other Securities | | | 2,165,518 | | | | 54,501,284 | | |
| | | | 68,420,896 | | |
| CONSUMER STAPLES (3.5%) | |
| Church & Dwight Co., Inc. | | | 30,420 | | | | 2,099,588 | | |
| Energizer Hldgs., Inc.* | | | 30,637 | | | | 2,233,437 | | |
| Other Securities | | | 347,883 | | | | 12,933,620 | | |
| | | | 17,266,645 | | |
| ENERGY (5.8%) | |
| Arch Coal, Inc. | | | 70,233 | | | | 2,462,369 | | |
| Cimarex Energy Co. | | | 36,805 | | | | 3,258,347 | | |
Plains Exploration &
Production Co.* | | | 60,939 | | | | 1,958,579 | | |
| Pride International, Inc.* | | | 76,683 | | | | 2,530,539 | | |
| Other Securities | | | 589,440 | | | | 18,330,697 | | |
| | | | 28,540,531 | | |
| FINANCIALS (19.1%) | |
| Affiliated Managers Group, Inc.* | | | 22,162 | | | | 2,198,914 | | |
| AMB Property Corp. | | | 72,445 | | | | 2,297,231 | | |
| Everest Re Group Ltd. | | | 23,826 | | | | 2,020,921 | | |
| Federal Realty Investment Trust | | | 26,413 | | | | 2,058,365 | | |
| MSCI, Inc. Cl A* | | | 50,499 | | | | 1,967,441 | | |
| Nationwide Health Pptys., Inc. | | | 54,180 | | | | 1,971,068 | | |
New York Community
Bancorp, Inc. | | | 189,524 | | | | 3,572,527 | | |
| SL Green Realty Corp | | | 33,700 | | | | 2,275,087 | | |
| The Macerich Co. | | | 54,607 | | | | 2,586,734 | | |
| Other Securities | | | 3,116,234 | | | | 73,487,590 | | |
| | | | 94,435,878 | | |
| HEALTH CARE (10.8%) | |
| Beckman Coulter, Inc. | | | 30,137 | | | | 2,267,207 | | |
| Edwards Lifesciences Corp.* | | | 47,968 | | | | 3,877,730 | | |
| Hologic, Inc.* | | | 112,105 | | | | 2,109,816 | | |
| Mettler-Toledo Int'l., Inc.* | | | 13,981 | | | | 2,114,067 | | |
| Perrigo Co. | | | 36,314 | | | | 2,299,766 | | |
| ResMed, Inc.* | | | 64,522 | | | | 2,235,042 | | |
| | | Shares | | Value | |
| INDEXED ASSETS (CONTINUED): | |
| COMMON STOCKS (CONTINUED) | |
| HEALTH CARE (CONTINUED) | |
| Schein (Henry), Inc.* | | | 39,770 | | | $ | 2,441,480 | | |
| Vertex Pharmaceuticals, Inc.* | | | 85,987 | | | | 3,012,125 | | |
| Other Securities | | | 1,006,464 | | | | 33,018,864 | | |
| | | | 53,376,097 | | |
| INDUSTRIALS (15.7%) | |
| AGCO Corp.* | | | 39,503 | | | | 2,001,222 | | |
| AMETEK, Inc. | | | 69,821 | | | | 2,740,455 | | |
| Bucyrus International, Inc. | | | 35,200 | | | | 3,146,880 | | |
| Donaldson Co., Inc. | | | 32,830 | | | | 1,913,332 | | |
| Joy Global, Inc. | | | 45,040 | | | | 3,907,215 | | |
| Kansas City Southern* | | | 44,723 | | | | 2,140,443 | | |
| KBR, Inc. | | | 64,314 | | | | 1,959,648 | | |
| Manpower, Inc. | | | 34,521 | | | | 2,166,538 | | |
| Other Securities | | | 1,573,572 | | | | 57,900,606 | | |
| | | | 77,876,339 | | |
| INFORMATION TECHNOLOGY (15.2%) | |
| ANSYS, Inc.* | | | 38,852 | | | | 2,023,024 | | |
| Atmel Corp.* | | | 196,596 | | | | 2,422,063 | | |
| Avnet, Inc.* | | | 65,534 | | | | 2,164,588 | | |
| Cree, Inc.* | | | 46,517 | | | | 3,065,005 | | |
| Lam Research Corp.* | | | 52,382 | | | | 2,712,340 | | |
| Riverbed Technology, Inc.* | | | 62,284 | | | | 2,190,528 | | |
| Rovi Corp.* | | | 46,066 | | | | 2,856,553 | | |
| Skyworks Solutions, Inc.* | | | 77,601 | | | | 2,221,717 | | |
| Trimble Navigation Ltd.* | | | 51,376 | | | | 2,051,444 | | |
| Other Securities | | | 2,057,322 | | | | 53,264,070 | | |
| | | | 74,971,332 | | |
| MATERIALS (6.6%) | |
| Albemarle Corp. | | | 39,518 | | | | 2,204,314 | | |
| Lubrizol Corp. | | | 28,498 | | | | 3,045,866 | | |
| Other Securities | | | 812,937 | | | | 27,421,084 | | |
| | | | 32,671,264 | | |
| TELECOMMUNICATION SERVICES (0.8%) | |
| Other Securities | | | 226,542 | | | | 3,799,264 | | |
| UTILITIES (5.7%) | |
| National Fuel Gas Co. | | | 35,526 | | | | 2,331,216 | | |
| Other Securities | | | 1,011,553 | | | | 25,980,736 | | |
| | | | 28,311,952 | | |
TOTAL INDEXED ASSETS-COMMON STOCKS
(Cost: $400,792,429) 97.1% | | $ | 479,670,198 | | |
| | | Rating** | | Rate | | Maturity | | Face
Amount | | Value | |
| SHORT-TERM DEBT SECURITIES: | |
| U.S. GOVERNMENT (0.4%) | |
| U.S. Treasury Bill (1) | | AAA | | | 0.12 | % | | 02/03/11 | | $ | 600,000 | | | $ | 599,934 | | |
| U.S. Treasury Bill (1) | | AAA | | | 0.16 | | | 03/03/11 | | | 800,000 | | | | 799,835 | | |
| U.S. Treasury Bill (1) | | AAA | | | 0.16 | | | 03/03/11 | | | 500,000 | | | | 499,896 | | |
| | | | 1,899,665 | | |
| U.S. GOVERNMENT AGENCIES (1.0%) | |
| Farmer Mac | | AAA | | | 0.01 | | | 01/03/11 | | | 5,000,000 | | | | 4,999,997 | | |
| COMMERCIAL PAPER (1.4%) | |
| General Electric Capital Corp. | | A-1+ | | | 0.15 | | | 01/31/11 | | | 6,800,000 | | | | 6,799,150 | | |
TOTAL SHORT-TERM DEBT SECURITIES
(Cost: $13,698,735) 2.8% | | | 13,698,812 | | |
TEMPORARY CASH INVESTMENTS (2)
(Cost: $179,800) 0.0% (3) | | | 179,800 | | |
TOTAL INVESTMENTS
(Cost: $414,670,964) 99.9% | | | 493,548,810 | | |
| OTHER NET ASSETS 0.1% | | | 291,691 | | |
| NET ASSETS 100.0% | | $ | 493,840,501 | | |
The accompanying notes are an integral part of these portfolio schedules.
44
MUTUAL OF AMERICA INVESTMENT CORPORATION (INTERNATIONAL FUND)
PORTFOLIO OF INVESTMENTS IN SECURITIES
December 31, 2010
| | | Shares | | Value | |
| COMMON STOCKS: | |
| FINANCIALS (94.9%) | |
| iShares MSCI EAFE Growth Index Fund | | | 80,971 | | | $ | 4,945,304 | | |
| iShares MSCI EAFE Index Fund | | | 109,546 | | | | 6,378,864 | | |
| iShares MSCI EAFE Value Index Fund | | | 97,590 | | | | 4,954,644 | | |
| Vanguard Europe Pacific ETF | | | 785,371 | | | | 28,391,162 | | |
| Vanguard European ETF | | | 177,835 | | | | 8,729,920 | | |
| Vanguard Pacific ETF | | | 80,359 | | | | 4,583,677 | | |
| | | | 57,983,571 | | |
TOTAL COMMON STOCKS
(Cost: $52,966,512) 94.9% | | $ | 57,983,571 | | |
| | | Rating** | | Rate | | Maturity | | Face
Amount | | Value | |
| SHORT-TERM DEBT SECURITIES: | |
| U.S. GOVERNMENT AGENCIES (5.2%) | |
| Farmer Mac | | AAA | | | 0.01 | % | | 01/03/11 | | $ | 2,000,000 | | | $ | 1,999,999 | | |
| FNMA | | AAA | | | 0.09 | | | 02/14/11 | | | 1,200,000 | | | | 1,199,868 | | |
| | | | 3,199,867 | | |
TOTAL SHORT-TERM DEBT SECURITIES
(Cost: $3,199,867) 5.2% | | | 3,199,867 | | |
TOTAL INVESTMENTS
(Cost: $56,166,379) 100.1% | | | 61,183,438 | | |
| OTHER NET ASSETS -0.1% | | | (75,408 | ) | |
| NET ASSETS 100.0% | | $ | 61,108,030 | | |
The accompanying notes are an integral part of these portfolio schedules.
45
MUTUAL OF AMERICA INVESTMENT CORPORATION (COMPOSITE FUND)
SUMMARY PORTFOLIO OF INVESTMENTS IN SECURITIES
December 31, 2010
| | | Shares | | Value | |
| COMMON STOCKS: | |
| CONSUMER DISCRETIONARY (6.7%) | |
| Amazon.com, Inc.* | | | 6,758 | | | $ | 1,216,440 | | |
| Ford Motor Co.* | | | 66,350 | | | | 1,114,017 | | |
| Johnson Controls, Inc. | | | 23,444 | | | | 895,561 | | |
| Starbucks Corp. | | | 39,731 | | | | 1,276,557 | | |
| Other Securities | | | 158,044 | | | | 6,629,777 | | |
| | | | 11,132,352 | | |
| CONSUMER STAPLES (5.7%) | |
| PepsiCo, Inc. | | | 24,704 | | | | 1,613,912 | | |
| Proctor & Gamble Co. | | | 31,541 | | | | 2,029,033 | | |
| Wal-Mart Stores, Inc. | | | 33,048 | | | | 1,782,279 | | |
| Other Securities | | | 142,118 | | | | 4,136,300 | | |
| | | | 9,561,524 | | |
| ENERGY (7.2%) | |
| Apache Corp. | | | 8,876 | | | | 1,058,285 | | |
| ConocoPhillips | | | 25,055 | | | | 1,706,246 | | |
| Exxon Mobil Corp. | | | 47,917 | | | | 3,503,688 | | |
| Halliburton Co. | | | 29,517 | | | | 1,205,179 | | |
| National Oilwell Varco, Inc. | | | 13,277 | | | | 892,878 | | |
| Occidental Petroleum Corp. | | | 13,978 | | | | 1,371,242 | | |
| Other Securities | | | 33,074 | | | | 2,182,968 | | |
| | | | 11,920,486 | | |
| FINANCIALS (9.5%) | |
| Bank of America Corp. | | | 98,909 | | | | 1,319,446 | | |
| Berkshire Hathaway, Inc. Cl B* | | | 16,501 | | | | 1,321,895 | | |
| Capital One Financial Corp. | | | 26,830 | | | | 1,141,885 | | |
| Citigroup, Inc.* | | | 260,443 | | | | 1,231,895 | | |
| Goldman Sachs Group, Inc. | | | 9,230 | | | | 1,552,117 | | |
| JPMorgan Chase & Co. | | | 59,302 | | | | 2,515,591 | | |
| Wells Fargo & Co. | | | 73,250 | | | | 2,270,018 | | |
| Other Securities | | | 101,749 | | | | 4,370,303 | | |
| | | | 15,723,150 | | |
| HEALTH CARE (6.4%) | |
| Abbott Laboratories | | | 30,113 | | | | 1,442,714 | | |
| Johnson & Johnson | | | 31,704 | | | | 1,960,892 | | |
| Merck & Co., Inc. | | | 41,263 | | | | 1,487,119 | | |
| Other Securities | | | 135,029 | | | | 5,752,041 | | |
| | | | 10,642,766 | | |
| | | Shares | | Value | |
| COMMON STOCKS (CONTINUED): | |
| INDUSTRIALS (6.1%) | |
| Boeing Co. | | | 19,823 | | | $ | 1,293,649 | | |
| Cummins, Inc. | | | 10,067 | | | | 1,107,471 | | |
| Expeditors Int'l. of Wash. | | | 18,492 | | | | 1,009,663 | | |
| General Electric Co. | | | 116,595 | | | | 2,132,523 | | |
| Precision Castparts Corp. | | | 7,904 | | | | 1,100,316 | | |
| Other Securities | | | 79,196 | | | | 3,549,388 | | |
| | | | 10,193,010 | | |
| INFORMATION TECHNOLOGY (11.5%) | |
| Apple, Inc.* | | | 10,766 | | | | 3,472,681 | | |
| Cisco Systems, Inc.* | | | 62,172 | | | | 1,257,740 | | |
| Google, Inc.* | | | 3,166 | | | | 1,880,509 | | |
| Hewlett-Packard Co. | | | 29,252 | | | | 1,231,509 | | |
| Int'l. Business Machines Corp. | | | 11,860 | | | | 1,740,574 | | |
| Microsoft Corp. | | | 61,228 | | | | 1,709,486 | | |
| Oracle Corp. | | | 39,863 | | | | 1,247,712 | | |
| QUALCOMM, Inc. | | | 21,800 | | | | 1,078,882 | | |
| Salesforce.com, inc.* | | | 8,465 | | | | 1,117,380 | | |
| Other Securities | | | 134,064 | | | | 4,399,007 | | |
| | | | 19,135,480 | | |
| MATERIALS (2.6%) | |
Freeport-McMoRan Copper &
Gold, Inc. | | | 10,949 | | | | 1,314,865 | | |
| Other Securities | | | 50,202 | | | | 2,982,491 | | |
| | | | 4,297,356 | | |
| TELECOMMUNICATION SERVICES (1.7%) | |
| AT&T, Inc. | | | 51,848 | | | | 1,523,294 | | |
| Other Securities | | | 245,227 | | | | 1,335,690 | | |
| | | | 2,858,984 | | |
| UTILITIES (1.7%) | |
| Other Securities | | | 73,906 | | | | 2,869,803 | | |
TOTAL COMMON STOCKS
(Cost: $86,379,344) 59.1% | | $ | 98,334,911 | | |
The accompanying notes are an integral part of these portfolio schedules.
46
MUTUAL OF AMERICA INVESTMENT CORPORATION (COMPOSITE FUND)
SUMMARY PORTFOLIO OF INVESTMENTS IN SECURITIES (Continued)
December 31, 2010
| | | Rating** | | Rate | | Maturity | | Face
Amount | | Value | |
| LONG-TERM DEBT SECURITIES: | |
| U.S. GOVERNMENT (4.5%) | |
| U.S. Treasury Note | | AAA | | | 2.25 - 3.13 | % | | 11/30/17 - 05/15/19 | | $ | 1,350,000 | | | $ | 1,354,708 | | |
| U.S. Treasury Strip | | AAA | | | 0.00 | | | 08/15/21 - 11/15/21 | | | 9,200,000 | | | | 6,087,415 | | |
| | | | 7,442,123 | | |
| U.S. GOVERNMENT AGENCIES (13.6%) | |
| MORTGAGE-BACKED OBLIGATIONS (13.6%) | |
| FHARM | | AAA | | | 4.64 - 5.77 | | | 02/01/36 - 09/01/39 | | | 1,328,163 | | | | 1,408,608 | | |
| FHLMC | | AAA | | | 4.00 - 6.00 | | | 02/01/25 - 08/15/35 | | | 1,730,839 | | | | 1,822,552 | | |
| FNMA | | AAA | | | 4.00 - 8.00 | | | 09/01/16 - 12/25/49 | | | 16,762,022 | | | | 17,867,420 | | |
| GNMA (4) | | AAA | | | 3.50 - 7.00 | | | 04/15/31 - 11/15/39 | | | 1,117,504 | | | | 1,163,139 | | |
| Other Securities | | | | | | | | | 400,824 | | | | 435,580 | | |
| | | | 22,697,299 | | |
| CORPORATE DEBT (18.9%) | |
| CONSUMER DISCRETIONARY (2.8%) | |
| Black & Decker Corp. | | A | | | 4.75 | | | 11/01/14 | | | 750,000 | | | | 807,195 | | |
| Other Securities | | | | | | | | | 3,750,000 | | | | 3,909,720 | | |
| | | | 4,716,915 | | |
| CONSUMER STAPLES (0.6%) | |
| Other Securities | | | | | | | | | 1,000,000 | | | | 1,070,269 | | |
| ENERGY (3.9%) | |
| Noble Corp. | | A- | | | 7.50 | | | 03/15/19 | | | 800,000 | | | | 959,809 | | |
| Seariver Maritime, Inc. | | AAA | | | 0.00 | | | 09/01/12 | | | 3,000,000 | | | | 2,885,325 | | |
| Other Securities | | | | | | | | | 2,600,000 | | | | 2,724,761 | | |
| | | | 6,569,895 | | |
| FINANCIALS (6.6%) | |
| Ally Financial, Inc. | | B | | | 0.00 | | | 12/01/12 | | | 2,500,000 | | | | 2,256,250 | | |
| First Horizon National Corp. | | BB+ | | | 4.50 | | | 05/15/13 | | | 1,500,000 | | | | 1,514,330 | | |
| Other Securities | | | | | | | | | 6,997,000 | | | | 7,243,278 | | |
| | | | 11,013,858 | | |
| HEALTH CARE (1.1%) | |
| Other Securities | | | | | | | | | 1,750,000 | | | | 1,874,860 | | |
| INDUSTRIALS (1.4%) | |
| Other Securities | | | | | | | | | 2,250,000 | | | | 2,330,437 | | |
| MATERIALS (1.4%) | |
| Geon Co. | | B+ | | | 7.50 | | | 12/15/15 | | | 1,000,000 | | | | 1,028,750 | | |
| Other Securities | | | | | | | | | 1,228,000 | | | | 1,306,149 | | |
| | | | 2,334,899 | | |
| TELECOMMUNICATION SERVICES (0.3%) | |
| Other Securities | | | | | | | | | 500,000 | | | | 510,563 | | |
| UTILITIES (0.8%) | |
| Other Securities | | | | | | | | | 1,250,000 | | | | 1,314,038 | | |
TOTAL LONG-TERM DEBT SECURITIES
(Cost: $58,779,729) 37.0% | | $ | 61,875,156 | | |
The accompanying notes are an integral part of these portfolio schedules.
47
MUTUAL OF AMERICA INVESTMENT CORPORATION (COMPOSITE FUND)
SUMMARY PORTFOLIO OF INVESTMENTS IN SECURITIES (Continued)
December 31, 2010
| | | Rating** | | Rate | | Maturity | | Face
Amount | | Value | |
| SHORT-TERM DEBT SECURITIES: | |
| U.S. GOVERNMENT AGENCIES (1.4%) | |
| Farmer Mac | | AAA | | | 0.01 | % | | 01/03/11 | | $ | 2,400,000 | | | $ | 2,399,999 | | |
| COMMERCIAL PAPER (2.0%) | |
| General Electric Capital Corp. | | A-1+ | | | 0.15 - 0.23 | | | 01/31/11 - 02/04/11 | | | 1,850,000 | | | | 1,849,677 | | |
| Madison Gas & Electric | | A-1+ | | | 0.18 | | | 01/14/11 | | | 428,000 | | | | 427,972 | | |
| NetJets, Inc.† | | A-1+ | | | 0.12 | | | 01/03/11 | | | 1,000,000 | | | | 999,993 | | |
| | | | 3,277,642 | | |
TOTAL SHORT-TERM DEBT SECURITIES
(Cost: $5,677,641) 3.4% | | | 5,677,641 | | |
TEMPORARY CASH INVESTMENTS (2)
(Cost: $137,400) 0.1% | | | 137,400 | | |
TOTAL INVESTMENTS
(Cost: $150,974,114) 99.6% | | | 166,025,108 | | |
| OTHER NET ASSETS 0.4% | | | 651,607 | | |
| NET ASSETS 100.0% | | $ | 166,676,715 | | |
The accompanying notes are an integral part of these portfolio schedules.
48
MUTUAL OF AMERICA INVESTMENT CORPORATION (RETIREMENT INCOME FUND)
PORTFOLIO OF INVESTMENTS IN SECURITIES
December 31, 2010
| | | Shares | | Value | |
| COMMON STOCKS: | |
| DIVERSIFIED MUTUAL FUNDS (100.0%) | |
| Mutual of America Investment Corporation | |
| Bond Fund (29.4%) | | | 3,972,162 | | | $ | 5,333,092 | | |
| Equity Index Fund (21.2%) | | | 1,857,188 | | | | 3,847,905 | | |
| Mid-Cap Equity Index Fund (5.7%) | | | 686,574 | | | | 1,037,774 | | |
| Mid-Term Bond Fund (37.1%) | | | 6,550,955 | | | | 6,730,065 | | |
| Money Market Fund (6.6%) | | | 993,502 | | | | 1,196,839 | | |
TOTAL INVESTMENTS
(Cost: $17,425,694) 100.0% | | | | | 18,145,675 | | |
| OTHER NET ASSETS | | | | | — | | |
| NET ASSETS 100.0% | | | | $ | 18,145,675 | | |
MUTUAL OF AMERICA INVESTMENT CORPORATION (2010 RETIREMENT FUND)
PORTFOLIO OF INVESTMENTS IN SECURITIES
December 31, 2010
| | | Shares | | Value | |
| COMMON STOCKS: | |
| DIVERSIFIED MUTUAL FUNDS (100.0%) | |
| Mutual of America Investment Corporation | |
| Bond Fund (24.0%) | | | 3,428,295 | | | $ | 4,602,887 | | |
| Equity Index Fund (25.9%) | | | 2,390,935 | | | | 4,953,774 | | |
| International Fund (3.9%) | | | 1,055,264 | | | | 749,270 | | |
| Mid-Cap Equity Index Fund (15.7%) | | | 1,992,577 | | | | 3,011,830 | | |
| Mid-Term Bond Fund (26.0%) | | | 4,856,746 | | | | 4,989,534 | | |
| Money Market Fund (4.5%) | | | 721,792 | | | | 869,520 | | |
TOTAL INVESTMENTS
(Cost: $17,117,322) 100.0% | | | | | 19,176,815 | | |
| OTHER NET ASSETS | | | | | — | | |
| NET ASSETS 100.0% | | | | $ | 19,176,815 | | |
MUTUAL OF AMERICA INVESTMENT CORPORATION (2015 RETIREMENT FUND)
PORTFOLIO OF INVESTMENTS IN SECURITIES
December 31, 2010
| | | Shares | | Value | |
| COMMON STOCKS: | |
| DIVERSIFIED MUTUAL FUNDS (100.0%) | |
| Mutual of America Investment Corporation | |
| Bond Fund (24.0%) | | | 13,960,970 | | | $ | 18,744,236 | | |
| Equity Index Fund (30.5%) | | | 11,530,033 | | | | 23,889,051 | | |
| International Fund (7.7%) | | | 8,481,053 | | | | 6,021,811 | | |
| Mid-Cap Equity Index Fund (12.3%) | | | 6,330,669 | | | | 9,568,964 | | |
| Mid-Term Bond Fund (17.3%) | | | 13,121,632 | | | | 13,480,390 | | |
| Money Market Fund (3.6%) | | | 2,354,179 | | | | 2,836,002 | | |
| Small Cap Growth Fund (2.4%) | | | 1,541,597 | | | | 1,835,586 | | |
| Small Cap Value Fund (2.2%) | | | 1,448,823 | | | | 1,752,046 | | |
TOTAL INVESTMENTS
(Cost: $69,759,249) 100.0% | | | | | 78,128,086 | | |
| OTHER NET ASSETS | | | | | — | | |
| NET ASSETS 100.0% | | | | $ | 78,128,086 | | |
The accompanying notes are an integral part of these portfolio schedules.
49
MUTUAL OF AMERICA INVESTMENT CORPORATION (2020 RETIREMENT FUND)
PORTFOLIO OF INVESTMENTS IN SECURITIES
December 31, 2010
| | | Shares | | Value | |
| COMMON STOCKS: | |
| DIVERSIFIED MUTUAL FUNDS (100.0%) | |
| Mutual of America Investment Corporation | |
| Bond Fund (22.8%) | | | 15,325,246 | | | $ | 20,575,936 | | |
| Equity Index Fund (35.0%) | | | 15,297,924 | | | | 31,695,739 | | |
| International Fund (8.7%) | | | 11,139,663 | | | | 7,909,506 | | |
| Mid-Cap Equity Index Fund (12.1%) | | | 7,223,561 | | | | 10,918,593 | | |
| Mid-Term Bond Fund (12.4%) | | | 10,877,275 | | | | 11,174,670 | | |
| Small Cap Growth Fund (4.6%) | | | 3,513,887 | | | | 4,184,000 | | |
| Small Cap Value Fund (4.4%) | | | 3,304,996 | | | | 3,996,695 | | |
TOTAL INVESTMENTS
(Cost: $80,993,147) 100.0% | | | | | 90,455,139 | | |
| OTHER NET ASSETS | | | | | — | | |
| NET ASSETS 100.0% | | | | $ | 90,455,139 | | |
MUTUAL OF AMERICA INVESTMENT CORPORATION (2025 RETIREMENT FUND)
PORTFOLIO OF INVESTMENTS IN SECURITIES
December 31, 2010
| | | Shares | | Value | |
| COMMON STOCKS: | |
| DIVERSIFIED MUTUAL FUNDS (100.0%) | |
| Mutual of America Investment Corporation | |
| Bond Fund (18.9%) | | | 11,337,362 | | | $ | 15,221,734 | | |
| Equity Index Fund (39.4%) | | | 15,293,379 | | | | 31,686,322 | | |
| International Fund (8.6%) | | | 9,798,257 | | | | 6,957,066 | | |
| Mid-Cap Equity Index Fund (16.2%) | | | 8,647,911 | | | | 13,071,534 | | |
| Mid-Term Bond Fund (5.7%) | | | 4,486,782 | | | | 4,609,455 | | |
| Small Cap Growth Fund (5.7%) | | | 3,853,787 | | | | 4,588,719 | | |
| Small Cap Value Fund (5.5%) | | | 3,625,136 | | | | 4,383,838 | | |
TOTAL INVESTMENTS
(Cost: $70,409,290) 100.0% | | | | | 80,518,668 | | |
| OTHER NET ASSETS | | | | | — | | |
| NET ASSETS 100.0% | | | | $ | 80,518,668 | | |
MUTUAL OF AMERICA INVESTMENT CORPORATION (2030 RETIREMENT FUND)
PORTFOLIO OF INVESTMENTS IN SECURITIES
December 31, 2010
| | | Shares | | Value | |
| COMMON STOCKS: | |
| DIVERSIFIED MUTUAL FUNDS (100.0%) | |
| Mutual of America Investment Corporation | |
| Bond Fund (18.5%) | | | 9,324,048 | | | $ | 12,518,626 | | |
| Equity Index Fund (39.6%) | | | 12,882,255 | | | | 26,690,719 | | |
| International Fund (9.5%) | | | 9,042,980 | | | | 6,420,796 | | |
| Mid-Cap Equity Index Fund (19.1%) | | | 8,504,825 | | | | 12,855,256 | | |
| Small Cap Growth Fund (6.8%) | | | 3,829,020 | | | | 4,559,229 | | |
| Small Cap Value Fund (6.5%) | | | 3,603,982 | | | | 4,358,256 | | |
TOTAL INVESTMENTS
(Cost: $58,303,447) 100.0% | | | | | 67,402,882 | | |
| OTHER NET ASSETS | | | | | — | | |
| NET ASSETS 100.0% | | | | $ | 67,402,882 | | |
The accompanying notes are an integral part of these portfolio schedules.
50
MUTUAL OF AMERICA INVESTMENT CORPORATION (2035 RETIREMENT FUND)
PORTFOLIO OF INVESTMENTS IN SECURITIES
December 31, 2010
| | | Shares | | Value | |
| COMMON STOCKS: | |
| DIVERSIFIED MUTUAL FUNDS (100.0%) | |
| Mutual of America Investment Corporation | |
| Bond Fund (12.0%) | | | 4,732,331 | | | $ | 6,353,708 | | |
| Equity Index Fund (39.3%) | | | 10,012,589 | | | | 20,745,063 | | |
| International Fund (11.3%) | | | 8,441,045 | | | | 5,993,403 | | |
| Mid-Cap Equity Index Fund (22.1%) | | | 7,717,801 | | | | 11,665,650 | | |
| Small Cap Growth Fund (7.8%) | | | 3,472,086 | | | | 4,134,227 | | |
| Small Cap Value Fund (7.5%) | | | 3,265,415 | | | | 3,948,830 | | |
TOTAL INVESTMENTS
(Cost: $45,209,479) 100.0% | | | | | 52,840,881 | | |
| OTHER NET ASSETS | | | | | — | | |
| NET ASSETS 100.0% | | | | $ | 52,840,881 | | |
MUTUAL OF AMERICA INVESTMENT CORPORATION (2040 RETIREMENT FUND)
PORTFOLIO OF INVESTMENTS IN SECURITIES
December 31, 2010
| | | Shares | | Value | |
| COMMON STOCKS: | |
| DIVERSIFIED MUTUAL FUNDS (100.0%) | |
| Mutual of America Investment Corporation | |
| Bond Fund (9.9%) | | | 3,450,978 | | | $ | 4,633,341 | | |
| Equity Index Fund (34.2%) | | | 7,693,208 | | | | 15,939,543 | | |
| International Fund (13.2%) | | | 8,658,039 | | | | 6,147,476 | | |
| Mid-Cap Equity Index Fund (25.3%) | | | 7,814,466 | | | | 11,811,761 | | |
| Small Cap Growth Fund (8.9%) | | | 3,479,504 | | | | 4,143,060 | | |
| Small Cap Value Fund (8.5%) | | | 3,271,733 | | | | 3,956,471 | | |
TOTAL INVESTMENTS
(Cost: $39,550,275) 100.0% | | | | | 46,631,652 | | |
| OTHER NET ASSETS | | | | | — | | |
| NET ASSETS 100.0% | | | | $ | 46,631,652 | | |
MUTUAL OF AMERICA INVESTMENT CORPORATION (2045 RETIREMENT FUND)
PORTFOLIO OF INVESTMENTS IN SECURITIES
December 31, 2010
| | | Shares | | Value | |
| COMMON STOCKS: | |
| DIVERSIFIED MUTUAL FUNDS (100.0%) | |
| Mutual of America Investment Corporation | |
| Bond Fund (9.0%) | | | 3,614,468 | | | $ | 4,852,846 | | |
| Equity Index Fund (34.1%) | | | 8,869,003 | | | | 18,375,670 | | |
| International Fund (14.1%) | | | 10,709,075 | | | | 7,603,775 | | |
| Mid-Cap Equity Index Fund (21.1%) | | | 7,495,662 | | | | 11,329,880 | | |
| Small Cap Growth Fund (11.1%) | | | 5,001,130 | | | | 5,954,866 | | |
| Small Cap Value Fund (10.6%) | | | 4,706,177 | | | | 5,691,128 | | |
TOTAL INVESTMENTS
(Cost: $45,282,665) 100.0% | | | | | 53,808,165 | | |
| OTHER NET ASSETS | | | | | — | | |
| NET ASSETS 100.0% | | | | $ | 53,808,165 | | |
The accompanying notes are an integral part of these portfolio schedules.
51
MUTUAL OF AMERICA INVESTMENT CORPORATION (CONSERVATIVE ALLOCATION FUND)
PORTFOLIO OF INVESTMENTS IN SECURITIES
December 31, 2010
| | | Shares | | Value | |
| COMMON STOCKS: | |
| DIVERSIFIED MUTUAL FUNDS (100.0%) | |
| Mutual of America Investment Corporation | |
| Bond Fund (30.0%) | | | 11,546,570 | | | $ | 15,502,621 | | |
| Equity Index Fund (25.0%) | | | 6,289,413 | | | | 13,031,022 | | |
| Mid-Term Bond Fund (45.0%) | | | 22,581,531 | | | | 23,198,932 | | |
TOTAL INVESTMENTS
(Cost: $48,753,004) 100.0% | | | | | 51,732,575 | | |
| OTHER NET ASSETS | | | | | — | | |
| NET ASSETS 100.0% | | | | $ | 51,732,575 | | |
MUTUAL OF AMERICA INVESTMENT CORPORATION (MODERATE ALLOCATION FUND)
PORTFOLIO OF INVESTMENTS IN SECURITIES
December 31, 2010
| | | Shares | | Value | |
| COMMON STOCKS: | |
| DIVERSIFIED MUTUAL FUNDS (100.0%) | |
| Mutual of America Investment Corporation | |
| Bond Fund (29.9%) | | | 36,212,593 | | | $ | 48,619,643 | | |
| Equity Index Fund (35.1%) | | | 27,612,496 | | | | 57,210,275 | | |
| Mid-Cap Equity Index Fund (15.1%) | | | 16,222,888 | | | | 24,521,301 | | |
| Mid-Term Bond Fund (19.9%) | | | 31,475,338 | | | | 32,335,905 | | |
TOTAL INVESTMENTS
(Cost: $149,874,796) 100.0% | | | | | 162,687,124 | | |
| OTHER NET ASSETS | | | | | — | | |
| NET ASSETS 100.0% | | | | $ | 162,687,124 | | |
MUTUAL OF AMERICA INVESTMENT CORPORATION (AGGRESSIVE ALLOCATION FUND)
PORTFOLIO OF INVESTMENTS IN SECURITIES
December 31, 2010
| | | Shares | | Value | |
| COMMON STOCKS: | |
| DIVERSIFIED MUTUAL FUNDS (100.0%) | |
| Mutual of America Investment Corporation | |
| Bond Fund (24.9%) | | | 27,272,235 | | | $ | 36,616,166 | | |
| Equity Index Fund (45.1%) | | | 32,083,700 | | | | 66,474,153 | | |
| Mid-Cap Equity Index Fund (20.0%) | | | 19,546,501 | | | | 29,545,026 | | |
| Small Cap Growth Fund (5.0%) | | | 6,215,689 | | | | 7,401,046 | | |
| Small Cap Value Fund (5.0%) | | | 6,092,534 | | | | 7,367,634 | | |
TOTAL INVESTMENTS
(Cost: $137,166,653) 100.0% | | | | | 147,404,025 | | |
| OTHER NET ASSETS | | | | | — | | |
| NET ASSETS 100.0% | | | | $ | 147,404,025 | | |
The accompanying notes are an integral part of these portfolio schedules.
52
MUTUAL OF AMERICA INVESTMENT CORPORATION (MONEY MARKET FUND)
PORTFOLIO OF INVESTMENTS IN SECURITIES
December 31, 2010
| | | Rating** | | Rate | | Maturity | | Face
Amount | | Value | |
| SHORT-TERM DEBT SECURITIES: | |
| U.S. GOVERNMENT (7.3%) | |
| U.S. Treasury Bill | | AAA | | | 0.14 | % | | 03/31/11 | | $ | 8,000,000 | | | $ | 7,997,687 | | |
| U.S. GOVERNMENT AGENCIES (27.8%) | |
| FHLB | | AAA | | | 0.10 | | | 02/24/11 | | | 360,000 | | | | 359,946 | | |
| FHLB | | AAA | | | 0.15 | | | 02/25/11 | | | 3,715,000 | | | | 3,714,149 | | |
| FHLB | | AAA | | | 0.17 | | | 01/28/11 | | | 5,294,000 | | | | 5,293,344 | | |
| FHLB | | AAA | | | 0.17 | | | 02/04/11 | | | 4,775,000 | | | | 4,774,233 | | |
| FHLB | | AAA | | | 0.17 | | | 03/02/11 | | | 2,152,000 | | | | 2,151,380 | | |
| FHLB | | AAA | | | 0.18 | | | 02/02/11 | | | 6,150,000 | | | | 6,149,323 | | |
| FHLB | | AAA | | | 0.18 | | | 02/23/11 | | | 4,700,000 | | | | 4,699,403 | | |
| FHLB | | AAA | | | 0.19 | | | 02/02/11 | | | 100,000 | | | | 99,989 | | |
| FNMA | | AAA | | | 0.16 | | | 02/16/11 | | | 2,180,000 | | | | 2,179,708 | | |
| FNMA | | AAA | | | 0.16 | | | 03/01/11 | | | 500,000 | | | | 499,933 | | |
| FNMA | | AAA | | | 0.20 | | | 02/02/11 | | | 300,000 | | | | 299,969 | | |
| | | | 30,221,377 | | |
| COMMERCIAL PAPER (64.9%) | |
| Abbott Laboratories† | | A-1+ | | | 0.18 | | | 01/11/11 | | | 1,000,000 | | | | 999,950 | | |
| Abbott Laboratories† | | A-1+ | | | 0.18 | | | 02/08/11 | | | 1,900,000 | | | | 1,899,639 | | |
| Archer-Daniels-Midland Co.† | | A-1 | | | 0.22 | | | 01/27/11 | | | 2,400,000 | | | | 2,399,686 | | |
| Archer-Daniels-Midland Co.† | | A-1 | | | 0.23 | | | 02/14/11 | | | 500,000 | | | | 499,871 | | |
| Bank of America Corp. | | A-1 | | | 0.27 | | | 01/31/11 | | | 2,800,000 | | | | 2,799,391 | | |
| Becton, Dickinson & Co. | | A-1+ | | | 0.18 | | | 01/26/11 | | | 1,071,000 | | | | 1,070,866 | | |
| Becton, Dickinson & Co. | | A-1+ | | | 0.19 | | | 01/21/11 | | | 1,729,000 | | | | 1,728,817 | | |
| Campbell Soup Co.† | | A-1 | | | 0.17 | | | 01/03/11 | | | 2,900,000 | | | | 2,899,973 | | |
| Cargill, Inc.† | | A-1 | | | 0.19 | | | 01/21/11 | | | 2,900,000 | | | | 2,899,694 | | |
| Chevron Funding Corp. | | A-1+ | | | 0.16 | | | 01/05/11 | | | 1,400,000 | | | | 1,399,975 | | |
| Chevron Funding Corp. | | A-1+ | | | 0.16 | | | 01/12/11 | | | 1,500,000 | | | | 1,499,927 | | |
| Coca-Cola Co.† | | A-1 | | | 0.19 | | | 01/14/11 | | | 1,447,000 | | | | 1,446,901 | | |
| Coca-Cola Co.† | | A-1 | | | 0.20 | | | 01/06/11 | | | 650,000 | | | | 649,983 | | |
| Coca-Cola Co.† | | A-1 | | | 0.20 | | | 02/16/11 | | | 800,000 | | | | 799,824 | | |
| Danaher Corp. | | A-1 | | | 0.19 | | | 01/14/11 | | | 2,800,000 | | | | 2,799,808 | | |
| Disney (Walt) Co.† | | A-1 | | | 0.17 | | | 02/14/11 | | | 550,000 | | | | 549,886 | | |
| Disney (Walt) Co.† | | A-1 | | | 0.19 | | | 01/12/11 | | | 2,350,000 | | | | 2,349,881 | | |
| eBay, Inc.† | | A-1 | | | 0.18 | | | 01/10/11 | | | 2,900,000 | | | | 2,899,869 | | |
| General Electric Capital Corp. | | A-1+ | | | 0.21 | | | 03/01/11 | | | 2,400,000 | | | | 2,399,174 | | |
| General Electric Capital Svcs. | | A-1+ | | | 0.22 | | | 02/28/11 | | | 400,000 | | | | 399,858 | | |
| Google, Inc.† | | A-1+ | | | 0.18 | | | 02/15/11 | | | 2,900,000 | | | | 2,899,369 | | |
| Grainger (W.W.), Inc. | | A-1+ | | | 0.18 | | | 01/25/11 | | | 2,634,000 | | | | 2,633,684 | | |
| Grainger (W.W.), Inc. | | A-1+ | | | 0.25 | | | 01/21/11 | | | 250,000 | | | | 249,965 | | |
| Hewlett-Packard Co.† | | A-1 | | | 0.18 | | | 01/07/11 | | | 2,800,000 | | | | 2,799,916 | | |
| Int'l. Business Machines Corp.† | | A-1 | | | 0.15 | | | 01/05/11 | | | 750,000 | | | | 749,988 | | |
| Int'l. Business Machines Corp.† | | A-1 | | | 0.16 | | | 01/07/11 | | | 2,050,000 | | | | 2,049,945 | | |
| Johnson & Johnson† | | A-1+ | | | 0.17 | | | 02/28/11 | | | 2,550,000 | | | | 2,549,570 | | |
| Johnson & Johnson† | | A-1+ | | | 0.20 | | | 01/05/11 | | | 350,000 | | | | 349,992 | | |
| Madison Gas & Electric | | A-1+ | | | 0.18 | | | 01/14/11 | | | 1,322,000 | | | | 1,321,914 | | |
| Madison Gas & Electric | | A-1+ | | | 0.20 | | | 01/03/11 | | | 500,000 | | | | 499,994 | | |
| National Rural Utilities | | A-1 | | | 0.23 | | | 01/06/11 | | | 2,800,000 | | | | 2,799,911 | | |
| Nestle Capital Corp.† | | A-1+ | | | 0.18 | | | 02/04/11 | | | 950,000 | | | | 949,838 | | |
The accompanying notes are an integral part of these portfolio schedules.
53
MUTUAL OF AMERICA INVESTMENT CORPORATION (MONEY MARKET FUND)
PORTFOLIO OF INVESTMENTS IN SECURITIES (Continued)
December 31, 2010
| | | Rating** | | Rate | | Maturity | | Face
Amount | | Value | |
| SHORT-TERM DEBT SECURITIES: (CONTINUED) | |
| COMMERCIAL PAPER (CONTINUED) | |
| Nestle Capital Corp.† | | A-1+ | | | 0.18 | % | | 01/04/11 | | $ | 1,950,000 | | | $ | 1,949,971 | | |
| New Jersey Natural Gas | | A-1 | | | 0.19 | | | 01/19/11 | | | 2,900,000 | | | | 2,899,724 | | |
| PepsiCo, Inc.† | | A-1 | | | 0.16 | | | 02/07/11 | | | 460,000 | | | | 459,924 | | |
| PepsiCo, Inc.† | | A-1 | | | 0.17 | | | 02/25/11 | | | 2,340,000 | | | | 2,339,392 | | |
| Procter & Gamble† | | A-1+ | | | 0.19 | | | 01/18/11 | | | 1,900,000 | | | | 1,899,835 | | |
| Procter & Gamble† | | A-1+ | | | 0.19 | | | 01/31/11 | | | 1,000,000 | | | | 999,842 | | |
| Toyota Motor Credit Corp. | | A-1+ | | | 0.22 | | | 02/08/11 | | | 500,000 | | | | 499,884 | | |
| Toyota Motor Credit Corp. | | A-1+ | | | 0.22 | | | 03/01/11 | | | 2,400,000 | | | | 2,399,135 | | |
| Washington Gas Light Co. | | A-1+ | | | 0.19 | | | 01/03/11 | | | 2,900,000 | | | | 2,899,969 | | |
| | | | 70,594,735 | | |
TOTAL SHORT-TERM DEBT SECURITIES
(Cost: $108,811,710) 100.0% | | | 108,813,799 | | |
TOTAL INVESTMENTS
(Cost: $108,811,710) 100.0% | | | 108,813,799 | | |
| OTHER NET ASSETS 0.0% (3) | | | 3,811 | | |
| NET ASSETS 100.0% | | $ | 108,817,610 | | |
The accompanying notes are an integral part of these portfolio schedules.
54
MUTUAL OF AMERICA INVESTMENT CORPORATION (MID-TERM BOND FUND)
SUMMARY PORTFOLIO OF INVESTMENTS IN SECURITIES
December 31, 2010
| | | Rating** | | Rate | | Maturity | | Face
Amount | | Value | |
| LONG-TERM DEBT SECURITIES: | |
| U.S. GOVERNMENT (46.9%) | |
| U.S. Treasury Note | | AAA | | | 1.25 - 3.25 | % | | 09/15/12 - 05/15/19 | | $ | 93,750,000 | | | $ | 95,325,333 | | |
| U.S. Treasury Strip | | AAA | | | 0.00 | | | 08/15/17 - 08/15/18 | | | 55,000,000 | | | | 44,614,388 | | |
| | | | 139,939,721 | | |
| U.S. GOVERNMENT AGENCIES (7.2%) | |
| MORTGAGE-BACKED OBLIGATIONS (0.6%) | |
| FHLMC | | AAA | | | 5.00 - 8.50 | | | 02/01/14 - 03/15/21 | | | 1,837,855 | | | | 1,892,354 | | |
| Other Securities | | | | | | | | | 25,047 | | | | 25,953 | | |
| | | | 1,918,307 | | |
| NON-MORTGAGE-BACKED OBLIGATIONS (6.6%) | |
| FFCB | | AAA | | | 4.95 - 5.10 | | | 08/05/13 - 10/10/14 | | | 17,500,000 | | | | 19,605,623 | | |
| CORPORATE DEBT (42.7%) | |
| CONSUMER DISCRETIONARY (4.7%) | |
| AutoZone, Inc. | | BBB | | | 6.50 | | | 01/15/14 | | | 1,000,000 | | | | 1,110,532 | | |
| Best Buy Co., Inc. | | BBB- | | | 6.75 | | | 07/15/13 | | | 1,000,000 | | | | 1,106,177 | | |
| Black & Decker Corp. | | A | | | 4.75 - 5.75 | | | 11/01/14 - 11/15/16 | | | 1,000,000 | | | | 1,094,111 | | |
| Brinker International, Inc. | | BBB- | | | 5.75 | | | 06/01/14 | | | 1,000,000 | | | | 1,050,998 | | |
| Whirlpool Corp. | | BBB- | | | 5.50 - 6.50 | | | 03/01/13 - 06/15/16 | | | 1,000,000 | | | | 1,082,389 | | |
| Other Securities | | | | | | | | | 8,242,000 | | | | 8,578,029 | | |
| | | | 14,022,236 | | |
| CONSUMER STAPLES (3.1%) | |
| Anheuser-Busch Cos., Inc. | | BBB+ | | | 4.38 - 4.70 | | | 04/15/12 - 01/15/13 | | | 1,100,000 | | | | 1,158,833 | | |
| Hershey Co. | | A | | | 4.85 - 5.00 | | | 04/01/13 - 08/15/15 | | | 1,000,000 | | | | 1,086,977 | | |
| Safeway, Inc. | | BBB | | | 3.95 - 6.50 | | | 03/01/11 - 08/15/20 | | | 1,500,000 | | | | 1,450,857 | | |
| Other Securities | | | | | | | | | 5,115,000 | | | | 5,456,843 | | |
| | | | 9,153,510 | | |
| ENERGY (3.6%) | |
| CenterPoint Energy Resources | | BBB | | | 7.75 - 7.88 | | | 02/15/11 - 04/01/13 | | | 1,170,000 | | | | 1,270,974 | | |
| Enbridge, Inc. | | A- | | | 5.80 | | | 06/15/14 | | | 1,065,000 | | | | 1,184,715 | | |
| Noble Corp. | | A- | | | 5.88 | | | 06/01/13 | | | 1,000,000 | | | | 1,091,903 | | |
| Sunoco, Inc. | | BBB- | | | 4.88 - 9.63 | | | 10/15/14 - 04/15/15 | | | 1,000,000 | | | | 1,113,718 | | |
| Transocean, Inc. | | BBB | | | 1.50 | | | 12/15/37 | | | 1,200,000 | | | | 1,161,000 | | |
| Valero Energy Corp. | | BBB | | | 4.75 | | | 06/15/13 | | | 1,000,000 | | | | 1,065,726 | | |
| Other Securities | | | | | | | | | 3,500,000 | | | | 3,677,952 | | |
| | | | 10,565,988 | | |
| FINANCIALS (12.5%) | |
| American Express Credit Corp. | | BBB+ | | | 5.88 | | | 05/02/13 | | | 1,000,000 | | | | 1,087,538 | | |
| Caterpillar Financial Services | | A | | | 6.13 | | | 02/17/14 | | | 1,000,000 | | | | 1,124,238 | | |
| CNA Financial Corp. | | BBB- | | | 5.85 - 6.50 | | | 12/15/14 - 08/15/16 | | | 1,200,000 | | | | 1,281,911 | | |
| General Electric Capital Corp. | | AA+ | | | 5.00 | | | 11/15/11 - 01/08/16 | | | 1,500,000 | | | | 1,571,846 | | |
| KeyCorp | | BBB+ | | | 6.50 | | | 05/14/13 | | | 1,050,000 | | | | 1,140,001 | | |
| Kimco Realty Corp. | | BBB+ | | | 6.00 | | | 11/30/12 | | | 1,000,000 | | | | 1,072,310 | | |
| Morgan Stanley | | A | | | 3.22 - 4.00 | | | 02/01/11 - 07/24/15 | | | 1,500,000 | | | | 1,505,280 | | |
| Nat'l. Rural Utilities Coop. | | A | | | 7.25 | | | 03/01/12 | | | 1,000,000 | | | | 1,071,996 | | |
| Unitrin, Inc. | | BBB- | | | 6.00 | | | 11/30/15 | | | 1,500,000 | | | | 1,517,028 | | |
| Other Securities | | | | | | | | | 25,025,000 | | | | 25,840,645 | | |
| | | | 37,212,793 | | |
| HEALTH CARE (4.0%) | |
| Biogen Idec, Inc. | | BBB+ | | | 6.88 | | | 03/01/18 | | | 1,250,000 | | | | 1,409,201 | | |
| Cardinal Health, Inc. | | BBB+ | | | 5.50 | | | 06/15/13 | | | 1,000,000 | | | | 1,083,204 | | |
| Humana, Inc. | | BBB- | | | 6.45 | | | 06/01/16 | | | 1,415,000 | | | | 1,547,869 | | |
| McKesson Corp. | | A- | | | 7.75 | | | 02/01/12 | | | 1,000,000 | | | | 1,068,983 | | |
| Other Securities | | | | | | | | | 6,460,000 | | | | 6,823,610 | | |
| | | | 11,932,867 | | |
The accompanying notes are an integral part of these portfolio schedules.
55
MUTUAL OF AMERICA INVESTMENT CORPORATION (MID-TERM BOND FUND)
SUMMARY PORTFOLIO OF INVESTMENTS IN SECURITIES (Continued)
December 31, 2010
| | | Rating** | | Rate | | Maturity | | Face
Amount | | Value | |
| LONG-TERM DEBT SECURITIES: (CONTINUED) | |
| INDUSTRIALS (4.7%) | |
| Cargill, Inc.† | | A | | | 5.20 | % | | 01/22/13 | | $ | 1,000,000 | | | $ | 1,078,879 | | |
| CSX Corp. | | BBB- | | | 6.25 | | | 04/01/15 | | | 1,000,000 | | | | 1,136,428 | | |
| Dun & Bradstreet Corp. | | A- | | | 6.00 | | | 04/01/13 | | | 1,000,000 | | | | 1,089,422 | | |
| Federal Express Corp. | | BBB | | | 9.65 | | | 06/15/12 | | | 1,000,000 | | | | 1,118,057 | | |
| Roper Industries, Inc. | | BBB- | | | 6.63 | | | 08/15/13 | | | 1,000,000 | | | | 1,114,543 | | |
| Ryder System, Inc. | | BBB+ | | | 6.00 - 7.20 | | | 03/01/13 - 09/01/15 | | | 1,500,000 | | | | 1,684,394 | | |
| Union Pacific Corp. | | BBB+ | | | 4.88 - 6.13 | | | 01/15/12 - 01/15/15 | | | 1,000,000 | | | | 1,063,845 | | |
| Other Securities | | | | | | | | | 5,550,000 | | | | 5,803,498 | | |
| | | | 14,089,066 | | |
| INFORMATION TECHNOLOGY (2.0%) | |
| Ingram Micro, Inc. | | BBB- | | | 5.25 | | | 09/01/17 | | | 1,500,000 | | | | 1,517,984 | | |
| Other Securities | | | | | | | | | 4,205,000 | | | | 4,437,570 | | |
| | | | 5,955,554 | | |
| MATERIALS (2.6%) | |
| Airgas, Inc. | | BBB | | | 3.25 | | | 10/01/15 | | | 1,500,000 | | | | 1,481,775 | | |
| Cytec Industries, Inc. | | BBB | | | 6.00 | | | 10/01/15 | | | 1,000,000 | | | | 1,095,376 | | |
| Vulcan Materials Co. | | BBB- | | | 6.30 | | | 06/15/13 | | | 1,000,000 | | | | 1,061,455 | | |
| Other Securities | | | | | | | | | 3,893,000 | | | | 4,091,042 | | |
| | | | 7,729,648 | | |
| TELECOMMUNICATION SERVICES (1.1%) | |
| CenturyLink, Inc. | | BBB- | | | 5.00 | | | 02/15/15 | | | 1,250,000 | | | | 1,276,406 | | |
| Other Securities | | | | | | | | | 1,900,000 | | | | 1,998,923 | | |
| | | | 3,275,329 | | |
| UTILITIES (4.4%) | |
| AGL Capital Corp. | | BBB+ | | | 6.38 - 7.13 | | | 01/14/11 - 07/15/16 | | | 1,500,000 | | | | 1,569,750 | | |
| Atmos Energy Corp. | | BBB+ | | | 4.95 | | | 10/15/14 | | | 1,000,000 | | | | 1,071,662 | | |
| Black Hills Corp. | | BBB- | | | 9.00 | | | 05/15/14 | | | 2,000,000 | | | | 2,295,740 | | |
| Exelon Generation Co. LLC | | BBB | | | 5.35 | | | 01/15/14 | | | 1,000,000 | | | | 1,082,571 | | |
| PPL Energy Supply LLC | | BBB+ | | | 5.70 - 6.40 | | | 11/01/11 - 10/15/15 | | | 1,700,000 | | | | 1,808,144 | | |
| TransAlta Corp. | | BBB | | | 5.75 | | | 12/15/13 | | | 1,000,000 | | | | 1,090,945 | | |
| Other Securities | | | | | | | | | 3,900,000 | | | | 4,080,231 | | |
| | | | 12,999,043 | | |
TOTAL LONG-TERM DEBT SECURITIES
(Cost: $276,486,369) 96.8% | | | 288,399,685 | | |
| SHORT-TERM DEBT SECURITIES: | |
| COMMERCIAL PAPER (1.7%) | |
| NetJets, Inc.† | | A-1+ | | | 0.10 | | | 01/03/11 | | | 4,900,000 | | | | 4,899,973 | | |
TOTAL SHORT-TERM DEBT SECURITIES
(Cost: $4,899,973) 1.7% | | | 4,899,973 | | |
TEMPORARY CASH INVESTMENTS (2)
(Cost: $750,000) 0.2% | | | 750,000 | | |
TOTAL INVESTMENTS
(Cost: $282,136,342) 98.7% | | | 294,049,658 | | |
| OTHER NET ASSETS 1.3% | | | 3,802,590 | | |
| NET ASSETS 100.0% | | $ | 297,852,248 | | |
The accompanying notes are an integral part of these portfolio schedules.
56
MUTUAL OF AMERICA INVESTMENT CORPORATION (BOND FUND)
SUMMARY PORTFOLIO OF INVESTMENTS IN SECURITIES
December 31, 2010
| | | Rating** | | Rate | | Maturity | | Face
Amount | | Value | |
| LONG-TERM DEBT SECURITIES: | |
| U.S. GOVERNMENT (20.3%) | |
| U.S. Treasury Bond | | AAA | | | 3.50 | % | | 02/15/39 | | $ | 8,000,000 | | | $ | 6,893,752 | | |
| U.S. Treasury Note | | AAA | | | 0.88 - 3.50 | | | 03/31/11 - 05/15/20 | | | 111,500,000 | | | | 114,163,348 | | |
| | | | 121,057,100 | | |
| U.S. GOVERNMENT AGENCIES (31.9%) | |
| MORTGAGE-BACKED OBLIGATIONS (29.8%) | |
| FHARM | | AAA | | | 4.64 - 5.77 | | | 02/01/36 - 09/01/39 | | | 7,838,719 | | | | 8,296,800 | | |
| FHLMC | | AAA | | | 4.00 - 6.00 | | | 12/15/20 - 08/15/35 | | | 20,800,028 | | | | 21,952,548 | | |
| FNMA | | AAA | | | 4.00 - 8.00 | | | 09/01/16 - 12/25/49 | | | 128,273,067 | | | | 136,193,739 | | |
| GNMA (4) | | AAA | | | 3.50 - 7.00 | | | 02/20/20 - 11/15/39 | | | 8,922,550 | | | | 9,299,566 | | |
| Vendee Mortgage Trust (4) | | AAA | | | 5.25 | | | 01/15/32 | | | 2,204,531 | | | | 2,395,688 | | |
| | | | 178,138,341 | | |
| NON-MORTGAGE-BACKED OBLIGATIONS (2.1%) | |
| FNMA | | AAA | | | 0.00 | | | 10/09/19 | | | 20,000,000 | | | | 12,628,460 | | |
| CORPORATE DEBT (42.6%) | |
| CONSUMER DISCRETIONARY (5.2%) | |
| Fortune Brands, Inc. | | BBB- | | | 4.88 - 5.38 | | | 12/01/13 - 01/15/16 | | | 2,400,000 | | | | 2,487,300 | | |
| Home Depot, Inc. | | BBB+ | | | 5.40 | | | 03/01/16 | | | 2,000,000 | | | | 2,241,210 | | |
| Johnson Controls, Inc. | | BBB+ | | | 4.88 | | | 09/15/13 | | | 2,500,000 | | | | 2,686,305 | | |
| Whirlpool Corp. | | BBB- | | | 6.50 | | | 06/15/16 | | | 2,000,000 | | | | 2,205,486 | | |
| Other Securities | | | | | | | | | 21,109,000 | | | | 21,543,244 | | |
| | | | 31,163,545 | | |
| CONSUMER STAPLES (2.2%) | |
| CVS Caremark Corp. | | BBB+ | | | 6.13 | | | 08/15/16 | | | 2,000,000 | | | | 2,269,166 | | |
| Safeway, Inc. | | BBB | | | 3.95 | | | 08/15/20 | | | 2,900,000 | | | | 2,746,155 | | |
| Other Securities | | | | | | | | | 7,758,000 | | | | 8,031,305 | | |
| | | | 13,046,626 | | |
| ENERGY (5.1%) | |
| Noble Corp. | | A- | | | 7.50 | | | 03/15/19 | | | 2,000,000 | | | | 2,399,522 | | |
| Seacor Hldgs., Inc. | | BBB- | | | 7.38 | | | 10/01/19 | | | 2,775,000 | | | | 2,878,391 | | |
| Seariver Maritime, Inc. | | AAA | | | 0.00 | | | 09/01/12 | | | 10,000,000 | | | | 9,617,760 | | |
| Transocean, Inc. | | BBB | | | 1.50 | | | 12/15/37 | | | 3,000,000 | | | | 2,902,500 | | |
| Other Securities | | | | | | | | | 12,000,000 | | | | 12,548,062 | | |
| | | | 30,346,235 | | |
| FINANCIALS (15.3%) | |
| Alleghany Corp. | | BBB | | | 5.63 | | | 09/15/20 | | | 2,500,000 | | | | 2,441,408 | | |
| Allstate Corp. | | A- | | | 7.45 | | | 05/16/19 | | | 2,000,000 | | | | 2,427,302 | | |
| Ally Financial, Inc. | | B | | | 0.00 | | | 12/01/12 | | | 10,000,000 | | | | 9,025,000 | | |
| Berkley (W.R.) Corp. | | BBB+ | | | 7.38 | | | 09/15/19 | | | 2,000,000 | | | | 2,219,644 | | |
| Fairfax Financial Hldgs. | | BBB- | | | 8.25 | | | 10/01/15 | | | 2,500,000 | | | | 2,634,375 | | |
| First Horizon National Corp. | | BB+ | | | 4.50 | | | 05/15/13 | | | 5,000,000 | | | | 5,047,765 | | |
| Health Care REIT, Inc. | | BBB- | | | 6.13 | | | 04/15/20 | | | 2,500,000 | | | | 2,631,663 | | |
| JP Morgan Chase Bank NA | | A+ | | | 6.00 | | | 10/01/17 | | | 2,000,000 | | | | 2,217,124 | | |
| KeyCorp | | BBB+ | | | 6.50 | | | 05/14/13 | | | 2,000,000 | | | | 2,171,430 | | |
| Retail Properties, Inc.† | | A- | | | 7.88 | | | 03/15/16 | | | 5,000,000 | | | | 5,938,490 | | |
| Unitrin, Inc. | | BBB- | | | 6.00 | | | 11/30/15 | | | 2,500,000 | | | | 2,528,380 | | |
| Other Securities | | | | | | | | | 50,118,000 | | | | 51,827,512 | | |
| | | | 91,110,093 | | |
| HEALTH CARE (4.3%) | |
| Allergan, Inc. | | A+ | | | 5.75 | | | 04/01/16 | | | 2,000,000 | | | | 2,278,296 | | |
| AmerisourceBergen Corp. | | BBB+ | | | 4.88 | | | 11/15/19 | | | 2,500,000 | | | | 2,549,420 | | |
| Biogen Idec, Inc. | | BBB+ | | | 6.88 | | | 03/01/18 | | | 2,500,000 | | | | 2,818,403 | | |
| Humana, Inc. | | BBB- | | | 7.20 | | | 06/15/18 | | | 2,000,000 | | | | 2,259,296 | | |
| Laboratory Corp. of America | | BBB+ | | | 4.63 - 5.63 | | | 02/01/13 - 11/15/20 | | | 2,500,000 | | | | 2,658,692 | | |
| Quest Diagnostics, Inc. | | BBB+ | | | 4.75 | | | 01/30/20 | | | 2,850,000 | | | | 2,818,909 | | |
| Other Securities | | | | | | | | | 9,500,000 | | | | 10,028,822 | | |
| | | | 25,411,838 | | |
The accompanying notes are an integral part of these portfolio schedules.
57
MUTUAL OF AMERICA INVESTMENT CORPORATION (BOND FUND)
SUMMARY PORTFOLIO OF INVESTMENTS IN SECURITIES (Continued)
December 31, 2010
| | | Rating** | | Rate | | Maturity | | Face
Amount | | Value | |
| LONG-TERM DEBT SECURITIES: (CONTINUED) | |
| INDUSTRIALS (3.0%) | |
| CSX Corp. | | BBB- | | | 6.25 | % | | 04/01/15 | | $ | 2,000,000 | | | $ | 2,272,856 | | |
| L-3 Communications Corp. | | BBB- | | | 4.75 | | | 07/15/20 | | | 2,750,000 | | | | 2,701,823 | | |
| Precision Castparts Corp. | | A- | | | 5.60 | | | 12/15/13 | | | 2,000,000 | | | | 2,214,946 | | |
| Other Securities | | | | | | | | | 10,500,000 | | | | 10,914,422 | | |
| | | | 18,104,047 | | |
| INFORMATION TECHNOLOGY (1.4%) | |
| Avnet, Inc. | | BBB- | | | 5.88 - 6.00 | | | 09/01/15 - 06/15/20 | | | 2,600,000 | | | | 2,741,601 | | |
| Fiserv, Inc. | | BBB- | | | 4.63 | | | 10/01/20 | | | 2,770,000 | | | | 2,690,459 | | |
| Other Securities | | | | | | | | | 3,000,000 | | | | 3,035,687 | | |
| | | | 8,467,747 | | |
| MATERIALS (2.7%) | |
| Cytec Industries, Inc. | | BBB | | | 6.00 | | | 10/01/15 | | | 2,000,000 | | | | 2,190,752 | | |
| Eastman Chemical Co. | | BBB | | | 4.50 | | | 01/15/21 | | | 2,500,000 | | | | 2,450,375 | | |
| Geon Co. | | B+ | | | 7.50 | | | 12/15/15 | | | 3,750,000 | | | | 3,857,813 | | |
| Lubrizol Corp. | | BBB+ | | | 5.50 | | | 10/01/14 | | | 2,000,000 | | | | 2,188,986 | | |
| Other Securities | | | | | | | | | 5,500,000 | | | | 5,589,651 | | |
| | | | 16,277,577 | | |
| TELECOMMUNICATION SERVICES (1.1%) | |
| Alltel Corp. | | A- | | | 7.00 | | | 03/15/16 | | | 2,000,000 | | | | 2,357,682 | | |
| Other Securities | | | | | | | | | 4,000,000 | | | | 4,211,840 | | |
| | | | 6,569,522 | | |
| UTILITIES (2.3%) | |
| Ameren Energy Generating Co. | | BBB- | | | 6.30 | | | 04/01/20 | | | 2,500,000 | | | | 2,426,098 | | |
| Progress Energy Enterprise | | A | | | 5.25 | | | 12/15/15 | | | 2,000,000 | | | | 2,242,320 | | |
| UIL Hldgs. Corp. | | BBB- | | | 4.63 | | | 10/01/20 | | | 2,725,000 | | | | 2,580,360 | | |
| Other Securities | | | | | | | | | 6,075,000 | | | | 6,460,623 | | |
| | | | 13,709,401 | | |
| SOVEREIGN DEBT (0.7%) | |
| Sri Lanka AID | | NR | | | 6.59 | | | 09/15/28 | | | 3,791,476 | | | | 4,265,259 | | |
TOTAL LONG-TERM DEBT SECURITIES
(Cost: $550,526,965) 95.5% | | | 570,295,791 | | |
| SHORT-TERM DEBT SECURITIES: | |
| COMMERCIAL PAPER (3.7%) | |
| Coca-Cola Co.† | | A-1 | | | 0.19 | | | 01/14/11 | | | 353,000 | | | | 352,976 | | |
| Int'l. Business Machines Corp.† | | A-1 | | | 0.16 | | | 01/07/11 | | | 850,000 | | | | 849,977 | | |
| NetJets, Inc.† | | A-1+ | | | 0.10 | | | 01/03/11 | | | 10,100,000 | | | | 10,099,944 | | |
| New Jersey Natural Gas | | A-1 | | | 0.19 | | | 01/19/11 | | | 500,000 | | | | 499,953 | | |
| Sysco Corp.† | | A-1+ | | | 0.10 | | | 01/03/11 | | | 10,000,000 | | | | 9,999,944 | | |
| | | | 21,802,794 | | |
TOTAL SHORT-TERM DEBT SECURITIES
(Cost: $21,802,794) 3.7% | | | 21,802,794 | | |
TEMPORARY CASH INVESTMENTS (2)
(Cost: $105,200) 0.0% (3) | | | 105,200 | | |
TOTAL INVESTMENTS
(Cost: $572,434,959) 99.2% | | | 592,203,785 | | |
| OTHER NET ASSETS 0.8% | | | 4,978,933 | | |
| NET ASSETS 100.0% | | $ | 597,182,718 | | |
The accompanying notes are an integral part of these portfolio schedules.
58
MUTUAL OF AMERICA INVESTMENT CORPORATION
FOOTNOTES TO SUMMARY PORTFOLIOS OF INVESTMENTS IN SECURITIES
December 31, 2010
Abbreviations: FFCB = Federal Farm Credit Bank
FHARM = Federal Home Adjustable Rate Mortgage
FHLB = Federal Home Loan Bank
FHLMC = Federal Home Loan Mortgage Corporation
FNMA = Federal National Mortgage Association
GNMA = Government National Mortgage Association
NR = Not Rated
"Other Securities" represent securities in the respective category that individually, or in the aggregate by issuer, do not exceed 1% of net assets.
* Non-income producing security.
** Ratings as per Standard & Poors Corporation.
*** Includes a security fair valued in accordance with procedures established by the Funds' Board of Directors. This security is listed as a Level 3 security in Note 1, Fair Value.
† Security is exempt from registration under Rule 144A of the Securities Act of 1933. These securities may be resold in transactions exempt from registration, normally to qualified institutional buyers. At December 31, 2010, the aggregate values of these securities and similar ones included in the Funds' "Other Securities" categories and their percentages of the respective Funds' net assets were as follows:
| Fund | | Aggregate
Market
Value | | Percentage
of
Net Assets | |
| EQUITY INDEX FUND | | $ | 9,999,933 | | | | 1.1 | % | |
| ALL AMERICA FUND | | $ | 1,429,291 | | | | 0.5 | % | |
| SMALL CAP VALUE FUND | | $ | 5,919,909 | | | | 2.1 | % | |
| SMALL CAP GROWTH FUND | | $ | 3,799,979 | | | | 1.4 | % | |
| MID CAP VALUE FUND | | $ | 2,099,964 | | | | 3.8 | % | |
| COMPOSITE FUND | | $ | 1,618,370 | | | | 1.0 | % | |
| MONEY MARKET FUND | | $ | 40,292,739 | | | | 37.0 | % | |
| MID-TERM BOND FUND | | $ | 11,492,090 | | | | 3.9 | % | |
| BOND FUND | | $ | 32,468,345 | | | | 5.4 | % | |
(1) This security, or a portion thereof, has been segregated to cover initial margin requirements on open futures contracts. Information on futures contracts outstanding in the Funds as of December 31, 2010, were as follows:
| Fund | | Number of
Contracts | | Contract Type | | Purchased (P)
or Sold (S) | | Expiration
Date | | Underlying
Face Amount
at Value(a) | | Unrealized
Gain(Loss) | | Face Value
of Futures
as a %
of Total
Investments | |
| EQUITY INDEX FUND | | | 344 | | | E-mini S&P 500
Stock Index | | | P | | | March 2011 | | $ | 21,551,600 | | | $ | 212,955 | | | | 2.4 | % | |
| ALL AMERICA FUND | | | 61 | | | E-mini S&P 500
Stock Index | | | P | | | March 2011 | | $ | 3,821,650 | | | $ | 73,960 | | | | 1.4 | % | |
MID-CAP EQUITY
INDEX FUND | | | 152 | | | E-mini S&P MidCap
400 Stock Index | | | P | | | March 2011 | | $ | 13,760,560 | | | $ | 45,435 | | | | 2.8 | % | |
(a) Includes the cumulative appreciation(depreciation) of futures contracts, which is included in Net Unrealized Appreciation (Depreciation) of Investments and Futures Contracts in the Components of Net Assets section of the Statements of Assets and Liabilities. The Receivable or Payable for Daily Variation on Futures Contracts in the Statements of Assets and Liabilities only includes the current day's variation margin payable or receivable.
(2) The fund has an arrangement with its custodian bank, JP Morgan Chase Bank, whereby uninvested cash, subject to parameters set by the fund, is automatically invested in the fund's name by the bank in overnight commercial paper issued by J.P. Morgan Chase & Co. On the next business day, these funds (and earned interest) are automatically returned to the fund. The annual rate of interest earned on this temporary cash investment at December 31, 2010 was 0.15%.
(3) Percentage is less than 0.05%.
(4) U.S. Government guaranteed security.
59
MUTUAL OF AMERICA INVESTMENT CORPORATION
STATEMENTS OF ASSETS AND LIABILITIES
December 31, 2010
| | | Equity Index
Fund | | All America
Fund | | Small Cap
Value Fund | | Small Cap
Growth Fund | | Mid Cap
Value Fund | | Mid-Cap
Equity Index
Fund | | International
Fund | |
| ASSETS: | |
Investments at market value
(Cost: Equity Index Fund — $778,560,434
All America Fund — $238,516,092
Small Cap Value Fund — $228,090,923
Small Cap Growth Fund — $199,879,287
Mid Cap Value Fund — $50,881,771
Mid-Cap Equity Index Fund — $414,670,964
International Fund $56,166,379)
Composite Fund — $150,974,114
Retirement Income Fund — $17,425,694
Retirement 2010 Fund — $17,117,322
Retirement 2015 Fund — $69,759,249
Retirement 2020 Fund — $80,993,147
Retirement 2025 Fund — $70,409,290)
(Notes 1 and 3) | | $ | 904,355,706 | | | $ | 270,269,148 | | | $ | 284,952,855 | | | $ | 280,641,500 | | | $ | 56,059,150 | | | $ | 493,548,810 | | | $ | 61,183,438 | | |
| Cash | | | 1,456 | | | | 14,568 | | | | 270,341 | | | | 80,635 | | | | 81,663 | | | | 48 | | | | 1,249,134 | | |
| Interest and dividends receivable | | | 1,042,636 | | | | 270,195 | | | | 177,160 | | | | 50,770 | | | | 61,475 | | | | 384,823 | | | | — | | |
| Receivable for securities sold | | | — | | | | 10,115 | | | | 82,580 | | | | — | | | | 1,504,077 | | | | — | | | | 165,050 | | |
| Other receivables | | | — | | | | — | | | | — | | | | — | | | | — | | | | — | | | | 326,104 | | |
| TOTAL ASSETS | | | 905,399,798 | | | | 270,564,026 | | | | 285,482,936 | | | | 280,772,905 | | | | 57,706,365 | | | | 493,933,681 | | | | 62,923,726 | | |
| LIABILITIES: | |
| Payable for securities purchased | | | — | | | | 48,211 | | | | 8,293,101 | | | | 5,023 | | | | 3,016,512 | | | | — | | | | 1,815,696 | | |
| Payable for daily variation margin on future contracts | | | 22,810 | | | | 5,520 | | | | — | | | | — | | | | — | | | | — | | | | — | | |
| Other Liabilities | | | — | | | | — | | | | — | | | | — | | | | — | | | | 93,180 | | | | — | | |
| TOTAL LIABILITIES | | | 22,810 | | | | 53,731 | | | | 8,293,101 | | | | 5,023 | | | | 3,016,512 | | | | 93,180 | | | | 1,815,696 | | |
| NET ASSETS | | $ | 905,376,988 | | | $ | 270,510,295 | | | $ | 277,189,835 | | | $ | 280,767,882 | | | $ | 54,689,853 | | | $ | 493,840,501 | | | $ | 61,108,030 | | |
| NUMBER OF SHARES OUTSTANDING (Note 4) | | | 436,979,517 | | | | 164,065,152 | | | | 229,217,197 | | | | 235,799,898 | | | | 47,569,341 | | | | 326,716,727 | | | | 86,063,890 | | |
| NET ASSET VALUES, offering and redemption price per share | | $ | 2.07 | | | $ | 1.65 | | | $ | 1.21 | | | $ | 1.19 | | | $ | 1.15 | | | $ | 1.51 | | | $ | 0.71 | | |
| COMPONENTS OF NET ASSETS: | |
| Paid-in capital | | $ | 788,351,398 | | | $ | 263,351,217 | | | $ | 251,643,087 | | | $ | 230,661,692 | | | $ | 51,220,969 | | | $ | 407,740,156 | | | $ | 57,449,144 | | |
| Accumulated undistributed net investment income (loss) | | | 1,826,673 | | | | 3,029,011 | | | | — | | | | — | | | | — | | | | 319,737 | | | | 6,662 | | |
Accumulated undistributed net realized gain (loss)
on investments and futures contracts | | | (10,809,310 | ) | | | (27,696,949 | ) | | | (31,315,184 | ) | | | (30,656,023 | ) | | | (1,708,495 | ) | | | 6,857,327 | | | | (1,364,835 | ) | |
Net unrealized appreciation (depreciation)
of investments and futures contracts | | | 126,008,227 | | | | 31,827,016 | | | | 56,861,932 | | | | 80,762,213 | | | | 5,177,379 | | | | 78,923,281 | | | | 5,017,059 | | |
| NET ASSETS | | $ | 905,376,988 | | | $ | 270,510,295 | | | $ | 277,189,835 | | | $ | 280,767,882 | | | $ | 54,689,853 | | | $ | 493,840,501 | | | $ | 61,108,030 | | |
The accompanying notes are an integral part of these financial statements.
60
| | | Composite
Fund | | Retirement
Income
Fund | | 2010
Retirement
Fund | | 2015
Retirement
Fund | | 2020
Retirement
Fund | | 2025
Retirement
Fund | |
| ASSETS: | |
Investments at market value
(Cost: Equity Index Fund — $778,560,434
All America Fund — $238,516,092
Small Cap Value Fund — $228,090,923
Small Cap Growth Fund — $199,879,287
Mid Cap Value Fund — $50,881,771
Mid-Cap Equity Index Fund — $414,670,964
International Fund $56,166,379)
Composite Fund — $150,974,114
Retirement Income Fund — $17,425,694
Retirement 2010 Fund — $17,117,322
Retirement 2015 Fund — $69,759,249
Retirement 2020 Fund — $80,993,147
Retirement 2025 Fund — $70,409,290)
(Notes 1 and 3) | | $ | 166,025,108 | | | $ | 18,145,675 | | | $ | 19,176,815 | | | $ | 78,128,086 | | | $ | 90,455,139 | | | $ | 80,518,668 | | |
| Cash | | | 116 | | | | — | | | | — | | | | — | | | | — | | | | — | | |
| Interest and dividends receivable | | | 613,269 | | | | — | | | | — | | | | — | | | | — | | | | — | | |
| Receivable for securities sold | | | 38,222 | | | | — | | | | — | | | | — | | | | — | | | | — | | |
| Other receivables | | | — | | | | — | | | | — | | | | — | | | | — | | | | — | | |
| TOTAL ASSETS | | | 166,676,715 | | | | 18,145,675 | | | | 19,176,815 | | | | 78,128,086 | | | | 90,455,139 | | | | 80,518,668 | | |
| LIABILITIES: | |
| Payable for securities purchased | | | — | | | | — | | | | — | | | | — | | | | — | | | | — | | |
| Payable for daily variation margin on future contracts | | | — | | | | — | | | | — | | | | — | | | | — | | | | — | | |
| Other Liabilities | | | — | | | | — | | | | — | | | | — | | | | — | | | | — | | |
| TOTAL LIABILITIES | | | — | | | | — | | | | — | | | | — | | | | — | | | | — | | |
| NET ASSETS | | $ | 166,676,715 | | | $ | 18,145,675 | | | $ | 19,176,815 | | | $ | 78,128,086 | | | $ | 90,455,139 | | | $ | 80,518,668 | | |
| NUMBER OF SHARES OUTSTANDING (Note 4) | | | 111,151,229 | | | | 17,677,383 | | | | 19,977,014 | | | | 83,797,669 | | | | 99,880,789 | | | | 89,584,434 | | |
| NET ASSET VALUES, offering and redemption price per share | | $ | 1.50 | | | $ | 1.03 | | | $ | 0.96 | | | $ | 0.93 | | | $ | 0.91 | | | $ | 0.90 | | |
| COMPONENTS OF NET ASSETS: | |
| Paid-in capital | | $ | 167,440,131 | | | $ | 17,073,785 | | | $ | 17,503,031 | | | $ | 70,425,108 | | | $ | 80,853,464 | | | $ | 69,733,498 | | |
| Accumulated undistributed net investment income (loss) | | | 3,739,588 | | | | 468,628 | | | | 429,453 | | | | 1,673,163 | | | | 1,877,029 | | | | 1,439,888 | | |
Accumulated undistributed net realized gain (loss)
on investments and futures contracts | | | (19,553,998 | ) | | | (116,719 | ) | | | (815,162 | ) | | | (2,339,022 | ) | | | (1,737,346 | ) | | | (764,096 | ) | |
Net unrealized appreciation (depreciation)
of investments and futures contracts | | | 15,050,994 | | | | 719,981 | | | | 2,059,493 | | | | 8,368,837 | | | | 9,461,992 | | | | 10,109,378 | | |
| NET ASSETS | | $ | 166,676,715 | | | $ | 18,145,675 | | | $ | 19,176,815 | | | $ | 78,128,086 | | | $ | 90,455,139 | | | $ | 80,518,668 | | |
The accompanying notes are an integral part of these financial statements.
61
MUTUAL OF AMERICA INVESTMENT CORPORATION
STATEMENTS OF ASSETS AND LIABILITIES (Continued)
December 31, 2010
| | | 2030
Retirement
Fund | | 2035
Retirement
Fund | | 2040
Retirement
Fund | | 2045
Retirement
Fund | | Conservative
Allocation
Fund | |
| ASSETS: | |
Investments at market value
(Cost: Retirement 2030 Fund — $58,303,447
Retirement 2035 Fund — $45,209,479
Retirement 2040 Fund — $39,550,275
Retirement 2045 Fund — $45,282,665
Conservative Allocation Fund — $48,753,004
Moderate Allocation Fund — $149,874,796
Aggressive Allocation Fund — $137,166,653
Money Market Fund — $108,811,710
Mid-Term Bond Fund — $282,136,342
Bond Fund — $572,434,959)
(Notes 1 and 3) | | $ | 67,402,882 | | | $ | 52,840,881 | | | $ | 46,631,652 | | | $ | 53,808,165 | | | $ | 51,732,575 | | |
| Cash | | | — | | | | — | | | | — | | | | — | | | | — | | |
| Interest and dividends receivable | | | — | | | | — | | | | — | | | | — | | | | — | | |
| Receivable for securities sold | | | — | | | | — | | | | — | | | | — | | | | — | | |
| Other receivables | | | — | | | | — | | | | — | | | | — | | | | — | | |
| TOTAL ASSETS | | | 67,402,882 | | | | 52,840,881 | | | | 46,631,652 | | | | 53,808,165 | | | | 51,732,575 | | |
| LIABILITIES: | |
| Payable for securities purchased | | | — | | | | — | | | | — | | | | — | | | | — | | |
| Payable for daily variation margin on future contracts | | | — | | | | — | | | | — | | | | — | | | | — | | |
| Other Liabilities | | | — | | | | — | | | | — | | | | — | | | | — | | |
| TOTAL LIABILITIES | | | — | | | | — | | | | — | | | | — | | | | — | | |
| NET ASSETS | | $ | 67,402,882 | | | $ | 52,840,881 | | | $ | 46,631,652 | | | $ | 53,808,165 | | | $ | 51,732,575 | | |
| NUMBER OF SHARES OUTSTANDING (Note 4) | | | 75,141,561 | | | | 59,862,854 | | | | 53,059,793 | | | | 61,484,646 | | | | 47,977,563 | | |
| NET ASSET VALUES, offering and redemption price per share | | $ | 0.90 | | | $ | 0.88 | | | $ | 0.88 | | | $ | 0.88 | | | $ | 1.08 | | |
| COMPONENTS OF NET ASSETS: | |
| Paid-in capital | | $ | 57,918,209 | | | $ | 44,827,474 | | | $ | 39,070,246 | | | $ | 44,757,256 | | | $ | 48,826,360 | | |
| Accumulated undistributed net investment income (loss) | | | 1,098,228 | | | | 788,269 | | | | 670,393 | | | | 759,321 | | | | 1,499,650 | | |
Accumulated undistributed net realized gain(loss)
on investments and futures contracts | | | (712,990 | ) | | | (406,264 | ) | | | (190,364 | ) | | | (233,912 | ) | | | (1,573,006 | ) | |
Net unrealized appreciation (depreciation)
of investments and futures contracts | | | 9,099,435 | | | | 7,631,402 | | | | 7,081,377 | | | | 8,525,500 | | | | 2,979,571 | | |
| NET ASSETS | | $ | 67,402,882 | | | $ | 52,840,881 | | | $ | 46,631,652 | | | $ | 53,808,165 | | | $ | 51,732,575 | | |
The accompanying notes are an integral part of these financial statements.
62
| | | Moderate
Allocation
Fund | | Aggressive
Allocation
Fund | | Money
Market
Fund | | Mid-Term
Bond Fund | | Bond
Fund | |
| ASSETS: | |
Investments at market value
(Cost: Retirement 2030 Fund — $58,303,447
Retirement 2035 Fund — $45,209,479
Retirement 2040 Fund — $39,550,275
Retirement 2045 Fund — $45,282,665
Conservative Allocation Fund — $48,753,004
Moderate Allocation Fund — $149,874,796
Aggressive Allocation Fund — $137,166,653
Money Market Fund — $108,811,710
Mid-Term Bond Fund — $282,136,342
Bond Fund — $572,434,959)
(Notes 1 and 3) | | $ | 162,687,124 | | | $ | 147,404,025 | | | $ | 108,813,799 | | | $ | 294,049,658 | | | $ | 592,203,785 | | |
| Cash | | | — | | | | — | | | | 3,811 | | | | 1,191,138 | | | | 14 | | |
| Interest and dividends receivable | | | — | | | | — | | | | — | | | | 2,611,387 | | | | 4,788,867 | | |
| Receivable for securities sold | | | — | | | | — | | | | — | | | | 65 | | | | 190,052 | | |
| Other receivables | | | — | | | | — | | | | — | | | | — | | | | — | | |
| TOTAL ASSETS | | | 162,687,124 | | | | 147,404,025 | | | | 108,817,610 | | | | 297,852,248 | | | | 597,182,718 | | |
| LIABILITIES: | |
| Payable for securities purchased | | | — | | | | — | | | | — | | | | — | | | | — | | |
| Payable for daily variation margin on future contracts | | | — | | | | — | | | | — | | | | — | | | | — | | |
| Other Liabilities | | | — | | | | — | | | | — | | | | — | | | | — | | |
| TOTAL LIABILITIES | | | — | | | | — | | | | — | | | | — | | | | — | | |
| NET ASSETS | | $ | 162,687,124 | | | $ | 147,404,025 | | | $ | 108,817,610 | | | $ | 297,852,248 | | | $ | 597,182,718 | | |
| NUMBER OF SHARES OUTSTANDING (Note 4) | | | 139,889,356 | | | | 119,017,515 | | | | 90,330,033 | | | | 289,925,398 | | | | 444,790,076 | | |
| NET ASSET VALUES, offering and redemption price per share | | $ | 1.16 | | | $ | 1.24 | | | $ | 1.20 | | | $ | 1.03 | | | $ | 1.34 | | |
| COMPONENTS OF NET ASSETS: | |
| Paid-in capital | | $ | 152,349,769 | | | $ | 139,153,212 | | | $ | 108,815,756 | | | $ | 285,726,975 | | | $ | 599,424,026 | | |
| Accumulated undistributed net investment income (loss) | | | 3,821,299 | | | | 2,784,610 | | | | — | | | | 211,957 | | | | 300,944 | | |
Accumulated undistributed net realized gain(loss)
on investments and futures contracts | | | (6,296,272 | ) | | | (4,771,169 | ) | | | (235 | ) | | | — | | | | (22,311,078 | ) | |
Net unrealized appreciation (depreciation)
of investments and futures contracts | | | 12,812,328 | | | | 10,237,372 | | | | 2,089 | | | | 11,913,316 | | | | 19,768,826 | | |
| NET ASSETS | | $ | 162,687,124 | | | $ | 147,404,025 | | | $ | 108,817,610 | | | $ | 297,852,248 | | | $ | 597,182,718 | | |
The accompanying notes are an integral part of these financial statements.
63
MUTUAL OF AMERICA INVESTMENT CORPORATION
STATEMENTS OF OPERATIONS
For the Year Ended December 31, 2010
| | | Equity Index
Fund | | All America
Fund | | Small Cap
Value Fund | | Small Cap
Growth Fund | | Mid Cap
Value Fund | | Mid-Cap
Equity Index
Fund | | International
Fund | |
| INVESTMENT INCOME AND EXPENSES: | |
| INCOME: | |
| Dividends | | $ | 16,226,282 | | | $ | 4,557,977 | | | $ | 4,457,907 | | | $ | 1,479,557 | | | $ | 914,350 | | | $ | 5,929,022 | | | $ | 1,617,119 | (b) | |
| Interest | | | 34,452 | | | | 9,653 | | | | 14,184 | | | | 15,515 | | | | 3,353 | | | | 26,916 | | | | 262 | | |
| Total income | | | 16,260,734 | | | | 4,567,630 | | | | 4,472,091 | | | | 1,495,072 | | | | 917,703 | | | | 5,955,938 | | | | 1,617,381 | | |
| EXPENSES: | |
| Investment advisory fees (Note 2) | | | 607,342 | | | | 1,026,172 | | | | 1,754,258 | | | | 1,693,766 | | | | 256,249 | | | | 317,422 | | | | 32,557 | | |
| Accounting and recordkeeping expenses | | | 411,675 | | | | 109,095 | | | | 112,640 | | | | 107,173 | | | | 21,742 | | | | 206,585 | | | | 20,562 | | |
| Shareholders reports | | | 175,991 | | | | 46,638 | | | | 48,154 | | | | 45,816 | | | | 9,295 | | | | 88,315 | | | | 8,790 | | |
| Custodian expenses | | | 38,985 | | | | 71,033 | | | | 15,770 | | | | 18,823 | | | | 6,775 | | | | 36,499 | | | | 4,841 | | |
| Independent directors' fees and expenses | | | 21,682 | | | | 18,145 | | | | 20,524 | | | | 20,226 | | | | 2,742 | | | | 20,809 | | | | 2,593 | | |
| Audit | | | 117,265 | | | | 31,076 | | | | 32,085 | | | | 30,528 | | | | 6,193 | | | | 58,845 | | | | 5,857 | | |
| Legal and Compliance | | | 161,529 | | | | 42,806 | | | | 44,197 | | | | 42,052 | | | | 8,531 | | | | 81,058 | | | | 8,068 | | |
| Administrative | | | 372,768 | | | | 98,785 | | | | 101,995 | | | | 97,044 | | | | 19,687 | | | | 187,061 | | | | 18,619 | | |
| Licenses | | | 31,657 | | | | 8,390 | | | | 8,662 | | | | 8,242 | | | | 1,672 | | | | 15,887 | | | | 1,581 | | |
| Other | | | 53,917 | | | | 14,288 | | | | 14,753 | | | | 14,037 | | | | 2,848 | | | | 27,057 | | | | 2,693 | | |
| Total expenses | | | 1,992,811 | | | | 1,466,428 | | | | 2,153,038 | | | | 2,077,707 | | | | 335,734 | | | | 1,039,538 | | | | 106,161 | | |
| Net Investment Income (Loss) | | | 14,267,923 | | | | 3,101,202 | | | | 2,319,053 | | | | (582,635 | ) | | | 581,969 | | | | 4,916,400 | | | | 1,511,220 | | |
NET REALIZED AND UNREALIZED GAIN (LOSS) ON INVESTMENTS AND
FUTURES CONTRACTS (Note 1): | |
| Net realized gain (loss) on: | |
| Investment securities | | | 5,556,901 | | | | 3,735,130 | | | | 9,620,852 | | | | 14,144,867 | | | | 569,199 | | | | 16,828,867 | | | | (580,595 | ) | |
| Futures contracts | | | 846,071 | | | | 213,805 | | | | — | | | | — | | | | — | | | | 2,129,024 | | | | — | | |
| | | | 6,402,972 | | | | 3,948,935 | | | | 9,620,852 | | | | 14,144,867 | | | | 569,199 | | | | 18,957,891 | | | | (580,595 | ) | |
| Change in net unrealized appreciation (depreciation) of: | |
| Investment securities | | | 93,861,035 | | | | 35,277,199 | | | | 46,714,836 | | | | 53,488,934 | | | | 7,131,981 | | | | 77,716,579 | | | | 3,681,223 | | |
| Futures contracts | | | 95,173 | | | | 53,845 | | | | — | | | | — | | | | — | | | | (427,555 | ) | | | — | | |
| | | | 93,956,208 | | | | 35,331,044 | | | | 46,714,836 | | | | 53,488,934 | | | | 7,131,981 | | | | 77,289,024 | | | | 3,681,223 | | |
NET REALIZED AND UNREALIZED GAIN (LOSS) ON INVESTMENTS AND
FUTURES CONTRACTS | | | 100,359,180 | | | | 39,279,979 | | | | 56,335,688 | | | | 67,633,801 | | | | 7,701,180 | | | | 96,246,915 | | | | 3,100,628 | | |
| NET INCREASE (DECREASE) IN NET ASSETS RESULTING FROM OPERATIONS | | $ | 114,627,103 | | | $ | 42,381,181 | | | $ | 58,654,741 | | | $ | 67,051,166 | | | $ | 8,283,149 | | | $ | 101,163,315 | | | $ | 4,611,848 | | |
(a) The Retirement Funds incur no operating expenses other than those included in each of the underlying funds in which they invest. The Allocation Funds incur no advisory or operating expenses other than those included in each of the underlying funds in which they invest.
(b) Net of foreign income taxes of $141,192.
The accompanying notes are an integral part of these financial statements.
64
| | | Composite
Fund | | Retirement
Income
Fund | | 2010
Retirement
Fund | | 2015
Retirement
Fund | | 2020
Retirement
Fund | | 2025
Retirement
Fund | |
| INVESTMENT INCOME AND EXPENSES: | |
| INCOME: | |
| Dividends | | $ | 1,690,999 | | | $ | 467,651 | | | $ | 443,166 | | | $ | 1,702,134 | | | $ | 1,883,337 | | | $ | 1,486,356 | | |
| Interest | | | 3,008,744 | | | | — | | | | — | | | | — | | | | — | | | | — | | |
| Total income | | | 4,699,743 | | | | 467,651 | | | | 443,166 | | | | 1,702,134 | | | | 1,883,337 | | | | 1,486,356 | | |
| EXPENSES: | |
| Investment advisory fees (Note 2) | | | 663,426 | | | | 6,333 | (a) | | | 8,167 | (a) | | | 29,991 | (a) | | | 33,597 | (a) | | | 29,255 | (a) | |
| Accounting and recordkeeping expenses | | | 73,800 | | | | — | | | | — | | | | — | | | | — | | | | — | | |
| Shareholders reports | | | 31,550 | | | | — | | | | — | | | | — | | | | — | | | | — | | |
| Custodian expenses | | | 28,816 | | | | — | | | | — | | | | — | | | | — | | | | — | | |
| Independent directors' fees and expenses | | | 18,989 | | | | — | | | | — | | | | — | | | | — | | | | — | | |
| Audit | | | 21,022 | | | | — | | | | — | | | | — | | | | — | | | | — | | |
| Legal and Compliance | | | 28,957 | | | | — | | | | — | | | | — | | | | — | | | | — | | |
| Administrative | | | 66,826 | | | | — | | | | — | | | | — | | | | — | | | | — | | |
| Licenses | | | 5,676 | | | | — | | | | — | | | | — | | | | — | | | | — | | |
| Other | | | 9,666 | | | | — | | | | — | | | | — | | | | — | | | | — | | |
| Total expenses | | | 948,728 | | | | 6,333 | | | | 8,167 | | | | 29,991 | | | | 33,597 | | | | 29,255 | | |
| Net Investment Income (Loss) | | | 3,751,015 | | | | 461,318 | | | | 434,999 | | | | 1,672,143 | | | | 1,849,740 | | | | 1,457,101 | | |
NET REALIZED AND UNREALIZED GAIN (LOSS) ON INVESTMENTS AND
FUTURES CONTRACTS (Note 1): | |
| Net realized gain (loss) on: | |
| Investment securities | | | 3,806,011 | | | | 305,728 | | | | 227,271 | | | | 8,827 | | | | 178,077 | | | | 180,834 | | |
| Futures contracts | | | — | | | | — | | | | — | | | | — | | | | — | | | | — | | |
| | | | 3,806,011 | | | | 305,728 | | | | 227,271 | | | | 8,827 | | | | 178,077 | | | | 180,834 | | |
| Change in net unrealized appreciation (depreciation) of: | |
| Investment securities | | | 9,664,571 | | | | 276,589 | | | | 1,087,254 | | | | 5,378,514 | | | | 7,123,855 | | | | 7,402,621 | | |
| Futures contracts | | | — | | | | — | | | | — | | | | — | | | | — | | | | — | | |
| | | | 9,664,571 | | | | 276,589 | | | | 1,087,254 | | | | 5,378,514 | | | | 7,123,855 | | | | 7,402,621 | | |
NET REALIZED AND UNREALIZED GAIN (LOSS) ON INVESTMENTS AND
FUTURES CONTRACTS | | | 13,470,582 | | | | 582,317 | | | | 1,314,525 | | | | 5,387,341 | | | | 7,301,932 | | | | 7,583,455 | | |
| NET INCREASE (DECREASE) IN NET ASSETS RESULTING FROM OPERATIONS | | $ | 17,221,597 | | | $ | 1,043,635 | | | $ | 1,749,524 | | | $ | 7,059,484 | | | $ | 9,151,672 | | | $ | 9,040,556 | | |
The accompanying notes are an integral part of these financial statements.
65
MUTUAL OF AMERICA INVESTMENT CORPORATION
STATEMENTS OF OPERATIONS (Continued)
For the Year Ended December 31, 2010
| | | 2030
Retirement
Fund | | 2035
Retirement
Fund | | 2040
Retirement
Fund | | 2045
Retirement
Fund | | Conservative
Allocation
Fund | |
| INVESTMENT INCOME AND EXPENSES: | |
| INCOME: | |
| Dividends | | $ | 1,155,482 | | | $ | 830,109 | | | $ | 701,204 | | | $ | 795,429 | | | $ | 1,487,663 | | |
| Interest | | | — | | | | — | | | | — | | | | — | | | | — | | |
| Total income | | | 1,155,482 | | | | 830,109 | | | | 701,204 | | | | 795,429 | | | | 1,487,663 | | |
| EXPENSES: | |
| Investment advisory fees (Note 2) | | | 23,907 | (a) | | | 18,488 | (a) | | | 16,087 | (a) | | | 18,197 | (a) | | | — | (a) | |
| Accounting and recordkeeping expenses | | | — | | | | — | | | | — | | | | — | | | | — | | |
| Shareholders reports | | | — | | | | — | | | | — | | | | — | | | | — | | |
| Custodian expenses | | | — | | | | — | | | | — | | | | — | | | | — | | |
| Independent directors' fees and expenses | | | — | | | | — | | | | — | | | | — | | | | — | | |
| Audit | | | — | | | | — | | | | — | | | | — | | | | — | | |
| Legal and Compliance | | | — | | | | — | | | | — | | | | — | | | | — | | |
| Administrative | | | — | | | | — | | | | — | | | | — | | | | — | | |
| Licenses | | | — | | | | — | | | | — | | | | — | | | | — | | |
| Other | | | — | | | | — | | | | — | | | | — | | | | — | | |
| Total expenses | | | 23,907 | | | | 18,488 | | | | 16,087 | | | | 18,197 | | | | — | | |
| Net Investment Income (Loss) | | | 1,131,575 | | | | 811,621 | | | | 685,117 | | | | 777,232 | | | | 1,487,663 | | |
| NET REALIZED AND UNREALIZED GAIN (LOSS) ON INVESTMENTS AND FUTURES CONTRACTS (Note 1): | |
| Net realized gain(loss) on: | |
| Investment securities | | | 194,637 | | | | 164,197 | | | | 225,115 | | | | 232,700 | | | | 105,535 | | |
| Futures contracts | | | — | | | | — | | | | — | | | | — | | | | — | | |
| | | | 194,637 | | | | 164,197 | | | | 225,115 | | | | 232,700 | | | | 105,535 | | |
| Change in net unrealized appreciation (depreciation) of: | |
| Investment securities | | | 6,645,443 | | | | 5,697,075 | | | | 5,214,389 | | | | 6,073,407 | | | | 2,175,653 | | |
| Futures contracts | | | — | | | | — | | | | — | | | | — | | | | — | | |
| | | | 6,645,443 | | | | 5,697,075 | | | | 5,214,389 | | | | 6,073,407 | | | | 2,175,653 | | |
| NET REALIZED AND UNREALIZED GAIN (LOSS) ON INVESTMENTS AND FUTURES CONTRACTS | | | 6,840,080 | | | | 5,861,272 | | | | 5,439,504 | | | | 6,306,107 | | | | 2,281,188 | | |
| NET INCREASE (DECREASE) IN NET ASSETS RESULTING FROM OPERATIONS | | $ | 7,971,655 | | | $ | 6,672,893 | | | $ | 6,124,621 | | | $ | 7,083,339 | | | $ | 3,768,851 | | |
(a) The Retirement Funds incur no operating expenses other than those included in each of the underlying funds in which they invest. The Allocation Funds incur no advisory or operating expenses other than those included in each of the underlying funds in which they invest.
The accompanying notes are an integral part of these financial statements.
66
| | | Moderate
Allocation
Fund | | Aggressive
Allocation
Fund | | Money
Market
Fund | | Mid-Term
Bond Fund | | Bond
Fund | |
| INVESTMENT INCOME AND EXPENSES: | |
| INCOME: | |
| Dividends | | $ | 3,858,871 | | | $ | 2,667,516 | | | $ | — | | | $ | — | | | $ | — | | |
| Interest | | | — | | | | — | | | | 194,974 | | | | 11,326,214 | | | | 23,936,055 | | |
| Total income | | | 3,858,871 | | | | 2,667,516 | | | | 194,974 | | | | 11,326,214 | | | | 23,936,055 | | |
| EXPENSES: | |
| Investment advisory fees (Note 2) | | | — | (a) | | | — | (a) | | | 169,929 | | | | 1,071,201 | | | | 2,186,000 | | |
| Accounting and recordkeeping expenses | | | — | | | | — | | | | 50,140 | | | | 131,317 | | | | 274,735 | | |
| Shareholders reports | | | — | | | | — | | | | 21,435 | | | | 56,138 | | | | 117,449 | | |
| Custodian expenses | | | — | | | | — | | | | 15,127 | | | | 14,908 | | | | 31,009 | | |
| Independent directors' fees and expenses | | | — | | | | — | | | | 18,894 | | | | 20,902 | | | | 21,433 | | |
| Audit | | | — | | | | — | | | | 14,282 | | | | 37,405 | | | | 78,258 | | |
| Legal and Compliance | | | — | | | | — | | | | 19,673 | | | | 51,525 | | | | 107,798 | | |
| Administrative | | | — | | | | — | | | | 45,401 | | | | 118,906 | | | | 248,770 | | |
| Licenses | | | — | | | | — | | | | 3,856 | | | | 10,099 | | | | 21,128 | | |
| Other | | | — | | | | — | | | | 6,567 | | | | 17,199 | | | | 35,982 | | |
| Total expenses | | | — | | | | — | | | | 365,304 | | | | 1,529,600 | | | | 3,122,562 | | |
| Net Investment Income (Loss) | | | 3,858,871 | | | | 2,667,516 | | | | (170,330 | ) | | | 9,796,614 | | | | 20,813,493 | | |
| NET REALIZED AND UNREALIZED GAIN (LOSS) ON INVESTMENTS AND FUTURES CONTRACTS (Note 1): | |
| Net realized gain(loss) on: | |
| Investment securities | | | (363,131 | ) | | | 35,357 | | | | 2,007 | | | | 631,791 | | | | 4,845,755 | | |
| Futures contracts | | | — | | | | — | | | | — | | | | — | | | | — | | |
| | | | (363,131 | ) | | | 35,357 | | | | 2,007 | | | | 631,791 | | | | 4,845,755 | | |
| Change in net unrealized appreciation (depreciation) of: | |
| Investment securities | | | 14,197,108 | | | | 18,099,295 | | | | (1,572 | ) | | | 6,362,184 | | | | 11,056,903 | | |
| Futures contracts | | | — | | | | — | | | | — | | | | — | | | | — | | |
| | | | 14,197,108 | | | | 18,099,295 | | | | (1,572 | ) | | | 6,362,184 | | | | 11,056,903 | | |
| NET REALIZED AND UNREALIZED GAIN (LOSS) ON INVESTMENTS AND FUTURES CONTRACTS | | | 13,833,977 | | | | 18,134,652 | | | | 435 | | | | 6,993,975 | | | | 15,902,658 | | |
| NET INCREASE (DECREASE) IN NET ASSETS RESULTING FROM OPERATIONS | | $ | 17,692,848 | | | $ | 20,802,168 | | | $ | (169,895 | ) | | $ | 16,790,589 | | | $ | 36,716,151 | | |
The accompanying notes are an integral part of these financial statements.
67
MUTUAL OF AMERICA INVESTMENT CORPORATION
STATEMENTS OF CHANGES IN NET ASSETS
For the Years Ended December 31,
| | | Equity Index Fund | | All America Fund | | Small Cap Value Fund | |
| | | 2010 | | 2009 | | 2010 | | 2009 | | 2010 | | 2009 | |
| INCREASE (DECREASE) IN NET ASSETS: | |
| FROM OPERATIONS: | |
| Net investment income (loss) | | $ | 14,267,923 | | | $ | 12,288,697 | | | $ | 3,101,202 | | | $ | 3,264,755 | | | $ | 2,319,053 | | | $ | 2,194,931 | | |
| Net realized gain (loss) on investments and futures contracts | | | 6,402,972 | | | | 4,103,447 | | | | 3,948,935 | | | | (11,683,827 | ) | | | 9,620,852 | | | | (11,306,654 | ) | |
Change in net unrealized appreciation (depreciation) of investments and
futures contracts | | | 93,956,208 | | | | 142,086,168 | | | | 35,331,044 | | | | 60,682,745 | | | | 46,714,836 | | | | 55,219,929 | | |
| NET INCREASE (DECREASE) IN NET ASSETS RESULTING FROM OPERATIONS | | | 114,627,103 | | | | 158,478,312 | | | | 42,381,181 | | | | 52,263,673 | | | | 58,654,741 | | | | 46,108,206 | | |
| DIVIDEND DISTRIBUTIONS (Note 5) | |
| From net investment income | | | (14,303,185 | ) | | | (12,136,940 | ) | | | (3,289,983 | ) | | | (4,552,237 | ) | | | (2,642,181 | ) | | | (2,026,043 | ) | |
| From capital gains | | | — | | | | — | | | | — | | | | — | | | | — | | | | — | | |
| Return of capital | | | — | | | | — | | | | — | | | | — | | | | — | | | | (147,499 | ) | |
| Total distributions | | | (14,303,185 | ) | | | (12,136,940 | ) | | | (3,289,983 | ) | | | (4,552,237 | ) | | | (2,642,181 | ) | | | (2,173,542 | ) | |
| CAPITAL SHARE TRANSACTIONS (Note 4): | |
| Net proceeds from sale of shares | | | 120,677,137 | | | | 131,586,187 | | | | 4,558,409 | | | | 16,036,349 | | | | 30,474,048 | | | | 25,084,409 | | |
| Dividends reinvested | | | 14,303,185 | | | | 12,136,940 | | | | 3,289,983 | | | | 4,552,237 | | | | 2,642,181 | | | | 2,173,542 | | |
| Cost of shares redeemed | | | (97,562,295 | ) | | | (67,614,289 | ) | | | (32,350,662 | ) | | | (33,884,392 | ) | | | (17,323,368 | ) | | | (21,139,747 | ) | |
| NET INCREASE (DECREASE) IN NET ASSETS FROM CAPITAL SHARE TRANSACTIONS | | | 37,418,027 | | | | 76,108,838 | | | | (24,502,270 | ) | | | (13,295,806 | ) | | | 15,792,861 | | | | 6,118,204 | | |
| INCREASE (DECREASE) IN NET ASSETS | | | 137,741,945 | | | | 222,450,210 | | | | 14,588,928 | | | | 34,415,630 | | | | 71,805,421 | | | | 50,052,868 | | |
| NET ASSETS, BEGINNING OF PERIOD | | | 767,635,043 | | | | 545,184,833 | | | | 255,921,367 | | | | 221,505,737 | | | | 205,384,414 | | | | 155,331,546 | | |
| NET ASSETS, END OF PERIOD | | $ | 905,376,988 | | | $ | 767,635,043 | | | $ | 270,510,295 | | | $ | 255,921,367 | | | $ | 277,189,835 | | | $ | 205,384,414 | | |
| ACCUMULATED UNDISTRIBUTED NET INVESTMENT INCOME (LOSS) | | $ | 1,826,673 | | | $ | 1,999,957 | | | $ | 3,029,011 | | | $ | 3,215,664 | | | $ | — | | | $ | — | | |
| OTHER INFORMATION: | |
| Shares outstanding at the beginning of period | | | 418,006,160 | | | | 368,420,865 | | | | 180,351,927 | | | | 191,846,309 | | | | 214,817,947 | | | | 207,820,402 | | |
| Shares sold | | | 63,290,986 | | | | 84,333,429 | | | | 3,041,549 | | | | 12,431,453 | | | | 28,384,353 | | | | 29,873,198 | | |
| Shares issued as reinvestment of dividends | | | 7,039,110 | | | | 6,714,675 | | | | 2,339,727 | | | | 3,592,572 | | | | 2,223,496 | | | | 2,273,375 | | |
| Shares redeemed | | | (51,356,739 | ) | | | (41,462,809 | ) | | | (21,668,051 | ) | | | (27,518,407 | ) | | | (16,208,599 | ) | | | (25,149,028 | ) | |
| Net increase (decrease) | | | 18,973,357 | | | | 49,585,295 | | | | (16,286,775 | ) | | | (11,494,382 | ) | | | 14,399,250 | | | | 6,997,545 | | |
| Shares outstanding at the end of period | | | 436,979,517 | | | | 418,006,160 | | | | 164,065,152 | | | | 180,351,927 | | | | 229,217,197 | | | | 214,817,947 | | |
The accompanying notes are an integral part of these financial statements.
68
| | | Small Cap Growth Fund | | Mid-Cap Value Fund | | Mid-Cap Equity Index Fund | |
| | | 2010 | | 2009 | | 2010 | | 2009 | | 2010 | | 2009 | |
| INCREASE (DECREASE) IN NET ASSETS: | |
| FROM OPERATIONS: | |
| Net investment income (loss) | | $ | (582,635 | ) | | $ | (413,891 | ) | | $ | 581,969 | | | $ | 526,629 | | | $ | 4,916,400 | | | $ | 4,161,060 | | |
| Net realized gain (loss) on investments and futures contracts | | | 14,144,867 | | | | (13,320,386 | ) | | | 569,199 | | | | (1,261,680 | ) | | | 18,957,891 | | | | 5,939,815 | | |
Change in net unrealized appreciation (depreciation) of investments and
futures contracts | | | 53,488,934 | | | | 55,426,844 | | | | 7,131,981 | | | | 8,845,477 | | | | 77,289,024 | | | | 88,357,146 | | |
| NET INCREASE (DECREASE) IN NET ASSETS RESULTING FROM OPERATIONS | | | 67,051,166 | | | | 41,692,567 | | | | 8,283,149 | | | | 8,110,426 | | | | 101,163,315 | | | | 98,458,021 | | |
| DIVIDEND DISTRIBUTIONS (Note 5) | |
| From net investment income | | | — | | | | — | | | | (580,763 | ) | | | (505,962 | ) | | | (4,618,284 | ) | | | (3,808,316 | ) | |
| From capital gains | | | — | | | | — | | | | — | | | | — | | | | (12,019,783 | ) | | | (3,411,479 | ) | |
| Return of capital | | | — | | | | — | | | | — | | | | (20,110 | ) | | | — | | | | — | | |
| Total distributions | | | — | | | | — | | | | (580,763 | ) | | | (526,072 | ) | | | (16,638,067 | ) | | | (7,219,795 | ) | |
| CAPITAL SHARE TRANSACTIONS (Note 4): | |
| Net proceeds from sale of shares | | | 37,830,981 | | | | 24,697,625 | | | | 7,889,343 | | | | 8,799,815 | | | | 67,640,106 | | | | 76,415,175 | | |
| Dividends reinvested | | | — | | | | — | | | | 580,763 | | | | 526,072 | | | | 16,638,067 | | | | 7,219,795 | | |
| Cost of shares redeemed | | | (18,010,361 | ) | | | (19,424,850 | ) | | | (3,455,235 | ) | | | (4,851,635 | ) | | | (52,165,400 | ) | | | (45,195,352 | ) | |
| NET INCREASE (DECREASE) IN NET ASSETS FROM CAPITAL SHARE TRANSACTIONS | | | 19,820,620 | | | | 5,272,775 | | | | 5,014,871 | | | | 4,474,252 | | | | 32,112,773 | | | | 38,439,618 | | |
| INCREASE (DECREASE) IN NET ASSETS | | | 86,871,786 | | | | 46,965,342 | | | | 12,717,257 | | | | 12,058,606 | | | | 116,638,021 | | | | 129,677,844 | | |
| NET ASSETS, BEGINNING OF PERIOD | | | 193,896,096 | | | | 146,930,754 | | | | 41,972,596 | | | | 29,913,990 | | | | 377,202,480 | | | | 247,524,636 | | |
| NET ASSETS, END OF PERIOD | | $ | 280,767,882 | | | $ | 193,896,096 | | | $ | 54,689,853 | | | $ | 41,972,596 | | | $ | 493,840,501 | | | $ | 377,202,480 | | |
| ACCUMULATED UNDISTRIBUTED NET INVESTMENT INCOME (LOSS) | | $ | — | | | $ | — | | | $ | — | | | $ | — | | | $ | 319,737 | | | $ | 565,311 | | |
| OTHER INFORMATION: | |
| Shares outstanding at the beginning of period | | | 217,012,966 | | | | 209,988,389 | | | | 42,960,517 | | | | 37,860,539 | | | | 304,220,329 | | | | 267,560,565 | | |
| Shares sold | | | 37,244,882 | | | | 32,071,799 | | | | 7,485,020 | | | | 10,252,180 | | | | 49,166,354 | | | | 72,282,216 | | |
| Shares issued as reinvestment of dividends | | | — | | | | — | | | | 503,349 | | | | 547,291 | | | | 11,309,916 | | | | 5,908,130 | | |
| Shares redeemed | | | (18,457,950 | ) | | | (25,047,222 | ) | | | (3,379,545 | ) | | | (5,699,493 | ) | | | (37,979,872 | ) | | | (41,530,582 | ) | |
| Net increase (decrease) | | | 18,786,932 | | | | 7,024,577 | | | | 4,608,824 | | | | 5,099,978 | | | | 22,496,398 | | | | 36,659,764 | | |
| Shares outstanding at the end of period | | | 235,799,898 | | | | 217,012,966 | | | | 47,569,341 | | | | 42,960,517 | | | | 326,716,727 | | | | 304,220,329 | | |
The accompanying notes are an integral part of these financial statements.
69
MUTUAL OF AMERICA INVESTMENT CORPORATION
STATEMENTS OF CHANGES IN NET ASSETS (Continued)
For the Years Ended December 31,
| | | International Fund | | Composite Fund | | Retirement Income Fund | |
| | | 2010 | | 2009 | | 2010 | | 2009 | | 2010 | | 2009 | |
| INCREASE (DECREASE) IN NET ASSETS: | |
| FROM OPERATIONS: | |
| Net investment income (loss) | | $ | 1,511,220 | | | $ | 713,204 | | | $ | 3,751,015 | | | $ | 4,167,446 | | | $ | 461,318 | | | $ | 258,621 | | |
| Net realized gain (loss) on investments and futures contracts | | | (580,595 | ) | | | (784,240 | ) | | | 3,806,011 | | | | (9,692,893 | ) | | | 305,728 | | | | (157,075 | ) | |
Change in net unrealized appreciation (depreciation) of investments and
futures contracts | | | 3,681,223 | | | | 5,728,205 | | | | 9,664,571 | | | | 31,508,207 | | | | 276,589 | | | | 808,383 | | |
| NET INCREASE (DECREASE) IN NET ASSETS RESULTING FROM OPERATIONS | | | 4,611,848 | | | | 5,657,169 | | | | 17,221,597 | | | | 25,982,760 | | | | 1,043,635 | | | | 909,929 | | |
| DIVIDEND DISTRIBUTIONS (Note 5) | |
| From net investment income | | | (1,504,558 | ) | | | (716,989 | ) | | | (4,166,967 | ) | | | (4,490,474 | ) | | | (263,708 | ) | | | (3,557 | ) | |
| From capital gains | | | — | | | | — | | | | — | | | | — | | | | (172,945 | ) | | | — | | |
| Return of capital | | | — | | | | (279,706 | ) | | | — | | | | — | | | | — | | | | — | | |
| Total distributions | | | (1,504,558 | ) | | | (996,695 | ) | | | (4,166,967 | ) | | | (4,490,474 | ) | | | (436,653 | ) | | | (3,557 | ) | |
| CAPITAL SHARE TRANSACTIONS (Note 4): | |
| Net proceeds from sale of shares | | | 25,058,019 | | | | 18,501,183 | | | | 3,571,993 | | | | 14,470,419 | | | | 11,419,128 | | | | 7,251,235 | | |
| Dividends reinvested | | | 1,791,399 | | | | 709,854 | | | | 4,166,967 | | | | 4,490,474 | | | | 436,653 | | | | 3,557 | | |
| Cost of shares redeemed | | | (1,937,175 | ) | | | (3,070,256 | ) | | | (20,097,971 | ) | | | (24,597,867 | ) | | | (3,161,532 | ) | | | (2,833,653 | ) | |
| NET INCREASE (DECREASE) IN NET ASSETS FROM CAPITAL SHARE TRANSACTIONS | | | 24,912,243 | | | | 16,140,781 | | | | (12,359,011 | ) | | | (5,636,974 | ) | | | 8,694,249 | | | | 4,421,139 | | |
| INCREASE (DECREASE) IN NET ASSETS | | | 28,019,533 | | | | 20,801,255 | | | | 695,619 | | | | 15,855,312 | | | | 9,301,231 | | | | 5,327,511 | | |
| NET ASSETS, BEGINNING OF PERIOD | | | 33,088,497 | | | | 12,287,242 | | | | 165,981,096 | | | | 150,125,784 | | | | 8,844,444 | | | | 3,516,933 | | |
| NET ASSETS, END OF PERIOD | | $ | 61,108,030 | | | $ | 33,088,497 | | | $ | 166,676,715 | | | $ | 165,981,096 | | | $ | 18,145,675 | | | $ | 8,844,444 | | |
| ACCUMULATED UNDISTRIBUTED NET INVESTMENT INCOME (LOSS) | | $ | 6,662 | | | $ | — | | | $ | 3,739,588 | | | $ | 4,166,967 | | | $ | 468,628 | | | $ | 261,549 | | |
| OTHER INFORMATION: | |
| Shares outstanding at the beginning of period | | | 49,223,378 | | | | 22,203,777 | | | | 119,708,439 | | | | 124,623,815 | | | | 9,122,224 | | | | 4,214,590 | | |
| Shares sold | | | 37,614,297 | | | | 31,104,990 | | | | 2,492,126 | | | | 10,926,433 | | | | 11,243,178 | | | | 8,003,583 | | |
| Shares issued as reinvestment of dividends | | | 2,130,664 | | | | 1,055,262 | | | | 3,021,499 | | | | 3,492,246 | | | | 432,230 | | | | 3,866 | | |
| Shares redeemed | | | (2,904,449 | ) | | | (5,140,651 | ) | | | (14,070,835 | ) | | | (19,334,055 | ) | | | (3,120,249 | ) | | | (3,099,815 | ) | |
| Net increase (decrease) | | | 36,840,512 | | | | 27,019,601 | | | | (8,557,210 | ) | | | (4,915,376 | ) | | | 8,555,159 | | | | 4,907,634 | | |
| Shares outstanding at the end of period | | | 86,063,890 | | | | 49,223,378 | | | | 111,151,229 | | | | 119,708,439 | | | | 17,677,383 | | | | 9,122,224 | | |
The accompanying notes are an integral part of these financial statements.
70
| | | 2010 Retirement Fund | | 2015 Retirement Fund | | 2020 Retirement Fund | |
| | | 2010 | | 2009 | | 2010 | | 2009 | | 2010 | | 2009 | |
| INCREASE (DECREASE) IN NET ASSETS: | |
| FROM OPERATIONS: | |
| Net investment income (loss) | | $ | 434,999 | | | $ | 375,141 | | | $ | 1,672,143 | | | $ | 1,051,835 | | | $ | 1,849,740 | | | $ | 1,125,171 | | |
| Net realized gain (loss) on investments and futures contracts | | | 227,271 | | | | (728,238 | ) | | | 8,827 | | | | (1,816,017 | ) | | | 178,077 | | | | (1,349,890 | ) | |
Change in net unrealized appreciation (depreciation) of investments and
futures contracts | | | 1,087,254 | | | | 2,346,843 | | | | 5,378,514 | | | | 7,126,794 | | | | 7,123,855 | | | | 7,322,355 | | |
| NET INCREASE (DECREASE) IN NET ASSETS RESULTING FROM OPERATIONS | | | 1,749,524 | | | | 1,993,746 | | | | 7,059,484 | | | | 6,362,612 | | | | 9,151,672 | | | | 7,097,636 | | |
| DIVIDEND DISTRIBUTIONS (Note 5) | |
| From net investment income | | | (26,710 | ) | | | (347,066 | ) | | | (63,956 | ) | | | (974,899 | ) | | | (43,965 | ) | | | (1,093,278 | ) | |
| From capital gains | | | (71,240 | ) | | | (51,151 | ) | | | (77,361 | ) | | | (108,474 | ) | | | (121,062 | ) | | | (120,898 | ) | |
| Return of capital | | | — | | | | (16,645 | ) | | | — | | | | (54,360 | ) | | | — | | | | (978 | ) | |
| Total distributions | | | (97,950 | ) | | | (414,862 | ) | | | (141,317 | ) | | | (1,137,733 | ) | | | (165,027 | ) | | | (1,215,154 | ) | |
| CAPITAL SHARE TRANSACTIONS (Note 4): | |
| Net proceeds from sale of shares | | | 6,456,097 | | | | 8,873,325 | | | | 32,178,154 | | | | 27,583,963 | | | | 35,200,831 | | | | 29,189,086 | | |
| Dividends reinvested | | | 97,950 | | | | 414,862 | | | | 141,317 | | | | 1,137,733 | | | | 165,027 | | | | 1,215,154 | | |
| Cost of shares redeemed | | | (3,646,018 | ) | | | (4,524,564 | ) | | | (5,168,786 | ) | | | (9,904,433 | ) | | | (3,580,821 | ) | | | (7,289,009 | ) | |
| NET INCREASE (DECREASE) IN NET ASSETS FROM CAPITAL SHARE TRANSACTIONS | | | 2,908,029 | | | | 4,763,623 | | | | 27,150,685 | | | | 18,817,263 | | | | 31,785,037 | | | | 23,115,231 | | |
| INCREASE (DECREASE) IN NET ASSETS | | | 4,559,603 | | | | 6,342,507 | | | | 34,068,852 | | | | 24,042,142 | | | | 40,771,682 | | | | 28,997,713 | | |
| NET ASSETS, BEGINNING OF PERIOD | | | 14,617,212 | | | | 8,274,705 | | | | 44,059,234 | | | | 20,017,092 | | | | 49,683,457 | | | | 20,685,744 | | |
| NET ASSETS, END OF PERIOD | | $ | 19,176,815 | | | $ | 14,617,212 | | | $ | 78,128,086 | | | $ | 44,059,234 | | | $ | 90,455,139 | | | $ | 49,683,457 | | |
| ACCUMULATED UNDISTRIBUTED NET INVESTMENT INCOME (LOSS) | | $ | 429,453 | | | $ | — | | | $ | 1,673,163 | | | $ | — | | | $ | 1,877,029 | | | $ | — | | |
| OTHER INFORMATION: | |
| Shares outstanding at the beginning of period | | | 16,871,361 | | | | 11,114,476 | | | | 52,963,259 | | | | 28,429,170 | | | | 62,378,472 | | | | 31,210,997 | | |
| Shares sold | | | 7,046,802 | | | | 10,809,241 | | | | 36,728,456 | | | | 35,584,981 | | | | 41,604,821 | | | | 39,377,766 | | |
| Shares issued as reinvestment of dividends | | | 102,082 | | | | 479,268 | | | | 151,623 | | | | 1,367,660 | | | | 182,211 | | | | 1,525,648 | | |
| Shares redeemed | | | (4,043,231 | ) | | | (5,531,624 | ) | | | (6,045,669 | ) | | | (12,418,552 | ) | | | (4,284,715 | ) | | | (9,735,939 | ) | |
| Net increase (decrease) | | | 3,105,653 | | | | 5,756,885 | | | | 30,834,410 | | | | 24,534,089 | | | | 37,502,317 | | | | 31,167,475 | | |
| Shares outstanding at the end of period | | | 19,977,014 | | | | 16,871,361 | | | | 83,797,669 | | | | 52,963,259 | | | | 99,880,789 | | | | 62,378,472 | | |
The accompanying notes are an integral part of these financial statements.
71
MUTUAL OF AMERICA INVESTMENT CORPORATION
STATEMENTS OF CHANGES IN NET ASSETS (Continued)
For the Years Ended December 31,
| | | 2025 Retirement Fund | | 2030 Retirement Fund | | 2035 Retirement Fund | |
| | | 2010 | | 2009 | | 2010 | | 2009 | | 2010 | | 2009 | |
| INCREASE (DECREASE) IN NET ASSETS: | |
| FROM OPERATIONS: | |
| Net investment income (loss) | | $ | 1,457,101 | | | $ | 828,472 | | | $ | 1,131,575 | | | $ | 628,195 | | | $ | 811,621 | | | $ | 435,797 | | |
| Net realized gain (loss) on investments and futures contracts | | | 180,834 | | | | (653,965 | ) | | | 194,637 | | | | (560,617 | ) | | | 164,197 | | | | (361,974 | ) | |
Change in net unrealized appreciation (depreciation) of investments and
futures contracts | | | 7,402,621 | | | | 6,341,369 | | | | 6,645,443 | | | | 5,503,915 | | | | 5,697,075 | | | | 4,419,064 | | |
| NET INCREASE (DECREASE) IN NET ASSETS RESULTING FROM OPERATIONS | | | 9,040,556 | | | | 6,515,876 | | | | 7,971,655 | | | | 5,571,493 | | | | 6,672,893 | | | | 4,492,887 | | |
| DIVIDEND DISTRIBUTIONS (Note 5) | |
| From net investment income | | | (97,929 | ) | | | (801,582 | ) | | | (110,038 | ) | | | (603,408 | ) | | | (93,247 | ) | | | (417,357 | ) | |
| From capital gains | | | (75,919 | ) | | | (88,070 | ) | | | (42,053 | ) | | | (74,035 | ) | | | (34,003 | ) | | | (67,653 | ) | |
| Return of capital | | | — | | | | (5,210 | ) | | | — | | | | (3,475 | ) | | | — | | | | (340 | ) | |
| Total distributions | | | (173,848 | ) | | | (894,862 | ) | | | (152,091 | ) | | | (680,918 | ) | | | (127,250 | ) | | | (485,350 | ) | |
| CAPITAL SHARE TRANSACTIONS (Note 4): | |
| Net proceeds from sale of shares | | | 33,366,113 | | | | 25,813,392 | | | | 26,971,229 | | | | 21,345,134 | | | | 20,810,940 | | | | 16,136,587 | | |
| Dividends reinvested | | | 173,848 | | | | 894,862 | | | | 152,091 | | | | 680,918 | | | | 127,250 | | | | 485,350 | | |
| Cost of shares redeemed | | | (3,875,461 | ) | | | (5,164,202 | ) | | | (2,273,130 | ) | | | (3,844,922 | ) | | | (1,616,364 | ) | | | (2,437,002 | ) | |
| NET INCREASE (DECREASE) IN NET ASSETS FROM CAPITAL SHARE TRANSACTIONS | | | 29,664,500 | | | | 21,544,052 | | | | 24,850,190 | | | | 18,181,130 | | | | 19,321,826 | | | | 14,184,935 | | |
| INCREASE (DECREASE) IN NET ASSETS | | | 38,531,208 | | | | 27,165,066 | | | | 32,669,754 | | | | 23,071,705 | | | | 25,867,469 | | | | 18,192,472 | | |
| NET ASSETS, BEGINNING OF PERIOD | | | 41,987,460 | | | | 14,822,394 | | | | 34,733,128 | | | | 11,661,423 | | | | 26,973,412 | | | | 8,780,940 | | |
| NET ASSETS, END OF PERIOD | | $ | 80,518,668 | | | $ | 41,987,460 | | | $ | 67,402,882 | | | $ | 34,733,128 | | | $ | 52,840,881 | | | $ | 26,973,412 | | |
| ACCUMULATED UNDISTRIBUTED NET INVESTMENT INCOME (LOSS) | | $ | 1,439,888 | | | $ | — | | | $ | 1,098,228 | | | $ | — | | | $ | 788,269 | | | $ | — | | |
| OTHER INFORMATION: | |
| Shares outstanding at the beginning of period | | | 53,840,361 | | | | 23,272,827 | | | | 45,047,756 | | | | 18,754,328 | | | | 35,870,616 | | | | 14,569,870 | | |
| Shares sold | | | 40,165,428 | | | | 36,321,906 | | | | 32,777,870 | | | | 30,770,820 | | | | 25,949,007 | | | | 24,116,768 | | |
| Shares issued as reinvestment of dividends | | | 193,273 | | | | 1,147,478 | | | | 169,350 | | | | 883,129 | | | | 143,926 | | | | 645,443 | | |
| Shares redeemed | | | (4,614,628 | ) | | | (6,901,850 | ) | | | (2,853,415 | ) | | | (5,360,521 | ) | | | (2,100,695 | ) | | | (3,461,465 | ) | |
| Net increase (decrease) | | | 35,744,073 | | | | 30,567,534 | | | | 30,093,805 | | | | 26,293,428 | | | | 23,992,238 | | | | 21,300,746 | | |
| Shares outstanding at the end of period | | | 89,584,434 | | | | 53,840,361 | | | | 75,141,561 | | | | 45,047,756 | | | | 59,862,854 | | | | 35,870,616 | | |
The accompanying notes are an integral part of these financial statements.
72
| | | 2040 Retirement Fund | | 2045 Retirement Fund | | Conservative Allocation Fund | |
| | | 2010 | | 2009 | | 2010 | | 2009 | | 2010 | | 2009 | |
| INCREASE (DECREASE) IN NET ASSETS: | |
| FROM OPERATIONS: | |
| Net investment income (loss) | | $ | 685,117 | | | $ | 348,130 | | | $ | 777,232 | | | $ | 377,502 | | | $ | 1,487,663 | | | $ | 1,243,150 | | |
| Net realized gain (loss) on investments and futures contracts | | | 225,115 | | | | (204,541 | ) | | | 232,700 | | | | (290,738 | ) | | | 105,535 | | | | (890,826 | ) | |
Change in net unrealized appreciation (depreciation) of investments and
futures contracts | | | 5,214,389 | | | | 3,622,433 | | | | 6,073,407 | | | | 4,235,532 | | | | 2,175,653 | | | | 4,033,599 | | |
| NET INCREASE (DECREASE) IN NET ASSETS RESULTING FROM OPERATIONS | | | 6,124,621 | | | | 3,766,022 | | | | 7,083,339 | | | | 4,322,296 | | | | 3,768,851 | | | | 4,385,923 | | |
| DIVIDEND DISTRIBUTIONS (Note 5) | |
| From net investment income | | | (85,340 | ) | | | (333,402 | ) | | | (85,259 | ) | | | (362,960 | ) | | | (1,380 | ) | | | (1,243,401 | ) | |
| From capital gains | | | (32,272 | ) | | | (61,213 | ) | | | (32,852 | ) | | | (57,107 | ) | | | (214,954 | ) | | | (186,851 | ) | |
| Return of capital | | | — | | | | (131 | ) | | | — | | | | (1,040 | ) | | | — | | | | — | | |
| Total distributions | | | (117,612 | ) | | | (394,746 | ) | | | (118,111 | ) | | | (421,107 | ) | | | (216,334 | ) | | | (1,430,252 | ) | |
| CAPITAL SHARE TRANSACTIONS (Note 4): | |
| Net proceeds from sale of shares | | | 19,144,703 | | | | 14,505,770 | | | | 28,272,725 | | | | 16,895,737 | | | | 15,774,421 | | | | 15,100,574 | | |
| Dividends reinvested | | | 117,612 | | | | 394,746 | | | | 118,111 | | | | 421,107 | | | | 216,334 | | | | 1,430,252 | | |
| Cost of shares redeemed | | | (1,196,531 | ) | | | (1,913,635 | ) | | | (6,527,140 | ) | | | (3,096,986 | ) | | | (5,931,584 | ) | | | (4,970,278 | ) | |
| NET INCREASE (DECREASE) IN NET ASSETS FROM CAPITAL SHARE TRANSACTIONS | | | 18,065,784 | | | | 12,986,881 | | | | 21,863,696 | | | | 14,219,858 | | | | 10,059,171 | | | | 11,560,548 | | |
| INCREASE (DECREASE) IN NET ASSETS | | | 24,072,793 | | | | 16,358,157 | | | | 28,828,924 | | | | 18,121,047 | | | | 13,611,688 | | | | 14,516,219 | | |
| NET ASSETS, BEGINNING OF PERIOD | | | 22,558,859 | | | | 6,200,702 | | | | 24,979,241 | | | | 6,858,194 | | | | 38,120,887 | | | | 23,604,668 | | |
| NET ASSETS, END OF PERIOD | | $ | 46,631,652 | | | $ | 22,558,859 | | | $ | 53,808,165 | | | $ | 24,979,241 | | | $ | 51,732,575 | | | $ | 38,120,887 | | |
| ACCUMULATED UNDISTRIBUTED NET INVESTMENT INCOME (LOSS) | | $ | 670,393 | | | $ | — | | | $ | 759,321 | | | $ | — | | | $ | 1,499,650 | | | $ | 1,382 | | |
| OTHER INFORMATION: | |
| Shares outstanding at the beginning of period | | | 30,313,753 | | | | 10,465,972 | | | | 33,773,391 | | | | 11,628,887 | | | | 38,492,999 | | | | 26,598,668 | | |
| Shares sold | | | 24,125,147 | | | | 22,008,340 | | | | 35,466,792 | | | | 25,962,595 | | | | 15,084,924 | | | | 15,596,065 | | |
| Shares issued as reinvestment of dividends | | | 133,567 | | | | 530,445 | | | | 134,702 | | | | 569,361 | | | | 201,239 | | | | 1,444,239 | | |
| Shares redeemed | | | (1,512,674 | ) | | | (2,691,004 | ) | | | (7,890,239 | ) | | | (4,387,452 | ) | | | (5,801,599 | ) | | | (5,145,973 | ) | |
| Net increase (decrease) | | | 22,746,040 | | | | 19,847,781 | | | | 27,711,255 | | | | 22,144,504 | | | | 9,484,564 | | | | 11,894,331 | | |
| Shares outstanding at the end of period | | | 53,059,793 | | | | 30,313,753 | | | | 61,484,646 | | | | 33,773,391 | | | | 47,977,563 | | | | 38,492,999 | | |
The accompanying notes are an integral part of these financial statements.
73
MUTUAL OF AMERICA INVESTMENT CORPORATION
STATEMENTS OF CHANGES IN NET ASSETS (Continued)
For the Years Ended December 31,
| | | Moderate Allocation Fund | | Aggressive Allocation Fund | | Money Market Fund | |
| | | 2010 | | 2009 | | 2010 | | 2009 | | 2010 | | 2009 | |
| INCREASE (DECREASE) IN NET ASSETS: | |
| FROM OPERATIONS: | |
| Net investment income (loss) | | $ | 3,858,871 | | | $ | 3,314,581 | | | $ | 2,667,516 | | | $ | 2,280,953 | | | $ | (170,330 | ) | | $ | (60,152 | ) | |
| Net realized gain (loss) on investments and futures contracts | | | (363,131 | ) | | | (3,867,311 | ) | | | 35,357 | | | | (3,407,174 | ) | | | 2,007 | | | | (2,242 | ) | |
Change in net unrealized appreciation (depreciation) of investments and
futures contracts | | | 14,197,108 | | | | 21,155,502 | | | | 18,099,295 | | | | 23,875,879 | | | | (1,572 | ) | | | (45,827 | ) | |
| NET INCREASE (DECREASE) IN NET ASSETS RESULTING FROM OPERATIONS | | | 17,692,848 | | | | 20,602,772 | | | | 20,802,168 | | | | 22,749,658 | | | | (169,895 | ) | | | (108,221 | ) | |
| DIVIDEND DISTRIBUTIONS (Note 5) | |
| From net investment income | | | (216,675 | ) | | | (3,071,232 | ) | | | (400,140 | ) | | | (1,924,987 | ) | | | — | | | | (85,964 | ) | |
| From capital gains | | | (632,136 | ) | | | (369,648 | ) | | | — | | | | (180,100 | ) | | | — | | | | (17,483 | ) | |
| Return of capital | | | — | | | | (105,339 | ) | | | — | | | | — | | | | — | | | | — | | |
| Total distributions | | | (848,811 | ) | | | (3,546,219 | ) | | | (400,140 | ) | | | (2,105,087 | ) | | | — | | | | (103,447 | ) | |
| CAPITAL SHARE TRANSACTIONS (Note 4): | |
| Net proceeds from sale of shares | | | 26,068,783 | | | | 30,015,339 | | | | 15,725,574 | | | | 24,420,545 | | | | 13,788,717 | | | | 34,613,637 | | |
| Dividends reinvested | | | 848,811 | | | | 3,546,219 | | | | 400,140 | | | | 2,105,087 | | | | — | | | | 103,447 | | |
| Cost of shares redeemed | | | (6,360,719 | ) | | | (14,837,161 | ) | | | (5,692,631 | ) | | | (11,849,411 | ) | | | (23,538,279 | ) | | | (116,758,031 | ) | |
| NET INCREASE (DECREASE) IN NET ASSETS FROM CAPITAL SHARE TRANSACTIONS | | | 20,556,875 | | | | 18,724,397 | | | | 10,433,083 | | | | 14,676,221 | | | | (9,749,562 | ) | | | (82,040,947 | ) | |
| INCREASE (DECREASE) IN NET ASSETS | | | 37,400,912 | | | | 35,780,950 | | | | 30,835,111 | | | | 35,320,792 | | | | (9,919,457 | ) | | | (82,252,615 | ) | |
| NET ASSETS, BEGINNING OF PERIOD | | | 125,286,212 | | | | 89,505,262 | | | | 116,568,914 | | | | 81,248,122 | | | | 118,737,067 | | | | 200,989,682 | | |
| NET ASSETS, END OF PERIOD | | $ | 162,687,124 | | | $ | 125,286,212 | | | $ | 147,404,025 | | | $ | 116,568,914 | | | $ | 108,817,610 | | | $ | 118,737,067 | | |
| ACCUMULATED UNDISTRIBUTED NET INVESTMENT INCOME (LOSS) | | $ | 3,821,299 | | | $ | — | | | $ | 2,784,610 | | | $ | 323,630 | | | $ | — | | | $ | — | | |
| OTHER INFORMATION: | |
| Shares outstanding at the beginning of period | | | 121,209,452 | | | | 102,039,836 | | | | 109,796,967 | | | | 94,418,460 | | | | 98,421,821 | | | | 166,343,903 | | |
| Shares sold | | | 23,767,216 | | | | 30,987,848 | | | | 13,943,562 | | | | 25,537,227 | | | | 11,435,232 | | | | 28,648,847 | | |
| Shares issued as reinvestment of dividends | | | 730,064 | | | | 3,431,162 | | | | 357,258 | | | | 1,982,795 | | | | — | | | | 89,884 | | |
| Shares redeemed | | | (5,817,376 | ) | | | (15,249,394 | ) | | | (5,080,272 | ) | | | (12,141,515 | ) | | | (19,527,020 | ) | | | (96,660,813 | ) | |
| Net increase (decrease) | | | 18,679,904 | | | | 19,169,616 | | | | 9,220,548 | | | | 15,378,507 | | | | (8,091,788 | ) | | | (67,922,082 | ) | |
| Shares outstanding at the end of period | | | 139,889,356 | | | | 121,209,452 | | | | 119,017,515 | | | | 109,796,967 | | | | 90,330,033 | | | | 98,421,821 | | |
The accompanying notes are an integral part of these financial statements.
74
| | | Mid-Term Bond Fund | | Bond Fund | |
| | | 2010 | | 2009 | | 2010 | | 2009 | |
| INCREASE (DECREASE) IN NET ASSETS: | |
| FROM OPERATIONS: | |
| Net investment income (loss) | | $ | 9,796,614 | | | $ | 8,603,484 | | | $ | 20,813,493 | | | $ | 19,131,665 | | |
| Net realized gain (loss) on investments and futures contracts | | | 631,791 | | | | 2,884,973 | | | | 4,845,755 | | | | (3,299,948 | ) | |
Change in net unrealized appreciation (depreciation) of investments and
futures contracts | | | 6,362,184 | | | | 10,061,760 | | | | 11,056,903 | | | | 38,771,964 | | |
| NET INCREASE (DECREASE) IN NET ASSETS RESULTING FROM OPERATIONS | | | 16,790,589 | | | | 21,550,217 | | | | 36,716,151 | | | | 54,603,681 | | |
| DIVIDEND DISTRIBUTIONS (Note 5) | |
| From net investment income | | | (9,571,460 | ) | | | (8,815,591 | ) | | | (20,675,187 | ) | | | (19,172,093 | ) | |
| From capital gains | | | (637,800 | ) | | | (2,092,181 | ) | | | — | | | | — | | |
| Return of capital | | | — | | | | — | | | | — | | | | — | | |
| Total distributions | | | (10,209,260 | ) | | | (10,907,772 | ) | | | (20,675,187 | ) | | | (19,172,093 | ) | |
| CAPITAL SHARE TRANSACTIONS (Note 4): | |
| Net proceeds from sale of shares | | | 76,981,280 | | | | 61,709,976 | | | | 128,689,182 | | | | 118,066,876 | | |
| Dividends reinvested | | | 10,209,260 | | | | 10,907,772 | | | | 20,675,187 | | | | 19,172,093 | | |
| Cost of shares redeemed | | | (30,342,069 | ) | | | (32,257,019 | ) | | | (55,849,454 | ) | | | (57,145,127 | ) | |
| NET INCREASE (DECREASE) IN NET ASSETS FROM CAPITAL SHARE TRANSACTIONS | | | 56,848,471 | | | | 40,360,729 | | | | 93,514,915 | | | | 80,093,842 | | |
| INCREASE (DECREASE) IN NET ASSETS | | | 63,429,800 | | | | 51,003,174 | | | | 109,555,879 | | | | 115,525,430 | | |
| NET ASSETS, BEGINNING OF PERIOD | | | 234,422,448 | | | | 183,419,274 | | | | 487,626,839 | | | | 372,101,409 | | |
| NET ASSETS, END OF PERIOD | | $ | 297,852,248 | | | $ | 234,422,448 | | | $ | 597,182,718 | | | $ | 487,626,839 | | |
| ACCUMULATED UNDISTRIBUTED NET INVESTMENT INCOME (LOSS) | | $ | 211,957 | | | $ | (19,889 | ) | | $ | 300,944 | | | $ | 162,638 | | |
| OTHER INFORMATION: | |
| Shares outstanding at the beginning of period | | | 235,599,737 | | | | 195,477,588 | | | | 376,097,392 | | | | 315,997,008 | | |
| Shares sold | | | 73,210,601 | | | | 61,128,118 | | | | 94,058,496 | | | | 90,803,181 | | |
| Shares issued as reinvestment of dividends | | | 9,961,089 | | | | 10,961,345 | | | | 15,438,532 | | | | 14,786,835 | | |
| Shares redeemed | | | (28,846,029 | ) | | | (31,967,314 | ) | | | (40,804,344 | ) | | | (45,489,632 | ) | |
| Net increase (decrease) | | | 54,325,661 | | | | 40,122,149 | | | | 68,692,684 | | | | 60,100,384 | | |
| Shares outstanding at the end of period | | | 289,925,398 | | | | 235,599,737 | | | | 444,790,076 | | | | 376,097,392 | | |
The accompanying notes are an integral part of these financial statements.
75
MUTUAL OF AMERICA INVESTMENT CORPORATION
FINANCIAL HIGHLIGHTS
Income from investment operations and distributions per share for a Fund share outstanding throughout the five years ended December 31, 2010 (or since the Fund's inception date if in existence less than five years) and other supplementary data with respect to each Fund are presented below and in the pages following:
| | | Equity Index Fund | | All America Fund | |
| | | Years Ended December 31, | | Years Ended December 31, | |
| | | 2010 | | 2009 | | 2008 | | 2007 | | 2006 | | 2010 | | 2009 | | 2008 | | 2007 | | 2006 | |
| Net Asset Value, Beginning of Period | | $ | 1.84 | | | $ | 1.48 | | | $ | 2.41 | | | $ | 2.38 | | | $ | 2.14 | | | $ | 1.42 | | | $ | 1.15 | | | $ | 1.86 | | | $ | 2.00 | | | $ | 1.94 | | |
| INCOME (LOSS) FROM INVESTMENT OPERATIONS: | |
| Net Investment Income | | | 0.03 | | | | 0.03 | | | | 0.04 | | | | 0.05 | | | | 0.04 | | | | 0.02 | | | | 0.02 | | | | 0.03 | | | | 0.03 | | | | 0.02 | | |
| Net Realized and Unrealized Gains (Losses) on Investments and Futures Contracts | | | 0.23 | | | | 0.36 | | | | (0.93 | ) | | | 0.07 | | | | 0.30 | | | | 0.23 | | | | 0.28 | | | | (0.68 | ) | | | 0.06 | | | | 0.28 | | |
| Total From Investment Operations | | | 0.26 | | | | 0.39 | | | | (0.89 | ) | | | 0.12 | | | | 0.34 | | | | 0.25 | | | | 0.30 | | | | (0.65 | ) | | | 0.09 | | | | 0.30 | | |
Less: Dividend Distributions:
From Net Investment Income | | | (0.03 | ) | | | (0.03 | ) | | | (0.03 | ) | | | (0.05 | ) | | | (0.04 | ) | | | (0.02 | ) | | | (0.03 | ) | | | (0.02 | ) | | | (0.03 | ) | | | (0.03 | ) | |
| From Capital Gains | | | — | | | | — | | | | (0.01 | ) | | | (0.04 | ) | | | (0.06 | ) | | | — | | | | — | | | | (0.04 | ) | | | (0.20 | ) | | | (0.21 | ) | |
| From Return of Capital | | | — | | | | — | | | | — | | | | — | | | | — | | | | — | | | | — | | | | — | | | | — | | | | — | | |
| Total Distributions | | | (0.03 | ) | | | (0.03 | ) | | | (0.04 | ) | | | (0.09 | ) | | | (0.10 | ) | | | (0.02 | ) | | | (0.03 | ) | | | (0.06 | ) | | | (0.23 | ) | | | (0.24 | ) | |
| Net Asset Value, End of Period | | $ | 2.07 | | | $ | 1.84 | | | $ | 1.48 | | | $ | 2.41 | | | $ | 2.38 | | | $ | 1.65 | | | $ | 1.42 | | | $ | 1.15 | | | $ | 1.86 | | | $ | 2.00 | | |
| Total Return (%)(b) | | | 14.68 | | | | 26.13 | | | | (37.08 | ) | | | 5.22 | | | | 15.59 | | | | 17.78 | | | | 25.31 | | | | (35.49 | ) | | | 4.27 | | | | 15.74 | | |
| Net Assets, End of Period ($ millions) | | | 905 | | | | 768 | | | | 545 | | | | 816 | | | | 811 | | | | 271 | | | | 256 | | | | 222 | | | | 389 | | | | 423 | | |
| Ratio of Net Investment Income (Loss) to Average Net Assets (%) | | | 1.76 | | | | 1.98 | | | | 2.07 | | | | 1.82 | | | | 1.85 | | | | 1.21 | | | | 1.46 | | | | 1.64 | | | | 1.30 | | | | 1.36 | | |
| Ratio of Expenses to Average Net Assets Before Expense Reimbursement (%) | | | 0.25 | | | | 0.26 | | | | 0.25 | | | | 0.20 | | | | 0.17 | | | | 0.57 | | | | 0.58 | | | | 0.56 | | | | 0.55 | | | | 0.52 | | |
| Ratio of Expenses to Average Net Assets After Expense Reimbursement (%) | | | 0.25 | | | | 0.26 | | | | 0.25 | | | | 0.20 | | | | 0.14 | | | | 0.57 | | | | 0.58 | | | | 0.56 | | | | 0.55 | | | | 0.49 | | |
| Portfolio Turnover Rate (%)(a) | | | 4.50 | | | | 4.29 | | | | 4.70 | | | | 4.66 | | | | 4.91 | | | | 22.71 | | | | 35.15 | | | | 31.03 | | | | 29.24 | | | | 33.84 | | |
(a) Portfolio turnover rate excludes all short-term securities.
(b) Total return would have been lower had non-investment advisory expenses not been reduced through expense reimbursement in certain years (Note 2).
(c) Not annualized.
(d) Annualized.
(e) Allocation and Retirement Funds exclude expenses of the underlying funds.
(f) For the period November 5, 2007 (commencement of operations) through December 31, 2007.
(g) Includes less than $0.005 of tax-basis return of capital distributions.
(h) Includes less than $0.005 of dividend distributions.
N/A = Not Applicable
The accompanying notes are an integral part of these financial statements.
76
| | | Small Cap Value Fund | |
| | | Years Ended December 31, | |
| | | 2010 | | 2009 | | 2008 | | 2007 | | 2006 | |
| Net Asset Value, Beginning of Period | | $ | 0.96 | | | $ | 0.75 | | | $ | 1.06 | | | $ | 1.24 | | | $ | 1.07 | | |
| INCOME (LOSS) FROM INVESTMENT OPERATIONS: | |
| Net Investment Income | | | 0.01 | | | | 0.01 | | | | 0.01 | | | | 0.01 | | | | 0.01 | | |
| Net Realized and Unrealized Gains (Losses) on Investments and Futures Contracts | | | 0.25 | | | | 0.21 | | | | (0.30 | ) | | | (0.06 | ) | | | 0.18 | | |
| Total From Investment Operations | | | 0.26 | | | | 0.22 | | | | (0.29 | ) | | | (0.05 | ) | | | 0.19 | | |
Less: Dividend Distributions:
From Net Investment Income | | | (0.01 | ) | | | (0.01 | )(g) | | | (0.01 | ) | | | (0.01 | ) | | | (0.01 | ) | |
| From Capital Gains | | | — | | | | — | | | | — | | | | (0.12 | ) | | | (0.01 | ) | |
| From Return of Capital | | | — | | | | — | | | | (0.01 | ) | | | — | | | | — | | |
| Total Distributions | | | (0.01 | ) | | | (0.01 | ) | | | (0.02 | ) | | | (0.13 | ) | | | (0.02 | ) | |
| Net Asset Value, End of Period | | $ | 1.21 | | | $ | 0.96 | | | $ | 0.75 | | | $ | 1.06 | | | $ | 1.24 | | |
| Total Return (%)(b) | | | 27.72 | | | | 29.28 | | | | (27.76 | ) | | | (3.99 | ) | | | 17.68 | | |
| Net Assets, End of Period ($ millions) | | | 277 | | | | 205 | | | | 155 | | | | 215 | | | | 246 | | |
| Ratio of Net Investment Income (Loss) to Average Net Assets (%) | | | 0.99 | | | | 1.30 | | | | 1.23 | | | | 0.96 | | | | 1.42 | | |
| Ratio of Expenses to Average Net Assets Before Expense Reimbursement (%) | | | 0.92 | | | | 0.93 | | | | 0.92 | | | | 0.89 | | | | 0.81 | | |
| Ratio of Expenses to Average Net Assets After Expense Reimbursement (%) | | | 0.92 | | | | 0.93 | | | | 0.92 | | | | 0.89 | | | | 0.80 | | |
| Portfolio Turnover Rate (%)(a) | | | 35.34 | | | | 39.03 | | | | 59.64 | | | | 55.77 | | | | 62.55 | | |
The accompanying notes are an integral part of these financial statements.
77
MUTUAL OF AMERICA INVESTMENT CORPORATION
FINANCIAL HIGHLIGHTS (Continued)
| | | Small Cap Growth Fund | | Mid Cap Value Fund | |
| | | Years Ended December 31, | | Years Ended December 31, | |
| | | 2010 | | 2009 | | 2008 | | 2007 | | 2006 | | 2010 | | 2009 | | 2008 | | 2007 | | 2006 | |
| Net Asset Value, Beginning of Period | | $ | 0.89 | | | $ | 0.70 | | | $ | 1.08 | | | $ | 1.19 | | | $ | 1.06 | | | $ | 0.98 | | | $ | 0.79 | | | $ | 1.20 | | | $ | 1.21 | | | $ | 1.06 | | |
| INCOME (LOSS) FROM INVESTMENT OPERATIONS: | |
| Net Investment Income | | | — | | | | — | | | | — | | | | — | | | | — | | | | 0.01 | | | | 0.01 | | | | 0.02 | | | | 0.02 | | | | 0.01 | | |
| Net Realized and Unrealized Gains (Losses) on Investments and Futures Contracts | | | 0.30 | | | | 0.19 | | | | (0.36 | ) | | | 0.05 | | | | 0.16 | | | | 0.17 | | | | 0.19 | | | | (0.41 | ) | | | (0.01 | ) | | | 0.16 | | |
| Total From Investment Operations | | | 0.30 | | | | 0.19 | | | | (0.36 | ) | | | 0.05 | | | | 0.16 | | | | 0.18 | | | | 0.20 | | | | (0.39 | ) | | | 0.01 | | | | 0.17 | | |
Less: Dividend Distributions:
From Net Investment Income | | | — | | | | — | | | | — | | | | — | | | | — | | | | (0.01 | ) | | | (0.01 | )(g) | | | (0.02 | )(g) | | | (0.02 | ) | | | (0.01 | ) | |
| From Capital Gains | | | — | | | | — | | | | (0.02 | ) | | | (0.16 | ) | | | (0.03 | ) | | | — | | | | — | | | | — | | | | — | | | | (0.01 | ) | |
| From Return of Capital | | | — | | | | — | | | | — | | | | — | | | | — | | | | — | | | | — | | | | — | | | | — | | | | — | | |
| Total Distributions | | | — | | | | — | | | | (0.02 | ) | | | (0.16 | ) | | | (0.03 | ) | | | (0.01 | ) | | | (0.01 | ) | | | (0.02 | ) | | | (0.02 | ) | | | (0.02 | ) | |
| Net Asset Value, End of Period | | $ | 1.19 | | | $ | 0.89 | | | $ | 0.70 | | | $ | 1.08 | | | $ | 1.19 | | | $ | 1.15 | | | $ | 0.98 | | | $ | 0.79 | | | $ | 1.20 | | | $ | 1.21 | | |
| Total Return (%)(b) | | | 33.27 | | | | 27.69 | | | | (34.37 | ) | | | 4.68 | | | | 15.14 | | | | 18.94 | | | | 25.22 | | | | (32.64 | ) | | | 0.88 | | | | 15.93 | | |
| Net Assets, End of Period ($ millions) | | | 281 | | | | 194 | | | | 147 | | | | 223 | | | | 224 | | | | 55 | | | | 42 | | | | 30 | | | | 40 | | | | 33 | | |
| Ratio of Net Investment Income (Loss) to Average Net Assets (%) | | | (0.26 | ) | | | (0.26 | ) | | | (0.16 | ) | | | (0.26 | ) | | | (0.20 | ) | | | 1.25 | | | | 1.57 | | | | 1.62 | | | | 1.54 | | | | 1.69 | | |
| Ratio of Expenses to Average Net Assets Before Expense Reimbursement (%) | | | 0.92 | | | | 0.93 | | | | 0.92 | | | | 0.89 | | | | 0.83 | | | | 0.72 | | | | 0.73 | | | | 0.74 | | | | 0.75 | | | | 0.70 | | |
| Ratio of Expenses to Average Net Assets After Expense Reimbursement (%) | | | 0.92 | | | | 0.93 | | | | 0.92 | | | | 0.89 | | | | 0.81 | | | | 0.72 | | | | 0.73 | | | | 0.74 | | | | 0.75 | | | | 0.66 | | |
| Portfolio Turnover Rate (%)(a) | | | 50.73 | | | | 94.14 | | | | 93.16 | | | | 94.06 | | | | 85.67 | | | | 29.88 | | | | 20.16 | | | | 33.80 | | | | 27.24 | | | | 30.41 | | |
(a) Portfolio turnover rate excludes all short-term securities.
(b) Total return would have been lower had non-investment advisory expenses not been reduced through expense reimbursement in certain years (Note 2).
(c) Not annualized.
(d) Annualized.
(e) Allocation and Retirement Funds exclude expenses of the underlying funds.
(f) For the period November 5, 2007 (commencement of operations) through December 31, 2007.
(g) Includes less than $0.005 of tax-basis return of capital distributions.
(h) Includes less than $0.005 of dividend distributions.
N/A = Not Applicable
The accompanying notes are an integral part of these financial statements.
78
| | | Mid-Cap Equity Index Fund | | International Fund | |
| | | Years Ended December 31, | | Years Ended December 31, | | Period Ended
December 31, | |
| | | 2010 | | 2009 | | 2008 | | 2007 | | 2006 | | 2010 | | 2009 | | 2008 | | 2007(f) | |
| Net Asset Value, Beginning of Period | | $ | 1.24 | | | $ | 0.93 | | | $ | 1.51 | | | $ | 1.56 | | | $ | 1.53 | | | $ | 0.67 | | | $ | 0.55 | | | $ | 0.95 | | | $ | 1.00 | | |
| INCOME (LOSS) FROM INVESTMENT OPERATIONS: | |
| Net Investment Income | | | 0.01 | | | | 0.01 | | | | 0.02 | | | | 0.03 | | | | 0.02 | | | | 0.02 | | | | 0.01 | | | | 0.02 | | | | 0.02 | | |
| Net Realized and Unrealized Gains (Losses) on Investments and Futures Contracts | | | 0.31 | | | | 0.32 | | | | (0.56 | ) | | | 0.09 | | | | 0.14 | | | | 0.04 | | | | 0.13 | | | | (0.40 | ) | | | (0.05 | ) | |
| Total From Investment Operations | | | 0.32 | | | | 0.33 | | | | (0.54 | ) | | | 0.12 | | | | 0.16 | | | | 0.06 | | | | 0.14 | | | | (0.38 | ) | | | (0.03 | ) | |
Less: Dividend Distributions:
From Net Investment Income | | | (0.01 | ) | | | (0.01 | ) | | | (0.02 | ) | | | (0.03 | ) | | | (0.03 | ) | | | (0.02 | ) | | | (0.01 | ) | | | (0.02 | ) | | | (0.02 | ) | |
| From Capital Gains | | | (0.04 | ) | | | (0.01 | ) | | | (0.02 | ) | | | (0.14 | ) | | | (0.10 | ) | | | — | | | | — | | | | — | | | | — | | |
| From Return of Capital | | | — | | | | — | | | | — | | | | — | | | | — | | | | — | | | | (0.01 | ) | | | — | | | | — | | |
| Total Distributions | | | (0.05 | ) | | | (0.02 | ) | | | (0.04 | ) | | | (0.17 | ) | | | (0.13 | ) | | | (0.02 | ) | | | (0.02 | ) | | | (0.02 | ) | | | (0.02 | ) | |
| Net Asset Value, End of Period | | $ | 1.51 | | | $ | 1.24 | | | $ | 0.93 | | | $ | 1.51 | | | $ | 1.56 | | | $ | 0.71 | | | $ | 0.67 | | | $ | 0.55 | | | $ | 0.95 | | |
| Total Return (%)(b) | | | 26.28 | | | | 36.69 | | | | (36.31 | ) | | | 7.74 | | | | 10.10 | | | | 8.32 | | | | 25.22 | | | | (40.06 | ) | | | (2.93 | )(c) | |
| Net Assets, End of Period ($ millions) | | | 494 | | | | 377 | | | | 248 | | | | 379 | | | | 357 | | | | 61 | | | | 33 | | | | 12 | | | | 3 | | |
| Ratio of Net Investment Income (Loss) to Average Net Assets (%) | | | 1.16 | | | | 1.41 | | | | 1.47 | | | | 1.52 | | | | 1.40 | | | | 3.48 | | | | 3.45 | | | | 5.17 | | | | 3.38 | (c) | |
| Ratio of Expenses to Average Net Assets Before Expense Reimbursement (%) | | | 0.25 | | | | 0.26 | | | | 0.25 | | | | 0.22 | | | | 0.17 | | | | 0.24 | | | | 0.25 | | | | 0.20 | | | | 0.22 | (d) | |
| Ratio of Expenses to Average Net Assets After Expense Reimbursement (%) | | | 0.25 | | | | 0.26 | | | | 0.25 | | | | 0.22 | | | | 0.14 | | | | 0.24 | | | | 0.25 | | | | 0.20 | | | | 0.22 | (d) | |
| Portfolio Turnover Rate (%)(a) | | | 13.29 | | | | 15.41 | | | | 22.66 | | | | 20.53 | | | | 16.02 | | | | 9.17 | | | | 4.95 | | | | — | | | | — | | |
The accompanying notes are an integral part of these financial statements.
79
MUTUAL OF AMERICA INVESTMENT CORPORATION
FINANCIAL HIGHLIGHTS (Continued)
| | | Composite Fund | | Retirement Income Fund | |
| | | Years Ended December 31, | | Years Ended
December 31, | | Period Ended
December 31, | |
| | | 2010 | | 2009 | | 2008 | | 2007 | | 2006 | | 2010 | | 2009 | | 2008 | | 2007(f) | |
| Net Asset Value, Beginning of Period | | $ | 1.39 | | | $ | 1.20 | | | $ | 1.60 | | | $ | 1.55 | | | $ | 1.43 | | | $ | 0.97 | | | $ | 0.83 | | | $ | 0.96 | | | $ | 1.00 | | |
| INCOME (LOSS) FROM INVESTMENT OPERATIONS: | |
| Net Investment Income | | | 0.04 | | | | 0.04 | | | | 0.04 | | | | 0.05 | | | | 0.05 | | | | 0.02 | | | | 0.03 | | | | 0.03 | | | | 0.04 | | |
| Net Realized and Unrealized Gains (Losses) on Investments and Futures Contracts | | | 0.11 | | | | 0.19 | | | | (0.40 | ) | | | 0.05 | | | | 0.11 | | | | 0.07 | | | | 0.11 | | | | (0.13 | ) | | | (0.04 | ) | |
| Total From Investment Operations | | | 0.15 | | | | 0.23 | | | | (0.36 | ) | | | 0.10 | | | | 0.16 | | | | 0.09 | | | | 0.14 | | | | (0.10 | ) | | | — | | |
Less: Dividend Distributions:
From Net Investment Income | | | (0.04 | ) | | | (0.04 | ) | | | (0.04 | ) | | | (0.05 | ) | | | (0.04 | ) | | | (0.02 | ) | | | — | | | | (0.03 | ) | | | (0.03 | ) | |
| From Capital Gains | | | — | | | | — | | | | — | | | | — | | | | — | | | | (0.01 | ) | | | — | | | | — | | | | (0.01 | ) | |
| Total Distributions | | | (0.04 | ) | | | (0.04 | ) | | | (0.04 | ) | | | (0.05 | ) | | | (0.04 | ) | | | (0.03 | ) | | | — | | | | (0.03 | ) | | | (0.04 | ) | |
| Net Asset Value, End of Period | | $ | 1.50 | | | $ | 1.39 | | | $ | 1.20 | | | $ | 1.60 | | | $ | 1.55 | | | $ | 1.03 | | | $ | 0.97 | | | $ | 0.83 | | | $ | 0.96 | | |
| Total Return (%)(b) | | | 11.02 | | | | 18.45 | | | | (22.51 | ) | | | 6.69 | | | | 10.80 | | | | 9.04 | | | | 16.25 | | | | (9.61 | ) | | | 0.07 | (c) | |
| Net Assets, End of Period ($ millions) | | | 167 | | | | 166 | | | | 150 | | | | 220 | | | | 229 | | | | 18 | | | | 9 | | | | 4 | | | | 1 | | |
| Ratio of Net Investment Income (Loss) to Average Net Assets (%) | | | 2.26 | | | | 2.74 | | | | 3.01 | | | | 2.72 | | | | 2.70 | | | | 3.65 | | | | 4.39 | | | | 5.42 | | | | 6.12 | (c) | |
| Ratio of Expenses to Average Net Assets Before Expense Reimbursement (%)(e) | | | 0.57 | | | | 0.58 | | | | 0.57 | | | | 0.55 | | | | 0.52 | | | | 0.05 | | | | 0.05 | | | | 0.05 | | | | 0.05 | (d) | |
| Ratio of Expenses to Average Net Assets After Expense Reimbursement (%)(e) | | | 0.57 | | | | 0.58 | | | | 0.57 | | | | 0.55 | | | | 0.48 | | | | 0.05 | | | | 0.05 | | | | 0.05 | | | | 0.05 | (d) | |
| Portfolio Turnover Rate (%)(a) | | | 36.00 | | | | 31.73 | | | | 37.98 | | | | 24.95 | | | | 26.77 | | | | 17.62 | | | | 35.31 | | | | 82.92 | | | | 14.38 | (c) | |
(a) Portfolio turnover rate excludes all short-term securities.
(b) Total return would have been lower had non-investment advisory expenses not been reduced through expense reimbursement in certain years (Note 2).
(c) Not annualized.
(d) Annualized.
(e) Allocation and Retirement Funds exclude expenses of the underlying funds.
(f) For the period November 5, 2007 (commencement of operations) through December 31, 2007.
(g) Includes less than $0.005 of tax-basis return of capital distributions.
(h) Includes less than $0.005 of dividend distributions.
N/A = Not Applicable
The accompanying notes are an integral part of these financial statements.
80
| | | 2010 Retirement Fund | | 2015 Retirement Fund | | 2020 Retirement Fund | |
| | | Years Ended
December 31, | | Period Ended
December 31, | | Years Ended
December 31, | | Period Ended
December 31, | | Years Ended
December 31, | | Period Ended
December 31, | |
| | | 2010 | | 2009 | | 2008 | | 2007(f) | | 2010 | | 2009 | | 2008 | | 2007(f) | | 2010 | | 2009 | | 2008 | | 2007(f) | |
| Net Asset Value, Beginning of Period | | $ | 0.87 | | | $ | 0.74 | | | $ | 0.94 | | | $ | 0.99 | | | $ | 0.83 | | | $ | 0.70 | | | $ | 0.92 | | | $ | 0.98 | | | $ | 0.80 | | | $ | 0.66 | | | $ | 0.91 | | | $ | 0.97 | | |
| INCOME (LOSS) FROM INVESTMENT OPERATIONS: | |
| Net Investment Income | | | 0.02 | | | | 0.02 | | | | 0.03 | | | | 0.03 | | | | 0.02 | | | | 0.02 | | | | 0.03 | | | | 0.03 | | | | 0.02 | | | | 0.02 | | | | 0.02 | | | | 0.02 | | |
| Net Realized and Unrealized Gains (Losses) on Investments and Futures Contracts | | | 0.07 | | | | 0.13 | | | | (0.20 | ) | | | (0.03 | ) | | | 0.08 | | | | 0.13 | | | | (0.22 | ) | | | (0.04 | ) | | | 0.09 | | | | 0.14 | | | | (0.25 | ) | | | (0.04 | ) | |
| Total From Investment Operations | | | 0.09 | | | | 0.15 | | | | (0.17 | ) | | | — | | | | 0.10 | | | | 0.15 | | | | (0.19 | ) | | | (0.01 | ) | | | 0.11 | | | | 0.16 | | | | (0.23 | ) | | | (0.02 | ) | |
Less: Dividend Distributions:
From Net Investment Income | | | — | (h) | | | (0.02 | )(g) | | | (0.03 | ) | | | (0.03 | ) | | | — | (h) | | | (0.02 | )(g) | | | (0.03 | )(g) | | | (0.03 | ) | | | — | (h) | | | (0.02 | )(g) | | | (0.02 | )(g) | | | (0.02 | ) | |
| From Capital Gains | | | — | (h) | | | — | | | | — | | | | (0.02 | ) | | | — | (h) | | | — | | | | — | | | | (0.02 | ) | | | — | (h) | | | — | | | | — | | | | (0.02 | ) | |
| Total Distributions | | | — | | | | (0.02 | ) | | | (0.03 | ) | | | (0.05 | ) | | | — | | | | (0.02 | ) | | | (0.03 | ) | | | (0.05 | ) | | | — | | | | (0.02 | ) | | | (0.02 | ) | | | (0.04 | ) | |
| Net Asset Value, End of Period | | $ | 0.96 | | | $ | 0.87 | | | $ | 0.74 | | | $ | 0.94 | | | $ | 0.93 | | | $ | 0.83 | | | $ | 0.70 | | | $ | 0.92 | | | $ | 0.91 | | | $ | 0.80 | | | $ | 0.66 | | | $ | 0.91 | | |
| Total Return (%)(b) | | | 11.36 | | | | 19.79 | | | | (17.45 | ) | | | (0.68 | )(c) | | | 12.27 | | | | 21.27 | | | | (21.01 | ) | | | (1.18 | )(c) | | | 13.90 | | | | 23.18 | | | | (24.81 | ) | | | (1.54 | )(c) | |
| Net Assets, End of Period ($ millions) | | | 19 | | | | 15 | | | | 8 | | | | 2 | | | | 78 | | | | 44 | | | | 20 | | | | 5 | | | | 90 | | | | 50 | | | | 21 | | | | 5 | | |
| Ratio of Net Investment Income (Loss) to Average Net Assets (%) | | | 2.67 | | | | 3.51 | | | | 5.36 | | | | 5.28 | (c) | | | 2.79 | | | | 3.45 | | | | 4.65 | | | | 5.39 | (c) | | | 2.76 | | | | 3.61 | | | | 4.73 | | | | 5.29 | (c) | |
| Ratio of Expenses to Average Net Assets Before Expense Reimbursement (%)(e) | | | 0.05 | | | | 0.05 | | | | 0.05 | | | | 0.04 | (d) | | | 0.05 | | | | 0.05 | | | | 0.05 | | | | 0.04 | (d) | | | 0.05 | | | | 0.05 | | | | 0.05 | | | | 0.04 | (d) | |
| Ratio of Expenses to Average Net Assets After Expense Reimbursement (%)(e) | | | 0.05 | | | | 0.05 | | | | 0.05 | | | | 0.04 | (d) | | | 0.05 | | | | 0.05 | | | | 0.05 | | | | 0.04 | (d) | | | 0.05 | | | | 0.05 | | | | 0.05 | | | | 0.04 | (d) | |
| Portfolio Turnover Rate (%)(a) | | | 18.31 | | | | 38.17 | | | | 32.37 | | | | 32.49 | (c) | | | 5.64 | | | | 26.96 | | | | 21.47 | | | | 2.79 | (c) | | | 2.62 | | | | 13.70 | | | | 14.74 | | | | 2.51 | (c) | |
The accompanying notes are an integral part of these financial statements.
81
MUTUAL OF AMERICA INVESTMENT CORPORATION
FINANCIAL HIGHLIGHTS (Continued)
| | | 2025 Retirement Fund | | 2030 Retirement Fund | | 2035 Retirement Fund | |
| | | Years Ended
December 31, | | Period Ended
December 31, | | Years Ended
December 31, | | Period Ended
December 31, | | Years Ended
December 31, | | Period Ended
December 31, | |
| | | 2010 | | 2009 | | 2008 | | 2007(f) | | 2010 | | 2009 | | 2008 | | 2007(f) | | 2010 | | 2009 | | 2008 | | 2007(f) | |
| Net Asset Value, Beginning of Period | | $ | 0.78 | | | $ | 0.64 | | | $ | 0.92 | | | $ | 0.99 | | | $ | 0.77 | | | $ | 0.62 | | | $ | 0.92 | | | $ | 0.99 | | | $ | 0.75 | | | $ | 0.60 | | | $ | 0.92 | | | $ | 1.00 | | |
| INCOME (LOSS) FROM INVESTMENT OPERATIONS: | |
| Net Investment Income | | | 0.02 | | | | 0.02 | | | | 0.02 | | | | 0.02 | | | | 0.02 | | | | 0.01 | | | | 0.02 | | | | 0.02 | | | | 0.01 | | | | 0.01 | | | | 0.02 | | | | 0.02 | | |
| Net Realized and Unrealized Gains (Losses) on Investments and Futures Contracts | | | 0.10 | | | | 0.14 | | | | (0.28 | ) | | | (0.04 | ) | | | 0.11 | | | | 0.15 | | | | (0.30 | ) | | | (0.04 | ) | | | 0.12 | | | | 0.15 | | | | (0.32 | ) | | | (0.05 | ) | |
| Total From Investment Operations | | | 0.12 | | | | 0.16 | | | | (0.26 | ) | | | (0.02 | ) | | | 0.13 | | | | 0.16 | | | | (0.28 | ) | | | (0.02 | ) | | | 0.13 | | | | 0.16 | | | | (0.30 | ) | | | (0.03 | ) | |
Less: Dividend Distributions:
From Net Investment Income | | | — | (h) | | | (0.02 | )(g) | | | (0.02 | )(g) | | | (0.02 | ) | | | — | (h) | | | (0.01 | )(g) | | | (0.02 | )(g) | | | (0.02 | ) | | | — | (h) | | | (0.01 | )(g) | | | (0.02 | )(g) | | | (0.02 | ) | |
| From Capital Gains | | | — | (h) | | | — | | | | — | | | | (0.03 | ) | | | — | (h) | | | — | | | | — | | | | (0.03 | ) | | | — | (h) | | | — | | | | — | | | | (0.03 | ) | |
| Total Distributions | | | — | | | | (0.02 | ) | | | (0.02 | ) | | | (0.05 | ) | | | — | | | | (0.01 | ) | | | (0.02 | ) | | | (0.05 | ) | | | — | | | | (0.01 | ) | | | (0.02 | ) | | | (0.05 | ) | |
| Net Asset Value, End of Period | | $ | 0.90 | | | $ | 0.78 | | | $ | 0.64 | | | $ | 0.92 | | | $ | 0.90 | | | $ | 0.77 | | | $ | 0.62 | | | $ | 0.92 | | | $ | 0.88 | | | $ | 0.75 | | | $ | 0.60 | | | $ | 0.92 | | |
| Total Return (%)(b) | | | 15.49 | | | | 25.10 | | | | (28.32 | ) | | | (1.95 | )(c) | | | 16.59 | | | | 26.47 | | | | (29.95 | ) | | | (2.22 | )(c) | | | 17.66 | | | | 27.05 | | | | (32.53 | ) | | | (2.54 | )(c) | |
| Net Assets, End of Period ($ millions) | | | 81 | | | | 42 | | | | 15 | | | | 2 | | | | 67 | | | | 35 | | | | 12 | | | | 2 | | | | 53 | | | | 27 | | | | 9 | | | | 2 | | |
| Ratio of Net Investment Income (Loss) to Average Net Assets (%) | | | 2.50 | | | | 3.25 | | | | 5.06 | | | | 4.48 | (c) | | | 2.37 | | | | 3.07 | | | | 4.61 | | | | 4.82 | (c) | | | 2.20 | | | | 2.74 | | | | 4.21 | | | | 3.76 | (c) | |
| Ratio of Expenses to Average Net Assets Before Expense Reimbursement (%)(e) | | | 0.05 | | | | 0.05 | | | | 0.05 | | | | 0.04 | (d) | | | 0.05 | | | | 0.05 | | | | 0.05 | | | | 0.05 | (d) | | | 0.05 | | | | 0.05 | | | | 0.05 | | | | 0.05 | (d) | |
| Ratio of Expenses to Average Net Assets After Expense Reimbursement (%)(e) | | | 0.05 | | | | 0.05 | | | | 0.05 | | | | 0.04 | (d) | | | 0.05 | | | | 0.05 | | | | 0.05 | | | | 0.05 | (d) | | | 0.05 | | | | 0.05 | | | | 0.05 | | | | 0.05 | (d) | |
| Portfolio Turnover Rate (%)(a) | | | 3.16 | | | | 9.21 | | | | 10.06 | | | | 0.28 | (c) | | | 1.74 | | | | 8.96 | | | | 12.34 | | | | 4.11 | (c) | | | 1.47 | | | | 6.27 | | | | 7.62 | | | | 0.71 | (c) | |
(a) Portfolio turnover rate excludes all short-term securities.
(b) Total return would have been lower had non-investment advisory expenses not been reduced through expense reimbursement in certain years (Note 2).
(c) Not annualized.
(d) Annualized.
(e) Allocation and Retirement Funds exclude expenses of the underlying funds.
(f) For the period November 5, 2007 (commencement of operations) through December 31, 2007.
(g) Includes less than $0.005 of tax-basis return of capital distributions.
(h) Includes less than $0.005 of dividend distributions.
N/A = Not Applicable
The accompanying notes are an integral part of these financial statements.
82
| | | 2040 Retirement Fund | | 2045 Retirement Fund | |
| | | Years Ended
December 31, | | Period Ended
December 31, | | Years Ended
December 31, | | Period Ended
December 31, | |
| | | 2010 | | 2009 | | 2008 | | 2007(f) | | 2010 | | 2009 | | 2008 | | 2007(f) | |
| Net Asset Value, Beginning of Period | | $ | 0.74 | | | $ | 0.59 | | | $ | 0.91 | | | $ | 0.99 | | | $ | 0.74 | | | $ | 0.59 | | | $ | 0.91 | | | $ | 0.99 | | |
| INCOME (LOSS) FROM INVESTMENT OPERATIONS: | |
| Net Investment Income | | | 0.01 | | | | 0.01 | | | | 0.02 | | | | 0.02 | | | | 0.01 | | | | 0.01 | | | | 0.02 | | | | 0.02 | | |
| Net Realized and Unrealized Gains (Losses) on Investments and Futures Contracts | | | 0.13 | | | | 0.15 | | | | (0.32 | ) | | | (0.05 | ) | | | 0.13 | | | | 0.15 | | | | (0.32 | ) | | | (0.05 | ) | |
| Total From Investment Operations | | | 0.14 | | | | 0.16 | | | | (0.30 | ) | | | (0.03 | ) | | | 0.14 | | | | 0.16 | | | | (0.30 | ) | | | (0.03 | ) | |
Less: Dividend Distributions:
From Net Investment Income | | | — | (h) | | | (0.01 | )(g) | | | (0.02 | )(g) | | | (0.02 | ) | | | — | (h) | | | (0.01 | )(g) | | | (0.02 | )(g) | | | (0.02 | ) | |
| From Capital Gains | | | — | (h) | | | — | | | | — | | | | (0.03 | ) | | | — | (h) | | | — | | | | — | | | | (0.03 | ) | |
| Total Distributions | | | — | | | | (0.01 | ) | | | (0.02 | ) | | | (0.05 | ) | | | — | | | | (0.01 | ) | | | (0.02 | ) | | | (0.05 | ) | |
| Net Asset Value, End of Period | | $ | 0.88 | | | $ | 0.74 | | | $ | 0.59 | | | $ | 0.91 | | | $ | 0.88 | | | $ | 0.74 | | | $ | 0.59 | | | $ | 0.91 | | |
| Total Return (%)(b) | | | 18.38 | | | | 27.84 | | | | (32.75 | ) | | | (2.68 | )(c) | | | 18.57 | | | | 27.55 | | | | (32.90 | ) | | | (2.79 | )(c) | |
| Net Assets, End of Period ($ millions) | | | 47 | | | | 23 | | | | 6 | | | | 1 | | | | 54 | | | | 25 | | | | 7 | | | | 1 | | |
| Ratio of Net Investment Income (Loss) to Average Net Assets (%) | | | 2.13 | | | | 2.75 | | | | 4.20 | | | | 3.93 | (c) | | | 2.14 | | | | 2.61 | | | | 4.49 | | | | 4.17 | (c) | |
| Ratio of Expenses to Average Net Assets Before Expense Reimbursement (%)(e) | | | 0.05 | | | | 0.05 | | | | 0.05 | | | | 0.05 | (d) | | | 0.05 | | | | 0.05 | | | | 0.05 | | | | 0.03 | (d) | |
| Ratio of Expenses to Average Net Assets After Expense Reimbursement (%)(e) | | | 0.05 | | | | 0.05 | | | | 0.05 | | | | 0.05 | (d) | | | 0.05 | | | | 0.05 | | | | 0.05 | | | | 0.03 | (d) | |
| Portfolio Turnover Rate (%)(a) | | | 1.37 | | | | 5.79 | | | | 7.79 | | | | 1.18 | (c) | | | 1.04 | | | | 7.87 | | | | 6.77 | | | | 6.34 | (c) | |
��
The accompanying notes are an integral part of these financial statements.
83
MUTUAL OF AMERICA INVESTMENT CORPORATION
FINANCIAL HIGHLIGHTS (Continued)
| | | Conservative Allocation Fund | | Moderate Allocation Fund | |
| | | Years Ended December 31, | | Years Ended December 31, | |
| | | 2010 | | 2009 | | 2008 | | 2007 | | 2006 | | 2010 | | 2009 | | 2008 | | 2007 | | 2006 | |
| Net Asset Value, Beginning of Period | | $ | 0.99 | | | $ | 0.89 | | | $ | 1.03 | | | $ | 1.02 | | | $ | 1.00 | | | $ | 1.03 | | | $ | 0.88 | | | $ | 1.14 | | | $ | 1.14 | | | $ | 1.11 | | |
| INCOME (LOSS) FROM INVESTMENT OPERATIONS: | |
| Net Investment Income | | | 0.03 | | | | 0.03 | | | | 0.04 | | | | 0.04 | | | | 0.04 | | | | 0.03 | | | | 0.03 | | | | 0.03 | | | | 0.04 | | | | 0.03 | | |
| Net Realized and Unrealized Gains (Losses) on Investments and Futures Contracts | | | 0.06 | | | | 0.11 | | | | (0.14 | ) | | | 0.02 | | | | 0.03 | | | | 0.11 | | | | 0.15 | | | | (0.25 | ) | | | 0.03 | | | | 0.06 | | |
| Total From Investment Operations | | | 0.09 | | | | 0.14 | | | | (0.10 | ) | | | 0.06 | | | | 0.07 | | | | 0.14 | | | | 0.18 | | | | (0.22 | ) | | | 0.07 | | | | 0.09 | | |
Less: Dividend Distributions:
From Net Investment Income | | | — | (h) | | | (0.03 | ) | | | (0.04 | ) | | | (0.04 | ) | | | (0.03 | ) | | | — | (h) | | | (0.03 | )(g) | | | (0.03 | ) | | | (0.04 | ) | | | (0.03 | ) | |
| From Capital Gains | | | — | (h) | | | (0.01 | ) | | | — | | | | (0.01 | ) | | | (0.02 | ) | | | (0.01 | ) | | | — | | | | (0.01 | ) | | | (0.03 | ) | | | (0.03 | ) | |
| Total Distributions | | | — | | | | (0.04 | ) | | | (0.04 | ) | | | (0.05 | ) | | | (0.05 | ) | | | (0.01 | ) | | | (0.03 | ) | | | (0.04 | ) | | | (0.07 | ) | | | (0.06 | ) | |
| Net Asset Value, End of Period | | $ | 1.08 | | | $ | 0.99 | | | $ | 0.89 | | | $ | 1.03 | | | $ | 1.02 | | | $ | 1.16 | | | $ | 1.03 | | | $ | 0.88 | | | $ | 1.14 | | | $ | 1.14 | | |
| Total Return (%)(b) | | | 9.34 | | | | 15.94 | | | | (10.19 | ) | | | 6.43 | | | | 6.96 | | | | 13.11 | | | | 21.27 | | | | (19.85 | ) | | | 6.36 | | | | 9.20 | | |
| Net Assets, End of Period ($ millions) | | | 52 | | | | 38 | | | | 24 | | | | 20 | | | | 13 | | | | 163 | | | | 125 | | | | 90 | | | | 102 | | | | 76 | | |
| Ratio of Net Investment Income (Loss) to Average Net Assets (%) | | | 3.47 | | | | 4.24 | | | | 4.04 | | | | 4.48 | | | | 4.11 | | | | 2.73 | | | | 3.22 | | | | 3.14 | | | | 3.54 | | | | 3.30 | | |
| Ratio of Expenses to Average Net Assets Before Expense Reimbursement (%)(e) | | | — | | | | — | | | | — | | | | — | | | | — | | | | — | | | | — | | | | — | | | | — | | | | — | | |
| Ratio of Expenses to Average Net Assets After Expense Reimbursement (%)(e) | | | — | | | | — | | | | — | | | | — | | | | — | | | | — | | | | — | | | | — | | | | — | | | | — | | |
| Portfolio Turnover Rate (%)(a) | | | 20.11 | | | | 14.24 | | | | 38.30 | | | | 13.72 | | | | 49.05 | | | | 15.68 | | | | 15.29 | | | | 25.21 | | | | 12.35 | | | | 9.78 | | |
(a) Portfolio turnover rate excludes all short-term securities.
(b) Total return would have been lower had non-investment advisory expenses not been reduced through expense reimbursement in certain years (Note 2).
(c) Not annualized.
(d) Annualized.
(e) Allocation and Retirement Funds exclude expenses of the underlying funds.
(f) For the period November 5, 2007 (commencement of operations) through December 31, 2007.
(g) Includes less than $0.005 of tax-basis return of capital distributions.
(h) Includes less than $0.005 of dividend distributions.
N/A = Not Applicable
The accompanying notes are an integral part of these financial statements.
84
| | | Aggressive Allocation Fund | |
| | | Years Ended December 31, | |
| | | 2010 | | 2009 | | 2008 | | 2007 | | 2006 | |
| Net Asset Value, Beginning of Period | | $ | 1.06 | | | $ | 0.86 | | | $ | 1.24 | | | $ | 1.27 | | | $ | 1.22 | | |
| INCOME (LOSS) FROM INVESTMENT OPERATIONS: | |
| Net Investment Income | | | 0.02 | | | | 0.02 | | | | 0.02 | | | | 0.03 | | | | 0.03 | | |
| Net Realized and Unrealized Gains (Losses) on Investments and Futures Contracts | | | 0.16 | | | | 0.20 | | | | (0.37 | ) | | | 0.04 | | | | 0.11 | | |
| Total From Investment Operations | | | 0.18 | | | | 0.22 | | | | (0.35 | ) | | | 0.07 | | | | 0.14 | | |
Less: Dividend Distributions:
From Net Investment Income | | | — | (h) | | | (0.02 | ) | | | (0.02 | )(g) | | | (0.04 | )(g) | | | (0.03 | ) | |
| From Capital Gains | | | — | | | | — | | | | (0.01 | ) | | | (0.06 | ) | | | (0.06 | ) | |
| Total Distributions | | | — | | | | (0.02 | ) | | | (0.03 | ) | | | (0.10 | ) | | | (0.09 | ) | |
| Net Asset Value, End of Period | | $ | 1.24 | | | $ | 1.06 | | | $ | 0.86 | | | $ | 1.24 | | | $ | 1.27 | | |
| Total Return (%)(b) | | | 17.02 | | | | 25.64 | | | | (28.20 | ) | | | 5.52 | | | | 11.87 | | |
| Net Assets, End of Period ($ millions) | | | 147 | | | | 117 | | | | 81 | | | | 101 | | | | 73 | | |
| Ratio of Net Investment Income (Loss) to Average Net Assets (%) | | | 2.07 | | | | 2.44 | | | | 2.41 | | | | 2.75 | | | | 2.82 | | |
| Ratio of Expenses to Average Net Assets Before Expense Reimbursement (%)(e) | | | — | | | | — | | | | — | | | | — | | | | — | | |
| Ratio of Expenses to Average Net Assets After Expense Reimbursement (%)(e) | | | — | | | | — | | | | — | | | | — | | | | — | | |
| Portfolio Turnover Rate (%)(a) | | | 12.91 | | | | 11.70 | | | | 20.56 | | | | 9.14 | | | | 6.75 | | |
The accompanying notes are an integral part of these financial statements.
85
MUTUAL OF AMERICA INVESTMENT CORPORATION
FINANCIAL HIGHLIGHTS (Continued)
| | | Money Market Fund | | Mid-Term Bond Fund | |
| | | Years Ended December 31, | | Years Ended December 31, | |
| | | 2010 | | 2009 | | 2008 | | 2007 | | 2006 | | 2010 | | 2009 | | 2008 | | 2007 | | 2006 | |
| Net Asset Value, Beginning of Period | | $ | 1.21 | | | $ | 1.21 | | | $ | 1.21 | | | $ | 1.21 | | | $ | 1.20 | | | $ | 1.00 | | | $ | 0.94 | | | $ | 0.96 | | | $ | 0.93 | | | $ | 0.92 | | |
| INCOME (LOSS) FROM INVESTMENT OPERATIONS: | |
| Net Investment Income | | | — | | | | — | | | | 0.03 | | | | 0.05 | | | | 0.05 | | | | 0.04 | | | | 0.04 | | | | 0.04 | | | | 0.04 | | | | 0.03 | | |
| Net Realized and Unrealized Gains (Losses) on Investments and Futures Contracts | | | (0.01 | ) | | | — | | | | — | | | | — | | | | — | | | | 0.02 | | | | 0.07 | | | | (0.02 | ) | | | 0.03 | | | | 0.01 | | |
| Total From Investment Operations | | | (0.01 | ) | | | — | | | | 0.03 | | | | 0.05 | | | | 0.05 | | | | 0.06 | | | | 0.11 | | | | 0.02 | | | | 0.07 | | | | 0.04 | | |
Less: Dividend Distributions:
From Net Investment Income | | | — | | | | — | | | | (0.03 | ) | | | (0.05 | ) | | | (0.04 | ) | | | (0.03 | ) | | | (0.04 | ) | | | (0.04 | ) | | | (0.04 | ) | | | (0.03 | ) | |
| From Capital Gains | | | — | | | | — | | | | — | | | | — | | | | — | | | | — | (h) | | | (0.01 | ) | | | — | | | | — | | | | — | | |
| Total Distributions | | | — | | | | — | | | | (0.03 | ) | | | (0.05 | ) | | | (0.04 | ) | | | (0.03 | ) | | | (0.05 | ) | | | (0.04 | ) | | | (0.04 | ) | | | (0.03 | ) | |
| Net Asset Value, End of Period | | $ | 1.20 | | | $ | 1.21 | | | $ | 1.21 | | | $ | 1.21 | | | $ | 1.21 | | | $ | 1.03 | | | $ | 1.00 | | | $ | 0.94 | | | $ | 0.96 | | | $ | 0.93 | | |
| Total Return (%)(b) | | | (0.14 | ) | | | (0.08 | ) | | | 2.34 | | | | 5.03 | | | | 4.89 | | | | 6.93 | | | | 11.22 | | | | 1.84 | | | | 7.22 | | | | 4.22 | | |
| Net Assets, End of Period ($ millions) | | | 109 | | | | 119 | | | | 201 | | | | 312 | | | | 239 | | | | 298 | | | | 234 | | | | 183 | | | | 122 | | | | 107 | | |
| Ratio of Net Investment Income to Average Net Assets (%) | | | (0.15 | ) | | | (0.04 | ) | | | 2.38 | | | | 4.89 | | | | 4.83 | | | | 3.66 | | | | 4.16 | | | | 4.27 | | | | 4.28 | | | | 3.88 | | |
| Ratio of Expenses to Average Net Assets Before Expense Reimbursement (%) | | | 0.32 | | | | 0.33 | | | | 0.32 | | | | 0.28 | | | | 0.24 | | | | 0.57 | | | | 0.58 | | | | 0.55 | | | | 0.56 | | | | 0.50 | | |
| Ratio of Expenses to Average Net Assets After Expense Reimbursement (%) | | | 0.32 | | | | 0.33 | | | | 0.32 | | | | 0.28 | | | | 0.22 | | | | 0.57 | | | | 0.58 | | | | 0.55 | | | | 0.56 | | | | 0.47 | | |
| Portfolio Turnover Rate (%)(a) | | | NA | | | | NA | | | | NA | | | | NA | | | | NA | | | | 16.70 | | | | 30.76 | | | | 34.95 | | | | 26.78 | | | | 30.91 | | |
(a) Portfolio turnover rate excludes all short-term securities.
(b) Total return would have been lower had non-investment advisory expenses not been reduced through expense reimbursement in certain years (Note 2).
(c) Not annualized.
(d) Annualized.
(e) Allocation and Retirement Funds exclude expenses of the underlying funds.
(f) For the period November 5, 2007 (commencement of operations) through December 31, 2007.
(g) Includes less than $0.005 of tax-basis return of capital distributions.
(h) Includes less than $0.005 of dividend distributions.
N/A = Not Applicable
The accompanying notes are an integral part of these financial statements.
86
| | | Bond Fund | |
| | | Years Ended December 31, | |
| | | 2010 | | 2009 | | 2008 | | 2007 | | 2006 | |
| Net Asset Value, Beginning of Period | | $ | 1.30 | | | $ | 1.18 | | | $ | 1.27 | | | $ | 1.26 | | | $ | 1.26 | | |
| INCOME (LOSS) FROM INVESTMENT OPERATIONS: | |
| Net Investment Income | | | 0.05 | | | | 0.05 | | | | 0.07 | | | | 0.06 | | | | 0.06 | | |
| Net Realized and Unrealized Gains (Losses) on Investments and Futures Contracts | | | 0.04 | | | | 0.12 | | | | (0.09 | ) | | | 0.01 | | | | — | | |
| Total From Investment Operations | | | 0.09 | | | | 0.17 | | | | (0.02 | ) | | | 0.07 | | | | 0.06 | | |
Less: Dividend Distributions:
From Net Investment Income | | | (0.05 | ) | | | (0.05 | ) | | | (0.07 | ) | | | (0.06 | ) | | | (0.06 | ) | |
| From Capital Gains | | | — | | | | — | | | | — | | | | — | | | | — | | |
| Total Distributions | | | (0.05 | ) | | | (0.05 | ) | | | (0.07 | ) | | | (0.06 | ) | | | (0.06 | ) | |
| Net Asset Value, End of Period | | $ | 1.34 | | | $ | 1.30 | | | $ | 1.18 | | | $ | 1.27 | | | $ | 1.26 | | |
| Total Return (%)(b) | | | 7.29 | | | | 14.61 | | | | (1.75 | ) | | | 5.90 | | | | 4.79 | | |
| Net Assets, End of Period ($ millions) | | | 597 | | | | 488 | | | | 372 | | | | 384 | | | | 343 | | |
| Ratio of Net Investment Income to Average Net Assets (%) | | | 3.81 | | | | 4.62 | | | | 5.05 | | | | 4.95 | | | | 4.84 | | |
| Ratio of Expenses to Average Net Assets Before Expense Reimbursement (%) | | | 0.57 | | | | 0.58 | | | | 0.56 | | | | 0.53 | | | | 0.50 | | |
| Ratio of Expenses to Average Net Assets After Expense Reimbursement (%) | | | 0.57 | | | | 0.58 | | | | 0.56 | | | | 0.53 | | | | 0.47 | | |
| Portfolio Turnover Rate (%)(a) | | | 40.33 | | | | 46.27 | | | | 23.76 | | | | 17.56 | | | | 19.03 | | |
The accompanying notes are an integral part of these financial statements.
87
MUTUAL OF AMERICA INVESTMENT CORPORATION
NOTES TO FINANCIAL STATEMENTS
1. SIGNIFICANT ACCOUNTING POLICIES AND ORGANIZATION
Mutual of America Investment Corporation (the "Investment Company") is a diversified, open-end management investment company — a type of company commonly known as a "mutual fund". It is registered as such under the Investment Company Act of 1940 (the "Investment Company Act"). The Investment Company was formed on February 21, 1986 as a Maryland corporation and principally offers its shares exclusively to separate accounts of Mutual of America Life Insurance Company ("Mutual of America Life") and its affiliates. As a "series" type mutual fund, the Investment Company issues separate classes (or series) of capital stock, each of which represents a separate Fund of investments. At December 31, 2010, there were 23 Funds (collectively, "the Funds"): Equity Index Fund, All America Fund, Small Cap Value Fund, Small Cap Growth Fund, Mid Cap Value Fund, Mid-Cap Equity Index Fund, International Fund, Composite Fund, Money Market Fund, Mid-Term Bond Fund, Bond Fund; Retirement Income Fund, 2010 Retirement Fund, 2015 Retirement Fund, 2020 Retirement Fund, 2025 Retirement Fund, 2030 Retirement Fund, 2035 Retirement Fund, 2040 Retirement Fund and 2045 Retirement Fund (collectively, "Retirement Funds"); a Conservative Allocation Fund, a Moderate Allocation Fund and an Aggressive Allocation Fund (collectively "Allocation Funds"). The International Fund and the Retirement Funds began operations on November 5, 2007.
Investment Company shares are issued to Mutual of America Life, and on a limited basis, to Wilton Reassurance Life Company of New York (formerly The American Life Insurance Company of New York), for allocation to their Separate Accounts as a funding medium for variable accumulation annuity contracts and variable life insurance policies. In addition, shares of selected equity and fixed income funds of the Investment Company are directly issued to one or more of the Investment Company's Allocation Funds.
The preparation of financial statements in accordance with U.S. generally accepted accounting principles requires management to make estimates and assumptions that affect the reported amounts of assets, liabilities, income, expenses and related disclosures. Actual results, however, may differ from those estimates.
The following is a summary of the significant accounting policies consistently followed by the Investment Company, which are in conformity with U.S. generally accepted accounting principles ("GAAP"):
Fair Value — The Investment Company values its investments at fair value. Fair value is an estimate of the price the Fund would receive upon selling a security in an orderly arms-length transaction. Investments are categorized based on a three-level valuation hierarchy for measurement and disclosure of fair value. The valuation hierarchy is based upon the transparency of inputs used to measure fair value. The three levels are as follows:
• Level 1 — quoted prices in active markets for identical securities.
• Level 2 — other significant observable inputs (including yield, quality, coupon rate, maturity, issue type, quoted prices for similar securities, prepayment speeds, trading characteristics, etc.).
• Level 3 — significant unobservable inputs (including the Fund's own assumptions in determining the fair value of investments).
As of December 31, 2010, management determined that the fair value inputs for all equity securities, including shares of registered investment companies, were considered Level 1, with the exception of non-registered securities under Rule 144A of the Securities Act of 1933 which were considered Level 2. In addition, certain Rule 144A securities not actively traded were considered Level 3. Fair value inputs for all debt securities were considered Level 2. The inputs used for valuing securities are not necessarily an indication of the risk associated with investing in those securities. Transfers between levels are reflected based on the fair value at the beginning of a reporting period.
88
MUTUAL OF AMERICA INVESTMENT CORPORATION
NOTES TO FINANCIAL STATEMENTS (Continued)
1. SIGNIFICANT ACCOUNTING POLICIES AND ORGANIZATION (CONTINUED)
The following is a summary of the inputs used to value the Funds' investments and other financial instruments as of December 31, 2010, by fair value input hierarchy:
| Fund | | Level 1 — Quoted
Prices | | Level 2 — Significant
Observable Inputs | | Level 3 — Significant
Unobservable Inputs | | Total | |
Investments at Market Value:
(See Portfolios of Investments for More Details) | |
| Equity Index Fund | |
| Common Stock | | $ | 879,890,835 | | | | — | | | | — | | | $ | 879,890,835 | | |
| Short-Term Debt Securities | | | — | | | $ | 24,313,571 | | | | — | | | $ | 24,313,571 | | |
| Temporary Cash Investments | | | — | | | $ | 151,300 | | | | — | | | $ | 151,300 | | |
| | | $ | 879,890,835 | | | $ | 24,464,871 | | | | — | | | $ | 904,355,706 | | |
| All America Fund | |
| Common Stock-Indexed | | $ | 137,537,637 | | | | — | | | | — | | | $ | 137,537,637 | | |
| Common Stock-Active | | $ | 125,385,075 | | | | — | | | $ | 329,297 | (1) | | $ | 125,714,372 | | |
| Convertible Preferred Stock | | $ | 164,993 | | | | — | | | | — | | | $ | 164,993 | | |
| Short-Term Debt Securities | | | — | | | $ | 6,699,546 | | | | — | | | $ | 6,699,546 | | |
| Temporary Cash Investments | | | — | | | $ | 152,600 | | | | — | | | $ | 152,600 | | |
| | | $ | 263,087,705 | | | $ | 6,852,146 | | | $ | 329,297 | | | $ | 270,269,148 | | |
| Small Cap Value Fund | |
| Common Stock | | $ | 265,370,967 | | | | — | | | $ | 1,919,931 | (1) | | $ | 267,290,898 | | |
| Convertible Preferred Stock | | $ | 1,262,671 | | | | — | | | | — | | | $ | 1,262,671 | | |
| Short-Term Debt Securities | | | — | | | $ | 16,399,286 | | | | — | | | $ | 16,399,286 | | |
| | | $ | 266,633,638 | | | $ | 16,399,286 | | | $ | 1,919,931 | | | $ | 284,952,855 | | |
| Small Cap Growth Fund | |
| Common Stock | | $ | 273,141,523 | | | | — | | | | — | | | $ | 273,141,523 | | |
| Short-Term Debt Securities | | | — | | | $ | 7,499,977 | | | | — | | | $ | 7,499,977 | | |
| | | $ | 273,141,523 | | | $ | 7,499,977 | | | | — | | | $ | 280,641,500 | | |
| Mid Cap Value Fund | |
| Common Stock | | $ | 52,759,187 | | | | — | | | | — | | | $ | 52,759,187 | | |
| Short-Term Debt Securities | | | — | | | $ | 3,299,963 | | | | — | | | $ | 3,299,963 | | |
| | | $ | 52,759,187 | | | $ | 3,299,963 | | | | | | | $ | 56,059,150 | | |
| Mid-Cap Equity Index Fund | |
| Common Stock | | $ | 479,670,198 | | | | — | | | | — | | | $ | 479,670,198 | | |
| Short-Term Debt Securities | | | — | | | $ | 13,698,812 | | | | — | | | $ | 13,698,812 | | |
| Temporary Cash Investments | | | — | | | $ | 179,800 | | | | — | | | $ | 179,800 | | |
| | | $ | 479,670,198 | | | $ | 13,878,612 | | | | — | | | $ | 493,548,810 | | |
| International Fund | |
| Common Stock | | $ | 57,983,571 | | | | — | | | | — | | | $ | 57,983,571 | | |
| Short-Term Debt Securities | | | — | | | $ | 3,199,867 | | | | — | | | $ | 3,199,867 | | |
| | | $ | 57,983,571 | | | $ | 3,199,867 | | | | — | | | $ | 61,183,438 | | |
| Composite Fund | |
| Common Stock | | $ | 98,334,911 | | | | — | | | | — | | | $ | 98,334,911 | | |
| U.S. Government Debt | | | — | | | $ | 7,442,123 | | | | — | | | $ | 7,442,123 | | |
U.S. Government Agency Residential
Mortgage-Backed Obligations | | | — | | | $ | 22,697,299 | | | | — | | | $ | 22,697,299 | | |
| Corporate Long-Term Debt | | | — | | | $ | 31,735,734 | | | | — | | | $ | 31,735,734 | | |
| Short-Term Debt | | | — | | | $ | 5,677,641 | | | | — | | | $ | 5,677,641 | | |
| Temporary Cash Investments | | | — | | | $ | 137,400 | | | | — | | | $ | 137,400 | | |
| | | $ | 98,334,911 | | | $ | 67,690,197 | | | | — | | | $ | 166,025,108 | | |
| Retirement Income Fund | |
| Common Stock | | $ | 18,145,675 | | | | — | | | | — | | | $ | 18,145,675 | | |
| 2010 Retirement Fund | | | | | | | | | | | | | | | | | |
| Common Stock | | $ | 19,176,815 | | | | — | | | | — | | | $ | 19,176,815 | | |
89
MUTUAL OF AMERICA INVESTMENT CORPORATION
NOTES TO FINANCIAL STATEMENTS (Continued)
1. SIGNIFICANT ACCOUNTING POLICIES AND ORGANIZATION (CONTINUED)
| Fund | | Level 1 — Quoted
Prices | | Level 2 — Significant
Observable Inputs | | Level 3 — Significant
Unobservable Inputs | | Total | |
| 2015 Retirement Fund | | | | | | | | | | | |
| Common Stock | | $ | 78,128,086 | | | | — | | | | — | | | $ | 78,128,086 | | |
| 2020 Retirement Fund | | | | | | | | | | | |
| Common Stock | | $ | 90,455,139 | | | | — | | | | — | | | $ | 90,455,139 | | |
| 2025 Retirement Fund | | | | | | | | | | | |
| Common Stock | | $ | 80,518,668 | | | | — | | | | — | | | $ | 80,518,668 | | |
| 2030 Retirement Fund | | | | | | | | | | | |
| Common Stock | | $ | 67,402,882 | | | | — | | | | — | | | $ | 67,402,882 | | |
| 2035 Retirement Fund | | | | | | | | | | | |
| Common Stock | | $ | 52,840,881 | | | | — | | | | — | | | $ | 52,840,881 | | |
| 2040 Retirement Fund | | | | | | | | | | | |
| Common Stock | | $ | 46,631,652 | | | | — | | | | — | | | $ | 46,631,652 | | |
| 2045 Retirement Fund | | | | | | | | | | | |
| Common Stock | | $ | 53,808,165 | | | | — | | | | — | | | $ | 53,808,165 | | |
| Conservative Allocation Fund | |
| Common Stock | | $ | 51,732,575 | | | | — | | | | — | | | $ | 51,732,575 | | |
| Moderate Allocation Fund | |
| Common Stock | | $ | 162,687,124 | | | | — | | | | — | | | $ | 162,687,124 | | |
| Aggressive Allocation Fund | |
| Common Stock | | $ | 147,404,025 | | | | — | | | | — | | | $ | 147,404,025 | | |
| Money Market Fund | |
| U.S. Government Debt | | | — | | | $ | 7,997,687 | | | | — | | | $ | 7,997,687 | | |
U.S. Government Agency
Short-Term Debt | | | — | | | $ | 30,221,377 | | | | — | | | $ | 30,221,377 | | |
| Commercial Paper | | | — | | | $ | 70,594,735 | | | | — | | | $ | 70,594,735 | | |
| | | | — | | | $ | 108,813,799 | | | | — | | | $ | 108,813,799 | | |
| Mid-Term Bond Fund | |
| U.S. Government Debt | | | — | | | $ | 139,939,721 | | | | — | | | $ | 139,939,721 | | |
U.S. Government Agency Residential
Mortgage-Backed Obligations | | | — | | | $ | 1,918,307 | | | | — | | | $ | 1,918,307 | | |
U.S. Government Agency
Non-Mortgage-Backed Obligations | | | — | | | $ | 19,605,623 | | | | — | | | $ | 19,605,623 | | |
| Corporate Debt | | | — | | | $ | 126,936,034 | | | | — | | | $ | 126,936,034 | | |
| Short-Term Debt | | | — | | | $ | 4,899,973 | | | | — | | | $ | 4,899,973 | | |
| Temporary Cash Investments | | | — | | | $ | 750,000 | | | | — | | | $ | 750,000 | | |
| | | | — | | | $ | 294,049,658 | | | | — | | | $ | 294,049,658 | | |
| Bond Fund | |
| U.S. Government Debt | | | — | | | $ | 121,057,100 | | | | — | | | $ | 121,057,100 | | |
U.S. Government Agency Residential
Mortgage-Backed Obligations | | | — | | | $ | 178,138,341 | | | | — | | | $ | 178,138,341 | | |
U.S. Government Agency
Non-Mortgage-Backed Obligations | | | — | | | $ | 12,628,460 | | | | — | | | $ | 12,628,460 | | |
| Long-Term Corporate Debt | | | — | | | $ | 254,206,631 | | | | — | | | $ | 254,206,631 | | |
| Sovereign Debt | | | — | | | $ | 4,265,259 | | | | — | | | $ | 4,265,259 | | |
| Short-Term Debt | | | — | | | $ | 21,802,794 | | | | — | | | $ | 21,802,794 | | |
| Temporary Cash Investments | | | — | | | $ | 105,200 | | | | — | | | $ | 105,200 | | |
| | | | — | | | $ | 592,203,785 | | | | — | | | $ | 592,203,785 | | |
| Other Financial Instruments:* | |
| Equity Index Fund | | $ | 212,955 | | | | — | | | | — | | | $ | 212,955 | | |
| All America Fund | | $ | 73,960 | | | | — | | | | — | | | $ | 73,960 | | |
| Mid-Cap Equity Index Fund | | $ | 45,435 | | | | — | | | | — | | | $ | 45,435 | | |
* Other financial instruments are derivative instruments not reflected in the Portfolio of Investments, such as futures, which are valued at the unrealized appreciation/depreciation on the instrument.
(1) Reflects securities issued by NBH Hldgs. Co. included in "Other Securities" in the Financials section of the active asset segment of the All America Fund and the Financials section of the Small Cap Value Fund.
90
MUTUAL OF AMERICA INVESTMENT CORPORATION
NOTES TO FINANCIAL STATEMENTS (Continued)
1. SIGNIFICANT ACCOUNTING POLICIES AND ORGANIZATION (CONTINUED)
| | | Fair Value Measurement Using Significant Unobservable
Inputs (Level 3) for the Year Ended December 31, 2010 | |
| | | Balance
December 31,
2009 | | Change in
Unrealized
Gains
(Losses)(a) | | Transfers
Into
Level 3 | | Transfers
Out of
Level 3(b) | | Balance
December 31,
2010 | | Net Change in
Unrealized Gains/(Losses)
of Level 3 Assets Held as of
December 31, 2010 Included
in Statement of Operations | |
All America Fund —
Active Common Stock | | $ | 761,962 | | | $ | (12,665 | ) | | | — | | | $ | (420,000 | ) | | $ | 329,297 | | | $ | (8,443 | ) | |
Small Cap Value Fund —
Common Stock | | $ | 4,471,775 | | | $ | (73,844 | ) | | | — | | | $ | (2,478,000 | ) | | $ | 1,919,931 | | | $ | (49,229 | ) | |
(a) Unrealized gains and losses on Level 3 securities are included in Change in Net Unrealized Appreciation (Depreciation) of Investments in the Statements of Operations
(b) Reflects transfers into Level 1 as a result of a security beginning to trade on national exchanges upon its initial public offering.
In January 2010, the Financial Accounting Standards Board issued Accounting Standards Update ("ASU") No. 2010-06, "Improving Disclosures About Fair Value Measurements." The ASU clarifies existing disclosure and requires additional disclosure regarding fair value measurements. The above disclosure reflects the additional requirements of ASU No. 2010-06.
Security Valuation — Investment securities are carried at fair value as follows:
Exchange-traded equity securities are valued at the last sales price on the principal exchange on which the security is traded. If there is no trading volume for a particular valuation day, the last bid price is used. For equity securities traded in the over-the-counter market, the security is valued at the last sale price, or if no sale, at the latest bid price available.
Short-term debt securities with a maturity of 60 days or less are valued at amortized cost, which approximates fair value for such securities.
Debt securities, including short-term debt securities maturing in excess of 60 days, are valued on the basis of prices obtained from an independent pricing source. The pricing source may utilize various pricing methodologies that incorporate both models (which consider factors such as yield, quality, coupon rate, maturity, issue type, quoted prices for similar securities, prepayment speeds and trading characteristics) and dealer-supplied valuations to derive a valuation.
In the rare instance when a price is not available from an independent pricing source or when prices may not reflect fair value, such as when the price provided by the pricing source is not based on a recent trade, a calculated fair value is used, as determined in good faith by the Adviser and reviewed by a Valuation Committee, in accordance with procedures adopted by the Board of Directors of the Investment Company. The Advisor uses a market approach to calculate fair value for equity securities which are categorized as Level 3 above. The Adviser's valuation is primarily based on information regarding the specific equity issuer, such as financial statements, the relationship of per-share book value to the last trade price and operating information. The Adviser also considers industry-specific conditions and overall market conditions, to determine whether the last trade price reflects fair value or needs to be adjusted.
The Retirement Funds and the Allocation Funds value their investments in the underlying Funds of the Investment Company at their respective net asset values.
Investment Transactions — Investment transactions are accounted for as of the trade date. Realized gains and losses on the sale of short and long-term debt securities are computed on the basis of amortized cost at the time of sale. Realized gains and losses on the sale of stock are based on the identified cost basis of the security, determined on the first-in, first-out ("FIFO") basis.
Futures Contracts — The Equity Index Fund, Mid-Cap Equity Index Fund and a portion of the All America Fund each maintain indexed asset portfolios which are subject to equity price risk. In order to remain more fully invested in the equity markets while minimizing transaction costs, the funds purchase stock index futures contracts. An initial cash margin deposit (represented by cash or Treasury bills) is made upon entering into a futures contract and serves as collateral for the
91
MUTUAL OF AMERICA INVESTMENT CORPORATION
NOTES TO FINANCIAL STATEMENTS (Continued)
1. SIGNIFICANT ACCOUNTING POLICIES AND ORGANIZATION (CONTINUED)
contract. This initial margin, maintained in a segregated account, is equal to approximately 5%-6% of the contract amount, and does not involve the borrowing of funds to finance the transaction. During the period the futures contract is outstanding, changes in the value of the contract are recognized as unrealized gains or losses by "marking-to-market" on a daily basis to reflect the market value of the contract at the end of each trading day. The accumulated unrealized gain or loss on the contract is included in Net Unrealized Appreciation (Depreciation) of Investments in the Components of Net Assets section of the Statement of Assets and Liabilities. Futures contracts are valued at the settlement price established each day by the exchange on which traded. Depending upon whether unrealized gains or losses are incurred, variation margin payments are received or made daily. The net change in unrealized appreciation or deprecation of futures contracts is recorded in the Statement of Operations. When the contract is closed, a realized gain or loss from futures transactions is recorded in the Statement of Operations, equal to the net variation margin received or paid over the period the contract was outstanding.
The "Underlying Face Amount at Value" (appearing in the "Notes to the Summary Portfolio of Investments in Securities") representing the aggregate of outstanding contractual amounts under futures contracts reflects the extent of a Fund's exposure to off-balance sheet risk. The use of futures transactions involves the risk of imperfect correlation in the price movements of the contract and the underlying securities. With futures contracts, there is minimal counterparty credit risk to the Fund since futures are exchange traded and the exchange's clearinghouse, as counterparty to all exchange traded futures, guarantees the futures against default.
During the year ended December 31, 2010, the Equity Index Fund, Mid-Cap Equity Index Fund and the All America Fund purchased futures contracts with total principal amounts of $187,919,235, $129,235,380 and $44,775,821, respectively.
Retirement Funds — Each of the Retirement Funds invests in equity (stock) funds and fixed income (bond) funds and targets different percentages to these asset classes. The targets reflect varying emphases on achieving capital appreciation and gains versus preserving capital and producing income, depending on the specific Fund's time horizon.
The Retirement Funds target their investments in the following underlying funds of the Investment Company in accordance with the percentage allocations noted:
| | | Equity
Index
Fund | | Mid-Cap
Equity
Index
Fund | | Small Cap
Growth
Fund | | Small Cap
Value
Fund | | International
Fund | | Bond
Fund | | Mid-Term
Bond
Fund | | Money
Market
Fund | |
| Retirement Income Fund | | | 20 | % | | | 5 | % | | | — | | | | — | | | | — | | | | 30 | % | | | 30 | % | | | 15 | % | |
| 2010 Retirement Fund | | | 25 | % | | | 14 | % | | | — | | | | — | | | | 4 | % | | | 25 | % | | | 22 | % | | | 10 | % | |
| 2015 Retirement Fund | | | 30 | % | | | 11 | % | | | 2 | % | | | 2 | % | | | 8 | % | | | 25 | % | | | 13 | % | | | 9 | % | |
| 2020 Retirement Fund | | | 35 | % | | | 11 | % | | | 4 | % | | | 4 | % | | | 9 | % | | | 24 | % | | | 13 | % | | | — | | |
| 2025 Retirement Fund | | | 40 | % | | | 15 | % | | | 5 | % | | | 5 | % | | | 9 | % | | | 20 | % | | | 6 | % | | | — | | |
| 2030 Retirement Fund | | | 40 | % | | | 18 | % | | | 6 | % | | | 6 | % | | | 10 | % | | | 20 | % | | | — | | | | — | | |
| 2035 Retirement Fund | | | 40 | % | | | 21 | % | | | 7 | % | | | 7 | % | | | 12 | % | | | 13 | % | | | — | | | | — | | |
| 2040 Retirement Fund | | | 35 | % | | | 24 | % | | | 8 | % | | | 8 | % | | | 14 | % | | | 11 | % | | | — | | | | — | | |
| 2045 Retirement Fund | | | 35 | % | | | 20 | % | | | 10 | % | | | 10 | % | | | 15 | % | | | 10 | % | | | — | | | | — | | |
Generally, rebalancing of the Retirement Funds' holdings is performed on a quarterly or other periodic basis and the mix of underlying Funds is reviewed annually.
Allocation Funds — The Allocation Funds target their investments in the following underlying Funds of the Investment Company in accordance with the percentage allocations noted:
| Conservative Allocation: | | Equity Index (25%), Bond (30%), | |
|
| | Mid-Term Bond (45%). | |
|
| Moderate Allocation: | | Equity Index (35%), Bond (30%), | |
|
| | Mid-Term Bond (20%), Mid-Cap Equity Index (15%). | |
|
| Aggressive Allocation: | | Equity Index (45%), Bond (25%), | |
|
| | Mid-Cap Equity Index (20%), Small Cap Value (5%), Small Cap Growth (5%). | |
|
Generally, rebalancing of the Allocation Funds' holdings is performed on a monthly basis.
92
MUTUAL OF AMERICA INVESTMENT CORPORATION
NOTES TO FINANCIAL STATEMENTS (Continued)
1. SIGNIFICANT ACCOUNTING POLICIES AND ORGANIZATION (CONTINUED)
Investment Income — Interest income, accretion of discount and amortization of premium are recorded daily on an accrual basis using the effective interest method. A debt obligation may cease accrual of income and result in a reduction to interest income when the collection of all or a portion of current and past due interest is in doubt. Dividend income is recorded on the ex-dividend date. Foreign source tax withheld from dividends is recorded as a reduction from dividend income. Should reclamation efforts succeed, such amounts are recorded as income upon collection.
Distributions to Shareholders ("Dividends") — Distributions to shareholders are recorded on the ex-dividend date. It is the Investment Company's policy to make distributions of its net investment income twice a year and, on an annual basis, to distribute net realized gains, if any, in accordance with Federal income tax regulations, which may differ from U.S. generally accepted accounting principles. Accordingly, periodic reclassifications (which do not impact the funds' net asset values) are made within the funds' capital accounts to reflect income and gains available for distribution under Federal income tax regulations.
Federal Income Taxes — Each Fund in the Investment Company intends to comply with the requirements of the Internal Revenue Code applicable to regulated investment companies and to distribute substantially all of its taxable income to shareholders. Therefore, no Federal income or excise tax provision is required.
GAAP requires the evaluation of tax positions taken in the course of preparing a fund's tax return to determine whether it is "more-likely-than-not" that tax positions taken in the fund's tax return will be ultimately sustained, and, if not, a tax liability and expense is recorded.
As of December 31, 2010, management has evaluated the tax positions taken on the Funds' tax returns for all open tax years and has concluded that no tax provision is required in any of the Funds' financial statements. Each Fund's federal and state income, franchise and federal excise tax returns for tax years for which the applicable statutes of limitations have not expired are subject to examination by the Internal Revenue Service and state departments of revenue.
At December 31, 2010, the Funds had the following capital loss carry forwards to offset net capital gains, to the extent provided by Federal income tax regulations, which if unused expire on the dates noted. In addition, the Small Cap Value and the Mid Cap Value funds generated a Post-October 2010 net capital loss of $321,789 and $36,720, respectively, which if unused will expire on December 31, 2019.
| Expiring on December 31, | | Equity
Index Fund | | All America
Fund | | Small Cap
Value Fund | | Small Cap
Growth Fund | | Mid Cap
Value Fund | |
| 2010 | | $ | 0 | | | $ | 0 | | | $ | 0 | | | $ | 0 | | | $ | 0 | | |
| 2011 | | | 0 | | | | 0 | | | | 0 | | | | 0 | | | | 0 | | |
| 2012 | | | 0 | | | | 0 | | | | 0 | | | | 0 | | | | 0 | | |
| 2013 | | | 0 | | | | 0 | | | | 0 | | | | 0 | | | | 0 | | |
| 2014 | | | 0 | | | | 0 | | | | 0 | | | | 0 | | | | 0 | | |
| 2015 | | | 0 | | | | 0 | | | | 0 | | | | 0 | | | | 0 | | |
| 2016 | | | 7,606,847 | | | | 2,213,770 | | | | 13,708,502 | | | | 1,881,966 | | | | 314,010 | | |
| 2017 | | | 0 | | | | 16,386,898 | | | | 15,058,092 | | | | 28,341,185 | | | | 1,374,534 | | |
| 2018 | | | 0 | | | | 0 | | | | 0 | | | | 0 | | | | 0 | | |
| Total | | $ | 7,606,847 | | | $ | 18,600,668 | | | $ | 28,766,594 | | | $ | 30,223,151 | | | $ | 1,688,544 | | |
| Expiring on December 31, | | Mid-Cap
Equity Index
Fund | | International
Fund | | Composite
Fund | | Retirement
Income
Fund | | 2010
Retirement
Fund | |
| 2010 | | $ | 0 | | | $ | 0 | | | $ | 0 | | | $ | 0 | | | $ | 0 | | |
| 2011 | | | 0 | | | | 0 | | | | 0 | | | | 0 | | | | 0 | | |
| 2012 | | | 0 | | | | 0 | | | | 0 | | | | 0 | | | | 0 | | |
| 2013 | | | 0 | | | | 0 | | | | 0 | | | | 0 | | | | 0 | | |
| 2014 | | | 0 | | | | 0 | | | | 0 | | | | 0 | | | | 0 | | |
| 2015 | | | 0 | | | | 0 | | | | 0 | | | | 0 | | | | 0 | | |
| 2016 | | | 0 | | | | 0 | | | | 6,800,156 | | | | 0 | | | | 0 | | |
| 2017 | | | 0 | | | | 0 | | | | 11,795,277 | | | | 0 | | | | 0 | | |
| 2018 | | | 0 | | | | 0 | | | | 0 | | | | 0 | | | | 0 | | |
| Total | | $ | 0 | | | $ | 0 | | | $ | 18,595,433 | | | $ | 0 | | | $ | 0 | | |
93
MUTUAL OF AMERICA INVESTMENT CORPORATION
NOTES TO FINANCIAL STATEMENTS (Continued)
1. SIGNIFICANT ACCOUNTING POLICIES AND ORGANIZATION (CONTINUED)
| Expiring on December 31, | | 2015
Retirement
Fund | | 2020
Retirement
Fund | | 2025
Retirement
Fund | | 2030
Retirement
Fund | | 2035
Retirement
Fund | |
| 2010 | | $ | 0 | | | $ | 0 | | | $ | 0 | | | $ | 0 | | | $ | 0 | | |
| 2011 | | | 0 | | | | 0 | | | | 0 | | | | 0 | | | | 0 | | |
| 2012 | | | 0 | | | | 0 | | | | 0 | | | | 0 | | | | 0 | | |
| 2013 | | | 0 | | | | 0 | | | | 0 | | | | 0 | | | | 0 | | |
| 2014 | | | 0 | | | | 0 | | | | 0 | | | | 0 | | | | 0 | | |
| 2015 | | | 0 | | | | 0 | | | | 0 | | | | 0 | | | | 0 | | |
| 2016 | | | 0 | | | | 0 | | | | 0 | | | | 0 | | | | 0 | | |
| 2017 | | | 0 | | | | 0 | | | | 0 | | | | 0 | | | | 0 | | |
| 2018 | | | 0 | | | | 0 | | | | 0 | | | | 0 | | | | 0 | | |
| Total | | $ | 0 | | | $ | 0 | | | $ | 0 | | | $ | 0 | | | $ | 0 | | |
| Expiring on December 31, | | 2040
Retirement
Fund | | 2045
Retirement
Fund | | Conservative
Allocation
Fund | | Moderate
Allocation
Fund | | Aggressive
Allocation
Fund | |
| 2010 | | $ | 0 | | | $ | 0 | | | $ | 0 | | | $ | 0 | | | $ | 0 | | |
| 2011 | | | 0 | | | | 0 | | | | 0 | | | | 0 | | | | 0 | | |
| 2012 | | | 0 | | | | 0 | | | | 0 | | | | 0 | | | | 0 | | |
| 2013 | | | 0 | | | | 0 | | | | 0 | | | | 0 | | | | 0 | | |
| 2014 | | | 0 | | | | 0 | | | | 0 | | | | 0 | | | | 0 | | |
| 2015 | | | 0 | | | | 0 | | | | 0 | | | | 0 | | | | 0 | | |
| 2016 | | | 0 | | | | 0 | | | | 0 | | | | 0 | | | | 0 | | |
| 2017 | | | 0 | | | | 0 | | | | 0 | | | | 0 | | | | 518,634 | | |
| 2018 | | | 0 | | | | 0 | | | | 0 | | | | 0 | | | | 0 | | |
| Total | | $ | 0 | | | $ | 0 | | | $ | 0 | | | $ | 0 | | | $ | 518,634 | | |
| Expiring on December 31, | | Money
Market Fund | | Mid-Term
Bond Fund | | Bond
Fund | |
| 2010 | | $ | 0 | | | $ | 0 | | | $ | 0 | | |
| 2011 | | | 0 | | | | 0 | | | | 15,092,668 | | |
| 2012 | | | 0 | | | | 0 | | | | 171,798 | | |
| 2013 | | | 0 | | | | 0 | | | | 439,879 | | |
| 2014 | | | 0 | | | | 0 | | | | 3,306,785 | | |
| 2015 | | | 0 | | | | 0 | | | | 0 | | |
| 2016 | | | 0 | | | | 0 | | | | 0 | | |
| 2017 | | | 235 | | | | 0 | | | | 3,299,948 | | |
| 2018 | | | 0 | | | | 0 | | | | 0 | | |
| Total | | $ | 235 | | | $ | 0 | | | $ | 22,311,078 | | |
The Regulated Investment Company Modernization Act of 2010 (the "Act") was enacted on December 22, 2010. The Act makes changes to several tax rules impacting the Funds. In general, the provisions of the Act will be effective for the Funds' fiscal year ending December 31, 2011.
Under the Act, the Fund will be permitted to carry forward capital losses incurred in taxable years beginning after December 22, 2010 for an unlimited period. However, any losses incurred during those future taxable years will be required to be utilized prior to the losses incurred in pre-enactment taxable years. As a result of this ordering rule, pre-enactment capital loss carryforwards may be more likely to expire unused. Additionally, post-enactment capital losses that are carried forward will retain their character as either short-term or long-term capital losses rather than being considered all short-term as under previous law.
2. EXPENSES
The Investment Company has an Investment Advisory Agreement with Mutual of America Capital Management Corporation ("the Adviser"), an indirect wholly-owned subsidiary of Mutual of America Life. For providing investment management services to each of the Funds of the Investment Company, the Adviser receives a fee, calculated as a daily
94
MUTUAL OF AMERICA INVESTMENT CORPORATION
NOTES TO FINANCIAL STATEMENTS (Continued)
2. EXPENSES (CONTINUED)
charge, at the annual rate of .05% of the value of the net assets of the Retirement Funds, .075% of the value of the net assets of the Equity Index Fund, the Mid-Cap Equity Index Fund and the International Fund, .15% of the value of the net assets of the Money Market Fund, .40% of the value of the net assets of the All America Fund, Composite Fund, Mid-Term Bond Fund and Bond Fund, .55% of the value of the net assets of the Mid Cap Value Fund and .75% of the value of the net assets of the Small Cap Value Fund and Small Cap Growth Fund. The Adviser does not assess a fee for investment management to the Allocation Funds. However, shareholders in the Allocation Funds (and the Retirement Funds) will indirectly bear their pro-rata share of the investment management fees incurred by the underlying Funds in which they invest.
Prior to May 1, 2006, the Adviser's investment management fee was .125% of the value of the net assets of the Equity Index Fund and the Mid-Cap Equity Index Fund, .25% of the value of the net assets of the Money Market Fund, .50% of the value of the net assets of the All America Fund, Composite Fund, Mid-Term Bond Fund and Bond Fund, .65% of the value of the net assets of the Mid Cap Value Fund and .85% of the value of the net assets of the Small Cap Value Fund and Small Cap Growth Fund.
Through April 30, 2006, the Adviser contractually limited the expenses of each Fund, other than for brokers' commissions and other fees relating to portfolio transactions, to the amount of the advisory fee paid by the Funds to the Adviser. Effective May 1, 2006, the Adviser terminated its expense limitation policy and each Fund is charged with the full amount of its expenses. Investment company-wide expenses are allocated to each Fund based on its proportional share of net assets or equally, as appropriate.
3. INVESTMENTS
The cost of investment purchases and proceeds from sales of investments, excluding short-term securities and futures contracts, for the year ended December 31, 2010, were as follows:
| | | Equity Index
Fund | | All America
Fund | | Small Cap
Value Fund | | Small Cap
Growth Fund | | Mid Cap
Value Fund | |
| Cost of investment purchases | | $ | 74,022,527 | | | $ | 56,055,821 | | | $ | 95,504,980 | | | $ | 122,893,221 | | | $ | 18,417,386 | | |
| Proceeds from sales of investments | | $ | 35,012,712 | | | $ | 81,710,851 | | | $ | 78,676,662 | | | $ | 108,926,985 | | | $ | 12,991,321 | | |
| | | Mid-Cap
Equity Index
Fund | | International
Fund | | Composite
Fund | | Retirement
Income
Fund | | 2010
Retirement
Fund | |
| Cost of investment purchases | | $ | 83,196,201 | | | $ | 25,813,710 | | | $ | 57,137,756 | | | $ | 10,989,953 | | | $ | 6,314,075 | | |
| Proceeds from sales of investments | | $ | 53,397,251 | | | $ | 3,852,953 | | | $ | 70,459,629 | | | $ | 2,232,666 | | | $ | 2,986,381 | | |
| | | 2015
Retirement
Fund | | 2020
Retirement
Fund | | 2025
Retirement
Fund | | 2030
Retirement
Fund | | 2035
Retirement
Fund | |
| Cost of investment purchases | | $ | 32,302,466 | | | $ | 35,542,335 | | | $ | 33,100,185 | | | $ | 26,957,426 | | | $ | 20,819,262 | | |
| Proceeds from sales of investments | | $ | 3,365,802 | | | $ | 1,748,365 | | | $ | 1,836,030 | | | $ | 826,485 | | | $ | 538,730 | | |
| | | 2040
Retirement
Fund | | 2045
Retirement
Fund | | Conservative
Allocation
Fund | | Moderate
Allocation
Fund | | Aggressive
Allocation
Fund | |
| Cost of investment purchases | | $ | 19,347,268 | | | $ | 23,162,584 | | | $ | 19,996,672 | | | $ | 46,308,067 | | | $ | 29,929,476 | | |
| Proceeds from sales of investments | | $ | 436,699 | | | $ | 374,070 | | | $ | 8,616,522 | | | $ | 22,066,011 | | | $ | 16,502,438 | | |
| | | Money
Market Fund | | Mid-Term
Bond Fund | | Bond
Fund | |
| Cost of investment purchases | | | — | | | $ | 91,983,382 | | | $ | 286,792,602 | | |
| Proceeds from sales of investments | | | — | | | $ | 43,827,943 | | | $ | 215,715,470 | | |
The cost of short-term security purchases for the Money Market Fund for the year ended December 31, 2010, was $1,412,452,299; net proceeds from sales for the year were $1,422,568,178.
95
MUTUAL OF AMERICA INVESTMENT CORPORATION
NOTES TO FINANCIAL STATEMENTS (Continued)
3. INVESTMENTS (CONTINUED)
The components of net unrealized appreciation (depreciation) of investments for Federal income tax purposes and the cost of investments for Federal income tax purposes at December 31, 2010 for each of the funds were as follows. Differences with amounts reflected in the Statements of Assets and Liabilities arise principally from wash sales and the treatment of distributions from Real Estate Investment Trusts (REITs).
| | | Equity
Index Fund | | All America
Fund | | Small Cap
Value Fund | | Small Cap
Growth Fund | | Mid Cap
Value Fund | |
| Unrealized Appreciation | | $ | 218,299,010 | | | $ | 52,583,370 | | | $ | 66,947,788 | | | $ | 83,799,269 | | | $ | 8,263,664 | | |
| Unrealized Depreciation | | | (96,617,981 | ) | | | (30,053,977 | ) | | | (10,444,422 | ) | | | (3,469,929 | ) | | | (3,070,027 | ) | |
| Net | | $ | 121,681,029 | | | $ | 22,529,393 | | | $ | 56,503,366 | | | $ | 80,329,340 | | | $ | 5,193,637 | | |
| Tax Cost of Investments | | $ | 781,674,678 | | | $ | 247,739,755 | | | $ | 228,449,489 | | | $ | 200,312,160 | | | $ | 50,865,513 | | |
| | | Mid-Cap
Equity Index
Fund | | International
Fund | | Composite
Fund | | Retirement
Income
Fund | | 2010
Retirement
Fund | |
| Unrealized Appreciation | | $ | 105,308,527 | | | $ | 5,017,063 | | | $ | 18,761,450 | | | $ | 765,443 | | | $ | 2,061,818 | | |
| Unrealized Depreciation | | | (28,497,382 | ) | | | (1,576,769 | ) | | | (4,669,021 | ) | | | (209,600 | ) | | | (843,268 | ) | |
| Net | | $ | 76,811,145 | | | $ | 3,440,294 | | | $ | 14,092,429 | | | $ | 555,843 | | | $ | 1,218,550 | | |
| Tax Cost of Investments | | $ | 416,737,665 | | | $ | 57,743,144 | | | $ | 151,932,679 | | | $ | 17,589,832 | | | $ | 17,958,265 | | |
| | | 2015
Retirement
Fund | | 2020
Retirement
Fund | | 2025
Retirement
Fund | | 2030
Retirement
Fund | | 2035
Retirement
Fund | |
| Unrealized Appreciation | | $ | 8,381,026 | | | $ | 9,461,992 | | | $ | 10,109,378 | | | $ | 9,099,435 | | | $ | 7,631,402 | | |
| Unrealized Depreciation | | | (2,471,346 | ) | | | (1,876,443 | ) | | | (965,199 | ) | | | (908,976 | ) | | | (580,065 | ) | |
| Net | | $ | 5,909,680 | | | $ | 7,585,549 | | | $ | 9,144,179 | | | $ | 8,190,459 | | | $ | 7,051,337 | | |
| Tax Cost of Investments | | $ | 72,218,406 | | | $ | 82,869,590 | | | $ | 71,374,489 | | | $ | 59,212,423 | | | $ | 45,789,544 | | |
| | | 2040
Retirement
Fund | | 2045
Retirement
Fund | | Conservative
Allocation
Fund | | Moderate
Allocation
Fund | | Aggressive
Allocation
Fund | |
| Unrealized Appreciation | | $ | 7,081,377 | | | $ | 8,525,500 | | | $ | 2,979,571 | | | $ | 12,812,328 | | | $ | 10,237,372 | | |
| Unrealized Depreciation | | | (373,246 | ) | | | (407,252 | ) | | | (1,592,444 | ) | | | (6,600,781 | ) | | | (4,252,535 | ) | |
| Net | | $ | 6,708,131 | | | $ | 8,118,248 | | | $ | 1,387,127 | | | $ | 6,211,547 | | | $ | 5,984,837 | | |
| Tax Cost of Investments | | $ | 39,923,521 | | | $ | 45,689,917 | | | $ | 50,345,448 | | | $ | 156,475,577 | | | $ | 141,419,188 | | |
| | | Money
Market Fund | | Mid-Term
Bond Fund | | Bond
Fund | |
| Unrealized Appreciation | | $ | 2,100 | | | $ | 12,983,383 | | | $ | 22,706,314 | | |
| Unrealized Depreciation | | | (11 | ) | | | (1,077,255 | ) | | | (2,937,488 | ) | |
| Net | | $ | 2,089 | | | $ | 11,906,128 | | | $ | 19,768,826 | | |
| Tax Cost of Investments | | $ | 108,811,710 | | | $ | 282,143,530 | | | $ | 572,434,959 | | |
96
MUTUAL OF AMERICA INVESTMENT CORPORATION
NOTES TO FINANCIAL STATEMENTS (Continued)
4. CAPITAL SHARE ACTIVITY
The Investment Company has registered an indefinite number of its capital shares pursuant to Rule 24f-2 under the Investment Company Act of 1940. As of December 31, 2010, shares authorized were allocated into the 23 series of Funds as follows:
| | | Authorized No. of Shares | |
| Equity Index Fund | | | 500,000,000 | | |
| All America Fund | | | 400,000,000 | | |
| Small Cap Value Fund | | | 350,000,000 | | |
| Small Cap Growth Fund | | | 350,000,000 | | |
| Mid Cap Value Fund | | | 100,000,000 | | |
| Mid-Cap Equity Index Fund | | | 400,000,000 | | |
| International Fund | | | 100,000,000 | | |
| Composite Fund | | | 200,000,000 | | |
| Retirement Income Fund | | | 50,000,000 | | |
| 2010 Retirement Fund | | | 50,000,000 | | |
| 2015 Retirement Fund | | | 100,000,000 | | |
| 2020 Retirement Fund | | | 100,000,000 | | |
| 2025 Retirement Fund | | | 100,000,000 | | |
| 2030 Retirement Fund | | | 100,000,000 | | |
| 2035 Retirement Fund | | | 100,000,000 | | |
| 2040 Retirement Fund | | | 100,000,000 | | |
| 2045 Retirement Fund | | | 100,000,000 | | |
| Conservative Allocation Fund | | | 100,000,000 | | |
| Moderate Allocation Fund | | | 200,000,000 | | |
| Aggressive Allocation Fund | | | 200,000,000 | | |
| Money Market Fund | | | 350,000,000 | | |
| Mid-Term Bond Fund | | | 350,000,000 | | |
| Bond Fund | | | 450,000,000 | | |
| Sub-Total | | | 4,850,000,000 | | |
| Shares to be allocated at the discretion of the Board of Directors | | | 150,000,000 | | |
| Total | | | 5,000,000,000 | | |
See Footnote 6, "Subequent Event," for information regarding changes to the allocation of authorized shares among funds that took place in January 2011.
5. DIVIDENDS
On December 30, 2010, dividend distributions were declared and paid or accrued for each of the funds from net investment income and, as applicable, from net realized gains on investment transactions. Additionally, remaining required distributions relating to 2009 were made in accordance with Internal Revenue Sec. 855(a) and paid on September 7, 2010. Pursuant to shareholders' instructions, substantially all dividend distributions throughout 2010 and 2009 were immediately reinvested into their respective funds. The tax character of the distributions paid during 2010 and 2009 was as follows:
| | | Equity
Index Fund | | All America
Fund | | Small Cap
Value Fund | | Small Cap
Growth | | Mid Cap
Value Fund | |
| Ordinary Income (a) | | | |
| | 2010 | | | $ | 14,303,185 | | | $ | 3,289,983 | | | $ | 2,642,181 | | | $ | 0 | | | $ | 580,763 | | |
| | 2009 | | | $ | 12,136,940 | | | $ | 4,552,237 | | | $ | 2,026,043 | | | $ | 0 | | | $ | 505,962 | | |
| Long-Term Capital Gains (b) | | | |
| | 2010 | | | $ | 0 | | | $ | 0 | | | $ | 0 | | | $ | 0 | | | $ | 0 | | |
| | 2009 | | | $ | 0 | | | $ | 0 | | | $ | 0 | | | $ | 0 | | | $ | 0 | | |
| Return of Capital | | | |
| | 2010 | | | $ | 0 | | | $ | 0 | | | $ | 0 | | | $ | 0 | | | $ | 0 | | |
| | 2009 | | | $ | 0 | | | $ | 0 | | | $ | 147,499 | | | $ | 0 | | | $ | 20,110 | | |
97
MUTUAL OF AMERICA INVESTMENT CORPORATION
NOTES TO FINANCIAL STATEMENTS (Continued)
5. DIVIDENDS (CONTINUED)
| | | Mid-Cap
Equity
Index Fund | | International
Fund | | Composite
Fund | | Retirement
Fund | | 2010
Retirement
Fund | |
| Ordinary Income (a) | | | |
| | 2010 | | | $ | 7,789,431 | | | $ | 1,504,558 | | | $ | 4,166,967 | | | $ | 263,708 | | | $ | 26,710 | | |
| | 2009 | | | $ | 6,215,815 | | | $ | 716,989 | | | $ | 4,490,475 | | | $ | 3,557 | | | $ | 398,217 | | |
| Long-Term Capital Gains (b) | | | |
| | 2010 | | | $ | 8,848,636 | | | $ | 0 | | | $ | 0 | | | $ | 172,945 | | | $ | 71,240 | | |
| | 2009 | | | $ | 1,003,979 | | | $ | 0 | | | $ | 0 | | | $ | 0 | | | $ | 0 | | |
| Return of Capital | | | |
| | 2010 | | | $ | 0 | | | $ | 0 | | | $ | 0 | | | $ | 0 | | | $ | 0 | | |
| | 2009 | | | $ | 0 | | | $ | 279,706 | | | $ | 0 | | | $ | 0 | | | $ | 16,645 | | |
| | | 2015
Retirement
Fund | | 2020
Retirement
Fund | | 2025
Retirement
Fund | | 2030
Retirement
Fund | | 2035
Retirement
Fund | |
| Ordinary Income (a) | | | |
| | 2010 | | | $ | 63,956 | | | $ | 43,965 | | | $ | 97,929 | | | $ | 110,038 | | | $ | 93,247 | | |
| | 2009 | | | $ | 1,083,373 | | | $ | 1,160,492 | | | $ | 869,097 | | | $ | 668,472 | | | $ | 472,250 | | |
| Long-Term Capital Gains (b) | | | |
| | 2010 | | | $ | 77,361 | | | $ | 121,062 | | | $ | 75,919 | | | $ | 42,053 | | | $ | 34,003 | | |
| | 2009 | | | $ | 0 | | | $ | 53,684 | | | $ | 20,555 | | | $ | 8,971 | | | $ | 12,760 | | |
| Return of Capital | | | |
| | 2010 | | | $ | 0 | | | $ | 0 | | | $ | 0 | | | $ | 0 | | | $ | 0 | | |
| | 2009 | | | $ | 54,360 | | | $ | 978 | | | $ | 5,210 | | | $ | 3,475 | | | $ | 340 | | |
| | | 2040
Retirement
Fund | | 2045
Retirement
Equity Fund | | Conservative
Allocation
Fund | | Moderate
Allocation
Fund | | Aggressive
Allocation
Fund | |
| Ordinary Income (a) | | | |
| | 2010 | | | $ | 85,340 | | | $ | 85,259 | | | $ | 1,380 | | | $ | 216,675 | | | $ | 400,140 | | |
| | 2009 | | | $ | 382,954 | | | $ | 409,630 | | | $ | 1,243,401 | | | $ | 3,440,880 | | | $ | 2,105,087 | | |
| Long-Term Capital Gains (b) | | | |
| | 2010 | | | $ | 32,272 | | | $ | 32,852 | | | $ | 214,954 | | | $ | 632,136 | | | $ | 0 | | |
| | 2009 | | | $ | 11,661 | | | $ | 10,437 | | | $ | 186,851 | | | $ | 0 | | | $ | 0 | | |
| Return of Capital | | | |
| | 2010 | | | $ | 0 | | | $ | 0 | | | $ | 0 | | | $ | 0 | | | $ | 0 | | |
| | 2009 | | | $ | 131 | | | $ | 1,040 | | | $ | 0 | | | $ | 105,339 | | | $ | 0 | | |
| | | Money
Market Fund | | Mid-Term
Bond Fund | | Bond
Fund | |
| Ordinary Income (a) | | | |
| | 2010 | | | $ | 0 | | | $ | 9,734,898 | | | $ | 20,675,187 | | |
| | 2009 | | | $ | 103,447 | | | $ | 8,746,678 | | | $ | 19,172,093 | | |
| Long-Term Capital Gains (b) | | | |
| | 2010 | | | $ | 0 | | | $ | 474,362 | | | $ | 0 | | |
| | 2009 | | | $ | 0 | | | $ | 2,161,094 | | | $ | 0 | | |
| Return of Capital | | | |
| | 2010 | | | $ | 0 | | | $ | 0 | | | $ | 0 | | |
| | 2009 | | | $ | 0 | | | $ | 0 | | | $ | 0 | | |
Notes:
(a) Includes distributions from Fund-level net short-term capital gains.
(b) To the extent reported, each Fund designates these amounts as capital gain dividends for Federal income tax purposes.
98
MUTUAL OF AMERICA INVESTMENT CORPORATION
NOTES TO FINANCIAL STATEMENTS (Continued)
5. DIVIDENDS (CONTINUED)
Undistributed net income and gains (losses) — As of December 31, 2010, undistributed net income and undistributed accumulated gain (loss) on a tax basis were as follows:
| | | Equity Index
Fund | | All America
Fund | | Small Cap
Value Fund | | Small Cap
Growth Fund | | Mid Cap
Value Fund | |
Accumulated undistributed net
investment income | | $ | 2,951,415 | | | $ | 3,230,347 | | | $ | 0 | | | $ | 0 | | | $ | 0 | | |
Accumulated undistributed net realized
gain/(loss) on investments
and futures contracts | | $ | (7,606,847 | ) | | $ | (18,600,668 | ) | | $ | (29,088,385 | ) | | $ | (30,223,151 | ) | | $ | (1,724,754 | ) | |
Net unrealized appreciation (depreciation)
of investments and futures contracts | | $ | 121,681,029 | | | $ | 22,529,393 | | | $ | 56,503,366 | | | $ | 80,329,341 | | | $ | 5,193,637 | | |
| | | Mid-Cap
Equity Index
Fund | | International
Fund | | Composite
Fund | | Retirement
Income
Fund | | 2010
Retirement
Fund | |
Accumulated undistributed net
investment income | | $ | 1,132,561 | | | $ | 6,662 | | | $ | 3,739,588 | | | $ | 468,628 | | | $ | 429,453 | | |
Accumulated undistributed net realized
gain/(loss) on investments
and futures contracts | | $ | 8,156,639 | | | $ | 211,930 | | | $ | (18,595,433 | ) | | $ | 47,419 | | | $ | 25,781 | | |
Net unrealized appreciation (depreciation)
of investments and futures contracts | | $ | 76,811,145 | | | $ | 3,440,294 | | | $ | 14,092,429 | | | $ | 555,843 | | | $ | 1,218,550 | | |
| | | 2015
Retirement
Fund | | 2020
Retirement
Fund | | 2025
Retirement
Fund | | 2030
Retirement
Fund | | 2035
Retirement
Fund | |
Accumulated undistributed net
investment income | | $ | 1,673,162 | | | $ | 1,877,029 | | | $ | 1,439,888 | | | $ | 1,098,228 | | | $ | 788,269 | | |
Accumulated undistributed net realized
gain/(loss) on investments
and futures contracts | | $ | 120,136 | | | $ | 139,097 | | | $ | 201,103 | | | $ | 195,986 | | | $ | 173,801 | | |
Net unrealized appreciation (depreciation)
of investments and futures contracts | | $ | 5,909,680 | | | $ | 7,585,549 | | | $ | 9,144,179 | | | $ | 8,190,459 | | | $ | 7,051,337 | | |
| | | 2040
Retirement
Fund | | 2045
Retirement
Fund | | Conservative
Allocation
Fund | | Moderate
Allocation
Fund | | Aggressive
Allocation
Fund | |
Accumulated undistributed net
investment income | | $ | 670,393 | | | $ | 759,321 | | | $ | 1,499,648 | | | $ | 3,821,299 | | | $ | 2,784,610 | | |
Accumulated undistributed net realized
gain/(loss) on investments
and futures contracts | | $ | 182,882 | | | $ | 173,340 | | | $ | 19,438 | | | $ | 304,509 | | | $ | (518,634 | ) | |
Net unrealized appreciation (depreciation)
of investments and futures contracts | | $ | 6,708,131 | | | $ | 8,118,248 | | | $ | 1,387,127 | | | $ | 6,211,547 | | | $ | 5,984,837 | | |
| | | Money
Market Fund | | Mid-Term
Bond Fund | | Bond
Fund | |
Accumulated undistributed net
investment income | | $ | 0 | | | $ | 219,145 | | | $ | 300,944 | | |
Accumulated undistributed net realized
gain/(loss) on investments
and futures contracts | | $ | (235 | ) | | $ | 0 | | | $ | (22,311,078 | ) | |
Net unrealized appreciation (depreciation)
of investments and futures contracts | | $ | 2,089 | | | $ | 11,906,128 | | | $ | 19,768,826 | | |
99
MUTUAL OF AMERICA INVESTMENT CORPORATION
NOTES TO FINANCIAL STATEMENTS (Continued)
5. DIVIDENDS (CONTINUED)
The difference between the components of distributable earnings on a tax basis and the amounts reflected in the statements of assets and liabilities are primarily due to wash sales, post-October losses and the Federal income tax treatment of futures contracts.
Reclassifications — Periodically, the Funds may reclassify book to tax differences as a result of the differences arising from the accounting for REIT securities, non-deductible net operating loss, return of capital distributions and Fund distributions for Federal income tax purposes versus financial reporting purposes. Each Fund's net assets are not affected by these reclassifications.
During the year ended December 31, 2010, each Fund reclassified the following book to tax differences [increases (decreases)]:
| | | Equity
Index Fund | | All America
Fund | | Small Cap
Value Fund | | Small Cap
Growth Fund | | Mid Cap
Value Fund | |
| Accumulated undistributed net investment income | | $ | (138,022 | ) | | $ | 2,128 | | | $ | 323,129 | | | $ | 582,635 | | | $ | (1,206 | ) | |
Accumulated undistributed net realized gains
(loss) on investments and futures contracts | | $ | 138,022 | | | $ | (84 | ) | | $ | (176,348 | ) | | $ | 69,679 | | | $ | 47,698 | | |
| Paid in capital | | $ | 0 | | | $ | (2,044 | ) | | $ | (146,781 | ) | | $ | (652,314 | ) | | $ | (46,492 | ) | |
| | | Mid-Cap
Equity Index
Fund | | International
Fund | | Composite
Fund | | Retirement
Income
Fund | | 2010
Retirement
Fund | |
| Accumulated undistributed net investment income | | $ | (543,690 | ) | | $ | 0 | | | $ | (11,427 | ) | | $ | 9,469 | | | $ | 21,164 | | |
Accumulated undistributed net realized gains
(loss) on investments and futures contracts | | $ | 543,690 | | | $ | 0 | | | $ | 16,303,852 | | | $ | (9,469 | ) | | $ | (21,164 | ) | |
| Paid in capital | | $ | 0 | | | $ | 0 | | | $ | (16,292,425 | ) | | $ | 0 | �� | | $ | 0 | | |
| | | 2015
Retirement
Fund | | 2020
Retirement
Fund | | 2025
Retirement
Fund | | 2030
Retirement
Fund | | 2035
Retirement
Fund | |
| Accumulated undistributed net investment income | | $ | 64,976 | | | $ | 71,254 | | | $ | 80,716 | | | $ | 76,691 | | | $ | 69,895 | | |
Accumulated undistributed net realized gains
(loss) on investments and futures contracts | | $ | (64,976 | ) | | $ | (71,254 | ) | | $ | (80,716 | ) | | $ | (76,691 | ) | | $ | (69,895 | ) | |
| Paid in capital | | $ | 0 | | | $ | 0 | | | $ | 0 | | | $ | 0 | | | $ | 0 | | |
| | | 2040
Retirement
Fund | | 2045
Retirement
Fund | | Conservative
Allocation
Fund | | Moderate
Allocation
Fund | | Aggressive
Allocation
Fund | |
| Accumulated undistributed net investment income | | $ | 70,616 | | | $ | 67,348 | | | $ | 11,985 | | | $ | 179,103 | | | $ | 193,604 | | |
Accumulated undistributed net realized gains
(loss) on investments and futures contracts | | $ | (70,616 | ) | | $ | (67,348 | ) | | $ | (11,985 | ) | | $ | (179,103 | ) | | $ | (193,604 | ) | |
| Paid in capital | | $ | 0 | | | $ | 0 | | | $ | 0 | | | $ | 0 | | | $ | 0 | | |
| | | Money
Market Fund | | Mid-Term
Bond Fund | | Bond
Fund | |
| Accumulated undistributed net investment income | | $ | 170,330 | | | $ | 6,692 | | | $ | 0 | | |
Accumulated undistributed net realized gains
(loss) on investments and futures contracts | | $ | 0 | | | $ | 6,009 | | | $ | 0 | | |
| Paid in capital | | $ | (170,330 | ) | | $ | (12,701 | ) | | $ | 0 | | |
These reclassifications were made as a result of the differences arising from the disallowance of net operating losses, expiration of capital loss carryforwards, distributions from REITs, distribution reclassifications and other cumulative adjustments for Federal income tax purposes versus financial reporting purposes.
100
MUTUAL OF AMERICA INVESTMENT CORPORATION
NOTES TO FINANCIAL STATEMENTS (Continued)
6. SUBSEQUENT EVENT
On January 12, 2011, the Board of Directors of the Investment Company made the following reallocations of authorized shares among the funds noted below. As a result, the amount of unallocated shares increased by 50,000,000 to 200,000,000. No change to the total amount of authorized shares was made.
| Fund | | Number of Allocated
Shares as of
December 31, 2010 | | January 12, 2011
Increase (Decrease) | | Number of Allocated
Shares as of
January 12, 2011 | |
| Money Market Fund | | | 350,000,000 | | | | (100,000,000 | ) | | | 250,000,000 | | |
| All America Fund | | | 400,000,000 | | | | (100,000,000 | ) | | | 300,000,000 | | |
| Bond Fund | | | 450,000,000 | | | | 50,000,000 | | | | 500,000,000 | | |
| International Fund | | | 100,000,000 | | | | 25,000,000 | | | | 125,000,000 | | |
| 2020 Retirement Fund | | | 100,000,000 | | | | 50,000,000 | | | | 150,000,000 | | |
| 2025 Retirement Fund | | | 100,000,000 | | | | 25,000,000 | | | | 125,000,000 | | |
101
REPORT OF INDEPENDENT REGISTERED PUBLIC ACCOUNTING FIRM
The Shareholders and Board of Directors
of Mutual of America Investment Corporation:
We have audited the accompanying statement of assets and liabilities of Mutual of America Investment Corporation (comprised of: Equity Index Fund, All America Fund, Small Cap Value Fund, Small Cap Growth Fund, Mid Cap Value Fund, Mid-Cap Equity Index Fund, International Fund, Composite Fund, Retirement Income Fund, 2010 Retirement Fund, 2015 Retirement Fund, 2020 Retirement Fund, 2025 Retirement Fund, 2030 Retirement Fund, 2035 Retirement Fund, 2040 Retirement Fund, 2045 Retirement Fund, Conservative Allocation Fund, Moderate Allocation Fund, Aggressive Allocation Fund, Money Market Fund, Mid-Term Bond Fund and Bond Fund (collectively, the "Funds")), including the portfolios of investments in securities for the Conservative Allocation Fund, Moderate Allocation Fund, Aggressive Allocation Fund, Money Market Fund, International Fund, Retirement Income Fund, 2010 Retirement Fund, 2015 Retirement Fund, 2020 Retirement Fund, 2025 Retirement Fund, 2030 Retirement Fund, 2035 Retirement Fund, 2040 Retirement Fund and 2045 Retirement Fund, and the summary portfolios of investments in securities for each of the remaining Funds as of December 31, 2010, and the related statements of operations for the year then ended, the statements of changes in net assets for each of the years in the two-year period then ended, and the financial highlights for each of the years or period in the five-year period then ended. These financial statements and financial highlights are the responsibility of the Funds' management. Our responsibility is to express an opinion on these financial statements and financial highlights based on our audits.
We conducted our audits in accordance with the standards of the Public Company Accounting Oversight Board (United States). Those standards require that we plan and perform the audit to obtain reasonable assurance about whether the financial statements and financial highlights are free of material misstatement. An audit includes examining, on a test basis, evidence supporting the amounts and disclosures in the financial statements. Our procedures included confirmation of securities owned as of December 31, 2010, by correspondence with the custodian and brokers. An audit also includes assessing the accounting principles used and significant estimates made by management, as well as evaluating the overall financial statement presentation. We believe that our audits provide a reasonable basis for our opinion.
In our opinion, the financial statements and financial highlights referred to above present fairly, in all material respects, the financial position of each of the aforementioned Funds of Mutual of America Investment Corporation as of December 31, 2010, the results of their operations for the year then ended, the changes in their net assets for each of the years in the two-year period then ended, and the financial highlights for each of the years or period in the five-year period then ended, in conformity with U.S. generally accepted accounting principles.

February 25, 2011
102
MUTUAL OF AMERICA INVESTMENT CORPORATION
Directors and Officers — unaudited
The tables below show information about the Directors and officers of the Investment Company. The address of each Director and officer is c/o Mutual of America Investment Corporation, 320 Park Avenue, New York, New York 10022. The Investment Company does not hold annual meetings of shareholders, and each Director has been elected by shareholders to serve until a successor is duly elected at a meeting of shareholders called for the purpose of electing directors. Each officer of the Investment Company has been elected by the Board of Directors to serve until a successor is duly elected. The Independent Directors do not serve as directors of any other fund that is affiliated with the Adviser or Mutual of America with the sole exception of Patrick J. Waide, Jr., who serves on the boards of Mutual of America Investment Corporation and Mutual of America Institutional Funds, Inc. The Interested Directors and officers of the Investment Company do not receive compensation from the Investment Company for their service.
The Investment Company's Statement of Additional Information ("SAI"), filed with the Securities and Exchange Commission, contains additional information about the Investment Company's Directors and Officers. A copy of the latest SAI can be obtained, without charge, by writing to Mutual of America Investment Corporation at 320 Park Avenue, New York, NY 10022-6839 or by calling 1-800-468-3785 or through the following websites: http://www.mutualofamerica.com or http://www.sec.gov.
Independent Directors
| Name and Age | | Length of
Time Served | | Principal Occupation(s)
in Past Five Years | | Other Directorships
Held by Director | |
Kevin M. Kearney
age 58 | | since May 2008 | | Partner, Wingate, Kearney & Cullen | | Concern Worldwide, USA | |
|
George Mertz
age 82 | | since 1989 | | Retired, since September 1994 | | None | |
|
Howard J. Nolan
age 74 | | since 1989 | | President & CEO, United Way of San Antonio & Bexar County | | None | |
|
Margaret M. Smyth
age 47 | | since February 2007 | | Vice President Finance and Chief Financial Officer, Hamilton Sundstrand; prior thereto Vice President, Controller, United Technologies Corporation; prior thereto Vice President and Chief Accounting Officer, 3M Company | | Member, Henry Crown Fellowship Program, Aspen Institute; Member, Business Executives for National Security; Trustee, Concern Worldwide (U.S.) Inc.; Trustee and Trustee Fellow, Fordham University; Executive Board Member, Committee on Financial Reporting, Financial Executives International; Member, Interpretations Committee, International Accounting Standards Group | |
|
Patrick J. Waide, Jr.
age 73 | | since 2003 | | | | Trustee, John Simon Guggenheim Memorial Foundation; Director, The National Catholic Reporter Publishing Company; Director, Mutual of America Institutional Funds, Inc. | |
|
103
Independent Directors
| Name and Age | | Length of
Time Served | | Principal Occupation(s)
in Past Five Years | | Other Directorships
Held by Director | |
William Whiston
age 57 | | since February 2011 | | Chief Financial Officer, the Archdiocese of New York; Adjunct Professor in Finance, Fordham University Graduate School of Business; prior thereto Executive Vice President and Member, United States Management Board of Allied Irish Bank | | Trustee and Treasurer, Trustees of St. Patrick's Cathedral in New York City; Trustee, St. Joseph's Seminary; Trustee, New York Medical College | |
|
Interested Director
| Name and Age | | Length of
Time Served | | Principal Occupation(s)
in Past Five Years | | Other Directorships
Held by Director | |
John R. Greed
Chairman of the Board, President and Chief Executive Officer, age 50 | | since September 2003 | | Senior Executive Vice President and Chief Financial Officer, Mutual of America and Mutual of America Holding Company, Inc. since December 2007; prior thereto, Senior Executive Vice President and Treasurer; Chairman of the Board, President and Chief Executive Officer, Mutual of America Institutional Funds, Inc., prior thereto Senior Executive Vice President, Chief Financial Officer and Treasurer, Mutual of America Institutional Funds and Mutual of America Capital Management Corporation | | Mutual of America Holding Company, Inc. Mutual of America Institutional Funds, Inc. | |
|
Mr. Greed is an "interested person" as an officer of the Adviser and of affiliates of the Adviser.
Officers
| Name, Position and Age | | Length of
Time Served | | Principal Occupation(s)
in Past Five Years | | Other Directorships
Held by Director | |
James J. Roth
Executive Vice President and General Counsel, age 61 | | since April 2009 | | Executive Vice President and General Counsel, Mutual of America, prior thereto, Executive Vice President, Deputy General Counsel, prior thereto, Executive Vice President and Chief Compliance Officer, prior thereto Vice President and Associate General Counsel; Executive Vice President and General Counsel, Mutual of America Capital Management Corporation, Mutual of America Securities Corporation, and Mutual of America Institutional Funds, Inc; Chairman, President and Chief Executive Officer, Mutual of America Holding Company, Inc. | | Mutual of America; Mutual of America Holding Company, Inc.; Mutual of America Foundation; Respect for Law Alliance; Stuyvesant Town Peter Cooper Village Tenants Association | |
|
104
Officers
| Name, Position and Age | | Length of
Time Served | | Principal Occupation(s)
in Past Five Years | | Other Directorships
Held by Director | |
George L. Medlin
Executive Vice President, Chief Financial Officer and Treasurer, age 58 | | since July 2010 | | Executive Vice President and Treasurer, Mutual of America; prior thereto, Executive Vice President, Internal Audit, Mutual of America; Executive Vice President, Chief Financial Officer and Treasurer, Mutual of America Institutional Funds, Inc. | | Director and Board Treasurer, Nassau County Coalition Against Domestic Violence | |
|
Thomas L. Martin
Executive Vice President and Secretary, age 61 | | since 2003 | | Executive Vice President and Deputy General Counsel, Mutual of America since November 2008; prior thereto, Senior Vice President and Associate General Counsel | | None | |
|
Kathryn Lu
Executive Vice President and Chief Compliance Officer, age 50 | | since July 2008 | | Executive Vice President and Chief Compliance Officer, Mutual of America, prior thereto Senior Vice President and Chief Compliance Officer, Mutual of America, prior thereto Senior Vice President and Associate General Counsel, Mutual of America; Executive Vice President and Chief Compliance Officer, Mutual of America Institutional Funds, Inc. | | None | |
|
John Corrigan
Executive Vice President and Internal Auditor, age 50 | | since February 2008 | | Executive Vice President and Internal Auditor, Mutual of America, prior thereto Senior Vice President and Internal Auditor, Mutual of America; Executive Vice President and Internal Auditor, Mutual of America Institutional Funds, Inc. | | None | |
|
105
MUTUAL OF AMERICA INVESTMENT CORPORATION
ADDITIONAL INFORMATION
Quarterly Portfolio Schedules
Included in this Annual Report are summary schedules of Mutual of America Investment Corporation's ("Investment Company") Fund portfolio holdings as of December 31, 2010. The Investment Company files complete schedules of Fund portfolio holdings with the Securities and Exchange Commission ("SEC") for the first and third quarters of each fiscal year on Form N-Q and for the second and fourth quarters of each fiscal year on Form N-CSR. The Forms N-Q and N-CSR are available on the SEC's website at http://www.sec.gov. Additionally, the Forms N-Q and N-CSR may be reviewed and copied at the SEC's Public Reference Room in Washington, DC. Information on the operation of the Public Reference Room may be obtained by calling 1-800-SEC-0330.
Proxy Voting Policies and Procedures
A copy of the Investment Company's proxy voting policies and procedures can be obtained free of charge by calling 1-800-468-3785. It is also available on the SEC's website at http://www.sec.gov.
Information regarding how the Investment Company voted proxies relating to portfolio securities during the 12-month period ended June 30, 2010 is available without charge by calling 1-800-468-3785. It is also available on the SEC website.
Supplemental Dividend Information — Unaudited
Dividends from the International, Mid-Term Bond and Bond Funds do not qualify for the corporate dividends received deduction. The Small Cap Growth and Money Market Funds did not distribute any dividends during 2010. The following are the percentages of the ordinary dividends distributed in 2010 by the other Investment Corporation Funds that qualify for the corporate dividends received deduction:
| | | Equity
Index Fund | | All America
Fund | | Small Cap
Value Fund | | Mid-Cap
Equity Index
Fund | | Mid Cap
Value Fund | |
Ordinary dividend qualifying
percentage | | | 100.0 | % | | | 100.0 | % | | | 100.0 | % | | | 61.54 | % | | | 100.0 | % | |
| | | Composite
Fund | | Retirement
Income Fund | | 2010
Retirement
Fund | | 2015
Retirement
Fund | | 2020
Retirement
Fund | |
Ordinary dividend qualifying
percentage | | | 47.01 | % | | | 12.20 | % | | | 23.21 | % | | | 27.46 | % | | | 32.71 | % | |
| | | 2025
Retirement
Fund | | 2030
Retirement
Fund | | 2035
Retirement
Fund | | 2040
Retirement
Fund | | 2045
Retirement
Fund | |
Ordinary dividend qualifying
percentage | | | 42.33 | % | | | 47.22 | % | | | 52.87 | % | | | 52.01 | % | | | 52.37 | % | |
| | | Conservative
Allocation
Fund | | Moderate
Allocation
Fund | | Aggressive
Allocation
Fund | |
| |
| |
Ordinary dividend qualifying
percentage | | | 11.82 | % | | | 28.43 | % | | | 48.32 | % | | | | | | | | | |
106
Important tax information: The following amounts of 2010 Investment Corporation Fund long-term capital gains (if any) have been designated as capital gains dividends.
| | | Equity
Index Fund | | All America
Fund | | Small Cap
Value Fund | | Small Cap
Growth Fund | | Mid-Cap
Equity Index
Fund | |
Dividends qualifying for reduced
long-term capital gains tax rate | | $ | 0 | | | $ | 0 | | | $ | 0 | | | $ | 0 | | | $ | 8,848,636 | | |
| | | Mid Cap
Value Fund | | International | | Composite
Fund | | Retirement
Income
Fund | | 2010
Retirement
Fund | |
Dividends qualifying for reduced
long-term capital gains tax rate | | $ | 0 | | | $ | 0 | | | $ | 0 | | | $ | 172,945 | | | $ | 71,240 | | |
| | | 2015
Retirement
Fund | | 2020
Retirement
Fund | | 2025
Retirement
Fund | | 2030
Retirement
Fund | | 2035
Retirement
Fund | |
Dividends qualifying for reduced
long-term capital gains tax rate | | $ | 77,361 | | | $ | 121,062 | | | $ | 75,919 | | | $ | 42,053 | | | $ | 34,003 | | |
| | | 2040
Retirement
Fund | | 2045
Retirement
Fund | | Conservative
Allocation
Fund | | Moderate
Allocation
Fund | | Aggressive
Allocation
Fund | |
Dividends qualifying for reduced
long-term capital gains tax rate | | $ | 32,272 | | | $ | 32,852 | | | $ | 214,954 | | | $ | 632,136 | | | $ | 0 | | |
| | | Money
Market Fund | | Mid-Term
Bond Fund | |
Bond Fund | |
| |
| |
Dividends qualifying for reduced
long-term capital gains tax rate | | $ | 0 | | | $ | 474,362 | | | $ | 0 | | | | | | | | | | |
107
(This page has been left blank intentionally.)
MUTUAL OF AMERICA
LIFE INSURANCE COMPANY
320 PARK AVENUE
NEW YORK, NY 10022-6839
www.mutualofamerica.com

320 PARK AVENUE
NEW YORK NY 10022-6839
ADDRESS SERVICE REQUESTED

You can receive these and other important documents electronically. Sign up for eDocuments and we'll waive the monthly participant charge.
Find out more at mutualofamerica.com
or call 1-800-468-3785.
ITEM 2. CODE OF ETHICS.
Mutual of America Investment Corporation has adopted a Code of Ethics that applies to its principal executive and financial officers, as well as all Access Persons as defined under Rule 17j-1 of the Investment Company Act of 1940. The Code consists of two sections. The first section, designated as Section A, is the Code of Ethics required under Rule 17j-1. Section A requires those subject to it to submit periodic reports detailing their securities holdings and transactions (subject to several exemptions contained in the rules) and requires pre-approval for certain securities transactions by such persons, including purchases and sales of reportable securities, investments in initial public offerings and private placements.
The second section, designated as Section B, is to assure compliance with the Code of Ethics requirements of Section 406 of the Sarbanes-Oxley Act of 2002. It applies specifically to the Corporation’s principal executive and financial officers.
The two sections are not mutually exclusive and must be observed independently by each person to whom they are intended to apply. Section A applies to all individuals while Section B applies to the individuals designated in Section B. Both Sections explicitly require those individuals subject to the provisions of the Code of Ethics to promptly report violations of the Code of Ethics to the Chief Compliance Officer.
There have been no amendments to Section A or B during the period covered by this report.
The Annual Report to Shareholders includes information on how to obtain a copy of the Code of Ethics at no charge.
ITEM 3. AUDIT COMMITTEE FINANCIAL EXPERT.
(a) (1) Mutual of America Investment Corporation’s Board of Directors has determined that one audit committee financial expert serves on its Audit Committee.
(a) (2) The audit committee financial expert is Patrick J. Waide, Jr. He was Senior Vice-President, Administration at Sullivan & Company until March 1998; Director of the Drucker Foundation from 1996-1999 and President, Drucker Foundation in 1999. Mr. Waide is considered an independent director.
(a) (3) Not applicable.
ITEM 4. PRINCIPAL ACCOUNTANT FEES AND SERVICES.
(a) Aggregate Audit Fees:
2009: $432,816
2009: $346,097
(b), (c), (d) There were no Audit-Related, Tax or Other Fees.
(e) All non-audit fees are pre-approved by the Audit Committee in advance.
(f), (g), (h) Not applicable.
ITEM 5. AUDIT COMMITTEE OF LISTED REGISTRANTS.
Not applicable.
ITEM 6. INVESTMENTS.
(a) Schedule I – Portfolios of Investments in Securities follows for those Funds for which a summary portfolio is presented in the Annual Report to Shareholders:
(b) Not applicable.
MUTUAL OF AMERICA INVESTMENT CORPORATION - EQUITY INDEX FUND
PORTFOLIO OF INVESTMENTS IN SECURITIES
December 31, 2010
| | Shares | | Value | |
INDEXED ASSETS: | | | | | |
COMMON STOCKS: | | | | | |
CONSUMER DISCRETIONARY (10.3%) | | | | | |
Abercrombie & Fitch Co. Cl A | | 6,631 | | 382,145 | |
Amazon.com, Inc.* | | 27,379 | | 4,928,220 | |
Apollo Group, Inc.* | | 9,771 | | 385,857 | |
AutoNation, Inc.* | | 4,914 | | 138,575 | |
AutoZone, Inc.* | | 2,087 | | 568,895 | |
Bed Bath & Beyond, Inc.* | | 19,891 | | 977,643 | |
Best Buy Co., Inc. | | 25,630 | | 878,853 | |
Big Lots, Inc.* | | 5,734 | | 174,658 | |
Cablevision Systems Corp. Cl A | | 18,438 | | 623,942 | |
CarMax, Inc.* | | 17,261 | | 550,281 | |
Carnival Corp. | | 33,154 | | 1,528,731 | |
CBS Corp. Cl B | | 50,346 | | 959,091 | |
Coach, Inc. | | 22,682 | | 1,254,541 | |
Comcast Corp. Cl A | | 216,807 | | 4,763,250 | |
D.R. Horton, Inc. | | 21,697 | | 258,845 | |
Darden Restaurants, Inc. | | 10,624 | | 493,379 | |
DeVry, Inc. | | 4,694 | | 225,218 | |
DIRECTV Cl A* | | 64,774 | | 2,586,426 | |
Discovery Communications, Inc. Cl A* | | 21,790 | | 908,643 | |
Disney (Walt) Co. | | 145,991 | | 5,476,122 | |
Expedia, Inc. | | 15,367 | | 385,558 | |
Family Dollar Stores, Inc. | | 9,604 | | 477,415 | |
Ford Motor Co.* | | 290,179 | | 4,872,105 | |
Fortune Brands, Inc. | | 11,822 | | 712,276 | |
GameStop Corp. Cl A* | | 11,668 | | 266,964 | |
Gannett Co., Inc. | | 18,520 | | 279,467 | |
Gap, Inc. | | 33,722 | | 746,605 | |
Genuine Parts Co. | | 12,163 | | 624,448 | |
Goodyear Tire & Rubber Co.* | | 18,818 | | 222,993 | |
H&R Block, Inc. | | 23,864 | | 284,220 | |
Harley-Davidson, Inc. | | 18,062 | | 626,210 | |
Harman Int’l. Industries, Inc.* | | 5,319 | | 246,270 | |
Hasbro, Inc. | | 10,488 | | 494,824 | |
Home Depot, Inc. | | 126,260 | | 4,426,676 | |
International Game Technology | | 22,463 | | 397,370 | |
Interpublic Group of Cos., Inc.* | | 37,944 | | 402,965 | |
Johnson Controls, Inc. | | 51,838 | | 1,980,212 | |
Kohl’s Corp.* | | 23,996 | | 1,303,943 | |
Leggett & Platt, Inc. | | 11,098 | | 252,590 | |
Lennar Corp. Cl A | | 12,149 | | 227,794 | |
Limited Brands, Inc. | | 20,051 | | 616,167 | |
Lowe’s Cos., Inc. | | 106,390 | | 2,668,261 | |
Macy’s, Inc | | 32,339 | | 818,177 | |
Marriott International, Inc. Cl A | | 22,132 | | 919,363 | |
Mattel, Inc. | | 27,422 | | 697,341 | |
McDonald’s Corp. | | 81,244 | | 6,236,289 | |
McGraw-Hill Cos., Inc. | | 23,863 | | 868,852 | |
Meredith Corp. | | 2,819 | | 97,678 | |
Netflix, Inc.* | | 3,301 | | 579,986 | |
Newell Rubbermaid, Inc. | | 22,247 | | 404,450 | |
News Corp. Cl A | | 175,878 | | 2,560,784 | |
NIKE, Inc. Cl B | | 29,135 | | 2,488,712 | |
Nordstrom, Inc. | | 12,926 | | 547,804 | |
O’Reilly Automotive, Inc.* | | 10,828 | | 654,228 | |
Omnicom Group, Inc. | | 23,007 | | 1,053,721 | |
Penney (J.C.) Co., Inc. | | 17,882 | | 577,767 | |
Polo Ralph Lauren Corp. | | 4,940 | | 547,945 | |
Priceline.com, Inc.* | | 3,765 | | 1,504,306 | |
Pulte Homes, Inc.* | | 25,507 | | 191,813 | |
RadioShack Corp. | | 8,799 | | 162,694 | |
Ross Stores, Inc. | | 9,357 | | 591,830 | |
Scripps Networks Interactive, Inc. Cl A | | 6,876 | | 355,833 | |
Sears Hldgs. Corp.* | | 3,408 | | 251,340 | |
Stanley Black & Decker, Inc. | | 12,831 | | 858,009 | |
Staples, Inc. | | 56,048 | | 1,276,213 | |
Starbucks Corp. | | 56,557 | | 1,817,176 | |
Starwood Hotels & Resorts | | 14,720 | | 894,682 | |
Target Corp. | | 54,874 | | 3,299,574 | |
Tiffany & Co. | | 9,693 | | 603,583 | |
Time Warner Cable, Inc. | | 27,189 | | 1,795,290 | |
Time Warner, Inc. | | 85,100 | | 2,737,667 | |
TJX Cos., Inc. | | 30,706 | | 1,363,039 | |
Urban Outfitters, Inc.* | | 9,893 | | 354,268 | |
V.F. Corp. | | 6,597 | | 568,529 | |
Viacom, Inc. Cl B | | 46,576 | | 1,844,875 | |
Washington Post Co. Cl B | | 419 | | 184,151 | |
Whirlpool Corp. | | 5,819 | | 516,902 | |
Wyndham Worldwide Corp. | | 13,234 | | 396,491 | |
Wynn Resorts Ltd. | | 5,815 | | 603,830 | |
Yum! Brands, Inc. | | 36,011 | | 1,766,340 | |
| | | | 93,570,180 | |
CONSUMER STAPLES (10.3%) | | | | | |
Altria Group, Inc. | | 161,166 | | 3,967,907 | |
Archer-Daniels-Midland Co. | | 49,650 | | 1,493,472 | |
Avon Products, Inc. | | 32,909 | | 956,336 | |
Brown-Forman Corp. Cl B | | 8,022 | | 558,492 | |
Campbell Soup Co. | | 14,714 | | 511,312 | |
Clorox Co. | | 10,764 | | 681,146 | |
Coca-Cola Co. | | 178,755 | | 11,756,716 | |
Coca-Cola Enterprises, Inc.* | | 26,197 | | 655,711 | |
Colgate-Palmolive Co. | | 37,381 | | 3,004,311 | |
ConAgra Foods, Inc. | | 33,893 | | 765,304 | |
Constellation Brands, Inc. Cl A* | | 13,780 | | 305,227 | |
Costco Wholesale Corp. | | 33,474 | | 2,417,158 | |
CVS Caremark Corp. | | 104,684 | | 3,639,863 | |
Dean Foods Co.* | | 14,104 | | 124,679 | |
Dr. Pepper Snapple Group, Inc. | | 17,226 | | 605,666 | |
Estee Lauder Cos., Inc. Cl A | | 8,652 | | 698,216 | |
General Mills, Inc. | | 50,146 | | 1,784,696 | |
Heinz (H.J.) Co. | | 24,805 | | 1,226,855 | |
Hershey Co. | | 11,838 | | 558,162 | |
Hormel Foods Corp. | | 5,333 | | 273,370 | |
J.M. Smucker Co. | | 9,212 | | 604,768 | |
Kellogg Co. | | 19,565 | | 999,380 | |
Kimberly-Clark Corp. | | 31,338 | | 1,975,548 | |
Kraft Foods, Inc. Cl A | | 133,857 | | 4,217,834 | |
Kroger Co. | | 48,792 | | 1,090,989 | |
Lorillard, Inc. | | 11,580 | | 950,255 | |
McCormick & Co., Inc. | | 10,256 | | 477,212 | |
Mead Johnson Nutrition Co. | | 15,760 | | 981,060 | |
Molson Coors Brewing Co. Cl B | | 12,218 | | 613,221 | |
PepsiCo, Inc. | | 121,795 | | 7,956,867 | |
Philip Morris Int’l., Inc. | | 139,630 | | 8,172,544 | |
Proctor & Gamble Co. | | 214,421 | | 13,793,703 | |
Reynolds American, Inc. | | 25,880 | | 844,206 | |
Safeway, Inc. | | 28,275 | | 635,905 | |
Sara Lee Corp. | | 49,254 | | 862,438 | |
SUPERVALU, Inc. | | 16,250 | | 156,488 | |
Sysco Corp. | | 45,216 | | 1,329,350 | |
Tyson Foods, Inc. Cl A | | 23,250 | | 400,365 | |
Wal-Mart Stores, Inc. | | 151,273 | | 8,158,153 | |
Walgreen Co. | | 71,456 | | 2,783,926 | |
Whole Foods Market, Inc.* | | 11,130 | | 563,067 | |
| | | | 93,551,878 | |
ENERGY (11.7%) | | | | | |
Anadarko Petroleum Corp. | | 38,748 | | 2,951,048 | |
Apache Corp. | | 28,235 | | 3,366,459 | |
Baker Hughes, Inc. | | 32,824 | | 1,876,548 | |
Cabot Oil & Gas Corp. | | 7,894 | | 298,788 | |
Cameron International Corp.* | | 18,703 | | 948,803 | |
Chesapeake Energy Corp. | | 50,937 | | 1,319,778 | |
Chevron Corp. | | 156,124 | | 14,246,315 | |
ConocoPhillips | | 114,234 | | 7,779,335 | |
Consol Energy, Inc. | | 17,423 | | 849,197 | |
Denbury Resources, Inc.* | | 30,661 | | 585,318 | |
Devon Energy Corp. | | 33,392 | | 2,621,606 | |
Diamond Offshore Drilling, Inc | | 5,343 | | 357,286 | |
El Paso Corp. | | 54,550 | | 750,608 | |
EOG Resources, Inc. | | 19,372 | | 1,770,795 | |
EQT Corp. | | 11,418 | | 511,983 | |
Exxon Mobil Corp. | | 389,217 | | 28,459,542 | |
FMC Technologies, Inc.* | | 9,396 | | 835,398 | |
Halliburton Co. | | 70,371 | | 2,873,248 | |
Helmerich & Payne, Inc. | | 8,157 | | 395,451 | |
Hess Corp. | | 22,723 | | 1,739,218 | |
Marathon Oil Corp. | | 54,692 | | 2,025,245 | |
Massey Energy Co. | | 7,757 | | 416,163 | |
Murphy Oil Corp. | | 14,601 | | 1,088,505 | |
Nabors Industries Ltd.* | | 21,982 | | 515,698 | |
National Oilwell Varco, Inc. | | 32,026 | | 2,153,749 | |
Newfield Exploration Co.* | | 10,274 | | 740,858 | |
Noble Energy, Inc. | | 13,346 | | 1,148,824 | |
Occidental Petroleum Corp. | | 62,414 | | 6,122,813 | |
Peabody Energy Corp. | | 20,788 | | 1,330,016 | |
Pioneer Natural Resources Co. | | 8,998 | | 781,206 | |
QEP Resources, Inc.* | | 13,755 | | 499,444 | |
Range Resources Corp. | | 12,267 | | 551,770 | |
Rowan Cos., Inc.* | | 9,578 | | 334,368 | |
Schlumberger Ltd. | | 104,774 | | 8,748,629 | |
Southwestern Energy Co.* | | 26,583 | | 995,002 | |
Spectra Energy Corp. | | 50,029 | | 1,250,225 | |
Sunoco, Inc. | | 9,455 | | 381,131 | |
Tesoro Corp. | | 10,919 | | 202,438 | |
Valero Energy Corp. | | 43,732 | | 1,011,084 | |
Williams Cos., Inc. | | 44,437 | | 1,098,483 | |
| | | | 105,932,375 | |
FINANCIALS (15.6%) | | | | | |
ACE Ltd. | | 26,291 | | 1,636,615 | |
Aflac, Inc. | | 35,592 | | 2,008,457 | |
Allstate Corp. | | 41,484 | | 1,322,510 | |
American Express Co. | | 81,682 | | 3,505,791 | |
American Int’l. Group, Inc.* | | 10,764 | | 620,222 | |
Ameriprise Financial, Inc. | | 19,219 | | 1,106,053 | |
Aon Corp. | | 25,044 | | 1,152,274 | |
Apartment Investment & Management Co. Cl A | | 9,045 | | 233,723 | |
Assurant, Inc. | | 8,267 | | 318,445 | |
AvalonBay Communities, Inc. | | 6,517 | | 733,488 | |
Bank of America Corp. | | 773,554 | | 10,319,210 | |
Bank of New York Mellon Corp. | | 96,037 | | 2,900,317 | |
BB&T Corp. | | 53,715 | | 1,412,167 | |
Berkshire Hathaway, Inc. Cl B* | | 133,301 | | 10,678,743 | |
Boston Properties, Inc. | | 10,692 | | 920,581 | |
Capital One Financial Corp. | | 35,706 | | 1,519,647 | |
CB Richard Ellis Group, Inc. Cl A* | | 22,370 | | 458,138 | |
Charles Schwab Corp. | | 76,491 | | 1,308,761 | |
Chubb Corp. | | 23,666 | | 1,411,440 | |
Cincinnati Financial Corp. | | 12,630 | | 400,245 | |
Citigroup, Inc.* | | 2,211,968 | | 10,462,609 | |
CME Group, Inc. | | 5,203 | | 1,674,065 | |
Comerica, Inc. | | 13,406 | | 566,269 | |
Discover Financial Svcs. | | 43,257 | | 801,552 | |
E*Trade Financial Corp.* | | 14,986 | | 239,776 | |
Equity Residential | | 21,796 | | 1,132,302 | |
Federated Investors, Inc. Cl B | | 7,035 | | 184,106 | |
Fifth Third Bancorp | | 60,659 | | 890,474 | |
First Horizon National Corp.* | | 17,770 | | 209,327 | |
Franklin Resources, Inc. | | 11,439 | | 1,272,131 | |
Genworth Financial, Inc. Cl A* | | 37,472 | | 492,382 | |
Goldman Sachs Group, Inc. | | 39,484 | | 6,639,629 | |
Hartford Financial Svcs. Group, Inc. | | 33,847 | | 896,607 | |
HCP, Inc. | | 24,769 | | 911,252 | |
Health Care REIT, Inc. | | 11,053 | | 526,565 | |
Host Hotels & Resorts, Inc. | | 50,390 | | 900,469 | |
Hudson City Bancorp, Inc. | | 40,294 | | 513,346 | |
Huntington Bancshares, Inc. | | 54,624 | | 375,267 | |
IntercontinentalExchange, Inc.* | | 5,539 | | 659,972 | |
Invesco Ltd. | | 35,351 | | 850,545 | |
Janus Capital Group, Inc. | | 14,109 | | 182,994 | |
JPMorgan Chase & Co. | | 302,131 | | 12,816,397 | |
KeyCorp | | 65,660 | | 581,091 | |
Kimco Realty Corp. | | 30,731 | | 554,387 | |
Legg Mason, Inc. | | 11,583 | | 420,115 | |
Leucadia National Corp.* | | 15,108 | | 440,851 | |
Lincoln National Corp. | | 24,136 | | 671,222 | |
Loews Corp. | | 24,389 | | 948,976 | |
M&T Bank Corp. | | 9,202 | | 801,034 | |
Marsh & McLennan Cos., Inc. | | 41,663 | | 1,139,066 | |
Marshall & Ilsley Corp. | | 34,609 | | 239,494 | |
MetLife, Inc. | | 69,478 | | 3,087,602 | |
Moody’s Corp. | | 15,913 | | 422,331 | |
Morgan Stanley | | 115,234 | | 3,135,517 | |
Nasdaq OMX Group, Inc.* | | 10,832 | | 256,827 | |
Northern Trust Corp. | | 18,842 | | 1,044,035 | |
NYSE Euronext | | 20,081 | | 602,028 | |
People’s United Financial, Inc. | | 28,473 | | 398,907 | |
Plum Creek Timber Co., Inc. | | 12,457 | | 466,515 | |
PNC Financial Svcs. Grp., Inc. | | 40,489 | | 2,458,492 | |
Principal Financial Grp., Inc. | | 24,877 | | 809,995 | |
Progressive Corp. | | 51,512 | | 1,023,543 | |
ProLogis | | 43,485 | | 627,923 | |
Prudential Financial, Inc. | | 37,075 | | 2,176,673 | |
Public Storage | | 10,675 | | 1,082,659 | |
Regions Financial Corp. | | 93,249 | | 652,743 | |
Simon Property Group, Inc. | | 22,488 | | 2,237,331 | |
SLM Corp.* | | 37,399 | | 470,853 | |
State Street Corp. | | 38,837 | | 1,799,707 | |
SunTrust Banks, Inc. | | 37,142 | | 1,096,060 | |
T. Rowe Price Group, Inc. | | 19,623 | | 1,266,468 | |
Torchmark Corp. | | 6,169 | | 368,536 | |
Travelers Cos., Inc. | | 35,389 | | 1,971,521 | |
U.S. Bancorp | | 147,850 | | 3,987,515 | |
Unum Group | | 24,228 | | 586,802 | |
Ventas, Inc. | | 12,003 | | 629,917 | |
Vornado Realty Trust | | 12,604 | | 1,050,291 | |
Wells Fargo & Co. | | 402,829 | | 12,483,671 | |
Weyerhaeuser Co. | | 40,824 | | 772,798 | |
XL Capital Ltd. Cl A* | | 24,517 | | 534,961 | |
Zions Bancorporation | | 13,496 | | 327,008 | |
| | | | 140,790,328 | |
HEALTH CARE (10.7%) | | | | | |
Abbott Laboratories | | 119,928 | | 5,745,750 | |
Aetna, Inc. | | 30,796 | | 939,586 | |
Agilent Technologies, Inc.* | | 25,959 | | 1,075,481 | |
Allergan, Inc. | | 23,630 | | 1,622,672 | |
AmerisourceBergen Corp. | | 21,032 | | 717,612 | |
Amgen, Inc.* | | 71,543 | | 3,927,711 | |
Bard (C.R.), Inc. | | 7,124 | | 653,769 | |
Baxter International, Inc. | | 45,455 | | 2,300,932 | |
Becton, Dickinson & Co. | | 17,659 | | 1,492,539 | |
Biogen Idec, Inc.* | | 18,223 | | 1,221,852 | |
Boston Scientific Corp.* | | 111,833 | | 846,576 | |
Bristol-Myers Squibb Co. | | 132,758 | | 3,515,432 | |
Cardinal Health, Inc. | | 26,422 | | 1,012,227 | |
CareFusion Corp.* | | 16,830 | | 432,531 | |
Celgene Corp.* | | 36,069 | | 2,133,121 | |
Cephalon, Inc.* | | 5,622 | | 346,990 | |
Cerner Corp.* | | 5,306 | | 502,690 | |
CIGNA Corp. | | 20,689 | | 758,459 | |
Coventry Health Care, Inc.* | | 11,456 | | 302,438 | |
DaVita, Inc.* | | 7,437 | | 516,797 | |
Dentsply International, Inc. | | 10,894 | | 372,248 | |
Express Scripts, Inc.* | | 40,364 | | 2,181,674 | |
Forest Laboratories, Inc.* | | 22,543 | | 720,925 | |
Genzyme Corp.* | | 19,945 | | 1,420,084 | |
Gilead Sciences, Inc.* | | 63,538 | | 2,302,617 | |
Hospira, Inc.* | | 12,953 | | 721,353 | |
Humana, Inc.* | | 12,936 | | 708,117 | |
Intuitive Surgical, Inc.* | | 2,978 | | 767,580 | |
Johnson & Johnson | | 212,434 | | 13,139,043 | |
King Pharmaceuticals, Inc.* | | 19,651 | | 276,097 | |
Laboratory Corp. of America Hldgs.* | | 7,840 | | 689,293 | |
Life Technologies Corp.* | | 14,505 | | 805,028 | |
Lilly (Eli) & Co. | | 78,528 | | 2,751,621 | |
McKesson Corp. | | 19,375 | | 1,363,613 | |
Medco Health Solutions, Inc.* | | 32,467 | | 1,989,253 | |
Medtronic, Inc. | | 80,900 | | 3,000,581 | |
Merck & Co., Inc. | | 240,519 | | 8,668,305 | |
Mylan, Inc.* | | 33,438 | | 706,545 | |
Patterson Cos., Inc. | | 7,443 | | 227,979 | |
PerkinElmer, Inc. | | 9,086 | | 234,601 | |
Pfizer, Inc. | | 622,877 | | 10,906,576 | |
Quest Diagnostics, Inc. | | 10,809 | | 583,362 | |
St. Jude Medical, Inc.* | | 26,175 | | 1,118,981 | |
Stryker Corp. | | 26,303 | | 1,412,471 | |
Tenet Healthcare Corp.* | | 37,383 | | 250,092 | |
Thermo Fisher Scientific, Inc.* | | 30,405 | | 1,683,221 | |
UnitedHealth Group, Inc. | | 86,030 | | 3,106,543 | |
Varian Medical Systems, Inc.* | | 9,094 | | 630,032 | |
Waters Corp.* | | 7,047 | | 547,622 | |
Watson Pharmaceuticals, Inc.* | | 9,686 | | 500,282 | |
WellPoint, Inc.* | | 30,517 | | 1,735,197 | |
Zimmer Hldgs., Inc.* | | 15,123 | | 811,803 | |
| | | | 96,397,904 | |
INDUSTRIALS (10.7%) | | | | | |
3M Co. | | 55,121 | | 4,756,942 | |
Avery Dennison Corp. | | 8,277 | | 350,448 | |
Boeing Co. | | 55,917 | | 3,649,143 | |
Caterpillar, Inc. | | 49,382 | | 4,625,118 | |
Cintas Corp. | | 9,701 | | 271,240 | |
CSX Corp. | | 29,014 | | 1,874,595 | |
Cummins, Inc. | | 15,272 | | 1,680,073 | |
Danaher Corp. | | 41,404 | | 1,953,027 | |
Deere & Co. | | 32,917 | | 2,733,757 | |
Donnelley (R.R.) & Sons Co. | | 15,854 | | 276,969 | |
Dover Corp. | | 14,368 | | 839,810 | |
Dun & Bradstreet Corp. | | 3,826 | | 314,076 | |
Eaton Corp. | | 13,105 | | 1,330,289 | |
Emerson Electric Co. | | 58,217 | | 3,328,266 | |
Equifax, Inc. | | 9,486 | | 337,702 | |
Expeditors Int’l. of Wash. | | 16,619 | | 907,397 | |
Fastenal Co. | | 11,257 | | 674,407 | |
FedEx Corp. | | 24,618 | | 2,289,720 | |
Flowserve Corp. | | 4,307 | | 513,481 | |
Fluor Corp. | | 13,626 | | 902,859 | |
General Dynamics Corp. | | 29,292 | | 2,078,560 | |
General Electric Co. | | 826,966 | | 15,125,208 | |
Goodrich Corp. | | 9,709 | | 855,072 | |
Grainger (W.W.), Inc. | | 4,481 | | 618,871 | |
Honeywell International, Inc. | | 60,421 | | 3,211,980 | |
Illinois Tool Works, Inc. | | 37,915 | | 2,024,661 | |
Ingersoll-Rand PLC | | 24,660 | | 1,161,239 | |
Iron Mountain, Inc. | | 15,472 | | 386,955 | |
ITT Corp. | | 13,935 | | 726,153 | |
Jacobs Engineering Group, Inc.* | | 9,546 | | 437,684 | |
L-3 Communications Hldgs., Inc. | | 8,802 | | 620,453 | |
Lockheed Martin Corp. | | 22,949 | | 1,604,365 | |
Masco Corp. | | 27,661 | | 350,188 | |
Norfolk Southern Corp. | | 28,108 | | 1,765,745 | |
Northrop Grumman Corp. | | 22,655 | | 1,467,591 | |
Paccar, Inc. | | 28,439 | | 1,632,967 | |
Pall Corp. | | 8,893 | | 440,915 | |
Parker Hannifin Corp. | | 12,455 | | 1,074,867 | |
Pitney Bowes, Inc. | | 15,703 | | 379,699 | |
Precision Castparts Corp. | | 10,878 | | 1,514,326 | |
Quanta Services, Inc.* | | 16,874 | | 336,130 | |
Raytheon Co. | | 28,261 | | 1,309,615 | |
Republic Services, Inc. | | 23,443 | | 700,008 | |
Robert Half Int’l., Inc. | | 11,252 | | 344,311 | |
Robinson (C.H.) Worldwide, Inc. | | 12,782 | | 1,024,989 | |
Rockwell Automation, Inc. | | 10,934 | | 784,077 | |
Rockwell Collins, Inc. | | 12,053 | | 702,208 | |
Roper Industries, Inc. | | 7,304 | | 558,245 | |
Ryder System, Inc. | | 3,948 | | 207,823 | |
Snap-On, Inc. | | 4,481 | | 253,535 | |
Southwest Airlines Co. | | 56,226 | | 729,813 | |
Stericycle, Inc.* | | 6,607 | | 534,638 | |
Textron, Inc. | | 21,043 | | 497,457 | |
Tyco International Ltd. | | 38,050 | | 1,576,792 | |
Union Pacific Corp. | | 38,547 | | 3,571,765 | |
United Parcel Service, Inc. Cl B | | 76,990 | | 5,587,934 | |
United Technologies Corp. | | 71,261 | | 5,609,666 | |
Waste Management, Inc. | | 36,824 | | 1,357,701 | |
| | | | 96,773,525 | |
INFORMATION TECHNOLOGY (18.1%) | | | | | |
Adobe Systems, Inc.* | | 38,996 | | 1,200,297 | |
Advanced Micro Devices, Inc.* | | 44,586 | | 364,713 | |
Akamai Technologies, Inc.* | | 14,044 | | 660,770 | |
Altera Corp. | | 24,013 | | 854,383 | |
Amphenol Corp. Cl A | | 13,412 | | 707,885 | |
Analog Devices, Inc. | | 22,845 | | 860,571 | |
Apple, Inc.* | | 70,723 | | 22,812,407 | |
Applied Materials, Inc. | | 100,574 | | 1,413,065 | |
Autodesk, Inc.* | | 17,278 | | 660,020 | |
Automatic Data Processing, Inc. | | 38,012 | | 1,759,195 | |
BMC Software, Inc.* | | 13,769 | | 649,071 | |
Broadcom Corp. Cl A | | 35,248 | | 1,535,050 | |
CA, Inc. | | 29,392 | | 718,340 | |
Cisco Systems, Inc.* | | 431,471 | | 8,728,658 | |
Citrix Systems, Inc.* | | 14,323 | | 979,836 | |
Cognizant Technology Solutions* | | 22,786 | | 1,669,986 | |
Computer Sciences Corp. | | 11,883 | | 589,397 | |
Compuware Corp.* | | 16,886 | | 197,060 | |
Corning, Inc. | | 118,955 | | 2,298,211 | |
Dell, Inc.* | | 126,900 | | 1,719,495 | |
eBay, Inc.* | | 89,968 | | 2,503,809 | |
Electronic Arts, Inc.* | | 25,543 | | 418,394 | |
EMC Corp.* | | 156,735 | | 3,589,232 | |
F5 Networks, Inc.* | | 6,061 | | 788,900 | |
Fidelity Nat’l. Information Svcs., Inc. | | 20,658 | | 565,823 | |
First Solar, Inc.* | | 4,223 | | 549,581 | |
Fiserv, Inc.* | | 11,449 | | 670,453 | |
FLIR Systems, Inc.* | | 12,037 | | 358,101 | |
Google, Inc.* | | 19,250 | | 11,433,923 | |
Harris Corp. | | 9,928 | | 449,738 | |
Hewlett-Packard Co. | | 174,835 | | 7,360,554 | |
Int’l. Business Machines Corp. | | 95,410 | | 14,002,372 | |
Intel Corp. | | 427,033 | | 8,980,504 | |
Intuit, Inc.* | | 21,458 | | 1,057,879 | |
Jabil Circuit, Inc. | | 14,859 | | 298,517 | |
JDS Uniphase Corp.* | | 17,044 | | 246,797 | |
Juniper Networks, Inc.* | | 40,203 | | 1,484,295 | |
KLA-Tencor Corp. | | 12,810 | | 494,978 | |
Lexmark International, Inc. Cl A* | | 6,117 | | 212,994 | |
Linear Technology Corp. | | 17,220 | | 595,640 | |
LSI Corp.* | | 47,547 | | 284,807 | |
MasterCard, Inc. | | 7,564 | | 1,695,168 | |
McAfee, Inc.* | | 11,945 | | 553,173 | |
MEMC Electronic Materials, Inc.* | | 17,263 | | 194,381 | |
Microchip Technology, Inc. | | 14,435 | | 493,821 | |
Micron Technology, Inc.* | | 65,618 | | 526,256 | |
Microsoft Corp. | | 580,089 | | 16,196,085 | |
Molex, Inc. | | 10,691 | | 242,900 | |
Monster Worldwide, Inc.* | | 9,997 | | 236,229 | |
Motorola, Inc.* | | 181,663 | | 1,647,683 | |
National Semiconductor Corp. | | 18,280 | | 251,533 | |
NetApp, Inc.* | | 27,860 | | 1,531,186 | |
Novell, Inc.* | | 27,144 | | 160,692 | |
Novellus Systems, Inc.* | | 6,987 | | 225,820 | |
Nvidia Corp.* | | 44,456 | | 684,622 | |
Oracle Corp. | | 283,574 | | 8,875,866 | |
Paychex, Inc. | | 24,569 | | 759,428 | |
QLogic Corp.* | | 8,264 | | 140,653 | |
QUALCOMM, Inc. | | 124,775 | | 6,175,115 | |
Red Hat, Inc.* | | 14,731 | | 672,470 | |
SAIC, Inc.* | | 22,442 | | 355,930 | |
Salesforce.com, inc.* | | 9,098 | | 1,200,936 | |
SanDisk Corp.* | | 17,993 | | 897,131 | |
Symantec Corp.* | | 60,494 | | 1,012,670 | |
Tellabs, Inc. | | 28,255 | | 191,569 | |
Teradata Corp.* | | 12,737 | | 524,255 | |
Teradyne, Inc.* | | 13,851 | | 194,468 | |
Texas Instruments, Inc. | | 90,069 | | 2,927,243 | |
Total System Services, Inc. | | 12,540 | | 192,865 | |
VeriSign, Inc.* | | 13,117 | | 428,532 | |
Visa, Inc. Cl A | | 37,320 | | 2,626,582 | |
Western Digital Corp.* | | 17,763 | | 602,166 | |
Western Union Co. | | 50,297 | | 934,015 | |
Xerox Corp. | | 107,371 | | 1,236,914 | |
Xilinx, Inc. | | 20,291 | | 588,033 | |
Yahoo!, Inc.* | | 100,540 | | 1,671,980 | |
| | | | 163,574,071 | |
MATERIALS (3.6%) | | | | | |
Air Products & Chemicals, Inc. | | 16,421 | | 1,493,490 | |
Airgas, Inc. | | 5,786 | | 361,394 | |
AK Steel Hldg. Corp. | | 8,015 | | 131,206 | |
Alcoa, Inc. | | 78,513 | | 1,208,315 | |
Allegheny Technologies, Inc. | | 7,166 | | 395,420 | |
Ball Corp. | | 6,853 | | 466,347 | |
Bemis Co., Inc. | | 8,248 | | 269,380 | |
CF Industries Hldgs., Inc. | | 5,340 | | 721,701 | |
Cliffs Natural Resources, Inc. | | 10,354 | | 807,716 | |
Dow Chemical Co. | | 90,080 | | 3,075,331 | |
Du Pont (E.I.) de Nemours & Co. | | 69,977 | | 3,490,453 | |
Eastman Chemical Co. | | 5,593 | | 470,259 | |
Ecolab, Inc. | | 17,781 | | 896,518 | |
FMC Corp. | | 5,601 | | 447,464 | |
Freeport-McMoRan Copper & Gold, Inc. | | 35,607 | | 4,276,045 | |
Int’l. Flavors & Fragrances, Inc. | | 6,173 | | 343,157 | |
International Paper Co. | | 33,140 | | 902,734 | |
MeadWestvaco Corp. | | 12,949 | | 338,746 | |
Monsanto Co. | | 40,235 | | 2,801,965 | |
Newmont Mining Corp. | | 38,210 | | 2,347,240 | |
Nucor Corp. | | 24,156 | | 1,058,516 | |
Owens-Illinois, Inc.* | | 12,691 | | 389,614 | |
PPG Industries, Inc. | | 12,519 | | 1,052,472 | |
Praxair, Inc. | | 23,612 | | 2,254,238 | |
Sealed Air Corp. | | 12,268 | | 312,221 | |
Sherwin-Williams Co. | | 6,877 | | 575,949 | |
Sigma-Aldrich Corp. | | 9,367 | | 623,468 | |
Titanium Metals Corp.* | | 6,585 | | 113,130 | |
United States Steel Corp. | | 10,745 | | 627,723 | |
Vulcan Materials Co. | | 10,097 | | 447,903 | |
| | | | 32,700,115 | |
TELECOMMUNICATION SERVICES (3.0%) | | | | | |
American Tower Corp. Cl A* | | 30,947 | | 1,598,103 | |
AT&T, Inc. | | 457,740 | | 13,448,401 | |
CenturyLink, Inc. | | 23,404 | | 1,080,563 | |
Frontier Communications Corp. | | 77,898 | | 757,948 | |
MetroPCS Communications, Inc.* | | 20,566 | | 259,749 | |
Qwest Communications Int’l., Inc. | | 134,729 | | 1,025,288 | |
Sprint Nextel Corp.* | | 230,930 | | 976,834 | |
Verizon Communications, Inc. | | 219,938 | | 7,869,382 | |
Windstream Corp. | | 37,566 | | 523,670 | |
| | | | 27,539,938 | |
UTILITIES (3.2%) | | | | | |
AES Corp.* | | 50,565 | | 615,882 | |
Allegheny Energy, Inc. | | 13,008 | | 315,314 | |
Ameren Corp. | | 18,640 | | 525,462 | |
American Electric Power Co., Inc. | | 37,265 | | 1,340,795 | |
CenterPoint Energy, Inc. | | 32,730 | | 514,516 | |
CMS Energy Corp. | | 18,925 | | 352,005 | |
Consolidated Edison, Inc. | | 22,506 | | 1,115,622 | |
Constellation Energy Group, Inc. | | 15,297 | | 468,547 | |
Dominion Resources, Inc. | | 44,636 | | 1,906,850 | |
DTE Energy Co. | | 13,106 | | 593,964 | |
Duke Energy Corp. | | 102,353 | | 1,822,907 | |
Edison International | | 25,017 | | 965,656 | |
Entergy Corp. | | 14,013 | | 992,541 | |
Exelon Corp. | | 50,987 | | 2,123,099 | |
FirstEnergy Corp. | | 23,432 | | 867,453 | |
Integrys Energy Group, Inc. | | 6,032 | | 292,612 | |
NextEra Energy, Inc. | | 32,089 | | 1,668,307 | |
Nicor, Inc. | | 3,523 | | 175,868 | |
NiSource, Inc. | | 21,660 | | 381,649 | |
Northeast Utilities | | 13,651 | | 435,194 | |
NRG Energy, Inc.* | | 18,757 | | 366,512 | |
Oneok, Inc. | | 8,186 | | 454,077 | |
Pepco Hldgs., Inc. | | 17,448 | | 318,426 | |
PG&E Corp. | | 30,201 | | 1,444,816 | |
Pinnacle West Capital Corp. | | 8,414 | | 348,760 | |
PPL Corp. | | 36,858 | | 970,103 | |
Progress Energy Enterprise | | 22,715 | | 987,648 | |
Public Svc. Enterprise Group, Inc. | | 39,148 | | 1,245,298 | |
SCANA Corp. | | 8,755 | | 355,453 | |
Sempra Energy | | 18,438 | | 967,626 | |
Southern Co. | | 64,523 | | 2,466,714 | |
TECO Energy, Inc. | | 16,481 | | 293,362 | |
Wisconsin Energy Corp. | | 9,026 | | 531,270 | |
Xcel Energy, Inc. | | 35,508 | | 836,213 | |
| | | | 29,060,521 | |
TOTAL INDEXED ASSETS - COMMON STOCKS
(Cost: $754,095,669) 97.2% | | | | 879,890,835 | |
| | Rating** | | Rate(%) | | Maturity | | Face Amount | | Value | |
SHORT-TERM DEBT SECURITIES: | | | | | | | | | | | |
U.S. GOVERNMENT (0.5%) | | | | | | | | | | | |
U.S. Treasury Bill (1) | | AAA | | 0.12 | | 02/03/11 | | 1,000,000 | | 999,890 | |
U.S. Treasury Bill (1) | | AAA | | 0.14 | | 03/31/11 | | 2,000,000 | | 1,999,343 | |
U.S. Treasury Bill (1) | | AAA | | 0.16 | | 03/03/11 | | 700,000 | | 699,855 | |
U.S. Treasury Bill (1) | | AAA | | 0.16 | | 03/03/11 | | 500,000 | | 499,896 | |
| | | | | | | | | | 4,198,984 | |
U.S. GOVERNMENT AGENCIES (0.6%) | | | | | | | | | | | |
FHLMC | | AAA | | 0.09 | | 02/14/11 | | 4,385,000 | | 4,384,518 | |
FHLMC | | AAA | | 0.17 | | 02/22/11 | | 1,231,000 | | 1,230,698 | |
| | | | | | | | | | 5,615,216 | |
COMMERCIAL PAPER (1.6%) | | | | | | | | | | | |
General Electric Capital Corp. | | A-1+ | | 0.15 | | 01/31/11 | | 4,500,000 | | 4,499,438 | |
NetJets, Inc.† | | A-1+ | | 0.12 | | 01/03/11 | | 10,000,000 | | 9,999,933 | |
| | | | | | | | | | 14,499,371 | |
TOTAL SHORT-TERM DEBT SECURITIES
(Cost: $24,313,465) 2.7% | | | | | | | | | | 24,313,571 | |
| | | | | | | | | | | |
TEMPORARY CASH INVESTMENTS (2)
(Cost: $151,300) 0.0% (3) | | | | | | | | | | 151,300 | |
| | | | | | | | | | | |
TOTAL INVESTMENTS
(Cost: $778,560,434) 99.9% | | | | | | | | | | 904,355,706 | |
| | | | | | | | | | | |
OTHER NET ASSETS 0.1% | | | | | | | | | | 1,021,282 | |
| | | | | | | | | | | |
NET ASSETS 100.0% | | | | | | | | | | $ | 905,376,988 | |
| | | | | | | | | | | | |
The accompanying notes are an integral part of these portfolio schedules.
MUTUAL OF AMERICA INVESTMENT CORPORATION - ALL AMERICA FUND
PORTFOLIO OF INVESTMENTS IN SECURITIES
December 31, 2010
| | Shares | | Value | |
INDEXED ASSETS: | | | | | |
COMMON STOCKS: | | | | | |
CONSUMER DISCRETIONARY (5.4%) | | | | | |
Abercrombie & Fitch Co. Cl A | | 1,037 | | 59,762 | |
Amazon.com, Inc.* | | 4,279 | | 770,220 | |
Apollo Group, Inc.* | | 1,528 | | 60,341 | |
AutoNation, Inc.* | | 767 | | 21,629 | |
AutoZone, Inc.* | | 327 | | 89,137 | |
Bed Bath & Beyond, Inc.* | | 3,110 | | 152,857 | |
Best Buy Co., Inc. | | 4,007 | | 137,400 | |
Big Lots, Inc.* | | 897 | | 27,323 | |
Cablevision Systems Corp. Cl A | | 2,882 | | 97,527 | |
CarMax, Inc.* | | 2,698 | | 86,012 | |
Carnival Corp. | | 5,183 | | 238,988 | |
CBS Corp. Cl B | | 7,870 | | 149,924 | |
Coach, Inc. | | 3,546 | | 196,129 | |
Comcast Corp. Cl A | | 33,888 | | 744,519 | |
D.R. Horton, Inc. | | 3,391 | | 40,455 | |
Darden Restaurants, Inc. | | 1,661 | | 77,137 | |
DeVry, Inc. | | 734 | | 35,217 | |
DIRECTV Cl A* | | 10,125 | | 404,291 | |
Discovery Communications, Inc. Cl A* | | 3,406 | | 142,030 | |
Disney (Walt) Co. | | 22,820 | | 855,978 | |
Expedia, Inc. | | 2,403 | | 60,291 | |
Family Dollar Stores, Inc. | | 1,502 | | 74,664 | |
Ford Motor Co.* | | 45,357 | | 761,544 | |
Fortune Brands, Inc. | | 1,847 | | 111,282 | |
GameStop Corp. Cl A* | | 1,823 | | 41,710 | |
Gannett Co., Inc. | | 2,894 | | 43,670 | |
Gap, Inc. | | 5,271 | | 116,700 | |
Genuine Parts Co. | | 1,901 | | 97,597 | |
Goodyear Tire & Rubber Co.* | | 2,941 | | 34,851 | |
H&R Block, Inc. | | 3,730 | | 44,424 | |
Harley-Davidson, Inc. | | 2,824 | | 97,908 | |
Harman Int’l. Industries, Inc.* | | 832 | | 38,522 | |
Hasbro, Inc. | | 1,640 | | 77,375 | |
Home Depot, Inc. | | 19,736 | | 691,944 | |
International Game Technology | | 3,512 | | 62,127 | |
Interpublic Group of Cos., Inc.* | | 5,930 | | 62,977 | |
Johnson Controls, Inc. | | 8,103 | | 309,535 | |
Kohl’s Corp.* | | 3,750 | | 203,775 | |
Leggett & Platt, Inc. | | 1,735 | | 39,489 | |
Lennar Corp. Cl A | | 1,899 | | 35,606 | |
Limited Brands, Inc. | | 3,134 | | 96,308 | |
Lowe’s Cos., Inc. | | 16,630 | | 417,080 | |
Macy’s, Inc | | 5,055 | | 127,892 | |
Marriott International, Inc. Cl A | | 3,459 | | 143,687 | |
Mattel, Inc. | | 4,287 | | 109,018 | |
McDonald’s Corp. | | 12,699 | | 974,775 | |
McGraw-Hill Cos., Inc. | | 3,729 | | 135,773 | |
Meredith Corp. | | 440 | | 15,246 | |
Netflix, Inc.* | | 516 | | 90,661 | |
Newell Rubbermaid, Inc. | | 3,478 | | 63,230 | |
News Corp. Cl A | | 27,491 | | 400,269 | |
NIKE, Inc. Cl B | | 4,554 | | 389,003 | |
Nordstrom, Inc. | | 2,021 | | 85,650 | |
O’Reilly Automotive, Inc.* | | 1,692 | | 102,231 | |
Omnicom Group, Inc. | | 3,597 | | 164,743 | |
Penney (J.C.) Co., Inc. | | 2,796 | | 90,339 | |
Polo Ralph Lauren Corp. | | 773 | | 85,741 | |
Priceline.com, Inc.* | | 588 | | 234,935 | |
Pulte Homes, Inc.* | | 3,987 | | 29,982 | |
RadioShack Corp. | | 1,375 | | 25,424 | |
Ross Stores, Inc. | | 1,462 | | 92,472 | |
Scripps Networks Interactive, Inc. Cl A | | 1,075 | | 55,631 | |
Sears Hldgs. Corp.* | | 533 | | 39,309 | |
Stanley Black & Decker, Inc. | | 2,005 | | 134,074 | |
Staples, Inc. | | 8,761 | | 199,488 | |
Starbucks Corp. | | 8,841 | | 284,061 | |
Starwood Hotels & Resorts | | 2,300 | | 139,794 | |
Target Corp. | | 8,578 | | 515,795 | |
Tiffany & Co. | | 1,515 | | 94,339 | |
Time Warner Cable, Inc. | | 4,250 | | 280,628 | |
Time Warner, Inc. | | 13,302 | | 427,925 | |
TJX Cos., Inc. | | 4,800 | | 213,072 | |
Urban Outfitters, Inc.* | | 1,547 | | 55,398 | |
V.F. Corp. | | 1,032 | | 88,938 | |
Viacom, Inc. Cl B | | 7,281 | | 288,400 | |
Washington Post Co. Cl B | | 66 | | 29,007 | |
Whirlpool Corp. | | 910 | | 80,835 | |
Wyndham Worldwide Corp. | | 2,069 | | 61,987 | |
Wynn Resorts Ltd. | | 909 | | 94,391 | |
Yum! Brands, Inc. | | 5,629 | | 276,102 | |
| | | | 14,626,500 | |
CONSUMER STAPLES (5.4%) | | | | | |
Altria Group, Inc. | | 25,191 | | 620,202 | |
Archer-Daniels-Midland Co. | | 7,760 | | 233,421 | |
Avon Products, Inc. | | 5,144 | | 149,485 | |
Brown-Forman Corp. Cl B | | 1,253 | | 87,234 | |
Campbell Soup Co. | | 2,300 | | 79,925 | |
Clorox Co. | | 1,682 | | 106,437 | |
Coca-Cola Co. | | 27,940 | | 1,837,614 | |
Coca-Cola Enterprises, Inc.* | | 4,094 | | 102,473 | |
Colgate-Palmolive Co. | | 5,843 | | 469,602 | |
ConAgra Foods, Inc. | | 5,298 | | 119,629 | |
Constellation Brands, Inc. Cl A* | | 2,154 | | 47,711 | |
Costco Wholesale Corp. | | 5,233 | | 377,875 | |
CVS Caremark Corp. | | 16,487 | | 573,253 | |
Dean Foods Co.* | | 2,204 | | 19,483 | |
Dr. Pepper Snapple Group, Inc. | | 2,693 | | 94,686 | |
Estee Lauder Cos., Inc. Cl A | | 1,353 | | 109,187 | |
General Mills, Inc. | | 7,838 | | 278,954 | |
Heinz (H.J.) Co. | | 3,877 | | 191,756 | |
Hershey Co. | | 1,851 | | 87,275 | |
Hormel Foods Corp. | | 834 | | 42,751 | |
J.M. Smucker Co. | | 1,440 | | 94,536 | |
Kellogg Co. | | 3,059 | | 156,254 | |
Kimberly-Clark Corp. | | 4,899 | | 308,833 | |
Kraft Foods, Inc. Cl A | | 20,923 | | 659,284 | |
Kroger Co. | | 7,627 | | 170,540 | |
Lorillard, Inc. | | 1,810 | | 148,529 | |
McCormick & Co., Inc. | | 1,603 | | 74,588 | |
Mead Johnson Nutrition Co. | | 2,464 | | 153,384 | |
Molson Coors Brewing Co. Cl B | | 1,909 | | 95,813 | |
PepsiCo, Inc. | | 19,038 | | 1,243,753 | |
Philip Morris Int’l., Inc. | | 21,826 | | 1,277,476 | |
Proctor & Gamble Co. | | 33,516 | | 2,156,084 | |
Reynolds American, Inc. | | 4,046 | | 131,981 | |
Safeway, Inc. | | 4,420 | | 99,406 | |
Sara Lee Corp. | | 7,699 | | 134,809 | |
SUPERVALU, Inc. | | 2,540 | | 24,460 | |
Sysco Corp. | | 7,068 | | 207,799 | |
Tyson Foods, Inc. Cl A | | 3,633 | | 62,560 | |
Wal-Mart Stores, Inc. | | 23,645 | | 1,275,175 | |
Walgreen Co. | | 11,169 | | 435,144 | |
Whole Foods Market, Inc.* | | 1,740 | | 88,027 | |
| | | | 14,627,388 | |
ENERGY (6.1%) | | | | | |
Anadarko Petroleum Corp. | | 6,056 | | 461,225 | |
Apache Corp. | | 4,414 | | 526,281 | |
Baker Hughes, Inc. | | 5,131 | | 293,339 | |
Cabot Oil & Gas Corp. | | 1,234 | | 46,707 | |
Cameron International Corp.* | | 2,923 | | 148,284 | |
Chesapeake Energy Corp. | | 7,961 | | 206,270 | |
Chevron Corp. | | 24,403 | | 2,226,774 | |
ConocoPhillips | | 17,856 | | 1,215,994 | |
Consol Energy, Inc. | | 2,723 | | 132,719 | |
Denbury Resources, Inc.* | | 4,793 | | 91,498 | |
Devon Energy Corp. | | 5,220 | | 409,822 | |
Diamond Offshore Drilling, Inc | | 836 | | 55,903 | |
El Paso Corp. | | 8,526 | | 117,318 | |
EOG Resources, Inc. | | 3,028 | | 276,789 | |
EQT Corp. | | 1,785 | | 80,039 | |
Exxon Mobil Corp. | | 60,838 | | 4,448,470 | |
FMC Technologies, Inc.* | | 1,468 | | 130,520 | |
Halliburton Co. | | 10,999 | | 449,089 | |
Helmerich & Payne, Inc. | | 1,275 | | 61,812 | |
Hess Corp. | | 3,551 | | 271,794 | |
Marathon Oil Corp. | | 8,549 | | 316,569 | |
Massey Energy Co. | | 1,213 | | 65,077 | |
Murphy Oil Corp. | | 2,283 | | 170,198 | |
Nabors Industries Ltd.* | | 3,436 | | 80,609 | |
National Oilwell Varco, Inc. | | 5,006 | | 336,654 | |
Newfield Exploration Co.* | | 1,606 | | 115,809 | |
Noble Energy, Inc. | | 2,087 | | 179,649 | |
Occidental Petroleum Corp. | | 9,756 | | 957,064 | |
Peabody Energy Corp. | | 3,249 | | 207,871 | |
Pioneer Natural Resources Co. | | 1,406 | | 122,069 | |
QEP Resources, Inc.* | | 2,149 | | 78,030 | |
Range Resources Corp. | | 1,918 | | 86,272 | |
Rowan Cos., Inc.* | | 1,497 | | 52,260 | |
Schlumberger Ltd. | | 16,377 | | 1,367,480 | |
Southwestern Energy Co.* | | 4,155 | | 155,522 | |
Spectra Energy Corp. | | 7,819 | | 195,397 | |
Sunoco, Inc. | | 1,477 | | 59,538 | |
Tesoro Corp. | | 1,707 | | 31,648 | |
Valero Energy Corp. | | 6,835 | | 158,025 | |
Williams Cos., Inc. | | 6,946 | | 171,705 | |
| | | | 16,558,093 | |
FINANCIALS (8.1%) | | | | | |
ACE Ltd. | | 4,109 | | 255,785 | |
Aflac, Inc. | | 5,564 | | 313,977 | |
Allstate Corp. | | 6,485 | | 206,742 | |
American Express Co. | | 12,767 | | 547,960 | |
American Int’l. Group, Inc.* | | 1,682 | | 96,917 | |
Ameriprise Financial, Inc. | | 3,004 | | 172,880 | |
Aon Corp. | | 3,914 | | 180,083 | |
Apartment Investment & Management Co. Cl A | | 1,413 | | 36,512 | |
Assurant, Inc. | | 1,292 | | 49,768 | |
AvalonBay Communities, Inc. | | 1,019 | | 114,688 | |
Bank of America Corp. | | 120,912 | | 1,612,966 | |
Bank of New York Mellon Corp. | | 15,011 | | 453,332 | |
BB&T Corp. | | 8,395 | | 220,705 | |
Berkshire Hathaway, Inc. Cl B* | | 20,836 | | 1,669,172 | |
Boston Properties, Inc. | | 1,672 | | 143,959 | |
Capital One Financial Corp. | | 5,581 | | 237,527 | |
CB Richard Ellis Group, Inc. Cl A* | | 3,496 | | 71,598 | |
Charles Schwab Corp. | | 11,955 | | 204,550 | |
Chubb Corp. | | 3,700 | | 220,668 | |
Cincinnati Financial Corp. | | 1,974 | | 62,556 | |
Citigroup, Inc.* | | 345,745 | | 1,635,374 | |
CME Group, Inc. | | 813 | | 261,583 | |
Comerica, Inc. | | 2,096 | | 88,535 | |
Discover Financial Svcs. | | 6,761 | | 125,281 | |
E*Trade Financial Corp.* | | 2,343 | | 37,488 | |
Equity Residential | | 3,407 | | 176,994 | |
Federated Investors, Inc. Cl B | | 1,100 | | 28,787 | |
Fifth Third Bancorp | | 9,482 | | 139,196 | |
First Horizon National Corp.* | | 2,779 | | 32,735 | |
Franklin Resources, Inc. | | 1,787 | | 198,732 | |
Genworth Financial, Inc. Cl A* | | 5,858 | | 76,974 | |
Goldman Sachs Group, Inc. | | 6,172 | | 1,037,884 | |
Hartford Financial Svcs. Group, Inc. | | 5,291 | | 140,159 | |
HCP, Inc. | | 3,871 | | 142,414 | |
Health Care REIT, Inc. | | 1,727 | | 82,274 | |
Host Hotels & Resorts, Inc. | | 7,877 | | 140,762 | |
Hudson City Bancorp, Inc. | | 6,299 | | 80,249 | |
Huntington Bancshares, Inc. | | 8,539 | | 58,663 | |
IntercontinentalExchange, Inc.* | | 866 | | 103,184 | |
Invesco Ltd. | | 5,526 | | 132,956 | |
Janus Capital Group, Inc. | | 2,206 | | 28,612 | |
JPMorgan Chase & Co. | | 47,226 | | 2,003,327 | |
KeyCorp | | 10,264 | | 90,836 | |
Kimco Realty Corp. | | 4,804 | | 86,664 | |
Legg Mason, Inc. | | 1,811 | | 65,685 | |
Leucadia National Corp.* | | 2,362 | | 68,923 | |
Lincoln National Corp. | | 3,773 | | 104,927 | |
Loews Corp. | | 3,813 | | 148,364 | |
M&T Bank Corp. | | 1,438 | | 125,178 | |
Marsh & McLennan Cos., Inc. | | 6,513 | | 178,065 | |
Marshall & Ilsley Corp. | | 5,410 | | 37,437 | |
MetLife, Inc. | | 10,860 | | 482,618 | |
Moody’s Corp. | | 2,487 | | 66,005 | |
Morgan Stanley | | 18,011 | | 490,079 | |
Nasdaq OMX Group, Inc.* | | 1,694 | | 40,165 | |
Northern Trust Corp. | | 2,945 | | 163,182 | |
NYSE Euronext | | 3,139 | | 94,107 | |
People’s United Financial, Inc. | | 4,451 | | 62,359 | |
Plum Creek Timber Co., Inc. | | 1,947 | | 72,915 | |
PNC Financial Svcs. Grp., Inc. | | 6,329 | | 384,297 | |
Principal Financial Grp., Inc. | | 3,888 | | 126,593 | |
Progressive Corp. | | 8,051 | | 159,973 | |
ProLogis | | 6,797 | | 98,149 | |
Prudential Financial, Inc. | | 5,795 | | 340,224 | |
Public Storage | | 1,669 | | 169,270 | |
Regions Financial Corp. | | 14,576 | | 102,032 | |
Simon Property Group, Inc. | | 3,515 | | 349,707 | |
SLM Corp.* | | 5,846 | | 73,601 | |
State Street Corp. | | 6,070 | | 281,284 | |
SunTrust Banks, Inc. | | 5,806 | | 171,335 | |
T. Rowe Price Group, Inc. | | 3,068 | | 198,009 | |
Torchmark Corp. | | 965 | | 57,649 | |
Travelers Cos., Inc. | | 5,532 | | 308,188 | |
U.S. Bancorp | | 23,110 | | 623,277 | |
Unum Group | | 3,787 | | 91,721 | |
Ventas, Inc. | | 1,877 | | 98,505 | |
Vornado Realty Trust | | 1,969 | | 164,077 | |
Wells Fargo & Co. | | 62,965 | | 1,951,285 | |
Weyerhaeuser Co. | | 6,381 | | 120,792 | |
XL Capital Ltd. Cl A* | | 3,833 | | 83,636 | |
Zions Bancorporation | | 2,109 | | 51,101 | |
| | | | 22,006,722 | |
HEALTH CARE (5.6%) | | | | | |
Abbott Laboratories | | 18,745 | | 898,073 | |
Aetna, Inc. | | 4,814 | | 146,875 | |
Agilent Technologies, Inc.* | | 4,058 | | 168,123 | |
Allergan, Inc. | | 3,694 | | 253,667 | |
AmerisourceBergen Corp. | | 3,288 | | 112,187 | |
Amgen, Inc.* | | 11,183 | | 613,947 | |
Bard (C.R.), Inc. | | 1,114 | | 102,232 | |
Baxter International, Inc. | | 7,104 | | 359,604 | |
Becton, Dickinson & Co. | | 2,761 | | 233,360 | |
Biogen Idec, Inc.* | | 2,849 | | 191,025 | |
Boston Scientific Corp.* | | 17,481 | | 132,331 | |
Bristol-Myers Squibb Co. | | 20,750 | | 549,460 | |
Cardinal Health, Inc. | | 4,130 | | 158,220 | |
CareFusion Corp.* | | 2,630 | | 67,591 | |
Celgene Corp.* | | 5,638 | | 333,431 | |
Cephalon, Inc.* | | 879 | | 54,252 | |
Cerner Corp.* | | 830 | | 78,634 | |
CIGNA Corp. | | 3,234 | | 118,558 | |
Coventry Health Care, Inc.* | | 1,790 | | 47,256 | |
DaVita, Inc.* | | 1,163 | | 80,817 | |
Dentsply International, Inc. | | 1,703 | | 58,192 | |
Express Scripts, Inc.* | | 6,310 | | 341,056 | |
Forest Laboratories, Inc.* | | 3,523 | | 112,666 | |
Genzyme Corp.* | | 3,117 | | 221,930 | |
Gilead Sciences, Inc.* | | 9,932 | | 359,936 | |
Hospira, Inc.* | | 2,024 | | 112,717 | |
Humana, Inc.* | | 2,022 | | 110,684 | |
Intuitive Surgical, Inc.* | | 466 | | 120,112 | |
Johnson & Johnson | | 33,205 | | 2,053,729 | |
King Pharmaceuticals, Inc.* | | 3,010 | | 42,291 | |
Laboratory Corp. of America Hldgs.* | | 1,226 | | 107,790 | |
Life Technologies Corp.* | | 2,267 | | 125,819 | |
Lilly (Eli) & Co. | | 12,274 | | 430,081 | |
McKesson Corp. | | 3,029 | | 213,181 | |
Medco Health Solutions, Inc.* | | 5,075 | | 310,945 | |
Medtronic, Inc. | | 12,646 | | 469,040 | |
Merck & Co., Inc. | | 37,594 | | 1,354,888 | |
Mylan, Inc.* | | 5,226 | | 110,425 | |
Patterson Cos., Inc. | | 1,164 | | 35,653 | |
PerkinElmer, Inc. | | 1,421 | | 36,690 | |
Pfizer, Inc. | | 97,359 | | 1,704,756 | |
Quest Diagnostics, Inc. | | 1,690 | | 91,209 | |
St. Jude Medical, Inc.* | | 4,092 | | 174,933 | |
Stryker Corp. | | 4,112 | | 220,814 | |
Tenet Healthcare Corp.* | | 5,844 | | 39,096 | |
Thermo Fisher Scientific, Inc.* | | 4,753 | | 263,126 | |
UnitedHealth Group, Inc. | | 13,447 | | 485,571 | |
Varian Medical Systems, Inc.* | | 1,422 | | 98,516 | |
Waters Corp.* | | 1,102 | | 85,636 | |
Watson Pharmaceuticals, Inc.* | | 1,514 | | 78,198 | |
WellPoint, Inc.* | | 4,770 | | 271,222 | |
Zimmer Hldgs., Inc.* | | 2,364 | | 126,900 | |
| | | | 15,067,445 | |
INDUSTRIALS (5.6%) | | | | | |
3M Co. | | 8,615 | | 743,475 | |
Avery Dennison Corp. | | 1,294 | | 54,788 | |
Boeing Co. | | 8,741 | | 570,438 | |
Caterpillar, Inc. | | 7,718 | | 722,868 | |
Cintas Corp. | | 1,517 | | 42,415 | |
CSX Corp. | | 4,536 | | 293,071 | |
Cummins, Inc. | | 2,387 | | 262,594 | |
Danaher Corp. | | 6,471 | | 305,237 | |
Deere & Co. | | 5,145 | | 427,292 | |
Donnelley (R.R.) & Sons Co. | | 2,479 | | 43,308 | |
Dover Corp. | | 2,246 | | 131,279 | |
Dun & Bradstreet Corp. | | 598 | | 49,090 | |
Eaton Corp. | | 2,048 | | 207,892 | |
Emerson Electric Co. | | 9,099 | | 520,190 | |
Equifax, Inc. | | 1,483 | | 52,795 | |
Expeditors Int’l. of Wash. | | 2,597 | | 141,796 | |
Fastenal Co. | | 1,760 | | 105,442 | |
FedEx Corp. | | 3,847 | | 357,809 | |
Flowserve Corp. | | 674 | | 80,354 | |
Fluor Corp. | | 2,130 | | 141,134 | |
General Dynamics Corp. | | 4,579 | | 324,926 | |
General Electric Co. | | 129,260 | | 2,364,163 | |
Goodrich Corp. | | 1,517 | | 133,602 | |
Grainger (W.W.), Inc. | | 701 | | 96,815 | |
Honeywell International, Inc. | | 9,444 | | 502,043 | |
Illinois Tool Works, Inc. | | 5,927 | | 316,502 | |
Ingersoll-Rand PLC | | 3,855 | | 181,532 | |
Iron Mountain, Inc. | | 2,419 | | 60,499 | |
ITT Corp. | | 2,179 | | 113,548 | |
Jacobs Engineering Group, Inc.* | | 1,492 | | 68,408 | |
L-3 Communications Hldgs., Inc. | | 1,376 | | 96,994 | |
Lockheed Martin Corp. | | 3,587 | | 250,767 | |
Masco Corp. | | 4,323 | | 54,729 | |
Norfolk Southern Corp. | | 4,394 | | 276,031 | |
Northrop Grumman Corp. | | 3,542 | | 229,451 | |
Paccar, Inc. | | 4,445 | | 255,232 | |
Pall Corp. | | 1,390 | | 68,916 | |
Parker Hannifin Corp. | | 1,946 | | 167,940 | |
Pitney Bowes, Inc. | | 2,455 | | 59,362 | |
Precision Castparts Corp. | | 1,701 | | 236,796 | |
Quanta Services, Inc.* | | 2,637 | | 52,529 | |
Raytheon Co. | | 4,418 | | 204,730 | |
Republic Services, Inc. | | 3,665 | | 109,437 | |
Robert Half Int’l., Inc. | | 1,759 | | 53,825 | |
Robinson (C.H.) Worldwide, Inc. | | 1,998 | | 160,220 | |
Rockwell Automation, Inc. | | 1,710 | | 122,624 | |
Rockwell Collins, Inc. | | 1,884 | | 109,762 | |
Roper Industries, Inc. | | 1,141 | | 87,207 | |
Ryder System, Inc. | | 618 | | 32,532 | |
Snap-On, Inc. | | 701 | | 39,663 | |
Southwest Airlines Co. | | 8,789 | | 114,081 | |
Stericycle, Inc.* | | 1,032 | | 83,509 | |
Textron, Inc. | | 3,290 | | 77,776 | |
Tyco International Ltd. | | 5,948 | | 246,485 | |
Union Pacific Corp. | | 6,025 | | 558,277 | |
United Parcel Service, Inc. Cl B | | 12,033 | | 873,355 | |
United Technologies Corp. | | 11,139 | | 876,862 | |
Waste Management, Inc. | | 5,756 | | 212,224 | |
| | | | 15,126,621 | |
INFORMATION TECHNOLOGY (9.4%) | | | | | |
Adobe Systems, Inc.* | | 6,096 | | 187,635 | |
Advanced Micro Devices, Inc.* | | 6,969 | | 57,006 | |
Akamai Technologies, Inc.* | | 2,195 | | 103,275 | |
Altera Corp. | | 3,753 | | 133,532 | |
Amphenol Corp. Cl A | | 2,096 | | 110,627 | |
Analog Devices, Inc. | | 3,571 | | 134,520 | |
Apple, Inc.* | | 11,054 | | 3,565,573 | |
Applied Materials, Inc. | | 15,721 | | 220,880 | |
Autodesk, Inc.* | | 2,701 | | 103,178 | |
Automatic Data Processing, Inc. | | 5,941 | | 274,949 | |
BMC Software, Inc.* | | 2,153 | | 101,492 | |
Broadcom Corp. Cl A | | 5,509 | | 239,917 | |
CA, Inc. | | 4,595 | | 112,302 | |
Cisco Systems, Inc.* | | 67,442 | | 1,364,352 | |
Citrix Systems, Inc.* | | 2,239 | | 153,170 | |
Cognizant Technology Solutions* | | 3,562 | | 261,059 | |
Computer Sciences Corp. | | 1,858 | | 92,157 | |
Compuware Corp.* | | 2,640 | | 30,809 | |
Corning, Inc. | | 18,594 | | 359,236 | |
Dell, Inc.* | | 19,836 | | 268,778 | |
eBay, Inc.* | | 14,062 | | 391,345 | |
Electronic Arts, Inc.* | | 3,992 | | 65,389 | |
EMC Corp.* | | 24,499 | | 561,027 | |
F5 Networks, Inc.* | | 947 | | 123,262 | |
Fidelity Nat’l. Information Svcs., Inc. | | 3,229 | | 88,442 | |
First Solar, Inc.* | | 660 | | 85,892 | |
Fiserv, Inc.* | | 1,790 | | 104,822 | |
FLIR Systems, Inc.* | | 1,882 | | 55,990 | |
Google, Inc.* | | 3,008 | | 1,786,662 | |
Harris Corp. | | 1,552 | | 70,306 | |
Hewlett-Packard Co. | | 27,328 | | 1,150,509 | |
Int’l. Business Machines Corp. | | 14,914 | | 2,188,779 | |
Intel Corp. | | 66,749 | | 1,403,731 | |
Intuit, Inc.* | | 3,355 | | 165,402 | |
Jabil Circuit, Inc. | | 2,323 | | 46,669 | |
JDS Uniphase Corp.* | | 2,665 | | 38,589 | |
Juniper Networks, Inc.* | | 6,284 | | 232,005 | |
KLA-Tencor Corp. | | 2,003 | | 77,396 | |
Lexmark International, Inc. Cl A* | | 956 | | 33,288 | |
Linear Technology Corp. | | 2,692 | | 93,116 | |
LSI Corp.* | | 7,432 | | 44,518 | |
MasterCard, Inc. | | 1,182 | | 264,898 | |
McAfee, Inc.* | | 1,867 | | 86,461 | |
MEMC Electronic Materials, Inc.* | | 2,699 | | 30,391 | |
Microchip Technology, Inc. | | 2,256 | | 77,178 | |
Micron Technology, Inc.* | | 10,257 | | 82,261 | |
Microsoft Corp. | | 90,672 | | 2,531,557 | |
Molex, Inc. | | 1,671 | | 37,965 | |
Monster Worldwide, Inc.* | | 1,563 | | 36,934 | |
Motorola, Inc.* | | 28,395 | | 257,543 | |
National Semiconductor Corp. | | 2,858 | | 39,326 | |
NetApp, Inc.* | | 4,354 | | 239,296 | |
Novell, Inc.* | | 4,242 | | 25,113 | |
Novellus Systems, Inc.* | | 1,093 | | 35,326 | |
Nvidia Corp.* | | 6,948 | | 106,999 | |
Oracle Corp. | | 44,325 | | 1,387,373 | |
Paychex, Inc. | | 3,841 | | 118,725 | |
QLogic Corp.* | | 1,292 | | 21,990 | |
QUALCOMM, Inc. | | 19,503 | | 965,203 | |
Red Hat, Inc.* | | 2,302 | | 105,086 | |
SAIC, Inc.* | | 3,508 | | 55,637 | |
Salesforce.com, inc.* | | 1,422 | | 187,704 | |
SanDisk Corp.* | | 2,812 | | 140,206 | |
Symantec Corp.* | | 9,456 | | 158,293 | |
Tellabs, Inc. | | 4,417 | | 29,947 | |
Teradata Corp.* | | 1,991 | | 81,950 | |
Teradyne, Inc.* | | 2,165 | | 30,397 | |
Texas Instruments, Inc. | | 14,079 | | 457,568 | |
Total System Services, Inc. | | 1,960 | | 30,145 | |
VeriSign, Inc.* | | 2,051 | | 67,006 | |
Visa, Inc. Cl A | | 5,834 | | 410,597 | |
Western Digital Corp.* | | 2,776 | | 94,106 | |
Western Union Co. | | 7,862 | | 145,997 | |
Xerox Corp. | | 16,782 | | 193,329 | |
Xilinx, Inc. | | 3,171 | | 91,896 | |
Yahoo!, Inc.* | | 15,716 | | 261,357 | |
| | | | 25,567,346 | |
MATERIALS (1.9%) | | | | | |
Air Products & Chemicals, Inc. | | 2,566 | | 233,378 | |
Airgas, Inc. | | 898 | | 56,089 | |
AK Steel Hldg. Corp. | | 1,253 | | 20,512 | |
Alcoa, Inc. | | 12,272 | | 188,866 | |
Allegheny Technologies, Inc. | | 1,120 | | 61,802 | |
Ball Corp. | | 1,072 | | 72,950 | |
Bemis Co., Inc. | | 1,290 | | 42,131 | |
CF Industries Hldgs., Inc. | | 835 | | 112,850 | |
Cliffs Natural Resources, Inc. | | 1,619 | | 126,298 | |
Dow Chemical Co. | | 14,080 | | 480,691 | |
Du Pont (E.I.) de Nemours & Co. | | 10,937 | | 545,538 | |
Eastman Chemical Co. | | 874 | | 73,486 | |
Ecolab, Inc. | | 2,780 | | 140,168 | |
FMC Corp. | | 875 | | 69,904 | |
Freeport-McMoRan Copper & Gold, Inc. | | 5,566 | | 668,421 | |
Int’l. Flavors & Fragrances, Inc. | | 965 | | 53,644 | |
International Paper Co. | | 5,180 | | 141,103 | |
MeadWestvaco Corp. | | 2,024 | | 52,948 | |
Monsanto Co. | | 6,289 | | 437,966 | |
Newmont Mining Corp. | | 5,972 | | 366,860 | |
Nucor Corp. | | 3,776 | | 165,464 | |
Owens-Illinois, Inc.* | | 1,983 | | 60,878 | |
PPG Industries, Inc. | | 1,957 | | 164,525 | |
Praxair, Inc. | | 3,690 | | 352,284 | |
Sealed Air Corp. | | 1,918 | | 48,813 | |
Sherwin-Williams Co. | | 1,075 | | 90,031 | |
Sigma-Aldrich Corp. | | 1,464 | | 97,444 | |
Titanium Metals Corp.* | | 1,030 | | 17,695 | |
United States Steel Corp. | | 1,680 | | 98,146 | |
Vulcan Materials Co. | | 1,578 | | 70,000 | |
| | | | 5,110,885 | |
TELECOMMUNICATION SERVICES (1.6%) | | | | | |
American Tower Corp. Cl A* | | 4,837 | | 249,783 | |
AT&T, Inc. | | 71,547 | | 2,102,051 | |
CenturyLink, Inc. | | 3,658 | | 168,890 | |
Frontier Communications Corp. | | 12,175 | | 118,463 | |
MetroPCS Communications, Inc.* | | 3,214 | | 40,593 | |
Qwest Communications Int’l., Inc. | | 21,059 | | 160,259 | |
Sprint Nextel Corp.* | | 36,095 | | 152,682 | |
Verizon Communications, Inc. | | 34,377 | | 1,230,009 | |
Windstream Corp. | | 5,871 | | 81,842 | |
| | | | 4,304,572 | |
UTILITIES (1.7%) | | | | | |
AES Corp.* | | 7,904 | | 96,271 | |
Allegheny Energy, Inc. | | 2,034 | | 49,304 | |
Ameren Corp. | | 2,913 | | 82,117 | |
American Electric Power Co., Inc. | | 5,824 | | 209,548 | |
CenterPoint Energy, Inc. | | 5,115 | | 80,408 | |
CMS Energy Corp. | | 2,958 | | 55,019 | |
Consolidated Edison, Inc. | | 3,517 | | 174,338 | |
Constellation Energy Group, Inc. | | 2,391 | | 73,236 | |
Dominion Resources, Inc. | | 6,977 | | 298,057 | |
DTE Energy Co. | | 2,048 | | 92,815 | |
Duke Energy Corp. | | 15,998 | | 284,924 | |
Edison International | | 3,911 | | 150,965 | |
Entergy Corp. | | 2,191 | | 155,189 | |
Exelon Corp. | | 7,969 | | 331,829 | |
FirstEnergy Corp. | | 3,663 | | 135,604 | |
Integrys Energy Group, Inc. | | 942 | | 45,696 | |
NextEra Energy, Inc. | | 5,015 | | 260,730 | |
Nicor, Inc. | | 550 | | 27,456 | |
NiSource, Inc. | | 3,385 | | 59,644 | |
Northeast Utilities | | 2,133 | | 68,000 | |
NRG Energy, Inc.* | | 2,932 | | 57,291 | |
Oneok, Inc. | | 1,280 | | 71,002 | |
Pepco Hldgs., Inc. | | 2,727 | | 49,768 | |
PG&E Corp. | | 4,720 | | 225,805 | |
Pinnacle West Capital Corp. | | 1,315 | | 54,507 | |
PPL Corp. | | 5,762 | | 151,656 | |
Progress Energy Enterprise | | 3,550 | | 154,354 | |
Public Svc. Enterprise Group, Inc. | | 6,119 | | 194,645 | |
SCANA Corp. | | 1,368 | | 55,541 | |
Sempra Energy | | 2,882 | | 151,247 | |
Southern Co. | | 10,085 | | 385,550 | |
TECO Energy, Inc. | | 2,576 | | 45,853 | |
Wisconsin Energy Corp. | | 1,410 | | 82,993 | |
Xcel Energy, Inc. | | 5,550 | | 130,703 | |
| | | | 4,542,065 | |
TOTAL INDEXED ASSETS - COMMON STOCKS
(Cost: $130,702,241) 50.8% | | | | 137,537,637 | |
| | Rating** | | Rate(%) | | Maturity | | Face Amount | | Value | |
INDEXED ASSETS: | | | | | | | | | | | |
SHORT-TERM DEBT SECURITIES: | | | | | | | | | | | |
U.S. GOVERNMENT (0.3%) | | | | | | | | | | | |
U.S. Treasury Bill (1) | | AAA | | 0.12 | | 02/03/11 | | 400,000 | | 399,956 | |
U.S. Treasury Bill (1) | | AAA | | 0.14 | | 03/31/11 | | 500,000 | | 499,835 | |
| | | | | | | | | | 899,791 | |
U.S. GOVERNMENT AGENCIES (0.7%) | | | | | | | | | | | |
Farmer Mac | | AAA | | 0.01 | | 01/03/11 | | 1,800,000 | | 1,799,999 | |
COMMERCIAL PAPER (0.4%) | | | | | | | | | | | |
General Electric Capital Corp. | | A-1+ | | 0.15 | | 01/31/11 | | 1,100,000 | | 1,099,863 | |
TOTAL INDEXED ASSETS - SHORT-TERM DEBT SECURITIES
(Cost: $3,799,645) 1.4% | | | | | | | | | | 3,799,653 | |
| | | | | | | | | | | |
TOTAL INDEXED ASSETS
(Cost: $134,501,886) 52.2% | | | | | | | | | | 141,337,290 | |
| | Shares | | Value | |
ACTIVE ASSETS: | | | | | |
COMMON STOCKS: | | | | | |
CONSUMER DISCRETIONARY (5.4%) | | | | | |
AFC Enterprises, Inc.* | | 9,762 | | 135,692 | |
Amazon.com, Inc.* | | 3,875 | | 697,500 | |
American Axle & Mfg. Hldgs., Inc.* | | 6,975 | | 89,699 | |
Apollo Group, Inc.* | | 6,580 | | 259,844 | |
Bassett Furniture Industries, Inc.* | | 23,740 | | 99,708 | |
California Pizza Kitchen, Inc.* | | 22,025 | | 380,592 | |
Carter’s, Inc.* | | 12,076 | | 356,363 | |
Collective Brands, Inc.* | | 12,010 | | 253,411 | |
CPI Corp. | | 16,481 | | 371,647 | |
Dana Hldg. Corp.* | | 5,475 | | 94,225 | |
Darden Restaurants, Inc. | | 5,739 | | 266,519 | |
Deckers Outdoor Corp.* | | 6,027 | | 480,593 | |
Denny’s Corp.* | | 68,260 | | 244,371 | |
Dillard’s, Inc. Cl A | | 17,843 | | 676,963 | |
Discovery Communications, Inc. Cl A* | | 5,192 | | 216,506 | |
Disney (Walt) Co. | | 15,420 | | 578,404 | |
Ford Motor Co.* | | 38,038 | | 638,658 | |
Fossil, Inc.* | | 4,150 | | 292,492 | |
G-III Apparel Group Ltd.* | | 6,892 | | 242,254 | |
Johnson Controls, Inc. | | 13,431 | | 513,064 | |
Lincoln Educational Svcs. Corp.* | | 13,787 | | 213,836 | |
Maidenform Brands, Inc.* | | 5,450 | | 129,547 | |
NIKE, Inc. Cl B | | 6,218 | | 531,142 | |
OfficeMax, Inc.* | | 32,346 | | 572,524 | |
P.F. Chang’s China Bistro, Inc. | | 3,919 | | 189,915 | |
Pep Boys - Manny, Moe & Jack | | 21,160 | | 284,179 | |
Pinnacle Entertainment, Inc.* | | 35,217 | | 493,742 | |
Rent-A-Center, Inc.* | | 16,303 | | 526,261 | |
Shutterfly, Inc.* | | 20,459 | | 716,679 | |
Smith & Wesson Hldg. Corp.* | | 6,969 | | 26,064 | |
Sotheby’s | | 3,486 | | 156,870 | |
Staples, Inc. | | 13,739 | | 312,837 | |
Starbucks Corp. | | 22,773 | | 731,696 | |
Steve Madden Ltd.* | | 6,874 | | 286,783 | |
Target Corp. | | 4,275 | | 257,056 | |
Tenneco, Inc.* | | 5,445 | | 224,116 | |
Time Warner Cable, Inc. | | 5,762 | | 380,465 | |
Time Warner, Inc. | | 9,696 | | 311,920 | |
Tupperware Brands Corp. | | 9,150 | | 436,181 | |
Urban Outfitters, Inc.* | | 6,948 | | 248,808 | |
Viacom, Inc. Cl B | | 11,009 | | 436,066 | |
Wolverine World Wide, Inc. | | 10,246 | | 326,642 | |
| | | | 14,681,834 | |
CONSUMER STAPLES (2.4%) | | | | | |
Avon Products, Inc. | | 7,522 | | 218,589 | |
ConAgra Foods, Inc. | | 16,095 | | 363,425 | |
Constellation Brands, Inc. Cl A* | | 14,423 | | 319,469 | |
Diamond Foods, Inc.* | | 4,287 | | 227,983 | |
Dr. Pepper Snapple Group, Inc. | | 15,722 | | 552,786 | |
General Mills, Inc. | | 10,734 | | 382,023 | |
Kraft Foods, Inc. Cl A | | 16,969 | | 534,693 | |
Pantry, Inc.* | | 16,215 | | 322,030 | |
PepsiCo, Inc. | | 14,156 | | 924,811 | |
Proctor & Gamble Co. | | 18,072 | | 1,162,572 | |
TreeHouse Foods, Inc.* | | 5,287 | | 270,113 | |
Vector Group Ltd. | | 8,772 | | 151,931 | |
Wal-Mart Stores, Inc. | | 18,945 | | 1,021,704 | |
| | | | 6,452,129 | |
ENERGY (4.3%) | | | | | |
Apache Corp. | | 5,088 | | 606,642 | |
Brigham Exploration Co.* | | 47,372 | | 1,290,413 | |
ConocoPhillips | | 14,355 | | 977,576 | |
Energy XXI (Bermuda) Ltd.* | | 21,803 | | 603,289 | |
Exxon Mobil Corp. | | 27,470 | | 2,008,606 | |
Halliburton Co. | | 16,927 | | 691,129 | |
Hess Corp. | | 4,919 | | 376,500 | |
Hornbeck Offshore Svcs., Inc.* | | 14,997 | | 313,137 | |
Houston American Energy Corp.* | | 7,030 | | 127,173 | |
Lufkin Industries, Inc. | | 4,487 | | 279,944 | |
MarkWest Energy Partners LP | | 15,127 | | 655,150 | |
McMoRan Exploration Co.* | | 85,766 | | 1,470,029 | |
National Oilwell Varco, Inc. | | 7,614 | | 512,042 | |
Noble Energy, Inc. | | 6,515 | | 560,811 | |
Occidental Petroleum Corp. | | 8,012 | | 785,977 | |
Range Resources Corp. | | 4,271 | | 192,110 | |
Southwestern Energy Co.* | | 3,249 | | 121,610 | |
| | | | 11,572,138 | |
FINANCIALS (8.5%) | | | | | |
Allstate Corp. | | 17,342 | | 552,863 | |
AmTrust Financial Svcs., Inc. | | 6,242 | | 109,235 | |
Ashford Hospitality Trust, Inc.* | | 65,198 | | 629,161 | |
Aspen Insurance Hldgs. Ltd. | | 11,833 | | 338,660 | |
Associated Estates Realty Corp.* | | 12,280 | | 187,761 | |
BancFirst Corp. | | 4,584 | | 188,815 | |
Bank Mutual Corp. | | 19,170 | | 91,633 | |
Bank of America Corp. | | 56,706 | | 756,458 | |
Bank of Marin Bancorp | | 3,000 | | 105,000 | |
Banner Corp. | | 36,610 | | 84,935 | |
BB&T Corp. | | 15,666 | | 411,859 | |
Berkshire Hathaway, Inc. Cl B* | | 9,460 | | 757,841 | |
Brookline Bancorp, Inc. | | 31,755 | | 344,542 | |
Bryn Mawr Bank Corp. | | 9,050 | | 157,923 | |
Capital One Financial Corp. | | 15,257 | | 649,338 | |
Cash America Int’l., Inc.* | | 7,400 | | 273,282 | |
Chesapeake Lodging Trust* | | 14,407 | | 270,996 | |
Citigroup, Inc.* | | 149,236 | | 705,886 | |
Colonial Properties Trust | | 16,840 | | 303,962 | |
Dime Community Bancshares | | 15,045 | | 219,507 | |
EastGroup Properties, Inc. | | 6,180 | | 261,538 | |
Ellington Financial LLC* | | 22,160 | | 492,838 | |
FBR Capital Markets Corp.* | | 5,293 | | 20,219 | |
FelCor Lodging Trust, Inc.* | | 41,400 | | 291,456 | |
First Financial Bancorp. | | 10,925 | | 201,894 | |
First Interstate BancSytem, Inc. | | 13,866 | | 211,318 | |
First Niagara Financial Group, Inc. | | 17,620 | | 246,328 | |
Forest City Enterprises, Inc. Cl A* | | 23,340 | | 389,545 | |
Glacier Bancorp, Inc. | | 16,879 | | 255,042 | |
Goldman Sachs Group, Inc. | | 5,238 | | 880,822 | |
Hersha Hospitality Trust* | | 23,780 | | 156,948 | |
Highwoods Properties, Inc. | | 10,466 | | 333,342 | |
IBERIABANK Corp. | | 3,835 | | 226,764 | |
Investors Bancorp, Inc.* | | 15,780 | | 207,034 | |
iShares Russell 2000 Growth Index Fund | | 2,000 | | 174,840 | |
JPMorgan Chase & Co. | | 33,775 | | 1,432,736 | |
KKR Financial Hldgs. LLC | | 11,180 | | 103,974 | |
Marlin Business Svcs. Corp.* | | 18,753 | | 237,225 | |
MB Financial, Inc. | | 11,160 | | 193,291 | |
Meadowbrook Insurance Group, Inc. | | 36,043 | | 369,441 | |
Medical Properties Trust, Inc. | | 11,507 | | 124,621 | |
MetLife, Inc. | | 12,531 | | 556,878 | |
Mid-America Apt. Communities, Inc. | | 3,599 | | 228,501 | |
National Retail Pptys., Inc. | | 9,339 | | 247,484 | |
NBH Hldgs. Co.†*** | | 16,887 | | 329,297 | |
NewAlliance Bancshares, Inc. | | 26,144 | | 391,637 | |
Northwest Bancshares, Inc. | | 18,853 | | 221,711 | |
Pennsylvania REIT | | 23,297 | | 338,505 | |
PHH Corp.* | | 12,742 | | 294,977 | |
PNC Financial Svcs. Grp., Inc. | | 6,683 | | 405,792 | |
ProAssurance Corp.* | | 5,952 | | 360,691 | |
Prosperity Bancshares, Inc. | | 5,910 | | 232,145 | |
PS Business Parks, Inc. | | 3,220 | | 179,418 | |
S.Y. Bancorp, Inc. | | 17,481 | | 429,159 | |
SeaBright Hldgs., Inc. | | 29,213 | | 269,344 | |
Senior Housing Pptys. Trust | | 22,807 | | 500,386 | |
Signature Bank* | | 12,397 | | 619,850 | |
Simon Property Group, Inc. | | 5,504 | | 547,593 | |
Stifel Financial Corp.* | | 4,446 | | 275,830 | |
SVB Financial Group* | | 7,280 | | 386,204 | |
Symetra Financial Corp. | | 11,780 | | 161,386 | |
UMB Financial Corp. | | 5,290 | | 219,112 | |
Urstadt Biddle Properties Cl A* | | 8,110 | | 157,740 | |
Wells Fargo & Co. | | 41,694 | | 1,292,097 | |
Westamerica Bancorporation | | 6,267 | | 347,630 | |
Westfield Financial, Inc. | | 9,039 | | 83,611 | |
| | | | 23,027,851 | |
HEALTH CARE (5.1%) | | | | | |
Abbott Laboratories | | 17,263 | | 827,070 | |
Abiomed, Inc.* | | 32,489 | | 312,219 | |
Acorda Therapeutics, Inc.* | | 7,625 | | 207,858 | |
Allied Healthcare Int’l., Inc.* | | 46,044 | | 115,570 | |
Alphatec Hldgs., Inc.* | | 89,878 | | 242,671 | |
American Medical Systems Hldgs., Inc.* | | 19,429 | | 366,431 | |
Auxilium Pharmaceuticals, Inc.* | | 4,205 | | 88,726 | |
Bruker Corp.* | | 11,850 | | 196,710 | |
Celgene Corp.* | | 7,137 | | 422,082 | |
Conceptus, Inc.* | | 17,666 | | 243,791 | |
Cyberonics, Inc.* | | 10,174 | | 315,597 | |
DexCom, Inc.* | | 8,687 | | 118,578 | |
Emergent Biosolutions, Inc.* | | 9,326 | | 218,788 | |
Enzon Pharmaceuticals, Inc.* | | 70,881 | | 862,622 | |
Exelixis, Inc.* | | 32,021 | | 262,892 | |
Geron Corp.* | | 12,100 | | 62,557 | |
Gilead Sciences, Inc.* | | 13,212 | | 478,803 | |
HMS Hldgs. Corp.* | | 5,124 | | 331,881 | |
Human Genome Sciences, Inc.* | | 7,031 | | 167,971 | |
Inspire Pharmaceuticals, Inc.* | | 19,068 | | 160,171 | |
Insulet Corp.* | | 3,512 | | 54,436 | |
IPC The Hospitalist Co.* | | 8,100 | | 315,981 | |
Johnson & Johnson | | 18,173 | | 1,124,000 | |
Laboratory Corp. of America Hldgs.* | | 4,087 | | 359,329 | |
McKesson Corp. | | 7,333 | | 516,097 | |
MedAssets, Inc.* | | 11,818 | | 238,605 | |
Medco Health Solutions, Inc.* | | 5,560 | | 340,661 | |
Medidata Solutions, Inc.* | | 9,600 | | 229,248 | |
Merck & Co., Inc. | | 23,663 | | 852,815 | |
Mylan, Inc.* | | 23,057 | | 487,194 | |
Neogen Corp.* | | 7,660 | | 314,290 | |
NuPathe, Inc.* | | 8,941 | | 81,005 | |
Omnicell, Inc.* | | 16,276 | | 235,188 | |
Onyx Pharmaceuticals, Inc.* | | 5,904 | | 217,680 | |
Optimer Pharmaceuticals, Inc.* | | 6,218 | | 70,326 | |
OSI Pharmaceuticals, Inc. - rights* | | 1,570 | | 0 | |
PAREXEL International Corp.* | | 6,375 | | 135,341 | |
Quidel Corp.* | | 7,500 | | 108,375 | |
RehabCare Group, Inc.* | | 8,950 | | 212,115 | |
Salix Pharmaceuticals Ltd.* | | 8,822 | | 414,281 | |
Seattle Genetics, Inc.* | | 11,490 | | 171,776 | |
St. Jude Medical, Inc.* | | 11,830 | | 505,733 | |
Steris Corp. | | 10,100 | | 368,246 | |
SXC Health Solutions Corp.* | | 5,228 | | 224,072 | |
UnitedHealth Group, Inc. | | 5,172 | | 186,761 | |
| | | | 13,766,543 | |
INDUSTRIALS (6.3%) | | | | | |
Acco Brands Corp.* | | 26,602 | | 226,649 | |
Actuant Corp. Cl A | | 13,957 | | 371,535 | |
Administaff, Inc. | | 3,590 | | 105,187 | |
Alaska Air Group, Inc.* | | 4,812 | | 272,792 | |
Ameron International Corp. | | 6,678 | | 509,999 | |
ArvinMeritor, Inc.* | | 9,600 | | 196,992 | |
Astec Industries, Inc.* | | 6,745 | | 218,605 | |
Astronics Corp.* | | 4,750 | | 99,750 | |
AZZ, Inc. | | 12,080 | | 483,321 | |
Belden, Inc. | | 4,940 | | 181,891 | |
Boeing Co. | | 11,365 | | 741,680 | |
Cenveo, Inc.* | | 10,810 | | 57,725 | |
Clarcor, Inc. | | 4,575 | | 196,222 | |
CTPartners Executive Search, Inc.* | | 7,399 | | 116,534 | |
Cummins, Inc. | | 5,770 | | 634,758 | |
EMCOR Group, Inc.* | | 6,310 | | 182,864 | |
Encore Wire Corp. | | 14,281 | | 358,167 | |
EnPro Industries, Inc.* | | 3,275 | | 136,109 | |
Expeditors Int’l. of Wash. | | 10,601 | | 578,815 | |
FedEx Corp. | | 5,782 | | 537,784 | |
Flowserve Corp. | | 2,935 | | 349,911 | |
Force Protection, Inc.* | | 42,500 | | 234,175 | |
General Electric Co. | | 66,845 | | 1,222,595 | |
Genesee & Wyoming, Inc. Cl A* | | 16,037 | | 849,159 | |
Graham Corp. | | 10,060 | | 201,200 | |
Great Lakes Dredge & Dock Co. | | 24,625 | | 181,486 | |
Healthcare Svcs. Group, Inc. | | 12,637 | | 205,604 | |
Hub Group, Inc. Cl A* | | 6,732 | | 236,562 | |
Illinois Tool Works, Inc. | | 8,630 | | 460,842 | |
JetBlue Airways Corp* | | 26,040 | | 172,124 | |
Kaydon Corp. | | 15,263 | | 621,509 | |
Miller Industries, Inc. | | 22,160 | | 315,337 | |
Mueller Industries, Inc. | | 14,096 | | 460,939 | |
Old Dominion Freight Line, Inc.* | | 25,246 | | 807,620 | |
Orion Marine Group, Inc.* | | 22,105 | | 256,418 | |
Powell Industries, Inc.* | | 4,556 | | 149,801 | |
Precision Castparts Corp. | | 4,529 | | 630,482 | |
Raven Industries, Inc.* | | 4,650 | | 221,759 | |
RBC Bearings, Inc.* | | 7,503 | | 293,217 | |
Robbins & Myers, Inc. | | 10,874 | | 389,072 | |
SFN Group, Inc.* | | 42,402 | | 413,844 | |
Southwest Airlines Co. | | 24,012 | | 311,676 | |
Sun Hydraulics Corp. | | 9,673 | | 365,639 | |
Teledyne Technologies, Inc.* | | 6,916 | | 304,097 | |
Tutor Perini Corp.* | | 27,724 | | 593,571 | |
Union Pacific Corp. | | 4,042 | | 374,532 | |
UniTek Global Services, Inc.* | | 7,940 | | 77,966 | |
Universal Forest Products, Inc.* | | 3,690 | | 143,541 | |
| | | | 17,052,057 | |
INFORMATION TECHNOLOGY (9.0%) | | | | | |
ADPT Corp.* | | 31,810 | | 93,203 | |
Adtran, Inc. | | 9,393 | | 340,121 | |
Anaren, Inc.* | | 8,300 | | 173,055 | |
Anixter International, Inc.* | | 4,212 | | 251,583 | |
Apple, Inc.* | | 6,171 | | 1,990,518 | |
Ariba, Inc.* | | 11,519 | | 270,581 | |
Automatic Data Processing, Inc. | | 6,898 | | 319,239 | |
Ceragon Networks Ltd.* | | 18,044 | | 237,820 | |
Cirrus Logic, Inc.* | | 9,556 | | 152,705 | |
Cisco Systems, Inc.* | | 35,630 | | 720,795 | |
Cognizant Technology Solutions* | | 5,006 | | 366,890 | |
CommVault Systems, Inc.* | | 15,706 | | 449,506 | |
comScore, Inc.* | | 12,682 | | 282,935 | |
DemandTec, Inc.* | | 11,325 | | 122,763 | |
EMC Corp.* | | 12,720 | | 291,288 | |
Entropic Communications, Inc.* | | 17,379 | | 209,938 | |
Forrester Research, Inc.* | | 9,850 | | 347,607 | |
Global Cash Access Hldgs., Inc.* | | 31,096 | | 99,196 | |
Google, Inc.* | | 1,814 | | 1,077,462 | |
Hewlett-Packard Co. | | 16,767 | | 705,891 | |
iGATE Corp. | | 13,075 | | 257,708 | |
Informatica Corp.* | | 18,472 | | 813,322 | |
Int’l. Business Machines Corp. | | 6,802 | | 998,262 | |
Intersil Corp. Cl A | | 14,475 | | 221,033 | |
Intevac, Inc.* | | 14,498 | | 203,117 | |
JDA Software Group, Inc.* | | 7,000 | | 196,000 | |
KLA-Tencor Corp. | | 7,904 | | 305,411 | |
Lattice Semiconductor Corp.* | | 37,247 | | 225,717 | |
Lawson Software, Inc.* | | 26,164 | | 242,017 | |
Linear Technology Corp. | | 8,080 | | 279,487 | |
LogMeIn, Inc.* | | 11,809 | | 523,611 | |
Mercury Computer Systems, Inc.* | | 18,186 | | 334,259 | |
Microsemi Corp.* | | 22,968 | | 525,967 | |
Microsoft Corp. | | 35,092 | | 979,769 | |
MKS Instruments, Inc.* | | 17,999 | | 440,796 | |
Monolithic Power Systems, Inc.* | | 11,848 | | 195,729 | |
Monotype Imaging Hldgs., Inc.* | | 15,771 | | 175,058 | |
Netlogic Microsystems, Inc.* | | 8,099 | | 254,390 | |
Oracle Corp. | | 22,854 | | 715,330 | |
Parametric Technology Corp.* | | 32,308 | | 727,899 | |
Plexus Corp.* | | 17,590 | | 544,235 | |
Polycom, Inc.* | | 5,208 | | 203,008 | |
QUALCOMM, Inc. | | 12,487 | | 617,982 | |
Rackspace Hosting, Inc.* | | 8,800 | | 276,408 | |
Red Hat, Inc.* | | 6,422 | | 293,164 | |
RightNow Technologies, Inc.* | | 11,942 | | 282,667 | |
Riverbed Technology, Inc.* | | 14,219 | | 500,082 | |
Rogers Corp.* | | 7,490 | | 286,493 | |
Salesforce.com, inc.* | | 4,853 | | 640,596 | |
Sapient Corp. | | 13,840 | | 167,464 | |
SAVVIS, Inc.* | | 9,525 | | 243,078 | |
Semtech Corp.* | | 8,731 | | 197,670 | |
Smith Micro Software, Inc.* | | 8,041 | | 126,565 | |
Sourcefire, Inc.* | | 11,734 | | 304,263 | |
SuccessFactors, Inc.* | | 8,111 | | 234,895 | |
Super Micro Computer, Inc.* | | 19,464 | | 224,615 | |
Texas Instruments, Inc. | | 14,347 | | 466,278 | |
Tibco Software, Inc.* | | 43,297 | | 853,384 | |
TTM Technologies, Inc.* | | 16,920 | | 252,277 | |
Websense, Inc.* | | 17,886 | | 362,192 | |
Xyratex Ltd.* | | 12,175 | | 198,574 | |
Yahoo!, Inc.* | | 12,000 | | 199,560 | |
| | | | 24,593,428 | |
MATERIALS (3.0%) | | | | | |
Allied Nevada Gold Corp.* | | 9,873 | | 259,759 | |
Ball Corp. | | 4,575 | | 311,329 | |
Buckeye Technologies, Inc.* | | 12,700 | | 266,827 | |
Commercial Metals Co. | | 16,058 | | 266,402 | |
Crown Hldgs., Inc.* | | 24,176 | | 806,995 | |
Cytec Industries, Inc. | | 6,905 | | 366,379 | |
Dow Chemical Co. | | 12,303 | | 420,024 | |
Eastman Chemical Co. | | 6,626 | | 557,114 | |
Ferro Corp.* | | 10,750 | | 157,380 | |
FMC Corp. | | 5,268 | | 420,861 | |
Freeport-McMoRan Copper & Gold, Inc. | | 6,275 | | 753,565 | |
Innophos Hldgs., Inc. | | 10,171 | | 366,970 | |
Kaiser Aluminum Corp. | | 9,690 | | 485,372 | |
Sensient Technologies Corp. | | 5,612 | | 206,129 | |
Silgan Hldgs., Inc. | | 25,128 | | 899,834 | |
Taseko Mines Ltd.* | | 52,409 | | 275,147 | |
Universal Stainless & Alloy Products, Inc.* | | 7,497 | | 234,506 | |
US Gold Corp.* | | 105,791 | | 853,733 | |
Zep, Inc. | | 11,617 | | 230,946 | |
| | | | 8,139,272 | |
TELECOMMUNICATION SERVICES (1.1%) | | | | | |
Alaska Comm. Systems Group, Inc. | | 9,420 | | 104,562 | |
AT&T, Inc. | | 29,713 | | 872,968 | |
Consolidated Comms. Hldgs., Inc. | | 30,854 | | 595,482 | |
Qwest Communications Int’l., Inc. | | 50,705 | | 385,865 | |
Sprint Nextel Corp.* | | 89,975 | | 380,594 | |
Syniverse Hldgs., Inc.* | | 20,297 | | 626,162 | |
| | | | 2,965,633 | |
UTILITIES (1.3%) | | | | | |
Avista Corp. | | 16,118 | | 362,977 | |
Black Hills Corp. | | 4,501 | | 135,030 | |
Dominion Resources, Inc. | | 10,515 | | 449,201 | |
Edison International | | 6,081 | | 234,727 | |
Entergy Corp. | | 1,643 | | 116,374 | |
Idacorp, Inc. | | 8,568 | | 316,845 | |
Northwest Natural Gas Co. | | 8,689 | | 403,778 | |
PNM Resources, Inc. | | 17,863 | | 232,576 | |
PPL Corp. | | 6,743 | | 177,476 | |
Public Svc. Enterprise Group, Inc. | | 11,846 | | 376,821 | |
Sempra Energy | | 5,530 | | 290,214 | |
Unisource Energy Corp. | | 10,253 | | 367,468 | |
| | | | 3,463,487 | |
TOTAL ACTIVE ASSETS - COMMON STOCKS
(Cost: $100,906,113) 46.4% | | | | 125,714,372 | |
| | Shares | | Value | |
ACTIVE ASSETS: | | | | | |
CONVERTIBLE PREFERRED STOCKS: | | | | | |
ENERGY (0.1%) (3) | | | | | |
Energy XXI (Bermuda) Ltd., 7.25% | | 556 | | 164,993 | |
TOTAL ACTIVE ASSETS - CONVERTIBLE PREFERRED STOCKS
(Cost: $55,600) 0.1% | | | | 164,993 | |
| | Rating** | | Rate(%) | | Maturity | | Face Amount | | Value | |
ACTIVE ASSETS: | | | | | | | | | | | |
SHORT-TERM DEBT SECURITIES: | | | | | | | | | | | |
U.S. GOVERNMENT AGENCIES (0.4%) | | | | | | | | | | | |
Farmer Mac | | AAA | | 0.01 | | 01/03/11 | | 1,000,000 | | 999,999 | |
COMMERCIAL PAPER (0.7%) | | | | | | | | | | | |
General Electric Capital Corp. | | A-1+ | | 0.15 | | 01/31/11 | | 800,000 | | 799,900 | |
NetJets, Inc.† | | A-1+ | | 0.10 | | 01/03/11 | | 1,100,000 | | 1,099,994 | |
| | | | | | | | | | 1,899,894 | |
TOTAL SHORT-TERM DEBT SECURITIES
(Cost: $2,899,893) 1.1% | | | | | | | | | | 2,899,893 | |
| | | | | | | | | | | |
TOTAL ACTIVE ASSETS
(Cost: $103,861,606) 47.6% | | | | | | | | | | 128,779,258 | |
| | | | | | | | | | | |
TEMPORARY CASH INVESTMENTS (2)
(Cost: $152,600) 0.1% | | | | | | | | | | 152,600 | |
| | | | | | | | | | | |
TOTAL INVESTMENTS
(Cost: $238,516,092) 99.9% | | | | | | | | | | 270,269,148 | |
| | | | | | | | | | | |
OTHER NET ASSETS 0.1% | | | | | | | | | | 241,147 | |
| | | | | | | | | | | |
NET ASSETS 100.0% | | | | | | | | | | $ | 270,510,295 | |
| | | | | | | | | | | | |
The accompanying notes are an integral part of these portfolio schedules.
MUTUAL OF AMERICA INVESTMENT CORPORATION - SMALL CAP VALUE FUND
PORTFOLIO OF INVESTMENTS IN SECURITIES
December 31, 2010
| | Shares | | Value | |
COMMON STOCKS: | | | | | |
CONSUMER DISCRETIONARY (7.9%) | | | | | |
Bassett Furniture Industries, Inc.* | | 193,067 | | 810,881 | |
CPI Corp. | | 131,346 | | 2,961,852 | |
Dillard’s, Inc. Cl A | | 139,995 | | 5,311,410 | |
Pep Boys - Manny, Moe & Jack | | 166,501 | | 2,236,108 | |
Rent-A-Center, Inc.* | | 130,928 | | 4,226,356 | |
Shutterfly, Inc.* | | 51,196 | | 1,793,396 | |
Tupperware Brands Corp. | | 41,139 | | 1,961,096 | |
Wolverine World Wide, Inc. | | 80,484 | | 2,565,830 | |
| | | | 21,866,929 | |
CONSUMER STAPLES (0.4%) | | | | | |
Vector Group Ltd. | | 56,116 | | 971,929 | |
| | | | | |
ENERGY (7.4%) | | | | | |
Brigham Exploration Co.* | | 177,057 | | 4,823,033 | |
Energy XXI (Bermuda) Ltd.* | | 69,784 | | 1,930,923 | |
Hornbeck Offshore Svcs., Inc.* | | 119,970 | | 2,504,974 | |
Houston American Energy Corp.* | | 58,895 | | 1,065,411 | |
MarkWest Energy Partners LP | | 87,066 | | 3,770,828 | |
McMoRan Exploration Co.* | | 371,483 | | 6,367,219 | |
| | | | 20,462,388 | |
FINANCIALS (35.4%) | | | | | |
AmTrust Financial Svcs., Inc. | | 50,041 | | 875,718 | |
Ashford Hospitality Trust, Inc.* | | 428,207 | | 4,132,198 | |
Aspen Insurance Hldgs. Ltd. | | 95,723 | | 2,739,592 | |
Associated Estates Realty Corp.* | | 98,269 | | 1,502,533 | |
BancFirst Corp. | | 36,557 | | 1,505,783 | |
Bank Mutual Corp. | | 155,894 | | 745,173 | |
Bank of Marin Bancorp | | 23,912 | | 836,920 | |
Banner Corp. | | 282,920 | | 656,374 | |
Brookline Bancorp, Inc. | | 254,994 | | 2,766,685 | |
Bryn Mawr Bank Corp. | | 72,109 | | 1,258,302 | |
Cash America Int’l., Inc.* | | 58,545 | | 2,162,067 | |
Chesapeake Lodging Trust* | | 114,895 | | 2,161,175 | |
Colonial Properties Trust | | 133,963 | | 2,418,032 | |
Dime Community Bancshares | | 119,831 | | 1,748,334 | |
EastGroup Properties, Inc. | | 49,299 | | 2,086,334 | |
Ellington Financial LLC* | | 176,181 | | 3,918,265 | |
FBR Capital Markets Corp.* | | 43,046 | | 164,436 | |
FelCor Lodging Trust, Inc.* | | 331,367 | | 2,332,824 | |
First Interstate BancSytem, Inc. | | 110,722 | | 1,687,403 | |
First Niagara Financial Group, Inc. | | 141,473 | | 1,977,793 | |
Forest City Enterprises, Inc. Cl A* | | 185,447 | | 3,095,110 | |
Glacier Bancorp, Inc. | | 137,239 | | 2,073,681 | |
Hersha Hospitality Trust* | | 189,869 | | 1,253,135 | |
Highwoods Properties, Inc. | | 82,762 | | 2,635,970 | |
IBERIABANK Corp. | | 30,519 | | 1,804,588 | |
Investors Bancorp, Inc.* | | 125,737 | | 1,649,669 | |
KKR Financial Hldgs. LLC | | 90,670 | | 843,231 | |
Marlin Business Svcs. Corp.* | | 128,034 | | 1,619,630 | |
MB Financial, Inc. | | 89,095 | | 1,543,125 | |
Meadowbrook Insurance Group, Inc. | | 284,977 | | 2,921,014 | |
Medical Properties Trust, Inc. | | 96,395 | | 1,043,958 | |
Mid-America Apt. Communities, Inc. | | 28,461 | | 1,806,989 | |
National Retail Pptys., Inc. | | 73,573 | | 1,949,685 | |
NBH Hldgs. Co.†*** | | 98,458 | | 1,919,931 | |
NewAlliance Bancshares, Inc. | | 209,969 | | 3,145,336 | |
Northwest Bancshares, Inc. | | 150,143 | | 1,765,682 | |
Pennsylvania REIT | | 183,503 | | 2,666,299 | |
PHH Corp.* | | 100,371 | | 2,323,589 | |
ProAssurance Corp.* | | 47,058 | | 2,851,715 | |
Prosperity Bancshares, Inc. | | 47,083 | | 1,849,420 | |
S.Y. Bancorp, Inc. | | 84,989 | | 2,086,480 | |
SeaBright Hldgs., Inc. | | 232,826 | | 2,146,656 | |
Senior Housing Pptys. Trust | | 103,372 | | 2,267,982 | |
Signature Bank* | | 48,822 | | 2,441,100 | |
SVB Financial Group* | | 57,998 | | 3,076,794 | |
Symetra Financial Corp. | | 94,046 | | 1,288,430 | |
UMB Financial Corp. | | 42,166 | | 1,746,516 | |
Urstadt Biddle Properties Cl A* | | 64,884 | | 1,261,994 | |
Westamerica Bancorporation | | 50,335 | | 2,792,082 | |
Westfield Financial, Inc. | | 69,875 | | 646,344 | |
| | | | 98,192,076 | |
HEALTH CARE (4.4%) | | | | | |
Abiomed, Inc.* | | 73,234 | | 703,779 | |
Allied Healthcare Int’l., Inc.* | | 368,372 | | 924,614 | |
Alphatec Hldgs., Inc.* | | 364,853 | | 985,103 | |
American Medical Systems Hldgs., Inc.* | | 66,529 | | 1,254,737 | |
Conceptus, Inc.* | | 148,168 | | 2,044,718 | |
Enzon Pharmaceuticals, Inc.* | | 371,642 | | 4,522,883 | |
RehabCare Group, Inc.* | | 72,222 | | 1,711,661 | |
| | | | 12,147,495 | |
INDUSTRIALS (16.1%) | | | | | |
Actuant Corp. Cl A | | 111,596 | | 2,970,686 | |
Administaff, Inc. | | 28,045 | | 821,719 | |
Alaska Air Group, Inc.* | | 38,270 | | 2,169,526 | |
Ameron International Corp. | | 52,613 | | 4,018,055 | |
AZZ, Inc. | | 56,450 | | 2,258,565 | |
Cenveo, Inc.* | | 86,137 | | 459,972 | |
CTPartners Executive Search, Inc.* | | 23,234 | | 365,936 | |
EMCOR Group, Inc.* | | 49,773 | | 1,442,422 | |
Encore Wire Corp. | | 112,400 | | 2,818,992 | |
Force Protection, Inc.* | | 346,919 | | 1,911,524 | |
Genesee & Wyoming, Inc. Cl A* | | 75,690 | | 4,007,786 | |
Kaydon Corp. | | 77,208 | | 3,143,910 | |
Miller Industries, Inc. | | 173,800 | | 2,473,174 | |
Mueller Industries, Inc. | | 112,072 | | 3,664,754 | |
Old Dominion Freight Line, Inc.* | | 124,405 | | 3,979,716 | |
Orion Marine Group, Inc.* | | 173,012 | | 2,006,939 | |
SFN Group, Inc.* | | 169,636 | | 1,655,647 | |
Tutor Perini Corp.* | | 129,053 | | 2,763,025 | |
UniTek Global Services, Inc.* | | 66,543 | | 653,452 | |
Universal Forest Products, Inc.* | | 29,499 | | 1,147,511 | |
| | | | 44,733,311 | |
INFORMATION TECHNOLOGY (8.6%) | | | | | |
ADPT Corp.* | | 253,537 | | 742,863 | |
Anixter International, Inc.* | | 33,810 | | 2,019,471 | |
Cirrus Logic, Inc.* | | 75,314 | | 1,203,518 | |
CommVault Systems, Inc.* | | 30,509 | | 873,168 | |
DemandTec, Inc.* | | 88,840 | | 963,026 | |
Global Cash Access Hldgs., Inc.* | | 240,733 | | 767,938 | |
Informatica Corp.* | | 36,312 | | 1,598,817 | |
Microsemi Corp.* | | 78,695 | | 1,802,116 | |
MKS Instruments, Inc.* | | 65,269 | | 1,598,438 | |
Parametric Technology Corp.* | | 89,687 | | 2,020,648 | |
Plexus Corp.* | | 38,456 | | 1,189,829 | |
Semtech Corp.* | | 69,852 | | 1,581,449 | |
Super Micro Computer, Inc.* | | 40,012 | | 461,738 | |
Tibco Software, Inc.* | | 209,373 | | 4,126,742 | |
TTM Technologies, Inc.* | | 135,437 | | 2,019,366 | |
Websense, Inc.* | | 51,172 | | 1,036,233 | |
| | | | 24,005,360 | |
MATERIALS (9.5%) | | | | | |
Buckeye Technologies, Inc.* | | 100,145 | | 2,104,046 | |
Commercial Metals Co. | | 127,737 | | 2,119,157 | |
Crown Hldgs., Inc.* | | 192,373 | | 6,421,408 | |
Cytec Industries, Inc. | | 54,889 | | 2,912,410 | |
Kaiser Aluminum Corp. | | 75,892 | | 3,801,430 | |
Silgan Hldgs., Inc. | | 149,949 | | 5,369,674 | |
Taseko Mines Ltd.* | | 414,590 | | 2,176,598 | |
US Gold Corp.* | | 183,000 | | 1,476,810 | |
| | | | 26,381,533 | |
TELECOMMUNICATION SERVICES (2.0%) | | | | | |
Alaska Comm. Systems Group, Inc. | | 75,057 | | 833,133 | |
Consolidated Comms. Hldgs., Inc. | | 121,107 | | 2,337,365 | |
Syniverse Hldgs., Inc.* | | 72,082 | | 2,223,730 | |
| | | | 5,394,228 | |
UTILITIES (4.7%) | | | | | |
Avista Corp. | | 127,493 | | 2,871,142 | |
Black Hills Corp. | | 35,563 | | 1,066,890 | |
Idacorp, Inc. | | 67,739 | | 2,504,988 | |
Northwest Natural Gas Co. | | 41,737 | | 1,939,518 | |
PNM Resources, Inc. | | 140,275 | | 1,826,381 | |
Unisource Energy Corp. | | 81,661 | | 2,926,730 | |
| | | | 13,135,649 | |
TOTAL COMMON STOCKS
(Cost: $211,266,137) 96.4% | | | | 267,290,898 | |
| | Shares | | Value | |
CONVERTIBLE PREFERRED STOCKS: | | | | | |
ENERGY (0.5%) | | | | | |
Energy XXI (Bermuda) Ltd., 7.25% | | 4,255 | | 1,262,671 | |
TOTAL CONVERTIBLE PREFERRED STOCKS | | | | | |
(Cost: $425,500) 0.5% | | | | 1,262,671 | |
| | | | | |
| | Rating** | | Rate(%) | | Maturity | | Face Amount | | Value | |
SHORT-TERM DEBT SECURITIES: | | | | | | | | | | | |
U.S. GOVERNMENT AGENCIES (2.5%) | | | | | | | | | | | |
Farmer Mac | | AAA | | 0.01 | | 01/03/11 | | 6,900,000 | | 6,899,996 | |
COMMERCIAL PAPER (3.4%) | | | | | | | | | | | |
General Electric Capital Corp. | | A-1+ | | 0.15 | | 01/31/11 | | 5,500,000 | | 5,499,312 | |
NetJets, Inc.† | | A-1+ | | 0.10 | | 01/03/11 | | 4,000,000 | | 3,999,978 | |
| | | | | | | | | | 9,499,290 | |
TOTAL SHORT-TERM DEBT SECURITIES | | | | | | | | | | | |
(Cost: $16,399,286) 5.9% | | | | | | | | | | 16,399,286 | |
| | | | | | | | | | | |
TOTAL INVESTMENTS | | | | | | | | | | | |
(Cost: $228,090,923) 102.8% | | | | | | | | | | 284,952,855 | |
| | | | | | | | | | | |
OTHER NET ASSETS -2.8% | | | | | | | | | | (7,763,020 | ) |
| | | | | | | | | | | |
NET ASSETS 100.0% | | | | | | | | | | $ | 277,189,835 | |
| | | | | | | | | | | | |
The accompanying notes are an integral part of these portfolio schedules.
MUTUAL OF AMERICA INVESTMENT CORPORATION - SMALL CAP GROWTH FUND
PORTFOLIO OF INVESTMENTS IN SECURITIES
December 31, 2010
| | Shares | | Value | |
COMMON STOCKS: | | | | | |
CONSUMER DISCRETIONARY (15.1%) | | | | | |
AFC Enterprises, Inc.* | | 76,948 | | 1,069,577 | |
American Axle & Mfg. Hldgs., Inc.* | | 54,475 | | 700,549 | |
California Pizza Kitchen, Inc.* | | 167,597 | | 2,896,076 | |
Carter’s, Inc.* | | 91,846 | | 2,710,375 | |
Collective Brands, Inc.* | | 94,299 | | 1,989,709 | |
Dana Hldg. Corp.* | | 42,850 | | 737,449 | |
Deckers Outdoor Corp.* | | 45,897 | | 3,659,827 | |
Denny’s Corp.* | | 537,974 | | 1,925,947 | |
Fossil, Inc.* | | 31,613 | | 2,228,084 | |
G-III Apparel Group Ltd.* | | 52,358 | | 1,840,384 | |
Lincoln Educational Svcs. Corp.* | | 103,770 | | 1,609,473 | |
Maidenform Brands, Inc.* | | 42,950 | | 1,020,922 | |
OfficeMax, Inc.* | | 245,688 | | 4,348,678 | |
P.F. Chang’s China Bistro, Inc. | | 30,855 | | 1,495,233 | |
Pinnacle Entertainment, Inc.* | | 267,932 | | 3,756,407 | |
Shutterfly, Inc.* | | 106,198 | | 3,720,116 | |
Smith & Wesson Hldg. Corp.* | | 56,635 | | 211,815 | |
Sotheby’s | | 26,504 | | 1,192,680 | |
Steve Madden Ltd.* | | 50,782 | | 2,118,625 | |
Tenneco, Inc.* | | 42,660 | | 1,755,886 | |
Tupperware Brands Corp. | | 31,322 | | 1,493,120 | |
| | | | 42,480,932 | |
CONSUMER STAPLES (2.7%) | | | | | |
Diamond Foods, Inc.* | | 34,267 | | 1,822,319 | |
Pantry, Inc.* | | 123,823 | | 2,459,125 | |
TreeHouse Foods, Inc.* | | 40,201 | | 2,053,869 | |
Vector Group Ltd. | | 67,088 | | 1,161,964 | |
| | | | 7,497,277 | |
ENERGY (5.9%) | | | | | |
Brigham Exploration Co.* | | 199,283 | | 5,428,467 | |
Energy XXI (Bermuda) Ltd.* | | 98,436 | | 2,723,724 | |
Lufkin Industries, Inc. | | 34,209 | | 2,134,300 | |
MarkWest Energy Partners LP | | 33,268 | | 1,440,837 | |
McMoRan Exploration Co.* | | 283,038 | | 4,851,271 | |
| | | | 16,578,599 | |
FINANCIALS (4.2%) | | | | | |
First Financial Bancorp. | | 83,681 | | 1,546,425 | |
iShares Russell 2000 Growth Index Fund | | 15,725 | | 1,374,680 | |
PS Business Parks, Inc. | | 24,650 | | 1,373,498 | |
S.Y. Bancorp, Inc. | | 51,638 | | 1,267,713 | |
Senior Housing Pptys. Trust | | 74,578 | | 1,636,241 | |
Signature Bank* | | 47,137 | | 2,356,850 | |
Stifel Financial Corp.* | | 33,997 | | 2,109,174 | |
| | | | 11,664,581 | |
HEALTH CARE (16.8%) | | | | | |
Abiomed, Inc.* | | 181,681 | | 1,745,954 | |
Acorda Therapeutics, Inc.* | | 57,904 | | 1,578,463 | |
Alphatec Hldgs., Inc.* | | 338,914 | | 915,068 | |
American Medical Systems Hldgs., Inc.* | | 83,774 | | 1,579,978 | |
Auxilium Pharmaceuticals, Inc.* | | 32,219 | | 679,821 | |
Bruker Corp.* | | 90,125 | | 1,496,075 | |
Cyberonics, Inc.* | | 77,511 | | 2,404,391 | |
DexCom, Inc.* | | 65,912 | | 899,699 | |
Emergent Biosolutions, Inc.* | | 71,397 | | 1,674,974 | |
Enzon Pharmaceuticals, Inc.* | | 179,966 | | 2,190,186 | |
Exelixis, Inc.* | | 245,099 | | 2,012,263 | |
Geron Corp.* | | 91,696 | | 474,068 | |
HMS Hldgs. Corp.* | | 39,108 | | 2,533,025 | |
Human Genome Sciences, Inc.* | | 53,486 | | 1,277,781 | |
Inspire Pharmaceuticals, Inc.* | | 145,909 | | 1,225,636 | |
Insulet Corp.* | | 26,712 | | 414,036 | |
IPC The Hospitalist Co.* | | 61,650 | | 2,404,967 | |
MedAssets, Inc.* | | 90,505 | | 1,827,296 | |
Medidata Solutions, Inc.* | | 72,625 | | 1,734,285 | |
Neogen Corp.* | | 59,849 | | 2,455,604 | |
NuPathe, Inc.* | | 68,007 | | 616,143 | |
Omnicell, Inc.* | | 124,598 | | 1,800,441 | |
Onyx Pharmaceuticals, Inc.* | | 45,190 | | 1,666,155 | |
Optimer Pharmaceuticals, Inc.* | | 47,604 | | 538,401 | |
PAREXEL International Corp.* | | 50,825 | | 1,079,015 | |
Quidel Corp.* | | 57,125 | | 825,456 | |
Salix Pharmaceuticals Ltd.* | | 67,041 | | 3,148,245 | |
Seattle Genetics, Inc.* | | 87,302 | | 1,305,165 | |
Steris Corp. | | 78,839 | | 2,874,470 | |
SXC Health Solutions Corp.* | | 39,616 | | 1,697,942 | |
| | | | 47,075,003 | |
INDUSTRIALS (15.2%) | | | | | |
Acco Brands Corp.* | | 197,748 | | 1,684,813 | |
ArvinMeritor, Inc.* | | 75,025 | | 1,539,513 | |
Astec Industries, Inc.* | | 51,660 | | 1,674,301 | |
Astronics Corp.* | | 37,125 | | 779,625 | |
AZZ, Inc. | | 38,130 | | 1,525,581 | |
Belden, Inc. | | 37,836 | | 1,393,122 | |
Clarcor, Inc. | | 34,525 | | 1,480,777 | |
CTPartners Executive Search, Inc.* | | 36,393 | | 573,190 | |
EnPro Industries, Inc.* | | 25,750 | | 1,070,170 | |
Genesee & Wyoming, Inc. Cl A* | | 50,613 | | 2,679,958 | |
Graham Corp. | | 76,622 | | 1,532,440 | |
Great Lakes Dredge & Dock Co. | | 187,275 | | 1,380,217 | |
Healthcare Svcs. Group, Inc. | | 96,075 | | 1,563,140 | |
Hub Group, Inc. Cl A* | | 51,483 | | 1,809,113 | |
JetBlue Airways Corp* | | 198,229 | | 1,310,294 | |
Kaydon Corp. | | 41,300 | | 1,681,736 | |
Old Dominion Freight Line, Inc.* | | 76,189 | | 2,437,286 | |
Powell Industries, Inc.* | | 34,523 | | 1,135,116 | |
Raven Industries, Inc.* | | 36,363 | | 1,734,151 | |
RBC Bearings, Inc.* | | 57,125 | | 2,232,445 | |
Robbins & Myers, Inc. | | 82,682 | | 2,958,362 | |
SFN Group, Inc.* | | 159,117 | | 1,552,982 | |
Sun Hydraulics Corp. | | 74,184 | | 2,804,155 | |
Teledyne Technologies, Inc.* | | 52,422 | | 2,304,995 | |
Tutor Perini Corp.* | | 86,338 | | 1,848,497 | |
| | | | 42,685,979 | |
INFORMATION TECHNOLOGY (28.9%) | | | | | |
Adtran, Inc. | | 75,241 | | 2,724,477 | |
Anaren, Inc.* | | 64,675 | | 1,348,474 | |
Ariba, Inc.* | | 87,183 | | 2,047,929 | |
Ceragon Networks Ltd.* | | 137,146 | | 1,807,584 | |
CommVault Systems, Inc.* | | 90,430 | | 2,588,107 | |
comScore, Inc.* | | 101,516 | | 2,264,822 | |
Entropic Communications, Inc.* | | 139,164 | | 1,681,101 | |
Forrester Research, Inc.* | | 74,830 | | 2,640,751 | |
iGATE Corp. | | 99,148 | | 1,954,207 | |
Informatica Corp.* | | 105,536 | | 4,646,750 | |
Intersil Corp. Cl A | | 115,925 | | 1,770,175 | |
Intevac, Inc.* | | 110,315 | | 1,545,513 | |
JDA Software Group, Inc.* | | 53,150 | | 1,488,200 | |
Lattice Semiconductor Corp.* | | 283,311 | | 1,716,865 | |
Lawson Software, Inc.* | | 199,219 | | 1,842,776 | |
LogMeIn, Inc.* | | 88,076 | | 3,905,290 | |
Mercury Computer Systems, Inc.* | | 138,344 | | 2,542,763 | |
Microsemi Corp.* | | 99,129 | | 2,270,054 | |
MKS Instruments, Inc.* | | 74,570 | | 1,826,219 | |
Monolithic Power Systems, Inc.* | | 90,092 | | 1,488,320 | |
Monotype Imaging Hldgs., Inc.* | | 119,538 | | 1,326,872 | |
Netlogic Microsystems, Inc.* | | 61,539 | | 1,932,940 | |
Parametric Technology Corp.* | | 161,282 | | 3,633,683 | |
Plexus Corp.* | | 97,593 | | 3,019,527 | |
Polycom, Inc.* | | 39,855 | | 1,553,548 | |
Rackspace Hosting, Inc.* | | 66,861 | | 2,100,104 | |
RightNow Technologies, Inc.* | | 90,924 | | 2,152,171 | |
Riverbed Technology, Inc.* | | 113,777 | | 4,001,537 | |
Rogers Corp.* | | 57,017 | | 2,180,900 | |
Sapient Corp. | | 105,924 | | 1,281,680 | |
SAVVIS, Inc.* | | 72,388 | | 1,847,342 | |
Smith Micro Software, Inc.* | | 63,869 | | 1,005,298 | |
Sourcefire, Inc.* | | 88,237 | | 2,287,985 | |
SuccessFactors, Inc.* | | 62,023 | | 1,796,186 | |
Super Micro Computer, Inc.* | | 113,299 | | 1,307,470 | |
Tibco Software, Inc.* | | 124,561 | | 2,455,097 | |
Websense, Inc.* | | 86,278 | | 1,747,130 | |
Xyratex Ltd.* | | 92,613 | | 1,510,518 | |
| | | | 81,240,365 | |
MATERIALS (6.3%) | | | | | |
Allied Nevada Gold Corp.* | | 74,962 | | 1,972,250 | |
Ferro Corp.* | | 81,775 | | 1,197,186 | |
Innophos Hldgs., Inc. | | 77,471 | | 2,795,154 | |
Sensient Technologies Corp. | | 44,899 | | 1,649,140 | |
Silgan Hldgs., Inc. | | 47,366 | | 1,696,176 | |
Universal Stainless & Alloy Products, Inc.* | | 56,944 | | 1,781,208 | |
US Gold Corp.* | | 636,404 | | 5,135,780 | |
Zep, Inc. | | 79,186 | | 1,574,218 | |
| | | | 17,801,112 | |
TELECOMMUNICATION SERVICES (1.8%) | | | | | |
Consolidated Comms. Hldgs., Inc. | | 118,601 | | 2,288,999 | |
Syniverse Hldgs., Inc.* | | 85,451 | | 2,636,163 | |
| | | | 4,925,162 | |
UTILITIES (0.4%) | | | | | |
Northwest Natural Gas Co. | | 25,662 | | 1,192,513 | |
| | | | | |
TOTAL COMMON STOCKS | | | | | |
(Cost: $192,379,310) 97.3% | | | | 273,141,523 | |
| | Rating** | | Rate(%) | | Maturity | | Face Amount | | Value | |
SHORT-TERM DEBT SECURITIES: | | | | | | | | | | | |
U.S. GOVERNMENT AGENCIES (1.3%) | | | | | | | | | | | |
Farmer Mac | | AAA | | 0.01 | | 01/03/11 | | 3,700,000 | | 3,699,998 | |
COMMERCIAL PAPER (1.4%) | | | | | | | | | | | |
NetJets, Inc.† | | A-1+ | | 0.10 | | 01/03/11 | | 3,800,000 | | 3,799,979 | |
TOTAL SHORT-TERM DEBT SECURITIES | | | | | | | | | | | |
(Cost: $7,499,977) 2.7% | | | | | | | | | | 7,499,977 | |
| | | | | | | | | | | |
TOTAL INVESTMENTS | | | | | | | | | | | |
(Cost: $199,879,287) 100.0% | | | | | | | | | | 280,641,500 | |
| | | | | | | | | | | |
OTHER NET ASSETS 0.0% (3) | | | | | | | | | | 126,382 | |
| | | | | | | | | | | |
NET ASSETS 100.0% | | | | | | | | | | $ | 280,767,882 | |
| | | | | | | | | | | | |
The accompanying notes are an integral part of these portfolio schedules.
MUTUAL OF AMERICA INVESTMENT CORPORATION - MID CAP VALUE FUND
PORTFOLIO OF INVESTMENTS IN SECURITIES
December 31, 2010
| | Shares | | Value | |
COMMON STOCKS: | | | | | |
CONSUMER DISCRETIONARY (9.6%) | | | | | |
Cablevision Systems Corp. Cl A | | 10,405 | | 352,105 | |
CBS Corp. Cl B | | 19,823 | | 377,628 | |
Discovery Communications, Inc. Cl A* | | 6,026 | | 251,284 | |
Discovery Communications, Inc. Cl C* | | 5,945 | | 218,122 | |
DreamWorks Animation SKG Cl A* | | 7,129 | | 210,092 | |
GameStop Corp. Cl A* | | 5,220 | | 119,434 | |
Lamar Advertising Co. Cl A* | | 9,754 | | 388,599 | |
Mohawk Industries, Inc.* | | 9,110 | | 517,084 | |
Newell Rubbermaid, Inc. | | 26,786 | | 486,969 | |
Penney (J.C.) Co., Inc. | | 3,815 | | 123,263 | |
Rent-A-Center, Inc.* | | 12,521 | | 404,178 | |
Skechers U.S.A., Inc. Cl A* | | 19,225 | | 384,500 | |
V.F. Corp. | | 10,322 | | 889,550 | |
Whirlpool Corp. | | 6,068 | | 539,020 | |
| | | | 5,261,828 | |
CONSUMER STAPLES (6.4%) | | | | | |
ConAgra Foods, Inc. | | 32,633 | | 736,853 | |
Dr. Pepper Snapple Group, Inc. | | 18,290 | | 643,076 | |
J.M. Smucker Co. | | 7,040 | | 462,176 | |
Molson Coors Brewing Co. Cl B | | 9,596 | | 481,623 | |
Safeway, Inc. | | 18,143 | | 408,036 | |
Vector Group Ltd. | | 43,771 | | 758,114 | |
| | | | 3,489,878 | |
ENERGY (10.8%) | | | | | |
Arch Coal, Inc. | | 18,731 | | 656,709 | |
Atwood Oceanics, Inc.* | | 16,190 | | 605,020 | |
Denbury Resources, Inc.* | | 22,070 | | 421,316 | |
Enterprise Products Partners LP | | 6,535 | | 271,921 | |
McMoRan Exploration Co.* | | 30,722 | | 526,575 | |
Noble Energy, Inc. | | 8,725 | | 751,048 | |
Plains Exploration & Production Co.* | | 12,640 | | 406,250 | |
Pride International, Inc.* | | 16,064 | | 530,112 | |
Range Resources Corp. | | 14,921 | | 671,147 | |
Spectra Energy Corp. | | 18,186 | | 454,468 | |
Unit Corp.* | | 13,292 | | 617,812 | |
| | | | 5,912,378 | |
FINANCIALS (25.9%) | | | | | |
American Financial Group, Inc. | | 23,401 | | 755,618 | |
Ameriprise Financial, Inc. | | 16,144 | | 929,087 | |
Annaly Capital Mgmt., Inc. | | 17,900 | | 320,768 | |
Aon Corp. | | 13,623 | | 626,794 | |
Associated Banc-Corp. | | 36,404 | | 551,521 | |
Assurant, Inc. | | 3,679 | | 141,715 | |
BOK Financial Corp. | | 12,306 | | 657,140 | |
Boston Properties, Inc. | | 6,058 | | 521,594 | |
City National Corp. | | 4,682 | | 287,288 | |
Cullen/Frost Bankers, Inc. | | 6,131 | | 374,727 | |
Developers Diversified Realty Corp. | | 12,752 | | 179,676 | |
Discover Financial Svcs. | | 6,265 | | 116,090 | |
Equity Residential | | 17,622 | | 915,463 | |
Everest Re Group Ltd. | | 5,907 | | 501,032 | |
Fulton Financial Corp. | | 41,368 | | 427,745 | |
Genworth Financial, Inc. Cl A* | | 17,885 | | 235,009 | |
HCC Insurance Hldgs., Inc. | | 5,270 | | 152,514 | |
Host Hotels & Resorts, Inc. | | 35,760 | | 639,031 | |
Legg Mason, Inc. | | 15,970 | | 579,232 | |
Marsh & McLennan Cos., Inc. | | 12,864 | | 351,702 | |
National Retail Pptys., Inc. | | 17,093 | | 452,965 | |
People’s United Financial, Inc. | | 42,023 | | 588,742 | |
Principal Financial Grp., Inc. | | 6,976 | | 227,139 | |
Progressive Corp. | | 18,618 | | 369,940 | |
ProLogis | | 33,671 | | 486,209 | |
Public Storage | | 5,302 | | 537,729 | |
SPDR KBW Regional Banking ETF | | 20,968 | | 554,604 | |
StanCorp Financial Group, Inc. | | 13,389 | | 604,379 | |
Vornado Realty Trust | | 10,209 | | 850,716 | |
Wilmington Trust Corp. | | 55,450 | | 240,653 | |
| | | | 14,176,822 | |
HEALTH CARE (6.0%) | | | | | |
AmerisourceBergen Corp. | | 18,305 | | 624,567 | |
CIGNA Corp. | | 11,911 | | 436,657 | |
Hospira, Inc.* | | 9,674 | | 538,745 | |
Laboratory Corp. of America Hldgs.* | | 4,777 | | 419,994 | |
Mednax, Inc.* | | 3,790 | | 255,029 | |
Mettler-Toledo Int’l., Inc.* | | 5,191 | | 784,931 | |
Mylan, Inc.* | | 9,239 | | 195,220 | |
| | | | 3,255,143 | |
INDUSTRIALS (10.6%) | | | | | |
Alliant TechSystems, Inc.* | | 5,015 | | 373,266 | |
Flowserve Corp. | | 3,023 | | 360,402 | |
General Cable Corp.* | | 12,211 | | 428,484 | |
ITT Corp. | | 5,143 | | 268,002 | |
Joy Global, Inc. | | 8,515 | | 738,676 | |
Kirby Corp.* | | 14,332 | | 631,325 | |
L-3 Communications Hldgs., Inc. | | 3,475 | | 244,953 | |
Lincoln Electric Hldgs., Inc. | | 6,225 | | 406,306 | |
Oshkosh Corp.* | | 15,991 | | 563,523 | |
Precision Castparts Corp. | | 6,080 | | 846,397 | |
Shaw Group, Inc.* | | 11,791 | | 403,606 | |
Southwest Airlines Co. | | 16,401 | | 212,885 | |
Timken Co. | | 7,097 | | 338,740 | |
| | | | 5,816,565 | |
INFORMATION TECHNOLOGY (4.2%) | | | | | |
Amdocs Ltd.* | | 14,072 | | 386,558 | |
Harris Corp. | | 7,076 | | 320,543 | |
McAfee, Inc.* | | 4,766 | | 220,713 | |
NCR Corp.* | | 24,712 | | 379,823 | |
Teradata Corp.* | | 13,026 | | 536,150 | |
Xerox Corp. | | 38,042 | | 438,244 | |
| | | | 2,282,031 | |
MATERIALS (8.8%) | | | | | |
Agnico-Eagle Mines Ltd. | | 7,619 | | 584,377 | |
Crown Hldgs., Inc.* | | 53,946 | | 1,800,718 | |
Cytec Industries, Inc. | | 13,998 | | 742,734 | |
Eastman Chemical Co. | | 7,613 | | 640,101 | |
Sonoco Products Co. | | 22,460 | | 756,228 | |
Steel Dynamics, Inc. | | 14,364 | | 262,861 | |
| | | | 4,787,019 | |
TELECOMMUNICATION SERVICES (2.2%) | | | | | |
CenturyLink, Inc. | | 14,595 | | 673,851 | |
Windstream Corp. | | 36,802 | | 513,020 | |
| | | | 1,186,871 | |
UTILITIES (12.0%) | | | | | |
Ameren Corp. | | 22,774 | | 641,999 | |
Atmos Energy Corp. | | 18,857 | | 588,338 | |
Constellation Energy Group, Inc. | | 19,151 | | 586,595 | |
Edison International | | 19,188 | | 740,657 | |
Entergy Corp. | | 6,518 | | 461,670 | |
FirstEnergy Corp. | | 20,317 | | 752,135 | |
Genon Energy, Inc.* | | 134,913 | | 514,019 | |
Great Plains Energy, Inc. | | 28,570 | | 553,972 | |
Integrys Energy Group, Inc. | | 11,119 | | 539,383 | |
ITC Hldgs. Corp. | | 10,037 | | 622,093 | |
NV Energy, Inc. | | 41,978 | | 589,791 | |
| | | | 6,590,652 | |
TOTAL COMMON STOCKS | | | | | |
(Cost: $47,581,808) 96.5% | | | | 52,759,187 | |
| | | | | |
| | Rating** | | Rate(%) | | Maturity | | Face Amount | | Value | |
SHORT-TERM DEBT SECURITIES: | | | | | | | | | | | |
U.S. GOVERNMENT AGENCIES (2.2%) | | | | | | | | | | | |
Farmer Mac | | AAA | | 0.01 | | 01/03/11 | | 1,200,000 | | 1,199,999 | |
COMMERCIAL PAPER (3.8%) | | | | | | | | | | | |
Hewlett-Packard Co.† | | A-1 | | 0.18 | | 01/07/11 | | 1,000,000 | | 999,970 | |
NetJets, Inc.† | | A-1+ | | 0.10 | | 01/03/11 | | 1,100,000 | | 1,099,994 | |
| | | | | | | | | | 2,099,964 | |
TOTAL SHORT-TERM DEBT SECURITIES | | | | | | | | | | | |
(Cost: $3,299,963) 6.0% | | | | | | | | | | 3,299,963 | |
| | | | | | | | | | | |
TOTAL INVESTMENTS | | | | | | | | | | | |
(Cost: $50,881,771) 102.5% | | | | | | | | | | 56,059,150 | |
| | | | | | | | | | | |
OTHER NET ASSETS -2.5% | | | | | | | | | | (1,369,297 | ) |
| | | | | | | | | | | |
NET ASSETS 100.0% | | | | | | | | | | $ | 54,689,853 | |
| | | | | | | | | | | | |
The accompanying notes are an integral part of these portfolio schedules.
MUTUAL OF AMERICA INVESTMENT CORPORATION - MID-CAP EQUITY INDEX FUND
PORTFOLIO OF INVESTMENTS IN SECURITIES
December 31, 2010
| | Shares | | Value | |
INDEXED ASSETS: | | | | | |
COMMON STOCKS: | | | | | |
CONSUMER DISCRETIONARY (13.9%) | | | | | |
99 Cents Only Stores* | | 20,540 | | 327,408 | |
Aaron’s, Inc.* | | 31,977 | | 652,011 | |
Advance Auto Parts, Inc. | | 37,149 | | 2,457,406 | |
Aeropostale, Inc.* | | 39,801 | | 980,697 | |
American Eagle Outfitters, Inc. | | 85,414 | | 1,249,607 | |
American Greetings Corp. Cl A | | 17,297 | | 383,302 | |
AnnTaylor Stores Corp.* | | 25,138 | | 688,530 | |
Ascena Retail Group, Inc.* | | 30,062 | | 794,238 | |
Bally Technologies, Inc.* | | 23,156 | | 976,952 | |
Barnes & Noble, Inc. | | 17,286 | | 244,597 | |
Bob Evans Farms, Inc. | | 13,136 | | 432,963 | |
BorgWarner, Inc.* | | 49,277 | | 3,565,684 | |
Boyd Gaming Corp.* | | 24,947 | | 264,438 | |
Brinker International, Inc. | | 39,748 | | 829,938 | |
Career Education Corp.* | | 28,349 | | 587,675 | |
Cheesecake Factory, Inc.* | | 25,435 | | 779,837 | |
Chico’s FAS, Inc. | | 76,751 | | 923,315 | |
Chipotle Mexican Grill, Inc. Cl A* | | 13,179 | | 2,802,646 | |
Collective Brands, Inc.* | | 28,201 | | 595,041 | |
Deckers Outdoor Corp.* | | 16,107 | | 1,284,372 | |
Dick’s Sporting Goods, Inc.* | | 37,787 | | 1,417,013 | |
Dollar Tree, Inc.* | | 54,831 | | 3,074,922 | |
DreamWorks Animation SKG Cl A* | | 31,486 | | 927,892 | |
Eastman Kodak Co.* | | 113,669 | | 609,266 | |
Foot Locker, Inc. | | 66,529 | | 1,305,299 | |
Fossil, Inc.* | | 22,196 | | 1,564,374 | |
Gentex Corp. | | 60,589 | | 1,791,011 | |
Guess?, Inc. | | 26,925 | | 1,274,091 | |
Hanesbrands, Inc.* | | 42,069 | | 1,068,553 | |
Harte-Hanks, Inc. | | 16,953 | | 216,490 | |
International Speedway Corp. Cl A | | 12,686 | | 331,993 | |
ITT Educational Svcs., Inc.* | | 11,184 | | 712,309 | |
J. Crew Group, Inc.* | | 27,820 | | 1,200,155 | |
KB Home | | 30,991 | | 418,069 | |
Lamar Advertising Co. Cl A* | | 24,492 | | 975,761 | |
Life Time Fitness, Inc.* | | 18,243 | | 747,781 | |
LKQ Corp.* | | 62,987 | | 1,431,065 | |
Matthews International Corp. Cl A | | 12,806 | | 447,954 | |
MDC Hldgs., Inc. | | 16,273 | | 468,174 | |
Mohawk Industries, Inc.* | | 24,488 | | 1,389,939 | |
New York Times Co. Cl A* | | 50,318 | | 493,116 | |
NVR, Inc.* | | 2,447 | | 1,690,926 | |
Office Depot, Inc.* | | 119,748 | | 646,639 | |
Panera Bread Co. Cl A* | | 13,092 | | 1,325,041 | |
PetSmart, Inc. | | 50,702 | | 2,018,954 | |
Phillips-Van Heusen Corp. | | 28,403 | | 1,789,673 | |
Polaris Industries, Inc.* | | 14,728 | | 1,149,079 | |
Regis Corp. | | 24,645 | | 409,107 | |
Rent-A-Center, Inc.* | | 27,330 | | 882,212 | |
Ryland Group, Inc. | | 19,064 | | 324,660 | |
Saks, Inc.* | | 69,644 | | 745,191 | |
Scholastic Corp. | | 10,142 | | 299,595 | |
Scientific Games Corp. Cl A* | | 26,948 | | 268,402 | |
Service Corp. International | | 104,261 | | 860,153 | |
Sotheby’s | | 28,282 | | 1,272,690 | |
Strayer Education, Inc. | | 5,836 | | 888,356 | |
The Warnaco Group, Inc.* | | 18,713 | | 1,030,525 | |
Thor Industries, Inc. | | 18,230 | | 619,091 | |
Timberland Co.* | | 16,658 | | 409,620 | |
Toll Brothers, Inc.* | | 62,377 | | 1,185,163 | |
Tractor Supply Co. | | 31,847 | | 1,544,261 | |
Tupperware Brands Corp. | | 26,863 | | 1,280,559 | |
Under Armour, Inc. Cl A* | | 14,942 | | 819,419 | |
Wendy’s/Arby’s Group, Inc. Cl A | | 137,558 | | 635,518 | |
Wiley (John) & Sons, Inc. Cl A | | 20,241 | | 915,703 | |
Williams-Sonoma, Inc. | | 44,815 | | 1,599,447 | |
WMS Industries, Inc.* | | 24,868 | | 1,125,028 | |
| | | | 68,420,896 | |
CONSUMER STAPLES (3.5%) | | | | | |
Alberto-Culver Co. | | 37,287 | | 1,381,110 | |
BJ’s Wholesale Club, Inc.* | | 23,746 | | 1,137,433 | |
Church & Dwight Co., Inc. | | 30,420 | | 2,099,588 | |
Corn Products Int’l., Inc. | | 32,933 | | 1,514,918 | |
Energizer Hldgs., Inc.* | | 30,637 | | 2,233,437 | |
Flowers Foods, Inc. | | 32,795 | | 882,513 | |
Green Mountain Coffee Roasters, Inc.* | | 49,243 | | 1,618,125 | |
Hansen Natural Corp.* | | 28,757 | | 1,503,416 | |
Lancaster Colony Corp. | | 8,285 | | 473,902 | |
Ralcorp Hldgs., Inc.* | | 23,415 | | 1,522,209 | |
Ruddick Corp. | | 18,790 | | 692,224 | |
Smithfield Foods, Inc.* | | 71,612 | | 1,477,356 | |
Tootsie Roll Industries, Inc. | | 10,665 | | 308,965 | |
Universal Corp. | | 10,355 | | 421,449 | |
| | | | 17,266,645 | |
ENERGY (5.8%) | | | | | |
Arch Coal, Inc. | | 70,233 | | 2,462,369 | |
Atwood Oceanics, Inc.* | | 24,248 | | 906,148 | |
Bill Barrett Corp.* | | 19,732 | | 811,577 | |
Cimarex Energy Co. | | 36,805 | | 3,258,347 | |
Comstock Resources, Inc.* | | 20,464 | | 502,596 | |
Dril-Quip, Inc.* | | 15,055 | | 1,170,075 | |
Exterran Hldgs., Inc.* | | 27,011 | | 646,913 | |
Forest Oil Corp.* | | 48,731 | | 1,850,316 | |
Frontier Oil Corp. | | 45,555 | | 820,446 | |
Helix Energy Solutions Group* | | 47,042 | | 571,090 | |
Oceaneering Int’l., Inc.* | | 23,184 | | 1,707,038 | |
Overseas Shipholding Group, Inc. | | 11,716 | | 414,981 | |
Patriot Coal Corp.* | | 34,001 | | 658,599 | |
Patterson-UTI Energy, Inc. | | 67,262 | | 1,449,496 | |
Plains Exploration & Production Co.* | | 60,939 | | 1,958,579 | |
Pride International, Inc.* | | 76,683 | | 2,530,539 | |
Quicksilver Resources, Inc.* | | 51,150 | | 753,951 | |
SM Energy Co.* | | 26,948 | | 1,588,046 | |
Southern Union Co. | | 54,298 | | 1,306,953 | |
Superior Energy Services, Inc.* | | 33,612 | | 1,176,084 | |
Tidewater, Inc. | | 22,233 | | 1,197,025 | |
Unit Corp.* | | 17,198 | | 799,363 | |
| | | | 28,540,531 | |
FINANCIALS (19.1%) | | | | | |
Affiliated Managers Group, Inc.* | | 22,162 | | 2,198,914 | |
Alexandria Real Estate Equities, Inc. | | 24,103 | | 1,765,786 | |
AMB Property Corp. | | 72,445 | | 2,297,231 | |
American Financial Group, Inc. | | 34,295 | | 1,107,386 | |
Apollo Investment Corp. | | 85,728 | | 949,009 | |
Associated Banc-Corp. | | 75,108 | | 1,137,886 | |
Astoria Financial Corp. | | 35,774 | | 497,616 | |
BancorpSouth, Inc. | | 31,439 | | 501,452 | |
Bank of Hawaii Corp. | | 20,929 | | 988,058 | |
Berkley (W.R.) Corp. | | 51,947 | | 1,422,309 | |
BRE Properties, Inc. | | 27,607 | | 1,200,905 | |
Brown & Brown, Inc. | | 50,612 | | 1,211,651 | |
Camden Property Trust | | 29,603 | | 1,597,970 | |
Cathay General Bancorp | | 33,798 | | 564,427 | |
City National Corp. | | 19,715 | | 1,209,712 | |
Commerce Bancshares, Inc. | | 33,475 | | 1,329,962 | |
Corporate Office Pptys. Trust | | 28,776 | | 1,005,721 | |
Cousins Properties, Inc. | | 46,565 | | 388,352 | |
Cullen/Frost Bankers, Inc. | | 26,230 | | 1,603,178 | |
Duke Realty Corp. | | 110,503 | | 1,376,867 | |
East West Bancorp, Inc. | | 64,255 | | 1,256,185 | |
Eaton Vance Corp. | | 51,128 | | 1,545,599 | |
Equity One, Inc. | | 19,936 | | 362,436 | |
Essex Property Trust, Inc. | | 13,572 | | 1,550,194 | |
Everest Re Group Ltd. | | 23,826 | | 2,020,921 | |
Federal Realty Investment Trust | | 26,413 | | 2,058,365 | |
Fidelity Nat’l. Financial, Inc. Cl A | | 97,840 | | 1,338,451 | |
First American Financial Corp. | | 45,291 | | 676,648 | |
First Niagara Financial Group, Inc. | | 91,048 | | 1,272,851 | |
FirstMerit Corp. | | 46,883 | | 927,815 | |
Fulton Financial Corp. | | 86,408 | | 893,459 | |
Gallagher (Arthur J.) & Co. | | 46,262 | | 1,345,299 | |
Greenhill & Co., Inc. | | 10,881 | | 888,760 | |
Hanover Insurance Group, Inc. | | 19,535 | | 912,675 | |
HCC Insurance Hldgs., Inc. | | 50,481 | | 1,460,920 | |
Highwoods Properties, Inc. | | 30,921 | | 984,834 | |
Hospitality Properties Trust | | 52,884 | | 1,218,447 | |
International Bancshares Corp. | | 22,864 | | 457,966 | |
Jefferies Group, Inc. | | 52,520 | | 1,398,608 | |
Jones Lang LaSalle, Inc. | | 18,322 | | 1,537,582 | |
Liberty Property Trust | | 48,975 | | 1,563,282 | |
Mack-Cali Realty Corp. | | 34,227 | | 1,131,545 | |
Mercury General Corp. | | 15,702 | | 675,343 | |
MSCI, Inc. Cl A* | | 50,499 | | 1,967,441 | |
Nationwide Health Pptys., Inc. | | 54,180 | | 1,971,068 | |
New York Community Bancorp, Inc. | | 189,524 | | 3,572,527 | |
NewAlliance Bancshares, Inc. | | 45,737 | | 685,140 | |
Old Republic Int’l. Corp. | | 110,536 | | 1,506,606 | |
OMEGA Healthcare Investors, Inc. | | 42,001 | | 942,502 | |
PacWest Bancorp | | 13,507 | | 288,780 | |
Potlatch Corp. | | 17,434 | | 567,477 | |
Prosperity Bancshares, Inc. | | 20,211 | | 793,888 | |
Protective Life Corp. | | 37,344 | | 994,844 | |
Raymond James Financial, Inc. | | 42,779 | | 1,398,873 | |
Rayonier, Inc. | | 34,441 | | 1,808,841 | |
Realty Income Corp. | | 50,382 | | 1,723,064 | |
Regency Centers Corp. | | 35,087 | | 1,482,075 | |
Reinsurance Grp. of America, Inc. | | 31,623 | | 1,698,471 | |
SEI Investments Co. | | 62,669 | | 1,490,896 | |
Senior Housing Pptys. Trust | | 59,853 | | 1,313,175 | |
SL Green Realty Corp | | 33,700 | | 2,275,087 | |
StanCorp Financial Group, Inc. | | 20,036 | | 904,425 | |
SVB Financial Group* | | 17,755 | | 941,903 | |
Synovus Financial Corp. | | 335,304 | | 885,203 | |
TCF Financial Corp. | | 53,754 | | 796,097 | |
The Macerich Co. | | 54,607 | | 2,586,734 | |
Transatlantic Hldgs., Inc. | | 27,519 | | 1,420,531 | |
Trustmark Corp. | | 24,578 | | 610,518 | |
UDR, Inc. | | 78,787 | | 1,853,070 | |
Unitrin, Inc. | | 21,496 | | 527,512 | |
Valley National Bancorp | | 69,344 | | 991,619 | |
Waddell & Reed Financial, Inc. Cl A | | 36,522 | | 1,288,861 | |
Washington Federal, Inc. | | 48,556 | | 821,568 | |
Webster Financial Corp. | | 28,107 | | 553,708 | |
Weingarten Realty Investors | | 52,027 | | 1,236,162 | |
Westamerica Bancorporation | | 12,703 | | 704,635 | |
| | | | 94,435,878 | |
HEALTH CARE (10.8%) | | | | | |
Allscripts Healthcare Solutions, Inc.* | | 78,707 | | 1,516,684 | |
Beckman Coulter, Inc. | | 30,137 | | 2,267,207 | |
Bio-Rad Laboratories, Inc. Cl A* | | 8,566 | | 889,579 | |
Charles River Laboratories Int’l., Inc.* | | 25,109 | | 892,374 | |
Community Health Systems, Inc.* | | 41,232 | | 1,540,840 | |
Covance, Inc.* | | 28,166 | | 1,448,014 | |
Edwards Lifesciences Corp.* | | 47,968 | | 3,877,730 | |
Endo Pharmaceuticals Hldgs., Inc.* | | 51,441 | | 1,836,958 | |
Gen-Probe, Inc.* | | 20,859 | | 1,217,123 | |
Health Management Associates, Inc. Cl A* | | 111,013 | | 1,059,064 | |
Health Net, Inc.* | | 40,642 | | 1,109,120 | |
Hill-Rom Hldgs., Inc. | | 27,839 | | 1,096,021 | |
Hologic, Inc.* | | 112,105 | | 2,109,816 | |
IDEXX Laboratories, Inc.* | | 24,683 | | 1,708,557 | |
Immucor, Inc.* | | 30,538 | | 605,569 | |
Kindred Healthcare, Inc.* | | 17,337 | | 318,481 | |
Kinetic Concepts, Inc.* | | 27,375 | | 1,146,465 | |
LifePoint Hospitals, Inc.* | | 23,021 | | 846,022 | |
Lincare Hldgs., Inc.* | | 42,993 | | 1,153,502 | |
Masimo Corp. | | 25,687 | | 746,721 | |
Medicis Pharmaceutical Corp. Cl A | | 26,486 | | 709,560 | |
Mednax, Inc.* | | 20,684 | | 1,391,826 | |
Mettler-Toledo Int’l., Inc.* | | 13,981 | | 2,114,067 | |
Omnicare, Inc. | | 49,775 | | 1,263,787 | |
Owens & Minor, Inc. | | 27,209 | | 800,761 | |
Perrigo Co. | | 36,314 | | 2,299,766 | |
Pharmaceutical Product Development, Inc. | | 52,210 | | 1,416,979 | |
ResMed, Inc.* | | 64,522 | | 2,235,042 | |
Schein (Henry), Inc.* | | 39,770 | | 2,441,480 | |
Steris Corp. | | 25,555 | | 931,735 | |
Techne Corp. | | 16,039 | | 1,053,281 | |
Teleflex, Inc. | | 17,413 | | 936,994 | |
Thoratec Corp.* | | 25,269 | | 715,618 | |
United Therapeutics Corp.* | | 21,989 | | 1,390,145 | |
Universal Health Svcs., Inc. Cl B | | 42,272 | | 1,835,450 | |
VCA Antech, Inc.* | | 37,722 | | 878,545 | |
Vertex Pharmaceuticals, Inc.* | | 85,987 | | 3,012,125 | |
WellCare Health Plans, Inc.* | | 18,633 | | 563,089 | |
| | | | 53,376,097 | |
INDUSTRIALS (15.7%) | | | | | |
Acuity Brands, Inc. | | 18,339 | | 1,057,610 | |
Aecom Technology Corp.* | | 50,672 | | 1,417,296 | |
AGCO Corp.* | | 39,503 | | 2,001,222 | |
AirTran Hldgs., Inc.* | | 58,533 | | 432,559 | |
Alaska Air Group, Inc.* | | 15,773 | | 894,171 | |
Alexander & Baldwin, Inc. | | 17,915 | | 717,137 | |
Alliant TechSystems, Inc.* | | 14,316 | | 1,065,540 | |
AMETEK, Inc. | | 69,821 | | 2,740,455 | |
Baldor Electric Co. | | 20,432 | | 1,288,033 | |
BE Aerospace, Inc.* | | 43,837 | | 1,623,284 | |
Bucyrus International, Inc. | | 35,200 | | 3,146,880 | |
Carlisle Cos., Inc. | | 26,418 | | 1,049,851 | |
Clean Harbors, Inc.* | | 9,800 | | 823,984 | |
Con-way, Inc. | | 23,598 | | 862,979 | |
Copart, Inc.* | | 30,395 | | 1,135,253 | |
Corporate Executive Board Co. | | 14,780 | | 554,989 | |
Corrections Corp. of America* | | 47,425 | | 1,188,471 | |
Crane Co. | | 20,065 | | 824,070 | |
Deluxe Corp. | | 22,059 | | 507,798 | |
Donaldson Co., Inc. | | 32,830 | | 1,913,332 | |
FTI Consulting, Inc.* | | 20,143 | | 750,931 | |
Gardner Denver, Inc. | | 23,059 | | 1,586,920 | |
GATX Corp. | | 20,233 | | 713,820 | |
Graco, Inc. | | 25,820 | | 1,018,599 | |
Granite Construction, Inc. | | 14,549 | | 399,079 | |
Harsco Corp. | | 34,925 | | 989,076 | |
HNI Corp. | | 19,292 | | 601,910 | |
Hubbell, Inc. Cl B | | 26,156 | | 1,572,760 | |
Hunt (J.B.) Transport Svcs., Inc. | | 38,492 | | 1,570,859 | |
IDEX Corp. | | 35,119 | | 1,373,855 | |
JetBlue Airways Corp* | | 88,122 | | 582,486 | |
Joy Global, Inc. | | 45,040 | | 3,907,215 | |
Kansas City Southern* | | 44,723 | | 2,140,443 | |
KBR, Inc. | | 64,314 | | 1,959,648 | |
Kennametal, Inc. | | 35,597 | | 1,404,658 | |
Kirby Corp.* | | 23,224 | | 1,023,017 | |
Korn/Ferry International* | | 19,492 | | 450,460 | |
Landstar System, Inc. | | 21,197 | | 867,805 | |
Lennox International, Inc. | | 19,611 | | 927,404 | |
Lincoln Electric Hldgs., Inc. | | 18,294 | | 1,194,049 | |
Manpower, Inc. | | 34,521 | | 2,166,538 | |
Miller (Herman), Inc. | | 24,887 | | 629,641 | |
Mine Safety Appliances Co. | | 13,423 | | 417,858 | |
MSC Industrial Direct Co., Inc. Cl A | | 19,262 | | 1,246,059 | |
Navigant Consulting, Inc.* | | 22,185 | | 204,102 | |
Nordson Corp. | | 14,540 | | 1,335,935 | |
Oshkosh Corp.* | | 39,993 | | 1,409,353 | |
Pentair, Inc. | | 42,824 | | 1,563,504 | |
Regal-Beloit Corp. | | 16,526 | | 1,103,276 | |
Rollins, Inc. | | 27,461 | | 542,355 | |
Shaw Group, Inc.* | | 36,499 | | 1,249,361 | |
SPX Corp. | | 21,622 | | 1,545,757 | |
Terex Corp.* | | 45,741 | | 1,419,801 | |
The Brink’s Co. | | 20,165 | | 542,035 | |
Thomas & Betts Corp.* | | 22,284 | | 1,076,317 | |
Timken Co. | | 34,523 | | 1,647,783 | |
Towers Watson & Co. Cl A | | 19,367 | | 1,008,246 | |
Trinity Industries, Inc. | | 35,337 | | 940,318 | |
United Rentals, Inc.* | | 26,599 | | 605,127 | |
URS Corp.* | | 35,563 | | 1,479,776 | |
Valmont Industries, Inc. | | 9,197 | | 816,050 | |
Wabtec Corp. | | 20,660 | | 1,092,707 | |
Waste Connections, Inc.* | | 49,735 | | 1,369,205 | |
Watsco, Inc.* | | 12,296 | | 775,632 | |
Werner Enterprises, Inc. | | 19,255 | | 435,163 | |
Woodward Governor Co. | | 25,946 | | 974,532 | |
| | | | 77,876,339 | |
INFORMATION TECHNOLOGY (15.2%) | | | | | |
ACI Worldwide, Inc.* | | 14,410 | | 387,197 | |
Acxiom Corp.* | | 35,037 | | 600,885 | |
Adtran, Inc. | | 27,427 | | 993,132 | |
Advent Software, Inc.* | | 6,889 | | 399,011 | |
Alliance Data Systems Corp.* | | 22,600 | | 1,605,278 | |
ANSYS, Inc.* | | 38,852 | | 2,023,024 | |
AOL, Inc.* | | 46,656 | | 1,106,214 | |
Arrow Electronics, Inc.* | | 50,094 | | 1,715,720 | |
Atmel Corp.* | | 196,596 | | 2,422,063 | |
Avnet, Inc.* | | 65,534 | | 2,164,588 | |
Broadridge Financial Solutions, Inc. | | 54,249 | | 1,189,681 | |
Cadence Design Systems, Inc.* | | 116,108 | | 959,052 | |
Ciena Corp.* | | 39,398 | | 829,328 | |
CommScope, Inc.* | | 40,639 | | 1,268,750 | |
Concur Technologies, Inc.* | | 19,582 | | 1,016,893 | |
Convergys Corp.* | | 52,476 | | 691,109 | |
CoreLogic, Inc. | | 45,348 | | 839,845 | |
Cree, Inc.* | | 46,517 | | 3,065,005 | |
Diebold, Inc. | | 28,476 | | 912,656 | |
Digital River, Inc.* | | 17,278 | | 594,709 | |
DST Systems, Inc. | | 15,536 | | 689,022 | |
Equinix, Inc.* | | 20,516 | | 1,667,130 | |
FactSet Research Systems, Inc. | | 20,179 | | 1,891,983 | |
Fair Isaac Corp. | | 17,322 | | 404,815 | |
Fairchild Semiconductor Int’l., Inc.* | | 53,926 | | 841,785 | |
Gartner, Inc.* | | 31,029 | | 1,030,163 | |
Global Payments, Inc. | | 33,921 | | 1,567,489 | |
Henry (Jack) & Associates, Inc. | | 37,176 | | 1,083,680 | |
Informatica Corp.* | | 40,346 | | 1,776,434 | |
Ingram Micro, Inc. Cl A* | | 67,847 | | 1,295,199 | |
Integrated Device Technology, Inc.* | | 67,797 | | 451,528 | |
International Rectifier Corp.* | | 29,912 | | 888,087 | |
Intersil Corp. Cl A | | 53,705 | | 820,075 | |
Itron, Inc.* | | 17,856 | | 990,115 | |
Lam Research Corp.* | | 52,382 | | 2,712,340 | |
Lender Processing Svcs., Inc. | | 39,646 | | 1,170,350 | |
ManTech International Corp. Cl A* | | 9,764 | | 403,546 | |
Mentor Graphics Corp.* | | 47,500 | | 570,000 | |
Micros Systems, Inc.* | | 35,281 | | 1,547,425 | |
National Instruments Corp. | | 25,316 | | 952,894 | |
NCR Corp.* | | 68,261 | | 1,049,172 | |
NeuStar, Inc. Cl A* | | 32,123 | | 836,804 | |
Parametric Technology Corp.* | | 50,746 | | 1,143,307 | |
Plantronics, Inc. | | 20,687 | | 769,970 | |
Polycom, Inc.* | | 37,040 | | 1,443,819 | |
Quest Software, Inc.* | | 25,979 | | 720,657 | |
Rackspace Hosting, Inc.* | | 41,339 | | 1,298,458 | |
RF Micro Devices, Inc.* | | 119,304 | | 876,884 | |
Riverbed Technology, Inc.* | | 62,284 | | 2,190,528 | |
Rovi Corp.* | | 46,066 | | 2,856,553 | |
Semtech Corp.* | | 27,378 | | 619,838 | |
Silicon Laboratories, Inc.* | | 18,978 | | 873,368 | |
Skyworks Solutions, Inc.* | | 77,601 | | 2,221,717 | |
Solera Hldgs., Inc. | | 30,315 | | 1,555,766 | |
SRA International, Inc. Cl A* | | 18,169 | | 371,556 | |
Synopsys, Inc.* | | 63,871 | | 1,718,769 | |
Tech Data Corp.* | | 20,494 | | 902,146 | |
Tibco Software, Inc.* | | 70,605 | | 1,391,625 | |
Trimble Navigation Ltd.* | | 51,376 | | 2,051,444 | |
ValueClick, Inc.* | | 35,375 | | 567,061 | |
Vishay Intertechnology, Inc.* | | 70,835 | | 1,039,858 | |
Zebra Technologies Corp. Cl A* | | 24,581 | | 933,832 | |
| | | | 74,971,332 | |
MATERIALS (6.6%) | | | | | |
Albemarle Corp. | | 39,518 | | 2,204,314 | |
AptarGroup, Inc. | | 29,229 | | 1,390,424 | |
Ashland, Inc. | | 34,162 | | 1,737,479 | |
Cabot Corp. | | 28,535 | | 1,074,343 | |
Carpenter Technology Corp. | | 18,616 | | 749,108 | |
Commercial Metals Co. | | 48,934 | | 811,815 | |
Compass Minerals Int’l., Inc.* | | 14,090 | | 1,257,814 | |
Cytec Industries, Inc. | | 21,164 | | 1,122,962 | |
Greif, Inc. Cl A | | 13,455 | | 832,865 | |
Intrepid Potash, Inc.* | | 18,921 | | 705,564 | |
Louisiana-Pacific Corp.* | | 56,280 | | 532,409 | |
Lubrizol Corp. | | 28,498 | | 3,045,866 | |
Martin Marietta Materials, Inc | | 19,916 | | 1,837,052 | |
Minerals Technologies, Inc. | | 8,041 | | 525,962 | |
NewMarket Corp. | | 4,290 | | 529,257 | |
Olin Corp. | | 34,327 | | 704,390 | |
Packaging Corp. of America | | 44,324 | | 1,145,332 | |
Reliance Steel & Aluminum Co. | | 31,966 | | 1,633,463 | |
Rock-Tenn Co. Cl A | | 16,741 | | 903,177 | |
RPM International, Inc. | | 56,288 | | 1,243,965 | |
Scotts Miracle-Gro Co. Cl A | | 19,892 | | 1,009,917 | |
Sensient Technologies Corp. | | 21,441 | | 787,528 | |
Silgan Hldgs., Inc. | | 21,803 | | 780,765 | |
Sonoco Products Co. | | 44,686 | | 1,504,578 | |
Steel Dynamics, Inc. | | 91,729 | | 1,678,641 | |
Temple-Inland, Inc. | | 47,358 | | 1,005,884 | |
Valspar Corp. | | 42,799 | | 1,475,710 | |
Worthington Industries, Inc. | | 23,950 | | 440,680 | |
| | | | 32,671,264 | |
TELECOMMUNICATION SERVICES (0.8%) | | | | | |
Cincinnati Bell, Inc.* | | 89,462 | | 250,494 | |
Syniverse Hldgs., Inc.* | | 31,648 | | 976,341 | |
Telephone & Data Systems, Inc. | | 39,734 | | 1,452,278 | |
tw telecom inc* | | 65,698 | | 1,120,151 | |
| | | | 3,799,264 | |
UTILITIES (5.7%) | | | | | |
AGL Resources, Inc. | | 34,015 | | 1,219,438 | |
Alliant Energy Corp. | | 48,391 | | 1,779,337 | |
Aqua America, Inc. | | 60,199 | | 1,353,274 | |
Atmos Energy Corp. | | 39,237 | | 1,224,194 | |
Black Hills Corp. | | 17,090 | | 512,700 | |
Cleco Corp. | | 26,358 | | 810,772 | |
DPL, Inc. | | 51,322 | | 1,319,489 | |
Dynegy, Inc. Cl A* | | 44,331 | | 249,140 | |
Energen Corp. | | 31,158 | | 1,503,685 | |
Great Plains Energy, Inc. | | 58,741 | | 1,138,988 | |
Hawaiian Electric Industries, Inc. | | 41,027 | | 935,005 | |
Idacorp, Inc. | | 21,350 | | 789,523 | |
MDU Resources Group | | 82,495 | | 1,672,174 | |
National Fuel Gas Co. | | 35,526 | | 2,331,216 | |
NSTAR | | 45,004 | | 1,898,719 | |
NV Energy, Inc. | | 101,769 | | 1,429,854 | |
OGE Energy Corp. | | 42,013 | | 1,913,272 | |
PNM Resources, Inc. | | 37,339 | | 486,154 | |
Questar Corp. | | 75,653 | | 1,317,119 | |
UGI Corp. | | 47,700 | | 1,506,366 | |
Vectren Corp. | | 35,671 | | 905,330 | |
Westar Energy, Inc. | | 48,292 | | 1,215,027 | |
WGL Hldgs., Inc. | | 22,398 | | 801,176 | |
| | | | 28,311,952 | |
TOTAL INDEXED ASSETS - COMMON STOCKS | | | | | |
(Cost: $400,792,429) 97.1% | | | | 479,670,198 | |
| | | | | |
| | Rating** | | Rate(%) | | Maturity | | Face Amount | | Value | |
SHORT-TERM DEBT SECURITIES: | | | | | | | | | | | |
U.S. GOVERNMENT (0.4%) | | | | | | | | | | | |
U.S. Treasury Bill (1) | | AAA | | 0.12 | | 02/03/11 | | 600,000 | | 599,934 | |
U.S. Treasury Bill (1) | | AAA | | 0.16 | | 03/03/11 | | 800,000 | | 799,835 | |
U.S. Treasury Bill (1) | | AAA | | 0.16 | | 03/03/11 | | 500,000 | | 499,896 | |
| | | | | | | | | | 1,899,665 | |
U.S. GOVERNMENT AGENCIES (1.0%) | | | | | | | | | | | |
Farmer Mac | | AAA | | 0.01 | | 01/03/11 | | 5,000,000 | | 4,999,997 | |
COMMERCIAL PAPER (1.4%) | | | | | | | | | | | |
General Electric Capital Corp. | | A-1+ | | 0.15 | | 01/31/11 | | 6,800,000 | | 6,799,150 | |
TOTAL SHORT-TERM DEBT SECURITIES | | | | | | | | | | | |
(Cost: $13,698,735) 2.8% | | | | | | | | | | 13,698,812 | |
| | | | | | | | | | | |
TEMPORARY CASH INVESTMENTS (2) | | | | | | | | | | | |
(Cost: $179,800) 0.0% (3) | | | | | | | | | | 179,800 | |
| | | | | | | | | | | |
TOTAL INVESTMENTS | | | | | | | | | | | |
(Cost: $414,670,964) 99.9% | | | | | | | | | | 493,548,810 | |
| | | | | | | | | | | |
OTHER NET ASSETS 0.1% | | | | | | | | | | 291,691 | |
| | | | | | | | | | | |
NET ASSETS 100.0% | | | | | | | | | | $ | 493,840,501 | |
| | | | | | | | | | | | |
The accompanying notes are an integral part of these portfolio schedules.
MUTUAL OF AMERICA INVESTMENT CORPORATION - INTERNATIONAL FUND
PORTFOLIO OF INVESTMENTS IN SECURITIES
December 31, 2010
| | Shares | | Value | |
COMMON STOCKS: | | | | | |
FINANCIALS (94.9%) | | | | | |
iShares MSCI EAFE Growth Index Fund | | 80,971 | | 4,945,304 | |
iShares MSCI EAFE Index Fund | | 109,546 | | 6,378,864 | |
iShares MSCI EAFE Value Index Fund | | 97,590 | | 4,954,644 | |
Vanguard Europe Pacific ETF | | 785,371 | | 28,391,162 | |
Vanguard European ETF | | 177,835 | | 8,729,920 | |
Vanguard Pacific ETF | | 80,359 | | 4,583,677 | |
| | | | 57,983,571 | |
TOTAL COMMON STOCKS | | | | | |
(Cost: $52,966,512) 94.9% | | | | 57,983,571 | |
| | | | | |
| | Rating** | | Rate(%) | | Maturity | | Face Amount | | Value | |
SHORT-TERM DEBT SECURITIES: | | | | | | | | | | | |
U.S. GOVERNMENT AGENCIES (5.2%) | | | | | | | | | | | |
Farmer Mac | | AAA | | 0.01 | | 01/03/11 | | 2,000,000 | | 1,999,999 | |
FNMA | | AAA | | 0.09 | | 02/14/11 | | 1,200,000 | | 1,199,868 | |
| | | | | | | | | | 3,199,867 | |
TOTAL SHORT-TERM DEBT SECURITIES | | | | | | | | | | | |
(Cost: $3,199,867) 5.2% | | | | | | | | | | 3,199,867 | |
| | | | | | | | | | | |
TOTAL INVESTMENTS | | | | | | | | | | | |
(Cost: $56,166,379) 100.1% | | | | | | | | | | 61,183,438 | |
| | | | | | | | | | | |
OTHER NET ASSETS -0.1% | | | | | | | | | | (75,408 | ) |
| | | | | | | | | | | |
NET ASSETS 100.0% | | | | | | | | | | $ | 61,108,030 | |
| | | | | | | | | | | | |
The accompanying notes are an integral part of these portfolio schedules.
MUTUAL OF AMERICA INVESTMENT CORPORATION - COMPOSITE FUND
PORTFOLIO OF INVESTMENTS IN SECURITIES
December 31, 2010
| | Shares | | Value | |
COMMON STOCKS: | | | | | |
CONSUMER DISCRETIONARY (6.7%) | | | | | |
Amazon.com, Inc.* | | 6,758 | | 1,216,440 | |
Apollo Group, Inc.* | | 11,478 | | 453,266 | |
Darden Restaurants, Inc. | | 10,013 | | 465,004 | |
Discovery Communications, Inc. Cl A* | | 9,058 | | 377,719 | |
Disney (Walt) Co. | | 26,898 | | 1,008,944 | |
Ford Motor Co.* | | 66,350 | | 1,114,017 | |
Johnson Controls, Inc. | | 23,444 | | 895,561 | |
NIKE, Inc. Cl B | | 10,850 | | 926,807 | |
Staples, Inc. | | 23,964 | | 545,660 | |
Starbucks Corp. | | 39,731 | | 1,276,557 | |
Target Corp. | | 7,457 | | 448,389 | |
Time Warner Cable, Inc. | | 10,059 | | 664,196 | |
Time Warner, Inc. | | 16,935 | | 544,799 | |
Urban Outfitters, Inc.* | | 12,123 | | 434,125 | |
Viacom, Inc. Cl B | | 19,209 | | 760,868 | |
| | | | 11,132,352 | |
CONSUMER STAPLES (5.7%) | | | | | |
Avon Products, Inc. | | 13,124 | | 381,383 | |
ConAgra Foods, Inc. | | 28,078 | | 634,001 | |
Constellation Brands, Inc. Cl A* | | 25,157 | | 557,228 | |
Dr. Pepper Snapple Group, Inc. | | 27,430 | | 964,439 | |
General Mills, Inc. | | 18,726 | | 666,458 | |
Kraft Foods, Inc. Cl A | | 29,603 | | 932,791 | |
PepsiCo, Inc. | | 24,704 | | 1,613,912 | |
Proctor & Gamble Co. | | 31,541 | | 2,029,033 | |
Wal-Mart Stores, Inc. | | 33,048 | | 1,782,279 | |
| | | | 9,561,524 | |
ENERGY (7.2%) | | | | | |
Apache Corp. | | 8,876 | | 1,058,285 | |
ConocoPhillips | | 25,055 | | 1,706,246 | |
Exxon Mobil Corp. | | 47,917 | | 3,503,688 | |
Halliburton Co. | | 29,517 | | 1,205,179 | |
Hess Corp. | | 8,585 | | 657,096 | |
National Oilwell Varco, Inc. | | 13,277 | | 892,878 | |
Noble Energy, Inc. | | 11,366 | | 978,385 | |
Occidental Petroleum Corp. | | 13,978 | | 1,371,242 | |
Range Resources Corp. | | 7,456 | | 335,371 | |
Southwestern Energy Co.* | | 5,667 | | 212,116 | |
| | | | 11,920,486 | |
FINANCIALS (9.5%) | | | | | |
Allstate Corp. | | 30,249 | | 964,338 | |
Bank of America Corp. | | 98,909 | | 1,319,446 | |
BB&T Corp. | | 27,327 | | 718,427 | |
Berkshire Hathaway, Inc. Cl B* | | 16,501 | | 1,321,895 | |
Capital One Financial Corp. | | 26,830 | | 1,141,885 | |
Citigroup, Inc.* | | 260,443 | | 1,231,895 | |
Goldman Sachs Group, Inc. | | 9,230 | | 1,552,117 | |
JPMorgan Chase & Co. | | 59,302 | | 2,515,591 | |
MetLife, Inc. | | 22,545 | | 1,001,900 | |
PNC Financial Svcs. Grp., Inc. | | 12,023 | | 730,037 | |
Simon Property Group, Inc. | | 9,605 | | 955,601 | |
Wells Fargo & Co. | | 73,250 | | 2,270,018 | |
| | | | 15,723,150 | |
HEALTH CARE (6.4%) | | | | | |
Abbott Laboratories | | 30,113 | | 1,442,714 | |
Celgene Corp.* | | 12,456 | | 736,648 | |
Gilead Sciences, Inc.* | | 23,045 | | 835,151 | |
Johnson & Johnson | | 31,704 | | 1,960,892 | |
Laboratory Corp. of America Hldgs.* | | 7,130 | | 626,870 | |
McKesson Corp. | | 12,793 | | 900,371 | |
Medco Health Solutions, Inc.* | | 9,700 | | 594,319 | |
Merck & Co., Inc. | | 41,263 | | 1,487,119 | |
Mylan, Inc.* | | 40,233 | | 850,123 | |
St. Jude Medical, Inc.* | | 20,648 | | 882,702 | |
UnitedHealth Group, Inc. | | 9,024 | | 325,857 | |
| | | | 10,642,766 | |
INDUSTRIALS (6.1%) | | | | | |
Boeing Co. | | 19,823 | | 1,293,649 | |
Cummins, Inc. | | 10,067 | | 1,107,471 | |
Expeditors Int’l. of Wash. | | 18,492 | | 1,009,663 | |
FedEx Corp. | | 10,083 | | 937,820 | |
Flowserve Corp. | | 5,121 | | 610,526 | |
General Electric Co. | | 116,595 | | 2,132,523 | |
Illinois Tool Works, Inc. | | 15,055 | | 803,937 | |
Precision Castparts Corp. | | 7,904 | | 1,100,316 | |
Southwest Airlines Co. | | 41,885 | | 543,667 | |
Union Pacific Corp. | | 7,052 | | 653,438 | |
| | | | 10,193,010 | |
INFORMATION TECHNOLOGY (11.5%) | | | | | |
Apple, Inc.* | | 10,766 | | 3,472,681 | |
Automatic Data Processing, Inc. | | 12,033 | | 556,887 | |
Cisco Systems, Inc.* | | 62,172 | | 1,257,740 | |
Cognizant Technology Solutions* | | 8,734 | | 640,115 | |
EMC Corp.* | | 22,189 | | 508,128 | |
Google, Inc.* | | 3,166 | | 1,880,509 | |
Hewlett-Packard Co. | | 29,252 | | 1,231,509 | |
Int’l. Business Machines Corp. | | 11,860 | | 1,740,574 | |
KLA-Tencor Corp. | | 13,795 | | 533,039 | |
Linear Technology Corp. | | 14,097 | | 487,615 | |
Microsoft Corp. | | 61,228 | | 1,709,486 | |
Nortel Networks Corp.* | | 6,040 | | 83 | |
Oracle Corp. | | 39,863 | | 1,247,712 | |
QUALCOMM, Inc. | | 21,800 | | 1,078,882 | |
Red Hat, Inc.* | | 11,204 | | 511,463 | |
Salesforce.com, inc.* | | 8,465 | | 1,117,380 | |
Texas Instruments, Inc. | | 25,026 | | 813,345 | |
Yahoo!, Inc.* | | 20,946 | | 348,332 | |
| | | | 19,135,480 | |
MATERIALS (2.6%) | | | | | |
Ball Corp. | | 7,977 | | 542,835 | |
Dow Chemical Co. | | 21,468 | | 732,918 | |
Eastman Chemical Co. | | 11,566 | | 972,469 | |
FMC Corp. | | 9,191 | | 734,269 | |
Freeport-McMoRan Copper & Gold, Inc. | | 10,949 | | 1,314,865 | |
| | | | 4,297,356 | |
TELECOMMUNICATION SERVICES (1.7%) | | | | | |
AT&T, Inc. | | 51,848 | | 1,523,294 | |
Qwest Communications Int’l., Inc. | | 88,278 | | 671,796 | |
Sprint Nextel Corp.* | | 156,949 | | 663,894 | |
| | | | 2,858,984 | |
UTILITIES (1.7%) | | | | | |
Dominion Resources, Inc. | | 18,342 | | 783,570 | |
Edison International | | 10,607 | | 409,430 | |
Entergy Corp. | | 2,868 | | 203,140 | |
PPL Corp. | | 11,769 | | 309,760 | |
Public Svc. Enterprise Group, Inc. | | 20,672 | | 657,576 | |
Sempra Energy | | 9,648 | | 506,327 | |
| | | | 2,869,803 | |
TOTAL COMMON STOCKS
(Cost: $86,379,344) 59.1% | | | | 98,334,911 | |
| | Rating** | | Rate(%) | | Maturity | | Face Amount | | Value | |
LONG-TERM DEBT SECURITIES: | | | | | | | | | | | |
U.S. GOVERNMENT (4.5%) | | | | | | | | | | | |
U.S. Treasury Note | | AAA | | 2.25 | | 11/30/17 | | 250,000 | | 243,106 | |
U.S. Treasury Note | | AAA | | 3.13 | | 05/15/19 | | 1,100,000 | | 1,111,602 | |
U.S. Treasury Strip | | AAA | | 0.00 | | 08/15/21 | | 300,000 | | 201,797 | |
U.S. Treasury Strip | | AAA | | 0.00 | | 11/15/21 | | 8,900,000 | | 5,885,618 | |
| | | | | | | | | | 7,442,123 | |
U.S. GOVERNMENT AGENCIES (13.6%) | | | | | | | | | | | |
MORTGAGE-BACKED OBLIGATIONS (13.6%) | | | | | | | | | | | |
FHARM | | AAA | | 4.64 | | 09/01/39 | | 272,146 | | 284,834 | |
FHARM | | AAA | | 5.22 | | 04/01/37 | | 306,388 | | 323,724 | |
FHARM | | AAA | | 5.24 | | 02/01/36 | | 251,342 | | 267,744 | |
FHARM | | AAA | | 5.43 | | 05/01/37 | | 323,533 | | 344,330 | |
FHARM | | AAA | | 5.77 | | 03/01/37 | | 174,754 | | 187,976 | |
FHLMC | | AAA | | 4.00 | | 02/01/25 | | 318,734 | | 328,346 | |
FHLMC | | AAA | | 4.50 | | 08/01/34 | | 313,306 | | 323,214 | |
FHLMC | | AAA | | 4.50 | | 08/15/35 | | 205,890 | | 206,062 | |
FHLMC | | AAA | | 5.00 | | 02/01/26 | | 160,745 | | 169,734 | |
FHLMC | | AAA | | 5.50 | | 01/15/32 | | 190,000 | | 206,791 | |
FHLMC | | AAA | | 5.50 | | 07/01/32 | | 305,751 | | 328,203 | |
FHLMC | | AAA | | 6.00 | | 03/15/32 | | 236,413 | | 260,202 | |
FNMA | | AAA | | 4.00 | | 05/01/19 | | 166,640 | | 173,749 | |
FNMA | | AAA | | 4.00 | | 10/01/30 | | 615,174 | | 619,890 | |
FNMA | | AAA | | 4.00 | | 05/01/35 | | 402,389 | | 405,224 | |
FNMA | | AAA | | 4.50 | | 05/01/18 | | 226,775 | | 240,240 | |
FNMA | | AAA | | 4.50 | | 05/01/30 | | 413,458 | | 428,340 | |
FNMA | | AAA | | 4.50 | | 08/01/33 | | 317,750 | | 328,543 | |
FNMA | | AAA | | 4.50 | | 09/01/33 | | 553,952 | | 572,768 | |
FNMA | | AAA | | 4.50 | | 06/01/34 | | 420,174 | | 433,789 | |
FNMA | | AAA | | 4.50 | | 08/01/35 | | 465,082 | | 480,007 | |
FNMA | | AAA | | 4.50 | | 12/01/35 | | 291,832 | | 301,197 | |
FNMA | | AAA | | 4.50 | | 05/01/40 | | 441,213 | | 458,675 | |
FNMA | | AAA | | 5.00 | | 04/01/18 | | 460,797 | | 493,413 | |
FNMA | | AAA | | 5.00 | | 06/01/33 | | 514,893 | | 544,577 | |
FNMA | | AAA | | 5.00 | | 09/01/33 | | 298,846 | | 316,075 | |
FNMA | | AAA | | 5.00 | | 11/01/33 | | 907,141 | | 959,439 | |
FNMA | | AAA | | 5.00 | | 11/01/33 | | 343,106 | | 362,886 | |
FNMA | | AAA | | 5.00 | | 03/01/34 | | 163,391 | | 172,810 | |
FNMA | | AAA | | 5.00 | | 04/01/34 | | 166,093 | | 175,461 | |
FNMA | | AAA | | 5.00 | | 09/01/35 | | 239,299 | | 252,646 | |
FNMA | | AAA | | 5.00 | | 11/25/35 | | 300,000 | | 314,646 | |
FNMA | | AAA | | 5.00 | | 05/01/39 | | 413,758 | | 440,173 | |
FNMA | | AAA | | 5.50 | | 04/01/17 | | 35,811 | | 38,614 | |
FNMA | | AAA | | 5.50 | | 05/01/17 | | 18,958 | | 20,442 | |
FNMA | | AAA | | 5.50 | | 06/01/17 | | 5,907 | | 6,370 | |
FNMA | | AAA | | 5.50 | | 07/01/33 | | 376,710 | | 406,055 | |
FNMA | | AAA | | 5.50 | | 10/01/33 | | 577,698 | | 622,699 | |
FNMA | | AAA | | 5.50 | | 03/01/34 | | 119,857 | | 129,193 | |
FNMA | | AAA | | 5.50 | | 05/01/34 | | 897,724 | | 966,252 | |
FNMA | | AAA | | 5.50 | | 07/01/34 | | 206,142 | | 221,878 | |
FNMA | | AAA | | 5.50 | | 09/01/34 | | 422,912 | | 455,328 | |
FNMA | | AAA | | 5.50 | | 09/01/34 | | 270,848 | | 291,523 | |
FNMA | | AAA | | 5.50 | | 10/01/34 | | 183,429 | | 197,431 | |
FNMA | | AAA | | 5.50 | | 02/01/35 | | 240,374 | | 258,724 | |
FNMA | | AAA | | 5.50 | | 02/01/35 | | 203,559 | | 218,907 | |
FNMA | | AAA | | 5.50 | | 04/01/35 | | 279,182 | | 300,232 | |
FNMA | | AAA | | 5.50 | | 08/01/35 | | 110,081 | | 118,381 | |
FNMA | | AAA | | 5.50 | | 07/01/36 | | 334,025 | | 359,523 | |
FNMA | | AAA | | 5.50 | | 08/01/37 | | 148,531 | | 159,034 | |
FNMA | | AAA | | 5.50 | | 11/01/38 | | 189,586 | | 201,274 | |
FNMA | | AAA | | 5.50 | | 06/01/48 | | 183,198 | | 194,720 | |
FNMA | | AAA | | 6.00 | | 03/01/17 | | 13,574 | | 14,807 | |
FNMA | | AAA | | 6.00 | | 05/01/23 | | 96,659 | | 106,788 | |
FNMA | | AAA | | 6.00 | | 03/01/32 | | 10,690 | | 11,776 | |
FNMA | | AAA | | 6.00 | | 04/01/32 | | 75,533 | | 83,207 | |
FNMA | | AAA | | 6.00 | | 04/01/32 | | 37,686 | | 41,515 | |
FNMA | | AAA | | 6.00 | | 05/01/32 | | 67,913 | | 74,814 | |
FNMA | | AAA | | 6.00 | | 04/01/33 | | 243,800 | | 268,570 | |
FNMA | | AAA | | 6.00 | | 05/01/33 | | 164,938 | | 181,696 | |
FNMA | | AAA | | 6.00 | | 06/01/34 | | 149,651 | | 164,154 | |
FNMA | | AAA | | 6.00 | | 09/01/34 | | 76,091 | | 83,466 | |
FNMA | | AAA | | 6.00 | | 10/01/34 | | 130,722 | | 143,391 | |
FNMA | | AAA | | 6.00 | | 11/01/34 | | 156,247 | | 171,390 | |
FNMA | | AAA | | 6.00 | | 12/01/36 | | 252,746 | | 275,503 | |
FNMA | | AAA | | 6.00 | | 01/01/37 | | 218,079 | | 237,715 | |
FNMA | | AAA | | 6.00 | | 04/01/37 | | 144,515 | | 156,443 | |
FNMA | | AAA | | 6.00 | | 05/01/37 | | 178,401 | | 193,126 | |
FNMA | | AAA | | 6.00 | | 06/01/37 | | 229,362 | | 248,293 | |
FNMA | | AAA | | 6.00 | | 10/25/44 | | 226,453 | | 249,522 | |
FNMA | | AAA | | 6.00 | | 02/25/47 | | 180,522 | | 198,913 | |
FNMA | | AAA | | 6.00 | | 12/25/49 | | 196,882 | | 216,940 | |
FNMA | | AAA | | 6.50 | | 09/01/16 | | 16,166 | | 17,639 | |
FNMA | | AAA | | 6.50 | | 03/01/17 | | 31,965 | | 34,976 | |
FNMA | | AAA | | 6.50 | | 05/01/17 | | 16,442 | | 17,991 | |
FNMA | | AAA | | 6.50 | | 06/01/17 | | 35,496 | | 38,840 | |
FNMA | | AAA | | 6.50 | | 04/01/32 | | 34,750 | | 39,074 | |
FNMA | | AAA | | 6.50 | | 05/01/32 | | 89,249 | | 100,353 | |
FNMA | | AAA | | 6.50 | | 05/01/32 | | 68,679 | | 77,224 | |
FNMA | | AAA | | 6.50 | | 07/01/32 | | 26,618 | | 29,929 | |
FNMA | | AAA | | 6.50 | | 07/01/34 | | 117,237 | | 131,457 | |
FNMA | | AAA | | 6.50 | | 05/01/37 | | 162,939 | | 181,225 | |
FNMA | | AAA | | 6.50 | | 09/01/37 | | 192,560 | | 214,170 | |
FNMA | | AAA | | 7.00 | | 09/01/31 | | 30,320 | | 34,542 | |
FNMA | | AAA | | 7.00 | | 11/01/31 | | 23,149 | | 26,373 | |
FNMA | | AAA | | 7.00 | | 04/01/32 | | 28,539 | | 32,527 | |
FNMA | | AAA | | 7.50 | | 06/01/31 | | 18,663 | | 21,418 | |
FNMA | | AAA | | 7.50 | | 02/01/32 | | 13,098 | | 15,040 | |
FNMA | | AAA | | 7.50 | | 04/01/32 | | 24,524 | | 28,173 | |
FNMA | | AAA | | 7.50 | | 06/01/32 | | 20,469 | | 23,515 | |
FNMA | | AAA | | 8.00 | | 03/01/31 | | 15,729 | | 18,191 | |
FNMA | | AAA | | 8.00 | | 04/01/32 | | 14,621 | | 16,919 | |
FNMA | | AAA | | 8.00 | | 04/01/32 | | 4,049 | | 4,687 | |
GNMA (4) | | AAA | | 3.50 | | 09/20/33 | | 500,000 | | 511,469 | |
GNMA (4) | | AAA | | 5.00 | | 06/20/39 | | 215,543 | | 218,660 | |
GNMA (4) | | AAA | | 5.00 | | 11/15/39 | | 330,860 | | 351,986 | |
GNMA (4) | | AAA | | 6.50 | | 04/15/31 | | 9,646 | | 10,952 | |
GNMA (4) | | AAA | | 6.50 | | 10/15/31 | | 12,561 | | 14,261 | |
GNMA (4) | | AAA | | 6.50 | | 12/15/31 | | 10,311 | | 11,707 | |
GNMA (4) | | AAA | | 6.50 | | 05/15/32 | | 12,424 | | 14,105 | |
GNMA (4) | | AAA | | 7.00 | | 05/15/31 | | 8,872 | | 10,178 | |
GNMA (4) | | AAA | | 7.00 | | 09/15/31 | | 10,047 | | 11,526 | |
GNMA (4) | | AAA | | 7.00 | | 09/15/31 | | 2,474 | | 2,838 | |
GNMA (4) | | AAA | | 7.00 | | 05/15/32 | | 4,766 | | 5,457 | |
Vendee Mortgage Trust (4) | | AAA | | 5.25 | | 01/15/32 | | 400,824 | | 435,580 | |
| | | | | | | | | | 22,697,299 | |
CORPORATE DEBT (18.9%) | | | | | | | | | | | |
CONSUMER DISCRETIONARY (2.8%) | | | | | | | | | | | |
Black & Decker Corp. | | A | | 4.75 | | 11/01/14 | | 750,000 | | 807,195 | |
Ethan Allen Interiors, Inc. | | B+ | | 5.38 | | 10/01/15 | | 500,000 | | 480,669 | |
Expedia, Inc. | | BBB- | | 5.95 | | 08/15/20 | | 250,000 | | 251,250 | |
Fortune Brands, Inc. | | BBB- | | 4.88 | | 12/01/13 | | 500,000 | | 522,424 | |
Home Depot, Inc. | | BBB+ | | 5.40 | | 03/01/16 | | 500,000 | | 560,303 | |
Johnson Controls, Inc. | | BBB+ | | 4.88 | | 09/15/13 | | 500,000 | | 537,261 | |
Marriott International, Inc. | | BBB | | 5.63 | | 02/15/13 | | 500,000 | | 536,245 | |
Omnicom Group, Inc. | | BBB+ | | 4.45 | | 08/15/20 | | 250,000 | | 244,632 | |
Scholastic Corp. | | BB- | | 5.00 | | 04/15/13 | | 500,000 | | 501,250 | |
Whirlpool Corp. | | BBB- | | 6.50 | | 06/15/16 | | 250,000 | | 275,686 | |
| | | | | | | | | | 4,716,915 | |
CONSUMER STAPLES (0.6%) | | | | | | | | | | | |
Corn Products Int’l., Inc. | | BBB | | 4.63 | | 11/01/20 | | 250,000 | | 246,569 | |
CVS Caremark Corp. | | BBB+ | | 6.13 | | 08/15/16 | | 250,000 | | 283,646 | |
Kroger Co. | | BBB | | 4.95 | | 01/15/15 | | 500,000 | | 540,054 | |
| | | | | | | | | | 1,070,269 | |
ENERGY (3.9%) | | | | | | | | | | | |
Diamond Offshore Drilling, Inc. | | A- | | 4.88 | | 07/01/15 | | 500,000 | | 540,602 | |
Enbridge, Inc. | | A- | | 5.80 | | 06/15/14 | | 100,000 | | 111,241 | |
Kinder Morgan, Inc. | | BB | | 5.15 | | 03/01/15 | | 500,000 | | 503,750 | |
National Oilwell Varco, Inc. | | BBB+ | | 6.13 | | 08/15/15 | | 250,000 | | 258,184 | |
Noble Corp. | | A- | | 7.50 | | 03/15/19 | | 800,000 | | 959,809 | |
Seacor Hldgs., Inc. | | BBB- | | 7.38 | | 10/01/19 | | 250,000 | | 259,315 | |
Seariver Maritime, Inc. | | AAA | | 0.00 | | 09/01/12 | | 3,000,000 | | 2,885,325 | |
Sunoco, Inc. | | BBB- | | 4.88 | | 10/15/14 | | 500,000 | | 521,116 | |
Weatherford Int’l. Ltd. | | BBB | | 5.50 | | 02/15/16 | | 500,000 | | 530,553 | |
| | | | | | | | | | 6,569,895 | |
FINANCIALS (6.6%) | | | | | | | | | | | |
Alleghany Corp. | | BBB | | 5.63 | | 09/15/20 | | 250,000 | | 244,141 | |
Ally Financial, Inc. | | B | | 0.00 | | 12/01/12 | | 2,500,000 | | 2,256,250 | |
Bank of America Corp. | | A | | 3.70 | | 09/01/15 | | 250,000 | | 247,841 | |
Berkley (W.R.) Corp. | | BBB+ | | 7.38 | | 09/15/19 | | 250,000 | | 277,456 | |
Block Financial LLC | | BBB | | 5.13 | | 10/30/14 | | 250,000 | | 247,317 | |
Bunge Ltd. Finance Corp. | | BBB- | | 5.35 | | 04/15/14 | | 500,000 | | 525,557 | |
CNA Financial Corp. | | BBB- | | 6.50 | | 08/15/16 | | 250,000 | | 267,725 | |
Colonial Realty LP | | BB+ | | 4.80 | | 04/01/11 | | 250,000 | | 250,581 | |
Duke Realty LP | | BBB- | | 4.63 | | 05/15/13 | | 250,000 | | 260,151 | |
Fairfax Financial Hldgs. | | BBB- | | 8.25 | | 10/01/15 | | 500,000 | | 526,875 | |
First Horizon National Corp. | | BB+ | | 4.50 | | 05/15/13 | | 1,500,000 | | 1,514,330 | |
First Industrial LP | | BB- | | 6.88 | | 04/15/12 | | 250,000 | | 249,271 | |
Fosters Finance Corp.† | | BBB | | 6.88 | | 06/15/11 | | 500,000 | | 513,277 | |
Hartford Financial Svcs. | | BBB | | 5.50 | | 10/15/16 | | 250,000 | | 259,426 | |
HCP, Inc. | | BBB | | 5.65 | | 12/15/13 | | 250,000 | | 268,540 | |
Health Care REIT, Inc. | | BBB- | | 6.13 | | 04/15/20 | | 250,000 | | 263,166 | |
Heinz (H.J.) Finance Co. | | BBB | | 6.00 | | 03/15/12 | | 500,000 | | 528,126 | |
Lincoln National Corp. | | A- | | 5.65 | | 08/27/12 | | 500,000 | | 531,861 | |
Markel Corp. | | BBB | | 6.80 | | 02/15/13 | | 250,000 | | 264,829 | |
Morgan Stanley | | A | | 4.00 | | 07/24/15 | | 250,000 | | 251,296 | |
Pacific LifeCorp.† | | BBB+ | | 6.00 | | 02/10/20 | | 100,000 | | 105,100 | |
Regency Centers LP | | BBB | | 4.95 | | 04/15/14 | | 250,000 | | 261,494 | |
Shurgard Storage Centers | | A | | 7.75 | | 02/22/11 | | 250,000 | | 252,620 | |
Vornado Realty LP | | BBB | | 5.60 | | 02/15/11 | | 250,000 | | 250,989 | |
Zions Bancorporation | | BB+ | | 5.65 | | 05/15/14 | | 397,000 | | 395,639 | |
| | | | | | | | | | 11,013,858 | |
HEALTH CARE (1.1%) | | | | | | | | | | | |
Allergan, Inc. | | A+ | | 5.75 | | 04/01/16 | | 250,000 | | 284,787 | |
Laboratory Corp. of America | | BBB+ | | 5.63 | | 12/15/15 | | 500,000 | | 548,059 | |
Quest Diagnostics, Inc. | | BBB+ | | 4.75 | | 01/30/20 | | 250,000 | | 247,273 | |
WellPoint, Inc. | | A- | | 4.35 | | 08/15/20 | | 250,000 | | 248,052 | |
Wyeth | | AA | | 5.50 | | 03/15/13 | | 500,000 | | 546,689 | |
| | | | | | | | | | 1,874,860 | |
INDUSTRIALS (1.4%) | | | | | | | | | | | |
CSX Corp. | | BBB- | | 6.25 | | 04/01/15 | | 250,000 | | 284,107 | |
Donnelley (R.R.) & Sons Co. | | BBB | | 4.95 | | 04/01/14 | | 500,000 | | 512,271 | |
L-3 Communications Corp. | | BBB- | | 4.75 | | 07/15/20 | | 250,000 | | 245,620 | |
Masco Corp. | | BBB | | 5.88 | | 07/15/12 | | 500,000 | | 524,153 | |
Pitney Bowes, Inc. | | BBB+ | | 5.25 | | 01/15/37 | | 250,000 | | 253,324 | |
Steelcase, Inc. | | BBB- | | 6.50 | | 08/15/11 | | 500,000 | | 510,962 | |
| | | | | | | | | | 2,330,437 | |
MATERIALS (1.4%) | | | | | | | | | | | |
Geon Co. | | B+ | | 7.50 | | 12/15/15 | | 1,000,000 | | 1,028,750 | |
Lubrizol Corp. | | BBB+ | | 5.50 | | 10/01/14 | | 500,000 | | 547,247 | |
Martin Marietta Materials, Inc. | | BBB+ | | 6.88 | | 04/01/11 | | 250,000 | | 252,952 | |
Temple-Inland, Inc. | | BBB | | 7.88 | | 05/01/12 | | 228,000 | | 243,920 | |
Vulcan Materials Co. | | BBB- | | 7.00 | | 06/15/18 | | 250,000 | | 262,030 | |
| | | | | | | | | | 2,334,899 | |
TELECOMMUNICATION SERVICES (0.3%) | | | | | | | | | | | |
CenturyLink, Inc. | | BBB- | | 5.00 | | 02/15/15 | | 500,000 | | 510,563 | |
| | | | | | | | | | | |
UTILITIES (0.8%) | | | | | | | | | | | |
Ameren Energy Generating Co. | | BBB- | | 6.30 | | 04/01/20 | | 250,000 | | 242,610 | |
Arizona Public Svc. Co. | | BBB- | | 6.50 | | 03/01/12 | | 250,000 | | 264,207 | |
Entergy Corp. | | BBB- | | 5.13 | | 09/15/20 | | 250,000 | | 246,641 | |
Progress Energy Enterprise | | A | | 5.25 | | 12/15/15 | | 500,000 | | 560,580 | |
| | | | | | | | | | 1,314,038 | |
TOTAL LONG-TERM DEBT SECURITIES
(Cost: $58,779,729) 37.0% | | | | | | | | | | 61,875,156 | |
| | Rating** | | Rate(%) | | Maturity | | Face Amount | | Value | |
SHORT-TERM DEBT SECURITIES: | | | | | | | | | | | |
U.S. GOVERNMENT AGENCIES (1.4%) | | | | | | | | | | | |
Farmer Mac | | AAA | | 0.01 | | 01/03/11 | | 2,400,000 | | 2,399,999 | |
| | | | | | | | | | | |
COMMERCIAL PAPER (2.0%) | | | | | | | | | | | |
General Electric Capital Corp. | | A-1+ | | 0.15 | | 01/31/11 | | 850,000 | | 849,894 | |
General Electric Capital Svcs. | | A-1+ | | 0.23 | | 02/04/11 | | 1,000,000 | | 999,783 | |
Madison Gas & Electric | | A-1+ | | 0.18 | | 01/14/11 | | 428,000 | | 427,972 | |
NetJets, Inc.† | | A-1+ | | 0.12 | | 01/03/11 | | 1,000,000 | | 999,993 | |
| | | | | | | | | | 3,277,642 | |
TOTAL SHORT-TERM DEBT SECURITIES
(Cost: $5,677,641) 3.4% | | | | | | | | | | 5,677,641 | |
TEMPORARY CASH INVESTMENTS (2)
(Cost: $137,400) 0.1% | | | | | | | | | | 137,400 | |
| | | | | | | | | | | |
TOTAL INVESTMENTS
(Cost: $150,974,114) 99.6% | | | | | | | | | | 166,025,108 | |
| | | | | | | | | | | |
OTHER NET ASSETS 0.4% | | | | | | | | | | 651,607 | |
| | | | | | | | | | | |
NET ASSETS 100.0% | | | | | | | | | | $ | 166,676,715 | |
| | | | | | | | | | | | |
The accompanying notes are an integral part of these portfolio schedules.
MUTUAL OF AMERICA INVESTMENT CORPORATION - RETIREMENT INCOME FUND
PORTFOLIO OF INVESTMENTS IN SECURITIES
December 31, 2010
| | Shares | | Value | |
COMMON STOCKS: | | | | | |
DIVERSIFIED MUTUAL FUNDS (100.0%) | | | | | |
Mutual of America Investment Corporation | | | | | |
Bond Fund (29.4%) | | 3,972,162 | | 5,333,092 | |
Equity Index Fund (21.2%) | | 1,857,188 | | 3,847,905 | |
Mid-Cap Equity Index Fund (5.7%) | | 686,574 | | 1,037,774 | |
Mid-Term Bond Fund (37.1%) | | 6,550,955 | | 6,730,065 | |
Money Market Fund (6.6%) | | 993,502 | | 1,196,839 | |
TOTAL INVESTMENTS
(Cost: $17,425,694) 100.0% | | | | 18,145,675 | |
OTHER NET ASSETS | | | | — | |
| | | | | |
NET ASSETS 100.0% | | | | $ | 18,145,675 | |
| | | | | | |
The accompanying notes are an integral part of these portfolio schedules.
MUTUAL OF AMERICA INVESTMENT CORPORATION - 2010 RETIREMENT FUND
PORTFOLIO OF INVESTMENTS IN SECURITIES
December 31, 2010
| | Shares | | Value | |
COMMON STOCKS: | | | | | |
DIVERSIFIED MUTUAL FUNDS (100.0%) | | | | | |
Mutual of America Investment Corporation | | | | | |
Bond Fund (24.0%) | | 3,428,295 | | 4,602,887 | |
Equity Index Fund (25.9%) | | 2,390,935 | | 4,953,774 | |
International Fund (3.9%) | | 1,055,264 | | 749,270 | |
Mid-Cap Equity Index Fund (15.7%) | | 1,992,577 | | 3,011,830 | |
Mid-Term Bond Fund (26.0%) | | 4,856,746 | | 4,989,534 | |
Money Market Fund (4.5%) | | 721,792 | | 869,520 | |
TOTAL INVESTMENTS
(Cost: $17,117,322) 100.0% | | | | 19,176,815 | |
OTHER NET ASSETS | | | | — | |
| | | | | |
NET ASSETS 100.0% | | | | $ | 19,176,815 | |
| | | | | | |
The accompanying notes are an integral part of these portfolio schedules.
MUTUAL OF AMERICA INVESTMENT CORPORATION - 2015 RETIREMENT FUND
PORTFOLIO OF INVESTMENTS IN SECURITIES
December 31, 2010
| | Shares | | Value | |
COMMON STOCKS: | | | | | |
DIVERSIFIED MUTUAL FUNDS (100.0%) | | | | | |
Mutual of America Investment Corporation | | | | | |
Bond Fund (24.0%) | | 13,960,970 | | 18,744,236 | |
Equity Index Fund (30.5%) | | 11,530,033 | | 23,889,051 | |
International Fund (7.7%) | | 8,481,053 | | 6,021,811 | |
Mid-Cap Equity Index Fund (12.3%) | | 6,330,669 | | 9,568,964 | |
Mid-Term Bond Fund (17.3%) | | 13,121,632 | | 13,480,390 | |
Money Market Fund (3.6%) | | 2,354,179 | | 2,836,002 | |
Small Cap Growth Fund (2.4%) | | 1,541,597 | | 1,835,586 | |
Small Cap Value Fund (2.2%) | | 1,448,823 | | 1,752,046 | |
TOTAL INVESTMENTS
(Cost: $69,759,249) 100.0% | | | | 78,128,086 | |
OTHER NET ASSETS | | | | — | |
| | | | | |
NET ASSETS 100.0% | | | | $ | 78,128,086 | |
| | | | | | |
The accompanying notes are an integral part of these portfolio schedules.
MUTUAL OF AMERICA INVESTMENT CORPORATION - 2020 RETIREMENT FUND
PORTFOLIO OF INVESTMENTS IN SECURITIES
December 31, 2010
| | Shares | | Value | |
COMMON STOCKS: | | | | | |
DIVERSIFIED MUTUAL FUNDS (100.0%) | | | | | |
Mutual of America Investment Corporation | | | | | |
Bond Fund (22.8%) | | 15,325,246 | | 20,575,936 | |
Equity Index Fund (35.0%) | | 15,297,924 | | 31,695,739 | |
International Fund (8.7%) | | 11,139,663 | | 7,909,506 | |
Mid-Cap Equity Index Fund (12.1%) | | 7,223,561 | | 10,918,593 | |
Mid-Term Bond Fund (12.4%) | | 10,877,275 | | 11,174,670 | |
Small Cap Growth Fund (4.6%) | | 3,513,887 | | 4,184,000 | |
Small Cap Value Fund (4.4%) | | 3,304,996 | | 3,996,695 | |
TOTAL INVESTMENTS
(Cost: $80,993,147) 100.0% | | | | 90,455,139 | |
OTHER NET ASSETS | | | | — | |
| | | | | |
NET ASSETS 100.0% | | | | $ | 90,455,139 | |
| | | | | | |
The accompanying notes are an integral part of these portfolio schedules.
MUTUAL OF AMERICA INVESTMENT CORPORATION - 2025 RETIREMENT FUND
PORTFOLIO OF INVESTMENTS IN SECURITIES
December 31, 2010
| | Shares | | Value | |
COMMON STOCKS: | | | | | |
DIVERSIFIED MUTUAL FUNDS (100.0%) | | | | | |
Mutual of America Investment Corporation | | | | | |
Bond Fund (18.9%) | | 11,337,362 | | 15,221,734 | |
Equity Index Fund (39.4%) | | 15,293,379 | | 31,686,322 | |
International Fund (8.6%) | | 9,798,257 | | 6,957,066 | |
Mid-Cap Equity Index Fund (16.2%) | | 8,647,911 | | 13,071,534 | |
Mid-Term Bond Fund (5.7%) | | 4,486,782 | | 4,609,455 | |
Small Cap Growth Fund (5.7%) | | 3,853,787 | | 4,588,719 | |
Small Cap Value Fund (5.5%) | | 3,625,136 | | 4,383,838 | |
TOTAL INVESTMENTS
(Cost: $70,409,290) 100.0% | | | | 80,518,668 | |
OTHER NET ASSETS | | | | — | |
| | | | | |
NET ASSETS 100.0% | | | | $ | 80,518,668 | |
| | | | | | |
The accompanying notes are an integral part of these portfolio schedules.
MUTUAL OF AMERICA INVESTMENT CORPORATION - 2030 RETIREMENT FUND
PORTFOLIO OF INVESTMENTS IN SECURITIES
December 31, 2010
| | Shares | | Value | |
COMMON STOCKS: | | | | | |
DIVERSIFIED MUTUAL FUNDS (100.0%) | | | | | |
Mutual of America Investment Corporation | | | | | |
Bond Fund (18.5%) | | 9,324,048 | | 12,518,626 | |
Equity Index Fund (39.6%) | | 12,882,255 | | 26,690,719 | |
International Fund (9.5%) | | 9,042,980 | | 6,420,796 | |
Mid-Cap Equity Index Fund (19.1%) | | 8,504,825 | | 12,855,256 | |
Small Cap Growth Fund (6.8%) | | 3,829,020 | | 4,559,229 | |
Small Cap Value Fund (6.5%) | | 3,603,982 | | 4,358,256 | |
TOTAL INVESTMENTS
(Cost: $58,303,447) 100.0% | | | | 67,402,882 | |
OTHER NET ASSETS | | | | — | |
| | | | | |
NET ASSETS 100.0% | | | | $ | 67,402,882 | |
| | | | | | |
The accompanying notes are an integral part of these portfolio schedules.
MUTUAL OF AMERICA INVESTMENT CORPORATION - 2035 RETIREMENT FUND
PORTFOLIO OF INVESTMENTS IN SECURITIES
December 31, 2010
| | Shares | | Value | |
COMMON STOCKS: | | | | | |
DIVERSIFIED MUTUAL FUNDS (100.0%) | | | | | |
Mutual of America Investment Corporation | | | | | |
Bond Fund (12.0%) | | 4,732,331 | | 6,353,708 | |
Equity Index Fund (39.3%) | | 10,012,589 | | 20,745,063 | |
International Fund (11.3%) | | 8,441,045 | | 5,993,403 | |
Mid-Cap Equity Index Fund (22.1%) | | 7,717,801 | | 11,665,650 | |
Small Cap Growth Fund (7.8%) | | 3,472,086 | | 4,134,227 | |
Small Cap Value Fund (7.5%) | | 3,265,415 | | 3,948,830 | |
TOTAL INVESTMENTS
(Cost: $45,209,479) 100.0% | | | | 52,840,881 | |
OTHER NET ASSETS | | | | — | |
| | | | | |
NET ASSETS 100.0% | | | | $ | 52,840,881 | |
| | | | | | |
The accompanying notes are an integral part of these portfolio schedules.
MUTUAL OF AMERICA INVESTMENT CORPORATION - 2040 RETIREMENT FUND
PORTFOLIO OF INVESTMENTS IN SECURITIES
December 31, 2010
| | Shares | | Value | |
COMMON STOCKS: | | | | | |
DIVERSIFIED MUTUAL FUNDS (100.0%) | | | | | |
Mutual of America Investment Corporation | | | | | |
Bond Fund (9.9%) | | 3,450,978 | | 4,633,341 | |
Equity Index Fund (34.2%) | | 7,693,208 | | 15,939,543 | |
International Fund (13.2%) | | 8,658,039 | | 6,147,476 | |
Mid-Cap Equity Index Fund (25.3%) | | 7,814,466 | | 11,811,761 | |
Small Cap Growth Fund (8.9%) | | 3,479,504 | | 4,143,060 | |
Small Cap Value Fund (8.5%) | | 3,271,733 | | 3,956,471 | |
TOTAL INVESTMENTS
(Cost: $39,550,275) 100.0% | | | | 46,631,652 | |
OTHER NET ASSETS | | | | — | |
| | | | | |
NET ASSETS 100.0% | | | | $ | 46,631,652 | |
| | | | | | |
The accompanying notes are an integral part of these portfolio schedules.
MUTUAL OF AMERICA INVESTMENT CORPORATION - 2045 RETIREMENT FUND
PORTFOLIO OF INVESTMENTS IN SECURITIES
December 31, 2010
| | Shares | | Value | |
COMMON STOCKS: | | | | | |
DIVERSIFIED MUTUAL FUNDS (100.0%) | | | | | |
Mutual of America Investment Corporation | | | | | |
Bond Fund (9.0%) | | 3,614,468 | | 4,852,846 | |
Equity Index Fund (34.1%) | | 8,869,003 | | 18,375,670 | |
International Fund (14.1%) | | 10,709,075 | | 7,603,775 | |
Mid-Cap Equity Index Fund (21.1%) | | 7,495,662 | | 11,329,880 | |
Small Cap Growth Fund (11.1%) | | 5,001,130 | | 5,954,866 | |
Small Cap Value Fund (10.6%) | | 4,706,177 | | 5,691,128 | |
TOTAL INVESTMENTS
(Cost: $45,282,665) 100.0% | | | | 53,808,165 | |
OTHER NET ASSETS | | | | — | |
| | | | | |
NET ASSETS 100.0% | | | | $ | 53,808,165 | |
| | | | | | |
The accompanying notes are an integral part of these portfolio schedules.
MUTUAL OF AMERICA INVESTMENT CORPORATION - CONSERVATIVE ALLOCATION FUND
PORTFOLIO OF INVESTMENTS IN SECURITIES
December 31, 2010
| | Shares | | Value | |
COMMON STOCKS: | | | | | |
DIVERSIFIED MUTUAL FUNDS (100.0%) | | | | | |
Mutual of America Investment Corporation | | | | | |
Bond Fund (30.0%) | | 11,546,570 | | 15,502,621 | |
Equity Index Fund (25.0%) | | 6,289,413 | | 13,031,022 | |
Mid-Term Bond Fund (45.0%) | | 22,581,531 | | 23,198,932 | |
TOTAL INVESTMENTS
(Cost: $48,753,004) 100.0% | | | | 51,732,575 | |
OTHER NET ASSETS | | | | — | |
| | | | | |
NET ASSETS 100.0% | | | | $ | 51,732,575 | |
| | | | | | |
The accompanying notes are an integral part of these portfolio schedules.
MUTUAL OF AMERICA INVESTMENT CORPORATION - MODERATE ALLOCATION FUND
PORTFOLIO OF INVESTMENTS IN SECURITIES
December 31, 2010
| | Shares | | Value | |
COMMON STOCKS: | | | | | |
DIVERSIFIED MUTUAL FUNDS (100.0%) | | | | | |
Mutual of America Investment Corporation | | | | | |
Bond Fund (29.9%) | | 36,212,593 | | 48,619,643 | |
Equity Index Fund (35.1%) | | 27,612,496 | | 57,210,275 | |
Mid-Cap Equity Index Fund (15.1%) | | 16,222,888 | | 24,521,301 | |
Mid-Term Bond Fund (19.9%) | | 31,475,338 | | 32,335,905 | |
TOTAL INVESTMENTS
(Cost: $149,874,796) 100.0% | | | | 162,687,124 | |
OTHER NET ASSETS | | | | — | |
| | | | | |
NET ASSETS 100.0% | | | | $ | 162,687,124 | |
| | | | | | |
The accompanying notes are an integral part of these portfolio schedules.
MUTUAL OF AMERICA INVESTMENT CORPORATION - AGGRESSIVE ALLOCATION FUND
PORTFOLIO OF INVESTMENTS IN SECURITIES
December 31, 2010
| | Shares | | Value | |
COMMON STOCKS: | | | | | |
DIVERSIFIED MUTUAL FUNDS (100.0%) | | | | | |
Mutual of America Investment Corporation | | | | | |
Bond Fund (24.9%) | | 27,272,235 | | 36,616,166 | |
Equity Index Fund (45.1%) | | 32,083,700 | | 66,474,153 | |
Mid-Cap Equity Index Fund (20.0%) | | 19,546,501 | | 29,545,026 | |
Small Cap Growth Fund (5.0%) | | 6,215,689 | | 7,401,046 | |
Small Cap Value Fund (5.0%) | | 6,092,534 | | 7,367,634 | |
TOTAL INVESTMENTS
(Cost: $137,166,653) 100.0% | | | | 147,404,025 | |
OTHER NET ASSETS | | | | — | |
| | | | | |
NET ASSETS 100.0% | | | | $ | 147,404,025 | |
| | | | | | |
The accompanying notes are an integral part of these portfolio schedules.
MUTUAL OF AMERICA INVESTMENT CORPORATION - MONEY MARKET FUND
PORTFOLIO OF INVESTMENTS IN SECURITIES
December 31, 2010
| | Rating** | | Rate(%) | | Maturity | | Face Amount | | Value | |
SHORT-TERM DEBT SECURITIES: | | | | | | | | | | | |
U.S. GOVERNMENT (7.3%) | | | | | | | | | | | |
U.S. Treasury Bill | | AAA | | 0.14 | | 03/31/11 | | 8,000,000 | | 7,997,687 | |
| | | | | | | | | | | |
U.S. GOVERNMENT AGENCIES (27.8%) | | | | | | | | | | | |
FHLB | | AAA | | 0.10 | | 02/24/11 | | 360,000 | | 359,946 | |
FHLB | | AAA | | 0.15 | | 02/25/11 | | 3,715,000 | | 3,714,149 | |
FHLB | | AAA | | 0.17 | | 01/28/11 | | 5,294,000 | | 5,293,344 | |
FHLB | | AAA | | 0.17 | | 02/04/11 | | 4,775,000 | | 4,774,233 | |
FHLB | | AAA | | 0.17 | | 03/02/11 | | 2,152,000 | | 2,151,380 | |
FHLB | | AAA | | 0.18 | | 02/02/11 | | 6,150,000 | | 6,149,323 | |
FHLB | | AAA | | 0.18 | | 02/23/11 | | 4,700,000 | | 4,699,403 | |
FHLB | | AAA | | 0.19 | | 02/02/11 | | 100,000 | | 99,989 | |
FNMA | | AAA | | 0.16 | | 02/16/11 | | 2,180,000 | | 2,179,708 | |
FNMA | | AAA | | 0.16 | | 03/01/11 | | 500,000 | | 499,933 | |
FNMA | | AAA | | 0.20 | | 02/02/11 | | 300,000 | | 299,969 | |
| | | | | | | | | | 30,221,377 | |
COMMERCIAL PAPER (64.9%) | | | | | | | | | | | |
Abbott Laboratories† | | A-1+ | | 0.18 | | 01/11/11 | | 1,000,000 | | 999,950 | |
Abbott Laboratories† | | A-1+ | | 0.18 | | 02/08/11 | | 1,900,000 | | 1,899,639 | |
Archer-Daniels-Midland Co.† | | A-1 | | 0.22 | | 01/27/11 | | 2,400,000 | | 2,399,686 | |
Archer-Daniels-Midland Co.† | | A-1 | | 0.23 | | 02/14/11 | | 500,000 | | 499,871 | |
Bank of America Corp. | | A-1 | | 0.27 | | 01/31/11 | | 2,800,000 | | 2,799,391 | |
Becton, Dickinson & Co. | | A-1+ | | 0.18 | | 01/26/11 | | 1,071,000 | | 1,070,866 | |
Becton, Dickinson & Co. | | A-1+ | | 0.19 | | 01/21/11 | | 1,729,000 | | 1,728,817 | |
Campbell Soup Co.† | | A-1 | | 0.17 | | 01/03/11 | | 2,900,000 | | 2,899,973 | |
Cargill, Inc.† | | A-1 | | 0.19 | | 01/21/11 | | 2,900,000 | | 2,899,694 | |
Chevron Funding Corp. | | A-1+ | | 0.16 | | 01/05/11 | | 1,400,000 | | 1,399,975 | |
Chevron Funding Corp. | | A-1+ | | 0.16 | | 01/12/11 | | 1,500,000 | | 1,499,927 | |
Coca-Cola Co.† | | A-1 | | 0.19 | | 01/14/11 | | 1,447,000 | | 1,446,901 | |
Coca-Cola Co.† | | A-1 | | 0.20 | | 01/06/11 | | 650,000 | | 649,983 | |
Coca-Cola Co.† | | A-1 | | 0.20 | | 02/16/11 | | 800,000 | | 799,824 | |
Danaher Corp. | | A-1 | | 0.19 | | 01/14/11 | | 2,800,000 | | 2,799,808 | |
Disney (Walt) Co.† | | A-1 | | 0.17 | | 02/14/11 | | 550,000 | | 549,886 | |
Disney (Walt) Co.† | | A-1 | | 0.19 | | 01/12/11 | | 2,350,000 | | 2,349,881 | |
eBay, Inc.† | | A-1 | | 0.18 | | 01/10/11 | | 2,900,000 | | 2,899,869 | |
General Electric Capital Corp. | | A-1+ | | 0.21 | | 03/01/11 | | 2,400,000 | | 2,399,174 | |
General Electric Capital Svcs. | | A-1+ | | 0.22 | | 02/28/11 | | 400,000 | | 399,858 | |
Google, Inc.† | | A-1+ | | 0.18 | | 02/15/11 | | 2,900,000 | | 2,899,369 | |
Grainger (W.W.), Inc. | | A-1+ | | 0.18 | | 01/25/11 | | 2,634,000 | | 2,633,684 | |
Grainger (W.W.), Inc. | | A-1+ | | 0.25 | | 01/21/11 | | 250,000 | | 249,965 | |
Hewlett-Packard Co.† | | A-1 | | 0.18 | | 01/07/11 | | 2,800,000 | | 2,799,916 | |
Int’l. Business Machines Corp.† | | A-1 | | 0.15 | | 01/05/11 | | 750,000 | | 749,988 | |
Int’l. Business Machines Corp.† | | A-1 | | 0.16 | | 01/07/11 | | 2,050,000 | | 2,049,945 | |
Johnson & Johnson† | | A-1+ | | 0.17 | | 02/28/11 | | 2,550,000 | | 2,549,570 | |
Johnson & Johnson† | | A-1+ | | 0.20 | | 01/05/11 | | 350,000 | | 349,992 | |
Madison Gas & Electric | | A-1+ | | 0.18 | | 01/14/11 | | 1,322,000 | | 1,321,914 | |
Madison Gas & Electric | | A-1+ | | 0.20 | | 01/03/11 | | 500,000 | | 499,994 | |
National Rural Utilities | | A-1 | | 0.23 | | 01/06/11 | | 2,800,000 | | 2,799,911 | |
Nestle Capital Corp.† | | A-1+ | | 0.18 | | 02/04/11 | | 950,000 | | 949,838 | |
Nestle Capital Corp.† | | A-1+ | | 0.18 | | 01/04/11 | | 1,950,000 | | 1,949,971 | |
New Jersey Natural Gas | | A-1 | | 0.19 | | 01/19/11 | | 2,900,000 | | 2,899,724 | |
PepsiCo, Inc.† | | A-1 | | 0.16 | | 02/07/11 | | 460,000 | | 459,924 | |
PepsiCo, Inc.† | | A-1 | | 0.17 | | 02/25/11 | | 2,340,000 | | 2,339,392 | |
Procter & Gamble† | | A-1+ | | 0.19 | | 01/18/11 | | 1,900,000 | | 1,899,835 | |
Procter & Gamble† | | A-1+ | | 0.19 | | 01/31/11 | | 1,000,000 | | 999,842 | |
Toyota Motor Credit Corp. | | A-1+ | | 0.22 | | 02/08/11 | | 500,000 | | 499,884 | |
Toyota Motor Credit Corp. | | A-1+ | | 0.22 | | 03/01/11 | | 2,400,000 | | 2,399,135 | |
| | Rating** | | Rate(%) | | Maturity | | Face Amount | | Value | |
Washington Gas Light Co. | | A-1+ | | 0.19 | | 01/03/11 | | 2,900,000 | | 2,899,969 | |
| | | | | | | | | | 70,594,735 | |
TOTAL SHORT-TERM DEBT SECURITIES
(Cost: $108,811,710) 100.0% | | | | | | | | | | 108,813,799 | |
| | | | | | | | | | | |
TOTAL INVESTMENTS
(Cost: $108,811,710) 100.0% | | | | | | | | | | 108,813,799 | |
| | | | | | | | | | | |
OTHER NET ASSETS 0.0% (3) | | | | | | | | | | 3,811 | |
| | | | | | | | | | | |
NET ASSETS 100.0% | | | | | | | | | | $ | 108,817,610 | |
| | | | | | | | | | | | |
The accompanying notes are an integral part of these portfolio schedules.
MUTUAL OF AMERICA INVESTMENT CORPORATION - MID-TERM BOND FUND
PORTFOLIO OF INVESTMENTS IN SECURITIES
December 31, 2010
| | Rating** | | Rate(%) | | Maturity | | Face Amount | | Value | |
LONG-TERM DEBT SECURITIES: | | | | | | | | | | | |
U.S. GOVERNMENT (46.9%) | | | | | | | | | | | |
U.S. Treasury Note | | AAA | | 1.25 | | 08/31/15 | | 9,000,000 | | 8,753,202 | |
U.S. Treasury Note | | AAA | | 1.38 | | 09/15/12 | | 10,000,000 | | 10,144,920 | |
U.S. Treasury Note | | AAA | | 1.88 | | 06/30/15 | | 8,000,000 | | 8,031,872 | |
U.S. Treasury Note | | AAA | | 1.88 | | 10/31/17 | | 5,000,000 | | 4,753,125 | |
U.S. Treasury Note | | AAA | | 2.25 | | 01/31/15 | | 1,500,000 | | 1,539,843 | |
U.S. Treasury Note | | AAA | | 2.25 | | 11/30/17 | | 5,000,000 | | 4,862,110 | |
U.S. Treasury Note | | AAA | | 2.38 | | 10/31/14 | | 5,750,000 | | 5,951,699 | |
U.S. Treasury Note | | AAA | | 2.38 | | 03/31/16 | | 3,500,000 | | 3,544,296 | |
U.S. Treasury Note | | AAA | | 2.50 | | 03/31/15 | | 5,000,000 | | 5,175,400 | |
U.S. Treasury Note | | AAA | | 2.50 | | 06/30/17 | | 2,000,000 | | 1,992,500 | |
U.S. Treasury Note | | AAA | | 3.00 | | 02/28/17 | | 17,500,000 | | 18,046,870 | |
U.S. Treasury Note | | AAA | | 3.13 | | 05/15/19 | | 3,000,000 | | 3,031,641 | |
U.S. Treasury Note | | AAA | | 3.25 | | 05/31/16 | | 11,500,000 | | 12,129,809 | |
U.S. Treasury Note | | AAA | | 3.25 | | 07/31/16 | | 7,000,000 | | 7,368,046 | |
U.S. Treasury Strip | | AAA | | 0.00 | | 08/15/17 | | 15,000,000 | | 12,534,763 | |
U.S. Treasury Strip | | AAA | | 0.00 | | 11/15/17 | | 5,000,000 | | 4,129,540 | |
U.S. Treasury Strip | | AAA | | 0.00 | | 08/15/18 | | 35,000,000 | | 27,950,085 | |
| | | | | | | | | | 139,939,721 | |
U.S. GOVERNMENT AGENCIES (7.2%) | | | | | | | | | | | |
MORTGAGE-BACKED OBLIGATIONS (0.6%) | | | | | | | | | | | |
FHLMC | | AAA | | 5.00 | | 06/15/17 | | 1,748,412 | | 1,794,502 | |
FHLMC | | AAA | | 6.00 | | 02/01/19 | | 15,073 | | 16,651 | |
FHLMC | | AAA | | 6.50 | | 04/01/14 | | 39,949 | | 42,620 | |
FHLMC | | AAA | | 7.00 | | 02/01/14 | | 16,528 | | 17,712 | |
FHLMC | | AAA | | 7.50 | | 03/15/21 | | 12,329 | | 14,633 | |
FHLMC | | AAA | | 8.00 | | 09/01/18 | | 1,938 | | 2,167 | |
FHLMC | | AAA | | 8.50 | | 09/01/17 | | 3,626 | | 4,069 | |
FNMA | | AAA | | 6.00 | | 09/01/12 | | 3,111 | | 3,380 | |
FNMA | | AAA | | 6.50 | | 08/01/13 | | 8,194 | | 8,724 | |
FNMA | | AAA | | 6.50 | | 12/25/23 | | 13,163 | | 13,263 | |
FNMA | | AAA | | 8.00 | | 06/01/17 | | 579 | | 586 | |
| | | | | | | | | | 1,918,307 | |
NON-MORTGAGE-BACKED OBLIGATIONS (6.6%) | | | | | | | | | | | |
FFCB | | AAA | | 4.95 | | 10/10/14 | | 12,500,000 | | 14,079,808 | |
FFCB | | AAA | | 5.10 | | 08/05/13 | | 5,000,000 | | 5,525,815 | |
| | | | | | | | | | 19,605,623 | |
CORPORATE DEBT (42.7%) | | | | | | | | | | | |
CONSUMER DISCRETIONARY (4.7%) | | | | | | | | | | | |
AutoZone, Inc. | | BBB | | 6.50 | | 01/15/14 | | 1,000,000 | | 1,110,532 | |
Best Buy Co., Inc. | | BBB- | | 6.75 | | 07/15/13 | | 1,000,000 | | 1,106,177 | |
Black & Decker Corp. | | A | | 4.75 | | 11/01/14 | | 500,000 | | 538,130 | |
Black & Decker Corp. | | A | | 5.75 | | 11/15/16 | | 500,000 | | 555,981 | |
Brinker International, Inc. | | BBB- | | 5.75 | | 06/01/14 | | 1,000,000 | | 1,050,998 | |
DaimlerChrysler N.A. LLC | | A- | | 5.75 | | 09/08/11 | | 1,000,000 | | 1,033,281 | |
Ethan Allen Interiors, Inc. | | B+ | | 5.38 | | 10/01/15 | | 500,000 | | 480,669 | |
Fortune Brands, Inc. | | BBB- | | 4.88 | | 12/01/13 | | 1,000,000 | | 1,044,848 | |
Home Depot, Inc. | | BBB+ | | 5.40 | | 03/01/16 | | 250,000 | | 280,151 | |
Johnson Controls, Inc. | | BBB+ | | 4.88 | | 09/15/13 | | 250,000 | | 268,631 | |
Johnson Controls, Inc. | | BBB+ | | 5.25 | | 01/15/11 | | 750,000 | | 750,867 | |
Kohl’s Corp. | | BBB+ | | 7.38 | | 10/15/11 | | 500,000 | | 525,368 | |
Leggett & Platt, Inc. | | BBB+ | | 4.70 | | 04/01/13 | | 750,000 | | 792,689 | |
Marriott International, Inc. | | BBB | | 5.63 | | 02/15/13 | | 750,000 | | 804,367 | |
Mattel, Inc. | | BBB | | 6.13 | | 06/15/11 | | 1,000,000 | | 1,021,168 | |
Newell Rubbermaid, Inc. | | BBB- | | 5.50 | | 04/15/13 | | 500,000 | | 537,999 | |
Scholastic Corp. | | BB- | | 5.00 | | 04/15/13 | | 250,000 | | 250,625 | |
Stanley Black & Decker, Inc. | | A | | 4.90 | | 11/01/12 | | 525,000 | | 555,176 | |
Starwood Hotels & Resorts | | BB+ | | 6.25 | | 02/15/13 | | 217,000 | | 232,190 | |
Whirlpool Corp. | | BBB- | | 5.50 | | 03/01/13 | | 500,000 | | 531,017 | |
Whirlpool Corp. | | BBB- | | 6.50 | | 06/15/16 | | 500,000 | | 551,372 | |
| | | | | | | | | | 14,022,236 | |
CONSUMER STAPLES (3.1%) | | | | | | | | | | | |
Anheuser-Busch Cos., Inc. | | BBB+ | | 4.38 | | 01/15/13 | | 1,000,000 | | 1,054,401 | |
Anheuser-Busch Cos., Inc. | | BBB+ | | 4.70 | | 04/15/12 | | 100,000 | | 104,432 | |
Brown-Forman Corp. | | A | | 5.20 | | 04/01/12 | | 1,000,000 | | 1,050,892 | |
Clorox Co. | | BBB+ | | 5.00 | | 03/01/13 | | 500,000 | | 534,068 | |
Clorox Co. | | BBB+ | | 5.00 | | 01/15/15 | | 300,000 | | 325,194 | |
ConAgra Foods, Inc. | | BBB | | 6.75 | | 09/15/11 | | 1,000,000 | | 1,040,667 | |
CVS Caremark Corp. | | BBB+ | | 6.13 | | 08/15/16 | | 500,000 | | 567,292 | |
Hershey Co. | | A | | 4.85 | | 08/15/15 | | 500,000 | | 545,595 | |
Hershey Co. | | A | | 5.00 | | 04/01/13 | | 500,000 | | 541,382 | |
Kraft Foods, Inc. | | BBB- | | 5.25 | | 10/01/13 | | 500,000 | | 546,601 | |
Kraft Foods, Inc. | | BBB- | | 5.63 | | 11/01/11 | | 65,000 | | 67,528 | |
Kroger Co. | | BBB | | 4.95 | | 01/15/15 | | 500,000 | | 540,054 | |
Safeway, Inc. | | BBB | | 3.95 | | 08/15/20 | | 1,000,000 | | 946,950 | |
Safeway, Inc. | | BBB | | 6.50 | | 03/01/11 | | 500,000 | | 503,907 | |
Sara Lee Corp. | | BBB | | 3.88 | | 06/15/13 | | 750,000 | | 784,547 | |
| | | | | | | | | | 9,153,510 | |
ENERGY (3.6%) | | | | | | | | | | | |
CenterPoint Energy Resources | | BBB | | 7.75 | | 02/15/11 | | 420,000 | | 423,148 | |
CenterPoint Energy Resources | | BBB | | 7.88 | | 04/01/13 | | 750,000 | | 847,826 | |
Diamond Offshore Drilling, Inc. | | A- | | 4.88 | | 07/01/15 | | 500,000 | | 540,602 | |
Enbridge, Inc. | | A- | | 5.80 | | 06/15/14 | | 1,065,000 | | 1,184,715 | |
Kinder Morgan, Inc. | | BB | | 5.15 | | 03/01/15 | | 250,000 | | 251,875 | |
Nabors Industries Ltd. | | BBB | | 5.38 | | 08/15/12 | | 750,000 | | 791,817 | |
National Oilwell Varco, Inc. | | BBB+ | | 6.13 | | 08/15/15 | | 1,000,000 | | 1,032,737 | |
Noble Corp. | | A- | | 5.88 | | 06/01/13 | | 1,000,000 | | 1,091,903 | |
Sunoco, Inc. | | BBB- | | 4.88 | | 10/15/14 | | 500,000 | | 521,116 | |
Sunoco, Inc. | | BBB- | | 9.63 | | 04/15/15 | | 500,000 | | 592,602 | |
Transocean, Inc. | | BBB | | 1.50 | | 12/15/37 | | 1,200,000 | | 1,161,000 | |
Valero Energy Corp. | | BBB | | 4.75 | | 06/15/13 | | 1,000,000 | | 1,065,726 | |
Weatherford Int’l. Ltd. | | BBB | | 5.15 | | 03/15/13 | | 500,000 | | 530,368 | |
Weatherford Int’l. Ltd. | | BBB | | 5.50 | | 02/15/16 | | 500,000 | | 530,553 | |
| | | | | | | | | | 10,565,988 | |
FINANCIALS (12.5%) | | | | | | | | | | | |
American Express Credit Corp. | | BBB+ | | 5.88 | | 05/02/13 | | 1,000,000 | | 1,087,538 | |
Bank of America Corp. | | A | | 3.70 | | 09/01/15 | | 250,000 | | 247,841 | |
Bank of America Corp. | | A | | 5.38 | | 08/15/11 | | 250,000 | | 256,991 | |
Bank of America Corp. | | A- | | 5.75 | | 08/15/16 | | 500,000 | | 510,719 | |
Block Financial LLC | | BBB | | 5.13 | | 10/30/14 | | 750,000 | | 741,950 | |
Bunge Ltd. Finance Corp. | | BBB- | | 5.10 | | 07/15/15 | | 1,000,000 | | 1,031,494 | |
Caterpillar Financial Services | | A | | 6.13 | | 02/17/14 | | 1,000,000 | | 1,124,238 | |
CNA Financial Corp. | | BBB- | | 5.85 | | 12/15/14 | | 200,000 | | 211,011 | |
CNA Financial Corp. | | BBB- | | 6.50 | | 08/15/16 | | 1,000,000 | | 1,070,900 | |
Colonial Realty LP | | BB+ | | 4.80 | | 04/01/11 | | 300,000 | | 300,697 | |
Duke Realty LP | | BBB- | | 4.63 | | 05/15/13 | | 500,000 | | 520,301 | |
ERP Operating LP | | BBB+ | | 5.38 | | 08/01/16 | | 500,000 | | 546,681 | |
Fairfax Financial Hldgs. | | BBB- | | 8.25 | | 10/01/15 | | 742,000 | | 781,883 | |
First Horizon National Corp. | | BB+ | | 4.50 | | 05/15/13 | | 125,000 | | 126,194 | |
First Industrial LP | | BB- | | 6.88 | | 04/15/12 | | 750,000 | | 747,814 | |
Fosters Finance Corp.† | | BBB | | 4.88 | | 10/01/14 | | 500,000 | | 529,315 | |
Fosters Finance Corp.† | | BBB | | 6.88 | | 06/15/11 | | 500,000 | | 513,277 | |
General Electric Capital Corp. | | AA+ | | 5.00 | | 11/15/11 | | 1,000,000 | | 1,038,145 | |
General Electric Capital Corp. | | AA+ | | 5.00 | | 01/08/16 | | 500,000 | | 533,701 | |
Harley-Davidson Funding† | | BBB | | 5.25 | | 12/15/12 | | 1,000,000 | | 1,047,235 | |
Hartford Financial Svcs. | | BBB | | 5.50 | | 10/15/16 | | 1,000,000 | | 1,037,704 | |
HCP, Inc. | | BBB | | 5.65 | | 12/15/13 | | 500,000 | | 537,079 | |
Heinz (H.J.) Finance Co. | | BBB | | 6.00 | | 03/15/12 | | 1,000,000 | | 1,056,252 | |
HSBC Finance Corp. | | A | | 3.22 | | 04/10/11 | | 20,000 | | 19,977 | |
HSBC Finance Corp. | | A | | 3.22 | | 06/10/11 | | 10,000 | | 10,003 | |
HSBC Finance Corp. | | A | | 5.39 | | 11/10/13 | | 40,000 | | 40,287 | |
HSBC Finance Corp. | | A | | 5.42 | | 11/10/13 | | 43,000 | | 43,631 | |
HSBC Finance Corp. | | A | | 5.60 | | 11/10/13 | | 70,000 | | 71,364 | |
Jefferson-Pilot Corp. | | A- | | 4.75 | | 01/30/14 | | 500,000 | | 524,805 | |
JPMorgan Chase & Co. | | A+ | | 5.60 | | 06/01/11 | | 250,000 | | 255,339 | |
KeyCorp | | BBB+ | | 6.50 | | 05/14/13 | | 1,050,000 | | 1,140,001 | |
Kimco Realty Corp. | | BBB+ | | 6.00 | | 11/30/12 | | 1,000,000 | | 1,072,310 | |
Lehman Brothers Hldgs. (5) | | NR | | 5.75 | | 07/18/11 | | 250,000 | | 57,813 | |
Lincoln National Corp. | | A- | | 5.65 | | 08/27/12 | | 400,000 | | 425,488 | |
Mack-Cali Realty LP | | BBB | | 5.80 | | 01/15/16 | | 1,000,000 | | 1,055,365 | |
Markel Corp. | | BBB | | 6.80 | | 02/15/13 | | 1,000,000 | | 1,059,316 | |
MetLife, Inc. | | A- | | 5.00 | | 11/24/13 | | 250,000 | | 270,890 | |
Morgan Stanley | | A | | 3.22 | | 02/01/11 | | 500,000 | | 500,095 | |
Morgan Stanley | | A | | 4.00 | | 07/24/15 | | 1,000,000 | | 1,005,185 | |
Nat’l. Rural Utilities Coop. | | A | | 7.25 | | 03/01/12 | | 1,000,000 | | 1,071,996 | |
National City Corp. | | A | | 4.00 | | 02/01/11 | | 1,000,000 | | 1,001,250 | |
Nationwide Health Pptys., Inc. | | BBB | | 6.50 | | 07/15/11 | | 1,000,000 | | 1,027,425 | |
Nissan Motor Acceptance Corp.† | | BBB+ | | 4.50 | | 01/30/15 | | 790,000 | | 820,281 | |
Nissan Motor Acceptance Corp.† | | BBB+ | | 5.63 | | 03/14/11 | | 500,000 | | 504,641 | |
Odyssey Re Hldgs. Corp. | | BBB- | | 6.88 | | 05/01/15 | | 250,000 | | 269,762 | |
Protective Life Corp. | | A- | | 4.88 | | 11/01/14 | | 1,000,000 | | 1,055,399 | |
Prudential Financial, Inc. | | A | | 4.75 | | 09/17/15 | | 1,000,000 | | 1,057,985 | |
Regency Centers LP | | BBB | | 4.95 | | 04/15/14 | | 500,000 | | 522,988 | |
SLM Corp. | | BBB- | | 4.72 | | 06/15/12 | | 60,000 | | 58,763 | |
Southtrust Bank, N.A. | | AA- | | 4.75 | | 03/01/13 | | 250,000 | | 266,104 | |
Textron Financial Corp. | | BB+ | | 5.40 | | 04/28/13 | | 1,000,000 | | 1,036,299 | |
Travelers Cos., Inc. | | A- | | 5.38 | | 06/15/12 | | 1,000,000 | | 1,060,642 | |
Tyco Int’l. Finance | | A- | | 6.00 | | 11/15/13 | | 675,000 | | 748,803 | |
Unitrin, Inc. | | BBB- | | 6.00 | | 11/30/15 | | 1,500,000 | | 1,517,028 | |
Vornado Realty LP | | BBB | | 5.60 | | 02/15/11 | | 500,000 | | 501,978 | |
Wachovia Bank, N.A. | | AA- | | 5.60 | | 03/15/16 | | 500,000 | | 544,049 | |
Zions Bancorporation | | BB+ | | 5.65 | | 05/15/14 | | 1,000,000 | | 996,571 | |
| | | | | | | | | | 37,212,793 | |
HEALTH CARE (4.0%) | | | | | | | | | | | |
Abbott Laboratories | | AA | | 5.60 | | 05/15/11 | | 500,000 | | 509,846 | |
Allergan, Inc. | | A+ | | 5.75 | | 04/01/16 | | 500,000 | | 569,574 | |
Baxter International, Inc. | | A+ | | 4.63 | | 03/15/15 | | 250,000 | | 272,257 | |
Beckman Coulter, Inc. | | BBB | | 6.88 | | 11/15/11 | | 925,000 | | 966,822 | |
Biogen Idec, Inc. | | BBB+ | | 6.88 | | 03/01/18 | | 1,250,000 | | 1,409,201 | |
Blue Cross & Blue Shield of FL† | | A- | | 8.25 | | 11/15/11 | | 1,000,000 | | 1,041,805 | |
Boston Scientific Corp. | | BBB- | | 4.25 | | 01/12/11 | | 500,000 | | 500,217 | |
Cardinal Health, Inc. | | BBB+ | | 5.50 | | 06/15/13 | | 1,000,000 | | 1,083,204 | |
Humana, Inc. | | BBB- | | 6.45 | | 06/01/16 | | 1,415,000 | | 1,547,869 | |
Laboratory Corp. of America | | BBB+ | | 5.50 | | 02/01/13 | | 285,000 | | 304,119 | |
Laboratory Corp. of America | | BBB+ | | 5.63 | | 12/15/15 | | 500,000 | | 548,059 | |
Lilly (Eli) & Co. | | AA- | | 5.20 | | 03/15/17 | | 500,000 | | 554,220 | |
McKesson Corp. | | A- | | 7.75 | | 02/01/12 | | 1,000,000 | | 1,068,983 | |
UnitedHealth Group, Inc. | | A- | | 5.25 | | 03/15/11 | | 250,000 | | 252,119 | |
UnitedHealth Group, Inc. | | A- | | 5.50 | | 11/15/12 | | 750,000 | | 804,044 | |
WellPoint, Inc. | | A- | | 5.00 | | 01/15/11 | | 500,000 | | 500,528 | |
| | | | | | | | | | 11,932,867 | |
INDUSTRIALS (4.7%) | | | | | | | | | | | |
Avery Dennison Corp. | | BBB | | 4.88 | | 01/15/13 | | 500,000 | | 529,588 | |
Burlington Northern Santa Fe | | BBB+ | | 4.30 | | 07/01/13 | | 500,000 | | 535,054 | |
Cargill, Inc.† | | A | | 5.20 | | 01/22/13 | | 1,000,000 | | 1,078,879 | |
CSX Corp. | | BBB- | | 6.25 | | 04/01/15 | | 1,000,000 | | 1,136,428 | |
Dun & Bradstreet Corp. | | A- | | 6.00 | | 04/01/13 | | 1,000,000 | | 1,089,422 | |
Federal Express Corp. | | BBB | | 9.65 | | 06/15/12 | | 1,000,000 | | 1,118,057 | |
Masco Corp. | | BBB | | 4.80 | | 06/15/15 | | 500,000 | | 492,266 | |
Masco Corp. | | BBB | | 5.88 | | 07/15/12 | | 300,000 | | 314,492 | |
Pitney Bowes, Inc. | | BBB+ | | 5.25 | | 01/15/37 | | 1,000,000 | | 1,013,295 | |
Precision Castparts Corp. | | A- | | 5.60 | | 12/15/13 | | 750,000 | | 830,605 | |
Roper Industries, Inc. | | BBB- | | 6.63 | | 08/15/13 | | 1,000,000 | | 1,114,543 | |
Ryder System, Inc. | | BBB+ | | 6.00 | | 03/01/13 | | 500,000 | | 537,498 | |
Ryder System, Inc. | | BBB+ | | 7.20 | | 09/01/15 | | 1,000,000 | | 1,146,896 | |
Southwest Airlines Co. | | BBB | | 5.25 | | 10/01/14 | | 500,000 | | 525,869 | |
Steelcase, Inc. | | BBB- | | 6.50 | | 08/15/11 | | 1,000,000 | | 1,021,924 | |
Union Pacific Corp. | | BBB+ | | 4.88 | | 01/15/15 | | 500,000 | | 537,675 | |
Union Pacific Corp. | | BBB+ | | 6.13 | | 01/15/12 | | 500,000 | | 526,170 | |
Waste Management, Inc. | | BBB | | 5.00 | | 03/15/14 | | 500,000 | | 540,405 | |
| | | | | | | | | | 14,089,066 | |
INFORMATION TECHNOLOGY (2.0%) | | | | | | | | | | | |
Arrow Electronics, Inc. | | BBB- | | 6.88 | | 07/01/13 | | 750,000 | | 824,421 | |
Avnet, Inc. | | BBB- | | 6.00 | | 09/01/15 | | 980,000 | | 1,048,235 | |
Cisco Systems, Inc. | | A+ | | 5.25 | | 02/22/11 | | 250,000 | | 251,567 | |
Ingram Micro, Inc. | | BBB- | | 5.25 | | 09/01/17 | | 1,500,000 | | 1,517,984 | |
Intuit, Inc. | | BBB | | 5.40 | | 03/15/12 | | 725,000 | | 759,238 | |
Western Union Co. | | A- | | 5.40 | | 11/17/11 | | 500,000 | | 519,789 | |
Xerox Corp. | | BBB- | | 6.88 | | 08/15/11 | | 1,000,000 | | 1,034,320 | |
| | | | | | | | | | 5,955,554 | |
MATERIALS (2.6%) | | | | | | | | | | | |
Airgas, Inc. | | BBB | | 3.25 | | 10/01/15 | | 1,500,000 | | 1,481,775 | |
Bemis Co., Inc. | | BBB | | 4.88 | | 04/01/12 | | 500,000 | | 520,428 | |
Cytec Industries, Inc. | | BBB | | 6.00 | | 10/01/15 | | 1,000,000 | | 1,095,376 | |
Lubrizol Corp. | | BBB+ | | 5.50 | | 10/01/14 | | 500,000 | | 547,247 | |
Martin Marietta Materials, Inc. | | BBB+ | | 6.88 | | 04/01/11 | | 1,000,000 | | 1,011,807 | |
Rohm & Haas Co. | | BBB- | | 5.60 | | 03/15/13 | | 750,000 | | 801,891 | |
Sealed Air Corp.† | | BB+ | | 5.63 | | 07/15/13 | | 1,000,000 | | 1,056,684 | |
Temple-Inland, Inc. | | BBB | | 7.88 | | 05/01/12 | | 143,000 | | 152,985 | |
Vulcan Materials Co. | | BBB- | | 6.30 | | 06/15/13 | | 1,000,000 | | 1,061,455 | |
| | | | | | | | | | 7,729,648 | |
TELECOMMUNICATION SERVICES (1.1%) | | | | | | | | | | | |
BellSouth Corp. | | A- | | 4.75 | | 11/15/12 | | 900,000 | | 960,030 | |
CenturyLink, Inc. | | BBB- | | 5.00 | | 02/15/15 | | 1,250,000 | | 1,276,406 | |
Verizon New England, Inc. | | A- | | 6.50 | | 09/15/11 | | 1,000,000 | | 1,038,893 | |
| | | | | | | | | | 3,275,329 | |
UTILITIES (4.4%) | | | | | | | | | | | |
AGL Capital Corp. | | BBB+ | | 6.38 | | 07/15/16 | | 500,000 | | 568,351 | |
AGL Capital Corp. | | BBB+ | | 7.13 | | 01/14/11 | | 1,000,000 | | 1,001,399 | |
Arizona Public Svc. Co. | | BBB- | | 6.38 | | 10/15/11 | | 500,000 | | 520,688 | |
Arizona Public Svc. Co. | | BBB- | | 6.50 | | 03/01/12 | | 500,000 | | 528,414 | |
Atmos Energy Corp. | | BBB+ | | 4.95 | | 10/15/14 | | 1,000,000 | | 1,071,662 | |
Black Hills Corp. | | BBB- | | 9.00 | | 05/15/14 | | 2,000,000 | | 2,295,740 | |
Entergy New Orleans, Inc. | | BBB+ | | 5.25 | | 08/01/13 | | 1,000,000 | | 1,059,224 | |
Exelon Generation Co. LLC | | BBB | | 5.35 | | 01/15/14 | | 1,000,000 | | 1,082,571 | |
PPL Energy Supply LLC | | BBB+ | | 5.70 | | 10/15/15 | | 600,000 | | 656,720 | |
PPL Energy Supply LLC | | BBB+ | | 6.40 | | 11/01/11 | | 1,100,000 | | 1,151,424 | |
Progress Energy, Inc. | | BBB | | 6.85 | | 04/15/12 | | 900,000 | | 964,050 | |
Southwest Gas Corp. | | NR | | 8.38 | | 02/15/11 | | 1,000,000 | | 1,007,855 | |
TransAlta Corp. | | BBB | | 5.75 | | 12/15/13 | | 1,000,000 | | 1,090,945 | |
| | | | | | | | | | 12,999,043 | |
TOTAL LONG-TERM DEBT SECURITIES
(Cost: $276,486,369) 96.8% | | | | | | | | | | 288,399,685 | |
| | Rating** | | Rate(%) | | Maturity | | Face Amount | | Value | |
SHORT-TERM DEBT SECURITIES: | | | | | | | | | | | |
COMMERCIAL PAPER (1.7%) | | | | | | | | | | | |
NetJets, Inc.† | | A-1+ | | 0.10 | | 01/03/11 | | 4,900,000 | | 4,899,973 | |
TOTAL SHORT-TERM DEBT SECURITIES
(Cost: $4,899,973) 1.7% | | | | | | | | | | 4,899,973 | |
| | | | | | | | | | | |
TEMPORARY CASH INVESTMENTS (2)
(Cost: $750,000) 0.2% | | | | | | | | | | 750,000 | |
| | | | | | | | | | | |
TOTAL INVESTMENTS
(Cost: $282,136,342) 98.7% | | | | | | | | | | 294,049,658 | |
| | | | | | | | | | | |
OTHER NET ASSETS 1.3% | | | | | | | | | | 3,802,590 | |
| | | | | | | | | | | |
NET ASSETS 100.0% | | | | | | | | | | $ | 297,852,248 | |
| | | | | | | | | | | | |
The accompanying notes are an integral part of these portfolio schedules.
MUTUAL OF AMERICA INVESTMENT CORPORATION - BOND FUND
PORTFOLIO OF INVESTMENTS IN SECURITIES
December 31, 2010
| | Rating** | | Rate(%) | | Maturity | | Face Amount | | Value | |
LONG-TERM DEBT SECURITIES: | | | | | | | | | | | |
U.S. GOVERNMENT (20.3%) | | | | | | | | | | | |
U.S. Treasury Bond | | AAA | | 3.50 | | 02/15/39 | | 8,000,000 | | 6,893,752 | |
U.S. Treasury Note | | AAA | | 0.88 | | 03/31/11 | | 4,000,000 | | 4,006,564 | |
U.S. Treasury Note | | AAA | | 1.25 | | 08/31/15 | | 13,000,000 | | 12,643,514 | |
U.S. Treasury Note | | AAA | | 1.88 | | 06/30/15 | | 500,000 | | 501,992 | |
U.S. Treasury Note | | AAA | | 2.38 | | 03/31/16 | | 10,000,000 | | 10,126,560 | |
U.S. Treasury Note | | AAA | | 2.50 | | 03/31/15 | | 7,000,000 | | 7,245,560 | |
U.S. Treasury Note | | AAA | | 3.13 | | 05/15/19 | | 24,000,000 | | 24,253,127 | |
U.S. Treasury Note | | AAA | | 3.25 | | 05/31/16 | | 36,000,000 | | 37,971,571 | |
U.S. Treasury Note | | AAA | | 3.50 | | 05/15/20 | | 17,000,000 | | 17,414,460 | |
| | | | | | | | | | 121,057,100 | |
U.S. GOVERNMENT AGENCIES (31.9%) | | | | | | | | | | | |
MORTGAGE-BACKED OBLIGATIONS (29.8%) | | | | | | | | | | | |
FHARM | | AAA | | 4.64 | | 09/01/39 | | 2,194,728 | | 2,297,050 | |
FHARM | | AAA | | 5.22 | | 04/01/37 | | 1,263,851 | | 1,335,363 | |
FHARM | | AAA | | 5.24 | | 02/01/36 | | 1,111,705 | | 1,184,254 | |
FHARM | | AAA | | 5.39 | | 04/01/37 | | 1,295,755 | | 1,371,694 | |
FHARM | | AAA | | 5.43 | | 05/01/37 | | 1,186,287 | | 1,262,545 | |
FHARM | | AAA | | 5.77 | | 03/01/37 | | 786,393 | | 845,894 | |
FHLMC | | AAA | | 4.00 | | 05/01/24 | | 1,199,812 | | 1,235,994 | |
FHLMC | | AAA | | 4.00 | | 02/01/25 | | 2,357,762 | | 2,428,862 | |
FHLMC | | AAA | | 4.50 | | 03/01/34 | | 2,129,379 | | 2,199,378 | |
FHLMC | | AAA | | 4.50 | | 08/01/34 | | 2,349,795 | | 2,424,102 | |
FHLMC | | AAA | | 4.50 | | 08/15/35 | | 530,322 | | 530,767 | |
FHLMC | | AAA | | 5.00 | | 02/01/26 | | 602,795 | | 636,504 | |
FHLMC | | AAA | | 5.00 | | 04/15/29 | | 2,195,922 | | 2,341,687 | |
FHLMC | | AAA | | 5.50 | | 12/15/20 | | 3,500,000 | | 3,707,169 | |
FHLMC | | AAA | | 5.50 | | 03/01/21 | | 640,508 | | 690,849 | |
FHLMC | | AAA | | 5.50 | | 07/01/32 | | 1,528,755 | | 1,641,016 | |
FHLMC | | AAA | | 5.50 | | 01/15/33 | | 1,179,631 | | 1,288,753 | |
FHLMC | | AAA | | 5.50 | | 01/15/35 | | 617,000 | | 674,080 | |
FHLMC | | AAA | | 6.00 | | 07/15/29 | | 928,132 | | 1,008,500 | |
FHLMC | | AAA | | 6.00 | | 03/15/32 | | 1,040,215 | | 1,144,887 | |
FNMA | | AAA | | 4.00 | | 05/01/19 | | 1,366,451 | | 1,424,738 | |
FNMA | | AAA | | 4.00 | | 10/01/30 | | 3,444,975 | | 3,471,384 | |
FNMA | | AAA | | 4.00 | | 01/01/31 | | 4,500,000 | | 4,534,497 | |
FNMA | | AAA | | 4.00 | | 03/01/35 | | 1,838,145 | | 1,851,096 | |
FNMA | | AAA | | 4.00 | | 05/01/35 | | 1,609,556 | | 1,620,897 | |
FNMA | | AAA | | 4.50 | | 05/01/18 | | 1,077,181 | | 1,141,139 | |
FNMA | | AAA | | 4.50 | | 05/01/19 | | 258,968 | | 274,020 | |
FNMA | | AAA | | 4.50 | | 06/01/19 | | 446,663 | | 472,625 | |
FNMA | | AAA | | 4.50 | | 07/25/24 | | 1,767,145 | | 1,785,179 | |
FNMA | | AAA | | 4.50 | | 07/01/29 | | 2,456,911 | | 2,545,146 | |
FNMA | | AAA | | 4.50 | | 05/01/30 | | 2,296,991 | | 2,379,669 | |
FNMA | | AAA | | 4.50 | | 08/01/33 | | 1,277,456 | | 1,321,646 | |
FNMA | | AAA | | 4.50 | | 08/01/33 | | 1,205,259 | | 1,246,198 | |
FNMA | | AAA | | 4.50 | | 09/01/33 | | 2,820,118 | | 2,915,908 | |
FNMA | | AAA | | 4.50 | | 10/01/33 | | 2,410,644 | | 2,492,526 | |
FNMA | | AAA | | 4.50 | | 10/01/33 | | 1,182,190 | | 1,222,345 | |
FNMA | | AAA | | 4.50 | | 05/01/34 | | 690,926 | | 713,314 | |
FNMA | | AAA | | 4.50 | | 06/01/34 | | 1,710,707 | | 1,766,141 | |
FNMA | | AAA | | 4.50 | | 07/01/34 | | 2,001,515 | | 2,066,372 | |
FNMA | | AAA | | 4.50 | | 01/01/35 | | 2,295,799 | | 2,375,215 | |
FNMA | | AAA | | 4.50 | | 08/01/35 | | 2,325,410 | | 2,400,037 | |
FNMA | | AAA | | 4.50 | | 12/01/35 | | 1,418,424 | | 1,463,944 | |
FNMA | | AAA | | 4.50 | | 05/01/40 | | 2,206,064 | | 2,293,373 | |
FNMA | | AAA | | 5.00 | | 04/01/18 | | 246,856 | | 264,328 | |
FNMA | | AAA | | 5.00 | | 09/01/18 | | 1,006,896 | | 1,078,166 | |
FNMA | | AAA | | 5.00 | | 09/01/20 | | 849,008 | | 906,979 | |
FNMA | | AAA | | 5.00 | | 10/01/20 | | 1,244,697 | | 1,329,686 | |
FNMA | | AAA | | 5.00 | | 10/01/25 | | 947,119 | | 1,001,329 | |
FNMA | | AAA | | 5.00 | | 06/01/33 | | 1,215,720 | | 1,285,807 | |
FNMA | | AAA | | 5.00 | | 09/01/33 | | 4,469,268 | | 4,726,926 | |
FNMA | | AAA | | 5.00 | | 11/01/33 | | 3,230,307 | | 3,416,538 | |
FNMA | | AAA | | 5.00 | | 11/01/33 | | 2,302,744 | | 2,435,499 | |
FNMA | | AAA | | 5.00 | | 01/01/34 | | 1,580,614 | | 1,671,737 | |
FNMA | | AAA | | 5.00 | | 03/01/34 | | 726,180 | | 768,045 | |
FNMA | | AAA | | 5.00 | | 04/01/34 | | 980,740 | | 1,036,055 | |
FNMA | | AAA | | 5.00 | | 04/01/34 | | 372,680 | | 393,699 | |
FNMA | | AAA | | 5.00 | | 04/01/35 | | 1,305,425 | | 1,378,236 | |
FNMA | | AAA | | 5.00 | | 06/01/35 | | 892,665 | | 942,454 | |
FNMA | | AAA | | 5.00 | | 09/01/35 | | 2,871,588 | | 3,031,753 | |
FNMA | | AAA | | 5.00 | | 11/25/35 | | 2,500,000 | | 2,622,053 | |
FNMA | | AAA | | 5.00 | | 05/01/39 | | 2,817,076 | | 2,996,920 | |
FNMA | | AAA | | 5.50 | | 04/01/17 | | 131,306 | | 141,585 | |
FNMA | | AAA | | 5.50 | | 05/01/17 | | 254,037 | | 273,923 | |
FNMA | | AAA | | 5.50 | | 01/01/24 | | 797,115 | | 859,471 | |
FNMA | | AAA | | 5.50 | | 03/01/24 | | 1,828,146 | | 1,969,813 | |
FNMA | | AAA | | 5.50 | | 09/01/25 | | 803,826 | | 864,731 | |
FNMA | | AAA | | 5.50 | | 11/01/26 | | 762,519 | | 818,844 | |
FNMA | | AAA | | 5.50 | | 01/01/27 | | 496,094 | | 532,739 | |
FNMA | | AAA | | 5.50 | | 07/01/33 | | 2,148,314 | | 2,315,663 | |
FNMA | | AAA | | 5.50 | | 09/01/33 | | 1,272,586 | | 1,371,718 | |
FNMA | | AAA | | 5.50 | | 10/01/33 | | 1,656,067 | | 1,785,071 | |
FNMA | | AAA | | 5.50 | | 03/01/34 | | 1,082,296 | | 1,166,605 | |
FNMA | | AAA | | 5.50 | | 03/01/34 | | 513,671 | | 553,685 | |
FNMA | | AAA | | 5.50 | | 07/01/34 | | 824,566 | | 887,510 | |
FNMA | | AAA | | 5.50 | | 09/01/34 | | 1,065,113 | | 1,146,751 | |
FNMA | | AAA | | 5.50 | | 09/01/34 | | 1,056,306 | | 1,136,940 | |
FNMA | | AAA | | 5.50 | | 09/01/34 | | 448,378 | | 482,606 | |
FNMA | | AAA | | 5.50 | | 10/01/34 | | 2,413,543 | | 2,597,783 | |
FNMA | | AAA | | 5.50 | | 02/01/35 | | 865,348 | | 931,405 | |
FNMA | | AAA | | 5.50 | | 02/01/35 | | 732,814 | | 788,067 | |
FNMA | | AAA | | 5.50 | | 04/01/35 | | 1,000,055 | | 1,075,457 | |
FNMA | | AAA | | 5.50 | | 08/01/35 | | 2,038,704 | | 2,192,418 | |
FNMA | | AAA | | 5.50 | | 07/01/36 | | 3,461,716 | | 3,725,969 | |
FNMA | | AAA | | 5.50 | | 02/25/37 | | 1,168,242 | | 1,273,433 | |
FNMA | | AAA | | 5.50 | | 11/01/38 | | 1,050,017 | | 1,114,748 | |
FNMA | | AAA | | 5.50 | | 06/01/48 | | 1,038,120 | | 1,103,415 | |
FNMA | | AAA | | 6.00 | | 03/01/17 | | 172,792 | | 188,479 | |
FNMA | | AAA | | 6.00 | | 05/01/23 | | 951,236 | | 1,050,915 | |
FNMA | | AAA | | 6.00 | | 01/01/25 | | 587,457 | | 646,512 | |
FNMA | | AAA | | 6.00 | | 03/01/28 | | 1,021,894 | | 1,115,009 | |
FNMA | | AAA | | 6.00 | | 04/01/32 | | 296,089 | | 326,173 | |
FNMA | | AAA | | 6.00 | | 04/01/32 | | 137,134 | | 151,068 | |
FNMA | | AAA | | 6.00 | | 05/01/32 | | 910,039 | | 1,002,501 | |
FNMA | | AAA | | 6.00 | | 04/01/33 | | 1,392,479 | | 1,533,959 | |
FNMA | | AAA | | 6.00 | | 11/01/34 | | 772,261 | | 847,104 | |
FNMA | | AAA | | 6.00 | | 12/01/36 | | 977,001 | | 1,064,970 | |
FNMA | | AAA | | 6.00 | | 01/01/37 | | 1,058,919 | | 1,154,264 | |
FNMA | | AAA | | 6.00 | | 03/01/37 | | 692,892 | | 750,084 | |
FNMA | | AAA | | 6.00 | | 04/01/37 | | 722,573 | | 782,214 | |
FNMA | | AAA | | 6.00 | | 05/01/37 | | 801,802 | | 867,982 | |
FNMA | | AAA | | 6.00 | | 06/01/37 | | 963,320 | | 1,042,832 | |
FNMA | | AAA | | 6.00 | | 07/01/37 | | 741,418 | | 806,785 | |
FNMA | | AAA | | 6.00 | | 08/01/37 | | 1,537,086 | | 1,672,603 | |
FNMA | | AAA | | 6.00 | | 12/01/37 | | 765,466 | | 832,953 | |
FNMA | | AAA | | 6.00 | | 10/25/44 | | 1,149,682 | | 1,266,806 | |
FNMA | | AAA | | 6.00 | | 02/25/47 | | 2,185,040 | | 2,407,640 | |
FNMA | | AAA | | 6.00 | | 12/25/49 | | 1,968,825 | | 2,169,399 | |
FNMA | | AAA | | 6.50 | | 09/01/16 | | 57,317 | | 62,538 | |
FNMA | | AAA | | 6.50 | | 03/01/17 | | 426,194 | | 466,349 | |
FNMA | | AAA | | 6.50 | | 05/01/17 | | 68,118 | | 74,536 | |
FNMA | | AAA | | 6.50 | | 04/01/32 | | 126,365 | | 142,087 | |
FNMA | | AAA | | 6.50 | | 05/01/32 | | 934,041 | | 1,050,249 | |
FNMA | | AAA | | 6.50 | | 05/01/32 | | 349,949 | | 393,488 | |
FNMA | | AAA | | 6.50 | | 09/01/36 | | 590,324 | | 654,915 | |
FNMA | | AAA | | 6.50 | | 05/01/37 | | 733,224 | | 815,513 | |
FNMA | | AAA | | 6.50 | | 07/01/37 | | 376,873 | | 419,169 | |
FNMA | | AAA | | 6.50 | | 09/01/37 | | 734,580 | | 817,020 | |
FNMA | | AAA | | 6.50 | | 05/01/38 | | 952,380 | | 1,059,061 | |
FNMA | | AAA | | 7.00 | | 09/01/31 | | 109,370 | | 124,599 | |
FNMA | | AAA | | 7.00 | | 11/01/31 | | 92,597 | | 105,491 | |
FNMA | | AAA | | 7.00 | | 01/25/44 | | 1,305,077 | | 1,538,360 | |
FNMA | | AAA | | 7.50 | | 04/01/32 | | 98,105 | | 112,705 | |
FNMA | | AAA | | 7.50 | | 06/01/32 | | 290,660 | | 333,915 | |
FNMA | | AAA | | 8.00 | | 03/01/31 | | 59,770 | | 69,124 | |
FNMA | | AAA | | 8.00 | | 04/01/32 | | 52,634 | | 60,936 | |
FNMA | | AAA | | 8.00 | | 04/01/32 | | 34,103 | | 39,463 | |
GNMA (4) | | AAA | | 3.50 | | 09/20/33 | | 3,000,000 | | 3,068,814 | |
GNMA (4) | | AAA | | 4.50 | | 02/20/20 | | 1,826,748 | | 1,942,755 | |
GNMA (4) | | AAA | | 5.00 | | 06/20/39 | | 1,886,003 | | 1,913,273 | |
GNMA (4) | | AAA | | 5.00 | | 11/15/39 | | 1,890,629 | | 2,011,347 | |
GNMA (4) | | AAA | | 6.50 | | 04/15/31 | | 36,012 | | 40,886 | |
GNMA (4) | | AAA | | 6.50 | | 12/15/31 | | 146,937 | | 166,822 | |
GNMA (4) | | AAA | | 6.50 | | 05/15/32 | | 47,437 | | 53,856 | |
GNMA (4) | | AAA | | 7.00 | | 09/15/31 | | 36,325 | | 41,672 | |
GNMA (4) | | AAA | | 7.00 | | 09/15/31 | | 33,926 | | 38,919 | |
GNMA (4) | | AAA | | 7.00 | | 05/15/32 | | 18,533 | | 21,222 | |
Vendee Mortgage Trust (4) | | AAA | | 5.25 | | 01/15/32 | | 2,204,531 | | 2,395,688 | |
| | | | | | | | | | 178,138,341 | |
NON-MORTGAGE-BACKED OBLIGATIONS (2.1%) | | | | | | | | | | | |
FNMA | | AAA | | 0.00 | | 10/09/19 | | 20,000,000 | | 12,628,460 | |
| | | | | | | | | | | |
CORPORATE DEBT (42.6%) | | | | | | | | | | | |
CONSUMER DISCRETIONARY (5.2%) | | | | | | | | | | | |
Best Buy Co., Inc. | | BBB- | | 6.75 | | 07/15/13 | | 500,000 | | 553,089 | |
Black & Decker Corp. | | A | | 4.75 | | 11/01/14 | | 2,000,000 | | 2,152,520 | |
Brinker International, Inc. | | BBB- | | 5.75 | | 06/01/14 | | 2,000,000 | | 2,101,996 | |
Ethan Allen Interiors, Inc. | | B+ | | 5.38 | | 10/01/15 | | 2,000,000 | | 1,922,674 | |
Expedia, Inc. | | BBB- | | 5.95 | | 08/15/20 | | 2,000,000 | | 2,010,000 | |
Fortune Brands, Inc. | | BBB- | | 4.88 | | 12/01/13 | | 500,000 | | 522,424 | |
Fortune Brands, Inc. | | BBB- | | 5.38 | | 01/15/16 | | 1,900,000 | | 1,964,876 | |
Home Depot, Inc. | | BBB+ | | 5.40 | | 03/01/16 | | 2,000,000 | | 2,241,210 | |
Johnson Controls, Inc. | | BBB+ | | 4.88 | | 09/15/13 | | 2,500,000 | | 2,686,305 | |
Kohl’s Corp. | | BBB+ | | 6.30 | | 03/01/11 | | 1,500,000 | | 1,512,524 | |
Leggett & Platt, Inc. | | BBB+ | | 4.70 | | 04/01/13 | | 2,000,000 | | 2,113,838 | |
Marriott International, Inc. | | BBB | | 5.63 | | 02/15/13 | | 2,000,000 | | 2,144,978 | |
Mattel, Inc. | | BBB | | 4.35 | | 10/01/20 | | 1,000,000 | | 969,039 | |
Newell Rubbermaid, Inc. | | BBB- | | 4.70 | | 08/15/20 | | 2,000,000 | | 1,983,898 | |
Omnicom Group, Inc. | | BBB+ | | 4.45 | | 08/15/20 | | 2,000,000 | | 1,957,058 | |
Scholastic Corp. | | BB- | | 5.00 | | 04/15/13 | | 2,000,000 | | 2,005,000 | |
Starwood Hotels & Resorts | | BB+ | | 6.25 | | 02/15/13 | | 109,000 | | 116,630 | |
Whirlpool Corp. | | BBB- | | 6.50 | | 06/15/16 | | 2,000,000 | | 2,205,486 | |
| | | | | | | | | | 31,163,545 | |
CONSUMER STAPLES (2.2%) | | | | | | | | | | | |
Clorox Co. | | BBB+ | | 5.00 | | 03/01/13 | | 2,000,000 | | 2,136,270 | |
Corn Products Int’l., Inc. | | BBB | | 4.63 | | 11/01/20 | | 2,000,000 | | 1,972,554 | |
CVS Caremark Corp. | | BBB+ | | 6.13 | | 08/15/16 | | 2,000,000 | | 2,269,166 | |
Kraft Foods, Inc. | | BBB- | | 5.63 | | 11/01/11 | | 258,000 | | 268,033 | |
Kroger Co. | | BBB | | 4.95 | | 01/15/15 | | 2,000,000 | | 2,160,214 | |
Ralcorp Hldgs., Inc. | | BBB- | | 4.95 | | 08/15/20 | | 1,500,000 | | 1,494,234 | |
Safeway, Inc. | | BBB | | 3.95 | | 08/15/20 | | 2,900,000 | | 2,746,155 | |
| | | | | | | | | | 13,046,626 | |
ENERGY (5.1%) | | | | | | | | | | | |
CenterPoint Energy Resources | | BBB | | 7.75 | | 02/15/11 | | 2,000,000 | | 2,014,990 | |
Diamond Offshore Drilling, Inc. | | A- | | 4.88 | | 07/01/15 | | 2,000,000 | | 2,162,408 | |
Enbridge, Inc. | | A- | | 5.80 | | 06/15/14 | | 1,000,000 | | 1,112,408 | |
Kinder Morgan, Inc. | | BB | | 5.15 | | 03/01/15 | | 2,000,000 | | 2,015,000 | |
Nabors Industries Ltd. | | BBB | | 5.38 | | 08/15/12 | | 1,000,000 | | 1,055,756 | |
National Oilwell Varco, Inc. | | BBB+ | | 6.13 | | 08/15/15 | | 2,000,000 | | 2,065,474 | |
Noble Corp. | | A- | | 7.50 | | 03/15/19 | | 2,000,000 | | 2,399,522 | |
Seacor Hldgs., Inc. | | BBB- | | 7.38 | | 10/01/19 | | 2,775,000 | | 2,878,391 | |
Seariver Maritime, Inc. | | AAA | | 0.00 | | 09/01/12 | | 10,000,000 | | 9,617,760 | |
Transocean, Inc. | | BBB | | 1.50 | | 12/15/37 | | 3,000,000 | | 2,902,500 | |
Weatherford Int’l. Ltd. | | BBB | | 5.15 | | 03/15/13 | | 500,000 | | 530,368 | |
Weatherford Int’l. Ltd. | | BBB | | 5.50 | | 02/15/16 | | 1,500,000 | | 1,591,658 | |
| | | | | | | | | | 30,346,235 | |
FINANCIALS (15.3%) | | | | | | | | | | | |
Alleghany Corp. | | BBB | | 5.63 | | 09/15/20 | | 2,500,000 | | 2,441,408 | |
Allstate Corp. | | A- | | 7.45 | | 05/16/19 | | 2,000,000 | | 2,427,302 | |
Ally Financial, Inc. | | B | | 0.00 | | 12/01/12 | | 10,000,000 | | 9,025,000 | |
American Express Credit Corp. | | BBB+ | | 5.88 | | 05/02/13 | | 500,000 | | 543,769 | |
Bank of America Corp. | | A | | 3.70 | | 09/01/15 | | 2,000,000 | | 1,982,730 | |
Berkley (W.R.) Corp. | | BBB+ | | 7.38 | | 09/15/19 | | 2,000,000 | | 2,219,644 | |
Block Financial LLC | | BBB | | 5.13 | | 10/30/14 | | 1,750,000 | | 1,731,217 | |
Bunge Ltd. Finance Corp. | | BBB- | | 5.35 | | 04/15/14 | | 2,000,000 | | 2,102,228 | |
CNA Financial Corp. | | BBB- | | 6.50 | | 08/15/16 | | 2,000,000 | | 2,141,800 | |
Colonial Realty LP | | BB+ | | 4.80 | | 04/01/11 | | 1,500,000 | | 1,503,486 | |
Duke Realty LP | | BBB- | | 4.63 | | 05/15/13 | | 2,000,000 | | 2,081,204 | |
Fairfax Financial Hldgs. | | BBB- | | 8.25 | | 10/01/15 | | 2,500,000 | | 2,634,375 | |
First Horizon National Corp. | | BB+ | | 4.50 | | 05/15/13 | | 5,000,000 | | 5,047,765 | |
First Industrial LP | | BB- | | 6.88 | | 04/15/12 | | 2,000,000 | | 1,994,170 | |
Fosters Finance Corp.† | | BBB | | 6.88 | | 06/15/11 | | 2,000,000 | | 2,053,108 | |
General Electric Capital Corp. | | AA+ | | 5.00 | | 11/15/11 | | 2,000,000 | | 2,076,290 | |
Goldman Sachs Group, Inc. | | A | | 3.70 | | 08/01/15 | | 1,000,000 | | 1,018,912 | |
Harley-Davidson Funding† | | BBB | | 5.25 | | 12/15/12 | | 500,000 | | 523,618 | |
Hartford Financial Svcs. | | BBB | | 5.50 | | 10/15/16 | | 2,000,000 | | 2,075,408 | |
HCP, Inc. | | BBB | | 5.65 | | 12/15/13 | | 2,000,000 | | 2,148,316 | |
Health Care REIT, Inc. | | BBB- | | 6.13 | | 04/15/20 | | 2,500,000 | | 2,631,663 | |
Heinz (H.J.) Finance Co. | | BBB | | 6.00 | | 03/15/12 | | 2,000,000 | | 2,112,504 | |
HSBC Finance Corp. | | A | | 5.39 | | 11/10/13 | | 100,000 | | 100,718 | |
HSBC Finance Corp. | | A | | 5.56 | | 10/10/13 | | 70,000 | | 69,945 | |
JP Morgan Chase Bank NA | | A+ | | 6.00 | | 10/01/17 | | 2,000,000 | | 2,217,124 | |
KeyCorp | | BBB+ | | 6.50 | | 05/14/13 | | 2,000,000 | | 2,171,430 | |
Kimco Realty Corp. | | BBB+ | | 6.00 | | 11/30/12 | | 1,000,000 | | 1,072,310 | |
Lincoln National Corp. | | A- | | 5.65 | | 08/27/12 | | 2,000,000 | | 2,127,442 | |
Markel Corp. | | BBB | | 6.80 | | 02/15/13 | | 2,000,000 | | 2,118,632 | |
Morgan Stanley | | A | | 4.00 | | 07/24/15 | | 2,000,000 | | 2,010,370 | |
National City Corp. | | A | | 4.00 | | 02/01/11 | | 2,000,000 | | 2,002,500 | |
Nationwide Health Pptys., Inc. | | BBB | | 6.50 | | 07/15/11 | | 2,000,000 | | 2,054,850 | |
Pacific LifeCorp.† | | BBB+ | | 6.00 | | 02/10/20 | | 2,000,000 | | 2,101,990 | |
Protective Life Corp. | | A- | | 4.88 | | 11/01/14 | | 1,000,000 | | 1,055,399 | |
Protective Life Secured Trust | | AA- | | 4.92 | | 12/10/14 | | 124,000 | | 123,333 | |
Protective Life Secured Trust | | AA- | | 5.07 | | 10/10/14 | | 53,000 | | 52,653 | |
Protective Life Secured Trust | | AA- | | 5.17 | | 08/10/14 | | 21,000 | | 20,938 | |
Prudential Financial, Inc. | | A | | 4.75 | | 09/17/15 | | 2,000,000 | | 2,115,970 | |
Regency Centers LP | | BBB | | 4.95 | | 04/15/14 | | 2,000,000 | | 2,091,952 | |
Retail Properties, Inc.† | | A- | | 7.88 | | 03/15/16 | | 5,000,000 | | 5,938,490 | |
Shurgard Storage Centers | | A | | 7.75 | | 02/22/11 | | 750,000 | | 757,859 | |
Southtrust Bank, N.A. | | AA- | | 4.75 | | 03/01/13 | | 1,250,000 | | 1,330,518 | |
Travelers Cos., Inc. | | A- | | 5.38 | | 06/15/12 | | 500,000 | | 530,321 | |
Unitrin, Inc. | | BBB- | | 6.00 | | 11/30/15 | | 2,500,000 | | 2,528,380 | |
Vornado Realty LP | | BBB | | 5.60 | | 02/15/11 | | 2,000,000 | | 2,007,910 | |
Zions Bancorporation | | BB+ | | 5.65 | | 05/15/14 | | 2,000,000 | | 1,993,142 | |
| | | | | | | | | | 91,110,093 | |
HEALTH CARE (4.3%) | | | | | | | | | | | |
Allergan, Inc. | | A+ | | 5.75 | | 04/01/16 | | 2,000,000 | | 2,278,296 | |
AmerisourceBergen Corp. | | BBB+ | | 4.88 | | 11/15/19 | | 2,500,000 | | 2,549,420 | |
Biogen Idec, Inc. | | BBB+ | | 6.88 | | 03/01/18 | | 2,500,000 | | 2,818,403 | |
CIGNA Corp. | | BBB | | 5.38 | | 03/15/17 | | 2,000,000 | | 2,116,160 | |
Humana, Inc. | | BBB- | | 7.20 | | 06/15/18 | | 2,000,000 | | 2,259,296 | |
Laboratory Corp. of America | | BBB+ | | 4.63 | | 11/15/20 | | 500,000 | | 495,490 | |
Laboratory Corp. of America | | BBB+ | | 5.50 | | 02/01/13 | | 1,000,000 | | 1,067,085 | |
Laboratory Corp. of America | | BBB+ | | 5.63 | | 12/15/15 | | 1,000,000 | | 1,096,117 | |
McKesson Corp. | | A- | | 7.75 | | 02/01/12 | | 1,750,000 | | 1,870,720 | |
Quest Diagnostics, Inc. | | BBB+ | | 4.75 | | 01/30/20 | | 2,850,000 | | 2,818,909 | |
UnitedHealth Group, Inc. | | A- | | 5.50 | | 11/15/12 | | 2,000,000 | | 2,144,116 | |
WellPoint, Inc. | | A- | | 4.35 | | 08/15/20 | | 2,000,000 | | 1,984,416 | |
Wyeth | | AA | | 5.50 | | 03/15/13 | | 1,750,000 | | 1,913,410 | |
| | | | | | | | | | 25,411,838 | |
INDUSTRIALS (3.0%) | | | | | | | | | | | |
Cargill, Inc.† | | A | | 5.00 | | 11/15/13 | | 500,000 | | 548,298 | |
CSX Corp. | | BBB- | | 6.25 | | 04/01/15 | | 2,000,000 | | 2,272,856 | |
Donnelley (R.R.) & Sons Co. | | BBB | | 4.95 | | 04/01/14 | | 2,000,000 | | 2,049,084 | |
L-3 Communications Corp. | | BBB- | | 4.75 | | 07/15/20 | | 2,750,000 | | 2,701,823 | |
Masco Corp. | | BBB | | 5.88 | | 07/15/12 | | 2,000,000 | | 2,096,610 | |
Pitney Bowes, Inc. | | BBB+ | | 5.25 | | 01/15/37 | | 2,000,000 | | 2,026,590 | |
Precision Castparts Corp. | | A- | | 5.60 | | 12/15/13 | | 2,000,000 | | 2,214,946 | |
Ryder System, Inc. | | BBB+ | | 6.00 | | 03/01/13 | | 2,000,000 | | 2,149,992 | |
Steelcase, Inc. | | BBB- | | 6.50 | | 08/15/11 | | 2,000,000 | | 2,043,848 | |
| | | | | | | | | | 18,104,047 | |
INFORMATION TECHNOLOGY (1.4%) | | | | | | | | | | | |
Avnet, Inc. | | BBB- | | 5.88 | | 06/15/20 | | 600,000 | | 602,345 | |
Avnet, Inc. | | BBB- | | 6.00 | | 09/01/15 | | 2,000,000 | | 2,139,256 | |
Cisco Systems, Inc. | | A+ | | 5.25 | | 02/22/11 | | 2,000,000 | | 2,012,532 | |
Fiserv, Inc. | | BBB- | | 4.63 | | 10/01/20 | | 2,770,000 | | 2,690,459 | |
Ingram Micro, Inc. | | BBB- | | 5.25 | | 09/01/17 | | 500,000 | | 505,995 | |
Xerox Corp. | | BBB- | | 6.88 | | 08/15/11 | | 500,000 | | 517,160 | |
| | | | | | | | | | 8,467,747 | |
MATERIALS (2.7%) | | | | | | | | | | | |
Airgas, Inc. | | BBB | | 3.25 | | 10/01/15 | | 2,000,000 | | 1,975,700 | |
Cytec Industries, Inc. | | BBB | | 6.00 | | 10/01/15 | | 2,000,000 | | 2,190,752 | |
Eastman Chemical Co. | | BBB | | 4.50 | | 01/15/21 | | 2,500,000 | | 2,450,375 | |
Geon Co. | | B+ | | 7.50 | | 12/15/15 | | 3,750,000 | | 3,857,813 | |
Lubrizol Corp. | | BBB+ | | 5.50 | | 10/01/14 | | 2,000,000 | | 2,188,986 | |
Martin Marietta Materials, Inc. | | BBB+ | | 6.88 | | 04/01/11 | | 1,500,000 | | 1,517,711 | |
Vulcan Materials Co. | | BBB- | | 7.00 | | 06/15/18 | | 2,000,000 | | 2,096,240 | |
| | | | | | | | | | 16,277,577 | |
TELECOMMUNICATION SERVICES (1.1%) | | | | | | | | | | | |
Alltel Corp. | | A- | | 7.00 | | 03/15/16 | | 2,000,000 | | 2,357,682 | |
CenturyLink, Inc. | | BBB- | | 5.00 | | 02/15/15 | | 2,000,000 | | 2,042,250 | |
Verizon Florida LLC | | A- | | 6.13 | | 01/15/13 | | 2,000,000 | | 2,169,590 | |
| | | | | | | | | | 6,569,522 | |
UTILITIES (2.3%) | | | | | | | | | | | |
AGL Capital Corp. | | BBB+ | | 6.38 | | 07/15/16 | | 500,000 | | 568,351 | |
Ameren Energy Generating Co. | | BBB- | | 6.30 | | 04/01/20 | | 2,500,000 | | 2,426,098 | |
Arizona Public Svc. Co. | | BBB- | | 6.50 | | 03/01/12 | | 2,000,000 | | 2,113,656 | |
Entergy Corp. | | BBB- | | 5.13 | | 09/15/20 | | 500,000 | | 493,282 | |
Entergy New Orleans, Inc. | | BBB+ | | 5.25 | | 08/01/13 | | 1,075,000 | | 1,138,666 | |
PPL Energy Supply LLC | | BBB+ | | 5.40 | | 08/15/14 | | 2,000,000 | | 2,146,668 | |
Progress Energy Enterprise | | A | | 5.25 | | 12/15/15 | | 2,000,000 | | 2,242,320 | |
UIL Hldgs. Corp. | | BBB- | | 4.63 | | 10/01/20 | | 2,725,000 | | 2,580,360 | |
| | | | | | | | | | 13,709,401 | |
SOVEREIGN DEBT (0.7%) | | | | | | | | | | | |
Sri Lanka AID | | NR | | 6.59 | | 09/15/28 | | 3,791,476 | | 4,265,259 | |
| | | | | | | | | | | |
TOTAL LONG-TERM DEBT SECURITIES
(Cost: $550,526,965) 95.5% | | | | | | | | | | 570,295,791 | |
| | Rating** | | Rate(%) | | Maturity | | Face Amount | | Value | |
SHORT-TERM DEBT SECURITIES: | | | | | | | | | | | |
COMMERCIAL PAPER (3.7%) | | | | | | | | | | | |
Coca-Cola Co.† | | A-1 | | 0.19 | | 01/14/11 | | 353,000 | | 352,976 | |
Int’l. Business Machines Corp.† | | A-1 | | 0.16 | | 01/07/11 | | 850,000 | | 849,977 | |
NetJets, Inc.† | | A-1+ | | 0.10 | | 01/03/11 | | 10,100,000 | | 10,099,944 | |
New Jersey Natural Gas | | A-1 | | 0.19 | | 01/19/11 | | 500,000 | | 499,953 | |
Sysco Corp.† | | A-1+ | | 0.10 | | 01/03/11 | | 10,000,000 | | 9,999,944 | |
| | | | | | | | | | 21,802,794 | |
TOTAL SHORT-TERM DEBT SECURITIES
(Cost: $21,802,794) 3.7% | | | | | | | | | | 21,802,794 | |
| | | | | | | | | | | |
TEMPORARY CASH INVESTMENTS (2)
(Cost: $105,200) 0.0% (3) | | | | | | | | | | 105,200 | |
| | | | | | | | | | | |
TOTAL INVESTMENTS
(Cost: $572,434,959) 99.2% | | | | | | | | | | 592,203,785 | |
| | | | | | | | | | | |
OTHER NET ASSETS 0.8% | | | | | | | | | | 4,978,933 | |
| | | | | | | | | | | |
NET ASSETS 100.0% | | | | | | | | | | $ | 597,182,718 | |
| | | | | | | | | | | | |
The accompanying notes are an integral part of these portfolio schedules.
MUTUAL OF AMERICA INVESTMENT CORPORATION
FOOTNOTES TO PORTFOLIOS OF INVESTMENTS IN SECURITIES
December 31, 2010
Abbreviations: | FFCB = Federal Farm Credit Bank |
| FHARM = Federal Home Adjustable Rate Mortgage |
| FHLB = Federal Home Loan Bank |
| FHLMC = Federal Home Loan Mortgage Corporation |
| FNMA = Federal National Mortgage Association |
| GNMA = Government National Mortgage Association |
| NR = Not Rated |
* Non-income producing security.
** Ratings as per Standard & Poors Corporation.
*** This security is fair valued in accordance with procedures established by the Funds’ Board of Directors. This security is listed as a Level 3 security in Note 1, Fair Value.
† Security is exempt from registration under Rule 144A of the Securities Act of 1933. These securities may be resold in transactions exempt from registration, normally to qualified institutional buyers. At December 31, 2010, the aggregate values of these securities and their percentages of the respective Funds’ net assets were as follows:
| | Aggregate | | Percentage | |
| | Market | | of | |
Fund | | Value | | Net Assets | |
| | | | | |
EQUITY INDEX FUND | | $ | 9,999,933 | | 1.1 | % |
ALL AMERICA FUND | | $ | 1,429,291 | | 0.5 | % |
SMALL CAP VALUE FUND | | $ | 5,919,909 | | 2.1 | % |
SMALL CAP GROWTH FUND | | $ | 3,799,979 | | 1.4 | % |
MID CAP VALUE FUND | | $ | 2,099,964 | | 3.8 | % |
COMPOSITE FUND | | $ | 1,618,370 | | 1.0 | % |
MONEY MARKET FUND | | $ | 40,292,739 | | 37.0 | % |
MID-TERM BOND FUND | | $ | 11,492,090 | | 3.9 | % |
BOND FUND | | $ | 32,468,345 | | 5.4 | % |
(1) | This security, or a portion thereof, has been segregated to cover initial margin requirements on open futures contracts. |
| Information on futures contracts outstanding in the Funds as of December 31, 2010, were as follows: |
| | | | | | | | | | | | | | Face Value | |
| | | | | | | | | | | | | | of Futures | |
| | | | | | | | | | Underlying | | | | as a % of | |
| | Number of | | | | Purchased (P) | | Expiration | | Face Amount | | Unrealized | | Total | |
Fund | | Contracts | | Contract Type | | or Sold (S) | | Date | | at Value(a) | | Gain(Loss) | | Investments | |
| | | | | | | | | | | | | | | |
EQUITY INDEX FUND | | 344 | | E-mini S&P 500 Stock Index | | P | | March 2011 | | $ | 21,551,600 | | $ | 212,955 | | 2.4 | % |
ALL AMERICA FUND | | 61 | | E-mini S&P 500 Stock Index | | P | | March 2011 | | $ | 3,821,650 | | $ | 73,960 | | 1.4 | % |
MID-CAP EQUITY INDEX FUND | | 152 | | E-mini S&P MidCap 400 Stock Index | | P | | March 2011 | | $ | 13,760,560 | | $ | 45,435 | | 2.8 | % |
(a) | Includes the cumulative appreciation(depreciation) of futures contracts, which is included in Net Unrealized Appreciation (Depreciation) of Investments and Futures Contracts in the Components of Net Assets section of the Statements of Assets and Liabilities. The Receivable or Payable for Daily Variation on Futures Contracts in the Statements of Assets and Liabilities only includes the current day’s variation margin payable or receivable. |
| |
(2) | The fund has an arrangement with its custodian bank, JP Morgan Chase Bank, whereby uninvested cash, subject to parameters set by the fund, is automatically invested in the fund’s name by the bank in overnight commercial paper issued by J.P. Morgan Chase & Co. On the next business day, these funds (and earned interest) are automatically returned to the fund. The annual rate of interest earned on this temporary cash investment at December 31, 2010 was 0.15%. |
| |
(3) | Percentage is less than 0.05%. |
| |
(4) | U.S. Government guaranteed security. |
| |
(5) | Issuer has filed for Chapter XI bankruptcy law (or equivalent) protection; issue is non-income producing. |
Fair Value—The Investment Company values its investments at fair value. Fair value is an estimate of the price the Fund would receive upon selling a security in an orderly arms-length transaction. Investments are categorized based on a three-level valuation hierarchy for measurement and disclosure of fair value. The valuation hierarchy is based upon the transparency of inputs used to measure fair value. The three levels are as follows:
· | Level 1 — quoted prices in active markets for identical securities. |
· | Level 2 — other significant observable inputs (including yield, quality, coupon rate, maturity, issue type, quoted prices for similar securities, prepayment speeds, trading characteristics, etc.). |
· | Level 3 — significant unobservable inputs (including the Fund’s own assumptions in determining the fair value of investments). |
As of December 31, 2010, management determined that the fair value inputs for all equity securities, including shares of registered investment companies, were considered Level 1, with the exception of non-registered securities under Rule 144A of the Securities Act of 1933 which were considered Level 2. In addition, certain Rule 144A securities not actively traded were considered Level 3. Fair value inputs for all debt securities were considered Level 2. The inputs used for valuing securities are not necessarily an indication of the risk associated with investing in those securities. Transfers between levels are reflected based on the fair value at the beginning of a reporting period.
The following is a summary of the inputs used to value the Funds’ investments and other financial instruments as of December 31, 2010, by fair value input hierarchy:
Fund | | Level 1 – Quoted
Prices | | Level 2 – Significant
Observable Inputs | | Level 3 – Significant
Unobservable Inputs | | Total | |
Investments at Market Value: | | | | | | | | | |
(See Portfolios of Investments for More Details) | | | | | | | | | |
Equity Index Fund | | | | | | | | | |
Common Stock | | $ | 879,890,835 | | — | | — | | $ | 879,890,835 | |
Short-Term Debt Securities | | — | | $ | 24,313,571 | | — | | $ | 24,313,571 | |
Temporary Cash Investments | | — | | $ | 151,300 | | — | | $ | 151,300 | |
| | $ | 879,890,835 | | $ | 24,464,871 | | — | | $ | 904,355,706 | |
| | | | | | | | | |
All America Fund | | | | | | | | | |
Common Stock - Indexed | | $ | 137,537,637 | | — | | — | | $ | 137,537,637 | |
Common Stock - Active | | $ | 125,385,075 | | — | | $ | 329,297 | (1) | $ | 125,714,372 | |
Convertible Preferred Stock | | $ | 164,993 | | — | | — | | $ | 164,993 | |
Short-Term Debt Securities | | — | | $ | 6,699,546 | | — | | $ | 6,699,546 | |
Temporary Cash Investments | | — | | $ | 152,600 | | — | | $ | 152,600 | |
| | $ | 263,087,705 | | $ | 6,852,146 | | $ | 329,297 | | $ | 270,269,148 | |
| | | | | | | | | |
Small Cap Value Fund | | | | | | | | | |
Common Stock | | $ | 265,370,967 | | — | | $ | 1,919,931 | (1) | $ | 267,290,898 | |
Convertible Preferred Stock | | $ | 1,262,671 | | — | | — | | $ | 1,262,671 | |
Short-Term Debt Securities | | — | | $ | 16,399,286 | | — | | $ | 16,399,286 | |
| | $ | 266,633,638 | | $ | 16,399,286 | | $ | 1,919,931 | | $ | 284,952,855 | |
| | | | | | | | | |
Small Cap Growth Fund | | | | | | | | | |
Common Stock | | $ | 273,141,523 | | — | | — | | $ | 273,141,523 | |
Short-Term Debt Securities | | — | | $ | 7,499,977 | | — | | $ | 7,499,977 | |
| | $ | 273,141,523 | | $ | 7,499,977 | | — | | $ | 280,641,500 | |
| | | | | | | | | |
Mid Cap Value Fund | | | | | | | | | |
Common Stock | | $ | 52,759,187 | | — | | — | | $ | 52,759,187 | |
Short-Term Debt Securities | | — | | $ | 3,299,963 | | — | | $ | 3,299,963 | |
| | $ | 52,759,187 | | $ | 3,299,963 | | — | | $ | 56,059,150 | |
| | | | | | | | | |
Mid-Cap Equity Index Fund | | | | | | | | | |
Common Stock | | $ | 479,670,198 | | — | | — | | $ | 479,670,198 | |
Short-Term Debt Securities | | — | | $ | 13,698,812 | | — | | $ | 13,698,812 | |
Temporary Cash Investments | | — | | $ | 179,800 | | — | | $ | 179,800 | |
| | $ | 479,670,198 | | $ | 13,878,612 | | — | | $ | 493,548,810 | |
| | | | | | | | | |
International Fund | | | | | | | | | |
Common Stock | | $ | 57,983,571 | | — | | — | | $ | 57,983,571 | |
Short-Term Debt Securities | | — | | $ | 3,199,867 | | — | | $ | 3,199,867 | |
| | $ | 57,983,571 | | $ | 3,199,867 | | — | | $ | 61,183,438 | |
| | | | | | | | | |
Composite Fund | | | | | | | | | |
Common Stock | | $ | 98,334,911 | | — | | — | | $ | 98,334,911 | |
U.S. Government Debt | | — | | $ | 7,442,123 | | — | | $ | 7,442,123 | |
U.S. Government Agency Residential Mortgage-Backed Obligations | | — | | $ | 22,697,299 | | — | | $ | 22,697,299 | |
Corporate Long-Term Debt | | — | | $ | 31,735,734 | | — | | $ | 31,735,734 | |
Short-Term Debt | | — | | $ | 5,677,641 | | — | | $ | 5,677,641 | |
Temporary Cash Investments | | — | | $ | 137,400 | | — | | $ | 137,400 | |
| | $ | 98,334,911 | | $ | 67,690,197 | | — | | $ | 166,025,108 | |
| | | | | | | | | |
Retirement Income Fund | | | | | | | | | |
Common Stock | | $ | 18,145,675 | | — | | — | | $ | 18,145,675 | |
| | | | | | | | | |
2010 Retirement Fund | | | | | | | | | |
Common Stock | | $ | 19,176,815 | | — | | — | | $ | 19,176,815 | |
| | | | | | | | | |
2015 Retirement Fund | | | | | | | | | |
Common Stock | | $ | 78,128,086 | | — | | — | | $ | 78,128,086 | |
2020 Retirement Fund | | | | | | | | | |
Common Stock | | $ | 90,455,139 | | — | | — | | $ | 90,455,139 | |
| | | | �� | | | | | |
2025 Retirement Fund | | | | | | | | | |
Common Stock | | $ | 80,518,668 | | — | | — | | $ | 80,518,668 | |
| | | | | | | | | |
2030 Retirement Fund | | | | | | | | | |
Common Stock | | $ | 67,402,882 | | — | | — | | $ | 67,402,882 | |
| | | | | | | | | |
2035 Retirement Fund | | | | | | | | | |
Common Stock | | $ | 52,840,881 | | — | | — | | $ | 52,840,881 | |
| | | | | | | | | |
2040 Retirement Fund | | | | | | | | | |
Common Stock | | $ | 46,631,652 | | — | | — | | $ | 46,631,652 | |
| | | | | | | | | |
2045 Retirement Fund | | | | | | | | | |
Common Stock | | $ | 53,808,165 | | — | | — | | $ | 53,808,165 | |
| | | | | | | | | |
Conservative Allocation Fund | | | | | | | | | |
Common Stock | | $ | 51,732,575 | | — | | — | | $ | 51,732,575 | |
| | | | | | | | | |
Moderate Allocation Fund | | | | | | | | | |
Common Stock | | $ | 162,687,124 | | — | | — | | $ | 162,687,124 | |
| | | | | | | | | |
Aggressive Allocation Fund | | | | | | | | | |
Common Stock | | $ | 147,404,025 | | — | | — | | $ | 147,404,025 | |
| | | | | | | | | |
Money Market Fund | | | | | | | | | |
U.S. Government Debt | | — | | $ | 7,997,687 | | — | | $ | 7,997,687 | |
U.S. Government Agency Short-Term Debt | | — | | $ | 30,221,377 | | — | | $ | 30,221,377 | |
Commercial Paper | | — | | $ | 70,594,735 | | — | | $ | 70,594,735 | |
| | — | | $ | 108,813,799 | | — | | $ | 108,813,799 | |
| | | | | | | | | |
Mid-Term Bond Fund | | | | | | | | | |
U.S. Government Debt | | — | | $ | 139,939,721 | | — | | $ | 139,939,721 | |
U.S. Government Agency Residential Mortgage-Backed Obligations | | — | | $ | 1,918,307 | | — | | $ | 1,918,307 | |
U.S. Government Agency Non-Mortgage-Backed Obligations | | — | | $ | 19,605,623 | | — | | $ | 19,605,623 | |
Corporate Debt | | — | | $ | 126,936,034 | | — | | $ | 126,936,034 | |
Short-Term Debt | | — | | $ | 4,899,973 | | — | | $ | 4,899,973 | |
Temporary Cash Investments | | — | | $ | 750,000 | | — | | $ | 750,000 | |
| | — | | $ | 294,049,658 | | — | | $ | 294,049,658 | |
| | | | | | | | | |
Bond Fund | | | | | | | | | |
U.S. Government Debt | | — | | $ | 121,057,100 | | — | | $ | 121,057,100 | |
U.S. Government Agency Residential Mortgage-Backed Obligations | | — | | $ | 178,138,341 | | — | | $ | 178,138,341 | |
U.S. Government Agency Non-Mortgage-Backed Obligations | | — | | $ | 12,628,460 | | — | | $ | 12,628,460 | |
Long-Term Corporate Debt | | — | | $ | 254,206,631 | | — | | $ | 254,206,631 | |
Sovereign Debt | | — | | $ | 4,265,259 | | — | | $ | 4,265,259 | |
Short-Term Debt | | — | | 21,802,794 | | — | | 21,802,794 | |
Temporary Cash Investments | | — | | 105,200 | | — | | 105,200 | |
| | — | | $ | 592,203,785 | | — | | $ | 592,203,785 | |
| | | | | | | | | |
Other Financial Instruments:* | | | | | | | | | |
Equity Index Fund | | $ | 212,955 | | — | | — | | $ | 212,955 | |
All America Fund | | $ | 73,960 | | — | | — | | $ | 73,960 | |
Mid-Cap Equity Index Fund | | $ | 45,435 | | — | | — | | $ | 45,435 | |
* Other financial instruments are derivative instruments not reflected in the Portfolio of Investments, such as futures, which are valued at the unrealized appreciation/depreciation on the instrument.
(1) Reflects securities issued by NBH Hldgs. Co. included in the Financials section of the active asset segment of the All America Fund and the Financials section of the Small Cap Value Fund.
Fair Value Measurement Using Signficant Unobservable Inputs (Level 3)
for the Year Ended December 31, 2010
| | | | Change in | | | | | | | | Net Change in | |
| | Balance | | Unrealized | | Transfers | | Transfers | | Balance | | Unrealized Gains/(Losses) | |
| | December 31, | | Gains | | Into | | Out of | | December 31, | | of Level 3 Assets Held as of | |
| | 2009 | | (Losses) (b) | | Level 3 | | Level 3 (c) | | 2010 | | December 31, 2010 | |
All America Fund - Active Common Stock | | $ | 761,962 | | $ | (12,665 | ) | — | | $ | (420,000 | ) | $ | 329,297 | | $ | (8,443 | ) |
Small Cap Value Fund - Common Stock | | $ | 4,471,775 | | $ | (73,844 | ) | — | | $ | (2,478,000 | ) | $ | 1,919,931 | | $ | (49,229 | ) |
(b) Unrealized gains and losses on Level 3 securities are included in Change in Net Unrealized Appreciation (Depreciation) of Investments in the Statements of Operations.
(c) Reflects transfers into Level 1 as a result of a security beginning to trade on national exchanges upon its initial public offering.
Security Valuation — Investment securities are carried at fair value as follows:
Exchange-traded equity securities are valued at the last sales price on the principal exchange on which the security is traded. If there is no trading volume for a particular valuation day, the last bid price is used. For equity securities traded in the over-the-counter market, the security is valued at the last sale price, or if no sale, at the latest bid price available.
Short-term debt securities with a maturity of 60 days or less are valued at amortized cost, which approximates fair value for such securities.
Debt securities, including short-term debt securities maturing in excess of 60 days, are valued on the basis of prices obtained from an independent pricing source. The pricing source may utilize various pricing methodologies that incorporate both models (which consider factors such as yield, quality, coupon rate, maturity, issue type, quoted prices for similar securities, prepayment speeds and trading characteristics) and dealer supplied valuations to derive a valuation.
In the rare instance when a price is not available from an independent pricing source or when prices may not reflect fair value, such as when the pricing service price is not the result of a recent trade, a calculated fair value is used, as determined in good faith by the Adviser and reviewed by a Valuation Committee, in accordance with procedures adopted by the Board of Directors of the Investment Company. The Adviser uses a market approach to calculate fair value for equity securities, which are categorized as Level 3 above. The Adviser’s valuation is primarily based on information regarding the specific equity issuer, such as financial statements, the relationship of per-share book value to the last trade price and operating information. The Adviser also considers industry-specific conditions and overall market conditions, to determine whether the last trade price reflects fair value or needs to be adjusted.
Retirement Funds and the Allocation Funds value their investments in the underlying Funds of the Investment Company at their respective net asset values.
Investment Transactions — Investment transactions are accounted for as of the trade date. Realized gain and loss on the sale of short and long-term debt securities is computed on the basis of amortized cost at the time of sale. Realized gain and loss on the sale of common stock is based on the identified cost basis of the security determined on a first-in, first-out (“FIFO”) basis.
Futures Contracts - The Equity Index Fund, Mid-Cap Equity Index Fund and a portion of the All America Fund each maintain indexed asset portfolios which are subject to equity price risk. In order to remain more fully invested in the equity markets while minimizing transaction costs, the funds purchase stock index futures contracts. An initial cash margin deposit (represented by cash or Treasury bills) is made upon entering into a futures contract and serves as collateral for the contract. This initial margin, maintained in a segregated account, is equal to approximately 5%-6% of the contract amount, and does not involve the borrowing of funds to finance the transaction. During the period the futures contract is outstanding, changes in the value of the contract are recognized as unrealized gains or losses by “marking-to-market” on a daily basis to reflect the market value of the contract at the end of each trading day. The accumulated unrealized gain or loss on the contract is included in Net Unrealized Appreciation (Depreciation) of Investments in the Components of Net Assets section of the Statement of Assets and Liabilities. Futures contracts are valued at the settlement price established each day by the exchange on which traded. Depending upon whether unrealized gains or losses are incurred, variation margin payments are received or made daily. The net change in unrealized appreciation or deprecation of futures contracts is recorded in the Statement of Operations. When the contract is closed, a realized gain or loss from futures transactions is recorded in the Statement of Operations, equal to the net variation margin received or paid over the period the contract was outstanding. The “Underlying Face Amount at Value” (appearing in the “Notes to the Summary Portfolio of Investments in Securities”) representing the aggregate of outstanding contractual amounts under futures contracts reflects the extent of a Fund’s exposure to off-balance sheet risk. The use of futures transactions involves the risk of imperfect correlation in the price movements of the contract and the underlying securities. With futures contracts, there is minimal counterparty credit risk to the Fund since futures are exchange traded and the exchange’s clearinghouse, as counterparty to all exchange traded futures, guarantees the futures against default.
Tax Information - The components of net unrealized appreciation (depreciation) of investments for Federal income tax purposes and the cost of investments for Federal income tax purposes at December 31, 2010 for each of the funds were as follows.
| | Equity
Index Fund | | All America
Fund | | Small Cap
Value Fund | | Small Cap
Growth Fund | | Mid Cap
Value Fund | |
Unrealized Appreciation | | $ | 218,299,010 | | $ | 52,583,370 | | $ | 66,947,788 | | $ | 83,799,269 | | $ | 8,263,664 | |
Unrealized Depreciation | | (96,617,981 | ) | (30,053,977 | ) | (10,444,422 | ) | (3,469,929 | ) | (3,070,027 | ) |
Net | | $ | 121,681,029 | | $ | 22,529,393 | | $ | 56,503,366 | | $ | 80,329,340 | | $ | 5,193,637 | |
Tax Cost of Investments | | $ | 781,674,678 | | $ | 247,739,755 | | $ | 228,449,489 | | $ | 200,312,160 | | $ | 50,865,513 | |
| | Mid-Cap
Equity Index
Fund | | International
Fund | | Composite
Fund | | Retirement
Income
Fund | | 2010
Retirement
Fund | |
Unrealized Appreciation | | $ | 105,308,527 | | $ | 5,017,063 | | $ | 18,761,450 | | $ | 765,443 | | $ | 2,061,818 | |
Unrealized Depreciation | | (28,497,382 | ) | (1,576,769 | ) | (4,669,021 | ) | (209,600 | ) | (843,268 | ) |
Net | | $ | 76,811,145 | | $ | 3,440,294 | | $ | 14,092,429 | | $ | 555,843 | | $ | 1,218,550 | |
Tax Cost of Investments | | $ | 416,737,665 | | $ | 57,743,144 | | $ | 151,932,679 | | $ | 17,589,832 | | $ | 17,958,265 | |
| | 2015
Retirement
Fund | | 2020
Retirement
Fund | | 2025
Retirement
Fund | | 2030
Retirement
Fund | | 2035
Retirement
Fund | |
Unrealized Appreciation | | $ | 8,381,026 | | $ | 9,461,992 | | $ | 10,109,378 | | $ | 9,099,435 | | $ | 7,631,402 | |
Unrealized Depreciation | | (2,471,346 | ) | (1,876,443 | ) | (965,199 | ) | (908,976 | ) | (580,065 | ) |
Net | | $ | 5,909,680 | | $ | 7,585,549 | | $ | 9,144,179 | | $ | 8,190,459 | | $ | 7,051,337 | |
Tax Cost of Investments | | $ | 72,218,406 | | $ | 82,869,590 | | $ | 71,374,489 | | $ | 59,212,423 | | $ | 45,789,544 | |
| | 2040
Retirement
Fund | | 2045
Retirement
Fund | | Conservative
Allocation
Fund | | Moderate
Allocation
Fund | | Aggressive
Allocation
Fund | |
Unrealized Appreciation | | $ | 7,081,377 | | $ | 8,525,500 | | $ | 2,979,571 | | $ | 12,812,328 | | $ | 10,237,372 | |
Unrealized Depreciation | | (373,246 | ) | (407,252 | ) | (1,592,444 | ) | (6,600,781 | ) | (4,252,535 | ) |
Net | | $ | 6,708,131 | | $ | 8,118,248 | | $ | 1,387,127 | | $ | 6,211,547 | | $ | 5,984,837 | |
Tax Cost of Investments | | $ | 39,923,521 | | $ | 45,689,917 | | $ | 50,345,448 | | $ | 156,475,577 | | $ | 141,419,188 | |
| | Money
Market Fund | | Mid-Term
Bond Fund | | Bond
Fund | | | | | |
Unrealized Appreciation | | $ | 2,100 | | $ | 12,983,383 | | $ | 22,706,314 | | | | | |
Unrealized Depreciation | | (11 | ) | (1,077,255 | ) | (2,937,488 | ) | | | | |
Net | | $ | 2,089 | | $ | 11,906,128 | | $ | 19,768,826 | | | | | |
Tax Cost of Investments | | $ | 108,811,710 | | $ | 282,143,530 | | $ | 572,434,959 | | | | | |
ITEM 7. DISCLOSURE OF PROXY VOTING POLICIES AND PROCEDURES FOR CLOSED-END MANAGEMENT INVESTMENT COMPANIES.
Not applicable.
ITEM 8. PORTFOLIO MANAGERS OF CLOSED-END MANAGEMENT INVESTMENT COMPANIES.
Not applicable.
ITEM 9. PURCHASES OF EQUITY SECURITES BY CLOSED-END MANAGEMENT INVESTMENT COMPANY AND AFFILIATED PURCHASERS.
Not applicable.
ITEM 10. SUBMISSION OF MATTERS TO A VOTE OF SECURITY HOLDERS.
Not applicable.
ITEM 11. CONTROLS AND PROCEDURES.
(a) The registrant’s principal executive officer and principal financial officer have evaluated the registrant’s disclosure controls and procedures within 90 days of this filing and have concluded that the registrant’s disclosure controls and procedures were effective, as of that date, in ensuring that information required to be disclosed by the registrant in this Form N-CSR was recorded, processed, summarized, and reported in a timely and accurate manner.
(b) The registrant’s principal executive officer and principal financial officer are aware of no changes in the registrant’s internal control over financial reporting that occurred during the second fiscal quarter of the period covered by this report that has materially affected, or is likely to materially affect, the registrant’s internal control over financial reporting.
ITEM 12. EXHIBITS.
Attached hereto:
(a) (1) Not applicable.
| (2) Exhibit 99.CERT | Certifications by the registrant’s principal executive officer and principal financial officer, pursuant to Section 302 of the Sarbanes-Oxley Act of 2002 and required by Rule 30a-2(a) under the Investment Company Act of 1940. |
(3) Not applicable.
(b) | Exhibit 99.906CERT | Certifications pursuant to Section 906 of the Sarbanes-Oxley Act of 2002 and required by Rule 30a-2(b) under the Investment Company Act of 1940. |
| | |
| Exhibit 99.REPT | Report of Independent Registered Public Accounting Firm |
SIGNATURES
Pursuant to the requirements of the Securities Exchange Act of 1934 and the Investment Company Act of 1940, the registrant has duly caused this report to be signed on its behalf by the undersigned, thereunto duly authorized.
| Mutual of America Investment Corporation | | |
| | | |
By: | /s/ JOHN R. GREED | | |
| John R. Greed | | |
| Chairman of the Board, | | |
| President and Chief Executive Officer of | | |
| Mutual of America Investment Corporation | | |
Date: March 7, 2011
Pursuant to the requirements of the Securities Exchange Act of 1934 and the Investment Company Act of 1940, this report has been signed below by the following persons on behalf of the registrant and in the capacities and on the dates indicated.
By: | /s/ JOHN R. GREED | | |
| John R. Greed | | |
| Chairman of the Board, | | |
| President and Chief Executive Officer of | | |
| Mutual of America Investment Corporation | | |
| | | |
Date: March 7, 2011 | | |
| | |
By: | /s/ GEORGE L. MEDLIN | | |
| George L. Medlin | | |
| Executive Vice President, | | |
| Chief Financial Officer and Treasurer of | | |
| Mutual of America Investment Corporation | | |
| | | |
Date: March 7, 2011 | | |