UNITED STATES
SECURITIES AND EXCHANGE COMMISSION
Washington, D.C. 20549
FORM N-CSR
CERTIFIED SHAREHOLDER REPORT OF REGISTERED
MANAGEMENT INVESTMENT COMPANIES
Investment Company Act file number | 811-05084 |
|
Mutual of America Investment Corporation |
(Exact name of registrant as specified in charter) |
|
320 Park Avenue, New York, N.Y. | | 10022 |
(Address of principal executive offices) | | (Zip code) |
|
John R. Greed
Executive Vice President and Treasurer
Mutual of America Life Insurance Company
320 Park Avenue
New York, NY 10022 |
(Name and address of agent for service) |
|
Registrant’s telephone number, including area code: | (212) 224-1600 | |
|
Date of fiscal year end: | December 31 | |
|
Date of reporting period: | December 31, 2006 | |
| | | | | | | | |
ITEM 1. REPORTS TO STOCKHOLDERS.
The Annual Report to Shareholders follows:
ANNUAL REPORTS OF
MUTUAL OF AMERICA INVESTMENT CORPORATION
AND
FIDELITY INVESTMENTS® VARIABLE INSURANCE
PRODUCT FUNDS
DECEMBER 31, 2006
This report is not to be construed as an offering for sale of any Variable Policy. No offering is made except in conjunction with a prospectus which must precede or accompany this report.
VOLUME I
CONTENTS
| Volume I | | Page | |
| Annual Report of Mutual of America Investment Corporation | |
|
| President's Message | | | 1 | | |
|
| Portfolio Management Discussions | | | 4 | | |
|
| Asset Allocations | | | 17 | | |
|
| Expense Example | | | 20 | | |
|
| Summary Portfolios of Investments in Securities: | |
|
| Equity Index Fund | | | 24 | | |
|
| All America Fund | | | 26 | | |
|
| Small Cap Value Fund | | | 30 | | |
|
| Small Cap Growth Fund | | | 32 | | |
|
| Mid Cap Value Fund | | | 34 | | |
|
| Mid-Cap Equity Index Fund | | | 36 | | |
|
| Composite Fund | | | 38 | | |
|
| Conservative Allocation Fund | | | 41 | | |
|
| Moderate Allocation Fund | | | 41 | | |
|
| Aggressive Allocation Fund | | | 41 | | |
|
| Money Market Fund | | | 42 | | |
|
| Mid-Term Bond Fund | | | 44 | | |
|
| Bond Fund | | | 47 | | |
|
| Statements of Assets and Liabilities | | | 50 | | |
|
| Statements of Operations | | | 52 | | |
|
| Statements of Changes in Net Assets | | | 54 | | |
|
| Financial Highlights | | | 58 | | |
|
| Notes to Financial Statements | | | 64 | | |
|
| Additional Information | | | 74 | | |
|
Annual Report of Fidelity Investments® Variable Insurance Products Funds: Equity-Income Portfolio
Annual Report of Fidelity Investments® Variable Insurance Products Funds: Asset ManagerSM Portfolio
Annual Report of Fidelity Investments® Variable Insurance Products Funds: Contrafund Portfolio
Annual Report of Fidelity Investments® Variable Insurance Products Funds: Mid Cap Portfolio
Annual Report of Vanguard Variable Insurance Fund: Diversified Value Portfolio
Annual Report of Vanguard Variable Insurance Fund: International Portfolio
Annual Report of DWS Variable Series I: Bond Portfolio
Annual Report of DWS Variable Series I: Capital Growth Portfolio
Annual Report of DWS Variable Series I: International Portfolio
Annual Report of Oppenheimer Main Street Fund®/VA
Annual Report of VP Capital Appreciation Fund of American Century Variable Portfolios, Inc.
Annual Report of Calvert Social Balanced Portfolio of Calvert Variable Series, Inc.
MUTUAL OF AMERICA INVESTMENT CORPORATION
We are pleased to present to you the Mutual of America Investment Corporation (the "Investment Company") Annual Report for the year ended December 31, 2006. This Annual Report includes important information regarding the performance and financial positions of the Investment Company's funds during 2006.
The S&P 500® Index (the "Index") advanced 13.6% in 2006, based on price. The Index moved up steadily through the first four months of the year, but then gave back most of those gains over the next two months. However, during the second half of the year, the Index more than made up for its losses and gained 11.7%. What changed between the first half and the second half of the year? Essentially, the market developed a greater sense of certainty over the future course of the economy, interest rates and inflation. Not absolute certainty, but a rising level of confidence that the path of interest rates, and then oil, was becoming more discernable.
In 2006, the Federal Reserve (the "Fed") raised the Federal Funds target rate four times to 5.25%. The last increase was on June 29, when the Fed announced its 17th consecutive 25-basis-point increase in the Federal Funds rate over the last two years. Importantly, though, the text of the commentary that accompanied the rate announcement noted a slowdown in economic growth, a bit less concern about inflationary forces, and a repeat of a commitment to make future decisions based on how subsequently reported data unfolded. The statement seemed much more balanced, and conveyed a more sanguine tone, than earlier releases. The bond market responded with a rally that drove the 10-Year Treasury note from an annual peak of 5.25% registered on the day before the Fed's June announcement to an interim trough of 4.92% on the day before the Fed's August meeting announcement.
On August 8, the Fed announced that it was keeping the Federal Funds rate at 5.25%, confirming the bond market's expectation of at least a "pause" in the regimen of rate increases. Ironically, August 8 was the same day that the price per barrel of oil hit an all-time record high of $76.98. While cause and effect would be hard to prove, the irony is probably related to at least a market-sentiment connection. In any event, the 10-Year Treasury note proceeded to drop from 4.92% to an annual low of 4.43% in early December, while the price of oil plummeted over 20% through mid-November to $55.81 per barrel. As already noted, stocks responded by advancing more than 10% over the remainder of the year.
The positive behavior of the markets over the second half of 2006 was consistent with our mid-year suggestion that the economy was heading for a "soft landing," defined as a slowdown in growth for an interim period before reaccelerating, and avoiding recession. That outlook envisioned an imminent end to interest-rate increases in the face of clearly unfolding downturns in housing and autos. The reversal in oil prices was an added plus, because it signaled reduced pressure on consumer incomes and on the general level of inflation, thus supporting a Fed "pause" in rate increases.
The subsequent economic data have confirmed a growth slowdown. Second-quarter GDP came in at 2.6%, down from 5.6% in the first quarter, as noted in our mid-year report. Third-quarter GDP came in at the reduced pace of 2.0%, and was originally reported as 1.6%. Such slowdowns are generally accompanied by reduced inflation, and such was the case as the GDP Price Index registered an annualized rate of 1.9% for the third quarter versus the 3.3% reported for the second quarter. However, the preliminary report for the fourth quarter of 2006, released in mid-February 2007, reported GDP growth of 3.5%, with inflation actually declining to 1.5% on an annualized rate. A pick-up in growth and a reduction in inflation! The best an economy, an economist, and especially, a Federal Reserve Board Member could hope for!
But that's the past. Markets are always focused on the future, attempting to discern the prospective course of factors that determine the direction and magnitude of change.
Our best thinking at this time argues that U.S. economic growth has settled into a growth path in line with our nation's productive capacity, thought to be about 2.5% to 3.0% GDP growth. Annualized GDP growth for 2005 and 2006 came in at 3.2% and 3.4%, respectively. Most of the drivers behind that growth remain in place, including: (1) a consumer that keeps spending even in the face of higher gasoline prices and a weakening housing market; (2) a business sector that has continued to make capital investments at a solid pace while maintaining healthy balance sheets; (3) a government that has fostered such investment through liberal tax policy and supplemental spending on defense; and (4) a global economy that continues to expand robustly, driven largely by China, India and the rest of Asia, with an assist from an improving Europe. And the deflationary effects of this globalizing economy are helping to keep our own domestic inflation under cont rol.
Sustained, non-inflationary growth is the ultimate goal of any economy, whether national or worldwide. At this moment, we seem to be experiencing just such a favorable environment. However, things change, change yields risk, and risk generally means trouble for markets. What could go wrong?
China's economy could falter, whether in response to a crisis within its financial system, unrest and dissent among those in its citizenry who have either been hurt by, or not benefited from, the tremendous economic growth
1
that nation has experienced over the last decade, or external pressures that result in disruption to international trade or currency markets. The probability of this latter scenario is heightened by the buildup of huge currency — especially U.S. dollar — reserves by China as a result of its success in export markets. If China were to precipitate a large and rapid decline in the dollar through attempts to diversify its reserve holdings, the entire global economic and financial system would feel the reverberations. There is no doubt that China has been the engine of global growth during this expansion, and anything that disrupts that growth in the future will have tremendous ramifications for all economies throughout the world. That is the new reality, and therein lies a continuing risk.
Far less dramatic, but still a risk, would be a failure of the current Japanese, European or U.S. expansions, especially the latter. A re-escalation in the price of oil would be one factor that could instigate a drag on these developed economies. Another is the possibility that the monetary authorities raise interest rates too far too quickly. Both Japan and Europe are in the midst of rate increase regimes, although so far the authorities in both regions have proceeded with caution and a much more discretionary sequence than the U.S. Federal Reserve has employed over the past two years.
And, of course, unfortunately, there remains the possibility of some international crisis with military implications, whether in the Middle East, Asia, or perhaps even Latin America, which has taken a decidedly anti-Western, anti-capitalist turn recently.
But markets always price assets (stocks, bonds, houses, etc.) in terms of an assessment of the risk to the potential return. It is our judgment that valuations in the stock and bond markets are not currently excessive, despite what is a very favorable outlook. Over the next six months, we believe the U.S. stock markets can continue their advance on the basis of continued, yet modest, earnings growth and a bit more willingness to pay for that advance through an upward tick in price-to-earnings multiples. That is not to say we won't have an interim correction, but we still expect stock prices to achieve new expansion highs. The bond market is likely to generate a return equivalent to its coupon, plus or minus 2%, given prospects for no change by the Federal Reserve in short-term rates, and perhaps a little volatility in price as sentiment shifts in response to new economic data as it is released. In other words, a good year, much like 2006, al though a bit more muted. As we move through the year, and investors begin to think about prospects for 2008, the same issues regarding the sustainability of growth and the outlook for inflation that we faced in the middle of 2006 should reemerge.
The views expressed in this Annual Report are subject to change at any time based on market and other conditions and should not be construed as a recommendation. This Report contains forward-looking statements, which speak only as of the date they were made and involve a number of risks and uncertainties that could cause actual results to differ materially from those expressed herein. Readers are cautioned not to place undue reliance on our forward-looking statements, as we assume no obligation to update these forward-looking statements. Readers assume any and all responsibility for any investment decision made as a result of the views expressed herein.
The total return performance for each of the Investment Company Funds is reflected below:
Total Returns — Year Ended December 31, 2006
| Equity Index Fund | | | +15.59 | % | |
| All America Fund | | | +15.74 | % | |
| Small Cap Value Fund | | | +17.68 | % | |
| Small Cap Growth Fund | | | +15.14 | % | |
| Mid Cap Value | | | +15.93 | % | |
| Mid-Cap Equity Index Fund | | | +10.10 | % | |
| Composite Fund | | | +10.80 | % | |
| Conservative Allocation Fund | | | + 6.96 | % | |
| Moderate Allocation Fund Fund | | | + 9.20 | % | |
| Aggressive Allocation Fund | | | +11.87 | % | |
| Money Market Fund | | | + 4.89 | % | |
| Mid-Term Bond Fund | | | + 4.22 | % | |
| Bond Fund | | | + 4.79 | % | |
The above total return performance figures do not reflect the deduction of respective Separate Account fees and expenses imposed by Mutual of America Life Insurance Company. All Fund performances presented throughout this report are historical, reflect the full reinvestment of dividends paid, and should not be considered indicative of future results.
2
On the pages immediately following are brief presentations and graphs for each Fund (except the Money Market Fund) which illustrate each Fund's respective:
• Historical total return achieved over specified periods, expressed as an average annual rate and as a cumulative rate;
• Equivalent in dollars of a $10,000 hypothetical investment at the beginning of each specified period; and
• Historical performance compared with an appropriate index.
Following that are graphical representations of the asset allocations of each Fund and an illustration of each Fund's operating expenses. The summarized portfolios of each Fund and financial statements are presented in the pages which then follow.
Thank you for your continued investment in our Funds.
Sincerely,

Manfred Altstadt
Chairman of the Board, President
and Chief Executive Officer
Mutual of America Investment Corporation
3
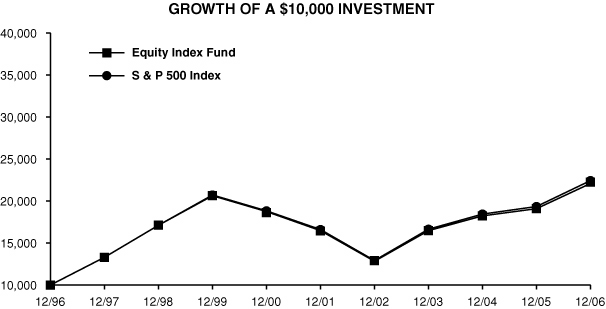
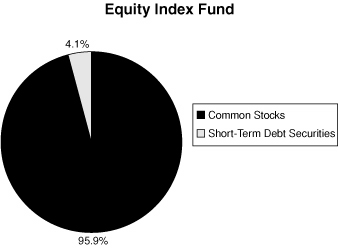
EQUITY INDEX FUND
The Equity Index Fund's objective is to replicate the performance of the S&P 500® Index (the "S&P 500"), which consists of 500 stocks chosen by Standard & Poor's for market size, liquidity and industry group representation. The S&P 500 is a market-weighted index of 500 stocks traded on the New York Stock Exchange, American Stock Exchange and Nasdaq, with each stock's weight in the index proportionate to its market value. The weightings make each company's influence on the S&P 500's performance directly proportional to that company's market value.
The S&P 500 had a total return of 15.79% for 2006; in fact, all major indices posted double-digit returns. In the large-cap space, Telecommunication Services was the best-performing sector, posting a 36% total return, followed closely by Energy and Utilities. The rally in the fourth quarter caused overall market gains, and all sectors ended 2006 in positive territory.
The Equity Index Fund's performance for the 12 months ended December 31, 2006 was 15.59%, in line with the benchmark return of 15.79%. Note that the Equity Index Fund's performance includes expenses, such as transaction costs and management fees, which are not applicable to the benchmark.
Equity Index Fund
| Period | | Growth | | Total Return | |
Ended
12/31/06 | | of
$10,000 | | Cumu-
lative | | Average
Annual | |
| 1 Year | | $ | 11,560 | | | | 15.60 | % | | | 15.60 | % | |
| 5 Years | | $ | 13,401 | | | | 34.01 | % | | | 6.03 | % | |
| 10 Years | | $ | 22,105 | | | | 121.05 | % | | | 8.26 | % | |
S & P 500 Index
| Period | | Growth | | Total Return | |
Ended
12/31/06 | | of
$10,000 | | Cumu-
lative | | Average
Annual | |
| 1 Year | | $ | 11,579 | | | | 15.79 | % | | | 15.79 | % | |
| 5 Years | | $ | 13,502 | | | | 35.02 | % | | | 6.19 | % | |
| 10 Years | | $ | 22,443 | | | | 124.43 | % | | | 8.42 | % | |
The line representing the performance return of the Equity Index Fund includes expenses, such as transaction costs and management fees that reduce returns, while the performance return line of the Index does not.
4
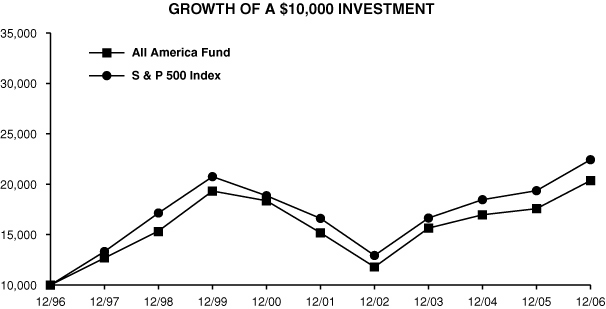
ALL AMERICA FUND
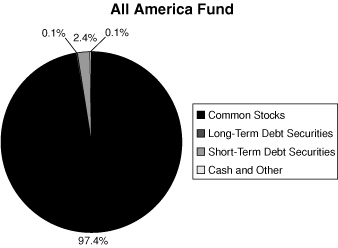
The investment objective of the All America Fund is to outperform the S&P 500® Index (the "S&P 500"). The All America Fund is approximately 60% invested in the 500 stocks that comprise the S&P 500 with the remaining 40% actively managed, using four different investment approaches. The actively managed portion of the All America Fund is approximately equally distributed among large-cap growth, small- and mid-cap growth, large-cap value and small- and mid-cap value.
The U.S. equity markets performed well in 2006, as discussed in the President's Letter. Large and mid-cap stocks underperformed small stocks - the S&P 500 finished the year up 15.79% and the S&P MidCap 400© Index was up 10.32%, while the Russell 2000® Index (representative of the small-cap universe) was up 18.37%. On a style basis, value outperformed growth in all capitalizations.
The All America Fund's return for the 12 months ended December 31, 2006 was 15.74% versus the benchmark return of 15.79%, in line with the index. Note that the All America Fund's performance includes expenses, such as transaction costs and management fees, which are not applicable to the benchmark.
All America Fund*
| Period | | Growth | | Total Return | |
Ended
12/31/06 | | of
$10,000 | | Cumu-
lative | | Average
Annual | |
| 1 Year | | $ | 11,574 | | | | 15.74 | % | | | 15.74 | % | |
| 5 Years | | $ | 13,412 | | | | 34.12 | % | | | 6.05 | % | |
| 10 Years | | $ | 20,363 | | | | 103.63 | % | | | 7.37 | % | |
S & P 500 INDEX
| Period | | Growth | | Total Return | |
Ended
12/31/06 | | of
$10,000 | | Cumu-
lative | | Average
Annual | |
| 1 Year | | $ | 11,579 | | | | 15.79 | % | | | 15.79 | % | |
| 5 Years | | $ | 13,502 | | | | 35.02 | % | | | 6.19 | % | |
| 10 Years | | $ | 22,443 | | | | 124.43 | % | | | 8.42 | % | |
The line representing the performance return of the All America Fund includes expenses, such as transaction costs and management fees that reduce returns, while the performance return line of the Index does not.
5
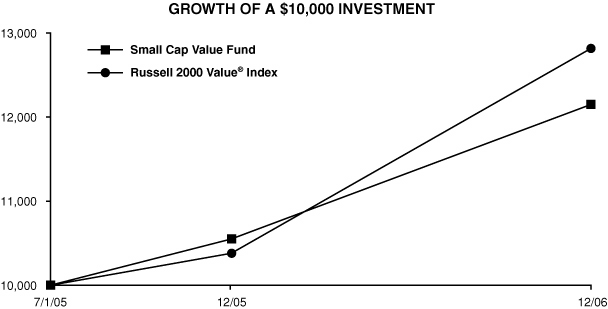
SMALL CAP VALUE FUND
The investment objective of the Small Cap Value Fund is to outperform the Russell 2000 Value® Index. The Small Cap Value Fund generally invests in companies that are below $3 billion in market capitalization and have lower price-to-book characteristics than the overall market.
For the year ending December 31, 2006, the best-performing sectors within the benchmark were Materials, REITs and Retail. The worst-performing sectors were Insurance, Finance and Consumer Discretionary.
For the year ending December 31, 2006, the Small Cap Value Fund returned 17.68% versus a 23.48% return for the Russell 2000 Value® Index. Stock selection was the primary driver of the performance trailing the benchmark. Sectors contributing to Fund performance included Industrials, Materials, and REITs, while sectors detracting from Fund performance included Consumer Cyclical, Technology, and Retail.
Small Cap Value Fund
| Period | | Growth | | Total Return | |
Ended
12/31/06 | | of
$10,000 | | Cumu-
lative | | Average
Annual | |
| 1 Year | | $ | 11,768 | | | | 17.68 | % | | | 17.68 | % | |
Since 7/1/05
(Inception) | | $ | 12,664 | | | | 26.64 | % | | | 17.05 | % | |
Russell 2000 Value Index
| Period | | Growth | | Total Return | |
Ended
12/31/06 | | of
$10,000 | | Cumu-
lative | | Average
Annual | |
| 1 Year | | $ | 11,335 | | | | 23.48 | % | | | 23.48 | % | |
Since 7/1/05
(Inception) | | $ | 12,245 | | | | 28.15 | % | | | 17.98 | % | |
The line representing the performance return of the Small Cap Value Fund includes expenses, such as transaction costs and management fees that reduce returns, while the performance return line of the Index does not.
6
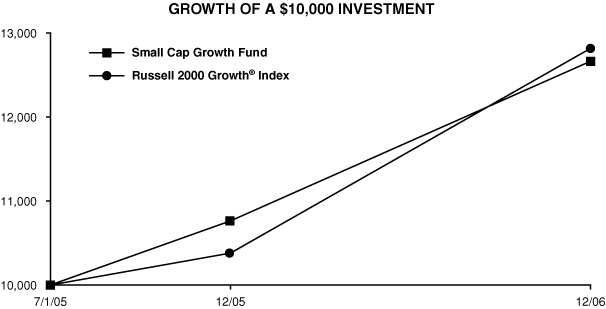
SMALL CAP GROWTH FUND
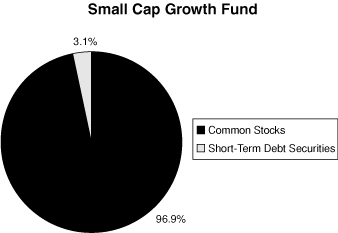
The investment objective of the Small Cap Growth Fund is capital appreciation. The Small Cap Growth Fund invests in growth stocks within the small capitalization marketplace. The Fund returned 15.14% during the year ended December 31, 2006. The Fund's benchmark, the Russell 2000 Growth® Index, returned 13.35% for the year.
The Small Cap Growth Fund outperformed its benchmark, due to stock selection in the Healthcare, Materials and Industrial sectors. The Utilities sector was the best-performing sector in the small-capitalization growth segment of the equity marketplace, although it is one of the smallest sectors in this segment. Equity returns in the small-capitalization growth marketplace were somewhat dependent on having competitive performance in the Information Technology, Industrial and Consumer Discretionary sectors. These three sectors are among the largest sectors in the small-capitalization growth equity segment, which significantly contributed to the attractive results that this equity segment produced for the year.
Small Cap Growth Fund
| Period | | Growth | | Total Return | |
Ended
12/31/06 | | of
$10,000 | | Cumu-
lative | | Average
Annual | |
| 1 Year | | $ | 11,514 | | | | 15.14 | % | | | 15.14 | % | |
Since 7/1/05
(Inception) | | $ | 12,148 | | | | 21.48 | % | | | 13.85 | % | |
Russell 2000 Growth Index
| Period | | Growth | | Total Return | |
Ended
12/31/06 | | of
$10,000 | | Cumu-
lative | | Average
Annual | |
| 1 Year | | $ | 11,335 | | | | 13.35 | % | | | 13.35 | % | |
Since 7/1/05
(Inception) | | $ | 12,245 | | | | 22.45 | % | | | 14.46 | % | |
The line representing the performance return of the Small Cap Growth Fund includes expenses, such as transaction costs and management fees that reduce returns, while the performance return line of the Index does not.
7
MID-CAP VALUE FUND
The investment objective of the Mid Cap Value Fund is to outperform the Russell Mid Cap Value® Index. The Mid Cap Value Fund generally invests in companies that are between $1 billion and $20 billion in market capitalization and have lower price-to-book characteristics.
During the year ending December 31, 2006, the best-performing sectors within the benchmark were REITs, Retail and Consumer Staples. The worst-performing sectors were Consumer Healthcare, Consumer Cyclical and Energy.
For the year ending December 31, 2006, the Mid Cap Value Fund returned 15.93% versus a 20.22% return for the Russell Mid Cap Value® Index. Stock selection was the primary driver of the performance trailing the benchmark. Sectors contributing to Mid Cap Value Fund performance included Materials, Technology and Finance, while sectors detracting from Mid Cap Value Fund performance included Retail, Industrial and Insurance.

Mid Cap Value Fund
| Period | | Growth | | Total Return | |
Ended
12/31/06 | | of
$10,000 | | Cumu-
lative | | Average
Annual | |
| 1 Year | | $ | 11,593 | | | | 15.93 | % | | | 15.93 | % | |
Since 7/1/05
(Inception) | | $ | 12,394 | | | | 23.94 | % | | | 15.39 | % | |
Russell Mid Cap Value Index
| Period | | Growth | | Total Return | |
Ended
12/31/06 | | of
$10,000 | | Cumu-
lative | | Average
Annual | |
| 1 Year | | $ | 12,022 | | | | 20.22 | % | | | 20.22 | % | |
Since 7/1/05
(Inception) | | $ | 12,835 | | | | 28.35 | % | | | 18.10 | % | |
The line representing the performance return of the Mid Cap Value Fund includes expenses, such as transaction costs and management fees that reduce returns, while the performance return line of the Index does not.
8
MID-CAP EQUITY INDEX FUND
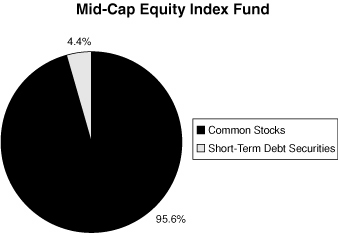
The Mid-Cap Equity Index Fund invests in the 400 stocks that comprise the S&P MidCap 400 Index (the "S&P MidCap 400"). The S&P MidCap 400 is a market-weighted index of 400 stocks traded on the New York Stock Exchange, American Stock Exchange and Nasdaq. The weightings make each company's influence on the S&P MidCap 400's performance directly proportional to that company's market value. The companies included in the S&P MidCap 400 tend to be typical of this asset class, the medium-capitalized sector of the U.S. securities market.
The S&P MidCap 400 underperformed the S&P 500® Index in 2006 for the first time in five years. Even though mid-cap stocks enjoyed the fifth straight year of double-digit growth with a total return of 10.32%, the S&P 500® Index surged ahead with a return of 15.79%. Telecommunication Services was the top-performing mid-cap sector, with a 48% return for the year. During the first half of 2006, Telecommunications was the only sector ending in negative territory, but rebounded strongly as investors bought higher-yielding stocks and felt the worst was over.
The Mid-Cap Equity Index Fund's performance for the 12-month period ending December 31, 2006 was 10.10%, in line with the 10.32% return of the S&P MidCap 400. Note that the performance of the Mid-Cap Equity Index Fund includes expenses, such as transaction costs and management fees, which are not applicable to the benchmark.
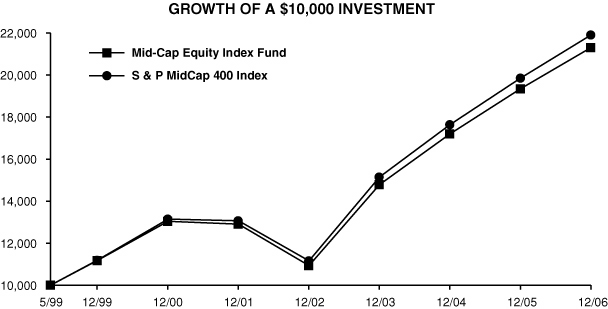
Mid-Cap Equity Index Fund
| Period | | Growth | | Total Return | |
Ended
12/31/06 | | of
$10,000 | | Cumu-
lative | | Average
Annual | |
| 1 Year | | $ | 11,010 | | | | 10.10 | % | | | 10.10 | % | |
| 5 Years | | $ | 16,510 | | | | 65.10 | % | | | 10.55 | % | |
Since 5/3/99
(Inception) | | $ | 21,298 | | | | 112.98 | % | | | 10.37 | % | |
S & P MidCap 400 Index
| Period | | Growth | | Total Return | |
Ended
12/31/06 | | of
$10,000 | | Cumu-
lative | | Average
Annual | |
| 1 Year | | $ | 11,032 | | | | 10.32 | % | | | 10.32 | % | |
| 5 Years | | $ | 16,770 | | | | 67.70 | % | | | 10.89 | % | |
Since 5/3/99
(Inception) | | $ | 21,899 | | | | 118.99 | % | | | 10.77 | % | |
The line representing the performance return of the Mid-Cap Equity Index Fund includes expenses, such as transaction costs and management fees that reduce returns, while the performance return line of the Index does not.
9
COMPOSITE FUND
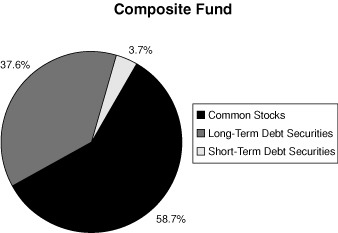
The Composite Fund invests in a diversified portfolio of common stocks and fixed-income securities, seeking appreciation and current income. The equity portion of the Composite Fund invests in stocks within the S&P 500® Index.
The S&P 500® Index had a total return of 15.79% for 2006, most of which occurred during the second half of the year. All sectors contributed positively to this performance, with the largest contributions coming from Financials and Energy, and the smallest from Materials and Utilities. Telecommunications Services actually had the greatest sector appreciation at 37.05%, but its small weight in the S&P 500 Index® reduced its overall contribution, relative to other sectors. The worst-performing sectors were Healthcare and Information Technology.
The equity portion of the Composite Fund maintains sector weights within plus or minus 100 basis points of the S&P 500 Index®, and does not take positions in individual stocks with overweights of more than 200 basis points. This structural discipline produces a relatively low-risk portfolio that emphasizes stock selection based on strong fundamental analysis. In 2006, the equity portion of the Fund returned 15.50% versus 15.79% for the S&P 500 Index®.
The 2006 bond market was characterized by rising interest rates, a flat yield curve, and tightening credit spreads. Concern about inflation caused the Federal Reserve to raise the Federal Funds rate four times during the first half of 2006. This resulted in an inverted yield curve that persisted through year-end. For the year, 90-Day Treasury Bills rose from 4.07% to 5.01%, an increase of 94 basis points. Long Treasury rates rose only 27 basis points, from 4.54% to 4.81%, which left them 20 basis points lower than short rates.
The fixed-income portion of the Composite Fund maintained a duration that was slightly shorter than the Lehman Brothers Aggregate Bond Index® because of inflation concerns. This helped returns, as did an emphasis on higher-yielding bonds whose spreads tightened during the year. To minimize credit risk, corporate maturities of less than seven years were emphasized and new holdings were limited to .005% of the portfolio. For the year, the fixed-income portion of the Composite Fund returned 5.09% versus 4.33% for the Lehman Brothers Aggregate Bond Index®.
For the 12 months ended December 31, 2006, the Composite Fund returned 10.80%, compared to the weighted benchmark return of 11.21%, 40% of which is based on the Lehman Brothers Aggregate Bond Index® and 60% of which is based on the S&P 500 Index®. This slight underperformance was entirely due to Composite Fund expenses, such as transaction costs and management fees, which are not applicable to the weighted benchmark.

10
COMPOSITE FUND (Continued)
Composite Fund
| Period | | Growth | | Total Return | |
Ended
12/31/06 | | of
$10,000 | | Cumu-
lative | | Average
Annual | |
| 1 Year | | $ | 11,080 | | | | 10.80 | % | | | 10.80 | % | |
| 5 Years | | $ | 13,010 | | | | 30.10 | % | | | 5.40 | % | |
| 10 Years | | $ | 17,872 | | | | 78.72 | % | | | 5.98 | % | |
S & P 500 Index
| Period | | Growth | | Total Return | |
Ended
12/31/06 | | of
$10,000 | | Cumu-
lative | | Average
Annual | |
| 1 Year | | $ | 11,579 | | | | 15.79 | % | | | 15.79 | % | |
| 5 Years | | $ | 13,502 | | | | 35.02 | % | | | 6.19 | % | |
| 10 Years | | $ | 22,443 | | | | 124.43 | % | | | 8.42 | % | |
Lehman Bros. Aggregate Bond Index
| Period | | Growth | | Total Return | |
Ended
12/31/06 | | of
$10,000 | | Cumu-
lative | | Average
Annual | |
| 1 Year | | $ | 10,433 | | | | 4.33 | % | | | 4.33 | % | |
| 5 Years | | $ | 12,800 | | | | 28.00 | % | | | 5.06 | % | |
| 10 Years | | $ | 18,311 | | | | 83.11 | % | | | 6.24 | % | |
Citigroup 3-Month T-Bill Index
| Period | | Growth | | Total Return | |
Ended
12/31/06 | | of
$10,000 | | Cumu-
lative | | Average
Annual | |
| 1 Year | | $ | 10,476 | | | | 4.76 | % | | | 4.76 | % | |
| 5 Years | | $ | 11,228 | | | | 12.28 | % | | | 2.34 | % | |
| 10 Years | | $ | 14,341 | | | | 43.41 | % | | | 3.67 | % | |
The line representing the performance return of the Composite Fund includes expenses, such as transaction costs and management fees that reduce returns, while the performance return lines of the Indices do not.
11
CONSERVATIVE ALLOCATION FUND
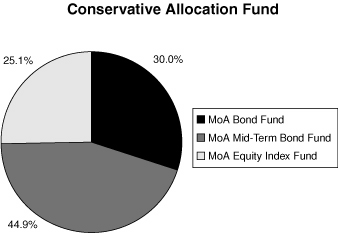
The objective of the Conservative Allocation Fund is current income and, to a lesser extent, capital appreciation. The Conservative Allocation Fund invests primarily in the fixed-income funds of the Investment Company and also invests in an equity fund of the Investment Company. The Conservative Allocation Fund's target allocation is approximately 75% of net assets in fixed-income funds (approximately 30% in the Bond Fund and approximately 45% in the Mid-Term Bond Fund) and approximately 25% of net assets in equity funds (the Equity Index Fund).
Performance for the Conservative Allocation Fund is compared to the Lehman Brothers Aggregate Bond Index® (75% weighting) and the S&P 500® Index (25% weighting). For the 12 months ended December 31, 2006, the Conservative Allocation Fund returned 6.96% versus a 7.20% return in the weighted benchmark. The small underperformance of the Conservative Allocation Fund is mainly attributable to the Fund's expenses, which are not reflected in the weighted benchmark's return.

Conservative Allocation Fund
| Period | | Growth | | Total Return | |
Ended
12/31/06 | | of
$10,000 | | Cumu-
lative | | Average
Annual | |
| 1 Year | | $ | 10,696 | | | | 6.96 | % | | | 6.96 | % | |
Since 5/20/03
(Inception) | | $ | 12,068 | | | | 20.68 | % | | | 5.34 | % | |
S & P 500 Index
| Period | | Growth | | Total Return | |
Ended
12/31/06 | | of
$10,000 | | Cumu-
lative | | Average
Annual | |
| 1 Year | | $ | 11,579 | | | | 15.79 | % | | | 15.79 | % | |
Since 5/20/03
(Inception) | | $ | 16,443 | | | | 64.43 | % | | | 14.75 | % | |
Lehman Bros. Aggregate Bond Index
| Period | | Growth | | Total Return | |
Ended
12/31/06 | | of
$10,000 | | Cumu-
lative | | Average
Annual | |
| 1 Year | | $ | 10,433 | | | | 4.33 | % | | | 4.33 | % | |
Since 5/20/03
(Inception) | | $ | 11,192 | | | | 11.92 | % | | | 3.16 | % | |
The line representing the performance return of the Conservative Allocation Fund includes expenses, such as transaction costs and management fees in the underlying funds that reduce returns, while the performance return line of the Indicies do not.
12
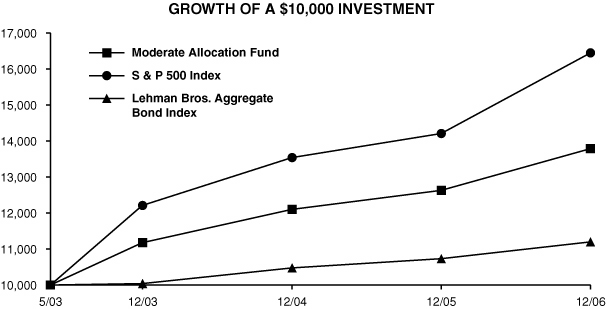
MODERATE ALLOCATION FUND
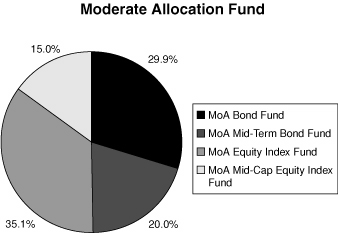
The objective of the Moderate Allocation Fund is capital appreciation and current income. The Moderate Allocation Fund invests in the equity and fixed-income funds of the Investment Company. The Moderate Allocation Fund's target allocation is approximately 50% of net assets in equity funds (approximately 35% of its net assets in the Equity Index Fund and approximately 15% of its net assets in the Mid-Cap Equity Index Fund) and approximately 50% of net assets in fixed-income funds (approximately 30% of its net assets in the Bond Fund and approximately 20% of its net assets in the Mid-Term Bond Fund).
Performance for the Moderate Allocation Fund is compared to the S&P 500® Index (50% weighting) and the Lehman Brothers Aggregate Bond Index® (50% weighting). For the 12 months ending December 31, 2006, the Moderate Allocation Fund returned 9.20% versus a 10.06% return for the weighted benchmark. The underperformance of the Moderate Allocation Fund was due largely to the Mid-Cap Equity Index Fund underperforming the stock component of the weighted benchmark, as well as the Moderate Allocation Fund's expenses, which are not reflected in the weighted benchmark's return.
| Moderate Allocation Fund | |
| Period | | Growth | | Total Return | |
Ended
12/31/06 | | of
$10,000 | | Cumu-
lative | | Average
Annual | |
| 1 Year | | $ | 10,920 | | | | 9.20 | % | | | 9.20 | % | |
Since 5/20/03
(Inception) | | $ | 13,786 | | | | 37.86 | % | | | 9.29 | % | |
| S & P 500 Index | |
| Period | | Growth | | Total Return | |
Ended
12/31/06 | | of
$10,000 | | Cumu-
lative | | Average
Annual | |
| 1 Year | | $ | 11,579 | | | | 15.79 | % | | | 15.79 | % | |
Since 5/20/03
(Inception) | | $ | 16,443 | | | | 64.43 | % | | | 14.75 | % | |
| Lehman Bros. Aggregate Bond Index | |
| Period | | Growth | | Total Return | |
Ended
12/31/06 | | of
$10,000 | | Cumu-
lative | | Average
Annual | |
| 1 Year | | $ | 10,433 | | | | 4.33 | % | | | 4.33 | % | |
Since 5/20/03
(Inception) | | $ | 11,192 | | | | 11.92 | % | | | 3.16 | % | |
The line representing the performance return of the Moderate Allocation Fund includes expenses, such as transaction costs and management fees in the underlying funds that reduce returns, while the performance return line of the Indicies do not.
13
AGGRESSIVE ALLOCATION FUND
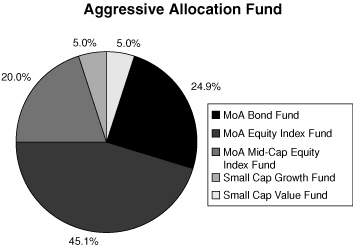
The objective of the Aggressive Allocation Fund is capital appreciation and, to a lesser extent, current income. The Aggressive Allocation Fund invests in the equity and fixed-income funds of the Investment Company. The Aggressive Allocation Fund's target allocation is approximately 75% of net assets in equity funds (approximately 45% of its net assets in the Equity Index Fund, approximately 20% of its net assets in the Mid-Cap Equity Index Fund, approximately 5% of its net assets in the Small Cap Value Fund and approximately 5% of its net assets in the Small Cap Growth Fund) and approximately 25% of net assets in fixed-income funds (approximately 25% of its net assets in the Bond Fund).
Performance for the Aggressive Allocation Fund is compared to the S&P 500 Index® (75% weighting) and the Lehman Brothers Aggregate Bond Index® (25% weighting). For the 12 months ending December 31, 2006, the Aggressive Allocation Fund returned 11.87% versus a 12.92% return for the weighted benchmark. The underperformance was mainly due to the Mid-Cap Equity Index Fund component and, to a lesser extent, the small-capitalization stock exposure of the Aggressive Allocation Fund underperforming the benchmark's stock component, which is a large-capitalization stock index.

| Aggressive Allocation Fund | |
| Period | | Growth | | Total Return | |
Ended
12/31/06 | | of
$10,000 | | Cumu-
lative | | Average
Annual | |
| 1 Year | | $ | 11,187 | | | | 11.87 | % | | | 11.87 | % | |
Since 5/20/03
(Inception) | | $ | 15,514 | | | | 55.14 | % | | | 12.92 | % | |
| S & P 500 Index | |
| Period | | Growth | | Total Return | |
Ended
12/31/06 | | of
$10,000 | | Cumu-
lative | | Average
Annual | |
| 1 Year | | $ | 11,579 | | | | 15.79 | % | | | 15.79 | % | |
Since 5/20/03
(Inception) | | $ | 16,443 | | | | 64.43 | % | | | 14.75 | % | |
| Lehman Bros. Aggregate Bond Index | |
| Period | | Growth | | Total Return | |
Ended
12/31/06 | | of
$10,000 | | Cumu-
lative | | Average
Annual | |
| 1 Year | | $ | 10,433 | | | | 4.33 | % | | | 4.33 | % | |
Since 5/20/03
(Inception) | | $ | 11,192 | | | | 11.92 | % | | | 3.16 | % | |
The line representing the performance return of the Aggressive Allocation Fund includes expenses, such as transaction costs and management fees in the underlying funds that reduce returns, while the performance return line of the Indicies do not.
14
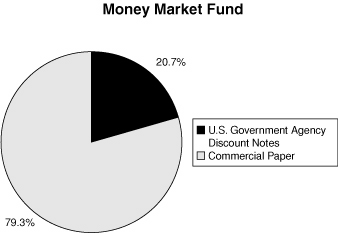
MONEY MARKET FUND
The Money Market Fund's investment objective is to realize current income while maintaining liquidity, investment quality and stability of capital through investing in high-quality commercial paper issued by U.S. corporations and securities issued by the U.S. government and its agencies. The Fund returned 4.89% for the 12 months ended December 31, 2006, compared to a 4.76% return for the Citigroup Three-Month Treasury Bill Index.
Short-term rates moved higher during the first half of 2006 as the Federal Reserve raised the Federal Funds rate four more times, bringing it to 5.25% from 4.25% at the beginning of the year. The seven-day effective yield as of February 13, 2006 was 5.20%. As with all performance reporting, this yield is not necessarily indicative of future annual yields. Neither the Federal Deposit Insurance Corporation nor any other U.S. Government Agency insures or guarantees the Separate Account's investments in shares of the Money Market Fund.
MID-TERM BOND FUND
The Mid-Term Bond Fund seeks a high level of return consistent with the preservation of capital through investment in publicly traded debt securities. The Mid-Term Bond Fund primarily invests in corporate and U.S. Government agency securities, which normally yield more than U.S. Treasury issues.
The Mid-Term Bond Fund continued to emphasize Agency issues and to underweight Treasury and corporate bonds during 2006. So long as credit spreads are compressed and Agency yields are similar to corporates, this position will be retained. The Mid-Term Bond Fund also maintains extreme diversification in its credit exposure in order to minimize event risk.
For the 12 months ended December 31, 2006, the Mid-Term Bond Fund returned 4.22%, compared to 4.35% for the Citigroup Government/Corporate 3-7 Year Bond Index. The Mid-Term Bond Fund's shorter duration and holdings of higher-yielding corporate issues contributed to outperformance on a pre-expense basis. However, after transaction costs and management fees, the Mid-Term Bond Fund slightly underperformed its index return.

| Mid-Term Bond Fund | |
| Period | | Growth | | Total Return | |
Ended
12/31/06 | | of
$10,000 | | Cumu-
lative | | Average
Annual | |
| 1 Year | | $ | 10,422 | | | | 4.22 | % | | | 4.22 | % | |
| 5 Years | | $ | 12,102 | | | | 21.02 | % | | | 3.89 | % | |
| 10 Years | | $ | 16,218 | | | | 62.18 | % | | | 4.95 | % | |
| Citigroup 3-7 Year Bond Index | |
| Period | | Growth | | Total Return | |
Ended
12/31/06 | | of
$10,000 | | Cumu-
lative | | Average
Annual | |
| 1 Year | | $ | 10,435 | | | | 4.35 | % | | | 4.35 | % | |
| 5 Years | | $ | 12,704 | | | | 27.04 | % | | | 4.90 | % | |
| 10 Years | | $ | 18,139 | | | | 81.39 | % | | | 6.13 | % | |
The line representing the performance return of the Mid-Term Bond Fund includes expenses, such as transaction costs and management fees that reduce returns, while the performance return line of the Index does not.
15
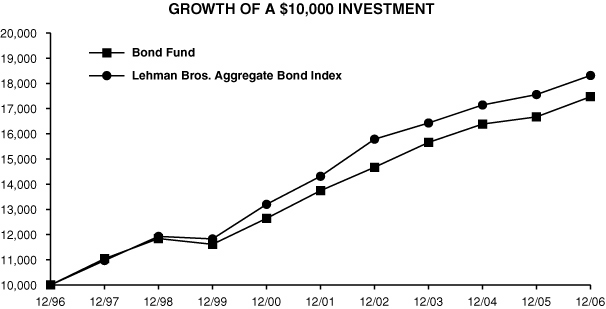
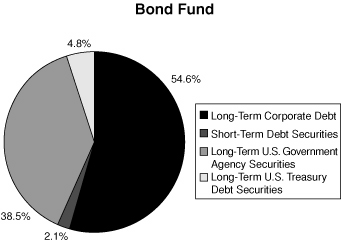
BOND FUND
The Bond Fund's primary investment objective is to provide as high a level of current income over time as is believed to be consistent with prudent investment risk by investing primarily in investment grade, publicly traded debt securities. A secondary objective is preservation of capital. The Bond Fund primarily invests in corporate, U.S. Government agency and mortgage-backed securities, all of which normally yield more than U.S. Treasury issues.
The 2006 bond market was characterized by rising interest rates, a flat yield curve and tightening credit spreads. Concern about inflation caused the Federal Reserve to raise the Federal Funds rate four times during the first half of the year. This resulted in an inverted yield curve that persisted through year-end. For the year, 90-Day Treasury Bills rose from 4.07% to 5.01%, an increase of 94 basis points. Long Treasury rates only rose 27 basis points, from 4.54% to 4.81%, which left them 20 basis points lower than short rates.
The Bond Fund's return for the year ended December 31, 2006 was 4.79%, compared to 4.33% for the Lehman Brothers Aggregate Bond Index®. The Bond Fund's strategy was to maintain a slightly shorter duration than its benchmark, put emphasis on relatively short corporate bonds with high yields, establish extreme credit diversification, and take a market weight in mortgage-related securities. So long as inflation is perceived as a threat, this strategy will be maintained in the Bond Fund.
| Bond Fund | |
| Period | | Growth | | Total Return | |
Ended
12/31/06 | | of
$10,000 | | Cumu-
lative | | Average
Annual | |
| 1 Year | | $ | 10,479 | | | | 4.79 | % | | | 4.79 | % | |
| 5 Years | | $ | 12,713 | | | | 27.13 | % | | | 4.92 | % | |
| 10 Years | | $ | 17,467 | | | | 74.67 | % | | | 5.74 | % | |
| Lehman Bros. Aggregate Bond Index | |
| Period | | Growth | | Total Return | |
Ended
12/31/06 | | of
$10,000 | | Cumu-
lative | | Average
Annual | |
| 1 Year | | $ | 10,433 | | | | 4.33 | % | | | 4.33 | % | |
| 5 Years | | $ | 12,800 | | | | 28.00 | % | | | 5.06 | % | |
| 10 Years | | $ | 18,311 | | | | 83.11 | % | | | 6.24 | % | |
The line representing the performance return of the Bond Fund includes expenses, such as transaction costs and management fees that reduce returns, while the performance return lines of the Indices do not.
16
MUTUAL OF AMERICA INVESTMENT CORPORATION
ASSET ALLOCATIONS AS OF DECEMBER 31, 2006 (Unaudited)


17
MUTUAL OF AMERICA INVESTMENT CORPORATION
ASSET ALLOCATIONS AS OF DECEMBER 31, 2006 (Unaudited) (Continued)

18
MUTUAL OF AMERICA INVESTMENT CORPORATION
ASSET ALLOCATIONS AS OF DECEMBER 31, 2006 (Unaudited) (Continued)
19
MUTUAL OF AMERICA INVESTMENT CORPORATION
EXPENSE EXAMPLE (Unaudited)
EXAMPLE
As a shareholder of one of the Mutual of America Investment Corporation Funds, you incur ongoing costs, including management fees and other Fund expenses. You do not incur transactional costs, such as sales charges (loads), redemption fees or exchange fees.
This Example is intended to help you understand your ongoing costs (in dollars) of investing in a Fund and to compare these costs with the ongoing costs of investing in other mutual funds. The Example is based on an investment of $1,000 invested at July 1, 2006 and held for the entire period ending December 31, 2006.
ACTUAL EXPENSES
The first line of the tables below provides information about actual account values and actual expenses. You may use the information in this line, together with the amount you invested, to estimate the expenses that you paid over the period. Simply divide your account value by $1,000 (for example, an $8,600 account value divided by $1,000=8.6), then multiply the result by the number in the first line under the heading entitled "Expenses Paid During Period" to estimate the expenses you paid on your account during this period.
HYPOTHETICAL EXAMPLE FOR COMPARISON PURPOSES
The second line of the tables below provides information about hypothetical account values and hypothetical expenses based on each Fund's actual expense ratio and an assumed rate of return of 5% per year before expenses, which is not the Fund's actual return. The hypothetical account values and expenses may not be used to estimate the actual ending account balance or expenses you paid for the period. You may use this information to compare the ongoing costs of investing in the Fund with other funds. To do so, compare this 5% hypothetical example with the 5% hypothetical examples that appear in the shareholder reports of the other funds.
Please note that the second line of the table is useful in comparing ongoing costs only, and will not help you determine the relative total costs of owning other funds, which may also charge transactional costs, such as sales charges (loads), redemption fees or exchange fees.
| Equity Index Fund | |
| | | Beginning
Account Value
July 1, 2006 | | Ending
Account Value
December 31, 2006 | | Expenses Paid
During Period*
July 1 –
December 31, 2006 | |
| Actual | | $ | 1,000.00 | | | $ | 1,26.36 | | | $ | 0.56 | | |
Hypothetical
(5% Return before Expenses) | | $ | 1,000.00 | | | $ | 1,024.36 | | | $ | 0.53 | | |
* Expenses are equal to the Fund's annual expense ratio of 0.10%, multiplied by the average account value over the period, multiplied by 184/365 (to reflect the one-half year period).
| All America Fund | |
| | | Beginning
Account Value
July 1, 2006 | | Ending
Account Value
December 31, 2006 | | Expenses Paid
During Period*
July 1 –
December 31, 2006 | |
| Actual | | $ | 1,000.00 | | | $ | 1,113.63 | | | $ | 2.34 | | |
Hypothetical
(5% Return before Expenses) | | $ | 1,000.00 | | | $ | 1,022.63 | | | $ | 2.24 | | |
* Expenses are equal to the Fund's annual expense ratio of 0.44%, multiplied by the average account value over the period, multiplied by 184/365 (to reflect the one-half year period).
20
MUTUAL OF AMERICA INVESTMENT CORPORATION
EXPENSE EXAMPLE (Unaudited) (Continued)
| Small Cap Value Fund | |
| | | Beginning
Account Value
July 1, 2006 | | Ending
Account Value
December 31, 2006 | | Expenses Paid
During Period*
July 1 –
December 31, 2006 | |
| Actual | | $ | 1,000.00 | | | $ | 1,076.50 | | | $ | 4.10 | | |
Hypothetical
(5% Return before expenses) | | $ | 1,000.00 | | | $ | 1,020.85 | | | $ | 3.99 | | |
* Expenses are equal to the Fund's annual expense ratio of 0.78%, multiplied by the average account value over the period, multiplied by 184/365 (to reflect the one-half year period).
| Small Cap Growth Fund | |
| | | Beginning
Account Value
July 1, 2006 | | Ending
Account Value
December 31, 2006 | | Expenses Paid
During Period*
July 1 –
December 31, 2006 | |
| Actual | | $ | 1,000.00 | | | $ | 1,081.30 | | | $ | 4.14 | | |
Hypothetical
(5% Return before expenses) | | $ | 1,000.00 | | | $ | 1,020.83 | | | $ | 4.02 | | |
* Expenses are equal to the Fund's annual expense ratio of 0.79%, multiplied by the average account value over the period, multiplied by 184/365 (to reflect the one-half year period).
| | | Beginning
Account Value
July 1, 2006 | | Ending
Account Value
December 31, 2006 | | Expenses Paid
During Period*
July 1 –
December 31, 2006 | |
| Actual | | $ | 1,000.00 | | | $ | 1,086.66 | | | $ | 3.39 | | |
Hypothetical
(5% Return before expenses) | | $ | 1,000.00 | | | $ | 1,021.57 | | | $ | 3.29 | | |
Mid-Cap Value Fund
* Expenses are equal to the Fund's annual expense ratio of 0.65%, multiplied by the average account value over the period, multiplied by 184/365 (to reflect the one-half year period).
| Mid-Cap Equity Index Fund | |
| | | Beginning
Account Value
July 1, 2006 | | Ending
Account Value
December 31, 2006 | | Expenses Paid
During Period*
July 1 –
December 31, 2006 | |
| Actual | | $ | 1,000.00 | | | $ | 1,057.32 | | | $ | 0.55 | | |
Hypothetical
(5% Return before expenses) | | $ | 1,000.00 | | | $ | 1,024.35 | | | $ | 0.55 | | |
* Expenses are equal to the Fund's annual expense ratio of 0.11%, multiplied by the average account value over the period, multiplied by 184/365 (to reflect the one-half year period).
21
MUTUAL OF AMERICA INVESTMENT CORPORATION
EXPENSE EXAMPLE (Unaudited) (Continued)
| Composite Fund | |
| | | Beginning
Account Value
July 1, 2006 | | Ending
Account Value
December 31, 2006 | | Expenses Paid
During Period*
July 1 –
December 31, 2006 | |
| Actual | | $ | 1,000.00 | | | $ | 1,088.68 | | | $ | 2.21 | | |
Hypothetical
(5% Return before Expenses) | | $ | 1,000.00 | | | $ | 1,022.74 | | | $ | 2.14 | | |
* Expenses are equal to the Fund's annual expense ratio of 0.42%, multiplied by the average account value over the period, multiplied by 184/365 (to reflect the one-half year period).
| Conservative Allocation Fund | |
| | | Beginning
Account Value
July 1, 2006 | | Ending
Account Value
December 31, 2006 | | Expenses Paid
During Period*
July 1 –
December 31, 2006 | |
| Actual | | $ | 1,000.00 | | | $ | 1,061.75 | | | $ | 1.73 | | |
Hypothetical
(5% Return before Expenses) | | $ | 1,000.00 | | | $ | 1,023.18 | | | $ | 1.70 | | |
* Expenses are equal to the Fund's annual expense ratio of 0.33% (reflecting the proportional expense ratios of the underlying funds in which the Fund invests), multiplied by the average account value over the period, multiplied by 184/365 (to reflect the one-half year period).
| Moderate Allocation Fund | |
| | | Beginning
Account Value
July 1, 2006 | | Ending
Account Value
December 31, 2006 | | Expenses Paid
During Period*
July 1 –
December 31, 2006 | |
| Actual | | $ | 1,000.00 | | | $ | 1,076.30 | | | $ | 1.34 | | |
Hypothetical
(5% Return before Expenses) | | $ | 1,000.00 | | | $ | 1,023.57 | | | $ | 1.31 | | |
* Expenses are equal to the Fund's annual expense ratio of 0.26% (reflecting the proportional expense ratios of the underlying funds in which the Fund invests), multiplied by the average account value over the period, multiplied by 184/365 (to reflect the one-half year period).
| Aggressive Allocation Fund | |
| | | Beginning
Account Value
July 1, 2006 | | Ending
Account Value
December 31, 2006 | | Expenses Paid
During Period*
July 1 –
December 31, 2006 | |
| Actual | | $ | 1,000.00 | | | $ | 1,088.78 | | | $ | 1.31 | | |
Hypothetical
(5% Return before Expenses) | | $ | 1,000.00 | | | $ | 1,023.61 | | | $ | 1.27 | | |
* Expenses are equal to the Fund's annual expense ratio of 0.25% (reflecting the proportional expense ratios of the underlying funds in which the Fund invests), multiplied by the average account value over the period, multiplied by 184/365 (to reflect the one-half year period).
22
MUTUAL OF AMERICA INVESTMENT CORPORATION
EXPENSE EXAMPLE (Unaudited) (Continued)
| Money Market Fund | |
| | | Beginning
Account Value
July 1, 2006 | | Ending
Account Value
December 31, 2006 | | Expenses Paid
During Period*
July 1 –
December 31, 2006 | |
| Actual | | $ | 1,000.00 | | | $ | 1,025.75 | | | $ | 0.89 | | |
Hypothetical
(5% Return before Expenses) | | $ | 1,000.00 | | | $ | 1,024.00 | | | $ | 0.89 | | |
* Expenses are equal to the Fund's annual expense ratio of 0.17%, multiplied by the average account value over the period, multiplied by 184/365 (to reflect the one-half year period).
| Mid-Term Bond Fund | |
| | | Beginning
Account Value
July 1, 2006 | | Ending
Account Value
December 31, 2006 | | Expenses Paid
During Period*
July 1 –
December 31, 2006 | |
| Actual | | $ | 1,000.00 | | | $ | 1,042.01 | | | $ | 2.12 | | |
Hypothetical
(5% Return before Expenses) | | $ | 1,000.00 | | | $ | 1,022.78 | | | $ | 2.10 | | |
* Expenses are equal to the Fund's annual expense ratio of 0.41%, multiplied by the average account value over the period, multiplied by 184/365 (to reflect the one-half year period).
| Bond Fund | |
| | | Beginning
Account Value
July 1, 2006 | | Ending
Account Value
December 31, 2006 | | Expenses Paid
During Period*
July 1 –
December 31, 2006 | |
| Actual | | $ | 1,000.00 | | | $ | 1,051.20 | | | $ | 2.10 | | |
Hypothetical
(5% Return before Expenses) | | $ | 1,000.00 | | | $ | 1,022.80 | | | $ | 2.08 | | |
* Expenses are equal to the Fund's annual expense ratio of 0.41%, multiplied by the average account value over the period, multiplied by 184/365 (to reflect the one-half year period).
23
MUTUAL OF AMERICA INVESTMENT CORPORATION (EQUITY INDEX FUND)
SUMMARY PORTFOLIO OF INVESTMENTS IN SECURITIES
December 31, 2006
| | | Shares | | Value | |
| COMMON STOCKS: | |
| BASIC MATERIALS (2.9%) | |
| Other Securities | | | 475,207 | | | $ | 23,433,848 | | |
| CONSUMER, CYCLICAL (9.8%) | |
| Comcast Corp. Cl A* | | | 127,043 | | | | 5,377,730 | | |
| Disney (Walt) Co. | | | 126,268 | | | | 4,327,204 | | |
| Home Depot, Inc. | | | 124,584 | | | | 5,003,293 | | |
| Time Warner, Inc. | | | 243,712 | | | | 5,308,047 | | |
| Other Securities | | | 1,644,506 | | | | 59,702,726 | | |
| | | | 79,719,000 | | |
| CONSUMER, NON-CYCLICAL (9.3%) | |
| Altria Group, Inc. | | | 127,942 | | | | 10,979,982 | | |
| Coca-Cola Co. | | | 124,476 | | | | 6,005,967 | | |
| PepsiCo, Inc. | | | 100,240 | | | | 6,270,012 | | |
| Proctor & Gamble Co. | | | 193,435 | | | | 12,432,067 | | |
| Wal-Mart Stores, Inc. | | | 150,117 | | | | 6,930,902 | | |
| Other Securities | | | 800,075 | | | | 33,295,263 | | |
| | | | 75,914,193 | | |
| ENERGY (9.4%) | |
| ChevronTexaco Corp. | | | 133,076 | | | | 9,785,078 | | |
| ConocoPhillips | | | 100,465 | | | | 7,228,457 | | |
| Exxon Mobil Corp. | | | 356,042 | | | | 27,283,498 | | |
| Schlumberger, Ltd. | | | 71,953 | | | | 4,544,551 | | |
| Other Securities | | | 578,356 | | | | 27,047,200 | | |
| | | | 75,888,784 | | |
| FINANCIAL (21.1%) | |
| American Express Co. | | | 73,545 | | | | 4,461,975 | | |
| American Int'l. Group, Inc. | | | 158,699 | | | | 11,372,370 | | |
| Bank of America Corp. | | | 274,132 | | | | 14,635,907 | | |
| Citigroup, Inc. | | | 299,953 | | | | 16,707,382 | | |
| Goldman Sachs Group, Inc. | | | 25,995 | | | | 5,182,103 | | |
| J.P. Morgan Chase & Co. | | | 211,761 | | | | 10,228,056 | | |
| Merrill Lynch & Co., Inc. | | | 53,962 | | | | 5,023,862 | | |
| Morgan Stanley | | | 64,619 | | | | 5,261,925 | | |
| US Bancorp | | | 107,308 | | | | 3,883,477 | | |
| Wachovia Corp. | | | 116,368 | | | | 6,627,158 | | |
| Wells Fargo & Company | | | 206,085 | | | | 7,328,383 | | |
| Other Securities | | | 1,576,629 | | | | 80,227,873 | | |
| | | | 170,940,471 | | |
* Non-income producing security.
| | | Shares | | Value | |
| COMMON STOCKS (CONTINUED): | |
| HEALTHCARE (11.5%) | |
| Abbott Laboratories | | | 93,695 | | | $ | 4,563,883 | | |
| Amgen, Inc.* | | | 71,210 | | | | 4,864,355 | | |
| Johnson & Johnson | | | 176,990 | | | | 11,684,880 | | |
| Medtronic, Inc. | | | 70,270 | | | | 3,760,148 | | |
| Merck & Co., Inc. | | | 132,528 | | | | 5,778,221 | | |
| Pfizer, Inc. | | | 440,159 | | | | 11,400,118 | | |
| UnitedHealth Group, Inc. | | | 82,227 | | | | 4,418,057 | | |
| Wyeth | | | 82,209 | | | | 4,186,082 | | |
| Other Securities | | | 998,645 | | | | 42,770,680 | | |
| | | | 93,426,424 | | |
| INDUSTRIAL (11.8%) | |
| Boeing Co. | | | 48,306 | | | | 4,291,505 | | |
| General Electric Co. | | | 629,254 | | | | 23,414,541 | | |
| Google, Inc.* | | | 13,082 | | | | 6,023,999 | | |
| United Parcel Service Cl B | | | 65,534 | | | | 4,913,739 | | |
| United Technologies Corp. | | | 61,268 | | | | 3,830,475 | | |
| Other Securities | | | 1,069,468 | | | | 52,982,050 | | |
| | | | 95,456,309 | | |
| TECHNOLOGY (13.3%) | |
| Apple Computer, Inc.* | | | 51,919 | | | | 4,404,808 | | |
| Cisco Systems, Inc.* | | | 370,707 | | | | 10,131,422 | | |
| Hewlett-Packard Co. | | | 167,199 | | | | 6,886,926 | | |
| IBM Corp. | | | 91,955 | | | | 8,933,427 | | |
| Intel Corp. | | | 351,983 | | | | 7,127,656 | | |
| Microsoft Corp. | | | 528,085 | | | | 15,768,615 | | |
| Oracle Corp.* | | | 244,210 | | | | 4,185,759 | | |
| Qualcomm, Inc. | | | 100,879 | | | | 3,812,217 | | |
| Other Securities | | | 2,155,117 | | | | 46,785,187 | | |
| | | | 108,036,017 | | |
| TELECOMMUNICATIONS (3.2%) | |
| AT&T | | | 234,589 | | | | 8,386,557 | | |
| BellSouth Corp. | | | 111,350 | | | | 5,245,699 | | |
| Verizon Communications | | | 178,221 | | | | 6,636,950 | | |
| Other Securities | | | 324,347 | | | | 6,127,561 | | |
| | | | 26,396,767 | | |
| UTILITIES (3.4%) | |
| Other Securities | | | 642,839 | | | | 27,615,223 | | |
TOTAL COMMON STOCKS
(Cost: $601,148,252) 95.7% | | | | | | $ | 776,827,036 | | |
The accompanying notes are an integral part of these financial statements.
24
MUTUAL OF AMERICA INVESTMENT CORPORATION (EQUITY INDEX FUND)
SUMMARY PORTFOLIO OF INVESTMENTS IN SECURITIES (Continued)
December 31, 2006
| | | Rate | | Maturity | | Face
Amount | | Value | |
| SHORT-TERM DEBT SECURITIES: | |
| U.S. GOVERNMENT (0.4%) | |
| Other Securities (a) | | | — | | | | — | | | $ | 2,900,000 | | | $ | 2,884,457 | | |
| U.S. GOVERNMENT AGENCIES (1.4%) | |
| Federal Home Loan Bank | | | 4.80 | % | | 01/02/07 | | | 8,742,000 | | | | 8,738,503 | | |
| Federal National Mortgage Assoc. | | | 5.20 | | | 01/24/07 | | | 2,668,000 | | | | 2,658,363 | | |
| | | | 11,396,866 | | |
| COMMERCIAL PAPER (2.4%) | |
| Novartis Finance | | | 5.28 | | | 01/02/07 | | | 19,330,000 | | | | 19,321,494 | | |
TOTAL SHORT-TERM DEBT SECURITIES
(Cost: $33,603,190) 4.2% | | | | | | | | | | | | | 33,602,817 | | |
TOTAL INVESTMENTS
(Cost: $634,751,442) 99.9% | | | | | | | | | | | | | 810,429,853 | | |
| OTHER NET ASSETS 0.1% | | | | | | | | | | | | | 1,067,479 | | |
| NET ASSETS 100.0% | | | | | | | | | | | | $ | 811,497,332 | | |
(a) Certain of these securities have been segregated to cover initial margin requirements on open futures contracts.
The total value of non-income producing investments was $107,629,677 or 13.3% of the Fund's total investments as of December 31, 2006.
FUTURES CONTRACTS OUTSTANDING AS OF DECEMBER 31, 2006:
| | | Expiration
Date | | Underlying Face
Amount at Value | | Unrealized
Gain (Loss) | |
| PURCHASED | |
| 91 S&P 500 Stock Index Futures Contracts | | March 2007 | | $ | 32,496,100 | | | $ | 34,313 | | |
Face Value of futures purchased and outstanding as percentage of total investments in securities: 4.0%
The accompanying notes are an integral part of these financial statements.
25
MUTUAL OF AMERICA INVESTMENT CORPORATION (ALL AMERICA FUND)
SUMMARY PORTFOLIO OF INVESTMENTS IN SECURITIES
December 31, 2006
| | | Shares | | Value | |
| INDEXED ASSETS: | |
| COMMON STOCKS: | |
| BASIC MATERIALS (1.8%) | |
| Other Securities | | | 151,431 | | | $ | 7,467,089 | | |
| CONSUMER, CYCLICAL (6.0%) | |
| Comcast Corp. Cl A* | | | 40,435 | | | | 1,711,614 | | |
| Home Depot, Inc. | | | 39,634 | | | | 1,591,701 | | |
| Time Warner, Inc. | | | 77,587 | | | | 1,689,845 | | |
| Other Securities | | | 563,849 | | | | 20,389,251 | | |
| | | | 25,382,411 | | |
| CONSUMER, NON-CYCLICAL (5.7%) | |
| Altria Group, Inc. | | | 40,717 | | | | 3,494,333 | | |
| Coca-Cola Co. | | | 39,626 | | | | 1,911,955 | | |
| PepsiCo, Inc. | | | 31,892 | | | | 1,994,845 | | |
| Proctor & Gamble Co. | | | 61,553 | | | | 3,956,011 | | |
| Wal-Mart Stores, Inc. | | | 47,779 | | | | 2,205,956 | | |
| Other Securities | | | 254,994 | | | | 10,609,797 | | |
| | | | 24,172,897 | | |
| ENERGY (5.7%) | |
| ChevronTexaco Corp. | | | 42,352 | | | | 3,114,143 | | |
| ConocoPhillips | | | 31,969 | | | | 2,300,170 | | |
| Exxon Mobil Corp. | | | 113,296 | | | | 8,681,872 | | |
| Schlumberger, Ltd. | | | 22,886 | | | | 1,445,480 | | |
| Other Securities | | | 184,169 | | | | 8,613,750 | | |
| | | | 24,155,415 | | |
| FINANCIAL (12.8%) | |
| American Int'l. Group, Inc. | | | 50,499 | | | | 3,618,758 | | |
| Bank of America Corp. | | | 87,231 | | | | 4,657,263 | | |
| Citigroup, Inc. | | | 95,465 | | | | 5,317,401 | | |
| Goldman Sachs Group, Inc. | | | 8,272 | | | | 1,649,023 | | |
| J.P. Morgan Chase & Co. | | | 67,384 | | | | 3,254,647 | | |
| Merrill Lynch & Co., Inc. | | | 17,176 | | | | 1,599,086 | | |
| Morgan Stanley | | | 20,557 | | | | 1,673,957 | | |
| Wachovia Corp. | | | 37,030 | | | | 2,108,859 | | |
| Wells Fargo & Company | | | 65,596 | | | | 2,332,594 | | |
| Other Securities | | | 559,576 | | | | 28,199,886 | | |
| | | | 54,411,474 | | |
* Non-income producing security.
| | | Shares | | Value | |
| INDEXED ASSETS (CONTINUED): | |
| COMMON STOCKS (CONTINUED): | |
| HEALTHCARE (7.0%) | |
| Abbott Laboratories | | | 29,814 | | | $ | 1,452,240 | | |
| Amgen, Inc.* | | | 22,666 | | | | 1,548,314 | | |
| Johnson & Johnson | | | 56,337 | | | | 3,719,369 | | |
| Merck & Co., Inc. | | | 42,181 | | | | 1,839,092 | | |
| Pfizer, Inc. | | | 140,063 | | | | 3,627,632 | | |
| Other Securities | | | 392,697 | | | | 17,555,086 | | |
| | | | 29,741,733 | | |
| INDUSTRIAL (7.2%) | |
| General Electric Co. | | | 200,236 | | | | 7,450,782 | | |
| Google, Inc.* | | | 4,162 | | | | 1,916,518 | | |
| United Parcel Service Cl B | | | 20,870 | | | | 1,564,833 | | |
| Other Securities | | | 375,345 | | | | 19,450,352 | | |
| | | | 30,382,485 | | |
| TECHNOLOGY (8.1%) | |
| Cisco Systems, Inc.* | | | 118,006 | | | | 3,225,104 | | |
| Hewlett-Packard Co. | | | 53,204 | | | | 2,191,473 | | |
| IBM Corp. | | | 29,251 | | | | 2,841,735 | | |
| Intel Corp. | | | 112,059 | | | | 2,269,195 | | |
| Microsoft Corp. | | | 168,042 | | | | 5,017,734 | | |
| Other Securities | | | 812,504 | | | | 18,840,707 | | |
| | | | 34,385,948 | | |
| TELECOMMUNICATIONS (2.0%) | |
| AT&T | | | 74,648 | | | | 2,668,666 | | |
| BellSouth Corp. | | | 35,432 | | | | 1,669,202 | | |
| Verizon Communications | | | 56,727 | | | | 2,112,513 | | |
| Other Securities | | | 103,288 | | | | 1,950,516 | | |
| | | | 8,400,897 | | |
| UTILITIES (2.1%) | |
| Other Securities | | | 204,626 | | | | 8,789,056 | | |
TOTAL INDEXED ASSETS
(Cost: $187,363,973) 58.4% | | | | | | $ | 247,289,405 | | |
The accompanying notes are an integral part of these financial statements.
26
MUTUAL OF AMERICA INVESTMENT CORPORATION (ALL AMERICA FUND)
SUMMARY PORTFOLIO OF INVESTMENTS IN SECURITIES (Continued)
December 31, 2006
| | | Rate | | Maturity | | Face
Amount | | Value | |
| INDEXED ASSETS SHORT-TERM DEBT SECURITIES: | |
| U.S. GOVERNMENT (0.1%) | |
| U.S. Treasury Bill (a) | | | 4.79 | % | | 03/08/07 | | $ | 400,000 | | | $ | 396,265 | | |
| U.S. Treasury Bill (a) | | | 4.89 | | | 01/11/07 | | | 200,000 | | | | 199,670 | | |
| | | | 595,935 | | |
| COMMERCIAL PAPER (1.3%) | |
| Novartis Finance | | | 5.28 | | | 01/02/07 | | | 5,480,000 | | | | 5,477,588 | | |
TOTAL SHORT-TERM DEBT SECURITIES
(Cost: $6,073,631) 1.4% | | | | | | | | | | | | | 6,073,523 | | |
TOTAL INDEXED ASSETS-COMMON STOCKS
(Cost: $193,437,604) 59.8% | | | | | | | | | | | | $ | 253,362,928 | | |
(a) This security, or a portion thereof, has been segregated to cover initial margin requirements on open futures contracts.
FUTURES CONTRACTS OUTSTANDING AS OF DECEMBER 31, 2006:
| | | Expiration
Date | | Underlying Face
Amount at Value | | Unrealized
Gain (Loss) | |
| PURCHASED | |
| 18 S&P 500 Stock Index Futures Contracts | | March 2007 | | $ | 6,427,800 | | | $ | (4,188 | ) | |
Face Value of futures purchased and outstanding as a percentage of total investments in securities: 1.5%
The accompanying notes are an integral part of these financial statements.
27
MUTUAL OF AMERICA INVESTMENT CORPORATION (ALL AMERICA FUND)
SUMMARY PORTFOLIO OF INVESTMENTS IN SECURITIES (Continued)
December 31, 2006
| | | Shares | | Value | |
| ACTIVE ASSETS: | |
| COMMON STOCKS: | |
| BASIC MATERIALS (0.8%) | |
| Other Securities | | | 75,088 | | | $ | 3,224,381 | | |
| CONSUMER, CYCLICAL (4.6%) | |
| Other Securities | | | 711,684 | | | | 19,507,576 | | |
| CONSUMER, NON-CYCLICAL (3.0%) | |
| Proctor & Gamble Co. | | | 35,274 | | | | 2,267,060 | | |
| Other Securities | | | 276,766 | | | | 10,305,913 | | |
| | | | 12,572,973 | | |
| ENERGY (3.2%) | |
| Exxon Mobil Corp. | | | 63,270 | | | | 4,848,380 | | |
| Other Securities | | | 305,977 | | | | 8,876,437 | | |
| | | | 13,724,817 | | |
| FINANCIAL (9.5%) | |
| American Int'l. Group, Inc. | | | 17,839 | | | | 1,278,343 | | |
| Bank of America Corp. | | | 42,175 | | | | 2,251,723 | | |
| Citigroup, Inc. | | | 35,181 | | | | 1,959,582 | | |
| ISHARES Russel Midcap | | | 18,222 | | | | 1,432,067 | | |
| J.P. Morgan Chase & Co. | | | 27,110 | | | | 1,309,413 | | |
| Merrill Lynch & Co., Inc. | | | 19,164 | | | | 1,784,168 | | |
| Wells Fargo & Company | | | 54,216 | | | | 1,927,921 | | |
| Other Securities | | | 888,972 | | | | 28,135,188 | | |
| | | | 40,078,405 | | |
| HEALTHCARE (3.7%) | |
| Johnson & Johnson | | | 30,728 | | | | 2,028,663 | | |
| Pfizer, Inc. | | | 49,325 | | | | 1,277,518 | | |
| Other Securities | | | 440,144 | | | | 12,562,924 | | |
| | | | 15,869,105 | | |
* Non-income producing security.
| | | Shares | | Value | |
| ACTIVE ASSETS (CONTINUED): | |
| COMMON STOCKS (CONTINUED): | |
| INDUSTRIAL (6.2%) | |
| General Electric Co. | | | 86,168 | | | $ | 3,206,311 | | |
| Other Securities | | | 696,856 | | | | 23,116,915 | | |
| | | | 26,323,226 | | |
| TECHNOLOGY (6.1%) | |
| Cisco Systems, Inc.* | | | 64,086 | | | | 1,751,470 | | |
| Microsoft Corp. | | | 92,545 | | | | 2,763,394 | | |
| Other Securities | | | 897,061 | | | | 21,472,550 | | |
| | | | 25,987,414 | | |
| TELECOMMUNICATIONS (0.8%) | |
| Other Securities | | | 143,740 | | | | 3,263,472 | | |
| UTILITIES (1.3%) | |
| Other Securities | | | 135,543 | | | | 5,607,659 | | |
TOTAL ACTIVE ASSETS
(Cost: $142,714,713) 39.2% | | | | | | | 166,159,028 | | |
| PREFERRED STOCKS | |
| FINANCIAL (0.1%) | |
| Quanta Capital Holdings | | | 13,420 | | | | 248,941 | | |
TOTAL PREFERRED STOCKS
(Cost: $335,500) 0.1% | | | | | | $ | 248,941 | | |
The accompanying notes are an integral part of these financial statements.
28
MUTUAL OF AMERICA INVESTMENT CORPORATION (ALL AMERICA FUND)
SUMMARY PORTFOLIO OF INVESTMENTS IN SECURITIES (Continued)
December 31, 2006
| | | Rate | | Maturity | | Face
Amount | | Value | |
| LONG-TERM DEBT SECURITIES: | |
| FINANCIAL (0.1%) | |
| GSC Capital Corp. (a) | | | 7.25 | % | | 07/15/10 | | $ | 460,000 | | | $ | 460,000 | | |
TOTAL LONG-TERM DEBT SECURITIES
(Cost: $460,000) 0.1% | | | | | | | | | | | | | 460,000 | | |
| SHORT-TERM DEBT SECURITIES: | |
| U.S. GOVERNMENT AGENCIES (0.3%) | |
| Federal Home Loan Bank | | | 4.80 | | | 01/02/07 | | | 280,000 | | | | 279,888 | | |
| Federal Farm Credit Corp. | | | 4.80 | | | 01/02/07 | | | 765,000 | | | | 764,694 | | |
| | | | 1,044,582 | | |
| COMMERCIAL PAPER (0.7%) | |
| Abbott Labs | | | 5.26 | | | 01/02/07 | | | 345,000 | | | | 344,849 | | |
| Anheuser-Busch Co. | | | 5.22 | | | 01/02/07 | | | 2,800,000 | | | | 2,798,782 | | |
| | | | 3,143,631 | | |
TOTAL SHORT-TERM DEBT SECURITIES
(Cost: $4,188,213) 1.0% | | | | | | | | | | | | | 4,188,213 | | |
TEMPORARY CASH INVESTMENTS**
(Cost: $133,200) 0.0% (1) | | | | | | | | | | | | | 133,200 | | |
TOTAL ACTIVE ASSETS-COMMON STOCKS
(Cost: $147,831,626) 40.4% | | | | | | | | | | | | | 171,189,382 | | |
TOTAL INVESTMENTS
(Cost: $341,269,230) 100.2% | | | | | | | | | | | | | 424,552,310 | | |
| OTHER NET LIABILITIES -0.2% | | | | | | | | | | | | | (1,085,430 | ) | |
| NET ASSETS 100.0% | | | | | | | | | | | | $ | 423,466,880 | | |
(1) Less than 0.05%.
(a) Rule 144a restricted security
** The fund has an arrangement with its custodian bank, JPMorgan Chase Bank, whereby uninvested cash, subject to parameters set by the fund, is automatically invested in the fund's name by the bank in overnight commercial paper issued by J.P. Morgan Chase & Co. On the next business day, these funds (and earned interest) are automatically returned to the fund. The annual rate of interest earned on this temporary cash investment at December 31, 2006 was 4.83%.
The total value of non-income producing investments was $92,285,706 or 21.7% of the Fund's total investments as of December 31, 2006.
The accompanying notes are an integral part of these financial statements.
29
MUTUAL OF AMERICA INVESTMENT CORPORATION (SMALL CAP VALUE)
SUMMARY PORTFOLIO OF INVESTMENTS IN SECURITIES
December 31, 2006
| | | Shares | | Value | |
| COMMON STOCKS: | |
| BASIC MATERIALS (3.5%) | |
| Schnitzer Steel Inds., Inc. Cl A | | | 15,240 | | | $ | 605,028 | | |
| Cytec Industries, Inc. | | | 42,990 | | | | 2,429,365 | | |
| Longview Fibre Co. | | | 112,536 | | | | 2,470,165 | | |
| Lubrizol Corp. | | | 60,169 | | | | 3,016,272 | | |
| | | | 8,520,830 | | |
| CONSUMER, CYCLICAL (13.7%) | | | | | |
| Audiovox Corp. Cl A* | | | 311,229 | | | | 4,385,217 | | |
| Belo Corporation | | | 123,253 | | | | 2,264,158 | | |
| Big Lots, Inc.* | | | 46,031 | | | | 1,055,031 | | |
| CSK Auto Corp.* | | | 81,902 | | | | 1,404,619 | | |
| Charming Shoppes, Inc.* | | | 101,718 | | | | 1,376,245 | | |
| Crown Holdings, Inc.* | | | 291,709 | | | | 6,102,552 | | |
| Hartmarx Corp.* | | | 126,765 | | | | 894,961 | | |
| Landry's Restaurant, Inc. | | | 61,364 | | | | 1,846,443 | | |
| Lithia Motors, Inc. Cl A | | | 31,335 | | | | 901,195 | | |
| Modine Manufacturing Co. | | | 78,898 | | | | 1,974,817 | | |
| Payless Shoesource, Inc.* | | | 63,615 | | | | 2,087,844 | | |
| Rent-A-Center, Inc.* | | | 51,320 | | | | 1,514,453 | | |
| Sunterra Corporation* | | | 210,176 | | | | 2,532,621 | | |
| Tupperware Corp. | | | 114,751 | | | | 2,594,520 | | |
| Wolverine World Wide, Inc. | | | 99,731 | | | | 2,844,328 | | |
| | | | 33,779,004 | | |
| CONSUMER, NON-CYCLICAL (4.6%) | | | | | |
| Boston Beer Co., Inc. Cl A* | | | 22,983 | | | | 826,928 | | |
| Conmed Corp.* | | | 58,003 | | | | 1,341,029 | | |
| Flowers Foods, Inc. | | | 36,572 | | | | 987,078 | | |
| Great Atlantic & Pac. Tea, Inc. | | | 23,370 | | | | 601,544 | | |
| Longs Drug Stores Corp. | | | 56,833 | | | | 2,408,583 | | |
| Mueller Industries, Inc. | | | 78,700 | | | | 2,494,790 | | |
| Vector Group, Ltd. | | | 156,030 | | | | 2,769,533 | | |
| | | | 11,429,485 | | |
| ENERGY (6.6%) | | | | | |
| Aegean Marine Petroleum* | | | 53,500 | | | | 877,400 | | |
| CNX Gas Corp.* | | | 91,485 | | | | 2,332,868 | | |
| Ellora Energy, Inc.*(a) | | | 119,800 | | | | 1,437,600 | | |
| Holly Corp. | | | 21,220 | | | | 1,090,708 | | |
| Range Resources Corp. | | | 123,128 | | | | 3,381,095 | | |
| Superior Well Services, Inc.* | | | 31,960 | | | | 816,898 | | |
| Unisource Energy Corp. | | | 78,130 | | | | 2,854,089 | | |
| Whittier Energy* | | | 372,950 | | | | 3,457,247 | | |
| | | | 16,247,905 | | |
| FINANCIAL (32.2%) | | | | | |
| Accredited Home Lenders* | | | 55,070 | | | | 1,506,165 | | |
| American Home Mortgage Inv. | | | 50,152 | | | | 1,761,338 | | |
| AmericanWest Bancorp | | | 47,528 | | | | 1,151,128 | | |
| Assured Guaranty Co.* | | | 111,226 | | | | 2,958,612 | | |
| Asta Funding, Inc. | | | 71,709 | | | | 2,182,822 | | |
| Bank Mutual Corp. | | | 195,060 | | | | 2,362,177 | | |
| Banner Corporation | | | 30,430 | | | | 1,349,266 | | |
| Brookline Bankcorp | | | 226,356 | | | | 2,981,109 | | |
| Capital Lease Funding, Inc. | | | 50,448 | | | | 585,197 | | |
| Columbia Banking System | | | 38,985 | | | | 1,369,153 | | |
| Equity Inns, Inc. | | | 172,103 | | | | 2,746,764 | | |
| FBR Capital Markets Corp.*(a) | | | 159,700 | | | | 2,395,500 | | |
| First Niagara Financial Grp. | | | 183,659 | | | | 2,729,173 | | |
| First State Bank Corporation | | | 89,965 | | | | 2,226,634 | | |
| FirstFed Financial Corp.* | | | 38,085 | | | | 2,550,552 | | |
| Friedman, Billings, Ramsey Grp. | | | 115,719 | | | | 925,752 | | |
| Glacier Bancorp, Inc. | | | 73,983 | | | | 1,808,145 | | |
| | | Shares | | Value | |
| COMMON STOCKS (CONTINUED): | |
| FINANCIAL (CONTINUED) | |
| Highwoods Properties, Inc. | | | 59,714 | | | $ | 2,433,943 | | |
| ISHARES Russel Midcap | | | 29,120 | | | | 2,273,398 | | |
| Iberia Bank Corp. | | | 17,245 | | | | 1,018,317 | | |
| JER Investors Trust, Inc. | | | 75,149 | | | | 1,553,330 | | |
| KNBT Bancorp, Inc. | | | 136,790 | | | | 2,288,497 | | |
| Knight Capital Group, Inc.* | | | 58,443 | | | | 1,120,352 | | |
| LandAmerica Financial Group | | | 45,476 | | | | 2,869,990 | | |
| MAF Bancorp | | | 66,145 | | | | 2,956,020 | | |
| Medical Properties Trust, Inc. | | | 162,976 | | | | 2,493,533 | | |
| Mid-America Apt. Communities | | | 32,763 | | | | 1,875,354 | | |
| National Financial Partners | | | 15,800 | | | | 694,726 | | |
| NewAlliance Bankshare | | | 189,207 | | | | 3,102,995 | | |
| PHH Corp.* | | | 137,956 | | | | 3,982,790 | | |
Pennsylvania Real Estate
Investment Trust | | | 32,340 | | | | 1,273,549 | | |
| Phoenix Companies, Inc. | | | 108,827 | | | | 1,729,261 | | |
| Provident Financial Services | | | 154,976 | | | | 2,809,715 | | |
| Rait Finiancial Trust | | | 112,630 | | | | 3,883,486 | | |
| Santander Bancorp | | | 31,725 | | | | 566,291 | | |
| Sterling Financial Corp. | | | 55,237 | | | | 1,867,563 | | |
| SWS Group, Inc. | | | 69,578 | | | | 2,483,935 | | |
| Taylor Capital Gowth, Inc. | | | 34,570 | | | | 1,265,608 | | |
| Vintage Wine Trust, Inc. (a) | | | 189,970 | | | | 1,139,820 | | |
| | | | 79,271,960 | | |
| HEALTHCARE (2.3%) | | | | | |
| Discovery Laboratories, Inc.* | | | 325,920 | | | | 769,171 | | |
| Enzon, Inc.* | | | 280,478 | | | | 2,386,868 | | |
| Genesis HealthCare Corp.* | | | 26,701 | | | | 1,261,088 | | |
| Inverness Medical Innovations* | | | 32,031 | | | | 1,239,600 | | |
| | | | 5,656,727 | | |
| INDUSTRIAL (15.3%) | | | | | |
| Agnico-Eagle Mines, Ltd. | | | 57,295 | | | | 2,362,846 | | |
| Alaska Air Group, Inc.* | | | 58,220 | | | | 2,299,690 | | |
| Apogee Enterprises, Inc. | | | 100,638 | | | | 1,943,320 | | |
| Aspect Medical Systems, Inc.* | | | 63,214 | | | | 1,189,055 | | |
| Benchmark Electronics* | | | 32,066 | | | | 781,128 | | |
| Bronco Drilling Co., Inc.* | | | 64,824 | | | | 1,114,325 | | |
| Chaparral Steel Co. | | | 54,900 | | | | 2,430,423 | | |
| Felcor Lodging Trust, Inc. | | | 44,130 | | | | 963,799 | | |
| Frozen Foods Express Ind. | | | 109,986 | | | | 945,880 | | |
| General Cable Corp.* | | | 68,817 | | | | 3,007,991 | | |
| Genlyte Group, Inc.* | | | 13,433 | | | | 1,049,252 | | |
| Granite Construction | | | 47,210 | | | | 2,375,607 | | |
| Healthcare Services Group | | | 50,561 | | | | 1,464,247 | | |
| Komag, Inc.* | | | 28,495 | | | | 1,079,391 | | |
| Levitt Corporation | | | 94,010 | | | | 1,150,682 | | |
| Littelfuse, Inc.* | | | 43,590 | | | | 1,389,649 | | |
| RailAmerica, Inc.* | | | 370,404 | | | | 5,956,096 | | |
| Semitool, Inc.* | | | 42,410 | | | | 564,477 | | |
| Siligan Holdings, Inc. | | | 72,339 | | | | 3,177,129 | | |
| Texas Industries, Inc. | | | 35,478 | | | | 2,278,752 | | |
| Other Securities | | | 9,150 | | | | 256,658 | | |
| | | | 37,780,397 | | |
| TECHNOLOGY (10.7%) | | | | | |
| Anixter International, Inc.* | | | 51,283 | | | | 2,784,666 | | |
| Cirrus Logic, Inc.* | | | 72,340 | | | | 497,698 | | |
| CommScope, Inc.* | | | 106,219 | | | | 3,237,554 | | |
| Dot Hill Systems* | | | 182,875 | | | | 718,698 | | |
| Electronics For Imaging, Inc.* | | | 67,753 | | | | 1,800,874 | | |
| Fairchild Semiconductor Intl.* | | | 20,363 | | | | 342,301 | | |
The accompanying notes are an integral part of these financial statements.
30
MUTUAL OF AMERICA INVESTMENT CORPORATION (SMALL CAP VALUE)
SUMMARY PORTFOLIO OF INVESTMENTS IN SECURITIES (Continued)
December 31, 2006
| | | Shares | | Value | |
| COMMON STOCKS (CONTINUED): | |
| TECHNOLOGY (CONTINUED) | |
| Global Imaging Systems., Inc.* | | | 95,164 | | | $ | 2,088,849 | | |
| Hyperion Solutions, Corp.* | | | 41,460 | | | | 1,490,071 | | |
| Imation Corp. | | | 36,021 | | | | 1,672,455 | | |
| Lecroy Corp.* | | | 38,780 | | | | 446,358 | | |
| Marlin Business Services* | | | 59,642 | | | | 1,433,197 | | |
| Micrel, Inc.* | | | 52,360 | | | | 564,441 | | |
| Perot Systems Corp. Cl A* | | | 70,607 | | | | 1,157,249 | | |
| Rogers Corp.* | | | 20,940 | | | | 1,238,601 | | |
| Semtech Corp.* | | | 41,220 | | | | 538,745 | | |
| Syniverse Holdings, Inc.* | | | 52,020 | | | | 779,780 | | |
| Tech Data Corp.* | | | 66,485 | | | | 2,517,787 | | |
| Technitrol, Inc. | | | 101,207 | | | | 2,417,835 | | |
| Website Pros, Inc.* | | | 58,675 | | | | 531,009 | | |
| | | | 26,258,168 | | |
| TELECOMMUNICATIONS (1.8%) | |
| CT Communications, Inc. | | | 54,808 | | | | 1,256,199 | | |
| Cincinnati Bell, Inc.* | | | 213,929 | | | | 977,656 | | |
| Iowa Telecomunications Service | | | 106,500 | | | | 2,099,115 | | |
| | | | 4,332,970 | | |
* Non-income producing security.
| | | Shares | | Value | |
| COMMON STOCKS (CONTINUED): | |
| UTILITIES (4.7%) | | | | | |
| Avista Corp. | | | 69,806 | | | $ | 1,766,790 | | |
| Black Hills Corp. | | | 30,840 | | | | 1,139,230 | | |
| Northwestern Corp. | | | 29,681 | | | | 1,050,114 | | |
| PNM Resources, Inc. | | | 91,913 | | | | 2,858,494 | | |
| Sierra Pacific Resources* | | | 140,835 | | | | 2,370,253 | | |
| Westar Energy, Inc. | | | 91,525 | | | | 2,375,989 | | |
| | | | 11,560,870 | | |
TOTAL COMMON STOCKS
(Cost: $219,101,395) 95.4% | | | | | | | 234,838,316 | | |
| PREFERRED STOCKS: | |
| FINANCIAL (0.4%) | |
| Quanta Capital Holdings | | | 57,230 | | | | 1,061,617 | | |
TOTAL PREFERRED STOCKS
(Cost: $1,000,971) 0.4% | | | | | | $ | 1,061,617 | | |
| | | Rate | | Maturity | | Face
Amount | | Value | |
| LONG-TERM DEBT SECURITIES: | |
| FINANCIAL (0.8%) | |
| GSC Capital Corp. (a) | | | 7.25 | % | | 07/15/10 | | $ | 1,890,000 | | | $ | 1,890,000 | | |
TOTAL LONG-TERM DEBT SECURITIES
(Cost: $1,890,000) 0.8% | | | | | | | | | 1,890,000 | | |
| SHORT-TERM DEBT SECURITIES: | |
| U.S. GOVERNMENT AGENCIES (5.0%) | |
| Federal Farm Credit Corp. | | | 4.80 | | | 01/02/07 | | | 12,413,000 | | | | 12,408,034 | | |
TOTAL SHORT-TERM DEBT SECURITIES
(Cost: $12,408,034) 5.0% | | | | | | | | | 12,408,034 | | |
TOTAL INVESTMENTS
(Cost: $234,400,400) 101.6% | | | | | | | | | 250,197,967 | | |
| OTHER NET LIABILITIES -1.6% | | | | | | | | | (3,951,862 | ) | |
| NET ASSETS 100.0% | | | | | | | | $ | 246,246,105 | | |
The total value of non-income producing investments was $96,817,714 or 38.7% of the Fund's total investments as of December 31, 2006.
(a) Rule 144a restricted security.
The accompanying notes are an integral part of these financial statements.
31
MUTUAL OF AMERICA INVESTMENT CORPORATION (SMALL CAP GROWTH)
SUMMARY PORTFOLIO OF INVESTMENTS IN SECURITIES
December 31, 2006
| | | Shares | | Value | |
| COMMON STOCKS: | |
| BASIC MATERIALS (0.5%) | |
| TETRA Technologies* | | | 62,027 | | | $ | 1,122,068 | | |
| CONSUMER, CYCLICAL (14.5%) | | | | | |
| AAR Corp* | | | 80,637 | | | | 2,353,794 | | |
| Aaron Rents, Inc. | | | 45,202 | | | | 1,300,914 | | |
| Children's Place Retail Stores | | | 12,344 | | | | 784,091 | | |
| Gamestop Corp.* | | | 49,681 | | | | 2,737,920 | | |
| Gymboree Corp.* | | | 28,462 | | | | 1,086,110 | | |
| Hibbett Sporting Goods, Inc.* | | | 59,685 | | | | 1,822,183 | | |
| Hudson Highland Group* | | | 85,623 | | | | 1,428,192 | | |
| ICT Group, Inc.* | | | 38,602 | | | | 1,219,437 | | |
| Marvel Entertainment, Inc.* | | | 33,568 | | | | 903,315 | | |
| Modine Manufacturing Co. | | | 42,726 | | | | 1,069,432 | | |
| P.F. Changs China Bistro, Inc. | | | 38,754 | | | | 1,487,379 | | |
| Payless Shoesource, Inc.* | | | 102,350 | | | | 3,359,127 | | |
| Phillips Van Heusen Corp. | | | 15,633 | | | | 784,308 | | |
| Pinnacle Entertainment, Inc.* | | | 75,334 | | | | 2,496,569 | | |
| RC2 Corp.* | | | 21,679 | | | | 953,876 | | |
| Rare Hospitality Int'l., Inc.* | | | 33,796 | | | | 1,112,902 | | |
| Red Robin Gourmet Burgers* | | | 43,662 | | | | 1,565,283 | | |
| Sunopta* | | | 88,025 | | | | 774,620 | | |
| Tween Brands, Inc.* | | | 23,778 | | | | 949,456 | | |
| Wild Oaks Markets, Inc.* | | | 92,486 | | | | 1,329,949 | | |
| Wolverine World Wide, Inc. | | | 101,003 | | | | 2,880,606 | | |
| Other Securities | | | 32,115 | | | | 116,577 | | |
| | | | 32,516,040 | | |
| CONSUMER, NON-CYCLICAL (6.9%) | | | | | |
| Alkermes, Inc.* | | | 58,462 | | | | 781,637 | | |
| Chattem, Inc.* | | | 51,172 | | | | 2,562,694 | | |
| Comsys ITPartners, Inc.* | | | 28,686 | | | | 579,744 | | |
| Dynamex, Inc.* | | | 34,251 | | | | 800,103 | | |
| Forrester Research, Inc.* | | | 45,628 | | | | 1,236,975 | | |
| Hain Celestial Group, Inc.* | | | 46,064 | | | | 1,437,657 | | |
| Hologic, Inc.* | | | 56,091 | | | | 2,651,982 | | |
| Longs Drug Stores Corp. | | | 26,025 | | | | 1,102,940 | | |
| Medicines Company* | | | 17,000 | | | | 539,240 | | |
| Mentor Corp. | | | 26,378 | | | | 1,289,093 | | |
| Sovran Self-Storage, Inc. | | | 10,867 | | | | 622,462 | | |
| Watson Wyatt Worldwide, Inc. | | | 40,087 | | | | 1,809,928 | | |
| | | | 15,414,455 | | |
| ENERGY (4.4%) | | | | | |
| Aegean Marine Petroleum * | | | 16,060 | | | | 263,384 | | |
| Helix Energy Solutions Group* | | | 77,333 | | | | 2,425,936 | | |
| Holly Corp. | | | 64,514 | | | | 3,316,020 | | |
| Range Resources Corp. | | | 125,323 | | | | 3,441,370 | | |
| Superior Well Services, Inc.* | | | 15,770 | | | | 403,081 | | |
| | | | 9,849,791 | | |
| FINANCIAL (17.0%) | | | | | |
| Acadia Realty Trust | | | 47,124 | | | | 1,179,042 | | |
| Argonaut Group, Inc.* | | | 39,847 | | | | 1,389,066 | | |
| Assured Guaranty Co.* | | | 51,475 | | | | 1,369,235 | | |
| Choice Hotels Intl., Inc. | | | 69,361 | | | | 2,920,098 | | |
| Euronet Worldwide* | | | 82,083 | | | | 2,437,044 | | |
| First Financial Holdings, Inc. | | | 42,404 | | | | 1,661,389 | | |
| First State Bank Corporation | | | 47,818 | | | | 1,183,496 | | |
| Getty Realty Corp. | | | 32,072 | | | | 991,025 | | |
| Glacier Bancorp, Inc. | | | 50,005 | | | | 1,222,122 | | |
| IShares Russell Midcap | | | 96,949 | | | | 7,619,222 | | |
| IShares Russell Micropac | | | 55,495 | | | | 3,243,683 | | |
| Intl. Securities Exchange, Inc. | | | 33,131 | | | | 1,550,199 | | |
| | | Shares | | Value | |
| COMMON STOCKS (CONTINUED): | |
| FINANCIAL (CONTINUED) | |
| Jackson Hewitt Tax Service | | | 42,254 | | | $ | 1,435,368 | | |
| La Salle Hotel Properties | | | 50,698 | | | | 2,324,503 | | |
| Lazard, Ltd. Cl A* | | | 50,774 | | | | 2,403,641 | | |
| National Financial Partners | | | 47,726 | | | | 2,098,512 | | |
| NewAlliance Bankshare | | | 67,930 | | | | 1,114,052 | | |
| Tower Group, Inc. | | | 63,295 | | | | 1,966,576 | | |
| | | | 38,108,273 | | |
| HEALTHCARE (10.8%) | | | | | |
| ALNYLAM Pharmaceuticals, Inc.* | | | 23,340 | | | | 499,476 | | |
| Allscripts Healthcare Solution | | | 69,695 | | | | 1,881,068 | | |
| Arthrocare Corp.* | | | 16,073 | | | | 641,634 | | |
| DJ Orthopedics, Inc.* | | | 56,346 | | | | 2,412,736 | | |
| Digene Corp.* | | | 35,355 | | | | 1,694,212 | | |
| Human Genome Sciences, Inc.* | | | 124,311 | | | | 1,546,429 | | |
| Inverness Medical Innovations* | | | 60,875 | | | | 2,355,863 | | |
| Keryx Biopharmaceuticals, Inc. | | | 48,440 | | | | 644,252 | | |
| Myriad Genetics, Inc.* | | | 23,775 | | | | 744,158 | | |
| PSS World Medical, Inc.* | | | 69,115 | | | | 1,349,816 | | |
| Psychiatric Solutions* | | | 51,829 | | | | 1,944,624 | | |
| Rigel Pharmaceuticals, Inc.* | | | 43,915 | | | | 521,271 | | |
| Sciele Pharma, Inc.* | | | 26,750 | | | | 642,000 | | |
| Seattle Genetics, Inc.* | | | 68,275 | | | | 363,906 | | |
| Senomyx, Inc.* | | | 31,990 | | | | 415,550 | | |
| Theravance, Inc.* | | | 44,102 | | | | 1,362,311 | | |
| Valeant Pharmaceuticals | | | 79,606 | | | | 1,372,407 | | |
| Ventana Medical Systems, Inc.* | | | 48,533 | | | | 2,088,375 | | |
| Viasys Healthcare, Inc.* | | | 57,537 | | | | 1,600,679 | | |
| | | | 24,080,767 | | |
| INDUSTRIAL (21.2%) | | | | | |
| Actuant Corp. Cl A | | | 26,223 | | | | 1,249,526 | | |
| Acuity Brands, Inc. | | | 33,564 | | | | 1,746,671 | | |
| Affymetrix, Inc.* | | | 61,698 | | | | 1,422,756 | | |
| Agnico-Eagle Mines, Ltd. | | | 63,014 | | | | 2,598,697 | | |
| Allis-Chalmers Corp.* | | | 80,455 | | | | 1,853,683 | | |
| Benchmark Electronics* | | | 42,867 | | | | 1,044,240 | | |
| Bucyrus International, Inc. | | | 53,342 | | | | 2,760,982 | | |
| Curtis Wright Corp. Cl B | | | 33,774 | | | | 1,252,340 | | |
| DIODES, Inc.* | | | 37,948 | | | | 1,346,395 | | |
| Eclipsys Corp.* | | | 56,644 | | | | 1,164,601 | | |
| FLIR Systems, Inc.* | | | 88,523 | | | | 2,817,687 | | |
| General Cable Corp.* | | | 39,120 | | | | 1,709,935 | | |
| Genesee & Wyoming, Inc. Cl A* | | | 88,254 | | | | 2,315,785 | | |
| Genlyte Group, Inc.* | | | 18,133 | | | | 1,416,369 | | |
| Granite Construction | | | 19,934 | | | | 1,003,079 | | |
| HUB Group, Inc. Cl A* | | | 58,857 | | | | 1,621,510 | | |
| Harmonic, Inc.* | | | 145,666 | | | | 1,058,992 | | |
| Heidrick & Struggles Intl., Inc.* | | | 39,041 | | | | 1,653,777 | | |
| ICO, Inc.* | | | 160,264 | | | | 903,889 | | |
| Interline Brands, Inc.* | | | 43,990 | | | | 988,455 | | |
| Ladish Co., Inc.* | | | 42,776 | | | | 1,586,134 | | |
| Lincoln Electric Holdings | | | 34,209 | | | | 2,066,908 | | |
| Littelfuse, Inc.* | | | 50,394 | | | | 1,606,561 | | |
| Live Nation, Inc.* | | | 32,625 | | | | 730,800 | | |
| Miller (Herman), Inc. | | | 44,082 | | | | 1,602,822 | | |
| Moog, Inc. Cl A* | | | 29,008 | | | | 1,107,816 | | |
| RTI International Metals, Inc.* | | | 40,180 | | | | 3,142,880 | | |
| Semitool, Inc.* | | | 68,899 | | | | 917,046 | | |
| Waste Connections, Inc.* | | | 34,100 | | | | 1,416,855 | | |
| Wright Express Corp.* | | | 41,604 | | | | 1,296,797 | | |
| | | | 47,403,988 | | |
The accompanying notes are an integral part of these financial statements.
32
MUTUAL OF AMERICA INVESTMENT CORPORATION (SMALL CAP GROWTH)
SUMMARY PORTFOLIO OF INVESTMENTS IN SECURITIES (Continued)
December 31, 2006
| | | Shares | | Value | |
| COMMON STOCKS (CONTINUED): | |
| TECHNOLOGY (21.4%) | | | | | |
| Activision, Inc.* | | | 102,403 | | | $ | 1,765,427 | | |
| Altiris, Inc.* | | | 40,848 | | | | 1,036,721 | | |
| Ansys, Inc.* | | | 22,996 | | | | 1,000,095 | | |
| Arris Group, Inc.* | | | 114,849 | | | | 1,436,760 | | |
| Aspen Technology, Inc.* | | | 106,077 | | | | 1,168,968 | | |
| CommScope, Inc.* | | | 50,452 | | | | 1,537,776 | | |
| Computer Programs & Systems | | | 27,643 | | | | 939,585 | | |
| Digital Insight Corporation* | | | 32,103 | | | | 1,235,644 | | |
| Digitas* | | | 109,660 | | | | 1,470,541 | | |
| EFJ, Inc.* | | | 174,095 | | | | 1,175,141 | | |
| Electronics For Imaging, Inc.* | | | 53,601 | | | | 1,424,715 | | |
| Equinix, Inc.* | | | 11,762 | | | | 889,442 | | |
| Exelixis, Inc.* | | | 53,530 | | | | 481,770 | | |
| FormFactor, Inc.* | | | 38,842 | | | | 1,446,865 | | |
| Informatica Corp.* | | | 83,150 | | | | 1,015,262 | | |
| Lecroy Corp.* | | | 63,952 | | | | 736,088 | | |
| Medics Pharmaceutical Corp. | | | 141,342 | | | | 4,965,344 | | |
| Micrel, Inc.* | | | 123,232 | | | | 1,328,441 | | |
| Microsemi Corp.* | | | 82,275 | | | | 1,616,704 | | |
* Non-income producing security
| | | Shares | | Value | |
| COMMON STOCKS (CONTINUED): | |
| TECHNOLOGY (CONTINUED) | |
| Netlogic Microsystems, Inc.* | | | 69,541 | | | $ | 1,508,344 | | |
| Neustar, Inc. Cl A* | | | 32,687 | | | | 1,060,366 | | |
| Parametric Technology Corp.* | | | 73,520 | | | | 1,324,830 | | |
| Rogers Corp.* | | | 33,477 | | | | 1,980,165 | | |
| SPSS, Inc.* | | | 44,992 | | | | 1,352,909 | | |
| Syniverse Holdings, Inc.* | | | 71,156 | | | | 1,066,628 | | |
| Technitrol, Inc. | | | 40,691 | | | | 972,108 | | |
| Tibco Software, Inc.* | | | 54,821 | | | | 517,510 | | |
| Varian Semiconductor Equip.* | | | 61,493 | | | | 2,799,161 | | |
| Verint Systems, Inc.* | | | 42,245 | | | | 1,448,159 | | |
| Viasat, Inc.* | | | 95,404 | | | | 2,843,993 | | |
| Wabtech | | | 69,162 | | | | 2,101,142 | | |
| aQuantive, Inc.* | | | 89,994 | | | | 2,219,252 | | |
| | | | 47,865,856 | | |
| UTILITIES (0.5%) | | | | | |
| PNM Resources, Inc. | | | 32,366 | | | | 1,006,583 | | |
TOTAL COMMON STOCKS
(Cost: $183,436,671) 97.2% | | | | | | $ | 217,367,821 | | |
| | | Rate | | Maturity | | Face
Amount | | Value | |
| SHORT-TERM DEBT SECURITIES: | |
| U.S. GOVERNMENT AGENCIES (3.1%) | |
| Federal Farm Credit Corp. | | | 4.80 | % | | 01/02/07 | | $ | 6,915,000 | | | $ | 6,912,234 | | |
TOTAL SHORT-TERM DEBT SECURITIES
(Cost: $6,912,234) 3.1% | | | | | | | | | 6,912,234 | | |
TOTAL INVESTMENTS
(Cost: $190,348,905) 100.3% | | | | | | | | | 224,280,055 | | |
| OTHER NET LIABILITIES -0.3% | | | | | | | | | (751,529 | ) | |
| NET ASSETS 100.0% | | | | | | | | $ | 223,528,526 | | |
The total value of non-income producing investments was $140,178,884 or 62.5% of the Fund's total investments as of December 31, 2006.
The accompanying notes are an integral part of these financial statements.
33
MUTUAL OF AMERICA INVESTMENT CORPORATION (MID CAP VALUE)
SUMMARY PORTFOLIO OF INVESTMENTS IN SECURITIES
December 31, 2006
| | | Shares | | Value | |
| COMMON STOCKS: | |
| BASIC MATERIALS (5.5%) | |
| Cytec Industries, Inc. | | | 3,111 | | | $ | 175,803 | | |
| Eastman Chemical Co. | | | 3,939 | | | | 233,622 | | |
| Huntsman Corp.* | | | 15,449 | | | | 293,068 | | |
| Lubrizol Corp. | | | 3,438 | | | | 172,347 | | |
| Lyondell Chemical Co. | | | 7,247 | | | | 185,306 | | |
| Sonoco Products Co. | | | 11,614 | | | | 442,029 | | |
| Steel Dynamics, Inc. | | | 6,177 | | | | 200,444 | | |
| Other Securities | | | 3,688 | | | | 110,751 | | |
| | | | 1,813,370 | | |
| CONSUMER, CYCLICAL (12.3%) | | | | | |
| Belo Corporation | | | 12,368 | | | | 227,200 | | |
| Black & Decker Corp. | | | 2,885 | | | | 230,713 | | |
| Circuit City Group, Inc. | | | 12,441 | | | | 236,130 | | |
| Crown Holdings, Inc.* | | | 24,462 | | | | 511,745 | | |
| Federated Dept Stores | | | 3,890 | | | | 148,326 | | |
| Fortune Brands, Inc. | | | 2,844 | | | | 242,849 | | |
| Johnson Controls, Inc. | | | 4,805 | | | | 412,846 | | |
| Mohawk Industries, Inc.* | | | 2,639 | | | | 197,556 | | |
| Newell Rubbermaid, Inc. | | | 5,980 | | | | 173,121 | | |
| Office Depot, Inc.* | | | 6,925 | | | | 264,327 | | |
| Polo Ralph Lauren Corp. | | | 6,844 | | | | 531,505 | | |
| Rent-A-Center, Inc.* | | | 6,476 | | | | 191,107 | | |
| V F Corp. | | | 3,909 | | | | 320,851 | | |
| Whirlpool Corp. | | | 2,616 | | | | 217,180 | | |
| Other Securities | | | 2,081 | | | | 166,845 | | |
| | | | 4,072,301 | | |
| CONSUMER, NON-CYCLICAL (5.9%) | | | | | |
| Clorox Co. | | | 3,234 | | | | 207,461 | | |
| Coca-Cola Enterprises | | | 9,736 | | | | 198,809 | | |
| Dean Foods Co.* | | | 7,002 | | | | 296,045 | | |
| Kroger Co. | | | 16,831 | | | | 388,291 | | |
| Reynolds American, Inc. | | | 5,938 | | | | 388,761 | | |
| Tyson Foods, Inc. | | | 9,804 | | | | 161,276 | | |
| Vector Group, Ltd. | | | 18,619 | | | | 330,487 | | |
| | | | 1,971,130 | | |
| ENERGY (3.6%) | | | | | |
| CNX Gas Corp.* | | | 11,087 | | | | 282,719 | | |
| Frontier Oil Corp. | | | 7,742 | | | | 222,505 | | |
| Grant Prideco, Inc.* | | | 8,745 | | | | 347,789 | | |
| Range Resources Corp. | | | 12,659 | | | | 347,616 | | |
| | | | 1,200,629 | | |
| FINANCIAL (34.0%) | | | | | |
| American Financial Group | | | 12,100 | | | | 434,511 | | |
| Ameriprise Financial, Inc. | | | 2,825 | | | | 153,963 | | |
| Aon Corp. | | | 7,046 | | | | 249,006 | | |
Apartment Investment &
Mgmt. Co. | | | 6,554 | | | | 367,155 | | |
| Associated Banc-Corp. | | | 9,698 | | | | 338,266 | | |
| Assurant, Inc. | | | 4,109 | | | | 227,022 | | |
| Bear Stearns Cos., Inc. | | | 3,338 | | | | 543,360 | | |
| CIT Group, Inc. | | | 5,701 | | | | 317,945 | | |
| Comerica, Inc. | | | 5,743 | | | | 336,999 | | |
| Conseco, Inc.* | | | 11,244 | | | | 224,655 | | |
| Developers Divers Rlty. | | | 5,972 | | | | 375,937 | | |
| E*Trade Financial Corp.* | | | 9,563 | | | | 214,402 | | |
| Equity Office Properties | | | 11,666 | | | | 561,951 | | |
| Equity Residential | | | 9,113 | | | | 462,485 | | |
| First American Corp. | | | 4,884 | | | | 198,681 | | |
| | | Shares | | Value | |
| COMMON STOCKS (CONTINUED): | |
| FINANCIAL (CONTINUED) | |
| First Tennessee Natl. Bank | | | 8,433 | | | $ | 352,331 | | |
| Friedman, Billings, Ramsey Grp. | | | 24,838 | | | | 198,704 | | |
| Fulton Financial Corp. | | | 14,056 | | | | 234,735 | | |
| Genworth Financial, Inc. | | | 9,248 | | | | 316,374 | | |
| Host Hotels & Resorts, Inc. | | | 12,060 | | | | 296,073 | | |
| Huntington Bancshares, Inc. | | | 13,204 | | | | 313,595 | | |
| ISHARES Russel Midcap | | | 4,878 | | | | 714,286 | | |
| ISHARES Russel Midcap | | | 5,913 | | | | 590,354 | | |
| KeyCorp. | | | 11,085 | | | | 421,563 | | |
| M & T Bank Corp. | | | 2,561 | | | | 312,852 | | |
| Peoples Bank | | | 8,178 | | | | 364,902 | | |
| Principal Financial Group, Inc. | | | 9,128 | | | | 535,814 | | |
| Radian Group, Inc. | | | 5,532 | | | | 298,230 | | |
| StanCorp Financial | | | 6,925 | | | | 311,971 | | |
| Vornado Realty Trust | | | 5,097 | | | | 619,286 | | |
| Zions Bancorporation | | | 4,560 | | | | 375,926 | | |
| | | | 11,263,334 | | |
| HEALTHCARE (3.5%) | | | | | |
| CIGNA Corp. | | | 3,175 | | | | 417,735 | | |
| Hillenbrand Industries, Inc. | | | 3,019 | | | | 171,872 | | |
| Hospira, Inc.* | | | 5,004 | | | | 168,034 | | |
| King Pharmaceuticals, Inc.* | | | 11,369 | | | | 180,994 | | |
| McKesson Corp. | | | 4,151 | | | | 210,456 | | |
| | | | 1,149,091 | | |
| INDUSTRIAL (8.4%) | | | | | |
| Agnico-Eagle Mines, Ltd. | | | 9,559 | | | | 394,213 | | |
| Alliant TechSystems, Inc.* | | | 3,497 | | | | 273,430 | | |
| CSX Corp. | | | 5,859 | | | | 201,725 | | |
| Donnelley R.R. & Sons | | | 11,451 | | | | 406,969 | | |
| General Growth Pptys., Inc. | | | 5,849 | | | | 305,493 | | |
| Mettler-Toledo International* | | | 4,676 | | | | 368,703 | | |
| Southwest Airlines Co. | | | 10,297 | | | | 157,750 | | |
| Textron, Inc. | | | 3,175 | | | | 297,720 | | |
| Trinity Industries | | | 7,767 | | | | 273,398 | | |
| Other Securities | | | 2,781 | | | | 104,927 | | |
| | | | 2,784,328 | | |
| TECHNOLOGY (7.0%) | | | | | |
| Arrow Electronics* | | | 6,765 | | | | 213,435 | | |
| Computer Sciences Corp.* | | | 2,735 | | | | 145,967 | | |
| DRS Technologies, Inc. | | | 5,520 | | | | 290,794 | | |
| Electronic Data Systems Corp. | | | 10,471 | | | | 288,476 | | |
| Intersil Corp. Cl A | | | 5,318 | | | | 127,207 | | |
| McAfee, Inc.* | | | 5,372 | | | | 152,457 | | |
| Medics Pharmaceutical Corp. | | | 3,986 | | | | 140,028 | | |
| NCR Corp.* | | | 4,191 | | | | 179,207 | | |
| Sybase, Inc.* | | | 7,370 | | | | 182,039 | | |
| Tellabs, Inc.* | | | 15,488 | | | | 158,907 | | |
| Xerox Corp.* | | | 21,197 | | | | 359,289 | | |
| Other Securities | | | 4,878 | | | | 75,511 | | |
| | | | 2,313,317 | | |
| TELECOMMUNICATIONS (1.4%) | | | | | |
| CenturyTel, Inc. | | | 7,331 | | | | 320,071 | | |
| Qwest Communications Intl.* | | | 19,735 | | | | 165,182 | | |
| | | | 485,253 | | |
The accompanying notes are an integral part of these financial statements.
34
MUTUAL OF AMERICA INVESTMENT CORPORATION (MID CAP VALUE)
SUMMARY PORTFOLIO OF INVESTMENTS IN SECURITIES (Continued)
December 31, 2006
| | | Shares | | Value | |
| COMMON STOCKS (CONTINUED): | |
| UTILITIES (13.7%) | | | | | |
| American Electric Power, Inc. | | | 11,937 | | | $ | 508,277 | | |
| Constellation Energy Group | | | 4,151 | | | | 285,879 | | |
| Edison International | | | 9,922 | | | | 451,253 | | |
| Energen Corp. | | | 10,183 | | | | 477,990 | | |
| Entergy Corp. | | | 3,372 | | | | 311,303 | | |
| PG & E Corp. | | | 9,680 | | | | 458,154 | | |
| PPL Corporation | | | 12,144 | | | | 435,241 | | |
| Pepco Holdings, Inc. | | | 13,862 | | | | 360,551 | | |
| Pinnacle West Capital Corp. | | | 7,370 | | | | 373,585 | | |
| Sempra Energy | | | 9,151 | | | | 512,822 | | |
| Sierra Pacific Resources* | | | 21,552 | | | | 362,720 | | |
| | | | 4,537,775 | | |
TOTAL COMMON STOCKS
(Cost: $28,433,476) 95.3% | | | | | | $ | 31,590,528 | | |
* Non-income producing security
| | | Rate | | Maturity | | Face
Amount | | Value | |
| SHORT-TERM DEBT SECURITIES: | |
| U.S. GOVERNMENT AGENCIES (5.1%) | |
| Federal Farm Credit Corp. | | | 4.80 | % | | 01/02/07 | | $ | 1,689,000 | | | $ | 1,688,324 | | |
TOTAL SHORT-TERM DEBT SECURITIES
(Cost: $1,688,324) 5.1% | | | | | | | | | 1,688,324 | | |
TOTAL INVESTMENTS
(Cost: $30,121,800) 100.4% | | | | | | | | | 33,278,852 | | |
| OTHER NET LIABILITIES -0.4% | | | | | | | | | (131,461 | ) | |
| NET ASSETS 100.0% | | | | | | | | $ | 33,147,391 | | |
The total value of non-income producing investments was $5,914,216 or 17.8% of the Fund's total investments as of December 31, 2006.
The accompanying notes are an integral part of these financial statements.
35
MUTUAL OF AMERICA INVESTMENT CORPORATION (MID-CAP EQUITY INDEX FUND)
SUMMARY PORTFOLIO OF INVESTMENTS IN SECURITIES
December 31, 2006
| | | Shares | | Value | |
| COMMON STOCKS: | |
| BASIC MATERIALS (5.7%) | |
| Lyondell Chemical Co. | | | 64,771 | | | $ | 1,656,194 | | |
| Martin Marietta Materials, Inc. | | | 13,844 | | | | 1,438,530 | | |
| Other Securities | | | 592,984 | | | | 17,281,614 | | |
| | | | 20,376,338 | | |
| CONSUMER, CYCLICAL (13.3%) | |
| Abercrombie & Fitch Co. Cl A | | | 27,062 | | | | 1,884,327 | | |
| American Eagle Outfitters | | | 61,537 | | | | 1,920,570 | | |
| CarMax, Inc.* | | | 32,761 | | | | 1,756,972 | | |
| Polo Ralph Lauren Corp. | | | 18,812 | | | | 1,460,940 | | |
| Other Securities | | | 1,355,444 | | | | 40,317,814 | | |
| | | | 47,340,623 | | |
| CONSUMER, NON-CYCLICAL (2.2%) | |
| Other Securities | | | 223,488 | | | | 7,989,930 | | |
| ENERGY (5.8%) | |
| ENSCO International, Inc. | | | 46,570 | | | | 2,331,294 | | |
| Grant Prideco, Inc.* | | | 39,266 | | | | 1,561,609 | | |
| NewField Exploration Company* | | | 39,553 | | | | 1,817,460 | | |
| Noble Energy, Inc. | | | 53,303 | | | | 2,615,578 | | |
| Pioneer Natural Resources Co. | | | 37,603 | | | | 1,492,463 | | |
| Pride International, Inc.* | | | 50,313 | | | | 1,509,893 | | |
| Other Securities | | | 272,117 | | | | 9,343,004 | | |
| | | | 20,671,301 | | |
| FINANCIAL (17.7%) | |
| AMB Property Corp. | | | 27,390 | | | | 1,605,328 | | |
| Berkley (WR) Corp. | | | 51,712 | | | | 1,784,581 | | |
| Developers Divers Rlty. | | | 33,395 | | | | 2,102,215 | | |
| Edwards (A.G.), Inc. | | | 23,313 | | | | 1,475,480 | | |
| Everest RE Group* | | | 19,933 | | | | 1,955,627 | | |
| Fidelity National Financial, Inc. | | | 67,581 | | | | 1,613,834 | | |
| Macerich Co. | | | 22,022 | | | | 1,906,445 | | |
| Mercantile Bankshares Corp. | | | 38,484 | | | | 1,800,666 | | |
| Old Republic Intl. Corp. | | | 70,681 | | | | 1,645,454 | | |
| Regency Centers Corp. | | | 21,132 | | | | 1,651,888 | | |
| Other Securities | | | 1,301,139 | | | | 45,858,356 | | |
| | | | 63,399,874 | | |
| HEALTHCARE (10.0%) | |
| Health Net, Inc.* | | | 35,746 | | | | 1,739,400 | | |
| Omnicare, Inc. | | | 37,238 | | | | 1,438,504 | | |
| Sepracor, Inc.* | | | 33,596 | | | | 2,068,842 | | |
| Varian Medical Systems, Inc.* | | | 39,585 | | | | 1,883,058 | | |
| Vertex Pharmaceutical* | | | 38,515 | | | | 1,441,231 | | |
| Other Securities | | | 754,652 | | | | 27,181,915 | | |
| | | | 35,752,950 | | |
* Non-income producing security.
| | | Shares | | Value | |
| COMMON STOCKS (CONTINUED): | |
| INDUSTRIAL (17.4%) | |
| C.H. Robinson Worldwide, Inc. | | | 53,409 | | | $ | 2,183,894 | | |
| Cameron International Corp.* | | | 34,095 | | | | 1,808,740 | | |
| Dun & Bradstreet* | | | 18,833 | | | | 1,559,184 | | |
| Expeditors Int'l Wash., Inc. | | | 65,372 | | | | 2,647,566 | | |
| Jacobs Engineering Group, Inc. | | | 18,113 | | | | 1,476,934 | | |
| Joy Global, Inc. | | | 36,393 | | | | 1,759,238 | | |
| Manpower, Inc. | | | 26,050 | | | | 1,951,927 | | |
| Precision Castparts Corp. | | | 41,617 | | | | 3,257,779 | | |
| Other Securities | | | 1,273,106 | | | | 45,437,056 | | |
| | | | 62,082,318 | | |
| TECHNOLOGY (14.7%) | |
| Amphenol Corp Cl A | | | 26,794 | | | | 1,663,371 | | |
| Cadence Design Systems, Inc.* | | | 85,083 | | | | 1,523,837 | | |
| Harris Corp. | | | 41,130 | | | | 1,886,222 | | |
| Lam Research Corp.* | | | 43,697 | | | | 2,211,942 | | |
| MEMC Elect. Materials, Inc.* | | | 51,132 | | | | 2,001,306 | | |
| Microchip Technology, Inc. | | | 66,178 | | | | 2,164,021 | | |
| Other Securities | | | 2,043,225 | | | | 40,948,955 | | |
| | | | 52,399,654 | | |
| TELECOMMUNICATIONS (0.6%) | |
| Telephone & Data Systems, Inc. | | | 31,922 | | | | 1,734,322 | | |
| Other Securities | | | 75,813 | | | | 346,465 | | |
| | | | 2,080,787 | | |
| UTILITIES (8.3%) | |
| Equitable Resources, Inc. | | | 37,021 | | | | 1,545,627 | | |
| Oneok, Inc. | | | 33,799 | | | | 1,457,413 | | |
| Pepco Holdings, Inc. | | | 58,678 | | | | 1,526,215 | | |
| SCANA Corp. | | | 35,725 | | | | 1,451,150 | | |
| Southwestern Energy Co.* | | | 51,603 | | | | 1,808,685 | | |
| Wisconsin Energy Corp. | | | 35,874 | | | | 1,702,580 | | |
| Other Securities | | | 788,165 | | | | 19,994,579 | | |
| | | | 29,486,249 | | |
TOTAL COMMON STOCKS
(Cost: $278,331,722) 95.7% | | | | | | $ | 341,580,024 | | |
The accompanying notes are an integral part of these financial statements.
36
MUTUAL OF AMERICA INVESTMENT CORPORATION (MID-CAP EQUITY INDEX FUND)
SUMMARY PORTFOLIO OF INVESTMENTS IN SECURITIES (Continued)
December 31, 2006
| | | Rate | | Maturity | | Face
Amount | | Value | |
| SHORT-TERM DEBT SECURITIES: | |
| U.S. GOVERNMENT (0.4%) | |
| Other Securities (a) | | | — | | | | — | | | $ | 1,400,000 | | | $ | 1,393,078 | | |
| U.S. GOVERNMENT AGENCIES (1.8%) | |
| Federal Home Loan Bank | | | 4.80 | % | | 01/02/07 | | | 6,320,000 | | | | 6,317,472 | | |
| COMMERCIAL PAPER (2.2%) | |
| Novartis Finance | | | 5.28 | | | 01/02/07 | | | 8,000,000 | | | | 7,996,479 | | |
TOTAL SHORT-TERM DEBT SECURITIES
(Cost: $15,707,190) 4.4% | | | | | | | | | | | | | 15,707,029 | | |
TEMPORARY CASH INVESTMENTS**
(Cost: $14,500) 0.0% (1) | | | | | | | | | | | | | 14,500 | | |
TOTAL INVESTMENTS
(Cost: $294,053,412) 100.1% | | | | | | | | | | | | | 357,301,553 | | |
| OTHER NET LIABILITIES (0.1%) | | | | | | | | | | | | | (311,226 | ) | |
| NET ASSETS 100.0% | | | | | | | | | | | | $ | 356,990,327 | | |
(1) Less than 0.05%.
** The fund has an arrangement with its custodian bank, JPMorgan Chase Bank, whereby uninvested cash, subject to parameters set by the fund, is automatically invested in the fund's name by the bank in overnight commercial paper issued by J.P. Morgan Chase & Co. On the next business day, these funds (and earned interest) are automatically returned to the fund. The annual rate of interest earned on this temporary cash investment at December 31, 2006 was 4.83%.
(a) Certain of these securities have been segregated to cover initial margin requirements on open futures contracts.
The total value of non-income producing investments was $117,060,807 or 32.8% of the Fund's total investments as of December 31, 2006.
FUTURES CONTRACTS OUTSTANDING AS OF DECEMBER 31, 2006:
| | | Expiration
Date | | Underlying Face
Amount at Value | | Unrealized
Gain(Loss) | |
| PURCHASED | |
| 37 S&P 400 Index Futures Contracts | | March 2007 | | $ | 15,009,050 | | | $ | (191,475 | ) | |
Face Value of futures purchased and outstanding as a percentage of total investments in securities: 4.2%
The accompanying notes are an integral part of these financial statements.
37
MUTUAL OF AMERICA INVESTMENT CORPORATION (COMPOSITE FUND)
PORTFOLIO OF INVESTMENTS IN SECURITIES
December 31, 2006
| | | Shares | | Value | |
| COMMON STOCKS: | |
| BASIC MATERIALS (1.1%) | |
| Phelps Dodge Corp. | | | 11,897 | | | $ | 1,424,309 | | |
| Other Securities | | | 27,400 | | | | 1,094,356 | | |
| | | | 2,518,665 | | |
| CONSUMER, CYCLICAL (5.3%) | |
| Other Securities | | | 297,048 | | | | 12,097,060 | | |
| CONSUMER, NON-CYCLICAL (5.4%) | |
| CVS Corp. | | | 48,519 | | | | 1,499,722 | | |
| PepsiCo, Inc. | | | 28,063 | | | | 1,755,341 | | |
| Proctor & Gamble Co. | | | 56,298 | | | | 3,618,272 | | |
| Wal-Mart Stores, Inc. | | | 36,236 | | | | 1,673,016 | | |
| Other Securities | | | 78,403 | | | | 3,754,326 | | |
| | | | 12,300,677 | | |
| ENERGY (6.2%) | |
| Exxon Mobil Corp. | | | 100,993 | | | | 7,739,094 | | |
| Halliburton Co. | | | 60,136 | | | | 1,867,223 | | |
| Schlumberger, Ltd. | | | 22,455 | | | | 1,418,258 | | |
| Transocean, Inc.* | | | 18,759 | | | | 1,517,416 | | |
| Other Securities | | | 31,900 | | | | 1,717,781 | | |
| | | | 14,259,772 | | |
| FINANCIAL (13.3%) | |
| American Int'l. Group, Inc. | | | 28,477 | | | | 2,040,662 | | |
| Bank of America Corp. | | | 67,321 | | | | 3,594,268 | | |
| Bear Stearns Cos., Inc. | | | 12,529 | | | | 2,039,471 | | |
| Citigroup, Inc. | | | 56,710 | | | | 3,158,747 | | |
| Goldman Sachs Group, Inc. | | | 7,180 | | | | 1,431,333 | | |
| J.P. Morgan Chase & Co. | | | 42,710 | | | | 2,062,893 | | |
| Merrill Lynch & Co., Inc. | | | 30,590 | | | | 2,847,929 | | |
| MetLife, Inc. | | | 24,587 | | | | 1,450,879 | | |
| Wachovia Corp. | | | 37,119 | | | | 2,113,927 | | |
| Wells Fargo & Company | | | 86,546 | | | | 3,077,576 | | |
| Other Securities | | | 92,271 | | | | 6,796,884 | | |
| | | | 30,614,569 | | |
* Non-income producing security.
| | | Shares | | Value | |
| COMMON STOCKS (CONTINUED): | |
| HEALTHCARE (7.2%) | |
| Abbott Laboratories | | | 34,075 | | | $ | 1,659,793 | | |
| Amgen, Inc.* | | | 27,277 | | | | 1,863,292 | | |
| Johnson & Johnson | | | 49,046 | | | | 3,238,017 | | |
| Medtronic, Inc. | | | 26,732 | | | | 1,430,429 | | |
| Pfizer, Inc. | | | 78,728 | | | | 2,039,055 | | |
| Wyeth | | | 28,520 | | | | 1,452,238 | | |
| Other Securities | | | 102,501 | | | | 4,904,250 | | |
| | | | 16,587,074 | | |
| INDUSTRIAL (7.6%) | |
| General Electric Co. | | | 137,548 | | | | 5,118,161 | | |
| Lockheed Martin Corp. | | | 15,803 | | | | 1,454,982 | | |
| Other Securities | | | 210,147 | | | | 10,817,927 | | |
| | | | 17,391,070 | | |
| TECHNOLOGY (8.7%) | |
| Cisco Systems, Inc.* | | | 102,287 | | | | 2,795,503 | | |
| Corning, Inc.* | | | 73,204 | | | | 1,369,646 | | |
| Hewlett-Packard Co. | | | 37,406 | | | | 1,540,753 | | |
| IBM Corp. | | | 17,167 | | | | 1,667,774 | | |
| Intel Corp. | | | 84,008 | | | | 1,701,162 | | |
| Microsoft Corp. | | | 147,728 | | | | 4,411,158 | | |
| Other Securities | | | 215,189 | | | | 6,421,732 | | |
| | | | 19,907,728 | | |
| TELECOMMUNICATIONS (1.8%) | |
| AT&T | | | 48,486 | | | | 1,733,375 | | |
| Verizon Communications | | | 45,616 | | | | 1,698,740 | | |
| Other Securities | | | 31,802 | | | | 600,740 | | |
| | | | 4,032,855 | | |
| UTILITIES (2.4%) | |
| Exelon Corp. | | | 30,166 | | | | 1,866,974 | | |
| Other Securities | | | 54,964 | | | | 3,701,437 | | |
| | | | 5,568,411 | | |
TOTAL COMMON STOCKS
(Cost: $116,116,095) 59.0% | | | | | | | 135,277,881 | | |
The accompanying notes are an integral part of these financial statements.
38
MUTUAL OF AMERICA INVESTMENT CORPORATION (COMPOSITE FUND)
SUMMARY PORTFOLIO OF INVESTMENTS IN SECURITIES (Continued)
December 31, 2006
| | | Rating* | | Rate | | Maturity | | Face
Amount | | Value | |
| LONG-TERM DEBT SECURITIES: | |
| U.S. GOVERNMENT (2.3%) | |
| U.S. Treasury Strip | | AAA | | | 0.00 | % | | | 08/15/21 | | | $ | 7,000,000 | | | $ | 3,400,047 | | |
| U.S. Treasury Strip | | AAA | | | 0.00 | | | | 02/15/17 | | | | 3,000,000 | | | | 1,856,112 | | |
| | | | 5,256,159 | | |
| U.S. GOVERNMENT AGENCIES (15.0%) | |
| MORTGAGE-BACKED OBLIGATIONS | |
| FHLMC | | AAA | | | 5.00 | | | | 06/15/17 | | | | 4,000,000 | | | | 3,954,300 | | |
| FHLMC | | AAA | | | — | | | | — | | | | 1,591,982 | | | | 1,567,454 | | |
| FNMA | | AAA | | | 5.00 | | | | 11/01/33 | | | | 1,454,708 | | | | 1,407,181 | | |
| FNMA | | AAA | | | 5.50 | | | | 05/01/34 | | | | 1,646,445 | | | | 1,628,794 | | |
| FNMA | | AAA | | | — | | | | — | | | | 22,891,550 | | | | 22,647,776 | | |
| GNMA (1) | | AAA | | | 6.27 | | | | 10/16/27 | | | | 3,000,000 | | | | 3,110,310 | | |
| GNMA (1) | | AAA | | | — | | | | — | | | | 175,827 | | | | 181,037 | | |
| | | | 34,496,852 | | |
| BASIC MATERIALS (1.7%) | |
| Other Securities | | | | | — | | | | — | | | | 3,900,000 | | | | 3,842,231 | | |
| CONSUMER, CYCLICAL (3.8%) | |
| Other Securities | | | | | — | | | | — | | | | 8,888,068 | | | | 8,633,925 | | |
| CONSUMER, NON-CYCLICAL (1.3%) | |
| Wal-Mart Stores, Inc. | | AA | | | 6.88 | | | | 08/10/09 | | | | 1,000,000 | | | | 1,041,826 | | |
| Other Securities | | | | | — | | | | — | | | | 2,000,000 | | | | 1,976,519 | | |
| | | | 3,018,345 | | |
| ENERGY (1.4%) | |
| Other Securities | | | | | — | | | | — | | | | 3,250,000 | | | | 3,174,610 | | |
| FINANCIAL (7.5%) | |
| Berkley (WR) Corp. | | BBB+ | | | 8.70 | | | | 01/01/22 | | | | 1,500,000 | | | | 1,771,903 | | |
| First Tennessee Natl. Bank | | BBB+ | | | 4.50 | | | | 05/15/13 | | | | 1,500,000 | | | | 1,401,049 | | |
| GE Capital Corp. | | AAA | | | 5.45 | | | | 01/15/13 | | | | 2,000,000 | | | | 2,019,133 | | |
| GMAC | | BB+ | | | 0.00 | | | | 12/01/12 | | | | 2,500,000 | | | | 1,655,017 | | |
| Wells Fargo & Company | | AA | | | 3.50 | | | | 04/04/08 | | | | 250,000 | | | | 244,823 | | |
| Other Securities | | | | | — | | | | — | | | | 10,161,200 | | | | 10,076,478 | | |
| | | | 17,168,403 | | |
| HEALTHCARE (0.8%) | |
| Other Securities | | | | | — | | | | — | | | | 1,750,000 | | | | 1,735,945 | | |
| INDUSTRIAL (1.9%) | |
| Seariver Maritime | | AAA | | | 0.00 | | | | 09/01/12 | | | | 3,000,000 | | | | 2,240,589 | | |
| Other Securities | | | | | — | | | | — | | | | 2,250,000 | | | | 2,184,271 | | |
| | | | 4,424,860 | | |
| TECHNOLOGY (0.4%) | |
| Other Securities | | | | | — | | | | — | | | | 1,000,000 | | | | 1,017,783 | | |
| TELECOMMUNICATIONS (0.4%) | |
| Other Securities | | | | | — | | | | — | | | | 1,000,000 | | | | 982,685 | | |
| UTILITIES (1.3%) | |
| Other Securities | | | | | — | | | | — | | | | 3,000,000 | | | | 2,900,486 | | |
TOTAL LONG-TERM DEBT SECURITIES
(Cost: $88,340,327) 37.8% | | | | | | | | | | | | | | | | $ | 86,652,284 | | |
* The ratings are provided by Standard & Poor's Corporation/Moody's Investor Service, Inc.
The accompanying notes are an integral part of these financial statements.
39
MUTUAL OF AMERICA INVESTMENT CORPORATION (COMPOSITE FUND)
SUMMARY PORTFOLIO OF INVESTMENTS IN SECURITIES (Continued)
December 31, 2006
| | | Rate | | Maturity | | Face
Amount | | Value | |
| SHORT-TERM DEBT SECURITIES: | |
| COMMERCIAL PAPER (3.7%) | |
| Anheuser-Busch Co. | | | 5.22 | % | | 01/02/07 | | $ | 5,100,000 | | | $ | 5,097,781 | | |
| Anheuser-Busch Co. | | | 5.22 | | | 01/02/07 | | | 1,700,000 | | | | 1,699,260 | | |
| Novartis Finance | | | 5.28 | | | 01/02/07 | | | 1,620,000 | | | | 1,619,287 | | |
| | | | 8,416,328 | | |
TOTAL SHORT-TERM DEBT SECURITIES
(Cost: $8,416,328 ) 3.7% | | | | | | | | | | | | | 8,416,328 | | |
TEMPORARY CASH INVESTMENTS**
(Cost: $112,700) 0.0% (2) | | | | | | | | | | | | | 112,700 | | |
TOTAL INVESTMENTS
(Cost: $212,985,450 ) 100.5% | | | | | | | | | | | | | 230,459,193 | | |
| OTHER NET LIABILITIES -0.5% | | | | | | | | | | | | | (1,113,221 | ) | |
| NET ASSETS 100.0% | | | | | | | | | | | | $ | 229,345,972 | | |
Abbreviations: FHLMC = Federal Home Loan Mortgage Corporation
NMA = Federal National Mortgage Association
GNMA = Government National Mortgage Association
(1) U.S. Government guaranteed security.
(2) Less than 0.05%.
** The fund has an arrangement with its custodian bank, JPMorgan Chase Bank, whereby uninvested cash, subject to parameters set by the fund, is automatically invested in the fund's name by the bank in overnight commercial paper issued by J.P. Morgan Chase & Co. On the next business day, these funds (and earned interest) are automatically returned to the fund. The annual rate of interest earned on this temporary cash investment at December 31, 2006 was 4.83%.
The total value of investments not rated or below-investment grade was $7,261,828, or 3.2% of the Fund's total investments as of December 31, 2006.
The total value of non-income producing investments was $15,663,595 or 6.8% of the Fund's total investments as of December 31, 2006.
The accompanying notes are an integral part of these financial statements.
40
MUTUAL OF AMERICA INVESTMENT CORPORATION (CONSERVATIVE ALLOCATION FUND)
PORTFOLIO OF INVESTMENTS IN SECURITIES
December 31, 2006
| | | Shares | | Value | |
| COMMON STOCKS: | |
| DIVERSIFIED MUTUAL FUNDS (100.0%) | |
| Mutual of America Investment Corporation | |
| Bond Fund (30.0%) | | | 3,107,704 | | | $ | 3,903,854 | | |
| Equity Index Fund (25.1%) | | | 1,376,035 | | | | 3,269,053 | | |
| Mid Term Bond Fund (44.9%) | | | 6,289,769 | | | | 5,858,020 | | |
TOTAL INVESTMENTS
(Cost: $12,941,485 ) 100.0% | | | | | | | 13,030,927 | | |
| OTHER NET ASSETS 0.0% | | | | | | | — | | |
| NET ASSETS 100.0% | | | | | | $ | 13,030,927 | | |
MUTUAL OF AMERICA INVESTMENT CORPORATION (MODERATE ALLOCATION FUND)
PORTFOLIO OF INVESTMENTS IN SECURITIES
December 31, 2006
| | | Shares | | Value | |
| COMMON STOCKS: | |
| DIVERSIFIED MUTUAL FUNDS (100.0%) | |
| Mutual of America Investment Corporation | |
| Bond Fund (29.9%) | | | 18,189,689 | | | $ | 22,849,634 | | |
| Mid Cap Equity Index Fund (15.0%) | | | 7,340,894 | | | | 11,437,384 | | |
| Equity Index Fund (35.1%) | | | 11,276,029 | | | | 26,788,507 | | |
| Mid Term Bond Fund (20.0%) | | | 16,362,495 | | | | 15,239,324 | | |
TOTAL INVESTMENTS
(Cost: $74,058,824) 100.0% | | | | | | | 76,314,849 | | |
| OTHER NET ASSETS 0.0% | | | | | | | — | | |
| NET ASSETS 100.0% | | | | | | $ | 76,314,849 | | |
MUTUAL OF AMERICA INVESTMENT CORPORATION (AGGRESSIVE ALLOCATION FUND)
PORTFOLIO OF INVESTMENTS IN SECURITIES
December 31, 2006
| | | Shares | | Value | |
| COMMON STOCKS: | |
| DIVERSIFIED MUTUAL FUNDS (100.0%) | |
| Mutual of America Investment Corporation | |
| Bond Fund (24.9%) | | | 14,411,231 | | | $ | 18,103,187 | | |
| Mid Cap Equity Index Fund (20.0%) | | | 9,305,857 | | | | 14,498,869 | | |
| Equity Index Fund (45.1%) | | | 13,783,741 | | | | 32,746,089 | | |
| Small Cap Growth Fund (5.0%) | | | 3,058,609 | | | | 3,632,749 | | |
| Small Cap Value Fund (5.0%) | | | 2,947,396 | | | | 3,640,903 | | |
TOTAL INVESTMENTS
(Cost: $69,512,897) 100.0% | | | | | | | 72,621,797 | | |
| OTHER NET ASSETS 0.0% | | | | | | | — | | |
| NET ASSETS 100.0% | | | | | | $ | 72,621,797 | | |
The accompanying notes are an integral part of these financial statements.
41
MUTUAL OF AMERICA INVESTMENT CORPORATION (MONEY MARKET FUND)
PORTFOLIO OF INVESTMENTS IN SECURITIES
December 31, 2006
| | | Rating* | | Rate | | Maturity | | Face
Amount | | Value | |
| SHORT-TERM DEBT SECURITIES: | |
| U.S. GOVERNMENT AGENCIES (20.7%) | |
| FHLB | | AAA | | | 5.16 | % | | 01/19/07 | | $ | 12,192,000 | | | $ | 12,157,045 | | |
| FHLB | | AAA | | | 4.95 | | | 01/02/07 | | | 3,427,000 | | | | 3,425,586 | | |
| FHLMC | | AAA | | | 5.21 | | | 01/23/07 | | | 20,000,000 | | | | 19,930,503 | | |
| FNMA | | AAA | | | 5.20 | | | 01/24/07 | | | 14,000,000 | | | | 13,949,430 | | |
| | | | 49,462,564 | | |
| COMMERCIAL PAPER (79.3%) | |
| 7-Eleven Inc | | A1+/P1 | | | 5.22 | | | 01/12/07 | | | 6,700,000 | | | | 6,687,339 | | |
| Abbott Labs | | A1+/P1 | | | 5.21 | | | 01/16/07 | | | 5,800,000 | | | | 5,785,668 | | |
| Abbott Labs | | A1+/P1 | | | 5.25 | | | 01/09/07 | | | 1,000,000 | | | | 998,535 | | |
| Alabama Power Co. | | A1/P1 | | | 5.28 | | | 01/05/07 | | | 3,908,000 | | | | 3,904,557 | | |
| Alabama Power Co. | | A1/P1 | | | 5.27 | | | 01/05/07 | | | 2,422,000 | | | | 2,419,872 | | |
| American Express Credit Corp. | | A1/P1 | | | 5.26 | | | 01/12/07 | | | 7,000,000 | | | | 6,986,702 | | |
| Anheuser-Busch Co. | | A1/P1 | | | 5.23 | | | 01/02/07 | | | 7,000,000 | | | | 6,996,949 | | |
| Archer Daniels | | A1/P1 | | | 5.23 | | | 01/16/07 | | | 1,200,000 | | | | 1,197,023 | | |
| Archer Daniels | | A1/P1 | | | 5.25 | | | 01/17/07 | | | 600,000 | | | | 598,415 | | |
| Archer Daniels Midland | | A1/P1 | | | 5.24 | | | 01/31/07 | | | 5,000,000 | | | | 4,976,537 | | |
| Becton Dickinson & Co. | | A1/P1 | | | 5.21 | | | 01/31/07 | | | 6,800,000 | | | | 6,768,408 | | |
| Caterpillar, Inc. | | A1/P1 | | | 5.25 | | | 01/05/07 | | | 7,000,000 | | | | 6,993,874 | | |
| Coca-Cola Company | | A1/P1 | | | 5.20 | | | 01/04/07 | | | 7,000,000 | | | | 6,994,944 | | |
| Coca-Cola Enterprises | | A1/P1 | | | 5.26 | | | 02/02/07 | | | 2,400,000 | | | | 2,388,072 | | |
| Coca-Cola Enterprises | | A1/P1 | | | 5.22 | | | 01/24/07 | | | 2,300,000 | | | | 2,291,633 | | |
| Coca-Cola Enterprises | | A1/P1 | | | 5.24 | | | 01/26/07 | | | 2,100,000 | | | | 2,091,734 | | |
| Colgate-Palmolive Corp. | | A1+/P1 | | | 5.22 | | | 01/19/07 | | | 7,000,000 | | | | 6,979,697 | | |
| Emerson Electric | | A1/P1 | | | 5.25 | | | 01/08/07 | | | 1,500,000 | | | | 1,498,028 | | |
| Emerson Electric Co. | | A1/P1 | | | 5.25 | | | 01/02/07 | | | 5,272,000 | | | | 5,269,690 | | |
| General Electric Capital Corp. | | A1+/P1 | | | 5.25 | | | 01/26/07 | | | 2,000,000 | | | | 1,992,087 | | |
| General Electric Capital Corp. | | A1+/P1 | | | 5.24 | | | 02/06/07 | | | 1,000,000 | | | | 994,428 | | |
| General Electric Capital Corp. | | A1+/P1 | | | 5.24 | | | 01/16/07 | | | 800,000 | | | | 798,012 | | |
| General Electric Capital Corp. | | A1+/P1 | | | 5.29 | | | 01/23/07 | | | 712,000 | | | | 709,500 | | |
| General Electric Capital Corp. | | A1+/P1 | | | 5.24 | | | 02/14/07 | | | 600,000 | | | | 595,957 | | |
| General Electric Capital Corp. | | A1+/P1 | | | 5.25 | | | 01/16/07 | | | 415,000 | | | | 413,962 | | |
| General Electric Co. | | A1+/P1 | | | 5.23 | | | 03/29/07 | | | 1,500,000 | | | | 1,480,262 | | |
| Hershey Foods | | A1/P1 | | | 5.20 | | | 01/23/07 | | | 4,700,000 | | | | 4,683,688 | | |
| IBM Corp. | | A1/P1 | | | 5.23 | | | 01/16/07 | | | 6,800,000 | | | | 6,783,181 | | |
| Johnson & Johnson | | A1+/P1 | | | 5.23 | | | 01/12/07 | | | 6,900,000 | | | | 6,886,963 | | |
| Kimberly-Clark Worldwide | | A1+/P1 | | | 5.25 | | | 01/29/07 | | | 6,700,000 | | | | 6,670,640 | | |
| National Rural Utilities | | A1/P1 | | | 5.25 | | | 01/16/07 | | | 2,200,000 | | | | 2,194,531 | | |
| National Rural Utilities | | A1/P1 | | | 5.26 | | | 01/16/07 | | | 1,800,000 | | | | 1,795,519 | | |
| National Rural Utilities | | A1/P1 | | | 5.27 | | | 01/11/07 | | | 1,225,000 | | | | 1,222,845 | | |
| National Rural Utilities | | A1/P1 | | | 5.25 | | | 01/09/07 | | | 1,200,000 | | | | 1,198,240 | | |
| National Rural Utilities | | A1/P1 | | | 5.30 | | | 01/10/07 | | | 375,000 | | | | 374,390 | | |
| Nestle Capital Corp. | | A1+/P1 | | | 5.22 | | | 02/01/07 | | | 2,900,000 | | | | 2,886,075 | | |
| Nestle Capital Corp. | | A1+/P1 | | | 5.22 | | | 01/17/07 | | | 2,000,000 | | | | 1,994,755 | | |
| Nestle Capital Corp. | | A1+/P1 | | | 5.23 | | | 01/11/07 | | | 1,000,000 | | | | 998,255 | | |
| Nestle Capital Corp. | | A1+/P1 | | | 5.21 | | | 02/28/07 | | | 850,000 | | | | 842,592 | | |
| New Jersey Natural Gas | | A1/P1 | | | 5.24 | | | 01/08/07 | | | 6,700,000 | | | | 6,691,208 | | |
| Novartis Finance | | A1+/P1 | | | 5.28 | | | 01/02/07 | | | 6,000,000 | | | | 5,997,360 | | |
The accompanying notes are an integral part of these financial statements.
42
MUTUAL OF AMERICA INVESTMENT CORPORATION (MONEY MARKET FUND)
PORTFOLIO OF INVESTMENTS IN SECURITIES (Continued)
December 31, 2006
| | | Rating* | | Rate | | Maturity | | Face
Amount | | Value | |
| SHORT-TERM DEBT SECURITIES: (Continued) | |
| COMMERCIAL PAPER (CONTINUED) | |
| Novartis Finance | | A1+/P1 | | | 5.30 | % | | 01/02/07 | | $ | 1,000,000 | | | $ | 999,558 | | |
| Pitney Bowes | | A1/P1 | | | 5.29 | | | 01/03/07 | | | 7,000,000 | | | | 6,995,885 | | |
| Procter & Gamble | | A1+/P1 | | | 5.21 | | | 01/16/07 | | | 3,000,000 | | | | 2,992,595 | | |
| Procter & Gamble | | A1+/P1 | | | 5.22 | | | 02/22/07 | | | 3,000,000 | | | | 2,976,476 | | |
| Procter & Gamble | | A1+/P1 | | | 5.23 | | | 02/22/07 | | | 800,000 | | | | 793,714 | | |
| Siemens Capital | | A1+/P1 | | | 5.26 | | | 01/30/07 | | | 5,700,000 | | | | 5,674,171 | | |
| Siemens Capital | | A1+/P1 | | | 5.26 | | | 01/19/07 | | | 1,100,000 | | | | 1,096,781 | | |
| UPS | | A1+/P1 | | | 5.20 | | | 01/12/07 | | | 7,000,000 | | | | 6,986,854 | | |
| Unilever Capital | | A1/P1 | | | 5.27 | | | 01/02/07 | | | 7,065,000 | | | | 7,061,897 | | |
| Washington Gas Light Co. | | A1/P1 | | | 5.26 | | | 01/05/07 | | | 5,150,000 | | | | 5,145,471 | | |
| Washington Gas Light Co. | | A1/P1 | | | 5.24 | | | 01/04/07 | | | 1,700,000 | | | | 1,698,760 | | |
| XTRA, Inc. | | A1+/P1 | | | 5.35 | | | 01/16/07 | | | 1,300,000 | | | | 1,296,711 | | |
| XTRA, Inc. | | A1+/P1 | | | 5.27 | | | 01/09/07 | | | 1,200,000 | | | | 1,198,238 | | |
| XTRA, Inc. | | A1+/P1 | | | 5.26 | | | 01/03/07 | | | 1,150,000 | | | | 1,149,326 | | |
| XTRA, Inc. | | A1+/P1 | | | 5.30 | | | 01/12/07 | | | 1,100,000 | | | | 1,097,891 | | |
| XTRA, Inc. | | A1+/P1 | | | 5.35 | | | 01/08/07 | | | 1,030,000 | | | | 1,028,620 | | |
| XTRA, Inc. | | A1+/P1 | | | 5.26 | | | 01/04/07 | | | 1,000,000 | | | | 999,266 | | |
| | | | 189,224,341 | | |
TOTAL INVESTMENTS
(Cost: $238,687,246) 100.0% | | | | | | | | | | | | | | | 238,686,905 | | |
| OTHER NET ASSETS 0.0% (1) | | | | | | | | | | | | | | | 2,564 | | |
| NET ASSETS 100.0% | | | | | | | | | | | | | | $ | 238,689,469 | | |
(1) Less than 0.05%.
* The ratings are provided by Standard & Poor's Corporation/Moody's Investor Service, Inc.
Abbreviations: FHLB = Federal Home Loan Bank
FHLMC = Federal Home Loan Mortgage Corporation
FNMA = Federal National Mortgage Association
The accompanying notes are an integral part of these financial statements.
43
MUTUAL OF AMERICA INVESTMENT CORPORATION (MID-TERM BOND FUND)
SUMMARY PORTFOLIO OF INVESTMENTS IN SECURITIES
December 31, 2006
| | | Rating* | | Rate | | Maturity | | Face
Amount | | Value | |
| LONG-TERM DEBT SECURITIES: | |
| U.S. GOVERNMENT (17.5%) | |
| U.S. Treasury Note | | AAA | | | 5.00 | % | | | 08/15/11 | | | $ | 3,000,000 | | | $ | 3,041,952 | | |
| U.S. Treasury Note | | AAA | | | 4.00 | | | | 11/15/12 | | | | 2,000,000 | | | | 1,931,016 | | |
| U.S. Treasury Strip | | AAA | | | 0.00 | | | | 05/15/13 | | | | 8,500,000 | | | | 6,325,947 | | |
| U.S. Treasury Strip | | AAA | | | 0.00 | | | | 11/15/12 | | | | 5,000,000 | | | | 3,810,590 | | |
| U.S. Treasury Strip | | AAA | | | 0.00 | | | | 11/15/08 | | | | 4,000,000 | | | | 3,659,428 | | |
| | | | 18,768,933 | | |
| U.S. GOVERNMENT AGENCIES - | |
| MORTGAGE-BACKED OBLIGATIONS (4.9%) | |
| FHLMC | | AAA | | | 5.00 | | | | 06/15/17 | | | | 3,000,000 | | | | 2,965,724 | | |
| FHLMC | | AAA | | | — | | | | — | | | | 1,089,905 | | | | 1,093,124 | | |
| FNMA | | AAA | | | 4.50 | | | | 10/25/17 | | | | 641,677 | | | | 636,072 | | |
| FNMA | | AAA | | | — | | | | — | | | | 444,774 | | | | 445,903 | | |
| Other Securities | | AAA | | | — | | | | — | | | | 63,979 | | | | 64,385 | | |
| | | | 5,205,208 | | |
| U.S. GOVERNMENT AGENCIES - | |
| NON-MORTGAGE-BACKED OBLIGATION (39.0%) | |
| FFCB | | AAA | | | 5.10 | | | | 08/05/13 | | | | 5,000,000 | | | | 5,033,130 | | |
| FHLB | | AAA | | | 3.00 | | | | 04/15/09 | | | | 3,500,000 | | | | 3,356,462 | | |
| FHLB | | AAA | | | 3.75 | | | | 08/18/09 | | | | 3,500,000 | | | | 3,396,320 | | |
| FHLB | | AAA | | | 5.75 | | | | 05/15/12 | | | | 4,500,000 | | | | 4,669,781 | | |
| FHLMC | | AAA | | | 3.88 | | | | 06/15/08 | | | | 3,750,000 | | | | 3,686,816 | | |
| FHLMC | | AAA | | | 3.63 | | | | 09/15/08 | | | | 1,500,000 | | | | 1,465,355 | | |
| FHLMC | | AAA | | | 6.63 | | | | 09/15/09 | | | | 5,000,000 | | | | 5,207,495 | | |
| FHLMC | | AAA | | | 5.63 | | | | 03/15/11 | | | | 3,250,000 | | | | 3,333,506 | | |
| FNMA | | AAA | | | 3.25 | | | | 02/15/09 | | | | 500,000 | | | | 482,428 | | |
| FNMA | | AAA | | | 4.25 | | | | 05/15/09 | | | | 2,000,000 | | | | 1,967,980 | | |
| FNMA | | AAA | | | 6.63 | | | | 09/15/09 | | | | 5,500,000 | | | | 5,726,837 | | |
| FNMA | | AAA | | | 4.38 | | | | 09/15/12 | | | | 3,500,000 | | | | 3,400,597 | | |
| | | | 41,726,707 | | |
| BASIC MATERIALS (2.2%) | |
| Bemis Co. | | A | | | 4.88 | | | | 04/01/12 | | | | 500,000 | | | | 484,903 | | |
| Lubrizol Corp. | | BBB- | | | 5.50 | | | | 10/01/14 | | | | 500,000 | | | | 487,434 | | |
| Other Securities | | . | | | — | | | | — | | | | 1,360,000 | | | | 1,372,917 | | |
| | | | 2,345,254 | | |
| CONSUMER, CYCLICAL (5.6%) | |
| Caterpillar Fin. Svc. | | A | | | 2.63 | | | | 01/30/07 | | | | 500,000 | | | | 499,001 | | |
| Cox Communications, Inc. Cl A | | BBB- | | | 3.88 | | | | 10/01/08 | | | | 500,000 | | | | 486,457 | | |
| Newell Rubbermaid | | BBB+ | | | 4.63 | | | | 12/15/09 | | | | 500,000 | | | | 488,343 | | |
| Target Corp. | | A+ | | | 5.38 | | | | 06/15/09 | | | | 1,000,000 | | | | 1,005,676 | | |
| Other Securities | | | | | — | | | | — | | | | 3,615,000 | | | | 3,558,035 | | |
| | | | 6,037,512 | | |
| CONSUMER, NON-CYCLICAL (3.5%) | |
| CVS Corp. | | BBB+ | | | 6.13 | | | | 08/15/16 | | | | 500,000 | | | | 515,898 | | |
| Campbell Soup Co. | | A | | | 5.50 | | | | 03/15/07 | | | | 500,000 | | | | 500,104 | | |
| Safeway, Inc. | | BBB- | | | 4.13 | | | | 11/01/08 | | | | 500,000 | | | | 488,367 | | |
| Other Securities | | | | | — | | | | — | | | | 2,250,000 | | | | 2,225,368 | | |
| | | | 3,729,737 | | |
The accompanying notes are an integral part of these financial statements.
44
MUTUAL OF AMERICA INVESTMENT CORPORATION (MID-TERM BOND FUND)
SUMMARY PORTFOLIO OF INVESTMENTS IN SECURITIES (Continued)
December 31, 2006
| | | Rating* | | Rate | | Maturity | | Face
Amount | | Value | |
| LONG-TERM DEBT SECURITIES: (Continued) | |
| ENERGY (4.2%) | |
| AGL Capital Corporation | | BBB+ | | | 6.38 | % | | | 07/15/16 | | | $ | 500,000 | | | $ | 517,149 | | |
| Halliburton Co. | | BBB+ | | | 5.50 | | | | 10/15/10 | | | | 500,000 | | | | 499,112 | | |
| Premco Refining Group | | BBB | | | 7.50 | | | | 06/15/15 | | | | 500,000 | | | | 522,888 | | |
| Weatherford Enterra, Inc. | | BBB+ | | | 5.50 | | | | 02/15/16 | | | | 500,000 | | | | 485,678 | | |
| Other Securities | | | | | — | | | | — | | | | 2,550,000 | | | | 2,464,423 | | |
| | | | 4,489,250 | | |
| FINANCIAL (11.7%) | |
| American Honda Fin. (a) | | A+ | | | 3.85 | | | | 11/06/08 | | | | 700,000 | | | | 683,080 | | |
| Bank of America Corp. | | A+ | | | 5.75 | | | | 08/15/16 | | | | 500,000 | | | | 510,313 | | |
| Bank of America Corp. | | AA- | | | 5.38 | | | | 08/15/11 | | | | 250,000 | | | | 251,728 | | |
| Bank of Oklahoma | | BBB+ | | | 7.13 | | | | 08/15/07 | | | | 600,000 | | | | 605,538 | | |
| Ford Motor Credit Co. | | B | | | 7.38 | | | | 10/28/09 | | | | 750,000 | | | | 751,598 | | |
| GE Capital Corp. | | AAA | | | 5.00 | | | | 01/08/16 | | | | 500,000 | | | | 488,641 | | |
| MACK-CALI Realty LP | | BBB | | | 5.80 | | | | 01/15/16 | | | | 500,000 | | | | 501,381 | | |
| Roslyn Bancorp, Inc. | | BBB- | | | 7.50 | | | | 12/01/08 | | | | 500,000 | | | | 516,297 | | |
| SLM Corp. | | A | | | 4.00 | | | | 01/15/09 | | | | 500,000 | | | | 488,897 | | |
| Simon Property Gp. (a) | | A- | | | 4.88 | | | | 08/15/10 | | | | 500,000 | | | | 493,066 | | |
| Wachovia Bank | | A+ | | | 5.60 | | | | 03/15/16 | | | | 500,000 | | | | 504,888 | | |
| Other Securities | | | | | — | | | | — | | | | 6,770,000 | | | | 6,714,659 | | |
| | | | 12,510,086 | | |
| HEALTHCARE (2.1%) | |
| Abbott Laboratories | | AA | | | 5.60 | | | | 05/15/11 | | | | 500,000 | | | | 506,905 | | |
| Allergan, Inc. | | A | | | 5.75 | | | | 04/01/16 | | | | 500,000 | | | | 505,664 | | |
| WellPoint, Inc. | | BBB+ | | | 5.00 | | | | 01/15/11 | | | | 500,000 | | | | 493,899 | | |
| Other Securities | | | | | — | | | | — | | | | 790,000 | | | | 772,279 | | |
| | | | 2,278,747 | | |
| INDUSTRIAL (3.3%) | |
| Deluxe Corp. | | BB- | | | 3.50 | | | | 10/01/07 | | | | 750,000 | | | | 733,125 | | |
| ERP Operating LP | | A- | | | 5.38 | | | | 08/01/16 | | | | 500,000 | | | | 494,775 | | |
| Masco Corp. | | BBB+ | | | 4.80 | | | | 06/15/15 | | | | 500,000 | | | | 456,592 | | |
| Masco Corp. | | BBB+ | | | 5.88 | | | | 07/15/12 | | | | 300,000 | | | | 300,332 | | |
| Other Securities | | | | | — | | | | — | | | | 1,620,000 | | | | 1,590,376 | | |
| | | | 3,575,200 | | |
| TECHNOLOGY (1.2%) | |
| General Dynamics Corporation | | A | | | 4.50 | | | | 08/15/10 | | | | 500,000 | | | | 489,382 | | |
| Other Securities | | | | | — | | | | — | | | | 750,000 | | | | 750,575 | | |
| | | | 1,239,957 | | |
| TELECOMMUNICATIONS (0.2%) | |
| Other Securities | | | | | — | | | | — | | | | 250,000 | | | | 244,688 | | |
| UTILITIES (2.5%) | |
| Duke Energy Corp. | | BBB+ | | | 4.50 | | | | 04/01/10 | | | | 500,000 | | | | 488,143 | | |
| Telecom de Puerto Rico | | BBB+ | | | 6.80 | | | | 05/15/09 | | | | 500,000 | | | | 510,385 | | |
| Other Securities | | | | | — | | | | — | | | | 1,785,000 | | | | 1,722,021 | | |
| | | | 2,720,549 | | |
TOTAL LONG-TERM DEBT SECURITIES
(Cost: $106,041,895 ) 97.9% | | | | | | | | | | | | | | | | $ | 104,871,828 | | |
* Ratings as per Standard & Poor's Corporation.
The accompanying notes are an integral part of these financial statements.
45
MUTUAL OF AMERICA INVESTMENT CORPORATION (MID-TERM BOND FUND)
SUMMARY PORTFOLIO OF INVESTMENTS IN SECURITIES (Continued)
December 31, 2006
| | | Rate | | Maturity | | Face
Amount | | Value | |
| SHORT-TERM DEBT SECURITIES: | |
| COMMERCIAL PAPER (1.0%) | |
| Novartis Finance | | | 5.28 | % | | 01/02/07 | | $ | 1,060,000 | | | $ | 1,059,534 | | |
TOTAL SHORT-TERM DEBT SECURITIES
(Cost: $1,059,534) 1.0% | | | | | | | | | 1,059,534 | | |
TEMPORARY CASH INVESTMENTS**
(Cost: $11,200) 0.0% (3) | | | | | | | | | 11,200 | | |
TOTAL INVESTMENTS
(Cost: $107,112,629) 98.9% | | | | | | | | | 105,942,562 | | |
| OTHER NET ASSETS 1.1% | | | | | | | | | 1,134,474 | | |
| NET ASSETS 100.0% | | | | | | | | $ | 107,077,036 | | |
Abbreviations: FFCB = Federal Farm Credit Bank
FHLB = Federal Home Loan Bank
FHLMC = Federal Home Loan Mortgage Corporation
FNMA = Federal National Mortgage Association
The total value of investments not rated or below-investment grade was $2,411,704, or 2.3% of the Fund's total investments as of December 31, 2006.
** The fund has an arrangement with its custodian bank, JPMorgan Chase Bank, whereby uninvested cash, subject to parameters set by the fund, is automatically invested in the fund's name by the bank in overnight commercial paper issued by J.P. Morgan Chase & Co. On the next business day, these funds (and earned interest) are automatically returned to the fund. The annual rate of interest earned on this temporary cash investment at December 31, 2006 was 4.83%.
(a) Rule 144a restricted security
The accompanying notes are an integral part of these financial statements.
46
MUTUAL OF AMERICA INVESTMENT CORPORATION (BOND FUND)
SUMMARY PORTFOLIO OF INVESTMENTS IN SECURITIES
December 31, 2006
| | | Rating* | | Rate | | Maturity | | Face
Amount | | Value | |
| LONG-TERM DEBT SECURITIES: | |
| U.S. GOVERNMENT (4.8%) | |
| U.S. Treasury Strip | | AAA | | | 0.00 | % | | | 02/15/17 | | | $ | 15,000,000 | | | $ | 9,280,560 | | |
| U.S. Treasury Strip | | AAA | | | 0.00 | | | | 05/15/14 | | | | 10,000,000 | | | | 7,094,920 | | |
| | | | 16,375,480 | | |
| U.S. GOVERNMENT AGENCIES - | |
| MORTGAGE-BACKED OBLIGATIONS (34.4%) | |
| FHLMC | | AAA | | | — | | | | — | | | | 2,256,537 | | | | 2,265,167 | | |
| FNMA | | AAA | | | 5.00 | | | | 09/01/35 | | | | 5,505,088 | | | | 5,316,494 | | |
| FNMA | | AAA | | | 5.50 | | | | 10/01/34 | | | | 4,821,697 | | | | 4,770,004 | | |
| FNMA | | AAA | | | 5.50 | | | | 07/01/33 | | | | 4,181,562 | | | | 4,138,935 | | |
| FNMA | | AAA | | | 5.50 | | | | 08/01/35 | | | | 4,042,821 | | | | 3,996,644 | | |
| FNMA | | AAA | | | 5.50 | | | | 03/01/24 | | | | 3,917,382 | | | | 3,896,522 | | |
| FNMA | | AAA | | | 5.00 | | | | 11/01/33 | | | | 3,692,720 | | | | 3,572,075 | | |
| FNMA | | AAA | | | 5.00 | | | | 10/01/20 | | | | 3,126,096 | | | | 3,073,274 | | |
| FNMA | | AAA | | | 5.00 | | | | 01/01/34 | | | | 2,866,338 | | | | 2,772,692 | | |
| FNMA | | AAA | | | 6.00 | | | | 04/01/33 | | | | 2,671,760 | | | | 2,696,143 | | |
| FNMA | | AAA | | | 5.50 | | | | 07/01/34 | | | | 2,719,455 | | | | 2,690,299 | | |
| FNMA | | AAA | | | 4.50 | | | | 05/01/18 | | | | 2,762,897 | | | | 2,671,860 | | |
| FNMA | | AAA | | | 5.50 | | | | 10/01/33 | | | | 2,680,041 | | | | 2,652,721 | | |
| FNMA | | AAA | | | 4.00 | | | | 05/01/19 | | | | 2,635,122 | | | | 2,483,450 | | |
| FNMA | | AAA | | | 6.50 | | | | 05/01/32 | | | | 2,419,484 | | | | 2,474,941 | | |
| FNMA | | AAA | | | 5.00 | | | | 06/01/33 | | | | 2,529,459 | | | | 2,446,819 | | |
| FNMA | | AAA | | | 5.00 | | | | 09/01/20 | | | | 2,415,437 | | | | 2,374,624 | | |
| FNMA | | AAA | | | 6.00 | | | | 01/01/37 | | | | 2,355,000 | | | | 2,370,946 | | |
| FNMA | | AAA | | | 6.00 | | | | 12/01/36 | | | | 2,300,000 | | | | 2,315,573 | | |
| FNMA | | AAA | | | 6.00 | | | | 05/01/32 | | | | 2,282,844 | | | | 2,303,677 | | |
| FNMA | | AAA | | | 6.00 | | | | 11/01/34 | | | | 2,266,486 | | | | 2,283,473 | | |
| FNMA | | AAA | | | 5.00 | | | | 04/01/35 | | | | 2,349,384 | | | | 2,268,899 | | |
| FNMA | | AAA | | | 5.50 | | | | 11/01/26 | | | | 2,273,642 | | | | 2,258,952 | | |
| FNMA | | AAA | | | 4.50 | | | | 06/01/34 | | | | 2,372,327 | | | | 2,226,296 | | |
| FNMA | | AAA | | | 6.00 | | | | 05/01/23 | | | | 2,177,407 | | | | 2,204,726 | | |
| FNMA | | AAA | | | — | | | | — | | | | 42,437,325 | | | | 41,907,611 | | |
| GNMA (1) | | AAA | | | 6.27 | | | | 10/16/27 | | | | 3,000,000 | | | | 3,110,310 | | |
| GNMA (1) | | AAA | | | — | | | | — | | | | 784,926 | | | | 807,669 | | |
| | | | 118,350,796 | | |
| U.S GOVERNMENT AGENCIES - | |
| NON-MORTGAGE-BACKED OBLIGATION (4.0%) | |
| AID - Sri Lanka | | AAA | | | 6.59 | | | | 09/15/28 | | | | 4,000,000 | | | | 4,045,520 | | |
| FHLMC | | AAA | | | 5.20 | | | | 03/05/19 | | | | 10,000,000 | | | | 9,722,120 | | |
| | | | 13,767,640 | | |
| BASIC MATERIALS (4.7%) | |
| Lyondell Chemical Co. | | B+ | | | 10.25 | | | | 11/01/10 | | | | 5,000,000 | | | | 5,525,000 | | |
| PolyOne Corp. | | B+ | | | 7.50 | | | | 12/15/15 | | | | 3,750,000 | | | | 3,281,250 | | |
| Other Securities | | | | | — | | | | — | | | | 7,500,000 | | | | 7,430,210 | | |
| | | | 16,236,460 | | |
| CONSUMER, CYCLICAL (11.4%) | |
| Johnson Controls, Inc. | | A- | | | 4.88 | | | | 09/15/13 | | | | 2,500,000 | | | | 2,387,063 | | |
| Kellwood, Co. | | BB | | | 7.88 | | | | 07/15/09 | | | | 4,000,000 | | | | 4,057,396 | | |
| Newell Rubbermaid | | BBB+ | | | 4.63 | | | | 12/15/09 | | | | 2,500,000 | | | | 2,441,713 | | |
| Target Corp. | | A+ | | | 5.38 | | | | 06/15/09 | | | | 3,250,000 | | | | 3,268,447 | | |
| Other Securities | | | | | — | | | | — | | | | 27,595,170 | | | | 26,873,113 | | |
| | | | 39,027,732 | | |
The accompanying notes are an integral part of these financial statements.
47
MUTUAL OF AMERICA INVESTMENT CORPORATION (BOND FUND)
SUMMARY PORTFOLIO OF INVESTMENTS IN SECURITIES (Continued)
December 31, 2006
| | | Rating* | | Rate | | Maturity | | Face
Amount | | Value | |
| LONG-TERM DEBT SECURITIES: (Continued) | |
| CONSUMER, NON-CYCLICAL (3.2%) | |
| Other Securities | | | | | — | | | | — | | | $ | 11,000,000 | | | $ | 10,931,962 | | |
| ENERGY (3.4%) | |
| Other Securities | | | | | — | | | | — | | | | 11,750,000 | | | | 11,601,298 | | |
| FINANCIAL (18.8%) | |
| BOAA | | AAA | | | 5.75 | % | | | 05/25/33 | | | | 3,500,000 | | | | 3,423,165 | | |
| Berkley (WR) Corp. | | BBB+ | | | 8.70 | | | | 01/01/22 | | | | 5,000,000 | | | | 5,906,345 | | |
| Deere Capital Corp. | | A | | | 3.90 | | | | 01/15/08 | | | | 2,500,000 | | | | 2,465,085 | | |
| Executive Risk, Inc. | | A | | | 7.13 | | | | 12/15/07 | | | | 5,000,000 | | | | 5,069,060 | | |
| Fairfax Fin. Hldgs. | | BB | | | 8.25 | | | | 10/01/15 | | | | 2,500,000 | | | | 2,462,500 | | |
| First Horizon Mtge.Trust | | AAA | | | 5.00 | | | | 06/25/33 | | | | 2,599,957 | | | | 2,570,908 | | |
| First Tennessee Natl. Bank | | BBB+ | | | 4.50 | | | | 05/15/13 | | | | 5,000,000 | | | | 4,670,165 | | |
| Ford Motor Credit Co. | | B | | | 7.38 | | | | 10/28/09 | | | | 3,000,000 | | | | 3,006,390 | | |
| GMAC | | BB+ | | | 0.00 | | | | 12/01/12 | | | | 10,000,000 | | | | 6,620,070 | | |
| National City Bank | | A+ | | | 3.38 | | | | 10/15/07 | | | | 2,250,000 | | | | 2,211,570 | | |
| SLM Corp. | | A | | | 4.00 | | | | 01/15/09 | | | | 2,250,000 | | | | 2,200,037 | | |
| Simon Property Group Inc. (a) | | A- | | | 7.88 | | | | 03/15/16 | | | | 5,000,000 | | | | 5,812,270 | | |
| Other Securities | | | | | — | | | | — | | | | 18,250,000 | | | | 18,254,129 | | |
| | | | 64,671,694 | | |
| HEALTHCARE (2.4%) | |
| UnitedHealth Group | | A | | | 3.38 | | | | 08/15/07 | | | | 2,500,000 | | | | 2,469,288 | | |
| Other Securities | | | | | — | | | | — | | | | 5,750,000 | | | | 5,728,057 | | |
| | | | 8,197,345 | | |
| INDUSTRIAL (4.8%) | |
| Seariver Maritime | | AAA | | | 0.00 | | | | 09/01/12 | | | | 10,000,000 | | | | 7,468,630 | | |
| Other Securities | | | | | — | | | | — | | | | 9,250,000 | | | | 9,008,232 | | |
| | | | 16,476,862 | | |
| TECHNOLOGY (1.2%) | |
| Other Securities | | | | | — | | | | — | | | | 4,000,000 | | | | 4,071,130 | | |
| TELECOMMUNICATIONS (1.7%) | |
| Other Securities | | | | | — | | | | — | | | | 6,000,000 | | | | 5,983,852 | | |
| UTILITIES (2.9%) | |
| Other Securities | | | | | — | | | | — | | | | 10,250,000 | | | | 9,871,191 | | |
TOTAL LONG-TERM DEBT SECURITIES
(Cost: $338,449,234 ) 97.7% | | | | | | | | | | | | | | | | $ | 335,563,442 | | |
* Ratings as per Standard & Poor's Corporation.
The accompanying notes are an integral part of these financial statements.
48
MUTUAL OF AMERICA INVESTMENT CORPORATION (BOND FUND)
SUMMARY PORTFOLIO OF INVESTMENTS IN SECURITIES (Continued)
December 31, 2006
| | | Rate | | Maturity | | Face
Amount | | Value | |
| SHORT-TERM DEBT SECURITIES: | |
| COMMERCIAL PAPER (2.1%) | |
| Novartis Finance | | | 5.28 | % | | 01/02/07 | | $ | 7,270,000 | | | $ | 7,266,801 | | |
TOTAL SHORT-TERM DEBT SECURITIES
(Cost: $7,266,801) 2.1% | | | | | | | | | 7,266,801 | | |
TEMPORARY CASH INVESTMENTS**
(Cost: $13,800) 0.0% (2) | | | | | | | | | 13,800 | | |
TOTAL INVESTMENTS
(Cost: $345,729,835) 99.8% | | | | | | | | | 342,844,043 | | |
| OTHER NET ASSETS 0.2% | | | | | | | | | 645,788 | | |
| NET ASSETS 100.0% | | | | | | | | $ | 343,489,831 | | |
Abrreviations: FHLMC = Federal Home Loan Mortgage Corporation
FNMA = Federal National Mortgage Association
GNMA= Government National Mortgage Association
(1) U.S. Government guaranteed security.
(2) Less than 0.05%.
(a) Rule 144a restricted security
The total value of investments not rated or below-investment grade was $33,170,422, or 9.7% of the Fund's total investments as of December 31, 2006.
** The fund has an arrangement with its custodian bank, JPMorgan Chase Bank, whereby uninvested cash, subject to parameters set by the fund, is automatically invested in the fund's name by the bank in overnight commercial paper issued by J.P. Morgan Chase & Co. On the next business day, these funds (and earned interest) are automatically returned to the fund. The annual rate of interest earned on this temporary cash investment at December 31, 2006 was 4.83%.
The accompanying notes are an integral part of these financial statements.
49
MUTUAL OF AMERICA INVESTMENT CORPORATION
STATEMENTS OF ASSETS AND LIABILITIES
December 31, 2006
| | | Equity Index
Fund | | All America
Fund | | Small Cap
Value Fund | | Small Cap
Growth Fund | | Mid-Cap
Value Fund | | Mid-Cap
Equity Index
Fund | | Composite
Fund | |
| ASSETS: | |
Investments at market value
(Cost: Equity Index Fund — $634,751,442,
All America Fund — $341,269,230,
Small Cap Value Fund — $234,400,400,
Small Cap Growth Fund — $190,348,905,
Mid-Cap Value Fund — $30,121,800,
Mid-Cap Equity Index Fund — $294,053,412,
Composite Fund — $212,985,450,
Conservative Allocation Fund — $12 ,941,485,
Moderate Allocation Fund — $74,058,824,
Aggressive Allocation Fund — $69,512,897,
Money Market Fund — $238,687,246,
Mid-Term Bond Fund — $107,112,629,
Bond Fund — $345,729,835)
(Notes 1 and 3) | | $ | 810,429,853 | | | $ | 424,552,310 | | | $ | 250,197,967 | | | $ | 224,280,055 | | | $ | 33,278,852 | | | $ | 357,301,553 | | | $ | 230,459,193 | | |
| Cash | | | 7,975 | | | | — | | | | 3,108 | | | | 243,723 | | | | 3,069 | | | | 97 | | | | 3,049 | | |
| Interest and dividends receivable | | | 1,060,160 | | | | 531,254 | | | | 507,697 | | | | 83,232 | | | | 51,328 | | | | 234,492 | | | | 870,534 | | |
| Receivable for securities sold | | | 122,194 | | | | 1,193,297 | | | | 3,863,053 | | | | — | | | | 86,817 | | | | 159,579 | | | | 404,273 | | |
| TOTAL ASSETS | | | 811,620,182 | | | | 426,276,861 | | | | 254,571,825 | | | | 224,607,010 | | | | 33,420,066 | | | | 357,695,721 | | | | 231,737,049 | | |
| LIABILITIES: | |
| Payable for securities purchased | | | — | | | | 2,760,571 | | | | 8,325,720 | | | | 1,078,484 | | | | 272,675 | | | | 603,644 | | | | 2,391,077 | | |
| Payable for daily variation margin on future contracts | | | 122,850 | | | | 24,300 | | | | — | | | | — | | | | — | | | | 101,750 | | | | — | | |
| Other | | | — | | | | 25,110 | | | | — | | | | — | | | | — | | | | — | | | | — | | |
| TOTAL LIABILITIES | | | 122,850 | | | | 2,809,981 | | | | 8,325,720 | | | | 1,078,484 | | | | 272,675 | | | | 705,394 | | | | 2,391,077 | | |
| NET ASSETS | | $ | 811,497,332 | | | $ | 423,466,880 | | | $ | 246,246,105 | | | $ | 223,528,526 | | | $ | 33,147,391 | | | $ | 356,990,327 | | | $ | 229,345,972 | | |
| NUMBER OF SHARES OUTSTANDING (Note 4) | | | 341,581,939 | | | | 211,396,296 | | | | 199,327,799 | | | | 188,200,676 | | | | 27,416,448 | | | | 229,128,404 | | | | 148,173,743 | | |
| NET ASSET VALUES, offering and redemption price per share | | $ | 2.38 | | | $ | 2.00 | | | $ | 1.24 | | | $ | 1.19 | | | $ | 1.21 | | | $ | 1.56 | | | $ | 1.55 | | |
| COMPONENTS OF NET ASSETS: | |
| Paid-in capital | | $ | 638,326,898 | | | $ | 338,015,309 | | | $ | 228,974,946 | | | $ | 186,345,700 | | | $ | 29,830,563 | | | $ | 289,859,794 | | | $ | 247,475,125 | | |
| Accumulated undistributed net investment income (loss) | | | 496,438 | | | | 4,562,788 | | | | — | | | | — | | | | — | | | | 800,096 | | | | 4,723,923 | | |
Accumulated undistributed net realized gain (loss)
on investments and futures contracts | | | (3,038,727 | ) | | | (2,390,110 | ) | | | 1,473,592 | | | | 3,251,676 | | | | 159,776 | | | | 3,273,771 | | | | (40,326,819 | ) | |
Unrealized appreciation (depreciation)
of investments and futures contracts | | | 175,712,723 | | | | 83,278,893 | | | | 15,797,567 | | | | 33,931,150 | | | | 3,157,052 | | | | 63,056,666 | | | | 17,473,743 | | |
| NET ASSETS | | $ | 811,497,332 | | | $ | 423,466,880 | | | $ | 246,246,105 | | | $ | 223,528,526 | | | $ | 33,147,391 | | | $ | 356,990,327 | | | $ | 229,345,972 | | |
The accompanying notes are an integral part of these financial statements.
50
| | | Conservative
Allocation
Fund | | Moderate
Allocation
Fund | | Aggressive
Allocation
Fund | | Money
Market
Fund | | Mid-Term
Bond Fund | | Bond
Fund | |
| ASSETS: | |
Investments at market value
(Cost: Equity Index Fund — $634,751,442,
All America Fund — $341,269,230,
Small Cap Value Fund — $234,400,400,
Small Cap Growth Fund — $190,348,905,
Mid-Cap Value Fund — $30,121,800,
Mid-Cap Equity Index Fund — $294,053,412,
Composite Fund — $212,985,450,
Conservative Allocation Fund — $12 ,941,485,
Moderate Allocation Fund — $74,058,824,
Aggressive Allocation Fund — $69,512,897,
Money Market Fund — $238,687,246,
Mid-Term Bond Fund — $107,112,629,
Bond Fund — $345,729,835)
(Notes 1 and 3) | | $ | 13,030,927 | | | $ | 76,314,849 | | | $ | 72,621,797 | | | $ | 238,686,905 | | | $ | 105,942,562 | | | $ | 342,844,043 | | |
| Cash | | | — | | | | — | | | | — | | | | 2,564 | | | | 57 | | | | 10 | | |
| Interest and dividends receivable | | | — | | | | — | | | | — | | | | — | | | | 1,130,560 | | | | 3,025,125 | | |
| Receivable for securities sold | | | — | | | | — | | | | — | | | | — | | | | 3,857 | | | | — | | |
| TOTAL ASSETS | | | 13,030,927 | | | | 76,314,849 | | | | 72,621,797 | | | | 238,689,469 | | | | 107,077,036 | | | | 345,869,178 | | |
| LIABILITIES: | |
| Payable for securities purchased | | | — | | | | — | | | | — | | | | — | | | | — | | | | 2,379,347 | | |
| Payable for daily variation margin on future contracts | | | — | | | | — | | | | — | | | | — | | | | — | | | | — | | |
| Other | | | — | | | | — | | | | — | | | | — | | | | — | | | | — | | |
| TOTAL LIABILITIES | | | — | | | | — | | | | — | | | | — | | | | — | | | | 2,379,347 | | |
| NET ASSETS | | $ | 13,030,927 | | | $ | 76,314,849 | | | $ | 72,621,797 | | | $ | 238,689,469 | | | $ | 107,077,036 | | | $ | 343,489,831 | | |
| NUMBER OF SHARES OUTSTANDING (Note 4) | | | 12,771,880 | | | | 66,772,504 | | | | 57,189,062 | | | | 197,536,255 | | | | 114,968,714 | | | | 273,438,408 | | |
| NET ASSET VALUES, offering and redemption price per share | | $ | 1.02 | | | $ | 1.14 | | | $ | 1.27 | | | $ | 1.21 | | | $ | 0.93 | | | $ | 1.26 | | |
| COMPONENTS OF NET ASSETS: | |
| Paid-in capital | | $ | 13,049,066 | | | $ | 74,259,115 | | | $ | 69,516,039 | | | $ | 238,439,005 | | | $ | 109,446,438 | | | $ | 372,313,201 | | |
| Accumulated undistributed net investment income (loss) | | | 19,051 | | | | 51,695 | | | | 66,675 | | | | 259,187 | | | | 43,767 | | | | 1,181,762 | | |
Accumulated undistributed net realized gain (loss)
on investments and futures contracts | | | (126,632 | ) | | | (251,986 | ) | | | (69,817 | ) | | | (8,382 | ) | | | (1,243,102 | ) | | | (27,119,340 | ) | |
Unrealized appreciation (depreciation)
of investments and futures contracts | | | 89,442 | | | | 2,256,025 | | | | 3,108,900 | | | | (341 | ) | | | (1,170,067 | ) | | | (2,885,792 | ) | |
| NET ASSETS | | $ | 13,030,927 | | | $ | 76,314,849 | | | $ | 72,621,797 | | | $ | 238,689,469 | | | $ | 107,077,036 | | | $ | 343,489,831 | | |
The accompanying notes are an integral part of these financial statements.
51
MUTUAL OF AMERICA INVESTMENT CORPORATION
STATEMENTS OF OPERATIONS
For the Year Ended December 31, 2006
| | | Equity Index
Fund | | All America
Fund | | Small Cap
Value Fund | | Small Cap
Growth Fund | | Mid Cap
Value Fund | | Mid-Cap
Equity Index
Fund | | Composite
Fund | |
| INVESTMENT INCOME AND EXPENSES: | |
| INCOME: | |
| Dividends | | $ | 13,861,361 | | | $ | 6,732,910 | | | $ | 2,008,296 | | | $ | 416,238 | | | $ | 453,607 | | | $ | 4,887,984 | | | $ | 2,334,738 | | |
| Interest | | | 960,644 | | | | 808,236 | | | | 385,810 | | | | 175,854 | | | | 103,938 | | | | 808,277 | | | | 4,869,272 | | |
| Total income | | | 14,822,005 | | | | 7,541,146 | | | | 2,394,106 | | | | 592,092 | | | | 557,545 | | | | 5,696,261 | | | | 7,204,010 | | |
| EXPENSES: | |
| Investment advisory fees (Note 2) | | | 677,281 | | | | 1,765,871 | | | | 813,412 | | | | 729,201 | | | | 135,517 | | | | 338,099 | | | | 980,544 | | |
| Accounting and recordkeeping expenses | | | 267,141 | | | | 138,096 | | | | 23,077 | | | | 23,608 | | | | 5,412 | | | | 129,829 | | | | 81,566 | | |
| Shareholders reports | | | 34,241 | | | | 17,701 | | | | 2,958 | | | | 3,026 | | | | 694 | | | | 16,641 | | | | 10,455 | | |
| Custodian expenses | | | 54,148 | | | | 107,284 | | | | 15,817 | | | | 19,947 | | | | 10,210 | | | | 39,851 | | | | 41,359 | | |
| Independent directors' fees and expenses | | | 17,982 | | | | 16,851 | | | | 12,051 | | | | 13,812 | | | | 11,764 | | | | 17,479 | | | | 17,900 | | |
| Audit | | | 75,761 | | | | 39,163 | | | | 6,544 | | | | 6,695 | | | | 1,535 | | | | 36,819 | | | | 23,131 | | |
| Licenses | | | 74,069 | | | | 20,995 | | | | — | | | | — | | | | — | | | | 41,459 | | | | — | | |
| Other | | | 49,002 | | | | 25,332 | | | | 4,233 | | | | 4,330 | | | | 991 | | | | 23,815 | | | | 14,962 | | |
| Total expenses before reimbursement | | | 1,249,625 | | | | 2,131,293 | | | | 878,092 | | | | 800,619 | | | | 166,123 | | | | 643,992 | | | | 1,169,917 | | |
| Expense reimbursement (Note 2) | | | (214,061 | ) | | | (135,383 | ) | | | (12,503 | ) | | | (17,575 | ) | | | (8,591 | ) | | | (118,953 | ) | | | (79,314 | ) | |
| Net Expenses | | | 1,035,564 | | | | 1,995,910 | | | | 865,589 | | | | 783,044 | | | | 157,532 | | | | 525,039 | | | | 1,090,603 | | |
| Net Investment Income (Loss) | | | 13,786,441 | | | | 5,545,236 | | | | 1,528,517 | | | | (190,952 | ) | | | 400,013 | | | | 5,171,222 | | | | 6,113,407 | | |
NET REALIZED AND UNREALIZED GAIN (LOSS) ON INVESTMENTS AND FUTURES CONTRACTS
(Note 1): | |
| Net realized gain (loss) on investments and futures contracts: | |
| Net realized gain (loss) on investments | | | 12,187,318 | | | | 31,102,372 | | | | 3,718,208 | | | | 9,242,313 | | | | 378,136 | | | | 22,568,298 | | | | 5,468,807 | | |
| Net realized gain (loss) on futures contracts | | | 1,468,758 | | | | 946,965 | | | | — | | | | — | | | | — | | | | 99,619 | | | | — | | |
| | | | 13,656,076 | | | | 32,049,337 | | | | 3,718,208 | | | | 9,242,313 | | | | 378,136 | | | | 22,667,917 | | | | 5,468,807 | | |
Net unrealized appreciation (depreciation) of investments and
futures contracts: | |
| Net unrealized appreciation (depreciation) of investments | | | 81,958,877 | | | | 22,316,243 | | | | 15,458,945 | | | | 12,504,469 | | | | 2,711,947 | | | | 6,002,037 | | | | 11,584,858 | | |
| Net unrealized appreciation (depreciation) of futures contracts | | | 371,288 | | | | 119,663 | | | | — | | | | — | | | | — | | | | 176,525 | | | | — | | |
| | | | 82,330,165 | | | | 22,435,906 | | | | 15,458,945 | | | | 12,504,469 | | | | 2,711,947 | | | | 6,178,562 | | | | 11,584,858 | | |
NET REALIZED AND UNREALIZED GAIN (LOSS) ON INVESTMENTS AND
FUTURES CONTRACTS | | | 95,986,241 | | | | 54,485,243 | | | | 19,177,153 | | | | 21,746,782 | | | | 3,090,083 | | | | 28,846,479 | | | | 17,053,665 | | |
| NET INCREASE (DECREASE) IN NET ASSETS RESULTING FROM OPERATIONS | | $ | 109,772,682 | | | $ | 60,030,479 | | | $ | 20,705,670 | | | $ | 21,555,830 | | | $ | 3,490,096 | | | $ | 34,017,701 | | | $ | 23,167,072 | | |
(a) The Allocation Funds incur no other advisory or operating expenses other than those included in each of the underlying funds in which they invest.
The accompanying notes are an integral part of these financial statements.
52
| | | Conservative
Allocation
Fund | | Moderate
Allocation
Fund | | Aggressive
Allocation
Fund | | Money
Market Fund | | Mid-Term
Bond Fund | | Bond
Fund | |
| INVESTMENT INCOME AND EXPENSES: | |
| INCOME: | |
| Dividends | | $ | 452,679 | | | $ | 2,125,838 | | | $ | 1,658,329 | | | $ | — | | | $ | — | | | $ | — | | |
| Interest | | | — | | | | — | | | | — | | | | 9,183,749 | | | | 3,571,703 | | | | 18,363,404 | | |
| Total income | | | 452,679 | | | | 2,125,838 | | | | 1,658,329 | | | | 9,183,749 | | | | 3,571,703 | | | | 18,363,404 | | |
| EXPENSES: | |
| Investment advisory fees (Note 2) | | | — | (a) | | | — | (a) | | | — | (a) | | | 316,601 | | | | 350,151 | | | | 1,497,991 | | |
| Accounting and recordkeeping expenses | | | — | | | | — | | | | — | | | | 49,709 | | | | 23,059 | | | | 126,749 | | |
| Shareholders reports | | | — | | | | — | | | | — | | | | 6,372 | | | | 2,955 | | | | 16,247 | | |
| Custodian expenses | | | — | | | | — | | | | — | | | | 34,132 | | | | 8,990 | | | | 22,523 | | |
| Independent directors' fees and expenses | | | — | | | | — | | | | — | | | | 13,944 | | | | 14,355 | | | | 18,215 | | |
| Audit | | | — | | | | — | | | | — | | | | 14,097 | | | | 6,540 | | | | 35,945 | | |
| Licenses | | | — | | | | — | | | | — | | | | — | | | | — | | | | — | | |
| Other | | | — | | | | — | | | | — | | | | 9,118 | | | | 4,229 | | | | 23,250 | | |
| Total expenses before reimbursement | | | — | | | | — | | | | — | | | | 443,973 | | | | 410,279 | | | | 1,740,920 | | |
| Expense reimbursement (Note 2) | | | — | | | | — | | | | — | | | | (46,391 | ) | | | (25,782 | ) | | | (101,561 | ) | |
| Net Expenses | | | — | | | | — | | | | — | | | | 397,582 | | | | 384,497 | | | | 1,639,359 | | |
| Net Investment Income (Loss) | | | 452,679 | | | | 2,125,838 | | | | 1,658,329 | | | | 8,786,167 | | | | 3,187,206 | | | | 16,724,045 | | |
NET REALIZED AND UNREALIZED GAIN (LOSS) ON INVESTMENTS AND FUTURES CONTRACTS
(Note 1): | |
| Net realized gain (loss) on investments and futures contracts: | |
| Net realized gain (loss) on investments | | | 83,210 | | | | 1,668,541 | | | | 3,262,896 | | | | 24 | | | | (557,134 | ) | | | (2,938,762 | ) | |
| Net realized gain (loss) on futures contracts | | | — | | | | — | | | | — | | | | — | | | | — | | | | — | | |
| | | | 83,210 | | | | 1,668,541 | | | | 3,262,896 | | | | 24 | | | | (557,134 | ) | | | (2,938,762 | ) | |
Net unrealized appreciation (depreciation) of investments and
futures contracts: | |
| Net unrealized appreciation (depreciation) of investments | | | 266,775 | | | | 2,086,148 | | | | 1,853,052 | | | | 454 | | | | 875,588 | | | | 1,624,799 | | |
| Net unrealized appreciation (depreciation) of futures contracts | | | — | | | | — | | | | — | | | | — | | | | — | | | | — | | |
| | | | 266,775 | | | | 2,086,148 | | | | 1,853,052 | | | | 454 | | | | 875,588 | | | | 1,624,799 | | |
NET REALIZED AND UNREALIZED GAIN (LOSS) ON INVESTMENTS AND
FUTURES CONTRACTS | | | 349,985 | | | | 3,754,689 | | | | 5,115,948 | | | | 478 | | | | 318,454 | | | | (1,313,963 | ) | |
| NET INCREASE (DECREASE) IN NET ASSETS RESULTING FROM OPERATIONS | | $ | 802,664 | | | $ | 5,880,527 | | | $ | 6,774,277 | | | $ | 8,786,645 | | | $ | 3,505,660 | | | $ | 15,410,082 | | |
The accompanying notes are an integral part of these financial statements.
53
MUTUAL OF AMERICA INVESTMENT CORPORATION
STATEMENTS OF CHANGES IN NET ASSETS
For the Years Ended December 31,
| | | Equity Index Fund | | All America Fund | | Small Cap Value Fund | |
| | | 2006 | | 2005 | | 2006 | | 2005 | | 2006 | | 2005(b) | |
| INCREASE (DECREASE) IN NET ASSETS: | |
| FROM OPERATIONS: | |
| Net investment income (loss) | | $ | 13,786,441 | | | $ | 12,607,717 | | | $ | 5,545,236 | | | $ | 4,963,123 | | | $ | 1,528,517 | | | $ | 161,101 | | |
| Net realized gain (loss) on investments and futures contracts | | | 13,656,076 | | | | 16,241,495 | | | | 32,049,337 | | | | 41,998,229 | | | | 3,718,208 | | | | 371,282 | | |
| Unrealized appreciation (depreciation) of investments and futures contracts | | | 82,330,165 | | | | 5,084,383 | | | | 22,435,906 | | | | (32,508,783 | ) | | | 15,458,945 | | | | 338,622 | | |
| NET INCREASE (DECREASE) IN NET ASSETS RESULTING FROM OPERATIONS | | | 109,772,682 | | | | 33,933,595 | | | | 60,030,479 | | | | 14,452,569 | | | | 20,705,670 | | | | 871,005 | | |
| DIVIDEND DISTRIBUTIONS (Note 5) | |
| From net investment income | | | (13,998,891 | ) | | | (11,157,235 | ) | | | (5,801,768 | ) | | | (1,487,487 | ) | | | (1,537,335 | ) | | | (154,687 | ) | |
| From capital gains | | | (17,677,823 | ) | | | (14,754,098 | ) | | | (40,507,083 | ) | | | (33,401,686 | ) | | | (2,487,356 | ) | | | (126,138 | ) | |
| Total distributions | | | (31,676,714 | ) | | | (25,911,333 | ) | | | (46,308,851 | ) | | | (34,889,173 | ) | | | (4,024,691 | ) | | | (280,825 | ) | |
| CAPITAL SHARE TRANSACTIONS (Notes 4 and 6): | |
| Net proceeds from sale of shares | | | 45,027,919 | | | | 72,178,177 | | | | 7,538,927 | | | | 9,541,654 | | | | 31,430,245 | | | | 40,058,358 | | |
| Dividends reinvested | | | 31,676,714 | | | | 25,911,333 | | | | 46,308,851 | | | | 34,889,172 | | | | 4,024,691 | | | | 280,825 | | |
| Proceeds from fund reorganizations (Note 6) | | | — | | | | — | | | | — | | | | — | | | | 169,534,350 | | | | — | | |
| Cost of shares redeemed | | | (69,077,427 | ) | | | (102,155,792 | ) | | | (50,614,468 | ) | | | (75,212,021 | ) | | | (9,270,751 | ) | | | (7,082,772 | ) | |
| NET INCREASE (DECREASE) IN NET ASSETS FROM CAPITAL SHARE TRANSACTIONS | | | 7,627,206 | | | | (4,066,282 | ) | | | 3,233,310 | | | | (30,781,195 | ) | | | 195,718,535 | | | | 33,256,411 | | |
| INCREASE (DECREASE) IN NET ASSETS | | | 85,723,174 | | | | 3,955,980 | | | | 16,954,938 | | | | (51,217,799 | ) | | | 212,399,514 | | | | 33,846,591 | | |
| NET ASSETS, BEGINNING OF PERIOD | | | 725,774,158 | | | | 721,818,178 | | | | 406,511,942 | | | | 457,729,741 | | | | 33,846,591 | | | | — | | |
| NET ASSETS, END OF PERIOD | | $ | 811,497,332 | | | $ | 725,774,158 | | | $ | 423,466,880 | | | $ | 406,511,942 | | | $ | 246,246,105 | | | $ | 33,846,591 | | |
| OTHER INFORMATION: | |
| Shares outstanding at the beginning of period | | | 339,245,640 | | | | 341,035,099 | | | | 209,390,329 | | | | 223,626,559 | | | | 31,714,079 | | | | — | | |
| Shares sold | | | 19,704,936 | | | | 34,348,696 | | | | 3,682,180 | | | | 4,805,388 | | | | 26,938,491 | | | | 38,192,504 | | |
| Shares issued as reinvestment of dividends | | | 13,427,417 | | | | 12,098,877 | | | | 23,099,870 | | | | 17,922,112 | | | | 3,270,732 | | | | 260,950 | | |
| Shares issued in connection with fund reorganizations (Note 6) | | | — | | | | — | | | | — | | | | — | | | | 145,227,730 | | | | — | | |
| Shares redeemed | | | (30,796,054 | ) | | | (48,237,032 | ) | | | (24,776,083 | ) | | | (36,963,730 | ) | | | (7,823,233 | ) | | | (6,739,375 | ) | |
| Net increase (decrease) | | | 2,336,299 | | | | (1,789,459 | ) | | | 2,005,967 | | | | (14,236,230 | ) | | | 167,613,720 | | | | 31,714,079 | | |
| Shares outstanding at the end of period | | | 341,581,939 | | | | 339,245,640 | | | | 211,396,296 | | | | 209,390,329 | | | | 199,327,799 | | | | 31,714,079 | | |
(b) For the period July 1, 2005 (Date of Inception) to December 31, 2005.
The accompanying notes are an integral part of these financial statements.
54
| | | Small Cap Growth Fund | | Mid Cap Value Fund | | Mid-Cap Equity Index Fund | |
| | | 2006 | | 2005(b) | | 2006 | | 2005(b) | | 2006 | | 2005 | |
| INCREASE (DECREASE) IN NET ASSETS: | |
| FROM OPERATIONS: | |
| Net investment income (loss) | | $ | (190,952 | ) | | $ | (350 | ) | | $ | 400,013 | | | $ | 70,577 | | | $ | 5,171,222 | | | $ | 4,411,409 | | |
| Net realized gain (loss) on investments and futures contracts | | | 9,242,313 | | | | (521,227 | ) | | | 378,136 | | | | (212 | ) | | | 22,667,917 | | | | 22,009,933 | | |
| Unrealized appreciation (depreciation) of investments and futures contracts | | | 12,504,469 | | | | 975,883 | | | | 2,711,947 | | | | 445,105 | | | | 6,178,562 | | | | 12,446,860 | | |
| NET INCREASE (DECREASE) IN NET ASSETS RESULTING FROM OPERATIONS | | | 21,555,830 | | | | 454,306 | | | | 3,490,096 | | | | 515,470 | | | | 34,017,701 | | | | 38,868,202 | | |
| DIVIDEND DISTRIBUTIONS (Note 5) | |
| From net investment income | | | — | | | | — | | | | (388,178 | ) | | | (64,584 | ) | | | (5,364,688 | ) | | | (4,436,689 | ) | |
| From capital gains | | | (4,977,945 | ) | | | — | | | | (235,976 | ) | | | — | | | | (22,309,971 | ) | | | (19,851,398 | ) | |
| Total distributions | | | (4,977,945 | ) | | | — | | | | (624,154 | ) | | | (64,584 | ) | | | (27,674,659 | ) | | | (24,288,087 | ) | |
| CAPITAL SHARE TRANSACTIONS (Notes 4 and 6): | |
| Net proceeds from sale of shares | | | 27,231,756 | | | | 30,294,715 | | | | 21,479,086 | | | | 17,024,729 | | | | 32,420,061 | | | | 65,055,325 | | |
| Dividends reinvested | | | 4,977,945 | | | | — | | | | 624,154 | | | | 64,584 | | | | 27,674,659 | | | | 24,288,087 | | |
| Proceeds from fund reorganizations (Note 6) | | | 169,534,395 | | | | — | | | | — | | | | — | | | | — | | | | — | | |
| Cost of shares redeemed | | | (19,022,097 | ) | | | (6,520,379 | ) | | | (3,025,444 | ) | | | (6,336,546 | ) | | | (66,976,767 | ) | | | (41,392,768 | ) | |
| NET INCREASE (DECREASE) IN NET ASSETS FROM CAPITAL SHARE TRANSACTIONS | | | 182,721,999 | | | | 23,774,336 | | | | 19,077,796 | | | | 10,752,767 | | | | (6,882,047 | ) | | | 47,950,644 | | |
| INCREASE (DECREASE) IN NET ASSETS | | | 199,299,884 | | | | 24,228,642 | | | | 21,943,738 | | | | 11,203,653 | | | | (539,005 | ) | | | 62,530,759 | | |
| NET ASSETS, BEGINNING OF PERIOD | | | 24,228,642 | | | | — | | | | 11,203,653 | | | | — | | | | 357,529,332 | | | | 294,998,573 | | |
| NET ASSETS, END OF PERIOD | | $ | 223,528,526 | | | $ | 24,228,642 | | | $ | 33,147,391 | | | $ | 11,203,653 | | | $ | 356,990,327 | | | $ | 357,529,332 | | |
| OTHER INFORMATION: | |
| Shares outstanding at the beginning of period | | | 22,964,804 | | | | — | | | | 10,540,041 | | | | — | | | | 233,305,253 | | | | 201,869,864 | | |
| Shares sold | | | 23,519,364 | | | | 29,215,716 | | | | 18,979,609 | | | | 16,588,121 | | | | 20,176,349 | | | | 43,090,777 | | |
| Shares issued as reinvestment of dividends | | | 4,191,202 | | | | — | | | | 516,772 | | | | 60,408 | | | | 17,814,367 | | | | 15,794,620 | | |
| Shares issued in connection with fund reorganizations (Note 6) | | | 154,363,827 | | | | — | | | | — | | | | — | | | | — | | | | — | | |
| Shares redeemed | | | (16,838,521 | ) | | | (6,250,912 | ) | | | (2,619,974 | ) | | | (6,108,488 | ) | | | (42,167,565 | ) | | | (27,450,008 | ) | |
| Net increase (decrease) | | | 165,235,872 | | | | 22,964,804 | | | | 16,876,407 | | | | 10,540,041 | | | | (4,176,849 | ) | | | 31,435,389 | | |
| Shares outstanding at the end of period | | | 188,200,676 | | | | 22,964,804 | | | | 27,416,448 | | | | 10,540,041 | | | | 229,128,404 | | | | 233,305,253 | | |
The accompanying notes are an integral part of these financial statements.
55
MUTUAL OF AMERICA INVESTMENT CORPORATION
STATEMENTS OF CHANGES IN NET ASSETS (Continued)
For the Years Ended December 31,
| | | Composite Fund | | Conservative Allocation Fund | | Moderate Allocation Fund | | Aggressive Allocation Fund | |
| | | 2006 | | 2005 | | 2006 | | 2005 | | 2006 | | 2005 | | 2006 | | 2005 | |
| INCREASE (DECREASE) IN NET ASSETS: | |
| FROM OPERATIONS: | |
| Net investment income | | $ | 6,113,407 | | | $ | 5,987,002 | | | $ | 452,679 | | | $ | 337,442 | | | $ | 2,125,838 | | | $ | 1,516,270 | | | $ | 1,658,329 | | | $ | 967,997 | | |
Net realized gain (loss) on investments and
futures contracts | | | 5,468,807 | | | | 5,338,875 | | | | 83,210 | | | | 131,899 | | | | 1,668,541 | | | | 1,121,198 | | | | 3,262,896 | | | | 1,332,695 | | |
Unrealized appreciation (depreciation) of
investments and futures contracts | | | 11,584,858 | | | | (9,535,117 | ) | | | 266,775 | | | | (218,500 | ) | | | 2,086,148 | | | | (509,418 | ) | | | 1,853,052 | | | | 81,434 | | |
NET INCREASE (DECREASE) IN NET ASSETS RESULTING
FROM OPERATIONS | | | 23,167,072 | | | | 1,790,760 | | | | 802,664 | | | | 250,841 | | | | 5,880,527 | | | | 2,128,050 | | | | 6,774,277 | | | | 2,382,126 | | |
| DIVIDEND DISTRIBUTIONS (Note 5) | |
| From net investment income | | | (5,905,979 | ) | | | (5,978,084 | ) | | | (416,761 | ) | | | (316,515 | ) | | | (2,160,569 | ) | | | (1,434,825 | ) | | | (1,599,186 | ) | | | (817,301 | ) | |
| From capital gains | | | — | | | | — | | | | (221,257 | ) | | | (102,125 | ) | | | (1,885,795 | ) | | | (1,086,067 | ) | | | (3,334,117 | ) | | | (1,474,545 | ) | |
| Total distributions | | | (5,905,979 | ) | | | (5,978,084 | ) | | | (638,018 | ) | | | (418,640 | ) | | | (4,046,364 | ) | | | (2,520,892 | ) | | | (4,933,303 | ) | | | (2,291,846 | ) | |
| CAPITAL SHARE TRANSACTIONS (Notes 4 and 6): | |
| Net proceeds from sale of shares | | | 4,252,998 | | | | 3,033,563 | | | | 5,165,830 | | | | 5,489,917 | | | | 19,189,928 | | | | 21,862,461 | | | | 20,732,045 | | | | 20,218,460 | | |
| Dividends reinvested | | | 5,905,979 | | | | 5,978,084 | | | | 638,018 | | | | 418,640 | | | | 4,046,364 | | | | 2,520,892 | | | | 4,933,303 | | | | 2,291,846 | | |
Proceeds from fund reorganizations
(Note 6) | | | — | | | | — | | | | — | | | | — | | | | — | | | | — | | | | — | | | | — | | |
| Cost of shares redeemed | | | (30,439,481 | ) | | | (29,607,363 | ) | | | (4,108,313 | ) | | | (2,929,906 | ) | | | (4,999,532 | ) | | | (5,197,282 | ) | | | (2,423,783 | ) | | | (4,709,581 | ) | |
NET INCREASE (DECREASE) IN NET ASSETS FROM
CAPITAL SHARE TRANSACTIONS | | | (20,280,504 | ) | | | (20,595,716 | ) | | | 1,695,535 | | | | 2,978,651 | | | | 18,236,760 | | | | 19,186,071 | | | | 23,241,565 | | | | 17,800,725 | | |
| INCREASE (DECREASE) IN NET ASSETS | | | (3,019,411 | ) | | | (24,783,040 | ) | | | 1,860,181 | | | | 2,810,852 | | | | 20,070,923 | | | | 18,793,229 | | | | 25,082,539 | | | | 17,891,005 | | |
| NET ASSETS, BEGINNING OF PERIOD | | | 232,365,383 | | | | 257,148,423 | | | | 11,170,746 | | | | 8,359,894 | | | | 56,243,926 | | | | 37,450,697 | | | | 47,539,258 | | | | 29,648,253 | | |
| NET ASSETS, END OF PERIOD | | $ | 229,345,972 | | | $ | 232,365,383 | | | $ | 13,030,927 | | | $ | 11,170,746 | | | $ | 76,314,849 | | | $ | 56,243,926 | | | $ | 72,621,797 | | | $ | 47,539,258 | | |
| OTHER INFORMATION: | |
Shares outstanding at the beginning
of period | | | 161,982,972 | | | | 176,457,672 | | | | 11,134,470 | | | | 8,204,622 | | | | 50,880,141 | | | | 33,766,624 | | | | 39,032,769 | | | | 24,504,532 | | |
| Shares sold | | | 2,758,176 | | | | 2,056,025 | | | | 5,029,915 | | | | 5,367,888 | | | | 16,748,563 | | | | 19,296,576 | | | | 16,169,487 | | | | 16,358,834 | | |
| Shares issued as reinvestment of dividends | | | 3,949,199 | | | | 4,182,055 | | | | 624,905 | | | | 417,050 | | | | 3,540,576 | | | | 2,464,401 | | | | 3,884,947 | | | | 2,022,596 | | |
Shares issued in connection with fund
reorganizations (Note 6) | | | — | | | | — | | | | — | | | | — | | | | — | | | | — | | | | — | | | | — | | |
| Shares redeemed | | | (20,516,604 | ) | | | (20,712,780 | ) | | | (4,017,410 | ) | | | (2,855,090 | ) | | | (4,396,776 | ) | | | (4,647,460 | ) | | | (1,898,141 | ) | | | (3,853,193 | ) | |
| Net increase (decrease) | | | (13,809,229 | ) | | | (14,474,700 | ) | | | 1,637,410 | | | | 2,929,848 | | | | 15,892,363 | | | | 17,113,517 | | | | 18,156,293 | | | | 14,528,237 | | |
| Shares outstanding at the end of period | | | 148,173,743 | | | | 161,982,972 | | | | 12,771,880 | | | | 11,134,470 | | | | 66,772,504 | | | | 50,880,141 | | | | 57,189,062 | | | | 39,032,769 | | |
The accompanying notes are an integral part of these financial statements.
56
| | | Money Market Fund | | Mid-Term Bond Fund | | Bond Fund | |
| | | 2006 | | 2005 | | 2006 | | 2005 | | 2006 | | 2005 | |
| INCREASE (DECREASE) IN NET ASSETS: | |
| FROM OPERATIONS: | |
| Net investment income | | $ | 8,786,167 | | | $ | 2,691,191 | | | $ | 3,187,206 | | | $ | 2,362,121 | | | $ | 16,724,045 | | | $ | 16,385,320 | | |
Net realized gain (loss) on investments and
futures contracts | | | 24 | | | | (4 | ) | | | (557,134 | ) | | | (338,934 | ) | | | (2,938,762 | ) | | | (826,477 | ) | |
Unrealized appreciation (depreciation) of
investments and futures contracts | | | 454 | | | | (795 | ) | | | 875,588 | | | | (1,517,652 | ) | | | 1,624,799 | | | | (8,811,420 | ) | |
NET INCREASE (DECREASE) IN NET ASSETS RESULTING
FROM OPERATIONS | | | 8,786,645 | | | | 2,690,392 | | | | 3,505,660 | | | | 505,535 | | | | 15,410,082 | | | | 6,747,423 | | |
| DIVIDEND DISTRIBUTIONS (Note 5) | |
| From net investment income | | | (8,602,243 | ) | | | (2,660,081 | ) | | | (3,191,812 | ) | | | (2,313,748 | ) | | | (15,711,330 | ) | | | (16,217,492 | ) | |
| From capital gains | | | — | | | | — | | | | — | | | | — | | | | — | | | | — | | |
| Total distributions | | | (8,602,243 | ) | | | (2,660,081 | ) | | | (3,191,812 | ) | | | (2,313,748 | ) | | | (15,711,330 | ) | | | (16,217,492 | ) | |
| CAPITAL SHARE TRANSACTIONS (Notes 4 and 6): | |
| Net proceeds from sale of shares | | | 169,477,576 | | | | 102,597,545 | | | | 11,379,662 | | | | 11,365,816 | | | | 30,705,904 | | | | 46,628,254 | | |
| Dividends reinvested | | | 8,602,243 | | | | 2,660,081 | | | | 3,191,812 | | | | 2,313,748 | | | | 15,711,330 | | | | 16,217,492 | | |
Proceeds from fund reorganizations
(Note 6) | | | — | | | | — | | | | 33,432,403 | | | | — | | | | — | | | | — | | |
| Cost of shares redeemed | | | (69,277,507 | ) | | | (54,072,408 | ) | | | (12,683,943 | ) | | | (13,640,196 | ) | | | (71,460,930 | ) | | | (53,568,712 | ) | |
NET INCREASE (DECREASE) IN NET ASSETS FROM
CAPITAL SHARE TRANSACTIONS | | | 108,802,312 | | | | 51,185,218 | | | | 35,319,934 | | | | 39,368 | | | | (25,043,696 | ) | | | 9,277,034 | | |
| INCREASE (DECREASE) IN NET ASSETS | | | 108,986,714 | | | | 51,215,529 | | | | 35,633,782 | | | | (1,768,845 | ) | | | (25,344,944 | ) | | | (193,035 | ) | |
| NET ASSETS, BEGINNING OF PERIOD | | | 129,702,755 | | | | 78,487,226 | | | | 71,443,254 | | | | 73,212,099 | | | | 368,834,775 | | | | 369,027,810 | | |
| NET ASSETS, END OF PERIOD | | $ | 238,689,469 | | | $ | 129,702,755 | | | $ | 107,077,036 | | | $ | 71,443,254 | | | $ | 343,489,831 | | | $ | 368,834,775 | | |
| OTHER INFORMATION: | |
Shares outstanding at the beginning
of period | | | 108,513,501 | | | | 66,233,088 | | | | 77,559,677 | | | | 77,501,724 | | | | 293,607,621 | | | | 285,870,568 | | |
| Shares sold | | | 138,825,990 | | | | 85,220,056 | | | | 12,157,911 | | | | 12,004,896 | | | | 24,001,093 | | | | 35,969,954 | | |
| Shares issued as reinvestment of dividends | | | 7,117,774 | | | | 2,225,659 | | | | 3,426,418 | | | | 2,511,834 | | | | 12,503,843 | | | | 12,909,763 | | |
Shares issued in connection with fund
reorganizations (Note 6) | | | — | | | | — | | | | 35,427,766 | | | | — | | | | — | | | | — | | |
| Shares redeemed | | | (56,921,010 | ) | | | (45,165,302 | ) | | | (13,603,058 | ) | | | (14,458,777 | ) | | | (56,674,150 | ) | | | (41,142,664 | ) | |
| Net increase (decrease) | | | 89,022,754 | | | | 42,280,413 | | | | 37,409,037 | | | | 57,953 | | | | (20,169,214 | ) | | | 7,737,053 | | |
| Shares outstanding at the end of period | | | 197,536,255 | | | | 108,513,501 | | | | 114,968,714 | | | | 77,559,677 | | | | 273,438,407 | | | | 293,607,621 | | |
The accompanying notes are an integral part of these financial statements.
57
MUTUAL OF AMERICA INVESTMENT CORPORATION
FINANCIAL HIGHLIGHTS
Income from investment operations and distributions per share for a Fund share outstanding throughout each of the five years ended December 31, (or since the Fund's inception date if in existence less than five years) and other supplementary data with respect to each Fund are presented below and in the pages following:
| | | Equity Index Fund | | All America Fund | |
| | | Years Ended
December 31, | | Years Ended
December 31, | |
| | | 2006 | | 2005 | | 2004 | | 2003 | | 2002 | | 2006 | | 2005 | | 2004 | | 2003 | | 2002 | |
| Net Asset Value, Beginning of Period | | $ | 2.14 | | | $ | 2.12 | | | $ | 1.95 | | | $ | 1.54 | | | $ | 2.02 | | | $ | 1.94 | | | $ | 2.05 | | | $ | 2.12 | | | $ | 1.60 | | | $ | 2.09 | | |
| INCOME (LOSS) FROM INVESTMENT OPERATIONS: | |
| Net Investment Income | | | 0.04 | | | | 0.04 | | | | 0.05 | | | | 0.03 | | | | 0.03 | | | | 0.02 | | | | 0.01 | | | | 0.02 | | | | 0.01 | | | | 0.03 | | |
| Net Realized and Unrealized Gains (Losses) on Investments and Futures Contracts | | | 0.30 | | | | 0.06 | | | | 0.17 | | | | 0.41 | | | | (0.48 | ) | | | 0.28 | | | | 0.06 | | | | 0.15 | | | | 0.52 | | | | (0.50 | ) | |
| Total From Investment Operations | | | 0.34 | | | | 0.10 | | | | 0.22 | | | | 0.44 | | | | (0.45 | ) | | | 0.30 | | | | 0.07 | | | | 0.17 | | | | 0.53 | | | | (0.47 | ) | |
Less Dividend Distributions:
From Net Investment Income | | | (0.04 | ) | | | (0.03 | ) | | | (0.04 | ) | | | (0.03 | ) | | | (0.03 | ) | | | (0.03 | ) | | | (0.01 | ) | | | (0.02 | ) | | | (0.01 | ) | | | (0.02 | ) | |
| From Capital Gains | | | (0.06 | ) | | | (0.05 | ) | | | (0.01 | ) | | | — | | | | — | | | | (0.21 | ) | | | (0.17 | ) | | | (0.22 | ) | | | — | | | | — | | |
| Total Distributions | | | (0.10 | ) | | | (0.08 | ) | | | (0.05 | ) | | | (0.03 | ) | | | (0.03 | ) | | | (0.24 | ) | | | (0.18 | ) | | | (0.24 | ) | | | (0.01 | ) | | | (0.02 | ) | |
| Net Asset Value, End of Period | | $ | 2.38 | | | $ | 2.14 | | | $ | 2.12 | | | $ | 1.95 | | | $ | 1.54 | | | $ | 2.00 | | | $ | 1.94 | | | $ | 2.05 | | | $ | 2.12 | | | $ | 1.60 | | |
| Total Return (%)(b) | | | 15.59 | | | | 4.81 | | | | 10.69 | | | | 28.32 | | | | (22.14 | ) | | | 15.74 | | | | 3.71 | | | | 8.23 | | | | 33.01 | | | | (22.38 | ) | |
| Net Assets, End of Period ($ millions) | | | 811 | | | | 726 | | | | 722 | | | | 618 | | | | 390 | | | | 423 | | | | 407 | | | | 458 | | | | 492 | | | | 421 | | |
| Ratio of Net Investment Income (Loss) to Average Net Assets (%) | | | 1.85 | | | | 1.76 | | | | 1.91 | | | | 1.65 | | | | 1.49 | | | | 1.36 | | | | 1.17 | | | | 1.16 | | | | 0.84 | | | | 0.80 | | |
| Ratio of Expenses to Average Net Assets Before Expense Reimbursement (%) | | | 0.17 | | | | 0.24 | | | | 0.22 | | | | 0.21 | | | | 0.20 | | | | 0.52 | | | | 0.64 | | | | 0.62 | | | | 0.61 | | | | 0.58 | | |
| Ratio of Expenses to Average Net Assets After Expense Reimbursement (%) | | | 0.14 | | | | 0.13 | | | | 0.13 | | | | 0.13 | | | | 0.13 | | | | 0.49 | | | | 0.50 | | | | 0.50 | | | | 0.50 | | | | 0.50 | | |
| Portfolio Turnover Rate (%)(a) | | | 4.91 | | | | 9.36 | | | | 4.87 | | | | 0.89 | | | | 7.36 | | | | 33.84 | | | | 48.00 | | | | 53.03 | | | | 76.73 | | | | 85.27 | | |
(a) Portfolio turnover rate excludes all short-term securities.
(b) Total return would have been lower had non-investment advisory expenses not been reduced through expense reimbursement (Note 2).
(c) Not annualized.
(d) Annualized.
(e) For the period July 1, 2005 (commencement of operations) through December 31, 2005.
(f) Excludes expenses of the underlying funds.
(g) For the period May 20, 2003 (commencement of operations) through December 31, 2003.
N/A = Not Applicable
The accompanying notes are an integral part of these financial statements.
58
| | | Small Cap Value Fund | | Small Cap Growth Fund | | Mid Cap Value Fund | |
| | | Year Ended
December 31, | | Period Ended
December 31, | | Year Ended
December 31, | | Period Ended
December 31, | | Period Ended
December 31, | | Period Ended
December 31, | |
| | | 2006 | | 2005(e) | | 2006 | | 2005(e) | | 2006 | | 2005(e) | |
| Net Asset Value, Beginning of Period | | $ | 1.07 | | | $ | 1.00 | | | $ | 1.06 | | | $ | 1.00 | | | $ | 1.06 | | | $ | 1.00 | | |
| INCOME (LOSS) FROM INVESTMENT OPERATIONS: | |
| Net Investment Income | | | 0.01 | | | | 0.01 | | | | — | | | | — | | | | 0.01 | | | | 0.01 | | |
| Net Realized and Unrealized Gains (Losses) on Investments and Futures Contracts | | | 0.18 | | | | 0.07 | | | | 0.16 | | | | 0.06 | | | | 0.16 | | | | 0.06 | | |
| Total From Investment Operations | | | 0.19 | | | | 0.08 | | | | 0.16 | | | | 0.06 | | | | 0.17 | | | | 0.07 | | |
Less Dividend Distributions:
From Net Investment Income | | | (0.01 | ) | | | (0.01 | ) | | | — | | | | — | | | | (0.01 | ) | | | (0.01 | ) | |
| From Capital Gains | | | (0.01 | ) | | | — | | | | (0.03 | ) | | | — | | | | (0.01 | ) | | | — | | |
| Total Distributions | | | (0.02 | ) | | | (0.01 | ) | | | (0.03 | ) | | | — | | | | (0.02 | ) | | | (0.01 | ) | |
| Net Asset Value, End of Period | | $ | 1.24 | | | $ | 1.07 | | | $ | 1.19 | | | $ | 1.06 | | | $ | 1.21 | | | $ | 1.06 | | |
| Total Return (%)(b) | | | 17.68 | | | | 7.61 | (c) | | | 15.14 | | | | 5.49 | (c) | | | 15.93 | | | | 6.91 | (c) | |
| Net Assets, End of Period ($ millions) | | | 246 | | | | 34 | | | | 224 | | | | 24 | | | | 33 | | | | 11 | | |
| Ratio of Net Investment Income (Loss) to Average Net Assets (%) | | | 1.42 | | | | 1.19 | (d) | | | (0.20 | ) | | | 0.00 | (d) | | | 1.69 | | | | 1.76 | (d) | |
| Ratio of Expenses to Average Net Assets Before Expense Reimbursement (%) | | | 0.81 | | | | 0.96 | (d) | | | 0.83 | | | | 0.95 | (d) | | | 0.70 | | | | 0.75 | (d) | |
| Ratio of Expenses to Average Net Assets After Expense Reimbursement (%) | | | 0.80 | | | | 0.84 | (d) | | | 0.81 | | | | 0.83 | (d) | | | 0.66 | | | | 0.62 | (d) | |
| Portfolio Turnover Rate (%)(a) | | | 62.55 | | | | 32.67 | (c) | | | 85.67 | | | | 64.38 | (c) | | | 30.41 | | | | 14.39 | (c) | |
The accompanying notes are an integral part of these financial statements.
59
MUTUAL OF AMERICA INVESTMENT CORPORATION
FINANCIAL HIGHLIGHTS (Continued)
| | | Mid-Cap Equity Index Fund | | Composite Fund | |
| | | Years Ended December 31, | | Years Ended December 31, | |
| | | 2006 | | 2005 | | 2004 | | 2003 | | 2002 | | 2006 | | 2005 | | 2004 | | 2003 | | 2002 | |
| Net Asset Value, Beginning of Period | | $ | 1.53 | | | $ | 1.46 | | | $ | 1.30 | | | $ | 0.97 | | | $ | 1.16 | | | $ | 1.43 | | | $ | 1.46 | | | $ | 1.40 | | | $ | 1.22 | | | $ | 1.37 | | |
| INCOME (LOSS) FROM INVESTMENT OPERATIONS: | |
| Net Investment Income | | | 0.02 | | | | 0.02 | | | | 0.01 | | | | 0.01 | | | | 0.01 | | | | 0.05 | | | | 0.04 | | | | 0.04 | | | | 0.03 | | | | 0.02 | | |
| Net Realized and Unrealized Gains (Losses) on Investments and Futures Contracts | | | 0.14 | | | | 0.16 | | | | 0.19 | | | | 0.33 | | | | (0.18 | ) | | | 0.11 | | | | (0.03 | ) | | | 0.06 | | | | 0.18 | | | | (0.13 | ) | |
| Total From Investment Operations | | | 0.16 | | | | 0.18 | | | | 0.20 | | | | 0.34 | | | | (0.17 | ) | | | 0.16 | | | | 0.01 | | | | 0.10 | | | | 0.21 | | | | (0.11 | ) | |
| Less Dividend Distributions: | |
| From Net Investment Income | | | (0.03 | ) | | | (0.02 | ) | | | (0.01 | ) | | | (0.01 | ) | | | — | | | | (0.04 | ) | | | (0.04 | ) | | | (0.04 | ) | | | (0.03 | ) | | | (0.02 | ) | |
| From Capital Gains | | | (0.10 | ) | | | (0.09 | ) | | | (0.03 | ) | | | — | | | | (0.02 | ) | | | — | | | | — | | | | — | | | | — | | | | (0.02 | ) | |
| Total Distributions | | | (0.13 | ) | | | (0.11 | ) | | | (0.04 | ) | | | (0.01 | ) | | | (0.02 | ) | | | (0.04 | ) | | | (0.04 | ) | | | (0.04 | ) | | | (0.03 | ) | | | (0.04 | ) | |
| Net Asset Value, End of Period | | $ | 1.56 | | | $ | 1.53 | | | $ | 1.46 | | | $ | 1.30 | | | $ | 0.97 | | | $ | 1.55 | | | $ | 1.43 | | | $ | 1.46 | | | $ | 1.40 | | | $ | 1.22 | | |
| Total Return (%)(b) | | | 10.10 | | | | 12.50 | | | | 16.28 | | | | 35.23 | | | | (15.24 | ) | | | 10.80 | | | | 0.96 | | | | 6.34 | | | | 18.23 | | | | (7.51 | ) | |
| Net Assets, End of Period ($ millions) | | | 357 | | | | 358 | | | | 295 | | | | 217 | | | | 114 | | | | 229 | | | | 232 | | | | 257 | | | | 259 | | | | 225 | | |
| Ratio of Net Investment Income to Average Net Assets (%) | | | 1.40 | | | | 1.37 | | | | 1.08 | | | | 1.06 | | | | 1.00 | | | | 2.70 | | | | 2.48 | | | | 2.46 | | | | 2.59 | | | | 3.37 | | |
| Ratio of Expenses to Average Net Assets Before Expense Reimbursement (%) | | | 0.17 | | | | 0.25 | | | | 0.24 | | | | 0.22 | | | | 0.25 | | | | 0.52 | | | | 0.63 | | | | 0.61 | | | | 0.63 | | | | 0.58 | | |
| Ratio of Expenses to Average Net Assets After Expense Reimbursement (%) | | | 0.14 | | | | 0.13 | | | | 0.13 | | | | 0.13 | | | | 0.13 | | | | 0.48 | | | | 0.50 | | | | 0.50 | | | | 0.50 | | | | 0.50 | | |
| Portfolio Turnover Rate (%)(a) | | | 16.02 | | | | 18.65 | | | | 15.73 | | | | 7.87 | | | | 28.11 | | | | 26.77 | | | | 93.84 | | | | 94.56 | | | | 177.43 | | | | 204.99 | | |
(a) Portfolio turnover rate excludes all short-term securities.
(b) Total return would have been lower had non-investment advisory expenses not been reduced through expense reimbursement (Note 2).
(c) Not annualized.
(d) Annualized.
(e) For the period July 1, 2005 (commencement of operations) through December 31, 2005.
(f) Excludes expenses of the underlying funds.
(g) For the period May 20, 2003 (commencement of operations) through December 31, 2003.
N/A = Not Applicable
The accompanying notes are an integral part of these financial statements.
60
| | | Conservative Allocation Fund | | Moderate Allocation Fund | |
| | | Years Ended December 31, | | Years Ended December 31, | |
| | | 2006 | | 2005 | | 2004 | | 2003(g) | | 2006 | | 2005 | | 2004 | | 2003(g) | |
| Net Asset Value, Beginning of Period | | $ | 1.00 | | | $ | 1.02 | | | $ | 1.01 | | | $ | 1.00 | | | $ | 1.11 | | | $ | 1.11 | | | $ | 1.08 | | | $ | 1.00 | | |
| INCOME (LOSS) FROM INVESTMENT OPERATIONS: | |
| Net Investment Income | | | 0.04 | | | | 0.03 | | | | 0.03 | | | | 0.01 | | | | 0.03 | | | | 0.03 | | | | 0.03 | | | | 0.01 | | |
| Net Realized and Unrealized Gains (Losses) on Investments and Futures Contracts | | | 0.03 | | | | (0.01 | ) | | | 0.02 | | | | 0.05 | | | | 0.06 | | | | 0.02 | | | | 0.06 | | | | 0.11 | | |
| Total From Investment Operations | | | 0.07 | | | | 0.02 | | | | 0.05 | | | | 0.06 | | | | 0.09 | | | | 0.05 | | | | 0.09 | | | | 0.12 | | |
| Less Dividend Distributions: | |
| From Net Investment Income | | | (0.03 | ) | | | (0.03 | ) | | | (0.03 | ) | | | (0.01 | ) | | | (0.03 | ) | | | (0.03 | ) | | | (0.03 | ) | | | (0.01 | ) | |
| From Capital Gains | | | (0.02 | ) | | | (0.01 | ) | | | (0.01 | ) | | | (0.04 | ) | | | (0.03 | ) | | | (0.02 | ) | | | (0.03 | ) | | | (0.03 | ) | |
| Total Distributions | | | (0.05 | ) | | | (0.04 | ) | | | (0.04 | ) | | | (0.05 | ) | | | (0.06 | ) | | | (0.05 | ) | | | (0.06 | ) | | | (0.04 | ) | |
| Net Asset Value, End of Period | | $ | 1.02 | | | $ | 1.00 | | | $ | 1.02 | | | $ | 1.01 | | | $ | 1.14 | | | $ | 1.11 | | | $ | 1.11 | | | $ | 1.08 | | |
| Total Return (%)(b) | | | 6.96 | | | | 2.30 | | | | 4.72 | | | | 5.32 | (c) | | | 9.20 | | | | 4.35 | | | | 8.27 | | | | 11.73 | (c) | |
| Net Assets, End of Period ($ millions) | | | 13 | | | | 11 | | | | 8 | | | | 3 | | | | 76 | | | | 56 | | | | 37 | | | | 15 | | |
| Ratio of Net Investment Income to Average Net Assets (%) | | | 4.11 | | | | 3.39 | | | | 4.51 | | | | 8.59 | (d) | | | 3.30 | | | | 3.28 | | | | 3.81 | | | | 8.85 | (d) | |
| Ratio of Expenses to Average Net Assets Before Expense Reimbursement (%) | | | 0.00 | (f) | | | 0.00 | (f) | | | 0.00 | (f) | | | 0.00 | (d)(f) | | | 0.00 | (f) | | | 0.00 | (f) | | | 0.00 | (f) | | | 0.00 | (d)(f) | |
| Ratio of Expenses to Average Net Assets After Expense Reimbursement (%) | | | 0.00 | (f) | | | 0.00 | (f) | | | 0.00 | (f) | | | 0.00 | (d)(f) | | | 0.00 | (f) | | | 0.00 | (f) | | | 0.00 | (f) | | | 0.00 | (d)(f) | |
| Portfolio Turnover Rate (%)(a) | | | 48.90 | | | | 8.39 | | | | 92.83 | | | | 66.44 | (c) | | | 9.74 | | | | 14.09 | | | | 99.27 | | | | 18.44 | (c) | |
The accompanying notes are an integral part of these financial statements.
61
MUTUAL OF AMERICA INVESTMENT CORPORATION
FINANCIAL HIGHLIGHTS (Continued)
Years Ended December 31,
| | | Aggressive Allocation Fund | | Money Market Fund | |
| | | Years Ended December 31, | | Years Ended December 31, | |
| | | 2006 | | 2005 | | 2004 | | 2003(g) | | 2006 | | 2005 | | 2004 | | 2003 | | 2002 | |
| Net Asset Value, Beginning of Period | | $ | 1.22 | | | $ | 1.21 | | | $ | 1.17 | | | $ | 1.00 | | | $ | 1.20 | | | $ | 1.19 | | | $ | 1.18 | | | $ | 1.19 | | | $ | 1.19 | | |
| INCOME (LOSS) FROM INVESTMENT OPERATIONS: | |
| Net Investment Income | | | 0.03 | | | | 0.02 | | | | 0.02 | | | | 0.03 | | | | 0.05 | | | | 0.04 | | | | 0.02 | | | | 0.01 | | | | 0.02 | | |
| Net Realized and Unrealized Gains (Losses) on Investments and Futures Contracts | | | 0.11 | | | | 0.05 | | | | 0.09 | | | | 0.17 | | | | — | | | | — | | | | — | | | | (0.01 | ) | | | — | | |
| Total From Investment Operations | | | 0.14 | | | | 0.07 | | | | 0.11 | | | | 0.20 | | | | 0.05 | | | | 0.04 | | | | 0.02 | | | | — | | | | 0.02 | | |
| Less Dividend Distributions: | |
| From Net Investment Income | | | (0.03 | ) | | | (0.02 | ) | | | (0.03 | ) | | | (0.01 | ) | | | (0.04 | ) | | | (0.03 | ) | | | (0.01 | ) | | | (0.01 | ) | | | (0.02 | ) | |
| From Capital Gains | | | (0.06 | ) | | | (0.04 | ) | | | (0.04 | ) | | | (0.02 | ) | | | — | | | | — | | | | — | | | | — | | | | — | | |
| Total Distributions | | | (0.09 | ) | | | (0.06 | ) | | | (0.07 | ) | | | (0.03 | ) | | | (0.04 | ) | | | (0.03 | ) | | | (0.01 | ) | | | (0.01 | ) | | | (0.02 | ) | |
| Net Asset Value, End of Period | | $ | 1.27 | | | $ | 1.22 | | | $ | 1.21 | | | $ | 1.17 | | | $ | 1.21 | | | $ | 1.20 | | | $ | 1.19 | | | $ | 1.18 | | | $ | 1.19 | | |
| Total Return (%)(b) | | | 11.87 | | | | 5.78 | | | | 9.92 | | | | 19.27 | (c) | | | 4.89 | | | | 2.97 | | | | 1.10 | | | | 0.84 | | | | 1.45 | | |
| Net Assets, End of Period ($ millions) | | | 73 | | | | 48 | | | | 30 | | | | 11 | | | | 239 | | | | 130 | | | | 78 | | | | 74 | | | | 93 | | |
| Ratio of Net Investment Income to Average Net Assets (%) | | | 2.82 | | | | 2.58 | | | | 2.98 | | | | 6.48 | (d) | | | 4.83 | | | | 3.05 | | | | 1.12 | | | | 0.90 | | | | 1.48 | | |
| Ratio of Expenses to Average Net Assets Before Expense Reimbursement (%) | | | 0.00 | (f) | | | 0.00 | (f) | | | 0.00 | (f) | | | 0.00 | (d)(f) | | | 0.24 | | | | 0.38 | | | | 0.38 | | | | 0.38 | | | | 0.33 | | |
| Ratio of Expenses to Average Net Assets After Expense Reimbursement (%) | | | 0.00 | (f) | | | 0.00 | (f) | | | 0.00 | (f) | | | 0.00 | (d)(f) | | | 0.22 | | | | 0.25 | | | | 0.25 | | | | 0.25 | | | | 0.25 | | |
| Portfolio Turnover Rate (%)(a) | | | 6.72 | | | | 14.96 | | | | 48.24 | | | | 26.92 | (c) | | | NA | | | | NA | | | | NA | | | | NA | | | | NA | | |
(a) Portfolio turnover rate excludes all short-term securities.
(b) Total return would have been lower had non-investment advisory expenses not been reduced through expense reimbursement (Note 2).
(c) Not annualized.
(d) Annualized.
(e) For the period July 1, 2005 (commencement of operations) through December 31, 2005.
(f) Excludes expenses of the underlying funds.
(g) For the period May 20, 2003 (commencement of operations) through December 31, 2003.
NA = Not Applicable
The accompanying notes are an integral part of these financial statements.
62
| | | Mid-Term Bond Fund | | Bond Fund | |
| | | Years Ended December 31, | | Years Ended December 31, | |
| | | 2006 | | 2005 | | 2004 | | 2003 | | 2002 | | 2006 | | 2005 | | 2004 | | 2003 | | 2002 | |
| Net Asset Value, Beginning of Period | | $ | 0.92 | | | $ | 0.94 | | | $ | 0.96 | | | $ | 0.98 | | | $ | 0.91 | | | $ | 1.26 | | | $ | 1.29 | | | $ | 1.29 | | | $ | 1.27 | | | $ | 1.30 | | |
| INCOME (LOSS) FROM INVESTMENT OPERATIONS: | |
| Net Investment Income | | | 0.03 | | | | 0.03 | | | | 0.02 | | | | 0.03 | | | | 0.03 | | | | 0.06 | | | | 0.06 | | | | 0.06 | | | | 0.07 | | | | 0.09 | | |
| Net Realized and Unrealized Gains (Losses) on Investments and Futures Contracts | | | 0.01 | | | | (0.02 | ) | | | (0.01 | ) | | | — | | | | 0.07 | | | | — | | | | (0.03 | ) | | | — | | | | 0.02 | | | | (0.01 | ) | |
| Total From Investment Operations | | | 0.04 | | | | 0.01 | | | | 0.01 | | | | 0.03 | | | | 0.10 | | | | 0.06 | | | | 0.03 | | | | 0.06 | | | | 0.09 | | | | 0.08 | | |
| Less Dividend Distributions: | |
| From Net Investment Income | | | (0.03 | ) | | | (0.03 | ) | | | (0.03 | ) | | | (0.04 | ) | | | (0.03 | ) | | | (0.06 | ) | | | (0.06 | ) | | | (0.06 | ) | | | (0.07 | ) | | | (0.08 | ) | |
| From Capital Gains | | | — | | | | — | | | | — | | | | (0.01 | ) | | | — | | | | — | | | | — | | | | — | | | | — | | | | (0.03 | ) | |
| Total Distributions | | | (0.03 | ) | | | (0.03 | ) | | | (0.03 | ) | | | (0.05 | ) | | | (0.03 | ) | | | (0.06 | ) | | | (0.06 | ) | | | (0.06 | ) | | | (0.07 | ) | | | (0.11 | ) | |
| Net Asset Value, End of Period | | $ | 0.93 | | | $ | 0.92 | | | $ | 0.94 | | | $ | 0.96 | | | $ | 0.98 | | | $ | 1.26 | | | $ | 1.26 | | | $ | 1.29 | | | $ | 1.29 | | | $ | 1.27 | | |
| Total Return (%)(b) | | | 4.22 | | | | 0.77 | | | | 2.26 | | | | 2.76 | | | | 9.66 | | | | 4.79 | | | | 1.79 | | | | 4.61 | | | | 6.73 | | | | 6.75 | | |
| Net Assets, End of Period ($ millions) | | | 107 | | | | 71 | | | | 73 | | | | 75 | | | | 88 | | | | 343 | | | | 369 | | | | 369 | | | | 349 | | | | 437 | | |
| Ratio of Net Investment Income to Average Net Assets (%) | | | 3.88 | | | | 3.30 | | | | 3.25 | | | | 3.23 | | | | 4.11 | | | | 4.84 | | | | 4.30 | | | | 4.44 | | | | 5.10 | | | | 6.38 | | |
| Ratio of Expenses to Average Net Assets Before Expense Reimbursement (%) | | | 0.50 | | | | 0.66 | | | | 0.65 | | | | 0.64 | | | | 0.62 | | | | 0.50 | | | | 0.61 | | | | 0.59 | | | | 0.60 | | | | 0.57 | | |
| Ratio of Expenses to Average Net Assets After Expense Reimbursement (%) | | | 0.47 | | | | 0.50 | | | | 0.50 | | | | 0.50 | | | | 0.50 | | | | 0.47 | | | | 0.50 | | | | 0.50 | | | | 0.50 | | | | 0.50 | | |
| Portfolio Turnover Rate (%)(a) | | | 30.91 | | | | 21.99 | | | | 27.23 | | | | 41.55 | | | | 106.79 | | | | 19.03 | | | | 23.27 | | | | 35.12 | | | | 72.09 | | | | 76.91 | | |
The accompanying notes are an integral part of these financial statements.
63
MUTUAL OF AMERICA INVESTMENT CORPORATION
NOTES TO FINANCIAL STATEMENTS
1. SIGNIFICANT ACCOUNTING POLICIES AND ORGANIZATION
Mutual of America Investment Corporation (the "Investment Company") is a diversified, open-end management investment company — a type of company commonly known as a "mutual fund". It is registered as such under the Investment Company Act of 1940 (the "Investment Company Act"). The Investment Company was formed on February 21, 1986 as a Maryland corporation and principally offers its shares exclusively to separate accounts of Mutual of America Life Insurance Company ("Mutual of America Life") and its affiliates. As a "series" type mutual fund, the Investment Company issues separate classes (or series) of capital stock, each of which represents a separate Fund of investments. At December 31, 2006, there were thirteen Funds: Equity Index Fund, All America Fund, Small Cap Value Fund, Small Cap Growth Fund, Mid Cap Value Fund, Mid-Cap Equity Index Fund, Composite Fund, Money Market Fund, Mid-Term Bond Fund, Bond Fund; a Conservative Allocati on Fund, a Moderate Allocation Fund and an Aggressive Allocation Fund (collectively "Allocation Funds"). The Small Cap Value Fund, Small Cap Growth Fund and the Mid Cap Value Fund began operations on July 1, 2005. The Allocation Funds began operations on May 20, 2003.
Investment Company shares are issued to Mutual of America Life, and on a limited basis, to Wilton Reassurance Life Company of New York (formerly The American Life Insurance Company of New York), for allocation to their Separate Accounts as a funding medium for variable accumulation annuity contracts and variable life insurance policies. In addition, shares of selected equity and fixed income funds of the Investment Company are directly issued to one or more of the Investment Company's Allocation Funds.
The preparation of financial statements in accordance with U.S. generally accepted accounting principles may require management to make estimates and assumptions that affect the reported amounts of assets, liabilities, income, expenses and related disclosures. Actual results, however, may differ from those estimates.
The following is a summary of the significant accounting policies consistently followed by the Investment Company, which are in conformity with U.S. generally accepted accounting principles:
Security Valuation — Investment securities are valued as follows:
Equity securities are valued at the last sales price on the principal exchange on which the security is traded. If there is no trading volume for a particular valuation day, the last bid price is used. For any equity securities traded in the over-the-counter market, the security is valued at the last sale price, or if no sale, at the latest bid price available.
The Allocation Funds value their investments in the underlying Funds of the Investment Company at their respective net asset values.
Debt securities are valued on the basis of prices obtained from an independent pricing source. The pricing source may utilize various pricing methodologies that incorporate both dealer supplied valuations and analytical modeling techniques which consider factors such as yield, quality, coupon rate, maturity, issue type, broker quotes and trading characteristics to derive a valuation. In the rare instance when such a price is not available from an independent pricing source, a fair value is used, as determined in good faith by the Adviser, in accordance with procedures adopted by the Board of Directors of the Investment Company.
Short-term debt investments with a maturity of 60 days or less are valued at amortized cost, which approximates market value. Short-term debt securities which mature in more than 60 days are stated at market value.
Investment Transactions — Investment transactions are accounted for as of the trade date. Realized gains and losses on the sale of short and long-term debt securities are computed on the basis of amortized cost at the time of sale. Realized gains and losses on the sale of stock are based on the identified cost basis of the security, determined on the first-in, first-out ("FIFO") basis.
Equity-type funds with an indexed portfolio component may, in order to remain more fully invested in the equity markets while minimizing transaction costs, purchase stock index futures contracts. Initial cash margin deposits (represented by cash or Treasury bills) are made upon entering into futures contracts. (This initial margin, maintained in a segregated account, is equal to approximately 5%-6% of the contract amount, and does not involve the borrowing of funds to finance the transaction.) During the period the futures contract is outstanding, changes in the value of the contract are recognized as unrealized gains or losses by "marking-to-market" on a daily basis to reflect the
64
MUTUAL OF AMERICA INVESTMENT CORPORATION
NOTES TO FINANCIAL STATEMENTS (Continued)
1. SIGNIFICANT ACCOUNTING POLICIES AND ORGANIZATION (CONTINUED)
market value of the contract at the end of each trading day. Futures contracts are valued at the settlement price established each day by the exchange on which traded. Depending upon whether unrealized gains or losses are incurred, variation margin payments are received or made. When the contract is closed, a realized gain or loss from futures transactions is recorded, equal to the net variation margin received or paid over the period the contract was outstanding. The "Underlying Face Amount at Value" (appearing in the "Summary Portfolio of Investments in Securities") representing the aggregate of outstanding contractual amounts under futures contracts reflects the extent of a Fund's exposure to off-balance sheet risk. The use of futures transactions involves the risk of imperfect correlation in the price movements of the contract and the underlying securities.
Each of the Allocation Funds invests in equity (stock) funds and fixed income (bond) funds and targets different percentages to these asset classes. The targets reflect three different approaches to asset allocation based on risk tolerance.
The Allocation Funds invest in the following underlying funds of the Investment Company in accordance with the percentage allocations noted:
| Conservative Allocation: | | Equity Index (25%), Bond (30%), | |
|
| | | Mid-Term Bond (45%). | |
|
| Moderate Allocation: | | Equity Index (35%), Bond (30%), | |
|
| | | Mid-Term Bond (20%), Mid-Cap Equity Index (15%). | |
|
| Aggressive Allocation: | | Equity Index (45%), Bond (25%), | |
|
| | | Mid-Cap Equity Index (20%), Small Cap Value (5%), Small Cap Growth (5%). | |
|
Generally, rebalancing of the Allocation Funds' holdings are performed on a monthly basis.
Investment Income — Interest income, accretion of discount and amortization of premium are recorded daily on an accrual basis. A debt obligation may cease accrual of income and result in a reduction to interest income when the collection of all or a portion of current and past due interest is in doubt. Dividend income is recorded on the ex-dividend date. Foreign source tax withheld from dividends is recorded as a reduction from dividend income. Should reclamation efforts succeed, such amounts are recorded as income upon collection.
Distributions to Shareholders ("Dividends") — Distributions to shareholders are recorded on the ex-dividend date. It is the Investment Company's policy to make distributions of its net investment income and to distribute net realized gains, if any, on an annual basis, in accordance with Federal income tax regulations, which may differ from U.S. generally accepted accounting principles. Accordingly, periodic reclassifications (which do not impact the funds' net asset values) are made within the funds' capital accounts to reflect income and gains available for distribution under federal income tax regulations.
Federal Income Taxes — Each Fund in the Investment Company intends to comply with the requirements of the Internal Revenue Code applicable to regulated investment companies and to distribute substantially all of its taxable income to shareholders. Therefore, no Federal income or excise tax provision is required.
At December 31, 2006, the Funds had the following capital loss carryforwards to offset net capital gains, to the extent provided by Federal income tax regulations. In addition, the Equity Index Fund and the Bond Fund generated post-October 2006 net capital losses of $425,109, and $83,720, respectively, which if unused will expire on December 31, 2015.
65
MUTUAL OF AMERICA INVESTMENT CORPORATION
NOTES TO FINANCIAL STATEMENTS (Continued)
1. SIGNIFICANT ACCOUNTING POLICIES AND ORGANIZATION (CONTINUED)
| Expiring on December 31, | | Equity
Index Fund | | All America
Fund | | Small Cap
Value Fund | | Small Cap
Growth Fund | | Mid Cap
Value Fund | |
| 2007 | | $ | 0 | | | $ | 0 | | | $ | 0 | | | $ | 0 | | | $ | 0 | | |
| 2008 | | | 0 | | | | 0 | | | | 0 | | | | 0 | | | | 0 | | |
| 2009 | | | 0 | | | | 0 | | | | 0 | | | | 0 | | | | 0 | | |
| 2010 | | | 0 | | | | 0 | | | | 0 | | | | 0 | | | | 0 | | |
| 2011 | | | 0 | | | | 0 | | | | 0 | | | | 0 | | | | 0 | | |
| 2012 | | | 0 | | | | 0 | | | | 0 | | | | 0 | | | | 0 | | |
| 2013 | | | 0 | | | | 0 | | | | 0 | | | | 0 | | | | 0 | | |
| 2014 | | | 0 | | | | 0 | | | | 0 | | | | 0 | | | | 0 | | |
| Total | | $ | 0 | | | $ | 0 | | | $ | 0 | | | $ | 0 | | | $ | 0 | | |
| Expiring on December 31, | | Mid-Cap
Equity Index
Fund | | Composite
Fund | | Conservative
Allocation
Fund | | Moderate
Allocation
Fund | | Aggressive
Allocation
Fund | |
| 2007 | | $ | 0 | | | $ | 0 | | | $ | 0 | | | $ | 0 | | | $ | 0 | | |
| 2008 | | | 0 | | | | 0 | | | | 0 | | | | 0 | | | | 0 | | |
| 2009 | | | 0 | | | | 19,578,648 | | | | 0 | | | | 0 | | | | 0 | | |
| 2010 | | | 0 | | | | 20,417,938 | | | | 0 | | | | 0 | | | | 0 | | |
| 2011 | | | | | | | 0 | | | | 0 | | | | 0 | | | | 0 | | |
| 2012 | | | 0 | | | | 0 | | | | 0 | | | | 0 | | | | 0 | | |
| 2013 | | | 0 | | | | 0 | | | | 0 | | | | 0 | | | | 0 | | |
| 2014 | | | 0 | | | | 0 | | | | 0 | | | | 0 | | | | 0 | | |
| Total | | $ | 0 | | | $ | 39,996,586 | | | $ | 0 | | | $ | 0 | | | $ | 0 | | |
| Expiring on December 31, | | Money
Market Fund | | Mid-Term
Bond Fund | | Bond
Fund | |
| 2007 | | $ | 1,434 | | | $ | 101 | | | $ | 0 | | |
| 2008 | | | 5,103 | | | | 0 | | | | 0 | | |
| 2009 | | | 0 | | | | 0 | | | | 0 | | |
| 2010 | | | 295 | | | | 111,136 | | | | 0 | | |
| 2011 | | | 0 | | | | 56,820 | | | | 23,117,159 | | |
| 2012 | | | 1,539 | | | | 58,241 | | | | 171,797 | | |
| 2013 | | | 4 | | | | 283,503 | | | | 439,879 | | |
| 2014 | | | 0 | | | | 733,301 | | | | 3,306,785 | | |
| Total | | $ | 8,375 | | | $ | 1,243,102 | | | $ | 27,035,620 | | |
2. EXPENSES
The Investment Company has an Investment Advisory Agreement with Mutual of America Capital Management Corporation ("the Adviser"), an indirect wholly-owned subsidiary of Mutual of America Life. Effective May 1, 2006, for providing investment management services to each of the Funds of the Investment Company, the Adviser receives a fee, calculated as a daily charge, at the annual rate of .075% of the value of the net assets of the Equity Index Fund and the Mid-Cap Equity Index Fund, .15% of the value of the net assets of the Money Market Fund, .40% of the value of the net assets of the All America Fund, Composite Fund, Mid-Term Bond Fund and Bond Fund, .55% of the value of the net assets of the Mid Cap Value Fund and .75% of the value of the net assets of the Small Cap Value Fund and Small Cap Growth Fund.
Prior to May 1, 2006, the Adviser's investment management fee was .125% of the value of the net assets of the Equity Index Fund and the Mid-Cap Equity Index Fund, .25% of the value of the net assets of the Money Market Fund, .50% of the value of the net assets of the All America Fund, Composite Fund, Mid-Term Bond Fund and Bond Fund, .65% of the value of the net assets of the Mid Cap Value Fund and .85% of the value of the net assets of the Small Cap Value Fund and Small Cap Growth Fund.
66
MUTUAL OF AMERICA INVESTMENT CORPORATION
NOTES TO FINANCIAL STATEMENTS (Continued)
2. EXPENSES (CONTINUED)
The Adviser does not assess a fee for investment management to the Allocation Funds. However, shareholders in the Allocation Funds will indirectly bear their pro-rata share of the investment management fees incurred by the underlying Funds in which they invest.
Through April 30, 2006, the Adviser contractually limited the expenses of each Fund, other than for brokers' commissions and other fees relating to portfolio transactions, to the amount of the advisory fee paid by the Funds to the Adviser. Effective May 1, 2006, the Adviser terminated its expense limitation policy and each Fund is charged with the full amount of its expenses.
Under a Sub-Advisory Agreement for the All America Fund, through July 27, 2005 the Adviser delegated investment advisory responsibilities to a subadviser responsible for providing management services for a portion of the Fund's assets. The Adviser (not the Fund) was responsible for compensation payable under such Sub-Advisory Agreement.
3. INVESTMENTS
The cost of investment purchases and proceeds from sales of investments, excluding short-term securities and futures contracts, for the year ended December 31, 2006 were as follows:
| | | Equity Index
Fund | | All America
Fund | | Small Cap
Value Fund | | Small Cap
Growth | | Mid Cap
Value Fund | |
| Cost of investment purchases | | $ | 35,711,988 | | | $ | 133,673,814 | | | $ | 247,492,719 | | | $ | 228,962,947 | | | $ | 24,448,874 | | |
| Proceeds from sales of investments | | $ | 58,445,112 | | | $ | 163,060,528 | | | $ | 61,272,853 | | | $ | 76,224,192 | | | $ | 6,735,968 | | |
| | | Mid-Cap
Equity Index
Fund | | Composite
Fund | | Conservative
Allocation
Fund | | Moderate
Allocation
Fund | | Aggressive
Allocation
Fund | |
| Cost of investment purchases | | $ | 56,341,442 | | | $ | 58,434,649 | | | $ | 6,989,679 | | | $ | 23,873,711 | | | $ | 26,836,506 | | |
| Proceeds from sales of investments | | $ | 75,068,282 | | | $ | 77,860,784 | | | $ | 5,408,980 | | | $ | 6,282,956 | | | $ | 3,949,471 | | |
| | | Money
Market Fund | | Mid-Term
Bond Fund | | Bond
Fund | |
| Cost of investment purchases | | $ | — | | | $ | 58,748,610 | | | $ | 64,458,611 | | |
| Proceeds from sales of investments | | $ | — | | | $ | 24,713,724 | | | $ | 78,932,264 | | |
The cost of short-term security purchases for the Money Market Fund for the year ended December 31, 2006, was $7,741,069,184; net proceeds from sales for the year were $7,641,219,605.
The components of net unrealized appreciation (depreciation) of investments for Federal income tax purposes and the cost of investments for Federal income tax purposes at December 31, 2006 for each of the funds were as follows. Differences with amounts reflected in the Statements of Assets and Liabilities arise principally from wash sales and the treatment of distributions from Real Estate Investment Trusts (REITs).
| | | Equity
Index Fund | | All America
Fund | | Small Cap
Value Fund | | Small Cap
Growth | | Mid Cap
Value Fund | |
| Unrealized Appreciation | | $ | 211,052,697 | | | $ | 99,069,613 | | | $ | 19,406,664 | | | $ | 36,882,318 | | | $ | 3,568,648 | | |
| Unrealized Depreciation | | | 37,953,591 | | | | 18,786,851 | | | | 3,527,528 | | | | 3,249,303 | | | | 404,404 | | |
| Net | | $ | 173,099,106 | | | $ | 80,282,762 | | | $ | 15,879,136 | | | $ | 33,633,015 | | | $ | 3,164,244 | | |
| Cost of Investments | | $ | 637,330,747 | | | $ | 344,269,548 | | | $ | 234,318,831 | | | $ | 190,647,040 | | | $ | 30,114,608 | | |
| | | Mid-Cap
Equity Index
Fund | | Composite
Fund | | Conservative
Allocation
Fund | | Moderate
Allocation
Fund | | Aggressive
Allocation
Fund | |
| Unrealized Appreciation | | $ | 77,667,023 | | | $ | 22,196,269 | | | $ | 247,515 | | | $ | 3,266,102 | | | $ | 3,872,515 | | |
| Unrealized Depreciation | | | 18,197,708 | | | | 5,052,760 | | | | 284,704 | | | | 1,262,063 | | | | 833,432 | | |
| Net | | $ | 59,469,315 | | | $ | 17,143,509 | | | $ | (37,189 | ) | | $ | 2,004,039 | | | $ | 3,039,083 | | |
| Cost of Investments | | $ | 297,832,238 | | | $ | 213,315,684 | | | $ | 13,068,116 | | | $ | 74,310,810 | | | $ | 69,582,714 | | |
67
MUTUAL OF AMERICA INVESTMENT CORPORATION
NOTES TO FINANCIAL STATEMENTS (Continued)
3. INVESTMENTS (CONTINUED)
| | | Money
Market Fund | | Mid-Term
Bond Fund | | Bond
Fund | |
| Unrealized Appreciation | | $ | 0 | | | $ | 415,082 | | | $ | 4,045,425 | | |
| Unrealized Depreciation | | | 341 | | | | 1,585,149 | | | | 6,931,217 | | |
| Net | | $ | (341 | ) | | $ | (1,170,067 | ) | | $ | (2,885,792 | ) | |
| Cost of Invesmtents | | $ | 238,687,246 | | | $ | 107,112,629 | | | $ | 345,729,835 | | |
4. CAPITAL SHARE ACTIVITY
The Investment Company has registered an indefinite number of its capital shares pursuant to Rule 24f-2 under the Investment Company Act of 1940. As of December 31, 2006, shares authorized were allocated into the thirteen series of Funds as follows:
| | | Authorized No. of Shares | |
| Equity Index Fund | | | 500,000,000 | | |
| All America Fund | | | 400,000,000 | | |
| Small Cap Value Fund | | | 450,000,000 | | |
| Small Cap Growth Fund | | | 450,000,000 | | |
| Mid Cap Value Fund | | | 100,000,000 | | |
| Mid-Cap Equity Index Fund | | | 400,000,000 | | |
| Composite Fund | | | 300,000,000 | | |
| Conservative Allocation Fund | | | 100,000,000 | | |
| Moderate Allocation Fund | | | 100,000,000 | | |
| Aggressive Allocation Fund | | | 100,000,000 | | |
| Money Market Fund | | | 250,000,000 | | |
| Mid-Term Bond Fund | | | 175,000,000 | | |
| Bond Fund | | | 450,000,000 | | |
| Sub-Total | | | 3,775,000,000 | | |
| Shares to be allocated at the discretion of the Board of Directors | | | 225,000,000 | | |
| Total | | | 4,000,000,000 | | |
5. DIVIDENDS
On December 31, 2006, dividend distributions were declared and paid for each of the funds from net investment income and, as applicable, from net realized gains on investment transactions. Additionally, remaining required distributions relating to 2005 were made in accordance with Internal Revenue Sec. 855(a) and paid on September 15, 2006. Pursuant to shareholders' instructions, substantially all dividend distributions throughout 2006 and 2005 were immediately reinvested into their respective funds. The tax character of the distributions paid during 2006 and 2005 were as follows:
| | | Equity
Index Fund | | All America
Fund | | Small Cap
Value Fund | | Small Cap
Growth | | Mid Cap
Value
Fund | |
| Ordinary Income (a) | | | |
| 2006 | | $ | 15,117,674 | | | $ | 13,611,537 | | | $ | 3,897,409 | | | $ | 1,641,006 | | | $ | 555,471 | | |
| 2005 | | $ | 11,700,903 | | | $ | 2,609,110 | | | $ | 280,825 | | | $ | 0 | | | $ | 64,584 | | |
| Long-Term Capital Gains (b) | | | |
| 2006 | | $ | 16,559,040 | | | $ | 32,697,314 | | | $ | 127,287 | | | $ | 3,336,939 | | | $ | 68,683 | | |
| 2005 | | $ | 14,210,430 | | | $ | 32,280,063 | | | $ | 0 | | | $ | 0 | | | $ | 0 | | |
68
MUTUAL OF AMERICA INVESTMENT CORPORATION
NOTES TO FINANCIAL STATEMENTS (Continued)
5. DIVIDENDS (CONTINUED)
| | | Mid-Cap
Equity Index
Fund | | Composite
Equity
Fund | | Conservative
Allocation
Fund | | Moderate
Allocation
Fund | | Aggressive
Allocation
Fund | |
| Ordinary Income (a) | | | |
| 2006 | | $ | 7,664,502 | | | $ | 5,905,979 | | | $ | 451,941 | | | $ | 2,283,248 | | | $ | 1,830,562 | | |
| 2005 | | $ | 6,521,459 | | | $ | 5,978,084 | | | $ | 350,757 | | | $ | 1,496,609 | | | $ | 954,523 | | |
| Long-Term Capital Gains (b) | | | |
| 2006 | | $ | 20,010,157 | | | $ | 0 | | | $ | 186,077 | | | $ | 1,763,116 | | | $ | 3,102,741 | | |
| 2005 | | $ | 17,766,628 | | | $ | 0 | | | $ | 67,883 | | | $ | 1,024,283 | | | $ | 1,337,323 | | |
| | | Money
Market Fund | | Mid-Term
Bond Fund | | Bond
Fund | |
| Ordinary Income (a) | | | |
| 2006 | | $ | 8,602,243 | | | $ | 3,191,812 | | | $ | 15,711,330 | | |
| 2005 | | $ | 2,660,081 | | | $ | 2,313,748 | | | $ | 16,217,492 | | |
| Long-Term Capital Gains (b) | | | |
| 2006 | | $ | 0 | | | $ | 0 | | | $ | 0 | | |
| 2005 | | $ | 0 | | | $ | 0 | | | $ | 0 | | |
Notes:
No distribution paid during 2006 or 2005 constituted a return of capital for Federal income tax purposes.
(a) Includes distributions from Fund-level net short-term capital gains.
(b) To the extent reported, each Fund designates these amounts as capital gain dividends for Federal income tax purposes.
As of December 31, 2006, undistributed net income and undistributed accumulated gain (loss) on a tax basis were as follows:
| | |
Equity Index
Fund | |
All America
Fund | | Small Cap
Value
Fund | | Small Cap
Growth
Fund | | Mid Cap
Value
Fund | |
Accumulated undistributed net
investment income | | $ | 496,438 | | | $ | 5,168,810 | | | $ | 1,017,235 | | | $ | 2,010,755 | | | $ | 81,907 | | |
Accumulated net realized gain/(loss)
on investments and futures contracts | | $ | 0 | | | $ | 0 | | | $ | 374,788 | | | $ | 1,539,056 | | | $ | 70,677 | | |
Net unrealized appreciation (depreciation)
of investments and futures contracts | | $ | 173,099,106 | | | $ | 80,282,762 | | | $ | 15,879,136 | | | $ | 33,633,015 | | | $ | 3,164,244 | | |
| | | Mid-Cap
Equity Index
Fund | |
Composite
Fund | | Conservative
Allocation
Fund | | Moderate
Allocation
Fund | | Aggressive
Allocation
Fund | |
Accumulated undistributed net
investment income | | $ | 1,296,182 | | | $ | 4,723,923 | | | $ | 19,050 | | | $ | 51,695 | | | $ | 66,675 | | |
Accumulated net realized gain/(loss)
on investments and futures contracts | | $ | 6,365,037 | | | $ | (39,996,585 | ) | | $ | 0 | | | $ | 0 | | | $ | 0 | | |
Net unrealized appreciation (depreciation)
of investments and futures contracts | | $ | 59,469,315 | | | $ | 17,143,509 | | | $ | (37,190 | ) | | $ | 2,004,039 | | | $ | 3,039,083 | | |
| | | Money
Market Fund | | Mid-Term
Bond Fund | | Bond
Fund | |
Accumulated undistributed net
investment income | | $ | 259,187 | | | $ | 43,767 | | | $ | 1,181,762 | | |
Accumulated net realized gain/(loss)
on investments and futures contracts | | $ | (8,375 | ) | | $ | (1,243,102 | ) | | $ | (27,035,620 | ) | |
Net unrealized appreciation (depreciation)
of investments and futures contracts | | $ | (341 | ) | | $ | (1,170,067 | ) | | $ | (2,885,792 | ) | |
69
MUTUAL OF AMERICA INVESTMENT CORPORATION
NOTES TO FINANCIAL STATEMENTS (Continued)
5. DIVIDENDS (CONTINUED)
The difference between the components of distributable earnings on a tax basis and the amounts reflected in the statements of changes in net assets are primarily due to wash sales, post-October losses and the Federal income tax treatment of futures contracts.
During the year ended December 31, 2006, each fund reclassified the following book to tax differences [increases (decreases)]:
| | | Equity Index
Fund | | All America
Fund | | Small Cap
Value
Fund | | Small Cap
Growth
Fund | | Mid Cap
Value
Fund | |
Accumulated undistributed net investment
income | | $ | (632,505 | ) | | $ | (143,803 | ) | | $ | 2,404 | | | $ | 190,952 | | | $ | (17,828 | ) | |
Accumulated undistributed net realized gains
(loss) on investments and futures contracts | | | 632,505 | | | | 143,803 | | | | (2,404 | ) | | | (491,465 | ) | | | 17,828 | | |
| Paid in capital | | $ | 0 | | | $ | 0 | | | $ | 0 | | | $ | 300,513 | | | $ | 0 | | |
| | | Mid-Cap
Equity Index
Fund | | Composite
Fund | | Conservative
Allocation
Fund | | Moderate
Allocation
Fund | | Aggressive
Allocation
Fund | |
Accumulated undistributed net investment
income | | $ | (320,980 | ) | | $ | (3,784 | ) | | $ | (34,051 | ) | | $ | (45,120 | ) | | $ | (74,583 | ) | |
Accumulated undistributed net realized gains
(loss) on investments and futures contracts | | | 320,980 | | | | 3,784 | | | | 34,051 | | | | 45,120 | | | | 74,583 | | |
| Paid in capital | | $ | 0 | | | $ | 0 | | | $ | 0 | | | $ | 0 | | | $ | 0 | | |
| | | Money Market
Fund | | Mid-Term
Bond Fund | | Bond
Fund | |
Accumulated undistributed net investment
income | | $ | 0 | | | $ | 0 | | | $ | 0 | | |
Accumulated undistributed net realized gains
(loss) on investments and futures contracts | | | 2,207 | | | | (347,034 | ) | | | 0 | | |
| Paid in capital | | $ | (2,207 | ) | | $ | 347,034 | | | $ | 0 | | |
These reclassifications were made as a result of the differences arising from the disallowance of net operating losses, expiration of capital loss carryforwards, distributions from REITs, distribution reclassifications and other cumulative adjustments for Federal income tax purposes versus financial reporting purposes. Each Fund's net assets were not affected by these reclassifications.
6. FUND REORGANIZATIONS
On July 24, 2006, Investment Company shareholders approved a plan of reorganization for the Aggressive Equity Fund. Under the reorganization plan, on September 1, 2006, all shareholders of the Aggressive Equity Fund as of the close of trading on August 31, 2006, received units of the Small Cap Value and Small Cap Growth Funds equal in total value to the units they owned in the Aggressive Equity Fund. On August 31, 2006, the net assets of the Aggressive Equity Fund were $339,068,746 and the fund had 217,265,969 shares outstanding. In exchange for all of the outstanding shares of the Aggressive Equity Fund, the shareholders received 145,227,730 shares of the Small Cap Value Fund with a value of $169,534,350 and 154,363,827 shares of the Small Cap Growth Fund with a value of $169,534,395. The proportion of Small Cap Value and Small Cap Growth Fund shares received corresponded to the respective net assets of the small cap value and small cap gro wth segments of the Aggressive Equity Fund on the close of trading on August 31, 2006. The portion of the reorganization involving the Small Cap Value Fund was considered a taxable exchange and the portion involving the Small Cap Growth Fund was considered a tax-free exchange. The Funds did not recognize any tax gain or loss and there were no tax consequences to their shareholders as a result of this reorganization. The net assets of the Small Cap Value Fund were $56,319,329 immediately prior to the reorganization and $225,853,728 immediately after the reorganization. The net assets of the Small Cap Growth Fund were $38,504,665 immediately prior to the reorganization and $208,039,060 immediately after the reorganization. As of September 1, 2006, the Aggressive Equity Fund ceased to exist.
Also on July 24, 2006, Investment Company shareholders approved the merger of the Short-Term Bond Fund into the Mid-Term Bond Fund. Pursuant to the merger, which was a tax free exchange, on September 1, 2006, all shareholders of the Short-Term Bond Fund as of the close of trading on August 31, 2006, received 35,427,766 shares of the Mid-Term Bond Fund with a value of $33,432,403 in exchange for the 32,962,683 shares they owned in the Short-Term Bond Fund with an equivalent value. There were no tax consequences to the Funds or their shareholders as a result of this reorganization. The net assets of the Mid-Term Bond Fund were $71,029,891 immediately prior to the reorganization and $104,462,294 immediately after the reorganization. As of September 1, 2006, the Short-Term Bond Fund ceased to exist.
70
REPORT OF INDEPENDENT REGISTERED PUBLIC ACCOUNTING FIRM
The Board of Directors and Shareholders
of Mutual of America Investment Corporation:
We have audited the accompanying statements of assets and liabilities of Mutual of America Investment Corporation (comprised of: Equity Index Fund, All America Fund, Small Cap Value Fund, Small Cap Growth Fund, Mid Cap Value Fund, Mid-Cap Equity Index Fund, Composite Fund, Conservative Allocation Fund, Moderate Allocation Fund, Aggressive Allocation Fund, Money Market Fund, Mid-Term Bond Fund, and Bond Fund ("the Funds")), including the portfolios of investments in securities for the Conservative Allocation Fund, Moderate Allocation Fund, Aggressive Allocation Fund, and Money Market Fund, and the summary portfolios of investments in securities for each of the other Funds as of December 31, 2006, and the related statements of operations for the year then ended, the statements of changes in net assets for each of the years or period in the two-year period then ended, and the financial highlights for each of the years or periods in the five-yea r period then ended. These financial statements and financial highlights are the responsibility of the Funds' management. Our responsibility is to express an opinion on these financial statements and financial highlights based on our audits.
We conducted our audits in accordance with the standards of the Public Company Accounting Oversight Board (United States). Those standards require that we plan and perform the audit to obtain reasonable assurance about whether the financial statements and financial highlights are free of material misstatement. An audit includes examining, on a test basis, evidence supporting the amounts and disclosures in the financial statements. Our procedures included confirmation of securities owned as of December 31, 2006, by correspondence with custodian and brokers or by other appropriate auditing procedures where replies from brokers were not received. An audit also includes assessing the accounting principles used and significant estimates made by management, as well as evaluating the overall financial statement presentation. We believe that our audits provide a reasonable basis for our opinion.
In our opinion, the financial statements and financial highlights referred to above present fairly, in all material respects, the assets and liabilities of the Funds as of December 31, 2006, and the results of their operations for the year then ended, the changes in their net assets for each of the years or period in the two-year period then ended, and the financial highlights for each of the years or periods in the five-year period then ended, in conformity with U.S. generally accepted accounting principles.

New York, New York
February 28, 2007
71
MUTUAL OF AMERICA INVESTMENT CORPORATION
Directors and Officers — unaudited
The tables below show information about the Directors and officers of the Investment Company. The address of each Director and officer is c/o Mutual of America Investment Corporation, 320 Park Avenue, New York, New York 10022. The Investment Company does not hold annual meetings of shareholders, and each Director has been elected by shareholders to serve until a successor is duly elected at a meeting of shareholders called for the purpose of electing directors. Each officer of the Investment Company has been elected by the Board of Directors to serve until a successor is duly elected. The Independent Directors do not serve as directors of any other fund that is affiliated with the Adviser or Mutual of America with the sole exception of Patrick J. Waide, Jr., who serves on the boards of Mutual of America Investment Corporation and Mutual of America Institutional Funds, Inc. The Interested Directors and officers of the Investment Company do no t receive compensation from the Investment Company for their service.
The Investment Company's Statement of Additional Information ("SAI"), filed with the Securities and Exchange Commission, contains additional information about the Investment Company's Directors and Officers. A copy of the latest SAI can be obtained, without charge, by writing to Mutual of America Investment Corporation at 320 Park Avenue, New York, NY 10022-6839 or by calling 1-800-468-3785 or through the following websites: http://www.mutualofamerica.com or http://www.sec.gov.
Independent Directors
| Name and Age | | Length of
Time Served | | Principal Occupation(s)
in Past Five Years | | Other Directorships
Held by Director | |
Peter J. Flanagan
age 76 | | since 1992 | | Consultant and President Emeritus, Life Insurance Council of New York, since 1998; prior thereto, President | | None | |
|
Robert J. McGuire
age 70 | | since 2000 | | Attorney and Consultant, Morvillo, Abramowitz, Grand, Iason & Silberberg, P.C. (law firm), since January 1998; President, Police Athletic League; President, Kroll Associates (investigation and consulting) until 1997 | | Emigrant Savings Bank; GAM Funds, Inc.; Brazilian Equity Fund (special litigation committee); Police Athletic League; Volunteers of Legal Service; Office of the Appellate Defender; Trump Hotels & Casino Resorts; Trustee of Iona College | |
|
George Mertz
age 78 | | since 1989 | | Retired, since September 1994 | | None | |
|
Howard J. Nolan
age 70 | | since 1989 | | President & CEO, United Way of San Antonio & Bexar County | | None | |
|
Patrick J. Waide, Jr.
age 69 | | since 12/03 | | | | Trustee, School of Ethical Education; Director, American Federation for Aging Research; Mutual of America Institutional Funds, Inc. | |
|
Margaret M. Smyth
age 43 | | since 2/07 | | Vice President and Chief Accounting Officer, Minnesota Mining and Manufacturing Company | | Archdiocese of St. Paul; Trustee, Concern Worldwide (U.S.) Inc.; Trustee, Fordham University | |
|
72
Independent Directors
| Name and Age | | Length of
Time Served | | Principal Occupation(s)
in Past Five Years | | Other Directorships
Held by Director | |
Manfred Altstadt Chairman of the Board, President and Chief Executive Officer,
age 57 | | since 1992 | | Senior Executive Vice President and Chief Financial Officer, Mutual of America, and Mutual of America Holding Company, Inc.; Chairman and Chief Executive Officer, Mutual of America Capital Management Corporation; Senior Executive Vice President, Chief Financial Officer and Treasurer, Mutual of America Institutional Funds, Inc. | | Mutual of America; Mutual of America Securities Corporation; Mutual of America Holding Company, Inc.; Calvary Hospital; Calvary Fund; Calvary Holding Company; McQuade Children's Services, Army War College Foundation; Hazelden New York | |
|
Mr. Altstadt is an "interested person" as an officer of the Adviser and of affiliates of the Adviser.
Officers
| Name, Position and Age | | Length of
Time Served | | Principal Occupation(s)
in Past Five Years | | Other Directorships
Held by Director | |
Patrick A. Burns
Senior Executive Vice President and General Counsel, age 60 | | since 1986 | | Senior Executive Vice President and General Counsel, Mutual of America, Mutual of America Capital Management Corporation, Mutual of America Securities Corporation, Mutual of America Holding Company, Inc. and Mutual of America Institutional Funds, Inc. | | Mutual of America; Mutual of America Holding Company, Inc.; Irish American Legal and Education Research Foundation | |
|
John R. Greed
Executive Vice President, Chief Financial Officer and Treasurer, age 46 | | since 1997 | | Executive Vice President and Treasurer, Mutual of America, Mutual of America Capital Management Corporation and Mutual of America Holding Company, Inc.; Chairman of the Board, President and Chief Executive Officer, Mutual of America Institutional Funds, Inc. | | None | |
|
Thomas L. Martin
Senior Vice President and Secretary, age 57 | | since 8/03 | | Senior Vice President and Associate General Counsel, Mutual of America | | None | |
|
73
MUTUAL OF AMERICA INVESTMENT CORPORATION
ADDITIONAL INFORMATION
Quarterly Portfolio Schedules
Included in this Annual Report are summary schedules of Mutual of America Investment Corporation's ("Investment Company") Fund portfolio holdings as of December 31, 2006. The Investment Company files complete schedules of Fund portfolio holdings with the Securities and Exchange Commission ("SEC") for the first and third quarters of each fiscal year on Form N-Q and for the second and fourth quarters of each fiscal year on Form N-CSR. The Forms N-Q and N-CSR are available on the SEC's website at http://www.sec.gov. Additionally, the Forms N-Q and N-CSR may be reviewed and copied at the SEC's Public Reference Room in Washington, DC. Information on the operation of the Public Reference Room may be obtained by calling 1-800-SEC-0330.
Proxy Voting Policies and Procedures
A copy of the Investment Company's proxy voting policies and procedures can be obtained free of charge by calling 1-800-468-3785. It is also available on the SEC's website at http://www.sec.gov.
Information regarding how the Investment Company voted proxies relating to portfolio securities during the 12-month period ended June 30, 2006 is available without charge by calling 1-800-468-3785. It is also available on the SEC website.
Code of Ethics
The Investment Company has adopted a Code of Ethics that complies with Rule 17j-1 of the Investment Company Act of 1940 and with the requirements of the Sarbanes-Oxley Act of 2002. A copy of the Code of Ethics is available free of charge, upon request. To obtain a free copy of the Code of Ethics, please call (212) 224-1569 or write to:
Mr. James Roth
Chief Compliance Officer
Mutual of America Investment Corporation
320 Park Avenue
New York, NY 10022-6839
Supplemental Dividend Information — Unaudited
Dividends from the Money Market Fund, Mid-Term Bond Fund, and Bond Fund do not qualify for the corporate dividends received deduction. The percentages of the ordinary dividends distributed in 2006 by the All America, Equity Index, Small Cap Value, Small Cap Growth, Mid Cap Value, Mid-Cap Equity Index, Composite, Conservative Allocation, Moderate Allocation, and Aggressive Allocation Funds that qualify for the corporate dividends received deduction are 60.2%, 95.5%, 26.9%, 8.0%, 58.8%, 66.1%, 41.0%, 96.2%, 91.2% and 87.8%, respectively.
Important tax information: The Equity Index, All America, Mid-Cap Equity Index, Small Cap Value, Small Cap Growth, Mid Cap Value, Conservative Allocation, Moderate Allocation, and Aggressive Allocation Funds designate $16,559,040, $32,697,314, $20,010,157, $127,287, $3,336,939, $68,683, $186,077, $1,763,116 and $3,102,741, respectively, of 2006 long-term capital gains dividends as qualifying for the 15% reduced rate on long-term capital gains.
74
MUTUAL OF AMERICA
LIFE INSURANCE COMPANY
320 PARK AVENUE
NEW YORK, NY 10022-6839
www.mutualofamerica.com
ITEM 2. CODE OF ETHICS.
Mutual of America Investment Corporation has adopted a Code of Ethics that applies to its principal executive and financial officers. The Code of Ethics was not amended during the period covered by this report.
The Annual Report to Shareholders includes information on how to obtain a copy of the Code of Ethics at no charge.
ITEM 3. AUDIT COMMITTEE FINANCIAL EXPERT.
(a) (1) Mutual of America Investment Corporation’s Board of Directors has determined that one audit committee financial expert serves on its Audit Committee.
(a) (2) The audit committee financial expert is Patrick J. Waide, Jr. He was Senior Vice-President, Administration at Sullivan & Company until March 1998; Director of the Drucker Foundation from 1996-1999 and President, Drucker Foundation in 1999. Mr. Waide is considered an independent director.
ITEM 4. PRINCIPAL ACCOUNTANT FEES AND SERVICES.
(a) Aggregate Audit Fees:
2006: $246,230
2005: $154,491
(b), (c), (d) There were no Audit-Related, Tax or Other Fees.
(e) All non-audit fees are pre-approved by the Audit Committee in advance.
(f), (g), (h) Not applicable.
ITEM 5. AUDIT COMMITTEE OF LISTED REGISTRANTS.
Not applicable.
ITEM 6. SCHEDULE OF INVESTMENTS.
Schedule I —Portfolios of Investments in Securities follows:
MUTUAL OF AMERICA INVESTMENT CORPORATION (EQUITY INDEX FUND )
PORTFOLIO OF INVESTMENTS IN SECURITIES
December 31, 2006
| | Shares | | Value($) | |
COMMON STOCKS: | | | | | |
BASIC MATERIALS (2.9%) | | | | | |
Air Products & Chemicals, Inc. | | 13,451 | | $ | 945,336 | |
Alcoa, Inc. | | 52,932 | | 1,588,489 | |
Allegheny Technologies, Inc. | | 6,113 | | 554,327 | |
Ball Corp. | | 6,330 | | 275,988 | |
Bemis Co. | | 6,371 | | 216,487 | |
Dow Chemical Co. | | 58,298 | | 2,328,422 | |
Du Pont EI de Nemours | | 56,149 | | 2,735,018 | |
Eastman Chemical Co. | | 4,999 | | 296,491 | |
Ecolab, Inc. | | 10,857 | | 490,736 | |
Freeport-McMoran Copper Cl B | | 12,021 | | 669,930 | |
Hercules, Inc.* | | 6,887 | | 132,988 | |
International Paper Co. | | 27,773 | | 947,059 | |
Intl. Flavors & Fragrances | | 4,794 | | 235,673 | |
MeadWestvaco Corp. | | 11,060 | | 332,464 | |
Monsanto Co. | | 33,166 | | 1,742,210 | |
Newmont Mining Corp. Hldg. Co. | | 27,484 | | 1,240,903 | |
Nucor Corp. | | 18,443 | | 1,008,094 | |
PPG Industries, Inc. | | 10,088 | | 647,750 | |
Pactiv Corp.* | | 8,123 | | 289,910 | |
Peabody Energy Corp. | | 16,104 | | 650,763 | |
Phelps Dodge Corp. | | 12,452 | | 1,490,753 | |
Praxair, Inc. | | 19,711 | | 1,169,454 | |
Rohm & Haas Co. | | 8,667 | | 443,057 | |
Sealed Air Corp. | | 4,933 | | 320,250 | |
Sigma-Aldrich Corp. | | 4,035 | | 313,600 | |
Temple-Inland, Inc. | | 6,531 | | 300,622 | |
United States Steel Group | | 7,232 | | 528,948 | |
Vulcan Materials Co. | | 5,764 | | 518,011 | |
Weyerhaeuser Co. | | 14,439 | | 1,020,115 | |
| | | | 23,433,848 | |
CONSUMER, CYCLICAL (9.8%) | | | | | |
Amazon.com, Inc.* | | 18,859 | | 744,176 | |
AutoZone, Inc.* | | 3,090 | | 357,080 | |
Autonation, Inc.* | | 9,131 | | 194,673 | |
Bed Bath & Beyond, Inc.* | | 17,256 | | 657,454 | |
Best Buy Co., Inc. | | 24,626 | | 1,211,353 | |
Big Lots, Inc.* | | 6,684 | | 153,197 | |
Black & Decker Corp. | | 4,128 | | 330,116 | |
Brunswick Corp. | | 5,635 | | 179,757 | |
| | | | | | |
1
| | Shares | | Value($) | |
COMMON STOCKS: | | | | | |
CONSUMER, CYCLICAL (Cont'd.) | | | | | |
Carnival Corp. | | 27,164 | | 1,332,394 | |
Centex Corp. | | 7,203 | | 405,313 | |
Circuit City Group, Inc. | | 8,661 | | 164,386 | |
Clear Channel Communications | | 30,160 | | 1,071,886 | |
Coach, Inc.* | | 22,432 | | 963,679 | |
Comcast Corp. Cl A* | | 127,043 | | 5,377,730 | |
D.R. Horton, Inc. | | 16,847 | | 446,277 | |
Darden Restaurants, Inc. | | 8,963 | | 360,044 | |
Dillard's, Inc. Cl A | | 3,674 | | 128,480 | |
DIRECTV Group Inc* | | 47,057 | | 1,173,602 | |
Disney (Walt) Co. | | 126,268 | | 4,327,204 | |
Dollar General Corp. | | 19,048 | | 305,911 | |
Dow Jones & Co. | | 3,949 | | 150,062 | |
EW Scripps Co. Cl A | | 5,064 | | 252,896 | |
Eastman Kodak Co. | | 17,538 | | 452,480 | |
Family Dollar Stores, Inc. | | 9,215 | | 270,276 | |
Federated Dept Stores | | 32,059 | | 1,222,410 | |
Ford Motor Co. | | 115,307 | | 865,956 | |
Fortune Brands, Inc. | | 9,241 | | 789,089 | |
Gannett Co., Inc. | | 14,304 | | 864,820 | |
Gap, Inc. | | 32,165 | | 627,218 | |
General Motors Corp. | | 34,528 | | 1,060,700 | |
Genuine Parts Co. | | 10,410 | | 493,746 | |
Goodyear Tire & Rubber Co.* | | 10,834 | | 227,406 | |
Harley-Davidson, Inc. | | 15,819 | | 1,114,765 | |
Harman Intl. Inds | | 3,961 | | 395,744 | |
Harrah's Entertainment, Inc. | | 11,356 | | 939,368 | |
Hasbro, Inc. | | 9,696 | | 264,216 | |
Hilton Hotels Corp. | | 23,601 | | 823,675 | |
Home Depot, Inc. | | 124,584 | | 5,003,293 | |
International Game Technology | | 20,719 | | 957,218 | |
Interpublic Grp. of Cos., Inc. | | 26,932 | | 329,648 | |
Johnson Controls, Inc. | | 11,952 | | 1,026,916 | |
Jones Apparel Group, Inc. | | 6,730 | | 224,984 | |
KB Home | | 4,772 | | 244,708 | |
Kohl's Corp.* | | 19,963 | | 1,366,068 | |
Leggett & Platt | | 10,926 | | 261,131 | |
Lennar Corp. | | 8,411 | | 441,241 | |
Limited Brands, Inc. | | 20,879 | | 604,238 | |
2
| | Shares | | Value($) | |
COMMON STOCKS: | | | | | |
CONSUMER, CYCLICAL (Cont'd.) | | | | | |
Liz Claiborne, Inc. | | 6,270 | | 272,494 | |
Lowe's Companies, Inc. | | 92,958 | | 2,895,642 | |
Marriott International, Inc. | | 20,516 | | 979,024 | |
Mattel, Inc. | | 23,283 | | 527,593 | |
McDonald's Corp. | | 75,497 | | 3,346,782 | |
McGraw-Hill Cos., Inc. | | 21,622 | | 1,470,728 | |
Meredith Corp. | | 2,366 | | 133,324 | |
NIKE, Inc. Cl B | | 11,478 | | 1,136,666 | |
New York Times Co. Cl A | | 8,780 | | 213,881 | |
Newell Rubbermaid, Inc. | | 16,922 | | 489,892 | |
News Corp, Inc. | | 142,887 | | 3,069,213 | |
Nordstrom, Inc. | | 13,965 | | 689,033 | |
Office Depot, Inc.* | | 16,995 | | 648,699 | |
OfficeMax, Inc. | | 4,509 | | 223,872 | |
Omnicom Group, Inc. | | 10,440 | | 1,091,398 | |
Penney (J.C.) Co., Inc. | | 13,734 | | 1,062,462 | |
Pulte Homes, Inc. | | 12,863 | | 426,023 | |
RadioShack Corp. | | 8,247 | | 138,385 | |
Sears Holding Corp.* | | 5,055 | | 848,886 | |
Sherwin-Williams Co. | | 6,848 | | 435,396 | |
Snap-On, Inc. | | 3,528 | | 168,074 | |
Stanley Works | | 4,917 | | 247,276 | |
Staples, Inc. | | 44,149 | | 1,178,778 | |
Starbucks Corp.* | | 46,154 | | 1,634,775 | |
TJX Companies, Inc. | | 27,781 | | 792,314 | |
Target Corp. | | 52,430 | | 2,991,132 | |
Tiffany & Co. | | 8,262 | | 324,201 | |
Time Warner, Inc. | | 243,712 | | 5,308,047 | |
Tribune Co. | | 11,638 | | 358,218 | |
Univision Communications, Inc. | | 15,399 | | 545,433 | |
V F Corp. | | 5,458 | | 447,993 | |
Wendy's International, Inc. | | 5,836 | | 193,113 | |
Whirlpool Corp. | | 4,754 | | 394,677 | |
Windstream Corp. | | 29,105 | | 413,873 | |
Wyndham Worldwide Corp* | | 12,095 | | 387,282 | |
Yum! Brands, Inc. | | 16,181 | | 951,443 | |
eBay, Inc.* | | 70,635 | | 2,123,994 | |
| | | | 79,719,000 | |
3
| | Shares | | Value($) | |
COMMON STOCKS: | | | | | |
CONSUMER, NON-CYCLICAL (9.3%) | | | | | |
Altria Group, Inc. | | 127,942 | | 10,979,982 | |
Anheuser-Busch Cos., Inc. | | 46,932 | | 2,309,054 | |
Archer-Daniels-Midland Co. | | 40,121 | | 1,282,267 | |
Avon Products, Inc. | | 27,137 | | 896,606 | |
Brown-Forman Corp. Cl B | | 4,772 | | 316,097 | |
CVS Corp. | | 49,474 | | 1,529,241 | |
Campbell Soup Co. | | 13,295 | | 517,043 | |
Clorox Co. | | 9,268 | | 594,542 | |
Coca-Cola Co. | | 124,476 | | 6,005,967 | |
Coca-Cola Enterprises | | 16,919 | | 345,486 | |
Colgate-Palmolive Co. | | 31,382 | | 2,047,362 | |
ConAgra Foods, Inc. | | 31,105 | | 839,835 | |
Constellation Brands, Inc.Cl A | | 12,815 | | 371,891 | |
Costco Wholesale Corp. | | 27,975 | | 1,479,038 | |
Dean Foods Co.* | | 8,165 | | 345,216 | |
Estee Lauder Co. Cl A | | 7,774 | | 317,335 | |
FNMA | | 59,522 | | 3,535,012 | |
General Mills, Inc. | | 20,943 | | 1,206,317 | |
Heinz (H.J.) Co. | | 20,144 | | 906,681 | |
Hershey Food Corp. | | 10,614 | | 528,577 | |
IAC Interactive Corp.* | | 13,625 | | 506,305 | |
Kellogg Co. | | 15,319 | | 766,869 | |
Kimberly Clark Corp. | | 27,977 | | 1,901,037 | |
Kroger Co. | | 43,795 | | 1,010,351 | |
McCormick & Co., Inc. | | 8,011 | | 308,904 | |
Molson Coors Brewing Co. | | 2,774 | | 212,045 | |
Pepsi Bottling Group, Inc. | | 8,356 | | 258,284 | |
PepsiCo, Inc. | | 100,240 | | 6,270,012 | |
Proctor & Gamble Co. | | 193,435 | | 12,432,067 | |
Reynolds American Inc | | 10,417 | | 682,001 | |
Safeway, Inc. | | 27,018 | | 933,742 | |
Sara Lee Corp. | | 45,590 | | 776,398 | |
Supervalu, Inc. | | 12,568 | | 449,306 | |
Sysco Corp. | | 37,733 | | 1,387,065 | |
Tyson Foods, Inc. | | 15,381 | | 253,017 | |
UST, Inc. | | 9,773 | | 568,789 | |
Wal-Mart Stores, Inc. | | 150,117 | | 6,930,902 | |
Walgreen Co. | | 61,256 | | 2,811,038 | |
4
| | Shares | | Value($) | |
COMMON STOCKS: | | | | | |
CONSUMER, NON-CYCLICAL (Cont'd.) | | | | | |
Whole Foods Market, Inc. | | 8,725 | | 409,464 | |
Wrigley (Wm.) Jr. Co. | | 13,400 | | 693,048 | |
| | | | 75,914,193 | |
ENERGY (9.4%) | | | | | |
Anadarko Petroleum | | 28,065 | | 1,221,389 | |
Apache Corp. | | 20,109 | | 1,337,450 | |
Ashland, Inc. | | 3,489 | | 241,369 | |
BJ Services Co. | | 17,895 | | 524,681 | |
Baker Hughes, Inc. | | 19,579 | | 1,461,768 | |
Chesapeake Energy Corp. | | 25,389 | | 737,550 | |
ChevronTexaco Corp. | | 133,076 | | 9,785,078 | |
ConocoPhillips | | 100,465 | | 7,228,457 | |
Consol Energy, Inc. | | 11,142 | | 357,992 | |
Devon Energy Corp. | | 26,982 | | 1,809,953 | |
EOG Resources, Inc. | | 14,863 | | 928,194 | |
El Paso Corp. | | 43,060 | | 657,957 | |
Exxon Mobil Corp. | | 356,042 | | 27,283,498 | |
HESS Corp. | | 16,526 | | 819,194 | |
Halliburton Co. | | 61,381 | | 1,905,880 | |
Kinder Morgan, Inc. | | 6,511 | | 688,538 | |
Marathon Oil Corp. | | 21,458 | | 1,984,865 | |
Murphy Oil Corp. | | 11,419 | | 580,656 | |
Nabors Industries, Ltd.* | | 18,274 | | 544,200 | |
National-Oilwell, Inc.* | | 10,713 | | 655,421 | |
Noble Corporation* | | 8,276 | | 630,217 | |
Occidental Petroleum | | 52,592 | | 2,568,067 | |
Rowan Cos., Inc. | | 6,709 | | 222,739 | |
Schlumberger, Ltd. | | 71,953 | | 4,544,551 | |
Smith International, Inc. | | 12,172 | | 499,904 | |
Sunoco, Inc. | | 7,516 | | 468,698 | |
Transocean, Inc.* | | 17,849 | | 1,443,806 | |
Valero Energy Corp. | | 36,909 | | 1,888,264 | |
Weatherford Int'l., Ltd.* | | 20,737 | | 866,599 | |
Williams Cos., Inc. | | 36,403 | | 950,846 | |
XTO Energy, Inc. | | 22,338 | | 1,051,003 | |
| | | | 75,888,784 | |
FINANCIAL (21.1%) | | | | | |
Ace, Ltd. | | 19,873 | | 1,203,708 | |
Aflac, Inc. | | 30,150 | | 1,386,900 | |
5
| | Shares | | Value($) | |
COMMON STOCKS: | | | | | |
FINANCIAL (Cont'd.) | | | | | |
Allstate Corp. | | 38,149 | | 2,483,881 | |
Ambac Financial Group, Inc. | | 6,437 | | 573,344 | |
American Express Co. | | 73,545 | | 4,461,975 | |
American Int'l. Group, Inc. | | 158,699 | | 11,372,370 | |
Ameriprise Financial, Inc. | | 14,813 | | 807,309 | |
Aon Corp. | | 18,904 | | 668,067 | |
Apartment Investment & Mgmt.Co | | 5,917 | | 331,470 | |
Archstone-Smith Trust | | 13,331 | | 775,998 | |
BB & T Corp. | | 33,021 | | 1,450,613 | |
Bank of America Corp. | | 274,132 | | 14,635,907 | |
Bank of New York Co., Inc. | | 46,650 | | 1,836,611 | |
Bear Stearns Cos., Inc. | | 7,161 | | 1,165,668 | |
Boston Properties | | 7,131 | | 797,816 | |
CB Richard Ellis Group Inc.* | | 11,280 | | 374,496 | |
CIT Group, Inc. | | 12,083 | | 673,869 | |
Capital One Financial Corp. | | 24,905 | | 1,913,202 | |
Charles Schwab Corp. | | 62,440 | | 1,207,590 | |
Chicago Mercantile Exchange | | 2,162 | | 1,102,080 | |
Chubb Corp. | | 25,129 | | 1,329,575 | |
Cincinnati Financial Corp. | | 10,527 | | 476,978 | |
Citigroup, Inc. | | 299,953 | | 16,707,382 | |
Comerica, Inc. | | 9,697 | | 569,020 | |
Commerce Bancorp (N.J.) | | 11,448 | | 403,771 | |
Compass Bancshares, Inc. | | 7,925 | | 472,726 | |
Countrywide Financial Corp. | | 37,913 | | 1,609,407 | |
E*Trade Financial Corp.* | | 26,063 | | 584,332 | |
Equity Office Properties | | 21,456 | | 1,033,536 | |
Equity Residential | | 17,833 | | 905,025 | |
Federated Investors, Inc. | | 5,505 | | 185,959 | |
Fidelity Natl. Info. Svc., Inc | | 9,882 | | 396,169 | |
Fifth Third Bancorp | | 34,067 | | 1,394,362 | |
First Tennessee Natl. Bank | | 7,598 | | 317,444 | |
Franklin Resources, Inc. | | 10,130 | | 1,116,022 | |
Freddie Mac | | 42,304 | | 2,872,442 | |
Genworth Financial, Inc. | | 27,055 | | 925,552 | |
Goldman Sachs Group, Inc. | | 25,995 | | 5,182,103 | |
Hartford Fin, Svc .Gp., Inc. | | 19,347 | | 1,805,269 | |
Huntington Bancshares, Inc. | | 14,506 | | 344,518 | |
J.P. Morgan Chase & Co. | | 211,761 | | 10,228,056 | |
6
| | Shares | | Value($) | |
COMMON STOCKS: | | | | | |
FINANCIAL (Cont'd.) | | | | | |
Janus Capital Group | | 12,098 | | 261,196 | |
KeyCorp. | | 24,508 | | 932,039 | |
Kimco Realty Corp. | | 13,798 | | 620,220 | |
Legg Mason, Inc. | | 8,022 | | 762,491 | |
Lehman Brothers Hlds. | | 32,357 | | 2,527,729 | |
Lincoln National Corp. | | 17,528 | | 1,163,859 | |
Loews Corp. | | 27,894 | | 1,156,764 | |
M & T Bank Corp. | | 4,722 | | 576,840 | |
MBIA, Inc. | | 8,189 | | 598,288 | |
MGIC Investment Corp. | | 5,068 | | 316,953 | |
Marsh & McLennan Cos., Inc. | | 33,643 | | 1,031,494 | |
Marshall & Ilsley Corp. | | 15,573 | | 749,217 | |
Mellon Financial Corp. | | 25,142 | | 1,059,735 | |
Merrill Lynch & Co., Inc. | | 53,962 | | 5,023,862 | |
MetLife, Inc. | | 46,408 | | 2,738,536 | |
Moody's Corp. | | 14,390 | | 993,773 | |
Morgan Stanley | | 64,619 | | 5,261,925 | |
National City Corp. | | 38,554 | | 1,409,534 | |
Northern Trust Corp. | | 11,444 | | 694,536 | |
PNC Financial Services Group | | 17,897 | | 1,325,094 | |
Plum Creek Timber Co. | | 10,807 | | 430,659 | |
Principal Financial Group Inc. | | 16,468 | | 966,672 | |
Progressive Corp. of Ohio | | 46,497 | | 1,126,157 | |
Prologis Trust | | 15,105 | | 917,931 | |
Prudential Financial, Inc. | | 29,118 | | 2,500,071 | |
Public Storage, Inc. | | 7,480 | | 729,300 | |
Realogy Corp.* | | 13,087 | | 396,798 | |
Regions Financial Corp. | | 44,506 | | 1,664,524 | |
SLM Corporation | | 24,918 | | 1,215,251 | |
Safeco Corp. | | 6,425 | | 394,174 | |
Simon Property Group | | 13,509 | | 1,368,327 | |
Sovereign Bancorp, Inc. | | 21,940 | | 557,057 | |
St. Paul Travelers Co., Inc. | | 42,122 | | 2,261,530 | |
State Street Corp. | | 20,271 | | 1,367,076 | |
Suntrust Banks, Inc. | | 21,618 | | 1,825,640 | |
Synovus Financial Corp. | | 19,838 | | 611,606 | |
T. Rowe Price Group, Inc. | | 16,094 | | 704,434 | |
Torchmark Corp. | | 6,012 | | 383,325 | |
Western Union Co. | | 46,788 | | 1,048,987 | |
| | | | | |
7
| | Shares | | Value($) | |
COMMON STOCKS: | | | | | |
FINANCIAL (Cont'd.) | | | | | |
UNUM Provident Corp. | | 20,910 | | 434,510 | |
US Bancorp | | 107,308 | | 3,883,477 | |
Vornado Realty Trust | | 7,882 | | 957,663 | |
Wachovia Corp. | | 116,368 | | 6,627,158 | |
Washington Mutual, Inc. | | 57,701 | | 2,624,819 | |
Wells Fargo & Company | | 206,085 | | 7,328,383 | |
XL Capital Limited | | 11,023 | | 793,876 | |
Zions Bancorporation | | 6,483 | | 534,459 | |
| | | | 170,940,471 | |
HEALTHCARE (11.5%) | | | | | |
Abbott Laboratories | | 93,695 | | 4,563,883 | |
Aetna, Inc. | | 31,865 | | 1,375,931 | |
Allergan, Inc. | | 9,386 | | 1,123,880 | |
Amerisource Bergen Corp. | | 11,726 | | 527,201 | |
Amgen, Inc.* | | 71,210 | | 4,864,355 | |
Applera Corp.-Applied Biosys | | 11,184 | | 410,341 | |
Bard (C.R.), Inc. | | 6,290 | | 521,881 | |
Barr Pharmaceuticals, Inc.* | | 6,459 | | 323,725 | |
Bausch & Lomb, Inc. | | 3,267 | | 170,080 | |
Baxter International, Inc. | | 39,951 | | 1,853,327 | |
Becton Dickinson & Co. | | 15,056 | | 1,056,178 | |
Biogen Idec, Inc.* | | 20,580 | | 1,012,330 | |
Biomet, Inc. | | 14,951 | | 617,028 | |
Boston Scientific Corp.* | | 71,982 | | 1,236,651 | |
Bristol-Myers Squibb Co. | | 120,058 | | 3,159,927 | |
CIGNA Corp. | | 6,222 | | 818,629 | |
Cardinal Health, Inc. | | 24,724 | | 1,592,967 | |
Caremark Rx, Inc. | | 26,033 | | 1,486,745 | |
Celgene Corp.* | | 22,736 | | 1,308,002 | |
Coventry Health Care* | | 9,728 | | 486,886 | |
Express Scripts, Inc.* | | 8,268 | | 591,989 | |
Forest Laboratories, Inc.* | | 19,323 | | 977,744 | |
Genzyme Corp. (Genl. Div)* | | 16,046 | | 988,113 | |
Gilead Sciences, Inc.* | | 28,070 | | 1,822,585 | |
Health Management Associates | | 14,685 | | 310,000 | |
Hospira, Inc.* | | 9,541 | | 320,387 | |
Humana, Inc.* | | 10,147 | | 561,231 | |
IMS Health, Inc. | | 12,114 | | 332,893 | |
Johnson & Johnson | | 176,990 | | 11,684,880 | |
8
| | Shares | | Value($) | |
COMMON STOCKS: | | | | | |
HEALTHCARE (Cont'd.) | | | | | |
King Pharmaceuticals, Inc.* | | 14,841 | | 236,269 | |
Laboratory Corp. of America* | | 7,608 | | 558,960 | |
Lilly (Eli) & Co. | | 60,097 | | 3,131,054 | |
Manor Care, Inc. | | 4,476 | | 210,014 | |
McKesson Corp. | | 18,067 | | 915,997 | |
Medco Health Solutions* | | 17,912 | | 957,217 | |
Medimmune, Inc.* | | 14,602 | | 472,667 | |
Medtronic, Inc. | | 70,270 | | 3,760,148 | |
Merck & Co., Inc. | | 132,528 | | 5,778,221 | |
Millipore Corp.* | | 3,238 | | 215,651 | |
Mylan Laboratories, Inc. | | 12,936 | | 258,203 | |
Patterson Cos., Inc.* | | 8,444 | | 299,846 | |
PerkinElmer, Inc. | | 7,507 | | 166,881 | |
Pfizer, Inc. | | 440,159 | | 11,400,118 | |
Quest Diagnostics, Inc. | | 9,764 | | 517,492 | |
Schering-Plough Corp. | | 90,503 | | 2,139,491 | |
St. Jude Medical, Inc.* | | 21,577 | | 788,855 | |
Stryker Corp. | | 18,144 | | 999,916 | |
Tenet Healthcare Corp.* | | 28,771 | | 200,534 | |
Thermo Fisher Scientific Inc* | | 24,911 | | 1,128,219 | |
UnitedHealth Group, Inc. | | 82,227 | | 4,418,057 | |
Waters Corp.* | | 6,226 | | 304,887 | |
Watson Pharmaceuticals, Inc.* | | 6,212 | | 161,698 | |
WellPoint, Inc.* | | 37,849 | | 2,978,338 | |
Wyeth | | 82,209 | | 4,186,082 | |
Zimmer Holdings, Inc.* | | 14,568 | | 1,141,840 | |
| | | | 93,426,424 | |
INDUSTRIAL (11.8%) | | | | | |
3M Company | | 44,951 | | 3,503,031 | |
Allied Waste Industries* | | 15,500 | | 190,495 | |
American Power Conversion | | 10,302 | | 315,138 | |
American Standard Cos. | | 10,603 | | 486,148 | |
Apollo Group, Inc. Cl A* | | 8,504 | | 331,401 | |
Avery Dennison Corp. | | 5,737 | | 389,714 | |
Block (H. & R.), Inc. | | 19,675 | | 453,312 | |
Boeing Co. | | 48,306 | | 4,291,505 | |
Burlington North Santa Fe | | 21,928 | | 1,618,506 | |
CBS Corp. Cl B | | 47,708 | | 1,487,535 | |
CSX Corp. | | 26,566 | | 914,667 | |
9
| | Shares | | Value($) | |
COMMON STOCKS: | | | | | |
INDUSTRIAL (Cont'd.) | | | | | |
Caterpillar, Inc. | | 39,712 | | 2,435,537 | |
Cintas Corp. | | 8,299 | | 329,553 | |
Cooper Industries, Ltd.* | | 5,563 | | 503,062 | |
Cummins, Inc. | | 3,194 | | 377,467 | |
Danaher Corp. | | 14,468 | | 1,048,062 | |
Deere & Co. | | 14,113 | | 1,341,723 | |
Donnelley R.R. & Sons | | 13,234 | | 470,336 | |
Dover Corp. | | 12,463 | | 610,936 | |
Eaton Corp. | | 9,115 | | 684,901 | |
Emerson Electric Co. | | 48,980 | | 2,158,549 | |
Equifax, Inc. | | 7,638 | | 310,103 | |
FedEx Corp. | | 18,718 | | 2,033,149 | |
Fluor Corp. | | 5,375 | | 438,869 | |
General Dynamics Corp. | | 24,701 | | 1,836,519 | |
General Electric Co. | | 629,254 | | 23,414,541 | |
Goodrich Corporation | | 7,579 | | 345,223 | |
Google, Inc.* | | 13,082 | | 6,023,999 | |
Grainger (W.W.), Inc. | | 4,464 | | 312,212 | |
Honeywell International, Inc. | | 49,844 | | 2,254,943 | |
ITT Industries, Inc. | | 11,275 | | 640,646 | |
Illinois Tool Works, Inc. | | 25,608 | | 1,182,834 | |
Ingersoll Rand Co.* | | 18,717 | | 732,396 | |
L-3 Communications Hldgs., Inc | | 7,627 | | 623,736 | |
Lockheed Martin Corp. | | 21,736 | | 2,001,234 | |
Masco Corp. | | 24,064 | | 718,792 | |
Monster Worldwide, Inc.* | | 7,801 | | 363,839 | |
Norfolk Southern | | 24,228 | | 1,218,426 | |
Northrop Grumman Corp. | | 21,086 | | 1,427,522 | |
PACCAR, Inc. | | 15,150 | | 983,235 | |
Pall Corp. | | 7,473 | | 258,192 | |
Parker Hannifin Corp. | | 7,198 | | 553,382 | |
Pitney Bowes, Inc. | | 13,545 | | 625,644 | |
Raytheon Co. | | 27,142 | | 1,433,098 | |
Robert Half Intl., Inc. | | 10,230 | | 379,738 | |
Rockwell Automation, Inc. | | 10,388 | | 634,499 | |
Rockwell Collins | | 10,207 | | 646,001 | |
Ryder System, Inc. | | 3,707 | | 189,279 | |
Southwest Airlines Co. | | 48,337 | | 740,523 | |
Starwood Hotels & Resort World | | 12,942 | | 808,875 | |
10
| | Shares | | Value($) | |
COMMON STOCKS: | | | | | |
INDUSTRIAL (Cont'd.) | | | | | |
Terex Corp* | | 6,216 | | 401,429 | |
Textron, Inc. | | 7,673 | | 719,497 | |
Tyco International, Ltd. | | 121,409 | | 3,690,834 | |
Union Pacific Corp. | | 16,465 | | 1,515,109 | |
United Parcel Service Cl B | | 65,534 | | 4,913,739 | |
United Technologies Corp. | | 61,268 | | 3,830,475 | |
Verisign, Inc.* | | 14,964 | | 359,884 | |
Viacom Inc. Cl B.* | | 42,686 | | 1,751,407 | |
Waste MGT Inc. | | 32,660 | | 1,200,908 | |
| | | | 95,456,309 | |
TECHNOLOGY (13.3%) | | | | | |
ADC Telecommunications, Inc.* | | 7,124 | | 103,512 | |
Adobe Systems, Inc.* | | 35,610 | | 1,464,283 | |
Advanced Micro Devices, Inc.* | | 33,489 | | 681,501 | |
Affiliated Computer Svcs.* | | 7,206 | | 351,941 | |
Agilent Technologies, Inc.* | | 24,948 | | 869,438 | |
Altera Corp.* | | 22,089 | | 434,712 | |
Analog Devices, Inc. | | 20,877 | | 686,227 | |
Apple Computer, Inc.* | | 51,919 | | 4,404,808 | |
Applied Materials, Inc. | | 84,786 | | 1,564,302 | |
Autodesk, Inc.* | | 14,144 | | 572,266 | |
Automatic Data Processing | | 33,612 | | 1,655,391 | |
Avaya, Inc.* | | 27,770 | | 388,225 | |
BMC Software, Inc.* | | 12,520 | | 403,144 | |
Broadcom Corp. Cl A* | | 28,627 | | 924,938 | |
CA Inc. | | 25,071 | | 567,858 | |
Ciena Corp.* | | 5,131 | | 142,180 | |
Cisco Systems, Inc.* | | 370,707 | | 10,131,422 | |
Citrix Systems, Inc.* | | 11,024 | | 298,199 | |
Cognizant Tech Solutions* | | 8,656 | | 667,897 | |
Computer Sciences Corp.* | | 10,435 | | 556,916 | |
Compuware Corp.* | | 21,502 | | 179,112 | |
Comverse Technology, Inc.* | | 12,331 | | 260,307 | |
Convergys Corp.* | | 8,437 | | 200,632 | |
Corning, Inc.* | | 95,492 | | 1,786,655 | |
Dell, Inc.* | | 138,670 | | 3,479,230 | |
EMC Corp.* | | 134,445 | | 1,774,674 | |
Electronic Arts, Inc.* | | 18,832 | | 948,380 | |
Electronic Data Systems Corp. | | 31,574 | | 869,864 | |
11
| | Shares | | Value($) | |
COMMON STOCKS: | | | | | |
TECHNOLOGY (Cont'd.) | | | | | |
Embarq Corp. | | 9,126 | | 479,663 | |
First Data Corp. | | 46,748 | | 1,193,009 | |
Fiserv, Inc.* | | 10,588 | | 555,023 | |
Hewlett-Packard Co. | | 167,199 | | 6,886,926 | |
IBM Corp. | | 91,955 | | 8,933,427 | |
Intel Corp. | | 351,983 | | 7,127,656 | |
Intuit, Inc.* | | 21,284 | | 649,375 | |
JDS Uniphase Corp.* | | 12,886 | | 214,681 | |
Jabil Circuit, Inc. | | 11,274 | | 276,777 | |
Juniper Networks Inc.* | | 34,536 | | 654,112 | |
KLA Tencor Corp. | | 12,153 | | 604,612 | |
LSI Logic Corp.* | | 24,456 | | 220,104 | |
Lexmark Int'l, Inc.* | | 5,978 | | 437,590 | |
Linear Technology Corp. | | 18,249 | | 553,310 | |
Maxim Integrated Products, Inc | | 19,576 | | 599,417 | |
Micron Technology, Inc.* | | 46,053 | | 642,900 | |
Microsoft Corp. | | 528,085 | | 15,768,615 | |
Molex, Inc. Cl A | | 8,654 | | 273,726 | |
Motorola, Inc. | | 147,573 | | 3,034,101 | |
NCR Corp.* | | 10,878 | | 465,143 | |
NVIDIA Corporation* | | 21,704 | | 803,265 | |
National Semiconductor Corp. | | 17,615 | | 399,861 | |
Network Appliance, Inc.* | | 22,821 | | 896,409 | |
Novell, Inc.* | | 20,695 | | 128,309 | |
Novellus Systems, Inc.* | | 7,545 | | 259,699 | |
Oracle Corp.* | | 244,210 | | 4,185,759 | |
PMC Sierra, Inc.* | | 12,808 | | 85,942 | |
Paychex, Inc. | | 20,669 | | 817,252 | |
QLogic Corp.* | | 9,623 | | 210,936 | |
Qualcomm, Inc. | | 100,879 | | 3,812,217 | |
Sabre Group Holdings, Inc. | | 8,081 | | 257,703 | |
Sandisk Corp.* | | 13,737 | | 591,103 | |
Sanmina Corp.* | | 32,527 | | 112,218 | |
Solectron Corp.* | | 55,829 | | 179,769 | |
Sun Microsystems, Inc.* | | 214,850 | | 1,164,487 | |
Symantec Corp.* | | 57,261 | | 1,193,892 | |
Symbol Technologies, Inc. | | 15,550 | | 232,317 | |
Tektronix, Inc. | | 5,035 | | 146,871 | |
Tellabs, Inc.* | | 26,969 | | 276,702 | |
12
| | Shares | | Value($) | |
COMMON STOCKS: | | | | | |
TECHNOLOGY (Cont'd.) | | | | | |
Teradyne, Inc.* | | 11,585 | | 173,312 | |
Texas Instruments, Inc. | | 90,583 | | 2,608,790 | |
Unisys Corp.* | | 21,035 | | 164,914 | |
Xerox Corp.* | | 58,925 | | 998,779 | |
Xilinx, Inc. | | 20,525 | | 488,700 | |
Yahoo!, Inc.* | | 74,731 | | 1,908,630 | |
| | | | 108,036,017 | |
TELECOMMUNICATIONS (3.2%) | | | | | |
AT&T | | 234,589 | | 8,386,557 | |
Alltel Corp. | | 22,808 | | 1,379,428 | |
BellSouth Corp. | | 111,350 | | 5,245,699 | |
CenturyTel, Inc. | | 7,007 | | 305,926 | |
Citizens Communications Co. | | 19,650 | | 282,371 | |
Qwest Communications Intl.* | | 98,164 | | 821,633 | |
Sprint Nextel Corp. | | 176,718 | | 3,338,203 | |
Verizon Communications | | 178,221 | | 6,636,950 | |
| | | | 26,396,767 | |
UTILITIES (3.4%) | | | | | |
AES Corp.* | | 40,545 | | 893,612 | |
Allegheny Energy, Inc.* | | 10,088 | | 463,140 | |
Ameren Corp. | | 12,591 | | 676,514 | |
American Electric Power, Inc. | | 24,148 | | 1,028,222 | |
CMS Energy Corp.* | | 13,578 | | 226,753 | |
Centerpoint Energy, Inc. | | 19,097 | | 316,628 | |
Consolidated Edison, Inc. | | 15,676 | | 753,545 | |
Constellation Energy Group | | 10,989 | | 756,812 | |
DTE Energy Co. | | 10,864 | | 525,926 | |
Dominion Resources, Inc. | | 21,593 | | 1,810,357 | |
Duke Energy Corp | | 76,655 | | 2,545,713 | |
Dynergy, Inc.* | | 23,108 | | 167,302 | |
Edison International | | 19,889 | | 904,552 | |
Entergy Corp. | | 12,662 | | 1,168,956 | |
Exelon Corp. | | 40,958 | | 2,534,891 | |
FPL Group, Inc. | | 24,677 | | 1,342,922 | |
FirstEnergy Corp. | | 19,486 | | 1,175,006 | |
Keyspan Corporation | | 10,700 | | 440,626 | |
NiSource, Inc. | | 16,665 | | 401,627 | |
Nicor, Inc. | | 2,706 | | 126,641 | |
PG & E Corp. | | 21,293 | | 1,007,798 | |
13
| | Shares | | Value($) | |
COMMON STOCKS: | | | | | |
UTILITIES (Cont'd.) | | | | | |
PPL Corporation | | 23,293 | | 834,821 | |
Peoples Energy Corp. | | 2,338 | | 104,205 | |
Pinnacle West Capital Corp. | | 6,095 | | 308,956 | |
Progress Energy, Inc. | | 15,517 | | 761,574 | |
Public Svc. Enterprise Group | | 15,396 | | 1,021,986 | |
Questar Corp. | | 5,242 | | 435,348 | |
Sempra Energy | | 16,004 | | 896,864 | |
Southern Co. | | 45,340 | | 1,671,232 | |
TXU Corp. | | 28,037 | | 1,519,886 | |
Teco Energy, Inc. | | 12,771 | | 220,044 | |
Xcel Energy, Inc. | | 24,838 | | 572,764 | |
| | | | 27,615,223 | |
| | | | | |
TOTAL COMMON STOCKS (Cost: $601,148,252) 95.7% | | | | 776,827,036 | |
*Non-income producing security.
14
| | Rate(%) | | Maturity | | Face Amount($) | | Value($) | |
SHORT-TERM DEBT SECURITIES: | | | | | | | | | |
U.S. GOVERNMENT (0.4%) | | | | | | | | | |
U.S. Treasury Bill (a) | | 4.89 | | 01/11/07 | | 1,500,000 | | 1,497,528 | |
U.S. Treasury Bill (a) | | 4.79 | | 03/08/07 | | 1,400,000 | | 1,386,929 | |
| | | | | | | | 2,884,457 | |
U.S. GOVERNMENT AGENCIES (1.4%) | | | | | | | | | |
Federal Home Loan Bank | | 4.80 | | 01/02/07 | | 8,742,000 | | 8,738,503 | |
Federal National Mortgage Assoc. | | 5.20 | | 01/24/07 | | 2,668,000 | | 2,658,363 | |
| | | | | | | | 11,396,866 | |
COMMERCIAL PAPER (2.4%) | | | | | | | | | |
Novartis Finance | | 5.28 | | 01/02/07 | | 19,330,000 | | 19,321,494 | |
| | | | | | | | | |
TOTAL SHORT-TERM DEBT SECURITIES (Cost: $33,603,190) 4.2% | | | | | | | | 33,602,817 | |
| | | | | | | | | |
TOTAL INVESTMENTS (Cost: $634,751,442) 99.9% | | | | | | | | 810,429,853 | |
| | | | | | | | | |
OTHER NET ASSETS 0.1% | | | | | | | | 1,067,479 | |
| | | | | | | | | |
NET ASSETS 100.0% | | | | | | | | $ | 811,497,332 | |
| | | | | | | | | | |
(a) This security, or a portion thereof, has been segregated to cover initial margin requirements on open futures contracts.
FUTURES CONTRACTS OUTSTANDING AS OF DECEMBER 31, 2006:
| | Expiration | | Underlying Face | | Unrealized | |
| | Date | | Amount at Value | | Gain(Loss) | |
| | | | | | | |
Purchased | | | | | | | |
| | | | | | | |
91 S&P 500 Stock Index Futures Contracts | | March 2007 | | $ | 32,496,100 | | $ | 34,313 | |
| | | | | | | | | |
Face Value of futures purchased and outstanding as percentage of total investments in securities: 4.0 %
15
MUTUAL OF AMERICA INVESTMENT CORPORATION (ALL AMERICA FUND )
PORTFOLIO OF INVESTMENTS IN SECURITIES
December 31, 2006
| | Shares | | Value($) | |
INDEXED ASSETS: | | | | | |
COMMON STOCKS: | | | | | |
BASIC MATERIALS (1.8%) | | | | | |
Air Products & Chemicals, Inc. | | 4,280 | | $ | 300,798 | |
Alcoa, Inc. | | 16,854 | | 505,789 | |
Allegheny Technologies, Inc. | | 1,959 | | 177,642 | |
Ball Corp. | | 2,024 | | 88,246 | |
Bemis Co. | | 2,036 | | 69,183 | |
Dow Chemical Co. | | 18,563 | | 741,406 | |
Du Pont EI de Nemours | | 17,874 | | 870,643 | |
Eastman Chemical Co. | | 1,599 | | 94,837 | |
Ecolab, Inc. | | 3,466 | | 156,663 | |
Freeport-McMoran Copper Cl B | | 3,827 | | 213,279 | |
Hercules, Inc.* | | 2,208 | | 42,636 | |
International Paper Co. | | 8,845 | | 301,614 | |
Intl. Flavors & Fragrances | | 1,517 | | 74,576 | |
MeadWestvaco Corp. | | 3,520 | | 105,811 | |
Monsanto Co. | | 10,562 | | 554,822 | |
Newmont Mining Corp. Hldg. Co. | | 8,751 | | 395,108 | |
Nucor Corp. | | 5,873 | | 321,018 | |
PPG Industries, Inc. | | 3,210 | | 206,114 | |
Pactiv Corp.* | | 2,585 | | 92,259 | |
Peabody Energy Corp. | | 5,128 | | 207,222 | |
Phelps Dodge Corp. | | 3,963 | | 474,450 | |
Praxair, Inc. | | 6,272 | | 372,118 | |
Rohm & Haas Co. | | 2,858 | | 146,101 | |
Sealed Air Corp. | | 1,566 | | 101,665 | |
Sigma-Aldrich Corp. | | 1,282 | | 99,637 | |
Temple-Inland, Inc. | | 2,079 | | 95,696 | |
United States Steel Group | | 2,302 | | 168,368 | |
Vulcan Materials Co. | | 1,834 | | 164,822 | |
Weyerhaeuser Co. | | 4,594 | | 324,566 | |
| | | | 7,467,089 | |
CONSUMER, CYCLICAL (6.0%) | | | | | |
Amazon.com, Inc.* | | 6,001 | | 236,799 | |
AutoZone, Inc.* | | 983 | | 113,595 | |
Autonation, Inc.* | | 2,905 | | 61,935 | |
Bed Bath & Beyond, Inc.* | | 5,493 | | 209,283 | |
Best Buy Co., Inc. | | 7,852 | | 386,240 | |
Big Lots, Inc.* | | 2,128 | | 48,774 | |
Black & Decker Corp. | | 1,320 | | 105,560 | |
| | | | | |
| | | | | | |
16
| | Shares | | Value($) | |
INDEXED ASSETS: | | | | | |
COMMON STOCKS: | | | | | |
CONSUMER, CYCLICAL (Cont'd.) | | | | | |
Brunswick Corp. | | 1,786 | | 56,973 | |
Carnival Corp. | | 8,643 | | 423,939 | |
Centex Corp. | | 2,307 | | 129,815 | |
Circuit City Group, Inc. | | 2,753 | | 52,252 | |
Clear Channel Communications | | 9,597 | | 341,077 | |
Coach, Inc.* | | 7,138 | | 306,648 | |
Comcast Corp. Cl A* | | 40,435 | | 1,711,614 | |
D.R. Horton, Inc. | | 5,364 | | 142,092 | |
Darden Restaurants, Inc. | | 2,857 | | 114,766 | |
Dillard's, Inc. Cl A | | 1,183 | | 41,370 | |
DIRECTV Group Inc* | | 14,985 | | 373,726 | |
Disney (Walt) Co. | | 40,191 | | 1,377,346 | |
Dollar General Corp. | | 6,069 | | 97,468 | |
Dow Jones & Co. | | 1,264 | | 48,032 | |
EW Scripps Co. Cl A | | 1,619 | | 80,853 | |
Eastman Kodak Co. | | 5,582 | | 144,016 | |
Family Dollar Stores, Inc. | | 2,953 | | 86,611 | |
Federated Dept Stores | | 10,201 | | 388,964 | |
Ford Motor Co. | | 36,743 | | 275,940 | |
Fortune Brands, Inc. | | 2,942 | | 251,217 | |
Gannett Co., Inc. | | 4,551 | | 275,153 | |
Gap, Inc. | | 10,245 | | 199,778 | |
General Motors Corp. | | 10,987 | | 337,521 | |
Genuine Parts Co. | | 3,311 | | 157,041 | |
Goodyear Tire & Rubber Co.* | | 3,451 | | 72,436 | |
Harley-Davidson, Inc. | | 5,035 | | 354,816 | |
Harman Intl. Inds | | 1,269 | | 126,786 | |
Harrah's Entertainment, Inc. | | 3,613 | | 298,867 | |
Hasbro, Inc. | | 3,088 | | 84,148 | |
Hilton Hotels Corp. | | 7,510 | | 262,099 | |
Home Depot, Inc. | | 39,634 | | 1,591,701 | |
International Game Technology | | 6,595 | | 304,689 | |
Interpublic Grp. of Cos., Inc. | | 8,577 | | 104,982 | |
Johnson Controls, Inc. | | 3,806 | | 327,012 | |
Jones Apparel Group, Inc. | | 2,141 | | 71,574 | |
KB Home | | 1,524 | | 78,151 | |
Kohl's Corp.* | | 6,362 | | 435,352 | |
Leggett & Platt | | 3,478 | | 83,124 | |
| | | | | |
17
| | Shares | | Value($) | |
INDEXED ASSETS: | | | | | |
COMMON STOCKS: | | | | | |
CONSUMER, CYCLICAL (Cont'd.) | | | | | |
Lennar Corp. | | 2,679 | | 140,540 | |
Limited Brands, Inc. | | 6,643 | | 192,248 | |
Liz Claiborne, Inc. | | 1,991 | | 86,529 | |
Lowe's Companies, Inc. | | 29,599 | | 922,009 | |
Marriott International, Inc. | | 6,529 | | 311,564 | |
Mattel, Inc. | | 7,408 | | 167,865 | |
McDonald's Corp. | | 24,035 | | 1,065,472 | |
McGraw-Hill Cos., Inc. | | 6,880 | | 467,978 | |
Meredith Corp. | | 752 | | 42,375 | |
NIKE, Inc. Cl B | | 3,654 | | 361,856 | |
New York Times Co. Cl A | | 2,793 | | 68,037 | |
Newell Rubbermaid, Inc. | | 5,390 | | 156,041 | |
News Corp, Inc. | | 45,468 | | 976,653 | |
Nordstrom, Inc. | | 4,444 | | 219,267 | |
Office Depot, Inc.* | | 5,408 | | 206,423 | |
OfficeMax, Inc. | | 1,447 | | 71,844 | |
Omnicom Group, Inc. | | 3,319 | | 346,968 | |
Penney (J.C.) Co., Inc. | | 4,376 | | 338,527 | |
Pulte Homes, Inc. | | 4,104 | | 135,924 | |
RadioShack Corp. | | 2,641 | | 44,316 | |
Sears Holding Corp.* | | 1,615 | | 271,207 | |
Sherwin-Williams Co. | | 2,173 | | 138,159 | |
Snap-On, Inc. | | 1,133 | | 53,976 | |
Stanley Works | | 1,580 | | 79,458 | |
Staples, Inc. | | 14,058 | | 375,349 | |
Starbucks Corp.* | | 14,690 | | 520,320 | |
TJX Companies, Inc. | | 8,840 | | 252,117 | |
Target Corp. | | 16,683 | | 951,765 | |
Tiffany & Co. | | 2,630 | | 103,201 | |
Time Warner, Inc. | | 77,587 | | 1,689,845 | |
Tribune Co. | | 3,708 | | 114,132 | |
Univision Communications, Inc. | | 4,901 | | 173,593 | |
V F Corp. | | 1,738 | | 142,655 | |
Wendy's International, Inc. | | 1,857 | | 61,448 | |
Whirlpool Corp. | | 1,523 | | 126,439 | |
Windstream Corp. | | 9,274 | | 131,876 | |
Wyndham Worldwide Corp* | | 3,847 | | 123,181 | |
Yum! Brands, Inc. | | 5,154 | | 303,055 | |
| | | | | |
18
| | Shares | | Value($) | |
INDEXED ASSETS: | | | | | |
COMMON STOCKS: | | | | | |
CONSUMER, CYCLICAL (Cont'd.) | | | | | |
eBay, Inc.* | | 22,483 | | 676,064 | |
| | | | 25,382,411 | |
CONSUMER, NON-CYCLICAL (5.7%) | | | | | |
Altria Group, Inc. | | 40,717 | | 3,494,333 | |
Anheuser-Busch Cos., Inc. | | 14,949 | | 735,491 | |
Archer-Daniels-Midland Co. | | 12,775 | | 408,289 | |
Avon Products, Inc. | | 8,645 | | 285,631 | |
Brown-Forman Corp. Cl B | | 1,530 | | 101,347 | |
CVS Corp. | | 16,003 | | 494,653 | |
Campbell Soup Co. | | 4,232 | | 164,582 | |
Clorox Co. | | 2,950 | | 189,243 | |
Coca-Cola Co. | | 39,626 | | 1,911,955 | |
Coca-Cola Enterprises | | 5,386 | | 109,982 | |
Colgate-Palmolive Co. | | 9,993 | | 651,943 | |
ConAgra Foods, Inc. | | 9,897 | | 267,219 | |
Constellation Brands, Inc.Cl A | | 4,088 | | 118,634 | |
Costco Wholesale Corp. | | 8,901 | | 470,596 | |
Dean Foods Co.* | | 2,599 | | 109,886 | |
Estee Lauder Co. Cl A | | 2,474 | | 100,989 | |
FNMA | | 18,937 | | 1,124,668 | |
General Mills, Inc. | | 6,665 | | 383,904 | |
Heinz (H.J.) Co. | | 6,400 | | 288,064 | |
Hershey Food Corp. | | 3,381 | | 168,374 | |
IAC Interactive Corp.* | | 4,336 | | 161,126 | |
Kellogg Co. | | 4,877 | | 244,143 | |
Kimberly Clark Corp. | | 8,905 | | 605,095 | |
Kroger Co. | | 13,936 | | 321,504 | |
McCormick & Co., Inc. | | 2,555 | | 98,521 | |
Molson Coors Brewing Co. | | 888 | | 67,879 | |
Pepsi Bottling Group, Inc. | | 2,659 | | 82,190 | |
PepsiCo, Inc. | | 31,892 | | 1,994,845 | |
Proctor & Gamble Co. | | 61,553 | | 3,956,011 | |
Reynolds American Inc | | 3,331 | | 218,081 | |
Safeway, Inc. | | 8,611 | | 297,596 | |
Sara Lee Corp. | | 14,507 | | 247,054 | |
Supervalu, Inc. | | 4,001 | | 143,036 | |
Sysco Corp. | | 12,013 | | 441,598 | |
Tyson Foods, Inc. | | 4,897 | | 80,556 | |
| | | | | |
19
| | Shares | | Value($) | |
INDEXED ASSETS: | | | | | |
COMMON STOCKS: | | | | | |
CONSUMER, NON-CYCLICAL (Cont'd.) | | | | | |
UST, Inc. | | 3,126 | | 181,933 | |
Wal-Mart Stores, Inc. | | 47,779 | | 2,205,956 | |
Walgreen Co. | | 19,505 | | 895,084 | |
Whole Foods Market, Inc. | | 2,778 | | 130,372 | |
Wrigley (Wm.) Jr. Co. | | 4,264 | | 220,534 | |
| | | | 24,172,897 | |
ENERGY (5.7%) | | | | | |
Anadarko Petroleum | | 8,936 | | 388,895 | |
Apache Corp. | | 6,409 | | 426,263 | |
Ashland, Inc. | | 1,133 | | 78,381 | |
BJ Services Co. | | 5,696 | | 167,007 | |
Baker Hughes, Inc. | | 6,233 | | 465,356 | |
Chesapeake Energy Corp. | | 8,081 | | 234,753 | |
ChevronTexaco Corp. | | 42,352 | | 3,114,143 | |
ConocoPhillips | | 31,969 | | 2,300,170 | |
Consol Energy, Inc. | | 3,544 | | 113,869 | |
Devon Energy Corp. | | 8,599 | | 576,821 | |
EOG Resources, Inc. | | 4,732 | | 295,513 | |
El Paso Corp. | | 13,720 | | 209,642 | |
Exxon Mobil Corp. | | 113,296 | | 8,681,872 | |
HESS Corp. | | 5,258 | | 260,639 | |
Halliburton Co. | | 19,532 | | 606,469 | |
Kinder Morgan, Inc. | | 2,084 | | 220,383 | |
Marathon Oil Corp. | | 6,829 | | 631,683 | |
Murphy Oil Corp. | | 3,634 | | 184,789 | |
Nabors Industries, Ltd.* | | 5,814 | | 173,141 | |
National-Oilwell, Inc.* | | 3,408 | | 208,501 | |
Noble Corporation* | | 2,634 | | 200,579 | |
Occidental Petroleum | | 16,756 | | 818,195 | |
Rowan Cos., Inc. | | 2,145 | | 71,214 | |
Schlumberger, Ltd. | | 22,886 | | 1,445,480 | |
Smith International, Inc. | | 3,873 | | 159,064 | |
Sunoco, Inc. | | 2,391 | | 149,103 | |
Transocean, Inc.* | | 5,680 | | 459,455 | |
Valero Energy Corp. | | 11,744 | | 600,823 | |
Weatherford Int'l., Ltd.* | | 6,601 | | 275,856 | |
| | | | | |
| | | | | |
| | | | | |
20
| | Shares | | Value($) | |
INDEXED ASSETS: | | | | | |
COMMON STOCKS: | | | | | |
ENERGY (Cont'd.) | | | | | |
Williams Cos., Inc. | | 11,592 | | 302,783 | |
XTO Energy, Inc. | | 7,111 | | 334,573 | |
| | | | 24,155,415 | |
FINANCIAL (12.8%) | | | | | |
Ace, Ltd. | | 6,326 | | 383,166 | |
Aflac, Inc. | | 9,605 | | 441,830 | |
Allstate Corp. | | 12,146 | | 790,826 | |
Ambac Financial Group, Inc. | | 2,084 | | 185,622 | |
American Express Co. | | 23,410 | | 1,420,285 | |
American Int'l. Group, Inc. | | 50,499 | | 3,618,758 | |
Ameriprise Financial, Inc. | | 4,700 | | 256,150 | |
Aon Corp. | | 6,017 | | 212,641 | |
Apartment Investment & Mgmt. Co. | | 1,875 | | 105,038 | |
Archstone-Smith Trust | | 4,236 | | 246,578 | |
BB & T Corp. | | 10,507 | | 461,573 | |
Bank of America Corp. | | 87,231 | | 4,657,263 | |
Bank of New York Co., Inc. | | 14,844 | | 584,408 | |
Bear Stearns Cos., Inc. | | 2,280 | | 371,138 | |
Boston Properties | | 2,271 | | 254,079 | |
CB Richard Ellis Group Inc.* | | 3,593 | | 119,288 | |
CIT Group, Inc. | | 3,854 | | 214,938 | |
Capital One Financial Corp. | | 7,928 | | 609,029 | |
Charles Schwab Corp. | | 19,869 | | 384,266 | |
Chicago Mercantile Exchange | | 676 | | 344,591 | |
Chubb Corp. | | 7,999 | | 423,227 | |
Cincinnati Financial Corp. | | 3,367 | | 152,559 | |
Citigroup, Inc. | | 95,465 | | 5,317,401 | |
Comerica, Inc. | | 3,086 | | 181,086 | |
Commerce Bancorp (N.J.) | | 3,643 | | 128,489 | |
Compass Bancshares, Inc. | | 2,524 | | 150,557 | |
Countrywide Financial Corp. | | 12,055 | | 511,735 | |
E*Trade Financial Corp.* | | 8,297 | | 186,019 | |
Equity Office Properties | | 6,827 | | 328,857 | |
Equity Residential | | 5,673 | | 287,905 | |
Federated Investors, Inc. | | 1,756 | | 59,318 | |
Fidelity Natl. Info. Svc., Inc | | 3,145 | | 126,083 | |
Fifth Third Bancorp | | 10,840 | | 443,681 | |
First Tennessee Natl. Bank | | 2,418 | | 101,024 | |
| | | | | |
21
| | Shares | | Value($) | |
INDEXED ASSETS: | | | | | |
COMMON STOCKS: | | | | | |
FINANCIAL (Cont'd.) | | | | | |
Franklin Resources, Inc. | | 3,240 | | 356,951 | |
Freddie Mac | | 13,461 | | 914,002 | |
Genworth Financial, Inc. | | 8,609 | | 294,514 | |
Goldman Sachs Group, Inc. | | 8,272 | | 1,649,023 | |
Hartford Fin, Svc .Gp., Inc. | | 6,161 | | 574,883 | |
Huntington Bancshares, Inc. | | 4,619 | | 109,701 | |
J.P. Morgan Chase & Co. | | 67,384 | | 3,254,647 | |
Janus Capital Group | | 3,851 | | 83,143 | |
KeyCorp. | | 7,804 | | 296,786 | |
Kimco Realty Corp. | | 4,390 | | 197,331 | |
Legg Mason, Inc. | | 2,554 | | 242,758 | |
Lehman Brothers Hlds. | | 10,300 | | 804,636 | |
Lincoln National Corp. | | 5,578 | | 370,379 | |
Loews Corp. | | 8,880 | | 368,254 | |
M & T Bank Corp. | | 1,504 | | 183,729 | |
MBIA, Inc. | | 2,618 | | 191,271 | |
MGIC Investment Corp. | | 1,612 | | 100,814 | |
Marsh & McLennan Cos., Inc. | | 10,712 | | 328,430 | |
Marshall & Ilsley Corp. | | 4,958 | | 238,529 | |
Mellon Financial Corp. | | 8,002 | | 337,284 | |
Merrill Lynch & Co., Inc. | | 17,176 | | 1,599,086 | |
MetLife, Inc. | | 14,772 | | 871,696 | |
Moody's Corp. | | 4,567 | | 315,397 | |
Morgan Stanley | | 20,557 | | 1,673,957 | |
National City Corp. | | 12,275 | | 448,774 | |
Northern Trust Corp. | | 3,642 | | 221,033 | |
PNC Financial Services Group | | 5,707 | | 422,546 | |
Plum Creek Timber Co. | | 3,438 | | 137,004 | |
Principal Financial Group Inc. | | 5,244 | | 307,823 | |
Progressive Corp. of Ohio | | 14,808 | | 358,650 | |
Prologis Trust | | 4,815 | | 292,608 | |
Prudential Financial, Inc. | | 9,263 | | 795,321 | |
Public Storage, Inc. | | 2,383 | | 232,343 | |
Realogy Corp.* | | 4,164 | | 126,252 | |
Regions Financial Corp. | | 14,170 | | 529,958 | |
SLM Corporation | | 7,948 | | 387,624 | |
Safeco Corp. | | 2,136 | | 131,044 | |
Simon Property Group | | 4,299 | | 435,446 | |
| | | | | |
22
| | Shares | | Value($) | |
INDEXED ASSETS: | | | | | |
COMMON STOCKS: | | | | | |
FINANCIAL (Cont'd.) | | | | | |
Sovereign Bancorp, Inc. | | 6,981 | | 177,248 | |
St. Paul Travelers Co., Inc. | | 13,413 | | 720,144 | |
State Street Corp. | | 6,456 | | 435,393 | |
Suntrust Banks, Inc. | | 6,882 | | 581,185 | |
Synovus Financial Corp. | | 6,314 | | 194,661 | |
T. Rowe Price Group, Inc. | | 5,121 | | 224,146 | |
Torchmark Corp. | | 1,905 | | 121,463 | |
UNUM Provident Corp. | | 6,663 | | 138,457 | |
US Bancorp | | 34,156 | | 1,236,106 | |
Vornado Realty Trust | | 2,509 | | 304,844 | |
Wachovia Corp. | | 37,030 | | 2,108,859 | |
Washington Mutual, Inc. | | 18,364 | | 835,378 | |
Wells Fargo & Company | | 65,596 | | 2,332,594 | |
Western Union Co. | | 14,888 | | 333,789 | |
XL Capital Limited | | 3,511 | | 252,862 | |
Zions Bancorporation | | 2,078 | | 171,310 | |
| | | | 54,411,474 | |
HEALTHCARE (7.0%) | | | | | |
Abbott Laboratories | | 29,814 | | 1,452,240 | |
Aetna, Inc. | | 10,142 | | 437,932 | |
Allergan, Inc. | | 2,987 | | 357,663 | |
Amerisource Bergen Corp. | | 3,733 | | 167,836 | |
Amgen, Inc.* | | 22,666 | | 1,548,314 | |
Applera Corp.-Applied Biosys | | 3,558 | | 130,543 | |
Bard (C.R.), Inc. | | 2,002 | | 166,106 | |
Barr Pharmaceuticals, Inc.* | | 2,066 | | 103,548 | |
Bausch & Lomb, Inc. | | 1,045 | | 54,403 | |
Baxter International, Inc. | | 12,718 | | 589,988 | |
Becton Dickinson & Co. | | 4,790 | | 336,019 | |
Biogen Idec, Inc.* | | 6,552 | | 322,293 | |
Biomet, Inc. | | 4,757 | | 196,321 | |
Boston Scientific Corp.* | | 22,934 | | 394,006 | |
Bristol-Myers Squibb Co. | | 38,248 | | 1,006,687 | |
CIGNA Corp. | | 1,993 | | 262,219 | |
Cardinal Health, Inc. | | 7,868 | | 506,935 | |
Caremark Rx, Inc. | | 8,285 | | 473,156 | |
Celgene Corp.* | | 7,237 | | 416,345 | |
Coventry Health Care* | | 3,097 | | 155,005 | |
| | | | | |
23
| | Shares | | Value($) | |
INDEXED ASSETS: | | | | | |
COMMON STOCKS: | | | | | |
HEALTHCARE (Cont'd.) | | | | | |
Express Scripts, Inc.* | | 2,630 | | 188,308 | |
Forest Laboratories, Inc.* | | 6,154 | | 311,392 | |
Genzyme Corp. (Genl. Div)* | | 5,108 | | 314,551 | |
Gilead Sciences, Inc.* | | 8,936 | | 580,214 | |
Health Management Associates | | 4,672 | | 98,626 | |
Hospira, Inc.* | | 3,029 | | 101,714 | |
Humana, Inc.* | | 3,230 | | 178,651 | |
IMS Health, Inc. | | 3,860 | | 106,073 | |
Johnson & Johnson | | 56,337 | | 3,719,369 | |
King Pharmaceuticals, Inc.* | | 4,722 | | 75,174 | |
Laboratory Corp. of America* | | 2,436 | | 178,973 | |
Lilly (Eli) & Co. | | 19,127 | | 996,517 | |
Manor Care, Inc. | | 1,438 | | 67,471 | |
McKesson Corp. | | 5,750 | | 291,525 | |
Medco Health Solutions* | | 5,700 | | 304,608 | |
Medimmune, Inc.* | | 4,646 | | 150,391 | |
Medtronic, Inc. | | 22,365 | | 1,196,751 | |
Merck & Co., Inc. | | 42,181 | | 1,839,092 | |
Millipore Corp.* | | 1,038 | | 69,131 | |
Mylan Laboratories, Inc. | | 4,118 | | 82,195 | |
Patterson Cos., Inc.* | | 2,699 | | 95,841 | |
PerkinElmer, Inc. | | 2,391 | | 53,152 | |
Pfizer, Inc. | | 140,063 | | 3,627,632 | |
Quest Diagnostics, Inc. | | 3,108 | | 164,724 | |
Schering-Plough Corp. | | 28,811 | | 681,092 | |
St. Jude Medical, Inc.* | | 6,871 | | 251,204 | |
Stryker Corp. | | 5,770 | | 317,985 | |
Tenet Healthcare Corp.* | | 9,155 | | 63,810 | |
Thermo Fisher Scientific Inc* | | 7,928 | | 359,059 | |
UnitedHealth Group, Inc. | | 26,175 | | 1,406,383 | |
Waters Corp.* | | 1,971 | | 96,520 | |
Watson Pharmaceuticals, Inc.* | | 1,993 | | 51,878 | |
WellPoint, Inc.* | | 12,048 | | 948,057 | |
Wyeth | | 26,164 | | 1,332,271 | |
Zimmer Holdings, Inc.* | | 4,642 | | 363,840 | |
| | | | 29,741,733 | |
| | | | | |
| | | | | |
| | | | | |
24
| | Shares | | Value($) | |
INDEXED ASSETS: | | | | | |
COMMON STOCKS: | | | | | |
INDUSTRIAL (7.2%) | | | | | |
3M Company | | 14,303 | | 1,114,633 | |
Allied Waste Industries* | | 4,932 | | 60,614 | |
American Power Conversion | | 3,283 | | 100,427 | |
American Standard Cos. | | 3,369 | | 154,469 | |
Apollo Group, Inc. Cl A* | | 2,720 | | 105,998 | |
Avery Dennison Corp. | | 1,834 | | 124,584 | |
Block (H. & R.), Inc. | | 6,268 | | 144,415 | |
Boeing Co. | | 15,360 | | 1,364,582 | |
Burlington North Santa Fe | | 6,981 | | 515,268 | |
CBS Corp. Cl B | | 15,190 | | 473,624 | |
CSX Corp. | | 8,455 | | 291,106 | |
Caterpillar, Inc. | | 12,636 | | 774,966 | |
Cintas Corp. | | 2,651 | | 105,271 | |
Cooper Industries, Ltd.* | | 1,766 | | 159,699 | |
Cummins, Inc. | | 1,020 | | 120,544 | |
Danaher Corp. | | 4,606 | | 333,659 | |
Deere & Co. | | 4,491 | | 426,959 | |
Donnelley R.R. & Sons | | 4,212 | | 149,694 | |
Dover Corp. | | 3,964 | | 194,315 | |
Eaton Corp. | | 2,896 | | 217,605 | |
Emerson Electric Co. | | 15,586 | | 686,875 | |
Equifax, Inc. | | 2,435 | | 98,861 | |
FedEx Corp. | | 5,958 | | 647,158 | |
Fluor Corp. | | 1,713 | | 139,866 | |
General Dynamics Corp. | | 7,863 | | 584,614 | |
General Electric Co. | | 200,236 | | 7,450,782 | |
Goodrich Corporation | | 2,424 | | 110,413 | |
Google, Inc.* | | 4,162 | | 1,916,518 | |
Grainger (W.W.), Inc. | | 1,421 | | 99,385 | |
Honeywell International, Inc. | | 15,860 | | 717,506 | |
ITT Industries, Inc. | | 3,590 | | 203,984 | |
Illinois Tool Works, Inc. | | 8,152 | | 376,541 | |
Ingersoll Rand Co.* | | 5,960 | | 233,215 | |
L-3 Communications Hldgs., Inc | | 2,429 | | 198,644 | |
Lockheed Martin Corp. | | 6,916 | | 636,756 | |
Masco Corp. | | 7,657 | | 228,715 | |
Monster Worldwide, Inc.* | | 2,495 | | 116,367 | |
Norfolk Southern | | 7,717 | | 388,088 | |
| | | | | |
25
| | Shares | | Value($) | |
INDEXED ASSETS: | | | | | |
COMMON STOCKS: | | | | | |
INDUSTRIAL (Cont'd.) | | | | | |
Northrop Grumman Corp. | | 6,713 | | 454,470 | |
PACCAR, Inc. | | 4,825 | | 313,143 | |
Pall Corp. | | 2,380 | | 82,229 | |
Parker Hannifin Corp. | | 2,291 | | 176,132 | |
Pitney Bowes, Inc. | | 4,314 | | 199,264 | |
Raytheon Co. | | 8,638 | | 456,086 | |
Robert Half Intl., Inc. | | 3,258 | | 120,937 | |
Rockwell Automation, Inc. | | 3,306 | | 201,930 | |
Rockwell Collins | | 3,250 | | 205,693 | |
Ryder System, Inc. | | 1,179 | | 60,200 | |
Southwest Airlines Co. | | 15,391 | | 235,790 | |
Starwood Hotels & Resort World | | 4,120 | | 257,500 | |
Terex Corp* | | 1,978 | | 127,739 | |
Textron, Inc. | | 2,437 | | 228,517 | |
Tyco International, Ltd. | | 38,659 | | 1,175,234 | |
Union Pacific Corp. | | 5,242 | | 482,369 | |
United Parcel Service Cl B | | 20,870 | | 1,564,833 | |
United Technologies Corp. | | 19,502 | | 1,219,265 | |
Verisign, Inc.* | | 4,761 | | 114,502 | |
Viacom Inc. - Class B.* | | 13,590 | | 557,598 | |
Waste MGT Inc. | | 10,398 | | 382,334 | |
| | | | 30,382,485 | |
TECHNOLOGY (8.1%) | | | | | |
ADC Telecommunications, Inc.* | | 2,278 | | 33,099 | |
Adobe Systems, Inc.* | | 11,328 | | 465,807 | |
Advanced Micro Devices, Inc.* | | 10,666 | | 217,053 | |
Affiliated Computer Svcs.* | | 2,307 | | 112,674 | |
Agilent Technologies, Inc.* | | 7,938 | | 276,639 | |
Altera Corp.* | | 7,029 | | 138,331 | |
Analog Devices, Inc. | | 6,643 | | 218,355 | |
Apple Computer, Inc.* | | 16,507 | | 1,400,454 | |
Applied Materials, Inc. | | 26,994 | | 498,039 | |
Autodesk, Inc.* | | 4,500 | | 182,070 | |
Automatic Data Processing | | 10,702 | | 527,074 | |
Avaya, Inc.* | | 8,854 | | 123,779 | |
BMC Software, Inc.* | | 3,986 | | 128,349 | |
Broadcom Corp. Cl A* | | 9,101 | | 294,053 | |
CA Inc. | | 7,992 | | 181,019 | |
| | | | | |
26
| | Shares | | Value($) | |
INDEXED ASSETS: | | | | | |
COMMON STOCKS: | | | | | |
TECHNOLOGY (Cont'd.) | | | | | |
Ciena Corp.* | | 1,642 | | 45,500 | |
Cisco Systems, Inc.* | | 118,006 | | 3,225,104 | |
Citrix Systems, Inc.* | | 3,515 | | 95,081 | |
Cognizant Tech Solutions* | �� | 2,756 | | 212,653 | |
Computer Sciences Corp.* | | 3,335 | | 177,989 | |
Compuware Corp.* | | 6,842 | | 56,994 | |
Comverse Technology, Inc.* | | 3,925 | | 82,857 | |
Convergys Corp.* | | 2,679 | | 63,707 | |
Corning, Inc.* | | 30,418 | | 569,121 | |
Dell, Inc.* | | 44,109 | | 1,106,695 | |
EMC Corp.* | | 42,781 | | 564,709 | |
Electronic Arts, Inc.* | | 5,993 | | 301,807 | |
Electronic Data Systems Corp. | | 10,061 | | 277,181 | |
Embarq Corp. | | 2,908 | | 152,844 | |
First Data Corp. | | 14,881 | | 379,763 | |
Fiserv, Inc.* | | 3,366 | | 176,446 | |
Hewlett-Packard Co. | | 53,204 | | 2,191,473 | |
IBM Corp. | | 29,251 | | 2,841,735 | |
Intel Corp. | | 112,059 | | 2,269,195 | |
Intuit, Inc.* | | 6,779 | | 206,827 | |
JDS Uniphase Corp.* | | 4,100 | | 68,306 | |
Jabil Circuit, Inc. | | 3,587 | | 88,061 | |
Juniper Networks Inc.* | | 10,995 | | 208,245 | |
KLA Tencor Corp. | | 3,869 | | 192,483 | |
LSI Logic Corp.* | | 7,790 | | 70,110 | |
Lexmark Int'l, Inc.* | | 1,902 | | 139,226 | |
Linear Technology Corp. | | 5,812 | | 176,220 | |
Maxim Integrated Products, Inc | | 6,229 | | 190,732 | |
Micron Technology, Inc.* | | 14,710 | | 205,352 | |
Microsoft Corp. | | 168,042 | | 5,017,728 | |
Molex, Inc. Cl A | | 2,753 | | 87,077 | |
Motorola, Inc. | | 46,982 | | 965,950 | |
NCR Corp.* | | 3,465 | | 148,163 | |
NVIDIA Corporation* | | 6,906 | | 255,591 | |
National Semiconductor Corp. | | 5,610 | | 127,347 | |
Network Appliance, Inc.* | | 7,263 | | 285,291 | |
Novell, Inc.* | | 6,596 | | 40,895 | |
Novellus Systems, Inc.* | | 2,404 | | 82,746 | |
| | | | | |
27
| | Shares | | Value($) | |
INDEXED ASSETS: | | | | | |
COMMON STOCKS: | | | | | |
TECHNOLOGY (Cont'd.) | | | | | |
Oracle Corp.* | | 77,710 | | 1,331,949 | |
PMC Sierra, Inc.* | | 4,075 | | 27,343 | |
Paychex, Inc. | | 6,578 | | 260,094 | |
QLogic Corp.* | | 3,062 | | 67,119 | |
Qualcomm, Inc. | | 32,109 | | 1,213,399 | |
Sabre Group Holdings, Inc. | | 2,572 | | 82,021 | |
Sandisk Corp.* | | 4,376 | | 188,299 | |
Sanmina Corp.* | | 10,379 | | 35,808 | |
Solectron Corp.* | | 17,818 | | 57,374 | |
Sun Microsystems, Inc.* | | 68,367 | | 370,549 | |
Symantec Corp.* | | 18,221 | | 379,908 | |
Symbol Technologies, Inc. | | 4,951 | | 73,968 | |
Tektronix, Inc. | | 1,608 | | 46,905 | |
Tellabs, Inc.* | | 8,590 | | 88,133 | |
Teradyne, Inc.* | | 3,691 | | 55,217 | |
Texas Instruments, Inc. | | 28,824 | | 830,131 | |
Unisys Corp.* | | 6,693 | | 52,473 | |
Xerox Corp.* | | 18,772 | | 318,185 | |
Xilinx, Inc. | | 6,531 | | 155,503 | |
Yahoo!, Inc.* | | 23,789 | | 607,571 | |
| | | | 34,385,948 | |
TELECOMMUNICATIONS (2.0%) | | | | | |
AT&T | | 74,648 | | 2,668,666 | |
Alltel Corp. | | 7,256 | | 438,843 | |
BellSouth Corp. | | 35,432 | | 1,669,202 | |
CenturyTel, Inc. | | 2,233 | | 97,493 | |
Citizens Communications Co. | | 6,252 | | 89,841 | |
Qwest Communications Intl.* | | 31,314 | | 262,098 | |
Sprint Nextel Corp. | | 56,233 | | 1,062,241 | |
Verizon Communications | | 56,727 | | 2,112,513 | |
| | | | 8,400,897 | |
UTILITIES (2.1%) | | | | | |
AES Corp.* | | 12,913 | | 284,603 | |
Allegheny Energy, Inc.* | | 3,211 | | 147,417 | |
Ameren Corp. | | 4,013 | | 215,618 | |
American Electric Power, Inc. | | 7,685 | | 327,227 | |
CMS Energy Corp.* | | 4,323 | | 72,194 | |
Centerpoint Energy, Inc. | | 6,076 | | 100,740 | |
| | | | | |
28
| | Shares | | Value($) | |
INDEXED ASSETS: | | | | | |
COMMON STOCKS: | | | | | |
UTILITIES (Cont'd.) | | | | | |
Consolidated Edison, Inc. | | 4,993 | | 240,014 | |
Constellation Energy Group | | 3,496 | | 240,770 | |
DTE Energy Co. | | 3,458 | | 167,402 | |
Dominion Resources, Inc. | | 6,872 | | 576,148 | |
Duke Energy Corp | | 24,399 | | 810,291 | |
Dynergy, Inc.* | | 7,364 | | 53,315 | |
Edison International | | 6,328 | | 287,797 | |
Entergy Corp. | | 4,017 | | 370,849 | |
Exelon Corp. | | 13,035 | | 806,736 | |
FPL Group, Inc. | | 7,856 | | 427,524 | |
FirstEnergy Corp. | | 6,205 | | 374,162 | |
Keyspan Corporation | | 3,405 | | 140,218 | |
NiSource, Inc. | | 5,307 | | 127,899 | |
Nicor, Inc. | | 868 | | 40,622 | |
PG & E Corp. | | 6,777 | | 320,755 | |
PPL Corporation | | 7,416 | | 265,789 | |
Peoples Energy Corp. | | 748 | | 33,338 | |
Pinnacle West Capital Corp. | | 1,938 | | 98,237 | |
Progress Energy, Inc. | | 4,942 | | 242,553 | |
Public Svc. Enterprise Group | | 4,899 | | 325,196 | |
Questar Corp. | | 1,668 | | 138,527 | |
Sempra Energy | | 5,092 | | 285,356 | |
Southern Co. | | 14,427 | | 531,779 | |
TXU Corp. | | 8,920 | | 483,553 | |
Teco Energy, Inc. | | 4,068 | | 70,092 | |
Xcel Energy, Inc. | | 7,907 | | 182,335 | |
| | | | 8,789,056 | |
| | | | | |
| | | | | |
TOTAL INDEXED ASSETS (Cost: $187,363,973) 58.4% | | | | 247,289,405 | |
*Non-income producing security.
29
| | Rate(%) | | Maturity | | Face
Amount($) | | Value($) | |
INDEXED ASSETS SHORT-TERM DEBT SECURITIES: | | | | | | | | | |
U.S. GOVERNMENT (0.1%) | | | | | | | | | |
U.S. Treasury Bill (a) | | 4.79 | | 03/08/07 | | 400,000 | | 396,265 | |
U.S. Treasury Bill (a) | | 4.89 | | 01/11/07 | | 200,000 | | 199,670 | |
| | | | | | | | 595,935 | |
COMMERCIAL PAPER (1.3%) | | | | | | | | | |
Novartis Finance | | 5.28 | | 01/02/07 | | 5,480,000 | | 5,477,588 | |
| | | | | | | | | |
TOTAL SHORT-TERM DEBT SECURITIES (Cost: $6,073,631) 1.4% | | | | | | | | 6,073,523 | |
| | | | | | | | | |
TOTAL INDEXED ASSETS-COMMON STOCKS (Cost: $193,437,604) 59.8% | | | | | | | | 253,362,928 | |
| | | | | | | | | |
| | | | | | | | | |
(a) This security, or a portion thereof, has been segregated to cover initial margin requirements on open futures contracts.
FUTURES CONTRACTS OUTSTANDING AS OF DECEMBER 31, 2006:
| | Expiration | | Underlying Face | | Unrealized | |
| | Date | | Amount at Value | | Gain(Loss) | |
Purchased | | | | | | | |
| | | | | | | |
18 S&P 500 Stock Index Futures Contracts | | March 2007 | | $ | 6,427,800 | | ($4,188 | ) |
| | | | | | | |
| | | | | | | | |
Face Value of futures purchased and outstanding as a percentage of total investments in securities: 1.5 %
30
| | Shares | | Value($) | |
ACTIVE ASSETS: | | | | | |
COMMON STOCKS: | | | | | |
BASIC MATERIALS (0.8%) | | | | | |
Schnitzer Steel Inds., Inc. Cl A | | 2,620 | | 104,014 | |
Cytec Industries, Inc. | | 7,380 | | 417,044 | |
Dow Chemical Co. | | 17,162 | | 685,450 | |
Longview Fibre Co. | | 18,566 | | 407,524 | |
Lubrizol Corp. | | 10,338 | | 518,244 | |
Phelps Dodge Corp. | | 7,360 | | 881,139 | |
TETRA Technologies* | | 11,662 | | 210,966 | |
| | | | 3,224,381 | |
CONSUMER, CYCLICAL (4.6%) | | | | | |
AAR Corp* | | 15,151 | | 442,258 | |
Aaron Rents, Inc | | 8,445 | | 243,047 | |
Audiovox Corp. Cl A* | | 52,076 | | 733,751 | |
Belo Corporation | | 21,067 | | 387,001 | |
Best Buy Co., Inc. | | 8,336 | | 410,048 | |
Big Lots, Inc.* | | 7,967 | | 182,604 | |
CSK Auto Corp* | | 14,914 | | 255,775 | |
Carnival Corp. | | 6,250 | | 306,563 | |
Charming Shoppes, Inc.* | | 17,619 | | 238,385 | |
Children's Place Retail Stores | | 2,327 | | 147,811 | |
Circuit City Group, Inc. | | 22,801 | | 432,763 | |
Coach, Inc.* | | 7,277 | | 312,620 | |
Comcast Corp. Cl A* | | 14,520 | | 614,632 | |
Crown Holdings, Inc.* | | 47,962 | | 1,003,365 | |
Crown Media Holdings Cl A* | | 6,040 | | 21,925 | |
Gamestop Corp.* | | 9,342 | | 514,838 | |
Gymboree Corp.* | | 5,363 | | 204,652 | |
Hartmarx Corp.* | | 21,790 | | 153,837 | |
Hibbett Sporting Goods, Inc.* | | 11,223 | | 342,638 | |
Home Depot, Inc. | | 7,609 | | 305,577 | |
Hudson Highland Group* | | 18,721 | | 312,266 | |
ICT Group, Inc.* | | 7,260 | | 229,343 | |
International Game Technology | | 14,834 | | 685,331 | |
Johnson Controls, Inc. | | 7,473 | | 642,080 | |
Kohl's Corp.* | | 2,489 | | 170,322 | |
Landry's Restaurant, Inc. | | 10,010 | | 301,201 | |
Lithia Motors, Inc. Cl A | | 5,109 | | 146,935 | |
Marvel Entertainment Inc* | | 6,299 | | 169,506 | |
McDonald's Corp. | | 11,472 | | 508,554 | |
| | | | | |
31
| | Shares | | Value($) | |
ACTIVE ASSETS: | | | | | |
COMMON STOCKS: | | | | | |
CONSUMER, CYCLICAL (Cont'd.) | | | | | |
Modine Manufacturing Co. | | 21,576 | | 540,047 | |
Omnicom Group, Inc. | | 5,422 | | 566,816 | |
P.F. Changs China Bistro, Inc. | | 7,285 | | 279,598 | |
Payless Shoesource, Inc.* | | 30,130 | | 988,867 | |
Phillips Van Heusen Corp. | | 2,934 | | 147,199 | |
Pinnacle Entertainment, Inc.* | | 13,805 | | 457,498 | |
RC2 Corp.* | | 4,073 | | 179,212 | |
Rare Hospitality Int'l., Inc.* | | 6,349 | | 209,073 | |
Red Robin Gourmet Burgers* | | 8,145 | | 291,998 | |
Rent-A-Center, Inc.* | | 8,890 | | 262,344 | |
Staples, Inc. | | 18,626 | | 497,314 | |
Starbucks Corp.* | | 15,226 | | 539,305 | |
Sunopta* | | 16,152 | | 142,138 | |
Sunterra Corporation* | | 38,474 | | 463,612 | |
Target Corp. | | 6,134 | | 349,945 | |
Time Warner, Inc. | | 30,992 | | 675,006 | |
Tupperware Corp. | | 19,715 | | 445,756 | |
Tween Brands, Inc.* | | 4,478 | | 178,807 | |
V F Corp. | | 6,863 | | 563,315 | |
Wild Oaks Markets, Inc.* | | 17,614 | | 253,289 | |
Wolverine World Wide, Inc. | | 37,055 | | 1,056,809 | |
| | | | 19,507,576 | |
CONSUMER, NON-CYCLICAL (3.0%) | | | | | |
Alkermes, Inc.* | | 10,765 | | 143,928 | |
Boston Beer Co., Inc. Cl A* | | 3,934 | | 141,545 | |
CVS Corp. | | 30,640 | | 947,082 | |
Chattem, Inc.* | | 9,620 | | 481,770 | |
Colgate-Palmolive Co. | | 10,866 | | 708,898 | |
Comsys ITPartners, Inc.* | | 5,388 | | 108,891 | |
Conmed Corp.* | | 9,701 | | 224,287 | |
Dynamex, Inc.* | | 6,425 | | 150,088 | |
Flowers Foods, Inc. | | 6,262 | | 169,011 | |
Forrester Research Inc* | | 8,575 | | 232,468 | |
General Mills, Inc. | | 7,233 | | 416,621 | |
Great Atlantic & Pac. Tea, Inc | | 4,060 | | 104,504 | |
Hain Celestial Group Inc.* | | 8,652 | | 270,029 | |
Hershey Food Corp. | | 10,130 | | 504,474 | |
Hologic, Inc.* | | 10,544 | | 498,520 | |
| | | | | |
32
| | Shares | | Value($) | |
ACTIVE ASSETS: | | | | | |
COMMON STOCKS: | | | | | |
CONSUMER, NON- CYCLICAL (Cont'd.) | | | | | |
Longs Drug Stores Corp. | | 14,462 | | 612,900 | |
Medicines Company* | | 3,200 | | 101,504 | |
Mentor Corp. | | 4,956 | | 242,200 | |
Mueller Industries, Inc. | | 13,634 | | 432,198 | |
PepsiCo, Inc. | | 17,581 | | 1,099,692 | |
Proctor & Gamble Co. | | 35,274 | | 2,267,060 | |
Safeway, Inc. | | 20,887 | | 721,855 | |
Sovran Self-Storage, Inc. | | 2,277 | | 130,427 | |
Vector Group, Ltd. | | 26,734 | | 474,529 | |
Wal-Mart Stores, Inc. | | 22,702 | | 1,048,151 | |
Watson Wyatt Worldwide Inc | | 7,538 | | 340,341 | |
| | | | 12,572,973 | |
ENERGY (3.2%) | | | | | |
Aegean Marina Pretroleum* | | 12,299 | | 201,704 | |
CNX Gas Corp.* | | 15,843 | | 403,997 | |
Devon Energy Corp. | | 3,371 | | 226,127 | |
Ellora Energy Inc* (b) | | 21,800 | | 261,600 | |
Exxon Mobil Corp. | | 63,270 | | 4,848,380 | |
Halliburton Co. | | 37,673 | | 1,169,747 | |
Helix Energy Solutions Group* | | 14,428 | | 452,606 | |
Holly Corp. | | 15,806 | | 812,428 | |
Range Resources Corp. | | 46,689 | | 1,282,080 | |
Schlumberger, Ltd. | | 14,068 | | 888,535 | |
Superior Well Services Inc* | | 8,784 | | 224,519 | |
Transocean, Inc.* | | 11,750 | | 950,458 | |
Unisource Energy Corp. | | 12,757 | | 466,013 | |
Valero Energy Corp. | | 16,609 | | 849,716 | |
Whittier Energy* | | 74,100 | | 686,907 | |
| | | | 13,724,817 | |
FINANCIAL (9.5%) | | | | | |
Acadia Realty Trust | | 8,810 | | 220,426 | |
Accredited Home Lenders* | | 10,080 | | 275,688 | |
Allstate Corp. | | 10,132 | | 659,695 | |
American Home Mortgage Inv. | | 8,612 | | 302,453 | |
American Int'l. Group, Inc. | | 17,839 | | 1,278,343 | |
AmericanWest Bancorp | | 7,795 | | 188,795 | |
Argonaut Group, Inc.* | | 7,348 | | 256,151 | |
Assured Guaranty Co.* | | 27,533 | | 732,378 | |
| | | | | |
33
| | Shares | | Value($) | |
ACTIVE ASSETS: | | | | | |
COMMON STOCKS: | | | | | |
FINANCIAL (Cont'd.) | | | | | |
Asta Funding Inc. | | 12,490 | | 380,196 | |
Bank Mutual Corp. | | 32,143 | | 389,252 | |
Bank of America Corp. | | 42,175 | | 2,251,723 | |
Banner Corporation | | 6,148 | | 272,602 | |
Bear Stearns Cos., Inc. | | 7,845 | | 1,277,009 | |
Brookline Bankcorp | | 37,177 | | 489,621 | |
Capital Lease Funding, Inc. | | 8,735 | | 101,326 | |
Capital One Financial Corp. | | 10,634 | | 816,904 | |
Choice Hotels Intl., Inc. | | 13,028 | | 548,479 | |
Citigroup, Inc. | | 35,181 | | 1,959,582 | |
Columbia Banking System | | 7,876 | | 276,605 | |
Equity Inns, Inc. | | 28,401 | | 453,280 | |
Euronet Worldwide* | | 15,436 | | 458,295 | |
FBR Capital Markets Corp.* (b) | | 29,100 | | 436,500 | |
First Financial Holdings, Inc. | | 7,987 | | 312,931 | |
First Niagara Financial Grp. | | 29,561 | | 439,276 | |
First State Bank Corporation | | 23,817 | | 589,471 | |
FirstFed Financial Corp.* | | 6,544 | | 438,252 | |
Friedman, Billings, Ramsey Grp | | 20,043 | | 160,344 | |
Getty Realty Corp. | | 5,930 | | 183,237 | |
Glacier Bancorp, Inc. | | 21,604 | | 528,002 | |
Goldman Sachs Group, Inc. | | 4,499 | | 896,876 | |
Hartford Fin, Svc .Gp., Inc. | | 7,344 | | 685,269 | |
Highwoods Properties, Inc. | | 9,482 | | 386,486 | |
ISHARES Russel Midcap | | 18,222 | | 1,432,067 | |
ISHARES Russel Midcap | | 5,047 | | 394,019 | |
IShares Russell Micropac | | 10,428 | | 609,517 | |
Iberia Bank Corp. | | 2,955 | | 174,493 | |
Intl. Securities Exchange Inc. | | 6,222 | | 291,127 | |
J.P. Morgan Chase & Co. | | 27,110 | | 1,309,413 | |
JER Investors Trust, Inc. | | 12,907 | | 266,788 | |
Jackson Hewitt Tax Service | | 7,907 | | 268,601 | |
KNBT Bancorp, Inc. | | 23,328 | | 390,277 | |
Knight Capital Group, Inc.* | | 9,401 | | 180,217 | |
La Salle Hotel Properties | | 9,532 | | 437,042 | |
LandAmerica Financial Group | | 7,302 | | 460,829 | |
Lazard, Ltd. Cl A* | | 9,544 | | 451,813 | |
Legg Mason, Inc. | | 3,458 | | 328,683 | |
| | | | | |
34
| | Shares | | Value($) | |
ACTIVE ASSETS: | | | | | |
COMMON STOCKS: | | | | | |
FINANCIAL (Cont'd.) | | | | | |
MAF Bancorp | | 10,659 | | 476,351 | |
Medical Properties Trust Inc | | 28,230 | | 431,919 | |
Merrill Lynch & Co., Inc. | | 19,164 | | 1,784,168 | |
MetLife, Inc. | | 15,406 | | 909,108 | |
Mid-America Apt. Communities | | 5,248 | | 300,396 | |
Morgan Stanley | | 8,088 | | 658,606 | |
National Financial Partners | | 11,722 | | 515,416 | |
NewAlliance Bankshare | | 43,515 | | 713,646 | |
PHH Corp.* | | 26,878 | | 775,968 | |
Pennsylvania REIT | | 5,144 | | 202,571 | |
Phoenix Companies, Inc. | | 18,853 | | 299,574 | |
Prologis Trust | | 7,769 | | 472,122 | |
Provident Financial Services | | 24,955 | | 452,434 | |
Rait Finiancial Trust | | 25,296 | | 872,206 | |
Safeco Corp. | | 10,390 | | 637,427 | |
Santander Bancorp | | 5,445 | | 97,193 | |
Sterling Financial Corp. | | 9,504 | | 321,330 | |
Sws Group, Inc. | | 11,416 | | 407,551 | |
Taylor Capital Gowth, Inc. | | 5,924 | | 216,878 | |
Tower Group, Inc. | | 11,903 | | 369,826 | |
Vintage Wine Trust, Inc. (b) | | 45,210 | | 271,260 | |
Wachovia Corp. | | 23,252 | | 1,324,201 | |
Wells Fargo & Company | | 54,216 | | 1,927,921 | |
| | | | 40,078,405 | |
HEALTHCARE (3.7%) | | | | | |
ALNYLAM Pharmaceuticals, Inc.* | | 4,388 | | 93,903 | |
Abbott Laboratories | | 21,345 | | 1,039,715 | |
Aetna, Inc. | | 13,121 | | 566,565 | |
Allscripts Healthcare Solution | | 13,103 | | 353,650 | |
Amerisource Bergen Corp. | | 8,810 | | 396,098 | |
Amgen, Inc.* | | 17,094 | | 1,167,691 | |
Arthrocare Corp.* | | 2,980 | | 118,962 | |
Caremark Rx, Inc. | | 6,826 | | 389,833 | |
DJ Orthopedics, Inc.* | | 10,556 | | 452,008 | |
Digene Corp.* | | 6,661 | | 319,195 | |
Discovery Laboratories Inc* | | 59,630 | | 140,727 | |
Enzon, Inc.* | | 48,207 | | 410,242 | |
Genesis HealthCare Corp.* | | 4,303 | | 203,231 | |
| | | | | |
35
| | Shares | | Value($) | |
ACTIVE ASSETS: | | | | | |
COMMON STOCKS: | | | | | |
HEALTHCARE (Cont'd.) | | | | | |
Genzyme Corp. (Genl. Div)* | | 6,243 | | 384,444 | |
Human Genome Sciences, Inc.* | | 23,359 | | 290,586 | |
Humana, Inc.* | | 3,923 | | 216,981 | |
Inverness Medical Innovations* | | 16,808 | | 650,470 | |
Johnson & Johnson | | 30,728 | | 2,028,663 | |
Keryx Biopharmaceuticals, Inc. | | 9,105 | | 121,097 | |
McKesson Corp. | | 8,160 | | 413,712 | |
Medimmune, Inc.* | | 4,297 | | 139,094 | |
Medtronic, Inc. | | 16,751 | | 896,346 | |
Myriad Genetics Inc.* | | 4,475 | | 140,068 | |
OSI Pharmaceuticals, Inc.* | | 1,570 | | 57 | |
PSS World Medical Inc.* | | 12,999 | | 253,870 | |
Pfizer, Inc. | | 49,325 | | 1,277,518 | |
Psychiatric Solutions* | | 9,755 | | 366,008 | |
Quest Diagnostics, Inc. | | 5,902 | | 312,806 | |
Rigel Pharmaceuticals, Inc.* | | 8,247 | | 97,892 | |
Sciele Pharma, Inc.* | | 5,028 | | 120,672 | |
Seattle Genetics, Inc.* | | 12,846 | | 68,469 | |
Senomyx, Inc.* | | 5,960 | | 77,420 | |
St. Jude Medical, Inc.* | | 6,961 | | 254,494 | |
Theravance, Inc.* | | 8,120 | | 250,827 | |
Valeant Pharmaceuticals | | 14,956 | | 257,841 | |
Ventana Medical Systems, Inc.* | | 9,160 | | 394,155 | |
Viasys Healthcare, Inc.* | | 10,700 | | 297,674 | |
Wyeth | | 17,795 | | 906,121 | |
| | | | 15,869,105 | |
INDUSTRIAL (6.2%) | | | | | |
3M Company | | 9,336 | | 727,554 | |
Actuant Corp. Cl A | | 4,934 | | 235,105 | |
Acuity Brands, Inc. | | 6,311 | | 328,424 | |
Affymetrix, Inc.* | | 11,586 | | 267,173 | |
Agnico-Eagle Mines, Ltd. | | 21,612 | | 891,279 | |
Alaska Air Group, Inc.* | | 10,090 | | 398,555 | |
Allis-Chalmers Corp* | | 15,127 | | 348,526 | |
Apogee Enterprises, Inc. | | 17,438 | | 336,728 | |
Aspect Medical Systems, Inc.* | | 10,866 | | 204,389 | |
Benchmark Electronics* | | 13,463 | | 327,959 | |
Boeing Co. | | 4,838 | | 429,808 | |
| | | | | |
36
| | Shares | | Value($) | |
ACTIVE ASSETS: | | | | | |
COMMON STOCKS: | | | | | |
INDUSTRIAL (Cont'd.) | | | | | |
Bronco Drilling Co., Inc.* | | 12,022 | | 206,658 | |
Bucyrus International , Inc. | | 10,017 | | 518,480 | |
Chaparral Steel Co. | | 9,514 | | 421,185 | |
Curtis Wright Corp. Cl B | | 6,599 | | 244,691 | |
DIODES, Inc.* | | 7,132 | | 253,043 | |
Eclipsys Corp.* | | 10,534 | | 216,579 | |
FLIR Systems Inc.* | | 16,645 | | 529,810 | |
FLOTEK Industries, Inc.* | | 1,590 | | 44,600 | |
Felcor Lodging Trust, Inc. | | 7,595 | | 165,875 | |
Frozen Foods Express Ind. | | 19,550 | | 168,130 | |
General Cable Corp.* | | 19,184 | | 838,533 | |
General Electric Co. | | 86,168 | | 3,206,311 | |
Genesee & Wyoming, Inc. Cl A* | | 16,576 | | 434,954 | |
Genlyte Group, Inc.* | | 5,729 | | 447,492 | |
Google, Inc.* | | 1,339 | | 616,583 | |
Granite Construction | | 11,938 | | 600,720 | |
HUB Group, Inc. Cl A* | | 11,051 | | 304,455 | |
Harmonic, Inc.* | | 27,376 | | 199,024 | |
Healthcare Services Group | | 8,234 | | 238,457 | |
Heidrick & Struggles Intl., Inc.* | | 7,335 | | 310,711 | |
ICO, Inc.* | | 30,081 | | 169,657 | |
ITT Industries, Inc. | | 13,608 | | 773,207 | |
Illinois Tool Works, Inc. | | 8,767 | | 404,948 | |
Interline Brands, Inc.* | | 8,272 | | 185,872 | |
Komag, Inc.* | | 4,652 | | 176,218 | |
Ladish Co., Inc.* | | 8,045 | | 298,309 | |
Levitt Corporation | | 16,290 | | 199,390 | |
Lincoln Electric Holdings | | 6,428 | | 388,380 | |
Littelfuse, Inc.* | | 17,020 | | 542,598 | |
Live Nation Inc* | | 6,125 | | 137,200 | |
Lockheed Martin Corp. | | 9,901 | | 911,585 | |
Miller (Herman), Inc. | | 8,284 | | 301,206 | |
Moog, Inc. Cl A* | | 5,460 | | 208,517 | |
Northrop Grumman Corp. | | 10,764 | | 728,723 | |
RTI International Metals Inc* | | 7,538 | | 589,622 | |
RailAmerica, Inc.* | | 63,739 | | 1,024,923 | |
Semitool, Inc.* | | 20,344 | | 270,779 | |
Siligan Holdings, Inc. | | 12,400 | | 544,608 | |
| | | | | |
37
| | Shares | | Value($) | |
ACTIVE ASSETS: | | | | | |
COMMON STOCKS: | | | | | |
INDUSTRIAL (Cont'd.) | | | | | |
Southwest Airlines Co. | | 33,584 | | 514,507 | |
Starwood Hotels & Resort World | | 8,728 | | 545,500 | |
Texas Industries, Inc. | | 6,143 | | 394,565 | |
Tyco International, Ltd. | | 19,925 | | 605,720 | |
United Parcel Service Cl B | | 10,003 | | 750,025 | |
United Technologies Corp. | | 10,954 | | 684,844 | |
Waste Connections Inc.* | | 6,423 | | 266,876 | |
Wright Express Corp* | | 7,817 | | 243,656 | |
| | | | 26,323,226 | |
TECHNOLOGY (6.1%) | | | | | |
Activision, Inc.* | | 19,082 | | 328,974 | |
Altiris, Inc.* | | 7,699 | | 195,401 | |
Anixter International, Inc.* | | 8,789 | | 477,243 | |
Ansys, Inc.* | | 4,305 | | 187,224 | |
Apple Computer, Inc.* | | 5,738 | | 486,812 | |
Arris Group, Inc.* | | 21,600 | | 270,216 | |
Aspen Technology, Inc.* | | 20,199 | | 222,593 | |
Automatic Data Processing | | 9,803 | | 482,798 | |
Broadcom Corp. Cl A* | | 20,773 | | 671,176 | |
Cirrus Logic, Inc.* | | 12,402 | | 85,326 | |
Cisco Systems, Inc.* | | 64,086 | | 1,751,470 | |
CommScope, Inc.* | | 27,886 | | 849,965 | |
Computer Programs & Systems | | 5,133 | | 174,471 | |
Corning, Inc.* | | 45,852 | | 857,891 | |
Dell, Inc.* | | 17,540 | | 440,079 | |
Digital Insight Corporation* | | 6,002 | | 231,017 | |
Digitas* | | 20,626 | | 276,595 | |
Dot Hill Systems* | | 31,832 | | 125,100 | |
EFJ, Inc.* | | 32,725 | | 220,894 | |
EMC Corp.* | | 18,313 | | 241,732 | |
Electronics For Imaging, Inc.* | | 21,863 | | 581,119 | |
Equinix Inc* | | 2,201 | | 166,440 | |
Exelixis, Inc* | | 10,065 | | 90,585 | |
Fairchild Semiconductor Intl.* | | 3,739 | | 62,853 | |
FormFactor, Inc.* | | 7,310 | | 272,298 | |
Global Imaging Systems., Inc.* | | 16,483 | | 361,802 | |
Hewlett-Packard Co. | | 23,438 | | 965,411 | |
Hyperion Solutions, Corp.* | | 7,187 | | 258,301 | |
| | | | | |
38
| | Shares | | Value($) | |
ACTIVE ASSETS: | | | | | |
COMMON STOCKS: | | | | | |
TECHNOLOGY (Cont'd.) | | | | | |
IBM Corp. | | 10,752 | | 1,044,557 | |
Imation Corp. | | 5,878 | | 272,916 | |
Informatica Corp.* | | 15,633 | | 190,879 | |
Intel Corp. | | 52,627 | | 1,065,697 | |
Lecroy Corp.* | | 18,783 | | 216,192 | |
Marlin Business Services* | | 10,219 | | 245,563 | |
Medics Pharmaceutical Corp. | | 26,430 | | 928,486 | |
Micrel, Inc.* | | 32,717 | | 352,689 | |
Microsemi Corp.* | | 15,474 | | 304,064 | |
Microsoft Corp. | | 92,545 | | 2,763,375 | |
Motorola, Inc. | | 33,869 | | 696,347 | |
Netlogic Microsystems, Inc.* | | 13,053 | | 283,120 | |
Neustar, Inc. Cl A* | | 6,127 | | 198,760 | |
Parametric Technology Corp.* | | 13,819 | | 249,018 | |
Perot Systems Corp. Cl A* | | 11,819 | | 193,713 | |
Qualcomm, Inc. | | 19,466 | | 735,620 | |
Rogers Corp.* | | 9,875 | | 584,106 | |
SPSS, Inc.* | | 8,741 | | 262,842 | |
Semtech Corp.* | | 7,530 | | 98,417 | |
Syniverse Holdings, Inc.* | | 22,010 | | 329,930 | |
Tech Data Corp.* | | 11,379 | | 430,923 | |
Technitrol, Inc. | | 25,039 | | 598,182 | |
Texas Instruments, Inc. | | 9,547 | | 274,954 | |
Tibco Software, Inc.* | | 10,364 | | 97,836 | |
Varian Semiconductor Equip.* | | 11,508 | | 523,844 | |
Verint Systems, Inc.* | | 7,943 | | 272,286 | |
Viasat, Inc.* | | 17,927 | | 534,404 | |
Wabtech | | 12,996 | | 394,818 | |
Website Pros, Inc.* | | 10,027 | | 90,744 | |
aQuantive, Inc.* | | 16,924 | | 417,346 | |
| | | | 25,987,414 | |
TELECOMMUNICATIONS (0.8%) | | | | | |
AT&T | | 30,376 | | 1,085,942 | |
CT Communications, Inc. | | 8,833 | | 202,452 | |
Cincinnati Bell, Inc.* | | 36,650 | | 167,491 | |
Iowa Telecomunications Service | | 18,451 | | 363,669 | |
| | | | | |
| | | | | |
| | | | | |
39
| | Shares | | Value($) | |
ACTIVE ASSETS: | | | | | |
COMMON STOCKS: | | | | | |
TELECOMMUNICATIONS (Cont'd.) | | | | | |
Sprint Nextel Corp. | | 21,627 | | 408,534 | |
Verizon Communications | | 27,803 | | 1,035,384 | |
| | | | 3,263,472 | |
UTILITIES (1.3%) | | | | | |
Avista Corp. | | 11,396 | | 288,433 | |
Black Hills Corp. | | 5,340 | | 197,260 | |
Constellation Energy Group | | 6,073 | | 418,248 | |
Dominion Resources, Inc. | | 10,052 | | 842,760 | |
Exelon Corp. | | 18,900 | | 1,169,721 | |
FirstEnergy Corp. | | 7,507 | | 452,672 | |
Northwestern Corp. | | 5,089 | | 180,049 | |
PNM Resources, Inc. | | 21,038 | | 654,282 | |
Sempra Energy | | 10,810 | | 605,792 | |
Sierra Pacific Resources* | | 24,400 | | 410,652 | |
Westar Energy, Inc. | | 14,938 | | 387,790 | |
| | | | 5,607,659 | |
| | | | | |
TOTAL ACTIVE ASSETS (Cost: $142,714,713) 39.2% | | | | 166,159,028 | |
| | | | | |
| | | | | |
| | | | | |
*Non-income producing security.
40
| | Shares | | Value($) | |
PREFERRED STOCKS | | | | | |
FINANCIAL (0.1%) | | | | | |
Quanta Capital Holdings | | 13,420 | | 248,941 | |
TOTAL PREFERRRED STOCKS (Cost: $335,500) 0.1% | | | | 248,941 | |
| | | | | |
| | Rate(%) | | Maturity | | Face
Amount($) | | Value($) | |
LONG-TERM DEBT SECURITIES: | | | | | | | | | |
FINANCIAL (0.1%) | | | | | | | | | |
GSC Capital Corp. (b) | | 7.25 | | 07/15/10 | | 460,000 | | 460,000 | |
TOTAL LONG-TERM DEBT SECURITIES (Cost: $460,000) 0.1% | | | | | | | | 460,000 | |
| | | | | | | | | |
| | Rate(%) | | Maturity | | Face
Amount($) | | Value($) | |
SHORT-TERM DEBT SECURITIES: | | | | | | | | | |
U.S. GOVERNMENT AGENCIES (0.3%) | | | | | | | | | |
Federal Home Loan Bank | | 4.80 | | 01/02/07 | | 280,000 | | 279,888 | |
Federal Farm Credit Corp. | | 4.80 | | 01/02/07 | | 765,000 | | 764,694 | |
| | | | | | | | 1,044,582 | |
COMMERCIAL PAPER (0.7%) | | | | | | | | | |
Abbott Labs | | 5.26 | | 01/02/07 | | 345,000 | | 344,849 | |
Anheuser-Busch Co. | | 5.22 | | 01/02/07 | | 2,800,000 | | 2,798,782 | |
| | | | | | | | 3,143,631 | |
TOTAL SHORT-TERM DEBT SECURITIES (Cost: $4,188,213) 1.0% | | | | | | | | 4,188,213 | |
| | | | | | | | | |
TEMPORARY CASH INVESTMENTS**(Cost: $133,200) 0.0% (1) | | | | | | | | 133,200 | |
| | | | | | | | | |
TOTAL ACTIVE ASSETS—COMMON STOCKS (Cost: $147,831,626) 40.4% | | | | | | | | 171,189,382 | |
| | | | | | | | | |
TOTAL INVESTMENTS (Cost: $341,269,230) 100.2% | | | | | | | | 424,552,310 | |
| | | | | | | | | |
OTHER NET ASSETS—0.2% | | | | | | | | (1,085,430 | ) |
| | | | | | | | | |
NET ASSETS 100.0% | | | | | | | | $ | 423,466,880 | |
| | | | | | | | | | |
(1) Less than 0.05%.
(b) Rule 144a restricted security.
** The fund has an arrangement with its custodian bank, JPMorgan Chase Bank, whereby uninvested cash, subject to parameters set by the fund, is automatically invested in the fund's name by the bank in overnight commercial paper issued by J.P. Morgan Chase & Co. On the next business day, these funds (and earned interest) are automatically returned to the fund. The annual rate of interest earned on this temporary cash investment at December 31, 2006 was 4.83 %.
41
MUTUAL OF AMERICA INVESTMENT CORPORATION (SMALL CAP VALUE )
PORTFOLIO OF INVESTMENTS IN SECURITIES
December 31, 2006
| | Shares | | Value($) | |
COMMON STOCKS: | | | | | |
BASIC MATERIALS (3.5%) | | | | | |
Schnitzer Steel Inds, Inc. Cl A | | 15,240 | | $ | 605,028 | |
Cytec Industries, Inc. | | 42,990 | | 2,429,365 | |
Longview Fibre Co. | | 112,536 | | 2,470,165 | |
Lubrizol Corp. | | 60,169 | | 3,016,272 | |
| | | | 8,520,830 | |
CONSUMER, CYCLICAL (13.7%) | | | | | |
Audiovox Corp. Cl A* | | 311,229 | | 4,385,217 | |
Belo Corporation | | 123,253 | | 2,264,158 | |
Big Lots, Inc.* | | 46,031 | | 1,055,031 | |
CSK Auto Corp* | | 81,902 | | 1,404,619 | |
Charming Shoppes, Inc.* | | 101,718 | | 1,376,245 | |
Crown Holdings, Inc.* | | 291,709 | | 6,102,552 | |
Hartmarx Corp.* | | 126,765 | | 894,961 | |
Landry's Restaurant, Inc. | | 61,364 | | 1,846,443 | |
Lithia Motors, Inc. Cl A | | 31,335 | | 901,195 | |
Modine Manufacturing Co. | | 78,898 | | 1,974,817 | |
Payless Shoesource, Inc.* | | 63,615 | | 2,087,844 | |
Rent-A-Center, Inc.* | | 51,320 | | 1,514,453 | |
Sunterra Corporation* | | 210,176 | | 2,532,621 | |
Tupperware Corp. | | 114,751 | | 2,594,520 | |
Wolverine World Wide, Inc. | | 99,731 | | 2,844,328 | |
| | | | 33,779,004 | |
CONSUMER, NON-CYCLICAL (4.6%) | | | | | |
Boston Beer Co., Inc. Cl A* | | 22,983 | | 826,928 | |
Conmed Corp.* | | 58,003 | | 1,341,029 | |
Flowers Foods, Inc. | | 36,572 | | 987,078 | |
Great Atlantic & Pac. Tea, Inc | | 23,370 | | 601,544 | |
Longs Drug Stores Corp. | | 56,833 | | 2,408,583 | |
Mueller Industries, Inc. | | 78,700 | | 2,494,790 | |
Vector Group, Ltd. | | 156,030 | | 2,769,533 | |
| | | | 11,429,485 | |
ENERGY (6.6%) | | | | | |
Aegean Marina Petroleum* | | 53,500 | | 877,400 | |
CNX Gas Corp.* | | 91,485 | | 2,332,868 | |
Ellora Energy, Inc.* (a) | | 119,800 | | 1,437,600 | |
Holly Corp. | | 21,220 | | 1,090,708 | |
Range Resources Corp. | | 123,128 | | 3,381,095 | |
Superior Well Services Inc* | | 31,960 | | 816,898 | |
| | | | | | |
42
| | Shares | | Value($) | |
COMMON STOCKS: | | | | | |
ENERGY (Cont'd.) | | | | | |
Unisource Energy Corp. | | 78,130 | | 2,854,089 | |
Whittier Energy* | | 372,950 | | 3,457,247 | |
| | | | 16,247,905 | |
FINANCIAL (32.2%) | | | | | |
Accredited Home Lenders* | | 55,070 | | 1,506,165 | |
American Home Mortgage Inves | | 50,152 | | 1,761,338 | |
AmericanWest Bancorp | | 47,528 | | 1,151,128 | |
Assured Guaranty Co.* | | 111,226 | | 2,958,612 | |
Asta Funding Inc. | | 71,709 | | 2,182,822 | |
Bank Mutual Corp. | | 195,060 | | 2,362,177 | |
Banner Corporation | | 30,430 | | 1,349,266 | |
Brookline Bankcorp | | 226,356 | | 2,981,109 | |
Capital Lease Funding, Inc. | | 50,448 | | 585,197 | |
Columbia Banking System | | 38,985 | | 1,369,153 | |
Equity Inns, Inc. | | 172,103 | | 2,746,764 | |
FBR Capital Markets Corp.* (a) | | 159,700 | | 2,395,500 | |
First Niagara Financial Grp. | | 183,659 | | 2,729,173 | |
First State Bank Corporation | | 89,965 | | 2,226,634 | |
FirstFed Financial Corp.* | | 38,085 | | 2,550,552 | |
Friedman, Billings, Ramsey Grp | | 115,719 | | 925,752 | |
Glacier Bancorp, Inc. | | 73,983 | | 1,808,145 | |
Highwoods Properties, Inc. | | 59,714 | | 2,433,943 | |
ISHARES Russel Midcap | | 29,120 | | 2,273,398 | |
Iberia Bank Corp. | | 17,245 | | 1,018,317 | |
JER Investors Trust, Inc. | | 75,149 | | 1,553,330 | |
KNBT Bancorp, Inc. | | 136,790 | | 2,288,497 | |
Knight Capital Group, Inc.* | | 58,443 | | 1,120,352 | |
LandAmerica Financial Group | | 45,476 | | 2,869,990 | |
MAF Bancorp | | 66,145 | | 2,956,020 | |
Medical Properties Trust Inc | | 162,976 | | 2,493,533 | |
Mid-America Apt. Communities | | 32,763 | | 1,875,354 | |
National Financial Partners | | 15,800 | | 694,726 | |
NewAlliance Bankshare | | 189,207 | | 3,102,995 | |
PHH Corp.* | | 137,956 | | 3,982,790 | |
Pennsylvania REIT | | 32,340 | | 1,273,549 | |
Phoenix Companies, Inc. | | 108,827 | | 1,729,261 | |
Provident Financial Services | | 154,976 | | 2,809,715 | |
Rait Finiancial Trust | | 112,630 | | 3,883,486 | |
Santander Bancorp | | 31,725 | | 566,291 | |
43
| | Shares | | Value($) | |
COMMON STOCKS: | | | | | |
FINANCIAL (Cont'd.) | | | | | |
Sterling Financial Corp. | | 55,237 | | 1,867,563 | |
Sws Group, Inc. | | 69,578 | | 2,483,935 | |
Taylor Capital Gowth, Inc. | | 34,570 | | 1,265,608 | |
Vintage Wine Trust, Inc. (a) | | 189,970 | | 1,139,820 | |
| | | | 79,271,960 | |
HEALTHCARE (2.3%) | | | | | |
Discovery Laboratories Inc* | | 325,920 | | 769,171 | |
Enzon, Inc.* | | 280,478 | | 2,386,868 | |
Genesis HealthCare Corp.* | | 26,701 | | 1,261,088 | |
Inverness Medical Innovations* | | 32,031 | | 1,239,600 | |
| | | | 5,656,727 | |
INDUSTRIAL (15.3%) | | | | | |
Agnico-Eagle Mines, Ltd. | | 57,295 | | 2,362,846 | |
Alaska Air Group, Inc.* | | 58,220 | | 2,299,690 | |
Apogee Enterprises, Inc. | | 100,638 | | 1,943,320 | |
Aspect Medical Systems, Inc.* | | 63,214 | | 1,189,055 | |
Benchmark Electronics* | | 32,066 | | 781,128 | |
Bronco Drilling Co., Inc.* | | 64,824 | | 1,114,325 | |
Chaparral Steel Co. | | 54,900 | | 2,430,423 | |
FLOTEK Industries, Inc.* | | 9,150 | | 256,658 | |
Felcor Lodging Trust, Inc. | | 44,130 | | 963,799 | |
Frozen Foods Express Ind. | | 109,986 | | 945,880 | |
General Cable Corp.* | | 68,817 | | 3,007,991 | |
Genlyte Group, Inc.* | | 13,433 | | 1,049,252 | |
Granite Construction | | 47,210 | | 2,375,607 | |
Healthcare Services Group | | 50,561 | | 1,464,247 | |
Komag, Inc.* | | 28,495 | | 1,079,391 | |
Levitt Corporation | | 94,010 | | 1,150,682 | |
Littelfuse, Inc.* | | 43,590 | | 1,389,649 | |
RailAmerica, Inc.* | | 370,404 | | 5,956,096 | |
Semitool, Inc.* | | 42,410 | | 564,477 | |
Siligan Holdings, Inc. | | 72,339 | | 3,177,129 | |
Texas Industries, Inc. | | 35,478 | | 2,278,752 | |
| | | | 37,780,397 | |
TECHNOLOGY (10.7%) | | | | | |
Anixter International, Inc.* | | 51,283 | | 2,784,666 | |
Cirrus Logic, Inc.* | | 72,340 | | 497,698 | |
CommScope, Inc.* | | 106,219 | | 3,237,554 | |
Dot Hill Systems* | | 182,875 | | 718,698 | |
| | | | | |
44
| | Shares | | Value($) | |
COMMON STOCKS: | | | | | |
TECHNOLOGY (Cont'd.) | | | | | |
Electronics For Imaging, Inc.* | | 67,753 | | 1,800,874 | |
Fairchild Semiconductor Intl.* | | 20,363 | | 342,301 | |
Global Imaging Systems., Inc.* | | 95,164 | | 2,088,849 | |
Hyperion Solutions, Corp.* | | 41,460 | | 1,490,071 | |
Imation Corp. | | 36,021 | | 1,672,455 | |
Lecroy Corp.* | | 38,780 | | 446,358 | |
Marlin Business Services* | | 59,642 | | 1,433,197 | |
Micrel, Inc.* | | 52,360 | | 564,441 | |
Perot Systems Corp. Cl A* | | 70,607 | | 1,157,249 | |
Rogers Corp.* | | 20,940 | | 1,238,601 | |
Semtech Corp.* | | 41,220 | | 538,745 | |
Syniverse Holdings, Inc.* | | 52,020 | | 779,780 | |
Tech Data Corp.* | | 66,485 | | 2,517,787 | |
Technitrol, Inc. | | 101,207 | | 2,417,835 | |
Website Pros, Inc.* | | 58,675 | | 531,009 | |
| | | | 26,258,168 | |
TELECOMMUNICATIONS (1.8%) | | | | | |
CT Communications, Inc. | | 54,808 | | 1,256,199 | |
Cincinnati Bell, Inc.* | | 213,929 | | 977,656 | |
Iowa Telecomunications Service | | 106,500 | | 2,099,115 | |
| | | | 4,332,970 | |
UTILITIES (4.7%) | | | | | |
Avista Corp. | | 69,806 | | 1,766,790 | |
Black Hills Corp. | | 30,840 | | 1,139,230 | |
Northwestern Corp. | | 29,681 | | 1,050,114 | |
PNM Resources, Inc. | | 91,913 | | 2,858,494 | |
Sierra Pacific Resources* | | 140,835 | | 2,370,253 | |
Westar Energy, Inc. | | 91,525 | | 2,375,989 | |
| | | | 11,560,870 | |
| | | | | |
TOTAL COMMON STOCKS (Cost: $219,101,395) 95.4% | | | | 234,838,316 | |
*Non-income producing security.
45
| | Shares | | Value($) | |
PREFERRED STOCKS: | | | | | |
FINANCIAL (0.4%) | | | | | |
Quanta Capital Holdings | | 57,230 | | 1,061,617 | |
| | | | | |
TOTAL PREFERRRED STOCKS (Cost: $1,000,971) 0.4% | | | | 1,061,617 | |
| | Rate(%) | | Maturity | | Face
Amount($) | | Value($) | |
LONG-TERM DEBT SECURITIES: | | | | | | | | | |
FINANCIAL (0.8%) | | | | | | | | | |
GSC Capital Corp. (a) | | 7.25 | | 07/15/10 | | 1,890,000 | | 1,890,000 | |
| | | | | | | | | |
TOTAL LONG-TERM DEBT SECURITIES (Cost: $1,890,000) 0.8% | | | | | | | | 1,890,000 | |
| | Rate(%) | | Maturity | | Face Amount($) | | Value($) | |
SHORT-TERM DEBT SECURITIES: | | | | | | | | | |
U.S. GOVERNMENT AGENCIES (5.0%) | | | | | | | | | |
Federal Farm Credit Corp. | | 4.80 | | 01/02/07 | | 12,413,000 | | 12,408,034 | |
| | | | | | | | | |
TOTAL SHORT-TERM DEBT SECURITIES (Cost: $12,408,034) 5.0% | | | | | | | | 12,408,034 | |
| | | | | | | | | |
TOTAL INVESTMENTS (Cost: $234,400,400) 101.6% | | | | | | | | 250,197,967 | |
| | | | | | | | | |
OTHER NET ASSETS -1.6% | | | | | | | | (3,951,862 | ) |
| | | | | | | | | |
NET ASSETS 100.0% | | | | | | | | $ | 246,246,105 | |
| | | | | | | | | | |
(a) Rule 144a restricted security.
46
MUTUAL OF AMERICA INVESTMENT CORPORATION (SMALL CAP GROWTH )
PORTFOLIO OF INVESTMENTS IN SECURITIES
December 31, 2006
| | Shares | | Value($) | |
COMMON STOCKS: | | | | | |
BASIC MATERIALS (0.5%) | | | | | |
TETRA Technologies* | | 62,027 | | $ | 1,122,068 | |
| | | | | |
CONSUMER, CYCLICAL (14.5%) | | | | | |
AAR Corp* | | 80,637 | | 2,353,794 | |
Aaron Rents, Inc | | 45,202 | | 1,300,914 | |
Children's Place Retail Stores | | 12,344 | | 784,091 | |
Crown Media Holdings Cl A* | | 32,115 | | 116,577 | |
Gamestop Corp.* | | 49,681 | | 2,737,920 | |
Gymboree Corp.* | | 28,462 | | 1,086,110 | |
Hibbett Sporting Goods, Inc.* | | 59,685 | | 1,822,183 | |
Hudson Highland Group* | | 85,623 | | 1,428,192 | |
ICT Group, Inc.* | | 38,602 | | 1,219,437 | |
Marvel Entertainment Inc* | | 33,568 | | 903,315 | |
Modine Manufacturing Co. | | 42,726 | | 1,069,432 | |
P.F. Changs China Bistro, Inc. | | 38,754 | | 1,487,379 | |
Payless Shoesource, Inc.* | | 102,350 | | 3,359,127 | |
Phillips Van Heusen Corp. | | 15,633 | | 784,308 | |
Pinnacle Entertainment, Inc.* | | 75,334 | | 2,496,569 | |
RC2 Corp.* | | 21,679 | | 953,876 | |
Rare Hospitality Int'l., Inc.* | | 33,796 | | 1,112,902 | |
Red Robin Gourmet Burgers* | | 43,662 | | 1,565,283 | |
Sunopta* | | 88,025 | | 774,620 | |
Tween Brands, Inc.* | | 23,778 | | 949,456 | |
Wild Oaks Markets, Inc.* | | 92,486 | | 1,329,949 | |
Wolverine World Wide, Inc. | | 101,003 | | 2,880,606 | |
| | | | 32,516,040 | |
CONSUMER, NON-CYCLICAL (6.9%) | | | | | |
Alkermes, Inc.* | | 58,462 | | 781,637 | |
Chattem, Inc.* | | 51,172 | | 2,562,694 | |
Comsys ITPartners, Inc.* | | 28,686 | | 579,744 | |
Dynamex, Inc.* | | 34,251 | | 800,103 | |
Forrester Research Inc* | | 45,628 | | 1,236,975 | |
Hain Celestial Group Inc.* | | 46,064 | | 1,437,657 | |
Hologic, Inc.* | | 56,091 | | 2,651,982 | |
Longs Drug Stores Corp. | | 26,025 | | 1,102,940 | |
Medicines Company* | | 17,000 | | 539,240 | |
Mentor Corp. | | 26,378 | | 1,289,093 | |
Sovran Self-Storage, Inc. | | 10,867 | | 622,462 | |
Watson Wyatt Worldwide Inc | | 40,087 | | 1,809,928 | |
| | | | 15,414,455 | |
| | | | | | |
47
| | Shares | | Value($) | |
COMMON STOCKS: | | | | | |
ENERGY (4.4%) | | | | | |
Aegean Marina Pretroleum* | | 16,060 | | 263,384 | |
Helix Energy Solutions Group* | | 77,333 | | 2,425,936 | |
Holly Corp. | | 64,514 | | 3,316,020 | |
Range Resources Corp. | | 125,323 | | 3,441,370 | |
Superior Well Services Inc* | | 15,770 | | 403,081 | |
| | | | 9,849,791 | |
FINANCIAL (17.0%) | | | | | |
Acadia Realty Trust | | 47,124 | | 1,179,042 | |
Argonaut Group, Inc.* | | 39,847 | | 1,389,066 | |
Assured Guaranty Co.* | | 51,475 | | 1,369,235 | |
Choice Hotels Intl., Inc. | | 69,361 | | 2,920,098 | |
Euronet Worldwide* | | 82,083 | | 2,437,044 | |
First Financial Holdings, Inc. | | 42,404 | | 1,661,389 | |
First State Bank Corporation | | 47,818 | | 1,183,496 | |
Getty Realty Corp. | | 32,072 | | 991,025 | |
Glacier Bancorp, Inc. | | 50,005 | | 1,222,122 | |
ISHARES Russel Midcap | | 96,949 | | 7,619,222 | |
IShares Russell Micropac | | 55,495 | | 3,243,683 | |
Intl. Securities Exchange Inc. | | 33,131 | | 1,550,199 | |
Jackson Hewitt Tax Service | | 42,254 | | 1,435,368 | |
La Salle Hotel Properties | | 50,698 | | 2,324,503 | |
Lazard, Ltd. Cl A* | | 50,774 | | 2,403,641 | |
National Financial Partners | | 47,726 | | 2,098,512 | |
NewAlliance Bankshare | | 67,930 | | 1,114,052 | |
Tower Group, Inc. | | 63,295 | | 1,966,576 | |
| | | | 38,108,273 | |
HEALTHCARE (10.8%) | | | | | |
ALNYLAM Pharmaceuticals, Inc.* | | 23,340 | | 499,476 | |
Allscripts Healthcare Solution | | 69,695 | | 1,881,068 | |
Arthrocare Corp.* | | 16,073 | | 641,634 | |
DJ Orthopedics, Inc.* | | 56,346 | | 2,412,736 | |
Digene Corp.* | | 35,355 | | 1,694,212 | |
Human Genome Sciences, Inc.* | | 124,311 | | 1,546,429 | |
Inverness Medical Innovations* | | 60,875 | | 2,355,863 | |
Keryx Biopharmaceuticals, Inc. | | 48,440 | | 644,252 | |
Myriad Genetics Inc.* | | 23,775 | | 744,158 | |
PSS World Medical Inc.* | | 69,115 | | 1,349,816 | |
Psychiatric Solutions* | | 51,829 | | 1,944,624 | |
Rigel Pharmaceuticals, Inc.* | | 43,915 | | 521,271 | |
Sciele Pharma, Inc.* | | 26,750 | | 642,000 | |
48
| | Shares | | Value($) | |
COMMON STOCKS: | | | | | |
HEALTHCARE (Cont'd.) | | | | | |
Seattle Genetics, Inc.* | | 68,275 | | 363,906 | |
Senomyx, Inc.* | | 31,990 | | 415,550 | |
Theravance, Inc.* | | 44,102 | | 1,362,311 | |
Valeant Pharmaceuticals* | | 79,606 | | 1,372,407 | |
Ventana Medical Systems, Inc.* | | 48,533 | | 2,088,375 | |
Viasys Healthcare, Inc.* | | 57,537 | | 1,600,679 | |
| | | | 24,080,767 | |
INDUSTRIAL (21.2%) | | | | | |
Actuant Corp. Cl A | | 26,223 | | 1,249,526 | |
Acuity Brands, Inc. | | 33,564 | | 1,746,671 | |
Affymetrix, Inc.* | | 61,698 | | 1,422,756 | |
Agnico-Eagle Mines, Ltd. | | 63,014 | | 2,598,697 | |
Allis-Chalmers Corp* | | 80,455 | | 1,853,683 | |
Benchmark Electronics* | | 42,867 | | 1,044,240 | |
Bucyrus International , Inc. | | 53,342 | | 2,760,982 | |
Curtis Wright Corp. Cl B | | 33,774 | | 1,252,340 | |
DIODES, Inc.* | | 37,948 | | 1,346,395 | |
Eclipsys Corp.* | | 56,644 | | 1,164,601 | |
FLIR Systems Inc.* | | 88,523 | | 2,817,687 | |
General Cable Corp.* | | 39,120 | | 1,709,935 | |
Genesee & Wyoming, Inc. Cl A* | | 88,254 | | 2,315,785 | |
Genlyte Group, Inc.* | | 18,133 | | 1,416,369 | |
Granite Construction | | 19,934 | | 1,003,079 | |
HUB Group, Inc. Cl A* | | 58,857 | | 1,621,510 | |
Harmonic, Inc.* | | 145,666 | | 1,058,992 | |
Heidrick & Struggles Intl Inc* | | 39,041 | | 1,653,777 | |
ICO, Inc.* | | 160,264 | | 903,889 | |
Interline Brands, Inc.* | | 43,990 | | 988,455 | |
Ladish Co Inc* | | 42,776 | | 1,586,134 | |
Lincoln Electric Holdings | | 34,209 | | 2,066,908 | |
Littelfuse, Inc.* | | 50,394 | | 1,606,561 | |
Live Nation Inc* | | 32,625 | | 730,800 | |
Miller (Herman), Inc. | | 44,082 | | 1,602,822 | |
Moog, Inc. Cl A* | | 29,008 | | 1,107,816 | |
RTI International Metals Inc* | | 40,180 | | 3,142,880 | |
Semitool, Inc.* | | 68,899 | | 917,046 | |
Waste Connections Inc.* | | 34,100 | | 1,416,855 | |
Wright Express Corp* | | 41,604 | | 1,296,797 | |
| | | | 47,403,988 | |
49
| | Shares | | Value($) | |
COMMON STOCKS: | | | | | |
TECHNOLOGY (21.4%) | | | | | |
Activision, Inc.* | | 102,403 | | 1,765,427 | |
Altiris, Inc.* | | 40,848 | | 1,036,721 | |
Ansys, Inc.* | | 22,996 | | 1,000,095 | |
Arris Group, Inc.* | | 114,849 | | 1,436,760 | |
Aspen Technology, Inc.* | | 106,077 | | 1,168,968 | |
CommScope, Inc.* | | 50,452 | | 1,537,776 | |
Computer Programs & Systems | | 27,643 | | 939,585 | |
Digital Insight Corporation* | | 32,103 | | 1,235,644 | |
Digitas* | | 109,660 | | 1,470,541 | |
EFJ, Inc.* | | 174,095 | | 1,175,141 | |
Electronics For Imaging, Inc.* | | 53,601 | | 1,424,715 | |
Equinix Inc* | | 11,762 | | 889,442 | |
Exelixis, Inc* | | 53,530 | | 481,770 | |
FormFactor, Inc.* | | 38,842 | | 1,446,865 | |
Informatica Corp.* | | 83,150 | | 1,015,262 | |
Lecroy Corp.* | | 63,952 | | 736,088 | |
Medics Pharmaceutical Corp. | | 141,342 | | 4,965,344 | |
Micrel, Inc.* | | 123,232 | | 1,328,441 | |
Microsemi Corp.* | | 82,275 | | 1,616,704 | |
Netlogic Microsystems, Inc.* | | 69,541 | | 1,508,344 | |
Neustar, Inc. Cl A* | | 32,687 | | 1,060,366 | |
Parametric Technology Corp.* | | 73,520 | | 1,324,830 | |
Rogers Corp.* | | 33,477 | | 1,980,165 | |
SPSS, Inc.* | | 44,992 | | 1,352,909 | |
Syniverse Holdings, Inc.* | | 71,156 | | 1,066,628 | |
Technitrol, Inc. | | 40,691 | | 972,108 | |
Tibco Software, Inc.* | | 54,821 | | 517,510 | |
Varian Semiconductor Equip.* | | 61,493 | | 2,799,161 | |
Verint Systems Inc* | | 42,245 | | 1,448,159 | |
Viasat, Inc.* | | 95,404 | | 2,843,993 | |
Wabtech | | 69,162 | | 2,101,142 | |
aQuantive, Inc.* | | 89,994 | | 2,219,252 | |
| | | | 47,865,856 | |
UTILITIES (0.5%) | | | | | |
PNM Resources, Inc. | | 32,366 | | 1,006,583 | |
| | | | | |
TOTAL COMMON STOCKS (Cost: $183,436,671) 97.2% | | | | 217,367,821 | |
*Non-income producing security.
50
| | Rate(%) | | Maturity | | Face Amount($) | | Value($) | |
SHORT-TERM DEBT SECURITIES: | | | | | | | | | |
U.S. GOVERNMENT AGENCIES (3.1%) | | | | | | | | | |
Federal Farm Credit Corp. | | 4.80 | | 01/02/07 | | 6,915,000 | | 6,912,234 | |
| | | | | | | | | |
TOTAL SHORT-TERM DEBT SECURITIES (Cost: $6,912,234) 3.1% | | | | | | | | 6,912,234 | |
| | | | | | | | | |
TOTAL INVESTMENTS (Cost: $190,348,905) 100.3% | | | | | | | | 224,280,055 | |
| | | | | | | | | |
OTHER NET ASSETS -0.3% | | | | | | | | (751,529 | ) |
| | | | | | | | | |
NET ASSETS 100.0% | | | | | | | | $ | 223,528,526 | |
| | | | | | | | | | |
51
MUTUAL OF AMERICA INVESTMENT CORPORATION (MID CAP VALUE )
PORTFOLIO OF INVESTMENTS IN SECURITIES
December 31, 2006
| | Shares | | Value($) | |
COMMON STOCKS: | | | | | |
BASIC MATERIALS (5.5%) | | | | | |
Arch Coal, Inc. | | 3,688 | | $ | 110,751 | |
Cytec Industries, Inc. | | 3,111 | | 175,803 | |
Eastman Chemical Co. | | 3,939 | | 233,622 | |
Huntsman Corp.* | | 15,449 | | 293,068 | |
Lubrizol Corp. | | 3,438 | | 172,347 | |
Lyondell Chemical Co. | | 7,247 | | 185,306 | |
Sonoco Products Co. | | 11,614 | | 442,029 | |
Steel Dynamics, Inc. | | 6,177 | | 200,444 | |
| | | | 1,813,370 | |
CONSUMER, CYCLICAL (12.3%) | | | | | |
Belo Corporation | | 12,368 | | 227,200 | |
Black & Decker Corp. | | 2,885 | | 230,713 | |
Circuit City Group, Inc. | | 12,441 | | 236,130 | |
Crown Holdings, Inc.* | | 24,462 | | 511,745 | |
Federated Dept Stores | | 3,890 | | 148,326 | |
Fortune Brands, Inc. | | 2,844 | | 242,849 | |
Harrah's Entertainment, Inc. | | 1,093 | | 90,413 | |
Johnson Controls, Inc. | | 4,805 | | 412,846 | |
Mohawk Industries, Inc.* | | 2,639 | | 197,556 | |
Newell Rubbermaid, Inc. | | 5,980 | | 173,121 | |
Office Depot, Inc.* | | 6,925 | | 264,327 | |
Penney (J.C.) Co., Inc. | | 988 | | 76,432 | |
Polo Ralph Lauren Corp. | | 6,844 | | 531,505 | |
Rent-A-Center, Inc.* | | 6,476 | | 191,107 | |
V F Corp. | | 3,909 | | 320,851 | |
Whirlpool Corp. | | 2,616 | | 217,180 | |
| | | | 4,072,301 | |
CONSUMER, NON-CYCLICAL (5.9%) | | | | | |
Clorox Co. | | 3,234 | | 207,461 | |
Coca-Cola Enterprises | | 9,736 | | 198,809 | |
Dean Foods Co.* | | 7,002 | | 296,045 | |
Kroger Co. | | 16,831 | | 388,291 | |
Reynolds American, Inc. | | 5,938 | | 388,761 | |
Tyson Foods, Inc. | | 9,804 | | 161,276 | |
Vector Group, Ltd. | | 18,619 | | 330,487 | |
| | | | 1,971,130 | |
| | | | | | |
52
| | Shares | | Value($) | |
COMMON STOCKS: | | | | | |
ENERGY (3.6%) | | | | | |
CNX Gas Corp.* | | 11,087 | | 282,719 | |
Frontier Oil Corp. | | 7,742 | | 222,505 | |
Grant Prideco, Inc.* | | 8,745 | | 347,789 | |
Range Resources Corp. | | 12,659 | | 347,616 | |
| | | | 1,200,629 | |
FINANCIAL (34.0%) | | | | | |
American Financial Group | | 12,100 | | 434,511 | |
Ameriprise Financial, Inc. | | 2,825 | | 153,963 | |
Aon Corp. | | 7,046 | | 249,006 | |
Apartment Investment & Mgmt. Co. | | 6,554 | | 367,155 | |
Associated Banc-Corp. | | 9,698 | | 338,266 | |
Assurant, Inc. | | 4,109 | | 227,022 | |
Bear Stearns Cos., Inc. | | 3,338 | | 543,360 | |
CIT Group, Inc. | | 5,701 | | 317,945 | |
Comerica, Inc. | | 5,743 | | 336,999 | |
Conseco, Inc.* | | 11,244 | | 224,655 | |
Developers Divers Rlty. | | 5,972 | | 375,937 | |
E*Trade Financial Corp.* | | 9,563 | | 214,402 | |
Equity Office Properties | | 11,666 | | 561,951 | |
Equity Residential | | 9,113 | | 462,485 | |
First American Corp. | | 4,884 | | 198,681 | |
First Tennessee Natl. Bank | | 8,433 | | 352,331 | |
Friedman, Billings, Ramsey Grp. | | 24,838 | | 198,704 | |
Fulton Financial Corp | | 14,056 | | 234,735 | |
Genworth Financial, Inc. | | 9,248 | | 316,374 | |
Host Hotels & Resorts Inc. | | 12,060 | | 296,073 | |
Huntington Bancshares, Inc. | | 13,204 | | 313,595 | |
ISHARES Russel Midcap | | 4,878 | | 714,286 | |
ISHARES Russel Midcap* | | 5,913 | | 590,354 | |
KeyCorp. | | 11,085 | | 421,563 | |
M & T Bank Corp. | | 2,561 | | 312,852 | |
Peoples Bank | | 8,178 | | 364,902 | |
Principal Financial Group Inc. | | 9,128 | | 535,814 | |
Radian Group, Inc. | | 5,532 | | 298,230 | |
StanCorp Financial Grp. | | 6,925 | | 311,971 | |
Vornado Realty Trust | | 5,097 | | 619,286 | |
Zions Bancorporation | | 4,560 | | 375,926 | |
| | | | 11,263,334 | |
53
| | Shares | | Value($) | |
COMMON STOCKS: | | | | | |
HEALTHCARE (3.5%) | | | | | |
CIGNA Corp. | | 3,175 | | 417,735 | |
Hillenbrand Industries, Inc. | | 3,019 | | 171,872 | |
Hospira, Inc.* | | 5,004 | | 168,034 | |
King Pharmaceuticals, Inc.* | | 11,369 | | 180,994 | |
McKesson Corp. | | 4,151 | | 210,456 | |
| | | | 1,149,091 | |
INDUSTRIAL (8.4%) | | | | | |
Agnico-Eagle Mines, Ltd. | | 9,559 | | 394,213 | |
Alliant TechSystems, Inc.* | | 3,497 | | 273,430 | |
CSX Corp. | | 5,859 | | 201,725 | |
Donnelley R.R. & Sons | | 11,451 | | 406,969 | |
General Growth Pptys Inc | | 5,849 | | 305,493 | |
Mettler-Toledo International* | | 4,676 | | 368,703 | |
Southwest Airlines Co. | | 10,297 | | 157,750 | |
Textron, Inc. | | 3,175 | | 297,720 | |
Trinity Industries | | 7,767 | | 273,398 | |
Yellow Roadway Corp.* | | 2,781 | | 104,927 | |
| | | | 2,784,328 | |
TECHNOLOGY (7.0%) | | | | | |
Arrow Electronics* | | 6,765 | | 213,435 | |
Computer Sciences Corp.* | | 2,735 | | 145,967 | |
DRS Technologies Inc | | 5,520 | | 290,794 | |
Electronic Data Systems Corp. | | 10,471 | | 288,476 | |
Integrated Device Tech., Inc.* | | 4,878 | | 75,511 | |
Intersil Corp. Cl A | | 5,318 | | 127,207 | |
McAfee, Inc.* | | 5,372 | | 152,457 | |
Medics Pharmaceutical Corp. | | 3,986 | | 140,028 | |
NCR Corp.* | | 4,191 | | 179,207 | |
Sybase, Inc.* | | 7,370 | | 182,039 | |
Tellabs, Inc.* | | 15,488 | | 158,907 | |
Xerox Corp.* | | 21,197 | | 359,289 | |
| | | | 2,313,317 | |
TELECOMMUNICATIONS (1.4%) | | | | | |
CenturyTel, Inc. | | 7,331 | | 320,071 | |
Qwest Communications Intl.* | | 19,735 | | 165,182 | |
| | | | 485,253 | |
54
| | Shares | | Value($) | |
COMMON STOCKS: | | | | | |
UTILITIES (13.7%) | | | | | |
American Electric Power, Inc. | | 11,937 | | 508,277 | |
Constellation Energy Group | | 4,151 | | 285,879 | |
Edison International | | 9,922 | | 451,253 | |
Energen Corp. | | 10,183 | | 477,990 | |
Entergy Corp. | | 3,372 | | 311,303 | |
PG & E Corp. | | 9,680 | | 458,154 | |
PPL Corporation | | 12,144 | | 435,241 | |
Pepco Holdings, Inc. | | 13,862 | | 360,551 | |
Pinnacle West Capital Corp. | | 7,370 | | 373,585 | |
Sempra Energy | | 9,151 | | 512,822 | |
Sierra Pacific Resources* | | 21,552 | | 362,720 | |
| | | | 4,537,775 | |
| | | | | |
TOTAL COMMON STOCKS (Cost: $28,433,476) 95.3% | | | | 31,590,528 | |
*Non-income producing security.
55
| | Rate(%) | | Maturity | | Face Amount($) | | Value($) | |
SHORT-TERM DEBT SECURITIES: | | | | | | | | | |
U.S. GOVERNMENT AGENCIES (5.1%) | | | | | | | | | |
Federal Farm Credit Corp. | | 4.80 | | 01/02/07 | | 1,689,000 | | 1,688,324 | |
| | | | | | | | | |
TOTAL SHORT-TERM DEBT SECURITIES (Cost: $1,688,324) 5.1% | | | | | | | | 1,688,324 | |
| | | | | | | | | |
TOTAL INVESTMENTS (Cost: $30,121,800) 100.4% | | | | | | | | 33,278,852 | |
| | | | | | | | | |
OTHER NET ASSETS -0.4% | | | | | | | | (131,461 | ) |
| | | | | | | | | |
NET ASSETS 100.0% | | | | | | | | $ | 33,147,391 | |
| | | | | | | | | | |
56
MUTUAL OF AMERICA INVESTMENT CORPORATION (MID-CAP EQUITY INDEX FUND )
PORTFOLIO OF INVESTMENTS IN SECURITIES
December 31, 2006
| | Shares | | Value($) | |
COMMON STOCKS: | | | | | |
BASIC MATERIALS (5.7%) | | | | | |
Airgas, Inc. | | 23,922 | | $ | 969,319 | |
Albemarle Corp. | | 12,086 | | 867,775 | |
Arch Coal, Inc. | | 43,548 | | 1,307,746 | |
Bowater, Inc. | | 17,153 | | 385,943 | |
Cabot Corp. | | 19,422 | | 846,217 | |
Chemtura Corp. | | 73,807 | | 710,761 | |
Commercial Metals Co. | | 36,262 | | 935,560 | |
Cytec Industries, Inc. | | 12,828 | | 724,910 | |
FMC Corp. | | 11,766 | | 900,687 | |
Ferro Corp. | | 13,126 | | 271,577 | |
Glatfelter | | 13,733 | | 212,862 | |
Longview Fibre Co. | | 20,166 | | 442,644 | |
Louisiana-Pacific Corp. | | 31,962 | | 688,142 | |
Lubrizol Corp. | | 21,098 | | 1,057,643 | |
Lyondell Chemical Co. | | 64,771 | | 1,656,194 | |
Martin Marietta Materials, Inc | | 13,844 | | 1,438,530 | |
Minerals Technologies, Inc. | | 5,874 | | 345,332 | |
Olin Corp. | | 22,363 | | 369,437 | |
Packaging Corp of America | | 24,999 | | 552,478 | |
Potlatch Corp | | 11,882 | | 520,669 | |
RPM International Inc. | | 36,595 | | 764,470 | |
Scotts Co. Cl A | | 14,112 | | 728,885 | |
Sensient Technologies Corp. | | 14,250 | | 350,550 | |
Sonoco Products Co. | | 30,589 | | 1,164,217 | |
Steel Dynamics, Inc. | | 27,926 | | 906,199 | |
Valspar Corp. | | 31,180 | | 861,815 | |
Worthington Industries, Inc. | | 22,335 | | 395,776 | |
| | | | 20,376,338 | |
CONSUMER, CYCLICAL (13.3%) | | | | | |
99 Cent Only Stores* | | 14,267 | | 173,629 | |
Abercrombie & Fitch Co. Cl A | | 27,062 | | 1,884,327 | |
Advance Auto Parts | | 32,276 | | 1,147,735 | |
Aeropostale, Inc.* | | 16,122 | | 497,686 | |
American Eagle Outfitters | | 61,537 | | 1,920,570 | |
American Greetings Corp. Cl A | | 18,389 | | 438,945 | |
Ann Taylor Stores Corp.* | | 22,024 | | 723,268 | |
Applebees Intl., Inc. | | 22,779 | | 561,958 | |
ArvinMeritor, Inc. | | 21,668 | | 395,008 | |
Bandag, Inc. | | 3,511 | | 177,060 | |
| | | | | | |
57
| | Shares | | Value($) | |
COMMON STOCKS: | | | | | |
CONSUMER, CYCLICAL (Cont’d.) | | | | | |
Barnes & Noble, Inc. | | 15,693 | | 623,169 | |
Beazer Homes USA, Inc. | | 11,998 | | 564,026 | |
Belo Corporation | | 26,932 | | 494,741 | |
Blyth, Inc. | | 7,712 | | 160,024 | |
Bob Evans Farms, Inc. | | 11,226 | | 384,154 | |
Borders Group, Inc. | | 18,219 | | 407,195 | |
Borg-Warner, Inc. | | 17,649 | | 1,041,644 | |
Boyd Gaming Corp. | | 12,994 | | 588,758 | |
Brinker International, Inc. | | 37,672 | | 1,136,188 | |
CBRL Group, Inc. | | 9,626 | | 430,860 | |
Callaway Golf Co. | | 19,071 | | 274,813 | |
CarMax, Inc.* | | 32,761 | | 1,756,972 | |
Catalina Marketing Corp. | | 11,162 | | 306,955 | |
Charming Shoppes, Inc.* | | 37,813 | | 511,610 | |
Cheesecake Factory, Inc.* | | 23,864 | | 587,054 | |
Chico’s FAS, Inc.* | | 53,899 | | 1,115,170 | |
Claire’s Stores, Inc. | | 28,539 | | 945,782 | |
Coldwater Creek Inc* | | 18,554 | | 454,944 | |
Dick’s Sporting Goods Inc.* | | 11,533 | | 565,002 | |
Dollar Tree Stores* | | 31,465 | | 947,097 | |
Entercom Communications | | 8,593 | | 242,151 | |
Foot Locker, Inc. | | 47,731 | | 1,046,741 | |
Furniture Brands Intl., Inc. | | 14,822 | | 240,561 | |
Gamestop Corp.* | | 23,258 | | 1,281,748 | |
Gentex Corp. | | 43,926 | | 683,489 | |
Hanesbrands, Inc.* | | 29,534 | | 697,593 | |
Harte-Hanks, Inc. | | 14,857 | | 411,687 | |
Hovanian Enterprises, Inc.* | | 11,156 | | 378,188 | |
International Speedway Corp. | | 10,945 | | 558,633 | |
Lear Corp.* | | 20,662 | | 610,149 | |
Lee Enterprises | | 14,043 | | 436,176 | |
MDC Holdings, Inc. | | 10,635 | | 606,727 | |
Media General Inc. Cl A | | 7,365 | | 273,757 | |
Modine Manufacturing Co. | | 10,047 | | 251,476 | |
Mohawk Industries, Inc.* | | 16,407 | | 1,228,228 | |
O’Reilly Automotive, Inc.* | | 34,850 | | 1,117,291 | |
Pacific Sunwear of Calif* | | 21,301 | | 417,074 | |
Payless Shoesource, Inc.* | | 20,235 | | 664,113 | |
PetSmart, Inc. | | 41,618 | | 1,201,095 | |
58
| | Shares | | Value($) | |
COMMON STOCKS: | | | | | |
CONSUMER, CYCLICAL (Cont’d.) | | | | | |
Polo Ralph Lauren Corp. | | 18,812 | | 1,460,940 | |
Reader’s Digest Assn. | | 29,128 | | 486,438 | |
Regis Corporation | | 13,818 | | 546,364 | |
Rent-A-Center, Inc.* | | 21,482 | | 633,934 | |
Ross Stores, Inc. | | 42,856 | | 1,255,681 | |
Ruby Tuesday, Inc. | | 17,973 | | 493,359 | |
Ryland Group, Inc. | | 13,065 | | 713,610 | |
Saks Incorporated | | 42,588 | | 758,918 | |
Scholastic Corp.* | | 7,903 | | 283,244 | |
Strayer Education Inc. | | 4,405 | | 467,150 | |
Thor Industries, Inc. | | 10,763 | | 473,464 | |
Timberland Company Cl A* | | 15,505 | | 489,648 | |
Toll Brothers, Inc.* | | 38,595 | | 1,243,917 | |
Tupperware Corp. | | 18,575 | | 419,981 | |
Urban Outfitters, Inc.* | | 34,343 | | 790,919 | |
Valassis Communication, Inc.* | | 14,661 | | 212,585 | |
Washington Post Co. Cl B | | 1,736 | | 1,294,362 | |
Westwood One, Inc. | | 21,502 | | 151,804 | |
Wiley (John) & Sons Cl A | | 13,511 | | 519,768 | |
Williams-Sonoma, Inc. | | 34,393 | | 1,081,316 | |
| | | | 47,340,623 | |
CONSUMER, NON-CYCLICAL (2.2%) | | | | | |
Alberto-Culver Co. | | 24,502 | | 525,568 | |
BJ’s Wholesale Club, Inc.* | | 19,732 | | 613,863 | |
Church & Dwight | | 20,005 | | 853,213 | |
Energizer Holdings, Inc.* | | 17,445 | | 1,238,421 | |
Hansen Natural Corp.* | | 18,666 | | 628,671 | |
Hormel Foods Corp. | | 22,429 | | 837,499 | |
J.M. Smucker Co. | | 17,416 | | 844,154 | |
Lancaster Colony Corp. | | 7,207 | | 319,342 | |
PepsiAmericas, Inc. | | 18,600 | | 390,228 | |
Ruddick Corp. | | 11,003 | | 305,333 | |
Smithfield Foods, Inc.* | | 30,525 | | 783,272 | |
Tootsie Roll Inds., Inc. | | 8,077 | | 264,118 | |
Universal Corp. | | 7,881 | | 386,248 | |
| | | | 7,989,930 | |
ENERGY (5.8%) | | | | | |
Denbury Resources, Inc.* | | 36,803 | | 1,022,755 | |
ENSCO International, Inc. | | 46,570 | | 2,331,294 | |
59
| | Shares | | Value($) | |
COMMON STOCKS: | | | | | |
ENERGY (Cont’d.) | | | | | |
FMC Technologies Inc.* | | 20,862 | | 1,285,725 | |
Forest Oil Corp.* | | 16,790 | | 548,697 | |
Grant Prideco, Inc.* | | 39,266 | | 1,561,609 | |
Hanover Compressor Co.* | | 31,665 | | 598,152 | |
Helmerich & Payne, Inc. | | 32,260 | | 789,402 | |
NewField Exploration Company* | | 39,553 | | 1,817,460 | |
Noble Energy, Inc. | | 53,303 | | 2,615,578 | |
Overseas Shipholding Group | | 9,076 | | 510,979 | |
Patterson UTI Energy, Inc. | | 48,727 | | 1,131,928 | |
Pioneer Natural Resources Co. | | 37,603 | | 1,492,463 | |
Plains Exploration & Prod. Co. | | 23,521 | | 1,117,953 | |
Pogo Producing Co. | | 17,906 | | 867,367 | |
Pride International, Inc.* | | 50,313 | | 1,509,893 | |
Quicksilver Resources* | | 16,883 | | 617,749 | |
Tidewater, Inc. | | 17,624 | | 852,297 | |
| | | | 20,671,301 | |
FINANCIAL (17.7%) | | | | | |
AMB Property Corp. | | 27,390 | | 1,605,328 | |
American Financial Group | | 21,481 | | 771,383 | |
Americredit Corp.* | | 35,423 | | 891,597 | |
Associated Banc-Corp. | | 39,961 | | 1,393,840 | |
Astoria Financial Corp. | | 26,139 | | 788,352 | |
Bank of Hawaii Corp | | 15,241 | | 822,252 | |
Berkley (WR) Corp. | | 51,712 | | 1,784,581 | |
Brown & Brown, Inc. | | 35,197 | | 992,907 | |
Cathay General Bancorp | | 15,892 | | 548,433 | |
City National Corp. | | 12,259 | | 872,841 | |
Colonial BancGroup, Inc. | | 46,905 | | 1,207,335 | |
Cullen Frost Bankers, Inc. | | 18,319 | | 1,022,567 | |
Developers Divers Rlty. | | 33,395 | | 2,102,215 | |
Eaton Vance Corp. | | 38,960 | | 1,286,070 | |
Edwards (A.G.), Inc. | | 23,313 | | 1,475,480 | |
Everest RE Group* | | 19,933 | | 1,955,627 | |
Fidelity National Financial In | | 67,581 | | 1,613,834 | |
First American Corp. | | 29,638 | | 1,205,674 | |
First Niagara Financial Grp. | | 33,960 | | 504,646 | |
Firstmerit Corp. | | 24,559 | | 592,854 | |
GATX Corp. | | 15,724 | | 681,321 | |
Gallagher (Arthur J.) & Co. | | 30,084 | | 888,982 | |
60
| | Shares | | Value($) | |
COMMON STOCKS: | | | | | |
FINANCIAL (Cont’d.) | | | | | |
Greater Bay Bancorp | | 15,654 | | 412,170 | |
HCC Insurance Holdings Inc. | | 34,101 | | 1,094,301 | |
Hanover Insurance Group | | 15,642 | | 763,330 | |
Highwoods Properties, Inc. | | 17,193 | | 700,787 | |
Horace Mann Educators Corp. | | 13,202 | | 266,680 | |
Hospitality Properties Trust | | 22,965 | | 1,091,526 | |
Indymac Bancorp, Inc. | | 21,734 | | 981,507 | |
Investors Financial Services | | 20,258 | | 864,409 | |
Jefferies Group | | 30,989 | | 831,125 | |
Leucadia National | | 49,756 | | 1,403,119 | |
Liberty Property Trust | | 27,729 | | 1,362,603 | |
Macerich Co. | | 22,022 | | 1,906,445 | |
Mack-Cali Realty Corp. | | 19,199 | | 979,149 | |
Mercantile Bankshares Corp. | | 38,484 | | 1,800,666 | |
Mercury General Corporation | | 10,878 | | 573,597 | |
MoneyGram International, Inc. | | 25,775 | | 808,304 | |
New Plan Excel Realty Trust | | 31,674 | | 870,402 | |
New York Community Bancorp | | 79,650 | | 1,282,365 | |
Nuveen Investments, Inc. | | 24,145 | | 1,252,643 | |
Ohio Casualty Corp. | | 18,705 | | 557,596 | |
Old Republic Intl. Corp. | | 70,681 | | 1,645,454 | |
PMI Group, Inc. | | 26,804 | | 1,264,345 | |
Protective Life Corp. | | 21,446 | | 1,018,685 | |
Radian Group, Inc. | | 24,713 | | 1,332,278 | |
Raymond James Financial, Inc. | | 27,769 | | 841,678 | |
Rayonier, Inc. | | 23,505 | | 964,880 | |
Regency Centers Corp. | | 21,132 | | 1,651,888 | |
SEI Investments | | 19,411 | | 1,156,119 | |
SVB Financial Group* | | 10,524 | | 490,629 | |
StanCorp Financial GP | | 16,416 | | 739,541 | |
TCF Financial | | 34,531 | | 946,840 | |
United Dominion Rlty.Tr., Inc. | | 41,306 | | 1,313,118 | |
Unitrin, Inc. | | 12,352 | | 618,959 | |
Waddell & Reed Financial, Inc. | | 25,804 | | 705,997 | |
Washington Federal, Inc. | | 26,794 | | 630,463 | |
Webster Financial Corp. | | 17,222 | | 839,056 | |
Weingarten Realty Investors | | 23,099 | | 1,065,095 | |
61
| | Shares | | Value($) | |
COMMON STOCKS: | | | | | |
FINANCIAL (Cont’d.) | | | | | |
Westamerica Bancorp | | 9,438 | | 477,846 | |
Wilmington Trust Corp. | | 21,014 | | 886,160 | |
| | | | 63,399,874 | |
HEALTHCARE (10.0%) | | | | | |
Advanced Medical Optics, Inc.* | | 18,157 | | 639,126 | |
Apria Healthcare Group, Inc.* | | 13,073 | | 348,395 | |
Beckman Coulter, Inc. | | 19,101 | | 1,142,240 | |
Cephalon, Inc.* | | 18,696 | | 1,316,385 | |
Charles River Laboratories Inc | | 20,517 | | 887,360 | |
Community Health Systems Inc.* | | 29,172 | | 1,065,361 | |
Covance, Inc.* | | 19,622 | | 1,155,932 | |
Cytyc Corp.* | | 34,540 | | 977,482 | |
Dentsply International, Inc. | | 46,567 | | 1,390,025 | |
Edwards Lifesciences Corp.* | | 17,754 | | 835,148 | |
Gen-Probe, Inc.* | | 15,967 | | 836,192 | |
Health Net, Inc.* | | 35,746 | | 1,739,400 | |
Hillenbrand Industries, Inc. | | 18,842 | | 1,072,675 | |
Intuitive Surgical, Inc.* | | 11,331 | | 1,086,643 | |
Invitrogen Corp.* | | 14,753 | | 834,872 | |
Lifepoint Hospitals, Inc.* | | 17,592 | | 592,850 | |
Lincare Holdings, Inc.* | | 28,394 | | 1,131,217 | |
Millennium Pharmaceuticals Inc | | 93,828 | | 1,022,725 | |
Omnicare, Inc. | | 37,238 | | 1,438,504 | |
Par Pharmaceutical Cos Inc* | | 10,727 | | 239,963 | |
Pdl BioPharma Inc* | | 35,336 | | 711,667 | |
Perrigo Co. | | 23,264 | | 402,467 | |
Pharmaceutical Prod. Dev. Inc. | | 31,634 | | 1,019,247 | |
Psychiatric Solutions* | | 16,333 | | 612,814 | |
ResMed, Inc.* | | 23,319 | | 1,147,761 | |
Schein (Henry), Inc.* | | 27,162 | | 1,330,395 | |
Sepracor, Inc.* | | 33,596 | | 2,068,842 | |
Steris Corp. | | 19,842 | | 499,423 | |
Techne Corp.* | | 12,053 | | 668,339 | |
Triad Hospitals, Inc.* | | 26,993 | | 1,129,117 | |
Universal Health Services Cl B | | 16,641 | | 922,411 | |
VCA Antech, Inc.* | | 25,606 | | 824,257 | |
Valeant Pharmaceuticals | | 28,514 | | 491,581 | |
Varian Medical Systems, Inc.* | | 39,585 | | 1,883,058 | |
Varian, Inc.* | | 9,329 | | 417,846 | |
62
| | Shares | | Value($) | |
COMMON STOCKS: | | | | | |
HEALTHCARE (Cont’d.) | | | | | |
Ventana Medical Systems, Inc.* | | 9,993 | | 429,999 | |
Vertex Pharmaceutical* | | 38,515 | | 1,441,231 | |
| | | | 35,752,950 | |
INDUSTRIAL (17.4%) | | | | | |
ADESA, Inc. | | 27,582 | | 765,401 | |
AGCO Corp.* | | 27,939 | | 864,433 | |
Affymetrix, Inc.* | | 20,807 | | 479,809 | |
AirTran Holdings, Inc.* | | 27,923 | | 327,816 | |
Alaska Air Group, Inc.* | | 12,274 | | 484,823 | |
Alexander & Baldwin, Inc. | | 13,104 | | 581,031 | |
Alliant TechSystems Inc.* | | 10,099 | | 789,641 | |
Ametek, Inc. | | 32,464 | | 1,033,654 | |
Avis Budget Group | | 30,933 | | 670,937 | |
Banta Corp. | | 7,515 | | 273,546 | |
C.H. Robinson Worldwide, Inc. | | 53,409 | | 2,183,894 | |
Cameron International Corp.* | | 34,095 | | 1,808,740 | |
Career Education Corp.* | | 29,064 | | 720,206 | |
Carlisle Companies, Inc. | | 9,460 | | 742,610 | |
ChoicePoint, Inc.* | | 24,462 | | 963,314 | |
Con-Way Inc | | 14,432 | | 635,585 | |
Copart, Inc.* | | 21,667 | | 650,010 | |
Corinthian Colleges, Inc.* | | 26,479 | | 360,909 | |
Corporate Executive Board Co. | | 11,972 | | 1,049,944 | |
Crane Co. | | 15,724 | | 576,127 | |
DeVry, Inc. | | 18,247 | | 510,916 | |
Deluxe Corp. | | 15,796 | | 398,059 | |
Donaldson Company, Inc. | | 21,532 | | 747,376 | |
Dun & Bradstreet* | | 18,833 | | 1,559,184 | |
Dycom Industries, Inc.* | | 12,462 | | 263,197 | |
Expeditors Int’l Wash., Inc. | | 65,372 | | 2,647,566 | |
Fastenal Co. | | 38,423 | | 1,378,617 | |
Federal Signal Corp. | | 14,617 | | 234,457 | |
Florida Rock Industries | | 15,136 | | 651,605 | |
Flowserve Corporation* | | 17,830 | | 899,880 | |
Graco, Inc. | | 20,621 | | 817,004 | |
Granite Construction | | 10,372 | | 521,919 | |
HNI Corporation | | 14,909 | | 662,109 | |
Harsco Corp. | | 12,858 | | 978,494 | |
Hubbell, Inc. Cl B | | 18,473 | | 835,164 | |
63
| | Shares | | Value($) | |
COMMON STOCKS: | | | | | |
INDUSTRIAL (Cont’d.) | | | | | |
Hunt (JB) Transport Svcs., Inc | | 31,860 | | 661,732 | |
ITT Educational Services, Inc. | | 9,895 | | 656,731 | |
Jacobs Engineering Group, Inc. | | 18,113 | | 1,476,934 | |
JetBlue Airways Corp* | | 53,886 | | 765,181 | |
Joy Global, Inc. | | 36,393 | | 1,759,238 | |
Kelly Services, Inc. | | 6,526 | | 188,862 | |
Kennametal, Inc. | | 11,842 | | 696,902 | |
Korn/Ferry International* | | 12,914 | | 296,505 | |
Laureate Education, Inc.* | | 15,773 | | 767,041 | |
Lincoln Electric Holdings | | 13,078 | | 790,173 | |
MSC Ind. Direct Co. Cl A | | 16,638 | | 651,378 | |
Manpower, Inc. | | 26,050 | | 1,951,927 | |
Martek Biosciences Corp.* | | 9,841 | | 229,689 | |
Miller (Herman), Inc. | | 19,912 | | 724,000 | |
Mine Safety Appliances Co. | | 9,241 | | 338,683 | |
Navigant Consulting Co.* | | 16,468 | | 325,408 | |
Nordson Corp. | | 10,304 | | 513,448 | |
OSI Restaurant Partners Inc. | | 22,827 | | 894,818 | |
Oshkosh Truck Corp. | | 22,624 | | 1,095,454 | |
Pentair, Inc. | | 30,596 | | 960,714 | |
Precision Castparts Corp. | | 41,617 | | 3,257,779 | |
Quanta Services, Inc.* | | 36,350 | | 715,005 | |
Reliance Steel & Aluminum Co. | | 19,687 | | 775,274 | |
Republic Services, Inc. | | 34,813 | | 1,415,845 | |
Rollins, Inc. | | 9,142 | | 202,130 | |
Roper Industries, Inc. | | 26,739 | | 1,343,367 | |
SPX, Inc. | | 17,598 | | 1,076,294 | |
Scientific Games Corp* | | 20,508 | | 619,957 | |
Sequa Corp. Cl A* | | 2,102 | | 241,856 | |
Sotheby’s (Deleware) | | 17,232 | | 534,537 | |
Stericycle, Inc.* | | 13,610 | | 1,027,555 | |
Swift Transportation Co., Inc. | | 16,540 | | 434,506 | |
Teleflex, Inc. | | 11,965 | | 772,460 | |
The Brink’s Company | | 14,783 | | 944,929 | |
Thomas & Betts Corp.* | | 15,982 | | 755,629 | |
Timken Co. | | 28,868 | | 842,368 | |
Trinity Industries | | 24,462 | | 861,062 | |
United Rentals* | | 20,396 | | 518,670 | |
Werner Enterprises, Inc. | | 15,411 | | 269,384 | |
64
| | Shares | | Value($) | |
COMMON STOCKS: | | | | | |
INDUSTRIAL (Cont’d.) | | | | | |
Yellow Roadway Corp.* | | 17,517 | | 660,916 | |
| | | | 62,082,318 | |
TECHNOLOGY (14.7%) | | | | | |
3Com Corp.* | | 121,624 | | 499,874 | |
Activision, Inc.* | | 76,523 | | 1,319,256 | |
Acxiom Corp. | | 20,960 | | 537,623 | |
Adtran, Inc. | | 19,305 | | 438,223 | |
Advent Software, Inc.* | | 6,111 | | 215,657 | |
Alliance Data Systems* | | 20,294 | | 1,267,765 | |
Amphenol Corp Cl A | | 26,794 | | 1,663,371 | |
Andrew Corp.* | | 48,963 | | 500,891 | |
Arrow Electronics* | | 37,485 | | 1,182,652 | |
Atmel Corp.* | | 131,370 | | 794,789 | |
Avnet, Inc.* | | 39,141 | | 999,270 | |
Avocent Corp.* | | 15,592 | | 527,789 | |
BISYS Group, Inc.* | | 36,926 | | 476,715 | |
CDW Corp. | | 18,509 | | 1,301,553 | |
CSG Systems Intl., Inc.* | | 14,465 | | 386,649 | |
Cadence Design Systems, Inc.* | | 85,083 | | 1,523,837 | |
Ceridian Corp.* | | 42,665 | | 1,193,767 | |
CheckFree Corp.* | | 27,144 | | 1,090,103 | |
CommScope, Inc.* | | 18,280 | | 557,174 | |
Cree , Inc.* | | 23,638 | | 409,410 | |
Cypress Semiconductor Corp.* | | 44,130 | | 744,473 | |
DRS Technologies Inc | | 12,347 | | 650,440 | |
DST Systems, Inc.* | | 17,035 | | 1,066,902 | |
Diebold, Inc. | | 20,089 | | 936,147 | |
F5 Networks, Inc.* | | 12,410 | | 920,946 | |
Fair Isaac Corporation | | 17,722 | | 720,399 | |
Fairchild Semiconductor Intl.* | | 37,598 | | 632,022 | |
Gartner, Inc.* | | 17,494 | | 346,206 | |
Harris Corp. | | 41,130 | | 1,886,222 | |
Henry (Jack) & Associates | | 23,920 | | 511,888 | |
Imation Corp. | | 10,646 | | 494,294 | |
Ingram Micro, Inc.* | | 42,668 | | 870,854 | |
Integrated Device Tech., Inc.* | | 60,922 | | 943,073 | |
International Rectifier* | | 22,129 | | 852,630 | |
Intersil Corp. Cl A | | 42,341 | | 1,012,797 | |
Kemet Corp.* | | 26,689 | | 194,830 | |
65
| | Shares | | Value($) | |
COMMON STOCKS: | | | | | |
TECHNOLOGY (Cont’d.) | | | | | |
Lam Research Corp.* | | 43,697 | | 2,211,942 | |
Lattice Semiconductor Corp.* | | 35,114 | | 227,539 | |
MEMC Elect. Materials, Inc* | | 51,132 | | 2,001,306 | |
MPS Group, Inc.* | | 31,427 | | 445,635 | |
Macrovision Corp.* | | 15,716 | | 444,134 | |
McAfee, Inc.* | | 48,921 | | 1,388,378 | |
McData Corporation Cl A* | | 49,698 | | 275,824 | |
Medics Pharmaceutical Corp. | | 16,873 | | 592,748 | |
Mentor Graphics Corp.* | | 25,407 | | 458,088 | |
Micrel, Inc.* | | 17,533 | | 189,006 | |
Microchip Technology, Inc. | | 66,178 | | 2,164,021 | |
National Instruments Corp. | | 17,459 | | 475,583 | |
Newport Corp.* | | 12,581 | | 263,572 | |
Palm, Inc.* | | 31,878 | | 449,161 | |
Parametric Technology Corp.* | | 33,480 | | 603,310 | |
Plantronics, Inc. | | 14,594 | | 309,393 | |
Plexus Corp.* | | 14,184 | | 338,714 | |
Polycom, Inc.* | | 27,216 | | 841,247 | |
Powerwave Technologies, Inc.* | | 39,885 | | 257,258 | |
RF Micro Devices* | | 59,037 | | 400,861 | |
SRA International, Inc. Cl A* | | 12,587 | | 336,576 | |
Semtech Corp.* | | 22,339 | | 291,971 | |
Silicon Laboratories, Inc.* | | 16,747 | | 580,284 | |
Sybase, Inc.* | | 27,942 | | 690,167 | |
Synopsys, Inc.* | | 43,267 | | 1,156,527 | |
Tech Data Corp.* | | 16,702 | | 632,505 | |
Transaction Systems Architects | | 11,484 | | 374,034 | |
Triquint Semiconductor, Inc.* | | 42,097 | | 189,437 | |
Utstarcom, Inc.* | | 32,611 | | 285,346 | |
ValueClick , Inc.* | | 29,993 | | 708,735 | |
Vishay Intertechnology, Inc.* | | 56,567 | | 765,917 | |
Western Digital Corp.* | | 67,988 | | 1,391,034 | |
Wind River Systems* | | 23,162 | | 237,411 | |
Zebra Technologies Cl A* | | 21,601 | | 751,499 | |
| | | | 52,399,654 | |
TELECOMMUNICATIONS (0.6%) | | | | | |
Cincinnati Bell, Inc.* | | 75,813 | | 346,465 | |
Telephone & Data Systems, Inc. | | 31,922 | | 1,734,322 | |
| | | | 2,080,787 | |
66
| | Shares | | Value($) | |
COMMON STOCKS: | | | | | |
UTILITIES (8.3%) | | | | | |
AGL Resources, Inc. | | 23,835 | | 927,420 | |
Alliant Energy Corp. | | 35,601 | | 1,344,650 | |
Aqua America, Inc. | | 40,508 | | 922,772 | |
Aquila, Inc.* | | 114,838 | | 539,739 | |
Black Hills Corp. | | 10,216 | | 377,379 | |
DPL, Inc. | | 34,655 | | 962,716 | |
Duquesne Light Holdings, Inc. | | 26,868 | | 533,330 | |
Energy East Corporation | | 45,297 | | 1,123,366 | |
Equitable Resources, Inc. | | 37,021 | | 1,545,627 | |
Great Plains Energy Inc. | | 24,626 | | 783,107 | |
Hawaiian Electric Inds. | | 24,947 | | 677,311 | |
IdaCorp, Inc. | | 13,166 | | 508,866 | |
MDU Resources Group | | 55,470 | | 1,422,251 | |
NSTAR | | 32,754 | | 1,125,427 | |
National Fuel Gas Co. | | 25,265 | | 973,713 | |
Northeast Utilities | | 47,234 | | 1,330,109 | |
OGE Energy Corp. | | 27,950 | | 1,118,000 | |
Oneok, Inc. | | 33,799 | | 1,457,413 | |
PNM Resources, Inc. | | 23,139 | | 719,623 | |
Pepco Holdings, Inc. | | 58,678 | | 1,526,215 | |
Puget Energy, Inc. | | 35,697 | | 905,276 | |
SCANA Corp. | | 35,725 | | 1,451,150 | |
Sierra Pacific Resources* | | 67,754 | | 1,140,300 | |
Southwestern Energy Co.* | | 51,603 | | 1,808,685 | |
Vectren Corporation | | 23,369 | | 660,875 | |
WGL Holdings, Inc. | | 14,928 | | 486,354 | |
WPS Resources | | 13,265 | | 716,708 | |
Westar Energy, Inc. | | 26,783 | | 695,287 | |
Wisconsin Energy Corp. | | 35,874 | | 1,702,580 | |
| | | | 29,486,249 | |
| | | | | |
TOTAL COMMON STOCKS (Cost: $278,331,722) 95.7% | | | | 341,580,024 | |
*Non-income producing security.
67
| | Rate(%) | | Maturity | | Face
Amount($) | | Value($) | |
SHORT-TERM DEBT SECURITIES: | | | | | | | | | |
U.S. GOVERNMENT (0.4%) | | | | | | | | | |
U.S. Treasury Bill (a) | | 4.79 | | 03/08/07 | | 600,000 | | 594,398 | |
U.S. Treasury Bill (a) | | 4.89 | | 01/11/07 | | 500,000 | | 499,176 | |
U.S. Treasury Bill (a) | | 4.91 | | 01/11/07 | | 300,000 | | 299,504 | |
| | | | | | | | 1,393,078 | |
U.S. GOVERNMENT AGENCIES (1.8%) | | | | | | | | | |
Federal Home Loan Bank | | 4.80 | | 01/02/07 | | 6,320,000 | | 6,317,472 | |
| | | | | | | | | |
COMMERCIAL PAPER (2.2%) | | | | | | | | | |
Novartis Finance | | 5.28 | | 01/02/07 | | 8,000,000 | | 7,996,479 | |
| | | | | | | | | |
TOTAL SHORT-TERM DEBT SECURITIES (Cost: $15,707,190) 4.4% | | | | | | | | 15,707,029 | |
| | | | | | | | | |
TEMPORARY CASH INVESTMENTS**(Cost: $14,500) 0.0% (1) | | | | | | | | 14,500 | |
| | | | | | | | | |
TOTAL INVESTMENTS (Cost: $294,053,412) 100.1% | | | | | | | | 357,301,553 | |
| | | | | | | | | |
OTHER NET ASSETS—0.1% | | | | | | | | (311,226 | ) |
| | | | | | | | | |
NET ASSETS 100.0% | | | | | | | | $ | 356,990,327 | |
| | | | | | | | | | |
(1) Less than 0.05%.
** The fund has an arrangement with its custodian bank, JPMorgan Chase Bank, whereby uninvested cash, subject to parameters set by the fund, is automatically invested in the fund’s name by the bank in overnight commercial paper issued by J.P. Morgan Chase & Co. On the next business day, these funds (and earned interest) are automatically returned to the fund. The annual rate of interest earned on this temporary cash investment at December 31, 2006 was 4.83 %.
(a) This security, or a portion thereof, has been segregated to cover initial margin requirements on open futures contracts.
FUTURES CONTRACTS OUTSTANDING AS OF DECEMBER 31, 2006:
| | Expiration | | Underlying Face | | Unrealized | |
| | Date | | Amount at Value | | Gain(Loss) | |
Purchased | | | | | | | |
| | | | | | | |
37 S&P 400 Index Futures Contracts | | March 2007 | | $ | 15,009,050 | | $ | (191,475 | ) |
| | | | | | | | | |
Face Value of futures purchased and outstanding as a percentage of total investments in securities: 4.2 %
68
MUTUAL OF AMERICA INVESTMENT CORPORATION (COMPOSITE FUND )
PORTFOLIO OF INVESTMENTS IN SECURITIES
December 31, 2006
| | Shares | | Value($) | |
COMMON STOCKS: | | | | | |
BASIC MATERIALS (1.1%) | | | | | |
Dow Chemical Co. | | 27,400 | | $ | 1,094,356 | |
Phelps Dodge Corp. | | 11,897 | | 1,424,309 | |
| | | | 2,518,665 | |
CONSUMER, CYCLICAL (5.3%) | | | | | |
Best Buy Co., Inc. | | 13,304 | | 654,424 | |
Carnival Corp. | | 10,011 | | 491,040 | |
Circuit City Group, Inc. | | 36,288 | | 688,746 | |
Coach, Inc.* | | 11,619 | | 499,152 | |
Comcast Corp. Cl A* | | 23,171 | | 980,828 | |
Home Depot, Inc. | | 12,148 | | 487,864 | |
International Game Technology | | 23,672 | | 1,093,646 | |
Johnson Controls, Inc. | | 11,923 | | 1,024,424 | |
Kohl's Corp.* | | 3,977 | | 272,146 | |
McDonald's Corp. | | 18,363 | | 814,032 | |
Omnicom Group, Inc. | | 8,655 | | 904,794 | |
Staples, Inc. | | 29,727 | | 793,711 | |
Starbucks Corp.* | | 24,310 | | 861,060 | |
Target Corp. | | 9,898 | | 564,681 | |
Time Warner, Inc. | | 49,035 | | 1,067,982 | |
V F Corp. | | 10,947 | | 898,530 | |
| | | | 12,097,060 | |
CONSUMER, NON-CYCLICAL (5.4%) | | | | | |
CVS Corp. | | 48,519 | | 1,499,722 | |
Colgate-Palmolive Co. | | 17,344 | | 1,131,523 | |
General Mills, Inc. | | 11,550 | | 665,280 | |
Hershey Food Corp. | | 16,174 | | 805,465 | |
PepsiCo, Inc. | | 28,063 | | 1,755,341 | |
Proctor & Gamble Co. | | 56,298 | | 3,618,272 | |
Safeway, Inc. | | 33,335 | | 1,152,058 | |
Wal-Mart Stores, Inc. | | 36,236 | | 1,673,016 | |
| | | | 12,300,677 | |
ENERGY (6.2%) | | | | | |
Devon Energy Corp. | | 5,388 | | 361,427 | |
Exxon Mobil Corp. | | 100,993 | | 7,739,094 | |
Halliburton Co. | | 60,136 | | 1,867,223 | |
Schlumberger, Ltd. | | 22,455 | | 1,418,258 | |
Transocean, Inc.* | | 18,759 | | 1,517,416 | |
| | | | | | |
69
| | Shares | | Value($) | |
COMMON STOCKS: | | | | | |
ENERGY (Cont'd.) | | | | | |
Valero Energy Corp. | | 26,512 | | 1,356,354 | |
| | | | 14,259,772 | |
FINANCIAL (13.3%) | | | | | |
Allstate Corp. | | 16,178 | | 1,053,350 | |
American Int'l. Group, Inc. | | 28,477 | | 2,040,662 | |
Bank of America Corp. | | 67,321 | | 3,594,268 | |
Bear Stearns Cos., Inc. | | 12,529 | | 2,039,471 | |
Capital One Financial Corp. | | 16,970 | | 1,303,635 | |
Citigroup, Inc. | | 56,710 | | 3,158,747 | |
Goldman Sachs Group, Inc. | | 7,180 | | 1,431,333 | |
Hartford Fin, Svc .Gp., Inc. | | 11,722 | | 1,093,780 | |
J.P. Morgan Chase & Co. | | 42,710 | | 2,062,893 | |
Legg Mason, Inc. | | 5,523 | | 524,961 | |
Merrill Lynch & Co., Inc. | | 30,590 | | 2,847,929 | |
MetLife, Inc. | | 24,587 | | 1,450,879 | |
Morgan Stanley | | 12,905 | | 1,050,854 | |
Prologis Trust | | 12,396 | | 753,305 | |
Safeco Corp. | | 16,577 | | 1,016,999 | |
Wachovia Corp. | | 37,119 | | 2,113,927 | |
Wells Fargo & Company | | 86,546 | | 3,077,576 | |
| | | | 30,614,569 | |
HEALTHCARE (7.2%) | | | | | |
Abbott Laboratories | | 34,075 | | 1,659,793 | |
Aetna, Inc. | | 20,943 | | 904,319 | |
Amerisource Bergen Corp. | | 14,130 | | 635,285 | |
Amgen, Inc.* | | 27,277 | | 1,863,292 | |
Caremark Rx, Inc. | | 10,890 | | 621,928 | |
Genzyme Corp. (Genl. Div)* | | 9,972 | | 614,076 | |
Humana, Inc.* | | 6,258 | | 346,130 | |
Johnson & Johnson | | 49,046 | | 3,238,017 | |
McKesson Corp. | | 12,940 | | 656,058 | |
Medimmune, Inc.* | | 6,851 | | 221,767 | |
Medtronic, Inc. | | 26,732 | | 1,430,429 | |
Pfizer, Inc. | | 78,728 | | 2,039,055 | |
Quest Diagnostics, Inc. | | 9,403 | | 498,359 | |
St. Jude Medical, Inc.* | | 11,114 | | 406,328 | |
Wyeth | | 28,520 | | 1,452,238 | |
| | | | 16,587,074 | |
70
| | Shares | | Value($) | |
COMMON STOCKS: | | | | | |
INDUSTRIAL (7.6%) | | | | | |
3M Company | | 14,898 | | 1,161,001 | |
Boeing Co. | | 7,720 | | 685,845 | |
General Electric Co. | | 137,548 | | 5,118,161 | |
Google, Inc.* | | 2,135 | | 983,125 | |
ITT Industries, Inc. | | 21,727 | | 1,234,528 | |
Illinois Tool Works, Inc. | | 13,987 | | 646,060 | |
Lockheed Martin Corp. | | 15,803 | | 1,454,982 | |
Northrop Grumman Corp. | | 17,187 | | 1,163,560 | |
Southwest Airlines Co. | | 53,324 | | 816,924 | |
Starwood Hotels & Resort World | | 13,927 | | 870,438 | |
Tyco International, Ltd. | | 31,799 | | 966,690 | |
United Parcel Service Cl B | | 15,963 | | 1,196,906 | |
United Technologies Corp. | | 17,480 | | 1,092,850 | |
| | | | 17,391,070 | |
TECHNOLOGY (8.7%) | | | | | |
Apple Computer, Inc.* | | 9,117 | | 773,485 | |
Automatic Data Processing | | 15,653 | | 770,909 | |
Broadcom Corp. Cl A* | | 33,158 | | 1,071,334 | |
Cisco Systems, Inc.* | | 102,287 | | 2,795,503 | |
Corning, Inc.* | | 73,204 | | 1,369,646 | |
Dell, Inc.* | | 28,000 | | 702,519 | |
EMC Corp.* | | 29,226 | | 385,783 | |
Hewlett-Packard Co. | | 37,406 | | 1,540,753 | |
IBM Corp. | | 17,167 | | 1,667,774 | |
Intel Corp. | | 84,008 | | 1,701,162 | |
Microsoft Corp. | | 147,728 | | 4,411,158 | |
Motorola, Inc. | | 53,720 | | 1,104,483 | |
Qualcomm, Inc. | | 31,073 | | 1,174,249 | |
Texas Instruments, Inc. | | 15,242 | | 438,970 | |
| | | | 19,907,728 | |
TELECOMMUNICATIONS (1.8%) | | | | | |
AT&T | | 48,486 | | 1,733,375 | |
Sprint Nextel Corp. | | 31,802 | | 600,740 | |
Verizon Communications | | 45,616 | | 1,698,740 | |
| | | | 4,032,855 | |
UTILITIES (2.4%) | | | | | |
Constellation Energy Group | | 9,693 | | 667,557 | |
Dominion Resources, Inc. | | 16,039 | | 1,344,710 | |
71
| | Shares | | Value($) | |
COMMON STOCKS: | | | | | |
UTILITIES (Cont'd.) | | | | | |
Exelon Corp. | | 30,166 | | 1,866,974 | |
FirstEnergy Corp. | | 11,974 | | 722,032 | |
Sempra Energy | | 17,258 | | 967,138 | |
| | | | 5,568,411 | |
| | | | | |
| | | | | |
| | | | | |
| | | | | |
| | | | | |
TOTAL COMMON STOCKS (Cost: $116,116,095) 59.0% | | | | 135,277,881 | |
*Non-income preducing security.
72
LONG-TERM DEBT SECURITIES: | | Rating* | | Rate(%) | | Maturity | | Face
Amount($) | | Value($) | |
U.S. GOVERNMENT (2.3%) | | | | | | | | | | | |
U.S. Treasury Strip | | AAA | | 0.00 | | 08/15/21 | | 7,000,000 | | 3,400,047 | |
U.S. Treasury Strip | | AAA | | 0.00 | | 02/15/17 | | 3,000,000 | | 1,856,112 | |
| | | | | | | | | | 5,256,159 | |
| | | | | | | | | | | |
| | | | | | | | | | | |
U.S. GOVERNMENT AGENCIES (15.0%) | | | | | | | | | | | |
MORTGAGE-BACKED OBLIGATIONS | | | | | | | | | | | |
FHLMC | | AAA | | 5.00 | | 06/15/17 | | 4,000,000 | | 3,954,300 | |
FHLMC | | AAA | | 4.00 | | 10/15/26 | | 1,100,000 | | 1,070,325 | |
FHLMC | | AAA | | 6.00 | | 07/15/29 | | 491,982 | | 497,129 | |
FNMA | | AAA | | 5.50 | | 05/01/34 | | 1,646,445 | | 1,628,794 | |
FNMA | | AAA | | 5.00 | | 11/01/33 | | 1,454,708 | | 1,407,181 | |
FNMA | | AAA | | 5.00 | | 04/01/18 | | 1,169,258 | | 1,152,053 | |
FNMA | | AAA | | 5.00 | | 06/01/33 | | 1,071,300 | | 1,036,300 | |
FNMA | | AAA | | 6.00 | | 01/01/25 | | 964,998 | | 976,200 | |
FNMA | | AAA | | 5.50 | | 10/01/33 | | 934,898 | | 925,368 | |
FNMA | | AAA | | 5.50 | | 03/01/24 | | 835,390 | | 830,941 | |
FNMA | | AAA | | 5.50 | | 07/01/33 | | 733,243 | | 725,768 | |
FNMA | | AAA | | 5.50 | | 07/01/34 | | 679,864 | | 672,575 | |
FNMA | | AAA | | 5.00 | | 04/01/35 | | 678,711 | | 655,460 | |
FNMA | | AAA | | 5.50 | | 09/01/33 | | 634,846 | | 628,374 | |
FNMA | | AAA | | 6.00 | | 12/01/36 | | 595,000 | | 599,029 | |
FNMA | | AAA | | 5.00 | | 09/01/18 | | 575,604 | | 567,133 | |
FNMA | | AAA | | 4.50 | | 05/01/18 | | 581,663 | | 562,497 | |
FNMA | | AAA | | 4.50 | | 06/01/34 | | 582,677 | | 546,810 | |
FNMA | | AAA | | 4.50 | | 05/01/19 | | 561,268 | | 542,108 | |
FNMA | | AAA | | 5.50 | | 04/01/35 | | 539,856 | | 533,689 | |
FNMA | | AAA | | 5.50 | | 09/01/34 | | 520,787 | | 515,204 | |
FNMA | | AAA | | 5.50 | | 11/01/26 | | 494,270 | | 491,076 | |
FNMA | | AAA | | 6.00 | | 01/01/37 | | 485,000 | | 488,284 | |
FNMA | | AAA | | 4.50 | | 12/01/18 | | 490,773 | | 474,602 | |
FNMA | | AAA | | 6.00 | | 04/01/33 | | 467,780 | | 472,049 | |
FNMA | | AAA | | 6.00 | | 11/01/34 | | 458,565 | | 462,002 | |
FNMA | | AAA | | 5.00 | | 09/01/35 | | 458,757 | | 443,041 | |
FNMA | | AAA | | 5.50 | | 02/01/35 | | 447,584 | | 442,785 | |
FNMA | | AAA | | 5.00 | | 10/01/25 | | 452,249 | | 440,087 | |
FNMA | | AAA | | 5.50 | | 09/01/25 | | 399,607 | | 397,168 | |
FNMA | | AAA | | 4.50 | | 06/01/19 | | 387,570 | | 374,340 | |
73
LONG-TERM DEBT SECURITIES: | | Rating* | | Rate(%) | | Maturity | | Face
Amount($) | | Value($) | |
U.S. GOVERNMENT AGENCIES (Cont'd) | | | | | | | | | | | |
MORTGAGE-BACKED OBLIGATIONS (Cont'd.) | | | | | | | | | | | |
FNMA | | AAA | | 6.00 | | 04/01/23 | | 360,455 | | 364,978 | |
FNMA | | AAA | | 5.50 | | 02/01/35 | | 367,521 | | 363,323 | |
FNMA | | AAA | | 5.50 | | 10/01/34 | | 366,449 | | 362,520 | |
FNMA | | AAA | | 5.00 | | 04/01/34 | | 352,044 | | 340,310 | |
FNMA | | AAA | | 6.00 | | 06/01/34 | | 318,226 | | 320,611 | |
FNMA | | AAA | | 5.00 | | 03/01/34 | | 318,543 | | 308,136 | |
FNMA | | AAA | | 6.00 | | 02/25/47 | | 301,763 | | 304,591 | |
FNMA | | AAA | | 4.00 | | 05/01/19 | | 321,356 | | 302,860 | |
FNMA | | AAA | | 6.00 | | 10/01/34 | | 297,290 | | 299,518 | |
FNMA | | AAA | | 6.50 | | 07/01/34 | | 279,217 | | 284,750 | |
FNMA | | AAA | | 5.50 | | 03/01/34 | | 241,734 | | 239,270 | |
FNMA | | AAA | | 4.50 | | 02/01/19 | | 244,009 | | 235,679 | |
FNMA | | AAA | | 6.00 | | 05/01/33 | | 230,677 | | 232,622 | |
FNMA | | AAA | | 6.00 | | 05/01/23 | | 221,256 | | 224,032 | |
FNMA | | AAA | | 5.50 | | 08/01/35 | | 218,295 | | 215,802 | |
FNMA | | AAA | | 6.00 | | 09/01/34 | | 182,674 | | 184,043 | |
FNMA | | AAA | | 6.50 | | 05/01/32 | | 177,903 | | 181,981 | |
FNMA | | AAA | | 6.50 | | 05/01/32 | | 177,753 | | 181,827 | |
FNMA | | AAA | | 6.00 | | 05/01/32 | | 170,361 | | 171,916 | |
FNMA | | AAA | | 6.00 | | 04/01/32 | | 156,749 | | 158,179 | |
FNMA | | AAA | | 6.00 | | 04/01/32 | | 151,899 | | 153,285 | |
FNMA | | AAA | | 6.50 | | 04/01/32 | | 141,418 | | 144,659 | |
FNMA | | AAA | | 5.50 | | 04/01/17 | | 92,554 | | 92,774 | |
FNMA | | AAA | | 6.50 | | 03/01/17 | | 84,691 | | 86,739 | |
FNMA | | AAA | | 6.50 | | 06/01/17 | | 79,826 | | 81,757 | |
FNMA | | AAA | | 6.50 | | 07/01/32 | | 74,082 | | 75,780 | |
FNMA | | AAA | | 5.50 | | 05/01/17 | | 70,845 | | 71,014 | |
FNMA | | AAA | | 7.50 | | 04/01/32 | | 57,976 | | 60,263 | |
FNMA | | AAA | | 7.00 | | 09/01/31 | | 57,617 | | 59,289 | |
FNMA | | AAA | | 7.00 | | 04/01/32 | | 52,858 | | 54,374 | |
FNMA | | AAA | | 7.00 | | 11/01/31 | | 52,196 | | 53,710 | |
FNMA | | AAA | | 7.50 | | 06/01/32 | | 47,724 | | 49,607 | |
FNMA | | AAA | | 6.50 | | 09/01/16 | | 48,032 | | 49,205 | |
FNMA | | AAA | | 5.50 | | 06/01/17 | | 47,476 | | 47,589 | |
FNMA | | AAA | | 5.50 | | 05/01/17 | | 46,844 | | 46,956 | |
FNMA | | AAA | | 6.00 | | 03/01/32 | | 42,843 | | 43,263 | |
74
LONG-TERM DEBT SECURITIES: | | Rating* | | Rate(%) | | Maturity | | Face
Amount($) | | Value($) | |
U.S. GOVERNMENT AGENCIES (Cont'd) | | | | | | | | | | | |
MORTGAGE-BACKED OBLIGATIONS (Cont'd.) | | | | | | | | | | | |
FNMA | | AAA | | 6.50 | | 05/01/17 | | 41,577 | | 42,583 | |
FNMA | | AAA | | 8.00 | | 03/01/31 | | 38,310 | | 40,407 | |
FNMA | | AAA | | 7.50 | | 06/01/31 | | 38,664 | | 40,261 | |
FNMA | | AAA | | 6.00 | | 03/01/17 | | 37,574 | | 38,126 | |
FNMA | | AAA | | 7.50 | | 02/01/32 | | 30,931 | | 32,182 | |
FNMA | | AAA | | 8.00 | | 04/01/32 | | 20,310 | | 21,427 | |
FNMA | | AAA | | 7.00 | | 06/01/32 | | 19,046 | | 19,592 | |
FNMA | | AAA | | 8.00 | | 04/01/32 | | 10,464 | | 11,043 | |
GNMA (1) | | AAA | | 6.27 | | 10/16/27 | | 3,000,000 | | 3,110,310 | |
GNMA (1) | | AAA | | 6.50 | | 05/15/32 | | 33,465 | | 34,381 | |
GNMA (1) | | AAA | | 6.50 | | 10/15/31 | | 28,948 | | 29,749 | |
GNMA (1) | | AAA | | 6.50 | | 12/15/31 | | 26,628 | | 27,366 | |
GNMA (1) | | AAA | | 6.50 | | 04/15/31 | | 25,283 | | 25,983 | |
GNMA (1) | | AAA | | 7.00 | | 09/15/31 | | 23,533 | | 24,320 | |
GNMA (1) | | AAA | | 7.00 | | 05/15/31 | | 19,396 | | 20,045 | |
GNMA (1) | | AAA | | 7.00 | | 05/15/32 | | 15,928 | | 16,459 | |
GNMA (1) | | AAA | | 7.00 | | 09/15/31 | | 2,646 | | 2,734 | |
| | | | | | | | | | 34,496,852 | |
BASIC MATERIALS (1.7%) | | | | | | | | | | | |
International Paper Co. | | BBB | | 4.25 | | 01/15/09 | | 500,000 | | 489,305 | |
Lubrizol Corp. | | BBB- | | 5.50 | | 10/01/14 | | 500,000 | | 487,434 | |
Lyondell Chemical Co. | | B+ | | 10.25 | | 11/01/10 | | 500,000 | | 552,500 | |
Monsanto Co. | | A- | | 4.00 | | 05/15/08 | | 500,000 | | 489,842 | |
PolyOne Corp. | | B+ | | 7.50 | | 12/15/15 | | 1,000,000 | | 875,000 | |
Temple-Inland, Inc. | | BBB | | 7.88 | | 05/01/12 | | 400,000 | | 434,717 | |
Worthington Industries, Inc. | | BBB | | 6.70 | | 12/01/09 | | 500,000 | | 513,433 | |
| | | | | | | | | | 3,842,231 | |
CONSUMER, CYCLICAL (3.8%) | | | | | | | | | | | |
Belo Corporation | | BBB- | | 8.00 | | 11/01/08 | | 500,000 | | 518,742 | |
Comcast Cable Communications | | BBB+ | | 6.20 | | 11/15/08 | | 500,000 | | 507,916 | |
Coors Brewing Co | | BBB | | 6.38 | | 05/15/12 | | 500,000 | | 517,407 | |
Cox Communications, Inc. Cl A | | BBB- | | 3.88 | | 10/01/08 | | 500,000 | | 486,457 | |
Daimlerchrysler | | BBB | | 4.05 | | 06/04/08 | | 250,000 | | 244,659 | |
Dow Jones & Co. | | BBB | | 3.88 | | 02/15/08 | | 250,000 | | 244,789 | |
Ethan Allen Interiors (a) | | A- | | 5.38 | | 10/01/15 | | 500,000 | | 473,399 | |
Fruit of the Loom (2) | | NR | | 7.38 | | 11/15/23 | | 138,068 | | 14 | |
75
LONG-TERM DEBT SECURITIES: | | Rating* | | Rate(%) | | Maturity | | Face
Amount($) | | Value($) | |
CONSUMER, CYCLICAL (Cont'd.) | | | | | | | | | | | |
Home Depot, Inc. | | A+ | | 5.40 | | 03/01/16 | | 500,000 | | 489,023 | |
Johnson Controls, Inc. | | A- | | 4.88 | | 09/15/13 | | 500,000 | | 477,413 | |
Kellwood, Co. | | BB | | 7.88 | | 07/15/09 | | 750,000 | | 760,762 | |
May Dept Stores Co. (a) | | BBB | | 4.80 | | 07/15/09 | | 500,000 | | 492,023 | |
Newell Rubbermaid | | BBB+ | | 4.63 | | 12/15/09 | | 500,000 | | 488,343 | |
Pulte Homes, Inc. | | BBB | | 4.88 | | 07/15/09 | | 250,000 | | 246,177 | |
Quebecor World, Inc. | | B+ | | 4.88 | | 11/15/08 | | 500,000 | | 483,750 | |
RadioShack Corp. | | BB | | 7.38 | | 05/15/11 | | 500,000 | | 507,820 | |
Scholastic Corp. | | BB | | 5.00 | | 04/15/13 | | 500,000 | | 443,587 | |
Stanley Works (a) | | A | | 3.50 | | 11/01/07 | | 250,000 | | 245,968 | |
Target Corp. | | A+ | | 5.38 | | 06/15/09 | | 1,000,000 | | 1,005,676 | |
| | | | | | | | | | 8,633,925 | |
CONSUMER, NON-CYCLICAL (1.3%) | | | | | | | | | | | |
CVS Corp. | | BBB+ | | 6.13 | | 08/15/16 | | 250,000 | | 257,949 | |
Kellogg Co. | | BBB+ | | 2.88 | | 06/01/08 | | 500,000 | | 482,599 | |
Kroger Co. | | BBB- | | 4.95 | | 01/15/15 | | 500,000 | | 472,398 | |
PepsiAmericas, Inc. | | A | | 6.38 | | 05/01/09 | | 250,000 | | 254,340 | |
Sara Lee Corp. | | BBB+ | | 6.25 | | 09/15/11 | | 500,000 | | 509,233 | |
Wal-Mart Stores, Inc. | | AA | | 6.88 | | 08/10/09 | | 1,000,000 | | 1,041,826 | |
| | | | | | | | | | 3,018,345 | |
ENERGY (1.4%) | | | | | | | | | | | |
Anadarko Petroleum | | BBB- | | 3.25 | | 05/01/08 | | 500,000 | | 484,563 | |
Cooper Cameron Corp. | | BBB+ | | 2.65 | | 04/15/07 | | 250,000 | | 247,968 | |
Diamond Offshore Drilling | | A- | | 4.88 | | 07/01/15 | | 500,000 | | 469,328 | |
Ocean Energy, Inc. | | BBB | | 4.38 | | 10/01/07 | | 500,000 | | 496,075 | |
Premco Refining Group | | BBB | | 7.50 | | 06/15/15 | | 500,000 | | 522,888 | |
Sunoco, Inc. | | BBB | | 4.88 | | 10/15/14 | | 500,000 | | 468,110 | |
Weatherford Enterra, Inc. | | BBB+ | | 5.50 | | 02/15/16 | | 500,000 | | 485,678 | |
| | | | | | | | | | 3,174,610 | |
FINANCIAL (7.5%) | | | | | | | | | | | |
American Express Credit Corp. | | A+ | | 3.00 | | 05/16/08 | | 250,000 | | 242,641 | |
American Honda Fin. (a) | | A+ | | 3.85 | | 11/06/08 | | 500,000 | | 487,913 | |
Berkley (WR) Corp. | | BBB+ | | 8.70 | | 01/01/22 | | 1,500,000 | | 1,771,903 | |
Berkshire Hathaway Fin | | AAA | | 4.20 | | 12/15/10 | | 500,000 | | 482,470 | |
Brandywine Realty Tr. | | BBB- | | 4.50 | | 11/01/09 | | 500,000 | | 486,778 | |
Capital One Bank | | A- | | 5.75 | | 09/15/10 | | 250,000 | | 254,023 | |
Colonial Properties Tr. | | BBB- | | 4.80 | | 04/01/11 | | 250,000 | | 240,374 | |
76
LONG-TERM DEBT SECURITIES: | | Rating* | | Rate(%) | | Maturity | | Face
Amount($) | | Value($) | |
FINANCIAL (Cont'd.%) | | | | | | | | | | | |
Deere Capital Corp. | | A | | 3.90 | | 01/15/08 | | 500,000 | | 493,016 | |
Developers Divers Rlty. | | BBB | | 5.00 | | 05/03/10 | | 250,000 | | 246,577 | |
Fairfax Fin. Hldgs. | | BB | | 8.25 | | 10/01/15 | | 500,000 | | 492,499 | |
First Horizon MtgeTr | | AAA | | 5.00 | | 06/25/33 | | 911,200 | | 901,018 | |
First Tennessee Natl. Bank | | BBB+ | | 4.50 | | 05/15/13 | | 1,500,000 | | 1,401,049 | |
FleetBoston Financial Group | | AA- | | 3.85 | | 02/15/08 | | 250,000 | | 246,157 | |
Ford Motor Credit Co. | | B | | 7.38 | | 10/28/09 | | 1,000,000 | | 1,002,129 | |
GATX Financial Corp. | | BBB | | 5.13 | | 04/15/10 | | 250,000 | | 246,714 | |
GE Capital Corp. | | AAA | | 5.45 | | 01/15/13 | | 2,000,000 | | 2,019,133 | |
GMAC | | BB+ | | 0.00 | | 12/01/12 | | 2,500,000 | | 1,655,017 | |
Goldman Sachs Group, Inc. | | AA- | | 3.88 | | 01/15/09 | | 500,000 | | 487,088 | |
HJ Heinz Finance | | BBB | | 6.00 | | 03/15/12 | | 500,000 | | 507,832 | |
Lehman Brothers Hlds. | | A+ | | 4.00 | | 01/22/08 | | 500,000 | | 493,112 | |
Markel Corp. | | BBB- | | 6.80 | | 02/15/13 | | 250,000 | | 259,594 | |
Markel Corp. | | BBB- | | 7.00 | | 05/15/08 | | 250,000 | | 253,877 | |
National City Bank | | A+ | | 3.38 | | 10/15/07 | | 500,000 | | 491,460 | |
Natl Rural Utls. Coop. Fin. | | A+ | | 3.88 | | 02/15/08 | | 250,000 | | 246,130 | |
Roslyn Bancorp, Inc. | | BBB- | | 7.50 | | 12/01/08 | | 250,000 | | 258,148 | |
SLM Corp. | | A | | 4.00 | | 01/15/09 | | 500,000 | | 488,897 | |
Shurgard Storage Centers, Inc. | | A- | | 7.75 | | 02/22/11 | | 250,000 | | 268,488 | |
Union Planters Bank | | A+ | | 5.13 | | 06/15/07 | | 500,000 | | 499,543 | |
Wells Fargo & Company | | AA | | 3.50 | | 04/04/08 | | 250,000 | | 244,823 | |
| | | | | | | | | | 17,168,403 | |
HEALTHCARE (0.8%) | | | | | | | | | | | |
Allergan, Inc. (a) | | A | | 5.75 | | 04/01/16 | | 250,000 | | 252,832 | |
UnitedHealth Group | | A | | 3.38 | | 08/15/07 | | 500,000 | | 493,858 | |
WellPoint, Inc. | | BBB+ | | 4.25 | | 12/15/09 | | 500,000 | | 486,020 | |
Wyeth | | A | | 5.50 | | 03/15/13 | | 500,000 | | 503,235 | |
| | | | | | | | | | 1,735,945 | |
INDUSTRIAL (1.9%) | | | | | | | | | | | |
Bunge, Ltd. | | BBB- | | 5.35 | | 04/15/14 | | 500,000 | | 480,555 | |
Deluxe Corp. | | BB- | | 3.50 | | 10/01/07 | | 500,000 | | 488,750 | |
Donnelley R.R. & Sons | | BBB+ | | 4.95 | | 04/01/14 | | 500,000 | | 461,112 | |
Lafarge Corp. | | BBB | | 6.50 | | 07/15/08 | | 250,000 | | 253,300 | |
Masco Corp. | | BBB+ | | 5.88 | | 07/15/12 | | 500,000 | | 500,554 | |
Seariver Maritime | | AAA | | 0.00 | | 09/01/12 | | 3,000,000 | | 2,240,589 | |
| | | | | | | | | | 4,424,860 | |
77
LONG-TERM DEBT SECURITIES: | | Rating* | | Rate(%) | | Maturity | | Face
Amount($) | | Value($) | |
TECHNOLOGY (0.4%) | | | | | | | | | | | |
Arrow Electronics | | BBB- | | 6.88 | | 06/01/18 | | 500,000 | | 516,528 | |
Cisco Systems, Inc. | | A+ | | 5.25 | | 02/22/11 | | 500,000 | | 501,255 | |
| | | | | | | | | | 1,017,783 | |
TELECOMMUNICATIONS (0.4%) | | | | | | | | | | | |
Nextel Communications, Inc. | | BBB+ | | 5.25 | | 01/15/10 | | 500,000 | | 489,375 | |
Verizon Global | | A | | 4.00 | | 01/15/08 | | 500,000 | | 493,310 | |
| | | | | | | | | | 982,685 | |
UTILITIES (1.3%) | | | | | | | | | | | |
Duke Energy Corp. | | BBB+ | | 4.50 | | 04/01/10 | | 500,000 | | 488,143 | |
Kinder Morgan | | BBB | | 5.15 | | 03/01/15 | | 500,000 | | 448,651 | |
Pepco Holdings, Inc. | | BBB- | | 4.00 | | 05/15/10 | | 500,000 | | 477,182 | |
Progress Energy, Inc. | | BBB | | 5.25 | | 12/15/15 | | 500,000 | | 491,660 | |
Telecom de Puerto Rico | | BBB+ | | 6.80 | | 05/15/09 | | 500,000 | | 510,385 | |
Virginia Elect.& Pwr. | | BBB | | 4.50 | | 12/15/10 | | 500,000 | | 484,465 | |
| | | | | | | | | | 2,900,486 | |
| | | | | | | | | | | |
| | | | | | | | | | | |
| | | | | | | | | | | |
| | | | | | | | | | | |
TOTAL LONG-TERM DEBT SECURITIES (Cost: $88,340,327) 37.8% | | | | | | | | | | 86,652,284 | |
*The ratings are provided by Standard & Poor's Corporation/Moody's Investor Service, Inc.
78
SHORT-TERM DEBT SECURITIES: | | Rate(%) | | Maturity | | Face
Amount($) | | Value($) | |
COMMERCIAL PAPER (3.7%) | | | | | | | | | |
Anheuser-Busch Co. | | 5.22 | | 01/02/07 | | 5,100,000 | | 5,097,781 | |
Anheuser-Busch Co. | | 5.22 | | 01/02/07 | | 1,700,000 | | 1,699,260 | |
Novartis Finance | | 5.28 | | 01/02/07 | | 1,620,000 | | 1,619,287 | |
| | | | | | | | 8,416,328 | |
| | | | | | | | | |
TOTAL SHORT-TERM DEBT SECURITIES (Cost: $8,416,328) 3.7% | | | | | | | | 8,416,328 | |
| | | | | | | | | |
TEMPORARY CASH INVESTMENTS**(Cost: $112,700) 0.0% (3) | | | | | | | | 112,700 | |
| | | | | | | | | |
TOTAL INVESTMENTS (Cost: $212,985,450) 100.5% | | | | | | | | 230,459,193 | |
| | | | | | | | | |
OTHER NET ASSETS-0.5% | | | | | | | | (1,113,221 | ) |
| | | | | | | | | |
NET ASSETS 100.0% | | | | | | | | $ | 229,345,972 | |
| | | | | | | | | | |
Abbreviations: FHLMC =Federal Home Loan Mortgage Corporation
FNMA =Federal National Mortgage Association
GNMA = Government National Mortgage Association
NR = Not Rated
(1) U.S. Government guaranteed security.
(2) Issuer has filed for Chapter XI bankruptcy law (or equivalent) protection; issue is non-income producing.
(3) Less than 0.05 %.
(a) Rule 144a restricted security.
**The fund has an arrangement with its custodian bank, JPMorgan Chase Bank, whereby uninvested cash, subject to parameters set by the fund, is automatically invested in the fund's name by the bank in overnight commercial paper issued by J.P. Morgan Chase & Co. On the next business day, these funds (and earned interest) are automatically returned to the fund. The annual rate of interest earned on this temporary cash investment at December 31, 2006 was 4.83 %.
The total value of investments not rated or below-investment grade was $7,261,828, or 3.2% of the Fund's total investments as of December 31, 2006.
79
MUTUAL OF AMERICA INVESTMENT CORPORATION (CONSERVATIVE ALLOCATION FUND )
PORTFOLIO OF INVESTMENTS IN SECURITIES
December 31, 2006
COMMON STOCKS: | | Shares | | Value($) | |
DIVERSIFIED MUTUAL FUNDS (100.0%) | | | | | |
Mutual of America Investment Corporation | | | | | |
Bond Fund (30.0%) | | 3,107,704 | | $ | 3,903,854 | |
Equity Index Fund (25.1%) | | 1,376,035 | | 3,269,053 | |
Mid Term Bond Fund (44.9%) | | 6,289,769 | | 5,858,020 | |
| | | | | |
TOTAL INVESTMENTS (Cost: $12,941,485) 100.0% | | | | 13,030,927 | |
| | | | | |
OTHER NET ASSETS 0.0% | | | | — | |
| | | | | |
NET ASSETS 100.0% | | | | $ | 13,030,927 | |
80
MUTUAL OF AMERICA INVESTMENT CORPORATION (MODERATE ALLOCATION FUND )
PORTFOLIO OF INVESTMENTS IN SECURITIES
December 31, 2006
COMMON STOCKS: | | Shares | | Value($) | |
DIVERSIFIED MUTUAL FUNDS (100.0%) | | | | | |
Mutual of America Investment Corporation | | | | | |
Bond Fund (29.9%) | | 18,189,689 | | $ | 22,849,634 | |
Mid Cap Equity Index Fund (15.0%) | | 7,340,894 | | 11,437,384 | |
Equity Index Fund (35.1%) | | 11,276,029 | | 26,788,507 | |
Mid Term Bond Fund (20.0%) | | 16,362,495 | | 15,239,324 | |
| | | | | |
TOTAL INVESTMENTS (Cost: $74,058,824) 100.0% | | | | 76,314,849 | |
| | | | | |
OTHER NET ASSETS 0.0% | | | | — | |
| | | | | |
NET ASSETS 100.0% | | | | $ | 76,314,849 | |
81
MUTUAL OF AMERICA INVESTMENT CORPORATION (AGGRESSIVE ALLOCATION FUND )
PORTFOLIO OF INVESTMENTS IN SECURITIES
December 31, 2006
COMMON STOCKS: | | Shares | | Value($) | |
DIVERSIFIED MUTUAL FUNDS (100.0%) | | | | | |
Mutual of America Investment Corporation | | | | | |
Bond Fund (24.9%) | | 14,411,231 | | $ | 18,103,187 | |
Mid Cap Equity Index Fund (20.0%) | | 9,305,857 | | 14,498,869 | |
Equity Index Fund (45.1%) | | 13,783,741 | | 32,746,089 | |
Small Cap Growth Fund (5.0%) | | 3,058,609 | | 3,632,749 | |
Small Cap Value Fund (5.0%) | | 2,947,396 | | 3,640,903 | |
| | | | | |
TOTAL INVESTMENTS (Cost: $69,512,897) 100.0% | | | | 72,621,797 | |
| | | | | |
OTHER NET ASSETS 0.0% | | | | — | |
| | | | | |
NET ASSETS 100.0% | | | | $ | 72,621,797 | |
82
EMUTUAL OF AMERICA INVESTMENT CORPORATION (MONEY MARKET FUND )
PORTFOLIO OF INVESTMENTS IN SECURITIES
December 31, 2006
SHORT-TERM DEBT SECURITIES: | | Rating* | | Rate(%) | | Maturity | | Face Amount($) | | Value($) | |
U.S. GOVERNMENT AGENCIES (20.7%) | | | | | | | | | | | |
FHLB | | AAA | | 5.16 | | 01/19/07 | | 12,192,000 | | $ | 12,157,045 | |
FHLB | | AAA | | 4.95 | | 01/02/07 | | 3,427,000 | | 3,425,586 | |
FHLMC | | AAA | | 5.21 | | 01/23/07 | | 20,000,000 | | 19,930,503 | |
FNMA | | AAA | | 5.20 | | 01/24/07 | | 14,000,000 | | 13,949,430 | |
| | | | | | | | | | 49,462,564 | |
COMMERCIAL PAPER (79.3%) | | | | | | | | | | | |
7-Eleven Inc | | A1+/P1 | | 5.22 | | 01/12/07 | | 6,700,000 | | 6,687,339 | |
Abbott Labs | | A1+/P1 | | 5.21 | | 01/16/07 | | 5,800,000 | | 5,785,668 | |
Abbott Labs | | A1+/P1 | | 5.25 | | 01/09/07 | | 1,000,000 | | 998,535 | |
Alabama Power Co. | | A1/P1 | | 5.28 | | 01/05/07 | | 3,908,000 | | 3,904,557 | |
Alabama Power Co. | | A1/P1 | | 5.27 | | 01/05/07 | | 2,422,000 | | 2,419,872 | |
American Express Credit Corp. | | A1/P1 | | 5.26 | | 01/12/07 | | 7,000,000 | | 6,986,702 | |
Anheuser-Busch Co. | | A1/P1 | | 5.23 | | 01/02/07 | | 7,000,000 | | 6,996,949 | |
Archer Daniels | | A1/P1 | | 5.23 | | 01/16/07 | | 1,200,000 | | 1,197,023 | |
Archer Daniels | | A1/P1 | | 5.25 | | 01/17/07 | | 600,000 | | 598,415 | |
Archer Daniels Midland | | A1/P1 | | 5.24 | | 01/31/07 | | 5,000,000 | | 4,976,537 | |
Becton Dickinson & Co. | | A1/P1 | | 5.21 | | 01/31/07 | | 6,800,000 | | 6,768,408 | |
Caterpillar, Inc. | | A1/P1 | | 5.25 | | 01/05/07 | | 7,000,000 | | 6,993,874 | |
Coca-Cola Company | | A1/P1 | | 5.20 | | 01/04/07 | | 7,000,000 | | 6,994,944 | |
Coca-Cola Enter | | A1/P1 | | 5.26 | | 02/02/07 | | 2,400,000 | | 2,388,072 | |
Coca-Cola Enter | | A1/P1 | | 5.22 | | 01/24/07 | | 2,300,000 | | 2,291,633 | |
Coca-Cola Enter | | A1/P1 | | 5.24 | | 01/26/07 | | 2,100,000 | | 2,091,734 | |
Colgate-Palmolive Corp | | A1+/P1 | | 5.22 | | 01/19/07 | | 7,000,000 | | 6,979,697 | |
Emerson Electric | | A1/P1 | | 5.25 | | 01/08/07 | | 1,500,000 | | 1,498,028 | |
Emerson Electric Co. | | A1/P1 | | 5.25 | | 01/02/07 | | 5,272,000 | | 5,269,690 | |
General Electric Capital Corp. | | A1+/P1 | | 5.25 | | 01/26/07 | | 2,000,000 | | 1,992,087 | |
General Electric Capital Corp. | | A1+/P1 | | 5.24 | | 02/06/07 | | 1,000,000 | | 994,428 | |
General Electric Capital Corp. | | A1+/P1 | | 5.24 | | 01/16/07 | | 800,000 | | 798,012 | |
General Electric Capital Corp. | | A1+/P1 | | 5.29 | | 01/23/07 | | 712,000 | | 709,500 | |
General Electric Capital Corp. | | A1+/P1 | | 5.24 | | 02/14/07 | | 600,000 | | 595,957 | |
General Electric Capital Corp. | | A1+/P1 | | 5.25 | | 01/16/07 | | 415,000 | | 413,962 | |
General Electric Co. | | A1+/P1 | | 5.23 | | 03/29/07 | | 1,500,000 | | 1,480,262 | |
Hershey Foods | | A1/P1 | | 5.20 | | 01/23/07 | | 4,700,000 | | 4,683,688 | |
IBM Corp. | | A1/P1 | | 5.23 | | 01/16/07 | | 6,800,000 | | 6,783,181 | |
Johnson & Johnson | | A1+/P1 | | 5.23 | | 01/12/07 | | 6,900,000 | | 6,886,963 | |
Kimberly-Clark Worldwide | | A1+/P1 | | 5.25 | | 01/29/07 | | 6,700,000 | | 6,670,640 | |
National Rural Utilities | | A1/P1 | | 5.25 | | 01/16/07 | | 2,200,000 | | 2,194,531 | |
National Rural Utilities | | A1/P1 | | 5.26 | | 01/16/07 | | 1,800,000 | | 1,795,519 | |
National Rural Utilities | | A1/P1 | | 5.27 | | 01/11/07 | | 1,225,000 | | 1,222,845 | |
| | | | | | | | | | | | |
83
SHORT-TERM DEBT SECURITIES: | | Rating* | | Rate(%) | | Maturity | | Face Amount($) | | Value($) | |
COMMERCIAL PAPER (Cont'd.) | | | | | | | | | | | |
National Rural Utilities | | A1/P1 | | 5.25 | | 01/09/07 | | 1,200,000 | | 1,198,240 | |
National Rural Utilities | | A1/P1 | | 5.30 | | 01/10/07 | | 375,000 | | 374,390 | |
Nestle Capital Corp. | | A1+/P1 | | 5.22 | | 02/01/07 | | 2,900,000 | | 2,886,075 | |
Nestle Capital Corp. | | A1+/P1 | | 5.22 | | 01/17/07 | | 2,000,000 | | 1,994,755 | |
Nestle Capital Corp. | | A1+/P1 | | 5.23 | | 01/11/07 | | 1,000,000 | | 998,255 | |
Nestle Capital Corp. | | A1+/P1 | | 5.21 | | 02/28/07 | | 850,000 | | 842,592 | |
New Jersey Natural Gas | | A1/P1 | | 5.24 | | 01/08/07 | | 6,700,000 | | 6,691,208 | |
Novartis Finance | | A1+/P1 | | 5.28 | | 01/02/07 | | 6,000,000 | | 5,997,360 | |
Novartis Finance | | A1+/P1 | | 5.30 | | 01/02/07 | | 1,000,000 | | 999,558 | |
Pitney Bowes | | A1/P1 | | 5.29 | | 01/03/07 | | 7,000,000 | | 6,995,885 | |
Procter & Gamble | | A1+/P1 | | 5.21 | | 01/16/07 | | 3,000,000 | | 2,992,595 | |
Procter & Gamble | | A1+/P1 | | 5.22 | | 02/22/07 | | 3,000,000 | | 2,976,476 | |
Procter & Gamble | | A1+/P1 | | 5.23 | | 02/22/07 | | 800,000 | | 793,714 | |
Siemens Capital | | A1+/P1 | | 5.26 | | 01/30/07 | | 5,700,000 | | 5,674,171 | |
Siemens Capital | | A1+/P1 | | 5.26 | | 01/19/07 | | 1,100,000 | | 1,096,781 | |
UPS | | A1+/P1 | | 5.20 | | 01/12/07 | | 7,000,000 | | 6,986,854 | |
Unilever Capital | | A1/P1 | | 5.27 | | 01/02/07 | | 7,065,000 | | 7,061,897 | |
Washington Gas Light Co. | | A1/P1 | | 5.26 | | 01/05/07 | | 5,150,000 | | 5,145,471 | |
Washington Gas Light Co. | | A1/P1 | | 5.24 | | 01/04/07 | | 1,700,000 | | 1,698,760 | |
XTRA, Inc. | | A1+/P1 | | 5.35 | | 01/16/07 | | 1,300,000 | | 1,296,711 | |
XTRA, Inc. | | A1+/P1 | | 5.27 | | 01/09/07 | | 1,200,000 | | 1,198,238 | |
XTRA, Inc. | | A1+/P1 | | 5.26 | | 01/03/07 | | 1,150,000 | | 1,149,326 | |
XTRA, Inc. | | A1+/P1 | | 5.30 | | 01/12/07 | | 1,100,000 | | 1,097,891 | |
XTRA, Inc. | | A1+/P1 | | 5.35 | | 01/08/07 | | 1,030,000 | | 1,028,620 | |
XTRA, Inc. | | A1+/P1 | | 5.26 | | 01/04/07 | | 1,000,000 | | 999,266 | |
| | | | | | | | | | 189,224,341 | |
| | | | | | | | | | | |
TOTAL INVESTMENTS (Cost: $238,687,246) 100.0% | | | | | | | | | | 238,686,905 | |
| | | | | | | | | | | |
OTHER NET ASSETS0.0% | | | | | | | | | | 2,564 | |
| | | | | | | | | | | |
NET ASSETS 100.0% | | | | | | | | | | $ | 238,689,469 | |
| | | | | | | | | | | | |
(1) Less than 0.05 %.
*The ratings are provided by Standard & Poor's Corporation/Moody's Investor Service, Inc.
Abbreviations: | FHLB = Federal Home Loan Bank |
| |
| FHLMC = Federal Home Loan Mortgage Corporation |
| |
| FNMA = Federal National Mortgage Association |
84
MUTUAL OF AMERICA INVESTMENT CORPORATION (MID-TERM BOND FUND )
PORTFOLIO OF INVESTMENTS IN SECURITIES
December 31, 2006
LONG-TERM DEBT SECURITIES: | | Rating* | | Rate(%) | | Maturity | | Face
Amount($) | | Value($) | |
U.S. GOVERNMENT (17.5%) | | | | | | | | | | | |
U.S. Treasury Note | | AAA | | 5.00 | | 08/15/11 | | 3,000,000 | | $ | 3,041,952 | |
U.S. Treasury Note | | AAA | | 4.00 | | 11/15/12 | | 2,000,000 | | 1,931,016 | |
U.S. Treasury Strip | | AAA | | 0.00 | | 05/15/13 | | 8,500,000 | | 6,325,947 | |
U.S. Treasury Strip | | AAA | | 0.00 | | 11/15/12 | | 5,000,000 | | 3,810,590 | |
U.S. Treasury Strip | | AAA | | 0.00 | | 11/15/08 | | 4,000,000 | | 3,659,428 | |
| | | | | | | | | | 18,768,933 | |
U.S. GOVERNMENT AGENCIES (43.9%) | | | | | | | | | | | |
MORTGAGE-BACKED OBLIGATIONS (4.9%) | | | | | | | | | | | |
FHLMC | | AAA | | 5.00 | | 06/15/17 | | 3,000,000 | | 2,965,724 | |
FHLMC | | AAA | | 4.00 | | 11/15/26 | | 325,867 | | 320,796 | |
FHLMC | | AAA | | 4.50 | | 03/15/22 | | 245,825 | | 245,220 | |
FHLMC | | AAA | | 6.50 | | 04/01/14 | | 163,224 | | 167,532 | |
FHLMC | | AAA | | 7.00 | | 02/01/14 | | 77,090 | | 79,723 | |
FHLMC | | AAA | | 6.00 | | 02/01/19 | | 50,408 | | 51,192 | |
FHLMC | | AAA | | 5.50 | | 04/01/09 | | 38,326 | | 38,273 | |
FHLMC | | AAA | | 5.50 | | 06/01/09 | | 34,273 | | 34,340 | |
FHLMC | | AAA | | 6.00 | | 11/01/10 | | 30,475 | | 30,705 | |
FHLMC | | AAA | | 7.50 | | 03/15/21 | | 26,532 | | 26,481 | |
FHLMC | | AAA | | 7.75 | | 05/01/08 | | 21,918 | | 22,093 | |
FHLMC | | AAA | | 6.00 | | 10/01/08 | | 19,334 | | 19,404 | |
FHLMC | | AAA | | 8.00 | | 09/01/18 | | 17,438 | | 17,609 | |
FHLMC | | AAA | | 6.00 | | 07/01/16 | | 16,150 | | 16,481 | |
FHLMC | | AAA | | 6.50 | | 11/01/09 | | 10,396 | | 10,539 | |
FHLMC | | AAA | | 8.50 | | 09/01/17 | | 6,713 | | 6,749 | |
FHLMC | | AAA | | 8.00 | | 05/01/14 | | 3,176 | | 3,199 | |
FHLMC | | AAA | | 8.25 | | 10/01/09 | | 2,273 | | 2,285 | |
FHLMC | | AAA | | 7.50 | | 02/15/07 | | 318 | | 317 | |
FHLMC | | AAA | | 7.00 | | 03/15/07 | | 169 | | 167 | |
FNMA | | AAA | | 4.50 | | 10/25/17 | | 641,677 | | 636,072 | |
FNMA | | AAA | | 6.50 | | 12/25/23 | | 113,549 | | 113,695 | |
FNMA | | AAA | | 4.00 | | 11/25/26 | | 64,382 | | 63,458 | |
FNMA | | AAA | | 6.00 | | 09/01/12 | | 54,226 | | 55,001 | |
FNMA | | AAA | | 6.50 | | 08/01/13 | | 39,087 | | 39,646 | |
FNMA | | AAA | | 6.00 | | 07/01/09 | | 27,344 | | 27,407 | |
FNMA | | AAA | | 5.50 | | 11/01/08 | | 24,770 | | 24,736 | |
FNMA | | AAA | | 6.00 | | 09/01/08 | | 17,574 | | 17,614 | |
FNMA | | AAA | | 5.50 | | 02/01/09 | | 16,123 | | 16,100 | |
FNMA | | AAA | | 6.50 | | 01/25/23 | | 13,499 | | 13,475 | |
| | | | | | | | | | | |
| | | | | | | | | | | | |
85
LONG-TERM DEBT SECURITIES: | | Rating* | | Rate(%) | | Maturity | | Face
Amount($) | | Value($) | |
U.S. GOVERNMENT AGENCIES (Cont’d.) | | | | | | | | | | | |
MORTGAGE-BACKED OBLIGATIONS (Cont’d.) | | | | | | | | | | | |
FNMA | | AAA | | 6.00 | | 01/01/11 | | 13,249 | | 13,280 | |
FNMA | | AAA | | 8.50 | | 12/01/09 | | 12,796 | | 13,206 | |
FNMA | | AAA | | 8.75 | | 09/01/16 | | 11,474 | | 11,470 | |
FNMA | | AAA | | 5.50 | | 12/01/08 | | 7,083 | | 7,073 | |
FNMA | | AAA | | 7.50 | | 09/01/08 | | 6,517 | | 6,539 | |
FNMA | | AAA | | 8.25 | | 01/01/10 | | 6,199 | | 6,194 | |
FNMA | | AAA | | 8.00 | | 04/01/08 | | 5,278 | | 5,371 | |
FNMA | | AAA | | 7.75 | | 03/01/08 | | 4,488 | | 4,500 | |
FNMA | | AAA | | 7.00 | | 04/25/07 | | 3,370 | | 3,365 | |
FNMA | | AAA | | 8.00 | | 06/01/17 | | 2,335 | | 2,332 | |
FNMA | | AAA | | 7.50 | | 01/01/09 | | 1,432 | | 1,441 | |
GNMA (1) | | AAA | | 6.00 | | 11/15/08 | | 29,461 | | 29,569 | |
GNMA (1) | | AAA | | 6.00 | | 06/15/09 | | 13,225 | | 13,326 | |
GNMA (1) | | AAA | | 7.00 | | 08/15/07 | | 10,047 | | 10,067 | |
GNMA (1) | | AAA | | 7.50 | | 05/20/08 | | 6,601 | | 6,661 | |
GNMA (1) | | AAA | | 9.00 | | 03/15/10 | | 2,488 | | 2,617 | |
GNMA (1) | | AAA | | 7.50 | | 07/15/07 | | 2,156 | | 2,164 | |
| | | | | | | | | | 5,205,208 | |
| | | | | | | | | | | |
NON-MORTGAGE-BACKED OBLIGATION (39.0%) | | | | | | | | | | | |
FFCB | | AAA | | 5.10 | | 08/05/13 | | 5,000,000 | | 5,033,130 | |
FHLB | | AAA | | 5.75 | | 05/15/12 | | 4,500,000 | | 4,669,781 | |
FHLB | | AAA | | 3.75 | | 08/18/09 | | 3,500,000 | | 3,396,320 | |
FHLB | | AAA | | 3.00 | | 04/15/09 | | 3,500,000 | | 3,356,462 | |
FHLMC | | AAA | | 6.63 | | 09/15/09 | | 5,000,000 | | 5,207,495 | |
FHLMC | | AAA | | 3.88 | | 06/15/08 | | 3,750,000 | | 3,686,816 | |
FHLMC | | AAA | | 5.63 | | 03/15/11 | | 3,250,000 | | 3,333,506 | |
FHLMC | | AAA | | 3.63 | | 09/15/08 | | 1,500,000 | | 1,465,355 | |
FNMA | | AAA | | 6.63 | | 09/15/09 | | 5,500,000 | | 5,726,837 | |
FNMA | | AAA | | 4.38 | | 09/15/12 | | 3,500,000 | | 3,400,597 | |
FNMA | | AAA | | 4.25 | | 05/15/09 | | 2,000,000 | | 1,967,980 | |
FNMA | | AAA | | 3.25 | | 02/15/09 | | 500,000 | | 482,428 | |
| | | | | | | | | | 41,726,707 | |
BASIC MATERIALS (2.2%) | | | | | | | | | | | |
Bemis Co. | | A | | 4.88 | | 04/01/12 | | 500,000 | | 484,903 | |
International Paper Co. | | BBB | | 4.25 | | 01/15/09 | | 250,000 | | 244,652 | |
International Paper Co. | | BBB | | 3.80 | | 04/01/08 | | 200,000 | | 195,926 | |
Lubrizol Corp. | | BBB- | | 5.50 | | 10/01/14 | | 500,000 | | 487,434 | |
86
LONG-TERM DEBT SECURITIES: | | Rating* | | Rate(%) | | Maturity | | Face
Amount($) | | Value($) | |
BASIC MATERIALS (Cont’d.) | | | | | | | | | | | |
Lubrizol Corp. | | BBB- | | 5.88 | | 12/01/08 | | 200,000 | | 201,173 | |
Praxair, Inc. | | A | | 2.75 | | 06/15/08 | | 210,000 | | 202,752 | |
Temple-Inland, Inc. | | BBB | | 7.88 | | 05/01/12 | | 250,000 | | 271,698 | |
Worthington Industries, Inc. | | BBB | | 6.70 | | 12/01/09 | | 250,000 | | 256,716 | |
| | | | | | | | | | 2,345,254 | |
CONSUMER, CYCLICAL (5.6%) | | | | | | | | | | | |
Belo Corporation | | BBB- | | 8.00 | | 11/01/08 | | 150,000 | | 155,622 | |
Caterpillar Fin. Svc. | | A | | 2.63 | | 01/30/07 | | 500,000 | | 499,001 | |
Centex Corp. | | BBB | | 4.75 | | 01/15/08 | | 200,000 | | 198,098 | |
Comcast Cable Communications | | BBB+ | | 6.20 | | 11/15/08 | | 200,000 | | 203,166 | |
Cox Communications, Inc. Cl A | | BBB- | | 3.88 | | 10/01/08 | | 500,000 | | 486,457 | |
Daimlerchrysler | | BBB | | 4.05 | | 06/04/08 | | 400,000 | | 391,455 | |
Dow Jones & Co. | | BBB | | 3.88 | | 02/15/08 | | 150,000 | | 146,873 | |
Home Depot, Inc. | | A+ | | 5.40 | | 03/01/16 | | 250,000 | | 244,512 | |
Johnson Controls, Inc. | | A- | | 4.88 | | 09/15/13 | | 250,000 | | 238,706 | |
May Dept Stores Co. (a) | | BBB | | 4.80 | | 07/15/09 | | 250,000 | | 246,011 | |
May Dept Stores Co. | | BBB | | 3.95 | | 07/15/07 | | 140,000 | | 138,639 | |
Newell Rubbermaid | | BBB+ | | 4.63 | | 12/15/09 | | 500,000 | | 488,343 | |
Nordstrom, Inc. | | A | | 5.63 | | 01/15/09 | | 175,000 | | 175,827 | |
Pulte Homes, Inc. | | BBB | | 4.88 | | 07/15/09 | | 250,000 | | 246,177 | |
RadioShack Corp. | | BB | | 7.38 | | 05/15/11 | | 400,000 | | 406,256 | |
Scholastic Corp. | | BB | | 5.00 | | 04/15/13 | | 250,000 | | 221,794 | |
Stanley Works (a) | | A | | 3.50 | | 11/01/07 | | 250,000 | | 245,968 | |
Target Corp. | | A+ | | 5.38 | | 06/15/09 | | 1,000,000 | | 1,005,676 | |
Wendy's International, Inc. | | BB+ | | 6.25 | | 11/15/11 | | 300,000 | | 298,931 | |
| | | | | | | | | | 6,037,512 | |
CONSUMER, NON-CYCLICAL (3.5%) | | | | | | | | | | | |
Anheuser-Busch Cos., Inc. | | A | | 4.70 | | 04/15/12 | | 100,000 | | 96,795 | |
CVS Corp. | | BBB+ | | 6.13 | | 08/15/16 | | 500,000 | | 515,898 | |
Campbell Soup Co. | | A | | 5.50 | | 03/15/07 | | 500,000 | | 500,104 | |
Clorox Co. | | A- | | 4.20 | | 01/15/10 | | 250,000 | | 242,519 | |
Coca Cola Bottle Consolidated | | BBB | | 6.38 | | 05/01/09 | | 200,000 | | 204,249 | |
Earthgrains Co. | | BBB+ | | 6.50 | | 04/15/09 | | 150,000 | | 152,553 | |
General Mills, Inc. | | BBB+ | | 3.88 | | 11/30/07 | | 200,000 | | 197,004 | |
Kroger Co. | | BBB- | | 4.95 | | 01/15/15 | | 500,000 | | 472,398 | |
PepsiAmericas, Inc. | | A | | 6.38 | | 05/01/09 | | 150,000 | | 152,604 | |
Safeway, Inc. | | BBB- | | 4.13 | | 11/01/08 | | 500,000 | | 488,367 | |
Sara Lee Corp. | | BBB+ | | 6.25 | | 09/15/11 | | 250,000 | | 254,617 | |
87
LONG-TERM DEBT SECURITIES: | | Rating* | | Rate(%) | | Maturity | | Face
Amount($) | | Value($) | |
CONSUMER, NON-CYCLICAL (Cont’d.) | | | | | | | | | | | |
Sara Lee Corp. | | BBB+ | | 2.75 | | 06/15/08 | | 200,000 | | 192,172 | |
Wal-Mart Stores, Inc. | | AA | | 6.88 | | 08/10/09 | | 250,000 | | 260,457 | |
| | | | | | | | | | 3,729,737 | |
ENERGY (4.2%) | | | | | | | | | | | |
AGL Capital Corporation | | BBB+ | | 6.38 | | 07/15/16 | | 500,000 | | 517,149 | |
Anadarko Petroleum | | BBB- | | 3.25 | | 05/01/08 | | 500,000 | | 484,563 | |
Cooper Cameron Corp. | | BBB+ | | 2.65 | | 04/15/07 | | 200,000 | | 198,374 | |
Diamond Offshore Drilling | | A- | | 4.88 | | 07/01/15 | | 500,000 | | 469,328 | |
Dominion Resources | | BBB | | 4.13 | | 02/15/08 | | 200,000 | | 197,015 | |
Halliburton Co. | | BBB+ | | 5.50 | | 10/15/10 | | 500,000 | | 499,112 | |
Halliburton Co. | | BBB+ | | 5.63 | | 12/01/08 | | 200,000 | | 200,566 | |
Ocean Energy, Inc. | | BBB | | 4.38 | | 10/01/07 | | 450,000 | | 446,467 | |
Premco Refining Group | | BBB | | 7.50 | | 06/15/15 | | 500,000 | | 522,888 | |
Sunoco, Inc. | | BBB | | 4.88 | | 10/15/14 | | 500,000 | | 468,110 | |
Weatherford Enterra, Inc. | | BBB+ | | 5.50 | | 02/15/16 | | 500,000 | | 485,678 | |
| | | | | | | | | | 4,489,250 | |
FINANCIAL (11.7%) | | | | | | | | | | | |
American Express Credit Corp. | | A+ | | 3.00 | | 05/16/08 | | 250,000 | | 242,642 | |
American Honda Fin. (a) | | A+ | | 3.85 | | 11/06/08 | | 700,000 | | 683,080 | |
Bank of America Corp. | | A+ | | 5.75 | | 08/15/16 | | 500,000 | | 510,313 | |
Bank of America Corp. | | AA- | | 5.38 | | 08/15/11 | | 250,000 | | 251,728 | |
Bank of Oklahoma | | BBB+ | | 7.13 | | 08/15/07 | | 600,000 | | 605,538 | |
Berkshire Hathaway Fin. | | AAA | | 4.20 | | 12/15/10 | | 500,000 | | 482,471 | |
Brandywine Realty Tr. | | BBB- | | 4.50 | | 11/01/09 | | 250,000 | | 243,390 | |
CIT Group, Inc. | | A | | 5.80 | | 07/28/11 | | 250,000 | | 254,240 | |
Capital One Bank | | A- | | 5.75 | | 09/15/10 | | 250,000 | | 254,024 | |
Capital One Bank | | A- | | 4.88 | | 05/15/08 | | 200,000 | | 198,767 | |
Colonial Properties Tr. | | BBB- | | 4.80 | | 04/01/11 | | 300,000 | | 288,449 | |
Developers Divers Rlty. | | BBB | | 5.00 | | 05/03/10 | | 250,000 | | 246,578 | |
Fifth Third Bank | | AA- | | 3.38 | | 08/15/08 | | 200,000 | | 194,222 | |
First Tennessee Bank | | A- | | 5.75 | | 12/01/08 | | 200,000 | | 201,076 | |
First Tennessee Natl. Bank | | BBB+ | | 4.50 | | 05/15/13 | | 125,000 | | 116,754 | |
Ford Motor Credit Co. | | B | | 7.38 | | 10/28/09 | | 750,000 | | 751,598 | |
Franklin Resources, Inc. | | A+ | | 3.70 | | 04/15/08 | | 200,000 | | 195,884 | |
GATX Financial Corp. | | BBB | | 5.13 | | 04/15/10 | | 250,000 | | 246,715 | |
GE Capital Corp. | | AAA | | 5.00 | | 01/08/16 | | 500,000 | | 488,641 | |
HJ Heinz Finance | | BBB | | 6.00 | | 03/15/12 | | 250,000 | | 253,916 | |
Household Fin. Corp. | | AA- | | 4.13 | | 12/15/08 | | 200,000 | | 196,028 | |
88
LONG-TERM DEBT SECURITIES: | | Rating* | | Rate(%) | | Maturity | | Face
Amount($) | | Value($) | |
FINANCIAL (Cont’d.) | | | | | | | | | | | |
Huntington National Bank | | A- | | 3.13 | | 05/15/08 | | 200,000 | | 194,177 | |
IBM Corp. | | A+ | | 3.80 | | 02/01/08 | | 100,000 | | 98,425 | |
International Lease Fin. Corp. | | AA- | | 4.50 | | 05/01/08 | | 200,000 | | 197,297 | |
JP Morgan Chase Bank | | A+ | | 5.60 | | 06/01/11 | | 250,000 | | 253,153 | |
Lehman Brothers Hldgs. | | A+ | | 5.75 | | 07/18/11 | | 250,000 | | 254,887 | |
MACK-CALI Realty LP | | BBB | | 5.80 | | 01/15/16 | | 500,000 | | 501,381 | |
Markel Corp. | | BBB- | | 7.00 | | 05/15/08 | | 150,000 | | 152,326 | |
Merrill Lynch | | AA- | | 3.13 | | 07/15/08 | | 200,000 | | 193,726 | |
National City Bank | | A+ | | 3.38 | | 10/15/07 | | 250,000 | | 245,730 | |
Nationwide Hlt. Prop. | | BBB- | | 7.60 | | 11/20/28 | | 350,000 | | 378,305 | |
Roslyn Bancorp, Inc. | | BBB- | | 7.50 | | 12/01/08 | | 500,000 | | 516,297 | |
SLM Corp. | | A | | 4.00 | | 01/15/09 | | 500,000 | | 488,897 | |
Simon Property Grp. | | A- | | 4.88 | | 08/15/10 | | 500,000 | | 493,066 | |
Simon Property Grp. | | A- | | 5.38 | | 08/28/08 | | 200,000 | | 199,127 | |
Textron Financial Corp. | | A- | | 5.13 | | 02/03/11 | | 250,000 | | 248,150 | |
Toronto-Dominion Bank | | A+ | | 6.50 | | 08/15/08 | | 100,000 | | 101,810 | |
Union Planters Corp. | | A | | 4.38 | | 12/01/10 | | 250,000 | | 243,037 | |
Vornado Realty Trust | | BBB | | 5.63 | | 06/15/07 | | 145,000 | | 144,904 | |
Wachovia Bank | | A+ | | 5.60 | | 03/15/16 | | 500,000 | | 504,888 | |
Wachovia Corp. | | A+ | | 3.50 | | 08/15/08 | | 200,000 | | 194,449 | |
| | | | | | | | | | 12,510,086 | |
HEALTHCARE (2.1%) | | | | | | | | | | | |
Abbott Laboratories | | AA | | 5.60 | | 05/15/11 | | 500,000 | | 506,905 | |
Allergan, Inc. (a) | | A | | 5.75 | | 04/01/16 | | 500,000 | | 505,664 | |
Baxter International, Inc. | | A | | 4.63 | | 03/15/15 | | 250,000 | | 235,545 | |
Thermo Fisher Scientific, Inc. | | BBB+ | | 7.63 | | 10/30/08 | | 140,000 | | 144,783 | |
UnitedHealth Group | | A | | 3.38 | | 08/15/07 | | 200,000 | | 197,543 | |
WellPoint, Inc. | | BBB+ | | 5.00 | | 01/15/11 | | 500,000 | | 493,899 | |
WellPoint, Inc. | | BBB+ | | 4.25 | | 12/15/09 | | 200,000 | | 194,408 | |
| | | | | | | | | | 2,278,747 | |
INDUSTRIAL (3.3%) | | | | | | | | | | | |
Bunge, Ltd. | | BBB- | | 4.38 | | 12/15/08 | | 200,000 | | 195,785 | |
Danaher Corp. | | A+ | | 6.00 | | 10/15/08 | | 200,000 | | 201,492 | |
Deluxe Corp. | | BB- | | 3.50 | | 10/01/07 | | 750,000 | | 733,125 | |
ERP Operating LP | | A- | | 5.38 | | 08/01/16 | | 500,000 | | 494,775 | |
FedEx Corp. | | BBB | | 3.50 | | 04/01/09 | | 200,000 | | 192,088 | |
General Dynamics Corp. | | A | | 3.00 | | 05/15/08 | | 200,000 | | 193,652 | |
Harley Davidson Funding (a) | | A+ | | 3.63 | | 12/15/08 | | 400,000 | | 387,558 | |
89
LONG-TERM DEBT SECURITIES: | | Rating* | | Rate(%) | | Maturity | | Face
Amount($) | | Value($) | |
INDUSTRIAL (Cont’d.) | | | | | | | | | | | |
Lafarge Corp. | | BBB | | 6.50 | | 07/15/08 | | 100,000 | | 101,320 | |
Masco Corp. | | BBB+ | | 4.80 | | 06/15/15 | | 500,000 | | 456,592 | |
Masco Corp. | | BBB+ | | 5.88 | | 07/15/12 | | 300,000 | | 300,332 | |
Raytheon Co. | | BBB+ | | 4.50 | | 11/15/07 | | 200,000 | | 198,416 | |
Union Pacific Corp. | | BBB | | 5.75 | | 10/15/07 | | 120,000 | | 120,065 | |
| | | | | | | | | | 3,575,200 | |
TECHNOLOGY (1.2%) | | | | | | | | | | | |
Cisco Systems, Inc. | | A+ | | 5.25 | | 02/22/11 | | 250,000 | | 250,627 | |
First Data Corp. | | A | | 3.38 | | 08/01/08 | | 100,000 | | 96,959 | |
General Dynamics Corporation | | A | | 4.50 | | 08/15/10 | | 500,000 | | 489,382 | |
Motorola, Inc. | | A- | | 5.80 | | 10/15/08 | | 200,000 | | 201,846 | |
Pitney Bowes, Inc. | | A+ | | 5.75 | | 08/15/08 | | 200,000 | | 201,143 | |
| | | | | | | | | | 1,239,957 | |
TELECOMMUNICATIONS (0.2%) | | | | | | | | | | | |
Nextel Communications, Inc. | | BBB+ | | 5.25 | | 01/15/10 | | 250,000 | | 244,688 | |
| | | | | | | | | | | |
UTILITIES (2.5%) | | | | | | | | | | | |
Consolidated Edison, Inc. | | A- | | 3.63 | | 08/01/08 | | 200,000 | | 194,846 | |
Duke Energy Corp. | | BBB+ | | 4.50 | | 04/01/10 | | 500,000 | | 488,143 | |
Exelon Corp. | | A- | | 3.50 | | 05/01/08 | | 150,000 | | 146,450 | |
Kinder Morgan | | BBB | | 5.15 | | 03/01/15 | | 250,000 | | 224,325 | |
PNM Resources, Inc. | | BBB | | 4.40 | | 09/15/08 | | 135,000 | | 132,527 | |
Pepco Holdings, Inc. | | BBB- | | 4.00 | | 05/15/10 | | 250,000 | | 238,591 | |
Progress Energy, Inc. | | BBB | | 5.95 | | 03/01/09 | | 200,000 | | 202,432 | |
Public Svc. Elec. & Gas | | A- | | 4.00 | | 11/01/08 | | 200,000 | | 195,278 | |
Telecom de Puerto Rico | | BBB+ | | 6.80 | | 05/15/09 | | 500,000 | | 510,385 | |
Virginia Elect.& Pwr. | | BBB | | 4.50 | | 12/15/10 | | 400,000 | | 387,572 | |
| | | | | | | | | | 2,720,549 | |
| | | | | | | | | | | |
TOTAL LONG-TERM DEBT SECURITIES (Cost: $106,041,895) 97.9% | | 104,871,828 | |
*Ratings as per Standard & Poor's Corporation.
90
SHORT-TERM DEBT SECURITIES: | | | | Rate(%) | | Maturity | | Face Amount($) | | Value($) | |
COMMERCIAL PAPER (1.0%) | | | | | | | | | | | |
Novartis Finance | | | | 5.28 | | 01/02/07 | | 1,060,000 | | 1,059,534 | |
| | | | | | | | | | | |
TOTAL SHORT-TERM DEBT SECURITIES (Cost: $1,059,534) 1.0% | | | | 1,059,534 | |
| | | | | | | | | | | |
TEMPORARY CASH INVESTMENTS**(Cost: $11,200) 0.0% (3) | | | | 11,200 | |
| | | | | | | | | | | |
TOTAL INVESTMENTS (Cost: $107,112,629) 98.9% | | | | | | | | | | 105,942,562 | |
| | | | | | | | | | | |
OTHER NET ASSETS 1.1% | | | | | | | | | | 1,134,474 | |
| | | | | | | | | | | |
NET ASSETS 100.0% | | | | | | | | | | $ | 107,077,036 | |
| | | | | | | | | | | | |
(1) U.S. Government guaranteed security.
(a) Rule 144a restricted security.
Abbreviations: | FFCB = Federal Farm Credit Bank |
| FHLB = Federal Home Loan Bank |
| FHLMC = Federal Home Loan Mortgage Corporation |
| FNMA = Federal National Mortgage Association |
| GNMA= Government National Mortgage Association |
The total value of investments not rated or below-investment grade was $2,411,704, or 2.3 % of the Fund's total investments as of December 31, 2006.
** The fund has an arrangement with its custodian bank, JPMorgan Chase Bank, whereby uninvested cash, subject to parameters set by the fund, is automatically invested in the fund's name by the bank in overnight commercial paper issued by J.P. Morgan Chase & Co. On the next business day, these funds (and earned interest) are automatically returned to the fund. The annual rate of interest earned on this temporary cash investment at December 31, 2006 was 4.83 %.
91
MUTUAL OF AMERICA INVESTMENT CORPORATION (BOND FUND )
PORTFOLIO OF INVESTMENTS IN SECURITIES
December 31, 2006
LONG-TERM DEBT SECURITIES: | | Rating* | | Rate(%) | | Maturity | | Face
Amount($) | | Value($) | |
U.S. GOVERNMENT (4.8%) | | | | | | | | | | | |
U.S. Treasury Strip | | AAA | | 0.00 | | 02/15/17 | | 15,000,000 | | $ | 9,280,560 | |
U.S. Treasury Strip | | AAA | | 0.00 | | 05/15/14 | | 10,000,000 | | 7,094,920 | |
| | | | | | | | | | 16,375,480 | |
U.S. GOVERNMENT AGENCIES (38.4%) | | | | | | | | | | | |
MORTGAGE-BACKED OBLIGATIONS (34.4%) | | | | | | | | | | | |
FHLMC | | AAA | | 6.00 | | 07/15/29 | | 1,856,537 | | 1,875,958 | |
FHLMC | | AAA | | 4.00 | | 10/15/26 | | 400,000 | | 389,209 | |
FNMA | | AAA | | 5.00 | | 09/01/35 | | 5,505,088 | | 5,316,494 | |
FNMA | | AAA | | 5.50 | | 10/01/34 | | 4,821,697 | | 4,770,004 | |
FNMA | | AAA | | 5.50 | | 07/01/33 | | 4,181,562 | | 4,138,935 | |
FNMA | | AAA | | 5.50 | | 08/01/35 | | 4,042,821 | | 3,996,644 | |
FNMA | | AAA | | 5.50 | | 03/01/24 | | 3,917,382 | | 3,896,522 | |
FNMA | | AAA | | 5.00 | | 11/01/33 | | 3,692,720 | | 3,572,075 | |
FNMA | | AAA | | 5.00 | | 10/01/20 | | 3,126,096 | | 3,073,274 | |
FNMA | | AAA | | 5.00 | | 01/01/34 | | 2,866,338 | | 2,772,692 | |
FNMA | | AAA | | 6.00 | | 04/01/33 | | 2,671,760 | | 2,696,143 | |
FNMA | | AAA | | 5.50 | | 07/01/34 | | 2,719,455 | | 2,690,299 | |
FNMA | | AAA | | 4.50 | | 05/01/18 | | 2,762,897 | | 2,671,860 | |
FNMA | | AAA | | 5.50 | | 10/01/33 | | 2,680,041 | | 2,652,721 | |
FNMA | | AAA | | 4.00 | | 05/01/19 | | 2,635,122 | | 2,483,450 | |
FNMA | | AAA | | 6.50 | | 05/01/32 | | 2,419,484 | | 2,474,941 | |
FNMA | | AAA | | 5.00 | | 06/01/33 | | 2,529,459 | | 2,446,819 | |
FNMA | | AAA | | 5.00 | | 09/01/20 | | 2,415,437 | | 2,374,624 | |
FNMA | | AAA | | 6.00 | | 01/01/37 | | 2,355,000 | | 2,370,946 | |
FNMA | | AAA | | 6.00 | | 12/01/36 | | 2,300,000 | | 2,315,573 | |
FNMA | | AAA | | 6.00 | | 05/01/32 | | 2,282,844 | | 2,303,677 | |
FNMA | | AAA | | 6.00 | | 11/01/34 | | 2,266,486 | | 2,283,473 | |
FNMA | | AAA | | 5.00 | | 04/01/35 | | 2,349,384 | | 2,268,899 | |
FNMA | | AAA | | 5.50 | | 11/01/26 | | 2,273,642 | | 2,258,952 | |
FNMA | | AAA | | 4.50 | | 06/01/34 | | 2,372,327 | | 2,226,296 | |
FNMA | | AAA | | 6.00 | | 05/01/23 | | 2,177,407 | | 2,204,726 | |
FNMA | | AAA | | 5.50 | | 09/01/33 | | 2,221,960 | | 2,199,310 | |
FNMA | | AAA | | 5.00 | | 04/01/34 | | 2,078,736 | | 2,009,450 | |
FNMA | | AAA | | 5.50 | | 09/01/34 | | 2,031,070 | | 2,009,295 | |
FNMA | | AAA | | 5.50 | | 03/01/34 | | 2,022,223 | | 2,001,609 | |
FNMA | | AAA | | 5.00 | | 09/01/18 | | 2,014,612 | | 1,984,967 | |
FNMA | | AAA | | 5.50 | | 04/01/35 | | 1,933,811 | | 1,911,723 | |
FNMA | | AAA | | 5.50 | | 09/01/25 | | 1,772,169 | | 1,761,352 | |
| | | | | | | | | | | |
| | | | | | | | | | | | |
92
LONG-TERM DEBT SECURITIES: | | Rating* | | Rate(%) | | Maturity | | Face Amount($) | | Value($) | |
U.S. GOVERNMENT AGENCIES (Cont'd) | | | | | | | | | | | |
MORTGAGE-BACKED OBLIGATIONS (Cont'd.) | | | | | | | | | | | |
FNMA | | AAA | | 5.00 | | 10/01/25 | | 1,808,997 | | 1,760,348 | |
FNMA | | AAA | | 5.00 | | 06/01/35 | | 1,808,098 | | 1,746,156 | |
FNMA | | AAA | | 4.50 | | 06/01/19 | | 1,771,750 | | 1,711,268 | |
FNMA | | AAA | | 5.50 | | 02/01/35 | | 1,611,301 | | 1,594,027 | |
FNMA | | AAA | | 6.00 | | 02/25/47 | | 1,479,845 | | 1,493,714 | |
FNMA | | AAA | | 5.00 | | 03/01/34 | | 1,415,745 | | 1,369,491 | |
FNMA | | AAA | | 4.50 | | 12/01/18 | | 1,402,209 | | 1,356,006 | |
FNMA | | AAA | | 5.50 | | 02/01/35 | | 1,323,074 | | 1,307,962 | |
FNMA | | AAA | | 6.50 | | 03/01/17 | | 1,129,210 | | 1,156,520 | |
FNMA | | AAA | | 4.50 | | 05/01/34 | | 1,227,530 | | 1,151,969 | |
FNMA | | AAA | | 6.00 | | 01/01/25 | | 1,098,101 | | 1,110,848 | |
FNMA | | AAA | | 5.50 | | 03/01/34 | | 1,036,003 | | 1,025,442 | |
FNMA | | AAA | | 4.50 | | 02/01/19 | | 1,045,753 | | 1,010,054 | |
FNMA | | AAA | | 4.50 | | 06/01/19 | | 981,611 | | 948,102 | |
FNMA | | AAA | | 5.50 | | 09/01/34 | | 801,844 | | 793,247 | |
FNMA | | AAA | | 5.00 | | 04/01/34 | | 738,262 | | 713,655 | |
FNMA | | AAA | | 6.50 | | 05/01/32 | | 696,979 | | 712,954 | |
FNMA | | AAA | | 7.50 | | 06/01/32 | | 677,685 | | 704,414 | |
FNMA | | AAA | | 4.50 | | 05/01/19 | | 688,006 | | 664,519 | |
FNMA | | AAA | | 5.50 | | 05/01/17 | | 627,709 | | 629,207 | |
FNMA | | AAA | | 6.00 | | 04/01/32 | | 614,456 | | 620,063 | |
FNMA | | AAA | | 5.00 | | 04/01/18 | | 626,388 | | 617,171 | |
FNMA | | AAA | | 6.00 | | 04/01/32 | | 552,744 | | 557,789 | |
FNMA | | AAA | | 6.50 | | 04/01/32 | | 514,246 | | 526,033 | |
FNMA | | AAA | | 6.00 | | 03/01/17 | | 478,288 | | 485,315 | |
FNMA | | AAA | | 5.50 | | 04/01/17 | | 339,363 | | 340,173 | |
FNMA | | AAA | | 5.50 | | 05/01/17 | | 283,381 | | 284,057 | |
FNMA | | AAA | | 7.00 | | 06/01/32 | | 264,098 | | 271,674 | |
FNMA | | AAA | | 7.50 | | 04/01/32 | | 231,928 | | 241,076 | |
FNMA | | AAA | | 7.00 | | 11/01/31 | | 208,783 | | 214,842 | |
FNMA | | AAA | | 7.00 | | 09/01/31 | | 207,832 | | 213,863 | |
FNMA | | AAA | | 6.50 | | 05/01/17 | | 172,248 | | 176,413 | |
FNMA | | AAA | | 6.50 | | 09/01/16 | | 170,295 | | 174,455 | |
FNMA | | AAA | | 8.00 | | 03/01/31 | | 145,579 | | 153,547 | |
FNMA | | AAA | | 8.00 | | 04/01/32 | | 136,030 | | 143,553 | |
FNMA | | AAA | | 8.00 | | 04/01/32 | | 47,373 | | 49,978 | |
GNMA (1) | | AAA | | 6.27 | | 10/16/27 | | 3,000,000 | | 3,110,310 | |
| | | | | | | | | | | |
93
LONG-TERM DEBT SECURITIES: | | Rating* | | Rate(%) | | Maturity | | Face Amount($) | | Value($) | |
U.S. GOVERNMENT AGENCIES (Cont'd) | | | | | | | | | | | |
MORTGAGE-BACKED OBLIGATIONS (Cont'd.) | | | | | | | | | | | |
GNMA (1) | | AAA | | 6.50 | | 12/15/31 | | 379,455 | | 389,961 | |
GNMA (1) | | AAA | | 6.50 | | 05/15/32 | | 127,774 | | 131,274 | |
GNMA (1) | | AAA | | 6.50 | | 04/15/31 | | 94,389 | | 97,002 | |
GNMA (1) | | AAA | | 7.00 | | 09/15/31 | | 85,080 | | 87,926 | |
GNMA (1) | | AAA | | 7.00 | | 05/15/32 | | 61,942 | | 64,006 | |
GNMA (1) | | AAA | | 7.00 | | 09/15/31 | | 36,286 | | 37,500 | |
| | | | | | | | | | 118,350,796 | |
NON-MORTGAGE-BACKED OBLIGATION (4.0%) | | | | | | | | | | | |
AID - Sri Lanka | | AAA | | 6.59 | | 09/15/28 | | 4,000,000 | | 4,045,520 | |
FHLMC | | AAA | | 5.20 | | 03/05/19 | | 10,000,000 | | 9,722,120 | |
| | | | | | | | | | 13,767,640 | |
BASIC MATERIALS (4.7%) | | | | | | | | | | | |
International Paper Co. | | BBB | | 4.25 | | 01/15/09 | | 2,000,000 | | 1,957,218 | |
Lubrizol Corp. | | BBB- | | 5.50 | | 10/01/14 | | 2,000,000 | | 1,949,736 | |
Lyondell Chemical Co. | | B+ | | 10.25 | | 11/01/10 | | 5,000,000 | | 5,525,000 | |
Monsanto Co. | | A- | | 4.00 | | 05/15/08 | | 1,500,000 | | 1,469,526 | |
PolyOne Corp. | | B+ | | 7.50 | | 12/15/15 | | 3,750,000 | | 3,281,250 | |
Worthington Industries, Inc. | | BBB | | 6.70 | | 12/01/09 | | 2,000,000 | | 2,053,730 | |
| | | | | | | | | | 16,236,460 | |
CONSUMER, CYCLICAL (11.4%) | | | | | | | | | | | |
Belo Corporation | | BBB- | | 8.00 | | 11/01/08 | | 2,000,000 | | 2,074,966 | |
Centex Corp. | | BBB- | | 8.75 | | 03/01/07 | | 2,000,000 | | 2,008,508 | |
Comcast Cable Communications | | BBB+ | | 6.20 | | 11/15/08 | | 2,000,000 | | 2,031,662 | |
Coors Brewing Co | | BBB | | 6.38 | | 05/15/12 | | 2,000,000 | | 2,069,628 | |
Cox Communications, Inc. Cl A | | BBB- | | 3.88 | | 10/01/08 | | 2,000,000 | | 1,945,826 | |
Daimlerchrysler | | BBB | | 4.05 | | 06/04/08 | | 1,000,000 | | 978,637 | |
Dow Jones & Co. | | BBB | | 3.88 | | 02/15/08 | | 1,000,000 | | 979,156 | |
Ethan Allen Interiors (a) | | A- | | 5.38 | | 10/01/15 | | 2,000,000 | | 1,893,596 | |
Fruit of the Loom (2) | | NR | | 7.38 | | 11/15/23 | | 345,170 | | 35 | |
Home Depot, Inc. | | A+ | | 5.40 | | 03/01/16 | | 2,000,000 | | 1,956,092 | |
Johnson Controls, Inc. | | A- | | 4.88 | | 09/15/13 | | 2,500,000 | | 2,387,063 | |
Kellwood, Co. | | BB | | 7.88 | | 07/15/09 | | 4,000,000 | | 4,057,396 | |
May Dept Stores Co. (a) | | BBB | | 4.80 | | 07/15/09 | | 2,000,000 | | 1,968,090 | |
Newell Rubbermaid | | BBB+ | | 4.63 | | 12/15/09 | | 2,500,000 | | 2,441,713 | |
Pulte Homes, Inc. | | BBB | | 4.88 | | 07/15/09 | | 2,000,000 | | 1,969,418 | |
Quebecor World, Inc. | | B+ | | 4.88 | | 11/15/08 | | 1,500,000 | | 1,451,250 | |
RadioShack Corp. | | BB | | 7.38 | | 05/15/11 | | 2,000,000 | | 2,031,280 | |
| | | | | | | | | | | |
94
LONG-TERM DEBT SECURITIES: | | Rating* | | Rate(%) | | Maturity | | Face Amount($) | | Value($) | |
CONSUMER, CYCLICAL (Cont'd.) | | | | | | | | | | | |
Scholastic Corp. | | BB | | 5.00 | | 04/15/13 | | 2,000,000 | | 1,774,348 | |
Stanley Works (a) | | A | | 3.50 | | 11/01/07 | | 250,000 | | 245,968 | |
Target Corp. | | A+ | | 5.38 | | 06/15/09 | | 3,250,000 | | 3,268,447 | |
Wendy's International, Inc. | | BB+ | | 6.25 | | 11/15/11 | | 1,500,000 | | 1,494,653 | |
| | | | | | | | | | 39,027,732 | |
CONSUMER, NON-CYCLICAL (3.2%) | | | | | | | | | | | |
CVS Corp. | | BBB+ | | 6.13 | | 08/15/16 | | 2,000,000 | | 2,063,592 | |
Kellogg Co. | | BBB+ | | 2.88 | | 06/01/08 | | 2,000,000 | | 1,930,396 | |
Kroger Co. | | BBB- | | 4.95 | | 01/15/15 | | 2,000,000 | | 1,889,590 | |
PepsiAmericas, Inc. | | A | | 6.38 | | 05/01/09 | | 2,000,000 | | 2,034,718 | |
Safeway, Inc. | | BBB- | | 4.13 | | 11/01/08 | | 1,000,000 | | 976,734 | |
Sara Lee Corp. | | BBB+ | | 6.25 | | 09/15/11 | | 2,000,000 | | 2,036,932 | |
| | | | | | | | | | 10,931,962 | |
ENERGY (3.4%) | | | | | | | | | | | |
AGL Capital Corporation | | BBB+ | | 6.38 | | 07/15/16 | | 500,000 | | 517,149 | |
Anadarko Petroleum | | BBB- | | 3.25 | | 05/01/08 | | 2,000,000 | | 1,938,250 | |
Cooper Cameron Corp. | | BBB+ | | 2.65 | | 04/15/07 | | 2,000,000 | | 1,983,744 | |
Diamond Offshore Drilling | | A- | | 4.88 | | 07/01/15 | | 2,000,000 | | 1,877,310 | |
Ocean Energy, Inc. | | BBB | | 4.38 | | 10/01/07 | | 1,750,000 | | 1,736,261 | |
Premco Refining Group | | BBB | | 7.50 | | 06/15/15 | | 2,000,000 | | 2,091,550 | |
Weatherford Enterra, Inc. | | BBB+ | | 5.50 | | 02/15/16 | | 1,500,000 | | 1,457,034 | |
| | | | | | | | | | 11,601,298 | |
FINANCIAL (18.8%) | | | | | | | | | | | |
American Honda Fin. (a) | | A+ | | 3.85 | | 11/06/08 | | 2,000,000 | | 1,951,656 | |
BOAA | | AAA | | 5.75 | | 05/25/33 | | 3,500,000 | | 3,423,165 | |
Berkley (WR) Corp. | | BBB+ | | 8.70 | | 01/01/22 | | 5,000,000 | | 5,906,344 | |
Brandywine Realty Tr. | | BBB- | | 4.50 | | 11/01/09 | | 2,000,000 | | 1,947,116 | |
Capital One Bank | | A- | | 5.75 | | 09/15/10 | | 2,000,000 | | 2,032,194 | |
Colonial Properties Tr. | | BBB- | | 4.80 | | 04/01/11 | | 1,500,000 | | 1,442,247 | |
Deere Capital Corp. | | A | | 3.90 | | 01/15/08 | | 2,500,000 | | 2,465,085 | |
Developers Divers Rlty. | | BBB | | 5.00 | | 05/03/10 | | 2,000,000 | | 1,972,620 | |
Executive Risk, Inc. | | A | | 7.13 | | 12/15/07 | | 5,000,000 | | 5,069,060 | |
Fairfax Fin. Hldgs. | | BB | | 8.25 | | 10/01/15 | | 2,500,000 | | 2,462,500 | |
First Horizon MtgeTr | | AAA | | 5.00 | | 06/25/33 | | 2,599,957 | | 2,570,908 | |
First Tennessee Natl. Bank | | BBB+ | | 4.50 | | 05/15/13 | | 5,000,000 | | 4,670,165 | |
Ford Motor Credit Co. | | B | | 7.38 | | 10/28/09 | | 3,000,000 | | 3,006,390 | |
GATX Financial Corp. | | BBB | | 5.13 | | 04/15/10 | | 1,000,000 | | 986,859 | |
GMAC | | BB+ | | 0.00 | | 12/01/12 | | 10,000,000 | | 6,620,070 | |
| | | | | | | | | | | |
95
LONG-TERM DEBT SECURITIES: | | Rating* | | Rate(%) | | Maturity | | Face Amount($) | | Value($) | |
FINANCIAL (Cont'd.) | | | | | | | | | | | |
HJ Heinz Finance | | BBB | | 6.00 | | 03/15/12 | | 2,000,000 | | 2,031,326 | |
Markel Corp. | | BBB- | | 6.80 | | 02/15/13 | | 1,000,000 | | 1,038,376 | |
Markel Corp. | | BBB- | | 7.00 | | 05/15/08 | | 1,000,000 | | 1,015,508 | |
National City Bank | | A+ | | 3.38 | | 10/15/07 | | 2,250,000 | | 2,211,570 | |
Roslyn Bancorp, Inc. | | BBB- | | 7.50 | | 12/01/08 | | 1,000,000 | | 1,032,593 | |
SLM Corp. | | A | | 4.00 | | 01/15/09 | | 2,250,000 | | 2,200,037 | |
Shurgard Storage Centers, Inc. | | A- | | 7.75 | | 02/22/11 | | 750,000 | | 805,465 | |
Simon Property Group Inc. (a) | | A- | | 7.88 | | 03/15/16 | | 5,000,000 | | 5,812,270 | |
Union Planters Bank | | A+ | | 5.13 | | 06/15/07 | | 2,000,000 | | 1,998,170 | |
| | | | | | | | | | 64,671,694 | |
HEALTHCARE (2.4%) | | | | | | | | | | | |
Allergan, Inc. (a) | | A | | 5.75 | | 04/01/16 | | 2,000,000 | | 2,022,656 | |
UnitedHealth Group | | A | | 3.38 | | 08/15/07 | | 2,500,000 | | 2,469,288 | |
WellPoint, Inc. | | BBB+ | | 4.25 | | 12/15/09 | | 2,000,000 | | 1,944,078 | |
Wyeth | | A | | 5.50 | | 03/15/13 | | 1,750,000 | | 1,761,323 | |
| | | | | | | | | | 8,197,345 | |
INDUSTRIAL (4.8%) | | | | | | | | | | | |
Bunge, Ltd. | | BBB- | | 5.35 | | 04/15/14 | | 2,000,000 | | 1,922,218 | |
Deluxe Corp. | | BB- | | 3.50 | | 10/01/07 | | 1,500,000 | | 1,466,250 | |
Donnelley R.R. & Sons | | BBB+ | | 4.95 | | 04/01/14 | | 2,000,000 | | 1,844,448 | |
Lafarge Corp. | | BBB | | 6.50 | | 07/15/08 | | 1,750,000 | | 1,773,100 | |
Masco Corp. | | BBB+ | | 5.88 | | 07/15/12 | | 2,000,000 | | 2,002,216 | |
Seariver Maritime | | AAA | | 0.00 | | 09/01/12 | | 10,000,000 | | 7,468,630 | |
| | | | | | | | | | 16,476,862 | |
TECHNOLOGY (1.2%) | | | | | | | | | | | |
Arrow Electronics | | BBB- | | 6.88 | | 06/01/18 | | 2,000,000 | | 2,066,112 | |
Cisco Systems, Inc. | | A+ | | 5.25 | | 02/22/11 | | 2,000,000 | | 2,005,018 | |
| | | | | | | | | | 4,071,130 | |
TELECOMMUNICATIONS (1.7%) | | | | | | | | | | | |
Alltel Corp. | | A- | | 7.00 | | 03/15/16 | | 2,000,000 | | 2,053,114 | |
Nextel Communications, Inc. | | BBB+ | | 5.25 | | 01/15/10 | | 2,000,000 | | 1,957,500 | |
Verizon Global | | A | | 4.00 | | 01/15/08 | | 2,000,000 | | 1,973,238 | |
| | | | | | | | | | 5,983,852 | |
UTILITIES (2.9%) | | | | | | | | | | | |
Duke Energy Corp. | | BBB+ | | 4.50 | | 04/01/10 | | 750,000 | | 732,215 | |
Kinder Morgan | | BBB | | 5.15 | | 03/01/15 | | 2,000,000 | | 1,794,602 | |
Pepco Holdings, Inc. | | BBB- | | 4.00 | | 05/15/10 | | 2,000,000 | | 1,908,726 | |
Progress Energy, Inc. | | BBB | | 5.25 | | 12/15/15 | | 2,000,000 | | 1,966,637 | |
| | | | | | | | | | | |
96
LONG-TERM DEBT SECURITIES: | | Rating* | | Rate(%) | | Maturity | | Face Amount($) | | Value($) | |
UTILITIES (Cont'd.) | | | | | | | | | | | |
Telecom de Puerto Rico | | BBB+ | | 6.80 | | 05/15/09 | | 1,500,000 | | 1,531,154 | |
Virginia Elect.& Pwr. | | BBB | | 4.50 | | 12/15/10 | | 2,000,000 | | 1,937,857 | |
| | | | | | | | | | 9,871,191 | |
| | | | | | | | | | | |
TOTAL LONG-TERM DEBT
SECURITIES (Cost: $338,449,234) 97.7% | | | | | | | | | | 335,563,442 | |
*Ratings as per Standard & Poor's Corporation.
97
SHORT-TERM DEBT SECURITIES: | | Rate(%) | | Maturity | | Face Amount($) | | Value($) | |
COMMERCIAL PAPER (2.1%) | | | | | | | | | |
Novartis Finance | | 5.28 | | 01/02/07 | | 7,270,000 | | 7,266,801 | |
| | | | | | | | | |
TOTAL SHORT-TERM DEBT SECURITIES (Cost: $7,266,801) 2.1% | | | | | | | | 7,266,801 | |
| | | | | | | | | |
TEMPORARY CASH INVESTMENTS**(Cost: $13,800) 0.0% (3) | | | | | | | | 13,800 | |
| | | | | | | | | |
TOTAL INVESTMENTS (Cost: $345,729,835) 99.8% | | | | | | | | 342,844,043 | |
| | | | | | | | | |
OTHER NET ASSETS 0.2% | | | | | | | | 645,788 | |
| | | | | | | | | |
NET ASSETS 100.0% | | | | | | | | $ | 343,489,831 | |
| | | | | | | | | |
| | | | | | | | | | |
Abrreviations: FHLMC = Federal Home Loan Mortgage Corporation
FNMA = Federal National Mortgage Association
GNMA= Government National Mortgage Association
NR = Not Rated
(1) U.S. Government guaranteed security.
(2) Issuer has filed for Chapter XI bankruptcy law (or equivalent) protection; issue is non-income producing.
(3) Less than 0.05 %.
(a) Rule 144a restricted security.
The total value of investments not rated or below-investment grade was $33,170,422, or 9.7 % of the Fund's total investments as of December 31, 2006.
**The fund has an arrangement with its custodian bank, JPMorgan Chase Bank, whereby uninvested cash, subject to parameters set by the fund, is automatically invested in the fund's name by the bank in overnight commercial paper issued by J.P. Morgan Chase & Co. On the next business day, these funds (and earned interest) are automatically returned to the fund. The annual rate of interest earned on this temporary cash investment at December 31, 2006 was 4.83 %.
98
ITEM 7. DISCLOSURE OF PROXY VOTING POLICIES AND PROCEDURES FOR CLOSED-END MANAGEMENT INVESTMENT COMPANIES.
Not applicable.
ITEM 8. PORTFOLIO MANAGERS OF CLOSED-END MANAGEMENT INVESTMENT COMPANIES.
Not applicable.
ITEM 9. PURCHASES OF EQUITY SECURITES BY CLOSED-END MANAGEMENT INVESTMENT COMPANY AND AFFILIATED PURCHASERS.
Not applicable.
ITEM 10. SUBMISSION OF MATTERS TO A VOTE OF SECURITY HOLDERS.
Not applicable.
ITEM 11. CONTROLS AND PROCEDURES.
(a) & #160; The registrant’s principal executive officer and principal financial officer have evaluated the registrant’s disclosure controls and procedures within 90 days of this filing and have concluded that the registrant’s disclosure controls and procedures were effective, as of that date, in ensuring that information required to be disclosed by the registrant in this Form N-CSR was recorded, processed, summarized, and reported in a timely and accurate manner.
(b) The registrant’s principal executive officer and principal financial officer are aware of no changes in the registrant’s internal control over financial reporting that occ urred during the second fiscal quarter of the period covered by this report that has materially affected, or is likely to materially affect, the registrant’s internal control over financial reporting.
ITEM 12. EXHIBITS.
Attached hereto:
(a) (1) Not applicable – The Annual Report to Shareholders includes information on how to obtain a copy of the Code of Ethics at no charge.
(2) Exhibit 99.CERT Certifications by the registrant’s principal executive officer and principal financial officer, pursuant to Section 302 of the Sarbanes-Oxley Act of 2002 and required by Rule 30a-2(a) under the Investment Company Act of 1940.
(3) Not applicable.
(b) Exhibit 99.906CERT Certifications pursuant to Section 906 of the Sarbanes-Oxley Act of 2002 and required by Rule 30a-2(b) under the Investment Company Act of 1940.
Exhibit 99.REPT ; �� Report of Independent Registered Public Accounting Firm
SIGNATURES
Pursuant to the requirements of the Securities Exchange Act of 1934 and the Investment Company Act of 1940, the registrant has duly caused this report to be signed on its behalf by the undersigned, thereunto duly authorized.
| Mutual of America Investment Corporation |
| |
By: | /s/ MANFRED ALTSTADT | |
| Manfred Altstadt |
| Chairman of the Board, |
| President and Chief Executive Officer of |
| Mutual of America Investment Corporation |
| |
Date: February 28, 2007 |
Pursuant to the requirements of the Securities Exchange Act of 1934 and the Investment Company Act of 1940, this report has been signed below by the following persons on behalf of the registrant and in the capacities and on the dates indicated.
By: | /s/ MANFRED ALTSTADT | |
| Manfred Altstadt |
| Chairman of the Board, |
| President and Chief Executive Officer of |
| Mutual of America Investment Corporation |
| |
Date: February 28, 2007 |
By: | /s/ JOHN R. GREED | |
| John R. Greed |
| Executive Vice President, |
| Chief Financial Officer and Treasurer of |
| Mutual of America Investment Corporation |
| |
Date: February 28, 2007 |