Table of Contents
UNITED STATES
SECURITIES AND EXCHANGE COMMISSION
Washington, D.C. 20549
FORM N-CSR
CERTIFIED SHAREHOLDER REPORT OF REGISTERED
MANAGEMENT
INVESTMENT COMPANIES
Investment Company Act File Number 811-4946
THOMPSON IM FUNDS, INC.
(Exact name of registrant as specified in charter)
1255 Fourier Drive, Suite 200
Madison, Wisconsin 53717
(Address of principal executive offices)--(Zip code)
Jason L. Stephens
Chief Executive Officer
Thompson IM Funds, Inc.
1255 Fourier Drive, Suite 200
Madison, Wisconsin 53717
(Name and address of agent for service)
With a copy to:
Matthew C. Vogel, Esq.
Quarles & Brady LLP
411 East Wisconsin Avenue
Milwaukee, Wisconsin 53202
Registrant’s telephone number, including area code: (608) 827-5700
Date of fiscal year end: November 30, 2021
Date of reporting period: November 30, 2021
Form N-CSR is to be used by management investment companies to file reports with the Commission not later than 10 days after the transmission to stockholders of any report that is required to be transmitted to stockholders under Rule 30e-1 under the Investment Company Act of 1940 (17 CFR 270.30e-1). The Commission may use the information provided on Form N-CSR in its regulatory, disclosure review, inspection and policymaking roles.
A registrant is required to disclose the information specified by Form N-CSR, and the Commission will make this information public. A registrant is not required to respond to the collection of information contained in Form N-CSR unless the Form displays a currently valid Office of Management and Budget (“OMB”) control number. Please direct comments concerning the accuracy of the information collection burden estimate and any suggestions for reducing the burden to Secretary, Securities and Exchange Commission, 450 Fifth Street, N.W., Washington, DC 20549-0609. The OMB has reviewed this collection of information under the clearance requirements of 44 U.S.C. § 3507.
Table of Contents
Item 1. Reports to Stockholders.
Item 1(a):

ANNUAL REPORT November 30, 2021 |
| | | | | |
| | | | | |
| | | | | |
| | | | | |
| | | | | |
| | | | | |
| | | | | |
| | | | | |
| | | | | |
| | | | | |
| | | | | |
| | | | | |
| | | | | |
LARGECAP
FUND®
(THPGX) | | MIDCAP
FUND®
(THPMX) | | BOND
FUND®
(THOPX) |
| | | | |
| | | | | |
| | | | | |
| | | | | |
| | | | | |
| | | | | |
| | | | | |
| | | | | |
| | | | | |
| | | | | |
Telephone: 1-800-999-0887 www.thompsonim.com |
Table of Contents
THOMPSON IM FUNDS, INC.
ANNUAL REPORT TO SHAREHOLDERS
NOTE ON FORWARD-LOOKING STATEMENTS
The matters discussed in this report may constitute forward-looking statements. These include any Advisor or portfolio manager predictions, assessments, analyses or outlooks for individual securities, industries, investment styles, market sectors, interest rates, economic trends and/or markets. These statements involve risks and uncertainties. In addition to the general risks described for each Fund in its current Prospectus, other factors bearing on these reports include the accuracy of the Advisor’s or portfolio manager’s forecasts and predictions, the appropriateness of the investment strategies designed by the Advisor or portfolio manager and the ability of the Advisor or portfolio manager to implement its strategies efficiently and successfully. Any one or more of these factors, as well as other risks affecting the securities markets generally, could cause the actual results of any Fund to differ materially as compared to its benchmarks.
Table of Contents
THOMPSON IM FUNDS, INC.
ANNUAL REPORT TO SHAREHOLDERS
November 30, 2021
CONTENTS
This report contains information for existing shareholders of Thompson IM Funds, Inc. It does not constitute an offer to sell. This Annual Report is authorized for distribution to prospective investors only when preceded or accompanied by a Fund Prospectus, which contains information about the Funds’ objectives and policies, risks, management, expenses and other information.
A Prospectus can be obtained by calling 1-800-999-0887.
Please read your Prospectus carefully.
1
Table of Contents
LARGECAP FUND INVESTMENT REVIEW (Unaudited)
Portfolio Managers
James T. Evans, CFA
Jason L. Stephens, CFA
Performance
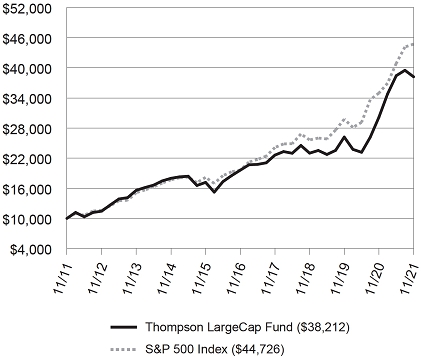
The LargeCap Fund produced a total return of 26.71% for the fiscal year ended November 30, 2021, as compared to its benchmark, the S&P 500 Index, which returned 27.92%.
| Comparison of Change in Value of a Hypothetical $10,000 Investment |
| |
 |
| |
| Average Annual Total Returns |
| Through 11/30/21 |
| | | 1 Year | | 3 Year | | 5 Year | | 10 Year |
| Thompson LargeCap Fund | | 26.71% | | 18.44% | | 14.28% | | 14.35% |
| S&P 500 Index | | 27.92% | | 20.38% | | 17.90% | | 16.16% |
Gross Expense Ratio as of 03/31/21 was 1.23%.
Net Expense Ratio after reimbursement as of 03/31/21 was 0.99%*
| * | The Advisor has contractually agreed to waive management fees and/or reimburse expenses incurred by the LargeCap Fund through March 31, 2022, so that the annual operating expenses of the Fund do not exceed 0.99% of its average daily net assets. Net expense ratios are current as of the most recent Prospectus and are applicable to investors. |
Performance data quoted represents past performance; past performance does not guarantee future results. The investment return and principal value of an investment will fluctuate so that an investor’s shares, when redeemed, may be worth more or less than their original cost. Current performance of the Fund may be lower or higher than the performance quoted. Performance data current to the most recent month-end may be obtained by calling 1-800-999-0887 or visiting www. thompsonim.com.
Results include the reinvestment of all dividends and capital gains distributions. Investment performance reflects all fee waivers that may be in effect. In the absence of such waivers, total return would be reduced. The performance information reflected in the graph and the table above does not reflect the deduction of taxes that a shareholder would pay on fund distributions or the redemption of fund shares, nor does it imply future performance. The S&P 500 Index is an unmanaged index commonly used to measure the performance of U.S. stocks. You cannot directly invest in an index.
The S&P 500 Index is a product of S&P Dow Jones Indices LLC and has been licensed for use by Thompson Investment Management, Inc. S&P® and S&P 500® are registered trademarks of Standard & Poor’s Financial Services LLC (“S&P”). The Thompson IM Funds are not sponsored, endorsed, sold or promoted by S&P Dow Jones Indices LLC, Dow Jones, S&P or their respective affiliates, and none of S&P Dow Jones Indices LLC, Dow Jones, S&P nor their respective affiliates make any representation regarding the advisability of investing in such products.
See Notes to Financial Statements.
2
Table of Contents
LARGECAP FUND INVESTMENT REVIEW (Unaudited) (Continued)
Management Commentary
While we follow a strategy that generally favors a blend of growth and value stocks, because growth stock valuations are in our view excessive relative to those of value stocks, the Fund currently is tilted more heavily toward the value side of the market. Our concern is that should the market dynamic in this respect revert to its mean, growth stocks stand the risk of significant relative underperformance. Should this valuation gap normalize to more historical levels, we anticipate that the nature of the Fund’s aggregate holdings will again shift toward a more neutral mix of the two styles. Until then, we believe the portfolio’s current composition is appropriate.
For now, this strategy is likely to continue to explain the majority of the Fund’s relative performance. This fiscal year presented two opposite trends for equity investors, both of which illustrate this point. During the first half of the year, the significant valuation gap between value and growth stocks began to close as money flowed out of growth and into value. That the Fund favored value during the year contributed significantly to its competitive risk-adjusted performance during those first 6 months. This trend reversed in the second half of the year, and the Fund’s relative performance suffered. The ultimate result was that for the full year the Fund’s return modestly lagged its benchmark – an event that can be entirely attributed to not owning Nvidia, and to having less exposure to Microsoft and Apple stock than the benchmark.
To some degree, concerns about potentially sticky inflation and continued supply chain backups in the second half of the year may have pushed investors back toward safe-haven technology stocks and away from cyclical companies more likely to benefit from a post-pandemic return to normal life. Erratic foot traffic at a number of retailers and operational issues at companies in many different industries caused by dysfunctional supply chains do seem to be putting some pressure on corporate profit margins. Though we believe these issues to be transient, investors are showing little patience for stalled progress these days. Why wait for a post-pandemic boost when many tech companies’ earnings haven’t sputtered?
All things equal, we’d agree with this assessment. There’s a limit, though, and until the prices on these stocks pull back, we’ll strive to remain patient. Cisco is a good company that has shown strong earnings growth over time. Investors who bought Cisco stock at its peak in 1999 only just started making money on their investment 21 years later. We fear a similar fate may be in store for a number of high-flying growth stocks with similarly high current valuations today.
Opinions expressed are subject to change, are not guaranteed and should not be considered investment advice.
Mutual fund investing involves risk. Principal loss is possible. Investments in smaller companies involve additional risks such as limited liquidity and greater volatility. Investments in American Depositary Receipts (“ADRs”) are subject to some extent to the risks associated with directly investing in securities of foreign issuers, including the risk of changes in currency exchange rates, expropriation or nationalization of assets, and the impact of political, diplomatic, or social events. Investments in real estate securities may involve greater risk and volatility including greater exposure to economic downturns and changes in real estate values, rents, property taxes, and tax and other laws. A real estate investment trust’s (REIT’s) share price may decline because of adverse developments affecting the real estate industry.
Please refer to the Schedule of Investments on page 5 of this report for holdings information. The management commentary above as well as Fund holdings and asset/sector allocations should not be considered a recommendation to buy or sell any security. In addition, please note that Fund holdings and asset/sector allocations are subject to change.
Earnings Growth is a measure of growth in a company’s net income over a specific period, often one year. It is not a prediction of the Fund’s future returns.
See Notes to Financial Statements.
3
Table of Contents
LARGECAP FUND INVESTMENT REVIEW (Unaudited) (Continued)
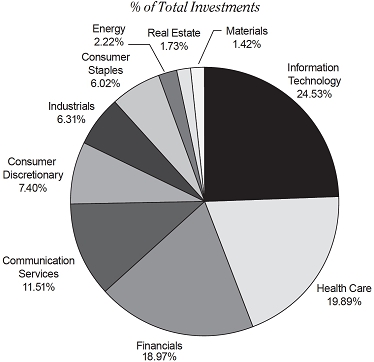
| Sector Weightings at 11/30/21 |
 |
| |
| Top 10 Equity Holdings at 11/30/21 |
| Company | | Industry | | % of Fund’s
Net Assets |
| Alphabet Inc. Class A | | Interactive Media & Services | | 4.83% |
| Microsoft Corp. | | Software | | 3.99% |
| Qualcomm Inc. | | Semiconductors & Semiconductor Equipment | | 2.85% |
| Apple Inc. | | Technology Hardware, Storage & Peripherals | | 2.59% |
| Bank of America Corp. | | Banks | | 2.50% |
| General Electric Co. | | Industrial Conglomerates | | 2.43% |
| JPMorgan Chase & Co. | | Banks | | 2.27% |
| META Platforms, Inc. Class A | | Interactive Media & Services | | 2.22% |
| Citigroup Inc. | | Banks | | 2.20% |
| UnitedHealth Group Inc. | | Health Care Providers & Services | | 2.15% |
As of November 30, 2021, 99.9% of the Fund’s net assets were in equity and short-term investments.
See Notes to Financial Statements.
4
Table of Contents
LARGECAP FUND SCHEDULE OF INVESTMENTS
| | | Shares | | Value |
| COMMON STOCKS - 99.8% | | | | $165,185,083 |
| (COST $111,263,738) | | | | |
| |
| Communication Services - 11.5% | | | | 19,029,795 |
| Entertainment - 1.0% | | | | |
| Electronic Arts Inc. | | 13,575 | | 1,686,287 |
| Interactive Media & Services - 7.1% | | | | |
| Alphabet Inc. Class A (a) | | 2,815 | | 7,988,829 |
| META Platforms, Inc. Class A (a) | | 11,325 | | 3,674,510 |
| Media - 3.4% | | | | |
| Discovery, Inc. Class A (a) | | 105,075 | | 2,445,095 |
| Loyalty Ventures Inc. (a) | | 12,520 | | 359,324 |
| ViacomCBS Inc. Class B | | 92,916 | | 2,875,750 |
| |
| Consumer Discretionary - 7.4% | | | | 12,223,645 |
| Distributors - 1.7% | | | | |
| LKQ Corp. | | 50,600 | | 2,828,540 |
| Hotels, Restaurants & Leisure - 2.1% | | | | |
| Las Vegas Sands Corp. (a) | | 66,150 | | 2,356,263 |
| Starbucks Corp. | | 10,825 | | 1,186,853 |
| Household Durables - 1.0% | | | | |
| TopBuild Corp. (a) | | 6,390 | | 1,723,958 |
| Internet & Direct Marketing Retail - 1.2% | | | | |
| eBay Inc. | | 28,995 | | 1,956,003 |
| Multiline Retail - 1.0% | | | | |
| Target Corp. | | 6,410 | | 1,563,014 |
| Specialty Retail - 0.4% | | | | |
| Bed Bath & Beyond Inc. (a) | | 33,225 | | 609,014 |
| |
| Consumer Staples - 6.0% | | | | 9,949,116 |
| Food & Staples Retailing - 2.8% | | | | |
| Performance Food Group Co. (a) | | 37,350 | | 1,505,579 |
| Walgreens Boots Alliance, Inc. | | 71,850 | | 3,218,880 |
| Food Products - 1.6% | | | | |
| The Kraft Heinz Co. | | 78,225 | | 2,629,142 |
| Household Products - 1.6% | | | | |
| Kimberly-Clark Corp. | | 19,918 | | 2,595,515 |
| |
| Energy - 2.2% | | | | 3,665,252 |
| Energy Equipment & Services - 0.5% | | | | |
| Schlumberger Ltd. | | 28,944 | | 830,114 |
| Oil, Gas & Consumable Fuels - 1.7% | | | | |
| Chevron Corp. | | 10,820 | | 1,221,253 |
| Exxon Mobil Corp. | | 26,970 | | 1,613,885 |
See Notes to Financial Statements.
5
Table of Contents
LARGECAP FUND SCHEDULE OF INVESTMENTS (Continued)
| | | Shares | | Value |
| COMMON STOCKS (continued) | | | | |
| | | | | |
| Financials - 18.9% | | | | $31,266,242 |
| Banks - 11.2% | | | | |
| Bank of America Corp. | | 93,025 | | 4,136,822 |
| Citigroup Inc. | | 57,140 | | 3,639,818 |
| Citizens Financial Group, Inc. | | 26,625 | | 1,258,564 |
| JPMorgan Chase & Co. | | 23,620 | | 3,751,565 |
| PNC Financial Services Group, Inc. | | 7,695 | | 1,515,915 |
| Truist Financial Corp. | | 15,432 | | 915,272 |
| Wells Fargo & Co. | | 43,275 | | 2,067,679 |
| Zions Bancorporation, N.A. | | 19,550 | | 1,233,214 |
| Capital Markets - 6.0% | | | | |
| Northern Trust Corp. | | 20,985 | | 2,427,964 |
| State Street Corp. | | 37,400 | | 3,327,478 |
| The Charles Schwab Corp. | | 31,800 | | 2,461,002 |
| The Goldman Sachs Group, Inc. | | 4,500 | | 1,714,455 |
| Consumer Finance - 0.6% | | | | |
| Discover Financial Services | | 9,120 | | 983,592 |
| Insurance - 1.1% | | | | |
| Fidelity National Financial, Inc. | | 37,475 | | 1,832,902 |
| | | | | |
| Health Care - 19.9% | | | | 32,873,971 |
| Biotechnology - 4.2% | | | | |
| AbbVie Inc. | | 22,225 | | 2,562,098 |
| Amgen Inc. | | 8,125 | | 1,615,900 |
| Exact Sciences Corp. (a) | | 28,150 | | 2,403,165 |
| MiMedx Group Inc. (a) | | 54,600 | | 382,746 |
| Health Care Equipment & Supplies - 0.7% | | | | |
| Abbott Laboratories | | 8,675 | | 1,091,055 |
| Health Care Providers & Services - 8.4% | | | | |
| Cigna Corp. | | 10,550 | | 2,024,545 |
| CVS Health Corp. | | 36,975 | | 3,292,993 |
| HCA Healthcare, Inc. | | 6,775 | | 1,528,372 |
| McKesson Corp. | | 16,385 | | 3,551,613 |
| UnitedHealth Group Inc. | | 8,000 | | 3,553,760 |
| Pharmaceuticals - 6.6% | | | | |
| Bristol-Myers Squibb Co. | | 61,775 | | 3,312,993 |
| Johnson & Johnson | | 10,425 | | 1,625,570 |
| Merck & Co., Inc. | | 22,525 | | 1,687,348 |
| Pfizer Inc. | | 63,375 | | 3,405,139 |
| Viatris Inc. | | 67,967 | | 836,674 |
See Notes to Financial Statements.
6
Table of Contents
LARGECAP FUND SCHEDULE OF INVESTMENTS (Continued)
| | | Shares | | Value |
| COMMON STOCKS (continued) | | | | |
| | | | | |
| Industrials - 6.3% | | | | $10,421,985 |
| Aerospace & Defense - 0.9% | | | | |
| General Dynamics Corp. | | 8,175 | | 1,544,830 |
| Air Freight & Logistics - 1.4% | | | | |
| FedEx Corp. | | 9,950 | | 2,292,182 |
| Industrial Conglomerates - 3.0% | | | | |
| General Electric Co. | | 42,250 | | 4,013,327 |
| 3M Co. | | 5,400 | | 918,216 |
| Machinery - 1.0% | | | | |
| Westinghouse Air Brake Technologies Corp. | | 18,626 | | 1,653,430 |
| | | | | |
| Information Technology - 24.5% | | | | 40,549,690 |
| Communications Equipment - 3.0% | | | | |
| Cisco Systems, Inc. | | 60,110 | | 3,296,432 |
| Lumentum Holdings Inc. (a) | | 10,125 | | 878,546 |
| Viavi Solutions Inc. (a) | | 58,735 | | 869,865 |
| Electronic Equipment, Instruments & Components - 3.2% | | | | |
| Corning Inc. | | 46,850 | | 1,737,667 |
| II-VI Inc. (a) | | 40,750 | | 2,548,097 |
| Keysight Technologies, Inc. (a) | | 4,950 | | 962,676 |
| IT Services - 4.2% | | | | |
| Alliance Data Systems Corp. | | 32,300 | | 2,201,568 |
| Fiserv, Inc. (a) | | 34,349 | | 3,315,365 |
| PayPal Holdings, Inc. (a) | | 4,535 | | 838,476 |
| Visa Inc. Class A | | 3,750 | | 726,638 |
| Semiconductors & Semiconductor Equipment - 5.7% | | | | |
| Infineon Technologies A.G. ADR | | 58,775 | | 2,669,560 |
| NXP Semiconductors N.V. | | 8,700 | | 1,943,232 |
| Qualcomm Inc. | | 26,080 | | 4,709,005 |
| Software - 5.8% | | | | |
| Microsoft Corp. | | 19,976 | | 6,603,866 |
| Oracle Corp. | | 32,575 | | 2,955,856 |
| Technology Hardware, Storage & Peripherals - 2.6% | | | | |
| Apple Inc. | | 25,970 | | 4,292,841 |
| | | | | |
| Materials - 1.4% | | | | 2,345,310 |
| Metals & Mining - 1.4% | | | | |
| Freeport-McMoRan Inc. | | 63,250 | | 2,345,310 |
| | | | | |
| Real Estate - 1.7% | | | | 2,860,077 |
| Equity Real Estate Investment - 0.9% | | | | |
| Simon Property Group, Inc. | | 10,300 | | 1,574,252 |
| Real Estate Management & Development - 0.8% | | | | |
| Colliers Int’l. Group, Inc. | | 9,500 | | 1,285,825 |
See Notes to Financial Statements.
7
Table of Contents
LARGECAP FUND SCHEDULE OF INVESTMENTS (Continued)
| | | Shares | | Value |
| SHORT-TERM INVESTMENTS - 0.1% | | | | $92,390 |
| (COST $92,390) | | | | |
| | | | | |
| Money Market Funds - 0.1% | | | | 92,390 |
| First American Gov’t. Obligations Fund Class X, 0.026% (b) | | 92,390 | | 92,390 |
| | | | | |
| TOTAL INVESTMENTS - 99.9% (COST $111,356,128) | | | | 165,277,473 |
| | | | | |
| NET OTHER ASSETS AND LIABILITIES - 0.1% | | | | 164,501 |
| | | | | |
| NET ASSETS - 100.0% | | | | $165,441,974 |
| | |
| (a) | Non-income producing security. |
| (b) | Represents the 7 day yield as of November 30, 2021. |
| | |
| Abbreviations: |
| ADR | American Depositary Receipt |
| A.G. | Aktiengesellschaft is the German term for a public limited liability corporation. |
| N.V. | Naamloze Vennootschap is the Dutch term for a public limited liability corporation. |
The Global Industry Classification Standard (“GICS”) was developed by and is the exclusive property and a service mark of MSCI Inc. (“MSCI”) and Standard & Poor’s Financial Services LLC (“S&P”) and is licensed for use by Thompson Investment Management, Inc. Neither MSCI, S&P, nor any other party involved in making or compiling the GICS or any GICS classifications makes any warranties with respect there to or the results to be obtained by the use thereof, and no such party shall have any liability whatsoever with respect thereto.
The following is a summary of the inputs used to value the Funds’ investments as of November 30, 2021:
| | | Level 1 | | Level 2 | | Level 3 | | Total |
| Common stocks | | | | | | | | |
| Communication services | | $19,029,795 | | $– | | $– | | $19,029,795 |
| Consumer discretionary | | 12,223,645 | | – | | – | | 12,223,645 |
| Consumer staples | | 9,949,116 | | – | | – | | 9,949,116 |
| Energy | | 3,665,252 | | – | | – | | 3,665,252 |
| Financials | | 31,266,242 | | – | | – | | 31,266,242 |
| Health care | | 32,873,971 | | – | | – | | 32,873,971 |
| Industrials | | 10,421,985 | | – | | – | | 10,421,985 |
| Information technology | | 40,549,690 | | – | | – | | 40,549,690 |
| Materials | | 2,345,310 | | – | | – | | 2,345,310 |
| Real estate | | 2,860,077 | | – | | – | | 2,860,077 |
| Total common stocks | | 165,185,083 | | – | | – | | 165,185,083 |
| Short-term investments | | | | | | | | |
| Money market funds | | 92,390 | | – | | – | | 92,390 |
| Total short-term investments | | 92,390 | | – | | – | | 92,390 |
| Total investments | | $165,277,473 | | $– | | $– | | $165,277,473 |
The Fund did not invest in any level-3 investments as of and during the fiscal year ended November 30, 2021.
For more information on valuation inputs, see financial statement Note 2 - Significant Accounting Policies.
See Notes to Financial Statements.
8
Table of Contents
MIDCAP FUND INVESTMENT REVIEW (Unaudited)
Portfolio Managers
James T. Evans, CFA
Jason L. Stephens, CFA
Performance
The MidCap Fund produced a total return of 29.75% for the fiscal year ended November 30, 2021, as compared to its benchmark, the Russell Midcap Index, which returned 23.29%.
| Comparison of Change in Value of a Hypothetical $10,000 Investment |
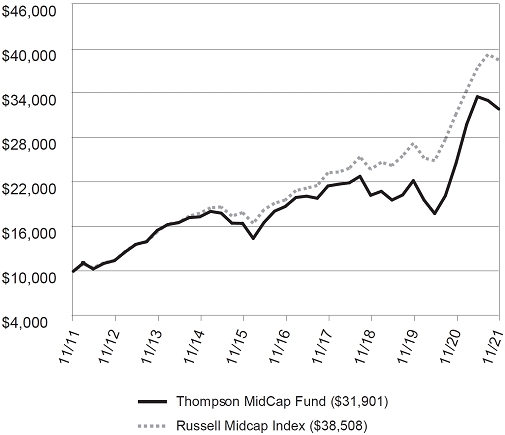
| Average Annual Total Returns |
| Through 11/30/21 |
| | | 1 Year | | 3 Year | | 5 Year | | 10 Year |
| Thompson MidCap Fund | | 29.75% | | 16.34% | | 11.22% | | 12.30% |
| Russell Midcap Index | | 23.29% | | 17.49% | | 14.44% | | 14.43% |
Gross Expense Ratio as of 03/31/21 was 1.53%.
Net Expense Ratio after reimbursement as of 03/31/21 was 1.15%.*
| * | The Advisor has contractually agreed to waive management fees and/or reimburse expenses incurred by the MidCap Fund through March 31, 2022, so that the annual operating expenses of the Fund do not exceed 1.15% of its average daily net assets. Net expense ratios are current as of the most recent Prospectus and are applicable to investors. |
Performance data quoted represents past performance; past performance does not guarantee future results. The investment return and principal value of an investment will fluctuate so that an investor’s shares, when redeemed, may be worth more or less than their original cost. Current performance of the Fund may be lower or higher than the performance quoted. Performance data current to the most recent month-end may be obtained by calling 1-800-999-0887 or visiting www.thompsonim.com.
Results include the reinvestment of all dividends and capital gains distributions. Investment performance reflects all fee waivers that may be in effect. In the absence of such waivers, total return would be reduced. The performance information reflected in the graph and the table above does not reflect the deduction of taxes that a shareholder would pay on fund distributions or the redemption of fund shares, nor does it imply future performance. The Russell Midcap Index measures the performance of the 800 smallest companies in the Russell 1000 Index based on total market capitalization. You cannot directly invest in an index.
FTSE Russell is the source and owner of the trademarks, service marks, and copyrights related to the Russell Indexes. “FTSE®” and “Russell®” are trademarks of the London Stock Exchange Group.
See Notes to Financial Statements.
9
Table of Contents
MIDCAP FUND INVESTMENT REVIEW (Unaudited) (Continued)
Management Commentary
While we follow a strategy that generally favors a blend of growth and value stocks, because growth stock valuations are in our view excessive relative to those of value stocks, the Fund currently is tilted more heavily toward the value side of the market. Our concern is that should the market dynamic in this respect revert to its mean, growth stocks stand the risk of significant relative underperformance. Should this valuation gap normalize to more historical levels, we anticipate that the nature of the Fund’s aggregate holdings will again shift toward a more neutral mix of the two styles. Until then, we believe the portfolio’s current composition is appropriate.
For now, this strategy is likely to continue to explain the majority of the Fund’s relative performance, and that was certainly the case during the fiscal year. Though in the second half of the year the trend reversed to some degree, the Russell Midcap Value Index outperformed the Russell Midcap Growth Index for the period. This strongly influenced the competitive performance produced by the Fund. This is in contrast to large-cap stocks, where growth ultimately outperformed value by a wide margin over the same timeframe.
This speaks to the outsized influence mega-cap technology stocks have on that universe. Microsoft, for example, made up over 6% of the S&P 500 Index as of November 30, 2021, while the largest stock in the Russell Midcap Index as of that date made up just over 0.5% of that index. When large-cap investors have gotten nervous recently, they’ve often flooded into large, safe-haven technology companies with high valuations like Microsoft. We’re not seeing the same kind of dynamic at play in mid-caps, which might explain (unlike the S&P 500) why the Russell Midcap Index valuation isn’t quite at what we would consider a nosebleed level.
Still, midcap stock valuations are historically high, and the midcap valuation gap between value and growth remains quite large. Until the prices on growth stocks pull back, we’ll strive to remain patient.
Opinions expressed are subject to change, are not guaranteed and should not be considered investment advice.
Mutual fund investing involves risk. Principal loss is possible. Midcap companies tend to have more limited liquidity and greater volatility than large-capitalization companies. Investments in American Depositary Receipts (“ADRs”) are subject to some extent to the risks associated with directly investing in securities of foreign issuers, including the risk of changes in currency exchange rates, expropriation or nationalization of assets, and the impact of political, diplomatic, or social events. Investments in real estate securities may involve greater risk and volatility including greater exposure to economic downturns and changes in real estate values, rents, property taxes, and tax and other laws. A real estate investment trust’s (REIT’s) share price may decline because of adverse developments affecting the real estate industry.
Please refer to the Schedule of Investments on page 12 of this report for holdings information. The management commentary above as well as Fund holdings and asset/sector allocations should not be considered a recommendation to buy or sell any security. In addition, please note that Fund holdings and asset/sector allocations are subject to change.
The Russell Midcap Growth Index measures the performance of those Russell Midcap companies with higher price-to-book ratios and higher forecasted growth values.
The Russell Midcap Value Index measures the performance of those Russell Midcap companies with lower price-to-book ratios and lower forecasted growth values.
The S&P 500 Index is an unmanaged index commonly used to measure the performance of U.S. stocks.
See Notes to Financial Statements.
10
Table of Contents
MIDCAP FUND INVESTMENT REVIEW (Unaudited) (Continued)
| |
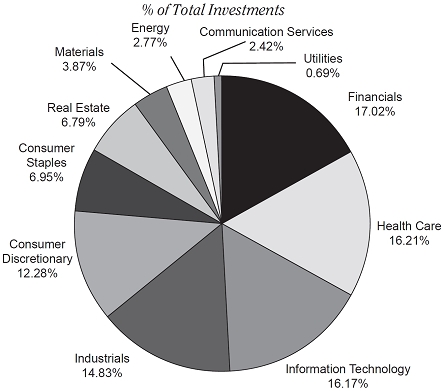
| Sector Weightings at 11/30/21 |
| |
| Top 10 Equity Holdings at 11/30/21 |
| Company | | Industry | | % of Fund’s
Net Assets |
| First Horizon National Corp. | | Banks | | 2.24% |
| LKQ Corp. | | Distributors | | 2.11% |
| Walgreens Boots Alliance, Inc. | | Food & Staples Retailing | | 2.00% |
| Alliance Data Systems Corp. | | IT Services | | 1.91% |
| Northern Trust Corp. | | Capital Markets | | 1.82% |
| Zions Bancorporation, N.A. | | Banks | | 1.79% |
| NXP Semiconductors N.V. | | Semiconductors & Semiconductor Equipment | | 1.69% |
| Jazz Pharmaceuticals PLC | | Pharmaceuticals | | 1.68% |
| Associated Banc-Corp | | Banks | | 1.68% |
| SS&C Technologies Holdings, Inc. | | Software | | 1.68% |
As of November 30, 2021, 99.9% of the Fund’s net assets were in equity and short-term investments.
See Notes to Financial Statements.
11
Table of Contents
MIDCAP FUND SCHEDULE OF INVESTMENTS
| | | Shares | | | Value |
| COMMON STOCKS - 99.9% | | | | | $60,883,344 |
| (COST $40,973,035) | | | | | |
| | | | | | |
| Communication Services - 2.4% | | | | | 1,475,105 |
| Entertainment - 1.1% | | | | | |
| Take-Two Interactive Software, Inc. (a) | | 4,100 | | | 680,108 |
| Media - 1.3% | | | | | |
| Discovery, Inc. Class A (a) | | 25,760 | | | 599,435 |
| Loyalty Ventures Inc. (a) | | 6,814 | | | 195,562 |
| | | | | | |
| Consumer Discretionary - 12.3% | | | | | 7,475,713 |
| Distributors - 2.1% | | | | | |
| LKQ Corp. | | 22,950 | | | 1,282,905 |
| Hotels, Restaurants & Leisure - 1.0% | | | | | |
| Noodles & Co. (a) | | 59,332 | | | 610,526 |
| Household Durables - 2.6% | | | | | |
| Newell Brands, Inc. | | 45,026 | | | 966,708 |
| TopBuild Corp. (a) | | 2,290 | | | 617,819 |
| Internet & Direct Marketing Retail - 1.2% | | | | | |
| Duluth Holdings Inc. Class B (a) | | 54,025 | | | 749,327 |
| Leisure Products - 1.0% | | | | | |
| Callaway Golf Co. (a) | | 23,100 | | | 622,776 |
| Specialty Retail - 1.2% | | | | | |
| Bed Bath & Beyond Inc. (a) | | 10,680 | | | 195,765 |
| Urban Outfitters, Inc. (a) | | 16,520 | | | 523,189 |
| Textiles, Apparel & Luxury Goods - 3.2% | | | | | |
| Hanesbrands, Inc. | | 37,655 | | | 608,128 |
| Levi Strauss & Co. Class A | | 13,700 | | | 350,309 |
| Skechers U.S.A., Inc. Class A (a) | | 21,110 | | | 948,261 |
| | | | | | |
| Consumer Staples - 6.9% | | | | | 4,231,069 |
| Beverages - 1.8% | | | | | |
| MGP Ingredients, Inc. | | 3,919 | | | 305,604 |
| Molson Coors Brewing Co. Class B | | 17,805 | | | 791,254 |
| Food & Staples Retailing - 3.0% | | | | | |
| Performance Food Group Co. (a) | | 14,900 | | | 600,619 |
| Walgreens Boots Alliance, Inc. | | 27,165 | | | 1,216,992 |
| Food Products - 1.1% | | | | | |
| The Kraft Heinz Co. | | 20,600 | | | 692,366 |
| Household Products - 1.0% | | | | | |
| Energizer Holdings, Inc. | | 16,785 | | | 624,234 |
| | | | | | |
| Energy - 2.8% | | | | | 1,687,167 |
| Oil, Gas & Consumable Fuels - 2.8% | | | | | |
| Cameco Corp. | | 12,400 | | | 287,432 |
| Cheniere Energy, Inc. | | 7,145 | | | 748,867 |
| Pioneer Natural Resources Co. | | 3,650 | | | 650,868 |
See Notes to Financial Statements.
12
Table of Contents
MIDCAP FUND SCHEDULE OF INVESTMENTS (Continued)
| | | Shares | | Value |
| COMMON STOCKS (continued) | | | | |
| | | | | |
| Financials - 17.0% | | | | $10,359,416 |
| Banks - 8.6% | | | | |
| Associated Banc-Corp | | 46,758 | | 1,024,000 |
| Citizens Financial Group, Inc. | | 16,225 | | 766,956 |
| First Horizon National Corp. | | 84,605 | | 1,364,679 |
| Regions Financial Corp. | | 17,585 | | 400,059 |
| Truist Financial Corp. | | 10,091 | | 598,497 |
| Zions Bancorporation, N.A. | | 17,245 | | 1,087,815 |
| Capital Markets - 3.7% | | | | |
| Northern Trust Corp. | | 9,580 | | 1,108,406 |
| State Street Corp. | | 9,145 | | 813,631 |
| The Charles Schwab Corp. | | 4,415 | | 341,677 |
| Consumer Finance - 1.5% | | | | |
| Discover Financial Services | | 8,579 | | 925,245 |
| Insurance - 1.0% | | | | |
| Fidelity National Financial, Inc. | | 12,140 | | 593,767 |
| Mortgage Real Estate Investment Trusts (REITs) - 1.0% | | | | |
| Annaly Capital Management, Inc. | | 72,845 | | 590,044 |
| Thrifts & Mortgage Finance - 1.2% | | | | |
| Flagstar Bancorp, Inc. | | 16,000 | | 744,640 |
| | | | | |
| Health Care - 16.2% | | | | 9,868,871 |
| Biotechnology - 2.1% | | | | |
| Exact Sciences Corp. (a) | | 7,465 | | 637,287 |
| MiMedx Group Inc. (a) | | 9,015 | | 63,195 |
| Neurocrine Biosciences, Inc. (a) | | 7,180 | | 597,735 |
| Health Care Equipment & Supplies - 0.9% | | | | |
| Accelerate Diagnostics, Inc. (a) | | 110,900 | | 554,500 |
| Health Care Providers & Services - 7.8% | | | | |
| Acadia Healthcare Co., Inc. (a) | | 12,260 | | 688,644 |
| AMN Healthcare Services, Inc. (a) | | 7,450 | | 849,375 |
| Hanger, Inc. (a) | | 35,200 | | 593,824 |
| Henry Schein, Inc. (a) | | 4,080 | | 289,925 |
| LHC Group, Inc. (a) | | 4,000 | | 458,880 |
| McKesson Corp. | | 1,945 | | 421,598 |
| Premier, Inc. Class A | | 22,830 | | 846,308 |
| Universal Health Services, Inc., Class B | | 5,100 | | 605,523 |
| Pharmaceuticals - 5.4% | | | | |
| Aerie Pharmaceuticals, Inc. (a) | | 59,212 | | 598,041 |
| AstraZeneca PLC ADR | | 7,609 | | 417,202 |
| Bausch Health Cos., Inc. (a) | | 25,675 | | 612,092 |
| Jazz Pharmaceuticals PLC (a) | | 8,545 | | 1,024,289 |
| Viatris Inc. | | 49,590 | | 610,453 |
See Notes to Financial Statements.
13
Table of Contents
MIDCAP FUND SCHEDULE OF INVESTMENTS (Continued)
| | | | Shares | | | | Value |
| COMMON STOCKS (continued) | | | | | | | |
| | | | | | | | |
| Industrials - 14.8% | | | | | | $ | 9,027,165 |
| Building Products - 2.1% | | | | | | | |
| A.O. Smith Corp. | | | 9,680 | | | | 765,204 |
| Trane Technologies PLC | | | 2,650 | | | | 494,623 |
| Commercial Services & Supplies - 0.8% | | | | | | | |
| Steelcase Inc. Class A | | | 45,810 | | | | 512,614 |
| Construction & Engineering - 2.3% | | | | | | | |
| MasTec, Inc. (a) | | | 8,590 | | | | 791,740 |
| Willscot Mobile Mini Holdings Corp. (a) | | | 16,041 | | | | 611,002 |
| Electrical Equipment - 0.7% | | | | | | | |
| Regal Rexnord Corp. | | | 2,805 | | | | 443,470 |
| Machinery - 8.1% | | | | | | | |
| Evoqua Water Technologies Corp. (a) | | | 12,000 | | | | 539,760 |
| Hillenbrand, Inc. | | | 14,750 | | | | 657,850 |
| Ingersoll-Rand Inc. | | | 2,972 | | | | 173,386 |
| Kornit Digital Ltd. (a) | | | 2,715 | | | | 420,581 |
| Mueller Water Products, Inc. Class A | | | 30,225 | | | | 412,269 |
| Oshkosh Corp. | | | 5,910 | | | | 635,916 |
| REV Group, Inc. | | | 39,995 | | | | 627,922 |
| SPX Corp. (a) | | | 4,495 | | | | 261,384 |
| SPX Flow, Inc. | | | 11,070 | | | | 924,456 |
| Westinghouse Air Brake Technologies Corp. | | | 3,225 | | | | 286,283 |
| Trading Companies & Distributors - 0.8% | | | | | | | |
| Hudson Technologies, Inc. (a) | | | 124,325 | | | | 468,705 |
| | | | | | | | |
| Information Technology - 16.2% | | | | | | | 9,842,106 |
| Communications Equipment - 2.1% | | | | | | | |
| Calix, Inc. (a) | | | 4,500 | | | | 301,320 |
| Lumentum Holdings Inc. (a) | | | 6,275 | | | | 544,482 |
| Viavi Solutions Inc. (a) | | | 28,771 | | | | 426,099 |
| Electronic Equipment, Instruments & Components - 3.5% | | | | | | | |
| Corning Inc. | | | 13,200 | | | | 489,588 |
| II-VI Inc. (a) | | | 15,270 | | | | 954,833 |
| Keysight Technologies, Inc. (a) | | | 3,585 | | | | 697,211 |
| IT Services - 3.4% | | | | | | | |
| Alliance Data Systems Corp. | | | 17,035 | | | | 1,161,106 |
| Fiserv, Inc. (a) | | | 9,393 | | | | 906,612 |
| Semiconductors & Semiconductor Equipment - 4.0% | | | | | | | |
| Infineon Technologies A.G. ADR | | | 13,375 | | | | 607,492 |
| Marvell Technology, Inc. | | | 11,200 | | | | 797,104 |
| NXP Semiconductors N.V. | | | 4,605 | | | | 1,028,573 |
| Software - 2.4% | | | | | | | |
| Black Knight, Inc. (a) | | | 5,890 | | | | 420,958 |
| SS&C Technologies Holdings, Inc. | | | 13,400 | | | | 1,022,822 |
| Technology Hardware, Storage & Peripherals - 0.8% | | | | | | | |
| Pure Storage, Inc. Class A (a) | | | 15,625 | | | | 483,906 |
See Notes to Financial Statements.
14
Table of Contents
MIDCAP FUND SCHEDULE OF INVESTMENTS (Continued)
| | | Shares | | Value |
| COMMON STOCKS (continued) | | | | |
| | | | | |
| Materials - 3.9% | | | | $ 2,358,888 |
| Containers & Packaging - 2.2% | | | | |
| Berry Global Group, Inc. (a) | | 10,000 | | 690,500 |
| Crown Holdings, Inc. | | 5,830 | | 616,814 |
| Metals & Mining - 1.7% | | | | |
| Freeport-McMoRan Inc. | | 24,885 | | 922,736 |
| Lundin Mining Corp. | | 16,350 | | 128,838 |
| | | | | |
| Real Estate - 6.7% | | | | 4,136,648 |
| Equity Real Estate Investment - 4.4% | | | | |
| DiamondRock Hospitality Co. (a) | | 52,225 | | 454,880 |
| Host Hotels & Resorts Inc. (a) | | 27,625 | | 433,713 |
| Iron Mountain Inc. | | 17,935 | | 814,966 |
| Service Properties Trust (a) | | 51,505 | | 438,308 |
| Simon Property Group, Inc. | | 3,835 | | 586,141 |
| Real Estate Management & Development - 2.3% | | | | |
| Colliers Int’l. Group Inc. | | 7,100 | | 960,985 |
| FirstService Corp. | | 2,325 | | 447,655 |
| | | | | |
| Utilities - 0.7% | | | | 421,196 |
| Electric Utilities - 0.2% | | | | |
| Xcel Energy, Inc. | | 2,080 | | 132,558 |
| Multi-Utilities - 0.5% | | | | |
| MDU Resources Group, Inc. | | 10,600 | | 288,638 |
| | | | | |
| SHORT-TERM INVESTMENTS - 0.0%^ | | | | 71 |
| (COST $71) | | | | |
| | | | | |
| Money Market Funds - 0.0%^ | | | | 71 |
| First American Gov’t. Obligations Fund Class X, 0.026% (b) | | 71 | | 71 |
| | | | | |
| TOTAL INVESTMENTS - 99.9% (COST $40,973,106) | | | | 60,883,415 |
| | | | | |
| NET OTHER ASSETS AND LIABILITIES - 0.1% | | | | 33,238 |
| | | | | |
| NET ASSETS - 100.0% | | | | $60,916,653 |
| | |
| (a) | Non-income producing security. |
| (b) | Represents the 7-day yield at November 30, 2021. |
| ^ | Rounds to 0.0%. |
| |
| Abbreviations: |
| ADR | American Depositary Receipt |
| A.G. | Aktiengesellschaft is the German term for a public limited liability corporation. |
| N.V. | Naamloze Vennootschap is the Dutch term for a public limited liability corporation. |
| PLC | Public Limited Company |
See Notes to Financial Statements.
15
Table of Contents
MIDCAP FUND SCHEDULE OF INVESTMENTS (Continued)
The Global Industry Classification Standard (“GICS”) was developed by and is the exclusive property and a service mark of MSCI Inc. (“MSCI”) and Standard & Poor’s Financial Services LLC (“S&P”) and is licensed for use by Thompson Investment Management Inc. Neither MSCI, S&P, nor any other party involved in making or compiling the GICS or any GICS classifications makes any warranties with respect there to or the results to be obtained by the use thereof, and no such party shall have any liability whatsoever with respect thereto.
The following is a summary of the inputs used to value the Funds’ investments as of November 30, 2021:
| | | Level 1 | | Level 2 | | Level 3 | | Total |
| Common stocks | | | | | | | | |
| Communication services | | $1,475,105 | | $- | | $- | | $1,475,105 |
| Consumer discretionary | | 7,475,713 | | - | | - | | 7,475,713 |
| Consumer staples | | 4,231,069 | | - | | - | | 4,231,069 |
| Energy | | 1,687,167 | | - | | - | | 1,687,167 |
| Financials | | 10,359,416 | | - | | - | | 10,359,416 |
| Health care | | 9,868,871 | | - | | - | | 9,868,871 |
| Industrials | | 9,027,165 | | - | | - | | 9,027,165 |
| Information technology | | 9,842,106 | | - | | - | | 9,842,106 |
| Materials | | 2,358,888 | | - | | - | | 2,358,888 |
| Real estate | | 4,136,648 | | - | | - | | 4,136,648 |
| Utilities | | 421,196 | | - | | - | | 421,196 |
| Total common stocks | | 60,883,344 | | - | | - | | 60,883,344 |
| Short-term investments | | | | | | | | |
| Money market funds | | 71 | | - | | - | | 71 |
| Total short-term investments | | 71 | | - | | - | | 71 |
| Total investments | | $60,883,415 | | $- | | $- | | $60,883,415 |
The Fund did not invest in any level-3 investments as of and during the fiscal year ended November 30, 2021.
For more information on valuation inputs, see financial statement Note 2 - Significant Accounting Policies.
See Notes to Financial Statements.
16
Table of Contents
BOND FUND INVESTMENT REVIEW (Unaudited)
Portfolio Managers
James T. Evans, CFA
Jason L. Stephens, CFA
Performance
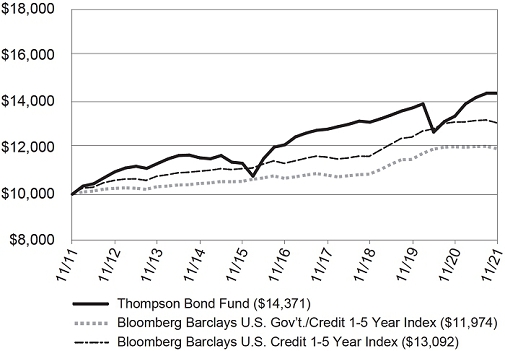
The Bond Fund produced a total return of 7.43% for the fiscal year ended November 30, 2021, as compared to its benchmark, the Bloomberg Barclays U.S. Government/Credit 1-5 Year Index, which returned -0.66%, and as compared to the Bloomberg Barclays U.S. Credit 1-5 Year Index, which returned -0.23%.
| Comparison of Change in Value of a Hypothetical $10,000 Investment |
| Average Annual Total Returns |
| Through 11/30/21 |
| | | 1 Year | | 3 Year | | 5 Year | | 10 Year |
| Thompson Bond Fund | | 7.43% | | 3.09% | | 3.44% | | 3.69% |
| Bloomberg Barclays U.S. Gov’t./Credit 1-5 Year Index | | -0.66% | | 3.29% | | 2.30% | | 1.82% |
| Bloomberg Barclays U.S. Credit 1-5 Year Index | | -0.23% | | 4.00% | | 2.92% | | 2.73% |
| | |
| Gross Expense Ratio as of 03/31/21 was 0.72%. | 30-Day SEC Yield as of 11/30/21 was 3.13%. |
Performance data quoted represents past performance; past performance does not guarantee future results. The investment return and principal value of an investment will fluctuate so that an investor’s shares, when redeemed, may be worth more or less than their original cost. Current performance of the Fund may be lower or higher than the performance quoted. Performance data current to the most recent month-end may be obtained by calling 1-800-999-0887 or visiting www.thompsonim.com.
Results include the reinvestment of all dividends and capital gains distributions. Investment performance reflects all fee waivers that may have been in effect. In the absence of such waivers, total return would have been reduced. The performance information reflected in the graph and the table above does not reflect the deduction of taxes that a shareholder would pay on fund distributions or the redemption of fund shares, nor does it imply future performance. The Bloomberg Barclays U.S. Government/Credit 1-5 Year Index is a market-value-weighted index of all investment-grade bonds with maturities of more than one year and less than 5 years. The Bloomberg Barclays U.S. Credit 1-5 Year Index is a market-value-weighted index which includes virtually every major investment-grade rated corporate bond with 1-5 years remaining until maturity that serves as a supplementary benchmark. You cannot directly invest in an index.
Bloomberg® is a trademark and service mark of Bloomberg Finance L.P. Barclays® is a trademark and service mark of Barclays Bank PLC.
See Notes to Financial Statements.
17
Table of Contents
BOND FUND INVESTMENT REVIEW (Unaudited) (Continued)
Management Commentary
The Fund’s performance for the annual period was a good one for shareholders, as returns were solidly positive in the face of a negative return from the Fund’s benchmarks. Some of the Fund’s return can be attributed to a continued recovery from bond prices that had been depressed in 2020, especially in the asset-backed and commercial mortgage areas. Still, after entering the fiscal year with a 30-day SEC yield of 4.61%, the majority of the period’s return was simply earned by clipping interest coupons and the passage of time. The Fund ended the November 30, 2021, fiscal year with a 30-day SEC yield of 3.13%, suggesting this effect is likely to help shareholders during the next fiscal year too.
Going forward, we believe fixed-income returns will be challenged by rising inflation and interest rates. Some of these challenges will probably be temporary, while others could be longer lasting. For example, it has been widely reported that Covid-19-related supply chain disruptions with semiconductors have impacted the number of new automobiles being built in 2021. This has created a scarcity of inventory at the dealer level, pushing the price of a new car generally up above the manufacturer’s suggested retail price. Used cars have appreciated as a consequence. This is the type of inflation that, while acute in 2021, is not likely to persist multiple years into the future. Eventually vaccine disbursement will have reached sufficient levels globally that the supply chain should return to a more efficient operating level. When that happens the supply of autos should increase, bringing prices back down. More worrisome is inflation associated with higher labor costs and higher real estate prices translating into higher rent equivalents. These types of costs (salaries and rent) tend to be negotiated a year at a time and are much more persistent. And while it’s too early to be certain, it appears the country may be headed for an extended period of inflation from those two sources.
Within the portfolio we have taken several steps during the fiscal year to attempt to mitigate the effects of higher inflation and potentially higher interest rates. They include the following:
| ● | Keeping the average duration as low as possible while still generating an attractive 30-day SEC yield. The Fund finished the annual year with an average duration of 1.85. |
| | |
| ● | Investing in floating-rate securities tied to a benchmark that would be expected to yield more if interest rates increase. At fiscal year-end, roughly 26.41% of the Fund was invested in such floating-rate securities, with another 16.10% of the Fund in bonds scheduled to float at some point in the future if they are not called prior to that time. |
| | |
| ● | Focusing recent purchases of bonds on those in the 2022-23 maturity range. While bonds in this maturity range generally yield less than the overall portfolio, their short maturity means the Fund expects to receive the proceeds from the bonds sooner and be in a position to reinvest at higher rates if yields rise. At fiscal year-end, roughly 25.25% of the Fund was scheduled to mature before the end of 2023. The sinkable nature of other longer-maturity holdings is also expected to provide additional cash before the end of 2023 that could be reinvested. |
No plan is foolproof, and if rates rise quickly enough they could overwhelm the efforts described above. We saw some of this during the final two months of the fiscal year as yields on 2-3-year maturity Treasuries increased between 29 and 33 basis points. However, we believe the Fund on a relative basis is more insulated from potentially rising rates than other strategies that have a heavier allocation to Treasury bills or to intermediate- and long-term debt. Such approaches either generate very little current yield (Treasury bills) or have much higher durations (intermediate and long-term bonds). Such approaches only make sense to us in an environment of steady or falling interest rates.
There has been another key change to the Fund’s portfolio over the past several quarters. We have made a conscious effort to shift the Fund’s holdings towards securities with higher credit quality ratings. As a result, holdings rated A- or better have risen as a percentage of Fund net assets, from 26.32% at the beginning of the fiscal year to 31.57% at fiscal end. This has largely come from holdings in the BBB-rated tier, which have shrunk from 57.38% to 53.12% of net assets. We’ve been able to do this while maintaining a higher 30-day SEC yield by increasing the Fund’s allocation to government-related securities, as well as to higher-rated (A- or better) commercial mortgage and asset-backed securities. The Fund has a history of operating in both spaces, with exposure dating back between 5 and 11 years depending on the security type. These are not new asset classes to the Fund or our investment team. The difference today is that on a relative basis we view them as more attractive than many simpler BBB-rated corporate bonds thanks to significant spread narrowing among the latter group. Thus our allocation to them is larger than before. Should spreads widen back out on BBB-rated corporate bonds to more attractive levels, we would consider partially reversing this trade.
See Notes to Financial Statements.
18
Table of Contents
BOND FUND INVESTMENT REVIEW (Unaudited) (Continued)
As managers we realize our investment strategy is different than many others. We appreciate shareholders who have taken the time to understand those differences, and who share our concerns over interest-rate risk. We are optimistic the Fund can generate competitive returns in a variety of possible future scenarios, and look forward to sharing those future returns with you.
Opinions expressed are subject to change, are not guaranteed and should not be considered investment advice.
Mutual fund investing involves risk. Principal loss is possible. Investments in debt securities typically decrease in value when interest rates rise. The risk is usually greater for longer-term debt securities. Investments in bonds of foreign issuers involve greater volatility, political and economic risks, and differences in accounting methods. Investment by the Fund in lower-rated and non-rated securities presents a greater risk of loss to principal and interest than higher-rated securities.
Please refer to the Schedule of Investments on page 21 of this report for holdings information. The management commentary above as well as Fund holdings should not be considered a recommendation to buy or sell any security. In addition, please note that Fund holdings are subject to change.
The federal government guarantees interest payments from government securities while dividend payments carry no such guarantee. Government securities, if held to maturity, guarantee the timely payment of principal and interest.
Basis Point is a unit that is equal to 1/100th of 1%, and is used to denote the change in a financial instrument. The basis point is commonly used for calculating changes in interest rates, equity indexes and the yield of a fixed-income security.
Coupon is the annual interest rate paid on a bond, expressed as a percentage of the face value and paid from issue date until maturity.
Duration is a commonly used measure of the potential volatility of the price of a debt security, or the aggregate market value of a portfolio of debt securities, prior to maturity. Securities with a longer duration generally have more volatile prices than securities of comparable quality with a shorter duration.
SEC Yield is a standardized yield computed by dividing the net investment income per share earned during the 30-day period prior to quarter-end and was created to allow for fairer comparisons among bond funds.
Spread is the percentage point difference between yields of various classes of bonds compared to treasury bonds.
Yield is the income earned from a bond, which takes into account the sum of the interest payment, the redemption value at the bond’s maturity, and the initial purchase price of the bond.
See Notes to Financial Statements.
19
Table of Contents
BOND FUND INVESTMENT REVIEW (Unaudited) (Continued)
Although the makeup of the Bond Fund’s portfolio is constantly changing, as of November 30, 2021, 54.00% of the Fund’s portfolio was invested in corporate bonds. Due to prevailing market conditions, the percentage of corporate bonds held in the Fund’s portfolio over the past 5 years has generally equaled or exceeded the percentage of corporate bonds held in the Fund’s portfolio as of that date. In addition, as of that date 25.45% of the Fund’s portfolio was invested in securities rated BBB by Standard & Poor’s, while an additional 7.45% of the Fund’s portfolio was rated below investment-grade and 50.47% of the Fund’s portfolio was not rated by Standard & Poor’s. Additional information regarding the ratings of securities held in the Fund’s portfolio, including information pertaining to securities that have not been rated by Standard & Poor’s but have been rated by another Nationally Recognized Statistical Credit Rating Organization, is reflected in the quality composition table below. For portfolio information current as of the most recent quarter-end, please call 1-800-999-0887 or visit our website at www.thompsonim.com. Compared to a portfolio that is more evenly allocated between government and corporate bonds, a portfolio that is heavily allocated to corporate bonds may provide higher returns but is also subject to greater levels of credit and liquidity risk and to greater price fluctuations. A portfolio that is significantly allocated to bonds having lower and below-investment-grade ratings may also be subject to greater levels of credit and liquidity risk and experience greater price fluctuations than a portfolio comprised of higher-rated investment-grade bonds.
| Asset Allocation at 11/30/21 |
(Includes cash equivalents)
% of Total Investments |
| Corporate Bonds | | 54.00% |
| Commercial Mortgage-Backed Securities | | 15.53% |
| Asset-Backed Securities | | 14.50% |
| U.S. Government Agency Mortgage-Backed Securities | | 8.65% |
| U.S. Government & Agency Securities | | 4.51% |
| Convertible Bonds | | 2.43% |
| Sovereign Bonds | | 0.22% |
| Taxable Municipal Bonds | | 0.11% |
| Residential Mortgage-Backed Securities | | 0.05% |
| | | 100.00% |
| | | |
| Quality Composition at 11/30/21^ |
(Includes cash equivalents)
% of Total Investments |
| U.S. Government & Agency Issues | | 13.16% |
| AAA | | 2.16% |
| AA | | 2.04% |
| A | | 14.20% |
| BBB | | 53.12% |
| BB and Below | | 13.26% |
| Not Rated | | 2.06% |
| | | 100.00% |
| | | |
| ^ | The Bond Fund’s quality composition is calculated using ratings from Standard & Poor’s. If Standard & Poor’s does not rate a holding then Moody’s is used. If Standard & Poor’s and Moody’s do not rate a holding then Fitch is used. For certain securities that are not rated by any of these three agencies, credit ratings from other Nationally Recognized Statistical Credit Rating Organization (NRSRO) agencies may be used. Not rated category includes holdings that are not rated by any NRSRO. All ratings are as of 11/30/21. |
| | |
| Top 10 Bond Holdings by Issuer at 11/30/21 |
| % of Fund’s Net Assets |
| Ginnie Mae REMIC Trust | | 4.89% |
| U.S. Treasury Bills | | 4.45% |
| COMM Mortgage Trust | | 2.89% |
| Freddie Mac REMIC | | 2.02% |
| Lincoln National Corp. | | 1.90% |
| General Electric Co. | | 1.87% |
| Morgan Stanley Bank of America Merrill Lynch Trust | | 1.71% |
| JPMBB Commercial Mortgage Securities Trust | | 1.66% |
| WFRBS Commercial Mortgage Trust | | 1.55% |
| AmTrust Financial Services, Inc. | | 1.54% |
See Notes to Financial Statements.
20
Table of Contents
BOND FUND SCHEDULE OF INVESTMENTS
| | | | | | | | | |
| | | Rate (%) | | Maturity Date | | Principal Amount | | Value |
| BONDS - 94.2% | | | | | | | | $2,432,000,710 |
| (COST $2,519,513,627) | | | | | | | | |
| | | | | | | | | |
| Asset-Backed Securities - 14.3% | | | | | | | | 369,216,910 |
| AASET Trust, Series 2018-2A A (h) | | 4.454 | | 11/18/38 | | 773,047 | | 744,013 |
| Air Canada, Series 2015-1B (h) | | 3.875 | | 09/15/24 | | 1,368,213 | | 1,377,782 |
| American Airlines, Series 2013-2 A | | 4.950 | | 07/15/24 | | 118,101 | | 121,067 |
| American Airlines, Series 2014-1 B | | 4.375 | | 04/01/24 | | 79,401 | | 79,568 |
| American Airlines, Series 2015-1 B | | 3.700 | | 11/01/24 | | 2,082,929 | | 2,051,021 |
| American Airlines, Series 2016-1 B | | 5.250 | | 07/15/25 | | 1,085,566 | | 1,078,570 |
| American Airlines, Series 2017-1 A | | 4.000 | | 08/15/30 | | 245,313 | | 245,705 |
| American Tower Trust #1 (h) | | 3.070 | | 03/15/48 | | 13,100,000 | | 13,112,851 |
| Aqua Finance Trust, Series 2017-A C (h) | | 8.350 | | 11/15/35 | | 1,750,000 | | 1,796,303 |
| Blackbird Capital Aircraft Lease Securitization Ltd., Series 2016-1A A (h) | | 4.213 | | 12/16/41 | | 5,824,003 | | 5,833,475 |
| Blackbird Capital Aircraft Lease Securitization Ltd., Series 2016-1A B (h) | | 5.682 | | 12/16/41 | | 1,248,698 | | 1,219,737 |
| Burlington Northern and Santa Fe Railway Co. Trust, Series 2002-1 | | 5.943 | | 01/15/23 | | 647 | | 651 |
| Business Jet Securities, LLC, Series 2019-1 B (h) | | 5.193 | | 07/15/34 | | 1,107,377 | | 1,097,875 |
| Castle Aircraft Securitization Trust, Series 2019-1A A (h) | | 3.967 | | 04/15/39 | | 3,690,611 | | 3,679,242 |
| Castle Aircraft Securitization Trust, Series 2021-1A B (h) | | 6.656 | | 01/15/46 | | 4,933,541 | | 5,288,406 |
| Cibolo Canyons Special Improvement District (h) | | 4.250 | | 08/20/34 | | 2,520,000 | | 2,381,400 |
| Coinstar Funding, LLC, Series 2017-1A A2 (h) | | 5.216 | | 04/25/47 | | 27,021,725 | | 27,019,312 |
| DCAL Aviation Finance Ltd., Series 2015-1A A1 (h) | | 4.213 | | 02/15/40 | | 1,335,180 | | 1,198,438 |
| ECAF I Ltd., Series 2015-1A A2 (h) | | 4.947 | | 06/15/40 | | 9,702,443 | | 8,923,876 |
| ECAF I Ltd., Series 2015-1A B1 (h) | | 5.802 | | 06/15/40 | | 20,369,101 | | 11,423,032 |
| GAIA Aviation Ltd. ( TAILWIND), Series 2019-1 B (h) | | 5.193 | | 12/15/44 | | 3,732,055 | | 3,494,194 |
| Harley Marine Financing LLC, Series 2018-1A A2 (h) | | 5.682 | | 05/15/43 | | 13,342,091 | | 13,214,065 |
| HOA Funding LLC, Series 2021-1A A2 (h) | | 4.723 | | 08/20/51 | | 12,967,500 | | 13,033,310 |
| Horizon Aircraft Finance I Ltd., Series 2018-1 B (h) | | 5.270 | | 12/15/38 | | 2,702,399 | | 2,514,984 |
| Horizon Aircraft Finance II Ltd., Series 2019-1 A (h) | | 3.721 | | 07/15/39 | | 3,808,098 | | 3,775,217 |
| HP Communities LLC (h) | | 5.320 | | 03/15/23 | | 96,712 | | 97,068 |
| Icon Brand Holdings LLC, Series 2012-1A A (h) | | 4.229 | | 01/25/43 | | 7,009,399 | | 2,763,278 |
| JOL Air Limited, Series 2019-1 B (h) | | 4.948 | | 04/15/44 | | 907,397 | | 860,280 |
| KDAC Aviation Finance Ltd., Series 2017-1A A (h) | | 4.212 | | 12/15/42 | | 3,614,296 | | 3,291,627 |
| KDAC Aviation Finance Ltd., Series 2017-1A B (h) | | 5.926 | | 12/15/42 | | 17,132,629 | | 13,713,036 |
| Kestrel Aircraft Funding Ltd., Series 2018-1A A (h) | | 4.250 | | 12/15/38 | | 2,312,620 | | 2,283,441 |
| Kestrel Aircraft Funding Ltd., Series 2018-1A B (h) | | 5.500 | | 12/15/38 | | 2,691,017 | | 2,319,387 |
| Labrador Aviation Finance Ltd., Series 2016-1A B1 (h) | | 5.682 | | 01/15/42 | | 33,166,314 | | 29,310,492 |
| MACH 1 Cayman Ltd., Series 2019-1 B (h) | | 4.335 | | 10/15/39 | | 4,341,879 | | 4,169,404 |
| MAPS Ltd., Series 2018-1A B (h) | | 5.193 | | 05/15/43 | | 1,688,779 | | 1,538,606 |
| ME Funding, LLC, Series 2019-1 A2 (h) | | 6.448 | | 07/30/49 | | 22,540,000 | | 23,693,349 |
| Merlin Aviation Holdings D.A.C., Series 2016-1 A (h) | | 4.500 | | 12/15/32 | | 7,483,250 | | 6,868,363 |
| Merlin Aviation Holdings D.A.C., Series 2016-1 B (f)(h)(i) | | 6.500 | | 12/15/32 | | 1,554,779 | | 1,282,008 |
| METAL LLC, Series 2017-1 A (h)(j) | | 4.581 | | 10/15/42 | | 16,411,490 | | 14,737,267 |
| METAL LLC, Series 2017-1 B (h) | | 6.500 | | 10/15/42 | | 26,657,035 | | 15,120,278 |
| Mosaic Solar Loans, LLC, Series 2017-2A C (h) | | 2.000 | | 06/22/43 | | 652,384 | | 651,739 |
| Pioneer Aircraft Finance Ltd., Series 2019-1 B (h) | | 4.948 | | 06/15/44 | | 1,419,643 | | 1,350,224 |
| PNMAC GMSR Issuer Trust, Series 2018-GT1 A (1 month LIBOR + 2.850%, floor 2.850%) (d)(h) | | 2.942 | | 02/25/23 | | 4,000,000 | | 4,007,216 |
| Project Silver, Series 2019-1 A (h) | | 3.967 | | 07/15/44 | | 5,429,380 | | 5,328,495 |
| PROP Limited, Series 2017-1 B (h)(j) | | 6.900 | | 03/15/42 | | 4,173,230 | | 2,128,347 |
| Sapphire Aviation Finance I Ltd., Series 2018-1A B (h) | | 5.926 | | 03/15/40 | | 7,772,262 | | 6,835,586 |
| S-Jets Limited, Series 2017-1 A (h) | | 3.967 | | 08/15/42 | | 3,612,353 | | 3,601,184 |
| S-Jets Limited, Series 2017-1 B (h) | | 5.682 | | 08/15/42 | | 12,342,901 | | 11,142,512 |
| SMB Private Education Loan Trust, Series 2014-A C (h) | | 4.500 | | 09/15/45 | | 7,000,000 | | 6,842,033 |
See Notes to Financial Statements.
21
Table of Contents
BOND FUND SCHEDULE OF INVESTMENTS (Continued)
| | | | | | | | | |
| | | Rate (%) | | Maturity Date | | Principal Amount | | Value |
| BONDS (continued) | | | | | | | | |
| | | | | | | | | |
| Asset-Backed Securities (continued) | | | | | | | | |
| Sprite Limited, Series 2017-1 B (h) | | 5.750 | | 12/15/37 | | 14,177,604 | | $12,532,120 |
| Sprite Limited, Series 2021-1 A (h) | | 3.750 | | 11/15/46 | | 10,000,000 | | 9,949,440 |
| Sprite Limited, Series 2021-1 B (h) | | 5.100 | | 11/15/46 | | 5,000,000 | | 4,919,480 |
| TGIF Funding LLC, Series 2017-1A A2 (h) | | 6.202 | | 04/30/47 | | 26,914,606 | | 26,114,274 |
| Thunderbolt Aircraft Lease Ltd., Series 2017-A A (h) | | 4.212 | | 05/17/32 | | 782,745 | | 787,274 |
| Thunderbolt Aircraft Lease Ltd., Series 2017-A B (h) | | 5.750 | | 05/17/32 | | 5,175,793 | | 4,855,382 |
| Thunderbolt Aircraft Lease Ltd., Series 2019-1 B (h) | | 4.750 | | 11/15/39 | | 4,314,678 | | 4,088,343 |
| United Air Lines, Series 2020-1 A | | 5.875 | | 04/15/29 | | 4,516,500 | | 4,934,919 |
| US Airways, Series 2011-1A | | 7.125 | | 04/22/25 | | 4,118,906 | | 4,357,383 |
| WAVE Trust, Series 2017-1A A (h) | | 3.844 | | 11/15/42 | | 2,372,676 | | 2,323,671 |
| Willis Engine Structured Trust IV, Series 2018-A A (h) | | 4.750 | | 09/15/43 | | 5,794,162 | | 5,715,310 |
| | | | | | | | | |
| Commercial Mortgage-Backed Securities - 15.3% | | | | | | | | 395,607,346 |
| BBCMS Mortgage Trust, Series 2015-VFM A2 (h) | | 3.375 | | 03/12/36 | | 6,000,000 | | 6,260,786 |
| CG-CCRE Commercial Mortgage Trust, Series 2014-FL1 B (1 month LIBOR + 1.150%, floor 1.150%) (d)(h) | | 1.240 | | 06/15/31 | | 5,608,848 | | 5,473,483 |
| CG-CCRE Commercial Mortgage Trust, Series 2014-FL1 D (1 month LIBOR + 2.750%, floor 2.750%) (d)(h) | | 2.840 | | 06/15/31 | | 12,000,000 | | 5,530,553 |
| Citigroup Commercial Mortgage Trust, Series 2015-GC35 C (d) | | 4.462 | | 11/10/48 | | 7,000,000 | | 6,580,236 |
| Citigroup Commercial Mortgage Trust, Series 2016-GC36 C (d) | | 4.750 | | 02/10/49 | | 5,000,000 | | 5,132,464 |
| Citigroup Commercial Mortgage Trust, Series 2018-B2 A1 | | 2.856 | | 03/10/51 | | 201,759 | | 203,700 |
| COMM Mortgage Trust, Series 2012-CR1 AM | | 3.912 | | 05/15/45 | | 1,909,520 | | 1,926,181 |
| COMM Mortgage Trust, Series 2012-CR1 B | | 4.612 | | 05/15/45 | | 5,500,000 | | 5,518,415 |
| COMM Mortgage Trust, Series 2012-CR1 C (d) | | 5.383 | | 05/15/45 | | 1,500,000 | | 1,463,117 |
| COMM Mortgage Trust, Series 2012-CR3 E (d)(h) | | 4.749 | | 10/15/45 | | 5,000,000 | | 2,843,093 |
| COMM Mortgage Trust, Series 2012-CR4 AM | | 3.251 | | 10/15/45 | | 3,000,000 | | 3,024,942 |
| COMM Mortgage Trust, Series 2012-CR4 B (h) | | 3.703 | | 10/15/45 | | 5,606,000 | | 5,210,915 |
| COMM Mortgage Trust, Series 2012-LC4 AM | | 4.063 | | 12/10/44 | | 4,595,715 | | 4,612,300 |
| COMM Mortgage Trust, Series 2012-LC4 B | | 4.934 | | 12/10/44 | | 5,000,000 | | 5,002,096 |
| COMM Mortgage Trust, Series 2012-LC4 C (d) | | 5.558 | | 12/10/44 | | 2,514,188 | | 2,399,023 |
| COMM Mortgage Trust, Series 2013-CR6 A4 | | 3.101 | | 03/10/46 | | 2,865,000 | | 2,899,181 |
| COMM Mortgage Trust, Series 2013-CR9 C (d)(h) | | 4.279 | | 07/10/45 | | 1,500,000 | | 1,419,858 |
| COMM Mortgage Trust, Series 2013-CR9 D (d)(h)(j) | | 4.279 | | 07/10/45 | | 4,898,000 | | 3,647,574 |
| COMM Mortgage Trust, Series 2013-CR12 B | | 4.762 | | 10/10/46 | | 3,020,000 | | 3,136,250 |
| COMM Mortgage Trust, Series 2014-CC17 D (d)(h) | | 4.848 | | 05/10/47 | | 5,210,000 | | 4,858,584 |
| COMM Mortgage Trust, Series 2014-CR16 C (d) | | 4.919 | | 04/10/47 | | 5,000,000 | | 5,205,038 |
| COMM Mortgage Trust, Series 2014-UBS4 D (d)(h) | | 4.712 | | 08/10/47 | | 9,740,000 | | 8,623,091 |
| COMM Mortgage Trust, Series 2014-UBS5 | | 4.514 | | 09/10/47 | | 3,270,000 | | 3,455,990 |
| COMM Mortgage Trust, Series 2014-UBS5 C (d) | | 4.613 | | 09/10/47 | | 6,500,000 | | 6,663,238 |
| COMM Mortgage Trust, Series 2015-DC1 C (d) | | 4.306 | | 02/10/48 | | 540,000 | | 545,514 |
| COMM Mortgage Trust, Series 2015-PC1 D (d) | | 4.321 | | 07/10/50 | | 2,500,000 | | 2,262,275 |
| Credit Suisse Commercial Mortgage Securities Corp., Series 2016-NXSR C (d) | | 4.455 | | 12/15/49 | | 3,000,000 | | 2,623,448 |
| Credit Suisse Commercial Mortgage Securities Corp., Series 2019-SKLZ C (1 month LIBOR + 2.750%, floor 2.750%) (d)(h) | | 2.840 | | 01/15/34 | | 2,000,000 | | 1,986,051 |
| CSAIL Commercial Mortgage Trust, Series 2015-C1 C (d) | | 4.261 | | 04/15/50 | | 1,780,000 | | 1,688,691 |
| CSAIL Commercial Mortgage Trust, Series 2015-C2 B (d) | | 4.187 | | 06/15/57 | | 5,000,000 | | 5,154,192 |
| CSAIL Commercial Mortgage Trust, Series 2015-C2 C (d) | | 4.187 | | 06/15/57 | | 3,579,000 | | 3,430,588 |
| CSAIL Commercial Mortgage Trust, Series 2015-C3 B (d) | | 4.119 | | 08/15/48 | | 3,905,000 | | 4,039,076 |
| CSAIL Commercial Mortgage Trust, Series 2015-C3 D (d) | | 3.369 | | 08/15/48 | | 5,795,000 | | 3,393,007 |
| DBUBS Mortgage Trust, Series 2011-LC3A PM1 (h) | | 4.452 | | 05/10/44 | | 7,476,810 | | 7,474,283 |
See Notes to Financial Statements.
22
Table of Contents
BOND FUND SCHEDULE OF INVESTMENTS (Continued)
| | | | | | | | | |
| | | Rate (%) | | Maturity Date | | Principal Amount | | Value |
| BONDS (continued) | | | | | | | | |
| | | | | | | | | |
| Commercial Mortgage-Backed Securities (continued) | | | | | | | | |
| DBUBS Mortgage Trust, Series 2011-LC3A PM2 (d)(h) | | 5.098 | | 05/10/44 | | 4,197,000 | | $4,203,014 |
| GS Mortgage Securities Trust, Series 2011-GC5 B (d)(h) | | 5.158 | | 08/10/44 | | 3,000,000 | | 3,004,312 |
| GS Mortgage Securities Trust, Series 2012-GCJ7 AS | | 4.085 | | 05/10/45 | | 800,000 | | 804,927 |
| GS Mortgage Securities Trust, Series 2013-G1 A2 (h) | | 3.557 | | 04/10/31 | | 1,210,000 | | 1,210,028 |
| GS Mortgage Securities Trust, Series 2013-GC12 C | | 4.179 | | 06/10/46 | | 4,705,000 | | 4,811,060 |
| GS Mortgage Securities Trust, Series 2014-GC24 B (d) | | 4.512 | | 09/10/47 | | 7,340,000 | | 7,518,071 |
| GS Mortgage Securities Trust, Series 2014-GC24 D (d)(h)(j) | | 4.533 | | 09/10/47 | | 2,955,000 | | 2,071,299 |
| GS Mortgage Securities Trust, Series 2018-3PCK A (1 month LIBOR + 1.700%, floor 1.700%) (d)(h) | | 1.790 | | 09/15/31 | | 4,943,106 | | 4,926,136 |
| HMH Trust, Series 2017-NSS A (h) | | 3.062 | | 07/05/31 | | 5,850,000 | | 5,858,012 |
| J.P. Morgan Chase Commercial Mortgage Securities Trust, Series 2011-C3 B (h) | | 5.013 | | 02/15/46 | | 5,833,325 | | 5,885,451 |
| J.P. Morgan Chase Commercial Mortgage Securities Trust, Series 2011-C3 C (h) | | 5.360 | | 02/15/46 | | 9,250,000 | | 9,169,691 |
| J.P. Morgan Chase Commercial Mortgage Securities Trust, Series 2012-CBX AS | | 4.271 | | 06/15/45 | | 2,133,285 | | 2,160,127 |
| J.P. Morgan Chase Commercial Mortgage Securities Trust, Series 2012-CBX B (d) | | 4.595 | | 06/15/45 | | 5,863,000 | | 5,924,194 |
| J.P. Morgan Chase Commercial Mortgage Securities Trust, Series 2012-LC9 C (d)(h) | | 4.363 | | 12/15/47 | | 3,000,000 | | 3,031,759 |
| J.P. Morgan Chase Commercial Mortgage Securities Trust, Series 2013-LC11 B | | 3.499 | | 04/15/46 | | 5,000,000 | | 5,065,030 |
| J.P. Morgan Chase Commercial Mortgage Securities Trust, Series 2014-C20 D (d)(h)(i) | 4.576 | | 07/15/47 | | 5,000,000 | | 4,223,379 |
| JPMBB Commercial Mortgage Securities Trust, Series 2013-C12 C (d) | | 4.098 | | 07/15/45 | | 6,048,000 | | 6,203,185 |
| JPMBB Commercial Mortgage Securities Trust, Series 2013-C14 B (d) | | 4.548 | | 08/15/46 | | 6,310,000 | | 6,417,038 |
| JPMBB Commercial Mortgage Securities Trust, Series 2013-C14 C (d) | | 4.548 | | 08/15/46 | | 5,000,000 | | 4,750,130 |
| JPMBB Commercial Mortgage Securities Trust, Series 2014-C18 C (d) | | 4.793 | | 02/15/47 | | 5,060,000 | | 4,823,688 |
| JPMBB Commercial Mortgage Securities Trust, Series 2014-C22 D (d)(h) | | 4.553 | | 09/15/47 | | 4,966,000 | | 3,861,081 |
| JPMBB Commercial Mortgage Securities Trust, Series 2014-C24 B | | 4.116 | | 11/15/47 | | 10,400,000 | | 10,744,749 |
| JPMBB Commercial Mortgage Securities Trust, Series 2015-C28 C (d) | | 4.148 | | 10/15/48 | | 5,496,426 | | 5,564,797 |
| JPMBB Commercial Mortgage Securities Trust, Series 2015-C32 B | | 4.389 | | 11/15/48 | | 500,000 | | 498,605 |
| Morgan Stanley Bank of America Merrill Lynch Trust, Series 2012-C5 A4 | | 3.176 | | 08/15/45 | | 656,528 | | 659,627 |
| Morgan Stanley Bank of America Merrill Lynch Trust, Series 2013-C7 B | | 3.769 | | 02/15/46 | | 200,000 | | 201,319 |
| Morgan Stanley Bank of America Merrill Lynch Trust, Series 2013-C7 C (d) | | 4.097 | | 02/15/46 | | 7,000,000 | | 6,964,341 |
| Morgan Stanley Bank of America Merrill Lynch Trust, Series 2013-C10 AS (d) | | 4.075 | | 07/15/46 | | 1,478,864 | | 1,527,912 |
| Morgan Stanley Bank of America Merrill Lynch Trust, Series 2013-C10 C (d) | | 4.075 | | 07/15/46 | | 2,750,000 | | 2,434,315 |
| Morgan Stanley Bank of America Merrill Lynch Trust, Series 2013-C11 AS (d) | | 4.351 | | 08/15/46 | | 6,881,000 | | 6,761,153 |
| Morgan Stanley Bank of America Merrill Lynch Trust, Series 2013-C12 C (d) | | 4.763 | | 10/15/46 | | 2,110,000 | | 2,102,679 |
| Morgan Stanley Bank of America Merrill Lynch Trust, Series 2014-C16 C (d) | | 4.765 | | 06/15/47 | | 7,015,936 | | 6,924,942 |
| Morgan Stanley Bank of America Merrill Lynch Trust, Series 2014-C18 D (h) | | 3.389 | | 10/15/47 | | 5,000,000 | | 4,660,398 |
| Morgan Stanley Bank of America Merrill Lynch Trust, Series 2015-C21 C (d) | | 4.135 | | 03/15/48 | | 8,000,000 | | 7,846,247 |
| Morgan Stanley Bank of America Merrill Lynch Trust, Series 2015-C22 D (d)(h) | | 4.210 | | 04/15/48 | | 5,000,000 | | 4,190,062 |
See Notes to Financial Statements.
23
Table of Contents
BOND FUND SCHEDULE OF INVESTMENTS (Continued)
| | | | | | | | | |
| | | Rate (%) | | Maturity Date | | Principal Amount | | Value |
| BONDS (continued) | | | | | | | | |
| | | | | | | | | |
| Commercial Mortgage-Backed Securities (continued) | | | | | | | | |
| Morgan Stanley Capital I Trust, Series 2011-C2 D (d)(h) | | 5.211 | | 06/15/44 | | 758,178 | | $741,142 |
| Morgan Stanley Capital I Trust, Series 2012-C4 A4 | | 3.244 | | 03/15/45 | | 780,305 | | 783,333 |
| Morgan Stanley Capital I Trust, Series 2012-C4 C (d)(h) | | 5.412 | | 03/15/45 | | 383,000 | | 382,351 |
| Morgan Stanley Capital I Trust, Series 2015-UBS8 C (d) | | 4.582 | | 12/15/48 | | 6,500,000 | | 6,220,610 |
| Morgan Stanley Capital I Trust, Series 2016-UB12 C (d) | | 4.150 | | 12/15/49 | | 5,000,000 | | 4,785,517 |
| Morgan Stanley Capital I Trust, Series 2017-HR2 A2 | | 3.345 | | 12/15/50 | | 400,000 | | 407,134 |
| Morgan Stanley Capital I Trust, Series 2019-BPR A (1 month LIBOR + 1.400%, floor 1.400%) (d)(h) | | 1.487 | | 05/15/36 | | 7,090,000 | | 7,001,684 |
| Palisades Center Trust, Series 2016-PLSD A (h) | | 2.713 | | 04/13/33 | | 5,000,000 | | 4,627,288 |
| UBS-Barclays Commercial Mortgage Trust, Series 2012-C2 A4 | | 3.525 | | 05/10/63 | | 1,585,000 | | 1,596,422 |
| UBS-Citigroup Commercial Mortgage Trust, Series 2011-C1 B (d)(h) | | 6.412 | | 01/10/45 | | 112,315 | | 112,336 |
| Wells Fargo Commercial Mortgage Trust, Series 2013-LC12 AS (d) | | 4.306 | | 07/15/46 | | 714,000 | | 736,084 |
| Wells Fargo Commercial Mortgage Trust, Series 2013-LC12 B (d) | | 4.306 | | 07/15/46 | | 7,000,000 | | 6,966,116 |
| Wells Fargo Commercial Mortgage Trust, Series 2014-LC16 AS | | 4.020 | | 08/15/50 | | 1,035,000 | | 1,062,254 |
| Wells Fargo Commercial Mortgage Trust, Series 2015-C27 C | | 3.894 | | 02/15/48 | | 6,982,500 | | 6,908,524 |
| Wells Fargo Commercial Mortgage Trust, Series 2015-C31 C (d) | | 4.601 | | 11/15/48 | | 5,000,000 | | 5,142,762 |
| Wells Fargo Commercial Mortgage Trust, Series 2015-C31 D | | 3.852 | | 11/15/48 | | 5,189,370 | | 4,816,407 |
| Wells Fargo Commercial Mortgage Trust, Series 2015-LC22 B (d) | | 4.557 | | 09/15/58 | | 800,000 | | 861,348 |
| Wells Fargo Commercial Mortgage Trust, Series 2015-SG1 C (d) | | 4.455 | | 09/15/48 | | 5,000,000 | | 4,617,449 |
| Wells Fargo Commercial Mortgage Trust, Series 2016-C36 C (d) | | 4.172 | | 11/15/59 | | 3,000,000 | | 2,628,491 |
| Wells Fargo Commercial Mortgage Trust, Series 2017-SMP A (1 month LIBOR + 0.875%, floor 0.875%) (d)(h) | | 0.965 | | 12/15/34 | | 1,625,000 | | 1,623,211 |
| WFRBS Commercial Mortgage Trust, Series 2012-C10 AS | | 3.241 | | 12/15/45 | | 1,806,194 | | 1,833,265 |
| WFRBS Commercial Mortgage Trust, Series 2012-C10 B | | 3.744 | | 12/15/45 | | 1,645,000 | | 1,633,302 |
| WFRBS Commercial Mortgage Trust, Series 2012-C10 C (d) | | 4.347 | | 12/15/45 | | 7,000,000 | | 6,226,043 |
| WFRBS Commercial Mortgage Trust, Series 2013-C14 B | | 3.841 | | 06/15/46 | | 1,500,000 | | 1,531,466 |
| WFRBS Commercial Mortgage Trust, Series 2013-C14 C (d) | | 3.960 | | 06/15/46 | | 5,000,000 | | 4,988,002 |
| WFRBS Commercial Mortgage Trust, Series 2013-C15 B (d) | | 4.503 | | 08/15/46 | | 3,800,000 | | 3,768,694 |
| WFRBS Commercial Mortgage Trust, Series 2013-C16 C (d) | | 5.001 | | 09/15/46 | | 2,225,000 | | 2,285,246 |
| WFRBS Commercial Mortgage Trust, Series 2014-C19 C | | 4.646 | | 03/15/47 | | 6,000,000 | | 6,140,315 |
| WFRBS Commercial Mortgage Trust, Series 2014-C20 C | | 4.513 | | 05/15/47 | | 4,500,000 | | 4,269,112 |
| WFRBS Commercial Mortgage Trust, Series 2014-C21 C | | 4.234 | | 08/15/47 | | 3,000,000 | | 2,995,511 |
| WFRBS Commercial Mortgage Trust, Series 2014-C21 D (h) | | 3.497 | | 08/15/47 | | 5,000,000 | | 4,462,189 |
| WP Glimcher Mall Trust, Series 2015-WPG B (d)(h) | | 3.516 | | 06/05/35 | | 2,900,000 | | 2,763,747 |
| | | | | | | | | |
| Convertible Bonds - 2.4% | | | | | | | | 61,866,084 |
| Blackstone Mortgage Trust, Inc. | | 4.375 | | 05/05/22 | | 2,000,000 | | 2,003,038 |
| DigitalBridge Group, Inc. | | 5.000 | | 04/15/23 | | 19,225,000 | | 19,790,266 |
| FedNat Holding Co. (h) | | 5.000 | | 04/19/26 | | 5,000,000 | | 5,000,000 |
| Goldman Sachs BDC, Inc. | | 4.500 | | 04/01/22 | | 10,000,000 | | 10,099,908 |
| Hope Bancorp Inc. | | 2.000 | | 05/15/38 | | 25,750,000 | | 24,773,072 |
| Prospect Capital Corp. | | 4.950 | | 07/15/22 | | 198,000 | | 199,800 |
| | | | | | | | | |
| Corporate Bonds - 53.3% | | | | | | | | 1,375,532,231 |
| A10 Capital, LLC (h) | | 5.875 | | 08/17/26 | | 5,000,000 | | 5,080,187 |
| ACRES Commercial Realty Corp. | | 5.750 | | 08/15/26 | | 8,000,000 | | 8,094,660 |
| Adani Abbot Point Terminal Pty. Ltd. (h) | | 4.450 | | 12/15/22 | | 8,570,000 | | 8,312,900 |
| AerCap Ireland Capital DAC / AerCap Global Aviation Trust | | 3.950 | | 02/01/22 | | 725,000 | | 726,901 |
| AerCap Ireland Capital DAC / AerCap Global Aviation Trust | | 3.500 | | 05/26/22 | | 300,000 | | 303,482 |
| AerCap Ireland Capital DAC / AerCap Global Aviation Trust | | 4.625 | | 07/01/22 | | 4,050,000 | | 4,141,384 |
See Notes to Financial Statements.
24
Table of Contents
BOND FUND SCHEDULE OF INVESTMENTS (Continued)
| | | | | | | | | |
| | | Rate (%) | | Maturity Date | | Principal Amount | | Value |
| BONDS (continued) | | | | | | | | |
| | | | | | | | | |
| Corporate Bonds (continued) | | | | | | | | |
| AerCap Ireland Capital DAC / AerCap Global Aviation Trust | | 3.300 | | 01/23/23 | | 2,328,000 | | $2,384,242 |
| AerCap Ireland Capital DAC / AerCap Global Aviation Trust | | 4.125 | | 07/03/23 | | 2,795,000 | | 2,916,110 |
| AerCap Ireland Capital DAC / AerCap Global Aviation Trust | | 4.500 | | 09/15/23 | | 20,529,000 | | 21,636,759 |
| AerCap Ireland Capital DAC / AerCap Global Aviation Trust | | 1.150 | | 10/29/23 | | 500,000 | | 498,751 |
| Agrium Inc. | | 3.150 | | 10/01/22 | | 389,000 | | 393,801 |
| Aircastle Ltd. | | 5.000 | | 04/01/23 | | 7,577,000 | | 7,959,652 |
| Aircastle Ltd. | | 4.400 | | 09/25/23 | | 600,000 | | 630,966 |
| Allergan, Inc. | | 2.800 | | 03/15/23 | | 303,000 | | 307,397 |
| Amerant Bancorp Inc. | | 5.750 | | 06/30/25 | | 10,000,000 | | 10,582,070 |
| Ameris Bancorp (5.750% to 03/15/22, then 3 month LIBOR + 3.616%) (d) | | 5.750 | | 03/15/27 | | 5,000,000 | | 5,062,298 |
| AmTrust Financial Services, Inc. | | 6.125 | | 08/15/23 | | 39,078,000 | | 39,823,604 |
| Arbor Realty Trust, Inc. | | 5.625 | | 05/01/23 | | 16,495,000 | | 16,926,554 |
| Arbor Realty Trust, Inc. (h) | | 5.750 | | 04/01/24 | | 10,000,000 | | 10,226,515 |
| Arbor Realty Trust, Inc. (h) | | 4.750 | | 10/15/24 | | 10,000,000 | | 10,010,078 |
| Arbor Realty Trust, Inc. | | 4.750 | | 10/15/24 | | 1,000,000 | | 1,001,008 |
| Arena Finance II LLC (h) | | 6.750 | | 09/30/25 | | 2,000,000 | | 2,000,000 |
| Aspen Insurance Holdings Ltd. | | 4.650 | | 11/15/23 | | 3,313,000 | | 3,534,331 |
| Assured Guaranty US Holdings Inc. (3 month LIBOR + 2.380%) (d) | | 2.496 | | 12/15/66 | | 31,751,000 | | 25,242,045 |
| Atlantic Union Bankshares Corp. (5.000% to 12/15/21, then 3 month LIBOR + 3.175%) (d) | | 5.000 | | 12/15/26 | | 1,011,000 | | 1,011,218 |
| Avana Bonhon, LLC (h) | | 6.125 | | 09/15/24 | | 2,884,615 | | 3,021,427 |
| Avnet, Inc. | | 4.875 | | 12/01/22 | | 2,054,000 | | 2,134,579 |
| Axos Financial, Inc. (4.875% to 10/01/25, then SOFRRATE + 4.760%) (d) | | 4.875 | | 10/01/30 | | 8,000,000 | | 8,608,272 |
| BAC Capital Trust XIII (Greater of 4.000% or 3 month LIBOR + 0.400%, floor 4.000%) (d)(g) | | 4.000 | | 12/16/21 | | 2,600,000 | | 2,541,481 |
| Banc of California, Inc. | | 5.250 | | 04/15/25 | | 5,400,000 | | 5,644,862 |
| Banc of California, Inc. (4.375% to 10/30/25, then SOFRRATE + 4.195%) (d) | | 4.375 | | 10/30/30 | | 12,500,000 | | 13,196,580 |
| Bank of America Corp. (5.200% to 06/01/23, then 3 month LIBOR + 3.135%) (d)(g) | | 5.200 | | 06/01/23 | | 2,500,000 | | 2,543,750 |
| Bank of America Corp. (4.0 times (USISDA10 - USISDA02 - 0.250%), floor 0.000%, cap 10.000%) (d) | | 2.656 | | 11/19/30 | | 671,000 | | 638,988 |
| Bank of Montreal (4.800% to 08/25/24, then H15T5Y + 2.979%) (d)(g) | | 4.800 | | 08/25/24 | | 6,977,000 | | 7,139,634 |
| Bank of New York Mellon Corp. (3 month LIBOR + 3.420%) (d)(g) | | 3.542 | | 12/20/21 | | 9,989,000 | | 10,003,983 |
| Bay Banks of Virginia, Inc. (5.625% to 10/15/24, then SOFRRATE + 4.335%) (d)(h) | | 5.625 | | 10/15/29 | | 3,000,000 | | 3,055,321 |
| BayCom Corp. (5.250% to 09/15/25, then SOFRRATE + 5.210%) (d) | | 5.250 | | 09/15/30 | | 8,460,000 | | 8,837,338 |
| BCB Bancorp, Inc. (5.625% to 08/01/23, then 3 month LIBOR + 2.720%) (d)(h) | | 5.625 | | 08/01/28 | | 9,000,000 | | 8,903,985 |
| Becton Dickinson and Co. (3 month LIBOR + 1.030%) (d) | | 1.148 | | 06/06/22 | | 25,355,000 | | 25,472,891 |
| Block Financial LLC | | 5.500 | | 11/01/22 | | 3,493,000 | | 3,557,614 |
| Boeing Co. | | 2.125 | | 03/01/22 | | 628,000 | | 629,402 |
| Boeing Co. | | 2.700 | | 05/01/22 | | 889,000 | | 896,300 |
| Boeing Co. | | 4.508 | | 05/01/23 | | 1,050,000 | | 1,096,608 |
| BOKF Merger Corp. Number Sixteen (5.625% to 06/25/25, then 3 month LIBOR + 3.170%) (d) | | 5.625 | | 06/25/30 | | 15,000,000 | | 16,121,861 |
| Broadmark Realty Capital Inc. (h) | | 5.000 | | 11/15/26 | | 5,000,000 | | 5,069,781 |
| Byline Bancorp, Inc. (6.000% to 07/01/25, then SOFRRATE + 5.880%) (d) | | 6.000 | | 07/01/30 | | 12,000,000 | | 12,777,992 |
| CA, Inc. | | 4.500 | | 08/15/23 | | 85,000 | | 88,543 |
| Cabot Corp. | | 3.700 | | 07/15/22 | | 702,000 | | 715,078 |
| Capital Funding Bancorp, Inc. (h) | | 6.000 | | 12/01/23 | | 20,000,000 | | 21,345,128 |
| Carpenter Technology Corp. | | 4.450 | | 03/01/23 | | 2,763,000 | | 2,837,784 |
See Notes to Financial Statements.
25
Table of Contents
BOND FUND SCHEDULE OF INVESTMENTS (Continued)
| | | | | | | | | |
| | | Rate (%) | | Maturity Date | | Principal Amount | | Value |
| BONDS (continued) | | | | | | | | |
| | | | | | | | | |
| Corporate Bonds (continued) | | | | | | | | |
| Carrington Holding Co., LLC (h) | | 8.000 | | 01/01/26 | | 12,000,000 | | $12,097,933 |
| CBS Broadcasting Inc. | | 7.125 | | 11/01/23 | | 150,000 | | 165,328 |
| CDW LLC / CDW Finance Corp. | | 4.125 | | 05/01/25 | | 1,000,000 | | 1,022,500 |
| CenterState Bank Corp. (5.750% to 06/01/25, then SOFRRATE + 5.617%) (d) | | 5.750 | | 06/01/30 | | 690,000 | | 757,451 |
| Change Co. CDFI LLC (4.750% to 09/30/26, then SOFRRATE + 4.080%) (d)(h) | | 4.750 | | 09/30/31 | | 7,000,000 | | 6,907,231 |
| Charles Schwab Corp. (4.625% to 03/01/22, then 3 month LIBOR + 3.315%) (d)(g) | | 4.625 | | 03/01/22 | | 21,618,000 | | 21,699,067 |
| Citigroup, Inc. (4.0 times (USISDA30 - USISDA05), floor 0.000%, cap 10.000%) (d) | 3.104 | | 07/09/28 | | 740,000 | | 665,442 |
| Citigroup, Inc. (4.0 times (USISDA30 - USISDA05), floor 0.000%, cap 10.000%) (d) | 1.632 | | 11/15/28 | | 245,000 | | 213,462 |
| Citigroup, Inc. (4.0 times (USISDA30 - USISDA02), floor 0.000%, cap 10.000%) (d) | 5.124 | | 12/23/29 | | 1,152,000 | | 1,120,094 |
| Citigroup, Inc. (4.0 times (USISDA10 - USISDA02 - 0.250%), floor 0.000%, cap 10.000%) (d) | 2.656 | | 11/19/30 | | 727,000 | | 601,382 |
| Citigroup, Inc. (4.35 times (USISDA30 - USISDA05), floor 0.000%, cap 10.000%) (d) | 3.376 | | 07/09/33 | | 1,394,000 | | 1,166,517 |
| Citigroup, Inc. (5.0 times (USISDA30 - USISDA05), floor 0.000%, cap 10.000%) (d) | 3.550 | | 12/20/33 | | 2,863,000 | | 2,386,502 |
| Citigroup, Inc. (3 month LIBOR + 0.550%) (d) | | 0.730 | | 08/25/36 | | 868,000 | | 759,618 |
| Clear Blue Financial Holdings, LLC (h) | | 7.000 | | 04/15/25 | | 5,000,000 | | 5,010,374 |
| CNH Industrial Capital LLC | | 4.375 | | 04/05/22 | | 100,000 | | 101,206 |
| CNH Industrial Capital LLC | | 4.200 | | 01/15/24 | | 475,000 | | 503,629 |
| CNH Industrial N.V. | | 4.500 | | 08/15/23 | | 2,831,000 | | 2,988,613 |
| Coach, Inc. | | 3.000 | | 07/15/22 | | 1,668,000 | | 1,688,735 |
| Congressional Bancshares, Inc. (5.750% to 12/01/24, then SOFRRATE + 4.390%) (d)(h) | | 5.750 | | 12/01/29 | | 5,000,000 | | 5,084,687 |
| ConnectOne Bancorp, Inc. (5.200% to 02/01/23, then 3 month LIBOR + 2.840%) (d) | 5.200 | | 02/01/28 | | 6,375,000 | | 6,481,229 |
| ConnectOne Bancorp, Inc. (5.750% to 06/15/25, then SOFRRATE + 5.605%) (d) | | 5.750 | | 06/15/30 | | 7,780,000 | | 8,426,216 |
| County Bancorp, Inc. (5.875% to 06/01/23, then 3 month LIBOR + 2.884%) (d) | | 5.875 | | 06/01/28 | | 8,250,000 | | 8,611,414 |
| Cowen Inc. (h) | | 7.250 | | 05/06/24 | | 20,000,000 | | 21,613,101 |
| CRB Group, Inc. (h) | | 6.250 | | 06/15/23 | | 5,000,000 | | 5,290,022 |
| Credit Suisse Group Funding Guernsey Ltd. | | 3.800 | | 09/15/22 | | 250,000 | | 256,220 |
| Deutsche Bank AG | | 3.050 | | 09/15/22 | | 115,000 | | 116,006 |
| Deutsche Bank AG | | 3.950 | | 02/27/23 | | 2,250,000 | | 2,329,644 |
| Digital Equipment Corp. | | 7.750 | | 04/01/23 | | 624,000 | | 664,633 |
| Discovery Communications, LLC | | 3.250 | | 04/01/23 | | 100,000 | | 102,307 |
| Eagle Bancorp, Inc. | | 5.750 | | 09/01/24 | | 1,825,000 | | 1,961,281 |
| Eastman Chemical Co. | | 3.500 | | 12/01/21 | | 250,000 | | 250,000 |
| EF Holdco Inc. / EF Cayman Holdings Ltd. (h) | | 5.500 | | 09/01/22 | | 3,500,000 | | 3,527,790 |
| Energy Transfer LP | | 3.600 | | 02/01/23 | | 200,000 | | 204,706 |
| Energy Transfer LP | | 4.250 | | 03/15/23 | | 1,250,000 | | 1,291,024 |
| Energy Transfer LP | | 4.200 | | 09/15/23 | | 1,643,000 | | 1,722,482 |
| Energy Transfer LP | | 5.875 | | 01/15/24 | | 1,850,000 | | 1,994,698 |
| Energy Transfer LP | | 7.600 | | 02/01/24 | | 1,838,000 | | 2,031,833 |
| Energy Transfer LP / Regency Energy Finance Corp. | | 4.500 | | 11/01/23 | | 7,517,000 | | 7,914,948 |
| Enstar Group Ltd. | | 4.500 | | 03/10/22 | | 28,162,000 | | 28,369,256 |
See Notes to Financial Statements.
26
Table of Contents
BOND FUND SCHEDULE OF INVESTMENTS (Continued)
| | | Rate (%) | | Maturity Date | | Principal Amount | | Value |
| BONDS (continued) | | | | | | | | |
| | | | | | | | | |
| Corporate Bonds (continued) | | | | | | | | |
| Enterprise Products Operating LLC (3 month LIBOR + 2.7775%) (d) | | 2.897 | | 06/01/67 | | 8,538,000 | | $7,811,160 |
| Enterprise Products Operating LLC (5.250% to 08/16/27, then 3 month LIBOR + 3.033%) (d) | | 5.250 | | 08/16/77 | | 6,666,000 | | 6,854,041 |
| EverBank Financial Corp. (3 month LIBOR + 4.704%) (d) | | 4.820 | | 03/15/26 | | 4,000,000 | | 4,009,366 |
| Everest Reinsurance Holdings Inc. (3 month LIBOR + 2.385%) (d) | | 2.541 | | 05/01/67 | | 17,705,000 | | 17,152,395 |
| Expedia Group, Inc. | | 3.600 | | 12/15/23 | | 250,000 | | 260,794 |
| F&M Financial Services Corp. (5.950% to 09/15/24, then SOFRRATE + 4.840%) (d)(h) | 5.950 | | 09/15/29 | | 9,000,000 | | 9,375,167 |
| FedNat Holding Co. | | 7.750 | | 03/15/29 | | 17,000,000 | | 18,105,000 |
| Fidelity Federal Bancorp (6.875% to 10/15/23, then 3 month LIBOR + 3.790%) (d)(h) | 6.875 | | 10/15/28 | | 6,500,000 | | 6,875,512 |
| Fidelity Federal Bancorp (6.000% to 11/01/24, then SOFRRATE + 4.650%) (d)(h) | | 6.000 | | 11/01/29 | | 7,000,000 | | 7,239,952 |
| Fifth Third Bancorp (3 month LIBOR + 3.129%) (d)(g) | | 3.261 | | 12/31/21 | | 14,997,000 | | 14,809,596 |
| First American Financial Corp. | | 4.300 | | 02/01/23 | | 1,600,000 | | 1,655,932 |
| First Financial Bancorp (5.250% to 05/15/25, then SOFRRATE + 5.090%) (d) | | 5.250 | | 05/15/30 | | 3,000,000 | | 3,199,804 |
| Flex Ltd. | | 5.000 | | 02/15/23 | | 3,119,000 | | 3,268,253 |
| Flushing Financial Corp. (5.250% to 12/15/21, then 3 month LIBOR + 3.440%) (d) | | 5.250 | | 12/15/26 | | 6,030,000 | | 6,026,363 |
| FNB Corp. | | 2.200 | | 02/24/23 | | 125,000 | | 126,488 |
| FNB Corp. | | 4.875 | | 10/02/25 | | 2,000,000 | | 2,117,450 |
| FPL Group, Inc. (3 month LIBOR + 2.0675%) (d) | | 2.198 | | 10/01/66 | | 9,285,000 | | 8,844,940 |
| FS KKR Capital Corp. | | 4.750 | | 05/15/22 | | 9,532,000 | | 9,673,199 |
| General Electric Capital Corp. (3 month LIBOR + 0.380%) (d) | | 0.520 | | 05/05/26 | | 5,148,000 | | 5,086,379 |
| General Electric Co. (3 month LIBOR + 3.330%) (d)(g) | | 3.446 | | 03/15/22 | | 44,245,000 | | 43,138,875 |
| General Motors Co. | | 4.875 | | 10/02/23 | | 1,500,000 | | 1,595,719 |
| General Motors Co. | | 5.400 | | 10/02/23 | | 1,000,000 | | 1,077,747 |
| General Motors Financial Co., Inc. | | 3.700 | | 05/09/23 | | 600,000 | | 620,922 |
| General Motors Financial Co., Inc. | | 4.250 | | 05/15/23 | | 3,551,000 | | 3,717,449 |
| General Motors Financial Co., Inc. | | 5.100 | | 01/17/24 | | 932,000 | | 1,003,164 |
| Genpact Luxembourg Sarl | | 3.700 | | 04/01/22 | | 730,000 | | 735,845 |
| Georgia-Pacific LLC | | 8.000 | | 01/15/24 | | 1,500,000 | | 1,714,076 |
| GLP Capital L.P. / GLP Financing II, Inc. | | 5.375 | | 11/01/23 | | 4,501,000 | | 4,788,029 |
| Goldcorp Inc. | | 3.700 | | 03/15/23 | | 147,000 | | 149,707 |
| Government Properties Income Trust | | 4.000 | | 07/15/22 | | 39,000 | | 39,646 |
| Great Southern Bank (5.500% to 06/15/25, then SOFRRATE + 5.325%) (d) | | 5.500 | | 06/15/30 | | 2,000,000 | | 2,157,105 |
| Green Bancorp, Inc. (8.500% to 12/15/21, then 3 month LIBOR + 6.685%) (d) | | 8.500 | | 12/15/26 | | 7,000,000 | | 7,014,749 |
| Hallmark Financial Services, Inc. | | 6.250 | | 08/15/29 | | 13,000,000 | | 12,350,000 |
| Hanmi Financial Corp. (5.450% to 03/30/22, then 3 month LIBOR + 3.315%) (d) | | 5.450 | | 03/30/27 | | 10,050,000 | | 10,149,374 |
| HCA Inc. | | 4.750 | | 05/01/23 | | 6,733,000 | | 7,074,795 |
| Highwoods Realty L.P. | | 3.625 | | 01/15/23 | | 205,000 | | 209,392 |
| Hilltop Holdings Inc. (5.750% to 05/15/25, then SOFRRATE + 5.680%) (d) | | 5.750 | | 05/15/30 | | 8,000,000 | | 8,538,697 |
| HollyFrontier Corp. | | 2.625 | | 10/01/23 | | 1,638,000 | | 1,676,985 |
| Home BancShares Inc. (5.625% to 04/15/22, then 3 month LIBOR + 3.575%) (d) | | 5.625 | | 04/15/27 | | 7,526,000 | | 7,634,482 |
| Horizon Bancorp, Inc. (5.625% to 07/01/25, then SOFRRATE + 5.490%) (d) | | 5.625 | | 07/01/30 | | 6,000,000 | | 6,578,035 |
See Notes to Financial Statements.
27
Table of Contents
BOND FUND SCHEDULE OF INVESTMENTS (Continued)
| | | Rate (%) | | Maturity Date | | Principal Amount | | Value |
| BONDS (continued) | | | | | | | | |
| | | | | | | | | |
| Corporate Bonds (continued) | | | | | | | | |
| Hospitality Properties Trust | | 4.500 | | 03/15/25 | | 720,000 | | $694,800 |
| Hospitality Properties Trust | | 4.750 | | 10/01/26 | | 3,295,000 | | 3,148,521 |
| Hospitality Properties Trust | | 4.950 | | 02/15/27 | | 1,549,000 | | 1,477,731 |
| Hospitality Properties Trust | | 3.950 | | 01/15/28 | | 1,436,000 | | 1,292,343 |
| Host Hotels & Resorts LP | | 3.750 | | 10/15/23 | | 3,069,000 | | 3,218,013 |
| Host Hotels & Resorts LP | | 3.875 | | 04/01/24 | | 7,340,000 | | 7,714,279 |
| Howard Bancorp Inc. (6.000% to 12/06/23, then 3 month LIBOR + 3.020%) (d)(h) | | 6.000 | | 12/06/28 | | 3,000,000 | | 3,135,691 |
| Hyatt Hotels Corp. | | 1.300 | | 10/01/23 | | 400,000 | | 400,257 |
| IIP Operating Partnership, LP | | 5.500 | | 05/25/26 | | 3,000,000 | | 3,230,068 |
| International Lease Finance Corp. | | 8.625 | | 01/15/22 | | 728,000 | | 734,731 |
| International Lease Finance Corp. | | 5.875 | | 08/15/22 | | 818,000 | | 847,265 |
| Investar Holding Corp. (6.000% to 03/30/22, then 3 month LIBOR +3.945%) (d) | | 6.000 | | 03/30/27 | | 796,000 | | 801,568 |
| Jabil Circuit, Inc. | | 4.700 | | 09/15/22 | | 104,000 | | 107,101 |
| Jefferies Group LLC / Jefferies Group Capital Finance Inc. (4.000% to 01/27/22, then 6.000%) (c) | | 4.000 | | 01/27/32 | | 750,000 | | 745,338 |
| Jones Lang LaSalle Inc. | | 4.400 | | 11/15/22 | | 1,008,000 | | 1,033,914 |
| JPMorgan Chase & Co. (3 month LIBOR + 3.320%) (d)(g) | | 3.451 | | 01/01/22 | | 9,552,000 | | 9,456,480 |
| JPMorgan Chase & Co. (3 month LIBOR + 3.470%) (d)(g) | | 3.599 | | 01/30/22 | | 9,030,000 | | 9,040,904 |
| JPMorgan Chase & Co. (3 month LIBOR + 3.800%) (d)(g) | | 3.932 | | 02/01/22 | | 2,000,000 | | 2,005,600 |
| JPMorgan Chase & Co. (4.000% to 04/01/25, then SOFRRATE + 2.745%) (d)(g) | | 4.000 | | 04/01/25 | | 5,000,000 | | 4,951,250 |
| Kohl’s Corp. | | 4.750 | | 12/15/23 | | 338,000 | | 358,321 |
| Liberty Commercial Finance LLC (h) | | 6.000 | | 06/30/26 | | 6,000,000 | | 6,007,575 |
| Lincoln National Corp. (3 month LIBOR + 2.3575%) (d) | | 2.515 | | 05/17/66 | | 29,378,000 | | 26,680,218 |
| Lincoln National Corp. (3 month LIBOR + 2.040%) (d) | | 2.172 | | 04/20/67 | | 25,384,000 | | 22,307,459 |
| Lorillard Tobacco Co. | | 3.750 | | 05/20/23 | | 339,000 | | 346,620 |
| Main Street Capital Corp. | | 4.500 | | 12/01/22 | | 11,470,000 | | 11,880,160 |
| Marathon Petroleum Corp. | | 4.500 | | 05/01/23 | | 250,000 | | 261,291 |
| Marriott Int’l., Inc. | | 2.300 | | 01/15/22 | | 1,800,000 | | 1,801,133 |
| Marriott Int’l., Inc. | | 3.250 | | 09/15/22 | | 148,000 | | 149,942 |
| Marriott Int’l., Inc. | | 2.125 | | 10/03/22 | | 1,824,000 | | 1,844,245 |
| Marriott Int’l., Inc. | | 3.125 | | 02/15/23 | | 1,320,000 | | 1,346,176 |
| Marriott Int’l., Inc. | | 4.150 | | 12/01/23 | | 5,280,000 | | 5,575,584 |
| Marvell Technology Group Ltd. | | 4.200 | | 06/22/23 | | 1,633,000 | | 1,707,329 |
| Medallion Financial Corp. (h) | | 8.250 | | 03/22/24 | | 10,000,000 | | 10,475,000 |
| Meridian Corp. (5.375% to 12/30/24, then SOFRRATE + 3.950%) (d) | | 5.375 | | 12/30/29 | | 10,000,000 | | 10,279,713 |
| Merrill Lynch & Co. (3 month LIBOR + 0.760%) (d) | | 0.876 | | 09/15/26 | | 3,870,000 | | 3,848,840 |
| Meta Financial Group, Inc. (3 month LIBOR + 4.630%) (d) | | 4.786 | | 08/15/26 | | 6,225,000 | | 6,345,307 |
| Metropolitan Bank Holding Corp. (6.250% to 03/15/22, then 3 month LIBOR + 4.260%) (d)(h) | | 6.250 | | 03/15/27 | | 2,000,000 | | 2,002,060 |
| Midland States Bancorp, Inc. (5.000% to 09/30/24, then SOFRRATE + 3.610%) (d) | | 5.000 | | 09/30/29 | | 5,500,000 | | 5,731,422 |
| Mileage Plus Holdings LLC/Mileage Plus Intellectual Property Assets Ltd. (h) | | 6.500 | | 06/20/27 | | 7,000,000 | | 7,472,500 |
| Minnwest Corp. (5.875% to 07/15/23, then 3 month LIBOR + 2.980%) (d)(h) | | 5.875 | | 07/15/28 | | 6,000,000 | | 6,208,663 |
| MM Finished Lots Holdings, LLC (h) | | 7.250 | | 01/31/24 | | 563,868 | | 563,868 |
See Notes to Financial Statements.
28
Table of Contents
BOND FUND SCHEDULE OF INVESTMENTS (Continued)
| | | Rate (%) | | Maturity Date | | Principal Amount | | Value |
| BONDS (continued) | | | | | | | | |
| | | | | | | | | |
| Corporate Bonds (continued) | | | | | | | | |
| MM Finished Lots Holdings, LLC (h) | | 6.500 | | 11/30/25 | | 2,006,745 | | $2,006,745 |
| Monsanto Co. | | 2.200 | | 07/15/22 | | 2,032,000 | | 2,036,107 |
| Morgan Stanley | | 3.875 | | 10/11/22 | | 400,000 | | 408,038 |
| Mylan Inc. | | 4.200 | | 11/29/23 | | 695,000 | | 732,612 |
| NatWest Group PLC | | 3.875 | | 09/12/23 | | 350,000 | | 366,045 |
| New York Mortgage Trust, Inc. | | 5.750 | | 04/30/26 | | 5,000,000 | | 4,971,565 |
| Newport Realty Trust, Inc. (h) | | 6.250 | | 12/01/24 | | 10,000,000 | | 10,099,795 |
| Newport Realty Trust, Inc. | | 6.250 | | 12/01/24 | | 1,000,000 | | 1,009,980 |
| NexBank Capital, Inc. (6.375% to 09/30/22, then 3 month LIBOR + 4.585%) (d)(h) | | 6.375 | | 09/30/27 | | 5,000,000 | | 5,154,683 |
| Nexpoint Real Estate Finance, Inc. | | 5.750 | | 05/01/26 | | 7,000,000 | | 7,515,295 |
| Northpointe Bancshares, Inc. (6.000% to 09/30/24, then SOFRRATE + 4.905%) (d)(h) | 6.000 | | 09/30/29 | | 5,000,000 | | 5,113,340 |
| Northpointe Bank (6.875% to 10/01/23, then 3 month LIBOR + 3.765%) (d)(h) | | 6.875 | | 10/01/28 | | 5,000,000 | | 5,282,989 |
| OceanFirst Financial Corp. (5.250% to 05/15/25, then SOFRRATE + 5.095%) (d) | | 5.250 | | 05/15/30 | | 6,000,000 | | 6,441,944 |
| Office Properties Income Trust | | 4.250 | | 05/15/24 | | 16,838,000 | | 17,644,065 |
| Office Properties Income Trust | | 4.500 | | 02/01/25 | | 100,000 | | 105,913 |
| Ohio National Financial Services, Inc. (e)(h) | | 5.800 | | 01/24/30 | | 5,000,000 | | 5,741,516 |
| Old Second Bancorp, Inc. (5.750% to 12/31/21, then 3 month LIBOR + 3.850%) (d) | | 5.750 | | 12/31/26 | | 1,945,000 | | 1,951,297 |
| Omega Healthcare Investors, Inc. | | 4.375 | | 08/01/23 | | 1,478,000 | | 1,548,829 |
| OneBeacon U.S. Holdings, Inc. | | 4.600 | | 11/09/22 | | 2,881,000 | | 2,975,547 |
| Orrstown Financial Services, Inc. (6.000% to 12/30/23, then 3 month LIBOR + 3.160%) (d) | | 6.000 | | 12/30/28 | | 1,750,000 | | 1,866,005 |
| Pacific Continental Corp. (3 month LIBOR + 4.715%) (d) | | 4.847 | | 06/30/26 | | 510,000 | | 510,066 |
| Pacific Premier Bancorp, Inc. (5.375% to 06/15/25, then SOFRRATE + 5.170%) (d) | | 5.375 | | 06/15/30 | | 5,000,000 | | 5,366,035 |
| Parkway Bancorp, Inc. (6.000% to 03/31/25, then 3 month LIBOR + 5.390%) (d)(h) | | 6.000 | | 03/31/30 | | 10,000,000 | | 10,561,335 |
| Pathfinder Bancorp, Inc. (5.500% to 10/15/25, then SOFRRATE + 5.320%) (d) | | 5.500 | | 10/15/30 | | 9,650,000 | | 10,149,574 |
| PCAP Holdings LP (h) | | 6.500 | | 07/15/28 | | 10,000,000 | | 10,065,643 |
| Pedcor Bancorp (7.250% to 02/15/24, then 3 month LIBOR + 4.600%) (d)(h) | | 7.250 | | 02/15/29 | | 3,000,000 | | 3,111,940 |
| Pelorus Fund REIT LLC (h) | | 7.000 | | 09/30/26 | | 5,000,000 | | 4,931,051 |
| Pershing Road Development Co., LLC (3 month LIBOR + 0.400%) (d)(h) | | 0.520 | | 09/15/22 | | 2,738,000 | | 2,731,155 |
| Pershing Road Development Co., LLC (3 month LIBOR + 0.400%) (d)(h) | | 0.520 | | 09/15/22 | | 1,000,000 | | 997,500 |
| Pershing Road Development Co., LLC (3 month LIBOR + 0.400%) (d)(h) | | 0.520 | | 09/15/23 | | 3,841,000 | | 3,807,391 |
| Pershing Road Development Co., LLC (3 month LIBOR + 0.400%) (d)(h) | | 0.520 | | 09/15/23 | | 1,705,000 | | 1,690,081 |
| Pershing Road Development Co., LLC (3 month LIBOR + 0.400%) (d)(h) | | 0.520 | | 09/15/24 | | 4,799,000 | | 4,727,015 |
| Pershing Road Development Co., LLC (3 month LIBOR + 0.400%) (d)(h) | | 0.520 | | 09/15/24 | | 1,815,000 | | 1,787,775 |
| Pershing Road Development Co., LLC (3 month LIBOR + 0.400%) (d)(h) | | 0.520 | | 09/15/25 | | 1,530,000 | | 1,503,225 |
| Pershing Road Development Co., LLC (3 month LIBOR + 0.400%) (d)(h) | | 0.520 | | 09/15/26 | | 1,415,000 | | 1,381,747 |
| Phillips-Van Heusen Corp. | | 7.750 | | 11/15/23 | | 1,666,000 | | 1,878,081 |
| Pinnacle Financial Partners, Inc. (4.125% to 09/15/24, then 3 month LIBOR + 2.775%) (d) | | 4.125 | | 09/15/29 | | 5,000,000 | | 5,085,309 |
| Principal Financial Group, Inc. (3 month LIBOR + 3.044%) (d) | | 3.200 | | 05/15/55 | | 26,065,000 | | 25,794,181 |
See Notes to Financial Statements.
29
Table of Contents
BOND FUND SCHEDULE OF INVESTMENTS (Continued)
| | | Rate (%) | | Maturity Date | | Principal Amount | | Value |
| BONDS (continued) | | | | | | | | |
| | | | | | | | | |
| Corporate Bonds (continued) | | | | | | | | |
| ProAssurance Corp. | | 5.300 | | 11/15/23 | | 5,001,000 | | $5,283,305 |
| Prospect Capital Corp. | | 5.875 | | 03/15/23 | | 3,087,000 | | 3,233,615 |
| Qwest Corp. | | 6.750 | | 12/01/21 | | 1,920,000 | | 1,920,000 |
| RBB Bancorp (6.180% to 12/01/23, then 3 month LIBOR + 3.150%) (d) | | 6.180 | | 12/01/28 | | 7,000,000 | | 7,338,593 |
| ReadyCap Holdings, LLC (h) | | 4.500 | | 10/20/26 | | 10,000,000 | | 9,953,896 |
| Reinsurance Group of America, Inc. (3 month LIBOR + 2.665%) (d) | | 2.781 | | 12/15/65 | | 33,529,000 | | 32,275,397 |
| Reliant Bancorp Inc. (5.125% to 12/15/24, then SOFRRATE + 3.765%) (d) | | 5.125 | | 12/15/29 | | 13,000,000 | | 13,268,157 |
| Renasant Corp. (3 month LIBOR + 3.840%) (d) | | 3.960 | | 09/01/26 | | 4,100,000 | | 3,961,380 |
| Retail Opportunity Investments Partnership, LP | | 5.000 | | 12/15/23 | | 1,500,000 | | 1,595,396 |
| Royal Caribbean Cruises Ltd. | | 5.250 | | 11/15/22 | | 100,000 | | 100,875 |
| RPM Int’l., Inc. | | 3.450 | | 11/15/22 | | 371,000 | | 378,081 |
| Scripps Networks Interactive, Inc. | | 3.950 | | 06/15/25 | | 491,000 | | 515,910 |
| Signature Bank New York (4.000% to 10/15/25, then AMERIBOR RATE + 3.890%) (d) | 4.000 | | 10/15/30 | | 4,295,000 | | 4,548,968 |
| SL Green Operating Partnership LP | | 3.250 | | 10/15/22 | | 752,000 | | 762,908 |
| Southern National Bancorp of Virginia, Inc. (5.875% to 01/31/22, then 3 month LIBOR + 3.950%) (d)(h) | | 5.875 | | 01/31/27 | | 2,000,000 | | 2,006,037 |
| Southern National Bancorp of Virginia, Inc. (5.400% to 09/01/25, then SOFRRATE + 5.310%) (d) | | 5.400 | | 09/01/30 | | 2,000,000 | | 2,099,999 |
| Spend Life Wisely Co., Inc. (5.875% to 03/15/22, then 3 month LIBOR + 3.742%) (d)(h) | 5.875 | | 03/15/27 | | 8,500,000 | | 8,564,880 |
| StanCorp Financial Group, Inc. | | 5.000 | | 08/15/22 | | 165,000 | | 169,997 |
| State Street Corp. (3 month LIBOR + 3.597%) (d)(g) | | 3.713 | | 03/15/22 | | 1,703,000 | | 1,711,349 |
| Steel Dynamics, Inc. | | 5.000 | | 12/15/26 | | 1,122,000 | | 1,146,901 |
| Sterling Bancorp (4.000% to 12/30/24, then SOFRRATE + 2.530%) (d) | | 4.000 | | 12/30/29 | | 9,700,000 | | 10,024,178 |
| Synchrony Bank | | 3.000 | | 06/15/22 | | 1,000,000 | | 1,011,215 |
| Synovus Financial Corp. | | 3.125 | | 11/01/22 | | 2,992,000 | | 3,040,310 |
| Texas State Bankshares, Inc. (5.750% to 06/15/24, then 3 month LIBOR + 3.550%) (d)(h) | | 5.750 | | 06/15/29 | | 4,000,000 | | 4,068,123 |
| TransCanada PipeLines Ltd. (3 month LIBOR + 2.210%) (d) | | 2.366 | | 05/15/67 | | 24,473,000 | | 20,985,598 |
| Trimble Inc. | | 4.150 | | 06/15/23 | | 8,100,000 | | 8,463,523 |
| Trinitas Capital Management, LLC (h) | | 6.000 | | 07/30/26 | | 3,000,000 | | 2,948,470 |
| TriState Capital Holdings, Inc. (5.750% to 05/15/25, then 3 month LIBOR + 5.360%) (d) | 5.750 | | 05/15/30 | | 10,775,000 | | 11,766,971 |
| Truist Financial Corp. (4.800% to 09/01/24, then H15T5Y + 3.003%) (d)(g) | | 4.800 | | 09/01/24 | | 10,552,000 | | 10,853,260 |
| United Insurance Holdings Corp. | | 6.250 | | 12/15/27 | | 2,250,000 | | 2,312,838 |
| Universal Insurance Holdings, Inc. (h) | | 5.625 | | 11/30/26 | | 7,000,000 | | 7,028,004 |
| USX Corp. | | 8.125 | | 07/15/23 | | 110,000 | | 120,744 |
| UTB Financial Holding Co. (6.500% to 09/01/23, then 3 month LIBOR + 3.620%) (d)(h) | | 6.500 | | 09/01/28 | | 6,000,000 | | 6,341,246 |
| Valley National Bancorp | | 5.125 | | 09/27/23 | | 8,201,000 | | 8,758,647 |
| VeriSign, Inc. | | 4.750 | | 07/15/27 | | 3,561,000 | | 3,699,381 |
| Volunteer State Bancshares, Inc. (5.750% to 11/15/24, then SOFRRATE + 4.365%) (d)(h) | | 5.750 | | 11/15/29 | | 9,000,000 | | 9,223,090 |
| WEC Energy Group, Inc. (3 month LIBOR + 2.1125%) (d) | | 2.269 | | 05/15/67 | | 570,000 | | 530,100 |
| Western Gas Partners LP | | 4.500 | | 03/01/28 | | 139,000 | | 148,383 |
| Westinghouse Air Brake Technologies Corp. | | 4.375 | | 08/15/23 | | 336,000 | | 350,933 |
| WT Holdings, Inc. (h) | | 7.000 | | 04/30/23 | | 18,000,000 | | 18,499,619 |
See Notes to Financial Statements.
30
Table of Contents
BOND FUND SCHEDULE OF INVESTMENTS (Continued)
| | | Rate (%) | | Maturity Date | | Principal Amount | | Value |
| BONDS (continued) | | | | | | | | |
| | | | | | | | | |
| Residential Mortgage-Backed Securities - 0.1% | | | | | | | | $1,259,163 |
| Hawaii Housing Finance & Development Corp. | | 2.600 | | 07/01/37 | | 194,647 | | 195,202 |
| Minnesota Housing Finance Agency | | 2.700 | | 09/01/41 | | 1,049,643 | | 1,063,961 |
| | | | | | | | | |
| Sovereign Bonds - 0.2% | | | | | | | | 5,581,613 |
| Antares Holdings LP (h) | | 6.000 | | 08/15/23 | | 4,830,000 | | 5,178,852 |
| BOC Aviation Ltd. (h) | | 3.000 | | 05/23/22 | | 400,000 | | 402,761 |
| | | | | | | | | |
| Taxable Municipal Bonds - 0.1% | | | | | | | | 2,675,091 |
| County of Reeves TX Certs. of Participation | | 6.375 | | 12/01/21 | | 25,074 | | 25,074 |
| Guam Gov’t. Business Privilege Tax Revenue | | 4.383 | | 01/01/22 | | 530,000 | | 531,199 |
| New Jersey Sports & Exposition Authority | | 6.076 | | 03/01/23 | | 190,000 | | 194,622 |
| Pontotoc County OK Educational Facilities Authority | | 4.119 | | 09/01/23 | | 90,000 | | 92,349 |
| Summit County OH Development Finance Authority | | 6.250 | | 05/15/26 | | 535,000 | | 537,324 |
| Utah Infrastructure Agency Telecommunications Revenue and Refunding | | 3.500 | | 10/15/23 | | 1,280,000 | | 1,294,523 |
| | | | | | | | | |
| U.S. Government Agency Mortgage-Backed Securities - 8.5% | | | | | | | | 220,262,272 |
| Fannie Mae Interest Strip, Series 419 C6 (IO) | | 3.500 | | 05/25/44 | | 3,470,595 | | 496,830 |
| Fannie Mae Pool, Series 890163 | | 5.500 | | 03/01/24 | | 51,092 | | 51,656 |
| Fannie Mae REMIC, Series 2010-2 SG (IO) (-1.0 times 1 month LIBOR + 6.450%, floor 0.000%, cap 6.450%) (d) | | 6.358 | | 10/25/39 | | 535,022 | | 4,803 |
| Fannie Mae REMIC, Series 2011-3 KA | | 5.000 | | 04/25/40 | | 129,000 | | 135,533 |
| Fannie Mae REMIC, Series 2011-136 ES (IO) (-1.0 times 1 month LIBOR + 6.550%, floor 0.000%, cap 6.550%) (d) | | 6.458 | | 02/25/41 | | 1,064,114 | | 47,909 |
| Fannie Mae REMIC, Series 2012-14 DS (IO) (-1.0 times 1 month LIBOR + 6.500%, floor 0.000%, cap 6.500%) (d) | | 6.408 | | 03/25/42 | | 7,559,846 | | 1,578,168 |
| Fannie Mae REMIC, Series 2012-14 SH (IO) (-1.0 times 1 month LIBOR + 6.550%, floor 0.000%, cap 6.550%) (d) | | 6.458 | | 07/25/40 | | 303,777 | | 4,268 |
| Fannie Mae REMIC, Series 2012-114 HS (IO) (-1.0 times 1 month LIBOR + 6.150%, floor 0.000%, cap 6.150%) (d) | | 6.058 | | 03/25/40 | | 78,584 | | 390 |
| Fannie Mae REMIC, Series 2012-122 SA (IO) (-1.0 times 1 month LIBOR + 6.200%, floor 0.000%, cap 6.200%) (d) | | 6.108 | | 02/25/40 | | 622,227 | | 8,629 |
| Fannie Mae REMIC, Series 2013-7 EI (IO) | | 3.000 | | 10/25/40 | | 5,316,097 | | 317,260 |
| Fannie Mae REMIC, Series 2013-20 CS (IO) (-1.0 times 1 month LIBOR + 6.150%, floor 0.000%, cap 6.150%) (d) | | 6.058 | | 03/25/43 | | 2,276,688 | | 274,154 |
| Fannie Mae REMIC, Series 2013-29 AI (IO) | | 2.500 | | 04/25/28 | | 2,644,819 | | 129,051 |
| Fannie Mae REMIC, Series 2013-31 IH (IO) | | 3.500 | | 02/25/43 | | 2,441,586 | | 192,234 |
| Fannie Mae REMIC, Series 2013-38 CI (IO) | | 3.000 | | 04/25/28 | | 6,867,400 | | 378,557 |
| Fannie Mae REMIC, Series 2013-93 SI (IO) (-1.0 times 1 month LIBOR + 5.170%, floor 0.000%, cap 5.170%) (d) | | 5.084 | | 09/25/43 | | 10,914,610 | | 1,385,226 |
| Fannie Mae REMIC, Series 2013-111 AP | | 2.125 | | 10/25/42 | | 276,623 | | 276,378 |
| Fannie Mae REMIC, Series 2016-64 CI (IO) | | 3.500 | | 07/25/43 | | 2,975,190 | | 184,261 |
| Fannie Mae REMIC, Series 2018-66 CB | | 3.000 | | 05/25/47 | | 147,165 | | 146,994 |
| Fannie Mae REMIC, Series 2019-44 IP (IO) | | 4.000 | | 09/25/46 | | 1,870,464 | | 119,402 |
| Fannie Mae REMIC, Series 2020-63 KG | | 2.500 | | 09/25/50 | | 3,431,560 | | 3,476,169 |
| Fannie Mae REMIC, Series 2020-82 EB | | 1.250 | | 11/25/50 | | 210,258 | | 206,554 |
| Fannie Mae REMIC, Series 2020-88 Z | | 2.000 | | 12/25/50 | | 2,950,400 | | 2,826,458 |
| Fannie Mae REMIC, Series 2020-94 HC | | 1.000 | | 01/25/51 | | 1,491,000 | | 1,487,101 |
| Fannie Mae REMIC, Series 2021-23 JB | | 1.000 | | 04/25/51 | | 1,663,249 | | 1,605,734 |
| Fannie Mae REMIC, Series 2021-34 KZ | | 1.500 | | 03/25/51 | | 522,439 | | 521,328 |
See Notes to Financial Statements.
31
Table of Contents
BOND FUND SCHEDULE OF INVESTMENTS (Continued)
| | | | | | | | | |
| | | Rate (%) | | Maturity Date | | Principal Amount | | Value |
| BONDS (continued) | | | | | | | | |
| | | | | | | | | |
| U.S. Government Agency Mortgage-Backed Securities (continued) | | | | | | | | |
| Fannie Mae REMIC, Series 2021-57 EA | | 1.000 | | 05/25/46 | | 10,985,548 | | $10,774,756 |
| Fannie Mae REMIC, Series 2021-57 EB | | 1.250 | | 05/25/46 | | 4,187,998 | | 4,090,027 |
| Fannie Mae REMIC, Series 2021-72 UZ | | 2.000 | | 10/25/51 | | 2,563,180 | | 2,507,276 |
| Freddie Mac Multifamily Structured Pass Through Certificates, Series K045 X1 (IO) (d) | | 0.429 | | 11/25/25 | | 175,693,550 | | 2,032,282 |
| Freddie Mac Multifamily Structured Pass Through Certificates, Series K050 X1 (IO) (d) | | 0.313 | | 08/25/25 | | 175,689,212 | | 1,902,363 |
| Freddie Mac Multifamily Structured Pass Through Certificates, Series K056 X1 (IO) (d) | | 1.258 | | 05/25/26 | | 78,153,918 | | 3,757,922 |
| Freddie Mac Multifamily Structured Pass Through Certificates, Series K060 X1 (IO) (d) | | 0.069 | | 10/25/26 | | 221,990,437 | | 913,202 |
| Freddie Mac REMIC, Series 4060 SJ (IO) (-1.0 times 1 month LIBOR + 6.650%, floor 0.000%, cap 6.650%) (d) | | 6.561 | | 02/15/41 | | 1,118,896 | | 62,159 |
| Freddie Mac REMIC, Series 4109 AI (IO) | | 3.000 | | 07/15/31 | | 8,149,898 | | 326,311 |
| Freddie Mac REMIC, Series 4116 US (IO) (-1.0 times 1 month LIBOR + 4.600%, floor 0.000%, cap 4.600%) (d) | | 4.514 | | 10/15/42 | | 4,868,776 | | 460,288 |
| Freddie Mac REMIC, Series 4136 IH (IO) | | 3.500 | | 09/15/27 | | 3,296,680 | | 176,470 |
| Freddie Mac REMIC, Series 4139 EI (IO) | | 3.000 | | 09/15/31 | | 2,787,589 | | 162,521 |
| Freddie Mac REMIC, Series 4219 AI (IO) | | 3.500 | | 01/15/43 | | 1,396,898 | | 128,744 |
| Freddie Mac REMIC, Series 4238 NS (IO) (-1.0 times 1 month LIBOR + 6.700%, floor 0.000%, cap 6.700%) (d) | | 6.611 | | 02/15/42 | | 1,213,733 | | 141,911 |
| Freddie Mac REMIC, Series 4328 DA | | 4.000 | | 01/15/36 | | 337,246 | | 339,899 |
| Freddie Mac REMIC, Series 4469 HA (c) | | 4.250 | | 02/15/39 | | 546,179 | | 551,709 |
| Freddie Mac REMIC, Series 4504 (IO) | | 3.500 | | 05/15/42 | | 236,906 | | 2,533 |
| Freddie Mac REMIC, Series 4746 NV | | 3.500 | | 04/15/38 | | 2,719,727 | | 2,725,515 |
| Freddie Mac REMIC, Series 4760 IB (IO) | | 4.000 | | 10/15/42 | | 6,847,702 | | 782,303 |
| Freddie Mac REMIC, Series 5041 JH | | 1.500 | | 11/25/50 | | 935,755 | | 948,646 |
| Freddie Mac REMIC, Series 5083 ZJ | | 2.000 | | 03/25/51 | | 3,720,270 | | 3,593,574 |
| Freddie Mac REMIC, Series 5115 CZ | | 3.000 | | 04/25/51 | | 3,644,151 | | 3,652,006 |
| Freddie Mac REMIC, Series 5129 BH | | 1.000 | | 07/25/50 | | 4,729,114 | | 4,587,894 |
| Freddie Mac REMIC, Series 5129 DM | | 1.000 | | 08/25/50 | | 4,745,660 | | 4,586,707 |
| Freddie Mac REMIC, Series 5141 PA | | 1.000 | | 04/25/50 | | 9,437,613 | | 9,319,464 |
| Freddie Mac REMIC, Series 5142 ZH | | 2.500 | | 09/25/51 | | 2,656,492 | | 2,656,729 |
| Freddie Mac REMIC, Series 5146 LZ | | 1.000 | | 06/25/50 | | 2,483,734 | | 2,444,154 |
| Freddie Mac REMIC, Series 5146 ZY | | 2.000 | | 07/25/51 | | 4,227,494 | | 4,115,918 |
| Freddie Mac REMIC, Series 5154 ZQ | | 2.500 | | 10/25/51 | | 4,912,246 | | 4,825,800 |
| Freddie Mac REMIC, Series 5160 TZ | | 1.500 | | 08/25/50 | | 5,586,594 | | 5,587,969 |
| Ginnie Mae Pool, Series 78-2071X | | 7.000 | | 05/15/33 | | 10,640 | | 12,161 |
| Ginnie Mae REMIC Trust, Series 2011-32 NA | | 4.000 | | 06/20/40 | | 62,156 | | 62,578 |
| Ginnie Mae REMIC Trust, Series 2012-27 (IO) (d) | | 0.718 | | 04/16/53 | | 26,697,690 | | 282,590 |
| Ginnie Mae REMIC Trust, Series 2013-35 A | | 1.618 | | 02/16/40 | | 74,322 | | 74,556 |
| Ginnie Mae REMIC Trust, Series 2015-81 (IO) (d) | | 0.199 | | 10/16/56 | | 50,053,034 | | 805,048 |
| Ginnie Mae REMIC Trust, Series 2016-51 ID (IO) | | 4.000 | | 03/20/43 | | 4,233,014 | | 240,640 |
| Ginnie Mae REMIC Trust, Series 2016-137 (IO) (d) | | 0.548 | | 10/16/56 | | 23,672,324 | | 829,071 |
| Ginnie Mae REMIC Trust, Series 2017-24 (IO) (d) | | 0.806 | | 12/16/56 | | 56,069,703 | | 2,518,449 |
| Ginnie Mae REMIC Trust, Series 2017-104 JI (IO) | | 4.000 | | 06/20/44 | | 8,015,723 | | 274,353 |
| Ginnie Mae REMIC Trust, Series 2017-169 (IO) (d) | | 0.588 | | 01/16/60 | | 114,974,936 | | 5,169,905 |
| Ginnie Mae REMIC Trust, Series 2018-25 (IO) (d) | | 0.474 | | 02/16/60 | | 100,632,890 | | 4,181,357 |
| Ginnie Mae REMIC Trust, Series 2019-37 (IO) (d) | | 0.803 | | 11/16/60 | | 17,021,986 | | 1,119,349 |
See Notes to Financial Statements.
32
Table of Contents
BOND FUND SCHEDULE OF INVESTMENTS (Continued)
| | | | | | | | | |
| | | Rate (%) | | Maturity Date | | Principal Amount | | Value |
| BONDS (continued) | | | | | | | | |
| | | | | | | | | |
| U.S. Government Agency Mortgage-Backed Securities (continued) | | | | | | | | |
| Ginnie Mae REMIC Trust, Series 2019-59 IM (IO) | | 4.000 | | 12/20/48 | | 211,143 | | $4,252 |
| Ginnie Mae REMIC Trust, Series 2019-59 MI (IO) | | 4.000 | | 05/20/49 | | 264,569 | | 16,049 |
| Ginnie Mae REMIC Trust, Series 2019-63 (IO) (d) | | 0.796 | | 12/16/60 | | 50,677,665 | | 3,155,556 |
| Ginnie Mae REMIC Trust, Series 2019-71 IO (IO) | | 3.500 | | 06/20/49 | | 406,257 | | 25,624 |
| Ginnie Mae REMIC Trust, Series 2019-71 IQ (IO) | | 3.500 | | 06/20/49 | | 375,244 | | 13,816 |
| Ginnie Mae REMIC Trust, Series 2019-78 IQ (IO) | | 4.000 | | 04/20/49 | | 403,512 | | 11,580 |
| Ginnie Mae REMIC Trust, Series 2019-78 QI (IO) | | 4.000 | | 06/20/49 | | 415,098 | | 15,032 |
| Ginnie Mae REMIC Trust, Series 2019-94 (IO) (d) | | 0.963 | | 08/16/61 | | 25,206,664 | | 1,721,638 |
| Ginnie Mae REMIC Trust, Series 2019-118 (IO) (d) | | 0.858 | | 06/16/61 | | 26,695,555 | | 1,620,767 |
| Ginnie Mae REMIC Trust, Series 2019-122 (IO) (d) | | 1.032 | | 07/16/61 | | 34,336,786 | | 2,458,696 |
| Ginnie Mae REMIC Trust, Series 2019-124 (IO) (d) | | 1.046 | | 06/16/61 | | 68,151,859 | | 5,044,621 |
| Ginnie Mae REMIC Trust, Series 2019-136 ES (IO) (-1.0 times 1 month LIBOR + 6.050%, floor 0.000%, cap 6.050%) (d) | | 5.959 | | 03/20/48 | | 6,530,698 | | 767,247 |
| Ginnie Mae REMIC Trust, Series 2019-136 P | | 1.500 | | 10/20/45 | | 12,087,107 | | 12,017,822 |
| Ginnie Mae REMIC Trust, Series 2019-139 (IO) (d) | | 0.689 | | 11/16/61 | | 33,930,937 | | 1,935,207 |
| Ginnie Mae REMIC Trust, Series 2020-15 QC | | 1.500 | | 02/20/50 | | 4,346,598 | | 4,316,032 |
| Ginnie Mae REMIC Trust, Series 2020-20 (IO) (d) | | 0.737 | | 05/16/61 | | 26,819,207 | | 1,707,568 |
| Ginnie Mae REMIC Trust, Series 2020-40 (IO) (d) | | 1.034 | | 01/16/62 | | 35,228,295 | | 2,767,323 |
| Ginnie Mae REMIC Trust, Series 2020-44 (IO) (d) | | 1.102 | | 02/16/62 | | 79,138,237 | | 6,586,129 |
| Ginnie Mae REMIC Trust, Series 2020-47 MZ | | 3.500 | | 04/20/50 | | 1,011,958 | | 1,020,683 |
| Ginnie Mae REMIC Trust, Series 2020-47 YI (IO) | | 2.500 | | 04/20/50 | | 3,117,495 | | 145,984 |
| Ginnie Mae REMIC Trust, Series 2020-49 (IO) (d) | | 1.014 | | 07/16/62 | | 37,547,964 | | 2,860,164 |
| Ginnie Mae REMIC Trust, Series 2020-58 (IO) (d) | | 0.932 | | 01/16/62 | | 37,742,071 | | 2,700,124 |
| Ginnie Mae REMIC Trust, Series 2020-123 TZ | | 1.000 | | 08/20/50 | | 1,893,654 | | 1,832,165 |
| Ginnie Mae REMIC Trust, Series 2020-134 BZ | | 1.000 | | 09/16/50 | | 1,499,394 | | 1,415,770 |
| Ginnie Mae REMIC Trust, Series 2021-16 BU | | 1.000 | | 01/20/51 | | 580,001 | | 579,836 |
| Ginnie Mae REMIC Trust, Series 2021-27 ZL | | 1.000 | | 02/20/51 | | 2,033,092 | | 1,945,028 |
| Ginnie Mae REMIC Trust, Series 2021-29 PU | | 1.000 | | 02/20/51 | | 323,009 | | 323,020 |
| Ginnie Mae REMIC Trust, Series 2021-46 BU | | 1.000 | | 03/20/51 | | 224,566 | | 223,977 |
| Ginnie Mae REMIC Trust, Series 2021-46 PU | | 1.000 | | 03/20/51 | | 198,264 | | 197,833 |
| Ginnie Mae REMIC Trust, Series 2021-66 PU | | 1.000 | | 04/20/51 | | 1,091,412 | | 1,087,228 |
| Ginnie Mae REMIC Trust, Series 2021-77 BA | | 1.000 | | 07/20/50 | | 4,480,113 | | 4,355,953 |
| Ginnie Mae REMIC Trust, Series 2021-89 BU | | 1.000 | | 05/20/51 | | 2,303,098 | | 2,295,997 |
| Ginnie Mae REMIC Trust, Series 2021-130 CZ | | 3.000 | | 07/20/51 | | 3,699,639 | | 3,719,292 |
| Ginnie Mae REMIC Trust, Series 2021-131 MZ | | 2.000 | | 07/20/51 | | 2,228,746 | | 2,217,257 |
| Ginnie Mae REMIC Trust, Series 2021-136 EZ | | 2.500 | | 08/20/51 | | 4,977,166 | | 4,935,478 |
| Ginnie Mae REMIC Trust, Series 2021-136 KZ | | 2.000 | | 08/20/51 | | 8,563,258 | | 8,350,677 |
| Ginnie Mae REMIC Trust, Series 2021-136 QZ | | 2.000 | | 08/20/51 | | 4,798,963 | | 4,688,124 |
| Ginnie Mae REMIC Trust, Series 2021-139 TZ | | 1.250 | | 01/16/40 | | 567,949 | | 550,642 |
| Ginnie Mae REMIC Trust, Series 2021-139 ZJ | | 2.500 | | 08/20/51 | | 4,236,294 | | 4,212,002 |
| Ginnie Mae REMIC Trust, Series 2021-142 MZ | | 2.000 | | 08/20/50 | | 1,249,857 | | 1,243,339 |
| Ginnie Mae REMIC Trust, Series 2021-154 AZ | | 2.500 | | 09/20/51 | | 4,463,763 | | 4,437,336 |
| Ginnie Mae REMIC Trust, Series 2021-154 PZ | | 2.500 | | 09/20/51 | | 4,388,502 | | 4,356,526 |
| Ginnie Mae REMIC Trust, Series 2021-156 NZ | | 2.000 | | 09/20/51 | | 5,450,766 | | 5,430,751 |
| Ginnie Mae REMIC Trust, Series 2021-158 PU | | 1.000 | | 09/20/51 | | 1,375,000 | | 1,369,971 |
See Notes to Financial Statements.
33
Table of Contents
BOND FUND SCHEDULE OF INVESTMENTS (Continued)
| | | | | | | | | |
| | | Rate (%) | | Maturity Date | | Shares or
Principal Amount | | Value |
| SHORT-TERM INVESTMENTS - 4.5% | | | | | | | | $115,096,639 |
| (COST $115,096,800) | | | | | | | | |
| | | | | | | | | |
| Money Market Fund - 0.0%^ | | | | | | | | 100,000 |
| First American Gov’t. Obligations Fund Class X (a) | | 0.026 | | | | 100,000 | | 100,000 |
| | | | | | | | | |
| U.S. Government & Agency Securities - 4.5% | | | | | | | | 114,996,639 |
| U.S. Treasury Bills (b) | | 0.024 | | 12/02/21 | | 40,000,000 | | 39,999,947 |
| U.S. Treasury Bills (b) | | 0.085 | | 12/15/21 | | 5,000,000 | | 4,999,887 |
| U.S. Treasury Bills (b) | | 0.068 | | 12/16/21 | | 10,000,000 | | 9,999,808 |
| U.S. Treasury Bills (b) | | 0.141 | | 12/23/21 | | 10,000,000 | | 9,999,676 |
| U.S. Treasury Bills (b) | | 0.081 | | 12/30/21 | | 30,000,000 | | 29,998,953 |
| U.S. Treasury Bills (b) | | 0.030 | | 01/11/22 | | 10,000,000 | | 9,999,590 |
| U.S. Treasury Bills (b) | | 0.045 | | 02/22/22 | | 10,000,000 | | 9,998,778 |
| TOTAL INVESTMENTS - 98.7% (COST $2,634,610,427) | | | | | | | | 2,547,097,349 |
| | | | | | | | | |
| NET OTHER ASSETS AND LIABILITIES - 1.3% | | | | | | | | 34,923,568 |
| | | | | | | | | |
| NET ASSETS - 100.0% | | | | | | | | $2,582,020,917 |
| | |
| (a) | Rate shown represents the 7-day yield at November 30, 2021. |
| (b) | Rate shown represents the current yield for U.S. Treasury Bills at November 30, 2021. |
| (c) | Security is a “step-up” bond where the coupon increases or steps up at a predetermined date. Securities which do not indicate a future coupon rate in their description above are at their final coupon rate at November 30, 2021. |
| (d) | Variable rate security. Interest rates reset periodically. Interest rate shown reflects the rate in effect at November 30, 2021. For securities based on a published reference rate and spread, the reference rate and spread are indicated in the description above. Certain variable rate securities are not based on a published reference rate and spread but are determined by the issuer or agent and are based on current market conditions. These securities do not indicate a reference rate and spread in their description above. |
| (e) | Rate is subject to adjustment due to credit ratings service downgrades or subsequent upgrades. |
| (f) | Non-income producing security. |
| (g) | Perpetual maturity. Date shown represents next contractual call date. |
| (h) | Security subject to restrictions on resale under federal securities laws and which therefore may only be resold upon registration under the Securities Act of 1933, as amended, or in transactions exempt from registration, including sales to qualified institutional buyers under Rule 144A of the Securities Act of 1933, as amended. As of November 30, 2021, the aggregate value of these securities was $843,507,219, representing 32.67% of net assets. |
| (i) | Issuer in default on interest and/or principal repayment. |
| (j) | Illiquid security at November 30, 2021. |
| ^ | Rounds to 0.0%. |
| Abbreviations: |
| AMERIBOR | American Interbank Offered Rate |
| H15T5Y | 5-Year Treasury Constant Maturity Rate |
| IO | Interest Only Security |
| LIBOR | London Interbank Offered Rate |
| SOFRRATE | U.S. Secured Overnight Financing Rate |
| USISDA02 | 2-Year Dollar ICE Swap Rate |
| USISDA05 | 5-Year Dollar ICE Swap Rate |
| USISDA10 | 10-Year Dollar ICE Swap Rate |
| USISDA30 | 30-Year Dollar ICE Swap Rate |
See Notes to Financial Statements.
34
Table of Contents
BOND FUND SCHEDULE OF INVESTMENTS (Continued)
| | |
| A.G. | Aktiengesellschaft is the German term for a public limited liability corporation. |
| DAC | Designated Activity Company |
| N.V. | Naamloze Vennootschap is the Dutch term for a public limited liability corporation. |
| PLC | Public Limited Company |
| Pty. Ltd. | Proprietary Limited Company under Australian law. |
| REIT | Real Estate Investment Trust |
| REMIC | Real Estate Mortgage Investment Conduit |
| SARL | Società a responsabilità limitata is the Italian term for a public limited company. |
The following is a summary of the inputs used to value the Funds’ investments as of November 30, 2021:
| | | Level 1 | | Level 2 | | Level 3 | | Total |
| Bonds | | | | | | | | |
| Asset-backed securities | | $– | | $369,216,910 | | $– | | $369,216,910 |
| Commercial mortgage-backed securities | | – | | 395,607,346 | | – | | 395,607,346 |
| Convertible bonds | | – | | 61,866,084 | | – | | 61,866,084 |
| Corporate bonds | | – | | 1,375,532,231 | | – | | 1,375,532,231 |
| Residential mortgage-backed securities | | – | | 1,259,163 | | – | | 1,259,163 |
| Sovereign bonds | | – | | 5,581,613 | | – | | 5,581,613 |
| Taxable municipal bonds | | – | | 2,675,091 | | – | | 2,675,091 |
| U.S. government agency mortgage-backed securities | | – | | 220,262,272 | | – | | 220,262,272 |
| Total bonds | | – | | 2,432,000,710 | | – | | 2,432,000,710 |
| Short-term investments | | | | | | | | |
| Money market funds | | 100,000 | | – | | – | | 100,000 |
| U.S. government & agency securities | | – | | 114,996,639 | | – | | 114,996,639 |
| Total short-term investments | | 100,000 | | 114,996,639 | | – | | 115,096,639 |
| Total investments | | $100,000 | | $2,546,997,349 | | – | | $2,547,097,349 |
The Fund did not invest in any level-3 investments during the fiscal year ended November 30, 2021.
For more information on valuation inputs, see financial statement Note 2 - Significant Accounting Policies.
See Notes to Financial Statements.
35
Table of Contents
FUND EXPENSE EXAMPLES (Unaudited)
Example
A Fund shareholder may incur two types of costs: (1) transaction costs such as redemption fees; and (2) ongoing costs, including management fees and other Fund expenses. This example is intended to help you understand your ongoing costs (in dollars) of investing in a Fund and to compare these costs with the ongoing costs of investing in other mutual funds.
The example is based on an investment of $1,000 invested at the beginning of the period and held for the entire period from June 1, 2021 to November 30, 2021.
Actual Expenses
The first line of the table below under each Fund provides information about actual account values and actual expenses for such Fund. You may use the information in this line, together with the amount you invested, to estimate the expenses that you paid over the period. Simply divide your account value by $1,000 (for example, an $8,600 account value divided by $1,000 = 8.6), then multiply the result by the number in the first line under the heading entitled “Expenses Paid During Period” to estimate the expenses you paid on your account during this period.
Hypothetical Example for Comparison Purposes
The second line of the table below under each Fund provides information about hypothetical account values and hypothetical expenses based on such Fund’s actual expense ratio and an assumed rate of return of 5% per year before expenses, which is not the Fund’s actual return. The hypothetical account values and expenses may not be used to estimate the actual ending account balance or expenses you paid for the period. You may use this information to compare the ongoing costs of investing in each Fund and other funds. To do so, compare the 5% hypothetical example with the 5% hypothetical examples that appear in the shareholder reports of the other funds.
Please note that the expenses shown in the table are meant to highlight your ongoing costs only and do not reflect any transactional costs, such as redemption fees. Therefore, the second line of the table is useful in comparing ongoing costs only, and will not help you determine the relative costs of owning different funds. In addition, if these transactional costs were included, your costs would have been higher.
| Six-Month Period Ended November 30, 2021 | | Expense Ratio
for the Period | | Beginning
Account Value
06/01/21 | | Ending
Account Value
11/30/21 | | Expenses Paid
During the Period* |
| LargeCap Fund | | | | | | | | | | | | | | |
| Actual | | 0.99% | | | $1,000.00 | | | | $989.34 | | | | $4.94 | |
| Hypothetical (5% return before expenses) | | 0.99% | | | $1,000.00 | | | | $1,020.04 | | | | $5.01 | |
| MidCap Fund | | | | | | | | | | | | | | |
| Actual | | 1.13% | | | $1,000.00 | | | | $944.73 | | | | $5.51 | |
| Hypothetical (5% return before expenses) | | 1.13% | | | $1,000.00 | | | | $1,019.33 | | | | $5.72 | |
| Bond Fund | | | | | | | | | | | | | | |
| Actual | | 0.71% | | | $1,000.00 | | | | $1,009.14 | | | | $3.58 | |
| Hypothetical (5% return before expenses) | | 0.71% | | | $1,000.00 | | | | $1,021.44 | | | | $3.60 | |
| | |
| * | Expenses are equal to the annualized [net] expense ratio for each Fund, multiplied by the average account value over the period, multiplied by 183/365 (to reflect the one-half year period). |
| | |
| | For more information, please refer to the Funds’ Prospectus. |
See Notes to Financial Statements.
36
Table of Contents
STATEMENTS OF ASSETS AND LIABILITIES
| November 30, 2021 (In thousands, except per share amounts) |
| |
| | | LARGECAP
FUND | | MIDCAP
FUND | | BOND
FUND |
| | | | | | | | | | | | | |
| Assets | | | | | | | | | | | | |
| Total investments in securities, at value (a) | | | $165,277 | | | | $60,883 | | | | $2,547,097 | |
| Cash | | | – | | | | – | | | | 16,151 | |
| Due from sale of securities | | | 1,314 | | | | 457 | | | | 236 | |
| Receivable from fund shares sold | | | 20 | | | | – | | | | 5,254 | |
| Dividends and interest receivable | | | 269 | | | | 94 | | | | 18,930 | |
| Prepaid expenses | | | 9 | | | | 5 | | | | 106 | |
| Total Assets | | | 166,889 | | | | 61,439 | | | | 2,587,774 | |
| Liabilities | | | | | | | | | | | | |
| Due on purchase of securities | | | 1,278 | | | | 395 | | | | – | |
| Payable for fund shares redeemed | | | 3 | | | | – | | | | 4,199 | |
| Line of credit | | | – | | | | 42 | | | | – | |
| Accrued expenses payable | | | 33 | | | | 26 | | | | 141 | |
| Accrued directors expense payable | | | – | | | | – | | | | 2 | |
| Due to Advisor | | | 133 | | | | 59 | | | | 1,411 | |
| Total liabilities | | | 1,447 | | | | 522 | | | | 5,753 | |
| Net assets | | | $165,442 | | | | $60,917 | | | | $2,582,021 | |
| Net assets consist of | | | | | | | | | | | | |
| Capital stock ($.001 par value) | | | $103,517 | | | | $35,704 | | | | $2,939,028 | |
| Total distributable earnings (accumulated deficit) | | | 61,925 | | | | 25,213 | | | | (357,007 | ) |
| Net Assets | | | $165,442 | | | | $60,917 | | | | $2,582,021 | |
| Net asset value per share | | | | | | | | | | | | |
| Shares of capital stock outstanding (unlimited shares authorized) | | | 1,570 | | | | 3,570 | | | | 233,829 | |
| Offering and redemption price | | | $105.38 | | | | $17.07 | (b) | | | $11.04 | |
| | | | | | | | | | | | | |
| (a) Cost of investments in securities | | | $111,356 | | | | $40,973 | | | | $2,634,610 | |
| (b) Does not recalculate due to rounding. | | | | | | | | | | | | |
See Notes to Financial Statements.
37
Table of Contents
STATEMENTS OF OPERATIONS
| Year Ended November 30, 2021 (In thousands) |
| |
| | | LARGECAP
FUND | | MIDCAP
FUND | | BOND
FUND |
| | | | | | | | | | | | | |
| Investment income | | | | | | | | | | | | |
| Interest | | | $ – | | | | $ – | | | | $110,087 | |
| Dividends | | | 2,816 | | | | 835 | | | | – | |
| Less foreign taxes withheld | | | (8 | ) | | | (4 | ) | | | – | |
| Total investment income | | | 2,808 | | | | 831 | | | | 110,087 | |
| Expenses | | | | | | | | | | | | |
| Investment advisory fees | | | 1,528 | | | | 601 | | | | 14,832 | |
| Shareholder servicing costs | | | 75 | | | | 28 | | | | 1,030 | |
| Administrative & accounting services fees | | | 132 | | | | 76 | | | | 739 | |
| Custody fees | | | 13 | | | | 6 | | | | 199 | |
| Directors fees | | | 31 | | | | 26 | | | | 157 | |
| Federal & state registration | | | 33 | | | | 30 | | | | 101 | |
| Professional fees | | | 36 | | | | 34 | | | | 78 | |
| Interest expense from line of credit (see note 2) | | | 2 | | | | – | | | | – | |
| Other expenses | | | 34 | | | | 25 | | | | 468 | |
| Total expenses | | | 1,884 | | | | 826 | | | | 17,604 | |
| Less expenses reimbursed by Advisor | | | (259 | ) | | | (128 | ) | | | – | |
| Net expenses | | | 1,625 | | | | 698 | | | | 17,604 | |
| Net investment income | | | 1,183 | | | | 133 | | | | 92,483 | |
| Realized and unrealized gain (loss) | | | | | | | | | | | | |
| Net realized gain (loss) on investments | | | 8,207 | | | | 6,395 | | | | (26,579 | ) |
| Net unrealized appreciation (depreciation) on investments | | | 27,473 | | | | 8,182 | | | | 102,811 | |
| Net realized and unrealized gain (loss) | | | 35,680 | | | | 14,577 | | | | 76,232 | |
| Increase (Decrease) in net assets resulting from operations | | | $36,863 | | | | $14,710 | | | | $168,715 | |
See Notes to Financial Statements.
38
Table of Contents
STATEMENTS OF CHANGES IN NET ASSETS
| | | LARGECAP
FUND | | MIDCAP
FUND | | BOND
FUND |
| | | | | | | | | | | | | | | | | | | | | | | | | |
| | | Year Ended
November 30,
2021 | | Year Ended
November 30,
2020 | | Year Ended
November 30,
2021 | | Year Ended
November 30,
2020 | | Year Ended
November 30,
2021 | | Year Ended
November 30,
2020 |
| Operations | | | | | | | | | | | | | | | | | | | | | | | | |
| Net investment income | | | $1,183 | | | | $1,302 | | | | $133 | | | | $172 | | | | $92,483 | | | | $128,039 | |
| Net realized gain (loss) on investments | | | 8,207 | | | | (989 | ) | | | 6,395 | | | | (707 | ) | | | (26,579 | ) | | | (110,870 | ) |
| Net unrealized appreciation (depreciation) on investments | | | 27,473 | | | | 19,060 | | | | 8,182 | | | | 6,579 | | | | 102,811 | | | | (168,300 | ) |
| Net increase (decrease) in net assets resulting from operations | | | 36,863 | | | | 19,373 | | | | 14,710 | | | | 6,044 | | | | 168,715 | | | | (151,131 | ) |
| Distributions to shareholders | | | | | | | | | | | | | | | | | | | | | | | | |
| Total distributions to shareholders | | | (1,302 | ) | | | (3,502 | ) | | | (172 | ) | | | (1,306 | ) | | | (103,580 | ) | | | (131,066 | ) |
| Net increase (decrease) in net assets resulting from distributions to shareholders | | | (1,302 | ) | | | (3,502 | ) | | | (172 | ) | | | (1,306 | ) | | | (103,580 | ) | | | (131,066 | ) |
| Fund share transactions | | | | | | | | | | | | | | | | | | | | | | | | |
| Proceeds from shares sold | | | 7,105 | | | | 7,694 | | | | 3,008 | | | | 4,055 | | | | 951,450 | | | | 797,584 | |
| Reinvestment of distributions | | | 1,278 | | | | 3,443 | | | | 171 | | | | 1,292 | | | | 96,748 | | | | 122,456 | |
| Cost of shares redeemed | | | (19,589 | ) | | | (14,787 | ) | | | (7,392 | ) | | | (4,601 | ) | | | (797,841 | ) | | | (2,159,936 | ) |
| Net increase (decrease) in net assets resulting from fund share transactions | | | (11,206 | ) | | | (3,650 | ) | | | (4,213 | ) | | | 746 | | | | 250,357 | | | | (1,239,896 | ) |
| Total increase (decrease) in net assets | | | 24,355 | | | | 12,221 | | | | 10,325 | | | | 5,484 | | | | 315,492 | | | | (1,522,093 | ) |
| Net assets | | | | | | | | | | | | | | | | | | | | | | | | |
| Beginning of year | | | 141,087 | | | | 128,866 | | | | 50,592 | | | | 45,108 | | | | 2,266,529 | | | | 3,788,622 | |
| End of year | | | $165,442 | | | | $141,087 | | | | $60,917 | | | | $50,592 | | | | $2,582,021 | | | | $2,266,529 | |
| | | | | | | | | | | | | | | | | | | | | | | | | |
| Share transactions | | | | | | | | | | | | | | | | | | | | | | | | |
| Shares sold | | | 69 | | | | 135 | | | | 175 | | | | 491 | | | | 86,468 | | | | 72,294 | |
| Shares issued in reinvestment of distributions | | | 15 | | | | 46 | | | | 13 | | | | 104 | | | | 8,892 | | | | 11,469 | |
| Shares redeemed | | | (195 | ) | | | (220 | ) | | | (451 | ) | | | (433 | ) | | | (72,825 | ) | | | (201,403 | ) |
| Net increase (decrease) in fund shares outstanding | | | (111 | ) | | | (39 | ) | | | (263 | ) | | | 162 | | | | 22,535 | | | | (117,640 | ) |
See Notes to Financial Statements.
39
Table of Contents
NOTES TO FINANCIAL STATEMENTS
NOTE 1 - ORGANIZATION
Thompson IM Funds, Inc. (the “Company”) is a Wisconsin corporation registered under the Investment Company Act of 1940, as amended (the “1940 Act”), as an open-end, diversified management investment company.
The Company consists of separate mutual funds series (each, a “Fund,” and collectively, the “Funds”): Thompson LargeCap Fund (the “LargeCap Fund”), Thompson MidCap Fund (the “MidCap Fund”) and Thompson Bond Fund (the “Bond Fund”). The assets and liabilities of each Fund are segregated and a shareholder’s interest is limited to the Fund in which the shareholder owns shares. The objectives and strategies of each Fund are described in the Funds’ Prospectus.
NOTE 2 - SIGNIFICANT ACCOUNTING POLICIES
The following is a summary of significant accounting policies followed by the Funds in the preparation of their financial statements. The Funds are investment companies and accordingly follow the investment company accounting and reporting guidance of the Financial Accounting Standards Board (“FASB”) Accounting Standards Codification Topic 946 Financial Services — Investment Companies.
VALUATION POLICY AND PROCEDURES - The Funds’ Board of Directors (the “Funds’ Board”) has adopted methods for valuing securities set forth in the Funds’ Pricing Policies and Procedures, including circumstances in which market quotes are not readily available or deemed to be unreliable, and has delegated authority to the Advisor to apply those methods in making fair value determinations, subject to oversight by the Funds’ Board. The Advisor has established a valuation committee that, along with other Advisor employees, administers, implements, and oversees the fair valuation process and makes fair value decisions. The valuation committee regularly reviews its own fair value decisions, as well as valuations, valuation techniques and services furnished by pricing services; considers circumstances in the markets which may require it to make or adjust valuation determinations; and reviews previous valuation determinations. The valuation committee reports on its activities and any changes to the fair valuation guidelines to the Funds’ Board.
VALUATION MEASUREMENTS - In accordance with generally accepted accounting principles in the United States of America (“GAAP”), fair value is defined as the price that each Fund would receive to sell an investment or pay to transfer a liability in an orderly transaction with an independent buyer in the principal market, or in the absence of a principal market the most advantageous market for the investment or liability. GAAP established a three-tier hierarchy to maximize the use of observable market data and minimize the use of unobservable inputs and to establish classification of fair value measurements for disclosure purposes.
Various inputs are used in determining the value of each Fund’s investments. These inputs are summarized in the three broad levels listed below:
Level 1 – Quoted prices in active markets for identical securities.
Level 2 – Other significant observable inputs (including quoted prices for similar securities, interest rates, prepayment speeds, credit risk, etc.).
Level 3 – Significant unobservable inputs (including the Fund’s own assumptions in determining the fair value of investments).
Inputs may include price information, specific and broad credit data, liquidity statistics, and other factors. The Funds consider observable data to be that market data which is readily available, regularly distributed or updated, reliable and verifiable, not proprietary, and provided by independent sources that are actively involved in the relevant market. The determination of what constitutes “observable” requires significant judgment by the Funds. The categorization of a security within the hierarchy is based upon the pricing transparency of the security and does not necessarily correspond to a Fund’s perceived risk of that security. The inputs used to measure fair value may fall into different levels of the fair valuation hierarchy. In such cases, for disclosure purposes, the level in the fair value hierarchy within which the fair value measurement falls in its entirety is determined based on the lowest level that is significant to the fair value measurement in its entirety.
40
Table of Contents
NOTES TO FINANCIAL STATEMENTS (Continued)
SECURITY VALUATION - Each Fund’s equity securities, including common stocks, ADRs, REITs and rights, are valued at their market prices (generally the last reported sales price on the exchange where the securities are primarily traded or, for Nasdaq-listed securities, at their Nasdaq Official Closing Prices). If no sales are reported on a particular day, the mean between the highest bid and lowest asked quotations at the close of the exchanges will generally be used. To the extent these securities are actively traded, and valuation adjustments are not applied, they are categorized in level 1 of the fair value hierarchy. When adjustments to observable prices are applied or when the market is considered inactive, securities will be categorized in level 2 of the fair value hierarchy.
Investments in money market mutual funds are generally priced at the ending net asset value provided by the service agent of the funds. These securities will be categorized as level 1 securities.
Fixed-income securities such as corporate bonds, convertible bonds, asset-backed securities, mortgage-backed securities, U.S. government and agency securities, sovereign bonds, municipal bonds and commercial paper are typically valued based on valuations published by an independent pricing service, which uses various valuation methodologies such as matrix pricing and other analytical pricing models as well as market transactions and dealer quotations. Factors considered by pricing services include market characteristics such as benchmark yield curves, option-adjusted spreads, credit spreads and fundamental analytical data relating to the issuer. Short-term investments in fixed-income securities (those with remaining maturities of 60 days or less) are generally valued on an amortized cost basis. Fixed-income securities will generally be categorized in level 2 of the fair value hierarchy, in instances where lower relative weight is placed on transaction prices, quotations, or similar observable inputs, they are categorized in level 3.
Where market quotations are not readily available or are unreliable, a value is determined in good faith pursuant to procedures established by the Funds’ Board. When determining the value of a security, consideration is given to the facts and circumstances relevant to the particular situation, which includes factors such as fundamental analytical data relating to the investment, which may include consideration of yields or prices of securities of comparable quality, coupon rate, maturity and type of issue, nature and duration of any restrictions on disposition of the security and an evaluation of forces that influence the market in which the securities are purchased or sold. Fair value pricing is an inherently subjective process, and no single standard exists for determining fair value. Different funds could reasonably arrive at different values for the same security.
In December 2020, the SEC adopted a rule addressing fair valuation of fund investments. The new rule sets forth requirements for good faith determinations of fair value as well as for the performance of fair value determinations, including related oversight and reporting obligations. The new rule also defines “readily available market quotations” for purposes of the definition of “value” under the 1940 Act, and the SEC noted that this definition would apply in all contexts under the 1940 Act. The effective date for the rule is March 8, 2021. The SEC adopted an eighteen-month transition period beginning from the effective date for both the new rule and the associated new recordkeeping requirements. At this time, management is evaluating the implications of these changes on the financial statements.
SECURITIES TRANSACTIONS AND INVESTMENT INCOME - Investment securities transactions are accounted for on the trade date. Dividend income is recorded on the ex-dividend date. Interest income is recorded as earned. Gains or losses realized on sales of securities are determined by comparing the identified cost of the security lot sold with the net sales proceeds. Discounts/ premiums on debt securities purchased are accreted/amortized over the life of the respective securities using the effective interest method for both book and tax purposes. Gains and losses on paydowns of asset-backed and mortgage-backed securities are reflected in interest income on the Statements of Operations. Payments received for interest-only or “IO” class mortgage securities are included in interest income. Because no principal will be received at the maturity of an IO, adjustments are made to the cost of the security on a daily basis until maturity. These adjustments are included in interest income on the Statements of Operations. Income and capital gains on some foreign securities may be subject to foreign withholding taxes, which are accrued as applicable, and have been provided for in accordance with the Funds’ understanding of the applicable country’s tax rules and rates. The ability of the issuers of the debt securities held by the Funds to meet their obligations may be affected by economic developments in a specific industry, state, or region. Debt obligations may be placed on non-accrual status and related interest income may be reduced by ceasing current accruals and writing off interest receivables when the collection of all or a portion of interest has become doubtful. A debt obligation is removed from non-accrual status when the issuer resumes interest payments or when collectability of interest is reasonably assured.
41
Table of Contents
NOTES TO FINANCIAL STATEMENTS (Continued)
In March 2017, the Financial Accounting Standards Board (“FASB”) issued Accounting Standards Update (“ASU”) No. 2017-08, Receivables-Nonrefundable Fees and Other Costs (Subtopic 310-20): Premium Amortization on Purchased Callable Debt Securities. The amendments in the ASU shorten the amortization period for certain callable debt securities, held at a premium, to be amortized to the earliest call date. The ASU does not require an accounting change for securities held at a discount; which continues to be amortized to estimated maturity. Management has evaluated and adopted ASU 2017-08 and concluded these changes do not have a material impact on the Funds’ financial statements.
EXPENSES - Each Fund is charged for those expenses that are directly attributed to it. Expenses that are not readily identifiable to a specific Fund are generally allocated among the Funds in proportion to the relative sizes of the Funds.
SECURITIES PURCHASED ON A WHEN-ISSUED OR DELAYED-DELIVERY BASIS - Each Fund may purchase securities on a when-issued or delayed-delivery basis. When-issued securities are securities purchased with delivery to occur at a later date at a stated price and/or yield, thereby involving the risk that the price and/or yield obtained may be more or less than those available in the market when delivery takes place. At the time a Fund makes a commitment to purchase a security on a when-issued basis, the Fund records the transaction and reflects the value of the security in determining net asset value. Each Fund designates and maintains cash and marketable securities at least equal in value to commitments for when-issued securities. There were no when-issued or delayed-delivery transactions at November 30 2021.
LINE OF CREDIT - The Funds have established an unsecured line of credit (“LOC”) with U.S. Bank N.A. which expires November 4, 2022, used primarily to finance redemption payments. Each individual Fund’s borrowing under the LOC is limited to 5% of the value of that Fund’s net assets, 33.33% of the value of the Fund’s investments, or any explicit borrowing limits imposed by the LOC, whatever is less. Interest is charged at the prime rate, which was 3.25% as of November 30, 2021. As of November 30, 2021, the limits established are: LargeCap Fund - $8,000,000, MidCap Fund - $3,000,000 and Bond Fund - $130,000,000. All terms and borrowing limits imposed by the LOC are subject to review and approval by the Funds’ Board. The following table shows the average balance, average interest rate, interest expense, and maximum borrowings incurred by the Funds on the LOC for the fiscal year ended November 30, 2021.
| | | Average
Balance | | Average
Interest
Rate | | Interest
Expense | | Maximum
Borrowing | | Date of
Maximum
Borrowing |
| LargeCap Fund | | $70,611 | | 3.25% | | $2,327 | | $2,583,000 | | 07/30/2021 to 08/01/2021 |
| MidCap Fund | | $14,729 | | 3.25% | | $485 | | $814,000 | | 05/12/2021 |
| Bond Fund | | $7,534 | | 3.25% | | $248 | | $2,750,000 | | 02/04/2021 |
USE OF ESTIMATES - The preparation of financial statements in conformity with GAAP requires management to make estimates and assumptions that affect the reported amounts of assets and liabilities and disclosure of contingent assets and liabilities at the date of the financial statements and the reported amounts of revenues and expenses during the reporting period. Actual results could differ from these estimates.
GUARANTEES AND INDEMNIFICATIONS - Under the Funds’ organizational documents, each Director, officer, employee or other agent of the Funds (including the Funds’ investment advisor) is indemnified, to the extent permitted by the 1940 Act, against certain liabilities that may arise out of performance of their duties to the Funds. Additionally, in the normal course of business, the Funds enter into contracts that contain a variety of indemnification clauses. The Funds’ maximum exposure under these arrangements is unknown as this would involve future claims that may be made against the Funds that have not yet occurred. However, the Funds have not had prior claims or losses pursuant to these contracts and believe the risk of loss to be remote.
DISTRIBUTIONS TO SHAREHOLDERS - Distributions to shareholders from net investment income and realized gains on securities for the LargeCap Fund and MidCap Fund normally are declared at least annually. Bond Fund distributions to shareholders from net investment income normally are declared on a quarterly basis, and distributions to shareholders from realized gains on securities normally are declared at least annually. Distributions are recorded on the ex-dividend date.
42
Table of Contents
NOTES TO FINANCIAL STATEMENTS (Continued)
FEDERAL INCOME TAXES - No provision has been made for federal income taxes since the Funds have elected to be taxed as regulated investment companies under the requirements of Subchapter M of the Internal Revenue Code and intend to distribute substantially all of their taxable income and net realized gains from the sale of investment securities to their shareholders.
ACCOUNTING FOR UNCERTAINTY IN INCOME TAXES - As of and during the fiscal year ended November 30, 2021, the Funds did not have a liability for unrecognized tax benefits in the accompanying financial statements. Also, the Funds recognized no interest or penalties related to unrecognized tax benefits during the same period. The Funds recognize interest and penalties, if any, related to unrecognized tax benefits as income tax expense in the Statements of Operations. The Funds are also not aware of any tax positions for which it is reasonably possible that the total amounts of unrecognized tax benefits will significantly change in the next twelve months.
SUBSEQUENT EVENTS - The Funds have evaluated subsequent events through the issuance of the Funds’ financial statements. Other than as described in Notes 5, 6 and 7, there were no additional subsequent events which were deemed to have an impact on the Funds’ financial statements.
NOTE 3 - INVESTMENT ADVISORY AND ADMINISTRATIVE AND ACCOUNTING SERVICES AGREEMENTS AND OTHER TRANSACTIONS WITH AFFILIATES
The Investment Advisory Agreement pursuant to which Thompson Investment Management, Inc. (“TIM” or “Advisor”) is retained by the Funds provides for monthly compensation to TIM computed on average daily net assets at the following annual rates:
| | | First
$50 Million | | Over
$50 Million |
| LargeCap Fund | | 1.00% | | 0.90% |
| MidCap Fund | | 1.00% | | 0.90% |
| Bond Fund | | 0.65% | | 0.60% |
The Advisor is contractually bound to waive management fees and/or reimburse expenses incurred by the Funds through March 31, 2022 so that the annual operating expenses of the Funds do not exceed the following percentages of their respective average daily net assets: LargeCap Fund - 0.99%, MidCap Fund - 1.15% and Bond Fund - 0.80%. For the fiscal year ended November 30, 2021, the Advisor reimbursed expenses incurred by the LargeCap Fund and the MidCap Fund in the amounts of $258,567 and $127,967, respectively. The Funds are not obligated to reimburse the Advisor for any fees or expenses waived in previous fiscal years.
As of November 30, 2021, affiliated shareholders whose individual accounts are greater than 10% held 10.23% and 29.32% of outstanding shares of the LargeCap Fund and MidCap Fund, respectively. Transactions by the shareholders may have a material impact on the Funds.
Pursuant to an Administrative and Accounting Services Agreement, TIM maintains the Funds’ financial records in accordance with the 1940 Act, prepares all necessary financial statements of the Funds and calculates the net asset value per share of the Funds on a daily basis. Effective September 1, 2021, as compensation for its services, each Fund pays TIM a fee computed daily and payable monthly at the annual rate of 0.15% of average daily net assets up to $30 million, 0.10% of the next $70 million of average daily net assets and 0.03% of average daily net assets in excess of $100 million. The fee is subject to an annual minimum per Fund equal to the sum of the actual out-of-pocket costs to TIM attributable to all outsourced sub-fund accounting and sub-fund administrative services performed by U.S. Bank Global Fund Services. Prior to September 1, 2021, each Fund paid TIM a fee computed daily and payable monthly at the annual rate of 0.15% of average daily net assets up to $30 million, 0.10% of the next $70 million of average daily net assets and 0.025% of average daily net assets in excess of $100 million with an annual minimum fee of $30,000 per Fund. The calculations of daily net asset value and as of May 1, 2021 sub administrative services are subcontracted to U.S. Bank Global Fund Services, resulting in fees paid by TIM for the fiscal year ended November 30, 2021, in the following amounts:
| | | Administrative &
Accounting Fees Paid |
| LargeCap Fund | | $81,405 |
| MidCap Fund | | $60,747 |
| Bond Fund | | $485,303 |
43
Table of Contents
NOTES TO FINANCIAL STATEMENTS (Continued)
The Funds reimburse the Advisor for a portion of amounts paid by the Advisor out of the Advisor’s own resources under various shareholder, account maintenance, networking and other services provided to the Funds by broker-dealers and other intermediaries. The amount reimbursed by the Funds is equal to (1) for those accounts maintained through a shareholder servicing arrangement, an annual rate of no more than 0.10% of the average daily net assets of the omnibus accounts in the Funds for which all broker-dealers and other intermediaries, in the aggregate, are responsible, and (2) for those accounts maintained through a networking arrangement, no more than $6 per year per account in the Funds for which the broker-dealers and other intermediaries are responsible; provided however, in all cases only one of these fees shall be applicable to the assets in an account. This amount has been determined by the Funds’ Board to approximate (or not to exceed) the transfer agency fees that would otherwise have been payable by the Funds if such broker-dealers and intermediaries did not maintain these accounts. Such amounts are recorded within Shareholder servicing costs on each Fund’s Statement of Operations. For the fiscal year ended November 30, 2021, the amounts reimbursed by the Funds to the Advisor were:
| | | Intermediary
Fees Reimbursed |
| LargeCap Fund | | $19,130 |
| MidCap Fund | | $3,463 |
| Bond Fund | | $666,768 |
NOTE 4 - PURCHASE AND SALE OF SECURITIES
Investment transactions for the fiscal year ended November 30, 2021 were as follows:
| | | Securities other than U.S.
Government and Short-term
Investments | | U.S. Government Securities |
| | | Purchases | | Sales | | Purchases | | Sales |
| LargeCap Fund | | $19,423,798 | | $30,684,527 | | $– | | $– |
| MidCap Fund | | $11,456,008 | | $15,602,059 | | $– | | $– |
| Bond Fund | | $848,893,807 | | $667,499,307 | | $962,721,106 | | $874,498,364 |
NOTE 5 – INCOME TAX INFORMATION
At November 30, 2021, the investment cost, aggregate unrealized appreciation and depreciation on investments and other components of distributable earnings for federal income tax purposes were as follows:
| | | LARGECAP
FUND | | MIDCAP
FUND | | BOND
FUND |
| Federal tax cost | | $111,573,658 | | | $41,320,611 | | | $2,634,610,427 | |
| | | | | | | | | | |
| Unrealized appreciation | | $61,305,613 | | | $22,786,417 | | | $40,177,919 | |
| Unrealized depreciation | | (7,601,798 | ) | | (3,223,613 | ) | | (127,690,997 | ) |
| Net unrealized appreciation (depreciation) | | $53,703,815 | | | $19,562,804 | | | ($87,513,078 | ) |
| Distributable ordinary income | | 1,181,559 | | | 261,054 | | | 15,992,955 | |
| Distributable long-term capital gains | | 7,039,715 | | | 5,389,152 | | | – | |
| Post-October losses | | – | | | – | | | (41,452 | ) |
| Capital loss carryforwards | | – | | | – | | | (285,445,420 | ) |
| Total distributable earnings (accumulated deficit) | | $61,925,089 | | | $25,213,010 | | | ($357,006,995 | ) |
The cost basis of investments for tax and financial reporting purposes differ principally due to wash sales.
Book/tax differences may be temporary or permanent. To the extent these differences are permanent in nature, they are charged to paid-in capital or distributable earnings, in the period that the differences arise. These reclassifications have no impact on net assets or net asset value per share.
44
Table of Contents
NOTES TO FINANCIAL STATEMENTS (Continued)
The tax basis post-October losses as of November 30, 2021 and capital loss carryforward as of November 30, 2021, which are not being recognized for tax purposes until the first day of the following fiscal year, are as follows:
| | | LARGECAP
FUND | | MIDCAP
FUND | | BOND
FUND |
| Post-October losses | | | | | | | | | |
| Short-term | | $– | | | $– | | | ($39,154 | ) |
| Long-term | | – | | | – | | | (2,298 | ) |
| Total Post-October losses | | $– | | | $– | | | ($41,452 | ) |
| Net capital loss carryforward | | | | | | | | | |
| Short-term | | $– | | | $– | | | ($50,165,406 | ) |
| Long-term | | – | | | – | | | (235,280,014 | ) |
| Total capital loss carryforward | | $– | | | $– | | | ($285,445,420 | ) |
Capital losses are carried forward indefinitely and are available to offset future net realized gains, to the extent permitted by the Internal Revenue Code.
During the fiscal year ended November 30, 2021, the LargeCap Fund, MidCap Fund and Bond Fund utilized capital loss carryforwards in the amount of $748,278, $870,664 and $1,454,699, respectively. Capital losses are carried forward indefinitely and are available to offset future net realized gains, to the extent permitted by the Internal Revenue Code.
The tax components of distributions paid during fiscal years ended November 30, 2021 and November 30, 2020 are as follows:
| | | LARGECAP
FUND | | MIDCAP
FUND | | BOND
FUND |
| Fiscal year ended November 30, 2021 | | | | | | |
| Distributions paid from | | | | | | |
| Ordinary income | | $1,302,301 | | $171,632 | | $103,580,283 |
| Long-term capital gains | | – | | – | | – |
| Total distributions paid | | $1,302,301 | | $171,632 | | $103,580,283 |
| Fiscal year ended November 30, 2020 | | | | | | |
| Distributions paid from | | | | | | |
| Ordinary income | | $1,578,138 | | $155,807 | | $131,065,684 |
| Long-term capital gains | | 1,923,289 | | 1,149,402 | | – |
| Total distributions paid | | $3,501,427 | | $1,305,209 | | $131,065,684 |
The following distributions were declared on December 21, 2021, payable to shareholders on December 22, 2021:
| | | LARGECAP
FUND | | MIDCAP
FUND | | BOND
FUND |
| Ordinary income distributions | | | | | | |
| Amount | | $1,182,983 | | $262,626 | | $22,741,113 |
| Per share | | $0.76 | | $0.07 | | $0.10 |
| Long-term capital gains distributions | | | | | | |
| Amount | | $7,039,925 | | $5,389,316 | | $– |
| Per share | | $4.49 | | $1.52 | | $– |
45
Table of Contents
NOTES TO FINANCIAL STATEMENTS (Continued)
NOTE 6 – CORONAVIRUS (COVID-19) PANDEMIC
As a result of the global outbreak of the 2019 novel coronavirus (“COVID-19”), along with resulting voluntary and governmental actions, including but not limited to mandatory business closures, public gathering limitations, restrictions on travel and quarantines, as well as supply chain disruptions has meaningfully unsettled the global economy and markets. Businesses across most sectors have experienced significant challenges to their revenues and business, which could lead to widespread defaults on outstanding corporate debt or make it difficult for businesses to continue as a going concern. Although the long-term economic fallout of COVID-19 is difficult to predict, it has had and is expected to continue to have ongoing material adverse effects across many, if not all, aspects of regional, national and global economies. These current market conditions (as well as market conditions arising from similar infectious illnesses) are likely to amplify the other risks to which the Funds are subject. They also subject each Fund to a variety of unknown risks, including the risk that government actions and intervention in the markets distort which businesses emerge successfully from these conditions and which do not or that they unintentionally exacerbate these conditions.
NOTE 7 – LIBOR DISCONTINUATION RISK
The London Interbank Offered Rate (“LIBOR”) is expected to cease to be available, or appropriate for use, by June 30, 2023. Many financial instruments use or may use a floating rate based on the LIBOR which is the offered rate for short-term Eurodollar deposits between major international banks. There remains uncertainty regarding the future utilization of LIBOR and the nature of any replacement rate. As such, the potential impact of a transition away from LIBOR on the Bond Fund or the financial instruments in which the Bond Fund invests cannot yet be determined. The elimination of LIBOR or changes to other reference rates or any other changes or reforms to the determination or supervision of reference rates could have an adverse impact on the market for, or value of, any securities or payments linked to those reference rates, which may adversely affect the Bond Fund’s performance and/or net asset value. Furthermore, the risks associated with the expected discontinuation of LIBOR and transition may be exacerbated if the work necessary to effect an orderly transition to an alternative reference rate is not completed in a timely manner. Because the usefulness of LIBOR as a benchmark could deteriorate during the transition period, these effects could occur prior to the end of the first half of 2023.
In March 2020, the FASB issued Accounting Standards Update 2020-04, Reference Rate Reform (Topic 848) – Facilitation of the Effects of Reference Rate Reform on Financial Reporting (“ASU 2020-04”), which provides optional, temporary relief with respect to the financial reporting of contracts subject to certain types of modifications due to the planned discontinuation of certain tenors of the London Interbank Offered Rate (LIBOR) and other LIBOR-based reference rates. The temporary relief provided by ASU 2020-04 is effective for certain reference rate-related contract modifications that occur during the period from March 12, 2020 through December 31, 2022. Management is evaluating the impact of ASU 2020-04 on the Funds’ investments, debt and other contracts that will undergo reference rate-related modifications as a result of the reference rate reform.
46
Table of Contents
FINANCIAL HIGHLIGHTS
The following table presents information relating to a share of capital stock outstanding for the entire period.
| LARGECAP FUND | | Year Ended November 30, |
| | | 2021 | | | 2020 | | | 2019 | | | 2018 | | | 2017 | |
| Per share operating performance | | | | | | | | | | | | | | | |
| Net asset value, beginning of period | | $83.93 | | | $74.93 | | | $66.36 | | | $65.77 | | | $57.48 | |
| Income from investment operations | | | | | | | | | | | | | | | |
| Net investment income | | 0.76 | | | 0.78 | | | 0.68 | | | 0.55 | | | 0.37 | |
| Net realized and unrealized gains (losses) on investments | | 21.47 | | | 10.29 | | | 8.41 | | | 0.59 | | | 8.38 | |
| Total from investment operations | | 22.23 | | | 11.07 | | | 9.09 | | | 1.14 | | | 8.75 | |
| Less distributions | | | | | | | | | | | | | | | |
| Distributions from net investment income | | (0.78 | ) | | (0.60 | ) | | (0.52 | ) | | (0.45 | ) | | (0.46 | ) |
| Distributions from net realized gains | | – | | | (1.47 | ) | | – | | | (0.10 | ) | | – | |
| Total distributions | | (0.78 | ) | | (2.07 | ) | | (0.52 | ) | | (0.55 | ) | | (0.46 | ) |
| Net asset value, end of period | | $105.38 | | | $83.93 | | | $74.93 | | | $66.36 | | | $65.77 | |
| Total return | | 26.71% | | | 15.08% | | | 13.93% | | | 1.72% | | | 15.32% | |
| Ratios and supplemental data | | | | | | | | | | | | | | | |
| Net assets, end of period (millions) | | $165.4 | | | $141.1 | | | $128.9 | | | $121.7 | | | $129.0 | |
| Ratios to average net assets: | | | | | | | | | | | | | | | |
| Ratios of expenses | | 0.99% | | | 0.99% | | | 1.03% | | | 1.05% | | | 1.10% | |
| Ratio of expenses without reimbursement | | 1.15% | | | 1.23% | | | 1.23% | | | 1.21% | | | 1.22% | |
| Ratio of net investment income | | 0.72% | | | 1.09% | | | 0.96% | | | 0.80% | | | 0.59% | |
| Ratio of net investment income without reimbursement | | 0.56% | | | 0.85% | | | 0.76% | | | 0.64% | | | 0.47% | |
| Portfolio turnover rate | | 12% | | | 25% | | | 24% | | | 29% | | | 89% | |
See Notes to Financial Statements.
47
Table of Contents
FINANCIAL HIGHLIGHTS (Continued)
The following table presents information relating to a share of capital stock outstanding for the entire period.
| MIDCAP FUND | | Year Ended November 30, |
| | | 2021 | | 2020 | | 2019 | | 2018 | | 2017 |
| Per share operating performance | | | | | | | | | | |
| Net asset value, beginning of period | | $13.20 | | | $12.29 | | | $12.02 | | | $13.73 | | | $12.53 | |
| Income from investment operations | | | | | | | | | | | | | | | |
| Net investment income | | 0.05 | | | 0.04 | | | 0.04 | | | 0.03 | | | 0.01 | |
| Net realized and unrealized gains (losses) on investments | | 3.87 | | | 1.23 | | | 0.93 | | | (0.75 | ) | | 1.78 | |
| Total from investment operations | | 3.92 | | | 1.27 | | | 0.97 | | | (0.72 | ) | | 1.79 | |
| Less distributions | | | | | | | | | | | | | | | |
| Distributions from net investment income | | (0.05 | ) | | (0.04 | ) | | (0.03 | ) | | (0.01 | ) | | (0.01 | ) |
| Distributions from net realized gains | | – | | | (0.32 | ) | | (0.67 | ) | | (0.98 | ) | | (0.58 | ) |
| Total distributions | | (0.05 | ) | | (0.36 | ) | | (0.70 | ) | | (0.99 | ) | | (0.59 | ) |
| Net asset value, end of period | | $17.07 | | | $13.20 | | | $12.29 | | | $12.02 | | | $13.73 | |
| Total return | | 29.75% | | | 10.56% | | | 9.78% | | | (5.85% | ) | | 14.78% | |
| Ratios and supplemental data | | | | | | | | | | | | | | | |
| Net assets, end of period (millions) | | $60.9 | | | $50.6 | | | $45.1 | | | $45.0 | | | $50.9 | |
| Ratios to average net assets: | | | | | | | | | | | | | | | |
| Ratios of expenses | | 1.14% | | | 1.15% | | | 1.15% | | | 1.15% | | | 1.20% | |
| Ratio of expenses without reimbursement | | 1.35% | | | 1.53% | | | 1.53% | | | 1.42% | | | 1.44% | |
| Ratio of net investment income | | 0.22% | | | 0.42% | | | 0.37% | | | 0.19% | | | 0.06% | |
| Ratio of net investment income (loss) without reimbursement | | 0.01% | | | 0.04% | | | (0.01% | ) | | (0.08% | ) | | (0.18% | ) |
| Portfolio turnover rate | | 19% | | | 37% | | | 34% | | | 30% | | | 29% | |
See Notes to Financial Statements.
48
Table of Contents
FINANCIAL HIGHLIGHTS (Continued)
The following table presents information relating to a share of capital stock outstanding for the entire period.
| BOND FUND | | Year Ended November 30, |
| | | 2021 | | | 2020 | | | 2019 | | | 2018 | | | 2017 | |
| Per share operating performance | | | | | | | | | | | | | | | |
| Net asset value, beginning of period | | $10.73 | | | $11.52 | | | $11.38 | | | $11.45 | | | $11.22 | |
| Income from investment operations | | | | | | | | | | | | | | | |
| Net investment income | | 0.42 | | | 0.52 | | | 0.40 | | | 0.36 | | | 0.35 | |
| Net realized and unrealized gains (losses) on investments | | 0.36 | | | (0.83 | ) | | 0.13 | | | (0.09 | ) | | 0.27 | |
| Total from investment operations | | 0.78 | | | (0.31 | ) | | 0.53 | | | 0.27 | | | 0.62 | |
| Less distributions | | | | | | | | | | | | | | | |
| Distributions from net investment income | | (0.47 | ) | | (0.48 | ) | | (0.39 | ) | | (0.34 | ) | | (0.39 | ) |
| Distributions from net realized gains | | – | | | – | | | – | | | – | | | – | |
| Total distributions | | (0.47 | ) | | (0.48 | ) | | (0.39 | ) | | (0.34 | ) | | (0.39 | ) |
| Net asset value, end of period | | $11.04 | | | $10.73 | | | $11.52 | | | $11.38 | | | $11.45 | |
| Total return | | 7.43% | | | (2.60% | ) | | 4.70% | | | 2.37% | | | 5.57% | |
| Ratios and supplemental data | | | | | | | | | | | | | | | |
| Net assets, end of period (millions) | | $2,582.0 | | | $2,266.5 | | | $3,788.6 | | | $3,655.2 | | | $2,620.6 | |
| Ratios to average net assets: | | | | | | | | | | | | | | | |
| Ratios of expenses | | 0.71% | | | 0.72% | | | 0.71% | | | 0.71% | | | 0.71% | |
| Ratio of net investment income | | 3.75% | | | 4.27% | | | 3.49% | | | 3.21% | | | 3.01% | |
| Portfolio turnover rate | | 34% | | | 38% | | | 53% | | | 39% | | | 43% | |
See Notes to Financial Statements.
49
Table of Contents
REPORT OF INDEPENDENT REGISTERED PUBLIC ACCOUNTING FIRM
To the Shareholders and Board of
Directors of Thompson IM Funds, Inc.
Opinion on the Financial Statements
We have audited the accompanying statements of assets and liabilities, including the schedules of investments, of Thompson IM Funds, Inc., comprising Thompson LargeCap Fund, Thompson MidCap Fund,and Thompson Bond Fund (the “Funds”), as of November 30, 2021, and the related statements of operations for the year then ended, the statements of changes in net assets for each of the two years in the period then ended, the related notes, and the financial highlights for each of the five years in the period then ended (collectively referred to as the “financial statements”). In our opinion, the financial statements present fairly, in all material respects, the financial position of each of the Funds as of November 30, 2021, the results of their operations for the year then ended, the changes in net assets for each of the two years in the period then ended, and the financial highlights for each of the five years in the period then ended, in conformity with accounting principles generally accepted in the United States of America.
Basis for Opinion
These financial statements are the responsibility of the Funds’ management. Our responsibility is to express an opinion on the Funds’ financial statements based on our audits. We are a public accounting firm registered with the Public Company Accounting Oversight Board (United States) (“PCAOB”) and are required to be independent with respect to the Funds in accordance with the U.S. federal securities laws and the applicable rules and regulations of the Securities and Exchange Commission and the PCAOB.
We conducted our audits in accordance with the standards of the PCAOB. Those standards require that we plan and perform the audit to obtain reasonable assurance about whether the financial statements are free of material misstatement whether due to error or fraud.
Our audits included performing procedures to assess the risks of material misstatement of the financial statements, whether due to error or fraud, and performing procedures that respond to those risks. Such procedures included examining, on a test basis, evidence regarding the amounts and disclosures in the financial statements. Our procedures included confirmation of securities owned as of November 30, 2021, by correspondence with the custodian and brokers. Our audits also included evaluating the accounting principles used and significant estimates made by management, as well as evaluating the overall presentation of the financial statements. We believe that our audits provide a reasonable basis for our opinion.
We have served as the Funds’ auditor since 2010.

COHEN & COMPANY, LTD.
Cleveland, Ohio
January 27, 2022
50
Table of Contents
DIRECTORS AND OFFICERS (Unaudited)
| Information as of December 31, 2021 |
| | | | | | | | | |
Name and
Birth Date | | Position(s) Held with
Thompson IM Funds, Inc.
and Length of Time Served (1) | | Principal Occupation(s)
During Past Five Years | | Number of
Thompson IM
Funds Overseen
by Director | | Other
Directorships
Held
by Director |
| Independent Directors |
George E. Austin Birth date: 9/15/52 | | Chairman since 2021 Director since 2011 | | ● President of AVA Civic Enterprises Inc. (consulting firm), since 2011 ● Director of W. Jerome Frautschi Foundation Inc. (private foundation), since 2012; President from 1998 to 2012 ● Director of the Home Savings Bank since 1998 ● Director of Overture Development Corporation (support organization for Overture Center Foundation), since 2001; President from 2001 to 2009 | | 3 | | None |
Cornelia Boyle Birth date: 9/23/53 | | Director since 2015 | | ● Currently retired ● Director of North Track Funds, Inc. (investment company) from 2003 to 2009 ● Trustee of Ziegler Exchange Traded Trust (investment company) from 2005 to 2009 ● Executive Vice President and Chief Operations Officer, AIG Sun America Retirement Markets, Inc. (distribution and marketing company for variable annuity and retirement products) from 2000 to 2003 ● Executive Vice President, Fidelity Investments from 1996 to 2000 | | 3 | | None |
Patricia Lipton Birth date: 12/9/42 | | Chairman from 2018 to 2021 Director since 2007 | | ● Currently retired ● Executive Director, State of Wisconsin Investment Board (“SWIB”) from 1989 to 2004 ● Assistant Executive Director, SWIB from 1982 to 1989 ● Former Director, State Tax Policy Bureau of the Wisconsin Department of Revenue | | 3 | | None |
Joyce Minor Birth date: 5/1/66 | | Director since 2019 | | ● Professor of Economics, Macalester College, since 2008 ● Senior Vice President, Equity Research, Lehman Brothers (investment bank), 1996-2004 ● Vice President, Equity Research, Duff & Phelps (financial advisory and consultancy firm), 1994-1996 | | 3 | | None |
51
Table of Contents
DIRECTORS AND OFFICERS (Unaudited) (Continued)
| Information as of December 31, 2021 |
| | | | | | | | | |
Name and
Birth Date | | Position(s) Held with
Thompson IM Funds, Inc.
and Length of Time Served (1) | | Principal Occupation(s)
During Past Five Years | | Number of
Thompson IM
Funds Overseen
by Director | | Other
Directorships
Held
by Director |
| Interested Directors and Officers |
Jason L. Stephens (2)
Birth date: 10/15/74 | | Director since 2011 Chief Executive Officer since 2015 President since 2020 | | ● Chief Executive Officer of Thompson Investment Management (“TIM”) since 2015 ● President of TIM since 2020 ● Corporate Secretary of TIM from 2004 to 2020 ● Portfolio Manager of TIM since 2007 ● A Chartered Financial Analyst | | 3 | | None |
James T. Evans Birth date: 6/6/75 | | Vice President since 2009 | | ● Chief Investment Officer of TIM since 2009 ● Portfolio Manager of TIM since 2008 ● Managing Director of Nakoma Capital Management from 2000 to 2005 ● A Chartered Financial Analyst | | N/A | | N/A |
Penny M. Hubbard Birth date: 6/2/61 | | Chief Financial Officer and Treasurer since 2005 | | ● Vice President of TIM since 2004 ● Corporate Secretary of TIM since 2020 ● Assistant Vice President - Client Services of TPA and various other capacities 1984-2004 | | N/A | | N/A |
Nedra S. Pierce Birth date: 10/2/61 | | Chief Compliance Officer since 2006 | | ● Chief Compliance Officer of TIM since 2006 ● Director of Business Development of TIM from 2004 to 2006 and since 2010 ● Director of Business Development of TPA from 1998 to 2003 | | N/A | | N/A |
Lesley T. Bailey Birth date: 9/30/78 | | Vice President since 2021 Secretary since 2010 | | ● Fund Accounting and Administration at TIM since 2004 ● Fund Accounting and Administration at TPA from 2001 to 2004 | | N/A | | N/A |
Patsy J. Endres Birth date: 3/4/62 | | Assistant Vice President since 2021 | | ● Fund Accounting and Administration at TIM since 2019 | | N/A | | N/A |
The address of each Director and officer as it relates to the Company’s business is 1255 Fourier Dr., Suite 200, Madison WI 53717.
(1) Officers of the Company serve one-year terms, subject to annual reappointment by the Board of Directors. Directors of the Investment Company serve a term of indefinite length until their resignation or removal, and stand for re-election by shareholders as and when required under the 1940 Act.
(2) Jason L. Stephens is an “interested person” of the Company by virtue of his position with the Company and TIM.
52
Table of Contents
ADDITIONAL INFORMATION (Unaudited)
THOMPSON IM FUNDS, INC.
Thompson Investment Management, Inc.
1255 Fourier Drive, Suite 200
Madison, Wisconsin 53717
Quasar Distributors, LLC
111 East Kilbourn Avenue, Suite 2200
Milwaukee, Wisconsin 53202
U.S. Bank Global Fund Services
615 East Michigan Street
Milwaukee, Wisconsin 53202
Independent Registered
Public Accounting Firm |
Cohen & Company, Ltd.
1350 Euclid Avenue, Suite 800
Cleveland, Ohio 44115
Quarles & Brady LLP
411 East Wisconsin Avenue
Milwaukee, Wisconsin 53202
The Statement of Additional Information contains additional information about the directors and officers of Thompson IM Funds, Inc. and is available without charge, upon request, by calling 1-800-999-0887.
Proxy Voting Policy
A description of the policies and procedures that the Funds use to determine how to vote proxies relating to portfolio securities and information regarding how the Funds actually voted proxies during the most recent 12-month period ended June 30 are available without charge, upon request, by calling 1-800-999-0887, through the Funds’ website at www.thompsonim.com and on the SEC’s website at www.sec.gov.
Information About Portfolio Securities
The Funds file complete schedules of their portfolio holdings with the Securities and Exchange Commission for the Funds’ first and third quarters of its fiscal year on Form N-PORT. The Funds’ Forms N-PORT are available on the Securities and Exchange Commission’s website at www.sec.gov. The Funds’ Forms N-PORT are also available without charge, upon request, by calling 1-800-999-0887.
53
Table of Contents
ADDITIONAL INFORMATION (Unaudited) (Continued)
Board Approval of Investment Advisory Agreement
The Investment Company Act of 1940 (the “Act”) requires that the existing Investment Advisory Agreement (the “Agreement”) for Thompson IM Funds, Inc. (the “Funds”) be approved annually by a vote of a majority of the Board of Directors, including a majority of the Directors who are not parties to the Agreement or “interested persons” of the Funds as that term is defined in the Act (the “Independent Directors”).
At its in-person meeting on November 17, 2021, the Board of Directors of the Funds voted unanimously to renew the Agreement between the Funds and Thompson Investment Management, Inc. (the “Advisor”) for each of the LargeCap Fund, the MidCap Fund, and the Bond Fund (each of these series of the Funds is sometimes referred to as a “Fund” in this section). The approval of the Agreement included the approval of all of the Independent Directors.
The Board’s approval of the Agreement was based on its consideration and evaluation of a variety of factors, including: (1) the nature, extent, and quality of the services provided by the Advisor; (2) the performance of each of the Funds in comparison to its benchmark index and to a peer group of mutual funds; (3) the management fees and total operating expenses of each Fund, including comparative information with respect to a peer group of mutual funds and with respect to fees charged by the Advisor to other clients whose assets are managed under similar objectives and strategies; (4) the extent to which economies of scale may be realized as a Fund grows; and (5) whether fee levels reflect any potential economies of scale for the benefit of shareholders. The Board generally viewed these factors in their totality, with no single factor serving as the principal reason for determining whether to renew the Agreement and with individual Board members giving different weight to different factors in each case.
In connection with the approval process, both the Independent Directors as well as the full Board met separately in person on November 17, 2021, and the full Board met by telephone on November 10, 2021, to consider information relevant to the approval process. The Independent Directors and the full Board are referred to collectively as the “Board” in this section.
To facilitate evaluation of the Agreement, the Board worked with the Advisor and independent legal counsel to request, obtain, and review information prepared or compiled by the Advisor as well as an independent analysis of each Fund’s performance, expenses, and profitability prepared by Broadridge, a leading independent provider of data for independent directors of investment companies for purposes of their review of investment advisory agreements. Information reviewed included a memorandum from Fund counsel discussing the fiduciary duty of Directors under Section 15(c) of the Act; an executive summary and memorandum from Fund management providing its recommendation regarding the Agreement; the Advisor’s analysis of profitability of the Advisor through its relationship with the Funds, including under the Agreement as well as the profitability of related service contracts with the Advisor; a separate profitability comparison prepared by Broadridge; a detailed statistical report from Broadridge comparing each Fund’s respective performance and expenses with both a comparison “group” and a comparison “universe” and a report from Broadridge outlining its methodology in preparing that report; supplementary performance information as of the most recent calendar quarter for the Funds, including a comparison of each Fund’s performance to an applicable category of funds as determined by Morningstar, Inc., a ranking service widely recognized in the mutual fund industry; information regarding the composition of and fees charged for standardized investment products offered to separately managed account clients of the Advisor; the Advisor’s Form ADV, which, among other things, showed fees charged by the Advisor to manage the investments of other clients with objectives and programs similar to the Funds; the Agreement and other service agreements with the Advisor; and background information on the Funds’ portfolio managers and reports from the Funds’ Chief Compliance Officer. In addition, the Board had received and considered detailed information on the Funds’ investment performance and expenses at each of its quarterly meetings during the year as well as in-person reports (including in some instances via live videoconference) from the Fund’s portfolio managers and reports from the Funds’ Chief Compliance Officer. Throughout the review and approval process, the Independent Directors were represented by independent legal counsel. The Board consulted with independent legal counsel and the Advisor throughout the review and approval process to evaluate the information provided, including the methodology employed by Broadridge in the reports produced for the Board, and to confirm that the content of the information produced as a result of its follow-up requests was satisfactory.
54
Table of Contents
ADDITIONAL INFORMATION (Unaudited) (Continued)
The Board considered the nature, extent, and quality of services provided by the Advisor, including services required to be provided under the Agreement, services required to be provided under other agreements with the Advisor and with affiliates of the Advisor, and additional services provided by the Advisor that were not required under any of those agreements. The Board considered the background and experience of the Funds’ portfolio managers, other advisory personnel, compliance personnel, and other support personnel. It noted that in addition to considering these factors at this meeting, it had also considered many of these factors during the course of its quarterly meetings over the past year as well as at its November 10 special meeting. The Board considered that, in addition to investment management and broker-selection services, the Advisor prepares compliance and other materials for each of the Board’s meetings; provides office space, equipment, information technology and administrative services necessary for operation of the Funds; and performs regular compliance and risk-analysis functions for the Funds.
The Board believed that the nature, extent, and quality of services provided by the Advisor were comparable to those provided by advisors to comparable funds, and that such services were adequate for the Funds’ needs and were being performed by the Advisor in a competent and appropriate manner.
The Board reviewed the one-, two-, three-, four-, five- and ten-year investment performances of each Fund.
The Board observed that the investment performance for the LargeCap Fund was in the top 20 percent of its Broadridge performance group and performance universe for the one- and two-year periods as well as in the top 40 percent or 60 percent of its performance group and performance universe for each other period measured.
The Board observed that the performance of the MidCap Fund ranked in the top 20 percent of its performance group for the one-, two-, four-, and five-year periods and of its performance universe for the one-, two-, three-, and five-year periods, as well as that the Fund ranked in the top 40 percent for all other periods with respect to both its performance group and its performance universe.
The Board noted that the Bond Fund ranked in the top 20 percent of its performance group for the one-, four-, five-, and ten-year periods and of its performance universe for the one-, five-, and ten year periods, while ranking in the top 40 percent of its performance universe for the four-year period. It noted, however, that the Fund ranked in the bottom 20 percent of its performance group and performance universe for both the two- and three-year periods.
The Board determined that relative to the performances of comparable funds and to each Fund’s benchmark index, the performance of each Fund was within an acceptable range and was generally in line with its expectations in light of the strategies employed by the Advisor.
In reviewing the cost of services provided to the Funds and profits realized by the Advisor from these relationships, the Board compared information relating to the various management fees charged to separately managed accounts of the Advisor that have relatively analogous investment objectives as those of a Fund. Among the information reviewed by the Board was information relating to standardized investment products offered to separately managed account clients of the Advisor. The Board determined that these standardized products in most instances had investment objectives and styles that were sufficiently different from the investment objectives and styles of any of the Funds so as to make the comparison of limited utility. With respect to those standardized products available to separately managed account clients of the Advisor that the Board determined to be sufficiently similar in investment objective and strategy to a Fund to be relevant for comparative purposes, the Board determined that in light of the significantly different level of services and resources required for the management of these products and the Funds, the management fees charged by the Advisor with respect to each of the Funds were reasonable relative to the management fees charged by the Advisor with respect to the relevant standardized separately managed account product.
The information provided by Broadridge indicated that the advisory fees of the LargeCap Fund, after taking into account the waiver of a portion of those fees, were in the highest 40 percent of both the Fund’s Broadridge comparison group and comparison universe. The Board observed that after accounting for the fee waiver instituted by the Advisor, which provided for a ceiling on the maximum total expense ratio that the Fund could incur at 0.99 percent of average daily net assets of the Fund, the Fund was near the median of its comparison group from a total-expense-ratio perspective. After taking into account all of these considerations, the Board determined that the management fee and total expense ratio of the LargeCap Fund were reasonable.
55
Table of Contents
ADDITIONAL INFORMATION (Unaudited) (Continued)
The Board noted that the MidCap Fund’s actual management fees after taking into account the waiver of a portion thereof by the Advisor ranked in the lowest 40 percent of its comparison group and the middle quintile of its comparison universe. It further observed that its total expenses ranked in the middle quintile of its comparison group. The Board observed that the total expense ratio and the non-management expense ratio of the Fund continued to be relatively high as compared to the Fund’s Broadridge comparison universe, but that the actual management fees of the Fund compared more favorably relative to that universe. The Board considered that the Advisor was proposing to continue the fee waiver for the Fund, capping the maximum total expense ratio that the Fund could incur at 1.15 percent. After taking into account all of these considerations, the Board determined that the management fee and total expense ratio of the MidCap Fund were reasonable.
The Board noted that the Bond Fund’s contractual management fee was the highest of its Broadridge comparison group and that its actual management fee was the highest of both its comparison group and comparison universe. The Board also noted, however, that the Fund’s total expense ratio was in the lowest 40 percent of both its Broadridge comparison group and comparison universe, which the Board determined was reasonable.
With regard to profitability, the Board noted that the Advisor’s pre-tax profitability before accounting for marketing fees borne by the Advisor, as well as its profitability on a post-marketing basis, ranked above the median of firms included in the Broadridge analysis. The Board observed that all of the investment advisors for which profitability information was publicly available and that were included in the Broadridge comparison were publicly traded entities having materially different marketing strategies from that of the Advisor. The Board considered profitability challenges arising as a result of the ongoing COVID-19 pandemic. The Board determined that the operating margins of the Advisor were reasonable and, after reviewing information provided by Broadridge and reviewing the Advisor’s own analysis, the Board concluded that the cost of services provided by the Advisor and its affiliates to the Funds and the profits realized with respect thereto were reasonable.
The Board also considered whether economies of scale might be realized as the Funds’ assets increase. It noted that the Agreement provides for a fee breakpoint at $50 million of assets. This breakpoint is equal to ten basis points for the LargeCap Fund and MidCap Fund and five basis points for the Bond Fund. The Board considered that an increase in assets could provide economies of scale in the Funds’ operations. However, it noted that the level of assets of both the LargeCap Fund and the MidCap Fund presented no meaningful opportunity for such economies. Therefore the Board concluded that neither of these Funds was likely to realize material economies of scale until its assets grew significantly. The Board noted that assets in the Bond Fund had not reached a point where the Fund was realizing any material economies of scale, particularly after accounting for a recent decline in assets of that Fund.
The Board considered additional benefits to the Advisor arising from the Agreement, such as that the Funds may enhance the Advisor’s reputation as an investment adviser, thereby helping the Advisor to attract other clients and investment personnel. The Board determined that benefits of the sort derived from the Agreement were consistent with the benefits received by other advisers to mutual funds.
Based primarily on these considerations, the Board renewed the Agreement with respect to each Fund.
56
Table of Contents
TP - ANNUAL
Table of Contents
Item (b): No notice transmitted to stockholders in reliance on Rule 30e-3 under the Investment Company Act of 1940 contained disclosures specified by paragraph (c)(3) of that rule.
Item 2. Code of Ethics.
As of the end of the period covered by this report on Form N-CSR, the Registrant has adopted a Code of Ethics (as defined in Item 2(b) of Form N-CSR) that applies to the Registrant’s principal executive officer, principal financial officer and principal accounting officer. The Registrant’s Code of Ethics (as defined in Item 2(b) of Form N-CSR) and any amendments or waivers thereto are available on the Registrant’s website at www.thompsonim.com.
Item 3. Audit Committee Financial Expert.
The Registrant’s Board of Directors has determined that the Registrant has at least one audit committee financial expert serving on its audit committee. Joyce Minor, a director of the Registrant since 2019, has been determined to be an audit committee financial expert and is “independent” within the meaning of Item 3(a)(2) of Form N-CSR. Ms. Minor holds a Bachelor of Economics degree from Macalester College and a Master of Business Administration degree from Harvard University. She currently serves as Karl Egge Professor of Economics at Macalester College, where she has taught courses on securities analysis, investment banking, and applied economics. Ms. Minor has experience working in the investment banking industry in roles as senior vice president and equity research analyst. She has extensive professional experience relating to financial statement analysis, capital structure considerations, and equity valuations.
Item 4. Principal Accountant Fees and Services.
The following table sets forth information as to the fees billed to the Registrant for each of the last two fiscal years for audit-related, tax and other services and products provided by Cohen & Company, Ltd., the Registrant’s principal accountant.
| | | Fiscal Year Ended November 30, | |
| | | 2020 | | | 2021 | |
| Audit Fees(1) | | $ | 41,500.00 | | | $ | 41,500.00 | |
| Audit-Related Fees(2) | | $ | 0.00 | | | $ | 0.00 | |
| Tax Fees(3) | | $ | 9,000.00 | | | $ | 9,000.00 | |
| All Other Fees(4) | | $ | 0.00 | | | $ | 0.00 | |
| TOTAL | | $ | 50,500.00 | | | $ | 50,500.00 | |
2
Table of Contents
| (1) | This category relates to professional services rendered by the principal accountant for the audit of the Registrant’s annual financial statements or services that are normally provided by the accountant in connection with statutory and regulatory filings or engagements for those fiscal years. |
| | |
| (2) | This category relates to assurance and related services by the principal accountant that are reasonably related to the performance of the audit of the Registrant’s financial statements and are not reported under “Audit Fees” above. |
| | |
| (3) | This category relates to professional services rendered by the principal accountant for tax compliance, tax advice and tax planning. For 2020 and 2021, the tax services provided by the Registrant’s principal accountant specifically related to the preparation of the Registrant’s federal and state income and excise tax returns and a review of the Registrant’s distributions of capital gains and dividend and interest income. |
| | |
| (4) | This category relates to products and services provided by the principal accountant other than those reported under “Audit Fees,” “Audit-Related Fees,” and “Tax Fees” above. |
Cohen & Company, Ltd. did not bill any amounts over the last two fiscal years for services or products provided to Thompson Investment Management, Inc., the Registrant’s investment advisor, or any entity controlling, controlled by or under common control with such advisor that provides ongoing services for the Registrant.
The audit committee of the Registrant’s Board of Directors has not adopted any pre-approval policies and procedures (as described in paragraph (c)(7) of Rule 2-01 of Regulation S-X) regarding the provision of audit or non-audit services to the Registrant.
No services described in paragraphs (b)-(d) of this Item were approved by the audit committee pursuant to paragraph (c)(7)(i)(C) of Rule 2-01 of Regulation S-X.
Item 5. Audit Committee of Listed Registrants.
Not applicable to this Registrant because it is not a “listed issuer” within the meaning of Rule 10A-3 under the Securities Exchange Act of 1934.
Item 6. Investments.
The required Schedules of Investments in securities of unaffiliated issuers is included as part of the Registrant’s Annual Report to Shareholders dated as of November 30, 2021 provided under Item 1 of this Form N-CSR.
Item 7. Disclosure of Proxy Voting Policies and Procedures for Closed-End Management Investment Companies.
Not applicable to this Registrant because it is not a closed-end management investment company.
Item 8. Portfolio Managers of Closed-End Management Investment Companies.
Not applicable to this Registrant because it is not a closed-end management investment company.
Item 9. Purchases of Equity Securities by Closed-End Management Investment Companies and Affiliated Purchasers.
Not applicable to this Registrant because it is not a closed-end management investment company.
3
Table of Contents
Item 10. Submission of Matters to a Vote of Securities Holders.
The Registrant has not made any material changes to the procedures by which shareholders may recommend nominees to the Registrant’s Board of Directors after the Registrant last provided disclosure in response to the requirements of Item 407(c)(2)(iv) of Regulation S-K or this Item.
Item 11. Controls and Procedures.
| | (a) | Disclosure Controls and Procedures. Based on an evaluation of the Registrant’s disclosure controls and procedures (as defined in Rule 30a-3(c) under the Investment Company Act of 1940) carried out under the supervision and with the participation of the Registrant’s management, including its principal executive and financial officers, within 90 days prior to the filing date of this report on Form N-CSR, the Registrant’s principal executive and financial officers have concluded that the design and operation of the Registrant’s disclosure controls and procedures are effective in providing reasonable assurance that the information required to be disclosed on Form N-CSR is recorded, processed, summarized and reported within the applicable time periods. |
| | | |
| | (b) | Change in Internal Controls Over Financial Reporting. There were no changes in the Registrant’s internal control over financial reporting (as defined in Rule 30a-3(d) under the Investment Company Act of 1940) that occurred during the period covered by this Form N-CSR that have materially affected, or are reasonably likely to materially affect, the Registrant’s internal control over financial reporting. |
Item 12. Disclosure of Securities Lending Activities for Closed-End Management Investment Companies.
Not applicable to this Registrant because it is not a closed-end management investment company.
Item 13. Exhibits.
The following exhibits are attached to this Form N-CSR:
4
Table of Contents
5
Table of Contents
SIGNATURES
Pursuant to the requirements of the Securities Exchange Act of 1934 and the Investment Company Act of 1940, the Registrant has duly caused this report to be signed on its behalf by the undersigned, thereunto duly authorized, on this 4th day of February 2022.
| | THOMPSON IM FUNDS, INC. |
| | |
| | By: | /s/ Jason L. Stephens |
| | | Jason L. Stephens, Chief Executive Officer |
Pursuant to the requirements of the Securities Exchange Act of 1934 and the Investment Company Act of 1940, this report has been signed below by the following persons on behalf of the Registrant and in the capacities indicated on this 4th day of February 2022.
| | By: | /s/ Jason L. Stephens |
| | | Jason L. Stephens, Chief Executive
Officer (Principal Executive Officer) |
| | | |
| | By: | /s/ Penny Hubbard |
| | | Penny Hubbard, Chief Financial
Officer (Principal Financial Officer) |
6