Exhibit 99.2
MANAGEMENT’S DISCUSSION AND ANALYSIS
This Management’s Discussion and Analysis (MD&A), dated effective as of February 9, 2006, should be read in conjunction with the audited Consolidated Financial Statements and Notes for the year ended December 31, 2005, included in the 2005 Financial Report and the 2005 Annual Information Form. Financial data has been prepared in accordance with Canadian generally accepted accounting principles (GAAP), unless otherwise specified. All dollar values are Canadian dollars, unless otherwise indicated. All oil and natural gas production and reserves volumes are stated before deduction of royalties, unless otherwise indicated. Graphs accompanying the text identify our “value drivers,” the key measures of performance in each segment of our business. A glossary of financial terms and ratios can be found on page 88 of this report.
NON-GAAP MEASURES
Cash flow, which is expressed before changes in non-cash working capital, is used by the Company to analyse operating performance, leverage and liquidity. Operating earnings, which represent net earnings excluding gains or losses on foreign currency translation, disposal of assets and unrealized gains or losses on the mark-to-market of the derivative contracts associated with the Buzzard acquisition, are used by the Company to evaluate operating performance. Cash flow and operating earnings do not have a standardized meaning prescribed by Canadian GAAP and, therefore, may not be comparable with the calculation of similar measures for other companies. For reconciliation of the operating earnings and cash flow amounts to the associated GAAP measures, refer to the tables on pages 10 and 12 respectively, of this MD&A.
BUSINESS ENVIRONMENT
Economic factors influencing Petro-Canada’s upstream financial performance include crude oil and natural gas prices, and foreign exchange, particularly the Canadian dollar/U.S. dollar rates. Prices for energy commodities are affected by a number of factors, including supply and demand balance, weather and political events. Factors influencing Downstream financial performance include the level and volatility of crude oil prices, industry refining margins, movements in crude oil price differentials, demand for refined petroleum products and the degree of market competition.
BUSINESS ENVIRONMENT IN 2005
The year 2005 established another milestone in the history of commodity prices. The price of light crude, North Sea Brent (Brent) and West Texas Intermediate (WTI), and of North American natural gas reached new peaks, while light/heavy crude price differentials continued to widen to record levels.
The highest oil prices recorded in the history of the oil market were driven by steady demand growth from China and India; slower growth in Russian production; Iraqi export interruptions; and the impact of hurricanes Katrina and Rita on U.S. Gulf of Mexico production. At the same time, international and domestic light/heavy crude price differentials were substantially wider than in 2004 due to strong growth in output from the Organization of Petroleum Exporting Countries (OPEC); higher levels of heavy crude production in Mexico and Canada; and a prolonged U.S. refinery capacity shutdown due to significant damage from hurricanes.
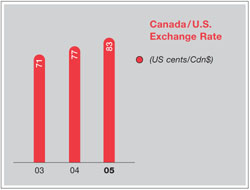
The appreciation of the Canadian dollar during 2005 dampened the positive impact of higher international prices on Canadian crude prices. The Canadian dollar averaged 83 cents US in 2005, compared with 77 cents US in 2004.
North American natural gas prices enjoyed another record year, despite weaker demand due to warm winter weather and inter-fuel substitution, which led to storage gas staying at comfortable levels in 2005. High Henry Hub gas prices reflected concerns about natural gas supply growth in North America and the impact of hurricanes on U.S. Gulf of Mexico production. Canadian natural gas prices improved in line with U.S. prices and averaged higher than in 2004, despite a widening of the price differential between the Henry and the AECO-C hubs and the negative impact of the strengthening Canadian dollar.
In the downstream sector, refined petroleum product sales in Canada declined by 1%, compared to growth of 3.9% in 2004. Most of the decline was due to lower motor gasoline, heating and heavy fuel oil sales. In contrast, diesel sales grew by 4.7% in 2005, building on growth of 6.1% in 2004.
Despite lower overall product sales, refining margins rose to very high levels in 2005. Heating fuel margins reached record levels in the summer of 2005. This was due to fears there would be inadequate inventories to meet demand during the 2005-06 winter season. Gasoline margins increased at the end of the third quarter due to the temporary shutdown of more than four million barrels per day (b/d) of refining capacity in the U.S. Gulf Coast damaged by hurricanes. Record wide light/heavy crude price differentials also contributed to higher margins.
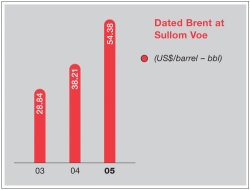
Commodity Price Indicators and Exchange Rates
(averages for the years indicated) | | 2005 | 2004 | 2003 |
| | | | | |
Crude oil price indicators (per bbl) | | | | |
Dated Brent at Sullom Voe | US$ | 54.38 | 38.21 | 28.84 |
WTI at Cushing | US$ | 56.56 | 41.40 | 31.04 |
WTI/Brent price differential | US$ | 2.18 | 3.19 | 2.20 |
Brent/Maya price differential | US$ | 13.52 | 8.20 | 4.60 |
Edmonton Light | Cdn$ | 69.22 | 52.78 | 43.77 |
Edmonton Light/Lloydminster Blend (heavy) price differential | Cdn$ | 26.17 | 17.07 | 12.68 |
| Natural gas price indicators | | | | |
Henry Hub (per MMBtu) | US$ | 8.55 | 6.09 | 5.44 |
AECO-C spot(per thousand cubic feet - Mcf) | Cdn$ | 8.84 | 7.08 | 6.99 |
Henry Hub/AECO basis differential (per MMBtu) | US$ | 1.53 | 0.87 | 0.70 |
New York Harbour 3-2-1 refinery crack spread (per bbl) | US$ | 9.47 | 7.02 | 5.31 |
| US$ per Cdn$ exchange rate | US$ | 0.83 | 0.77 | 0.71 |
COMPETITIVE CONDITIONS
It is becoming increasingly challenging for the energy sector to find new sources of oil and gas. Petro-Canada is well positioned in this environment to compete for new opportunities which will develop upstream resources and grow production of oil and gas. The Company has an estimated 15 billion barrels of oil equivalent (boe) of resources from which to develop new production. Approximately two-thirds of the resource base is located in Alberta’s oil sands. As well, with four different upstream businesses operating in Canada and internationally, the Company has the flexibility to pursue a wider range of opportunities that an upstream business with only one kind of operation in a single geographical area. While the Company has wider operational scope, it remains medium-sized as measured by production levels. Petro-Canada is neither a small junior oil and gas company, nor a super major in the energy sector. This means Petro-Canada has the operational capability and balance sheet strength to invest in large projects, but even smaller acquisitions can impact the Company’s production levels and financial returns.
Petro-Canada is also well positioned to compete in petroleum product refining and marketing in Canada. The Company has a 16% share of the petroleum products market in Canada. Its 1,323 retail service station network has the highest gasoline sales per site in Canada’s urban market amongst the national integrated oil companies. It also has Canada’s largest commercial road transport network of 212 locations, and a bulk fuel sales channel.
The Company believes that its strong financial postion, track record of executing large capital projects and depth of management experience will enable it to continue to compete successfully in the current business environment.
OUTLOOK FOR BUSINESS ENVIRONMENT IN 2006
Prices for energy commodities are expected to remain volatile in 2006, reflecting the vagaries of weather, the level of industry inventories, and political and natural events. Slower growth in global oil demand and production gains from non-OPEC countries are expected to ease the upward pressure experienced by oil prices during 2005. The extent of the anticipated price correction will depend on OPEC adjustments to output to prevent prices from declining as global supply/demand conditions slacken.
Demand growth in North American natural gas markets is expected to be minimal due to warmer winter weather and continuing demand response to high natural gas prices, particularly in the industrial and power generation sectors. The resultant downward pressure on natural gas prices could be partially offset by the challenge to grow production, the slow recovery from production losses caused by the hurricanes and drilling difficulties in Western Canada due to warm winter temperatures.
In the industry’s downstream sector, 2006 refining margins are unlikely to remain at the high levels experienced in 2005 due to the expectation of slower growth in U.S. and Canadian refined product sales. However, another hurricane season or similar occurrence resulting in similar damage to key refining centres could drive such margins to higher than anticipated levels.
ECONOMIC SENSITIVITIES
The following table shows the estimated after-tax effects that changes in certain factors would have had on Petro-Canada’s 2005 net earnings from continuing operations had these changes occurred. Amounts are in Canadian dollars unless otherwise specified.
Sensitivities affecting net earnings
Factor1, 2 | | Change (+) | | Annual Net Earnings Impact | | Annual Net Earnings Impact | |
| | | | | | | (millions of dollars) | | | ($/share) 3 | |
Upstream | | | | | | | | | | |
Price received for crude oil and liquids4 | | $ | 1.00/bbl | | $ | 43 | | $ | 0.08 | |
| Price received for natural gas | | $ | 0.25/Mcf | | | 32 | | | 0.06 | |
Exchange rate: Cdn$/US$ refers to impact on upstream operating earnings from continuing operations5 | | $ | 0.01 | | | (36 | ) | | (0.07 | ) |
| Crude oil and liquids production | | | 1,000 b/d | | | 9 | | | 0.02 | |
| Natural gas production | | | 10 MMcf/d | | | 11 | | | 0.02 | |
Buzzard derivative contracts (unrealized)6 | | $ | 1.00/bbl | | | (19 | ) | | (0.04 | ) |
Downstream | | | | | | | | | | |
| New York Harbour 3-2-1 crack spread | | $ | 0.10 US/bbl | | | 6 | | | 0.01 | |
| Light/heavy crude price differential | | $ | 1.00 US/bbl | | | 7 | | | 0.01 | |
Corporate | | | | | | | | | | |
Exchange rate: Cdn$/US$ refers to impact of the revaluation of U.S. dollar denominated, long-term debt7 | | $ | 0.01 | | $ | 14 | | $ | 0.03 | |
1 The impact of a change in one factor may be compounded or offset by changes in other factors. This table does not consider the impact of any inter-relationship among the factors.
2 The impact of these factors is illustrative.
3 Per share amounts are quoted on a post-stock dividend basis.
4 This sensitivity is based upon an equivalent change in the price of WTI and Dated Brent.
5 A strengthening Canadian dollar versus the U.S. dollar has a negative effect on upstream earnings from continuing operations.
6 This item refers to gains or losses on the forward sales contracts for the future sale of 35.8 million barrels of Brent crude oil that were entered into in connection with the Company’s acquisition of an interest in the Buzzard field in the United Kingdom (U.K.) sector of the North Sea.
7 A strengthening Canadian dollar versus the U.S. dollar has a positive effect on corporate earnings because the Company holds U.S. denominated debt. The impact refers to gains or losses on $1.4 billion US of the Company’s U.S. denominated long-term debt and interest costs on U.S. denominated debt. Gains or losses on $1.1 billion US of the Company’s U.S. denominated long-term debt, associated with the self-sustaining International business segment and the U.S. Rockies operations included in the North American Natural Gas business segment, are deferred and included as part of shareholders’ equity.
BUSINESS STRATEGY
Petro-Canada has maintained a consistent strategy over the past six years. The two-pronged strategy is to improve the profitability of the base businesses by selecting the right assets and then driving for first quartile performance1, and to take a disciplined approach to profitable, long-term growth.
BASE BUSINESS PROFITABILITY
The Company wants to deliver first quartile performance amongst our benchmarked peers as measured in a number of ways, such as reliability and operating cost efficiency.
In 2005, management continued to make safety, environmental impact and reliability key priorities, resulting in performance improvements in all three areas. Total recordable injury frequency decreased by 18% in 2005. Environmental exceedances were reduced by 38%. Reliability2 at operated facilities improved substantially. In the Downstream business, the two refineries and lubricants plant ran at a reliability index rate of well over 90. The Terra Nova Floating Production Storage and Offloading vessel (FPSO) operated at 90% reliability after a fall turnaround. In Oil Sands, the MacKay River in situ plant ran at 98% reliability.
In 2006, Petro-Canada’s priorities for improving base business profitability include continuing to progress safety, environmental and reliability initiatives, and placing an increased focus on cost management. On the first priority, the Company will follow up on initiatives from a contractor safety forum and introduce a safety and health recognition program. Petro-Canada will also conduct a major turnaround at Terra Nova to reach and sustain first quartile reliability levels. The second priority, managing costs, is important given industry pressure for limited services and escalating prices. Employees have been asked to put an increased focus on cost efficiency. The business environment has also created a challenge in recruiting skilled employees. The human resources department is working on a detailed workforce plan to allow the Company to attract employees for growth in all areas of the business.
LONG-TERM PROFITABLE GROWTH
Petro-Canada is taking a disciplined approach to profitable, long-term growth by:
| • | expanding and exploiting the current portfolio of assets; |
| • | targeting acquisitions and new opportunities with a focus on long-life assets; and |
| • | developing an exploration program which balances risks and rewards to replace reserves over time. |
In 2005, the Company continued to expand and exploit the current portfolio of assets. In East Coast Oil, life-of-field estimates at Terra Nova, Hibernia and White Rose increased. In Oil Sands, an application was filed to expand the MacKay River in situ project. In North American Natural Gas, the business used its existing foundation in conventional production in Western Canada and the recently acquired U.S. Rockies platform to shift to production from unconventional sources. In the North Sea, the International business leveraged existing infrastructure and competencies to add the Pict project. International also strengthened its portfolio by selling its mature producing assets in Syria. This focus on expanding and exploiting the current portfolio is expected to continue in 2006. For example, production from another North Sea project called De Ruyter is expected to come on-stream, and MacKay River is expected to reach plateau production. It is anticipated that U.S. Rockies coal bed methane projects will begin to ramp up and production from the Far East Block at Terra Nova is expected in the first quarter of 2006.
Petro-Canada also continues to target acquisitions and new opportunities with a focus on long-life assets. In 2005, the Company’s main acquisition was a 55% interest and operatorship in the Fort Hills mining project. The Fort Hills oil sands mining leases are estimated to contain at least 2.8 billion bbls of bitumen recoverable resource (1.5 billion bbls net to Petro-Canada). The Company also made smaller acquisitions, such as a paraxylene facility next to the Montreal refinery, and some leases and facilities adjacent to the MacKay River in situ project. Also during 2005, Petro-Canada continued to develop its interests in other major upstream projects. These developments included the East Coast Oil White Rose project, which achieved first oil in the fourth quarter (27.5% interest), and the Buzzard project in the North Sea (29.9% interest), which is expected to come on-stream in late 2006. In 2006, the Company expects to continue to develop business development opportunities, particularly in the International business. These include the potential liquefied natural gas (LNG) project in Russia, and other opportunities in the Middle East and North Africa. In North America, Petro-Canada and its partner, TransCanada PipeLines Limited, will seek regulatory approval for the LNG re-gasification project at Gros-Cacouna, Quebec.
| 1 | References to first quartile operations in this report do not refer to industry-wide benchmarks or externally known measures. The Company has a variety of internal metrics which define and track first quartile operational performance. |
| 2 | Throughout this MD&A, the company refers to reliability within the five business units. These reliability rates are calculated using internal methods that vary among the business units and take various factors into account. There are no existing external or industry-wide standards used in calculating reliability rates, and, therefore, resulting calculations are not necessarily comparable to other companies in the oil and gas industry. |
Petro-Canada continues to build a substantive, balanced exploration program. Building a quality program takes time and maintaining a substansive portfolio of opportunities is an ongoing project. Internationally, in 2005, the Company made two discoveries in the U.K. Sector of the North Sea, drilled a successful apprassal well in Denmark and drilled two discoveries on existing concessions in Libya. Seismic programs were completed in Algeria, Syria and the Netherlands, and started in Trinidad and Tobago. The Company also added new exploration opportunities in the U.K. and Norwegian sectors of the North Sea, Trinidad and Tobago, and Morocco. Early in 2006, Petro-Canada added new, non-operated opportunities in Tunisia. The Company also added to its gas exploration portfolio in North America, pooling Alaskan acreage with another operator to increase the joint land position to 2.5 million acres and acquiring an additional licence in the Mackenzie Corridor, for a gross land position of about 560,000 acres. In 2006, Petro-Canada has prepared an 11-well International drilling plan in the Northwest Europe and North Africa/Near East regions and an extensive seismic program to firm up additional prospects that are focused on Trinidad and Tobago, and the U.K. sector of the North Sea.
All together, Petro-Canada has a diverse portfolio of growth opportunities across all five businesses. In the next three years, near-term upstream projects will deliver average annual production growth of 8% to 11%. At the same time, the Downstream business is moving from a focus on investments to meet regulatory requirements to a focus on growth. As regulatory projects to produce cleaner-burning fuels are completed, the Downstream will invest in conversion projects, such as work to convert the conventional crude train at the Edmonton refinery to process oil sands feedstock. The Downstream is also investigating options to build a coker in Montreal. These Downstream projects are expected to lead to the next wave of earnings growth near the end of the decade. Further ahead, Petro-Canada is advancing the second wave of upstream growth projects, adding production from Oil Sands (the Fort Hills mine and upgrader, and MacKay River expansion), northern oil and gas in Alaska and the Mackenzie Delta/Corridor, the Hebron project in East Coast Oil and further exploration success.
RISK MANAGEMENT
PETRO-CANADA’S RISK PROFILE
Petro-Canada’s results are impacted by management’s strategy for handling risks in the business. These risks fall into four broad categories: business risks; operational risks; foreign risks; and market risks. Management believes each major risk requires a unique response based on Petro-Canada’s business strategy and financial tolerance. While some risks can be effectively managed through internal controls and business processes, others are managed through insurance and hedging. The Audit, Finance and Risk Committee of the Board of Directors has responsibility to oversee risk management1. The following describes Petro-Canada’s approach to managing major risks.
BUSINESS RISKS
Exploration
Petro-Canada’s future cash flows from continuing operations are highly dependent on its ability to offset natural declines as reserves are produced. Reserves can be added through successful exploration or acquisitions; however, as basins mature, replacement of reserves becomes more challenging and expensive. In some geographic areas, the Company may choose to allow its reserves to decline if replacement is uneconomic. In 2005, the Company replaced 111% of its production on a proved reserves basis, compared to 103% in 2004. The Company targets to fully replace proved reserves over a five-year period. Petro-Canada’s five-year proved replacement ratio was 161%2. There is no assurance Petro-Canada will successfully replace all production in any given year.
| 1 | Further detail regarding the Audit, Finance and Risk Committee can be found on page 73 of the Annual Information Form (AIF) and a copy of its Charter is attached as Schedule C in the AIF. |
| 2 | Proved reserves replacement ratio is calculated by dividing the year-over-year net change in proved reserves, before deducting production, by the annual production over the same period. The reserves replacement ratio is a general indicator of the Company’s reserves growth. It is only one of a number of metrics which can be used to analyse a company’s upstream business. |
Reserves Estimates
Estimates of economically recoverable oil and gas reserves are based upon a number of variables and assumptions that include geoscientific interpretation, commodity prices, operating and capital costs, and historical production from properties. Petro-Canada has well-established, corporate-wide reserves booking practices that have been continuously improved for more than a decade. PricewaterhouseCoopers LLP, as contract internal auditor, has tested aspects of the non-engineering control processes used in establishing reserves. As well, independent engineering firms assess a significant portion of reserves estimates every year. Over time, this means all of Petro-Canada’s reserves estimates are assessed by external evaluators. The Board of Directors also reviews and approves the Company’s annual reserves filings. More information on reserves booking practices can be found in the Company’s AIF.
Project Execution
Petro-Canada manages a number of different-sized projects to support continuing operations and future growth. Many projects are influenced by external factors beyond the Company’s control. These factors include items such as material costs, labour productivity, timely availability of skilled labour and currency fluctuations.
While Petro-Canada cannot control all project inputs, the Company is committed to continuing to improve its project management capability. Petro-Canada’s goal is to consistently and predictably deliver projects on time and on budget, and achieve defined expectations. Enhanced project management capability is expected to improve all elements of project execution, including safety and environmental performance, quality, cycle time and cost. By leveraging experience gained from major project developments, the Company has established project management “best practices.”
Non-Operated Interests
Other companies may manage the construction or operation of assets in which Petro-Canada has a significant interest. Business assets in which Petro-Canada has a major interest, but does not operate, include Hibernia (20% interest), Syncrude (12% interest), White Rose (27.5% interest) and Buzzard (29.9% interest). Major projects are managed through different forms of joint venture executive committees, resulting in Petro-Canada having some ability to influence these projects. As well, Petro-Canada has joint venture or other operating agreements which specify our expectations from third-party operators. Nevertheless, third-party operation and management of the Company’s assets could adversely affect Petro-Canada’s financial performance.
Environmental Regulations
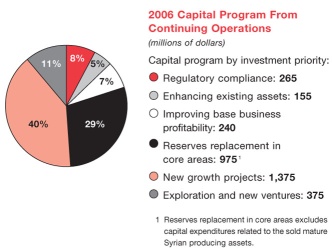
Environmental risks in the oil and gas industry are significant. This situation has arisen because related laws and regulations are becoming more stringent in Canada and in other countries where Petro-Canada operates. Due to increased regulations, Petro-Canada is investing additional capital to satisfy new product specifications and/or address environmental issues. In 2006, the Company anticipates that it will invest $265 million of its capital expenditure program toward regulatory compliance, most of which will be incurred to modify refineries to produce low-sulphur distillates. Other environmental regulations may result in future increased operating costs as a result of creating a future liability when dismantling or remediating assets.
Petro-Canada conducts Life-Cycle Value Assessments (LCVA) to integrate and balance environmental, social and economic decisions related to major projects. A key component of the LCVA process is the assessment and planning for all life-cycle stages involved in constructing, manufacturing, distributing and eventually abandoning an asset or a product. This process encourages more comprehensive exploration of alternatives. The LCVA is a useful technique; however, its predictive capability is limited by assumptions that involve the reliance on the current regulatory regime or one that can be reasonably expected.
Emission of Greenhouse Gases
The Kyoto Protocol, ratified by the Government of Canada in December 2002 and effective as of February 16, 2005, requires signatory nations to reduce their emissions of carbon dioxide and other greenhouse gases. As a result, Petro-Canada may be required to reduce emissions of greenhouse gases from operations or to purchase emission-trading credits. While the details of implementation of the Kyoto Protocol in Canada have not been finalized, the impact on Petro-Canada could be higher capital expenditures and operating expenses. The Government of Canada may also impose higher vehicle fuel efficiency standards. The impact of this action could be to decrease the demand for gasoline and diesel fuels sold by Petro-Canada and depress the Company’s margins for refined products.
Petro-Canada is committed to reducing emissions. Additional detail will be available in the Company’s Report to the Community, which is expected to be released in the second quarter of 2006. The Report will be posted on www.petro-canada.ca. Through industry organizations, Petro-Canada continues to work with a number of regulatory groups and government associations to find a cost-effective approach which will minimize the negative financial impact of the Kyoto Protocol on the Company, while still reducing emissions. The level of influence these discussions and co-operative efforts have on the Government of Canada’s implementation plan may be quite limited.
Government Regulations
Petro-Canada’s operations are regulated by, and could be intervened upon by, a variety of governments around the world. Governments’ actions could impact the contracting of exploration and production interests, impose specific drilling obligations, and possibly expropriate or cancel contract rights. Governments may also regulate prices of commodities or refined products, or intervene through taxes, royalties and exploration rights.
Petro-Canada tries to mitigate the impact of government regulations by selecting operating environments with stable governments. To date, Petro-Canada has had a co-operative relationship with its regulators and the governments in the countries in which it operates. Most of the contact with regulators occurs through the Company’s management, regulatory affairs personnel in each business unit and a centralized corporate government relations department. Petro-Canada aims to have regular, constructive communication with regulators and governments so issues can be resolved in a mutually acceptable fashion. The Company also has a strong record of regulatory compliance within the jurisdictions where it operates. Petro-Canada operates in many different jurisdictions and derives revenue from several categories of products. This diversification makes financial performance less sensitive to the action of any single government. Nevertheless, Petro-Canada has limited ability to influence regulations which may have a material adverse effect on the Company.
Counterparties
In the normal course of business, Petro-Canada is exposed to credit risk resulting from the uncertainty of business partners’ or counterparties’ ability to fulfill their obligations. The Company has established internal credit policies and procedures that include financial assessments, exposure limits and processes to monitor and minimize the exposures against these limits. Where appropriate, Petro-Canada also uses netting and collateral arrangements to minimize risk.
OPERATIONAL RISKS
Exploring for, developing, producing, refining, transporting and marketing oil, natural gas and refined products involve significant operational hazards. These risks include well blowouts, fires, explosions, gaseous leaks, migration of harmful substances and oil spills. Any of these operational incidents could cause personal injury, environmental contamination, or damage and destruction of the Company’s assets. These incidents could also interrupt production.
Petro-Canada manages operational risks primarily through a Total Loss Management (TLM) system. TLM is an internally developed management system based on external “best practices” with standards for preventing operational incidents. Regular TLM audits test compliance with these standards.
The Company also purchases insurance to transfer the financial impact of some operational risks to high credit quality third-party insurers. Petro-Canada regularly evaluates its exposures related to operational risks and adjusts the nature of its coverage, including deductibles and limits. Although Petro-Canada maintains insurance in line with customary industry practices, the Company cannot and does not fully insure against all risks. Losses resulting from operational incidents could have a material adverse impact on the Company.
FOREIGN RISKS
Petro-Canada has significant operations in a number of countries that have varying political, economic and social systems. As a result, the Company’s operations and related assets are subject to potential risks of actions by governmental authorities, internal unrest, war, political disruption, economic and legal sanctions (such as restrictions against countries that the U.S. government may deem to sponsor terrorism), and changes in global trade policies. The Company’s operations may be restricted, disrupted or prohibited in any country in which these risks occur. Petro-Canada also has production in OPEC-member countries, which is constrained by OPEC quotas.
The Company continually evaluates exposure in any one country in the context of total operations. Investment may be limited to avoid excessive exposure in any one country or region. The Company also purchases political risk insurance to partially mitigate some political risks.
MARKET RISKS
More detailed quantification of the impact of some of the following risks can be found in the earnings sensitivities table on page four of the Business Environment section in the MD&A.
Commodity Prices
In Petro-Canada’s upstream businesses, significant market risk exposure exists due to changing commodity prices of crude oil and natural gas. Commodity prices are volatile and influenced by factors such as supply and demand fundamentals, geopolitical events, OPEC decisions and weather. In 2005, the monthly average Brent crude oil price ranged between $44.23 US/bbl and $64.12 US/bbl, and the AECO-C hub index ranged between $6.16 per gigajoule (GJ) and $12.08/GJ. These commodity prices also impact the refined products margins realized by the Downstream business, another significant market risk. In 2005, the benchmark monthly average New York Harbour 3-2-1 refinery crack spread per bbl ranged from $4.86 US/bbl to $21.74 US/bbl. Petro-Canada’s ability to maintain product margins in an environment of higher feedstock costs is contingent upon the Company’s ability to flow higher costs through to customers.
Petro-Canada generally does not hedge large volumes of production. Management believes commodity prices are volatile and difficult to predict. The business is managed so that the Company can substantially withstand the impact of a lower price environment, while maintaining the opportunity to capture significant upside when the price environment is higher. However, commodity prices and margins may be hedged occasionally to capture opportunities that represent extraordinary value and to ensure the economic value of an acquisition. For example, as part of the Company’s acquisition of an interest in the Buzzard field in the U.K. sector of the North Sea, the Company entered into a series of derivative contracts related to the future sale of Brent crude oil (see Derivative Instruments below). Certain Downstream physical transactions are routinely hedged for operational needs and to facilitate sales to customers.
Foreign Exchange
As energy commodity prices are primarily priced in U.S. dollars, a large portion of Petro-Canada’s revenue stream is affected by the Canada/U.S. exchange rate. As a result, the Company’s earnings are negatively affected by a strengthening Canadian dollar. The Company is also exposed to fluctuations in other foreign currencies, such as the euro and the British pound. Generally, Petro-Canada does not hedge foreign exchange exposures, although the Company partially mitigates the U.S. dollar exposure by denominating the majority of its debt obligations in U.S. dollars. Foreign exchange exposure related to asset acquisitions or divestitures, or project capital expenditures, may be hedged on a case-by-case basis.
Interest Rates
Petro-Canada targets a blend of fixed and floating rate debt. Generally, this strategy enables the Company to take advantage of lower interest rates on floating debt, while matching overall debt maturities with the life of cash-generating assets. The Company is exposed to fluctuations in the rate of interest it pays on floating rate debt. This interest rate exposure is within the Company’s risk tolerance.
Derivative Instruments
Petro-Canada’s Market Risk and Derivative Policy prohibits the use of derivative instruments for speculative purposes. Petro-Canada instead uses derivatives primarily to hedge physical transactions for operational needs and to facilitate sales to customers. The gains and losses associated with these financial instruments essentially offset gains and losses on the physical transactions. Except as specifically authorized by the Board of Directors, the term of hedging instruments cannot exceed 18 months. Monitoring and reporting of the derivatives portfolio includes periodic testing of the fair value of all outstanding derivatives. Fair values are determined by obtaining independent third-party quotes for the value of each derivative instrument. The objectives and strategies of all hedge transactions are documented and the effectiveness of the derivative instrument in offsetting a change in the value of the hedged exposure is assessed on a regular basis.
Effective January 1, 2004, the Company elected to discontinue hedge accounting for certain hedging programs. All derivatives that do not qualify as a hedge, or are not designated as a hedge, are accounted for using the mark-to-market accounting method. These derivatives are recorded in the balance sheet as either an asset or liability, with the fair value recognized in earnings in each reporting period. As a result, the realized and unrealized values of these transactions are recognized in Investment and Other Income.
During 2004, as part of the Company’s acquisition of an interest in the Buzzard field, the Company entered into a series of derivative contracts related to the future sale of Brent crude oil. The purpose of these transactions was to ensure value-added returns to Petro-Canada on this investment, even in the event of a material decrease in oil prices. These contracts effectively lock in an average forward price of approximately $26 US/bbl on a volume of 35,840,000 barrels. This volume represents approximately 50% of the Company’s share of estimated plateau production in the 2007-2010 time frame. As at December 31, 2005, this hedge had a mark-to-market unrealized loss of $767 million after-tax, of which $562 million was recognized in the income statement in 2005.
In 2005, other derivative instruments in place for refining supply and product purchases resulted in an increase in net earnings from continuing operations of about $4 million after-tax. This result compared with a decrease in net earnings from continuing operations of about $1 million in 2004.
CONSOLIDATED FINANCIAL RESULTS
ANALYSIS OF CONSOLIDATED EARNINGS AND CASH FLOW
Consolidated Financial Results
In 2005, Petro-Canada reached an agreement to sell the Company’s producing assets in Syria. The sale was closed on January 31, 2006. These assets and associated results are reported as discontinued operations and are excluded from continuing operations.
(millions of dollars, unless otherwise indicated) | | 2005 | | 2004 | | 2003 | |
Net earnings | | $ | 1,791 | | $ | 1,757 | | $ | 1,650 | |
| Net earnings from discontinued operations | | | 98 | | | 59 | | | 115 | |
Net earnings from continuing operations | | $ | 1,693 | | $ | 1,698 | | $ | 1,535 | |
Gain on foreign currency translation 1 | | | 73 | | | 63 | | | 239 | |
Unrealized loss on Buzzard derivative contracts 2 | | | (562 | ) | | (205 | ) | | - | |
| Gain on sale of assets | | | 34 | | | 11 | | | 29 | |
Operating earnings from continuing operations 3, 4 | | $ | 2,148 | | $ | 1,829 | | $ | 1,267 | |
| Stock-based compensation | | | (66 | ) | | (11 | ) | | (13 | ) |
Insurance premium surcharges 5 | | | (77 | ) | | - | | | - | |
| Income tax adjustments | | | 22 | | | 13 | | | 45 | |
| Oakville closure costs | | | 2 | | | (46 | ) | | (151 | ) |
| Terra Nova insurance proceeds | | | 2 | | | 31 | | | 17 | |
| Edmonton refinery conversion provision | | | - | | | - | | | (82 | ) |
| Kazakhstan impairment | | | - | | | - | | | (46 | ) |
| International provisions | | | - | | | - | | | 45 | |
Operating earnings from continuing operations adjusted for unusual items | | $ | 2,265 | | $ | 1,842 | | $ | 1,452 | |
Earnings per share from continuing operations (dollars) | | | | | | | | | | |
| - basic | | $ | 3.27 | | $ | 3.21 | | $ | 2.90 | |
| | | 3.22 | | | 3.17 | | | 2.87 | |
Earnings per share (dollars) | | | | | | | | | | |
| - basic | | $ | 3.45 | | $ | 3.32 | | $ | 3.11 | |
| - diluted | | | 3.41 | | | 3.28 | | | 3.08 | |
Cash flow from continuing operating activities before changes in non-cash working capital 4, 6 | | | 3,787 | | | 3,425 | | | 3,042 | |
Cash flow from continuing operating activities before changes in non-cash working capital per share (dollars) | | | 7.31 | | | 6.47 | | | 5.74 | |
| Debt | | | 2,913 | | | 2,580 | | | 2,229 | |
Cash and cash equivalents 7 | | | 789 | | | 170 | | | 635 | |
Average capital employed 7 | | $ | 11,860 | | $ | 10,533 | | $ | 9,268 | |
Return on capital employed (%) 7 | | | 16.0 | | | 17.5 | | | 19.0 | |
Operating return on capital employed (%) 7 | | | 19.8 | | | 18.8 | | | 16.1 | |
Return on equity (%) 7 | | | 19.7 | | | 21.5 | | | 24.9 | |
1 Foreign currency translation reflects gains or losses on U.S. dollar denominated long-term debt not associated with the self-sustaining International business unit and the U.S. Rockies operations included in the North American Natural Gas business unit.
2 As part of its acquisition of an interest in the Buzzard field in the U.K. sector of the North Sea in June 2004, the Company entered into derivative contracts for half of its share of estimated production for the first 3 ½ years. Unrealized mark-to-market losses are recorded each quarter because these transactions do not currently qualify for hedge accounting.
3 Operating earnings, which represent net earnings excluding gains or losses on foreign currency translation and on disposal of assets and the unrealized gains or losses associated with the Buzzard derivative contracts, is used by the Company to evaluate operating performance.
4 Operating earnings and cash flow do not have any standardized meaning prescribed by Canadian GAAP and, therefore, may not be comparable with the calculation of similar measures for other companies.
5 Insurance premium surcharges include accruals and surcharges for Oil Insurance Ltd. (OIL) and sEnergy Insurance Ltd. (sEnergy) policies. OIL is a mutual insurance company that insures against property damage in the energy sector. sEnergy is a mutual insurance company that provides business interruption and excess property insurance to the energy sector.
6 Cash flow, which is expressed before changes in non-cash working capital items relating to operating activities, is used by the Company to analyse operating performance, leverage and liquidity.
7 Includes discontinued operations.
2005 COMPARED WITH 2004
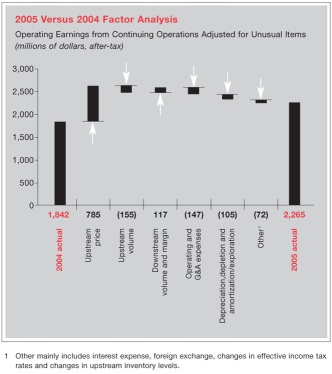
Operating earnings from continuing operations adjusted for unusual items rose 23% to $2,265 million in 2005, compared with $1,842 million in 2004. Higher realized commodity prices and Downstream margins were partially offset by lower upstream volumes, higher operating and exploration costs, and a stronger Canadian dollar.
In 2005, operating earnings from continuing operations included a number of unusual items: a $77 million insurance premium surcharge; a $66 million charge related to the mark-to-market of stock-based compensation; a $22 million positive adjustment related to income tax rate and other tax adjustments; a $2 million recovery related to the consolidation of the Eastern Canada refinery operations; and $2 million of insurance proceeds due to the delayed startup of Terra Nova. The insurance premium surcharge is reflected in operating costs and represents the Company’s share of anticipated payments to OIL and sEnergy related in part to hurricanes Katrina and Rita.
In 2004, operating earnings from continuing operations included a number of unusual items: a $46 million charge for additional depreciation and other charges related to the consolidation of Eastern Canada refinery operations and the closure of the Oakville refinery; $31 million of insurance proceeds due to the delayed startup of Terra Nova; a $13 million positive adjustment to future income taxes reflecting announced changes to Canadian provincial income tax rates; and a $11 million charge related to the mark-to-market of stock-based compensation.
Net earnings from continuing operations in 2005 were $1,693 million, down slightly from $1,698 million in 2004 primarily due to unrealized losses on Buzzard derivative contracts. Net earnings from continuing operations included gains or losses on foreign currency translation, unrealized losses on Buzzard derivative contracts and gains on asset sales.
QUARTERLY INFORMATION
Consolidated Quarterly Financial Results
(millions of dollars, unless otherwise indicated) | | 2005 | | 2004 | |
| | | | Quarter 1 | | | Quarter 2 | | | Quarter 3 | | | Quarter 4 | | | Quarter 1 | | | Quarter 2 | | | Quarter 3 | | | Quarter 4 | |
| Total revenue from continuing operations | | $ | 3,275 | | $ | 3,945 | | $ | 4,721 | | $ | 4,838 | | $ | 3,365 | | $ | 3,455 | | $ | 3,515 | | $ | 3,623 | |
| Operating earnings from continuing operations | | | 427 | | | 476 | | | 597 | | | 648 | | | 500 | | | 453 | | | 444 | | | 432 | |
| Net earnings from continuing operations | | | 110 | | | 322 | | | 593 | | | 668 | | | 496 | | | 375 | | | 393 | | | 434 | |
| Cash flow from continuing operating activities before changes in non-cash working capital | | | 801 | | | 869 | | | 1,001 | | | 1,116 | | | 840 | | | 801 | | | 818 | | | 966 | |
Earnings per share from continuing operations (dollars) | | | | | | | | | | | | | | | | | | | | | | | | | |
| - basic | | $ | 0.21 | | $ | 0.62 | | $ | 1.14 | | $ | 1.29 | | $ | 0.93 | | $ | 0.70 | | $ | 0.74 | | $ | 0.83 | |
| - diluted | | $ | 0.21 | | $ | 0.61 | | $ | 1.13 | | $ | 1.28 | | $ | 0.92 | | $ | 0.70 | | $ | 0.73 | | $ | 0.82 | |
Earnings per share (dollars) | | | | | | | | | | | | | | | | | | | | | | | | | |
| - basic | | $ | 0.23 | | $ | 0.66 | | $ | 1.19 | | $ | 1.38 | | $ | 0.96 | | $ | 0.74 | | $ | 0.77 | | $ | 0.85 | |
| - diluted | | $ | 0.22 | | $ | 0.66 | | $ | 1.17 | | $ | 1.36 | | $ | 0.95 | | $ | 0.73 | | $ | 0.76 | | $ | 0.83 | |
Revenue and net earnings variances from quarter to quarter resulted mainly from: fluctuations in commodity prices and refinery cracking margins; the impact on production and processed volumes from maintenance and other shutdowns at major facilities; and the level of exploration drilling activity. For further analysis of quarterly results, refer to Petro-Canada’s Quarterly Reports to shareholders available on the Company’s Web site at www.petro-canada.ca.
LIQUIDITY AND CAPITAL RESOURCES
Summary of Cash Flows
(millions of dollars) | | 2005 | | 2004 | | 2003 | |
Cash flow from continuing operating activities | | $ | 3,783 | | $ | 3,928 | | $ | 2,896 | |
| Increase (decrease) in non-cash working capital related to continuing operating activities and other | | | 4 | | | (503 | ) | | 146 | |
Cash flow from continuing operations | | $ | 3,787 | | $ | 3,425 | | $ | 3,042 | |
| Cash flow from discontinued operations | | | 245 | | | 204 | | | 247 | |
Cash flow | | | 4,032 | | | 3,629 | | | 3,289 | |
| Net cash inflows (outflows) from: | | | | | | | | | | |
Investing activities before changes in non-cash working capital | | | (3,595 | ) | | (4,591 | ) | | (2,214 | ) |
Financing activities before changes in non-cash working capital | | | (10 | ) | | (19 | ) | | (604 | ) |
| (Increase) decrease in non-cash working capital | | | 192 | | | 516 | | | (70 | ) |
| Increase (decrease) in cash and cash equivalents | | $ | 619 | | $ | (465 | ) | $ | 401 | |
Cash and cash equivalents at end of year | | $ | 789 | | $ | 170 | | $ | 635 | |
Cash and cash equivalents - discontinued operations | | $ | 68 | | $ | 206 | | $ | 227 | |
In 2005, cash flow from continuing operations was $3,787 million ($7.31/share), compared with $3,425 million ($6.47/share) in 2004. The increase in cash flow reflected higher operating earnings from continuing operations.
Financial Ratios
| | | 2005 | | 2004 | | 2003 | |
Interest coverage from continuing operations (times) | | | | | | | | | | |
Net earnings basis | | | 17.9 | | | 20.0 | | | 15.4 | |
EBITDAX basis | | | 25.4 | | | 29.2 | | | 24.4 | |
Cash flow basis | | | 28.9 | | | 30.4 | | | 23.0 | |
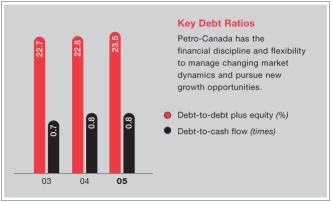
Debt-to-cash flow (times) 1 | | | 0.8 | | | 0.8 | | | 0.7 | |
Debt-to-debt plus equity (%) | | | 23.5 | | | 22.8 | | | 22.7 | |
1 From continuing operations.
Petro-Canada’s financing strategy ensures financial discipline and flexibility to support profitable growth in all business environments. Two key measures that Petro-Canada uses to measure the Company’s overall financial strength are debt-to-cash flow and debt-to-debt plus equity. Petro-Canada’s debt-to-cash flow from continuing operations ratio, the key short-term measure, was 0.8 times at December 31, 2005 and 2004. This was within the Company’s target range of no more than 2.0 times. Debt-to-debt plus equity, the long-term measure for capital structure, was 23.5% at year-end 2005, up from 22.8% at year-end 2004. This was slightly below the target range of 25% to 35% for both years. Petro-Canada has controls in place to ensure compliance with all financial covenants.
OPERATING ACTIVITIES
Excluding cash and cash equivalents, short-term notes payable and the current portion of long-term debt, the operating working capital deficiency including discontinued operations was $656 million as at December 31, 2005, compared with an operating working capital deficiency of $777 million as at December 31, 2004. The working capital deficiency was lower primarily due to an increase in accounts receivable, which was partially offset by an increase in current payables.
INVESTING ACTIVITIES
Capital and Exploration Expenditures
(millions of dollars) | | 2006 Outlook 1 | | 2005 | | 2004 | | 2003 | |
Upstream | | | | | | | | | | | | | |
| North American Natural Gas | | $ | 850 | | $ | 713 | | $ | 666 | | $ | 517 | |
| East Coast Oil | | | 305 | | | 314 | | | 275 | | | 344 | |
| Oil Sands | | | 355 | | | 772 | | | 397 | | | 443 | |
International 2 | | | 815 | | | 696 | | | 1,707 | 3 | | 400 | |
| | | $ | 2,325 | | $ | 2,495 | | $ | 3,045 | | $ | 1,704 | |
Downstream | | | | | | | | | | | | | |
| Refining and Supply | | $ | 840 | | $ | 883 | | $ | 656 | | $ | 296 | |
| Sales and Marketing | | | 150 | | | 108 | | | 171 | | | 117 | |
| Lubricants | | | 40 | | | 62 | | | 12 | | | 11 | |
| | | $ | 1,030 | | $ | 1,053 | | $ | 839 | | $ | 424 | |
Shared Services | | $ | 30 | | $ | 12 | | $ | 9 | | $ | 14 | |
Total property, plant and equipment and exploration | | $ | 3,385 | | $ | 3,560 | | $ | 3,893 | | $ | 2,142 | |
| Deferred charges and other assets | | | - | | | 70 | | | 36 | | | 147 | |
| Acquisition of Prima Energy Corporation | | | - | | | - | | | 644 | | | - | |
Total continuing operations | | $ | 3,385 | | $ | 3,630 | | $ | 4,573 | | $ | 2,289 | |
| Discontinued operations | | $ | 50 | | $ | 46 | | $ | 62 | | $ | 90 | |
Total | | $ | 3,435 | | $ | 3,676 | | $ | 4,635 | | $ | 2,379 | |
1 The 2006 outlook was previously released on December 15, 2005, with the exception of the separation of discontinued operations.
2 International excludes capital expenditures related to the Syrian producing assets, which are reflected as discontinued operations.
3 Includes $1,218 million for the Buzzard acquisition.
Capital and exploration expenditures were down 21% from $4,635 million in 2004 to $3,676 million in 2005, reflecting higher investment in existing long-life assets compared with 2004.
In 2006, it is planned that over 85% of the capital program for continuing operations will support delivering profitable growth and improving base business profitability. The remainder is expected to be directed toward complying with regulations and enhancing existing assets. This portion of the program was larger in 2005, primarily due to investments to produce clean-burning fuels in the Downstream business.
FINANCING ACTIVITIES AND DIVIDENDS
Sources of Capital Employed
(millions of dollars) | | 2005 | | 2004 | | 2003 | |
| Short-term notes payable | | $ | - | | $ | 299 | | $ | - | |
| Long-term debt, including current portion | | | 2,913 | | | 2,281 | | | 2,229 | |
| Shareholders’ equity | | | 9,488 | | | 8,739 | | | 7,588 | |
Total | | $ | 12,401 | | $ | 11,319 | | $ | 9,817 | |
Total debt increased to $2,913 million as at December 31, 2005, compared with $2,580 million at the previous year end. The increase in debt was associated with the issue of senior notes offset by repayment of short-term notes and a stronger Canadian dollar. There were no short-term notes payable outstanding as at December 31, 2005. Short-term notes payable as at December 31, 2004 consisted of $299 million of commercial paper.
2005 Financing Activities
During the second quarter, Petro-Canada completed a $600 million US offering of 5.95% 30-year senior notes. Net proceeds were used to repay existing short-term borrowing, with the balance used for working capital purposes. Under the accounts receivable securitization program, an additional $80 million in accounts receivable were sold in March 2005. Proceeds were used to repay short-term borrowing.
During the fourth quarter, Petro-Canada increased its syndicated committed credit facilities to $2,000 million from $1,500 million. As at December 31, 2005, the Company also had bilateral demand credit facilities of $408 million. A total of $1,141 million of the credit facilities were used for letters of credit and overdraft coverage as at December 31, 2005. The syndicated facilities also provide liquidity support to Petro-Canada’s commercial paper program. No commercial paper was outstanding at year-end 2005. The Company will continue to use its cash position, draw on bank lines and issue commercial paper as necessary to meet working capital and other financing requirements. Petro-Canada plans to meet remaining debt repayment commitments out of a combination of cash flow and debt refinancing.
The Company’s unsecured long-term debt securities are rated Baa2 by Moody’s Investor Services, BBB by Standard & Poor’s and A (low) by Dominion Bond Rating Service. The Company’s long-term debt ratings remained unchanged from year-end 2004.
In July 2005, the Company effected a two for one stock-split in the form of a stock dividend.
Returning Cash to Shareholders
Petro-Canada’s priority uses of cash are to fund the capital program and profitable growth opportunities, and to return cash to shareholders through dividends and a share buyback program.
Petro-Canada regularly reviews its dividend strategy to ensure the alignment of the dividend policy with shareholder expectations, and financial and growth objectives. Commencing with the fourth quarter dividend paid on October 1, 2005, the Company increased the quarterly dividend 33% to $0.20/share on a pre-stock dividend basis ($0.10/share on a post-stock dividend basis). Total dividends paid in 2005 were $181 million, compared with $159 million in 2004.
In 2004, Petro-Canada initiated a Normal Course Issuer Bid (NCIB) program, which was renewed in 2005. The current program, which extends to June 21, 2006, entitles the Company to purchase up to 5% of the outstanding common shares, subject to certain conditions. The majority of the proceeds from the sale of the mature Syrian producing assets, which closed in January 2006, are expected to be used to buy back shares under the NCIB program.
| Period | | Shares Repurchased 1 | | Average Price | | Total Cost | |
| | | 2005 | | 2004 | | 2005 | | 2004 | | 2005 | | 2004 | |
| Full year | | | 8,333,400 | | | 13,736,164 | | $ | 41.54 | | $ | 32.51 | | $ | 346 million | | $ | 447 million | |
| 1 | Stated on a post-stock dividend basis. |
Off Balance Sheet
The Company has certain retail licensee agreements that qualify as variable interest entities as described in Note 26 to the Consolidated Financial Statements. These entities are not consolidated as Petro-Canada is not the primary beneficiary and the Company’s maximum exposure to losses from these arrangements would not be material. Other off balance sheet activities are limited to matters such as the accounts receivable securitization program, which does not meet the criteria for consolidation and guarantees.
Pension Plans
At year-end 2005, Petro-Canada’s defined benefit pension plans were underfunded by $378 million, compared to an underfunded position of $330 million at year-end 2004. The Company made cash contributions of $112 million and recorded a pension expense of $78 million before-tax in 2005. This compares with $93 million of cash contributions and $71 million of pension expense in 2004. Pension contributions of approximately $107 million are expected to be made in 2006.
Contractual Obligations - Summary
(millions of dollars)
| | | PAYMENTS DUE BY PERIOD | |
| | | Total | | 2006 | | 2007-2008 | | 2009-2010 | | 2011 and thereafter | |
Unsecured debentures and senior notes 1 | | $ | 6,439 | | $ | 175 | | $ | 351 | | $ | 351 | | $ | 5,562 | |
Capital lease obligations 1 | | | 158 | | | 17 | | | 25 | | | 22 | | | 94 | |
| Operating leases | | | 678 | | | 137 | | | 201 | | | 144 | | | 196 | |
| Transportation agreements | | | 1,719 | | | 200 | | | 319 | | | 257 | | | 943 | |
Product purchase/delivery obligations 2 | | | 2,103 | | | 115 | | | 245 | | | 249 | | | 1,494 | |
Exploration work commitments 3 | | | 162 | | | 52 | | | 49 | | | 60 | | | 1 | |
| Asset retirement obligations | | | 2,839 | | | 77 | | | 82 | | | 77 | | | 2,603 | |
Other long-term obligations 4, 5 | | | 2,567 | | | 126 | | | 207 | | | 965 | | | 1,269 | |
| Total contractual obligations | | $ | 16,665 | | $ | 899 | | $ | 1,479 | | $ | 2,125 | | $ | 12,162 | |
1 Obligations include related interest. For further details, see Note 18 to the 2005 Consolidated Financial Statements.
2 Excludes supply purchase agreements contracted at market prices, where the products could reasonably be re-sold into the market.
3 Excludes other amounts related to the Company’s expected future capital spending. Capital spending plans are reviewed and revised annually to reflect Petro-Canada’s strategy,
operating performance and economic conditions. For further information regarding future capital spending plans, refer to the business segment and investing activities discussions in
the sections of the 2005 MD&A.
4 Includes processing agreement with Suncor Energy Inc., receivables securitization program, pension funding obligations for the periods prior to the Company’s next required pension
plan valuation, and other obligations. Pension obligations beyond the next required pension valuation date were excluded due to the uncertainty as to the amount or timing of these
obligations.
5 Petro-Canada is involved in litigation and claims associated with normal operations. Management is of the opinion that any resulting settlements would not materially affect the
financial position of the Company. The table excludes amounts for these contingencies due to the uncertainty as to the amount or timing of any settlements.
During 2005, Petro-Canada’s total contractual obligations increased by approximately $3.3 billion, mainly due to the issuance of long-term debt, an increase in the estimate of asset retirement obligations, additional commitments for pipeline transportation, additional product purchase obligations and new commitments related to the Fort Hills project.
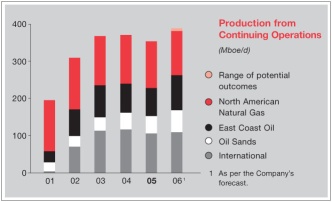
UPSTREAM
Petro-Canada’s upstream operations consist of four business segments: North American Natural Gas, with current production in Western Canada and the U.S. Rockies; East Coast Oil, with three major developments offshore Newfoundland and Labrador; Oil Sands operations in northeastern Alberta; and International, where the Company is active in three core areas: Northwest Europe; North Africa/Near East; and Northern Latin America. The diverse asset base provides a balanced portfolio and a platform for long-term growth.
NORTH AMERICAN NATURAL GAS
Business Summary And Strategy
North American Natural Gas explores for and produces natural gas, crude oil and natural gas liquids (NGL) in Western Canada and the U.S. Rockies. This business also markets natural gas in North America, has established resources in the Mackenzie Delta/Corridor and has landholdings in Alaska.
The North American Natural Gas strategy is to be a significant and sustainable market participant by accessing new and diverse natural gas supply sources in North America. Key features of the strategy include:
| • | transitioning further into unconventional gas plays; |
| • | optimizing core properties in Western Canada and developing coal bed methane and tight gas in the U.S. Rockies; |
| • | stepping out of traditional operating areas, with an increased focus on exploration; |
| • | developing LNG import capacity at Gros-Cacouna, Quebec; and |
| • | building the northern resource base for long-term growth. |
North American Natural Gas Financial Results
(millions of dollars) | | 2005 | | 2004 | | 2003 | |
Net earnings | | $ | 674 | | $ | 500 | | $ | 492 | |
| Gain on sale of assets | | | 14 | | | - | | | 33 | |
Operating earnings | | $ | 660 | | $ | 500 | | $ | 459 | |
| Insurance premium surcharges | | | (4 | ) | | - | | | - | |
| Income tax adjustments | | | 28 | | | 7 | | | 10 | |
Operating earnings adjusted for unusual items | | $ | 636 | | $ | 493 | | $ | 449 | |
| Cash flow from operating activities before changes in non-cash working capital | | $ | 1,193 | | $ | 882 | | $ | 942 | |
| Expenditures on property, plant and equipment and exploration | | $ | 713 | | $ | 666 | | $ | 517 | |
| Total assets | | $ | 3,763 | | $ | 3,477 | | $ | 2,341 | |
2005 Compared With 2004
North American Natural Gas contributed $636 million of operating earnings adjusted for unusual items, up 29% from $493 million in 2004. Strong realized natural gas prices and the addition of U.S. Rockies production were partially offset by Western Canada production declines, increased operating costs, and higher depreciation, depletion and amortization.
Net earnings for North American Natural Gas were $674 million in 2005, up from $500 million in 2004. Net earnings in 2005 included a $14 million gain on the sale of assets, a $4 million insurance premium surcharge and a $28 million positive adjustment to income tax rate and other tax adjustments. Net earnings in 2004 included a $7 million positive adjustment to reflect a reduction in provincial income tax rates.
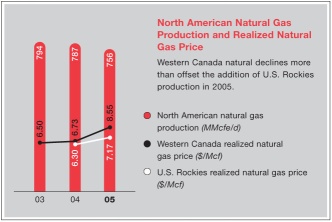
Oil and natural gas production averaged 756 million cubic feet/day of natural gas equivalent (MMcfe/d) in 2005, down from 787 MMcfe/d in 2004 as natural declines in Western Canada more than offset the addition of U.S. Rockies production. Natural gas commodity prices rose in 2005. The North American realized natural gas price averaged $8.47/Mcf in 2005, up 26% from $6.72/Mcf in 2004.
2005 Operating Review And Strategic Initiatives
The North American Natural Gas business is positioning for the future with an increased focus on unconventional gas plays, acquisition of land in the Far North and progress on the proposed Quebec LNG project.
2005 Operating Review
| | | 2005 | | 2004 | | 2003 | |
Production (MMcfe/d) | | | 756 | | | 787 | | | 794 | |
Western Canada realized natural gas price ($/Mcf) | | $ | 8.55 | | $ | 6.73 | | $ | 6.50 | |
U.S. Rockies realized natural gas price ($/Mcf) | | $ | 7.17 | | $ | 6.30 | | $ | - | |
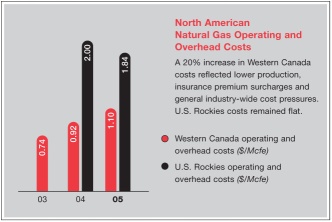
Western Canada operating and overhead costs ($/Mcfe) | | $ | 1.10 | | $ | 0.92 | | $ | 0.74 | |
U.S. Rockies operating and overhead costs ($/Mcfe) | | $ | 1.84 | | $ | 2.00 | | $ | - | |
Western Canada
Western Canada natural gas production averaged 704 MMcfe/d in 2005, down 8% from 764 MMcfe/d in 2004. Exploration and development drilling activity in Western Canada resulted in 373 gross successful wells, for an overall success rate of 94% in 2005. Western Canada operating and overhead costs were $1.10/Mcfe in 2005, up from $0.92/Mcfe in the previous year. The operating and overhead cost increase in Western Canada reflected lower production, insurance premium surcharges and general industry-wide cost pressures for materials, fuel and labour. The Company’s cost increases reflect industry-wide operating cost trends which have been rising approximately 15% per year.
U.S. Rockies
U.S. Rockies natural gas production averaged 52 MMcfe/d in 2005, compared to 23 MMcfe/d in 2004, which reflected the mid-year 2004 acquisition. Exploration and development drilling activity in the U.S. Rockies resulted in more than 300 development wells in 2005, up from 148 wells in 2004. In addition, Petro-Canada obtained 407 permits for new coal bed methane wells in 2005, with 292 applications submitted for consideration. Most of the new wells are currently in the de-watering phase. U.S. Rockies operating and overhead costs were $1.84/Mcfe in 2005, compared to $2.00/Mcfe in 2004.
2005 Strategic Initiatives
Petro-Canada advanced the proposed LNG import and re-gasification terminal at Gros-Cacouna, Quebec, by filing the Environmental Impact Statement in the second quarter of 2005.
During 2005, the Company continued to position itself for long-term North American supply by building its land position in the Mackenzie Corridor and by acquiring extensive acreage in Alaska in preparation for the proposed pipelines. Early in 2005, Petro-Canada and Anadarko Petroleum Corporation entered into a joint venture arrangement in the gas prospective North Slope region of the Brooks Range in Alaska. The two companies increased their joint land position to 2.5 million acres. In January 2006, BG (Alaska) E&P, Inc. joined the Foothills joint venture and each company now holds a one-third interest in the acreage. In the Mackenzie Corridor, Petro-Canada acquired two exploration licences covering 410,000 acres, with work commitment bids totalling approximately $35 million.
Capital expenditures in 2005 totalled $713 million, with $618 million for exploration and development of natural gas in Western Canada, $84 million for U.S. Rockies development and $11 million for other natural gas opportunities in North America.
Outlook
Production expectations in 2006:
| - | production to average about 720 MMcfe/d of natural gas, crude oil and NGL; and |
| - | unconventional gas production is expected to be about 25% of production. |
Action plans in 2006:
| - | drill approximately 500 gross wells in Western Canada and approximately 450 gross wells in the U.S. Rockies; |
| - | advance long-term opportunities in Northern Canada and Alaska; and |
| - | advance the re-gasification project at Gros-Cacouna to a project decision point. |
Capital spending plans in 2006:
| - | approximately $440 million for replacing reserves in Western Canada core areas; |
| - | approximately $150 million for new growth opportunities in the U.S. Rockies and LNG; |
| - | approximately $235 million directed to exploration in Western Canada, the U.S. Rockies and the Far North; and |
| - | approximately $25 million for environmental work and maintenance. |
The shift to longer-term projects, as well as declines in Western Canada, is expected to result in approximately a 5% drop in production in 2006, compared to 2005. Production is expected to increase in subsequent years as more capital is directed to bring on production from unconventional sources. In 2006, almost half of the North American Natural Gas capital spending program is expected to go to development of unconventional sources, including U.S. Rockies coal bed methane and deep tight gas, infill drilling in the Medicine Hat area and Western Canada tight sands. At the same time, the business is expected to step out of traditional operating areas with an increased focus on exploration.
The Company will also continue to advance long-term supply opportunities. A modest exploration program and land acquisition plan is expected in the Alaska and the Mackenzie Corridor until such time as pipeline timing becomes clear. As well, Petro-Canada is expected to continue to advance the Gros-Cacouna LNG project. The Company, along with its partner, TransCanada PipeLines Limited, is aiming to secure regulatory approval by late 2006. A joint provincial and federal government hearing is scheduled in 2006 and pre-construction engineering is proceeding in anticipation of regulatory approvals to allow for timely construction startup. The project continues to plan for a scheduled startup in late 2009.
Over the long term, the North American Natural Gas business strategy is to secure new supply for the North American market. The Company is transitioning current production from conventional sources to unconventional sources; building reserves and land position in the Mackenzie Delta/Corridor and Alaska; and progressing LNG through the re-gasification facility partnership in Quebec. The business intends to grow production from unconventional sources to 50% of production by 2010.
Link to Petro-Canada’s Corporate and Strategic Priorities
The North American Natural Gas business is aligned with Petro-Canada’s strategic priorities as outlined by its progress in 2005 and goals for 2006.
| 2005 PROGRESS | 2006 GOALS |
DELIVERING PROFITABLE GROWTH WITH A FOCUS ON OPERATED, LONG-LIFE ASSETS | § drilled 100 gross wells in Western Canada and 290 wells in the Western Canada Medicine Hat region1; § drilled 310 wells, added 37,000 net acres of land and obtained 407 permits for new coal bed methane wells in the U.S. Rockies; § filed regulatory application for the LNG facility at Gros-Cacouna; and § increased joint land position with partner in Alaska to 2.5 million acres and acquired 410,000 acres in the Mackenzie Corridor. | § create a stronger exploration focus; § expand growth of unconventional gas plays to about 25% of production; § optimize core asset concentric opportunities; and § advance exploration prospects in the Mackenzie Delta/Corridor and Alaska. |
DRIVING FOR FIRST QUARTILE OPERATION OF OUR ASSETS | § achieved better than 98% reliability at Western Canada facilities; and § conducted major turnarounds at Wildcat Hills, Wilson Creek and Gilby gas plants, with no lost-time incidents. | § achieve reliability rate approaching 99%; § conduct major turnaround of the Hanlan gas plant; and § continue to leverage costs through strategic alliances and preferred suppliers. |
CONTINUING TO WORK AT BEING A RESPONSIBLE COMPANY | § saw 44% increase in total recordable injury frequency compared to 2004. While contractor injury frequency improved, an upswing in employee injuries had a negative effect; § continued to reduce injury severity; § improved employee and contractor safety culture through the initial phase of behaviour-based safety programs; § proactively remediated and reclaimed old sites; and § saw slight increase in regulatory compliance exceedances compared to 2004. | § reduce total recordable injury frequency and regulatory exceedances; § continue safety culture improvements by rolling out the next phase of behaviour-based safety for employees and contractors; § drive for continuous improvement in contractor safety performance; § develop and implement stakeholder relations strategy; and § proactively remediate and reclaim old sites on a risked basis. |
| 1 | Only includes wells where Petro-Canada has a working interest. |
EAST COAST OIL
Business Summary and Strategy
Petro-Canada is positioned in every major oil development off Canada’s East Coast. The Company is the operator and holds the largest interest in Terra Nova (34%), as well as a 20% interest in nearby Hibernia and a 27.5% interest in White Rose.
The East Coast Oil strategy is to improve reliability and sustain profitable production well into the next decade. Key features of the strategy include:
| • | delivering top quartile safety and operating performance; |
| • | sustaining profitable production through reservoir extensions and add-ons; and |
| • | pursuing high potential development projects. |
East Coast Oil Financial Results
(millions of dollars) | | 2005 | | 2004 | | 2003 | |
Net earnings and operating earnings | | $ | 775 | | $ | 711 | | $ | 597 | |
| Insurance premium surcharges | | | (25 | ) | | - | | | - | |
| Income tax adjustments | | | (2 | ) | | 3 | | | 7 | |
| Terra Nova insurance proceeds | | | 2 | | | 31 | | | 17 | |
Operating earnings adjusted for unusual items | | $ | 800 | | $ | 677 | | $ | 573 | |
| Cash flow from operating activities before changes in non-cash working capital | | $ | 1,062 | | $ | 993 | | $ | 869 | |
| Expenditures on property, plant and equipment and exploration | | $ | 314 | | $ | 275 | | $ | 344 | |
| Total assets | | $ | 2,442 | | $ | 2,265 | | $ | 2,288 | |
2005 Compared With 2004
East Coast Oil contributed $800 million of operating earnings adjusted for unusual items, up 18% from $677 million in 2004. Strong realized prices were partially offset by lower production and increased operating costs.
Net earnings for East Coast Oil were $775 million in 2005, up from $711 million in 2004. Net earnings in 2005 included a $25 million insurance premium surcharge, a $2 million charge reflecting changes in income tax rates and $2 million of insurance proceeds due to the delayed startup of Terra Nova. Net earnings in 2004 included a $3 million positive adjustment to reflect a reduction in provincial income tax rates and $31 million of insurance proceeds related to the delayed startup of Terra Nova.
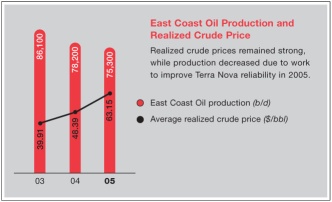
Realized crude prices remained strong, while production decreased due to work to improve Terra Nova reliability in 2005. East Coast Oil realized crude prices averaged $63.15/bbl in 2005, up from $48.39/bbl in 2004. Petro-Canada’s share of East Coast Oil production averaged 75,300 b/d in 2005, down from 78,200 b/d in 2004, mainly due to the 40-day planned turnaround at Terra Nova.
2005 Operating Review And Strategic Initiatives
White Rose achieved first oil and further improvements were made to Terra Nova’s reliability in 2005.
2005 Operating Review
| | | 2005 | | 2004 | | 2003 | |
Production (b/d) | | | | | | | | | | |
Hibernia | | | 39,800 | | | 40,800 | | | 40,600 | |
Terra Nova | | | 33,700 | | | 37,400 | | | 45,500 | |
White Rose | | | 1,800 | | | - | | | - | |
Average realized crude price ($/bbl) | | $ | 63.15 | | $ | 48.39 | | $ | 39.91 | |
Operating and overhead costs ($/bbl) | | $ | 4.52 | | $ | 2.89 | | $ | 2.88 | |
Petro-Canada’s share of Hibernia’s production averaged 39,800 b/d in 2005, down slightly from 40,800 b/d in 2004. The Hibernia platform continued to operate at first quartile levels during 2005, with slightly lower production reflecting normal reservoir decline rates.
At Terra Nova, the Company’s share of production averaged 33,700 b/d, down from 37,400 b/d in 2004. During the fourth quarter of 2005, Petro-Canada successfully completed a 40-day turnaround at Terra Nova. The turnaround included regulatory inspections on equipment and modifications to improve the reliability of the gas compression and injection systems. At the end of the turnaround, Terra Nova was operating at a 90% reliability rate. Royalty rates at Terra Nova increased in 2005 from 5% of gross revenues to a range of 27% to 29% of gross revenues in the fourth quarter of 2005. This increase reflected the provincial profit-sensitive royalty regime.
In November 2005, White Rose achieved first oil on budget and ahead of schedule. At year end, production rates averaged between 17,000 b/d to 19,000 b/d net to Petro-Canada.
East Coast Oil operating and overhead costs averaged $4.52/bbl in 2005, compared with $2.89/bbl in 2004. Operating costs for East Coast Oil have remained relatively flat, excluding insurance premium surcharges and startup costs for White Rose.
2005 Strategic Initiatives
Early in 2005, operator Chevron, Petro-Canada and the other joint venture participants signed a unitization and joint operating agreement to advance the joint evaluation of the Hebron, Ben Nevis and West Ben Nevis oilfields offshore Newfoundland and Labrador. Petro-Canada has a 23.9% interest in the development. These oilfields, collectively known as the Hebron development, are estimated to have total resources of approximately 580 million barrels (MMbbls) gross.
In 2005, the Canada-Newfoundland and Labrador Offshore Petroleum Board approved development of the Far East Block, an extension of the Terra Nova field.
Capital expenditures for exploration and development of crude oil offshore Canada’s East Coast were $314 million in 2005, including $167 million related to the development of the White Rose oilfield, $131 million for ongoing activities at Hibernia and Terra Nova, and $16 million for other East Coast Oil growth opportunities.
Outlook
Production expectations in 2006:
| - | East Coast Oil production is expected to average 94,000 b/d, reflecting a 70- to 90-day planned turnaround at Terra Nova and a 14-day planned turnaround at White Rose. |
Growth plans:
| - | achieve first quartile operating performance at Terra Nova; |
| - | continue development drilling of Terra Nova’s Far East Block; |
| - | delineation of the West White Rose Block at the White Rose field; and |
| - | achieve Hebron benefits agreement with Newfoundland and Labrador government and progress front-end engineering and design (FEED). |
Capital spending plans in 2006:
| - | approximately $275 million is expected to be spent on drilling to replace reserves at Hibernia, Terra Nova and White Rose, and on developing Terra Nova’s Far East Block; and |
| - | approximately $30 million is expected to fund growth opportunities such as the Hebron development, and exploration and new ventures. |
East Coast Oil production is expected to be about 94,000 b/d in 2006, compared with 75,300 b/d in 2005. The 2006 production estimate reflects the ramp up of the White Rose project and a planned 14-day turnaround. At White Rose, plans to increase well availability are expected to increase production to 90,000 b/d (25,000 b/d net to Petro-Canada) by mid-year. As well, the first production well in Terra Nova’s Far East reservoir is being drilled and is expected to be on-stream in the first quarter of 2006. Partially offsetting these production increases will be a 70- to 90-day turnaround at Terra Nova commencing in July 2006. It is anticipated that the FPSO will be relocated to a dry dock to complete work required for regulatory certification and compliance; completion of reliability improvements to the gas compression system; and expansion of the accommodations to enable a larger crew to perform ongoing maintenance. Upon completion of the Terra Nova turnaround, reliability is expected to be sustained at first quartile levels. There is no major turnaround planned for Hibernia in 2006.
A delineation well is currently being drilled to assess the growth potential of the southern extension of the Hibernia reservoir. Delineation wells are also planned for 2006 to test the growth potential of White Rose. Progress on the Hebron project continues; critical milestones for 2006 include arriving at a benefits agreement with the Government of Newfoundland and Labrador, and beginning FEED.
The East Coast Oil business has budgeted for a $305 million capital expenditure program in 2006. It is expected about $275 million will be spent on drilling to replace reserves at Hibernia, Terra Nova and White Rose, and to develop Terra Nova’s Far East Block. A further $30 million in capital is expected to fund growth opportunities such as the Hebron development, and exploration and new ventures.
Beyond 2006, the East Coast Oil business intends to offset natural declines in the main reservoirs and sustain profitable production by adding production from reservoir extensions and satellite tie-ins, and by continuing to develop the Hebron project.
Link to Petro-Canada’s Corporate and Strategic Priorities
The East Coast Oil business is aligned with Petro-Canada’s strategic priorities as outlined by its progress in 2005 and goals for 2006.
| | 2005 PROGRESS | 2006 GOALS |
DELIVERING PROFITABLE GROWTH WITH A FOCUS ON OPERATED, LONG-LIFE ASSETS | § achieved first oil production from the White Rose development; § signed joint operating agreement for Hebron; and § received regulatory approval for Far East development at Terra Nova. | § secure Hebron project provincial benefits agreement and begin FEED; § achieve first production from the Far East development at Terra Nova; § advance in-field Hibernia growth prospects; and § delineate West White Rose prospect. |
DRIVING FOR FIRST QUARTILE OPERATION OF OUR ASSETS | § improved Terra Nova reliability to 90%; and § maintained relatively flat operating and overhead costs excluding insurance premium surcharges and startup costs for White Rose. | § conduct a 70- to 90-day turnaround scheduled at Terra Nova for regulatory compliance and first quartile reliability initiatives; and § achieve White Rose plateau production. |
CONTINUING TO WORK AT BEING A RESPONSIBLE COMPANY | § saw 6% increase in total recordable injury frequency compared to 2004; § worked with regulators to address the outcomes of the 2004 oily water discharge; § conducted Terra Nova turnaround ahead of schedule and with improved safety record; and § improved the produced water system, resulting in zero regulatory compliance exceedances for 2005. | § reduce total recordable injury frequency; § apply lessons learned from oily water discharge to prevent future incidents; § maintain zero regulatory exceedances; and § ensure major TLM focus during the significant Terra Nova turnaround and startup. |
OIL SANDS
Business Summary and Strategy
Petro-Canada’s major Oil Sands interests include a 12% ownership in the Syncrude joint venture (an oil sands mining operation and upgrading facility), 100% ownership of the MacKay River in situ bitumen development (a steam-assisted gravity drainage (SAGD) operation), a 55% ownership in and operatorship of the Fort Hills oil sands mining and upgrading project, and extensive oil sands acreage considered prospective for in situ development of bitumen resources.
The Oil Sands strategy for profitable growth includes:
| | • | phased and integrated development of reserves to incorporate knowledge gained; |
| | • | disciplined capital investment to ensure long-life projects are value creating; and |
| | • | a staged approach to development of capital-intensive Oil Sands projects to allow rigorous cost management and the opportunity to benefit from evolving technology. |
Oil Sands Financial Results
(millions of dollars) | | 2005 | | 2004 | | 2003 | |
Net earnings (loss) | | $ | 115 | | $ | 120 | | $ | (52 | ) |
| Gain on sale of assets | | | 3 | | | - | | | - | |
Operating earnings (loss) | | $ | 112 | | $ | 120 | | | (52 | ) |
| Insurance premium surcharges | | | (7 | ) | | - | | | - | |
| Income tax adjustments | | | - | | | 2 | | | 5 | |
| Edmonton refinery conversion program | | | - | | | - | | | (82 | ) |
Operating earnings adjusted for unusual items | | $ | 119 | | $ | 118 | | $ | 25 | |
| Cash flow from operating activities before changes in non-cash working capital | | $ | 380 | | $ | 332 | | $ | 122 | |
| Expenditures on property, plant and equipment and exploration | | $ | 772 | | $ | 397 | | $ | 443 | |
| Total assets | | $ | 2,623 | | $ | 1,883 | | $ | 1,770 | |
2005 Compared With 2004
Oil Sands contributed $119 million of operating earnings adjusted for unusual items, up 1% from $118 million in 2004. Higher realized prices and production were largely offset by increased operating costs, and higher depreciation, depletion and amortization.
Net earnings for Oil Sands were $115 million in 2005, down from $120 million in 2004. Net earnings in 2005 included a $3 million gain on the sale of assets and a $7 million insurance premium surcharge. Net earnings in 2004 included a $2 million positive adjustment to reflect a reduction in provincial income tax rates.
Record prices at Syncrude and reliable production at MacKay River were highlights of 2005 performance. Syncrude realized price for synthetic crude oil averaged $70.41/bbl in 2005, up from $52.40/bbl in 2004. MacKay River realized price for bitumen averaged $18.53/bbl in 2005, compared with $18.37/bbl in 2004. Oil Sands production averaged 47,000 b/d in 2005, compared with 45,200 b/d in 2004.
2005 Operating Review And Strategic Initiatives
Oil Sands strategic progress included securing an interest and operatorship of the Fort Hills mining and upgrading project, and improvements to MacKay River reliability.
2005 Operating Review
| | | 2005 | | 2004 | | 2003 | |
Production (b/d) | | | | | | | | | | |
Syncrude | | | 25,700 | | | 28,600 | | | 25,400 | |
MacKay River | | | 21,300 | | | 16,600 | | | 10,700 | |
Syncrude realized crude price ($/bbl) | | $ | 70.41 | | $ | 52.40 | | $ | 42.67 | |
MacKay River realized bitumen price ($/bbl) | | $ | 18.53 | | $ | 18.37 | | $ | 16.69 | |
Syncrude operating and overhead costs ($/bbl) | | $ | 31.90 | | $ | 21.13 | | $ | 23.94 | |
MacKay River operating and overhead costs ($/bbl) | | $ | 17.06 | | $ | 21.87 | | $ | 23.73 | |
Syncrude’s production and operating costs were affected by turnarounds in 2005. Petro-Canada’s share of Syncrude’s production averaged 25,700 b/d in 2005, compared with 28,600 b/d in 2004. Coker and vacuum distillation unit turnarounds at Syncrude and a hydrogen plant shutdown reduced production by 2,900 b/d in 2005. Average unit operating and overhead costs increased to $31.90/bbl in 2005, up from $21.13/bbl in 2004. Higher operating costs were mainly due to lower production, higher maintenance costs, rising natural gas costs, an insurance premium surcharge and Syncrude incentive-based compensation.
MacKay River’s reliability improved and unit operating costs decreased in 2005. Production averaged 21,300 b/d in 2005, up from an average of 16,600 b/d in 2004. MacKay River reliability averaged 98% in 2005, up from 79% in 2004. Unit operating and overhead costs decreased by 22% in 2005, averaging $17.06/bbl, compared with $21.87/bbl in 2004. Lower unit operating costs were due to higher production which lowered per unit fixed costs, partially offset by higher natural gas costs.
Oil Sands capital expenditures of $772 million in 2005 included $301 million for the Fort Hills acquisition and development, $271 million for the Syncrude Stage III expansion and operations, $91 million for MacKay River and $109 million for the Dover acquisition and other in situ projects.
2005 Strategic Initiatives
Oil Sands acquired significant new assets in 2005, expanding leases in both mining and in situ developments.
At Syncrude, progress continued on the construction of the Stage III project, which includes a second Aurora mine and an upgrading expansion. In September 2005, the project announced a 2% increase to its total cost estimate from $8.1 billion to $8.3 billion, which was further increased to $8.4 billion in January 2006. Syncrude’s Stage III expansion is on schedule and expected to be on-stream in mid-2006.
At MacKay River, work to tie-in a third well pad progressed during the year. Early in 2005, Petro-Canada acquired the Dover Underground Test Facility (UTF) and oil sands leases adjacent to the MacKay River development. The leases provide additional SAGD development potential. Later in the year, Petro-Canada filed an application for a potential MacKay River in situ expansion project with first production by the end of the decade and peak production of an additional 40,000 b/d to follow. Petro-Canada also continued to evaluate its Lewis leases in 2005.
In early 2005, Petro-Canada strengthened its position in oil sands mining by securing the majority interest and operatorship of the Fort Hills project from UTS Energy Corporation (UTS). Later in the year, a mining partner, Teck Cominco Limited (Teck Cominco), joined the consortium. Petro-Canada is project operator with a 55% interest; UTS has a 30% interest; and Teck Cominco holds a 15% interest. Petro-Canada will market 100% of the production from Fort Hills. The Fort Hills oil sands mining and upgrading project has leases estimated to contain at least 2.8 billion bbls of bitumen resource (1.5 billion bbls net to Petro-Canada), which are expected to be recovered over a 30- to 40-year period. The project has received regulatory approval to produce up to 190,000 b/d of bitumen from the mine.
Outlook
Production expectations in 2006:
| - | Petro-Canada’s share of Syncrude production is expected to average 34,000 b/d; and |
| - | MacKay River bitumen production is expected to average 25,000 b/d. |
Growth plans:
| - | Syncrude Stage III expansion to come on-stream in mid-2006; |
| - | increased production capacity at MacKay River; |
| - | continue evaluation of the MacKay River expansion project; |
| - | advancement of the Fort Hills oil sands mining and upgrading project; and |
| - | progression of SAGD technology through research and development. |
Capital spending plans in 2006:
| - | approximately $135 million to enhance existing operations at MacKay River and Syncrude; |
| - | approximately $165 million to advance the Fort Hills development and the Syncrude Stage III expansion; |
| - | approximately $40 million to advance development of in situ oil sands leases; and |
| - | approximately $15 million to replace reserves through ongoing pad development at MacKay River. |
Oil Sands production is expected to increase to 59,000 b/d in 2006, compared with 47,000 b/d in 2005. Higher production in 2006 is due to a third well pad at MacKay River, which will contribute to targeted production of 27,000 b/d to 30,000 b/d by late 2006, and the planned startup of the Syncrude Stage III expansion. This expansion is expected to be on-stream by mid-2006 and will increase Petro-Canada’s share of production capacity from 28,000 b/d to 42,000 b/d. Production will reach this level following a ramp up period of two to three years. It is expected Syncrude will reach royalty payout in early 2006, at which time royalty payable will shift to 25% of net operating revenues from 1% of gross revenue. The total royalty payable in 2006 is expected to equate to a rate of between 3% and 10% of gross revenue, depending on crude oil prices.
In 2006, the Company expects to work on the Fort Hills mine, extraction and upgrading Design Basis Memorandum (DBM), which establishes key design parameters and a more detailed project schedule. Early in 2006, Petro-Canada announced plans to locate the Fort Hills upgrader northeast of Edmonton in Sturgeon County, in an area zoned for heavy industrial development. The upgrader is expected to use delayed coking technology to convert Fort Hills bitumen into light synthetic crude oil. Once the DBM is completed near the end of the year, a regulatory application will be filed in either late 2006 or early 2007.
The Oil Sands business has a capital program of about $355 million in 2006. Spending to enhance existing operations, comply with regulations at Syncrude and improve base business profitability at MacKay River is expected to be approximately $135 million. Capital for new growth opportunities of $165 million includes funding the preliminary engineering and design for the Fort Hills project ($125 million) and the Syncrude Stage III expansion ($30 million). Approximately $40 million of exploration and new venture capital will further evaluate the leases at MacKay River. Investments of $15 million are anticipated to replace reserves through ongoing pad development at MacKay River.
With Fort Hills and the MacKay River expansion, Petro-Canada has the potential to grow the Oil Sands business to more than 200,000 b/d over the next decade. Challenges to implementation of the strategy include capital cost pressures, skilled labour shortages, and environmental and stakeholder issues. As an experienced and responsible operator, Petro-Canada is well positioned to meet these challenges.
The Company has chosen to participate in the full oil sands value chain due to its resource potential and strong position with bitumen upgrading capacity. Petro-Canada not only has processing capacity through Syncrude and Suncor Energy Inc. (starting in 2008), but the Company is also converting the conventional crude oil train at its Edmonton refinery to refine oil sands feedstock from northern Alberta by 2008. This conversion, along with the existing synthetic crude train, will result in the refinery running on an exclusive diet of oil sands based feedstocks. This connection between resource and upgrading capacity provides more economic certainty in a business where volatile light/heavy differentials affect bitumen pricing.
The Oil Sands business also manages the Edmonton desulphurization project, which remains on budget and on schedule for startup in June 2006.
Link to Petro-Canada’s Corporate and Strategic Priorities
The Oil Sands business is aligned with Petro-Canada’s strategic priorities as outlined by its progress in 2005 and goals for 2006.
| | 2005 PROGRESS | 2006 GOALS |
DELIVERING PROFITABLE GROWTH WITH A FOCUS ON OPERATED, LONG-LIFE ASSETS | § secured a position in oil sands mining with Petro-Canada becoming operator and owning a 55% interest in Fort Hills; § acquired the Dover UTF and oil sands leases adjacent to MacKay River; § progressed construction of the Syncrude Stage III expansion; and § undertook an extensive drilling program at Lewis. | § advance Fort Hills and MacKay River expansion development plans; § start up Syncrude Stage III expansion; and § increase MacKay River production to between 27,000 b/d and 30,000 b/d by year end. |
DRIVING FOR FIRST QUARTILE OPERATION OF OUR ASSETS | § decreased MacKay River unit operating costs by 22%; § achieved average reliability at MacKay River of 98%, up from 79% in 2004; and § saw Syncrude non-fuel unit operating costs increased by 47%. | § decrease MacKay River non-fuel unit operating costs by 15%; § decrease Syncrude non-fuel unit operating costs by 25%; and § sustain MacKay River reliability at 2005 levels or better. |
CONTINUING TO WORK AT BEING A RESPONSIBLE COMPANY | § saw no change to total recordable injury frequency compared to 2004; § on behalf of Downstream, completed recycled waterline for reusing wastewater at the Edmonton refinery; and § established the McLelland Lake Wetland Complex Sustainability Committee to assist in the management of the patterned fen. | § maintain focus on total recordable injury frequency; and § ensure regulators, First Nations and other key stakeholders affected by major projects are properly consulted and engaged. |
INTERNATIONAL
BUSINESS SUMMARY AND STRATEGY
International production and exploration interests are currently focused in three regions. In Northwest Europe, production comes from the U.K. and the Netherlands sectors of the North Sea. The North Africa/Near East region provides crude oil production from interests in Libya, with exploration activity extending to Syria, Algeria, Tunisia and Morocco. In Northern Latin America, operations are focused in Trinidad and Tobago, and Venezuela.
In 2005, Petro-Canada reached an agreement to sell the Company’s mature producing assets in Syria. The sale was closed on January 31, 2006. These assets and associated results are reported as discontinued operations and excluded from continuing operations.
The International strategy is to access a sizable resource base using a three-fold approach to:
| | • | optimize and leverage existing assets; |
| | • | seek out new, long-life opportunities; and |
| | • | build a balanced exploration program. |
International Financial Results
(millions of dollars) | | 2005 | | 2004 | | 2003 | |
Net earnings (loss) from continuing operations | | $ | (109 | ) | $ | 116 | | $ | 192 | |
| Unrealized loss on Buzzard derivative contracts | | | (562 | ) | | (205 | ) | | - | |
| Gain on sale of assets | | | - | | | 8 | | | 10 | |
Operating earnings from continuing operations | | $ | 453 | | $ | 313 | | $ | 182 | |
| Insurance premium surcharges | | | (18 | ) | | - | | | - | |
| Income tax adjustments | | | 29 | | | - | | | - | |
| Kazakhstan impairment | | | - | | | - | | | (46 | ) |
| International provisions | | | - | | | - | | | 45 | |
Operating earnings from continuing operations adjusted for unusual items | | $ | 442 | | $ | 313 | | $ | 183 | |
| Cash flow from continuing operating activities before changes in non-cash working capital | | $ | 770 | | $ | 768 | | $ | 608 | |
| Expenditures on property, plant and equipment and exploration from continuing operations | | $ | 696 | | $ | 1,707 | | $ | 400 | |
| Total assets from continuing operations | | $ | 4,856 | | $ | 4,969 | | $ | 2,842 | |
2005 COMPARED WITH 2004
International contributed $442 million of operating earnings from continuing operations adjusted for unusual items, up 41% from $313 million in 2004. Higher realized prices and lower depreciation, depletion and amortization were partially offset by lower production and increased operating and exploration costs.
International net loss from continuing operations was $109 million in 2005, down from net earnings of $116 million in 2004. Net loss from continuing operations in 2005 included an unrealized loss on the Buzzard derivative contracts of $562 million, an $18 million insurance premium surcharge and a $29 million positive adjustment for income tax rate and other tax adjustments. Net earnings from continuing operations in 2004 included an unrealized loss on Buzzard derivative contracts of $205 million and an $8 million gain on the sale of non-core assets.
Strong realized commodity prices were partially offset by lower production in 2005. International production from continuing operations averaged 106,300 boe/d in 2005, compared with 117,400 boe/d in 2004. The decrease was primarily due to lower production in Northwest Europe. International crude oil and liquids realized prices from continuing operations averaged $65.90/bbl and natural gas realized prices averaged $6.97/Mcf in 2005, compared with $49.19/bbl and $5.27/Mcf, respectively, in 2004. Operating and overhead costs from continuing operations averaged $7.60/boe in 2005, up from $7.13/boe in 2004, due to lower production and higher overhead costs to support growth projects.
International capital expenditures from continuing operations in 2005 were $696 million, with $562 million directed to Northwest Europe primarily for North Sea developments, $99 million invested in the North Africa/Near East region and $35 million going toward the Northern Latin America region and other capital projects.
2005 OPERATING REVIEW AND STRATEGIC INITIATIVES
The International business enhanced its portfolio in 2005 with the sale of the mature, non-operated assets in Syria, achieving first oil at Pict and progressing growth prospects in all regions.
2005 Operating Review
| | | 2005 | | 2004 | | 2003 | |
Production from continuing operations (boe/d) | | | | | | | | | | |
Northwest Europe | | | 44,600 | | | 54,600 | | | 51,000 | |
North Africa/Near East | | | 49,800 | | | 50,900 | | | 53,400 | |
Northern Latin America | | | 11,900 | | | 11,900 | | | 10,500 | |
Average realized crude oil and NGL price from continuing operations ($/bbl) | | $ | 65.90 | | $ | 49.19 | | $ | 39.86 | |
Average realized natural gas price from continuing operations ($/Mcf) | | $ | 6.97 | | $ | 5.27 | | $ | 4.80 | |
Operating and overhead costs from continuing operations ($/boe) | | $ | 7.60 | | $ | 7.13 | | $ | 6.23 | |
Northwest Europe
Petro-Canada’s Northwest Europe production averaged 44,600 boe/d in 2005, compared with 54,600 boe/d in 2004. Production from the new Pict field was more than offset by production declines in the Netherlands sector of the North Sea, an unscheduled Triton platform shutdown at the end of the year and a maintenance turnaround at the Scott platform mid-year. Northwest Europe crude oil and liquids realized prices averaged $66.13/bbl and natural gas averaged $7.35/Mcf in 2005, compared with $50.37/bbl and $5.65/Mcf, respectively, in 2004.
During 2005, Petro-Canada leveraged its existing infrastructure through concentric development near core areas and through new discoveries. Although the basin is mature, there are many new developments, including the Buzzard and Pict fields in the U.K. sector of the North Sea, and the De Ruyter and L5b-C fields in the Netherlands sector of the North Sea.
In the U.K. sector of the North Sea, Petro-Canada’s Pict development, located in Block 21/23b, achieved first oil in mid-2005. Owned and operated by Petro-Canada, this field is estimated to have resources of approximately 13 MMbbls of oil and produced an average of 15,000 boe/d during the last half of 2005. The Buzzard field, in which the Company has a 29.9% interest, will be Petro-Canada’s next U.K. North Sea development to come on-stream. Progress on this development continues on schedule and on budget, with more than 88% of the construction completed by year-end 2005. First oil is expected near the end of 2006, with peak production of 60,000 boe/d net to Petro-Canada in 2007.
In the Netherlands sector of the North Sea, development of De Ruyter and L5b-C are on schedule. De Ruyter, a Petro-Canada operated development, is expected to be on-stream in late 2006, with peak production expected to be 10,000 boe/d, net to Petro-Canada. L5b-C, a small non-operated asset, is also expected to be on-stream in late 2006, with peak production in excess of 3,000 boe/d, net to Petro-Canada.
Petro-Canada continues to focus on building a balanced exploration program. In 2005, the Company made two discoveries in the U.K. sector of the North Sea and progressed work on the Hejre discovery in Denmark. Petro-Canada has a 100% working interest in the Saxon discovery, a Pict look-alike in the Triton area, which could be on-stream in the second half of 2007. A second discovery has been made in Block 13/27a, which is located northwest of the Buzzard field. Petro-Canada is determining if additional appraisal is warranted to establish commercial viability. In Denmark, work progressed on the previously discovered Hejre field, in which Petro-Canada has a 25% working interest. A successful appraisal well is being evaluated.
In the third quarter of 2005, Petro-Canada was awarded eight blocks in the U.K. Continental Shelf 23rd round of licensing. Petro-Canada is the operator and currently has a 90% working interest in these blocks and a total work program of four commitment wells, plus seismic acquisition and reprocessing.
During the fourth quarter of 2005, Petro-Canada was awarded five production licences by the Norwegian Ministry of Petroleum and Energy. The licences are located in the North Sea where Petro-Canada has established knowledge and expertise. The Company is operator of two licences and non-operator for the remaining three licences. The work program on four of the licences covers reprocessing 3D seismic and a two-year drill-or-drop commitment. The work program for the remaining licence involves seismic exploration and a one-well commitment to be drilled within four years.
North Africa/Near East
In 2005, Petro-Canada’s production from continuing operations averaged 49,800 boe/d, relatively unchanged from 50,900 boe/d in 2004. North Africa/Near East crude oil and liquids realized prices from continuing operations averaged $65.75/bbl in 2005, compared with $48.26/bbl in 2004.
In the North Africa/Near East region, Petro-Canada continues to assess the significant potential, using the Company’s experience and assets in the area as leverage for long-term growth. In Syria, the Block II seismic program was completed and two exploration wells are planned for 2006. In Libya, two exploration wells were completed as discoveries on existing concessions, consistent with plans to maintain existing reserves and production. Petro-Canada continues to process seismic data acquired earlier in 2005 on the Zotti Block in Algeria, with a well planned for 2006. In Tunisia, the Company continues to investigate other deep gas potential. Subsequent to year end, Petro-Canada was awarded two offshore, non-operated prospecting permits.
In mid-2005, Petro-Canada signed a one-year reconnaissance licence with the Moroccan Office National Bureau for Hydrocarbons and Mines. The Company will carry out field work and studies in the Bas Draa Block (covering 59,000 square kilometres) during the reconnaissance licence period.
Northern Latin America
In 2005, Petro-Canada’s share of Trinidad and Tobago production averaged 72 MMcf/d, unchanged from 2004. Northern Latin America realized price for natural gas averaged $6.62/Mcf in 2005, compared with $4.81/Mcf in 2004.
In Northern Latin America, Petro-Canada is pursuing growth opportunities in Trinidad and Tobago by optimizing the Company’s 17% working interest in the North Coast Marine Area-1 (NCMA-1) asset and capturing exploration potential that could lead to further gas development. In Venezuela, Petro-Canada continues to pursue opportunities to leverage existing technical and operating expertise.
In 2005, Petro-Canada signed production-sharing contracts with the Trinidad and Tobago Ministry of Energy and Energy Industries for offshore exploration Blocks 1a, 1b and 22. These blocks cover 4,258 kilometres, with Block 1a containing four discoveries. Awarding of these three blocks considerably strengthens Petro-Canada’s prospects for future growth in the area. During 2005, work on the Trinidad and Tobago offshore exploration Blocks 1a, 1b and 22 advanced with the start of a 3D seismic survey in Block 22. A second seismic 3D survey on 1a and 1b began shooting in early 2006. The Company expects to invest more than $100 million in the first phase of exploration, which includes shooting two 3D seismic surveys and the drilling of six exploration wells. Drilling is expected to commence in 2007.
In Venezuela, a declaration of commercial viability and a field development plan was filed for the La Ceiba development in 2005. If approved, peak production from La Ceiba is expected to be about 13,000 b/d, net to Petro-Canada. This project is expected to provide the Company with a meaningful foothold in the country, which is perceived to have significant future opportunities.
Outlook
Production expectations in 2006:
| - | North Africa/Near East oil and gas production to average 55,000 boe/d; |
| - | Northwest Europe oil and gas production to average 43,000 boe/d; and |
| - | Northern Latin American natural gas production to average 72 MMcf/d. |
Growth plans:
| - | advance De Ruyter development for 2006 startup; |
| - | progress Buzzard project for first oil in 2006; |
| - | execute the exploration program in Northern Latin America, Northwest Europe and North Africa/Near East; and |
| - | continue to pursue new business opportunities in LNG and from established reserves in the Middle East. |
Capital spending plans in 2006:
| - | approximately $210 million for reserves replacement spending in core areas; |
| - | approximately $515 million primarily for new North Sea growth projects; and |
| - | approximately $90 million for exploration and new ventures. |
International production from continuing operations is expected to be about 110,000 boe/d in 2006, compared with 106,300 boe/d in 2005. Higher production in 2006 reflects improved performance in Libya and contributions from the start up of projects in Northwest Europe (De Ruyter and L5b-C). The addition of initial Buzzard production at the end of 2006 and other new development projects will further increase production in 2007.
In 2006, the International business has a capital budget of about $815 million. Investments to replace reserves in core areas are expected to be approximately $210 million. About $515 million is expected to be invested in new growth projects, with a focus on bringing on new North Sea projects such as De Ruyter (startup late 2006), Buzzard (startup late 2006) and Saxon (startup late 2007). Approximately $90 million is expected to be allocated to exploration.
The Company continues to advance discussions on importing gas from Russia to North America through a joint LNG project with OAO «Gazprom» (Gazprom). The project proposed in the St. Petersburg region is expected to export 3.5 million to 5 million tonnes per annum (or 500 MMcf/d to 700 MMcf/d) with the gas supplied from the Russian gas grid. A Memorandum of Understanding was signed with Gazprom in October 2004 to develop a feasibility study by mid-2005. The work was completed and Petro-Canada and Gazprom are currently discussing details of moving to a commercial proposal for the project.
Overall, the International business has well-defined plans for profitable growth in all three operating regions.
Link to Petro-Canada’s Corporate and Strategic Priorities
The International business is aligned with Petro-Canada’s strategic priorities as outlined by its progress in 2005 and goals for 2006.
| | 2005 PROGRESS | 2006 GOALS |
DELIVERING PROFITABLE GROWTH WITH A FOCUS ON OPERATED, LONG-LIFE ASSETS | § advanced Buzzard development on schedule and on budget; § achieved first oil at Pict in June 2005; § progressed exploration with two discoveries in the U.K. sector of the North Sea and the Hejre appraisal; and § was awarded eight blocks in the 23rd U.K. licensing round and five Norwegian production licences. | § achieve first production by year end at Buzzard in the U.K. sector of the North Sea and at De Ruyter and L5b-C in the Netherlands sector of the North Sea; § conduct 11-well drilling program with balanced risk profile; § complete seismic program in Trinidad and Tobago and refine exploration well locations; and § advance field development plans for La Ceiba in Venezuela and Saxon in the U.K. sector of the North Sea. |
DRIVING FOR FIRST QUARTILE OPERATION OF OUR ASSETS | § completed Hanze turnaround in nine days versus planned 14 days; § participated in peer benchmarking studies for North Sea producing facilities; and § secured lease on new London office building on very favourable terms. | § conduct North Sea Triton de-bottlenecking study; § ensure De Ruyter operations readiness; § increase technical and environment, health and safety co-operation in Libya; § improve reliability and uptime on the Scott platform; and § roll out International management system. |
CONTINUING TO WORK AT BEING A RESPONSIBLE COMPANY | § reduced total recordable injury frequency by 22% compared to 2004; § initiated program of Zero Harm inspections by management; § rolled out Zero Harm supervisory training for leaders; § worked with community to minimize impact of onshore well in Tunisia; § developed oil spill strategy and coastline mapping for offshore well in Tunisia; and § initiated plan to protect forest reserve during seismic operations in Syria. | § maintain focus on total recordable injury frequency; § consult with communities in Trinidad and Tobago in preparation for exploration drilling program; § reduce oil in produced water at Triton; and § introduce Employee Assistance Program for International employees. |
Discontinued Operations
In late 2005, Petro-Canada reached an agreement to sell the Company’s producing assets in Syria for EUR 484 million (Canadian equivalent of $676 million as at December 20, 2005), before adjustments. The sale was closed on January 31, 2006 and a gain on disposal of approximately $140 million will be recorded in the first quarter of 2006. The sale of these mature assets aligns with Petro-Canada’s strategy to increase the proportion of long-life and operated assets within the portfolio. Syria remains an important part of the North Africa/Near East producing region, with an active exploration program in Block II and the continued pursuit of new opportunities.
Producing assets in Syria are presented as discontinued operations in the Consolidated Financial Statements. Petro-Canada’s net earnings from discontinued operations in 2005 were $98 million and included an insurance premium surcharge of $2 million. Summary information is presented below. Additional information concerning Petro-Canada’s discontinued operations can be found in Note 3 to the Consolidated Financial Statements.
Discontinued Financial Results
(millions of dollars, unless otherwise noted) | | 2005 | | 2004 | | 2003 | |
Net earnings and operating earnings from discontinued operations | | $ | 98 | | $ | 59 | | $ | 115 | |
| Insurance premium surcharges | | | (2 | ) | | - | | | - | |
Operating earnings from discontinued operations adjusted for unusual items | | $ | 100 | | $ | 59 | | $ | 115 | |
| Cash flow from discontinued operating activities before changes in non-cash working capital | | $ | 245 | | $ | 204 | | $ | 247 | |
| Expenditures on property, plant and equipment and exploration | | $ | 46 | | $ | 62 | | $ | 90 | |
| Total assets | | $ | 648 | | $ | 985 | | $ | 1,131 | |
Total volumes (boe/d) | | | | | | | | | | |
| - net before royalties | | | 70,100 | | | 79,200 | | | 95,000 | |
| - net after royalties | | | 21,000 | | | 24,200 | | | 35,600 | |
Average realized crude oil and NGL price ($/bbl) | | $ | 61.82 | | $ | 46.70 | | $ | 38.32 | |
Average realized natural gas price ($/Mcf) | | $ | 6.43 | | $ | 4.81 | | $ | 4.84 | |
UPSTREAM PRODUCTION
2005 COMPARED WITH 2004
In 2005, Petro-Canada’s production from continuing operations of crude oil, NGL and natural gas averaged 354,600 boe/d, in line with the Company’s guidance for the year.
| 2005 Average Daily Production Volumes | North American Natural Gas | East Coast Oil | Oil Sands | International | Total |
| | | | | | |
Crude oil, NGL and bitumen (b/d) | | | | | |
- net before royalties | 14,700 | 75,300 | 21,300 | 83,500 | 194,800 |
- net after royalties | 11,200 | 69,600 | 21,100 | 77,300 | 179,200 |
Synthetic crude oil (b/d) | | | | | |
- net before royalties | - | - | 25,700 | - | 25,700 |
- net after royalties | - | - | 25,400 | - | 25,400 |
Natural gas (MMcf/d) | | | | | |
- net before royalties | 668 | - | - | 138 | 806 |
- net after royalties | 512 | - | - | 122 | 634 |
Continuing operations (boe/d) | | | | | |
- net before royalties | 126,000 | 75,300 | 47,000 | 106,300 | 354,600 |
- net after royalties | 96,500 | 69,600 | 46,500 | 97,700 | 310,300 |
Discontinued operations (boe/d) | | | | | |
- net before royalties | - | - | - | 70,100 | 70,100 |
- net after royalties | - | - | - | 21,000 | 21,000 |
Total volumes (boe/d) | | | | | |
- net before royalties | 126,000 | 75,300 | 47,000 | 176,400 | 424,700 |
- net after royalties | 96,500 | 69,600 | 46,500 | 118,700 | 331,300 |
| 2004 Average Daily Production Volumes | North American Natural Gas | East Coast Oil | Oil Sands | International | Total |
| | | | | | |
Crude oil, NGL and bitumen (b/d) | | | | | |
- net before royalties | 15,300 | 78,200 | 16,600 | 91,300 | 201,400 |
- net after royalties | 11,400 | 75,100 | 16,500 | 84,100 | 187,100 |
Synthetic crude oil (b/d) | | | | | |
- net before royalties | - | - | 28,600 | - | 28,600 |
- net after royalties | - | - | 28,300 | - | 28,300 |
Natural gas (MMcf/d) | | | | | |
- net before royalties | 695 | - | - | 157 | 852 |
- net after royalties | 530 | - | - | 136 | 666 |
Continuing operations (boe/d) | | | | | |
- net before royalties | 131,100 | 78,200 | 45,200 | 117,400 | 371,900 |
- net after royalties | 99,700 | 75,100 | 44,800 | 106,800 | 326,400 |
Discontinued operations (boe/d) | | | | | |
- net before royalties | - | - | - | 79,200 | 79,200 |
- net after royalties | - | - | - | 24,200 | 24,200 |
Total volumes (boe/d) | | | | | |
- net before royalties | 131,100 | 78,200 | 45,200 | 196,600 | 451,100 |
- net after royalties | 99,700 | 75,100 | 44,800 | 131,000 | 350,600 |
2006 Production Outlook
Upstream production from continuing operations is expected to average 365,000 boe/d to 390,000 boe/d in 2006. Petro-Canada’s production range is higher than in 2005, primarily due to additional production from White Rose, the De Ruyter startup, the Syncrude Stage III expansion and a new well pad at MacKay River. Factors that may impact production during 2006 include reservoir performance, drilling results, facility reliability, the ramp up of production at White Rose and the successful execution of the planned turnaround at Terra Nova.
Consolidated Production (thousands of boe/d) | 2006 Outlook (+/-) |
North American Natural Gas | |
Natural gas | 106 |
Liquids | 14 |
East Coast Oil | 94 |
Oil Sands | |
Syncrude | 34 |
MacKay River | 25 |
International | |
North Africa/Near East 1 | 55 |
Northwest Europe | 43 |
Northern Latin America | 12 |
Total continuing operations | 365-390 |
Discontinued operations 2 | 58 |
Total | 425-450 |
1 North Africa/Near East excludes production related to the sale of the Syrian producing assets.
2 Represents Petro-Canada’s interests in the Syrian producing assets.
RESERVES
The Company's reserves data and reserves quantities are determined by Petro-Canada's staff of qualified reserves evaluators using corporate-wide policies, procedures and practices. The Company believes that these reserves policies, procedures and practices conform with the requirements in Canada, the U.S. SEC and the Association of Professional Engineers, Geologists and Geophysicists of Alberta's Standard of Practice for the Evaluation of Oil and Gas Reserves for Public Disclosure. Petro-Canada also employs independent third parties to evaluate, audit and/or review its reserves processes and estimates. In 2005, 30% of North American and 39% of International proved reserves were assessed by independent reserves evaluators. The independent reserves evaluators concluded that the Company's year-end reserves estimates were reasonable.
December 31, 2005 Consolidated Reserves 1 | | Proved Liquids | | Proved Gas | | Proved Reserves Additions Liquids 3 | | Proved Reserves Additions Gas 3 | | Proved 2 | | Proved Reserves Additions 3 | |
(working interest before royalties) | | | (MMbbls) | | | (Bcf) | | | (MMbbls) | | | (Bcf) | | | (MMboe) | | | (MMboe) | |
| North American Natural Gas | | | 49 | | | 1,825 | | | 11 | | | 30 | | | 353 | | | 16 | |
| East Coast Oil | | | 132 | | | - | | | 91 | | | - | | | 132 | | | 91 | |
Oil Sands 4 | | | 342 | | | - | | | 28 | | | - | | | 342 | | | 28 | |
International 5 | | | 343 | | | 370 | | | 39 | | | (6 | ) | | 405 | | | 38 | |
| Total | | | 866 | | | 2,195 | | | 169 | | | 24 | | | 1,232 | | | 173 | |
| Production | | | | | | | | | 105 | | | 303 | | | | | | 155 | |
Proved replacement ratio 6, 7 | | | | | | | | | | | | | | | | | | 111 | % |
Five-year proved plus probable replacement ratio | | | 195 | % | | | | | | | | | | | | | | | |
Proved plus probable reserves life index 7, 8 | | | 14.7 | | | | | | | | | | | | | | | | |
| 1 | A comparative table for 2005 versus 2004 is shown on page 74. |
| 2 | At year-end 2005, 65% of proved reserves were classified as proved developed reserves. Of the total undeveloped reserves, 85% are associated with large projects currently producing or under active development, including Buzzard, Syncrude, Hibernia, Terra Nova, White Rose, and Trinidad and Tobago natural gas. |
| 3 | Proved reserves additions are the sum of revisions of previous estimates, net purchases/sales, and discoveries, extensions and improved recovery in 2005. Further detail on these categories is provided in the reserves table on page 74. |
| 4 | Oil Sands proved reserves only include reserves from Syncrude. The 2005 bitumen production of 8 MMboe is included in calculating the Oil Sands proved replacement ratio and proved plus probable reserves life index. |
| 5 | The Company’s Syrian producing assets were in the process of being sold at year end. As at December 31, 2005, the sale had not closed. The Syria 2005 year-end proved reserves (49 MMboe), the proved plus probable reserves (67 MMboe), and the 2005 production (26 MMboe) are included in reserves and calculated ratios. |
| 6 | This ratio is the year-over-year net change in proved reserves (before deducting production), divided by annual production over the same time period. Proved reserves replacement ratio is a general indicator of the Company's reserves growth. It is only one of a number of metrics which can be used to analyse a company's upstream business. |
| 7 | Reserves replacement ratio and reserves life index are non-standardized measures and may not be comparable to similar measures of other companies. They are illustrative only. |
| 8 | This index is proved plus probable reserves at year-end 2005, divided by annual production. |
Petro-Canada's objective is to replace reserves over time through exploration, development and acquisition. The Company believes that, due to the specific nature of its upstream portfolio and attributes of its probable reserves, the combination of proved plus probable reserves provides the best perspective of Petro-Canada’s reserves. Petro-Canada’s proved plus probable reserves replacement on a consolidated basis was 195% over the last five years. The proved plus probable reserves life index was 14.7 at year-end 2005, compared to 13.5 at year-end 2004.
In 2005, the Company replaced 111% of production on a proved basis. Proved reserves additions totalled 173 MMboe, compared to production of 155 MMboe in 2004. As a result, total proved reserves increased from 1,214 MMboe at year-end 2004 to 1,232 MMboe at year-end 2005.
In North American Natural Gas, proved reserves additions were 16 MMboe. The U.S. Rockies added reserves as planned and it continued to develop unconventional coal bed methane and tight gas resources.
In East Coast Oil, a total of 91 MMbbls were added to proved reserves. This was due to better than anticipated reservoir performance, ongoing development well drilling at Terra Nova and Hibernia, and the startup of production and the corresponding water flood at White Rose. The life-of-field estimates for Hibernia, Terra Nova and White Rose increased in 2005.
In Oil Sands, proved reserves additions were 28 MMbbls in 2005. The SEC prescribes the use of year-end prices and costs in determining proved reserves. The combination of wide light/heavy price differentials and high prices for synthetic crude used for blending contributed to low prices for Canadian bitumen at year-end 2005, so no proved in situ reserves were booked at MacKay River. As a result, proved reserves additions of 8 MMbbls equalled production. At Syncrude, 20 MMbbls were added to proved reserves, reflecting the inclusion of an additional pit area and the reappraisal of delineation drilling and the Syncrude mine plan.
In International, a total of 38 MMboe were added to proved reserves in 2005. This primarily reflected reservoir performance in Libya and the addition of new projects in Northwest Europe. Reserves additions associated with the Buzzard acquisition were booked in 2004. In December 2005, the Company announced the potential sale of Syrian producing assets. At year end, these assets represented 49 MMboe of proved reserves. The sale closed on January 31, 2006.
Further detail on Petro-Canada’s reserves is provided in the reserves table at the end of this Report (see page 74).
DOWNSTREAM
BUSINESS SUMMARY AND STRATEGY
Petro-Canada is the second-largest Downstream business and the “brand of choice” in Canada. In 2005, Petro-Canada accounted for approximately 13% of the total refining capacity in Canada and about 16% of total petroleum products sold in Canada.
Downstream operations include: two refineries in Edmonton and Montreal with a total rated capacity of 40,500 cubic metres/day (m3/d) (255,000 b/d)1; a lubricants plant which is the largest producer of lubricant base stocks in Canada; a network of more than 1,300 retail service stations; Canada’s largest commercial road transport network of 212 locations; and a bulk fuel sales channel.
The strategy in the Downstream business is to increase the profitability of the base business through effective capital investment and discipline over controllable factors. In 2006, Downstream capital investment will shift to growth projects as regulatory projects to produce cleaner-burning fuels are complete. The goal is superior returns and growth, including a 12% return on capital employed (ROCE) based on a mid-cycle business environment. Key features of the strategy include:
| | • | achieving and maintaining first quartile operating performance in all areas; |
| | • | advancing Petro-Canada as the “brand of choice” for Canadian gasoline consumers; and |
| | • | increasing sales of high-margin specialty lubricants. |
Downstream Financial Results
(millions of dollars) | | 2005 | | 2004 | | 2003 | |
Net earnings | | $ | 415 | | $ | 314 | | $ | 248 | |
| Gain (loss) on sale of assets | | | 17 | | | 4 | | | (15 | ) |
Operating earnings | | $ | 398 | | $ | 310 | | $ | 263 | |
| Insurance premium surcharges | | | (23 | ) | | - | | | - | |
| Income tax adjustments | | | (2 | ) | | 2 | | | 34 | |
| Oakville closure costs | | | 2 | | | (46 | ) | | (151 | ) |
Operating earnings adjusted for unusual items | | $ | 421 | | $ | 354 | | $ | 380 | |
| Cash flow from operating activities before changes in non-cash working capital | | $ | 607 | | $ | 556 | | $ | 601 | |
| Expenditures on property, plant and equipment | | $ | 1,053 | | $ | 839 | | $ | 424 | |
| Total assets | | $ | 5,609 | | $ | 4,462 | | $ | 3,827 | |
| 1 | Capacity reflects small expansion of Montreal refinery, effective January 1, 2005, and closure of Oakville refinery operations, effective April 11, 2005. |
2005 COMPARED WITH 2004
Downstream contributed $421 million of operating earnings adjusted for unusual items, up 19% from $354 million in 2004. Strong reliability at all our plants allowed Petro-Canada to maximize the benefits of favourable refining margins and a wider light/heavy crude price differential. These benefits were partially offset by the impact of rising crude prices on margins for heavy products, lower sales volumes and increased operating expenses due to planned shutdowns, higher energy prices and one-time expenses including additional insurance premiums.
Net earnings from Downstream were a record $415 million in 2005, up from $314 million in 2004. Net earnings in 2005 included a $17 million gain on the sale of assets, a $23 million insurance premium surcharge, a $2 million charge related to an income tax rate adjustment and a $2 million recovery due to the consolidation of the Eastern Canada refinery operations. Net earnings in 2004 included a $4 million gain on the sale of assets, a $2 million positive adjustment to reflect a reduction in provincial income tax rates and a $46 million charge for additional depreciation and other charges related to the consolidation of the Eastern Canada refinery operations.
Refining and supply contributed 2005 operating earnings adjusted for unusual items of $366 million, compared with $288 million in 2004. Earnings were positively impacted by improved reliability, favourable U.S. refining margins, wider light/heavy crude differentials and a recovery related to the Oakville refinery closure. These factors were offset by the effects of major planned turnarounds at the Edmonton and Montreal refineries and Mississauga lubricants plant, a 7% reduction in overall crude capacity as a result of the Oakville closure, and lower asphalt and heavy fuel oil margins as prices failed to keep pace with rising crude oil costs throughout most of 2005.
Total sales of refined products were down 7% compared to 2004. The reduced volumes were mainly a result of lower asphalt and jet fuel sales associated with the consolidation of the Eastern Canada refinery operations and a decrease in furnace fuel oil sales due to warmer weather.
Marketing contributed 2005 operating earnings adjusted for unusual items of $55 million, compared with $66 million in 2004. Improved marketing margins higher margins from non-petroleum products were more than offset by increased costs related to higher fuel prices.
Total Downstream operating, marketing and general and administration unit costs of 7.5 cents/litre in 2005 were up from 6.4 cents/litre in 2004. The increase mainly reflected increased shutdown and operating costs driven by higher energy prices and transportation costs, and one-time expenses including additional insurance premiums.
2005 OPERATING REVIEW AND STRATEGIC INITIATIVES
With the Eastern Canada consolidation completed, Petro-Canada is well positioned with the supply flexibility to optimize profitability within a range of future business environment scenarios.
Refining and Supply
In 2005, the business processed an average of 40,900 m3/d of crude oil, down from 48,200 m3/d in 2004. The overall utilization rate at Petro-Canada’s three refineries, adjusted for the closure of the Oakville refinery in April 2005, averaged 96% in 2005, down slightly from 98% in 2004. The decline reflected planned major turnarounds at the Edmonton and Montreal refineries for maintenance and to facilitate tie-ins of low-sulphur diesel equipment.
Total Downstream sales decreased to an average 52,800 m3/d in 2005, compared to 56,600 m3/d in 2004. Lower volumes were mainly due to decreased asphalt, heavy fuel oil and jet fuel sales associated with the consolidation of Eastern Canada refinery operations and lower sales of furnace fuel oil due to warmer weather.
Overall plant reliability, a critical component of success in the refining business, improved in 2005. All three refineries ran at a reliability index rate of well over 90 and work on the Edmonton diesel desulphurization project surpassed the four-million-hour mark without a lost-time injury. The Montreal refinery showed a significant improvement due to selective equipment upgrades and an increased focus on operations and maintenance procedures.
Refining and Supply successfully consolidated Eastern Canada operations to Montreal in 2005. The completion of the consolidation included expanding and upgrading the Oakville terminal facilities and closing the remaining Oakville refining operations in April 2005. Excellent safety and reliability was maintained at the Oakville refinery throughout the transition. The Ontario market is now supplied via the Trans-Northern Pipeline Inc. pipeline from the expanded Montreal refinery and from new gasoline, diesel and feedstock supply contracts.
Work continued at the Montreal and Edmonton refineries to bring new diesel desulphurization units on-stream. This work remains on schedule and on budget to meet federal ultra-low sulphur diesel requirements, which will be in effect on June 1, 2006.
With the refining industry in need of more capacity to refine heavier crude stocks, Petro-Canada is well positioned with its plans to reduce feedstock costs at its refineries. In 2005, Downstream commenced detailed engineering work to convert the Edmonton refinery to process 100% oil sands feedstock and initiated work to evaluate the feasibility of adding a coker to the Montreal refinery.
In the first quarter of 2005, Petro-Canada acquired a 51% interest in a paraxylene facility adjacent to the Montreal refinery. This partnership allows Petro-Canada to build on the strengths of its newly consolidated Eastern Canada refining and supply hub, and capture more of the petrochemical value chain.
Marketing
In the retail business, Petro-Canada completed most of its re-imaging program, contributing to industry-leading throughputs. Within the Company’s network, annual gasoline sales from re-imaged sites averaged in excess of 6.5 million litres per site. The Company extended the re-imaging program to independent retailers and nearly 60% of these retailers chose to participate.
Petro-Canada continued to leverage its position as "Canada's Gas Station," with the advancement of previously launched innovative product developments and new product firsts such as the Citi Petro-Points MasterCard, the first general-purpose credit card in North America to offer cardholders an instant discount on gasoline, and the roll out of its Cash Point Program, the industry's first privately owned automated bank machine network. In 2005, the Company continued to focus on expanding its non-petroleum revenue base, as evidenced by the 10% year-over-year sales growth of its convenience store business and 5% increase in same-store sales compared to 2004.
In 2005, the PETRO-PASS network, which includes 212 truck stop facilities, continued to be the leading national marketer of fuel in the commercial road transport segment in Canada. The distribution network was upgraded during the year, leading to higher sales volumes.
Lubricants
Overall sales of lubricants totalled 779 million litres in 2005, a decrease of 7% compared to sales volumes of 833 million litres in 2004. The decrease in sales volume was primarily due to lower sales of wax and white oils. Sales of higher-margin products increased 3%, resulting in 73% of production going into higher-margin product segments. Over the past five years, growth in high-margin sales has averaged close to 10% per year.
In 2005, Lubricants continued to focus on improving plant reliability. Petro-Canada delivered strong reliability through its intensified efforts to optimize operations and maintenance procedures based on industry “best practices.” A major five-year cycle maintenance turnaround was completed at the white oils plant, which will help ensure continued reliability improvements at the Lubricants facility.
Lubricants is positioned for profitable future growth as tougher performance and environmental standards increase global demand for higher-quality base oils and finished products. In 2005, the Lubricants business initiated a plant expansion to increase high-quality base stock production in the latter half of 2006.
Outlook
Growth plans:
| - | drive for first quartile refinery safety and reliability; |
| - | complete investments in Montreal and Edmonton refineries to produce low-sulphur diesel; |
| - | advance Edmonton refinery conversion project to process oil sands based feedstock by 2008; |
| - | evaluate feasibility of a coker at the Montreal refinery; |
| - | increase service station network effectiveness with a focus on increasing non-petroleum revenue; |
| - | build wholesale volumes primarily through our commercial road transport and bulk fuels sales channels; and |
| - | increase sales of higher-margin, value-added lubricants, supported by increased plant capacity in 2006. |
Capital spending plans in 2006:
| - | approximately $245 million primarily focused on completion of diesel desulphurization at Montreal and Edmonton refineries; |
| - | approximately $70 million to enhance existing operations; |
| - | approximately $180 million to improve profitability in the base business; and |
| - | approximately $535 million for Edmonton refinery conversion program and new growth opportunities. |
Downstream capital spending shifts from regulatory requirements to growth during 2006, in particular, with the conversion of the Edmonton refinery, expansion of the lubricants plant and a feasibility study for a Montreal coker.
The Downstream business will have a capital program of approximately $1,030 million in 2006. The business will invest approximately $245 million in regulatory compliance, primarily to complete modifications at the Montreal and Edmonton refineries to produce low-sulphur distillates in line with regulations, which come into effect June 1, 2006. Approximately $70 million is expected to be directed to the enhancement of existing operations. This includes reliability and safety improvements at the facilities, as well as product storage and information technology upgrades within the wholesale and retail networks.
A further $180 million is expected to be invested to improve the profitability of the Downstream’s base business. This approach includes continuing to develop the retail and wholesale network, and de-bottlenecking the lubricants plant with a 25% increase in capacity to support the growth of its high-margin, specialty lubricants business.
The majority of new growth projects funding of $535 million is expected to go toward advancing the Edmonton refinery conversion to run oil sands feedstock by 2008. Other new growth projects are expected to include the continuation of a feasibility study for the addition of a coker at the Montreal refinery and funding for the development of innovative marketing concepts to increase non-petroleum revenue.
At the end of 2005, the Downstream business had a mid-cycle ROCE of just over 10%. Over time, it is anticipated that yield improvement and conversion projects will help drive the mid-cycle ROCE to the target of 12%.
Link to Petro-Canada’s Corporate and Strategic Priorities
The Downstream business is aligned with Petro-Canada’s strategic priorities as outlined by its progress in 2005 and goals for 2006.
| | 2005 PROGRESS | 2006 GOALS |
DELIVERING PROFITABLE GROWTH WITH A FOCUS ON OPERATED, LONG-LIFE ASSETS | § completed Eastern Canada consolidation; § initiated detailed engineering of Edmonton refinery conversion to synthetic crude diet; and § acquired 51% interest in a paraxylene facility adjacent to the Montreal refinery. | § progress Edmonton refinery feed conversion project for completion in 2008; § conduct Montreal coker feasibility study for decision in 2007; § de-bottleneck Lubricants plant; and § continue to make refinery yield and reliability improvements. |
DRIVING FOR FIRST QUARTILE OPERATION OF OUR ASSETS | § improved the Downstream plant reliability index score by more than 16%; § achieved leading share of retail major urban market; and § increased sales of high-margin lubricants. | § continue to focus on safety, and refinery operating and maintenance procedures; § increase retail non-petroleum revenue; and § achieve 75% high-margin lubricants sales mix. |
CONTINUING TO WORK AT BEING A RESPONSIBLE COMPANY | § reduced total recordable injury frequency by 51% compared to 2004; § surpassed four million hours of work without a lost-time injury on the Edmonton Diesel Desulphurization Project; § reduced community complaints by 57% compared to 2004; § invested into producing cleaner-burning fuels; and § reduced regulatory compliance exceedances by 59% compared to 2004. | § maintain focus on total recordable injury frequency and regulatory compliance exceedances in 2006; § produce ultra-low sulphur diesel; and § meet provincial ethanol regulations. |
SHARED SERVICES
Shared Services includes investment income, interest expense, foreign currency translation and general corporate revenue and expenses.
Shared Services Financial Results
(millions of dollars) | | 2005 | | 2004 | | 2003 | |
Net earnings (loss) | | $ | (177 | ) | $ | (63 | ) | $ | 58 | |
| Gain (loss) on sale of assets | | | - | | | (1 | ) | | 1 | |
| Foreign currency translation | | | 73 | | | 63 | | | 239 | |
Operating loss | | $ | (250 | ) | $ | (125 | ) | $ | (182 | ) |
| Stock-based compensation | | | (66 | ) | | (11 | ) | | (13 | ) |
| Income tax adjustments | | | (31 | ) | | (1 | ) | | (11 | ) |
Operating loss adjusted for unusual items | | $ | (153 | ) | $ | (113 | ) | $ | (158 | ) |
| Cash flow from operating activities before changes in non-cash working capital | | $ | (225 | ) | $ | (106 | ) | $ | (100 | ) |
2005 COMPARED WITH 2004
Shared Services recorded an operating loss adjusted for unusual items of $153 million, compared with a loss of $113 million for the same period in 2004.
Shared services net loss was $177 million in 2005, compared to a net loss of $63 million in 2004. The 2005 net loss included a $73 million gain on foreign currency translation related to long-term debt, a $66 million charge related to the mark-to-market valuation of stock-based compensation and a $31 million charge related to income tax adjustments. The 2004 net loss included a $1 million loss on the sale of assets, a $63 million gain on foreign currency translation related to long-term debt, an $11 million charge related to the mark-to-market valuation of stock-based compensation and a $1 million charge to reflect a change in the provincial income tax rate.
FINANCIAL REPORTING
CRITICAL ACCOUNTING ESTIMATES
The preparation of the Company’s financial statements requires management to adopt accounting policies that involve the use of significant estimates and assumptions. These estimates and assumptions are developed based on the best available information and are believed by management to be reasonable under the existing circumstances. New events or additional information may result in the revision of these estimates over time. The Audit, Finance and Risk Committee of the Board of Directors regularly reviews the Company’s critical accounting policies and any significant changes thereto. A summary of the significant accounting policies used by Petro-Canada can be found in Note 1 to the 2005 Consolidated Financial Statements. The following discussion outlines what management believes to be the most critical accounting policies involving the use of significant estimates or assumptions.
Property, Plant and Equipment/Depreciation, Depletion and Amortization
Investments in exploration and development activities are accounted for under the successful efforts method. Under this method, the acquisition costs of unproved acreage, the costs of exploratory wells pending determination of proved reserves, the costs of wells which are assigned proved reserves and development costs, including costs of all wells, are capitalized. The cost of unsuccessful wells and all other exploration costs, including geological and geophysical costs, are charged to earnings as incurred. Capitalized costs of oil and gas producing properties are depreciated and depleted using the unit of production method based upon estimated reserves (see Estimated Oil and Gas Reserves discussion on page 39). Reserves estimates can have a significant impact on net earnings, as they are a key component in the calculation of depreciation and depletion related to the capitalized costs of property, plant and equipment. A revision in reserve estimates could result in either a higher or lower depreciation and depletion charge to net earnings. A downward revision in reserves could result in a write-down of oil and gas producing properties as part of the impairment assessment (see Asset Impairment discussion below).
Asset Retirement Obligations
The Company currently records the obligation for estimated asset retirement costs at fair value when incurred. Factors that can affect the fair values of the obligations include the expected costs and the useful lives of the assets. Cost estimates are influenced by factors such as the number and type of assets subject to asset retirement obligations, the extent of work required and changes in environmental legislation. A revision to the estimated costs or useful lives of the assets could result in an increase or decrease in the total obligation, which would change the amount of amortization and accretion expense recognized in net earnings over time.
Asset Impairment
Producing properties and significant unproved properties are assessed annually, or as economic events dictate, for potential impairment. Impairment is assessed by comparing the estimated undiscounted future cash flows to the carrying value of the asset. The cash flows used in the impairment assessment require management to make assumptions and estimates about recoverable reserves (see Estimated Oil and Gas Reserves discussion on page 39), future commodity prices and operating costs. Changes in any of the assumptions, such as a downward revision in reserves, a decrease in future commodity prices or an increase in operating costs, could result in an impairment of an asset’s carrying value.
Purchase Price Allocation
Business acquisitions are accounted for by the purchase method of accounting. Under this method, the purchase price is allocated to the assets acquired and the liabilities assumed based on the fair value at the time of the acquisition. The excess purchase price over the fair value of identifiable assets and liabilities acquired is goodwill. The determination of fair value often requires management to make assumptions and estimates about future events. The assumptions and estimates with respect to determining the fair value of property, plant and equipment acquired generally require the most judgment, and include estimates of reserves acquired (see Estimated Oil and Gas Reserves discussion on page 39), future commodity prices and discount rates. Changes in any of the assumptions or estimates used in determining the fair value of acquired assets and liabilities could impact the amounts assigned to assets, liabilities, and goodwill in the purchase price allocation. Future net earnings can be affected as a result of changes in future depreciation and depletion, asset impairment or goodwill impairment.
Goodwill Impairment
Goodwill is subject to impairment tests annually, or as economic events dictate, by comparing the fair value of the reporting unit to its carrying value, including goodwill. If the fair value of the reporting unit is less than its carrying value, a goodwill impairment loss is recognized as the excess of the carrying value of the goodwill over the fair value of the goodwill. The determination of fair value requires management to make assumptions and estimates about recoverable reserves (see Estimated Oil and Gas Reserves discussion below), future commodity prices, operating costs, production profiles and discount rates. Changes in any of these assumptions, such as a downward revision in reserves, a decrease in future commodity prices, an increase in operating costs or an increase in discount rates, could result in an impairment of all or a portion of the goodwill carrying value in future periods.
Estimated Oil and Gas Reserves
Reserve estimates, although not reported as part of the Company’s Consolidated Financial Statements, can have a significant effect on net earnings as a result of their impact on depreciation and depletion rates, asset impairments and goodwill impairments (see discussion of these items above and on page 38). The Company’s staff of qualified reserves evaluators performs internal evaluations on all of its oil and gas reserves on an annual basis using corporate-wide policies, procedures and practices. Independent qualified petroleum reservoir engineering consultants also conduct annual evaluations, technical audits and/or reviews of a significant portion of the Company’s reserves and audit the Company’s reserves policies, procedures and practices. In addition, the Company’s contract internal auditors test the non-engineering management control processes used in establishing reserves. However, the estimation of reserves is an inherently complex process requiring significant judgment. Estimates of economically recoverable oil and gas reserves are based upon a number of variables and assumptions, such as geoscientific interpretation, economic conditions, commodity prices, operating and capital costs, and production forecasts, all of which may vary considerably from actual results. These estimates are expected to be revised upward or downward over time as additional information, such as reservoir performance, becomes available, or as economic conditions change.
Employee Future Benefits
The Company maintains defined benefit pension plans and provides certain post-retirement benefits to qualifying retirees. Obligations under employee future benefits plans are recorded net of plan assets where applicable. The cost of pension and other post-retirement benefits are actuarially determined by an independent actuary using the projected benefit method, prorated based on service. The determination of these costs requires management to estimate or make assumptions regarding the expected plan investment performance, salary escalation, retirement ages of employees, expected health care costs, employee turnover, discount rates and return on plan assets. Changes in these estimates or assumptions could result in an increase or decrease to the accrued benefit obligation and the related costs for both pensions and other post-retirement benefits.
Income Taxes
The Company follows the liability method of accounting for income taxes whereby future income taxes are recognized based on the differences between the carrying amounts of assets and liabilities reported in the financial statements and their respective tax bases. The determination of the income tax provision is an inherently complex process requiring management to interpret continually changing regulations and to make certain judgments. While income tax ӿlings are subject to audits and reassessments, management believes adequate provision has been made for all income tax obligations. However, changes in the interpretations or judgments may result in an increase or decrease in the Company’s income tax provision in the future.
Contingencies
The Company is involved in litigation and claims in the normal course of operations. Management is of the opinion that any resulting settlements would not materially affect the financial position of the Company as at December 31, 2005. However, the determination of contingent liabilities relating to the litigation and claims is a complex process that involves judgments as to the outcomes and interpretation of laws and regulations. Changes in the judgments or interpretations may result in an increase or decrease in the Company’s contingent liabilities in the future.
SHARE DATA
The authorized share capital of Petro-Canada consists of an unlimited number of common shares and an unlimited number of preferred shares issuable in series designated as either senior preferred shares or junior preferred shares. As at March 7, 2006, there were 511,731,556 common shares outstanding and no preferred shares outstanding. For details of the Company’s share capital and stock options outstanding at December 31, 2005, refer to Notes 21 and 22 of the 2005 Consolidated Financial Statements.
ADDITIONAL INFORMATION
Copies of this MD&A and the following Consolidated Financial Statements, as well as the Company’s latest Annual Information Form and Management Proxy Circular, may be obtained from the Company’s Web site at www.petro-canada.ca or by mail upon request from the corporate secretary, 150 - 6 Avenue S.W., Calgary, Alberta, T2P 3E3. Other disclosure documents, and any reports, statements or other information filed by Petro-Canada with the Canadian provincial securities commissions or other similar regulatory authorities, are accessible through the Internet on the Canadian System for Electronic Document Analysis and Retrieval, which is commonly known by the acronym SEDAR, and is located at www.sedar.com. SEDAR is the Canadian equivalent of the U.S. SEC’s Electronic and Document Gathering and Retrieval System, which is commonly known by the acronym EDGAR, and is located at www.sec.gov.