Exhibit 2
MANAGEMENT’S DISCUSSION & ANALYSIS
Management’s Discussion and Analysis (MD&A) should be read in conjunction with the Financial Statements and Notes included in this annual report. Graphs accompanying the text identify our ‘value drivers’, key measures of performance in each component of our business.
RESULTS OF OPERATIONS
Summarized Financial Results
Consolidated Financial Results
(millions of dollars, unless otherwise indicated) | | 2002 | | 2001(1) | | 2000(1) | |
| | | | | | | |
Earnings from operations(2) | | $ | 1 024 | | $ | 912 | | $ | 879 | |
Loss on foreign currency translation | | (52 | ) | (96 | ) | (53 | ) |
Gain on disposal of assets | | 2 | | 30 | | 71 | |
Reorganization costs | | — | | — | | (38 | ) |
Net earnings | | $ | 974 | | $ | 846 | | $ | 859 | |
Earnings per share (dollars) | - basic | | $ | 3.71 | | $ | 3.19 | | $ | 3.15 | |
| - diluted | | 3.67 | | 3.16 | | 3.13 | |
| | | | | | | |
Cash flow(3) | | 2 276 | | 1 688 | | 1 870 | |
Cash flow per share (dollars) | | 8.66 | | 6.37 | | 6.87 | |
Debt | | 3 057 | | 1 401 | | 1 774 | |
Cash and short-term investments | | 234 | | 781 | | 1 415 | |
Average capital employed | | $ | 7 826 | | $ | 6 259 | | $ | 5 883 | |
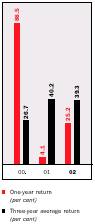
Return on capital employed (per cent) | | 13.9 | | 14.8 | | 16.0 | |
Operating return on capital employed(2) (per cent) | | 14.5 | | 15.8 | | 16.4 | |
Return on equity (per cent) | | 18.3 | | 18.1 | | 20.7 | |
(1) | Effective January 1, 2002 the Company adopted, retroactively, the recommendations of the Canadian Institute of Chartered Accountants on accounting for foreign currency translation of long-term debt and, as a result, prior year comparative figures have been restated to conform with the current year’s presentation. |
| |
(2) | Earnings from operations are earnings before gains or losses on foreign currency translation and on disposal of assets. In 2000, earnings from operations are before reorganization costs. |
| |
(3) | Before changes in non-cash working capital items. |
Shareholder Value
Shareholder value grew 25.2 per cent through share price appreciation and dividends.
• Shareholder value measures the change in the Petro-Canada share price plus dividend returns.
This MD&A contains forward-looking statements, including, but not limited to, references to: future capital and other expenditures (including the amount, nature and sources of funding thereof ); oil and gas production levels and the sources of their growth; tax and royalty rates; oil and gas prices; the Canadian dollar exchange rate; interest rates; refining and marketing margins; demand for refined petroleum products; planned facilities construction and expansion; retail site throughputs; pre-production and operating costs; reserve estimates; reserves life; natural gas export capacity; plans for and results of exploration and development activities; environmental matters; drilling plans; acquisition and disposition of resource properties; and the dates by which certain areas and facilities will be developed or will come on-stream. Undue reliance should not be placed on these forward-looking statements, which are based upon Petro-Canada’s assumptions and are subject to known and unknown risks and uncertainties and other factors which may cause actual results, levels of activity and achievements to differ materially from those expressed or implied by such statements. Such factors include, but are not limited to: general economic, market and business conditions; industry capacity; competitive action by other companies; fluctuations in oil and gas prices; refining and marketing margins; the ability to produce and transport crude oil and natural gas to markets; the results of exploration and development drilling and related activities; fluctuation in foreign currency exchange rates and interest rates; the ability of suppliers to meet commitments; actions by governmental authorities including increases in taxes; decisions or approvals of administrative tribunals; changes in environmental and other regulations; the availability of capital markets; risks attendant with oil and gas operations; and other factors, many of which are beyond the control of Petro-Canada. Petro-Canada undertakes no obligation to update publicly or revise any forward-looking statements contained herein, and such statements are expressly qualified by this cautionary statement.
6
2002 COMPARED WITH 2001
Earnings from operations climbed 12 per cent to a record $1 024 million in 2002. The improvement reflected a substantial increase in Upstream earnings, with partial offsets from a decline in the Downstream and an increase in the net cost of Shared Services. Net earnings and cash flow also climbed to record levels in 2002, reflecting the impact of Petro-Canada’s new Upstream International segment, established following the acquisition of most of the oil and gas businesses of Veba Oil & Gas GmbH on May 2, 2002. This new business contributed $225 million to earnings in 2002. The record cash flow includes contributions of $1 417 million from Upstream Canada and $583 million from Upstream International. A $431 million increase in the current portion of the provision for income taxes, affecting cash flow, was largely related to Upstream International business operations.
While return on equity improved to 18.3 per cent from 18.1 in 2001, the operating return on capital employed declined to 14.5 per cent from 15.8, reflecting a weaker business environment and additional investment for future upstream growth.
Business Conditions
Economic factors influencing Petro-Canada’s Upstream financial performance include crude oil and natural gas prices as well as the Canadian/U.S. dollar and Canadian dollar /euro exchange rates. Prices for energy commodities are primarily affected by supply and demand, weather, political events and the level of industry inventories.
Factors influencing Downstream performance include the level and volatility of crude oil prices, industry refining margins, movements in light/heavy crude oil price differentials, demand for refined petroleum products and the degree of market competition.
Earnings from Operations and Cash Flow
Earnings from operations topped $1 billion in 2002.

• Earnings from operations do not include gains or losses on foreign currency translation and on disposal of assets. In 2000, earnings from operations are before reorganization costs.
Operating Return on Capital Employed
Operating return on capital employed reflected a weaker business environment and additional investment for future upstream growth.
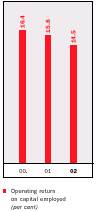
• Earnings from operations do not include gains or losses on foreign currency translation and on disposal of assets. In 2000, earnings from operations are before reorganization costs.
BUSINESS CONDITIONS IN 2002
The evolution of oil prices in 2002 was again marked by major swings in response to changes in market fundamentals as well as political developments with a major bearing on global oil markets. Major political developments having a significant influence on oil prices in 2002 included the persistent threat of war with Iraq and, late in the year, political instability in Venezuela.
The evolution of North American natural gas prices was also subject to considerable volatility. The combination of softening demand and production growth during 2001 resulted in a massive build-up of working gas in storage as we entered the 2001/02 winter season. The year 2002 started with abundant gas in storage and warmer-than-normal winter conditions prevailed across the continent. This led to substantially weaker prices than those that characterized the 2000/2001 winter season and provided little opportunity for any significant strengthening in prices until the onset of winter weather late in the year.
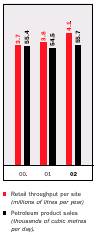
Sales of Canadian refined petroleum products increased in 2002 by approximately 0.8 per cent compared with a decline of 1.0 per cent in 2001. For most of 2002, refining margins were softer and light/heavy oil price differentials were narrower than in the previous year.
Commodity Price Indicators and Exchange Rates
(averages for the years indicated) | | 2002 | | 2001 | |
| | | | | | | | | |
Crude oil price indicators (per barrel): | | | | | | | | | |
North Sea Brent | | US$ | | 24.98 | | US$ | | 24.46 | |
West Texas Intermediate (WTI) at Cushing | | US$ | | 26.08 | | US$ | | 25.90 | |
WTI/Brent price differential | | US$ | | 1.10 | | US$ | | 1.44 | |
Brent/Maya price differential | | US$ | | 4.08 | | US$ | | 7.31 | |
Edmonton Light | | Cdn$ | | 40.41 | | Cdn$ | | 39.58 | |
Edmonton Light/Bow River (heavy) price differential | | Cdn$ | | 8.90 | | Cdn$ | | 14.97 | |
Natural gas price indicators: | | | | | | | | | |
At Henry Hub – per million British thermal units (mmbtu) | | US$ | | 3.25 | | US$ | | 4.38 | |
AECO spot – per thousand cubic feet (mcf) | | Cdn$ | | 4.24 | | Cdn$ | | 6.57 | |
Henry Hub-AECO-C basis differential – per mmbtu | | US$ | | 0.66 | | US$ | | 0.27 | |
New York Harbor 3-2-1 refinery crack spread – per barrel | | US$ | | 3.36 | | US$ | | 4.44 | |
Exchange rates | – US$ per Cdn$ | | US$ | | 0.637 | | US$ | | 0.646 | |
| – euro per Cdn$ | | euro | | 0.674 | | euro | | 0.721 | |
7
OUTLOOK FOR BUSINESS CONDITIONS IN 2003
Although business conditions are expected to remain volatile in 2003, Petro-Canada's business is managed for the long term.
The global energy outlook in 2003 remains clouded by the uncertainties arising from a delayed global economic recovery and, at time of writing, the continuing threat of a U.S.-led military intervention in Iraq and the political crisis in Venezuela. Given these conditions, Petro-Canada expects volatility in oil prices to continue through 2003. Given current low levels of crude oil stocks globally, worries about potential supply disruptions arising from a war in Iraq and from political instability in Venezuela will continue to dominate the behaviour of oil prices during the first half of the year and possibly beyond. These concerns are being reinforced by doubts about OPEC’s ability to make up for the potential loss of Venezuelan and Iraqi barrels.
In North America, the energy outlook during 2003 is complicated further by the rapid tightening of the natural gas supply/demand balance, due to unseasonably cold winter weather in key consuming markets at a time of a very poor supply performance across the continent. This has led to much faster rates of gas withdrawals from storage than anticipated. If, as a consequence, the heating season closes with low levels of natural gas inventories, there will be increased need for gas injections to replenish storage levels before next winter. Thus, natural gas prices across North America are expected to remain strong but highly volatile in 2003 as the rapid depletion of natural gas in storage reduces the ability of inventories to cushion unexpected swings in supply and/or demand. Moreover, the continuing weak outlook for production growth in 2003, due to the maturity of traditional basins in the United States and the Western Canada Sedimentary Basin, will continue to provide support to gas prices during the remainder of the year.
Only a modest improvement in the volume of domestic sales of refined products and refinery margins is anticipated for 2003, as external business conditions that have a major influence on downstream operations are expected to remain more or less similar to those that prevailed in 2002.
ECONOMIC SENSITIVITIES
The following table shows the estimated after-tax effects that changes in certain factors would have had on Petro-Canada’s 2002 net earnings had these changes occurred. We base these calculations on business conditions, production and sales volumes realized in 2002.
Sensitivities Affecting Net Earnings
Factor | | 2002 Averages | | Change (+/-) | | Approximate
Change (+/-)
in Net Earnings(1) | |
| | | | | | (millions of
Canadian dollars) | |
Total Upstream | | | | | | | |
Price received for crude oil and liquids | | $38.50/bbl | | Cdn$1.00/bbl | (2) | 34 | |
Price received for natural gas | | $4.07/mcf | | $0.25/mcf | | 38 | |
Production of crude oil and liquids | | 244 900 barrels per day (b/d) | | 1 000 b/d | | 4 | |
Production of natural gas available for sale | | 825 million cubic feet per day (mmcf/d) | | 10 mmcf/d | | 3 | |
| | | | | | | |
| | | | | | | |
Downstream | | | | | | | |
New York Harbor 3-2-1 crack spread(3) | | US$3.36/bbl | | US$0.10/bbl | | 5 | |
Light/heavy crude price differential(4) | | $8.90/bbl | | $1.00/bbl | | 13 | |
| | | | | | | |
Corporate | | | | | | | |
Exchange rate: US$ per Cdn$(5) | | US$0.637 | | US$0.01 | | (9 | ) |
(1) | The impact of a change in one factor may be compounded or offset by changes in other factors. This table does not consider the impact of any inter-relationship among the factors. The application of these factors may not necessarily lead to an accurate prediction of future results of operations. We may undertake risk management initiatives from time to time that affect these sensitivities. |
(2) | This sensitivity is based upon an equivalent change in the price of WTI and North Sea Brent. In 2002 WTI averaged US$26.08/bbl and North Sea Brent averaged US$24.98/bbl. |
(3) | New York Harbor 3-2-1 crack spread applies mainly to Eastern Canada markets. |
(4) | The spread between the prices of benchmark Edmonton Light and Bow River (heavy) crude oils. |
(5) | A strengthening Canadian dollar versus the U.S. dollar has a negative effect on Petro-Canada’s earnings. |
8
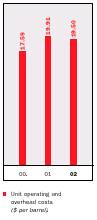
Upstream
Petro-Canada’s Upstream operations are diversified both in resource type and geographically. In Canada, we have three Upstream core businesses: East Coast offshore oil; Oil Sands in northeastern Alberta; and North American natural gas, with current production in Western Canada. Internationally, as a result of a major acquisition of oil and gas assets in 2002, we are active in three core areas: Northwest Europe; North Africa/Near East; and Northern Latin America.
Petro-Canada’s portfolio offers a platform for long-term growth in crude oil and natural gas. Our goal is superior profitability and profitable growth. Our strategy combines a drive for first quartile operating performance with a strict discipline as to where and how we invest.
In 2002, Petro-Canada’s Upstream operating return on capital employed was 17.6 per cent, down from 20.9 per cent in 2001, reflecting lower natural gas prices and additional investment for future growth in Canada and internationally.
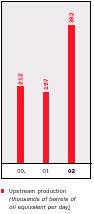
Total Upstream production in 2002 consisted of an average 244 900 b/d of oil and liquids and 825 mmcf/d of natural gas, or a record 382 400 barrels of oil equivalent per day (boe/d), almost double the 196 500 boe/d achieved in 2001. (Natural gas is converted at the rate of 6 000 cubic feet to one barrel of oil equivalent). The contribution to 2002 production from Upstream Canada averaged 239 700 boe/d and from Upstream International 142 700 boe/d. At 2002 year-end, proved reserves totalled 1 290 million boe (mmboe), up 57 per cent from a year earlier. The impact of the newly-acquired international assets combined with additions from drilling at Hibernia and Terra Nova and development of Syncrude’s Aurora Mine more than offset production in the year. During 2002, independent petroleum reservoir engineering consultants Sproule Associates Limited and DeGolyer and MacNaughton conducted evaluations, technical audits and reviews of Petro-Canada’s hydrocarbon reserves. Based on the results of this work, we conclude that the Company’s year-end 2002 reserves estimates are reasonable. In addition, PricewaterhouseCoopers LLP, as contract internal auditor, tested the non-engineering management control processes used in establishing Canadian reserves.
Oil and Gas Production
Production increased due to the international acquisition, the start-up of Terra Nova and higher volumes from Hibernia.
Reserves Replacement
Total conventional oil and gas reserves replacement increased in 2002.
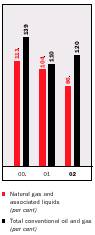
• Excludes acquisitions and divestitures.
• Excludes Syncrude and MacKay River.
Upstream Canada
Upstream Canada Financial Results
(millions of dollars) | | 2002 | | 2001 | | 2000 | |
| | | | | | | |
Earnings from operations | | $ | 689 | | $ | 690 | | $ | 685 | |
(Loss) gain on sale of assets | | (1 | ) | 29 | | 113 | |
Net earnings | | $ | 688 | | $ | 719 | | $ | 798 | |
Cash flow | | $ | 1 417 | | $ | 1 125 | | $ | 1 460 | |
Expenditures on property, plant and equipment and exploration | | $ | 1 281 | | $ | 1 131 | | $ | 884 | |
Total assets | | $ | 5 922 | | $ | 5 118 | | $ | 4 811 | |
2002 COMPARED WITH 2001
Petro-Canada's production of oil and gas nearly doubled in 2002 to a record 382 400 barrels of oil equivalent per day.
Earnings from operations in 2002 were virtually unchanged from the previous year, as a $251 million increase in operating revenues combined with a $19 million decrease in income taxes was offset by a $48 million increase in operating costs, a $140 million increase in depreciation, depletion and amortization expense and a $52 million rise in exploration expense. The revenue gain reflected increased East Coast crude oil production, with a partial offset from lower prices for natural gas. Total crude oil and natural gas liquids production from Canadian operations in 2002 averaged 119 400 b/d, up 59 per cent from 75 100 b/d in 2001, with the increase resulting from the start-up of Terra Nova, averaging 35 800 b/d, and a 6 400 b/d improvement at Hibernia. Natural gas production averaged 722 mmcf/d, up from 714 mmcf/d in 2001. The average price received for Upstream Canada crude oil and other liquids production was $37.95/bbl in 2002, compared with $37.24/bbl a year earlier. Canadian natural gas prices averaged $4.01/mcf, down from $6.00/mcf in the previous year. The increases in operating costs and depreciation, depletion and amortization expense mainly reflect the start-up of Terra Nova. The rise in exploration expense was due in large part to increased drilling in the Mackenzie Delta and the Scotian Slope. Current income taxes, affecting cash flow, decreased $88 million from the prior year. The decrease relates in part to net deferrals of current income taxes, mainly related to earnings of the Petro-Canada Oil and Gas partnership. The deferrals increased current taxes by about $50 million in 2002 compared to an increase of about $100 million in 2001.
9
Upstream Canada Review & Outlook
EAST COAST OIL
Strategy
• Continue to profitably add reserves and production through the development of White Rose and field extensions at Terra Nova and Hibernia.
• Pursue exploration opportunities in the largely unexplored deeper waters off the Grand Banks.
Executing the strategy
2002 began with the world-class start-up of Terra Nova. Both Terra Nova and Hibernia exceeded production expectations.
Our share of East Coast oil production more than doubled to 71 900 b/d in 2002 as a result of production start-up at Terra Nova and solid gains at Hibernia. Terra Nova came on stream January 20, 2002, and the performance of the production system was outstanding throughout the first year of operation. Production uptime, including a planned three-week maintenance shutdown, was 86 per cent, exceptional for a start-up year. As a result, production for the year averaged 105 400 b/d (35 800 b/d net to Petro-Canada), well above planned volumes. Operating costs in 2002, averaging $4.25/bbl, are not a good indicator of costs going forward, as they are founded on a build-up of production volumes over less than a full year of operations and one-time start-up costs, as well as the three-week maintenance shutdown. In 2003, we expect to reduce operating costs to below $2.70/bbl. Field activity at Terra Nova in 2002 included the drilling of five production and injection wells.
Production from Hibernia in 2002 rose to a new record of 180 500 b/d (36 100 b/d net to Petro-Canada), up from 148 500 b/d (29 700 b/d net to Petro-Canada) in the previous year, despite a two-week planned maintenance shutdown of the production platform. Operating costs in 2002 averaged $2.16/bbl, down from $2.62/bbl in 2001, with the per-unit improvement driven mainly by the volume gain. Drilling in 2002 added eight wells. Further strengthening our position on the East Coast in 2002, we began development of the White Rose oil field (Petro-Canada – 27.5 per cent interest). The project includes construction of a Floating Production Storage and Offloading vessel (FPSO) with a production capacity of 100 000 barrels of oil per day and a subsea production system. Field development plans anticipate 19 to 21 wells to recover an estimated 200 million to 250 million barrels of oil. Our Terra Nova experience has been incorporated into White Rose planning, reducing risk and uncertainty. Petro-Canada’s estimate of the project’s gross pre-production cost, including the first 10 wells, is $2.3 billion.
Hibernia Operating and Overhead Costs
Operating and overhead costs per barrel continued to decline.

Outlook
2003 Production expectations:
• East Coast conventional crude oil production to average 79 000 b/d.
Growth plans:
• Extend the production plateau at both Hibernia and Terra Nova.
• Complete White Rose development by late 2005.
• Test the exploration potential of the Flemish Pass.
2003 Capital spending plans:
• $170 million for development of the White Rose project.
• $140 million for ongoing Hibernia and Terra Nova drilling and development programs.
• $40 million for exploratory drilling.
In addition to development of White Rose, our Grand Banks mid-term growth focus includes extensions to existing reservoirs and evaluation of potential subsea tiebacks of smaller discoveries and prospects to the Hibernia and Terra Nova facilities. While the Hibernia reservoir currently provides most of the reserves and production for the Hibernia project, significant reserves potential also exists in the Ben Nevis Avalon formation. The reservoir quality of these sandstones does not match that of the prolific Hibernia reservoir but a substantial portion may be economically accessible. Results of an appraisal well drilled in late 2002 to test the extent of the Ben Nevis Avalon structure continue to be evaluated and further appraisal drilling may be required. At Terra Nova, where development is currently focused on the Graben and East Flank segments of the reservoir, we are continuing to assess the potential of the adjacent Far East block. A first Far East well, drilled in 2001, encountered 80 metres of oil-bearing net pay in the Jeanne d’Arc sands. Results of a second delineation well, completed in late 2002, are being analysed. At least one delineation well is scheduled for 2003. Project plans for White Rose anticipate production start-up in late 2005 and a field life of 10 to 12 years, with peak annual average production of 90 000 b/d (24 700 b/d net to Petro-Canada) sustainable for about four years.
10
Our regional exploration work has identified a number of prospects in the Flemish Pass and Salar Basins. These two basins are located in average water depths of 1 100 and 1 500 metres, respectively, compared to water depths of less than 100 metres for the Jeanne d’Arc basin, where all major oil discoveries to date have been made. In early February 2003, we commenced drilling the Mizzen L-11 well (Petro-Canada – 33.34 per cent working interest) in the Flemish Pass region. It is the first of two wells planned for the region in 2003.
OIL SANDS
Strategy
• Continue reliability improvements and pursue profitable long-term growth from expansion of Syncrude.
• Capture the full value of in situ bitumen production through staged development integrated with our Edmonton refinery.
Executing the strategy
We celebrated the on-time and on-budget start-up of the MacKay River in situ oil sands project in 2002.
The successful completion in 2002 of our 100 per cent owned, 30 000 b/d, MacKay River in situ development, on schedule and on budget, was a significant milestone in our long-term oil sands plans. Start-up began late in the third quarter with initial steaming of the reservoir, followed by first bitumen production in November. Petro-Canada expects production to climb from an average 9 400 b/d in December 2002 to plant capacity of 30 000 b/d by the end of 2003. We believe we can sustain production at capacity for 25 years. The MacKay River production process uses steam-assisted gravity drainage (SAGD), a technology Petro-Canada helped to develop, which can economically recover over 60 per cent of the bitumen in place. SAGD combines horizontal drilling with thermal steam injection. Steam is injected into the reservoir through the top well of a horizontal well pair to mobilize the bitumen, which flows to the lower producing well. Initial development at MacKay River includes 25 horizontal well pairs. The water used to generate steam comes from underground, with more than 90 per cent recycled – a key feature of the facility’s environmental efficiency. Total capital expenditures at MacKay River came in at $274 million.
With the knowledge gained from participation in a SAGD pilot project at an adjacent test facility, our operating technical risks at MacKay River are minimized. The result is high capital efficiency, reservoir confidence and lower operating cost. On completion of a 165 megawatt co-generation facility currently being constructed by TransCanada Energy Limited, we expect MacKay River operating costs to average about $2.25 plus one mcf of gas per barrel, which will be at the lower end of heavy oil supply costs in Canada. The co-generation plant, planned for start-up late in 2003, will provide MacKay River with a long-term assured supply of low-cost power and steam and reduce related greenhouse gas emissions by about 50 per cent when compared to the equivalent steam and electricity produced without co-generation. The facility will be owned by TransCanada Energy but operated as part of the MacKay River project.
Petro-Canada’s 12 per cent share of Syncrude, the world’s largest oil sands mining operation, forms another cornerstone of our oil sands growth plans. In 2002, Petro-Canada’s share of Syncrude production averaged 27 500 b/d, up from 26 800 b/d in 2001. Syncrude management is directing increased resources towards resolving outstanding reliability concerns in an effort to fully realize Syncrude’s production potential, and reduce operating costs. Unit operating costs declined to $19.50/bbl in 2002 from $19.91/bbl in the previous year. An extended planned maintenance program in the summer of 2002 impacted unit costs.
Syncrude Operating and Overhead Costs
Reliability of operations is being addressed.
Outlook
2003 Production expectations:
• Petro-Canada’s share of Syncrude production to average 27 900 b/d.
• MacKay River bitumen production to average 22 000 b/d.
Growth plans:
• Continue participation in the expansion program at Syncrude.
• Develop our second in situ bitumen production project at Meadow Creek.
• Advance our development plans for a large-scale, fully integrated project linking the production and refining of bitumen.
2003 Capital spending plans:
• $255 million for our share of Syncrude’s expenditures.
• About $400 million for our proposed Edmonton refinery bitumen feed conversion and Meadow Creek development.
11
At Syncrude, engineering and construction is currently underway on the third stage of a multi-stage expansion program. Stage 3 includes a second Aurora mine and an upgrading expansion. This stage is expected to increase production capacity by 100 000 b/d to a total of 360 000 b/d (over 43 000 b/d net to Petro-Canada) by 2005.
Over the next decade, assuming an appropriate regulatory climate concerning environmental issues including the Kyoto Protocol, we expect oil sands will be a major engine of growth for Petro-Canada. With interests in about 300 000 net acres of oil sands leases considered prospective for in situ development, we are well positioned to pursue this growth opportunity.
Completion of the MacKay River project was the first step in creating a large-scale, fully integrated bitumen production and refining operation. Our next step will be a second in situ development at Meadow Creek (owned 75 per cent by Petro-Canada), 45 kilometres south of Fort McMurray. Meadow Creek will have a bitumen production capacity of 80 000 b/d, more than twice that of MacKay River. Extensive seismic evaluation and delineation drilling on the property have confirmed significant bitumen resources. The property is well situated on existing infrastructure corridors. Development could begin by late 2004, with initial production by year-end 2007, giving us time to optimize the MacKay River development and incorporate our experience into the design and plans for Meadow Creek.
Timelines for start-up at Meadow Creek will be coordinated with the first phase of a major conversion to enable the Edmonton refinery to replace its existing light crude oil feedstock with bitumen. The initial conversion will provide upgrading and refining capability for about 85 000 b/d of bitumen. At a later date, we have plans for a third in situ development and a doubling of bitumen processing capacity at the Edmonton refinery. Complete implementation of our integrated oil sands strategy could take bitumen production to 170 000 b/d by 2012. Linkage of bitumen production with refining provides considerable insulation from heavy oil price fluctuations, eliminates bitumen marketing risks and provides Petro-Canada with a competitive advantage over non-integrated bitumen producers. Our staged approach to these capital-intensive projects will facilitate cost management, while allowing us to benefit from evolving technology.
Our application for the Meadow Creek development is under review. Regulatory approval for the feed conversion project at the Edmonton refinery is anticipated in early 2003. Decisions to proceed with these plans will only be made following regulatory approvals and continuing economic evaluations, particularly with respect to the impact of the federal government’s Kyoto Protocol implementation plan. While both the federal and provincial governments have stated that the oil sands economic opportunity must be maintained, Petro-Canada is seeking further certainty as to the specifics of Kyoto Protocol implementation and its impact on economics.
NORTH AMERICAN NATURAL GAS
Strategy
• Maximize profitability through consistent top quartile performance in finding and development costs and in the efficient operation of our production facilities.
• For longer term growth, pursue high potential exploration in the Mackenzie Delta, offshore Nova Scotia and Alaska.
Executing the strategy
Petro-Canada continues to be one of the most profitable producers of natural gas in Western Canada, with strong performance in operating and finding & development costs.
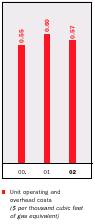
Natural gas production averaged 722 mmcf/d in 2002, up from 714 mmcf/d in 2001, as additional volumes from ongoing development and reduced gas plant turnarounds more than offset natural declines. Natural gas price realizations averaged $4.01/mcf, down 33 per cent from the previous year, due to soft market conditions for a large part of the year. Our conventional crude oil and natural gas liquids production in Western Canada averaged 18 900 b/d, up from 18 600 b/d in 2001. Operating and overhead costs in 2002 were $0.57 per thousand cubic feet of gas equivalent (mcfe), down from $0.60/mcfe in the previous year, partly reflecting the reduced turnarounds.
Exploration and development drilling in Western Canada resulted in 351 successful wells, for a success rate of 93 per cent. At 2002 year-end, Petro-Canada’s proved natural gas reserves in Western Canada totalled 2 181 bcf, compared with 2 228 bcf at the close of 2001. Proved crude oil and natural gas liquids reserves, at 55 million barrels, were up from 54 million barrels a year earlier. Exploration and development successes added 247 billion cubic feet equivalent (bcfe) of natural gas and associated liquids to proved reserves, replacing 86 per cent of 2002 production.
12
The shortfall from our target of full reserves replacement reflects our focus on profitability and the challenging environment for economic reserves additions in the increasingly mature Western Canada Sedimentary Basin. As a result of strict investment discipline, our three-year average finding and development cost for natural gas and associated liquids remained highly competitive at $1.39/mcfe.
The success of our natural gas business over the past several years has resulted from a strategy of exploitation within our three core areas – the Alberta Foothills, northeastern British Columbia and southeastern Alberta – especially in the Foothills, where we have developed a strong technical competency in finding, developing and operating deep sour gas. In the Wildcat Hills area alone, the application of this competency over the past five years has resulted in 50 successful wells and a more than 300 per cent increase in area production. Drilling successes in 2002 included the Wildcat Hills 8-32 well – our best well ever in this area. This vertical well has net pay of 194 metres and is on production at 20 mmcf/d.
In the shallow gas region of Medicine Hat in southern Alberta, we completed our first winter drilling program, which continued into the summer months and resulted in 271 gross (164 net) successful wells. Reflecting the success of this ongoing development program, production from the area rose to 68 mmcf/d late in the year.
For longer term growth, we are continuing to pursue frontier opportunities. In early 2002, an aggressive exploration program in the Mackenzie Delta was rewarded with a significant natural gas discovery. The Tuk M-18 well (Petro-Canada – 50 per cent interest) tested at restricted rates up to 30 mmcf/d, with sustained deliverability estimated at 60 to 80 mmcf/d. Recoverable gas from the field is estimated at 200 bcf to 300 bcf. Tuk M-18 was one of three wells drilled during the winter of 2001/02; the remaining two were dry and aban-doned. Offshore Nova Scotia, we participated in the Newburn H-23 exploratory well (Petro-Canada – 43 per cent interest) on the Scotian Slope, only the fifth industry well to test this deep water play. The well found non-commercial quantities of gas. In Alaska, where our focus is the foothills area north of the Brooks mountain range, a field geological study has confirmed that the geology and prospectivity of the area is similar to the Alberta Foothills, where Petro-Canada has developed considerable expertise and has had significant success finding gas. At year-end, we held 100 per cent interests in over 400 000 acres. While it is unlikely the region will be serviced by a pipeline for some time, Petro-Canada’s acreage is close to a proposed pipeline route to southern markets.
Western Canada Operating and Overhead Costs
Costs per unit were down marginally from the previous year.
• Includes Western Canada gas, conventional oil and liquids.
Natural Gas and Associated Liquids Finding and Development Costs in Western Canada
Finding and development costs remained competitive despite rising service and supply costs.

• Three-year rolling average for proved reserves.
• Excludes acquisitions and divestitures.
Outlook
2003 Production expectations:
• Western Canada natural gas production to average 690 mmcf/d.
Growth plans:
• Continue pursuit of attractive prospects in the Western Canada Sedimentary Basin while focusing on profitability rather than volume gain.
• Advance exploration programs in the Mackenzie Delta, Scotian Slope and Alaska.
2003 Capital spending plans:
• Continue substantial funding with investment plans totalling $455 million, including drilling in the Western Canada Sedimentary Basin and in the Mackenzie Delta.
Our plans for the Mackenzie Delta in 2003 include at least one exploration well that will test the same trend where we had success with Tuk M-18. In January 2002, the Mackenzie Delta Producers Group, led by Imperial Oil Limited, completed preliminary feasibility studies on development of a Mackenzie Valley pipeline and began work on applications for regulatory approval. In July, the group called for non-binding nomina-tions. Petro-Canada nominated 30 mmcf/d from its share of the Tuk gas pool. Given the long-term nature of Arctic development, as well as the antic-ipated lengthy regulatory review and approval process, a pipeline to southern markets is unlikely to be in place before the end of this decade. Our plans for offshore Nova Scotia include a 3-D seismic survey over additional licensed exploratory acreage, which could lead to an exploratory well in 2005.
13
Upstream International
Upstream International Financial Results
(millions of dollars) | | 2002 | | 2001 | | 2000 | |
| | | | | | | |
Earnings (loss) from operations | | $ | 225 | | $ | (27 | ) | $ | 19 | |
Loss on sale of assets | | — | | — | | (41 | ) |
Net earnings (loss) | | $ | 225 | | $ | (27 | ) | $ | (22 | ) |
Cash flow | | $ | 583 | | $ | 27 | | $ | 78 | |
Expenditures on property, plant and equipment and exploration | | $ | 221 | | $ | 153 | | $ | 43 | |
Total assets | | $ | 3 544 | | $ | 186 | | $ | 148 | |
The substantial improvement in financial performance in 2002 reflects the impact of a major acquisition, completed on May 2. In 2001, international operations were limited to modest activity in Algeria, Libya and Tunisia.
Averaged over the full year, production from International operations in 2002 equated to 142 700 boe/d. Production of crude oil and gas liquids averaged 125 500 b/d and natural gas 103 mmcf/d. Upstream International crude oil and liquids prices averaged $39.53/bbl and natural gas prices averaged $4.52/mcf.
Upstream International Review & Outlook
Strategy
• Exploit the existing reserve base and pursue new exploration and development opportunities, leveraging off existing relationships, skills and infrastructure.
• Establish a significant portfolio of growth opportunities, well balanced as to technical risk and economic return.
Executing the strategy
International is a new core business that contributed 25 per cent of Petro-Canada’s operating earnings and cash flow in the second half of 2002.
Petro-Canada gained a new platform for longer-term growth on May 2, 2002, with the acquisition of significant international oil and gas operations, while securing an immediate and substantial contribution to earnings. In addition to expanding our position in North Africa/Near East, a region of considerable underdeveloped potential, the new international properties provided Petro-Canada with solid footholds in the highly profitable North Sea and the highly prospective Northern Latin America region. Integration of the new operations was essentially completed prior to 2002 year-end. Rights of first refusal were exercised by third parties with respect to assets in Norway and Egypt. From May 2 to December 31, 2002, production from the acquired assets averaged 210 000 boe/d, with performance boosted by completion of development projects in the United Kingdom and Trinidad.
Northwest Europe
In Northwest Europe, our production comes from the U.K. and Netherlands sectors of the North Sea, with exploration programs extending into Denmark and the Faroe Islands. In the U.K. sector, Petro-Canada’s operations are centred around existing infrastructure, principally the Scott platform in the Outer Moray Firth and the Triton FPSO, located further south in the central North Sea, 190 kilometres east of Aberdeen. We hold interests in the Scott and Telford oil fields, the Guillemot West and Northwest oil fields, and the Bittern oil field. The Guillemot and Bittern fields are tied in to the Triton facilities. Production from the Netherlands sector includes natural gas from blocks L8b and L5c and oil from the Petro-Canada operated Hanze field. Over the last eight months of 2002, Petro-Canada’s share of production from Northwest Europe averaged 40 500 b/d for crude oil and natural gas liquids and 89.5 mmcf/d for natural gas.
North Sea activity in 2002 included the tieback of a new subsea satellite at the western extension of the Guillemot West oil field to the Triton FPSO. This project, adding initial production of 18 000 barrels of oil per day net to Petro-Canada, typifies the profitable North Sea investment opportunities we are pursuing. Drilling results offering opportunities for development included a successful appraisal well at Clapham (Petro-Canada – 100 per cent working interest) in the U.K. North Sea and a gas discovery in block L5b (Petro-Canada – 30 per cent working interest) in the Netherlands.
14
North Africa/Near East
In the North Africa/Near East region, which provides the major portion of Petro-Canada’s international production, our previously modest position in Algeria, Libya and Tunisia has been significantly expanded with the addition of new interests in Syria, Libya and Kazakhstan. In Syria, Petro-Canada’s interests in three production sharing contracts are consolidated under the umbrella of a joint venture firm, Al Furat Petroleum Company (AFPC), which produces about 55 per cent of Syrian production. Our share of production for the period from May 2 to December 31, 2002 averaged 107 200 boe/d. With the emphasis on improved recovery from existing fields, AFPC has established a technical Study Centre dedicated to the integrated study of the latest technologies, including underbalanced drilling, 4-D seismic and high-resolution seismic stratigraphy.
In Libya, Petro-Canada is one of the largest producers and well positioned to play a significant role in the country’s drive to expand reserves and production. Our major holding is a 49 per cent interest in a joint venture with the National Oil Company (NOC), which combines the operations of more than 20 fields. Our share of production over the last eight months of 2002 averaged 43 400 barrels of oil per day. Under a separate production sharing arrangement with NOC, development of two oil fields on the En Naga block was progressing towards completion at 2002 year-end. Production from this project (Petro-Canada working interest – 50 per cent) is expected to come on-stream in 2003 at an average annual rate of 6 800 b/d. Libya is a member of the Organization of the Petroleum Exporting Countries (OPEC). As such, production in that country may be constrained from time to time by OPEC quotas.
In Kazakhstan, initial production was achieved during the second half of 2002 from a small oil field development on the Temir licence (Petro-Canada – 40 per cent working interest). Early in 2003, following completion of a central production facility, we expect production to build to capacity of 12 000 b/d (4 800 b/d net to Petro-Canada).
Northern Latin America
Petro-Canada’s interests in Northern Latin America are focused on natural gas in Trinidad and crude oil in Venezuela. In Trinidad, we hold a 17.3 per cent working interest in the North Coast Marine Area-1 (NCMA-1) offshore gas project. In August 2002, NCMA-1 achieved first production from initial development of the Hibiscus, Poinsettia and Chaconia natural gas fields. The 2002 program included commissioning the Hibiscus production platform and drilling of production wells. Our share of production from start-up to 2002 year-end averaged 32 mmcf/d. Production is delivered to the Atlantic LNG facility at Point Fortin for liquefaction and sale into United States markets. Late in 2002, Petro-Canada completed the acquisition of a 50 per cent working interest in the La Ceiba block, which straddles the eastern shores of Lake Maracaibo in Venezuela. This property was initially excluded from the Veba acquisition pending resolution of pre-emptive rights. Commercial development of discoveries on the block continues to be evaluated. A right of first refusal concerning Veba’s Cerro Negro heavy oil operations in Venezuela was still unresolved at year-end.
Outlook
Our International acquisition establishes a platform for longer-term growth.
2003 Production expectations:
• Total International production to average 210 000 boe/d.
• Northwest Europe to average 44 000 boe/d.
• North Africa/Near East to average 157 000 boe/d.
• Trinidad to average 48 mmcf/d.
Growth plans:
• In the North Sea, acquire resources adjacent to infrastructure.
• Advance opportunities to improve reserve recovery rates in Syria and Libya through the application of modern technology.
• Exploitation and concentric exploration in underdeveloped areas of Libya and Syria.
• Identify and develop growth opportunities in new areas.
2003 Capital spending plans:
• $260 million to sustain existing production.
• $190 million for new developments, including the Clapham project in the North Sea.
• $95 million for exploration opportunities.
In Northwest Europe, our key strategy is focused exploration and development on low-risk opportunities in the North Sea, centred on existing infrastructure. While the region is a mature play, even small developments are attractive. We are focusing on low-cost development of small and mid-size pools that can be rapidly brought into production. Our plans include expanding our presently modest exploration portfolio with the emphasis on securing licence operatorships or high working interests.
15
Our goal is to sustain profitable production over the medium term. The near-term focus includes development of a gas discovery on block L5b in the Netherlands sector, where first production is expected early in 2004 at an anticipated rate of 12 mmcf/d. In the U.K., development plans for the Clapham field include drilling two producing wells and two injectors and tie-in to the Triton production facility. Production from this new field is expected to rise rapidly to an anticipated peak of 15 000 boe/d in 2004.
In North Africa/Near East, our strategy is to exploit the large underdeveloped reserves potential in this region. In Syria, AFPC’s near term goal is to sustain gross production at the 300 000 boe/d level for the next few years. For the longer term, we are assessing exploration opportunities. In Libya, we see an opportunity for the future in the application of modern technology to further improve reserves recovery.
In Northern Latin America, our expectations for production growth are currently focused on Trinidad, where Atlantic LNG is building an additional production train to serve the NCMA-1 project. When the train comes on stream in mid-2003, we expect our share of production to grow to 60 mmcf/d. For the longer term, we are looking at emerging exploration opportunities.
Downstream
Downstream Financial Results
(millions of dollars) | | 2002 | | 2001 | | 2000 | |
| | | | | | | |
Earnings from operations | | $ | 254 | | $ | 300 | | $ | 273 | |
Gain (loss) on sale of assets | | 3 | | 1 | | (1 | ) |
Net earnings | | $ | 257 | | $ | 301 | | $ | 272 | |
Cash flow | | $ | 380 | | $ | 589 | | $ | 434 | |
Expenditures on property, plant and equipment | | $ | 344 | | $ | 383 | | $ | 264 | |
Total assets | | $ | 3 841 | | $ | 3 556 | | $ | 3 609 | |
2002 COMPARED WITH 2001
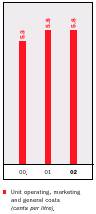
Strong operating performance throughout the Downstream in 2002 yielded solid results in a difficult business environment. Total sales of refined products, buoyed by an uplift in retail fuel and asphalt sales, increased to a record 55 700 cubic metres per day (m3/d) from 54 500 m3/d in 2001. Despite rising feedstock costs, the earnings contribution from Lubricants operations was up significantly in large part due to a further increase in high-margin sales. Despite the operating performance improvements, Downstream net earnings declined, mainly due to the adverse effects on Refining and Supply of lower refining margins, particularly for distillate, and narrower light/heavy oil price differentials. Downstream operating return on capital employed declined to 10.8 per cent in 2002 from 13.3 per cent in 2001 for the same reasons. Total Downstream operating, marketing and overhead unit costs, at 5.8 cents per litre, were unchanged from 2001. Current income taxes, affecting cash flow, increased to $242 million in 2002 from $90 million in the previous year, mainly due to the net deferral of current taxes, resulting from the inventory accounting method required for income tax purposes. This method resulted in an $85 million increase in current taxes in 2002, compared to a $98 million reduction in 2001.
Downstream Review & Outlook
Strategy
• Generate superior returns by focusing on first-quartile refining performance, advancing Petro-Canada as the brand of choice for Canadian gasoline consumers, and increasing sales of high-margin specialty lubricants.
Operating strategies are focused on strengthening the foundations for improved profitability through effective capital investment and discipline over controllable factors. The target is a minimum 12 per cent return on capital employed, based on a mid-cycle business environment. Petro-Canada’s three refineries, strategically located in the major markets of Alberta (Edmonton), Ontario (Oakville) and Quebec (Montreal), account for about 17 per cent of Canada’s total refining capacity. The refineries and lubricants plant are already benefiting from restructuring and planning initiatives
16
implemented over the past two years. A reorganization of the Sales and Marketing group during 2002 has further improved cost structure and is part of the drive towards top quartile Downstream performance.
Executing the strategy
In the Downstream, profitability improvement initiatives are delivering results.
In 2002, our three refineries ran at full capacity, processing a record average 50 400 m3/d of crude oil, a six per cent increase over 2001 volumes. Improved plant reliability spearheaded the improvement. The overall crude capacity utilization rate was 101 per cent, compared to 96 per cent in 2001. To optimize operations and maintenance procedures, we have implemented Solomon & Associates best practices. As part of efforts to reduce both costs and greenhouse gas emissions, Petro-Canada is committed to reduce energy consumption by an average of at least one per cent per year through 2005.
The capability of the Oakville and Montreal refineries to process heavy oil allows us to lower feedstock costs and gives us a strong position in the asphalt markets in eastern Canada. In 2002, asphalt produced from these heavy crudes totalled a record 1.6 billion litres; however, the financial benefit was moderated by weak industry margins.
In 2002, modifications were completed at the Oakville refinery to reduce sulphur in gasoline to 150 parts per million (ppm) gasoline pool average, as required by the federal government. Construction of desulphurization units for the regulatory requirement of 30 ppm gasoline limit by 2005 has begun at the Edmonton and Montreal refineries. Engineering of the technology solution for sulphur reduction to 30 ppm at Oakville is underway. We expect to meet government timelines in the legislative requirements for low-sulphur gasoline supply.
In Sales and Marketing, the throughput from Petro-Canada’s retail network of 1 537 sites averaged 4.1 million litres per site, compared with 3.8 million litres in 2001. The improvement reflects the success of new-image sites, which are achieving annual throughputs averaging in excess of seven million litres. Fast-tracking the re-imaging program has enabled us to capitalize on this compelling market advantage.
Retail site re-imaging and successful sales and marketing programs have generated substantial growth in sales of non-petroleum products and services. Convenience store sales, which were up 30 per cent in 2002 compared with 2001, have grown more than 150 per cent since 1998. In recognition of the quality and success of our convenience store business, Petro-Canada was named 2002 Convenience Store Chain of the Year by leading U.S. trade journal Convenience Store Decisions. The award identified outstanding performance in all eight fields of measurement: product quality; customer service; marketing innovation; operating efficiency; management effectiveness; community involvement; image enhancement; and sales and profit performance. This is the first time a non-U.S. retailer has won the award, considered the most prestigious in the North American convenience store industry.
Petro-Canada’s growing achievements in retail sales and marketing also include an expanding membership in Petro-Points, Petro-Canada’s branded customer loyalty program. At year-end 2002, about 6.6 million Canadian households were Petro-Points members, up 20 per cent from a year earlier. The strong membership growth is being driven by continued program improvements, including points exchange with President’s Choice Financial points program and the acceptance of Sears credit cards, which complements the existing points exchange with the Sears points program. The newly launched Petro-Canada Pre-Paid Card, which can be used to purchase any product or service at Petro-Canada locations across the country, is also proving to be a valuable product as well as an additional reward option for Petro-Point members. The Pre-Paid Card is the first of its kind to be offered by a major oil and gas company in Canada.
In the wholesale channel, key strategic initiatives have been implemented, all focused on maintaining our best-in-class position. The Petro-Pass network of 208 truck stop facilities is the leading national marketer of fuel in the commercial road transport segment in Canada. These facilities provide 24-hour access to high speed pumps for faster fueling, as well as a range of enhanced services to meet the needs of the trucking industry. In 2002, we focused on enhancing our leadership position through network expansion and additional wholesale site re-imaging based on the successful retail design. In bulk fuels, new logistics technology was implemented and consolidations were completed to further improve the efficiency of our network.
In Lubricants, our strategy is focused on growing volume in high-margin channels. Petro-Canada enjoys worldwide recognition for its state-of-the-art base oil manufacturing technology, the result of more than 20 years of pioneering work.
17
The lubricants plant produces the highest quality hydro-treated products as well as low-cost pharmaceutical grade white oils and high viscosity index oils. Products include premium quality lubricants for high-end industrial applications, next-generation engine oils and transmission fluids. In 2002, Lubricants sales totalled 768 million litres, an increase of over three per cent in comparison with sales volume of 744 million litres in 2001, reflecting strong growth in higher value base oils and sales to the automotive sector. In total, high-margin sales rose 10 per cent and now represent over 60 per cent of total Lubricants sales.
Downstream Operating, Marketing and General Costs
Per-litre costs were unchanged from 2001.
Refinery Utilization
Refinery utilization increased reflecting continued reliable operations at the Company’s refineries.
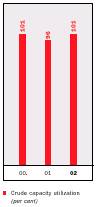
• Our rated refinery crude capacity increased in 2001 following process improvements.
Product Sales
Total Downstream sales and sales per retail site continued to grow in 2002.
Outlook
Plans for improved profitability:
• Maximize refinery plant reliability.
• Increase product value from refinery feedstock slates.
• Secure further reductions in operating costs.
• Continue roll-out of and maximize benefits from retail site re-imaging program.
• Capitalize on the increasing demand for higher quality base oils.
2003 Capital spending plans:
• $360 million for Refining and Supply.
• $125 million for Sales and Marketing.
• $15 million for Lubricants.
The 2003 capital expenditure plans are focused on positioning Petro-Canada for continued profitability, while lessening the environmental impact of our operations and products. The major portion of expenditures in Refining and Supply will focus on refinery reconfigurations to meet new lower limits for sulphur in gasoline. Expenditures in Sales and Marketing will provide for the continued roll-out of Petro-Canada’s successful new-image service station program and further development of the Petro-Pass network. At year-end 2002, we were 70 per cent of the way through the retail site re-imaging program, which is focused on converting only those Company-controlled sites that meet economic return criteria. The goal is to complete the program by the end of 2005.
Petro-Canada currently sells over two-thirds of its 350 manufactured lubricants, specialty fluids and greases outside of Canada and the increasing global demand for higher quality base oils offers significant opportunity for long-term growth. As both performance and environmental standards get tougher, the demand for Petro-Canada’s finished products and base fluids is expected to continue to grow. By 2005, Lubricants’ target is to achieve over 75 per cent of total sales in the higher-margin channel.
Shared Services
Shared Services Financial Results
(millions of dollars) | | 2002 | | 2001 | | 2000 | |
| | | | | | | |
Net expenses from operations(1) | | $ | (144 | ) | $ | (51 | ) | $ | (98 | ) |
Foreign currency translation loss | | (52 | ) | (96 | ) | (53 | ) |
Net expenses(1) | | $ | (196 | ) | $ | (147 | ) | $ | (151 | ) |
Cash flow(1) | | $ | (104 | ) | $ | (53 | ) | $ | (67 | ) |
(1) | Before reorganization costs in 2000. |
2002 COMPARED WITH 2001
Shared Services is structured as a cost centre that includes investment income, interest expense, foreign currency translation and general corporate revenues and expenditures. The rise in net expenses in 2002 reflects a drop in investment and other income and an increase in interest expense, both related to the financing of the Veba acquisition, with a partial offset from a reduction in foreign currency translation loss.
The foreign currency translation loss of $52 million in 2002 includes a $63 million exchange loss from the translation of international subsidiaries. Effective January 1, 2003, Petro-Canada commenced operating Upstream International on a self-sustaining basis. As a consequence, the Company prospectively changed the accounting for the foreign currency translation of its international subsidiaries, whereby future gains or losses arising from the translation of financial statements into Canadian dollars will be deferred and included as part of shareholders’ equity.
18
LIQUIDITY AND CAPITAL RESOURCES
Summary of Cash Flows
(millions of dollars) | | 2002 | | 2001 | | 2000 | |
| | | | | | | |
Net cash inflows (outflows) before changes in non-cash working capital: | | | | | | | |
Cash flow | | $ | 2 276 | | $ | 1 688 | | $ | 1 870 | |
Investing activities | | (4 141 | ) | (1 564 | ) | (489 | ) |
Financing activities | | 1 560 | | (909 | ) | (214 | ) |
| | (305 | ) | (785 | ) | 1 167 | |
(Increase) decrease in non-cash working capital and other | | (242 | ) | 151 | | 42 | |
(Decrease) increase in cash and short-term investments | | $ | (547 | ) | $ | (634 | ) | $ | 1 209 | |
Cash and short-term investments at year-end | | $ | 234 | | $ | 781 | | $ | 1 415 | |
Operating Activities
The reduction in net cash outflow before changes in non-cash working capital primarily reflects the impact of the Veba acquisition, with offsets from the related financing arrangements and increased cash flow from operations.
The increase of $242 million in non-cash operating working capital, excluding working capital relating to acquisitions, was mainly due to an increase in accounts receivable and a decrease in income taxes payable, partially offset by an increase in accounts payable and accrued liabilities. The higher levels of accounts receivable and payable reflect the significantly higher prices for both oil and natural gas at 2002 year-end compared with 2001 year-end. The decrease in cash and short-term investments reflects the use of funds towards financing the Veba acquisition, as well as to repay $461 million of the related credit facilities.
Investing Activities
Capital and Exploration Expenditures
(millions of dollars) | | 2002 | | 2001 | | 2000 | |
| | | | | | | |
Acquisition of oil and gas operations of Veba Oil & Gas GmbH | | $ | 2 234 | | $ | — | | $ | — | |
Upstream Canada(1) | | | | | | | |
North American Natural Gas | | 529 | | 554 | | 434 | |
East Coast Oil | | 290 | | 273 | | 340 | |
Oil Sands | | 462 | | 304 | | 110 | |
| | 1 281 | | 1 131 | | 884 | |
Upstream International(1) | | | | | | | |
Northwest Europe | | 93 | | — | | 23 | |
North Africa/Near East | | 108 | | 153 | | 20 | |
Northern Latin America | | 20 | | — | | — | |
| | 221 | | 153 | | 43 | |
Downstream | | | | | | | |
Refining and supply | | 210 | | 206 | | 102 | |
Sales and marketing | | 118 | | 156 | | 143 | |
Lubricants | | 16 | | 21 | | 19 | |
| | 344 | | 383 | | 264 | |
Shared Services | | 15 | | 14 | | 12 | |
Total property, plant and equipment and exploration | | 1 861 | | 1 681 | | 1 203 | |
Deferred charges and other assets | | 72 | | 10 | | 8 | |
Total | | $ | 4 167 | | $ | 1 691 | | $ | 1 211 | |
(1) | Includes exploration expenses charged to earnings, totalling $301 million in 2002, $245 million in 2001 and $171 million in 2000. |
19
2002 COMPARED WITH 2001
The substantial capital spending in the Upstream reflects Petro-Canada’s continuing commitment to long-term profitable growth. Investments in Upstream Canada included $399 million for exploration and development of natural gas in Western Canada and $110 million for other natural gas opportunities in North America, principally in the Mackenzie Delta and offshore Nova Scotia. Major funding for exploration and development of crude oil offshore Canada’s East Coast included $82 million to complete development of Terra Nova and $132 million towards development of White Rose, mostly related to the fabrication of a new FPSO vessel. Oil sands investments included $222 million for Syncrude, mainly for the Stage 3 expansion; $114 million to complete development of the MacKay River oil sands in situ project; $97 million for the Edmonton refinery conversion and $29 million for other oil sands work, principally drilling activity at Meadow Creek, Petro-Canada’s planned second in situ development project.
Expenditures in Upstream International were incurred, for the most part, over the last eight months of the year following the Veba acquisition, and largely related to ongoing programs in the U.K. North Sea, Syria, Libya, Kazakhstan and Trinidad. Major investments in the Downstream focused on the fast-track development of our new-image retail sites and programs to comply with sulphur-in-gasoline regulations.
Petro-Canada’s capital expenditure budget for 2003 is $2 575 million, up 38 per cent from the $1 861 million of expenditures on property, plant and equipment and exploration in 2002, reaffirming our commitment to profitable growth and the creation of long-term shareholder value. About $1 500 million of 2003 budgeted expenditures are allocated to activities in Upstream Canada, $545 million to Upstream International, $500 million to the Downstream, and $30 million for corporate and other purposes. We plan to fund the 2003 capital expenditure program from cash flow.
Financing Activities and Dividends
Sources of Capital Employed
(millions of dollars) | | 2002 | | 2001 | | 2000 | |
| | | | | | | |
Long-term debt, including current portion | | $ | 3 057 | | $ | 1 401 | | $ | 1 774 | |
Shareholders’ equity | | 5 776 | | 4 877 | | 4 465 | |
Total | | $ | 8 833 | | $ | 6 278 | | $ | 6 239 | |
We retired $461 million by year-end 2002 and an additional $100 million in January 2003 of the $2.1 billion debt we assumed to finance the International acquisition.
On May 2, 2002, Petro-Canada acquired the majority of the international oil and gas businesses of Veba Oil & Gas GmbH and, on December 10, 2002, Petro-Canada acquired from Veba a 50 per cent working interest in the La Ceiba block in Venezuela which had been subject to rights of first refusal. The total acquisition cost, consisting of a cash consideration and acquisition costs, was $2 234 million. This is considerably lower than the previously announced $3 200 million, due to the exercise of rights of first refusal affecting a number of properties included in the original acquisition proposal and the unresolved right of first refusal related to assets in Venezuela. Funds for the acquisition were provided from new credit facilities arranged with certain banks (See Note 16 of Notes to Consolidated Financial Statements) and from cash and short-term investments. The net increase in debt at 2002 year-end reflects the drawdown of $2 100 million of the acquisition credit facility, less total debt repayments of $465 million during the year, and a new capital lease of $32 million. An additional $100 million of the acquisition credit facility was repaid in January 2003. Petro-Canada plans to meet remaining repayment commitments out of a combination of cash flow and by accessing debt capital markets.
For operating purposes, Petro-Canada has access to a portion of the new credit facilities and other undrawn bank lines of credit for a total of $1 427 million. As of December 31, 2002, Petro-Canada had cash and short-term investments of $234 million and no commercial paper outstanding. Petro-Canada will continue to use its cash position, and the issuance of short-term debt if necessary, to meet working capital and other financing requirements.
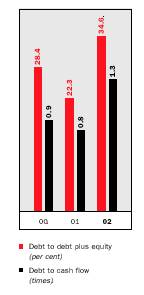
While the debt taken on to finance the acquisition significantly increased our financial leverage, we expect debt to cash flow, our key leverage measure, to remain within our target range of no more than two times. At December 31, 2002, this ratio stood at 1.3 times, up from 0.8 times at the end of 2001. Debt to debt plus equity, our long-
20
term measure for capital structure, rose to 34.6 per cent at 2002 year-end compared with 22.3 per cent at the prior year-end, but we expect to reduce this, over time, to our target level of 30 per cent.
Petro-Canada does not engage in off-balance sheet accounting to structure any of its financial arrangements. Off-balance sheet activities are limited to matters such as guarantees, none of which would have a material impact on the Company’s financial results, liquidity or capital resources.
At 2002 year-end, Petro-Canada’s defined benefits pension plans were under-funded for accounting purposes by $279 million, up from $80 million at the end of 2001, mainly reflecting the impact of weak capital markets on fund assets. As a consequence of the increased deficit, Petro-Canada will make a cash contribution of about $30 million to the fund during 2003 and we expect the pension expense to increase by approximately $45 million before tax. On a per share basis, the after-tax expense increase represents about $0.10 per share for the year.
Petro-Canada reviews its dividend strategy from time to time to ensure the alignment of dividend policy with shareholder expectations and our financial and growth objectives. In 2002, Petro-Canada paid $105 million in dividends, compared with $106 million in 2001. The current quarterly dividend is $0.10 per share.
Financial Ratios
| | 2002 | | 2001 | | 2000 | |
| | | | | | | |
Interest coverage (times): | | | | | | | |
earnings basis | | 10.5 | | 9.7 | | 10.0 | |
EBITDAX basis | | 17.1 | | 15.1 | | 14.9 | |
cash flow basis | | 17.9 | | 15.6 | | 15.2 | |
Debt to cash flow (times) | | 1.3 | | 0.8 | | 0.9 | |
Debt to debt plus equity (per cent) | | 34.6 | | 22.3 | | 28.4 | |
Key Debt Ratios
Despite debt taken on to finance the International acquisition, we are well positioned relative to our target levels.
Interest Coverage
A positive interest coverage ratio demonstrates more than sufficient earnings to cover interest charges on debt.
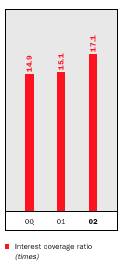
• Calculated on an EBITDAX basis.
RISK MANAGEMENT
Petro-Canada’s risk management activities are conducted according to policies and guidelines established by the Board of Directors, using insurance, selective hedging and other techniques. Our risk management policy prohibits the use of derivative instruments for speculative purposes. Petro-Canada uses derivatives primarily to hedge physical transactions for operational needs and to facilitate sales to customers. Commodity prices and margins may be hedged occasionally to capture opportunities that represent extraordinary value. Except as specifically authorized by the Board, the term of hedging instruments cannot exceed 18 months. We transact derivatives with counterparties who possess a minimum long-term credit rating of A (unless otherwise approved by the Board) under a signed International Swap Dealers Association agreement. Credit limits take into account current and potential exposure to losses due to non-performance of a counterparty and reduce credit risk concentration with any single counterparty. Monitoring and reporting of the derivatives portfolio includes periodic testing of the fair value of all outstanding derivatives. Commodity, currency and interest rate hedges resulted in a net decrease in earnings of about $22 million after tax in 2002, compared with a net increase in earnings of about $10 million in 2001.
As at December 31, 2002, crude oil, natural gas and foreign exchange contracts had been bought forward to mitigate exposure on fixed-price natural gas and refined product sales. Short-term hedge positions were also in place for refining supply and product purchases. Short duration Forward Rate Agreements have been implemented to manage the interest rate exposure on floating debt and, in anticipation of accessing debt capital markets in 2003, Petro-Canada has entered into interest rate derivatives to hedge a portion of its exposure to adverse interest rate fluctuations.
Petro-Canada has future commitments to sell and transport natural gas associated with normal operations. About four per cent of our estimated 2003 Upstream Canada natural gas production is sold under future fixed-price commitments at an average plant gate netback price of $2.73 per mcf. Sales under these contracts will drop by about 40 per cent in 2004 compared to the 2003 level of sales.
Petro-Canada manages operational risk through comprehensive risk assessment and loss
21
management processes, and maintains adequate insurance coverage. We place insurance coverage globally, with financially secure insurers. Limits of insurance are based on engineering risk assessments and deductibles are set at levels that reflect our ability to retain the risk.
We also employ high levels of technical expertise and leading-edge technology to mitigate exploratory risks. To secure strategic and competitive advantages, Petro-Canada has entered into a variety of alliances with world-class suppliers of industry goods and services. These alliances provide preferential access, reliability, advanced technology, high quality and competitive prices, mitigating variability in costs associated with exploration and development as industry conditions fluctuate.
CORPORATE RESPONSIBILITY
At Petro-Canada, we take pride in being a good corporate citizen. Strong environment, health and safety performance is fundamental to our business as an energy company.
While Petro-Canada is in business to provide a competitive return to shareholders, we recognize that economic performance is not the only criterion on which our company is evaluated.
To review our performance in environmental stewardship, health and safety and community involvement in more detail than can be accommodated in the Annual Report, we publish an annual Report to the Community. The report gathers data on key non-financial performance measures, enabling the public to assess our ongoing efforts in these areas. The Report to the Community can be viewed on our Web site at www.petro-canada.ca, or obtained from Corporate Communications. The 2002 Report to the Community will be available in July 2003.
Corporate Governance
Petro-Canada strives to attain the highest standards of corporate governance. The company has evolved its management and internal reporting systems to provide a high level of assurance that corporate responsibility is part of our day-to-day business decision-making process. These governance systems begin with the Board of Directors and extend throughout the company.
Petro-Canada has a range of tools to establish and enforce appropriate conduct for all employees, including a Code of Business Conduct and Principles for Investment and Operations. Both of these documents can be viewed on our Web site at www.petro-canada.ca.
The Company’s Management Proxy Circular, which is mailed to shareholders and is also available for viewing online, includes a Statement of Corporate Governance Practices, reference to the Corporate Governance Handbook, mandates and reports of Board committees, and detail on Directors’ business background, tenure, committee membership, remuneration and share ownership.
The Board of Directors has responsibility for ensuring timely and appropriate information disclosure to security holders and regulators. We believe the Corporation is well aligned with the guidelines adopted by the Toronto Stock Exchange and the recently proposed disclosure requirements under the Sarbanes-Oxley Act of 2002. For detailed information, please refer to Appendix A in the Management Proxy Circular.
The Corporate Governance and Nominating Committee, composed entirely of unrelated directors, oversees the Corporation’s corporate governance process and is responsible for addressing governance issues and proposing to the Board candidates for election to the Board of Directors. The committee and management undertook an extensive review following proclamation of the Sarbanes-Oxley Act of 2002, and recommended areas of improvement in the Corporation’s current practices as well as highlighted achievements.
Environment, Health and Safety
Petro-Canada executives are responsible for developing operational procedures and standards in compliance with our environment, health and safety policies and Total Loss Management standards under which we conduct a major review of each business unit every four years. Our Executive Leadership Team reviews environment, health and safety performance monthly. As well, critical issues and EHS performance are reviewed by the Environment, Health and Safety Committee of the Board of Directors three times per year.
In 2002, we invested $318 million in environmental programs, including $90 million for operating expenses and $228 million in capital expenditures for facility upgrades. Some of the expenditures include site remediation, environmental assessments, and pollution prevention and control equipment. We expect environmental
22
costs to remain high, as we prepare to meet new federal limits for sulphur in gasoline, future fuel reformulation requirements, and tighter environmental standards for oil and gas production. The cost impact of the federal government’s ratification of the Kyoto Protocol on greenhouse gas emissions, particularly on large, capital-intensive projects, has yet to be determined.
Climate change is one of the most complex issues facing Canadian industry, the Canadian public, and governments today. At Petro-Canada, we support a balanced and responsible approach that promotes action on the issue of climate change.
Petro-Canada has renewed its commitment to improve energy efficiency in each business sector by an average of one per cent per year from 2000 to 2005. Key components of these improvements include reductions in fuel consumption and the corresponding lowering of greenhouse gas emissions.
Since 1990, Petro-Canada has improved energy efficiency in the Downstream by 15 per cent and in the Upstream by 52 per cent. By implementing energy efficiency and emissions reduction projects, we have reduced ongoing annual greenhouse gas emissions by approximately 1.2 million tonnes of CO2 equivalent, while increasing overall production by 23 per cent. Data for 2002 will be provided in this year’s Report to the Community.
The safety and well-being of our employees is a high priority for Petro-Canada. Occupational health and safety programs are designed to contribute to employee well-being and provide a safe and healthy work environment. Our overall Employee Recordable Injury Frequency (per 200 000 person hours) decreased to 0.94 in 2002 from 1.14 in 2001. Recordable injuries decreased to 44 in 2002 from 46 in 2001. Over the past year, Petro-Canada has renewed efforts to introduce further initiatives focused on injury reduction.
Greenhouse Gas Emissions versus Production
Petro-Canada is committed to reducing GHG emissions in our Upstream and Downstream operations, primarily by improving energy efficiency.
* Year 2000 data has been restated and is slightly higher than was reported in last year’s report.
• 2002 data is not yet available; data is based on reporting 100 per cent from Petro-Canada operated properties.
Community Involvement
Petro-Canada’s success depends on the support of Canadians, so we actively invest and participate in the communities where we work and live across the country.
In 2002, Petro-Canada invested $5 million in 375 Canadian non-profit organizations in four sectors – education, the environment, health and community services, and arts and culture. We also contributed another $800 000 from our Olympic Torch Scholarship Fund, and approximately $300 000 in in-kind contributions. Through our Volunteer Energy Program, we provided 403 grants of $500 each to non-profit organizations supported by employees and retirees who give their time to the community.

23