Exhibit 2
Management’s Discussion & Analysis
Management’s Discussion and Analysis (MD&A) should be read in conjunction with the Financial Statements and Notes included in this annual report. Financial data has been prepared in accordance with Canadian generally accepted accounting principles (GAAP), unless otherwise specified. All dollar values are Canadian dollars, unless otherwise indicated. All oil and gas production and reserves volumes are stated before deduction of royalties, unless otherwise indicated. Graphs accompanying the text identify our ‘value drivers’, key measures of performance in each component of our business.
RESULTS OF OPERATIONS
Shareholder Value
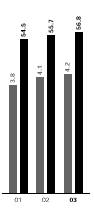
Shareholder value grew 31.5 per cent through share price appreciation and dividends in 2003.
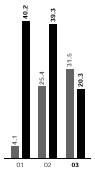
• One-year return
(per cent)
• Three-year average return
(per cent)
• Shareholder value measures the change in the Petro-Canada share price plus dividend returns.
ANALYSIS OF CONSOLIDATED EARNINGS AND CASH FLOW
Consolidated Financial Results
(millions of dollars, unless otherwise indicated) | | 2003 | | 2002 | | 2001 | |
| | | | | | | |
Earnings from operations(1),(3) | | $ | 1 401 | | $ | 1 024 | | $ | 912 | |
Gain (loss) on foreign currency translation | | 239 | | (52 | ) | (96 | ) |
Gain on disposal of assets | | 29 | | 2 | | 30 | |
Net earnings | | $ | 1 669 | | $ | 974 | | $ | 846 | |
Earnings per share (dollars) | – basic | | $ | 6.30 | | $ | 3.71 | | $ | 3.19 | |
| – diluted | | 6.23 | | 3.67 | | 3.16 | |
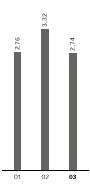
Cash flow(2),(3) | | 3 372 | | 2 276 | | 1 688 | |
Cash flow per share (dollars) | | 12.73 | | 8.66 | | 6.37 | |
Debt | | 2 229 | | 3 057 | | 1 401 | |
Cash and cash equivalents | | 635 | | 234 | | 781 | |
Average capital employed | | $ | 9 392 | | $ | 7 826 | | $ | 6 259 | |
Return on capital employed (per cent) | | 18.9 | | 13.9 | | 14.8 | |
Operating return on capital employed (per cent) | | 16.1 | | 14.5 | | 15.8 | |
Return on equity (per cent) | | 24.7 | | 18.3 | | 18.1 | |
(1) Earnings from operations, which represents net earnings excluding gains or losses on foreign currency translation and on disposal of assets, is used by the Company to evaluate operating performance.
(2) Cash flow, which is expressed before changes in non-cash working capital items, is used by the Company to analyze operating performance, leverage and liquidity.
(3) Earnings from operations and cash flow do not have any standardized meaning prescribed by Canadian generally accepted accounting principles (GAAP) and, therefore, may not be comparable with the calculation of similar measures for other companies.
This Management’s Discussion and Analysis (“MD&A”) contains forward-looking statements. Such statements are generally identifiable by the terminology used, such as “plan”, “anticipate”, “intend”, “expect”, “estimate”, “budget” or other similar wording. Forward looking statements include but are not limited to: references to future capital and other expenditures; drilling plans; construction activities; the submission of development plans; seismic activity; refining margins; oil and gas production levels and the sources of growth thereof; results of exploration activities and dates by which certain areas may be developed or may come on-stream; retail throughputs; pre-production and operating costs; reserves estimates; reserves life; natural gas export capacity; and environmental matters. These forward-looking statements are subject to known and unknown risks and uncertainties and other factors which may cause actual results, levels of activity and achievements to differ materially from those expressed or implied by such statements. Such factors include, but are not limited to: general economic, market and business conditions; industry capacity; competitive action by other companies; fluctuations in oil and gas prices; refining and marketing margins; the ability to produce and transport crude oil and natural gas to markets; the results of exploration and development drilling and related activities; fluctuation in interest rates and foreign currency exchange rates; the ability of suppliers to meet commitments; actions by governmental authorities including increases in taxes; decisions or approvals of administrative tribunals; changes in environmental and other regulations; risks attendant with oil and gas operations; and other factors, many of which are beyond the control of Petro-Canada. These factors are discussed in greater detail in filings made by Petro-Canada with the Canadian provincial securities commissions and the United States Securities and Exchange Commission (“SEC”).
Petro-Canada’s staff of qualified reserves evaluators generate the reserves estimates used by this corporation. Our reserves staff and management are not considered independent of the corporation for purposes of the Canadian provincial securities commissions. The use of terms such as “probable”, “possible”, “recoverable” or “potential” reserves and resources does not meet the guidelines of the SEC for inclusion in documents filed with the SEC. Petro-Canada has obtained an exemption from certain Canadian reserves disclosure requirements to permit it to make disclosure in accordance with SEC standards in order to provide comparability with U.S. and other international issuers. Therefore, Petro-Canada’s reserves data and other oil and gas formal disclosure is made in accordance with U.S. disclosure requirements and practices and may differ from Canadian domestic standards and practices. Where the term boe (barrel of oil equivalent) is used in this MD&A it may be misleading, particularly if used in isolation. A boe conversion ratio of 6 mcf: 1 bbl is based on an energy equivalency conversion method primarily applicable at the burner tip and does not represent a value equivalency at the wellhead.
Readers are cautioned that the foregoing list of important factors affecting forward-looking statements is not exhaustive. Furthermore, the forward-looking statements contained herein are made as of the date of this MD&A, and Petro-Canada does not undertake any obligation to update publicly or to revise any of the included forward-looking statements, whether as a result of new information, future events or otherwise. The forward-looking statements contained in this MD&A are expressly qualified by this cautionary statement.
1
2003 COMPARED WITH 2002
Stronger commodity prices and margins combined with higher production volumes to boost earnings from operations to a record $1 401 million in 2003. Net earnings, including gains on foreign currency translation and disposals of assets, and cash flow rose to record levels. The improved financial performance reflected higher prices for natural gas, an additional four months of operations from International assets acquired in May 2002, increased production from East Coast Oil, higher refinery cracking margins and positive adjustments for income tax rate changes and International provisions. Offsetting factors included after-tax charges of $151 million for the consolidation of Eastern Canada refinery operations, $82 million for the write-off of costs related to the original Edmonton refinery conversion plan and a $46 million provision related to the impending sale of a non-core asset in Kazakhstan.
Earnings from Operations and Cash Flow
Earnings from operations were $1.4 billion in 2003.
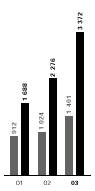
• Earnings from operations
($ millions)
• Cash flow
($ millions)
• Earnings from operations do not include gains or losses on foreign currency translation and on disposal of assets.
Earnings from Operations
Variance Factors - 2003 compared with 2002
(millions of dollars, after tax) | | | |
| | | | |
2002 Earnings from operations | | $ | 1 024 | |
Higher Upstream commodity prices(1) | | 338 | |
Increased Upstream production volumes(2),(3) | | 279 | |
Increased Downstream margins | | 143 | |
Adjustment to International provisions | | 45 | |
Decrease in the provision for future income taxes(4) | | 45 | |
Decrease in depreciation, depletion and amortization, and exploration expense(3),(5) | | 31 | |
Increased operating and G&A costs(6) | | (183 | ) |
Costs related to the planned shutdown of Oakville refinery | | (151 | ) |
Costs related to revised Edmonton refinery feedstock conversion plan | | (82 | ) |
Asset impairment in Kazakhstan | | (46 | ) |
Other | | (42 | ) |
2003 Earnings from operations | | $ | 1 401 | |
(1) The major portion relates to higher natural gas price realizations in Canada.
(2) Reflects four additional months of International activity, 10 additional months of MacKay River operations and significant volume gains at Hibernia and Terra Nova.
(3) The impact of higher volumes on depreciation, depletion and amortization expense is included in production volume variance.
(4) Reflects income tax adjustments related to federal and provincial rate changes.
(5) Excludes depreciation, depletion and amortization related to costs associated with the Oakville shutdown, the Edmonton refinery feedstock conversion and the Kazakhstan asset impairment.
(6) Reflects four additional months of International activity and 10 additional months of MacKay River operations.
Operating Return on Capital Employed
Operating return on capital employed reflected higher earnings due to a stronger business environment.
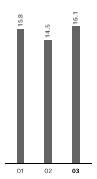
• Operating return on capital employed
(per cent)
• Earnings from operations do not include gains or losses on foreign currency translation and on disposal of assets.
Consolidated 2003 cash flow was $3 372 million compared with $2 276 million in 2002. Cash flow in 2003 reflected the higher operating earnings, about $120 million of net deferrals of current income taxes related to earnings of the Petro-Canada Oil and Gas Partnership (PCOG) and about a $25 million decrease in current income taxes resulting from the inventory valuation method prescribed for income tax purposes in the Downstream. In 2002, net deferrals related to earnings of PCOG increased current taxes by about $50 million and the inventory valuation method increased current taxes by about $85 million.
The increased returns on equity and capital employed resulted primarily from the 71 per cent improvement in net earnings.
QUARTERLY INFORMATION
Consolidated Quarterly Financial Results
(millions of dollars, unless otherwise indicated) | | 2003 | | 2002 | |
| Quarter 1 | | Quarter 2 | | Quarter 3 | | Quarter 4 | | Quarter 1 | | Quarter 2 | | Quarter 3 | | Quarter 4 | |
Total revenue | | $ | 3 507 | | $ | 2 826 | | $ | 2 959 | | $ | 2 929 | | $ | 1 708 | | $ | 2 437 | | $ | 2 767 | | $ | 3 005 | |
Net earnings | | 583 | | 585 | | 301 | | 200 | | 88 | | 321 | | 209 | | 356 | |
Earnings per share (dollars) | | | | | | | | | | | | | | | | | |
• basic | | 2.21 | | 2.21 | | 1.13 | | 0.75 | | 0.34 | | 1.22 | | 0.79 | | 1.35 | |
• diluted | | $ | 2.18 | | $ | 2.18 | | $ | 1.12 | | $ | 0.75 | | $ | 0.33 | | $ | 1.21 | | $ | 0.79 | | $ | 1.34 | |
2
Variances from quarter to quarter in revenues and net earnings resulted mainly from: fluctuations in commodity prices and refinery cracking margins; the acquisition of international producing properties effective May 2, 2002; the impact on production and processed volumes from maintenance and other shutdowns at major facilities; and the level of exploration drilling activity, particularly in high-cost frontier and offshore areas. Other significant factors affecting 2003 net earnings included after-tax charges of $46 million in the first quarter related to the pending Kazakhstan asset sale, $136 million in the third quarter for the consolidation of our Eastern Canada refinery operations, and $82 million in the fourth quarter related to the revised Edmonton refinery conversion plan. Income tax rate changes increased first quarter earnings by $96 million and decreased fourth quarter earnings by $51 million in 2003. In addition, gains on foreign currency translation were also a significant factor, particularly in the first and second quarters of 2003.
For further analysis of quarterly results, refer to Petro-Canada’s quarterly reports to shareholders available on the Web site at www.petro-canada.ca.
BUSINESS ENVIRONMENT
Economic factors influencing Petro-Canada’s Upstream financial performance include crude oil and natural gas prices, and foreign exchange rates, particularly the Canadian dollar/U.S. dollar rate. Factors of supply and demand, weather, political events and the level of industry product inventories affect prices for energy commodities. Factors influencing Downstream performance include the level and volatility of crude oil prices, industry refining margins, movements in light/heavy crude oil price differentials, demand for refined petroleum products and the degree of market competition.
The stronger Canadian dollar dampened the impact of higher commodity prices in 2003.
Business Environment in 2003
During 2003, U.S. dollar-denominated international crude oil prices reached their highest annual average since 1982. The strength of international crude prices in 2003 was due to a confluence of geopolitical and market factors. OPEC decision-making, supported by production discipline among member nations, continued to be the major factor in keeping prices high. Additionally, a general strike in Venezuela, the war in Iraq and political unrest in Nigeria reduced crude oil supplies. As well, a very cold winter in the Northern Hemisphere and the resumption of economic growth in key consuming areas led to a tight global supply/demand situation. The strengthening of the Canadian dollar throughout 2003 dampened the impact of increased international oil prices on Canadian prices. The value of the Canadian dollar rose from 63.3 cents US on December 31, 2002 to 77.4 cents US on December 31, 2003, an unprecedented 12-month increase of 14.1 cents US or 22.3 per cent.
Colder-than-normal weather in North America during the first quarter of 2003 led to rising natural gas prices. Strong gas injection activity to replenish depleted storage levels lent support to prices from April through October. In the fourth quarter, gas prices lost some of the gains made during the injection season as the heating season began with close-to-normal levels of gas in storage.
In the Canadian industry’s downstream sector, refined product sales in 2003 grew by approximately 4.7 per cent compared with 0.8 per cent in 2002. Refining margins also noticeably improved, reflecting the strong refined product sales and substantially wider light-heavy crude price differentials.
Commodity Price Indicators and Exchange Rates
(averages for the years indicated) | | 2003 | | 2002 | |
| | | | | |
Crude oil price indicators (per barrel): | | | | | |
Dated Brent at Sullom Voe | | US$ | 28.84 | | US$ | 24.98 | |
West Texas Intermediate (WTI) at Cushing | | US$ | 31.04 | | US$ | 26.08 | |
WTI/Brent price differential | | US$ | 2.20 | | US$ | 1.10 | |
Brent/Maya price differential | | US$ | 4.61 | | US$ | 4.08 | |
Edmonton Light | | Cdn$ | 43.77 | | Cdn$ | 40.41 | |
Edmonton Light/Bow River (heavy) price differential | | Cdn$ | 11.67 | | Cdn$ | 8.90 | |
Natural gas price indicators: | | | | | | | |
At Henry Hub – per million British thermal units (mmbtu) | | US$ | 5.44 | | US$ | 3.25 | |
AECO spot – per thousand cubic feet (mcf) | | Cdn$ | 6.99 | | Cdn$ | 4.24 | |
Henry Hub-AECO-C basis differential – per mmbtu | | US$ | 0.70 | | US$ | 0.66 | |
New York Harbor 3-2-1 refinery crack spread – per barrel | | US$ | 5.31 | | US$ | 3.36 | |
US$ per Cdn$ exchange rate | | US$ | 0.714 | | US$ | 0.637 | |
3
Petro-Canada’s businesses are managed for the long term.
Outlook for Business Environment in 2004
Prices for energy commodities are expected to remain volatile in 2004, reflecting the vagaries of weather, the level of industry inventories, and political and natural events. Current low global crude inventories combined with cold winter weather, uncertainty about the reliability of Iraq’s oil infrastructure and the political stability of Venezuela and Nigeria are expected to maintain international oil prices near record levels. Given the current low level of oil inventories worldwide and continuing growth in demand, the upward pressure on world oil prices is likely to be amplified by the recent OPEC decision to lower its production ceiling by one million barrels per day starting April 1, 2004.
We expect the North American natural gas supply/demand balance to remain tight in 2004, as low-cost supplies from conventional areas continue to decline despite very high drilling activity. In the absence of increased supplies, natural gas prices are expected to rise to the levels necessary to ration demand and re-balance the market.
In the industry’s downstream sector, refined product margins are expected to face continued pressure from high and volatile crude oil costs, particularly during the first half of 2004, resulting in lower margins than in 2003. Expectations of improving economic conditions lead management to anticipate, weather trends aside, another year of positive growth in domestic sales of refined products.
Economic Sensitivities
The following table shows the estimated after-tax effects that changes in certain factors would have had on Petro-Canada’s 2003 net earnings, had these changes occurred. These calculations are based on business conditions, production and sales volumes realized in 2003.
Sensitivities Affecting Net Earnings
Factor(1) | | 2003 Averages | | Increase | | Impact on
Net Earnings | |
| | | | | | (millions of
Canadian dollars) | |
Upstream | | | | | | | |
Price received for crude oil and liquids | | $38.80/bbl | | $1.00/bbl | (2) | $ | 48 | |
Price received for natural gas | | $6.16/mcf | | $0.25/mcf | | 36 | |
Production of crude oil and liquids | | 319 900 barrels per day (b/d | ) | 1 000 b/d | | 4 | |
Production of natural gas available for sale | | 868 million cubic feet per day | | 10 mmcf/d | | 6 | |
| | (mmcf/d | ) | | | | |
Exchange rate (impact on Upstream earnings): | | | | | | | |
Cdn$ per US$ | | Cdn $1.401 | | Cdn $0.01 | | (39 | ) |
| | | | | | | |
Downstream | | | | | | | |
New York Harbor 3-2-1 crack spread(3) | | US$5.31/bbl | | US$0.10/bbl | | 4 | |
Light/heavy crude price differential(4) | | $11.67/bbl | | $1.00/bbl | | 11 | |
| | | | | | | |
Corporate | | | | | | | |
Exchange rate: Cdn$ per US$(5) | | Cdn $1.401 | | Cdn $0.01 | | $ | 9 | |
(1) The impact of a change in one factor may be compounded or offset by changes in other factors. This table does not consider the impact of any inter-relationship among the factors. The application of these factors may not necessarily lead to an accurate prediction of future results of operations. We may undertake risk management initiatives from time to time that affect these sensitivities.
(2) This sensitivity is based upon an equivalent change in the price of WTI and North Sea Brent. In 2003, WTI averaged US$31.04 per barrel (bbl) and North Sea Brent averaged US$28.84/bbl.
(3) New York Harbor 3-2-1 crack spread applies mainly to Eastern Canada markets.
(4) This refers to the spread between the prices of benchmark Edmonton Light and Bow River (heavy) crude oils.
(5) This refers to gains or losses on a portion (US$873 million) of the Company’s long-term debt. Gains or loses on foreign currency denominated long-term debt associated with the self-sustaining International business segment are deferred and included as part of shareholders’ equity.
4
UPSTREAM
Petro-Canada’s Upstream operations consist of four business segments: North American Gas, with current production in Western Canada; East Coast Oil, with three major developments offshore Newfoundland; Oil Sands operations in northeastern Alberta; and International, where we are active in three core areas: Northwest Europe, North Africa/Near East; and Northern Latin America. Our diverse asset base provides a balanced portfolio and a platform for longer-term growth.
In 2003, Petro-Canada’s worldwide production before royalties averaged 319 900 barrels per day (b/d) of oil and liquids and 868 million cubic feet per day (mmcf/d) of natural gas, or a record 464 500 barrels of oil equivalent per day (boe/d). A significant portion of the 21 per cent increase from the 2002 level of 382 400 boe/d is related to the additional four months of International operations.
Oil and Gas Production
Production increased due to an additional four months of International operations and higher East Coast Oil and Oil Sands production.

• Upstream production
(thousands of barrels of oil equivalent per day)
Production | | North
American Gas | | East
Coast Oil | | Oil Sands | | International | | Total | |
2002 Average Daily Volumes | | | | | | | | | | | |
Crude oil, NGL and bitumen (b/d) | | | | | | | | | | | |
net before royalties | | 18 900 | | 71 900 | | 1 100 | | 125 500 | | 217 400 | |
net after royalties | | 14 200 | | 70 900 | | 1 000 | | 75 200 | | 161 300 | |
Synthetic crude oil (b/d) | | | | | | | | | | | |
net before royalties | | — | | — | | 27 500 | | — | | 27 500 | |
net after royalties | | — | | — | | 27 200 | | — | | 27 200 | |
Natural gas (mmcf/d) | | | | | | | | | | | |
net before royalties | | 722 | | — | | — | | 103 | | 825 | |
net after royalties | | 558 | | — | | — | | 80 | | 638 | |
Total volumes (boe/d) | | | | | | | | | | | |
net before royalties | | 139 200 | | 71 900 | | 28 600 | | 142 700 | | 382 400 | |
net after royalties | | 107 200 | | 70 900 | | 28 200 | | 88 500 | | 294 800 | |
2003 Average Daily Volumes | | | | | | | | | | | |
Crude oil, NGL and bitumen (b/d) | | | | | | | | | | | |
net before royalties | | 16 900 | | 86 100 | | 10 700 | | 180 800 | | 294 500 | |
net after royalties | | 12 600 | | 84 000 | | 10 600 | | 115 600 | | 222 800 | |
Synthetic crude oil (b/d) | | | | | | | | | | | |
net before royalties | | — | | — | | 25 400 | | — | | 25 400 | |
net after royalties | | — | | — | | 25 100 | | — | | 25 100 | |
Natural gas (mmcf/d) | | | | | | | | | | | |
net before royalties | | 693 | | — | | — | | 175 | | 868 | |
net after royalties | | 521 | | — | | — | | 149 | | 670 | |
Total volumes (boe/d) | | | | | | | | | | | |
net before royalties | | 132 300 | | 86 100 | | 36 100 | | 210 000 | | 464 500 | |
net after royalties | | 99 500 | | 84 000 | | 35 700 | | 140 400 | | 359 600 | |
5
North American Gas
Western Canada Operating and Overhead Costs
Cost per unit was up due to lower volumes and higher utility and labour costs.
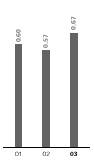
• Unit operating and overhead costs
($ per thousand cubic feet of gas equivalent)
• Includes Western Canada gas, conventional oil and liquids.
North American Gas Financial Results
(millions of dollars) | | 2003 | | 2002 | | 2001 | |
| | | | | | | | | | |
Earnings from operations | | $ | 479 | | $ | 180 | | $ | 463 | |
Gain (loss) on sale of assets | | 33 | | (1 | ) | 29 | |
Net earnings | | $ | 512 | | $ | 179 | | $ | 492 | |
Cash flow | | $ | 985 | | $ | 534 | | $ | 651 | |
Expenditures on property, plant and equipment and exploration | | $ | 560 | | $ | 530 | | $ | 548 | |
Total assets | | $ | 2 301 | | $ | 2 240 | | $ | 2 129 | |
2003 COMPARED WITH 2002
Higher prices for natural gas and solid operating performance boosted earnings from operations for North American Gas to a record $479 million in 2003, 166 per cent higher than in the previous year.
The exceptional financial result also reflected a $60 million pre-tax decrease in exploration expense due to reduced activity in the Mackenzie Delta/Corridor and the Scotian Slope.
Petro-Canada’s natural gas price realizations averaged $6.50/mcf, up 62 per cent from $4.01/mcf in 2002, due to tighter market conditions for natural gas for a large part of the year. Natural gas production averaged 693 mmcf/d in 2003, down from 722 mmcf/d in 2002, as additional volumes from ongoing development were insufficient to offset declines in older fields. Production of conventional crude oil and natural gas liquids production in Western Canada averaged 16 900 b/d, down from 18 900 b/d in 2002, mainly as the result of non-core asset sales. The asset sales, representing production of about 10 mmcf/d of natural gas and 2 000 b/d of oil and natural gas liquid, resulted in an after-tax gain of $33 million. Operating and overhead costs in 2003 were $0.67 per thousand cubic feet of gas equivalent (mcfe), up from $0.57/mcfe in the previous year, reflecting lower volumes and higher utility and labour costs.
Our strategy in North American Gas is to sustain long-term profitability.
STRATEGY
Petro-Canada is one of the larger producers of natural gas in Western Canada. Our goal is to maintain exceptional profitability in Western Canada, while positioning ourselves for longer-term opportunities. Our strategy is to:
• Capitalize on opportunities in the Western Canada Sedimentary Basin, balancing profitability with production growth.
• Maintain focus on capital investment performance and operating efficiency.
• Optimize existing core properties and add new core areas through focused exploration and acquisitions.
• For the longer term, pursue high-potential exploration in the Mackenzie Delta/Corridor, on the Scotian Slope and in Alaska.
Executing the strategy
Capital expenditures in 2003 included $472 million for exploration and development of natural gas in Western Canada and $58 million for other natural gas opportunities in North America, principally in the Mackenzie Delta/Corridor. Capital spending was above plan due to increased development drilling activity and a $30 million acquisition of a 60 per cent interest in the Savanna Creek gas field in southwest Alberta. Exploration and development drilling activity in Western Canada in 2003 resulted in 421 gross successful wells, for a success rate of 92 per cent.
In Western Canada we are focused on four core areas – the Alberta Foothills, northeastern British Columbia, southeastern Alberta, and west-central Alberta. In the Foothills, we have developed a strong technical competency in finding, developing and operating deep sour gas. A key feature of our strategy has been concentric exploitation in and around existing developments and infrastructure, such as the area surrounding the Petro-Canada operated Hanlan gas plant in the northern Foothills. Through the successful drilling of multiple Turner Valley structures, combined with successful sweet gas exploration
6
and development in the Narraway area, we have increased production in the Hanlan region from an average of 105 mmcf/d in 2000 to 138 mmcf/d exiting 2003. Results from the 2003 drilling program included 10 successful Turner Valley wells. Additionally, follow-up drilling in 2003 on a 2002 Wabamum discovery has resulted in four horizontal wells, each capable of about 10 mmcf/d of gross production. Drilling plans for the Hanlan area in 2004 include the drilling of a further six Turner Valley wells and additional wells in the Wabamum.
In the shallow gas region of southeastern Alberta our annual drilling program resulted in 322 gross (204 net) successful wells, raising gas production to 70 mmcf/d at 2003 year end. To further support production volumes, we are reviewing opportunities to double the well spacing in our properties from the current four wells per section.
For longer-term growth, we continue to pursue frontier opportunities. Activity in 2003 included the initial drilling of our fifth exploration well in the Mackenzie Delta. The Nuna I-30, about 10 kilometres southwest of the successful Tuk M-18 well, was spudded in mid-February, later than originally planned due to an unseasonably warm start to winter weather. The well was suspended in April before reaching its target depth of 3 500 metres because of the onset of spring break-up. Offshore Nova Scotia, we continue to evaluate the results of an 1 800 square kilometre 3-D seismic program shot over a deep-water area northeast of Sable Island during 2003. In Alaska, we continue to review the prospectivity of our land position in the foothills area north of the Brooks mountain range. While our acreage is close to a proposed pipeline route to southern markets, we do not expect the region to be serviced by a pipeline this decade.
OUTLOOK
2004 production expectations:
• Western Canada production to average 640 mmcf/d of natural gas and 13 000 b/d of crude oil and natural gas liquids.
Growth plans:
• Increase Western Canada exploration over time to improve reserves replacement.
• Pursue exploration and development prospects in North America.
• Drill over 100 exploration and development wells and over 300 shallow gas wells in Western Canada.
• Advance exploration programs in the Mackenzie Delta/Corridor, Scotian Slope and Alaska.
2004 capital spending plans:
• $460 million for Western Canada.
• $35 million for Alaska and Mackenzie Delta/Corridor.
We’re looking beyond core producing areas for new natural gas opportunities.
About $460 million will be invested in new and existing Western Canada exploration and development opportunities. The $35 million allocated to Alaska and the Mackenzie Delta/Corridor will enable us to assess future opportunities. While we continue to invest substantial amounts in Western Canada, this is proving to be insufficient to achieve 100 per cent reserves replacement because of the maturing nature of the region. Going forward, our strategy will continue to emphasize profitability through concentric exploitation of existing assets but will also include an expanded focus outside of existing core areas. Of the funding planned for 2004, $170 million will target exploration opportunities.
We do not plan any natural gas drilling in Canada’s frontier regions in 2004. In the Mackenzie Delta, the ongoing program has secured our most prospective acreage for future exploration and allowed us to make a non-binding nomination of 30 mmcf/d from our share of the Tuk gas pool to support the development proposal for the Mackenzie Valley pipeline. Pending further pipeline developments, our strategy is to defer any major activity in the Mackenzie Delta over the 2004 winter drilling season and re-evaluate our program next year. In Alaska, we will continue the technical analysis of our prospects and exploitation strategy.
7
East Coast Oil
East Coast Oil Operating and Overhead Costs
Operating and overhead costs were lower due to high production volumes.
• Unit operating and overhead costs
($ per barrel)
East Coast Oil Financial Results
(millions of dollars) | | 2003 | | 2002 | | 2001 | |
| | | | | | | |
Earnings from operations and net earnings | | $ | 593 | | $ | 430 | | $ | 168 | |
Cash flow | | $ | 869 | | $ | 687 | | $ | 338 | |
Expenditures on property, plant and equipment and exploration | | $ | 344 | | $ | 289 | | $ | 279 | |
Total assets | | $ | 2 247 | | $ | 2 209 | | $ | 2 090 | |
2003 COMPARED WITH 2002
East Coast earnings from operations in 2003, at $593 million, were up 38 per cent from 2002 due to production gains, strong operating performance and crude oil price improvements.
Petro-Canada’s share of East Coast production before royalties rose to 86 100 b/d from 71 900 b/d the previous year, reflecting significant improvements at both Hibernia (Petro-Canada – 20 per cent working interest) and Terra Nova (Petro-Canada – 34 per cent working interest), despite severe weather conditions during the first quarter. The improvement at Hibernia, where gross field production climbed above 200 000 b/d for the first time, resulted from additional drilling and outstanding reservoir performance with lower than expected increases in the gas-oil and water-oil ratios. Approval by the Canada-Newfoundland Offshore Petroleum Board (CNOPB) to increase the average daily gross field production rate to 220 000 b/d enabled the production improvement. At Terra Nova, gross field production averaged 134 000 b/d (Petro-Canada share – 45 500 b/d), up from 105 400 b/d (Petro-Canada share – 35 800 b/d), in 2002, mainly due to the approval of an increase in the average daily gross field production rate from 100 000 b/d to 180 000 b/d by the CNOPB. Continued focus on reservoir management/optimization will enable us to maintain high reservoir production capability. The average price realized for our East Coast oil production in 2003 was $39.91/bbl, up from $38.84/bbl in 2002.
East Coast Oil operating and overhead costs averaged $2.74/bbl in 2003, down from $3.32/bbl in 2002. Hibernia operating costs were unchanged, while Terra Nova costs fell, reflecting the transition from start-up to steady state operations.
STRATEGY
We believe the East Coast offers exceptional opportunities for profitable growth in both the near term and the long term. Key features of our strategy are:
• Profitably expand reserves and production base.
• Continue to strive for top quartile safety and operating performance.
• Pursue high-potential exploration opportunities.
Terra Nova and Hibernia continued to exceed production expectations in 2003.
Executing the strategy
Petro-Canada’s capital expenditures for exploration and development of crude oil offshore Canada’s East Coast in 2003 amounted to $344 million, with half related to the development of the White Rose oil field (Petro-Canada – 27.5 per cent working interest). Solid progress in 2003 kept the White Rose project on track for production start-up in early 2006. Key components of the project have either been completed or remain on schedule, except construction of the topsides for the project’s Floating Production, Storage and Offloading vessel (FPSO). Concrete steps have been taken to make up for earlier delays in topsides and engineering and procurement and still deliver first oil in early 2006. At year-end 2003, construction of the FPSO, which has a planned gross production capacity of 100 000 b/d, was approximately two-thirds complete. Progress also was made during 2003 on fabrication of the subsea production systems. The first of the subsea wellhead assemblies was completed in November.
White Rose field development activity in 2003 included completion of three glory holes – nine-metre-deep excavations to protect the subsea wellheads and associated production equipment against icebergs, and commencement of the development drilling program. The White Rose development plan
8
includes the drilling of 19 to 21 wells to recover an estimated 200 million to 250 million barrels of oil over a 10- to 12-year time frame. Ten wells – five producing, four water injection and one gas injection – will be drilled prior to start-up. Petro-Canada’s estimate of the project’s total pre-production cost, including the first 10 wells, is $2.3 billion. Estimated peak gross production from the project of 90 000 b/d is believed sustainable for about four years. Encouraging results from 2003 delineation drilling in a previously undrilled fault block south of the main reservoir indicate potential for incremental oil reserves.
Our plans to extend plateau production at Hibernia and Terra Nova focus on expanding existing developments, while also evaluating the potential for subsea tiebacks of smaller discoveries and prospects to the Hibernia and Terra Nova facilities. At Hibernia, assessment of the development potential of the Ben Nevis Avalon continues. A comprehensive evaluation is underway on the results of the B-44 appraisal well, drilled late in 2002. Analysis of the reservoir will determine if additional delineation drilling is necessary before further development is started or pursued.
At Terra Nova, our near-term goals are to optimize reservoir performance and delineate field limits. Activity in 2003 included drilling one injection and three production wells. We are evaluating development options for the adjoining Far East block, where a 2001 well encountered 80 metres of oil-bearing net pay in the Jeanne d’Arc sands. Two subsequent wells were dry and abandoned. We are currently evaluating drilling results and reprocessed seismic data to better understand the options, as well as drilling requirements and timing.
With an overall focus on base business profitability, good progress continued to be made towards top quartile safety and operating performance at each of our East Coast developments. Hibernia has already achieved top quartile operating performance and Terra Nova is incorporating lessons learned from Hibernia and North Sea operations in a planned process to achieve the same results. Opportunities to capture synergies between Hibernia, Terra Nova and White Rose are also being pursued to reduce costs and improve efficiency.
In deeper waters 450 kilometres off Newfoundland, two high-risk, high-potential exploration wells drilled in the Flemish Pass basin in 2003 failed to encounter commercial quantities of hydrocarbons. These wells were abandoned, with the related costs written off against earnings in 2003. Information gained from the wells, together with other exploration data, continue to be evaluated to determine our future plans for the area.
Our strategy is to extend profitable East Coast oil production.
OUTLOOK
2004 production expectations:
• Petro-Canada’s East Coast oil production to average 80 000 b/d.
Our production outlook takes into account a six-day potential shutdown at Terra Nova and a 10-day potential shutdown at Hibernia. We are investigating ways to minimize the duration of shutdowns at both fields.
Growth plans:
• Complete White Rose development by early 2006.
• Extend plateau production at both Hibernia and Terra Nova.
2004 capital spending plans:
• $180 million for development of White Rose.
• $140 million for ongoing Hibernia and Terra Nova drilling and development.
The ongoing high level of spending at White Rose, Hibernia and Terra Nova underscores the importance of these world-class projects to our long-term growth plans. Development spending at Hibernia and Terra Nova in 2004 will include drilling 14 wells – eight at Hibernia and six at Terra Nova. No exploratory drilling is planned for this offshore region in 2004.
9
Oil Sands
Syncrude Operating and Overhead Costs
Operating and overhead costs increased due to lower reliability and production volumes.
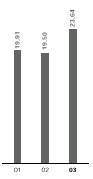
• Unit operating and overhead costs
($ per barrel)
Oil Sands Financial Results
(millions of dollars) | | 2003 | | 2002 | | 2001 | |
| | | | | | | |
Earnings (loss) from operations and net earnings (loss) | | $ | (50 | ) | $ | 79 | | $ | 59 | |
Cash flow | | $ | 127 | | $ | 196 | | $ | 136 | |
Expenditures on property, plant and equipment and exploration | | $ | 448 | | $ | 462 | | $ | 304 | |
Total assets | | $ | 1 746 | | $ | 1 473 | | $ | 899 | |
2003 COMPARED WITH 2002
Oil Sands suffered a loss from operations in 2003. The loss was due to an $82 million after-tax write off of costs related to the original Edmonton refinery conversion plan, a start-up phase operating loss from Petro-Canada’s 100 per cent owned in situ bitumen project at MacKay River and reliability problems at Syncrude.
The contribution to earnings from Petro-Canada’s 12 per cent interest in Syncrude was down from the previous year due to lower production volume and an increase in operating costs, partially offset by higher oil prices. Our share of Syncrude production averaged 25 400 b/d before royalties, down from 27 500 b/d in 2002. The volume decline was due to extended maintenance turnarounds at the Aurora mine and one of the upgrader coking units and an unscheduled turnaround on the other coking unit in the fourth quarter. Our average price realized for synthetic crude oil production in 2003 was $42.67/bbl, up from $40.66/bbl in 2002. Average unit operating costs increased to $23.64/bbl in 2003, compared with $19.50/bbl in the previous year, due to higher natural gas costs, lower production volumes and increased maintenance costs.
The MacKay River project, a steam-assisted gravity drainage (SAGD) operation, worked through technical issues during its start-up year. The operating loss in 2003 was due to a longer start-up phase than originally envisaged, which resulted in lower production and higher operating costs. A major factor was a six-week shutdown of steam generation to allow for process modifications to resolve a water treating issue. The producing formation cooled during the shutdown, further delaying the initial production build-up. In the fourth quarter, with water treatment under control, production regained momentum, rising steadily to a December average of 18 600 b/d. Reflecting the setback, bitumen production for the year was less than half of the expected volume, averaging 10 700 b/d. The average price realized for MacKay River bitumen in 2003 was $16.69/bbl. While start-up phase operating costs averaged $22.11/bbl in 2003, they are expected to decline going forward as performance improves and volumes grow.
MacKay River SAGD production ramped up in 2003.
STRATEGY
Petro-Canada’s Oil Sands assets include about 300 000 net acres of leases considered prospective for in situ development of bitumen reserves. These are long-life resources that can deliver production for well over 30 years. Our strategy for profitable growth includes:
• Phased and integrated development of reserves, incorporating the benefits of our learnings as we go.
• Disciplined capital investment to ensure these long-life projects are value creating.
Our staged approach to development of capital-intensive Oil Sands projects ensures vigorous cost management, while allowing us to benefit from evolving technology.
10
Executing the strategy
Oil Sands capital expenditures of $448 million in 2003 included $292 million for Syncrude (mainly for the Stage 3 expansion), $112 million for reconfiguration of the Edmonton refinery (a portion of which, relating to feedstock conversion, was written off in 2003) and $44 million for the MacKay River in situ project and other Oil Sands work.
At Syncrude, progress continued on the construction of the third stage of a multi-stage expansion program. Stage 3 includes a second Aurora mine and an upgrading expansion. The Aurora 2 mine was commissioned in the fourth quarter of 2003 and is contributing to the overall bitumen supply.
At MacKay River, reliability improved significantly in the fourth quarter of 2003 and the plant is on track to reach 30 000 b/d around mid-2004. With the reservoir responding well to steam injection, we expect to sustain plateau production of 25 000 to 30 000 b/d for 25 to 30 years after accounting for turnarounds and unplanned events. Starting in 2004, a 165-megawatt co-generation facility completed by TransCanada Energy Limited will contribute to operating cost reduction, as well as increase steam capacity at MacKay River. By converting waste heat from an existing gas turbine, the co-generation facility is expected to improve overall energy efficiency and reduce MacKay River gas consumption by about 10 to 15 per cent.
Following start-up of MacKay River in 2002, our plans anticipated creation of a large-scale, fully-integrated bitumen production and refining operation centered around our best-in-class Edmonton refinery. However, over the past year, as we completed our basic engineering for conversion of the Edmonton refinery, we could foresee the same significant cost escalations as were taking place in all other large bitumen upgrading projects within the industry. Our disciplined project management processes prevented us from proceeding with the project at an uneconomic level but required the write-off against earnings of the engineering costs incurred to that date. After evaluating our options, we formulated a new, scaled-down plan for upgrading and refining oil sands feedstock at Edmonton.
The new plan retains our longer-term objective of a fully integrated bitumen production and refining operation, while also providing the flexibility to pace the upstream portion of our strategy without having to move in lockstep with refinery projects. The plan builds on the $1.4 billion strategic investments we are already making in the refinery for long-term positioning and gasoline/diesel desulphurization. Key elements of the new plan (with new investment estimated at $1.2 billion) include building new crude and vacuum units, expanding the capacity of the existing coker and building additional sulphur and hydrogen capability. The new configuration will allow the refinery to directly upgrade approximately 26 000 b/d of bitumen and process 48 000 b/d of sour synthetic crude oil. These lower-cost feedstocks will replace the conventional feedstock that is refined today. The refinery will also continue to process about 50 000 b/d of sweet synthetic crude through its synthetic train.
Petro-Canada has a staged and integrated approach to oil sands development.
OUTLOOK
2004 production expectations:
• Our share of Syncrude production to average 28 000 b/d.
• MacKay River bitumen production to average 25 000 b/d.
Growth plans:
• Continued participation in Syncrude Stage 3 expansion.
• Optimize reliability and performance of MacKay River.
• Continue prospect evaluation for next in situ bitumen project.
2004 capital spending plans:
• $305 million for our share of Syncrude’s Stage 3 expansion, sustaining capital for both Syncrude and MacKay River, delineation of future bitumen resources and other expenses.
11
The Syncrude upgrader expansion is behind schedule. More information on the schedule and costs to complete Stage 3 is expected in the first half of 2004. Completion of Stage 3 will enable Petro-Canada’s share of Syncrude production capacity to rise by 13 000 b/d. Syncrude management continues to direct considerable resources towards improving plant reliability to secure more consistent achievement of production targets and lower unit operating costs.
Initially, on completion of the Edmonton refinery reconfiguration in 2008, Petro-Canada will fill out the refinery’s bitumen processing capability through the purchase of 26 000 b/d of bitumen from other producers. This external feedstock will be replaced in due course by supply from our next in situ SAGD development. Another important element of our plan is an agreement with Suncor Energy Inc. that takes effect in 2008, subject to regulatory approval. Under the agreement, Suncor will process a minimum 27 000 b/d of our MacKay River bitumen production, on a fee-for-service basis, to produce an estimated 22 000 b/d of sour synthetic. This sour crude, combined with an additional 26 000 b/d of sour synthetic crude purchased from Suncor, will complete our feedstock requirements. Both the processing and sales components of the bitumen agreement will be for minimum 10-year terms.
During 2003, the federal government’s implementation plan for the Kyoto Protocol became clearer. The government has given assurances that its commitment to climate change action will not jeopardize economic growth and that it understands the importance of the issue to oil sands development. Petro-Canada remains committed to seeking improvements to in situ technology that will further improve its energy efficiency.
As part of our revised strategy, earlier plans for development of Meadow Creek (owned 75 per cent by Petro-Canada) as our next in situ bitumen production project were suspended. Under the revised strategy, we believe smaller plants similar to MacKay River will enable us to leverage knowledge gained through MacKay River operations and benefit from rapidly changing technology advances. Our oil sands winter drilling evaluation program is therefore focusing on delineation of “sweet spots” at Meadow Creek and evaluation of expansion potential at MacKay River. Our revised plan anticipates our next in situ project coming on-stream late in this decade.
In December 2003, Petro-Canada announced a new plan to upgrade bitumen at the Edmonton refinery.
International
International Financial Results
(millions of dollars) | | 2003 | | 2002 | | 2001 | |
| | | | | | | |
Earnings (loss) from operations | | $ | 297 | | $ | 225 | | $ | (27 | ) |
Gain on sale of assets | | 10 | | — | | — | |
Net earnings (loss) | | $ | 307 | | $ | 225 | | $ | (27 | ) |
Cash flow | | $ | 890 | | $ | 583 | | $ | 27 | |
Expenditures on property, plant and equipment and exploration | | $ | 525 | | $ | 221 | | $ | 153 | |
Total assets | | $ | 3 883 | | $ | 3 544 | | $ | 186 | |
2003 COMPARED WITH 2002
The solid improvement in International earnings from operations in 2003 mainly reflects an additional four months contribution from assets acquired in 2002, and higher commodity prices. Positive adjustments related to the clarification of production rights and the settlement of a tax issue associated with a former operation also contributed to the improvement.
Offsetting factors included a $46 million impairment provision related to the impending sale of assets in Kazakhstan. This sale was completed in February 2004. Petro-Canada’s International production of crude oil and natural gas in 2003 averaged 210 000 boe/d, essentially unchanged from an average of 212 000 boe/d over the last eight months of 2002.
12
STRATEGY
Petro-Canada’s International operations are currently focused on three core exploration and production regions: Northwest Europe; North Africa/Near East; and Northern Latin America. The Company is positioning itself to become a larger international player. Our strategy is to build a platform to deliver long-term profitable growth. This strategy includes the following key elements:
• Expand and exploit the existing portfolio of assets.
• Target new theatres of operation and acquisitions.
• Develop a balanced exploration program.
International is a solid business focused on three core areas.
Executing the strategy
Over the past two years, we have established a platform for successful international growth. In 2003, International capital expenditures amounted to $525 million, exceeding original plans due to the acquisition of additional assets in the U.K. North Sea, partially offset by exploration program reductions and lower spending in Libya. By core area, spending totalled $362 million in Northwest Europe, $137 million in North Africa/Near East, and $26 million in Northern Latin America.
Northwest Europe
In Northwest Europe, we have a solid foothold in the highly profitable North Sea with production from the U.K. and Netherlands sectors. We also have exploration programs in Denmark and the Faroe Islands. While the region is mature, we believe small- to mid-size reserves can be produced economically, especially if tied back to existing infrastructure. In 2003, Petro-Canada’s production from Northwest Europe averaged 37 700 b/d of crude oil and natural gas liquids and 80 mmcf/d of natural gas, compared with averages of 40 500 b/d and 90 mmcf/d respectively over the last eight months of 2002. The lower volumes mainly reflected extended maintenance shutdowns at the Triton FPSO and Scott platform in the U.K. North Sea.
In 2003, Petro-Canada expanded its position in the U.K. North Sea through the exchange and acquisition of property interests. The property acquisitions are in and around the Triton FPSO and include increased interests in the Guillemot West and Northwest producing fields and a 100 per cent working interest in block 21/23b. This block contains the undeveloped Pict oil discovery (previously named Grebe), which is similar in size to our Clapham field (Petro-Canada – 100 per cent working interest). Development of Clapham in 2003 included the tie-back of two production and two injector wells and subsea facilities to the Triton FPSO via the Guillemot West subsea infrastructure. Field production came on stream in November and reached a planned peak of 15 000 b/d prior to year-end.
In the Netherlands sector, development of a prior year natural gas discovery on Block L5b (Petro-Canada – 30 per cent working interest) was completed ahead of schedule, with first gas on stream in October. At year-end, Petro-Canada’s share of production had reached a peak of 18 mmcf/d. In a strategic realignment of our Netherlands holdings during 2003 we divested non-core acreage and acquired additional exploration assets, licences F6 and L6a, concentric to our remaining holdings and infrastructure.
North Africa/Near East
Our interests in this core region, particularly in Syria and Libya, provide a significant base of production as well as considerable re-development potential. In 2003, Petro-Canada’s North Africa/Near East production of crude oil and natural gas liquids averaged 143 100 b/d and 32 mmcf/d for natural gas, compared with averages of 145 400 b/d and 44 mmcf/d, respectively, over the last eight months of 2002. The lower volumes reflected a production decline in Syria with some offset from increased volumes from Libya, including new production from the En Naga block which came on stream in February 2003.
In mid-2003, Petro-Canada, together with Syria Shell Petroleum Development B.V., finalized an agreement with the Syrian government that extends rights to deep and lateral reserves on existing acreage. The agreement supplements the three existing Production Sharing Contracts under which the companies operate, through the Al Furat Petroleum Company joint venture. The new agreement is of particular significance as production from this area will partially offset the production declines we are seeing from existing fields.
13
Furthering our plans for a balanced International exploration program for longer-term growth, we have expanded our portfolio of operated exploration assets in Tunisia, Syria and Algeria. In Tunisia, subject to final government approval, we have farmed in to the 845 000-acre (3 420-square-kilometre) Melitta Exploration Permit, located mainly offshore in the Mediterranean Sea. In northeast Syria, we were awarded the 1 680 000-acre (6 800-square-kilometre) exploration Block II. In Algeria, subject to final government approval, we have been awarded the 691 000-acre (2 800-square-kilometre) Zotti 431b block, located in the Amguid Messaoud basin.
Northern Latin America
In Trinidad, Petro-Canada’s 17 per cent working interest share of production from the North Coast Marine Area-1 offshore gas project averaged 63 mmcf/d before royalties, up from 32 mmcf/d for the period from start-up to the end of 2002. Natural gas is delivered to the Atlantic LNG facility at Point Fortin for liquefaction and sale into United States markets. During the second half of 2003, operating results exceeded expectations following start-up of the new Train 3. Contributing factors included better than expected productivity and performance from wells and the Hibiscus production platform, and the LNG facility, which consistently exceeded design capacity. In 2003, a successful exploration well drilled from the Hibiscus platform in 2003 was completed as a production well, providing additional gas volumes to the project.
Late in 2003, discussions concerning the potential acquisition of the Cerro Negro heavy oil assets in Venezuela were terminated, as pre-emptive rights held by other joint owners could not be resolved.
We’re targeting new International opportunities to add profitable long-term growth.
OUTLOOK
2004 production expectations:
• Northwest Europe oil and gas production to average 54 000 boe/d.
• North Africa/Near East oil and gas production to average 133 000 boe/d.
• Northern Latin America natural gas production to average 60 mmcf/d.
Growth plans:
• Development of De Ruyter and Pict in the North Sea.
• Exploration in Syria, Tunisia and Algeria.
• Identify and develop growth opportunities in new areas.
2004 capital spending plans:
• $240 million on existing assets.
• $400 million for new developments and exploration.
Planned expenditures on existing assets in 2004 will focus primarily on Syria, Libya and the U.K. New development investments will include Pict in the U.K. and De Ruyter in the Netherlands. In Venezuela, an extended production test will be undertaken to evaluate the commercial viability of the La Ceiba crude oil discovery (Petro-Canada – 50 per cent working interest). Exploration and new venture plans anticipate work on Block II in Syria, Melitta in Tunisia, Zotti in Algeria and concentric exploration associated with existing ventures.
14
RESERVES
Reserves Inventory
Our large reserves inventory provides a strong base for future growth.

• Proved reserves
(millions of barrels of oil equivalent)
At year-end 2003, proved reserves before royalties (including synthetic crude oil from oil sands mining) totalled 1 220 million barrels of oil equivalent (mmboe), down five per cent from a year earlier. As part of our long-term reserves replacement strategy, we have added exploration capability and funding – especially internationally – to develop a balanced exploration program aimed at increasing our reserves base over time. In particular, we will target long-life reserves and aim for greater Petro-Canada operatorship. Our goal is a growth portfolio that provides a balanced range of risk/reward opportunities. The new exploration acreage recently acquired in Syria, Tunisia and Algeria are early examples of initiatives in the International business. In Canada, Petro-Canada continues to pursue opportunities off the East Coast and North of 60 while in Western Canada, we plan to gradually increase our exploration program over time to improve reserves replacement.
In order to harmonize its oil and gas disclosure in both Canada and the U.S., Petro-Canada applied for, and received, certain exemptions to reserves disclosure requirements as set out in National Instrument 51-101; Standards of Disclosure for Oil and Gas Activities (NI 51-101), which was adopted in 2003 by the securities regulatory authorities in Canada. These exemptions permit Petro-Canada to use its own staff of qualified reserves evaluators to prepare the Company’s reserves estimates and to use U.S. Securities Exchange Commission (SEC) and Financial Accounting Standards Board (FASB) standards when reporting reserves.
Petro-Canada strongly believes that its use of its own staff of qualified reserves evaluators who are familiar with the Company’s oil and gas assets as a result of working with them on a day-to-day basis, combined with independent third party evaluation/audit of both its reserves processes and its reserves estimates, provides a level of confidence in its reserves data that is at least as good as would be provided if the work was done solely by a third party.
Petro-Canada’s staff of qualified reserves evaluators determine the Company’s reserves data and reserves quantities based on corporate-wide policies, procedures and practices. These reserves policies, procedures and practices conform with the requirements of Canadian as well as SEC regulations and the Association of Professional Engineers, Geologists and Geophysicists of Alberta Standard of Practice for the Evaluation of Oil and Gas Reserves for Public Disclosure. To confirm the quality of the reserves policies, procedures and practices and the internally-generated reserves estimates, Petro-Canada employs the services of independent engineering evaluators/auditors. During 2003, independent petroleum reservoir engineering consultants Sproule Associates Limited (Sproule) and Gaffney, Cline & Associates Ltd. (GCA) conducted evaluations, technical audits and reviews of Petro-Canada’s hydrocarbon reserves. GCA completed an independent audit of 70 per cent of the Company’s proved crude oil, natural gas and natural gas liquids reserves outside of Canada. Similarly, Sproule audited Petro-Canada’s proved oil and gas reserves estimates for Hibernia and Terra Nova, evaluated 54 per cent of Western Canada proved conventional oil and gas reserves and reviewed the balance of Western Canada, White Rose and Syncrude. The independent auditors’/evaluators’ reports concluded that the Company’s year-end 2003 proved reserves estimates are reasonable.
Sproule and GCA also audited Petro-Canada’s reserves policies, procedures and practices and concluded that Petro-Canada’s reserve booking standards meet applicable disclosure regulations, that management is complying with those standards and the reserves process is performed in a manner and standard consistent with the auditors’ practices. In addition, PricewaterhouseCoopers LLP, as contract internal auditor, tested the non-engineering management control processes used in establishing reserves.
Detailed information about Petro-Canada’s reserves of crude oil, natural gas liquids, natural gas, bitumen and synthetic crude oil is available on pages 60-63 of this Annual Report.
Petro-Canada reserves processes and estimates are audited by independent consultants.
15
DOWNSTREAM
Downstream Operating, Marketing and General Costs
Per-litre costs reflected increased costs for the planned closure of the Oakville refinery and the incident at the Lubricants plant.
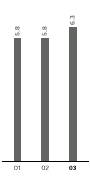
• Unit operating, marketing and general costs
(cents per litre)
Our Downstream operations include three refineries with a total rated capacity of 49 800 cubic metres (313 000 barrels) per day, and a lubricants plant that is the largest producer of lubricant base stocks in Canada and the largest producer of white oils in the world. In 2003, Petro-Canada accounted for about 17 per cent of the Canadian industry’s total refining capacity and our product sales represented about 17 per cent of total petroleum products sold in Canada.
Downstream Financial Results
(millions of dollars) | | 2003 | | 2002 | | 2001 | |
| | | | | | | |
Earnings from operations | | $ | 264 | | $ | 254 | | $ | 300 | |
(Loss) gain on sale of assets | | (15 | ) | 3 | | 1 | |
Net earnings | | $ | 249 | | $ | 257 | | $ | 301 | |
Cash flow | | $ | 601 | | $ | 380 | | $ | 589 | |
Expenditures on property, plant and equipment | | $ | 424 | | $ | 344 | | $ | 383 | |
Total assets | | $ | 3 838 | | $ | 3 841 | | $ | 3 556 | |
2003 COMPARED WITH 2002
Downstream financial performance in 2003 reflected improved revenues from higher cracking margins, lower income taxes, and a one-time charge for a refinery closure.
The lower income taxes reflect a $34 million net positive adjustment resulting primarily from changes in income tax rates. The one-time charge for the refinery closure, amounting to $151 million after tax, relates to the planned closure of Petro-Canada’s Oakville refinery. Net earnings of $249 million in 2003 are after deduction of a $15 million loss on asset sales mainly related to the selective rationalization of marketing networks in Eastern Canada. The increase in cash flow reflects the higher earnings before the non-cash charge for Oakville and lower current taxes resulting from the inventory accounting method required for income tax purposes. This method resulted in a $25 million decrease in current taxes in 2003, compared with an $85 million increase in 2002.
Strong performance in Refining and Supply mainly resulted from higher refinery crack spreads and wider light/heavy crude oil price differentials, which more than offset the effects of a one per cent decline in overall crude capacity utilization at our three refineries. Total crude oil processed in 2003 averaged 49 900m3/d, down from 50 400 m3/d in 2002. The decline reflected unplanned shutdowns and the impact on the Oakville refinery of a major power outage in Ontario in August.
Sales and Marketing results also improved, as sales of refined products, boosted by strong wholesale distillate sales, increased to a record 56 800 cubic metres per day (m3/d) from 55 700 m3/d in 2002. Additionally, the contribution from non-petroleum product sales continued to demonstrate strong growth with convenience store sales rising 16 per cent from the previous year. The strong performance was achieved despite a challenging business environment for much of the year, including concerns over SARS, which reduced travel in important urban markets, the power outage in Ontario and problems in the beef and lumber industries that affected distillate sales. Additionally, high crude prices continued to place considerable pressure on product margins. Total Downstream operating, marketing and general unit costs, at 6.3 cents per litre, were up from 5.8 cents per litre in 2002. The increase mainly reflected the de-commissioning and employee-related costs associated with the planned closure of the Oakville refinery, and a partial shutdown of the Lubricants plant following the August power outage.
In September 2003, Petro-Canada announced the planned closure of the Oakville refinery.
STRATEGY
Our Downstream strategies are focused on strengthening the foundations for improved profitability through effective capital investment and discipline over controllable factors. Our goal is superior returns and growth, including a minimum 12 per cent return on capital employed, based on a mid-cycle business environment. Key features of our strategy include:
• Achieving and maintaining first-quartile operating performance.
• Advancing Petro-Canada as the brand of choice for Canadian gasoline consumers.
• Building on our marketplace strengths and increasing sales of high-margin specialty lubricants.
16
Executing the strategy
Refinery Utilization
Lower refinery utilization was due to unplanned shutdowns.
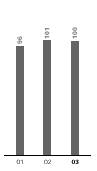
• Crude capacity utilization
(per cent)
• Our rated refinery crude capacity was increased in 2001 following process improvements.
In 2003, Petro-Canada advanced two key strategic initiatives that will position Refining and Supply operations for long-term profitability.
In the third quarter of 2003, plans were finalized for the consolidation of our Eastern Canada refining operations at the Montreal refinery. These plans include shutting down the Oakville refinery by the end of 2004 and expanding the existing Oakville terminal facilities and the Montreal refinery. The changes will enable the transition from a refining-focused operation to a supply and logistics centered function where best-in-class performance is achievable. We will complete the project in time to meet compliance with federal legislation lowering limits for sulphur in gasoline, effective January 1, 2005.
The second key initiative is a new plan for upgrading and refining oil sands feedstock at our Edmonton refinery. Details are outlined in the Oil Sands section of this MD&A.
Plant reliability, a critical component of success in the refining business, fell below our target in 2003, due to unplanned shutdowns at our refineries and Lubricants plant. Going forward, we will intensify our efforts to optimize operations and maintenance procedures to achieve first quartile performance based on Solomon & Associates benchmarking. As part of our efforts to reduce costs and greenhouse gas emissions, we remain committed to reduce energy consumption by an average of one per cent per year through 2005.
Downstream capital expenditures on property, plant and equipment were $424 million in 2003, marginally below plan as reduced spending on the Oakville refinery was essentially offset by acquisitions in the home heating business. A major portion of 2003 spending was directed at meeting the federal regulatory requirement of 30 parts per million of sulphur in gasoline by 2005.
The new gasoline desulphurization unit at the Montreal refinery was completed and successfully commissioned in the fourth quarter of 2003. Construction of the Edmonton gasoline desulphurization unit is ongoing and it will be operational ahead of the legislated date.
In Sales and Marketing, we continued to take steps to grow the profitability of our retail network by focusing on two key areas. The first involved leveraging all aspects of the Petro-Canada brand and product service to be the brand of choice for Canadians. In 2003, this resulted in:
• 16 per cent overall growth in convenience store sales (including nine per cent growth in same store sales)
• 10 per cent growth in the number of Petro-Points loyalty program members; and
• the growing success of our first-in-the-industry prepaid card program, particularly in the business to business segment.
Product Sales
Total Downstream sales per retail site continued to grow in 2003.
Secondly, we focused on achieving appropriate Petro-Canada representation to generate high site throughputs and profitable share of market. In 2003, this resulted in the sale of Petro-Canada’s Newfoundland and Labrador retail network and the selective rationalization of our Eastern Canada retail network. The impact of reduced product sales resulting from these divestitures was offset by growth initiatives such as the continued roll-out of Petro-Canada’s successful new-image service stations. At year-end, the program of converting all Company-controlled sites that meet our economic return criteria was about 80 per cent complete. Significant progress was also made in the number of independent retailers participating in the new-image program. About 40 per cent of our retail sites are independent and, at year-end, over 30 per cent of these retailers were operating with the new-image standard. This program has been instrumental in driving incremental increases in throughputs and profitability. In 2003, total throughput from our retail network of 1 432 sites averaged 4.2 million litres per site, compared with 4.1 million litres in the previous year. Average annual throughputs from re-imaged sites averaged in excess of seven million litres, representing a significant competitive advantage.
• Retail throughput per site
(millions of litres per year)
• Petroleum product sales
(thousands of cubic metres per day)
In the Wholesale business, the focus has been on growing profitability in high-value channels. Examples include acquisitions in the home heat business in Ontario and the launch of a new innovative product in Eastern Canada called ThermaClean®, a higher-value proprietary furnace fuel that helps lessen the impact of home heating on the environment while helping prolong furnace life. In the commercial road transport business, Petro-Canada is maintaining its best-in-class position. With our Petro-Pass network of 210 truck stop facilities and our premiere fleet management card, Petro-Canada is the market leader in serving Canada’s commercial road transport industry. In 2003, we focused on enhancing our leadership position by further upgrading our network and increasing volume through sales efforts in this high-value channel.
In Lubricants, financial performance in 2003 was impacted by a difficult business environment, including softness in some key export markets, particularly the United States where a weak economy dampened sales. Other factors included high natural gas prices and the regional power outage in August.
17
While Lubricants sales in 2003 were unchanged from the 768 million litres achieved in 2002, the high-margin product component rose five per cent, reflecting strong growth in automotive sales, drilling industry sales and higher-value base oils. At year-end, high-margin sales accounted for over 65 per cent of total lubricants sold. About two-thirds of our manufactured lubricants, specialty fluids and greases are currently sold outside of Canada. We continue to target accelerated growth in international markets to take advantage of increasing global demand for higher-quality base oils. An improving high-margin sales mix, cost-reduction initiatives in the areas of energy and distribution, and delivery on plans to achieve efficient and reliable plant operations will position Lubricants for continued profitable growth.
In 2004 we will focus on improving plant reliability.
OUTLOOK
Growth plans:
• Improve plant reliability.
• Implement key strategic initiatives in Refining and Supply.
• Secure further reductions in operating costs.
• Maximize benefits from retail site re-imaging program.
• Capitalize on the increasing demand for higher quality base oils.
2004 capital spending plans:
• $705 million for Refining and Supply.
• $150 million for Sales and Marketing.
• $10 million for Lubricants.
While a substantial portion of our planned Downstream investments in 2004 will be directed towards lessening the environmental impact of our operations and products, we remain focused on positioning Petro-Canada for improved profitability. Estimated capital expenditures for Refining and Supply include about $445 million for refinery reconfigurations to meet new lower limits for sulphur in gasoline and diesel at our Edmonton and Montreal locations; about $135 million to consolidate our Eastern Canada refinery operations at Montreal, including the conversion of our Oakville facility; and $50 million for engineering, site preparation and other costs associated with the new feedstock conversion plans for the Edmonton refinery. Sales and Marketing expenditures include $100 million for retail growth initiatives, including the continued roll-out of the new-image service station program, and $30 million for wholesale growth initiatives to further develop our Petro-Pass network.
SHARED SERVICES
Shared Services include investment income, interest expense, foreign currency translation and general corporate revenue and expenses.
Shared Services Financial Results
(millions of dollars) | | 2003 | | 2002 | | 2001 | |
| | | | | | | | | | |
Net expenses from operations | | $ | (182 | ) | $ | (144 | ) | $ | (51 | ) |
Foreign currency translation | | 239 | | (52 | ) | (96 | ) |
Gain on sale of assets | | 1 | | — | | — | |
Net earnings (expense) | | $ | 58 | | $ | (196 | ) | $ | (147 | ) |
Cash flow | | $ | (100 | ) | $ | (104 | ) | $ | (53 | ) |
2003 COMPARED WITH 2002
The rise in net expenses from operations in 2003 primarily reflects higher income taxes including increases resulting from changes in federal and provincial income tax rates. The 2003 foreign currency translation gain on U.S. dollar-denominated long-term debt reflects the significant improvement in the strength of the Canadian dollar versus the U.S. dollar. The foreign currency translation loss of $52 million in 2002 includes a one-time $63 million exchange loss from the translation of the International business segment and an $11 million gain on translation of U.S.-dollar-denominated debt.
18
LIQUIDITY AND CAPITAL RESOURCES
Summary of Cash Flows
(millions of dollars) | | 2003 | | 2002 | | 2001 | |
| | | | | | | |
Net cash inflows (outflows) before changes in non-cash working capital: | | | | | | | |
Cash flow | | $ | 3 372 | | $ | 2 276 | | $ | 1 688 | |
Investing activities | | (2 297 | ) | (4 141 | ) | (1 564 | ) |
Financing activities | | (604 | ) | 1 560 | | (909 | ) |
| | 471 | | (305 | ) | (785 | ) |
(Increase) decrease in non-cash working capital and other | | (70 | ) | (242 | ) | 151 | |
Increase (decrease) in cash and cash equivalents | | $ | 401 | | $ | (547 | ) | $ | (634 | ) |
Cash and cash equivalents at end of year | | $ | 635 | | $ | 234 | | $ | 781 | |
Petro-Canada has the financial strength and flexibility to pursue new opportunities.
OPERATING ACTIVITIES
The improvement in cash flow before changes in non-cash working capital to $3 372 million in 2003 resulted primarily from higher commodity prices, production gains and improved refinery crack spreads, partially offset by an increase in current income taxes. The reduced cash outflow on investing activities reflects the acquisition of oil and gas assets from Veba Oil & Gas GmbH in 2002. The net cash outflow on financing activities in 2003 results primarily from the repayment of a substantial portion of the credit facility set up to finance the Veba acquisition.
The $70 million increase in non-cash operating working capital reflects decreases in accounts payable and accrued liabilities and the current portion of long-term liabilities partially offset by a decrease in accounts receivable and an increase in income taxes payable.
INVESTING ACTIVITIES
Capital and Exploration Expenditures
(millions of dollars) | | 2003 | | 2002 | | 2001 | |
| | | | | | | |
Upstream(1) | | | | | | | |
North American Gas | | $ | 560 | | $ | 530 | | $ | 548 | |
East Coast Oil | | 344 | | 289 | | 279 | |
Oil Sands | | 448 | | 462 | | 304 | |
International | | 525 | | 221 | | 153 | |
| | 1 877 | | 1 502 | | 1 284 | |
| | | | | | | |
Downstream | | | | | | | |
Refining and Supply | | 296 | | 210 | | 206 | |
Sales and Marketing | | 117 | | 118 | | 156 | |
Lubricants | | 11 | | 16 | | 21 | |
| | 424 | | 344 | | 383 | |
Shared Services | | 14 | | 15 | | 14 | |
Total property, plant and equipment and exploration | | 2 315 | | 1 861 | | 1 681 | |
Deferred charges and other assets | | 147 | | 72 | | 10 | |
Acquisition of oil and gas operations of Veba Oil & Gas GmbH | | — | | 2 234 | | — | |
Total | | $ | 2 462 | | $ | 4 167 | | $ | 1 691 | |
(1) Includes exploration expenses charged to earnings, totalling $271 million in 2003, $301 million in 2002 and $245 million in 2001.
19
Petro-Canada’s substantial capital spending on property, plant and equipment and exploration in 2003 reflects our commitment to long-term profitable growth and added value for shareholders. The 24 per cent increase in expenditures to $2 315 million in 2003, primarily reflects an additional four months of major international activity, the White Rose development and increased spending in the Downstream to meet lower limits for sulphur in gasoline. The increase in deferred charges and other assets includes higher corporate expenditures resulting from the issuance and interest hedging costs associated with the placement of U.S. dollar-denominated long-term debt.
Planned investments for 2004, totalling $2 645 million, reaffirm our growth commitment. Upstream expenditures are estimated at $1 765 million, with $495 million allocated to North American Gas, $325 million to East Coast Oil, $305 million to Oil Sands and $640 million to International. Planned Downstream expenditures amount to $865 million, with $705 million for Refining and Supply, including a recent $50 million addition for anticipated spending on new feedstock conversion plans for the Edmonton refinery, $150 million for Sales and Marketing and $10 million for Lubricants. Additionally, $15 million is provided for corporate and other purposes. We plan to fund the 2004 capital expenditure program from cash flow.
Capital investments are forecast to be $2 645 million in 2004.
FINANCING ACTIVITIES AND DIVIDENDS
Sources of Capital Employed
(millions of dollars) | | 2003 | | 2002 | | 2001 | |
| | | | | | | |
Long-term debt, including current portion | | $ | 2 229 | | $ | 3 057 | | $ | 1 401 | |
Shareholders’ equity | | 7 721 | | 5 776 | | 4 877 | |
Total | | $ | 9 950 | | $ | 8 833 | | $ | 6 278 | |
The decrease in total debt to $2 229 million at December 31, 2003, compared with $3 057 million the previous year-end, reflects $548 million of net debt repayments and a $280 million reduction due to the revaluation of U.S. dollar denominated long-term debt. During the year 2002, the Company borrowed $2 100 million, by way of an acquisition credit facility, to finance the funding of the purchase of the upstream assets of Veba Oil & Gas GmbH. During 2002, the Company repaid $461 million from cash flow. During 2003, a further $542 million was repaid from cash flow and $804 million was refinanced by way of a long-term debt offering completed in June 2003.
In 2003, we repaid $548 million of debt.
Debt Offering – June 2003
Purpose of offering: | | To repay bank indebtedness incurred in the acquisition of oil and gas operations from Veba Oil & Gas GmbH |
Size of offering: | | US$600 million |
Form of securities: | | US$300 million of 4.00% Notes and US$300 million of 5.35% Notes |
Net proceeds of issue: | | US$592 million |
Application of proceeds: | | Reduction of short-term, floating rate acquisition credit facility |
20
Key Debt Ratios
With the repayment of $548 million of debt in 2003, the Company is well positioned relative to its target levels.
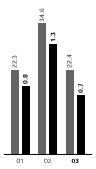
• Debt to debt plus equity
(per cent)
• Debt to cash flow
(times)
The following table summarizes Petro-Canada’s contractual obligations as at December 31, 2003.
Contractual Obligations – Summary
(millions of dollars)
| | | | PAYMENTS DUE BY PERIOD | |
| | Total | | 2004 | | 2005-2006 | | 2007-2008 | | 2009 and
thereafter | |
| | | | | | | | | | | |
Unsecured debentures and notes(1) | | $ | 1 842 | | $ | — | | $ | — | | $ | — | | $ | 1 842 | |
Acquisition credit facility(1) | | 293 | | — | | 293 | | — | | — | |
Capital lease obligations(1) | | 94 | | 6 | | 15 | | 10 | | 63 | |
Operating leases | | 687 | | 115 | | 168 | | 129 | | 275 | |
Transportation agreements | | 1 357 | | 158 | | 302 | | 246 | | 651 | |
Product purchase/delivery obligations(2) | | 1 216 | | 70 | | 150 | | 150 | | 846 | |
Exploration work commitments(3) | | 71 | | 36 | | 27 | | 8 | | — | |
Other long-term obligations(4),(5) | | 102 | | 82 | | 4 | | 2 | | 14 | |
Total contractual obligations | | $ | 5 662 | | $ | 467 | | $ | 959 | | $ | 545 | | $ | 3 691 | |
(1) Obligations exclude related interest. For further details see Note 16 to the 2003 Consolidated Financial Statements.
(2) Excludes supply purchase agreements that are contracted at market prices where the products could reasonably be resold into the market.
(3) Excludes other amounts related to the Company’s expected future capital spending. Capital spending plans are reviewed and revised annually to reflect the Company’s strategy, operating performance and economic conditions. For further information regarding future capital spending plans refer to the business segment and investing activities discussions in the previous sections of the 2003 MD&A.
(4) Includes pension funding obligations for the periods prior to the Company’s next required pension plan valuation. Obligations beyond the next required valuation date have been excluded due to the uncertainty as to the amount or timing of these obligations.
(5) The Company is involved in litigation and claims associated with normal operations. Management is of the opinion that any resulting settlements would not materially affect the financial position of the Company. The table excludes amounts for these contingencies due to the uncertainty as to the amount or timing of any settlements.
Petro-Canada plans to meet remaining debt repayment commitments out of a combination of cash flow and debt financing.
As a result of the substantial debt reduction in 2003, our financial ratios have returned to pre-acquisition levels, providing expanded financial capacity to fund continued growth and new opportunities.
Interest Coverage
A positive interest coverage ratio demonstrates more than sufficient earnings to cover interest charges on debt.
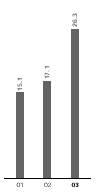
• Interest coverage ratio
(times)
• Calculated on an EBITDAX basis.
Financial Ratios
| | 2003 | | 2002 | | 2001 | |
| | | | | | | |
Interest coverage (times): | | | | | | | |
Earnings basis | | 16.7 | | 10.5 | | 9.7 | |
EBITDAX basis | | 26.3 | | 17.1 | | 15.1 | |
Cash flow basis | | 25.4 | | 17.9 | | 15.6 | |
Debt to cash flow (times) | | 0.7 | | 1.3 | | 0.8 | |
Debt to debt plus equity (per cent) | | 22.4 | | 34.6 | | 22.3 | |
Petro-Canada’s debt to cash flow ratio, our key short-term leverage measure, strengthened to 0.7 times at December 31, 2003, compared with 1.3 times at the end of 2002. We expect to remain well within our target range of no more than 2.0 times through 2004. Debt to debt plus equity, our long-term measure for capital structure, improved to 22.4 per cent from 34.6 per cent at the prior year-end. Our target range is from 25 to 30 per cent. Petro-Canada has controls in place to ensure compliance with all financial covenants.
For operating purposes, Petro-Canada had cash and cash equivalents of $635 million and undrawn committed bank credit facilities totalling $1 159 million at 2003 year-end. Petro-Canada will continue to use its cash position and will draw on bank lines and issue commercial paper if necessary to meet working capital and other financing requirements.
The Company’s unsecured long-term debt securities are rated Baa2 by Moody’s Investors Service, BBB by Standard & Poor’s Rating Services and A (low) by Dominion Bond Rating Service. The Company’s long-term debt ratings remain unchanged from year-end 2002.
21
Excluding cash and cash equivalents and the current portion of long-term debt, Petro-Canada had an operating working capital deficiency of $52 million at the end of 2003 compared with operating working capital of $36 million as at December 31, 2002.
Petro-Canada does not currently have any off-balance sheet accounting in place to structure any of its financial arrangements. Off-balance sheet activities are limited to matters such as guarantees, none of which would have a material impact on the Company’s financial results, liquidity or capital resources.
At 2003 year-end, Petro-Canada’s defined benefits pension plans were under-funded by $292 million, compared with an under-funded position of $279 million at the end of 2002. In 2003, Petro-Canada made cash contributions of $86 million to the pension plans and recorded a pension expense of $72 million before tax. This compares with $22 million and $28 million, respectively, for 2002. In 2004, the Company expects to make a contribution of approximately $86 million and record an expense of about $65 million.
Petro-Canada reviews its dividend strategy from time to time to ensure the alignment of dividend policy with shareholder expectations and our financial and growth objectives. Currently, our first priority for available cash is to fund growth opportunities. Our second priority is to return funds to shareholders. In 2003, when the quarterly dividend was $0.10 per share, Petro-Canada paid $106 million in dividends, compared with $105 million in 2002. The quarterly dividend payable on April 1, 2004, to shareholders of record on March 3, 2004, has been increased to $0.15 per share.
Petro-Canada announced a 50 per cent dividend increase in January 2004.
RISK MANAGEMENT
Petro-Canada’s results are impacted by management’s strategy for handling risks inherent in the underlying business, which fall into four broad categories: business risks; operational risks; political risks; and market risks.
Management believes each major risk requires a unique response within our broad business strategy and Petro-Canada’s financial tolerance. While some risks can be effectively managed through internal controls and business processes, others are managed through insurance. The Audit, Finance and Risk Committee of the Board of Directors has oversight responsibility for risk management. The following describes Petro-Canada’s approach to managing major risks.
BUSINESS RISKS
Exploration
Petro-Canada’s future cash flows are highly dependent on our ability to replace natural decline as reserves are produced. Reserves can be added through successful exploration or acquisition. However, as basins mature, replacement of reserves becomes more challenging and expensive, and we may choose to allow reserves to decline in some areas if replacement is uneconomic. Petro-Canada maintains an extensive exploration program in Canada and internationally. To support this program, we have entered into a variety of alliances with world-class suppliers. These alliances provide preferential access to equipment, labour and advanced technology at competitive prices. There is no assurance that we will successfully replace all reserves in any given year.
Reserve Estimates
Estimates of economically recoverable oil and gas reserves are based upon a number of variables and assumptions such as geoscientific interpretation, commodity prices, operating and capital costs, and production forecasts, all of which may vary considerably from actual results.
22
Project Execution
Petro-Canada manages a variety of small and large projects in support of continuing operations and future growth. Many project risks, such as those involving material costs, labour productivity, timely availability of skilled labour, and currency fluctuations are influenced by external factors beyond our control. Petro-Canada is enhancing its project management capability. We have built on our experience in major project development to establish effective standardized processes, backed by well-trained people, to manage projects across the organization. The goal is to consistently and predictably deliver projects on time, on budget, and achieve defined expectations, thereby improving all elements of project execution including safety and environmental performance, quality, cycle time and cost.
Third Party Operator
Other companies may manage construction or operation of assets in which Petro-Canada has an interest. The Company has limited ability to exercise influence over operations of these assets or their associated costs, which could adversely affect financial performance.
Environmental Regulations
Environmental risks inherent in the oil and gas industry are increasingly significant as related laws and regulations become more stringent in Canada and other countries where Petro-Canada operates. Increased regulations may require the Company to invest additional capital to satisfy new product specifications or address environmental issues, increase operating costs by reducing the yield of desirable products, or create a future liability for dismantling and remediating production facilities.
Petro-Canada conducts Life-Cycle Value Assessment (LCVA) to integrate and balance environmental, social and economic decisions related to major projects. A key component of the LCVA process is to include in front-end planning all life-cycle stages involved in constructing, manufacturing, distribution and eventually abandoning an asset or a product. This process encourages more comprehensive exploration for alternatives. Although LCVA is a useful technique, it relies on the current regulatory regime or one that can be reasonably expected.
Government Regulations
The Company is subject to regulation and intervention by governments in such matters as contracting of exploration and production interests, imposition of specific drilling obligations, and possibly expropriation or cancellation of contract rights. As well, governments may regulate or intervene with respect to price, taxes, royalties and exploration. The Company has limited ability to influence these regulations and they may have a material adverse effect on the Company.
Counter-parties
In the normal course of business, Petro-Canada is exposed to credit risk resulting from the uncertainty of a counter-party’s ability to fulfill an obligation in accordance with the terms and conditions of a contract. To minimize credit exposure, we have established internal credit policies and procedures that include financial assessments, exposure limits and processes to monitor the exposures against these limits. Where appropriate, we use netting and collateral arrangements to minimize risk.
Petro-Canada only transacts derivatives with counter-parties who possess a minimum long-term credit rating of A (unless otherwise approved by the Board) under a signed International Swap Dealers Association agreement. Credit limits take into account both current and potential exposure to a counter-party and limit concentration of risk.
23
OPERATIONAL RISKS
Production, refining, transporting and marketing oil and gas involve significant operational hazards. We manage operational risks primarily through our integrated Total Loss Management (TLM) system and a Corporate Insurance Program. TLM is an internally developed management system with standards for preventing operational incidents. A program of regular TLM audits tests compliance to the standards. The Corporate Insurance Program transfers some operational risks to third party insurers worldwide. Limits of insurance are based on financial quantification of a ‘maximum foreseeable exposure’ related to major assets. Petro-Canada optimizes the program by evaluating deductibles, limits and coverage. The Company’s financial tolerance to withstand the impact of a major isolated event may be utilized to manage total premium cost. Although Petro-Canada maintains insurance in accordance with customary industry practices, we cannot fully insure against all risks. Losses resulting from operational incidents could have a material adverse impact on the Company.
POLITICAL RISKS
Internationally, Petro-Canada operates in numerous countries with differing political, economic and social systems. Our operations and related assets are subject to the risks of actions by governmental authorities, insurgent groups or terrorists. Additionally, Petro-Canada operates in OPEC-member countries and production in those countries may be constrained from time to time by OPEC quotas. We evaluate our exposure in any one country in the context of the Company’s total operations, may limit investment to avoid excessive exposure in any one country or region and may choose not to invest in a country based on our assessment of risk.
MARKET RISKS
Commodity Prices
A significant market risk exposure for Petro-Canada is the commodity price of crude oil, refined products and natural gas. International commodity prices are volatile and are influenced by factors such as supply and demand fundamentals, geo-political events, OPEC decisions and weather. Refining margins are affected by North American supply and demand fundamentals and crude oil prices. These risks may be positive in a higher-price environment and negative in a lower-price environment.
Petro-Canada is generally averse to hedging large volumes of production. Management believes commodity prices go through price swings that are difficult to predict. We manage the business so that the Company can withstand the impact of a lower price environment, and is also fully exposed to capturing significant upside when the price environment is higher. However, commodity prices and margins may be hedged occasionally to capture opportunities that represent extraordinary value. Certain Downstream physical transactions are routinely hedged for operational needs and to facilitate sales to customers.
Foreign Exchange
As energy commodity prices are primarily priced in U.S. dollars, a large portion of Petro-Canada’s expense and revenue stream is affected by the U.S. dollar/Canadian dollar exchange rate. Although there is a significant natural offset to this exposure as a result of our integrated business, on a net basis Petro-Canada’s earnings are negatively affected by a strengthening Canadian dollar. We do not hedge this exposure, but it is partially mitigated by issuing U.S. dollar-denominated long-term debt. Foreign exchange exposure related to asset acquisitions or divestitures, or project capital expenditures, may be hedged on a case-by-case basis. Petro-Canada is also exposed to fluctuations in other foreign currencies such as the euro and British pound.
Interest Rates
Petro-Canada targets a blend of fixed and floating rate debt that enables the Company to take advantage of generally lower interest rates on floating debt while generally matching overall debt maturity with the life of cash generating assets. The Company is exposed to fluctuations in the rate of interest it pays on floating rate debt. Management’s perspective is that this interest rate exposure is consistent with industry practice and it is within the Company’s risk tolerance.
24
FINANCIAL INSTRUMENTS
Petro-Canada’s market risk and derivative policy prohibits the use of derivative instruments for speculative purposes. Petro-Canada uses derivatives primarily to hedge physical transactions for operational needs and to facilitate sales to customers. The gains and losses associated with these financial instruments essentially offset gains and losses on the physical transactions. Except as specifically authorized by the Board of Directors, the term of hedging instruments cannot exceed 18 months. Monitoring and reporting of the derivatives portfolio includes periodic testing of the fair value of all outstanding derivatives. Fair values are determined by obtaining independent third party quotes for the value of each derivative instrument. The objectives and strategies of all hedge transactions are documented, as well as an assessment of the effectiveness of the derivative instrument in offsetting a change in the value of the hedged exposure.
In 2003, commodity, currency and interest rate hedges resulted in a net decrease in earnings of about $30 million after tax, compared with a net decrease in earnings of about $22 million in 2002. As at December 31, 2003, crude oil and natural gas contracts had been bought forward to mitigate exposure on fixed-price natural gas and refined product sales. Short-term hedge positions were also in place for refining supply and product purchases. At year end, these instruments had a fair value of $9 million. In accordance with our derivative accounting policy, this value has been deferred and will be recognized in the period in which the derivative instrument is realized.
CRITICAL ACCOUNTING ESTIMATES
The preparation of the Company’s financial statements requires management to adopt accounting policies that involve the use of significant estimates and assumptions. These estimates and assumptions are developed based on the best available information and are believed by management to be reasonable under the existing circumstances. New events or additional information may result in the revision of these estimates over time. The Audit, Finance and Risk Committee regularly reviews the Company’s critical accounting policies and any significant changes thereto. A summary of the significant accounting policies used by Petro-Canada can be found in Note 1 to the 2003 Consolidated Financial Statements. The following discussion outlines what management believes to be the most critical accounting policies involving the use of significant estimates or assumptions.
PROPERTY, PLANT AND EQUIPMENT/DEPRECIATION, DEPLETION AND AMORTIZATION
Investments in exploration and development activities are accounted for under the successful efforts method. Under this method, the acquisition costs of unproved acreage, the costs of exploratory wells pending determination of proved reserves, the costs of wells which are assigned proved reserves, and development costs including costs of all wells are capitalized. The cost of unsuccessful wells and all other exploration costs, including geological and geophysical costs, are charged to earnings as incurred. Capitalized costs of oil and gas producing properties are depreciated and depleted using the unit of production method based upon estimated reserves (see Estimated Oil and Gas Reserves discussion below). Reserve estimates can have a significant impact on net earnings, as they are a key component in the calculation of depreciation and depletion related to the capitalized costs of property, plant and equipment. A revision in reserve estimates could result in either a higher or lower depreciation and depletion charge to net earnings. A downward revision in reserves could result in a writedown of oil and gas producing properties as part of the impairment assessment (see Asset Impairment discussion below).
FUTURE REMOVAL AND SITE RESTORATION COSTS
The Company currently provides for estimated future removal and site restoration costs which are probable and can be reasonably determined on either the unit of production method or the straight line method based on estimated service lives of the related assets as appropriate. Future removal and site restorations costs for inactive Downstream sites, net of expected recoveries, are provided for at the time a decision is made to decommission the site. Factors that can affect the provision include the expected costs and the estimated reserves (see Estimated Oil and Gas Reserves discussion below). Cost estimates
25
are influenced by factors such as the number and type of sites subject to removal and restoration, the extent of site restoration work required and changes in environmental legislation. A revision to the estimated costs or reserves could result in an increase or decrease in future removal and site restoration costs charged to net earnings.
ASSET IMPAIRMENT
Producing properties and significant unproved properties are assessed annually, or as economic events dictate, for potential impairment. Impairment is assessed by comparing the estimated undiscounted future cash flows to the carrying value of the asset. The cash flows used in the impairment assessment require management to make assumptions and estimates about recoverable reserves (see Estimated Oil and Gas Reserves discussion below), future commodity prices and operating costs. Changes in any of the assumptions, such as a downward revision in reserves, a decrease in future commodity prices, or an increase in operating costs could result in an impairment of an asset’s carrying value.
PURCHASE PRICE ALLOCATION
Business acquisitions are accounted for by the purchase method of accounting. Under this method, the purchase price is allocated to the assets acquired and the liabilities assumed based on the fair value at the time of the acquisition. The excess purchase price over the fair value of identifiable assets and liabilities acquired is goodwill. The determination of fair value often requires management to make assumptions and estimates about future events. The assumptions and estimates with respect to determining the fair value of property, plant and equipment acquired generally require the most judgement and include estimates of reserves acquired (see Estimated Oil and Gas Reserves discussion below), future commodity prices, and discount rates. Changes in any of the assumptions or estimates used in determining the fair value of acquired assets and liabilities could impact the amounts assigned to assets, liabilities, and goodwill in the purchase price allocation. Future net earnings can be affected as a result of changes in future depreciation and depletion, asset impairment or goodwill impairment.
GOODWILL IMPAIRMENT
Goodwill is subject to impairment tests annually, or as economic events dictate, by comparing the fair value of the reporting unit to its carrying value, including goodwill. If the fair value of the reporting unit is less than its carrying value, a goodwill impairment loss is recognized as the excess of the carrying value of the goodwill over the fair value of the goodwill. The determination of fair value requires management to make assumptions and estimates about recoverable reserves (see Estimated Oil and Gas Reserves discussion below), future commodity prices, operating costs, production profiles, and discount rates. Changes in any of these assumptions, such as a downward revision in reserves, a decrease in future commodity prices, an increase in operating costs or an increase in discount rates could result in an impairment of all or a portion of the goodwill carrying value in future periods.
ESTIMATED OIL AND GAS RESERVES
Reserves estimates, although not reported as part of the Company’s financial statements, can have a significant effect on net earnings as a result of their impact on depreciation and depletion rates, future removal and site restoration provisions, asset impairments, and goodwill impairment (see discussion of these items above). The Company’s staff of qualified reserves evaluators performs internal evaluations on all of its oil and gas reserves on an annual basis using corporate-wide policies, procedures and practices. Independent petroleum reservoir engineering consultants also conduct annual evaluations, technical audits and reviews of a significant portion of the Company’s reserves. In addition, the Company’s contract internal auditor tests the non-engineering management control processes used in establishing reserves. However, the estimation of reserves is an inherently complex process requiring significant judgment. Estimates of economically recoverable oil and gas reserves are based upon a number of variables and assumptions such as geoscientific interpretation, commodity prices, operating and capital costs and production forecasts, all of which may vary considerably from actual results. These estimates are expected to be revised upward or downward over time, as additional information such as reservoir performance becomes available, or as economic conditions change.
26
EMPLOYEE FUTURE BENEFITS
The Company maintains defined benefit pension plans and provides certain post-retirement benefits to qualifying retirees. Obligations under employee future benefits plans are recorded net of plan assets where applicable. The cost of pension and other post-retirement benefits are actuarially determined by an independent actuary using the projected benefit method prorated based on service. The determination of these costs requires management to estimate or make assumptions regarding the expected plan investment performance, salary escalation, retirement ages of employees, expected health care costs, employee turnover, discount rates, and return on plan assets. Changes in these estimates or assumptions could result in an increase or decrease to the accrued benefit obligation and the related costs for both pensions and other post-retirement benefits.
INCOME TAXES
The Company follows the liability method of accounting for income taxes whereby future income taxes are recognized based on the differences between the carrying amounts of assets and liabilities reported in the financial statements and their respective tax bases. The determination of the income tax provision is an inherently complex process requiring management to interpret continually changing regulations and to make certain judgments. While income tax filings are subject to audits and reassessments, management believes adequate provision has been made for all income tax obligations. However, changes in the interpretations or judgments may result in an increase or decrease in the Company’s income tax provision in the future.
CONTINGENCIES
The Company is involved in litigation and claims associated with normal operations. Management is of the opinion that any resulting settlements would not materially affect the financial position of the Company as at December 31, 2003. However, the determination of contingent liabilities relating to the litigation and claims is a complex process that involves judgments as to the outcomes and interpretation of laws and regulations. Changes in the judgments or interpretations may result in an increase or decrease in the Company’s contingent liabilities in the future.
ACCOUNTING CHANGES
ACCOUNTING CHANGES IN THE CURRENT YEAR
During 2003 the Company revised its accounting policies, as described below, with respect to the translation of its International segment and the expensing of stock options. For details, refer to Note 2 of the 2003 Consolidated Financial Statements.
Translation of International Segment
Effective January 1, 2003 Petro-Canada commenced operating its International segment on a self-sustaining (financially and operationally independent) basis. As a consequence, the Company prospectively changed its accounting for the foreign currency translation of its International business segment, whereby gains and losses arising from the translation of the International financial statements and associated long-term debt into Canadian dollars are now deferred and included as part of shareholders’ equity. Previously, these gains and losses were included in earnings in the period of translation. The effect of this change for the year ended December 31, 2003 was a decrease in net earnings of $70 million.
27
Stock Options
During the fourth quarter of 2003, the Company elected to begin prospectively expensing, effective January 1, 2003, the value of stock options pursuant to transitional accounting provisions. As a result, the fair value of stock options granted during 2003 is being charged to earnings over the vesting period with a corresponding increase in contributed surplus. The effect of this change for the year ended December 31, 2003 was a decrease in net earnings of $9 million. For stock options granted in 2002, the Company elected to continue accounting for these options based on the intrinsic value at the grant date and to disclose the pro forma results as if the fair value method has been used. Pro forma information is provided in Note 18 to the 2003 Consolidated Financial Statements.
FUTURE ACCOUNTING CHANGES
As a result of recent accounting pronouncements issued by the Canadian Institute of Chartered Accountants the following changes, to be implemented effective January 1, 2004, will affect the Company’s reported results.
Asset Retirement Obligations
Beginning in 2004, asset retirement obligations will be recorded pursuant to new accounting rules. Currently, asset retirement obligations are accrued on an undiscounted unit of production or straight-line basis over the life of the asset. The new accounting standard requires companies to record the fair value of legal obligations associated with the retirement of tangible long-lived assets. The obligations are recorded as liabilities on a discounted basis when incurred and amounts recorded for the related assets are increased by the amount of these liabilities. Over time the liabilities are accreted for the change in their present value and the initial capitalized costs are depreciated over the useful lives of the related assets. The new rules are to be applied retroactively and the impact on the 2004 opening balance sheet is an increase in property, plant and equipment of $184 million, an increase in deferred credits and other liabilities of $391 million, a decrease in future income taxes of $74 million, and a decrease in retained earnings of $133 million. Had the new standard been in effect for 2003, the effect would have been a decrease in net earnings of $9 million.
Classification of Expenses
Beginning in 2004 the Company will begin accounting for certain transportation costs, certain third-party gas purchases and diluent purchases as expenses in the consolidated statement of earnings. Currently, these costs and purchases are netted against revenue. The change in accounting represents a reclassification of revenue and expenses and will have no effect on net earnings.
RELATED PARTY TRANSACTIONS
As disclosed in Note 21 to the 2003 Consolidated Financial Statements, transactions with the Government of Canada (which holds approximately 19% of the Company’s issued shares at December 31, 2003), its agencies and other related parties, are in the normal course of business and are therefore on the same terms as those accorded other non-related parties.
SHARE DATA
The authorized share capital of Petro-Canada consists of an unlimited number of Common Shares and an unlimited number of preferred shares issuable in series designated as either Senior Preferred Shares or Junior Preferred Shares. As at February 29, 2004 there were 269 934 188 common shares outstanding and no preferred shares outstanding. For details of the Company’s share capital and stock options outstanding refer to Note 18 of the 2003 Consolidated Financial Statements.
28
CORPORATE RESPONSIBILITY
Petro-Canada is deeply committed to responsible business practices. This commitment extends to corporate governance practices, environment, health and safety performance and involvement with the communities where employees live and work. Management, internal reporting and external disclosure systems have evolved to ensure that corporate responsibility is part of day-to-day decision-making. To review Petro-Canada’s performance in these areas in more detail, a Report to the Community is published annually to enable the public to assess performance and ongoing efforts in the environmental, social and economic aspects of sustainable development.
Petro-Canada is committed to maintaining the highest standards of corporate governance.
CORPORATE GOVERNANCE
Petro-Canada strives to maintain the highest standards of corporate governance, with a focus on a strong and diligent Board of Directors and transparency for shareholders. The Corporation has solid governance and disclosure practices, a commitment to continuously improve those practices, and an ethical corporate culture. Our Code of Business Conduct is required reading for all employees, who must acknowledge their awareness and understanding of the Code every two years.
The Board of Directors is responsible for the oversight of the management of the Corporation’s business and affairs. The Board has the statutory authority and obligation to protect and enhance the Corporation’s assets and the interest of all shareholders. Members of the Board of Directors, along with management and employees, believe that good corporate governance contributes to the creation of shareholder value.
Petro-Canada’s corporate governance practices are aligned with the Toronto Stock Exchange guidelines, and Petro-Canada already satisfies the proposals of several provincial securities regulators published in Multilateral Instrument 58-101, even though they are not yet in effect. As a foreign issuer on the NYSE, Petro-Canada is also subject to the many new rules, regulations and guidelines established by the SEC, NYSE and Sarbanes-Oxley legislation. Petro-Canada is in compliance, and in some cases goes beyond these new corporate governance requirements.
More information about Petro-Canada’s corporate governance procedures – including Director independence, compensation, Board committee mandates and the integrity of communication with stakeholders – can be viewed on our Web site at www.petro-canada.ca.
Greenhouse Gas Emissions versus Production(1)
In 2002, our total Canadian GHG emissions rose 9 per cent above 1990 levels, mainly due to the start-up of Terra Nova. Petro-Canada remains committed to improving energy efficiency to mitigate the impact of growing production levels on GHG emissions.
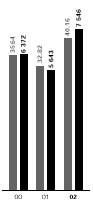
• Total Canadian Upstream and Downstream production (million cubic metres of oil equivalent/year)
• GHG emissions (kilotonnes/year)
(1) 2003 data is not yet available; data is based on reporting 100 per cent from Petro-Canada operated properties.
ENVIRONMENT, HEALTH AND SAFETY
Petro-Canada executives are accountable for the effective execution of our Company’s Total Loss Management policy and standards which set our environment, health and safety expectations. Petro-Canada conducts a major audit of each business unit or area every four years to assess the implementation of the policy and standards. Our Executive Leadership Team reviews environment, health and safety performance monthly. As well, the Environment, Health and Safety Committee of the Board of Directors reviews critical issues and EHS performance throughout the year.
In 2003, we invested $414 million in environmental programs, including $96 million for operating expenses and $318 million in capital expenditures. Some of the expenditures include site remediation, environmental assessments, and pollution prevention and control equipment. We expect environmental costs to remain high as we prepare to meet federal limits for sulphur in gasoline and distillate, future fuel reformulation requirements, and tighter environmental standards for oil and gas production.
Climate change is one of the most complex issues facing Canadian industry, the Canadian public, and governments today. At Petro-Canada, we support a balanced and responsible approach that promotes action on the issue of climate change. This approach includes the application of best practices and development of technology to reduce greenhouse gas emissions while protecting competitiveness, jobs and prosperity.
Petro-Canada has renewed its commitment to improve energy efficiency in the Upstream and Downstream sectors by an average of one per cent per year from 2000 to 2005. Key components of these improvements include reductions in fuel consumption and the corresponding lowering of greenhouse gas emissions and operating costs.
29
In 2002, Petro-Canada’s total Canadian greenhouse gas emissions increased 34 per cent from the previous year’s level, from 5 643 to 7 546 kilotonnes per year. This increase in greenhouse gas emissions corresponds to the large increase in production generated mainly by our Terra Nova facility located off the East Coast of Canada. The total Canadian greenhouse gas emissions in 2002 were nine per cent above 1990 levels, despite the fact that combined Upstream and Downstream production grew by 51 per cent over the same period.
Since 1990, Petro-Canada has improved energy efficiency in the Downstream by 21 per cent and in the Canadian Upstream by 24 per cent. By implementing energy efficiency and emissions reduction projects, our voluntary initiatives have eliminated almost 1.3 million tonnes of annual greenhouse gas emissions since 1990.
Data for 2003 will be provided in this year’s Report to the Community.
The safety and well-being of our employees and those working on our behalf is an absolute business priority for Petro-Canada. Our overall Employee Recordable Injury Frequency (per 200 000 person hours) decreased to 0.69 in 2003 from 0.94 in 2002. Recordable injuries decreased to 33 in 2003 from 44 in 2002. Our Contractor Recordable Injury Frequency (per 200 000 person hours) decreased to 2.32 in 2003 from 3.22 in 2002. Contractor recordable injuries decreased to 120 in 2003 from 139 in 2002. Petro-Canada believes that all workplace injuries and illnesses are preventable, and that a ‘Zero Harm’ workplace is possible and our goal. To achieve the goal of Zero Harm, Petro-Canada continues to innovate in the field of health and safety.
COMMUNITY INVOLVEMENT
Petro-Canada’s success as an energy company depends on the support we receive from our stakeholders. We are determined to continually earn that support, not just through excellence in meeting our customers’ energy needs, but by playing an active and important role in the communities where we live and operate.
In 2003, Petro-Canada invested approximately $15 million in over 400 Canadian non-profit organizations in four sectors – education, the environment, health and community services, and arts and culture. This included two unique in-kind contributions: we donated a corporate aircraft and avionics shop, valued at $1.6 million, to the Southern Alberta Institute of Technology; and turned over the Petro-Canada Research Laboratory, valued at $6.9 million, to the University of Calgary. We contributed $630 000 to support Canada’s Olympic team, including scholarships, the Podium Fund and the Coaching Excellence Awards. Through our Volunteer Energy Program, we provided 430 grants of $500 each to non-profit organizations supported by employees and retirees who give their time to the community. The total amount of grants, given out since 1992, surpassed the $1 million mark in 2003.

Additional information relating to Petro-Canada may be found on the SEDAR Web site at www.sedar.com.
March 4, 2004
30