Legal Notice – Forward-Looking Information |
This annual report contains forward-looking information. You can usually identify this information by such words as "plan," "anticipate," "forecast," "believe," "target," "intend," "expect," "estimate," "budget" or other terms that suggest future outcomes or references to outlooks. Forward-looking information in this annual report includes references to:
· business strategies and goals · future investment decisions · outlook (including operational updates and strategic milestones) · future capital, exploration and other expenditures · future cash flows · future resource purchases and sales · anticipated construction and repair activities · anticipated turnarounds at refineries and other facilities · anticipated refining margins · future oil and natural gas production levels and the sources of their growth · project development, and expansion schedules and results · future exploration activities and results, and dates by which certain areas may be developed or come on-stream | | · anticipated retail throughputs · anticipated pre-production and operating costs · reserves and resources estimates · future royalties and taxes payable · production life-of-field estimates · natural gas export capacity · future financing and capital activities (including purchases of Petro-Canada common shares under the Company's normal course issuer bid (NCIB) program) · contingent liabilities (including potential exposure to losses related to retail licensee agreements) · the impact and cost of compliance with existing and potential environmental regulations · future regulatory approvals · expected rates of return |
Such forward-looking information is based on a number of assumptions and analysis made by the Company. These assumptions and analysis are described in greater detail throughout this annual report and include, without limitation, assumptions with respect to future commodity prices, the state of the economy, required capital expenditures, levels of cash flow, regulatory requirements, industry capacity, the results of exploration and development drilling and the ability of suppliers to meet commitments.
Undue reliance should not be placed on forward-looking information. Such forward-looking information is subject to known and unknown risks and uncertainties which may cause actual results, levels of activity and achievements to differ materially from those expressed or implied by such information. Such risks and uncertainties include, but are not limited to:
· changes in industry capacity · imprecise reserves estimates of recoverable quantities of oil, natural gas and liquids from resource plays, and other sources not currently classified as reserves · the effects of weather and climate conditions · the results of exploration and development drilling, and related activities · the ability of suppliers to meet commitments · decisions or approvals from administrative tribunals · risks associated with domestic and international oil and natural gas operations · changes in general economic, market and business conditions | | · competitive action by other companies · fluctuations in oil and natural gas prices · changes in refining and marketing margins · the ability to produce and transport crude oil and natural gas to markets · fluctuations in interest rates and foreign currency exchange rates · actions by governmental authorities (including changes in taxes, royalty rates and resource-use strategies) · changes in environmental and other regulations · international political events · nature and scope of actions by stakeholders and/or the general public |
Many of these and other similar factors are beyond the control of Petro-Canada. Petro-Canada discusses these factors in greater detail in filings with the Canadian provincial securities commissions and the United States (U.S.) Securities and Exchange Commission (SEC). See also "Risk Management – Risks Relating to Petro-Canada's Business" in this annual report for a discussion of factors that could impact Petro-Canada's operations or results.

| 2008 Annual Report PETRO-CANADA | 1 |
Readers are cautioned that this list of important factors affecting forward-looking information is not exhaustive. Furthermore, the forward-looking information in this annual report is made as of February 23, 2009 and, except as required by applicable law, will not be publicly updated or revised. This cautionary statement expressly qualifies the forward-looking information in this annual report.
Petro-Canada disclosure of reserves
Petro-Canada's qualified reserves evaluators prepare the reserves estimates the Company uses. The Canadian provincial securities commissions do not consider Petro-Canada's reserves staff and management as independent of the Company. Petro-Canada has obtained an exemption from certain Canadian reserves disclosure requirements that allows Petro-Canada to make disclosure in accordance with SEC standards where noted in this annual report. This exemption allows comparisons with U.S. and other international issuers.
As a result, Petro-Canada formally discloses its proved reserves data using U.S. requirements and practices, and these may differ from Canadian domestic standards and practices. The use of the terms such as "probable," "possible," "resources" and "life-of-field production" in this annual report does not meet the SEC guidelines for SEC filings. To disclose reserves in SEC filings, oil and natural gas companies must prove they are economically and legally producible under existing economic and operating conditions. Note that when the term barrels of oil equivalent (boe) is used in this annual report, it may be misleading, particularly if used in isolation. A boe conversion ratio of six thousand cubic feet (Mcf) to one barrel (bbl) is based on an energy equivalency conversion method. This method primarily applies at the burner tip and does not represent a value equivalency at the wellhead. The table below describes the industry definitions that Petro-Canada currently uses:
Definitions Petro-Canada uses | | Reference |
| | |
Proved oil and natural gas reserves (includes both proved developed and proved undeveloped) | | SEC reserves definition (Accounting Rules Regulation S-X 210.4-10, U.S. Financial Accounting Standards Board (FASB) Statement No. 69) |
| | |
| | SEC Guide 7 for Oil Sands Mining |
| | |
Unproved reserves, probable and possible reserves | | Canadian Securities Administrators: Canadian Oil and Gas Evaluation (COGE) Handbook, Vol. 1 Section 5 prepared by the Society of Petroleum Evaluation Engineers (SPEE) and the Canadian Institute of Mining Metallurgy and Petroleum (CIM) |
| | |
Contingent and Prospective Resources | | Petroleum Resources Management System: Society of Petroleum Engineers, SPEE, World Petroleum Congress and American Association of Petroleum Geologist definitions (approved March 2007) |
| | |
| | Canadian Securities Administrators: COGE Handbook Vol. 1 Section 5 |
| | |
Although the Society of Petroleum Engineers resource classification has categories of 1C, 2C and 3C for Contingent Resources, and low, best and high estimates for Prospective Resources, Petro-Canada will only refer to the unrisked 2C for Contingent Resources and the partially risked best estimate for Prospective Resources when referencing resources in this annual report. Estimates of resources in this annual report include contingent resources that have not been adjusted for risk based on the chance of development and partially risked prospective resources that have been risked for chance of discovery, but have not been risked for chance of development. Such estimates are not estimates of volumes that may be recovered and actual recovery is likely to be less and may be substantially less or zero. If a discovery is made, there is no certainty that it will be developed or, if it is developed, there is no certainty as to the timing of such development.
Canadian Oil Sands represents approximately 68% of Petro-Canada's total for Contingent and Prospective Resources. The balance of Petro-Canada's resources is spread out across the business, most notably in the North American frontier and International areas. Also, when Petro-Canada references resources for the Company, unrisked Contingent Resources are approximately 70% of the Company's total resources and partially risked Prospective Resources are approximately 30% of the Company's total resources.
2 | PETRO-CANADA 2008 Annual Report | 
|
Cautionary statement: In the case of discovered resources or a subcategory of discovered resources other than reserves, there is no certainty that it will be commercially viable to produce any portion of the resources. In the case of undiscovered resources or a subcategory of undiscovered resources, there is no certainty that any portion of the resources will be discovered. If discovered, there is no certainty that it will be commercially viable to produce any portion of the resources.
For movement of resources to reserves categories, all projects must have an economic depletion plan and may require:
· additional delineation drilling and/or new technology for unrisked Contingent Resources
· exploration success with respect to partially risked Prospective Resources
· project sanction and regulatory approvals
Reserves and resources information contained in this annual report is as at December 31, 2008.
| 2008 Annual Report PETRO-CANADA | 3 |
Management's Discussion and Analysis
This Management's Discussion and Analysis (MD&A), dated effective as of February 23, 2009, should be read in conjunction with the audited Consolidated Financial Statements and Notes for the year ended December 31, 2008, included within this 2008 annual report and the 2008 Annual Information Form (AIF). Financial data has been prepared in accordance with Canadian generally accepted accounting principles (GAAP), unless otherwise specified. All dollar values are Canadian (Cdn) dollars, unless otherwise indicated. All oil and natural gas production and reserves volumes are stated before deduction of royalties, unless otherwise indicated. Graphs accompanying the text portray performance of the Company within its “value drivers,” which are the key measures of performance in each segment of Petro-Canada's business. A glossary of financial terms, ratios and acronyms can be found on page 114 of this report.
BUSINESS ENVIRONMENT
The major economic factors influencing Petro-Canada's upstream financial performance include crude oil and natural gas prices and foreign exchange, particularly the Cdn dollar/U.S. dollar rates (US). Crude oil and natural gas prices are affected by a number of factors, including the balance of supply and demand, weather and political events. Economic factors influencing Downstream financial performance include the level and volatility of crude oil prices, industry refining margins, levels of crude oil price differentials, demand for refined petroleum products, the degree of market competition and foreign exchange, particularly the Cdn dollar/U.S. dollar rates.
Business Environment in 2008
The year 2008 was one of the most volatile on record for oil markets. The first half of the year saw significant upward momentum in oil prices as weak supply growth fell short of robust demand growth in non-Organization of Economic Co-operation and Development (OECD) countries. Economic momentum slowed dramatically in the second half of the year as the global financial crisis intensified, depressing crude oil demand appreciably. By the end of 2008, demand was negative. The swings in oil prices through 2008 were also accompanied by record inflows, followed by record outflows, of investment dollars from commodity market funds. The price of North Sea Brent (Dated Brent) opened the year at just under $100 US/barrel (bbl),
climbed to record highs of over $140 US/bbl in early July, and then fell steadily to under $45 US/bbl by early December. Despite the declines in the latter half of the year, the annual average price of Dated Brent was the highest ever at $96.99 US/bbl, approximately one-third above the 2007 average. | | |
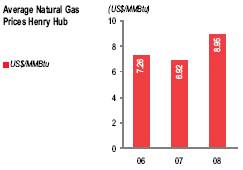
In 2008, the international light/heavy crude (Dated Brent/Mexican Maya) price differential averaged $13.15 US/bbl, somewhat wider than the $12.67 US/bbl posted in 2007. Canadian light/heavy crude (Edmonton Light/Western Canada Select (WCS)) spreads narrowed in 2008 to $19.91 Cdn/bbl from $24.07 Cdn/bbl in 2007. Canadian heavy crudes continued to be sold at a greater discount to light crudes, compared with international heavy crudes. This is due to Canadian heavy crude oil production growing at a faster rate than North American investment to convert refineries to process heavy feedstock. The Canadian discount narrowed in 2008, however, as the supply of competing heavy oil imports from Mexico and Venezuela declined. North American natural gas prices were very volatile in 2008. Natural gas prices at the Henry Hub ranged from over $13.50 US/million British thermal units (MMBtu) in July to under $6.50 US/MMBtu in November. Overall, Henry Hub prices averaged $8.95 US/MMBtu in 2008, about 30% higher than in 2007. The increase was due to higher crude oil prices, which raised the cost of distillate fuels that in turn competed with natural gas. In 2008, the Canadian natural gas price at the AECO-C hub rose 23%, somewhat less than U.S. prices, as the strength of the | | 
|
8 | PETRO-CANADA Management's Discussion and Analysis | 
|
Canadian dollar in the first half of the year offset some of the gains in natural gas prices. The Canadian dollar was also extremely volatile in 2008, falling from parity with the U.S. dollar in the first half of the year to under 80 cents US by December. Overall, the Canadian dollar averaged 94 cents US in 2008, compared with 93 cents US in 2007. The strength of the Canadian currency in the first half of the year reduced some of the impact of stronger international prices on Canadian crude oil and natural gas prices. Similarly, the decline in the Canadian dollar in the second half of the year offset some of the impact from the declines in international crude oil and natural gas prices. In the downstream sector, refined petroleum products sales in Canada increased by 0.5% in 2008, compared with a gain of 3.4% in 2007. Demand growth in 2008 was relatively stronger in Canada than in the U.S., but momentum slowed steadily through the year. The New York Harbor 3-2-1 crack spread, an indicator of overall refining margins, averaged $9.58 US/bbl in 2008, compared with $14.15 US/bbl in 2007. Declines in gasoline cracking margins more than offset gains in distillate cracking margins. With the exception of relatively brief hurricane-induced spikes in September, gasoline cracking margins were pressured downward by declining U.S. consumption. Distillate margins rose markedly, averaging over $19.61 US/bbl, as strong demand for diesel fuel from non-OECD countries and commodity producers led to sharply higher product exports from the U.S. | | 

|
Commodity Price Indicators and Exchange Rates
(averages for the years indicated) | | | | 2008 | | 2007 | | 2006 | |
Crude oil price indicators (per bbl) | | | | | | | | | |
Dated Brent at Sullom Voe | | US$ | | 96.99 | | 72.52 | | 65.14 | |
West Texas Intermediate (WTI) at Cushing | | US$ | | 99.65 | | 72.31 | | 66.22 | |
WTI/Dated Brent price differential | | US$ | | 2.66 | | (0.21 | ) | 1.08 | |
Dated Brent/Mexican Maya price differential | | US$ | | 13.15 | | 12.67 | | 13.94 | |
Edmonton Light | | Cdn$ | | 102.83 | | 76.84 | | 73.23 | |
Edmonton Light/WCS (heavy) price differential | | Cdn$ | | 19.91 | | 24.07 | | 22.40 | |
Natural gas price indicators | | | | | | | | | |
Henry Hub (per MMBtu) | | US$ | | 8.95 | | 6.92 | | 7.26 | |
AECO-C spot (per thousand cubic feet – Mcf) | | Cdn$ | | 8.47 | | 6.89 | | 7.28 | |
Henry Hub/AECO basis differential (per MMBtu) | | US$ | | 1.15 | | 0.80 | | 1.09 | |
New York Harbor 3-2-1 refinery crack spread (per bbl)1 | | US$ | | 9.58 | | 14.15 | | 9.80 | |
US$/Cdn$ exchange rate | | US$ | | 0.94 | | 0.93 | | 0.88 | |
1 On January 1, 2007, the New York Harbor 3-2-1 crack spread calculation changed. It is now based on Reformulated Gasoline Blendstock for Oxygenate Blending (RBOB) gasoline (the base for blending gasoline with 10% denatured ethanol) as opposed to conventional gasoline. Due to this change in specification, the 2007 and 2008 crack spread values are not directly comparable to 2006 values.

| Management's Discussion and Analysis PETRO-CANADA | 9 |
Competitive Conditions
It is increasingly challenging for the energy sector to find new sources of oil and natural gas. Petro-Canada is well positioned to successfully increase production of oil and natural gas and compete for new opportunities that could complement existing upstream resources. The Company has an estimated 14 billion barrels of oil equivalent (boe) of resources from which to develop new production, with approximately 68% of the resources located in Alberta's oil sands. With upstream business operations in Canada and internationally, the Company has the flexibility to pursue a wide range of opportunities. While the Company has significant operational scope, as measured by production levels, it remains a mid-sized global company. This means Petro-Canada has the operational capability and balance sheet strength to invest in large projects, but smaller investments can also have a meaningful impact on the Company's production levels and financial returns.
Petro-Canada is well positioned to compete in the petroleum product refining and marketing business in Canada. Petro-Canada has the second largest downstream business in Canada and is the “brand of choice.” The Company conducts business in the downstream throughout Canada as an integrated business unit and participates in the refining, distribution and marketing of petroleum products. The Company also offers a wide range of ancillary non-petroleum goods and services, such as convenience retailing, automotive repair and car washes.
The Company's strong financial position, track record of successfully executing large capital projects and depth of management experience should enable it to continue to compete effectively in the current business environment.
Outlook for Business Environment in 2009
Prices for energy commodities are expected to remain volatile in 2009, reflecting the high degree of uncertainty associated with the global financial crisis and the unprecedented scale and scope of official stimulus measures being implemented around the world. On the demand side, the world economy has moved into recession in 2009 following one of the strongest and longest global expansions since the Second World War.
The global financial crisis has led to a marked increase in the cost and a large decrease in the availability of capital. The petroleum industry is highly capital intensive, requiring significant reinvestment rates in order to maintain output to offset natural reservoir declines. Reduced cash flows from lower commodity prices coupled with capital constraints will lead to lower supply growth over the coming years. Supply may also be influenced by the Organization of the Petroleum Exporting Countries (OPEC) production decisions.
More stringent environmental regulations are anticipated which, relative to the situation, will slow the growth rate of energy demand by directly or indirectly increasing the cost of consuming fossil fuels.
There are several downside risks for North American natural gas markets in 2009. Higher residential demand due to colder-than-normal temperatures this winter across most of North America has been offset by very weak industrial demand, the latter of which is expected to persist until the economy recovers. Slower economic growth in both Europe and Asia, where relatively higher natural gas prices attracted virtually all of the global liquefied natural gas (LNG) supply in 2008, could push some of these shipments back into the U.S. market in 2009. U.S. domestic natural gas supply rose strongly over the past year owing to innovative applications of horizontal drilling and fracturing technologies in non-conventional reservoirs (especially shale and tight-sands gas deposits). Although drilling activity declined sharply alongside the collapse in commodity prices and rising cost of capital, this is not expected to reverse the upward trend in domestic supplies until late 2009 at the earliest.
Barring refinery mishaps or accidents of nature, 2009 refining margins in the downstream are expected to be weaker than in 2008. North American refined petroleum products demand will likely remain well below aggregate refining capacity until the economy begins to recover.
Finally, the Canadian dollar is expected to remain loosely correlated with crude oil prices in 2009, providing some offset to fluctuations in international crude oil and natural gas prices.
10 | PETRO-CANADA Management's Discussion and Analysis |
|
Economic Sensitivities
The following table illustrates the estimated after-tax effects that changes in certain factors would have had on Petro-Canada's 2008 net earnings had these changes occurred.
Sensitivities Affecting Net Earnings
Factor1, 2 | | Change (+) | | Annual Net
Earnings
Impact | | Annual Net
Earnings
Impact | |
| | | (millions of Canadian
dollars) | | ($/share)3 | |
Upstream | | | | | | | |
Price received for crude oil and natural gas liquids (NGL)4 | | $ | 1.00/bbl | | $ | 54 | | $ | 0.11 | |
Price received for natural gas | | $ | 0.25/Mcf | | 30 | | 0.06 | |
Exchange rate: US$/Cdn$ refers to impact on upstream earnings5 | | $ | 0.01 | | (60 | ) | (0.12 | ) |
Crude oil and NGL production (barrels/day – b/d) | | 1,000 b/d | | 15 | | 0.03 | |
Natural gas production (million cubic feet/day – MMcf/d) | | 10 MMcf/d | | 11 | | 0.02 | |
Downstream | | | | | | | |
New York Harbor 3-2-1 crack spread | | $ | 1.00 US/bbl | | 22 | | 0.05 | |
Chicago 3-2-1 crack spread | | $ | 1.00 US/bbl | | 20 | | 0.04 | |
Seattle 3-2-1 crack spread | | $ | 1.00 US/bbl | | 9 | | 0.02 | |
WTI/Dated Brent price differential | | $ | 1.00 US/bbl | | 25 | | 0.05 | |
Dated Brent/Maya FOB price differential | | $ | 1.00 US/bbl | | 5 | | 0.01 | |
WTI/synthetic price differential | | $ | 1.00 US/bbl | | 14 | | 0.03 | |
Exchange rate: US$/Cdn$ refers to impact on downstream cracking margins and crude price differentials6 | | $ | 0.01 | | (11 | ) | (0.02 | ) |
Natural gas fuel cost – AECO natural gas price | | $ | 1.00 Cdn/Mcf | | (10 | ) | (0.02 | ) |
Asphalt –% of Maya crude oil price | | 1% | | 2 | | – | |
Heavy fuel oil –% of WTI crude oil price | | 1% | | 2 | | – | |
Corporate | | | | | | | |
Exchange rate: US$/Cdn$ refers to impact of the revaluation of U.S. dollar-denominated, long-term debt7 | | $ | 0.01 | | $ | 31 | | $ | 0.06 | |
1 The impact of a change in one factor may be compounded or offset by changes in other factors. This table does not consider the impact of any inter-relationship among the factors.
2 The impact of these factors is illustrative.
3 Per share amounts are based on the number of shares outstanding at December 31, 2008.
4 This sensitivity is based upon an equivalent change in the price of WTI and Dated Brent.
5 A strengthening Canadian dollar compared with the U.S. dollar has a negative effect on upstream net earnings.
6 A strengthening Canadian dollar compared with the U.S. dollar has a negative effect on downstream cracking margins and crude price differentials.
7 A strengthening Canadian dollar versus the U.S. dollar has a positive effect on corporate earnings with respect to the Company's U.S. dollar-denominated debt. The impact refers to gains or losses on $2.9 billion US of the Company's U.S. dollar-denominated long-term debt and interest costs on U.S. dollar-denominated debt. Gains or losses on $1.1 billion US of the Company's U.S. dollar-denominated long-term debt, associated with the self-sustaining International business segment and the U.S. Rockies operations included in the North American Natural Gas business segment, are deferred and included as part of shareholders' equity.
| Management's Discussion and Analysis PETRO-CANADA | 11 |
BUSINESS STRATEGY
Value Proposition and Strategy
The value proposition Petro-Canada offers to its investors can best be summarized as “Integrated Value from a Diversified Resource Base.” The Company's business strategy continues to be:
· improving the profitability of the base business
· meeting annual production guidance
· selecting the right assets to develop and then driving for first quartile performance1
· taking a disciplined approach to profitable growth
· leveraging existing assets
· accessing new opportunities with a focus on long-life assets
· building a balanced exploration program
The Company believes its structure and scope strategically position Petro-Canada to deliver long-term shareholder value. With a base in Canada, Petro-Canada is situated in a stable, resource-rich and demand-driven market. An ever-increasing international presence and integration across businesses provide the Company access to more value-adding growth opportunities and an ability to better manage risk through a diversified portfolio. As a mid-sized global company, even smaller sized investments can have a material impact. Through its major growth projects, Petro-Canada has visible and flexible growth over the next several years. The Company remains committed to developing energy resources responsibly and providing growth opportunities for employees.
Execution of the Strategy in 2008
Improving Base Business Profitability
For 2008, Petro-Canada focused on two areas to deliver improved base business profitability, delivering upstream production in line with updated annual guidance and continuing to improve safety and reliability performance. Safety, reliability and cost management are measures that are continuously tracked, reported and improved upon.
Through a focus on execution, the Company achieved upstream production at the high end of its guidance range of 400,000 to 420,000 barrels of oil equivalent/day (boe/d) in 2008. This strong production growth was largely due to strong reliability at most of the Company's major facilities.
Western Canada natural gas processing facilities operated at reliability rates of 99%. The two Downstream refineries and lubricants plant had a combined reliability index of 86. The lower Downstream reliability in 2008 was due to unplanned outages at the Edmonton refinery. The most significant improvements in 2008 were at the Terra Nova facility and the Oil Sands' MacKay River in situ operation, with reliabilities of 90% and 97%, respectively. The Company has a continued focus to improve facility reliability in 2009.
Corporate-wide, Petro-Canada views safety as an indicator of operational excellence. The Company has a Zero-Harm philosophy. This means the Company believes that work-related injuries and illnesses are foreseeable and preventable. The Company is committed to maintaining a first quartile safety record. In 2008, Petro-Canada achieved a Total Recordable Injury Frequency (TRIF) of 0.73, a 16% improvement over the previous year, and one of the best safety records in the sector.
Managing costs is another key to improving base business profitability. Petro-Canada has a disciplined approach to financial management with efforts constantly made across the Company to responsibly manage expenses and improve efficiencies. Petro-Canada entered 2009 with a strong liquidity position, providing the Company with flexibility to execute its capital program.
1 References to first quartile operations in this report do not refer to industry-wide benchmarks or externally known measures. The Company has a variety of internal metrics that define and track first quartile operational performance.
12 | PETRO-CANADA Management's Discussion and Analysis |
|
Maintaining Financial Discipline and Flexibility
PRIORITY | | | 2008 GOALS | | | 2008 RESULTS | | | 2009 GOALS | |
Fund Capital
Expenditures with
Cash Flow and Debt
As Required | | | · fund $5.3 billion capital expenditure
program through a combination of
cash flow and access to capital
markets, as needed · prioritize execution of projects · maintain investment grade credit ratings | | | · funded capital expenditure program of $6.4 billion from liquidity sources · exercised flexibility within major
projects in response to business
environment · maintained investment grade credit
ratings of Baa2 from Moody's
Investors Services (Moody's), BBB
from Standard & Poor's (S&P) and A (low) from DBRS Limited (DBRS) · ended 2008 strong, with debt levels at 23.5% of total capital and a ratio of 0.7 times debt-to-cash flow from
operating activities · maintained adequate liquidity, with a year-end cash balance of $1.4 billion and unutilized credit facility capacity of $4.7 billion | | | · fund $4.0 billion capital expenditure
program from expected cash flow,
cash on hand and accessing balance sheet strength, as needed · manage operating and capital costs
within budgets · maintain investment-grade credit ratings | |
Fund Profitable
Growth | | | · identify and invest in long-life assets | | | · made final investment decision (FID)
on Syria Ebla gas project, signed
Libya Exploration and Production
Sharing Agreements (EPSAs), funded Edmonton refinery conversion project (RCP) and received approval for North Amethyst portion of White Rose
Extensions · postponed making FID on Fort Hills Phase 1, MacKay River expansion (MRX) and Montreal coker | | | · invest in additional growth
opportunities when there is a strong
business case | |
Return Cash to
Shareholders | | | · regularly review the dividend strategy to align with financial and growth objectives and shareholder
expectations · buy back shares, when appropriate
with priority to first fund profitable
growth | | | · increased quarterly dividend by 54% to $0.20/share · renewed normal course issuer bid
(NCIB) program in June 2008,
entitling the Company to purchase up to 5 of the outstanding common
shares, subject to certain conditions · purchased zero shares during 2008 | | | · regularly review the dividend strategy to align with financial and growth objectives, and shareholder
expectations · buy back shares when appropriate,
with priority to first fund profitable
growth | |
Long-Term Profitable Growth
Adding new material opportunities is fundamental to long-term growth. In 2008, one of Petro-Canada's priorities was to advance its seven major growth projects. Highlights included completing construction of the Edmonton RCP, signing six new Libya EPSAs and making a FID on the Syria Ebla gas development. In the East Coast business, project partners received regulatory approval for the North Amethyst development of the White Rose Extensions project to proceed. The Company also completed preliminary front-end engineering and design (FEED) work on the Fort Hills project, received regulatory approval for expansion of the MacKay River facility and progressed engineering on the Montreal coker project.
In pursuing these growth projects, Petro-Canada is seeking to increase the relative proportion of long-life resources in the portfolio as a means to deliver sustainable cash flow and earnings. With the exception of the White Rose Extensions, all of

| Management's Discussion and Analysis PETRO-CANADA | 13 |
these major growth projects are considered long-life assets. In the upstream, Petro-Canada defines long-life assets as those projects that have more than 10 years of peak production and sustainable cash flow. In the Downstream, refineries and gasoline stations share the same long-life characteristics. These kinds of assets provide sustainable cash flow and make the Company less dependent on exploration success for growth. The Company also seeks to expand long-life assets from existing infrastructure.
Long-Life Production (%)
In 2008, about 30% of Petro-Canada's production came from assets considered long-life. Successful execution of the business strategy will mean a higher proportion of long-life resources in the future.
Along with long-life assets, the Company pursues profitable growth through a balanced exploration program. A balanced exploration program is one that provides a balanced risk/reward profile and that collectively adds to reserves over time. In 2008, Petro-Canada and its partners drilled 14 exploration wells.
Five of these wells were completed as discoveries and two were completed as successful appraisal wells. Drilling of an Alaskan well was suspended, and there is a plan for re-entry in 2009. Six wells were abandoned as dry holes or non-commercial discoveries and were written off. At year-end 2008, operations continued on one well.
This table represents exploration in International, East Coast Canada, Alaska and the Northwest Territories (NWT) but does not include Western Canada and U.S. Rockies.
| | 2008 Results | | 2009 Outlook | |
(number of wells) | | Discoveries –
Oil | | Discoveries –
Natural Gas | | Still being
evaluated | | Dry and
abandoned | | | |
North Sea | | 2 | | 2 | | – | | 2 | | 4 | |
Syria | | – | | – | | – | | – | | – | |
Libya | | 1 | | – | | – | | – | | 4 | |
Trinidad and Tobago | | – | | 4 | | – | | 2 | | – | |
Alaska | | – | | 1 | | 1 | | – | | 3 | |
NWT | | – | | – | | – | | 1 | | – | |
East Coast Canada | | – | | – | | – | | – | | 1 | |
Total1 | | 3 | | 7 | | 1 | | 5 | | 12 | |
1 Two wells were carried over into 2008 from 2007.
14 | PETRO-CANADA Management's Discussion and Analysis | 
|
Following our Principles for Responsible Investment and Operations
| Our principles guide our actions and track our performance in the areas of business conduct, community support, environment, working conditions and human rights. Petro-Canada's Community Partnerships Program supports significant community initiatives relating to key business areas. Education and capacity building are themes that underpin all the Company's investments. The Company's community initiatives aim to create long-term programs with a measurable investment return for the Company and its partners. There is a growing concern about the impact the energy sector has on the environment. The Company shares this concern and actively seeks to minimize the impact of Petro-Canada's operations on land, water and air. The Company's areas of focus are use of water, and management of greenhouse gas (GHG) emissions and air emissions. Petro-Canada had approximately 6,100 employees and many contractors working on its behalf at year-end 2008. In 2008, Petro-Canada recruited more than 950 new employees. The Company is committed to providing them with a safe and rewarding place to work where they can learn and make a difference. |
Following our Principles for Responsible Investment and Operations
PRIORITY | | | PRINCIPLES | | | 2008 GOALS | | | 2008 RESULTS | | | 2009 GOALS |
Business Conduct | | | · comply with applicable laws
and regulations · apply our Code of Business
Conduct wherever we
operate · seek contractors, suppliers
and agents whose practices
are consistent with our
principles | | | · update Code of Business
Conduct and introduce
interactive web-based
training on the new Code of Business Conduct · continue to strengthen
communication of Code of
Business Conduct
expectations with an
increasing contractor
workforce · improve new employee
orientation process across
the Company to emphasize Zero-Harm and Total Loss Management (TLM) culture
and principles · implement online TLM
training to strengthen
employee understanding | | | · updated Code of Business
Conduct · interactive web-based training completed by 4,419
employees and 408
contractors · delivered workshop-style anti-corruption training at nine Company locations, training both employees and
contractors · implemented new employee
orientation process,
integrating TLM and Zero-
Harm to reduce the risk of
loss or injury · conducted online TLM training modules in four priority elements for 4,869
employees · developed online training to
strengthen risk assessment
capability | | | · update policy for the
Prevention of Improper
Payments · introduce interactive web-
based training on the Policy for the Prevention
of Improper Payments · review and update the
Company's anti-trust and fair competition
compliance program · integrate risk assessment
methodology into all TLM
processes, including the
event management
system |
| Management's Discussion and Analysis PETRO-CANADA | 15 |
Following our Principles for Responsible Investment and Operations (continued)
PRIORITY | | PRINCIPLES | | 2008 GOALS | | 2008 RESULTS | | 2009 GOALS |
Community | | | · strive within our sphere of
influence to ensure a fair
share of benefits to
stakeholders impacted by
our activities · conduct meaningful and
transparent consultation with
all stakeholders · endeavour to integrate our activities with, and participate in, local communities as good corporate citizens | | | · improve the consistency
and capability relative to
engaging with stakeholders · solicit feedback from
external stakeholders
regarding the effectiveness
of the Company's
interactions · initiate and implement a
social investment program
that is integral to the Libya
EPSAs · introduce a number of new
key community
partnerships in our
education, environment and
local community support
areas · advance Olympic initiatives
in anticipation of the 2010
Winter Olympics | | | · delivered training based on
Stakeholder and Community
Engagement principles to 134
stakeholder practitioners
across all business units · integrated stakeholder issue
management system into key
projects and emergency
response plans
· solicited focused stakeholder
feedback on specific projects · piloted a World Business
Council for Sustainable
Development (WBCSD)
framework to guide
investment proposals for
Libya sustainable
development program · extended long-term
sponsorships, introduced new
community partnerships and
deepened existing
partnerships · supported the Canadian
Olympic and Paralympic
teams in Beijing, and
announced Petro-Canada
Athlete Family Program for
2010 Games in Vancouver · launched Employee Olympic
Centre website | | | · continue to broaden
stakeholder engagement
capability across operational
roles and with contractors · update TLM standards and
audit criteria to reflect
stakeholder management
framework expectations · integrate stakeholder
engagement practices into
North African development
and exploration projects · work jointly with the Libya
National Oil Corporation
(NOC) on identifying projects for the Libya
sustainable development
program · enhance content of key
community partnerships,
identify synergies and
increase stakeholder
awareness of initiatives · launch 2010 Olympic
glassware campaign to
support Canadian athletes,
and develop operations plan
to “Fuel the Games" in
Vancouver |
Environment | | | · conduct our activities with
sound environmental
management and
conservation practices · strive to minimize the
environmental impact of our
operations · work diligently to prevent
any risk to community health
and safety from our
operations or our products · seek opportunities to transfer expertise in
environmental protection to
host communities | | | · integrate Water Principles
into the environmental
stewardship process · pilot carbon intensity
performance measures · continue to review internal
and external GHG
mitigation opportunities · meet 2008 auditable
emissions reporting
requirements · commence development of
second phase of
environmental information
management system for
water and waste
management · advance major water-
related community
partnership projects | | | · experienced 43 environmental
regulatory exceedances,
compared with 21 in 2007 · advanced water management
plans through water risk
assessments based on Water
Principles · made limited progress on
carbon performance
measures · strengthened resources and
capability in managing carbon
mitigation opportunities · participated in Alberta carbon
market · complied with Alberta
regulations for verified
emissions reporting · improved emission
functionality of first phase of
environmental information
management system · created program content and
materials for major water
partnerships | | | · reinforce senior
management focus on
environmental regulatory
exceedances in 2009 · develop and integrate
relevant water measurement
and reporting functionality
into next phase of
environmental information
management system · pursue viable opportunities
to purchase carbon credits · participate in WBCSD
protocol development to
better understand
Petro-Canada's broader
GHG emissions footprint · initiate work on development
of ecosystem principles · build strength in water
partnerships and promote
publicly |
16 | PETRO-CANADA Management's Discussion and Analysis |
|
Following our Principles for Responsible Investment and Operations (continued)
PRIORITY | | PRINCIPLES | | 2008 GOALS | | 2008 RESULTS | | 2009 GOALS |
Working Conditions and Human Rights | | | · provide a healthy, safe and
secure work environment · honour internationally
accepted labour standards
prohibiting child labour,
forced labour and
discrimination in
employment · respect freedom of
association and expression in the workplace · not be complicit in human
rights abuses · support and respect the
protection of human rights
within our sphere of
influence | | | · establish enterprise-wide
contractor engagement
process for selection,
performance monitoring
and management · attract 925 new employees · develop capability in
managing the social issues of a temporary foreign workforce · pilot a social risk
assessment that will apply to new operations · enhance management,
systems and work
processes related to
process safety · strengthen process for
communicating and
learning from internal high potential and serious events | | | · achieved TRIF of 0.73 in
2008, compared with 0.87 in 2007 · experienced a contractor
work-related fatality at the
Edmonton RCP in September 2008 · assessed current state, and best practices for contractor engagement and identified quick wins · attracted 951 new employees · assessed and developed
mitigation plans for social
risks related to bringing
temporary foreign workers
into Oil Sands project camps · developing standards,
incorporating process safety
criteria into TLM audits and
capturing event data · established a formal process for reviewing
internal and external
events and ensuring
that learnings reach the
front line · conducted emergency
response exercises in four out of five business groups | | | · develop enterprise-wide
training for front-line
supervisors to enhance their ability to execute work safely · develop processes, tools
and expectations for
stronger contractor
engagement on safety · enhance emergency
response advisor capability
through increased training · upgrade emergency
response command centre
facility · implement new corporate
standards for management
of change and process
safety competency · integrate use of social risk
assessment process into
project delivery model · review and strengthen
Company's human rights
management framework |
| | | | | | | | | | | | |
Business Strategy Looking Forward
Key priorities for Petro-Canada in 2009 are striving to ensure that existing facilities run safely, reliably and efficiently through excellent execution and prudently managing the Company's financial strength. This same focus on execution and cost management will apply to the advancement of Petro-Canada's major projects over the next several years. Capital expenditures are expected to be $4.0 billion in 2009, down 38% from 2008, reflecting the Company's focus on the preservation of cash. In 2009, growth highlights are expected to include moving the Company's Board of Directors-approved projects (Libya EPSAs, which came on-stream in 2008, the North Amethyst portion of the White Rose Extensions project and the Syria Ebla gas development) ahead, as originally planned.
Major Approved Project | | Target On-Stream Date | |
Libya EPSAs | | 2008 | |
White Rose Extensions | | 2009 | |
Syria Ebla Gas Development | | 2010 | |
The three unsanctioned projects (Montreal coker, MRX and Fort Hills Phase 1) are on hold until the commodity and financial markets strengthen. The Company is reworking costs to improve project economics.
The Company also plans on drilling up to 12 exploration wells in the North Sea, Libya, East Coast Canada and the Alaska Foothills.
| Management's Discussion and Analysis PETRO-CANADA | 17 |
RISK MANAGEMENT
Risks Relating to Petro-Canada's Business
Petro-Canada's results are impacted by several risks and management's strategies for handling these risks. Management believes each major risk requires a unique response based on Petro-Canada's business strategy and financial tolerance. Some risks can be effectively managed through internal controls, business processes, insurance and hedging. Hedging is used in limited circumstances, mainly to mitigate Downstream risks associated with refinery feedstock costs. Petro-Canada's business risks include, but are not limited to, the following items. These risks could have a material adverse effect on the Company's business, financial conditions and results of operations.
A substantial or extended decline in crude oil or natural gas prices could have a material adverse effect on Petro-Canada.
The Company's financial condition depends substantially on the market prices of crude oil and natural gas. Fluctuations in crude oil or natural gas prices could have a material adverse effect on Petro-Canada's financial condition, as well as the value and amount of the Company's reserves. Prices for crude oil and natural gas fluctuate in response to changes in the supply of and demand for crude oil and natural gas, market uncertainty and a variety of other factors beyond Petro-Canada's control. These factors include, but are not limited to, the actions of OPEC, world economic conditions, government regulation, political developments, the foreign supply of oil, the price of foreign imports, the availability of alternate fuel sources and weather conditions. Canadian natural gas prices are primarily affected by North American supply and demand, weather conditions, the level of industry inventories, political events, and, to a lesser extent, the price of alternate sources of energy.
Any substantial or extended decline in the prices of crude oil or natural gas could result in a delay or cancellation of existing or future drilling, development or construction programs, curtailment in production at some properties and unused long-term transportation commitments.
The margins realized for Petro-Canada's refined products are also affected by factors such as crude oil price fluctuations due to the impact on refinery feedstock costs, third-party refined product purchases and the demand for refined petroleum products. The Company's ability to maintain product margins in an environment of higher feedstock costs depends upon its ability to pass higher costs on to customers.
Petro-Canada's operations are subject to physical damage, business interruption and casualty losses.
Petro-Canada is subject to the operating risks associated with exploring for, and producing, oil and natural gas, as well as operating midstream and downstream facilities. These risks include blowouts, explosions, fires, gaseous leaks, equipment failures, migration of harmful substances, adverse weather conditions and oil spills. These risks could cause personal injury, could result in damage or destruction to oil and natural gas wells, formations, production facilities, other property and equipment, and the environment, and could interrupt operations. In addition, Petro-Canada's operations are subject to the risks related to transporting, processing and storing of oil, natural gas and other related products, drilling of oil and natural gas wells, and operating and developing oil and natural gas properties.
Factors that affect Petro-Canada's ability to execute projects could adversely affect business results.
Petro-Canada manages a variety of projects to support operations and future growth. Significant project cost overruns could make certain projects uneconomic. The Company's ability to execute projects depends upon numerous factors, which may include, but are not limited to, changes in project scope, labour availability and productivity, staff resourcing, availability and cost of material and services, design and/or construction errors, delays in regulatory approvals, the ability of partners to deliver on project commitments and access to capital funding. As a result, Petro-Canada may not be able to execute projects on time, on budget or at all.
Fluctuations in exchange rates create foreign currency exposure.
Due to the fact that energy commodity prices are primarily in U.S. dollars, Petro-Canada's revenue stream is affected by the Cdn/U.S. dollar exchange rate. The Company's net earnings are negatively affected by a strengthening Canadian dollar. Petro-Canada is also exposed to fluctuations in other foreign currencies, such as the euro and British pounds sterling.
18 | PETRO-CANADA Management's Discussion and Analysis | 
|
Reduced liquidity in capital markets can limit the availability of capital and raise borrowing costs.
From time to time, Petro-Canada accesses the debt and/or equity markets to raise capital. The reasons may include, among other things, the need to raise financing for new operations, mergers, acquisitions and expansions. Reduced liquidity in the capital markets may restrict the Company's ability to raise the required financing and/or may significantly increase the associated cost of that capital. An inability to raise capital could jeopardize the ability of the Company to undertake a certain project and a higher cost of capital would reduce the profitability of that project.
A failure to acquire or find additional reserves would cause a decline in Petro-Canada's reserves and production levels.
The Company's future oil and natural gas reserves and production and, therefore, cash flows, are highly dependent upon success in exploiting Petro-Canada's current reserves and resources base and acquiring or discovering additional reserves and resources. Without reserves additions through exploration, acquisition or development activities, Petro-Canada's reserves and production will decline over time. Exploring for, developing or acquiring reserves is capital intensive. To the extent cash flows from operations are insufficient to fund the Company's capital expenditures and external sources of capital become limited or unavailable, Petro-Canada's ability to make the necessary capital investments to maintain oil and natural gas reserves will be impaired. Costs to find and develop or acquire additional reserves also depend on success rates, which vary over time.
Petro-Canada's oil and natural gas reserves data and future net revenue estimates are subject to variability.
There are many uncertainties inherent in estimating quantities of oil and natural gas reserves, including many factors beyond the Company's control. Estimates of economically recoverable oil and natural gas reserves are based upon a number of variables and assumptions. These include geoscientific interpretation, commodity prices, operating and capital costs and historical production from properties. These estimates have some degree of uncertainty and reserves classifications are best estimates. For these reasons, estimates of the economically recoverable oil and natural gas reserves attributed to properties and classification of reserves based on recovery risk may vary substantially. Petro-Canada's actual production, revenues, taxes and development and operating expenditures related to reserves may vary materially from estimates.
Changes in governmental regulation affecting the oil and natural gas industry could have a material adverse impact on Petro-Canada.
The petroleum industry is subject to regulation and intervention by governments, including the awarding of exploration and production interests, the imposition of specific drilling obligations, environmental protection controls, regulation of the development and abandonment of fields (including restrictions on production) and, possibly, expropriation or cancellation of contract rights. As well, governments may regulate or intervene on prices, taxes, royalties and the exportation of oil and natural gas. Regulations may be changed in response to economic or political conditions. New regulations or changes to existing regulations that affect the oil and natural gas industry could reduce demand for natural gas or crude oil and increase Petro-Canada's costs.
Petro-Canada's foreign operations may expose the Company to risks, which could negatively affect results of operations.
The Company has operations in a number of countries with different political, economic and social systems. As a result, Petro-Canada's operations and related assets are subject to a number of risks, which may include, among other things, currency restrictions and exchange rate fluctuations, loss of revenue, property and equipment as a result of expropriation, nationalization, war, insurrection and geopolitical and other political risks, increases in taxes and governmental royalties, renegotiation of contracts with governmental entities and quasi-governmental agencies, changes in laws and policies governing operations of foreign-based companies, economic and legal sanctions (such as restrictions against countries that the U.S. government may deem to sponsor terrorism) and other uncertainties arising from foreign government sovereignty over Petro-Canada's international operations. If a dispute arises in Petro-Canada's foreign operations, the Company may be subject to the exclusive jurisdiction of foreign courts or may not be able to subject foreign persons to the jurisdiction of a court in the U.S. or Canada.
The Company has operations in Libya, which is a member of OPEC. Petro-Canada may operate in other OPEC-member countries in the future. Production in those countries may be constrained by OPEC quotas.

| Management's Discussion and Analysis PETRO-CANADA | 19 |
Petro-Canada's oil and natural gas production and refining operations impact communities and surrounding environments.
Those impacted by Petro-Canada's operations can become concerned over the use of resources, such as land and water, the perceived or real threat to human health, the potential impact on biodiversity, and/or possible societal changes to surrounding communities. The Company must secure and maintain formal regulatory approvals and licences in order to conduct operations. In addition, broader societal acceptance of Petro-Canada's activities is necessary for resource development. An inability for the Company to secure local community support, necessary regulatory approvals and licences, and broader societal acceptance can result in projects being delayed or stopped, resulting in higher project costs. Lack of local community and stakeholder support can lead to pressure to limit or shut down operations.
Petro-Canada is subject to environmental legislation in all jurisdictions where it operates. Changes in this legislation could negatively affect the Company's results of operations.
Petro-Canada is subject to environmental regulation under a variety of Canadian, U.S. and other foreign, federal, provincial, territorial, state and municipal laws and regulations. This is collectively referred to below as environmental legislation.
Environmental legislation imposes, among other things, restrictions, liabilities and obligations in connection with the generation, handling, use, storage, transportation, treatment and disposal of hazardous and non-hazardous substances, including natural resources and waste, and in connection with spills, releases and emissions of various substances to the environment. Environmental legislation requires that wells, facility sites and other properties associated with Petro-Canada's operations be operated, maintained, abandoned and reclaimed to the satisfaction of the applicable regulatory authorities. Certain types of operations, including exploration and development projects, and changes to certain existing projects, may require submitting and seeking the approval of environmental impact assessments (EIAs) or permit applications. Complying with environmental legislation can require significant expenditures, including costs for cleanup and damages due to contaminated properties. Failure to comply with environmental legislation may result in fines and penalties. Petro-Canada is also exposed to civil and criminal liability for environmental matters, including private parties commencing actions, new theories of liability and new heads of damages. Although it is not expected that the costs of complying with environmental legislation or dealing with environmental liabilities, as they are known today, will have a material adverse effect on Petro-Canada's financial condition or results of operations, no assurance can be made that the costs of complying with future environmental legislation will not have a material effect.
Petro-Canada operates in jurisdictions that have regulated or have proposed to regulate industrial GHG emissions. Jurisdictions that currently regulate GHG emissions include Alberta and the European Union. Jurisdictions that have proposed to regulate GHG emissions include the U.S., British Columbia (B.C.), Quebec, Ontario and Canada. Those jurisdictions that have announced the intent to regulate GHG emissions support cap-and-trade systems and, in some cases, have also proposed implementing complementary measures, including low carbon fuel standards. To date, these jurisdictions have started or have announced plans to start consultations on the design of their regulations, as well as explore opportunities to harmonize regulations across jurisdictions within North America. Petro-Canada participates in these consultations, either directly or through industry associations. In 2007, Petro-Canada established an internal senior management team to steward these activities and, in 2008, this organization was enhanced by creating the role of Director, Climate Change. While these jurisdictions have not published details on their proposed regulations or on their compliance mechanisms, many, most notably the U.S., have identified the importance of balancing the environment, economy and energy security when developing regulations. While it is premature to predict what impact these anticipated regulations may have on Petro-Canada and the broader oil and gas sector, Petro-Canada will likely face increased capital and operating costs in order to comply with these regulations, and these costs could be material. Petro-Canada is actively following policy development to ensure the Company is prepared to operate within a new framework.
Reduced asset reliability could adversely affect Petro-Canada's business.
Petro-Canada operates facilities in both the upstream and downstream sectors of the industry. A reduction in the reliability of these facilities as a result of, but not limited to, damage to equipment, plant or material, loss of production capability or operational integrity, or the extension of shutdown time could contribute to reduced profitability.
Counterparties exposure.
Petro-Canada is exposed to credit risk, and operational risk associated with counterparties' abilities to fulfil their obligations to the Company.
20 | PETRO-CANADA Management's Discussion and Analysis |
|
CONSOLIDATED FINANCIAL RESULTS Analysis of Consolidated Earnings and Cash Flow Consolidated Financial Results On January 31, 2006, Petro-Canada closed the sale of the Company's producing assets in Syria. These assets and associated results are reported as discontinued operations and are excluded from continuing operations. | 
|
(millions of Canadian dollars, unless otherwise indicated) | | 2008 | | 2007 | | 2006 | |
Net earnings | | $ | 3,134 | | $ | 2,733 | | $ | 1,740 | |
Net earnings from discontinued operations | | – | | – | | 152 | |
Net earnings from continuing operations | | $ | 3,134 | | $ | 2,733 | | $ | 1,588 | |
Earnings per share from continuing operations (dollars) | – basic | | $ | 6.47 | | $ | 5.59 | | $ | 3.15 | |
| – diluted | | 6.43 | | 5.53 | | 3.11 | |
Earnings per share (dollars) | – basic | | $ | 6.47 | | $ | 5.59 | | $ | 3.45 | |
| – diluted | | 6.43 | | 5.53 | | 3.41 | |
Cash flow from continuing operating activities 1 | | 6,522 | | 3,339 | | 3,608 | |
Debt | | 4,749 | | 3,450 | | 2,894 | |
Cash and cash equivalents 2 | | 1,445 | | 231 | | 499 | |
Average capital employed 2 | | $ | 17,772 | | $ | 14,328 | | $ | 12,868 | |
Return on capital employed (%) 2 | | 18.6 | | 19.8 | | 14.3 | |
Return on equity (%) 2 | | 22.9 | | 24.5 | | 17.5 | |
1 Cash flow from continuing operating activities in 2007 was reduced by the payment of $1,145 million after-tax to settle the hedged portion of Buzzard production.
2 Includes discontinued operations.
2008 Compared with 2007 Net earnings increased 15% to $3,134 million in 2008, compared with $2,733 million in 2007. Higher realized crude oil prices, lower other expenses and lower tax adjustments contributed to the increase. These factors were partially offset by foreign currency translation losses, weaker Downstream refining margins, increased operating and general and administrative (G&A) expenses, higher exploration and depreciation, depletion and amortization (DD&A) expenses and lower upstream production. | | 
|
| Management's Discussion and Analysis PETRO-CANADA | 21 |
In 2008, net earnings included a number of items: a foreign currency translation loss on long-term debt of $606 million, a $255 million charge due to declining crude oil feedstock costs while using a "first-in, first-out" (FIFO) method for valuing inventories in the Downstream, charges due to the deferral of the Fort Hills FID of $156 million, a $215 million income tax recovery, a $126 million recovery related to the mark-to-market of stock-based compensation, a $52 million charge for asset impairment, $29 million in insurance proceeds, a $20 million insurance premium surcharge and a gain on sale of assets of $4 million.
In 2007, net earnings included a number of items: net losses on the derivative contracts associated with the hedged portion of Buzzard production of $331 million, a foreign currency translation gain on long-term debt of $208 million, a $191 million income tax recovery, a $97 million charge for asset impairment, a gain on sale of assets of $58 million, a $54 million charge related to the mark-to-market of stock-based compensation, $30 million in insurance proceeds and a $7 million insurance premium recovery.
Quarterly Information
Consolidated Quarterly Financial Results
| | | | 2008 | | | | | | 2007 | | | |
(millions of Canadian dollars,
unless otherwise indicated) | | Quarter 1 | | Quarter 2 | | Quarter 3 | | Quarter 4 | | Quarter 1 | | Quarter 2 | | Quarter 3 | | Quarter 4 | |
Total revenue | | $ 6,586 | | $ 7,646 | | $ 8,286 | | $ 5,267 | | $ 4,841 | | $ 5,478 | | $ 5,497 | | $ 5,434 | |
Net earnings | | 1,076 | | 1,498 | | 1,251 | | (691 | ) | 590 | | 845 | | 776 | | 522 | |
Cash flow from (used in) operating activities 1 | | 1,435 | | 2,479 | | 1,279 | | 1,329 | | 1,166 | | 1,435 | | 1,340 | | (602 | ) |
Earnings per share (dollars) | | | | | | | | | | | | | | | | | |
| – basic | | $ 2.22 | | $ 3.10 | | $ 2.58 | | $ (1.43 | ) | $ 1.19 | | $ 1.71 | | $ 1.59 | | $ 1.08 | |
| – diluted | | $ 2.20 | | $ 3.07 | | $ 2.56 | | $ (1.43 | ) | $ 1.18 | | $ 1.70 | | $ 1.58 | | $ 1.07 | |
1 Cash flow from (used in) continuing operating activities in the fourth quarter of 2007 was significantly reduced due to the payment of $1,145 million after-tax to settle the hedged portion of Buzzard production.
Revenue and net earnings variances from quarter to quarter resulted mainly from fluctuations in commodity prices and refinery cracking margins, the impact on production and processed volumes from maintenance and other shutdowns at major facilities, and the level of exploration drilling activity. For further analysis of quarterly results, refer to Petro-Canada's quarterly reports to shareholders available on the Company's website at www.petro-canada.ca.
22 | PETRO-CANADA Management's Discussion and Analysis |
|
LIQUIDITY AND CAPITAL RESOURCES
Summary of Cash Flows
(millions of Canadian dollars) | | 2008 | | 2007 | | 2006 | |
Cash flow from continuing operating activities | | $ | 6,522 | | $ | 3,339 | | $ | 3,608 | |
Cash flow from discontinued operating activities | | – | | – | | 15 | |
Net cash inflows (outflows) from: | | | | | | | |
– investing activities | | (5,384 | ) | (3,647 | ) | (2,738 | ) |
– financing activities | | 76 | | 40 | | (1,175 | ) |
Increase (decrease) in cash and cash equivalents | | $ | 1,214 | | $ | (268 | ) | $ | (290 | ) |
Cash and cash equivalents at end of year | | $ | 1,445 | | $ | 231 | | $ | 499 | |
Cash and cash equivalents – discontinued operations | | $ | – | | $ | – | | $ | – | |
In 2008, cash flow from continuing operating activities was $6,522 million ($13.47/share), compared with $3,339 million ($6.83/share) in 2007. The increase in cash flow was primarily due to higher net earnings and a decrease in the operating working capital deficiency. In 2007, cash flow was significantly reduced due to the payment of $1,145 million after-tax to settle the hedged portion of Buzzard production.
Financial Ratios
| | 2008 | | 2007 | | 2006 | |
Interest coverage from continuing operations (times)1 | | | | | | | |
Net earnings basis | | 21.5 | | 26.0 | | 19.2 | |
EBITDAX basis1 | | 31.3 | | 39.2 | | 27.0 | |
Cash flow basis | | 33.7 | | 27.2 | | 27.1 | |
Debt-to-cash flow from continuing operating activities (times) | | 0.7 | | 1.0 | | 0.8 | |
Debt-to-debt plus equity (%) | | 23.5 | | 22.5 | | 21.7 | |
1 Refer to the Glossary of Terms, Ratios and Acronyms on page 114 for methods of calculation.
Petro-Canada's financing strategy is designed to maintain financial strength and flexibility to support profitable growth in all business environments. Two key measures that Petro-Canada uses to measure the Company's overall financial strength are debt-to-cash flow from continuing operating activities and debt-to-debt plus equity. Petro-Canada's debt-to-cash flow from continuing operating activities ratio, the key short-term measure, was 0.7 times at December 31, 2008, down from 1.0 times at year-end 2007. This was well within the Company's long-term range of no more than 2.0 times. Debt-to-debt plus equity, the long-term measure for capital structure, was 23.5% at year-end 2008, up from 22.5% at year-end 2007. This was below the long-term range of 25% to 35% for both years, providing the financial flexibility to fund the Company's capital program and profitable growth opportunities. In the future, from time to time, Petro-Canada may exceed long-term ranges for short periods of time, but always with the goal to return back to within the long-term ranges. Financial covenants associated with the Company's various debt arrangements are reviewed regularly and controls are in place to maintain compliance with these covenants. The Company complied with all financial covenants as at December 31, 2008. | | 
|

| Management's Discussion and Analysis PETRO-CANADA | 23 |
Operating Activities
Excluding cash and cash equivalents, short-term notes payable and the current portion of long-term debt, the operating working capital deficiency was $46 million at December 31, 2008, compared with an operating working capital deficiency of $565 million at December 31, 2007. The working capital deficiency was lower at December 31, 2008, primarily due to the increase in inventories from adoption of the FIFO method for valuing inventories, the increase to accounts receivable resulting from the effective unwinding of the accounts receivable securitization program and the decrease in accounts payable and accrued liabilities due to the recovery related to the mark-to-market valuation of stock-based compensation.
Investing Activities
Capital and Exploration Expenditures
(millions of Canadian dollars) | | 2009 Outlook | | 2008 | | 2007 | | 2006 | |
Upstream | | | | | | | | | |
North American Natural Gas | | $ | 580 | | $ | 1,023 | | $ | 866 | | $ | 788 | |
Oil Sands | | 985 | | 1,063 | | 779 | | 377 | |
International & Offshore | | | | | | | | | |
East Coast Canada | | 530 | | 276 | | 159 | | 256 | |
International 1 | | 1,270 | | 2,115 | | 762 | | 760 | |
| | $ | 3,365 | | $ | 4,477 | | $ | 2,566 | | $ | 2,181 | |
Downstream | | | | | | | | | |
Refining and Supply | | $ | 460 | | $ | 1,651 | | $ | 1,214 | | $ | 1,038 | |
Sales and Marketing | | 70 | | 156 | | 155 | | 142 | |
Lubricants | | 30 | | 27 | | 27 | | 49 | |
| | $ | 560 | | $ | 1,834 | | $ | 1,396 | | $ | 1,229 | |
Shared Services | | $ | 35 | | $ | 33 | | $ | 26 | | $ | 24 | |
Total property, plant and equipment and exploration | | $ | 3,960 | | $ | 6,344 | | $ | 3,988 | | $ | 3,434 | |
Other assets | | – | | 29 | | 121 | | 50 | |
Total continuing operations | | $ | 3,960 | | $ | 6,373 | | $ | 4,109 | | $ | 3,484 | |
Discontinued operations | | $ | – | | $ | – | | $ | – | | $ | 1 | |
Total | | $ | 3,960 | | $ | 6,373 | | $ | 4,109 | | $ | 3,485 | |
1 International excludes capital expenditures related to the Syrian producing assets, which were sold in 2006 and are reflected as discontinued operations.
Capital and exploration expenditures were $6,373 million in 2008, up 55% compared with $4,109 million in 2007, mainly reflecting higher investment in Libya, the Oil Sands and the Edmonton RCP. In 2009, spending on new growth projects is expected to decrease substantially. Approximately half of planned capital expenditures support delivering profitable new growth and funding exploration and new ventures. This is down by more than $2 billion, compared with the same categories in 2008. The remaining half of 2009 planned capital expenditures is directed toward replacing reserves in core areas, enhancing existing assets, improving base business profitability and complying with new regulations. | |
|
24 | PETRO-CANADA Management's Discussion and Analysis | 
|
Financing Activities and Dividends
Sources of Capital Employed
(millions of Canadian dollars) | | 2008 | | 2007 | | 2006 | |
Short-term notes payable | | $ | – | | $ | 109 | | $ | – | |
Long-term debt, including current portion | | 4,749 | | 3,341 | | 2,894 | |
Shareholders' equity | | 15,475 | | 11,870 | | 10,441 | |
Total | | $ | 20,224 | | $ | 15,320 | | $ | 13,335 | |
Total debt increased to $4,749 million at December 31, 2008, compared with $3,450 million at the previous year end. The increase in debt occurred due to a debt issuance in the second quarter of 2008, as well as the impact of a weakening Canadian dollar.
2008 Financing Activities
During 2008, Petro-Canada increased its syndicated committed credit facilities from $2,200 million to $3,570 million. At December 31, 2008, the Company's syndicated bilateral demand credit facilities totalled $777 million. A total of $348 million of the Company's credit facilities was used for letters of credit and overdraft coverage. Subsequent to December 31, 2008, the Company's liquidity was increased by $244 million through the addition of a bilateral committed credit facility. The syndicated facilities, which are in place until 2013, may also be used to provide liquidity support to a commercial paper program. The Company had no commercial paper outstanding at December 31, 2008 and does not plan to issue commercial paper in the near term.
In 2008, the Company issued $600 million US of 10-year notes, bearing interest at the rate of 6.05% per year, and $900 million US of 30-year notes, bearing interest at the rate of 6.80% per year, under its previously filed base shelf prospectus. The base shelf prospectus provides for the offering of up to $4 billion US of debt securities in Canada or the U.S. over the course of a 25-month period from March 31, 2008.
During 2008, the Company's $480 million accounts receivable securitization program was effectively unwound because it was no longer a cost-effective means of borrowing. The program remains outstanding as a liquidity source until June 24, 2009.
As at December 31, 2008, the credit ratings of the Company's unsecured long-term debt securities were Baa2 with a stable outlook by Moody's, BBB with a stable outlook by S&P and A (low) with a Negative Trend by DBRS. Petro-Canada's short-term debt securities are rated R-1 (low) with a Negative Trend by DBRS. A Positive or Negative Trend is not an indication that a rating change is imminent. Rather, a Positive or Negative Trend represents an indication that there is a greater likelihood that the rating could change in the future than would be the case if a Stable Trend was assigned to the security. A credit rating is not a recommendation to buy, sell or hold securities and may be subject to revision or withdrawal at any time by the rating organization.
The Company's financial capacity and flexibility remain strong despite the recent turmoil in the financial markets. This is due to the Company's continuing ability to generate cash flow, having access to existing cash balances and significant credit facility capacity, and requiring no near-term refinancing. For 2009, the Company expects to cover its capital program with cash flow, cash and, if necessary, from available credit facilities. The Company will monitor energy and financial markets through the year and take advantage of the flexibility in its capital program to pace projects and adjust capital expenditures accordingly.
| Management's Discussion and Analysis PETRO-CANADA | 25 |
Returning Cash to Shareholders
Petro-Canada's priority uses of cash are to fund the capital program and profitable growth opportunities, and then to return cash to shareholders through dividends and a share buyback program.
Petro-Canada regularly reviews its dividend strategy to ensure the alignment of the dividend policy with shareholder expectations, and financial and growth objectives. Consistent with this objective, on July 23, 2008, the Company declared a 54% increase in its quarterly dividend to $0.20/share, commencing with the dividend payable on October 1, 2008. Total dividends paid in 2008 were $320 million ($0.66/share), compared with $255 million ($0.52/share) in 2007.
Petro-Canada's current NCIB program entitles the Company to repurchase up to 5% of its outstanding common shares from June 22, 2008 to June 21, 2009, subject to certain conditions. Throughout the year 2008, the Company did not repurchase any of its shares, compared with 16 million in 2007. Future share repurchases will depend on excess cash available after consideration of the Company's priority uses of cash.
| | Shares Repurchased | | Average Price ($/share) | | Total Cost | |
Period | | 2008 | | 2007 | | 2008 | | 2007 | | 2008 | | 2007 | |
Full year | | – | | 15,998,000 | | $ | – | | $ | 52.42 | | $ | – | | $ | 839 million | |
| | | | | | | | | | | | | | | | | |
Off Balance Sheet
The Company has certain retail licensee and wholesale marketing agreements that would constitute variable interest entities as described in Note 29 to the Consolidated Financial Statements. These entities are not consolidated because Petro-Canada is not the primary beneficiary and, therefore, consolidation is not required. The Company's maximum exposure to losses from these arrangements would not be material. Other off balance sheet activities are limited to the accounts receivable securitization program, which does not meet the criteria for consolidation and pursuant to which there are no amounts currently outstanding.
Pension Plans
At year-end 2008, Petro-Canada's defined benefit pension plans were under funded by $407 million, compared with an under funded position of $282 million at year-end 2007. For both the defined benefit and defined contribution pension plans, the Company made cash contributions of $67 million and recorded a pension expense of $93 million before-tax in 2008. This compares with $121 million of cash contributions and $81 million before-tax of pension expense in 2007. The Company expects to make pension contributions of approximately $62 million in 2009.
26 | PETRO-CANADA Management's Discussion and Analysis |
|
Contractual Obligations – Summary
| Payments due by period |
(millions of Canadian dollars) | | Total | | 2009 | | 2010-2011 | | 2012-2013 | | 2014 and thereafter | |
Unsecured debentures and senior notes 1 | | $ | 10,729 | | $ | 305 | | $ | 610 | | $ | 975 | | $ | 8,839 | |
Capital lease obligations 1 | | 119 | | 11 | | 22 | | 24 | | 62 | |
Operating leases | | 2,082 | | 484 | | 516 | | 213 | | 869 | |
Transportation agreements | | 1,436 | | 197 | | 332 | | 230 | | 677 | |
Product purchase/delivery obligations | | 12,733 | | 3,361 | | 3,242 | | 1,918 | | 4,212 | |
Exploration work commitments 2 | | 769 | | 381 | | 291 | | 85 | | 12 | |
Asset retirement obligations | | 5,389 | | 54 | | 106 | | 119 | | 5,110 | |
Other long-term obligations 3, 4 | | 3,786 | | 661 | | 1,600 | | 473 | | 1,052 | |
Total contractual obligations | | $ | 37,043 | | $ | 5,454 | | $ | 6,719 | | $ | 4,037 | | $ | 20,833 | |
1 Obligations include related interest.
2 Excludes other amounts related to the Company's expected future capital spending. Capital spending plans are reviewed and revised annually to reflect Petro-Canada's strategy, operating performance and economic conditions. For further information regarding future capital spending plans, refer to the business segment and investing activities discussions in the 2008 MD&A.
3 Includes processing agreement with Suncor Energy Inc., Libya EPSA signature bonus, Fort Hills purchase obligation, pension funding obligations for the periods prior to the Company's next required pension plan valuation and other obligations. Pension obligations beyond the next required pension valuation date were excluded due to the uncertainty as to the amount or timing of these obligations.
4 Petro-Canada is involved in litigation and claims associated with normal operations. Management is of the opinion that any resulting settlements would not materially affect the financial position of the Company. The table excludes amounts for these contingencies due to the uncertainty as to the amount or timing of any settlements.
During 2008, Petro-Canada's total contractual obligations increased by $5.3 billion, mainly due to an additional $1.5 billion US of unsecured senior notes issued in May, losses on the translation of foreign currency denominated unsecured debentures and senior notes and increased estimates for asset retirement obligations. This was partially offset by decreased product purchase obligations.
| Management's Discussion and Analysis PETRO-CANADA | 27 |
UPSTREAM
Petro-Canada's upstream operations consisted of three business units in 2008: North American Natural Gas, with production in Western Canada and the U.S. Rockies; Oil Sands with operations in northeast Alberta; and International & Offshore. International & Offshore has two segments: East Coast Canada, with three major developments offshore Newfoundland and Labrador; and International, where the Company is active in two core areas: North Sea and Other International (Libya, Syria and Trinidad and Tobago). The diverse asset base provides a balanced portfolio and a platform for long-term growth.
North American Natural Gas
Business Summary and Strategy
North American Natural Gas explores for and produces natural gas, crude oil and NGL in Western Canada and the U.S. Rockies. This business also markets natural gas in North America and has established resources in Alaska, the NWT and Arctic Islands. | 
|
|
The North American Natural Gas strategy is to be a significant market participant by accessing new and diverse natural gas supply sources in North America. Key features of the strategy include: |
|
· | optimizing core properties in Western Canada and in the U.S. Rockies |
|
· | targeting 50% to 60% reserves replacement |
|
· | increasing focus on unconventional exploration in Western Canada and the U.S. Rockies |
| |
· | building the northern resource base for long-term growth |
North American Natural Gas Financial Results
(millions of Canadian dollars) | | 2008 | | 2007 | | 2006 | |
Net earnings | $ | 344 | $ | 191 | $ | 405 | |
Cash flow from continuing operating activities | $ | 1,055 | $ | 725 | $ | 651 | |
Expenditures on property, plant and equipment and exploration1 | $ | 1,023 | $ | 866 | $ | 788 | |
Total assets | $ | 4,605 | $ | 4,119 | $ | 4,151 | |
1 In 2008, Petro-Canada made a small acquisition of oil production and exploration land located in the Denver-Julesburg Basin.
2008 Compared with 2007
North American Natural Gas contributed $344 million of net earnings, up significantly from $191 million in 2007. Strong natural gas prices, higher U.S. Rockies production and lower exploration expenses were partially offset by lower Western Canada production, increased operating costs and increased DD&A expenses.
Net earnings in 2008 included a loss on sale of assets of $91 million, a charge of $28 million for a discontinued pilot project in northern B.C. and a charge of $24 million related to accumulated project development costs for the proposed LNG re-gasification facility at Gros-Cacouna, Quebec, which has been postponed due to global LNG business conditions. Net earnings in 2007 included a $97 million charge related to the impairment of coal bed methane (CBM) assets in the U.S. Rockies, a $41 million gain on sale of assets and an $8 million income tax recovery.
28 | PETRO-CANADA Management's Discussion and Analysis | 
|
North American Natural Gas production was strong in 2008 due to increased production in the U.S. Rockies and strong performance in Western Canada, which significantly offset natural declines. Oil and natural gas production averaged 665 million cubic feet of gas equivalent/day (MMcfe/d) in 2008, compared with 674 MMcfe/d in 2007, as natural declines in Western Canada were partially offset by U.S. Rockies production growth. Natural gas commodity prices remained strong over the course of 2008. The North American realized natural gas price averaged $8.05/Mcf in 2008, up 28% from $6.30/Mcf in 2007.
2008 Operating Review and Strategic Initiatives
The North American Natural Gas business is selectively investing to optimize the existing core assets in Western Canada and the U.S. Rockies, focusing exploration in these basins and building the northern resource base for the longer term.
2008 Operating Review
| | 2008 | | 2007 | | 2006 | |
Production net (MMcfe/d) | | | | | | | |
Western Canada | | 562 | | 590 | | 646 | |
U.S. Rockies | | 103 | | 84 | | 55 | |
Total North American Natural Gas production net | | 665 | | 674 | | 701 | |
Western Canada realized natural gas price ($/Mcf) | $ | 8.28 | $ | 6.48 | $ | 6.88 | |
U.S. Rockies realized natural gas price ($/Mcf) | $ | 6.63 | $ | 4.88 | $ | 6.36 | |
Western Canada operating and overhead costs | $ | 1.72 | $ | 1.50 | $ | 1.31 | |
($/thousand cubic feet of gas equivalent – $/Mcfe) | | | | | | | |
U.S. Rockies operating and overhead costs ($/Mcfe) | $ | 2.26 | $ | 2.21 | $ | 2.29 | |
Western Canada
Western Canada production averaged 562 MMcfe/d in 2008, down 5% from 590 MMcfe/d in 2007. Exploration and development drilling activity in Western Canada resulted in 292 successful wells (gross), for an overall success rate of 97% in 2008. Western Canada realized natural gas price was $8.28/Mcf in 2008, compared with $6.48/Mcf in 2007. Western Canada operating and overhead costs were $1.72/Mcfe in 2008, up from $1.50/Mcfe in the previous year. The operating and overhead cost increase in Western Canada reflected industry-wide cost pressures for materials, fuel and labour, combined with lower production.

| Management's Discussion and Analysis PETRO-CANADA | 29 |
U.S. Rockies
U.S. Rockies production averaged 103 MMcfe/d in 2008, up 23% from 84 MMcfe/d in 2007. The increase reflected the ramp up of production from CBM fields in the Powder River Basin and increased drilling activity in the Denver-Julesburg Basin. Exploration and development drilling activity in the U.S. Rockies during 2008 resulted in 287 gross wells, up from 150 wells in 2007. U.S. Rockies realized natural gas price was $6.63/Mcf in 2008, up 36% from $4.88/Mcf in 2007. U.S. Rockies operating and overhead costs were $2.26/Mcfe in 2008, up from $2.21/Mcfe in 2007 due to industry-wide cost pressures for materials, fuel and labour.
2008 Strategic Initiatives
In Western Canada, the Company continued its planned shallow tight gas drilling program in the Medicine Hat, Alberta area, drilling 271 wells in 2008. The business expects to drill another 280 wells in 2009. In the other core areas of B.C. and Alberta, the Company continued to optimize existing fields, with the drilling of more than 30 exploration and development wells in 2008. As part of the Company's ongoing optimization of its portfolio of assets, Petro-Canada completed the sale of its Minehead assets in Western Canada, resulting in a loss on sale of $153 million before-tax ($112 million after-tax). The sale of these assets is aligned with the business unit's strategy to continuously optimize the assets in its portfolio.
During 2008, the Company and its joint venture partners advanced its exploration activities in Alaska with a two-well program. The Kwijika well drilled in the NWT was dry and abandoned.
The Company sees long-term potential for the development of Arctic Island natural resources discovered in the 1970s and 1980s. The two largest assets Petro-Canada holds in the region are the Drake and Hecla fields on Melville Island. In 2008, a small team advanced a feasibility study to the point where uncertainty regarding regulatory approval timing was identified as a significant issue. The Company will continue to work with governments and stakeholders to streamline this process but, in the meantime, the Company has slowed down Arctic Island efforts.
Capital expenditures in 2008 totalled $1,023 million, with $451 million for exploration and development of natural gas in Western Canada, $498 million for U.S. Rockies exploration and development, and $74 million for other natural gas opportunities in North America.
Outlook
Production expectations in 2009 | Capital spending plans in 20091 |
| | | |
· | production is expected to average about 570 MMcfe/d
net of natural gas, crude oil and NGL | · | capital program of approximately $580 million is planned for North American Natural Gas |
| | | |
Action plans in 2009 | | · | approximately $320 million for replacing reserves and maintenance in Western Canada and U.S. Rockies |
| | | |
· | drill approximately 304 gross wells in Western Canada and approximately 241 gross wells in the U.S. Rockies | | · | approximately $180 million for growth opportunities in the U.S. Rockies |
| | | | |
· | three-well program planned for the Alaska Foothills | | · | approximately $40 million directed to exploration and developing long-term supply opportunities in the Far North |
| | | | |
| | | · | approximately $40 million to enhance existing assets, comply with regulations and improve base business profitability |
1 | Petro-Canada will monitor energy and financial markets through 2009 and take advantage of the flexibility in its capital program to pace projects and adjust capital expenditures, as necessary. |
30 | PETRO-CANADA Management's Discussion and Analysis |
|
Link to Petro-Canada's Corporate and Strategic Priorities
The North American Natural Gas business is aligned with Petro-Canada's strategic priorities as outlined by its progress in 2008 and goals for 2009.
PRIORITY | | 2008 GOALS | | 2008 RESULTS | | 2009 GOALS |
| | | | | | |
Delivering Profitable Growth with a Focus on Operated, Long-Life Assets | · continue to selectively optimize Western Canada core assets · continue U.S. Rockies CBM and tight natural gas development · target 50% to 60% reserves replacement from these core assets · focus exploration activity in Western Canada, with increasing emphasis on the U.S. · advance exploration prospects in the NWT and Alaska · initiate an Arctic LNG feasibility study | · implemented drilling and optimization initiatives, resulting in lower decline rates · drilled 287 gross wells in the U.S. Rockies · continued to increase exploration focus in the U.S. Rockies and B.C. shale gas · participated in three wells in Alaska and NWT, resulting in one gas discovery, one dry and abandoned and one suspended as planned · progressed Arctic LNG feasibility study, encountering uncertainty with regard to regulatory approval timing | · continue to optimize Western Canada and U.S. core assets · target 50% to 60% reserves replacement from core assets · focus exploration activity in Western Canada and U.S. Rockies with an emphasis on unconventional exploration · advance exploration prospects in Alaska |
| | | |
Driving for First Quartile Operation of Our Assets | · continue to focus on safety and reliability performance · continue to leverage costs through strategic alliances and preferred suppliers | · maintained reliability of 99% at Western Canada natural gas processing facilities · delivered value to the organization through preferred supplier relationships, while continuing to ensure competitive supply costs through selective bidding | · continue to focus on safety and reliability performance · continue to leverage costs through strategic alliances and preferred suppliers · renegotiate contracts to reflect economic environment |
| | | |
Continuing to Work at Being a Responsible Company | · continue to focus on TRIF and maintain low regulatory exceedances · conduct internal stakeholder engagement training for project managers and other key business roles · strengthen approach to investigating and learning from events | · TRIF decreased to 1.31, compared with 1.54 in 2007 · experienced eight environmental regulatory exceedances in 2008, compared with three in 2007 · conducted training for stakeholder practitioners, project managers and key contractors · set up a formal process to identify and communicate key learnings from significant events | · pursue initiatives aimed at developing front-line supervisory capability in safety management · develop a water management plan for operations in areas of water scarcity and develop measures related to usage and capacity of the source · continually improve community emergency response programs |
| Management's Discussion and Analysis PETRO-CANADA | 31 |
Oil Sands
Business Summary and Strategy
Petro-Canada estimates that it has 1.21 billion bbls of total Oil Sands proved plus probable reserves and 9.52 billion bbls of total Oil Sands Contingent and Prospective Resources. The Company's major Oil Sands interests include a 12% ownership in the Syncrude joint venture (an oil sands mining operation and upgrading facility), 100% ownership of the MacKay River in situ bitumen development (a steam-assisted gravity drainage (SAGD) operation), a 60% ownership in and operatorship of the proposed Fort Hills oil sands mining project, and extensive oil sands acreage considered prospective for in situ development of bitumen resources. | 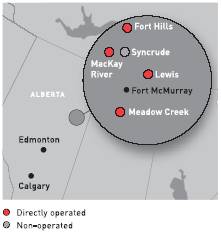
|
|
The Oil Sands strategy for profitable growth includes: |
| |
· | integrated development of resources to maximize leverage of infrastructure and to promote long-term stability of financial returns |
| |
· | being positioned to capture the value opportunities inherent in long-life projects |
| |
· | applying a phased and disciplined approach to development of capital-intensive projects to allow rigorous cost management and to create opportunities to benefit from evolving technology |
The Company has chosen to participate in the full oil sands value chain due to its resource potential and strong position with bitumen upgrading capacity. Petro-Canada has processing capacity through Syncrude and Suncor Energy Inc. In 2008, the Company converted the conventional crude oil train at its Edmonton refinery to refine oil sands-based feedstock from northern Alberta. This conversion, along with the existing synthetic crude supply, resulted in the refinery being able to run on an exclusive diet of oil sands-based feedstock. This connection between resource and upgrading capacity should provide more economic certainty in a business where volatile light/heavy differentials affect bitumen pricing.
Oil Sands Financial Results
(millions of Canadian dollars) | | 2008 | | 2007 | | 2006 | |
Net earnings | $ | 334 | $ | 316 | $ | 245 | |
Cash flow from continuing operating activities | $ | 622 | $ | 512 | $ | 499 | |
Expenditures on property, plant and equipment and exploration | $ | 1,063 | $ | 779 | $ | 377 | |
Total assets | $ | 4,566 | $ | 3,659 | $ | 2,885 | |
2008 Compared with 2007
Oil Sands contributed a record $334 million of net earnings, up 6% from $316 million in 2007. Higher realized prices at Syncrude and MacKay River, in addition to stronger MacKay River production were partially offset by lower Syncrude production and increased operating costs at both Syncrude and MacKay River.
Net earnings in 2008 included charges due to the deferral of the Fort Hills FID of $156 million. Net earnings in 2007 included a $62 million income tax recovery.
1 | | These reserves numbers represent the sum of oil sands mining and oil and gas activities, including probable reserves, and are presented before royalties. Reporting reserves in this manner does not conform to SEC standards and is for general supplemental information only. |
2 | | 25% of total Oil Sands resources are risked Prospective Resources and 75% are Contingent Resources. See "Legal Notice – Petro-Canada disclosure of reserves" for additional risks to develop resources. |
32 | PETRO-CANADA Management's Discussion and Analysis |
|
Strong production and reliability at MacKay River were highlights of 2008 performance. Syncrude realized price for synthetic crude oil averaged $106.63/bbl in 2008, up from $79.20/bbl in 2007. MacKay River realized price for bitumen averaged $60.26/bbl in 2008, compared with $28.23/bbl in 2007. Oil Sands production averaged 59,900 b/d net in 2008, compared with 56,900 b/d net in 2007.
2008 Operating Review and Strategic Initiatives
2008 Operating Review
| | 2008 | | 2007 | | 2006 | |
Production net (b/d) | | | | | | | |
Syncrude | | 34,700 | | 36,600 | | 31,000 | |
MacKay River | | 25,200 | | 20,300 | | 21,200 | |
Total Oil Sands production net | | 59,900 | | 56,900 | | 52,200 | |
Syncrude realized crude price ($/bbl) | $ | 106.63 | $ | 79.20 | $ | 72.13 | |
MacKay River realized bitumen price ($/bbl) | $ | 60.26 | $ | 28.23 | $ | 28.93 | |
Syncrude operating and overhead costs ($/bbl) | $ | 37.79 | $ | 26.94 | $ | 30.00 | |
MacKay River operating and overhead costs ($/bbl) | $ | 24.65 | $ | 20.97 | $ | 17.83 | |
Syncrude's production averaged 289,000 b/d gross (34,700 b/d net) in 2008, compared with 305,000 b/d gross (36,600 b/d net) in 2007. Syncrude production was negatively impacted by turnarounds at Cokers 8-1 and 8-2 in 2008. Higher unit operating costs were mainly due to lower production, higher costs associated with moving additional overburden to increase exposed minable ore inventory, higher maintenance costs and higher natural gas costs. The total royalty paid in 2008 equated to a rate of 14% of gross revenues. In the fourth quarter, Petro-Canada and its partners in Syncrude concluded negotiations with the Government of Alberta regarding the province's desire for Syncrude to move to the New Alberta Royalty Framework recommendations in advance of the expiry of its existing royalty agreement in 2015.
MacKay River's average production increased to 25,200 b/d in 2008, up 24% compared with 20,300 b/d in 2007. Higher production reflected increased reliability and capacity at MacKay River. MacKay River reliability averaged 97% in 2008, up from 87% in 2007, when operational upsets occurred. Unit operating and overhead costs increased by 18% in 2008, averaging $24.65/bbl, compared with $20.97/bbl in 2007. Higher unit operating costs were due to higher maintenance and repair costs, a major turnaround and higher natural gas costs, partially offset by increased production for the year.
| Management's Discussion and Analysis PETRO-CANADA | 33 |
2008 Strategic Initiatives
In the first quarter of 2008, Petro-Canada received regulatory approval for the proposed MacKay River 40,000 b/d in situ expansion project. The MRX project is on hold until commodity prices and financial markets strengthen. Petro-Canada is pursuing cost-saving opportunities, including using international engineering, procurement and construction (EPC) contractors on a lump-sum basis.
In June 2007, Petro-Canada and its Fort Hills partners completed and announced the design basis and initiated the detailed FEED for Fort Hills Phase 1, which consists of the proposed Fort Hills mine and upgrader. At the completion of the FEED phase in September 2008, the estimated costs to complete the project increased by approximately 50%. The FID on the mining portion of the project is being deferred until the extension of the Fort Hills mine leases is resolved, costs can be reduced and commodity prices and financial markets strengthen. In 2008, the Fort Hills upgrader portion of the project was put on hold, and a decision on whether to proceed with the upgrader will be made at a later date. Bitumen production from the first phase of the mine is expected to be about 160,000 b/d gross (96,000 b/d net).
The Fort Hills Energy Limited Partnership has entered into an agreement, subject to the FID, with Enbridge Pipelines (Athabasca) Inc. to develop pipeline and terminalling facilities to meet the requirements of the Fort Hills mine Phase 1 and subsequent phases of the project.
The partners selected Sturgeon County, 40 kilometres northeast of Edmonton, as the location for the proposed upgrading facility to process bitumen from the Fort Hills mine. The upgrader will use delayed coking technology to convert Fort Hills' bitumen into light synthetic crude oil. Late in 2006, Petro-Canada filed the regulatory application for the Fort Hills upgrader. Conditional Energy Resources Conservation Board (ERCB) regulatory approval was received in January 2009. While the upgrader investment decision is being delayed, FEED is being fully completed and some long-lead equipment already ordered will be received and securely stored. The upgrader will remain in a holding status that permits re-engagement.
In two of the Oil Sands leases granted to the Fort Hills Energy Corporation by the Alberta government, there are several conditions, including a production milestone requiring that a mine be completed and producing 100,000 b/d gross (60,000 b/d net) of bitumen by mid-2011. Discussions are in progress with the Government of Alberta to amend the two Oil Sands leases. In the event that an amendment is not achieved and that the Fort Hills Partnership is unable to meet the existing conditions associated with the two leases, the Alberta government may impose a performance deposit or cancel the two leases if the performance deposit is not provided within the applicable time period.
Oil Sands capital expenditures of $1,063 million in 2008 included $751 million for the Fort Hills project, $41 million for the MRX, $168 million for MacKay River, $90 million at the Syncrude operations and $13 million for other Oil Sands projects.
Outlook
Production expectations in 2009 | | Capital spending plans in 20091 |
· | Petro-Canada's share of Syncrude production is expected to average 38,000 b/d net | | · | capital program of approximately $985 million is planned for Oil Sands |
| | | | |
· | MacKay River bitumen production is expected to average 27,000 b/d net, which includes two major 10- to 15-day planned maintenance turnarounds | | | · | approximately $745 million for new growth opportunities, the majority of which is to advance the Fort Hills project (forecast to be $348 million) and for facilities, drilling and infrastructure for the MRX project (forecast to be $325 million) |
Growth plans | | | | |
· | work to improve reliability at Syncrude and MacKay River | | | · | approximately $210 million to enhance existing operations, |
| | | | | comply with regulations and improve the base business |
· | progress SAGD technology through research and development | | | | profitability at Syncrude and MacKay River |
| | | | | |
| | | | · | approximately $30 million to replace reserves through ongoing pad development at MacKay River |
| | | | | |
1 | | Petro-Canada will monitor energy and financial markets through 2009 and take advantage of the flexibility in its capital program to pace projects and adjust capital expenditures, as necessary. |
34 | PETRO-CANADA Management's Discussion and Analysis |
|
Oil Sands production is expected to increase to 65,000 b/d net in 2009, compared with actual production of 59,900 b/d net in 2008. Higher expected production in 2009 is due to higher volumes anticipated at both Syncrude and MacKay River. The total Syncrude royalty payable in 2009 is expected to be approximately 12% of gross bitumen revenue, depending on crude prices. The total MacKay River royalty payable in 2009 is expected to be approximately 2% of gross bitumen revenue, depending on crude prices.
With the completion of the Fort Hills Phase 1 and MRX projects, Petro-Canada’s production from Oil Sands is expected to grow to more than 200,000 b/d net. Beyond that, the Company has the potential to grow the Oil Sands business to approximately 300,000 b/d net. Petro-Canada is focused on capturing the opportunities in its Oil Sands strategy, including taking advantage of a low-cost environment, while addressing the challenges of environmental and stakeholder issues. As an experienced and responsible operator, Petro-Canada is well positioned to meet these challenges.
Link to Petro-Canada’s Corporate and Strategic Priorities
The Oil Sands business is aligned with Petro-Canada’s strategic priorities as outlined by its progress in 2008 and goals for 2009.
PRIORITY | 2008 GOALS | 2008 RESULTS | 2009 GOALS |
| | | |
Delivering Profitable Growth with a Focus on Operated, Long-Life Assets | | | · complete Fort Hills FEED and make FID in the third quarter of 2008 · order long-lead items for Fort Hills project · continue to ramp up Syncrude Stage III expansion · receive regulatory decision on MRX project · continue to advance MRX project in preparation for the FID in the first quarter of 2009 · receive regulatory decision on the Fort Hills upgrader | | | · completed Fort Hills Phase 1 FEED · deferred making the FID for Fort Hills mine due to more than a 50% increase from initial project cost estimates and market conditions · delayed the investment decision on the Fort Hills upgrader · revisiting Fort Hills FEED and ordering of long-lead items for the Fort Hills upgrader · received regulatory approval of the Fort Hills amended mine processes and tailings locations · Syncrude production decreased due to two planned turnarounds at two cokers, and operational upsets · received regulatory approval on MRX project in the first quarter of 2008 · received fixed bids from three international engineering firms for the MRX project · deferred making the FID for MRX due to market conditions · received regulatory approval of Fort Hills upgrader in January 2009 · reached a Syncrude royalty agreement along with its partners, with the Province of Alberta | | | · complete a new estimate for the Fort Hills mine costs by taking advantage of the current market softness · take delivery of some long-lead equipment for the Fort Hills upgrader and secure the asset for future re-activation · maintain spending discipline for 2009 capital commitments · position MRX for sanction once commodity and financial markets improve · continue to ramp up Syncrude Stage III expansion toward its design capacity |
| | | | | | | | | |

| Management's Discussion and Analysis PETRO-CANADA 35 |
Link to Petro-Canada’s Corporate and Strategic Priorities (continued)
PRIORITY | 2008 GOALS | 2008 RESULTS | 2009 GOALS |
| | | |
Driving for First Quartile Operation of Our Assets | | | · ramp up MacKay River production to hit 30,000 b/d and increase reliability to greater than 90% · commence shipping MacKay River bitumen to the Edmonton refinery after it has been upgraded into synthetic crude oil at Suncor · decrease Syncrude non-fuel unit operating costs by 10%, compared with 2007 | | | · achieved 97% reliability at MacKay River · achieved daily throughput average of 30,000 b/d for 30 days at MacKay River · achieved record average production of 25,200 b/d at MacKay River · commenced shipping of MacKay River bitumen to Suncor for processing and subsequent shipping to the Edmonton refinery, effective January 1, 2009 · experienced higher Syncrude non-fuel unit operating costs due to lower production and higher maintenance costs | | | · maintain MacKay River production at 27,000 b/d and reliability above 95% · optimize the integration of MacKay River bitumen and Suncor processing through to the Edmonton refinery · work through the Syncrude joint venture owners to improve reliability and lower operating and sustaining capital costs |
Continuing to Work at Being a Responsible Company | | | · drive for continuous improvement in safety · continue relevant and transparent engagement with key stakeholders to obtain approval for the Fort Hills upgrader and mine expansion · develop capability in managing the social issues of a temporary foreign workforce · pursue research on practical solutions for tailings management | | | · TRIF decreased in 2008 to 0.67, compared with 0.75 in 2007 · experienced 20 environmental regulatory exceedances in 2008, compared with six in 2007 · received regulatory approval for the Fort Hills mine amendment without a hearing · received regulatory approval for the Fort Hills upgrader in January 2009 · implemented a risk assessment to understand and mitigate the social risks related to bringing temporary foreign workers into oil sands project camps · pursuing research and industry solutions to tailings management continues to be a priority | | | · incorporate zero-liquid discharge into MRX facility design · implement performance measures aimed at lowering environmental regulatory exceedances · better understand how to manage the language and cultural aspects of the safety of foreign contract workers on Petro-Canada’s sites |
36 PETRO-CANADA Management's Discussion and Analysis | 
|
International & Offshore
East Coast Canada
Business Summary and Strategy
Petro-Canada has a strong position in every major producing oil development off Canada’s east coast. The Company holds a 20% interest in Hibernia, a 27.5% interest in White Rose1 and a 22.7% interest in Hebron, and is the operator of Terra Nova with a 34% interest. The East Coast Canada strategy is to deliver reliable and profitable production well into the next decade, leveraging the existing infrastructure while pursuing profitable development opportunities. Key features of the strategy include: · delivering top quartile operating performance · sustaining profitable production through reservoir extensions and add-ons · pursuing high potential, near field development and exploration projects | | 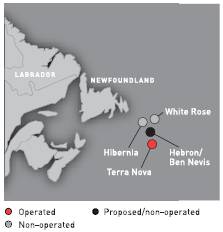
|
East Coast Canada Financial Results
(millions of Canadian dollars) | | 2008 | | 2007 | | 2006 | |
Net earnings | | $ | 1,368 | | $ | 1,229 | | $ | 934 | |
Cash flow from continuing operating activities | | $ | 1,850 | | $ | 1,491 | | $ | 1,129 | |
Expenditures on property, plant and equipment and exploration | | $ | 276 | | $ | 159 | | $ | 256 | |
Total assets | | $ | 2,149 | | $ | 2,345 | | $ | 2,465 | |
2008 Compared with 2007
East Coast Canada contributed a record $1,368 million of net earnings, up 11% from $1,229 million in 2007. Strong realized prices and reliability were partially offset by decreased production due to natural declines, increased royalties and increased DD&A expenses.
Net earnings in 2008 included $29 million of insurance proceeds related to historical mechanical failures on the Terra Nova Floating Production, Storage and Offloading (FPSO) vessel. Net earnings in 2007 included a $52 million income tax recovery and $27 million of insurance proceeds.
In 2008, realized crude oil prices remained strong, while production decreased. East Coast Canada realized crude prices averaged $99.13/bbl in 2008, up from $75.87/bbl in 2007. East Coast oil production averaged 90,500 b/d in 2008, down from 98,700 b/d in 2007. Decreased production reflected natural declines in all East Coast assets. Additionally, pack ice at the White Rose field in the second quarter of 2008 caused production deferments and drilling delays.
1 | Petro-Canada’s working interest in the White Rose Extensions is 26.125% after the Newfoundland and Labrador Energy Corporation (NALCOR) acquired its 5% working interest effective with the signing of the final project agreements in February 2009. There is no change to the White Rose 27.5% working interest for the original field development as NALCOR is not a partner. |
| Management's Discussion and Analysis PETRO-CANADA 37 |
2008 Operating Review and Strategic Initiatives
2008 Operating Review
| | 2008 | | 2007 | | 2006 | |
Production net (b/d) | | | | | | | |
Hibernia | | 27,800 | | 26,900 | | 35,700 | |
Terra Nova | | 34,900 | | 39,500 | | 12,800 | |
White Rose | | 27,800 | | 32,300 | | 24,200 | |
Total East Coast Canada production net | | 90,500 | | 98,700 | | 72,700 | |
Average realized crude price ($/bbl) | | $ | 99.13 | | $ | 75.87 | | $ | 71.12 | |
Operating and overhead costs ($/bbl) | | $ | 5.92 | | $ | 4.86 | | $ | 7.71 | |
Hibernia production averaged 139,000 b/d gross (27,800 b/d net) in 2008, up from 134,500 b/d gross (26,900 b/d net) in 2007, reflecting excellent reliability, a successful well workover campaign and the addition of two new wells. These factors offset natural reservoir declines. Hibernia had a 30-day maintenance turnaround in 2007, but no turnaround in 2008. The total royalty paid at Hibernia in 2008 equated to a rate of 5% of gross revenues.
At Terra Nova, production averaged 102,700 b/d gross (34,900 b/d net), compared with 116,200 b/d gross (39,500 b/d net) in 2007. Terra Nova production was lower in 2008 due to a planned 16-day maintenance turnaround and natural reservoir declines. In 2008, the Terra Nova FPSO operated at solid reliability of 90%, a 4% improvement over 2007. In December 2006, the Terra Nova FPSO experienced a mechanical issue in a swivel connection on the turret system that supports water injection to the reservoir. A repair was completed in December 2006 and production returned to normal rates. Performance of the water injection swivel was satisfactory throughout 2008. Contingency plans have been developed and parts have been sourced for the modification or replacement of the swivel in the event performance deteriorates. In 2008, Terra Nova achieved tier II payout, thereby increasing royalties to 42.5% of net revenues. The total royalty paid at Terra Nova in 2008 equated to a rate of 37% of net revenues.
White Rose production averaged 101,100 b/d gross (27,800 b/d net), compared with 117,500 b/d gross (32,300 b/d net) in 2007. White Rose production was impacted by pack ice in the field in the second quarter that caused production shut-ins and delayed development drilling. In 2008, White Rose achieved tier II payout, thereby increasing royalties to 30% of net revenues. The total royalty paid in 2008 equated to a rate of 27% of net revenues.
East Coast Canada operating and overhead costs averaged $5.92/bbl in 2008, up from $4.86/bbl in 2007. Unit operating costs for East Coast Canada increased as a result of lower production and higher operating expenses in the year.
2008 Strategic Initiatives
In August 2008, the Hebron partners reached an agreement with the Government of Newfoundland and Labrador on commercial terms that will allow development activities to proceed for Hebron. The partners also agreed to transfer operatorship from Chevron Canada Ltd. to ExxonMobil.
38 PETRO-CANADA Management's Discussion and Analysis | |
In September 2007, the Government of Newfoundland and Labrador approved the Canada-Newfoundland and Labrador Offshore Petroleum Board (C-NLOPB) recommendation to permit development of the South White Rose Extension. Subsequently, the White Rose partners reached an agreement in principle with the province on fiscal and other terms for the White Rose Extensions development, incorporating the South White Rose Extension, North Amethyst and West White Rose satellite fields. This activity was concluded in December 2007 when Petro-Canada and its partners signed a formal agreement with the province for the development of these oilfields. North Amethyst will be developed initially, with first oil targeted for late 2009. The development of the West White Rose satellite is expected to follow. FEED for the North Amethyst portion of the project is complete and detailed design, procurement and fabrication are underway, with necessary long-lead equipment and drilling commitments in hand. In April 2008, the project received regulatory and government approval to proceed.
Capital expenditures for exploration and development of crude oil offshore Canada’s east coast were $276 million in 2008, including $208 million related to the development of the White Rose oilfield, $45 million for Hibernia development drilling, $14 million for Terra Nova and $9 million relating to exploration drilling and preliminary Hebron activities.
Outlook
Production expectations in 2009 · East Coast production is expected to average 68,000 b/d net, reflecting 28-day planned turnarounds at both Terra Nova and White Rose, and a 21-day planned turnaround at Hibernia · East Coast’s objective is to achieve greater than 90% reliability at Terra Nova Growth plans · begin development drilling in the White Rose Extensions’ North Amethyst satellite field and achieve first oil · advance Hibernia Southern Extension development plan discussions with the Government of Newfoundland and Labrador to facilitate project planning and approvals · drill an exploration well in the Jeanne d’Arc Basin on the Ballicatters prospect | | · advance the Hebron project for regulatory approval in the 2010 time frame · advance the development concept for West White Rose Capital spending plans in 20091 · capital program of approximately $530 million is planned for East Coast · approximately $490 million is expected to be spent primarily on advancing the White Rose Extensions developments and drilling to replace reserves at Hibernia, Terra Nova and White Rose · approximately $40 million is planned for investments in new growth opportunities and exploration |
1 | Petro-Canada will monitor energy and financial markets through 2009 and take advantage of the flexibility in its capital program to pace projects and adjust capital expenditures, as necessary. |
East Coast Canada production is expected to be 68,000 b/d in 2009, compared with actual production of 90,500 b/d in 2008. The 2009 production estimate reflects natural declines and maintenance turnarounds at all three East Coast assets. The 28-day White Rose maintenance shutdown is concurrent with a 101-day shutdown of the south drill centre to tie in the White Rose Extensions’ satellites. Beyond 2009, the East Coast Canada business intends to offset natural declines in the main reservoirs and sustain profitable production by adding production from reservoir extensions and satellite tie-ins. The Hebron project remains a significant resource the Company also wants to see developed.
| Management's Discussion and Analysis PETRO-CANADA 39 |
Link to Petro-Canada's Corporate and Strategic Priorities
The East Coast Canada business is aligned with Petro-Canada's strategic priorities as outlined by its progress in 2008 and goals for 2009.
PRIORITY | | 2008 GOALS | | 2008 RESULTS | | 2009 GOALS | |
| | | | | | | |
Delivering Profitable Growth with a Focus on Operated, Long-Life Assets | | · advance White Rose Extensions development toward regulatory approval and FID in 2008, with first oil targeted for late 2009 · commence development drilling for the White Rose Extensions project · achieve binding formal agreements and re-establish the Hebron project team, with the goal of submitting the project for regulatory approval in the 2010 time frame · advance the Hibernia Southern Extension growth project | | · achieved internal and regulatory approval for North Amethyst portion of the White Rose Extensions in 2008; on track for first oil in late 2009 · drilled a pilot well in North Amethyst for the White Rose Extensions project · signed binding formal agreements for Hebron · filed a development plan amendment application for the Hibernia Southern Extension project | | · drill two development wells in the main Terra Nova field · drill exploration well in Ballicatters prospect · achieve formal agreement for Hibernia Southern Extension development · advance the target Hebron first oil date · achieve first oil at North Amethyst and finalize development concept for West White Rose | |
| | | | | | | |
| | | | | | | |
Driving for First Quartile Operation of Our Assets | | · achieve and maintain greater than 90% reliability at Terra Nova · finalize Terra Nova swivel repair plans · complete 16-day turnarounds at Terra Nova and partner-operated White Rose | | · achieved 90% reliability at Terra Nova · put in place all swivel contingency plans and materials, if repair/replacement is required · completed Terra Nova and White Rose turnarounds on time | | · maintain greater than 90% reliability at Terra Nova and close process safety gaps · complete 28-day turnarounds at Terra Nova and White Rose, and 21-day turnaround at Hibernia · identify and implement opportunities to reduce administrative and operating costs across the business | |
| | | | | | | |
| | | | | | | |
Continuing to Work at Being a Responsible Company | | · continue to reduce injuries and illnesses through implementation of Exposure Based Safety program and first aid reduction initiatives · enhance focus on process safety management · continue to implement loss containment improvement plan · continue to enhance produced water management · integrate stakeholder management process and tools and streamline with regulatory processes and requirements | | · TRIF increased to 2.5, compared with 0.5 in 2007 · achieved lower combined first aids, medical aids and restricted work cases in 2008, compared with 2007 · scored 93% on TLM process safety audit · recorded one environmental regulatory exceedance, compared with zero in 2007 · improved produced water quality · trained more than 60 employees on stakeholder information management system · successfully completed an on-water oil spill countermeasure exercise · successfully completed Terra Nova operations authorization | | · develop action plan to address injury frequency · develop gap closure plan and stewardship to address process safety and TLM self-assessment gap · implement continuous improvement initiatives relating to oil spill response · develop and implement GHG emissions reduction strategy and continue initiatives to improve flare management and produced water quality · support research and development initiatives that have personal safety, environmental and community benefits | |
| | | | | | | |
40 | Petro-CANADA Management's Discussion and Analysis | 
|
International & Offshore
International
For reporting purposes, Petro-Canada has consolidated its International activities into two core areas: the North Sea (the United Kingdom (U.K.), the Netherlands and Norway sectors) and Other International areas (Libya, Syria, and offshore Trinidad and Tobago).
Business Summary and Strategy
International is concentrating on countries and regions where material positions may be built, with a particular focus on increasing the proportion of long-life assets in the portfolio. These regions include the North Sea, Libya, Syria, and Trinidad and Tobago. Petro-Canada's International strategy capitalizes on the strengths of a mid-sized exploration and production company, which is big enough to execute large scale projects and agile enough to develop smaller projects that can still create significant value, such as the Company's concentric developments around the Triton hub in the North Sea. Key features of the International strategy are: · expanding and exploiting the existing portfolio · targeting new growth opportunities · executing a substantial and balanced exploration program | 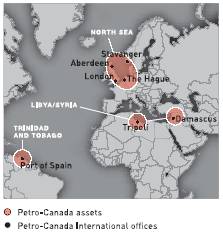
|
In 2005, Petro-Canada reached an agreement to sell the Company's mature producing assets in Syria. The sale was closed on January 31, 2006. These assets and associated results are reported as discontinued operations and excluded from continuing operations.
International Financial Results
(millions of Canadian dollars) | | 2008 | | 2007 | | 2006 | |
Net earnings (loss) from continuing operations | | $ | 1,684 | | $ | 374 | | $ | (206 | ) |
Cash flow from continuing operating activities1 | | $ | 2,380 | | $ | 220 | | $ | 840 | |
Expenditures on property, plant and equipment and exploration from continuing operations | | $ | 2,115 | | $ | 762 | | $ | 760 | |
Total assets from continuing operations | | $ | 8,277 | | $ | 5,180 | | $ | 6,031 | |
1 International cash flow from continuing operating activities in 2007 was reduced by the payment of $1,145 million after-tax to settle the hedged portion of Buzzard production.

| Management's Discussion and Analysis Petro-CANADA | 41 |
2008 Compared with 2007
International contributed a record $1,684 million of net earnings, up 350% compared with net earnings of $374 million in 2007. Higher realized prices and production were partially offset by higher exploration and DD&A expenses.
Net earnings from continuing operations in 2008 included a $227 million income tax recovery and an $88 million gain on the sale of non-core assets. Net earnings from continuing operations in 2007 included net losses on the derivative contracts associated with the hedged portion of Buzzard production of $331 million, a $30 million income tax recovery, a $9 million gain on the sale of non-core assets and $5 million in insurance proceeds from the Scott platform fire.
Late in 2007, the Company entered into derivative contracts to close out the hedged portion of its Buzzard production from January 1, 2008 to December 31, 2010. Under the terms of the contracts, the Company repurchased 30,688,000 bbls of Dated Brent crude oil at an average price of approximately $85.79 US/bbl, resulting in a reduction in cash flow of $1,145 million after-tax.
International production from continuing operations averaged 157,200 boe/d net in 2008, compared with 150,500 boe/d net in 2007. The increase was primarily due to additional North Sea production. International crude oil and NGL realized prices from continuing operations averaged $98.25/bbl and natural gas realized prices averaged $10.15/Mcf in 2008, compared with $75.90/bbl and $6.46/Mcf, respectively, in 2007. Operating and overhead costs from continuing operations averaged $7.33/boe in 2008, down 20% compared with $9.12/boe in 2007, due to lower operating expenses related to new EPSAs in Libya.
International capital expenditures from continuing operations in 2008 were $2,115 million, with $281 million directed to the North Sea region, primarily for the Buzzard enhancement project, and $1,834 million invested in Other International, primarily related to the signature bonus payment in Libya and the Ebla gas development in Syria.
2008 Operating Review and Strategic Initiatives
2008 Operating Review
| | 2008 | | 2007 | | 2006 | |
Production from continuing operations net (boe/d) | | | | | | | |
North Sea | | 97,700 | | 91,000 | | 43,700 | |
Other International | | 59,500 | | 59,500 | | 59,900 | |
Total International production net | | | 157,200 | | | 150,500 | | | 103,600 | |
Average realized crude oil and NGL price from continuing operations ($/bbl) | | $ | 98.25 | | $ | 75.90 | | $ | 72.69 | |
Average realized natural gas price from continuing operations ($/Mcf) | | $ | 10.15 | | $ | 6.46 | | $ | 7.64 | |
Operating and overhead costs from continuing operations ($/boe) | | $ | 7.33 | | $ | 9.12 | | $ | 7.61 | |
42 | Petro-CANADA Management's Discussion and Analysis |
|
North Sea
Petro-Canada's North Sea production averaged 97,700 boe/d net in 2008, compared with 91,000 boe/d net in 2007. Additional production from Buzzard and Saxon and full-year production from De Ruyter and L5b-C were partially offset by natural declines and problems with two producing wells in the Triton area. North Sea crude oil and NGL realized prices averaged $97.76/bbl and natural gas averaged $12.15/Mcf in 2008, compared with $75.12/bbl and $7.94/Mcf, respectively, in 2007.
During 2008, Petro-Canada continued to leverage its existing infrastructure through concentric development near core areas and through new discoveries.
In the U.K. sector of the North Sea, the Buzzard development, in which the Company has a 29.9% interest, achieved first oil in January 2007 and ramped up to peak production of 220,000 boe/d gross (65,700 boe/d net) in July 2007.
Sections of the Buzzard field contain higher than expected levels of hydrogen sulphide. In order to meet the crude quality requirements of the Forties pipeline system, the partners are installing additional sulphur handling equipment on the facility. This work is on schedule for installation in late 2010 or early 2011.
U.K. exploration success continued in 2008 with the non-operated Pink discovery, located in Block 20/1 North, where the non-operated Golden Eagle discovery was drilled in late 2006. Together with its joint venture partners, the Company is evaluating more exploration opportunities in the immediate area, with a view to optimizing the development plan for the discovered resources. Petro-Canada holds a 25% working interest in the Golden Eagle discovery and a 33% interest in the Pink discovery.
In the Netherlands sector of the North Sea, oil production comes from the Petro-Canada operated Hanze and De Ruyter platforms. The Company has a 45% working interest in Hanze and a 54.07% working interest in De Ruyter. At a current combined gross production rate of approximately 25,000 boe/d, these assets were the largest source of domestic oil in the Netherlands in 2008.
The major source of the Company's natural gas production in the Netherlands is from the L5b-L8b non-operated natural gas area (Petro-Canada working interest of approximately 30%), with net production of approximately 33 MMcf/d.
In the Netherlands sector of the North Sea, the Company, as operator with a 50% working interest, drilled a successful exploration well in 2008: van Ghent. The Company drilled two successful exploration wells in 2007, van Nes and van Brakel, as operator with a 50% and 60% working interest, respectively. Both van Nes and van Brakel were suspended as gas discoveries. As all three wells are in the vicinity of the De Ruyter development, the potential to tie these wells back to De Ruyter is being assessed.
In the third quarter of 2008, the Company completed a sales and purchase agreement with Bayerngas Norge AS for the sale of all the Company's interests in Denmark for net proceeds of $140 million, resulting in a $107 million ($82 million after-tax) gain on the sale of these assets. The sale of all of Petro-Canada's interests in Denmark is consistent with the International & Offshore business unit strategy to optimize the portfolio by reducing participation in countries where the Company cannot foresee developing a material position.
In 2008, the Company was awarded four additional production licences in the 2007 Awards in Predefined Areas round in Norway. Petro-Canada is operator of five of the 17 licences in Norway.
| Management's Discussion and Analysis Petro-CANADA | 43 |
Other International
Libya
Petro-Canada is one of the larger producers in Libya through its 50% interest in Harouge Oil Operations, a joint venture with the NOC. In 2008, Petro-Canada's production from continuing operations in Libya averaged 48,800 boe/d net, up 2% from 47,700 boe/d net in 2007. In early January 2009, the NOC advised the Company that production from Petro-Canada's Libya EPSAs will be limited to 85,000 b/d gross (42,500 b/d net) due to the quota agreed to by OPEC producers in December 2008.
Libyan crude oil and NGL realized prices averaged $101.97/bbl in 2008, compared with $77.26/bbl in 2007. Petro-Canada's production is currently sold on contract to the NOC. In 2008, 12 development wells were completed in the producing fields in Libya, consisting of 11 production wells and one injection well. Additionally, one appraisal well was drilled. A further five development wells were being drilled at year end.
Petro-Canada is the operator, with a 50% working interest, of Block 137 in the Sirte Basin. In 2008, the Company completed 2D and 3D seismic acquisitions and is evaluating the data in preparation for drilling an exploration well.
In June 2008, Petro-Canada signed six new EPSAs with the Libya NOC to replace its existing concession agreements. The new EPSAs were ratified as of the signing, with an effective date of January 1, 2008. Following ratification of the new agreements, a payment of $500 million US, representing 50% of the signature bonus, was made to the Libya NOC in July 2008, with the remainder to be paid between 2009 and 2013.
The new EPSAs will run for 30 years and enable the Company and the NOC to jointly design and implement the redevelopment of the existing fields in the Sirte Basin. Petro-Canada and the NOC will each pay one-half of development expenditures, which are expected to total up to $7 billion US gross over the term of the licences. It is expected that the investment will double existing production to 200,000 boe/d gross (100,000 boe/d net).
Under the new agreements, the Company is the exploration operator and has committed to fully fund an exploration program at an estimated cost of $460 million US over a five-year period. Petro-Canada has started to acquire 3D seismic over the new EPSA acreage and expects to start exploration drilling in 2009.
Following the signing of the new EPSAs, work began immediately on building the management, technical and administration staff necessary for the successful execution of the new exploration and development programs. By the end of 2008, four seismic crews had been deployed in the Sirte Basin and planning was well underway to begin exploration drilling in the second half of 2009. In the redevelopment program, priority is being given to the Amal field, where a comprehensive field development plan is expected to be completed in 2009. Work is also underway to identify opportunities to increase production in the near term through well reactivations and workovers.
Syria
In 2008, the Company completed FEED and undertook 2D and 3D seismic operations for the Ebla gas project. The Ebla gas project is expected to produce an estimated 80 MMcf/d of natural gas from the Ash Shaer and Cherrife natural gas fields, with first gas anticipated in 2010. The EPC contract for the project's production facilities was awarded and construction was 50% complete at the end of 2008. The Ebla gas project progressed on time and on budget.
The Company believes there is significant upside potential in the Ebla gas fields. A 3D seismic survey program to map the known reservoir and new structures over 900 square kilometres is underway, and is expected to be completed during the second quarter of 2009. Two drilling rigs are now working on the Ebla gas project and first gas is targeted for mid-2010.
The Company is building an exploration position in Syria by securing Block II, where two exploration wells were drilled in 2008, and by continuing negotiations on two further exploration blocks.
44 | Petro-CANADA Management's Discussion and Analysis |
|
Trinidad and Tobago
In 2008, Petro-Canada's share of Trinidad and Tobago offshore production averaged 64 MMcf/d net, down from 71 MMcf/d net in 2007. Decreased production reflected additional maintenance at the Atlantic LNG plant, rebalancing of mutual aid production among producers to the Atlantic LNG plant and several brief shutdowns of the North Coast Marine Area (NCMA-1) asset to prepare for the startup of the new Poinsettia field. Trinidad and Tobago realized prices for natural gas averaged $7.15/Mcf in 2008, compared with $4.34/Mcf in 2007.
The Company holds a 17.3% working interest in the NCMA-1 offshore natural gas development project, where first gas was achieved in late 2006. Development of the Poinsettia field, with a platform and pipeline tie-back to the Hibiscus platform, was carried out on schedule during 2008. First gas is planned for the first quarter of 2009 from one subsea well, and six platform wells will commence drilling in the third quarter of 2009.
In 2008, Petro-Canada completed its eight-well exploration program in Block 22 and Block 1a/1b, which yielded four material discoveries (two on Block 22 and two on Block 1a). The Company expects to develop a strategy to commercialize these discoveries in 2009.
Other
In July 2008, Petro-Canada converted its existing reconnaissance licence in southern Morocco to an exploration permit. The Company's partners in the exploration licence include German company RWE and the Moroccan National Office of Hydrocarbons.
Outlook
Production expectations in 2009 · North Sea oil and gas production to average 85,000 boe/d net · Other International oil and gas production to average 52,000 boe/d net Growth plans · advance the redevelopment and exploration programs in Libya · achieve scheduled milestones for the Syria Ebla gas project · develop a commercialization strategy for discoveries in Trinidad and Tobago · carry out a successful exploration program | | Capital spending plans in 20091 · capital program of approximately $1,270 million is planned for International · approximately $670 million, primarily for new growth projects in Syria and Libya · approximately $470 million for reserves replacement spending in core areas, primarily at Buzzard, Guillemot West and Saxon · approximately $130 million for exploration |
| | |
1 | Petro-Canada will monitor energy and financial markets through 2009 and take advantage of the flexibility in its capital program to pace projects and adjust capital expenditures, as necessary. |
International production from continuing operations is expected to be 137,000 boe/d net in 2009, lower than production levels of 157,200 boe/d net in 2008. Lower expected production in 2009 reflects a 28-day planned turnaround at Buzzard, announced OPEC production target cuts and natural declines in several fields.

| Management's Discussion and Analysis Petro-CANADA | 45 |
Link to Petro-Canada's Corporate and Strategic Priorities
The International business is aligned with Petro-Canada's strategic priorities as outlined by its progress in 2008 and goals for 2009.
PRIORITY | | 2008 GOALS | | 2008 RESULTS | | 2009 GOALS | |
| | | | | | | |
Delivering Profitable Growth with a Focus on Operated, Long-Life Assets | | · evaluate 2007 exploration results and deliver 2008 exploration program · develop a transition plan for the Libya Concession Development project · develop a detailed exploration program in Libya · award EPC contract for Syria Ebla gas project and finalize commercial agreements · spud first well for the Syria Ebla gas project · evaluate opportunities to commercialize Trinidad and Tobago gas discoveries, subject to exploration results | | · drilled 13 exploration wells, with nine wells completed as discoveries, four wells abandoned as dry holes and one well still drilling at year end · signed six new EPSAs with the Libya NOC, adding reserves and extending terms by an expected 30 years with improved commercial terms · commenced 3D seismic program in Libya · completed 50% of Syria Ebla gas project · commenced seismic and development drilling on the Syria Ebla gas project · participated in four gas discoveries in Trinidad and Tobago and began study of commercialization options | | · continue appraisal and development planning for the U.K. and the Netherlands exploration discoveries · drill up to three exploration wells in the U.K. and Norway depending on rig availability · continue Libya exploration 3D seismic program and start exploration drilling program · prepare and submit redevelopment plans for the Libya Amal field and pursue early production gains across the new contract areas · complete the Syria Ebla seismic program and continue development drilling and construction of the Syria Ebla gas plant with a first gas target of mid-2010 · develop appraisal and commercialization strategies for the Trinidad and Tobago discoveries | |
| | | | | | | |
| | | | | | | |
Driving for First Quartile Operation of Our Assets | | · maintain excellent production efficiency at the Petro-Canada operated De Ruyter and Hanze platforms · deliver plateau level production at Buzzard while the enhancement program is implemented | | · delivered 97% reliability at both De Ruyter and Hanze facilities · Buzzard achieved average production of 205,000 boe/d gross (61,300 boe/d net), in line with plateau production expectations | | · maintain greater than 90% reliability at Hanze and De Ruyter and drill a Hanze Pliocene development well · develop and implement Triton de-bottlenecking and reliability improvement plans · identify and implement opportunities to reduce administrative and operating costs across the business | |
| | | | | | | |
| | | | | | | |
Continuing to Work at Being a Responsible Company | | · continue to work with contractors to reduce injuries and illnesses · continue to improve TLM systems and processes in Libya · complete the EIA for the Ebla gas project in Syria · continue to develop stakeholder management processes to maintain positive outcomes with key stakeholders | | · TRIF was 0.62, a decrease of 56% compared with 1.42 in 2007 · held Zero-Harm conference for major contractors in the Netherlands and Syria · experienced one environmental regulatory exceedance, compared with zero in 2007 · established fully capable Environment Safety and Social Responsibility (ES&SR) organizations in Libya and Syria · completed the EIA for the Syria Ebla gas project · addressed local stakeholder concerns in Trinidad and Tobago (impact on fishing activities) and in Syria (feeding grounds of Northern Bald Ibis) | | · focus on contractor management to improve safety performance, with particular emphasis in Syria and Libya on land transport safety · monitor water consumption required to support Syria and Libya activities and identify opportunities to reduce water use · continue stakeholder engagement training in Syria and Libya and support implementation of processes and tools | |
| | | | | | | |
46 | Petro-CANADA Management's Discussion and Analysis | 
|
Discontinued Operations
On January 31, 2006, Petro-Canada completed the sale of the Company's producing assets in Syria to a joint venture of companies owned by India's Oil and Natural Gas Corporation Limited and the China National Petroleum Corporation for net proceeds of $640 million. The sale resulted in a gain on disposal of $134 million recorded in the first quarter of 2006. This sale aligned with Petro-Canada's strategy to increase the proportion of long-life and operated assets within its portfolio. Petro-Canada's activities in Syria remain part of the Other International producing region, with an active exploration program in Block II and the addition of the Ebla gas project in Syria during 2006.
Producing assets in Syria are presented as discontinued operations in the Consolidated Financial Statements. Petro-Canada's net earnings from discontinued operations in 2006 were $152 million and included a gain on disposal of $134 million. Summary information is presented below. Additional information concerning Petro-Canada's discontinued operations can be found in Note 5 to the Consolidated Financial Statements.
Discontinued Financial Results
(millions of Canadian dollars, unless otherwise noted) | | | 2008 | | | 2007 | | | 2006 | |
Net earnings from discontinued operations | | | $ | – | | | $ | – | | | $ | 152 | |
Cash flow from discontinued operating activities | | | $ | – | | | $ | – | | | $ | 15 | |
Expenditures on property, plant and equipment and exploration | | | $ | – | | | $ | – | | | $ | 1 | |
Total assets | | | $ | – | | | $ | – | | | $ | – | |
Total volumes (boe/d) | | | | | | | | | | |
– net before royalties | | | – | | | – | | | 5,500 | |
– net after royalties | | | – | | | – | | | 1,400 | |
Average realized crude oil and NGL price ($/bbl) | | | $ | – | | | $ | – | | | $ | 71.84 | |
Average realized natural gas price ($/Mcf) | | | $ | – | | | $ | – | | | $ | 7.94 | |

| Management's Discussion and Analysis PETRO-CANADA | 47 |
Upstream Production
2008 Compared with 2007
In 2008, Petro-Canada's production of crude oil, NGL and natural gas averaged 418,000 boe/d net, flat compared with 2007.
| | | | | | | International & Offshore | | | | |
2008 Average Daily Production Volumes Net | | North
American
Natural Gas | | Oil Sands | | | East
Coast
Canada | | International | | | Total | |
Crude oil, NGL and bitumen (b/d) | | | | | | | | | | | | | |
– net before royalties | | 13,100 | | 25,200 | | | 90,500 | | 137,200 | | | 266,000 | |
– net after royalties | | 9,900 | | 25,000 | | | 68,600 | | 119,400 | | | 222,900 | |
Synthetic crude oil (b/d) | | | | | | | | | | | | | |
– net before royalties | | – | | 34,700 | | | – | | – | | | 34,700 | |
– net after royalties | | – | | 29,700 | | | – | | – | | | 29,700 | |
Natural gas (MMcf/d) | | | | | | | | | | | | | |
– net before royalties | | 586 | | – | | | – | | 120 | | | 706 | |
– net after royalties | | 466 | | – | | | – | | 119 | | | 585 | |
Total volumes (boe/d) | | | | | | | | | | | | | |
– net before royalties | | 110,800 | | 59,900 | | | 90,500 | | 157,200 | | | 418,400 | |
– net after royalties | | 87,600 | | 54,700 | | | 68,600 | | 139,200 | | | 350,100 | |
| | | | | | | International & Offshore | | | | |
2007 Average Daily Production Volumes Net | | North
American
Natural Gas | | Oil Sands | | | East
Coast
Canada | | International | | | Total | |
Crude oil, NGL and bitumen (b/d) | | | | | | | | | | | | | |
– net before royalties | | 12,500 | | 20,300 | | | 98,700 | | 129,000 | | | 260,500 | |
– net after royalties | | 9,500 | | 20,100 | | | 84,400 | | 124,700 | | | 238,700 | |
Synthetic crude oil (b/d) | | | | | | | | | | | | | |
– net before royalties | | – | | 36,600 | | | – | | – | | | 36,600 | |
– net after royalties | | – | | 31,100 | | | – | | – | | | 31,100 | |
Natural gas (MMcf/d) | | | | | | | | | | | | | |
– net before royalties | | 599 | | – | | | – | | 129 | | | 728 | |
– net after royalties | | 471 | | – | | | – | | 123 | | | 594 | |
Total volumes (boe/d) | | | | | | | | | | | | | |
– net before royalties | | 112,300 | | 56,900 | | | 98,700 | | 150,500 | | | 418,400 | |
– net after royalties | | 88,000 | | 51,200 | | | 84,400 | | 145,200 | | | 368,800 | |
48 | PETRO-CANADA Management's Discussion and Analysis | 
|
2009 Production Outlook
In 2008, production of crude oil, NGL and natural gas averaged 418,000 boe/d net, which was at the high end of the Company's 2008 guidance. Upstream production is expected to decrease in 2009, due to large facility turnarounds in East Coast Canada and International, natural declines in East Coast Canada and Western Canada, cutbacks to 2009 planned capital expenditures that affect near-term production and OPEC quota restraints in Libya. Offsetting these decreases is the expectation of higher Oil Sands production. Production is expected to average in the range of 345,000 boe/d to 385,000 boe/d in 2009. The production guidance range was expanded to reflect market uncertainty in the current environment, the potential impact on near-term production if low commodity prices persist or worsen, and whether further reductions to capital expenditures are needed. | | 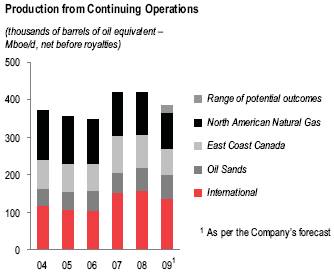
|
|
Factors that may impact production during 2009 include reservoir performance, drilling results, facility reliability, changes in OPEC production quotas and the successful execution of planned turnarounds.
Consolidated Production Net
(thousands of boe/d) | | 2008 Outlook (+/-)
As at July 24,
2008 | | 2008 Actual | | 2009 Outlook
(+/-)
As at January
29, 2009 | |
North American Natural Gas | | | | | | | |
Natural gas | | 94 | | 98 | | 81 | |
Liquids | | 12 | | 13 | | 14 | |
Oil Sands | | | | | | | |
Syncrude | | 35 | | 35 | | 38 | |
MacKay River | | 25 | | 25 | | 27 | |
International & Offshore | | | | | | | |
East Coast Canada | | 87 | | 90 | | 68 | |
International | | | | | | | |
North Sea | | 94 | | 98 | | 85 | |
Other International | | 58 | | 59 | | 52 | |
Total | | 400 – 420 | | 418 | | 345 – 385 | |
| Management's Discussion and Analysis PETRO-CANADA | 49 |
Reserves Summary
The Company's reserves data and reserves quantities are determined by Petro-Canada's staff of qualified reserves evaluators using corporate-wide policies, procedures and practices. These reserves policies, procedures and practices conform with the U.S. Securities and Exchange Commission (SEC) standards, as well as with the requirements in Canada, and the Association of Professional Engineers, Geologists and Geophysicists of Alberta's Standard of Practice for the Evaluation of Oil and Gas Reserves for Public Disclosure. Petro-Canada also employs independent third parties to evaluate, audit and/or review its reserves processes and estimates. In 2008, 49% of North American (excluding Oil Sands) and 60% of International proved reserves were assessed by independent reserves evaluators. Also in 2008, 100% of Oil Sands bitumen proved reserves were audited and 100% of Oil Sands mining proved reserves were reviewed by independent reserves evaluators. The independent reserves evaluators concluded that the Company's year-end reserves estimates were reasonable.
Petro-Canada's proved reserves table that conforms to SEC standards for Oil and Gas activities can be found on page 104.
The following table and the accompanying narrative do not conform to SEC standards and are for supplemental general information. The reporting of working interest reserves before royalties and MMboe do not conform to SEC standards.
December 31, 2008
Consolidated Reserves – for Oil and
Gas Activities | | Proved
liquids | | Proved
gas | | 2008 Proved
reserves
additions
liquids1 | | 2008 Proved
reserves
additions
gas1 | | Proved2 | | 2008 Proved
reserves
additions1 | |
(working interest before royalties) | | (MMbbls) | | (Billion cubic
feet – Bcf) | | (MMbbls) | | (Bcf) | | (MMboe) | | (MMboe) | |
North American Natural Gas | | 42 | | 1,274 | | 2 | | 9 | | 254 | | 3 | |
Oil Sands3 | | 258 | | – | | (9 | ) | – | | 258 | | (9 | ) |
International & Offshore | | | | | | | | | | | | | |
East Coast Canada | | 81 | | – | | 14 | | – | | 81 | | 14 | |
International | | 290 | | 220 | | 89 | | (16 | ) | 327 | | 87 | |
Total | | 671 | | 1,494 | | 96 | | (7 | ) | 920 | | 95 | |
Production net | | (97 | ) | (258 | ) | | | | | (140 | ) | | |
1 | Proved reserves additions are the sum of revisions of previous estimates, net purchases/sales, and discoveries, extensions and improved recovery. |
2 | At year-end 2008, 54% of proved reserves were classified as proved developed reserves. Of the total proved undeveloped reserves, 96% were associated with large projects currently producing or under active development, including Buzzard, Syncrude, MacKay River, Hibernia, Terra Nova, and Trinidad and Tobago natural gas. |
3 | Oil Sands proved reserves excluded reserves from Syncrude, which is considered a mining activity by the SEC. |
At year-end 2008, the Company had 920 MMboe of proved reserves from oil and gas activities, compared with 965 MMboe at the end of 2007.
December 31, 2008
Reserves – for Syncrude Mining Operation | | Proved
liquids | | 2008 Proved reserves
additions liquids1 | |
(working interest before royalties) | | (MMbbls) | | (MMbbls) | |
Reserves of synthetic crude oil | | 366 | | 29 | |
Production net | | (13 | ) | | |
1 | Proved reserves additions are the sum of revisions of previous estimates, net purchases/sales, and discoveries, extensions and improved recovery. |
At year-end 2008, the Company had 366 MMbbls of proved reserves from Oil Sands mining operations, compared with 350 MMbbls at year-end 2007.
50 | PETRO-CANADA Management's Discussion and Analysis |
|
The following table and the accompanying narrative do not conform to SEC standards and are for supplemental general information. Working interest reserves before royalties, MMboe and combining oil and gas and oil sands mining activities do not conform to SEC standards.
December 31, 2008
Consolidated Reserves – for Oil and
Gas and Oil Sands Mining Activities | | Proved
liquids | | Proved
gas | | 2008 Proved
reserves
additions
liquids1 | | 2008 Proved
reserves
additions
gas1 | | Proved2 | | 2008 Proved
reserves
additions1 | |
(working interest before royalties) | | (MMbbls) | | (Bcf) | | (MMbbls) | | (Bcf) | | (MMboe) | | (MMboe) | |
North American Natural Gas | | 42 | | 1,274 | | 2 | | 9 | | 254 | | 3 | |
Oil Sands3 | | 624 | | – | | 20 | | – | | 624 | | 20 | |
International & Offshore | | | | | | | | | | | | | |
East Coast Canada | | 81 | | – | | 14 | | – | | 81 | | 14 | |
International | | 290 | | 220 | | 89 | | (16 | ) | 327 | | 87 | |
Total | | 1,037 | | 1,494 | | 125 | | (7 | ) | 1,286 | | 124 | |
Production net | | (110 | ) | (258 | ) | | | | | (153 | ) | | |
1 | Proved reserves additions are the sum of revisions of previous estimates, net purchases/sales, and discoveries, extensions and improved recovery. |
2 | At year-end 2008, 54% of proved reserves were classified as proved developed reserves. Of the total proved undeveloped reserves, 96% were associated with large projects currently producing or under active development, including Buzzard, Syncrude, MacKay River, Hibernia, Terra Nova, and Trinidad and Tobago natural gas. |
3 | Oil Sands proved reserves included reserves from Syncrude and MacKay River. |
Petro-Canada's objective is to replace reserves over time through exploration, development and acquisition. The Company believes that, due to the specific nature of its upstream portfolio and attributes of its probable reserves, the combination of proved plus probable reserves provides the best perspective of Petro-Canada's reserves.
In 2008, proved reserves additions totalled 124 MMboe, excluding 2008 production of 153 MMboe net. As a result, total proved reserves decreased to 1,286 MMboe at year-end 2008, compared with 1,315 MMboe at year-end 2007. This decrease included a (37) MMboe revision associated with the lower 2008 year-end crude oil prices, compared with 2007 year-end prices. The majority of the lower year-end prices negatively impacted the North American Natural Gas and International business units and are reflected in the volume numbers listed below.
The North American Natural Gas business added 3 MMboe of proved reserves additions in 2008. Reserves additions were due to exploration and development activity, partially offset by technical revisions related to reservoir performance and the year-end price impact.
In 2008, 20 MMbbls of proved reserves were added in Oil Sands.1 At Syncrude, 29 MMbbls were added to proved reserves as a result of a planned mine extension. At MacKay River, delineation drilling resulted in a revision of (9) MMbbls of proved reserves.
In East Coast Canada, a total of 14 MMbbls were added to proved reserves during 2008, due to ongoing development well drilling and production performance at White Rose, Terra Nova and Hibernia.
International proved reserves increased by 87 MMboe in 2008, due primarily to development activity at Buzzard and the contract extensions in Libya, partially offset by the year-end price impact.
Further detail on Petro-Canada's reserves is provided in the reserves table at the end of this report (see pages 103 to 107).
1 | Oil Sands proved reserves include reserves from Syncrude and MacKay River. Syncrude is an oil sands mining operation. Oil sands mining is not an oil and gas activity as defined by the SEC. The oil sands mining proved reserves are estimated in accordance with the SEC Industry Guide 7. |
| Management's Discussion and Analysis PETRO-CANADA | 51 |
Downstream
Business Summary and Strategy
Petro-Canada has the second largest downstream business and is the "brand of choice" in Canada. In 2008, Petro-Canada accounted for approximately 13% of the total refining capacity in Canada and about 15% of total petroleum products sold in Canada. Downstream operations include two refineries - one in Edmonton and one in Montreal - with a total daily rated capacity of 40,500 cubic metres/day (m3/d) (255,000 b/d), a lubricants plant that is the largest producer of lubricant-base stocks in Canada, a network of 1,323 retail service stations, Canada's largest national commercial road transport network of 233 locations and a robust bulk fuel sales channel. The strategy in the Downstream business is to increase the profitability of the base business through effective capital investment and disciplined management of controllable factors. The Downstream business goal is to deliver superior returns and growth, including a 12% return on capital employed (ROCE) based on a mid-cycle business environment. Key features of the strategy include: · achieving and maintaining first quartile operating performance in all areas · managing and reducing costs, with a specific focus on reducing feedstock costs · growing revenue | | 
|
The trend toward increased heavy crude production globally has resulted in an increased need for refining capacity that can process this feedstock. As a result, Petro-Canada converted the conventional crude oil train at its Edmonton refinery to refine oil sands-based feedstock, and the Company is considering construction of a 25,000 b/d coker at its Montreal refinery. An investment decision on a new coker at the Montreal refinery is on hold, pending suitable project costs and return to a more stable financial market.
Downstream Financial Results
(millions of Canadian dollars) | | | 2008 | | | 2007 | | | 2006 | |
Net earnings | | | $ | – | | | $ | 629 | | | $ | 473 | |
Cash flow from continuing operating activities | | | $ | 464 | | | $ | 994 | | | $ | 835 | |
Expenditures on property, plant and equipment | | | $ | 1,834 | | | $ | 1,396 | | | $ | 1,229 | |
Total assets | | | $ | 10,057 | | | $ | 7,989 | | | $ | 6,649 | |
52 | PETRO-CANADA Management's Discussion and Analysis |
|
2008 Compared with 2007
Downstream contributed net earnings of $nil in 2008, down significantly from $629 million in 2007. Net earnings were impacted by a weaker business environment for gasoline cracking margins, a change in inventory accounting methodology and lower refinery yields predominantly at Edmonton due to planned turnaround activity to tie in and ramp up the new RCP units and unplanned operational upsets. Net earnings in 2008 included an $8 million insurance premium surcharge, partially offset by a $4 million gain on the sale of assets and a $2 million income tax recovery. Net earnings in 2007 included a $34 million income tax recovery and a $7 million gain on the sale of assets. | | 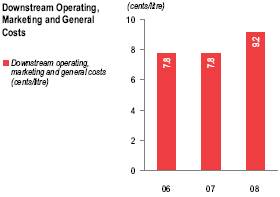 |
In 2008, Refining and Supply had a net loss of $205 million, compared with net earnings of $446 million in 2007. The net loss in 2008 reflected lower gasoline cracking margins, the negative impact from declining crude oil feedstock costs while using a FIFO inventory valuation methodology and lower refinery yields predominantly at Edmonton due to planned turnaround activity to tie in the new RCP units and unplanned upsets.
Total sales of refined products decreased by 1% compared with 2007. The decreased volumes reflected lower Marketing sales, which were impacted by a slowdown in demand and reduced low-margin Refinery and Supply sales, partially offset by higher lubricants sales volumes.
In 2008, Marketing contributed net earnings of $205 million, compared with $183 million in 2007. Improved margins were partially offset by increased operating expenses for distribution and costs related to higher fuel prices and lower volume.
Total Downstream operating, marketing, and G&A unit costs of 9.2 cents/litre in 2008 were up compared with 2007. The increase mainly reflected higher maintenance and repair activity, planned turnarounds and higher salaries and wage costs.
2008 Operating Review and Strategic Initiatives
Petro-Canada is well positioned with the supply capability to optimize profitability within a range of future business environment scenarios.
Refining and Supply
In 2008, the business processed an average of 36,000 m3/d of crude oil, down from 40,100 m3/d in 2007. The overall utilization rate at Petro-Canada's two refineries averaged 89% in 2008, down from 99% in 2007. The decrease was largely due to planned turnaround activity associated with the Edmonton RCP and subsequent ramp up activity, and in part to unplanned outages at the Edmonton refinery in the third quarter. Overall plant reliability is a critical component of success in the refining business. In 2008, the overall refinery reliability index was 84. This is down from 2007 due to unplanned outages at the Edmonton refinery in the third quarter. | | 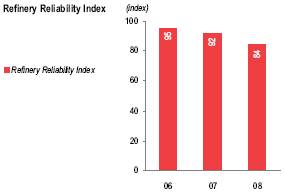 |

| Management's Discussion and Analysis PETRO-CANADA | 53 |
At the Edmonton refinery, construction was completed on the RCP to upgrade and refine oil sands-based feedstock. This project came on-stream in the fourth quarter of 2008. At its Montreal refinery, the Company furthered work to evaluate the feasibility of adding a 25,000 b/d coker to the refinery. An investment decision on a new coker at the Montreal refinery is on hold, pending suitable project costs and return to a more stable financial market.
Marketing
Total Downstream sales decreased to an average 52,400 m3/d in 2008, compared with 53,300 m3/d in 2007. Decreased volumes reflect lower Marketing sales impacted by a slowdown in demand and reduced low-margin refinery and supply sales, partially offset by higher lubricants sales volumes. In the retail business, Petro-Canada led the industry in key urban market metrics, focusing on selective representation and site development and generating high site throughputs. Within the Company's network, annual sales averaged 6.1 million litres per site. In 2008, the Company also continued to expand its independent retail network. | | 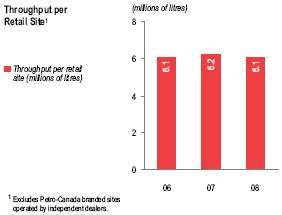 |
|
|
Petro-Canada continued to expand its non-petroleum revenue base. This included advancing previously launched product offerings and implementing new products, such as the Fuel Savings Reward Card and car wash Seasons' Passes. The business continued to expand the Neighbours fresh food offering and the industry-leading GLIDE Autowash offering. Despite a challenging business environment in 2008, year-over-year convenience store sales grew by 1% while same-store sales declined by 1%, compared with 2007.
In 2008, the wholesale PETRO-PASS network, which includes 233 truck stop facilities, continued to be the leading national marketer of fuel in the commercial road transport segment in Canada. This distribution network was upgraded during the year.
Lubricants
Overall sales of lubricants totalled 850 million litres in 2008, an increase of 9% compared with sales volumes of 778 million litres in 2007. The increase in sales volumes was primarily due to higher process fluid, white oil, base oil and commercial and industrial product sales, partially offset by lower wax and automotive product sales. Sales into high value product segments grew to 635 million litres, a 13% increase compared with 2007. High value product segments now represent 75% of total sales. Over the past five years, sales of high value products have grown by approximately 26%. | | 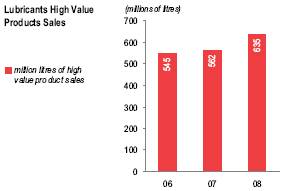 |
|
|
Lubricants is positioned for profitable future growth as tougher product performance and environmental standards increase global demand for higher quality base oils and finished products like those produced at the Mississauga, Ontario lubricants plant. In 2008, Lubricants advanced product development and commercialization of its new eco-friendly lawn care product lines, receiving U.S. National Environmental Protection Agency approval for sales into the U.S. market. Product launch plans are currently underway. Also in 2008, Lubricants obtained a business licence to begin direct sales into the China market.
Downstream capital expenditure of $1,834 million in 2008 included $1,651 million in Refining and Supply, predominantly associated with the Edmonton RCP of $1,198 million, $156 million in Sales and Marketing and $27 million in Lubricants.
54 | PETRO-CANADA Management's Discussion and Analysis | 
|
Outlook
Growth plans | | Capital spending plans in 20091 |
| | | | | |
• | | increase service station network effectiveness, with a focus on increasing non-petroleum revenue | | • | capital program of approximately $560 million is planned for the Downstream |
| | | | | |
• | | build wholesale volumes primarily through the commercial road transport and bulk fuels sales channels | | | • approximately $325 million focused on new growth projects, such as the possible Montreal coker |
| | | | | |
• | | increase sales of high quality, higher value lubricants through expansion into new markets and introduction of new products | | | • approximately $105 million to enhance existing operations, including reliability and safety improvements at Downstream facilities and site enhancement within the retail and wholesale networks |
| | | | | |
| | | | | • approximately $60 million to improve profitability in the base business, including continued development of the retail and wholesale network and a number of refinery improvement programs |
| | | | | |
| | | | | • approximately $70 million for regulatory compliance projects and safety upgrade programs |
1 | Petro-Canada will monitor energy and financial markets through 2009 and take advantage of the flexibility in its capital program to pace projects and adjust capital expenditures, as necessary. |
Downstream investment is focused on growth and improving base business profitability. The Edmonton RCP project is expected to add earnings and cash flow with the first full year in 2009.
Based on the current mid-cycle business environment, the Downstream business delivered a mid-cycle ROCE of just under 10% in 2008. Over time, it is anticipated that improvement in the base business and growth projects, including the Edmonton RCP, will help drive the mid-cycle ROCE to 12%.
| Management's Discussion and Analysis PETRO-CANADA | 55 |
Link to Petro-Canada's Corporate and Strategic Priorities
The Downstream business is aligned with Petro-Canada's strategic priorities as outlined by its progress in 2008 and goals for 2009.
PRIORITY | | | 2008 GOALS | | | 2008 RESULTS | | | 2009 GOALS |
Delivering Profitable Growth with a Focus on Operated, Long-Life Assets | | | • advance Montreal coker, with FID expected in the second quarter of 2008 • complete Edmonton RCP for startup in the fourth quarter of 2008 • continue to invest in smaller scale refinery yield and reliability improvement projects • selectively invest in retail and wholesale assets | | | • completed FEED for proposed 25,000 b/d Montreal coker; FID for project was delayed due to market conditions • completed construction of the Edmonton RCP and started up in the fourth quarter • invested $41 million in smaller scale refinery yield and reliability improvement projects • made selective investments in retail and wholesale assets | | | • review costs for Montreal coker project and position it for sanction when commodity and financial markets improve • realize value of the Edmonton RCP investment • prudently manage refinery capital expenditure spending consistent with economic conditions • selectively invest in retail and wholesale assets |
Driving for First Quartile Operation of Our Assets | | | • continue to focus on safety and refinery reliability, with increased focus on process safety • reduce feedstock costs • increase retail non-petroleum revenue • grow high value lubricants sales volumes | | | • achieved a combined reliability index of 84 at the Company's two refineries • began processing lower cost oil sands-based feedstock at completed Edmonton RCP • grew convenience store sales by 1%, while same-store sales declined by 1% compared with 2007 • increased high value lubricants sales volumes by 13% | | | • continue to focus on personal and process safety, refinery reliability and environmental responsibility • reduce feedstock costs • increase retail non-petroleum revenue • grow high value lubricants sales volumes |
Continuing to Work at Being a Responsible Company | | | • maintain focus on TRIF and regulatory compliance exceedances • assess highest risk retail sites for safety and security enhancements • assess water use at retail and wholesale facilities and review current management activities in high risk areas | | | • TRIF decreased to 0.60, compared with 0.64 in 2007 • recorded 13 environmental regulatory exceedances, compared with 12 in 2007 • completed safety and security assessments at retail sites and implemented upgrades based on priority profile • assessed water quality risks and identified highest risk retail and wholesale facilities and developed water quality management plans based on corporate water principles | | | • execute drinking water management plans for high risk wholesale and retail facilities and develop criteria to audit success • employ Life-Cycle Value Assessment (LCVA) to help inform decisions regarding waste management and minimization at refineries • maintain focus on energy efficiency and GHG mitigation opportunities and establish a baseline for new Edmonton refinery configuration • maintain focus on TRIF and integrate new measures related to process safety activities |
56 | PETRO-CANADA Management's Discussion and Analysis |
|
Shared Services and Eliminations
Shared Services and Eliminations includes investment income, interest expense, foreign currency translation and general corporate revenue and expenses.
Shared Services and Eliminations Financial Results
(millions of Canadian dollars) | | 2008 | | 2007 | | 2006 | |
Net loss | | $ (596 | ) | $ (6) | | $ (263) | |
Cash flow from (used in) continuing operating activities | | $ 151 | | $ (603) | | $ (346) | |
2008 Compared with 2007
Shared Services and Eliminations recorded a net loss of $596 million in 2008, compared with a loss of $6 million in 2007.
The 2008 net loss included a $606 million foreign currency translation gain on long-term debt, a $126 million recovery related to the mark-to-market valuation of stock-based compensation and an $18 million income tax recovery. The 2007 net loss included a $208 million foreign currency translation gain on long-term debt, a $54 million charge related to the mark-to-market valuation of stock-based compensation and a $5 million income tax recovery.
Fourth Quarter 2008
For a discussion and analysis of the Company's fourth quarter 2008 performance and results, see Petro-Canada's MD&A for that period, which is incorporated herein, by reference.
| Management's Discussion and Analysis PETRO-CANADA | 57 |
Financial Reporting
Critical Accounting Estimates
The preparation of the Company's financial statements requires management to adopt accounting policies that involve the use of significant estimates and assumptions. These estimates and assumptions are developed based on the best available information and are believed by management to be reasonable under the existing circumstances. New events or additional information may result in the revision of these estimates over time. The Audit, Finance and Risk Committee of the Board of Directors regularly reviews the Company's critical accounting policies and any significant changes thereto. A summary of the significant accounting policies used by Petro-Canada can be found in Note 1 to the 2008 Consolidated Financial Statements. The following discussion outlines what management believes to be the most critical accounting policies involving the use of significant estimates or assumptions.
Property, Plant and Equipment/Depreciation, Depletion and Amortization
Investments in exploration and development activities, including in situ oil sands activities, are accounted for under the successful efforts method. Under this method, the acquisition costs of unproved acreage; the costs of exploratory wells pending determination of proved reserves; and the costs of wells, which are assigned proved reserves and development costs, including costs of all wells, are capitalized. The cost of unsuccessful wells and all other exploration costs, including geological and geophysical costs, are charged to earnings as incurred. Acquisition, exploration and development of oil sands mining activities are capitalized when costs are recoverable and directly result in an identifiable future benefit. Capitalized costs of oil and gas producing properties, including in situ oil sands properties and oil sands mining properties, are depreciated and depleted using the unit of production method based upon estimated reserves (see Estimated Oil and Gas Reserves discussion on page 59). Reserves estimates can have a significant impact on net earnings, because they are a key component in the calculation of depreciation and depletion related to the capitalized costs of property, plant and equipment. A revision in reserves estimates could result in a higher or lower depreciation and depletion charge to net earnings. A downward revision in reserves could result in a writedown of oil and gas producing properties as part of the impairment assessment (see Asset Impairment discussion below).
Asset Retirement Obligations
The Company currently records the obligation for estimated asset retirement costs at fair value when incurred. Factors that can affect the fair values of the obligations include the expected costs to be incurred, the useful lives of the assets and discount rates applied. Cost estimates are influenced by factors such as the number and type of assets subject to asset retirement obligations, the extent of work required and changes in environmental legislation. A revision to the estimated costs to be incurred, useful lives of the assets or discount rates applied could result in an increase or decrease in the total obligation, which would change the amount of amortization and accretion expense recognized in net earnings over time.
Asset Impairment
Producing properties and significant unproved properties are assessed annually, or as economic events dictate, for potential impairment. Impairment is assessed by comparing the estimated net undiscounted future cash flows with the carrying value of the asset. The cash flows used in the impairment assessment require management to make assumptions and estimates about recoverable reserves (see Estimated Oil and Gas Reserves discussion on page 59), future commodity prices and operating costs. Changes in any of the assumptions, such as a downward revision in reserves, a decrease in future commodity prices or an increase in operating costs, could result in an impairment of an asset's carrying value.
Purchase Price Allocation
Business acquisitions are accounted for by the purchase method of accounting. Under this method, the purchase price is allocated to the assets acquired and the liabilities assumed based on the fair value at the time of the acquisition. The excess purchase price over the fair value of identifiable assets and liabilities acquired is goodwill. The determination of fair value often requires management to make assumptions and estimates about future events. The assumptions and estimates with respect to
58 | PETRO-CANADA Management's Discussion and Analysis | 
|
determining the fair value of property, plant and equipment acquired generally require the most judgment and include estimates of reserves acquired (see Estimated Oil and Gas Reserves discussion below), future commodity prices and discount rates. Changes in any of the assumptions or estimates used in determining the fair value of acquired assets and liabilities could impact the amounts assigned to assets, liabilities and goodwill in the purchase price allocation. Future net earnings can be affected as a result of changes in future depreciation and depletion, asset impairment or goodwill impairment.
Goodwill Impairment
Goodwill is subject to impairment tests annually, or as economic events dictate, by comparing the fair value of the reporting unit to its carrying value, including goodwill. If the fair value of the reporting unit is less than its carrying value, a goodwill impairment loss is recognized as the excess of the carrying value of the goodwill over the fair value of the goodwill. The determination of fair value requires management to make assumptions and estimates about recoverable reserves (see Estimated Oil and Gas Reserves discussion below), future commodity prices, operating costs, production profiles and discount rates. Changes in any of these assumptions, such as a downward revision in reserves, a decrease in future commodity prices, an increase in operating costs or an increase in discount rates, could result in an impairment of all or a portion of the goodwill carrying value in future periods.
Estimated Oil and Gas Reserves
Reserves estimates, although not reported as part of the Company's Consolidated Financial Statements, can have a significant effect on net earnings as a result of their impact on depreciation and depletion rates, asset impairments and goodwill impairments (see discussion of these items above and on page 58). The Company's staff of qualified reserves evaluators performs internal evaluations on all of its oil and gas reserves on an annual basis using corporate-wide policies, procedures and practices. Independent qualified petroleum reservoir engineering consultants also conduct annual evaluations, technical audits and/or reviews of a significant portion of the Company's reserves and audit the Company's reserves policies, procedures and practices. In addition, the Company's contract internal auditors test the non-engineering management control processes used in establishing reserves. However, the estimation of reserves is an inherently complex process, requiring significant judgment. Estimates of economically recoverable oil and gas reserves are based upon a number of variables and assumptions, such as geoscientific interpretation, economic conditions, commodity prices, operating and capital costs, and production forecasts, all of which may vary considerably from actual results. These estimates are expected to be revised upward or downward over time as additional information such as reservoir performance become available or as economic conditions change.
Employee Future Benefits
The Company maintains defined benefit pension plans and provides certain post-retirement benefits to qualifying retirees. The cost of pension and other post-retirement benefits are actuarially determined by an independent actuary using the projected benefit method, pro-rated based on service. The determination of these costs requires management to estimate or make assumptions regarding the expected plan investment performance, salary escalation, retirement ages of employees, expected health care costs, employee turnover and discount rates. Changes in these estimates or assumptions could result in an increase or decrease to the accrued benefit obligation and the related costs for both pensions and other post-retirement benefits.
Income Taxes
The Company follows the liability method of accounting for income taxes, whereby future income taxes are recognized based on the differences between the carrying amounts of assets and liabilities reported in the financial statements and their respective tax bases. The determination of the income tax provision is an inherently complex process, requiring management to interpret continually changing regulations and to make certain judgments. While income tax filings are subject to audits and reassessments, management believes adequate provision has been made for all income tax obligations. However, changes in the interpretations or judgments may result in an increase or decrease in the Company's income tax provision in the future.

| Management's Discussion and Analysis PETRO-CANADA | 59 |
Contingencies
The Company is involved in litigation and claims in the normal course of operations. Management is of the opinion that any resulting settlements would not materially affect the financial position of the Company as at December 31, 2008. However, the determination of contingent liabilities relating to litigation and claims is a complex process that involves judgments as to the outcomes and interpretation of laws and regulations. Changes in the judgments or interpretations may result in an increase or decrease in the Company's contingent liabilities in the future.
International Financial Reporting Standards (IFRS)
During 2008, the Canadian Accounting Standards Board (AcSB) confirmed that publicly accountable enterprises will be required to adopt International Financial Reporting Standards (IFRS) in place of Canadian GAAP for interim and annual reporting purposes. The required changeover date is for fiscal years beginning on or after January 1, 2011.
The Company has commenced the process to transition from current Canadian GAAP to IFRS. It has established a project plan and a project team. The project team is led by finance management and includes representatives from various areas of the organization, as necessary, to plan for and achieve a smooth transition to IFRS.
The project plan consists of three phases: initiation, detailed assessment and design and implementation. The Company has completed the first phase, which involved the development of a detailed timeline for assessing resources and training and the completion of a high level review of the major differences between current Canadian GAAP and IFRS. Education and training sessions for employees throughout the organization and discussions with the Company's external auditors have commenced and will continue throughout the subsequent phases. Regular reporting is provided to the Company's senior executive management and to the Audit, Finance and Risk Committee of the Board of Directors.
The Company is currently engaged in the detailed assessment and design phase of the project. The detailed assessment and design phase involves establishing work teams to complete a comprehensive analysis of the impact of the IFRS differences identified in the initial scoping assessment. In addition, an initial evaluation of IFRS 1 transition exemptions and an analysis of financial systems will be performed.
During the implementation phase, the Company will execute the required changes to business processes, financial systems, accounting policies, disclosure controls and internal controls over financial reporting.
At this time, the impact on financial statements is not reasonably determinable.
Share Data
The authorized share capital of Petro-Canada consists of an unlimited number of common shares and an unlimited number of preferred shares issuable in series designated as either senior preferred shares or junior preferred shares. As at February 27, 2009, there were 484,852,311 common shares outstanding and no preferred shares outstanding. For details of the Company's share capital and stock options outstanding at December 31, 2008, refer to Notes 23 and 24 of the 2008 Consolidated Financial Statements.
Additional Information
Copies of this MD&A and the following Consolidated Financial Statements, as well as the Company's latest AIF and Management Proxy Circular, may be obtained from the Company's website at www.petro-canada.ca or by mail upon request from the Corporate Secretary, 150 – 6 Avenue S.W., Calgary, Alberta, T2P 3E3. Other disclosure documents, and any reports, statements or other information filed by Petro-Canada with the Canadian provincial securities commissions or other similar regulatory authorities, are accessible through the Internet on the Canadian System for Electronic Document Analysis and Retrieval, which is commonly known by the acronym SEDAR, and located at www.sedar.com. SEDAR is the Canadian equivalent of the U.S. SEC's Electronic Data Gathering, Analysis, and Retrieval System, which is commonly known by the acronym EDGAR, and located at www.sec.gov.
60 | PETRO-CANADA Management's Discussion and Analysis |
|