UNITED STATES
SECURITIES AND EXCHANGE COMMISSION
Washington, D.C. 20549
FORM N-CSR
CERTIFIED SHAREHOLDER REPORT OF REGISTERED MANAGEMENT
INVESTMENT COMPANIES
| | |
| Investment Company Act file number: | | 811-04710 |
| |
| Exact name of registrant as specified in charter: | | The Asia Pacific Fund, Inc. |
| |
| Address of principal executive offices: | | Gateway Center 3, |
| | 100 Mulberry Street, |
| | Newark, New Jersey 07102 |
| |
| Name and address of agent for service: | | Deborah A. Docs |
| | Gateway Center 3, |
| | 100 Mulberry Street, |
| | Newark, New Jersey 07102 |
| |
| Registrant’s telephone number, including area code: | | 973-367-7521 |
| |
| Date of fiscal year end: | | 3/31/2008 |
| |
| Date of reporting period: | | 9/30/2007 |
| | | | | | | | |
| Item 1 | | – | | | | Reports to Stockholders |
Directors
Michael J. Downey, Chairman
Jessica M. Bibliowicz
David J. Brennan
Robert H. Burns
Olarn Chaipravat
Robert F. Gunia
Douglas Tong Hsu
Duncan M. McFarland
David G. P. Scholfield
Nicholas T. Sibley
Officers
Brian A. Corris, President
Robert F. Gunia, Vice President and Treasurer
M. Sadiq Peshimam, Assistant Treasurer
Deborah A. Docs, Secretary and Chief Legal Officer
Andrew R. French, Assistant Secretary
Valerie M. Simpson, Chief Compliance Officer
Investment Manager
Baring Asset Management (Asia) Limited
1901 Edinburgh Tower
15 Queen’s Road Central
Hong Kong
Administrator
Prudential Investments LLC
Gateway Center Three
100 Mulberry Street
Newark, NJ 07102-4077
Custodian
The Bank of New York
One Wall Street
New York, NY 10286
Transfer Agent
Computershare Trust Company N.A.
P.O. Box 43011
Providence, RI 02940-3011
Independent Auditors
Ernst & Young LLP
5 Times Square
New York, NY 10036
Legal Counsel
Sullivan & Cromwell LLP
125 Broad Street
New York, New York 10004
Notice is hereby given in accordance with Section 23(c) of the Investment Company Act of 1940 that the Fund may purchase, from time to time, shares of its common stock at market prices.
The accompanying financial statements as of September 30, 2007 were not audited and, accordingly, no opinion is expressed on them.
This report, including the financial statements herein, is transmitted to the shareholders of The Asia Pacific Fund, Inc. for their information. This is not a prospectus, circular or representation intended for use in the purchase of shares of the Fund or any securities mentioned in this report.
The Asia Pacific Fund, Inc.
Gateway Center Three
100 Mulberry Street
Newark, NJ 07102-4077
For general information on the Fund, please call (toll-free) the Altman Group, our shareholders’ servicing agent toll-free at:
1-(888) 4-ASIA-PAC
Current information about the Fund is available on its website (http://www.asiapacificfund.com). This website includes monthly updates of the Fund’s performance and other data as well as the Manager’s quarterly presentation of performance and asset allocations and comments on the current Asian outlook.
The Fund’s CUSIP number is 044901106
APBS

The Asia Pacific Fund, Inc.
Semi-Annual Report
September 30, 2007
www.asiapacificfund.com
The Asia Pacific Fund, Inc.
As of September 30, 2007 (Unaudited)
OUR TOLL-FREE LINE:
1-888-4-ASIA-PAC
For further information on the Fund, please call. In addition, the Fund makes available monthly portfolio information. If you would like to receive this information please call the toll-free number indicated above.
Statistics
| | | |
Total Net Assets | | $ | 370,979,923 |
Shares Outstanding | | | 10,344,073 |
Net Asset Value | | | $35.86 |
Equity | | | 97.3%(a) |
Total Returns (US Dollar terms)
| | | | |
| Period | | Market
Price(b) | | NAV(c) |
3 months ended 9/30/07 | | 28.2% | | 24.7% |
6 months ended 9/30/07 | | 52.9% | | 49.2% |
9 months ended 9/30/07 | | 42.3% | | 52.9% |
1 Year ended 9/30/07 | | 84.3% | | 84.5% |
3 Years ended 9/30/07 | | 186.1% | | 191.1% |
5 Years ended 9/30/07 | | 367.7% | | 338.9% |
10 Years ended 9/30/07 | | 282.4% | | 253.1% |
Since inception(d) | | 904.3% | | 984.2% |
Since inception(d) (annualized) | | 11.9% | | 12.4% |
Other Information
| | |
Ticker Symbol | | APB |
Primary Exchange | | NYSE |
Dividend Repurchase Program | | Yes |
Footnote section
| (a) | Expressed as a percentage of total investments. |
| (b) | Total investment return is calculated assuming a purchase of common stock at the current market value on the first day and a sale at the current market value on the last day of each period reported. Dividends and distributions are assumed, for purposes of this calculation, to be reinvested at prices obtained under the Fund’s dividend reinvestment plan. These calculations do not include brokerage commissions. |
| (c) | This information represents the historical net asset value per share performance of The Asia Pacific Fund, Inc. Net asset value per share performance has been computed by the Investment Manager and is calculated assuming reinvestment of dividends and distributions. Because net asset value per share performance does not reflect market price, it is not the same as total investment return. |
| (d) | Investment operations commenced on May 4, 1987. |
Portfolio Characteristics
(As of September 30, 2007)
Top Ten Equity Holdings
(% of Total Net Assets)
| | |
Guangzhou R&F Properties Co., Ltd. (Class “H” Shares) | | 4.1% |
Samsung Electronics Co., Ltd. | | 3.8% |
iShares Asia Trust-iShares A50 China Tracker | | 3.2% |
China Shenhua Energy Co., Ltd. (Class “H” Shares) | | 2.7% |
Hon Hai Precision Industry Co., Ltd. | | 2.7% |
Posco | | 2.6% |
Yangzijiang Shipbuilding Holdings, Ltd. | | 2.4% |
China Mobile, Ltd. | | 2.3% |
Ports Design, Ltd. | | 2.1% |
Innolux Display Corp. | | 2.0% |
Equity Country Weightings
(% of Total Net Assets)
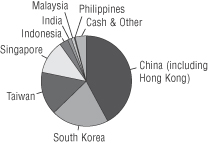
| | | | | | |
China (including Hong Kong) | | 42.3% | | India | | 1.3% |
South Korea | | 20.5% | | Malaysia | | 1.1% |
Taiwan | | 15.5% | | Philippines | | 0.3% |
Singapore | | 11.9% | | Cash & Other | | 3.9% |
Indonesia | | 3.2% | | | | |
Sector Breakdown: Top Ten Industries
(% of Total Net Assets)
| | |
Industrials | | 16.7% |
Information Technology | | 16.5% |
Materials | | 13.5% |
Real Estate-Developers | | 8.3% |
Banking | | 8.2% |
Energy | | 8.1% |
Consumer Discretionary | | 8.1% |
Diversified Financials | | 6.2% |
Mutual Funds | | 5.8% |
Consumer Staples | | 3.7% |
1
REPORT OF THE INVESTMENT MANAGER
For the period from March 31 to September 30, 2007 (Unaudited)
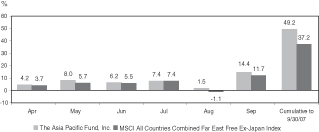
PERFORMANCE
During the six month period ended September 30, 2007, the Fund’s net asset value (NAV) per share increased by US$11.83, from US$24.03 to US$35.86. In percentage terms, the Fund’s total return performance was 49.2%. This compares with the return of its referenced benchmark index, the MSCI All Country Far East Ex-Japan Gross Index (“Index”), of 37.2%. The Fund’s share price rose by US$11.23, from US$21.22 to US$32.45. In percentage terms, the share price advanced by +52.9%.
The chart below illustrates the Fund’s NAV performance per share during the period:
Source: Baring Asset Management
Local Currencies vs the US Dollar
| | | | | | | | |
Currency
US$/local rate
| | March 31,
2007
| | June 30,
2007
| | Sept. 30,
2007
| | March 31 -
Sept. 30,
2007
Change %*
|
North Asia | | | | | | | | |
Chinese Renminbi | | 7.73 | | 7.61 | | 7.51 | | 3.0 |
Hong Kong Dollar | | 7.81 | | 7.82 | | 7.77 | | 0.6 |
South Korean Won | | 941 | | 924 | | 915 | | 2.8 |
New Taiwan Dollar | | 33.09 | | 32.87 | | 32.64 | | 1.4 |
ASEAN | | | | | | | | |
Malaysian Ringgit | | 3.46 | | 3.45 | | 3.41 | | 1.5 |
Philippine Peso | | 48.25 | | 46.25 | | 45.05 | | 7.1 |
Singaporean Dollar | | 1.52 | | 1.53 | | 1.48 | | 2.3 |
Thai Baht | | 35.01 | | 34.53 | | 34.28 | | 2.1 |
Indonesian Rupiah | | 9,125 | | 9,035 | | 9,145 | | -0.2 |
South Asia | | | | | | | | |
Indian Rupee | | 43.47 | | 40.73 | | 39.85 | | 9.1 |
* - denotes a depreciation of the local currency vs the USD
Source: Factset (Baring Asset Management)
STOCK MARKET PERFORMANCE
March 31 to September 30, 2007
| | | | | | |
Country - Index
| | March 31 to
June 30, 2007
Market
Change %
US $
| | June 30 to
Sept. 30, 2007
Market
Change %
US $
| | March 31 to
Sept. 30, 2007
Market
Change %
US $
|
North Asia | | | | | | |
MSCI Korea | | 18.3 | | 14.0 | | 34.8 |
MSCI China | | 24.5 | | 41.9 | | 76.6 |
MSCI Hong Kong | | 5.8 | | 23.9 | | 31.1 |
MSCI Taiwan | | 14.2 | | 6.9 | | 22.1 |
ASEAN | | | | | | |
MSCI Malaysia Free | | 8.8 | | 1.0 | | 9.9 |
MSCI Singapore Free | | 10.5 | | 9.0 | | 20.4 |
MSCI Thailand Free | | 18.1 | | 13.5 | | 34.1 |
MSCI Indonesia Free | | 16.0 | | 15.5 | | 34.0 |
MSCI Philippines Free | | 21.0 | | -0.2 | | 20.7 |
South Asia | | | | | | |
MSCI India | | 20.8 | | 20.2 | | 45.3 |
MSCI All Country Far East Free Ex Japan | | 15.6 | | 18.7 | | 37.2 |
Source: Factset (Baring Asset Management)
COUNTRY ALLOCATION
| | | | | | | | | |
Country
| | March 31,
2007
| | | June 30,
2007
| | | Sept. 30,
2007
| |
North Asia | | 72.9 | % | | 79.2 | % | | 78.3 | % |
China (including Hong Kong) | | 39.3 | | | 41.8 | | | 42.3 | |
South Korea | | 18.4 | | | 21.0 | | | 20.5 | |
Taiwan | | 15.2 | | | 16.4 | | | 15.5 | |
ASEAN | | 22.0 | | | 19.0 | | | 16.5 | |
Indonesia | | 3.2 | | | 2.3 | | | 3.2 | |
Philippines | | 0.8 | | | 0.8 | | | 0.3 | |
Malaysia | | 6.5 | | | 5.6 | | | 1.1 | |
Singapore | | 11.5 | | | 10.3 | | | 11.9 | |
Thailand | | — | | | — | | | — | |
South Asia | | | | | | | | | |
India | | 1.9 | | | 1.3 | | | 1.3 | |
Cash & Other | | 3.2 | | | 0.5 | | | 3.9 | |
2
PORTFOLIO & MARKET REVIEW
During the six month period the bullish trend in Asian equity markets resumed with the MSCI Index recording a rise of 37.2% in USD terms. The top three performing markets were China (+76.6%), India (+45.3%) and Korea (+34.8%). The bottom three were Malaysia (+9.9%), Singapore (+20.4%) and The Philippines (+20.7%).
Following a flat first calendar quarter of 2007, the Asian bull market resumed with vigor. This trend was only interrupted in August, when the US sub-prime debt crisis spread to Europe, impacting markets globally. In the first two weeks of August, the Asian markets fell, from peak to trough, by 18.2%, as measured by the Index. But with Asian economic and investment fundamentals perceived as more solid than their US and European counterparts, once investor sentiment stabilized, the Asian markets staged a sharp “V-shaped” recovery. The outstanding performer over the period was the Chinese market, which climbed to an all-time high.
So far as the trend of Asian currencies versus the USD is concerned, with the exception of the Indonesian Rupiah, all gained value against the weak USD.
The overall strategy of the Fund, during the period under review, was to add to those sectors expected to benefit from the strong China growth trend, including Energy and Materials. Exposure to Technology was also raised, as some attractive valuations appeared in Taiwan. These moves were funded by the reduction in exposure to Consumer, Financials and Telecoms. Highlights of asset allocation adjustments included additions to Korea and Taiwan, funded from Malaysia and Hong Kong. In terms of overall strategy, the Investment Manager maintained a significant exposure to China, where economic and corporate earnings growth continued to surprise on the upside and where liquidity remained very favorable.
Over the six month period, the Fund’s NAV rose by 49.2% in USD terms. The Fund’s favorable performance against its referenced benchmark was attributable to both stock selection and asset allocation. Favorable asset allocation contributors included an over-weighting to China. The Fund’s overweight exposure to cyclical growth sectors (Industrials and Materials) also contributed. At the stock selection level, value added derived mostly from Hong Kong, China and Taiwan. Major contributors at the individual stock level included Zijin Mining Group (China), Guangzhou R&F Properties (China), iShares FT/Xinhua A50 China (China) and China Oilfield Services (China).
Baring Asset Management (Asia) Ltd.
October 16th, 2007
3
THE ASIA PACIFIC FUND, INC.
Portfolio of Investments
September 30, 2007
(Unaudited)
| | | | | |
| Shares | | Description | | Value
(Note 1) |
| | | LONG-TERM INVESTMENTS—96.1% |
| | | EQUITIES |
| | | CHINA (INCLUDING
HONG KONG)—42.3% |
| 1,350,000 | | Air China, Ltd.
(Class “H” Shares) | | $ | 1,927,616 |
| | | (Industrials) | | | |
| 1,230,000 | | Aluminum Corp. of China, Ltd. (Class “H” Shares) | | | 3,536,279 |
| | | (Materials) | | | |
| 746,000 | | Angang Steel Co., Ltd.
(Class “H” Shares) | | | 2,888,479 |
| | | (Materials) | | | |
| 592,000 | | Anhui Conch Cement Co., Ltd. (Class “H” Shares) | | | 5,125,080 |
| | | (Materials) | | | |
| 42,000 | | Anta Sports Products, Ltd.(a) | | | 45,707 |
| | | (Consumer Discretionary) | | | |
| 75,000 | | China Aoyuan Property Group, Ltd.(a) | | | 50,168 |
| | | (Real Estate-Developers) | | | |
| 742,191 | | China Communications Construction Co., Ltd.
(Class “H” Shares)(a) | | | 1,764,337 |
| | | (Industrials) | | | |
| 6,125,000 | | China Construction Bank
(Class “H” Shares) | | | 5,586,196 |
| | | (Banking) | | | |
| 1,619,500 | | China Merchants Bank Co., Ltd. (Class “H” Shares) | | | 7,114,355 |
| | | (Banking) | | | |
| 518,500 | | China Mobile, Ltd. | | | 8,490,651 |
| | | (Telecommunications) | | | |
| 98,000 | | China Molybdenum Co., Ltd. (Class “H” Shares)(a) | | | 215,821 |
| | | (Materials) | | | |
| 3,080,000 | | China Oilfield Services, Ltd. (Class “H” Shares) | | | 7,091,981 |
| | | (Energy) | | | |
| 2,348,000 | | China Overseas Land & Investment, Ltd. | | | 5,358,158 |
| | | (Real Estate-Developers) | | | |
| | | | | |
| Shares | | Description | | Value
(Note 1) |
| 630,000 | | China Resources Power Holdings Co., Ltd. | | $ | 1,957,138 |
| | | (Utilities) | | | |
| 1,690,500 | | China Shenhua Energy Co., Ltd. (Class “H” Shares) | | | 10,155,373 |
| | | (Energy) | | | |
| 451,500 | | Esprit Holdings, Ltd. | | | 7,172,797 |
| | | (Consumer Discretionary) | | | |
| 3,264,000 | | Guangshen Railway Co., Ltd. (Class “H” Shares) | | | 2,808,925 |
| | | (Industrials) | | | |
| 3,256,800 | | Guangzhou R&F Properties Co., Ltd. (Class “H” Shares) | | | 15,375,209 |
| | | (Real Estate-Developers) | | | |
| 1,828,000 | | Hengan International Group Co., Ltd. | | | 6,866,302 |
| | | (Consumer Staples) | | | |
| 227,000 | | Hong Kong Exchanges and Clearing, Ltd. | | | 6,938,029 |
| | | (Diversified Financials) | | | |
| 363,100 | | iShares Asia Trust-iShares A50 China Tracker | | | 11,723,676 |
| | | (Mutual Fund) | | | |
| 1,118,000 | | Li & Fung, Ltd. | | | 4,745,911 |
| | | (Consumer Discretionary) | | | |
| 1,760,000 | | Lifestyle International Holdings, Ltd. | | | 4,958,161 |
| | | (Consumer Discretionary) | | | |
| 2,026,000 | | Nine Dragons Paper Holdings, Ltd. | | | 6,333,001 |
| | | (Materials) | | | |
| 1,846,000 | | Peace Mark Holdings, Ltd. | | | 2,749,819 |
| | | (Consumer Discretionary) | | | |
| 1,746,000 | | PetroChina Co., Ltd.
(Class “H” Shares) | | | 3,310,591 |
| | | (Energy) | | | |
| 343,500 | | Ping An Insurance Group Co. of China, Ltd. (Class “H” Shares) | | | 4,754,478 |
| | | (Diversified Financials) | | | |
See Notes to Financial Statements.
4
| | | | | |
| Shares | | Description | | Value
(Note 1) |
| | | CHINA (INCLUDING
HONG KONG)—(continued) |
| 2,200,000 | | Ports Design, Ltd. | | $ | 7,626,852 |
| | | (Consumer Discretionary) | | | |
| 3,468,000 | | Sinofert Holdings, Ltd. | | | 2,725,738 |
| | | (Materials) | | | |
| 4,734,000 | | Zijin Mining Group Co., Ltd. (Class “H” Shares) | | | 7,356,293 |
| | | | |
|
|
| | | (Materials) | | | |
| | | | | | 156,753,121 |
| | | | |
|
|
| | |
| | | INDIA—1.3% | | | |
| 78,147 | | Housing Development Finance Corp., Ltd. | | | 4,957,596 |
| | | | |
|
|
| | | (Banking) | | | |
| | |
| | | INDONESIA—3.2% | | | |
| 3,257,000 | | Bank Rakyat Indonesia | | | 2,350,596 |
| | | (Banking) | | | |
| 10,751,000 | | PT Bumi Resources Tbk | | | 4,202,824 |
| | | (Energy) | | | |
| 333,000 | | International Nickel Indonesia | | | 2,312,247 |
| | | (Materials) | | | |
| 2,401,500 | | Telekomunikasi Indonesia | | | 2,888,628 |
| | | | |
|
|
| | | (Telecommunications) | | | |
| | | | | | 11,754,295 |
| | | | |
|
|
| | |
| | | MALAYSIA—1.1% | | | |
| 499,600 | | Gamuda Berhad | | | 1,290,236 |
| | | (Industrials) | | | |
| 503,300 | | Lion Diversified Holdings Berhad | | | 1,713,362 |
| | | (Consumer Discretionary) | | | |
| 2,367,900 | | Tradewinds Corp. Berhad(a) | | | 938,126 |
| | | | |
|
|
| | | (Consumer Discretionary) | | | |
| | | | | | 3,941,724 |
| | | | |
|
|
| | |
| | | PHILIPPINES—0.3% | | | |
| 98,904 | | Ayala Corp. | | | 1,207,485 |
| | | | |
|
|
| | | (Diversified Financials) | | | |
| | |
| | | SINGAPORE—11.9% | | | |
| 1,889,000 | | Ascott Group, Ltd. | | | 2,072,750 |
| | | (Real Estate-Developers) | | | |
| 995,000 | | CapitaLand, Ltd. | | | 5,458,936 |
| | | (Real Estate-Developers) | | | |
| | | | | |
| Shares | | Description | | Value
(Note 1) |
| 629,000 | | Cosco Corp. Singapore, Ltd. | | $ | 2,519,387 |
| | | (Industrials) | | | |
| 132,000 | | DBS Group Holdings, Ltd. | | | 1,919,354 |
| | | (Banking) | | | |
| 572,000 | | Kepple Corp., Ltd. | | | 5,544,801 |
| | | (Industrials) | | | |
| 1,347,000 | | Noble Group, Ltd. | | | 1,967,681 |
| | | (Industrials) | | | |
| 1,405,000 | | Rickmers Maritime(a) | | | 1,532,211 |
| | | (Industrials) | | | |
| 807,800 | | SembCorp Marine, Ltd. | | | 2,501,434 |
| | | (Industrials) | | | |
| 945,000 | | SIA Engineering Co. | | | 3,117,132 |
| | | (Industrials) | | | |
| 163,333 | | Singapore Airlines, Ltd. | | | 2,045,098 |
| | | (Industrials) | | | |
| 490,000 | | Singapore Exchange, Ltd. | | | 4,255,133 |
| | | (Diversified Financials) | | | |
| 645,000 | | UOL Group, Ltd. | | | 2,257,826 |
| | | (Real Estate-Developers) | | | |
| 5,938,000 | | Yangzijiang Shipbuilding Holdings, Ltd.(a) | | | 8,913,995 |
| | | | |
|
|
| | | (Industrials) | | | |
| | | | | | 44,105,738 |
| | | | |
|
|
| | |
| | | SOUTH KOREA—20.5% | | | |
| 18,360 | | Doosan Heavy Industries & Construction Co., Ltd. | | | 1,939,917 |
| | | (Industrials) | | | |
| 76,140 | | Doosan Infracore Co., Ltd. | | | 2,957,580 |
| | | (Industrials) | | | |
| 42,157 | | GS Engineering & Construction Corp. | | | 7,324,042 |
| | | (Industrials) | | | |
| 40,660 | | Hynix Semiconductor, Inc.(a) | | | 1,390,579 |
| | | (Information Technology) | | | |
| 46,070 | | Hyundai Engineering & Construction Co., Ltd.(a) | | | 4,399,604 |
| | | (Industrials) | | | |
| 4,159 | | Hyundai Heavy Industries Co., Ltd. | | | 1,922,265 |
| | | (Industrials) | | | |
| 66,585 | | Kookmin Bank | | | 5,543,900 |
| | | (Banking) | | | |
See Notes to Financial Statements.
5
| | | | | |
| Shares | | Description | | Value
(Note 1) |
| |
| | | SOUTH KOREA—(continued) |
| 56,367 | | Korea Investment Holdings Co., Ltd. | | $ | 3,707,707 |
| | | (Diversified Financials) | | | |
| 61,422 | | KT&G Corp. | | | 4,798,594 |
| | | (Consumer Staples) | | | |
| 8,954 | | NHN Corp.(a) | | | 2,072,178 |
| | | (Information Technology) | | | |
| 12,942 | | Posco | | | 9,517,008 |
| | | (Materials) | | | |
| 53,480 | | Samsung Corp. | | | 3,932,697 |
| | | (Industrials) | | | |
| 22,369 | | Samsung Electronics Co., Ltd. | | | 14,053,949 |
| | | (Information Technology) | | | |
| 43,543 | | Shinhan Financial Group Co., Ltd. | | | 2,845,139 |
| | | (Banking) | | | |
| 2,961 | | Shinsegae Co., Ltd. | | | 2,060,923 |
| | | (Consumer Staples) | | | |
| 31,159 | | SK Energy Co., Ltd.(a) | | | 5,447,378 |
| | | (Energy) | | | |
| 79,710 | | Woori Investment & Securities Co., Ltd. | | | 2,255,779 |
| | | | |
|
|
| | | (Diversified Financials) | | | |
| | | | | | 76,169,239 |
| | | | |
|
|
| | |
| | | TAIWAN—15.5% | | | |
| 1,819,000 | | Advanced Semiconductor Engineering, Inc. | | | 1,995,410 |
| | | (Information Technology) | | | |
| 1,922,000 | | Asia Cement Corp. | | | 3,351,059 |
| | | (Materials) | | | |
| 2,306,000 | | China Steel Corp. | | | 3,363,432 |
| | | (Industrials) | | | |
| 1,081,200 | | D-Link Corp. | | | 2,683,536 |
| | | (Information Technology) | | | |
| 58,937 | | Far Eastern Textile, Ltd.(b) | | | 79,191 |
| | | (Industrials) | | | |
| 141,122 | | Firich Enterprises Co., Ltd. | | | 2,038,885 |
| | | (Information Technology) | | | |
| 534,796 | | Foxconn Technology Co., Ltd. | | | 6,194,358 |
| | | (Information Technology) | | | |
| 7,980,340 | | Goldsun Development & Construction Co., Ltd. | | | 5,012,930 |
| | | (Materials) | | | |
| | | | | |
| Shares | | Description | | Value
(Note 1) |
| 1,333,136 | | Hon Hai Precision Industry Co., Ltd. | | $ | 10,049,072 |
| | | (Information Technology) | | | |
| 1,766,688 | | Innolux Display Corp. | | | 7,578,867 |
| | | (Information Technology) | | | |
| 273,000 | | MediaTek, Inc. | | | 4,918,768 |
| | | (Information Technology) | | | |
| 778,800 | | Powertech Technology, Inc. | | | 3,138,109 |
| | | (Information Technology) | | | |
| 1,816,000 | | Synnex Technology International Corp. | | | 5,091,589 |
| | | (Information Technology) | | | |
| 775,000 | | Taiwan Fertilizer Co., Ltd. | | | 1,871,304 |
| | | | |
|
|
| | | (Materials) | | | |
| | | | | | 57,366,510 |
| | | | |
|
|
Units
| | | | |
| | | WARRANT |
| | | HONG KONG | | | |
| 195,666 | | China Overseas Land & Investment, Ltd.(a) Expiring August 27, 2008 @ $12.50 (Real Estate-Developers) (cost $0) | | | 160,835 |
| | | | |
|
|
| | | Total long-term investments (cost $179,255,068) | | | 356,416,543 |
| | | | |
|
|
| |
| | | SHORT-TERM INVESTMENT—2.6% |
| | | MONEY MARKET MUTUAL
FUND |
Shares
| | | | |
| | | UNITED STATES | | | |
| 9,865,679 | | JPMorgan Prime Money Market Fund/Premier
(cost $9,865,679) | | | 9,865,679 |
| | | | |
|
|
| | | Total Investments—98.7% (cost $189,120,747; Note 4) | | | 366,282,222 |
| | | Other assets in excess of liabilities—1.3% | | | 4,697,701 |
| | | | |
|
|
| | | Net Assets—100.0% | | | $370,979,923 |
| | | | |
|
|
The following annotations are used in the Portfolio of Investments:
| (a) | Non-income producing securities. |
| (b) | An Independent Director of the Fund is Chairman and Chief Executive Officer of the Company. |
See Notes to Financial Statements.
6
The industry classification of portfolio holdings and other assets in excess of liabilities shown as a percentage of net assets as of September 30, 2007 was as follows:
| | | |
Industrials | | 16.7 | % |
Information Technology | | 16.5 | |
Materials | | 13.5 | |
Real Estate-Developers | | 8.3 | |
Banking | | 8.2 | |
Energy | | 8.1 | |
Consumer Discretionary | | 8.1 | |
Diversified Financials | | 6.2 | |
Mutual Funds | | 5.8 | |
Consumer Staples | | 3.7 | |
Telecommunications | | 3.1 | |
Utilities | | 0.5 | |
| | |
|
|
| | | 98.7 | |
Other assets in excess of liabilities | | 1.3 | |
| | |
|
|
Total | | 100.0 | % |
| | |
|
|
See Notes to Financial Statements.
7
THE ASIA PACIFIC FUND, INC.
Statement of Assets and Liabilities
September 30, 2007
(Unaudited)
| | | |
| Assets | | | |
Investments, at value (cost $189,120,747) | | $ | 366,282,222 |
Foreign currency (cost $2,636,923) | | | 2,643,122 |
Cash | | | 20,226 |
Receivable for investments sold | | | 5,877,796 |
Dividends and interest receivable | | | 648,576 |
Prepaid assets | | | 135,416 |
| | |
|
|
Total assets | | | 375,607,358 |
| | |
|
|
| Liabilities | | | |
Payable for investments purchased | | | 3,915,218 |
Accrued expenses and other liabilities | | | 431,798 |
Investment management fee payable | | | 217,193 |
Administration fee payable | | | 63,226 |
| | |
|
|
Total liabilities | | | 4,627,435 |
| | |
|
|
| Net Assets | | $ | 370,979,923 |
| | |
|
|
Net assets comprised: | | | |
Common stock, at par | | $ | 103,441 |
Paid-in capital in excess of par | | | 131,192,212 |
| | |
|
|
| | | | 131,295,653 |
Undistributed net investment income | | | 625,346 |
Accumulated net realized gains on investments and foreign currency transactions | | | 61,891,722 |
Net unrealized appreciation on investments and foreign currencies | | | 177,167,202 |
| | |
|
|
Net Assets, September 30, 2007 | | $ | 370,979,923 |
| | |
|
|
Net Assets Value per share:
($370,979,923 ÷ 10,344,073 shares of common stock outstanding) | | | $35.86 |
| | |
|
|
See Notes to Financial Statements.
THE ASIA PACIFIC FUND, INC.
Statement of Operations
Six Months Ended September 30, 2007
(Unaudited)
| | | | |
| Net Investment Income | | | | |
Income | | | | |
Dividends (net of foreign withholding taxes of $193,028) | | $ | 3,230,911 | |
Interest | | | 7,641 | |
| | |
|
|
|
Total income | | | 3,238,552 | |
| | |
|
|
|
Expenses | | | | |
Investment management fee | | | 1,179,823 | |
Administration fee | | | 344,235 | |
Directors’ fees and expenses | | | 148,000 | |
Custodian’s fees and expenses | | | 146,000 | |
Reports to shareholders | | | 100,000 | |
Legal fees and expenses | | | 90,000 | |
Insurance expense | | | 76,000 | |
Audit fees and expenses | | | 27,000 | |
Transfer agent’s fees and expenses | | | 17,000 | |
Registration expenses | | | 12,000 | |
Miscellaneous | | | 44,989 | |
| | |
|
|
|
Total expenses | | | 2,185,047 | |
| | |
|
|
|
Net investment income | | | 1,053,505 | |
| | |
|
|
|
| Realized and Unrealized Gain/(Loss) on Investments and Foreign Currency Transactions | | | | |
Net realized gain/(loss) on: | | | | |
Investment transactions | | | 37,036,334 | |
Foreign currency transactions | | | (113,775 | ) |
| | |
|
|
|
| | | | 36,922,559 | |
| | |
|
|
|
Net change in unrealized appreciation on: | | | | |
Investments | | | 84,459,936 | |
Foreign currencies | | | 12,159 | |
| | |
|
|
|
| | | | 84,472,095 | |
| | |
|
|
|
Net gain on investments and foreign currencies | | | 121,394,654 | |
| | |
|
|
|
| Net Increase in Net Assets Resulting From Operations | | $ | 122,448,159 | |
| | |
|
|
|
See Notes to Financial Statements.
8
THE ASIA PACIFIC FUND, INC.
Statement of Changes in Net Assets
(Unaudited)
| | | | | | | |
Increase
in Net Assets | | Six Months
Ended
September 30,
2007
| | Year Ended
March 31,
2007
| |
| | |
Operations | | | | | | | |
| | |
Net investment income | | $ | 1,053,505 | | $ | 801,966 | |
| | |
Net realized gain on investments and foreign currency transactions | | | 36,922,559 | | | 39,582,752 | |
| | |
Net change in unrealized appreciation on investments and foreign currencies | | | 84,472,095 | | | 26,308,718 | |
| | |
|
| |
|
|
|
| | |
Net increase in net assets resulting from operations | | | 122,448,159 | | | 66,693,436 | |
| | |
|
| |
|
|
|
| | |
Dividends paid from net investment income (Note 1) | | | — | | | (2,011,922 | ) |
| | |
Distributions paid from net realized capital gains (Note 1) | | | — | | | (28,568,260 | ) |
| | |
|
| |
|
|
|
| | |
Total dividends and distributions | | | — | | | (30,580,182 | ) |
| | |
|
| |
|
|
|
| | |
Total increase | | | 122,448,159 | | | 36,113,254 | |
| | |
| Net Assets | | | | | | | |
| | |
Beginning of period | | | 248,531,764 | | | 212,418,510 | |
| | |
|
| |
|
|
|
| | |
End of period(a) | | $ | 370,979,923 | | $ | 248,531,764 | |
| | |
|
| |
|
|
|
(a) Includes undistributed net investment income of: | | $ | 625,346 | | | — | |
| | |
|
| |
|
|
|
See Notes to Financial Statements.
THE ASIA PACIFIC FUND, INC.
Notes to Financial Statements
(Unaudited)
The Asia Pacific Fund, Inc. (the “Fund”) is registered under the Investment Company Act of 1940 as a diversified, closed-end, management investment company. The Fund’s investment objective is to achieve long-term capital appreciation through investment primarily in equity securities of companies in the Asia Pacific countries.
Note 1. Accounting Policies
The following is a summary of significant accounting policies followed by the Fund in the preparation of its financial statements.
The Fund’s financial statements are prepared in accordance with U.S. generally accepted accounting principles, which may require the use of management estimates and assumptions. Actual results could differ from these assumptions.
Securities Valuation Investments are stated at value. Securities for which the primary market is on an exchange are valued at the last sale price on such exchange or market on the day of valuation or, if there was no sale on such day, at the last bid price quoted on such day. Securities for which reliable market quotations are not readily available, or whose value have been affected by events occurring after the close of the security’s foreign market and before the Fund’s normal pricing time, are valued at fair value in accordance with the Board of Director’s approved fair valuation procedures. When determining the fair valuation of securities, some of the factors influencing the valuation include, the nature of any restrictions on disposition of the securities; assessment of the general liquidity of the securities; the issuer’s financial condition and the markets in which it does business; the cost of the investment; the size of the holding and the capitalization of the issuer; the prices of any recent transactions or bids/offers for such securities or any comparable securities; any available analyst, media or other reports or information regarding the issuer or the markets or industry in which it operates; other analytical data; and consistency with valuation of similar securities held by other funds managed by Baring Asset Management (Asia) Limited. Using fair value to price securities
9
may result in a value that is different from a security’s most recent closing price and from the price used by other investment companies to calculate their net asset values.
Investments in mutual funds are valued at the net asset value on the date the New York Stock Exchange is open for trading.
Short-term securities which mature in more than 60 days are valued at current market quotations. Short-term securities which mature in 60 days or less are valued at amortized cost.
Foreign Currency Translation The books and records of the Fund are maintained in United States dollars. Foreign currency amounts are translated into United States dollars on the following basis:
(i) market value of investment securities, other assets and liabilities—at the current rate of exchange.
(ii) purchases and sales of investment securities, income and expenses—at the rate of exchange prevailing on the respective dates of such transactions.
Although the net assets of the Fund are presented at the foreign exchange rates and market values at the close of the fiscal period, the Fund does not isolate that portion of the results of operations arising as a result of changes in the foreign exchange rates from the fluctuations arising from changes in the market prices of securities held at fiscal period end. Similarly, the Fund does not isolate the effect of changes in foreign exchange rates from the fluctuations arising from changes in the market prices of portfolio securities sold during the fiscal year. Accordingly, these realized foreign currency gains (losses) are included in the reported net realized gains (losses) on investment transactions.
Net realized gains (losses) on foreign currency transactions represent net foreign exchange gains (losses) from sales and maturities of short-term securities, holding of foreign currencies, currency gains (losses) realized between the trade and settlement dates on security transactions, and the difference between the amounts of dividends, interest and foreign taxes recorded on the Fund’s books and the US dollar equivalent amounts actually received or paid. Net currency gains (losses) from valuing foreign currency denominated assets, other than investment securities, and liabilities at fiscal period end exchange rates are reflected as a component of unrealized appreciation on investments and foreign currencies.
Foreign security and currency transactions may involve certain considerations and risks not typically associated with those of US companies as a result of, among other factors, the level of governmental supervision and regulation of foreign securities markets and the possibility of political or economic instability.
Security Transactions and Net Investment Income Security transactions are recorded on the trade date. Realized and unrealized gains (losses) from security and foreign currency transactions are calculated on the identified cost basis. Dividend income is recorded on the ex-dividend date, and interest income and expenses are recorded on an accrual basis. Expenses are recorded on the accrual basis which may require the use of certain estimates by management.
Dividends and Distributions Dividends from net investment income, if any, are declared and paid at least annually. The Fund will distribute at least annually any net capital gains in excess of net capital loss carryforwards. Dividends and distributions are recorded on the ex-dividend date.
Income distributions and capital gain distributions are determined in accordance with income tax regulations, which may differ from U.S. generally accepted accounting principles.
Taxes It is the Fund’s intention to continue to meet the requirements of the US Internal Revenue Code applicable to regulated investment companies and to distribute all of its taxable income to shareholders. Therefore, no federal income tax provision is required.
Withholding taxes on foreign dividends, interest and capital gains have been provided for in accordance with the Fund’s understanding of the applicable country’s tax rules and rates.
Note 2. Investment Management and Administration Agreements
The Fund has a management agreement with Baring Asset Management (Asia) Limited (the "Investment Manager") and an administration agreement with Prudential Investments LLC (the "Administrator").
The investment management fee, is computed weekly and payable monthly at the following annual rates: 1.00% of the Fund’s average weekly net assets up to $100 million and 0.70% of such assets in excess of $100 million.
10
The administration fee is also computed weekly and payable monthly at the following annual rates: 0.25% of the Fund’s average weekly net assets up to $200 million and 0.20% of such assets in excess of $200 million.
Pursuant to the agreements, the Investment Manager provides continuous supervision of the investment portfolio and the Administrator provides occupancy and certain clerical, administrative and accounting services for the Fund. Both the Investment Manager and the Administrator pay the cost of compensation of certain directors and officers of the Fund. The Fund bears all other costs and expenses.
Note 3. Portfolio Securities
Purchases and sales of investment securities, other than short-term investments, for the six months ended September 30, 2007 aggregated $136,057,276 and $141,607,013 respectively.
Note 4. Tax Information
The United States federal income tax basis of the Fund's investments and the net unrealized appreciation on a tax basis as of September 30, 2007 were as follows:
| | | | | | | | | | | |
Tax Basis
| | Appreciation
| | Depreciation
| | | Total Net
Unrealized Appreciation
(Tax Basis)
|
| $ | 189,120,747 | | $ | 177,796,681 | | $ | (635,206 | ) | | $ | 177,161,475 |
The difference between book basis and tax basis is attributable to deferred losses on wash sales and mark-to-market of unrealized gains on passive foreign investment companies.
Note 5. Capital
There are 30 million shares of $0.01 par value common stock authorized.
The Fund currently is a party to a committed credit facility with a bank. The credit facility provides for a maximum commitment of $30,000,000 or 20% of the Fund's net assets, whichever is less. Interest on any borrowings under the credit facility will be at LIBOR plus 0.50%. The Fund pays a commitment fee of .05% on the unused portion of the facility. The commitment fee is accrued daily and paid quarterly. The Fund's obligations under the credit facility are secured by substantially all the assets of the Fund. The purpose of the credit facility is to assist the Fund with its general cash flow requirements, including the provision of portfolio leverage. For the six months ended September 30, 2007, there were no borrowings under this credit facility.
Note 7. New Accounting Pronouncements
On July 13, 2006, the Financial Accounting Standards Board (FASB) released FASB Interpretation No. 48 "Accounting for Uncertainty in Income Taxes" (FIN 48). FIN 48 provides guidance for how uncertain tax positions should be recognized, measured, presented and disclosed in the financial statements. FIN 48 requires the evaluation of tax positions taken or expected to be taken in the course of preparing the Fund's tax returns to determine whether the tax positions are "more-likely-than-not" of being sustained by the applicable tax authority. The impact of the tax positions not deemed to meet the more-likely-than-not threshold would be recorded in the year in which they arise. On December 22, 2006, the Securities and Exchange Commission delayed the effective date of FIN 48 until the last net asset value calculation in the first required financial reporting period for its fiscal year beginning after December 15, 2006. The Fund's financial statements have not been impacted by the adoption of FIN 48. However, the conclusions regarding FIN 48 may be subject to review and adjustment at a later date based on factors including, but not limited to, further implementation guidance expected from the FASB and on-going analysis of tax laws, regulations and interpretations thereof.
On September 20, 2006, the FASB released Statement of Financial Accounting Standards No. 157 “Fair Value Measurements” (FAS 157). FAS 157 establishes an authoritative definition of fair value, sets out a framework for measuring fair value, and requires additional disclosures about fair-value measurements. The application of FAS 157 is required for fiscal years beginning after November 15, 2007 and interim periods within those fiscal years. At this time, management is evaluating the implications of FAS 157 and its impact, if any, in the financial statements has not yet been determined.
11
THE ASIA PACIFIC FUND, INC.
Financial Highlights
(Unaudited)
| | | | | | | | | | | | | | | | | | | | | | | | |
Per Share Operating
Performance: | | Six Months
Ended
September 30, 2007
| | | Year ended March 31,
| |
| | | 2007
| | | 2006
| | | 2005
| | | 2004
| | | 2003
| |
Net asset value, beginning of period | | $ | 24.03 | | | $ | 20.54 | | | $ | 16.62 | | | $ | 14.90 | | | $ | 9.10 | | | $ | 11.67 | |
| | |
|
|
| |
|
|
| |
|
|
| |
|
|
| |
|
|
| |
|
|
|
Net investment income | | | 0.10 | | | | 0.08 | | | | 0.11 | | | | 0.18 | | | | 0.09 | | | | 0.01 | |
Net realized and unrealized gain (loss) on investments and foreign currency transactions | | | 11.73 | | | | 6.37 | | | | 4.49 | | | | 1.69 | | | | 5.89 | | | | (2.77 | ) |
| | |
|
|
| |
|
|
| |
|
|
| |
|
|
| |
|
|
| |
|
|
|
Total from investment operations | | | 11.83 | | | | 6.45 | | | | 4.60 | | | | 1.87 | | | | 5.98 | | | | (2.76 | ) |
| | |
|
|
| |
|
|
| |
|
|
| |
|
|
| |
|
|
| |
|
|
|
Less dividends and distributions: | | | | | | | | | | | | | | | | | | | | | | | | |
Dividends from net investment income | | | — | | | | (0.20 | ) | | | (0.12 | ) | | | (0.15 | ) | | | (0.18 | ) | | | — | |
Distributions paid from capital gains | | | — | | | | (2.76 | ) | | | (0.56 | ) | | | — | | | | — | | | | — | |
| | |
|
|
| |
|
|
| |
|
|
| |
|
|
| |
|
|
| |
|
|
|
Total dividends and distributions | | | — | | | | (2.96 | ) | | | (0.68 | ) | | | (0.15 | ) | | | (0.18 | ) | | | — | |
Increase resulting from tender offer | | | — | | | | — | | | | — | | | | — | | | | — | | | | 0.19 | |
| | |
|
|
| |
|
|
| |
|
|
| |
|
|
| |
|
|
| |
|
|
|
Net asset value, end of period | | $ | 35.86 | | | $ | 24.03 | | | $ | 20.54 | | | $ | 16.62 | | | $ | 14.90 | | | $ | 9.10 | |
| | |
|
|
| |
|
|
| |
|
|
| |
|
|
| |
|
|
| |
|
|
|
Market value, end of period | | $ | 32.45 | | | $ | 21.22 | | | $ | 18.39 | | | $ | 14.65 | | | $ | 13.90 | | | $ | 8.10 | |
| | |
|
|
| |
|
|
| |
|
|
| |
|
|
| |
|
|
| |
|
|
|
Total investment return(a) | | | 52.92 | % | | | 30.39 | % | | | 30.32 | % | | | 6.48 | % | | | 73.83 | % | | | (19.96 | )% |
| | |
|
|
| |
|
|
| |
|
|
| |
|
|
| |
|
|
| |
|
|
|
| Ratios to Average Net Assets: | | | | | | | | | | | | | | | | | | | | | | | | |
Total expenses (including loan interest) | | | 1.47 | %(c) | | | 1.78 | %(b) | | | 2.24 | %(b) | | | 2.01 | %(b) | | | 2.06 | %(b) | | | 2.25 | %(b) |
Net investment income | | | 0.71 | %(c) | | | 0.35 | % | | | 0.61 | % | | | 1.18 | % | | | 0.74 | % | | | 0.09 | % |
| Supplemental Data: | | | | | | | | | | | | | | | | | | | | | | | | |
Average net assets (000 omitted) | | $ | 297,264 | | | $ | 230,490 | | | $ | 184,611 | | | $ | 155,484 | | | $ | 128,632 | | | $ | 122,681 | |
Portfolio turnover rate | | | 46 | %(d) | | | 86 | % | | | 122 | % | | | 73 | % | | | 73 | % | | | 34 | % |
Net assets, end of period (000 omitted) | | $ | 370,980 | | | $ | 248,532 | | | $ | 212,419 | | | $ | 171,933 | | | $ | 154,135 | | | $ | 94,127 | |
| (a) | Total investment return is calculated assuming a purchase of common stock at the current market value on the first day and a sale at the current market value on the last day of each fiscal period reported. Dividends and distributions are assumed, for purposes of this calculation, to be reinvested at prices obtained under the Fund’s dividend reinvestment plan. These calculations do not include brokerage commissions. Total returns for periods of less than a full year are not annualized. |
| (b) | The expense ratio without loan interest expense would have been 1.68%, 1.78%, 1.94%, 2.03% and 2.24% for the fiscal years ended March 31, 2007, 2006, 2005, 2004, and 2003, respectively. |
Shown above is selected data for a share of common stock outstanding, total investment return, ratios to average net assets and other supplemental data for the periods indicated. This information has been determined based upon information provided in the financial statements and market price data for the Fund’s shares.
See Notes to Financial Statements.
12
Board of Directors’ Approval of Continuance of Investment Management Agreement
At a meeting held on May 18, 2007, the Board of Directors of the Fund (the “Board”), including a majority of the disinterested directors (the “Directors”), approved the continuance of the investment management agreement (the “Investment Management Agreement”) between the Fund and Baring Asset Management (Asia) Limited (the “Investment Manager”). Prior to acting on the continuance of the Investment Management Agreement, the Directors considered the factors discussed below.
Factors Considered by the Board
In preparation for the meeting, the Directors had requested and evaluated materials from the Investment Manager, including performance and expense information for other closed-end investment companies investing in one or more of the Asia Pacific countries derived from data compiled by Standard & Poor’s Micropal (“S&P Micropal”). The Directors reviewed the Investment Management Agreement with management and with experienced Fund counsel who are independent of the Investment Manager and who furnished a memorandum discussing the legal standards for the Board’s consideration of the proposed continuance. In reaching their determinations relating to the approvals of the Investment Management Agreement, the Directors considered all factors they believed relevant, including the following:
| | 1. | information comparing the performance of the Fund to other investment companies with similar investment objectives and to the MSCI All Countries Combined Far East Free Ex-Japan Index (the “Index”); |
| | 2. | the nature, extent and quality of investment, compliance and other services rendered by the Investment Manager; |
| | 3. | the costs borne by, and profitability of, the Investment Manager and its affiliates in providing services to the Fund; |
| | 4. | comparative fee and expense data for the Fund and other closed-end investment companies investing in one or more of the Asia Pacific countries; |
| | 5. | the extent to which economies of scale would be realized as the Fund grows and whether fee levels reflect these economies of scale for the benefit of investors; |
| | 6. | the Investment Manager’s policies and practices regarding allocation of portfolio transactions of the Fund, including the extent to which the Investment Manager benefits from soft dollar arrangements; |
| | 7. | fall-out benefits that the Investment Manager and its affiliates receive from their relationships to the Fund; |
| | 8. | information about fees charged by the Investment Manager to other clients with similar investment objectives; |
| | 9. | the professional experience and qualifications of the Fund’s portfolio management team and other senior personnel of the Investment Manager; and |
| | 10. | the terms of the Investment Management Agreement. |
Based on their experience gained as Fund Directors, the Directors also considered their knowledge of the nature and quality of the services provided by the Investment Manager to the Fund and their overall confidence in the Investment Manager’s integrity and competence.
In their deliberations, the Directors did not identify any particular information that was all-important or controlling, and each Director attributed different weights to the various factors.
13
The Directors determined that the overall arrangements between the Fund and the Investment Manager, as provided in the Investment Management Agreement, were fair and reasonable in light of the services performed, expenses incurred and such other matters as the Directors considered relevant in the exercise of their reasonable judgment.
The material factors and conclusions that formed the basis for the Directors’ reaching their determinations to approve the Investment Management Agreement (including their determinations that the Investment Manager should continue to be the investment adviser for the Fund and that the fees payable to the Investment Manager pursuant to the Investment Management Agreement are appropriate) were separately discussed by the Directors.
Nature, extent and quality of services provided by the Investment Manager
The Directors noted that under the Investment Management Agreement, the Manager, subject to the supervision of the Directors, manages, in accordance with the Fund’s stated investment objective, policies and limitations, the Fund’s investments and makes investment decisions on behalf of the Fund, including the selection of and placing of orders with brokers and dealers to execute portfolio transactions on behalf of the Fund. The Investment Manager pays all salaries and fees of the Fund’s directors and officers who are “interested persons” (as defined under the Investment Company Act) of the Investment Manager. The Directors noted that the Investment Manager also pays the salaries and travel expenses, including attendance at meetings of the Board, of the portfolio manager and all employees of the Investment Manager. The Directors also recognized that the Investment Manager provides additional services apart from its investment services, such as reports to the Board regarding changes in the Fund’s portfolio holdings, liaison services with shareholder servicing agents, and the provision of regulatory compliance reports and portfolio transaction allocations.
The Directors considered the scope and quality of services provided by the Investment Manager under the Investment Management Agreement and noted that the scope of services provided had expanded over time as a result of regulatory and other developments. For example, the Directors noted that the Investment Manager is responsible for maintaining and monitoring its own, and certain aspects of the Fund’s, compliance program, and these compliance programs have recently been refined and enhanced in light of applicable regulatory requirements. The Directors considered the quality of the investment research capabilities of the Investment Manager and the other resources it has dedicated to performing services for the Fund. The Directors concluded that they were satisfied with the nature, extent and quality of services provided to the Fund under the Investment Management Agreement.
Costs of Services Provided and Profitability to the Investment Manager
The Directors reviewed a schedule of the expenses and assets under management for 2006 and the estimated profitability of the Investment Management Agreement to the Investment Manager for 2006. The Directors reviewed the Investment Manager’s memorandum describing the assumptions and methods of allocation of estimated costs of managing the Fund in 2006 and in preparing Fund-specific profitability data.
The Directors recognized that it is difficult to make comparisons of profitability from fund advisory contracts because comparative information is not generally publicly available and is affected by numerous factors, including the structure of the particular adviser, the types of funds it manages, its business mix, numerous assumptions regarding allocations and the adviser’s capital structure and cost of capital. In considering profitability information, the Directors considered the effect of fall-out benefits on the Investment Manager’s expenses. The Directors focused on profitability of the Investment Manager’s relationship with the Fund before taxes. The Directors recognized that the Investment Manager should generally be entitled to earn a reasonable level of profits for the services it provides to the Fund and, based on their review, concluded that they were satisfied that the Investment Manager’s level of profitability from its relationship with the Fund was not excessive.
Fall-Out Benefits
The Directors considered that the Investment Manager benefits from soft dollar arrangements whereby it receives brokerage and research services from many of the brokers and dealers that execute purchases and sales of securities on
14
behalf of its clients, including the Fund. They considered the Investment Manager’s presentation regarding the Manager’s soft dollar arrangements. The Directors noted the Investment Manager’s representation that the achievement of best execution is the overriding policy in all soft dollar transactions. The Directors received and reviewed information concerning the Investment Manager’s policy on soft dollar arrangements, which included a description of the type of brokerage and research services the Investment Manager receives and a list of firms providing third-party research and brokerage to the Investment Manager. The Directors recognized that the Investment Manager’s profitability would be somewhat lower if it did not receive research for soft dollars. The Directors also believe that the Investment Manager derives reputational and other benefits from its association with the Fund.
Investment Results
The Directors considered the investment results of the Fund as compared to other funds investing in one or more of the Asia Pacific countries as provided by S&P Micropal. In addition to the information reviewed by the Directors at the meeting, the Directors receive detailed comparative performance information for the Fund at each regular Board meeting during the year, such as the Fund’s performance relative to the Index for each month since the last regularly-scheduled meeting of the Board. The Directors also reviewed information showing performance of the Fund compared to the Index and to funds in the S&P Micropal Universe of Asia Pacific funds over the 1-, 2-, 3-, 4-, 5- and 10-year periods ended March 31, 2007. The Directors noted that the Fund’s net asset value performance had been above that of the Index and of the S&P Micropal average for Asia Pacific funds for all periods. Based on their review and discussion, the Directors concluded that the Fund’s investment performance was satisfactory.
Advisory Fees and Other Expenses
The Directors considered the advisory fee rate paid by the Fund to the Investment Manager and information prepared by Lipper, Inc. (“Lipper”) concerning fee rates paid by other funds in the same Lipper category as the Fund, that is, “Pacific Ex Japan Funds.” The Directors recognized that it is difficult to make comparisons of advisory fees because there are variations in the services that are included in the fees paid by other funds. Nonetheless, the Directors noted that the Fund’s advisory fee as a percentage of average net assets was competitive with the average, the median and the dollar-weighted average of Lipper’s Pacific Ex Japan Funds. In considering the comparative information on fees, the Directors considered both the advisory fee rate and the fee rate under the Fund’s separate administration agreement.
The Directors also considered the fees the Investment Manager charges the only other registered investment company it manages, which invests in China, and with the Investment Manager’s other clients with investment objectives similar to those of the Fund. The Directors noted that the Investment Manager’s only other registered investment company client’s advisory fee schedule and combined advisory/administrative fee schedule were each higher than the Fund’s comparable fee schedules. They also noted that the advisory fee schedules for other institutional accounts with a comparable investment objective were lower and the Investment Manager’s representation that fees charged to these accounts were lower because they did not entail the same regulatory, supervisory or compliance costs that are incurred with respect to registered closed-end funds. The Investment Manager indicated that for some of these other institutional clients there are also performance fees. The Directors noted that the application of such institutional fee schedule to the Fund’s level of assets would have resulted in a fee that would have been significantly lower than that resulting from the Investment Management Agreement.
The Investment Manager reviewed with the Directors the significant differences in the scope of services it provides to institutional clients and to the Fund. For example, the Investment Management Agreement contemplates, in addition to investment advice, the Investment Manager’s providing certain directors and officers (such as the President and CEO of the Fund who provides required certifications pursuant to the Sarbanes-Oxley Act of 2002). The Investment Manager explained that these services normally are not provided to non-investment company clients and that fees charged to the Fund reflect the costs and risks of the additional obligations. In light of these facts, the Directors did not place significant weight on the fee comparisons with institutional accounts.
15
The Directors also considered the annualized total expense ratio for the Fund’s year- ended March 31, 2007 in comparison to the expense ratios of funds of Pacific Ex Japan Funds as of various dates as compiled by the Investment Manager from the funds’ annual reports. The Directors concluded that the Fund’s expense ratio was competitive.
The information reviewed by the Directors showed that at the Fund’s then current size, the Fund’s effective fee rate under the Investment Management Agreement was .93%, and the Fund’s effective combined advisory/administration fee rate was below the Lipper average and the Lipper median.
Economies of Scale
The Directors noted that the advisory fee schedule for the Fund contains a breakpoint at $100 million so that, when assets exceed the breakpoint, the fee rate is reduced from 1.00% to .70% on the incremental assets. The Directors recognized that there is no direct relationship between the economies of scale realized by funds and those realized by the Investment Manager as assets increase, largely because economies of scale are realized (if at all) by the Investment Manager across a variety of products and services, and not only in respect of a single fund. The Directors do not believe there is a uniform methodology for establishing breakpoints that give effect to fund-specific services provided by the Investment Manager and to the economies of scale that the Investment Manager may realize in its overall investment management business or those components of it which directly or indirectly affect the Fund’s operations. The Directors observed that in the mutual fund industry as a whole, as well as among funds similar to the Fund, there is no uniformity or pattern in the fees and asset levels at which breakpoints (if any) apply. Depending on the age and size of a particular fund and its adviser’s cost structure, different conclusions can be drawn as to whether there are economies of scale to be realized at any particular level of assets, notwithstanding the intuitive conclusion that such economies exist, or will be realized at some level of total assets. Moreover, because different advisers have different cost structures and service models, it is difficult to draw meaningful conclusions from the comparison of a fund’s advisory fee breakpoints with those of comparable funds. The Directors also noted that the advisory agreements for many competitor funds do not have breakpoints at all. Having taken these factors into account, the Directors concluded that the Fund’s breakpoint arrangements established a reasonable basis for realizing any economies of scale.
16
Supplemental Proxy Information
The Annual Meeting of Stockholders of the Asia Pacific Fund, Inc. (the “Meeting”) was held on August 17, 2007.
The number of shares issued, outstanding and eligible to vote as of the record date of June 8, 2007, was 10,344,073 shares. Proxies representing 8,233,081 shares of Common Stock or 79.59% of the total outstanding shares voted in the following manner:
Proposal I: (Election of Class III Directors; Term Expiring in 2010)
| | | | |
| | | Total Vote For
Each Director
| | Total Vote Withheld
Each Director
|
David J. Brennan | | 7,904,501.000 | | 328,580.000 |
Robert F. Gunia | | 7,941,987.000 | | 291,095.000 |
Nicholas T. Sibley | | 8,031,405.000 | | 201,676.000 |
The other directors, whose terms of office continued beyond the date of the Meeting, are Ms. Bibliowicz, and Messrs. Burns, Chaipravat, Downey, Hsu, McFarland and Scholfield.
Additional Information
The Fund is required to file its complete schedule of portfolio holdings with the Securities and Exchange Commission (“SEC”) on Form N-Q for its first and third fiscal quarters and within 60 days of the fiscal quarter end. Once filed, the Fund’s Form N-Q is available without charge on the SEC’s website (http//www.sec.gov) or by calling the Fund toll free at 1-(888) 4-ASIA-PAC. You can also obtain copies of the Fund’s Form N-Q by visiting the SEC’s Public Reference Room in Washington, DC (please call the SEC at (800) 732-0330 for information on the operation of the Public Reference Room).
Information regarding the Fund’s proxy voting policies and procedures and its proxy voting record for the 12-month period ending June 30 of each year is filed with the SEC on Form N-PX no later than August 31 of each year. The Fund’s Form N-PX is available without charge, upon request, by calling the Fund at its toll free number 1-(888) 4-ASIA-PAC on the cover of this report and on the SEC’s website (http//www.sec.gov) or on or through the Fund’s website address (www.asiapacificfund.com).
17
| | | | | | |
| Item 2 | | – | | Code of Ethics – Not required, as this is not an annual filing. | | |
| | |
| Item 3 | | – | | Audit Committee Financial Expert – Not required, as this is not an annual filing. |
| | |
| Item 4 | | – | | Principal Accountant Fees and Services – Not required, as this is not an annual filing. |
| | |
| Item 5 | | – | | Audit Committee of Listed Registrants – Not required, as this is not an annual filing. |
| | |
| Item 6 | | – | | Schedule of Investments – The schedule is included as part of the report to shareholders filed under Item 1 of this Form. |
| | |
| Item 7 | | – | | Disclosure of Proxy Voting Policies and Procedures for Closed-End Management Investment Companies – Not required, as this is not an annual filing. |
| | |
| Item 8 | | – | | Portfolio Managers of Closed-End Management Investment Companies – Not required, as this is not an annual filing. |
| | |
| Item 9 | | – | | Purchases of Equity Securities by Closed-End Management Investment Company and Affiliated Purchasers – There have been no purchases of equity securities by the registrant or any affiliated purchasers during the period covered by this report. |
| | |
| Item 10 | | – | | Submission of Matters to a Vote of Security Holders – Not applicable. |
| | |
| Item 11 | | – | | Controls and Procedures |
| | |
| | (a) | | It is the conclusion of the registrant’s principal executive officer and principal financial officer that the effectiveness of the registrant’s current disclosure controls and procedures (such disclosure controls and procedures having been evaluated within 90 days of the date of this filing) provide reasonable assurance that the information required to be disclosed by the registrant has been recorded, processed, summarized and reported within the time period specified in the Commission’s rules and forms and that the information required to be disclosed by the registrant has been accumulated and communicated to the registrant’s principal executive officer and principal financial officer in order to allow timely decisions regarding required disclosure. |
| | |
| | (b) | | There has been no significant change in the registrant’s internal control over financial reporting that occurred during the registrant’s most recent fiscal quarter of the period covered by this report that has materially affected, or is likely to materially affect, the registrant’s internal control over financial reporting. |
| | |
| Item 12 | | – | | Exhibits |
| | |
| | (a) | | (1) Code of Ethics – Not required, as this is not an annual filing. |
| | |
| | | | (2) Certifications pursuant to Section 302 of the Sarbanes-Oxley Act – Attached hereto as Exhibit EX-99.CERT. |
| | |
| | | | (3) Any written solicitation to purchase securities under Rule 23c-1. – Not applicable. |
| | |
| | (b) | | Certifications pursuant to Section 906 of the Sarbanes-Oxley Act – Attached hereto as Exhibit EX-99.906CERT. |
SIGNATURES
Pursuant to the requirements of the Securities Exchange Act of 1934 and the Investment Company Act of 1940, the registrant has duly caused this report to be signed on its behalf by the undersigned, thereunto duly authorized.
(Registrant) The Asia Pacific Fund, Inc.
| | | | |
| By (Signature and Title)* | | /s/ Deborah A. Docs | | |
| | Deborah A. Docs | | |
| | Secretary | | |
Date November 19, 2007
Pursuant to the requirements of the Securities Exchange Act of 1934 and the Investment Company Act of 1940, this report has been signed below by the following persons on behalf of the registrant and in the capacities and on the dates indicated.
| | | | |
| By (Signature and Title)* | | /s/ Ronald G.M. Watt | | |
| | Ronald G.M. Watt | | |
| | President and Principal Executive Officer | | |
| Date November 19, 2007 | | | | |
| | |
| By (Signature and Title)* | | /s/ Robert F. Gunia | | |
| | Robert F. Gunia | | |
| | Treasurer and Principal Financial Officer | | |
Date November 19, 2007
| * | Print the name and title of each signing officer under his or her signature. |