UNITED STATES
SECURITIES AND EXCHANGE COMMISSION
Washington, D.C. 20549
FORM N-CSR
CERTIFIED SHAREHOLDER REPORT OF REGISTERED
MANAGEMENT INVESTMENT COMPANIES
| | |
Investment Company Act file number: | | 811-04710 |
The Asia Pacific Fund, Inc.
|
| Exact name of registrant as specified in charter: |
|
Gateway Center 3, 100 Mulberry Street, Newark, New Jersey 07102 |
| Address of principal executive offices: |
Deborah A. Docs
Gateway Center 3,
100 Mulberry Street,
Newark, New Jersey 07102
|
| Name and address of agent for service: |
Registrant’s telephone number, including area code: 973-367-7521
Date of fiscal year end: 3/31/2009
Date of reporting period: 9/30/2008
Item 1 – Reports to Stockholders

The Asia Pacific
Fund, Inc.
Semi-Annual Report
September 30, 2008
www.asiapacificfund.com
Directors
Michael J. Downey, Chairman
Jessica M. Bibliowicz
David J. Brennan
Robert H. Burns
Robert F. Gunia
Douglas Tong Hsu
Duncan M. McFarland
David G. P. Scholfield
Nicholas T. Sibley
Officers
Brian A. Corris, President
Grace C. Torres, Vice President
M. Sadiq Peshimam, Treasurer and Principal Financial and Accounting Officer
Deborah A. Docs, Secretary and Chief Legal Officer
Andrew R. French, Assistant Secretary
Valerie M. Simpson, Chief Compliance Officer
Theresa C. Thompson, Deputy Chief Compliance Officer
Investment Manager
Baring Asset Management (Asia) Limited
1901 Edinburgh Tower
15 Queen’s Road Central
Hong Kong
Administrator
Prudential Investments LLC
Gateway Center Three
100 Mulberry Street
Newark, NJ 07102-4077
Custodian
The Bank of New York Mellon
One Wall Street
New York, NY 10286
Transfer Agent
Computershare Trust Company N.A.
P.O. Box 43011
Providence, RI 02940-3011
Independent Registered Public Accounting Firm
KPMG LLP
345 Park Avenue
New York, NY 10154
Legal Counsel
Sullivan & Cromwell LLP
125 Broad Street
New York, New York 10004
Notice is hereby given in accordance with Section 23(c) of the Investment Company Act of 1940 that the Fund may purchase, from time to time, shares of its common stock at market prices.
The accompanying financial statements as of September 30, 2008 were not audited and, accordingly, no opinion is expressed on them.
This report, including the financial statements herein, is transmitted to the shareholders of The Asia Pacific Fund, Inc. for their information. This is not a prospectus, circular or representation intended for use in the purchase of shares of the Fund or any securities mentioned in this report.
The Asia Pacific Fund, Inc.
Gateway Center Three
100 Mulberry Street
Newark, NJ 07102-4077
For general information on the Fund, please call (toll-free) the Altman Group, our shareholders’ servicing agent toll-free at:
1-(888) 4-ASIA-PAC
Current information about the Fund is available on its website (http://www.asiapacificfund.com). This website includes monthly updates of the Fund’s performance and other data as well as the Manager’s quarterly presentation of performance and asset allocations and comments on the current Asian outlook.
The Fund’s CUSIP number is 044901106
APBS
The Asia Pacific Fund, Inc.
As of September 30, 2008 (Unaudited)
OUR TOLL-FREE LINE:
1-888-4-ASIA-PAC
For further information on the Fund, please call. In addition, the Fund makes available monthly portfolio information. If you would like to receive this information please call the toll-free number indicated above.
Statistics
| | |
Total Net Assets | | $157,299,592 |
Shares Outstanding | | 10,344,073 |
Net Asset Value | | $15.21 |
Equity | | 97.1%(a) |
Total Returns (US Dollar terms)
| | | | |
| Period | | Market
Price(b) | | NAV(c) |
3 months ended 9/30/08 | | -26.4% | | -23.2% |
6 months ended 9/30/08 | | -33.1% | | -29.9% |
9 months ended 9/30/08 | | -45.5% | | -40.1% |
1 Year ended 9/30/08 | | -43.7% | | -44.1% |
3 Years ended 9/30/08 | | 32.3% | | 31.0% |
5 Years ended 9/30/08 | | 83.5% | | 92.4% |
10 Years ended 9/30/08 | | 347.4% | | 265.3% |
Since inception(d) | | 465.7% | | 504.9% |
Since inception(d) (annualized) | | 8.4% | | 8.8% |
Other Information
| | |
Ticker Symbol | | APB |
Primary Exchange | | NYSE |
Dividend Repurchase Program | | Yes |
Footnote section
| (a) | Expressed as a percentage of total investments. |
| (b) | Total investment return is calculated assuming a purchase of common stock at the current market value on the first day and a sale at the current market value on the last day of each period reported. Dividends and distributions are assumed, for purposes of this calculation, to be reinvested at prices obtained under the Fund’s dividend reinvestment plan. These calculations do not include brokerage commissions. |
| (c) | This information represents the historical net asset value per share performance of The Asia Pacific Fund, Inc. Net asset value per share performance has been computed by the Investment Manager and is calculated assuming reinvestment of dividends and distributions. Because net asset value per share performance does not reflect market price, it is not the same as total investment return. |
| (d) | Investment operations commenced on May 4, 1987. |
Portfolio Characteristics
(As of September 30, 2008)
Top Ten Equity Holdings*
(% of Total Net Assets)
| | |
China Mobile Ltd. | | 4.4% |
Taiwan Semiconductor Manufacturing Co. Ltd. | | 3.4% |
Samsung Electronics Co. Ltd. | | 3.4% |
Chunghwa Telecom Co. Ltd. | | 3.2% |
Industrial & Commercial Bank of China Ltd. (Class “H” Shares) | | 3.2% |
MTR Corp Ltd. | | 2.8% |
United Overseas Bank Ltd. | | 2.7% |
Cheung Kong Holdings Ltd. | | 2.7% |
iShares Asia Trust-iShares A50 China Tracker | | 2.4% |
China Petroleum & Chemical Corp. (Class “H” Shares) | | 2.3% |
* Excludes short-term investments.
Equity Country Weightings
(% of Total Net Assets)
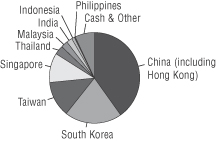
| | | | | | |
China (including Hong Kong) | | 40.2% | | Malaysia | | 2.5% |
South Korea | | 20.5% | | India | | 2.0% |
Taiwan | | 12.7% | | Indonesia | | 1.0% |
Singapore | | 10.5% | | Philippines | | 0.4% |
Thailand | | 3.2% | | Cash & Other | | 7.0% |
Sector Breakdown: Top Ten Industries**
(% of Total Net Assets)
| | |
Banking | | 17.4% |
Information Technology | | 13.9% |
Telecommunications | | 12.5% |
Industrials | | 10.3% |
Consumer Discretionary | | 8.0% |
Real Estate-Developers | | 7.3% |
Energy | | 6.2% |
Utilities | | 6.2% |
Diversified Financials | | 5.3% |
Mutual Funds | | 5.2% |
** Including short-term investments.
1
REPORT OF THE INVESTMENT MANAGER
For the period from March 31 to September 30, 2008 (Unaudited)
PERFORMANCE
During the six month period ended September 30, 2008, the Fund’s net asset value (NAV) per share decreased by US$6.49, from US$21.70 to US$15.21. In percentage terms, the Fund’s total return performance was -29.9%. This compares with the return of its reference index, the MSCI All Country Far East Ex-Japan Gross Index (“Index”), of -28.7%. The Fund’s share price fell by US$6.53, from US$19.75, to US$13.22. In percentage terms, the share price decreased by -33.1%.
The chart below illustrates the Fund’s NAV performance per share during the period:
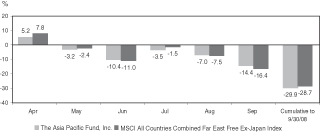
Source: Baring Asset Management
Local Currencies vs the US Dollar
| | | | | | | | |
Currency
US$/Local rate | | March 31,
2008 | | June 30,
2008 | | Sept. 30,
2008 | | March 31 -
Sept. 30,
2008
Change %* |
North Asia | | | | | | | | |
Hong Kong Dollar | | 7.78 | | 7.80 | | 7.76 | | 0.2 |
Chinese Renminbi | | 7.01 | | 6.85 | | 6.85 | | 2.4 |
New Taiwan Dollar | | 30.38 | | 30.35 | | 32.17 | | -5.6 |
South Korean Won | | 990 | | 1,046 | | 1,207 | | -17.9 |
ASEAN | | | | | | | | |
Indonesian Rupiah | | 9,205 | | 9,220 | | 9,430 | | -2.4 |
Singaporean Dollar | | 1.38 | | 1.36 | | 1.43 | | -3.6 |
Thai Baht | | 31.49 | | 33.44 | | 33.84 | | -7.0 |
Malaysian Ringgit | | 3.20 | | 3.27 | | 3.44 | | -7.1 |
Philippine Peso | | 41.77 | | 44.90 | | 47.05 | | -11.2 |
Indian Rupee | | 40.12 | | 43.03 | | 46.97 | | -14.6 |
* - denotes a depreciation of the local currency vs the USD
Source: Factset (Baring Asset Management)
STOCK MARKET PERFORMANCE
March 31 to September 30, 2008
| | | | | | |
Country - Index | | March 31 to
June 30, 2008
Market
Change %
US $ | | June 30 to
Sept. 30, 2008
Market
Change %
US $ | | March 31 to
Sept. 30, 2008
Market
Change %
US $ |
North Asia | | | | | | |
MSCI Hong Kong | | -3.9 | | -22.9 | | -26.0 |
MSCI China | | -3.5 | | -25.2 | | -27.8 |
MSCI Korea | | -7.6 | | -24.2 | | -30.0 |
MSCI Taiwan | | -10.5 | | -24.6 | | -32.5 |
ASEAN | | | | | | |
MSCI Philippines Free | | -24.8 | | 3.6 | | -22.0 |
MSCI Singapore Free | | -0.9 | | -22.2 | | -22.9 |
MSCI Malaysia Free | | -9.1 | | -17.9 | | -25.3 |
MSCI Indonesia Free | | -4.5 | | -26.2 | | -29.5 |
MSCI Thailand Free | | -11.8 | | -22.5 | | -31.6 |
South Asia | | | | | | |
MSCI India | | -19.7 | | -13.9 | | -30.9 |
MSCI All Country Far East Free Ex Japan | | -6.4 | | -23.8 | | -28.7 |
Source: Factset (Baring Asset Management)
COUNTRY ALLOCATION
| | | | | | | | | |
Country | | March 31,
2008 | | | June 30,
2008 | | | Sept. 30,
2008 | |
North Asia | | 77.4 | % | | 78.3 | % | | 73.4 | % |
Hong Kong/China | | 33.5 | | | 35.7 | | | 40.2 | |
South Korea | | 25.2 | | | 24.1 | | | 20.5 | |
Taiwan | | 18.7 | | | 18.5 | | | 12.7 | |
ASEAN | | 15.6 | | | 15.7 | | | 17.6 | |
Indonesia | | 1.9 | | | 2.8 | | | 1.0 | |
Philippines | | 0.3 | | | 0.3 | | | 0.4 | |
Malaysia | | 2.2 | | | 1.8 | | | 2.5 | |
Singapore | | 7.5 | | | 7.8 | | | 10.5 | |
Thailand | | 3.7 | | | 3.0 | | | 3.2 | |
South Asia | | | | | | | | | |
India | | 1.8 | | | 1.8 | | | 2.0 | |
Cash & Other | | 5.2 | | | 4.2 | | | 7.0 | |
2
PORTFOLIO & MARKET REVIEW
After reaching a peak in October last year, Asian equity markets followed the global trend and fell sharply during the period under review. The MSCI Index recorded a decline of 28.7% in US dollar terms. In relative terms, the top three performing markets were the Philippines (-22.0%), Singapore (-22.9%) and Malaysia (-25.3%). The bottom three were Taiwan (-32.5%), Thailand (-31.6%) and India (-30.9%).
A combination of concerns weighed heavily on investor sentiment during the period. The June quarter was negatively impacted by rising inflation (induced by rapidly rising commodity prices), the continuing sub-prime debt crisis and the bias towards monetary tightening maintained by the Chinese government. The September quarter was dominated by concerns over the Western banking system, which almost seized up after the collapse of Lehman Brothers, the looming global economic recession and the large amount of redemptions from mutual and hedge funds. Despite government intervention and a concerted effort by central banks around the world to ease monetary policy, the sell-off continued in October.
So far as Asian currencies are concerned, as reflected in the “Local Currencies vs the US Dollar” table on page 2, all lost value against the US dollar, with the exception of the Chinese Renminbi and Hong Kong dollar.
The overall strategy of the Fund during the period under review was to reduce economic sensitivity and exposure to smaller companies in the portfolio. Reductions were made in economically-
sensitive sectors such as Materials, Consumer Discretionary, Industrials and Technology. The proceeds were used to raise the exposure to Financials, Energy, Utilities and Telecoms. Highlights of asset allocation adjustments included the decision to add to Hong Kong and Singapore, funded from Korea and Taiwan.
In light of the volatility experienced in the market, and the threat of recession across much of the Western world and slower growth across Asia, the investment manager also took a more cautious approach towards stock selection, focusing on larger, more liquid companies which are well-managed, leaders in their industry and with a strong balance sheet. The level of cash in the portfolio was also raised.
Over the six month period, the Fund’s NAV fell by 29.9% in US dollar terms. Against its reference index, the Fund underperformed slightly, attributed to negative stock selection and sector allocation. Our decision to favour economically-sensitive areas of the market such as Industrials, Materials and Technology in the early part of the period detracted value, as did our initial caution towards more defensive areas. At the individual stock level, major detractors included GS Engineering & Construction (Korea) and Taiwan Cement (Taiwan), although the effect of this was offset somewhat by positive contributors from investments in companies such as MTR Corp (Hong Kong), Tencent (Hong Kong/China) and KT&G (Korea).
Baring Asset Management (Asia) Ltd.
October 31st, 2008
3
THE ASIA PACIFIC FUND, INC.
Portfolio of Investments
September 30, 2008
(Unaudited)
| | | | | |
| Shares | | Description | | Value
(Note 1) |
| | LONG-TERM INVESTMENTS—93.0% |
| | EQUITIES | | | |
| | CHINA (INCLUDING HONG KONG)—40.2% | | | |
| 5,500 | | ASM Pacific Technology | | $ | 31,790 |
| | (Information Technology) | | | |
| 6,358,000 | | Bank of China Ltd.
(Class “H” Shares) | | | 2,463,888 |
| | (Banking) | | | |
| 474,000 | | BOC Hong Kong Holdings Ltd. | | | 847,403 |
| | (Banking) | | | |
| 371,000 | | Cheung Kong Holdings Ltd. | | | 4,202,886 |
| | (Real Estate-Developers) | | | |
| 186,000 | | Cheung Kong Infrastructure Holdings Ltd. | | | 865,578 |
| | (Utilities) | | | |
| 925,000 | | China Life Insurance Co. Ltd. | | | 3,445,957 |
| | (Diversified Financials) | | | |
| 693,000 | | China Mobile Ltd. | | | 6,942,251 |
| | (Telecommunications) | | | |
| 1,342,000 | | China Overseas Land & Investment Ltd. | | | 1,626,562 |
| | (Real Estate-Developers) | | | |
| 4,664,000 | | China Petroleum &
Chemical Corp. (Class “H” Shares) | | | 3,680,979 |
| | (Energy) | | | |
| 289,500 | | China Shenhua Energy Co. Ltd.
(Class “H” Shares) | | | 710,121 |
| | (Energy) | | | |
| 215,500 | | CLP Holdings Ltd. | | | 1,738,384 |
| | (Utilities) | | | |
| 1,455,000 | | CNOOC Ltd. | | | 1,634,541 |
| | (Energy) | | | |
| 2,440,000 | | Datang International Power Generation Co. Ltd.
(Class “H” Shares) | | | 1,361,965 |
| | (Utilities) | | | |
| 5,036,000 | | Giordano International Ltd. | | | 1,758,896 |
| | (Consumer Discretionary) | | | |
| | | | | |
| Shares | | Description | | Value
(Note 1) |
| 44,100 | | Hang Seng Bank Ltd. | | $ | 833,672 |
| | (Banking) | | | |
| 141,000 | | Hengan International Group Co. Ltd. | | | 401,256 |
| | (Consumer Staples) | | | |
| 1,245,000 | | Hong Kong & China Gas Co. Ltd. | | | 2,841,980 |
| | (Utilities) | | | |
| 459,500 | | HongKong Electric Holdings | | | 2,886,105 |
| | (Utilities) | | | |
| 265,000 | | Hutchison Whampoa Ltd. | | | 2,035,344 |
| | (Industrials) | | | |
| 8,300,000 | | Industrial & Commercial Bank of China Ltd. (Class “H” Shares) | | | 5,016,481 |
| | (Banking) | | | |
| 2,747,200 | | iShares Asia Trust-iShares A50 China Tracker | | | 3,721,971 |
| | (Mutual Fund) | | | |
| 1,511,500 | | MTR Corp. Ltd. | | | 4,463,070 |
| | (Industrials) | | | |
| 1,676,000 | | PetroChina Co. Ltd.
(Class “H” Shares) | | | 1,739,847 |
| | (Energy) | | | |
| 428,500 | | Ping An Insurance Group Co. of China Ltd. (Class “H” Shares) | | | 2,509,281 |
| | (Diversified Financials) | | | |
| 562,600 | | Ports Design Ltd. | | | 1,030,425 |
| | (Consumer Discretionary) | | | |
| 201,000 | | Sun Hung Kai Properties Ltd. | | | 2,071,260 |
| | (Real Estate-Developers) | | | |
| 172,500 | | Swire Pacific Ltd.
(Class “A” Shares) | | | 1,516,300 |
| | (Real Estate-Developers) | | | |
| 107,600 | | Tencent Holdings Ltd. | | | 786,486 |
| | | | | |
| | (Information Technology) | | | |
| | | | | 63,164,679 |
| | | | | |
See Notes to Financial Statements.
4
| | | | | |
| Shares | | Description | | Value
(Note 1) |
| | INDIA—2.0% | | | |
| 13,679 | | Housing Development Finance Corp. Ltd. | | $ | 636,159 |
| | (Banking) | | | |
| 63,434 | | ICICI Bank Ltd. | | | 730,564 |
| | (Banking) | | | |
| 109,041 | | Satyam Computer Services Ltd. | | | 702,552 |
| | (Information Technology) | | | |
| 233,859 | | Zee Entertainment Enterprises Ltd. | | | 994,230 |
| | | | | |
| | (Consumer Discretionary) | | | |
| | | | | 3,063,505 |
| | | | | |
| | |
| | INDONESIA—1.0% | | | |
| 2,801,000 | | Bank Rakyat Indonesia | | | 1,582,550 |
| | | | | |
| | (Banking) | | | |
| | |
| | MALAYSIA—2.5% | | | |
| 552,200 | | Malayan Banking Berhad | | | 1,098,300 |
| | (Banking) | | | |
| 590,400 | | Public Bank Berhad | | | 1,717,231 |
| | (Banking) | | | |
| 1,192,200 | | Telekom Malaysia Berhad | | | 1,144,659 |
| | | | | |
| | (Telecommunications) | | | |
| | | | | 3,960,190 |
| | | | | |
| | |
| | PHILIPPINES—0.4% | | | |
| 102,076 | | Ayala Corp. | | | 646,485 |
| | | | | |
| | (Diversified Financials) | | | |
| | |
| | SINGAPORE—10.5% | | | |
| 204,000 | | City Developments Ltd. | | | 1,275,634 |
| | (Real Estate-Developers) | | | |
| 228,000 | | DBS Group Holdings Ltd. | | | 2,717,132 |
| | (Banking) | | | |
| 273,000 | | SembCorp Marine Ltd. | | | 580,388 |
| | (Industrials) | | | |
| 1,109,000 | | Singapore Press Holdings Ltd. | | | 3,094,081 |
| | (Consumer Discretionary) | | | |
| 1,218,000 | | Singapore Telecommunications Ltd. | | | 2,784,023 |
| | (Telecommunications) | | | |
| 1,328,000 | | SMRT Corp. Ltd. | | | 1,846,371 |
| | (Industrials) | | | |
| 353,000 | | United Overseas Bank Ltd. | | | 4,220,054 |
| | | | | |
| | (Banking) | | | |
| | | | | 16,517,683 |
| | | | | |
| | | | | |
| Shares | | Description | | Value
(Note 1) |
| | SOUTH KOREA—20.5% | | | |
| 4,265 | | CJ CheilJedang Corp.(a) | | $ | 693,481 |
| | (Consumer Staples) | | | |
| 18,882 | | GS Engineering & Construction Corp. | | | 1,524,845 |
| | (Industrials) | | | |
| 140,100 | | Hankook Tire Co. Ltd. | | | 1,965,811 |
| | (Consumer Discretionary) | | | |
| 11,312 | | Hite Brewery Co Ltd.(a) | | | 2,061,925 |
| | (Consumer Staples) | | | |
| 161,960 | | Hynix Semiconductor, Inc.(a) | | | 2,683,768 |
| | (Information Technology) | | | |
| 25,135 | | Hyundai Department Store Co. Ltd. | | | 1,954,435 |
| | (Consumer Discretionary) | | | |
| 48,970 | | Hyundai Development Co. | | | 1,764,941 |
| | (Industrials) | | | |
| 39,620 | | Hyundai Engineering & Construction Co. Ltd.(a) | | | 2,376,620 |
| | (Industrials) | | | |
| 22,771 | | Kookmin Bank | | | 1,017,513 |
| | (Banking) | | | |
| 22,007 | | KT&G Corp. | | | 1,642,539 |
| | (Consumer Staples) | | | |
| 10,609 | | LG Electronics, Inc. | | | 981,637 |
| | (Consumer Discretionary) | | | |
| 5,281 | | MegaStudy Co. Ltd. | | | 804,362 |
| | (Consumer Discretionary) | | | |
| 2,147 | | POSCO | | | 805,425 |
| | (Materials) | | | |
| 22,950 | | Samsung Card Co. | | | 782,867 |
| | (Diversified Financials) | | | |
| 11,766 | | Samsung Electronics Co. Ltd. | | | 5,391,814 |
| | (Information Technology) | | | |
| 47,219 | | Shinhan Financial Group Co. Ltd. | | | 1,689,382 |
| | (Banking) | | | |
| 11,279 | | SK Energy Co. Ltd. | | | 854,582 |
| | (Energy) | | | |
| 16,824 | | SK Holdings Co. Ltd. | | | 1,566,593 |
| | (Industrials) | | | |
| 9,694 | | SK Telecom Co. Ltd. | | | 1,659,352 |
| | | | | |
| | (Telecommunications) | | | |
| | | | | 32,221,892 |
| | | | | |
See Notes to Financial Statements.
5
| | | | | |
| Shares | | Description | | Value
(Note 1) |
| | TAIWAN—12.7% | | | |
| 37,087 | | Asustek Computer, Inc. | | $ | 73,400 |
| | (Information Technology) | | | |
| 750,350 | | Cathay Financial Holding Co. Ltd. | | | 1,036,120 |
| | (Diversified Financials) | | | |
| 2,145,000 | | Chunghwa Telecom Co. Ltd. | | | 5,045,971 |
| | (Telecommunications) | | | |
| 7,855 | | Far Eastern Textile Ltd.(b) | | | 5,561 |
| | (Industrials) | | | |
| 2,680,788 | | First Financial Holding Co. Ltd. | | | 1,678,700 |
| | (Banking) | | | |
| 1,020,206 | | Hon Hai Precision Industry Co. Ltd. | | | 3,654,069 |
| | (Information Technology) | | | |
| 62,000 | | HTC Corp. | | | 962,319 |
| | (Information Technology) | | | |
| 81,000 | | MediaTek, Inc. | | | 839,921 |
| | (Information Technology) | | | |
| 583,700 | | Powertech Technology, Inc. | | | 1,298,129 |
| | (Information Technology) | | | |
| 10,020 | | Taiwan Cement Corp. | | | 5,988 |
| | (Materials) | | | |
| 3,235,564 | | Taiwan Semiconductor Manufacturing Co. Ltd. | | | 5,426,144 |
| | | | | |
| | (Information Technology) | | | |
| | | | | 20,026,322 |
| | | | | |
| | |
| | THAILAND—3.2% | | | |
| 616,100 | | Advanced Info Service PCL | | | 1,464,739 |
| | (Telecommunications) | | | |
| 344,900 | | Bangkok Bank PCL | | | 1,056,703 |
| | (Banking) | | | |
| 303,700 | | PTT Exploration & Production PCL | | | 1,139,099 |
| | (Energy) | | | |
| 15,927,300 | | Quality House PCL | | | 834,439 |
| | (Real Estate-Developers) | | | |
| 933,800 | | Shin Corp. PCL | | | 573,628 |
| | | | | |
| | (Telecommunications) | | | |
| | | | | 5,068,608 |
| | | | | |
| | Total long-term investments (cost $155,303,476) | | | 146,251,914 |
| | | | | |
| | | | | |
| Shares | | Description | | Value
(Note 1) |
| | SHORT-TERM INVESTMENT—2.8% |
| | MONEY MARKET MUTUAL FUND |
| | UNITED STATES |
| 4,430,626 | | JPMorgan Prime Money Market Fund/Premier
(cost $4,430,626) | | $ | 4,430,626 |
| | | | | |
| | Total Investments(c)—95.8%
(cost $159,734,102) (Note 4) | | | 150,682,540 |
| | Other assets in excess of liabilities—4.2% | | | 6,617,052 |
| | | | | |
| | Net Assets—100.0% | | $ | 157,299,592 |
| | | | | |
The following annotations are used in the Portfolio of Investments:
| (a) | Non-income producing security. |
| (b) | An Independent Director of the Fund is Chairman and Chief Executive Officer of the Company. |
| (c) | As of September 30, 2008, 73 securities representing $135,525,612 and 86.2% of net assets were valued using an independent pricing source in accordance with the policies adopted by the Board of Directors. |
Various inputs are used in determining the value of the Fund’s investments. These inputs are summarized in the three broad levels listed below.
Level 1—quoted prices in active markets for identical securities
Level 2—other significant observable inputs (including quoted prices for similar securities, interest rates, prepayment speeds, credit risk, etc.)
Level 3—significant unobservable inputs (including the Fund’s own assumptions in determining the fair value of investments)
The following is a summary of the inputs used as of September 30, 2008 in valuing the Fund’s assets carried at fair value:
| | | | | |
Valuation inputs | | Investments
in Securities | | Other Financial
Instruments* |
Level 1—Quoted Prices | | $ | 15,156,928 | | — |
Level 2—Other Significant Observable Inputs | | | 135,525,612 | | — |
Level 3—Significant Unobservable Inputs | | | — | | — |
| | | | | |
Total | | $ | 150,682,540 | | — |
| | | | | |
| * | Other financial instruments are derivative instruments not reflected in the Portfolio of Investments, such as futures, forwards and swap contracts, which are valued at the unrealized appreciation/depreciation on the instrument. There were no such instruments held at period end. |
See Notes to Financial Statements.
6
As of March 31, 2008 and September 30, 2008, the Fund did not use any significant unobservable inputs (Level 3) in determining the value of investments.
The industry classification of portfolio holdings and other assets in excess of liabilities shown as a percentage of net assets as of September 30, 2008 was as follows:
| | | |
Banking | | 17.4 | % |
Information Technology | | 13.9 | |
Telecommunications | | 12.5 | |
Industrials | | 10.3 | |
Consumer Discretionary | | 8.0 | |
Real Estate-Developers | | 7.3 | |
Energy | | 6.2 | |
Utilities | | 6.2 | |
Diversified Financials | | 5.3 | |
Mutual Funds | | 5.2 | |
Consumer Staples | | 3.0 | |
Materials | | 0.5 | |
| | | |
| | 95.8 | |
Other assets in excess of liabilities | | 4.2 | |
| | | |
Total | | 100.0 | % |
| | | |
See Notes to Financial Statements.
7
THE ASIA PACIFIC FUND, INC.
Statement of Assets and Liabilities
September 30, 2008
(Unaudited)
| | | | |
| Assets | | | | |
Investments, at value (cost $159,734,102) | | $ | 150,682,540 | |
Foreign currency (cost $5,584,568) | | | 5,561,485 | |
Cash | | | 20,917 | |
Receivable for investments sold | | | 1,198,702 | |
Dividends and interest receivable | | | 291,435 | |
Prepaid assets | | | 148,925 | |
| | | | |
Total assets | | | 157,904,004 | |
| | | | |
| Liabilities | | | | |
Accrued expenses and other liabilities | | | 434,327 | |
Investment management fee payable | | | 123,891 | |
Administration fee payable | | | 36,571 | |
Payable for investments purchased | | | 9,623 | |
| | | | |
Total liabilities | | | 604,412 | |
| | | | |
| Net Assets | | $ | 157,299,592 | |
| | | | |
Net assets comprised: | | | | |
Common stock, at par | | $ | 103,441 | |
Paid-in capital in excess of par | | | 131,192,212 | |
| | | | |
| | | 131,295,653 | |
Distribution in excess of net investment income | | | (949,274 | ) |
Accumulated net realized gains on investments and foreign currency transactions | | | 36,029,204 | |
Net unrealized depreciation on investments and foreign currencies | | | (9,075,991 | ) |
| | | | |
Net Assets, September 30, 2008 | | $ | 157,299,592 | |
| | | | |
Net Assets Value per share:
($157,299,592 ÷ 10,344,073 shares of common stock outstanding) | | | $15.21 | |
| | | | |
See Notes to Financial Statements.
THE ASIA PACIFIC FUND, INC.
Statement of Operations
Six Months Ended September 30, 2008
(Unaudited)
| | | | |
| Net Investment Income | | | | |
Income | | | | |
Dividends (net of foreign withholding taxes of $274,045) | | $ | 3,250,575 | |
Expenses | | | | |
Investment management fee | | | 880,474 | |
Administration fee | | | 258,726 | |
Custodian’s fees and expenses | | | 199,000 | |
Directors’ fees and expenses | | | 166,000 | |
Reports to shareholders | | | 114,000 | |
Legal fees and expenses | | | 91,000 | |
Insurance expense | | | 54,000 | |
Audit fees and expenses | | | 22,000 | |
Transfer agent’s fees and expenses | | | 16,000 | |
Registration expenses | | | 12,000 | |
Miscellaneous | | | 10,791 | |
| | | | |
Total expenses | | | 1,823,991 | |
| | | | |
Net investment income | | | 1,426,584 | |
| | | | |
| Realized and Unrealized Gain (Loss) on Investments, Foreign Currency and Futures Transactions | | | | |
Net realized gain (loss) on: | | | | |
Investment transactions | | | (15,428,880 | ) |
Foreign currency transactions | | | (378,193 | ) |
Futures transactions | | | 25,996 | |
| | | | |
| | | (15,781,077 | ) |
| | | | |
Net change in unrealized appreciation (depreciation) on: | | | | |
Investments | | | (52,811,774 | ) |
Foreign currencies | | | (10,334 | ) |
| | | | |
| | | (52,822,108 | ) |
| | | | |
Net loss on investments, foreign currencies and futures | | | (68,603,185 | ) |
| | | | |
| Net Decrease in Net Assets Resulting From Operations | | $ | (67,176,601 | ) |
| | | | |
See Notes to Financial Statements.
8
THE ASIA PACIFIC FUND, INC.
Statement of Changes in Net Assets
(Unaudited)
| | | | | | | | |
Decrease
in Net Assets | | Six Months
Ended
September 30,
2008 | | | Year Ended
March 31,
2008 | |
| | |
Operations | | | | | | | | |
| | |
Net investment income | | $ | 1,426,584 | | | $ | 924,593 | |
| | |
Net realized gain (loss) on investments, foreign currency and futures transactions | | | (15,781,077 | ) | | | 108,273,017 | |
| | |
Net change in unrealized appreciation (depreciation) on investments and foreign currencies | | | (52,822,108 | ) | | | (48,948,990 | ) |
| | | | | | | | |
| | |
Net increase (decrease) in net assets resulting from operations | | | (67,176,601 | ) | | | 60,248,620 | |
| | | | | | | | |
| | |
Dividends from net investment income (Note 1) | | | — | | | | (9,413,105 | ) |
| | |
Distributions paid from capital gains (Note 1) | | | — | | | | (74,891,086 | ) |
| | | | | | | | |
| | |
Total dividends and distributions | | | — | | | | (84,304,191 | ) |
| | | | | | | | |
| | |
Total decrease | | | (67,176,601 | ) | | | (24,055,571 | ) |
| | |
| Net Assets | | | | | | | | |
| | |
Beginning of period | | $ | 224,476,193 | | | $ | 248,531,764 | |
| | | | | | | | |
| | |
End of period | | $ | 157,299,592 | | | $ | 224,476,193 | |
| | | | | | | | |
See Notes to Financial Statements.
THE ASIA PACIFIC FUND, INC.
Notes to Financial Statements
(Unaudited)
The Asia Pacific Fund, Inc. (the “Fund”) is registered under the Investment Company Act of 1940 as a diversified, closed-end, management investment company. The Fund’s investment objective is to achieve long-term capital appreciation through investment of at least 80% of investable assets in equity securities of companies in the Asia Pacific countries.
Note 1. Accounting Policies | |
The following is a summary of significant accounting policies followed by the Fund in the preparation of its financial statements.
The Fund’s financial statements are prepared in accordance with U.S. generally accepted accounting principles, which may require the use of management estimates and assumptions. Actual results could differ from these estimates and assumptions.
Securities Valuation Investments are stated at value. Securities for which the primary market is on an exchange are valued at the last sale price on such exchange or market on the day of valuation or, if there was no sale on such day, at the last bid price quoted on such day. Securities for which reliable market quotations are not readily available, or whose value have been affected by events occurring after the close of the security’s foreign market and before the Fund’s normal pricing time, are valued at fair value in accordance with the Board of Director’s approved fair valuation procedures. When determining the fair valuation of securities, some of the factors influencing the valuation include, the nature of any restrictions on disposition of the securities; assessment of the general liquidity of the securities; the issuer’s financial condition and the markets in which it does business; the cost of the investment; the size of the holding and the capitalization of the issuer; the prices of any recent transactions or bids/offers for such securities or any comparable securities; any available analyst, media or other reports or information regarding the issuer or the markets or industry in which it operates; other analytical data; and consistency with valuation of similar securities held by other funds managed by Baring Asset Management (Asia) Limited. Using fair value to price securities may result in a value that is different from a security’s
9
most recent closing price and from the price used by other mutual funds to calculate their net asset values.
Investments in mutual funds are valued at the net asset value on the date the New York Stock Exchange is open for trading.
Short-term debt securities which mature in more than 60 days are valued at current market quotations. Short-term securities which mature in 60 days or less are valued at amortized cost.
Foreign Currency Translation The books and records of the Fund are maintained in United States dollars. Foreign currency amounts are translated into United States dollars on the following basis:
(i) market value of investment securities, other assets and liabilities—at the current rate of exchange.
(ii) purchases and sales of investment securities, income and expenses—at the rate of exchange prevailing on the respective dates of such transactions.
Although the net assets of the Fund are presented at the foreign exchange rates and market values at the close of the fiscal period, the Fund does not isolate that portion of the results of operations arising as a result of changes in the foreign exchange rates from the fluctuations arising from changes in the market prices of securities held at fiscal period end. Similarly, the Fund does not isolate the effect of changes in foreign exchange rates from the fluctuations arising from changes in the market prices of portfolio securities sold during the fiscal year. Accordingly, these realized foreign currency gains (losses) are included in the reported net realized gains (losses) on investment transactions.
Net realized gains (losses) on foreign currency transactions represent net foreign exchange gains (losses) from sales and maturities of short-term securities, holding of foreign currencies, currency gains (losses) realized between the trade and settlement dates on security transactions, and the difference between the amounts of dividends, interest and foreign taxes recorded on the Fund’s books and the US dollar equivalent amounts actually received or paid. Net currency gains (losses) from valuing foreign currency denominated assets, other than investment securities, and liabilities at fiscal period end exchange rates are reflected as a component of unrealized appreciation (depreciation) on investments and foreign currencies.
Foreign security and currency transactions may involve certain considerations and risks not typically associated with those of US companies as a result of, among other factors, the level of governmental supervision and regulation of foreign securities markets and the possibility of political or economic instability.
Stock Index Futures Contracts A stock index futures contract is an agreement to purchase (long) or sell (short) an agreed amount of securities at a set price for delivery on a future date. Upon entering into a stock index futures contract, the Fund is required to pledge to the broker an amount of cash and/or other assets equal to a certain percentage of the contract amount. This amount is known as the “initial margin.” Subsequent payments known as “variation margin,” are made or received by the Fund each day, depending on the daily fluctuations in the value of the underlying security. Such variation margin is recorded for financial statement purposes on a daily basis as unrealized gain or loss. When the contract expires or is closed, the gain or loss is realized and is presented in the Statement of Operations as net realized gain or loss on stock index futures contracts.
The Fund may utilize stock index futures contracts for hedging and investment purposes. Should market prices for the futures contracts or the underlying assets move in ways not anticipated by the Fund, losses may result. The use of futures contracts for hedging and investment purposes involves the risk of imperfect correlation in the movements in prices of futures contracts and the underlying assets being hedged or the exposures desired by the Fund.
Security Transactions and Net Investment Income Security transactions are recorded on the trade date. Realized and unrealized gains (losses) from security and foreign currency transactions are calculated on the identified cost basis. Dividend income is recorded on the ex-dividend date, and interest income and expenses are recorded on an accrual basis. Expenses are recorded on the accrual basis which may require the use of certain estimates by management. Actual results may differ from such estimates.
Dividends and Distributions Dividends from net investment income, if any, are declared and paid at least annually in a manner that qualifies for the dividends-paid deduction. The Fund’s current intention is to distribute at least annually any net capital gains in excess of net capital loss carryforwards in a manner that avoids income
10
and excise taxes being imposed on the Fund. Dividends and distributions are recorded on the ex-dividend date. The Fund may choose to satisfy the foregoing by making distributions in cash, additional Fund shares, or both.
The Fund could determine in the future to retain net long-term capital gains in respect of any fiscal year without affecting the ability of the Fund to qualify as a regulated investment company. In that case, the Fund would be subject to taxation on the retained amount and shareholders subject to U.S. federal income taxation would be required to include in income for tax purposes their shares of the undistributed amount and would be entitled to credits or refunds against their U.S. federal income tax liabilities with respect to their proportionate shares of the tax paid by the Fund.
Income distributions and capital gain distributions are determined in accordance with income tax regulations, which may differ from U.S. generally accepted accounting principles.
Taxes It is the Fund’s current intention to continue to meet the requirements of the US Internal Revenue Code applicable to regulated investment companies and to distribute all of its taxable income and gain to shareholders. Therefore, no federal income tax provision is required. If the Fund determines in the future to retain capital gains, the Fund will provide for all required taxes.
Withholding taxes on foreign dividends and interest and foreign capital gains tax is accrued in accordance with the Fund’s understanding of the applicable country’s tax rules and rates.
Note 2. Investment Management and Administration Agreements | |
The Fund has a management agreement with Baring Asset Management (Asia) Limited (the "Investment Manager") and an administration agreement with Prudential Investments LLC (the "Administrator").
The investment management fee, is computed weekly and payable monthly at the following annual rates: 1.00% of the Fund’s average weekly net assets up to $100 million and 0.70% of such assets in excess of $100 million.
The administration fee is also computed weekly and payable monthly at the following annual rates: 0.25% of the Fund’s average weekly net assets up to $200 million and 0.20% of such assets in excess of $200 million.
Pursuant to the agreements, the Investment Manager provides continuous supervision of the investment portfolio and the Administrator provides occupancy and certain clerical, administrative and accounting services for the Fund. Both the Investment Manager and the Administrator pay the cost of compensation of certain directors and officers of the Fund. The Fund bears all other costs and expenses.
Note 3. Portfolio Securities | |
Purchases and sales of in-vestment securities, other than short-term invest-ments, for the six months ended September 30, 2008 aggregated $242,535,537 and $240,892,042 respectively.
The United States federal income tax basis of the Fund's investments and the net unrealized appreciation on a tax basis as of September 30, 2008 were as follows:
| | | | | | | | | | | | |
Tax Basis | | Appreciation | | Depreciation | | | Net Unrealized
Depreciation | |
| $ | 168,008,653 | | $ | 11,579,447 | | $ | (28,905,660 | ) | | $ | (17,326,213 | ) |
The difference between book basis and tax basis is attributable to deferred losses on wash sales and mark-to-market of unrealized gains on passive foreign investment companies.
Management has analyzed the Fund’s tax positions taken on federal income tax returns for all open tax years and has concluded that as of September 30, 2008, no provision for income tax would be required in the Fund’s financial statements. The Fund’s federal and state income and federal excise tax returns for tax years for which the applicable statutes of limitations have not expired are subject to examination by the Internal Revenue Service and state departments of revenue.
There are 30 million shares of $0.01 par value common stock authorized.
11
The Fund currently is a party to a committed credit facility with a bank. The credit facility provides for a maximum commitment of $30,000,000 or 20% of the Fund's net assets, whichever is less. Interest on any borrowings under the credit facility will be at LIBOR plus 0.50%. The Fund pays a commitment fee of .05% on the unused portion of the facility. The commitment fee is accrued daily and paid quarterly. The Fund's obligations under the credit facility are secured by substantially all the assets of the Fund. The purpose of the credit facility is to assist the Fund with its general cash flow requirements, including the provision of portfolio leverage. For the six months ended September 30, 2008, there were no borrowings under this credit facility.
Note 7. New Accounting Pronouncements | |
In March 2008, the FASB released Statement of Financial Accounting Standards No. 161, "Disclosures about Derivative Instruments and Hedging
Activities" ("FAS 161"). FAS 161 requires qualitative disclosures about objectives and strategies for using derivatives, quantitative disclosures about fair value amounts of and gains and losses on derivative instruments, and disclosures about credit-risk-related contingent features in derivative agreements. The application of FAS 161 is required for any reporting period beginning after November 15, 2008. At this time, management is evaluating the implications of FAS 161 and its impact on the financial statements has not yet been determined.
12
THE ASIA PACIFIC FUND, INC.
Financial Highlights
(Unaudited)
| | | | | | | | | | | | | | | | | | | | | | | | |
| Per Share Operating Performance: | | Six Months
Ended
September 30,
2008 | | | Year ended March 31, | |
| | | 2008 | | | 2007 | | | 2006 | | | 2005 | | | 2004 | |
Net asset value, beginning of period | | $ | 21.70 | | | $ | 24.03 | | | $ | 20.54 | | | $ | 16.62 | | | $ | 14.90 | | | $ | 9.10 | |
| | | | | | | | | | | | | | | | | | | | | | | | |
Net investment income | | | 0.14 | | | | 0.09 | | | | 0.08 | | | | 0.11 | | | | 0.18 | | | | 0.09 | |
Net realized and unrealized gain (loss) on investments and foreign currency transactions | | | (6.63 | ) | | | 5.73 | | | | 6.37 | | | | 4.49 | | | | 1.69 | | | | 5.89 | |
| | | | | | | | | | | | | | | | | | | | | | | | |
Total from investment operations | | | (6.49 | ) | | | 5.82 | | | | 6.45 | | | | 4.60 | | | | 1.87 | | | | 5.98 | |
| | | | | | | | | | | | | | | | | | | | | | | | |
Less dividends and distributions: | | | | | | | | | | | | | | | | | | | | | | | | |
Dividends from net investment income | | | — | | | | (0.91 | ) | | | (0.20 | ) | | | (0.12 | ) | | | (0.15 | ) | | | (0.18 | ) |
Distributions paid from capital gains | | | — | | | | (7.24 | ) | | | (2.76 | ) | | | (0.56 | ) | | | — | | | | — | |
| | | | | | | | | | | | | | | | | | | | | | | | |
Total dividends and distributions | | | — | | | | (8.15 | ) | | | (2.96 | ) | | | (0.68 | ) | | | (0.15 | ) | | | (0.18 | ) |
| | | | | | | | | | | | | | | | | | | | | | | | |
Net asset value, end of period | | $ | 15.21 | | | $ | 21.70 | | | $ | 24.03 | | | $ | 20.54 | | | $ | 16.62 | | | $ | 14.90 | |
| | | | | | | | | | | | | | | | | | | | | | | | |
Market value, end of period | | $ | 13.22 | | | $ | 19.75 | | | $ | 21.22 | | | $ | 18.39 | | | $ | 14.65 | | | $ | 13.90 | |
| | | | | | | | | | | | | | | | | | | | | | | | |
Total investment return(a) | | | (33.1 | )% | | | 28.68 | % | | | 30.39 | % | | | 30.32 | % | | | 6.48 | % | | | 73.83 | % |
| | | | | | | | | | | | | | | | | | | | | | | | |
| Ratios to Average Net Assets: | | | | | | | | | | | | | | | | | | | | | | | | |
Total expenses (including loan interest)(c) | | | 1.75 | %(d) | | | 1.54 | %(b) | | | 1.78 | %(b) | | | 2.24 | %(b) | | | 2.01 | %(b) | | | 2.06 | % |
Net investment income | | | 1.37 | %(d) | | | 0.31 | % | | | 0.35 | % | | | .61 | % | | | 1.18 | % | | | 0.74 | % |
| Supplemental Data: | | | | | | | | | | | | | | | | | | | | | | | | |
Average net assets (000 omitted) | | $ | 208,019 | | | $ | 297,765 | | | $ | 230,490 | | | $ | 184,611 | | | $ | 155,484 | | | $ | 128,632 | |
Portfolio turnover rate | | | 123 | %(e) | | | 105 | % | | | 86 | % | | | 122 | % | | | 73 | % | | | 73 | % |
Net assets, end of period (000 omitted) | | $ | 157,300 | | | $ | 224,476 | | | $ | 248,532 | | | $ | 212,419 | | | $ | 171,933 | | | $ | 154,135 | |
| (a) | Total investment return is calculated assuming a purchase of common stock at the current market value on the first day and a sale at the current market value on the last day of each fiscal period reported. Dividends and distributions are assumed, for purposes of this calculation, to be reinvested at prices obtained under the Fund’s dividend reinvestment plan. These calculations do not include brokerage commissions. Total returns for periods of less than a full year are not annualized. |
| (b) | The expense ratio without loan interest expense would have been 1.52%, 1.68%, 1.78%, 1.94% and 2.03% for the fiscal years ended March 31, 2008, 2007, 2006, 2005, and 2004, respectively. |
| (c) | Does not include expenses of the underlying funds in which the Fund invests. |
Shown above is selected data for a share of common stock outstanding, total investment return, ratios to average net assets and other supplemental data for the years indicated. This information has been determined based upon information provided in the financial statements and market price data for the Fund’s shares.
See Notes to Financial Statements.
13
Board of Directors’ Approval of Continuance of Investment Management Agreement
At a meeting held on May 16, 2008, the Board of Directors of the Fund (the “Board”), including a majority of the disinterested directors (the “Directors”), approved the continuance of the investment management agreement (the “Investment Management Agreement”) between the Fund and Baring Asset Management (Asia) Limited (the “Investment Manager”). Prior to acting on the continuance of the Investment Management Agreement, the Directors considered the factors discussed below.
Factors Considered by the Board
Prior to approval of the continuance of the Investment Management Agreement, the Directors had evaluated information provided by the Investment Manager. They reviewed the Investment Management Agreement with the Investment Manager and with experienced Fund counsel, who are independent of the Investment Manager, and who advised on the relevant legal standards.
Based on their experience gained as Fund Directors, the Directors considered their knowledge of the nature and quality of the services provided by the Investment Manager to the Fund and their overall confidence in the Investment Manager’s integrity and competence. The Directors noted that they receive presentations at regular Board meetings from the Investment Manager on the investment results of the Fund and review extensive materials and information provided by the Investment Manager.
The Directors also considered all other factors they believed relevant, including the specific matters described below. In their deliberations, the Directors did not identify any particular information that was all-important or controlling, and each Director attributed different weights to the various factors.
The Directors determined that the selection of the Investment Manager to manage the Fund and the overall arrangements between the Fund and the Investment Manager, including the investment management fee, as provided in the Investment Management Agreement, were fair and reasonable in light of the services performed, expenses incurred and such other matters as the Directors considered relevant in the exercise of their reasonable judgment.
The material factors and conclusions that formed the basis for the Directors’ determinations include the following:
Nature, extent and quality of services provided by the Investment Manager
The Directors considered the scope and quality of services provided by the Investment Manager under the Investment Management Agreement, including the quality of the investment research capabilities of the Investment Manager and the other resources it has dedicated to performing services for the Fund. They noted the professional experience of the Fund’s portfolio management team and other senior personnel of the Investment Manager. The Directors concluded that they were satisfied with the nature, extent and quality of services provided to the Fund under the Investment Management Agreement.
Costs of Services Provided and Profitability to the Investment Manager
The Directors reviewed a schedule of the expenses and assets under management for 2007 and the estimated profitability of the Investment Management Agreement to the Investment Manager for 2007. The Directors reviewed the Investment Manager’s memorandum describing the assumptions and methods of allocation of estimated costs of managing the Fund in 2007 and in preparing Fund-specific profitability data.
The Directors recognized that it is difficult to make comparisons of profitability from fund advisory contracts because comparative information is not generally publicly available and is affected by numerous factors. The Directors focused
14
on profitability of the Investment Manager’s relationship with the Fund before taxes. The Directors concluded that they were satisfied that the Investment Manager’s level of profitability from its relationship with the Fund was not unreasonable.
Fall-Out Benefits
The Directors considered the benefits to the Investment Manager from its relationship with the Fund other than fees payable under the Investment Management Agreement, including but not limited to soft dollar arrangements whereby the Investment Manager receives brokerage and research services from many of the brokers and dealers that execute purchases and sales of securities on behalf of its clients, including the Fund, on an agency basis. The Directors recognized that the Investment Manager’s profitability would be somewhat lower without these benefits. The Directors also believe that the Investment Manager derives reputational and other benefits from its association with the Fund.
Investment Results
The Directors considered the investment results of the Fund as compared to other funds investing in one or more of the Asia Pacific countries as provided by Standard & Poor’s Micropal (“S&P Micropal”). The Directors also reviewed information showing performance of the Fund compared to the MSCI All Countries Combined Far East Free Ex-Japan Index (the “Index”) and to funds in the S&P Micropal Universe of Asia Pacific funds over the 1-, 3-, 5- and 10-year periods ended March 31, 2008. The Directors noted that the Fund’s net asset value performance had been above that of the Index and of the S&P Micropal average for Asia Pacific funds for all periods. The Directors concluded that the Fund’s investment performance was satisfactory.
Advisory Fees
The Directors considered the advisory fee rate paid by the Fund to the Investment Manager and information prepared by Lipper, Inc. (“Lipper”) concerning fee rates paid by other funds in the same Lipper category as the Fund, that is, “Pacific Ex Japan Funds.” The Directors recognized that it is difficult to make comparisons of advisory fees because there are variations in the services that are included in the fees paid by other funds. Nonetheless, the Directors noted that the Fund’s advisory fee as a percentage of average net assets was competitive with the average, the median and the dollar-weighted average of Lipper’s Pacific Ex Japan Funds. In considering the comparative information on fees, the Directors considered both the advisory fee rate and the fee rate under the Fund’s separate administration agreement. The information reviewed by the Directors showed that the Fund’s effective fee rate under the Investment Management Agreement for calendar 2007 was .79%, and that the Fund’s effective investment management fee rate combined with the effective fee rate under the administration agreement compared favorably to other U.S. registered closed-end Pacific ex Japan funds.
The Directors also considered the fees the Investment Manager charges the only other registered investment company it manages, which invests in China, and with the Investment Manager’s other clients with investment objectives similar to those of the Fund. The Directors noted that the Investment Manager’s only other registered investment company client’s advisory fee schedule and combined advisory/administrative fee schedule were each higher than the Fund’s comparable fee schedules. They also noted that the advisory fee schedules for other institutional accounts with a comparable investment objective were lower and the Investment Manager’s representation that fees charged to these accounts were lower because they did not entail the same regulatory, supervisory or compliance costs that are incurred with respect to registered closed-end funds. The Investment Manager indicated that for some of these other institutional clients there are also performance fees. The Directors noted that the application of such institutional fee schedule to the Fund’s level of assets would have resulted in a fee that would have been lower than that resulting from the Investment Management Agreement.
15
The Investment Manager reviewed with the Directors the significantly greater scope of services it provides to the Fund relative to institutional clients. In light of this information, the Directors did not place significant weight on the fee comparisons with institutional accounts.
Economies of Scale
The Directors considered that the Fund is a closed-end fund and that it was not expected to have meaningful asset growth absent a rights offering or an acquisition. In such circumstances, they did not view the potential for realization of economies of scale as the Fund’s assets grow to be a meaningful factor in their deliberations. The Directors noted, however, that the advisory fee schedule for the Fund contains a breakpoint at $100 million so that, when assets exceed the breakpoint, the fee rate is reduced from 1.00% to .70% on the incremental assets. The Directors concluded that the Fund’s breakpoint arrangements established a reasonable basis for realizing economies of scale should they exist.
16
Supplemental Proxy Information
An Annual Meeting of Stockholders was held on August 13, 2008. At such meeting the stockholders elected the entire slate of Class I Directors.
Approval of Directors
| | | | |
| | | Affirmative
Votes Cast | | Shares Withheld |
Olarn Chaipravat | | 7,984,961 | | 197,002 |
Michael J. Downey | | 8,005,557 | | 176,406 |
Duncan M. McFarland | | 8,004,047 | | 177,916 |
Additional Information
The Fund is required to file its complete schedule of portfolio holdings with the Securities and Exchange Commission (“SEC”) on Form N-Q for its first and third fiscal quarters and within 60 days of the fiscal quarter end. Once filed, the Fund’s Form N-Q is available without charge on the SEC’s website (http//www.sec.gov) or by calling the Fund toll free at 1-(888) 4-ASIA-PAC. You can also obtain copies of the Fund’s Form N-Q by visiting the SEC’s Public Reference Room in Washington, DC (please call the SEC at (800) 732-0330 for information on the operation of the Public Reference Room).
Information regarding the Fund’s proxy voting policies and procedures and its proxy voting record for the 12-month period ending June 30 of each year is filed with the SEC on Form N-PX no later than August 31 of each year. The Fund’s Form N-PX is available without charge, upon request, by calling the Fund at its toll free number 1-(888) 4-ASIA-PAC on the cover of this report and on the SEC’s website (http//www.sec.gov) or on or through the Fund’s website address (www.asiapacificfund.com).
17
Item 2 – Code of Ethics – Not required, as this is not an annual filing.
Item 3 – Audit Committee Financial Expert – Not required, as this is not an annual filing.
Item 4 – Principal Accountant Fees and Services – Not required, as this is not an annual filing.
Item 5 – Audit Committee of Listed Registrants – Not required, as this is not an annual filing.
Item 6 – Schedule of Investments – The schedule is included as part of the report to shareholders filed under Item 1 of this Form.
Item 7 – Disclosure of Proxy Voting Policies and Procedures for Closed-End Management Investment Companies – Not required, as this is not an annual filing.
Item 8 – Portfolio Managers of Closed-End Management Investment Companies – Not required, as this is not an annual filing.
Item 9 – Purchases of Equity Securities by Closed-End Management Investment Company and Affiliated Purchasers – There have been no purchases of equity securities by the registrant or any affiliated purchasers during the period covered by this report.
Item 10 – Submission of Matters to a Vote of Security Holders – Not applicable.
Item 11 – Controls and Procedures
| | (a) | It is the conclusion of the registrant’s principal executive officer and principal financial officer that the effectiveness of the registrant’s current disclosure controls and procedures (such disclosure controls and procedures having been evaluated within 90 days of the date of this filing) provide reasonable assurance that the information required to be disclosed by the registrant has been recorded, processed, summarized and reported within the time period specified in the Commission’s rules and forms and that the information required to be disclosed by the registrant has been accumulated and communicated to the registrant’s principal executive officer and principal financial officer in order to allow timely decisions regarding required disclosure. |
| | (b) | There has been no significant change in the registrant’s internal control over financial reporting that occurred during the registrant’s most recent fiscal quarter of the period covered by this report that has materially affected, or is likely to materially affect, the registrant’s internal control over financial reporting. |
Item 12 – Exhibits
| | (a) | (1) Code of Ethics – Not required, as this is not an annual filing. |
(2) Certifications pursuant to Section 302 of the Sarbanes-Oxley Act – Attached hereto as Exhibit EX-99.CERT.
(3) Any written solicitation to purchase securities under Rule 23c-1. – Not applicable.
| | (b) | Certifications pursuant to Section 906 of the Sarbanes-Oxley Act – Attached hereto as Exhibit EX-99.906CERT. |
SIGNATURES
Pursuant to the requirements of the Securities Exchange Act of 1934 and the Investment Company Act of 1940, the registrant has duly caused this report to be signed on its behalf by the undersigned, thereunto duly authorized.
(Registrant) The Asia Pacific Fund, Inc.
| | | | |
| By (Signature and Title)* | | /s/ Deborah A. Docs | | |
| | Deborah A. Docs | | |
| | Secretary | | |
| |
| Date November 24, 2008 | | |
|
| Pursuant to the requirements of the Securities Exchange Act of 1934 and the Investment Company Act of 1940, this report has been signed below by the following persons on behalf of the registrant and in the capacities and on the dates indicated. |
| | |
| By (Signature and Title)* | | /s/ Brian A. Corris | | |
| | Brian A. Corris | | |
| | President and Principal Executive Officer | | |
| |
| Date November 24, 2008 | | |
| | |
| By (Signature and Title)* | | /s/ M. Sadiq Peshimam | | |
| | M. Sadiq Peshimam | | |
| | Treasurer and Principal Financial and Accounting Officer | | |
| |
| Date November 24, 2008 | | |
| * | Print the name and title of each signing officer under his or her signature. |