UNITED STATES
SECURITIES AND EXCHANGE COMMISSION
Washington, D.C. 20549
FORM N-CSR
CERTIFIED SHAREHOLDER REPORT OF REGISTERED
MANAGEMENT INVESTMENT COMPANIES
| Investment Company Act file number | 811-04750 | |
| Fenimore Asset Management Trust |
| (Exact name of registrant as specified in charter) |
| 384 North Grand Street, P.O. Box 399 Cobleskill, New York | | 12043 |
| (Address of principal executive offices) | | (Zip code) |
Michael F. Balboa
| Fenimore Asset Management Trust 384 North Grand Street, P.O. Box 399 Cobleskill, New York, 12043 |
| (Name and address of agent for service) |
| Registrant’s telephone number, including area code: | 1-800-453-4392 | |
| Date of fiscal year end: | December 31 | |
| | | |
| Date of reporting period: | December 31, 2024 | |
Form N-CSR is to be used by management investment companies to file reports with the Commission not later than 10 days after the transmission to stockholders of any report that is required to be transmitted to stockholders under Rule 30e-1 under the Investment Company Act of 1940 (17 CFR 270.30e-1). The Commission may use the information provided on Form N-CSR in its regulatory, disclosure review, inspection, and policymaking roles.
A registrant is required to disclose the information specified by Form N-CSR, and the Commission will make this information public. A registrant is not required to respond to the collection of information contained in Form N-CSR unless the Form displays a currently valid Office of Management and Budget (“OMB”) control number. Please direct comments concerning the accuracy of the information collection burden estimate and any suggestions for reducing the burden to Secretary, Securities and Exchange Commission, 450 Fifth Street, NW, Washington, DC 20549-0609. The OMB has reviewed this collection of information under the clearance requirements of 44 U.S.C. § 3507.
| Item 1. | Reports to Stockholders. |
FAM DIVIDEND FOCUS FUND - INVESTOR SHARES (FAMEX)
Annual Shareholder Report - December 31, 2024
This annual shareholder report contains important information about FAM Dividend Focus Fund for the period of January 1, 2024 to December 31, 2024. You can find additional information about the Fund at www.fenimoreasset.com/resources/reports/. You can also request this information by contacting us at (800) 932-3271.
What were the Fund’s costs for the last year?
(based on a hypothetical $10,000 investment)
| Class Name | Costs of a $10,000 investment | Costs paid as a percentage of a $10,000 investment |
|---|
| Investor Shares | $126 | 1.21% |
|---|
How did the Fund perform during the reporting period?
While the Fund delivered outperformance in the first half of 2024, a series of challenges in the second half weighed on full-year results. Periods of underperformance are inevitable, but our strategy is built with this in mind, prioritizing long-term compounding and not short-term performance. We believe a concentrated portfolio of quality businesses should outperform over the long term and remain confident in our holdings.
A key tenet of the Fund's strategy is to invest in companies that consistently grow their dividend over time. During the past 12 months, 26 of the Fund's 28 holdings increased their dividend.
Since the Fund’s inception, the managers continually follow the same strategy.
Average Annual Total Returns
| 1 Year | 5 Years | 10 Years |
|---|
| FAM Dividend Focus Fund - Investor Shares | 7.58% | 9.65% | 11.07% |
|---|
S&P 500® Index | 25.02% | 14.53% | 13.10% |
|---|
Russell Midcap® Index | 15.34% | 9.92% | 9.63% |
|---|
In connection with applicable mutual performance disclosure requirements, the Fund has adopted the use of the S&P 500® Index as its primary comparative benchmark performance index and it has adopted the use of the Russell Midcap® Index as an additional comparative benchmark performance index. The Russell Midcap® Index generally reflects the market sectors in which the Fund primarily invests and the S&P 500® Index is a broad-based securities markets index that is generally representative of the overall domestic US equity markets as a whole.
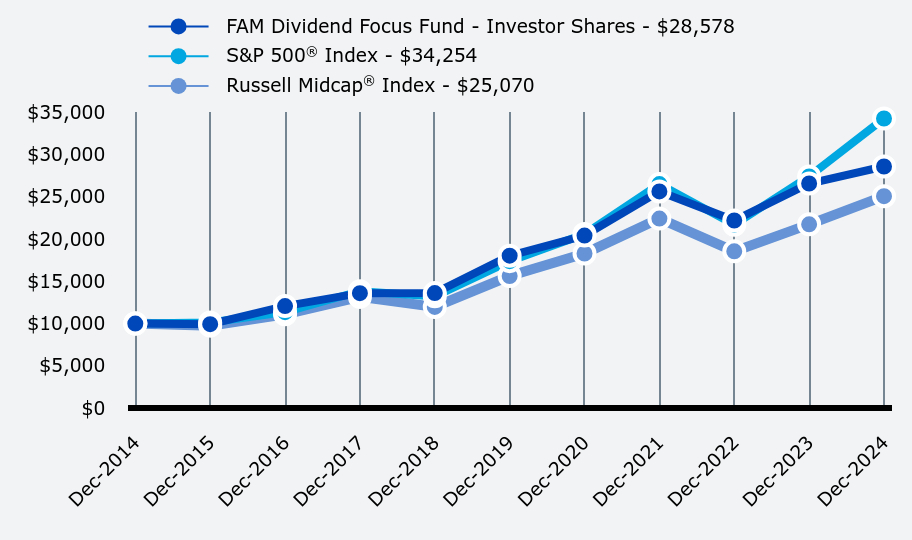
How has the Fund performed over the last ten years?
Total Return Based on $10,000 Investment
| FAM Dividend Focus Fund - Investor Shares | S&P 500® Index | Russell Midcap® Index |
|---|
| Dec-2014 | $10,000 | $10,000 | $10,000 |
|---|
| Dec-2015 | $9,927 | $10,138 | $9,756 |
|---|
| Dec-2016 | $12,070 | $11,351 | $11,102 |
|---|
| Dec-2017 | $13,596 | $13,829 | $13,158 |
|---|
| Dec-2018 | $13,603 | $13,223 | $11,966 |
|---|
| Dec-2019 | $18,033 | $17,386 | $15,621 |
|---|
| Dec-2020 | $20,413 | $20,585 | $18,292 |
|---|
| Dec-2021 | $25,633 | $26,494 | $22,424 |
|---|
| Dec-2022 | $22,193 | $21,696 | $18,541 |
|---|
| Dec-2023 | $26,564 | $27,399 | $21,735 |
|---|
| Dec-2024 | $28,578 | $34,254 | $25,070 |
|---|
The Fund's past performance is not a good predictor of how the Fund will perform in the future. The graph and table do not reflect the deduction of taxes that a shareholder would pay on fund distributions or redemption of fund shares.
- Net Assets$749,798,693
- Number of Portfolio Holdings28
- Advisory Fee $6,802,792
- Portfolio turnover7%
FAM DIVIDEND FOCUS FUND - INVESTOR SHARES (FAMEX)
Annual Shareholder Report - December 31, 2024
Top 10 Holdings (% of net assets)
| Holding Name | % of Net Assets |
| Trane Technologies plc | 8.7% |
| Arthur J. Gallagher & Company | 7.9% |
| Stryker Corporation | 5.1% |
| Broadridge Financial Solutions, Inc. | 5.1% |
| CDW Corporation | 5.0% |
| Ross Stores, Inc. | 4.8% |
| Paychex, Inc. | 4.3% |
| HEICO Corporation - Class A | 4.1% |
| Republic Services, Inc. | 4.1% |
| Cintas Corporation | 3.9% |
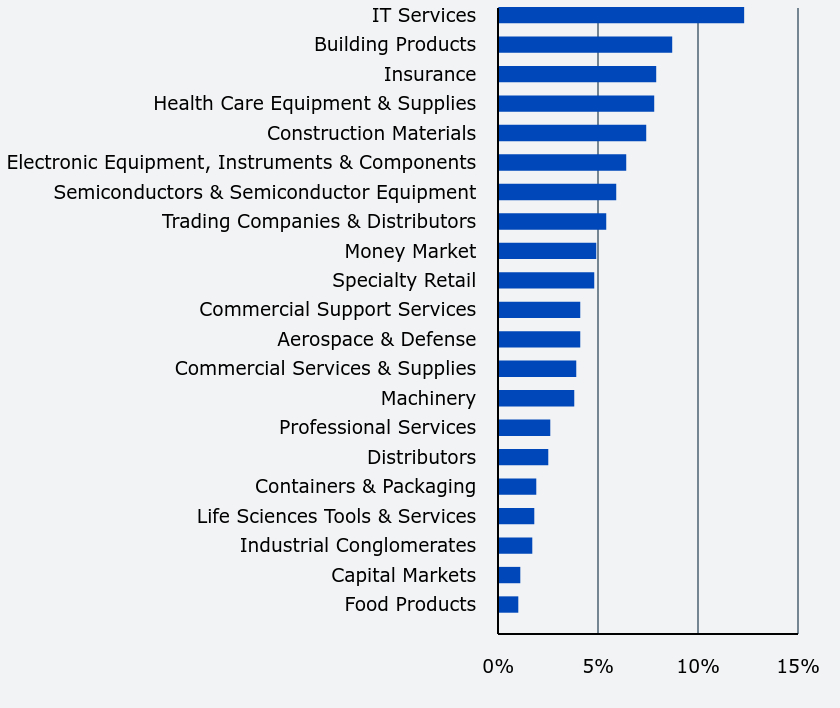
Portfolio Composition (% of net assets)
| Value | Value |
|---|
| Food Products | 1.0% |
| Capital Markets | 1.1% |
| Industrial Conglomerates | 1.7% |
| Life Sciences Tools & Services | 1.8% |
| Containers & Packaging | 1.9% |
| Distributors | 2.5% |
| Professional Services | 2.6% |
| Machinery | 3.8% |
| Commercial Services & Supplies | 3.9% |
| Aerospace & Defense | 4.1% |
| Commercial Support Services | 4.1% |
| Specialty Retail | 4.8% |
| Money Market | 4.9% |
| Trading Companies & Distributors | 5.4% |
| Semiconductors & Semiconductor Equipment | 5.9% |
| Electronic Equipment, Instruments & Components | 6.4% |
| Construction Materials | 7.4% |
| Health Care Equipment & Supplies | 7.8% |
| Insurance | 7.9% |
| Building Products | 8.7% |
| IT Services | 12.3% |
Access your account online!
• Review Account Summary, Account Holdings & Transaction History
• Set up an Automatic Investment Plan or Open a New Account
• Access Statements & Tax Forms
• Manage Your Document Delivery Settings (you can receive your annual shareholder report electronically).
Visit www.fenimoreasset.com/resources/reports/ and select “Account Access” at the top right.
Visit, call, or email us.
LOCATIONS: Albany and Cobleskill, NY
CALL:(800) 932-3271
EMAIL:info@fenimoreasset.com
No material changes occurred during the year ended December 31, 2024.
For additional information about the Fund, including a prospectus and performance data, visit www.fenimoreasset.com/resources/reports/or call (800) 932-3271.
FAM SMALL CAP FUND - INSTITUTIONAL SHARES (FAMDX)
Annual Shareholder Report - December 31, 2024
This annual shareholder report contains important information about FAM Small Cap Fund for the period of January 1, 2024 to December 31, 2024. You can find additional information about the Fund at www.fenimoreasset.com/resources/reports/. You can also request this information by contacting us at (800) 932-3271.
What were the Fund’s costs for the last year?
(based on a hypothetical $10,000 investment)
| Class Name | Costs of a $10,000 investment | Costs paid as a percentage of a $10,000 investment |
|---|
| Institutional Shares | $121 | 1.14% |
|---|
How did the Fund perform during the reporting period?
In 2024, our holdings, which we believe are quality businesses, produced solid performance. A notable source of outperformance was our underweight position in healthcare. We often encounter speculative healthcare companies with exciting potential but limited profitability. As a result, we have decided to invest in what we deem to be better opportunities that are aligned with our philosophy.
The holdings we prefer possess competitive differentiators that allow them to be more profitable and/or grow faster than their peers. We focus on owning what we believe are quality, small-cap firms run by top-notch leaders.
Since the Fund’s inception, the managers continually follow the same strategy.
Average Annual Total Returns
| 1 Year | 5 Years | 10 Years |
|---|
| FAM Small Cap Fund - Institutional Shares | 12.65% | 10.84% | 9.25% |
|---|
S&P 500® Index | 25.02% | 14.53% | 13.10% |
|---|
Russell 2000® Index | 11.54% | 7.40% | 7.82% |
|---|
In connection with applicable mutual performance disclosure requirements, the Fund has adopted the use of the S&P 500® Index as its primary comparative benchmark performance index and it has adopted the use of the Russell 2000® Total Return Index as an additional comparative benchmark performance index. The Russell 2000® Total Return Index generally reflects the market sectors in which the Fund primarily invests and the S&P 500® Index is a broad-based securities markets index that is generally representative of the overall domestic US equity markets as a whole.
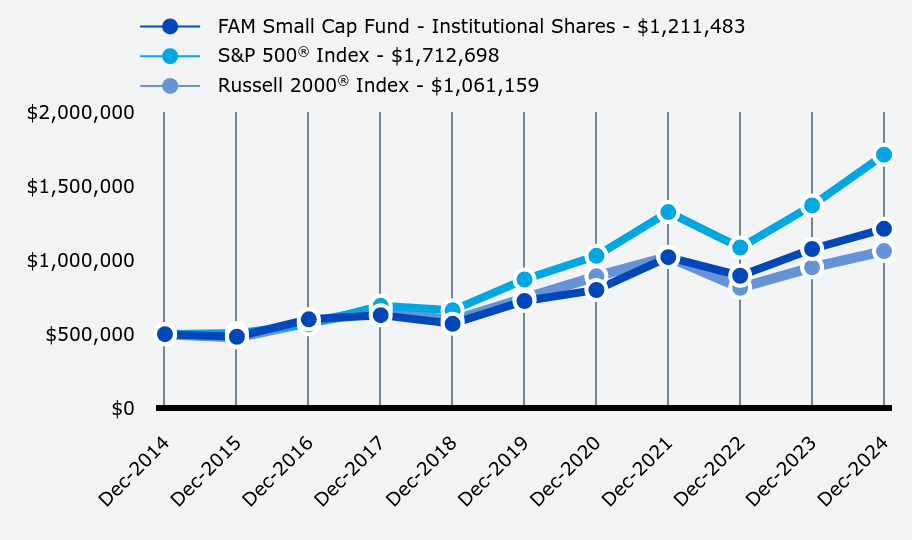
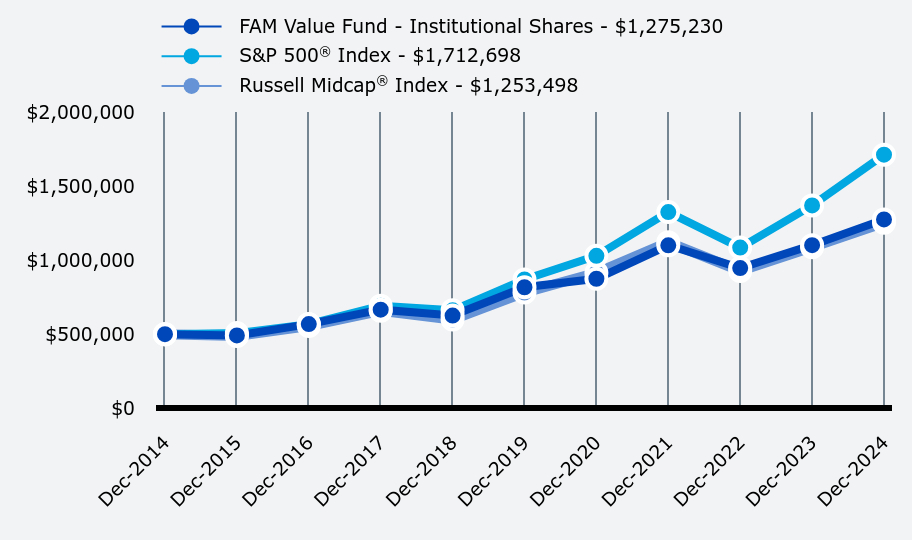
How has the Fund performed since inception?
Total Return Based on $500,000 Investment
| FAM Small Cap Fund - Institutional Shares | S&P 500® Index | Russell 2000® Index |
|---|
| Dec-2014 | $500,000 | $500,000 | $500,000 |
|---|
| Dec-2015 | $482,530 | $506,919 | $477,930 |
|---|
| Dec-2016 | $600,356 | $567,546 | $579,767 |
|---|
| Dec-2017 | $628,354 | $691,451 | $664,687 |
|---|
| Dec-2018 | $569,954 | $661,135 | $591,478 |
|---|
| Dec-2019 | $724,139 | $869,303 | $742,453 |
|---|
| Dec-2020 | $798,380 | $1,029,244 | $890,653 |
|---|
| Dec-2021 | $1,020,518 | $1,324,692 | $1,022,638 |
|---|
| Dec-2022 | $894,740 | $1,084,779 | $813,647 |
|---|
| Dec-2023 | $1,075,465 | $1,369,942 | $951,388 |
|---|
| Dec-2024 | $1,211,483 | $1,712,698 | $1,061,159 |
|---|
The Fund's past performance is not a good predictor of how the Fund will perform in the future. The graph and table do not reflect the deduction of taxes that a shareholder would pay on fund distributions or redemption of fund shares.
- Net Assets$418,522,858
- Number of Portfolio Holdings29
- Advisory Fee $3,529,215
- Portfolio turnover11%
FAM SMALL CAP FUND - INSTITUTIONAL SHARES (FAMDX)
Annual Shareholder Report - December 31, 2024
Top 10 Holdings (% of net assets)
| Holding Name | % of Net Assets |
| CBIZ, Inc. | 6.9% |
| ExlService Holdings, Inc. | 6.7% |
| Colliers International Group, Inc. | 5.5% |
| Pinnacle Financial Partners, Inc. | 5.0% |
| Dutch Bros, Inc. - Class A | 4.2% |
| Brookfield Infrastructure Corporation - Class A | 4.1% |
| Choice Hotels International, Inc. | 3.9% |
| OneSpaWorld Holdings Ltd. | 3.5% |
| Frontdoor, Inc. | 3.5% |
| FirstService Corporation | 3.4% |
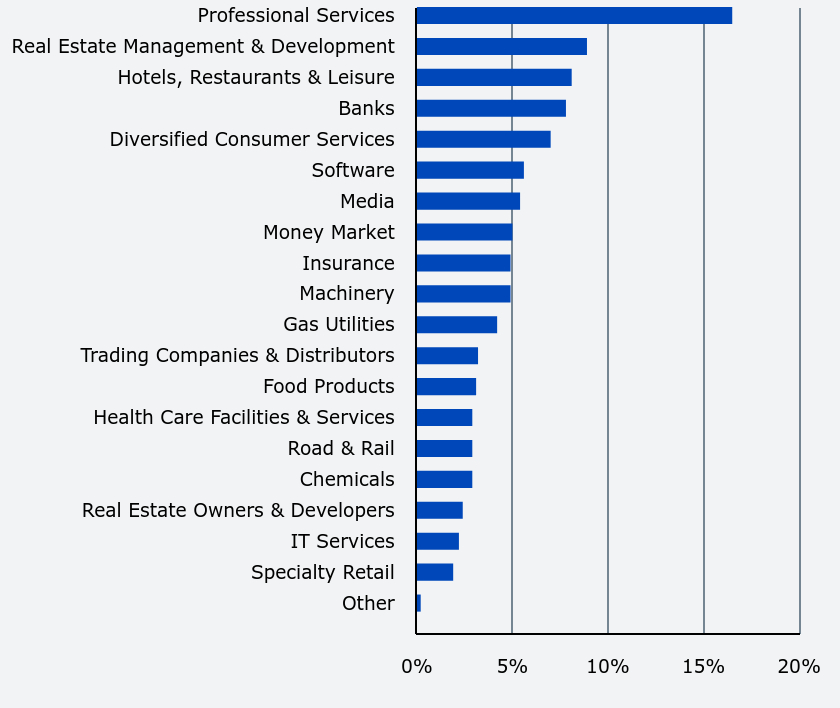
Portfolio Composition (% of net assets)
| Value | Value |
|---|
| Other | 0.2% |
| Specialty Retail | 1.9% |
| IT Services | 2.2% |
| Real Estate Owners & Developers | 2.4% |
| Chemicals | 2.9% |
| Road & Rail | 2.9% |
| Health Care Facilities & Services | 2.9% |
| Food Products | 3.1% |
| Trading Companies & Distributors | 3.2% |
| Gas Utilities | 4.2% |
| Machinery | 4.9% |
| Insurance | 4.9% |
| Money Market | 5.0% |
| Media | 5.4% |
| Software | 5.6% |
| Diversified Consumer Services | 7.0% |
| Banks | 7.8% |
| Hotels, Restaurants & Leisure | 8.1% |
| Real Estate Management & Development | 8.9% |
| Professional Services | 16.5% |
Access your account online!
With an online account, you can access your account information anytime.
• Review Account Summary, Account Holdings & Transaction History
• Set up an Automatic Investment Plan or Open a New Account
• Access Statements & Tax Forms
• Manage Your Document Delivery Settings (you can receive your annual shareholder report electronically).
Visit www.fenimoreasset.com/resources/reports/ and select “Account Access” at the top right.
Visit, call, or email us.
LOCATIONS: Albany and Cobleskill, NY
CALL:(800) 932-3271
EMAIL:info@fenimoreasset.com
No material changes occurred during the year ended December 31, 2024.
For additional information about the Fund, including a prospectus and performance data, visit www.fenimoreasset.com/resources/reports/or call (800) 932-3271.
FAM SMALL CAP FUND - INVESTOR SHARES (FAMFX)
Annual Shareholder Report - December 31, 2024
This annual shareholder report contains important information about FAM Small Cap Fund for the period of January 1, 2024 to December 31, 2024. You can find additional information about the Fund at www.fenimoreasset.com/resources/reports/. You can also request this information by contacting us at (800) 932-3271.
What were the Fund’s costs for the last year?
(based on a hypothetical $10,000 investment)
| Class Name | Costs of a $10,000 investment | Costs paid as a percentage of a $10,000 investment |
|---|
| Investor Shares | $131 | 1.23% |
|---|
How did the Fund perform during the reporting period?
In 2024, our holdings, which we believe are quality businesses, produced solid performance. A notable source of outperformance was our underweight position in healthcare. We often encounter speculative healthcare companies with exciting potential but limited profitability. As a result, we have decided to invest in what we deem to be better opportunities that are aligned with our philosophy.
The holdings we prefer possess competitive differentiators that allow them to be more profitable and/or grow faster than their peers. We focus on owning what we believe are quality, small-cap firms run by top-notch leaders.
Since the Fund’s inception, the managers continually follow the same strategy.
Average Annual Total Returns
| 1 Year | 5 Years | 10 Years |
|---|
| FAM Small Cap Fund - Investor Shares | 12.49% | 10.72% | 9.14% |
|---|
S&P 500® Index | 25.02% | 14.53% | 13.10% |
|---|
Russell 2000® Index | 11.54% | 7.40% | 7.82% |
|---|
In connection with applicable mutual performance disclosure requirements, the Fund has adopted the use of the S&P 500® Index as its primary comparative benchmark performance index and it has adopted the use of the Russell 2000® Total Return Index as an additional comparative benchmark performance index. The Russell 2000® Total Return Index generally reflects the market sectors in which the Fund primarily invests and the S&P 500® Index is a broad-based securities markets index that is generally representative of the overall domestic US equity markets as a whole.
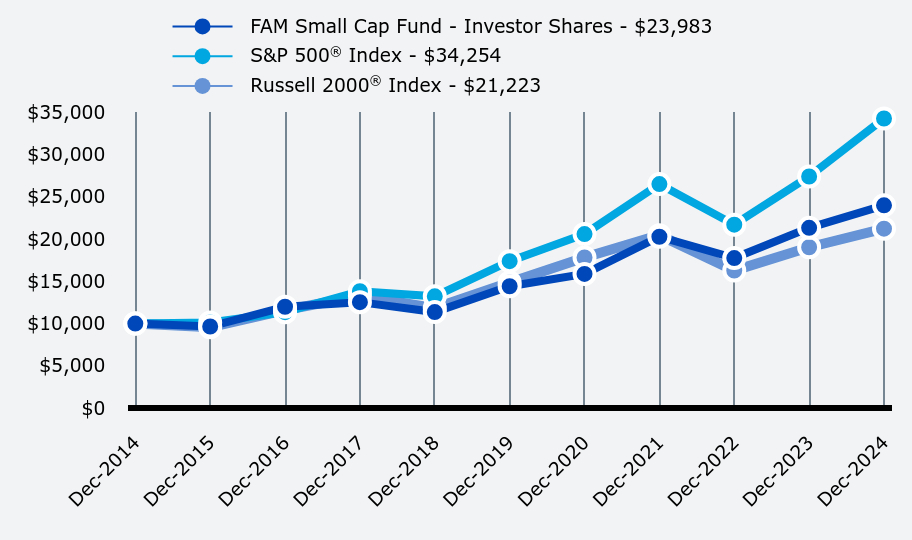
How has the Fund performed over the last ten years?
Total Return Based on $10,000 Investment
| FAM Small Cap Fund - Investor Shares | S&P 500® Index | Russell 2000® Index |
|---|
| Dec-2014 | $10,000 | $10,000 | $10,000 |
|---|
| Dec-2015 | $9,651 | $10,138 | $9,559 |
|---|
| Dec-2016 | $11,988 | $11,351 | $11,595 |
|---|
| Dec-2017 | $12,533 | $13,829 | $13,294 |
|---|
| Dec-2018 | $11,359 | $13,223 | $11,830 |
|---|
| Dec-2019 | $14,414 | $17,386 | $14,849 |
|---|
| Dec-2020 | $15,869 | $20,585 | $17,813 |
|---|
| Dec-2021 | $20,268 | $26,494 | $20,453 |
|---|
| Dec-2022 | $17,750 | $21,696 | $16,273 |
|---|
| Dec-2023 | $21,320 | $27,399 | $19,028 |
|---|
| Dec-2024 | $23,983 | $34,254 | $21,223 |
|---|
The Fund's past performance is not a good predictor of how the Fund will perform in the future. The graph and table do not reflect the deduction of taxes that a shareholder would pay on fund distributions or redemption of fund shares.
- Net Assets$418,522,858
- Number of Portfolio Holdings29
- Advisory Fee $3,529,215
- Portfolio turnover11%
FAM SMALL CAP FUND - INVESTOR SHARES (FAMFX)
Annual Shareholder Report - December 31, 2024
Top 10 Holdings (% of net assets)
| Holding Name | % of Net Assets |
| CBIZ, Inc. | 6.9% |
| ExlService Holdings, Inc. | 6.7% |
| Colliers International Group, Inc. | 5.5% |
| Pinnacle Financial Partners, Inc. | 5.0% |
| Dutch Bros, Inc. - Class A | 4.2% |
| Brookfield Infrastructure Corporation - Class A | 4.1% |
| Choice Hotels International, Inc. | 3.9% |
| OneSpaWorld Holdings Ltd. | 3.5% |
| Frontdoor, Inc. | 3.5% |
| FirstService Corporation | 3.4% |
Portfolio Composition (% of net assets)
| Value | Value |
|---|
| Other | 0.2% |
| Specialty Retail | 1.9% |
| IT Services | 2.2% |
| Real Estate Owners & Developers | 2.4% |
| Chemicals | 2.9% |
| Road & Rail | 2.9% |
| Health Care Facilities & Services | 2.9% |
| Food Products | 3.1% |
| Trading Companies & Distributors | 3.2% |
| Gas Utilities | 4.2% |
| Machinery | 4.9% |
| Insurance | 4.9% |
| Money Market | 5.0% |
| Media | 5.4% |
| Software | 5.6% |
| Diversified Consumer Services | 7.0% |
| Banks | 7.8% |
| Hotels, Restaurants & Leisure | 8.1% |
| Real Estate Management & Development | 8.9% |
| Professional Services | 16.5% |
Access your account online!
With an online account, you can access your account information anytime.
• Review Account Summary, Account Holdings & Transaction History
• Set up an Automatic Investment Plan or Open a New Account
• Access Statements & Tax Forms
• Manage Your Document Delivery Settings (you can receive your annual shareholder report electronically).
Visit www.fenimoreasset.com/resources/reports/ and select “Account Access” at the top right.
Visit, call, or email us.
LOCATIONS: Albany and Cobleskill, NY
CALL:(800) 932-3271
EMAIL:info@fenimoreasset.com
No material changes occurred during the year ended December 31, 2024.
For additional information about the Fund, including a prospectus and performance data, visit www.fenimoreasset.com/resources/reports/or call (800) 932-3271.
FAM VALUE FUND - INSTITUTIONAL SHARES (FAMWX)
Annual Shareholder Report - December 31, 2024
This annual shareholder report contains important information about FAM Value Fund for the period of January 1, 2024 to December 31, 2024. You can find additional information about the Fund at www.fenimoreasset.com/resources/reports/. You can also request this information by contacting us at (800) 932-3271.
What were the Fund’s costs for the last year?
(based on a hypothetical $10,000 investment)
| Class Name | Costs of a $10,000 investment | Costs paid as a percentage of a $10,000 investment |
|---|
| Institutional Shares | $107 | 0.99% |
|---|
How did the Fund perform during the reporting period?
The Fund delivered a healthy return in 2024. Financials were our largest contributor as our insurance holdings benefited from rising premiums and our banks experienced a more favorable yield curve. Additionally, across a diverse set of industries, our performance was driven by the strong fundamentals of many of our holdings, which achieved considerable earnings growth.
The Fund's strategy remains focused on long-term performance, achieved through our disciplined approach of investing in what we believe are quality companies with strong fundamentals and sustainable business models.
Since the Fund’s inception, the managers have consistently followed this strategy.
Average Annual Total Returns
| 1 Year | 5 Years | 10 Years |
|---|
| FAM Value Fund - Institutional Shares | 15.79% | 9.32% | 9.82% |
|---|
S&P 500® Index | 25.02% | 14.53% | 13.10% |
|---|
Russell Midcap® Index | 15.34% | 9.92% | 9.63% |
|---|
In connection with applicable mutual performance disclosure requirements, the Fund has adopted the use of the S&P 500® Index as its primary comparative benchmark performance index and it has adopted the use of the Russell Midcap® Index as an additional comparative benchmark performance index. The Russell Midcap® Index generally reflects the market sectors in which the Fund primarily invests and the S&P 500® Index is a broad-based securities markets index that is generally representative of the overall domestic US equity markets as a whole.
How has the Fund performed since inception?
Total Return Based on $500,000 Investment
| FAM Value Fund - Institutional Shares | S&P 500® Index | Russell Midcap® Index |
|---|
| Dec-2014 | $500,000 | $500,000 | $500,000 |
|---|
| Dec-2015 | $491,308 | $506,919 | $487,807 |
|---|
| Dec-2016 | $567,958 | $567,546 | $555,116 |
|---|
| Dec-2017 | $665,555 | $691,451 | $657,911 |
|---|
| Dec-2018 | $625,642 | $661,135 | $598,317 |
|---|
| Dec-2019 | $816,866 | $869,303 | $781,054 |
|---|
| Dec-2020 | $874,323 | $1,029,244 | $914,621 |
|---|
| Dec-2021 | $1,100,458 | $1,324,692 | $1,121,180 |
|---|
| Dec-2022 | $946,806 | $1,084,779 | $927,046 |
|---|
| Dec-2023 | $1,101,303 | $1,369,942 | $1,086,750 |
|---|
| Dec-2024 | $1,275,230 | $1,712,698 | $1,253,498 |
|---|
The Fund's past performance is not a good predictor of how the Fund will perform in the future. The graph and table do not reflect the deduction of taxes that a shareholder would pay on fund distributions or redemption of fund shares.
- Net Assets$1,764,902,747
- Number of Portfolio Holdings28
- Advisory Fee (net of waivers & recoupments)$15,541,786
- Portfolio turnover3%
FAM VALUE FUND - INSTITUTIONAL SHARES (FAMWX)
Annual Shareholder Report - December 31, 2024
Top 10 Holdings (% of net assets)
| Holding Name | % of Net Assets |
| Brown & Brown, Inc. | 8.0% |
| Ross Stores, Inc. | 6.9% |
| CDW Corporation | 5.5% |
| Markel Group, Inc. | 5.3% |
| Brookfield Corporation - Class A | 5.2% |
| IDEX Corporation | 5.1% |
| Progressive Corporation (The) | 4.6% |
| Amphenol Corporation - Class A | 4.5% |
| Vulcan Materials Company | 4.3% |
| Stryker Corporation | 4.3% |
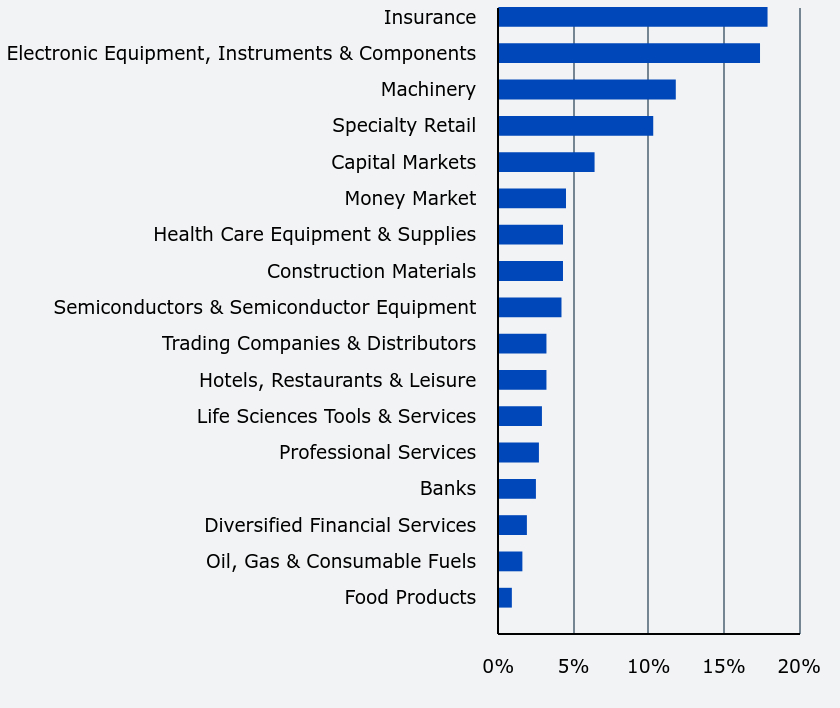
Portfolio Composition (% of net assets)
| Value | Value |
|---|
| Food Products | 0.9% |
| Oil, Gas & Consumable Fuels | 1.6% |
| Diversified Financial Services | 1.9% |
| Banks | 2.5% |
| Professional Services | 2.7% |
| Life Sciences Tools & Services | 2.9% |
| Hotels, Restaurants & Leisure | 3.2% |
| Trading Companies & Distributors | 3.2% |
| Semiconductors & Semiconductor Equipment | 4.2% |
| Construction Materials | 4.3% |
| Health Care Equipment & Supplies | 4.3% |
| Money Market | 4.5% |
| Capital Markets | 6.4% |
| Specialty Retail | 10.3% |
| Machinery | 11.8% |
| Electronic Equipment, Instruments & Components | 17.4% |
| Insurance | 17.9% |
Access your account online!
With an online account, you can access your account information anytime.
• Review Account Summary, Account Holdings & Transaction History
• Set up an Automatic Investment Plan or Open a New Account
• Access Statements & Tax Forms
• Manage Your Document Delivery Settings (you can receive your annual shareholder report electronically).
Visit www.fenimoreasset.com/resources/reports/ and select “Account Access” at the top right.
Visit, call, or email us.
LOCATIONS: Albany and Cobleskill, NY
CALL:(800) 932-3271
EMAIL:info@fenimoreasset.com
No material changes occurred during the year ended December 31, 2024.
For additional information about the Fund, including a prospectus and performance data, visit www.fenimoreasset.com/resources/reports/or call (800) 932-3271.
FAM VALUE FUND - INVESTOR SHARES (FAMVX)
Annual Shareholder Report - December 31, 2024
This annual shareholder report contains important information about FAM Value Fund for the period of January 1, 2024 to December 31, 2024. You can find additional information about the Fund at www.fenimoreasset.com/resources/reports/. You can also request this information by contacting us at (800) 932-3271.
What were the Fund’s costs for the last year?
(based on a hypothetical $10,000 investment)
| Class Name | Costs of a $10,000 investment | Costs paid as a percentage of a $10,000 investment |
|---|
| Investor Shares | $127 | 1.18% |
|---|
How did the Fund perform during the reporting period?
The Fund delivered a healthy return in 2024. Financials were our largest contributor as our insurance holdings benefited from rising premiums and our banks experienced a more favorable yield curve. Additionally, across a diverse set of industries, our performance was driven by the strong fundamentals of many of our holdings, which achieved considerable earnings growth.
The Fund's strategy remains focused on long-term performance, achieved through our disciplined approach of investing in what we believe are quality companies with strong fundamentals and sustainable business models.
Since the Fund’s inception, the managers have consistently followed this strategy.
Average Annual Total Returns
| 1 Year | 5 Years | 10 Years |
|---|
| FAM Value Fund - Investor Shares | 15.57% | 9.11% | 9.65% |
|---|
S&P 500® Index | 25.02% | 14.53% | 13.10% |
|---|
Russell Midcap® Index | 15.34% | 9.92% | 9.63% |
|---|
In connection with applicable mutual performance disclosure requirements, the Fund has adopted the use of the S&P 500® Index as its primary comparative benchmark performance index and it has adopted the use of the Russell Midcap® Index as an additional comparative benchmark performance index. The Russell Midcap® Index generally reflects the market sectors in which the Fund primarily invests and the S&P 500® Index is a broad-based securities markets index that is generally representative of the overall domestic US equity markets as a whole.
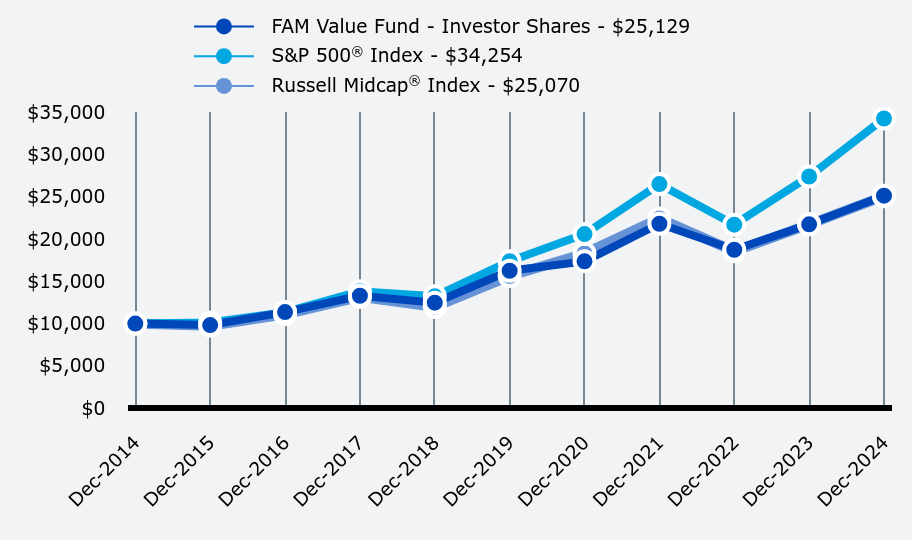
How has the Fund performed over the last ten years?
Total Return Based on $10,000 Investment
| FAM Value Fund - Investor Shares | S&P 500® Index | Russell Midcap® Index |
|---|
| Dec-2014 | $10,000 | $10,000 | $10,000 |
|---|
| Dec-2015 | $9,826 | $10,138 | $9,756 |
|---|
| Dec-2016 | $11,359 | $11,351 | $11,102 |
|---|
| Dec-2017 | $13,290 | $13,829 | $13,158 |
|---|
| Dec-2018 | $12,469 | $13,223 | $11,966 |
|---|
| Dec-2019 | $16,250 | $17,386 | $15,621 |
|---|
| Dec-2020 | $17,359 | $20,585 | $18,292 |
|---|
| Dec-2021 | $21,809 | $26,494 | $22,424 |
|---|
| Dec-2022 | $18,730 | $21,696 | $18,541 |
|---|
| Dec-2023 | $21,743 | $27,399 | $21,735 |
|---|
| Dec-2024 | $25,129 | $34,254 | $25,070 |
|---|
The Fund's past performance is not a good predictor of how the Fund will perform in the future. The graph and table do not reflect the deduction of taxes that a shareholder would pay on fund distributions or redemption of fund shares.
- Net Assets$1,764,902,747
- Number of Portfolio Holdings28
- Advisory Fee (net of waivers & recoupments)$15,541,786
- Portfolio turnover3%
FAM VALUE FUND - INVESTOR SHARES (FAMVX)
Annual Shareholder Report - December 31, 2024
Top 10 Holdings (% of net assets)
| Holding Name | % of Net Assets |
| Brown & Brown, Inc. | 8.0% |
| Ross Stores, Inc. | 6.9% |
| CDW Corporation | 5.5% |
| Markel Group, Inc. | 5.3% |
| Brookfield Corporation - Class A | 5.2% |
| IDEX Corporation | 5.1% |
| Progressive Corporation (The) | 4.6% |
| Amphenol Corporation - Class A | 4.5% |
| Vulcan Materials Company | 4.3% |
| Stryker Corporation | 4.3% |
Portfolio Composition (% of net assets)
| Value | Value |
|---|
| Food Products | 0.9% |
| Oil, Gas & Consumable Fuels | 1.6% |
| Diversified Financial Services | 1.9% |
| Banks | 2.5% |
| Professional Services | 2.7% |
| Life Sciences Tools & Services | 2.9% |
| Hotels, Restaurants & Leisure | 3.2% |
| Trading Companies & Distributors | 3.2% |
| Semiconductors & Semiconductor Equipment | 4.2% |
| Construction Materials | 4.3% |
| Health Care Equipment & Supplies | 4.3% |
| Money Market | 4.5% |
| Capital Markets | 6.4% |
| Specialty Retail | 10.3% |
| Machinery | 11.8% |
| Electronic Equipment, Instruments & Components | 17.4% |
| Insurance | 17.9% |
Access your account online!
With an online account, you can access your account information anytime.
• Review Account Summary, Account Holdings & Transaction History
• Set up an Automatic Investment Plan or Open a New Account
• Access Statements & Tax Forms
• Manage Your Document Delivery Settings (you can receive your annual shareholder report electronically).
Visit www.fenimoreasset.com/resources/reports/ and select “Account Access” at the top right.
Visit, call, or email us.
LOCATIONS: Albany and Cobleskill, NY
CALL:(800) 932-3271
EMAIL:info@fenimoreasset.com
No material changes occurred during the year ended December 31, 2024.
For additional information about the Fund, including a prospectus and performance data, visit www.fenimoreasset.com/resources/reports/or call (800) 932-3271.
As of the end of the period covered by this report, the registrant has adopted a code of ethics that applies to the registrant’s principal executive officer, principal financial officer, principal accounting officer or controller, or persons performing similar functions, regardless of whether these individuals are employed by the registrant or a third party. The Registrant has undertaken in this report filed on Form N-CSR to provide to any person without charge, upon request by calling 1-(800) 932-3271, a copy of such code of ethics. Pursuant to Item 13(a)(1), a copy of registrant’s code of ethics is filed as an exhibit to this Form N-CSR. During the period covered by this report, the code of ethics has not been amended, and the registrant has not granted any waivers, including implicit waivers, from the provisions of the code of ethics.
| Item 3. | Audit Committee Financial Expert. |
The registrant’s board of trustees has determined that Donald J. Boteler, Paul A. Keller, Kevin J. McCoy and Kenneth R. Stoll are each an “audit committee financial expert” and are “independent,” as these terms are defined in this Item.
| Item 4. | Principal Accountant Fees and Services. |
| (a) | Audit Fees. The aggregate fees billed for professional services rendered by the principal accountant for the audit of the registrant’s annual financial statements or for services that are normally provided by the accountant in connection with statutory and regulatory filings or engagements were $67,400 and $65,000 with respect to the registrant’s fiscal years ended December 31, 2024 and December 31, 2023, respectively. |
| (b) | Audit-Related Fees. No fees were billed in either of the last two fiscal years for assurance and related services by the principal accountant that are reasonably related to the performance of the audit of the registrant’s financial statements and are not reported under paragraph (a) of this Item. |
| (c) | Tax Fees. The aggregate fees billed for professional services rendered by the principal accountant for tax compliance, tax advice, and tax planning were $13,000 and $13,000 with respect to the registrant’s fiscal years ended December 31, 2024 and December 31, 2023, respectively. The services comprising these fees are the preparation of the registrant’s federal income and excise tax returns. |
| (d) | All Other Fees. No fees were billed in either of the last two fiscal years for products and services provided by the principal accountant, other than the services reported in paragraphs (a) through (c) of this Item. |
| (e)(1) | All services to be performed for the Registrant by Cohen & Co. must be pre-approved by the audit committee. With respect to the fiscal years ended December 31, 2024 and December 31, 2023, all services were performed by Cohen & Co., and BBD, LLP, respectively, and were pre-approved by the committee. |
| (e)(2) | 100 percent of any fees for services described in each of paragraphs (b) through (d) of this item were approved by the audit committee pursuant to paragraph (c)(7)(i)(C) of Rule 2-01 of Regulation S-X. |
| (f) | Less than 50% of hours expended on the principal accountant’s engagement to audit the registrant’s financial statements for the most recent fiscal year were attributed to work performed by persons other than the principal accountant’s full-time, permanent employees. |
| (g) | With respect to the fiscal years ended December 31, 2024 and December 31, 2023, aggregate non-audit fees of $13,000 and $13,000, respectively, were billed by the registrant’s principal accountant for services rendered to the registrant. With respect to the fiscal years ended December 31, 2024 and December 31, 2023, aggregate non-audit fees of $9,000 and $9,000, respectively, were billed by the registrant’s accountant for professional services rendered to the registrant’s affiliated broker-dealer. With respect to the fiscal years ended December 31, 2024 and December 31, 2023, aggregate non-audit fees of $18,550 and $18,500, respectively, were billed by the registrant’s accountant for professional services rendered to the registrant’s affiliated Private Offering-Limited Liability Company. |
| (h) | The principal accountant has not provided any non-audit services to the registrant’s investment adviser (not including any sub-adviser whose role is primarily portfolio management and is subcontracted with or overseen by another investment adviser), and any entity controlling, controlled by, or under common control with the investment adviser that provides ongoing services to the registrant. |
| Item 5. | Audit Committee of Listed Registrants. |
Not applicable
| (a) | The Registrant(s) schedule(s) of investments is included in the Financial Statements under Item 7 of this form. |
| Item 7. | Financial Statements and Financial Highlights for Open-End Management Investment Companies |
TABLE OF CONTENTS
| Schedule of Investments | | |
| FAM VALUE FUND | | 1 |
| FAM DIVIDEND FOCUS FUND | | 3 |
| FAM SMALL CAP FUND | | 5 |
| Statements of Assets and Liabilities | | 7 |
| Statements of Operations | | 8 |
| Statements of Changes in Net Assets | | 9 |
| Notes to Financial Statements | | 12 |
| Additional Information | | 26 |
| Supplemental Information | | 31 |
FAM Funds has adopted a Code of Ethics that applies to its principal executive and principal financial officers. You may obtain a copy of this Code without charge, by calling FAM Funds at (800) 932-3271.
FAM VALUE FUND — Schedule of Investments
December 31, 2024
| | | Shares | | | Value | |
| COMMON STOCKS — 95.5% | | | | | | | | |
| Banks — 2.5% | | | | | | | | |
| Pinnacle Financial Partners, Inc. | | | 386,527 | | | $ | 44,214,823 | |
| Capital Markets — 6.4% | | | | | | | | |
| Brookfield Asset Management Ltd. - Class A | | | 397,940 | | | | 21,564,369 | |
| Brookfield Corporation - Class A | | | 1,591,760 | | | | 91,446,612 | |
| | | | | | | | 113,010,981 | |
| Construction Materials — 4.3% | | | | | | | | |
| Vulcan Materials Company | | | 297,930 | | | | 76,636,534 | |
| Diversified Financial Services — 1.9% | | | | | | | | |
| Berkshire Hathaway, Inc. - Class A (a) | | | 48 | | | | 32,684,160 | |
| Electronic Equipment, Instruments & Components — 17.4% | | | | | | | | |
| AMETEK, Inc. | | | 132,000 | | | | 23,794,320 | |
| Amphenol Corporation - Class A | | | 1,146,480 | | | | 79,623,036 | |
| CDW Corporation | | | 558,200 | | | | 97,149,128 | |
| Keysight Technologies, Inc. (a) | | | 234,320 | | | | 37,638,822 | |
| Zebra Technologies Corporation - Class A (a) | | | 179,460 | | | | 69,311,041 | |
| | | | | | | | 307,516,347 | |
| Food Products — 0.9% | | | | | | | | |
| McCormick & Company, Inc. | | | 215,300 | | | | 16,414,472 | |
| Health Care Equipment & Supplies — 4.3% | | | | | | | | |
| Stryker Corporation | | | 208,000 | | | | 74,890,400 | |
| Hotels, Restaurants & Leisure — 3.2% | | | | | | | | |
| Booking Holdings, Inc. | | | 11,350 | | | | 56,391,567 | |
| Insurance — 17.9% | | | | | | | | |
| Brown & Brown, Inc. | | | 1,391,492 | | | | 141,960,014 | |
| Markel Group, Inc. (a) | | | 53,850 | | | | 92,957,485 | |
| Progressive Corporation (The) | | | 340,000 | | | | 81,467,400 | |
| | | | | | | | 316,384,899 | |
| Life Sciences Tools & Services — 2.9% | | | | | | | | |
| Waters Corporation (a) | | | 138,700 | | | | 51,454,926 | |
| Machinery — 11.8% | | | | | | | | |
| Graco, Inc. | | | 670,180 | | | | 56,489,472 | |
| IDEX Corporation | | | 431,530 | | | | 90,314,914 | |
| Illinois Tool Works, Inc. | | | 242,560 | | | | 61,503,514 | |
| | | | | | | | 208,307,900 | |
| Oil, Gas & Consumable Fuels — 1.6% | | | | | | | | |
| EOG Resources, Inc. | | | 233,500 | | | | 28,622,430 | |
| Professional Services — 2.7% | | | | | | | | |
| ExlService Holdings, Inc. (a) | | | 1,072,900 | | | | 47,615,302 | |
See Notes to Financial Statements
FAM VALUE FUND — Schedule of Investments Continued
December 31, 2024
| | | Shares | | | Value | |
| COMMON STOCKS — 95.5% (Continued) | | | | | | | | |
| Semiconductors & Semiconductor Equipment — 4.2% | | | | | | | | |
| Analog Devices, Inc. | | | 279,510 | | | $ | 59,384,694 | |
| Microchip Technology, Inc. | | | 258,860 | | | | 14,845,621 | |
| | | | | | | | 74,230,315 | |
| Specialty Retail — 10.3% | | | | | | | | |
| AutoZone, Inc. (a) | | | 18,265 | | | | 58,484,530 | |
| Ross Stores, Inc. | | | 810,688 | | | | 122,632,774 | |
| | | | | | | | 181,117,304 | |
| Trading Companies & Distributors — 3.2% | | | | | | | | |
| Fastenal Company | | | 780,900 | | | | 56,154,519 | |
| | | | | | | | | |
| Total Common Stocks (Cost $515,348,088) | | | | | | $ | 1,685,646,879 | |
| | | | | | | | | |
| | | | | | | | | |
| MONEY MARKET FUNDS — 4.5% | | | | | | | | |
| Invesco Treasury Portfolio - Institutional Class, 4.38% (b) (Cost $80,099,225) | | | 80,099,225 | | | $ | 80,099,225 | |
| | | | | | | | | |
| Total Investments at Value — 100.0% (Cost $595,447,313) | | | | | | $ | 1,765,746,104 | |
| | | | | | | | | |
| Liabilities in Excess of Other Assets – (0.0%) (c) | | | | | | | (843,357 | ) |
| | | | | | | | | |
| Net Assets — 100.0% | | | | | | $ | 1,764,902,747 | |
| | | | | | | | | |
| (a) | Non-income producing security. |
| (b) | The rate shown is the 7-day effective yield as of December 31, 2024. |
| (c) | Percentage rounds to less than 0.1%. |
See Notes to Financial Statements
FAM DIVIDEND FOCUS FUND — Schedule of Investments
December 31, 2024
| | | Shares | | | Value | |
| COMMON STOCKS — 95.1% | | | | | | | | |
| Aerospace & Defense — 4.1% | | | | | | | | |
| HEICO Corporation - Class A | | | 166,705 | | | $ | 31,020,466 | |
| Building Products — 8.7% | | | | | | | | |
| Trane Technologies plc | | | 176,000 | | | | 65,005,600 | |
| Capital Markets — 1.2% | | | | | | | | |
| Houlihan Lokey, Inc. | | | 50,074 | | | | 8,695,851 | |
| Commercial Services & Supplies — 3.9% | | | | | | | | |
| Cintas Corporation | | | 159,132 | | | | 29,073,417 | |
| Commercial Support Services — 4.1% | | | | | | | | |
| Republic Services, Inc. | | | 152,890 | | | | 30,758,410 | |
| Construction Materials — 7.4% | | | | | | | | |
| Martin Marietta Materials, Inc. | | | 56,194 | | | | 29,024,201 | |
| Vulcan Materials Company | | | 102,830 | | | | 26,450,961 | |
| | | | | | | | 55,475,162 | |
| Containers & Packaging — 1.9% | | | | | | | | |
| Avery Dennison Corporation | | | 75,157 | | | | 14,064,129 | |
| Distributors — 2.4% | | | | | | | | |
| Pool Corporation | | | 53,900 | | | | 18,376,666 | |
| Electronic Equipment, Instruments & Components — 6.4% | | | | | | | | |
| Amphenol Corporation - Class A | | | 150,502 | | | | 10,452,364 | |
| CDW Corporation | | | 217,000 | | | | 37,766,680 | |
| | | | | | | | 48,219,044 | |
| Food Products — 1.0% | | | | | | | | |
| McCormick & Company, Inc. | | | 103,200 | | | | 7,867,968 | |
| Health Care Equipment & Supplies — 7.9% | | | | | | | | |
| STERIS plc | | | 99,700 | | | | 20,494,332 | |
| Stryker Corporation | | | 107,000 | | | | 38,525,350 | |
| | | | | | | | 59,019,682 | |
| Industrial Conglomerates — 1.7% | | | | | | | | |
| Roper Technologies, Inc. | | | 25,200 | | | | 13,100,220 | |
| Insurance — 7.9% | | | | | | | | |
| Arthur J. Gallagher & Company | | | 208,500 | | | | 59,182,725 | |
| IT Services — 12.2% | | | | | | | | |
| Broadridge Financial Solutions, Inc. | | | 168,400 | | | | 38,073,556 | |
| Jack Henry & Associates, Inc. | | | 121,800 | | | | 21,351,540 | |
| Paychex, Inc. | | | 231,400 | | | | 32,446,908 | |
| | | | | | | | 91,872,004 | |
| Life Sciences Tools & Services — 1.8% | | | | | | | | |
| Agilent Technologies, Inc. | | | 99,730 | | | | 13,397,728 | |
| Machinery — 3.8% | | | | | | | | |
| IDEX Corporation | | | 135,165 | | | | 28,288,683 | |
See Notes to Financial Statements
FAM DIVIDEND FOCUS FUND — Schedule of Investments Continued
December 31, 2024
| | | Shares | | | Value | |
| COMMON STOCKS — 95.1% (Continued) | | | | | | | | |
| Professional Services — 2.6% | | | | | | | | |
| Verisk Analytics, Inc. | | | 70,320 | | | $ | 19,368,238 | |
| Semiconductors & Semiconductor Equipment — 5.9% | | | | | | | | |
| Entegris, Inc. | | | 285,750 | | | | 28,306,395 | |
| Microchip Technology, Inc. | | | 275,000 | | | | 15,771,250 | |
| | | | | | | | 44,077,645 | |
| Specialty Retail — 4.8% | | | | | | | | |
| Ross Stores, Inc. | | | 240,026 | | | | 36,308,733 | |
| Trading Companies & Distributors — 5.4% | | | | | | | | |
| Fastenal Company | | | 349,000 | | | | 25,096,590 | |
| Watsco, Inc. | | | 32,000 | | | | 15,164,480 | |
| | | | | | | | 40,261,070 | |
| | | | | | | | | |
| Total Common Stocks (Cost $344,177,395) | | | | | | $ | 713,433,441 | |
| | | | | | | | | |
| | | | | | | | | |
| MONEY MARKET FUNDS — 4.9% | | | | | | | | |
| Invesco Treasury Portfolio - Institutional Class, 4.38% (a) (Cost $36,533,839) | | | 36,533,839 | | | $ | 36,533,839 | |
| | | | | | | | | |
| Total Investments at Value — 100.0% (Cost $380,711,234) | | | | | | $ | 749,967,280 | |
| | | | | | | | | |
| Liabilities in Excess of Other Assets — (0.0%) (b) | | | | | | | (168,587 | ) |
| | | | | | | | | |
| Net Assets — 100.0% | | | | | | $ | 749,798,693 | |
| | | | | | | | | |
| (a) | The rate shown is the 7-day effective yield as of December 31, 2024. |
| (b) | Percentage rounds to less than 0.1%. |
See Notes to Financial Statements
FAM SMALL CAP FUND — Schedule of Investments
December 31, 2024
| | | Shares | | | Value | |
| COMMON STOCKS — 94.8% | | | | | | | | |
| Banks — 7.8% | | | | | | | | |
| Home BancShares, Inc. | | | 412,135 | | | $ | 11,663,421 | |
| Pinnacle Financial Partners, Inc. | | | 184,100 | | | | 21,059,199 | |
| | | | | | | | 32,722,620 | |
| Chemicals — 2.9% | | | | | | | | |
| Element Solutions, Inc. | | | 485,730 | | | | 12,352,114 | |
| Diversified Consumer Services — 7.0% | | | | | | | | |
| Frontdoor, Inc. (a) | | | 264,913 | | | | 14,482,794 | |
| OneSpaWorld Holdings Ltd. | | | 743,428 | | | | 14,794,217 | |
| | | | | | | | 29,277,011 | |
| Food Products — 3.1% | | | | | | | | |
| Nomad Foods Ltd. | | | 763,815 | | | | 12,816,816 | |
| Gas Utilities — 4.1% | | | | | | | | |
| Brookfield Infrastructure Corporation - Class A | | | 434,345 | | | | 17,378,143 | |
| Health Care Facilities & Services — 2.9% | | | | | | | | |
| Chemed Corporation | | | 22,655 | | | | 12,002,619 | |
| Hotels, Restaurants & Leisure — 8.1% | | | | | | | | |
| Choice Hotels International, Inc. | | | 115,350 | | | | 16,377,393 | |
| Dutch Bros, Inc. - Class A (a) | | | 332,317 | | | | 17,406,764 | |
| | | | | | | | 33,784,157 | |
| Insurance — 4.9% | | | | | | | | |
| Hagerty, Inc. - Class A (a) | | | 729,259 | | | | 7,037,349 | |
| Trisura Group Ltd. (a) | | | 492,980 | | | | 13,368,368 | |
| | | | | | | | 20,405,717 | |
| IT Services — 2.2% | | | | | | | | |
| Cass Information Systems, Inc. | | | 222,645 | | | | 9,108,407 | |
| Machinery — 4.9% | | | | | | | | |
| ESAB Corporation | | | 85,870 | | | | 10,299,248 | |
| Franklin Electric Company, Inc. | | | 104,500 | | | | 10,183,525 | |
| | | | | | | | 20,482,773 | |
| Media — 5.4% | | | | | | | | |
| Altus Group Ltd. | | | 314,338 | | | | 12,245,941 | |
| Boston Omaha Corporation - Class A (a) | | | 718,195 | | | | 10,184,005 | |
| | | | | | | | 22,429,946 | |
| Professional Services — 16.6% | | | | | | | | |
| CBIZ, Inc. (a) | | | 351,567 | | | | 28,768,727 | |
| ExlService Holdings, Inc. (a) | | | 634,470 | | | | 28,157,779 | |
| Exponent, Inc. | | | 139,437 | | | | 12,423,837 | |
| | | | | | | | 69,350,343 | |
| Real Estate Management & Development — 8.9% | | | | | | | | |
| Colliers International Group, Inc. | | | 167,455 | | | | 22,768,856 | |
| FirstService Corporation | | | 79,134 | | | | 14,324,837 | |
| | | | | | | | 37,093,693 | |
See Notes to Financial Statements
FAM SMALL CAP FUND — Schedule of Investments Continued
December 31, 2024
| | | Shares | | | Value | |
| COMMON STOCKS — 94.8% (Continued) | | | | | | | | |
| Real Estate Owners & Developers — 2.4% | | | | | | | | |
| Dream Finders Homes, Inc. - Class A (a) | | | 436,035 | | | $ | 10,146,534 | |
| Road & Rail — 2.9% | | | | | | | | |
| Landstar System, Inc. | | | 71,500 | | | | 12,287,990 | |
| Software — 5.6% | | | | | | | | |
| Descartes Systems Group, Inc. (The) (a) | | | 101,200 | | | | 11,496,320 | |
| SPS Commerce, Inc. (a) | | | 65,008 | | | | 11,960,822 | |
| | | | | | | | 23,457,142 | |
| Specialty Retail — 1.9% | | | | | | | | |
| Floor & Decor Holdings, Inc. - Class A (a) | | | 80,558 | | | | 8,031,633 | |
| Trading Companies & Distributors — 3.2% | | | | | | | | |
| SiteOne Landscape Supply, Inc. (a) | | | 101,377 | | | | 13,358,447 | |
| | | | | | | | | |
| Total Common Stocks (Cost $246,821,880) | | | | | | $ | 396,486,105 | |
| | | | | | | | | |
| | | | | | | | | |
| MONEY MARKET FUNDS — 5.0% | | | | | | | | |
| Invesco Treasury Portfolio - Institutional Class, 4.38% (b) (Cost $21,037,063) | | | 21,037,063 | | | $ | 21,037,063 | |
| | | | | | | | | |
| Total Investments at Value — 99.8% (Cost $267,858,943) | | | | | | $ | 417,523,168 | |
| | | | | | | | | |
| Other Assets in Excess of Liabilities — 0.2% | | | | | | | 999,690 | |
| | | | | | | | | |
| Net Assets — 100.0% | | | | | | $ | 418,522,858 | |
| | | | | | | | | |
| (a) | Non-income producing security. |
| (b) | The rate shown is the 7-day effective yield as of December 31, 2024. |
See Notes to Financial Statements
| FAM FUNDS — Statements of Assets and Liabilities | December 31, 2024 |
| | | FAM
Value
Fund | | | FAM
Dividend
Focus
Fund | | | FAM
Small Cap
Fund | |
| Assets | | | | | | | | | | | | |
| Investments in securities: | | | | | | | | | | | | |
| Investments in securities, at cost | | $ | 595,447,313 | | | $ | 380,711,234 | | | $ | 267,858,943 | |
| Investments in securities, at value | | $ | 1,765,746,104 | | | $ | 749,967,280 | | | $ | 417,523,168 | |
| Cash | | | 128,535 | | | | 147,840 | | | | 149,523 | |
| Receivable for Fund shares sold | | | 281,198 | | | | 599,709 | | | | 1,193,728 | |
| Dividends receivable | | | 1,171,375 | | | | 487,262 | | | | 174,699 | |
| Other assets | | | 28,244 | | | | 16,103 | | | | 23,802 | |
| Total Assets | | | 1,767,355,456 | | | | 751,218,194 | | | | 419,064,920 | |
| Liabilities | | | | | | | | | | | | |
| Payable for Fund shares redeemed | | | 361,661 | | | | 542,690 | | | | 53,371 | |
| Accrued investment advisory fees | | | 1,505,648 | | | | 599,391 | | | | 331,351 | |
| Accrued shareholder account servicing and administrative serving fees | | | 289,430 | | | | 146,159 | | | | 64,278 | |
| Accrued business management and fund accounting fees | | | 155,975 | | | | 67,121 | | | | 37,154 | |
| Accrued expenses | | | 139,995 | | | | 64,140 | | | | 55,908 | |
| Total Liabilities | | | 2,452,709 | | | | 1,419,501 | | | | 542,062 | |
| Net Assets | | $ | 1,764,902,747 | | | $ | 749,798,693 | | | $ | 418,522,858 | |
| | | | | | | | | | | | | |
| Net Assets Consist of: | | | | | | | | | | | | |
| Paid-in capital | | $ | 594,603,956 | | | $ | 380,542,647 | | | $ | 268,858,633 | |
| Distributable earnings | | | 1,170,298,791 | | | | 369,256,046 | | | | 149,664,225 | |
| Net Assets | | $ | 1,764,902,747 | | | $ | 749,798,693 | | | $ | 418,522,858 | |
| | | | | | | | | | | | | |
| Net asset value and offering price per share | | | | | | | | | | | | |
| Net assets - Investor Shares | | $ | 1,717,306,856 | | | $ | 749,798,693 | | | $ | 254,738,011 | |
| Net assets - Institutional Shares | | $ | 47,595,891 | | | | N/A | | | $ | 163,784,847 | |
| Shares outstanding - Investor Shares | | | 17,302,863 | | | | 13,508,952 | | | | 9,612,050 | |
| Shares outstanding - Institutional Shares | | | 475,054 | | | | N/A | | | | 6,105,600 | |
| Net Asset Value, offering and Redemption Price per share (unlimited shares of beneficial interest authorized at $0.001 par value) | | | | | | | | | | | | |
| Investor Shares | | $ | 99.25 | | | $ | 55.50 | | | $ | 26.50 | |
| Institutional Shares | | $ | 100.19 | | | | N/A | | | $ | 26.83 | |
See Notes to Financial Statements
| FAM FUNDS — Statements of Operations | Year Ended December 31, 2024 |
| | | FAM
Value
Fund | | | FAM
Dividend
Focus
Fund | | | FAM
Small Cap
Fund | |
| Investment Income | | | | | | | | | | | | |
| Dividends | | $ | 18,481,736 | | | $ | 10,108,223 | | | $ | 4,179,959 | |
| Foreign witholding taxes on dividends | | | (167,135 | ) | | | — | | | | (123,153 | ) |
| Total Investment Income | | | 18,314,601 | | | | 10,108,223 | | | | 4,056,806 | |
| Expenses | | | | | | | | | | | | |
| Investment advisory fees (Note 2) | | | 15,479,821 | | | | 6,802,792 | | | | 3,529,215 | |
| Shareholder account servicing fees (Note 2) | | | | | | | | | | | | |
| Investor shares | | | 1,428,005 | | | | 480,882 | | | | 158,324 | |
| Institutional shares | | | 2,055 | | | | — | | | | 9,713 | |
| Fund accounting fees (Note 2) | | | | | | | | | | | | |
| Investor shares | | | 1,175,612 | | | | 530,159 | | | | 166,515 | |
| Institutional shares | | | 30,614 | | | | — | | | | 108,693 | |
| Shareholder administrative fees (Note 2) | | | | | | | | | | | | |
| Investor shares | | | 750,694 | | | | 648,484 | | | | 198,801 | |
| Institutional shares | | | 16,933 | | | | — | | | | 73,908 | |
| Business management fees (Note 2) | | | 519,017 | | | | 228,856 | | | | 120,009 | |
| Legal fees | | | 204,487 | | | | 83,663 | | | | 45,064 | |
| Custodian and bank servicing fees | | | 144,839 | | | | 67,458 | | | | 38,462 | |
| Trustee’s fees and expenses | | | 74,477 | | | | 74,438 | | | | 74,438 | |
| Registration and filing fees | | | 53,394 | | | | 42,250 | | | | 57,673 | |
| Shareholder reporting expenses | | | 52,042 | | | | 42,765 | | | | 25,564 | |
| Audit and tax service fees | | | 39,653 | | | | 20,177 | | | | 20,272 | |
| Compliance services fees (Note 2) | | | 22,500 | | | | 22,500 | | | | 22,500 | |
| Other | | | 154,526 | | | | 73,029 | | | | 46,976 | |
| Total Expenses | | | 20,148,669 | | | | 9,117,453 | | | | 4,696,127 | |
| Fee reductions by Advisor (Note 2) | | | (63,035 | ) | | | — | | | | — | |
| Previous investment advisory fee reductions recouped by the Advisor (Note 2) | | | 125,000 | | | | — | | | | — | |
| Net Expenses | | | 20,210,634 | | | | 9,117,453 | | | | 4,696,127 | |
| Net Investment Income (Loss) | | | (1,896,033 | ) | | | 990,770 | | | | (639,321 | ) |
| Realized and Unrealized Gains on Investments | | | | | | | | | | | | |
| Net realized gains on investments | | | 105,015,715 | | | | 23,385,345 | | | | 17,803,143 | |
| Net change in unrealized appreciation (depreciation) on investments | | | 143,115,375 | | | | 27,389,703 | | | | 29,330,286 | |
| Net Realized and Unrealized Gains | | | 248,131,090 | | | | 50,775,048 | | | | 47,133,429 | |
| Net Increase in Net Assets From Operations | | $ | 246,235,057 | | | $ | 51,765,818 | | | $ | 46,494,108 | |
See Notes to Financial Statements
| FAM FUNDS — Statements of Changes in Net Assets |
| | | FAM Value Fund | |
| | | Year Ended
December 31,
2024 | | | Year Ended
December 31,
2023 | |
| Change in Net Assets | | | | | | | | |
| From Operations | | | | | | | | |
| Net investment income (loss) | | $ | (1,896,033 | ) | | $ | 2,366,950 | |
| Net realized gains on investments | | | 105,015,715 | | | | 74,582,151 | |
| Net change in unrealized appreciation (depreciation) on investments | | | 143,115,375 | | | | 149,505,731 | |
| Net increase in net assets resulting from operations | | | 246,235,057 | | | | 226,454,832 | |
| | | | | | | | | |
| Distributions to shareholders from (Note 5): | | | | | | | | |
| Distributable earnings - Investor Shares | | | (102,186,604 | ) | | | (74,952,494 | ) |
| Distributable earnings - Institutional Shares | | | (2,829,567 | ) | | | (2,001,889 | ) |
| Total distributions | | | (105,016,171 | ) | | | (76,954,383 | ) |
| | | | | | | | | |
| Capital share transactions (Note 3) | | | 21,862,593 | | | | 9,986,400 | |
| Total increase in net assets | | | 163,081,479 | | | | 159,486,849 | |
| | | | | | | | | |
| Net Assets | | | | | | | | |
| Beginning of year | | | 1,601,821,268 | | | | 1,442,334,419 | |
| End of year | | $ | 1,764,902,747 | | | $ | 1,601,821,268 | |
See Notes to Financial Statements
| FAM FUNDS — Statements of Changes in Net Assets |
| | | FAM Dividend Focus Fund | |
| | | Year Ended | | | Year Ended | |
| | | December 31, | | | December 31, | |
| | | 2024 | | | 2023 | |
| Change in Net Assets | | | | | | | | |
| From Operations | | | | | | | | |
| Net investment income | | $ | 990,770 | | | $ | 2,463,682 | |
| Net realized gains on investments | | | 23,385,345 | | | | 1,984,415 | |
| Net change in unrealized appreciation (depreciation) on investments | | | 27,389,703 | | | | 104,813,210 | |
| Net increase in net assets resulting from operations | | | 51,765,818 | | | | 109,261,307 | |
| | | | | | | | | |
| Distributions to shareholders from (Note 5): | | | | | | | | |
| Distributable earnings - Investor Shares | | | (24,378,895 | ) | | | (4,456,295 | ) |
| | | | | | | | | |
| Capital share transactions (Note 3) | | | 48,070,111 | | | | 10,410,728 | |
| Total increase in net assets | | | 75,457,034 | | | | 115,215,740 | |
| | | | | | | | | |
| Net Assets | | | | | | | | |
| Beginning of year | | | 674,341,659 | | | | 559,125,919 | |
| End of year | | $ | 749,798,693 | | | $ | 674,341,659 | |
See Notes to Financial Statements
| FAM FUNDS — Statements of Changes in Net Assets |
| | | FAM Small Cap Fund | |
| | | Year Ended | | | Year Ended | |
| | | December 31, | | | December 31, | |
| | | 2024 | | | 2023 | |
| Change in Net Assets | | | | | | | | |
| From Operations | | | | | | | | |
| Net investment loss | | $ | (639,321 | ) | | $ | (440,788 | ) |
| Net realized gains on investments | | | 17,803,143 | | | | 22,152,905 | |
| Net change in unrealized appreciation (depreciation) on investments | | | 29,330,286 | | | | 38,580,724 | |
| Net increase in net assets resulting from operations | | | 46,494,108 | | | | 60,292,841 | |
| | | | | | | | | |
| Distributions to shareholders from (Note 5): | | | | | | | | |
| Distributable earnings - Investor Shares | | | (10,805,462 | ) | | | (13,424,294 | ) |
| Distributable earnings - Institutional Shares | | | (6,998,454 | ) | | | (8,727,869 | ) |
| Total distributions | | | (17,803,916 | ) | | | (22,152,163 | ) |
| | | | | | | | | |
| Capital share transactions (Note 3) | | | 26,971,007 | | | | 37,678,968 | |
| Total increase in net assets | | | 55,661,199 | | | | 75,819,646 | |
| | | | | | | | | |
| Net Assets | | | | | | | | |
| Beginning of year | | | 362,861,659 | | | | 287,042,013 | |
| End of year | | $ | 418,522,858 | | | $ | 362,861,659 | |
See Notes to Financial Statements
FAM FUNDS — Notes to Financial Statements
Note 1. Nature of Business and Summary of Significant Accounting Policies
FAM Value Fund, FAM Dividend Focus Fund and FAM Small Cap Fund (individually a “Fund”, and collectively, the “Funds”) are each a series of Fenimore Asset Management Trust, a diversified, open-end management investment company registered under the Investment Company Act of 1940, as amended (the “1940 Act”).
Each Fund is authorized to issue two classes of shares: Investor Shares and Institutional Shares. The Investor Shares and the Institutional Shares represent interests in the same portfolio of investments in each Fund, however, each class of shares is subject to different expenses and have different investment minimums. Each share class has exclusive voting rights with respect to matters that affect just that class of shares. As of the date of this report, the Institutional Shares of the FAM Dividend Focus Fund are not currently offered.
The investment objective of the FAM Value Fund is to maximize long-term return on capital. The investment objective of the FAM Dividend Focus Fund is to provide current income and long-term capital appreciation from investing primarily in income-producing equity securities. The investment objective of the FAM Small Cap Fund is to maximize long-term return on capital.
Each Fund is an investment company and accordingly follows accounting and reporting guidance of the Financial Accounting Standards Board Accounting Standards Codification Topic 946 “Financial Services – Investment Companies.” The following is a summary of each Fund’s significant accounting policies, which are in accordance with accounting principles generally accepted in the United States of America (“GAAP”) and followed by the Funds in the preparation of their financial statements.
Each Fund operates as a single operating segment. Each Fund’s income, expenses, assets, and performance are regularly monitored and assessed as a whole by the Advisor (defined below), who is responsible for the oversight functions of each Fund, using the information presented in the financial statements and financial highlights.
| a) | Valuation of Securities |
Each Fund values its portfolio securities at market value as of the close of regular trading on the New York Stock Exchange, Inc. (the “NYSE”) (normally 4:00 p.m. Eastern time) on each business day that the NYSE is open for business. Securities traded on a national securities exchange or admitted to trading on NASDAQ are valued at the last reported sale price or the NASDAQ official closing price. Securities for which no sale was reported, over-the-counter securities, and securities for which market quotations are not readily available or have not traded are valued at fair value as determined by procedures established by Fenimore Asset Management, Inc. (the “Advisor”), as the Funds’ Valuation Designee, pursuant to Rule 2a-5 under the 1940 Act. Investments in other open-end investment companies, including money market funds, are valued at their net asset value (“NAV”) as reported by such companies.
GAAP establishes a three-tier framework for measuring fair value based on a hierarchy of inputs. The hierarchy distinguishes between market data obtained from independent sources (observable inputs) and the Funds’ own market assumptions (unobservable inputs).
These inputs are used in determining the value of each Fund’s investments. These inputs are summarized in the three broad levels listed below:
Level 1 – quoted prices in active markets for identical securities
Level 2 – other significant observable inputs (including quoted prices for identical securities in inactive markets and quoted prices for similar securities)
Level 3 – significant unobservable inputs (including each Fund’s own assumptions in determining the fair value of investments)
FAM FUNDS — Notes to Financial Statements
When market quotations are not readily available or when events occur that make established valuation methods unreliable, securities of the Fund may be valued in good faith by or under the direction of the Advisor as assigned by the Board of Trustees. Factors which may be considered when determining the value of a security include (a) the fundamental data relating to the investment; (b) an evaluation of the forces which influence the market in which the security is sold, including the liquidity and depth of the market; (c) the market value at date of purchase; (d) information as to any transactions or offers with respect to the security or comparable securities; and (e) any other relevant matters.
The inputs or methods used for valuing securities are not necessarily an indication of the risks associated with investing in those securities. The inputs used to measure fair value may fall into different levels of the fair value hierarchy. In such cases, for disclosure purposes, the level in the fair value hierarchy within which the fair value measurement falls in its entirety is determined based on the lowest level input that is significant to the fair value measurement.
The following is a summary of each Fund’s investments and the inputs used to value the investments as of December 31, 2024:
| FAM Value Fund | | | | | | | | | | | | |
| | | Level 1 | | | Level 2 | | | Level 3 | | | Total | |
| Common Stocks | | $ | 1,685,646,879 | | | $ | — | | | $ | — | | | $ | 1,685,646,879 | |
| Money Market Funds | | | 80,099,225 | | | | — | | | | — | | | | 80,099,225 | |
| | | | | | | | | | | | | | | | | |
| Total | | $ | 1,765,746,104 | | | $ | — | | | $ | — | | | $ | 1,765,746,104 | |
| | | | | | | | | | | | | | | | | |
| FAM Dividend Focus Fund | | | | | | | | | | | | |
| | | Level 1 | | | Level 2 | | | Level 3 | | | Total | |
| Common Stocks | | $ | 713,433,441 | | | $ | — | | | $ | — | | | $ | 713,433,441 | |
| Money Market Funds | | | 36,533,839 | | | | — | | | | — | | | | 36,533,839 | |
| | | | | | | | | | | | | | | | | |
| Total | | $ | 749,967,280 | | | $ | — | | | $ | — | | | $ | 749,967,280 | |
| | | | | | | | | | | | | | | | | |
| FAM Small Cap Fund | | | | | | | | | | | | |
| | | Level 1 | | | Level 2 | | | Level 3 | | | Total | |
| Common Stocks | | $ | 396,486,105 | | | $ | — | | | $ | — | | | $ | 396,486,105 | |
| Money Market Funds | | | 21,037,063 | | | | — | | | | — | | | | 21,037,063 | |
| | | | | | | | | | | | | | | | | |
| Total | | $ | 417,523,168 | | | $ | — | | | $ | — | | | $ | 417,523,168 | |
The Funds did not hold any derivative instruments or any assets or liabilities that were measured at fair value on a recurring basis using significant unobservable inputs (Level 3) as of or during the year ended December 31, 2024.
Refer to each Fund’s Schedule of Investments to view securities segregated by industry type.
| b) | Investment Transactions |
Investment transactions are recorded on trade date. Realized gains and losses on investments sold are determined on the basis of identified cost.
Interest income, if any, is accrued as earned, and dividend income is recorded on the ex-dividend date. Withholding taxes on foreign dividends, if any, have been recorded in accordance with the Trust’s understanding of the applicable country’s tax rules and tax rates. Non-cash dividends, if any, are included in dividend income on the ex-dividend date at the fair market value of the shares received. The Funds record distributions received in excess of income from underlying investments as a reduction of cost of investments
FAM FUNDS — Notes to Financial Statements
and/or realized gain. Such amounts are based on estimates if actual amounts are not available, and actual amounts of income, realized gain and return of capital may differ from the estimated amounts. The Funds adjust the estimated amounts of the components of distributions (and consequently its net investment income) as an increase to unrealized appreciation (depreciation) and realized gain (loss) on investments as necessary once the issuers provide information about the character of the distributions.
The NAV per share of each Class of shares of each Fund is calculated daily by dividing the total value of a Fund’s assets attributable to that Class, less liabilities attributable to that Class, by the number of shares of that Class outstanding.
| e) | Distributions to Shareholders |
Dividends from net investment income are declared and paid quarterly by the FAM Dividend Focus Fund, if applicable. Dividends from net investment income, if any, are declared and paid on an annual basis by each of the FAM Value Fund and FAM Small Cap Fund. Dividends are declared separately for each share class. No share class has preferential dividend rights; differences in per share rates are due to differences in the expenses of each share class.
Net realized capital gains, if any, are distributed at least annually for each of the Funds. Distributions from net investment income and from net realized capital gains are determined in accordance with U.S. income tax regulations, which may differ from GAAP. Permanent book and tax basis differences, if any, are reclassified among the components of net assets. Dividends and distributions to shareholders are recorded on the ex-dividend date.
It is each Fund’s policy to comply with the requirements of the Internal Revenue Code applicable to regulated investment companies and to distribute all of its taxable income to its shareholders. Therefore, no provision for federal income or excise tax is required.
GAAP requires uncertain tax positions to be recognized, measured, presented, and disclosed in the financial statements. For the year ended December 31, 2024, management has evaluated the tax positions taken or expected to be taken in the course of preparing each Fund’s tax returns to determine whether the tax positions are “more-likely-than-not” of being sustained upon review by the applicable tax authority. Tax positions not deemed to meet the “more-likely-than-not” threshold would be recorded as a tax expense in the current year. Based on its evaluation, management has determined that no liability for unrecognized tax expense is required. The current and all open tax years (generally, three years) remain subject to examination by U.S. and New York taxing authorities. No examination of the Funds’ tax filings is presently in progress.
Expenses of the Trust not attributable solely to one of the Funds are allocated among the Funds based on relative net assets of each Fund or the nature of the expense and the relative applicability to each Fund.
| h) | Allocation between Classes |
Investment income earned, realized capital gains and losses, and unrealized appreciation and depreciation are allocated daily to each Class of a Fund based upon its proportionate share of total net assets of that Fund. Class-specific expenses are charged directly to the Class incurring the expense.
The preparation of financial statements in conformity with GAAP requires management to make estimates and assumptions that affect the reported amounts of assets and liabilities and disclosure of contingent assets and liabilities at the date of the financial statements and the reported amounts of increases and decreases in net assets from operations during the reporting period. Actual results could differ from those estimates.
FAM FUNDS — Notes to Financial Statements
Note 2. Investment Advisory Fees and Other Transactions with Affiliates
Investment Advisory Agreement
Under an Investment Advisory Agreement, each Fund pays an investment advisory fee to the Advisor equal, on an annual basis, to 0.90% of its average daily net assets. In addition, under a Business Management Agreement, each Fund pays a business management fee to the Advisor equal, on an annual basis, to 0.03% of its average daily net assets. During the year ended December 31, 2024, the Advisor earned $15,479,821, $6,802,792, and $3,529,215 of fees under the Investment Advisory Agreement for FAM Value Fund, FAM Dividend Focus Fund and FAM Small Cap Fund, respectively and earned $519,017, $228,856, and $120,009 of fees under the Business Management Agreement for FAM Value Fund, FAM Dividend Focus Fund and FAM Small Cap Fund, respectively.
Expense Limitation Agreement
Pursuant to an Expense Limitation Agreement (the “ELA”) entered into between the Advisor and the Trust, on behalf of each Fund, the Advisor has contractually agreed, until May 1, 2025, to reduce its fees and/or reimburse certain expenses (excluding interest, taxes, brokerage costs, Acquired Fund Fees and Expenses, dividend expense, litigation, indemnification or extraordinary expenses) to the extent necessary to maintain annual operating expenses of each class of shares of each of the Funds as follows: for the Investor Shares: 1.18% for FAM Value Fund, 1.26% for FAM Dividend Focus Fund and 1.42% for FAM Small Cap Fund; and for the Institutional Shares: 0.99% for FAM Value Fund, 1.10% for FAM Dividend Focus Fund and 1.20% for FAM Small Cap Fund.
During the year ended December 31, 2024, pursuant to the terms of the ELA, the Advisor reduced its fees for FAM Value Fund in the amount of $63,035. The FAM Dividend Focus Fund and the FAM Small Cap Fund did not have any advisory fee reductions during the year ended December 31, 2024.
The Advisor may be reimbursed by the Funds for any fees waived pursuant to the ELA if such payment is made within three years of the fee waiver and does not cause the total annual Fund operating expenses after fee waiver (excluding interest, taxes, brokerage costs, Acquired Fund Fees and Expenses, dividend expense, litigation, indemnification or extraordinary expenses) of the Funds to exceed the lesser of (i) the then-current expense limit and (ii) the expense limit in place at the time the waiver. The FAM Dividend Focus Fund and FAM Small Cap Fund do not have fees that the Advisor may recoup. As of December 31, 2024, the amounts of previously reduced fees that the Advisor may recoup from the FAM Value Fund are shown below, along with the expiration dates of such recoupments:
| | | 2026 | | | 2027 | | | Total | |
| FAM Value Fund | | $ | 54,196 | | | $ | 63,035 | | | $ | 117,231 | |
During the year ended December 31, 2024, FAM Value Fund recouped $125,000 of prior years’ investment advisory fee reductions.
Shareholder Administration Services
The Funds have adopted Shareholder Administrative Services Plans (the “Plans”) for each class of shares pursuant to which each Fund may pay shareholder administrative servicing fees to the Advisor and to financial intermediaries for providing, or arranging for the provision of, certain types of shareholder administrative services to shareholders of each respective class of shares that are serviced by the Advisor, affiliates of the Advisor or the financial intermediary. Pursuant to the Shareholder Administrative Services Plan for Investor Shares, the Investor Shares of each Fund may pay shareholder administrative servicing fees of up to 0.25% per annum of the average daily net assets allocable to Investor Shares of each respective Fund; and pursuant to the Shareholder Administrative Services Plan for Institutional Shares, the Institutional Shares of each Fund may pay shareholder administrative servicing fees of up to 0.15% per annum of the average daily net assets allocable to Institutional Shares of each respective Fund.
FAM FUNDS — Notes to Financial Statements
For the year ended December 31, 2024, shareholder administrative servicing fees incurred pursuant to the Plans were as follows:
| FAM Value Fund | | $ | 767,627 | |
| FAM Dividend Focus Fund | | $ | 648,484 | |
| FAM Small Cap Fund | | $ | 272,709 | |
Shareholder Account Services
Pursuant to the terms of the Shareholder Account Services Agreement between the Funds and the Advisor, for the purpose of providing or procuring shareholder account services, with respect to the Investor Shares of the Funds, the Advisor receives a fee at the annual rate of 0.11% of the average daily net assets allocable to the Investor Shares of each Fund, and, pursuant to the terms of the Shareholder Account Services Agreement between the Funds and the Advisor with respect to the Institutional Shares of the Funds, the Advisor receives a fee at the annual rate of 0.03% of the average daily net assets allocable to the Institutional Shares of each Fund. For the year ended December 31, 2024, shareholder account servicing fees incurred by the Funds to the Advisor were as follows:
| FAM Value Fund | | $ | 1,430,060 | |
| FAM Dividend Focus Fund | | $ | 480,882 | |
| FAM Small Cap Fund | | $ | 168,037 | |
Fund Accounting
The Advisor serves as the fund accounting agent and receives a fee at the annual rate of 0.07% of average daily net assets of each Fund’s Investor Shares and daily net assets of each Fund’s Institutional Shares. For the year ended December 31, 2024, the Funds’ fund accounting fees incurred to the Advisor amounted to:
| FAM Value Fund | | $ | 1,206,226 | |
| FAM Dividend Focus Fund | | $ | 530,159 | |
| FAM Small Cap Fund | | $ | 275,208 | |
Distribution Agreement
Fenimore Securities, Inc. (“FSI”), a company also under common control with the Advisor, acts as distributor of the Funds’ shares. FSI receives no compensation for providing distribution services from the Funds.
Compliance
Ultimus Fund Solutions, LLC (“Ultimus”) provides the Chief Compliance Officer to the Funds, as well as certain additional compliance support functions. The Funds pay Ultimus fees in accordance with the agreement for such services. During the year ended December 31, 2024, the fee paid by each Fund for such services was $22,500.
Other
The Advisor has entered into a Master Services Agreement with Ultimus, pursuant to which Ultimus provides day-to-day operational services to each Fund including, but not limited to, accounting, administrative, co-transfer agency services and recordkeeping services. The fees payable to Ultimus are paid by the Advisor (not the Funds).
A Trustee and certain officers of the Trust are also officers or employees of the Advisor, FSI, or Ultimus, as applicable and are not compensated by the Funds for servicing in such capacities.
Note 3. Shares of Beneficial Interest
At December 31, 2024, an unlimited number of shares of beneficial interest ($0.001 par value) of each Fund were authorized.
FAM FUNDS — Notes to Financial Statements
Transactions for each Fund are as follows:
| | | Year Ended
December 31,
2024 | | | Year Ended
December 31,
2023 | |
| FAM Value Fund | | | | | | | | | | | | |
| | | Shares | | | Amount | | | Shares | | | Amount | |
| Investor Shares | | | | | | | | | | | | | | | | |
| Shares Sold | | | 450,151 | | | $ | 44,894,498 | | | | 432,620 | | | $ | 37,564,247 | |
| Shares Issued on reinvestment of distributions | | | 958,538 | | | | 95,981,288 | | | | 770,592 | | | | 70,416,766 | |
| Shares redeemed | | | (1,224,822 | ) | | | (123,035,251 | ) | | | (1,124,975 | ) | | | (98,300,691 | ) |
| | | | | | | | | | | | | | | | | |
| Investor Share Transactions | | | 183,867 | | | $ | 17,840,535 | | | | 78,237 | | | $ | 9,680,322 | |
| | | | | | | | | | | | | | | | | |
| Institutional Shares | | | | | | | | | | | | | | | | |
| Shares Sold | | | 67,195 | | | $ | 6,925,680 | | | | 83,235 | | | $ | 7,421,490 | |
| Shares Issued on reinvestment of distributions | | | 23,712 | | | | 2,396,827 | | | | 18,500 | | | | 1,702,362 | |
| Shares redeemed | | | (53,362 | ) | | | (5,300,449 | ) | | | (101,189 | ) | | | (8,817,774 | ) |
| | | | | | | | | | | | | | | | | |
| Investor Share Transactions | | | 37,545 | | | $ | 4,022,058 | | | | 546 | | | $ | 306,078 | |
| | | | | | | | | | | | | | | | | |
| Net increase from capital transactions | | | 221,412 | | | $ | 21,862,593 | | | | 78,783 | | | $ | 9,986,400 | |
| | | Year Ended
December 31,
2024 | | | Year Ended
December 31,
2023 | |
| FAM Dividend Focus Fund | | | | | | | | | | | | |
| | | Shares | | | Amount | | | Shares | | | Amount | |
| Investor Shares | | | | | | | | | | | | | | | | |
| Shares Sold | | | 2,162,152 | | | $ | 124,346,406 | | | | 1,744,909 | | | $ | 84,828,046 | |
| Shares Issued on reinvestment of distributions | | | 411,456 | | | | 23,112,607 | | | | 81,044 | | | | 4,174,790 | |
| Shares redeemed | | | (1,717,771 | ) | | | (99,388,902 | ) | | | (1,644,867 | ) | | | (78,592,108 | ) |
| | | | | | | | | | | | | | | | | |
| Net increase from capital transactions | | | 855,837 | | | $ | 48,070,111 | | | | 181,086 | | | $ | 10,410,728 | |
| | | Year Ended
December 31,
2024 | | | Year Ended
December 31,
2023 | |
| FAM Small Cap Fund | | | | | | | | | | | | |
| | | Shares | | | Amount | | | Shares | | | Amount | |
| Investor Shares | | | | | | | | | | | | | | | | |
| Shares Sold | | | 1,150,903 | | | $ | 29,753,281 | | | | 1,147,124 | | | $ | 26,949,283 | |
| Shares Issued on reinvestment of distributions | | | 398,317 | | | | 10,567,128 | | | | 527,574 | | | | 13,073,269 | |
| Shares redeemed | | | (904,929 | ) | | | (23,500,883 | ) | | | (1,255,539 | ) | | | (29,863,005 | ) |
| | | | | | | | | | | | | | | | | |
| Investor Share Transactions | | | 644,291 | | | $ | 16,819,526 | | | | 419,159 | | | $ | 10,159,547 | |
| | | | | | | | | | | | | | | | | |
| Institutional Shares | | | | | | | | | | | | | | | | |
| Shares Sold | | | 815,184 | | | $ | 21,260,207 | | | | 1,231,874 | | | $ | 29,567,371 | |
| Shares Issued on reinvestment of distributions | | | 216,009 | | | | 5,799,842 | | | | 301,092 | | | | 7,542,364 | |
| Shares redeemed | | | (647,645 | ) | | | (16,908,568 | ) | | | (394,524 | ) | | | (9,590,314 | ) |
| | | | | | | | | | | | | | | | | |
| Investor Share Transactions | | | 383,548 | | | $ | 10,151,481 | | | | 1,138,442 | | | $ | 27,519,421 | |
| | | | | | | | | | | | | | | | | |
| Net increase from capital transactions | | | 1,027,839 | | | $ | 26,971,007 | | | | 1,557,601 | | | $ | 37,678,968 | |
FAM FUNDS — Notes to Financial Statements
Note 4. Investment Transactions
During the year ended December 31, 2024, purchases and sales of investment securities, other than short-term obligations, were:
| | | Purchases | | | Sales | |
| FAM Value Fund | | $ | 56,310,476 | | | $ | 162,322,451 | |
| FAM Dividend Focus Fund | | $ | 57,677,232 | | | $ | 50,182,546 | |
| FAM Small Cap Fund | | $ | 47,992,131 | | | $ | 39,337,213 | |
Note 5. Income Taxes and Distributions to Shareholders
The tax composition of dividends and distributions paid to shareholders during the years ended December 31, 2024 and 2023 was:
| | | FAM
Value Fund | | | FAM Dividend
Focus Fund | | | FAM Small Cap Fund | |
| | | 2024 | | | 2023 | | | 2024 | | | 2023 | | | 2024 | | | 2023 | |
| Distributions paid from: | | | | | | | | | | | | | | | | | | | | | | | | |
| Ordinary income | | $ | — | | | $ | 2,371,177 | | | $ | 993,171 | | | $ | 2,470,650 | | | $ | — | | | $ | — | |
| Long-term capital gains | | | 105,016,171 | | | | 74,583,206 | | | | 23,385,724 | | | | 1,985,645 | | | | 17,803,916 | | | | 22,152,163 | |
| | | | | | | | | | | | | | | | | | | | | | | | | |
| Total Distributions | | $ | 105,016,171 | | | $ | 76,954,383 | | | $ | 24,378,895 | | | $ | 4,456,295 | | | $ | 17,803,916 | | | $ | 22,152,163 | |
The following information is computed on a tax basis for each item as of December 31, 2024:
| | | FAM
Value Fund | | | FAM Dividend
Focus Fund | | | FAM Small
Cap Fund | |
| Tax cost of investments | | $ | 595,447,313 | | | $ | 380,711,234 | | | $ | 267,858,943 | |
| | | | | | | | | | | | | |
| Gross unrealized appreciation | | $ | 1,170,298,791 | | | $ | 369,414,427 | | | $ | 157,996,595 | |
| Gross unrealized depreciation | | | — | | | | (158,381 | ) | | | (8,332,370 | ) |
| | | | | | | | | | | | | |
| Net unrealized appreciation | | | 1,170,298,791 | | | | 369,256,046 | | | | 149,664,225 | |
| | | | | | | | | | | | | |
| Distributable earnings | | $ | 1,170,298,791 | | | $ | 369,256,046 | | | $ | 149,664,225 | |
The Fund recognizes interest and penalties, if any, related to unrecognized tax benefits as income tax expenses on the Statement of Operations. During the year ended December 31, 2024, the Funds did not incur any interest or penalties.
Permanent book and tax differences, primarily attributable to net investment losses and recharacterization of distributions, resulted in the following reclassifications for the year ended December 31, 2024:
| | | FAM
Value Fund | | | FAM Dividend
Focus Fund | | | FAM Small
Cap Fund | |
| Paid-in capital | | $ | (1,896,489 | ) | | $ | (2,780 | ) | | $ | (639,352 | ) |
| Distributable earnings | | | 1,896,489 | | | | 2,780 | | | | 639,352 | |
Note 6. Line of Credit
FAM Value Fund, FAM Dividend Focus Fund and FAM Small Cap Fund have a line of credit up to the lesser of 33 1/3% of their unencumbered net assets, with a maximum of $200,000,000. Collectively, the three funds cannot exceed the $200,000,000.
FAM FUNDS — Notes to Financial Statements
Borrowings under the agreement bear interest at the prime rate as announced by the lending bank. The line of credit is still available through November 18, 2025, when any advances are to be repaid. During the year ended December 31, 2024, no amounts were drawn from the available lines.
Note 7. Commitments and Contingencies
In the normal course of business, the Funds enter into contracts that contain a variety of representations and warranties which provide general indemnifications. The Funds’ maximum exposure under these arrangements is unknown as this would involve future claims that might be made against the Funds that have not yet occurred. However, based on experience, the Trust expects the risk of loss to be remote.
Note 8. Subsequent Events
Management has evaluated subsequent events through the date these financial statements were available to be issued and has determined that there were no subsequent events requiring recognition or disclosure in these financial statements.
FAM FUNDS — Notes to Financial Statements
Note 9. Financial Highlights
FAM Value Fund
(Investor Shares)
Per share information
(For a share outstanding | | Years Ended December 31, |
| throughout each year) | | 2024 | | | 2023 | | | 2022 | | | 2021 | | | 2020 | |
| Net asset value, beginning of year | | $ | 91.22 | | | $ | 82.51 | | | $ | 99.58 | | | $ | 83.23 | | | $ | 80.83 | |
| Income (loss) from investment operations: | | | | | | | | | | | | | | | | | | | | |
| Net investment income (loss)(a) | | | (0.11 | ) | | | 0.13 | | | | 0.14 | | | | 0.02 | | | | (0.06 | ) |
| Net realized and unrealized gains (losses) on investments | | | 14.37 | | | | 13.15 | | | | (14.18 | ) | | | 21.30 | | | | 5.53 | |
| Total from investment operations | | | 14.26 | | | | 13.28 | | | | (14.04 | ) | | | 21.32 | | | | 5.47 | |
| Less distributions from: | | | | | | | | | | | | | | | | | | | | |
| Net investment income | | | — | | | | (0.14 | ) | | | (0.15 | ) | | | (0.02 | ) | | | — | |
| Net realized gains | | | (6.23 | ) | | | (4.43 | ) | | | (2.88 | ) | | | (4.95 | ) | | | (3.07 | ) |
| Return of Capital | | | — | | | | — | | | | — | | | | (0.00 | )(b) | | | — | |
| Total distributions | | | (6.23 | ) | | | (4.57 | ) | | | (3.03 | ) | | | (4.97 | ) | | | (3.07 | ) |
| Change in net asset value for the year | | $ | 8.03 | | | $ | 8.71 | | | $ | (17.07 | ) | | $ | 16.35 | | | $ | 2.40 | |
| Net asset value, end of year | | $ | 99.25 | | | $ | 91.22 | | | $ | 82.51 | | | $ | 99.58 | | | $ | 83.23 | |
| Total return(c) | | | 15.57 | % | | | 16.09 | % | | | (14.12 | %) | | | 25.63 | % | | | 6.82 | % |
| | | | | | | | | | | | | | | | | | | | | |
| Ratios/supplementary data | | | | | | | | | | | | | | | | | | | | |
| Net assets, end of year (000) | | $ | 1,717,307 | | | $ | 1,561,631 | | | $ | 1,406,047 | | | $ | 1,681,118 | | | $ | 1,385,432 | |
| Ratios to average net assets of: | | | | | | | | | | | | | | | | | | | | |
| Expenses, total | | | 1.17 | % | | | 1.17 | % | | | 1.18 | % | | | 1.18 | % | | | 1.19 | % |
| Expenses, net (includes fees reduced/recouped by Advisor) | | | 1.18 | % | | | 1.18 | % | | | 1.18 | % | | | 1.18 | % | | | 1.18 | % |
| Net investment income (loss) | | | (0.12 | %) | | | 0.15 | % | | | 0.17 | % | | | 0.02 | % | | | (0.08 | %) |
| Portfolio turnover rate | | | 3 | % | | | 10 | % | | | 9 | % | | | 6 | % | | | 14 | % |
| (a) | Based on average shares outstanding. |
| (b) | Amount rounds to less than $0.01 per share. |
| (c) | Total return is a measure of the change in value of an investment in the Fund over the periods covered. The returns shown do not reflect the deduction of taxes a shareholder would pay on Fund distributions, if any, or the redemption of Fund shares. The total returns would be lower/higher if the Advisor had not reduced and/or recouped advisory fees (Note 2). |
FAM FUNDS — Notes to Financial Statements
Note 9. Financial Highlights
FAM Value Fund
(Institutional Shares)
Per share information
(For a share outstanding | | Years Ended December 31, |
| throughout each year) | | 2024 | | | 2023 | | | 2022 | | | 2021 | | | 2020 | |
| Net asset value, beginning of year | | $ | 91.86 | | | $ | 83.04 | | | $ | 100.20 | | | $ | 83.71 | | | $ | 81.12 | |
| Income (loss) from investment operations: | | | | | | | | | | | | | | | | | | | | |
| Net investment income(a) | | | 0.08 | | | | 0.30 | | | | 0.30 | | | | 0.20 | | | | 0.09 | |
| Net realized and unrealized gains (losses) on investments | | | 14.48 | | | | 13.25 | | | | (14.27 | ) | | | 21.44 | | | | 5.57 | |
| Total from investment operations | | | 14.56 | | | | 13.55 | | | | (13.97 | ) | | | 21.64 | | | | 5.66 | |
| Less distributions from: | | | | | | | | | | | | | | | | | | | | |
| Net investment income | | | — | | | | (0.30 | ) | | | (0.31 | ) | | | (0.16 | ) | | | — | |
| Net realized gains | | | (6.23 | ) | | | (4.43 | ) | | | (2.88 | ) | | | (4.95 | ) | | | (3.07 | ) |
| Return of Capital | | | — | | | | — | | | | — | | | | (0.04 | ) | | | — | |
| Total distributions | | | (6.23 | ) | | | (4.73 | ) | | | (3.19 | ) | | | (5.15 | ) | | | (3.07 | ) |
| Change in net asset value for the year | | $ | 8.33 | | | $ | 8.82 | | | $ | (17.16 | ) | | $ | 16.49 | | | $ | 2.59 | |
| Net asset value, end of year | | $ | 100.19 | | | $ | 91.86 | | | $ | 83.04 | | | $ | 100.20 | | | $ | 83.71 | |
| Total return(b) | | | 15.79 | % | | | 16.32 | % | | | (13.96 | %) | | | 25.86 | % | | | 7.03 | % |
| | | | | | | | | | | | | | | | | | | | | |
| Ratios/supplementary data | | | | | | | | | | | | | | | | | | | | |
| Net assets, end of year (000) | | $ | 47,596 | | | $ | 40,190 | | | $ | 36,287 | | | $ | 52,941 | | | $ | 42,444 | |
| Ratios to average net assets of: | | | | | | | | | | | | | | | | | | | | |
| Expenses, total | | | 1.13 | % | | | 1.14 | % | | | 1.14 | % | | | 1.11 | % | | | 1.11 | % |
| Expenses, net (includes fees reduced by Advisor) | | | 0.99 | % | | | 0.99 | % | | | 0.99 | % | | | 0.99 | % | | | 0.99 | % |
| Net investment income | | | 0.08 | % | | | 0.34 | % | | | 0.34 | % | | | 0.21 | % | | | 0.12 | % |
| Portfolio turnover rate | | | 3 | % | | | 10 | % | | | 9 | % | | | 6 | % | | | 14 | % |
| (a) | Based on average shares outstanding. |
| | |
| (b) | Total return is a measure of the change in value of an investment in the Fund over the periods covered. The returns shown do not reflect the deduction of taxes a shareholder would pay on Fund distributions, if any, or the redemption of Fund shares. The total returns would be lower if the Advisor had not reduced advisory fees (Note 2). |
FAM FUNDS — Notes to Financial Statements
Note 9. Financial Highlights
FAM Dividend Focus Fund
(Investor Shares)
Per share information
(For a share outstanding | | Years Ended December 31, |
| throughout each year) | | 2024 | | | 2023 | | | 2022 | | | 2021 | | | 2020 | |
| Net asset value, beginning of year | | $ | 53.29 | | | $ | 44.83 | | | $ | 52.48 | | | $ | 42.35 | | | $ | 38.26 | |
| Income (loss) from investment operations: | | | | | | | | | | | | | | | | | | | | |
| Net investment income(a) | | | 0.08 | | | | 0.20 | | | | 0.08 | | | | 0.01 | | | | 0.11 | |
| Net realized and unrealized gains (losses) on investments | | | 3.99 | | | | 8.62 | | | | (7.12 | ) | | | 10.82 | | | | 4.90 | |
| Total from investment operations | | | 4.07 | | | | 8.82 | | | | (7.04 | ) | | | 10.83 | | | | 5.01 | |
| Less distributions from: | | | | | | | | | | | | | | | | | | | | |
| Net investment income | | | (0.08 | ) | | | (0.20 | ) | | | (0.09 | ) | | | — | | | | (0.11 | ) |
| Net realized gains | | | (1.78 | ) | | | (0.16 | ) | | | (0.52 | ) | | | (0.70 | ) | | | (0.80 | ) |
| Return of Capital | | | — | | | | — | | | | — | | | | — | | | | (0.01 | ) |
| Total distributions | | | (1.86 | ) | | | (0.36 | ) | | | (0.61 | ) | | | (0.70 | ) | | | (0.92 | ) |
| Change in net asset value for the year | | $ | 2.21 | | | $ | 8.46 | | | $ | (7.65 | ) | | $ | 10.13 | | | $ | 4.09 | |
| Net asset value, end of year | | $ | 55.50 | | | $ | 53.29 | | | $ | 44.83 | | | $ | 52.48 | | | $ | 42.35 | |
| Total return(b) | | | 7.58 | % | | | 19.70 | % | | | (13.42 | %) | | | 25.57 | % | | | 13.20 | % |
| | | | | | | | | | | | | | | | | | | | | |
| Ratios/supplementary data | | | | | | | | | | | | | | | | | | | | |
| Net assets, end of year (000) | | $ | 749,799 | | | $ | 674,342 | | | $ | 559,126 | | | $ | 664,225 | | | $ | 509,666 | |
| Ratios to average net assets of: | | | | | | | | | | | | | | | | | | | | |
| Expenses, total | | | 1.21 | % | | | 1.21 | % | | | 1.22 | % | | | 1.22 | % | | | 1.24 | % |
| Net investment income | | | 0.13 | % | | | 0.41 | % | | | 0.17 | % | | | 0.02 | % | | | 0.31 | % |
| Portfolio turnover rate | | | 7 | % | | | 10 | % | | | 4 | % | | | 4 | % | | | 25 | % |
| (a) | Based on average shares outstanding. |
| | |
| (b) | Total return is a measure of the change in value of an investment in the Fund over the periods covered. The returns shown do not reflect the deduction of taxes a shareholder would pay on Fund distributions, if any, or the redemption of Fund shares. |
FAM FUNDS — Notes to Financial Statements
Note 9. Financial Highlights
FAM Small Cap Fund
(Investor Shares)
Per share information
(For a share outstanding | | Years Ended December 31, |
| throughout each year) | | 2024 | | | 2023 | | | 2022 | | | 2021 | | | 2020 | |
| Net asset value, beginning of year | | $ | 24.60 | | | $ | 21.79 | | | $ | 24.97 | | | $ | 20.83 | | | $ | 18.92 | |
| Income (loss) from investment operations: | | | | | | | | | | | | | | | | | | | | |
| Net investment loss(a) | | | (0.05 | ) | | | (0.04 | ) | | | (0.12 | ) | | | (0.13 | ) | | | (0.09 | ) |
| Net realized and unrealized gains (losses) on investments | | | 3.13 | | | | 4.43 | | | | (2.98 | ) | | | 5.90 | | | | 2.00 | |
| Total from investment operations | | | 3.08 | | | | 4.39 | | | | (3.10 | ) | | | 5.77 | | | | 1.91 | |
| Less distributions from: | | | | | | | | | | | | | | | | | | | | |
| Net realized gains | | | (1.18 | ) | | | (1.58 | ) | | | (0.08 | ) | | | (1.63 | ) | | | — | |
| Change in net asset value for the year | | $ | 1.90 | | | $ | 2.81 | | | $ | (3.18 | ) | | $ | 4.14 | | | $ | 1.91 | |
| Net asset value, end of year | | $ | 26.50 | | | $ | 24.60 | | | $ | 21.79 | | | $ | 24.97 | | | $ | 20.83 | |
| Total return(b) | | | 12.49 | % | | | 20.11 | % | | | (12.42 | %) | | | 27.72 | % | | | 10.10 | % |
| | | | | | | | | | | | | | | | | | | | | |
| Ratios/supplementary data | | | | | | | | | | | | | | | | | | | | |
| Net assets, end of year (000) | | $ | 254,738 | | | $ | 220,594 | | | $ | 186,264 | | | $ | 213,588 | | | $ | 165,727 | |
| Ratios to average net assets of: | | | | | | | | | | | | | | | | | | | | |
| Expenses, total | | | 1.23 | % | | | 1.24 | % | | | 1.25 | % | | | 1.26 | % | | | 1.28 | % |
| Net investment loss | | | (0.20 | %) | | | (0.17 | %) | | | (0.52 | %) | | | (0.54 | %) | | | (0.55 | %) |
| Portfolio turnover rate | | | 11 | % | | | 16 | % | | | 15 | % | | | 23 | % | | | 16 | % |
| (a) | Based on average shares outstanding. |
| | |
| (b) | Total return is a measure of the change in value of an investment in the Fund over the periods covered. The returns shown do not reflect the deduction of taxes a shareholder would pay on Fund distributions, if any, or the redemption of Fund shares. |
FAM FUNDS — Notes to Financial Statements
Note 9. Financial Highlights
FAM Small Cap Fund
(Institutional Shares)
Per share information
(For a share outstanding | | Years Ended December 31, |
| throughout each year) | | 2024 | | | 2023 | | | 2022 | | | 2021 | | | 2020 | |
| Net asset value, beginning of year | | $ | 24.86 | | | $ | 21.99 | | | $ | 25.17 | | | $ | 20.97 | | | $ | 19.02 | |
| Income (loss) from investment operations: | | | | | | | | | | | | | | | | | | | | |
| Net investment loss(a) | | | (0.03 | ) | | | (0.02 | ) | | | (0.09 | ) | | | (0.11 | ) | | | (0.08 | ) |
| Net realized and unrealized gains (losses) on investments | | | 3.18 | | | | 4.47 | | | | (3.01 | ) | | | 5.94 | | | | 2.03 | |
| Total from investment operations | | | 3.15 | | | | 4.45 | | | | (3.10 | ) | | | 5.83 | | | | 1.95 | |
| Less distributions from: | | | | | | | | | | | | | | | | | | | | |
| Net realized gains | | | (1.18 | ) | | | (1.58 | ) | | | (0.08 | ) | | | (1.63 | ) | | | — | |
| Change in net asset value for the year | | $ | 1.97 | | | $ | 2.87 | | | $ | (3.18 | ) | | $ | 4.20 | | | $ | 1.95 | |
| Net asset value, end of year | | $ | 26.83 | | | $ | 24.86 | | | $ | 21.99 | | | $ | 25.17 | | | $ | 20.97 | |
| Total return(b) | | | 12.65 | % | | | 20.20 | % | | | (12.32 | %) | | | 27.82 | % | | | 10.25 | % |
| | | | | | | | | | | | | | | | | | | | | |
| Ratios/supplementary data | | | | | | | | | | | | | | | | | | | | |
| Net assets, end of year (000) | | $ | 163,785 | | | $ | 142,267 | | | $ | 100,778 | | | $ | 104,413 | | | $ | 77,023 | |
| Ratios to average net assets of: | | | | | | | | | | | | | | | | | | | | |
| Expenses, total | | | 1.14 | % | | | 1.14 | % | | | 1.15 | % | | | 1.15 | % | | | 1.18 | % |
| Net investment loss | | | (0.11 | %) | | | (0.08 | %) | | | (0.42 | %) | | | (0.43 | %) | | | (0.44 | %) |
| Portfolio turnover rate | | | 11 | % | | | 16 | % | | | 15 | % | | | 23 | % | | | 16 | % |
| (a) | Based on average shares outstanding. |
| | |
| (b) | Total return is a measure of the change in value of an investment in the Fund over the periods covered. The returns shown do not reflect the deduction of taxes a shareholder would pay on Fund distributions, if any, or the redemption of Fund shares. |
| FAM FUNDS — Report of Independent Registered Public Accounting Firm |
REPORT OF INDEPENDENT REGISTERED PUBLIC ACCOUNTING FIRM
To the Board of Trustees of Fenimore Asset Management Trust
and the Shareholders of FAM Value Fund, FAM Dividend Focus Fund, and FAM Small Cap Fund
Opinion on the Financial Statements
We have audited the accompanying statements of assets and liabilities, including the schedules of investments, of FAM Value Fund, FAM Dividend Focus Fund, and FAM Small Cap Fund, each a series of Fenimore Asset Management Trust (the “Funds”) as of December 31, 2024, the related statements of operations for the year then ended, the statements of changes in net assets and financial highlights for each of the years in the two year period then ended, and the related notes (collectively referred to as the “financial statements”). In our opinion, the financial statements present fairly, in all material respects, the financial position of each of the Funds as of December 31, 2024, the results of their operations for the year then ended, and the changes in net assets and financial highlights for each of the years in the two year period then ended, in conformity with accounting principles generally accepted in the United States of America.
The Funds’ financial highlights for the years ended December 31, 2022, and prior, were audited by other auditors whose report, dated February 27, 2023, expressed an unqualified opinion on those financial highlights.
Basis for Opinion
These financial statements are the responsibility of the Funds’ management. Our responsibility is to express an opinion on the Funds’ financial statements based on our audits. We are a public accounting firm registered with the Public Company Accounting Oversight Board (United States) (“PCAOB”) and are required to be independent with respect to the Funds in accordance with the U.S. federal securities laws and the applicable rules and regulations of the Securities and Exchange Commission and the PCAOB.
We conducted our audits in accordance with the standards of the PCAOB. Those standards require that we plan and perform the audits to obtain reasonable assurance about whether the financial statements are free of material misstatement whether due to error or fraud.
Our audits included performing procedures to assess the risks of material misstatement of the financial statements, whether due to error or fraud, and performing procedures that respond to those risks. Such procedures included examining, on a test basis, evidence regarding the amounts and disclosures in the financial statements. Our procedures included confirmation of securities owned as of December 31, 2024, by correspondence with the custodian. Our audits also included evaluating the accounting principles used and significant estimates made by management, as well as evaluating the overall presentation of the financial statements. We believe that our audits provide a reasonable basis for our opinion.
We have served as the Funds’ auditor since 2023.

COHEN & COMPANY, LTD.
Philadelphia, Pennsylvania
February 24, 2025
FAM FUNDS — Additional Information (Unaudited)
Changes in and Disagreements with Accountants
There were no changes in or disagreements with accountants during the period covered by this report.
Proxy Disclosures
Not applicable.
Remuneration Paid to Directors, Officers and Others
Refer to the financial statements included herein.
Board Consideration of the Continuation of the Investment Advisory Agreements for the Funds
In accordance with the Investment Company Act of 1940, the Board of Trustees of the Funds is required, on an annual basis, to consider the approval of the continuation of each of the Investment Advisory Agreements between the Funds and the Advisor, and this must take place at an in-person meeting of the Board. The relevant provisions of the Investment Company Act of 1940 specifically provide that it is the duty of the Board to request and evaluate such information as the Board determines is necessary to allow them to properly consider the approval of the continuation of the Advisory Agreements, and it is the duty of the Advisor to furnish the Trustees with such information that is responsive to their request.
Accordingly, in determining whether to renew each of the Advisory Agreements between the Value Fund, the Dividend Focus Fund and the Small Cap Fund with the Advisor, the Board of Trustees requested, and the Advisor provided, information and data relevant to the Board’s consideration. This included materials prepared by the Advisor and materials prepared by an independent mutual fund industry consulting firm that produced materials specifically for the Board that provided them with information regarding the investment performance of the Funds and information regarding the fees and expenses of the Funds, as compared to other similar mutual funds. As part of its deliberations, the Board also considered and relied upon the information about the Funds and the Advisor that had been provided to them throughout the year in connection with their regular Board meetings at which they engage in the ongoing oversight of the Funds and their operations.
The Board, including all of the Independent Trustees, engaged in a thorough review process in order to determine whether to approve the continuation of the Advisory Agreements with the Advisor. After receiving the materials that they had requested in order to assist them with their review, the Board had a preliminary meeting by video conference on November 14, 2024, with representatives of the Advisor in order to discuss the proposed approval of the continuation of the Advisory Agreements and to review the materials that had been presented. The Independent Trustees also met separately in connection with the contract renewal process in order to further consider and discuss the proposed approval of the Advisory Agreements.
The Board then met to consider the approval of the continuation of the Advisory Agreements at an in-person meeting of the Board held on December 5, 2024. Among the factors the Board considered was the overall performance of each of the Funds relative to the performance of other similar mutual funds on a long-term basis (five years and longer) and over shorter time periods (less than five years). In connection with its review of the performance results achieved for the Funds, the Board discussed with management the fact that the Advisor maintains a particular focus on long-term investment performance results and they reviewed the reasons why this may, from time to time, cause the longer-term performance results and the shorter-term performance results to under-perform when compared to other funds for similar time periods. In connection with this, the Board took note of management’s stated position that achieving favorable long-term investment results is a primary objective of the firm. The Board also considered and discussed with the Advisor their focus on “value investing” which may result in short-term performance that lags the performance results achieved by other managers, especially those managers that emphasize other types of investment strategies, such as “growth investing”.
FAM FUNDS — Additional Information (Unaudited)
The Board also took into consideration the Advisor’s stated objective of attaining investment results with less risk and less volatility than other funds. The Board determined that it has been beneficial to shareholders that the Advisor has continued to invest on behalf of the Funds in a manner that is consistent with its long-term investment objectives due to the fact that the Advisor has been able to achieve favorable long-term performance results for the Funds, and, when performance is adjusted for risk, it shows even more favorable results.
The Board also took note of the long-term relationship between the Advisor and each of the Funds and the efforts that have been undertaken by the Advisor to foster the growth and development of each of the Funds since their inception. The Board members further considered that the Advisor has retained and developed highly competent portfolio management teams and investment analysts to manage and oversee the investment operations of the Funds.
In addition, the Board compared expenses of each Fund to the expenses of other similar mutual funds. They noted the range of investment advisory and administrative services provided by the Advisor to the Funds and the level and quality of these services, and in particular, they considered the quality of the personnel providing these services, noting that they were of a high caliber.
In connection with these matters, the Board took notice of the fact that the Funds’ investment advisory fees are not subject to breakpoints on increased assets in the Funds. The Board also took note of the fact that there is no uniform set of guidelines within the mutual fund industry with respect to the application of breakpoints on fund assets, and they concluded that they will continue to evaluate the potential for the application of breakpoints in the future to the extent that assets in the Funds increase, at which time a determination can be made as to the potential appropriateness of implementing breakpoints.
The Board also observed that the Advisor has been willing to implement and maintain the effectiveness of the Expense Limitation Agreement for the Funds which is intended to limit the total overall operating expenses of the Funds and provide for economies of scale.
In connection with the Board’s consideration of the approval of the continuation of the Business Management Agreement with the Advisor, the Board determined that the fees payable to the Advisor for the business management services that are currently provided by the Advisor to the Funds were reasonable and that the business management services continued to be of a level and quality at least equal to the same or similar services that could be provided by independent third parties. With respect to its review of matters in connection with the continuation of the Business Management Agreement, the Board took into consideration the fact that the Advisor has retained the services of Ultimus Fund Solutions, LLC (“Ultimus”), an independent third-party service provider to provide certain of the services that the Advisor is contractually obligated to provide to, or procure for, the Funds under the terms of the Business Management Agreement, and the Board reviewed the terms of the fee arrangements entered into between the Advisor and Ultimus for these purposes and the nature and extent of the business management services that are being provided to the Funds in accordance with these arrangements. Following their review of these matters, the Board determined that the nature of the services and the level of the fees were reasonable and that this arrangement for obtaining the subject business management services for the Funds was in the best interest of the Funds and their shareholders.
The Board also considered that the Advisor has entered into Fund Accounting Services Agreements with the Funds pursuant to which the Advisor has agreed to either provide or procure certain fund accounting services for the Funds, and the Board reviewed the fees that are payable to the Advisor under the terms of the Fund Accounting Services Agreements and the Board determined that the fees payable to the Advisor for the fund accounting services provided by the Advisor were reasonable and that the fund accounting services continued to be of a level and quality at least equal to the same or similar services that could be provided by independent third parties based upon the nature and quality of the services that are provided to the Funds by the Advisor for fund accounting services. With respect to its review of matters in connection with the continuation of the Fund Accounting Services Agreements, the Board took into consideration the fact that the Advisor has retained the services of Ultimus to provide certain of the
FAM FUNDS — Additional Information (Unaudited)
services that the Advisor is contractually obligated to provide to, or procure for, the Funds under the terms of the Fund Accounting Services Agreements, and the Board reviewed the terms of the fee arrangements entered into between the Advisor and Ultimus for these purposes and the nature and extent of the fund accounting services that are being provided to the Funds in accordance with these arrangements. Following their review of these matters, the Board determined that the nature of the services and the level of the fees were reasonable and that this arrangement for obtaining the subject fund accounting services for the Funds was in the best interest of the Funds and their shareholders.
The Board next considered that the Advisor has entered into Shareholder Account Services Agreements pursuant to which the Advisor has agreed to either provide or procure certain shareholder account services for the Funds and the Board reviewed the fees that are payable to the Advisor under the terms of the Shareholder Account Services Agreements and the Board determined that the fees payable to the Advisor for the shareholder account services to be provided or procured by the Advisor were reasonable and that the shareholder account services continued to be of a level and quality at least equal to the same or similar services that could be provided by independent third parties based upon the nature and quality of the services that are provided to the Funds by the Advisor for the shareholder account services. The Trustees then determined that it is reasonable to expect that the Advisor will be able to continue to provide the Funds and their shareholders with the same level of high quality shareholder account services.
The Board then further considered matters with respect to the arrangements that the Advisor has entered into with Ultimus pursuant to the terms of the Shareholder Account Services Agreements to receive certain co-transfer agency and related shareholder account services and the Board took into consideration the fee arrangements that the Advisor has entered into with Ultimus in connection with the co-transfer agency and related shareholder account services pursuant to which the Advisor pays certain fees to Ultimus for these services. Following their review of these matters, the Board determined that the nature of the services and the level of the fees were reasonable and that this arrangement that the Advisor has entered into with Ultimus for obtaining the specified co-transfer agency and related shareholder account services for the Funds was in the best interest of the Funds and their shareholders.
The Board also considered that the Funds are distributed by an affiliate of the Advisor, Fenimore Securities, Inc., (“FSI”), and the Board reviewed the distribution-related services provided by FSI and they determined that the distribution services provided by FSI are useful and beneficial to the ongoing operations of the Funds. In connection with their consideration of the services provided to the Funds by FSI, the Board took into consideration that FSI does not receive any revenue or compensation from the Funds for the services that it provides to the Funds, and the Board further considered that the Advisor supports the ongoing operations of FSI from its own financial resources.
The Board also reviewed financial information concerning the Advisor relating to the operation of the Funds, noting the overall profitability of the relationship with the Funds to the Advisor and the financial soundness of the Advisor as demonstrated by the financial information provided. The Board further considered and discussed the manner in which the Advisor had calculated the profitability information that was provided to the Board members and they took into consideration the factors that had been relied upon by the Advisor when preparing the profitability analysis.
The Board also took note of the fact that the Advisor has previously used revenue sharing payments from its own financial resources to pay for all of the distribution-related costs incurred in connection with the marketing and sale of the Funds’ shares because the Funds are not subject to a Rule 12b-1 plan of distribution, and they further took note of the fact that the Advisor has continued its practice of using revenue sharing payments from its own financial resources to make payments to those financial intermediaries that provide certain types of distribution-related services to shareholders of each class of shares of the Funds. The members of the Board considered the profitability of the Advisor both before and after the impact of the marketing and distribution-related expenses that the Advisor incurs out of its own resources in connection with its management of the Funds.
FAM FUNDS — Additional Information (Unaudited)
The Board reviewed the Advisor’s brokerage practices and best-execution procedures, and noted that these were reasonable and consistent with standard industry practice. In connection with this review, the Board considered the fact that while the Advisor does not have any express arrangements in place with respect to “soft dollar” arrangements with brokers or other similar parties relating to the direct use of Fund brokerage commissions to obtain research or execution services, the Advisor does receive research services from certain broker-dealers with which it executes securities transactions on behalf of the Funds which is done in a manner that is consistent with the provisions of Section 28(e) of the Securities Exchange Act of 1934. With respect to the Advisor’s brokerage practices, the Board also took into consideration the fact that the Advisor has maintained low portfolio turnover rates for the Funds that are substantially lower than industry averages for equity-type funds, which the Board determined is beneficial to shareholders due to the reduced brokerage expenses that are attributable to low portfolio turnover rates.
The Board also considered information regarding the fees that the Advisor charges other clients, including privately managed accounts, model portfolio delivery program providers and a privately offered investment fund, for investment advisory services that are similar to the advisory services provided to the Funds and noted that the Funds’ fees were reasonable when compared to the relevant circumstances of the types of accounts involved and the services provided and the different types of additional services that are required in connection with the management of regulated investment companies such as the Funds.
In connection with the Board’s consideration of the ways in which economies of scale are reflected with respect to the Advisory Agreements, the Board took note of the fact that the Advisor had agreed to continue the use of an Expense Limitation Agreement with respect to each Fund which provides for a limit on the total operating expenses of each Fund and each class of shares of each Fund through May 1, 2026. With respect to the Board’s approval of the continuation of the Expense Limitation Agreement between the Funds and the Advisor, the Board took into consideration that pursuant to the terms of the Expense Limitation Agreement, the Advisor may seek recoupment of fees and expenses that it had previously waived or reimbursed under certain circumstances provided that such recoupment does not result in a Fund incurring total operating expenses that are in excess of the amounts provided under the terms of the Expense Limitation Agreement with respect to each class of shares of the Funds.
The Board also took into consideration with respect to their review of the matters relating to economies of scale the manner in which the Advisor has continued to make substantial investments in those areas of its business operations that directly support the ongoing operations of the Funds and their shareholders, including technology-related investments and personnel-related investments.
In connection with their consideration of the proposed continuation of the Advisory Agreements, the Trustees determined that the Advisor has made a substantial commitment to the recruitment and retention of high quality personnel, and that it maintains the appropriate level of financial, compliance and operational resources that are reasonably necessary to manage the Funds in a professional manner that is consistent with the best interests of the Funds and their shareholders. The Board also concluded that the Advisor has made a significant entrepreneurial commitment to the management and operation of the Funds, which entails a significant financial and professional commitment. The Trustees also took into consideration that the investment advisory fees charged by the Advisor with respect to the Funds generally reflect the level of fees charged by other smaller mutual fund sponsors.
Additionally, the Trustees considered the overall nature and extent of the risks incurred by the Advisor as a result of managing its own proprietary family of mutual funds, which risks include, but are not necessarily limited to, entrepreneurial risk, reputational risk, financial risk, litigation risk, regulatory risk and business risk, all of which can be expected to have an impact on the level of fees that fund sponsors charge to the funds that they manage, especially in the case of smaller fund sponsors, such as the Advisor.
In reaching their conclusion with respect to the approval of the continuation of the Advisory Agreements, the Trustees did not identify any one single factor as being controlling, rather, the Board took note of a combination of factors that influenced their decision-making process. The Board did, however, identify
FAM FUNDS — Additional Information (Unaudited)
the overall favorable investment performance of the Funds on a long-term basis, the commitment of the Advisor to the successful operation of each of the Funds, and the level of expenses of the Funds, in addition to the Advisor’s willingness to enter into a contractual Expense Limitation Agreement in order to limit the overall operating expenses of each of the Funds and each class of shares of the Funds, as being important elements of their consideration. Based upon their review and consideration of these factors and other matters deemed relevant by the Board in reaching an informed business judgment, the Board of Trustees, including all of the Independent Trustees, unanimously concluded that the terms of the Advisory Agreements are fair and reasonable and the Board voted to approve the continuation of the Advisory Agreements for a one-year period, subject to the applicable limitations on the total operating expenses of the Funds, as considered and approved at the meeting.
FAM FUNDS — Supplemental Information (Unaudited)
| SPECIAL 2024 TAX INFORMATION FOR FAM FUNDS |
This information for the fiscal year ended December 31, 2024, is included pursuant to provisions of the Internal Revenue Code. The Value Fund distributed $105,016,171, or the maximum amount available, as capital gain dividends (from net long-term capital gains) to shareholders during the fiscal year. The Dividend Focus Fund distributed $23,385,724, or the maximum amount available, as capital gain dividends (from net long-term capital gains) to shareholders during the fiscal year. For Dividend Focus Fund corporate shareholders, 100.0% of investment income (dividend income plus short-term gains, if any) qualifies for the dividends-received deduction. The Small Cap Fund distributed $17,803,916, or the maximum amount available, as capital gain dividends (from net long-term capital gains) to shareholders during the fiscal year. |
THIS PAGE INTENTIONALLY LEFT BLANK
384 North Grand Street
PO Box 399
Cobleskill, New York
12043-0399
(800) 932-3271
www.famfunds.com

| Item 8. | Changes in and Disagreements with Accountants for Open-End Management Investment Companies. |
Not applicable
| Item 9. | Proxy Disclosures for Open-End Management Investment Companies. |
Not applicable
| Item 10. | Remuneration Paid to Directors, Officers, and Others of Open-End Management Investment Companies. |
Included under Item 7
| Item 11. | Statement Regarding Basis for Approval of Investment Advisory Contract. |
Included under Item 7
| Item 12. | Disclosure of Proxy Voting Policies and Procedures for Closed-End Management Investment Companies. |
Not applicable
| Item 13. | Portfolio Managers of Closed-End Management Investment Companies. |
Not applicable
| Item 14. | Purchases of Equity Securities by Closed-End Management Investment Company and Affiliated Purchasers. |
Not applicable
| Item 15. | Submission of Matters to a Vote of Security Holders. |
The registrant has not adopted procedures by which shareholders may recommend nominees to the registrant’s board of trustees.
| Item 16. | Controls and Procedures. |
| (a) | Based on their evaluation of the registrant’s disclosure controls and procedures (as defined in Rule 30a-3(c) under the Investment Company Act of 1940) as of a date within 90 days of the filing date of this report, the registrant’s principal executive officer and principal financial officer have concluded that such disclosure controls and procedures are reasonably designed and are operating effectively to ensure that material information relating to the registrant, including its consolidated subsidiaries, is made known to them by others within those entities, particularly during the period in which this report is being prepared, and that the information required in filings on Form N-CSR is recorded, processed, summarized, and reported on a timely basis. |
| (b) | There were no changes in the registrant’s internal control over financial reporting (as defined in Rule 30a-3(d) under the Investment Company Act of 1940) that occurred during the period covered by this report that have materially affected, or are reasonably likely to materially affect, the registrant’s internal control over financial reporting. |
| Item 17. | Disclosure of Securities Lending Activities for Closed-End Management Investment Companies. |
Not applicable
| Item 18. | Recovery of Erroneously Awarded Compensation. |
File the exhibits listed below as part of this Form. Letter or number the exhibits in the sequence indicated.
| (a)(1) | Any code of ethics, or amendment thereto, that is the subject of the disclosure required by Item 2, to the extent that the registrant intends to satisfy the Item 2 requirements through filing of an exhibit: Attached hereto |
| (a)(2) | A separate certification for each principal executive officer and principal financial officer of the registrant as required by Rule 30a-2(a) under the Act (17 CFR 270.30a-2(a)): Attached hereto |
| (2) | Change in the registrant’s independent public accountant: Not applicable |
| (b) | Certifications required by Rule 30a-2(b) under the Act (17 CFR 270.30a-2(b)): Attached hereto |
SIGNATURES
Pursuant to the requirements of the Securities Exchange Act of 1934 and the Investment Company Act of 1940, the registrant has duly caused this report to be signed on its behalf by the undersigned, thereunto duly authorized.
| (Registrant) | Fenimore Asset Management Trust | | | |
| | | | | |
| By (Signature and Title)* | | /s/ Thomas O. Putnam | |
| | | | Thomas O. Putnam, President | |
| | | | | |
| Date | March 5, 2025 | | | |
| | | | | |
| | | | | |
| Pursuant to the requirements of the Securities Exchange Act of 1934 and the Investment Company Act of 1940, this report has been signed below by the following persons on behalf of the registrant and in the capacities and on the dates indicated. |
| | | | | |
| By (Signature and Title)* | | /s/ Thomas O. Putnam | |
| | | | Thomas O. Putnam, President | |
| | | | | |
| Date | March 5, 2025 | | | |
| | | | | |
| | | | | |
| By (Signature and Title)* | | /s/ Michael F. Balboa | |
| | | | Michael F. Balboa, Treasurer | |
| | | | | |
| Date | March 5, 2025 | | | |
| * | Print the name and title of each signing officer under his or her signature. |