UNITED STATES
SECURITIES AND EXCHANGE COMMISSION
Washington, D.C. 20549
FORM N-CSR
CERTIFIED SHAREHOLDER REPORT OF
REGISTERED MANAGEMENT INVESTMENT COMPANIES
Investment Company Act file Number: 811-4767
HERITAGE GROWTH AND INCOME TRUST
(Exact name of Registrant as Specified in Charter)
880 Carillon Parkway
St. Petersburg, FL 33716
(Address of Principal Executive Office) (Zip Code)
Registrant’s Telephone Number, including Area Code: (727) 573-3800
RICHARD K. RIESS, PRESIDENT
880 Carillon Parkway
St. Petersburg, FL 33716
(Name and Address of Agent for Service)
Copy to:
CLIFFORD J. ALEXANDER, ESQ.
Kirkpatrick & Lockhart LLP
1800 Massachusetts Avenue, NW
Washington, D.C. 20036
Date of fiscal year end: September 30
Date of reporting period: September 30, 2003
Item 1. Reports to Shareholders
Growth and
Income
Trust

The Intelligent Creation of Wealth
Annual Report
and Investment Performance Review
for the Fiscal Year Ended
September 30, 2003

November 10, 2003
Dear Valued Shareholders:
I am pleased to present the annual report for Heritage Growth and Income Trust (“the Fund”) for the fiscal year ended September 30, 2003.
In the following letter, portfolio manager William V. Fries discusses the Fund’s investment results, his economic outlook, and recent purchases. We would like you to know that the Fund’s “A” shares received a favorable rating(a) from Morningstar for the three-year period ended September 30, 2003. This is particularly significant because William Fries became the Fund’s manager 2½ years ago.
As you know, the mutual fund industry has recently become subject to numerous regulatory inquiries concerning late trading, market timing, and other matters. In some instances, certain principals have acted in an egregious manner placing their own financial interests above those of investors in their funds. Such breaches of fiduciary duty, even if limited to a small number of individuals, can destroy investor confidence and jeopardize the Industry’s record of good behavior established over the past 60 years.
We would like investors in the Heritage Funds to know that no officer or director of the funds or its investment adviser has ever engaged in market timing activities in shares of the funds. Furthermore, Heritage has never entered into any agreement with any party allowing such party to engage in market timing transactions. While it is impossible to identify all market-timing transactions, Heritage actively attempts to identify and eliminate market timing behavior that is detrimental to the Fund and its shareholders. For more information on this issue, we invite you to visit our Website at www.HeritageFunds.com.
On behalf of Heritage, I thank you for your investment in Heritage Growth and Income Trust. For more complete information, including investment objective, fees, risks, and expenses, please contact your financial advisor for a prospectus or call Heritage Family of Funds at (800) 421-4184.
Sincerely,

Richard K. Riess
President
(a) For more information regarding the Fund’s Morningstar rating, please see the following letter by William V. Fries.
October 29, 2003
Dear Fellow Shareholders:
The table below shows total return(a) figures for the Heritage Growth & Income Trust Class A, B, and C shares and the Standard & Poor 500 Composite Stock Price Index(b) (“S&P 500 Index) for the fiscal year ended September 30, 2003. Note that these returns are for investors who held shares for the entire periods shown, with the assumption that all dividends were reinvested in additional shares.
| | | Fiscal Year Ended September 30, 2003
| |
Heritage Growth and Income Trust-Class A | | 23.82 | % |
Heritage Growth and Income Trust-Class B | | 22.82 | % |
Heritage Growth and Income Trust-Class C | | 22.82 | % |
| |
S&P 500 Index | | 24.40 | % |
As a reminder, Thornburg Investment has been managing the Fund’s portfolio for close to 2½ years (since July 2, 2001). For the 3-year period ended September 30, 2003, Class A shares of the Fund received a favorable rating(c) of 4-stars from Morningstar, Inc. This rating reflects the risk-adjusted performance when compared to its peer group of 1,061 large blend funds. For the overall, 5-, and 10- year periods ended September 30, 2003, the Fund received 3-stars compared to its peer group of 1,061, 749 and 244 large blend funds, respectively.
The results for the year were not achieved without considerable volatility and stress along the way. Doubts about economic recovery, terrorist attacks; anxiety about the War in Iraq and SARS were among worries holding down stock prices through March. The success of our military effort in Iraq sparked a relief rally that extended through much of the rest of the Fund’s fiscal year. Underpinning the return of confidence was continued economic improvement and its impact on the outlook for corporate profits.
This was a year when patience and conviction paid off. Many of the best performing stocks for the year were issues that performed poorly last year even though we believed that business execution was sound and valuation was reasonable. Among the best such performers still held in the portfolio(d) were E-Trade, Comcast and Genzyme. New holdings that performed particularly well were: InteractiveCorp & Electronic Arts. Among the stocks that failed to contribute to positive performance were Southern Company, Mack Cali, Quest Diagnostics, Zions, Raytheon and Conagra Foods. All of which have been sold out of the portfolio except for Quest Diagnostics. Performance was not only achieved in stocks. What we believed to be an unusual opportunity indeeply depressed Level Three and El Paso Corporation bonds also contributed to the Fund’s performance. The table below lists current equity holdings purchased during the fiscal year as well as the sector holdings.
(a) Total returns include the effect of reinvesting dividends. Performance numbers do not reflect a front-end sales charge or contingent deferred sales charge. Past performance does not guarantee future results. Performance returns may be higher or lower than the performance quoted. Performance data quoted represents past performance and the investment return and principal value of an investment will fluctuate so that an investor’s shares, when redeemed, may be worth more or less than the original cost. For more complete information, including investment objective, fees, risks and expenses, contact your financial advisor or call Heritage Family of Funds at 800-421-4184 for a prospectus.
(b) The S&P 500 is an unmanaged index of 500 widely held stocks that are considered representative of the U.S. stock market. Keep in mind that individuals cannot invest directly in any index, and index performance does not include transaction costs or other fees, which will affect actual investment performance.
(c) Morningstar Inc. rates mutual funds from one to five stars based on how well they’ve performed (after adjusting for risk and accounting for all front-end or contingent deferred sales charges) in comparison to similar funds in its category. Within each Morningstar category, the top 10% of funds receive five stars, the next 22.5% four stars, the middle 35% three stars, the next 22.5% two stars, and the bottom 10% receive one star. Funds are rated for up to three time periods—three-, five-, and 10 years—and these ratings are combined to produce an overall rating. Ratings are objective, based on a mathematical evaluation of past performance. Past performance is no guarantee of future results.
(d) The views expressed here are not meant as investment advice. Although some of the described portfolio holdings were viewed favorably as of the date of this letter, there is no guarantee the Fund will continue to hold these securities in the future.
2
NEW PURCHASES(d) |
Chubb Corp | | Circuit City | | Deere | | Dominion Res. |
DoubleClick | | Eclipsys | | El Paso Corp. | | Electronic Arts |
First Data | | Freddie Mac | | Hewlett Packard | | Wells Fargo |
InterActiveCorp | | Kimberly Clark | | Lincoln National | | MBIA |
Marathon Oil | | Nextel | | Quest Diagnostic | | St Paul Companies |
| Target | | Texas Instruments | | | | |
|
HOLDINGS BY SECTOR |
| | | Financial | | 35 | % | | |
| | | Communications | | 17 | % | | |
| | | Consumer, Non-Cyclical | | 14 | % | | |
| | | Technology | | 14 | % | | |
| | | Energy | | 10 | % | | |
| | | Other Sectors | | 8 | % | | |
*Sector holdings are based on total net assets. Cash accounted for approximately 2% of total net assets for the fiscal year ended September 30, 2003.
Presently, we appear at a critical juncture in both economic development and equity market performance. Our expectations are for continued growth in the U. S. economy with the potential for earnings surprise on the upside. Corporate earnings are improving from cost cutting and the spending discipline of the past couple of years. A general consensus would have GDP rising over 4% this year with successful holiday season spending triggering expanding reorders in the consumer channel for next year. With this sound economic underpinning, S&P 500 weighted average earnings for the year ahead will likely approach $60 per share, making the earnings multiple on the market below 18 times, a healthy but not unreasonable level given expected sustained low interest rates.
Congress passed tax legislation establishing a maximum 15% tax rate on both dividends and long-term capital gains. The new rate, in our view, enhances the value of stocks with above-average dividend yields. Some of the new additions to the portfolio have taken this into consideration, although not exclusively.
Recent focus on the value of the dollar compared with other developed world currencies has created additional uncertainty to be absorbed by markets. In mid-September, the economic ministers of the major industrialized nations, known as the Group of Seven, met in Dubai. Their jointly issued communiqué has roiled currency markets since. Essentially, the communiqué fostered flexible exchange rate policies and has been interpreted as indicating a weak currency posture for the U. S. dollar. For foreign investors this may be viewed as a negative. For the U.S. industrial sector, this is a potential positive, if it proves stimulative to U.S. exports. Interestingly, this influence could be as important a stimulant for the economy as capital spending. Economies outside the U.S. would ultimately experience some benefit as well, related to increased demand from the U.S. from both the consumer and business suppliers as our economy expands.
Much of the stock market gains since the bottom of the market last year, in our view, reflect mostly a return of confidence. Gains from here will likely require earnings improvement or reinforcement that companies will enjoy accelerating profits with the economic expansion. Our recent stock purchase activity has been focused on this improving potential.
Thank you for investing with us, and for your trust and confidence.
Sincerely,

William V. Fries, CFA
Managing Director
Thornburg Investment Management, Inc.
Portfolio Manager, Growth and Income Trust
(d) The views expressed here are not meant as investment advice. Although some of the described portfolio holdings were viewed favorably as of the date of this letter, there is no guarantee the Fund will continue to hold these securities in the future.
3
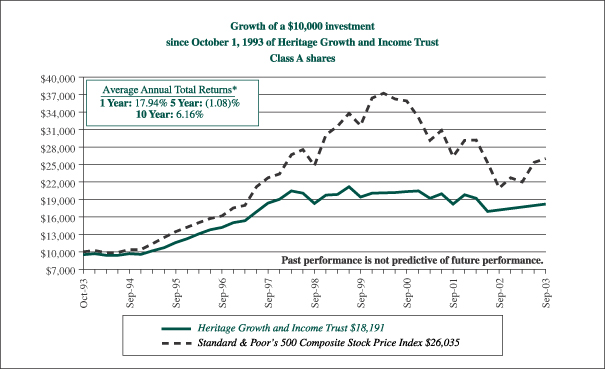
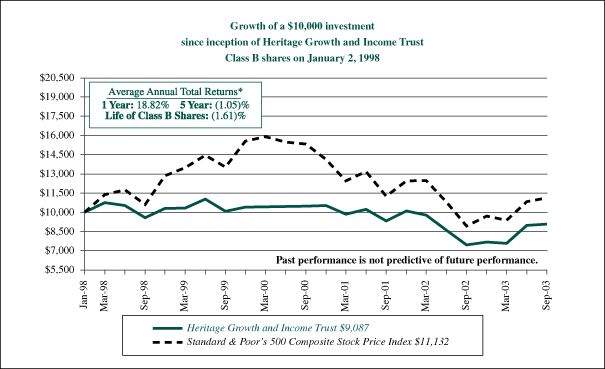
| * | Average annual returns for Heritage Growth and Income Trust Class A and B shares are calculated in conformance with Item 21 of Form N-1A, which assumes the maximum sales charge of 4.75% for Class A shares, a contingent deferred sales charge for Class B shares (4% for the one year period, 1% for the five year period and 1% for the life of Class B shares) and reinvestment of dividends for Class A and B shares. Performance presented represents historical data. The investment return and principal value of an investment will fluctuate so that an investor’s shares, when redeemed, may be worth more or less than their original cost. The Fund’s past performance is not indicative of future performance and should be considered in light of the Fund’s investment policy and objectives, the characteristics and quality of its portfolio securities, and the periods selected. The graph and table do not reflect the deduction of taxes that a shareholder would pay on fund distributions or the redemption of fund shares. |
| * | Average annual returns for Heritage Growth and Income Trust Class A and B shares are calculated in conformance with Item 21 of Form N-1A, which assumes the maximum sales charge of 4.75% for Class A shares, a contingent deferred sales charge for Class B shares (4% for the one year period, 1% for the five year period and 1% for the life of Class B shares) and reinvestment of dividends for Class A and B shares. Performance presented represents historical data. The investment return and principal value of an investment will fluctuate so that an investor’s shares, when redeemed, may be worth more or less than their original cost. The Fund’s past performance is not indicative of future performance and should be considered in light of the Fund’s investment policy and objectives, the characteristics and quality of its portfolio securities, and the periods selected. The graph and table do not reflect the deduction of taxes that a shareholder would pay on fund distributions or the redemption of fund shares. |
4
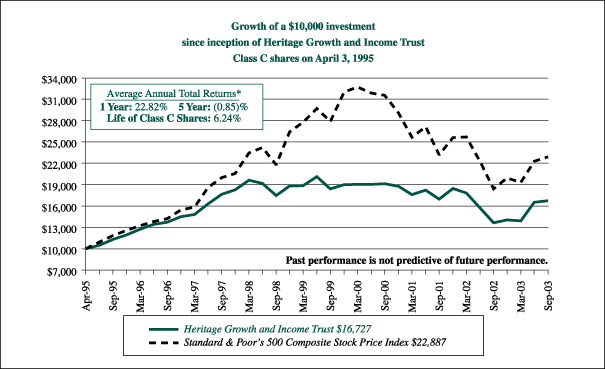
| * | Average annual returns for Heritage Growth and Income Trust Class C shares are calculated in conformance with Item 21 of Form N-1A, which assumes reinvestment of dividends for Class C shares. Performance presented represents historical data. The investment return and principal value of an investment will fluctuate so that an investor’s shares, when redeemed, may be worth more or less than their original cost. The Fund’s past performance is not indicative of future performance and should be considered in light of the Fund’s investment policy and objectives, the characteristics and quality of its portfolio securities, and the periods selected. The graph and table do not reflect the deduction of taxes that a shareholder would pay on fund distributions or the redemption of fund shares. |
5
Heritage Growth and Income Trust
Investment Portfolio
September 30, 2003
| | | Shares
| | | | Value
|
| |
Common Stocks—90.9% (a)
| | | |
| | |
| | | Banks—8.1%
| | | |
| | | 71,300 | | Bank of New York Company, Inc. | | $ | 2,075,543 |
| | | 47,600 | | SouthTrust Corporation | | | 1,398,964 |
| | | 28,700 | | Wells Fargo & Company | | | 1,478,050 |
| | | | | | |
|
|
| | | | | | | | 4,952,557 |
| | | | | | |
|
|
| | |
| | | Biotechnology—1.9%
| | | |
| | | 25,500 | | Genzyme Corporation, General Division* | | | 1,179,375 |
| | | | | | |
|
|
| | |
| | | Broadcasting Services/Programs—1.9%
| | | |
| | | 40,600 | | Fox Entertainment Group, Inc.* | | | 1,136,394 |
| | | | | | |
|
|
| | |
| | | Computers—3.4%
| | | |
| | | 19,900 | | Affiliated Computer Services Inc.* | | | 968,931 |
| | | 57,000 | | Hewlett-Packard Company | | | 1,103,520 |
| | | | | | |
|
|
| | | | | | | | 2,072,451 |
| | | | | | |
|
|
| | |
| | | Cosmetics/Personal Care—1.7%
| | | |
| | | 20,600 | | Kimberly-Clark Corporation | | | 1,057,192 |
| | | | | | |
|
|
| | |
| | | Electric—5.1%
| | | |
| | | 32,900 | | Dominion Resources, Inc. | | | 2,036,510 |
| | | 24,200 | | Progress Energy Inc. | | | 1,075,932 |
| | | | | | |
|
|
| | | | | | | | 3,112,442 |
| | | | | | |
|
|
| | |
| | | Financial Services—11.0%
| | | |
| | | 35,000 | | Citigroup Inc. | | | 1,592,850 |
| | | 160,200 | | E*TRADE Group, Inc.* | | | 1,483,452 |
| | | 23,100 | | Fannie Mae | | | 1,621,620 |
| | | 17,600 | | Freddie Mac | | | 921,360 |
| | | 40,200 | | Nuveen Investments, Inc., Class “A” | | | 1,105,500 |
| | | | | | |
|
|
| | | | | | | | 6,724,782 |
| | | | | | |
|
|
| | |
| | | Food—2.0%
| | | |
| | | 40,255 | | Dean Foods Company* | | | 1,249,113 |
| | | | | | |
|
|
| | |
| | | Healthcare Services—4.8%
| | | |
| | | 85,800 | | Health Management Associates, Inc., Class “A” | | | 1,871,298 |
| | | 17,800 | | Quest Diagnostics Inc.* | | | 1,079,392 |
| | | | | | |
|
|
| | | | | | | | 2,950,690 |
| | | | | | |
|
|
| | |
| | | Insurance—8.3%
| | | |
| | | 24,600 | | Chubb Corporation | | | 1,596,048 |
| | | 14,100 | | Lincoln National Corporation | | | 498,858 |
| | | 21,700 | | MBIA Inc. | | | 1,192,849 |
| | | 48,500 | | St. Paul Companies, Inc. | | | 1,795,955 |
| | | | | | |
|
|
| | | | | | | | 5,083,710 |
| | | | | | |
|
|
| | | Shares
| | | | Value
|
| | |
| | | Internet—3.5%
| | | |
| | | 75,700 | | DoubleClick Inc.* | | $ | 815,289 |
| | | 41,060 | | InterActiveCorp* | | | 1,357,033 |
| | | | | | |
|
|
| | | | | | | | 2,172,322 |
| | | | | | |
|
|
| | |
| | | Logic Semiconductors—0.9%
| | | |
| | | 25,000 | | Texas Instruments Inc. | | | 570,000 |
| | | | | | |
|
|
| | |
| | | Machinery—2.0%
| | | |
| | | 22,800 | | Deere & Company | | | 1,215,468 |
| | | | | | |
|
|
| | |
| | | Multimedia—2.1%
| | | |
| | | 85,500 | | AOL Time Warner Inc.* | | | 1,291,905 |
| | | | | | |
|
|
| | |
| | | Oil & Gas—6.4%
| | | |
| | | 24,400 | | BP PLC, Sponsored ADR | | | 1,027,240 |
| | | 46,800 | | Marathon Oil Corporation | | | 1,333,800 |
| | | 48,800 | | Unocal Corporation | | | 1,538,176 |
| | | | | | |
|
|
| | | | | | | | 3,899,216 |
| | | | | | |
|
|
| | |
| | | Pharmaceuticals—4.6%
| | | |
| | | 47,700 | | Caremark Rx, Inc.* | | | 1,078,020 |
| | | 57,500 | | Pfizer, Inc. | | | 1,746,850 |
| | | | | | |
|
|
| | | | | | | | 2,824,870 |
| | | | | | |
|
|
| | |
| | | Pipelines—1.7%
| | | |
| | | 140,290 | | El Paso Corporation | | | 1,024,117 |
| | | | | | |
|
|
| | |
| | | REITS—2.9%
| | | |
| | | 40,400 | | Boston Properties Inc. | | | 1,756,188 |
| | | | | | |
|
|
| | |
| | | Retail—4.8%
| | | |
| | | 83,800 | | Circuit City Stores-Circuit City Group | | | 798,614 |
| | | 24,700 | | Lowe’s Companies Inc. | | | 1,281,930 |
| | | 23,100 | | Target Corporation | | | 869,253 |
| | | | | | |
|
|
| | | | | | | | 2,949,797 |
| | | | | | |
|
|
| | |
| | | Savings & Loans—2.2%
| | | |
| | | 33,900 | | Washington Mutual, Inc. | | | 1,334,643 |
| | | | | | |
|
|
| | |
| | | Software—6.5%
| | | |
| | | 51,700 | | Eclipsys Corporation* | | | 826,683 |
| | | 10,000 | | Electronic Arts Inc.* | | | 922,300 |
| | | 37,100 | | First Data Corporation | | | 1,482,516 |
| | | 27,100 | | Microsoft Corporation | | | 753,109 |
| | | | | | |
|
|
| | | | | | | | 3,984,608 |
| | | | | | |
|
|
| | |
| | | Telecommunications—1.8%
| | | |
| | | 57,200 | | Nextel Communications, Inc., Class “A”* | | | 1,126,268 |
| | | | | | |
|
|
The accompanying notes are an integral part of the financial statements.
6
Heritage Growth and Income Trust
Investment Portfolio
September 30, 2003
(continued)
| | | Shares
| | | | Value
|
| | |
| | | Television, Cable & Radio—3.3%
| | | |
| | | 47,700 | | Comcast Corporation, Class “A” | | $ | 1,409,058 |
| | | 42,100 | | General Motors Corporation, Class “H” | | | 602,451 |
| | | | | | |
|
|
| | | | | | | | 2,011,509 |
| | | | | | |
|
|
| | | Total Common Stocks (cost $52,443,119) | | | 55,679,617 |
| | | | | | |
|
|
| | | |
| | | Principal
Amount
| | | | Value
|
| |
Convertible Bonds—1.0% (a)
| | | |
| | |
| | | Telecommunications—1.0%
| | | |
| | | $1,000,000 | | Level 3 Communications, Inc., 6.0%, 03/15/10 | | $ | 627,500 |
| | | | | | |
|
|
| | | Total Convertible Bonds (cost $540,655) | | | 627,500 |
| | | | | | |
|
|
| |
Corporate Bonds—5.9% (a)
| | | |
| | |
| | | Airlines—2.5%
| | | |
| | | 1,120,000 | | Delta Air Lines Inc.,
10.0%, 08/15/08 | | $ | 912,800 |
| | | 1,000,000 | | Delta Air Lines Inc.,
8.3%, 12/15/29 | | | 645,000 |
| | | | | | |
|
|
| | | | | | | | 1,557,800 |
| | | | | | |
|
|
| | |
| | | Pipelines—1.3%
| | | |
| | | 1,000,000 | | EL Paso Corporation, 7.375%, 12/15/12 | | | 817,500 |
| | | | | | |
|
|
| | |
| | | Telecommunications—2.1%
| | | |
| | | 1,500,000 | | Level 3 Communications Inc., 9.125%, 05/01/08 | | | 1,275,000 |
| | | | | | |
|
|
Total Corporate Bonds (cost $3,550,057) | | | 3,650,300 |
| | | | | | |
|
|
Total Investment Portfolio excluding repurchase agreement (cost $56,533,831) | | | 59,957,417 |
| | | | | | |
|
|
| | | | | | | Value
|
| |
Repurchase Agreement—1.8% (a)
| | | |
| Repurchase Agreement with State Street Bank and Trust Company, dated September 30, 2003 @ 0.87% to be repurchased at $1,086,026 on October 1, 2003, collateralized by $800,000 United States Treasury Bonds, 8.125% due August 15, 2019, (market value $1,111,250 including interest) (cost $1,086,000) | | $ | 1,086,000 |
| | | | | | |
|
|
Total Investment Portfolio
| | | |
(cost $57,619,831) (b), 99.6% (a) | | | 61,043,417 |
Other Assets and Liabilities, net, 0.4% (a) | | | 255,314 |
| | | | | | |
|
|
Net Assets, 100.0% | | $ | 61,298,731 |
| | | | | | |
|
|
| * | Non-income producing security. |
| (a) | Percentages indicated are based on net assets. |
| (b) | The aggregate identified cost for federal income tax purposes is the same. Market value includes net unrealized appreciation of $3,423,586 which consists of aggregate gross unrealized appreciation for all securities in which there is an excess of market value over tax cost of $5,993,656 and aggregate gross unrealized depreciation for all securities in which there is an excess of tax cost over market value of $2,570,070. |
ADR American Depository Receipt.
The accompanying notes are an integral part of the financial statements.
7
Heritage Growth and Income Trust
Statement of Assets And Liabilities
September 30, 2003
| | |
Assets | | | | | | | |
Investments, at value (identified cost $56,533,831) | | | | | $ | 59,957,417 | |
Repurchase agreement (identified cost $1,086,000) | | | | | | 1,086,000 | |
Cash | | | | | | 300 | |
Receivables: | | | | | | | |
Fund shares sold | | | | | | 221,174 | |
Dividends and interest | | | | | | 199,832 | |
Deferred state qualification expenses | | | | | | 9,709 | |
Prepaid insurance | | | | | | 1,410 | |
| | | | | |
|
|
|
Total assets | | | | | | 61,475,842 | |
| | |
Liabilities | | | | | | | |
Payables: | | | | | | | |
Fund shares redeemed | | $ | 48,505 | | | | |
Accrued management fee | | | 14,979 | | | | |
Accrued distribution fee | | | 28,216 | | | | |
Accrued shareholder servicing fee | | | 33,184 | | | | |
Accrued fund accounting fee | | | 10,200 | | | | |
Other accrued expenses | | | 42,027 | | | | |
| | |
|
| | | | |
Total liabilities | | | | | | 177,111 | |
| | | | | |
|
|
|
Net assets, at market value | | | | | $ | 61,298,731 | |
| | | | | |
|
|
|
| | |
Net Assets | | | | | | | |
Net assets consist of: | | | | | | | |
Paid-in capital | | | | | $ | 64,660,204 | |
Undistributed net investment income | | | | | | 124,686 | |
Accumulated net realized loss | | | | | | (6,909,745 | ) |
Net unrealized appreciation on investments | | | | | | 3,423,586 | |
| | | | | |
|
|
|
Net assets, at market value | | | | | $ | 61,298,731 | |
| | | | | |
|
|
|
| | |
Class A shares | | | | | | | |
Net asset value and redemption price per share ($36,229,765 divided by 3,264,039 shares of beneficial interest outstanding, no par value) | | | | | $ | 11.10 | |
| | | | | |
|
|
|
Maximum offering price per share (100/95.25 of $11.10 ) | | | | | $ | 11.65 | |
| | | | | |
|
|
|
| | |
Class B shares | | | | | | | |
Net asset value, offering price and redemption price per share ($5,994,309 divided by 550,961 shares of beneficial interest outstanding, no par value) | | | | | $ | 10.88 | |
| | | | | |
|
|
|
| | |
Class C shares | | | | | | | |
Net asset value, offering price and redemption price per share ($19,074,657 divided by 1,752,713 shares of beneficial interest outstanding, no par value) | | | | | $ | 10.88 | |
| | | | | |
|
|
|
The accompanying notes are an integral part of the financial statements.
8
Heritage Growth and Income Trust
Statement of Operations
For the Fiscal Year Ended September 30, 2003
| | |
Investment Income | | | | | | | |
Income: | | | | | | | |
Dividends | | | | | $ | 964,028 | |
Interest | | | | | | 366,794 | |
| | | | | |
|
|
|
Total income | | | | | | 1,330,822 | |
Expenses: | | | | | | | |
Management fee | | $ | 391,993 | | | | |
Distribution fee (Class A) | | | 79,726 | | | | |
Distribution fee (Class B) | | | 49,648 | | | | |
Distribution fee (Class C) | | | 154,106 | | | | |
Shareholder servicing fees | | | 90,674 | | | | |
Professional fees | | | 76,647 | | | | |
Fund accounting fee | | | 43,236 | | | | |
State qualification expenses | | | 42,182 | | | | |
Reports to shareholders | | | 26,231 | | | | |
Custodian fee | | | 17,678 | | | | |
Trustees’ fees and expenses | | | 13,984 | | | | |
Insurance | | | 5,446 | | | | |
Other | | | 1,362 | | | | |
| | |
|
| | | | |
Total expenses | | | | | | 992,913 | |
Fees waived by Manager | | | | | | (134,510 | ) |
| | | | | |
|
|
|
Total expenses after waiver | | | | | | 858,403 | |
| | | | | |
|
|
|
Net investment income | | | | | | 472,419 | |
| | | | | |
|
|
|
| | |
Realized and Unrealized Gain (Loss) on Investments | | | | | | | |
Net realized loss from investment transactions | | | | | | (1,970,650 | ) |
Net unrealized appreciation of investments during the fiscal year | | | | | | 12,239,253 | |
| | | | | |
|
|
|
Net gain on investments | | | | | | 10,268,603 | |
| | | | | |
|
|
|
Net increase in net assets resulting from operations | | | | | $ | 10,741,022 | |
| | | | | |
|
|
|
Statements of Changes in Net Assets
| | | For the Fiscal Years Ended
| |
| | | September 30, 2003
| | | September 30, 2002
| |
Increase (decrease) in net assets: | | | | | | | | |
Operations: | | | | | | | | |
Net investment income | | $ | 472,419 | | | $ | 379,691 | |
Net realized loss from investment transactions | | | (1,970,650 | ) | | | (4,930,163 | ) |
Net unrealized appreciation (depreciation) of investments during the fiscal year | | | 12,239,253 | | | | (7,341,996 | ) |
| | |
|
|
| |
|
|
|
Net increase (decrease) in net assets resulting from operations | | | 10,741,022 | | | | (11,892,468 | ) |
Distributions to shareholders from: | | | | | | | | |
Net investment income Class A shares, ($0.11 and $0.09 per share, respectively) | | | (365,425 | ) | | | (269,014 | ) |
Net investment income Class B shares, ($0.05 and $0.04 per share, respectively) | | | (22,491 | ) | | | (14,754 | ) |
Net investment income Class C shares, ($0.05 and $0.04 per share, respectively) | | | (70,377 | ) | | | (50,071 | ) |
| | |
|
|
| |
|
|
|
Net Distributions to shareholders | | | (458,293 | ) | | | (333,839 | ) |
Increase in net assets from Fund share transactions | | | 4,167,045 | | | | 9,281,899 | |
| | |
|
|
| |
|
|
|
Increase (decrease) in net assets | | | 14,449,774 | | | | (2,944,408 | ) |
Net assets, beginning of fiscal year | | | 46,848,957 | | | | 49,793,365 | |
| | |
|
|
| |
|
|
|
Net assets, end of fiscal year (including undistributed net investment income of
$124,686 and $133,107, respectively) | | $ | 61,298,731 | | | $ | 46,848,957 | |
| | |
|
|
| |
|
|
|
The accompanying notes are an integral part of the financial statements.
9
Heritage Growth and Income Trust
Financial Highlights
The following table includes selected data for a share outstanding throughout each period and other performance information derived from the financial statements.
| | | Class A Shares*
| | | Class B Shares*
| | | Class C Shares*
| |
| | | For the Fiscal Years Ended
September 30
| | | For the Fiscal Years Ended
September 30
| | | For the Fiscal Years Ended
September 30
| |
| | | 2003
| | | 2002
| | | 2001
| | | 2000
| | | 1999
| | | 2003
| | | 2002
| | | 2001
| | | 2000
| | | 1999
| | | 2003
| | | 2002
| | | 2001
| | | 2000
| | | 1999
| |
Net asset value, beginning of fiscal year | | $ | 9.07 | | | $ | 11.33 | | | $ | 15.40 | | | $ | 14.95 | | | $ | 14.99 | | | $ | 8.90 | | | $ | 11.15 | | | $ | 15.21 | | | $ | 14.76 | | | $ | 14.82 | | | $ | 8.90 | | | $ | 11.14 | | | $ | 15.21 | | | $ | 14.76 | | | $ | 14.82 | |
| | |
|
|
| |
|
|
| |
|
|
| |
|
|
| |
|
|
| |
|
|
| |
|
|
| |
|
|
| |
|
|
| |
|
|
| |
|
|
| |
|
|
| |
|
|
| |
|
|
| |
|
|
|
Income from Investment Operations: | | | | | | | | | | | | | | | | | | | | | | | | | | | | | | | | | | | | | | | | | | | | | | | | | | | | | | | | | | | | |
Net investment income | | | 0.12 | | | | 0.11 | | | | 0.15 | | | | 0.19 | | | | 0.34 | | | | 0.04 | | | | 0.02 | | | | 0.04 | | | | 0.08 | | | | 0.22 | | | | 0.04 | | | | 0.02 | | | | 0.04 | | | | 0.08 | | | | 0.22 | |
Net realized and unrealized gain (loss) on investments | | | 2.02 | | | | (2.28 | ) | | | (1.59 | ) | | | 0.51 | | | | 0.57 | | | | 1.99 | | | | (2.23 | ) | | | (1.55 | ) | | | 0.50 | | | | 0.56 | | | | 1.99 | | | | (2.22 | ) | | | (1.56 | ) | | | 0.50 | | | | 0.56 | |
| | |
|
|
| |
|
|
| |
|
|
| |
|
|
| |
|
|
| |
|
|
| |
|
|
| |
|
|
| |
|
|
| |
|
|
| |
|
|
| |
|
|
| |
|
|
| |
|
|
| |
|
|
|
Total from Investment Operations | | | 2.14 | | | | (2.17 | ) | | | (1.44 | ) | | | 0.70 | | | | 0.91 | | | | 2.03 | | | | (2.21 | ) | | | (1.51 | ) | | | 0.58 | | | | 0.78 | | | | 2.03 | | | | (2.20 | ) | | | (1.52 | ) | | | 0.58 | | | | 0.78 | |
| | |
|
|
| |
|
|
| |
|
|
| |
|
|
| |
|
|
| |
|
|
| |
|
|
| |
|
|
| |
|
|
| |
|
|
| |
|
|
| |
|
|
| |
|
|
| |
|
|
| |
|
|
|
Less Distributions: | | | | | | | | | | | | | | | | | | | | | | | | | | | | | | | | | | | | | | | | | | | | | | | | | | | | | | | | | | | | |
Dividends from net investment income | | | (0.11 | ) | | | (0.09 | ) | | | (0.11 | ) | | | (0.25 | ) | | | (0.33 | ) | | | (0.05 | ) | | | (0.04 | ) | | | (0.03 | ) | | | (0.13 | ) | | | (0.22 | ) | | | (0.05 | ) | | | (0.04 | ) | | | (0.03 | ) | | | (0.13 | ) | | | (0.22 | ) |
Distributions from net realized gains | | | — | | | | — | | | | (2.52 | ) | | | — | | | | (0.62 | ) | | | — | | | | — | | | | (2.52 | ) | | | — | | | | (0.62 | ) | | | — | | | | — | | | | (2.52 | ) | | | — | | | | (0.62 | ) |
| | |
|
|
| |
|
|
| |
|
|
| |
|
|
| |
|
|
| |
|
|
| |
|
|
| |
|
|
| |
|
|
| |
|
|
| |
|
|
| |
|
|
| |
|
|
| |
|
|
| |
|
|
|
Total Distributions | | | (0.11 | ) | | | (0.09 | ) | | | (2.63 | ) | | | (0.25 | ) | | | (0.95 | ) | | | (0.05 | ) | | | (0.04 | ) | | | (2.55 | ) | | | (0.13 | ) | | | (0.84 | ) | | | (0.05 | ) | | | (0.04 | ) | | | (2.55 | ) | | | (0.13 | ) | | | (0.84 | ) |
| | |
|
|
| |
|
|
| |
|
|
| |
|
|
| |
|
|
| |
|
|
| |
|
|
| |
|
|
| |
|
|
| |
|
|
| |
|
|
| |
|
|
| |
|
|
| |
|
|
| |
|
|
|
Net asset value, end of fiscal year | | $ | 11.10 | | | $ | 9.07 | | | $ | 11.33 | | | $ | 15.40 | | | $ | 14.95 | | | $ | 10.88 | | | $ | 8.90 | | | $ | 11.15 | | | $ | 15.21 | | | $ | 14.76 | | | $ | 10.88 | | | $ | 8.90 | | | $ | 11.14 | | | $ | 15.21 | | | $ | 14.76 | |
| | |
|
|
| |
|
|
| |
|
|
| |
|
|
| |
|
|
| |
|
|
| |
|
|
| |
|
|
| |
|
|
| |
|
|
| |
|
|
| |
|
|
| |
|
|
| |
|
|
| |
|
|
|
Total Return (%) (a) | | | 23.82 | | | | (19.29 | ) | | | (10.47 | ) | | | 4.74 | | | | 6.14 | | | | 22.82 | | | | (19.91 | ) | | | (11.04 | ) | | | 3.95 | | | | 5.32 | | | | 22.82 | | | | (19.83 | ) | | | (11.12 | ) | | | 3.95 | | | | 5.32 | |
Ratios and Supplemental Data | | | | | | | | | | | | | | | | | | | | | | | | | | | | | | | | | | | | | | | | | | | | | | | | | | | | | | | | | | | | |
Expenses to average daily net assets | | | | | | | | | | | | | | | | | | | | | | | | | | | | | | | | | | | | | | | | | | | | | | | | | | | | | | | | | | | | |
With expenses waived (%) | | | 1.35 | | | | 1.35 | | | | 1.35 | | | | 1.33 | | | | 1.27 | | | | 2.10 | | | | 2.10 | | | | 2.10 | | | | 2.08 | | | | 2.02 | | | | 2.10 | | | | 2.10 | | | | 2.10 | | | | 2.08 | | | | 2.02 | |
Without expenses waived (%) | | | 1.61 | | | | 1.59 | | | | 1.48 | | | | 1.33 | | | | 1.27 | | | | 2.36 | | | | 2.34 | | | | 2.23 | | | | 2.08 | | | | 2.02 | | | | 2.36 | | | | 2.34 | | | | 2.23 | | | | 2.08 | | | | 2.02 | |
Net investment income to average daily net
assets (%) | | | 1.20 | | | | 0.98 | | | | 1.08 | | | | 1.27 | | | | 2.19 | | | | 0.44 | | | | 0.22 | | | | 0.30 | | | | 0.55 | | | | 1.44 | | | | 0.45 | | | | 0.21 | | | | 0.32 | | | | 0.55 | | | | 1.44 | |
Portfolio turnover rate (%) | | | 82 | | | | 72 | | | | 178 | | | | 58 | | | | 46 | | | | 82 | | | | 72 | | | | 178 | | | | 58 | | | | 46 | | | | 82 | | | | 72 | | | | 178 | | | | 58 | | | | 46 | |
Net assets, end of fiscal year ($ millions) | | | 36 | | | | 29 | | | | 33 | | | | 46 | | | | 60 | | | | 6 | | | | 4 | | | | 4 | | | | 4 | | | | 7 | | | | 19 | | | | 14 | | | | 13 | | | | 16 | | | | 26 | |
| * | Per share amounts have been calculated using the monthly average share method. |
| (a) | These returns are calculated without the imposition of either front-end or contingent deferred sales charges. |
The accompanying notes are an integral part of the financial statements.
10
Heritage Growth and Income Trust
Notes to Financial Statements
| Note 1: | Significant Accounting Policies. Heritage Growth and Income Trust (the “Fund”) is organized as a Massachusetts business trust and is registered under the Investment Company Act of 1940, as amended, as a diversified, open-end management investment company. The Fund’s investment objective is to primarily seek long-term capital appreciation and, secondarily, to seek current income. The Fund currently offers Class A, Class B and Class C shares. Effective February 1, 2004, Class B shares will not be available for direct purchase. Class B shares will continue to be available through exchanges and dividend reinvestments as described in the Fund’s prospectus. Class A shares are sold subject to a maximum sales charge of 4.75% of the amount invested payable at the time of purchase. For Class A share investments greater than $1 million, where a sales charge is waived, those shares may be subject to a maximum contingent deferred sales charge of 1% upon redemptions made in less than 18 months of purchase. Class B shares are sold subject to a 5% maximum contingent deferred sales charge (based on the lower of purchase price or redemption price), declining over a six-year period. Class C shares are sold subject to a contingent deferred sales charge of 1% of the lower of net asset value or purchase price payable upon any redemption made in less than one year of purchase. The preparation of financial statements in accordance with accounting principles generally accepted in the United States of America requires management to make estimates and assumptions that affect the reported amounts and disclosures. Actual results could differ from those estimates. The following is a summary of significant accounting policies: |
Security Valuation: The Fund values investment securities at market value based on the last quoted sales price as reported by the principal securities exchange on which the security is traded or the Nasdaq Stock Market. If no sale is reported, market value is based on the most recent quoted bid price and in the absence of a market quote, securities are valued using such methods as the Board of Trustees believe would reflect fair market value. Investments in certain debt instruments not traded in an organized market are valued on the basis of valuations furnished by independent pricing services or broker/dealers that utilize information with respect to market transactions in such securities or comparable securities, quotations from dealers, yields, maturities, ratings and various relationships between securities. Short-term investments having a maturity of 60 days or less are valued at amortized cost, which approximates market value.
Repurchase Agreements: The Fund enters into repurchase agreements whereby the Fund, through its custodian, receives delivery of the underlying securities, the market value of which at the time of purchase is required to be an amount equal to at least 100% of the resale price. Repurchase agreements involve the risk that the seller will fail to repurchase the security, as agreed. In that case, the Fund will bear the risk of market value fluctuations until the security can be sold and may encounter delays and incur costs in liquidating the security. In the event of bankruptcy or insolvency of the seller, delays and costs may be incurred.
Federal Income Taxes: The Fund is treated as a single corporate taxpayer as provided for in the Tax Reform Act of 1986, as amended. The Fund’s policy is to comply with the requirements of the Internal Revenue Code of 1986, as amended, which are applicable to regulated investment companies and to distribute substantially all of its taxable income to its shareholders. Accordingly, no provision has been made for federal income and excise taxes.
Distribution of Income and Gains: Distributions of net investment income are made quarterly. Net realized gains from investment transactions during any particular year in excess of available capital loss carryforwards, which, if not distributed, would be taxable to the Fund, will be distributed to shareholders in the following fiscal year. The Fund uses the identified cost method for determining realized gain or loss on investments for both financial and federal income tax reporting purposes.
Expenses: The Fund is charged for those expenses that are directly attributable to it, while other expenses are allocated proportionately among the Heritage mutual funds based upon methods approved
11
Heritage Growth and Income Trust
Notes to Financial Statements
(continued)
by the Board of Trustees. Expenses of the Fund are allocated to each class of shares based upon their relative percentage of net assets. All expenses that are directly attributable to a specific class of shares, such as distribution fees, are charged directly to that class.
Other: Investment security transactions are accounted for on a trade date basis. Dividend income and distributions to shareholders are recorded on the ex-dividend date. Interest income is recorded on the accrual basis.
| Note 2: | Fund Shares. At September 30, 2003, there were an unlimited number of shares of beneficial interest of no par value authorized. |
Transactions in Class A, B and C shares of the Fund during the fiscal year ended September 30, 2003, were as follows:
| | | Class A Shares
| | | Class B Shares
| | | Class C Shares
| |
| | | Shares
| | | Amount
| | | Shares
| | | Amount
| | | Shares
| | | Amount
| |
Shares sold | | 736,559 | | | $ | 7,597,585 | | | 193,173 | | | $ | 1,931,884 | | | 818,016 | | | $ | 8,110,112 | |
Shares issued on reinvestment of distributions | | 33,933 | | | | 333,952 | | | 2,065 | | | | 20,038 | | | 6,763 | | | | 65,558 | |
Shares redeemed | | (654,351 | ) | | | (6,584,120 | ) | | (124,321 | ) | | | (1,183,555 | ) | | (646,830 | ) | | | (6,124,409 | ) |
| | |
|
| |
|
|
| |
|
| |
|
|
| |
|
| |
|
|
|
Net increase | | 116,141 | | | $ | 1,347,417 | | | 70,917 | | | $ | 768,367 | | | 177,949 | | | $ | 2,051,261 | |
| | | | | |
|
|
| | | | |
|
|
| | | | |
|
|
|
Shares outstanding: | | | | | | | | | | | | | | | | | | | | | |
Beginning of fiscal year | | 3,147,898 | | | | | | | 480,044 | | | | | | | 1,574,764 | | | | | |
| | |
|
| | | | | |
|
| | | | | |
|
| | | | |
End of fiscal year | | 3,264,039 | | | | | | | 550,961 | | | | | | | 1,752,713 | | | | | |
| | |
|
| | | | | |
|
| | | | | |
|
| | | | |
Transactions in Class A, B and C shares of the Fund during the fiscal year ended September 30, 2002, were as follows:
| | | Class A Shares
| | | Class B Shares
| | | Class C Shares
| |
| | | Shares
| | | Amount
| | | Shares
| | | Amount
| | | Shares
| | | Amount
| |
Shares sold | | 958,752 | | | $ | 10,771,227 | | | 218,867 | | | $ | 2,415,482 | | | 789,869 | | | $ | 8,729,610 | |
Shares issued on reinvestment of distributions | | 22,587 | | | | 247,692 | | | 1,146 | | | | 13,221 | | | 4,092 | | | | 47,186 | |
Shares redeemed | | (746,602 | ) | | | (8,120,252 | ) | | (89,833 | ) | | | (932,592 | ) | | (374,752 | ) | | | (3,889,675 | ) |
| | |
|
| |
|
|
| |
|
| |
|
|
| |
|
| |
|
|
|
Net increase | | 234,737 | | | $ | 2,898,667 | | | 130,180 | | | $ | 1,496,111 | | | 419,209 | | | $ | 4,887,121 | |
| | | | | |
|
|
| | | | |
|
|
| | | | |
|
|
|
Shares outstanding: | | | | | | | | | | | | | | | | | | | | | |
Beginning of fiscal year | | 2,913,161 | | | | | | | 349,864 | | | | | | | 1,155,555 | | | | | |
| | |
|
| | | | | |
|
| | | | | |
|
| | | | |
End of fiscal year | | 3,147,898 | | | | | | | 480,044 | | | | | | | 1,574,764 | | | | | |
| | |
|
| | | | | |
|
| | | | | |
|
| | | | |
| Note 3: | Purchases and Sales of Securities. For the fiscal year ended September 30, 2003, purchases and sales of investment securities (excluding repurchase agreements and short-term obligations) aggregated $44,342,397 and $41,293,777, respectively. |
12
Heritage Growth and Income Trust
Notes to Financial Statements
(continued)
| Note 4: | Management, Subadvisory, Distribution, Shareholder Servicing Agent, Fund Accounting and Trustees Fees. Under the Fund’s Investment Advisory and Administration Agreement with Heritage Asset Management, Inc. (the “Manager” or “Heritage”), the Fund agrees to pay to the Manager a fee equal to an annualized rate of 0.75% of the first $100 million of the Fund’s average daily net assets, and 0.60% of any excess over $100 million of such net assets, computed daily and payable monthly. The Manager contractually agreed to waive its fees and, if necessary, reimburse the Fund to the extent that Class A annual operating expenses exceed 1.35% of the Class A shares average daily net assets and to the extent that the Class B and Class C annual operating expenses each exceed 2.10% of these classes’ average daily net assets for the fiscal year ended September 30, 2003. Under these agreements, management fees of $134,510 were waived for the fiscal year ended September 30, 2003. If total Fund expenses fall below the expense limitation agreed to by the Manager before the end of the fiscal year ending September 30, 2005, the Fund may be required to pay the Manager a portion or all of the management fees waived. In addition, the Fund may be required to pay the Manager a portion or all of the management fees waived of $133,614 in fiscal 2002 if total Fund expenses fall below the annual expense limitations before the end of the fiscal year ending September 30, 2004. |
The Manager has entered into a subadvisory agreement with Thornburg Investment Management, Inc. (“Thornburg”) to provide to the Fund investment advice, portfolio management services (including the placement of brokerage orders) and certain compliance and other services for a fee payable, by the Manager, equal to 0.375% of the Fund’s average daily net assets on the first $100 million of net assets and 0.30% thereafter without regard to any reduction due to the imposition of expense limitations. Eagle Asset Management, Inc. (“Eagle”), a wholly owned subsidiary of Raymond James Financial, Inc. (“RJF”), serves as an additional subadviser to the Fund. However, the Manager currently has not allocated any assets of the Fund to Eagle.
The Manager also is the Shareholder Servicing Agent and Fund Accountant for the Fund. The Manager charged $90,674 for Shareholder Servicing fees and $43,236 for Fund Accounting services for the fiscal year ended September 30, 2003.
Raymond James & Associates, Inc. (the “Distributor” or “RJA”) has advised the Fund that it generated $67,165 in front-end sales charges and $675 in contingent deferred sales charges for Class A shares, $20,783 in contingent deferred sales charges for Class B shares and $1,419 in contingent deferred sales charges for Class C shares for the fiscal year ended September 30, 2003. From these fees, the Distributor paid commissions to salespersons and incurred other distribution costs. Agency brokerage commissions for the same period aggregated $109,431 of which $1,405 was paid to the Distributor.
Pursuant to the Class A Distribution Plan adopted in accordance with Rule 12b-1 of the Investment Company Act of 1940, as amended, the Fund is authorized to pay the Distributor a fee equal to 0.25% of the average daily net assets. The Class B and Class C Distribution Plans provide for payments at an annual rate of up to 1.00% of the average daily net assets. Such fees are accrued daily and payable monthly. Class B shares will convert to Class A shares eight years after the end of the calendar month in which the shareholder’s order to purchase was accepted. The Manager, Distributor, Fund Accountant and Shareholder Servicing Agent are all wholly owned subsidiaries of RJF.
Trustees of the Fund also serve as Trustees for Heritage Cash Trust, Heritage Capital Appreciation Trust, Heritage Income Trust, and Heritage Series Trust, investment companies that are also advised by the
13
Heritage Growth and Income Trust
Notes to Financial Statements
(continued)
| | Manager (collectively referred to as the “Heritage Mutual Funds”). Each Trustee of the Heritage Mutual Funds who is not an employee of the Manager or employee of an affiliate of the Manager received an annual fee of $18,000 and an additional fee of $3,000 for each combined quarterly meeting of the Heritage Mutual Funds attended. Each portfolio in the Heritage Mutual Funds shares trustees’ fees and expenses equally. |
| Note 5: | Federal Income Taxes. The timing and character of certain income and capital gain distributions are determined in accordance with income tax regulations, which may differ from accounting principles generally accepted in the United States of America. As a result, net investment income (loss) and net realized gain (loss) from investment transactions for a reporting period may differ from distributions during such period. These book/tax differences may be temporary or permanent in nature. To the extent these differences are permanent; they are charged or credited to paid in capital or accumulated net realized loss, as appropriate, in the period that the differences arise. These reclassifications have no effect on net assets or net asset value per share. For the fiscal year ended September 30, 2003, to reflect reclassifications arising from permanent book/tax differences attributable to distributions from R.E.I.T.s, the Fund decreased (debited) undistributed net investment income and increased (credited) accumulated net realized loss of $22,547. As of September 30, 2003, the Fund had net tax basis capital loss carryforwards in the aggregate of $6,124,512. Of this capital loss carryforward $125,673 and $6,008,839 may be applied to any net taxable capital gain until their expiration dates of 2010 and 2011, respectively. In addition, from November 1, 2002 to September 30, 2003, the fund incurred $775,233 of net realized capital losses (post October losses) which will be deferred and treated as arising on October 1, 2003 in accordance with regulations under the Internal Revenue Code. |
For income tax purposes, distributions paid during the fiscal years ended September 30, 2003 and 2002 were as follows:
| Distributions paid from: | | 2003
| | 2002
|
Ordinary Income | | $ | 458,293 | | $ | 333,839 |
Long-Term Capital Gains | | $ | 0 | | $ | 0 |
As of September 30, 2003, the components of distributable earnings on a tax basis were as follows:
Undistributed Ordinary Income | | $ | 124,686 |
Capital Loss Carryforwards | | $ | (6,134,512) |
Post October Losses | | $ | (775,233) |
Tax Basis Net Unrealized Appreciation | | $ | 3,423,586 |
14
Report of Independent Certified Public Accountants
To the Board of Trustees and Shareholders of
Heritage Growth and Income Trust
In our opinion, the accompanying statement of assets and liabilities, including the investment portfolio, and the related statements of operations and of changes in net assets and the financial highlights present fairly, in all material respects, the financial position of Heritage Growth and Income Trust (the “Fund”) at September 30, 2003, the results of its operations for the year then ended, the changes in its net assets for each of the two years in the period then ended and the financial highlights for each of the five years in the period then ended, in conformity with accounting principles generally accepted in the United States of America. These financial statements and financial highlights (hereafter referred to as “financial statements”) are the responsibility of the Fund’s management; our responsibility is to express an opinion on these financial statements based on our audits. We conducted our audits of these financial statements in accordance with auditing standards generally accepted in the United States of America, which require that we plan and perform the audit to obtain reasonable assurance about whether the financial statements are free of material misstatement. An audit includes examining, on a test basis, evidence supporting the amounts and disclosures in the financial statements, assessing the accounting principles used and significant estimates made by management, and evaluating the overall financial statement presentation. We believe that our audits, which included confirmation of securities at September 30, 2003 by correspondence with the custodian, provide a reasonable basis for our opinion.

PricewaterhouseCoopers LLP
Tampa, Florida
November 6, 2003
15
2003 Federal Income Tax Notice
(unaudited)
For the fiscal year ended September 30, 2003, certain dividends paid by the Heritage Growth and Income Trust may be subject to a maximum tax rate of 15%, as provided for by the Jobs and Growth Tax Relief Reconciliation Act of 2003. The Fund designates a maximum amount of $211,534 as qualified dividend income, which is taxed at a maximum rate of 15%. The information and distributions reported herein may differ from the information and distributions taxable to the shareholders for the calendar year ending December 31, 2003. Complete information will be computed and reported in conjunction with your 2003 Form 1099-DIV.
16
Heritage Growth and Income Trust
Trustees and Officers
Name, Address and Age | | Position(s) Held with Fund | | Term of Office* and Length of Time Served | | Principal Occupation(s) During Past 5 years | | Number of Portfolios in Heritage
Mutual Funds Complex Overseen by Trustee | | Other Directorships Held by Trustee |
|
| | | | | |
| Affiliated Trustees ** | | | | | | | | | | |
| | | | | |
Thomas A. James 880 Carillon Parkway St. Petersburg, FL 33716 (61) | | Trustee | | Since
inception in 1986 | | Chairman of the Board since 1986; Chief Executive Officer of RJF since 1969; Chairman of the Board of RJA since 1986; Chairman of the Board of Eagle since 1984. | | 13 | | Outback
Steakhouse,
Inc. |
|
| | | | | |
Richard K. Riess 880 Carillon Parkway St. Petersburg, FL 33716 (54) | | President and Trustee | | Since
2000 Since
inception in 1986 | | Executive Vice President and Managing Director for Asset Management of RJF since 1998; CEO of Eagle since 1996; CEO of Heritage since 2000; President of Eagle, 1995 to 2000. | | 13 | | N/A |
|
| | | | | |
| Independent Trustees | | | | | | | | | | |
| | | | | |
C. Andrew Graham 880 Carillon Parkway St. Petersburg, FL 33716 (63) | | Trustee | | Since
inception in 1986 | | First Financial Advisors, LLC & Graham Financial Partners LLC (financial planning insurance and investment services) since 1999; Representative of NFP Securities, Inc. (broker-dealer) since 2002; Representative of Multi- Financial Securities Corp. (broker-dealer), 1996 to 2001; V.P. of Financial Designs Ltd., 1996 to 1999. | | 13 | | N/A |
|
| | | | | |
William J. Meurer 880 Carillon Parkway St. Petersburg, FL 33716 (60) | | Trustee | | Since
2003 | | Private Financial consultant since September 2000; Board of Directors of Tribridge Consulting, Inc. (business consulting services) since 2000; Board of Trustees, St. Joseph’s-Baptist Health Care since 2000; Advisory Board, Bisk Publishing, Inc. (distance learning provider) since 2000; Managing Partner, Central Florida of Arthur Andersen LLP, 1987 to 2000; Managing Partner, Florida Audit and Business Advisory Services of Arthur Anderson, 1997 to 2000. | | 13 | | Sykes
Enterprises,
Incorporated
(inbound
call
systems). |
|
| | | | | |
James L. Pappas 880 Carillon Parkway St. Petersburg, FL 33716 (60) | | Trustee | | Since
1989 | | Lykes Professor of Banking and Finance since 1986 at University of South Florida; President, Graduate School of Banking since 1995; Trustee and Chairman of the Board, Tampa Museum of Art. | | 13 | | N/A |
|
17
Heritage Growth and Income Trust
Trustees and Officers
Name, Address and Age | | Position(s) Held with Fund | | Term of Office* and Length of Time Served | | Principal Occupation(s) During Past 5 years | | Number of Portfolios in Heritage
Mutual
Funds Complex Overseen by Trustee | | Other
Directorships
Held by Trustee |
|
| | | | |
| Independent Trustees (continued) | | | | | | | | |
| | | | | |
David M. Phillips 880 Carillon Parkway St. Petersburg, FL 33716 (64) | | Trustee | | Since inception in 1986 | | Chief Executive Officer of Evare LLC (information services); Chairman Emeritus of CCC Information Services, Inc.; Executive in Residence, University of North Carolina – Wilmington, 2000 to 2003. | | 13 | | N/A |
|
| | | | | |
Eric Stattin 880 Carillon Parkway St. Petersburg, FL 33716 (70) | | Trustee | | Since 1987 | | Private Investor since 1988. | | 13 | | Mill Creek Bank |
|
| | | | | |
Deborah L. Talbot 880 Carillon Parkway St. Petersburg, FL 33716 (53) | | Trustee | | Since 2002 | | Consultant/Advisor; Member, Academy of Senior Professionals, Eckerd College since 1998; Member, Dean’s Advisory Board of Fogelman School of Business, University of Memphis,
1999-2000; Advisory Board Member, Center for Global Studies, Pennsylvania State University, 1996-1999. | | 13 | | N/A |
|
| | | | | |
| Officers | | | | | | | | | | |
| | | | | |
K.C. Clark 880 Carillon Parkway St. Petersburg, FL 33716 (44) | | Executive Vice President and Principal
Executive Officer | | Since 2000 | | Executive Vice President and Chief Operating Officer of Heritage since 2000; Senior Vice President – Operations and Administration of Heritage, 1998 to 2000; Vice President – Operations and Administration of Heritage, 1993 to 1998. | | N/A | | N/A |
|
| | | | | |
Andrea N. Mullins 880 Carillon Parkway St. Petersburg, FL 33716 (36) | | Treasurer | | Since 2003 | | Treasurer and Vice President – Finance of Heritage since 2003; Vice President – Fund Accounting of Heritage, 1996 to 2003; | | N/A | | N/A |
|
| | | | | |
Clifford J. Alexander 1800 Massachusetts Ave. Washington, DC 20036 (60) | | Secretary | | Since inception
in 1986 | | Partner, Kirkpatrick & Lockhart LLP (law firm). | | N/A | | N/A |
|
18
Heritage Growth and Income Trust
Trustees and Officers
Name, Address and Age | | Position(s) Held with Fund | | Term of Office* and Length of Time Served | | Principal Occupation(s) During Past 5 years | | Number of Portfolios in Heritage
Mutual
Funds Complex Overseen by Trustee | | Other
Directorships
Held by Trustee |
|
| | | | | |
| Officers (continued) | | | | | | | | | | |
| | | | | |
Robert J. Zutz 1800 Massachusetts Ave. Washington, DC 20036 (50) | | Assistant Secretary | | Since 1989 | | Partner, Kirkpatrick & Lockhart LLP (law firm). | | N/A | | N/A |
|
| | | | | |
Deborah A. Malina 880 Carillon Parkway St. Petersburg, FL 33716 (37) | | Assistant Secretary | | Since 2000 | | Compliance Administrator of Heritage since 2000; Assistant Supervisor of Operations, Heritage, from 1997 to 2000. | | N/A | | N/A |
|
| * | Trustees serve for the lifetime of the Trust or until they are removed, resign or retire. The Board has adopted a retirement policy that requires Trustees to retire at the age of 72 for those Trustees in office prior to August 2000, and at the age 70 for those Trustees who are elected to office after August 2000. Officers are elected annually for one year terms. The Trust’s Statement of Additional Information includes additional information about the Trustees and officers and is available, without charge, upon request, by calling (800) 421-4184. |
| ** | Messrs. James and Riess are “interested” persons of the Trust as that term is defined by the Investment Company Act of 1940. Mr. James is affiliated with RJA and RJF. Mr. Riess is affiliated with Heritage and RJF. |
19
Heritage Family of FundsTM
The Intelligent Creation of Wealth
Would you like to receive future mailings via E-Mail?
If so, please let us know. Go to www.HeritageFunds.com to enroll.

Raymond James & Associates, Inc., Distributor
Member New York Stock Exchange/SIPC
880 Carillon Parkway
St. Petersburg, FL 33716
(727) 573-8143 (800) 421-4184
www.HeritageFunds.com
Not FDIC Insured May Lose Value No Bank Guarantee
We are pleased that many of you are also investors in the Heritage Family of Funds. For more complete information, including fees, risks and expenses, contact your financial advisor or call Heritage Family of Funds at (800) 421-4184 for a prospectus. Read the prospectus carefully before you invest or send money. This report is for the information of shareholders of Heritage Growth and Income Trust. It may also be used as sales literature when preceded or accompanied by a prospectus.
09/03 Copyright 2003 Heritage Asset Management, Inc.
Item 2. Code of Ethics
As of the end of the period September 30, 2003, Heritage Growth and Income Trust has adopted a code of ethics, as defined in Item 2 of Form N-CSR, that applies to the Principal Executive Officer and Treasurer. A copy of this code of ethics is filed as an exhibit to this Form N-CSR.
Item 3. Audit Committee Financial Expert
The Board of Trustees of Heritage Growth and Income Trust has determined that William J. Meurer is an audit committee financial expert, as defined in Item 3 of Form N-CSR, serving on its audit committee. Mr. Meurer is independent for purposes of Item 3 of Form N-CSR.
Item 4. Principal Accountant Fees and Services
Form N-CSR disclosure requirement not yet effective with respect to registrant.
Item 5. Audit Committee of Listed Registrants
Not applicable to the registrant.
Item 6. [Reserved]
Item 7. Disclosure of Proxy Voting Policies and Procedures for Closed-End Management Investment Companies
Not applicable to the registrant.
Item 8. [Reserved]
Item 9. Controls and Procedures
| (a) | Based on an evaluation of the disclosure controls and procedures (as defined in Rule 30a-2(c) under the Act), the Principal Executive Officer and Treasurer of Heritage Growth and Income Trust have concluded that such disclosure controls and procedures are effective as of December 2, 2003. |
| (b) | There was no change in the internal controls over financial reporting (as defined in Rule 30a-3(d) of Heritage Growth and Income Trust that occurred during the second half of its fiscal year that has materially affected or is reasonably likely to materially affect, its internal control over financial reporting. |
Item 10. Exhibits
(a)(1) Code of Ethics pursuant to Item 2 of Form N-CSR is filed and attached hereto as Exhibit 99.CODEETH.
(a)(2) The certifications required by Rule 30a-2(a) of the Investment Company Act of 1940, as amended, and Section 302 of the Sarbanes-Oxley Act of 2002 is filed and attached hereto as Exhibit 99.CERT.
(b) The certifications required by Rule 30a-2(b) of the Investment Company Act of 1940, as amended, and Section 906 of the Sarbanes-Oxley Act of 2002 is filed and attached hereto as Exhibit 99.906CERT.
SIGNATURES
Pursuant to the requirements of the Securities Exchange Act of 1934 and the Investment Company Act of 1940, the registrant has duly caused this report to be signed on its behalf by the undersigned, thereunto duly authorized.
Date: December 2, 2003 | | HERITAGE GROWTH AND INCOME TRUST /s/ K.C. Clark
K.C. Clark Executive Vice President and Principal Executive Officer |
Pursuant to the requirements of the Securities Exchange Act of 1934 and the Investment Company Act of 1940, this report has been signed below by the following persons on behalf of the registrant and in the capacities and on the dates indicated.
Date: December 2, 2003
| | | /s/ K.C. Clark
K.C. Clark Executive Vice President and Principal Executive Officer |
Date: December 2, 2003
| | | /s/ Andrea N. Mullins
Andrea N. Mullins Treasurer |