UNITED STATES
SECURITIES AND EXCHANGE COMMISSION
Washington, D.C. 20549
FORM N-CSR
CERTIFIED SHAREHOLDER REPORT OF REGISTERED
MANAGEMENT INVESTMENT COMPANIES
Investment Company Act file Number: 811-4767
HERITAGE GROWTH AND INCOME TRUST
_____________________________________________________________________________________________________________________________
(Exact name of Registrant as Specified in Charter)
880 Carillon Parkway
St. Petersburg, FL 33716
_______________________________________________________________________________________________________________________________________________________________________________
(Address of Principal Executive Office) (Zip Code)
Registrant’s Telephone Number, including Area Code: (727) 573-3800
RICHARD K. RIESS, PRESIDENT
880 Carillon Parkway
St. Petersburg, FL 33716
_____________________________________________________________________________________________________________________________
(Name and Address of Agent for Service)
Copy to:
CLIFFORD J. ALEXANDER, ESQ.
Kirkpatrick & Lockhart LLP
1800 Massachusetts Avenue, NW
Washington, D.C. 20036
Date of fiscal year end: September 30
Date of reporting period: September 30, 2004
Item 1. Reports to Shareholders


October 20, 2004
Dear Valued Shareholders:
It is a pleasure to report to you on the Heritage Growth and Income Trust (the “Fund”) for the fiscal year ended September 30, 2004(a). Stimulated by robust economic growth (3rd calendar quarter of 2003 seasonally adjusted at annual rates the Gross Domestic Product was up 7.4%) and sharply higher corporate profits, the market and the Fund got off to a positive start in the beginning of the fiscal year. Since that time, progress in the Fund has been challenging, with rallies in late spring and near the Fund’s fiscal year end bringing a full year return(a) of 7.57% for Class A shares. Please note that performance numbers quoted for Class A shares are shown without the imposition of a front-end or contingent deferred sales charge. If reflected, the imposition of a front-end or contingent deferred sales charge would reduce the performance. In addition, the performance data quoted represents past performance and the investment return and principal value of an investment will fluctuate so that an investor’s shares, when redeemed, may be worth more or less than the original cost. Please remember, past performance does not guarantee future results and current performance may be higher or lower than the performance data quoted. To obtain more current performance please visit the Heritage website at www.HeritageFunds.com.
The table below compares the total return for the Fund’s Class A shares with the Standard & Poor’s 500 Composite Stock Price Index (the “S&P 500 Index”)(b), the Fund’s benchmark index, for the fiscal year ended September 30, 2004. Note that returns are for investors who held shares for the entire period, with the assumption that all dividends were reinvested in additional shares of the same class.
| | | |
| | | For the Fiscal Year Ended September 30, 2004
| |
Heritage Growth and Income Trust Class A shares | | +7.57 | % |
S&P 500 Index | | +13.87 | % |
Reflecting on performance over the year, it is no surprise that with oil prices having risen dramatically, integrated oil companies would be prominent gainers among portfolio holdings. Interestingly, at this time last year, oil was among the few industry sectors expected to have lower earnings in 2004 than in 2003. This highlights just how much of a surprise the rise in oil prices has been. Amerada Hess, Marathon Oil, ExxonMobil, Unocal, and Petrobras were among the best performing stocks in the Fund. Amerada Hess and Marathon Oil reached target prices and are no longer held.
A number of our holdings in the healthcare industry also provided good returns. The Fund was, and continues to be, mostly invested in the service segment of the industry where stocks such as Caremark Rx, Quest Diagnostics, UnitedHealth Group, and Anthem have contributed positively to performance. Quest attained a target price and is no longer held. Guidant (a recent purchase) and Genzyme in the equipment and biotech segments, respectively, also contributed meaningfully. Long time holding Genzyme reached target levels and has been sold. Guidant remains in the portfolio for its leadership position in cardiac rhythm management and potential to ultimately gain
(a) The views expressed here are not meant as investment advice. Although some of the described portfolio holdings were viewed favorably as of the date of this letter, there is no guarantee the Fund will continue to hold these securities in the future. Please consider the investment objectives, risks, charges and expenses of any fund carefully before investing. Contact Heritage at (800) 421-4184 or your financial advisor for a prospectus, which contains this and other important information about the Fund. Read the prospectus carefully before you invest.
(b) The S&P 500 is an unmanaged index of 500 widely held stocks that are considered representative of the U.S. stock market. Keep in mind that individuals cannot invest directly in any index, and index performance does not include transaction costs or other fees, which will affect actual investment performance.
a leading position in treating heart disease with drug eluting stents. Prior to the introduction of a drug eluting stent by a competitor, Guidant was an industry leader.
Other material contributors to positive performance include: Aon, Boston Properties, E*Trade Financial, and Lincoln National. Boston Properties attained our price expectations and was sold. In addition, each of the others has been reduced, reflecting risk control considerations such as position size. E*Trade Financial is classified by us as an emerging franchise and trimming this position after a significant rise is illustrative of how we manage risk yet retain positions in “winners” for their longer-term potential.
A number of our retail holdings performed well during the period, including two issues that were fairly recent portfolio additions, Tesco and Kingfisher. These may not be familiar retail names to you because they are based in the UK. These companies are industry leaders (supermarkets and home repairs, respectively) in the UK and both are pursuing expansion potential outside the UK, including in the emerging markets of Eastern Europe and the Far East. Their Management have executed well in the past, and both stocks offer attractive dividend yields. You may have noticed that our number of non-U.S. holdings has increased. These holdings are consistent with the Fund’s primary investment objective of long term capital appreciation and secondarily, current income.
The Fund’s portfolio is much more focused than the S&P 500 Index benchmark and many other competitive funds, with currently 43 holdings, including three bond positions. Our philosophy is that though the portfolio will be diversified, a more concentrated portfolio can more dynamically reflect the results of effective fundamental research and stock selection. Relative to the Fund’s benchmark, this did not happen in its 2004 fiscal year. The period from April 2004 to August 2004 was particularly disappointing. Investors’ fears of an aborted profits recovery pressured the U.S. economy and market sensitive holdings. Information technology holdings, including internet related issues such as IAC/InterActiveCorp and Doubleclick, were particularly poor performers, both absolutely and relative to the sector. Business execution at these companies and two other technology holdings, Seagate Technology and Hewlett Packard, was disappointing. Each of these holdings has been eliminated from the portfolio.
Corporate bonds remain a small portion of the portfolio. Nonetheless, a holding in Delta Airlines hurt performance. Fuel prices rose well beyond our expectations, undermining confidence in cash flow adequacy. Offsetting operating cost savings have not been forthcoming so the bonds have been sold.
One of our largest holdings, Fannie Mae, has been persistently in the news. Its government overseer has recently issued a report damaging to the reputation of management, alleging inadequate documentation discipline with regard to derivative hedges. By agreement with its regulator, Fannie Mae will be rebuilding capital for several quarters, a process that will likely constrain growth below prior expectations. While the stock’s valuation appears to fully reflect the current controversy, we have recently trimmed our exposure.
As we start the new fiscal year, a litany of issues is foremost in investor awareness. Iraq, oil prices, interest rates, the dollar, the trade imbalance and budget deficit, and economic growth will likely remain the general issues of the day for investors. We believe that favorable developments with regard to any of these issues (most are linked) would likely be good for the economy and stocks. We believe that a portfolio of stocks such as our Fund, selected for both their promise and discount valuations, would seem to be positioned to benefit. Additions to the portfolio are made on the basis of individual stock attributes. Recent additions have been mostly in the very large capitalization market segment and as mentioned above, have included a number of foreign issues as well. Please review the holdings by industry on the following pages and the summary of sector diversification provided separately. In addition, please take into consideration that the Fund is still subject to market risks, and the price of the portfolio holdings may decline or fluctuate based on a broad market decline or market volatility. In addition, as the Fund’s name implies, the Fund invests in growth companies that are expected to increase their earnings at a certain rate. When these expectations are not met, investors may punish the stock’s price excessively, even if earnings showed an absolute increase. The Fund also invests in income-producing securities that may be subject to interest rate risk. If interest rates rise, the market value of these securities may fall and thus reduce the Fund’s
2
return. We strongly recommend that you review the Fund’s prospectus and become aware of the risks involved with your investment. Thank you very much for your continued confidence and trust.
| | |
| Sincerely, | | Sincerely, |
| |
 | |  /s/ William V. Fries |
| Richard K. Riess | | William V. Fries, CFA |
| President | | Managing Director |
| Heritage Growth and Income Trust | | Thornburg Investment Management, Inc. |
| | | Portfolio Manager |
| | | Heritage Growth and Income Trust |
3
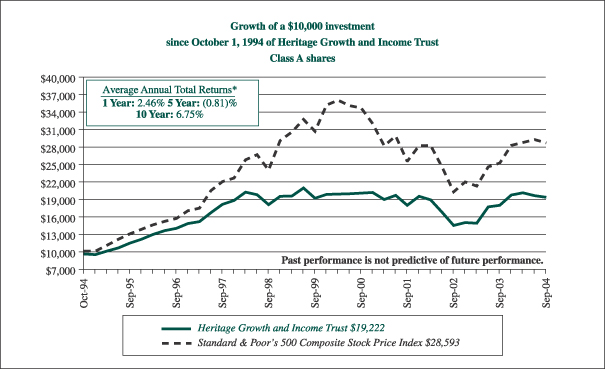
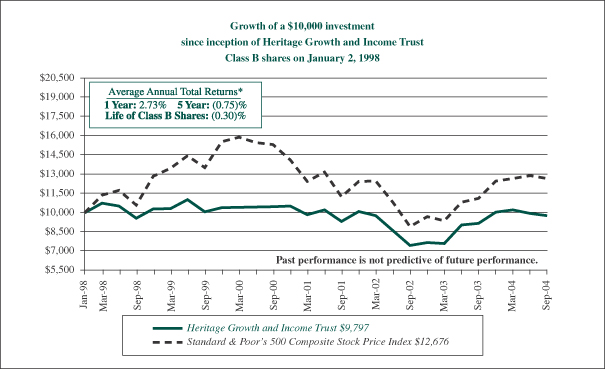
| * | Average annual returns for Heritage Growth and Income Trust Class A and B shares are calculated in conformance with Item 21 of Form N-1A, which assumes the maximum sales charge of 4.75% for Class A shares, a contingent deferred sales charge for Class B shares (4% for the one year period, 1% for the five year period and 0% for the life of Class B shares) and reinvestment of dividends for Class A and B shares. Performance presented represents historical data. The investment return and principal value of an investment will fluctuate so that an investor’s shares, when redeemed, may be worth more or less than their original cost. The Fund’s past performance is not indicative of future performance and should be considered in light of the Fund’s investment policy and objectives, the characteristics and quality of its portfolio securities, and the periods selected. The graph and table do not reflect the deduction of taxes that a shareholder would pay on fund distributions or the redemption of fund shares. |
4
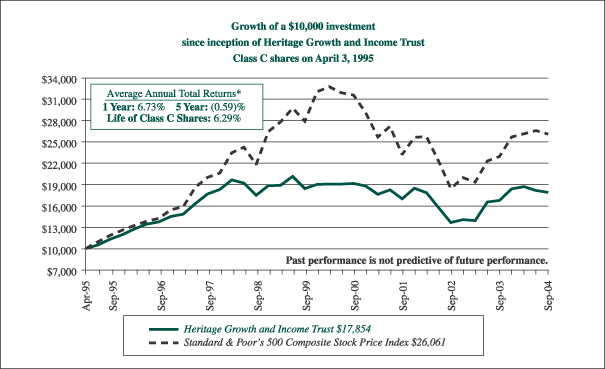
| * | Average annual returns for Heritage Growth and Income Trust Class C shares are calculated in conformance with Item 21 of Form N-1A, which assumes reinvestment of dividends for Class C shares. Performance presented represents historical data. The investment return and principal value of an investment will fluctuate so that an investor’s shares, when redeemed, may be worth more or less than their original cost. The Fund’s past performance is not indicative of future performance and should be considered in light of the Fund’s investment policy and objectives, the characteristics and quality of its portfolio securities, and the periods selected. The graph and table do not reflect the deduction of taxes that a shareholder would pay on fund distributions or the redemption of fund shares. |
5
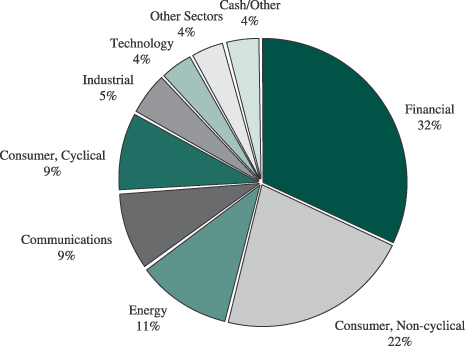
Heritage Growth and Income Trust
Portfolio Allocation
(unaudited)
Sector Allocation as of September 30, 2004 (% of net assets)
Beginning with the Fund’s fiscal quarter ending December 31, 2004, the Fund will file its complete schedule of portfolio holdings with the Securities Exchange Comission (“SEC”) for the first and third quarters of each fiscal year on Form N-Q; the Fund’s Forms N-Q will be available on the SEC’s website at http://www.sec.gov; and the Fund’s Forms N-Q may be reviewed and copied at the SEC’s Public Reference Room in Washington, DC. Information on the operation of the Public Reference Room may be obtained by calling 1-800-SEC-0330.
6
Heritage Growth and Income Trust
Understanding Your Fund’s Expenses
(unaudited)
Understanding Your Fund’s Expenses
As a mutual fund investor, you pay ongoing expenses, such as management fees, distribution fees and other expenses. Using the tables below, you can estimate how these expenses affect your investment and compare them with the expenses of other funds. Please note that the expenses shown in the table are meant to highlight your ongoing costs only and do not reflect one-time transaction expenses, such as sales charges (loads) or redemption fees. Therefore, if these transactional costs were included, your costs would have been higher. For more information, see your Fund’s prospectus or talk to your financial adviser.
Review Your Fund’s Actual Expenses
The table below shows the actual expenses you would have paid on a $1,000 investment in Heritage Growth and Income Trust on April 1, 2004 and held through September 30, 2004. It also shows how much a $1,000 investment would be worth at the close of the period, assuming actual returns after ongoing expenses. This table is useful in comparing ongoing costs only, and will not help you determine the relative total costs of owning different funds. Simply divide your account value by $1,000 (for example, an $8,600 account value divided by $1,000 = 8.6), then multiply the result by the number in the line under the heading entitled “Expenses Paid During Period” to estimate the expenses you paid on your account during this period.
| | | | | | | | | |
Actual
| | Beginning
Account Value
April 1, 2004
| | Ending
Account Value
September 30, 2004
| | Expenses Paid
During Period*
|
Class A | | $ | 1,000 | | $ | 961 | | $ | 6.62 |
Class B | | $ | 1,000 | | $ | 957 | | $ | 10.27 |
Class C | | $ | 1,000 | | $ | 957 | | $ | 10.27 |
Hypothetical Example for Comparison Purposes
All mutual funds now follow guidelines to assist shareholders in comparing expenses between different funds. Per these guidelines, the table below shows your Fund’s expenses based on a $1,000 investment, assuming a hypothetical 5% annualized return before ongoing expenses invested at the beginning of the period and held for the entire period. Please note that you should not use this information to estimate your actual ending account balance and expenses paid during the period. You can use this information to compare the ongoing expenses (but not transaction expenses or total costs) of investing in the Fund with those of other funds. All mutual fund shareholder reports will provide this information to help you make this comparison.
| | | | | | | | | |
Hypothetical (5% return before expenses)
| | Beginning
Account Value
April 1, 2004
| | Ending
Account Value
September 30, 2004
| | Expenses Paid
During Period*
|
Class A | | $ | 1,000 | | $ | 1,018 | | $ | 6.81 |
Class B | | $ | 1,000 | | $ | 1,014 | | $ | 10.58 |
Class C | | $ | 1,000 | | $ | 1,014 | | $ | 10.58 |
| | * | Expenses are calculated using the Fund’s annualized expense ratios for Class A (1.35%), Class B (2.10%) and Class C (2.10%) shares, multiplied by the average account value for the period, then multiplying the result by the actual number of days in the period (183); and then dividing that result by the actual number of days in the fiscal year (366). |
7
Heritage Growth and Income Trust
Investment Portfolio
September 30, 2004
| | | | | |
Shares
| | | | Value
|
Common Stocks—92.1% (a)
| | | |
Domestic—70.5%
| | | |
Agriculture—2.5%
| | | |
| 39,400 | | Altria Group Inc. | | $ | 1,853,376 |
| | | | |
|
|
Airlines—2.4%
| | | |
| 131,946 | | Southwest Airlines Company | | | 1,797,105 |
| | | | |
|
|
Banks—5.6%
| | | |
| 42,600 | | Bank of America Corporation | | | 1,845,858 |
| 78,500 | | The Bank of New York
Company, Inc. | | | 2,289,845 |
| | | | |
|
|
| | | | | | 4,135,703 |
| | | | |
|
|
Broadcasting Services/Programs—2.1%
| | | |
| 56,900 | | Fox Entertainment Group, Inc., Class “A”* | | | 1,578,406 |
| | | | |
|
|
Cosmetics/Personal Care—1.6%
| | | |
| 26,200 | | Colgate-Palmolive Company | | | 1,183,716 |
| | | | |
|
|
Diversified Manufacturer—3.1%
| | | |
| 68,800 | | General Electric Company | | | 2,310,304 |
| | | | |
|
|
Financial Services—10.2%
| | | |
| 44,200 | | Citigroup Inc. | | | 1,950,104 |
| 75,400 | | E*TRADE Financial Corporation* | | | 861,068 |
| 33,200 | | Fannie Mae | | | 2,104,880 |
| 40,200 | | Nuveen Investments, Inc., Class “A” | | | 1,189,920 |
| 29,000 | | T. Rowe Price Group, Inc. | | | 1,477,260 |
| | | | |
|
|
| | | | | | 7,583,232 |
| | | | |
|
|
Healthcare Products—1.9%
| | | |
| 20,900 | | Guidant Corporation | | | 1,380,236 |
| | | | |
|
|
Healthcare Services—6.2%
| | | |
| 16,300 | | Anthem, Inc.* | | | 1,422,175 |
| 69,900 | | Health Management Associates, Inc., Class “A” | | | 1,428,057 |
| 23,300 | | UnitedHealth Group Inc. | | | 1,718,142 |
| | | | |
|
|
| | | | | | 4,568,374 |
| | | | |
|
|
Insurance—8.0%
| | | |
| 21,500 | | American International Group, Inc. | | | 1,461,785 |
| 57,100 | | Aon Corporation | | | 1,641,054 |
| 26,300 | | Lincoln National Corporation | | | 1,236,100 |
| 48,500 | | The St. Paul Travelers Companies, Inc. | | | 1,603,410 |
| | | | |
|
|
| | | | | | 5,942,349 |
| | | | |
|
|
Logic Semiconductors—0.9%
| | | |
| 32,700 | | Texas Instruments Inc. | | | 695,856 |
| | | | |
|
|
| | | | | |
Shares
| | | | Value
|
Common Stocks (continued)
| | | |
Oil & Gas—6.8%
| | | |
| 61,200 | | Exxon Mobil Corporation | | $ | 2,957,796 |
| 48,800 | | Unocal Corporation | | | 2,098,400 |
| | | | |
|
|
| | | | | | 5,056,196 |
| | | | |
|
|
Pharmaceuticals—4.7%
| | | |
| 41,700 | | Caremark Rx, Inc.* | | | 1,337,319 |
| 71,000 | | Pfizer, Inc. | | | 2,172,600 |
| | | | |
|
|
| | | | | | 3,509,919 |
| | | | |
|
|
Retail—3.8%
| | | |
| 24,700 | | Lowe’s Companies Inc. | | | 1,342,445 |
| 32,500 | | Target Corporation | | | 1,470,625 |
| | | | |
|
|
| | | | | | 2,813,070 |
| | | | |
|
|
Software—3.5%
| | | |
| 93,200 | | Microsoft Corporation | | | 2,576,980 |
| | | | |
|
|
Telecommunications—5.0%
| | | |
| 35,400 | | ALLTEL Corporation | | | 1,943,814 |
| 43,500 | | NII Holdings, Inc.* | | | 1,792,635 |
| | | | |
|
|
| | | | | | 3,736,449 |
| | | | |
|
|
Transportation—2.2%
| | | |
| 27,500 | | Union Pacific Corporation | | | 1,611,500 |
| | | | |
|
|
Total Domestic Common Stocks
(cost $50,162,555) | | | 52,332,771 |
| | | | |
|
|
Foreign—21.6%
| | | |
Banks—4.9%
| | | |
| 222,300 | | Barclays PLC | | | 2,132,007 |
| 189,600 | | Lloyds TSB Group, PLC | | | 1,480,445 |
| | | | |
|
|
| | | | | | 3,612,452 |
| | | | |
|
|
Electric—2.1%
| | | |
| 50,500 | | Scottish Power PLC, Sponsored ADR | | | 1,557,420 |
| | | | |
|
|
Financial Services—3.5%
| | | |
| 754,900 | | China Merchants Holdings (International) Co. Ltd | | | 1,137,473 |
| 75,000 | | W.P. Stewart & Co., Ltd., Sponsored ADR | | | 1,499,250 |
| | | | |
|
|
| | | | | | 2,636,723 |
| | | | |
|
|
Food—3.5%
| | | |
| 500,000 | | Tesco PLC | | | 2,580,886 |
| | | | |
|
|
Oil & Gas—2.5%
| | | |
| 53,400 | | Petroleo Brasileiro SA,
Sponsored ADR | | | 1,882,350 |
| | | | |
|
|
Pharmaceuticals—2.2%
| | | |
| 37,300 | | Glaxo Wellcome, PLC,
Sponsored ADR | | | 1,631,129 |
| | | | |
|
|
The accompanying notes are an integral part of the financial statements.
8
Heritage Growth and Income Trust
Investment Portfolio
September 30, 2004
(continued)
| | | | | |
Shares
| | | | Value
|
Common Stocks (continued)
| | | |
Retail—2.9%
| | | |
| 388,900 | | Kingfisher PLC | | $ | 2,169,274 |
| | | | |
|
|
| Total Foreign Common Stocks (cost $14,806,517) | | | 16,070,234 |
| | | | |
|
|
| Total Common Stocks (cost $64,969,072) | | | 68,403,005 |
| | | | |
|
|
| | |
Principal
Amount
| | | | |
Convertible Bonds—0.7% (a)
| | | |
Telecommunications—0.7%
| | | |
| $1,000,000 | | Level 3 Communications, Inc.,
6.0%, 03/15/10 | | | 505,000 |
| | | | |
|
|
| Total Convertible Bonds (cost $582,341) | | | 505,000 |
| | | | |
|
|
Corporate Bonds—2.8% (a)
| | | |
Pipelines—1.3%
| | | |
| 1,000,000 | | EL Paso Corporation,
7.375%, 12/15/12 | | | 965,000 |
| | | | |
|
|
Telecommunications—1.5%
| | | |
| 1,500,000 | | Level 3 Communications, Inc., 9.125%, 05/01/08 | | | 1,102,500 |
| | | | |
|
|
| Total Corporate Bonds (cost $1,963,133) | | | 2,067,500 |
| | | | |
|
|
Total Investment Portfolio excluding repurchase
agreement (cost $67,514,546) | | | 70,975,505 |
| | | | |
|
|
| | | | | |
| | | | | Value
|
Repurchase Agreement—3.6% (a)
| | | |
Repurchase Agreement with State Street Bank and
Trust Company, dated September 30, 2004 @
1.65% to be repurchased at $2,687,123 on October
1, 2004, collateralized by $1,870,000 United States
Treasury Bonds, 8.75% due August 15, 2020,
(market value $2,731,003 including interest)
(cost $2,687,000) | | $ | 2,687,000 |
| | | | |
|
|
Total Investment Portfolio
(cost $70,201,546) (b), 99.2% (a) | | | 73,662,505 |
| | | | |
|
|
| Other Assets and Liabilities, net, 0.8% (a) | | | 628,621 |
| | | | |
|
|
| Net Assets, 100.0% | | $ | 74,291,126 |
| | | | |
|
|
| * | Non-income producing security. |
| (a) | Percentages indicated are based on net assets. |
| (b) | The aggregate identified cost for federal income tax purposes is the same. Market value includes net unrealized appreciation of $3,460,959 which consists of aggregate gross unrealized appreciation for all securities in which there is an excess of market value over tax cost of $6,386,437 and aggregate gross unrealized depreciation for all securities in which there is an excess of tax cost over market value of $2,925,478. |
ADR—American Depository Receipt.
The accompanying notes are an integral part of the financial statements.
9
Heritage Growth and Income Trust
Statement of Assets And Liabilities
September 30, 2004
| | | | | | | |
| | |
Assets | | | | | | | |
Investments, at value (identified cost $67,514,546) | | | | | $ | 70,975,505 | |
Repurchase agreement (identified cost $2,687,000) | | | | | | 2,687,000 | |
Cash | | | | | | 472 | |
Receivables: | | | | | | | |
Investments sold | | | | | | 441,172 | |
Fund shares sold | | | | | | 203,384 | |
Dividends and interest | | | | | | 336,207 | |
Deferred state qualification expenses | | | | | | 11,256 | |
Prepaid insurance | | | | | | 3,573 | |
| | | | | |
|
|
|
Total assets | | | | | $ | 74,658,569 | |
| | | | | |
|
|
|
| | |
Liabilities | | | | | | | |
Payables: | | | | | | | |
Fund shares redeemed | | $ | 201,520 | | | | |
Accrued management fee | | | 27,180 | | | | |
Accrued distribution fee | | | 35,605 | | | | |
Accrued shareholder servicing fee | | | 27,769 | | | | |
Accrued fund accounting fee | | | 16,500 | | | | |
Other accrued expenses | | | 58,869 | | | | |
| | |
|
| | | | |
Total liabilities | | | | | | 367,443 | |
| | | | | |
|
|
|
Net assets, at market value | | | | | $ | 74,291,126 | |
| | | | | |
|
|
|
| | |
Net Assets | | | | | | | |
Net assets consist of: | | | | | | | |
Paid-in capital | | | | | $ | 74,092,045 | |
Undistributed net investment income | | | | | | 256,326 | |
Accumulated net realized loss | | | | | | (3,518,204 | ) |
Net unrealized appreciation on investments | | | | | | 3,460,959 | |
| | | | | |
|
|
|
Net assets, at market value | | | | | $ | 74,291,126 | |
| | | | | |
|
|
|
| | |
Class A shares | | | | | | | |
Net asset value and redemption price per share ($41,208,704 divided by 3,493,311 shares of beneficial interest outstanding, no par value) | | | | | $ | 11.80 | |
| | | | | |
|
|
|
Maximum offering price per share (100/95.25 of $11.80) | | | | | $ | 12.39 | |
| | | | | |
|
|
|
| | |
Class B shares | | | | | | | |
Net asset value, offering price and redemption price per share ($7,024,823 divided by 607,155 shares of beneficial interest outstanding, no par value) | | | | | $ | 11.57 | |
| | | | | |
|
|
|
| | |
Class C shares | | | | | | | |
Net asset value, offering price and redemption price per share ($26,057,599 divided by 2,251,535 shares of beneficial interest outstanding, no par value) | | | | | $ | 11.57 | |
| | | | | |
|
|
|
The accompanying notes are an integral part of the financial statements.
10
Heritage Growth and Income Trust
Statement of Operations
For the Fiscal Year Ended September 30, 2004
| | | | | | | |
| | |
Investment Income | | | | | | | |
Income: | | | | | | | |
Dividends | | | | | $ | 1,392,752 | |
Interest | | | | | | 549,402 | |
| | | | | |
|
|
|
Total income | | | | | | 1,942,154 | |
Expenses: | | | | | | | |
Management fee | | $ | 546,525 | | | | |
Distribution fee (Class A) | | | 103,274 | | | | |
Distribution fee (Class B) | | | 71,494 | | | | |
Distribution fee (Class C) | | | 244,110 | | | | |
Shareholder servicing fees | | | 105,658 | | | | |
Professional fees | | | 83,478 | | | | |
Fund accounting fee | | | 59,989 | | | | |
State qualification expenses | | | 43,179 | | | | |
Reports to shareholders | | | 26,279 | | | | |
Custodian fee | | | 22,979 | | | | |
Trustees’ fees and expenses | | | 16,698 | | | | |
Insurance | | | 5,003 | | | | |
Other | | | 3,239 | | | | |
| | |
|
| | | | |
Total expenses | | | | | | 1,331,905 | |
Fees waived by Manager | | | | | | (111,456 | ) |
| | | | | |
|
|
|
Total expenses after waiver | | | | | | 1,220,449 | |
| | | | | |
|
|
|
Net investment income | | | | | | 721,705 | |
| | | | | |
|
|
|
| | |
Realized and Unrealized Gain on Investments | | | | | | | |
Net realized gain from investment transactions | | | | | | 3,397,390 | |
Net unrealized appreciation of investments during the fiscal year | | | | | | 37,373 | |
| | | | | |
|
|
|
Net gain on investments | | | | | | 3,434,763 | |
| | | | | |
|
|
|
Net increase in net assets resulting from operations | | | | | $ | 4,156,468 | |
| | | | | |
|
|
|
Statements of Changes in Net Assets
| | | | | | | | |
| | | For the Fiscal Years Ended
| |
| | | September 30, 2004
| | | September 30, 2003
| |
Increase in net assets: | | | | | | | | |
Operations: | | | | | | | | |
Net investment income | | $ | 721,705 | | | $ | 472,419 | |
Net realized gain (loss) from investment transactions | | | 3,397,390 | | | | (1,970,650 | ) |
Net unrealized appreciation of investments during the fiscal year | | | 37,373 | | | | 12,239,253 | |
| | |
|
|
| |
|
|
|
Net increase in net assets resulting from operations | | | 4,156,468 | | | | 10,741,022 | |
Distributions to shareholders from: | | | | | | | | |
Net investment income Class A shares, ($0.14 and $0.11 per share, respectively) | | | (481,050 | ) | | | (365,425 | ) |
Net investment income Class B shares, ($0.04 and $0.05 per share, respectively) | | | (26,120 | ) | | | (22,491 | ) |
Net investment income Class C shares, ($0.04 and $0.05 per share, respectively) | | | (88,744 | ) | | | (70,377 | ) |
| | |
|
|
| |
|
|
|
Net Distributions to shareholders | | | (595,914 | ) | | | (458,293 | ) |
Increase in net assets from Fund share transactions | | | 9,431,841 | | | | 4,167,045 | |
| | |
|
|
| |
|
|
|
Increase in net assets | | | 12,992,395 | | | | 14,449,774 | |
Net assets, beginning of fiscal year | | | 61,298,731 | | | | 46,848,957 | |
| | |
|
|
| |
|
|
|
Net assets, end of fiscal year (including undistributed net investment income of
$256,326 and $124,686, respectively) | | $ | 74,291,126 | | | $ | 61,298,731 | |
| | |
|
|
| |
|
|
|
The accompanying notes are an integral part of the financial statements.
11
Heritage Growth and Income Trust
Financial Highlights
The following table includes selected data for a share outstanding throughout each period and other performance information derived from the financial statements.
| | | | | | | | | | | | | | | | | | | | | | | | | | | | | | | | | | | | | | | | | | | | | | | | | | | | | | | | | | | | |
| | | Class A Shares*
| | | Class B Shares*
| | | Class C Shares*
| |
| | | For the Fiscal Years Ended
September 30
| | | For the Fiscal Years Ended
September 30
| | | For the Fiscal Years Ended
September 30
| |
| | | 2004
| | | 2003
| | | 2002
| | | 2001
| | | 2000
| | | 2004
| | | 2003
| | | 2002
| | | 2001
| | | 2000
| | | 2004
| | | 2003
| | | 2002
| | | 2001
| | | 2000
| |
Net asset value, beginning of fiscal year | | $ | 11.10 | | | $ | 9.07 | | | $ | 11.33 | | | $ | 15.40 | | | $ | 14.95 | | | $ | 10.88 | | | $ | 8.90 | | | $ | 11.15 | | | $ | 15.21 | | | $ | 14.76 | | | $ | 10.88 | | | $ | 8.90 | | | $ | 11.14 | | | $ | 15.21 | | | $ | 14.76 | |
| | |
|
|
| |
|
|
| |
|
|
| |
|
|
| |
|
|
| |
|
|
| |
|
|
| |
|
|
| |
|
|
| |
|
|
| |
|
|
| |
|
|
| |
|
|
| |
|
|
| |
|
|
|
Income from Investment Operations: | | | | | | | | | | | | | | | | | | | | | | | | | | | | | | | | | | | | | | | | | | | | | | | | | | | | | | | | | | | | |
Net investment income | | | 0.16 | | | | 0.12 | | | | 0.11 | | | | 0.15 | | | | 0.19 | | | | 0.07 | | | | 0.04 | | | | 0.02 | | | | 0.04 | | | | 0.08 | | | | 0.07 | | | | 0.04 | | | | 0.02 | | | | 0.04 | | | | 0.08 | |
Net realized and unrealized gain (loss) on investments | | | 0.68 | | | | 2.02 | | | | (2.28 | ) | | | (1.59 | ) | | | 0.51 | | | | 0.66 | | | | 1.99 | | | | (2.23 | ) | | | (1.55 | ) | | | 0.50 | | | | 0.66 | | | | 1.99 | | | | (2.22 | ) | | | (1.56 | ) | | | 0.50 | |
| | |
|
|
| |
|
|
| |
|
|
| |
|
|
| |
|
|
| |
|
|
| |
|
|
| |
|
|
| |
|
|
| |
|
|
| |
|
|
| |
|
|
| |
|
|
| |
|
|
| |
|
|
|
Total from Investment Operations | | | 0.84 | | | | 2.14 | | | | (2.17 | ) | | | (1.44 | ) | | | 0.70 | | | | 0.73 | | | | 2.03 | | | | (2.21 | ) | | | (1.51 | ) | | | 0.58 | | | | 0.73 | | | | 2.03 | | | | (2.20 | ) | | | (1.52 | ) | | | 0.58 | |
| | |
|
|
| |
|
|
| |
|
|
| |
|
|
| |
|
|
| |
|
|
| |
|
|
| |
|
|
| |
|
|
| |
|
|
| |
|
|
| |
|
|
| |
|
|
| |
|
|
| |
|
|
|
Less Distributions: | | | | | | | | | | | | | | | | | | | | | | | | | | | | | | | | | | | | | | | | | | | | | | | | | | | | | | | | | | | | |
Dividends from net investment income | | | (0.14 | ) | | | (0.11 | ) | | | (0.09 | ) | | | (0.11 | ) | | | (0.25 | ) | | | (0.04 | ) | | | (0.05 | ) | | | (0.04 | ) | | | (0.03 | ) | | | (0.13 | ) | | | (0.04 | ) | | | (0.05 | ) | | | (0.04 | ) | | | (0.03 | ) | | | (0.13 | ) |
Distributions from net realized gains | | | — | | | | — | | | | — | | | | (2.52 | ) | | | — | | | | — | | | | — | | | | — | | | | (2.52 | ) | | | — | | | | — | | | | — | | | | — | | | | (2.52 | ) | | | — | |
| | |
|
|
| |
|
|
| |
|
|
| |
|
|
| |
|
|
| |
|
|
| |
|
|
| |
|
|
| |
|
|
| |
|
|
| |
|
|
| |
|
|
| |
|
|
| |
|
|
| |
|
|
|
Total Distributions | | | (0.14 | ) | | | (0.11 | ) | | | (0.09 | ) | | | (2.63 | ) | | | (0.25 | ) | | | (0.04 | ) | | | (0.05 | ) | | | (0.04 | ) | | | (2.55 | ) | | | (0.13 | ) | | | (0.04 | ) | | | (0.05 | ) | | | (0.04 | ) | | | (2.55 | ) | | | (0.13 | ) |
| | |
|
|
| |
|
|
| |
|
|
| |
|
|
| |
|
|
| |
|
|
| |
|
|
| |
|
|
| |
|
|
| |
|
|
| |
|
|
| |
|
|
| |
|
|
| |
|
|
| |
|
|
|
Net asset value, end of fiscal year | | $ | 11.80 | | | $ | 11.10 | | | $ | 9.07 | | | $ | 11.33 | | | $ | 15.40 | | | $ | 11.57 | | | $ | 10.88 | | | $ | 8.90 | | | $ | 11.15 | | | $ | 15.21 | | | $ | 11.57 | | | $ | 10.88 | | | $ | 8.90 | | | $ | 11.14 | | | $ | 15.21 | |
| | |
|
|
| |
|
|
| |
|
|
| |
|
|
| |
|
|
| |
|
|
| |
|
|
| |
|
|
| |
|
|
| |
|
|
| |
|
|
| |
|
|
| |
|
|
| |
|
|
| |
|
|
|
Total Return (%) (a) | | | 7.57 | | | | 23.82 | | | | (19.29 | ) | | | (10.47 | ) | | | 4.74 | | | | 6.73 | | | | 22.82 | | | | (19.91 | ) | | | (11.04 | ) | | | 3.95 | | | | 6.73 | | | | 22.82 | | | | (19.83 | ) | | | (11.12 | ) | | | 3.95 | |
Ratios and Supplemental Data | | | | | | | | | | | | | | | | | | | | | | | | | | | | | | | | | | | | | | | | | | | | | | | | | | | | | | | | | | | | |
Expenses to average daily net assets | | | | | | | | | | | | | | | | | | | | | | | | | | | | | | | | | | | | | | | | | | | | | | | | | | | | | | | | | | | | |
With expenses waived/recovered (%) | | | 1.35 | | | | 1.35 | | | | 1.35 | | | | 1.35 | | | | 1.33 | | | | 2.10 | | | | 2.10 | | | | 2.10 | | | | 2.10 | | | | 2.08 | | | | 2.10 | | | | 2.10 | | | | 2.10 | | | | 2.10 | | | | 2.08 | |
Without expenses waived/recovered (%) | | | 1.50 | | | | 1.61 | | | | 1.59 | | | | 1.48 | | | | 1.33 | | | | 2.25 | | | | 2.36 | | | | 2.34 | | | | 2.23 | | | | 2.08 | | | | 2.25 | | | | 2.36 | | | | 2.34 | | | | 2.23 | | | | 2.08 | |
Net investment income to average daily net
assets (%) | | | 1.31 | | | | 1.20 | | | | 0.98 | | | | 1.08 | | | | 1.27 | | | | 0.56 | | | | 0.44 | | | | 0.22 | | | | 0.30 | | | | 0.55 | | | | 0.57 | | | | 0.45 | | | | 0.21 | | | | 0.32 | | | | 0.55 | |
Portfolio turnover rate (%) | | | 80 | | | | 82 | | | | 72 | | | | 178 | | | | 58 | | | | 80 | | | | 82 | | | | 72 | | | | 178 | | | | 58 | | | | 80 | | | | 82 | | | | 72 | | | | 178 | | | | 58 | |
Net assets, end of fiscal year ($ millions) | | | 41 | | | | 36 | | | | 29 | | | | 33 | | | | 46 | | | | 7 | | | | 6 | | | | 4 | | | | 4 | | | | 4 | | | | 26 | | | | 19 | | | | 14 | | | | 13 | | | | 16 | |
| * | Per share amounts have been calculated using the monthly average share method. |
| (a) | These returns are calculated without the imposition of either front-end or contingent deferred sales charges. |
The accompanying notes are an integral part of the financial statements.
12
Heritage Growth and Income Trust
Notes to Financial Statements
| Note 1: | Significant Accounting Policies. Heritage Growth and Income Trust (the “Fund”) is organized as a Massachusetts business trust and is registered under the Investment Company Act of 1940, as amended, as a diversified, open-end management investment company. The Fund’s investment objective is to primarily seek long-term capital appreciation and, secondarily, to seek current income. The Fund currently offers Class A and Class C shares to the public. Effective February 1, 2004, Class B shares were not available for direct purchase. Class B shares will continue to be available through exchanges and dividend reinvestments as described in the Fund’s prospectus. Class A shares are sold subject to a maximum sales charge of 4.75% of the amount invested payable at the time of purchase. For Class A share investments greater than $1 million, where a sales charge is waived, those shares may be subject to a maximum contingent deferred sales charge of 1% upon redemptions made in less than 18 months of purchase. Class B shares were sold and are still subject to a 5% maximum contingent deferred sales charge (based on the lower of purchase price or redemption price), declining over a six-year period. Class C shares are sold subject to a contingent deferred sales charge of 1% of the lower of net asset value or purchase price payable upon any redemption made in less than one year of purchase. The preparation of financial statements in accordance with accounting principles generally accepted in the United States of America requires management to make estimates and assumptions that affect the reported amounts and disclosures. Actual results could differ from those estimates and those differences could be material. The following is a summary of significant accounting policies: |
Security Valuation: The Fund values investment securities at market value based on the last quoted sales price as reported by the principal securities exchange on which the security is traded. If the security is traded on the Nasdaq Stock Market, the official NASDAQ closing price is used. If no sale is reported, market value is based on the most recent quoted bid price. In the absence of a market quote, when prices are not reflective of market value, or when a significant event has been recognized with respect to a security, securities are valued using such methods as the Board of Trustees believes would reflect fair market value. Investments in certain debt instruments not traded in an organized market are valued on the basis of valuations furnished by independent pricing services or broker/dealers that utilize information with respect to market transactions in such securities or comparable securities, quotations from dealers, yields, maturities, ratings and various relationships between securities. Securities that are quoted in a foreign currency will be valued daily in U.S. dollars at the foreign currency exchange rates prevailing at the time the Fund calculates its daily net asset value per share. Short-term investments having a maturity of 60 days or less are valued at amortized cost, which approximates market value.
Foreign Currency Transactions: The books and records of the Fund are maintained in U.S. dollars. Foreign currency transactions are translated into U.S. dollars on the following basis: (i) market value of investment securities, other assets and other liabilities at the daily rates of exchange, and (ii) purchases and sales of investment securities, dividend and interest income and certain expenses at the rates of exchange prevailing on the respective dates of such transactions. The Fund does not isolate that portion of gains and losses on investments which is due to changes in foreign exchange rates from that which is due to changes in market prices of the investments. Such fluctuations are included with the net realized and unrealized gains and losses from investments. Net realized gain (loss) and unrealized appreciation (depreciation) from foreign currency transactions include gains and losses between trade and settlement date on securities transactions, gains and losses arising from the purchase and sale of foreign currency and gains and losses between the ex and payment dates on dividends, interest, and foreign withholding taxes.
Repurchase Agreements: The Fund enters into repurchase agreements whereby the Fund, through its custodian, receives delivery of the underlying securities, the market value of which at the time of purchase is required to be an amount equal to at least 100% of the resale price. Repurchase agreements involve the risk that the seller will fail to repurchase the security, as agreed. In that case, the Fund will
13
Heritage Growth and Income Trust
Notes to Financial Statements
(continued)
bear the risk of market value fluctuations until the security can be sold and may encounter delays and incur costs in liquidating the security. In the event of bankruptcy or insolvency of the seller, delays and costs may be incurred.
Federal Income Taxes: The Fund is treated as a single corporate taxpayer as provided for in the Tax Reform Act of 1986, as amended. The Fund’s policy is to comply with the requirements of the Internal Revenue Code of 1986, as amended, which are applicable to regulated investment companies and to distribute substantially all of its taxable income to its shareholders. Accordingly, no provision has been made for federal income and excise taxes.
Distribution of Income and Gains: Distributions of net investment income are made quarterly. Net realized gains from investment transactions during any particular year in excess of available capital loss carryforwards, which, if not distributed, would be taxable to the Fund, will be distributed to shareholders in the following fiscal year. The Fund uses the identified cost method for determining realized gain or loss on investments for both financial and federal income tax reporting purposes.
Expenses: The Fund is charged for those expenses that are directly attributable to it, while other expenses are allocated proportionately among the Heritage mutual funds based upon methods approved by the Board of Trustees. Expenses that are directly attributable to a specific class of shares, such as distribution fees, are charged directly to that class. Other expenses of the Fund are allocated to each class of shares based upon their relative percentage of net assets.
Other: Investment security transactions are accounted for on a trade date basis. Dividend income and distributions to shareholders are recorded on the ex-dividend date. Interest income is recorded on the accrual basis.
In the normal course of business the Fund enters into contracts that contain a variety of representations and warranties, which provide general indemnifications. The Fund’s maximum exposure under these arrangements is unknown, as this would involve future claims that may be made against the Fund and/or its affiliates that have not yet occurred. However, based on experience, the Fund expects the risk of loss to be remote.
| Note 2: | Fund Shares. At September 30, 2004, there were an unlimited number of shares of beneficial interest of no par value authorized. |
Transactions in Class A, B and C shares of the Fund during the fiscal year ended September 30, 2004, were as follows:
| | | | | | | | | | | | | | | | | | | | | |
| | | Class A Shares
| | | Class B Shares
| | | Class C Shares
| |
| | | Shares
| | | Amount
| | | Shares
| | | Amount
| | | Shares
| | | Amount
| |
Shares sold | | 882,511 | | | $ | 10,550,190 | | | 143,884 | | | $ | 1,675,311 | | | 817,719 | | | $ | 9,614,700 | |
Shares issued on reinvestment of distributions | | 36,873 | | | | 436,464 | | | 1,966 | | | | 23,097 | | | 7,109 | | | | 83,543 | |
Shares redeemed | | (690,112 | ) | | | (8,137,136 | ) | | (89,656 | ) | | | (1,036,047 | ) | | (326,006 | ) | | | (3,778,281 | ) |
| | |
|
| |
|
|
| |
|
| |
|
|
| |
|
| |
|
|
|
Net increase | | 229,272 | | | $ | 2,849,518 | | | 56,194 | | | $ | 662,361 | | | 498,822 | | | $ | 5,919,962 | |
| | | | | |
|
|
| | | | |
|
|
| | | | |
|
|
|
Shares outstanding: | | | | | | | | | | | | | | | | | | | | | |
Beginning of fiscal year | | 3,264,039 | | | | | | | 550,961 | | | | | | | 1,752,713 | | | | | |
| | |
|
| | | | | |
|
| | | | | |
|
| | | | |
End of fiscal year | | 3,493,311 | | | | | | | 607,155 | | | | | | | 2,251,535 | | | | | |
| | |
|
| | | | | |
|
| | | | | |
|
| | | | |
14
Heritage Growth and Income Trust
Notes to Financial Statements
(continued)
Transactions in Class A, B and C shares of the Fund during the fiscal year ended September 30, 2003, were as follows:
| | | | | | | | | | | | | | | | | | | | | |
| | | Class A Shares
| | | Class B Shares
| | | Class C Shares
| |
| | | Shares
| | | Amount
| | | Shares
| | | Amount
| | | Shares
| | | Amount
| |
Shares sold | | 736,559 | | | $ | 7,597,585 | | | 193,173 | | | $ | 1,931,884 | | | 818,016 | | | $ | 8,110,112 | |
Shares issued on reinvestment of distributions | | 33,933 | | | | 333,952 | | | 2,065 | | | | 20,038 | | | 6,763 | | | | 65,558 | |
Shares redeemed | | (654,351 | ) | | | (6,584,120 | ) | | (124,321 | ) | | | (1,183,555 | ) | | (646,830 | ) | | | (6,124,409 | ) |
| | |
|
| |
|
|
| |
|
| |
|
|
| |
|
| |
|
|
|
Net increase | | 116,141 | | | $ | 1,347,417 | | | 70,917 | | | $ | 768,367 | | | 177,949 | | | $ | 2,051,261 | |
| | | | | |
|
|
| | | | |
|
|
| | | | |
|
|
|
Shares outstanding: | | | | | | | | | | | | | | | | | | | | | |
Beginning of fiscal year | | 3,147,898 | | | | | | | 480,044 | | | | | | | 1,574,764 | | | | | |
| | |
|
| | | | | |
|
| | | | | |
|
| | | | |
End of fiscal year | | 3,264,039 | | | | | | | 550,961 | | | | | | | 1,752,713 | | | | | |
| | |
|
| | | | | |
|
| | | | | |
|
| | | | |
| Note 3: | Purchases and Sales of Securities. For the fiscal year ended September 30, 2004, purchases and sales of investment securities (excluding repurchase agreements and short-term obligations) aggregated $64,336,857 and $56,843,612, respectively. |
| Note 4: | Management, Subadvisory, Distribution, Shareholder Servicing Agent, Fund Accounting and Trustees Fees. Under the Fund’s Investment Advisory and Administration Agreement with Heritage Asset Management, Inc. (the “Manager” or “Heritage”), the Fund agrees to pay to the Manager a fee equal to an annualized rate of 0.75% of the first $100 million of the Fund’s average daily net assets, and 0.60% of any excess over $100 million of such net assets, computed daily and payable monthly. The Manager has contractually agreed to waive its fees and, if necessary, reimburse the Fund to the extent that Class A annual operating expenses exceed 1.35% of the Class A shares average daily net assets and to the extent that the Class B and Class C annual operating expenses each exceed 2.10% of those classes’ average daily net assets for the fiscal year ended September 30, 2004. Under these agreements, management fees of $111,456 were waived for the fiscal year ended September 30, 2004. If total Fund expenses fall below the expense limitation agreed to by the Manager before the end of the fiscal year ending September 30, 2006, the Fund may be required to pay the Manager a portion or all of the management fees waived. In addition, the Fund may be required to pay the Manager a portion or all of the management fees waived of $134,510 in fiscal 2003 if total Fund expenses fall below the annual expense limitations before the end of the fiscal year ending September 30, 2005. No management fees were recovered for the fiscal year ended September 30, 2004. |
The Manager has entered into a subadvisory agreement with Thornburg Investment Management, Inc. (“Thornburg”) to provide to the Fund investment advice, portfolio management services (including the placement of brokerage orders) and certain compliance and other services for a fee payable by the Manager. Eagle Asset Management, Inc. (“Eagle”), a wholly owned subsidiary of Raymond James Financial, Inc. (“RJF”), serves as an additional subadviser to the Fund. However, the Manager currently has not allocated any assets of the Fund to Eagle.
Pursuant to the Class A Distribution Plan adopted in accordance with Rule 12b-1 of the Investment Company Act of 1940, as amended, the Fund is authorized to pay the Distributor a fee equal to 0.50% of
15
Heritage Growth and Income Trust
Notes to Financial Statements
(continued)
the average daily net assets. However, at the present time the Board of Trustees has authorized payments of only 0.25% of average daily net assets. The Class B and Class C Distribution Plans provide for payments at an annual rate of up to 1.00% of the average daily net assets. Such fees are accrued daily and payable monthly. Class B shares will convert to Class A shares eight years after the end of the calendar month in which the shareholder’s order to purchase was accepted. The Manager, Distributor, Fund Accountant and Shareholder Servicing Agent are all wholly owned subsidiaries of RJF.
Raymond James & Associates, Inc. (the “Distributor” or “RJA”) has advised the Fund that it generated $93,481 in front-end sales charges for Class A shares, $13,092 in contingent deferred sales charges for Class B shares and $3,754 in contingent deferred sales charges for Class C shares for the fiscal year ended September 30, 2004. From these fees, the Distributor paid commissions to salespersons and incurred other distribution costs. Agency brokerage commissions for security transactions during the same period aggregated $141,630 of which $1,685 was paid to the Distributor.
The Manager also is the Shareholder Servicing Agent and Fund Accountant for the Fund. For providing Shareholder Servicing and Fund Accounting Services the Manager is reimbursed for expenses incurred plus an additional amount up to 10%.
Trustees of the Fund also serve as Trustees for Heritage Cash Trust, Heritage Capital Appreciation Trust, Heritage Income Trust, and Heritage Series Trust, investment companies that are also advised by the Manager (collectively referred to as the “Heritage Mutual Funds”). Each Trustee of the Heritage Mutual Funds who is not an employee of the Manager or employee of an affiliate of the Manager received an annual fee of $18,000 and an additional fee of $3,000 for each combined quarterly meeting of the Heritage Mutual Funds attended. In addition, each independent Trustee that serves on the Audit Committee or Compliance Committee will receive $500 for attendance at their respective meeting (in person or telephonic). The Lead Independent Trustee, the Audit Committee Chair, and the Compliance Committee Chair each will receive an annual retainer of $2,500 in addition to meeting fees. Trustees’ fees and expenses are paid equally by each portfolio in the Heritage Mutual Funds.
| Note 5: | Federal Income Taxes. The timing and character of certain income and capital gain distributions are determined in accordance with income tax regulations, which may differ from accounting principles generally accepted in the United States of America. As a result, net investment income (loss) and net realized gain (loss) from investment transactions for a reporting period may differ from distributions during such period. These book/tax differences may be temporary or permanent in nature. To the extent these differences are permanent; they are charged or credited to paid in capital or accumulated net realized loss, as appropriate, in the period that the differences arise. These reclassifications have no effect on net assets or net asset value per share. For the fiscal year ended September 30, 2004, to reflect reclassifications arising from permanent book/tax differences attributable to reclassifications of foreign currency gains and losses and distributions from R.E.I.T.s, the Fund increased (credited) undistributed net investment income and decreased (debited) accumulated net realized loss of $5,849. As of September 30, 2004, the Fund had net tax basis capital loss carryforwards in the aggregate of $3,518,204. The capital loss carryforwards may be applied to any net taxable gain until their expiration date of September 30, 2011. |
For income tax purposes, distributions paid during the fiscal years ended September 30, 2004 and 2003 were as follows:
| | | | | | |
| Distributions paid from: | | 2004
| | 2003
|
Ordinary Income | | $ | 595,914 | | $ | 458,293 |
Long-Term Capital Gains | | $ | 0 | | $ | 0 |
16
Heritage Growth and Income Trust
Notes to Financial Statements
(continued)
As of September 30, 2004, the components of distributable earnings on a tax basis were as follows:
| | | |
Undistributed Ordinary Income | | $ | 256,326 |
Capital Loss Carryforwards | | $ | (3,518,204) |
Post October Losses | | $ | 0 |
Tax Basis Net Unrealized Appreciation | | $ | 3,460,959 |
2004 Federal Income Tax Notice
(unaudited)
For the fiscal year ended September 30, 2004, certain dividends paid by the Heritage Growth and Income Trust may be subject to a maximum tax rate of 15%, as provided for by the Jobs and Growth Tax Relief Reconciliation Act of 2004. The Fund designates a maximum amount of $595,914 as qualified dividend income, which is 100% of what was distributed. The information and distributions reported herein may differ from the information and distributions taxable to the shareholders for the calendar year ending December 31, 2004. Complete information will be computed and reported in conjunction with your 2004 Form 1099-DIV.
17
Report of Independent Registered Certified Public Accounting Firm
To the Board of Trustees and
Shareholders of Heritage Growth and Income Trust
In our opinion, the accompanying statement of assets and liabilities, including the investment portfolio, and the related statements of operations and of changes in net assets and the financial highlights present fairly, in all material respects, the financial position of Heritage Growth and Income Trust (the “Fund”) at September 30, 2004, the results of its operations for the year then ended, the changes in its net assets for each of the two years in the period then ended and the financial highlights for each of the five years in the period then ended, in conformity with accounting principles generally accepted in the United States of America. These financial statements and financial highlights (hereafter referred to as “financial statements”) are the responsibility of the Fund’s management; our responsibility is to express an opinion on these financial statements based on our audits. We conducted our audits of these financial statements in accordance with the standards of the Public Company Accounting Oversight Board (United States). Those standards require that we plan and perform the audit to obtain reasonable assurance about whether the financial statements are free of material misstatement. An audit includes examining, on a test basis, evidence supporting the amounts and disclosures in the financial statements, assessing the accounting principles used and significant estimates made by management, and evaluating the overall financial statement presentation. We believe that our audits, which included confirmation of securities at September 30, 2004 by correspondence with the custodian and brokers, provide a reasonable basis for our opinion.

PricewaterhouseCoopers LLP
Tampa, Florida
November 8, 2004
18
Heritage Growth and Income Trust
Trustees and Officers
| | | | | | | | | | |
Name, Address and Age | | Position(s) Held with Fund | | Term of Office* and Length of Time Served | | Principal Occupation(s) During Past 5 years | | Number of Portfolios in Heritage Mutual Funds Complex Overseen by Trustee | | Other Directorships Held by Trustee |
| | | | | |
Affiliated Trustees **
| | | | | | | | | | |
| | | | | |
Thomas A. James 880 Carillon Parkway St. Petersburg, FL 33716 (62) | | Trustee
and
Chairman | | Since
inception
in 1986 | | Chairman of the Board since 1986; Chief Executive Officer of RJF since 1969; Chairman of the Board of RJA since 1986; Chairman of the Board of Eagle since 1984. | | 12 | | Outback
Steakhouse,
Inc. |
| | | | | |
Richard K. Riess 880 Carillon Parkway St. Petersburg, FL 33716 (55) | | President
and
Trustee | | Since
2000
Since
inception
in 1986 | | Executive Vice President and Managing Director for Asset Management of RJF since 1998; CEO of Eagle since 1996; CEO of Heritage since 2000; President of Eagle, 1995 to 2000. | | 12 | | N/A |
| | | | | |
Independent Trustees
| | | | | | | | | | |
| | | | | |
C. Andrew Graham 880 Carillon Parkway St. Petersburg, FL 33716 (64) | | Trustee | | Since
inception
in 1986 | | First Financial Advisors, LLC & Graham Financial Partners LLC (financial planning insurance and investment services) since 1999; Representative of NFP Securities, Inc. (broker-dealer) since 2002; Representative of Multi-Financial Securities Corp. (broker-dealer), 1996 to 2001. | | 12 | | N/A |
| | | | | |
William J. Meurer 880 Carillon Parkway St. Petersburg, FL 33716 (61) | | Trustee | | Since
2003 | | Private Financial Consultant since September 2000; Board of Directors of Tribridge Consulting, Inc. (business consulting services) since 2000; Board of Trustees, Baycare HealthCare and St. Joseph’s-Baptist Health Care since 2000; Advisory Board, Bisk Publishing, Inc. (distance learning provider) since 2000; Managing Partner, Central Florida of Arthur Andersen LLP, 1987 to 2000; Managing Partner, Florida Audit and Business Advisory Services of Arthur Andersen, 1997 to 2000. | | 12 | | Sykes
Enterprises,
Incorporated
(inbound
call
systems). |
19
Heritage Growth and Income Trust
Trustees and Officers
| | | | | | | | | | |
Name, Address and Age | | Position(s) Held with Fund | | Term of Office* and Length of Time Served | | Principal Occupation(s) During Past 5 years | | Number of Portfolios in Heritage Mutual Funds Complex Overseen by Trustee | | Other Directorships Held by Trustee |
| | | | | |
Independent Trustees (continued)
| | | | | | | | | | |
| | | | | |
James L. Pappas 880 Carillon Parkway St. Petersburg, FL 33716 (61) | | Trustee | | Since
1989 | | Lykes Professor of Banking and Finance since 1986 at University of South Florida; President, Graduate School of Banking since 1995; Immediate Past Chairman of the Board, Tampa Museum
of Art. | | 12 | | N/A |
| | | | | |
David M. Phillips 880 Carillon Parkway St. Petersburg, FL 33716 (65) | | Trustee | | Since
inception
in 1986 | | Chief Executive Officer of Evare LLC (information services); Chairman Emeritus of CCC Information Services, Inc.; Executive in Residence, University of North
Carolina – Wilmington,
2000 to 2003. | | 12 | | N/A |
| | | | | |
Eric Stattin 880 Carillon Parkway St. Petersburg, FL 33716 (71) | | Trustee | | Since
1987 | | Private Investor since 1988. | | 12 | | N/A |
| | | | | |
Deborah L. Talbot 880 Carillon Parkway St. Petersburg, FL 33716 (54) | | Trustee | | Since
2002 | | Consultant/Advisor; Member, Academy of Senior Professionals, Eckerd College since 1998; Member, Dean’s Advisory Board of Fogelman School of Business, University of Memphis since 2002; Founder, Chairman of the Board, the Creative Tampa Bay. | | 12 | | N/A |
| | | | | |
Officers
| | | | | | | | | | |
| | | | | |
K.C. Clark 880 Carillon Parkway St. Petersburg, FL 33716 (45) | | Executive
Vice
President
and
Principal
Executive
Officer,
Chief
Compliance
Officer | | Since
2000 Since
2004 | | Executive Vice President and Chief Operating Officer of Heritage since 2000; Senior Vice President – Operations and Administration of Heritage, 1998 to 2000; Trustee, University of West Florida since 2001. | | N/A | | N/A |
| | | | | |
Andrea N. Mullins 880 Carillon Parkway St. Petersburg, FL 33716 (37) | | Treasurer
and
Secretary | | Since
2003 Since
2004 | | Treasurer and Vice
President – Finance of Heritage since 2003; Vice President – Fund Accounting of Heritage, 1996 to 2003. | | N/A | | N/A |
20
Heritage Growth and Income Trust
Trustees and Officers
| | | | | | | | | | |
Name, Address
and Age | | Position(s)
Held with Fund | | Term of Office*
and Length of
Time Served | | Principal Occupation(s)
During Past 5 years | | Number of
Portfolios in
Heritage
Mutual
Funds
Complex
Overseen
by Trustee | | Other
Directorships
Held by Trustee |
| | | | | |
Officers (continued)
| | | | | | | | | | |
| | | | | |
Deborah A. Malina 880 Carillon Parkway
St. Petersburg, FL 33716
(38) | | Assistant
Secretary | | Since 2000 | | Compliance Administrator of Heritage since 2000; Assistant Supervisor of Operations, Heritage, from 1997 to 2000. | | N/A | | N/A |
The Trust’s Statement of Additional Information includes additional information about the Trustees and officers and is available, without charge, upon request, by calling (800) 421-4184.
| * | Trustees serve for the lifetime of the Trust or until they are removed, resign or retire. The Board has adopted a retirement policy that requires Trustees to retire at the age of 72 for those Trustees in office prior to August 2000, and at the age 70 for those Trustees who are elected to office after August 2000. Officers are elected annually for one year terms. |
| ** | Messrs. James and Riess are “interested” persons of the Trust as that term is defined by the Investment Company Act of 1940. Mr. James is affiliated with RJA and RJF. Mr. Riess is affiliated with Heritage and RJF. |
21
Item 2. Code of Ethics
As of the end of the period September 30, 2004, Heritage Growth and Income Trust has adopted a code of ethics, as defined in Item 2 of Form N-CSR, that applies to the Principal Executive Officer and Treasurer. Heritage Growth and Income Trust has not made any amendments to its code of ethics during the covered period. Heritage Growth and Income Trust has not granted any waivers from any provisions of the code of ethics during the covered period. A copy of this code of ethics is filed as an exhibit to this Form N-CSR.
Item 3. Audit Committee Financial Expert
The Board of Trustees of Heritage Growth and Income Trust has determined that William J. Meurer is an audit committee financial expert, as defined in Item 3 of Form N-CSR, serving on its audit committee. Mr. Meurer is independent for purposes of Item 3 of Form N-CSR.
Item 4. Principal Accountant Fees and Services
(a) Audit Fees
The aggregate fees billed by registrant’s independent public accountants, PricewaterhouseCoopers LLP (“PwC”) for each of the last two fiscal years for professional services rendered in connection with the audit of registrant’s annual financial statements or services that are normally provided by the accountant in connection with statutory and regulatory filings or engagements were $19,000 for the year ended September 30, 2003, and $23,000 for the year ended September 30, 2004.
(b) Audit-Related Fees
The aggregate fees PwC billed to registrant for each of the last two fiscal years for assurance and other services which are reasonably related to the performance of registrant’s audit and are not reported under Item 4(a) were $0 and $0 for the years ended September 30, 2003 and September 30, 2004, respectively. The aggregate fees PwC billed to registrant’s investment adviser and any entity controlling, controlled by, or under common control with registrant’s investment adviser for assurance and other services directly related to the operations and financial reporting of registrant were $30,000 for the year ended September 30, 2003, and $31,000 for the year ended September 30, 2004.
(c) Tax Fees
The aggregate tax fees PwC billed to registrant for each of the last two fiscal years for tax compliance, tax advice, and tax planning services were $3,000 for the year ended September 30, 2003, and $3,000 for the year ended September 30, 2004. The aggregate tax fees PwC billed to registrant’s investment adviser and any entity controlling, controlled by, or under common control with registrant’s investment adviser for services directly related to the operations and financial reporting of registrant were $0 for the year ended September 30, 2004, and $0 for the year ended September 30, 2004.
(d) All Other Fees
For the fiscal years ended September 30, 2004 and 2003, registrant paid PwC no other fees. The aggregate fees PwC billed to registrant’s investment adviser and any entity controlling, controlled by, or under common control with registrant’s investment adviser for any other services directly related to the operations and financial reporting of registrant were $0 for the year ended September 30, 2003, and $0 for the year ended September 30, 2004.
(e) Registrant’s Audit Committee Charter provides that the audit committee (comprised of the Independent Trustees of registrant) is responsible for pre-approval of all auditing services performed for the registrant. The Audit Committee reports to the Board of Trustees (“Board”) regarding its approval of the engagement of the auditor and the proposed fees for the engagement, and the majority of the Board (including the members of the Board who are Independent Trustees) must approve the auditor at an in-person meeting. The Audit Committee also is responsible for pre-approval (subject to the de minimus exception for non-audit services described in the Securities Exchange Act of 1934, as amended, and applicable rule thereunder and not expecting to exceed $5,000) of all non-auditing services performed for the registrant or for any service affiliate of registrant. Registrant’s Audit Committee Charter also permits a designated member of the audit committee to pre-approve, between meetings, one or more non-audit service projects, subject to ratification by the Audit Committee at the next meeting of the Audit Committee. Registrant’s Audit Committee pre-approved all fees described above which PwC billed to registrant.
(f) Less than 50% of the hours billed by PwC for auditing services to registrant for the fiscal year ended September 30, 2004, were for work performed by persons other than full-time, permanent employees of PwC.
(g) The aggregate non-audit fees billed by PwC to registrant and to registrant’s investment adviser and any entity controlling, controlled by, or under common control with registrant’s investment adviser for the fiscal years ending September 30, 2003, and September 30, 2004, were $0 and $0.
(h) Registrant’s Audit Committee has considered the non-audit services provided to the registrant and registrant’s investment adviser and any entity controlling, controlled by, or under common control with registrant’s investment adviser as described above and determined that these services do not compromise PwC’s independence.
Item 5. Audit Committee of Listed Registrants
Not applicable to the registrant.
Item 6. Schedule of Investments
Included as part of report to shareholders under Item 1.
Item 7. Disclosure of Proxy Voting Policies and Procedures for Closed-End Management Investment Companies.
Not applicable to the registrant.
Item 8. Purchase of Equity Securities by Closed-End Management Investment Company and Affiliated Purchasers
Not applicable to the registrant.
Item 9. Submission of Matters to a Vote of Security Holders.
The Trust has adopted a Nominating Committee Charter, which sets forth procedures by which shareholders may recommend nominees to the Trust’s Board of Trustees. Shareholders submitting recommendations for Independent Trustees should submit recommendations in writing to the attention of the Chairperson of the Nominating Committee of the Trust, and provide at least the following information regarding a candidate: (1) name; (2) date of birth; (3) education; (4) business, professional or other relevant experience and areas of expertise; (5) current business, professional or other relevant experience and areas of expertise; (6) current business and home addresses and contact information; (7) other board positions or prior experience; and (8) any knowledge and experience relating to investment companies and investment company governance .
Item 10. Controls and Procedures
| (a) | Based on an evaluation of the disclosure controls and procedures (as defined in Rule 30a-2(c) under the Act), the Principal Executive Officer and Treasurer of Heritage Growth and Income Trust have concluded that such disclosure controls and procedures are effective as of November 19, 2004. |
| (b) | There was no change in the internal controls over financial reporting (as defined in Rule 30a-3(d) under the Act) of Heritage Growth and Income Trust that occurred during the second half of its fiscal year that has materially affected or is reasonably likely to materially affect, its internal control over financial reporting. |
Item 11. Exhibits
(a)(1) Code of Ethics pursuant to Item 2 of Form N-CSR is filed and attached hereto as Exhibit 99.CODEETH.
(a)(2) The certification required by Rule 30a-2(a) of the Investment Company Act of 1940, as amended, and Section 302 of the Sarbanes-Oxley Act of 2002 is filed and attached hereto as Exhibit 99.CERT.
(a)(3) Not applicable to the registrant.
(b) The certification required by Rule 30a-2(b) of the Investment Company Act of 1940, as amended, and Section 906 of the Sarbanes-Oxley Act of 2002 is filed and attached hereto as Exhibit 99.906CERT.
SIGNATURES
Pursuant to the requirements of the Securities Exchange Act of 1934 and the Investment Company Act of 1940, the registrant has duly caused this report to be signed on its behalf by the undersigned, thereunto duly authorized.
| | |
| | | HERITAGE GROWTH AND INCOME TRUST |
Date: November 19, 2004 | | |
| |
| | | /s/ K.C. Clark
|
| | | K.C. Clark |
| | | Executive Vice President, |
| | | Principal Executive Officer |
Pursuant to the requirements of the Securities Exchange Act of 1934 and the Investment Company Act of 1940, this report has been signed below by the following persons on behalf of the registrant and in the capacities and on the dates indicated.
Date: November 19, 2004
|
/s/ K.C. Clark
|
K.C. Clark |
Executive Vice President, |
Principal Executive Officer |
Date: November 19, 2004
|
/s/ Andrea N. Mullins
|
Andrea N. Mullins |
Treasurer |