UNITED STATES
SECURITIES AND EXCHANGE COMMISSION
Washington, D.C. 20549
FORM N-CSR
CERTIFIED SHAREHOLDER REPORT OF REGISTERED
MANAGEMENT INVESTMENT COMPANIES
Investment Company Act File Number: 811-4767
HERITAGE GROWTH AND INCOME TRUST
(Exact name of Registrant as Specified in Charter)
| | |
| 880 Carillon Parkway St. Petersburg, | | FL 33716 |
| |
| (Address of Principal Executive Offices) | | (Zip Code) |
RICHARD K. RIESS, PRESIDENT
880 Carillon Parkway
St. Petersburg, FL 33716
(Name and Address of Agent for Service)
Copy to:
CLIFFORD J. ALEXANDER, ESQ.
Kirkpatrick & Lockhart Nicholson Graham LLP
1800 Massachusetts Avenue, NW
Washington, D.C. 20036
Registrant’s Telephone Number, including Area Code:(727) 573-3800
Date of fiscal year end: September 30
Date of reporting period: September 30, 2005
Item 1. Reports to Shareholders


October 15, 2005
Dear Valued Shareholder:
It is a pleasure to report to you on the Heritage Growth and Income Trust (the “Fund”) for the fiscal year ended September 30, 2005(a). During this period, the Fund’s Class A shares outperformed the Standard & Poor’s 500 Composite Stock Price Index(b) by 7.16%. Stimulated by resilient economic growth in the first half of 2005 (with Gross Domestic Product growing above 3% despite core inflation as measured by the Consumer Price Index), the market and the Fund finished the fiscal year with positive returns. Overall, the Fund ended up with a twelve-month total return(a) of 19.41% for Class A shares. Please note that performance numbers quoted above for Class A shares are shown without the imposition of a front-end or contingent deferred sales charge. If reflected, the imposition of a front-end or contingent deferred sale charge would reduce the performance. In addition, the performance data quoted represents past performance and the investment return and principal value of an investment will fluctuate so that an investor’s shares, when redeemed, may be worth more or less than the original cost. Please remember, past performance does not guarantee future results and current performance may be higher or lower than the performance data quoted. To obtain more current performance, please visit the Fund’s website at www.HeritageFunds.com.
Excellent earnings results reported throughout the fiscal year supported the strength in stock prices. Oil and gas stocks were market leaders. Higher energy prices constrained the outlook for other sectors however, with weak consumer related issues, especially in the retail sector. Hurricane Katrina’s devastation and higher gasoline prices impacted consumer confidence. Nonetheless, the economy continued to expand, even in the retail sector, and inflation worries kept monetary policy in a tightening mode.
Reflecting on performance over the fiscal year, energy holdings led performance as commodity prices remained elevated due to stronger than anticipated global demand as well as more recent supply disruptions from the hurricanes in the Gulf of Mexico. Unocal and Marathon Oil were two new stocks in the portfolio that moved significantly higher. During the fiscal year, Unocal agreed to be acquired by Chevron Corporation, which is a new addition to the portfolio and has become a replacement for the former as we sold Unocal following the rumored merger of the two companies. Marathon witnessed strong results throughout the period in its Midwest downstream refining/marketing division on the back of record light/heavy crude spreads. Other top performing stocks included Altria Group, WellPoint, and Dominion Resources, which the Fund added to the portfolio during the year. Altria benefited from a more benign litigation environment in the United States coupled with stronger than expected sales and cash flow overseas. WellPoint continued to gain economies-of-scale through acquisitions of Blue Cross-Blue Shield networks, providing incremental growth in operating margins and new opportunities for patent enrollment. Dominion Resources benefited from record natural gas prices during the summer months as a significant portion of its business is tied to natural gas exploration and production activities.
Detractors from performance included our basic materials holdings PPG Industries and Dow Chemical as well as Pfizer, Kingfisher, and AON Corporation. As a result, the Fund sold out of Kingfisher and AON Corporation during the year. Both PPG and Dow Chemical have suffered temporary setbacks resulting from the Gulf Coast hurricanes. Unique company strengths for each of these companies remain in place. While Pfizer’s earnings progress has been near expected, the stock remains under pressure. Concern with generic competition, revenue replacement of drugs coming off patent and the importance of one product, Lipitor, has kept the stock at a historically low valuation. Potential productivity from Pfizer’s considerable research and development spending is one of the reasons we held onto the stock. Kingfisher faced strong headwinds in both its core United Kingdom and French markets, as consumer spending has been lackluster and weather has been poor. AON Corporation underperformed earlier in the period due to scrutiny surrounding an industry-wide probe regarding pricing and payment practices.
(a) The views expressed here are not meant as investment advice. Although some of the described portfolio holdings were viewed favorably as of the date of this letter, there is no guarantee the Fund will continue to hold these securities in the future. Please consider the investment objectives, risks, charges and expenses of any fund carefully before investing. Contact Heritage at (800) 421-4184 or your financial advisor for a prospectus, which contains this and other important information about the Fund. Read the prospectus carefully before you invest.
(b) The S&P 500 is an unmanaged index of 500 widely held stocks that are considered representative of the U.S. stock market. Keep in mind that individuals cannot invest directly in any index, and index performance does not include transaction costs or other fees, which will affect actual investment performance.
1
With respect to current income over the period, we added several new companies to the portfolio that pay a higher-than-average dividend with very defensible business models, which led to an increase in the net yield of the Fund. For example, we believe Host Marriot Services represents an attractive opportunity as the lodging industry is recovering from a protracted downturn and stands to benefit from accelerating cash flow and likely dividend increases. We also added Canadian Oil Sands Trust for its ability to pay a substantially higher dividend in the near future as fixed costs are spread across higher output levels leaving significant free cash flow for a higher payout ratio. Synagro Technologies, Macquarie Infrastructure Company Trust and Reddy Ice Holdings are all recent purchases that have high payouts supported by stable businesses with little competitive threat.
We believe investing in markets outside the United States is currently a rational complement to the portfolio because these investments improve the Fund’s risk/reward profile and dividend yield. Exposure to international stocks at the end of the period was 19.3% of total net assets. French pharmaceutical firm Sanofi-Aventis was added to the portfolio in light of its robust phase II/III pipeline relative to global competitors and the potential for strong demand for its anti-obesity drug, Accomplia. Other international higher-yielding stocks with attractive total return potential include China Merchant Holdings, Barclays, and Lloyds TSB Group. The Morgan Stanley Capital International Europe, Australia, Far East Index(c) returned +26.32% in U.S. dollar terms over the fiscal year. Given the near-term rebound in the dollar against major foreign currencies, our hedging strategy provided some support to local market returns overseas, particularly in our pound sterling and euro-based investments.
From a risk control perspective, during the period we sold Petrobras from the portfolio as concerns mounted over the geopolitical circumstances surrounding the current government as well as the heightened level of local currency appreciation in the Brazilian Real. We also recognized the ongoing uncertainty associated with owning American International Group as well as Fannie Mae early on during the period and were able to exit the positions at very favorable prices relative to current trading levels.
Assuming energy prices remain close to current levels, the period ahead will be challenging as individuals and businesses adapt to a new energy cost reality. Even though the current data suggests little impact of higher gasoline prices on consumer spending habits, it seems only a matter of time before budgets have to accommodate higher energy costs. Home heating costs will soon become an additional drag on personal finances. Even with retail spending soft, the economy can still grow. We believe business spending on capital equipment, including technology, will likely offset some of the weakness in retail. Also, government and insurance company spending on the Katrina cleanup will have a positive economic impact. In some cases, companies will have to test pricing power to sustain earnings. This cost increase for their customers will keep monetary authorities challenged to contain inflation. Nonetheless, it is a time when stock selection can make all the difference. This has been and will continue to be our focus.
Please take into consideration that the Fund is still subject to market risks, and the price of the portfolio holdings may decline or fluctuate based on broad market decline or market volatility. In addition, as the Fund’s name implies, the Fund invests in growth companies that are expected to increase their earnings at a certain rate. When these expectations are not met, investors may punish such companies’ stock’s price excessively, even if earnings showed an absolute increase. The Fund also invests in income-producing securities that may be subject to interest rate risk. If interest rates rise, the market value of these securities may fall and thus reduce the Fund’s return. We strongly recommend that you review the Fund’s prospectus and become aware of the opportunities as well as the risks involved with your investment. Thank you for your continued confidence and trust and we look forward to reporting to you in the future.
|
Sincerely, |
|

|
William V. Fries, CFA |
Managing Director |
Thornburg Investment Management, Inc. |
Portfolio Manager |
Heritage Growth and Income Trust |
(c) The Morgan Stanley Capital International Europe, Australia, Far East Index (EAFE Index) is an index, with dividends reinvested, representative of the securities markets of twenty developed market countries in Europe, Australasia and the Far East.
2
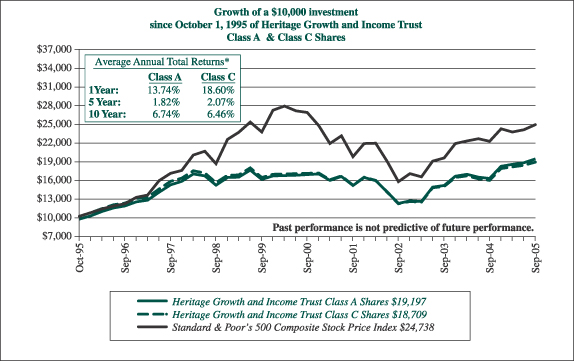
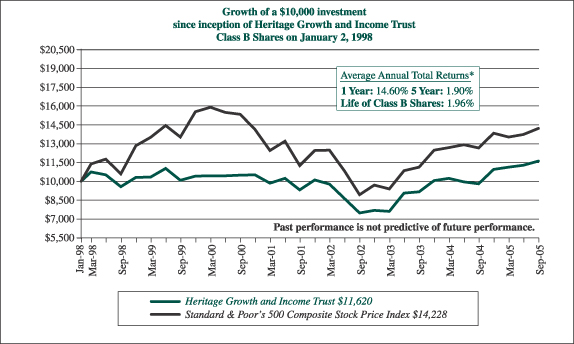
| * | Average annual returns for Heritage Growth and Income Trust Class A, B and C shares are calculated in conformance with Item 21 of Form N-1A, which assumes the maximum front-end sales charge of 4.75% for Class A shares, a contingent deferred sales charge for Class B shares (4% for the one year period, 1% for the five year period and 0% for the life of Class B shares) and reinvestment of dividends for Class A, B and C shares. Performance presented represents historical data. The investment return and principal value of an investment will fluctuate so that an investor’s shares, when redeemed, may be worth more or less than their original cost. The Fund’s past performance is not indicative of future performance and should be considered in light of the Fund’s investment policy and objectives, the characteristics and quality of its portfolio securities, and the periods selected. The graph and table do not reflect the deduction of taxes that a shareholder would pay on fund distributions or the redemption of fund shares. |
3
Heritage Growth and Income Trust
Investment Portfolio
September 30, 2005
| | | | | |
Shares
| | | | Value
|
| | | | | | |
Common Stocks—90.3% (a)
| | | |
Domestic—71.0%
| | | |
Agriculture—3.0%
| | | |
| 34,300 | | Altria Group, Inc. | | $ | 2,528,253 |
| | | | |
|
|
Airlines—2.4%
| | | |
| 131,946 | | Southwest Airlines Co. | | | 1,959,398 |
| | | | |
|
|
Banks—5.6%
| | | |
| 55,000 | | Bank of America Corporation | | | 2,315,500 |
| 78,500 | | The Bank of New York
Company, Inc. | | | 2,308,685 |
| | | | |
|
|
| | | | | | 4,624,185 |
| | | | |
|
|
Chemicals—5.2%
| | | |
| 33,700 | | PPG Industries, Inc. | | | 1,994,703 |
| 56,200 | | The Dow Chemical Company | | | 2,341,854 |
| | | | |
|
|
| | | | | | 4,336,557 |
| | | | |
|
|
Commercial Services—2.0%
| | | |
| 60,100 | | Macquarie Infrastructure Company Trust | | | 1,694,820 |
| | | | |
|
|
Cosmetics/Personal Care—1.7%
| | | |
| 26,200 | | Colgate-Palmolive Company | | | 1,383,098 |
| | | | |
|
|
Diversified Manufacturer—4.6%
| | | |
| 83,700 | | General Electric Company | | | 2,818,179 |
| 50,000 | | Reddy Ice Holdings, Inc. | | | 1,025,500 |
| | | | |
|
|
| | | | | | 3,843,679 |
| | | | |
|
|
Electric—3.7%
| | | |
| 36,200 | | Dominion Resources, Inc. | | | 3,118,268 |
| | | | |
|
|
Environmental Control—2.8%
| | | |
| 501,055 | | Synagro Technologies, Inc. | | | 2,354,958 |
| | | | |
|
|
Financial Services—7.8%
| | | |
| 50,100 | | Alliance Capital Management
Holding L.P. | | | 2,397,285 |
| 51,000 | | Citigroup Inc. | | | 2,321,520 |
| 52,300 | | JPMorgan Chase & Co. | | | 1,774,539 |
| | | | |
|
|
| | | | | | 6,493,344 |
| | | | |
|
|
Healthcare Services—4.3%
| | | |
| 69,900 | | Health Management Associates, Inc., Class “A” | | | 1,640,553 |
| 26,100 | | WellPoint, Inc.* | | | 1,978,902 |
| | | | |
|
|
| | | | | | 3,619,455 |
| | | | |
|
|
| | | | |
Shares
| | | | Value
|
| | | | | |
Common Stocks (continued)
| | |
Oil & Gas—9.0%
| | |
| 49,500 | | Chevron Corporation | | 3,204,135 |
| 31,400 | | Exxon Mobil Corporation | | 1,995,156 |
| 32,800 | | Marathon Oil Corporation | | 2,260,904 |
| | | | |
|
| | | | | 7,460,195 |
| | | | |
|
Pharmaceuticals—4.4%
| | |
| 37,200 | | Caremark Rx, Inc.* | | 1,857,396 |
| 72,900 | | Pfizer, Inc. | | 1,820,313 |
| | | | |
|
| | | | | 3,677,709 |
| | | | |
|
REITs—4.0%
| | |
| 195,400 | | Host Marriott Corporation | | 3,302,260 |
| | | | |
|
Retail—1.6%
| | |
| 26,300 | | Target Corporation | | 1,365,759 |
| | | | |
|
Software—1.8%
| | |
| 59,000 | | Microsoft Corporation | | 1,518,070 |
| | | | |
|
Telecommunications—4.7%
| | |
| 32,800 | | Alltel Corporation | | 2,135,608 |
| 80,400 | | Motorola, Inc. | | 1,776,036 |
| | | | |
|
| | | | | 3,911,644 |
| | | | |
|
Transportation—2.4%
| | |
| 27,500 | | Union Pacific Corporation | | 1,971,750 |
| | | | |
|
Total Domestic Common Stocks
(cost $53,902,602) | | 59,163,402 |
| | | | |
|
Foreign—19.3% (b)
| | |
Banks—3.5%
| | |
| 149,500 | | Barclays PLC | | 1,515,470 |
| 169,400 | | Lloyds TSB Group PLC | | 1,399,529 |
| | | | |
|
| | | | | 2,914,999 |
| | | | |
|
Diversified Manufacturer—2.0%
| | |
| 59,300 | | Tyco International Ltd. | | 1,651,505 |
| | | | |
|
Financial Services—4.3%
| | |
| 754,900 | | China Merchants Holdings (International) Company Ltd. | | 1,693,179 |
| 83,900 | | W.P. Stewart & Co., Ltd. | | 1,872,648 |
| | | | |
|
| | | | | 3,565,827 |
| | | | |
|
Food—2.8%
| | |
| 420,800 | | Tesco PLC | | 2,304,029 |
| | | | |
|
Oil & Gas—2.1%
| | |
| 15,700 | | Canadian Oil Sands Trust | | 1,737,606 |
| | | | |
|
The accompanying notes are an integral part of the financial statements.
4
Heritage Growth and Income Trust
Investment Portfolio
September 30, 2005
(continued)
| | | | | |
Shares
| | | | Value
|
| | | | | | |
Common Stocks (continued)
| | | |
Pharmaceuticals—4.6%
| | | |
| 43,300 | | GlaxoSmithKline PLC, Sponsored ADR | | $ | 2,220,425 |
| 20,000 | | Sanofi-Aventis | | | 1,657,765 |
| | | | |
|
|
| | | | | | 3,878,190 |
| | | | |
|
|
Total Foreign Common Stocks
(cost $14,183,028) | | | 16,052,156 |
| | | | |
|
|
| Total Common Stocks (cost $68,085,630) | | | 75,215,558 |
| | | | |
|
|
Preferred Stocks—1.8% (a)
| | | |
Financial Services—1.8%
| | | |
| 60,000 | | Merrill Lynch & Co., 4.51% | | | 1,455,000 |
| | | | |
|
|
| Total Preferred Stocks (cost $1,500,000) | | | 1,455,000 |
| | | | |
|
|
| | |
Principal
Amount
| | | | Value
|
Convertible Bonds—1.8% (a)
| | | |
Telecommunications—1.8%
| | | |
| $3,000,000 | | Level 3 Communications, Inc., 6.0%, 03/15/10 | | | 1,541,250 |
| | | | |
|
|
| Total Convertible Bonds (cost $1,867,943) | | | 1,541,250 |
| | | | |
|
|
Corporate Bonds—1.2% (a)
| | | |
Pipelines—1.2%
| | | |
| 1,000,000 | | El Paso Corporation, 7.375%, 12/15/12 | | | 1,005,000 |
| | | | |
|
|
| Total Corporate Bonds (cost $799,763) | | | 1,005,000 |
| | | | |
|
|
Total Investment Portfolio excluding repurchase
agreement (cost $72,253,336) | | | 79,216,808 |
| | | | |
|
|
| | | | | |
Principal
Amount
| | | | Value
|
| | | | | | |
Repurchase Agreement—4.2% (a)
| | | |
Repurchase Agreement with State Street Bank and
Trust Company, dated September 30, 2005 @
3.25% to be repurchased at $3,494,946 on
October 3, 2005, collateralized by $3,070,000
United States Treasury Bonds, 10.375% due
November 15, 2012, (market value $3,569,355
including interest) (cost $3,494,000) | | | 3,494,000 |
| | | | |
|
|
Total Investment Portfolio
(cost $75,747,336) (c), 99.3% (a) | | | 82,710,808 |
| Other Assets and Liabilities, net, 0.7% (a) | | | 624,337 |
| | | | |
|
|
| Net Assets, 100.0% | | $ | 83,335,145 |
| | | | |
|
|
| * | Non-income producing security. |
| (a) | Percentages indicated are based on net assets. |
| (b) | U.S. dollar denominated. |
| (c) | The aggregate identified cost for federal income tax purposes is $75,663,914. Market value includes net unrealized appreciation of $7,046,894 which consists of aggregate gross unrealized appreciation for all securities in which there is an excess of market value over tax cost of $9,160,886 and aggregate gross unrealized depreciation for all securities in which there is an excess of tax cost over market value of $2,113,992. |
ADR—American Depository Receipt.
Forward Foreign Currency Contracts Outstanding
| | | | | | | |
Contract to Deliver
| | In Exchange For
| | Delivery Date
| | Unrealized Appreciation (Depreciation)
|
| GBP 2,800,000 | | USD 4,995,620 | | 2/10/2006 | | | $48,440 |
| USD 3,131,094 | | GBP 1,700,000 | | 2/10/2006 | | | (29,410 |
| | | | | | |
|
|
| | | Net Unrealized Appreciation | | $ | 19,030 |
| | | | | | |
|
|
GBP—Great Britain Pound
USD—United States Dollar
The accompanying notes are an integral part of the financial statements.
5
Heritage Growth and Income Trust
Portfolio Allocation
(unaudited)
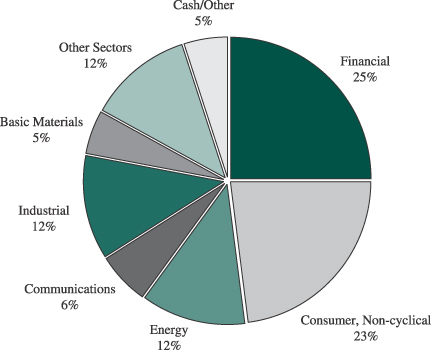
Sector Allocation as of September 30, 2005 (% of net assets)
Beginning with the Fund’s fiscal quarter ended December 31, 2004, the Fund began filing its complete schedule of portfolio holdings with the Securities Exchange Comission (“SEC”) for the first and third quarters of each fiscal year on Form N-Q; the Fund’s Forms N-Q are available on the SEC’s website at http://www.sec.gov; and the Fund’s Forms N-Q may be reviewed and copied at the SEC’s Public Reference Room in Washington, DC. Information on the operation of the Public Reference Room may be obtained by calling 1-800-SEC-0330.
The accompanying notes are an integral part of the financial statements.
6
Heritage Growth and Income Trust
Understanding Your Fund’s Expenses
(unaudited)
Understanding Your Fund’s Expenses
As a mutual fund investor, you pay two types of costs: (1) transaction costs, including sales charges (loads) on purchase payments, reinvested dividends, or other distributions; redemption fees; and exchange fees; and (2) ongoing costs, such as management fees; distribution [and/or service] (12b-1) fees; and other expenses. Using the tables below, you can estimate how these expenses affect your investment and compare them with the expenses of other funds. Please note that the expenses shown in the table are meant to highlight your ongoing costs only and do not reflect one-time transaction expenses, such as sales charges (loads) or redemption fees. Therefore, if these transactional costs were included, your costs would have been higher. For more information, see your Fund’s prospectus or talk to your financial advisor.
Review Your Fund’s Actual Expenses
The table below shows the actual expenses you would have paid on a $1,000 investment in Heritage Growth and Income Trust on April 1, 2005 and held through September 30, 2005. It also shows how much a $1,000 investment would be worth at the close of the period, assuming actual returns after ongoing expenses. This table is useful in comparing ongoing costs only, and will not help you determine the relative total costs of owning different funds. Simply divide your account value by $1,000 (for example, an $8,600 account value divided by $1,000 = 8.6), then multiply the result by the number in the line under the heading entitled “Expenses Paid During Period” to estimate the expenses you paid on your account during this period.
| | | | | | | | | |
Actual
| | Beginning
Account Value
April 1, 2005
| | Ending
Account Value
September 30, 2005
| | Expenses Paid
During Period*
|
| Class A | | $ | 1,000 | | $ | 1,048 | | $ | 6.93 |
| Class B | | $ | 1,000 | | $ | 1,044 | | $ | 10.76 |
| Class C | | $ | 1,000 | | $ | 1,044 | | $ | 10.76 |
Hypothetical Example for Comparison Purposes
All mutual funds now follow guidelines to assist shareholders in comparing expenses between different funds. Per these guidelines the table below shows your Fund’s actual expenses based on a $1,000 investment and assuming for the period a hypothetical 5% rate of return before ongoing expenses, which is not the Fund’s actual return. Please note that you should not use this information to estimate your actual ending account balance and expenses paid during the period. You can use this information to compare the ongoing expenses (but not transaction expenses or total costs) of investing in the Fund with those of other funds. All mutual fund shareholder reports will provide this information to help you make this comparison.
| | | | | | | | | |
Hypothetical (5% return before expenses)
| | Beginning
Account Value
April 1, 2005
| | Ending
Account Value
September 30, 2005
| | Expenses Paid
During Period*
|
| Class A | | $ | 1,000 | | $ | 1,018 | | $ | 6.83 |
| Class B | | $ | 1,000 | | $ | 1,015 | | $ | 10.61 |
| Class C | | $ | 1,000 | | $ | 1,015 | | $ | 10.61 |
| | * | Expenses are calculated using the Fund’s annualized expense ratios for Class A (1.35%), Class B (2.10%) and Class C (2.10%) shares, multiplied by the average account value for the period, then multiplying the result by the actual number of days in the period (183); and then dividing that result by the actual number of days in the fiscal year (365). |
The accompanying notes are an integral part of the financial statements.
7
Heritage Growth and Income Trust
Statement of Assets and Liabilities
September 30, 2005
| | | | | | |
Assets | | | | | | |
Investments, at value (identified cost $72,253,336) | | | | | $ | 79,216,808 |
Repurchase agreement (identified cost $3,494,000) | | | | | | 3,494,000 |
Cash | | | | | | 575 |
Receivables: | | | | | | |
Investments sold | | | | | | 1,285,031 |
Fund shares sold | | | | | | 429,090 |
Dividends and interest | | | | | | 293,964 |
Deferred state qualification expenses | | | | | | 10,848 |
Prepaid insurance | | | | | | 5,312 |
Unrealized appreciation of forward foreign currency contracts | | | | | | 19,030 |
| | | | | |
|
|
Total assets | | | | | | 84,754,658 |
Liabilities | | | | | | |
Payables: | | | | | | |
Investments purchased | | $ | 972,310 | | | |
Fund shares redeemed | | | 285,494 | | | |
Accrued management fee | | | 28,644 | | | |
Accrued distribution fee | | | 40,524 | | | |
Accrued shareholder servicing fee | | | 10,548 | | | |
Accrued fund accounting fee | | | 16,500 | | | |
Other accrued expenses | | | 65,493 | | | |
| | |
|
| | | |
Total liabilities | | | | | | 1,419,513 |
| | | | | |
|
|
Net assets, at market value | | | | | $ | 83,335,145 |
| | | | | |
|
|
Net Assets | | | | | | |
Net assets consist of: | | | | | | |
Paid-in capital | | | | | $ | 70,615,993 |
Undistributed net investment income | | | | | | 368,820 |
Accumulated net realized gain | | | | | | 5,380,654 |
Net unrealized appreciation on investments and other assets and liabilities denominated in foreign currencies | | | | | | 6,969,678 |
| | | | | |
|
|
Net assets, at market value | | | | | $ | 83,335,145 |
| | | | | |
|
|
Class A shares | | | | | | |
Net asset value and redemption price per share ($45,292,694 divided by 3,279,280 shares of beneficial interest outstanding, no par value) | | | | | $ | 13.81 |
| | | | | |
|
|
Maximum offering price per share (100/95.25 of $13.81) | | | | | $ | 14.50 |
| | | | | |
|
|
Class B shares | | | | | | |
Net asset value, offering price and redemption price per share ($7,516,260 divided by 555,242 shares of beneficial interest outstanding, no par value) | | | | | $ | 13.54 |
| | | | | |
|
|
Class C shares | | | | | | |
Net asset value, offering price and redemption price per share ($30,526,191 divided by 2,254,405 shares of beneficial interest outstanding, no par value) | | | | | $ | 13.54 |
| | | | | |
|
|
The accompanying notes are an integral part of the financial statements.
8
Heritage Growth and Income Trust
Statement of Operations
For the Fiscal Year Ended September 30, 2005
| | | | | | | |
Investment Income | | | | | | | |
Income: | | | | | | | |
Dividends (a) | | | | | $ | 2,254,907 | |
Interest | | | | | | 547,580 | |
| | | | | |
|
|
|
Total income | | | | | | 2,802,487 | |
Expenses: | | | | | | | |
Management fee | | $ | 604,719 | | | | |
Distribution fee (Class A) | | | 111,387 | | | | |
Distribution fee (Class B) | | | 73,695 | | | | |
Distribution fee (Class C) | | | 287,051 | | | | |
Professional fees | | | 100,972 | | | | |
Shareholder servicing fees | | | 98,090 | | | | |
Fund accounting fee | | | 67,110 | | | | |
State qualification expenses | | | 43,398 | | | | |
Reports to shareholders | | | 33,325 | | | | |
Custodian fee | | | 27,013 | | | | |
Trustees’ fees and expenses | | | 20,346 | | | | |
Insurance | | | 8,914 | | | | |
Other | | | 13,535 | | | | |
| | |
|
| | | | |
Total expenses | | | | | | 1,489,555 | |
Fees waived by Manager | | | | | | (130,500 | ) |
| | | | | |
|
|
|
Total expenses after waiver | | | | | | 1,359,055 | |
| | | | | |
|
|
|
Net investment income | | | | | | 1,443,432 | |
| | | | | |
|
|
|
Realized and Unrealized Gain on Investments | | | | | | | |
Net realized gain from investment transactions | | | | | | 8,878,676 | |
Net realized gain from forward foreign currency transactions | | | | | | 40,002 | |
Net unrealized appreciation of investments during the fiscal year | | | | | | 3,502,513 | |
Net unrealized gain from forward foreign currency transactions | | | | | | 19,030 | |
Net unrealized depreciation on the translation of assets and liabilities denominated in foreign currencies | | | | | | (12,825 | ) |
| | | | | |
|
|
|
Net gain on investments | | | | | | 12,427,396 | |
| | | | | |
|
|
|
Net increase in net assets resulting from operations. | | | | | $ | 13,870,828 | |
| | | | | |
|
|
|
| (a) | Net of $44,846 foreign withholding taxes. |
Statements of Changes in Net Assets
| | | | | | | | |
| | | For the Fiscal Years Ended
| |
| | | September 30, 2005
| | | September 30, 2004
| |
Increase in net assets: | | | | | | | | |
Operations: | | | | | | | | |
Net investment income | | $ | 1,443,432 | | | $ | 721,705 | |
Net realized gain from investment transactions | | | 8,878,676 | | | | 3,397,390 | |
Net realized gain from forward foreign currency transactions | | | 40,002 | | | | — | |
Net unrealized appreciation of investments during the fiscal year | | | 3,502,513 | | | | 37,373 | |
Net unrealized gain from forward foreign currency transactions | | | 19,030 | | | | — | |
Net unrealized depreciation on the translation of assets and liabilities denominated in foreign currencies | | | (12,825 | ) | | | — | |
| | |
|
|
| |
|
|
|
Net increase in net assets resulting from operations | | | 13,870,828 | | | | 4,156,468 | |
Distributions to shareholders from: | | | | | | | | |
Net investment income Class A shares, ($0.26 and $0.14 per share, respectively) | | | (878,926 | ) | | | (481,050 | ) |
Net investment income Class B shares, ($0.17 and $0.04 per share, respectively) | | | (96,842 | ) | | | (26,120 | ) |
Net investment income Class C shares, ($0.17 and $0.04 per share, respectively). | | | (374,990 | ) | | | (88,744 | ) |
| | |
|
|
| |
|
|
|
Net distributions to shareholders | | | (1,350,758 | ) | | | (595,914 | ) |
Increase (decrease) in net assets from Fund share transactions | | | (3,476,051 | ) | | | 9,431,841 | |
| | |
|
|
| |
|
|
|
Increase in net assets | | | 9,044,019 | | | | 12,992,395 | |
Net assets, beginning of fiscal year | | | 74,291,126 | | | | 61,298,731 | |
| | |
|
|
| |
|
|
|
Net assets, end of fiscal year (including undistributed net investment income of $349,000 and $256,326, respectively) | | $ | 83,335,145 | | | $ | 74,291,126 | |
| | |
|
|
| |
|
|
|
The accompanying notes are an integral part of the financial statements.
9
Heritage Growth and Income Trust
Financial Highlights
The following table includes selected data for a share outstanding throughout each period and other performance information derived from the financial statements.
| | | | | | | | | | | | | | | | | | | | | | | | | | | | | | | | | | | | | | | | | | | | | | | | | | | | | | | | | | | | |
| | | Class A Shares*
| | | Class B Shares*
| | | Class C Shares*
| |
| | | For the Fiscal Years Ended
September 30
| | | For the Fiscal Years Ended
September 30
| | | For the Fiscal Years Ended
September 30
| |
| | | 2005
| | | 2004
| | | 2003
| | | 2002
| | | 2001
| | | 2005
| | | 2004
| | | 2003
| | | 2002
| | | 2001
| | | 2005
| | | 2004
| | | 2003
| | | 2002
| | | 2001
| |
Net asset value, beginning of fiscal year | | $ | 11.80 | | | $ | 11.10 | | | $ | 9.07 | | | $ | 11.33 | | | $ | 15.40 | | | $ | 11.57 | | | $ | 10.88 | | | $ | 8.90 | | | $ | 11.15 | | | $ | 15.21 | | | $ | 11.57 | | | $ | 10.88 | | | $ | 8.90 | | | $ | 11.14 | | | $ | 15.21 | |
| | |
|
|
| |
|
|
| |
|
|
| |
|
|
| |
|
|
| |
|
|
| |
|
|
| |
|
|
| |
|
|
| |
|
|
| |
|
|
| |
|
|
| |
|
|
| |
|
|
| |
|
|
|
Income from Investment Operations: | | | | | | | | | | | | | | | | | | | | | | | | | | | | | | | | | | | | | | | | | | | | | | | | | | | | | | | | | | | | |
Net investment income | | | 0.28 | | | | 0.16 | | | | 0.12 | | | | 0.11 | | | | 0.15 | | | | 0.18 | | | | 0.07 | | | | 0.04 | | | | 0.02 | | | | 0.04 | | | | 0.18 | | | | 0.07 | | | | 0.04 | | | | 0.02 | | | | 0.04 | |
Net realized and unrealized gain (loss) on investments | | | 1.99 | | | | 0.68 | | | | 2.02 | | | | (2.28 | ) | | | (1.59 | ) | | | 1.96 | | | | 0.66 | | | | 1.99 | | | | (2.23 | ) | | | (1.55 | ) | | | 1.96 | | | | 0.66 | | | | 1.99 | | | | (2.22 | ) | | | (1.56 | ) |
| | |
|
|
| |
|
|
| |
|
|
| |
|
|
| |
|
|
| |
|
|
| |
|
|
| |
|
|
| |
|
|
| |
|
|
| |
|
|
| |
|
|
| |
|
|
| |
|
|
| |
|
|
|
Total from Investment Operations | | | 2.27 | | | | 0.84 | | | | 2.14 | | | | (2.17 | ) | | | (1.44 | ) | | | 2.14 | | | | 0.73 | | | | 2.03 | | | | (2.21 | ) | | | (1.51 | ) | | | 2.14 | | | | 0.73 | | | | 2.03 | | | | (2.20 | ) | | | (1.52 | ) |
| | |
|
|
| |
|
|
| |
|
|
| |
|
|
| |
|
|
| |
|
|
| |
|
|
| |
|
|
| |
|
|
| |
|
|
| |
|
|
| |
|
|
| |
|
|
| |
|
|
| |
|
|
|
Less Distributions: | | | | | | | | | | | | | | | | | | | | | | | | | | | | | | | | | | | | | | | | | | | | | | | | | | | | | | | | | | | | |
Dividends from net investment income | | | (0.26 | ) | | | (0.14 | ) | | | (0.11 | ) | | | (0.09 | ) | | | (0.11 | ) | | | (0.17 | ) | | | (0.04 | ) | | | (0.05 | ) | | | (0.04 | ) | | | (0.03 | ) | | | (0.17 | ) | | | (0.04 | ) | | | (0.05 | ) | | | (0.04 | ) | | | (0.03 | ) |
Distributions from net realized gains | | | — | | | | — | | | | — | | | | — | | | | (2.52 | ) | | | — | | | | — | | | | — | | | | — | | | | (2.52 | ) | | | — | | | | — | | | | — | | | | — | | | | (2.52 | ) |
| | |
|
|
| |
|
|
| |
|
|
| |
|
|
| |
|
|
| |
|
|
| |
|
|
| |
|
|
| |
|
|
| |
|
|
| |
|
|
| |
|
|
| |
|
|
| |
|
|
| |
|
|
|
Total Distributions | | | (0.26 | ) | | | (0.14 | ) | | | (0.11 | ) | | | (0.09 | ) | | | (2.63 | ) | | | (0.17 | ) | | | (0.04 | ) | | | (0.05 | ) | | | (0.04 | ) | | | (2.55 | ) | | | (0.17 | ) | | | (0.04 | ) | | | (0.05 | ) | | | (0.04 | ) | | | (2.55 | ) |
| | |
|
|
| |
|
|
| |
|
|
| |
|
|
| |
|
|
| |
|
|
| |
|
|
| |
|
|
| |
|
|
| |
|
|
| |
|
|
| |
|
|
| |
|
|
| |
|
|
| |
|
|
|
Net asset value, end of fiscal year | | $ | 13.81 | | | $ | 11.80 | | | $ | 11.10 | | | $ | 9.07 | | | $ | 11.33 | | | $ | 13.54 | | | $ | 11.57 | | | $ | 10.88 | | | $ | 8.90 | | | $ | 11.15 | | | $ | 13.54 | | | $ | 11.57 | | | $ | 10.88 | | | $ | 8.90 | | | $ | 11.14 | |
| | |
|
|
| |
|
|
| |
|
|
| |
|
|
| |
|
|
| |
|
|
| |
|
|
| |
|
|
| |
|
|
| |
|
|
| |
|
|
| |
|
|
| |
|
|
| |
|
|
| |
|
|
|
Total Return (%) (a) | | | 19.41 | | | | 7.57 | | | | 23.82 | | | | (19.29 | ) | | | (10.47 | ) | | | 18.60 | | | | 6.73 | | | | 22.82 | | | | (19.91 | ) | | | (11.04 | ) | | | 18.60 | | | | 6.73 | | | | 22.82 | | | | (19.83 | ) | | | (11.12 | ) |
Ratios and Supplemental Data | | | | | | | | | | | | | | | | | | | | | | | | | | | | | | | | | | | | | | | | | | | | | | | | | | | | | | | | | | | | |
Expenses to average daily net assets | | | | | | | | | | | | | | | | | | | | | | | | | | | | | | | | | | | | | | | | | | | | | | | | | | | | | | | | | | | | |
With expenses waived (%) | | | 1.35 | | | | 1.35 | | | | 1.35 | | | | 1.35 | | | | 1.35 | | | | 2.10 | | | | 2.10 | | | | 2.10 | | | | 2.10 | | | | 2.10 | | | | 2.10 | | | | 2.10 | | | | 2.10 | | | | 2.10 | | | | 2.10 | |
Without expenses waived (%) | | | 1.51 | | | | 1.50 | | | | 1.61 | | | | 1.59 | | | | 1.48 | | | | 2.26 | | | | 2.25 | | | | 2.36 | | | | 2.34 | | | | 2.23 | | | | 2.26 | | | | 2.25 | | | | 2.36 | | | | 2.34 | | | | 2.23 | |
Net investment income to average daily net
assets (%) | | | 2.13 | | | | 1.31 | | | | 1.20 | | | | 0.98 | | | | 1.08 | | | | 1.38 | | | | 0.56 | | | | 0.44 | | | | 0.22 | | | | 0.30 | | | | 1.37 | | | | 0.57 | | | | 0.45 | | | | 0.21 | | | | 0.32 | |
Portfolio turnover rate (%) | | | 73 | | | | 80 | | | | 82 | | | | 72 | | | | 178 | | | | 73 | | | | 80 | | | | 82 | | | | 72 | | | | 178 | | | | 73 | | | | 80 | | | | 82 | | | | 72 | | | | 178 | |
Net assets, end of fiscal year ($ millions) | | | 45 | | | | 41 | | | | 36 | | | | 29 | | | | 33 | | | | 8 | | | | 7 | | | | 6 | | | | 4 | | | | 4 | | | | 31 | | | | 26 | | | | 19 | | | | 14 | | | | 13 | |
| * | Per share amounts have been calculated using the monthly average share method. |
| (a) | These returns are calculated without the imposition of either front-end or contingent deferred sales charges. |
The accompanying notes are an integral part of the financial statements.
10
Heritage Growth and Income Trust
Notes to Financial Statements
| Note 1: | Significant Accounting Policies. Heritage Growth and Income Trust (the “Fund”) is organized as a Massachusetts business trust and is registered under the Investment Company Act of 1940, as amended, as a diversified, open-end management investment company. The Fund’s investment objective is to primarily seek long-term capital appreciation and, secondarily, to seek current income. The Fund currently offers Class A and Class C shares to the public. Class A shares are sold subject to a maximum sales charge of 4.75% of the amount invested payable at the time of purchase. Class A share investments greater than $1 million, where a maximum sales charge is waived, may be subject to a maximum contingent deferred sales charge of 1% upon redemptions made in less than 18 months of purchase. Effective February 1, 2004, Class B shares were not available for direct purchase. Class B shares will continue to be available through exchanges and dividend reinvestments as described in the Fund’s prospectus. Class B shares are still subject to a 5% maximum contingent deferred sales charge (based on the lower of purchase price or redemption price), declining over a six-year period. Class C shares are sold subject to a contingent deferred sales charge of 1% of the lower of net asset value or purchase price payable upon any redemption made in less than one year of purchase. The preparation of financial statements in accordance with accounting principles generally accepted in the United States of America requires management to make estimates and assumptions that affect the reported amounts and disclosures. Actual results could differ from those estimates and those differences could be material. The following is a summary of significant accounting policies: |
Security Valuation: The Fund values investment securities at market value based on the last quoted sales price as reported by the principal securities exchange on which the security is traded. If the security is traded on the Nasdaq Stock Market, the official NASDAQ closing price is used. If no sale is reported, market value is based on the most recent quoted bid price. In the absence of a market quote, when prices are not reflective of market value, or when a significant event has been recognized with respect to a security, securities are valued using such methods as the Board of Trustees believes would reflect fair market value. Investments in certain debt instruments not traded in an organized market are valued on the basis of valuations furnished by independent pricing services or broker/dealers that utilize information with respect to market transactions in such securities or comparable securities, quotations from dealers, yields, maturities, ratings and various relationships between securities. Securities that are quoted in a foreign currency will be valued daily in U.S. dollars at the foreign currency exchange rates prevailing at the time the Fund calculates its daily net asset value per share. Short-term investments having a maturity of 60 days or less are valued at amortized cost, which approximates market value.
Foreign Currency Transactions: The books and records of the Fund are maintained in U.S. dollars. Foreign currency transactions are translated into U.S. dollars on the following basis: (i) market value of investment securities, other assets and other liabilities at the daily rates of exchange, and (ii) purchases and sales of investment securities, dividend and interest income and certain expenses at the rates of exchange prevailing on the respective dates of such transactions. The Fund does not isolate that portion of gains and losses on investments which is due to changes in foreign exchange rates from that which is due to changes in market prices of the investments. Such fluctuations are included with the net realized and unrealized gains and losses from investment transactions. Net realized gain (loss) and unrealized appreciation (depreciation) from foreign currency transactions include gains and losses between trade and settlement date on securities transactions, gains and losses arising from the purchase and sale of forward foreign currency contracts and gains and losses between the ex and payment dates on dividends, interest, and foreign withholding taxes.
Forward Foreign Currency Contracts: The Fund is authorized to enter into forward foreign currency contracts for the purpose of hedging against exchange risk arising from current or anticipated investments in securities dominated in foreign currencies and to enhance total return. Forward foreign currency contracts are valued at the contractual forward rate and are marked-to-market daily, with the
11
Heritage Growth and Income Trust
Notes to Financial Statements
(continued)
change in market value recorded as an unrealized gain or loss. When the contracts are closed, the gain or loss is realized. Risks may arise from unanticipated movements in the currency’s value relative to the U.S. dollar and from the possible inability of counter-parties to meet the terms of their contracts.
Repurchase Agreements: The Fund enters into repurchase agreements whereby the Fund, through its custodian, receives delivery of the underlying securities, the market value of which is required to be in an amount of at least 100% of the resale price. Repurchase agreements involve the risk that the seller will fail to repurchase the security, as agreed. In that case, the Fund will bear the risk of market value fluctuations until the security can be sold and may encounter delays and incur costs in liquidating the security. In the event of bankruptcy or insolvency of the seller, delays and costs may be incurred.
Federal Income Taxes: The Fund is treated as a single corporate taxpayer as provided for in the Tax Reform Act of 1986, as amended. The Fund’s policy is to comply with the requirements of the Internal Revenue Code of 1986, as amended, which are applicable to regulated investment companies and to distribute substantially all of its taxable income to its shareholders. Accordingly, no provision has been made for federal income and excise taxes.
Distribution of Income and Gains: Distributions of net investment income are made quarterly. Net realized gains from investment transactions during any particular year in excess of available capital loss carryforwards, which, if not distributed, would be taxable to the Fund, will be distributed to shareholders in the following fiscal year. The Fund uses the identified cost method for determining realized gain or loss on investments for both financial and federal income tax reporting purposes.
Expenses: The Fund is charged for those expenses that are directly attributable to it, while other expenses are allocated proportionately among the Heritage mutual funds based upon methods approved by the Board of Trustees. Expenses that are directly attributable to a specific class of shares, such as distribution fees, are charged directly to that class. Other expenses of the Fund are allocated to each class of shares based upon their relative percentage of net assets.
Other: Investment security transactions are accounted for on a trade date basis. Dividend income and distributions to shareholders are recorded on the ex-dividend date. Interest income is recorded on the accrual basis.
In the normal course of business the Fund enters into contracts that contain a variety of representations and warranties, which provide general indemnifications. The Fund’s maximum exposure under these arrangements is unknown, as this would involve future claims that may be made against the Fund and/or its affiliates that have not yet occurred. However, based on experience, the Fund expects the risk of loss to be remote.
12
Heritage Growth and Income Trust
Notes to Financial Statements
(continued)
| Note 2: | Fund Shares. At September 30, 2005, there were an unlimited number of shares of beneficial interest of no par value authorized. |
Transactions in Class A, B and C shares of the Fund during the fiscal year ended September 30, 2005, were as follows:
| | | | | | | | | | | | | | | | | | | | | |
| | | Class A Shares
| | | Class B Shares
| | | Class C Shares
| |
| | | Shares
| | | Amount
| | | Shares
| | | Amount
| | | Shares
| | | Amount
| |
Shares sold | | 743,949 | | | $ | 9,855,035 | | | 66,498 | | | $ | 860,479 | | | 421,880 | | | $ | 5,462,579 | |
Shares issued on reinvestment of distributions | | 63,010 | | | | 806,579 | | | 6,611 | | | | 82,967 | | | 27,891 | | | | 350,870 | |
Shares redeemed | | (1,020,990 | ) | | | (13,547,116 | ) | | (125,022 | ) | | | (1,596,867 | ) | | (446,901 | ) | | | (5,750,578 | ) |
| | |
|
| |
|
|
| |
|
| |
|
|
| |
|
| |
|
|
|
Net increase (decrease) | | (214,031 | ) | | $ | (2,885,502 | ) | | (51,913 | ) | | $ | (653,421 | ) | | 2,870 | | | $ | 62,871 | |
| | | | | |
|
|
| | | | |
|
|
| | | | |
|
|
|
Shares outstanding: | | | | | | | | | | | | | | | | | | | | | |
Beginning of fiscal year | | 3,493,311 | | | | | | | 607,155 | | | | | | | 2,251,535 | | | | | |
| | |
|
| | | | | |
|
| | | | | |
|
| | | | |
End of fiscal year | | 3,279,280 | | | | | | | 555,242 | | | | | | | 2,254,405 | | | | | |
| | |
|
| | | | | |
|
| | | | | |
|
| | | | |
Transactions in Class A, B and C shares of the Fund during the fiscal year ended September 30, 2004, were as follows:
| | | | | | | | | | | | | | | | | | | | | |
| | | Class A Shares
| | | Class B Shares
| | | Class C Shares
| |
| | | Shares
| | | Amount
| | | Shares
| | | Amount
| | | Shares
| | | Amount
| |
Shares sold | | 882,511 | | | $ | 10,550,190 | | | 143,884 | | | $ | 1,675,311 | | | 817,719 | | | $ | 9,614,700 | |
Shares issued on reinvestment of distributions | | 36,873 | | | | 436,464 | | | 1,966 | | | | 23,097 | | | 7,109 | | | | 83,543 | |
Shares redeemed | | (690,112 | ) | | | (8,137,136 | ) | | (89,656 | ) | | | (1,036,047 | ) | | (326,006 | ) | | | (3,778,281 | ) |
| | |
|
| |
|
|
| |
|
| |
|
|
| |
|
| |
|
|
|
Net increase | | 229,272 | | | $ | 2,849,518 | | | 56,194 | | | $ | 662,361 | | | 498,822 | | | $ | 5,919,962 | |
| | | | | |
|
|
| | | | |
|
|
| | | | |
|
|
|
Shares outstanding: | | | | | | | | | | | | | | | | | | | | | |
Beginning of fiscal year | | 3,264,039 | | | | | | | 550,961 | | | | | | | 1,752,713 | | | | | |
| | |
|
| | | | | |
|
| | | | | |
|
| | | | |
End of fiscal year | | 3,493,311 | | | | | | | 607,155 | | | | | | | 2,251,535 | | | | | |
| | |
|
| | | | | |
|
| | | | | |
|
| | | | |
A redemption fee of 2% of the value of the shares sold is imposed on fund shares sold (by redemption or exchange to another Heritage mutual fund) within seven (7) calendar days of their acquisition by purchase or exchange. For the fiscal year ended September 30, 2005, the fund received $1,293 in redemption fees to offset the costs and market impact associated with short-term money movements.
| Note 3: | Purchases and Sales of Securities. For the fiscal year ended September 30, 2005, purchases and sales of investment securities (excluding repurchase agreements and short-term obligations) aggregated $56,141,988 and $60,367,779, respectively. |
13
Heritage Growth and Income Trust
Notes to Financial Statements
(continued)
| Note 4: | Management, Subadvisory, Distribution, Shareholder Servicing Agent, Fund Accounting and Trustees’ Fees. Under the Fund’s Investment Advisory and Administration Agreement with Heritage Asset Management, Inc. (the “Manager” or “Heritage”), the Fund agrees to pay to the Manager a fee equal to an annualized rate of 0.75% of the first $100 million of the Fund’s average daily net assets, 0.60% on the next $400 million of such net assets, and 0.55% of any excess over $500 million of such net assets, computed daily and payable monthly. The Manager has contractually agreed to waive its fees and, if necessary, reimburse the Fund to the extent that Class A annual operating expenses exceed 1.35% of the Class A shares average daily net assets and to the extent that the Class B and Class C annual operating expenses each exceed 2.10% of those classes’ average daily net assets for the fiscal year ended September 30, 2005. Under these agreements, management fees of $130,500 were waived for the fiscal year ended September 30, 2005. If total Fund expenses fall below the expense limitation agreed to by the Manager before the end of the fiscal year ending September 30, 2007, the Fund may be required to pay the Manager a portion or all of the management fees waived. In addition, the Fund may be required to pay the Manager a portion or all of the management fees waived of $111,456 in fiscal 2004, if total Fund expenses fall below the annual expense limitations before the end of the fiscal year ending September 30, 2006. No management fees were recovered for the fiscal year ended September 30, 2005. |
The Manager has entered into a subadvisory agreement with Thornburg Investment Management, Inc. (“Thornburg”) to provide to the Fund investment advice, portfolio management services (including the placement of brokerage orders) and certain compliance and other services for an annualized fee payable by the Manager. Eagle Asset Management, Inc. (“Eagle”), a wholly owned subsidiary of Raymond James Financial, Inc. (“RJF”), serves as an additional subadviser to the Fund. However, the Manager currently has not allocated any assets of the Fund to Eagle.
Pursuant to the Class A Distribution Plan adopted in accordance with Rule 12b-1 of the Investment Company Act of 1940, as amended, the Fund is authorized to pay Raymond James & Associates, Inc. (the “Distributor”) a fee of 0.25% of the average daily net assets. Under the Class B and Class C Distribution Plans, the Fund may pay the Distributor a fee of up to 1.00% of the average daily net assets. Such fees are accrued daily and payable monthly. Class B shares will convert to Class A shares eight years after the end of the calendar month in which the shareholder’s order to purchase was accepted. The Manager, Distributor, Fund Accountant and Shareholder Servicing Agent are all wholly owned subsidiaries of RJF.
Raymond James & Associates, Inc. (the “Distributor” or “RJA”) has advised the Fund that it generated $44,633 in front-end sales charges and $53 in contingent deferred sales charges for Class A shares, $17,683 in contingent deferred sales charges for Class B shares and $2,559 in contingent deferred sales charges for Class C shares for the fiscal year ended September 30, 2005. From these fees, the Distributor paid commissions to salespersons and incurred other distribution costs.
The Manager is also the Shareholder Servicing Agent and Fund Accountant for the Fund. For providing Shareholder Servicing and Fund Accounting Services the Manager is reimbursed for expenses incurred plus an additional amount up to 10%.
Trustees of the Fund also serve as Trustees for Heritage Cash Trust, Heritage Capital Appreciation Trust, Heritage Income Trust, and Heritage Series Trust, investment companies that are also advised by the Manager (collectively referred to as the “Heritage Mutual Funds”). Each Trustee of the Heritage Mutual Funds who is not an employee of the Manager or employee of an affiliate of the Manager receives an annual fee of $23,000 and an additional fee of $3,000 for each combined quarterly meeting of the Heritage Mutual Funds attended. In addition, each independent Trustee that serves on the Audit
14
Heritage Growth and Income Trust
Notes to Financial Statements
(continued)
Committee or Compliance Committee will receive $500 for attendance at their respective meeting (in person or telephonic). The Lead Independent Trustee, the Audit Committee Chair, and the Compliance Committee Chair each will receive an annual retainer of $2,500, in addition to meeting fees. Trustees’ fees and expenses are paid equally by each portfolio in the Heritage Mutual Funds.
| Note 5: | Federal Income Taxes. The timing and character of certain income and capital gain distributions are determined in accordance with income tax regulations, which may differ from accounting principles generally accepted in the United States of America. As a result, net investment income (loss) and net realized gain (loss) from investment transactions for a reporting period may differ from distributions during such period. These book/tax differences may be temporary or permanent in nature. To the extent these differences are permanent; they are charged or credited to paid in capital or accumulated net realized loss, as appropriate, in the period that the differences arise. These reclassifications have no effect on net assets or net asset value per share. For the fiscal year ended September 30, 2005, to reflect reclassifications arising from permanent book/tax differences attributable to reclassifications of foreign currency gains and losses and distributions from REITs, the Fund increased (credited) undistributed net investment income and decreased (debited) accumulated net realized loss of $19,820. As of September 30, 2005, the Fund had utilized capital loss carryforwards of $3,498,022. |
For income tax purposes, distributions paid during the fiscal years ended September 30, 2005 and September 30, 2004 were as follows:
| | | | | | |
| | | 2005
| | 2004
|
Distributions paid from: | | | | | | |
Ordinary Income | | $ | 1,350,758 | | $ | 595,914 |
Long-Term Capital Gains | | $ | — | | $ | — |
As of September 30, 2005, the components of distributable earnings on a tax basis were as follows:
| | | |
Undistributed Ordinary Income | | $ | 368,820 |
Capital Loss Carryforwards | | $ | — |
Post October Losses | | $ | — |
Tax Basis Net Unrealized Appreciation | | $ | 7,053,100 |
15
Report of Independent Registered Certified Public Accounting Firm
To the Board of Trustees and
Shareholders of Heritage Growth and Income Trust
In our opinion, the accompanying statement of assets and liabilities, including the investment portfolio, and the related statement of operations and of changes in net assets and the financial highlights present fairly, in all material respects, the financial position of Heritage Growth and Income Trust (the “Fund”) at September 30, 2005, the results of its operations for the year then ended, the changes in its net assets for each of the two years in the period then ended and the financial highlights for each of the five years in the period then ended, in conformity with accounting principles generally accepted in the United States of America. These financial statements and financial highlights (hereafter referred to as “financial statements”) are the responsibility of the Fund’s management; our responsibility is to express an opinion on these financial statements based on our audits. We conducted our audits of these financial statements in accordance with the standards of the Public Company Accounting Oversight Board (United States). Those standards require that we plan and perform the audit to obtain reasonable assurance about whether the financial statements are free of material misstatement. An audit includes examining, on a test basis, evidence supporting the amounts and disclosures in the financial statements, assessing the accounting principles used and significant estimates made by management, and evaluating the overall financial statement presentation. We believe that our audits, which included confirmation of securities at September 30, 2005 by correspondence with the custodian and brokers, provide a reasonable basis for our opinion.

Tampa, Florida
November 15, 2005
16
Heritage Growth and Income Trust
Trustees and Officers
| | | | | | | | | | |
Name, Address and Age | | Position(s) Held with Fund | | Term of Office* and Length of Time Served | | Principal Occupation(s) During Past 5 years | | Number of Portfolios in Heritage Mutual Funds Complex Overseen by Trustee | | Directorships of Public
Companies Held by Trustee |
| | | | | |
Affiliated Trustees **
| | | | | | | | | | |
| | | | | |
Thomas A. James 880 Carillon Parkway St. Petersburg, FL 33716 (63) | | Trustee
and
Chairman | | Since inception
in 1986 | | Chairman of the Board since 1986; Chief Executive Officer of RJF since 1969; Chairman of the Board of RJA since 1986; Chairman of the Board of Eagle since 1984. | | 13 | | Outback
Steakhouse,
Inc. |
| | | | | |
Richard K. Riess 880 Carillon Parkway St. Petersburg, FL 33716 (56) | | President
and
Trustee | | Since 2000
Since inception
in 1986 | | Executive Vice President and Managing Director for Asset Management of RJF since 1998; CEO of Eagle since 1996; CEO of Heritage since 2000. | | 13 | | N/A |
| | | | | |
Independent Trustees
| | | | | | | | | | |
| | | | | |
C. Andrew Graham 880 Carillon Parkway St. Petersburg, FL 33716 (65) | | Trustee | | Since inception
in 1986 | | First Financial Advisors, Ltd. & Graham Financial Partners LLC (financial planning insurance and investment services) since 1999. | | 13 | | N/A |
| | | | | |
Keith B. Jarrett 880 Carillon Parkway St. Petersburg, FL 33716 (57) | | Trustee | | Since 2005 | | President, KBJ, LLC (investment company) since 2001; Principal, Rockport Funding, LLC (specialty finance), and Ajax Partners (investment partnership) since 2003; President and CEO, TF Ventures (information technology), 1998-2001. | | 13 | | Penn
Virginia
Resources |
| | | | | |
William J. Meurer 880 Carillon Parkway St. Petersburg, FL 33716 (62) | | Trustee | | Since 2003 | | Private Financial Consultant since September 2000. | | 13 | | Sykes
Enterprises
Inc. |
| | | | | |
James L. Pappas 880 Carillon Parkway St. Petersburg, FL 33716 (62) | | Trustee | | Since 1989 | | Lykes Professor of Banking and Finance, University of South Florida since 1986; President, Graduate School of Banking 1995-2005. | | 13 | | N/A |
| | | | | |
David M. Phillips 880 Carillon Parkway St. Petersburg, FL 33716 (66) | | Trustee | | Since inception
in 1986 | | Chief Executive Officer, Evare LLC (information services) since 2003. | | 13 | | CCC
Information
Services,
Inc. |
17
Heritage Growth and Income Trust
Trustees and Officers
| | | | | | | | | | |
Name, Address and Age | | Position(s) Held with Fund | | Term of Office* and Length of Time Served | | Principal Occupation(s) During Past 5 years | | Number of Portfolios in Heritage Mutual Funds Complex Overseen by Trustee | | Directorships of Public
Companies Held by Trustee |
| | | | | |
Independent Trustees (continued)
| | | | | | | | | | |
| | | | | |
Eric Stattin 880 Carillon Parkway St. Petersburg, FL 33716 (72) | | Trustee | | Since 1987 | | Private Investor since 1988. | | 13 | | N/A |
| | | | | |
Deborah L. Talbot, PhD 880 Carillon Parkway St. Petersburg, FL 33716 (55) | | Trustee | | Since 2002 | | Independent Consultant and Researcher; Founder and Chairman of the Board, Creative Tampa Bay since 2003; Dean’s Advisory Board, College of Arts and Sciences, University of Memphis since 2002. | | 13 | | N/A |
| | | | | |
Officers
| | | | | | | | | | |
| | | | | |
K.C. Clark 880 Carillon Parkway St. Petersburg, FL 33716 (46) | | Executive Vice
President and
Principal
Executive Officer, | | Since 2000 | | Executive Vice President and Chief Operating Officer of Heritage since 2000. | | N/A | | N/A |
| | | | | |
Andrea N. Mullins 880 Carillon Parkway St. Petersburg, FL 33716 (38) | | Treasurer and
Secretary,
Principal
Financial
Officer | | Since 2003 Since 2004 | | Treasurer and Vice
President – Finance of Heritage since 2003; Vice President – Fund Accounting of Heritage, 1996-2003. | | N/A | | N/A |
| | | | | |
Deborah A. Malina 880 Carillon Parkway
St. Petersburg, FL 33716
(39) | | Assistant Secretary | | Since 2000 | | Compliance Advisor of Heritage since 2000. | | N/A | | N/A |
The Trust’s Statement of Additional Information includes additional information about the Trustees and Officers and is available, without charge, upon request, by calling (800) 421-4184.
| * | Trustees serve for the lifetime of the Trust or until they are removed, resign or retire. The Board has adopted a retirement policy that requires Trustees to retire at the age of 72 for those Trustees in office prior to August 2000, and at the age 70 for those Trustees who are elected to office after August 2000. Officers are elected annually for one year terms. |
| ** | Messrs. James and Riess are “interested” persons of the Trust as that term is defined by the Investment Company Act of 1940. Mr. James is affiliated with RJA and RJF. Mr. Riess is affiliated with Heritage and RJF. |
18
Heritage Growth and Income Trust
Renewal of Investment Advisory and Subadvisory Agreements
(unaudited)
Overview. At a meeting held August 16, 2005, the Board of Trustees, including the independent Trustees (together, the “Board”), approved the renewal of the Fund’s investment advisory agreement with Heritage Asset Management, Inc. (“Heritage”) and the subadvisory agreement for the Fund with Thornburg Investment Management, Inc. (“subadviser”) (together, the “Advisory Agreements”).
In reaching this decision, the Board took into consideration information furnished for the Board’s review and consideration throughout the year at regular Board meetings, as well as information specifically prepared in connection with the annual renewal process. The Board, acting directly or through its committees, has been provided with information and reports relevant to the annual renewal of the Fund’s Advisory Agreements, including: reports regarding the services and support provided to the Fund and its shareholders by Heritage and the subadviser; reports on the Fund’s performance and commentary on the reasons for the performance; presentations by Fund portfolio managers addressing, as applicable, Heritage’s and the subadviser’s investment philosophy, investment strategy, personnel and operation; compliance and audit reports concerning the Heritage Funds, Heritage and the subadviser, including responses to any issues raised therein; and information on relevant developments in the mutual fund industry and how the Heritage Funds and/or Heritage are responding to them. As part of the renewal process, the Board, with the assistance of independent legal counsel, requested and received additional reports containing information about the Fund, Heritage and the subadviser. The Board posed questions to various management personnel of Heritage regarding certain key aspects of the material submitted in support of the renewal.
With respect to the renewal of the Advisory Agreements, the Board considered all factors it believed relevant, including: (1) the nature, extent and quality of services provided to the Fund; (2) the investment performance of the Fund; (3) the costs of the services provided to the Fund and the profits realized or to be realized by Heritage, the subadviser and their respective affiliates from their relationship with the Fund; (4) the extent to which economies of scale have been realized as the Fund grows; (5) whether the level of fees reflects those economies of scale for the benefit of Fund investors; (6) comparisons of services and fees with contracts entered into by Heritage and the subadviser with other clients (such as pension funds and other institutional investors); and (7) any other benefits derived or anticipated to be derived by Heritage or the subadviser from its relationship with the Fund.
Provided below is an overview of the factors the Board considered at the August meeting. The Board did not identify any particular information that was most relevant to its consideration to renew the Advisory Agreements, and each Trustee may have afforded different weight to the various factors.
Nature, Extent and Quality of Services. The Board considered that Heritage and the subadviser are experienced in serving as an investment adviser for the Fund. Heritage oversees and monitors the performance and services provided by the Fund’s subadviser and is responsible for the selection of the Fund’s subadviser. Heritage provides investment management, administration, transfer agent and fund accounting services to the Fund. In addition, Heritage is responsible for the oversight of compliance with Fund policies and objectives, review of brokerage matters, oversight of Fund compliance with applicable law, and implementation of Board directives as they relate to the Fund. Heritage provides advisory services to one other non-investment company client. Finally, the Board noted that shareholders in the Fund have a broad range of investment choices available to them, including a wide choice among mutual funds offered by competitors to Heritage, and that the Fund’s shareholders, with the opportunity to review and weigh the disclosure provided by the Fund in its prospectus and other public disclosures, have chosen to invest in the Fund managed by Heritage.
With respect to the subadviser, the subadviser is responsible for making investment decisions on behalf of the Fund and placing all orders for the purchase and sale of investments for the Fund with brokers or dealers. The Board considered the experience of the subadviser’s investment advisory team. In addition, the Board considered Heritage’s recommendation to continue to retain the subadviser.
19
Heritage Growth and Income Trust
Renewal of Investment Advisory and Subadvisory Agreements
(unaudited)
(continued)
The Board also considered information provided regarding: (1) the Heritage and subadviser personnel who provide services to the Fund; (2) the adequacy of Heritage’s and the subadviser’s compliance program and a certification to this effect; and (3) the financial information regarding Heritage and the subadviser.
Investment Performance. The Board considered the short-, intermediate- and long-term performance of the Fund relative to its primary benchmark and peer group. In this connection, the Board noted the following: (1) the Fund’s relative performance over the one-, three- and five-year periods was better than its peer group and that the subadviser has been managing the Fund for four years; and (2) the Fund outperformed a similar fund managed by Thornburg over the one-, three- and five-year periods.
Costs, Profitability and Economies of Scale. The Board considered the fees payable under the Advisory Agreements. In this connection, the Board evaluated Heritage’s costs and profitability in providing services to the Fund. The Board noted that Heritage incurred losses on the operation of the Fund while continuing to provide services at a low cost to investors, manage the Fund’s assets, and provide a comprehensive compliance program for the Fund.
The Board also considered the Fund’s advisory and subadvisory fees in light of fees paid by comparable mutual funds. In this connection, the Board considered the management fee and the expense ratio for the Fund compared to the average management fee and expense ratio of its peer group. The Board noted that the Fund’s expense ratio, taking into consideration the expense cap arrangement, is competitive with that of its peer group. With respect to the subadvisory agreement, the Board considered the subadviser’s representation that the fees it charges in connection with the Fund are competitive with those charged to other institutional client’s with similar investment objectives and asset levels.
The Board considered that the Fund’s management fee structure provides for breakpoints, which is a reduction of the applicable advisory fee rate as assets increase. The Board noted that Heritage added a “breakpoint” to its advisory fees last year in order to pass on any economies of scale it realizes to shareholders when the Fund has significant assets to benefit from such breakpoints.
The Board further considered that Heritage had committed to continue the contractual expense cap arrangement through the Fund’s 2006 fiscal year, which is subject to renewal by the Board and Heritage on an annual basis.
The Board also considered that the Fund may benefit from economies of scale, and shareholders may realize such economies of scale, through: (1) reduced advisory and administration fees achieved when the Fund’s asset size reaches breakpoints in the fee schedules instituted by Heritage; (2) increased services to the Fund; (3) the waivers and/or reimbursements Heritage provides as a result of the contractual expense limitations on the Fund’s total operating expenses; or (4) fee or expense reductions under the transfer agent agreement may result from an increase in Fund assets.
Benefits. In evaluating Heritage’s compensation, the Board considered other benefits that may be realized by Heritage and its affiliates from their relationship with the Fund. In this connection, the Board noted, among other things, that Heritage also serves as the transfer agent and fund accountant for the Fund and receives compensation for acting in these capacities, and is responsible for, among other things, coordinating the Fund’s audits, financial statements and tax returns and managing expenses and budgeting for the Fund.
The Board also recognized that another affiliate of Heritage, Raymond James & Associates, Inc. (“RJA”), serves as the principal underwriter and distributor for the Fund, and as such, receives Rule 12b-1 payments from the
20
Heritage Growth and Income Trust
Renewal of Investment Advisory and Subadvisory Agreements
(unaudited)
(continued)
Fund to compensate them for providing service and distribution activities. The Board considered that these payments could lead to growth in the Fund’s assets and the corresponding benefits of that growth, including economies of scale and greater diversification. In addition, another affiliate of Heritage, Raymond James Financial Services, Inc. has entered into an agreement with RJA to sell fund shares and receives compensation from RJA.
Conclusions. Based on these considerations, the Board concluded with respect to the Fund that: (1) the Fund was reasonably likely to benefit from the nature, quality and extent of Heritage’s and the subadviser’s services; (2) the Fund’s performance was satisfactory in light of all the factors considered by the Board; (3) Heritage’s fee rate payable under the Advisory Agreement was reasonable in the context of all the factors considered by the Board; (4) the subadviser’s fee rate was reasonable in the context of all the factors considered by the Board; and (5) the advisory fee rate structure and the Fund’s total operating expenses currently provide Fund shareholders with reasonable benefits associated with economies of scale. Based on these conclusions and other factors, the Board determined in its business judgment to renew the Advisory Agreements.
Heritage Growth and Income Trust
2005 Federal Income Tax Notice
(unaudited)
For the fiscal year ended September 30, 2005, certain dividends paid by the Heritage Growth and Income Trust may be subject to a maximum tax rate of 15%, as provided for by the Jobs and Growth Tax Relief Reconciliation Act of 2004. The Fund designates a maximum amount of $1,350,758 as qualified dividend income, which is 100% of what was distributed. The information and distributions reported herein may differ from the information and distributions taxable to the shareholders for the calendar year ending December 31, 2005. Complete information will be computed and reported in conjunction with your 2005 Form 1099-DIV.
21

Item 2. Code of Ethics
As of the end of the period September 30, 2005, Heritage Growth and Income Trust has adopted a code of ethics, as defined in Item 2 of Form N-CSR, that applies to the Principal Executive Officer and Principal Financial Officer. Heritage Growth and Income Trust has not made any amendments to its code of ethics during the covered period. Heritage Growth and Income Trust has not granted any waivers from any provisions of the code of ethics during the covered period. A copy of this code of ethics is filed as an exhibit to this Form N-CSR.
Item 3. Audit Committee Financial Expert
The Board of Trustees of Heritage Growth and Income Trust has determined that William J. Meurer is an audit committee financial expert, as defined in Item 3 of Form N-CSR, serving on its audit committee. Mr. Meurer is independent for purposes of Item 3 of Form N-CSR.
Item 4. Principal Accountant Fees and Services
(a) Audit Fees
The aggregate fees billed by registrant’s independent public accountants, PricewaterhouseCoopers LLP (“PwC”) for each of the last two fiscal years for professional services rendered in connection with the audit of registrant’s annual financial statements or services that are normally provided by the accountant in connection with statutory and regulatory filings or engagements were $23, 000 for the year ended September 30, 2004, and $22,000 for the year ended September 30, 2005.
(b) Audit-Related Fees
The aggregate fees PwC billed to registrant for each of the last two fiscal years for assurance and other services which are reasonably related to the performance of registrant’s audit and are not reported under Item 4(a) were $0 and $0 for the years ended September 30, 2004 and September 30, 2005, respectively. The aggregate fees PwC billed to registrant’s investment adviser and any entity controlling, controlled by, or under common control with registrant’s investment adviser for assurance and other services directly related to the operations and financial reporting of registrant were $31,000 for the year ended September 30, 2004, and $33,000 for the year ended September 30, 2005.
(c) Tax Fees
The aggregate tax fees PwC billed to registrant for each of the last two fiscal years for tax compliance, tax advice, and tax planning services were $3,000 for the year ended September 30, 2004, and $3,000 for the year ended September 30, 2005. The aggregate tax fees PwC billed to registrant’s investment adviser and any entity controlling, controlled by, or under common control with registrant’s investment adviser for services directly related to the operations and financial reporting of registrant were $0 for the year ended September 30, 2004, and $0 for the year ended September 30, 2005.
(d) All Other Fees
For the fiscal years ended September 30, 2005 and 2004, registrant paid PwC no other fees. The aggregate fees PwC billed to registrant’s investment adviser and any entity controlling, controlled by, or under common control with registrant’s investment adviser for any other services directly related to the operations and financial reporting of registrant were $0 for the year ended September 30, 2004, and $0 for the year ended September 30, 2005.
(e) Registrant’s Audit Committee Charter provides that the audit committee (comprised of the Independent Trustees of registrant) is responsible for pre-approval of all auditing services performed for the registrant. The Audit Committee reports to the Board of Trustees (“Board”) regarding its approval of the engagement of the auditor and the proposed fees for the engagement, and the majority of the Board (including the members of the Board who are Independent Trustees) must approve the auditor at an in-person meeting. The Audit Committee also is responsible for pre-approval (subject to the de minimus exception for non-audit services described in the Securities Exchange Act of 1934, as amended, and applicable rule thereunder and not expecting to exceed $5,000) of all non-auditing services performed for the registrant or for any service affiliate of registrant. Registrant’s Audit Committee Charter also permits a designated member of the audit committee to pre-approve, between meetings, one or more non-audit service projects, subject to ratification by the Audit Committee at the next meeting of the Audit Committee. Registrant’s Audit Committee pre-approved all fees described above which PwC billed to registrant.
(f) Less than 50% of the hours billed by PwC for auditing services to registrant for the fiscal year ended September 30, 2005, were for work performed by persons other than full-time, permanent employees of PwC.
(g) The aggregate non-audit fees billed by PwC to registrant and to registrant’s investment adviser and any entity controlling, controlled by, or under common control with registrant’s investment adviser for the fiscal years ending September 30, 2004, and September 30, 2005, were $0 and $0.
(h) Registrant’s Audit Committee has considered the non-audit services provided to the registrant and registrant’s investment adviser and any entity controlling, controlled by, or under common control with registrant’s investment adviser as described above and determined that these services do not compromise PwC’s independence.
Item 5. Audit Committee of Listed Registrants
Not applicable to the registrant.
Item 6. Schedule of Investments
Included as part of report to shareholders under Item 1.
Item 7. Disclosure of Proxy Voting Policies and Procedures for Closed-End Management Investment Companies.
Not applicable to the registrant.
Item 8. Portfolio Managers of Closed-End Management Investment Companies
Not applicable to the registrant.
Item 9. Purchases of Equity Securities by Closed-End Management Investment Company and Affiliated Purchasers
Not applicable to the registrant.
Item 10. Submission of Matters to a Vote of Security Holders.
There have been no material changes to the Nominating Committee Charter, which sets forth procedures by which shareholders may recommend nominees to the Trust’s Board of Trustees, since the Trust last provided disclosure in response to this item.
Item 11. Controls and Procedures
| | |
| (a) | | Based on an evaluation of the disclosure controls and procedures (as defined in Rule 30a-2(c) under the Act), the Principal Executive Officer and Treasurer of Heritage Growth and Income Trust have concluded that such disclosure controls and procedures are effective as of December 2, 2005. |
| |
| (b) | | There was no change in the internal controls over financial reporting (as defined in Rule 30a-3(d) under the Act) of Heritage Growth and Income Trust that occurred during the second half of its fiscal year that has materially affected or is reasonably likely to materially affect, its internal control over financial reporting. |
Item 12. Exhibits
(a)(1) Code of Ethics pursuant to Item 2 of Form N-CSR is filed and attached hereto as Exhibit 99.CODEETH.
(a)(2) The certification required by Rule 30a-2(a) of the Investment Company Act of 1940, as amended, and Section 302 of the Sarbanes-Oxley Act of 2002 is filed and attached hereto as Exhibit 99.CERT.
(a)(3) Not applicable to the registrant.
(b) The certification required by Rule 30a-2(b) of the Investment Company Act of 1940, as amended, and Section 906 of the Sarbanes-Oxley Act of 2002 is filed and attached hereto as Exhibit 99.906CERT.
SIGNATURES
Pursuant to the requirements of the Securities Exchange Act of 1934 and the Investment Company Act of 1940, the registrant has duly caused this report to be signed on its behalf by the undersigned, thereunto duly authorized.
| | |
| | | HERITAGE GROWTH AND INCOME TRUST |
| Date: December 2, 2005 | | |
| | | /s/ K.C. Clark
|
| | | K.C. Clark |
| | | Executive Vice President and Principal Executive Officer |
Pursuant to the requirements of the Securities Exchange Act of 1934 and the Investment Company Act of 1940, this report has been signed below by the following persons on behalf of the registrant and in the capacities and on the dates indicated.
| | |
| Date: December 2, 2005 | | |
| | | /s/ K.C. Clark
|
| | | K.C. Clark |
| | | Executive Vice President and |
| | | Principal Executive Officer |
| |
| Date: December 2, 2005 | | |
| | | /s/ Andrea N. Mullins
|
| | | Andrea N. Mullins Principal Financial Officer |