UNITED STATES
SECURITIES AND EXCHANGE COMMISSION
Washington, D.C. 20549
FORM N-CSR
CERTIFIED SHAREHOLDER REPORT OF REGISTERED
MANAGEMENT INVESTMENT COMPANIES
Investment Company Act File Number: 811-4767
HERITAGE GROWTH AND INCOME TRUST
(Exact name of Registrant as Specified in Charter)
880 Carillon Parkway
St. Petersburg, FL 33716
(Address of Principal Executive Office) (Zip Code)
STEPHEN G. HILL, PRESIDENT
880 Carillon Parkway
St. Petersburg, FL 33716
(Name and Address of Agent for Service)
Copy to:
CLIFFORD J. ALEXANDER, ESQ.
Kirkpatrick & Lockhart Preston Gates Ellis, LLP
1601 K Street, NW
Washington, D.C. 20006
Registrant’s Telephone Number, including Area Code: (727) 573-3800
Date of fiscal year end: October 31
Date of reporting period: October 31, 2006
| Item 1. | Reports to Shareholders |


November 15, 2006
Dear Fellow Shareholders:
At the August 15, 2006 meeting of the Board of Trustees for the Heritage Funds, at the request of Heritage Asset Management, Inc., the Trustees voted and approved to change the fiscal year end to October 31 for the Capital Appreciation Trust, the Growth and Income Trust and the Heritage Income Trust - High Yield Bond Fund. We requested the change in the fiscal year end because we believe that the funds will benefit from lower expenses in addition to providing the shareholders more up to date performance information in the prospectus. This financial report covers the period since the prior fiscal year ended 2006, to the new fiscal year end, October 31, 2006. The table below provides the performance of the Class A shares returns for each fund and its comparative benchmark index for the applicable period covered by this report.
| | | | |
Period Total Returns | | Performance data presented in the table is
historical and does not guarantee future
results. The investment return and principal
value of an investment will fluctuate, and you
may have a gain or loss when you sell shares.
Current performance may be higher or lower
than the performance data quoted. To obtain
more current performance data as of the most
recent month end, please visit our website at
HeritageFunds.com. |
From 09/01/06 through 10/31/06 | | | |
Capital Appreciation Trust | | 3.78% | |
S&P 500 Index | | 5.22% | |
Russell 1000® Growth Index | | 6.36% | |
From 10/01/06 through 10/31/06 | | | |
Growth and Income Trust | | 2.52% | |
S&P 500 Index | | 3.26% | |
High Yield Bond Fund | | 1.40% | |
Citigroup High Yield Market IndexSM | | 1.43% | | |
All of the returns quoted include the effect of reinvested dividends. Please see the following page for a description of each fund’s benchmark index. The performance numbers quoted for Class A shares are shown without the imposition of a front-end sales charge and include the deduction of Fund expenses. If reflected, the imposition of a front-end sales charge would reduce the performance. Performance results for other classes of shares would differ based on expense ratios.
In the following pages, more detailed performance data is presented. In addition, the performance of each Fund is discussed in detail by each Fund’s portfolio managers, followed by additional financial statements and portfolio holding information. Please keep in mind that these views are not meant as investment advice and although some of the described portfolio holdings were viewed favorably, there is no guarantee a Fund will continue to hold these securities in the future.
I would like to take this opportunity to inform you that after twenty-one years of commitment to the Heritage Capital Appreciation Trust, Herb Ehlers will retire from Goldman Sachs Asset Management, the Fund’s subadviser, effective December 31, 2006. Over the years, Herb has built a very talented investment team comprised of nineteen portfolio managers and senior research analysts. The team will continue with their responsibilities and be accountable for portfolio decision-making for the Fund. Heritage has confidence in the team’s ability to continue to provide clients with an excellent investment management program. We appreciate Herb’s outstanding contributions to the Fund and wish him all the best in his future endeavors.
I would also like to remind you that your investment in any fund is subject to certain risks. For your convenience, we have included on the last two pages of this annual report, a list of these principal risk factors and their detailed explanations from the prospectus dated January 3, 2006. In addition to risks, we ask that you carefully consider the investment objectives, charges and expenses of each fund. Please contact Heritage at (800) 421-4184 or your financial advisor for a prospectus, which contains this and other important information about each Trust. Thank you for your support.
Sincerely,

Stephen G. Hill
President
1
Performance Table
The table below illustrates, for the periods indicated, the investment returns for each respective fund’s class of shares outstanding for the period ended October 31, 2006. Performance returns are calculated in conformance with SEC regulations which assumes the maximum front-end sales charge for Class A shares (4.75% for Capital Appreciation Trust and the Growth and Income Trust and 3.75% for the High Yield Bond Fund), a contingent deferred sales charge for Class B shares (4% for the one year period, 1% for the five year period and 0% for the life of Class B shares), the reinvestment of dividends for all the classes and the deduction of fund expenses.
| | | | | | | | | | | | | | | | | |
Total Returns (as of October 31, 2006) * | |
Share
Class | | Inception
Date | | Life
of
Fund | | | 1 -
Year | | | 3 -
Year | | | 5 -
Year | | | 10 - Year | |
Capital Appreciation Trust | |
Class A | | 12/12/85 | | 11.22 | % | | 8.95 | % | | 8.39 | % | | 5.92 | % | | 10.58 | % |
Class B | | 01/02/98 | | 7.11 | % | | 9.32 | % | | 8.45 | % | | 5.98 | % | | — | |
Class C | | 04/03/95 | | 11.35 | % | | 13.32 | % | | 9.30 | % | | 6.14 | % | | 10.36 | % |
Class I | | 03/21/06 | | 2.77 | % | | — | | | — | | | — | | | — | |
Class R-5 | | 10/02/06 | | 2.20 | % | | — | | | — | | | — | | | — | |
|
Growth and Income Trust | |
Class A | | 12/17/86 | | 8.15 | % | | 12.86 | % | | 10.95 | % | | 7.86 | % | | 6.06 | % |
Class B | | 01/02/98 | | 3.48 | % | | 13.57 | % | | 11.10 | % | | 7.94 | % | | — | |
Class C | | 04/03/95 | | 8.05 | % | | 17.57 | % | | 11.93 | % | | 8.10 | % | | 5.78 | % |
|
High Yield Bond Fund | |
Class A | | 03/01/90 | | 7.14 | % | | 5.23 | % | | 6.75 | % | | 8.88 | % | | 5.47 | % |
Class B | | 02/01/98 | | 4.29 | % | | 4.53 | % | | 6.63 | % | | 8.95 | % | | — | |
Class C | | 04/03/95 | | 6.07 | % | | 8.67 | % | | 7.49 | % | | 9.11 | % | | 5.30 | % |
| * | Returns for Life of Fund are annualized for classes of shares that have existed for one year or more. Returns for the 1-, 3-, 5-, and 10-year periods are annualized. |
Performance data presented in the table and the graphs is historical and does not guarantee future results. The investment return and principal value of an investment will fluctuate, and you may have a gain or loss when you sell shares. Current performance may be higher or lower than the performance data quoted. To obtain more current performance data as of the most recent month end, please visit our website at HeritageFunds.com.
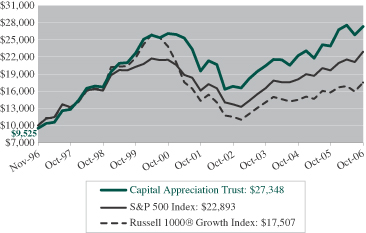
Investment in the Capital Appreciation Trust
from 11/01/96 to 10/31/06
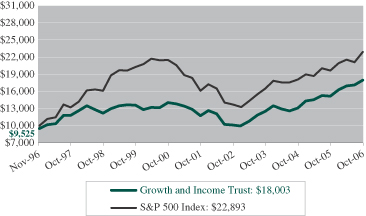
Investment in the Growth and Income Trust
from 11/01/96 to 10/31/06
Investment in the High Yield Bond Fund
from 11/01/96 to 10/31/06
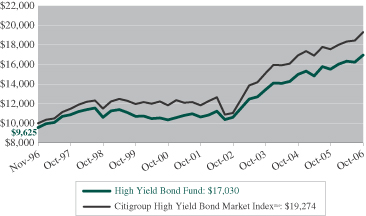
Performance Graph Information
For the periods indicated, each graph compares the growth of an initial hypothetical investment of $10,000 in the specified fund to that of its respective benchmark index. The growth of each fund is based on Class A shares only and reflect the effect of the maximum front-end sales charge of 4.75%; growth for other classes of shares will vary due to differences in fee structures and sales charges. The cumulative total return calculated for each fund and its benchmark index assumes the reinvestment of dividends. The graphs do not reflect the deduction of taxes that a shareholder would pay on fund distributions or the redemption of fund shares.
Index Descriptions
| | • | | S&P 500 Index is an unmanaged index of 500 widely held stocks that are considered representative of the U.S. stock market. |
| | • | | Russell 1000® Growth Index is constructed to provide a comprehensive and unbiased barometer of the large-cap growth market. |
| | • | | Citigroup High Yield Market IndexSM is a broad-based unmanaged index that measures the performance of below-investment grade debt issued by corporations domiciled in the U.S. or Canada. |
Keep in mind that individuals cannot invest directly in any index, and index performance does not include transaction costs or other fees, which will affect actual investment performance.
Please consider the investment objectives, risks, charges and expenses of each fund carefully before investing. Contact Heritage at (800) 421-4184 or your financial advisor for a prospectus, which contains this and other important information about each fund. Read the prospectus carefully before you invest or send money.
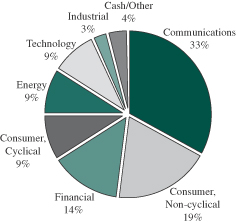
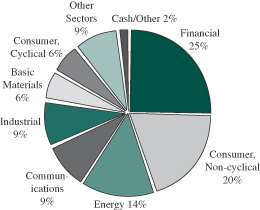
Sector Allocation for the Capital Appreciation Trust
October 31, 2006 (% of net assets)
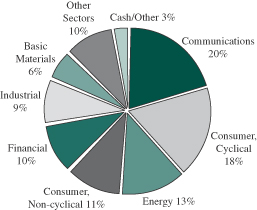
Sector Allocation for the Growth and Income Trust
October 31, 2006 (% of net assets)
Sector Allocation for the High Yield Bond Fund
October 31, 2006 (% of net assets)
|
Discussion of Capital Appreciation Trust Performance |
During an interview conducted on November 20, 2006, Herbert Ehlers, Steven Barry, Gregory Ekizian, and David Shell, the portfolio managers of the Heritage Capital Appreciation Trust (the “Fund”), discussed the Fund’s performance for the two-month reporting period ended October 31, 2006. For performance returns, please see Stephen G. Hill’s letter on page one of this report.
| Q: | Describe the investment strategies used for the Fund during the reporting period. |
| A: | For more than 25 years, we have invested with the belief that as a business grows in value over time, the stock price will ultimately reflect that value. Our strategy therefore is centered on buying growth businesses at attractive valuations and maintaining the long-term perspective required to benefit from the power of compounding. Sounds sensible, right? Or does it sound old-fashioned? |
There is no doubt that there is a short-term orientation in today’s market, with an overload of information from financial news networks and the Internet as well as the proliferation of hedge funds that are measured monthly by clients. Underlying this short-term focus is the demand to achieve an immediate payoff on an investment, not one that may play out over several years. Consequently, stock prices are increasingly volatile in response to every piece of data, and market participants are seeking the information edge that will allow them to trade ahead of others to benefit from a short-term jump in a stock or avoidance of a short-term decline.
While our long-term mindset may seem out of sync in a short-term world, we know that a long-term approach still works, because the economic value of a business cannot be ascertained by the most recent data point. The value is instead the result of such factors as its future cash flows, margin structure, market share, return on equity, and so on. We believe value can only be determined by in-depth research, through which the vast amounts of information available to all can be synthesized into knowledge, and with experience into wisdom.
Most managers talk about research as part of their process, but research can take many forms, from looking up a statistic on Google to reading a published sell-side analyst report to running screens and analyzing the quantitative characteristics of stocks. These types of activities are relatively small parts of our research regimen. Our fundamental research is just that — fundamental. It starts with the hiring process, particularly in highly technical industries: to invest in pharmaceuticals and biotech we start by hiring a medical doctor; to invest in semiconductors we hire an electrical engineer. This way, we know we have analysts that are trained in the science of the business. Then those analysts get out to where the business gets done to understand all elements of trade. The goal of our research is not simply to analyze a stock, rather it is to become so immersed in the industries we cover that we fully understand how industries are changing and which businesses may be affected by this change. The result is our own expert opinion formulated through front-line research.
One aspect of our approach is that we often find ourselves engaged in “solutions-based research.” Through our in-depth research we can identify challenges facing companies and then figure out who is best positioned to provide solutions to these problems. These solutions-providers are often companies that are highly valued by their clients, so that they exhibit the characteristics such as pricing power and sustainable growth that we hold dear. These are also companies whose future growth opportunities may not be reflected in the numbers of their current financial statements, giving us insight into future growth and an advantage over those who define research as simply building models and performing due diligence on company management.
| Q: | How would you describe the overall U.S. market environment and condition during the reporting period? |
| A: | During the reporting period, the United States equity markets trended upward and posted positive returns. The S&P 500 Index closed higher than it has in the past six years and the Dow Jones Industrial Average hit a new record high. Energy prices rose modestly after pulling back during the third quarter and many companies reported better-than-expected earnings along with some positive earnings surprises. While the consumer discretionary and media sectors performed well during the two-month period, the consumer staples sector did not perform as strongly. The Federal Reserve Board left short-term interest rates unchanged for the third consecutive time, indicating growth and inflation may be moderating. |
| Q: | Describe the investment environment in which your investment approach can be expected to be successful. |
The Fund has representation in most sectors of the market. This strategy has the potential to underperform in markets where the advance is narrow in breadth, or with an emphasis on lower quality, speculative names. However, we believe it will
4
|
Discussion of Capital Appreciation Trust Performance (continued) |
outperform in most environments, especially where quality is favored over the long-term. Philosophically, our mantra “investing in high quality growth businesses at a discount to their worth,” combined with the importance of understanding the interaction between income statements, balance sheets, and cash flow statements has helped us weather periods of severe volatility. We invest in high-quality, fundamentally strong companies that have historically been able to gain market share from weaker competitors during downturns and disproportionately profit from increased spending in economic recoveries.
We have confidence in our businesses and the potential for the strategy to outperform as our holdings are recognized by investors. In several instances, on both a stock and sector level, the Fund is meaningfully different from the benchmark, thus representing potential sources of superior relative returns. We believe that the Fund remains of the highest quality and our companies are financially healthy as evidenced by the fact that virtually all of our businesses generate free cash flow.
| Q: | How did the Fund compare to the S&P 500 Index and the Russell 1000® Growth Index during the two-month period? |
| A: | The Fund’s underweight holdings in the Consumer Staples sector in comparison to the S&P 500 Index contributed to performance, as it was the worst performing sector in the market during the reporting period. The Fund’s overweight holdings in the Producer Goods & Services and Media sectors versus the S&P 500 Index contributed to returns as well. |
The Fund’s underweight holdings in the Technology sector detracted from performance in comparison to the Russell 1000® Growth Index. The Fund’s overweight holdings in the Utilities sector compared to the Russell 1000® Growth Index detracted from Fund performance, while its overweight in the Finance sector contributed to performance.
| Q: | Which securities hindered the Fund’s performance during the reporting period? |
| A: | The stock price of Yahoo!, Inc. began to fall after it warned of weakness in third-quarter sales due to slower than expected growth in auto and financial advertising spending. Nothing has changed regarding our long-term secular view on growth in online advertising and we believe Yahoo is one of the top franchises, along with Google, in this area. We believe that Project Panama, Yahoo’s new search platform, should help close the monetization gap with Google. We have taken advantage of the stock’s recent weakness by adding to the position as we believe Yahoo’s valuation is attractive. |
Linear Technology Corporation detracted from performance due to share price weakness that was largely driven by a negative pre-announcement from its closest competitor, Maxim Integrated Products, for the third quarter. In addition, Microchip, a microcontroller company with similar customer exposures to Linear, negatively pre-announced its September quarter shortly after Maxim. While Linear had not commented on how its own third quarter was trending, and its outlook for the fourth quarter, the market was assuming the company was likely to see some level of weakness as well.
Shares of wireless tower company Crown Castle International Corp. pulled back from previously strong performance after the company announced its acquisition of Global Signal Inc., a competitor in the industry. Investors are concerned because Global Signal’s growth is currently not as strong as Crown Castle’s. However, we believe that the acquisition will prove to be a good deal for Crown Castle. We believe Crown Castle has superior systems and management and once the synergies are realized we feel that Global Signal’s growth could be at least as strong as Crown Castle’s. In our view, there is a lot of potential upside to this acquisition that the market is not currently factoring in.
Caremark RX, Inc. detracted from returns as a result of weakness across pharmacy benefit managers (“PBMs”). The two main issues that affected PBMs during the reporting period were Wal-Mart’s announcement that it would be cutting prices to $4 on select generic drugs and news of a potential legal settlement yielding changes in average wholesale price (“AWP”), a pricing mechanism common in pharmacy contracts. We believe the promotional effort by Wal-Mart is immaterial to the PBMs as all their customers have insurance by default, while the Wal-Mart promotion is largely targeting uninsured pharmacy customers. In addition, co-pays for generics are typically around $5, therefore we do not anticipate Wal-Mart’s discount meaningful enough to alter the purchasing behavior of insured customers. Separately, AWP has been the benchmark by which contracted pharmacy reimbursement is set. All players in the supply chain have an incentive for this metric to be inflated as it can benefit their customers. Historically, the AWP markup had been 20%, but First Databank, one of three private companies that issues AWP, decided to increase the markup to 25%. A recent lawsuit against First Databank has resulted in the company agreeing to reverse the markup back to 20%. The risk to PBMs is that a reduction in AWP leads to lower margins if their contracts do not protect them from changes in this benchmark or provide flexibility for renegotiation. Furthermore, all PBMs have indicated that their contracts reserve a right to “renegotiate” their reimbursement if there is a major change to the reference price, or
5
|
Discussion of Capital Appreciation Trust Performance (continued) |
provide more direct insulation. We believe this issue is not likely to be as dislocating as sentiment and the equity markets have discounted. Also, as part of the settlement, First Databank has agreed to phase out AWP as a pricing metric over time, implying this issue may also be transitory.
| Q: | Which securities contributed positively to the Fund’s performance during the reporting period? |
| A: | McGraw-Hill Companies, Inc. aided returns as it reported higher fiscal third quarter earnings and boosted its 2006 revenue outlook in October. While the education market continued to show weakness, management attributed the company’s strength to improved cost management and performance within its financial services segment, Standard & Poor’s. McGraw-Hill also announced that it expects to post double-digit earnings growth in 2007. We continue to favor the ratings agency and believe it has strong fundamentals which should enable it to sustain double-digit growth rates in the long term as global economic growth, the spread of capitalism, and a shift from banks to debt issuance as a source of capital supports further securitization of financial assets. |
During the reporting period, Harrah Entertainment, Inc. received a $15 billion bid from two private equity firms, which drove shares of the company up 14%. While it is still unclear if the company will accept the offer, the deal indicates private equity firms’ newfound interest in the gaming sector. We took the opportunity to trim the position as we feel the value of the business is beginning to be fully recognized by the market. This event demonstrates how adherence to our discipline regarding a high quality business recently out of favor, can benefit the portfolio when other market participants realize the company’s long-term growth potential.
Microsoft Corporation’s stock was up and contributed to performance during the period as the company reported an 11% rise in both quarterly revenue and profit, which beat market expectations. The company cited continued strong demand for its server software and a sharp rise in sales of its Xbox 360 video-gaming units as the driving factors of its positive performance. We believe Microsoft is well positioned for future growth as it is preparing to release new versions of Microsoft Office and a new operating system called Windows Vista. The company is also pushing into new growth areas, such as its Xbox video game console, Zune digital-media player, and Internet-based online services, called Windows Live.
Freddie Mac’s performance continued to trend upward. The company began its turn around in the third quarter as overhang from accounting and political issues started to lift. We believe as Freddie’s regulator and Congress work through resolutions in these areas, the stock will likely trade based more on its strong fundamentals than political uncertainty. We believe that market sentiment has already started to shift in this direction.
| Q: | What steps do you take to manage the Fund’s portfolio investment risks? |
| A: | We attempt to manage risk in three key ways: thorough knowledge of high-quality companies, a consistent investment style, and disciplined portfolio construction. Our ability to identify excellent companies, which we believe are strategically poised for long-term growth, is a key component of our risk management process. We perform rigorous fundamental research on each of our investments to ensure that we understand the risks and rewards. We define risk as related to the probability of a permanent loss of capital rather than the volatility of returns and we assess the real business worth of each company that meets our rigorous standards. Our research includes extensive visits with company managements as well as customers, competitors, and suppliers, in-depth balance sheet and income statement analysis, analysis of company- and industry-specific risks and continual reassessment of the threats to portfolio holdings. Since we invest in high-quality growth companies whose stocks are attractively valued, we believe that we are inherently limiting our level of risk over the long-term. |
The second component of risk management is a consistent investment style, which has remained the same since its inception. Our team approach to investment management helps ensure that we maintain our defined style. Our portfolio characteristics, which have remained consistent over time, reflect our disciplined style adherence.
The third component of risk management is disciplined portfolio construction. An experienced senior portfolio management team, rather than any one individual, manages client portfolios. We actively monitor the individual stock, sector, and thematic exposure of our portfolios in order to adhere to the risk profile of each client. Our guidelines are as follows: we strive to have no more than 10% of the portfolio concentrated in any one stock holding and no more than 50% of the portfolio concentrated in any single sector. We strive to remain fully invested, aiming for less than 5% cash at all times.
6
|
Discussion of Heritage Growth and Income Trust Performance |
During an interview conducted on November 29, 2006, William V. Fries, CFA and Brad Kinkelaar, the portfolio managers of the Heritage Growth and Income Trust (the “Fund”), discussed the Fund’s performance for the one-month period ended October 31, 2006. For performance returns, please see Stephen G. Hill’s letter on page one of this report.
| Q: | Describe the investment strategies used for the Fund during the reporting period. |
| A: | During the reporting period, using a “bottom up”(a) method of analysis, the Fund’s portfolio was constructed from companies with at least one of the following overall characteristics: |
| | (1) | A forecasted long-term growth rate that is greater than inflation; |
| | (2) | Securities priced below estimated intrinsic value, illustrated by the Fund’s overall value indicators relative to the S&P 500 Index; |
| | (3) | Greater profitability and shareholder orientation than the overall market based on our analysis; |
| | (4) | Broadly diversified across industries and sectors, as well as diversified with holdings outside the United States; |
| | (5) | Weighted average market capitalization approximating that of the S&P 500 Index. |
| Q: | How would you describe the overall U.S. market environment and condition during the one-month period? |
| A: | October was another strong month for domestic equities. Economic data released during the month seemed to suggest a cooling economy (yet not recessionary) and lessening inflationary pressures, which is good news to stock investors. The strong move to lower crude prices during September was not only maintained, but continued in October with crude oil closing almost 7% lower than it started the month. The $58.40 per barrel crude oil price on October 31, 2006 was the first sub-$60 per barrel month-end close price since November of last year. This seems to be having two impacts on our economy: not only is it helping to control energy inclusive measures of inflation, but lower prices at the gas pump seem to be keeping the U.S. consumer out and shopping. Third quarter results for many companies were reported during October and corporate earnings are growing at a healthy clip. With around 400 of the S&P 500 companies having reported, share-weighted average earnings per share are up almost 23% when compared to last year. Furthermore, almost three quarters of these companies have reported positive surprises relative to expectations. |
All sectors in the U.S. market moved higher during the month, including energy, which supports our belief that our energy holdings are undervalued even if crude oil prices move somewhat lower. Healthcare, broadly, did not keep pace during October, but this is to be expected in a strong equity market, as many managers trying to “catch up” with positive benchmark performance likely liquidated some of their more defensive holdings. We continue to like our positions in the healthcare sector.
| Q: | How did the investment strategies used during this market environment affect the Fund’s performance when compared to the S&P 500 Index? |
| A: | During the month of October, the Fund performance fell short of the S&P 500 Index. This was primarily due to the performance of our holdings in the Energy and Health Care sectors. These two sectors were in the bottom three of performers for the period. We select stocks one at a time using a bottom up, fundamental analysis approach, and believe that these holdings will perform as expected over our investment time horizon. |
Relative to the S&P 500 Index, the Fund was underweight in consumer discretionary, information technology, industrials, and consumer staples. The Fund’s underweight position in consumer discretionary, which was the top performing sector in the S&P 500, created a negative allocation effect. Information technology was a strong performing sector for the market, but our experience there during the month was not as positive. We were negatively impacted by our underweight position, but more significantly, the specific stocks in the sector that we own did not perform as well as the rest of the sector this month. Industrials were not a strong performer in the broad market during the month, so the Fund was not impacted by its underweight position. However, again, the specific Fund holdings in this sector did not perform well during the month. The reverse situation existed within the consumer staples sector, where the specific Fund holdings dramatically outperformed the overall sector for the month.
| (a) | A bottom-up method of analysis de-emphasizes the significance of economic and market cycles. The primary focus is the analysis of individual companies rather than the industry in which that company operates or the economy as a whole. |
7
|
Discussion of Heritage Growth and Income Trust Performance (continued) |
Relative to the S&P 500 Index, the Fund was overweight in the materials and energy sectors. In materials, the Fund benefited from the overweight position as the sector performed better than the overall market. In addition, the holdings in the Fund within the materials sector outperformed the overall sector, creating a positive selection effect. In the energy sector, the holdings in the Fund did not perform as well as the overall sector, creating a negative selection effect. The Fund also benefited during the month from strong performance in the financials and telecommunication sectors.
| Q: | Which securities negatively impacted the Fund’s performance during the one-month period? |
| A: | Caremark Rx Inc. stock price suffered from the perception that Wal-Mart’s generic prescription drug resale program will affect Caremark’s profitability. Pfizer Inc. is involved in an important clinical trial involving the results on the data surrounding its new drug, Lipitor. The ongoing trial hurt the company stock price. Precision Drilling Trust was affected by a proposed tax law change which would adversely affect Canadian trusts. The proposed change, if adopted, would not take effect for several years, allowing the trusts to maintain their current favorable tax treatment for the foreseeable future. Motorola Inc. maintained good business development and robust global handset unit and revenue growth for Motorola, but third-quarter results were generally below optimistic consensus expectations. Bank of New York Company Inc. did not perform strongly, but there does not appear to be any significant fundamental reason for the weak relative performance in October. AllianceBernstein Holding L.P. continued to benefit from robust assets flows, particularly for its global and style blend product offerings. Southern Copper Corporation experienced stabilization of copper prices during the month and renewed merger activity within the sector benefited the stock. Telefonica SA showed strong wireless results in the United Kingdom, through its Orange division, and solid cost controls benefited the stock. Altria Group Inc. benefited from potential separation of Kraft Foods from the Altria parent company. Fisher Scientific International Inc. benefited from improving visibility on the synergies of its merger with Thermo Electron. |
| Q: | Discuss how the investments in certain foreign countries/markets affected Fund performance. |
| A: | Consistent with the overall performance in the foreign markets in which the Fund is invested, the Fund’s specific holdings in the United Kingdom, Spain, Hong Kong, Greece, and Italy outperformed the broad U.S. market during the month of October and contributed positively to the Fund’s overall performance. The Fund’s holdings in Canada did not perform as well as the overall Canadian market, and contributed negatively to the Fund’s performance during the month. This was primarily because both of our Canadian holdings (Canadian Oil Sands Trust and Precision Drilling Trust) are in the energy sector, which underperformed relative to other areas of the market during the month. |
| Q: | What steps do you take to manage the Fund’s portfolio investment risks? |
| A: | We attempt to manage risk through diversification and stock selection. We are broadly diversified across market sectors, and over 25% of the Fund’s assets are invested in non-U.S. securities. In addition, we believe that the process of identifying companies at a discount through bottom-up fundamental research helps us to identify these potential risks and incorporate them into our evaluation of each stock’s risk/reward trade-off. |
The Fund is invested in forward currency contracts as a risk control measure. We evaluate currency risk on a stock-by-stock basis. We will hedge currencies utilizing forward contracts if deemed appropriate. We use currency hedging to protect the investment thesis for a given stock from being significantly undermined by dollar/foreign currency fluctuations.
During the reporting period, the Fund had very limited exposure to high yield securities. We attempt to manage the risks associated with these types of securities through comprehensive credit analysis techniques, including but not limited to cash flow analysis, balance sheet ratios, and competitive positioning. We used the results of our analysis to evaluate the risk/reward trade-off.
8
|
Discussion of Heritage Income Trust – High Yield Bond Performance |
During an interview conducted on November 22, 2006, with Investment Officers S. Kenneth Leech, Stephen A. Walsh and portfolio managers Michael C. Buchanan and Ian Edmonds, the investment team of the Heritage Income Trust - High Yield Bond Fund (the “Fund”), discussed the Fund’s performance for the one-month period ended October 31, 2006. For performance returns, please see Stephen G. Hill’s letter on page one of this report.
| Q: | Describe the investment strategy used for the Fund during the reporting period. |
| A: | Our goal is to manage the Fund to outperform the stated benchmark index while approximating benchmark risk. To meet this goal, we employ various strategies. These strategies include: capital structure allocation, industry and issuer over/under weightings and rating category rotation. During the reporting period, and since taking management responsibility for the Fund’s portfolio, we have actively pursued a strategy to ensure that the general structure of the Fund’s portfolio is consistent with our view of the market in terms of industry and issuer exposures. |
| Q: | How would you describe the high yield market environment and condition during October 2006? |
| A: | In general, high yield issuer fundamentals remain strong. Credit spreads have narrowed over the past four years for the broad high yield market from in excess of 1,000 basis points to less than 350 basis points. During this period corporate profitability and free cash flow have consistently posted double digit growth, net debt levels were reduced and the global high yield default rate declined from a historically high level to a historically low level. However, in light of increased shareholder and private equity firm activism and the potential for below trend economic growth for the rest of the year it would appear that the credit cycle has peaked. In our view, it is difficult to forecast any significant further credit spread tightening for the asset class. In our opinion, returns for the balance of the year will be driven more by lower treasury rates and coupon than capital appreciation. It is also our opinion that outperformance for the balance of 2006 will be largely driven by individual security/industry selection. |
The Citigroup High Yield IndexSM returned 1.43% for the period October 1, 2006 to October 31, 2006. The best performing industries included airlines and home builders which returned 3.34% and 3.21%, respectively. Airlines benefited from lower fuel costs, increased passenger traffic and higher fares. Performance for home builders was more a function of the fact that prices had been beat up so badly earlier in the year rather than any fundamental improvement. The worst performing industries included gaming and oil equipment which returned 0.45% and 0.46%, respectively. The gaming sector traded off due to the announcement that a private equity group had bid for Harrah’s Entertainment. The risk that other casino operators were now in play put pressure on the entire sector. Oil equipment performed poorly despite an improving fundamental and technical environment.
| Q: | How did the Fund compare to the Citigroup High Yield Market IndexSM during the one-month period? |
| A: | On a net basis, the Fund marginally underperformed the Citigroup High Yield Market IndexSM, it’s primary benchmark. As mentioned earlier, the relative overall quality, industry selection, and issuer exposures had no meaningful impact on relative performance as the dispersion of returns was muted in all of these areas. In addition, the average maturity of the Fund’s portfolio had no impact on relative performance. |
The overall credit quality of the Fund’s portfolio was on par with the market as measured by the Citigroup High Yield IndexSM and therefore had no meaningful impact on performance. A slight underweight to BB rated issues which returned 1.52% was offset by a slight underweight to B rated issues which returned 1.28% for the period. CCC rated issues returned the same as the benchmark, 1.43%. Similarly, industry allocation had no meaningful impact on relative performance. Overweights to out performing industries were offset by underweights to outperforming industries. For example, the fund was overweight in building product and cable, which returned 2.01% and 2.88% respectively, however, the positive impact to relative performance of these overweights was offset by overweights to gaming and oil equipment. Issue selection was also neutral to performance as eight of the funds top ten overweights underperformed while seven of the top ten underweights also underperformed.
9
|
Discussion of Heritage Income Trust – High Yield Bond Performance (continued) |
| Q: | Which securities hindered the Fund’s performance during the one-month period? |
| A: | The Fund’s overweight position in the gaming sector hurt relative performance. The unsolicited buyout offer of Harrah’s Entertainment by Apollo Management and Texas Pacific Group led private equity consortium had a negative impact on the fixed income securities of all casino operators. The funds overweights to Stations Casino hurt performance. In addition, the healthcare industry continues to remain under pressure in large part to the leveraged buyout of HCA Inc. An overweight to Tenet Healthcare also hurt performance. The energy sector continues to underperform and the Fund’s overweight to the sector and Pogo Producing in particular hurt performance. The Fund’s position in the securities mentioned was unchanged for the one-month period. |
| Q: | Which securities contributed positively to the Fund’s performance during the one-month period? |
| A: | The Fund benefited from overweight positions in five of the top ten performing issuers in the Citigroup High Yield IndexSM. The overweights included Charter Communications, Beazer Homes, Hovnanian Enterprises, Intelsat Bermuda and NRG Energy, Inc. Charter and Intelsat both posted better than expected results for the quarter. Beazer and Hovnanian rallied after the building industry had taken a beating in previous months. NRG management’s recently revised their forecast for 2007 (EBITDA over 30% to $2.1 billion). |
| Q: | What steps do you take to manage the Fund’s portfolio investment risks? |
We have a dedicated risk management team that oversees risk management and incorporates it into the investment process. The risk management team combines the best of technology and experience to develop useful risk management tools and procedures. These tools and procedures provide daily analysis for the investment team, ensuring the integration of professional risk management practices into the investment process. Furthermore, we have a risk management committee that is responsible for ensuring the risk management process is complete and monitored on a regular basis. Despite using a large number of independent models to evaluate the risk of different portfolios, we understand that quantitative models are only as good as the assumptions on which they are based. Therefore, the high-quality analysis and observation that comes with experience is applied to all model output, increasing the usefulness of the data.
Analysis of data is carried on throughout the trading day, and involves a thorough review of portfolio holdings and sector concentrations. Techniques such as factor analysis, key rate duration measurement and other analytic systems are also employed to evaluate portfolio risk. In addition, the investment team regularly performs scenario analysis and stress testing to analyze portfolio exposure to market factors. Tracking error is also monitored on a historical and a forward-looking basis.
10
Investment Portfolio | October 31, 2006 |
Heritage Capital Appreciation Trust
| | | | | |
| Shares | | | | Value |
| Common Stocks—96.2% (a) | | | |
| Advertising—2.1% | | | |
| 217,740 | | Lamar Advertising Company, Class “A”* | | $ | 12,559,243 |
| | | | | |
| Banks—1.0% | | | |
| 181,200 | | The Bank of New York Company, Inc. | | | 6,227,844 |
| | | | | |
| Beverages—4.2% | | | |
| 409,810 | | PepsiCo, Inc. | | | 25,998,346 |
| | | | | |
| Biotechnology—1.9% | | | |
| 142,200 | | Genentech Inc.* | | | 11,845,260 |
| | | | | |
| Commercial Services—6.0% | | | |
| 323,650 | | Moody’s Corporation | | | 21,457,995 |
| 689,148 | | The Western Union Company* | | | 15,195,713 |
| | | | | |
| | | | | 36,653,708 |
| | | | | |
| Diversified Manufacturer—3.0% | | | |
| 517,600 | | General Electric Company | | | 18,172,936 |
| | | | | |
| Financial Services—13.2% | | | |
| 330,798 | | American Express Company | | | 19,123,432 |
| 441,110 | | Freddie Mac | | | 30,432,179 |
| 1,722,629 | | The Charles Schwab Corporation | | | 31,386,300 |
| | | | | |
| | | | | 80,941,911 |
| | | | | |
| Food—1.2% | | | |
| 141,100 | | The Hershey Company | | | 7,465,601 |
| | | | | |
| Healthcare Products—2.3% | | | |
| 269,600 | | Stryker Corporation | | | 14,097,384 |
| | | | | |
| Internet—3.1% | | | |
| 717,900 | | Yahoo! Inc.* | | | 18,909,486 |
| | | | | |
| Lodging—6.2% | | | |
| 324,400 | | Harrah’s Entertainment, Inc. | | | 24,112,652 |
| 477,678 | | Hilton Hotels Corporation | | | 13,814,448 |
| | | | | |
| | | | | 37,927,100 |
| | | | | |
| Multimedia—8.9% | | | |
| 1,625,740 | | Entravision Communications Corporation,
Class “A”* | | | 11,932,932 |
| 553,440 | | The McGraw-Hill Companies, Inc. | | | 35,514,245 |
| 172,829 | | Viacom Inc., Class “B”* | | | 6,726,505 |
| | | | | |
| | | | | 54,173,682 |
| | | | | |
| Oil & Gas Services—9.2% | | | |
| 352,888 | | Baker Hughes Inc. | | | 24,366,916 |
| 505,300 | | Schlumberger Ltd. | | | 31,874,324 |
| | | | | |
| | | | | 56,241,240 |
| | | | | |
| | | | | |
| Shares | | | | Value |
| Common Stocks (continued) | | | |
| Pharmaceuticals—5.2% | | | |
| 525,103 | | Caremark Rx, Inc. | | | 25,850,821 |
| 111,800 | | Medco Health Solutions, Inc.* | | | 5,981,300 |
| | | | | |
| | | | | 31,832,121 |
| | | | | |
| Retail—2.4% | | | |
| 250,630 | | Target Corporation | | | 14,832,283 |
| | | | | |
| Semiconductors—1.5% | | | |
| 293,850 | | Linear Technology Corporation | | | 9,144,612 |
| | | | | |
| Software—5.2% | | | |
| 689,148 | | First Data Corporation | | | 16,711,839 |
| 519,850 | | Microsoft Corporation | | | 14,924,894 |
| | | | | |
| | | | | 31,636,733 |
| | | | | |
| Telecommunications—17.6% | | | |
| 669,450 | | American Tower Corporation, Class “A”* | | | 24,113,589 |
| 1,666,800 | | Crown Castle International Corporation* | | | 56,087,820 |
| 379,000 | | Motorola, Inc. | | | 8,739,740 |
| 506,440 | | QUALCOMM Inc. | | | 18,429,352 |
| | | | | |
| | | | | 107,370,501 |
| | | | | |
| Television, Cable & Radio—2.0% | | | |
| 446,961 | | Cablevision Systems Corporation, Class “A”* | | | 12,421,046 |
| | | | | |
| Total Common Stocks (cost $429,403,032) | | | 588,451,037 |
| | | | | |
| Repurchase Agreement—3.7% (a) | | | |
Repurchase Agreement with State Street Bank and Trust
Company, dated October 31, 2006 @ 5.0% to be repurchased
at $22,900,180 on November 1, 2006, collateralized by
$19,210,000 United States Treasury Bonds, 12.5% due August
15, 2014, (market value $23,629,475 including interest) (cost
$22,897,000) | | | 22,897,000 |
| | | | | |
Total Investment Portfolio
(cost $452,300,032) (b), 99.9% (a) | | | 611,348,037 |
| Other Assets and Liabilities, net, 0.1% (a) | | | 20,151 |
| | | | | |
| Net Assets, 100.0% | | $ | 611,368,188 |
| | | | | |
| * | Non-income producing security. |
| (a) | Percentages indicated are based on net assets. |
| (b) | The aggregate identified cost for federal income tax purposes is $453,431,571. Market value includes net unrealized appreciation of $7,916,466 which consists of aggregate gross unrealized appreciation for all securities in which there is an excess of market value over tax cost of $164,855,473 and aggregate gross unrealized depreciation for all securities in which there is an excess of tax cost over market value of $6,939,007. |
| | | | |
| | The accompanying notes are an integral part of the financial statements. | | 11 |
Investment Portfolio | October 31, 2006 |
Heritage Growth and Income Trust
| | | | | |
| Shares | | | | Value |
| Common Stocks—93.2% (a) | | | |
| Domestic— 64.7% | | | |
| Agriculture—4.0% | | | |
| 61,600 | | Altria Group, Inc. | | $ | 5,009,928 |
| | | | | |
| Banks—5.6% | | | |
| 34,960 | | Bank of America Corporation | | | 1,883,295 |
| 78,500 | | The Bank of New York Company, Inc. | | | 2,698,045 |
| 73,500 | | U.S. Bancorp | | | 2,487,240 |
| | | | | |
| | | | | 7,068,580 |
| | | | | |
| Chemicals—2.5% | | | |
| 45,000 | | Air Products & Chemicals Inc. | | | 3,135,150 |
| | | | | |
| Commercial Services—1.2% | | | |
| 49,300 | | Macquarie Infrastructure Company Trust | | | 1,470,620 |
| | | | | |
| Diversified Manufacturer—4.6% | | | |
| 129,000 | | General Electric Company | | | 4,529,190 |
| 50,000 | | Reddy Ice Holdings, Inc. | | | 1,200,000 |
| | | | | |
| | | | | 5,729,190 |
| | | | | |
| Electric—4.9% | | | |
| 36,200 | | Dominion Resources, Inc. | | | 2,931,838 |
| 37,000 | | Entergy Corporation | | | 3,175,710 |
| | | | | |
| | | | | 6,107,548 |
| | | | | |
| Electronics—2.6% | | | |
| 38,800 | | Fisher Scientific International Inc.* | | | 3,322,057 |
| | | | | |
| Environmental Control—1.6% | | | |
| 463,955 | | Synagro Technologies, Inc. | | | 2,004,286 |
| | | | | |
| Financial Services—8.5% | | | |
| 50,100 | | AllianceBernstein Holding LP | | | 3,892,770 |
| 36,600 | | Citigroup Inc. | | | 1,835,856 |
| 35,600 | | Freddie Mac | | | 2,456,044 |
| 52,000 | | JPMorgan Chase & Co. | | | 2,466,880 |
| | | | | |
| | | | | 10,651,550 |
| | | | | |
| Healthcare Services—1.6% | | | |
| 26,100 | | WellPoint, Inc.* | | | 1,991,952 |
| | | | | |
| Mining—3.4% | | | |
| 81,974 | | Southern Copper Corporation | | | 4,211,824 |
| | | | | |
| Oil & Gas—6.1% | | | |
| 44,500 | | Chevron Corporation | | | 2,990,400 |
| 40,851 | | ConocoPhillips | | | 2,460,864 |
| 31,400 | | Exxon Mobil Corporation | | | 2,242,588 |
| | | | | |
| | | | | 7,693,852 |
| | | | | |
| Pharmaceuticals—6.8% | | | |
| 62,300 | | Caremark Rx, Inc. | | | 3,067,029 |
| 203,005 | | Pfizer Inc. | | | 5,410,083 |
| | | | | |
| | | | | 8,477,112 |
| | | | | |
| REIT—3.0% | | | |
| 164,700 | | Host Hotels & Resorts, Inc. | | | 3,797,982 |
| | | | | |
| | | | |
| Shares | | | | Value |
| Common Stocks (continued) | | |
| Retail—3.7% | | |
| 73,600 | | McDonald’s Corporation | | 3,085,312 |
| 26,300 | | Target Corporation | | 1,556,434 |
| | | | |
| | | | 4,641,746 |
| | | | |
| Software—3.1% | | |
| 135,500 | | Microsoft Corporation | | 3,890,205 |
| | | | |
| Telecommunications—1.5% | | |
| 80,400 | | Motorola, Inc. | | 1,854,024 |
| | | | |
| Total Domestic Common Stocks (cost $65,406,517) | | 81,057,606 |
| | | | |
| Foreign— 28.5% (b) | | |
| Banks—6.1% | | |
| 135,500 | | Banco Bilbao Vizcaya Argentaria, SA | | 3,263,438 |
| 178,000 | | Barclays PLC | | 2,397,950 |
| 183,800 | | Lloyds TSB Group PLC | | 1,960,460 |
| | | | |
| | | | 7,621,848 |
| | | | |
| Entertainment—2.3% | | |
| 80,245 | | OPAP SA | | 2,857,548 |
| | | | |
| Financial Services—1.9% | | |
| 440,900 | | China Merchants Holdings (International) Company Ltd. | | 1,287,812 |
| 83,900 | | W.P. Stewart & Co., Ltd. | | 1,157,820 |
| | | | |
| | | | 2,445,632 |
| | | | |
| Food—2.7% | | |
| 850,000 | | Fu Ji Food and Catering Services Holdings Ltd. | | 1,492,368 |
| 244,500 | | Tesco PLC | | 1,834,962 |
| | | | |
| | | | 3,327,330 |
| | | | |
| Oil & Gas—7.5% | | |
| 97,500 | | Canadian Oil Sands Trust | | 2,647,106 |
| 147,800 | | ENI SpA | | 4,472,864 |
| 79,400 | | Precision Drilling Trust | | 2,263,408 |
| | | | |
| | | | 9,383,378 |
| | | | |
| Pharmaceuticals—2.5% | | |
| 58,800 | | GlaxoSmithKline PLC, Sponsored ADR | | 3,131,100 |
| | | | |
| Telecommunications—5.5% | | |
| 237,200 | | Telefonica SA | | 4,568,056 |
| 887,535 | | Vodafone Group PLC | | 2,281,614 |
| | | | |
| | | | 6,849,670 |
| | | | |
| Total Foreign Common Stocks (cost $32,512,582) | | 35,616,506 |
| | | | |
| Total Common Stocks (cost $97,919,099) | | 116,674,112 |
| | | | |
| Preferred Stocks—1.2% (a) | | |
| Financial Services—1.2% | | |
| 60,000 | | Merrill Lynch & Co., Inc., 6.05% | | 1,546,200 |
| | | | |
| Total Preferred Stocks (cost $1,500,000) | | 1,546,200 |
| | | | |
| | | | |
| 12 | | The accompanying notes are an integral part of the financial statements. | | |
Investment Portfolio (continued) | October 31, 2006 |
Heritage Growth and Income Trust
| | | | | |
Principal
Amount | | | | Value |
| Convertible Bonds—4.1% (a) | | | |
| Pharmaceuticals—1.9% | | | |
| $2,400,000 | | Cubist Pharmaceuticals, Inc., 2.25%, 06/15/13 | | $ | 2,373,000 |
| | | | | |
| Telecommunications—2.2% | | | |
| 3,000,000 | | Level 3 Communications, Inc., 6.0%, 03/15/10 | | | 2,715,000 |
| | | | | |
| Total Convertible Bonds (cost $4,466,136) | | | 5,088,000 |
| | | | | |
| Corporate Bonds—0.8% (a) | | | |
| Pipelines—0.8% | | | |
| 1,000,000 | | El Paso Corporation, 7.375%, 12/15/12 | | | 1,027,500 |
| | | | | |
| Total Corporate Bonds (cost $820,577) | | | 1,027,500 |
| | | | | |
Total Investment Portfolio Excluding Repurchase Agreement
(cost $104,705,812) | | | 124,335,812 |
| | | | | |
| | | | | | |
| | | | | Value | |
| Repurchase Agreement—2.3% (a) | | | | |
Repurchase Agreement with State Street Bank and Trust
Company, dated October 31, 2006 @ 5.0% to be repurchased
at $2,901,403 on November 1, 2006, collateralized by
$2,435,000 United States Treasury Bonds, 12.5% due August
15, 2014, (market value $2,995,199 including interest) (cost
$2,901,000) | | | 2,901,000 | |
| | | | | | |
Total Investment Portfolio
(cost $107,606,812) (c), 101.6% (a) | | | 127,236,812 | |
| Other Assets and Liabilities, net, (1.6)% (a) | | | (1,962,308 | ) |
| | | | | | |
| Net Assets, 100.0% | | $ | 125,274,504 | |
| | | | | | |
| * | Non-income producing security. |
| (a) | Percentages indicated are based on net assets. |
| (b) | U.S. dollar denominated. |
| (c) | The aggregate identified cost for federal income tax purposes is $107,695,785. Market value includes net unrealized appreciation of $19,537,694 which consists of aggregate gross unrealized appreciation for all securities in which there is an excess of market value over tax cost of $21,216,322 and aggregate gross unrealized depreciation for all securities in which there is an excess of tax cost over market value of $1,678,628. |
ADR—American Depository Receipt.
REIT—Real Estate Investment Trust.
|
| Forward Foreign Currency Contracts Outstanding October 31, 2006 |
| | |
| Heritage Growth and Income Trust | | |
| | | | | | | |
Contract To Deliver | | In Exchange For | | Delivery Date | | Unrealized Gain |
| GBP 1,500,000 | | USD 2,862,750 | | 12/05/06 | | $ | 1,383 |
GBP—Great Britain Pound
USD—United States Dollar
| | | | |
| | The accompanying notes are an integral part of the financial statements. | | 13 |
Investment Portfolio | October 31, 2006 |
Heritage Income Trust—High Yield Bond Fund
| | | | | |
Principal
Amount | | | | Value |
| Corporate Bonds—94.8% (a) | | | |
| Domestic—85.9% | | | |
| Advertising—1.5% | | | |
| $ 230,000 | | Affinion Group, Inc., 10.125%, 10/15/13 | | $ | 243,800 |
| 25,000 | | Affinion Group, Inc., 11.5%, 10/15/15 | | | 26,062 |
| 130,000 | | Lamar Media Corporation,
6.625%, 08/15/15 | | | 125,125 |
| 275,000 | | R.H. Donnelley Corporation, 144A,
10.875%, 12/15/12 | | | 300,781 |
| 50,000 | | R.H. Donnelley Corporation, Series “A-1”, 6.875%, 01/15/13 | | | 47,062 |
| 75,000 | | R.H. Donnelley Corporation, Series “A-2”, 6.875%, 01/15/13 | | | 70,594 |
| 100,000 | | R.H. Donnelley Corporation, Series “A-3”, 8.875%, 01/15/16 | | | 103,125 |
| | | | | |
| | | | | 916,549 |
| | | | | |
| Aerospace/Defense—2.0% | | | |
| 120,000 | | Alliant Techsystems, Inc., 6.75%, 04/01/16 | | | 119,100 |
| 375,000 | | Argo-Tech Corporation, 9.25%, 06/01/11 | | | 389,062 |
| 250,000 | | L-3 Communications Corporation,
7.625%, 06/15/12 | | | 259,688 |
| 235,000 | | Sequa Corporation, 9.0%, 08/01/09 | | | 247,925 |
| 145,000 | | TransDigm Inc., 144A, 7.75%, 07/15/14 | | | 148,988 |
| | | | | |
| | | | | 1,164,763 |
| | | | | |
| Agriculture—0.6% | | | |
| 50,000 | | Alliance One International, Inc.,
11.0%, 05/15/12 | | | 52,000 |
| 350,000 | | Hines Nurseries, Inc., 10.25%, 10/01/11 | | | 315,000 |
| | | | | |
| | | | | 367,000 |
| | | | | |
| Airlines—0.4% | | | |
| 190,000 | | Continental Airlines, Inc., Series “D”, 7.568%, 12/01/06 | | | 190,000 |
| 42,178 | | Continental Airlines, Inc., Series “981C”, 6.541%, 09/15/09 | | | 41,609 |
| | | | | |
| | | | | 231,609 |
| | | | | |
| Apparel—0.8% | | | |
| 440,000 | | Levi Strauss & Company, 9.75%, 01/15/15 | | | 466,400 |
| | | | | |
| Auto Manufacturers—4.4% | | | |
| 145,000 | | Ford Motor Company, 8.875%, 01/15/22 | | | 125,788 |
| 1,555,000 | | Ford Motor Company, 7.45%, 07/16/31 | | | 1,218,731 |
| 100,000 | | Ford Motor Company, 8.9%, 01/15/32 | | | 90,250 |
| 155,000 | | General Motors Corporation,
7.2%, 01/15/11 | | | 144,538 |
| 200,000 | | General Motors Corporation,
8.25%, 07/15/23 | | | 177,500 |
| 1,000,000 | | General Motors Corporation,
8.375%, 07/15/33 | | | 890,000 |
| | | | | |
| | | | | 2,646,807 |
| | | | | |
| Auto Parts & Equipment—1.2% | | | |
| 500,000 | | Breed Technologies, Inc.,
9.25%, 04/15/08 (c)(d)* | | | — |
| 185,000 | | Keystone Automotive Operations Inc.,
9.75%, 11/01/13 | | | 178,525 |
| | | | |
Principal
Amount | | | | Value |
| Corporate Bonds (continued) | | |
| Auto Parts & Equipment (continued) | | |
| 95,000 | | TRW Automotive Holdings Corporation,
11.0%, 02/15/13 | | 104,262 |
| 270,000 | | Visteon Corporation, 8.25%, 08/01/10 | | 257,850 |
| 205,000 | | Visteon Corporation, 7.0%, 03/10/14 | | 177,838 |
| | | | |
| | | | 718,475 |
| | | | |
| Broadcasting Services/Programs—0.3% | | |
| 65,000 | | XM Satellite Radio Holdings Inc., FRN
9.989%, 05/01/13 | | 61,100 |
| 135,000 | | XM Satellite Radio Holdings Inc.,
9.75%, 05/01/14 | | 128,250 |
| | | | |
| | | | 189,350 |
| | | | |
| Building Materials—1.5% | | |
| 350,000 | | Associated Materials Inc., 0.0% to 03/01/09, 11.25% to maturity (b), 03/01/14 | | 205,625 |
| 140,000 | | Associated Materials Inc.,
9.75%, 04/15/12 | | 143,150 |
| 175,000 | | Nortek, Inc., 8.5%, 09/01/14 | | 167,125 |
| 545,000 | | NTK Holdings, Inc., 0.0% to 09/01/09, 10.75% to maturity (b), 03/01/14 | | 373,325 |
| | | | |
| | | | 889,225 |
| | | | |
| Chemicals—2.4% | | |
| 150,000 | | Equistar Chemicals, LP and Equistar Funding Corporation,
10.625%, 05/01/11 | | 160,500 |
| 310,000 | | Georgia Gulf Corporation, 144A,
9.5%, 10/15/14 | | 305,350 |
| 125,000 | | Hexion U.S. Finance Corporation and Hexion Nova Scotia Finance, ULC, 144A,
9.75%, 11/15/14 | | 124,688 |
| 88,000 | | Lyondell Chemical Company,
9.5%, 12/15/08 | | 90,310 |
| 80,000 | | Lyondell Chemical Company,
8.0%, 09/15/14 | | 81,800 |
| 70,000 | | Lyondell Chemical Company,
8.25%, 09/15/16 | | 72,100 |
| 525,000 | | Millennium America Inc.,
9.25%, 06/15/08 | | 540,750 |
| 85,000 | | Westlake Chemical Corporation,
6.625%, 01/15/16 | | 81,388 |
| | | | |
| | | | 1,456,886 |
| | | | |
| Coal—0.4% | | |
| 215,000 | | International Coal Group, Inc., 144A,
10.25%, 07/15/14 | | 209,088 |
| | | | |
| Commercial Services—3.8% | | |
| 325,000 | | Allied Security Escrow Corporation,
11.375%, 07/15/11 | | 326,625 |
| 125,000 | | Ashtead Capital Inc., 144A,
9.0%, 08/15/16 | | 131,562 |
| 125,000 | | Brand Services, Inc., 12.0%, 10/15/12 | | 139,535 |
| 265,000 | | DynCorp International LLC and DIV Capital Corporation, Series “B”,
9.5%, 02/15/13 | | 275,600 |
| 150,000 | | Education Management Corporation, 144A,
8.75%, 06/01/14 | | 153,750 |
| 60,000 | | H&E Equipment Services, Inc., 144A, 8.375%, 07/15/16 | | 61,950 |
| | | | |
| 14 | | The accompanying notes are an integral part of the financial statements. | | |
Investment Portfolio (continued) | October 31, 2006 |
Heritage Income Trust—High Yield Bond Fund
| | | | | |
Principal
Amount | | | | Value |
| Corporate Bonds (continued) | | | |
| Commercial Services (continued) | | | |
| $ 645,000 | | Hertz Corporation, 144A,
10.5%, 01/01/16 | | $ | 707,888 |
| 120,000 | | Hertz Corporation, 144A,
8.875%, 01/01/14 | | | 125,400 |
| 255,000 | | Penhall International Corporation, 144A,
12.0%, 08/01/14 | | | 271,575 |
| 40,000 | | Service Corporation International,
7.875%, 02/01/13 | | | 41,200 |
| 20,000 | | Service Corporation International, 144A, 7.375%, 10/01/14 | | | 20,550 |
| | | | | |
| | | | | 2,255,635 |
| | | | | |
| Computers—1.1% | | | |
| 150,000 | | Activant Solutions Inc., 144A,
9.5%, 05/01/16 | | | 139,500 |
| 100,000 | | SunGard Data Systems Inc.,
9.125%, 08/15/13 | | | 103,750 |
| 365,000 | | SunGard Data Systems Inc.,
10.25%, 08/15/15 | | | 382,338 |
| | | | | |
| | | | | 625,588 |
| | | | | |
| Diversified Manufacturer—0.8% | | | |
| 145,000 | | Jacuzzi Brands, Inc., 9.625%, 07/01/10 | | | 155,331 |
| 151,000 | | Koppers Inc., 9.875%, 10/15/13 | | | 163,080 |
| 35,000 | | Nutro Products, Inc., 144A, FRN
9.40%, 10/15/13 | | | 35,962 |
| 90,000 | | Nutro Products, Inc., 144A,
10.75%, 04/15/14 | | | 96,750 |
| | | | | |
| | | | | 451,123 |
| | | | | |
| Electric—4.6% | | | |
| 175,000 | | Calpine Generating Company, LLC, 14.37% FRN, 04/01/11* | | | 186,812 |
| 35,000 | | Edison Mission Energy, 144A,
7.5%, 06/15/13 | | | 35,962 |
| 200,000 | | Edison Mission Energy, 144A,
7.75%, 06/15/16 | | | 206,500 |
| 87,675 | | Midwest Generation, LLC,
8.56%, 01/02/16 | | | 94,689 |
| 365,000 | | Mirant North America, LLC,
7.375%, 12/31/13 | | | 369,106 |
| 125,000 | | NRG Energy, Inc., 7.25%, 02/01/14 | | | 126,406 |
| 600,000 | | NRG Energy, Inc., 7.375%, 02/01/16 | | | 606,750 |
| 145,000 | | Orion Power Holdings, Inc.,
12.0%, 05/01/10 | | | 164,575 |
| 325,000 | | The AES Corporation, 9.5%, 06/01/09 | | | 348,156 |
| 250,000 | | The AES Corporation, 9.375%, 09/15/10 | | | 271,250 |
| 340,000 | | The AES Corporation, 7.75%, 03/01/14 | | | 356,150 |
| | | | | |
| | | | | 2,766,356 |
| | | | | |
| Entertainment—3.0% | | | |
| 40,000 | | AMC Entertainment Inc., Series “B”,
8.625%, 08/15/12 | | | 41,250 |
| 370,000 | | AMC Entertainment Inc., 11.0%, 02/01/16 | | | 409,312 |
| 275,000 | | Choctaw Resort Development Enterprise, 144A, 7.25%, 11/15/19 | | | 273,625 |
| 400,000 | | Herbst Gaming, Inc., 8.125%, 06/01/12 | | | 410,000 |
| | | | |
Principal
Amount | | | | Value |
| Corporate Bonds (continued) | | |
| Entertainment (continued) | | |
| 15,000 | | Isle of Capri Casinos, Inc., 9.0%, 03/15/12 | | 15,712 |
| 65,000 | | Isle of Capri Casinos, Inc., 7.0%, 03/01/14 | | 62,400 |
| 375,000 | | Pinnacle Entertainment, Inc.,
8.25%, 03/15/12 | | 380,625 |
| 25,000 | | River Rock Entertainment Authority,
9.75%, 11/01/11 | | 26,750 |
| 165,000 | | Warner Music Group Corporation, 7.375%, 04/15/14 | | 161,288 |
| | | | |
| | | | 1,780,962 |
| | | | |
| Environmental Control—0.3% | | |
| 150,000 | | Allied Waste North America, Inc., Series “B”,
7.25%, 03/15/15 | | 150,000 |
| 500,000 | | Safety-Kleen Services, Inc.,
9.25%, 06/01/08 (c)(d)* | | 500 |
| | | | |
| | | | 150,500 |
| | | | |
| Financial Services—7.3% | | |
| 493,850 | | Airplanes Pass Through Trust, Series “D”,
10.875%, 03/15/19 (c)(d)* | | — |
| 145,000 | | CCM Merger, Inc., 144A, 8.0%, 08/01/13 | | 139,744 |
| 85,000 | | CitiSteel USA, Inc., FRN
12.949%, 09/01/10 | | 87,762 |
| 57,635 | | CitiSteel USA, Inc., 144A, PIK
15.0%, 10/01/10 | | 62,246 |
| 140,000 | | E*TRADE Financial Corporation, 7.375%, 09/15/13 | | 143,850 |
| 65,000 | | E*TRADE Financial Corporation, 7.875%, 12/01/15 | | 68,738 |
| 275,000 | | Ford Motor Credit Company,
7.875%, 06/15/10 | | 268,349 |
| 293,000 | | Ford Motor Credit Company, 144A, FRN 10.64%, 06/15/11 | | 308,367 |
| 125,000 | | Ford Motor Credit Company,
9.875%, 08/10/11 | | 129,165 |
| 260,000 | | Ford Motor Credit Company,
7.0%, 10/01/13 | | 241,702 |
| 250,000 | | General Motors Acceptance Corporation, 6.875%, 08/28/12 | | 250,671 |
| 1,370,000 | | General Motors Acceptance Corporation, 8.0%, 11/01/31 | | 1,467,914 |
| 244,000 | | Global Cash Access Holdings, Inc. and Global Cash Finance Corporation,
8.75%, 03/15/12 | | 257,725 |
| 150,000 | | Hexion U.S. Finance Corporation and Hexion Nova Scotia Finance, ULC,
9.0%, 07/15/14 | | 168,750 |
| 80,000 | | Hughes Network Systems, LLC, 144A,
9.5%, 04/15/14 | | 82,800 |
| 40,000 | | Kansas City Southern Railway Company,
7.50%, 06/15/09 | | 40,450 |
| 700,000 | | Nebco Evans Holding Company,
12.375%, 07/15/07 (c)(d)* | | — |
| 275,000 | | Rainbow National Services LLC, 144A,
10.375%, 09/01/14 | | 305,938 |
| 100,000 | | UCAR Finance, Inc., 10.25%, 02/15/12 | | 105,125 |
| 195,000 | | Vanguard Health Holding Company II, LLC,
9.0%, 10/01/14 | | 188,662 |
| | | | |
| | | | 4,317,958 |
| | | | |
| | | | |
| | The accompanying notes are an integral part of the financial statements. | | 15 |
Investment Portfolio (continued) | October 31, 2006 |
Heritage Income Trust—High Yield Bond Fund
| | | | | |
Principal
Amount | | | | Value |
| Corporate Bonds (continued) | | | |
| Food—0.6% | | | |
| $ 350,000 | | Dole Food Company, Inc., 7.25%, 06/15/10 | | $ | 326,375 |
| 55,000 | | Dole Food Company Inc., 8.875%, 03/15/11 | | | 52,456 |
| | | | | |
| | | | | 378,831 |
| | | | | |
| Forest Products & Paper—1.5% | | | |
| 175,000 | | Appleton Papers Inc., 8.125%, 06/15/11 | | | 174,125 |
| 200,000 | | Appleton Papers Inc., Series “B”,
9.75%, 06/15/14 | | | 198,000 |
| 60,000 | | NewPage Corporation, FRN
11.739%, 05/01/12 | | | 64,800 |
| 105,000 | | NewPage Corporation, 10.0%, 05/01/12 | | | 109,988 |
| 80,000 | | NewPage Corporation, 12.0%, 05/01/13 | | | 83,600 |
| 65,000 | | P. H. Glatfelter Company, 144A,
7.125%, 05/01/16 | | | 64,809 |
| 75,000 | | Verso Paper Holdings LLC, 144A,
9.125%, 08/01/14 | | | 76,125 |
| 135,000 | | Verso Paper Holdings LLC, 144A,
11.375%, 08/01/16 | | | 137,025 |
| | | | | |
| | | | | 908,472 |
| | | | | |
| Healthcare Services—5.0% | | | |
| 325,000 | | Ameripath Inc., 10.5%, 04/01/13 | | | 349,375 |
| 225,000 | | Community Health Systems, Inc.,
6.5%, 12/15/12 | | | 215,156 |
| 380,000 | | DaVita Inc., 7.25% 03/15/15 | | | 378,100 |
| 675,000 | | HCA Inc., 6.5%, 02/15/16 | | | 534,938 |
| 100,000 | | HCA Inc., 7.5%, 11/15/95 | | | 74,072 |
| 450,000 | | IASIS Healthcare LLC and IASIS Capital Corporation, 8.75%, 06/15/14 | | | 434,812 |
| 133,000 | | Psychiatric Solutions, Inc.,
10.625%, 06/15/13 | | | 144,970 |
| 375,000 | | Tenet Healthcare Corporation,
7.375%, 02/01/13 | | | 332,344 |
| 200,000 | | Tenet Healthcare Corporation,
9.875%, 07/01/14 | | | 195,750 |
| 150,000 | | Tenet Healthcare Corporation,
9.25%, 02/01/15 | | | 142,312 |
| 85,000 | | Tenet Healthcare Corporation,
6.875%, 11/15/31 | | | 65,875 |
| 100,000 | | Triad Hospitals, Inc., 7.0%, 11/15/13 | | | 97,250 |
| | | | | |
| | | | | 2,964,954 |
| | | | | |
| Home Builders—1.2% | | | |
| 25,000 | | Beazer Homes USA, Inc., 6.875%, 07/15/15 | | | 23,500 |
| 205,000 | | Beazer Homes USA, Inc., 8.125%, 06/15/16 | | | 208,588 |
| 80,000 | | K. Hovnanian Enterprises, Inc.,
6.25%, 01/15/16 | | | 72,800 |
| 400,000 | | K. Hovnanian Enterprises, Inc.,
8.625%, 01/15/17 | | | 412,500 |
| | | | | |
| | | | | 717,388 |
| | | | | |
| Home Furnishings—1.4% | | | |
| 120,000 | | Norcraft Companies, L.P. and Norcraft Finance Corporation, 9.0%, 11/01/11 | | | 123,000 |
| 275,000 | | Norcraft Holdings LP and Norcraft Capital Corporation, 0.0% to 09/08,
9.75% to maturity (b), 09/01/12 | | | 227,562 |
| | | | |
Principal
Amount | | | | Value |
| Corporate Bonds (continued) | | |
| Home Furnishings (continued) | | |
| 325,000 | | Sealy Mattress Company,
8.25%, 06/15/14 | | 337,188 |
| 150,000 | | Simmons Bedding Company,
7.875%, 01/15/14 | | 148,125 |
| | | | |
| | | | 835,875 |
| | | | |
| Household Products—0.5% | | |
| 25,000 | | American Greetings Corporation, 7.375%, 06/01/16 | | 25,438 |
| 115,000 | | Playtex Products, Inc., 8.0%, 03/01/11 | | 119,888 |
| 100,000 | | Spectrum Brands, Inc., 8.5%, 10/01/13 | | 87,000 |
| 65,000 | | Spectrum Brands, Inc., 7.375%, 02/01/15 | | 52,650 |
| | | | |
| | | | 284,976 |
| | | | |
| Insurance—0.6% | | |
| 355,000 | | Crum & Forster Holdings Corporation,
10.375%, 06/15/13 | | 368,312 |
| | | | |
| Internet—0.3% | | |
| 165,000 | | FTD Inc., 7.75%, 02/15/14 | | 164,175 |
| | | | |
| Iron/Steel—0.3% | | |
| 165,000 | | RathGibson, Inc., 144A ,
11.25%, 02/15/14 | | 171,600 |
| | | | |
| Lodging—2.5% | | |
| 300,000 | | Caesars Entertainment, Inc.,
7.875%, 03/15/10 | | 306,750 |
| 265,000 | | Inn of the Mountain Gods Resort and Casino, 12.0%, 11/15/10 | | 283,550 |
| 175,000 | | MGM Mirage, 8.375%, 02/01/11 | | 181,781 |
| 320,000 | | Station Casinos, Inc., 7.75%, 08/15/16 | | 328,800 |
| 400,000 | | Turning Stone Casino Resort Enterprise, 144A, 9.125%, 12/15/10 | | 408,000 |
| | | | |
| | | | 1,508,881 |
| | | | |
| Metal Fabricate/Hardware—1.3% | | |
| 370,000 | | Metals USA, Inc., 11.125%, 12/01/15 | | 405,150 |
| 184,000 | | Mueller Group, Inc., 10.0%, 05/01/12 | | 200,560 |
| 205,000 | | Mueller Holdings (N.A.), Inc., 0.0% to 04/15/09, 14.75% to maturity (b), 04/15/14 | | 180,400 |
| | | | |
| | | | 786,110 |
| | | | |
| Office Furnishings—0.5% | | |
| 275,000 | | Interface, Inc., 9.5%, 02/01/14 | | 285,312 |
| | | | |
| Office/Business Equipment—0.5% | | |
| 290,000 | | Xerox Corporation, 6.75%, 02/01/17 | | 295,075 |
| | | | |
| Oil & Gas—6.3% | | |
| 310,000 | | Belden & Blake Corporation,
8.75%, 07/15/12 | | 316,200 |
| 450,000 | | Chesapeake Energy Corporation, 7.5%, 06/15/14 | | 460,688 |
| 15,000 | | Chesapeake Energy Corporation,
6.375%, 06/15/15 | | 14,475 |
| 45,000 | | Chesapeake Energy Corporation,
6.625%, 01/15/16 | | 44,044 |
| | | | | | |
| 16 | | The accompanying notes are an integral part of the financial statements. | | | | |
Investment Portfolio (continued) | October 31, 2006 |
Heritage Income Trust—High Yield Bond Fund
| | | | | |
Principal
Amount | | | | Value |
| Corporate Bonds (continued) | | | |
| Oil & Gas (continued) | | | |
| $ 40,000 | | Chesapeake Energy Corporation,
6.875%, 01/15/16 | | $ | 39,700 |
| 100,000 | | Chesapeake Energy Corporation, 6.5%, 08/15/17 | | | 94,250 |
| 520,000 | | Cimarex Energy Company and Magnum Hunter Resources, Inc., 9.6%, 03/15/12 | | | 548,600 |
| 45,000 | | Encore Acquisition Company,
6.0%, 07/15/15 | | | 41,062 |
| 140,000 | | Enterprise Products Operating L.P., 8.375%, 08/01/66 | | | 150,460 |
| 280,000 | | EXCO Resources, Inc., 7.25%, 01/15/11 | | | 269,500 |
| 600,000 | | Forest Oil Corporation, 8.0%, 12/15/11 | | | 621,000 |
| 115,000 | | Mariner Energy, Inc., 144A, 7.5%, 04/15/13 | | | 110,400 |
| 150,000 | | Petrohawk Energy Corporation, 144A, 9.125%, 07/15/13 | | | 153,000 |
| 90,000 | | Plains Exploration & Production Company, Series “B”, 8.75%, 07/01/12 | | | 95,625 |
| 180,000 | | Pogo Producing Company, 144A,
7.875%, 05/01/13 | | | 183,150 |
| 70,000 | | Pride International, Inc., 7.375%, 07/15/14 | | | 72,275 |
| 325,000 | | Stone Energy Corporation,
8.25%, 12/15/11 | | | 322,969 |
| 125,000 | | Swift Energy Company, 9.375%, 05/01/12 | | | 131,562 |
| 55,000 | | Whiting Petroleum Corporation,
7.0%, 02/01/14 | | | 54,175 |
| | | | | |
| | | | | 3,723,135 |
| | | | | |
| Oil & Gas Services—0.0% | | | |
| 10,000 | | Superior Energy Services Inc., 144A,
6.875%, 06/01/14 | | | 9,925 |
| | | | | |
| Packaging & Containers—1.8% | | | |
| 135,000 | | Berry Plastics Corporation, 144A, 8.875%, 09/15/14 | | | 136,350 |
| 295,000 | | Graham Packaging Holdings Company,
9.875%, 10/15/14 | | | 295,738 |
| 325,000 | | Graphic Packaging International Corporation, 8.5%, 08/15/11 | | | 333,938 |
| 25,000 | | Owens-Brockway Glass Container Inc.,
7.75%, 05/15/11 | | | 25,750 |
| 145,000 | | Owens-Brockway Glass Container Inc.,
8.75%, 11/15/12 | | | 152,975 |
| 115,000 | | Plastipak Holdings, Inc., 144A,
8.5%, 12/15/15 | | | 119,025 |
| 150,000 | | Radnor Holdings Corporation,
11.0%, 03/15/10 (c)* | | | 16,875 |
| | | | | |
| | | | | 1,080,651 |
| | | | | |
| Pharmaceuticals—0.4% | | | |
| 265,000 | | Leiner Health Products Inc.,
11.0%, 06/01/12 | | | 261,688 |
| | | | | |
| Pipelines—5.6% | | | |
| 25,000 | | Dynegy Holdings Inc., 8.375%, 05/01/16 | | | 25,688 |
| 300,000 | | Dynegy Holdings Inc., 7.625%, 10/15/26 | | | 279,000 |
| 375,000 | | El Paso Corporation,
7.875%, 06/15/12 | | | 390,938 |
| 525,000 | | El Paso Corporation, MTN,
7.8%, 08/01/31 | | | 547,312 |
| | | | |
Principal
Amount | | | | Value |
| Corporate Bonds (continued) | | |
| Pipelines (continued) | | |
| 725,000 | | El Paso Corporation, MTN,
7.75%, 01/15/32 | | 755,812 |
| 335,000 | | SemGroup, Ltd., 144A, 8.75%, 11/15/15 | | 337,512 |
| 125,000 | | The Williams Companies, Inc., 7.625%, 07/15/19 | | 131,562 |
| 310,000 | | The Williams Companies, Inc., 7.875%, 09/01/21 | | 327,825 |
| 500,000 | | The Williams Companies, Inc.,
8.75%, 03/15/32 | | 555,000 |
| | | | |
| | | | 3,350,649 |
| | | | |
| Printing & Publishing—0.9% | | |
| 100,000 | | Dex Media West LLC and Dex Media West Finance Co., Series “B”, 9.875%, 08/15/13 | | 108,625 |
| 210,000 | | Houghton Mifflin Company, 0.0% to 10/15/08, 11.5% to maturity (b), 10/15/13 | | 189,525 |
| 50,000 | | Houghton Mifflin Company,
9.875%, 02/01/13 | | 53,562 |
| 200,000 | | PRIMEDIA, Inc., 8.875%, 05/15/11 | | 198,500 |
| | | | |
| | | | 550,212 |
| | | | |
| Real Estate—0.2% | | |
| 25,000 | | Ashton Woods USA L.L.C. and Ashton Woods Finance Co., 9.50%, 10/01/15 | | 21,438 |
| 10,000 | | Forest City Enterprises, Inc.,
7.625%, 06/01/15 | | 10,150 |
| 120,000 | | Kimball Hill Inc., 10.5%, 12/15/12 | | 108,000 |
| | | | |
| | | | 139,588 |
| | | | |
| REITs—1.5% | | |
| 200,000 | | Host Marriott, LP, Series “I”,
9.5%, 01/15/07 | | 201,250 |
| 500,000 | | Host Marriott, LP, Series “O”, 6.375%, 03/15/15 | | 486,875 |
| 55,000 | | Ventas Realty, LP and Ventas Capital Corporation, 144A, 7.125%, 06/01/15 | | 56,581 |
| 50,000 | | Ventas Realty, LP and Ventas Capital Corporation, 6.5%, 06/01/16 | | 49,875 |
| 125,000 | | Ventas Realty, LP and Ventas Capital Corporation, 6.75%, 04/01/17 | | 125,938 |
| | | | |
| | | | 920,519 |
| | | | |
| Retail—2.8% | | |
| 55,000 | | AutoNation, Inc., 144A, FRN
7.374%, 04/15/13 | | 55,412 |
| 70,000 | | AutoNation, Inc., 7.0%, 04/15/14 | | 69,650 |
| 140,000 | | Blockbuster Inc., 9.0%, 09/01/12 | | 126,000 |
| 55,000 | | Brookstone Company, Inc.,
12.0%, 10/15/12 | | 53,075 |
| 40,000 | | Buffets, Inc., 144A, 12.5%, 11/01/14 | | 40,200 |
| 225,000 | | Carrols Corporation, 9.0%, 01/15/13 | | 227,812 |
| 50,000 | | EPL Finance Corporation, 144A, 11.75%, 11/15/13 | | 53,250 |
| 40,000 | | Eye Care Centers of America, Inc., 10.75%, 02/15/15 | | 43,700 |
| 175,000 | | Inergy, L.P. and Inergy Finance Corporation, 8.25%, 03/01/16 | | 181,562 |
| 25,000 | | Linens ‘n Things, Inc., FRN,
11.0%, 01/15/14 | | 24,500 |
| | | | |
| | The accompanying notes are an integral part of the financial statements. | | 17 |
Investment Portfolio (continued) | October 31, 2006 |
Heritage Income Trust—High Yield Bond Fund
| | | | | |
Principal
Amount | | | | Value |
| Corporate Bonds (continued) | | | |
| Retail (continued) | | | |
| $ 55,000 | | Michaels Stores, Inc., 144A,
11.375%, 11/01/16 | | $ | 55,069 |
| 320,000 | | Suburban Propane Partners, L.P. and Suburban Energy Finance Corporation,
6.875%, 12/15/13 | | | 308,000 |
| 25,000 | | The Neiman Marcus Group, Inc.,
9.0%, 10/15/15 | | | 26,812 |
| 350,000 | | The Neiman Marcus Group, Inc., 10.375%, 10/15/15 | | | 382,812 |
| | | | | |
| | | | | 1,647,854 |
| | | | | |
| Software—0.6% | | | |
| 223,989 | | UGS Capital Corporation II, 144A, PIK, FRN 10.38%, 06/01/11 | | | 231,269 |
| 120,000 | | UGS Corporation, 10.0%, 06/01/12 | | | 129,600 |
| | | | | |
| | | | | 360,869 |
| | | | | |
| Telecommunications—6.1% | | | |
| 50,000 | | Cincinnati Bell Inc., 8.375%, 01/15/14 | | | 51,000 |
| 230,000 | | Cincinnati Bell Inc., 7.0%, 02/15/15 | | | 225,975 |
| 30,000 | | Cincinnati Bell Inc., 6.3%, 12/01/28 | | | 26,550 |
| 195,000 | | Citizens Communications Company, 9.0%, 08/15/31 | | | 211,819 |
| 275,000 | | Hawaiian Telecom Communications, Inc., 12.5%, 05/01/15 | | | 293,562 |
| 204,000 | | Insight Midwest, LP and Insight Capital, Inc., 9.75%, 10/01/09 | | | 207,570 |
| 120,000 | | Level 3 Communications, Inc., 144A, 9.25% 11/01/14 | | | 120,750 |
| 40,000 | | Level 3 Financing, Inc.,
10.75%, 10/15/11 | | | 42,500 |
| 50,000 | | Level 3 Financing, Inc., FRN,
11.80%, 03/15/11 | | | 52,625 |
| 365,000 | | Lucent Technologies Inc.,
6.45%, 03/15/29 | | | 326,675 |
| 50,000 | | MetroPCS Communications, Inc., 144A,
9.25%, 11/01/14 | | | 50,438 |
| 210,000 | | Qwest Communications International Inc., Series “B”, 7.5%, 02/15/14 | | | 214,200 |
| 45,000 | | Qwest Communications International, Inc.,
7.5%, 02/15/14 | | | 45,900 |
| 310,000 | | Qwest Corporation, 7.875%, 09/01/11 | | | 328,212 |
| 445,000 | | Qwest Corporation, 6.875%, 09/15/33 | | | 416,631 |
| 590,000 | | Rural Cellular Corporation,
9.875%, 02/01/10 | | | 619,500 |
| 355,000 | | Windstream Corporation, 144A,
8.625%, 08/01/16 | | | 382,956 |
| 500,000 | | World Access, Inc.,
13.25%, 01/15/08 (c)(d)* | | | 20,000 |
| | | | | |
| | | | | 3,636,863 |
| | | | | |
| Television, Cable & Radio—6.7% | | | |
| 50,000 | | Charter Communications Holding Company LLC, 0.0% to 01/15/07, 12.125% to maturity (b), 01/15/12 | | | 43,500 |
| 300,000 | | Charter Communications Holdings II, LLC and Charter Communications Holdings II Capital Corporation, 10.25%, 09/15/10 | | | 309,750 |
| | | | |
Principal
Amount | | | | Value |
| Corporate Bonds (continued) | | |
| Television, Cable & Radio (continued) | | |
| 229,970 | | Charter Communications Holdings II, LLC and Charter Communications Holdings II Capital Corporation, 144A, 10.25%, 10/01/13 | | 236,869 |
| 350,000 | | Charter Communications Holdings, LLC and Charter Communications Holdings Capital Corporation, 11.0%, 10/01/15 | | 337,312 |
| 11,970 | | Charter Communications Holdings, LLC and Charter Communications Holdings Capital Corporation, 144A, 11.0%, 10/01/15 | | 11,491 |
| 300,000 | | Charter Communications Holdings, LLC, 0.0% to 05/15/06, 11.75% to maturity (b), 05/15/14 | | 255,750 |
| 100,000 | | Charter Communications Holdings, LLC, 0.0% to 01/15/07, 12.125% to maturity (b), 01/15/15 | | 83,750 |
| 155,000 | | CMP Susquehanna Corporation, 144A, 9.875%, 05/15/14 | | 149,769 |
| 420,000 | | CSC Holdings, Inc., 8.125%, 08/15/09 | | 433,125 |
| 265,000 | | DirecTV Holdings LLC and DirectTV Financing Co., Inc., 8.375%, 03/15/13 | | 274,938 |
| 110,000 | | Echostar DBS Corporation, 144A,
7.0%, 10/01/13 | | 109,038 |
| 495,000 | | Echostar DBS Corporation,
6.625%, 10/01/14 | | 477,675 |
| 200,000 | | Echostar DBS Corporation, 144A,
7.125%, 02/01/16 | | 195,500 |
| 450,000 | | LodgeNet Entertainment Corporation,
9.5%, 06/15/13 | | 481,500 |
| 275,000 | | Radio One, Inc., Series “B”,
8.875%, 07/01/11 | | 282,562 |
| 300,000 | | Sinclair Broadcast Group, Inc.,
8.0%, 03/15/12 | | 309,000 |
| | | | |
| | | | 3,991,529 |
| | | | |
| Transportation—0.4% | | |
| 95,000 | | GulfMark Offshore, Inc.,
7.75%, 07/15/14 | | 95,475 |
| 118,000 | | Horizon Lines, LLC, 9.0%, 11/01/12 | | 123,310 |
| | | | |
| | | | 218,785 |
| | | | |
| Total Domestic Corporate Bonds (cost $52,841,802) | | 51,166,502 |
| | | | |
| Foreign—8.9% (e) | | |
| Chemicals—1.3% | | |
| 300,000 | | Methanex Corporation,
8.75%, 08/15/12 | | 323,250 |
| 175,000 | | Montell Finance Co BV & Basell Holdings NV, 144A, 8.10%, 03/15/27 | | 164,500 |
| 233,000 | | Rhodia SA, 10.25%, 06/01/10 | | 263,872 |
| | | | |
| | | | 751,622 |
| | | | |
| Electric—0.1% | | |
| 90,000 | | AES China Generating Company, 8.25%, 06/26/10 | | 89,149 |
| | | | |
| | | | |
| 18 | | The accompanying notes are an integral part of the financial statements. | | |
Investment Portfolio (continued) | October 31, 2006 |
Heritage Income Trust—High Yield Bond Fund
| | | | |
Principal
Amount | | | | Value |
| Corporate Bonds (continued) | | |
| Electronics—0.3% | | |
| $ 145,000 | | NXP BV, 144A, 7.875%, 10/15/14 | | $ 147,175 |
| 45,000 | | NXP BV, 144A, 9.5%, 10/15/15 | | 45,394 |
| | | | |
| | | | 192,569 |
| | | | |
| Government Obligations & Agencies—1.7% | | |
| 43,000 | | Republic of Panama, 9.375%, 04/01/29 | | 55,792 |
| 550,000 | | Russian Federation, 5.0% to 03/31/07,
7.5% to maturity (b), 03/31/30 | | 616,055 |
| 80,000 | | The Federative Republic of Brazil, 8.0%, 01/15/18 | | 88,440 |
| 170,000 | | The Federative Republic of Brazil, 11.0%, 08/17/40 | | 223,890 |
| | | | |
| | | | 984,177 |
| | | | |
| Holding Companies—1.1% | | |
| 410,000 | | Smurfit Kappa Funding, PLC,
9.625%, 10/01/12 | | 434,088 |
| 190,000 | | Nell AF S.a.r.l., 144A, 8.375%, 08/15/15 | | 192,850 |
| | | | |
| | | | 626,938 |
| | | | |
| Multimedia—0.2% | | |
| 130,000 | | Quebecor Media Inc., 7.75%, 03/15/16 | | 131,300 |
| | | | |
| Oil & Gas Services—0.1% | | |
| 65,000 | | Compagnie Generale De Geophysique,
7.5%, 05/15/15 | | 64,188 |
| | | | |
| Pharmaceuticals—0.0% | | |
| 25,000 | | Angiotech Pharmaceuticals, Inc., 144A,
7.75%, 04/01/14 | | 23,750 |
| | | | |
| Telecommunications—2.4% | | |
| 105,000 | | Inmarsat Finance, PLC, 7.625%, 06/30/12 | | 108,281 |
| 225,000 | | Intelsat Bermuda, Ltd., 144A,
9.25%, 06/15/16 | | 240,188 |
| 440,000 | | Intelsat Bermuda, Ltd., 144A,
11.25%, 06/15/16 | | 479,050 |
| 25,000 | | Intelsat, Ltd., 7.625%, 04/15/12 | | 22,562 |
| 150,000 | | Nordic Telephone Company Holding ApS, 144A, 8.875%, 05/01/16 | | 157,125 |
| 135,000 | | NTL Cable PLC, 9.125%, 08/15/16 | | 141,919 |
| 30,000 | | Rogers Wireless Inc., 7.25%, 12/15/12 | | 31,500 |
| 225,000 | | Rogers Wireless Inc., 8.0%, 12/15/12 | | 237,938 |
| | | | |
| | | | 1,418,563 |
| | | | |
| Television, Cable & Radio—1.0% | | |
| 345,000 | | Kabel Deutschland GmbH, 144A,
10.625%, 07/01/14 | | 373,031 |
| 20,000 | | Rogers Cable Inc., 6.25% 06/15/13 | | 19,750 |
| 240,000 | | Rogers Cable Inc., 5.5% 03/15/14 | | 225,600 |
| | | | |
| | | | 618,381 |
| | | | |
| Transportation—0.7% | | |
| 35,000 | | OMI Corporation, 7.625%, 12/01/13 | | 35,700 |
| 30,000 | | Transportaction Ferroviaria Mexicana, S.A. DE C.V., 10.25%, 06/15/07 | | 30,638 |
| | | | |
Principal
Amount | | | | Value |
| Corporate Bonds (continued) | | |
| Transportation (continued) | | |
| 285,000 | | Transportaction Ferroviaria Mexicana, S.A. DE C.V., 9.375%, 05/01/12 | | 304,238 |
| 10,000 | | Transportaction Ferroviaria Mexicana, S.A. DE C.V., 12.5%, 06/15/12 | | 10,950 |
| | | | |
| | | | 381,526 |
| | | | |
| Total Foreign Corporate Bonds (cost $5,146,594) | | 5,282,163 |
| | | | |
| Total Corporate Bonds (cost $57,988,396) | | 56,448,665 |
| | | | |
| Convertible Bonds—0.4% (a) | | |
| Semiconductors—0.2% | | |
| 150,000 | | Amkor Technology, Inc.,
2.5%, 05/15/11 | | 126,562 |
| | | | |
| Telecommunications—0.2% | | |
| 125,000 | | American Tower Corporation,
5.0%, 02/15/10 | | 124,688 |
| | | | |
| Total Convertible Bonds (cost $223,509) | | 251,250 |
| | | | |
| | |
| Shares | | | | |
| Warrants, Common & Preferred Stocks—0.7% (a) |
| 3,781 | | American Tower Corporation, Class “A” (Common Stock)* | | 136,192 |
| 8,658 | | Applied Extrusion Technologies, Inc. (Common Stock) (d)(f)* | | 47,619 |
| 4,056 | | Axiohm Transaction Solutions, Inc.
(Common Stock) (d)(f)* | | — |
| 250 | | Brown Jordan International, Inc., 08/15/07 (Warrants) (d)* | | 2 |
| 368 | | Chesapeake Energy Corporation, 6.25%
(Convertible Preferred Stock) | | 100,758 |
| 17,241 | | ContinentalAFA Dispensing Company
(Common Stock) (d)(f)* | | 94,826 |
| 735,946 | | Home Interiors (Common Stock) (d)(f)* | | 7,359 |
| 344 | | Imperial Sugar Company (Common Stock) | | 9,126 |
| 200 | | Leap Wireless International, Inc., 04/15/10 (Warrants) (d)* | | — |
| 3,747 | | Mattress Discounters Corporation
(Common Stock) (d)* | | — |
| 250 | | Mattress Discounters Corporation, 07/15/07 (Warrants) (d)* | | — |
| 602 | | TCR Holding Corporation, Class “B”
(Preferred Stock) (d)* | | 1 |
| 331 | | TCR Holding Corporation, Class “C”
(Preferred Stock) (d)* | | — |
| 873 | | TCR Holding Corporation, Class “D”
(Preferred Stock) (d)* | | 1 |
| 1,807 | | TCR Holding Corporation, Class “E”
(Preferred Stock) (d)* | | 2 |
| 375 | | UbiquiTel Inc., 04/15/10 (Warrants) (d)* | | 4 |
| 1,571 | | World Access, Inc. (Common Stock)* | | 2 |
| | | | |
Total Warrants, Common & Preferred Stocks
(cost $1,542,944) | | 395,892 |
| | | | |
Total Investment Portfolio excluding repurchase agreement (cost
$59,754,849) | | 57,095,807 |
| | | | |
| | | | |
| | The accompanying notes are an integral part of the financial statements. | | 19 |
Investment Portfolio (continued) | October 31, 2006 |
Heritage Income Trust—High Yield Bond Fund
| | | | | |
| Shares | | Value |
| Repurchase Agreement — 2.7% (a) | | | |
Repurchase Agreement with State Street Bank and Trust
Company, dated October 31, 2006 @ 5.0% to be repurchased at
$1,609,223 on November 1, 2006, collateralized by $1,400,000
United States Treasury Bonds, 12.5% due August 15, 2014,
(market value $1,722,086 including interest)
(cost $1,609,000) | | $ | 1,609,000 |
| | | | | |
Total Investment Portfolio
(cost $61,363,849) (g), 98.6% (a) | | | 58,704,807 |
| | | | | |
| Other Assets and Liabilities, net, 1.4% (a) | | | 830,204 |
| | | | | |
| Net Assets, 100.0% | | $ | 59,535,011 |
| | | | | |
| * | Non-income producing security. |
| (a) | Percentages indicated are based on net assets. |
| (b) | Bonds reset to applicable coupon rate at a future date. |
| (d) | Restricted securities deemed to be illiquid for purposes of compliance limitations on holdings of illiquid securities and fair valued according to procedures adopted by the Board of Trustees. At October 31, 2006, these securities aggregated $170,314 or 0.3% of the net assets of the Fund. |
| (e) | U.S. dollar denominated. |
| (f) | Private Placement security acquired from issuers of bonds that have defaulted. At October 31, 2006, these securities aggregated $149,804 or 0.3%. |
| (g) | The aggregate identified cost for federal income tax purposes is $61,363,880. Market value includes net unrealized depreciation of $2,659,073 which consists of aggregate gross unrealized appreciation for all securities in which there is an excess of market value over tax cost of $1,911,922 and aggregate gross unrealized depreciation for all securities in which there is an excess of tax cost over market value of $4,570,995. |
| 144A— | 144A securities are issued pursuant to Rule 144A of the Securities Act of 1933. Most of these are deemed to be liquid for purposes of compliance limitations on holdings of illiquid securities and all may be resold as transactions exempt from registration to qualified institutional buyers. At October 31, 2006, these securities aggregated $9,727,539 or 16.3% of the net assets of the Fund. |
| FRN — | Floating Rate Notes reset their interest rate on a semiannually or quarterly basis. |
| PIK — | Payment-in-Kind bonds may pay interest in the form of additional bonds, as opposed to cash payouts. |
| REIT— | Real Estate Investment Trust. |
| | | | |
| 20 | | The accompanying notes are an integral part of the financial statements. | | |
|
| Statements of Assets and Liabilities October 31, 2006 |
| | | | | | | | | | | | |
| | | Capital
Appreciation
Trust | | | Growth and
Income Trust | | | High Yield
Bond Fund | |
Assets | | | | | | | | | | | | |
Investments, at value (identified cost $429,403,032, $104,705,812 and $59,754,849, respectively) | | $ | 588,451,037 | | | $ | 124,335,812 | | | $ | 57,095,807 | |
Repurchase agreements (identified cost is the same as value) | | | 22,897,000 | | | | 2,901,000 | | | | 1,609,000 | |
Cash | | | 220 | | | | 394 | | | | 210 | |
Unrealized gain on forward foreign currency contracts | | | — | | | | 1,383 | | | | — | |
Receivables: | | | | | | | | | | | | |
Investments sold | | | — | | | | — | | | | 186,505 | |
Fund shares sold | | | 1,403,765 | | | | 107,113 | | | | 25,708 | |
Dividends and interest | | | 136,741 | | | | 179,380 | | | | 1,290,198 | |
Deferred state qualification expenses | | | 40,692 | | | | 15,960 | | | | 10,204 | |
Prepaid insurance | | | 8,052 | | | | 5,263 | | | | 4,807 | |
| | | | | | | | | | | | |
Total assets | | | 612,937,507 | | | | 127,546,305 | | | | 60,222,439 | |
Liabilities | | | | | | | | | | | | |
Payables: | | | | | | | | | | | | |
Investments purchased | | $ | — | | | $ | 1,393,075 | | | $ | 373,063 | |
Fund shares redeemed | | | 772,105 | | | | 660,295 | | | | 199,668 | |
Accrued investment advisory fee | | | 385,055 | | | | 54,478 | | | | 275 | |
Accrued distribution fees | | | 239,558 | | | | 62,534 | | | | 25,788 | |
Accrued shareholder servicing fee | | | 56,707 | | | | 12,647 | | | | — | |
Accrued fund accounting fee | | | 8,318 | | | | 7,899 | | | | 9,420 | |
Accrued trustees and officers fees | | | 7,042 | | | | 7,042 | | | | 7,042 | |
Other accrued expenses | | | 100,534 | | | | 73,831 | | | | 72,172 | |
| | | | | | | | | | | | |
Total liabilities | | | 1,569,319 | | | | 2,271,801 | | | | 687,428 | |
| | | | | | | | | | | | |
Net assets | | $ | 611,368,188 | | | $ | 125,274,504 | | | $ | 59,535,011 | |
| | | | | | | | | | | | |
Net Assets | | | | | | | | | | | | |
Net assets consist of: | | | | | | | | | | | | |
Paid-in capital | | $ | 461,269,286 | | | $ | 101,330,856 | | | $ | 69,641,912 | |
Undistributed net investment income (loss) | | | — | | | | (74,972 | ) | | | 462,233 | |
Accumulated net realized gain (loss) | | | (8,949,104 | ) | | | 4,393,336 | | | | (7,910,092 | ) |
Net unrealized appreciation (depreciation) on investments and other assets
and liabilities denominated in foreign currencies | | | 159,048,006 | | | | 19,625,284 | | | | (2,659,042 | ) |
| | | | | | | | | | | | |
Net assets | | $ | 611,368,188 | | | $ | 125,274,504 | | | $ | 59,535,011 | |
| | | | | | | | | | | | |
Net assets, at market value | | | | | | | | | | | | |
Class A shares | | $ | 386,739,698 | | | $ | 68,454,637 | | | $ | 31,219,385 | |
Class B shares | | | 39,116,428 | | | | 9,876,910 | | | | 7,628,233 | |
Class C shares | | | 149,010,418 | | | | 46,942,957 | | | | 20,687,393 | |
Class I shares | | | 29,902,341 | | | | N/A | | | | N/A | |
Class R-5 shares | | | 6,599,303 | | | | N/A | | | | N/A | |
| | | | | | | | | | | | |
Total | | $ | 611,368,188 | | | $ | 125,274,504 | | | $ | 59,535,011 | |
| | | | | | | | | | | | |
Shares of beneficial interest outstanding | | | | | | | | | | | | |
Class A shares | | | 13,033,584 | | | | 4,661,780 | | | | 4,029,673 | |
Class B shares | | | 1,441,066 | | | | 687,115 | | | | 994,210 | |
Class C shares | | | 5,492,236 | | | | 3,264,744 | | | | 2,694,591 | |
Class I shares | | | 1,005,690 | | | | N/A | | | | N/A | |
Class R-5 shares | | | 222,354 | | | | N/A | | | | N/A | |
| | | |
Net Asset Value, offering and redemption price per share | | | | | | | | | | | | |
Class A shares | | | $29.67 | | | | $14.68 | | | | $7.75 | |
Maximum offering price (100/95.25 of $29.67, $14.68 and 100/96.25 of $7.75, respectively) | | | $31.15 | | | | $15.41 | | | | $8.05 | |
Class B shares | | | $27.14 | | | | $14.37 | | | | $7.67 | |
Class C shares | | | $27.13 | | | | $14.38 | | | | $7.68 | |
Class I shares | | | $29.73 | | | | N/A | | | | N/A | |
Class R-5 shares | | | $29.68 | | | | N/A | | | | N/A | |
| | | | |
| | The accompanying notes are an integral part of the financial statements. | | 21 |
| | | | | | | | | | | | | | | | | | | | | | | | |
| | | Capital Appreciation Trust | | | Growth and Income Trust | | | High Yield Bond Fund | |
| | | 09/01/06-
10/31/06 | | | 09/01/05-
08/31/06 | | | 10/01/06-
10/31/06 | | | 10/01/05-
09/30/06 | | | 10/01/06-
10/31/06 | | | 10/01/05-
09/30/06 | |
Investment Income | | | | | | | | | | | | | | | | | | | | | | | | |
Income: | | | | | | | | | | | | | | | | | | | | | | | | |
Gross dividends | | $ | 772,501 | | | $ | 4,811,155 | | | $ | 248,891 | | | $ | 4,035,502 | | | $ | — | | | $ | 8,788 | |
Dividend withholding tax | | | — | | | | (8,546 | ) | | | (24,839 | ) | | | (130,988 | ) | | | — | | | | — | |
| | | | | | | | | | | | | | | | | | | | | | | | |
Net dividends | | | 772,501 | | | | 4,802,609 | | | | 224,052 | | | | 3,904,514 | | | | — | | | | 8,788 | |
Interest | | | 273,081 | | | | 743,029 | | | | 60,048 | | | | 658,747 | | | | 416,997 | | | | 5,599,514 | |
| | | | | | | | | | | | | | | | | | | | | | | | |
Total income | | | 1,045,582 | | | | 5,545,638 | | | | 284,100 | | | | 4,563,261 | | | | 416,997 | | | | 5,608,302 | |
| | | | | | |
Expenses: | | | | | | | | | | | | | | | | | | | | | | | | |
Investment advisory fee | | | 750,886 | | | | 4,317,613 | | | | 76,278 | | | | 814,424 | | | | 22,721 | | | | 321,877 | |
Administrative fee | | | N/A | | | | N/A | | | | N/A | | | | N/A | | | | 7,573 | | | | 70,590 | |
Distribution fees | | | 469,331 | | | | 2,775,865 | | | | 62,535 | | | | 678,483 | | | | 25,788 | | | | 334,971 | |
Shareholder servicing fees | | | 130,880 | | | | 652,963 | | | | 12,637 | | | | 159,255 | | | | 5,097 | | | | 80,600 | |
Custodian fee | | | 5,067 | | | | 29,949 | | | | 1,567 | | | | 17,757 | | | | 746 | | | | 7,166 | |
Fund accounting fee | | | 16,559 | | | | 92,633 | | | | 7,826 | | | | 93,964 | | | | 9,347 | | | | 109,251 | |
Professional fees | | | 29,795 | | | | 107,687 | | | | 23,416 | | | | 90,228 | | | | 24,620 | | | | 112,670 | |
State qualification expenses | | | 18,717 | | | | 99,205 | | | | 3,847 | | | | 39,677 | | | | 3,537 | | | | 43,024 | |
Reports to shareholders | | | 11,182 | | | | 51,819 | | | | 4,260 | | | | 29,427 | | | | 1,200 | | | | 32,179 | |
Trustees and officers fees | | | 7,203 | | | | 36,617 | | | | 6,969 | | | | 37,241 | | | | 6,969 | | | | 37,241 | |
Insurance | | | 3,221 | | | | 18,279 | | | | 1,053 | | | | 11,628 | | | | 961 | | | | 11,127 | |
Other | | | 1,737 | | | | 22,709 | | | | 477 | | | | 10,729 | | | | 468 | | | | 7,975 | |
| | | | | | | | | | | | | | | | | | | | | | | | |
Total expenses before adjustments | | | 1,444,578 | | | | 8,205,339 | | | | 200,865 | | | | 1,982,813 | | | | 109,027 | | | | 1,168,671 | |
Fees and expenses waived | | | — | | | | — | | | | (21,800 | ) | | | (77,000 | ) | | | (35,120 | ) | | | (228,000 | ) |
Expense offsets | | | (241 | ) | | | (204 | ) | | | (45 | ) | | | (201 | ) | | | (153 | ) | | | (2,659 | ) |
| | | | | | | | | | | | | | | | | | | | | | | | |
Total expenses after adjustments | | | 1,444,337 | | | | 8,205,135 | | | | 179,020 | | | | 1,905,612 | | | | 73,754 | | | | 938,012 | |
| | | | | | | | | | | | | | | | | | | | | | | | |
Net investment income (loss) | | | (398,755 | ) | | | (2,659,497 | ) | | | 105,080 | | | | 2,657,649 | | | | 343,243 | | | | 4,670,290 | |
| | | | | | | | | | | | | | | | | | | | | | | | |
| | | | | | |
Realized and Unrealized Gain (Loss) on Investments | | | | | | | | | | | | | | | | | | | | | | | | |
Net realized gain (loss) from investment transactions | | | 8,653,090 | | | | 17,400,953 | | | | 1,538,982 | | | | 8,095,682 | | | | (29,939 | ) | | | 978,438 | |
Net realized loss from foreign currency transactions | | | — | | | | — | | | | (1,002 | ) | | | (612,138 | ) | | | — | | | | — | |
Net change in unrealized appreciation (depreciation) on investments | | | 13,834,753 | | | | 29,584,095 | | | | 1,501,569 | | | | 3,528,713 | | | | 517,265 | | | | (1,650,907 | ) |
Net change in unrealized appreciation (depreciation) on translation of assets and liabilities denominated in foreign currencies | | | — | | | | — | | | | (61,852 | ) | | | 57,136 | | | | — | | | | — | |
| | | | | | | | | | | | | | | | | | | | | | | | |
Net gain (loss) on investments | | | 22,487,843 | | | | 46,985,048 | | | | 2,977,697 | | | | 11,069,393 | | | | 487,326 | | | | (672,469 | ) |
| | | | | | | | | | | | | | | | | | | | | | | | |
Net increase in net assets resulting from operations | | $ | 22,089,088 | | | $ | 44,325,551 | | | $ | 3,082,777 | | | $ | 13,727,042 | | | $ | 830,569 | | | $ | 3,997,821 | |
| | | | | | | | | | | | | | | | | | | | | | | | |
|
| Statements of Changes in Net Assets |
Heritage Capital Appreciation Trust
| | | | | | | | | | | | |
| | | For the Two-Month
Period Ended October 31, 2006 | | | For the Fiscal Years Ended | |
| | | | August 31, 2006 | | | August 31, 2005 | |
Increase in net assets: | | | | | | | | | | | | |
Operations: | | | | | | | | | | | | |
Net investment loss | | $ | (398,755 | ) | | $ | (2,659,497 | ) | | $ | (1,079,520 | ) |
Net realized gain from investment transactions | | | 8,653,090 | | | | 17,400,953 | | | | 14,387,412 | |
Net change in unrealized appreciation on investments | | | 13,834,753 | | | | 29,584,095 | | | | 56,316,041 | |
| | | | | | | | | | | | |
Net increase in net assets resulting from operations | | | 22,089,088 | | | | 44,325,551 | | | | 69,623,933 | |
Increase (decrease) in net assets from Fund share transactions | | | 954,449 | | | | (1,009,808 | ) | | | 8,004,862 | |
| | | | | | | | | | | | |
Increase in net assets | | | 23,043,537 | | | | 43,315,743 | | | | 77,628,795 | |
Net assets, beginning of period | | | 588,324,651 | | | | 545,008,908 | | | | 467,380,113 | |
| | | | | | | | | | | | |
Net assets, end of period | | $ | 611,368,188 | | | $ | 588,324,651 | | | $ | 545,008,908 | |
| | | | | | | | | | | | |
| | | | |
| 22 | | The accompanying notes are an integral part of the financial statements. | | |
|
| Statements of Changes in Net Assets |
Heritage Growth and Income Trust
| | | | | | | | | | | | |
| | | For the One-Month
Period Ended
October 31, 2006 | | | For the Fiscal Years Ended | |
| | | | September 30, 2006 | | | September 30, 2005 | |
Increase in net assets: | | | | | | | | | | | | |
Operations: | | | | | | | | | | | | |
Net investment income | | $ | 105,080 | | | $ | 2,657,649 | | | $ | 1,443,432 | |
Net realized gain from investment transactions | | | 1,538,982 | | | | 8,095,682 | | | | 8,878,676 | |
Net realized gain (loss) from foreign currency transactions | | | (1,002 | ) | | | (612,138 | ) | | | 40,002 | |
Net change in unrealized appreciation on investments | | | 1,501,569 | | | | 3,528,713 | | | | 3,502,513 | |
Net change in unrealized appreciation (depreciation) on the translation of assets
and liabilities denominated in foreign currencies | | | (61,852 | ) | | | 57,136 | | | | 6,205 | |
| | | | | | | | | | | | |
Net increase in net assets resulting from operations | | | 3,082,777 | | | | 13,727,042 | | | | 13,870,828 | |
Distributions to shareholders from net investment income: | | | | | | | | | | | | |
Class A, ($0.11, $0.34 and $0.26 per share, respectively) | | | (526,580 | ) | | | (1,333,584 | ) | | | (878,926 | ) |
Class B, ($0.09, $0.24 and $0.17 per share, respectively) | | | (59,453 | ) | | | (157,271 | ) | | | (96,842 | ) |
Class C, ($0.09, $0.24 and $0.17 per share, respectively) | | | (284,232 | ) | | | (701,944 | ) | | | (374,990 | ) |
Distributions to shareholders from net realized gains: | | | | | | | | | | | | |
Class A, ($0.85 per share) | | | — | | | | (2,874,598 | ) | | | — | |
Class B, ($0.85 per share) | | | — | | | | (468,849 | ) | | | — | |
Class C, ($0.85 per share) | | | — | | | | (1,959,816 | ) | | | — | |
| | | | | | | | | | | | |
Net distributions to shareholders | | | (870,265 | ) | | | (7,496,062 | ) | | | (1,350,758 | ) |
Increase (decrease) in net assets from Fund share transactions | | | (609,863 | ) | | | 34,105,730 | | | | (3,476,051 | ) |
| | | | | | | | | | | | |
Increase in net assets | | | 1,602,649 | | | | 40,336,710 | | | | 9,044,019 | |
Net assets, beginning of period | | | 123,671,855 | | | | 83,335,145 | | | | 74,291,126 | |
| | | | | | | | | | | | |
Net assets, end of period (including undistributed net investment income (loss) of
($74,972), $149,373 and $368,820, respectively) | | $ | 125,274,504 | | | $ | 123,671,855 | | | $ | 83,335,145 | |
| | | | | | | | | | | | |
Heritage Income Trust — High Yield Bond Fund
| | | | | | | | | | | | |
| | | For the One-Month
Period Ended
October 31, 2006 | | | For the Fiscal Years Ended | |
| | | September 30, 2006 | | | September 30, 2005 | |
Decrease in net assets: | | | | | | | | | | | | |
Operations: | | | | | | | | | | | | |
Net investment income | | $ | 343,243 | | | $ | 4,670,290 | | | $ | 5,653,067 | |
Net realized gain (loss) from investment transactions | | | (29,939 | ) | | | 978,438 | | | | 1,010,489 | |
Net change in unrealized appreciation (depreciation) on investments | | | 517,265 | | | | (1,650,907 | ) | | | (1,993,880 | ) |
| | | | | | | | | | | | |
Net increase in net assets resulting from operations | | | 830,569 | | | | 3,997,821 | | | | 4,669,676 | |
Distributions to shareholders from net investment income: | | | | | | | | | | | | |
Class A, ($0.05, $0.58 and $0.56 per share, respectively) | | | (192,679 | ) | | | (2,620,471 | ) | | | (3,064,790 | ) |
Class B, ($0.04, $0.54 and $0.52 per share, respectively) | | | (44,345 | ) | | | (615,708 | ) | | | (742,725 | ) |
Class C, ($0.04, $0.54 and $0.52 per share, respectively) | | | (118,165 | ) | | | (1,617,388 | ) | | | (1,905,328 | ) |
| | | | | | | | | | | | |
Net distributions to shareholders | | | (355,189 | ) | | | (4,853,567 | ) | | | (5,712,843 | ) |
Decrease in net assets from Fund share transactions | | | (829,841 | ) | | | (12,589,616 | ) | | | (8,808,744 | ) |
| | | | | | | | | | | | |
Decrease in net assets | | | (354,461 | ) | | | (13,445,362 | ) | | | (9,851,911 | ) |
Net assets, beginning of period | | | 59,889,472 | | | | 73,334,834 | | | | 83,186,745 | |
| | | | | | | | | | | | |
Net assets, end of period (including undistributed net investment income of
$462,233, $474,179 and $657,457, respectively) | | $ | 59,535,011 | | | $ | 59,889,472 | | | $ | 73,334,834 | |
| | | | | | | | | | | | |
| | | | |
| | The accompanying notes are an integral part of the financial statements. | | 23 |
| | |
| Heritage Capital Appreciation Trust | | |
The following table includes selected data for a share outstanding throughout each period and other performance information derived from the financial statements.
| | | | | | | | | | | | | | | | | | | | | | | | | | | | | | | | | | | | |
Fiscal Periods | | | | | From Investment Operations | | | | | | | | | | | Ratios To Average Daily Net Assets | | | |
Beginning | | Ending | | | Beginning Net Asset
Value | | Income (Loss) | | | Realized &
Unrealized Gain (Loss) | | | Total | | | Ending Net Asset Value | | Total
Return(a) | | | Portfolio Turnover Rate | | | With Expenses Waived | | | Without Expenses Waived | | | Net Income (Loss) | | | Ending Net Assets (Millions) |
Class A | | | | | | | | | | | | | | | | | | | | | | | | | | | | | | | | | | | | |
09/01/06 | | 10/31/06 | * | | $ | 28.59 | | (0.01 | ) | | 1.09 | (b) | | 1.08 | | | $ | 29.67 | | 3.78 | %(c) | | 7 | %(c) | | 1.23 | %(d) | | 1.23 | %(d) | | (0.19 | )%(d) | | $ | 387 |
09/01/05 | | 08/31/06 | * | | $ | 26.28 | | (0.06 | ) | | 2.37 | (b) | | 2.31 | | | $ | 28.59 | | 8.79 | % | | 58 | % | | 1.19 | % | | 1.19 | % | | (0.23 | )% | | $ | 378 |
09/01/04 | | 08/31/05 | * | | $ | 22.85 | | 0.00 | | | 3.43 | (b) | | 3.43 | | | $ | 26.28 | | 15.01 | % | | 42 | % | | 1.18 | % | | 1.18 | % | | 0.01 | % | | $ | 391 |
09/01/03 | | 08/31/04 | | | $ | 21.82 | | (0.08 | ) | | 1.11 | | | 1.03 | | | $ | 22.85 | | 4.72 | % | | 27 | % | | 1.19 | % | | 1.19 | % | | (0.39 | )% | | $ | 321 |
09/01/02 | | 08/31/03 | | | $ | 18.26 | | (0.12 | ) | | 3.68 | | | 3.56 | | | $ | 21.82 | | 19.50 | % | | 22 | % | | 1.26 | % | | 1.26 | % | | (0.66 | )% | | $ | 248 |
09/01/01 | | 08/31/02 | | | $ | 23.61 | | (0.17 | ) | | (5.18 | ) | | (5.35 | ) | | $ | 18.26 | | (22.66 | )% | | 31 | % | | 1.23 | % | | 1.23 | % | | (0.80 | )% | | $ | 197 |
| | | | | | | | | | | | |
Class B | | | | | | | | | | | | | | | | | | | | | | | | | | | | | | | | | | | | |
09/01/06 | | 10/31/06 | * | | $ | 26.19 | | (0.04 | ) | | 0.99 | (b) | | 0.95 | | | $ | 27.14 | | 3.63 | %(c) | | 7 | %(c) | | 1.99 | %(d) | | 1.99 | %(d) | | (0.94 | )%(d) | | $ | 39 |
09/01/05 | | 08/31/06 | * | | $ | 24.30 | | (0.26 | ) | | 2.15 | (b) | | 1.89 | | | $ | 26.19 | | 7.78 | % | | 58 | % | | 1.94 | % | | 1.94 | % | | (0.99 | )% | | $ | 40 |
09/01/04 | | 08/31/05 | * | | $ | 21.28 | | (0.17 | ) | | 3.19 | (b) | | 3.02 | | | $ | 24.30 | | 14.19 | % | | 42 | % | | 1.93 | % | | 1.93 | % | | (0.73 | )% | | $ | 34 |
09/01/03 | | 08/31/04 | | | $ | 20.47 | | (0.26 | ) | | 1.07 | | | 0.81 | | | $ | 21.28 | | 3.96 | % | | 27 | % | | 1.94 | % | | 1.94 | % | | (1.15 | )% | | $ | 36 |
09/01/02 | | 08/31/03 | | | $ | 17.25 | | (0.24 | ) | | 3.46 | | | 3.22 | | | $ | 20.47 | | 18.67 | % | | 22 | % | | 1.97 | % | | 1.97 | % | | (1.37 | )% | | $ | 37 |
09/01/01 | | 08/31/02 | | | $ | 22.47 | | (0.31 | ) | | (4.91 | ) | | (5.22 | ) | | $ | 17.25 | | (23.23 | )% | | 31 | % | | 1.93 | % | | 1.93 | % | | (1.50 | )% | | $ | 32 |
| | | | | | | | | | | | |
Class C | | | | | | | | | | | | | | | | | | | | | | | | | | | | | | | | | | | | |
09/01/06 | | 10/31/06 | * | | $ | 26.17 | | (0.04 | ) | | 1.00 | (b) | | 0.96 | | | $ | 27.13 | | 3.67 | %(c) | | 7 | %(c) | | 1.99 | %(d) | | 1.99 | %(d) | | (0.94 | )%(d) | | $ | 149 |
09/01/05 | | 08/31/06 | * | | $ | 24.29 | | (0.25 | ) | | 2.13 | (b) | | 1.88 | | | $ | 26.17 | | 7.74 | % | | 58 | % | | 1.94 | % | | 1.94 | % | | (0.98 | )% | | $ | 145 |
09/01/04 | | 08/31/05 | * | | $ | 21.27 | | (0.17 | ) | | 3.19 | (b) | | 3.02 | | | $ | 24.29 | | 14.20 | % | | 42 | % | | 1.93 | % | | 1.93 | % | | (0.73 | )% | | $ | 120 |
09/01/03 | | 08/31/04 | | | $ | 20.46 | | (0.24 | ) | | 1.05 | | | 0.81 | | | $ | 21.27 | | 3.96 | % | | 27 | % | | 1.94 | % | | 1.94 | % | | (1.14 | )% | | $ | 111 |
09/01/02 | | 08/31/03 | | | $ | 17.25 | | (0.21 | ) | | 3.42 | | | 3.21 | | | $ | 20.46 | | 18.61 | % | | 22 | % | | 1.97 | % | | 1.97 | % | | (1.37 | )% | | $ | 96 |
09/01/01 | | 08/31/02 | | | $ | 22.46 | | (0.30 | ) | | (4.91 | ) | | (5.21 | ) | | $ | 17.25 | | (23.20 | )% | | 31 | % | | 1.93 | % | | 1.93 | % | | (1.50 | )% | | $ | 67 |
| | | | | | | | | | | | |
Class I | | | | | | | | | | | | | | | | | | | | | | | | | | | | | | | | | | | | |
09/01/06 | | 10/31/06 | * | | $ | 28.63 | | 0.01 | | | 1.09 | (b) | | 1.10 | | | $ | 29.73 | | 3.84 | %(c) | | 7 | %(c) | | 0.85 | %(d) | | 0.85 | %(d) | | 0.20 | %(d) | | $ | 30 |
03/21/06 | | 08/31/06 | * | | $ | 28.93 | | 0.01 | | | (0.31 | )(b) | | (0.30 | ) | | $ | 28.63 | | (1.04 | )%(c) | | 58 | %(c) | | 0.91 | %(d) | | 0.91 | %(d) | | 0.07 | %(d) | | $ | 26 |
| | | | | | | | | | | | |
Class R-5 | | | | | | | | | | | | | | | | | | | | | | | | | | | | | | | | | | | | |
10/02/06 | | 10/31/06 | * | | $ | 29.04 | | — | | | 0.64 | (b) | | 0.64 | | | $ | 29.68 | | 2.20 | %(c) | | 7 | %(c) | | 0.85 | %(d) | | 0.85 | %(d) | | (0.20 | )%(d) | | $ | 7 |
| * | Per share amounts have been calculated using the monthly average share method. |
| (a) | These returns are calculated without the imposition of either front-end or contingent deferred sales charges. |
| (b) | Redemption fee amounts represent less than $0.01 per share. |
The accompanying notes are an integral part of the financial statements.
24
| | |
| Heritage Growth and Income Trust | | |
The following table includes selected data for a share outstanding throughout each period and other performance information derived from the financial statements.
| | | | | | | | | | | | | | | | | | | | | | | | | | | | | | | | | | | | | | | | | | | |
Fiscal Periods | | | | From Investment Operations | | | Dividends & Distributions From | | | | | | | | | | | Ratios To Average Daily Net Assets | | | |
Beginning | | Ending | | Beginning
Net
Asset
Value | | Income
(Loss) | | Realized &
Unrealized
Gain
(Loss) | | | Total | | | Investment
Income | | | Realized
Gains | | | Total | | | Ending
Net
Asset
Value | | Total
Return(a) | | | Portfolio
Turnover
Rate | | | With
Expenses
Waived | | | Without
Expenses
Waived | | | Net
Income (Loss) | | | Ending
Net
Assets
(Millions) |
Class A* | | | | | | | | | | | | | | | | | | | | | | | | | | | | | | | | | | | | | | | | | | | |
10/01/06 | | 10/31/06 | | $ | 14.43 | | 0.02 | | 0.34 | (b) | | 0.36 | | | (0.11 | ) | | — | | | (0.11 | ) | | $ | 14.68 | | 2.52 | %(c) | | 4 | %(c) | | 1.35 | %(d) | | 1.56 | %(d) | | 1.33 | %(d) | | $ | 68 |
| | | | | | | | | | | | | | | |
10/01/05 | | 09/30/06 | | $ | 13.81 | | 0.38 | | 1.43 | (b) | | 1.81 | | | (0.34 | ) | | (0.85 | ) | | (1.19 | ) | | $ | 14.43 | | 13.90 | % | | 54 | % | | 1.35 | % | | 1.42 | % | | 2.74 | % | | $ | 68 |
10/01/04 | | 09/30/05 | | $ | 11.80 | | 0.28 | | 1.99 | (b) | | 2.27 | | | (0.26 | ) | | — | | | (0.26 | ) | | $ | 13.81 | | 19.41 | % | | 73 | % | | 1.35 | % | | 1.51 | % | | 2.13 | % | | $ | 45 |
10/01/03 | | 09/30/04 | | $ | 11.10 | | 0.16 | | 0.68 | | | 0.84 | | | (0.14 | ) | | — | | | (0.14 | ) | | $ | 11.80 | | 7.57 | % | | 80 | % | | 1.35 | % | | 1.50 | % | | 1.31 | % | | $ | 41 |
10/01/02 | | 09/30/03 | | $ | 9.07 | | 0.12 | | 2.02 | | | 2.14 | | | (0.11 | ) | | — | | | (0.11 | ) | | $ | 11.10 | | 23.82 | % | | 82 | % | | 1.35 | % | | 1.61 | % | | 1.20 | % | | $ | 36 |
10/01/01 | | 09/30/02 | | $ | 11.33 | | 0.11 | | (2.28 | ) | | (2.17 | ) | | (0.09 | ) | | — | | | (0.09 | ) | | $ | 9.07 | | (19.29 | )% | | 72 | % | | 1.35 | % | | 1.59 | % | | 0.98 | % | | $ | 29 |
| | | | | | | | | | | | | | | |
Class B* | | | | | | | | | | | | | | | | | | | | | | | | | | | | | | | | | | | | | | | | | | | |
10/01/06 | | 10/31/06 | | $ | 14.11 | | 0.01 | | 0.34 | (b) | | 0.35 | | | (0.09 | ) | | — | | | (0.09 | ) | | $ | 14.37 | | 2.46 | %(c) | | 4 | %(c) | | 2.10 | %(d) | | 2.31 | %(d) | | 0.58 | %(d) | | $ | 10 |
10/01/05 | | 09/30/06 | | $ | 13.54 | | 0.26 | | 1.40 | (b) | | 1.66 | | | (0.24 | ) | | (0.85 | ) | | (1.09 | ) | | $ | 14.11 | | 12.93 | % | | 54 | % | | 2.10 | % | | 2.17 | % | | 1.96 | % | | $ | 10 |
10/01/04 | | 09/30/05 | | $ | 11.57 | | 0.18 | | 1.96 | (b) | | 2.14 | | | (0.17 | ) | | — | | | (0.17 | ) | | $ | 13.54 | | 18.60 | % | | 73 | % | | 2.10 | % | | 2.26 | % | | 1.38 | % | | $ | 8 |
10/01/03 | | 09/30/04 | | $ | 10.88 | | 0.07 | | 0.66 | | | 0.73 | | | (0.04 | ) | | — | | | (0.04 | ) | | $ | 11.57 | | 6.73 | % | | 80 | % | | 2.10 | % | | 2.25 | % | | 0.56 | % | | $ | 7 |
10/01/02 | | 09/30/03 | | $ | 8.90 | | 0.04 | | 1.99 | | | 2.03 | | | (0.05 | ) | | — | | | (0.05 | ) | | $ | 10.88 | | 22.82 | % | | 82 | % | | 2.10 | % | | 2.36 | % | | 0.44 | % | | $ | 6 |
10/01/01 | | 09/30/02 | | $ | 11.15 | | 0.02 | | (2.23 | ) | | (2.21 | ) | | (0.04 | ) | | — | | | (0.04 | ) | | $ | 8.90 | | (19.91 | )% | | 72 | % | | 2.10 | % | | 2.34 | % | | 0.22 | % | | $ | 4 |
| | | | | | | | | | | | | | | |
Class C* | | | | | | | | | | | | | | | | | | | | | | | | | | | | | | | | | | | | | | | | | | | |
10/01/06 | | 10/31/06 | | $ | 14.12 | | 0.01 | | 0.34 | (b) | | 0.35 | | | (0.09 | ) | | — | | | (0.09 | ) | | $ | 14.38 | | 2.46 | %(c) | | 4 | %(c) | | 2.10 | %(d) | | 2.31 | %(d) | | 0.58 | %(d) | | $ | 47 |
| | | | | | | | | | | | | | | |
10/01/05 | | 09/30/06 | | $ | 13.54 | | 0.27 | | 1.40 | (b) | | 1.67 | | | (0.24 | ) | | (0.85 | ) | | (1.09 | ) | | $ | 14.12 | | 13.01 | % | | 54 | % | | 2.10 | % | | 2.17 | % | | 2.00 | % | | $ | 46 |
10/01/04 | | 09/30/05 | | $ | 11.57 | | 0.18 | | 1.96 | (b) | | 2.14 | | | (0.17 | ) | | — | | | (0.17 | ) | | $ | 13.54 | | 18.60 | % | | 73 | % | | 2.10 | % | | 2.26 | % | | 1.37 | % | | $ | 31 |
10/01/03 | | 09/30/04 | | $ | 10.88 | | 0.07 | | 0.66 | | | 0.73 | | | (0.04 | ) | | — | | | (0.04 | ) | | $ | 11.57 | | 6.73 | % | | 80 | % | | 2.10 | % | | 2.25 | % | | 0.57 | % | | $ | 26 |
10/01/02 | | 09/30/03 | | $ | 8.90 | | 0.04 | | 1.99 | | | 2.03 | | | (0.05 | ) | | — | | | (0.05 | ) | | $ | 10.88 | | 22.82 | % | | 82 | % | | 2.10 | % | | 2.36 | % | | 0.45 | % | | $ | 19 |
10/01/01 | | 09/30/02 | | $ | 11.14 | | 0.02 | | (2.22 | ) | | (2.20 | ) | | (0.04 | ) | | — | | | (0.04 | ) | | $ | 8.90 | | (19.83 | )% | | 72 | % | | 2.10 | % | | 2.34 | % | | 0.21 | % | | $ | 14 |
| * | Per share amounts have been calculated using the monthly average share method. |
| (a) | Total return is calculated without the imposition of either front-end or contingent deferred sales charges. |
| (b) | Redemption fee amounts represent less than $0.01 per share. |
The accompanying notes are an integral part of the financial statements.
25
| | |
| Heritage Income Trust—High Yield Bond Fund |
The following table includes selected data for a share outstanding throughout each period and other performance information derived from the financial statements.
| | | | | | | | | | | | | | | | | | | | | | | | | | | | | | | | | | | | | |
Fiscal Periods | | | | | From Investment Operations | | | | | | | | | | | | | Ratios To Average Daily Net Assets | | | |
Beginning | | Ending | | | Beginning
Net
Asset
Value | | Income
(Loss) | | Realized &
Unrealized
Gain
(Loss) | | | Total | | Dividends
From
Investment
Income | | | Ending
Net
Asset
Value | | Total
Return(a) | | | Portfolio
Turnover
Rate | | | With
Expenses
Waived | | | Without
Expenses
Waived | | | Net
Income (Loss) | | | Ending
Net
Assets
(Millions) |
Class A | | | | | | | | | | | | | | | | | | | | | | | | | | | | | | | | | | | | | |
10/01/06 | | 10/31/06 | * | | $ | 7.69 | | 0.05 | | 0.06 | (b) | | 0.11 | | (0.05 | ) | | $ | 7.75 | | 1.40 | %(c) | | 5 | %(c) | | 1.20 | %(d) | | 1.90 | %(d) | | 7.06 | %(d) | | $ | 31 |
10/01/05 | | 09/30/06 | * | | $ | 7.77 | | 0.57 | | (0.07 | )(b) | | 0.50 | | (0.58 | ) | | $ | 7.69 | | 6.79 | % | | 63 | % | | 1.17 | % | | 1.52 | % | | 7.40 | % | | $ | 32 |
10/01/04 | | 09/30/05 | * | | $ | 7.85 | | 0.57 | | (0.09 | )(b) | | 0.48 | | (0.56 | ) | | $ | 7.77 | | 6.35 | % | | 25 | % | | 1.10 | % | | 1.34 | % | | 7.14 | % | | $ | 38 |
10/01/03 | | 09/30/04 | * | | $ | 7.61 | | 0.58 | | 0.27 | | | 0.85 | | (0.61 | ) | | $ | 7.85 | | 11.60 | % | | 35 | % | | 1.10 | % | | 1.24 | % | | 7.54 | % | | $ | 43 |
10/01/02 | | 09/30/03 | * | | $ | 6.64 | | 0.56 | | 0.95 | | | 1.51 | | (0.54 | ) | | $ | 7.61 | | 23.70 | % | | 31 | % | | 1.10 | % | | 1.32 | % | | 7.75 | % | | $ | 52 |
10/01/01 | | 09/30/02 | | | $ | 7.10 | | 0.57 | | (0.44 | ) | | 0.13 | | (0.59 | ) | | $ | 6.64 | | 1.68 | % | | 61 | % | | 1.12 | % | | 1.59 | % | | 8.36 | % | | $ | 23 |
| | | | | | | | | | | | | |
Class B | | | | | | | | | | | | | | | | | | | | | | | | | | | | | | | | | | | | | |
10/01/06 | | 10/31/06 | * | | $ | 7.61 | | 0.04 | | 0.06 | (b) | | 0.10 | | (0.04 | ) | | $ | 7.67 | | 1.37 | %(c) | | 5 | %(c) | | 1.75 | %(d) | | 2.45 | %(d) | | 6.51 | %(d) | | $ | 8 |
10/01/05 | | 09/30/06 | * | | $ | 7.70 | | 0.52 | | (0.07 | )(b) | | 0.45 | | (0.54 | ) | | $ | 7.61 | | 6.13 | % | | 63 | % | | 1.72 | % | | 2.07 | % | | 6.85 | % | | $ | 8 |
10/01/04 | | 09/30/05 | * | | $ | 7.79 | | 0.51 | | (0.08 | )(b) | | 0.43 | | (0.52 | ) | | $ | 7.70 | | 5.68 | % | | 25 | % | | 1.65 | % | | 1.89 | % | | 6.59 | % | | $ | 10 |
10/01/03 | | 09/30/04 | * | | $ | 7.55 | | 0.54 | | 0.27 | | | 0.81 | | (0.57 | ) | | $ | 7.79 | | 11.08 | % | | 35 | % | | 1.65 | % | | 1.79 | % | | 7.01 | % | | $ | 12 |
10/01/02 | | 09/30/03 | * | | $ | 6.60 | | 0.52 | | 0.94 | | | 1.46 | | (0.51 | ) | | $ | 7.55 | | 22.91 | % | | 31 | % | | 1.65 | % | | 1.87 | % | | 7.19 | % | | $ | 12 |
10/01/01 | | 09/30/02 | | | $ | 7.06 | | 0.54 | | (0.45 | ) | | 0.09 | | (0.55 | ) | | $ | 6.60 | | 1.15 | % | | 61 | % | | 1.65 | % | | 2.12 | % | | 7.83 | % | | $ | 5 |
| | | | | | | | | | | | | |
Class C | | | | | | | | | | | | | | | | | | | | | | | | | | | | | | | | | | | | | |
10/01/06 | | 10/31/06 | * | | $ | 7.62 | | 0.04 | | 0.06 | (b) | | 0.10 | | (0.04 | ) | | $ | 7.68 | | 1.37 | %(c) | | 5 | %(c) | | 1.75 | %(d) | | 2.45 | %(d) | | 6.51 | %(d) | | $ | 21 |
10/01/05 | | 09/30/06 | * | | $ | 7.70 | | 0.52 | | (0.06 | )(b) | | 0.46 | | (0.54 | ) | | $ | 7.62 | | 6.26 | % | | 63 | % | | 1.72 | % | | 2.07 | % | | 6.85 | % | | $ | 21 |
10/01/04 | | 09/30/05 | * | | $ | 7.79 | | 0.52 | | (0.09 | )(b) | | 0.43 | | (0.52 | ) | | $ | 7.70 | | 5.68 | % | | 25 | % | | 1.65 | % | | 1.89 | % | | 6.59 | % | | $ | 25 |
10/01/03 | | 09/30/04 | * | | $ | 7.55 | | 0.54 | | 0.27 | | | 0.81 | | (0.57 | ) | | $ | 7.79 | | 11.07 | % | | 35 | % | | 1.65 | % | | 1.79 | % | | 7.00 | % | | $ | 28 |
10/01/02 | | 09/30/03 | * | | $ | 6.60 | | 0.52 | | 0.94 | | | 1.46 | | (0.51 | ) | | $ | 7.55 | | 22.90 | % | | 31 | % | | 1.65 | % | | 1.87 | % | | 7.15 | % | | $ | 31 |
10/01/01 | | 09/30/02 | | | $ | 7.06 | | 0.54 | | (0.45 | ) | | 0.09 | | (0.55 | ) | | $ | 6.60 | | 1.15 | % | | 61 | % | | 1.65 | % | | 2.12 | % | | 7.82 | % | | $ | 9 |
| | * | Per share amounts have been calculated using the monthly average share method. |
| | (a) | Total return is calculated without the imposition of either front-end or contingent deferred sales charges. |
| | (b) | Redemption fee amounts represent less than $0.01 per share. |
The accompanying notes are an integral part of the financial statements.
26
|
| Notes to Financial Statements |
| Note 1: | Organization and Investment Objective. Heritage Capital Appreciation Trust, Heritage Growth and Income Trust and Heritage Income Trust (each, a “Fund” and collectively, the “Funds”) are organized as separate Massachusetts business trusts and are registered under the Investment Company Act of 1940, as amended, as diversified, open-end management investment companies. The Heritage Income Trust presently offers shares in the High Yield Bond Fund. At a regular meeting of the Board of Trustees (the “Board”) on August 15, 2006, the Board voted to change the fiscal and tax year ends of each Fund to October 31. |
| | • | | The Heritage Capital Appreciation Trust (“Capital Appreciation Trust”) seeks long-term capital appreciation. | |
| | • | | The Heritage Growth and Income Trust (“Growth and Income Trust”) primarily seeks long-term capital appreciation and, secondarily, seeks current income. | |
| | • | | The Heritage Income Trust—High Yield Bond Fund (“High Yield Bond Fund”) seeks high current income. | |
Class Offerings. Each Fund currently offers Class A and Class C shares to the public. In addition, Capital Appreciation Trust offers Class I, R-3 and Class R-5 shares.
| | • | | Class A shares of Growth and Income Trust and High Yield Bond Fund are sold subject to a maximum sales charge of 4.75% and 3.75%, respectively, of the amount invested payable at the time of purchase. Class A share investments greater than $1 million, which are not sold subject to a sales charge, may be subject to a contingent deferred sales charge (“CDSC”) if redeemed within 18 months of purchase. | |
| | • | | Class C shares are sold subject to a CDSC of 1% of the lower of net asset value or purchase price if redeemed prior to 1 year of purchase. | |
| | • | | Class I, Class R-3 and Class R-5 shares are each sold without a front-end sales charge or a CDSC to qualified buyers. | |
Class B Shares. An additional class of shares, Class B shares, is no longer available for purchase, although existing Class B shareholders can exchange their shares for Class B shares of another Heritage mutual fund and acquire additional shares through dividend reinvestment. Class B shares were sold subject to a CDSC upon redemption of up to 5% of the lower of net asset value or purchase price, declining over a six-year period. Class B shares automatically convert to Class A shares of the Fund eight years after purchase. In addition, the Funds’ Board of Trustees has approved the conversion of all remaining Class B shares to Class A shares on March 30, 2007. The conversion from Class B shares will not be a taxable event and all shareholders as of the effective date will not be charged a CDSC. After that conversion, there will be no Class B shares outstanding.
| Note 2: | Significant Accounting Policies. |
Use of Estimates. The preparation of financial statements in accordance with accounting principles generally accepted in the United States of America requires management to make estimates and assumptions that affect the reported amounts and disclosures. Actual results could differ from those estimates and those differences could be material.
Valuation of Securities. The price of each Fund’s shares is the Fund’s net asset value per share. Each Fund determines the net asset value of its shares on each day the New York Stock Exchange (“NYSE”) is open for business, as of the close of the customary trading session (typically 4:00 ET), or earlier NYSE closing time that day. If the NYSE or other securities exchange modifies the closing price of securities traded on that exchange after the Fund is priced, Heritage Asset Management, Inc. (the “Manager” or “Heritage”) is not required to revalue the Fund.
Generally, the Funds value portfolio securities for which market quotations are readily available at market value; however, the Fund may adjust the market quotation price to reflect events that occur between the close of those markets and the Fund’s determination of net asset value.
Both the latest transaction prices and adjustments are furnished by an independent pricing service which are periodically approved by the Board of Trustees. The Funds value all other securities and assets for which market quotations are unavailable or unreliable at their fair value in good faith using procedures (“Procedures”) approved by the Boards of Trustees. Fair value is that amount that the owner might reasonably expect to receive for the security upon its current sale. Fair value requires consideration of all appropriate factors, including indications of fair value available from pricing services. A fair value price is an estimated price and may vary from the prices used by other mutual funds to calculate their net asset values. Fair value pricing methods, Procedures and pricing services can change from time to time as approved by the Boards of Trustees. Pursuant to the Procedures, the Boards of Trustees have delegated the day-to-day responsibility for applying and administering the Procedures to a Valuation Committee comprised of associates from Heritage, the manager and administrator for the Funds. The composition of this Valuation Committee may change from time to time.
27
|
| Notes to Financial Statements (continued) |
There can be no assurance, however, that a fair value price used by a Fund on any given day will more accurately reflect the market value of a security or securities than the market price of such security or securities on that day. Fair value pricing may deter shareholders from trading the Fund shares on a frequent basis in an attempt to take advantage of arbitrage opportunities resulting from potentially stale prices of portfolio holdings. However, it cannot eliminate the possibility of frequent trading. Specific types of securities are valued as follows:
| | • | | Domestic Exchange Traded Equity Securities. Market quotations are generally available and reliable for domestic exchange traded equity securities. If market quotations are not available or are unreliable, Heritage will value the security at fair value in good faith using the Procedures. | |
| | • | | Foreign Securities. If market quotations are available and reliable for foreign exchange traded equity securities, the securities will be valued at the market quotations. Because trading hours for certain foreign securities end before the close of the NYSE, closing market quotations may become unreliable. Consequently, fair valuation of portfolio securities may occur on a daily basis. The Fund may also fair value a security if certain events occur between the time trading ends on a particular security and the Fund’s net asset value calculation. The Fund may fair value the particular security if the events are significant and make the closing price unreliable. If an issuer specific event has occurred that Heritage determines, in its judgment, is likely to have affected the closing price of a foreign security, it will price the security at fair value. Heritage also relies on a screening process from a pricing vendor to indicate the degree of certainty, based on historical data, that the closing price in the principal market where a foreign security trades is not the current market value as of the close of the NYSE. Securities and other assets quoted in foreign currencies are valued in U.S. dollars based on exchange rates provided by a pricing service. The pricing vendor, pricing methodology or degree of certainty may change from time to time. | |
Fund securities primarily traded on foreign markets may trade on days that are not business days of the Fund. Because the net asset value of Fund shares is determined only on business days of the Fund, the value of the portfolio securities of a Fund that invests in foreign securities may change on days when you will not be able to purchase or redeem shares of the Fund.
| | • | | Fixed Income Securities. Government, corporate, asset-backed and municipal bonds and convertible securities, including high yield or junk bonds, normally are valued on the basis of prices provided by independent pricing services. Prices provided by the pricing services may be determined without exclusive reliance on quoted prices, and may reflect appropriate factors such as institution-size trading in similar groups of securities, developments related to special securities, dividend rate, maturity and other market data. Prices received from pricing services are fair value prices. In addition, if the prices provided by the pricing service and independent quoted prices are unreliable, the valuation committee described above will fair value the security using Procedures. | |
| | • | | Short-term Securities. The Funds’ short-term investments are valued at amortized cost when the security has 60 days or less to maturity. | |
Foreign Currency Transactions. The books and records of each Fund are maintained in U.S. dollars. Foreign currency transactions are translated into U.S. dollars on the following basis: (i) market value of investment securities, other assets and other liabilities at the daily rates of exchange, and (ii) purchases and sales of investment securities, dividend and interest income and certain expenses at the rates of exchange prevailing on the respective dates of such transactions. Each Fund does not isolate that portion of gains and losses on investments which is due to changes in foreign exchange rates from that which is due to changes in market prices of the investments. Such fluctuations are included with the net realized and unrealized gains and losses from investment transactions. Net realized gain (loss) from foreign currency transactions and the net change in unrealized appreciation (depreciation) on translation of assets and liabilities denominated in foreign currencies include gains and losses between trade and settlement date on securities transactions, gains and losses arising from the purchase and sale of forward foreign currency contracts and gains and losses between the ex and payment dates on dividends, interest, and foreign withholding taxes.
Forward Foreign Currency Contracts. The Growth and Income Trust is authorized to enter into forward foreign currency contracts for the purpose of hedging against exchange risk arising from current or anticipated investments in securities dominated in foreign currencies and to enhance total return. Forward foreign currency contracts are valued at the contractual forward rate and are marked-to-market daily, with the change in market value recorded as an unrealized gain or loss. When the contracts are closed, the gain or loss is realized. Risks may arise from unanticipated movements in the currency’s value relative to the U.S. dollar and from the possible inability of counter-parties to meet the terms of their contracts.
28
|
| Notes to Financial Statements (continued) |
Real Estate Investment Trusts (“REITs”). There are certain additional risks involved in investing in REITs. These include, but are not limited to, economic conditions, changes in zoning laws, real estate values, property taxes and interest rates. Dividend income is recorded at the Manager’s estimate of the income included in distributions from the REIT investments. Distributions received in excess of the estimated amount are recorded as a reduction of the cost investments. The actual amounts of income, return of capital and capital gains are only determined be each REIT after the fiscal year end and may differ from the estimated amounts.
Repurchase Agreements. Each Fund enters into repurchase agreements whereby a Fund, through its custodian, receives delivery of the underlying securities, the market value of which at the time of purchase is required to be in an amount of at least 100% of the resale price. Repurchase agreements involve the risk that the seller will fail to repurchase the security, as agreed. In that case, each Fund will bear the risk of market value fluctuations until the security can be sold and may encounter delays and incur costs in liquidating the security. In the event of bankruptcy or insolvency of the seller, delays and costs may be incurred.
Federal Income Taxes. Each Fund is treated as a single corporate taxpayer as provided for in the Tax Reform Act of 1986, as amended. Each Fund’s policy is to comply with the requirements of the Internal Revenue Code of 1986, as amended, which are applicable to regulated investment companies and to distribute substantially all of its taxable income to its shareholders. Accordingly, no provision has been made for federal income and excise taxes.
Distribution of Income and Gains. Distributions of net investment income are made monthly for the High Yield Bond Fund, quarterly for the Growth and Income Trust and annually for the Capital Appreciation Trust. Net realized gains from investment transactions during any particular year in excess of available capital loss carryforwards, which, if not distributed, would be taxable to each Fund, will be distributed to shareholders in the following fiscal year. Each Fund uses the identified cost method for determining realized gain or loss on investments for both financial and federal income tax reporting purposes.
Revenue Recognition. Investment security transactions are accounted for on a trade date basis. Dividend income is recorded on the ex-dividend date. Interest income is recorded on the accrual basis.
Expenses. Each Fund is charged for those expenses that are directly attributable to it, while other expenses are allocated proportionately among the Heritage mutual funds based upon methods approved by the Board of Trustees. Expenses that are directly attributable to a specific class of shares, such as distribution fees, are charged directly to that class. Other expenses of each Fund are allocated to each class of shares based upon their relative percentage of net assets. The Funds have entered into an arrangement with the custodian whereby each Fund receives credits on uninvested cash balances which are used to offset a portion of each Fund’s expenses. These custodian credits are shown as “Expense offsets” on the Statements of Operations.
Class Allocations. Each class of shares has equal rights as to earnings and assets except that each class may bear different expense for distribution and/or shareholder services. Income, expenses (other than expenses attributable to a specific class), and realized and unrealized gains or losses on investments are allocated to each class of shares based on its relative net assets.
Other. In the normal course of business each Fund enters into contracts that contain a variety of representations and warranties, which provide general indemnifications. Each Fund’s maximum exposure under these arrangements is unknown, as this would involve future claims that may be made against a Fund and/or its affiliates that have not yet occurred. However, based on experience, the risk of loss to each Fund is expected to be remote.
29
|
| Notes to Financial Statements (continued) |
| Note 3: | Capital Share Transactions. At October 31, 2006, there were an unlimited number of shares of beneficial interest of no par value authorized. Capital share transactions during the periods ended October 31, 2006 and fiscal years ended 2006 and 2005, respectively, were as follows: |
| | | | | | | | | | | | |
Capital Appreciation Trust | |
Period Ended October 31, 2006(a) | | Shares Sold | | | Shares
Redeemed | | | Net Increase
(Decrease) | |
Shares | | | | | | | | | | | | |
Class A | | | 460,352 | (b) | | | (649,177 | ) | | | (188,825 | ) |
Class B | | | 3,717 | | | | (76,330 | )(b) | | | (72,613 | ) |
Class C | | | 107,630 | | | | (147,179 | ) | | | (39,549 | ) |
Class I | | | 153,827 | | | | (51,143 | ) | | | 102,684 | |
Class R-5 | | | 231,477 | | | | (9,123 | ) | | | 222,354 | |
Amount | | | | | | | | | | | | |
Class A | | $ | 13,358,232 | (b) | | $ | (18,848,219 | ) | | $ | (5,489,987 | ) |
Class B | | | 98,629 | | | | (2,025,970 | )(b) | | | (1,927,341 | ) |
Class C | | | 2,866,559 | | | | (3,913,082 | ) | | | (1,046,523 | ) |
Class I | | | 4,450,510 | | | | (1,488,410 | ) | | | 2,962,100 | |
Class R-5 | | | 6,722,474 | | | | (267,132 | ) | | | 6,455,342 | |
Redemption Fees | | | 858 | | | | — | | | | 858 | |
| | (a) | Period denotes capital share activity from September 1, 2006 through October 31, 2006. | |
| | (b) | Shares Sold for Class A and Shares Redeemed for Class B include the conversion of 21,198 Class B shares in exchange for 19,407 Class A shares in the amount of $560,707. For further details, see Note 1. | |
| | | | | | | | | | | | | | |
Fiscal Year Ended August 31, 2006 | | Shares
Sold | | | Shares issued in
connection with
Fund reorganization(c) | | Shares
Redeemed | | | Net Increase
(Decrease) | |
Shares | | | | | | | | | | | | | | |
Class A | | | 3,083,097 | (d) | | 1,560,231 | | | (6,308,515 | ) | | | (1,665,187 | ) |
Class B | | | 35,445 | | | 597,804 | | | (514,176 | )(d) | | | 119,073 | |
Class C | | | 586,617 | | | 1,229,606 | | | (1,218,194 | ) | | | 598,029 | |
Class I | | | 925,006 | | | — | | | (22,000 | ) | | | 903,006 | |
Amount | | | | | | | | | | | | | | |
Class A | | $ | 86,460,612 | (d) | | $43,483,634 | | $ | (175,105,196 | ) | | $ | (45,160,950 | ) |
Class B | | | 908,994 | | | 15,363,572 | | | (13,432,578 | )(d) | | | 2,839,988 | |
Class C | | | 15,038,275 | | | 31,588,579 | | | (31,426,351 | ) | | | 15,200,503 | |
Class I | | | 26,735,728 | | | — | | | (627,937 | ) | | | 26,107,791 | |
Redemption Fees | | | 2,860 | | | — | | | — | | | | 2,860 | |
| | (c) | For further details, see Note 6. | |
| | (d) | Shares Sold for Class A and Shares Redeemed for Class B include the conversion of 186,383 Class B shares in exchange for 171,229 Class A shares in the amount of $4,965,497. For further details, see Note 1. | |
| | | | | | | | | | | |
Fiscal Year Ended August 31, 2005 | | Shares
Sold | | Shares
Redeemed | | | Net Increase
(Decrease) | |
Shares | | | | | | | | | | | |
Class A | | | 5,385,111 | | | (4,526,811 | ) | | | 858,300 | |
Class B | | | 72,931 | | | (356,598 | ) | | | (283,667 | ) |
Class C | | | 1,001,103 | | | (1,290,641 | ) | | | (289,538 | ) |
Amount | | | | | | | | | | | |
Class A | | $ | 134,134,931 | | $ | (112,988,671 | ) | | $ | 21,146,260 | |
Class B | | | 1,676,047 | | | (8,190,679 | ) | | | (6,514,632 | ) |
Class C | | | 22,955,620 | | | (29,594,508 | ) | | | (6,638,888 | ) |
Redemption Fees | | | 12,122 | | | — | | | | 12,122 | |
30
|
| Notes to Financial Statements (continued) |
| | | | | | | | | | | | | |
Growth & Income Trust | |
Period Ended October 31, 2006 (e) | | Shares
Sold | | | Shares issued on
reinvestment of
dividends | | Shares Redeemed | | | Net Increase
(Decrease) | |
Shares | | | | | | | | | | | | | |
Class A | | | 47,730 | (f) | | 33,080 | | | (114,385 | ) | | (33,575 | ) |
Class B | | | 7,651 | | | 3,670 | | | (11,709 | )(f) | | (388 | ) |
Class C | | | 42,006 | | | 18,652 | | | (68,775 | ) | | (8,117 | ) |
Amount | | | | | | | | | | | | | |
Class A | | $ | 694,981 | (f) | | $480,325 | | $ | (1,662,546 | ) | | $(487,240 | ) |
Class B | | | 109,163 | | | 52,185 | | | (166,212 | )(f) | | (4,864 | ) |
Class C | | | 601,167 | | | 265,228 | | | (984,154 | ) | | (117,759 | ) |
| | (e) | Period denotes capital share activity from October 1, 2006 through October 31, 2006. |
| | (f) | Shares Sold for Class A and Shares Redeemed for Class B include the conversion of 5,336 Class B shares in exchange in exchange for 5,217 Class A shares in the amount of $75,026. For further details, see Note 1. | |
| | | | | | | | | | | | | | | |
Fiscal Year Ended
September 30, 2006 | | Shares
Sold | | | Shares issued
on reinvestment
of dividends | | Shares issued
in connection with
Fund reorganization(g) | | Shares
Redeemed | | | Net Increase
(Decrease) |
Shares | | | | | | | | | | | | | | | |
Class A | | | 1,138,587 | (h) | | 281,937 | | 951,367 | | | (955,816 | ) | | | 1,416,075 |
Class B | | | 52,042 | | | 40,351 | | 263,719 | | | (223,851 | )(h) | | | 132,261 |
Class C | | | 483,689 | | | 193,018 | | 1,280,110 | | | (938,361 | ) | | | 1,018,456 |
Amount | | | | | | | | | | | | | | | |
Class A | | $ | 15,910,066 | (h) | | $3,780,354 | | $12,700,740 | | $ | (13,143,751 | ) | | $ | 19,247,409 |
Class B | | | 709,187 | | | 529,913 | | 3,452,077 | | | (3,032,591 | )(h) | | | 1,658,586 |
Class C | | | 6,543,558 | | | 2,535,748 | | 16,756,640 | | | (12,636,289 | ) | | | 13,199,657 |
Redemption Fees | | | 78 | | | — | | — | | | — | | | | 78 |
| | (g) | For further details, see Note 6. | |
| | (h) | Shares Sold for Class A and Shares Redeemed for Class B include the conversion of 98,423 Class B shares in exchange for 96,325 Class A shares in the amount of $1,340,461. For further details, see Note 1. | |
| | | | | | | | | | | | | |
Fiscal Year Ended September 30, 2005 | | Shares
Sold | | Shares issued
on reinvestment
of dividends | | Shares
Redeemed | | | Net Increase
(Decrease) | |
Shares | | | | | | | | | | | | | |
Class A | | | 743,949 | | 63,010 | | | (1,020,990 | ) | | | (214,031 | ) |
Class B | | | 66,498 | | 6,611 | | | (125,022 | ) | | | (51,913 | ) |
Class C | | | 421,880 | | 27,891 | | | (446,901 | ) | | | 2,870 | |
Amount | | | | | | | | | | | | | |
Class A | | $ | 9,854,320 | | $806,579 | | $ | (13,547,116 | ) | | $ | (2,886,217 | ) |
Class B | | | 860,360 | | 82,967 | | | (1,596,867 | ) | | | (653,540 | ) |
Class C | | | 5,462,120 | | 350,870 | | | (5,750,578 | ) | | | 62,412 | |
Redemption Fees | | | 1,293 | | — | | | — | | | | 1,293 | |
| | | | | | | | | | | | | |
High Yield Bond Fund | |
Period Ended October 31, 2006(i) | | Shares Sold | | | Shares issued
on reinvestment
of dividends | | Shares
Redeemed | | | Net Increase
(Decrease) | |
Shares | | | | | | | | | | | | | |
Class A | | | 40,703 | (j) | | 16,779 | | | (127,362 | ) | | (69,880 | ) |
Class B | | | — | | | 2,571 | | | (25,459 | )(j) | | (22,888 | ) |
Class C | | | 18,041 | | | 10,773 | | | (44,424 | ) | | (15,610 | ) |
Amount | | | | | | | | | | | | | |
Class A | | $ | 312,814 | (j) | | $128,355 | | $ | (978,632 | ) | | $(537,463 | ) |
Class B | | | — | | | 19,484 | | | (193,421 | )(j) | | (173,937 | ) |
Class C | | | 137,755 | | | 81,662 | | | (337,859 | ) | | (118,442 | ) |
Redemption Fees | | | 1 | | | — | | | — | | | 1 | |
| | (i) | Period denotes capital share activity from October 1, 2006 through October 31, 2006. | |
| | (j) | Shares Sold for Class A and Shares Redeemed for Class B include the conversion of 9,462 Class B shares in exchange for 9,375 Class A shares in the amount of $71,722. For further details, see Note 1. | |
31
|
| Notes to Financial Statements (continued) |
| | | | | | | | | | | | | | |
Fiscal Year Ended September 30, 2006 | | Shares Sold | | | Shares issued
on reinvestment
of dividends | | Shares
Redeemed | | | Net Increase
(Decrease) | |
Shares | | | | | | | | | | | | | | |
Class A | | | 580,128 | (k) | | 222,562 | | | (1,605,002 | ) | | | (802,312 | ) |
Class B | | | 33,589 | | | 36,885 | | | (344,039 | )(k) | | | (273,565 | ) |
Class C | | | 256,207 | | | 146,056 | | | (978,366 | ) | | | (576,103 | ) |
Amount | | | | | | | | | | | | | | |
Class A | | $ | 4,448,813 | (k) | | $1,699,574 | | $ | (12,279,869 | ) | | $ | (6,131,482 | ) |
Class B | | | 254,354 | | | 279,172 | | | (2,615,959 | )(k) | | | (2,082,433 | ) |
Class C | | | 1,942,868 | | | 1,106,492 | | | (7,425,064 | ) | | | (4,375,704 | ) |
Redemption Fees | | | 3 | | | — | | | — | | | | 3 | |
| | (k) | Shares Sold for Class A and Shares Redeemed for Class B include the conversion of 78,642 Class B shares in exchange for 77,918 Class A shares in the amount of $601,517. For further details, see Note 1. | |
| | | | | | | | | | | | |
Fiscal Year Ended September 30, 2005 | |
| Shares
Sold | | Shares issued
on reinvestment
of dividends | |
| Shares
Redeemed |
| | Net Increase
(Decrease) |
|
Shares | | | | | | | | | | | | |
Class A | | | 1,306,684 | | 239,564 | | | (2,109,978 | ) | | (563,730 | ) |
Class B | | | 55,549 | | 47,689 | | | (336,554 | ) | | (233,316 | ) |
Class C | | | 791,661 | | 167,487 | | | (1,316,089 | ) | | (356,941 | ) |
Amount | | | | | | | | | | | | |
Class A | | $ | 10,329,689 | | $1,878,364 | | $ | (16,516,817 | ) | | $(4,308,764 | ) |
Class B | | | 433,858 | | 370,816 | | | (2,614,106 | ) | | (1,809,432 | ) |
Class C | | | 6,203,829 | | 1,303,489 | | | (10,199,694 | ) | | (2,692,376 | ) |
Redemption Fees | | | 1,828 | | — | | | — | | | 1,828 | |
Redemption Fees. A redemption fee of 2% of the value of the shares sold is imposed on fund shares sold (by redemption or exchange to another Heritage mutual fund) within seven calendar days of their acquisition by purchase or exchange. Redemption fees are accounted for as an addition to paid in capital and offset the costs and market impact associated with short-term money movements. Effective January 2, 2007, this redemption fee will no longer be imposed for any type of transaction.
| Note 4: | Purchases and Sales of Securities. For the periods indicated, purchases and sales of investment securities (excluding repurchase agreements and short-term obligations) were as follows: |
| | | | | | |
| | | Investment Securities |
| | | Purchases | | Sales |
Capital Appreciation Trust (from 09/01/06 through 10/31/06) | | $ | 50,977,804 | | $ | 41,497,511 |
Growth and Income Trust (from 10/01/06 through 10/31/06) | | | 7,142,068 | | | 5,036,731 |
High Yield Bond Fund (from 10/01/06 through 10/31/06) | | | 2,641,241 | | | 3,948,803 |
32
|
| Notes to Financial Statements (continued) |
| Note 5: | Investment Advisory Fees and Other Transactions With Affiliates. Each Fund has agreed to pay to the Manager an investment advisory fee for advisory and administrative services equal to an annualized rate based on a percentage of each Fund’s average daily net assets, which is computed daily and payable monthly. For the periods indicated, the fee rate schedule for each fund is as follows: |
| | | | | | | | | | | |
| | | Investment Advisory and Administrative Fee Rate | |
| | | Prior To January 2, 2007 | | | | | Effective January 2, 2007 | |
| | | | Break Point(a) | | Advisory Fee | | | Administrative Fee(b) | |
Capital Appreciation Trust | | 0.75 | % | | First $1 billion | | 0.60 | % | | 0.15 | % |
| | 0.70 | % | | Over $1 billion | | 0.55 | % | | 0.15 | % |
Growth and Income Trust | | 0.75 | % | | First $100 million | | 0.60 | % | | 0.15 | % |
| | 0.60 | % | | $100 million to $500 million | | 0.45 | % | | 0.15 | % |
| | 0.55 | % | | Over $500 million | | 0.40 | % | | 0.15 | % |
| | | |
| | | Prior To
January 3, 2006 | | | | | Effective January 3, 2006 | |
| | | | | | Advisory Fee | | | Administrative Fee(b) | |
High Yield Bond Fund | | 0.60 | % | | First $500 million | | 0.45 | % | | 0.15 | % |
| | 0.50 | % | | $500 million to $1 billion | | 0.35 | % | | 0.15 | % |
| | 0.45 | % | | Over $1 billion | | 0.30 | % | | 0.15 | % |
| | (a) | When average daily net assets exceed the Fund’s respective break point, the investment advisory fee rate is reduced to the subsequent investment advisory fee rate on those assets greater than the break point. The break points shown apply to advisory fee rates before and after the periods indicated. |
| | (b) | Administrative Fee shown is based on the average daily assets of each Fund's Class A, Class B and Class C shares without the imposition of a breakpoint. Administrative fee rate for Class I, Class R-3 and Class R-5 for the Capital Appreciation Trust will be 0.10%, 0.15% and 0.10%, respectively, of the average daily net assets of each respective class. |
For the one-month period ended October 31, 2006, the High Yield Bond Fund was charged $3,983, $971 and $2,619 for administrative fees in Class A, Class B and Class C shares, respectively. For the fiscal year ended September 30, 2006, the High Yield Bond Fund was charged $37,071, $9,174 and $24,345 for administrative fees in Class A, Class B and Class C shares, respectively.
Distribution Fees. Pursuant to the Class A, Class B and Class C Distribution plans and in accordance with Rule 12b-1 of the Investment Company Act of 1940, as amended, the Funds are authorized to pay Heritage Fund Distributors, Inc. (“HFD”) and Raymond James & Associates, Inc. (“RJA”), both distributors of the Funds, a fee based on the average daily net assets of each class. Such fees are accrued daily and payable monthly. HFD, a wholly owned subsidiary of Heritage, is an approved distributor by the Heritage Board of Trustees and commenced operations on July 1, 2006. For the Funds’ fiscal year ending October 31, 2007, HFD will be the sole distributor of the Funds. The following table illustrates for each class the distribution fee rate and amount charged to the Funds for the periods indicated.
| | | | | | | | | | | |
| | | Distribution Fees |
| | | Class A | | Class B | | Class C | | Class R-3 |
Capital Appreciation Trust | | | | | | | | | | | |
Distribution Fee Charged | | | | | | | | | | | |
Period 09/01/06 through 10/31/06 | | $ | 159,342 | | $ | 65,401 | | $ | 244,588 | | — |
Prior fiscal year ended August 31, 2006 | | $ | 956,381 | | $ | 413,457 | | $ | 1,406,027 | | N/A |
Distribution Fee Rate | | | 0.25% | | | 1.00% | | | 1.00% | | 0.50% |
| | | | |
Growth and Income Trust | | | | | | | | | | | |
Distribution Fee Charged | | | | | | | | | | | |
Period 10/01/06 through 10/31/06 | | $ | 14,454 | | $ | 8,318 | | $ | 39,763 | | N/A |
Prior fiscal year ended September 30, 2006 | | $ | 145,523 | | $ | 95,776 | | $ | 437,184 | | N/A |
Distribution Fee Rate | | | 0.25% | | | 1.00% | | | 1.00% | | N/A |
| | | | |
High Yield Bond Fund | | | | | | | | | | | |
Distribution Fee Charged | | | | | | | | | | | |
Period 10/01/06 through 10/31/06 | | $ | 6,638 | | $ | 5,181 | | $ | 13,969 | | N/A |
Prior fiscal year ended September 30, 2006 | | $ | 85,600 | | $ | 68,781 | | $ | 180,590 | | N/A |
Distribution Fee Rate | | | 0.25% | | | 0.80% | | | 0.80% | | N/A |
33
|
| Notes to Financial Statements (continued) |
Sales Charges. Total front-end and contingent deferred sales charges paid to RJA for the periods indicated were as follows:
| | | | | | |
| | | Front-end Sales Charge | | Contingent
Deferred Sales Charge |
| | | Class A | | Class B | | Class C |
Capital Appreciation Trust (from 09/01/06 through 10/31/06) | | $39,472 | | $11,669 | | $1,204 |
Growth and Income Trust (from 10/01/06 through 10/31/06) | | 3,842 | | 425 | | 224 |
High Yield Bond Fund (from 10/01/06 through 10/31/06) | | 2,793 | | 1,969 | | 18 |
RJA paid commissions to salespersons from these fees and incurred other distribution costs. The Manager, Eagle Asset Management, Inc. (“Eagle”) and RJA are all wholly owned subsidiaries of Raymond James Financial, Inc. (“RJF”).
Agency Commissions. From September 1, 2006 through October 31, 2006, Capital Appreciation Trust paid $60,819 in total agency brokerage commissions, of which $3,056 was paid directly to RJA.
Subadvisory Fees. The Manager entered into agreements with unaffiliated subadvisors to provide to each Fund investment advice, portfolio management services (including the placement of brokerage orders) and certain compliance and other services for an annualized fee payable by the Manager, computed daily and payable monthly. In addition, the Manager has entered into an agreement with Eagle to serve as an additional subadviser to Capital Appreciation Trust and the Growth and Income Trust. However, the Manager currently has not allocated any assets of the Fund to Eagle.
Affiliate Transaction. The High Yield Bond Fund entered into a security transaction with RJA for the purchase of $30,000 par of a high yield bond on August 16, 2006. No commissions were paid to RJA for the transaction. On October 25, 2006, the High Yield Bond Fund sold the position for a $493 gain.
Fund Accounting Fees. The Manager is the Fund Accountant for the Funds. For providing Fund Accounting services, the Manager receives payment from the Funds at a fixed base fee per Fund, multiple class fee and any out-of-pocket expenses.
Shareholder Servicing Fees. The Manager is the Shareholder Servicing Agent for the Funds. For providing Shareholder Servicing, the Manager receives payment from the Funds at a fixed fee per shareholder account plus any out-of-pocket expenses. The following table illustrates the amount of Shareholder Servicing fees charged to the Funds for the periods indicated.
| | | | | | | | | | | | | | | |
| | | Shareholder Servicing Fees |
| | | Class A | | Class B | | Class C | | Class I | | Class R-5 |
Capital Appreciation Trust | | | | | | | | | | | | | | | |
Period 09/01/06 through 10/31/06 | | $ | 87,984 | | $ | 9,031 | | $ | 33,735 | | $ | 127 | | $ | 3 |
Fiscal year ended August 31, 2006 | | | 442,394 | | | 47,631 | | | 162,851 | | | 87 | | | — |
Growth and Income Trust | | | | | | | | | | | | | | | |
Period 10/01/06 through 10/31/06 | | | 6,899 | | | 993 | | | 4,745 | | | N/A | | | N/A |
Fiscal year ended September 30, 2006 | | | 83,496 | | | 13,682 | | | 62,077 | | | N/A | | | N/A |
High Yield Bond Fund | | | | | | | | | | | | | | | |
Period 10/01/06 through 10/31/06 | | | 2,680 | | | 654 | | | 1,763 | | | N/A | | | N/A |
Fiscal year ended September 30, 2006 | | | 42,200 | | | 10,586 | | | 27,814 | | | N/A | | | N/A |
34
|
| Notes to Financial Statements (continued) |
Expense Limitations. For the periods indicated in the table below, the Manager has contractually agreed to waive its fees and/or reimburse expenses to each class to the extent that the annual operating expense rate for each class of shares exceed the following annualized rates as a percentage of average daily net assets of each class of shares.
| | | | | | | | | | | | | | | | | | |
| | | Expense Limitations | |
| | | Class A | | | Class B | | | Class C | | | Class I | | | Class R-3 | | | Class R-5 | |
Capital Appreciation Trust | | | | | | | | | | | | | | | | | | |
Fiscal year ended August 31, 2006 | | 1.35 | % | | 2.10 | % | | 2.10 | % | | 1.35 | %(c) | | 1.85 | % | | 1.35 | %(c) |
Period 09/01/06 through 10/31/06 | | 1.35 | % | | 2.10 | % | | 2.10 | % | | 1.35 | %(c) | | 1.85 | % | | 1.35 | %(c) |
Fiscal year ending October 31, 2007 | | | | | | | | | | | | | | | | | | |
From 11/01/06 through 01/01/07 | | 1.35 | % | | 2.10 | % | | 2.10 | % | | 0.95 | % | | 1.65 | % | | 0.95 | % |
From 01/02/07 through 10/31/07 | | 1.35 | % | | 2.15 | % | | 2.15 | % | | 0.95 | % | | 1.65 | % | | 0.95 | % |
Growth and Income Trust | | | | | | | | | | | | | | | | | | |
Fiscal year ended September 30, 2006 | | 1.35 | % | | 2.10 | % | | 2.10 | % | | N/A | | | N/A | | | N/A | |
Period 10/01/06 through 10/31/06 | | 1.35 | % | | 2.10 | % | | 2.10 | % | | N/A | | | N/A | | | N/A | |
Fiscal year ending October 31, 2007 | | | | | | | | | | | | | | | | | | |
From 11/01/06 through 01/01/07 | | 1.35 | % | | 2.10 | % | | 2.10 | % | | N/A | | | N/A | | | N/A | |
From 01/02/07 through 10/31/07 | | 1.35 | % | | 2.15 | % | | 2.15 | % | | N/A | | | N/A | | | N/A | |
High Yield Bond Fund | | | | | | | | | | | | | | | | | | |
Fiscal year ended September 30, 2006 | | | | | | | | | | | | | | | | | | |
From 10/01/05 through 01/02/06 | | 1.10 | % | | 1.65 | % | | 1.65 | % | | N/A | | | N/A | | | N/A | |
From 01/03/06 through 09/30/06 | | 1.20 | % | | 1.75 | % | | 1.75 | % | | N/A | | | N/A | | | N/A | |
Period 10/01/06 through 10/31/06 | | 1.20 | % | | 1.75 | % | | 1.75 | % | | N/A | | | N/A | | | N/A | |
Fiscal year ending October 31, 2007 | | | | | | | | | | | | | | | | | | |
From 11/01/06 through 01/01/07 | | 1.20 | % | | 1.75 | % | | 1.75 | % | | N/A | | | N/A | | | N/A | |
From 01/02/07 through 10/31/07 | | 1.20 | % | | 1.80 | % | | 1.80 | % | | N/A | | | N/A | | | N/A | |
| | (c) | For the periods indicated, the Manager voluntarily, but not contractually, agreed to waive its fees and/or reimburse expenses to Class I and Class R-5 shares to the extent that the annual operating expense rate for each of these classes of shares exceed 0.95% of those shares average daily net assets. | |
Based on the applicable expense limitations from the table above, during the periods indicated the Manager waived the following fees for each fund and class.
| | | | | | |
| | | Growth and
Income Trust | | High Yield
Bond Fund |
Fiscal year ended September 30, 2006 | | | | | | |
Investment Advisory Fees | | $ | 77,000 | | $ | 228,000 |
Period 10/01/06 through 10/31/06 | | | | | | |
Investment Advisory Fees | | | 21,800 | | | 22,450 |
Administrative Fees Waived | | | | | | |
Class A | | | N/A | | | 3,982 |
Class B | | | N/A | | | 972 |
Class C | | | N/A | | | 2,619 |
Shareholder Servicing Fees Waived | | | | | | |
Class A | | | — | | | 2,681 |
Class B | | | — | | | 653 |
Class C | | | — | | | 1,763 |
35
|
| Notes to Financial Statements (continued) |
A portion or all of each Fund’s fees and expenses waived and/or reimbursed for the prior two fiscal years may be recoverable by the Manager if these fees and expenses fall below the expense limitation agreed to by the Manager. The following table illustrates the amounts that the Manager is allowed to recover and the date in which these amounts will expire. No fees were recovered for the period ended October 31, 2006.
| | | | | | | | | | |
| | | Recoverable Fees and Expenses |
| | | 10/31/08 | | | 09/30/08 | | 09/30/07 |
Growth and Income Trust | | $ | 21,800 | | | $ | 77,000 | | $ | 130,500 |
High Yield Bond Fund | | | 35,120 | (d) | | | 228,000 | | | 195,000 |
| | (d) | Fees previously waived for a specific class may only be recovered from that class. | |
Trustees and Officers Fees. Trustees of the Funds also serve as Trustees for Heritage Cash Trust and Heritage Series Trust, which are investment companies that are also advised by the Manager of the Fund (collectively referred to as the “Heritage Mutual Funds”). Each Trustee of the Heritage Mutual Funds who is not an employee of the Manager or employee of an affiliate of the Manager receives an annual retainer along with meeting fees for those Heritage Mutual Funds meetings attended. Trustees’ fees and expenses are paid equally by each portfolio in the Heritage Mutual Funds. Certain Officers of the Heritage Mutual Funds may also be Officers and/or Directors of Heritage. Such Officers receive no compensation from the Heritage Mutual Funds except for the Heritage Mutual Funds’ Chief Compliance Officer. A portion of the Chief Compliance Officer’s total compensation is paid equally by each portfolio in the Heritage Mutual Funds.
| Note 6: | Fund Reorganizations. On December 23, 2005, the Capital Appreciation Trust acquired all the net assets of the Heritage Series Trust—Growth Equity Fund (“Growth Equity Fund”) pursuant to a plan of reorganization approved by Growth Equity Fund shareholders on December 20, 2005. The reorganization was accomplished by a tax-free exchange of 3,387,641 shares of the Capital Appreciation Trust for 3,299,612 shares of Growth Equity Fund outstanding on December 23, 2005. Growth Equity Fund’s net assets at that date, $90,435,785, including $8,306,571 unrealized appreciation, were combined with those of the Capital Appreciation Trust. The aggregate net assets of the Capital Appreciation Trust immediately before the acquisition were $521,500,895. The combined net assets of the Capital Appreciation Trust immediately after the acquisition were $611,936,680. |
On December 23, 2005, Growth and Income Trust acquired all the assets and liabilities of the Heritage Series Trust—Value Equity Fund (“Value Equity Fund”) pursuant to a plan of reorganization approved by Value Equity Fund shareholders on December 20, 2005. The reorganization was accomplished by a tax-free exchange of 2,495,196 shares of Growth and Income Trust for 1,640,841 shares of Value Equity Fund outstanding on December 23, 2005. Value Equity Fund’s net assets at that date, $32,909,457, including $7,630,040 unrealized appreciation, were combined with those of Growth and Income Trust. The aggregate net assets of Growth and Income Trust immediately before the acquisition were $88,010,980. The combined net assets of Growth and Income Trust immediately after the acquisition were $120,920,437.
| Note 7: | Federal Income Taxes. The timing and character of certain income and capital gain distributions are determined in accordance with income tax regulations, which may differ from accounting principles generally accepted in the United States of America. As a result, net investment income (loss) and net realized gain (loss) from investment transactions for a reporting period may differ from distributions during such period. These book/tax differences may be temporary or permanent in nature. To the extent these differences are permanent; they are charged or credited to paid in capital, undistributed net investment income or accumulated net realized loss, as appropriate, in the period that the differences arise. These reclassifications have no effect on net assets or net asset value per share. |
Capital Appreciation Trust
For the period ended October 31, 2006, to reflect reclassifications arising from permanent book/tax differences attributable to a net operating loss, the Capital Appreciation Trust increased (credited) accumulated net investment loss and decreased (debited) paid-in capital by $398,756. Capital loss carryforwards of $5,616,665 were utilized in the period ended October 31, 2006.
36
|
| Notes to Financial Statements (continued) |
| | | | | | |
| | | Expiration |
| | | 2009 | | 2008 |
Capital Loss Carryforward. | | $ | 312,719 | | $ | 11,293,113 |
Growth and Income Trust
For the period ended October 31, 2006, to reflect reclassifications arising from permanent book/tax differences primarily attributable to a net operating loss, the Growth and Income Trust increased (credited) undistributed net investment income by $540,840 and decreased (debited) accumulated net realized gain by $357,953 and paid-in capital by $182,884.
High Yield Bond Fund
As of October 31, 2006, the High Yield Bond Fund had net tax basis capital loss carryforwards in the aggregate of $7,910,062 which may be applied to any net taxable capital gain until their expiration dates. The following table illustrates the amount of capital loss carryforwards available to offset future realized capital gains and the fiscal year in which these amounts will expire.
| | | | | | | | | | | | |
| | | Expiration |
| | | 2014 | | 2010 | | 2009 | | 2008 |
Capital Loss Carryforward. | | $ | 29,939 | | $ | 2,929,867 | | $ | 178,539 | | $ | 4,771,717 |
Distributions. For income tax purposes, distributions paid during the fiscal periods indicated were as follows:
| | | | | | | | | | | | | | | | | | |
| | | | | | | | | Capital Gains |
| | | Ordinary Income | | Long-Term |
| | | 10/31/06 | | 9/30/2006 | | 9/30/2005 | | 10/31/06 | | 9/30/2006 | | 9/30/2005 |
Growth and Income Trust | | $ | 826,184 | | $ | 2,429,719 | | $ | 1,350,758 | | $ | 44,081 | | $ | 5,066,343 | | $ | — |
High Yield Bond Fund | | | 355,189 | | | 4,853,567 | | | 5,712,843 | | | — | | | — | | | — |
As of October 31, 2006, the components of distributable earnings on a tax basis were as follows:
| | | | | | | | | | |
| | | Undistributed
Ordinary
Income | | Accumulated
Realized
Gain | | Capital Loss
Carryforwards | |
Capital Appreciation Trust | | $ | — | | $ | 3,788,265 | | $ | — | |
Growth and Income Trust | | | — | | | 4,361,875 | | | 11,605,832 | |
High Yield Bond Fund | | | 469,421 | | | — | | | (7,910,062 | ) |
| Note 8: | New Accounting Pronouncements. In July 2006, the Financial Accounting Standards Board (“FASB”) released FASB Interpretation No. 48 “Accounting for Uncertainty in Income Taxes” (“FIN 48”), an interpretation of FASB Statement No. 109. FIN 48 provides guidance for how uncertain tax positions should be recognized, measured, presented and disclosed in the financial statements. FIN 48 requires the accounting and disclosure of tax positions taken or expected to be taken in the course of preparing the Fund’s tax returns to determine whether the tax positions are “more-likely-than-not” of being sustained by the applicable tax authority. Tax positions not deemed to meet the more-likely-than-not threshold would be recorded as a tax benefit or expense in the current year. Adoption of FIN 48 is required for fiscal years beginning after December 15, 2006 and is to be applied to all open tax years as of the effective date. The Manager is evaluating the application of FIN 48 to each Fund, and is not in a position at this time to estimate the significance of its impact, if any, on each Fund’s financial statements. |
37
|
| Notes to Financial Statements (continued) |
In September 2006, FASB issued its new Standard No. 157, “Fair Value Measurements” (“FAS 157”). FAS 157 is designed to unify guidance for the measurement of fair value of all types of assets, including financial instruments, and certain liabilities, throughout a number of accounting standards. FAS 157 also establishes a hierarchy for measuring fair value in generally accepted accounting principles and expands financial statement disclosures about fair value measurements that are relevant to mutual funds. FAS 157 is effective for financial statements issued for fiscal years beginning after November 15, 2007, and earlier application is permitted. The Manager is evaluating the application of FAS 157 to each Fund, and is not in a position at this time to estimate the significance of its impact on each Funds’ financial statements.
38

Report of Independent Registered Certified Public Accounting Firm
To the Board of Trustees and Shareholders of
Heritage Capital Appreciation Trust, Heritage Growth and Income Trust and
Heritage Income Trust - High Yield Bond Fund:
In our opinion, the accompanying statements of assets and liabilities, including the investment portfolios, and the related statements of operations and of changes in net assets and the financial highlights present fairly, in all material respects, the financial position of Heritage Capital Appreciation Trust, Heritage Growth and Income Trust and Heritage Income Trust - High Yield Bond Fund (the “Funds”) at October 31, 2006, and the results of each of their operations, the changes in each of their net assets and the financial highlights for each of the periods indicated, in conformity with accounting principles generally accepted in the United States of America. These financial statements and financial highlights (hereafter referred to as “financial statements”) are the responsibility of the Funds’ management; our responsibility is to express an opinion on these financial statements based on our audits. We conducted our audits of these financial statements in accordance with the standards of the Public Company Accounting Oversight Board (United States). Those standards require that we plan and perform the audit to obtain reasonable assurance about whether the financial statements are free of material misstatement. An audit includes examining, on a test basis, evidence supporting the amounts and disclosures in the financial statements, assessing the accounting principles used and significant estimates made by management, and evaluating the overall financial statement presentation. We believe that our audits, which included confirmation of securities at October 31, 2006 by correspondence with the custodian and brokers, provide a reasonable basis for our opinion.

December 22, 2006
39
|
| Understanding Your Ongoing Costs (unaudited) |
As a shareholder of a Fund, you incur two types of costs: (1) transaction costs, including sales charges on purchases, contingent deferred sales charges, or redemption fees; and (2) ongoing costs, including investment advisory fees; distribution (12b-1) fees; and other fund expenses. The following sections are intended to help you understand your ongoing cost (in dollars) of investing in each Fund and to compare these costs with the ongoing costs of investing in other mutual funds. Please note that the expenses shown in the table are meant to highlight your ongoing costs only and do not reflect one-time transaction expenses, such as sales charges or redemption fees. Therefore, if these transactional costs were included, your costs would have been higher. For more information, see your Fund’s prospectus or contact your financial advisor.
Actual Expenses. The table below shows the actual expenses you would have paid on a $1,000 investment in each Fund held from the beginning period indicated through October 31, 2006. It also shows how much a $1,000 investment would be worth at the close of the period, assuming actual returns after ongoing expenses. This table is useful in comparing ongoing costs only, and will not help you determine the relative total costs of owning different funds. Simply divide your account value by $1,000 (for example, an $8,600 account value divided by $1,000 = 8.6), then multiply the result by the number in the line under the heading entitled "Expenses Paid During the Period" to estimate the expenses you paid on your account during this period.
| | | | | | | | | | | | | | | | |
| | | Beginning
Period Date | | Account Value
at Beginning
Period Date | | Ending
Account Value
October 31, 2006 | | Expenses
Paid During
Period(a) | | Annualized
Expense Ratios | | | Number of
Days in
the Period |
Capital Appreciation Trust | | | | | | | | | | | | | | | | |
Class A | | 09/01/06 | | $ | 1,000.00 | | $ | 1,037.80 | | $ | 2.10 | | 1.23 | % | | 61 |
Class B | | 09/01/06 | | $ | 1,000.00 | | $ | 1,036.30 | | $ | 3.37 | | 1.98 | % | | 61 |
Class C | | 09/01/06 | | $ | 1,000.00 | | $ | 1,036.70 | | $ | 3.37 | | 1.98 | % | | 61 |
Class I | | 09/01/06 | | $ | 1,000.00 | | $ | 1,038.40 | | $ | 1.44 | | 0.85 | % | | 61 |
Class R-5 | | 10/02/06 | | $ | 1,000.00 | | $ | 1,022.00 | | $ | 0.67 | | 0.84 | % | | 30 |
Growth and Income Trust | | | | | | | | | | | | | | | | |
Class A | | 10/01/06 | | $ | 1,000.00 | | $ | 1,025.20 | | $ | 1.16 | | 1.35 | % | | 31 |
Class B | | 10/01/06 | | $ | 1,000.00 | | $ | 1,024.60 | | $ | 1.81 | | 2.10 | % | | 31 |
Class C | | 10/01/06 | | $ | 1,000.00 | | $ | 1,024.60 | | $ | 1.81 | | 2.10 | % | | 31 |
High Yield Bond Fund | | | | | | | | | | | | | | | | |
Class A | | 10/01/06 | | $ | 1,000.00 | | $ | 1,014.00 | | $ | 1.03 | | 1.20 | % | | 31 |
Class B | | 10/01/06 | | $ | 1,000.00 | | $ | 1,013.70 | | $ | 1.50 | | 1.75 | % | | 31 |
Class C | | 10/01/06 | | $ | 1,000.00 | | $ | 1,013.70 | | $ | 1.50 | | 1.75 | % | | 31 |
| | (a) | Expenses are calculated using each Fund’s annualized expense ratios for each class of shares, multiplied by the average account value for the period, then multiplying the result by the actual number of days in the period; and then dividing that result by the actual number of days in the fiscal year (365). |
|
| Understanding Your Ongoing Costs (unaudited) (continued) |
Hypothetical Example for Comparison Purposes. All mutual funds now follow guidelines to assist shareholders in comparing expenses between different funds. Per these guidelines, the table below shows each Fund’s expenses based on a $1,000 investment held from from May 1, 2006 through October 31, 2006 and assuming for this period a hypothetical 5% annualized rate of return before ongoing expenses, which is not the Fund’s actual return. Please note that you should not use this information to estimate your actual ending account balance and expenses paid during the period. You can use this information to compare the ongoing expenses (but not transaction expenses or total costs) of investing in the Fund’s with those of other funds. All mutual fund shareholder reports will provide this information to help you make this comparison.
| | | | | | | | | | | | |
| | | Beginning
Account Value
May 1, 2006 | | Ending
Account Value
October 31, 2006 | | Expenses Paid
During Period(b) | | Annualized
Expense Ratios | |
Capital Appreciation Trust | | | | | | | | | | | | |
Class A | | $ | 1,000.00 | | $ | 1,019.00 | | $ | 6.27 | | 1.23 | % |
Class B | | $ | 1,000.00 | | $ | 1,015.22 | | $ | 10.06 | | 1.98 | % |
Class C | | $ | 1,000.00 | | $ | 1,015.22 | | $ | 10.06 | | 1.98 | % |
Class I | | $ | 1,000.00 | | $ | 1,020.94 | | $ | 4.31 | | 0.85 | % |
Class R-5 | | $ | 1,000.00 | | $ | 1,020.99 | | $ | 4.26 | | 0.84 | % |
Growth and Income Trust | | | | | | | | | | | | |
Class A | | $ | 1,000.00 | | $ | 1,018.40 | | $ | 6.87 | | 1.35 | % |
Class B | | $ | 1,000.00 | | $ | 1,014.62 | | $ | 10.66 | | 2.10 | % |
Class C | | $ | 1,000.00 | | $ | 1,014.62 | | $ | 10.66 | | 2.10 | % |
High Yield Bond Fund | | | | | | | | | | | | |
Class A | | $ | 1,000.00 | | $ | 1,019.16 | | $ | 6.11 | | 1.20 | % |
Class B | | $ | 1,000.00 | | $ | 1,016.38 | | $ | 8.89 | | 1.75 | % |
Class C | | $ | 1,000.00 | | $ | 1,016.38 | | $ | 8.89 | | 1.75 | % |
| | (b) | Expenses are calculated using each Fund’s annualized expense ratios for each class of shares, multiplied by the average account value for the period, then multiplying the result by the actual number of days in the period (184); and then dividing that result by the actual number of days in the fiscal year (365). |
41
| | | | | | | | |
Name, Age and Position(s)
Held with Fund | | Term of Office(a)
and Length of
Time Served | | Principal Occupation(s) During Past 5 years | | Number of Funds
in Fund Complex
Overseen by Trustee | | Directorships of
Public Companies
Held by Trustee |
| | | | |
Interested Trustees(b) | | | | | | | | |
| | | | |
Thomas A. James (64) Chairman of the Board and Trustee | | Since inception
in 1985 | | Chairman of the Board since 1985; Chief Executive Officer of RJF since 1969; Chairman of the Board of RJA since 1986; Chairman of the Board of Eagle since 1984. | | 10 | | OSI Restaurant
Partners, Inc. |
Richard K. Riess (57) Trustee | | Since inception
in 1985 | | Executive Vice President and Managing Director —Asset Management of RJF since 1998; Chief Executive Officer of Eagle since 1996; Chief Executive Officer of Heritage since 2000. | | 10 | | None |
Independent Trustees | | | | | | | | |
| | | | |
C. Andrew Graham (66) Trustee | | Since inception
in 1985 | | First Financial Advisors, Ltd. & Graham
Financial Partners, LLC (financial planning, insurance and investment services) since 1999. | | 10 | | None |
Keith B. Jarrett (58) Trustee | | Since 2005 | | President, KBJ, LLC (investment company) since 2001; Principal, Rockport Funding,
LLC (specialty finance), and Ajax Partners (investment partnership) since 2003; President and CEO, TF Ventures (information technology) 1998-2001. | | 10 | | Penn Virginia
Resources, MLP |
William J. Meurer (63) Trustee | | Since 2003 | | Private Financial Consultant since 2000. | | 10 | | Sykes
Enterprises, Inc. |
James L. Pappas (63) Lead Independent Trustee | | Since 2003
(Since 1989 as
Trustee) | | Lykes Professor of Banking and Finance, University of South Florida College of Business Administration 1986-2006; President, Graduate School of Banking,
University of Wisconsin 1995-2005. | | 10 | | None |
Deborah L. Talbot, PhD (56) Trustee | | Since 2002 | | Independent Consultant and Researcher; Founder and Chairman of the Board, Creative Tampa Bay since 2003; Dean’s Advisory Board, College of Arts and Sciences, University of Memphis since 2002. | | 10 | | None |
The Trust’s Statement of Additional Information includes additional information about the Trustees and Officers and is available, without charge, upon request, by calling (800) 421-4184. The address of each Trustee and Officer is 880 Carillon Parkway, St. Petersburg, FL 33716.
| (a) | Trustees serve for the lifetime of the Trust or until they are removed, resign or retire. The Board has adopted a Board Governance Policy that requires Independent Trustees to retire at the age of 72 for those Trustees in office prior to August 2000, and at the age of 70 for those Trustees who are elected to office after August 2000. |
| (b) | Messrs. James and Riess are “interested” persons of the Trust as that term is defined by the Investment Company Act of 1940. Mr. James is affiliated with RJA, Eagle and RJF. Mr. Riess is affiliated with Heritage, Eagle and RJF. |
42
|
| Trustees and Officers (continued) |
| | | | | | | | |
Name, Age and Position(s)
Held with Fund | | Term of Office(c)
and Length of
Time Served | | Principal Occupation(s) During Past 5 years | | Number of Funds
in Fund Complex
Overseen by Trustee | | Directorships of
Public Companies
Held by Trustee |
| | | | |
Officers | | | | | | | | |
| | | | |
Stephen G. Hill (47) President | | Since 2005 | | President of Heritage since 2005; Director of Heritage since 1994; President and Chief Operating Officer of Eagle since 2000; President and Chief Executive Officer of Awad Asset Management, Inc. (“Awad”) since 2004; Director of Awad since 1998;
Director of HFD since 2006. | | N/A | | N/A |
K.C. Clark (47) Executive Vice President and Principal Executive
Officer | | Since 2000 | | Executive Vice President and Chief Operating Officer of Heritage since 2000; Director of Heritage since 2005. | | N/A | | N/A |
Andrea N. Mullins (39) Treasurer and Secretary, Principal Financial Officer | | Since 2003
(Since 2004 as
Principal Financial
Officer) | | Treasurer and Vice President—Finance of
Heritage since 2003; Vice President—Fund Accounting of Heritage 1996-2003. | | N/A | | N/A |
Mathew J. Calabro (39) Chief Compliance Officer | | Since 2005 | | Senior Vice President and Chief Compliance Officer of Heritage since 2005; Vice President—Transfer Agent of Heritage 1996-2005. | | N/A | | N/A |
The Trust’s Statement of Additional Information includes additional information about the Trustees and Officers and is available, without charge, upon request, by calling (800) 421-4184. The address of each Trustee and Officer is 880 Carillon Parkway, St. Petersburg, FL 33716.
| (c) | Officers are elected annually for one year terms. |
|
| 2006 Federal Income Tax Notice (unaudited) |
| | |
| Heritage Growth and Income Trust | | |
For the fiscal year ended September 30, 2006, certain dividends paid by the Heritage Growth and Income Trust may be subject to a maximum tax rate of 15%, as provided for by the Jobs and Growth Tax Relief Reconciliation Act of 2004. The Fund designates a maximum amount of $5,066,343 as qualified dividend income, which is 100% of what was distributed. The information and distributions reported herein may differ from the information and distributions taxable to the shareholders for the calendar year ending December 31, 2006. Complete information will be computed and reported in conjunction with your 2006 Form 1099-DIV.
43
The greatest risk of investing in each fund is that you could lose money. Each fund invests primarily in common stocks whose values increase and decrease in response to the activities of the companies that issued such stocks, general market conditions and/or economic conditions. As a result, each fund’s net asset value also increases and decreases. The following table identifies the primary risk factors of each fund in light of their respective principal investment strategies. These risk factors are explained below.
| | | | | | |
| Risk Factor | | Capital
Appreciation Trust | | Growth and
Income Trust | | High Yield
Bond Fund |
Stock Market Risks | | X | | X | | |
Growth Stocks | | X | | X | | |
Value Stocks | | | | X | | |
Mid-Cap Companies | | X | | X | | |
Small-Cap Companies | | X | | | | |
High-Yield Securities | | | | X | | X |
Fixed Income Securities | | | | X | | X |
Foreign Securities | | | | X | | X |
Emerging Markets | | | | | | X |
Covered Call Options | | | | X | | |
Credit Risk | | | | | | X |
Changes in Interest Rates | | | | | | X |
Focused Holdings | | X | | | | |
Government Sponsored Entities | | X | | X | | |
Market Timing Activities | | | | X | | |
| | • | | Stock Market Risks. The value of a fund’s stock holdings may decline in price because of changes in prices of its holdings or a broad stock market decline. These fluctuations could be a sustained trend or a drastic movement. The stock markets generally move in cycles, with periods of rising prices followed by periods of declining prices. The value of your investment may reflect these fluctuations. |
| | • | | Growth Stocks. Growth companies are expected to increase their earnings at a certain rate. When these expectations are not met, investors may punish the prices of stocks excessively, even if earnings showed an absolute increase. Growth company stocks also typically lack the dividend yield that can cushion stock prices in market downturns. |
| | • | | Value Stocks. Investments in value stocks are subject to the risk that their true worth may not be fully realized by the market. This may result in the value stocks’ prices remaining undervalued for extended periods of time. A fund’s performance also may be affected adversely if value stocks remain unpopular with or lose favor among investors. |
| | • | | Mid-Cap Companies. Investments in medium-capitalization companies generally involve greater risks than investing in larger, more established companies. Mid-cap companies often have narrower commercial markets and more limited managerial and financial resources than larger, more established companies. As a result, their performance can be more volatile and they face greater risk of business failure, which could increase the volatility of a fund’s portfolio. Generally, the smaller the company size, the greater these risks. Additionally, mid-cap companies may have less market liquidity than large-cap companies. |
| | • | | Small-Cap Companies. Investments in small-cap companies generally involves greater risk than investing in mid- or large-capitalization companies. Small-cap companies often have narrower markets and more limited managerial and financial resources than larger, more established companies. As a result, their performance can be more volatile and they face greater risk of business failure, which could increase the volatility of a fund’s portfolio. Generally, the smaller the company size, the greater these risks. Additionally, small-cap companies may have less market liquidity than mid-cap companies and large-cap companies. |
| | • | | High-Yield Securities. Investments in securities rated below investment grade or “junk bonds” generally involves significantly greater risks of loss of your money than an investment in investment grade bonds. Compared with issuers of investment grade bonds, junk bonds are more likely to encounter financial difficulties and to be materially affected by these difficulties. Rising interest rates may compound these difficulties and reduce an issuer’s ability to repay principal and interest obligations. Issuers of lower-rated securities also have a greater risk of default or bankruptcy. Additionally, due to the greater number of considerations involved in the selection of a fund’s securities, the achievement of a fund’s objective depends more on the skills of the portfolio manager than investing only in higher rated securities. Therefore, your investment may experience greater volatility in price and yield. High yield securities may be less liquid than higher quality investments. A security whose credit rating has been lowered may be particularly difficult to sell. |
| | • | | Fixed Income Securities. A fund could lose money if the issuer of a fixed-income security is unable to meet its financial obligations or goes bankrupt. Credit risk usually applies to most fixed-income securities, but generally is not a factor for U.S. government obligations. In addition, investing in non-investment grade bonds generally involves significantly greater risk of loss than investments in investment-grade bonds. Issuers of non-investment grade bonds are more likely than issuers of investment-grade bonds to encounter financial difficulties and to be materially affected by these difficulties. |
| | • | | Foreign Securities. Investments in foreign securities involve greater risks than investing in domestic securities. As a result, a fund’s returns and net asset value may be affected by fluctuations in currency exchange rates or political or economic conditions and regulatory requirements in a particular country. Foreign markets, as well as foreign economies and political systems, may be less stable than U.S. markets, and changes in the exchange rates of foreign currencies can affect the value of a fund’s foreign assets. Foreign laws and accounting standards typically are not as strict as they are in the U.S., and there may be less public information available about foreign companies. |
|
| Principal Risks (continued) |
| | • | | Emerging Markets. When investing in emerging markets, there are risks of greater political uncertainties, an economy’s dependence on revenues from particular commodities or on international aid or development assistance, currency transfer restrictions, a limited number of potential buyers for such securities and delays and disruptions in securities settlement procedures. |
| | • | | Covered Call Options. Because a fund may write covered call options, a fund may be exposed to risk stemming from changes in the value of the stock that the option is written against. While call option premiums may generate incremental portfolio income, they also can limit gains from market movements. |
| | • | | Credit Risk. A fund could lose money if the issuer of a debt security is unable to meet its financial obligations or goes bankrupt. Credit risk usually applies to most fixed-income securities, but generally is not a factor for U.S. government obligations. A fund can be subject to more credit risk than other income mutual funds because it invests in high yield debt securities, which are considered predominantly speculative with respect to the issuer’s continuing ability to meet interest and principal payments. This is especially true during periods of economic uncertainty or economic downturns. In addition, investing in non- investment grade bonds generally involves significantly greater risk of loss than investments in investment-grade bonds. Issuers of non-investment grade bonds are more likely than issuers of investment-grade bonds to encounter financial difficulties and to be materially affected by these difficulties. |
| | • | | Changes in Interest Rates. Investments in investment-grade and non-investment grade fixed income securities are subject to interest rate risk. The value of a fund’s investments typically will fall when interest rates rise. A fund is particularly sensitive to changes in interest rates because it may invest in debt securities with intermediate and long terms to maturity. Debt securities with longer durations tend to be more sensitive to changes in interest rates, usually making them more volatile than debt securities with shorter durations. |
| | • | | Focused Holdings. Funds that normally hold a core portfolio of stocks of fewer companies than other greater diversified funds, the increase or decrease of the value of a single stock may have a greater impact on the fund’s net asset value and total return. |
| | • | | Government Sponsored Entities. Investments in government sponsored entities are obligations issued by agencies and instrumentalities of the U.S. Government. These obligations vary in the level of support they receive from the U.S. Government. They may be: (i) supported by the full faith and credit of the U.S. Treasury, such as those of the Government National Mortgage Association; (ii) supported by the right of the issuer to borrow from the U.S. Treasury, such as those of the Federal National Mortgage Association; (iii) supported by the discretionary authority of the U.S. Government to purchase the issuer’s obligations, such as those of the Student Loan Marketing Association; or (iv) supported only by the credit of the issuer, such as those of the Federal Farm Credit Bureau. The U.S. Government may choose not to provide financial support to U.S. Government sponsored agencies or instrumentalities if it is not legally obligated to do so in which case, if the issuer defaulted, the fund holding securities of such issuer might not be able to recover its investment from the U.S. Government. |
| | • | | Risk of Market Timing Activities. Because of specific securities a fund may invest in, it could be subject to the risk of market timing activities by fund shareholders. Some examples of these types of securities are small-cap, mid-cap and foreign securities. Typically, foreign securities offer the most opportunity for these market timing activities. A fund generally prices these foreign securities using their closing prices from the foreign markets in which they trade, typically prior to a fund’s calculation of its net asset value. These prices may be affected by events that occur after the close of a foreign market but before a fund prices its shares. In such instances, a fund may fair value foreign securities. However, some investors may engage in frequent short-term trading in a fund to take advantage of any price differentials that may be reflected in the net asset value of a fund’s shares. There is no assurance that fair valuation of securities can reduce or eliminate market timing. In order to discourage market timing activity in a fund, redemptions and exchanges of fund shares may be subject to a redemption fee, as described below in “How to Sell Your Investment”. While Heritage monitors trading in the fund, there is no guarantee that it can detect all market timing activities. |

The Intelligent Creation of Wealth
(727) 567-8143 n (800) 421-4184
HeritageFunds.com
Heritage Fund Distributors, Inc.
Member NASD
Not FDIC Insured n May Lose Value n No Bank Guarantee
Please consider the investment objectives, risks, charges, and expenses of any fund carefully before investing. Contact Heritage at (800) 421-4184 or your financial advisor for a prospectus, which contains this and other important information about the Funds. Read the prospectus carefully before you invest or send money.
This report is for the information of shareholders of the Capital Appreciation Trust, the Heritage Growth and Income Trust and the Heritage Income Trust—High Yield Bond Fund. A description of the Fund’s proxy voting policies, procedures and information regarding how the Fund voted proxies relating to portfolio securities during the 12-month period ended June 30, 2006, is available without charge, upon request, by calling the Heritage Family of Funds, toll-free at the number above, by accessing the SEC’s website at sec.gov or the Fund’s website at HeritageFunds.com. If you wish to review additional information on the portfolio holdings of the Fund, a complete schedule has been filed with the Securities and Exchange Commission for the first and third quarters of the Fund’s fiscal year end on Form N-Q. These filings are available on the SEC’s website at sec.gov and may be reviewed and copied at the SEC’s Public Reference Room in Washington, DC. Information on the operations of the Public Reference Room may be obtained by calling (800) SEC-0330.
| | |
| 12/06 | |  |
As of the end of the fiscal period October 31, 20061, Heritage Growth and Income Trust has adopted a code of ethics, as defined in Item 2 of Form N-CSR, that applies to the Principal Executive Officer and Principal Financial Officer. Heritage Growth and Income Trust has not made any amendments to its code of ethics during the covered period. Heritage Growth and Income Trust has not granted any waivers from any provisions of the code of ethics during the covered period. A copy of this code of ethics is filed as an exhibit to this Form N-CSR.
| Item 3. | Audit Committee Financial Expert |
The Board of Trustees of Heritage Growth and Income Trust has determined that William J. Meurer is an audit committee financial expert, as defined in Item 3 of Form N-CSR, serving on its audit committee. Mr. Meurer is independent for purposes of Item 3 of Form N-CSR.
| Item 4. | Principal Accountant Fees and Services2 |
(a) Audit Fees
The aggregate fees billed by registrant’s independent public accountants, PricewaterhouseCoopers LLP (“PwC”) for professional services rendered in connection with the audit of registrant’s annual financial statements or services that are normally provided by the accountant in connection with statutory and regulatory filings or engagements were $22,000 for the fiscal period ended September 30, 2005, $28,000 for the fiscal period ended September 30, 2006, and $19,000 for the fiscal period ended October 31, 2006.
(b) Audit-Related Fees
There were no aggregate fees PwC billed to registrant for assurance and other services which are reasonably related to the performance of registrant’s audit and are not reported under Item 4(a) for the fiscal periods ended September 30, 2005, September 30, 2006 and October 31, 2006. The aggregate fees PwC billed to registrant’s investment adviser and any entity controlling, controlled by, or under common control with registrant’s investment adviser for assurance and other services directly related to the operations and financial reporting of registrant were $33,000 for the fiscal period ended September 30, 2005, $35,000 for the fiscal periods ended September 30, 2006, and October 31, 2006.
(c) Tax Fees
The aggregate tax fees PwC billed to registrant for tax compliance, tax advice, and tax planning services were $3,000 for the fiscal period ended September 30, 2005, $5,000 for the fiscal period ended September 30, 2006, and $4,000 for the fiscal period ended October 31, 2006. There were no aggregate tax fees PwC billed to registrant’s investment adviser and any entity controlling, controlled by, or under common control with registrant’s investment adviser for services directly related to the operations and financial reporting of registrant for the fiscal periods ended September 30, 2005, September 30, 2006, and October 31, 2006.
| 1 | In the calendar year 2006, the fiscal year end for this Trust changed from September 30 to October 31. |
| 2 | All accountant fees and services amounts are rounded to the nearest whole thousand. |
(d) All Other Fees
For each of the fiscal periods ended September 30, 2005, September 30, 2006 and October 31, 2006, registrant paid PwC no other fees. There were no aggregate fees PwC billed to registrant’s investment adviser and any entity controlling, controlled by, or under common control with registrant’s investment adviser for any other services directly related to the operations and financial reporting of registrant for the fiscal periods ended September 30, 2005, September 30, 2006, and October 31, 2006.
(e) Registrant’s Audit Committee Charter provides that the Audit Committee (comprised of the Independent Trustees of registrant) is responsible for pre-approval of all auditing services performed for the registrant. The Audit Committee reports to the Board of Trustees (“Board”) regarding its approval of the engagement of the auditor and the proposed fees for the engagement, and the majority of the Board (including the members of the Board who are Independent Trustees) must approve the auditor at an in-person meeting. The Audit Committee also is responsible for pre-approval (subject to the de minimus exception for non-audit services described in the Securities Exchange Act of 1934, as amended, and applicable rule thereunder and not expecting to exceed $5,000) of all non-auditing services performed for the registrant or for any service affiliate of registrant. Registrant’s Audit Committee Charter also permits a designated member of the Audit Committee to pre-approve, between meetings, one or more non-audit service projects, subject to ratification by the Audit Committee at the next meeting of the Audit Committee. Registrant’s Audit Committee pre-approved all fees described above which PwC billed to registrant.
(f) Less than 50% of the hours billed by PwC for auditing services to registrant for the fiscal period ended October 31, 2006, were for work performed by persons other than full-time, permanent employees of PwC.
(g) There were no aggregate non-audit fees billed by PwC to registrant and to registrant’s investment adviser and any entity controlling, controlled by, or under common control with registrant’s investment adviser for the fiscal periods ended September 30, 2005, September 30, 2006, and October 31, 2006.
(h) Registrant’s Audit Committee has considered the non-audit services provided to the registrant and registrant’s investment adviser and any entity controlling, controlled by, or under common control with registrant’s investment adviser as described above and determined that these services do not compromise PwC’s independence.
| Item 5. | Audit Committee of Listed Registrants |
Not applicable to the registrant.
| Item 6. | Schedule of Investments |
Included as part of report to shareholders under Item 1.
| Item 7. | Disclosure of Proxy Voting Policies and Procedures for Closed-End Management Investment Companies. |
Not applicable to the registrant.
| Item 8. | Portfolio Managers of Closed-End Management Investment Companies |
Not applicable to the registrant.
| Item 9. | Purchases of Equity Securities by Closed-End Management Investment Company and Affiliated Purchasers |
Not applicable to the registrant.
| Item 10. | Submission of Matters to a Vote of Security Holders. |
There have been no material changes to the Nominating Committee Charter, which sets forth procedures by which shareholders may recommend nominees to the Trust’s Board of Trustees, since the Trust last provided disclosure in response to this item.
| Item 11. | Controls and Procedures |
| (a) | Based on an evaluation of the disclosure controls and procedures (as defined in Rule 30a-3(c) under the Act), the Principal Executive Officer and Principal Financial Officer of Heritage Growth and Income Trust have concluded that such disclosure controls and procedures are effective as of January 04, 2007. |
| (b) | There was no change in the internal controls over financial reporting (as defined in Rule 30a-3(d) under the Act) of Heritage Growth and Income Trust that occurred during the second half of its fiscal year that has materially affected or is reasonably likely to materially affect, its internal control over financial reporting. |
(a)(1) Code of Ethics pursuant to Item 2 of Form N-CSR is filed and attached hereto as Exhibit 99.CODEETH.
(a)(2) The certification required by Rule 30a-2(a) of the Investment Company Act of 1940, as amended, and Section 302 of the Sarbanes-Oxley Act of 2002 is filed and attached hereto as Exhibit 99.CERT.
(a)(3) Not applicable to the registrant.
(b) The certification required by Rule 30a-2(b) of the Investment Company Act of 1940, as amended, and Section 906 of the Sarbanes-Oxley Act of 2002 is filed and attached hereto as Exhibit 99.906CERT.
SIGNATURES
Pursuant to the requirements of the Securities Exchange Act of 1934 and the Investment Company Act of 1940, the registrant has duly caused this report to be signed on its behalf by the undersigned, thereunto duly authorized.
| | | | |
| | | | HERITAGE GROWTH AND INCOME TRUST |
| | |
| Date: January 04, 2007 | | | | |
| | |
| | | | | /s/ K. C. Clark |
| | | | K.C. Clark |
| | | | Executive Vice President and Principal Executive Officer |
Pursuant to the requirements of the Securities Exchange Act of 1934 and the Investment Company Act of 1940, this report has been signed below by the following persons on behalf of the registrant and in the capacities and on the dates indicated.
| | | | |
| | |
| Date: January 04, 2007 | | | | /s/ K. C. Clark |
| | | | K.C. Clark |
| | | | Executive Vice President and Principal Executive Officer |
| | |
| Date: January 04, 2007 | | | | /s/ Andrea N. Mullins |
| | | | Andrea N. Mullins |
| | | | Principal Financial Officer |