UNITED STATES
SECURITIES AND EXCHANGE COMMISSION
Washington, D.C. 20549
FORM N-CSR
CERTIFIED SHAREHOLDER REPORT OF
REGISTERED MANAGEMENT INVESTMENT COMPANIES
Investment Company Act File Number: 811-4767
EAGLE GROWTH & INCOME FUND
(Formerly: Heritage Growth & Income Trust)
(Exact name of Registrant as Specified in Charter)
880 Carillon Parkway
St. Petersburg, FL 33716
(Address of Principal Executive Office) (Zip Code)
Registrant’s Telephone Number, including Area Code: (727) 573-3800
STEPHEN G. HILL, PRESIDENT
880 Carillon Parkway
St. Petersburg, FL 33716
(Name and Address of Agent for Service)
Copy to:
FRANCINE J. ROSENBERGER, ESQ.
K&L Gates, LLP
1601 K Street, NW
Washington, D.C. 20006
Date of fiscal year end: October 31
Date of reporting period: October 31, 2008
| Item 1. | Reports to Shareholders |

Annual Report
and Investment Performance Review
for the fiscal year ended October 31, 2008
Eagle Capital Appreciation Fund
Eagle Growth & Income Fund
Eagle International Equity Fund
Eagle Large Cap Core Fund
Eagle Mid Cap Growth Fund
Eagle Mid Cap Stock Fund
Eagle Small Cap Growth Fund

Table of Contents
President’s Letter
Dear Fellow Shareholders:
I am pleased to present the annual report and investment performance review of the Eagle mutual funds for the fiscal year ended October 31, 2008 (the “reporting period”). The Heritage Family of Funds were renamed effective October 31, 2008.
As I write this letter, we are dealing with one of the worst financial crises on record. There has been unprecedented volatility in the global equity markets and unprecedented illiquidity in the debt markets. This crisis is driven by three main themes: a collapse in the housing market, the credit crisis and fears of a global recession.
The troubles in the housing market can be traced back to the model of mortgage financing that evolved over the past decade. The parties responsible for originating a mortgage generally sold that mortgage to an investment bank that securitized these loans and remarketed them to investors. In this model, the originators had incentives to issue mortgages without the same concern for credit quality that may have existed had they held these mortgages in their own accounts. This resulted in creative pricing models that brought unqualified buyers to the market which, in turn, helped drive home prices to unsustainable levels.
Simply put, the credit crisis is the result of many companies carrying too much debt. In some cases, this debt was not reflected on the balance sheets of the companies that had the ultimate exposure. Banks also set up structured investment vehicles (“SIVs”), which were essentially off-balance sheet subsidiaries. These SIVs bought high-risk assets and funded their operations in the commercial paper markets, the same way that good companies finance their everyday operating needs. As the market couldn’t discern good commercial paper from bad, the commercial paper market froze, with lending coming to a virtual standstill. The resulting failure of Lehman Brothers also caused a major money market fund to “break the buck,” prompting the U.S. Treasury to introduce a new guarantee program for money market funds.
The global economic boom of the past few years came to a halt this year as a slowdown pointed to signs of a global recession. In the United States, we have seen an economic contraction that can be dated back to the beginning of 2008.
In the past year, the financial services landscape has been reshaped as the government took control of Freddie Mac and Fannie Mae and other well-known firms either failed or were acquired in hastily arranged transactions in which the government acted as marriage broker. Financial institutions across the globe saw similar disruptions.
The U.S. Treasury and the Federal Reserve have taken many steps to inject capital into the commercial paper system and make credit available. Several lending and funding facilities have been introduced to improve liquidity and calm the markets, including the first ever guarantee program for money market fund
investors. Further, we saw unprecedented coordination among many of the world’s central banks in an effort to provide liquidity to the financial system.
As you would expect, the world’s equity markets performed poorly over the past year with virtually every major equity market index and business sector experiencing negative returns during the reporting period. In the commentaries that follow, each fund’s portfolio managers discuss the specific performance in their funds. While there can be no way to accurately predict short-term market movements, our portfolio managers generally are optimistic that there may be excellent long-term investment opportunities available today.
As I mentioned, the funds were renamed under the Eagle Family of Funds banner. Effective November 1, 2008, Eagle Asset Management, Inc. (“Eagle”) became the adviser to the Funds. This change was the result of an internal reorganization involving Eagle and Heritage Asset Management Inc., the previous adviser and affiliate of Eagle. This change allows us to provide investors with a more efficient way to access a broad range of investment products under a unified Eagle brand. Eagle, founded in 1976, provides an array of equity and fixed-income investing strategies to a variety of individual and institutional clients, both domestically and internationally and previously had served as a subadviser to many of the funds.
Along with this change, Eagle Boston Investment Management, Inc. (“EBIM”) is no longer managing a portion of the assets in the Eagle Small Cap Growth Fund. That Fund is now solely managed by Bert Boksen and Eric Mintz of Eagle. EBIM has been appointed as the subadviser to the Eagle Small Cap Core Value Fund, which began operations on November 3, 2008. All other portfolio management relationships remain the same under the Eagle brand.
I would like to remind you that investing in any mutual fund carries certain risks. The principal risk factors for each fund are described at the end of this report. Carefully consider the investment objectives, charges and expenses of any fund before you invest. Contact us at 800.421.4184 or eagleasset.com or your financial advisor for a prospectus, which contains this and other important information about the Eagle Family of Funds. Our website also has timely information about the Funds, including performance and portfolio holdings.
While our name has changed, our commitment to your financial well-being has not. We are grateful for your continued support and confidence in the Eagle Family of Funds.
Sincerely,

Stephen G. Hill
President
December 9, 2008
| | |
| Performance Summary and Commentary |
| Eagle Capital Appreciation Fund | | (formerly known as the Heritage Capital Appreciation Trust) |
Investment highlights | The Eagle Capital Appreciation Fund (the “Fund”) invests primarily in common stocks. The Fund’s portfolio management team believes that wealth is created through the long-term ownership of a growing business. They take a “bottom-up” approach to investing based on first-hand, fundamental research. A bottom-up method of analysis de-emphasizes the significance of economic and market cycles. The portfolio managers use an intensive research process and each company is analyzed as if they were going to own and operate that company indefinitely. Key characteristics of the companies in which the Fund currently seeks to invest may include: dominant market share, established brand name, pricing power, recurring revenue stream, free cash flow, high returns on invested capital, predictable growth, sustainable growth, long product life cycle, enduring competitive advantage, favorable demographic trends and excellent management.
This Morningstar Style Box™ shows the Fund’s investment style and size of companies held in the Fund.
© Copyright 2008 Morningstar, Inc. All Rights Reserved. The information contained herein: (1) is proprietary to Morningstar and/or its content providers; (2) may not be copied or distributed; and (3) is not warranted to be accurate, complete or timely. Neither Morningstar nor its content providers are responsible for any damages or losses arising from any use of this information.
Performance summary | The Fund’s class A shares returned -40.38% (excluding front-end sales charges) during the fiscal year ended October 31, 2008, underperforming its benchmark index, the Russell 1000® Growth Index, which returned -36.95%. The Russell 1000® Growth Index measures performance of those Russell 1000® companies with higher price-to-book ratios and higher forecasted growth values and is representative of U.S. securities exhibiting growth characteristics. Please keep in mind that an index is not available for direct investment; therefore, its performance does not reflect the expenses associated with the active management of an actual portfolio.
The following graph shows the growth of a hypothetical $10,000 investment into the Fund’s class A shares as well as the Fund’s respective benchmark index. The table within the graph shows the investment returns of the Fund’s class A shares for the fiscal year ended October 31, 2008.
Growth of a $10,000 investment from 11/1/98 to 10/31/08 (a)
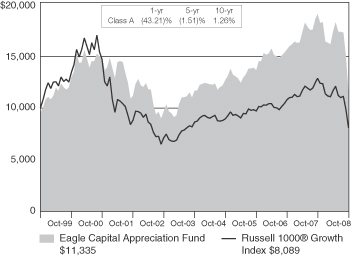
(a) The Fund’s values and returns reflect the maximum front-end sales charge of 4.75%, fund expenses and the reinvestment of dividends; however, they do not reflect the deduction of taxes that you would pay on fund distributions or redemption of fund shares. The value of an in investment in other share classes will differ due to each class’s respective sales charges and expenses.
Performance data represented is historical and does not guarantee future results. The investment return and principal value of an investment will fluctuate, and you may have a gain or loss when you sell shares. Current performance may be higher or lower than the performance data quoted. To obtain more current performance data as of the most recent month-end, please visit our website at eagleasset.com.
Meet the managers | Steven M. Barry, David G. Shell, CFA and Gregory H. Ekizian, CFA are Chief Investment Officers and Portfolio Managers at Goldman Sachs Asset Management L.P. and have been responsible for the day-to-day management of the Fund since 2002. Mr. Shell and Mr. Ekizian have been affiliated with the Fund since 1987 and 1990, respectively; Mr. Barry joined the team in 1999. Mr. Shell and Mr. Ekizian are Chartered Financial Analysts and have 21 and 18 years investment experience, respectively. Mr. Barry has 22 years investment experience.
On November 20, 2008, the portfolio managers gave the following discussion of the Fund’s performance.
|
| Performance Summary and Commentary |
| Eagle Capital Appreciation Fund (cont’d) |
Q: How did the Fund’s performance compare to its benchmark index during the reporting period?
A: In several instances, on both a stock and sector level, the Fund is meaningfully different from its primary benchmark index, thus representing potential sources of positive or negative relative returns. The Fund’s sector weightings are a direct result of our bottom-up, research intensive approach to investing. For example, when compared to the Russell 1000® Growth Index, the Fund’s portfolio is underweight in cyclicals, as most of these businesses do not typically meet our investment criteria. That is because their revenues predominately depend on the increasing price of an underlying commodity.
While our growth strategy is based on a purely bottom-up approach to investing, we do pay attention to the weights in the Russell 1000® Growth Index so we are aware of any weighting differences that may exist. During the reporting period, the Fund’s underperformance compared to the primary benchmark index was due to select energy holdings and an underweight position in the consumer staples sector. On the upside, strong stock selection within the finance sector and an underweight position in the cyclical sector contributed positively to relative returns when compared to the Fund’s primary benchmark index.
Q: Which securities had the most negative impact on the Fund’s performance during the reporting period?
A: Crown Castle International, Inc. detracted from performance as the company’s stock has been hampered over the last several months along with the overall equity market. We continue to have high conviction in the company and its future growth prospects.
Amylin Pharmaceutical Inc.’s stock pulled back during the reporting period as negative headlines surrounding the company’s diabetes drug, Byetta, weighed on its performance. We continue to have conviction in Amylin as we believe Byetta Long-Acting-Release can be the best in class drug for the treatment of type II diabetes.
Suncor, Inc. detracted from performance as the energy sector sold off during the period with little regard to the differences between individual businesses. While many energy companies have struggled with the decline in crude oil prices and concerns around project financing, we believe that Suncor’s business remains strong and well positioned for future growth.
Also within the energy sector, oil well services company Schlumberger Ltd. detracted from performance. While the
company reported strong revenues during its third fiscal quarter, its stock price pulled back as the entire energy sector was down. We believe Schlumberger is different from other energy businesses as it has more of a “toll keeper-like” business model. We continue to hold the stock in the Fund.
Google, Inc. detracted from performance after the company reported slower than expected growth. Earlier this year, the company reported a decline in “paid-clicks” growth and the smallest year over year growth in the company’s history. Google has largely attributed the decline in “paid-clicks” to initiatives taken by the company that are intended to reduce fraudulent clicks. In our view, these actions raise the value and integrity of Google’s services by increasing the probability that clicks are enacted by serious buyers. We believe that these types of initiatives maintain Google’s dominant market position as an industry innovator and should allow the company to continue to increase revenue by finding new ways to sell ads and improve the quality of their services. We continue to hold the stock in the Fund.
Q: Which securities had the most positive impact on the Fund’s performance during the reporting period?
A: St. Jude Medical’s stock contributed to performance during the period, primarily driven by an anticipated rebound in the implantable cardioverter defibrillators market. While we continue to have conviction in the company’s fundamentals, we decided to sell the Fund’s position as we believed the stock had reached a relatively full valuation.
Genentech, Inc., the maker of blockbuster cancer drug Avastin, was a top contributor to Fund performance during the reporting period. Shares of Genentech were boosted in July after its majority shareholder, Roche Holdings, made an offer to acquire the company. Genentech responded by forming a special committee, consisting of three independent board members, to evaluate Roche’s proposal. While the takeover remains undecided, we continue to have conviction in Genentech as it has monopolies in several cancer treatments and a robust product portfolio, including Rituxan and Herceptin.
While Moody’s contributed to performance during the reporting period, we decided to exit the Fund’s position. Moody’s was being accused of trying to cover up an internal mistake of assigning improper ratings to some European Constant Proportion Debt Obligation issuances due to a computer model error. Although no wrong-doing has been proven, we believe this situation increases the potential regulatory and litigation risks facing Moodys and we sold the Fund’s position.
| | |
| Performance Summary and Commentary |
| Eagle Growth & Income Fund | | (formerly known as the Heritage Growth and Income Trust) |
Investment highlights | The Eagle Growth & Income Fund (the “Fund”) invests primarily in domestic equity securities (primarily common stocks). The Fund’s portfolio managers look for promising stocks that can be purchased at a discount to their estimate of each stock’s intrinsic value. They seek investments that deliver a competitive total return over multiple time horizons. Holdings are classified in three categories: Basic Value, Consistent Earners and Emerging Franchises as a means of structuring diversification. Dividends and dividend growth are a consideration in stock selection and may include stocks outside the traditional dividend paying areas.
This Morningstar Style Box™ shows the Fund’s investment style and size of companies held in the Fund.
Performance summary | The Fund’s class A shares returned -37.25% (excluding front-end sales charges) during the fiscal year ended October 31, 2008, underperforming the Fund’s benchmark index, which returned -36.10% during the same period. The Fund’s benchmark index, the Standard & Poor’s 500 Composite Stock Index (“S&P 500 Index”), is an unmanaged index of 500 U.S. stocks and gives a broad look at how stock prices have performed. Please keep in mind that an index is not available for direct investment; therefore, its performance does not reflect the expenses associated with the active management of an actual portfolio.
The following graph shows the growth of a hypothetical $10,000 investment into the Fund’s class A shares as well as the Fund’s respective benchmark index. The table within the graph shows the investment returns of the Fund’s class A shares for the fiscal year ended October 31, 2008.
Growth of a $10,000 investment from 11/1/98 to 10/31/08 (a)
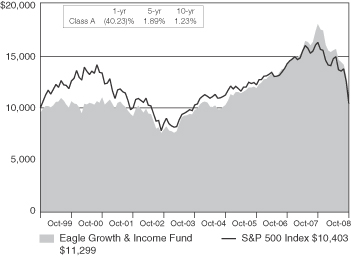
(a) The Fund’s values and returns reflect the maximum front-end sales charge of 4.75%, fund expenses and the reinvestment of dividends; however, they do not reflect the deduction of taxes that you would pay on fund distributions or redemption of fund shares. The value of an in investment in other share classes will differ due to each class’s respective sales charges and expenses.
Performance data represented is historical and does not guarantee future results. The investment return and principal value of an investment will fluctuate, and you may have a gain or loss when you sell shares. Current performance may be higher or lower than the performance data quoted. To obtain more current performance data as of the most recent month-end, please visit our website at eagleasset.com.
Meet the managers | William V. Fries, CFA, and Brad Kinkelaar are Managing Directors at Thornburg Investment Management, Inc. and Co-Portfolio Managers of the Fund. Mr. Fries has more than 32 years of investment experience and has been a Co-Portfolio Manager since 2001. Mr. Kinkelaar has 12 years of investment experience and has been a Co-Portfolio Manager since 2006.
On November 14, 2008, the portfolio managers gave the following discussion of the Fund’s performance.
Q: How did the Fund’s performance compare to its benchmark index during the reporting period?
A: There were a few factors that led to the Fund’s slight underperformance versus the S&P 500 Index during the reporting period. Stock selection in the consumer staples,
|
| Performance Summary and Commentary |
| Eagle Growth & Income Fund (cont’d) |
financials and information technology sectors hurt performance. Stock selection in the energy and utilities sectors was positive for the reporting period outperforming the benchmark index total return for those sectors. The Fund was also overweight versus the S&P 500 Index in the utilities sector, which contributed to the outperformance in this sector. When compared to the benchmark, the Fund was overweight in the materials sector and underweight in the industrials sector. While both the materials and industrials sectors underperformed, the Fund benefited from positive stock selection.
Every sector in the benchmark index showed negative performance. Financials, information technology, and energy were the weakest sectors for the benchmark during the reporting period. Despite the headlines highlighting the collapse of many storied financial institutions, the news from the financial sector was not universally bad, as the market perceived that dominant, well-capitalized firms actually stood to benefit from the contraction of players in the market. Over the course of the past twelve months, the Fund’s exposure to higher risk financial names dependent on wholesale financing had been reduced. As these positions were being reduced, they were replaced with franchises that were less reliant on leverage, which we felt could withstand the current credit crunch, and in fact gain market share once liquidity returned to the market. Telecommunication stocks, traditionally defensive areas of the market, fell by double digit percentages. Information technology stocks were also an area of weakness.
Q: Which securities had the most negative impact on the Fund’s performance during the reporting period?
A: Subsidiaries in Latin America are now worth less as the currencies there depreciated sharply which drove Telefonica SA’s stock price lower. The Fund still holds the stock for its utility-like business, attractive valuation and yield.
Despite the general equity market pullback, Hong Kong Exchanges & Clearing has seen its average daily turnover consistently rise over the last three years. The Fund continues to hold the stock because we believe it is well positioned to retain its important position among Asian securities exchanges.
The Fund’s position in CME Group Inc. performed poorly as volume growth in derivatives contracts has slowed dramatically in the short-term. The Fund sold its position in CME Group based on trading volumes below expectations which is likely to
cause earnings shortfall with resultant above average valuation a concern. The lack of dividend support was also a factor.
Hartford Financial Services’ stock price declined as assets under management in variable annuities underwritten by the firm fell along with the overall market. The Fund continues to hold the stock because we believe that Hartford will not have to raise dilutive equity capital and will be a beneficiary over the longer-term from an improved pricing cycle for life, property and casualty insurance.
Deterioration in the U.K. housing market was the primary reason that Persimmon PLC was a detractor to Fund performance. With the market tightening up more than expected, we sold Persimmon from the Fund because we felt its dividend was at risk.
Q: Which securities had the most positive impact on the Fund’s performance during the reporting period?
A: Stable business supported Philip Morris International’s stock better than most in this volatile market. The company continues to increase greatly in emerging markets and also benefitted from favorable currency valuations. The Fund continues to hold the stock.
Energy East Corporation was acquired by Iberdrola and the Fund’s shares were sold at a gain.
Visa Inc., acquired through its IPO, uses their vast payments network to process credit and debit transactions, benefiting from scale and a secular shift from paper to electronic transactions. We sold the Fund’s position in Visa because the stock reached our target price.
Over the past year, Cincinnati Financial Corporation has improved the diversification of its investment portfolio by substantially reducing its large holding in Fifth Third Bank. Although the company incurred losses from Hurricane Ike, we expect that insurance policy pricing will be more favorable in the future, making its stock valuation near book value compelling. We intend to hold the stock since it is well below our target price.
Chimera Investment Corporation was a recent investment that was bought through a secondary offering at a discount to market prices. We continue to like their opportunity to invest in the dislocated bond markets; therefore the Fund continues to hold the stock.
| | |
| Performance Summary and Commentary |
| Eagle International Equity Fund | | (formerly known as the International Equity Fund) |
Investment highlights | The Eagle International Equity Fund (the “Fund”) primarily invests in foreign equity securities. The Fund’s portfolio managers seek investment opportunities within the developed and emerging markets. In the developed markets, a “bottom-up” approach is adopted. A bottom-up method of analysis de-emphasizes the significance of economic and market cycles. In the emerging markets, a “top-down” assessment consisting of currency/interest rate risks, political environments/leadership assessment, growth rates, structural reforms and risk (liquidity) is applied. A top-down method of analysis emphasizes the significance of economy and market cycles. In Japan, given the highly segmented nature of this market comprised of both strong global competitors and protected domestic industries, a hybrid approach encompassing both bottom-up and top-down analyses is conducted.
This Morningstar Style Box™ shows the Fund’s investment style and size of companies held in the Fund.
Performance summary | The Fund’s class A shares returned -46.77% (excluding front-end sales charges) during the fiscal year ended October 31, 2008, outperforming the Fund’s benchmark index, which returned -48.53% during the same period. The Fund’s benchmark index, the Morgan Stanley Capital International® All World Index ex-US (“MSCI® ACWI ex- US”), is a free float-adjusted market capitalization index that is designed to measure equity market performance in the global developed and emerging markets. Please keep in mind that an index is not available for direct investment; therefore, its performance does not reflect the expenses associated with the active management of an actual portfolio.
The following graph shows the growth of a hypothetical $10,000 investment into the Fund’s class A shares as well as the Fund’s respective benchmark index. The table within the graph shows the investment returns of the Fund’s class A shares for the fiscal year ended October 31, 2008.
Growth of a $10,000 investment from 11/1/98 to 10/31/08 (a)
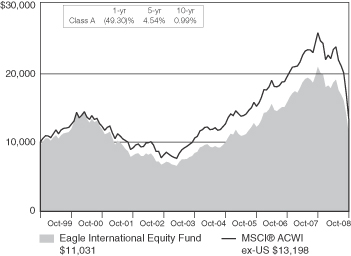
(a) The Fund’s values and returns reflect the maximum front-end sales charge of 4.75%, fund expenses and the reinvestment of dividends; however, they do not reflect the deduction of taxes that you would pay on fund distributions or redemption of fund shares. The value of an in investment in other share classes will differ due to each class’s respective sales charges and expenses.
Performance data represented is historical and does not guarantee future results. The investment return and principal value of an investment will fluctuate, and you may have a gain or loss when you sell shares. Current performance may be higher or lower than the performance data quoted. To obtain more current performance data as of the most recent month-end, please visit our website at eagleasset.com.
Meet the managers | Richard C. Pell is Chief Executive Officer at Artio Global Investors Inc. and Chief Investment Officer of its subsidiary, Artio Global Management LLC (“Artio Global”). Mr. Pell has 24 years of investment experience. Rudolph-Riad Younes, CFA, is Head of International Equities at Artio Global and has 18 years of investment experience. Messrs. Pell and Younes have managed the Fund since 2002.
On November 14, 2008, the portfolio managers gave the following discussion of the Fund’s performance.
Q: How did the Fund’s performance compare to its benchmark index during the reporting period?
A: The Fund managed to outperform the MSCI® ACWI ex-US, although absolute returns for both the Fund and markets were heavily impacted by one of the worst financial crises on record. Our decision to hold higher cash levels in the Fund was rewarded amid what seemed to be free-falling equity markets. From a sector perspective, the Fund’s investments in the materials sector had the largest positive contribution to relative returns.
|
| Performance Summary and Commentary |
| Eagle International Equity Fund (cont’d) |
This contribution was partially due to our decision to reduce the Fund’s exposure to metals and mining companies, including positions in Russia which we originally purchased based on their inexpensive valuations. The Japanese market suffered declines less than that of other developed markets and the Fund’s underweight position compared to its benchmark index had a negative impact on relative results.
The Fund’s exposure in emerging markets hurt its performance, particularly investments in financial companies in Hungary, India, Cyprus, Ukraine and Poland, although positions in the Czech Republic helped. Elsewhere in emerging markets, compared to the benchmark index, the Fund’s underweight position in Asia, particularly South Korea and China was supportive of relative returns.
Stock selection in the utilities and industrials sectors detracted from the Fund’s relative returns versus the benchmark index. In the utilities sector, various positions across Europe and Russia impacted relative performance. Within the industrial sector, while it appeared the Hong Kong market experienced a favorable spillover effect from China earlier in the period, stock selection, primarily the Fund’s holdings in the gaming industry, detracted from relative returns. In addition, the Fund’s investments in the stocks of airport operators underperformed the benchmark index. On a positive note, the Fund’s positions in the healthcare sector outperformed the benchmark index.
Q: Which securities had the most positive impact on the Fund’s performance during the reporting period?
A: Earlier in the reporting period companies involved in the production of agricultural chemicals such as Potash Corp of Saskatchewan Inc. experienced a rapid rise in share price as the demand for crop nutrients rose. Then, a move to reduce the Fund’s exposure to commodities in general proved beneficial as the share price suffered a dramatic decline during the latter part of the reporting period. The stock is no longer held in the Fund.
The Fund’s position in Nestle, a more defensively positioned company, proved beneficial as the shares declined less than that of the benchmark index. The Fund continues to hold the Nestle shares as we have decided to increase the Fund’s positions in consumer staples companies such as food and beverage companies.
The Fund’s position in Total helped performance primarily due to outperformance of the stock in the final month of the reporting period. Although the Fund is underweight in energy relative to the benchmark index, the stock remains a Fund holding.
The Fund’s position in Telekomunikacja Polska, Poland’s largest phone operator, contributed positively to Fund performance. The company has been able to beat analyst estimates, as mobile services have helped to offset declines in fixed-line revenues. The Fund continues to hold the position.
The Fund’s positioning of Sanofi-Aventis during the period had a positive impact on relative returns. Although the performance was negative, it declined less than the benchmark index. The Fund continues to hold the position.
Q: Which securities had the most negative impact on the Fund’s performance during the reporting period?
A: The Fund’s position held in OTP Bank, Hungary’s largest lender, had a negative impact on the Fund’s performance. Banks in this region were not immune to the unfolding global financial turmoil and the stock price of OTP Bank declined. We believe that the global financial and economic turmoil that has impacted the Central and Eastern European economies will, in the short-to-medium term, slow growth from the overheated pace of the last few years. Countries such as Hungary have also felt the effects of foreign currency-denominated loans which recently became popular in the region. The Fund continues to hold the position.
Fraport is the operator of the Frankfurt airport. The global financial crisis is affecting airports as traffic declines amid slowing economic growth. This position remains in the Fund.
The Fund’s investment in BP PLC, Europe’s second-largest oil company, detracted from results. However, from a sector perspective, the energy sector had little effect on the Fund’s return. The Fund continues to hold BP PLC.
Bank Polska Kasa Opieki is Poland’s largest bank and a unit of UniCredit SpA in Italy. The stock underperformed and the Fund’s position detracted from the Fund’s performance. We maintain our preference for banks within the region, including Bank Polska, which rely on deposit collection for funding that is derived from the countries’ growing middle class.
Raiffeisen International Bank Holding AG, an Austrian bank with lending activities in Russia, suffered dramatic declines over the reporting period amid the credit crisis. The position is no longer held in the Fund.
Q: Are there other factors that affected Fund performance during the reporting period?
A: Our ability to utilize forward foreign currency contracts to hedge part of our European exposure back to the U.S. dollar proved beneficial as the U.S. dollar gained strength during the latter half of the reporting period.
| | |
| Performance Summary and Commentary |
| Eagle Large Cap Core Fund | | (formerly known as the Core Equity Fund) |
Investment highlights | The Eagle Large Cap Core Fund (the “Fund”) invests primarily in common stocks. When identifying investments for the Fund, the portfolio managers use a “bottom-up” research process that is combined with a proprietary relative-valuation discipline. A bottom-up method of analysis de-emphasizes the significance of economic and market cycles. In general, the portfolio managers seek to select securities, that, at the time of purchase, typically have at least one of the following characteristics: projected earnings growth rate at or above the benchmark index, above-average earnings quality and stability, or a price-to-earnings ratio comparable to the benchmark index.
This Morningstar Style Box™ shows the Fund’s investment style and size of companies held in the Fund.
Performance summary | The Fund’s class A shares returned -37.08% (excluding front-end sales charges) during the fiscal year ended October 31, 2008, underperforming the Fund’s benchmark index, which returned -36.10% during the same period. The Fund’s benchmark index, the Standard & Poor’s 500 Composite Stock Index (“S&P 500 Index”), is an unmanaged index of 500 U.S. stocks and gives a broad look at how stock prices have performed. Please keep in mind that an index is not available for direct investment; therefore, its performance does not reflect the expenses associated with the active management of an actual portfolio.
The following graph shows the growth of a hypothetical $10,000 investment into the Fund’s class A shares as well as the Fund’s respective benchmark index. The table within the graph shows the investment returns of the Fund’s class A shares for the fiscal year ended October 31, 2008.
Growth of a $10,000 investment from 5/2/05 to 10/31/08 (a)
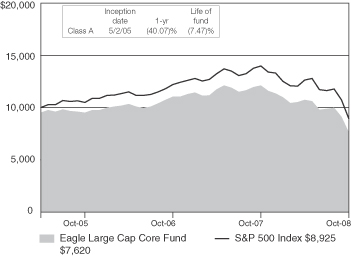
(a) The Fund’s values and returns reflect the maximum front-end sales charge of 4.75%, fund expenses and the reinvestment of dividends; however, they do not reflect the deduction of taxes that you would pay on fund distributions or redemption of fund shares. The value of an in investment in other share classes will differ due to each class’s respective sales charges and expenses.
Performance data represented is historical and does not guarantee future results. The investment return and principal value of an investment will fluctuate, and you may have a gain or loss when you sell shares. Current performance may be higher or lower than the performance data quoted. To obtain more current performance data as of the most recent month-end, please visit our website at eagleasset.com.
Meet the managers | Richard Skeppstrom, John “Jay” Jordan, Craig Dauer and Robert Marshall of Eagle Asset Management, Inc. (“Eagle”) have been Co-Portfolio Managers of the Fund since inception. Mr. Skeppstrom is a Managing Director of Eagle and has 17 years of investment experience. Mr. Jordan and Mr. Dauer are Chartered Financial Analysts and have 17 and 14 years of investing experience, respectively. Mr. Marshall has 21 years of investing experience.
On November 14, 2008, the portfolio managers gave the following discussion of the Fund’s performance.
Q: How did the Fund’s performance compare to its benchmark index during the reporting period?
A: Although all sectors in the S&P 500 Index posted negative returns over the Fund’s fiscal year, the consumer staples, healthcare, utilities, and energy sectors performed better than the financials, materials, information technology, industrials, telecommunication services, and consumer discretionary sectors.
|
| Performance Summary and Commentary |
| Eagle Large Cap Core Fund (cont’d) |
The Fund’s underperformance versus the S&P 500 Index was due to stock selection in the market-weighted financials and telecommunication services sectors. On the other hand, sectors of relative strength versus the benchmark index included the Fund’s overweight positions in the healthcare and consumer discretionary sectors, along with stock selection in market-weighted information technology and industrials sectors.
Q: Which securities had the most negative impact on the Fund’s performance during the reporting period?
A: American International Group stock was sold out of the Fund in September as capital market conditions deteriorated. The stock price declined as this leading international insurance company could not raise capital without suffering severe dilution.
The strength of General Electric’s global franchises, diversified end market exposure and AAA balance sheet was overwhelmed in the last year by the collapse in the credit markets. The resultant negative impact to earnings coupled with continued weakness in the credit markets resulted in a rerating downwards of GE’s stock. The Fund still holds the stock as we believe in its recovery potential.
Goldman Sachs’ share price fell in commiseration with the rest of the financial sector during the reporting period. We continue to believe that Goldman Sachs will be a survivor of the current financial turmoil, and that as the industry recovers, the company will be a major beneficiary of diminished competition. The Fund continued to own stock of Goldman Sachs at the end of the reporting period.
The Fund added to its position in Sprint Nextel over the reporting period based on our expectation of improving subscriber trends that to date have not occurred. Due to the importance of subscriber trends to profitability metrics, the stock price has reacted negatively to declining cash flows but is held in the Fund’s portfolio on the expectation of fundamental improvement.
As the credit crisis continued to unfold, Wachovia’s exposure to bad loans resulting from the Golden West acquisition grew. Because of an irrational deposit run, the company was forced by the FDIC to sell itself the end of September. While an agreement was initially reached for Citigroup to acquire its banking division, it now appears that Wells Fargo will acquire Wachovia in its entirety. The Fund sold its shares of Wachovia in early October.
Q: Which securities had the most positive impact on the Fund’s performance during the reporting period?
A: Adobe Systems’ stock, purchased into the Fund on October 24th, was a top performer as its price increase reflected the market rally that occurred during the final week of the reporting period. We believe that continuing secular growth trends in internet and mobile content development products, coupled with the continuing movement towards a paperless enterprise environment and its industry standard PDF document format, could continue to help support the stock’s valuation going forward. The fund continued to own Adobe’s stock at the end of the reporting period.
While sales of Apple’s notebook and desktop Mac products moderated a bit during its fiscal fourth quarter, sales of Apple’s new 3G iPhone significantly exceeded estimates. We continue to believe that the company’s consumer products franchise featuring the Mac, iPhone and iPod is a game changer, and that the company will continue to gain share on a global basis, despite the current macro headwinds. Apple has approximately $25 a share in net cash on the balance sheet, a strong cash position. The Fund continued to own the stock at the end of the reporting period.
In October, the Fund initiated a position in EOG Resources, a large independent oil and natural gas company, based on our belief that a combination of a solid production profile, a strong balance sheet and a favorable view of natural gas industry fundamentals. We believe that, at current levels, the stock reflects reasonable earnings expectations at an attractive valuation.
Back in March, we believed that JP Morgan Chase & Co’s large, well-run financial services franchise appeared to be undervalued and we initiated a position in the Fund. Its asset (loan) profile is somewhat different than the Fund’s other big bank holdings, and we believe this diversification is healthy for the Fund’s portfolio. The Fund continues to own most of the stock initially purchased.
Continued solid pricing power in the face of declining volumes allowed Waste Management to meet earnings expectations in a difficult environment. However, the stock was sold out of the Fund’s portfolio during the period due to concerns related to the sustainability of pricing and profit margins.
During the reporting period, the Fund held an average cash level of 9%. This above-normal position had the highest positive contribution to the Fund’s return due to significant stock market weakness during the period.
| | |
| Performance Summary and Commentary |
| Eagle Mid Cap Growth Fund | | (formerly known as the Diversified Growth Fund) |
Investment highlights | The Eagle Mid Cap Growth Fund (the “Fund”) primarily invests in equity securities. The Fund’s portfolio manager seeks to capture the significant long-term capital appreciation potential of mid-cap, rapidly growing companies. The portfolio manager uses a “bottom-up” investment approach through a proprietary research strategy that emphasizes the selection of mid-cap growth stocks that are reasonably priced. A bottom-up method of analysis de-emphasizes the significance of economic and market cycles. Since stock performance of mid-cap companies have historically been less impressive than that of large-cap stocks, the Fund’s portfolio manager believes that conducting extensive research on mid cap companies may enable the Fund to capitalize on market inefficiencies and thus outperform the market.
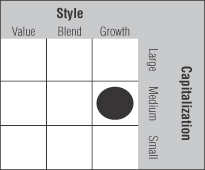
This Morningstar Style Box™ shows the Fund’s investment style and size of companies held in the Fund.
Performance summary | The Fund’s class A shares returned -35.68% (excluding front-end sales charges) during the fiscal year ended October 31, 2008, outperforming the Fund’s benchmark index, which returned -42.65% during the same period. The Fund’s benchmark index, the Russell Midcap® Growth Index, measures the performance of those Russell Midcap companies with higher price-to-book ratios and higher forecasted growth values. Please keep in mind that an index is not available for direct investment; therefore, its performance does not reflect the expenses associated with the active management of an actual portfolio.
The following graph shows the growth of a hypothetical $10,000 investment into the Fund’s class A shares as well as the Fund’s respective benchmark index. The table within the graph shows the investment returns of the Fund’s class A shares for the fiscal year ended October 31, 2008.
Growth of a $10,000 investment from 11/1/98 to 10/31/08 (a)
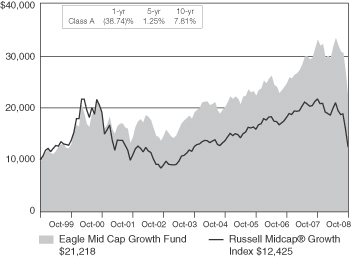
(a) The Fund’s values and returns reflect the maximum front-end sales charge of 4.75%, fund expenses and the reinvestment of dividends; however, they do not reflect the deduction of taxes that you would pay on fund distributions or redemption of fund shares. The value of an in investment in other share classes will differ due to each class’s respective sales charges and expenses.
Performance data represented is historical and does not guarantee future results. The investment return and principal value of an investment will fluctuate, and you may have a gain or loss when you sell shares. Current performance may be higher or lower than the performance data quoted. To obtain more current performance data as of the most recent month-end, please visit our website at eagleasset.com.
Meet the managers | Bert L. Boksen, CFA, is the Managing Director of Eagle Asset Management’s mid- and small-cap growth strategies and is the Portfolio Manager of the Fund. Mr. Boksen has 31 years of investment experience. Christopher Sassouni, DMD, and Eric Mintz, CFA, have been Assistant Portfolio Managers since 2006 and 2008, respectively. Mr. Sassouni has 19 years of investment experience. Mr. Mintz is a Chartered Financial Analyst and has 13 years of investment experience.
On November 13, 2008, the portfolio managers gave the following discussion of the Fund’s performance.
Q: How did the Fund’s performance compare to its benchmark index during the reporting period?
A: The Fund significantly outperformed its benchmark index over the reporting period. Strong stock selection in the industrials, information technology and financials sectors benefited the Fund’s relative performance to its benchmark
|
| Performance Summary and Commentary |
| Eagle Mid Cap Growth Fund (cont’d) |
index. However, an overweight position in the industrials sector slightly detracted from relative returns. The Fund’s relative return in the energy and healthcare sectors trailed the benchmark index. In the energy sector, the sharp decline in commodities prices and concerns regarding the outlook for global growth pulled down relative returns. Investments in the healthcare equipment and supplies industry reduced healthcare relative returns.
On an absolute basis, all sectors in the Fund’s portfolio had negative returns for the fiscal year. The Fund’s strongest performing sectors on an absolute basis were financials and industrials. Detractors from the Fund’s performance during the reporting period on an absolute basis were investments in the energy and consumer discretionary sectors.
Q: Which securities had the most positive impact on the Fund’s performance during the reporting period?
A: Wachovia Corporation is a financial-services company that was purchased after the stock traded below what we believed to be fair value. The company was subsequently acquired by Wells Fargo and the stock was sold at a significant profit.
Delta Air Lines cut capacity and raised ticket prices as the price of oil peaked, which we believe means that the company may be poised for strong earnings as fuel costs decline. We are also positive on the synergies following the merger with Northwest Airlines. The Fund continues to own the stock.
Celgene Corporation is a profitable biotechnology company that continues to benefit from strong sales of its multiple myeloma drug, Revlimid. We continue to hold the stock in the Fund’s portfolio as we believe that the company is poised to benefit from its acquisition of Pharmion and a promising early stage pipeline.
Express Scripts is a pharmacy benefits manager. As the leader in generic drug prescriptions, the company continues to benefit from the shift to generic drugs as branded drug patents expire and increased generic utilization given the tough macroeconomic conditions. The Fund continues to own the stock.
Apollo Group provides post-secondary education, a sector with counter-cyclical tendencies. The company significantly exceeded third quarter earnings estimates through increased revenues and margins driven by increasing enrollments. The Fund continues to own the stock.
Q: Which securities had the most negative impact on the Fund’s performance during the reporting period?
A: Hologic Inc. is a women’s health medical-device company. Shares traded down due to soft product growth. The Fund continues to hold the stock as we are excited about the launch of the company’s next-generation digital mammography system and believe its recent acquisition of Cytyc gives Hologic access to additional women’s health channels.
Oceaneering International provides remote operated vehicles for subsea repair and construction of oil rigs. The stock traded down due to the decline in commodity prices. The Fund continues to hold the stock as the company has a large backlog of work and we believe the company is fundamentally strong.
Cognizant Technology Solutions provides a wide array of offshore information technology (“IT”) services. The Fund sold the stock during the third quarter as we became concerned about the continued shrinking IT budget and lack of visibility into future earnings for the company.
Ameriprise Financial offers financial planning, brokerage, banking and retirement products along with life and disability insurance. The stock has traded down due to industry pressure. We like the company, particularly in this environment because of its strong balance sheet and continue to hold the stock in the Fund’s portfolio.
LKQ Corporation provides aftermarket and recycled auto parts. We sold the stock from the Fund due to concerns that current headwinds would continue to hurt earnings; the company is struggling with shrinking earnings due to the declining price of commodities and the global slowdown causing delayed discretionary repairs and declining claims.
Q: Are there other factors that affected Fund performance during the reporting period?
A: During the third fiscal quarter of 2008, we had an uncharacteristically large amount of cash, reflecting sales in response to historic volatility in the market. The high cash levels during this period helped to cushion declines. We will be working to reinvest this cash as market conditions stabilize.
| | |
| Performance Summary and Commentary |
| Eagle Mid Cap Stock Fund | | (formerly known as the Mid Cap Stock Fund) |
Investment highlights | The Eagle Mid Cap Stock Fund (the “Fund”) primarily invests in stocks of mid-capitalization companies. The portfolio managers of the Fund employ a thorough, “bottom-up” stock-selection process to identify growing, mid-cap companies that are reasonably priced. A bottom-up method of analysis de-emphasizes the significance of economic and market cycles. The portfolio managers seek to gain a comprehensive understanding of a company’s management, business plan, financials, real rate of growth and competitive threats and advantages.
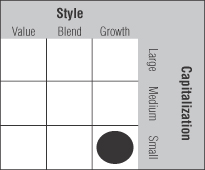
This Morningstar Style Box™ shows the Fund’s investment style and size of companies held in the Fund.
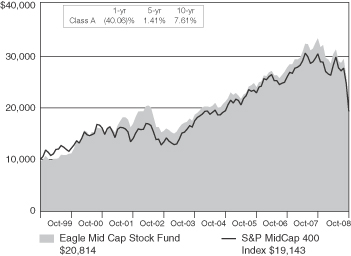
Performance summary | The Fund’s class A shares returned -37.04% (excluding front-end sales charges) during the fiscal year ended October 31, 2008, underperforming the Fund’s benchmark index, which returned -36.46% during the same period. The Fund’s benchmark index, the Standard & Poor’s MidCap 400 Index (“S&P MidCap 400”), is an unmanaged index that measures the performance of the mid-sized company segment of the U.S. market. Please keep in mind that an index is not available for direct investment; therefore, its performance does not reflect the expenses associated with the active management of an actual portfolio.
The following graph shows the growth of a hypothetical $10,000 investment into the Fund’s class A shares as well as the Fund’s respective benchmark index. The table within the graph shows the investment returns of the Fund’s class A shares for the fiscal year ended October 31, 2008.
Growth of a $10,000 investment from 11/1/98 to 10/31/08 (a)
(a) The Fund’s values and returns reflect the maximum front-end sales charge of 4.75%, fund expenses and the reinvestment of dividends; however, they do not reflect the deduction of taxes that you would pay on fund distributions or redemption of fund shares. The value of an in investment in other share classes will differ due to each class’s respective sales charges and expenses.
Performance data represented is historical and does not guarantee future results. The investment return and principal value of an investment will fluctuate, and you may have a gain or loss when you sell shares. Current performance may be higher or lower than the performance data quoted. To obtain more current performance data as of the most recent month-end, please visit our website at eagleasset.com.
Meet the managers | Todd L. McCallister, CFA, is a Managing Director at Eagle Asset Management, Inc. (“Eagle”) and Co-Portfolio Manager for the Fund. Mr. McCallister has 21 years of investment experience and has managed the Fund since its inception. Stacey Serafini Thomas, CFA, is a Vice President at Eagle and served as Assistant Portfolio Manager to the Fund from 2000 to 2005, before being named Co-Portfolio Manager. Ms. Thomas has more than 11 years of investment experience.
On November 11, 2008, the portfolio managers gave the following discussion of the Fund’s performance.
Q: How did the Fund’s performance compare to its benchmark index during the reporting period?
A: Every sector in the S&P MidCap 400 was very far into negative territory, yet the utilities and consumer staples sectors held some ground defensively and performed better than other sectors. The biggest declining sectors during the reporting period for the benchmark index were energy and telecommunication services. In relative comparison to the
|
| Performance Summary and Commentary |
| Eagle Mid Cap Stock Fund (cont’d) |
benchmark index, the Fund’s best performing sector was healthcare led by the equipment and supplies industry. In addition, the Fund’s positions in the telecommunication services and industrials sectors also outperformed the benchmark index mainly due to stock selection.
The Fund’s overall underperformance versus the S&P MidCap 400 can be attributed to stock selection in the utilities and energy sectors. In energy, our stock selection in the consumable fuels industry performed poorly. The Fund’s investments in the utilities sector were underweight compared to its benchmark index as the utilities sector performed relatively better than most sectors of the benchmark index.
In terms of absolute return, the Fund only recorded positive returns in one sector: telecommunication services. The Fund’s positions in information technology were the largest detractors from performance during the reporting period. Specifically, the semiconductor and information technology service industries pulled the Fund’s performance down the most.
Q: Which securities had the most negative impact on the Fund’s performance during the reporting period?
A: Service Corporation International, Inc. is the largest single provider of funeral, cremation and cemetery services in the country. The stock’s price declined in the reporting period over concerns over the company’s high debt level which could cause the company problems if it needed to go back to the capital markets. The Fund continued to hold the position at the end of the year because we believe that the industry should hold up defensively in this market.
SPX Corporation provides flow technology, test measurements, and thermal equipment. The stock has fared poorly recently as the strength of the U.S. dollar has hurt their international sales. In the past, the stock price has benefited from a hearty industrial economy and aggressive share repurchases. Both of these factors have worked against the stock’s price this year. The Fund continues to hold the position as we believe that stronger pricing will play a big part in this year.
Owens-Illinois, Inc. is the world’s largest maker of glass containers and one of the largest overall packaging manufacturers. The stock price declined due to management cutting free cash flow guidance in September. We believe inflationary concerns actually may put the company at a competitive advantage over lower-margin, U.S. market-oriented glass companies. Owens-Illinois trades at what we consider to be very attractive multiples and we continue to believe in its potential for strong earnings, free-cash-flow generation and margin expansion. The Fund continues to hold the stock.
Pioneer Natural Resources is an oil and gas exploration and production company that operates in the United States, Canada, South America and Africa. It traded down in sync with the rest of the energy sector, mostly on the substantial pullback in natural gas prices. The company has recently increased its long-term volume growth targets due primarily to a new shale discovery in Colorado. In addition, we think the company’s drilling efficiencies should result in margin expansion. We like Pioneer because it has material unbooked resources of two times its proved reserve base. We believe the company can grow production in mid-teens while shallow depletion rates should improve above average returns, so the Fund continues to hold the stock.
Liberty Media Corporation has been bought into the portfolio as an undervalued way to own DIRECTV. Liberty Media owns over a 50% share of DIRECTV yet, DIRECTV makes up 80% of the value of Liberty Media. Also, two strong contributors to the revenues are the regional sports channels and premium movie network channels such as Starz and Encore. The stock price declined with the market, creating what we believe to be significant potential for upside. The Fund continues to own the stock.
Q: Which securities had the most positive impact on the Fund’s performance during the reporting period?
A: DeVry Inc., which owns proprietary higher-education systems throughout the country, was the best performer for the Fund. We took advantage of an overreaction to credit fears and purchased this growth stock at very attractive levels. Before we did that, DeVry’s stock price traded down substantially on fears of potential credit losses within its private student-loan portfolio. In reality, its private-loan portfolio represents only 5% of revenue and the impact of losses from its sub-prime portfolio would be less than 0.5% of revenue.
TJX Companies Inc. retails off-price apparel and home fashions through its T.J. Maxx, Marshalls, HomeGoods and A.J. Wright stores. The company reported better-than-expected earnings, margins and same-store sales growth during the reporting period. We believe TJX’s stock price should benefit in a slower economic environment as it tends to benefit from consumer trade-down activity. In addition, TJX should gain access to more closeout deals and have lower inventory costs, as traditional retailers remain under pressure. We decided to sell the Fund’s position after it appreciated very highly in the summer, and we purchased it again after a price dip in the fall.
|
| Performance Summary and Commentary |
| Eagle Mid Cap Stock Fund (cont’d) |
Cellcom Israel posted strong results throughout the reporting period, with significant cost controls, earnings before interest, taxes, depreciation and amortization, margin expansion and strong subscriber additions. In addition, data revenue as a percentage of subscriber’s revenue, which we believe is the growth driver for Cellcom Israel, was the highest in the company’s history. The Fund maintains its position in the stock.
Steris Corporation is the leading creator of sterilization and surgical equipment for the U.S. healthcare industry. The company’s revenues were up 12% over last year. The management was able to expand operating margin by moving production to Mexico and streamlining existing production in
Europe. As a result, earnings per share grew 63% year over year. We believe that the company will continue to grow due to increased demand for surgical procedures and new hospital construction and we continue to hold the stock in the Fund.
Telus Corporation is a Canadian telecommunications company which has a wire line and wireless business unit. The company was rewarded for having a strong balance sheet as the credit markets went through dire problems. Telecommunications companies are seeing the Canadian wireless market as a place for growth because the market has 20% fewer participants than the U.S. market. The Fund continues to hold the stock.
| | |
| Performance Summary and Commentary |
| Eagle Small Cap Growth Fund | | (formerly known as the Small Cap Stock Fund) |
Investment highlights | The Eagle Small Cap Growth Fund (the “Fund”) primarily invests in stocks of small-capitalization companies. Using a “bottom-up” approach, the Fund’s portfolio managers seek to capture the significant long-term capital appreciation potential of small, rapidly growing companies. A bottom-up method of analysis de-emphasizes the significance of economic and market cycles. The portfolio managers also look for small-cap growth companies that are reasonably priced. Since the small-cap sector historically has been less efficient than the large-cap sector, the portfolio managers believe that conducting extensive proprietary research on small-cap growth companies may enable the Fund to capitalize on market inefficiencies and thus outperform the market.
This Morningstar Style Box™ shows the Fund’s investment style and size of companies held in the Fund.
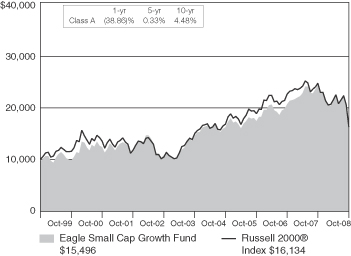
Performance summary | The Fund’s class A shares returned -35.81% (excluding front-end sales charges) during the fiscal year ended October 31, 2008, underperforming the Fund’s benchmark index, which returned -34.16% during the same period. The Fund’s benchmark index, the Russell 2000® Index, is an unmanaged index comprised of the 2,000 smallest companies in the Russell 3000® Index. The Russell 3000® Index measures the performance of the 3,000 largest U.S. companies based on total market capitalization. Please keep in mind that an index is not available for direct investment; therefore, its performance does not reflect the expenses associated with the active management of an actual portfolio.
The following graph shows the growth of a hypothetical $10,000 investment into the Fund’s class A shares as well as the Fund’s respective benchmark index. The table within the graph shows the investment returns of the Fund’s class A shares for the fiscal year ended October 31, 2008.
Growth of a $10,000 investment from 11/1/98 to 10/31/08 (a)
(a) The Fund’s values and returns reflect the maximum front-end sales charge of 4.75%, fund expenses and the reinvestment of dividends; however, they do not reflect the deduction of taxes that you would pay on fund distributions or redemption of fund shares. The value of an in investment in other share classes will differ due to each class’s respective sales charges and expenses.
Performance data represented is historical and does not guarantee future results. The investment return and principal value of an investment will fluctuate, and you may have a gain or loss when you sell shares. Current performance may be higher or lower than the performance data quoted. To obtain more current performance data as of the most recent month-end, please visit our website at eagleasset.com.
Meet the managers | The Fund had two subadvisers during the fiscal year ended October 31, 2008. Eagle Asset Management, Inc. (“Eagle”) and Eagle Boston Investment Management, Inc. (“EBIM”), formerly known as Awad Asset Management, Inc., each managed a portion of the Fund’s investment portfolio and had different management styles.
Bert L. Boksen, CFA, is Managing Director of the small-cap equity strategy at Eagle as well as a Chartered Financial Analyst and has been responsible for the management of Eagle’s portion of the Fund since 1995. Mr. Boksen has 31 years of investment experience. Eric Mintz, CFA, has been Assistant Portfolio Manager since 2008. Mr. Mintz is a Chartered Financial Analyst and has 13 years of investment experience.
David M. Adams, Lead Portfolio Manager, and John McPherson, Co-Portfolio Manager, are Managing directors at EBIM and have been responsible for the EBIM portion of the Fund’s portfolio since 2007. EBIM was a subadviser to the Fund since its inception through October 31, 2008. Both Mr. Adams and Mr. McPherson have 18 years of investment experience.
On November 17, 2008, the portfolio managers gave the following discussion of the Fund’s performance.
|
| Performance Summary and Commentary |
| Eagle Small Cap Growth Fund (cont’d) |
Q: How did the Fund’s performance compare to its benchmark index during the reporting period?
A: No sectors of the market were spared from the selling pressures realized during this time period, as all ten of the commonly defined economic sectors for the Russell 2000® Index realized negative returns over the reporting period. The utilities and consumer staples sectors, which are typically considered defensive in nature, realized the smallest drops while the more cyclical in nature sectors, consumer technology and information technology, were among the worst performers for the benchmark index. Relative to the benchmark index, the Fund slightly underperformed during the reporting period. Consumer discretionary and information technology contributed most significantly due to strong stock selection. The Fund’s slight overweight position versus the benchmark index in information technology detracted mildly from returns. The Fund’s performance lagged the benchmark index in financials, industrials and energy sectors. After significant declines, the financial sector in the benchmark index strengthened in the third quarter relative to other sectors and the Fund failed to keep up. The industrials sector lagged due to the Fund’s professional services industry investments. In energy, the sharp decline in commodities prices and concerns regarding the outlook for global growth pulled down returns.
On an absolute basis, all sectors in the portfolio had negative returns for the year. The Fund’s strongest performing sector on an absolute basis was healthcare. Detractors from the Fund’s absolute performance for the reporting period were investments in the energy and materials sectors.
Q: Which securities had the most negative impact on the Fund’s performance during the reporting period?
A: OYO Geospace is a provider of seismic equipment for oil companies. OYO Geospace had been a big winner in previous reporting periods and the Fund trimmed some of its position at much higher prices; however, the stock price declined dramatically during the reporting period due to delays in receiving anticipated contracts. The Fund continues to hold the stock as we believe after the delays, the company’s new seismic products will be well-received.
FC Stone Group is an integrated commodity risk management group. After reporting several strong quarters of earnings and revenue growth, the dramatic surge in volatility across all commodities and tightening credit market conditions negatively impacted the company’s third quarter results. The Fund recently sold the stock after the company disclosed a $20 million loss.
The Providence Service Corporation is a provider of outsourced government sponsored social services as well as non-emergency transportation services to Medicaid populations. The stock’s drop in price over the reporting period was due to disappointing fundamental results triggered by the budgetary problems of government agencies, its primary customer base. The weakening general economy has pressured state operating budgets, resulting in the company not receiving contractually anticipated cost of living adjustments at a time when their own operating costs were rising, thus squeezing operating margins and profitability. The Fund no longer holds the stock.
LECG Corporation is a provider of legal and economic consulting services, primarily to large corporations. Internal restructuring initiatives that we anticipated would enhance profitability have been offset by what we believe to be a temporary slowdown in demand, driven in part by the slowing global economy. The Fund continues to hold the stock.
Aspen Technology provides process automation software to energy and chemicals companies. In an increasingly globally competitive market, companies in processing-oriented industries seek out ways to be more efficient with their operations. Aspen’s product offerings have long been considered among the best available solutions. Despite strong fundamental results and a favorable long-term outlook, the stock’s price fell due to Securities and Exchange Commission filing delays which caused it to be de-listed from NASDAQ. These delays are related to a change in auditors and the accounting treatment of certain expenses, which date back to a previous management team. While not being dismissive of the negative aspects of these issues, we view them as being immaterial to the long-term value of the underlying business and are confident that these issues will be favorably resolved in the not too distant future. The Fund continues to hold the stock.
Q: Which securities had the most positive impact on the Fund’s performance during the reporting period?
A: Comstock Resources is an oil and gas exploration and production company with operations focused in several onshore U.S. regions. The strong absolute and relative performance of the stock this year is due to an attractive acreage position, favorable exploration activity, strong production results and the well-timed sale of non-core, offshore assets that left the company with a virtually debt-free balance sheet. The Fund continues to hold the stock.
|
| Performance Summary and Commentary |
| Eagle Small Cap Growth Fund (cont’d) |
Merit Medical Systems designs, manufactures and markets disposable medical devices used primarily in interventional cardiology and radiology procedures. We believe that company-specific product development and manufacturing efficiency initiatives have combined to boost fundamental results more than investors had anticipated at the beginning of the reporting period. The Fund continues hold the stock.
Cubist Pharmaceuticals is a profitable biotechnology company that continues to benefit from strong sales of its anti-bacterial drug, Cubicin. We remain optimistic about the company as it has a strong position in the market place and is pursuing new
business opportunities to leverage its hospital sales force. The Fund continues to hold the stock.
Bucyrus International manufactures underground and surface mining equipment. The company continues to experience robust demand from its mining customers and has a large order backlog that provides visibility into continued earnings growth. In addition, we believe there is also potential upside due to an emerging drag line replacement cycle. The Fund continues to hold the stock.
The Fund benefited from its holding in CNET Networks, an interactive media company which was acquired by CBS for a 45% premium.
Investment Portfolios
| | | | | | |
| EAGLE CAPITAL APPRECIATION FUND | | | | | | |
| Common stocks—98.1% (a) | | | | Shares | | Value |
| Domestic—83.7% | | | | | | |
| Advertising—0.6% | | | | | | |
| Lamar Advertising Company, Class A* | | | | 188,584 | | $2,860,819 |
| | | |
| Apparel—2.2% | | | | | | |
| Coach, Inc.* | | | | 462,421 | | 9,525,873 |
| | | |
| Beverages—4.0% | | | | | | |
| PepsiCo, Inc. | | | | 314,209 | | 17,913,055 |
| | | |
| Biotechnology—4.0% | | | | | | |
| Amylin Pharmaceuticals Inc.* | | | | 650,980 | | 6,646,506 |
| Genentech Inc.* | | | | 134,100 | | 11,122,254 |
| | | |
| Commercial services—5.5% | | | | | | |
| The Western Union Company | | | | 923,628 | | 14,094,563 |
| Visa Inc., Class A | | | | 180,901 | | 10,012,870 |
| | | |
| Computers—1.7% | | | | | | |
| Dell Inc.* | | | | 623,800 | | 7,579,170 |
| | | |
| Electronics—4.7% | | | | | | |
| Thermo Fisher Scientific Inc.* | | | | 508,476 | | 20,644,126 |
| | | |
| Financial services—5.6% | | | | | | |
| CME Group Inc. | | | | 33,800 | | 9,536,670 |
| The Charles Schwab Corporation | | | | 795,629 | | 15,212,426 |
| | | |
| Healthcare products—7.6% | | | | | | |
| Baxter International Inc. | | | | 180,500 | | 10,918,445 |
| Johnson & Johnson | | | | 216,700 | | 13,292,378 |
| Zimmer Holdings Inc.* | | | | 203,405 | | 9,444,094 |
| | | |
| Internet—5.9% | | | | | | |
| Equinix Inc.* | | | | 224,195 | | 13,994,252 |
| Google Inc., Class A* | | | | 33,300 | | 11,966,688 |
| | | |
| Multimedia—2.2% | | | | | | |
| Entravision Communications Corporation, Class A* | | | | 1,625,740 | | 3,072,649 |
| Viacom Inc., Class B* | | | | 329,308 | | 6,658,608 |
| | | |
| Oil & gas—4.1% | | | | | | |
| Hess Corporation | | | | 301,055 | | 18,126,522 |
| | | |
| Pharmaceuticals—2.7% | | | | | | |
| Merck & Co., Inc. | | | | 379,900 | | 11,757,905 |
| | | |
| Real estate—1.3% | | | | | | |
| CB Richard Ellis Group Inc., Class A* | | | | 847,432 | | 5,940,498 |
| | | |
| Retail—3.7% | | | | | | |
| Target Corporation | | | | 412,400 | | 16,545,488 |
| | | |
| Software—10.9% | | | | | | |
| Activision Blizzard Inc.* | | | | 1,828,920 | | 22,788,343 |
| Electronic Arts Inc.* | | | | 271,978 | | 6,195,659 |
| Microsoft Corporation | | | | 853,850 | | 19,066,470 |
| | | |
| Telecommunications—17.0% | | | | | | |
| American Tower Corporation, Class A* | | | | 758,250 | | 24,499,058 |
| Crown Castle International Corporation* | | | | 1,486,735 | | 31,474,180 |
| QUALCOMM Inc. | | | | 502,940 | | 19,242,484 |
| Total domestic (cost $425,817,248) | | | | | | 370,132,053 |
| | | |
| Foreign—14.4% (b) | | | | | | |
| Computers—2.2% | | | | | | |
| Research In Motion Ltd.* | | | | 194,802 | | 9,823,865 |
| | | |
| Oil & gas—3.0% | | | | | | |
| Suncor Energy Inc. | | | | 545,240 | | 13,042,141 |
| | | | | | |
| | | | | | | |
| Common stocks—98.1% (a) | | | | Shares | | Value |
| Oil & gas services—5.0% | | | | | | |
| Schlumberger Ltd. | | | | 251,600 | | $12,995,140 |
| Weatherford International Ltd.* | | | | 540,511 | | 9,123,826 |
| | | |
| Pharmaceuticals—4.2% | | | | | | |
| Teva Pharmaceutical Industries Ltd., Sponsored ADR | | | | 437,965 | | 18,779,939 |
| Total foreign (cost $87,583,724) | | | | | | 63,764,911 |
| Total common stocks (cost $513,400,972) | | | | | | 433,896,964 |
| | | |
| Repurchase agreement—1.90% (a) | | | | | | |
| Repurchase agreement with Fixed Income Clearing Corporation dated October 31, 2008 @ 0.03% to be repurchased at $8,384,021 on November 3, 2008, collateralized by $6,105,000 United States Treasury Bonds, 9.125% due May 15, 2018 (market value $8,610,144 including interest) (cost $8,384,000) | | 8,384,000 |
| |
| Total investment portfolio (cost $521,784,972) 100.0% (a) | | 442,280,964 |
| | | |
| Other assets and liabilities, net, 0.0% (a) | | | | | | 25,122 |
| | | |
| Net assets, 100.0% | | | | | | $442,306,086 |
| |
* Non-income producing security. (a) Percentages indicated are based on net assets. (b) U.S. dollar denominated. | | |
| | | |
| ADR—American depository receipt. | | | | | | |
| | |
| |
| Sector allocation | | |
| Sector | | Percent of net assets |
| Communications | | 26% |
| Consumer, non-cyclical | | 24% |
| Technology | | 19% |
| Energy | | 12% |
| Financial | | 7% |
| Consumer, cyclical | | 6% |
| Industrial | | 4% |
| Cash/Other | | 2% |
| | | | | | |
| | | | |
| EAGLE GROWTH & INCOME FUND | | | | | | |
| Common stocks—77.0% (a) | | | | Shares | | Value |
| Domestic—54.1% | | | | | | |
| Agriculture—2.8% | | | | | | |
| Philip Morris International Inc. | | | | 61,600 | | $2,677,752 |
| | | |
| Airlines—0.5% | | | | | | |
| JetBlue Airways Corporation* | | | | 91,000 | | 505,050 |
| | | |
| Banks—1.3% | | | | | | |
| Fifth Third Bancorp | | | | 117,571 | | 1,275,645 |
| | | |
| Beverages—4.3% | | | | | | |
| Dr. Pepper Snapple Group Inc.* | | | | 85,205 | | 1,951,194 |
| The Coca-Cola Company | | | | 49,700 | | 2,189,782 |
| | |
| 18 | | The accompanying notes are an integral part of the financial statements |
Investment Portfolios
| | | | | | |
| EAGLE GROWTH & INCOME FUND (cont’d) | | | | | | |
| Common stocks—77.0% (a) | | | | Shares | | Value |
| Biotechnology—2.9% | | | | | | |
| Gilead Sciences, Inc.* | | | | 62,500 | | $2,865,625 |
| | | |
| Computers—4.2% | | | | | | |
| Apple Inc.* | | | | 13,910 | | 1,496,577 |
| Dell Inc.* | | | | 212,800 | | 2,585,520 |
| | | |
| Diversified manufacturer—0.1% | | | | | | |
| Reddy Ice Holdings, Inc. | | | | 21,306 | | 56,674 |
| | | |
| Electric—3.0% | | | | | | |
| Entergy Corporation | | | | 37,600 | | 2,934,680 |
| | | |
| Financial services—2.6% | | | | | | |
| JPMorgan Chase & Company | | | | 25,612 | | 1,056,495 |
| The Goldman Sachs Group Inc. | | | | 15,593 | | 1,442,352 |
| | | |
| Food—3.4% | | | | | | |
| Kraft Foods Inc., Class A | | | | 44,928 | | 1,309,202 |
| Sysco Corporation | | | | 76,000 | | 1,991,200 |
| | | |
| Healthcare products—1.9% | | | | | | |
| Varian Medical Systems, Inc.* | | | | 41,500 | | 1,888,665 |
| | | |
| Insurance—2.7% | | | | | | |
| Cincinnati Financial Corporation | | | | 85,400 | | 2,219,546 |
| Hartford Financial Services Group Inc. | | | | 37,500 | | 387,000 |
| | | |
| Machinery—1.1% | | | | | | |
| Joy Global Inc. | | | | 36,725 | | 1,064,290 |
| | | |
| Oil & gas—5.7% | | | | | | |
| Diamond Offshore Drilling, Inc. | | | | 33,500 | | 2,974,800 |
| Exxon Mobil Corporation | | | | 35,300 | | 2,616,436 |
| | | |
| Pharmaceuticals—2.9% | | | | | | |
| Eli Lilly & Company | | | | 81,975 | | 2,772,394 |
| | | |
| REIT—1.0% | | | | | | |
| Chimera Investment Corporation | | | | 334,500 | | 963,360 |
| | | |
| Retail—4.8% | | | | | | |
| McDonald’s Corporation | | | | 79,800 | | 4,622,814 |
| | | |
| Semiconductors—2.0% | | | | | | |
| Intel Corporation | | | | 119,000 | | 1,904,000 |
| | | |
| Software—3.1% | | | | | | |
| Microsoft Corporation | | | | 135,500 | | 3,025,715 |
| | | |
| Telecommunications—3.8% | | | | | | |
| AT&T Inc. | | | | 136,600 | | 3,656,782 |
| Total domestic (cost $63,238,167) | | | | | | 52,433,550 |
| | | |
| Foreign—22.9% (b) | | | | | | |
| Banks—0.8% | | | | | | |
| Banco Bilbao Vizcaya Argentaria SA | | | | 66,300 | | 769,767 |
| | | |
| Entertainment—2.2% | | | | | | |
| OPAP SA | | | | 96,645 | | 2,117,604 |
| | | |
| Financial services—2.4% | | | | | | |
| Bolsas y Mercados Espanoles | | | | 38,300 | | 941,014 |
| Hong Kong Exchanges and Clearing Ltd. | | | | 133,000 | | 1,359,616 |
| | | |
| Food—0.5% | | | | | | |
| FU JI Food and Catering Services Holdings Ltd. | | | | 850,000 | | 458,124 |
| | | |
| Insurance—4.2% | | | | | | |
| ACE Ltd. | | | | 45,045 | | 2,583,781 |
| Swiss Reinsurance | | | | 36,900 | | 1,537,345 |
| | | |
| Oil & gas—2.7% | | | | | | |
| Canadian Oil Sands Trust | | | | 97,500 | | 2,616,071 |
| | | | | | |
| | | | | | | |
| Common stocks—77.0% (a) | | | | Shares | | Value |
| Telecommunications—10.1% | | | | | | |
| Amdocs Ltd.* | | | | 81,500 | | $1,838,640 |
| France Telecom SA | | | | 41,800 | | 1,054,808 |
| Nokia Oyj | | | | 121,400 | | 1,851,721 |
| Telefonica SA | | | | 183,200 | | 3,388,688 |
| Vodafone Group PLC | | | | 887,535 | | 1,709,537 |
| Total foreign (cost $26,615,072) | | | | | | 22,226,716 |
| Total common stocks (cost $89,853,239) | | | | | | 74,660,266 |
| | | |
| Investment company—0.8% (a) | | | | | | |
| KKR Financial Holdings LLC | | | | 203,000 | | 783,580 |
| Total investment company (cost $2,627,008) | | | | | | 783,580 |
| | | |
| Preferred stocks—0.8% (a) | | | | | | |
| Financial services—0.8% | | | | | | |
| CIT Group Inc., 8.75% (convertible) | | | | 9,500 | | 203,015 |
| Merrill Lynch & Company, Inc., Series H, 3.45938% | | | | 60,000 | | 599,400 |
| Total preferred stocks (cost $1,975,000) | | | | | | 802,415 |
| | | |
| Corporate bonds—1.8% (a) | | | | Principal
amount | | Value |
| Domestic—1.2% | | | | | | |
| Electric—0.8% | | | | | | |
| Entergy Gulf States, 144A, 6.0%, 05/01/18 | | $ | | 1,000,000 | | 780,047 |
| Financial services—0.4% | | | | | | |
| CIT Group Inc., 5.0%, 02/13/14 | | | | 130,600 | | 67,972 |
| CIT Group Inc., 5.0%, 02/01/15 | | | | 191,800 | | 97,550 |
| CIT Group Inc., 5.4%, 01/30/16 | | | | 377,700 | | 186,390 |
| CIT Group Inc., 5.85%, 09/15/16 | | | | 105,200 | | 52,465 |
| Total domestic (cost $1,191,979) | | | | | | 1,184,424 |
| | | |
| Foreign—0.6% (b) | | | | | | |
| Financial services—0.6% | | | | | | |
| Swiss Reinsurance Capital I LP, 144A, 6.854%, 05/25/16 (c) | | | | 1,000,000 | | 547,745 |
| Total foreign (cost $570,695) | | | | | | 547,745 |
| Total corporate bonds (cost $1,762,674) | | | | | | 1,732,169 |
| | | |
| Domestic convertible bonds—2.6% (a) | | | | | | |
| REIT—0.7% | | | | | | |
| Vornado Realty Trust, 2.85%, 04/01/27 | | | | 1,000,000 | | 705,000 |
| Telecommunications—1.9% | | | | | | |
| Level 3 Communications, Inc., 6.0%, 03/15/10 | | | | 3,000,000 | | 1,815,000 |
| Total domestic convertible bonds (cost $3,235,468) | | 2,520,000 |
| |
| Municipal variable rate demand notes—6.1% (a) (d) | | |
| Massachusetts—3.0% | | | | | | |
Massachusetts Health & Educational Facilities,
1.40%, 11/06/08, LOC: Bank of America, N.A. | | | | 2,945,000 | | 2,945,000 |
| New York—3.1% | | | | | | |
| New York City Municipal Water Finance Authority, 3.75%, Series C, 11/03/08, SPA: Dexia | | | | 3,000,000 | | 3,000,000 |
Total municipal variable rate demand notes
(cost $5,945,000) | | 5,945,000 |
| |
Total investment portfolio excluding repurchase agreement
(cost $105,398,389) | | 86,443,430 |
| | |
| The accompanying notes are an integral part of the financial statements | | 19 |
Investment Portfolios
| | | | | | | |
| EAGLE GROWTH & INCOME FUND (cont’d) | | | | | | | |
| Repurchase agreement—11.6% (a) | | | | | | Value | |
| Repurchase agreement with Fixed Income Clearing Corporation dated October 31, 2008 @ 0.03% to be repurchased at $11,216,028 on November 3, 2008, collateralized by $8,165,000 United States Treasury Bonds, 9.125% due May 15, 2018 (market value $11,515,451 including interest) (cost $11,216,000) | | $11,216,000 | |
| |
| Total investment portfolio (cost $116,614,389) 100.7% (a) | | 97,659,430 | |
| | | |
| Other assets and liabilities, net, (0.7%) (a) | | | | | | (670,625 | ) |
| | | |
| Net assets, 100.0% | | | | | | $96,988,805 | |
* Non-income producing security. (a) Percentages indicated are based on net assets. (b) U.S. dollar denominated. (c) Bond has a fixed coupon until 05/25/16; at that time, the coupon becomes variable and the bond becomes callable semiannually. (d) Variable rate demand notes are securities that are payable on demand within seven calendar days. | | | |
| |
| 144A—144A securities are issued pursuant to Rule 144A of the Securities Act of 1933. Most of these are deemed to be liquid for purposes of compliance limitations on holdings of illiquid securities and all may be resold as transactions exempt from registration to qualified institutional buyers. At October 31, 2008, these securities aggregated $1,327,792 or 1.4% of the net assets of the Fund. | | | |
| LOC—Credit enhancement provided by letter of credit issued by noted institution. | | | |
| REIT—Real estate investment trust. | | | |
| SPA—Standby bond purchase agreement. | | | |
| | |
| |
| Sector allocation | | |
| Sector | | Percent of net assets |
| Financial | | 18% |
| Communications | | 16% |
| Consumer, non-cyclical | | 16% |
| Technology | | 12% |
| Other sectors | | 11% |
| Energy | | 9% |
| Consumer, cyclical | | 7% |
| Cash/Other | | 11% |
| | | | | | |
| | | | |
| EAGLE INTERNATIONAL EQUITY FUND | | | | | | |
| Common stocks—81.9% (a) | | | | Shares | | Value |
| Australia—0.8% | | | | | | |
| BHP Billiton Ltd. | | | | 11,353 | | $218,124 |
| Macquarie Airports Ltd. | | | | 406,932 | | 582,181 |
| Newcrest Mining Ltd. | | | | 10,929 | | 151,068 |
| Rio Tinto Ltd. | | | | 6,404 | | 330,248 |
| | | |
| Austria—0.6% | | | | | | |
| Flughafen Wien AG | | | | 11,500 | | 471,415 |
| OMV AG | | | | 12,952 | | 416,378 |
| Telekom Austria AG | | | | 11,908 | | 147,806 |
| | | | | | |
| | | | | | | |
| Common stocks—81.9% (a) | | | | Shares | | Value |
| Belgium—0.0% | | | | | | |
| Fortis | | | | 25,949 | | $30,151 |
| | | |
| Bermuda—0.1% | | | | | | |
| Central European Media Enterprises Ltd., Class A* | | | | 6,169 | | 164,774 |
| | | |
| Canada—1.4% | | | | | | |
| Barrick Gold Corporation | | | | 49,193 | | 1,124,831 |
| Eldorado Gold Corporation* | | | | 42,060 | | 173,781 |
| Ivanhoe Mines Ltd.* | | | | 30,448 | | 79,575 |
| Kinross Gold Corporation | | | | 47,300 | | 492,504 |
| Research in Motion Ltd.* | | | | 3,635 | | 183,313 |
| Talisman Energy Inc. | | | | 17,278 | | 170,730 |
| | | |
| China—0.1% | | | | | | |
| Beijing Capital International Airport Company, Ltd., Class H | | | | 256,278 | | 147,064 |
| | | |
| Cyprus—0.1% | | | | | | |
| Bank of Cyprus Public Co., Ltd. | | | | 26,423 | | 138,968 |
| | | |
| Czech—2.4% | | | | | | |
| Komercni Banka, AS | | | | 26,049 | | 3,891,310 |
| | | |
| Denmark—0.8% | | | | | | |
| ALK-Abello AS, Class B | | | | 1,222 | | 98,059 |
| Novo Nordisk AS, Class B | | | | 21,505 | | 1,151,174 |
| | | |
| Finland—2.0% | | | | | | |
| Fortum Oyj | | | | 9,864 | | 242,807 |
| Nokia Oyj | | | | 154,752 | | 2,360,438 |
| Orion Oyj, Class B | | | | 12,142 | | 178,684 |
| Pohjola Bank PLC, Series A | | | | 8,565 | | 115,319 |
| Stora Enso Oyj, Series R | | | | 42,342 | | 397,101 |
| | | |
| France—17.0% | | | | | | |
| Accor SA | | | | 1,904 | | 74,184 |
| Aeroports de Paris SA | | | | 13,277 | | 789,006 |
| Air Liquide SA | | | | 2,760 | | 237,887 |
| Alstom SA | | | | 3,517 | | 174,804 |
| AXA SA | | | | 17,251 | | 332,432 |
| Bouygues SA | | | | 7,219 | | 307,547 |
| Carrefour SA | | | | 26,274 | | 1,110,288 |
| Casino Guichard-Perrachon SA | | | | 3,882 | | 271,653 |
| Compagnie de Saint-Gobain | | | | 12,276 | | 474,016 |
| Electricite de France | | | | 10,225 | | 611,213 |
| France Telecom SA | | | | 111,166 | | 2,805,232 |
| GDF Suez SA | | | | 68,025 | | 3,029,004 |
| Groupe Danone SA | | | | 42,758 | | 2,367,358 |
| Lafarge SA | | | | 2,227 | | 146,750 |
| L’Oreal Group | | | | 9,263 | | 700,241 |
| LVMH Moet Hennessy Louis Vuitton SA | | | | 17,499 | | 1,167,533 |
| Pinault-Printemps-Redoute SA (PPR) | | | | 7,921 | | 504,466 |
| Remy Cointreau SA | | | | 1,960 | | 81,189 |
| Renault SA | | | | 2,378 | | 73,019 |
| Sanofi-Aventis SA | | | | 67,669 | | 4,263,213 |
| Schneider Electric SA | | | | 2,576 | | 154,957 |
| Suez Environnement SA* | | | | 10,145 | | 195,051 |
| TOTAL SA | | | | 112,419 | | 6,174,586 |
| Vinci SA | | | | 12,176 | | 438,038 |
| Vivendi | | | | 52,510 | | 1,373,447 |
| | | |
| Germany—11.4% | | | | | | |
| Adidas AG | | | | 1,551 | | 54,267 |
| Allianz SE | | | | 4,414 | | 330,560 |
| BASF SE | | | | 34,111 | | 1,146,260 |
| Bayer AG | | | | 22,861 | | 1,257,573 |
| | |
| 20 | | The accompanying notes are an integral part of the financial statements |
Investment Portfolios
| | | | | | |
| EAGLE INTERNATIONAL EQUITY FUND (cont’d) | | | | | | |
| Common stocks—81.9% (a) | | | | Shares | | Value |
| Germany (cont’d) | | | | | | |
| Continental AG* | | | | 1,699 | | $121,266 |
| Daimler AG | | | | 9,067 | | 313,077 |
| Deutsche Post AG | | | | 5,555 | | 61,783 |
| Deutsche Telekom AG | | | | 186,108 | | 2,770,127 |
| E.ON AG | | | | 102,423 | | 3,909,147 |
| Fraport AG Frankfurt Airport Services Worldwide | | | | 59,370 | | 1,936,981 |
| Fresenius Medical Care AG & Co. KGaA | | | | 28,763 | | 1,292,627 |
| Fresenius SE | | | | 13,486 | | 792,045 |
| Henkel AG & Co. KGaA | | | | 3,303 | | 81,623 |
| Merck KGaA | | | | 2,408 | | 213,549 |
| Muenchener Rueckversicherungs AG | | | | 2,105 | | 276,073 |
| Rhoen-Klinikum AG | | | | 36,371 | | 775,527 |
| RWE AG | | | | 18,281 | | 1,519,863 |
| SAP AG | | | | 13,611 | | 483,928 |
| Siemens AG | | | | 22,428 | | 1,341,850 |
| | | |
| Greece—0.2% | | | | | | |
| Alapis Holding Industrial and Commercial SA | | | | 50,265 | | 72,424 |
| Hellenic Telecommunications Organization SA | | | | 12,463 | | 178,786 |
| | | |
| Hong Kong—0.3% | | | | | | |
| China Merchants Holdings (International) Company Ltd. | | | | 118,970 | | 281,310 |
| Galaxy Entertainment Group Ltd.* | | | | 148,139 | | 10,799 |
| GOME Electrical Appliances Holdings Ltd. | | | | 390,486 | | 76,288 |
| Shun Tak Holdings Ltd. | | | | 791,511 | | 160,642 |
| | | |
| Hungary—2.5% | | | | | | |
| Magyar Telekom Telecommunications PLC | | | | 314,713 | | 998,930 |
| OTP Bank Nyrt | | | | 170,403 | | 2,842,903 |
| Richter Gedeon Nyrt | | | | 1,553 | | 213,344 |
| | | |
| India—0.4% | | | | | | |
| State Bank of India, Sponsored GDR | | | | 15,497 | | 712,862 |
| | | |
| Ireland—0.5% | | | | | | |
| CRH PLC | | | | 22,571 | | 497,640 |
| Dragon Oil PLC* | | | | 96,189 | | 248,624 |
| | | |
| Italy—2.8% | | | | | | |
| Assicurazioni Generali SpA | | | | 12,212 | | 307,831 |
| Buzzi Unicem SpA | | | | 32,986 | | 400,994 |
| Credito Emiliano SpA | | | | 46,733 | | 299,951 |
| Enel SpA | | | | 150,603 | | 1,010,938 |
| ENI SpA | | | | 106,436 | | 2,536,204 |
| Italcementi SpA | | | | 7,017 | | 81,645 |
| | | |
| Japan—5.2% | | | | | | |
| Aisin Seiki Company, Ltd. | | | | 3,001 | | 52,156 |
| Canon Inc. | | | | 12,973 | | 446,421 |
| Central Japan Railway Company | | | | 55 | | 449,984 |
| Daikin Industries, Ltd. | | | | 2,800 | | 62,929 |
| Daiwa Securities Group Inc. | | | | 6,003 | | 33,343 |
| Denso Corporation | | | | 7,613 | | 150,340 |
| East Japan Railway Company | | | | 94 | | 667,971 |
| Eisai Co., Ltd. | | | | 3,800 | | 124,915 |
| Fanuc Ltd. | | | | 2,500 | | 169,679 |
| Fuji Television Network Inc. | | | | 41 | | 49,154 |
| Honda Motor Company, Ltd. | | | | 30,920 | | 767,921 |
| ITOCHU Corporation | | | | 7,000 | | 37,798 |
| Japan Tobacco Inc. | | | | 76 | | 269,863 |
| KDDI Corporation | | | | 70 | | 418,206 |
| Komatsu Ltd. | | | | 8,900 | | 96,640 |
| Kubota Corporation | | | | 7,491 | | 38,493 |
| | | | | | |
| | | | | | | |
| Common stocks—81.9% (a) | | | | Shares | | Value |
| Kyocera Corporation | | | | 1,400 | | $81,785 |
| Mitsubishi Corporation | | | | 5,200 | | 86,309 |
| Mitsubishi Electric Corporation | | | | 28,000 | | 172,568 |
| Mitsui & Company, Ltd. | | | | 7,000 | | 67,290 |
| Mitsui Fudosan Company, Ltd. | | | | 3,129 | | 53,870 |
| Mitsui Mining & Smelting Company, Ltd. | | | | 2 | | 4 |
| Nidec Corporation | | | | 1,300 | | 66,892 |
| Nintendo Company, Ltd. | | | | 1,461 | | 460,795 |
| Nippon Telegraph & Telephone Corporation | | | | 23 | | 94,398 |
| Nissan Motor Company, Ltd. | | | | 6,562 | | 34,323 |
| Nomura Holdings, Inc. | | | | 5,622 | | 52,274 |
| NTT DoCoMo, Inc. | | | | 281 | | 445,823 |
| Olympus Corporation | | | | 1,508 | | 28,808 |
| Panasonic Corporation | | | | 16,853 | | 262,055 |
| Ricoh Company Ltd. | | | | 5,000 | | 53,185 |
| Seven & I Holdings Co., Ltd. | | | | 3,800 | | 106,428 |
| Sharp Corporation | | | | 5,000 | | 35,298 |
| Shin-Etsu Chemical Company, Ltd. | | | | 2,900 | | 151,765 |
| Sony Corporation | | | | 3,886 | | 88,905 |
| Suzuki Motor Corporation | | | | 6,400 | | 92,704 |
| Takeda Pharmaceutical Company, Ltd. | | | | 4,800 | | 241,909 |
| Toyota Motor Corporation | | | | 47,632 | | 1,877,737 |
| Yamada Denki Company, Ltd. | | | | 1,590 | | 86,162 |
| | | |
| Luxembourg—0.1% | | | | | | |
| ArcelorMittal SA | | | | 7,871 | | 204,266 |
| | | |
| Mexico—0.0% | | | | | | |
| Grupo Cementos de Chihuahua, SAB de CV | | | | 21,355 | | 56,410 |
| | | |
| Netherlands—5.6% | | | | | | |
| Aegon NV | | | | 13,650 | | 55,923 |
| Heineken NV | | | | 11,706 | | 395,013 |
| ING Groep NV | | | | 22,456 | | 207,075 |
| Koninklijke KPN NV | | | | 69,348 | | 975,781 |
| Koninklijke Philips Electronics NV | | | | 10,643 | | 196,495 |
| Reed Elsevier NV | | | | 7,970 | | 106,645 |
| Royal Dutch Shell PLC, Class A | | | | 122,540 | | 3,376,683 |
| TNT NV | | | | 3,636 | | 76,124 |
| Unilever NV | | | | 160,188 | | 3,861,783 |
| | | |
| New Zealand—0.1% | | | | | | |
| Auckland International Airport Ltd. | | | | 238,381 | | 253,157 |
| | | |
| Poland—3.6% | | | | | | |
| Bank BPH SA | | | | 2,111 | | 34,605 |
| Bank Handlowy w Warszawie SA | | | | 32,134 | | 522,600 |
| Bank Pekao SA | | | | 55,847 | | 2,539,612 |
| Powszechna Kasa Oszczednosci Bank Polski SA | | | | 168,784 | | 1,903,301 |
| Telekomunikacja Polska SA | | | | 117,846 | | 888,548 |
| | | |
| Portugal—0.1% | | | | | | |
| Energias de Portugal SA | | | | 31,953 | | 110,081 |
| | | |
| Romania—0.2% | | | | | | |
| Romanian Development Bank-Groupe Societe Generale | | | | 88,073 | | 226,834 |
| SNP Petrom SA | | | | 2,344,606 | | 129,748 |
| | | |
| Russia—0.1% | | | | | | |
| OAO Federal Grid Company of the Unified Energy System, 144A, Sponsored GDR* | | | | 34,357 | | 54,102 |
| OAO Inter Rao UES, 144A, Sponsored GDR* | | | | 7,106 | | 14,212 |
| OAO Kuzbassenergo, 144A, Sponsored GDR* | | | | 2,363 | | 3,928 |
| OAO Mosenergo, 144A, Sponsored GDR* | | | | 11,407 | | 17,972 |
| OAO OGK-1 (Wholesale Generation Company No 1), 144A, Sponsored GDR* | | | | 32,708 | | 12,082 |
| | |
| The accompanying notes are an integral part of the financial statements | | 21 |
Investment Portfolios
| | | | | | |
| EAGLE INTERNATIONAL EQUITY FUND (cont’d) | | |
| Common stocks—81.9% (a) | | | | Shares | | Value |
| Russia (cont’d) | | | | | | |
| OAO OGK-2 (Wholesale Generation Company No 2), 144A, Sponsored GDR* | | | | 8,500 | | $8,698 |
| OAO OGK-3 (Wholesale Generation Company No 3), 144A, Sponsored GDR* | | | | 13,974 | | 8,956 |
| OAO OGK-6 (Wholesale Generation Company No 6), 144A, Sponsored GDR* | | | | 9,911 | | 8,970 |
| OAO Open Investments, Sponsored GDR* | | | | 1,361 | | 6,805 |
| OAO RAO Energy System of East* | | | | 1,700,000 | | 1,870 |
| OAO Sistema-Hals, 144A, Sponsored GDR* | | | | 21,005 | | 6,413 |
| OAO TGK-1 (Territorial Generation Company No 1), 144A, Sponsored GDR* | | | | 12,988 | | 7,197 |
| OAO TGK-2 (Territorial Generation Company No 2), 144A, Sponsored GDR* | | | | 2,193 | | 4,780 |
| OAO TGK-4 (Territorial Generation Company No 4), 144A, Sponsored GDR* | | | | 5,389 | | 10,551 |
| OAO TGK-9 (Territorial Generation Company No 9), 144A, Sponsored GDR* | | | | 5,712 | | 5,908 |
| OAO TGK-13 (Eniseyskaya Territorial Generation Company), 144A, Sponsored GDR* | | | | 5,848 | | 2,924 |
| OAO TGK-14 (Territorial Generation Company No 14), 144A, Sponsored GDR* | | | | 544 | | 1,145 |
| OAO Volga Territorial Generation Company, 144A, Sponsored GDR* | | | | 5,678 | | 5,453 |
| | | |
| Spain—1.9% | | | | | | |
| EDP Renovaveis SA* | | | | 40,090 | | 209,405 |
| Iberdrola Renovables SA* | | | | 24,153 | | 73,529 |
| Iberdrola SA | | | | 140,093 | | 1,013,614 |
| Inditex SA | | | | 5,065 | | 171,112 |
| Telefonica SA | | | | 90,919 | | 1,681,745 |
| | | |
| Sweden—0.4% | | | | | | |
| Getinge AB, Series B | | | | 13,019 | | 182,860 |
| Hennes & Mauritz AB, Series B | | | | 4,702 | | 169,792 |
| Svenska Cellulosa AB, Class B | | | | 32,912 | | 244,578 |
| TeliaSonera AB | | | | 19,512 | | 86,014 |
| | | |
| Switzerland—8.7% | | | | | | |
| ABB Ltd. | | | | 15,842 | | 209,468 |
| BKW FMB Energie AG | | | | 2,943 | | 266,461 |
| Compagnie Financiere Richemont SA | | | | 14,294 | | 303,924 |
| Flughafen Zuerich AG | | | | 1,537 | | 408,537 |
| Holcim Ltd.Holcim Ltd. | | | | 11,743 | | 669,486 |
| Nestle SA | | | | 122,202 | | 4,763,368 |
| Nobel Biocare Holding AG | | | | 3,440 | | 59,199 |
| Novartis AG | | | | 68,190 | | 3,449,639 |
| Roche Holding AG | | | | 23,064 | | 3,530,309 |
| Synthes Inc. | | | | 1,511 | | 195,094 |
| The Swatch Group AG | | | | 2,028 | | 317,194 |
| | | |
| Taiwan—0.0% | | | | | | |
| Cathay Financial Holding Co. Ltd., Sponsored GDR | | | | 283 | | 2,860 |
| | | |
| Ukraine—0.3% | | | | | | |
| Raiffeisen Bank Aval | | | | 1,908,985 | | 74,167 |
| Ukrnafta Oil Company* | | | | 5,473 | | 89,676 |
| Ukrnafta Oil Company, Sponsored ADR | | | | 34 | | 3,143 |
| Ukrsotsbank JSCB* | | | | 2,466,696 | | 96,668 |
| UkrTelecom | | | | 5,916,954 | | 269,861 |
| UkrTelecom, Sponsored GDR* | | | | 9,912 | | 22,361 |
| | | | | | |
| | | | | | | |
| Common stocks—81.9% (a) | | | | Shares | | Value |
| United Kingdom—12.1% | | | | | | |
| BHP Billiton PLC | | | | 24,817 | | $420,560 |
| BP PLC | | | | 208,274 | | 1,721,197 |
| British American Tobacco PLC | | | | 31,826 | | 874,025 |
| Cadbury PLC | | | | 189,897 | | 1,745,032 |
| Diageo PLC | | | | 118,407 | | 1,812,209 |
| GlaxoSmithKline PLC | | | | 166,763 | | 3,212,508 |
| Imperial Tobacco Group PLC | | | | 41,129 | | 1,106,003 |
| National Grid PLC | | | | 51,798 | | 588,145 |
| Peter Hambro Mining PLC | | | | 3,503 | | 11,430 |
| Reckitt Benckiser Group PLC | | | | 11,191 | | 470,067 |
| Rio Tinto PLC | | | | 10,762 | | 501,890 |
| Rolls-Royce Group PLC | | | | 37,380 | | 198,269 |
| Rolls-Royce Group PLC, Class C* | | | | 2,138,136 | | 3,441 |
| Royal Bank of Scotland Group PLC | | | | 1 | | 1 |
| Scottish & Southern Energy PLC | | | | 19,787 | | 387,872 |
| Smith & Nephew PLC | | | | 141,863 | | 1,299,068 |
| Tesco PLC | | | | 466,543 | | 2,548,320 |
| Vodafone Group PLC | | | | 1,135,764 | | 2,187,668 |
| WM Morrison Supermarkets PLC | | | | 139,888 | | 597,680 |
| WPP Group PLC | | | | 19,107 | | 115,312 |
| | | |
| United States—0.1% | | | | | | |
| Dr Pepper Snapple Group Inc.* | | | | 4,767 | | 109,164 |
| Total common stocks (cost $163,637,837) | | | | | | 134,178,833 |
| | | |
| Warrants—0.9% (a) | | | | | | |
| Bermuda—0.6% | | | | | | |
| CLSA Financial Products Ltd./State Bank of India Ltd, 144A, 05/13/10* | | | | 36,959 | | 865,688 |
| | | |
| Germany—0.0% | | | | | | |
| Deutsche Bank AG London, Series 71, 12/31/09 (b)* | | | | 17 | | 0 |
| | | |
| India—0.3% | | | | | | |
| Citigroup Global Markets Holdings/State Bank of India, 144A, 10/24/12* | | | | 21,408 | | 501,375 |
| | | |
| Russia—0.0% | | | | | | |
| Deutsche Bank AG/OAO TGK-4, 01/04/10 (b)* | | | | 17 | | 25,639 |
| Deutsche Bank AG/OAO TGK-11, 01/04/10 (b)* | | | | 17 | | 2,945 |
| Total warrants (cost $1,453,950) | | | | | | 1,395,647 |
| | | |
| Investment companies—8.4% (a) | | | | | | |
| British Virgin Islands—0.0% | | | | | | |
| RenShares Utilities Ltd, Class RenGen* | | | | 41,476 | | 31,107 |
| | | |
| France—5.1% | | | | | | |
| Eurazeo SA | | | | 2,484 | | 149,283 |
| Lyxor ETF DJ Stoxx 600 Banks | | | | 319,963 | | 8,246,228 |
| | | |
| Hong Kong—2.2% | | | | | | |
| Tracker Fund of Hong Kong | | | | 1,955,000 | | 3,581,908 |
| | | |
| United States—1.1% | | | | | | |
| iShares MSCI South Korea Index Fund, ETF | | | | 63,577 | | 1,789,059 |
| Total investment companies (cost $13,206,804) | | | | | | 13,797,585 |
| | | |
| Total investment portfolio excluding repurchase agreement (cost $178,298,591) | | | | | | 149,372,065 |
| | |
| 22 | | The accompanying notes are an integral part of the financial statements |
Investment Portfolios
| | | | | | |
| EAGLE INTERNATIONAL EQUITY FUND (cont’d) | | | | | | |
| Repurchase agreement—7.9% (a) | | | | | | Value |
| Repurchase agreement with Fixed Income Clearing Corporation dated October 31, 2008 @ 0.03% to be repurchased at $13,006,033 on November 3, 2008, collateralized by $12,365,000 United States Treasury Notes, 4.875% due April 30, 2011 (market value $13,435,943 including interest) (cost $13,006,000) | | $13,006,000 |
| |
| Total investment portfolio (cost $191,304,591) 99.1% (a) | | 162,378,065 |
| | | |
| Other assets and liabilities, net, 0.9% (a) | | | | | | 1,463,128 |
| | | |
| Net assets, 100.0% | | | | | | $163,841,193 |
| | | |
* Non-income producing security. (a) Percentages indicated are based on net assets. (b) Restricted securities deemed to be illiquid for purposes of compliance limitations on holdings of illiquid securities. At October 31, 2008, these securities aggregated $28,584 or 0.0% of the net assets of the Fund. | | | | | | |
| | | |
| ADR—American depository receipt. | | | | | | |
| ETF—Exchange-Traded fund. | | | | | | |
| GDR—Global depository receipt. | | | | | | |
| 144A—144A securities are issued pursuant to Rule 144A of the Securities Act of 1993. Most of these are deemed to be liquid for purposes of compliance limitations on holdings of illiquid securities and all may be resold as transactions exempt from registration to qualified institutional buyers. At October 31, 2008, these securities aggregated $1,540,354 or 0.9% of the net assets of the Fund. | | | | | | |
| | |
| |
| Sector allocation | | |
| Sector | | Percent of net assets |
| Consumer, non-cyclical | | 27% |
| Financial | | 19% |
| Communications | | 11% |
| Energy | | 9% |
| Utilities | | 8% |
| Industrial | | 7% |
| Other sectors | | 6% |
| Consumer, cyclical | | 4% |
| Cash/Other | | 9% |
| | | | |
| | |
| Industry allocation | | | | |
| Industry | | Value | | Percent of
net assets |
| Food | | $17,265,482 | | 10.6% |
| Pharmaceuticals | | 16,749,728 | | 10.2% |
| Telecommunications | | 16,331,723 | | 10.1% |
| Oil & gas | | 14,866,968 | | 9.1% |
| Banks | | 14,796,316 | | 9.0% |
| Investment companies | | 13,797,585 | | 8.4% |
| Electric | | 9,857,472 | | 6.0% |
| | | | |
| | |
| Industry allocation (cont’d) | | | | |
| Industry | | Value | | Percent of
net assets |
| Engineering & construction | | $5,543,393 | | 3.4% |
| Mining | | 3,504,015 | | 2.1% |
| Auto manufacturers | | 3,158,783 | | 1.9% |
| Gas | | 3,029,004 | | 1.8% |
| Chemicals | | 2,793,485 | | 1.7% |
| Healthcare products | | 2,528,265 | | 1.5% |
| Beverages | | 2,397,575 | | 1.5% |
| Building materials | | 2,389,870 | | 1.5% |
| Agriculture | | 2,249,891 | | 1.4% |
| Healthcare services | | 2,068,154 | | 1.3% |
| Retail | | 1,735,365 | | 1.1% |
| Financial services | | 1,534,459 | | 0.9% |
| Insurance | | 1,512,755 | | 0.9% |
| Multimedia | | 1,488,759 | | 0.9% |
| Diversified manufacturer | | 1,341,850 | | 0.8% |
| Transportation | | 1,255,862 | | 0.8% |
| Cosmetics/Personal care | | 700,241 | | 0.4% |
| Forest products & paper | | 641,678 | | 0.4% |
| Household products | | 551,690 | | 0.3% |
| Office/Business equipment | | 499,606 | | 0.3% |
| Software | | 483,928 | | 0.3% |
| Machinery | | 479,617 | | 0.3% |
| Toys/Games/Hobbies | | 460,795 | | 0.3% |
| Home furnishings | | 386,258 | | 0.2% |
| Electronics | | 345,173 | | 0.2% |
| Electrical components & equipment | | 327,524 | | 0.2% |
| Auto parts & equipment | | 323,761 | | 0.2% |
| Energy-Alternative sources | | 282,934 | | 0.2% |
| Real estate | | 227,730 | | 0.1% |
| Television, cable & radio | | 213,928 | | 0.1% |
| Iron/Steel | | 204,266 | | 0.1% |
| Aerospace/Defense | | 201,710 | | 0.1% |
| Water | | 195,051 | | 0.1% |
| Distribution/Wholesale | | 191,398 | | 0.1% |
| Computers | | 183,313 | | 0.1% |
| Printing & publishing | | 106,645 | | 0.1% |
| Lodging | | 84,983 | | 0.1% |
| Other | | 83,077 | | 0.1% |
| Total investment portfolio excluding repurchase agreement | | $149,372,065 | | 91.2% |
| | |
| The accompanying notes are an integral part of the financial statements | | 23 |
Investment Portfolios
| | | | | | |
| EAGLE INTERNATIONAL EQUITY FUND (cont’d) | | | | | | |
| | | | | | | | | | | |
| Forward foreign currency contracts outstanding | |
| Contract to deliver | | In exchange for | | Delivery
date | | Unrealized
appreciation
(depreciation) | |
| USD | | 1,993,495 | | PLN | | 6,115,108 | | 11/19/08 | | $213,818 | |
| PLN | | 6,115,108 | | USD | | 2,680,774 | | 11/19/08 | | 473,460 | |
| USD | | 1,541,346 | | MXN | | 17,657,031 | | 11/21/08 | | (176,131 | ) |
| MXN | | 17,657,031 | | USD | | 1,710,538 | | 11/21/08 | | 345,323 | |
| USD | | 7,982,573 | | EUR | | 5,700,866 | | 12/2/08 | | (724,413 | ) |
| EUR | | 5,700,866 | | USD | | 8,310,038 | | 12/2/08 | | 1,051,878 | |
| USD | | 29,604,939 | | EUR | | 21,827,879 | | 12/8/08 | | (1,817,843 | ) |
| EUR | | 27,117,592 | | USD | | 38,786,537 | | 12/8/08 | | 4,265,588 | |
| USD | | 5,803,635 | | CZK | | 108,830,720 | | 12/9/08 | | (28,121 | ) |
| CZK | | 113,479,379 | | USD | | 6,480,559 | | 12/9/08 | | 458,346 | |
| USD | | 7,803,499 | | PLN | | 22,238,544 | | 12/9/08 | | 211,439 | |
| PLN | | 23,552,696 | | USD | | 9,620,621 | | 12/9/08 | | 1,132,053 | |
| USD | | 2,509,847 | | CAD | | 2,589,082 | | 12/22/08 | | (361,873 | ) |
| CAD | | 2,589,082 | | USD | | 2,442,766 | | 12/22/08 | | 294,792 | |
| CZK | | 14,712,604 | | USD | | 799,946 | | 1/14/09 | | 20,428 | |
| CZK | | 1,972,410 | | USD | | 104,985 | | 1/21/09 | | 546 | |
| CZK | | 2,284,359 | | USD | | 122,067 | | 4/20/09 | | 1,396 | |
| EUR | | 9,585,437 | | USD | | 12,828,191 | | 4/21/09 | | 650,947 | |
| CZK | | 1,467,901 | | USD | | 79,995 | | 7/14/09 | | 2,550 | |
| CZK | | 1,473,500 | | USD | | 79,995 | | 10/14/09 | | 2,359 | |
| USD | | 1,148,669 | | PLN | | 3,070,608 | | 10/20/09 | | (50,386 | ) |
| PLN | | 3,070,608 | | USD | | 979,304 | | 10/20/09 | | (118,978 | ) |
| USD | | 311,174 | | CZK | | 5,750,501 | | 10/27/09 | | (8,250 | ) |
| CZK | | 26,716,364 | | USD | | 1,344,685 | | 10/27/09 | | (62,674 | ) |
| USD | | 2,274,697 | | PLN | | 6,148,702 | | 11/19/09 | | (81,195 | ) |
| PLN | | 6,148,702 | | USD | | 1,958,743 | | 11/19/09 | | (234,759 | ) |
| Net unrealized appreciation | | $5,460,300 | |
| | |
| |
| CAD—Canadian Dollar. | | MXN—Mexican Peso. |
| CZK—Czech Koruna. | | PLN—Polish Zloty. |
| EUR—Euro Currency. | | USD—United States Dollar. |
| | | | | | |
| | | | |
| EAGLE LARGE CAP CORE FUND | | | | | | |
| Common stocks—96.9% (a) | | | | Shares | | Value |
| Advertising—2.8% | | | | | | |
| Omnicom Group Inc. | | | | 145,095 | | $4,286,106 |
| | | |
| Aerospace/Defense—2.1% | | | | | | |
| United Technologies Corporation | | | | 57,850 | | 3,179,436 |
| | | |
| Banks—4.2% | | | | | | |
| Bank of America Corporation | | | | 128,430 | | 3,104,153 |
| State Street Corporation | | | | 37,930 | | 1,644,266 |
| SunTrust Banks, Inc. | | | | 38,680 | | 1,552,615 |
| | | | | | |
| | | |
| Common stocks—96.9% (a) | | | | Shares | | Value |
| Biotechnology—3.9% | | | | | | |
| Genzyme Corporation* | | | | 80,360 | | $5,856,637 |
| | | |
| Computers—3.6% | | | | | | |
| Apple, Inc.* | | | | 50,700 | | 5,454,813 |
| | | |
| Diversified manufacturer—5.8% | | | | | | |
| General Electric Company | | | | 318,830 | | 6,220,373 |
| Tyco International Ltd. | | | | 99,021 | | 2,503,251 |
| | | |
| Financial services—6.9% | | | | | | |
| American Express Company | | | | 75,670 | | 2,080,925 |
| JPMorgan Chase & Company | | | | 80,485 | | 3,320,006 |
| Morgan Stanley | | | | 89,735 | | 1,567,670 |
| The Goldman Sachs Group, Inc. | | | | 36,530 | | 3,379,025 |
| | | |
| Healthcare products—7.3% | | | | | | |
| Covidien Ltd. | | | | 32,586 | | 1,443,234 |
| Johnson & Johnson | | | | 106,685 | | 6,544,058 |
| Zimmer Holdings, Inc.* | | | | 64,030 | | 2,972,913 |
| | | |
| Insurance—1.6% | | | | | | |
| Hartford Financial Services Group, Inc. | | | | 105,980 | | 1,093,714 |
| MetLife, Inc. | | | | 37,795 | | 1,255,550 |
| | | |
| Internet—2.4% | | | | | | |
| eBay Inc.* | | | | 237,870 | | 3,632,275 |
| | | |
| Multimedia—1.5% | | | | | | |
| Viacom Inc., Class B* | | | | 108,540 | | 2,194,679 |
| | | |
| Oil & gas—8.1% | | | | | | |
| BP PLC, Sponsored ADR | | | | 98,370 | | 4,888,989 |
| EOG Resources Inc. | | | | 47,610 | | 3,852,601 |
| Exxon Mobil Corporation | | | | 47,105 | | 3,491,423 |
| | | |
| Oil & gas services—0.9% | | | | | | |
| Schlumberger Ltd. | | | | 26,000 | | 1,342,900 |
| | | |
| Pharmaceuticals—4.6% | | | | | | |
| Pfizer Inc. | | | | 387,055 | | 6,854,744 |
| | | |
| Retail—12.7% | | | | | | |
| CVS/Caremark Corporation | | | | 219,675 | | 6,733,039 |
| Home Depot, Inc. | | | | 112,850 | | 2,662,132 |
| McDonald’s Corporation | | | | 56,660 | | 3,282,314 |
| Staples, Inc. | | | | 330,780 | | 6,427,055 |
| | | |
| Semiconductors—9.3% | | | | | | |
| Applied Materials, Inc. | | | | 510,545 | | 6,591,136 |
| Intel Corporation | | | | 261,860 | | 4,189,760 |
| Texas Instruments Inc. | | | | 165,850 | | 3,244,026 |
| | | |
| Software—10.2% | | | | | | |
| Adobe Systems Inc.* | | | | 57,865 | | 1,541,524 |
| Electronic Arts Inc.* | | | | 159,740 | | 3,638,877 |
| Microsoft Corporation | | | | 287,860 | | 6,427,914 |
| Oracle Corporation* | | | | 202,870 | | 3,710,492 |
| Telecommunications—2.9% | | | | | | |
| Cisco Systems, Inc.* | | | | 135,125 | | 2,401,171 |
| Sprint Nextel Corporation | | | | 650,835 | | 2,037,114 |
| | | |
| Television, cable & radio—4.0% | | | | | | |
| Comcast Corporation, Class A | | | | 381,595 | | 6,013,937 |
| | | |
| Transportation—2.1% | | | | | | |
| United Parcel Service, Inc., Class B | | | | 60,640 | | 3,200,578 |
| Total common stocks (cost $191,806,317) | | | | | | 145,817,425 |
| | |
| 24 | | The accompanying notes are an integral part of the financial statements |
Investment Portfolios
| | | | | | | |
| EAGLE LARGE CAP CORE FUND (cont’d) | | | | | | | |
| Repurchase agreement—5.5% (a) | | | | Shares | | Value | |
| Repurchase agreement with Fixed Income Clearing Corporation dated October 31, 2008 @ 0.03% to be repurchased at $8,326,021 on November 3, 2008, collateralized by $6,065,000 United States Treasury Bonds, 9.125 due May 15, 2018 (market value $8,553,731 including interest) (cost $8,326,000) | | $8,326,000 | |
| |
| Total investment portfolio (cost $200,132,317) 102.4% (a) | | 154,143,425 | |
| | | |
| Other assets and liabilities, net, (2.4%) (a) | | | | | | (3,623,727 | ) |
| | | |
| Net assets, 100.0% | | | | | | $150,519,698 | |
| | | |
* Non-income producing security. (a) Percentages indicated are based on net assets. | | | | | | | |
| | | |
| ADR—American depository receipt. | | | | | | | |
| | |
| |
| Sector allocation | | |
| Sector | | Percent of net assets |
| Technology | | 27% |
| Communications | | 13% |
| Consumer, cyclical | | 13% |
| Financial | | 13% |
| Consumer, non-cyclical | | 12% |
| Industrial | | 10% |
| Energy | | 9% |
| Cash/Other | | 3% |
| | | | | | |
| | | | |
| EAGLE MID CAP GROWTH FUND | | | | | | |
| Common stocks—97.0% (a) | | | | Shares | | Value |
| Aerospace/Defense—3.0% | | | | | | |
| L-3 Communications Holdings, Inc. | | | | 46,865 | | $3,804,032 |
| | | |
| Airlines—2.6% | | | | | | |
| AMR Corporation* | | | | 112,230 | | 1,145,868 |
| Delta Air Lines Inc.* | | | | 199,805 | | 2,193,859 |
| | | |
| Biotechnology—3.3% | | | | | | |
| Celgene Corporation* | | | | 65,275 | | 4,194,572 |
| | | |
| Chemicals—7.8% | | | | | | |
| CF Industries Holdings Inc. | | | | 60,215 | | 3,865,201 |
| Huntsman Corporation | | | | 370,660 | | 3,743,666 |
| Intrepid Potash Inc.* | | | | 107,275 | | 2,332,158 |
| | | |
| Commercial services—13.7% | | | | | | |
| Alliance Data Systems Corporation* | | | | 68,515 | | 3,436,712 |
| Apollo Group Inc., Class A* | | | | 36,160 | | 2,513,482 |
| Corrections Corporation of America* | | | | 189,945 | | 3,629,849 |
| FTI Consulting, Inc.* | | | | 71,405 | | 4,159,341 |
| Quanta Services, Inc.* | | | | 98,765 | | 1,951,596 |
| SAIC Inc.* | | | | 104,780 | | 1,935,287 |
| | | |
| Computers—1.0% | | | | | | |
| NCR Corporation* | | | | 72,740 | | 1,329,687 |
| | | | | | |
| | | | | | | |
| Common stocks—97.0% (a) | | | | Shares | | Value |
| Electronics—5.2% | | | | | | |
| Dolby Laboratories, Inc., Class A* | | | | 118,890 | | $3,753,357 |
| Thermo Fisher Scientific Inc.* | | | | 73,210 | | 2,972,326 |
| | | |
| Energy-Alternative sources—2.3% | | | | | | |
| First Solar Inc.* | | | | 20,650 | | 2,967,405 |
| | | |
| Entertainment—4.8% | | | | | | |
| Bally Technologies, Inc.* | | | | 165,555 | | 3,667,043 |
| Penn National Gaming, Inc.* | | | | 127,235 | | 2,450,546 |
| | | |
| Environmental control—3.3% | | | | | | |
| Waste Connections, Inc.* | | | | 124,175 | | 4,203,324 |
| | | |
| Financial services—8.9% | | | | | | |
| Ameriprise Financial, Inc. | | | | 138,015 | | 2,981,124 |
| Federated Investors, Inc., Class B | | | | 114,090 | | 2,760,978 |
| IntercontinentalExchange, Inc.* | | | | 40,840 | | 3,494,270 |
| TD Ameritrade Holding Corporation* | | | | 166,980 | | 2,219,164 |
| | | |
| Healthcare products—5.4% | | | | | | |
| Hologic Inc.* | | | | 209,780 | | 2,567,707 |
| Intuitive Surgical, Inc.* | | | | 14,670 | | 2,534,829 |
| ResMed Inc.* | | | | 54,340 | | 1,861,688 |
| | | |
| Internet—4.9% | | | | | | |
| IAC/InterActiveCorp* | | | | 209,177 | | 3,505,807 |
| VeriSign, Inc.* | | | | 132,050 | | 2,799,460 |
| | | |
| Multimedia—2.1% | | | | | | |
| FactSet Research Systems Inc. | | | | 68,565 | | 2,659,636 |
| | | |
| Oil & gas—3.2% | | | | | | |
| CNX Gas Corporation* | | | | 55,612 | | 1,406,427 |
| Ultra Petroleum Corporation* | | | | 56,960 | | 2,651,488 |
| | | |
| Oil & gas services—3.2% | | | | | | |
| Core Laboratories NV | | | | 32,215 | | 2,374,246 |
| Oceaneering International, Inc.* | | | | 59,865 | | 1,686,397 |
| | | |
| Pharmaceuticals—1.9% | | | | | | |
| Express Scripts Inc.* | | | | 39,260 | | 2,379,549 |
| | | |
| Retail—3.3% | | | | | | |
| Copart, Inc.* | | | | 65,585 | | 2,288,916 |
| Urban Outfitters Inc.* | | | | 88,755 | | 1,929,534 |
| | | |
| Software—10.3% | | | | | | |
| Adobe Systems Inc.* | | | | 145,596 | | 3,878,677 |
| ANSYS, Inc.* | | | | 157,975 | | 4,522,824 |
| Cerner Corporation* | | | | 30,000 | | 1,116,900 |
| Eclipsys Corporation* | | | | 148,140 | | 2,199,879 |
| Novell, Inc.* | | | | 314,925 | | 1,467,550 |
| | | |
| Telecommunications—5.4% | | | | | | |
| Amdocs Ltd.* | | | | 211,090 | | 4,762,194 |
| Windstream Corporation | | | | 282,120 | | 2,118,721 |
| | | |
| Transportation—1.4% | | | | | | |
| Landstar System, Inc. | | | | 52,325 | | 2,019,222 |
| Total common stocks (cost $138,781,211) | | | | | | 124,436,498 |
| | |
| The accompanying notes are an integral part of the financial statements | | 25 |
Investment Portfolios
| | | | | | | |
| EAGLE MID CAP GROWTH FUND (cont’d) | | | | | | | |
| Repurchase agreement—3.9% (a) | | | | Shares | | Value | |
| Repurchase agreement with Fixed Income Clearing Corporation dated October 31, 2008 @ 0.03% to be repurchased at $5,045,013 on November 3, 2008, collateralized by $3,675,000 United States Treasury Bonds, 9.125% due May 15, 2018 (market value $5,183,011 including interest) (cost $5,045,000) | | $5,045,000 | |
| |
| Total investment portfolio (cost $143,826,211) 100.9% (a) | | 129,481,498 | |
| | | |
| Other assets and liabilities, net, (0.9%) (a) | | | | | | (1,140,446 | ) |
| | | |
| Net assets, 100.0% | | | | | | $128,341,052 | |
| | | |
* Non-income producing security. (a) Percentages indicated are based on net assets. | | | | | | | |
| | |
| |
| Sector allocation | | |
| Sector | | Percent of net assets |
| Consumer, non-cyclical | | 21% |
| Technology | | 15% |
| Industrial | | 13% |
| Communications | | 12% |
| Consumer, cyclical | | 11% |
| Financial | | 9% |
| Basic materials | | 8% |
| Energy | | 6% |
| Utilities | | 2% |
| Cash/Other | | 3% |
| | | | | | |
| | | | |
| EAGLE MID CAP STOCK FUND | | | | | | |
| Common stocks—97.6% (a) | | | | Shares | | Value |
| Auto parts & equipment—1.1% | | | | | | |
| BorgWarner Inc. | | | | 523,765 | | $11,769,000 |
| | | |
| Beverages—1.4% | | | | | | |
| Pepsi Bottling Group Inc. | | | | 676,875 | | 15,649,350 |
| | | |
| Biotechnology—1.7% | | | | | | |
| Bio-Rad Laboratories, Inc., Class A* | | | | 225,300 | | 19,236,114 |
| | | |
| Chemicals—2.1% | | | | | | |
| Ecolab Inc. | | | | 614,930 | | 22,912,292 |
| | | |
| Commercial services—7.6% | | | | | | |
| DeVry Inc. | | | | 553,005 | | 31,349,853 |
| McKesson Corporation | | | | 623,735 | | 22,947,211 |
| Service Corporation International | | | | 4,392,172 | | 30,305,987 |
| | | |
| Computers—5.1% | | | | | | |
| Cognizant Technology Solutions Corporation, Class A* | | | | 809,035 | | 15,533,472 |
| DST Systems, Inc.* | | | | 254,838 | | 10,341,326 |
| IHS Inc., Class A* | | | | 574,940 | | 20,347,127 |
| NCR Corporation* | | | | 603,195 | | 11,026,405 |
| | | |
| Diversified manufacturer—2.8% | | | | | | |
| Danaher Corporation | | | | 266,718 | | 15,800,374 |
| SPX Corporation | | | | 384,680 | | 14,902,503 |
| | | |
| Electrical components & equipment—2.6% | | | | | | |
| AMETEK, Inc. | | | | 876,644 | | 29,148,413 |
| | | | | | |
| | | | | | | |
| Common stocks—97.6% (a) | | | | Shares | | Value |
| Electronics—4.8% | | | | | | |
| Amphenol Corporation, Class A | | | | 802,806 | | $23,000,392 |
| Dolby Laboratories Inc., Class A* | | | | 380,465 | | 12,011,280 |
| Mettler Toledo International Inc.* | | | | 247,755 | | 18,963,168 |
| | | |
| Entertainment—1.1% | | | | | | |
| Penn National Gaming Inc.* | | | | 608,820 | | 11,725,873 |
| | | |
| Environmental control—2.1% | | | | | | |
| Waste Connections, Inc.* | | | | 675,525 | | 22,866,521 |
| | | |
| Financial services—2.2% | | | | | | |
| Affiliated Managers Group, Inc.* | | | | 175,470 | | 8,138,299 |
| IntercontinentalExchange Inc.* | | | | 193,600 | | 16,564,416 |
| | | |
| Food—4.1% | | | | | | |
| Dean Foods Company* | | | | 1,051,585 | | 22,987,648 |
| H.J. Heinz Company | | | | 504,630 | | 22,112,887 |
| | | |
| Forest products & paper—1.0% | | | | | | |
| Plum Creek Timber Company, Inc. | | | | 311,990 | | 11,630,987 |
| | | |
| Hand/machine tools—0.9% | | | | | | |
| Snap-On Inc. | | | | 263,440 | | 9,734,108 |
| | | |
| Healthcare products—3.8% | | | | | | |
| C.R. Bard, Inc. | | | | 481,468 | | 42,489,551 |
| | | |
| Healthcare services—7.1% | | | | | | |
| Laboratory Corporation of America Holdings* | | | | 542,012 | | 33,328,318 |
| Lincare Holdings Inc.* | | | | 1,104,145 | | 29,094,221 |
| Pediatrix Medical Group, Inc.* | | | | 442,295 | | 17,094,702 |
| | | |
| Insurance—10.7% | | | | | | |
| Aon Corporation | | | | 1,041,475 | | 44,054,392 |
| Arch Capital Group Ltd.* | | | | 406,802 | | 28,374,440 |
| Axis Capital Holdings Ltd. | | | | 507,440 | | 14,451,891 |
| Reinsurance Group of America Inc., Class A | | | | 652,135 | | 24,350,721 |
| Reinsurance Group of America Inc., Class B | | | | 62,725 | | 2,323,334 |
| Unum Group | | | | 345,765 | | 5,445,799 |
| | | |
| Machinery—1.7% | | | | | | |
| Roper Industries Inc. | | | | 414,415 | | 18,793,720 |
| | | |
| Metal fabricate/hardware—2.0% | | | | | | |
| Precision Castparts Corporation | | | | 348,405 | | 22,580,128 |
| | | |
| Multimedia—1.7% | | | | | | |
| Liberty Media Corporation—Entertainment, Class A* | | | | 1,198,325 | | 19,293,032 |
| | | |
| Oil & gas—1.1% | | | | | | |
| Pioneer Natural Resources Company | | | | 453,095 | | 12,609,634 |
| | | |
| Oil & gas services—2.4% | | | | | | |
| Core Laboratories NV | | | | 196,840 | | 14,507,108 |
| National Oilwell Varco, Inc.* | | | | 390,250 | | 11,664,572 |
| | | |
| Packaging & containers—5.3% | | | | | | |
| Owens-Illinois, Inc.* | | | | 1,239,100 | | 28,350,608 |
| Pactiv Corporation* | | | | 1,298,915 | | 30,602,437 |
| | | |
| Printing & publishing—4.4% | | | | | | |
| John Wiley & Sons, Inc., Class A | | | | 800,431 | | 27,838,990 |
| The Washington Post Company, Class B | | | | 48,750 | | 20,806,500 |
| Retail—2.7% | | | | | | |
| Copart Inc.* | | | | 522,795 | | 18,245,546 |
| TJX Companies, Inc. | | | | 434,790 | | 11,634,980 |
| | | |
| Semiconductors—2.8% | | | | | | |
| Analog Devices, Inc. | | | | 816,930 | | 17,449,625 |
| Microchip Technology Inc. | | | | 558,325 | | 13,751,545 |
| | |
| 26 | | The accompanying notes are an integral part of the financial statements |
Investment Portfolios
| | | | | | |
| EAGLE MID CAP STOCK FUND (cont’d) | | | | | | |
| Common stocks—97.6% (a) | | | | Shares | | Value |
| Software—5.4% | | | | | | |
| Ansys Inc.* | | | | 872,753 | | $24,986,918 |
| Electronic Arts Inc.* | | | | 473,475 | | 10,785,760 |
| Fiserv, Inc.* | | | | 307,520 | | 10,258,867 |
| SEI Investments Company | | | | 816,050 | | 14,427,764 |
| | | |
| Telecommunications—2.7% | | | | | | |
| Cellcom Israel Ltd. | | | | 385,770 | | 11,364,784 |
| TELUS Corporation | | | | 585,245 | | 19,078,987 |
| | | |
| Television, cable & radio—1.5% | | | | | | |
| The DIRECTV Group, Inc.* | | | | 755,245 | | 16,532,313 |
| | | |
| Transportation—1.7% | | | | | | |
| J.B. Hunt Transport Services, Inc. | | | | 653,710 | | 18,584,976 |
| Total common stocks (cost $1,343,922,358) | | | | | | 1,086,161,169 |
| | | |
| Repurchase agreement—2.0% (a) | | | | | | |
| Repurchase agreement with Fixed Income Clearing Corporation dated October 31, 2008 @ 0.03% to be repurchased at $22,763,057 on November 3, 2008, collateralized by $16,570,000 United States Treasury Bonds, 9.125% due May 15, 2018 (market value $23,369,385 including interest) (cost $22,763,000) | | 22,763,000 |
| |
| Total investment portfolio (cost $1,366,685,358) 99.6% (a) | | 1,108,924,169 |
| | | |
| Other assets and liabilities, net, 0.4% (a) | | | | | | 4,479,568 |
| | | |
| Net assets, 100.0% | | | | | | $1,113,403,737 |
| |
* Non-income producing security. (a) Percentages indicated are based on net assets. | | |
| | |
|
| Sector allocation |
| Sector | | Percent of net assets |
| Consumer, non-cyclical | | 24% |
| Industrial | | 24% |
| Technology | | 15% |
| Financial | | 13% |
| Communications | | 10% |
| Other sectors | | 7% |
| Consumer, cyclical | | 5% |
| Cash/Other | | 2% |
| | | | | | |
| | | | |
| EAGLE SMALL CAP GROWTH FUND | | | | | | |
| Common stocks—89.9% (a) | | | | Shares | | Value |
| Banks—3.7% | | | | | | |
| Cardinal Financial Corporation | | | | 23,450 | | $146,328 |
| Community Bank Systems Inc. | | | | 19,558 | | 487,972 |
| First Commonwealth Financial Corporation | | | | 127,630 | | 1,411,588 |
| PrivateBancorp Inc. | | | | 12,685 | | 456,787 |
| Signature Bank* | | | | 51,560 | | 1,679,825 |
| Southwest Bancorp, Inc. | | | | 59,649 | | 863,718 |
| Sterling Bancshares, Inc. | | | | 77,360 | | 615,786 |
| SVB Financial Group* | | | | 54,745 | | 2,816,630 |
| Texas Capital Bancshares, Inc.* | | | | 89,755 | | 1,602,127 |
| | | | | | |
| | | | | | | |
| Common stocks—89.9% (a) | | | | Shares | | Value |
| Biotechnology—2.6% | | | | | | |
| Charles River Laboratories International, Inc.* | | | | 36,055 | | $1,291,851 |
| Cubist Pharmaceuticals, Inc.* | | | | 180,580 | | 4,584,926 |
| Myriad Genetics, Inc.* | | | | 17,395 | | 1,097,451 |
| | | |
| Building materials—0.7% | | | | | | |
| Lennox International Inc. | | | | 25,589 | | 763,064 |
| Texas Industries Inc. | | | | 39,890 | | 1,261,721 |
| | | |
| Chemicals—1.8% | | | | | | |
| Intrepid Potash Inc.* | | | | 95,860 | | 2,083,996 |
| Quaker Chemical Corporation | | | | 61,690 | | 1,180,130 |
| Terra Industries Inc. | | | | 68,795 | | 1,512,802 |
| | | |
| Commercial services—8.6% | | | | | | |
| AerCap Holdings NV* | | | | 62,094 | | 393,676 |
| American Public Education, Inc.* | | | | 62,770 | | 2,778,828 |
| Chemed Corporation | | | | 74,585 | | 3,266,077 |
| Corrections Corp of America* | | | | 105,699 | | 2,019,908 |
| Cross Country Healthcare, Inc.* | | | | 181,377 | | 2,053,188 |
| Euronet Worldwide, Inc.* | | | | 97,674 | | 1,164,274 |
| Gartner, Inc.* | | | | 100,815 | | 1,854,996 |
| Interactive Data Corporation | | | | 92,358 | | 2,177,802 |
| K12 Inc.* | | | | 23,350 | | 642,125 |
| LECG Corporation* | | | | 71,404 | | 342,739 |
| Monster Worldwide, Inc.* | | | | 107,830 | | 1,535,499 |
| Net 1 UEPS Technologies, Inc.* | | | | 110,660 | | 1,549,240 |
| Ritchie Brothers Auctioneers Inc. | | | | 42,855 | | 795,817 |
| The GEO Group, Inc.* | | | | 153,295 | | 2,707,190 |
| | | |
| Computers—2.8% | | | | | | |
| Compellent Technologies, Inc.* | | | | 254,085 | | 2,769,526 |
| Electronics for Imaging, Inc.* | | | | 111,955 | | 1,186,723 |
| Insight Enterprises, Inc.* | | | | 79,420 | | 772,757 |
| Netezza Corporation* | | | | 219,905 | | 2,133,078 |
| SMART Modular Technologies (WWH), Inc.* | | | | 221,290 | | 599,696 |
| | | |
| Distribution/wholesale—1.8% | | | | | | |
| FGX International Holdings Ltd.* | | | | 79,636 | | 875,996 |
| MWI Veterinary Supply, Inc.* | | | | 33,600 | | 1,163,568 |
| School Specialty, Inc.* | | | | 135,184 | | 2,838,864 |
| | | |
| Diversified manufacturer—1.2% | | | | | | |
| Ameron International Corporation | | | | 55,070 | | 2,588,290 |
| Barnes Group Inc. | | | | 52,996 | | 768,972 |
| | | |
| Electric—0.4% | | | | | | |
| Allete, Inc. | | | | 26,945 | | 943,075 |
| | | |
| Electrical components & equipment—0.9% | | | | | | |
| Advanced Energy Industries, Inc.* | | | | 122,165 | | 1,303,501 |
| Belden, Inc. | | | | 51,245 | | 1,067,946 |
| | | |
| Electronics—3.5% | | | | | | |
| Benchmark Electronics, Inc.* | | | | 84,500 | | 1,013,155 |
| Coherent, Inc.* | | | | 157,775 | | 3,991,708 |
| Dolby Laboratories Inc.* | | | | 53,880 | | 1,700,992 |
| OYO Geospace Corporation* | | | | 96,818 | | 2,775,772 |
| | | |
| Engineering & construction—2.1% | | | | | | |
| Dycom Industries, Inc.* | | | | 209,340 | | 1,858,939 |
| KHD Humboldt Wedag International Ltd.* | | | | 48,456 | | 827,628 |
| URS Corporation* | | | | 105,790 | | 3,109,168 |
| | | |
| Entertainment—3.7% | | | | | | |
| Bally Technologies Inc.* | | | | 135,125 | | 2,993,019 |
| Lions Gate Entertainment Corporation* | | | | 557,870 | | 3,905,090 |
| | |
| The accompanying notes are an integral part of the financial statements | | 27 |
Investment Portfolios
| | | | | | |
| EAGLE SMALL CAP GROWTH FUND (cont’d) | | | | | | |
| Common stocks—89.9% (a) | | | | Shares | | Value |
| Entertainment (cont’d) | | | | | | |
| Penn National Gaming Inc.* | | | | 33,890 | | $652,721 |
| Shuffle Master, Inc.* | | | | 344,365 | | 1,329,249 |
| Vail Resorts, Inc.* | | | | 33,025 | | 1,098,412 |
| | | |
| Environmental control—1.7% | | | | | | |
| Casella Waste Systems, Inc., Class A* | | | | 153,625 | | 774,270 |
| Waste Connections Inc.* | | | | 108,933 | | 3,687,382 |
| | | |
| Financial services—1.9% | | | | | | |
| FCStone Group, Inc.* | | | | 160,643 | | 955,826 |
| Investment Technology Group, Inc.* | | | | 77,220 | | 1,576,060 |
| KBW Inc.* | | | | 9,375 | | 274,500 |
| MarketAxess Holdings Inc.* | | | | 84,590 | | 483,855 |
| optionsXpress Holdings, Inc. | | | | 84,737 | | 1,504,929 |
| Penson Worldwide, Inc.* | | | | 52,810 | | 377,063 |
| | | |
| Gas—1.0% | | | | | | |
| AGL Resources, Inc. | | | | 85,360 | | 2,594,944 |
| | | |
| Healthcare products—5.7% | | | | | | |
| American Medical Systems Holdings, Inc.* | | | | 272,440 | | 2,947,801 |
| Cutera, Inc.* | | | | 179,980 | | 1,531,630 |
| Exactech Inc.* | | | | 10,000 | | 202,000 |
| Hansen Medical, Inc.* | | | | 39,070 | | 363,742 |
| Mentor Corporation | | | | 57,585 | | 973,186 |
| Merit Medical Systems, Inc.* | | | | 29,302 | | 536,227 |
| Resmed Inc.* | | | | 18,980 | | 650,255 |
| SurModics, Inc.* | | | | 56,470 | | 1,496,455 |
| Thoratec Corporation* | | | | 226,800 | | 5,583,816 |
| Vital Images, Inc.* | | | | 82,465 | | 1,076,168 |
| | | |
| Healthcare services—6.6% | | | | | | |
| Amedisys Inc.* | | | | 11,570 | | 652,664 |
| AMERIGROUP Corporation* | | | | 62,325 | | 1,558,125 |
| Amsurg Corporation* | | | | 128,432 | | 3,203,094 |
| Brookdale Senior Living Inc. | | | | 120,455 | | 1,038,322 |
| Centene Corporation* | | | | 204,125 | | 3,845,715 |
| Icon PLC, Sponsored ADR* | | | | 127,602 | | 3,237,263 |
| Lincare Holdings Inc.* | | | | 26,025 | | 685,759 |
| Pediatrix Medical Group Inc.* | | | | 54,689 | | 2,113,730 |
| Psychiatric Solutions, Inc.* | | | | 47,495 | | 1,581,109 |
| | | |
| Home furnishings—1.3% | | | | | | |
| Universal Electronics, Inc.* | | | | 165,700 | | 3,501,241 |
| | | |
| Household products—0.6% | | | | | | |
| Jarden Corporation* | | | | 92,870 | | 1,653,086 |
| | | |
| Insurance—2.0% | | | | | | |
| American Equity Investment Life Holding Company | | | | 332,361 | | 1,502,272 |
| Assured Guaranty Ltd. | | | | 86,298 | | 969,127 |
| First Mercury Financial Corporation* | | | | 42,150 | | 454,798 |
| IPC Holdings, Ltd. | | | | 32,952 | | 909,805 |
| Platinum Underwriters Holdings, Ltd. | | | | 39,750 | | 1,261,665 |
| RAM Holdings, Ltd.* | | | | 44,145 | | 33,268 |
| Stewart Information Services Corporation | | | | 23,746 | | 394,184 |
| | | |
| Internet—1.9% | | | | | | |
| 1-800-FLOWERS.COM Inc., Class A* | | | | 97,702 | | 522,706 |
| Internet Capital Group, Inc.* | | | | 127,095 | | 726,983 |
| SonicWALL, Inc.* | | | | 370,547 | | 1,660,051 |
| TIBCO Software, Inc.* | | | | 417,190 | | 2,148,528 |
| U.S. Auto Parts Network, Inc.* | | | | 96,610 | | 197,084 |
| | | |
| Leisure time—0.9% | | | | | | |
| WMS Industries, Inc.* | | | | 97,075 | | 2,426,875 |
| | | | | | |
| | | | | | | |
| Common stocks—89.9% (a) | | | | Shares | | Value |
| Machinery—1.4% | | | | | | |
| Altra Holdings, Inc.* | | | | 97,709 | | $873,518 |
| Bucyrus International Inc., Class A | | | | 66,999 | | 1,616,686 |
| Sauer-Danfoss Inc. | | | | 59,075 | | 605,519 |
| Wabtec Corporation | | | | 19,160 | | 761,802 |
| | | |
| Machinery-Diversified—0.1% | | | | | | |
| Flowserve Corporation | | | | 2,835 | | 161,368 |
| | | |
| Metal fabricate/hardware—2.7% | | | | | | |
| CIRCOR International, Inc. | | | | 48,815 | | 1,496,180 |
| Kaydon Corporation | | | | 34,140 | | 1,140,617 |
| Northwest Pipe Company* | | | | 92,755 | | 2,664,851 |
| RBC Bearings Inc.* | | | | 79,490 | | 1,886,298 |
| | | |
| Mining—0.3% | | | | | | |
| IAMGOLD Corporation | | | | 253,949 | | 838,032 |
| | | |
| Miscellaneous manufacturer—0.5% | | | | | | |
| Polypore International, Inc.* | | | | 143,969 | | 1,228,056 |
| | | |
| Multimedia—0.9% | | | | | | |
| Entravision Communications Corporation, Class A* | | | | 297,930 | | 563,088 |
| Factset Research Systems Inc. | | | | 49,897 | | 1,935,505 |
| | | |
| Oil & gas—2.0% | | | | | | |
| Comstock Resources, Inc.* | | | | 44,694 | | 2,208,777 |
| Grey Wolf, Inc.* | | | | 165,435 | | 1,062,093 |
| McMoRan Exploration Co.* | | | | 49,000 | | 695,310 |
| Petroleum Development Corporation* | | | | 20,171 | | 417,741 |
| Rosetta Resources, Inc.* | | | | 90,085 | | 950,397 |
| | | |
| Oil & gas services—3.9% | | | | | | |
| Core Laboratories NV | | | | 28,660 | | 2,112,242 |
| Dresser-Rand Group, Inc.* | | | | 96,805 | | 2,168,432 |
| Lufkin Industries, Inc. | | | | 84,345 | | 4,412,930 |
| Oceaneering International, Inc.* | | | | 63,335 | | 1,784,147 |
| | | |
| Pharmaceuticals—1.6% | | | | | | |
| Animal Health International, Inc.* | | | | 217,330 | | 1,401,778 |
| BioMarin Pharmaceutical Inc.* | | | | 59,820 | | 1,095,902 |
| Herbalife Ltd. | | | | 72,985 | | 1,783,024 |
| | | |
| Printing & publishing—1.0% | | | | | | |
| John Wiley & Sons, Inc., Class A | | | | 77,535 | | 2,696,667 |
| | | |
| REITs—0.4% | | | | | | |
| BioMed Realty Trust, Inc. | | | | 43,359 | | 609,194 |
| Kite Realty Group Trust | | | | 94,593 | | 575,125 |
| | | |
| Retail—4.4% | | | | | | |
| BJ’s Restaurants, Inc.* | | | | 162,770 | | 1,447,025 |
| Carrols Restaurant Group, Inc.* | | | | 126,595 | | 256,988 |
| Cash America International, Inc. | | | | 93,420 | | 3,304,265 |
| Genesco Inc.* | | | | 151,415 | | 3,756,606 |
| Nu Skin Enterprises, Inc., Class A | | | | 144,635 | | 1,864,345 |
| Red Robin Gourmet Burgers, Inc.* | | | | 37,307 | | 566,693 |
| Stage Stores, Inc. | | | | 110,570 | | 852,495 |
| | | |
| Savings & loans—0.2% | | | | | | |
| Berkshire Hills Bancorp Inc. | | | | 21,467 | | 558,786 |
| | | |
| Semiconductors—2.5% | | | | | | |
| Eagle Test Systems, Inc.* | | | | 163,492 | | 2,475,269 |
| Macrovision Solutions Corporation* | | | | 136,725 | | 1,514,913 |
| Microsemi Corporation* | | | | 91,510 | | 1,989,427 |
| Varian Semiconductor Equipment Associates, Inc.* | | | | 36,820 | | 722,408 |
| | |
| 28 | | The accompanying notes are an integral part of the financial statements |
Investment Portfolios
| | | | | | |
| EAGLE SMALL CAP GROWTH FUND (cont’d) | | | | | | |
| Common stocks—89.9% (a) | | | | Shares | | Value |
| Software—7.2% | | | | | | |
| Ansys Inc.* | | | | 118,845 | | $3,402,532 |
| Aspen Technology, Inc.* | | | | 329,085 | | 2,576,736 |
| Avid Technology, Inc.* | | | | 90,990 | | 1,349,382 |
| Eclipsys Corporation* | | | | 312,315 | | 4,637,878 |
| Novell Inc.* | | | | 50,000 | | 233,000 |
| Quality Systems, Inc. | | | | 99,920 | | 3,845,921 |
| SPSS, Inc.* | | | | 61,255 | | 1,430,917 |
| Sybase, Inc.* | | | | 72,230 | | 1,923,485 |
| | | |
| Telecommunications—3.0% | | | | | | |
| Alaska Communications Systems Group, Inc. | | | | 168,705 | | 1,575,705 |
| CommScope, Inc.* | | | | 63,583 | | 935,306 |
| EMS Technologies, Inc.* | | | | 175,310 | | 3,663,979 |
| Switch & Data Facilities Company, Inc.* | | | | 175,572 | | 1,653,888 |
| Symmetricom, Inc.* | | | | 63,500 | | 282,575 |
| | | |
| Transportation—0.4% | | | | | | |
| Excel Maritime Carriers Ltd. | | | | 17,672 | | 202,168 |
| Genesee & Wyoming Inc., Class A* | | | | 29,315 | | 977,650 |
| Total common stocks (cost $293,377,876) | | | | | | 243,019,090 |
| | | |
| Investment companies—5.4% (a) | | | | | | |
| Apollo Investment Corporation | | | | 148,881 | | 1,962,252 |
| iShares Russell 2000 Growth Index Fund | | | | 12,425 | | 688,221 |
| iShares Russell 2000 Index Fund | | | | 149,990 | | 8,021,465 |
| iShares Russell 2000 Value Index Fund | | | | 77,845 | | 4,103,988 |
| Total investment companies (cost $16,620,087) | | 14,775,926 |
| |
Total investment portfolio excluding
repurchase agreement (cost $309,997,963) | | 257,795,016 |
| | | | | | | |
| | | | | | | | |
| Repurchase agreement—4.7% (a) | | | | | | Value | |
| Repurchase agreement with Fixed Income Clearing Corporation dated October 31, 2008 @ 0.03% to be repurchased at $12,615,032 on November 3, 2008, collateralized by $9,185,000 United States Treasury Bonds, 9.125% due May 15, 2018 (market value $12,954,001 including interest) (cost $12,615,000) | | $12,615,000 | |
| |
| Total investment portfolio (cost $322,612,963) 100.0% (a) | | 270,410,016 | |
| | | |
| Other assets and liabilities, net, 0.0% (a) | | | | | | (10,597 | ) |
| | | |
| Net assets, 100.0% | | | | | | $270,399,419 | |
| | | |
* Non-income producing security. (a) Percentages indicated are based on net assets. ADR—American depository receipt. REIT—Real estate investment trust. | | | | | | | |
| | |
|
| Sector allocation |
| Sector | | Percent of net assets |
| Consumer, non-cyclical | | 23% |
| Industrial | | 15% |
| Technology | | 15% |
| Financial | | 14% |
| Consumer, cyclical | | 12% |
| Communications | | 7% |
| Energy | | 6% |
| Other sectors | | 3% |
| Cash/Other | | 5% |
| | |
| The accompanying notes are an integral part of the financial statements | | 29 |
Statements of Assets and Liabilities
| | | | | | | | | | | | | | | | | | | | | |
| | | Eagle
Capital
Appreciation
Fund | | | Eagle
Growth
& Income
Fund | | | Eagle
International
Equity
Fund | | | Eagle
Large Cap
Core
Fund | | | Eagle
Mid Cap
Growth
Fund | | | Eagle
Mid Cap
Stock
Fund | | | Eagle
Small Cap
Growth
Fund | |
| | | | | | | |
| Assets | | | | | | | | | | | | | | | | | | | | | |
| Investments, at value (a) | | $433,896,964 | | | $86,443,430 | | | $149,372,065 | | | $145,817,425 | | | $124,436,498 | | | $1,086,161,169 | | | $257,795,016 | |
| Repurchase agreements (b) | | 8,384,000 | | | 11,216,000 | | | 13,006,000 | | | 8,326,000 | | | 5,045,000 | | | 22,763,000 | | | 12,615,000 | |
| Cash | | 613 | | | 687 | | | 985 | | | 681 | | | 898 | | | 667 | | | 282 | |
| Foreign currency (identified cost $4,006,724) | | — | | | — | | | 4,027,242 | | | — | | | — | | | — | | | — | |
| Receivable for investments sold | | — | | | 11,129 | | | 16,811,061 | | | — | | | 3,204,146 | | | 39,800,015 | | | 7,821,227 | |
| Receivable for fund shares sold | | 1,908,145 | | | 287,539 | | | 516,262 | | | 163,506 | | | 787,453 | | | 4,158,929 | | | 1,053,187 | |
| Receivable for dividends and interest | | 7 | | | 244,715 | | | 387,830 | | | 151,986 | | | 4,411 | | | 630,158 | | | 57,048 | |
| Receivable for recoverable foreign withholding taxes | | — | | | 1,289 | | | 143,685 | | | — | | | — | | | — | | | — | |
| Prepaid expenses | | 37,772 | | | 55,602 | | | 66,455 | | | 21,558 | | | 27,707 | | | 68,106 | | | 25,025 | |
| Unrealized unappreciation on forward foreign currency contracts | | — | | | — | | | 9,124,923 | | | — | | | — | | | — | | | — | |
| Total assets | | 444,227,501 | | | 98,260,391 | | | 193,456,508 | | | 154,481,156 | | | 133,506,113 | | | 1,153,582,044 | | | 279,366,785 | |
| | | | | | | |
| Liabilities | | | | | | | | | | | | | | | | | | | | | |
| Payable for investments purchased | | — | | | 687,613 | | | 24,681,787 | | | 3,109,834 | | | 4,789,744 | | | 36,039,295 | | | 7,844,673 | |
| Payable for fund shares redeemed | | 1,332,329 | | | 416,036 | | | 878,146 | | | 678,202 | | | 163,417 | | | 2,769,479 | | | 738,370 | |
| Accrued investment advisory fee | | 232,985 | | | 50,533 | | | 114,025 | | | 78,900 | | | 66,204 | | | 543,033 | | | 140,857 | |
| Accrued administrative fee | | 57,112 | | | 12,633 | | | 22,404 | | | 14,070 | | | 16,532 | | | 139,496 | | | 34,330 | |
| Accrued distribution fee | | 149,306 | | | 44,415 | | | 98,865 | | | 10,231 | | | 54,415 | | | 366,599 | | | 93,391 | |
| Accrued shareholder servicing fee | | 76,714 | | | 1,192 | | | 23,864 | | | 10,914 | | | 20,848 | | | 204,411 | | | 51,102 | |
| Accrued fund accounting fee | | 8,350 | | | 8,000 | | | 22,533 | | | 8,150 | | | 7,955 | | | 8,350 | | | 8,350 | |
| Accrued trustees and officers compensation | | 7,242 | | | 8,467 | | | 8,467 | | | 8,467 | | | 8,467 | | | 8,467 | | | 8,467 | |
| Unrealized depreciation on forward foreign currency contracts | | — | | | — | | | 3,664,623 | | | — | | | — | | | — | | | — | |
| Other accrued expenses | | 57,377 | | | 42,697 | | | 100,601 | | | 42,690 | | | 37,479 | | | 99,177 | | | 47,826 | |
| Total liabilities | | 1,921,415 | | | 1,271,586 | | | 29,615,315 | | | 3,961,458 | | | 5,165,061 | | | 40,178,307 | | | 8,967,366 | |
| Net assets | | 442,306,086 | | | 96,988,805 | | | 163,841,193 | | | 150,519,698 | | | 128,341,052 | | | 1,113,403,737 | | | 270,399,419 | |
| | | | | | | |
| Net assets consists of | | | | | | | | | | | | | | | | | | | | | |
| Paid-in capital | | 558,584,974 | | | 126,945,558 | | | 245,363,571 | | | 221,027,977 | | | 148,893,287 | | | 1,556,799,180 | | | 327,989,624 | |
| Undistributed net investment income (loss) | | — | | | 58,585 | | | (818,125 | ) | | 1,777,281 | | | — | | | (208,006 | ) | | (57,486 | ) |
| Accumulated net realized gain (loss) | | (36,774,880 | ) | | (11,060,147 | ) | | (57,121,182 | ) | | (26,296,668 | ) | | (6,207,522 | ) | | (185,426,248 | ) | | (5,329,772 | ) |
| Unrealized loss on forward foreign currency contracts | | — | | | — | | | 5,460,300 | | | — | | | — | | | — | | | — | |
| Net unrealized appreciation (depreciation) on investments and other assets and liabilities denominated in foreign currencies | | (79,504,008 | ) | | (18,955,191 | ) | | (29,043,371 | ) | | (45,988,892 | ) | | (14,344,713 | ) | | (257,761,189 | ) | | (52,202,947 | ) |
| Net assets | | 442,306,086 | | | 96,988,805 | | | 163,841,193 | | | 150,519,698 | | | 128,341,052 | | | 1,113,403,737 | | | 270,399,419 | |
| | | | | | | |
| Net assets, at market value | | | | | | | | | | | | | | | | | | | | | |
| Class A | | 329,463,704 | | | 61,254,008 | | | 72,679,937 | | | 12,235,153 | | | 85,756,934 | | | 780,436,288 | | | 188,906,583 | |
| Class C | | 86,837,965 | | | 35,734,797 | | | 91,161,256 | | | 8,764,641 | | | 42,134,649 | | | 228,843,386 | | | 59,128,524 | |
| Class I | | 9,579,910 | | | — | | | — | | | 129,509,033 | | | 449,469 | | | 78,883,093 | | | 10,363,918 | |
| Class R-3 | | 244,890 | | | — | | | — | | | — | | | — | | | 1,239,283 | | | 1,130,946 | |
| Class R-5 | | 16,179,617 | | | — | | | — | | | 10,871 | | | — | | | 24,001,687 | | | 10,869,448 | |
| | | | | | | |
Net asset value (“NAV”),
offering and redemption price per share | | | | | | | | | | | | | | | | | | | | | |
| Class A | | $18.58 | | | $9.71 | | | $17.80 | | | $10.70 | | | $18.63 | | | $18.34 | | | $22.52 | |
| Maximum offering price (c) | | $19.51 | | | $10.19 | | | $18.69 | | | $11.23 | | | $19.56 | | | $19.25 | | | $23.64 | |
| Class C | | $16.45 | | | $9.45 | | | $16.15 | | | $10.53 | | | $16.68 | | | $16.34 | | | $19.40 | |
| Class I | | $18.78 | | | $— | | | $— | | | $10.73 | | | $18.83 | | | $18.49 | | | $22.72 | |
| Class R-3 | | $18.51 | | | $— | | | $— | | | $— | | | $— | | | $18.26 | | | $22.44 | |
| Class R-5 | | $18.73 | | | $— | | | $— | | | $10.76 | | | $— | | | $18.50 | | | $22.72 | |
| | | | | | | |
| Shares of beneficial interest outstanding | | | | | | | | | | | | | | | | | | | | | |
| Class A | | 17,732,212 | | | 6,308,722 | | | 4,082,898 | | | 1,143,403 | | | 4,603,158 | | | 42,562,127 | | | 8,386,546 | |
| Class C | | 5,277,779 | | | 3,780,386 | | | 5,643,556 | | | 832,505 | | | 2,525,964 | | | 14,002,584 | | | 3,048,424 | |
| Class I | | 510,133 | | | — | | | — | | | 12,068,142 | | | 23,870 | | | 4,265,411 | | | 456,240 | |
| Class R-3 | | 13,227 | | | — | | | — | | | — | | | — | | | 67,873 | | | 50,405 | |
| Class R-5 | | 863,798 | | | — | | | — | | | 1,010 | | | — | | | 1,297,288 | | | 478,472 | |
| | | | | | | |
| (a) Identified cost | | $513,400,972 | | | $105,398,389 | | | $178,298,591 | | | $191,806,317 | | | $138,781,211 | | | $1,343,922,358 | | | $309,997,963 | |
(b) Identified cost is the same as value. (c) Maximum offering price is computed as 100/95.25 of NAV.
| | |
| 30 | | The accompanying notes are an integral part of the financial statements. |
Statements of Operations
| | | | | | | | | | | | | | | | | | | | | | | | | | | | |
| | | Eagle
Capital
Appreciation
Fund | | | Eagle
Growth
& Income
Fund | | | Eagle
International
Equity
Fund | | | Eagle
Large
Cap Core
Fund | | | Eagle
Mid Cap
Growth
Fund | | | Eagle
Mid Cap
Stock
Fund | | | Eagle
Small Cap
Growth
Fund | |
| | | | | | | |
| Investment income | | | | | | | | | | | | | | | | | | | | | | | | | | | | |
| Dividends (a) | | $ | 4,573,209 | | | $ | 4,856,171 | | | $ | 7,309,341 | | | $ | 4,325,699 | | | $ | 792,771 | | | $ | 12,170,984 | | | $ | 2,524,184 | |
| Interest | | | 569,675 | | | | 749,184 | | | | 194,600 | | | | 462,041 | | | | 218,434 | | | | 488,736 | | | | 298,405 | |
| Total income | | | 5,142,884 | | | | 5,605,355 | | | | 7,503,941 | | | | 4,787,740 | | | | 1,011,205 | | | | 12,659,720 | | | | 2,822,589 | |
| | | | | | | |
| Expenses | | | | | | | | | | | | | | | | | | | | | | | | | | | | |
| Investment advisory fee | | | 4,087,635 | | | | 764,686 | | | | 2,146,671 | | | | 1,222,352 | | | | 1,082,151 | | | | 8,627,806 | | | | 2,222,648 | |
| Administrative fee | | | 996,519 | | | | 205,046 | | | | 449,232 | | | | 220,595 | | | | 270,489 | | | | 2,299,867 | | | | 547,689 | |
| Distribution fees | | | 2,614,939 | | | | 722,459 | | | | 1,931,083 | | | | 186,667 | | | | 905,242 | | | | 6,182,285 | | | | 1,547,441 | |
| Shareholder servicing fees | | | 889,053 | | | | 181,034 | | | | 296,947 | | | | 346,369 | | | | 244,952 | | | | 2,422,228 | | | | 618,710 | |
| Fund accounting fee | | | 100,622 | | | | 93,871 | | | | 75,250 | | | | 98,121 | | | | 95,607 | | | | 100,422 | | | | 100,420 | |
| Professional fees | | | 77,871 | | | | 96,273 | | | | 95,530 | | | | 66,511 | | | | 63,842 | | | | 62,089 | | | | 76,629 | |
| State qualification expenses | | | 106,118 | | | | 42,116 | | | | 55,448 | | | | 59,842 | | | | 57,508 | | | | 115,737 | | | | 66,623 | |
| Reports to shareholders | | | 43,316 | | | | 11,205 | | | | 20,277 | | | | 26,691 | | | | 3,988 | | | | 131,316 | | | | 25,085 | |
| Trustees and officers compensation | | | 33,186 | | | | 38,852 | | | | 38,852 | | | | 38,852 | | | | 38,852 | | | | 38,852 | | | | 35,852 | |
| Custodian fee | | | 37,441 | | | | 27,504 | | | | 280,807 | | | | 10,799 | | | | 8,817 | | | | 92,025 | | | | 26,808 | |
| Other | | | 38,032 | | | | 22,227 | | | | 35,052 | | | | 26,403 | | | | 26,477 | | | | 56,052 | | | | 30,583 | |
| Total expenses before adjustments | | | 9,024,732 | | | | 2,205,273 | | | | 5,425,149 | | | | 2,303,202 | | | | 2,797,925 | | | | 20,128,679 | | | | 5,298,488 | |
| Fees and expenses waived | | | — | | | | — | | | | — | | | | (148,258 | ) | | | (83 | ) | | | — | | | | — | |
| Recovered fees previously waived by Manager | | | 2 | | | | 46,838 | | | | — | | | | — | | | | — | | | | — | | | | 1 | |
| Expense offsets | | | (1,194 | ) | | | (533 | ) | | | (5,780 | ) | | | (797 | ) | | | (2,938 | ) | | | (23,888 | ) | | | (5,521 | ) |
| Total expenses after adjustments | | | 9,023,540 | | | | 2,251,578 | | | | 5,419,369 | | | | 2,154,147 | | | | 2,794,904 | | | | 20,104,791 | | | | 5,292,968 | |
| Net investment income (loss) | | | (3,880,656 | ) | | | 3,353,777 | | | | 2,084,572 | | | | 2,633,593 | | | | (1,783,699 | ) | | | (7,445,071 | ) | | | (2,470,379 | ) |
| | | | | | | |
| Realized and unrealized gain (loss) on investments | | | | | | | | | | | | | | | | | | | | | | | | | | | | |
| Net realized gain (loss) on investments | | | (36,256,072 | ) | | | (11,144,112 | ) | | | (56,536,379 | ) | | | (26,265,250 | ) | | | (6,184,729 | ) | | | (184,448,892 | ) | | | (5,534,706 | ) |
| Net realized gain (loss) on foreign currency transactions | | | — | | | | (88,409 | ) | | | (5,613,165 | ) | | | — | | | | — | | | | — | | | | — | |
| Net change in unrealized appreciation (depreciation) on investments | | | (266,804,581 | ) | | | (52,549,084 | ) | | | (112,575,601 | ) | | | (65,481,119 | ) | | | (65,769,900 | ) | | | (484,155,218 | ) | | | (146,264,024 | ) |
| Net change in unrealized appreciation (depreciation) on translation of assets and liabilities denominated in foreign currencies | | | — | | | | (1,134 | ) | | | 8,890,840 | | | | — | | | | — | | | | — | | | | — | |
| Net gain (loss) on investments | | | (303,060,653 | ) | | | (63,782,739 | ) | | | (165,834,305 | ) | | | (91,746,369 | ) | | | (71,954,629 | ) | | | (668,604,110 | ) | | | (151,798,730 | ) |
Net increase (decrease) in net assets
resulting from operations | | | (306,941,309 | ) | | | (60,428,962 | ) | | | (163,749,733 | ) | | | (89,112,776 | ) | | | (73,738,328 | ) | | | (676,049,181 | ) | | | (154,269,109 | ) |
| | | | | | | |
| (a) Net of foreign withholding taxes | | $ | 38,214 | | | $ | 293,763 | | | $ | 744,579 | | | $ | — | | | $ | 8,790 | | | $ | 343,831 | | | $ | 4,589 | |
| | |
| The accompanying notes are an integral part of the financial statements. | | 31 |
Statements of Changes in Net Assets
| | | | | | | | | | | | | | | | | | |
| | | Eagle Capital Appreciation Fund | | | Eagle Growth & Income Fund | | | Eagle International Equity Fund | |
| | | 11/1/07 to
10/31/08 | | | 11/1/06 to
10/31/07 | | | 11/1/07 to
10/31/08 | | | 11/1/06 to
10/31/07 | | | 11/1/07 to
10/31/08 | | | 11/1/06 to
10/31/07 | |
| | | | | | |
| Net assets, beginning of period | | $798,609,436 | | | $611,368,188 | | | $155,175,889 | | | $125,274,504 | | | $355,441,137 | | | $214,233,953 | |
| Increase (decrease) in net assets from operations | | | | | | | | | | | | | | | | | | |
| Net investment income (loss) | | (3,880,656 | ) | | (371,125 | ) | | 3,353,777 | | | 2,619,676 | | | 2,084,572 | | | 1,076,510 | |
| Net realized gain (loss) on investments | | (36,256,072 | ) | | 108,925,891 | | | (11,144,112 | ) | | 16,322,391 | | | (56,536,379 | ) | | 31,857,601 | |
| Net realized gain (loss) on foreign currency transactions | | — | | | — | | | (88,409 | ) | | (91,022 | ) | | (5,613,165 | ) | | (365,868 | ) |
| Net change in unrealized appreciation (depreciation) on investments | | (266,804,581 | ) | | 28,252,567 | | | (52,549,084 | ) | | 13,964,125 | | | (112,575,601 | ) | | 48,090,567 | |
| Net change in unrealized appreciation (depreciation) on translation of assets and liabilities denominated in foreign currencies | | — | | | — | | | (1,134 | ) | | 5,619 | | | 8,890,840 | | | (3,475,712 | ) |
| Net increase (decrease) in net assets resulting from operations Distributions to shareholders from | | (306,941,309 | ) | | 136,807,333 | | | (60,428,962 | ) | | 32,820,789 | | | (163,749,733 | ) | | 77,183,098 | |
| Net investment income | | — | | | — | | | (3,132,953 | ) | | (2,539,676 | ) | | — | | | (2,846,330 | ) |
| Net realized gains | | (103,643,660 | ) | | (3,788,440 | ) | | (16,433,145 | ) | | (4,406,301 | ) | | (29,731,569 | ) | | (16,103,129 | ) |
Net distributions to shareholders
Fund share transactions | | (103,643,660 | ) | | (3,788,440 | ) | | (19,566,098 | ) | | (6,945,977 | ) | | (29,731,569 | ) | | (18,949,459 | ) |
| Proceeds from shares sold-Class A | | 118,285,838 | | | 138,904,200 | | | 26,881,601 | | | 16,513,271 | | | 33,902,443 | | | 51,170,648 | |
| Proceeds from shares converted-Class A | | — | | | 37,528,784 | | | — | | | 10,070,931 | | | — | | | 6,528,838 | |
| Issued as reinvestment of distributions-Class A | | 68,156,580 | | | 2,202,349 | | | 11,476,026 | | | 3,748,593 | | | 12,054,716 | | | 7,266,598 | |
| Cost of shares redeemed-Class A | | (125,108,543 | ) | | (91,369,855 | ) | | (23,383,744 | ) | | (18,275,435 | ) | | (49,902,065 | ) | | (16,638,735 | ) |
| Proceeds from shares sold-Class C | | 11,219,254 | | | 16,143,301 | | | 10,427,722 | | | 7,894,536 | | | 20,981,495 | | | 44,943,345 | |
| Issued as reinvestment of distributions-Class C | | 21,930,491 | | | 902,418 | | | 6,878,799 | | | 2,370,064 | | | 15,706,259 | | | 10,025,814 | |
| Cost of shares redeemed-Class C | | (28,890,205 | ) | | (25,724,333 | ) | | (10,472,428 | ) | | (8,186,586 | ) | | (30,861,490 | ) | | (14,413,095 | ) |
| Proceeds from shares sold-Class I | | 12,382,442 | | | 16,921,374 | | | — | | | — | | | — | | | — | |
| Issued as reinvestment of distributions-Class I | | 6,449,529 | | | 189,247 | | | — | | | — | | | — | | | — | |
| Cost of shares redeemed-Class I | | (44,403,907 | ) | | (4,060,070 | ) | | — | | | — | | | — | | | — | |
| Proceeds from shares sold-Class R-3 | | 400,004 | | | 467 | | | — | | | — | | | — | | | — | |
| Issued as reinvestment of distributions-Class R-3 | | 43,729 | | | — | | | — | | | — | | | — | | | — | |
| Cost of shares redeemed-Class R-3 | | (14,594 | ) | | — | | | — | | | — | | | — | | | — | |
| Proceeds from shares sold-Class R-5 | | 15,228,408 | | | 5,107,344 | | | — | | | — | | | — | | | — | |
| Issued as reinvestment of distributions-Class R-5 | | 1,474,877 | | | 39,845 | | | — | | | — | | | — | | | — | |
| Cost of shares redeemed-Class R-5 | | (2,872,284 | ) | | (2,055,464 | ) | | — | | | — | | | — | | | — | |
| Net decrease from fund share transactions-Class B | | — | | | (40,507,272 | ) | | — | | | (10,108,979 | ) | | — | | | (5,910,449 | ) |
| Proceeds from Fund redemption fees | | — | | | 20 | | | — | | | 178 | | | — | | | 581 | |
| Net increase (decrease) from fund share transactions | | 54,281,619 | | | 54,222,355 | | | 21,807,976 | | | 4,026,573 | | | 1,881,358 | | | 82,973,545 | |
| Increase (decrease) in net assets | | (356,303,350 | ) | | 187,241,248 | | | (58,187,084 | ) | | 29,901,385 | | | (191,599,944 | ) | | 141,207,184 | |
| Net assets, end of period (a) | | 442,306,086 | | | 798,609,436 | | | 96,988,805 | | | 155,175,889 | | | 163,841,193 | | | 355,441,137 | |
(a) Includes undistributed net investment income
(accumulated net investment loss) of: | | $— | | | $— | | | $58,585 | | | $(85,994 | ) | | $(818,125 | ) | | $2,615,079 | |
| | | | | | |
| Shares issued and redeemed | | | | | | | | | | | | | | | | | | |
| Shares sold-Class A | | 4,401,661 | | | 4,212,669 | | | 1,944,177 | | | 1,016,424 | | | 1,176,855 | | | 1,585,498 | |
| Shares converted-Class A | | — | | | 1,216,061 | | | — | | | 668,474 | | | — | | | 209,419 | |
| Issued as reinvestment of distributions-Class A | | 2,308,827 | | | 72,517 | | | 774,232 | | | 247,300 | | | 383,298 | | | 246,325 | |
| Shares redeemed-Class A | | (4,710,480 | ) | | (2,802,627 | ) | | (1,830,375 | ) | | (1,173,290 | ) | | (2,024,518 | ) | | (516,795 | ) |
| Shares sold-Class C | | 471,548 | | | 548,264 | | | 789,739 | | | 507,831 | | | 780,157 | | | 1,511,601 | |
| Issued as reinvestment of distributions-Class C | | 833,225 | | | 32,555 | | | 470,547 | | | 161,900 | | | 546,685 | | | 366,441 | |
| Shares redeemed-Class C | | (1,224,037 | ) | | (876,012 | ) | | (873,410 | ) | | (540,965 | ) | | (1,309,460 | ) | | (486,835 | ) |
| Shares sold-Class I | | 450,245 | | | 519,448 | | | — | | | — | | | — | | | — | |
| Issued as reinvestment of distributions-Class I | | 216,864 | | | 6,215 | | | — | | | — | | | — | | | — | |
| Shares redeemed-Class I | | (1,567,257 | ) | | (121,072 | ) | | — | | | — | | | — | | | — | |
| Shares sold-Class R-3 | | 12,238 | | | 13 | | | — | | | — | | | — | | | — | |
| Issued as reinvestment of distributions-Class R-3 | | 1,483 | | | — | | | — | | | — | | | — | | | — | |
| Shares redeemed-Class R-3 | | (507 | ) | | — | | | — | | | — | | | — | | | — | |
| Shares sold-Class R-5 | | 599,448 | | | 159,807 | | | — | | | — | | | — | | | — | |
| Issued as reinvestment of distributions-Class R-5 | | 49,709 | | | 1,311 | | | — | | | — | | | — | | | — | |
| Shares redeemed-Class R-5 | | (107,246 | ) | | (61,585 | ) | | — | | | — | | | — | | | — | |
| Net decrease from shares issued and redeemed-Class B | | — | | | (1,441,066 | ) | | — | | | (687,115 | ) | | — | | | (204,012 | ) |
| Shares issued and redeemed | | 1,735,721 | | | 1,466,498 | | | 1,274,910 | | | 200,559 | | | (446,983 | ) | | 2,711,642 | |
| | |
| 32 | | The accompanying notes are an integral part of the financial statements. |
Statements of Changes in Net Assets
| | | | | | | | | | | | | | | | | | | | | | |
| Eagle Large Cap Core Fund | | | Eagle Mid Cap Growth Fund | | | Eagle Mid Cap Stock Fund | | | Eagle Small Cap Growth Fund | |
11/1/07 to
10/31/08 | | | 11/1/06 to
10/31/07 | | | 11/1/07 to
10/31/08 | | | 11/1/06 to
10/31/07 | | | 11/1/07 to
10/31/08 | | | 11/1/06 to
10/31/07 | | | 11/1/07 to
10/31/08 | | | 11/1/06 to
10/31/07 | |
| | | | | | | |
| $227,229,575 | | | $165,300,826 | | | $199,359,924 | | | $213,089,008 | | | $1,851,253,969 | | | $1,336,135,358 | | | $453,905,178 | | | $391,432,606 | |
| | | | | | | | | | | | | | | | | | | | | | |
| 2,633,593 | | | 1,941,909 | | | (1,783,699 | ) | | (2,056,014 | ) | | (7,445,071 | ) | | (5,711,648 | ) | | (2,470,379 | ) | | (2,375,496 | ) |
| (26,265,250 | ) | | 9,853,047 | | | (6,184,729 | ) | | 38,129,001 | | | (184,448,892 | ) | | 196,324,615 | | | (5,534,706 | ) | | 67,742,702 | |
| — | | | — | | | — | | | — | | | — | | | — | | | — | | | — | |
(65,481,119 | ) | | 7,274,527 | | | (65,769,900 | ) | | 20,335,484 | | | (484,155,218 | ) | | 99,728,816 | | | (146,264,024 | ) | | 3,021,994 | |
— | | | — | | | — | | | — | | | — | | | — | | | — | | | — | |
(89,112,776 | ) | | 19,069,483 | | | (73,738,328 | ) | | 56,408,471 | | | (676,049,181 | ) | | 290,341,783 | | | (154,269,109 | ) | | 68,389,200 | |
| (2,264,236 | ) | | (1,206,000 | ) | | — | | | — | | | — | | | — | | | — | | | — | |
| (9,857,625 | ) | | (1,258,126 | ) | | (31,289,716 | ) | | (19,610,548 | ) | | (192,218,338 | ) | | (141,917,616 | ) | | (64,932,432 | ) | | (30,288,447 | ) |
(12,121,861
| )
| | (2,464,126 | ) | | (31,289,716 | ) | | (19,610,548 | ) | | (192,218,338 | ) | | (141,917,616 | ) | | (64,932,432 | ) | | (30,288,447 | ) |
| 1,310,227 | | | 5,744,266 | | | 43,348,883 | | | 16,056,256 | | | 299,989,289 | | | 399,168,466 | | | 53,347,219 | | | 71,844,759 | |
| — | | | — | | | — | | | 13,841,816 | | | — | | | 56,563,684 | | | — | | | 9,394,896 | |
| 1,255,722 | | | 265,763 | | | 18,440,356 | | | 11,255,297 | | | 123,720,543 | | | 88,138,319 | | | 40,301,242 | | | 18,044,955 | |
| (7,264,053 | ) | | (4,591,890 | ) | | (37,287,018 | ) | | (69,956,204 | ) | | (349,161,747 | ) | | (247,533,407 | ) | | (76,895,401 | ) | | (70,485,402 | ) |
| 1,174,441 | | | 3,550,960 | | | 7,343,501 | | | 3,163,935 | | | 35,563,183 | | | 56,839,496 | | | 7,442,761 | | | 10,617,679 | |
| 724,547 | | | 105,968 | | | 11,382,863 | | | 6,032,538 | | | 44,098,171 | | | 36,460,148 | | | 16,249,154 | | | 7,858,335 | |
| (3,842,387 | ) | | (2,133,706 | ) | | (9,809,215 | ) | | (16,813,493 | ) | | (69,639,518 | ) | | (56,388,856 | ) | | (20,554,061 | ) | | (16,545,310 | ) |
| 55,159,182 | | | 61,816,094 | | | 596,622 | | | 1,286 | | | 52,215,459 | | | 73,813,986 | | | 11,459,985 | | | 1,646,872 | |
| 9,891,817 | | | 2,040,608 | | | 3,067 | | | 1,246 | | | 8,841,731 | | | 1,805,339 | | | 261,024 | | | 60,929 | |
| (33,440,579 | ) | | (22,070,365 | ) | | (9,887 | ) | | (80 | ) | | (23,038,716 | ) | | (7,810,643 | ) | | (513,264 | ) | | (95,987 | ) |
| — | | | — | | | — | | | — | | | 736,148 | | | 1,175,337 | | | 1,055,844 | | | 1,054,630 | |
| — | | | — | | | — | | | — | | | 156,975 | | | 42,742 | | | 115,250 | | | 544 | |
| — | | | — | | | — | | | — | | | (307,396 | ) | | (285,060 | ) | | (439,855 | ) | | (164,912 | ) |
| 20,981 | | | 654,996 | | | — | | | — | | | 11,551,921 | | | 22,191,828 | | | 3,885,729 | | | 1,853,663 | |
| 32,104 | | | — | | | — | | | — | | | 3,591,397 | | | 1,230,356 | | | 2,091,439 | | | 966,637 | |
| (497,242 | ) | | (59,314 | ) | | — | | | — | | | (7,900,153 | ) | | (4,370,337 | ) | | (2,111,284 | ) | | (2,298,572 | ) |
| — | | | — | | | — | | | (14,109,621 | ) | | — | | | (54,349,258 | ) | | — | | | (9,382,149 | ) |
| — | | | 12 | | | — | | | 17 | | | — | | | 2,304 | | | — | | | 252 | |
| 24,524,760 | | | 45,323,392 | | | 34,009,172 | | | (50,527,007 | ) | | 130,417,287 | | | 366,694,444 | | | 35,695,782 | | | 24,371,819 | |
| (76,709,877 | ) | | 61,928,749 | | | (71,018,872 | ) | | (13,729,084 | ) | | (737,850,232 | ) | | 515,118,611 | | | (183,505,759 | ) | | 62,472,572 | |
| 150,519,698 | | | 227,229,575 | | | 128,341,052 | | | 199,359,924 | | | 1,113,403,737 | | | 1,851,253,969 | | | 270,399,419 | | | 453,905,178 | |
$1,777,281 | | | $1,407,924 | | | $— | | | $— | | | $(208,006 | ) | | $(208,006 | ) | | $(57,486 | ) | | $110,883 | |
| | | | | | | |
| | | | | | | | | | | | | | | | | | | | | | |
| 89,389 | | | 339,479 | | | 1,624,921 | | | 529,022 | | | 11,858,534 | | | 13,305,724 | | | 1,756,567 | | | 1,868,618 | |
| — | | | — | | | — | | | 488,654 | | | — | | | 1,955,768 | | | — | | | 249,290 | |
| 77,514 | | | 16,146 | | | 655,075 | | | 415,018 | | | 4,409,143 | | | 3,146,673 | | | 1,229,446 | | | 493,571 | |
| (508,538 | ) | | (264,864 | ) | | (1,451,021 | ) | | (2,446,968 | ) | | (13,976,492 | ) | | (8,167,648 | ) | | (2,503,255 | ) | | (1,816,194 | ) |
| 85,777 | | | 210,707 | | | 323,618 | | | 114,979 | | | 1,562,513 | | | 2,079,150 | | | 284,056 | | | 309,828 | |
| 45,143 | | | 6,485 | | | 448,674 | | | 240,724 | | | 1,752,013 | | | 1,422,557 | | | 571,952 | | | 240,537 | |
| (277,165 | ) | | (125,304 | ) | | (432,832 | ) | | (626,907 | ) | | (3,147,144 | ) | | (2,054,154 | ) | | (794,862 | ) | | (478,108 | ) |
| 3,778,562 | | | 3,596,750 | | | 23,582 | | | 44 | | | 2,046,289 | | | 2,480,668 | | | 417,971 | | | 42,145 | |
| 610,606 | | | 123,899 | | | 108 | | | 46 | | | 313,425 | | | 64,338 | | | 7,919 | | | 1,664 | |
| (2,462,445 | ) | | (1,273,788 | ) | | (390 | ) | | (3 | ) | | (955,523 | ) | | (254,540 | ) | | (16,748 | ) | | (2,422 | ) |
| — | | | — | | | — | | | — | | | 28,616 | | | 39,872 | | | 38,904 | | | 26,015 | |
| — | | | — | | | — | | | — | | | 5,610 | | | 1,527 | | | 3,526 | | | 15 | |
| — | | | — | | | — | | | — | | | (11,863 | ) | | (9,458 | ) | | (14,232 | ) | | (4,003 | ) |
| 1,379 | | | 35,967 | | | — | | | — | | | 435,351 | | | 729,209 | | | 128,628 | | | 48,285 | |
| 1,988 | | | — | | | — | | | — | | | 127,309 | | | 43,894 | | | 63,473 | | | 26,425 | |
| (34,958 | ) | | (3,366 | ) | | — | | | — | | | (303,381 | ) | | (141,916 | ) | | (69,307 | ) | | (59,047 | ) |
| — | | | — | | | — | | | (539,018 | ) | | — | | | (2,054,330 | ) | | — | | | (278,831 | ) |
| 1,407,252 | | | 2,662,111 | | | 1,191,735 | | | (1,824,409 | ) | | 4,144,400 | | | 12,587,334 | | | 1,104,038 | | | 667,788 | |
| | |
| The accompanying notes are an integral part of the financial statements. | | 33 |
Financial Highlights
| | | | | | | | | | | | | | | | | | | | | | | | | | | | | | | | | | | | | | | | | |
| | | | | | From investment operations | | | Dividends & distributions | | | | | Ratios to average daily net assets (%) | | | | | | | | |
Fiscal periods | | | Beginning
net asset
value | | Income
(loss) | | | Realized &
unrealized
gain (loss) | | | Total | | | From
investment
income | | | From
realized
gains | | | Total | | | Ending
net
asset
value | | With
expenses
waived/
recovered | | | Without
expenses
waived/
recovered | | | Net
income
(loss) | | | Portfolio
turnover
rate (%) | | Total
return
(%) (a) | | | Ending
net
assets
(millions) |
| Beginning | | Ending | | | | | | | | | | | | | | | |
| Eagle Capital Appreciation Fund | | | | | | | | | | | | | | | | | | | | | | | | | | | | | | | | | | | | |
| Class A | | | | | | | | | | | | | | | | | | | | | | | | | | | | | | | | | | | | |
| 11/01/07 | | 10/31/08 | * | | $35.99 | | ($0.13 | ) | | ($12.71 | ) | | ($12.84 | ) | | $ — | | | ($4.57 | ) | | ($4.57 | ) | | $18.58 | | 1.20 | | | 1.20 | | | (0.45 | ) | | 61 | | (40.38 | ) | | $329 |
| 11/01/06 | | 10/31/07 | * | | 29.67 | | 0.04 | | | 6.46 | (b) | | 6.50 | | | — | | | (0.18 | ) | | (0.18 | ) | | 35.99 | | 1.20 | | | 1.20 | | | 0.11 | | | 62 | | 22.02 | | | 566 |
| 09/01/06 | | 10/31/06 | *(c) | | 28.59 | | (0.01 | ) | | 1.09 | (b) | | 1.08 | | | — | | | — | | | — | | | 29.67 | | 1.23 | (d) | | 1.23 | (d) | | (0.19 | )(d) | | 7 | | 3.78 | (e) | | 387 |
| 09/01/05 | | 08/31/06 | * | | 26.28 | | (0.06 | ) | | 2.37 | (b) | | 2.31 | | | — | | | — | | | — | | | 28.59 | | 1.19 | | | 1.19 | | | (0.23 | ) | | 58 | | 8.79 | | | 378 |
| 09/01/04 | | 08/31/05 | * | | 22.85 | | — | | | 3.43 | (b) | | 3.43 | | | — | | | — | | | — | | | 26.28 | | 1.18 | | | 1.18 | | | 0.01 | | | 42 | | 15.01 | | | 391 |
| 09/01/03 | | 08/31/04 | | | 21.82 | | (0.08 | ) | | 1.11 | | | 1.03 | | | — | | | — | | | — | | | 22.85 | | 1.19 | | | 1.19 | | | (0.39 | ) | | 27 | | 4.72 | | | 321 |
| Class C | | | | | | | | | | | | | | | | | | | | | | | | | | | | | | | | | | | | |
| 11/01/07 | | 10/31/08 | * | | 32.64 | | (0.30 | ) | | (11.32 | ) | | (11.62 | ) | | — | | | (4.57 | ) | | (4.57 | ) | | 16.45 | | 1.95 | | | 1.95 | | | (1.19 | ) | | 61 | | (40.85 | ) | | 87 |
| 11/01/06 | | 10/31/07 | * | | 27.13 | | (0.19 | ) | | 5.88 | (b) | | 5.69 | | | — | | | (0.18 | ) | | (0.18 | ) | | 32.64 | | 1.96 | | | 1.96 | | | (0.65 | ) | | 62 | | 21.09 | | | 170 |
| 09/01/06 | | 10/31/06 | *(c) | | 26.17 | | (0.04 | ) | | 1.00 | (b) | | 0.96 | | | — | | | — | | | — | | | 27.13 | | 1.99 | (d) | | 1.99 | (d) | | (0.94 | )(d) | | 7 | | 3.67 | (e) | | 149 |
| 09/01/05 | | 08/31/06 | * | | 24.29 | | (0.25 | ) | | 2.13 | (b) | | 1.88 | | | — | | | — | | | — | | | 26.17 | | 1.94 | | | 1.94 | | | (0.98 | ) | | 58 | | 7.74 | | | 145 |
| 09/01/04 | | 08/31/05 | * | | 21.27 | | (0.17 | ) | | 3.19 | (b) | | 3.02 | | | — | | | — | | | — | | | 24.29 | | 1.93 | | | 1.93 | | | (0.73 | ) | | 42 | | 14.20 | | | 120 |
| 09/01/03 | | 08/31/04 | | | 20.46 | | (0.24 | ) | | 1.05 | | | 0.81 | | | — | | | — | | | — | | | 21.27 | | 1.94 | | | 1.94 | | | (1.14 | ) | | 27 | | 3.96 | | | 111 |
| Class I* | | | | | | | | | | | | | | | | | | | | | | | | | | | | | | | | | | | | |
| 11/01/07 | | 10/31/08 | | | 36.21 | | — | | | (12.86 | ) | | (12.86 | ) | | — | | | (4.57 | ) | | (4.57 | ) | | 18.78 | | 0.79 | | | 0.79 | | | (0.01 | ) | | 61 | | (40.16 | ) | | 10 |
| 11/01/06 | | 10/31/07 | | | 29.73 | | 0.17 | | | 6.49 | (b) | | 6.66 | | | — | | | (0.18 | ) | | (0.18 | ) | | 36.21 | | 0.80 | | | 0.80 | | | 0.51 | | | 62 | | 22.51 | | | 51 |
| 09/01/06 | | 10/31/06 | (c) | | 28.63 | | 0.01 | | | 1.09 | (b) | | 1.10 | | | — | | | — | | | — | | | 29.73 | | 0.85 | (d) | | 0.85 | (d) | | 0.20 | (d) | | 7 | | 3.84 | (e) | | 30 |
| 03/21/06 | | 08/31/06 | | | 28.93 | | 0.01 | | | (0.31 | )(b) | | (0.30 | ) | | — | | | — | | | — | | | 28.63 | | 0.91 | (d) | | 0.91 | (d) | | 0.07 | (d) | | 58 | | (1.04 | )(e) | | 26 |
| Class R-3* | | | | | | | | | | | | | | | | | | | | | | | | | | | | | | | | | | | | |
| 11/01/07 | | 10/31/08 | | | 35.97 | | (0.20 | ) | | (12.69 | ) | | (12.89 | ) | | — | | | (4.57 | ) | | (4.57 | ) | | 18.51 | | 1.42 | | | 1.42 | | | (0.70 | ) | | 61 | | (40.56 | ) | | 0 |
| 09/12/07 | | 10/31/07 | | | 33.30 | | (0.05 | ) | | 2.72 | (b) | | 2.67 | | | — | | | — | | | — | | | 35.97 | | 1.65 | (d) | | 7.17 | (d) | | (1.26 | )(d) | | 62 | | 8.02 | (e) | | 0 |
| Class R-5* | | | | | | | | | | | | | | | | | | | | | | | | | | | | | | | | | | | | |
| 11/01/07 | | 10/31/08 | | | 36.13 | | (0.04 | ) | | (12.79 | ) | | (12.83 | ) | | — | | | (4.57 | ) | | (4.57 | ) | | 18.73 | | 0.83 | | | 0.83 | | | (0.13 | ) | | 61 | | (40.17 | ) | | 16 |
| 11/01/06 | | 10/31/07 | | | 29.68 | | 0.16 | | | 6.47 | (b) | | 6.63 | | | — | | | (0.18 | ) | | (0.18 | ) | | 36.13 | | 0.85 | | | 0.85 | | | 0.48 | | | 62 | | 22.45 | | | 12 |
| 10/02/06 | | 10/31/06 | | | 29.04 | | — | | | 0.64 | (b) | | 0.64 | | | — | | | — | | | — | | | 29.68 | | 0.85 | (d) | | 0.85 | (d) | | (0.20 | )(d) | | 7 | | 2.20 | (e) | | 7 |
| | | | | | | | | | | | | |
| Eagle Growth & Income Fund | | | | | | | | | | | | | | | | | | | | | | | | | | | | | | | | | | | | |
| Class A* | | | | | | | | | | | | | | | | | | | | | | | | | | | | | | | | | | | | |
| 11/01/07 | | 10/31/08 | | | 17.77 | | 0.37 | | | (6.27 | ) | | (5.90 | ) | | (0.35 | ) | | (1.81 | ) | | (2.16 | ) | | 9.71 | | 1.35 | | | 1.33 | | | 2.75 | | | 64 | | (37.25 | ) | | 61 |
| 11/01/06 | | 10/31/07 | | | 14.68 | | 0.36 | | | 3.60 | (b) | | 3.96 | | | (0.34 | ) | | (0.53 | ) | | (0.87 | ) | | 17.77 | | 1.35 | | | 1.40 | | | 2.28 | | | 63 | | 28.17 | | | 96 |
| 10/01/06 | | 10/31/06 | (c) | | 14.43 | | 0.02 | | | 0.34 | (b) | | 0.36 | | | (0.11 | ) | | — | | | (0.11 | ) | | 14.68 | | 1.35 | (d) | | 1.56 | (d) | | 1.33 | (d) | | 4 | | 2.52 | (e) | | 68 |
| 10/01/05 | | 09/30/06 | | | 13.81 | | 0.38 | | | 1.43 | (b) | | 1.81 | | | (0.34 | ) | | (0.85 | ) | | (1.19 | ) | | 14.43 | | 1.35 | | | 1.42 | | | 2.74 | | | 54 | | 13.90 | | | 68 |
| 10/01/04 | | 09/30/05 | | | 11.80 | | 0.28 | | | 1.99 | (b) | | 2.27 | | | (0.26 | ) | | — | | | (0.26 | ) | | 13.81 | | 1.35 | | | 1.51 | | | 2.13 | | | 73 | | 19.41 | | | 45 |
| 10/01/03 | | 09/30/04 | | | 11.10 | | 0.16 | | | 0.68 | | | 0.84 | | | (0.14 | ) | | — | | | (0.14 | ) | | 11.80 | | 1.35 | | | 1.50 | | | 1.31 | | | 80 | | 7.57 | | | 41 |
| Class C* | | | | | | | | | | | | | | | | | | | | | | | | | | | | | | | | | | | | |
| 11/01/07 | | 10/31/08 | | | 17.34 | | 0.26 | | | (6.10 | ) | | (5.84 | ) | | (0.24 | ) | | (1.81 | ) | | (2.05 | ) | | 9.45 | | 2.15 | | | 2.09 | | | 1.95 | | | 64 | | (37.75 | ) | | 36 |
| 11/01/06 | | 10/31/07 | | | 14.38 | | 0.23 | | | 3.50 | (b) | | 3.73 | | | (0.24 | ) | | (0.53 | ) | | (0.77 | ) | | 17.34 | | 2.14 | | | 2.16 | | | 1.52 | | | 63 | | 27.05 | | | 59 |
| 10/01/06 | | 10/31/06 | (c) | | 14.12 | | 0.01 | | | 0.34 | (b) | | 0.35 | | | (0.09 | ) | | — | | | (0.09 | ) | | 14.38 | | 2.10 | (d) | | 2.31 | (d) | | 0.58 | (d) | | 4 | | 2.46 | (e) | | 47 |
| 10/01/05 | | 09/30/06 | | | 13.54 | | 0.27 | | | 1.40 | (b) | | 1.67 | | | (0.24 | ) | | (0.85 | ) | | (1.09 | ) | | 14.12 | | 2.10 | | | 2.17 | | | 2.00 | | | 54 | | 13.01 | | | 46 |
| 10/01/04 | | 09/30/05 | | | 11.57 | | 0.18 | | | 1.96 | (b) | | 2.14 | | | (0.17 | ) | | — | | | (0.17 | ) | | 13.54 | | 2.10 | | | 2.26 | | | 1.37 | | | 73 | | 18.60 | | | 31 |
| 10/01/03 | | 09/30/04 | | | 10.88 | | 0.07 | | | 0.66 | | | 0.73 | | | (0.04 | ) | | — | | | (0.04 | ) | | 11.57 | | 2.10 | | | 2.25 | | | 0.57 | | | 80 | | 6.73 | | | 26 |
| | | | | | | | | | | | | |
| Eagle International Equity Fund | | | | | | | | | | | | | | | | | | | | | | | | | | | | | | | | | | | | |
| Class A* | | | | | | | | | | | | | | | | | | | | | | | | | | | | | | | | | | | | |
| 11/01/07 | | 10/31/08 | | | 36.52 | | 0.32 | | | (16.15 | ) | | (15.83 | ) | | — | | | (2.89 | ) | | (2.89 | ) | | 17.80 | | 1.41 | | | 1.41 | | | 1.11 | | | 115 | | (46.77 | ) | | 73 |
| 11/01/06 | | 10/31/07 | | | 29.97 | | 0.27 | | | 8.87 | (b) | | 9.14 | | | (0.47 | ) | | (2.12 | ) | | (2.59 | ) | | 36.52 | | 1.47 | | | 1.41 | | | 0.83 | | | 56 | | 32.58 | | | 166 |
| 11/01/05 | | 10/31/06 | | | 25.20 | | 0.24 | | | 6.73 | (b) | | 6.97 | | | (0.16 | ) | | (2.04 | ) | | (2.20 | ) | | 29.97 | | 1.71 | | | 1.53 | | | 0.86 | | | 58 | | 29.31 | | | 91 |
| 11/01/04 | | 10/31/05 | | | 20.95 | | 0.09 | | | 4.49 | (b) | | 4.58 | | | (0.33 | ) | | — | | | (0.33 | ) | | 25.20 | | 1.78 | | | 2.00 | | | 0.38 | | | 78 | | 21.98 | | | 50 |
| 11/01/03 | | 10/31/04 | | | 17.93 | | 0.05 | | | 3.12 | | | 3.17 | | | (0.15 | ) | | — | | | (0.15 | ) | | 20.95 | | 1.78 | | | 2.15 | | | 0.24 | | | 162 | | 17.74 | | | 29 |
| Class C* | | | | | | | | | | | | | | | | | | | | | | | | | | | | | | | | | | | | |
| 11/01/07 | | 10/31/08 | | | 33.66 | | 0.09 | | | (14.71 | ) | | (14.62 | ) | | — | | | (2.89 | ) | | (2.89 | ) | | 16.15 | | 2.17 | | | 2.17 | | | 0.33 | | | 115 | | (47.19 | ) | | 91 |
| 11/01/06 | | 10/31/07 | | | 27.85 | | 0.01 | | | 8.23 | (b) | | 8.24 | | | (0.31 | ) | | (2.12 | ) | | (2.43 | ) | | 33.66 | | 2.23 | | | 2.17 | | | 0.05 | | | 56 | | 31.60 | | | 189 |
| 11/01/05 | | 10/31/06 | | | 23.58 | | 0.02 | | | 6.30 | (b) | | 6.32 | | | (0.01 | ) | | (2.04 | ) | | (2.05 | ) | | 27.85 | | 2.46 | | | 2.28 | | | 0.07 | | | 58 | | 28.38 | | | 118 |
| 11/01/04 | | 10/31/05 | | | 19.66 | | (0.08 | ) | | 4.20 | (b) | | 4.12 | | | (0.20 | ) | | — | | | (0.20 | ) | | 23.58 | | 2.53 | | | 2.75 | | | (0.35 | ) | | 78 | | 21.06 | | | 73 |
| 11/01/03 | | 10/31/04 | | | 16.89 | | (0.09 | ) | | 2.93 | | | 2.84 | | | (0.07 | ) | | — | | | (0.07 | ) | | 19.66 | | 2.53 | | | 2.90 | | | (0.46 | ) | | 162 | | 16.85 | | | 47 |
| | |
| 34 | | The accompanying notes are an integral part of the financial statements. |
Financial Highlights
| | | | | | | | | | | | | | | | | | | | | | | | | | | | | | | | | | | | | | | | |
| | | | | From investment operations | | | Dividends & distributions | | | | | Ratios to average daily net assets (%) | | | | | | | | |
Fiscal periods | | Beginning
net asset
value | | Income
(loss) | | | Realized &
unrealized
gain (loss) | | | Total | | | From
investment
income | | | From
realized
gains | | | Total | | | Ending
net
asset
value | | With
expenses
waived/
recovered | | | Without
expenses
waived/
recovered | | | Net
income
(loss) | | | Portfolio
turnover
rate (%) | | Total
return
(%) (a) | | | Ending
net
assets
(millions) |
| Beginning | | Ending | | | | | | | | | | | | | | |
| Eagle Large Cap Core Fund | | | | | | | | | | | | | | | | | | | | | | | | | | | | | | | | | | | | |
| Class A* | | | | | | | | | | | | | | | | | | | | | | | | | | | | | | | | | | | | |
| 11/01/07 | | 10/31/08 | | $17.95 | | $0.17 | | | ($6.52 | ) | | ($6.35 | ) | | ($0.13 | ) | | ($0.77 | ) | | ($0.90 | ) | | $10.70 | | 1.26 | | | 1.26 | | | 1.14 | | | 43 | | (37.08 | ) | | $12 |
| 11/01/06 | | 10/31/07 | | 16.54 | | 0.13 | | | 1.48 | (b) | | 1.61 | | | (0.08 | ) | | (0.12 | ) | | (0.20 | ) | | 17.95 | | 1.36 | | | 1.28 | | | 0.73 | | | 45 | | 9.85 | | | 27 |
| 11/01/05 | | 10/31/06 | | 14.29 | | 0.09 | | | 2.16 | (b) | | 2.25 | | | — | | | — | | | — | | | 16.54 | | 1.53 | | | 1.52 | | | 0.57 | | | 43 | | 15.75 | | | 23 |
| 05/02/05 | | 10/31/05 | | 14.29 | | (0.01 | ) | | 0.01 | (b) | | — | | | — | | | — | | | — | | | 14.29 | | 1.65 | (d) | | 3.25 | (d) | | (0.09 | )(d) | | 66 | | — | (e) | | 19 |
| Class C* | | | | | | | | | | | | | | | | | | | | | | | | | | | | | | | | | | | | | | |
| 11/01/07 | | 10/31/08 | | 17.68 | | 0.04 | | | (6.42 | ) | | (6.38 | ) | | — | | | (0.77 | ) | | (0.77 | ) | | 10.53 | | 2.10 | | | 2.10 | | | 0.28 | | | 43 | | (37.58 | ) | | 9 |
| 11/01/06 | | 10/31/07 | | 16.35 | | (0.02 | ) | | 1.47 | (b) | | 1.45 | | | — | | | (0.12 | ) | | (0.12 | ) | | 17.68 | | 2.18 | | | 2.11 | | | (0.10 | ) | | 45 | | 8.95 | | | 17 |
| 11/01/05 | | 10/31/06 | | 14.23 | | (0.03 | ) | | 2.15 | (b) | | 2.12 | | | — | | | — | | | — | | | 16.35 | | 2.28 | | | 2.27 | | | (0.19 | ) | | 43 | | 14.90 | | | 15 |
| 05/02/05 | | 10/31/05 | | 14.29 | | (0.05 | ) | | (0.01 | )(b) | | (0.06 | ) | | — | | | — | | | — | | | 14.23 | | 2.40 | (d) | | 4.00 | (d) | | (0.85 | )(d) | | 66 | | (0.42 | )(e) | | 10 |
| Class I* | | | | | | | | | | | | | | | | | | | | | | | | | | | | | | | | | | | | | | | | |
| 11/01/07 | | 10/31/08 | | 18.01 | | 0.20 | | | (6.51 | ) | | (6.31 | ) | | (0.20 | ) | | (0.77 | ) | | (0.97 | ) | | 10.73 | | 0.95 | | | 1.04 | | | 1.39 | | | 43 | | (36.86 | ) | | 130 |
| 11/01/06 | | 10/31/07 | | 16.60 | | 0.19 | | | 1.48 | (b) | | 1.67 | | | (0.14 | ) | | (0.12 | ) | | (0.26 | ) | | 18.01 | | 0.95 | | | 1.06 | | | 1.12 | | | 45 | | 10.22 | | | 183 |
| 03/03/06 | | 10/31/06 | | 15.17 | | 0.08 | | | 1.35 | (b) | | 1.43 | | | — | | | — | | | — | | | 16.60 | | 0.95 | (d) | | 1.23 | (d) | | 0.87 | (d) | | 43 | | 9.43 | (e) | | 128 |
| Class R-5* | | | | | | | | | | | | | | | | | | | | | | | | | | | | | | | | | | | | |
| 11/01/07 | | 10/31/08 | | 17.98 | | 0.27 | | | (6.51 | ) | | (6.24 | ) | | (0.21 | ) | | (0.77 | ) | | (0.98 | ) | | 10.76 | | 0.86 | | | 0.90 | | | 1.71 | | | 43 | | (36.52 | ) | | 0 |
| 04/02/07 | | 10/31/07 | | 16.51 | | — | | | 1.47 | (b) | | 1.47 | | | — | | | — | | | — | | | 17.98 | | 0.91 | (d) | | 0.91 | (d) | | 0.05 | (d) | | 45 | | 8.90 | (e) | | 1 |
| | | | | | | | | | | | | |
| Eagle Mid Cap Growth Fund | | | | | | | | | | | | | | | | | | | | | | | | | | | | | | | | | | | | |
| Class A* | | | | | | | | | | | | | | | | | | | | | | | | | | | | | | | | | | | | |
| 11/01/07 | | 10/31/08 | | 34.48 | | (0.20 | ) | | (10.29 | ) | | (10.49 | ) | | — | | | (5.36 | ) | | (5.36 | ) | | 18.63 | | 1.30 | | | 1.30 | | | (0.74 | ) | | 141 | | (35.68 | ) | | 86 |
| 11/01/06 | | 10/31/07 | | 28.11 | | (0.24 | ) | | 9.18 | (b) | | 8.94 | | | — | | | (2.57 | ) | | (2.57 | ) | | 34.48 | | 1.36 | | | 1.36 | | | (0.80 | ) | | 98 | | 34.28 | | | 130 |
| 11/01/05 | | 10/31/06 | | 26.72 | | (0.14 | ) | | 2.95 | (b) | | 2.81 | | | — | | | (1.42 | ) | | (1.42 | ) | | 28.11 | | 1.29 | | | 1.29 | | | (0.49 | ) | | 111 | | 10.70 | | | 135 |
| 11/01/04 | | 10/31/05 | | 25.26 | | (0.22 | ) | | 2.89 | (b) | | 2.67 | | | — | | | (1.21 | ) | | (1.21 | ) | | 26.72 | | 1.34 | | | 1.34 | | | (0.81 | ) | | 75 | | 10.66 | | | 127 |
| 11/01/03 | | 10/31/04 | | 23.92 | | (0.23 | ) | | 1.57 | | | 1.34 | | | — | | | — | | | — | | | 25.26 | | 1.38 | | | 1.38 | | | (0.92 | ) | | 92 | | 5.60 | | | 80 |
| Class C* | | | | | | | | | | | | | | | | | | | | | | | | | | | | | | | | | | | | |
| 11/01/07 | | 10/31/08 | | 31.65 | | (0.36 | ) | | (9.25 | ) | | (9.61 | ) | | — | | | (5.36 | ) | | (5.36 | ) | | 16.68 | | 2.05 | | | 2.05 | | | (1.48 | ) | | 141 | | (36.16 | ) | | 42 |
| 11/01/06 | | 10/31/07 | | 26.18 | | (0.42 | ) | | 8.46 | (b) | | 8.04 | | | — | | | (2.57 | ) | | (2.57 | ) | | 31.65 | | 2.11 | | | 2.11 | | | (1.54 | ) | | 98 | | 33.28 | | | 69 |
| 11/01/05 | | 10/31/06 | | 25.15 | | (0.32 | ) | | 2.77 | (b) | | 2.45 | | | — | | | (1.42 | ) | | (1.42 | ) | | 26.18 | | 2.04 | | | 2.04 | | | (1.23 | ) | | 111 | | 9.90 | | | 64 |
| 11/01/04 | | 10/31/05 | | 24.02 | | (0.39 | ) | | 2.73 | (b) | | 2.34 | | | — | | | (1.21 | ) | | (1.21 | ) | | 25.15 | | 2.09 | | | 2.09 | | | (1.55 | ) | | 75 | | 9.80 | | | 67 |
| 11/01/03 | | 10/31/04 | | 22.92 | | (0.40 | ) | | 1.50 | | | 1.10 | | | — | | | — | | | — | | | 24.02 | | 2.13 | | | 2.13 | | | (1.68 | ) | | 92 | | 4.80 | | | 65 |
| Class I* | | | | | | | | | | | | | | | | | | | | | | | | | | | | | | | | | | | | | | | | |
| 11/01/07 | | 10/31/08 | | 34.69 | | (0.12 | ) | | (10.38 | ) | | (10.50 | ) | | — | | | (5.36 | ) | | (5.36 | ) | | 18.83 | | 0.95 | | | 1.04 | | | (0.54 | ) | | 141 | | (35.46 | ) | | 0 |
| 11/01/06 | | 10/31/07 | | 28.16 | | (0.11 | ) | | 9.21 | (b) | | 9.10 | | | — | | | (2.57 | ) | | (2.57 | ) | | 34.69 | | 0.95 | | | 1.08 | | | (0.37 | ) | | 98 | | 34.83 | | | 0 |
| 06/21/06 | | 10/31/06 | | 26.63 | | (0.04 | ) | | 1.57 | (b) | | 1.53 | | | — | | | — | | | — | | | 28.16 | | 0.95 | (d) | | 1.05 | (d) | | (0.42 | )(d) | | 111 | | 5.75 | (e) | | 0 |
| | | | | | | | | | | | | |
| Eagle Mid Cap Stock Fund | | | | | | | | | | | | | | | | | | | | | | | | | | | | | | | | | | | | |
| Class A* | | | | | | | | | | | | | | | | | | | | | | | | | | | | | | | | | | | | | | | | |
| 11/01/07 | | 10/31/08 | | 32.59 | | (0.09 | ) | | (10.83 | ) | | (10.92 | ) | | — | | | (3.33 | ) | | (3.33 | ) | | 18.34 | | 1.15 | | | 1.15 | | | (0.34 | ) | | 176 | | (37.04 | ) | | 780 |
| 11/01/06 | | 10/31/07 | | 30.12 | | (0.06 | ) | | 5.61 | (b) | | 5.55 | | | — | | | (3.08 | ) | | (3.08 | ) | | 32.59 | | 1.13 | | | 1.13 | | | (0.18 | ) | | 185 | | 20.08 | | | 1,312 |
| 11/01/05 | | 10/31/06 | | 27.79 | | (0.10 | ) | | 4.39 | (b) | | 4.29 | | | — | | | (1.96 | ) | | (1.96 | ) | | 30.12 | | 1.13 | | | 1.13 | | | (0.35 | ) | | 180 | | 16.18 | | | 904 |
| 11/01/04 | | 10/31/05 | | 24.57 | | (0.13 | ) | | 3.35 | (b) | | 3.22 | | | — | | | — | | | — | | | 27.79 | | 1.15 | | | 1.15 | | | (0.48 | ) | | 146 | | 13.11 | | | 633 |
| 11/01/03 | | 10/31/04 | | 21.67 | | (0.15 | ) | | 3.05 | | | 2.90 | | | — | | | — | | | — | | | 24.57 | | 1.20 | | | 1.20 | | | (0.64 | ) | | 124 | | 13.38 | | | 370 |
| Class C* | | | | | | | | | | | | | | | | | | | | | | | | | | | | | | | | | | | | | | | | |
| 11/01/07 | | 10/31/08 | | 29.62 | | (0.25 | ) | | (9.70 | ) | | (9.95 | ) | | — | | | (3.33 | ) | | (3.33 | ) | | 16.34 | | 1.88 | | | 1.88 | | | (1.07 | ) | | 176 | | (37.53 | ) | | 229 |
| 11/01/06 | | 10/31/07 | | 27.83 | | (0.26 | ) | | 5.13 | (b) | | 4.87 | | | — | | | (3.08 | ) | | (3.08 | ) | | 29.62 | | 1.88 | | | 1.88 | | | (0.94 | ) | | 185 | | 19.21 | | | 410 |
| 11/01/05 | | 10/31/06 | | 26.00 | | (0.29 | ) | | 4.08 | (b) | | 3.79 | | | — | | | (1.96 | ) | | (1.96 | ) | | 27.83 | | 1.88 | | | 1.88 | | | (1.10 | ) | | 180 | | 15.31 | | | 345 |
| 11/01/04 | | 10/31/05 | | 23.16 | | (0.31 | ) | | 3.15 | (b) | | 2.84 | | | — | | | — | | | — | | | 26.00 | | 1.90 | | | 1.90 | | | (1.23 | ) | | 146 | | 12.26 | | | 284 |
| 11/01/03 | | 10/31/04 | | 20.59 | | (0.31 | ) | | 2.88 | | | 2.57 | | | — | | | — | | | — | | | 23.16 | | 1.95 | | | 1.95 | | | (1.39 | ) | | 124 | | 12.48 | | | 214 |
| Class I* | | | | | | | | | | | | | | | | | | | | | | | | | | | | | | | | | | | | | | | | |
| 11/01/07 | | 10/31/08 | | 32.74 | | — | | | (10.92 | ) | | (10.92 | ) | | — | | | (3.33 | ) | | (3.33 | ) | | 18.49 | | 0.81 | | | 0.81 | | | (0.02 | ) | | 176 | | (36.85 | ) | | 79 |
| 11/01/06 | | 10/31/07 | | 30.15 | | 0.05 | | | 5.62 | (b) | | 5.67 | | | — | | | (3.08 | ) | | (3.08 | ) | | 32.74 | | 0.81 | | | 0.81 | | | 0.17 | | | 185 | | 20.50 | | | 94 |
| 06/06/06 | | 10/31/06 | | 28.21 | | (0.01 | ) | | 1.95 | (b) | | 1.94 | | | — | | | — | | | — | | | 30.15 | | 0.84 | (d) | | 0.84 | (d) | | (0.15 | )(d) | | 180 | | 6.88 | (e) | | 17 |
| Class R-3* | | | | | | | | | | | | | | | | | | | | | | | | | | | | | | | | | | | | |
| 11/01/07 | | 10/31/08 | | 32.52 | | (0.13 | ) | | (10.80 | ) | | (10.93 | ) | | — | | | (3.33 | ) | | (3.33 | ) | | 18.26 | | 1.33 | | | 1.33 | | | (0.53 | ) | | 176 | | (37.16 | ) | | 1 |
| 11/01/06 | | 10/31/07 | | 30.10 | | (0.10 | ) | | 5.60 | (b) | | 5.50 | | | — | | | (3.08 | ) | | (3.08 | ) | | 32.52 | | 1.29 | | | 1.29 | | | (0.33 | ) | | 185 | | 19.91 | | | 1 |
| 08/10/06 | | 10/31/06 | | 27.82 | | (0.04 | ) | | 2.32 | (b) | | 2.28 | | | — | | | — | | | — | | | 30.10 | | 1.27 | (d) | | 1.27 | (d) | | (0.60 | )(d) | | 180 | | 8.20 | (e) | | 0 |
| | |
| The accompanying notes are an integral part of the financial statements. | | 35 |
Financial Highlights
| | | | | | | | | | | | | | | | | | | | | | | | | | | | | | | | | | | | | | | |
| | | | | From investment operations | | | Dividends & distributions | | | | | Ratios to average daily net assets (%) | | | | | | | | |
Fiscal periods | | Beginning
net asset
value | | Income
(loss) | | | Realized &
unrealized
gain (loss) | | | Total | | | From
investment
income | | From
realized
gains | | | Total | | | Ending
net
asset
value | | With
expenses
waived/
recovered | | | Without
expenses
waived/
recovered | | | Net
income
(loss) | | | Portfolio
turnover
rate (%) | | Total
return
(%) (a) | | | Ending
net
assets
(millions) |
| Beginning | | Ending | | | | | | | | | | | | | | |
| Eagle Mid Cap Stock Fund (cont’d) | | | | | | | | | | | | | | | | | | | | | | | | | | | | | | | | | | | |
| Class R-5* | | | | | | | | | | | | | | | | | | | | | | | | | | | | | | | | | | | |
| 11/01/07 | | 10/31/08 | | $32.73 | | $0.02 | | | ($10.92 | ) | | ($10.90 | ) | | $— | | ($3.33 | ) | | ($3.33 | ) | | $18.50 | | 0.74 | | | 0.74 | | | 0.06 | | | 176 | | (36.80 | ) | | $24 |
| 11/01/06 | | 10/31/07 | | 30.13 | | 0.07 | | | 5.61 | (b) | | 5.68 | | | — | | (3.08 | ) | | (3.08 | ) | | 32.73 | | 0.75 | | | 0.75 | | | 0.23 | | | 185 | | 20.55 | | | 34 |
| 10/02/06 | | 10/31/06 | | 28.96 | | — | | | 1.17 | (b) | | 1.17 | | | — | | — | | | — | | | 30.13 | | 0.67 | (d) | | 0.67 | (d) | | (0.15 | )(d) | | 180 | | 4.04 | (e) | | 12 |
| | | | | | | | | | | | | |
| Eagle Small Cap Growth Fund | | | | | | | | | | | | | | | | | | | | | | | | | | | | | | | | | | | |
| Class A* | | | | | | | | | | | | | | | | | | | | | | | | | | | | | | | | | | | |
| 11/01/07 | | 10/31/08 | | 41.33 | | (0.16 | ) | | (12.81 | ) | | (12.97 | ) | | — | | (5.84 | ) | | (5.84 | ) | | 22.52 | | 1.27 | | | 1.27 | | | (0.50 | ) | | 51 | | (35.81 | ) | | 189 |
| 11/01/06 | | 10/31/07 | | 37.87 | | (0.15 | ) | | 6.46 | (b) | | 6.31 | | | — | | (2.85 | ) | | (2.85 | ) | | 41.33 | | 1.25 | | | 1.25 | | | (0.38 | ) | | 64 | | 17.65 | | | 327 |
| 11/01/05 | | 10/31/06 | | 32.93 | | (0.15 | ) | | 6.23 | (b) | | 6.08 | | | — | | (1.14 | ) | | (1.14 | ) | | 37.87 | | 1.24 | | | 1.24 | | | (0.43 | ) | | 49 | | 18.89 | | | 269 |
| 11/01/04 | | 10/31/05 | | 32.19 | | (0.13 | ) | | 2.43 | (b) | | 2.30 | | | — | | (1.56 | ) | | (1.56 | ) | | 32.93 | | 1.30 | | | 1.25 | | | (0.39 | ) | | 50 | | 7.08 | | | 225 |
| 11/01/03 | | 10/31/04 | | 29.00 | | (0.16 | ) | | 3.35 | | | 3.19 | | | — | | — | | | — | | | 32.19 | | 1.33 | | | 1.33 | | | (0.50 | ) | | 59 | | 11.00 | | | 182 |
| Class C* | | | | | | | | | | | | | | | | | | | | | | | | | | | | | | | | | | | |
| 11/01/07 | | 10/31/08 | | 36.69 | | (0.34 | ) | | (11.11 | ) | | (11.45 | ) | | — | | (5.84 | ) | | (5.84 | ) | | 19.40 | | 2.02 | | | 2.02 | | | (1.25 | ) | | 51 | | (36.26 | ) | | 59 |
| 11/01/06 | | 10/31/07 | | 34.17 | | (0.39 | ) | | 5.76 | (b) | | 5.37 | | | — | | (2.85 | ) | | (2.85 | ) | | 36.69 | | 2.00 | | | 2.00 | | | (1.12 | ) | | 64 | | 16.75 | | | 110 |
| 11/01/05 | | 10/31/06 | | 30.03 | | (0.38 | ) | | 5.66 | (b) | | 5.28 | | | — | | (1.14 | ) | | (1.14 | ) | | 34.17 | | 1.99 | | | 1.99 | | | (1.18 | ) | | 49 | | 18.02 | | | 100 |
| 11/01/04 | | 10/31/05 | | 29.70 | | (0.34 | ) | | 2.23 | (b) | | 1.89 | | | — | | (1.56 | ) | | (1.56 | ) | | 30.03 | | 2.05 | | | 2.00 | | | (1.13 | ) | | 50 | | 6.26 | | | 91 |
| 11/01/03 | | 10/31/04 | | 26.96 | | (0.36 | ) | | 3.10 | | | 2.74 | | | — | | — | | | — | | | 29.70 | | 2.08 | | | 2.08 | | | (1.26 | ) | | 59 | | 10.16 | | | 78 |
| Class I* | | | | | | | | | | | | | | | | | | | | | | | | | | | | | | | | | | | |
| 11/01/07 | | 10/31/08 | | 41.51 | | (0.08 | ) | | (12.87 | ) | | (12.95 | ) | | — | | (5.84 | ) | | (5.84 | ) | | 22.72 | | 0.93 | | | 0.93 | | | (0.27 | ) | | 51 | | (35.57 | ) | | 10 |
| 11/01/06 | | 10/31/07 | | 37.91 | | (0.06 | ) | | 6.51 | (b) | | 6.45 | | | — | | (2.85 | ) | | (2.85 | ) | | 41.51 | | 0.95 | | | 0.96 | | | (0.15 | ) | | 64 | | 18.03 | | | 2 |
| 06/27/06 | | 10/31/06 | | 33.68 | | (0.02 | ) | | 4.25 | (b) | | 4.23 | | | — | | — | | | — | | | 37.91 | | 0.95 | (d) | | 1.08 | (d) | | (0.14 | )(d) | | 49 | | 12.56 | (e) | | 0 |
| Class R-3* | | | | | | | | | | | | | | | | | | | | | | | | | | | | | | | | | | | |
| 11/01/07 | | 10/31/08 | | 41.25 | | (0.20 | ) | | (12.77 | ) | | (12.97 | ) | | — | | (5.84 | ) | | (5.84 | ) | | 22.44 | | 1.42 | | | 1.42 | | | (0.67 | ) | | 51 | | (35.88 | ) | | 1 |
| 11/01/06 | | 10/31/07 | | 37.88 | | (0.28 | ) | | 6.50 | (b) | | 6.22 | | | — | | (2.85 | ) | | (2.85 | ) | | 41.25 | | 1.37 | | | 1.37 | | | (0.65 | ) | | 64 | | 17.40 | | | 1 |
| 09/19/06 | | 10/31/06 | | 35.99 | | (0.03 | ) | | 1.92 | (b) | | 1.89 | | | — | | — | | | — | | | 37.88 | | 1.60 | (d) | | 2.05 | (d) | | (1.04 | )(d) | | 49 | | 5.25 | (e) | | 0 |
| Class R-5* | | | | | | | | | | | | | | | | | | | | | | | | | | | | | | | | | | | |
| 11/01/07 | | 10/31/08 | | 41.50 | | (0.05 | ) | | (12.89 | ) | | (12.94 | ) | | — | | (5.84 | ) | | (5.84 | ) | | 22.72 | | 0.90 | | | 0.90 | | | (0.15 | ) | | 51 | | (35.55 | ) | | 11 |
| 11/01/06 | | 10/31/07 | | 37.88 | | — | | | 6.47 | (b) | | 6.47 | | | — | | (2.85 | ) | | (2.85 | ) | | 41.50 | | 0.88 | | | 0.88 | | | (0.01 | ) | | 64 | | 18.10 | | | 15 |
| 10/02/06 | | 10/31/06 | | 35.86 | | — | | | 2.02 | (b) | | 2.02 | | | — | | — | | | — | | | 37.88 | | 0.83 | (d) | | 0.83 | (d) | | (0.10 | )(d) | | 49 | | 5.63 | (e) | | 13 |
* Per share amounts have been calculated using the monthly average share method.
(a) Total returns are calculated without the imposition of either front-end or contingent deferred sales charges. (b) Redemption fee amounts represent less than $0.01 per share. (c) Denotes a partial period when the Eagle Capital Appreciation Fund and Eagle Growth & Income Fund changed their fiscal and tax year ends to October 31. (d) Annualized. (e) Not annualized.
| | |
| 36 | | The accompanying notes are an integral part of the financial statements. |
Notes to Financial Statements
NOTE 1 | Organization and investment objective The Eagle Capital Appreciation Fund, Eagle Growth & Income Fund and Eagle Series Trust, formerly known as the Heritage Capital Appreciation Trust, Heritage Growth and Income Trust and Heritage Series Trust, respectively (each a “Trust” and collectively the “Trusts”) are organized as separate Massachusetts business trusts and are registered under the Investment Company Act of 1940, as amended, as diversified, open-end management investment companies. Each Trust offers shares in the following series (each a “Fund” and collectively the “Funds”).
| | • | | The Eagle Capital Appreciation Fund (“Capital Appreciation Fund”), formerly known as Heritage Capital Appreciation Trust, seeks long-term capital appreciation. |
| | • | | The Eagle Growth & Income Fund (“Growth & Income Fund”), formerly known as Heritage Growth and Income Trust, primarily seeks long-term capital appreciation and, secondarily, seeks current income. |
The Eagle Series Trust currently offers shares in five series:
| | • | | The Eagle International Equity Fund (“International Equity Fund”), formerly known as the International Equity Fund, seeks capital appreciation principally through investment in a portfolio of international equity securities, |
| | • | | The Eagle Large Cap Core Fund (“Large Cap Core Fund”), formerly known as the Core Equity Fund, seeks long-term growth through capital appreciation, |
| | • | | The Eagle Mid Cap Growth Fund (“Mid Cap Growth Fund”), formerly known as the Diversified Growth Fund, seeks long-term capital appreciation, |
| | • | | The Eagle Mid Cap Stock Fund (“Mid Cap Stock Fund”), formerly known as the Mid Cap Stock Fund, seeks long-term capital appreciation, and |
| | • | | The Eagle Small Cap Growth Fund (“Eagle Small Cap Growth Fund”), formerly known as the Small Cap Stock Fund, seeks long-term capital appreciation. |
For the fiscal year ended October 31, 2008, Heritage Asset Management, Inc. (the “Manager”) served as the investment adviser and administrator of the Funds. Effective November 1, 2008, the Manager, as part of a corporate reorganization (the “Reorganization”), transferred its advisory and administrative service agreements with the Trusts to its affiliate, Eagle Asset Management, Inc. (“Eagle”). During the fiscal year ending October 31, 2009, Eagle will serve as the adviser and administrator for each Trust and Fund.
In accordance with the Reorganization, the names of the Trusts and Funds were changed on October 31, 2008 to reflect Eagle as the new adviser and administrator. The Eagle Family of Funds consist of the Trusts in addition to another investment company advised by the Manager, the Heritage Cash Trust. Members of the Boards of Trustees (the “Board”) for the Trusts may serve as trustees for one or more Trusts.
Class offerings Each Fund is authorized and currently offers Class A and Class C shares to the public and Class I, Class R-3 and Class R-5 shares to qualified buyers.
| | • | | Class A shares are sold at a maximum front-end sales charge of 4.75%. Class A share investments greater than $1 million, which are not sold subject to a sales charge, may be subject to a contingent deferred sales charge (“CDSC”) of 1% of the lower of net asset value (“NAV”) or purchase price if redeemed within 18 months of purchase. |
| | • | | Class C shares are sold subject to a CDSC of 1% of the lower of NAV or purchase price if redeemed prior to one year of purchase. |
| | • | | Class I, Class R-3 and Class R-5 shares are each sold without a front-end sales charge or a CDSC to qualified buyers. As of the fiscal year ended October 31, 2008, there were no shares issued in Class I for the Growth & Income Fund or the International Equity Fund. There were also no shares issued in Class R-3 for the Growth & Income Fund, International Equity Fund, Large Cap Core Fund or Mid Cap Growth Fund nor were there shares issued in Class R-5 for the Growth & Income Fund, International Equity Fund or the Mid Cap Growth Fund. |
| | • | | Class B shares, an additional class of shares, are no longer offered. As of March 30, 2007, all Class B shares were converted to Class A shares and are no longer outstanding. The conversion from Class B shares was not a taxable event and shareholders, as of the conversion date, were not charged a CDSC. |
NOTE 2 | Significant accounting policies
Use of estimates The preparation of financial statements in accordance with accounting principles generally accepted in the United States of America requires management to make estimates and assumptions that affect the reported amounts and disclosures. Actual results could differ from those estimates and those differences could be material.
Valuation of securities The price of each Fund’s shares is based on the Fund’s NAV per share. Each Fund determines the NAV of its shares on each day the New York Stock Exchange
Notes to Financial Statements
(“NYSE”) is open for business, as of the close of the regular trading session (typically 4:00 ET), or earlier NYSE closing time that day. If the NYSE or other securities exchange modifies the closing price of securities traded on that exchange after the Fund is priced, the Manager is not required to revalue the Fund.
Generally, the Funds value portfolio securities for which market quotations are readily available at market value; however, the Fund may adjust the market quotation price to reflect events that occur between the close of those markets and the time of the Fund’s determination of the NAV.
Both the latest transaction prices and adjustments are furnished by an independent pricing service subject to supervision by the Board. The Funds value all other securities and assets for which market quotations are unavailable or unreliable at their fair value in good faith using procedures (“Procedures”) approved by the Board. Fair value is that amount that the owner might reasonably expect to receive for the security upon its current sale. Fair value requires consideration of all appropriate factors, including indications of fair value available from pricing services. A fair value price is an estimated price and may vary from the prices used by other mutual funds to calculate their NAVs. Fair value pricing methods, Procedures and pricing services can change from time to time as approved by the Board. Pursuant to the Procedures, the Board has delegated the day-to-day responsibility for applying and administering the Procedures to a valuation committee comprised of certain officers of the Trusts and other employees of the Manager (“Valuation Committee”). The composition of this Valuation Committee may change from time to time.
There can be no assurance, however, that a fair value price used by a Fund on any given day will more accurately reflect the market value of a security or securities than the market price of such security or securities on that day. Fair value pricing may deter shareholders from trading the Fund shares on a frequent basis in an attempt to take advantage of arbitrage opportunities resulting from potentially stale prices of portfolio holdings. However, it cannot eliminate the possibility of frequent trading. Specific types of securities are valued as follows:
| | • | | Domestic exchange traded equity securities Market quotations are generally available and reliable for domestic exchange traded equity securities. If market quotations are not available or are unreliable, the Manager will value the security at fair value in good faith using the Procedures. |
| | • | | Foreign securities If market quotations from a pricing source are available and reliable for foreign exchange traded equity securities, the securities will be valued at the market quotations. Because trading hours for certain foreign securities end before the close of the NYSE, closing market quotations may become unreliable. The Manager relies on a screening process from a fair valuation vendor to indicate the degree of certainty, based on historical data, that the closing price in the principal market where a foreign security trades is not reliable and does not reflect the current market value as of the close of the NYSE. Consequently, fair valuation of portfolio securities may occur on a daily basis. The Fund may also fair value a security if certain events occur between the time trading ends on a particular security and the time of the Fund’s NAV calculation. The Fund may fair value the particular security if the events are significant and make the closing price unreliable. If an issuer specific event has occurred that the Manager determines, in its judgment, is likely to have affected the closing price of a foreign security, it will price the security at fair value. Securities and other assets quoted in foreign currencies are valued in U.S. dollars based on exchange rates provided by a pricing service. The pricing vendor, pricing methodology or degree of certainty may change from time to time. Fund securities primarily traded on foreign markets may trade on days that are not business days of the Fund. Because the NAV of Fund shares is determined only on business days of the Fund, the value of the portfolio securities of a Fund that invests in foreign securities may change on days when you will not be able to purchase or redeem shares of the Fund. |
| | • | | Fixed income securities Government, corporate, asset-backed and municipal bonds and convertible securities, including high yield or junk bonds, normally are valued on the basis of prices provided by independent pricing services. Prices provided by the pricing services may be determined without exclusive reliance on quoted prices, and may reflect appropriate factors such as institution-size trading in similar groups of securities, developments related to special securities, dividend rate, maturity and other market data. If the prices provided by the pricing service and independent quoted prices are unreliable, the Valuation Committee will fair value the security using the Procedures. |
| | • | | Short-term securities The amortized cost method of security valuation is used by the Funds (as set forth in Rule 2a-7 under the Investment Company Act of 1940, as amended) |
Notes to Financial Statements
| | for short-term investments (investments that have a maturity date of 60 days or less). The amortized cost of an instrument is determined by valuing it at cost as of the time of purchase and thereafter accreting/amortizing any purchase discount/premium at a constant rate until maturity. Amortized cost approximates market value. |
Foreign currency transactions The books and records of each Fund are maintained in U.S. dollars. Foreign currency transactions are translated into U.S. dollars on the following basis: (i) market value of investment securities, other assets and other liabilities at the daily rates of exchange, and (ii) purchases and sales of investment securities, dividend and interest income and certain expenses at the rates of exchange prevailing on the respective dates of such transactions. Each Fund does not isolate that portion of gains and losses on investments which is due to changes in foreign exchange rates from that which is due to changes in market prices of the investments. Such fluctuations are included with the net realized and unrealized gains and losses from investment transactions. Net realized gain (loss) from foreign currency transactions and the net change in unrealized appreciation (depreciation) on translation of assets and liabilities denominated in foreign currencies include gains and losses between trade and settlement date on securities transactions, gains and losses arising from the purchase and sale of forward foreign currency contracts and gains and losses between the ex and payment dates on dividends, interest and foreign withholding taxes.
Forward foreign currency contracts Each of the Funds except the Small Cap Growth Fund is authorized to enter into forward foreign currency contracts which are used primarily to hedge against foreign currency exchange rate risk on its non-U.S. dollar denominated investment securities. Forward foreign currency contracts are valued on each valuation day and the unrealized gain or loss is included in the Statement of Assets and Liabilities. When the contracts are closed, the gain or loss is realized. Realized and unrealized gains and losses are included in the Statements of Operations. Risks may arise from unanticipated movements in the currency’s value relative to the U.S. dollar and from the possible inability of counter-parties to meet the terms of their contracts.
Real estate investment trusts (“REITs”) There are certain additional risks involved in investing in REITs. These include, but are not limited to, economic conditions, changes in zoning laws, real estate values, property taxes and interest rates. Dividend income is recorded at the Manager’s estimate of the income included in distributions from the REIT investments.
Distributions received in excess of the estimated amount are recorded as a reduction of the cost of the investments. The actual amounts of income, return of capital and capital gains are only determined by each REIT after the fiscal year end and may differ from the estimated amounts.
Repurchase agreements Each Fund enters into repurchase agreements whereby a Fund, through its custodian, receives delivery of the underlying securities, the market value of which at the time of purchase is required to be in an amount of at least 100% of the resale price. Repurchase agreements involve the risk that the seller will fail to repurchase the security, as agreed. In that case, each Fund will bear the risk of market value fluctuations until the security can be sold and may encounter delays and incur costs in liquidating the security. In the event of bankruptcy or insolvency of the seller, delays and costs may be incurred.
Revenue recognition Investment security transactions are accounted for on a trade date basis. Dividend income is recorded on the ex-dividend date. Interest income is recorded on an accrual basis.
Expenses Each Fund is charged for those expenses that are directly attributable to it, while other expenses are allocated proportionately among the Eagle Family of Funds based upon methods approved by the Boards of Trustees. Expenses that are directly attributable to a specific class of shares, such as distribution fees, shareholder servicing fees and administrative fees, are charged directly to that class. Other expenses of each Fund are allocated to each class of shares based upon their relative percentage of net assets. The Funds have entered into an arrangement with the custodian whereby each Fund receives credits on uninvested cash balances which are used to offset a portion of each Fund’s expenses. These custodian credits are shown as “Expense offsets” in the Statements of Operations.
Class allocations Each class of shares has equal rights to earnings and assets except that each class may bear different expense for administration, distribution and/or shareholder services. Income, expenses (other than expenses attributable to a specific class), and realized and unrealized gains or losses on investments are allocated to each class of shares based on its relative net assets.
Distribution of income and gains In each of the Funds except the Growth & Income Fund, distributions of net investment income are made annually. In the Growth & Income Fund, distributions of net investment income are made quarterly. Net realized gains from investment transactions during any particular year
Notes to Financial Statements
in excess of available capital loss carryforwards, which, if not distributed, would be taxable to each Fund, will be distributed to shareholders in the following fiscal year. Each Fund uses the identified cost method for determining realized gain or loss on investments for both financial and federal income tax reporting purposes.
All dividends paid by the Funds from net investment income are deemed to be ordinary income for Federal income tax purposes. Dividends paid by each Fund to shareholders from net investment income were as follows:
| | | | |
| Distributions from net investment income | | 11/1/07 to
10/31/08 | | 11/1/06 to
10/31/07 |
| Growth & Income Fund | | | | |
| Class A | | $2,220,577 | | $1,699,237 |
| Class B | | — | | 47,329 |
| Class C | | 912,376 | | 793,110 |
| International Equity Fund | | | | |
| Class A | | — | | 1,450,575 |
| Class B | | — | | 63,016 |
| Class C | | — | | 1,332,739 |
| Large Cap Core Fund | | | | |
| Class A | | 189,225 | | 112,366 |
| Class I | | 2,068,073 | | 1,093,634 |
| Class R-5 | | 6,938 | | — |
Dividends paid by each Fund to shareholders from net realized gains were as follows:
| | | | |
| Distributions from net realized gains | | 11/1/07 to
10/31/08 | | 11/1/06 to
10/31/07 |
| Capital Appreciation Fund | | | | |
| Class A | | $72,026,182 | | $2,342,132 |
| Class B | | — | | 248,003 |
| Class C | | 23,540,004 | | 969,213 |
| Class I | | 6,558,868 | | 189,247 |
| Class R-3 | | 43,729 | | — |
| Class R-5 | | 1,474,877 | | 39,845 |
| Growth & Income Fund | | | | |
| Class A | | 10,152,491 | | 2,351,802 |
| Class B | | — | | 355,867 |
| Class C | | 6,280,654 | | 1,698,632 |
| International Equity Fund | | | | |
| Class A | | 13,242,330 | | 6,501,098 |
| Class B | | — | | 433,516 |
| Class C | | 16,489,239 | | 9,168,515 |
| | | | |
| Distributions from net realized gains (cont’d) | | 11/1/07 to
10/31/08 | | 11/1/06 to
10/31/07 |
| Large Cap Core Fund | | | | |
| Class A | | 1,122,952 | | 177,172 |
| Class C | | 746,545 | | 110,846 |
| Class I | | 7,962,962 | | 970,108 |
| Class R-5 | | 25,166 | | — |
| Mid Cap Growth Fund | | | | |
| Class A | | $19,595,467 | | $12,109,563 |
| Class B | | — | | 1,297,838 |
| Class C | | 11,691,182 | | 6,201,901 |
| Class I | | 3,067 | | 1,246 |
| Mid Cap Stock Fund | | | | |
| Class A | | 132,489,950 | | 94,068,687 |
| Class B | | — | | 6,231,135 |
| Class C | | 45,853,865 | | 38,164,272 |
| Class I | | 10,126,151 | | 2,180,424 |
| Class R-3 | | 156,975 | | 42,742 |
| Class R-5 | | 3,591,397 | | 1,230,356 |
| Small Cap Growth Fund | | | | |
| Class A | | 45,150,387 | | 20,253,581 |
| Class B | | — | | 747,867 |
| Class C | | 17,297,442 | | 8,258,155 |
| Class I | | 277,914 | | 61,663 |
| Class R-3 | | 115,250 | | 544 |
| Class R-5 | | 2,091,439 | | 966,637 |
Other In the normal course of business the Funds enter into contracts that contain a variety of representations and warranties, which provide general indemnifications. The Funds’ maximum exposure under these arrangements is unknown, as this would involve future claims that may be made against the Funds and/or its affiliates that have not yet occurred. However, based on experience, the risk of loss to each Fund is expected to be remote.
Redemption fees Effective January 2, 2007, a redemption fee was no longer imposed for any type of transaction. Prior to January 2, 2007, a redemption fee of 2% of the value of the shares sold was imposed on fund shares sold (by redemption or exchange to another Fund) within a specified period of time of their acquisition by purchase or exchange. Redemption fees were accounted for as an addition to paid-in capital and offset the costs and market impact associated with short-term money movements.
Notes to Financial Statements
NOTE 3 | Purchases and sales of securities For the fiscal year ended October 31, 2008, purchases and sales of investment securities (excluding repurchase agreements and short-term obligations) were as follows:
| | | | |
| | | Purchases | | Sales |
| Capital Appreciation Fund | | $401,327,401 | | $439,041,092 |
| Growth & Income Fund | | 88,613,644 | | 79,610,859 |
| International Equity Fund | | 326,280,070 | | 414,483,180 |
| Large Cap Core Fund | | 114,636,964 | | 79,671,285 |
| Mid Cap Growth Fund | | 254,310,528 | | 241,534,184 |
| Mid Cap Stock Fund | | 2,749,031,441 | | 2,835,181,887 |
| Small Cap Growth Fund | | 184,151,674 | | 211,688,450 |
NOTE 4 | Investment advisory fees and other transactions with affiliates Each Fund agreed to pay to the Manager an investment advisory and an administrative fee equal to an annualized rate based on a percentage of each Fund’s average daily net assets, which is computed daily and payable monthly. For advisory services provided by the Manager, the investment advisory rate for each Fund was as follows:
| | | | |
Investment advisory fee
rate schedule | | Breakpoint | | Investment
advisory fee |
| Capital Appreciation Fund | | First $1 billion
Over $1 billion | | 0.60%
0.55% |
| Growth & Income Fund | | First $100 million
$100 million to $500 million Over $500 million | | 0.60%
0.45% 0.40% |
| International Equity Fund | | First $100 million
$100 million to $1 billion Over $1 billion | | 0.85%
0.65% 0.55% |
| Large Cap Core Fund | | All assets | | 0.60% |
Mid Cap Growth Fund, Mid Cap Stock Fund and Small Cap Growth Fund | | First $500 million
$500 million to $1 billion Over $1 billion | | 0.60%
0.55% 0.50% |
For administrative services provided by the Manager, each Fund agreed to pay an administrative rate of 0.15% for Class A, Class C and Class R-3 shares and 0.10% for Class I and Class R-5. For the fiscal year ended October 31, 2008, the amount of administrative fees charged to the Funds were as follows:
| | | | | | |
| Administrative fees | | Class A | | | | Class C |
| Capital Appreciation Fund | | $737,682 | | | | $207,584 |
| Growth & Income Fund | | 128,903 | | | | 76,143 |
| International Equity Fund | | 212,759 | | | | 236,473 |
| Large Cap Core Fund | | 30,145 | | | | 20,464 |
| Mid Cap Growth Fund | | 179,472 | | | | 90,918 |
| Mid Cap Stock Fund | | 1,659,305 | | | | 511,446 |
| Small Cap Growth Fund | | 398,639 | | | | 131,809 |
| | | | | | |
| | | |
Administrative fees (cont’d) | | Class I | | Class R-3 | | Class R-5 |
| Capital Appreciation Fund | | $36,793 | | $473 | | $13,987 |
| Large Cap Core Fund | | 169,643 | | — | | 343 |
| Mid Cap Growth Fund | | 99 | | — | | — |
| Mid Cap Stock Fund | | 95,123 | | 2,141 | | 31,852 |
| Small Cap Growth Fund | | 2,426 | | 1,294 | | 13,521 |
Subadvisory fees The Manager entered into subadvisory agreements with certain parties to provide to the Funds investment advice, portfolio management services (including the placement of brokerage orders), certain compliance and other services.
The Manager entered into subadvisory agreements with unaffiliated parties to serve as subadviser to the Capital Appreciation Fund, Growth & Income Fund and International Equity Fund for the fiscal year ended October 31, 2008. The Manager also entered into subadvisory agreements with Eagle to serve as an additional subadviser to the Capital Appreciation Fund and Growth & Income Fund; however, the Manager did not allocate any assets of these Funds to Eagle.
For the fiscal year ended October 31, 2008, to serve as sole subadviser to the Large Cap Core Fund, Mid Cap Growth Fund and the Mid Cap Stock Fund, the Manager entered into subadvisory agreements with Eagle. Eagle Boston Investment Management, Inc. (“EBIM”), formerly known as Awad Asset Management, Inc., an affiliate of the Manager, and Eagle entered into subadvisory agreements with the Manager to serve as subadvisers for the Small Cap Growth Fund for the fiscal year ended October 31, 2008. For these subadvisory agreements with Eagle and EBIM, the Manager was charged an annualized rate as a percentage of each Fund’s average daily net assets, computed daily and payable monthly. For the Large Cap Core Fund, the rate charged was 0.375% on all Fund assets. For the Mid Cap Growth Fund, Mid Cap Stock Fund and Small Cap Growth Fund the rate charged to each Fund was 0.375% on the first $500 million of total assets, 0.35% on assets between $500 million and $1 billion, and 0.325% on all assets over $1 billion.
Distribution fees For the fiscal year ended October 31, 2008, pursuant to the Class A, Class C and Class R-3 Distribution plans and in accordance with Rule 12b-1 of the Investment Company Act of 1940, as amended, the Funds were authorized to pay Heritage Fund Distributors, Inc. (the “Distributor”), a wholly owned subsidiary of the Manager, a fee based on the average daily net assets for each class of shares, accrued daily and payable monthly. The distribution rate for Class A shares
Notes to Financial Statements
was 0.25%; for Class C shares was 1% and for Class R-3 shares was 0.50%. The Distribution plan for Class I and Class R-5 shares did not authorize a distribution fee to be paid from Fund assets. For the fiscal year ended October 31, 2008, the amount of distribution fees charged to the Funds were as follows:
| | | | | | |
| Distribution fees | | Class A | | Class C | | Class R-3 |
| Capital Appreciation Fund | | $1,229,468 | | $1,383,893 | | $1,578 |
| Growth & Income Fund | | 214,839 | | 507,620 | | — |
| International Equity Fund | | 354,599 | | 1,576,484 | | — |
| Large Cap Core Fund | | 50,242 | | 136,425 | | — |
| Mid Cap Growth Fund | | 299,119 | | 606,123 | | — |
| Mid Cap Stock Fund | | 2,765,508 | | 3,409,639 | | 7,138 |
| Small Cap Growth Fund | | 664,397 | | 878,729 | | 4,315 |
Pursuant to the Reorganization, the Distributor changed its name to Eagle Fund Distributors, Inc. effective November 1, 2008. The Manager, the Distributor, Eagle and EBIM are all wholly owned subsidiaries of Raymond James Financial, Inc. (“RJF”).
Sales charges For the fiscal year ended October 31, 2008, total front-end and CDSCs paid to the Distributor were as follows:
| | | | | | |
| | | Front-end
sales charge | | Contingent
deferred
sales charges |
| | | Class A | | Class A | | Class C |
| Capital Appreciation Fund | | $157,504 | | $— | | $7,265 |
| Growth & Income Fund | | 123,553 | | — | | 9,880 |
| International Equity Fund | | 147,733 | | — | | 27,093 |
| Large Cap Core Fund | | 8,200 | | — | | 983 |
| Mid Cap Growth Fund | | 44,422 | | — | | 1,896 |
| Mid Cap Stock Fund | | 467,654 | | 236 | | 28,443 |
| Small Cap Growth Fund | | 114,847 | | 203 | | 6,519 |
The Distributor paid commissions to salespersons from these fees and incurred other distribution costs.
Agency commissions For the fiscal year ended October 31, 2008, total agency brokerage commissions paid by the Funds and agency brokerage commissions paid directly to Raymond James & Associates, Inc., an affiliate of the Manager, were as follows:
| | | | |
| | | Total agency
brokerage commissions | | Paid to Raymond
James & Associates, Inc. |
| Capital Appreciation Fund | | $602,871 | | $— |
| Growth & Income Fund | | 98,095 | | — |
| International Equity Fund | | 602,804 | | 1,264 |
| Large Cap Core Fund | | 171,508 | | — |
| | | | |
| | | Total agency
brokerage commissions | | Paid to Raymond
James & Associates, Inc. |
| Mid Cap Growth Fund | | $497,346 | | $4,154 |
| Mid Cap Stock Fund | | 4,597,292 | | 73,531 |
| Small Cap Growth Fund | | 524,825 | | 14,052 |
Fund accounting fees For the fiscal year ended October 31, 2008, the Manager was the Fund Accountant for each of the Funds except the International Equity Fund. For providing fund accounting services, the Manager received payment from the Funds at a fixed base fee per fund, a multiple class fee and any out-of-pocket expenses. These fees are disclosed on each Fund’s Statement of Operations. The custodian, not the Manager, provides fund accounting services for the International Equity Fund.
Shareholder servicing fees The Manager was the Shareholder Servicing Agent for each of the Funds. For providing shareholder services, the Manager received payment from the Funds at a fixed fee per shareholder account plus any out-of-pocket expenses. For the fiscal year ended October 31, 2008, the amount of Shareholder Servicing fees charged to the Funds were as follows:
| | | | | | |
| Shareholder servicing fees | | Class A | | | | Class C |
| Capital Appreciation Fund | | $678,518 | | | | $190,380 |
| Growth & Income Fund | | 113,160 | | | | 67,874 |
| International Equity Fund | | 137,071 | | | | 159,876 |
| Large Cap Core Fund | | 20,023 | | | | 25,965 |
| Mid Cap Growth Fund | | 161,140 | | | | 83,655 |
| Mid Cap Stock Fund | | 1,789,315 | | | | 492,307 |
| Small Cap Growth Fund | | 451,957 | | | | 149,297 |
| | | |
| Shareholder servicing fees (cont’d) | | Class I | | Class R-3 | | Class R-5 |
| Capital Appreciation Fund | | $10,442 | | $347 | | $9,366 |
| Large Cap Core Fund | | 300,250 | | — | | 131 |
| Mid Cap Growth Fund | | 157 | | — | | — |
| Mid Cap Stock Fund | | 121,855 | | 1,342 | | 17,409 |
| Small Cap Growth Fund | | 2,946 | | 628 | | 13,882 |
Expense limitations For the periods indicated in the table below, the Manager and Eagle have contractually agreed to waive its fees and/or reimburse expenses to each class to the extent that the annual operating expense rate for each class of shares exceed the following annualized rates as a percentage of average daily net assets of each class of shares.
Notes to Financial Statements
| | | | | | |
| Expense limitations rate schedule | | 3/1/08 to
2/28/09 | | | 1/2/07 to
2/29/08 | |
| Capital Appreciation Fund | | | | | | |
| Class A | | 1.35% | | | 1.35% | |
| Class C | | 2.15% | | | 2.15% | |
| Class I | | 0.95% | | | 0.95% | |
| Class R-3 | | 1.65% | | | 1.65% | |
| Class R-5 | | 0.95% | | | 0.95% | |
| Growth & Income Fund | | | | | | |
| Class A | | 1.35% | | | 1.35% | |
| Class C | | 2.15% | | | 2.15% | |
| Class I | | 0.95% | (a) | | N/A | |
| Class R-3 | | 1.65% | (a) | | N/A | |
| Class R-5 | | 0.95% | (a) | | N/A | |
| International Equity Fund | | | | | | |
| Class A | | 1.65% | | | 1.65% | (b) |
| Class C | | 2.45% | | | 2.45% | (b) |
| Class I | | 1.15% | (a) | | N/A | |
| Class R-3 | | 1.75% | (a) | | N/A | |
| Class R-5 | | 1.15% | (a) | | N/A | |
| Large Cap Core Fund | | | | | | |
| Class A | | 1.35% | | | 1.65% | |
| Class C | | 2.15% | | | 2.45% | |
| Class I | | 0.95% | | | 0.95% | |
| Class R-3 | | 1.65% | | | 1.95% | |
| Class R-5 | | 0.95% | | | 0.95% | |
| Mid Cap Growth Fund | | | | | | |
| Class A | | 1.45% | | | 1.60% | |
| Class C | | 2.25% | | | 2.40% | |
| Class I | | 0.95% | | | 0.95% | |
| Class R-3 | | 1.75% | | | 1.90% | |
| Class R-5 | | 0.95% | | | 0.95% | |
| Mid Cap Stock Fund | | | | | | |
| Class A | | 1.45% | | | 1.45% | |
| Class C | | 2.25% | | | 2.25% | |
| Class I | | 0.95% | | | 0.95% | |
| Class R-3 | | 1.75% | | | 1.75% | |
| Class R-5 | | 0.95% | | | 0.95% | |
| Small Cap Growth Fund | | | | | | |
| Class A | | 1.40% | | | 1.40% | |
| Class C | | 2.20% | | | 2.20% | |
| Class I | | 0.95% | | | 0.95% | |
| Class R-3 | | 1.60% | | | 1.60% | |
| Class R-5 | | 0.95% | | | 0.95% | |
| (a) Rate effective September 15, 2008. (b) Effective July 1, 2007, the Manager voluntarily, but not contractually, agreed to waive its fees and/or reimburse expenses to Class A and Class C shares to the extent that the annual operating expense rate for each of these classes of shares exceed 1.45% and 2.25%, respectively, of those shares average daily net assets. | |
For the fiscal year ended October 31, 2008, fees and expenses waived and/or reimbursed based on the expense rate limitation schedule were as follows:
| | | | |
| Expenses waived and/or reimbursed | | Class I | | Class R-5 |
| Large Cap Core Fund | | $148,145 | | $113 |
| Mid Cap Growth Fund | | 83 | | — |
For the fiscal year ended October 31, 2008, a portion or all of a Fund’s fees and expenses previously waived and/or reimbursed by the Manager may be recoverable by Eagle prior to their expiration date. Eagle must recover from the same class of shares any previously waived and/or reimbursed fees and expenses within two years from the Fund’s fiscal year end during which the fees and expenses where originally waived and/or reimbursed. Previously waived and/or reimbursed fees and expenses are recovered by Eagle when expenses in the current fiscal year fall below the expense rate limitation in effect. The following table shows the amounts that Eagle may be allowed to recover by class of shares and the date in which these amounts will expire.
| | | | |
| Recoverable expenses | | 10/31/10 | | 10/31/09 |
| Growth & Income Fund Class A | | $— | | $38,361 |
| Growth & Income Fund Class C | | — | | 6,357 |
| Large Cap Core Fund Class I | | 148,145 | | 142,963 |
| Large Cap Core Fund Class R-5 | | 113 | | — |
| Mid Cap Growth Fund Class I | | 83 | | 21 |
| Small Cap Growth Fund Class I | | — | | 29 |
For the fiscal year ended October 31, 2008, the Manager recovered previously waived expenses from the Capital Appreciation Fund’s class R-3 shares in the amount of $2, the Growth & Income Fund’s class A shares in the amount of $14,008 and class C shares in the amount of $32,830 and the Small Cap Growth Fund’s class I shares in the amount of $1.
Trustees and officers compensation Each member of the Board of Trustees who was not an employee of the Manager received an annual retainer along with meeting fees for the Eagle Family of Funds’ regular or special meetings attended in person and 25% of such fees are received for telephonic meetings. All reasonable out-of-pocket expenses were also reimbursed. Trustees’ fees and expenses were allocated on a pro rata basis among each portfolio in the Eagle Family of Funds for which a Trustee was elected to serve. Certain Officers of the Trusts were also Officers and/or Directors of the Manager. Such Officers received no compensation from the Funds except for the Funds’ Chief Compliance
Notes to Financial Statements
Officer. A portion of the Chief Compliance Officer’s total compensation was paid equally by each portfolio in the Eagle Family of Funds.
NOTE 5 | Federal income taxes and distributions Each fund is treated as a single corporate taxpayer as provided for in the Tax Reform Act of 1986, as amended. Accordingly, no provision for federal income taxes is required since the Funds intend to continue to qualify as a regulated investment company under Subchapter M of the Internal Revenue Code and distribute to shareholders all of its taxable income and gains. Federal income tax regulations differ from generally accepted accounting principles; therefore, distributions determined in accordance with tax regulations may differ significantly in amount or character from net investment income and realized gains for financial reporting purposes. Financial reporting records are adjusted for permanent book/ tax differences to reflect tax character; these adjustments have no effect on net assets or NAV per share. Financial reporting records are not adjusted for temporary differences. The Funds have adopted the provisions of Financial Accounting Standards Board (“FASB”) Interpretation No. 48, “Accounting for Uncertainty in Income Taxes,” which prescribes a minimum threshold for financial statement recognition of the benefit of a tax position taken or expected to be taken in a tax return. The Manager has evaluated the Funds’ tax positions taken for all open tax years and has concluded that no provision for income tax is required in the Funds’ financial statements.
Capital Appreciation Fund For the fiscal year ended October 31, 2008, to reflect reclassifications arising from permanent book/ tax differences primarily attributable to net operating losses not utilized and the expiration of capital loss carryforwards, the Capital Appreciation Fund increased (credited) accumulated net investment loss by $3,880,656 and accumulated net realized loss by $3,321,183 and decreased (debited) paid-in capital by $7,201,839. As of October 31, 2008, the Capital Appreciation Fund had net tax basis capital loss carryforwards in the aggregate of $33,392,053 of which $312,719 may be applied to any net taxable capital gain until October 31, 2009 with the balance of $33,079,334 expiring on October 31, 2016.
Growth & Income Fund For the period ended October 31, 2008, to reflect reclassifications arising from permanent book/tax differences primarily attributable to foreign currency transactions and adjustments for partnership income, the Growth & Income Fund increased (credited) accumulated net realized loss by $296,093 and decreased (debited) accumulated net investment loss by $76,245 and paid-in capital by $219,848. As of October 31, 2008, the
Growth & Income Fund had net tax basis capital loss carryforwards of $11,124,861 which may be applied to any net taxable capital gain until October 31, 2016.
International Equity Fund For the fiscal year ended October 31, 2008, to reflect reclassifications arising from permanent book/tax differences primarily attributable to foreign currency losses and investments in passive foreign investment companies, the International Equity Fund increased (credited) accumulated net realized loss by $5,561,892 and decreased (debited) accumulated net investment loss by $5,517,778 and paid-in capital by $44,114. As of October 31, 2008, the International Equity Fund had net tax basis capital loss carryforwards of $45,088,818 which may be applied to any net taxable capital gain until October 31, 2016.
Large Cap Core Fund As of October 31, 2008, the Large Cap Core Fund had net tax basis capital loss carryforwards of $25,251,054 which may be applied to any net taxable capital gain until October 31, 2016.
Mid Cap Growth Fund For the fiscal year ended October 31, 2008, to reflect reclassifications arising from permanent book/ tax differences primarily attributable to net operating losses not utilized, the Mid Cap Growth Fund increased (credited) accumulated net investment loss by $1,783,699 and accumulated net realized loss by $110,453 and decreased (debited) paid-in capital by $1,894,152. As of October 31, 2008, the Mid Cap Growth Fund had net tax basis capital loss carryforwards of $3,290,794 which may be applied to any net taxable capital gain until October 31, 2016.
Mid Cap Stock Fund For the fiscal year ended October 31, 2008, to reflect reclassifications arising from permanent book/tax differences primarily attributable to net operating losses not utilized, the Mid Cap Stock Fund increased (credited) accumulated net investment loss by $7,445,071 and accumulated net realized loss by $1,082,308 and decreased (debited) paid-in capital by $8,527,379. As of October 31, 2008, the Mid Cap Stock Fund had net tax basis capital loss carryforwards of $158,218,626 which may be applied to any net taxable capital gain until October 31, 2016.
Small Cap Growth Fund For the fiscal year ended October 31,
2008, to reflect reclassifications arising from permanent book/ tax differences primarily attributable to net operating losses not utilized, the Small Cap Growth Fund increased (credited) accumulated net investment loss by $2,302,010 and decreased (debited) accumulated net realized loss by $49,941 and paid-in capital by $2,252,069. As of October 31, 2008, the Small Cap Growth Fund had net tax basis capital loss carryforwards of $2,773,744 which may be applied to any net taxable capital gain until October 31, 2016.
Notes to Financial Statements
For income tax purposes, distributions paid during the fiscal periods indicated were as follows:
| | | | | | | | |
| | | Ordinary income | | Long-term capital gains |
| | | 10/31/08 | | 10/31/07 | | 10/31/08 | | 10/31/07 |
| Capital Appreciation Fund | | $27,491,748 | | $— | | $76,151,912 | | $3,788,440 |
| Growth & Income Fund | | 7,186,854 | | 2,539,676 | | 12,379,244 | | 4,406,301 |
| International Equity Fund | | — | | 4,278,214 | | 29,731,569 | | 14,674,245 |
| Large Cap Core Fund | | 4,386,015 | | 2,085,566 | | 7,735,846 | | 378,560 |
| Mid Cap Growth Fund | | 15,369,629 | | 1,780,902 | | 15,920,087 | | 17,829,646 |
| Mid Cap Stock Fund | | 95,345,369 | | 62,496,340 | | 96,872,969 | | 79,421,276 |
| Small Cap Growth Fund | | 8,150,030 | | — | | 56,782,402 | | 30,288,447 |
As of October 31, 2008, the components of distributable earnings on a tax basis were as follows:
| | | | |
| | | Undistributed
ordinary
income | | Undistributed
long-term
gain |
| Capital Appreciation Fund | | $— | | $— |
| Growth & Income Fund | | 235,894 | | — |
| International Equity Fund | | 4,978,111 | | — |
| Large Cap Core Fund | | 1,777,450 | | — |
| Mid Cap Growth Fund | | — | | — |
| Mid Cap Stock Fund | | — | | — |
| Small Cap Growth Fund | | — | | — |
As of October 31, 2008, the identified cost of investments in securities owned by each Fund for federal income tax purposes were as follows:
| | |
| | | Identified cost |
| Capital Appreciation Fund | | $516,783,799 |
| Growth & Income Fund | | 105,472,126 |
| International Equity Fund | | 190,656,945 |
| Large Cap Core Fund | | 192,850,316 |
| Mid Cap Growth Fund | | 141,697,939 |
| Mid Cap Stock Fund | | 1,372,093,055 |
| Small Cap Growth Fund | | 313,011,675 |
As of October 31, 2008, the net unrealized appreciation (depreciation) of investments in securities owned by each Fund were as follows:
| | | | | | | | |
| | | Unrealized
appreciation | | Unrealized
depreciation | | | Net unrealized
depreciation | |
| Capital Appreciation Fund | | $38,772,758 | | $(121,659,593) | | | $(82,886,835) | |
| Growth & Income Fund | | 4,377,291 | | (23,405,987 | ) | | (19,028,696 | ) |
| International Equity Fund | | 4,322,798 | | (45,607,678 | ) | | (41,284,880 | ) |
| Large Cap Core Fund | | 4,186,666 | | (51,219,557 | ) | | (47,032,891 | ) |
| Mid Cap Growth Fund | | 4,743,876 | | (22,005,317 | ) | | (17,261,441 | ) |
| Mid Cap Stock Fund | | 24,769,595 | | (310,701,481 | ) | | (285,931,886 | ) |
| Small Cap Growth Fund | | 23,454,346 | | (78,671,005 | ) | | (55,216,659 | ) |
NOTE 6 | New accounting pronouncements In September 2006, FASB issued its new Standard No. 157, “Fair Value Measurements” (“FAS 157”). FAS 157 is designed to unify guidance for the measurement of fair value of all types of assets, including financial instruments, and certain liabilities, throughout a number of accounting standards. FAS 157 also establishes a hierarchy for measuring fair value in generally accepted accounting principles and expands financial statement disclosures about fair value measurements that are relevant to mutual funds. FAS 157 is effective for financial statements issued for fiscal years beginning after November 15, 2007, and earlier application is permitted. The Manager has evaluated the application of FAS 157 to the Funds, and does not anticipate that it will have a material impact on the Funds’ financial statements.
In March 2008, FASB issued its new Standard No. 161, “Disclosures about Derivative Instruments and Hedging Activities” (“FAS 161”). FAS 161 is intended to improve financial reporting about derivative instruments and hedging activities by requiring enhanced disclosures to enable investors to better understand their effects on an entity’s financial position, financial performance, and cash flows. FAS 161 is effective for financial statements issued for fiscal years beginning after November 15, 2008. The Manager is evaluating the application of FAS 161 to the Funds, and is not in a position at this time to estimate the significance of its impact on the Funds’ financial statements.

Report of Independent Registered Certified Public Accounting Firm
To the Board of Trustees and Shareholders of Eagle Capital Appreciation Fund, Eagle Growth & Income Fund, Eagle International Equity Fund, Eagle Large Cap Core Fund, Eagle Mid Cap Growth Fund, Eagle Mid Cap Stock Fund and Eagle Small Cap Growth Fund (formerly Heritage Capital Appreciation Trust, Heritage Growth and Income Trust, Heritage International Equity Fund, Heritage Core Equity Fund, Heritage Diversified Growth Fund, Heritage Mid Cap Stock Fund and Heritage Small Cap Stock Fund):
In our opinion, the accompanying statements of assets and liabilities, including the investment portfolios, and the related statements of operations and of changes in net assets and the financial highlights present fairly, in all material respects, the financial position of Eagle Capital Appreciation Fund, Eagle Growth & Income Fund, Eagle International Equity Fund, Eagle Large Cap Core Fund, Eagle Mid Cap Growth Fund, Eagle Mid Cap Stock Fund and Eagle Small Cap Growth Fund (hereafter referred to collectively as the “Funds”), at October 31, 2008, and the results of each of their operations, the changes in each of their net assets and the financial highlights for each of the periods indicated, in conformity with accounting principles generally accepted in the United States of America. These financial statements and financial highlights (hereafter referred to as “financial statements”) are the responsibility of the Funds’ management; our responsibility is to express an opinion on these financial statements based on our audits. We conducted our audits of these financial statements in accordance with the standards of the Public Company Accounting Oversight Board (United States). Those standards require that we plan and perform the audit to obtain reasonable assurance about whether the financial statements are free of material misstatement. An audit includes examining, on a test basis, evidence supporting the amounts and disclosures in the financial statements, assessing the accounting principles used and significant estimates made by management, and evaluating the overall financial statement presentation. We believe that our audits, which included confirmation of securities at October 31, 2008 by correspondence with the custodian and brokers, provide a reasonable basis for our opinion.

December 16, 2008
Renewal of Investment Advisory and Subadvisory Agreements
Overview At a meeting held on August 14, 2008, the Boards of Trustees, including their independent members (together, the “Board”) for the Eagle Capital Appreciation Fund, Eagle Growth & Income Fund and Eagle Series Trust on behalf of its series: Eagle International Equity Fund, Eagle Large Cap Core Fund, Eagle Mid Cap Growth Fund, Eagle Mid Cap Stock Fund and Eagle Small Cap Stock Fund (each a “Fund” and collectively the “Funds”), approved the renewal of each Fund’s investment advisory agreement with Heritage Asset Management, Inc. (the “Manager”). In addition, the Board also approved the renewal of the investment subadvisory agreements for the Funds. The investment advisory and subadvisory agreements are referred herein as an “Agreement” and collectively, the “Agreements.” Each Fund’s subadviser is referred herein as a “Subadviser” or collectively, as the “Subadvisers.” At this time, the Board also approved the transfer of each Agreement effective on November 1, 2008, from the Manager to Eagle, its affiliate, to reflect a corporate reorganization of the Manager (the “Reorganization”). Upon the Reorganization, Eagle would serve as each Fund’s manager.
In reaching these decisions, the Board took into consideration information furnished for the Board’s review and consideration throughout the year at regular Board meetings, as well as information specifically prepared in connection with the annual renewal process. The Board, acting directly or through its committees, was provided with information and reports relevant to the annual renewal of each Agreement, including: reports regarding the services and support provided to the Funds and their shareholders by the Manager and the Subadvisers; information on each Fund’s performance and commentary on the reasons for the performance; presentations by Fund portfolio managers addressing, as applicable, the Manager’s and the Subadvisers’ investment philosophy, investment strategy, personnel and operations; compliance and audit reports concerning the Funds, the Manager and the Subadvisers, including responses to issues raised therein; and information on relevant developments in the mutual fund industry and how the Funds and/or the Manager responded to them. The Board also met with management and received information in connection with its consideration to transfer the applicable Agreements in connection with the Reorganization.
As part of the approval and renewal process, the Board, with the assistance of independent legal counsel, requested and received additional reports containing substantial and detailed information about each Fund, the Manager and each Subadviser. Among other matters, these reports included information on: (1) the nature and extent of the advisory and
other services provided by the Manager and the Subadvisers, and those that would be provided by Eagle; (2) the personnel of the Manager and the Subadvisers; (3) the financial condition of the Manager and the Subadvisers; (4) the compliance programs and records of the Manager and the Subadvisers; (5) the performance of each Fund as compared to its peer group and an appropriate benchmark; (6) each Fund’s expenses, including the advisory fee rate, the overall expense structure of the Fund, both in absolute terms and relative to peer funds, and any applicable contractual expense limitations; (7) the anticipated effect of growth and size on each Fund’s performance and expenses, where applicable; (8) benefits to be realized by the Manager, the Subadvisers and their respective affiliates; (9) the estimated profitability of the Manager and the Subadvisers under the Agreements, when available; and (10) information related to the Reorganization, including its impact on fund expenses and key services provided to the Funds. The Board posed questions to various management personnel of the Manager and Eagle regarding certain key aspects of the materials submitted in support of the renewal.
With respect to the approval and renewal of the Agreements, the Board considered those factors it believed relevant, including: (1) the nature, extent and quality of services provided to the Funds; (2) the investment performance of each Fund; (3) the costs of the services provided to each Fund and the profits realized or that would be realized by the Manager, the Subadvisers and their respective affiliates from their relationship with the Funds; (4) the extent to which economies of scale were realized as the Funds grow; (5) whether the level of fees reflects those economies of scale for the benefit of each Fund’s investors; (6) comparisons of services and fees with contracts entered into by the Manager and the Subadvisers with other clients (such as pension funds and other institutional investors); and (7) any other benefits derived or anticipated that would be derived by the Manager or the Subadvisers from their relationships with the Funds.
Provided below is an overview of the factors the Board considered at its August meeting. The Board did not identify any particular information that was most relevant to its consideration to approve the Agreements and each Trustee may have afforded different weight to the various factors.
General considerations for all Funds:
Nature, extent and quality of services The Board considered that the Manager and the Subadvisers are experienced in serving as investment advisers for the Funds and have provided a
Renewal of Investment Advisory and Subadvisory Agreements
continuous investment program, including investment selection, credit review and market analysis among other matters, for the Funds. The Board noted that the Manager oversaw and monitored the performance and services provided by the Subadvisers and is responsible for the selection of Fund subadvisers. The Board also noted that the Manager provided administration, transfer agent and fund accounting services to the Funds. In addition, the Manager was responsible for oversight of compliance with each Fund’s policies and objectives, review of brokerage matters, oversight of each Fund’s compliance with applicable law, and implementation of Board directives as they relate to the Funds. The Board also noted the Manager’s representations that Eagle would provide to each Fund the same level and quality of services as the Manager and intended to retain after the Reorganization all of the Manager’s executive officers, resources and management personnel. Finally, the Board noted that shareholders in the Funds have a broad range of investment choices available to them, including a wide choice among mutual funds offered by competitors to the Manager, and that the Funds’ shareholders, with the opportunity to review and weigh the disclosure provided by the Funds in their prospectuses and other public disclosures, had chosen to invest in the Funds.
The Board noted that the Subadvisers are responsible for making investment decisions on behalf of the Funds and placing all orders for the purchase and sale of investments for the Funds with brokers or dealers. The Board considered the industry experience of each Subadviser’s portfolio management team and the Manager’s recommendation to continue to retain each Subadviser. The Board also considered information regarding: (1) the background and experience of the Manager and Subadviser personnel who provide services to the Funds; (2) material compliance matters during the last year, if any, and certifications as to the adequacy of the compliance programs of the Manager and each Subadviser; (3) the financial information regarding the Manager and each Subadviser, as provided; and (4) the Manager’s recommendation to continue to retain each Subadviser to manage their respective Fund(s). Additional details noted by the Board are discussed in the “Specific Considerations for Each Fund” section.
Investment performance The Board considered comparisons of each Fund’s Class A performance, including, as applicable, its one-, three-, five- and ten-year annualized total returns for the period ended June 30, 2008, relative to the average performance of its peer group funds and benchmark indexes. The Board also considered the performance of each Subadviser relative to other accounts managed by the Subadviser, to the
extent such information was available. Details regarding performance are discussed in the “Specific Considerations for Each Fund” section.
Fees and expenses The Board considered the advisory fee payable by each Fund to the Manager, the subadvisory fee rate payable to each Subadviser, each Fund’s total expense ratio and Rule 12b-1 fees. The Board also considered comparisons of each Fund’s Class A expense ratio (with and without Rule 12b-1 fees) to the average expense ratio of its peer group based on data ended June 30, 2008. The Board considered that the Manager had undertaken contractual and/or voluntary expense limitations with respect to each Fund for its 2008 fiscal year, which will continue through February 28, 2010. The Board also noted that Eagle did not intend to propose any changes to the existing fee rates and expense ratio structure of any of the Funds as a result of the Reorganization. Details regarding fees and expenses are discussed in the “Specific Considerations for Each Fund” section.
Costs, profitability and economies of scale The Board evaluated the Manager’s and, to the extent available, each Subadviser’s costs and profitability in providing services to the Funds. The Board determined that the Subadvisers’ costs and profitability generally were less significant to the Board’s evaluation of the fees and expenses paid by the Fund than the Manager’s advisory fee and profitability and the Fund’s overall expense ratios. The Board noted that the Manager’s profits on the services it provided to the Funds are reasonable in light of the Manager’s costs in providing services to the Funds and that the Manager manages each Fund’s assets and provides a comprehensive compliance program for the Funds. The Board considered that each Fund’s (except Eagle Large Cap Core) management fee structure provides for breakpoints, which is a reduction of the applicable fee rate as assets increase. The Board also considered that each Fund may benefit from economies of scale, and shareholders may realize such economies of scale, through (1) reduced advisory and administration fees achieved when a Fund’s asset size reaches breakpoints in the fee schedules instituted by the Manager; (2) increased services to the Funds; or (3) allocation of fixed fund expenses over a large asset size.
Benefits In evaluating compensation, the Board considered other benefits that may be realized by the Manager, each Subadviser and their respective affiliates from their relationship with the Funds. In this connection, the Board noted, among other things, that the Manager also served as the transfer agent and fund accountant for the Funds (except for the Eagle
Renewal of Investment Advisory and Subadvisory Agreements
International Equity Fund), and received compensation for acting in these capacities, and was responsible for, among other things, coordinating the Funds’ audits, financial statements and tax returns and managing expenses and budgets for the Funds. The Board also noted that the Manager has entered into revenue sharing and services agreements with its affiliates for promotion and/or shareholder services. The Board also considered that the Reorganization would result in distribution and marketing efficiencies that can be gained by the Manager and Eagle operating under a single name. In addition, the Board recognized that the Manager’s affiliates, Eagle and Eagle Boston Investment Management (“EBIM”), served as subadvisers to certain Funds and, as such, received advisory fees that were paid by the Manager out of the advisory fees that it earned from the Funds.
The Board also recognized that Heritage Fund Distributors, Inc. (“Distributor”), a subsidiary of the Manager, served as the principal underwriter and distributor for the Funds, and as such, received Rule 12b-1 payments from the Funds to compensate it for providing services and distribution activities. These activities could lead to growth in the Funds’ assets and the corresponding benefits of that growth, including economies of scale and greater diversification. In addition, other affiliates of the Manager have entered into agreements with the Distributor to sell fund shares and receive compensation from the Distributor. The Board noted that, as a result of the Reorganization, the Distributor would change its name to Eagle Fund Distributors, Inc. and be re-organized as a wholly owned subsidiary of Eagle.
Each Subadviser also may engage in soft dollar transactions in connection with transactions on behalf of the Funds. In this regard, the Board considered each Subadviser’s processes for selecting broker-dealers and for engaging in soft dollar transactions.
Specific considerations for each Fund:
Eagle Capital Appreciation Fund In considering the Agreements with the Manager and the Fund’s subadvisers, Eagle and Goldman Sachs Asset Management, L.P. (“GSAM”), the Board noted the following specific factors regarding the Fund’s performance: (1) the Fund outperformed its benchmark index for all relevant time periods; (2) the Fund outperformed the average performance of its peer group funds for all relevant time periods; (3) the Fund’s 4-star Morningstar rating; (4) the Fund has outperformed comparable accounts managed by GSAM for the year to date period; and (5) the Manager did not allocate any assets to Eagle.
The Board also considered comparisons of the Fund’s Class A expense ratio (with and without Rule 12b-1 fees) to the average expense ratio of its peer group based on data ended June 30, 2008. In this regard, the Board noted that the Fund’s expense ratio was lower in both cases. In addition, GSAM represented its fee rate schedule is lower than the standard fee rates charged to a comparable mutual fund subadvised by GSAM. The Board also noted that the Fund’s expense ratio had dropped over the last several years due to increased economies of scale.
Eagle Growth & Income Fund In considering the Agreements with the Manager and the Fund’s subadvisers, Eagle and Thornburg Investment Management, Inc. (“Thornburg”), the Board noted the following specific factors regarding the Fund’s performance: (1) the Fund outperformed its benchmark index for all relevant time periods; (2) the Fund outperformed the average performance of its peer group funds for all relevant time periods; (3) the Fund’s 4-star Morningstar rating; and (4) the Manager did not allocate any assets to Eagle.
The Board also considered comparisons of the Fund’s expense ratio (with and without Rule 12b-1 fees) to the average expense ratio of its peer group based on data ended June 30, 2008. In this regard, the Board noted that the Fund’s expense ratio (including the contractual cap) was higher in both cases. With respect to its fee rate, the Fund’s subadviser, Thornburg represented it does not have any subadvised fund clients with similar investment objectives and asset levels.
Eagle International Equity Fund In considering the Agreements with the Manager and the Fund’s subadviser, Artio Global Management, LLC (“Artio”), the Board noted the following specific factors regarding the Fund’s performance: (1) the Fund outperformed its peer group for the one-, three- and five-year periods, but underperformed for the ten-year period; (2) the Fund outperformed benchmark index for the three-year period, but underperformed for the one and five-year periods; and (3) the Fund has outperformed comparable accounts managed by Artio for the three- and five-year periods.
The Board also considered comparisons of the Fund’s expense ratio (with and without Rule 12b-1 fees) to the average expense ratio of its peer group based on data ended June 30, 2008. In this regard, the Board noted that the Fund’s expense ratio (including the contractual cap) was higher in both cases. With respect to Artio’s subadvisory fee rate, Artio indicated that its fee rate is lower than those charged to other comparable fund clients.
Renewal of Investment Advisory and Subadvisory Agreements
Eagle Large Cap Core Fund In considering the Agreements with the Manager and the Fund’s subadviser, Eagle, the Board noted the following specific factors regarding the Fund’s performance: (1) the Fund underperformed its peer group and benchmark index for the one- and three-year periods; (2) the Fund commenced operations in May 2005; (3) the Manager’s explanation that the Fund will underperform when sectors for which the portfolio management team does not believe are appropriate investments, contribute significantly to the benchmark index; (4) the Fund underperformed comparable institutional accounts managed by the Fund’s subadviser, Eagle, for the since inception period and the 2006 calendar year, but outperformed an Eagle blended category average for the 2007 calendar year; (5) Eagle’s explanation that sector position in certain quarters reduced Fund performance relative to its benchmark index; and (6) Eagle’s more competitive longer-term track record.
The Board also considered comparisons of the Fund’s expense ratio (with and without Rule 12b-1 fees) to the average expense ratio of its peer group based on data ended June 30, 2008. In this regard, the Board noted that the Fund’s expense ratio (including the contractual cap) was higher in both cases. The Board also considered that the Fund was relatively new and had increased its asset base, which had reduced the total expense ratio since 2005. With respect to Eagle’s subadvisory fee rate, Eagle represented that its fee rate is lower than that charged to comparable fund clients.
Eagle Mid Cap Growth Fund In considering the Agreements with the Manager and the Fund’s subadviser, Eagle, the Board noted the following specific factors regarding the Fund’s performance: (1) the Fund outperformed its peer group and benchmark index for all periods presented; (2) the Fund’s 3-star Morningstar rating overall and 4-star Morningstar rating for the three-year period; and (3) the Fund’s mixed performance relative to comparable Eagle institutional accounts for the 2003-2007 calendar years.
The Board also considered comparisons of the Fund’s expense ratio (with and without Rule 12b-1 fees) to the average expense ratio of its peer group based on data ended June 30, 2008. In this regard, the Board noted that the Fund’s expense ratio (including the contractual cap) was lower in both cases. With respect to Eagle’s subadvisory fee rate, Eagle represented that it has no mutual fund clients with comparable investment objectives, however the fee rates paid by the Fund are less than the fee rate charged for a standard institutional equity account.
Eagle Mid Cap Stock Fund In considering the Agreements with the Manager and the Fund’s subadviser, Eagle, the Board noted the following specific factors regarding the Fund’s performance: (1) the Fund outperformed its peer group for the three- and ten-year periods but underperformed for the one and five-year periods; (2) the Fund outperformed its benchmark index for the three- and ten-year periods but underperformed for the one and five-year periods; (3) the Fund’s 4-star Morningstar rating; and (4) the Fund’s outperformance relative to a comparable Eagle institutional accounts for the 2003-2007 calendar years.
The Board also considered comparisons of the Fund’s expense ratio (with and without Rule 12b-1 fees) to the average expense ratio of its peer group based on data ended June 30, 2008. In this regard, the Board noted that the Fund’s expense ratio (including the contractual cap) was lower in both cases. With respect to Eagle’s subadvisory fee rate, Eagle represented that it has no mutual fund clients with comparable investment objectives, however the fee rates paid by the Fund are less than the fee rate charged for a standard institutional equity account.
Eagle Small Cap Stock Fund In considering the Agreements with the Manager and the Fund’s subadvisers, Eagle and EBIM, the Board noted the following specific factors regarding the Fund’s performance: (1) the Fund outperformed its peer group and benchmark index for all relevant periods with the exception of the 10-year period, during which it underperformed; (2) the Fund’s 4-star Morningstar rating; and (3) the mixed performance of Eagle’s portion of the Fund relative to comparable Eagle institutional accounts for the last ten calendar years and underperformance for the since inception period; and (4) the mixed performance of the portion of the Fund managed by EBIM, relative to comparable EBIM institutional accounts for the last twelve calendar years and underperformance for the since inception period.
The Board also considered comparisons of the Fund’s expense ratio (with and without Rule 12b-1 fees) to the average expense ratio of its peer group based on data ended June 30, 2008. In this regard, the Board noted that the Fund’s expense ratio (including the contractual cap) was lower in both cases. With respect to Eagle’s subadvisory fee rate, Eagle represented that its fee rate is lower than that charged to comparable fund clients. With respect to EBIM’s subadvisory fee rate, EBIM represented that it does not manage any other mutual fund, but certain clients with performance incentive fee rates may pay a lower base fee rate than paid by the Fund.
Renewal of Investment Advisory and Subadvisory Agreements
Conclusions Based on these considerations, the Board concluded with respect to the Funds that: (1) each Fund was reasonably likely to benefit from the nature, quality and extent of the Manager’s and each Subadviser’s services, as applicable to the Funds; (2) each Fund’s performance was satisfactory in light of all the factors considered by the Board; (3) the fees payable under the Agreements and profits earned by the Manager or a Subadviser were reasonable in the context of all the factors considered by the Board; and (4) the current
advisory fee structure provides each Fund’s shareholders with reasonable benefits associated with economies of scale. Based on these conclusions and other factors, the Board determined in its business judgment to renew the Agreements and to approve the Agreements between each Fund and Eagle and Eagle and each Subadviser effective November 1, 2008, to reflect the transfer of the Fund’s advisory and administration services to Eagle.
Understanding Your Ongoing Costs
As a shareholder of a Fund, you incur two types of costs: (1) transaction costs, including sales charges on purchases, contingent deferred sales charges, or redemption fees; and (2) ongoing costs, including investment advisory fees; distribution (12b-1) fees; and other Fund expenses. The following sections are intended to help you understand your ongoing cost (in dollars) of investing in each Fund and to compare these costs with the ongoing costs of investing in other mutual funds. Please note that the expenses shown in the table are meant to highlight your ongoing costs only and do not reflect one-time transaction expenses, such as sales charges or redemption fees. Therefore, if these transactional costs were included, your costs would have been higher. For more information, see your Fund’s prospectus or contact your financial advisor.
Actual expenses | The table below shows the actual expenses you would have paid on a $1,000 investment in each Fund on May 1, 2008, and held through October 31, 2008. It also shows how much a $1,000 investment would be worth at the close of the period, assuming actual returns after ongoing expenses. This table is useful in comparing ongoing costs only, and will not help you determine the relative total costs of owning different funds. Simply divide your account value by $1,000 (for example, an $8,600 account value divided by $1,000 = 8.6), then multiply the result by the number in the line under the heading entitled “Expenses paid during period” to estimate the expenses you paid on your account during this period.
| | | | | | | | | |
| | | Beginning account value
May 1, 2008 | | Ending account value
October 31, 2008 | | Expenses paid
during period (a) | | Annualized
expense ratio | |
| | | | |
| Eagle Capital Appreciation Fund | | | | | | | | | |
| Class A | | $1,000.00 | | $655.10 | | $5.03 | | 1.21 | % |
| Class C | | $1,000.00 | | $652.50 | | $8.12 | | 1.96 | % |
| Class I | | $1,000.00 | | $656.20 | | $3.35 | | 0.80 | % |
| Class R-3 | | $1,000.00 | | $654.10 | | $6.14 | | 1.48 | % |
| Class R-5 | | $1,000.00 | | $656.30 | | $3.46 | | 0.83 | % |
| Eagle Growth & Income Fund | | | | | | | | | |
| Class A | | $1,000.00 | | $729.00 | | $5.87 | | 1.35 | % |
| Class C | | $1,000.00 | | $726.30 | | $9.33 | | 2.15 | % |
| Eagle International Equity Fund | | | | | | | | | |
| Class A | | $1,000.00 | | $596.90 | | $5.81 | | 1.45 | % |
| Class C | | $1,000.00 | | $594.40 | | $8.84 | | 2.21 | % |
| Eagle Large Cap Core Fund | | | | | | | | | |
| Class A | | $1,000.00 | | $710.00 | | $5.47 | | 1.27 | % |
| Class C | | $1,000.00 | | $707.20 | | $9.10 | | 2.12 | % |
| Class I | | $1,000.00 | | $711.10 | | $4.09 | | 0.95 | % |
| Class R-5 | | $1,000.00 | | $715.00 | | $3.76 | | 0.87 | % |
| Eagle Mid Cap Growth Fund | | | | | | | | | |
| Class A | | $1,000.00 | | $670.90 | | $5.42 | | 1.29 | % |
| Class C | | $1,000.00 | | $668.30 | | $8.60 | | 2.05 | % |
| Class I | | $1,000.00 | | $672.00 | | $4.01 | | 0.95 | % |
| Eagle Mid Cap Stock Fund | | | | | | | | | |
| Class A | | $1,000.00 | | $691.40 | | $4.92 | | 1.16 | % |
| Class C | | $1,000.00 | | $688.90 | | $8.02 | | 1.89 | % |
| Class I | | $1,000.00 | | $692.80 | | $3.51 | | 0.82 | % |
| Class R-3 | | $1,000.00 | | $690.80 | | $5.71 | | 1.34 | % |
| Class R-5 | | $1,000.00 | | $693.10 | | $3.16 | | 0.74 | % |
| Eagle Small Cap Growth Fund | | | | | | | | | |
| Class A | | $1,000.00 | | $729.50 | | $5.53 | | 1.27 | % |
| Class C | | $1,000.00 | | $727.10 | | $8.80 | | 2.03 | % |
| Class I | | $1,000.00 | | $731.30 | | $3.99 | | 0.92 | % |
| Class R-3 | | $1,000.00 | | $729.00 | | $6.37 | | 1.47 | % |
| Class R-5 | | $1,000.00 | | $731.30 | | $3.90 | | 0.90 | % |
(a) Expenses are calculated using each Funds’ annualized expense ratios for each class of shares, multiplied by the average account value for the period, then multiplying the result by the actual number of days in the period (184); and then dividing that result by the actual number of days in the fiscal year (366).
Understanding Your Ongoing Costs
Hypothetical example for comparison purposes | All mutual funds now follow guidelines to assist shareholders in comparing expenses between different funds. Per these guidelines, the table below shows each Fund’s expenses based on a $1,000 investment held from May 1, 2008 through October 31, 2008 and assuming for this period a hypothetical 5% annualized rate of return before ongoing expenses, which is not the Fund’s
actual return. Please note that you should not use this information to estimate your actual ending account balance and expenses paid during the period. You can use this information to compare the ongoing expenses (but not transaction expenses or total costs) of investing in the Funds with those of other funds. All mutual fund shareholder reports will provide this information to help you make this comparison.
| | | | | | | | | |
| | | Beginning account value
May 1, 2008 | | Ending account value
October 31, 2008 | | Expenses paid
during period (a) | | Annualized
expense ratio | |
| | | | |
| Eagle Capital Appreciation Fund | | | | | | | | | |
| Class A | | $1,000.00 | | $1,019.05 | | $6.14 | | 1.21 | % |
| Class C | | $1,000.00 | | $1,015.31 | | $9.91 | | 1.96 | % |
| Class I | | $1,000.00 | | $1,021.10 | | $4.08 | | 0.80 | % |
| Class R-3 | | $1,000.00 | | $1,017.71 | | $7.49 | | 1.48 | % |
| Class R-5 | | $1,000.00 | | $1,020.96 | | $4.22 | | 0.83 | % |
| Eagle Growth & Income Fund | | | | | | | | | |
| Class A | | $1,000.00 | | $1,018.35 | | $6.85 | | 1.35 | % |
| Class C | | $1,000.00 | | $1,014.33 | | $10.89 | | 2.15 | % |
| Eagle International Equity Fund | | | | | | | | | |
| Class A | | $1,000.00 | | $1,017.86 | | $7.34 | | 1.45 | % |
| Class C | | $1,000.00 | | $1,014.04 | | $11.17 | | 2.21 | % |
| Eagle Large Cap Core Fund | | | | | | | | | |
| Class A | | $1,000.00 | | $1,018.74 | | $6.45 | | 1.27 | % |
| Class C | | $1,000.00 | | $1,014.48 | | $10.73 | | 2.12 | % |
| Class I | | $1,000.00 | | $1,020.36 | | $4.83 | | 0.95 | % |
| Class R-5 | | $1,000.00 | | $1,020.75 | | $4.43 | | 0.87 | % |
| Eagle Mid Cap Growth Fund | | | | | | | | | |
| Class A | | $1,000.00 | | $1,018.65 | | $6.55 | | 1.29 | % |
| Class C | | $1,000.00 | | $1,014.83 | | $10.38 | | 2.05 | % |
| Class I | | $1,000.00 | | $1,020.34 | | $4.84 | | 0.95 | % |
| Eagle Mid Cap Stock Fund | | | | | | | | | |
| Class A | | $1,000.00 | | $1,019.32 | | $5.87 | | 1.16 | % |
| Class C | | $1,000.00 | | $1,015.64 | | $9.57 | | 1.89 | % |
| Class I | | $1,000.00 | | $1,020.99 | | $4.19 | | 0.82 | % |
| Class R-3 | | $1,000.00 | | $1,018.38 | | $6.81 | | 1.34 | % |
| Class R-5 | | $1,000.00 | | $1,021.41 | | $3.77 | | 0.74 | % |
| Eagle Small Cap Growth Fund | | | | | | | | | |
| Class A | | $1,000.00 | | $1,018.74 | | $6.45 | | 1.27 | % |
| Class C | | $1,000.00 | | $1,014.95 | | $10.26 | | 2.03 | % |
| Class I | | $1,000.00 | | $1,020.53 | | $4.66 | | 0.92 | % |
| Class R-3 | | $1,000.00 | | $1,017.77 | | $7.43 | | 1.47 | % |
| Class R-5 | | $1,000.00 | | $1,020.63 | | $4.55 | | 0.90 | % |
(a) Expenses are calculated using each Funds’ annualized expense ratios for each class of shares, multiplied by the average account value for the period, then multiplying the result by the actual number of days in the period (184); and then dividing that result by the actual number of days in the fiscal year (366).
Principal Risks
The greatest risk of investing in a mutual fund is that its returns will fluctuate and you could lose money. Unprecedented turbulence in financial markets and reduced liquidity in equity, credit and fixed income markets may negatively affect many issuers worldwide, which could have an adverse effect on the fund. The following table identifies the primary risk factors of each fund in light of their respective principal investment strategies. These risk factors are explained following the table.
| | | | | | | | | | | | | | |
| | | Eagle
Capital
Appreciation
Fund | | Eagle
Growth
& Income
Fund | | Eagle
International
Equity
Fund | | Eagle
Large Cap
Core
Fund | | Eagle
Mid Cap
Growth
Fund | | Eagle
Mid Cap
Stock
Fund | | Eagle
Small Cap
Growth
Fund |
| Covered call options | | | | X | | | | | | | | | | |
| Credit | | | | X | | X | | | | | | | | |
| Derivatives | | | | | | X | | | | | | | | |
| Emerging markets | | | | | | X | | | | | | | | |
| Focused holdings | | X | | | | | | X | | | | | | |
| Foreign securities | | X | | X | | X | | | | | | | | |
| Govt sponsored enterprises | | | | X | | | | | | | | | | |
| Growth stocks | | X | | X | | X | | X | | X | | X | | X |
| High-yield securities | | | | X | | X | | | | | | | | |
| Interest Rates | | | | X | | X | | | | | | | | |
| Market timing activities | | | | X | | X | | | | | | | | X |
| Mid-cap companies | | X | | X | | X | | | | X | | X | | X |
| Other investment companies | | | | | | X | | | | | | | | |
| Portfolio turnover | | | | | | X | | | | X | | X | | |
| Sectors | | X | | | | X | | X | | | | X | | |
| Small-cap companies | | X | | | | | | | | X | | X | | X |
| Stock market | | X | | X | | X | | X | | X | | X | | X |
| Value stocks | | | | X | | | | X | | | | X | | |
Covered Call Options | Because a fund may write covered call options, a fund may be exposed to risk stemming from changes in the value of the stock that the option is written against. While call option premiums may generate incremental portfolio income, they also can limit gains from market movements.
Credit | A fund could lose money if the issuer of a fixed-income security is unable to meet its financial obligations or goes bankrupt. Credit risk usually applies to most fixed-income securities, but generally is not a factor for U.S. government obligations.
Derivatives | A fund may use derivatives such as futures contracts, foreign currency forward contracts and options on futures to adjust the risk/return characteristics of its investment portfolio. These practices, however, may present risks different from or in addition to the risks associated with investments in foreign currencies. There can be no assurance that any strategy used will succeed. If a fund’s portfolio manager incorrectly forecasts stock market values or currency exchange rates in utilizing a strategy for the fund, the fund could lose money.
Emerging Markets | When investing in emerging markets, the risks mentioned above of investing in foreign securities are heightened. Emerging markets have unique risks that are greater than or in addition to investing in developed markets because emerging markets are generally smaller, less developed, less liquid and more volatile than the securities markets of the U.S. and other developed markets. There are also risks of: greater political uncertainties; an economy’s dependence on revenues from particular commodities or on international aid or development assistance; currency transfer restrictions; a limited number of potential buyers for such securities; and delays and disruptions in securities settlement procedures. In addition, there may be more volatile rates of return.
Focused Holdings | For funds that normally hold a core portfolio of stocks of fewer companies than other more diversified funds, the increase or decrease of the value of a single stock may have a greater impact on the fund’s NAV and total return.
Foreign Securities | Investments in foreign securities involve greater risks than investing in domestic securities. As a result,
Principal Risks
a fund’s return and NAV may be affected by fluctuations in currency exchange rates or political or economic conditions and regulatory requirements in a particular country. Foreign markets, as well as foreign economies and political systems, may be less stable than U.S. markets, and changes in the exchange rates of foreign currencies can affect the value of a fund’s foreign assets. Foreign laws and accounting standards typically are not as strict as they are in the U.S., and there may be less public information available about foreign companies.
Government Sponsored Enterprises | Investments in government sponsored enterprises are debt obligations issued by agencies and instrumentalities of the U.S. Government. These obligations vary in the level of support they receive from the U.S. Government. They may be: (i) supported by the full faith and credit of the U.S. Treasury, such as those of the Government National Mortgage Association; (ii) supported by the right of the issuer to borrow from the U.S. Treasury, such as those of the Federal National Mortgage Association; (iii) supported by the discretionary authority of the U.S. Government to purchase the issuer’s obligations, such as those of the Student Loan Marketing Association; or (iv) supported only by the credit of the issuer, such as those of the Federal Farm Credit Bureau. The U.S. Government may choose not to provide financial support to U.S. Government sponsored agencies or instrumentalities if it is not legally obligated to do so in which case, if the issuer defaulted, the fund holding securities of such issuer might not be able to recover its investment from the U.S. Government.
Growth Stocks | Growth companies are expected to increase their earnings at a certain rate. When these expectations are not met, investors may punish the prices of stocks excessively, even if earnings showed an absolute increase. Growth company stocks also typically lack the dividend yield that can cushion stock prices in market downturns.
High-Yield Securities | Investments in securities rated below investment grade, or “junk bonds”, generally involve significantly greater risks of loss of your money than an investment in investment grade bonds. Compared with issuers of investment grade bonds, junk bonds are more likely to encounter financial difficulties and to be materially affected by these difficulties. Rising interest rates may compound these difficulties and reduce an issuer’s ability to repay principal and interest obligations. Issuers of lower-rated securities also have a greater risk of default or bankruptcy. Additionally, due to the greater number of considerations involved in the selection of a
fund’s securities, the achievement of a fund’s objective depends more on the skills of the portfolio manager than investing only in higher rated securities. Therefore, your investment may experience greater volatility in price and yield. High-yield securities may be less liquid than higher quality investments. A security whose credit rating has been lowered may be particularly difficult to sell.
Interest Rates | Investments in investment-grade and non-investment grade fixed-income securities are subject to interest rate risk. The value of a fund’s investments typically will fall when interest rates rise. A fund is particularly sensitive to changes in interest rates because it may invest in debt securities with intermediate and long terms to maturity. Debt securities with longer durations tend to be more sensitive to changes in interest rates, usually making them more volatile than debt securities with shorter durations. Yields of debt securities will fluctuate over time.
Market Timing Activities | Because of specific securities a fund may invest in, it could be subject to the risk of market timing activities by fund shareholders. Some examples of these types of securities are high-yield, small-cap and foreign securities. Typically, foreign securities offer the most opportunity for these market timing activities. A fund generally prices these foreign securities using their closing prices from the foreign markets in which they trade, typically prior to a fund’s calculation of its NAV. These prices may be affected by events that occur after the close of a foreign market but before a fund prices its shares. In such instances, a fund may fair value foreign securities. However, some investors may engage in frequent short-term trading in a fund to take advantage of any price differentials that may be reflected in the NAV of a fund’s shares. There is no assurance that fair valuation of securities can reduce or eliminate market timing. While Eagle Fund Services, Inc. (“EFS”) monitors trading in the fund, there is no guarantee that it can detect all market timing activities.
Mid-Cap Companies | Investments in medium-capitalization companies generally involve greater risks than investing in larger, more established companies. Mid-cap companies often have narrower commercial markets and more limited managerial and financial resources than larger, more established companies. As a result, their performance can be more volatile and they face greater risk of business failure, which could increase the volatility of a fund’s portfolio. Generally, the smaller the company size, the greater these risks. Additionally, mid-cap companies may have less market liquidity than large-cap companies.
Principal Risks
Other Investment Companies and ETFs | Investments in the securities of other investment companies and ETFs, (which may, in turn invest in equities, bonds, and other financial vehicles) may involve duplication of advisory fees and certain other expenses. By investing in another investment company or ETF, a fund becomes a shareholder of that investment company or ETF. As a result, fund shareholders indirectly bear the fund’s proportionate share of the fees and expenses paid by shareholders of the other investment company or ETF, in addition to the fees and expenses fund shareholders directly bear in connection with the fund’s own operations.
As a shareholder, the fund must rely on the investment company or ETF to achieve its investment objective. If the investment company or ETF fails to achieve its investment objective, the value of the fund’s investment will decline, adversely affecting the fund’s performance. In addition, because ETFs are listed on national stock exchanges and are traded like stocks listed on an exchange, ETF shares potentially may trade at a discount or a premium. Investments in ETFs are also subject to brokerage and other trading costs, which could result in greater expenses to a fund. Finally, because the value of ETF shares depends on the demand in the market, the portfolio manager may not be able to liquidate a fund’s holdings at the most optimal time, adversely affecting the fund’s performance.
Portfolio Turnover | A fund may engage in more active and frequent trading of portfolio securities to a greater extent than certain other mutual funds with similar investment objectives. A fund’s turnover rate may vary greatly from year to year or during periods within a year. A high rate of portfolio turnover may lead to greater transaction costs, result in additional tax consequences to investors and adversely affect performance.
Sectors | Companies that are in similar businesses may be similarly affected by particular economic or market events, which may, in certain circumstances, cause the value of securities of all companies in a particular sector of the market to change. To the extent a fund has substantial holdings within a particular sector, the risks associated with that sector increase.
Small-Cap Companies | Investments in small-cap companies generally involve greater risks than investing in mid- or large-capitalization companies. Small-cap companies often have narrower markets and more limited managerial and financial resources than larger, more established companies. As a result, their performance can be more volatile and they face greater risk of business failure, which could increase the volatility of a fund’s portfolio. Generally, the smaller the company size, the greater these risks. Additionally, small-cap companies may have less market liquidity than mid-cap and large-cap companies.
Stock Market | The value of a fund’s stock holdings may decline in price because of changes in prices of its holdings or a broad stock market decline. These fluctuations could be a sustained trend or a drastic movement. The stock markets generally move in cycles, with periods of rising prices followed by periods of declining prices. The value of your investment may reflect these fluctuations.
Value Stocks | Investments in value stocks are subject to the risk that their true worth may not be fully realized by the market. This may result in the value stocks’ prices remaining undervalued for extended periods of time. A fund’s performance also may be affected adversely if value stocks remain unpopular with or lose favor among investors.
Trustees and Officers
| | | | | | | | |
| | | | |
Name, age and position(s)
held with fund | | Term of office and length of time served (a) | | Principal occupation during the past 5 years | | Number of funds in fund complex overseen by trustee | | Directorships of public companies held by trustee |
| | | | |
Interested Trustee (b) | | | | | | | | |
| | | | |
Richard K. Riess (59) Chairman of the Board and Trustee | | Chairman since 2007 (Trustee since inception in 1985) | | Executive Vice President and Managing Director—Asset Management Group of RJF since 1998; Chief Executive Officer of Eagle since 1996; Chief Executive Officer of Heritage Asset Management, Inc. (“Heritage”) since 2000. | | 10 | | None |
| | | | |
Independent Trustees | | | | | | | | |
| | | | |
James L. Pappas (65) Lead Independent Trustee | | Since 2003 (Trustee since 1989) | | Lykes Professor of Banking and Finance, University of South Florida 1986-2006; President, Graduate School of Banking, University of Wisconsin 1995-2005. | | 10 | | None |
| | | | |
C. Andrew Graham (68) Trustee | | Since inception in 1985 | | First Financial Advisors, Ltd. & Graham Financial Partners, LLC (financial planning, insurance and investment services) since 1999. | | 10 | | None |
| | | | |
Keith B. Jarrett (60) Trustee | | Since 2005 | | Founder, Rockport Funding, LLC (private equity), and Ajax Partners (investment partnership) since 2003; Director, Bankserv, Inc. since 2003; Director, Pertrac Strategic Financial Solutions since 2005; Director, Medfusion, Inc. since 2007; Visiting Professor, University of North Carolina since 2008. | | 10 | | None |
| | | | |
Lincoln Kinnicutt (64) Trustee | | Since 2006 | | Retired since 2002. | | 9 | | None |
| | | | |
William J. Meurer (64) Trustee | | Since 2003 | | Private Financial Consultant since 2000. | | 10 | | Sykes Enterprises, Inc. (inbound call systems) |
| | | | |
Deborah L. Talbot, PhD (57) Trustee | | Since 2002 | | Independent Consultant and Researcher; Founder and Chairman of the Board, Creative Tampa Bay (promotes, markets, and offers networking for the Tampa Bay community) since 2003; Deans’ Advisory Board, College of Arts and Sciences, University of Memphis since 2002. | | 10 | | None |
| | | | |
Officers (c) | | | | | | | | |
| | | | |
Stephen G. Hill (49) President | | Since 2005 | | President of Heritage since 2005; Director of Heritage and Heritage Fund Distributors, Inc. (“HFD”) since 1994 and 2006, respectively; President and Chief Operating Officer of Eagle since 2000; President and Chief Executive Officer of EBIM since 2004. | | N/A | | N/A |
| | | | |
Mathew J. Calabro (41) Senior Vice President and Principal Executive Officer | | Since 2007 | | Senior Vice President of Heritage and HFD since 2005 and 2007, respectively; Chief Compliance Officer of Heritage 2005-2007; Vice President of Heritage 1996-2005. | | N/A | | N/A |
Trustees and Officers
| | | | | | | | |
| | | | |
Name, age and position(s)
held with fund | | Term of office and length of time served (a) | | Principal occupation during the past 5 years | | Number of funds in fund complex overseen by trustee | | Directorships of public companies held by trustee |
| | | | |
Officers (cont’d) (c) | | | | | | | | |
| | | | |
Susan L. Walzer (41) Chief Compliance Officer | | Since 2007 | | Chief Compliance Officer of Heritage since 2007; Director of Compliance for Heritage 2005-2007; Associate Corporate Counsel for RJF 2003-2005. | | N/A | | N/A |
| | | | |
Andrea N. Mullins (41) Treasurer and Secretary, Principal Financial Officer | | Since 2003 (Secretary, Principal Financial Officer since 2004) | | Treasurer and Vice President—Finance of Heritage since 2003; Assistant Treasurer of HFD since 2007. | | N/A | | N/A |
Trustee and Officer information is current as of September 30, 2008. The Trust’s Statement of Additional Information includes additional information about the Trustees and Officers and is available, without charge, upon request, by calling 800.421.4184. The address of each Trustee and Officer is 880 Carillon Parkway, St. Petersburg, FL 33716.
(a) Trustees serve for the lifetime of the Trust or until they are removed, resign or retire. The Board has adopted a Board Governance Policy that requires Independent Trustees to retire no later than the end of the meeting which occurs immediately after his or her 72nd birthday. (b) Mr. Riess is an “interested” person of the Trust as that term is defined by the Investment Company Act of 1940. Mr. Riess is affiliated with Heritage, HFD, Eagle and RJF. (c) Officers are elected annually for one year terms.
2008 Federal Income Tax Notice
For the fiscal year ended October 31, 2008 certain dividends paid by the funds may be subject to a maximum tax rate of 15%, as provided for by the Jobs and Growth Tax Relief Reconciliation Act of 2004. For each applicable fund, the table below designates the maximum amount of qualified dividend income, which is 100% of what was distributed. In addition, the table designates amounts characterized as long-term capital gains which are also subject to the 15% tax rate. The information and distributions reported herein may differ from the information and distributions taxable to the shareholders for the calendar year ending December 31, 2008. Complete
information will be computed and reported in conjunction with your 2008 Form 1099-DIV.
| | | | |
| | | Qualified
dividend income | | Long-term
capital gains |
| Capital Appreciation Fund | | $27,491,748 | | $76,151,912 |
| Growth & Income Fund | | 7,186,854 | | 12,379,244 |
| International Equity Fund | | — | | 29,731,569 |
| Large Cap Core Fund | | 4,386,015 | | 7,735,846 |
| Mid Cap Growth Fund | | 15,369,629 | | 15,920,087 |
| Mid Cap Stock Fund | | 95,345,369 | | 96,872,969 |
| Small Cap Growth Fund | | 8,150,030 | | 56,782,402 |
eagleasset.com
| | |
| 727.567.8143 | | 800.421.4184 |
Eagle Fund Distributors, Inc.
Member FINRA
Not FDIC Insured — May Lose Value — No Bank Guarantee
Please consider the investment objectives, risks, charges, and expenses of any fund carefully before investing. Contact Heritage at 800.421.4184 or your financial advisor for a prospectus, which contains this and other important information about the Funds. Read the prospectus carefully before you invest or send money.
This report is for the information of shareholders of the Eagle mutual funds. If you wish to review additional information on the portfolio holdings of a fund, a complete schedule has been filed with the Securities and Exchange Commission (“Commission”) for the first and third quarters of each fund’s fiscal year end on Form N-Q. These filings are available on the Commission’s website at www.sec.gov and may be reviewed and copied at the Commission’s Public Reference Room in Washington, D.C. Information on the operations of the Public Reference Room may be obtained by calling 800.SEC.0330. A description of each fund’s proxy voting policies, procedures and information regarding how each fund voted proxies relating to portfolio securities during the 12-month period ended June 30, 2008, is available without charge, upon request, by calling the Eagle Family of Funds, toll-free at the number above, by accessing our website at eagleasset.com or by accessing the Commission’s website at www.sec.gov.
| | |
| Would you like to receive future mailings via e-mail? If so, please let us know. Visit eagleasset.com to enroll. | | |
| | | | |
10/08 | |  | | Printed on recycled paper |
As of the end of the period October 31, 2008, Eagle Growth & Income Fund (the “Trust”) has adopted a code of ethics, as defined in Item 2 of Form N-CSR, that applies to the Principal Executive Officer and Principal Financial Officer. The Trust has not made any amendments to its code of ethics during the covered period. The Trust has not granted any waivers from any provisions of the code of ethics during the covered period. A copy of this code of ethics is filed as an exhibit to this Form N-CSR.
| Item 3. | Audit Committee Financial Expert |
The Trust’s Board of Trustees (“Board”) has determined that William J. Meurer is an audit committee financial expert, as defined in Item 3 of Form N-CSR, serving on its audit committee. Mr. Meurer is independent for purposes of Item 3 of Form N-CSR.
Item 4. | Principal Accountant Fees and Services 1 |
The aggregate fees billed by the Trust’s independent public accountants, PricewaterhouseCoopers LLP (“PwC”) for professional services rendered in connection with the audit of the Trust’s annual financial statements or services that are normally provided by the accountant in connection with statutory and regulatory filings or engagements were $27,000 for the fiscal period ended October 31, 2007 and $28,000 for the fiscal period ended October 31, 2008.
There were no aggregate fees PwC billed to the Trust for assurance and other services which are reasonably related to the performance of the Trust’s audit and are not reported under Item 4(a) for the fiscal periods ended October 31, 2007 and October 31, 2008. The aggregate fees PwC billed to the Trust’s investment adviser and any entity controlling, controlled by, or under common control with the Trust’s investment adviser for assurance and other services directly related to the operations and financial reporting of the Trust were $35,000 for the fiscal period ended October 31, 2007 and $37,000 for the fiscal period ended October 31, 2008.
The aggregate tax fees PwC billed to the Trust for tax compliance, tax advice, and tax planning services were $22,0002 for the fiscal period ended October 31, 2007 and $7,000 for the fiscal period ended October 31, 2008. There were no aggregate tax fees PwC billed to the Trust’s investment adviser and any entity controlling, controlled by, or under common control with the Trust’s investment adviser for services directly related to the operations and financial reporting of the Trust for the fiscal periods ended October 31, 2007 and October 31, 2008.
1 | All accountant fees and services amounts are rounded to the nearest whole thousand. |
2 | Number includes $4,000 as noted in October 2007 and $18,000 for the filing of State Tax Returns. This fee will not be charged for 2008. |
For each of the fiscal periods ended October 31, 2007 and October 31, 2008 the Trust paid PwC no other fees. There were no aggregate fees PwC billed to the Trust’s investment adviser and any entity controlling, controlled by, or under common control with the Trust’s investment adviser for any other services directly related to the operations and financial reporting of the Trust for the fiscal periods ended October 31, 2007, and October 31, 2008.
(e) The Trust’s Audit Committee Charter provides that the Audit Committee (comprised of the Independent Trustees of the Trust) is responsible for pre-approval of all auditing services performed for the Trust. The Audit Committee reports to the Board regarding its approval of the engagement of the auditor and the proposed fees for the engagement, and the majority of the Board (including the members of the Board who are Independent Trustees) must approve the auditor at an in-person meeting. The Audit Committee also is responsible for pre-approval (subject to the de minimus exception for non-audit services described in the Securities Exchange Act of 1934, as amended, and applicable rule thereunder and not expecting to exceed $5,000) of all non-auditing services performed for the Trust or for any service affiliate of the Trust. The Trust’s Audit Committee Charter also permits a designated member of the Audit Committee to pre-approve, between meetings, one or more non-audit service projects, subject to ratification by the Audit Committee at the next meeting of the Audit Committee. The Trust’s Audit Committee pre-approved all fees described above which PwC billed to the Trust.
(f) Less than 50% of the hours billed by PwC for auditing services to the Trust for the fiscal period ended October 31, 2008, were for work performed by persons other than full-time, permanent employees of PwC.
(g) There were no aggregate non-audit fees billed by PwC to the Trust and to the Trust’s investment adviser and any entity controlling, controlled by, or under common control with the Trust’s investment adviser for the fiscal periods ended October 31, 2007 and October 31, 2008.
(h) The Trust’s Audit Committee has considered the non-audit services provided to the Trust and the Trust’s investment adviser and any entity controlling, controlled by, or under common control with the Trust’s investment adviser as described above and determined that these services do not compromise PwC’s independence.
| Item 5. | Audit Committee of Listed Registrants |
Not applicable to the Trust.
| Item 6. | Schedule of Investments |
Included as part of report to shareholders under Item 1.
| Item 7. | Disclosure of Proxy Voting Policies and Procedures for Closed-End Management Investment Companies. |
Not applicable to the Trust.
| Item 8. | Portfolio Managers of Closed-End Management Investment Companies |
Not applicable to the Trust.
| Item 9. | Purchases of Equity Securities by Closed-End Management Investment Company and Affiliated Purchasers |
Not applicable to the Trust.
| Item 10. | Submission of Matters to a Vote of Security Holders. |
There have been no material changes to the Trust’s Nominating Committee Charter, which sets forth procedures by which shareholders may recommend nominees to the Board, since the Trust last provided disclosure in response to this item.
| Item 11. | Controls and Procedures |
| (a) | Based on an evaluation of the disclosure controls and procedures (as defined in Rule 30a-3(c) under the Act), the Principal Executive Officer and Principal Financial Officer of the Trust have concluded that such disclosure controls and procedures are effective as of January 6, 2009. |
| (b) | There was no change in the internal controls over financial reporting (as defined in Rule 30a-3(d) under the Act) of the Trust that occurred during the second fiscal quarter of the period covered by this report that has materially affected or is reasonably likely to materially affect, its internal control over financial reporting. |
(a)(1) Code of Ethics pursuant to Item 2 of Form N-CSR is filed and attached hereto as Exhibit 99.CODEETH.
(a)(2) The certification required by Rule 30a-2(a) of the Investment Company Act of 1940, as amended, and Section 302 of the Sarbanes-Oxley Act of 2002 is filed and attached hereto as Exhibit 99.CERT.
(a)(3) Not applicable to the Trustt.
(b) The certification required by Rule 30a-2(b) of the Investment Company Act of 1940, as amended, and Section 906 of the Sarbanes-Oxley Act of 2002 is filed and attached hereto as Exhibit 99.906CERT.
SIGNATURES
Pursuant to the requirements of the Securities Exchange Act of 1934 and the Investment Company Act of 1940, the Trust has duly caused this report to be signed on its behalf by the undersigned, thereunto duly authorized.
| | | | |
| | EAGLE GROWTH & INCOME FUND |
| | |
Date: January 6, 2009 | | | | /s/ Mathew J. Calabro |
| | | | Mathew J. Calabro |
| | | | Principal Executive Officer |
Pursuant to the requirements of the Securities Exchange Act of 1934 and the Investment Company Act of 1940, this report has been signed below by the following persons on behalf of the Trust and in the capacities and on the dates indicated.
| | | | |
Date: January 6, 2009 | | | | /s/ Mathew J. Calabro |
| | | | Mathew J. Calabro |
| | | | Principal Executive Officer |
| | |
Date: January 6, 2009 | | | | /s/ Andrea N. Mullins |
| | | | Andrea N. Mullins |
| | | | Principal Financial Officer |