UNITED STATES
SECURITIES AND EXCHANGE COMMISSION
Washington, D.C. 20549
FORM N-CSR
CERTIFIED SHAREHOLDER REPORT OF REGISTERED
MANAGEMENT INVESTMENT COMPANIES
Investment Company Act File Number: 811-4767
EAGLE GROWTH & INCOME FUND
(Exact name of Registrant as Specified in Charter)
880 Carillon Parkway
St. Petersburg, FL 33716
(Address of Principal Executive Office) (Zip Code)
Registrant’s Telephone Number, including Area Code: (727) 567-8143
SUSAN L. WALZER, PRINCIPAL EXECUTIVE OFFICER
880 Carillon Parkway
St. Petersburg, FL 33716
(Name and Address of Agent for Service)
Copy to:
KATHY KRESCH INGBER, ESQ.
K&L Gates, LLP
1601 K Street, NW
Washington, D.C. 20006
Date of fiscal year end: October 31
Date of reporting period: October 31, 2015
Item 1. Reports to Shareholders

EAGLE MUTUAL FUNDS Annual Report and Investment Performance Review for the fiscal year ended October 31, 2015 Eagle Capital Appreciation Fund Eagle Growth & Income Fund Eagle International Stock Fund Eagle Investment Grade Bond Fund Eagle Mid Cap Growth Fund Eagle Mid Cap Stock Fund Eagle Small Cap Growth Fund Eagle Smaller Company Fund EAGLE | Family of Funds Go Paperless with eDelivery visit eagleasset.com/eDelivery For more information, see inside.
Table of Contents

Visit eagleasset.com/eDelivery to receive shareholder communications including prospectuses and fund reports with a service that helps protect the environment:
Environmentally friendly. Go green with eDelivery by reducing the number of trees used to produce paper.
Efficient. Stop waiting on regular mail. Your documents will be sent via email as soon as they are available.
Easy. Download and save files using your home computer with a few clicks of a mouse.
President’s Letter
Dear Fellow Shareholders:
I am pleased to present the annual report and investment-performance review of the Eagle Family of Funds for the fiscal year ended October 31, 2015 (the “reporting period”).
The current calendar year began with a market hiccup due to concerns about global growth, but investors quickly turned back to moving equity markets higher, which lasted until August. We believe that those global-growth concerns (particularly in China), as well as the second significant drop in energy prices in less than a year, sparked a long-anticipated market correction. The U.S. Federal Reserve Board (“the Fed”), which had said that domestic economic data would drive its decision regarding when to raise interest rates, in September stood pat on interest rates and indicated for the first time that global growth concerns were part of its decision-making process. Equity markets, long used to the Fed’s accommodative policy, subsequently popped back up nearly to the highs seen in late spring and early summer.
In sum, there have been—as there always are—many events that can impact the short-term direction of equity and bond markets. The Funds’ portfolio managers remain focused on striving to provide superior risk-adjusted returns over the long term.
I hope you will read the commentaries that follow in which our portfolio managers discuss their specific funds.
Here are just a few highlights from the reporting period:
| • | | The Eagle Mid Cap Growth Fund’s Class A Shares have an overall, three- and 10-year four-star rating from Morningstar.1,4* |
| • | | The Eagle Growth & Income Fund’s Class A Shares have a 10-year four-star rating from Morningstar.2,4* |
| • | | The Eagle Small Cap Growth Fund’s Class A Shares have a 10-year four-star rating from Morningstar.3,4* |
| • | | High-profile media outlets continue to seek Eagle managers. The Wall Street Journal and U.S. News & World Report have quoted James Camp, CFA®, co-portfolio manager of the Eagle Investment Grade Bond Fund. Chris Sassouni, DMD, an assistant portfolio manager of the Eagle Small Cap Growth and Eagle Mid Cap Growth fund, has been cited in Bloomberg Business. |
I would like to remind you that investing in any mutual fund carries certain risks. The principal risk factors for each fund are described at the end of this annual report. Carefully consider the investment objectives, risks, charges and expenses of any fund before you invest. Contact us at 800.421.4184 or eagleasset.com or your financial advisor for a prospectus, or a summary prospectus, which contains this and other important information about the Eagle Family of Funds. Read the prospectus, or summary prospectus, carefully before you invest or send money.
We are grateful for your continued support of, and confidence in, the Eagle Family of Funds.
Sincerely,

Richard J. Rossi
President
December 18, 2015
1 For the period ended Oct. 31, 2015, the Fund’s Class A shares are rated four stars for the three- and 10-year periods and overall and 3 stars for the five-year period among a total of 643, 437, 643 and 575 funds respectively, in the mid-cap growth category. Star ratings may be different for other share classes. Morningstar Rating® is based on risk-adjusted performance adjusted for fees and loads. Past performance is no guarantee of future results. Ratings are subject to change each month.
2 For the period ended Oct. 31, 2015, the Fund’s Class A shares are rated 4 stars for the 10-year, 3 stars for the overall and 2 stars for the five- and three-year periods among a total of 742, 1,197, 1,055 and 1,197 funds respectively, in the large-cap value category. Star ratings may be different for other share classes. Morningstar Rating® is based on risk-adjusted performance adjusted for fees and loads. Past performance is no guarantee of future results. Ratings are subject to change each month.
3 For the period ended Oct. 31, 2015, the Fund’s Class A shares are rated 4 stars for the 10-year, 3 stars for the five-year period and overall and 2 stars for the three-year period among a total of 416, 584, 658 and 658 funds respectively, in the small-cap growth category. Star ratings may be different for other share classes. Morningstar Rating® is based on risk-adjusted performance adjusted for fees and loads. Past performance is no guarantee of future results. Ratings are subject to change each month.
4 Performance data represented is historical and does not guarantee future results. The investment return and principal value of an investment will fluctuate, and you may have a gain or loss when you sell shares. Current performance may be higher or lower than the performance data quoted. To obtain more current performance data as of the most recent month-end, please visit our website at eagleasset.com.
* The information contained herein: (1) is proprietary to Morningstar and/or its content providers; (2) may not be copied or distributed; and (3) is not warranted to be accurate, complete or timely. Neither Morningstar nor its content providers are responsible for any damages or losses arising from any use of this information. Funds with at least three years of performance history are assigned ratings from the fund’s three-, five- and 10-year average annual returns (when available) and a risk factor that reflects fund performance relative to three-month Treasury bill monthly returns. Fund returns are adjusted for fees and sales loads. Ten percent of the funds in an investment category receive five stars, 22.5% receive four stars, 35% receive three stars, 22.5% receive two stars and the bottom 10% receive one star. Investment return and principal value will vary so that investors have a gain or loss when shares are sold. Funds are rated for up to three time periods (three-, five-, and 10-years) and these ratings are combined to produce an overall rating. Ratings may vary among share classes and are based on past performance. Past performance does not guarantee future results.
The Global Industry Classification Standard (GICS®) was developed by and/or is the exclusive property of Morgan Stanley Capital International, Inc. (“MSCI”) and Standard & Poor’s Financial Services LLC (“S&P”). GICS is a service mark of MSCI and S&P and has been licensed for use by U.S. Bancorp Fund Services, LLC.
Performance Summary and Commentary
| | |
| |
| | | |
| Eagle Capital Appreciation Fund | | |
Portfolio Managers | David J. Pavan, CFA®, C. Frank Feng, Ph.D., Ed Wagner, CFA®, and Stacey R. Nutt, Ph.D., of ClariVest Asset Management LLC (“ClariVest”), are Co-Portfolio Managers of the Eagle Capital Appreciation Fund (the “Fund”) and have been responsible for the day-to-day management of the Fund’s investment portfolio since June 2013.
Performance discussion | For the fiscal year ended October 31, 2015, the Fund’s Class A shares returned 10.29% (excluding front-end sales charges of 4.75%), outperforming its benchmark index, the Russell 1000® Growth Index, which returned 9.18%. The Fund posted positive absolute performance in all sectors for the period other than the relatively small materials and telecommunications services sectors for the period. Outperformance, relative to the benchmark, was led by the energy, industrials, and consumer staples sectors. In the energy sector, despite being hurt by an overweight position, strong security selection helped the Fund outperform the benchmark. In industrials and consumer staples, outperformance was also led by solid security selection. The Fund lost ground to the benchmark in the information technology and financials sectors, both due to weak stock selection. Please keep in mind that an index is not available for direct investment; therefore its performance does not reflect the expenses associated with the active management of an actual portfolio.
Growth of a $10,000 investment from 10/31/05 to 10/31/15 (a)
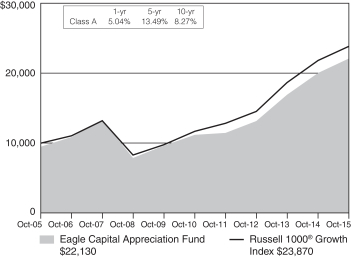
(a) The Fund’s values and returns reflect the maximum front-end sales charge of 4.75%, fund expenses and the reinvestment of dividends; however, they do not reflect the deduction of taxes that you would pay on fund distributions or redemption of fund shares. The value of an investment in other share classes will differ due to each class’s respective sales charges and expenses.
Performance data represented is historical and does not guarantee future results. The investment return and principal value of an investment will fluctuate, and you may have a gain or loss when you sell shares. Current performance may be higher or lower than the performance data quoted. To obtain more current performance data as of the most recent month-end, please visit our website at eagleasset.com.
Top performers | Apple Inc. designs, manufactures and markets mobile communication and media devices, personal computing products, and portable digital music players. The company continued beating earnings expectations on strong iPhone sales. Amazon. com, Inc. is the world’s largest online retailer,
offering a range of products including books, music, electronics, and household goods. Shares rose sharply on each of the company’s four quarterly earnings reports as the company, which was known for rapid sales growth but little profitability due to heavy investment spending, demonstrated it could also generate substantial profits. The company continued to gain share from traditional retailers, and achieved an estimated 44 million subscribers to its Prime membership program. NIKE, Inc. (Class B) designs, develops, and markets athletic footwear, apparel, equipment, and accessory products for men, women, and children. The company continued to beat earnings estimates and reported strong future orders even in the face of apparent foreign exchange headwinds and weak international economies. Northrop Grumman Corporation is a global security company which provides systems, products, and solutions in aerospace, electronics, information systems and technical services to government and commercial customers worldwide. The company appears to be using its ample free cash flow to repurchase shares, and defense multiples have increased as government budget concerns ease and conflicts rise in the Middle East. At the end of October, Northrop Grumman won a very large contract to build the U.S. Air Force’s next generation bomber (though this award is subject to appeal by the other bidders). Alphabet, Inc. (Class A and Class C) operates as a holding company. The company, through its subsidiaries including Google, provides web-based search, advertisements, maps, software applications, mobile operating systems, consumer content, enterprise solutions, commerce, and hardware products. The stock rose in the second half of the year as the company reported strong advertisement click growth and impressive cost control. The Fund continues to hold each of the securities noted above as “top performers.”
Underperformers | Corning Inc. produces optical fiber, cable, and photonic components for the telecommunications industry, as well as manufactures glass panels, funnels, liquid crystal display glass and projection video lens assemblies for the information display industry. The stock declined over the year as end markets for its products appeared to weaken in personal computers globally and televisions in China. Kohl’s Corp. operates a chain of family-oriented department stores, featuring apparel, footwear and accessories for women, men and children; soft home products such as sheets and pillows; and housewares targeted to middle income customers. Shares of Kohl’s declined as a store refresh program failed to produce improving sales, and the expected consumer windfall from cheaper gasoline did not appear for many department store chains. American Express Co. is a global payment and travel company, offering charge and credit payment card products and travel-related services to consumers and businesses around the world. Shares dropped as the company lost its lucrative partnership for Costco credit cards. Micron Technology, Inc., through its subsidiaries, manufactures and markets dynamic random access memory chips (“DRAMs”), very fast static random access memory chips, flash memory, other semiconductor components, and memory modules. The stock declined on weak personal computer end market demand and DRAM pricing weakness. QUALCOMM, Inc. manufactures digital wireless communications equipment and licenses its wireless communications intellectual property to other manufacturers. Earnings declined as the company struggled to collect royalties in China and lost business as Samsung Electronics Co., Ltd. eliminated the company’s chips from its latest phone design. The Fund no longer holds the securities noted above as “underperformers.”
Performance Summary and Commentary
| | |
| |
| | | |
| Eagle Growth & Income Fund | | |
Portfolio Managers | Edmund Cowart, CFA®, David Blount, CFA®, CPA, Jeff Vancavage, CFA® and Harald Hvideberg, CFA®, are Co-Portfolio Managers of the Eagle Growth & Income Fund (the “Fund”). Messrs. Cowart and Blount have been responsible for the day-to-day management of the Fund’s investment portfolio since June 2011, Mr. Vancavage since July 2013, and Mr. Hvideberg since August 2014.
Performance discussion | For the fiscal year ended October 31, 2015, the Fund’s Class A shares returned (1.55)% (excluding front-end sales charges of 4.75%), underperforming its benchmark index, the S&P 500® Index, which returned 5.20%. Though the Portfolio Management team (“PM team”) was not satisfied with trailing the benchmark, the PM team was faced with a severe dividend yield headwind. During the fiscal year, dividend paying stocks returned 3.4%, while non-dividend paying stocks returned 16.7%. Furthermore, as part of the strategy’s mandate is to achieve a higher yield than the benchmark, returns on stocks with above median yields trailed their below median yield counterparts by 310 basis points. Investments in the telecommunications services and utilities sectors contributed positively to performance relative to the benchmark. The decision not to be invested in utilities for most of the year proved correct as the sector traded down. Investments in industrials, consumer discretionary, and information technology sectors all detracted. Please keep in mind that an index is not available for direct investment; therefore its performance does not reflect the expenses associated with the active management of an actual portfolio.
Growth of a $10,000 investment from 10/31/05 to 10/31/15 (a)
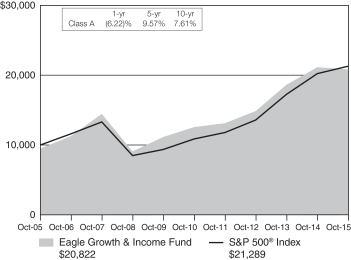
(a) The Fund’s values and returns reflect the maximum front-end sales charge of 4.75%, fund expenses and the reinvestment of dividends; however, they do not reflect the deduction of taxes that you would pay on fund distributions or redemption of fund shares. The value of an investment in other share classes will differ due to each class’s respective sales charges and expenses.
Performance data represented is historical and does not guarantee future results. The investment return and principal value of an investment will fluctuate, and you may have a gain or loss when you sell shares. Current performance may be higher or lower than the performance data quoted. To obtain more current performance data as of the most recent month-end, please visit our website at eagleasset.com.
Underperformers | The PM team believes that The Bank of Montreal, a highly diversified financial services provider, struggled due to recession fears in Canada coupled with lower energy prices. Although the company recently reported positive 3Q15 results, from a fundamentals perspective, the PM team believes a deceleration in the Canadian economy is likely to hamper profitability
in the intermediate-term, and the decision was made to sell the security. The PM team believes that global growth concerns also caused Applied Materials, Inc., a global leader in materials engineering solutions, to trade lower. The company was forced to terminate its merger with Tokyo Electron Limited due to trouble gaining the support of the U.S. Department of Justice. The stock was negatively impacted and adjusted downward. Management of the company remains ambitious for the future, because this company has over $1 billion in its R&D budget, substantial resources that have been invested continue gaining market share, and it remains a trusted name among customers. The Fund continues to hold this security. Trending with oil prices, shares of ConocoPhillips, the third largest U.S. oil exploration and production company, traded down. Operationally, the company continues to perform well in a difficult environment. However, because management of the company has noted that maintaining the dividend is a top priority, the Fund continues to hold this security. Sluggish sales have continued to plague Eaton Corporation PLC, a power management company. The PM team believes that any major new initiatives are likely to be muted as the company will transition to a new CEO next year. Company management noted demand has been slower in several of its markets, and after a $1.2 billion negative impact from foreign exchange this year the Fund sold out of its position. Chevron Corporation, a leading integrated energy company, faced difficulty during the year as revenues declined by more than half from last year on lower oil prices. The company has been able to offset some of the losses by more than doubling income from its downstream business year-over-year. Management also announced that it will not raise its dividend. The Fund continues to hold this security.
Top performers | The Home Depot, Inc., a retailer of home improvement and construction products and services, has constantly reported higher-than-expected revenue and raised its earnings guidance for the balance of 2015. Sales in the interior home improvement category and the professional segment were major drivers for the positive performance. The company has benefited from a strong U.S. housing market with housing starts and household formations appearing to pick up. As the world’s largest cloud provider, Microsoft Corporation, the leading platform and productivity company, appeared to continue to find new ways to drive value for shareholders. Its newest operating system, Windows 10, is free for 1 year to certain non-enterprise users of older versions of Windows. The new version is expected to increase demand for the company’s cloud offerings. Microsoft also announced an update to its accounting standards to recognize Windows revenue over 3 years, rather than at initial purchase. The multinational pharmaceutical company, Pfizer Inc., performed well during the year announcing higher than expected sales and earnings-per-share. Particularly, their pneumococcal bacteria vaccine, Prevnar, and their breast cancer medicine, Ibrance, sold much more than expected. With better margins, management was able to raise guidance for the remainder of the year. The stock of Apple Inc., a consumer products and information technology company, continued to rise following the release of several new products. During the year, the company unveiled a new Apple watch, a new iPad, a new iPhone, new software updates to all of its products, and an enhanced subscription feature to iTunes. The impact of a new CEO at McDonald’s Corporation, the world’s leading global foodservice retailer, has already begun to show positive signs within the company’s operations. Progress is visible within the domestic and international markets as the company is working with franchisees on new menu initiatives. The PM team believes that franchisees will make the capital investments needed to further drive revenue growth. The Fund continues to hold each of the securities noted above as “top performers.”
Performance Summary and Commentary
| | |
| |
| | | |
| Eagle International Stock Fund | | |
Portfolio Managers | David V. Vaughn, CFA®, Stacey R. Nutt, Ph.D., and Alex Turner, CFA® are Co-Portfolio Managers of the Eagle International Stock Fund (the “Fund”). Mr. Vaughn has been responsible for the day-to-day management of the Fund’s investment portfolio since its inception in February 2013 and Dr. Nutt since June 2013. Mr. Turner has been a Co-Portfolio Manager of the Fund since March 2015 and previously served as Assistant Portfolio Manager of the Fund since its inception. Priyanshu Mutreja, CFA®, has served as Assistant Portfolio Manager of the Fund since March 2015.
Performance discussion | For the fiscal year ended October 31, 2015, the Fund’s Class A shares returned 3.63% (excluding front-end sales charges of 4.75%), outperforming its benchmark index, the MSCI-EAFE Index, which returned (0.07)%. The Fund’s performance, relative to the benchmark, was modestly positive due to sector selection, where an overweight in the consumer discretionary sector and an underweight in the materials sector added to performance. On the other hand, being underweight in the consumer staples sector detracted from the Fund’s performance. Country selection was positive as well; being overweight in Japan and an underweight in Australia helped performance. Conversely, being underweight in France was a marginal detractor. Stock selection within countries and sectors was somewhat stronger than the corresponding allocation effects. Growth and momentum measures were strong across the globe, whereas valuation was flat. Please keep in mind that an index is not available for direct investment; therefore its performance does not reflect the expenses associated with the active management of an actual portfolio.
Growth of a $10,000 investment from 2/28/13 to 10/31/15 (a)
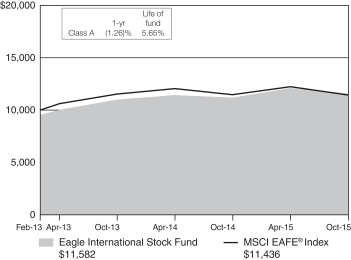
(a) The Fund’s values and returns reflect the maximum front-end sales charge of 4.75%, fund expenses and the reinvestment of dividends; however, they do not reflect the deduction of taxes that you would pay on fund distributions or redemption of fund shares. The value of an investment in other share classes will differ due to each class’s respective sales charges and expenses.
Performance data represented is historical and does not guarantee future results. The investment return and principal value of an investment will fluctuate, and you may have a gain or loss when you sell shares. Current performance may be higher or lower than the performance data quoted. To obtain more current performance data as of the most recent month-end, please visit our website at eagleasset.com.
Top performers | Qantas Airways Limited, the flag carrier airline of Australia, added to performance during the reporting period as the company posted its strongest profit in years, appeared to be helped by a recovery in passenger traffic, falling oil prices, and a major cost-cutting program implemented over the previous year. The Fund continues to hold this security. Central Japan Railway Co., a Japanese railway company operating between Tokyo and Osaka, contributed to performance as it reported an increase in profits, helped by an increase in ridership and a disciplined cost control program. The Fund no longer holds this position. The British tobacco company, Imperial Tobacco Group PLC, added to performance as it reported stable sales growth and gained market share from other tobacco brands. Fresenius SE & Co. KGaA, a German diversified health care company that provides products and services for dialysis, added to performance. This appeared to be, in part, due to strength in its North American Kabi segment, which, the Portfolio Management team (“PM team”) believes, benefitted from persistent U.S. drug shortages and new product launches. Taylor Wimpey PLC, one of the largest British based house building companies, contributed to performance as the company reported strong earnings growth apparently helped by a strong housing market amidst an improving economy. The Fund continues to hold the remaining securities listed as top performers.
Underperformers | Australian company, Western Areas Limited, a leading nickel producer, hurt performance despite strong production as nickel prices trended downward for most of the year. The PM team believes the stock price of Australia & New Zealand Banking Group Ltd., an Australian bank, fell due to exposure to Australia’s commodity-driven economy, as well as on concerns that the bank would need to do further capital raising. Volkswagen AG, the German car manufacturer, detracted from performance as the group appeared to face harsh conditions in Brazil and Russia, slowing growth in China and the company’s admission that it had falsified diesel emissions tests in the United States. A.P. Moller-Maersk A/S (Class B), the largest container shipper based in Denmark, detracted from performance as the company reported a lackluster first quarter apparently driven by weak freight rates and volumes, offsetting any gains from lower fuel costs. The Fund no longer holds any of the aforementioned underperformers. Royal Dutch Shell PLC (Class B), an integrated oil and gas company headquartered in the Netherlands, traded lower during the year, as it appeared to be hurt by declining oil prices. The Fund continues to hold the security.
Performance Summary and Commentary
| | |
| |
| | | |
| Eagle Investment Grade Bond Fund | | |
Portfolio Managers | James C. Camp, CFA®, and Joseph Jackson, CFA®, are Co-Portfolio Managers of the Eagle Investment Grade Bond Fund (the “Fund”) and have been responsible for the day-to-day management of the Fund’s investment portfolio since its inception in March 2010.
Performance discussion | For the fiscal year ended October 31, 2015, the Fund’s Class A shares returned 1.46% (excluding front-end sales charges of 3.75%), underperforming its benchmark index, the Barclays Capital U.S. Intermediate Government/Credit Bond Index, which returned 1.86%. The Portfolio Management team (“PM team”) believes that factors such as commodity deflation, geopolitical issues, brinksmanship between Greece and the Eurozone, and global economic concerns steming from China caused interest rates to finish the fiscal year lower. Angst over whether the U.S. Federal Reserve Board (“Fed”) would finally raise the Fed funds rate at each approaching Federal Open Market Committe meeting appeared to contribute to volatility throughout the fiscal year. The Portfolio Management team (“PM team”) believes that the uncertainty regarding the Fed’s decision, along with macro level concerns, drove a flattening in the yield curve causing outperformance in ten-year bonds. The main factors in the performance, relative to the benchmark, for the Fund during the period were the allocation to asset-backed securities and the underperformance of corporate utility sector holdings. The Fund earned positive relative returns in the corporate bonds sector due largely to a high quality bias. An allocation to mortgage-backed securities (“MBS”), which outperformed duration-matched U.S. Treasuries, as well as an allocation to longer-dated U.S. Treasuries, as compared to the benchmark, also added to the Fund’s performance. Please keep in mind that an index is not available for direct investment; therefore its performance does not reflect the expenses associated with the active management of an actual portfolio.
Growth of a $10,000 investment from 3/1/10 to 10/31/15 (a)
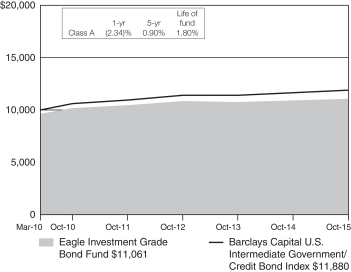
(a) The Fund’s values and returns reflect the maximum front-end sales charge of 3.75%, fund expenses and the reinvestment of dividends; however, they do not reflect the deduction of taxes that you would pay on fund distributions or redemption of fund shares. The value of an investment in other share classes will differ due to each class’s respective sales charges and expenses.
Performance data represented is historical and does not guarantee future results. The investment return and principal value of an investment will fluctuate, and you may have a gain or loss when you sell shares. Current performance may be higher or lower than the performance data quoted. To obtain more current performance data as of the most recent month-end, please visit our website at eagleasset.com.
Underperformers | The corporate bond, issued by Time Warner Cable, 4.13%, 02/15/21, which is a provider of video, high-speed data, and voice services over broadband cable systems, was bought as a merger arbitrage play when Charter Communications, Inc. announced that definitive merger agreement had been reached between the two companies. When the deal did not pass regulatory approval and the investment thesis was no longer in effect, the Fund exited its position. The corporate bond, issued by Petrobras Global Finance BV, 2.00%, 05/20/16, which is the financial services arm of Petroleo Brasiliero SA, a globally integrated oil company detracted from performance. Issues with money laundering and bribery changed the PM team’s outlook on the credit profile of the company. The Fund no longer holds this security. U.S. Treasury Note, 2.00%, 02/15/25, was an “underperformer” due mainly to timing as the security was sold to manage the Fund’s sector and duration characteristics even though longer-dated U.S. Treasuries performed well for the period due to various global and economic concerns, especially after rates peaked in June. The corporate bond, issued by Harris Corp., 2.70%, 04/27/20, which is an international communications equipment company focused on product, system, and service solutions to government and commercial customers also detracted from performance. The Fund sold out of this position when the Fund was shedding corporate bond exposure. The corporate bond, issued by Enable Midstream Partners LP, 144A, 2.40%, 05/15/19, which is a mid-stream oil and gas services provider, including gathering, processing, transporting, and storing detracted from performance. The security appears to have come under pressure as the entire lower BBB rated energy space underperformed the broader market. The Fund continues to hold this security as the PM team continues to favor the “toll road” business model as compared to exploration and production.
Top performers | Federal agency MBS, Freddie Mac Gold Pool, Series 13368, Class G, 6.00%, 11/01/23, is a well-seasoned, high coupon MBS that performed well despite the flattening yield curve. The Fund continues to hold this security. The corporate bond, issued by Medtronic, Inc., 3.15%, 03/15/22, which develops therapeutic and diagnostic medical products, was a top performer during the period due to attractive pricing in the primary market. The Fund continues to hold this position. The corporate bond, issued by Hospira, Inc., 6.05%, 03/30/17, which is a global pharmaceutical and medication delivery company that develops, manufactures, and markets products, had a strong total return apparently as a result of the company’s merger into higher credit-rated Pfizer, Inc. After the merger was complete, the PM team decided that valuation levels warranted selling this position and purchasing another security that offered a better risk/reward profile. Therefore, the Fund sold its position. The corporate bond, issued by Oracle Corp., 2.50%, 10/15/22, which is a provider of enterprise software and computer hardware products and services contributed to performance. The security is a high quality, longer-dated holding that appears to have benefited from the interest rate curve movement. The Fund continues to hold this position. The corporate bond, issued by Expedia, Inc., 4.50%, 08/15/24, which is an internet-based travel services provider for leisure and small business travelers, outperformed similarly low BBB rated peers. Extensive credit research on the company led the PM team to believe that it was valued attractively within the low BBB space at the time the corporate bond was purchased in August 2014. The Fund no longer holds the security as the PM team believed it reached an attractive valuation to sell.
Performance Summary and Commentary
| | |
| |
| | | |
| Eagle Mid Cap Growth Fund | | |
Portfolio Managers | Bert L. Boksen, CFA®, and Eric Mintz, CFA®, are Co-Portfolio Managers of the Eagle Mid Cap Growth Fund (the “Fund”). Mr. Boksen has been responsible for the day-to-day management of the Fund’s investment portfolio since its inception in August 1998. Mr. Mintz has been a Co-Portfolio Manager of the Fund since March 2011, and had previously served as Assistant Portfolio Manager since 2008. Christopher Sassouni, D.M.D., has served as Assistant Portfolio Manager of the Fund since January 2006.
Performance discussion | For the fiscal year ended October 31, 2015, the Fund’s Class A shares returned 4.70% (excluding front-end sales charges of 4.75%), underperforming its benchmark index, the Russell Midcap® Growth Index, which returned 4.94%. The Fund underperformed, relative to the benchmark, primarily due to stock selection in the materials and financials sectors. Within these sectors, the Fund was also hurt by being underweight in each. In contrast, outperformnace in the consumer staples and industrials sectors largely offset the Fund’s underperformance as these sectors performed better than the benchmark while the fund maintained a slightly overweight position in consumer staples and in-line position in industrials. Please keep in mind that an index is not available for direct investment; therefore, its performance does not reflect the expenses associated with the active management of an actual portfolio.
Growth of a $10,000 investment from 10/31/05 to 10/31/15 (a)
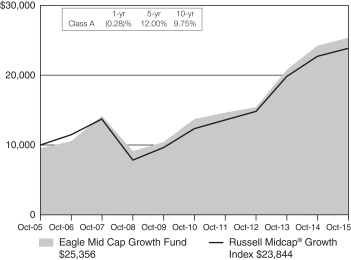
(a) The Fund’s values and returns reflect the maximum front-end sales charge of 4.75%, fund expenses and the reinvestment of dividends; however, they do not reflect the deduction of taxes that you would pay on fund distributions or redemption of fund shares. The value of an investment in other share classes will differ due to each class’s respective sales charges and expenses.
Performance data represented is historical and does not guarantee future results. The investment return and principal value of an investment will fluctuate, and you may have a gain or loss when you sell shares. Current performance may be higher or lower than the performance data quoted. To obtain more current performance data as of the most recent month-end, please visit our website at eagleasset.com.
Underperformers | Michael Kors Holdings Ltd. offers affordable luxury handbags and accessories. Prospects for a rebound from weakness early in the period appeared to further deteriorate as the company reported declining year-over-year sales results. The Fund sold out of its position in the stock. Genworth Financial, Inc. (Class A), a provider of insurance, wealth-management and investment solutions, encountered difficulty early in the period as the claims reserve pool for its long-term care unit was deemed severely underfunded as a result of a Securities and Exchange Commission review. The fund no longer maintains a position in this stock. Huntsman Corporation, a manufacturer of adhesives and coatings used in a myriad of industries, appeared to encounter some near-term pricing environment weakness within its polyurethanes and pigments segments, which led customers to delay orders during the period. The Portfolio Management team (“PM team”) believes eventual stabilization of the pricing environment is likely to support re-acceleration of customer order growth going forward. The Fund continues to hold this stock. Memorial Resource Development Corporation is an energy exploration & production (“E&P”) company operating primarily in northern Louisiana and eastern Texas. In the midst of a very difficult pricing environment for E&P companies, Memorial Resource Development encountered less-than-stellar oil well results that failed to prove the viability of its acreage outside of its core position, which the PM team believes tempered growth prospects as a result. The Fund no longer holds this position. Envision Healthcare Holdings, Inc., which provides clinical human capital management and related support for processes outsourced by hospitals, saw shares decline. The PM team believes this was due to weaker-than-anticipated patient volumes within its emergency department segment EmCare, some initial underperformance by a handful of recently-entered hospital contracts as well as elevated insurance claims reserves weighed on the stock toward the end of the reporting period. Despite the near-term difficulties, the PM team believes Envision Healthcare’s business model possesses a strong value proposition, which, in our opinion, is well-revered by its hospital and community customers. The Fund continues to hold this position.
Top Performers | Monster Beverage Corporation, a producer of energy drinks, has continued to execute well as its flagship Monster product line has experienced meaningful market-share gains. This product line also appears to be benefitting from The Coca-Cola Company’s global distribution opportunities as it is gaining better access to international markets and enhanced profitability. Constellation Brands, Inc. (Class A), which owns a variety of wine, beer and spirits brands (e.g., Robert Mondavi, Arbor Mist, Corona and Svedka), has performed well as a result of efficient distribution and a popular product portfolio. Cruise line operator Royal Caribbean Cruises, Ltd. appears to have performed well primarily as a result of disciplined cost-control efforts in addition to lower fuel costs during the period. Palo Alto Networks, Inc., a provider of next-generation network security platforms, appears to have benefitted from positive trends within cybersecurity as companies increasingly look to address and enhance the safety of their data networks and customer data. Acuity Brands, Inc., a designer and producer of LED lighting fixtures largely used in commercial applications, performed well as a result of positive trends in non-residential construction during the period. The Fund continues to hold each of the securities noted above as “top performers.”
Performance Summary and Commentary
Portfolio Managers | Charles Schwartz, CFA®, Betsy Pecor, CFA®, and Matthew McGeary, CFA®, are Co-Portfolio Managers of the Eagle Mid Cap Stock Fund (the “Fund”) and have been responsible for the day-to-day management of the Fund’s investment portfolio since October 2012.
Performance discussion | For the fiscal year ended October 31, 2015, the Fund’s Class A shares returned 2.07% (excluding front-end sales charges of 4.75%), underperforming both benchmark indices, the Russell Midcap® Index and, secondarily, the S&P MidCap 400® Index, which returned 2.77% and 3.42%, respectively. The Fund’s performance, relative to the benchmarks, benefitted from positive absolute performance in the consumer staples and information technology sectors. The financials and industrials sectors returned in-line relative results for the period. Healthcare posted positive returns but slightly lagged the benchmark for the period. Consumer discretionary stocks showed positive returns but underperformed the benchmark; while stock selections in the energy and utility sectors had negative returns while also underperforming the benchmark. Please keep in mind that an index is not available for direct investment; therefore its performance does not reflect the expenses associated with the active management of an actual portfolio.
Growth of a $10,000 investment from 10/31/05 to 10/31/15 (a)
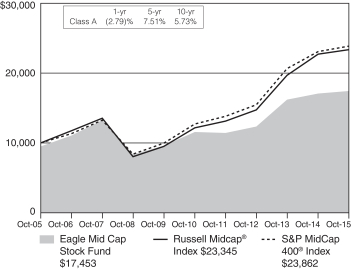
(a) The Fund’s values and returns reflect the maximum front-end sales charge of 4.75%, fund expenses and the reinvestment of dividends; however, they do not reflect the deduction of taxes that you would pay on fund distributions or redemption of fund shares. The value of an investment in other share classes will differ due to each class’s respective sales charges and expenses.
Performance data represented is historical and does not guarantee future results. The investment return and principal value of an investment will fluctuate, and you may have a gain or loss when you sell shares. Current performance may be higher or lower than the performance data quoted. To obtain more current performance data as of the most recent month-end, please visit our website at eagleasset.com.
Underperformers | Whiting Petroleum Corporation, an oil and gas exploration and production (E&P) company with primary exposure in the Bakken shale region, decreased in value along with most of its energy-sector peers. The Fund sold its position in this stock. Quanta Services, Inc. is a leading engineering and construction company focused on the electric power transmission and pipeline industries. The company’s shares have decreased in value recently apparently due to some contract delays and operating inefficiencies. The Portfolio Management team (“PM team”) continues to like the outlook for Quanta and, therefore, the Fund is maintaining its position in the security. Range Resources Corp. is an oil and gas company focused primarily in the Marcellus shale in Pennsylvania. Company shares have been weak apparently due to softness in the underlying commodities. The Fund continues to hold this position as the PM team sees long term growth opportunities in the company. NRG Energy, Inc. is an independent power producer that has several diverse businesses—retail, solar and clean energy technologies. The company’s underperformance appears to have been driven by lower hedged power prices for 2016, the absence of a tangible exit strategy for the company’s negative cash flow generating GreenCo business, and the absence of aggressive share repurchases. The Fund no longer holds this position. BorgWarner Inc. (“BorgWarner”) is a manufacturer and supplier of engineered automotive systems and components. The company’s stock price underperformance appears to have been driven by weaker light passenger vehicle sales in China and concerns over the company’s exposure to Volkswagen. The Fund continues to hold a position as the PM team believes BorgWarner is the best-positioned supplier to benefit from growing global regulatory requirements to improve fuel efficiency of vehicles.
Top performers | Skyworks Solutions, Inc., which sells analog semiconductors with a focus on wireless-connectivity solutions, continues to post solid financial results and offer encouraging earnings guidance. The PM team remains positive on the shares due to multiple growth drivers, increasing dollar content per device, and its current valuation. The Fund continues to hold the security but has reduced the position in recent months. NICE-Systems Ltd., Sponsored ADR, a leading cybersecurity and software company, has reported strong recent results and raised future guidance based on an uptick in cyber-crime. The Fund continues to hold this position. HCC Insurance Holdings, Inc., a diversified specialty insurance company, announced that it agreed to be acquired by Tokio Marine Holdings Inc. for a 38% premium. The Fund subsequently sold its position in the stock prior to the completion of the acquisition. SolarWinds, Inc., a provider of infrastructure management software to IT professionals, recently announced that it had entered into an agreement to be acquired by a private equity technology investment firm. The Fund continues to hold this position. Ulta Salon, Cosmetics & Fragrance, Inc. (“Ulta”), a cosmetics and fragrance specialty retailer, continues to post strong financial results as the PM team believes that fundamentals in the beauty category remain very strong. Further, the company is gaining significant market share as consumers appear to increasingly shop at specialty retailers rather than department stores for their beauty needs. The PM team continues to like the company’s growth opportunities and, as such, the Fund continues to maintain a position in Ulta.
Performance Summary and Commentary
| | |
| |
| | | |
| Eagle Small Cap Growth Fund | | |
Portfolio Managers | Bert L. Boksen, CFA®, and Eric Mintz, CFA®, are Co-Portfolio Managers of the Eagle Small Cap Growth Fund (the “Fund”). Mr. Boksen has been responsible for the day-to-day management of the Fund’s investment portfolio since August 1995 and Mr. Mintz since March 2011. Christopher Sassouni, D.M.D., has served as Assistant Portfolio Manager of the Fund since March 2015.
Performance discussion | For the fiscal year ended October 31, 2015, the Fund’s Class A shares returned 3.23% (excluding front-end sales charges of 4.75%), underperforming its benchmark index, the Russell 2000® Growth Index, which returned 3.52%. The Fund underperformed, relative to the benchmark, principally due to the consumer discretionary and information technology sectors. Within these sectors, the Fund was hurt by weak stock selection, while maintaining a slight underweight in the consumer discretionary sector and an in-line weight in the information technology sector. In contrast, the health care and industrials sectors were bright spots for the Fund, with solid absolute and relative performance generated in both sectors, while being slightly underweight in each. Please keep in mind that an index is not available for direct investment; therefore its performance does not reflect the expenses associated with the active management of an actual portfolio.
Growth of a $10,000 investment from 10/31/05 to 10/31/15 (a)
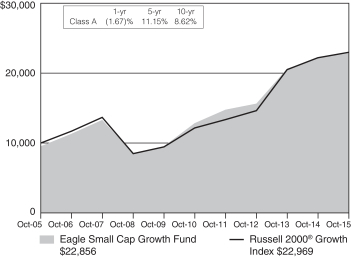
(a) The Fund’s values and returns reflect the maximum front-end sales charge of 4.75%, fund expenses and the reinvestment of dividends; however, they do not reflect the deduction of taxes that you would pay on fund distributions or redemption of fund shares. The value of an investment in other share classes will differ due to each class’s respective sales charges and expenses.
Performance data represented is historical and does not guarantee future results. The investment return and principal value of an investment will fluctuate, and you may have a gain or loss when you sell shares. Current performance may be higher or lower than the performance data quoted. To obtain more current performance data as of the most recent month-end, please visit our website at eagleasset.com.
Underperformers | Vitamin Shoppe, Inc. (“Vitamin Shoppe”) is a specialty retailer of vitamins, sports nutrition, and health and beauty-aid products. The company encountered weaker-than-expected same-store-sales growth while also modestly tempering guidance, which weighed on shares during the period. The Portfolio Management team (“PM team”) believes secular tailwinds supporting the vitamins and supplements industry (e.g., an aging U.S. baby boomer population and increasing public health awareness) continue to exist, which should ultimately bode well for Vitamin Shoppe. The Fund continues to hold this position. Huntsman Corporation manufactures adhesives and coatings used in a myriad of industries. The company encountered headwinds associated with a subdued pricing environment within its polyurethanes and pigments segments, which appeared to lead some customers to delay orders during the period. The PM team believes eventual stabilization of the pricing environment is likely to support re-acceleration of customer order growth going forward. The Fund continues to hold this position. Veeco Instruments, Inc. (“Veeco”) produces light-emitting diode products and systems used in a variety of applications. Share prices waned toward the end of the period as near-term weakness within the company’s Chinese segment appeared to weigh on the stock. Despite the near-term challenges, the PM team believes Veeco remains a dominant player in a key industry expected to see growth in the form of a multi-year upgrade cycle as general lighting applications transition to LED bulbs. The Fund continues to hold this position. Colfax Corporation (“Colfax”) manufactures fluid and gas-handling technology serving the petrochemical, oil, and gas industries. The end-market (e.g., China) appeared to temper the company’s results in the midst of a challenging capital expenditure environment. The PM team believes that when the energy markets re-find their footing, growth prospects for Colfax should re-emerge as capital expenditure conditions improve. The Fund continues to hold this stock. Vince Holding Corp., an apparel and accessories company, encountered sustained weakness within its wholesale segment while the unexpected departure of its CFO appeared to cloud the market perspective on the company’s near- to mid-term strategic direction. The Fund sold its position in this stock.
Top performers | Anacor Pharmaceuticals, Inc. is a company that focuses on therapies used to treat skin-related conditions. Share prices jumped as the company reported positive phase-3 results for a potential eczema-treatment compound. The Fund continues to hold this position. JetBlue Airways Corporation, a leading airline carrier, appears to be benefitting from a more disciplined and rational competitive environment as well as lower fuel prices. The Fund continues to hold this position. Thoratec Corporation is a developer of medical devices used to support patients with failing hearts. The company agreed to be acquired by St. Jude Medical Inc., during the period at a sizeable premium. The Fund held the position through the acquisition close. Proofpoint, Inc. provides software-as-a-service based comprehensive email security solutions for enterprise users. The PM team believes the company has benefitted from a strong product offering as well as associated tailwinds in cybersecurity as companies increasingly look to address and enhance the safety of their data networks. The Fund continues to hold this stock. Receptos, Inc., a developer of drug treatments for conditions such as multiple sclerosis, ulcerative colitis, and irritable-bowel syndrome, agreed to be acquired by Celgene Corp. during the period at a substantial premium. The Fund held the position through the acquisition close.
Performance Summary and Commentary
| | |
| |
| | | |
| Eagle Smaller Company Fund | | |
Portfolio Managers | Charles Schwartz, CFA®, Betsy Pecor, CFA®, and Matthew McGeary, CFA®, are Co-Portfolio Managers of the Eagle Smaller Company Fund (the “Fund”) and have been responsible for the day-to-day management of the Fund’s investment portfolio since its October 2014.
Performance discussion | For the fiscal year ended October 31, 2015, the Fund’s Class A shares returned (1.88)% (excluding front-end sales charges of 4.75%), underperforming both benchmark indices, the Russell 2000® Index and, secondarily, the Russell 2500® Index, which returned 0.34% and 1.50%, respectively. The Fund’s performance, relative to the benchmarks, benefited from strong performance in the health care sector due to strong stock selection in health care providers and a lack of exposure to biotechnology. In addition, the Fund was slightly overweight in the materials sector where stock selection in the metals and mining industry benefited the Fund. In contrast, the Fund’s holdings in the consumer discretionary sector underperformed the benchmark which the Portfolio Management team (“PM team”) believes is due to negative news about several companies. Furthermore, the Fund’s relative performance suffered due to lower allocations to highly defensive and high-yielding sectors, including utilities and telecommunications. Please keep in mind that an index is not available for direct investment; therefore its performance does not reflect the expenses associated with the active management of an actual portfolio.
Growth of a $10,000 investment from 11/3/08 to 10/31/15 (a)
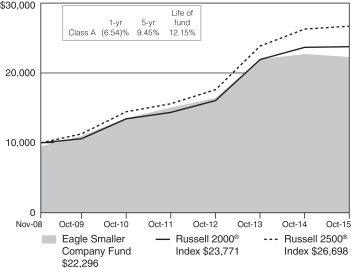
(a) The Fund’s values and returns reflect the maximum front-end sales charge of 4.75%, fund expenses and the reinvestment of dividends; however, they do not reflect the deduction of taxes that you would pay on fund distributions or redemption of fund shares. The value of an investment in other share classes will differ due to each class’s respective sales charges and expenses.
Performance data represented is historical and does not guarantee future results. The investment return and principal value of an investment will fluctuate, and you may have a gain or loss when you sell shares. Current performance may be higher or lower than the performance data quoted. To obtain more current performance data as of the most recent month-end, please visit our website at eagleasset.com.
Underperformers | Helix Energy Solutions Group, Inc., a specialized service provider to the offshore oil and gas industry, underperformed during the reporting period apparently due to the decline in the price of crude oil. In response to weak commodity prices, oil and gas producers appear to have radically reduced capital spending in order to preserve liquidity. Platform Specialty Products Corp., a producer of specialty chemicals for the electronics and agricultural markets, has grown rapidly through an acquisition over the past year. However, the stock has underperformed due to what the PM team believes are increasing concerns about the near-term health of its agricultural business and its exposure to weak currencies such as the Brazilian Real. LifeLock, Inc. is a provider of identity theft and fraud services. The company’s shares underperformed as the Company entered into litigation with the Federal Trade Commission and management reduced its fiscal 2015 guidance to reflect the likelihood of negative publicity. Tangoe, Inc., a provider of software solutions to help organizations manage and optimize their complex array of communications services and assets, reported lackluster financial results during the year, which appeared to cause some investors to question the organic growth rate of the business. The PM team decided to move to the sidelines on this stock until better execution and an accelerating organic growth rate are apparent. Iconix Brand Group, Inc. owns, licenses, and markets a growing portfolio of consumer brands. The company underperformed after the departures of the chief operating officer and chief financial officer following a period of weak operating results. The Fund no longer holds any of the securities noted above as “underperformers.”
Top performers | NICE-Systems Ltd., Sponsored ADR, a leading cyber security and software company, has reported strong recent results and raised future guidance based on an uptick in cyber-crime. The Fund continues to hold this position. SolarWinds, Inc., a provider of infrastructure management software to IT professionals, recently announced it had entered into an agreement to be acquired by a private equity technology investment firm. The Fund continues to hold this position. ICU Medical, Inc., which manufactures disposable products used in intravenous therapies, posted strong recent financial results. The PM team believes that the company has improved its manufacturing processes, bolstered product development and created strong financial-reporting communication to investors. The Fund continues to maintain a position in the security. Prestige Brands Holdings, Inc. is a leading provider of over-the-counter drug products. The company has delivered strong financial results which appeared to be driven by healthy organic sales growth and tight cost controls. The PM team likes how this company is positioned in the market and believes the management team is executing well. The Fund continues to maintain a position in the security. AmTrust Financial Services Inc., a specialty property and casualty insurance company, performed well recently apparently due to better than expected earnings growth driven by upside in net earned premium, service and fee income, and book value per share growth. The PM team elected to exit the Fund’s position due to valuation concerns.
Description of Indices
The Barclays Capital U.S. Intermediate Government/Credit Bond Index includes U.S. government and investment grade credit securities that have a greater than or equal to one year and less than ten years remaining to maturity and have $250,000,000 or more of outstanding face value. The returns of the index do not include the effect of any sales charges. That means that actual returns would be lower if they included the effect of sales charges.
The MSCI EAFE® Index is a free float-adjusted market capitalization index that is designed to measure the equity market performance of developed markets, excluding the U.S. and Canada. As of December 31, 2013, the index consisted of 21 developed market country indices. Its returns do not include the effect of any sales charges. That means that actual returns would be lower if they included the effect of sales charges.
The Russell 1000® Growth Index measures the performance of the large-cap growth segment of the U.S. equity universe. It includes those Russell 1000 Index companies with higher price-to-book ratios and higher forecasted growth values. Its returns do not include the effect of any sales charges. That means that actual returns would be lower if they included the effect of sales charges.
The Russell 2000® Index measures the performance of the small-cap segment of the U.S. equity universe. The Russell 2000 is a subset of the Russell 3000® Index representing approximately 10% of the total market capitalization of that index. It includes approximately 2000 of the smallest securities based on a combination of their market cap and current index membership. Its returns do not include the effect of any sales charges. That means that actual returns would be lower if they included the effect of sales charges.
The Russell 2500TM Index measures the performance of the small to mid-cap segment of the U.S. equity universe, commonly referred to as “smid” cap. The Russell 2500 is a subset of the Russell 3000® Index. It includes approximately 2,500 of the smallest securities based on a combination of their market cap and current index membership. Its returns do not include the effect of any sales charges. That means that actual returns would be lower if they included the effect of sales charges.
The Russell 2000® Growth Index measures the performance of the small-cap growth segment of the U.S. equity universe. It includes those Russell 2000 Index companies with higher price-to-value ratios and higher forecasted growth values. Its returns do not include the effect of any sales charges. That means that actual returns would be lower if they included the effect of sales charges.
The Russell Midcap® Index measures the performance of the mid-cap segment of the U.S. equity universe. The Russell Midcap is a subset of the Russell 1000® Index. It includes approximately 800 of the smallest securities based on a combination of their market cap and current index membership. Its returns do not include the effect of any sales charges. That means that actual returns would be lower if they included the effect of sales charges.
The Russell Midcap® Growth Index measures the performance of the mid-cap growth segment of the U.S. equity universe. It includes those Russell Midcap Index companies with higher price-to-book ratios and higher forecasted growth values. Its returns do not include the effect of any sales charges. That means that actual returns would be lower if they included the effect of sales charges.
The S&P 500® Index is an unmanaged index of 500 U.S. stocks and gives a broad look at how stock prices have performed. Its returns do not include the effect of any sales charges. That means that actual returns would be lower if they included the effect of sales charges.
The S&P MidCap 400® Index is an unmanaged index that measures the performance of the mid-sized company segment of the U.S. market. Its returns do not include the effect of any sales charges. That means that actual returns would be lower if they included the effect of sales charges.
Investment Portfolios
| | | | | | | | | | |
| EAGLE CAPITAL APPRECIATION FUND | | | | | | | | |
| COMMON STOCKS—98.9% | | | | Shares | | | Value | |
| Aerospace & defense—4.9% | | | | | | | | | | |
General Dynamics Corp. | | | | | 24,400 | | | | $3,625,352 | |
Honeywell International, Inc. | | | | | 46,480 | | | | 4,800,455 | |
Northrop Grumman Corp. | | | | | 45,600 | | | | 8,561,400 | |
| | | |
| Airlines—2.4% | | | | | | | | | | |
Delta Air Lines, Inc. | | | | | 115,500 | | | | 5,872,020 | |
JetBlue Airways Corp.* | | | | | 97,600 | | | | 2,424,384 | |
| | | |
| Auto components—1.5% | | | | | | | | | | |
Lear Corp. | | | | | 42,800 | | | | 5,352,568 | |
| | | |
| Beverages—3.6% | | | | | | | | | | |
Molson Coors Brewing Co., Class B | | | | | 46,900 | | | | 4,131,890 | |
PepsiCo, Inc. | | | | | 83,321 | | | | 8,514,573 | |
| | | |
| Biotechnology—7.0% | | | | | | | | | | |
AbbVie, Inc. | | | | | 54,700 | | | | 3,257,385 | |
Amgen, Inc. | | | | | 43,700 | | | | 6,912,466 | |
Celgene Corp.* | | | | | 34,900 | | | | 4,282,579 | |
Gilead Sciences, Inc. | | | | | 91,000 | | | | 9,839,830 | |
| | | |
| Building products—0.8% | | | | | | | | | | |
Owens Corning | | | | | 62,700 | | | | 2,854,731 | |
| | | |
| Capital markets—1.3% | | | | | | | | | | |
The Goldman Sachs Group, Inc. | | | | | 23,600 | | | | 4,425,000 | |
| | | |
| Chemicals—2.0% | | | | | | | | | | |
LyondellBasell Industries N.V., Class A | | | | | 53,100 | | | | 4,933,521 | |
The Mosaic Co. | | | | | 55,300 | | | | 1,868,587 | |
| | | |
| Communications equipment—2.3% | | | | | | | | | | |
Harris Corp. | | | | | 38,800 | | | | 3,070,244 | |
Juniper Networks, Inc. | | | | | 163,400 | | | | 5,129,126 | |
| | | |
| Diversified telecommunication—2.7% | | | | | | | | | | |
AT&T, Inc. | | | | | 101,181 | | | | 3,390,575 | |
Verizon Communications, Inc. | | | | | 129,000 | | | | 6,047,520 | |
| | | |
| Food & staples retailing—3.6% | | | | | | | | | | |
CVS Health Corp. | | | | | 67,300 | | | | 6,647,894 | |
The Kroger Co. | | | | | 156,100 | | | | 5,900,580 | |
| | | |
| Food products—1.9% | | | | | | | | | | |
Archer-Daniels-Midland Co. | | | | | 87,100 | | | | 3,976,986 | |
Tyson Foods, Inc., Class A | | | | | 58,100 | | | | 2,577,316 | |
| | | |
| Health care equipment & supplies—1.9% | | | | | | | | | | |
Edwards Lifesciences Corp.* | | | | | 31,600 | | | | 4,965,940 | |
St. Jude Medical, Inc. | | | | | 25,800 | | | | 1,646,298 | |
| | | |
| Health care providers & services—7.9% | | | | | | | | | | |
Aetna, Inc. | | | | | 37,500 | | | | 4,304,250 | |
Cardinal Health, Inc. | | | | | 37,200 | | | | 3,057,840 | |
Cigna Corp. | | | | | 30,800 | | | | 4,128,432 | |
Laboratory Corp. of America Holdings* | | | | | 32,800 | | | | 4,025,872 | |
McKesson Corp. | | | | | 28,800 | | | | 5,149,440 | |
UnitedHealth Group, Inc. | | | | | 59,800 | | | | 7,043,244 | |
| | | |
| Hotels restaurants & leisure—1.4% | | | | | | | | | | |
Darden Restaurants, Inc. | | | | | 46,400 | | | | 2,871,696 | |
Marriott International, lnc., Class A | | | | | 25,495 | | | | 1,957,506 | |
| | | |
| Household durables—1.8% | | | | | | | | | | |
D.R. Horton, Inc. | | | | | 135,600 | | | | 3,992,064 | |
Mohawk Industries, Inc.* | | | | | 10,900 | | | | 2,130,950 | |
| | | | | | | | | | |
| | | |
| COMMON STOCKS—98.9% | | | | Shares | | | Value | |
| Insurance—1.3% | | | | | | | | | | |
FNF Group | | | | | 66,740 | | | | $2,354,587 | |
XL Group PLC | | | | | 57,500 | | | | 2,189,600 | |
| | | |
| Internet & catalog retail—2.8% | | | | | | | | | | |
Amazon.com, Inc.* | | | | | 15,600 | | | | 9,764,040 | |
| | | |
| Internet software & services—7.0% | | | | | | | | | | |
Alphabet, Inc., Class A* | | | | | 13,614 | | | | 10,038,827 | |
Alphabet, Inc., Class C* | | | | | 10,512 | | | | 7,472,035 | |
Facebook, Inc., Class A* | | | | | 67,700 | | | | 6,903,369 | |
| | | |
| IT services—7.2% | | | | | | | | | | |
Amdocs Ltd. | | | | | 54,000 | | | | 3,216,780 | |
Fiserv, Inc.* | | | | | 45,700 | | | | 4,410,507 | |
FleetCor Technologies, Inc.* | | | | | 13,800 | | | | 1,999,068 | |
International Business Machines Corp. | | | | | 11,200 | | | | 1,568,896 | |
MasterCard, Inc., Class A | | | | | 93,630 | | | | 9,268,434 | |
Vantiv, Inc., Class A* | | | | | 95,404 | | | | 4,784,510 | |
| | | |
| Life sciences tools & services—1.1% | | | | | | | | | | |
Thermo Fisher Scientific, Inc. | | | | | 30,600 | | | | 4,001,868 | |
| | | |
| Media—3.8% | | | | | | | | | | |
Comcast Corp., Class A | | | | | 65,200 | | | | 4,082,824 | |
The Walt Disney Co. | | | | | 56,500 | | | | 6,426,310 | |
Time Warner, Inc. | | | | | 34,400 | | | | 2,591,696 | |
| | | |
| Oil, gas & consumable fuels—2.5% | | | | | | | | | | |
Marathon Petroleum Corp. | | | | | 46,400 | | | | 2,403,520 | |
Tesoro Corp. | | | | | 31,700 | | | | 3,389,681 | |
Valero Energy Corp. | | | | | 46,500 | | | | 3,065,280 | |
| | | |
| Pharmaceuticals—0.7% | | | | | | | | | | |
Allergan PLC* | | | | | 7,863 | | | | 2,425,500 | |
| |
| Real estate management & development—1.1% | | | | | |
CBRE Group, Inc., Class A* | | | | | 105,047 | | | | 3,916,152 | |
| | | |
| Semiconductors & semiconductor equipment—1.9% | | | | | | | | | | |
Lam Research Corp. | | | | | 45,300 | | | | 3,469,527 | |
Skyworks Solutions, Inc. | | | | | 40,400 | | | | 3,120,496 | |
| | | |
| Software—6.8% | | | | | | | | | | |
Electronic Arts, Inc.* | | | | | 90,200 | | | | 6,500,714 | |
Microsoft Corp. | | | | | 185,000 | | | | 9,738,400 | |
Oracle Corp. | | | | | 112,000 | | | | 4,350,080 | |
Synopsys, Inc.* | | | | | 66,000 | | | | 3,298,680 | |
| | | |
| Specialty retail—5.2% | | | | | | | | | | |
Foot Locker, Inc. | | | | | 50,900 | | | | 3,448,475 | |
Lowe’s Cos., Inc. | | | | | 89,245 | | | | 6,588,958 | |
The Home Depot, Inc. | | | | | 65,000 | | | | 8,036,600 | |
| | | |
| Technology hardware, storage & peripherals—5.8% | | | | | | | | | | |
Apple, Inc. | | | | | 168,866 | | | | 20,179,487 | |
| | | |
| Textiles, apparel & luxury goods—2.5% | | | | | | | | | | |
NIKE, Inc., Class B | | | | | 65,452 | | | | 8,576,176 | |
| | | |
| Tobacco—2.2% | | | | | | | | | | |
Reynolds American, Inc. | | | | | 157,100 | | | | 7,591,072 | |
| Total common stocks (cost $234,186,056) | | | | | | | | | 344,842,663 | |
| | | | |
| The accompanying notes are an integral part of the financial statements. | | | 11 | |
Investment Portfolios
| | | | | | | | | | |
| EAGLE CAPITAL APPRECIATION FUND (cont’d) | | | | |
| MONEY MARKET FUNDS—1.0% | | | | Shares | | | Value | |
Fidelity Institutional Money Market Funds—Government Portfolio—Institutional Shares, 0.01% # | | | | | 3,338,352 | | | | $ 3,338,352 | |
| Total money market funds (cost $3,338,352) | | | | 3,338,352 | |
| |
| Total investment portfolio (cost $237,524,408) 99.9% ‡ | | | | 348,181,015 | |
| | | |
Other assets in excess of liabilities 0.1% | | | | | | | | | 503,002 | |
| | | |
| Total net assets 100.0% | | | | | | | | | $348,684,017 | |
* Non-income producing security
# Annualized seven-day yield as of October 31, 2015
‡ As of October 31, 2015, aggregate cost for federal income tax purposes was $237,946,938, Net unrealized appreciation (depreciation) on a tax-basis was $110,234,077, including aggregate gross unrealized appreciation and depreciation of $114,010,214 and $(3,776,137), respectively. The difference between book-basis and tax-basis unrealized appreciation (depreciation) was primarily attributable to deferral of losses from wash sales.
| | | | |
| |
| Sector allocation (unaudited) | | | |
| Sector | | Percent of net assets | |
| Information technology | | | 31.1% | |
| Consumer discretionary | | | 18.9% | |
| Health care | | | 18.7% | |
| Consumer staples | | | 11.3% | |
| Industrials | | | 8.1% | |
| Financials | | | 3.7% | |
| Telecommunication services | | | 2.7% | |
| Energy | | | 2.5% | |
| Materials | | | 1.9% | |
| Money market funds | | | 1.0% | |
| | | | | | | | | | |
| | | | |
| EAGLE GROWTH & INCOME FUND | | | | | | | | |
| COMMON STOCKS—99.5% | | | | Shares | | | Value | |
| Aerospace & defense—5.7% | | | | | | | | | | |
Honeywell International, Inc. | | | | | 184,487 | | | | $19,053,817 | |
United Technologies Corp. | | | | | 142,035 | | | | 13,977,664 | |
| | | |
| Banks—8.7% | | | | | | | | | | |
JPMorgan Chase & Co. | | | | | 195,203 | | | | 12,541,793 | |
The PNC Financial Services Group, Inc. | | | | | 209,827 | | | | 18,938,985 | |
Wells Fargo & Co. | | | | | 353,791 | | | | 19,154,245 | |
| | | |
| Beverages—5.3% | | | | | | | | | | |
PepsiCo, Inc. | | | | | 164,515 | | | | 16,811,788 | |
The Coca-Cola Co. | | | | | 332,881 | | | | 14,097,510 | |
| | | |
| Chemicals—2.2% | | | | | | | | | | |
E.I. du Pont de Nemours & Co. | | | | | 202,302 | | | | 12,825,947 | |
| | | |
| Commercial services & supplies—2.9% | | | | | | | | | | |
Tyco International PLC | | | | | 454,534 | | | | 16,563,219 | |
| | | |
| Communications equipment—2.8% | | | | | | | | | | |
Cisco Systems, Inc. | | | | | 564,666 | | | | 16,290,614 | |
| | | | | | | | | | |
| | | |
| COMMON STOCKS—99.5% | | | | Shares | | | Value | |
| Diversified telecommunication—2.0% | | | | | | | | | | |
AT&T, Inc. | | | | | 337,301 | | | | $11,302,957 | |
| | | |
| Food & staples retailing—2.7% | | | | | | | | | | |
Sysco Corp. | | | | | 380,646 | | | | 15,701,648 | |
| | | |
| Food products—2.3% | | | | | | | | | | |
General Mills, Inc. | | | | | 224,166 | | | | 13,026,286 | |
| | | |
| Health care equipment & supplies—6.2% | | | | | | | | | | |
Abbott Laboratories | | | | | 424,264 | | | | 19,007,027 | |
St. Jude Medical, Inc. | | | | | 267,125 | | | | 17,045,246 | |
| | | |
| Hotels restaurants & leisure—1.9% | | | | | | | | | | |
McDonald’s Corp. | | | | | 99,120 | | | | 11,126,220 | |
| | | |
| Household products—2.5% | | | | | | | | | | |
The Procter & Gamble Co. | | | | | 191,647 | | | | 14,637,998 | |
| | | |
| Industrial conglomerates—3.8% | | | | | | | | | | |
3M Co. | | | | | 141,030 | | | | 22,171,326 | |
| | | |
| Media—3.9% | | | | | | | | | | |
Regal Entertainment Group, Class A | | | | | 1,177,939 | | | | 22,828,458 | |
| | | |
| Multi-utilities—3.8% | | | | | | | | | | |
PG&E Corp. | | | | | 202,529 | | | | 10,815,049 | |
Sempra Energy | | | | | 111,676 | | | | 11,436,739 | |
| | | |
| Oil, gas & consumable fuels—8.6% | | | | | | | | | | |
Chevron Corp. | | | | | 136,918 | | | | 12,443,108 | |
ConocoPhillips | | | | | 240,602 | | | | 12,836,117 | |
Occidental Petroleum Corp. | | | | | 178,523 | | | | 13,307,104 | |
TOTAL S.A., Sponsored ADR | | | | | 238,914 | | | | 11,522,822 | |
| | | |
| Pharmaceuticals—10.8% | | | | | | | | | | |
Johnson & Johnson | | | | | 183,725 | | | | 18,561,737 | |
Merck & Co., Inc. | | | | | 370,044 | | | | 20,226,605 | |
Pfizer, Inc. | | | | | 711,340 | | | | 24,057,519 | |
| | | |
| Real estate investment trusts (REITs)—4.1% | | | | | | | | | | |
Camden Property Trust | | | | | 110,180 | | | | 8,130,182 | |
Prologis, Inc. | | | | | 196,553 | | | | 8,398,710 | |
Simon Property Group, Inc. | | | | | 35,241 | | | | 7,099,652 | |
| | | |
| Road & rail—2.5% | | | | | | | | | | |
Union Pacific Corp. | | | | | 164,014 | | | | 14,654,651 | |
| | | |
| Semiconductors & semiconductor equipment—2.8% | | | | | | | | | | |
Applied Materials, Inc. | | | | | 974,479 | | | | 16,342,013 | |
| | | |
| Software—4.7% | | | | | | | | | | |
Microsoft Corp. | | | | | 512,201 | | | | 26,962,261 | |
| | | |
| Specialty retail—3.0% | | | | | | | | | | |
The Home Depot, Inc. | | | | | 140,399 | | | | 17,358,932 | |
| | | |
| Technology hardware, storage & peripherals—4.1% | | | | | | | | | | |
Apple, Inc. | | | | | 201,253 | | | | 24,049,733 | |
| | | |
| Tobacco—2.2% | | | | | | | | | | |
Altria Group, Inc. | | | | | 207,345 | | | | 12,538,152 | |
| Total common stocks (cost $452,339,243) | | | | | | | | | 577,843,834 | |
| | |
| 12 | | The accompanying notes are an integral part of the financial statements. |
Investment Portfolios
| | | | | | | | | | |
| | | |
| EAGLE GROWTH & INCOME FUND (cont’d) | | | | | | | | |
| MONEY MARKET FUNDS—0.6% | | | | Shares | | | Value | |
Fidelity Institutional Money Market Funds—Government Portfolio—Institutional Shares, 0.01% # | | | | | 3,636,636 | | | | $3,636,636 | |
| Total money market funds (cost $3,636,636) | | | | 3,636,636 | |
| |
| Total investment portfolio (cost $455,975,879) 100.1% ‡ | | | | 581,480,470 | |
| | | |
Liabilities in excess of other assets (0.1)% | | | | | | | | | (570,602 | ) |
| | | |
| Total net assets 100.0% | | | | | | | | | $580,909,868 | |
# Annualized seven-day yield as of October 31, 2015.
‡ As of October 31, 2015, aggregate cost for federal income tax purposes was $455,039,136, Net unrealized appreciation (depreciation) on a tax-basis was $126,441,334, including aggregate gross unrealized appreciation and depreciation of $138,321,251 and $(11,879,917), respectively. The difference between book-basis and tax-basis unrealized appreciation (depreciation) was primarily attributable to deferral of losses from wash sales.
ADR—American depository receipt
| | | | |
| |
| Sector allocation (unaudited) | | | |
| Sector | | Percent of net assets | |
| Health care | | | 17.0% | |
| Consumer staples | | | 15.0% | |
| Industrials | | | 14.9% | |
| Information technology | | | 14.4% | |
| Financials | | | 12.8% | |
| Consumer discretionary | | | 8.8% | |
| Energy | | | 8.6% | |
| Utilities | | | 3.8% | |
| Materials | | | 2.2% | |
| Telecommunication services | | | 2.0% | |
| Money market funds | | | 0.6% | |
| | | | | | | | | | |
| | | | |
| EAGLE INTERNATIONAL STOCK FUND | | | | | | | | |
| COMMON STOCKS—97.5% | | | | Shares | | | Value | |
| Australia—4.9% | | | | | | | | | | |
Aristocrat Leisure Ltd. | | | | | 38,375 | | | | $253,310 | |
Dexus Property Group | | | | | 14,585 | | | | 80,062 | |
Macquarie Group Ltd. | | | | | 575 | | | | 34,816 | |
OZ Minerals Ltd. | | | | | 19,124 | | | | 58,687 | |
Qantas Airways Ltd.* | | | | | 52,539 | | | | 147,989 | |
Suncorp Group Ltd. | | | | | 10,171 | | | | 94,484 | |
Treasury Wine Estates Ltd. | | | | | 31,715 | | | | 158,735 | |
| | | |
| Austria—0.5% | | | | | | | | | | |
Erste Group Bank AG* | | | | | 3,029 | | | | 88,822 | |
| | | |
| Belgium—0.5% | | | | | | | | | | |
AGFA-Gevaert N.V.* | | | | | 12,898 | | | | 54,980 | |
Elia System Operator S.A. | | | | | 710 | | | | 34,344 | |
| | | |
| Denmark—2.0% | | | | | | | | | | |
Danske Bank A/S | | | | | 11,151 | | | | 306,805 | |
DFDS A/S | | | | | 1,306 | | | | 39,667 | |
| | | | | | | | | | |
| | | |
| COMMON STOCKS—97.5% | | | | Shares | | | Value | |
| Finland—0.4% | | | | | | | | | | |
UPM-Kymmene OYJ | | | | | 3,957 | | | | $74,079 | |
| | | |
| France—8.0% | | | | | | | | | | |
BNP Paribas S.A. | | | | | 4,520 | | | | 273,899 | |
Cap Gemini S.A. | | | | | 705 | | | | 62,686 | |
Cie de Saint-Gobain S.A. | | | | | 979 | | | | 40,982 | |
Cie Generale des Etablissements Michelin | | | | | 1,462 | | | | 145,434 | |
Credit Agricole S.A. | | | | | 11,542 | | | | 145,781 | |
Nexans S.A.* | | | | | 1,511 | | | | 60,064 | |
Orange S.A. | | | | | 12,039 | | | | 212,268 | |
Renault S.A. | | | | | 2,886 | | | | 271,931 | |
Societe Generale S.A. | | | | | 3,016 | | | | 140,073 | |
| | | |
| Germany—13.9% | | | | | | | | | | |
Allianz SE | | | | | 1,136 | | | | 198,877 | |
Bayer AG | | | | | 1,545 | | | | 206,003 | |
Commerzbank AG* | | | | | 8,918 | | | | 98,078 | |
Daimler AG | | | | | 4,583 | | | | 397,409 | |
Deutsche Bank AG | | | | | 3,134 | | | | 87,717 | |
Deutsche Lufthansa AG* | | | | | 5,415 | | | | 79,967 | |
E.ON SE | | | | | 19,098 | | | | 201,468 | |
Fresenius SE & Co. KGaA | | | | | 4,439 | | | | 326,188 | |
Gerresheimer AG | | | | | 1,564 | | | | 121,953 | |
GFT Technologies SE | | | | | 1,697 | | | | 50,046 | |
HeidelbergCement AG | | | | | 875 | | | | 65,161 | |
Merck KGaA | | | | | 2,585 | | | | 252,370 | |
Muenchener Rueckversicherungs-Gesellschaft AG in Meunchen | | | | | 978 | | | | 195,007 | |
Rheinmetall AG | | | | | 770 | | | | 48,431 | |
Suedzucker AG | | | | | 1,801 | | | | 33,611 | |
| | | |
| Hong Kong—1.1% | | | | | | | | | | |
Orient Overseas International Ltd. | | | | | 13,000 | | | | 61,908 | |
Wheelock and Co. Ltd. | | | | | 26,000 | | | | 121,189 | |
| | | |
| Israel—2.9% | | | | | | | | | | |
Israel Discount Bank Ltd., Class A* | | | | | 44,111 | | | | 80,682 | |
Teva Pharmaceutical Industries Ltd. | | | | | 5,477 | | | | 325,186 | |
Tower Semiconductor Ltd.* | | | | | 6,872 | | | | 93,965 | |
| | | |
| Italy—2.6% | | | | | | | | | | |
Enel SpA | | | | | 36,769 | | | | 169,554 | |
Intesa Sanpaolo SpA | | | | | 69,046 | | | | 240,215 | |
Unipol Gruppo Finanziario SpA | | | | | 6,946 | | | | 32,354 | |
| | | |
| Japan—26.9% | | | | | | | | | | |
Alps Electric Co. Ltd. | | | | | 5,200 | | | | 161,404 | |
Bridgestone Corp. | | | | | 5,200 | | | | 190,689 | |
Fuji Heavy Industries Ltd. | | | | | 2,600 | | | | 100,551 | |
Fujitsu Ltd. | | | | | 13,000 | | | | 61,446 | |
Furuno Electric Co. Ltd. | | | | | 3,900 | | | | 26,360 | |
Heiwa Corp. | | | | | 3,900 | | | | 71,993 | |
Hokkaido Electric Power Co., Inc.* | | | | | 9,100 | | | | 97,212 | |
Hoya Corp. | | | | | 1,400 | | | | 57,773 | |
ITOCHU Corp. | | | | | 15,700 | | | | 196,454 | |
Japan Display, Inc. | | | | | 9,300 | | | | 29,217 | |
KDDI Corp. | | | | | 9,100 | | | | 220,205 | |
KYORIN Holdings, Inc. | | | | | 3,900 | | | | 65,562 | |
Marubeni Corp. | | | | | 36,000 | | | | 208,009 | |
Matsumotokiyoshi Holdings Co. Ltd. | | | | | 2,600 | | | | 111,322 | |
Mazda Motor Corp. | | | | | 14,400 | | | | 282,662 | |
MITSUBA Corp. | | | | | 2,600 | | | | 40,840 | |
Mitsubishi UFJ Financial Group, Inc. | | | | | 52,200 | | | | 337,605 | |
| | | | |
| The accompanying notes are an integral part of the financial statements. | | | 13 | |
Investment Portfolios
| | | | | | | | | | |
| | | |
| EAGLE INTERNATIONAL STOCK FUND (cont’d) | | | | | | | | |
| COMMON STOCKS—97.5% | | | | Shares | | | Value | |
| Japan (cont’d) | | | | | | | | | | |
Mizuho Financial Group, Inc. | | | | | 45,100 | | | | $92,899 | |
Nippon Soda Co. Ltd. | | | | | 13,000 | | | | 100,909 | |
Nippon Suisan Kaisha Ltd. | | | | | 26,100 | | | | 87,441 | |
Nippon Telegraph & Telephone Corp. | | | | | 10,400 | | | | 381,279 | |
NTT DOCOMO, Inc. | | | | | 9,100 | | | | 177,227 | |
Open House Co. Ltd. | | | | | 1,600 | | | | 29,188 | |
Resona Holdings, Inc. | | | | | 19,000 | | | | 100,535 | |
Sanden Holdings Corp. | | | | | 13,000 | | | | 44,752 | |
Sompo Japan Nippon Nipponkoa Holdings, Inc. | | | | | 8,100 | | | | 254,326 | |
Sumitomo Corp. | | | | | 21,500 | | | | 235,152 | |
Sumitomo Mitsui Financial Group, Inc. | | | | | 2,600 | | | | 103,723 | |
Toyoda Gosei Co. Ltd. | | | | | 2,700 | | | | 61,890 | |
Toyota Boshoku Corp. | | | | | 6,100 | | | | 130,338 | |
Toyota Motor Corp. | | | | | 6,700 | | | | 410,472 | |
ZEON Corp. | | | | | 13,000 | | | | 106,103 | |
| | | |
| Netherlands—3.4% | | | | | | | | | | |
Aegon N.V. | | | | | 10,837 | | | | 66,501 | |
Heineken N.V. | | | | | 1,699 | | | | 154,750 | |
ING Groep N.V., CVA | | | | | 15,407 | | | | 224,231 | |
Koninklijke Ahold N.V. | | | | | 2,246 | | | | 45,690 | |
NN Group N.V. | | | | | 2,638 | | | | 82,656 | |
| | | |
| New Zealand—0.3% | | | | | | | | | | |
Air New Zealand Ltd. | | | | | 25,696 | | | | 50,545 | |
| | | |
| Norway—1.4% | | | | | | | | | | |
Orkla ASA | | | | | 7,295 | | | | 62,081 | |
SalMar ASA | | | | | 2,089 | | | | 34,177 | |
Telenor ASA | | | | | 7,181 | | | | 135,277 | |
| | | |
| Singapore—2.2% | | | | | | | | | | |
Singapore Telecommunications Ltd. | | | | | 130,200 | | | | 369,931 | |
| | | |
| Spain—1.2% | | | | | | | | | | |
Almirall S.A. | | | | | 2,298 | | | | 44,233 | |
Banco Santander S.A. | | | | | 7,077 | | | | 39,533 | |
Iberdrola S.A. | | | | | 17,118 | | | | 122,071 | |
| | | |
| Sweden—5.3% | | | | | | | | | | |
Boliden AB | | | | | 14,702 | | | | 281,490 | |
Meda AB, Class A | | | | | 9,166 | | | | 134,522 | |
Skandinaviska Enskilda Banken AB, Class A | | | | | 18,750 | | | | 196,891 | |
Svenska Cellulosa AB SCA, Class B | | | | | 1,248 | | | | 36,759 | |
Telefonaktiebolaget LM Ericsson, Class B | | | | | 10,681 | | | | 103,953 | |
Tethys Oil AB | | | | | 2,794 | | | | 17,248 | |
Volvo AB, Class B | | | | | 12,052 | | | | 124,655 | |
| | | |
| Switzerland—4.4% | | | | | | | | | | |
Lafargeholcim Ltd.* | | | | | 457 | | | | 25,744 | |
Novartis AG | | | | | 4,701 | | | | 425,857 | |
Roche Holding AG | | | | | 248 | | | | 67,332 | |
Swiss Re AG | | | | | 1,998 | | | | 185,476 | |
Ypsomed Holding AG | | | | | 300 | | | | 39,456 | |
| | | |
| United Kingdom—15.6% | | | | | | | | | | |
Amec Foster Wheeler PLC | | | | | 3,881 | | | | 42,467 | |
Anglo American PLC | | | | | 5,197 | | | | 43,601 | |
AstraZeneca PLC | | | | | 1,462 | | | | 93,176 | |
Aviva PLC | | | | | 16,831 | | | | 125,787 | |
BAE Systems PLC | | | | | 22,171 | | | | 149,975 | |
Barclays PLC | | | | | 50,792 | | | | 180,960 | |
Barratt Developments PLC | | | | | 6,318 | | | | 59,518 | |
| | | | | | | | | | |
| | | |
| COMMON STOCKS—97.5% | | | | Shares | | | Value | |
| United Kingdom (cont’d) | | | | | | | | | | |
Bellway PLC | | | | | 1,815 | | | | $72,496 | |
Bovis Homes Group PLC | | | | | 1,893 | | | | 29,859 | |
BP PLC | | | | | 21,344 | | | | 126,847 | |
British American Tobacco PLC | | | | | 496 | | | | 29,467 | |
Britvic PLC | | | | | 4,883 | | | | 52,493 | |
BT Group PLC | | | | | 25,421 | | | | 181,544 | |
Direct Line Insurance Group PLC | | | | | 28,948 | | | | 175,594 | |
GlaxoSmithKline PLC | | | | | 1,632 | | | | 35,195 | |
HSBC Holdings PLC | | | | | 35,685 | | | | 278,804 | |
Imperial Tobacco Group PLC | | | | | 6,972 | | | | 375,427 | |
Investec PLC | | | | | 9,022 | | | | 75,155 | |
Lloyds Banking Group PLC | | | | | 204,318 | | | | 231,902 | |
Marks & Spencer Group PLC | | | | | 4,896 | | | | 38,660 | |
Royal Dutch Shell PLC, Class B | | | | | 2,455 | | | | 64,284 | |
Taylor Wimpey PLC | | | | | 66,108 | | | | 201,388 | |
| Total common stocks (Cost $16,233,493) | | | | | | | | | 16,578,433 | |
| | | |
| MONEY MARKET FUNDS—3.4% | | | | | | | | | | |
Fidelity Institutional Money Market Funds—Government Portfolio—Institutional Shares, 0.01% # | | | | | 585,947 | | | | 585,947 | |
| Total money market funds (Cost $585,947) | | | | | | | | | 585,947 | |
| | | |
| Total investment portfolio (Cost $16,819,440) 100.9% ‡ | | | | | | | | | 17,164,380 | |
| | | |
Liabilities in excess of other assets—(0.9)% | | | | | | | | | (155,722 | ) |
| | | |
| Total net assets—100.0% | | | | | | | | | $17,008,658 | |
*Non-income producing security
#Annualized seven-day yield as of October 31, 2015.
‡ As of October 31, 2015, aggregate cost for federal income tax purposes was $16,846,852, Net unrealized appreciation (depreciation) on a tax-basis was $317,528 including aggregate gross unrealized appreciation and depreciation of $1,288,130 and $(970,602), respectively. The difference between book-basis and tax-basis unrealized appreciation (depreciation) was primarily attributable to deferral of losses from wash sales.
CVA—Dutch certification
| | | | |
| |
| Sector Allocation (unaudited) | | | |
| Sector | | Percent of net assets | |
| Financials | | | 29.4% | |
| Consumer discretionary | | | 16.5% | |
| Health care | | | 13.2% | |
| Telecommunication services | | | 9.9% | |
| Industrials | | | 8.5% | |
| Consumer staples | | | 6.9% | |
| Materials | | | 4.4% | |
| Utilities | | | 3.7% | |
| Information technology | | | 3.5% | |
| Money market funds | | | 3.4% | |
| Energy | | | 1.5% | |
| | |
| 14 | | The accompanying notes are an integral part of the financial statements. |
Investment Portfolios
| | | | | | |
| EAGLE INTERNATIONAL STOCK FUND (cont’d) |
| | | | | | | | |
| Industry allocation (unaudited) | |
| Industry | | Value | | | Percent of
net assets | |
| Banks | | | $3,161,438 | | | | 18.6% | |
| Pharmaceuticals | | | 1,649,436 | | | | 9.7% | |
| Automobiles | | | 1,463,025 | | | | 8.6% | |
| Insurance | | | 1,411,062 | | | | 8.3% | |
| Diversified telecommunication | | | 1,280,299 | | | | 7.5% | |
| Trading companies & distributors | | | 639,615 | | | | 3.8% | |
| Auto components | | | 613,943 | | | | 3.6% | |
| Money market funds | | | 585,947 | | | | 3.4% | |
| Electric utilities | | | 423,181 | | | | 2.5% | |
| Tobacco | | | 404,894 | | | | 2.4% | |
| Wireless telecommunication services | | | 397,432 | | | | 2.3% | |
| Metals & mining | | | 383,778 | | | | 2.3% | |
| Beverages | | | 365,978 | | | | 2.2% | |
| Household durables | | | 363,261 | | | | 2.1% | |
| Health care providers & services | | | 326,188 | | | | 1.9% | |
| Airlines | | | 278,501 | | | | 1.6% | |
| Hotels, restaurants & leisure | | | 253,310 | | | | 1.5% | |
| Food products | | | 217,310 | | | | 1.3% | |
| Electronic equipment, instruments & components | | | 216,981 | | | | 1.3% | |
| Oil, gas & consumable fuels | | | 208,379 | | | | 1.2% | |
| Chemicals | | | 207,012 | | | | 1.2% | |
| Multi-utilities | | | 201,468 | | | | 1.2% | |
| Capital markets | | | 197,688 | | | | 1.2% | |
| IT services | | | 174,178 | | | | 1.0% | |
| Food & staples retailing | | | 157,012 | | | | 0.9% | |
| Real estate management & development | | | 150,377 | | | | 0.9% | |
| Aerospace & defense | | | 149,975 | | | | 0.9% | |
| Machinery | | | 124,655 | | | | 0.7% | |
| Life sciences tools & services | | | 121,953 | | | | 0.7% | |
| Communications equipment | | | 103,953 | | | | 0.6% | |
| Marine | | | 101,575 | | | | 0.6% | |
| Health care equipment & supplies | | | 97,229 | | | | 0.6% | |
| Semiconductors & semiconductor equipment | | | 93,965 | | | | 0.6% | |
| Construction materials | | | 90,905 | | | | 0.5% | |
| Real estate investment trusts (REITs) | | | 80,062 | | | | 0.5% | |
| Paper & forest products | | | 74,079 | | | | 0.4% | |
| Leisure products | | | 71,993 | | | | 0.4% | |
| Electrical equipment | | | 60,064 | | | | 0.4% | |
| Health care technology | | | 54,980 | | | | 0.3% | |
| Industrial conglomerates | | | 48,431 | | | | 0.3% | |
| Energy equipment & services | | | 42,467 | | | | 0.3% | |
| Building products | | | 40,982 | | | | 0.2% | |
| | | | | | | | |
|
| Industry allocation (unaudited) | |
| Industry | | Value | | | Percent of
net assets | |
| Multiline retail | | | $38,660 | | | | 0.2% | |
| Household products | | | 36,759 | | | | 0.2% | |
| Total investment portfolio | | | $17,164,380 | | | | 100.9% | |
| | | | | | | | | | |
| EAGLE INVESTMENT GRADE BOND FUND | | | | | | | | |
| CORPORATE BONDS—41.2% | | | | Principal
amount
(in thousands) | | | Value | |
| Aerospace & defense—0.4% | | | | | | | | | | |
Rolls-Royce PLC, 144A, 2.38%, 10/14/20 (a) | | | | | $200 | | | | $199,535 | |
| | | |
| Airlines—0.5% | | | | | | | | | | |
Southwest Airlines Co., 2.75%, 11/06/19 | | | | | 250 | | | | 253,251 | |
| | | |
| Auto manufacturers—0.5% | | | | | | | | | | |
Hyundai Capital America, 144A, 2.40%, 10/30/18 (a) | | | | | 250 | | | | 249,880 | |
| | | |
| Banks—6.0% | | | | | | | | | | |
BB&T Corp., 2.45%, 01/15/20 | | | | | 250 | | | | 251,594 | |
Capital One NA, 2.40%, 09/05/19 | | | | | 250 | | | | 248,278 | |
Citigroup, Inc., 2.55%, 04/08/19 | | | | | 250 | | | | 252,546 | |
Citizens Bank NA, 2.45%, 12/04/19 | | | | | 250 | | | | 247,411 | |
First Tennessee Bank NA, 2.95%, 12/01/19 | | | | | 250 | | | | 250,671 | |
JPMorgan Chase & Co., 2.20%, 10/22/19 | | | | | 250 | | | | 249,251 | |
KeyBank NA, 1.70%, 06/01/18 | | | | | 250 | | | | 249,519 | |
Manufacturer And Traders Trust Co., 2.30%, 01/30/19 | | | | | 250 | | | | 251,716 | |
National Australia Ltd., 144A, 2.25%, 07/01/19 (a) | | | | | 250 | | | | 250,390 | |
PNC Bank NA, 2.30%, 06/01/20 | | | | | 250 | | | | 248,391 | |
Royal Bank Of Canada, 2.10%, 10/14/20 | | | | | 250 | | | | 248,775 | |
The Huntington National Bank, 2.40%, 04/01/20 | | | | | 250 | | | | 248,347 | |
| | | |
| Beverages—0.3% | | | | | | | | | | |
PepsiCo, Inc., 2.15%, 10/14/20 | | | | | 150 | | | | 149,667 | |
| | | |
| Biotechnology—1.1% | | | | | | | | | | |
Biogen, Inc., 2.90%, 09/15/20 | | | | | 150 | | | | 151,373 | |
Celgene Corp., 3.95%, 10/15/20 | | | | | 135 | | | | 143,102 | |
Gilead Sciences, Inc., 2.55%, 09/01/20 | | | | | 250 | | | | 253,324 | |
| | | |
| Capital markets—1.5% | | | | | | | | | | |
Legg Mason, Inc., 2.70%, 07/15/19 | | | | | 250 | | | | 250,876 | |
State Street Corp., 2.55%, 08/18/20 | | | | | 250 | | | | 252,708 | |
The Goldman Sachs Group, Inc., 2.55%, 10/23/19 | | | | | 250 | | | | 251,795 | |
| | | |
| Chemicals—0.9% | | | | | | | | | | |
PetroLogistics LP/PetroLogistics Finance Corp.,
6.25%, 04/01/20 | | | | | 440 | | | | 462,150 | |
| | | |
| Commercial services—0.5% | | | | | | | | | | |
ERAC USA Finance LLC, 144A, 2.35%, 10/15/19 (a) | | | | | 250 | | | | 248,900 | |
| | | |
| Consumer finance—0.5% | | | | | | | | | | |
Synchrony Financial, 3.00%, 08/15/19 | | | | | 250 | | | | 252,588 | |
| | | |
| Diversified financial services—1.0% | | | | | | | | | | |
McGraw Hill Financial, Inc., 144A, 2.50%, 08/15/18 (a) | | | | | 250 | | | | 251,963 | |
Moody’s Corp., 2.75%, 07/15/19 | | | | | 250 | | | | 254,786 | |
| | | |
| Electric—1.0% | | | | | | | | | | |
Berkshire Hathaway Energy Co., 2.40%, 02/01/20 | | | | | 250 | | | | 249,520 | |
NextEra Energy Capital Holdings, Inc., 2.70%, 09/15/19 | | | | | 250 | | | | 250,475 | |
| | | |
| Electric utilities—0.5% | | | | | | | | | | |
The Southern Co., 2.15%, 09/01/19 | | | | | 250 | | | | 246,487 | |
| | | | |
| The accompanying notes are an integral part of the financial statements. | | | 15 | |
Investment Portfolios
| | | | | | | | | | |
| EAGLE INVESTMENT GRADE BOND FUND (cont’d) | | | | |
| CORPORATE BONDS—41.2% | | | | Principal
amount
(in thousands) | | | Value | |
| Electronic equipment, instruments & components—0.5% | | | | | |
Amphenol Corp., 3.13%, 09/15/21 | | | | | $250 | | | | $249,688 | |
| | | |
| Food—0.5% | | | | | | | | | | |
Kraft Heinz Foods Co., 144A, 2.80%, 07/02/20 (a) | | | | | 250 | | | | 251,002 | |
| | | |
| Food products—1.0% | | | | | | | | | | |
Ingredion, Inc., 1.80%, 09/25/17 | | | | | 250 | | | | 249,064 | |
The J.M. Smucker Co., 2.50%, 03/15/20 | | | | | 250 | | | | 249,920 | |
| | | |
| Gas—0.5% | | | | | | | | | | |
Dominion Gas Holdings LLC, 2.50%, 12/15/19 | | | | | 250 | | | | 251,778 | |
| | | |
| Health care equipment & supplies—1.5% | | | | | | | | | | |
CareFusion Corp., 6.38%, 08/01/19 | | | | | 103 | | | | 117,099 | |
Edwards Lifesciences Corp., 2.88%, 10/15/18 | | | | | 250 | | | | 254,525 | |
St. Jude Medical, Inc., 2.80%, 09/15/20 | | | | | 100 | | | | 100,645 | |
Zimmer Biomet Holdings, Inc., 2.70%, 04/01/20 | | | | | 250 | | | | 249,610 | |
| | | |
| Health care products—0.5% | | | | | | | | | | |
Medtronic, Inc., 3.15%, 03/15/22 | | | | | 250 | | | | 255,938 | |
| | | |
| Health care providers & services—2.1% | | | | | | | | | | |
Aetna, Inc., 3.95%, 09/01/20 | | | | | 500 | | | | 529,769 | |
Owens & Minor, Inc., 3.88%, 09/15/21 | | | | | 500 | | | | 506,204 | |
| | | |
| Health care services—1.0% | | | | | | | | | | |
Roche Holdings, Inc., 144A, 2.88%, 09/29/21 (a) | | | | | 500 | | | | 510,847 | |
| | | |
| Household durables—0.3% | | | | | | | | | | |
Newell Rubbermaid, Inc., 2.15%, 10/15/18 | | | | | 150 | | | | 150,056 | |
| |
| Independent power producers & energy traders—0.5% | | | | | |
Exelon Generation Co. LLC, 5.20%, 10/01/19 | | | | | 250 | | | | 271,120 | |
| | | |
| Insurance—4.2% | | | | | | | | | | |
ACE INA Holdings, Inc., 2.30%, 11/03/20 | | | | | 250 | | | | 250,147 | |
Assurant, Inc., 2.50%, 03/15/18 | | | | | 500 | | | | 504,160 | |
Jackson National Life Global Funding, 144A,
1.88%, 10/15/18 (a) | | | | | 250 | | | | 250,130 | |
Metropolitan Life Global Funding I, 144A, 2.30%, 04/10/19 (a) | | | | | 500 | | | | 504,993 | |
New York Life Global Funding, 144A, 1.55%, 11/02/18 (a) | | | | | 250 | | | | 248,644 | |
TIAA Asset Management Finance Co. LLC, 144A, 4.13%, 11/01/24 (a) | | | | | 335 | | | | 341,288 | |
| | | |
| Internet software & services—1.0% | | | | | | | | | | |
Baidu, Inc., 3.25%, 08/06/18 | | | | | 250 | | | | 255,057 | |
Tencent Holdings Ltd., 144A, 2.88%, 02/11/20 (a) | | | | | 250 | | | | 250,093 | |
| | | |
| IT services—1.6% | | | | | | | | | | |
Automatic Data Processing, Inc., 3.38%, 09/15/25 | | | | | 250 | | | | 257,393 | |
Broadridge Financial Solutions, Inc., 3.95%, 09/01/20 | | | | | 250 | | | | 261,417 | |
Fidelity National Information Services, Inc., 2.85%, 10/15/18 | | | | | 250 | | | | 252,636 | |
| | | |
| Media—2.7% | | | | | | | | | | |
Cox Communications, Inc., 7.25%, 11/15/15 | | | | | 500 | | | | 501,010 | |
DIRECTV Holdings LLC / DIRECTV Financing Co., Inc., 5.88%, 10/01/19 | | | | | 250 | | | | 280,062 | |
Sky PLC, 144A, 9.50%, 11/15/18 (a) | | | | | 205 | | | | 246,595 | |
The Interpublic Group of Cos., Inc., 4.20%, 04/15/24 | | | | | 335 | | | | 335,804 | |
| | | |
| Miscellaneous manufacturer—0.5% | | | | | | | | | | |
Tyco Electronics Group S.A., 2.38%, 12/17/18 | | | | | 250 | | | | 251,711 | |
| | | |
| Multi-utilities—0.5% | | | | | | | | | | |
PG&E Corp., 2.40%, 03/01/19 | | | | | 250 | | | | 251,291 | |
| | | | | | | | | | |
| | | |
| CORPORATE BONDS—41.2% | | | | Principal
amount
(in thousands) | | | Value | |
| Oil, gas & consumable fuels—1.2% | | | | | | | | | | |
Enable Midstream Partners LP, 144A, 2.40%, 05/15/19 (a) | | | | | $250 | | | | $236,574 | |
Kinder Morgan Energy Partners LP, 2.65%, 02/01/19 | | | | | 250 | | | | 244,378 | |
ONEOK Partners LP, 3.80%, 03/15/20 | | | | | 100 | | | | 101,141 | |
| | | |
| Pharmaceuticals—1.0% | | | | | | | | | | |
Bayer US Finance LLC, 144A, 3.00%, 10/08/21 (a) | | | | | 500 | | | | 509,315 | |
| | | |
| Professional services—0.2% | | | | | | | | | | |
The Dun & Bradstreet Corp., 4.00%, 06/15/20 | | | | | 100 | | | | 101,312 | |
| | | |
| Road & rail—0.8% | | | | | | | | | | |
J.B. Hunt Transport Services, Inc., 2.40%, 03/15/19 | | | | | 250 | | | | 251,711 | |
Ryder System, Inc., 2.65%, 03/02/20 | | | | | 150 | | | | 149,587 | |
| | | |
| Semiconductors & semiconductor equipment—0.5% | | | | | | | | | | |
KLA-Tencor Corp., 3.38%, 11/01/19 | | | | | 250 | | | | 253,809 | |
| | | |
| Software—1.6% | | | | | | | | | | |
Intuit, Inc.,5.75%, 03/15/17 | | | | | 250 | | | | 264,663 | |
Microsoft Corp., 3.63%, 12/15/23 | | | | | 250 | | | | 264,579 | |
Oracle Corp., 2.50%, 10/15/22 | | | | | 250 | | | | 244,585 | |
| | | |
| Specialty retail—0.6% | | | | | | | | | | |
AutoNation, Inc., 6.75%, 04/15/18 | | | | | 250 | | | | 276,658 | |
| | | |
| Technology hardware, storage & peripherals—1.0% | | | | | | | | | | |
Hewlett Packard Enterprise Co., 144A, 2.45%, 10/05/17 (a) | | | | | 250 | | | | 250,782 | |
NetApp, Inc., 3.38%, 06/15/21 | | | | | 250 | | | | 247,064 | |
| | | |
| Tobacco—0.2% | | | | | | | | | | |
Philip Morris International, Inc., 1.25%, 08/11/17 | | | | | 100 | | | | 100,328 | |
| | | |
| Trading companies & distributors—0.5% | | | | | | | | | | |
Air Lease Corp., 2.63%, 09/04/18 | | | | | 250 | | | | 249,688 | |
| Total corporate bonds (cost $20,477,238) | | | | | | | | | 20,555,139 | |
| |
| MORTGAGE AND ASSET-BACKED SECURITIES—29.3% | | | | | |
| Asset-backed securities—8.0% | | | | | | | | | | |
AmeriCredit Automobile Receivables Trust,
Series 2013-5, Class B, 1.52%, 01/08/19 | | | | | 1,000 | | | | 1,001,898 | |
CarMax Auto Owner Trust,
Series 2013-4, Class B, 1.71%, 07/15/19 | | | | | 1,000 | | | | 1,003,126 | |
Ford Credit Auto Owner Trust,
Series 2012-C, Class D, 2.43%, 01/15/19 | | | | | 1,000 | | | | 1,010,058 | |
Hyundai Auto Receivables Trust,
Series 2014-A, Class B, 1.73%, 08/15/19 | | | | | 1,000 | | | | 1,001,918 | |
| |
| Federal agency mortgage-backed obligations—21.3% | | | | | |
Fannie Mae Pool, | | | | | | | | | | |
Series 0323, Class AS, 2.50%, 08/01/23 | | | | | 396 | | | | 407,256 | |
Series 0798, Class AK, 3.50%, 01/01/27 | | | | | 486 | | | | 514,209 | |
Series 0957, Class MA, 3.00%, 01/01/22 | | | | | 724 | | | | 753,123 | |
Series 1212, Class MA, 2.50%, 10/01/22 | | | | | 816 | | | | 838,463 | |
Series 1895, Class MA, 2.50%, 05/01/24 | | | | | 450 | | | | 462,772 | |
Series 1935, Class MA, 3.00%, 06/01/24 | | | | | 421 | | | | 438,998 | |
Series 2020, Class MA, 2.50%, 09/01/24 | | | | | 443 | | | | 455,546 | |
Series 2126, Class MA, 3.50%, 12/01/24 | | | | | 643 | | | | 679,797 | |
Series 2154, Class MA, 3.00%, 01/01/25 | | | | | 507 | | | | 529,422 | |
Series 2185, Class MA, 3.00%, 02/01/25 | | | | | 440 | | | | 459,596 | |
Series 2233, Class MA, 2.50%, 04/01/25 | | | | | 462 | | | | 474,935 | |
Series 2239, Class MA, 3.00%, 04/01/25 | | | | | 918 | | | | 958,681 | |
| | |
| 16 | | The accompanying notes are an integral part of the financial statements. |
Investment Portfolios
| | | | | | | | | | |
| EAGLE INVESTMENT GRADE BOND FUND (cont’d) | | | | |
MORTGAGE AND ASSET-BACKED
SECURITIES—29.3% | | | | Principal
amount
(in thousands) | | | Value | |
Freddie Mac Gold Pool, | | | | | | | | | | |
Series 13368, Class G, 6.00%, 11/01/23 | | | | | $524 | | | | $568,154 | |
Series 18509, Class G, 3.50%, 04/01/29 | | | | | 565 | | | | 596,965 | |
Series 18513, Class G, 3.50%, 05/01/29 | | | | | 332 | | | | 350,996 | |
Series 18519, Class G, 3.50%, 07/01/29 | | | | | 1,027 | | | | 1,085,498 | |
Ginnie Mae I Pool, Series 783112, 5.50%, 09/15/22 | | | | | 427 | | | | 456,349 | |
Ginnie Mae II Pool, Series 5107, 4.00%, 07/20/26 | | | | | 573 | | | | 603,171 | |
| Total mortgage and asset-baked securities (cost $14,637,719) | | | | | | | | | 14,650,931 | |
| | | |
| FOREIGN GOVERNMENT BONDS—0.3% | | | | | | | | | | |
Province of Alberta Canada, 144A, 1.75%, 08/26/20 (a) | | | | | 150 | | | | 149,414 | |
| Total foreign government bonds (cost $149,308) | | | | | | | | | 149,414 | |
| | | |
| U.S. TREASURIES—20.6% | | | | | | | | | | |
U.S. Treasury Notes, | | | | | | | | | | |
1.63%, 07/31/20 | | | | | 2,750 | | | | 2,765,469 | |
3.63%, 02/15/21 | | | | | 1,500 | | | | 1,651,406 | |
2.13%, 09/30/21 | | | | | 1,100 | | | | 1,123,031 | |
1.75%, 09/30/22 | | | | | 750 | | | | 743,320 | |
2.75%, 11/15/23 | | | | | 1,750 | | | | 1,847,891 | |
2.75%, 02/15/24 | | | | | 1,100 | | | | 1,160,156 | |
2.00%, 08/15/25 | | | | | 1,000 | | | | 987,188 | |
| Total U.S. Treasuries (Cost $10,192,925) | | | | | | | | | 10,278,461 | |
| |
| U.S. GOVERNMENT AGENCY SECURITIES—4.1% | | | | | |
Federal Farm Credit Banks, 1.15%, 10/10/17 | | | | | 1,000 | | | | 1,006,676 | |
Private Export Funding Corp., Series CC,
2.25%, 12/15/17 | | | | | 1,000 | | | | 1,020,441 | |
| Total U.S. Government Agencies (Cost $2,005,961) | | | | 2,027,117 | |
| | | |
| SUPRANATIONAL BANKS—3.0% | | | | | | | | | | |
Inter-American Development Bank, | | | | | | | | | | |
1.75%, 10/15/19 | | | | | 1,000 | | | | 1,006,669 | |
1.88%, 06/16/20 | | | | | 500 | | | | 505,312 | |
| Total supranational banks (cost $1,495,090) | | | | | | | | | 1,511,981 | |
| | | |
| MONEY MARKET FUNDS—2.2% | | | | | Shares | | | | Value | |
Fidelity Institutional Money Market Funds—Government Portfolio—Institutional Shares, 0.01%# | | | | | 1,112,973 | | | | 1,112,973 | |
| Total money market funds (cost $1,112,973) | | | | | | | | | 1,112,973 | |
| |
| Total investment portfolio (cost $50,071,214) 100.7%‡ | | | | 50,286,016 | |
| | | |
Liabilities in excess of other assets—(0.7)% | | | | | | | | | (340,130 | ) |
| | | |
| Total net assets—100.0% | | | | | | | | | $49,945,886 | |
(a) Restricted securities deemed to be liquid for purpose of compliance limitations on holdings of illiquid securities. At October 31, 2015, these securities aggregated $4,950,345 or 9.9% of the net assets of the Fund.
#Annualized seven-day yield as of October 31, 2015.
‡ As of October 31, 2015, aggregate cost for federal income tax purposes was $50,071,214, Net unrealized appreciation (depreciation) on a tax-basis was $214,802, including aggregate gross unrealized appreciation and depreciation of $335,074 and $(120,272), respectively. The difference between book-basis and tax-basis unrealized appreciation (depreciation) was primarily attributable to deferral of losses from wash sales.
144A—Securities are purchased under Rule 144A of the Securities Act of 1933 or are private placements and, unless registered under the Securities Act of 1933 or exempted from registration, generally may only be sold to qualified institutional buyers.
| | | | |
| Credit quality breakdown (unaudited)* | | | |
| Rating | | Percent of
net assets | |
| AAA/Aaa | | | 58.8% | |
| AA/Aa | | | 6.2% | |
| A/A | | | 15.4% | |
| BBB/Baa | | | 18.1% | |
| Not rated | | | 0.0% | |
* The table depicts the long-term credit-quality ratings assigned to the Fund’s portfolio holdings by Standard & Poor’s® (“S&P”), Moody’s Investors Service (“Moody’s”), and Fitch Ratings Inc. (“Fitch”), each of which is a widely used independent nationally recognized statistical rating organization (“NRSRO”). NRSRO ratings are shown because they provide an independent analysis of the credit quality of the Fund’s investments. These credit quality ratings are shown without regard to gradations within a given rating category. For example, securities rated “A-” have been included in the “A” rated category. Securities may be rated by other NRSROs and these ratings may be higher or lower. When ratings from multiple agencies are available, the highest is used, consistent with the Fund’s portfolio investment process. Credit quality ratings are subject to change without notice. For more information on S&P’s rating methodology, please visit standardandpoors.com and select “Understanding Ratings” under Rating Resources on the homepage. For more information on Moody’s rating methodology, please visit moodys.com and select “Rating Methodologies” under Research & Ratings on the homepage. For more information on Fitch’s rating methodology, please visit fitchratings.com and select “Ratings Definitions” at the bottom of the homepage. Eagle Asset Management, Inc. (“Manager”) also performs its own fundamental credit analysis of each security. As part of its fundamental credit analysis, the Manager considers various criteria, including industry specific actions, peer comparisons, payment ranking, and structure-specific characteristics. Any securities that are not rated by S&P, Moody’s, or Fitch appear in the table as “Not rated.” However, these securities are analyzed and monitored by the Manager on an ongoing basis. Government securities that are issued or guaranteed as to principal and interest by the U.S. government are not rated, but are treated by the Fund, and reflected in the table above, as being rated AAA and Aaa for credit quality purposes.
| | | | |
| The accompanying notes are an integral part of the financial statements. | | | 17 | |
Investment Portfolios
| | | | | | | | | | |
| EAGLE MID CAP GROWTH FUND | |
| COMMON STOCK—95.9% | | | | Shares | | | Value | |
| Aerospace & defense—1.1% | | | | | | | | | | |
Hexcel Corp. | | | | | 269,819 | | | | $12,498,016 | |
| | | |
| Airlines—2.8% | | | | | | | | | | |
Delta Air Lines, Inc. | | | | | 371,405 | | | | 18,882,230 | |
Southwest Airlines Co. | | | | | 293,333 | | | | 13,578,385 | |
| | | |
| Automobiles—0.1% | | | | | | | | | | |
Ferrari N.V.* | | | | | 21,428 | | | | 1,080,614 | |
| | | |
| Banks—1.1% | | | | | | | | | | |
Signature Bank* | | | | | 87,469 | | | | 13,025,883 | |
| | | |
| Beverages—5.4% | | | | | | | | | | |
Constellation Brands, Inc., Class A | | | | | 218,294 | | | | 29,426,031 | |
Monster Beverage Corp.* | | | | | 250,980 | | | | 34,213,594 | |
| | | |
| Biotechnology—2.2% | | | | | | | | | | |
BioMarin Pharmaceutical, Inc.* | | | | | 100,845 | | | | 11,802,899 | |
Medivation, Inc.* | | | | | 176,323 | | | | 7,416,145 | |
Vertex Pharmaceuticals, Inc.* | | | | | 51,363 | | | | 6,407,021 | |
| | | |
| Building products—2.9% | | | | | | | | | | |
A.O. Smith Corp. | | | | | 146,539 | | | | 11,257,126 | |
Fortune Brands Home & Security, Inc. | | | | | 225,978 | | | | 11,825,429 | |
Owens Corning | | | | | 250,382 | | | | 11,399,893 | |
| | | |
| Capital markets—2.6% | | | | | | | | | | |
Ameriprise Financial, Inc. | | | | | 167,713 | | | | 19,347,372 | |
TD Ameritrade Holding Corp. | | | | | 321,209 | | | | 11,072,074 | |
| | | |
| Chemicals—1.4% | | | | | | | | | | |
Huntsman Corp. | | | | | 377,885 | | | | 4,976,746 | |
The Sherwin-Williams Co. | | | | | 42,075 | | | | 11,226,872 | |
| | | |
| Commercial services & supplies—2.0% | | | | | | | | | | |
Waste Connections, Inc. | | | | | 431,891 | | | | 23,529,422 | |
| | | |
| Communications equipment—1.4% | | | | | | | | | | |
Palo Alto Networks, Inc.* | | | | | 103,954 | | | | 16,736,594 | |
| | | |
| Construction materials—1.1% | | | | | | | | | | |
Martin Marietta Materials, Inc. | | | | | 85,109 | | | | 13,204,661 | |
| | | |
| Diversified financial services—1.6% | | | | | | | | | | |
FactSet Research Systems, Inc. | | | | | 39,372 | | | | 6,894,825 | |
Voya Financial, Inc. | | | | | 294,534 | | | | 11,949,244 | |
| | | |
| Electrical equipment—2.7% | | | | | | | | | | |
Acuity Brands, Inc. | | | | | 86,620 | | | | 18,935,132 | |
Sensata Technologies Holding N.V.* | | | | | 263,936 | | | | 12,692,682 | |
| |
Electronic equipment, instruments &
components—2.6% | | | | | |
Amphenol Corp., Class A | | | | | 206,257 | | | | 11,183,255 | |
Fitbit, Inc., Class A* | | | | | 164,773 | | | | 6,679,897 | |
IPG Photonics Corp.* | | | | | 148,073 | | | | 12,233,791 | |
| | | |
| Food products—1.4% | | | | | | | | | | |
The WhiteWave Foods Co.* | | | | | 389,471 | | | | 15,960,522 | |
| | | |
| Health care equipment & supplies—4.4% | | | | | | | | | | |
Align Technology, Inc.* | | | | | 118,553 | | | | 7,760,479 | |
Edwards Lifesciences Corp.* | | | | | 89,228 | | | | 14,022,180 | |
Intuitive Surgical, Inc.* | | | | | 16,748 | | | | 8,317,057 | |
Sirona Dental Systems, Inc.* | | | | | 144,839 | | | | 15,806,280 | |
The Cooper Companies, Inc. | | | | | 41,043 | | | | 6,253,312 | |
| | | |
| Health care providers & services—6.0% | | | | | | | | | | |
Acadia Healthcare Co., Inc.* | | | | | 91,447 | | | | 5,615,760 | |
AmerisourceBergen Corp. | | | | | 107,177 | | | | 10,343,652 | |
| | | | | | | | | | |
| | | |
| COMMON STOCK—95.9% | | | | Shares | | | Value | |
| Health care providers & services (cont’d) | | | | | | | | | | |
Centene Corp.* | | | | | 316,334 | | | | $ 18,815,546 | |
Cigna Corp. | | | | | 60,739 | | | | 8,141,456 | |
Envision Healthcare Holdings, Inc.* | | | | | 383,644 | | | | 10,818,761 | |
Universal Health Services, Inc., Class B | | | | | 84,668 | | | | 10,337,116 | |
VCA, Inc.* | | | | | 120,271 | | | | 6,587,243 | |
| | | |
| Health care technology—0.6% | | | | | | | | | | |
Cerner Corp.* | | | | | 103,354 | | | | 6,851,337 | |
| | | |
| Hotels restaurants & leisure—4.1% | | | | | | | | | | |
Chipotle Mexican Grill, Inc.* | | | | | 8,836 | | | | 5,657,072 | |
Dominos Pizza, Inc. | | | | | 37,749 | | | | 4,026,686 | |
Royal Caribbean Cruises Ltd. | | | | | 277,738 | | | | 27,315,532 | |
Starwood Hotels & Resorts Worldwide, Inc. | | | | | 142,273 | | | | 11,363,344 | |
| | | |
| Household durables—3.6% | | | | | | | | | | |
Harman International Industries, Inc. | | | | | 249,077 | | | | 27,388,507 | |
Lennar Corp., Class A | | | | | 295,708 | | | | 14,806,100 | |
| | | |
| Household products—1.7% | | | | | | | | | | |
Church & Dwight Co., Inc. | | | | | 234,272 | | | | 20,168,476 | |
| | | |
| Internet & catalog retail—2.5% | | | | | | | | | | |
Liberty Interactive Corp., Class A* | | | | | 727,340 | | | | 19,907,296 | |
TripAdvisor, Inc.* | | | | | 114,751 | | | | 9,613,839 | |
| | | |
| Internet software & services—2.5% | | | | | | | | | | |
CoStar Group, Inc.* | | | | | 34,090 | | | | 6,922,656 | |
LinkedIn Corp., Class A* | | | | | 55,072 | | | | 13,265,193 | |
Twitter, Inc.* | | | | | 318,817 | | | | 9,073,532 | |
| | | |
| IT services—2.9% | | | | | | | | | | |
FleetCor Technologies, Inc.* | | | | | 40,896 | | | | 5,924,194 | |
Gartner, Inc.* | | | | | 126,867 | | | | 11,503,031 | |
Sabre Corp. | | | | | 565,375 | | | | 16,576,795 | |
| | | |
| Leisure products—0.9% | | | | | | | | | | |
Brunswick Corp. | | | | | 205,213 | | | | 11,042,512 | |
| | | |
| Life sciences tools & services—0.9% | | | | | | | | | | |
Quintiles Transnational Holdings, Inc.* | | | | | 168,703 | | | | 10,737,946 | |
| | | |
| Machinery—1.1% | | | | | | | | | | |
The Middleby Corp.* | | | | | 54,285 | | | | 6,348,088 | |
WABCO Holdings, Inc.* | | | | | 55,108 | | | | 6,184,771 | |
| | | |
| Media—2.1% | | | | | | | | | | |
Sirius XM Holdings, Inc.* | | | | | 6,087,424 | | | | 24,836,690 | |
| | | |
| Multiline retail—0.6% | | | | | | | | | | |
Macy’s, Inc. | | | | | 146,515 | | | | 7,469,335 | |
| | | |
| Oil, gas & consumable fuels—2.4% | | | | | | | | | | |
Diamondback Energy, Inc.* | | | | | 209,717 | | | | 15,485,504 | |
RSP Permian, Inc.* | | | | | 448,572 | | | | 12,299,844 | |
| | | |
| Pharmaceuticals—1.0% | | | | | | | | | | |
Mylan N.V.* | | | | | 255,213 | | | | 11,252,341 | |
| | | |
| Professional services—2.1% | | | | | | | | | | |
IHS, Inc., Class A* | | | | | 113,827 | | | | 13,606,880 | |
Verisk Analytics, Inc.* | | | | | 145,474 | | | | 10,417,393 | |
| | | |
| Real estate investment trusts (REITs)—1.8% | | | | | | | | | | |
Brixmor Property Group, Inc. | | | | | 274,408 | | | | 7,030,333 | |
Crown Castle International Corp. | | | | | 167,692 | | | | 14,330,958 | |
| | | |
| Road & rail—0.6% | | | | | | | | | | |
Old Dominion Freight Line, Inc.* | | | | | 116,775 | | | | 7,233,043 | |
| | |
| 18 | | The accompanying notes are an integral part of the financial statements. |
Investment Portfolios
| | | | | | | | | | |
| EAGLE MID CAP GROWTH FUND (cont’d) | | | | | | | | |
| COMMON STOCK—95.9% | | | | Shares | | | Value | |
| Semiconductors & semiconductor equipment—3.1% | | | | | |
Atmel Corp. | | | | | 1,382,176 | | | | $ 10,504,538 | |
Cavium, Inc.* | | | | | 88,138 | | | | 6,253,391 | |
Microchip Technology, Inc. | | | | | 126,897 | | | | 6,127,856 | |
Skyworks Solutions, Inc. | | | | | 180,827 | | | | 13,967,078 | |
| | | |
| Software—7.3% | | | | | | | | | | |
ANSYS, Inc.* | | | | | 168,479 | | | | 16,057,734 | |
Autodesk, Inc.* | | | | | 181,520 | | | | 10,018,089 | |
Cadence Design Systems, Inc.* | | | | | 444,779 | | | | 9,882,989 | |
Mobileye N.V.* | | | | | 211,646 | | | | 9,634,126 | |
ServiceNow, Inc.* | | | | | 182,425 | | | | 14,895,001 | |
Splunk, Inc.* | | | | | 173,546 | | | | 9,746,343 | |
Synopsys, Inc.* | | | | | 199,772 | | | | 9,984,604 | |
Tableau Software, Inc., Class A* | | | | | 72,113 | | | | 6,054,607 | |
| | | |
| Specialty retail—6.1% | | | | | | | | | | |
AutoZone, Inc.* | | | | | 15,946 | | | | 12,508,202 | |
O’Reilly Automotive, Inc.* | | | | | 56,588 | | | | 15,633,001 | |
Ross Stores, Inc. | | | | | 142,304 | | | | 7,197,736 | |
Sally Beauty Holdings, Inc.* | | | | | 382,089 | | | | 8,982,912 | |
Tractor Supply Co. | | | | | 190,415 | | | | 17,592,442 | |
Ulta Salon, Cosmetics & Fragrance, Inc.* | | | | | 59,218 | | | | 10,301,563 | |
| | | |
| Textiles, apparel & luxury goods—1.3% | | | | | | | | | | |
Under Armour, Inc., Class A* | | | | | 162,062 | | | | 15,408,855 | |
| |
| Trading companies & distributors—2.0% | | | | | |
AerCap Holdings N.V.* | | | | | 253,483 | | | | 10,519,544 | |
HD Supply Holdings, Inc.* | | | | | 446,405 | | | | 13,298,405 | |
| |
| Wireless telecommunication services—1.9% | | | | | |
SBA Communications Corp., Class A* | | | | | 185,550 | | | | 22,084,161 | |
| Total common stocks (cost $894,997,577) | | | | 1,127,547,602 | |
| |
| MONEY MARKET FUNDS—3.9% | | | | | |
Fidelity Institutional Money Market Funds—Government Portfolio—Institutional Shares, 0.01%# | | | | | 45,430,615 | | | | 45,430,615 | |
| |
| Total money market funds (cost $45,430,615) | | | | 45,430,615 | |
| |
Total investment portfolio (cost $940,428,192)
99.8%‡ | | | | 1,172,978,217 | |
| | | |
Other assets in excess of liabilities 0.2% | | | | | | | | | 2,733,736 | |
| | | |
| Total net assets 100.0% | | | | | | | | | $1,175,711,953 | |
* Non-income producing security
# Annualized seven-day yield as of October 31, 2015
‡ As of October 31, 2015, aggregate cost for federal income tax purposes was $943,627,575, Net unrealized appreciation (depreciation) on a tax-basis was $229,350,642, including aggregate gross unrealized appreciation and depreciation of $266,405,001 and $(37,054,359), respectively. The difference between book-basis and tax-basis unrealized appreciation (depreciation) was primarily attributable to deferral of losses from wash sales.
| | | | |
|
| Sector allocation (unaudited) | |
| Sector | | Percent of net assets | |
| Consumer discretionary | | | 21.4% | |
| Information technology | | | 19.8% | |
| Industrials | | | 17.2% | |
| Health care | | | 15.1% | |
| Consumer staples | | | 8.5% | |
| Financials | | | 7.1% | |
| Money market funds | | | 3.9% | |
| Materials | | | 2.5% | |
| Energy | | | 2.4% | |
| Telecommunication services | | | 1.9% | |
| | | | | | | | | | |
| EAGLE MID CAP STOCK FUND | | | | | | | | |
| COMMON STOCKS—97.6% | | | | Shares | | | Value | |
| Aerospace & defense—0.6% | | | | | | | | | | |
B/E Aerospace, Inc. | | | | | 38,383 | | | | $1,802,082 | |
| | | |
| Air freight & logistics—0.8% | | | | | | | | | | |
Expeditors International of Washington, Inc. | | | | | 46,258 | | | | 2,303,186 | |
| | | |
| Auto components—0.5% | | | | | | | | | | |
BorgWarner, Inc. | | | | | 38,127 | | | | 1,632,598 | |
| | | |
| Banks—5.5% | | | | | | | | | | |
East West Bancorp, Inc. | | | | | 105,519 | | | | 4,261,912 | |
First Republic Bank | | | | | 49,499 | | | | 3,232,780 | |
Signature Bank* | | | | | 34,913 | | | | 5,199,244 | |
SVB Financial Group* | | | | | 35,812 | | | | 4,371,571 | |
| | | |
| Beverages—2.3% | | | | | | | | | | |
Constellation Brands, Inc., Class A | | | | | 53,161 | | | | 7,166,103 | |
| | | |
| Capital markets—3.8% | | | | | | | | | | |
Affiliated Managers Group, Inc.* | | | | | 28,685 | | | | 5,170,758 | |
Invesco Ltd. | | | | | 99,407 | | | | 3,297,330 | |
Lazard Ltd., Class A | | | | | 68,157 | | | | 3,157,032 | |
| | | |
| Chemicals—1.9% | | | | | | | | | | |
Airgas, Inc. | | | | | 33,974 | | | | 3,266,940 | |
The Sherwin-Williams Co. | | | | | 9,912 | | | | 2,644,819 | |
| | | |
| Commercial services & supplies—3.0% | | | | | | | | | | |
Stericycle, Inc.* | | | | | 50,655 | | | | 6,147,997 | |
Waste Connections, Inc. | | | | | 54,919 | | | | 2,991,987 | |
| | | |
| Communications equipment—1.1% | | | | | | | | | | |
F5 Networks, Inc.* | | | | | 30,517 | | | | 3,362,973 | |
| | | |
| Construction & engineering—1.0% | | | | | | | | | | |
Quanta Services, Inc.* | | | | | 148,621 | | | | 2,988,768 | |
| | | |
| Consumer finance—1.9% | | | | | | | | | | |
Discover Financial Services | | | | | 57,213 | | | | 3,216,515 | |
PRA Group, Inc.* | | | | | 46,281 | | | | 2,536,199 | |
| | | |
| Containers & packaging—2.4% | | | | | | | | | | |
Berry Plastics Group, Inc.* | | | | | 107,225 | | | | 3,592,037 | |
Crown Holdings, Inc.* | | | | | 73,649 | | | | 3,906,343 | |
| | | | |
| The accompanying notes are an integral part of the financial statements. | | | 19 | |
Investment Portfolios
| | | | | | | | | | |
| EAGLE MID CAP STOCK FUND (cont’d) | | | | |
| COMMON STOCKS—97.6% | | | | Shares | | | Value | |
| Distributors—2.0% | | | | | | | | | | |
LKQ Corp.* | | | | | 211,005 | | | | $ 6,247,858 | |
| | | |
| Electrical equipment—3.0% | | | | | | | | | | |
Acuity Brands, Inc. | | | | | 10,149 | | | | 2,218,571 | |
AMETEK, Inc. | | | | | 87,953 | | | | 4,821,584 | |
Sensata Technologies Holding N.V.* | | | | | 48,429 | | | | 2,328,951 | |
| |
| Electronic equipment, instruments & components—2.9% | | | | | |
Amphenol Corp., Class A | | | | | 60,178 | | | | 3,262,851 | |
Cognex Corp. | | | | | 54,087 | | | | 2,033,671 | |
FLIR Systems, Inc. | | | | | 135,667 | | | | 3,618,239 | |
| | | |
| Energy equipment & services—1.7% | | | | | | | | | | |
Core Laboratories N.V. | | | | | 14,473 | | | | 1,683,644 | |
FMC Technologies, Inc.* | | | | | 56,014 | | | | 1,894,954 | |
The Weatherford International PLC* | | | | | 152,522 | | | | 1,561,825 | |
| | | |
| Food products—2.2% | | | | | | | | | | |
The Hain Celestial Group, Inc.* | | | | | 51,134 | | | | 2,549,030 | |
The WhiteWave Foods Co.* | | | | | 103,439 | | | | 4,238,930 | |
| | | |
| Health care equipment & supplies—7.5% | | | | | | | | | | |
Align Technology, Inc.* | | | | | 36,876 | | | | 2,413,903 | |
DENTSPLY International, Inc. | | | | | 46,909 | | | | 2,854,413 | |
Edwards Lifesciences Corp.* | | | | | 17,287 | | | | 2,716,652 | |
IDEXX Laboratories, Inc.* | | | | | 33,634 | | | | 2,307,965 | |
Sirona Dental Systems, Inc.* | | | | | 32,912 | | | | 3,591,687 | |
STERIS Corp. | | | | | 35,573 | | | | 2,666,196 | |
The Cooper Companies, Inc. | | | | | 27,164 | | | | 4,138,707 | |
Varian Medical Systems, Inc.* | | | | | 32,902 | | | | 2,583,794 | |
| | | |
| Health care providers & services—3.0% | | | | | | | | | | |
Acadia Healthcare Co., Inc.* | | | | | 27,520 | | | | 1,690,003 | |
Centene Corp.* | | | | | 36,813 | | | | 2,189,637 | |
Envision Healthcare Holdings, Inc.* | | | | | 124,152 | | | | 3,501,086 | |
MEDNAX, Inc.* | | | | | 26,048 | | | | 1,835,603 | |
| | | |
| Hotels restaurants & leisure—3.7% | | | | | | | | | | |
Bloomin’ Brands, Inc. | | | | | 194,963 | | | | 3,308,522 | |
Dunkin’ Brands Group, Inc. | | | | | 95,713 | | | | 3,963,475 | |
Wyndham Worldwide Corp. | | | | | 49,856 | | | | 4,055,786 | |
| | | |
| Household durables—1.8% | | | | | | | | | | |
Jarden Corp.* | | | | | 125,746 | | | | 5,633,421 | |
| | | |
| Household products—1.7% | | | | | | | | | | |
Church & Dwight Co., Inc. | | | | | 45,797 | | | | 3,942,664 | |
Spectrum Brands Holdings, Inc. | | | | | 12,159 | | | | 1,165,440 | |
| | | |
| Industrial conglomerates—1.2% | | | | | | | | | | |
Roper Technologies, Inc. | | | | | 20,021 | | | | 3,730,913 | |
| | | |
| Insurance—2.1% | | | | | | | | | | |
Arthur J Gallagher & Co. | | | | | 87,650 | | | | 3,832,935 | |
Reinsurance Group of America, Inc. | | | | | 30,914 | | | | 2,789,679 | |
| | | |
| IT services—3.1% | | | | | | | | | | |
Amdocs Ltd. | | | | | 87,416 | | | | 5,207,371 | |
Fiserv, Inc.* | | | | | 43,997 | | | | 4,246,150 | |
| | | |
| Leisure products—0.5% | | | | | | | | | | |
Polaris Industries, Inc. | | | | | 13,173 | | | | 1,479,855 | |
| | | |
| Life sciences tools & services—0.9% | | | | | | | | | | |
Agilent Technologies, Inc. | | | | | 74,716 | | | | 2,821,276 | |
| | | | | | | | | | |
| | | |
| COMMON STOCKS—97.6% | | | | Shares | | | Value | |
| Machinery—3.0% | | | | | | | | | | |
IDEX Corp. | | | | | 33,521 | | | | $ 2,573,072 | |
The Middleby Corp.* | | | | | 33,108 | | | | 3,871,650 | |
Wabtec Corp. | | | | | 35,756 | | | | 2,963,100 | |
| | | |
| Metals & mining—0.9% | | | | | | | | | | |
Steel Dynamics, Inc. | | | | | 157,193 | | | | 2,903,355 | |
| | | |
| Multiline retail—0.7% | | | | | | | | | | |
Dollar Tree, Inc.* | | | | | 34,152 | | | | 2,236,615 | |
| | | |
| Multi-utilities—0.8% | | | | | | | | | | |
CMS Energy Corp. | | | | | 63,749 | | | | 2,299,426 | |
| | | |
| Oil, gas & consumable fuels—2.8% | | | | | | | | | | |
Cimarex Energy Co. | | | | | 28,222 | | | | 3,331,889 | |
Concho Resources, Inc.* | | | | | 26,686 | | | | 3,093,174 | |
Range Resources Corp. | | | | | 74,172 | | | | 2,257,796 | |
| | | |
| Pharmaceuticals—2.9% | | | | | | | | | | |
Endo International PLC* | | | | | 29,883 | | | | 1,792,681 | |
Perrigo Co. PLC | | | | | 17,118 | | | | 2,700,194 | |
Zoetis, Inc. | | | | | 106,618 | | | | 4,585,640 | |
| |
| Real estate investment trusts (REITs)—4.1% | | | | | |
Boston Properties, Inc. | | | | | 25,265 | | | | 3,179,600 | |
Brixmor Property Group, Inc. | | | | | 146,401 | | | | 3,750,794 | |
Essex Property Trust, Inc. | | | | | 17,088 | | | | 3,766,879 | |
Hudson Pacific Properties, Inc. | | | | | 74,128 | | | | 2,117,837 | |
| | | |
| Road & rail—1.8% | | | | | | | | | | |
Genesee & Wyoming, Inc., Class A* | | | | | 36,021 | | | | 2,417,009 | |
J.B. Hunt Transport Services, Inc. | | | | | 41,121 | | | | 3,140,411 | |
| | | |
| Semiconductors & semiconductor equipment—2.9% | | | | | | | | | | |
Microchip Technology, Inc. | | | | | 94,675 | | | | 4,571,856 | |
Skyworks Solutions, Inc. | | | | | 58,542 | | | | 4,521,784 | |
| | | |
| Software—8.3% | | | | | | | | | | |
ANSYS, Inc.* | | | | | 45,323 | | | | 4,319,735 | |
NICE- Systems Ltd., Sponsored ADR | | | | | 104,973 | | | | 6,489,431 | |
Nuance Communications, Inc.* | | | | | 151,214 | | | | 2,566,102 | |
Open Text Corp. | | | | | 37,390 | | | | 1,734,896 | |
Qlik Technologies, Inc.* | | | | | 101,051 | | | | 3,169,970 | |
SolarWinds, Inc.* | | | | | 124,369 | | | | 7,217,133 | |
| | | |
| Specialty retail—3.4% | | | | | | | | | | |
Tractor Supply Co. | | | | | 69,298 | | | | 6,402,442 | |
Ulta Salon, Cosmetics & Fragrance, Inc.* | | | | | 23,772 | | | | 4,135,377 | |
| | | |
| Textiles, apparel & luxury goods—3.0% | | | | | | | | | | |
Hanesbrands, Inc. | | | | | 198,374 | | | | 6,336,065 | |
PVH Corp. | | | | | 33,269 | | | | 3,025,816 | |
| | | |
| Trading companies & distributors—0.9% | | | | | | | | | | |
Fastenal Co. | | | | | 67,165 | | | | 2,630,181 | |
| Total common stocks (cost $243,730,025) | | | | | | | | | 301,478,325 | |
| | | |
| MONEY MARKET FUNDS—4.4% | | | | | | | | | | |
Fidelity Institutional Money Market Funds—Government Portfolio—Institutional Shares, 0.01%# | | | | | 13,708,651 | | | | 13,708,651 | |
| Total money market funds (cost $13,708,651) | | | | 13,708,651 | |
| |
| Total investment portfolio (cost $257,438,676) 102.0%‡ | | | | 315,186,976 | |
| | | |
Liabilities in excess of other assets (2.0)% | | | | | | | | | (6,204,820 | ) |
| | | |
| Total net assets 100.0% | | | | | | | | | $308,982,156 | |
| | |
| 20 | | The accompanying notes are an integral part of the financial statements. |
Investment Portfolios
* Non-income producing security
# Annualized seven-day yield as of October 31, 2015.
‡ As of October 31, 2015, aggregate cost for federal income tax purposes was $258,838,782, Net unrealized appreciation (depreciation) on a tax-basis was $56,348,194, including aggregate gross unrealized appreciation and depreciation of $68,919,781 and $(12,571,587), respectively. The difference between book-basis and tax-basis unrealized appreciation (depreciation) was primarily attributable to deferral of losses from wash sales.
ADR—American depository receipt
| | | | |
|
| Sector allocation (unaudited) | |
| Sector | | Percent of net assets | |
| Information technology | | | 18.2% | |
| Financials | | | 17.4% | |
| Consumer discretionary | | | 15.7% | |
| Industrials | | | 15.2% | |
| Health care | | | 14.4% | |
| Consumer staples | | | 6.2% | |
| Materials | | | 5.3% | |
| Energy | | | 4.5% | |
| Money market funds | | | 4.4% | |
| Utilities | | | 0.7% | |
| | | | | | | | | | |
| EAGLE SMALL CAP GROWTH FUND | | | | | | | | |
| COMMON STOCKS—97.8% | | | | Shares | | | Value | |
| Aerospace & defense—1.2% | | | | | | | | | | |
Hexcel Corp. | | | | | 1,056,896 | | | | $48,955,423 | |
| | | |
| Airlines—2.2% | | | | | | | | | | |
JetBlue Airways Corp.* | | | | | 3,518,043 | | | | 87,388,188 | |
| | | |
| Banks—1.3% | | | | | | | | | | |
Synovus Financial Corp. | | | | | 1,130,448 | | | | 35,756,070 | |
UMB Financial Corp. | | | | | 336,845 | | | | 16,532,353 | |
| | | |
| Biotechnology—9.1% | | | | | | | | | | |
Acorda Therapeutics, Inc.* | | | | | 1,020,871 | | | | 36,792,191 | |
Akebia Therapeutics, Inc.* | | | | | 1,421,053 | | | | 12,675,793 | |
Alder Biopharmaceuticals, Inc.* | | | | | 690,364 | | | | 22,077,841 | |
Anacor Pharmaceuticals, Inc.* | | | | | 665,144 | | | | 74,768,837 | |
Atara Biotherapeutics, Inc.* | | | | | 469,159 | | | | 12,090,227 | |
Chimerix, Inc.* | | | | | 651,380 | | | | 25,521,068 | |
Dyax Corp.* | | | | | 303,243 | | | | 8,348,280 | |
Enanta Pharmaceuticals, Inc.* | | | | | 635,252 | | | | 17,844,229 | |
Neurocrine Biosciences, Inc.* | | | | | 602,664 | | | | 29,584,776 | |
Ophthotech Corp.* | | | | | 551,756 | | | | 27,549,177 | |
Portola Pharmaceuticals, Inc.* | | | | | 738,719 | | | | 35,170,411 | |
Sage Therapeutics, Inc.* | | | | | 441,850 | | | | 22,194,125 | |
Seattle Genetics, Inc.* | | | | | 297,245 | | | | 12,332,695 | |
Ultragenyx Pharmaceutical, Inc.* | | | | | 209,045 | | | | 20,768,621 | |
| | | |
| Building products—0.5% | | | | | | | | | | |
Trex Co., Inc.* | | | | | 550,000 | | | | 21,488,500 | |
| | | |
| Capital markets—1.8% | | | | | | | | | | |
Artisan Partners Asset Management, Inc., Class A | | | | | 343,306 | | | | 13,131,455 | |
Stifel Financial Corp.* | | | | | 1,263,145 | | | | 56,121,532 | |
| | | | | | | | | | |
| COMMON STOCKS—97.8% | | | | Shares | | | Value | |
| Chemicals—2.9% | | | | | | | | | | |
Chemtura Corp.* | | | | | 1,016,903 | | | | $ 32,479,882 | |
Huntsman Corp. | | | | | 2,349,902 | | | | 30,948,209 | |
Quaker Chemical Corp. | | | | | 650,346 | | | | 51,624,466 | |
| | | |
| Commercial services & supplies—2.5% | | | | | | | | | | |
Waste Connections, Inc. | | | | | 1,816,935 | | | | 98,986,619 | |
| | | |
| Construction materials—1.4% | | | | | | | | | | |
Martin Marietta Materials, Inc. | | | | | 343,637 | | | | 53,315,281 | |
| | | |
| Diversified consumer services—2.3% | | | | | | | | | | |
Bright Horizons Family Solutions, Inc.* | | | | | 397,945 | | | | 25,476,439 | |
Houghton Mifflin Harcourt Co.* | | | | | 902,919 | | | | 17,688,183 | |
LifeLock, Inc.* | | | | | 1,874,182 | | | | 26,257,290 | |
Sotheby’s | | | | | 612,032 | | | | 21,206,909 | |
| | | |
| Electrical equipment—2.4% | | | | | | | | | | |
Acuity Brands, Inc. | | | | | 319,829 | | | | 69,914,619 | |
Thermon Group Holdings, Inc.* | | | | | 1,215,408 | | | | 24,441,855 | |
| | | |
| Electronic equipment, instruments & components—3.5% | | | | | | | | | | |
Cognex Corp. | | | | | 991,148 | | | | 37,267,165 | |
Coherent, Inc.* | | | | | 851,352 | | | | 46,143,278 | |
IPG Photonics Corp.* | | | | | 631,923 | | | | 52,209,478 | |
| | | |
| Energy equipment & services—0.2% | | | | | | | | | | |
Geospace Technologies Corp.* | | | | | 559,634 | | | | 8,595,978 | |
| | | |
| Food & staples retailing—0.3% | | | | | | | | | | |
United Natural Foods, Inc.* | | | | | 217,270 | | | | 10,961,271 | |
| | | |
| Food products—2.6% | | | | | | | | | | |
Pinnacle Foods, Inc. | | | | | 493,988 | | | | 21,774,991 | |
The Hain Celestial Group, Inc.* | | | | | 601,548 | | | | 29,987,168 | |
The WhiteWave Foods Co.* | | | | | 1,216,113 | | | | 49,836,311 | |
| | | |
| Health care equipment & supplies—7.5% | | | | | | | | | | |
Abiomed, Inc.* | | | | | 210,184 | | | | 15,482,153 | |
DexCom, Inc.* | | | | | 246,634 | | | | 20,549,545 | |
Natus Medical, Inc.* | | | | | 1,439,443 | | | | 65,537,840 | |
NuVasive, Inc.* | | | | | 440,055 | | | | 20,752,994 | |
Sirona Dental Systems, Inc.* | | | | | 550,528 | | | | 60,079,121 | |
STERIS Corp. | | | | | 548,771 | | | | 41,130,387 | |
West Pharmaceutical Services, Inc. | | | | | 632,499 | | | | 37,956,265 | |
ZELTIQ Aesthetics, Inc.* | | | | | 984,983 | | | | 33,233,326 | |
| | | |
| Health care providers & services—5.0% | | | | | | | | | | |
Acadia Healthcare Co., Inc.* | | | | | 514,606 | | | | 31,601,954 | |
Air Methods Corp.* | | | | | 570,828 | | | | 23,363,990 | |
Centene Corp.* | | | | | 1,312,337 | | | | 78,057,805 | |
HealthSouth Corp. | | | | | 401,394 | | | | 13,980,553 | |
Team Health Holdings, Inc.* | | | | | 835,202 | | | | 49,836,503 | |
| | | |
| Health care technology—1.7% | | | | | | | | | | |
HMS Holdings Corp.* | | | | | 2,047,943 | | | | 21,564,840 | |
MedAssets, Inc.* | | | | | 1,039,484 | | | | 24,614,981 | |
Medidata Solutions, Inc.* | | | | | 442,825 | | | | 19,041,475 | |
| | | |
| Hotels restaurants & leisure—3.6% | | | | | | | | | | |
Buffalo Wild Wings, Inc.* | | | | | 136,283 | | | | 21,024,378 | |
Chuy’s Holdings, Inc.* | | | | | 1,016,268 | | | | 27,652,652 | |
Cracker Barrel Old Country Store, Inc. | | | | | 165,576 | | | | 22,760,077 | |
Dominos Pizza, Inc. | | | | | 368,044 | | | | 39,259,254 | |
Intrawest Resorts Holdings, Inc.* | | | | | 1,685,772 | | | | 15,104,517 | |
Jack in the Box, Inc. | | | | | 224,507 | | | | 16,732,507 | |
| | | | |
| The accompanying notes are an integral part of the financial statements. | | | 21 | |
Investment Portfolios
| | | | | | | | | | |
| EAGLE SMALL CAP GROWTH FUND (cont’d) | | | | |
| COMMON STOCKS—97.8% | | | | Shares | | | Value | |
| Household durables—2.1% | | | | | | | | | | |
KB Home | | | | | 1,508,741 | | | | $ 19,764,507 | |
Universal Electronics, Inc.* | | | | | 1,311,307 | | | | 62,378,874 | |
| | | |
| Insurance—1.5% | | | | | | | | | | |
Enstar Group Ltd.* | | | | | 192,849 | | | | 30,431,572 | |
ProAssurance Corp. | | | | | 526,745 | | | | 27,896,415 | |
| | | |
| Internet & catalog retail—1.2% | | | | | | | | | | |
HSN, Inc. | | | | | 309,962 | | | | 19,171,150 | |
Nutrisystem, Inc. | | | | | 1,127,940 | | | | 26,089,252 | |
| | | |
| Internet software & services—2.5% | | | | | | | | | | |
Cornerstone OnDemand, Inc.* | | | | | 716,443 | | | | 22,567,954 | |
Demandware, Inc.* | | | | | 357,700 | | | | 20,281,590 | |
HomeAway, Inc.* | | | | | 722,759 | | | | 22,810,274 | |
WebMD Health Corp.* | | | | | 420,191 | | | | 17,084,966 | |
Zillow Group, Inc., Class A* | | | | | 188,196 | | | | 5,798,319 | |
Zillow Group, Inc., Class C* | | | | | 376,392 | | | | 10,422,294 | |
| | | |
| IT services—0.2% | | | | | | | | | | |
Everi Holdings, Inc.* | | | | | 1,966,198 | | | | 9,201,807 | |
| | | |
| Leisure products—0.9% | | | | | | | | | | |
Brunswick Corp. | | | | | 639,697 | | | | 34,422,096 | |
| | | |
| Life sciences tools & services—1.1% | | | | | | | | | | |
PAREXEL International Corp.* | | | | | 380,227 | | | | 23,999,928 | |
PRA Health Sciences, Inc.* | | | | | 549,784 | | | | 19,264,431 | |
| | | |
| Machinery—2.4% | | | | | | | | | | |
Colfax Corp.* | | | | | 610,926 | | | | 16,470,565 | |
Proto Labs, Inc.* | | | | | 198,071 | | | | 12,842,923 | |
WABCO Holdings, Inc.* | | | | | 402,720 | | | | 45,197,266 | |
Woodward, Inc. | | | | | 392,322 | | | | 17,850,651 | |
| | | |
| Multiline retail—0.9% | | | | | | | | | | |
Burlington Stores, Inc.* | | | | | 701,699 | | | | 33,737,688 | |
| | | |
| Oil, gas & consumable fuels—2.4% | | | | | | | | | | |
Diamondback Energy, Inc.* | | | | | 330,900 | | | | 24,433,656 | |
Gulfport Energy Corp.* | | | | | 857,483 | | | | 26,127,507 | |
RSP Permian, Inc.* | | | | | 1,612,345 | | | | 44,210,500 | |
| | | |
| Pharmaceuticals—2.1% | | | | | | | | | | |
Dermira, Inc.* | | | | | 854,147 | | | | 23,053,428 | |
Prestige Brands Holdings, Inc.* | | | | | 863,476 | | | | 42,318,959 | |
The Medicines Co.* | | | | | 443,081 | | | | 15,171,093 | |
| | | |
| Professional services—0.5% | | | | | | | | | | |
The Advisory Board Co.* | | | | | 456,040 | | | | 19,988,233 | |
| | | |
| Real estate investment trusts (REITs)—1.7% | | | | | | | | | | |
The GEO Group, Inc. | | | | | 1,283,247 | | | | 41,410,381 | |
Two Harbors Investment Corp. | | | | | 3,133,904 | | | | 26,512,828 | |
| | | |
| Road & rail—0.9% | | | | | | | | | | |
Landstar System, Inc. | | | | | 570,617 | | | | 35,971,696 | |
| |
| Semiconductors & semiconductor equipment—3.3% | | | | | |
Cavium, Inc.* | | | | | 1,014,448 | | | | 71,975,086 | |
Qorvo, Inc.* | | | | | 355,940 | | | | 15,636,444 | |
Teradyne, Inc. | | | | | 811,000 | | | | 15,830,720 | |
Veeco Instruments, Inc.* | | | | | 1,539,026 | | | | 27,733,249 | |
| | | |
| Software—14.1% | | | | | | | | | | |
ANSYS, Inc.* | | | | | 359,070 | | | | 34,222,962 | |
Aspen Technology, Inc.* | | | | | 565,366 | | | | 23,400,499 | |
Fortinet, Inc.* | | | | | 2,147,198 | | | | 73,777,723 | |
| | | | | | | | | | |
| | | |
| COMMON STOCKS —97.8% | | | | Shares | | | Value | |
| Software (cont’d) | | | | | | | | | | |
Guidewire Software, Inc.* | | | | | 535,436 | | | | $ 31,178,438 | |
Imperva, Inc.* | | | | | 446,309 | | | | 31,518,342 | |
Manhattan Associates, Inc.* | | | | | 611,746 | | | | 44,565,696 | |
Proofpoint, Inc.* | | | | | 1,132,558 | | | | 79,777,385 | |
PTC, Inc.* | | | | | 1,511,888 | | | | 53,581,311 | |
Qualys, Inc.* | | | | | 1,353,440 | | | | 47,803,501 | |
RealPage, Inc.* | | | | | 1,102,340 | | | | 18,629,546 | |
The Ultimate Software Group, Inc.* | | | | | 412,983 | | | | 84,393,076 | |
Tyler Technologies, Inc.* | | | | | 176,531 | | | | 30,073,821 | |
| | | |
| Specialty retail—3.9% | | | | | | | | | | |
Genesco, Inc.* | | | | | 1,547,653 | | | | 96,960,460 | |
Restoration Hardware Holdings, Inc.* | | | | | 130,600 | | | | 13,463,554 | |
Vitamin Shoppe, Inc.* | | | | | 1,458,783 | | | | 41,852,484 | |
| |
| Technology hardware, storage & peripherals—0.5% | | | | | |
Electronics For Imaging, Inc.* | | | | | 433,456 | | | | 20,129,697 | |
| | | |
| Textiles, apparel & luxury goods—2.0% | | | | | | | | | | |
Steven Madden Ltd.* | | | | | 1,449,700 | | | | 50,522,045 | |
Tumi Holdings, Inc.* | | | | | 1,847,380 | | | | 29,613,501 | |
| | | |
| Thrifts & mortgage finance—0.7% | | | | | | | | | | |
MGIC Investment Corp.* | | | | | 2,907,890 | | | | 27,334,166 | |
| | | |
| Trading companies & distributors—0.9% | | | | | | | | | | |
Air Lease Corp. | | | | | 658,930 | | | | 22,212,530 | |
H&E Equipment Services, Inc. | | | | | 605,641 | | | | 11,694,928 | |
| Total common stocks (cost $2,877,135,345) | | | | | | | | | 3,840,288,268 | |
| | | |
| MONEY MARKET FUNDS—2.2% | | | | | | | | | | |
Fidelity Institutional Money Market Funds—Government Portfolio—Institutional Shares, 0.01%# | | | | | 88,126,480 | | | | 88,126,480 | |
| Total money market funds (cost $88,126,480) | | | | 88,126,480 | |
| |
Total investment portfolio (cost $2,965,261,825)
100.0% ‡ | | | | 3,928,414,748 | |
| | | |
Liabilities in excess of other assets 0.0% | | | | | | | | | (1,028,731 | ) |
| | | |
| Total net assets 100.0% | | | | | | | | | $3,927,386,017 | |
* Non-income producing security
# Annualized seven-day yield as of October 31, 2015.
‡ As of October 31, 2015, aggregate cost for federal income tax purposes was $2,984,435,908, Net unrealized appreciation (depreciation) on a tax-basis was $943,978,840, including aggregate gross unrealized appreciation and depreciation of $1,134,866,811 and $(190,887,971), respectively. The difference between book-basis and tax-basis unrealized appreciation (depreciation) was primarily attributable to deferral of losses from wash sales.
| | |
| 22 | | The accompanying notes are an integral part of the financial statements. |
Investment Portfolios
| | | | |
|
| Sector allocation (unaudited) | |
| Sector | | Percent of net assets | |
| Health care | | | 26.4% | |
| Information technology | | | 24.2% | |
| Consumer discretionary | | | 16.8% | |
| Industrials | | | 13.6% | |
| Financials | | | 7.0% | |
| Materials | | | 4.3% | |
| Consumer staples | | | 2.9% | |
| Energy | | | 2.6% | |
| Money market funds | | | 2.2% | |
| | | | | | | | | | |
| EAGLE SMALLER COMPANY FUND | | | | | | | | |
| COMMON STOCKS—99.0% | | | | Shares | | | Value | |
| Aerospace & defense—1.7% | | | | | | | | | | |
Esterline Technologies Corp.* | | | | | 4,550 | | | | $350,578 | |
HEICO Corp. | | | | | 15,194 | | | | 766,385 | |
| | | |
| Auto components—1.4% | | | | | | | | | | |
Gentherm, Inc.* | | | | | 19,272 | | | | 947,411 | |
| | | |
| Banks—7.6% | | | | | | | | | | |
Eagle Bancorp, Inc.* | | | | | 14,910 | | | | 709,716 | |
Pacwest Bancorp | | | | | 16,963 | | | | 764,013 | |
Signature Bank* | | | | | 7,012 | | | | 1,044,227 | |
South State Corp. | | | | | 10,260 | | | | 795,150 | |
Texas Capital Bancshares, Inc.* | | | | | 11,911 | | | | 657,487 | |
Western Alliance Bancorporation* | | | | | 27,585 | | | | 986,164 | |
| | | |
| Building products—1.0% | | | | | | | | | | |
A.O. Smith Corp. | | | | | 8,250 | | | | 633,765 | |
| | | |
| Capital markets—2.9% | | | | | | | | | | |
Evercore Partners, Inc., Class A | | | | | 12,862 | | | | 694,548 | |
Financial Engines, Inc. | | | | | 16,501 | | | | 530,672 | |
HFF, Inc., Class A | | | | | 18,882 | | | | 651,807 | |
| | | |
| Chemicals—3.3% | | | | | | | | | | |
Albemarle Corp. | | | | | 8,112 | | | | 434,154 | |
Balchem Corp. | | | | | 17,237 | | | | 1,177,287 | |
Sensient Technologies Corp. | | | | | 8,120 | | | | 529,993 | |
| | | |
| Commercial services & supplies—3.4% | | | | | | | | | | |
Clean Harbors, Inc.* | | | | | 10,004 | | | | 465,086 | |
Copart, Inc.* | | | | | 11,608 | | | | 420,325 | |
Healthcare Services Group, Inc. | | | | | 22,432 | | | | 835,816 | |
Ritchie Bros Auctioneers, Inc. | | | | | 20,514 | | | | 532,749 | |
| | | |
| Communications equipment—1.4% | | | | | | | | | | |
Plantronics, Inc. | | | | | 16,517 | | | | 885,642 | |
| | | |
| Construction & engineering—1.0% | | | | | | | | | | |
Primoris Services Corp. | | | | | 32,725 | | | | 651,882 | |
| | | |
| Consumer finance—1.3% | | | | | | | | | | |
PRA Group, Inc.* | | | | | 16,002 | | | | 876,910 | |
| | | |
| Containers & packaging—3.2% | | | | | | | | | | |
AptarGroup, Inc. | | | | | 11,347 | | | | 834,686 | |
Berry Plastics Group, Inc.* | | | | | 28,104 | | | | 941,484 | |
Silgan Holdings, Inc. | | | | | 6,889 | | | | 350,443 | |
| | | | | | | | | | |
| | | |
| COMMON STOCKS—99.0% | | | | Shares | | | Value | |
| Diversified financial services—1.1% | | | | | | | | | | |
NASDAQ, Inc. | | | | | 12,819 | | | | $ 742,092 | |
| | | |
| Electric utilities—1.1% | | | | | | | | | | |
ALLETE, Inc. | | | | | 13,988 | | | | 702,337 | |
| |
| Electronic equipment, instruments & components—1.9% | | | | | |
Cognex Corp. | | | | | 14,366 | | | | 540,162 | |
FLIR Systems, Inc. | | | | | 25,593 | | | | 682,565 | |
| | | |
| Energy equipment & services—1.0% | | | | | | | | | | |
Core Laboratories N.V. | | | | | 3,683 | | | | 428,444 | |
Superior Energy Services, Inc. | | | | | 17,896 | | | | 253,407 | |
| | | |
| Food & staples retailing—1.3% | | | | | | | | | | |
Casey’s General Stores, Inc. | | | | | 7,841 | | | | 832,871 | |
| | | |
| Food products—2.7% | | | | | | | | | | |
J & J Snack Foods Corp. | | | | | 6,066 | | | | 744,844 | |
TreeHouse Foods, Inc.* | | | | | 11,695 | | | | 1,001,560 | |
| | | |
| Health care equipment & supplies—8.0% | | | | | | | | | | |
Align Technology, Inc.* | | | | | 9,068 | | | | 593,591 | |
Globus Medical, Inc., Class A* | | | | | 34,367 | | | | 768,103 | |
ICU Medical, Inc.* | | | | | 5,662 | | | | 622,650 | |
Integra LifeSciences Holdings Corp.* | | | | | 13,409 | | | | 798,774 | |
Neogen Corp.* | | | | | 7,501 | | | | 405,429 | |
NuVasive, Inc.* | | | | | 11,517 | | | | 543,142 | |
STERIS Corp. | | | | | 13,803 | | | | 1,034,535 | |
West Pharmaceutical Services, Inc. | | | | | 7,842 | | | | 470,598 | |
| | | |
| Health care providers & services—3.0% | | | | | | | | | | |
Acadia Healthcare Co., Inc.* | | | | | 8,716 | | | | 535,250 | |
AmSurg Corp.* | | | | | 12,445 | | | | 872,270 | |
MEDNAX, Inc.* | | | | | 7,985 | | | | 562,703 | |
| | | |
| Health care technology—0.5% | | | | | | | | | | |
Omnicell, Inc.* | | | | | 13,209 | | | | 359,285 | |
| | | |
| Hotels restaurants & leisure—3.8% | | | | | | | | | | |
Bloomin’ Brands, Inc. | | | | | 39,109 | | | | 663,680 | |
Dunkin’ Brands Group, Inc. | | | | | 14,339 | | | | 593,778 | |
Popeyes Louisiana Kitchen, Inc.* | | | | | 12,258 | | | | 691,841 | |
Texas Roadhouse, Inc. | | | | | 15,375 | | | | 528,131 | |
| | | |
| Household durables—1.4% | | | | | | | | | | |
Jarden Corp.* | | | | | 19,929 | | | | 892,819 | |
| | | |
| Household products—0.4% | | | | | | | | | | |
Spectrum Brands Holdings, Inc. | | | | | 2,542 | | | | 243,651 | |
| | | |
| Insurance—2.5% | | | | | | | | | | |
AMERISAFE, Inc. | | | | | 12,324 | | | | 674,493 | |
Selective Insurance Group, Inc. | | | | | 26,143 | | | | 953,958 | |
| | | |
| Internet software & services—1.8% | | | | | | | | | | |
j2 Global, Inc. | | | | | 8,187 | | | | 634,902 | |
SPS Commerce, Inc.* | | | | | 8,015 | | | | 575,637 | |
| | | |
| IT services—1.6% | | | | | | | | | | |
Gartner, Inc.* | | | | | 5,719 | | | | 518,542 | |
NeuStar, Inc., Class A* | | | | | 18,339 | | | | 498,637 | |
| | | |
| Life sciences tools & services—2.1% | | | | | | | | | | |
Bio-Rad Laboratories, Inc., Class A* | | | | | 6,108 | | | | 851,944 | |
Bio-Techne Corp. | | | | | 5,914 | | | | 521,615 | |
| | | |
| Machinery—4.8% | | | | | | | | | | |
CLARCOR, Inc. | | | | | 10,020 | | | | 499,597 | |
Graco, Inc. | | | | | 8,273 | | | | 607,238 | |
IDEX Corp. | | | | | 9,269 | | | | 711,488 | |
| | | | |
| The accompanying notes are an integral part of the financial statements. | | | 23 | |
Investment Portfolios
| | | | | | | | | | |
| EAGLE SMALLER COMPANY FUND (cont’d) | | | | |
| COMMON STOCKS—99.0% | | | | Shares | | | Value | |
| Machinery (cont’d) | | | | | | | | | | |
Proto Labs, Inc.* | | | | | 10,655 | | | | $ 690,870 | |
The Toro Co. | | | | | 8,576 | | | | 645,515 | |
| | | |
| Media—0.8% | | | | | | | | | | |
MDC Partners, Inc., Class A | | | | | 26,120 | | | | 542,774 | |
| | | |
| Metals & mining—1.0% | | | | | | | | | | |
Steel Dynamics, Inc. | | | | | 33,793 | | | | 624,157 | |
| | | |
| Multiline Retail—1.1% | | | | | | | | | | |
Burlington Stores, Inc.* | | | | | 14,810 | | | | 712,065 | |
| | | |
| Oil, gas & consumable fuels—2.0% | | | | | | | | | | |
Carrizo Oil & Gas, Inc.* | | | | | 11,998 | | | | 451,485 | |
SM Energy Co. | | | | | 14,838 | | | | 494,847 | |
Whiting Petroleum Corp.* | | | | | 19,705 | | | | 339,517 | |
| | | |
| Pharmaceuticals—2.1% | | | | | | | | | | |
Catalent, Inc.* | | | | | 27,346 | | | | 726,857 | |
Prestige Brands Holdings, Inc.* | | | | | 13,881 | | | | 680,308 | |
| | | |
| Professional services—1.1% | | | | | | | | | | |
WageWorks, Inc.* | | | | | 15,057 | | | | 723,037 | |
| | | |
| Real estate investment trusts (REITs)—5.1% | | | | | | | | | | |
American Assets Trust, Inc. | | | | | 19,031 | | | | 802,347 | |
Corporate Office Properties Trust | | | | | 33,478 | | | | 769,994 | |
Hudson Pacific Properties, Inc. | | | | | 21,481 | | | | 613,712 | |
Pebblebrook Hotel Trust | | | | | 22,628 | | | | 773,425 | |
Terreno Realty Corp. | | | | | 17,000 | | | | 380,460 | |
| | | |
| Road & rail—2.4% | | | | | | | | | | |
Genesee & Wyoming, Inc., Class A* | | | | | 12,556 | | | | 842,507 | |
Landstar System, Inc. | | | | | 7,846 | | | | 494,612 | |
Roadrunner Transportation Systems, Inc.* | | | | | 22,995 | | | | 244,667 | |
| |
| Semiconductors & semiconductor equipment—3.2% | | | | | |
Cavium, Inc.* | | | | | 7,745 | | | | 549,508 | |
Diodes, Inc.* | | | | | 30,746 | | | | 704,083 | |
Power Integrations, Inc. | | | | | 16,966 | | | | 858,649 | |
| | | |
| Software—9.0% | | | | | | | | | | |
Ellie Mae, Inc.* | | | | | 13,462 | | | | 982,457 | |
Monotype Imaging Holdings, Inc. | | | | | 20,787 | | | | 568,317 | |
NICE- Systems Ltd., Sponsored ADR | | | | | 17,823 | | | | 1,101,818 | |
Qlik Technologies, Inc.* | | | | | 31,255 | | | | 980,469 | |
Qualys, Inc.* | | | | | 20,137 | | | | 711,239 | |
SolarWinds, Inc.* | | | | | 26,441 | | | | 1,534,371 | |
| | | |
| Specialty retail—1.7% | | | | | | | | | | |
Mattress Firm Holding Corp.* | | | | | 8,017 | | | | 341,284 | |
Monro Muffler Brake, Inc. | | | | | 10,050 | | | | 745,408 | |
| | | |
| Textiles, apparel & luxury goods—1.5% | | | | | | | | | | |
Steven Madden Ltd.* | | | | | 16,241 | | | | 565,999 | |
Tumi Holdings, Inc.* | | | | | 27,888 | | | | 447,044 | |
| | | |
| Trading companies & distributors—0.8% | | | | | | | | | | |
MSC Industrial Direct Co., Inc., Class A | | | | | 8,575 | | | | 538,253 | |
| Total common stocks (cost $53,793,337) | | | | | | | | | 64,806,998 | |
| | | | | | | | | | |
| | | |
| MONEY MARKET FUNDS—2.1% | | | | | Shares | | | | Value | |
Fidelity Institutional Money Market Funds—Government Portfolio—Institutional Shares, 0.01%# | | | | | 1,373,329 | | | | $ 1,373,329 | |
| | | |
| Total money market funds (cost $1,373,329) | | | | | | | | | 1,373,329 | |
| |
| Total investment portfolio (cost $55,166,666) 101.1%‡ | | | | 66,180,327 | |
| | | |
Liabilities in excess of other assets (1.1)% | | | | | | | | | (715,226 | ) |
| | | |
| Total net assets 100.0% | | | | | | | | | $65,465,101 | |
* Non-income producing security
# Annualized seven-day yield as of October 31, 2015
‡ As of October 31, 2015, aggregate cost for federal income tax purposes was $55,633,253, Net unrealized appreciation (depreciation) on a tax-basis was $10,547,074 including aggregate gross unrealized appreciation and depreciation of $13,534,829 and $(2,987,755), respectively. The difference between book-basis and tax-basis unrealized appreciation (depreciation) was primarily attributable to deferral of losses from wash sales.
ADR—American depository receipt
| | | | |
|
| Sector allocation (unaudited) | |
| Sector | | Percent of net assets | |
| Financials | | | 20.5% | |
| Information technology | | | 18.8% | |
| Industrials | | | 16.3% | |
| Health care | | | 15.8% | |
| Consumer discretionary | | | 11.7% | |
| Materials | | | 7.5% | |
| Consumer staples | | | 4.3% | |
| Energy | | | 3.0% | |
| Money market funds | | | 2.1% | |
| Utilities | | | 1.1% | |
| | |
| 24 | | The accompanying notes are an integral part of the financial statements. |
[THIS PAGE INTENTIONALLY LEFT BLANK]
Statements of Assets and Liabilities
| | | | | | | | | | | | | | | | |
| | | Eagle
Capital
Appreciation
Fund | | | Eagle
Growth
& Income
Fund | | | Eagle
International
Stock
Fund | | | Eagle
Investment
Grade Bond
Fund | |
| | | | |
| Assets | | | | | | | | | | | | | | | | |
Investments, at value (a) | | | $348,181,015 | | | | $581,480,470 | | | | $17,164,380 | | | | $50,286,016 | |
Receivable for investments sold | | | — | | | | — | | | | 2,130,319 | | | | — | |
Receivable for fund shares sold | | | 765,410 | | | | 411,705 | | | | 35,505 | | | | 50,275 | |
Receivable for dividends and interest, net | | | 284,547 | | | | 986,634 | | | | 81,310 | | | | 231,794 | |
Receivable due from advisor, net | | | — | | | | — | | | | 18,243 | | | | 13,546 | |
Prepaid expenses | | | 23,227 | | | | 10,854 | | | | 2,798 | | | | 13,799 | |
| Total assets | | | 349,254,199 | | | | 582,889,663 | | | | 19,432,555 | | | | 50,595,430 | |
| | | | |
| Liabilities | | | | | | | | | | | | | | | | |
Payable for investments purchased | | | — | | | | — | | | | 2,327,318 | | | | 499,503 | |
Payable for fund shares redeemed | | | 158,036 | | | | 1,330,705 | | | | 21,986 | | | | 55,842 | |
Accrued custody fees | | | 1,673 | | | | 4,911 | | | | 2,920 | | | | 287 | |
Accrued investment advisory fees, net | | | 178,211 | | | | 227,212 | | | | — | | | | — | |
Accrued administrative fees | | | 40,042 | | | | 64,153 | | | | 2,018 | | | | 5,985 | |
Accrued distribution fees | | | 94,539 | | | | 202,840 | | | | 6,239 | | | | 22,096 | |
Accrued transfer agent and shareholder servicing fees | | | 26,004 | | | | 65,180 | | | | 1,916 | | | | 4,877 | |
Accrued internal audit fees | | | 1,195 | | | | 1,195 | | | | 1,195 | | | | 1,195 | |
Accrued trustees and officers compensation | | | 14,387 | | | | 14,387 | | | | 14,387 | | | | 14,387 | |
Other accrued expenses | | | 56,095 | | | | 69,212 | | | | 45,918 | | | | 45,372 | |
| Total liabilities | | | 570,182 | | | | 1,979,795 | | | | 2,423,897 | | | | 649,544 | |
| Net assets | | | 348,684,017 | | | | 580,909,868 | | | | 17,008,658 | | | | 49,945,886 | |
| | | | |
| Net assets consists of | | | | | | | | | | | | | | | | |
Paid-in capital | | | 191,144,402 | | | | 456,582,808 | | | | 16,743,614 | | | | 49,635,195 | |
Undistributed net investment income (loss) | | | 402,892 | | | | — | | | | 74,253 | | | | (45,676 | ) |
Accumulated net realized gain (loss) | | | 46,480,116 | | | | (1,173,046 | ) | | | (151,422 | ) | | | 141,565 | |
Net unrealized appreciation on investments and translation of assets and liabilities denominated in foreign currencies | | | 110,656,607 | | | | 125,500,106 | | | | 342,213 | | |
|
214,802 |
|
| Net assets | | | 348,684,017 | | | | 580,909,868 | | | | 17,008,658 | | | | 49,945,886 | |
| | | | |
| Net assets, at market value | | | | | | | | | | | | | | | | |
Class A | | | 167,755,247 | | | | 180,371,317 | | | | 9,738,710 | | | | 19,696,694 | |
Class C | | | 69,100,306 | | | | 197,249,951 | | | | 5,085,984 | | | | 21,129,705 | |
Class I | | | 103,027,547 | | | | 199,836,581 | | | | 2,150,026 | | | | 9,085,511 | |
Class R-3 | | | 883,766 | | | | 3,116,333 | | | | 3,024 | | | | 28,548 | |
Class R-5 | | | 7,914,654 | | | | 331,516 | | | | 27,834 | | | | 2,910 | |
Class R-6 | | | 2,497 | | | | 4,170 | | | | 3,080 | | | | 2,518 | |
| | | | |
Net asset value (“NAV”),
offering and redemption price per share (b) | | | | | | | | | | | | | | | | |
Class A | | | $40.32 | | | | $17.52 | | | | $16.02 | | | | $14.87 | |
Maximum offering price (c) | | | 42.33 | | | | 18.39 | | | | 16.82 | | | | 15.45 | |
Class C | | | 32.37 | | | | 16.86 | | | | 15.83 | | | | 14.84 | |
Class I | | | 41.83 | | | | 17.48 | | | | 16.08 | | | | 14.90 | |
Class R-3 | | | 39.33 | | | | 17.44 | | | | 15.99 | | | | 14.87 | |
Class R-5 | | | 41.70 | | | | 17.50 | | | | 16.09 | | | | 14.88 | |
Class R-6 | | | 41.66 | | | | 17.46 | | | | 16.11 | | | | 14.94 | |
| | | | |
| Shares of beneficial interest outstanding | | | | | | | | | | | | | | | | |
Class A | | | 4,160,865 | | | | 10,296,600 | | | | 608,097 | | | | 1,324,444 | |
Class C | | | 2,134,504 | | | | 11,700,264 | | | | 321,305 | | | | 1,423,929 | |
Class I | | | 2,463,284 | | | | 11,430,013 | | | | 133,706 | | | | 609,741 | |
Class R-3 | | | 22,473 | | | | 178,646 | | | | 189 | | | | 1,920 | |
Class R-5 | | | 189,805 | | | | 18,939 | | | | 1,730 | | | | 196 | |
Class R-6 | | | 60 | | | | 239 | | | | 191 | | | | 169 | |
| | | | |
| (a) identified cost | | | $237,524,408 | | | | $455,975,879 | | | | $16,819,440 | | | | $50,071,214 | |
(b) NAV amounts may not recalculate due to rounding of net assets and/or shares outstanding.
(c) For all funds except Eagle Investment Grade Bond Fund, the maximum offering price is computed as 100/95.25 of NAV. The maximum offering price for the Eagle Investment Grade Bond Fund is computed as 100/96.25 of NAV.
| | |
| 26 | | The accompanying notes are an integral part of the financial statements. |
Statements of Assets and Liabilities
| | | | | | | | | | | | | | |
Eagle
Mid Cap
Growth
Fund | | | Eagle
Mid Cap
Stock
Fund | | | Eagle
Small Cap
Growth
Fund | | | Eagle
Smaller
Company
Fund | |
| | | |
| | | | | | | | | | | | | | |
| | $1,172,978,217 | | | | $315,186,976 | | | | $3,928,414,748 | | | | $66,180,327 | |
| | 5,937,854 | | | | 5,348,536 | | | | 23,241,419 | | | | 547,331 | |
| | 1,473,798 | | | | 183,472 | | | | 5,709,302 | | | | 8,963 | |
| | 233,074 | | | | 100,470 | | | | 501,655 | | | | 14,489 | |
| | — | | | | — | | | | — | | | | — | |
| | 19,160 | | | | 8,592 | | | | 50,433 | | | | 4,182 | |
| | 1,180,642,103 | | | | 320,828,046 | | | | 3,957,917,557 | | | | 66,755,292 | |
| | | |
| | | | | | | | | | | | | | |
| | — | | | | 10,695,319 | | | | 19,425,323 | | | | 942,741 | |
| | 3,907,240 | | | | 669,204 | | | | 7,925,488 | | | | 199,368 | |
| | 5,408 | | | | 2,807 | | | | 18,702 | | | | 1,790 | �� |
| | 548,084 | | | | 191,796 | | | | 1,722,017 | | | | 34,555 | |
| | 117,348 | | | | 36,997 | | | | 375,425 | | | | 7,349 | |
| | 179,473 | | | | 123,560 | | | | 360,693 | | | | 21,945 | |
| | 46,774 | | | | 57,262 | | | | 382,648 | | | | 13,901 | |
| | 1,195 | | | | 1,195 | | | | 1,195 | | | | 1,195 | |
| | 14,387 | | | | 14,387 | | | | 14,387 | | | | 14,387 | |
| | 110,241 | | | | 53,363 | | | | 305,662 | | | | 52,960 | |
| | 4,930,150 | | | | 11,845,890 | | | | 30,531,540 | | | | 1,290,191 | |
| | 1,175,711,953 | | | | 308,982,156 | | | | 3,927,386,017 | | | | 65,465,101 | |
| | | |
| | | | | | | | | | | | | | |
| | 930,626,011 | | | | 216,216,743 | | | | 2,747,467,143 | | | | 55,735,692 | |
| | (4,473,377 | ) | | | (2,008,520 | ) | | | (15,076,793 | ) | | | (477,311 | ) |
| | 17,009,294 | | | | 37,025,633 | | | | 231,842,744 | | | | (806,941 | ) |
|
232,550,025 |
| | | 57,748,300 | | | | 963,152,923 | | | | 11,013,661 | |
| | 1,175,711,953 | | | | 308,982,156 | | | | 3,927,386,017 | | | | 65,465,101 | |
| | | |
| | | | | | | | | | | | | | |
| | 353,535,640 | | | | 146,535,300 | | | | 710,537,656 | | | | 19,554,247 | |
| | 116,709,742 | | | | 108,657,973 | | | | 185,937,760 | | | | 20,786,399 | |
| | 358,481,319 | | | | 51,280,225 | | | | 1,757,362,090 | | | | 14,974,360 | |
| | 23,664,629 | | | | 1,783,252 | | | | 118,503,930 | | | | 330,413 | |
| | 133,039,261 | | | | 275,031 | | | | 418,127,726 | | | | 8,369 | |
| | 190,281,362 | | | | 450,375 | | | | 736,916,855 | | | | 9,811,313 | |
| | | |
| | | | | | | | | | | | | | |
| | $43.39 | | | | $28.35 | | | | $52.98 | | | | $12.32 | |
| | 45.55 | | | | 29.76 | | | | 55.62 | | | | 12.93 | |
| | 35.76 | | | | 22.64 | | | | 42.10 | | | | 11.05 | |
| | 45.26 | | | | 29.50 | | | | 54.84 | | | | 13.07 | |
| | 42.46 | | | | 27.55 | | | | 51.82 | | | | 11.96 | |
| | 45.15 | | | | 29.65 | | | | 55.02 | | | | 12.93 | |
| | 45.43 | | | | 29.70 | | | | 55.27 | | | | 12.96 | |
| | | |
| | | | | | | | | | | | | | |
| | 8,148,752 | | | | 5,168,114 | | | | 13,410,751 | | | | 1,587,318 | |
| | 3,263,484 | | | | 4,798,581 | | | | 4,416,092 | | | | 1,880,800 | |
| | 7,920,612 | | | | 1,738,278 | | | | 32,047,769 | | | | 1,145,377 | |
| | 557,369 | | | | 64,727 | | | | 2,286,723 | | | | 27,625 | |
| | 2,946,284 | | | | 9,277 | | | | 7,599,078 | | | | 647 | |
| | 4,188,495 | | | | 15,166 | | | | 13,334,139 | | | | 757,297 | |
| | | |
| | $940,428,192 | | | | $257,438,676 | | | | $2,965,261,825 | | | | $55,166,666 | |
| | | | |
| The accompanying notes are an integral part of the financial statements. | | | 27 | |
Statements of Operations
| | | | | | | | | | | | | | | | |
| | | Eagle
Capital
Appreciation
Fund | | | Eagle
Growth
& Income
Fund | | | Eagle
International
Stock
Fund | | | Eagle
Investment
Grade Bond
Fund | |
| | | | |
| Investment income | | | | | | | | | | | | | | | | |
Dividends (a) | | | $4,802,418 | | | | $19,167,949 | | | | $313,814 | | | | $— | |
Interest | | | 22 | | | | 86 | | | | 11 | | | | 1,070,570 | |
| Total income | | | 4,802,440 | | | | 19,168,035 | | | | 313,825 | | | | 1,070,570 | |
| | | | |
| Expenses | | | | | | | | | | | | | | | | |
Investment advisory fees | | | 2,033,670 | | | | 2,954,663 | | | | 107,255 | | | | 161,185 | |
Administrative fees: | | | | | | | | | | | | | | | | |
Class A | | | 252,030 | | | | 316,819 | | | | 9,667 | | | | 32,068 | |
Class C | | | 103,019 | | | | 314,507 | | | | 6,953 | | | | 35,274 | |
Class I | | | 94,779 | | | | 212,024 | | | | 1,527 | | | | 8,801 | |
Class R-3 | | | 1,170 | | | | 4,770 | | | | 5 | | | | 44 | |
Class R-5 | | | 6,686 | | | | 2,494 | | | | 6 | | | | 3 | |
Class R-6 | | | 1 | | | | 84 | | | | 3 | | | | 1 | |
Distribution and service fees: | | | | | | | | | | | | | | | | |
Class A | | | 420,050 | | | | 528,032 | | | | 16,112 | | | | 53,446 | |
Class C | | | 686,791 | | | | 2,096,711 | | | | 46,350 | | | | 235,159 | |
Class R-3 | | | 3,901 | | | | 15,899 | | | | 15 | | | | 146 | |
Transfer agent and shareholder servicing fees: | | | | | | | | | | | | | | | | |
Class A | | | 140,036 | | | | 176,312 | | | | 8,166 | | | | 16,739 | |
Class C | | | 69,376 | | | | 218,380 | | | | 7,130 | | | | 23,110 | |
Class I | | | 87,106 | | | | 257,502 | | | | 1,726 | | | | 8,879 | |
Class R-3 | | | 1,178 | | | | 7,875 | | | | 1 | | | | 47 | |
Class R-5 | | | 3,029 | | | | 3,792 | | | | 1 | | | | 1 | |
Class R-6 | | | — | | | | 12 | | | | 1 | | | | — | |
Custodian fees | | | 15,045 | | | | 26,208 | | | | 20,018 | | | | 6,075 | |
Professional fees | | | 121,611 | | | | 126,335 | | | | 133,284 | | | | 129,006 | |
State registration fees | | | 80,044 | | | | 115,049 | | | | 81,441 | | | | 69,846 | |
Trustees and officers compensation | | | 68,869 | | | | 68,869 | | | | 68,869 | | | | 68,869 | |
Internal audit fees | | | 11,898 | | | | 11,898 | | | | 11,898 | | | | 11,898 | |
Other expenses | | | 80,989 | | | | 148,463 | | | | 28,112 | | | | 25,176 | |
| Total expenses before adjustments | | | 4,281,278 | | | | 7,606,698 | | | | 548,540 | | | | 885,773 | |
Fees and expenses waived | | | — | | | | — | | | | (319,604 | ) | | | (261,093 | ) |
Recovered fees previously waived by Manager | | | 6,282 | | | | — | | | | — | | | | — | |
Expense offsets | | | (3,764 | ) | | | (19,212 | ) | | | (512 | ) | | | (1,788 | ) |
| Total expenses after adjustments | | | 4,283,796 | | | | 7,587,486 | | | | 228,424 | | | | 622,892 | |
| | | | |
| Net investment income (loss) | | | 518,644 | | | | 11,580,549 | | | | 85,401 | | | | 447,678 | |
| | | | |
| Realized and unrealized gain (loss) on investments | | | | | | | | | | | | | | | | |
Net realized gain (loss) on investments | | | 51,957,713 | | | | (1,242,408 | ) | | | (144,269 | ) | | | 161,988 | |
Net realized loss on foreign currency translations | | | — | | | | (4,139 | ) | | | (11,144 | ) | | | — | |
Net change in unrealized appreciation (depreciation) on investments and translation of assets and liabilities denominated in foreign currencies | | | (20,354,740 | ) | | | (23,211,803 | ) | | | 306,709 | | | | 9,154 | |
| Net gain (loss) on investments | | | 31,602,973 | | | | (24,458,350 | ) | | | 151,296 | | | | 171,142 | |
| | | | |
Net increase (decrease) in assets
resulting from operations | | | 32,121,617 | | | | (12,877,801 | ) | | | 236,697 | | | | 618,820 | |
| | | | |
| (a) Net of foreign withholding taxes | | | $— | | | | $39,144 | | | | $6,052 | | | | $— | |
| | |
| 28 | | The accompanying notes are an integral part of the financial statements. |
Statements of Operations
| | | | | | | | | | | | | | |
Eagle
Mid Cap
Growth
Fund | | | Eagle
Mid Cap
Stock
Fund | | | Eagle
Small Cap
Growth
Fund | | | Eagle
Smaller
Company
Fund | |
| | | |
| | | | | | | | | | | | | | |
| | $5,023,504 | | | | $2,972,410 | | | | $20,108,863 | | | | $613,883 | |
| | 454 | | | | 137 | | | | 890 | | | | 29 | |
| | 5,023,958 | | | | 2,972,547 | | | | 20,109,753 | | | | 613,912 | |
| | | |
| | | | | | | | | | | | | | |
| | 5,301,205 | | | | 2,130,514 | | | | 20,937,888 | | | | 498,782 | |
| | | | | | | | | | | | | | |
| | 498,158 | | | | 244,715 | | | | 1,187,129 | | | | 32,403 | |
| | 168,298 | | | | 180,000 | | | | 293,602 | | | | 27,443 | |
| | 267,342 | | | | 68,667 | | | | 1,836,556 | | | | 19,753 | |
| | 31,088 | | | | 3,699 | | | | 190,055 | | | | 548 | |
| | 80,447 | | | | 292 | | | | 394,901 | | | | 7 | |
| | 108,667 | | | | 517 | | | | 692,264 | | | | 23,108 | |
| | | | | | | | | | | | | | |
| | 830,264 | | | | 407,858 | | | | 1,978,548 | | | | 54,005 | |
| | 1,121,988 | | | | 1,200,003 | | | | 1,957,347 | | | | 182,954 | |
| | 103,627 | | | | 12,330 | | | | 633,518 | | | | 1,827 | |
| | | | | | | | | | | | | | |
| | 356,200 | | | | 201,009 | | | | 1,166,771 | | | | 34,413 | |
| | 104,825 | | | | 151,559 | | | | 230,323 | | | | 30,661 | |
| | 253,449 | | | | 171,661 | | | | 2,366,209 | | | | 25,016 | |
| | 27,872 | | | | 5,701 | | | | 226,077 | | | | 1,331 | |
| | 77,434 | | | | 496 | | | | 392,418 | | | | 1 | |
| | 10,410 | | | | 103 | | | | 74,700 | | | | 11,041 | |
| | 35,262 | | | | 19,378 | | | | 142,842 | | | | 19,082 | |
| | 120,634 | | | | 120,634 | | | | 120,634 | | | | 152,789 | |
| | 105,242 | | | | 82,844 | | | | 119,718 | | | | 82,202 | |
| | 68,869 | | | | 68,869 | | | | 68,869 | | | | 68,891 | |
| | 11,898 | | | | 11,898 | | | | 11,898 | | | | 11,898 | |
| | 188,597 | | | | 110,773 | | | | 872,775 | | | | 33,905 | |
| | 9,871,776 | | | | 5,193,520 | | | | 35,895,042 | | | | 1,312,060 | |
| | — | | | | (75,185 | ) | | | — | | | | (216,645 | ) |
| | — | | | | — | | | | — | | | | — | |
| | (37,762 | ) | | | (18,746 | ) | | | (82,288 | ) | | | (4,064 | ) |
| | 9,834,014 | | | | 5,099,589 | | | | 35,812,754 | | | | 1,091,351 | |
| | | |
| | (4,810,056 | ) | | | (2,127,042 | ) | | | (15,703,001 | ) | | | (477,439 | ) |
| | | |
| | | | | | | | | | | | | | |
| | 17,451,158 | | | | 37,997,276 | | | | 248,468,849 | | | | 15,766,964 | |
| | — | | | | — | | | | — | | | | — | |
|
13,728,345 |
| | | (25,980,055 | ) | | | (137,448,677 | ) | | | (18,566,546 | ) |
| | 31,179,503 | | | | 12,017,221 | | | | 111,020,172 | | | | (2,799,582 | ) |
| | | |
|
26,369,447 |
| | | 9,890,179 | | | | 95,317,171 | | | | (3,277,021 | ) |
| | | |
| | $— | | | | $2,740 | | | | $— | | | | $922 | |
| | | | |
| The accompanying notes are an integral part of the financial statements. | | | 29 | |
Statements of Changes in Net Assets
| | | | | | | | | | | | | | | | | | | | | | | | |
| | | Eagle Capital
Appreciation Fund | | | Eagle Growth
& Income Fund | | | Eagle International
Stock Fund | |
| | | 11/1/14 to
10/31/2015 | | | 11/1/13 to
10/31/2014 | | | 11/1/14 to
10/31/2015 | | | 11/1/13 to
10/31/2014 | | | 11/1/14 to
10/31/2015 | | | 11/1/13 to
10/31/2014 | |
| | | | | | |
Net assets, beginning of year | | | $318,992,086 | | | | $324,382,862 | | | | $649,868,578 | | | | $486,405,768 | | | | $9,609,342 | | | | $6,748,495 | |
| Increase (decrease) in net assets from operations | | | | | | | | | | | | | | | | | | | | | | | | |
Net investment income (loss) | | | 518,644 | | | | (255,416 | ) | | | 11,580,549 | | | | 8,832,217 | | | | 85,401 | | | | 195,628 | |
Net realized gain (loss) on investments | | | 51,957,713 | | | | 58,437,026 | | | | (1,242,408 | ) | | | 6,058,856 | | | | (144,269 | ) | | | 367,821 | |
Net realized loss on foreign currency transactions | | | — | | | | — | | | | (4,139 | ) | | | — | | | | (11,144 | ) | | | (4,719 | ) |
Net change in unrealized appreciation (depreciation) on investments and translation of assets and liabilities denominated in foreign currencies | | | (20,354,740 | ) | | | (5,851,822 | ) | | | (23,211,803 | ) | | | 57,191,380 | | | | 306,709 | | | | (520,004 | ) |
| Net increase (decrease) in net assets resulting from operations | | | 32,121,617 | | | | 52,329,788 | | | | (12,877,801 | ) | | | 72,082,453 | | | | 236,697 | | | | 38,726 | |
| Distributions to shareholders from | | | | | | | | | | | | | | | | | | | | | | | | |
Net investment income | | | (115,740 | ) | | | — | | | | (10,641,982 | ) | | | (8,518,286 | ) | | | (196,447 | ) | | | (49,408 | ) |
Net realized gains | | | (43,827,035 | ) | | | (35,009,202 | ) | | | (4,636,851 | ) | | | (10,915,677 | ) | | | (367,993 | ) | | | (39,253 | ) |
Return of capital | | | — | | | | — | | | | (660,554 | ) | | | — | | | | — | | | | — | |
| Total distributions to shareholders | | | (43,942,775 | ) | | | (35,009,202 | ) | | | (15,939,387 | ) | | | (19,433,963 | ) | | | (564,440 | ) | | | (88,661 | ) |
| Fund share transactions | | | | | | | | | | | | | | | | | | | | | | | | |
Proceeds from shares sold-Class A | | | 33,136,485 | | | | 11,188,592 | | | | 23,264,358 | | | | 53,465,827 | | | | 6,395,621 | | | | 1,599,189 | |
Proceeds issued in connection with merger-Class A | | | N/A | | | | N/A | | | | N/A | | | | N/A | | | | N/A | | | | N/A | |
Issued as reinvestment of distributions-Class A | | | 20,299,251 | | | | 20,412,864 | | | | 4,820,342 | | | | 6,970,429 | | | | 234,175 | | | | 49,644 | |
Cost of shares redeemed-Class A | | | (37,453,147 | ) | | | (86,305,113 | ) | | | (60,811,651 | ) | | | (73,024,993 | ) | | | (884,504 | ) | | | (1,042,164 | ) |
Proceeds from shares sold-Class C | | | 4,446,482 | | | | 2,002,057 | | | | 24,729,602 | | | | 46,666,814 | | | | 1,412,539 | | | | 1,856,249 | |
Proceeds issued in connection with merger-Class C | | | N/A | | | | N/A | | | | N/A | | | | N/A | | | | N/A | | | | N/A | |
Issued as reinvestment of distributions-Class C | | | 10,611,069 | | | | 7,834,393 | | | | 3,354,086 | | | | 4,355,041 | | | | 235,418 | | | | 27,517 | |
Cost of shares redeemed-Class C | | | (9,606,335 | ) | | | (12,083,587 | ) | | | (33,234,997 | ) | | | (27,019,100 | ) | | | (596,199 | ) | | | (406,305 | ) |
Proceeds from shares sold-Class I | | | 21,883,378 | | | | 57,013,517 | | | | 52,192,777 | | | | 124,523,054 | | | | 1,569,614 | | | | 995,850 | |
Proceeds issued in connection with merger-Class I | | | N/A | | | | N/A | | | | N/A | | | | N/A | | | | N/A | | | | N/A | |
Issued as reinvestment of distributions-Class I | | | 11,392,648 | | | | 2,990,467 | | | | 4,753,546 | | | | 4,021,082 | | | | 86,523 | | | | 8,456 | |
Cost of shares redeemed-Class I | | | (16,357,631 | ) | | | (10,711,580 | ) | | | (54,463,116 | ) | | | (29,111,775 | ) | | | (750,130 | ) | | | (177,775 | ) |
Proceeds from shares sold-Class R-3 | | | 558,225 | | | | 222,505 | | | | 740,034 | | | | 1,351,166 | | | | — | | | | — | |
Proceeds issued in connection with merger-Class R-3 | | | N/A | | | | N/A | | | | N/A | | | | N/A | | | | N/A | | | | N/A | |
Issued as reinvestment of distributions-Class R-3 | | | 81,840 | | | | 84,996 | | | | 55,416 | | | | 117,466 | | | | 184 | | | | 33 | |
Cost of shares redeemed-Class R-3 | | | (311,328 | ) | | | (529,326 | ) | | | (1,665,403 | ) | | | (1,883,547 | ) | | | — | | | | — | |
Proceeds from shares sold-Class R-5 | | | 2,886,352 | | | | 956,571 | | | | 324,557 | | | | 422,245 | | | | 23,411 | | | | — | |
Proceeds issued in connection with merger-Class R-5 | | | N/A | | | | N/A | | | | N/A | | | | N/A | | | | N/A | | | | N/A | |
Issued as reinvestment of distributions-Class R-5 | | | 708,641 | | | | 2,133,186 | | | | 76,170 | | | | 139,639 | | | | 202 | | | | 43 | |
Cost of shares redeemed-Class R-5 | | | (765,341 | ) | | | (17,920,904 | ) | | | (4,179,809 | ) | | | (219,832 | ) | | | — | | | | — | |
Proceeds from shares sold-Class R-6 | | | 2,500 | | | | N/A | | | | 55,189 | | | | 38,065 | | | | — | | | | — | |
Proceeds issued in connection with merger-Class R-6 | | | N/A | | | | N/A | | | | N/A | | | | N/A | | | | N/A | | | | N/A | |
Issued as reinvestment of distributions-Class R-6 | | | — | | | | N/A | | | | 2,713 | | | | 2,880 | | | | 205 | | | | 45 | |
Cost of shares redeemed-Class R-6 | | | — | | | | N/A | | | | (155,336 | ) | | | (141 | ) | | | — | | | | — | |
| Net increase (decrease) from fund share transactions | | | 41,513,089 | | | | (22,711,362 | ) | | | (40,141,522 | ) | | | 110,814,320 | | | | 7,727,059 | | | | 2,910,782 | |
| Increase (decrease) in net assets | | | 29,691,931 | | | | (5,390,776 | ) | | | (68,958,710 | ) | | | 163,462,810 | | | | 7,399,316 | | | | 2,860,847 | |
Net assets, end of year (a) | | | 348,684,017 | | | | 318,992,086 | | | | 580,909,868 | | | | 649,868,578 | | | | 17,008,658 | | | | 9,609,342 | |
| (a) includes undistributed (accumulated) net investment income (loss) of | | | $402,892 | | | | $— | | | | $— | | | | $377,406 | | | | $74,253 | | | | $196,447 | |
| | | | | | |
| Shares issued and redeemed | | | | | | | | | | | | | | | | | | | | | | | | |
Shares sold-Class A | | | 836,060 | | | | 290,023 | | | | 1,291,847 | | | | 3,067,548 | | | | 399,470 | | | | 95,317 | |
Shares issued in connection with merger-Class A | | | N/A | | | | N/A | | | | N/A | | | | N/A | | | | N/A | | | | N/A | |
Issued as reinvestment of distributions-Class A | | | 542,616 | | | | 555,858 | | | | 270,191 | | | | 407,616 | | | | 15,467 | | | | 3,018 | |
Shares redeemed-Class A | | | (953,260 | ) | | | (2,287,788 | ) | | | (3,480,079 | ) | | | (4,095,582 | ) | | | (54,995 | ) | | | (62,896 | ) |
Shares sold-Class C | | | 141,111 | | | | 61,036 | | | | 1,419,072 | | | | 2,771,031 | | | | 86,814 | | | | 110,716 | |
Shares issued in connection with merger-Class C | | | N/A | | | | N/A | | | | N/A | | | | N/A | | | | N/A | | | | N/A | |
Issued as reinvestment of distributions-Class C | | | 350,895 | | | | 254,111 | | | | 194,455 | | | | 265,339 | | | | 15,622 | | | | 1,678 | |
Shares redeemed-Class C | | | (303,924 | ) | | | (371,357 | ) | | | (1,937,121 | ) | | | (1,597,125 | ) | | | (37,342 | ) | | | (25,241 | ) |
Shares sold-Class I | | | 543,861 | | | | 1,474,055 | | | | 2,890,819 | | | | 7,095,701 | | | | 95,575 | | | | 59,928 | |
Shares issued in connection with merger-Class I | | | N/A | | | | N/A | | | | N/A | | | | N/A | | | | N/A | | | | N/A | |
Issued as reinvestment of distributions-Class I | | | 294,308 | | | | 79,155 | | | | 267,917 | | | | 233,983 | | | | 5,711 | | | | 513 | |
Shares redeemed-Class I | | | (406,488 | ) | | | (266,428 | ) | | | (3,071,098 | ) | | | (1,657,345 | ) | | | (45,654 | ) | | | (10,575 | ) |
Shares sold-Class R-3 | | | 14,534 | | | | 5,876 | | | | 41,163 | | | | 78,381 | | | | — | | | | — | |
Shares issued in connection with merger-Class R-3 | | | N/A | | | | N/A | | | | N/A | | | | N/A | | | | N/A | | | | N/A | |
Issued as reinvestment of distributions-Class R-3 | | | 2,237 | | | | 2,351 | | | | 3,122 | | | | 6,915 | | | | 12 | | | | 2 | |
Shares redeemed-Class R-3 | | | (8,614 | ) | | | (13,901 | ) | | | (91,172 | ) | | | (107,186 | ) | | | — | | | | — | |
Shares sold-Class R-5 | | | 71,310 | | | | 24,209 | | | | 18,072 | | | | 24,393 | | | | 1,539 | | | | — | |
Shares issued in connection with merger-Class R-5 | | | N/A | | | | N/A | | | | N/A | | | | N/A | | | | N/A | | | | N/A | |
Issued as reinvestment of distributions-Class R-5 | | | 18,354 | | | | 56,613 | | | | 4,175 | | | | 8,167 | | | | 13 | | | | 3 | |
Shares redeemed-Class R-5 | | | (19,094 | ) | | | (466,843 | ) | | | (228,125 | ) | | | (12,840 | ) | | | — | | | | — | |
Shares sold-Class R-6 | | | 60 | | | | N/A | | | | 3,021 | | | | 2,269 | | | | — | | | | — | |
Shares issued in connection with merger-Class R-6 | | | N/A | | | | N/A | | | | N/A | | | | N/A | | | | N/A | | | | N/A | |
Issued as reinvestment of distributions-Class R-6 | | | — | | | | N/A | | | | 151 | | | | 166 | | | | 13 | | | | 3 | |
Shares redeemed-Class R-6 | | | — | | | | N/A | | | | (8,665 | ) | | | (8 | ) | | | — | | | | — | |
| Shares issued and redeemed | | | 1,123,966 | | | | (603,030 | ) | | | (2,412,255 | ) | | | 6,491,423 | | | | 482,245 | | | | 172,466 | |
| | |
| 30 | | The accompanying notes are an integral part of the financial statements. |
Statements of Changes in Net Assets
| | | | | | | | | | | | | | | | | | | | | | | | | | | | | | | | | | | | | | |
Eagle Investment Grade
Bond Fund | | | Eagle Mid Cap
Growth Fund | | | Eagle Mid Cap
Stock Fund | | | Eagle Small Cap
Growth Fund | | | Eagle Smaller
Company Fund | |
11/1/14 to
10/31/2015 | | | 11/1/13 to
10/31/2014 | | | 11/1/14 to
10/31/2015 | | | 11/1/13 to
10/31/2014 | | | 11/1/14 to
10/31/2015 | | | 11/1/13 to
10/31/2014 | | | 11/1/14 to
10/31/2015 | | | 11/1/13 to
10/31/2014 | | | 11/1/14 to
10/31/2015 | | | 11/1/13 to
10/31/2014 | |
| | | | | | | | | |
| | $57,903,233 | | | | $84,902,084 | | | | $698,785,887 | | | | $593,563,341 | | | | $388,881,638 | | | | $450,582,889 | | | | $3,769,291,164 | | | | $3,981,293,766 | | | | $88,240,501 | | | | $154,522,338 | |
| | | | | | | | | | | | | | | | | | | | | | | | | | | | | | | | | | | | | | |
| | 447,678 | | | | 543,142 | | | | (4,810,056 | ) | | | (2,771,207 | ) | | | (2,127,042 | ) | | | (2,526,804 | ) | | | (15,703,001 | ) | | | (16,316,601 | ) | | | (477,439 | ) | | | (95,431 | ) |
| | 161,988 | | | | 231,924 | | | | 17,451,158 | | | | 70,401,971 | | | | 37,997,276 | | | | 32,414,418 | | | | 248,468,849 | | | | 417,107,331 | | | | 15,766,964 | | | | 28,549,082 | |
| | — | | | | — | | | | — | | | | — | | | | — | | | | — | | | | — | | | | — | | | | — | | | | — | |
|
9,154 |
| | | (132,748 | ) | | | 13,728,345 | | | | 29,806,807 | | | | (25,980,055 | ) | | | (8,316,189 | ) | | | (137,448,677 | ) | | | (117,518,200 | ) | | | (18,566,546 | ) | | | (24,095,189 | ) |
| | 618,820 | | | | 642,318 | | | | 26,369,447 | | | | 97,437,571 | | | | 9,890,179 | | | | 21,571,425 | | | | 95,317,171 | | | | 283,272,530 | | | | (3,277,021 | ) | | | 4,358,462 | |
| | | | | | | | | | | | | | | | | | | | | | | | | | | | | | | | | | | | | | |
| | (458,386 | ) | | | (544,923 | ) | | | — | | | | — | | | | — | | | | — | | | | — | | | | — | | | | — | | | | (88,374 | ) |
| | (231,903 | ) | | | (195,041 | ) | | | (68,282,709 | ) | | | (28,381,810 | ) | | | (31,201,435 | ) | | | (30,758,828 | ) | | | (415,686,715 | ) | | | (49,712,316 | ) | | | (37,344,156 | ) | | | (3,368,574 | ) |
| | — | | | | — | | | | — | | | | — | | | | — | | | | — | | | | — | | | | — | | | | — | | | | — | |
| | (690,289 | ) | | | (739,964 | ) | | | (68,282,709 | ) | | | (28,381,810 | ) | | | (31,201,435 | ) | | | (30,758,828 | ) | | | (415,686,715 | ) | | | (49,712,316 | ) | | | (37,344,156 | ) | | | (3,456,948 | ) |
| | | | | | | | | | | | | | | | | | | | | | | | | | | | | | | | | | | | | | |
| | 1,804,098 | | | | 7,290,935 | | | | 154,981,624 | | | | 77,068,632 | | | | 4,198,810 | | | | 7,445,330 | | | | 297,090,315 | | | | 215,669,694 | | | | 1,630,067 | | | | 6,762,156 | |
| | N/A | | | | N/A | | | | N/A | | | | N/A | | | | N/A | | | | N/A | | | | N/A | | | | N/A | | | | 13,607,380 | | | | N/A | |
| | 315,286 | | | | 408,677 | | | | 24,891,239 | | | | 13,448,101 | | | | 12,520,760 | | | | 12,830,745 | | | | 78,356,875 | | | | 11,481,538 | | | | 7,518,494 | | | | 371,262 | |
| | (5,251,757 | ) | | | (21,636,890 | ) | | | (96,110,753 | ) | | | (143,394,429 | ) | | | (32,750,607 | ) | | | (53,322,412 | ) | | | (357,398,487 | ) | | | (517,675,872 | ) | | | (12,684,604 | ) | | | (7,698,299 | ) |
| | 1,550,375 | | | | 1,826,896 | | | | 23,171,267 | | | | 8,641,720 | | | | 2,704,544 | | | | 4,651,385 | | | | 23,022,664 | | | | 24,600,934 | | | | 4,375,469 | | | | 1,680,561 | |
| | N/A | | | | N/A | | | | N/A | | | | N/A | | | | N/A | | | | N/A | | | | N/A | | | | N/A | | | | 13,691,573 | | | | N/A | |
| | 183,902 | | | | 195,129 | | | | 11,057,171 | | | | 5,418,216 | | | | 11,274,729 | | | | 10,471,294 | | | | 22,545,321 | | | | 2,520,743 | | | | 4,792,335 | | | | 242,230 | |
| | (6,975,957 | ) | | | (16,956,200 | ) | | | (14,843,390 | ) | | | (24,912,497 | ) | | | (20,454,958 | ) | | | (23,627,973 | ) | | | (29,084,741 | ) | | | (35,298,025 | ) | | | (6,613,385 | ) | | | (2,407,271 | ) |
| | 3,777,682 | | | | 6,797,984 | | | | 210,208,261 | | | | 93,941,606 | | | | 10,853,022 | | | | 17,534,085 | | | | 572,029,963 | | | | 541,729,771 | | | | 4,862,500 | | | | 26,095,440 | |
| | N/A | | | | N/A | | | | N/A | | | | N/A | | | | N/A | | | | N/A | | | | N/A | | | | N/A | | | | 5,851,450 | | | | N/A | |
| | 148,462 | | | | 66,295 | | | | 18,968,090 | | | | 5,211,140 | | | | 6,015,615 | | | | 5,784,713 | | | | 159,129,969 | | | | 17,723,669 | | | | 8,475,402 | | | | 2,256,614 | |
| | (3,439,617 | ) | | | (4,894,849 | ) | | | (67,776,416 | ) | | | (32,981,220 | ) | | | (49,875,149 | ) | | | (33,225,113 | ) | | | (611,221,897 | ) | | | (719,366,030 | ) | | | (26,327,463 | ) | | | (102,058,840 | ) |
| | 240 | | | | 450 | | | | 10,436,504 | | | | 4,681,391 | | | | 736,793 | | | | 699,369 | | | | 28,626,053 | | | | 32,262,465 | | | | 153,620 | | | | 363,680 | |
| | N/A | | | | N/A | | | | N/A | | | | N/A | | | | N/A | | | | N/A | | | | N/A | | | | N/A | | | | 71,144 | | | | N/A | |
| | 374 | | | | 322 | | | | 1,518,526 | | | | 538,973 | | | | 374,968 | | | | 396,879 | | | | 13,661,003 | | | | 1,714,339 | | | | 150,787 | | | | 3,289 | |
| | (1,523 | ) | | | — | | | | (3,471,463 | ) | | | (2,231,093 | ) | | | (3,858,954 | ) | | | (2,223,327 | ) | | | (39,789,004 | ) | | | (48,426,097 | ) | | | (305,072 | ) | | | (151,818 | ) |
| | — | | | | — | | | | 102,996,374 | | | | 32,814,837 | | | | 62,933 | | | | 125,811 | | | | 145,476,829 | | | | 144,113,736 | | | | 315 | | | | 712 | |
| | N/A | | | | N/A | | | | N/A | | | | N/A | | | | N/A | | | | N/A | | | | N/A | | | | N/A | | | | 3,563 | | | | N/A | |
| | 51 | | | | 46 | | | | 4,875,830 | | | | 1,762,800 | | | | 29,218 | | | | 43,105 | | | | 38,385,435 | | | | 4,405,002 | | | | 2,565 | | | | 1,260 | |
| | — | | | | — | | | | (26,865,439 | ) | | | (24,188,817 | ) | | | (215,982 | ) | | | (393,822 | ) | | | (83,926,911 | ) | | | (162,191,616 | ) | | | — | | | | (55,426 | ) |
| | 2,500 | | | | N/A | | | | 187,190,750 | | | | 25,855,909 | | | | 37,633 | | | | 535,971 | | | | 406,839,390 | | | | 203,604,039 | | | | 6,791,015 | | | | 13,905,412 | |
| | N/A | | | | N/A | | | | N/A | | | | N/A | | | | N/A | | | | N/A | | | | N/A | | | | N/A | | | | 3,570 | | | | N/A | |
| | 6 | | | | N/A | | | | 3,132,740 | | | | 462,038 | | | | 51,774 | | | | 19,559 | | | | 62,838,102 | | | | 6,342,356 | | | | 12,875,708 | | | | 403,770 | |
| | — | | | | N/A | | | | (25,521,587 | ) | | | (5,970,522 | ) | | | (293,375 | ) | | | (259,447 | ) | | | (248,116,482 | ) | | | (168,773,462 | ) | | | (21,080,656 | ) | | | (6,898,083 | ) |
| | (7,885,878 | ) | | | (26,901,205 | ) | | | 518,839,328 | | | | 36,166,785 | | | | (58,588,226 | ) | | | (52,513,848 | ) | | | 478,464,397 | | | | (445,562,816 | ) | | | 17,845,777 | | | | (67,183,351 | ) |
| | (7,957,347 | ) | | | (26,998,851 | ) | | | 476,926,066 | | | | 105,222,546 | | | | (79,899,482 | ) | | | (61,701,251 | ) | | | 158,094,853 | | | | (212,002,602 | ) | | | (22,775,400 | ) | | | (66,281,837 | ) |
| | 49,945,886 | | | | 57,903,233 | | | | 1,175,711,953 | | | | 698,785,887 | | | | 308,982,156 | | | | 388,881,638 | | | | 3,927,386,017 | | | | 3,769,291,164 | | | | 65,465,101 | | | | 88,240,501 | |
| | $(45,676 | ) | | | $(55,386 | ) | | | $(4,473,377 | ) | | | $(960,788 | ) | | | $(2,008,520 | ) | | | $(2,159,767 | ) | | | $(15,076,793 | ) | | | $(11,990,571 | ) | | | $(477,311 | ) | | | $(223,432 | ) |
| | | | | | | | | |
| | | | | | | | | | | | | | | | | | | | | | | | | | | | | | | | | | | | | | |
| | 121,201 | | | | 491,175 | | | | 3,537,463 | | | | 1,795,231 | | | | 143,442 | | | | 253,061 | | | | 5,298,430 | | | | 3,868,886 | | | | 112,247 | | | | 286,905 | |
| | N/A | | | | N/A | | | | N/A | | | | N/A | | | | N/A | | | | N/A | | | | N/A | | | | N/A | | | | 1,038,708 | | | | N/A | |
| | 21,246 | | | | 27,606 | | | | 593,496 | | | | 330,258 | | | | 440,872 | | | | 445,357 | | | | 1,471,219 | | | | 209,402 | | | | 511,127 | | | | 15,725 | |
| | (352,849 | ) | | | (1,459,430 | ) | | | (2,186,789 | ) | | | (3,323,578 | ) | | | (1,115,292 | ) | | | (1,806,589 | ) | | | (6,541,425 | ) | | | (9,285,228 | ) | | | (854,809 | ) | | | (325,139 | ) |
| | 104,200 | | | | 123,339 | | | | 632,821 | | | | 236,658 | | | | 114,946 | | | | 190,909 | | | | 522,553 | | | | 535,321 | | | | 352,716 | | | | 74,007 | |
| | N/A | | | | N/A | | | | N/A | | | | N/A | | | | N/A | | | | N/A | | | | N/A | | | | N/A | | | | 1,158,849 | | | | N/A | |
| | 12,435 | | | | 13,226 | | | | 317,826 | | | | 156,319 | | | | 493,856 | | | | 440,682 | | | | 529,357 | | | | 55,571 | | | | 357,495 | | | | 10,742 | |
| | (469,439 | ) | | | (1,144,905 | ) | | | (404,639 | ) | | | (683,228 | ) | | | (864,095 | ) | | | (973,072 | ) | | | (655,014 | ) | | | (771,779 | ) | | | (471,908 | ) | | | (108,493 | ) |
| | 253,282 | | | | 458,013 | | | | 4,536,863 | | | | 2,071,455 | | | | 355,200 | | | | 574,652 | | | | 9,950,031 | | | | 9,472,409 | | | | 319,240 | | | | 1,081,117 | |
| | N/A | | | | N/A | | | | N/A | | | | N/A | | | | N/A | | | | N/A | | | | N/A | | | | N/A | | | | 422,219 | | | | N/A | |
| | 9,986 | | | | 4,466 | | | | 434,749 | | | | 123,868 | | | | 204,058 | | | | 194,575 | | | | 2,894,273 | | | | 315,200 | | | | 539,091 | | | | 93,635 | |
| | (230,793 | ) | | | (329,414 | ) | | | (1,479,921 | ) | | | (741,772 | ) | | | (1,627,944 | ) | | | (1,093,013 | ) | | | (10,701,063 | ) | | | (12,486,765 | ) | | | (1,508,034 | ) | | | (4,265,479 | ) |
| | 16 | | | | 30 | | | | 242,518 | | | | 110,032 | | | | 25,838 | | | | 24,311 | | | | 523,192 | | | | 588,013 | | | | 10,471 | | | | 15,389 | |
| | N/A | | | | N/A | | | | N/A | | | | N/A | | | | N/A | | | | N/A | | | | N/A | | | | N/A | | | | 5,582 | | | | N/A | |
| | 25 | | | | 22 | | | | 36,920 | | | | 13,431 | | | | 13,541 | | | | 14,064 | | | | 261,605 | | | | 31,718 | | | | 10,415 | | | | 141 | |
| | (101 | ) | | | — | | | | (79,611 | ) | | | (52,878 | ) | | | (138,763 | ) | | | (76,743 | ) | | | (736,395 | ) | | | (885,930 | ) | | | (19,124 | ) | | | (6,543 | ) |
| | — | | | | — | | | | 2,258,291 | | | | 736,366 | | | | 2,095 | | | | 4,089 | | | | 2,511,078 | | | | 2,495,451 | | | | 22 | | | | 29 | |
| | N/A | | | | N/A | | | | N/A | | | | N/A | | | | N/A | | | | N/A | | | | N/A | | | | N/A | | | | 260 | | | | N/A | |
| | 4 | | | | 3 | | | | 111,908 | | | | 41,941 | | | | 986 | | | | 1,443 | | | | 696,018 | | | | 78,131 | | | | 168 | | | | 52 | |
| | — | | | | — | | | | (586,680 | ) | | | (537,036 | ) | | | (7,092 | ) | | | (13,317 | ) | | | (1,465,804 | ) | | | (2,826,233 | ) | | | — | | | | (2,239 | ) |
| | 168 | | | | N/A | | | | 4,046,600 | | | | 575,680 | | | | 1,205 | | | | 17,180 | | | | 6,991,787 | | | | 3,525,589 | | | | 459,810 | | | | 569,876 | |
| | N/A | | | | N/A | | | | N/A | | | | N/A | | | | N/A | | | | N/A | | | | N/A | | | | N/A | | | | 260 | | | | N/A | |
| | 1 | | | | N/A | | | | 71,622 | | | | 10,970 | | | | 1,746 | | | | 655 | | | | 1,135,286 | | | | 112,294 | | | | 839,493 | | | | 16,761 | |
| | — | | | | N/A | | | | (555,759 | ) | | | (134,362 | ) | | | (9,849 | ) | | | (8,489 | ) | | | (4,460,601 | ) | | | (2,947,403 | ) | | | (1,580,210 | ) | | | (286,416 | ) |
| | (530,618 | ) | | | (1,815,869 | ) | | | 11,527,678 | | | | 729,355 | | | | (1,965,250 | ) | | | (1,810,245 | ) | | | 8,224,527 | | | | (7,915,353 | ) | | | 1,704,088 | | | | (2,829,930 | ) |
| | | | |
| The accompanying notes are an integral part of the financial statements. | | | 31 | |
Financial Highlights
| | | | | | | | | | | | | | | | | | | | | | | | | | | | | | | | | | | | | | | | | | | | | | | | | | | | | | | | | | | | | | | | |
Fiscal periods | | | | | | From investment operations | | | Dividends & distributions | | | | | | Ratios to average net asset (%) | | | | | | | | | | |
| | Beginning
net asset
value | | | Income
(loss) | | | Realized &
unrealized
gain (loss) | | | Total | | | From
investment
income | | | From
realized
gains | | | From
return of
capital | | | Total | | | Ending
net
asset
value | | | With
expenses
waived/
recovered (†) | | | Without
expenses
waived/
recovered (†) | | | Net
income
(loss) | | | Portfolio
turnover
rate (%) (a) | | | Total
return (%) (a)(b) | | | Ending
net
assets
(millions) | |
| Beginning | | Ending | | | | | | | | | | | | | | | | |
Eagle Capital Appreciation
Fund | | | | | | | | | | | | | | | | | | | | | | | | | | | | | | | | | | | | | | | | | | | | | | | | | | | | | | | | | |
| Class A* | | | | | | | | | | | | | | | | | | | | | | | | | | | | | | | | | | | | | | | | | | | | | | | | | | | | | | | | | | | | | | | | |
| 11/01/14 | | | 10/31/15 | | | | $42.02 | | | | $0.09 | | | | $3.80 | | | | $3.89 | | | | $— | | | | $(5.59 | ) | | | $— | | | | $(5.59 | ) | | | $40.32 | | | | 1.19 | | | | 1.19 | | | | 0.22 | | | | 42 | | | | 10.29 | | | | $168 | |
| 11/01/13 | | | 10/31/14 | | | | 39.59 | | | | 0.01 | | | | 6.64 | | | | 6.65 | | | | — | | | | (4.22 | ) | | | — | | | | (4.22 | ) | | | 42.02 | | | | 1.23 | | | | 1.23 | | | | 0.02 | | | | 33 | | | | 18.34 | | | | 157 | |
| 11/01/12 | | | 10/31/13 | | | | 30.95 | | | | 0.10 | | | | 8.66 | | | | 8.76 | | | | (0.12 | ) | | | — | | | | — | | | | (0.12 | ) | | | 39.59 | | | | 1.30 | | | | 1.30 | | | | 0.30 | | | | 69 | (c) | | | 28.41 | | | | 205 | |
| 11/01/11 | | | 10/31/12 | | | | 26.97 | | | | 0.02 | | | | 3.96 | | | | 3.98 | | | | — | | | | — | | | | — | | | | — | | | | 30.95 | | | | 1.24 | | | | 1.24 | | | | 0.06 | | | | 22 | | | | 14.76 | | | | 203 | |
| 11/01/10 | | | 10/31/11 | | | | 26.24 | | | | (0.01 | ) | | | 0.74 | | | | 0.73 | | | | — | | | | — | | | | — | | | | — | | | | 26.97 | | | | 1.22 | | | | 1.22 | | | | (0.03 | ) | | | 37 | | | | 2.78 | | | | 293 | |
| Class C* | | | | | | | | | | | | | | | | | | | | | | | | | | | | | | | | | | | | | | | | | | | | | | | | | | | | | | | | | | | | | | | | |
| 11/01/14 | | | 10/31/15 | | | | 35.05 | | | | (0.17 | ) | | | 3.08 | | | | 2.91 | | | | — | | | | (5.59 | ) | | | — | | | | (5.59 | ) | | | 32.37 | | | | 1.96 | | | | 1.96 | | | | (0.54 | ) | | | 42 | | | | 9.42 | | | | 69 | |
| 11/01/13 | | | 10/31/14 | | | | 33.93 | | | | (0.24 | ) | | | 5.58 | | | | 5.34 | | | | — | | | | (4.22 | ) | | | — | | | | (4.22 | ) | | | 35.05 | | | | 1.97 | | | | 1.97 | | | | (0.73 | ) | | | 33 | | | | 17.45 | | | | 68 | |
| 11/01/12 | | | 10/31/13 | | | | 26.62 | | | | (0.13 | ) | | | 7.44 | | | | 7.31 | | | | — | | | | — | | | | — | | | | — | | | | 33.93 | | | | 2.03 | | | | 2.03 | | | | (0.43 | ) | | | 69 | (c) | | | 27.46 | | | | 68 | |
| 11/01/11 | | | 10/31/12 | | | | 23.36 | | | | (0.16 | ) | | | 3.42 | | | | 3.26 | | | | — | | | | — | | | | — | | | | — | | | | 26.62 | | | | 1.94 | | | | 1.94 | | | | (0.64 | ) | | | 22 | | | | 13.96 | | | | 66 | |
| 11/01/10 | | | 10/31/11 | | | | 22.88 | | | | (0.18 | ) | | | 0.66 | | | | 0.48 | | | | — | | | | — | | | | — | | | | — | | | | 23.36 | | | | 1.92 | | | | 1.92 | | | | (0.74 | ) | | | 37 | | | | 2.10 | | | | 67 | |
| Class I* | | | | | | | | | | | | | | | | | | | | | | | | | | | | | | | | | | | | | | | | | | | | | | | | | | | | | | | | | | | | | | | | |
| 11/01/14 | | | 10/31/15 | | | | 43.34 | | | | 0.21 | | | | 3.93 | | | | 4.14 | | | | (0.06 | ) | | | (5.59 | ) | | | — | | | | (5.65 | ) | | | 41.83 | | | | 0.90 | | | | 0.90 | | | | 0.51 | | | | 42 | | | | 10.59 | | | | 103 | |
| 11/01/13 | | | 10/31/14 | | | | 40.60 | | | | 0.13 | | | | 6.83 | | | | 6.96 | | | | — | | | | (4.22 | ) | | | — | | | | (4.22 | ) | | | 43.34 | | | | 0.94 | | | | 0.93 | | | | 0.32 | | | | 33 | | | | 18.68 | | | | 88 | |
| 11/01/12 | | | 10/31/13 | | | | 31.72 | | | | 0.19 | | | | 8.92 | | | | 9.11 | | | | (0.23 | ) | | | — | | | | — | | | | (0.23 | ) | | | 40.60 | | | | 0.95 | | | | 0.99 | | | | 0.51 | | | | 69 | (c) | | | 28.87 | | | | 30 | |
| 11/01/11 | | | 10/31/12 | | | | 27.55 | | | | 0.11 | | | | 4.06 | | | | 4.17 | | | | — | | | | — | | | | — | | | | — | | | | 31.72 | | | | 0.92 | | | | 0.92 | | | | 0.38 | | | | 22 | | | | 15.14 | | | | 14 | |
| 11/01/10 | | | 10/31/11 | | | | 26.72 | | | | 0.08 | | | | 0.75 | | | | 0.83 | | | | — | | | | — | | | | — | | | | — | | | | 27.55 | | | | 0.90 | | | | 0.90 | | | | 0.28 | | | | 37 | | | | 3.11 | | | | 18 | |
| Class R-3* | | | | | | | | | | | | | | | | | | | | | | | | | | | | | | | | | | | | | | | | | | | | | | | | | | | | | | | | | | | | | | | | |
| 11/01/14 | | | 10/31/15 | | | | 41.24 | | | | (0.04 | ) | | | 3.72 | | | | 3.68 | | | | — | | | | (5.59 | ) | | | — | | | | (5.59 | ) | | | 39.33 | | | | 1.51 | | | | 1.51 | | | | (0.10 | ) | | | 42 | | | | 9.94 | | | | 1 | |
| 11/01/13 | | | 10/31/14 | | | | 39.05 | | | | (0.11 | ) | | | 6.52 | | | | 6.41 | | | | — | | | | (4.22 | ) | | | — | | | | (4.22 | ) | | | 41.24 | | | | 1.56 | | | | 1.56 | | | | (0.30 | ) | | | 33 | | | | 17.94 | | | | 1 | |
| 11/01/12 | | | 10/31/13 | | | | 30.53 | | | | 0.01 | | | | 8.52 | | | | 8.53 | | | | (0.01 | ) | | | — | | | | — | | | | (0.01 | ) | | | 39.05 | | | | 1.60 | | | | 1.60 | | | | 0.02 | | | | 69 | (c) | | | 27.94 | | | | 1 | |
| 11/01/11 | | | 10/31/12 | | | | 26.68 | | | | (0.06 | ) | | | 3.91 | | | | 3.85 | | | | — | | | | — | | | | — | | | | — | | | | 30.53 | | | | 1.53 | | | | 1.53 | | | | (0.22 | ) | | | 22 | | | | 14.43 | | | | 1 | |
| 11/01/10 | | | 10/31/11 | | | | 26.03 | | | | (0.09 | ) | | | 0.74 | | | | 0.65 | | | | — | | | | — | | | | — | | | | — | | | | 26.68 | | | | 1.51 | | | | 1.51 | | | | (0.33 | ) | | | 37 | | | | 2.50 | | | | 1 | |
| Class R-5* | | | | | | | | | | | | | | | | | | | | | | | | | | | | | | | | | | | | | | | | | | | | | | | | | | | | | | | | | | | | | | | | |
| 11/01/14 | | | 10/31/15 | | | | 43.20 | | | | 0.18 | | | | 3.93 | | | | 4.11 | | | | (0.02 | ) | | | (5.59 | ) | | | — | | | | (5.61 | ) | | | 41.70 | | | | 0.95 | | | | 0.86 | | | | 0.46 | | | | 42 | | | | 10.54 | | | | 8 | |
| 11/01/13 | | | 10/31/14 | | | | 40.50 | | | | 0.10 | | | | 6.82 | | | | 6.92 | | | | — | | | | (4.22 | ) | | | — | | | | (4.22 | ) | | | 43.20 | | | | 0.95 | | | | 0.94 | | | | 0.25 | | | | 33 | | | | 18.62 | | | | 5 | |
| 11/01/12 | | | 10/31/13 | | | | 31.66 | | | | 0.25 | | | | 8.83 | | | | 9.08 | | | | (0.24 | ) | | | — | | | | — | | | | (0.24 | ) | | | 40.50 | | | | 0.95 | | | | 0.99 | | | | 0.73 | | | | 69 | (c) | | | 28.84 | | | | 20 | |
| 11/01/11 | | | 10/31/12 | | | | 27.50 | | | | 0.11 | | | | 4.05 | | | | 4.16 | | | | — | | | | — | | | | — | | | | — | | | | 31.66 | | | | 0.92 | | | | 0.92 | | | | 0.37 | | | | 22 | | | | 15.13 | | | | 30 | |
| 11/01/10 | | | 10/31/11 | | | | 26.67 | | | | 0.07 | | | | 0.76 | | | | 0.83 | | | | — | | | | — | | | | — | | | | — | | | | 27.50 | | | | 0.93 | | | | 0.93 | | | | 0.25 | | | | 37 | | | | 3.11 | | | | 24 | |
| Class R-6* | | | | | | | | | | | | | | | | | | | | | | | | | | | | | | | | | | | | | | | | | | | | | | | | | | | | | | | | | | | | | | | | |
| 07/31/15 | | | 10/31/15 | | | | 41.71 | | | | 0.06 | | | | (0.11 | ) | | | (0.05 | ) | | | — | | | | — | | | | — | | | | — | | | | 41.66 | | | | 0.82 | (e) | | | 0.82 | (e) | | | 0.57 | (e) | | | 42 | | | | (0.12 | ) | | | 0 | |
| | | | | | | | | | | | | | |
| Eagle Growth & Income Fund | | | | | | | | | | | | | | | | | | | | | | | | | | | | | | | | | | | | | | | | | | | | | | | | | | | | | | | | | |
| Class A* | | | | | | | | | | | | | | | | | | | | | | | | | | | | | | | | | | | | | | | | | | | | | | | | | | | | | | | | | | | | | | | | |
| 11/01/14 | | | 10/31/15 | | | | 18.27 | | | | 0.36 | | | | (0.64 | ) | | | (0.28 | ) | | | (0.32 | ) | | | (0.13 | ) | | | (0.02 | ) | | | (0.47 | ) | | | 17.52 | | | | 1.02 | | | | 1.02 | | | | 1.99 | | | | 25 | | | | (1.55 | ) | | | 180 | |
| 11/01/13 | | | 10/31/14 | | | | 16.68 | | | | 0.30 | | | | 1.91 | | | | 2.21 | | | | (0.28 | ) | | | (0.34 | ) | | | — | | | | (0.62 | ) | | | 18.27 | | | | 1.02 | | | | 1.02 | | | | 1.71 | | | | 10 | | | | 13.52 | | | | 223 | |
| 11/01/12 | | | 10/31/13 | | | | 13.87 | | | | 0.33 | | | | 3.06 | | | | 3.39 | | | | (0.33 | ) | | | (0.25 | ) | | | — | | | | (0.58 | ) | | | 16.68 | | | | 1.09 | | | | 1.09 | | | | 2.17 | | | | 28 | | | | 25.14 | | | | 214 | |
| 11/01/11 | | | 10/31/12 | | | | 13.14 | | | | 0.30 | | | | 1.36 | | | | 1.66 | | | | (0.27 | ) | | | (0.66 | ) | | | — | | | | (0.93 | ) | | | 13.87 | | | | 1.12 | | | | 1.12 | | | | 2.25 | | | | 20 | | | | 13.48 | | | | 175 | |
| 11/01/10 | | | 10/31/11 | | | | 12.83 | | | | 0.27 | | | | 0.30 | | | | 0.57 | | | | (0.26 | ) | | | — | | | | — | | | | (0.26 | ) | | | 13.14 | | | | 1.21 | | | | 1.21 | | | | 2.02 | | | | 123 | (d) | | | 4.46 | | | | 134 | |
| Class C* | | | | | | | | | | | | | | | | | | | | | | | | | | | | | | | | | | | | | | | | | | | | | | | | | | | | | | | | | | | | | | | | |
| 11/01/14 | | | 10/31/15 | | | | 17.60 | | | | 0.21 | | | | (0.60 | ) | | | (0.39 | ) | | | (0.20 | ) | | | (0.13 | ) | | | (0.02 | ) | | | (0.35 | ) | | | 16.86 | | | | 1.79 | | | | 1.79 | | | | 1.21 | | | | 25 | | | | (2.30 | ) | | | 197 | |
| 11/01/13 | | | 10/31/14 | | | | 16.10 | | | | 0.16 | | | | 1.83 | | | | 1.99 | | | | (0.15 | ) | | | (0.34 | ) | | | — | | | | (0.49 | ) | | | 17.60 | | | | 1.79 | | | | 1.79 | | | | 0.92 | | | | 10 | | | | 12.63 | | | | 212 | |
| 11/01/12 | | | 10/31/13 | | | | 13.41 | | | | 0.21 | | | | 2.95 | | | | 3.16 | | | | (0.22 | ) | | | (0.25 | ) | | | — | | | | (0.47 | ) | | | 16.10 | | | | 1.84 | | | | 1.84 | | | | 1.39 | | | | 28 | | | | 24.23 | | | | 170 | |
| 11/01/11 | | | 10/31/12 | | | | 12.74 | | | | 0.20 | | | | 1.32 | | | | 1.52 | | | | (0.19 | ) | | | (0.66 | ) | | | — | | | | (0.85 | ) | | | 13.41 | | | | 1.86 | | | | 1.86 | | | | 1.50 | | | | 20 | | | | 12.67 | | | | 121 | |
| 11/01/10 | | | 10/31/11 | | | | 12.46 | | | | 0.17 | | | | 0.29 | | | | 0.46 | | | | (0.18 | ) | | | — | | | | — | | | | (0.18 | ) | | | 12.74 | | | | 1.93 | | | | 1.93 | | | | 1.30 | | | | 123 | (d) | | | 3.68 | | | | 80 | |
| Class I* | | | | | | | | | | | | | | | | | | | | | | | | | | | | | | | | | | | | | | | | | | | | | | | | | | | | | | | | | | | | | | | | |
| 11/01/14 | | | 10/31/15 | | | | 18.24 | | | | 0.40 | | | | (0.64 | ) | | | (0.24 | ) | | | (0.37 | ) | | | (0.13 | ) | | | (0.02 | ) | | | (0.52 | ) | | | 17.48 | | | | 0.76 | | | | 0.76 | | | | 2.23 | | | | 25 | | | | (1.33 | ) | | | 200 | |
| 11/01/13 | | | 10/31/14 | | | | 16.65 | | | | 0.33 | | | | 1.93 | | | | 2.26 | | | | (0.33 | ) | | | (0.34 | ) | | | — | | | | (0.67 | ) | | | 18.24 | | | | 0.77 | | | | 0.77 | | | | 1.89 | | | | 10 | | | | 13.86 | | | | 207 | |
| 11/01/12 | | | 10/31/13 | | | | 13.85 | | | | 0.37 | | | | 3.06 | | | | 3.43 | | | | (0.38 | ) | | | (0.25 | ) | | | — | | | | (0.63 | ) | | | 16.65 | | | | 0.80 | | | | 0.80 | | | | 2.37 | | | | 28 | | | | 25.49 | | | | 94 | |
| 11/01/11 | | | 10/31/12 | | | | 13.13 | | | | 0.34 | | | | 1.36 | | | | 1.70 | | | | (0.32 | ) | | | (0.66 | ) | | | — | | | | (0.98 | ) | | | 13.85 | | | | 0.83 | | | | 0.83 | | | | 2.49 | | | | 20 | | | | 13.79 | | | | 44 | |
| 11/01/10 | | | 10/31/11 | | | | 12.82 | | | | 0.32 | | | | 0.29 | | | | 0.61 | | | | (0.30 | ) | | | — | | | | — | | | | (0.30 | ) | | | 13.13 | | | | 0.88 | | | | 0.87 | | | | 2.39 | | | | 123 | (d) | | | 4.77 | | | | 14 | |
| Class R-3* | | | | | | | | | | | | | | | | | | | | | | | | | | | | | | | | | | | | | | | | | | | | | | | | | | | | | | | | | | | | | | | | |
| 11/01/14 | | | 10/31/15 | | | | 18.19 | | | | 0.28 | | | | (0.63 | ) | | | (0.35 | ) | | | (0.25 | ) | | | (0.13 | ) | | | (0.02 | ) | | | (0.40 | ) | | | 17.44 | | | | 1.44 | | | | 1.44 | | | | 1.57 | | | | 25 | | | | (1.99 | ) | | | 3 | |
| 11/01/13 | | | 10/31/14 | | | | 16.61 | | | | 0.23 | | | | 1.90 | | | | 2.13 | | | | (0.21 | ) | | | (0.34 | ) | | | — | | | | (0.55 | ) | | | 18.19 | | | | 1.40 | | | | 1.40 | | | | 1.33 | | | | 10 | | | | 13.08 | | | | 4 | |
| 11/01/12 | | | 10/31/13 | | | | 13.82 | | | | 0.28 | | | | 3.04 | | | | 3.32 | | | | (0.28 | ) | | | (0.25 | ) | | | — | | | | (0.53 | ) | | | 16.61 | | | | 1.43 | | | | 1.43 | | | | 1.81 | | | | 28 | | | | 24.71 | | | | 4 | |
| 11/01/11 | | | 10/31/12 | | | | 13.10 | | | | 0.26 | | | | 1.36 | | | | 1.62 | | | | (0.24 | ) | | | (0.66 | ) | | | — | | | | (0.90 | ) | | | 13.82 | | | | 1.41 | | | | 1.41 | | | | 1.95 | | | | 20 | | | | 13.13 | | | | 3 | |
| 11/01/10 | | | 10/31/11 | | | | 12.81 | | | | 0.23 | | | | 0.30 | | | | 0.53 | | | | (0.24 | ) | | | — | | | | — | | | | (0.24 | ) | | | 13.10 | | | | 1.51 | | | | 1.51 | | | | 1.71 | | | | 123 | (d) | | | 4.14 | | | | 1 | |
| | |
| 32 | | The accompanying notes are an integral part of the financial statements. |
Financial Highlights
| | | | | | | | | | | | | | | | | | | | | | | | | | | | | | | | | | | | | | | | | | | | | | | | | | | | | | | | | | | | | | | | |
Fiscal periods | | | | | | From investment operations | | | Dividends & distributions | | | | | | Ratios to average net asset (%) | | | | | | | | | | |
| | Beginning
net asset
value | | | Income
(loss) | | | Realized &
unrealized
gain (loss) | | | Total | | | From
investment
income | | | From
realized
gains | | | From
return of
capital | | | Total | | | Ending
net asset
value | | | With
expenses
waived/
recovered (†) | | | Without
expenses
waived/
recovered (†) | | | Net
income
(loss) | | | Portfolio turnover rate (%) (a) | | | Total
return (%) (a)(b) | | | Ending
net
assets
(millions) | |
| Beginning | | Ending | | | | | | | | | | | | | | | | |
Eagle Growth & Income
Fund (cont’d) | | | | | | | | | | | | | | | | | | | | | | | | | | | | | | | | | | | | | | | | | | | | | | | | | | | | | | | | | |
| Class R-5* | | | | | | | | | | | | | | | | | | | | | | | | | | | | | | | | | | | | | | | | | | | | | | | | | | | | | | | | | | | | | |
| 11/01/14 | | | 10/31/15 | | | | $18.21 | | | | $0.44 | | | | $(0.76 | ) | | | $(0.32 | ) | | | $(0.24 | ) | | | $(0.13 | ) | | | $(0.02 | ) | | | $(0.39 | ) | | | $17.50 | | | | 0.78 | | | | 0.79 | | | | 2.39 | | | | 25 | | | | (1.82 | ) | | | $0 | |
| 11/01/13 | | | 10/31/14 | | | | 16.63 | | | | 0.34 | | | | 1.90 | | | | 2.24 | | | | (0.32 | ) | | | (0.34 | ) | | | — | | | | (0.66 | ) | | | 18.21 | | | | 0.76 | | | | 0.76 | | | | 1.95 | | | | 10 | | | | 13.80 | | | | 4 | |
| 11/01/12 | | | 10/31/13 | | | | 13.84 | | | | 0.33 | | | | 3.10 | | | | 3.43 | | | | (0.39 | ) | | | (0.25 | ) | | | — | | | | (0.64 | ) | | | 16.63 | | | | 0.72 | | | | 0.72 | | | | 2.07 | | | | 28 | | | | 25.54 | | | | 3 | |
| 11/01/11 | | | 10/31/12 | | | | 13.13 | | | | 0.32 | | | | 1.37 | | | | 1.69 | | | | (0.32 | ) | | | (0.66 | ) | | | — | | | | (0.98 | ) | | | 13.84 | | | | 0.86 | | | | 0.84 | | | | 2.37 | | | | 20 | | | | 13.69 | | | | 0 | |
| 11/01/10 | | | 10/31/11 | | | | 12.83 | | | | 0.29 | | | | 0.32 | | | | 0.61 | | | | (0.31 | ) | | | — | | | | — | | | | (0.31 | ) | | | 13.13 | | | | 0.95 | | | | 0.85 | | | | 2.17 | | | | 123 | (d) | | | 4.77 | | | | 0 | |
| Class R-6* | | | | | | | | | | | | | | | | | | | | | | | | | | | | | | | | | | | | | | | | | | | | | | | | | | | | | | | | | | | | | |
| 11/01/14 | | | 10/31/15 | | | | 18.26 | | | | 0.45 | | | | (0.71 | ) | | | (0.26 | ) | | | (0.39 | ) | | | (0.13 | ) | | | (0.02) | | | | (0.54 | ) | | | 17.46 | | | | 0.65 | | | | 0.65 | | | | 2.47 | | | | 25 | | | | (1.46 | ) | | | 0 | |
| 11/01/13 | | | 10/31/14 | | | | 16.67 | | | | 0.35 | | | | 1.92 | | | | 2.27 | | | | (0.34 | ) | | | (0.34 | ) | | | — | | | | (0.68 | ) | | | 18.26 | | | | 0.66 | | | | 0.66 | | | | 2.01 | | | | 10 | | | | 13.94 | | | | 0 | |
| 11/01/12 | | | 10/31/13 | | | | 13.86 | | | | 0.34 | | | | 3.10 | | | | 3.44 | | | | (0.38 | ) | | | (0.25 | ) | | | — | | | | (0.63 | ) | | | 16.67 | | | | 0.71 | | | | 0.71 | | | | 2.09 | | | | 28 | | | | 25.59 | | | | 0 | |
| 11/01/11 | | | 10/31/12 | | | | 13.13 | | | | 0.34 | | | | 1.35 | | | | 1.69 | | | | (0.30 | ) | | | (0.66 | ) | | | — | | | | (0.96 | ) | | | 13.86 | | | | 0.85 | | | | 0.86 | | | | 2.54 | | | | 20 | | | | 13.73 | | | | 0 | |
| 08/15/11 | | | 10/31/11 | | | | 12.70 | | | | 0.06 | | | | 0.44 | | | | 0.50 | | | | (0.07 | ) | | | — | | | | — | | | | (0.07 | ) | | | 13.13 | | | | 0.85 | (e) | | | 0.96 | (e) | | | 2.17 | (e) | | | 123 | (d) | | | 4.00 | | | | 0 | |
Eagle International
Stock Fund | | | | | | | | | | | | | | | | | | | | | | | | | | | | | | | | | | | | | | | | | | | | | | | | | | | | | | | | | |
| Class A* | | | | | | | | | | | | | | | | | | | | | | | | | | | | | | | | | | | | | | | | | | | | | | | | | | | | | | | | | | | | | | | | |
| 11/01/14 | | | 10/31/15 | | | | 16.54 | | | | 0.14 | | | | 0.40 | | | | 0.54 | | | | (0.39 | ) | | | (0.67 | ) | | | — | | | | (1.06 | ) | | | 16.02 | | | | 1.58 | | | | 4.04 | | | | 0.88 | | | | 86 | | | | 3.63 | | | | 10 | |
| 11/01/13 | | | 10/31/14 | | | | 16.48 | | | | 0.42 | | | | (0.13 | ) | | | 0.29 | | | | (0.14 | ) | | | (0.09 | ) | | | — | | | | (0.23 | ) | | | 16.54 | | | | 1.57 | | | | 5.96 | | | | 2.49 | | | | 96 | | | | 1.73 | | | | 4 | |
| 02/28/13 | | | 10/31/13 | | | | 14.29 | | | | 0.15 | | | | 2.04 | | | | 2.19 | | | | — | | | | — | | | | — | | | | — | | | | 16.48 | | | | 1.55 | (e) | | | 11.48 | (e) | | | 1.50 | (e) | | | 42 | | | | 15.33 | | | | 4 | |
| Class C* | | | | | | | | | | | | | | | | | | | | | | | | | | | | | | | | | | | | | | | | | | | | | | | | | | | | | | | | | |
| 11/01/14 | | | 10/31/15 | | | | 16.38 | | | | 0.03 | | | | 0.38 | | | | 0.41 | | | | (0.29 | ) | | | (0.67 | ) | | | — | | | | (0.96 | ) | | | 15.83 | | | | 2.35 | | | | 4.95 | | | | 0.18 | | | | 86 | | | | 2.80 | | | | 5 | |
| 11/01/13 | | | 10/31/14 | | | | 16.38 | | | | 0.30 | | | | (0.14 | ) | | | 0.16 | | | | (0.07 | ) | | | (0.09 | ) | | | — | | | | (0.16 | ) | | | 16.38 | | | | 2.35 | | | | 6.68 | | | | 1.78 | | | | 96 | | | | 0.94 | | | | 4 | |
| 02/28/13 | | | 10/31/13 | | | | 14.29 | | | | 0.11 | | | | 1.98 | | | | 2.09 | | | | — | | | | — | | | | — | | | | — | | | | 16.38 | | | | 2.39 | (e) | | | 12.03 | (e) | | | 1.07 | (e) | | | 42 | | | | 14.63 | | | | 3 | |
| Class I* | | | | | | | | | | | | | | | | | | | | | | | | | | | | | | | | | | | | | | | | | | | | | | | | | | | | | | | | | |
| 11/01/14 | | | 10/31/15 | | | | 16.62 | | | | 0.21 | | | | 0.39 | | | | 0.60 | | | | (0.47 | ) | | | (0.67 | ) | | | — | | | | (1.14 | ) | | | 16.08 | | | | 1.15 | | | | 3.82 | | | | 1.31 | | | | 86 | | | | 4.04 | | | | 2 | |
| 11/01/13 | | | 10/31/14 | | | | 16.52 | | | | 0.53 | | | | (0.17 | ) | | | 0.36 | | | | (0.17 | ) | | | (0.09 | ) | | | — | | | | (0.26 | ) | | | 16.62 | | | | 1.15 | | | | 5.43 | | | | 3.16 | | | | 96 | | | | 2.18 | | | | 1 | |
| 02/28/13 | | | 10/31/13 | | | | 14.29 | | | | 0.13 | | | | 2.10 | | | | 2.23 | | | | — | | | | — | | | | — | | | | — | | | | 16.52 | | | | 1.15 | (e) | | | 4.25 | (e) | | | 1.21 | (e) | | | 42 | | | | 15.61 | | | | 0 | |
| Class R-3* | | | | | | | | | | | | | | | | | | | | | | | | | | | | | | | | | | | | | | | | | | | | | | | | | | | | | | | | | |
| 11/01/14 | | | 10/31/15 | | | | 16.53 | | | | 0.13 | | | | 0.37 | | | | 0.50 | | | | (0.37 | ) | | | (0.67 | ) | | | — | | | | (1.04 | ) | | | 15.99 | | | | 1.74 | | | | 4.38 | | | | 0.79 | | | | 86 | | | | 3.37 | | | | 0 | |
| 11/01/13 | | | 10/31/14 | | | | 16.45 | | | | 0.40 | | | | (0.13 | ) | | | 0.27 | | | | (0.10 | ) | | | (0.09 | ) | | | — | | | | (0.19 | ) | | | 16.53 | | | | 1.73 | | | | 6.22 | | | | 2.37 | | | | 96 | | | | 1.64 | | | | 0 | |
| 02/28/13 | | | 10/31/13 | | | | 14.29 | | | | 0.19 | | | | 1.97 | | | | 2.16 | | | | — | | | | — | | | | — | | | | — | | | | 16.45 | | | | 1.75 | (e) | | | 13.83 | (e) | | | 1.84 | (e) | | | 42 | | | | 15.12 | | | | 0 | |
| Class R-5* | | | | | | | | | | | | | | | | | | | | | | | | | | | | | | | | | | | | | | | | | | | | | | | | | | | | | | | | | |
| 11/01/14 | | | 10/31/15 | | | | 16.63 | | | | 0.25 | | | | 0.35 | | | | 0.60 | | | | (0.47 | ) | | | (0.67 | ) | | | — | | | | (1.14 | ) | | | 16.09 | | | | 1.15 | | | | 3.59 | | | | 1.58 | | | | 86 | | | | 4.01 | | | | 0 | |
| 11/01/13 | | | 10/31/14 | | | | 16.52 | | | | 0.50 | | | | (0.14 | ) | | | 0.36 | | | | (0.16 | ) | | | (0.09 | ) | | | — | | | | (0.25 | ) | | | 16.63 | | | | 1.15 | | | | 5.67 | | | | 2.96 | | | | 96 | | | | 2.18 | | | | 0 | |
| 02/28/13 | | | 10/31/13 | | | | 14.29 | | | | 0.25 | | | | 1.98 | | | | 2.23 | | | | — | | | | — | | | | — | | | | — | | | | 16.52 | | | | 1.15 | (e) | | | 13.27 | (e) | | | 2.44 | (e) | | | 42 | | | | 15.61 | | | | 0 | |
| Class R-6* | | | | | | | | | | | | | | | | | | | | | | | | | | | | | | | | | | | | | | | | | | | | | | | | | | | | | | | | | | | | | |
| 11/01/14 | | | 10/31/15 | | | | 16.65 | | | | 0.24 | | | | 0.37 | | | | 0.61 | | | | (0.48 | ) | | | (0.67 | ) | | | — | | | | (1.15 | ) | | | 16.11 | | | | 1.05 | | | | 3.80 | | | | 1.48 | | | | 86 | | | | 4.11 | | | | 0 | |
| 11/01/13 | | | 10/31/14 | | | | 16.53 | | | | 0.51 | | | | (0.13 | ) | | | 0.38 | | | | (0.17 | ) | | | (0.09 | ) | | | — | | | | (0.26 | ) | | | 16.65 | | | | 1.05 | | | | 5.67 | | | | 3.05 | | | | 96 | | | | 2.31 | | | | 0 | |
| 02/28/13 | | | 10/31/13 | | | | 14.29 | | | | 0.26 | | | | 1.98 | | | | 2.24 | | | | — | | | | — | | | | — | | | | — | | | | 16.53 | | | | 1.05 | (e) | | | 13.27 | (e) | | | 2.54 | (e) | | | 42 | | | | 15.68 | | | | 0 | |
Eagle Investment
Grade Bond Fund | | | | | | | | | | | | | | | | | | | | | | | | | | | | | | | | | | | | | | | | | | | | | | | | | | | | | | | | | |
| Class A* | | | | | | | | | | | | | | | | | | | | | | | | | | | | | | | | | | | | | | | | | | | | | | | | | | | | | | | | | | | | | | | | |
| 11/01/14 | | | 10/31/15 | | | | 14.89 | | | | 0.17 | | | | 0.04 | | | | 0.21 | | | | (0.17 | ) | | | (0.06 | ) | | | — | | | | (0.23 | ) | | | 14.87 | | | | 0.85 | | | | 1.36 | | | | 1.14 | | | | 82 | | | | 1.46 | | | | 20 | |
| 11/01/13 | | | 10/31/14 | | | | 14.89 | | | | 0.17 | | | | 0.04 | | | | 0.21 | | | | (0.17 | ) | | | (0.04 | ) | | | — | | | | (0.21 | ) | | | 14.89 | | | | 0.85 | | | | 1.21 | | | | 1.15 | | | | 139 | | | | 1.42 | | | | 23 | |
| 11/01/12 | | | 10/31/13 | | | | 15.51 | | | | 0.12 | | | | (0.27 | ) | | | (0.15 | ) | | | (0.11 | ) | | | (0.36 | ) | | | — | | | | (0.47 | ) | | | 14.89 | | | | 0.85 | | | | 1.01 | | | | 0.80 | | | | 136 | | | | (1.00 | ) | | | 37 | |
| 11/01/11 | | | 10/31/12 | | | | 15.25 | | | | 0.18 | | | | 0.39 | | | | 0.57 | | | | (0.18 | ) | | | (0.13 | ) | | | — | | | | (0.31 | ) | | | 15.51 | | | | 0.85 | | | | 0.96 | | | | 1.15 | | | | 94 | | | | 3.77 | | | | 65 | |
| 11/01/10 | | | 10/31/11 | | | | 15.15 | | | | 0.20 | | | | 0.21 | | | | 0.41 | | | | (0.23 | ) | | | (0.08 | ) | | | — | | | | (0.31 | ) | | | 15.25 | | | | 0.85 | | | | 1.04 | | | | 1.34 | | | | 78 | | | | 2.75 | | | | 58 | |
| Class C* | | | | | | | | | | | | | | | | | | | | | | | | | | | | | | | | | | | | | | | | | | | | | | | | | | | | | | | | | | | | | | | | |
| 11/01/14 | | | 10/31/15 | | | | 14.86 | | | | 0.05 | | | | 0.04 | | | | 0.09 | | | | (0.05 | ) | | | (0.06 | ) | | | — | | | | (0.11 | ) | | | 14.84 | | | | 1.65 | | | | 2.12 | | | | 0.34 | | | | 82 | | | | 0.64 | | | | 21 | |
| 11/01/13 | | | 10/31/14 | | | | 14.86 | | | | 0.05 | | | | 0.04 | | | | 0.09 | | | | (0.05 | ) | | | (0.04 | ) | | | — | | | | (0.09 | ) | | | 14.86 | | | | 1.65 | | | | 1.96 | | | | 0.35 | | | | 139 | | | | 0.60 | | | | 26 | |
| 11/01/12 | | | 10/31/13 | | | | 15.49 | | | | — | (f) | | | (0.26 | ) | | | (0.26 | ) | | | (0.01 | ) | | | (0.36 | ) | | | — | | | | (0.37 | ) | | | 14.86 | | | | 1.65 | | | | 1.77 | | | | 0.01 | | | | 136 | | | | (1.75 | ) | | | 41 | |
| 11/01/11 | | | 10/31/12 | | | | 15.23 | | | | 0.05 | | | | 0.40 | | | | 0.45 | | | | (0.06 | ) | | | (0.13 | ) | | | — | | | | (0.19 | ) | | | 15.49 | | | | 1.65 | | | | 1.72 | | | | 0.34 | | | | 94 | | | | 2.96 | | | | 63 | |
| 11/01/10 | | | 10/31/11 | | | | 15.13 | | | | 0.08 | | | | 0.21 | | | | 0.29 | | | | (0.11 | ) | | | (0.08 | ) | | | — | | | | (0.19 | ) | | | 15.23 | | | | 1.65 | | | | 1.79 | | | | 0.55 | | | | 78 | | | | 1.95 | | | | 53 | |
| Class I* | | | | | | | | | | | | | | | | | | | | | | | | | | | | | | | | | | | | | | | | | | | | | | | | | | | | | | | | | | | | | | | | |
| 11/01/14 | | | 10/31/15 | | | | 14.92 | | | | 0.21 | | | | 0.04 | | | | 0.25 | | | | (0.21 | ) | | | (0.06 | ) | | | — | | | | (0.27 | ) | | | 14.90 | | | | 0.60 | | | | 1.09 | | | | 1.39 | | | | 82 | | | | 1.71 | | | | 9 | |
| 11/01/13 | | | 10/31/14 | | | | 14.92 | | | | 0.21 | | | | 0.04 | | | | 0.25 | | | | (0.21 | ) | | | (0.04 | ) | | | — | | | | (0.25 | ) | | | 14.92 | | | | 0.60 | | | | 0.91 | | | | 1.40 | | | | 139 | | | | 1.67 | | | | 9 | |
| 11/01/12 | | | 10/31/13 | | | | 15.54 | | | | 0.16 | | | | (0.27 | ) | | | (0.11 | ) | | | (0.15 | ) | | | (0.36 | ) | | | — | | | | (0.51 | ) | | | 14.92 | | | | 0.60 | | | | 0.72 | | | | 1.04 | | | | 136 | | | | (0.74 | ) | | | 7 | |
| 11/01/11 | | | 10/31/12 | | | | 15.27 | | | | 0.21 | | | | 0.41 | | | | 0.62 | | | | (0.22 | ) | | | (0.13 | ) | | | — | | | | (0.35 | ) | | | 15.54 | | | | 0.60 | | | | 0.67 | | | | 1.38 | | | | 94 | | | | 4.09 | | | | 6 | |
| 11/01/10 | | | 10/31/11 | | | | 15.17 | | | | 0.24 | | | | 0.20 | | | | 0.44 | | | | (0.26 | ) | | | (0.08 | ) | | | — | | | | (0.34 | ) | | | 15.27 | | | | 0.60 | | | | 0.74 | | | | 1.58 | | | | 78 | | | | 2.97 | | | | 3 | |
| | | | |
| The accompanying notes are an integral part of the financial statements. | | | 33 | |
Financial Highlights
| | | | | | | | | | | | | | | | | | | | | | | | | | | | | | | | | | | | | | | | | | | | | | | | | | | | | | | | | | | | | | | | |
Fiscal periods | | | | | | From investment operations | | | Dividends & distributions | | | | | | Ratios to average net asset (%) | | | | | | | | | | |
| | Beginning
net asset
value | | | Income
(loss) | | | Realized &
unrealized
gain (loss) | | | Total | | | From
investment
income | | | From
realized
gains | | | From
return of
capital | | | Total | | | Ending
net asset
value | | | With
expenses
waived/
recovered (†) | | | Without
expenses
waived/
recovered (†) | | | Net
income
(loss) | | | Portfolio
turnover
rate (%) (a) | | | Total
return
(%) (a)(b) | | | Ending
net
assets
(millions) | |
| Beginning | | Ending | | | | | | | | | | | | | | | | |
Eagle Investment Grade Bond
Fund (cont’d) | | | | | | | | | | | | | | | | | | | | | | | | | | | | | | | | | | | | | | | | | | | | | | | | | | | | | | | | | |
| Class R-3* | | | | | | | | | | | | | | | | | | | | | | | | | | | | | | | | | | | | | | | | | | | | | | | | | | | | | | | | | | | | | | | | |
| 11/01/14 | | | 10/31/15 | | | | $14.89 | | | | $0.13 | | | | $0.04 | | | | $0.17 | | | | $(0.13 | ) | | | $(0.06 | ) | | | $— | | | | $(0.19 | ) | | | $14.87 | | | | 1.15 | | | | 1.69 | | | | 0.84 | | | | 82 | | | | 1.15 | | | | $0 | |
| 11/01/13 | | | 10/31/14 | | | | 14.89 | | | | 0.13 | | | | 0.04 | | | | 0.17 | | | | (0.13 | ) | | | (0.04 | ) | | | — | | | | (0.17 | ) | | | 14.89 | | | | 1.15 | | | | 1.55 | | | | 0.85 | | | | 139 | | | | 1.12 | | | | 0 | |
| 11/01/12 | | | 10/31/13 | | | | 15.51 | | | | 0.08 | | | | (0.27 | ) | | | (0.19 | ) | | | (0.07 | ) | | | (0.36 | ) | | | — | | | | (0.43 | ) | | | 14.89 | | | | 1.15 | | | | 1.34 | | | | 0.50 | | | | 136 | | | | (1.28 | ) | | | 0 | |
| 11/01/11 | | | 10/31/12 | | | | 15.24 | | | | 0.13 | | | | 0.40 | | | | 0.53 | | | | (0.13 | ) | | | (0.13 | ) | | | — | | | | (0.26 | ) | | | 15.51 | | | | 1.15 | | | | 1.35 | | | | 0.88 | | | | 94 | | | | 3.49 | | | | 0 | |
| 11/01/10 | | | 10/31/11 | | | | 15.15 | | | | 0.16 | | | | 0.19 | | | | 0.35 | | | | (0.18 | ) | | | (0.08 | ) | | | — | | | | (0.26 | ) | | | 15.24 | | | | 1.15 | | | | 1.39 | | | | 1.04 | | | | 78 | | | | 2.38 | | | | 0 | |
| Class R-5* | | | | | | | | | | | | | | | | | | | | | | | | | | | | | | | | | | | | | | | | | | | | | | | | | | | | | | | | | | | | | | | | |
| 11/01/14 | | | 10/31/15 | | | | 14.90 | | | | 0.18 | | | | 0.06 | | | | 0.24 | | | | (0.20 | ) | | | (0.06 | ) | | | — | | | | (0.26 | ) | | | 14.88 | | | | 0.60 | | | | 1.01 | | | | 1.23 | | | | 82 | | | | 1.66 | | | | 0 | |
| 11/01/13 | | | 10/31/14 | | | | 14.89 | | | | 0.20 | | | | 0.05 | | | | 0.25 | | | | (0.20 | ) | | | (0.04 | ) | | | — | | | | (0.24 | ) | | | 14.90 | | | | 0.60 | | | | 0.81 | | | | 1.34 | | | | 139 | | | | 1.70 | | | | 0 | |
| 11/01/12 | | | 10/31/13 | | | | 15.51 | | | | 0.16 | | | | (0.27 | ) | | | (0.11 | ) | | | (0.15 | ) | | | (0.36 | ) | | | — | | | | (0.51 | ) | | | 14.89 | | | | 0.60 | | | | 0.64 | | | | 1.04 | | | | 136 | | | | (0.77 | ) | | | 0 | |
| 11/01/11 | | | 10/31/12 | | | | 15.22 | | | | 0.22 | | | | 0.41 | | | | 0.63 | | | | (0.21 | ) | | | (0.13 | ) | | | — | | | | (0.34 | ) | | | 15.51 | | | | 0.60 | | | | 0.60 | | | | 1.41 | | | | 94 | | | | 4.20 | | | | 0 | |
| 11/01/10 | | | 10/31/11 | | | | 15.13 | | | | 0.24 | | | | 0.19 | | | | 0.43 | | | | (0.26 | ) | | | (0.08 | ) | | | — | | | | (0.34 | ) | | | 15.22 | | | | 0.60 | | | | 6.01 | | | | 1.59 | | | | 78 | | | | 2.91 | | | | 0 | |
| Class R-6* | | | | | | | | | | | | | | | | | | | | | | | | | | | | | | | | | | | | | | | | | | | | | | | | | | | | | | | | | | | | | | | | |
| 07/31/15 | | | 10/31/15 | | | | 14.87 | | | | 0.05 | | | | 0.06 | | | | 0.11 | | | | (0.04 | ) | | | — | | | | — | | | | (0.04 | ) | | | 14.94 | | | | 0.50 | (e) | | | 0.99 | (e) | | | 1.33 | (e) | | | 82 | | | | 0.71 | | | | 0 | |
| | | | | | | | | | | | | | |
| Eagle Mid Cap Growth Fund | | | | | | | | | | | | | | | | | | | | | | | | | | | | | | | | | | | | | | | | | | | | | | | | | | | | | | | | | |
| Class A* | | | | | | | | | | | | | | | | | | | | | | | | | | | | | | | | | | | | | | | | | | | | | | | | | | | | | | | | | | | | | | | | |
| 11/01/14 | | | 10/31/15 | | | | 45.68 | | | | (0.26 | ) | | | 2.26 | | | | 2.00 | | | | — | | | | (4.29 | ) | | | — | | | | (4.29 | ) | | | 43.39 | | | | 1.14 | | | | 1.14 | | | | (0.59 | ) | | | 52 | | | | 4.70 | | | | 354 | |
| 11/01/13 | | | 10/31/14 | | | | 41.03 | | | | (0.17 | ) | | | 6.74 | | | | 6.57 | | | | — | | | | (1.92 | ) | | | — | | | | (1.92 | ) | | | 45.68 | | | | 1.19 | | | | 1.19 | | | | (0.40 | ) | | | 60 | | | | 16.58 | | | | 283 | |
| 11/01/12 | | | 10/31/13 | | | | 31.52 | | | | (0.03 | ) | | | 10.68 | | | | 10.65 | | | | — | | | | (1.14 | ) | | | — | | | | (1.14 | ) | | | 41.03 | | | | 1.20 | | | | 1.20 | | | | (0.08 | ) | | | 52 | | | | 34.81 | | | | 304 | |
| 11/01/11 | | | 10/31/12 | | | | 29.96 | | | | (0.18 | ) | | | 1.74 | | | | 1.56 | | | | — | | | | — | | | | — | | | | — | | | | 31.52 | | | | 1.22 | | | | 1.22 | | | | (0.57 | ) | | | 87 | | | | 5.21 | | | | 233 | |
| 11/01/10 | | | 10/31/11 | | | | 28.03 | | | | (0.19 | ) | | | 2.12 | | | | 1.93 | | | | — | | | | — | | | | — | | | | — | | | | 29.96 | | | | 1.23 | | | | 1.23 | | | | (0.60 | ) | | | 91 | | | | 6.89 | | | | 231 | |
| Class C* | | | | | | | | | | | | | | | | | | | | | | | | | | | | | | | | | | | | | | | | | | | | | | | | | | | | | | | | | | | | | | | | |
| 11/01/14 | | | 10/31/15 | | | | 38.65 | | | | (0.48 | ) | | | 1.88 | | | | 1.40 | | | | — | | | | (4.29 | ) | | | — | | | | (4.29 | ) | | | 35.76 | | | | 1.87 | | | | 1.88 | | | | (1.32 | ) | | | 52 | | | | 3.92 | | | | 117 | |
| 11/01/13 | | | 10/31/14 | | | | 35.24 | | | | (0.41 | ) | | | 5.74 | | | | 5.33 | | | | — | | | | (1.92 | ) | | | — | | | | (1.92 | ) | | | 38.65 | | | | 1.89 | | | | 1.89 | | | | (1.12 | ) | | | 60 | | | | 15.75 | | | | 105 | |
| 11/01/12 | | | 10/31/13 | | | | 27.41 | | | | (0.25 | ) | | | 9.22 | | | | 8.97 | | | | — | | | | (1.14 | ) | | | — | | | | (1.14 | ) | | | 35.24 | | | | 1.92 | | | | 1.92 | | | | (0.80 | ) | | | 52 | | | | 33.87 | | | | 106 | |
| 11/01/11 | | | 10/31/12 | | | | 26.24 | | | | (0.34 | ) | | | 1.51 | | | | 1.17 | | | | — | | | | — | | | | — | | | | — | | | | 27.41 | | | | 1.92 | | | | 1.92 | | | | (1.27 | ) | | | 87 | | | | 4.46 | | | | 82 | |
| 11/01/10 | | | 10/31/11 | | | | 24.71 | | | | (0.35 | ) | | | 1.88 | | | | 1.53 | | | | — | | | | — | | | | — | | | | — | | | | 26.24 | | | | 1.94 | | | | 1.94 | | | | (1.30 | ) | | | 91 | | | | 6.19 | | | | 72 | |
| Class I* | | | | | | | | | | | | | | | | | | | | | | | | | | | | | | | | | | | | | | | | | | | | | | | | | | | | | | | | | | | | | | | | |
| 11/01/14 | | | 10/31/15 | | | | 47.33 | | | | (0.13 | ) | | | 2.35 | | | | 2.22 | | | | — | | | | (4.29 | ) | | | — | | | | (4.29 | ) | | | 45.26 | | | | 0.82 | | | | 0.83 | | | | (0.28 | ) | | | 52 | | | | 5.02 | | | | 358 | |
| 11/01/13 | | | 10/31/14 | | | | 42.31 | | | | (0.05 | ) | | | 6.99 | | | | 6.94 | | | | — | | | | (1.92 | ) | | | — | | | | (1.92 | ) | | | 47.33 | | | | 0.85 | | | | 0.85 | | | | (0.12 | ) | | | 60 | | | | 16.97 | | | | 210 | |
| 11/01/12 | | | 10/31/13 | | | | 32.36 | | | | 0.08 | | | | 11.01 | | | | 11.09 | | | | — | | | | (1.14 | ) | | | — | | | | (1.14 | ) | | | 42.31 | | | | 0.87 | | | | 0.87 | | | | 0.22 | | | | 52 | | | | 35.28 | | | | 126 | |
| 11/01/11 | | | 10/31/12 | | | | 30.66 | | | | (0.07 | ) | | | 1.77 | | | | 1.70 | | | | — | | | | — | | | | — | | | | — | | | | 32.36 | | | | 0.88 | | | | 0.88 | | | | (0.23 | ) | | | 87 | | | | 5.54 | | | | 81 | |
| 11/01/10 | | | 10/31/11 | | | | 28.58 | | | | (0.09 | ) | | | 2.17 | | | | 2.08 | | | | — | | | | — | | | | — | | | | — | | | | 30.66 | | | | 0.89 | | | | 0.88 | | | | (0.29 | ) | | | 91 | | | | 7.28 | | | | 60 | |
| Class R-3* | | | | | | | | | | | | | | | | | | | | | | | | | | | | | | | | | | | | | | | | | | | | | | | | | | | | | | | | | | | | | | | | |
| 11/01/14 | | | 10/31/15 | | | | 44.90 | | | | (0.37 | ) | | | 2.22 | | | | 1.85 | | | | — | | | | (4.29 | ) | | | — | | | | (4.29 | ) | | | 42.46 | | | | 1.41 | | | | 1.42 | | | | (0.86 | ) | | | 52 | | | | 4.42 | | | | 24 | |
| 11/01/13 | | | 10/31/14 | | | | 40.48 | | | | (0.31 | ) | | | 6.65 | | | | 6.34 | | | | — | | | | (1.92 | ) | | | — | | | | (1.92 | ) | | | 44.90 | | | | 1.48 | | | | 1.48 | | | | (0.73 | ) | | | 60 | | | | 16.23 | | | | 16 | |
| 11/01/12 | | | 10/31/13 | | | | 31.19 | | | | (0.14 | ) | | | 10.57 | | | | 10.43 | | | | — | | | | (1.14 | ) | | | — | | | | (1.14 | ) | | | 40.48 | | | | 1.49 | | | | 1.49 | | | | (0.39 | ) | | | 52 | | | | 34.46 | | | | 12 | |
| 11/01/11 | | | 10/31/12 | | | | 29.73 | | | | (0.26 | ) | | | 1.72 | | | | 1.46 | | | | — | | | | — | | | | — | | | | — | | | | 31.19 | | | | 1.49 | | | | 1.49 | | | | (0.84 | ) | | | 87 | | | | 4.91 | | | | 8 | |
| 11/01/10 | | | 10/31/11 | | | | 27.88 | | | | (0.27 | ) | | | 2.12 | | | | 1.85 | | | | — | | | | — | | | | — | | | | — | | | | 29.73 | | | | 1.52 | | | | 1.52 | | | | (0.89 | ) | | | 91 | | | | 6.64 | | | | 4 | |
| Class R-5* | | | | | | | | | | | | | | | | | | | | | | | | | | | | | | | | | | | | | | | | | | | | | | | | | | | | | | | | | | | | | | | | |
| 11/01/14 | | | 10/31/15 | | | | 47.28 | | | | (0.13 | ) | | | 2.29 | | | | 2.16 | | | | — | | | | (4.29 | ) | | | — | | | | (4.29 | ) | | | 45.15 | | | | 0.82 | | | | 0.83 | | | | (0.28 | ) | | | 52 | | | | 4.89 | | | | 133 | |
| 11/01/13 | | | 10/31/14 | | | | 42.27 | | | | (0.06 | ) | | | 6.99 | | | | 6.93 | | | | — | | | | (1.92 | ) | | | — | | | | (1.92 | ) | | | 47.28 | | | | 0.87 | | | | 0.87 | | | | (0.14 | ) | | | 60 | | | | 16.96 | | | | 55 | |
| 11/01/12 | | | 10/31/13 | | | | 32.34 | | | | 0.09 | | | | 10.98 | | | | 11.07 | | | | — | | | | (1.14 | ) | | | — | | | | (1.14 | ) | | | 42.27 | | | | 0.89 | | | | 0.89 | | | | 0.24 | | | | 52 | | | | 35.24 | | | | 39 | |
| 11/01/11 | | | 10/31/12 | | | | 30.64 | | | | (0.08 | ) | | | 1.78 | | | | 1.70 | | | | — | | | | — | | | | — | | | | — | | | | 32.34 | | | | 0.90 | | | | 0.90 | | | | (0.25 | ) | | | 87 | | | | 5.55 | | | | 30 | |
| 11/01/10 | | | 10/31/11 | | | | 28.56 | | | | (0.11 | ) | | | 2.19 | | | | 2.08 | | | | — | | | | — | | | | — | | | | — | | | | 30.64 | | | | 0.91 | | | | 0.91 | | | | (0.35 | ) | | | 91 | | | | 7.28 | | | | 19 | |
| Class R-6* | | | | | | | | | | | | | | | | | | | | | | | | | | | | | | | | | | | | | | | | | | | | | | | | | | | | | | | | | | | | | | | | |
| 11/01/14 | | | 10/31/15 | | | | 47.44 | | | | (0.10 | ) | | | 2.38 | | | | 2.28 | | | | — | | | | (4.29 | ) | | | — | | | | (4.29 | ) | | | 45.43 | | | | 0.73 | | | | 0.74 | | | | (0.21 | ) | | | 52 | | | | 5.15 | | | | 190 | |
| 11/01/13 | | | 10/31/14 | | | | 42.36 | | | | (0.05 | ) | | | 7.05 | | | | 7.00 | | | | — | | | | (1.92 | ) | | | — | | | | (1.92 | ) | | | 47.44 | | | | 0.77 | | | | 0.77 | | | | (0.10 | ) | | | 60 | | | | 17.10 | | | | 30 | |
| 11/01/12 | | | 10/31/13 | | | | 32.37 | | | | 0.02 | | | | 11.11 | | | | 11.13 | | | | — | | | | (1.14 | ) | | | — | | | | (1.14 | ) | | | 42.36 | | | | 0.78 | | | | 0.78 | | | | 0.05 | | | | 52 | | | | 35.40 | | | | 7 | |
| 11/01/11 | | �� | 10/31/12 | | | | 30.76 | | | | (0.05 | ) | | | 1.66 | | | | 1.61 | | | | — | | | | — | | | | — | | | | — | | | | 32.37 | | | | 0.80 | | | | 0.80 | | | | (0.16 | ) | | | 87 | | | | 5.23 | | | | 1 | |
| 08/15/11 | | | 10/31/11 | | | | 29.65 | | | | (0.02 | ) | | | 1.13 | | | | 1.11 | | | | — | | | | — | | | | — | | | | — | | | | 30.76 | | | | 0.85 | (e) | | | 0.85 | (e) | | | (0.32 | ) (e) | | | 91 | | | | 3.74 | | | | 0 | |
| | | | | | | | | | | | | | |
| Eagle Mid Cap Stock Fund | | | | | | | | | | | | | | | | | | | | | | | | | | | | | | | | | | | | | | | | | | | | | | | | | | | | | | | | | |
| Class A* | | | | | | | | | | | | | | | | | | | | | | | | | | | | | | | | | | | | | | | | | | | | | | | | | | | | | | | | | | | | | | | | |
| 11/01/14 | | | 10/31/15 | | | | 30.05 | | | | (0.12 | ) | | | 0.75 | | | | 0.63 | | | | — | | | | (2.33 | ) | | | — | | | | (2.33 | ) | | | 28.35 | | | | 1.24 | | | | 1.24 | | | | (0.40 | ) | | | 56 | | | | 2.07 | | | | 147 | |
| 11/01/13 | | | 10/31/14 | | | | 30.48 | | | | (0.13 | ) | | | 1.72 | | | | 1.59 | | | | — | | | | (2.02 | ) | | | — | | | | (2.02 | ) | | | 30.05 | | | | 1.22 | | | | 1.22 | | | | (0.43 | ) | | | 32 | | | | 5.51 | | | | 171 | |
| 11/01/12 | | | 10/31/13 | | | | 27.14 | | | | (0.04 | ) | | | 7.40 | | | | 7.36 | | | | — | | | | (4.02 | ) | | | — | | | | (4.02 | ) | | | 30.48 | | | | 1.22 | | | | 1.22 | | | | (0.14 | ) | | | 27 | | | | 30.90 | | | | 208 | |
| 11/01/11 | | | 10/31/12 | | | | 25.07 | | | | (0.02 | ) | | | 2.09 | | | | 2.07 | | | | — | | | | — | | | | — | | | | — | | | | 27.14 | | | | 1.20 | | | | 1.20 | | | | (0.09 | ) | | | 184 | | | | 8.26 | | | | 260 | |
| 11/01/10 | | | 10/31/11 | | | | 25.37 | | | | (0.03 | ) | | | (0.27 | ) | | | (0.30 | ) | | | — | | | | — | | | | — | | | | — | | | | 25.07 | | | | 1.14 | | | | 1.14 | | | | (0.11 | ) | | | 242 | | | | (1.18 | ) | | | 544 | |
| | |
| 34 | | The accompanying notes are an integral part of the financial statements. |
Financial Highlights
| | | | | | | | | | | | | | | | | | | | | | | | | | | | | | | | | | | | | | | | | | | | | | | | | | | | | | | | | | | | | | | | |
Fiscal periods | | | | | | From investment operations | | | Dividends & distributions | | | | | | Ratios to average net asset (%) | | | | | | | | | | |
| | Beginning
net asset
value | | | Income
(loss) | | | Realized &
unrealized
gain (loss) | | | Total | | | From
investment
income | | | From
realized
gains | | | From
return of
capital | | | Total | | | Ending
net
asset
value | | | With
expenses
waived/
recovered (†) | | | Without
expenses
waived/
recovered (†) | | | Net
income
(loss) | | | Portfolio
turnover rate (%) (a) | | | Total
return (%) (a)(b) | | | Ending
net
assets
(millions) | |
| Beginning | | Ending | | | | | | | | | | | | | | | | |
| Eagle Mid Cap Stock Fund (cont’d) | | | | | | | | | | | | | | | | | | | | | | | | | | | | | | | | | | | | | | | | | | | | | | | | | | | | | | | | | |
| Class C* | | | | | | | | | | | | | | | | | | | | | | | | | | | | | | | | | | | | | | | | | | | | | | | | | | | | | | | | | | | | | | | | |
| 11/01/14 | | | 10/31/15 | | | | $24.62 | | | | $(0.27 | ) | | | $0.62 | | | | $0.35 | | | | $— | | | | $(2.33 | ) | | | $— | | | | $(2.33 | ) | | | $22.64 | | | | 1.99 | | | | 1.99 | | | | (1.16 | ) | | | 56 | | | | 1.32 | | | | $109 | |
| 11/01/13 | | | 10/31/14 | | | | 25.52 | | | | (0.28 | ) | | | 1.40 | | | | 1.12 | | | | — | | | | (2.02 | ) | | | — | | | | (2.02 | ) | | | 24.62 | | | | 1.96 | | | | 1.96 | | | | (1.17 | ) | | | 32 | | | | 4.69 | | | | 124 | |
| 11/01/12 | | | 10/31/13 | | | | 23.49 | | | | (0.21 | ) | | | 6.26 | | | | 6.05 | | | | — | | | | (4.02 | ) | | | — | | | | (4.02 | ) | | | 25.52 | | | | 1.95 | | | | 1.95 | | | | (0.90 | ) | | | 27 | | | | 30.00 | | | | 138 | |
| 11/01/11 | | | 10/31/12 | | | | 21.86 | | | | (0.20 | ) | | | 1.83 | | | | 1.63 | | | | — | | | | — | | | | — | | | | — | | | | 23.49 | | | | 1.92 | | | | 1.92 | | | | (0.85 | ) | | | 184 | | | | 7.46 | | | | 147 | |
| 11/01/10 | | | 10/31/11 | | | | 22.28 | | | | (0.19 | ) | | | (0.23 | ) | | | (0.42 | ) | | | — | | | | — | | | | — | | | | — | | | | 21.86 | | | | 1.85 | | | | 1.85 | | | | (0.83 | ) | | | 242 | | | | (1.89 | ) | | | 204 | |
| Class I* | | | | | | | | | | | | | | | | | | | | | | | | | | | | | | | | | | | | | | | | | | | | | | | | | | | | | | | | | | | | | | | | |
| 11/01/14 | | | 10/31/15 | | | | 31.09 | | | | (0.03 | ) | | | 0.77 | | | | 0.74 | | | | — | | | | (2.33 | ) | | | — | | | | (2.33 | ) | | | 29.50 | | | | 0.95 | | | | 1.06 | | | | (0.10 | ) | | | 56 | | | | 2.37 | | | | 51 | |
| 11/01/13 | | | 10/31/14 | | | | 31.39 | | | | (0.05 | ) | | | 1.77 | | | | 1.72 | | | | — | | | | (2.02 | ) | | | — | | | | (2.02 | ) | | | 31.09 | | | | 0.95 | | | | 1.10 | | | | (0.16 | ) | | | 32 | | | | 5.78 | | | | 87 | |
| 11/01/12 | | | 10/31/13 | | | | 27.76 | | | | 0.03 | | | | 7.62 | | | | 7.65 | | | | — | | | | (4.02 | ) | | | — | | | | (4.02 | ) | | | 31.39 | | | | 0.95 | | | | 1.12 | | | | 0.11 | | | | 27 | | | | 31.31 | | | | 98 | |
| 11/01/11 | | | 10/31/12 | | | | 25.58 | | | | 0.04 | | | | 2.14 | | | | 2.18 | | | | — | | | | — | | | | — | | | | — | | | | 27.76 | | | | 0.91 | | | | 0.91 | | | | 0.16 | | | | 184 | | | | 8.52 | | | | 118 | |
| 11/01/10 | | | 10/31/11 | | | | 25.79 | | | | 0.07 | | | | (0.28 | ) | | | (0.21 | ) | | | — | | | | — | | | | — | | | | — | | | | 25.58 | | | | 0.79 | | | | 0.79 | | | | 0.24 | | | | 242 | | | | (0.81 | ) | | | 163 | |
| Class R-3* | | | | | | | | | | | | | | | | | | | | | | | | | | | | | | | | | | | | | | | | | | | | | | | | | | | | | | | | | | | | | |
| 11/01/14 | | | 10/31/15 | | | | 29.36 | | | | (0.21 | ) | | | 0.73 | | | | 0.52 | | | | — | | | | (2.33 | ) | | | — | | | | (2.33 | ) | | | 27.55 | | | | 1.59 | | | | 1.59 | | | | (0.73 | ) | | | 56 | | | | 1.71 | | | | 2 | |
| 11/01/13 | | | 10/31/14 | | | | 29.92 | | | | (0.21 | ) | | | 1.67 | | | | 1.46 | | | | — | | | | (2.02 | ) | | | — | | | | (2.02 | ) | | | 29.36 | | | | 1.53 | | | | 1.53 | | | | (0.73 | ) | | | 32 | | | | 5.16 | | | | 5 | |
| 11/01/12 | | | 10/31/13 | | | | 26.78 | | | | (0.13 | ) | | | 7.29 | | | | 7.16 | | | | — | | | | (4.02 | ) | | | — | | | | (4.02 | ) | | | 29.92 | | | | 1.52 | | | | 1.52 | | | | (0.48 | ) | | | 27 | | | | 30.53 | | | | 6 | |
| 11/01/11 | | | 10/31/12 | | | | 24.80 | | | | (0.12 | ) | | | 2.10 | | | | 1.98 | | | | — | | | | — | | | | — | | | | — | | | | 26.78 | | | | 1.49 | | | | 1.49 | | | | (0.47 | ) | | | 184 | | | | 7.98 | | | | 6 | |
| 11/01/10 | | | 10/31/11 | | | | 25.17 | | | | (0.11 | ) | | | (0.26 | ) | | | (0.37 | ) | | | — | | | | — | | | | — | | | | — | | | | 24.80 | | | | 1.43 | | | | 1.43 | | | | (0.43 | ) | | | 242 | | | | (1.47 | ) | | | 5 | |
| Class R-5* | | | | | | | | | | | | | | | | | | | | | | | | | | | | | | | | | | | | | | | | | | | | | | | | | | | | | | | | | | | | | |
| 11/01/14 | | | 10/31/15 | | | | 31.24 | | | | (0.03 | ) | | | 0.77 | | | | 0.74 | | | | — | | | | (2.33 | ) | | | — | | | | (2.33 | ) | | | 29.65 | | | | 0.95 | | | | 0.99 | | | | (0.10 | ) | | | 56 | | | | 2.36 | | | | 0 | |
| 11/01/13 | | | 10/31/14 | | | | 31.53 | | | | (0.05 | ) | | | 1.78 | | | | 1.73 | | | | — | | | | (2.02 | ) | | | — | | | | (2.02 | ) | | | 31.24 | | | | 0.94 | | | | 0.94 | | | | (0.16 | ) | | | 32 | | | | 5.79 | | | | 0 | |
| 11/01/12 | | | 10/31/13 | | | | 27.77 | | | | 0.19 | | | | 7.59 | | | | 7.78 | | | | — | | | | (4.02 | ) | | | — | | | | (4.02 | ) | | | 31.53 | | | | 0.84 | | | | 0.84 | | | | 0.69 | | | | 27 | | | | 31.84 | | | | 1 | |
| 11/01/11 | | | 10/31/12 | | | | 25.60 | | | | 0.05 | | | | 2.12 | | | | 2.17 | | | | — | | | | — | | | | — | | | | — | | | | 27.77 | | | | 0.94 | | | | 0.94 | | | | 0.19 | | | | 184 | | | | 8.48 | | | | 13 | |
| 11/01/10 | | | 10/31/11 | | | | 25.83 | | | | 0.05 | | | | (0.28 | ) | | | (0.23 | ) | | | — | | | | — | | | | — | | | | — | | | | 25.60 | | | | 0.85 | | | | 0.85 | | | | 0.18 | | | | 242 | | | | (0.89 | ) | | | 65 | |
| Class R-6* | | | | | | | | | | | | | | | | | | | | | | | | | | | | | | | | | | | | | | | | | | | | | | | | | | | | | | | | | | | | | |
| 11/01/14 | | | 10/31/15 | | | | 31.25 | | | | — | (f) | | | 0.78 | | | | 0.78 | | | | — | | | | (2.33 | ) | | | — | | | | (2.33 | ) | | | 29.70 | | | | 0.83 | | | | 0.84 | | | | 0.01 | | | | 56 | | | | 2.49 | | | | 0 | |
| 11/01/13 | | | 10/31/14 | | | | 31.50 | | | | (0.01 | ) | | | 1.78 | | | | 1.77 | | | | — | | | | (2.02 | ) | | | — | | | | (2.02 | ) | | | 31.25 | | | | 0.82 | | | | 0.82 | | | | (0.04 | ) | | | 32 | | | | 5.93 | | | | 1 | |
| 11/01/12 | | | 10/31/13 | | | | 27.81 | | | | (0.02 | ) | | | 7.73 | | | | 7.71 | | | | — | | | | (4.02 | ) | | | — | | | | (4.02 | ) | | | 31.50 | | | | 0.79 | | | | 0.79 | | | | (0.08 | ) | | | 27 | | | | 31.49 | | | | 0 | |
| 11/01/11 | | | 10/31/12 | | | | 25.70 | | | | 0.05 | | | | 2.06 | | | | 2.11 | | | | — | | | | — | | | | — | | | | — | | | | 27.81 | | | | 0.85 | | | | 0.91 | | | | 0.18 | | | | 184 | | | | 8.21 | | | | 0 | |
| 08/15/11 | | | 10/31/11 | | | | 25.41 | | | | 0.01 | | | | 0.28 | | | | 0.29 | | | | — | | | | — | | | | — | | | | — | | | | 25.70 | | | | 0.85 | (e) | | | 0.85 | (e) | | | 0.24 | (e) | | | 242 | | | | 1.14 | | | | 0 | |
| | | | | | | | | | | | | | |
| Eagle Small Cap Growth Fund | | | | | | | | | | | | | | | | | | | | | | | | | | | | | | | | | | | | | | | | | | | | | | | | | | | | | | | | | |
| Class A* | | | | | | | | | | | | | | | | | | | | | | | | | | | | | | | | | | | | | | | | | | | | | | | | | | | | | | | | | | | | | | | | |
| 11/01/14 | | | 10/31/15 | | | | 57.57 | | | | (0.33 | ) | | | 2.22 | | | | 1.89 | | | | — | | | | (6.48 | ) | | | — | | | | (6.48 | ) | | | 52.98 | | | | 1.10 | | | | 1.10 | | | | (0.60 | ) | | | 45 | | | | 3.23 | | | | 711 | |
| 11/01/13 | | | 10/31/14 | | | | 54.33 | | | | (0.34 | ) | | | 4.27 | | | | 3.93 | | | | — | | | | (0.69 | ) | | | — | | | | (0.69 | ) | | | 57.57 | | | | 1.11 | | | | 1.11 | | | | (0.61 | ) | | | 37 | | | | 7.30 | | | | 759 | |
| 11/01/12 | | | 10/31/13 | | | | 41.13 | | | | (0.16 | ) | | | 13.36 | | | | 13.20 | | | | — | | | | — | | | | — | | | | — | | | | 54.33 | | | | 1.10 | | | | 1.10 | | | | (0.33 | ) | | | 38 | | | | 32.09 | | | | 999 | |
| 11/01/11 | | | 10/31/12 | | | | 38.93 | | | | (0.24 | ) | | | 2.44 | | | | 2.20 | | | | — | | | | — | | | | — | | | | — | | | | 41.13 | | | | 1.11 | | | | 1.11 | | | | (0.61 | ) | | | 44 | | | | 5.65 | | | | 690 | |
| 11/01/10 | | | 10/31/11 | | | | 33.79 | | | | (0.27 | ) | | | 5.41 | | | | 5.14 | | | | — | | | | — | | | | — | | | | — | | | | 38.93 | | | | 1.16 | | | | 1.16 | | | | (0.69 | ) | | | 36 | | | | 15.21 | | | | 497 | |
| Class C* | | | | | | | | | | | | | | | | | | | | | | | | | | | | | | | | | | | | | | | | | | | | | | | | | | | | | | | | | | | | | | | | |
| 11/01/14 | | | 10/31/15 | | | | 47.33 | | | | (0.59 | ) | | | 1.84 | | | | 1.25 | | | | — | | | | (6.48 | ) | | | — | | | | (6.48 | ) | | | 42.10 | | | | 1.82 | | | | 1.82 | | | | (1.32 | ) | | | 45 | | | | 2.49 | | | | 186 | |
| 11/01/13 | | | 10/31/14 | | | | 45.11 | | | | (0.61 | ) | | | 3.52 | | | | 2.91 | | | | — | | | | (0.69 | ) | | | — | | | | (0.69 | ) | | | 47.33 | | | | 1.82 | | | | 1.82 | | | | (1.32 | ) | | | 37 | | | | 6.52 | | | | 190 | |
| 11/01/12 | | | 10/31/13 | | | | 34.40 | | | | (0.42 | ) | | | 11.13 | | | | 10.71 | | | | — | | | | — | | | | — | | | | — | | | | 45.11 | | | | 1.82 | | | | 1.82 | | | | (1.05 | ) | | | 38 | | | | 31.13 | | | | 189 | |
| 11/01/11 | | | 10/31/12 | | | | 32.78 | | | | (0.44 | ) | | | 2.06 | | | | 1.62 | | | | — | | | | — | | | | — | | | | — | | | | 34.40 | | | | 1.83 | | | | 1.83 | | | | (1.32 | ) | | | 44 | | | | 4.94 | | | | 129 | |
| 11/01/10 | | | 10/31/11 | | | | 28.65 | | | | (0.46 | ) | | | 4.59 | | | | 4.13 | | | | — | | | | — | | | | — | | | | — | | | | 32.78 | | | | 1.86 | | | | 1.86 | | | | (1.40 | ) | | | 36 | | | | 14.42 | | | | 108 | |
| Class I* | | | | | | | | | | | | | | | | | | | | | | | | | | | | | | | | | | | | | | | | | | | | | | | | | | | | | | | | | | | | | | | | |
| 11/01/14 | | | 10/31/15 | | | | 59.19 | | | | (0.16 | ) | | | 2.29 | | | | 2.13 | | | | — | | | | (6.48 | ) | | | — | | | | (6.48 | ) | | | 54.84 | | | | 0.78 | | | | 0.78 | | | | (0.28 | ) | | | 45 | | | | 3.58 | | | | 1,757 | |
| 11/01/13 | | | 10/31/14 | | | | 55.68 | | | | (0.16 | ) | | | 4.36 | | | | 4.20 | | | | — | | | | (0.69 | ) | | | — | | | | (0.69 | ) | | | 59.19 | | | | 0.78 | | | | 0.78 | | | | (0.29 | ) | | | 37 | | | | 7.61 | | | | 1,770 | |
| 11/01/12 | | | 10/31/13 | | | | 42.04 | | | | (0.01 | ) | | | 13.67 | | | | 13.66 | | | | (0.02 | ) | | | — | | | | — | | | | (0.02 | ) | | | 55.68 | | | | 0.79 | | | | 0.79 | | | | (0.01 | ) | | | 38 | | | | 32.49 | | | | 1,815 | |
| 11/01/11 | | | 10/31/12 | | | | 39.65 | | | | (0.11 | ) | | | 2.50 | | | | 2.39 | | | | — | | | | — | | | | — | | | | — | | | | 42.04 | | | | 0.78 | | | | 0.78 | | | | (0.28 | ) | | | 44 | | | | 6.03 | | | | 1,313 | |
| 11/01/10 | | | 10/31/11 | | | | 34.41 | | | | (0.14 | ) | | | 5.38 | | | | 5.24 | | | | — | | | | — | | | | — | | | | — | | | | 39.65 | | | | 0.82 | | | | 0.83 | | | | (0.37 | ) | | | 36 | | | | 15.23 | | | | 679 | |
| Class R-3* | | | | | | | | | | | | | | | | | | | | | | | | | | | | | | | | | | | | | | | | | | | | | | | | | | | | | | | | | | | | | |
| 11/01/14 | | | 10/31/15 | | | | 56.59 | | | | (0.48 | ) | | | 2.19 | | | | 1.71 | | | | — | | | | (6.48 | ) | | | — | | | | (6.48 | ) | | | 51.82 | | | | 1.38 | | | | 1.38 | | | | (0.88 | ) | | | 45 | | | | 2.94 | | | | 119 | |
| 11/01/13 | | | 10/31/14 | | | | 53.58 | | | | (0.50 | ) | | | 4.20 | | | | 3.70 | | | | — | | | | (0.69 | ) | | | — | | | | (0.69 | ) | | | 56.59 | | | | 1.42 | | | | 1.42 | | | | (0.92 | ) | | | 37 | | | | 6.97 | | | | 127 | |
| 11/01/12 | | | 10/31/13 | | | | 40.68 | | | | (0.29 | ) | | | 13.19 | | | | 12.90 | | | | — | | | | — | | | | — | | | | — | | | | 53.58 | | | | 1.37 | | | | 1.37 | | | | (0.62 | ) | | | 38 | | | | 31.71 | | | | 134 | |
| 11/01/11 | | | 10/31/12 | | | | 38.58 | | | | (0.35 | ) | | | 2.45 | | | | 2.10 | | | | — | | | | — | | | | — | | | | — | | | | 40.68 | | | | 1.38 | | | | 1.38 | | | | (0.88 | ) | | | 44 | | | | 5.44 | | | | 84 | |
| 11/01/10 | | | 10/31/11 | | | | 33.52 | | | | (0.34 | ) | | | 5.40 | | | | 5.06 | | | | — | | | | — | | | | — | | | | — | | | | 38.58 | | | | 1.37 | | | | 1.37 | | | | (0.90 | ) | | | 36 | | | | 15.10 | | | | 48 | |
| | | | |
| The accompanying notes are an integral part of the financial statements. | | | 35 | |
Financial Highlights
| | | | | | | | | | | | | | | | | | | | | | | | | | | | | | | | | | | | | | | | | | | | | | | | | | | | | | | | | | | | | | | | |
Fiscal periods | | | | | | From investment operations | | | Dividends & distributions | | | | | | Ratios to average net asset (%) | | | | | | | | | | |
| | Beginning
net asset
value | | | Income
(loss) | | | Realized &
unrealized
gain (loss) | | | Total | | | From
investment
income | | | From
realized
gains | | | From
return of
capital | | | Total | | | Ending
net asset
value | | | With
expenses
waived/
recovered (†) | | | Without
expenses
waived/
recovered (†) | | | Net
income
(loss) | | | Portfolio
turnover rate (%) (a) | | | Total
return
(%) (a)(b) | | | Ending
net
assets
(millions) | |
| Beginning | | Ending | | | | | | | | | | | | | | | | |
Eagle Small Cap Growth
Fund (cont’d) | | | | | | | | | | | | | | | | | | | | | | | | | | | | | | | | | | | | | | | | | | | | | | | | | | | | | | | | | |
| Class R-5* | | | | | | | | | | | | | | | | | | | | | | | | | | | | | | | | | | | | | | | | | | | | | | | | | | | | | | | | | | | | | |
| 11/01/14 | | | 10/31/15 | | | | $59.37 | | | | $(0.15 | ) | | | $2.28 | | | | $2.13 | | | | $— | | | | $(6.48 | ) | | | $— | | | | $(6.48 | ) | | | $55.02 | | | | 0.75 | | | | 0.75 | | | | (0.25 | ) | | | 45 | | | | 3.57 | | | | $418 | |
| 11/01/13 | | | 10/31/14 | | | | 55.83 | | | | (0.16 | ) | | | 4.39 | | | | 4.23 | | | | — | | | | (0.69 | ) | | | — | | | | (0.69 | ) | | | 59.37 | | | | 0.77 | | | | 0.77 | | | | (0.28 | ) | | | 37 | | | | 7.64 | | | | 348 | |
| 11/01/12 | | | 10/31/13 | | | | 42.14 | | | | 0.01 | | | | 13.69 | | | | 13.70 | | | | (0.01 | ) | | | — | | | | — | | | | (0.01 | ) | | | 55.83 | | | | 0.77 | | | | 0.77 | | | | 0.02 | | | | 38 | | | | 32.51 | | | | 341 | |
| 11/01/11 | | | 10/31/12 | | | | 39.74 | | | | (0.12 | ) | | | 2.52 | | | | 2.40 | | | | — | | | | — | | | | — | | | | — | | | | 42.14 | | | | 0.80 | | | | 0.80 | | | | (0.29 | ) | | | 44 | | | | 6.04 | | | | 242 | |
| 11/01/10 | | | 10/31/11 | | | | 34.39 | | | | (0.16 | ) | | | 5.51 | | | | 5.35 | | | | — | | | | — | | | | — | | | | — | | | | 39.74 | | | | 0.85 | | | | 0.85 | | | | (0.39 | ) | | | 36 | | | | 15.56 | | | | 138 | |
| Class R-6* | | | | | | | | | | | | | | | | | | | | | | | | | | | | | | | | | | | | | | | | | | | | | | | | | | | | | | | | | | | | | |
| 11/01/14 | | | 10/31/15 | | | | 59.55 | | | | (0.10 | ) | | | 2.30 | | | | 2.20 | | | | — | | | | (6.48 | ) | | | — | | | | (6.48 | ) | | | 55.27 | | | | 0.66 | | | | 0.66 | | | | (0.17 | ) | | | 45 | | | | 3.68 | | | | 737 | |
| 11/01/13 | | | 10/31/14 | | | | 55.92 | | | | (0.10 | ) | | | 4.42 | | | | 4.32 | | | | — | | | | (0.69 | ) | | | — | | | | (0.69 | ) | | | 59.55 | | | | 0.66 | | | | 0.66 | | | | (0.17 | ) | | | 37 | | | | 7.79 | | | | 576 | |
| 11/01/12 | | | 10/31/13 | | | | 42.20 | | | | 0.03 | | | | 13.74 | | | | 13.77 | | | | (0.05 | ) | | | — | | | | — | | | | (0.05 | ) | | | 55.92 | | | | 0.68 | | | | 0.68 | | | | 0.07 | | | | 38 | | | | 32.68 | | | | 502 | |
| 11/01/11 | | | 10/31/12 | | | | 39.76 | | | | (0.09 | ) | | | 2.53 | | | | 2.44 | | | | — | | | | — | | | | — | | | | — | | | | 42.20 | | | | 0.69 | | | | 0.69 | | | | (0.22 | ) | | | 44 | | | | 6.14 | | | | 260 | |
| 08/15/11 | | | 10/31/11 | | | | 37.85 | | | | (0.06 | ) | | | 1.97 | | | | 1.91 | | | | — | | | | — | | | | — | | | | — | | | | 39.76 | | | | 0.85 | (e) | | | 0.85 | (e) | | | (0.75 | )(e) | | | 36 | | | | 5.05 | | | | 65 | |
| | | | | | | | | | | | | | |
| Eagle Smaller Company Fund | | | | | | | | | | | | | | | | | | | | | | | | | | | | | | | | | | | | | | | | | | | | | | | | | | | | | | | | | |
| Class A* | | | | | | | | | | | | | | | | | | | | | | | | | | | | | | | | | | | | | | | | | | | | | | | | | | | | | | | | | | | | | | | | |
| 11/01/14 | | | 10/31/15 | | | | 23.65 | | | | (0.10 | ) | | | 0.08 | | | | (0.02 | ) | | | — | | | | (11.31 | ) | | | — | | | | (11.31 | ) | | | 12.32 | | | | 1.41 | | | | 1.60 | | | | (0.70 | ) | | | 79 | | | | (1.88 | ) | | | 20 | |
| 11/01/13 | | | 10/31/14 | | | | 23.38 | | | | (0.09 | ) | | | 0.87 | | | | 0.78 | | | | — | | | | (0.51 | ) | | | — | | | | (0.51 | ) | | | 23.65 | | | | 1.38 | | | | 1.36 | | | | (0.38 | ) | | | 68 | (g) | | | 3.34 | | | | 18 | |
| 11/01/12 | | | 10/31/13 | | | | 18.93 | | | | (0.03 | ) | | | 5.96 | | | | 5.93 | | | | (0.09 | ) | | | (1.39 | ) | | | — | | | | (1.48 | ) | | | 23.38 | | | | 1.37 | | | | 1.40 | | | | (0.13 | ) | | | 14 | | | | 33.60 | | | | 19 | |
| 11/01/11 | | | 10/31/12 | | | | 20.05 | | | | 0.04 | | | | 1.47 | | | | 1.51 | | | | — | | | | (2.63 | ) | | | — | | | | (2.63 | ) | | | 18.93 | | | | 1.35 | | | | 1.42 | | | | 0.23 | | | | 13 | | | | 9.31 | | | | 13 | |
| 11/01/10 | | | 10/31/11 | | | | 19.63 | | | | (0.05 | ) | | | 2.23 | | | | 2.18 | | | | — | | | | (1.76 | ) | | | — | | | | (1.76 | ) | | | 20.05 | | | | 1.40 | | | | 1.44 | | | | (0.25 | ) | | | 36 | | | | 11.35 | | | | 12 | |
| Class C* | | | | | | | | | | | | | | | | | | | | | | | | | | | | | | | | | | | | | | | | | | | | | | | | | | | | | | | | | | | | | | | | |
| 11/01/14 | | | 10/31/15 | | | | 22.46 | | | | (0.18 | ) | | | 0.08 | | | | (0.10 | ) | | | — | | | | (11.31 | ) | | | — | | | | (11.31 | ) | | | 11.05 | | | | 2.17 | | | | 2.35 | | | | (1.49 | ) | | | 79 | | | | (2.64 | ) | | | 21 | |
| 11/01/13 | | | 10/31/14 | | | | 22.38 | | | | (0.25 | ) | | | 0.84 | | | | 0.59 | | | | — | | | | (0.51 | ) | | | — | | | | (0.51 | ) | | | 22.46 | | | | 2.11 | | | | 2.09 | | | | (1.11 | ) | | | 68 | (g) | | | 2.63 | | | | 11 | |
| 11/01/12 | | | 10/31/13 | | | | 18.22 | | | | (0.18 | ) | | | 5.73 | | | | 5.55 | | | | — | | | | (1.39 | ) | | | — | | | | (1.39 | ) | | | 22.38 | | | | 2.12 | | | | 2.14 | | | | (0.88 | ) | | | 14 | | | | 32.62 | | | | 11 | |
| 11/01/11 | | | 10/31/12 | | | | 19.52 | | | | (0.10 | ) | | | 1.43 | | | | 1.33 | | | | — | | | | (2.63 | ) | | | — | | | | (2.63 | ) | | | 18.22 | | | | 2.11 | | | | 2.19 | | | | (0.54 | ) | | | 13 | | | | 8.54 | | | | 7 | |
| 11/01/10 | | | 10/31/11 | | | | 19.32 | | | | (0.22 | ) | | | 2.18 | | | | 1.96 | | | | — | | | | (1.76 | ) | | | — | | | | (1.76 | ) | | | 19.52 | | | | 2.28 | | | | 2.21 | | | | (1.13 | ) | | | 36 | | | | 10.31 | | | | 6 | |
| Class I* | | | | | | | | | | | | | | | | | | | | | | | | | | | | | | | | | | | | | | | | | | | | | | | | | | | | | | | | | | | | | | | | |
| 11/01/14 | | | 10/31/15 | | | | 24.27 | | | | (0.03 | ) | | | 0.14 | | | | 0.11 | | | | — | | | | (11.31 | ) | | | — | | | | (11.31 | ) | | | 13.07 | | | | 0.95 | | | | 1.27 | | | | (0.17 | ) | | | 79 | | | | (0.99 | ) | | | 15 | |
| 11/01/13 | | | 10/31/14 | | | | 23.86 | | | | 0.02 | | | | 0.91 | | | | 0.93 | | | | (0.01 | ) | | | (0.51 | ) | | | — | | | | (0.52 | ) | | | 24.27 | | | | 0.95 | | | | 1.10 | | | | 0.10 | | | | 68 | (g) | | | 3.93 | | | | 33 | |
| 11/01/12 | | | 10/31/13 | | | | 19.28 | | | | 0.06 | | | | 6.07 | | | | 6.13 | | | | (0.16 | ) | | | (1.39 | ) | | | — | | | | (1.55 | ) | | | 23.86 | | | | 0.95 | | | | 1.16 | | | | 0.27 | | | | 14 | | | | 34.20 | | | | 106 | |
| 11/01/11 | | | 10/31/12 | | | | 20.31 | | | | 0.12 | | | | 1.49 | | | | 1.61 | | | | (0.01 | ) | | | (2.63 | ) | | | — | | | | (2.64 | ) | | | 19.28 | | | | 0.95 | | | | 1.17 | | | | 0.61 | | | | 13 | | | | 9.74 | | | | 58 | |
| 11/01/10 | | | 10/31/11 | | | | 19.80 | | | | 0.04 | | | | 2.24 | | | | 2.28 | | | | (0.01 | ) | | | (1.76 | ) | | | — | | | | (1.77 | ) | | | 20.31 | | | | 0.95 | | | | 1.19 | | | | 0.20 | | | | 36 | | | | 11.81 | | | | 61 | |
| Class R-3* | | | | | | | | | | | | | | | | | | | | | | | | | | | | | | | | | | | | | | | | | | | | | | | | | | | | | | | | | | | | | |
| 11/01/14 | | | 10/31/15 | | | | 23.33 | | | | (0.13 | ) | | | 0.07 | | | | (0.06 | ) | | | — | | | | (11.31 | ) | | | — | | | | (11.31 | ) | | | 11.96 | | | | 1.70 | | | | 2.07 | | | | (0.94 | ) | | | 79 | | | | (2.19 | ) | | | 0 | |
| 11/01/13 | | | 10/31/14 | | | | 23.12 | | | | (0.17 | ) | | | 0.89 | | | | 0.72 | | | | — | | | | (0.51 | ) | | | — | | | | (0.51 | ) | | | 23.33 | | | | 1.70 | | | | 1.77 | | | | (0.72 | ) | | | 68 | (g) | | | 3.11 | | | | 0 | |
| 11/01/12 | | | 10/31/13 | | | | 18.77 | | | | (0.08 | ) | | | 5.89 | | | | 5.81 | | | | (0.07 | ) | | | (1.39 | ) | | | — | | | | (1.46 | ) | | | 23.12 | | | | 1.70 | | | | 1.85 | | | | (0.40 | ) | | | 14 | | | | 33.17 | | | | 0 | |
| 11/01/11 | | | 10/31/12 | | | | 19.96 | | | | — | (f) | | | 1.44 | | | | 1.44 | | | | — | | | | (2.63 | ) | | | — | | | | (2.63 | ) | | | 18.77 | | | | 1.70 | | | | 1.80 | | | | 0.02 | | | | 13 | | | | 8.95 | | | | 0 | |
| 11/01/10 | | | 10/31/11 | | | | 19.60 | | | | (0.11 | ) | | | 2.23 | | | | 2.12 | | | | — | | | | (1.76 | ) | | | — | | | | (1.76 | ) | | | 19.96 | | | | 1.70 | | | | 1.67 | | | | (0.55 | ) | | | 36 | | | | 11.03 | | | | 0 | |
| Class R-5* | | | | | | | | | | | | | | | | | | | | | | | | | | | | | | | | | | | | | | | | | | | | | | | | | | | | | | | | | | | | | |
| 11/01/14 | | | 10/31/15 | | | | 24.20 | | | | (0.03 | ) | | | 0.07 | | | | 0.04 | | | | — | | | | (11.31 | ) | | | — | | | | (11.31 | ) | | | 12.93 | | | | 0.95 | | | | 1.14 | | | | (0.24 | ) | | | 79 | | | | (1.41 | ) | | | 0 | |
| 11/01/13 | | | 10/31/14 | | | | 23.82 | | | | 0.04 | | | | 0.87 | | | | 0.91 | | | | (0.02 | ) | | | (0.51 | ) | | | — | | | | (0.53 | ) | | | 24.20 | | | | 0.95 | | | | 1.04 | | | | 0.18 | | | | 68 | (g) | | | 3.85 | | | | 0 | |
| 11/01/12 | | | 10/31/13 | | | | 19.25 | | | | (0.02 | ) | | | 6.15 | | | | 6.13 | | | | (0.17 | ) | | | (1.39 | ) | | | — | | | | (1.56 | ) | | | 23.82 | | | | 0.95 | | | | 1.00 | | | | (0.11 | ) | | | 14 | | | | 34.25 | | | | 0 | |
| 11/01/11 | | | 10/31/12 | | | | 20.30 | | | | 0.12 | | | | 1.48 | | | | 1.60 | | | | (0.02 | ) | | | (2.63 | ) | | | — | | | | (2.65 | ) | | | 19.25 | | | | 0.95 | | | | 1.28 | | | | 0.62 | | | | 13 | | | | 9.72 | | | | 0 | |
| 11/01/10 | | | 10/31/11 | | | | 19.79 | | | | 0.04 | | | | 2.25 | | | | 2.29 | | | | (0.02 | ) | | | (1.76 | ) | | | — | | | | (1.78 | ) | | | 20.30 | | | | 0.95 | | | | 1.13 | | | | 0.21 | | | | 36 | | | | 11.83 | | | | 0 | |
| Class R-6* | | | | | | | | | | | | | | | | | | | | | | | | | | | | | | | | | | | | | | | | | | | | | | | | | | | | | | | | | | | | | |
| 11/01/14 | | | 10/31/15 | | | | 24.22 | | | | (0.01 | ) | | | 0.06 | | | | 0.05 | | | | — | | | | (11.31 | ) | | | — | | | | (11.31 | ) | | | 12.96 | | | | 0.85 | | | | 1.20 | | | | (0.07 | ) | | | 79 | | | | (1.33 | ) | | | 10 | |
| 11/01/13 | | | 10/31/14 | | | | 23.86 | | | | 0.03 | | | | 0.87 | | | | 0.90 | | | | (0.03 | ) | | | (0.51 | ) | | | — | | | | (0.54 | ) | | | 24.22 | | | | 0.85 | | | | 0.94 | | | | 0.13 | | | | 68 | (g) | | | 3.78 | | | | 25 | |
| 11/01/12 | | | 10/31/13 | | | | 19.28 | | | | 0.01 | | | | 6.14 | | | | 6.15 | | | | (0.18 | ) | | | (1.39 | ) | | | — | | | | (1.57 | ) | | | 23.86 | | | | 0.85 | | | | 0.96 | | | | 0.04 | | | | 14 | | | | 34.33 | | | | 18 | |
| 11/01/11 | | | 10/31/12 | | | | 20.30 | | | | 0.14 | | | | 1.49 | | | | 1.63 | | | | (0.02 | ) | | | (2.63 | ) | | | — | | | | (2.65 | ) | | | 19.28 | | | | 0.85 | | | | 1.15 | | | | 0.72 | | | | 13 | | | | 9.85 | | | | 0 | |
| 08/15/11 | | | 10/31/11 | | | | 19.44 | | | | 0.01 | | | | 0.85 | | | | 0.86 | | | | — | | | | — | | | | — | | | | — | | | | 20.30 | | | | 0.85 | (e) | | | 1.24 | (e) | | | 0.17 | (e) | | | 36 | | | | 4.42 | | | | 0 | |
(†) The ratio of expenses to average net assets includes the effects of expense offsets, which have an impact of less than 0.01%.
* Per share amounts have been calculated using the daily average share method.
(a) Not annualized for periods less than one year.
(b) Total returns are calculated without the imposition of either front-end or contingent deferred sales charges.
(c) The Eagle Capital Appreciation Fund changed its subadvisor effective June 28, 2013.
(d) The Eagle Growth & Income Fund changed its subadvisor effective June 1, 2011.
(e) Annualized.
(f) Per share amount is less than $0.005.
(g) The Eagle Smaller Company Fund changed its subadvisor effective October 20, 2014
| | |
| 36 | | The accompanying notes are an integral part of the financial statements. |
Notes to Financial Statements
NOTE 1 | Organization and investment objective | The Eagle Capital Appreciation Fund, the Eagle Growth & Income Fund and the Eagle Series Trust (each a “Trust” and collectively the “Trusts” or the “Eagle Family of Funds”) are organized as separate Massachusetts business trusts, and are registered under the Investment Company Act of 1940, as amended, as open-end diversified management investment companies. Members of the Board of Trustees (“Board”) for the Trusts may serve as Trustees for one or more of the Trusts. Trusts offer shares in the following series (each a “Fund” and collectively the “Funds”) and are advised by Eagle Asset Management, Inc. (“Eagle” or “Manager”).
| | • | | The Eagle Capital Appreciation Fund (“Capital Appreciation Fund”) seeks long-term capital appreciation. |
| | • | | The Eagle Growth & Income Fund (“Growth & Income Fund”) primarily seeks long-term capital appreciation and, secondarily, seeks current income. |
The Eagle Series Trust currently offers shares in six series:
| | • | | The Eagle International Stock Fund (“International Stock Fund”) seeks capital appreciation, |
| | • | | The Eagle Investment Grade Bond Fund (“Investment Grade Bond Fund”) seeks current income and preservation of capital, |
| | • | | The Eagle Mid Cap Growth Fund (“Mid Cap Growth Fund”) seeks long-term capital appreciation, |
| | • | | The Eagle Mid Cap Stock Fund (“Mid Cap Stock Fund”) seeks long-term capital appreciation, |
| | • | | The Eagle Small Cap Growth Fund (“Small Cap Growth Fund”) seeks long-term capital appreciation, and |
| | • | | The Eagle Smaller Company Fund (“Smaller Company Fund”) seeks capital growth. |
The Eagle Series Trust also includes the Eagle Tax-Exempt Bond Fund which is not currently offered for sale.
Class offerings | Each Fund is authorized and currently offers Class A, Class C, Class I, Class R-3, Class R-5, and Class R-6 shares to qualified buyers.
| | • | | For all Funds except the Investment Grade Bond Fund, Class A shares are sold at a maximum front-end sales charge of 4.75%. For the Investment Grade Bond Fund, Class A shares are sold at a maximum front-end sales charge of 3.75%. Class A share investments greater than $1 million, which are not sold subject to a sales charge, may be subject to a contingent deferred sales charge (“CDSC”) of up to 1% of the lower of net asset value (“NAV”) or purchase price if redeemed within 18 months of purchase. |
| | • | | Class C shares are sold subject to a CDSC of 1% of the lower of NAV or purchase price if redeemed within one year of purchase. |
| | • | | Class I, Class R-3, Class R-5 and Class R-6 shares are each sold without a front-end sales charge or a CDSC to qualified buyers. |
NOTE 2 | Significant accounting policies | The following is a summary of significant accounting policies of the Funds. The policies are in conformity with accounting principles generally accepted in the United States of America (“U.S. GAAP”). The Funds are investment companies and, accordingly, follow the investment company accounting and reporting guidance of the Financial Accounting Standards Board (“FASB”) Accounting Standards Codification Topic 946 – Investment Companies, which is part of U.S.GAAP.
Use of estimates | The preparation of financial statements in accordance with U.S. GAAP requires management to make estimates and assumptions that affect the reported amounts and disclosures. Actual results could differ from those estimates and those differences could be material.
Valuation of securities | The price of each Fund’s shares is based on the NAV per share of each class of a Fund. The Funds determine the NAV of their shares on each day the New York Stock Exchange (“NYSE”) is open for business, as of the close of the regular trading session (typically 4:00 p.m. Eastern Time) (“NYSE Close”), or earlier NYSE closing time that day. If the NYSE or other securities exchange modifies the published closing price of securities traded on that exchange after the NAV is calculated, the Manager is not required to recalculate the NAV.
Generally, the Funds value securities for which market quotations are readily available at market value; however, a Fund may adjust the market quotation price of securities traded in foreign markets to reflect events that occur between the close of those markets and the time of the Fund’s determination of the NAV.
A market quotation may be considered unreliable or unavailable for various reasons, such as:
| | • | | The quotation may be stale; |
| | • | | The security is not actively traded; |
| | • | | Trading on the security halted before the close of the trading market; |
| | • | | The security is newly issued; |
| | • | | Issuer-specific events occurred after the security halted trading; or |
| | • | | Because of the passage of time between the close of the market on which the security trades and the close of the NYSE. |
Issuer-specific events may cause the last market quotation to be unreliable. Such events may include:
| | • | | A merger or insolvency; |
| | • | | Events which affect a geographical area or an industry segment, such as political events or natural disasters; or |
| | • | | Market events, such as a significant movement in the U.S. markets. |
For most securities, both the latest transaction prices and adjustments for securities traded in foreign markets are furnished by Board approved independent pricing services. The Funds value all other securities and assets for which market quotations are unavailable or unreliable at their fair value in good faith using Pricing and Valuation Procedures (“Procedures”) approved by the Board. A Fund may fair value small-cap securities, for example, that are thinly traded or illiquid. Fair value requires consideration of appropriate factors, including indications of fair value available from independent pricing services. A fair value price is an estimated price and may vary from the prices used by other mutual funds to calculate their NAV.
Pursuant to the Procedures, the Board has delegated the day-to-day responsibility for applying and administering the Procedures to a valuation committee (“Valuation Committee”) comprised of certain officers of the Trusts and other employees of the Manager. The composition of this Valuation Committee may change from time to time. The Valuation Committee follows fair valuation guidelines as set forth in the Procedures to make fair value determinations on all securities and assets for which market quotations are unavailable or unreliable. For securities fair valued by the Valuation Committee, Eagle checks fair value prices by comparing the fair value of the security with values that are available from other sources (if any). Eagle compares the fair value of the security to the next-day opening price or next actual sale price, when applicable. Eagle documents and reports to the Valuation Committee such comparisons when they are made. The Valuation Committee reports such comparisons to the Board at their regularly scheduled meetings. The Board retains the responsibility for periodic review and consideration of the appropriateness of any fair value pricing methodology established or implemented for a Fund. Fair value pricing methods, the Procedures and
Notes to Financial Statements
independent pricing services can change from time to time as approved by the Board, and may occur as a result of lookback testing results or changes in industry best practices.
There can be no assurance, however, that a fair value price used by a Fund on any given day will more accurately reflect the market value of a security than the market price of such security on that day, as fair valuation determinations may involve subjective judgments made by the Valuation Committee. Fair value pricing may deter shareholders from trading a Fund’s shares on a frequent basis in an attempt to take advantage of arbitrage opportunities resulting from potentially stale prices of portfolio holdings. However, it cannot eliminate the possibility of frequent trading. Specific types of securities are valued as follows:
| | • | | Domestic exchange-traded equity securities | Market quotations are generally available and reliable for domestic exchange-traded equity securities. If the prices provided by the independent pricing service and independent quoted prices are unavailable or unreliable, the Valuation Committee will fair value the security using the Procedures. |
| | • | | Foreign exchange-traded equity securities | If market quotations are available and reliable for foreign exchange-traded equity securities, the securities will be valued at the market quotations. Because trading hours for certain foreign securities end before the NYSE Close, closing market quotations may become unreliable. Consequently, fair valuation of securities may occur on a daily basis. The Valuation Committee, using the Procedures, may fair value a security if certain events occur between the time trading ends in a foreign market on a particular security and the Fund’s NAV calculation. The Valuation Committee, using the Procedures, may also fair value a particular security if the events are significant and make the closing price unavailable or unreliable. If an issuer-specific event has occurred that a Fund or Eagle determines, in its judgment, is likely to have affected the closing price of a foreign security, the security will be priced at fair value. The Fund also utilizes a screening process from a pricing vendor to indicate the degree of certainty, based on historical data, that the closing price in the principal market where a foreign security trades is not the current market value as of the NYSE Close. Securities and other assets quoted in foreign currencies are valued in U.S. dollars based on exchange rates provided by an independent pricing service. The pricing vendor, pricing methodology or degree of certainty may change from time to time. Securities primarily traded on foreign markets may trade on days that are not business days of the Funds. Because the NAV of a Fund’s shares is determined only on business days of the Fund, the value of the securities of a Fund that invests in foreign securities may change on days when shareholders would not be able to purchase or redeem shares of the Fund. |
| | • | | Fixed income securities | Government bonds, corporate bonds, asset-backed bonds, municipal bonds, convertible securities, including high yield or junk bonds, and debt securities with a maturity of sixty (60) days or less as of the valuation date normally are valued on the basis of prices provided by independent pricing services. Prices provided by the independent pricing services may be determined without exclusive reliance on quoted prices, and may reflect appropriate factors such as institution-size trading in similar groups of securities, developments related to special securities, dividend rate, maturity and other market data. If the prices provided by the independent pricing service and independent quoted prices are unavailable or unreliable, the Valuation Committee will fair value the security using the Procedures. |
| | • | | Futures and Options | Futures and options are valued on the basis of market quotations, if available and reliable. If prices provided by independent pricing services and independent quoted prices are unavailable or unreliable, the Valuation Committee will fair value the security using the Procedures. During the fiscal year ended October 31, 2015, none of the Funds held futures or options. |
| | • | | Investment companies and Exchange traded funds (ETFs) | Investments in other investment companies are valued at their reported NAV. Investments in ETFs are valued on the basis of market quotations, if available and reliable. If prices provided by independent pricing services and independent quoted prices are unavailable or unreliable, the Valuation Committee will fair value the security using the Procedures. |
Fair value measurements | Each Fund utilizes a three-level hierarchy of inputs to establish a classification of fair value measurements. The three levels are defined as:
Level 1—Valuations based on unadjusted quoted prices for identical securities in active markets;
Level 2—Valuations based on inputs other than quoted prices that are observable, either directly or indirectly, including inputs in markets that are not considered active; and
Level 3—Valuations based on inputs that are unobservable and significant to the fair value measurement, and may include the Valuation Committee’s own assumptions on determining fair value of investments.
Inputs that are used in determining fair value of an investment may include price information, credit data, volatility statistics, and other factors. These inputs can be either observable or unobservable. The availability of observable inputs can vary between investments, and is affected by various factors such as the type of investment, and the volume and/or level of activity for that investment or similar investments in the marketplace. The inputs will be considered by the Valuation Committee, along with any other relevant factors in the calculation of an investment’s fair value. A Fund uses prices and inputs that are current as of the valuation date, which may include periods of market dislocations. During these periods, the availability of prices and inputs may be reduced for many investments. This condition could cause an investment to be reclassified between the various levels within the hierarchy.
Investments falling into the Level 3 category may be classified as such due to a lack of market transparency and corroboration to support the quoted prices. Additionally, valuation models may be used as the pricing source for any remaining investments classified as Level 3. These models may rely on one or more significant unobservable inputs and/or significant assumptions by the Valuation Committee. Inputs used in valuations may include, but are not limited to, financial statement analysis, capital account balances, discount rates and estimated cash flows, and comparable entity data.
The following is a summary of the inputs used to value each Fund’s investments as of October 31, 2015.
| | | | | | | | | | | | |
| | | Quoted prices in
active markets
for identical
assets
(Level 1) | | | Significant
other
observable
inputs
(Level 2) | | | Total | |
| Capital Appreciation Fund | | | | | | | | | | | | |
| Common stocks (a) | | | $344,842,663 | | | | $— | | | | $344,842,663 | |
| Money market funds | | | 3,338,352 | | | | — | | | | 3,338,352 | |
| Total investment portfolio | | | $348,181,015 | | | | $— | | | | $348,181,015 | |
| Growth & Income Fund | | | | | | | | | | | | |
| Common stocks (a) | | | $577,843,834 | | | | $— | | | | $577,843,834 | |
| Money market funds | | | 3,636,636 | | | | — | | | | 3,636,636 | |
| Total investment portfolio | | | $581,480,470 | | | | $— | | | | $581,480,470 | |
Notes to Financial Statements
| | | | | | | | | | | | |
| | | Quoted prices in
active markets
for identical
assets
(Level 1) | | | Significant
other
observable
inputs
(Level 2) | | | Total | |
| International Stock Fund | | | | | | | | | | | | |
| Common stocks (a) | | | $— | | | | $16,578,433 | | | | $16,578,433 | |
| Money market funds | | | 585,947 | | | | — | | | | 585,947 | |
| Total investment portfolio | | | $585,947 | | | | $16,578,433 | | | | $17,164,380 | |
| Investment Grade Bond Fund | | | | | | | | | |
| Corporate bonds (a) | | | $— | | | | $20,555,139 | | | | $20,555,139 | |
| Mortgage and asset-backed securities | | | — | | | | 14,650,931 | | | | 14,650,931 | |
| Foreign Government Bonds | | | — | | | | 149,414 | | | | 149,414 | |
| U.S. Treasuries | | | — | | | | 10,278,461 | | | | 10,278,461 | |
| U.S. Government agency securities | | | — | | | | 2,027,117 | | | | 2,027,117 | |
| Supranational banks | | | — | | | | 1,511,981 | | | | 1,511,981 | |
| Money market funds | | | 1,112,973 | | | | — | | | | 1,112,973 | |
| Total investment portfolio | | | $1,112,973 | | | | $49,173,043 | | | | $50,286,016 | |
| Mid Cap Growth Fund | | | | | | | | | | | | |
| Common stocks (a) | | | $1,127,547,602 | | | | $— | | | | $1,127,547,602 | |
| Money market funds | | | 45,430,615 | | | | — | | | | 45,430,615 | |
| Total investment portfolio | | | $1,172,978,217 | | | | $— | | | | $1,172,978,217 | |
| Mid Cap Stock Fund | | | | | | | | | | | | |
| Common stocks (a) | | | $301,478,325 | | | | $— | | | | $301,478,325 | |
| Money market funds | | | 13,708,651 | | | | — | | | | 13,708,651 | |
| Total investment portfolio | | | $315,186,976 | | | | $— | | | | $315,186,976 | |
| Small Cap Growth Fund | | | | | | | | | | | | |
| Common stocks (a) | | | $3,840,288,268 | | | | $— | | | | $3,840,288,268 | |
| Money market funds | | | 88,126,480 | | | | — | | | | 88,126,480 | |
| Total investment portfolio | | | $3,928,414,748 | | | | $— | | | | $3,928,414,748 | |
| Smaller Company Fund | | | | | | | | | | | | |
| Common stocks(a) | | | $64,806,998 | | | | $— | | | | $64,806,998 | |
| Money market funds | | | 1,373,329 | | | | — | | | | 1,373,329 | |
| Total investment portfolio | | | $66,180,327 | | | | $— | | | | $66,180,327 | |
(a) Please see the investment portfolio for detail by industry.
The Fund recognizes transfers between levels at the end of the reporting period. During the fiscal year ended October 31, 2015, none of the Funds had any investments classified as Level 3 and there were no transfers in or out of Levels 1, 2 or 3.
Foreign currency transactions | The books and records of each Fund are maintained in U.S. dollars. Foreign currency transactions are translated into U.S. dollars on the following basis: (i) market value of investment securities, other assets and other liabilities at the daily rates of exchange, and (ii) purchases and sales of investment securities, dividend and interest income and certain expenses at the rates of exchange prevailing on the respective dates of such transactions. The Funds do not isolate that portion of gains and losses on investments which is due to changes in foreign exchange rates from
that which is due to changes in market prices of the investments. Such fluctuations are included with the net realized and unrealized gains and losses from investment transactions. Net realized gain (loss) on foreign currency transactions and the net change in unrealized appreciation (depreciation) on translation of assets and liabilities denominated in foreign currencies include gains and losses between trade and settlement date on securities transactions, gains and losses arising from the purchase and sale of forward foreign currency exchange contracts and gains and losses between the ex and payment dates on dividends, interest and foreign withholding taxes.
Forward foreign currency exchange contracts | Each of the Funds, except the Small Cap Growth Fund, is authorized to enter into forward foreign currency contracts which are used primarily to hedge against foreign currency exchange rate risk on its non-U.S. dollar denominated investment securities. Forward foreign currency exchange contracts are valued in U.S. dollars based upon forward exchange rates provided by an independent pricing service as of the close of the NYSE each valuation day and the unrealized gain or loss is included in the related Statement of Assets and Liabilities. When the contracts are closed, the gain or loss is realized. Realized and unrealized gains and losses are included in the related Statement of Operations. Risks may arise from unanticipated movements in the currency’s value relative to the U.S. dollar and from the possible inability of counter-parties to meet the terms of their contracts. During the fiscal year ended October 31, 2015, none of the Funds held forward foreign currency exchange contracts.
Real estate investment trusts (“REIT(s)”) | There are certain additional risks involved in investing in REITs. These include, but are not limited to, economic conditions, changes in zoning laws, real estate values, property taxes and interest rates. Dividend income is recorded at the Manager’s estimate of the income included in distributions from the REITs. Distributions received in excess of the estimated amount are recorded as a reduction of the cost of the investments. The actual amounts of income, return of capital and capital gains are only determined by each REIT after the Funds’ fiscal year-end and may differ from the estimated amounts.
Repurchase agreements | Each Fund may enter into repurchase agreements whereby a Fund, through its custodian, receives delivery of the underlying securities, the market value of which at the time of purchase is required to be in an amount of at least 100% of the resale price. Repurchase agreements involve the risk that the seller will fail to repurchase the security, as agreed. In that case, the Fund will bear the risk of market value fluctuations until the security can be sold and may encounter delays and incur costs in liquidating the security. In the event of bankruptcy or insolvency of the seller, delays and costs may be incurred. During the fiscal year ended October 31, 2015, none of the Funds held any repurchase agreements.
Revenue recognition | Investment security transactions are accounted for on a trade date basis. Dividend income is recorded on the ex-dividend date. Interest income is recorded on an accrual basis.
Foreign taxes | The Funds may be subject to taxes imposed by countries in which they invest, with respect to their investments in issuers existing or operating in such countries. The Funds may also be subject to foreign taxes on income, gains on investments or currency repatriation, a portion of which may or may not be recoverable. The Funds accrue such taxes and recoveries as applicable, when the related income or capital gains are earned and based upon the current interpretation of tax rules and regulations that exist in the markets in which a Fund invests. Some countries require governmental approval for the repatriation of investment income, capital or the proceeds of sales earned by foreign investors.
Expenses | Each Fund is charged for certain expenses which are directly attributable to it, and certain other expenses which are allocated proportionately among the Eagle Family of Funds based upon methods approved by the Board. Expenses that are directly attributable to a specific class of shares, such as distribution fees, shareholder servicing fees and administrative fees, are
Notes to Financial Statements
charged directly to that class of shares. Other expenses of each Fund are allocated to each class of shares based upon its relative percentage of net assets. The Funds have entered into an arrangement with the custodian whereby each Fund receives credits on uninvested cash balances which are used to offset a portion of each Fund’s expenses. These custodian credits are shown as “Expense offsets” in the related Statement of Operations.
Class allocations | Each class of shares has equal rights to earnings and assets except that each class may bear different expenses for administration, distribution and/or shareholder services. Income, expenses (other than expenses attributable to a specific class), and realized and unrealized gains or losses on investments are allocated to each class of shares based on its relative percentage of net assets.
Distributions | Each Fund, except the Investment Grade Bond Fund and the Growth & Income Fund, distributes net investment income annually. Distributions of net investment income in the Investment Grade Bond Fund and the Growth & Income Fund are made monthly and quarterly, respectively. Net realized gains from investment transactions during any particular fiscal year in excess of available capital loss carryforwards, which, if not distributed, would be taxable to each applicable Fund, will be distributed to shareholders annually in the following fiscal year. Each Fund uses the identified cost method for determining realized gain or loss on investments for both financial and federal income tax reporting purposes.
Dividends paid to shareholders from net investment income were as follows:
| | | | | | | | |
| Distributions from net investment income | | 11/1/14 to
10/31/15 | | | 11/1/13 to
10/31/14 | |
| Capital Appreciation Fund | |
| Class A | | | $— | | | | $— | |
| Class C | | | — | | | | — | |
| Class I | | | 113,793 | | | | — | |
| Class R-3 | | | — | | | | — | |
| Class R-5 | | | 1,947 | | | | — | |
| Class R-6 | | | — | | | | N/A | |
| Growth & Income Fund | | | | | | | | |
| Class A | | | 3,895,855 | * | | | 3,614,463 | |
| Class C | | | 2,482,573 | * | | | 1,770,808 | |
| Class I | | | 4,536,288 | * | | | 3,009,961 | |
| Class R-3 | | | 45,076 | * | | | 51,311 | |
| Class R-5 | | | 45,331 | * | | | 69,985 | |
| Class R-6 | | | 1,935 | * | | | 1,758 | |
| * Includes return of capital in the amount of $365,076. | |
| International Stock Fund | | | | | | | | |
| Class A | | | 86,181 | | | | 30,280 | |
| Class C | | | 72,288 | | | | 11,981 | |
| Class I | | | 37,744 | | | | 7,072 | |
| Class R-3 | | | 65 | | | | 17 | |
| Class R-5 | | | 83 | | | | 28 | |
| Class R-6 | | | 86 | | | | 30 | |
| | | | | | | | |
| Distributions from net investment income (con’d) | | 11/1/14 to
10/31/15 | | | 11/1/13 to
10/31/14 | |
| Investment Grade Bond Fund | | | | | | | | |
| Class A | | | $249,813 | | | | $352,303 | |
| Class C | | | 84,024 | | | | 110,243 | |
| Class C | | | 124,253 | | | | 82,088 | |
| Class R-3 | | | 251 | | | | 250 | |
| Class R-5 | | | 39 | | | | 39 | |
| Class R-6 | | | 6 | | | | N/A | |
| Smaller Company Fund | | | | | | | | |
| Class A | | | — | | | | — | |
| Class C | | | — | | | | — | |
| Class I | | | — | | | | 66,661 | |
| Class R-3 | | | — | | | | — | |
| Class R-5 | | | — | | | | 56 | |
| Class R-6 | | | — | | | | 21,657 | |
Distributions paid to shareholders from net realized gains were as follows:
| | | | | | | | |
| Distributions from net realized gains | | 11/1/14 to
10/31/15 | | | 11/1/13 to
10/31/14 | |
| Capital Appreciation Fund | | | | | | | | |
| Class A | | | $20,832,937 | | | | $21,395,874 | |
| Class C | | | 10,785,656 | | | | 8,299,481 | |
| Class I | | | 11,419,909 | | | | 3,095,665 | |
| Class R-3 | | | 81,839 | | | | 84,996 | |
| Class R-5 | | | 706,694 | | | | 2,133,186 | |
| Class R-6 | | | — | | | | N/A | |
| Growth & Income Fund | | | | | | | | |
| Class A | | | 1,655,129 | ^ | | | 4,415,858 | |
| Class C | | | 1,643,442 | ^ | | | 3,668,620 | |
| Class I | | | 1,577,964 | ^ | | | 2,679,903 | |
| Class R-3 | | | 24,176 | ^ | | | 80,520 | |
| Class R-5 | | | 30,840 | ^ | | | 69,654 | |
| Class R-6 | | | 778 | ^ | | | 1,122 | |
| ^ Includes return of capital in the amount of $295,478. | |
| International Stock Fund | | | | | | | | |
| Class A | | | 147,994 | | | | 19,718 | |
| Class C | | | 166,177 | | | | 15,816 | |
| Class I | | | 53,466 | | | | 3,673 | |
| Class R-3 | | | 118 | | | | 16 | |
| Class R-5 | | | 119 | | | | 15 | |
| Class R-6 | | | 119 | | | | 15 | |
Notes to Financial Statements
| | | | | | | | |
| Distributions from net realized gains (con’d) | | 11/1/14 to
10/31/15 | | | 11/1/13 to
10/31/14 | |
| Investment Grade Bond Fund | | | | | | | | |
| Class A | | | $91,386 | | | | $86,361 | |
| Class C | | | 106,233 | | | | 93,414 | |
| Class I | | | 34,149 | | | | 15,187 | |
| Class R-3 | | | 123 | | | | 72 | |
| Class R-5 | | | 12 | | | | 7 | |
| Class R-6 | | | — | | | | N/A | |
| Mid Cap Growth Fund | | | | | | | | |
| Class A | | | 26,793,835 | | | | 14,126,765 | |
| Class C | | | 11,654,418 | | | | 5,726,464 | |
| Class I | | | 20,217,916 | | | | 5,736,130 | |
| Class R-3 | | | 1,607,970 | | | | 567,613 | |
| Class R-5 | | | 4,875,830 | | | | 1,762,800 | |
| Class R-6 | | | 3,132,740 | | | | 462,038 | |
| Mid Cap Stock Fund | | | | | | | | |
| Class A | | | 12,929,183 | | | | 13,423,846 | |
| Class C | | | 11,465,291 | | | | 10,750,360 | |
| Class I | | | 6,350,615 | | | | 6,122,957 | |
| Class R-3 | | | 375,354 | | | | 398,181 | |
| Class R-5 | | | 29,218 | | | | 43,925 | |
| Class R-6 | | | 51,774 | | | | 19,559 | |
| Small Cap Growth Fund | | | | | | | | |
| Class A | | | 84,387,164 | | | | 12,363,095 | |
| Class C | | | 25,713,397 | | | | 2,914,205 | |
| Class I | | | 190,073,412 | | | | 21,911,755 | |
| Class R-3 | | | 14,232,137 | | | | 1,773,847 | |
| Class R-5 | | | 38,429,995 | | | | 4,407,058 | |
| Class R-6 | | | 62,850,610 | | | | 6,342,356 | |
| Smaller Company Fund | | | | | | | | |
| Class A | | | 8,138,310 | | | | 408,410 | |
| Class C | | | 5,160,921 | | | | 270,712 | |
| Class I | | | 10,961,615 | | | | 2,300,351 | |
| Class R-3 | | | 205,037 | | | | 5,784 | |
| Class R-5 | | | 2,565 | | | | 1,204 | |
| Class R-6 | | | 12,875,708 | | | | 382,113 | |
Other | In the normal course of business the Funds enter into contracts that contain a variety of representations and warranties which provide general indemnifications. The Funds’ maximum exposure under these arrangements is unknown, as this would involve future claims that may be made against the Funds and/or their affiliates that have not yet occurred. However, based on experience, the risk of loss to each Fund is expected to be remote.
NOTE 3 | Purchases and sales of securities | For the fiscal year ended October 31, 2015, purchases and sales of investment securities (excluding short-term obligations) were as follows:
| | | | | | | | |
| | | Purchases | | | Sales | |
| Capital Appreciation Fund | | | $141,895,738 | | | | $146,285,018 | |
| Growth & Income Fund | | | 154,987,053 | | | | 180,585,706 | |
| International Stock Fund | | | 17,303,082 | | | | 10,456,510 | |
| Investment Grade Bond Fund | | | | | | | | |
Debt securities | | | 22,014,681 | | | | 28,281,077 | |
U.S. Treasury securities | | | 20,660,293 | | | | 21,720,186 | |
| Mid Cap Growth Fund | | | 868,939,948 | | | | 465,771,928 | |
| Mid Cap Stock Fund | | | 193,790,090 | | | | 276,558,175 | |
| Small Cap Growth Fund | | | 1,774,668,736 | | | | 1,796,032,973 | |
| Smaller Company Fund | | | 64,365,555 | | | | 114,332,434 | |
NOTE 4 | Investment advisory fees and other transactions with affiliates | Each Fund has agreed to pay to the Manager an investment advisory and an administrative fee equal to an annualized rate based on a percentage of each Fund’s average daily net assets, computed daily and payable monthly. For advisory services provided by the Manager, the investment advisory rate for each Fund is as follows:
| | | | | | | | |
Investment advisory fee rate schedule | | Breakpoint | | | Investment
advisory fee | |
| Capital Appreciation Fund | |
| First $1 billion
Over $1 billion |
| |
| 0.60%
0.55% |
|
| Growth & Income Fund | |
| First $100 million
$100 million to $500 million
Over $500 million |
| |
| 0.60%
0.45% 0.40% |
|
| International Stock Fund | | | All assets | | | | 0.85% | |
| Investment Grade Bond Fund | | | All assets | | | | 0.30% | |
| Mid Cap Growth Fund, Mid Cap Stock Fund, Small Cap Growth Fund, Smaller Company Fund | |
| First $500 million
$500 million to $1 billion Over $1 billion |
| |
| 0.60%
0.55% 0.50% |
|
For administrative services provided by the Manager, each Fund has agreed to pay an administrative rate of 0.15% of the average daily net assets of Class A, Class C and Class R-3 shares and 0.10% of the average daily net assets of Class I, Class R-5 and Class R-6 shares.
Subadvisory fees | The Manager has entered into subadvisory agreements with certain parties to provide investment advice, portfolio management services (including the placement of brokerage orders), certain compliance and other services to the Funds.
The Manager entered into a subadvisory agreement with ClariVest Asset Management LLC (“ClariVest”), an affiliate of Eagle, to serve as subadvisor for the Capital Appreciation Fund and the International Stock Fund. Under this agreement, Eagle pays ClariVest an annualized rate of 0.55% and 0.85%, respectively, on all assets as a percentage of the Fund’s average daily net assets, computed daily and payable monthly for the Capital Appreciation Fund and the International Stock Fund, respectively.
Distribution and service fees | Pursuant to the Class A, Class C and Class R-3 Distribution plans and in accordance with Rule 12b-1 of the Investment Company Act of 1940, as amended (“Rule 12b-1 Plans”), the Funds are authorized to pay Eagle Fund Distributors, Inc. (“Distributor”), an affiliate of the Manager, a fee based on the average daily net assets for each class of shares, accrued daily and payable monthly. Each Fund of the Series Trust is authorized to pay the Distributor distribution and service fees of up to 0.35% of that fund’s average daily net assets attributable to Class A shares of that fund. The Capital
Notes to Financial Statements
Appreciation Fund and the Growth & Income Fund are authorized to pay the Distributor distribution and service fees of up to 0.50% of those Funds’ average daily net assets attributable to Class A shares of those Funds. Currently, the distribution and service fee is 0.25% for Class A shares of each Fund. Each Fund also is authorized, and currently pays, the Distributor distribution and services fees of 1% for Class C shares, and 0.50% for Class R-3 shares. The Funds do not incur any direct distribution expenses related to Class I, Class R-5 or Class R-6 shares. However, Eagle or any third party may make payments for the sale and distribution of all share classes, including Class I, Class R-5 or Class R-6 shares, from its own resources.
Sales charges | For the fiscal year ended October 31, 2015, total front-end sales charges and CDSCs paid to the Distributor were as follows:
| | | | | | | | | | | | |
| | | Front-end
sales charge | | | Contingent deferred
sales charges | |
| | | Class A | | | Class A | | | Class C | |
| Capital Appreciation Fund | | | $83,071 | | | | $— | | | | $587 | |
| Growth & Income Fund | | | 339,922 | | | | — | | | | 2,607 | |
| International Stock Fund | | | 15,144 | | | | — | | | | 332 | |
| Investment Grade Bond Fund | | | 7,041 | | | | — | | | | 58 | |
| Mid Cap Growth Fund | | | 406,377 | | | | — | | | | 1,165 | |
| Mid Cap Stock Fund | | | 49,075 | | | | — | | | | 418 | |
| Small Cap Growth Fund | | | 278,707 | | | | — | | | | 3,032 | |
| Smaller Company Fund | | | 23,084 | | | | — | | | | 270 | |
The Distributor paid commissions to salespersons from these fees and incurred other distribution costs.
Agency commissions | For the fiscal year ended October 31, 2015, total agency brokerage commissions paid by the Funds and agency brokerage commissions paid directly to Raymond James & Associates, Inc. (“RJA”), an affiliate of the Manager, were as follows:
| | | | | | | | |
| | | Total agency
brokerage commissions | | | Paid to Raymond
James & Associates, Inc. | |
| Capital Appreciation Fund | | | $86,052 | | | | $— | |
| Growth & Income Fund | | | 108,135 | | | | — | |
| International Stock Fund | | | 13,875 | | | | — | |
| Investment Grade Bond Fund | | | — | | | | — | |
| Mid Cap Growth Fund | | | 622,319 | | | | 12,844 | |
| Mid Cap Stock Fund | | | 196,130 | | | | 11,105 | |
| Small Cap Growth Fund | | | 2,260,111 | | | | 147,520 | |
| Smaller Company Fund | | | 96,922 | | | | 8,941 | |
Internal audit fees | RJA provides internal audit services to the Funds. Each Fund pays RJA a fixed and/or hourly fee for these services.
Shareholder servicing fees | Eagle Fund Services, Inc. (“EFS”), an affiliate of the Manager, is the shareholder servicing agent for each of the Funds. EFS’ actual cost of providing such services is reimbursed by the Funds on a pro-rata basis
of each Fund’s relative total net assets. The amount of shareholder servicing fees charged to the Funds were as follows:
| | | | |
| Shareholder servicing fees | | 11/1/2014 to
10/31/2015 | |
| Capital Appreciation Fund Class A | | | $10,150 | |
| Capital Appreciation Fund Class C | | | 4,146 | |
| Capital Appreciation Fund Class I | | | 5,757 | |
| Capital Appreciation Fund Class R-3 | | | 47 | |
| Capital Appreciation Fund Class R-5 | | | 406 | |
| Capital Appreciation Fund Class R-6 | | | — | |
| Growth & Income Fund Class A | | | 12,652 | |
| Growth & Income Fund Class C | | | 12,609 | |
| Growth & Income Fund Class I | | | 12,758 | |
| Growth & Income Fund Class R-3 | | | 189 | |
| Growth & Income Fund Class R-5 | | | 148 | |
| Growth & Income Fund Class R-6 | | | — | |
| International Stock Fund Class A | | | 398 | |
| International Stock Fund Class C | | | 283 | |
| International Stock Fund Class I | | | 93 | |
| International Stock Fund Class R-3 | | | — | |
| International Stock Fund Class R-5 | | | — | |
| International Stock Fund Class R-6 | | | — | |
| Investment Grade Bond Fund Class A | | | 1,289 | |
| Investment Grade Bond Fund Class C | | | 1,414 | |
| Investment Grade Bond Fund Class I | | | 535 | |
| Investment Grade Bond Fund Class R-3 | | | 2 | |
| Investment Grade Bond Fund Class R-5 | | | — | |
| Investment Grade Bond Fund Class R-6 | | | — | |
| Mid Cap Growth Fund Class A | | | 20,205 | |
| Mid Cap Growth Fund Class C | | | 6,804 | |
| Mid Cap Growth Fund Class I | | | 16,473 | |
| Mid Cap Growth Fund Class R-3 | | | 1,270 | |
| Mid Cap Growth Fund Class R-5 | | | 4,967 | |
| Mid Cap Growth Fund Class R-6 | | | — | |
| Mid Cap Stock Fund Class A | | | 9,785 | |
| Mid Cap Stock Fund Class C | | | 7,202 | |
| Mid Cap Stock Fund Class I | | | 4,091 | |
| Mid Cap Stock Fund Class R-3 | | | 138 | |
| Mid Cap Stock Fund Class R-5 | | | 17 | |
| Mid Cap Stock Fund Class R-6 | | | — | |
| Small Cap Growth Fund Class A | | | 47,615 | |
| Small Cap Growth Fund Class C | | | 11,789 | |
| Small Cap Growth Fund Class I | | | 110,802 | |
| Small Cap Growth Fund Class R-3 | | | 7,618 | |
| Small Cap Growth Fund Class R-5 | | | 23,906 | |
| Small Cap Growth Fund Class R-6 | | | — | |
Notes to Financial Statements
| | | | |
| Shareholder servicing fees (con’d) | | 11/1/2014 to
10/31/2015 | |
| Smaller Company Fund Class A | | | $1,332 | |
| Smaller Company Fund Class C | | | 1,148 | |
| Smaller Company Fund Class I | | | 1,172 | |
| Smaller Company Fund Class R-3 | | | 22 | |
| Smaller Company Fund Class R-5 | | | — | |
| Smaller Company Fund Class R-6 | | | — | |
Expense limitations | Eagle has contractually agreed to reduce its fees and/or reimburse expenses to each class of the Funds through February 29, 2016, to the extent that the annual operating expense rate for each class of shares exceeds the following annualized rates as a percentage of average daily net assets of each class of shares.
| | | | | | | | | | | | |
| Expense limitations rate schedule | | Class A | | | Class C | | | Class I | |
| Capital Appreciation Fund | | | 1.40 | % | | | 2.20 | % | | | 0.95 | % |
| Growth & Income Fund | | | 1.40 | % | | | 2.20 | % | | | 0.95 | % |
| International Stock Fund | | | 1.75 | % | | | 2.55 | % | | | 1.15 | % |
| Investment Grade Bond Fund | | | 0.85 | % | | | 1.65 | % | | | 0.60 | % |
| Mid Cap Growth Fund | | | 1.50 | % | | | 2.30 | % | | | 0.95 | % |
| Mid Cap Stock Fund | | | 1.50 | % | | | 2.30 | % | | | 0.95 | % |
| Small Cap Growth Fund | | | 1.50 | % | | | 2.30 | % | | | 0.95 | % |
| Smaller Company Fund | | | 1.50 | % | | | 2.30 | % | | | 0.95 | % |
| | | |
| Expense limitations rate schedule (cont’d) | | Class R-3 | | | Class R-5 | | | Class R-6 | |
| Capital Appreciation Fund | | | 1.65 | % | | | 0.95 | % | | | 0.85 | % |
| Growth & Income Fund | | | 1.65 | % | | | 0.95 | % | | | 0.85 | % |
| International Stock Fund | | | 1.75 | % | | | 1.15 | % | | | 1.05 | % |
| Investment Grade Bond Fund | | | 1.15 | % | | | 0.60 | % | | | 0.50 | % |
| Mid Cap Growth Fund | | | 1.70 | % | | | 0.95 | % | | | 0.85 | % |
| Mid Cap Stock Fund | | | 1.70 | % | | | 0.95 | % | | | 0.85 | % |
| Small Cap Growth Fund | | | 1.70 | % | | | 0.95 | % | | | 0.85 | % |
| Smaller Company Fund | | | 1.70 | % | | | 0.95 | % | | | 0.85 | % |
Fees and expenses waived and/or reimbursed based on the expense rate limitation schedule were as follows:
| | | | |
| Expenses waived and/or reimbursed | | 11/1/2014 to
10/31/2015 | |
| International Stock Fund | | | $317,873 | |
| International Stock Fund Class I | | | 1,726 | |
| International Stock Fund Class R-5 | | | 1 | |
| International Stock Fund Class R-6 | | | 4 | |
| Investment Grade Bond Fund | | | 201,626 | |
| Investment Grade Bond Fund Class A | | | 27,428 | |
| Investment Grade Bond Fund Class C | | | 23,111 | |
| Investment Grade Bond Fund Class I | | | 8,879 | |
| Investment Grade Bond Fund Class R-3 | | | 47 | |
| Investment Grade Bond Fund Class R-5 | | | 1 | |
| | | | |
| Expenses waived and/or reimbursed (con’d) | | 11/1/2014 to
10/31/2015 | |
| Investment Grade Bond Fund Class R-6 | | | $1 | |
| Mid Cap Stock Fund Class I | | | 75,095 | |
| Mid Cap Stock Fund Class R-5 | | | 90 | |
| Smaller Company Fund | | | 156,879 | |
| Smaller Company Fund Class I | | | 25,016 | |
| Smaller Company Fund Class R-3 | | | 600 | |
| Smaller Company Fund Class R-5 | | | 1 | |
| Smaller Company Fund Class R-6 | | | 34,149 | |
A portion or all of a Fund’s fees and expenses reduced and/or reimbursed by the Manager in prior fiscal years may be recoverable by Eagle prior to their expiration date. Eagle must recover from the same class of shares any previously reduced and/or reimbursed fees and expenses within two years from the Fund’s fiscal year-end during which the fees and expenses were originally reduced and/or reimbursed. Previously reduced and/or reimbursed fees and expenses are recovered by Eagle when expenses in the current fiscal year fall below the expense rate limitation then in effect. The following table shows the amounts that Eagle may be allowed to recover by class of shares and the date in which these amounts will expire:
| | | | | | | | |
| Recoverable expenses | | 10/31/2017 | | | 10/31/2016 | |
| International Stock Fund | | | $317,873 | | | | $376,583 | |
| International Stock Fund Class I | | | 1,726 | | | | 651 | |
| International Stock Fund Class R-5 | | | 1 | | | | 1 | |
| International Stock Fund Class R-6 | | | 4 | | | | 4 | |
| Investment Grade Bond Fund | | | 201,626 | | | | 86,061 | |
| Investment Grade Bond Fund Class A | | | 27,428 | | | | 70,495 | |
| Investment Grade Bond Fund Class C | | | 23,111 | | | | 60,494 | |
| Investment Grade Bond Fund Class I | | | 8,879 | | | | 10,603 | |
| Investment Grade Bond Fund Class R-3 | | | 47 | | | | 78 | |
| Investment Grade Bond Fund Class R-5 | | | 1 | | | | 3 | |
| Investment Grade Bond Fund Class R-6 | | | 1 | | | | N/A | |
| Mid Cap Stock Fund Class I | | | 75,095 | | | | 131,328 | |
| Mid Cap Stock Fund Class R -5 | | | 90 | | | | — | |
| Smaller Company Fund | | | 156,879 | | | | — | |
| Smaller Company Fund Class I | | | 25,016 | | | | 170,844 | |
| Smaller Company Fund Class R-3 | | | 600 | | | | 317 | |
| Smaller Company Fund Class R-5 | | | 1 | | | | 38 | |
| Smaller Company Fund Class R-6 | | | 34,149 | | | | 23,868 | |
The Manager recovered previously waived expenses as follows:
| | | | |
| Recovered fees previously waived | | 11/1/2014 to
10/31/2015 | |
| Capital Appreciation Fund Class R-5 | | | $6,282 | |
Trustees and officers compensation | Each Trustee of the Eagle Family of Funds who is not an employee of the Manager receives an annual retainer along with meeting fees for those Eagle Family of Funds’ regular or special meetings attended in person and 25% of such fees are received for telephonic meetings. All reasonable out-of-pocket expenses are also reimbursed. Except when
Notes to Financial Statements
directly attributable to a Fund, Trustees’ fees and expenses are paid equally by each Fund in the Eagle Family of Funds. Certain officers of the Eagle Family of Funds may also be officers and/or directors of Eagle. Such officers receive no compensation from the Funds except for the Funds’ Chief Compliance Officer. A portion of the Chief Compliance Officer’s total compensation is paid equally by each Fund in the Eagle Family of Funds.
NOTE 5 | Federal income taxes and distributions | Each Fund is treated as a single corporate taxpayer as provided for in the Tax Reform Act of 1986, as amended. Accordingly, no provision for federal income taxes is required since each of the Funds intends to continue to qualify as a regulated investment company under Subchapter M of the Internal Revenue Code and distribute to shareholders all of its taxable income and gains. The Manager has analyzed the Funds’ tax positions taken or expected to be taken on federal income tax returns for all open tax years (tax years ended October 31, 2012 to October 31, 2015) and has concluded that no provision for federal income tax is required in the Funds’ financial statements.
Federal income tax regulations differ from GAAP; therefore, distributions determined in accordance with tax regulations may differ significantly in amount or character from net investment income and net realized gains for financial reporting purposes. These differences primarily relate to deferral of losses from wash sales and non-REIT return of capital.
For income tax purposes, distributions paid during the fiscal years indicated were as follows:
| | | | | | | | | | | | | | | | |
| | | Ordinary income | | | Long-term capital gains | |
| | | 10/31/15 | | | 10/31/14 | | | 10/31/15 | | | 10/31/14 | |
| Capital Appreciation Fund | | | $3,601,350 | | | | $— | | | | $40,341,425 | | | | $35,009,202 | |
| Growth & Income Fund | | | 10,641,982 | | | | 8,518,286 | | | | 4,636,851 | | | | 10,915,677 | |
| International Stock Fund | | | 564,440 | | | | 88,661 | | | | — | | | | — | |
| Investment Grade Bond Fund | | | 690,289 | | | | 544,949 | | | | — | | | | 195,015 | |
| Mid Cap Growth Fund | | | — | | | | 4,820,359 | | | | 68,282,709 | | | | 23,561,451 | |
| Mid Cap Stock Fund | | | — | | | | 18,967,002 | | | | 31,201,435 | | | | 11,791,826 | |
| Small Cap Growth Fund | | | — | | | | — | | | | 415,686,715 | | | | 49,712,316 | |
| Smaller Company Fund | | | — | | | | 245,723 | | | | 37,344,156 | | | | 3,211,225 | |
| | | | | | | | |
| | | Return of capital | |
| | | 10/31/15 | | | 10/31/14 | |
| Capital Appreciation Fund | | | $— | | | | $— | |
| Growth & Income Fund | | | 660,554 | | | | — | |
| International Stock Fund | | | — | | | | — | |
| Investment Grade Bond Fund | | | — | | | | — | |
| Mid Cap Growth Fund | | | — | | | | — | |
| Mid Cap Stock Fund | | | — | | | | — | |
| Small Cap Growth Fund | | | — | | | | — | |
| Smaller Company Fund | | | — | | | | — | |
Financial reporting records are adjusted for permanent book/tax differences to reflect tax character; these adjustments have no effect on net assets or NAV per share. Financial reporting records are not adjusted for temporary differences. The reclassifications arise from permanent book/tax differences primarily attributable to net operating losses not utilized, foreign currency transactions, capital loss carryforwards expired, return of capital distributions from REITs, return of capital distributions from non-REITs, paydowns on debt securities, adjustments for partnership distributions and income, merger
adjustments, and the tax practice of equalization which treats a portion of the proceeds from each redemption of Fund shares as a distribution of undistributed taxable net investment income or realized gains. The reclassifications were as follows:
| | | | | | | | | | | | |
| Fund | | Undistributed
net investment
income (loss) | | | Accumulated
net realized
gain (loss) | | | Paid-in
capital | |
| Capital Appreciation Fund | | | $(12) | | | | $(5,045,079) | | | | $5,045,091 | |
| Growth & Income Fund | | | (1,315,973 | ) | | | 1,333,703 | | | | (17,730 | ) |
| International Stock Fund | | | (11,148 | ) | | | 11,148 | | | | — | |
| Investment Grade Bond Fund | | | 20,418 | | | | (20,418 | ) | | | — | |
| Mid Cap Growth Fund | | | 1,297,467 | | | | 133,443 | | | | (1,430,910 | ) |
| Mid Cap Stock Fund | | | 2,278,289 | | | | (226,258 | ) | | | (2,052,031 | ) |
| Small Cap Growth Fund | | | 12,616,779 | | | | (327,621 | ) | | | (12,289,158 | ) |
| Smaller Company Fund | | | 223,560 | | | | (3,780,759 | ) | | | 3,557,199 | |
At October 31, 2015, the Funds had capital loss carryforwards available to offset future realized gains through the years listed below as follows:
| | | | | | | | | | | | | | | | |
| Fund | | 10/31/16 | | | 10/31/17 | | | Indefinitely | | | Total | |
| Capital Appreciation Fund | | | $— | | | | $— | | | | $— | | | | $— | |
| Growth & Income Fund* | | | 632,144 | | | | 1,477,645 | | | | — | | | | 2,109,789 | |
| International Stock Fund | | | — | | | | — | | | | 124,010 | | | | 124,010 | |
| Investment Grade Bond Fund | | | — | | | | — | | | | — | | | | — | |
| Mid Cap Growth Fund | | | — | | | | — | | | | — | | | | — | |
| Mid Cap Stock Fund | | | — | | | | — | | | | — | | | | — | |
| Small Cap Growth Fund | | | — | | | | — | | | | — | | | | — | |
| Smaller Company Fund | | | — | | | | — | | | | 340,354 | | | | 340,354 | |
| | | | | | | | |
| Fund | | Capital loss
carryforwards
utilized during the
year fiscal ended
October 31, 2015 | | | Capital loss
carryforwards expired
during the fiscal year
ended October 31, 2015 | |
| Capital Appreciation Fund | | | $— | | | | $— | |
| Growth & Income Fund* | | | 37,385 | | | | — | |
| International Stock Fund | | | — | | | | — | |
| Investment Grade Bond Fund | | | — | | | | — | |
| Mid Cap Growth Fund | | | — | | | | — | |
| Mid Cap Stock Fund | | | — | | | | — | |
| Small Cap Growth Fund | | | — | | | | — | |
| Smaller Company Fund | | | — | | | | — | |
* Capital loss carryforwards reflected above are a result of the merger with Large Cap Core Fund on January 20, 2012. Of this amount, $1,394,065 is available for use in the fiscal year ending October 31, 2016 and the remaining $715,724 becomes available for use in the fiscal year ending October 31, 2017.
Notes to Financial Statements
As of October 31, 2015, the components of distributable earnings on a tax basis were as follows:
| | | | | | | | | | | | | | | | | | | | |
| Fund | | Undistributed
Ordinary
Income | | | Undistributed
Long-term
gain | | | Other
Accumulated
Losses | | | Late Year
Loss
Deferral | | | Net
unrealized
app/(dep) | |
| Capital Appreciation Fund | | | $402,892 | | | | $46,902,646 | | | | $— | | | | $— | | | | $110,234,077 | |
| Growth & Income Fund | | | — | | | | — | | | | (2,109,789 | ) | | | — | | | | 126,436,849 | † |
| International Stock Fund | | | 74,253 | | | | — | | | | (124,010 | ) | | | — | | | | 314,801 | †† |
| Investment Grade Bond Fund | | | 166,784 | | | | 4,436 | | | | (75,331 | ) | | | — | | | | 214,802 | |
| Mid Cap Growth Fund | | | — | | | | 20,208,677 | | | | — | | | | (4,473,377 | ) | | | 229,350,642 | |
| Mid Cap Stock Fund | | | — | | | | 38,425,739 | | | | — | | | | (2,008,520 | ) | | | 56,348,194 | |
| Small Cap Growth Fund | | | — | | | | 251,016,827 | | | | — | | | | (15,076,793 | ) | | | 943,978,840 | |
| Smaller Company Fund | | | — | | | | — | | | | (360,901 | ) | | | (456,764 | ) | | | 10,547,074 | |
† Includes currency appreciation/(depreciation) of $(4,485)
†† Includes currency appreciation/(depreciation) of $(2,727)
NOTE 6 | Fund Reorganization | After the close of business on February 20, 2015, the Smaller Company Fund acquired the net assets of the Eagle Small Cap Stock Fund (“Small Cap Stock Fund”) pursuant to a Plan of Reorganization and Termination as approved by the Board of Trustees of Eagle Series Trust on November 14, 2014. The purpose was to combine funds managed by Eagle Asset Management, Inc. with substantially similar investment objectives and policies, although they employed different investment strategies to reach those objectives. The reorganization was accomplished by a tax-free exchange resulting in the Smaller Company Fund issuing 1,038,708 Class A shares, 1,158,849 Class C shares, 422,219 Class I shares, 5,582 Class R-3 shares, 260 Class R-5 shares and 260 Class R-6 shares in exchange for 698,341 Class A shares, 714,580 Class C shares, 297,440 Class I shares, 3,670 Class R-3 shares, 181 Class R-5 shares and 181 Class R-6 shares of the Small Cap Stock Fund. The Small Cap Stock Fund’s net assets at the reorganization date of $33,228,680, including $4,230,305 of unrealized appreciation, were combined with those of the Smaller Company Fund. Assuming the acquisition had been completed on November 1, 2014, the beginning of the annual reporting period of the Smaller Company Fund, pro forma results of operations for the fiscal year ended October 31, 2015 would include net investment loss of $518,714, and net realized and change in unrealized loss on investments of $1,246,364,
resulting in a decrease in net assets from operations of $1,765,078. Because the combined investment portfolios have been managed as a single integrated portfolio since the reorganization date, it is not practicable to separate the amounts of revenue and earnings of the Small Cap Stock Fund that have been included in the Smaller Company Fund‘s statement of operations since the reorganization date. Prior to the reorganization, the net assets of the Smaller Company Fund totaled $64,268,290. Immediately after the reorganization, the net assets of the Smaller Company Fund totaled $97,496,970.
NOTE 7 | Subsequent events | On November 13, 2015, the Board of Trustees of the Eagle Series Trust (“Trust”) approved the establishment of the Eagle Tactical Allocation Fund as a new Fund of the Trust. Subsequently, Eagle Series Trust filed an amendment to its registration pursuant to Rule 485(a) and the Fund is expected to commence operation on December 31, 2015.
The Manager has evaluated subsequent events through December 18, 2015, the date these financial statements were issued, and determined that no other material events or transactions would require recognition or disclosure in the Funds’ financial statements.

Report of Independent Registered Certified Public Accounting Firm
To the Board of Trustees and Shareholders of Eagle Capital Appreciation Fund, Eagle Growth & Income Fund, Eagle International Stock Fund, Eagle Investment Grade Bond Fund, Eagle Mid Cap Growth Fund, Eagle Mid Cap Stock Fund, Eagle Small Cap Growth Fund, and Eagle Smaller Company Fund:
In our opinion, the accompanying statements of assets and liabilities, including the investment portfolios, and the related statements of operations and of changes in net assets and the financial highlights present fairly, in all material respects, the financial position of Eagle Capital Appreciation Fund, Eagle Growth & Income Fund, Eagle International Stock Fund, Eagle Investment Grade Bond Fund, Eagle Mid Cap Growth Fund, Eagle Mid Cap Stock Fund, Eagle Small Cap Growth Fund, and Eagle Smaller Company Fund (the “Funds”) at October 31, 2015, the results of each of their operations for the year then ended, the changes in each of their net assets for each of the two years in the period then ended and the financial highlights for each of the periods indicated, in conformity with accounting principles generally accepted in the United States of America. These financial statements and financial highlights (hereafter referred to as “financial statements”) are the responsibility of the Funds’ management. Our responsibility is to express an opinion on these financial statements based on our audits. We conducted our audits of these financial statements in accordance with the standards of the Public Company Accounting Oversight Board (United States). Those standards require that we plan and perform the audit to obtain reasonable assurance about whether the financial statements are free of material misstatement. An audit includes examining, on a test basis, evidence supporting the amounts and disclosures in the financial statements, assessing the accounting principles used and significant estimates made by management, and evaluating the overall financial statement presentation. We believe that our audits, which included confirmation of securities at October 31, 2015 by correspondence with the custodian and brokers, provide a reasonable basis for our opinion.

Tampa, Florida
December 18, 2015
PricewaterhouseCoopers LLP, 4040 West Boy Scout Blvd., Suite 1000, Tampa, FL 33607
T: (813) 348-7000, www.pwc.com/us
Understanding Your Ongoing Costs
As a shareholder of a Fund, you incur two types of costs: (1) transaction costs, including sales charges on purchases, contingent deferred sales charges, or redemption fees; and (2) ongoing costs, including investment advisory fees, distribution (12b-1) fees, and other fund expenses. The following sections are intended to help you understand your ongoing costs (in dollars) of investing in each Fund and to compare these costs with the ongoing costs of investing in other mutual funds. Please note that the expenses shown in the table are meant to highlight your ongoing costs only and do not reflect one-time transaction expenses, such as sales charges or redemption fees. Therefore, if these transactional costs were included, your costs would have been higher. For more information, see your Fund’s prospectus or contact your financial advisor.
Actual expenses | The table below shows the actual expenses you would have paid on a $1,000 investment made in each Fund on May 1, 2015 and held through October 31, 2015. It also shows how much a $1,000 investment would be worth at the close of the fiscal year, assuming actual returns after
ongoing expenses. This table is useful in comparing ongoing costs only, and will not help you determine the relative total costs of owning different funds. Simply divide your account value by $1,000 (for example, and $8,600 account value divided by $1,000 = 8.6), then multiply the result by the number in the line under the heading entitled “Expenses paid during the period” to estimate the expenses you paid on your account during this period.
Hypothetical example for comparison purposes | The table below shows each Fund’s expenses based on a $1,000 investment held from May 1, 2015 through October 31, 2015 and assuming for this period a hypothetical 5% annualized rate of return before ongoing expenses, which is not the Fund’s actual return. Please note that you should not use this information to estimate your actual ending account balance and expenses paid during the period. You can use this information to compare the ongoing expenses (but not transaction expenses or total costs) of investing in the Funds with those of other funds. All mutual fund shareholder reports will provide this information to help you make this comparison.
| | | | | | | | | | | | | | | | | | | | | | | | |
| | | | | | Actual expenses | | | Hypothetical expenses | | | | |
| Actual | | Beginning
Account Value | | | Ending
Account Value | | | Expenses paid
during period (a) | | | Ending
Account Value | | | Expenses paid
during period | | | Annualized
expense ratio | |
| Capital Appreciation Fund | | | | | | | | | | | | | | | | | | | | | | | | |
Class A | | | $1,000.00 | | | | $1,055.20 | | | | $6.21 | | | | $1,019.16 | | | | $6.10 | | | | 1.20 | % |
Class C | | | 1,000.00 | | | | 1,051.00 | | | | 10.18 | | | | 1,015.27 | | | | 10.01 | | | | 1.97 | |
Class I | | | 1,000.00 | | | | 1,056.80 | | | | 4.74 | | | | 1,020.60 | | | | 4.65 | | | | 0.91 | |
Class R-3 | | | 1,000.00 | | | | 1,053.90 | | | | 7.74 | | | | 1,017.67 | | | | 7.60 | | | | 1.49 | |
Class R-5 | | | 1,000.00 | | | | 1,056.50 | | | | 4.92 | | | | 1,020.42 | | | | 4.84 | | | | 0.95 | |
Class R-6* | | | 1,000.00 | | | | 998.80 | | | | 2.06 | | | | 1,021.08 | | | | 4.17 | | | | 0.82 | |
| Growth & Income Fund | | | | | | | | | | | | | | | | | | | | | | | | |
Class A | | | 1,000.00 | | | | 968.40 | | | | 5.14 | | | | 1,019.99 | | | | 5.27 | | | | 1.04 | |
Class C | | | 1,000.00 | | | | 964.50 | | | | 8.97 | | | | 1,016.07 | | | | 9.21 | | | | 1.81 | |
Class I | | | 1,000.00 | | | | 969.20 | | | | 3.88 | | | | 1,021.27 | | | | 3.98 | | | | 0.78 | |
Class R-3 | | | 1,000.00 | | | | 965.80 | | | | 7.05 | | | | 1,018.03 | | | | 7.24 | | | | 1.42 | |
Class R-5 | | | 1,000.00 | | | | 963.70 | | | | 5.03 | | | | 1,020.08 | | | | 5.17 | | | | 1.02 | |
Class R-6 | | | 1,000.00 | | | | 967.00 | | | | 3.27 | | | | 1,021.88 | | | | 3.36 | | | | 0.66 | |
| International Stock Fund | | | | | | | | | | | | | | | | | | | | | | | | |
Class A | | | 1,000.00 | | | | 956.40 | | | | 7.81 | | | | 1,017.22 | | | | 8.05 | | | | 1.58 | |
Class C | | | 1,000.00 | | | | 952.50 | | | | 11.58 | | | | 1,013.35 | | | | 11.94 | | | | 2.35 | |
Class I | | | 1,000.00 | | | | 958.30 | | | | 5.68 | | | | 1,019.41 | | | | 5.85 | | | | 1.15 | |
Class R-3 | | | 1,000.00 | | | | 955.20 | | | | 8.60 | | | | 1,016.41 | | | | 8.87 | | | | 1.74 | |
Class R-5 | | | 1,000.00 | | | | 958.30 | | | | 5.68 | | | | 1,019.41 | | | | 5.85 | | | | 1.15 | |
Class R-6 | | | 1,000.00 | | | | 958.90 | | | | 5.19 | | | | 1,019.91 | | | | 5.35 | | | | 1.05 | |
| Investment Grade Bond Fund | | | | | | | | | | | | | | | | | | | | | | | | |
Class A | | | 1,000.00 | | | | 999.40 | | | | 4.28 | | | | 1,020.92 | | | | 4.33 | | | | 0.85 | |
Class C | | | 1,000.00 | | | | 996.00 | | | | 8.30 | | | | 1,016.89 | | | | 8.39 | | | | 1.65 | |
Class I | | | 1,000.00 | | | | 1,001.40 | | | | 3.03 | | | | 1,022.18 | | | | 3.06 | | | | 0.60 | |
Class R-3 | | | 1,000.00 | | | | 998.60 | | | | 5.79 | | | | 1,019.41 | | | | 5.85 | | | | 1.15 | |
Class R-5 | | | 1,000.00 | | | | 1,001.00 | | | | 3.03 | | | | 1,022.18 | | | | 3.06 | | | | 0.60 | |
Class R-6* | | | 1,000.00 | | | | 1,007.10 | | | | 1.26 | | | | 1,022.70 | | | | 2.54 | | | | 0.50 | |
| Mid Cap Growth Fund | | | | | | | | | | | | | | | | | | | | | | | | |
Class A | | | 1,000.00 | | | | 980.60 | | | | 5.62 | | | | 1,019.53 | | | | 5.73 | | | | 1.13 | |
Class C | | | 1,000.00 | | | | 976.80 | | | | 9.33 | | | | 1,015.76 | | | | 9.52 | | | | 1.87 | |
Class I | | | 1,000.00 | | | | 982.00 | | | | 4.05 | | | | 1,021.12 | | | | 4.13 | | | | 0.81 | |
Class R-3 | | | 1,000.00 | | | | 979.20 | | | | 6.98 | | | | 1,018.16 | | | | 7.11 | | | | 1.40 | |
Class R-5 | | | 1,000.00 | | | | 981.90 | | | | 4.02 | | | | 1,021.15 | | | | 4.10 | | | | 0.81 | |
Class R-6 | | | 1,000.00 | | | | 982.90 | | | | 3.65 | | | | 1,021.53 | | | | 3.72 | | | | 0.73 | |
Understanding Your Ongoing Costs
| | | | | | | | | | | | | | | | | | | | | | | | |
| | | | | | Actual expenses | | | Hypothetical expenses | | | | |
| Actual | | Beginning
Account Value | | | Ending
Account Value | | | Expenses paid
during period (a) | | | Ending
Account Value | | | Expenses paid
during period | | | Annualized
expense ratio | |
| Mid Cap Stock Fund | | | | | | | | | | | | | | | | | | | | | | | | |
Class A | | | $1,000.00 | | | | $954.50 | | | | $6.14 | | | | $1,018.92 | | | | $6.34 | | | | 1.25 | % |
Class C | | | 1,000.00 | | | | 950.90 | | | | 9.87 | | | | 1,015.09 | | | | 10.19 | | | | 2.01 | |
Class I | | | 1,000.00 | | | | 956.20 | | | | 4.68 | | | | 1,020.42 | | | | 4.84 | | | | 0.95 | |
Class R-3 | | | 1,000.00 | | | | 952.60 | | | | 8.28 | | | | 1,016.72 | | | | 8.55 | | | | 1.68 | |
Class R-5 | | | 1,000.00 | | | | 956.50 | | | | 4.68 | | | | 1,020.42 | | | | 4.84 | | | | 0.95 | |
Class R-6 | | | 1,000.00 | | | | 956.80 | | | | 4.14 | | | | 1,020.97 | | | | 4.28 | | | | 0.84 | |
| Small Cap Growth Fund | | | | | | | | | | | | | | | | | | | | | | | | |
Class A | | | 1,000.00 | | | | 971.60 | | | | 5.41 | | | | 1,019.72 | | | | 5.54 | | | | 1.09 | |
Class C | | | 1,000.00 | | | | 968.00 | | | | 9.02 | | | | 1,016.04 | | | | 9.24 | | | | 1.82 | |
Class I | | | 1,000.00 | | | | 973.20 | | | | 3.87 | | | | 1,021.28 | | | | 3.97 | | | | 0.78 | |
Class R-3 | | | 1,000.00 | | | | 970.00 | | | | 7.05 | | | | 1,018.05 | | | | 7.22 | | | | 1.42 | |
Class R-5 | | | 1,000.00 | | | | 973.30 | | | | 3.67 | | | | 1,021.48 | | | | 3.76 | | | | 0.74 | |
Class R-6 | | | 1,000.00 | | | | 973.90 | | | | 3.27 | | | | 1,021.89 | | | | 3.35 | | | | 0.66 | |
| Smaller Company Fund | | | | | | | | | | | | | | | | | | | | | | | | |
Class A | | | 1,000.00 | | | | 952.10 | | | | 7.04 | | | | 1,017.99 | | | | 7.28 | | | | 1.43 | |
Class C | | | 1,000.00 | | | | 948.50 | | | | 10.89 | | | | 1,014.03 | | | | 11.26 | | | | 2.22 | |
Class I | | | 1,000.00 | | | | 954.00 | | | | 4.68 | | | | 1,020.42 | | | | 4.84 | | | | 0.95 | |
Class R-3 | | | 1,000.00 | | | | 950.70 | | | | 8.36 | | | | 1,016.64 | | | | 8.64 | | | | 1.70 | |
Class R-5 | | | 1,000.00 | | | | 954.90 | | | | 4.68 | | | | 1,020.42 | | | | 4.83 | | | | 0.95 | |
Class R-6 | | | 1,000.00 | | | | 955.00 | | | | 4.19 | | | | 1,020.92 | | | | 4.33 | | | | 0.85 | |
(a) Expenses are calculated using each Fund’s annualized expense ratios for each class of shares, multiplied by the average account value for the period, then multiplying the result by the actual number of days in the period (184), and then dividing that result by the actual number of days in the fiscal year (365).
* Commenced operations on July 31, 2015. Actual expenses information is for the period from July 31, 2015 to October 31, 2015.
Renewal of Investment Advisory and Subadvisory Agreements
OVERVIEW | At a meeting held on August 14, 2015, the Boards of Trustees for the Eagle Capital Appreciation Fund, Eagle Growth & Income Fund and Eagle Series Trust, including their independent members (together, the “Board”), approved the renewal of the investment advisory agreement between Eagle Asset Management, Inc. (“Eagle”) and: (1) Eagle Capital Appreciation Fund; (2) Eagle Growth & Income Fund; and (3) Eagle Series Trust, on behalf of the Eagle International Stock Fund, Eagle Investment Grade Bond Fund, Eagle Mid Cap Growth Fund, Eagle Mid Cap Stock Fund, Eagle Small Cap Growth Fund, Eagle Smaller Company Fund and Eagle Tax-Exempt Bond Fund. Each of the funds mentioned is referred to as a “Fund” and, collectively, as the “Funds.”
The Board also approved the renewal of the investment subadvisory agreement with ClariVest Asset Management LLC (“ClariVest”), the subadviser to the Eagle Capital Appreciation Fund and the Eagle International Stock Fund. Each of the investment advisory and subadvisory agreements is referred to herein as an “Agreement” and, collectively, as the “Agreements.”
In renewing the Agreements, the Board took into consideration information furnished for the Board’s review and consideration throughout the year at regular Board meetings, as well as information specifically prepared in connection with the annual renewal process. The Board, acting directly or through its committees, was provided with information and reports relevant to the annual renewal of the Agreements, including: reports regarding the services and support provided to the Funds and their shareholders by Eagle, ClariVest, J.P. Morgan Worldwide Securities Services Co. (“J.P. Morgan”), a third party that provides sub-administration, transfer agent, fund accounting and custody services to the Funds, and U.S. Bancorp Fund Services, LLC (“USBFS”), which provides certain sub-transfer agent services to the Funds; information on the Funds’ performance and commentary on the performance; presentations by Fund portfolio managers addressing, as applicable, Eagle’s and ClariVest’s investment philosophy, investment strategies, personnel and operations; compliance and audit reports concerning the Funds, Eagle, ClariVest, J.P. Morgan and USBFS, including responses to issues raised therein; and information on relevant developments in the mutual fund industry and how the Eagle Funds and/or Eagle are responding to them.
As part of the renewal process, the Board, with the assistance of independent legal counsel, requested and received additional reports containing substantial and detailed information regarding the Funds, Eagle, and ClariVest. Among other matters, these reports included information on: (1) the nature and extent of the advisory and other services provided by Eagle; (2) the personnel of Eagle and ClariVest; (3) the financial condition of Eagle and ClariVest; (4) the compliance programs and records of Eagle and ClariVest; (5) the performance of the Funds as compared to funds within their Morningstar category (“Morningstar Category”), Lipper, Inc. category (“Lipper Category”) and appropriate benchmarks; (6) the Funds’ expenses, including the advisory fee rates, the overall expense structures of the Funds, both in absolute terms and relative to funds within a refined Morningstar Category population (“Morningstar Population”), and any applicable contractual expense limitations; (7) the anticipated effect of growth and size on the Funds’ performance and expenses, where applicable; (8) benefits to be realized by Eagle, ClariVest and their respective affiliates; and (9) the estimated profitability of Eagle and ClariVest under the Agreements, if available. The Board posed questions to various management personnel of Eagle regarding certain key aspects of the materials submitted in support of the renewal.
With respect to the renewal of the Agreements, the Board considered various factors, including: (1) the nature, extent and quality of services provided to the Funds; (2) the investment performance of the Funds; (3) the costs of the services provided to the Funds and the profits realized by Eagle and ClariVest and their respective affiliates from their relationship with the Funds; (4) the extent to which economies of scale have been realized as the Funds grow; (5) whether the level of fees reflects those economies of scale for the benefit of the Funds’ investors; (6) comparisons of services and fees with contracts entered into by Eagle and ClariVest with other clients (such as pension funds
and other institutional investors); and (7) any other benefits derived by Eagle from its relationship with the Funds.
Provided below is a discussion of the factors the Board considered at its August meeting to form the basis of its renewal of the Agreements. The Board did not identify any particular information that was most relevant to its consideration to renew the Agreements and each Trustee may have accorded different weight to the various factors.
NATURE, EXTENT AND QUALITY OF SERVICES | The Board considered that Eagle and ClariVest are experienced in serving as investment advisers for the Funds and have provided a continuous investment program for the Funds. The Board noted that Eagle oversees and monitors the performance and services provided by ClariVest, and the Funds’ other service providers, and is responsible for the selection of Fund subadvisers. The Board also considered that Eagle and its affiliates, Eagle Fund Distributors, Inc. (“EFD”) and Eagle Fund Services, Inc. (“EFS”), provide certain administration, distribution and shareholder services to the Funds. In addition, the Board noted that Eagle is responsible for oversight of compliance with the Funds’ policies and objectives, review of brokerage matters, oversight of the Funds’ compliance with applicable law and implementation of Board directives as they relate to the Funds. The Board noted that shareholders in the Funds have a broad range of investment choices available to them, including a wide choice among mutual funds offered by Eagle’s competitors, and that the Funds’ shareholders, with the opportunity to review and weigh the disclosure provided by the Funds in their prospectuses and other public disclosures, have chosen to invest in the Funds.
The Board noted that ClariVest is responsible for making investment decisions on behalf of the Eagle Capital Appreciation Fund and the Eagle International Stock Fund. The Board considered that ClariVest is responsible for placing all orders for the purchase and sale of securities with broker-dealers for the Eagle International Stock Fund and that Eagle places purchase and sale orders for the other Funds. The Board considered information regarding: (1) the Eagle and ClariVest personnel who provide services to the Funds; (2) certifications as to the adequacy of the compliance programs of Eagle and ClariVest; (3) the financial information regarding Eagle and ClariVest, as provided; and (4) Eagle’s recommendation to continue to retain ClariVest to manage the Eagle Capital Appreciation Fund and Eagle International Stock Fund.
INVESTMENT PERFORMANCE | The Board considered comparisons of each Fund’s Class A performance, including, if applicable, a Fund’s year to date, one-, three-, five- and ten-year annualized total returns for the period ended June 30, 2015, relative to the average performance of its Morningstar Category and Lipper Category funds and benchmark indices. The Board also considered the performance of Eagle relative to the composite performance of comparable accounts managed by Eagle, as well as the performance of ClariVest relative to other accounts that ClariVest manages, to the extent such information was available.
With respect to the Eagle Capital Appreciation Fund, the Board noted that the following specific factors regarding performance: (1) the Fund outperformed its benchmark index for the year-to-date, one- and three-year periods, but underperformed for the five- and ten-year periods; (2) the Fund outperformed the average performance of its Morningstar Category for all relevant periods; (3) the Fund outperformed the average performance of its Lipper Category for all relevant periods other than the five-year period; (4) the Fund underperformed an institutional composite managed by ClariVest for all relevant periods; and (5) the Fund’s overall 3-star Morningstar rating. The Board also noted that ClariVest’s representation that the ClariVest composite and its constituents should not be considered “comparable accounts” due to limitations imposed on the implementation of ClariVest’s investment strategy to manage the tax consequences associated with the alignment of the Fund’s portfolio to ClariVest’s strategy. However, the Board considered that the Fund was added to ClariVest’s composite as of December 31, 2014.
Renewal of Investment Advisory and Subadvisory Agreements
With respect to the Eagle Growth & Income Fund, the Board noted the following specific factors regarding performance: (1) the Fund outperformed its benchmark index and the average performance of its Morningstar Category and Lipper Category for the ten-year period, but underperformed for all other relevant periods; (2) the Fund outperformed the composite performance of comparable institutional accounts managed by Eagle for all relevant time periods with the exception of the five-year period; and (3) the Fund’s overall 3-star Morningstar rating.
With respect to the Eagle International Stock Fund, the Board noted the following specific factors regarding performance: (1) the Fund outperformed its benchmark index and the average performance of its Morningstar Category and Lipper Category for the year-to-date and the one-year periods: (2) the Fund underperformed the composite performance of comparable institutional accounts managed by ClariVest for the year-to-date and one-year periods; and (3) the Fund has not yet received a Morningstar rating.
With respect to the Eagle Investment Grade Bond Fund, the Board noted the following specific factors regarding performance: (1) the Fund underperformed its benchmark index for all relevant periods; (2) the Fund outperformed the average performance of its Morningstar Category for the one- and five-year periods but underperformed for the year-to-date and three-year periods; (3) the Fund outperformed the average performance of its Lipper Category for the one-year period, but underperformed for all other relevant periods; (4) the Fund outperformed comparable institutional accounts managed by Eagle for all relevant periods; and (5) the Fund’s overall 2-star Morningstar rating.
With respect to the Eagle Mid Cap Growth Fund, the Board noted the following specific factors regarding performance: (1) the Fund outperformed its benchmark index for all relevant periods with the exception of the five-year period, during which it underperformed; (2) the Fund outperformed the average performance of its Morningstar Category and Lipper Category for all relevant time periods; (3) the Fund outperformed the composite performance of comparable institutional accounts managed by Eagle for the ten-year period, but underperformed for all other relevant periods; and (4) the Fund’s 4-star Morningstar rating.
With respect to the Eagle Mid Cap Stock Fund, the Board noted the following specific factors regarding performance: (1) the Fund outperformed its primary and secondary benchmark indices for the year-to-date and one-year periods, but underperformed for all other relevant periods; (2) the Fund outperformed the average performance of its Morningstar Category for the year-to-date period and underperformed for all relevant time periods; (3) the Fund outperformed the average performance of its Lipper Category for the year-to-date period and underperformed for all relevant time periods; (4) the Fund outperformed the composite performance of comparable institutional accounts managed by Eagle for all relevant time periods; and (5) the Fund’s 2-star Morningstar rating.
With respect to the Eagle Small Cap Growth Fund, the Board noted the following specific factors regarding performance: (1) the Fund outperformed its benchmark index for the one- and ten-year periods, but underperformed for the year-to-date, three- and five-year periods; (2) the Fund outperformed the average performance of its Morningstar Category and Lipper Category for all relevant periods; (3) the Fund outperformed the composite performance of comparable institutional accounts managed by Eagle for all relevant periods; and (4) the Fund’s 3-star Morningstar rating.
With respect to the Eagle Smaller Company Fund, the Board noted the following specific factors regarding performance: (1) the Fund underperformed its primary and secondary benchmark indices, its Morningstar Category, Lipper Category and comparable institutional accounts managed by Eagle for all relevant time periods; and (2) the Fund’s 2-star Morningstar rating.
With respect to the Eagle Tax Exempt Bond Fund, the Board noted that the Fund had no performance history because the fund had not yet commenced operations.
FEES AND EXPENSES | The Board considered the advisory fee rate payable by each Fund to Eagle under the Agreements, the subadvisory fee rate payable to ClariVest and each Fund’s total expense ratio and its Rule 12b-1 fees. The Board also considered comparisons of a Fund’s expense ratio (with Rule 12b-1 fees) to the average expense ratio of its Morningstar Category and Peer Group within that Morningstar Category based on data ended June 30, 2015. In addition, the Board noted that Eagle had undertaken contractual expense limitations with respect to the Funds for its 2015 fiscal year, which will continue for the 2016 fiscal year.
With respect to the Eagle Capital Appreciation Fund, the Board noted that the Fund’s net expense ratio was higher than the average net expense ratio of its Morningstar Population. The Board also noted that Eagle does not manage any similar accounts, and that the subadvisory fee rate paid to ClariVest by Eagle was higher than ClariVest’s standard fee rate for its large cap growth strategy at current asset levels.
With respect to Eagle Growth & Income Fund, the Board noted that the Fund’s net expense ratio was lower than the average net expense ratio of its Morningstar Population. The Board also noted that Eagle’s advisory and total management fee rates were higher than the fee rates charged to comparably-sized institutional accounts at comparable asset levels, but that the effective fee rate paid by the Fund was lower than the average advisory fee being paid by institutional accounts in the same strategy.
With respect to the Eagle International Stock Fund, the Board noted that the Fund’s net expense ratio was higher than the average net expense ratio of its Morningstar Population. In this regard, the Board noted the Fund’s relatively small amount of assets. The Board also noted that Eagle does not manage any similar accounts, and that the subadvisory fee rate paid to ClariVest by Eagle was higher than ClariVest’s standard fee rate for its international core strategy.
With respect to the Eagle Investment Grade Bond Fund, the Board noted that the Fund’s net expense ratio was the same as the average net expense ratio of its Morningstar Population. The Board also noted that Eagle’s advisory and total management fee rates were higher than the fee rate charged to comparably-sized institutional accounts.
With respect to the Eagle Mid Cap Growth Fund, the Board noted that the Fund’s net expense ratio was lower than the average net expense ratio of its Morningstar Population. The Board also noted that Eagle’s advisory and total management fee rates were lower than the fee rate charged to comparably-sized institutional accounts at comparable asset levels.
With respect to the Eagle Mid Cap Stock Fund, the Board noted that the Fund’s net expense ratio was lower than the average net expense ratio of its Morningstar Population. The Board also noted that Eagle’s representation that it does not manage any similar accounts in the mid-cap strategy, but that, at current asset levels, the Fund’s advisory fee rate was lower than Eagle’s standard fee rates for separate accounts in the mid cap strategy and its total management fee rate was the same as the fee rate charged to comparably-sized institutional accounts at comparable asset levels.
With respect to the Eagle Small Cap Growth Fund, the Board noted that the Fund’s net expense ratio was lower than the average net expense ratio of its Morningstar Population. The Board also noted that Eagle’s advisory and total management fee rates were lower than the fee rate charged to comparably-sized institutional accounts.
With respect to the Eagle Smaller Company Fund, the Board noted that the Fund’s net expense ratio was higher than the average net expense ratio of its Morningstar Population. The Board also noted that Eagle’s advisory and total management fee rates were lower than the fees charged to comparably-sized institutional accounts, but higher than the fee rate charged to an investment company subadvisory client.
Renewal of Investment Advisory and Subadvisory Agreements
With respect to the Tax Exempt Bond Fund, the Board noted the Fund’s estimated net expense ratio would be higher than the average net expense ratio of its Morningstar Population. The Board also noted that Eagle’s advisory fee rate would be lower and total management fee rate would be higher than the fee rates that Eagle charges to comparable institutional accounts at the lowest asset levels.
COSTS, PROFATIBILITY AND ECONOMIES OF SCALE | The Board evaluated Eagle’s and, to the extent available, ClariVest’s costs and profitability in providing services to the Funds. The Board noted that ClariVest’s costs and profitability generally are less significant to the Board’s evaluation of the fee rates and expenses paid by a Fund than Eagle’s advisory fee rate and profitability and the Fund’s overall expense ratios. The Board noted that Eagle’s profits on the services it provided to the Funds are reasonable in light of Eagle’s costs in providing services to each Fund and that Eagle manages each Fund’s assets and provides a comprehensive compliance program for each Fund.
The Board considered that the advisory fee rate structures for certain of the Funds provide for breakpoints, which is a reduction of the applicable fee rate as assets increase. The Board also considered that each Fund may benefit from economies of scale, and shareholders may realize such economies of scale, through: (1) reduced advisory fees achieved when a Fund’s asset size reaches breakpoints in the fee schedules instituted by Eagle; (2) increased services to a Fund; or (3) allocation of fixed fund expenses over a large asset size.
BENEFITS | In evaluating compensation, the Board considered other benefits that may be realized by Eagle, ClariVest and their respective affiliates from their relationship with the Funds. The Board noted that Eagle and its affiliates have entered into revenue sharing and services agreements with third parties for
marketing and/or shareholder services. The Board also considered that the Funds compensate Eagle for providing administrative services and EFS for providing shareholder services. The Board recognized that, as the Funds’ principal underwriter and distributor, EFD receives Rule 12b-1 payments from the Funds to compensate it for providing services and distribution activities. These activities could lead to growth in the Funds’ assets and the corresponding benefits of that growth, including economies of scale and greater diversification. In addition, other affiliates of Eagle have entered into agreements with EFD to sell Fund shares and receive compensation from EFD. The Board noted that ClariVest does not enter into formal soft dollar arrangements. However, the Board also noted that Eagle has entered into a marketing agreement with ClariVest pursuant to which ClariVest pays Eagle a fee for performing marketing and client services for the Funds and other clients of ClariVest.
CONCLUSIONS | Based on these considerations, the Board concluded with respect to the Funds that: (1) each Fund was reasonably likely to benefit from the nature, quality and extent of Eagle’s and ClariVest’s services, as applicable to the Funds; (2) each Fund’s performance was satisfactory in light of all the factors considered by the Board; (3) the fees payable under the Agreements and profits earned by Eagle and ClariVest were reasonable in the context of all the factors considered by the Board; and (4) the current advisory fee rate structure provides each Fund’s shareholders with reasonable benefits associated with economies of scale. Based on these conclusions and other factors, the Board determined in its business judgment to renew the Agreements and to approve the Agreements between each Fund and Eagle and between Eagle and ClariVest.
2015 Federal Tax Notice
The following information for the fiscal year ended October 31, 2015 for the Eagle Family of Funds is provided pursuant to provisions of the Internal Revenue Code.
The information and distributions reported herein may differ from the information and distributions taxable to the shareholders for the calendar year ended December 31, 2015. All dividends paid by the Funds from net investment income are deemed to be ordinary income for federal income tax purposes. Complete information will be computed and reported in conjunction with your 2015 Form 1099-DIV.
The amounts shown may differ from amounts disclosed elsewhere in this report due to differences between tax and financial reporting requirements.
| | | | | | | | | | | | |
| Fund | | Qualified
dividend
income | | | Dividends
Received
Deduction | | | Long-term
capital gains | |
| Capital Appreciation Fund | | | 100.00 | % | | | 100.00 | % | | | $45,386,516 | |
| Growth & Income Fund | | | 100.00 | % | | | 100.00 | % | | | 4,636,851 | |
| International Stock Fund | | | 15.41 | % | | | — | | | | — | |
| Investment Grade Bond Fund | | | — | | | | — | | | | — | |
| Mid Cap Growth Fund | | | — | | | | — | | | | 68,282,709 | |
| Mid Cap Stock Fund | | | — | | | | — | | | | 31,201,435 | |
| Small Cap Growth Fund | | | — | | | | — | | | | 415,686,715 | |
| Smaller Company Fund | | | — | | | | — | | | | 40,752,914 | |
Principal Risks
Additional Information About Principal Risk Factors
The greatest risk of investing in a mutual fund is that its returns will fluctuate and you could lose money. Turbulence in financial markets and reduced liquidity in equity, credit and fixed income markets may negatively affect many issuers worldwide, which could have an adverse effect on the Funds. Additionally, while the portfolio managers seek to take advantage of investment opportunities that will maximize a fund’s investment returns, there is no guarantee that such opportunities will ultimately benefit the fund. There is no assurance that the portfolio managers’ investment strategy will enable a fund to achieve its investment objective. The following table identifies the risk factors of each fund in light of their respective principal investment strategies. These risk factors are explained following the table.
| | | | | | | | | | | | | | | | | | | | | | | | | | | | | | | | |
| Risk | | Capital Appreciation Fund | | | Growth & Income Fund | | | International Stock Fund | | | Investment Grade Bond Fund | | | Mid Cap Growth Fund | | | Mid Cap Stock Fund | | | Small Cap Growth Fund | | | Smaller Company Fund | |
| Call | | | | | | | | | | | | | | | X | | | | | | | | | | | | | | | | | |
| Credit | | | | | | | | | | | | | | | X | | | | | | | | | | | | | | | | | |
| Equity Securities | | | X | | | | X | | | | X | | | | | | | | X | | | | X | | | | X | | | | X | |
| Fixed income market | | | | | | | | | | | | | | | X | | | | | | | | | | | | | | | | | |
| Focused holdings | | | | | | | X | | | | | | | | | | | | | | | | | | | | | | | | | |
| Foreign securities | | | | | | | X | | | | X | | | | X | | | | | | | | | | | | | | | | | |
| Government sponsored enterprises | | | | | | | | | | | | | | | X | | | | | | | | | | | | | | | | | |
| Growth stocks | | | X | | | | X | | | | X | | | | | | | | X | | | | X | | | | X | | | | X | |
| High-yield securities | | | | | | | | | | | | | | | X | | | | | | | | | | | | | | | | | |
| Inflation | | | | | | | | | | | | | | | X | | | | | | | | | | | | | | | | | |
| Interest rates | | | | | | | | | | | | | | | X | | | | | | | | | | | | | | | | | |
| Liquidity | | | | | | | | | | | X | | | | X | | | | | | | | | | | | | | | | | |
| Market timing | | | | | | | | | | | X | | | | | | | | | | | | | | | | X | | | | X | |
| Mid-cap companies | | | X | | | | X | | | | | | | | | | | | X | | | | X | | | | X | | | | X | |
| Mortgage- and asset-backed securities | | | | | | | | | | | | | | | X | | | | | | | | | | | | | | | | | |
| Municipal securities | | | | | | | | | | | | | | | X | | | | | | | | | | | | | | | | | |
| Other investments companies and ETFs | | | | | | | | | | | X | | | | | | | | | | | | | | | | | | | | X | |
| Portfolio turnover | | | | | | | | | | | X | | | | X | | | | | | | | | | | | | | | | | |
| Redemptions | | | | | | | | | | | | | | | X | | | | | | | | | | | | | | | | | |
| Sectors | | | | | | | | | | | X | | | | | | | | X | | | | | | | | X | | | | | |
| Small-cap companies | | | | | | | | | | | | | | | | | | | X | | | | X | | | | X | | | | X | |
| Stock market | | | X | | | | X | | | | X | | | | | | | | X | | | | X | | | | X | | | | X | |
| Value stocks | | | | | | | X | | | | | | | | | | | | | | | | X | | | | | | | | X | |
Call | Call risk is the possibility that, as interest rates decline to a level that is significantly lower than the rate assigned to the fixed income security, the security may be called (redeemed) prior to maturity. A fund would lose the benefit of holding a fixed income security that is paying a rate above the current market rate and would likely have to reinvest the proceeds in other fixed income securities that have lower yields.
Credit | A fund could lose money if the issuer of a fixed income security is unable or unwilling, or is perceived as unable or unwilling (whether by market participants, ratings agencies, pricing services or otherwise) to meet its financial obligations or goes bankrupt. Securities are subject to varying degrees of credit risk, which are often reflected in their credit ratings. The downgrade of the credit rating of a security held by a fund may decrease its value. Credit risk usually applies to most fixed income securities. U.S. government securities, especially those that are not backed by the full faith and credit of the U.S. Treasury, such as securities supported only by the credit of the issuing governmental agency or government-sponsored enterprise, carry at least some risk of nonpayment, and the maximum potential liability of the issuers of such
securities may greatly exceed their current resources. There is no assurance that the U.S. government would provide financial support to the issuing entity if not obligated to do so by law. Further, any government guarantees on U.S. government securities that a fund owns extend only to the timely payment of interest and the repayment of principal on the securities themselves and do not extend to the market value of the securities themselves or to shares of the fund.
Equity Securities | A fund’s equity securities investments are subject to stock market risk. Such investments may also expose a fund to additional risks:
| • | | Common Stocks. The value of a company’s common stock may fall as a result of factors directly relating to that company, such as decisions made by its management or decreased demand for the company’s products or services. A stock’s value may also decline because of factors affecting not just the company, but also companies in the same industry or sector. The price of a company’s stock may also be affected by changes in financial markets that are unrelated to the company, such as changes in interest rates, exchange rates or industry regulation. Companies that pay dividends |
Principal Risks
| | | on their common stock generally only do so after they invest in their own business and make required payments to bondholders and on other debt and preferred stock. Therefore, the value of a company’s common stock will usually be more volatile than its bonds, other debt and preferred stock. |
| • | | Preferred Stocks. Preferred securities are subject to issuer-specific and stock market risks; however, preferred securities may be less liquid than common stocks and offer more limited participation in the growth of an issuer. If interest rates rise, the dividend on preferred stocks may be less attractive, causing the price of preferred stocks to decline. Preferred shareholders may have only certain limited rights if distributions are not paid for a stated period, but generally have no legal recourse against the issuer and may suffer a loss of value if distributions are not paid. Preferred stocks may have mandatory sinking fund provisions, as well as provisions for their call or redemption prior to maturity which can have a negative effect on their prices when interest rates decline. Because the rights of preferred stock on distribution of a corporation’s assets in the event of its liquidation are generally subordinated to the rights associated with a corporation’s debt securities, in the event of an issuer’s bankruptcy, there is substantial risk that there will be nothing left to pay preferred stockholders after payments, if any, to bondholders have been made. For this reason, the value of preferred securities will usually react more strongly than bonds and other debt securities to actual or perceived changes in the company’s financial condition or prospects. |
| • | | Convertible Securities. The investment value of a convertible security (“convertible”) is based on its yield and tends to decline as interest rates increase. The conversion value of a convertible is the market value that would be received if the convertible were converted to its underlying common stock. Since it derives a portion of its value from the common stock into which it may be converted, a convertible is also subject to the same types of market and issuer-specific risks that apply to the underlying common stock. A convertible may be subject to redemption at the option of the issuer at a price established in the convertible’s governing instrument, which may be less than the current market price of the security. Convertibles typically are “junior” securities, which means an issuer may pay interest on its non-convertible debt before it can make payments on its convertibles. In the event of a liquidation, holders of convertibles may be paid before a company’s common stockholders but after holders of a company’s senior debt obligations. |
| • | | Depositary Receipts. A fund may invest in securities issued by foreign companies through ADRs, GDRs and EDRs. These securities are subject to many of the risks inherent in investing in foreign securities, including, but not limited to, currency fluctuations and political and financial instability in the home country of a particular depositary receipt. |
| • | | REITs. REITs or other real estate-related securities are subject to the risks associated with direct ownership of real estate, including declines in the value of real estate, risks related to general and local economic conditions or changes in demographic trends or tastes, increases in operating expenses, and adverse governmental, legal or regulatory action (such as changes to zoning laws, changes in interest rates, condemnation, tax increases, regulatory limitations on rents, or enforcement of or changes to environmental regulations). Shares of REITs may trade less frequently and, therefore, are subject to more erratic price movements than securities of larger issuers. REITs typically incur fees that are separate from those incurred by a fund, meaning a fund’s investment in REITs will result in the layering of expenses such that as a shareholder, a fund will indirectly bear a proportionate share of a REIT’s operating expenses. |
| • | | Rights and Warrants. Investments in rights and warrants may be more speculative than certain other types of investments because rights and warrants do not carry dividend or voting rights with respect to the underlying securities or any rights in the assets of the issuer. In addition, the value of a right or a warrant does not necessarily change with the value of the underlying securities and a right or a warrant ceases to have value if it is not exercised prior to its expiration date. |
Fixed income market | Fixed income market risk is the risk that the prices of, and the income generated by, fixed income securities held by a fund may decline significantly and/or rapidly in response to adverse issuer, political, regulatory, general economic and market conditions, or other developments, such as regional or global economic instability (including terrorism and related geopolitical risks), interest rate fluctuations, and those events directly involving the issuers that may cause broad changes in market value, public perceptions concerning these developments, and adverse investor sentiment. These events may lead to periods of volatility, which may be exacerbated by changes in bond market size and structure. In addition, adverse market events may lead to increased redemptions, which could cause a fund to experience a loss when selling securities to meet redemption requests by shareholders. The risk of loss increases if the redemption requests are unusually large or frequent.
Focused holdings | For funds that normally hold a core portfolio of stocks of fewer companies than other more diversified funds, the increase or decrease of the value of a single stock may have a greater impact on the fund’s net asset value (“NAV”) and total return.
Foreign securities | Investments in foreign securities involve greater risks than investing in domestic securities. As a result, a fund’s return and NAV may be affected by fluctuations in currency exchange rates or political or economic conditions and regulatory requirements in a particular country. Foreign markets, as well as foreign economies and political systems, may be less stable than U.S. markets, and changes in the exchange rates of foreign currencies can affect the value of a fund’s foreign assets. Foreign laws and accounting standards typically are not as strict as they are in the U.S., and there may be less public information available about foreign companies. Custodial and/or settlement systems in foreign markets may not be fully developed and the laws of certain countries may limit the ability to recover assets if a foreign bank or depository or their agents goes bankrupt. Over a given period of time, foreign securities may underperform U.S. securities—sometimes for years. A fund could also underperform if it invests in countries or regions whose economic performance falls short. The risks associated with investments in governmental or quasi-governmental entities of a foreign country are heightened by the potential for unexpected governmental change, which may lead to default or expropriation, and inadequate government oversight and accounting. The effect of recent, worldwide economic instability on specific foreign markets or issuers may be difficult to predict or evaluate. Some national economies continue to show profound instability, which may in turn affect their international trading and financial partners or other members of their currency bloc. Foreign security risk may also apply to ADRs, GDRs and EDRs.
Government sponsored enterprises | Investments in government sponsored enterprises are debt obligations issued by agencies and instrumentalities of the U.S. government. These obligations vary in the level of support they receive from the U.S. government. They may be: (1) supported by the full faith and credit of the U.S. Treasury, such as those of the Government National Mortgage Association; (2) supported by the right of the issuer to borrow from the U.S. Treasury, such as those of the Federal National Mortgage Association; (3) supported by the discretionary authority of the U.S. government to purchase the issuer’s obligations, such as those of the Student Loan Marketing Association; or (4) supported only by the credit of the issuer, such as those of the Federal Farm Credit Bureau. The U.S. government may choose not to provide financial support to U.S. government sponsored agencies or instrumentalities if it is not legally obligated to do so in which case, if the issuer defaulted, the fund holding securities of such issuer might not be able to recover its investment from the U.S. government.
Growth stocks | Growth companies are expected to increase their earnings at a certain rate. When these expectations are not met, investors may punish the prices of stocks excessively, even if earnings showed an absolute increase. Growth company stocks also typically lack the dividend yield that can cushion stock prices in market downturns.
Principal Risks
High-yield securities | Investments in securities rated below investment grade, or “junk bonds,” generally involve significantly greater risks of loss of your money than an investment in investment grade bonds. Compared with issuers of investment grade bonds, junk bonds are more likely to encounter financial difficulties and to be materially affected by these difficulties. Rising interest rates may compound these difficulties and reduce an issuer’s ability to repay principal and interest obligations. Issuers of lower-rated securities also have a greater risk of default or bankruptcy. Additionally, due to the greater number of considerations involved in the selection of a fund’s securities, the achievement of a fund’s objective depends more on the skills of the portfolio manager than investing only in higher-rated securities. Therefore, your investment may experience greater volatility in price and yield. High-yield securities may be less liquid than higher quality investments. A security whose credit rating has been lowered may be particularly difficult to sell.
Inflation | Inflation risk is the risk that the market value of securities will decrease as higher inflation shrinks the purchasing power of any affected currencies.
Interest rates | Investments in investment grade and non-investment grade fixed income securities are subject to interest rate risk. The value of a fund’s fixed income investments typically will fall when interest rates rise. A fund may be particularly sensitive to changes in interest rates if it invests in debt securities with intermediate and long terms to maturity. Debt securities with longer durations tend to be more sensitive to changes in interest rates, usually making them more volatile than debt securities with shorter durations. Since the financial crisis that started in 2008, the Federal Reserve has attempted to stabilize the economy and support the economic recovery by keeping the federal funds rate (the interest rate at which depository institutions lend reserve balances to other depository institutions overnight) at or near zero percent. In addition, as part of its monetary stimulus program known as quantitative easing, the Federal Reserve has purchased on the open market large quantities of securities issued or guaranteed by the U.S. government, its agencies or instrumentalities. The Federal Reserve has halted its asset purchases pursuant to quantitative easing. When the Federal Reserve raises the federal funds rate, which is expected to occur, interest rates are expected to rise. Floating rate securities generally are less sensitive to interest rate changes but may decline in value if their interest rates do not rise as much, or as quickly, as interest rates in general. Conversely, floating rate securities will not generally increase in value if interest rates decline. When a fund holds floating rate securities, a decrease in market interest rates will adversely affect the income received from such securities and the net asset value of the fund’s shares. As of the date of this Prospectus, interest rates are at or near historic lows, which may increase the risk that they could rise significantly and/or rapidly, potentially resulting in substantial losses to the fund.
Liquidity | Liquidity risk is the possibility that the fund might be unable to sell a security promptly and at an acceptable price, which could have the effect of decreasing the overall level of the fund’s liquidity. Market developments may cause the fund’s investments to become less liquid and subject to erratic price movements. The fund could lose money if it cannot sell a security at the time and price that would be most beneficial to the fund.
Market timing | Because of specific securities a fund may invest in, it could be subject to the risk of market timing activities by fund shareholders. Some examples of these types of securities are high-yield, small-cap and foreign securities. Typically, foreign securities offer the most opportunity for these market timing activities. A fund generally prices these foreign securities using their closing prices from the foreign markets in which they trade, typically prior to a fund’s calculation of its NAV. These prices may be affected by events that occur after the close of a foreign market but before a fund prices its shares. In such instances, a fund may fair value foreign securities. However, some investors may engage in frequent short-term trading in a fund to take advantage of any price differentials that may be reflected in the NAV of a fund’s shares. There is no assurance that fair valuation of securities can reduce or
eliminate market timing. While the manager and transfer agent of the Funds monitor trading in each fund, there is no guarantee that they can detect all market timing activities.
Mid-cap companies | Investments in mid-cap companies generally involve greater risks than investing in large-capitalization companies. Mid-cap companies often have narrower markets and limited managerial and financial resources compared to larger, more established companies. The performance of mid-cap companies can be more volatile compared to larger, more established companies, which could increase the volatility of a fund’s portfolio and performance. Shareholders of a fund that invests in mid-cap companies should expect that the value of the fund’s shares will be more volatile than a fund that invests exclusively in large-cap companies. Generally, the smaller the company size, the greater these risks.
Mortgage- and asset-backed securities | Mortgage- and asset-backed security risk, which is possible in an unstable or depressed housing market, arises from the potential for mortgage failure or premature repayment of principal, or a delay in the repayment of principal. The reduced value of the fund’s securities and the potential loss of principal as a result of a mortgagee’s failure to repay would have a negative impact on the fund. Premature repayment of principal would make it difficult for the fund to reinvest the prepaid principal at a time when interest rates on new mortgages are declining, thereby reducing the fund’s income. Conversely, a delay in the repayment of principal could lengthen the expected maturity of the securities, thereby increasing the potential for loss when prevailing interest rates rise, which could cause the values of the securities to fall sharply.
Municipal securities | A municipal security’s value, interest payments or repayment of principal could be affected by economic, legislative or political changes. Municipal securities are also subject to potential volatility in the municipal market and the fund’s share price, yield and total return may fluctuate in response to municipal bond market movements. Municipal securities with principal and interest payments that are made from the revenues of a specific project or facility, as opposed to general tax revenues, may have increased risks. Changes in a municipality’s financial health may affect its ability to make interest and principal payments when due.
Other investment companies, including ETFs | Investments in the securities of other investment companies , including exchange-traded funds (“ETFs”) (which may, in turn invest in equities, bonds, and other financial vehicles), may involve duplication of advisory fees and certain other expenses. By investing in another investment company, a fund becomes a shareholder of that investment company. As a result, fund shareholders indirectly bear the fund’s proportionate share of the fees and expenses paid by the other investment company, in addition to the fees and expenses fund shareholders indirectly bear in connection with the fund’s own operations.
As a shareholder, the fund must rely on the other investment company to achieve its investment objective. If the other investment company fails to achieve its investment objective, the value of the fund’s investment will decline, adversely affecting the fund’s performance. In addition, because ETFs are listed on national stock exchanges and are traded like stocks listed on an exchange, ETF shares may potentially trade at a discount or a premium. Investments in ETFs are also subject to brokerage and other trading costs, which could result in greater expenses to a fund. Finally, because the value of ETF shares depends on the demand in the market, the portfolio manager may not be able to liquidate a fund’s holdings of ETF shares at the most optimal time, adversely affecting the fund’s performance.
Portfolio turnover | A fund may engage in more active and frequent trading of portfolio securities to a greater extent than certain other mutual funds with similar investment objectives. A fund’s turnover rate may vary greatly from year to year or during periods within a year. A high rate of portfolio turnover may lead to greater transaction costs, result in adverse tax consequences to investors and adversely affect performance.
Principal Risks
Redemptions | A fund may experience periods of heavy redemptions that could cause a fund to sell assets at inopportune times or at a loss or depressed value. Redemption risk is greater to the extent that one or more investors or intermediaries control a large percentage of investments in a fund, have short investment horizons, or have unpredictable cash flow needs. A general rise in interest rates has the potential to cause investors to move out of fixed income securities on a large scale, which may increase redemptions from mutual funds that hold large amounts of fixed income securities. This, coupled with a reduction in the ability or willingness of dealers and other institutional investors to buy or hold fixed income securities, may result in decreased liquidity and increased volatility in the fixed income markets, and heightened redemption risk. Heavy redemptions, whether by a few large investors or many smaller investors, could hurt a fund’s performance.
Sectors | Companies that are in similar businesses may be similarly affected by particular economic or market events, which may, in certain circumstances, cause the value of securities of all companies in a particular sector of the market to change. To the extent a fund has substantial holdings within a particular sector, the risks associated with that sector increase.
Small-cap companies | Investments in small-cap companies generally involve greater risks than investing in large-capitalization companies. Companies with smaller market capitalizations generally have lower volume of shares traded daily, less liquid stock and more volatile stock prices. Companies with smaller market capitalizations also tend to have a limited product or service base and limited access to capital. Newer companies with unproven business strategies also tend to be smaller companies. The above factors increase risks and make these companies more likely to fail than companies with larger market capitalizations, and could increase the volatility of a fund’s portfolio and performance. Shareholders of a fund that invests in small-cap companies should expect that the value of the fund’s shares will be more volatile than a fund that invests exclusively in mid- cap or large-cap companies. Generally, the smaller the company size, the greater these risks.
Stock market | Markets may at times be volatile and the value of a fund’s stock holdings may decline in price, sometimes significantly and/or rapidly, because of changes in prices of its holdings or a broad stock market decline. The value of a security may decline due to adverse issuer-specific conditions or general market conditions which are not specifically related to a particular company, such as real or perceived adverse political, regulatory, market, economic or other developments that may cause broad changes in market value, changes in the general outlook for corporate earnings, changes in interest or currency rates, public perceptions concerning these developments or adverse investment sentiment generally. During a general downturn in the securities markets, multiple asset classes may decline in value simultaneously. Terrorism and related geopolitical risks have led, and may in the future lead, to increased short-term market volatility and may have adverse long-term effects on world economies and markets generally. In addition, markets and market participants are increasingly reliant upon both publicly available and proprietary information data systems. Data imprecision, software or other technology malfunctions, programming inaccuracies, unauthorized use or access, and similar circumstances may impair the performance of these systems and may have an adverse impact upon a single issuer, a group of issuers, or the market at large. In certain cases, an exchange or market may close or issue trading halts on either specific securities or even the entire market, which may result in a fund being, among other things, unable to buy or sell certain securities or financial instruments or accurately price its investments. These fluctuations in stock prices could be a sustained trend or a drastic movement. The stock markets generally move in cycles, with periods of rising prices followed by periods of declining prices. The value of your investment may reflect these fluctuations.
Value stocks | Investments in value stocks are subject to the risk that their true worth may not be fully realized by the market. This may result in the value stocks’ prices remaining undervalued for extended periods of time. A fund’s performance also may be affected adversely if value stocks remain unpopular with or lose favor among investors.
Trustees and Officers
| | | | | | |
Name, birth year, position,
term of office (a) and length of
time served | | Principal occupation(s)
during past five years | | Number of funds overseen in fund
complex | | Directorships
of other public companies
during the past five years |
| | | |
Interested Trustee (b) | | | | | | |
J. Cooper Abbott (1969) Trustee since 2012 | | Executive Vice President, Investments and Co-Chief Operating Officer of Eagle since 2009; Director of ClariVest Asset Management LLC since 2012; Director of Eagle Fund Services, Inc since 2009; President of Eagle Boston Management, Inc. since 2009 | | 9 | | N/A |
|
Independent Trustees |
Keith B. Jarrett, PhD (1948) Trustee since 2005 | | Managing Partner, PW1 LLC since 2013; Founder, Rockport Funding, LLC (private equity), and Ajax Partners (investment partnership) since 2003 | | 9 | | Safeguard Scientific, Inc. |
William J. Meurer (1943) Trustee since 2003 | | Private investor and financial consultant since 2000 | | 9 | | Sykes Enterprises, Inc.(c); Walter Investment Mgmt. Corp.; LifeLink Foundation (private) |
Liana O’Drobinak (1963) Trustee since 2014 | | Managing Member, Bay Consulting Partners, LLC since 2010; Board Member, Florida Prepaid College Board 2012-2014; Board Member, Health Insurance Innovations, Inc. 2/2013-10/2013 | | 9 | | N/A |
James L. Pappas, PhD (1943) Trustee since 1989; Chariman of the Board of Trustees since 2012 | | Private investor; Lykes Professor of Banking and Finance at University of South Florida 1986-2006; President, Graduate School of Banking, University of Wisconsin 1995-2005 | | 9 | | Walter Investment Mgmt. Corp. |
Deborah L. Talbot, PhD (1950) Trustee since 2002 | | Independent Consultant; Principal, Lazure Enterprises since 2013; Director, ethiKids, Inc. (child development) 2009-2011; Founder and Board Member, Creative Tampa Bay (community networking) 2003-2009; Deans’ Advisory Board, College of Arts and Sciences, University of Memphis since 2002 | | 9 | | N/A |
| | |
Officers (d) | | | | |
Richard J. Rossi (1956) President since March 2010 | | President and Co-Chief Operating Officer of Eagle since 2009 and 2007, respectively; Director of ClariVest Asset Management LLC since December 2012; Executive Vice President Eagle 2000-2009; President and Director of EFD 2005-2011; Chief Executive Officer and Director of EFD since 2011 | | | | |
Susan L. Walzer (1967) Principal Executive Officer since May 2011 | | Vice President of Fund Administration since May 2011; Chief Compliance Officer of Eagle Family of Funds and Eagle Fund Services (“EFS”) (e) 2007-2011; Director of Compliance for Eagle 2005-2007 | | | | |
Carolyn K. Gill (1978) Principal Financial Officer and Treasurer since May 2011 | | Manager of Fund Accounting and Fund Reporting for Eagle since 2005 and 2010, respectively | | | | |
Daniel R. Dzibinski (1974) Chief Compliance Officer and Secretary since May 2011 | | Manager of Fund Compliance for Eagle since May 2011; Director of Compliance for Eagle 2007-2011 | | | | |
The principal address for each Trustee and Officer is P.O. Box 33022, St. Petersburg, Florida, 33733-8022.
Additional information about the Funds’ Board Members can be found in the Statement of Additional Information, which is available, without charge, upon request, by calling the Eagle Family of Funds toll free at 1-800-421-4184 or by accessing our website at eagleasset.com.
(a) Trustees serve for life or until they are removed, resign or retire. The Board has adopted a Board Governance Policy that requires Independent Trustees to retire no later than at the end of the meeting which occurs immediately after his or her 75th birthday. (b) Mr. Abbott is an “interested” person of the Trust as that term is defined by the 1940 Act. Mr. Abbott is affiliated with Clarivest, EFD, Eagle and RJF. (c) Sykes Enterprises, Inc. is a technical support company. (d) Officers each serve one year terms. (e) Prior to September 13, 2010, EFS served as the Funds’ transfer agent.

Go Paperless with eDelivery eDelivery is the most convenient, economical and environmentally-conscious way to receive information about your fund. To enroll, please visit eagleasset.com/eDelivery Please consider the investment objectives, risks, charges and expenses of any fund carefully before investing. Contact Eagle at 800.421.4184 or your financial advisor for a prospectus, which contains this and other important information about the Funds. Read the prospectus carefully before you invest or send money. This report is for the information of shareholders of the Eagle mutual funds. If you wish to review additional information on the portfolio holdings of a fund, a complete schedule has been filed with the Securities and Exchange Commission (“Commission”) for the first and third quarters of each fund’s fiscal year end on Form N-Q. These filings are available on the Commission’s website at www.sec.gov and may be reviewed and copied at the Commission’s Public Reference Room in Washington, D.C. Information on the operations of the Public Reference Room may be obtained by calling 800.SEC.0330. A description of each fund’s proxy voting policies, procedures and information regarding how each fund voted proxies relating to portfolio securities during the 12-month period ended June 30, 2015, is available without charge, upon request, by calling the Eagle Family of Funds, toll-free at the number below, by accessing our website at eagleasset. com or by accessing the Commission’s website at www.sec.gov. 727.567.8143 | 800.421.4184 Eagle Fund Distributors, Inc., Member FINRA | Not FDIC Insured | May Lose Value | No Bank Guarantee
Item 2. Code of Ethics
As of the end of the period October 31, 2015, Eagle Growth & Income Fund (the “Trust”) has adopted a code of ethics, as defined in Item 2 of Form N-CSR that applies to the Principal Executive Officer and Principal Financial Officer. The Trust has not made any amendments to its code of ethics during the covered period. The Trust has not granted any waivers from any provisions of the code of ethics during the covered period. A copy of this code of ethics is filed as an exhibit to this Form N-CSR.
Item 3. Audit Committee Financial Expert
The Trust’s Board of Trustees (“Board”) has determined that William J. Meurer is an audit committee financial expert, as defined in Item 3 of Form N-CSR, serving on its audit committee. Mr. Meurer is independent for purposes of Item 3 of Form N-CSR.
Item 4. Principal Accountant Fees and Services 1
(a) Audit Fees
The aggregate fees billed by the Trust’s independent public accountants, PricewaterhouseCoopers LLP (“PwC”) for professional services rendered in connection with the audit of the Trust’s annual financial statements or services that are normally provided by the accountant in connection with statutory and regulatory filings or engagements were $33,000 for the fiscal period ended October 31, 2014, and $38,000 for the fiscal period ended October 31, 2015.
(b) Audit-Related Fees
There were no aggregate fees PwC billed to the Trust for assurance and other services which are reasonably related to the performance of the Trust’s audit and are not reported under Item 4(a) for the fiscal periods ended October 31, 2014, and October 31, 2015. The aggregate fees PwC billed to the Trust’s investment adviser and any entity controlling, controlled by, or under common control with the Trust’s investment adviser for assurance and other services directly related to the operations and financial reporting of the Trust were $0.00 for the fiscal period ended October 31, 2014, and $0.00 for the fiscal period ended October 31, 2015.
(c) Tax Fees
The aggregate tax fees PwC billed to the Trust for tax compliance, tax advice, and tax planning services were $6,000 for the fiscal period ended October 31, 2014, and $6,000 for the fiscal period ended October 31, 2015. There were no aggregate tax fees PwC billed to the Trust’s investment adviser and any entity controlling, controlled by, or under common control with the Trust’s investment adviser for services directly related to the operations and financial reporting of the Trust for the fiscal periods ended October 31, 2014, and October 31, 2015.
| 1 | All accountant fees and services amounts are rounded to the nearest whole thousand. |
(d) All Other Fees
For each of the fiscal periods ended October 31, 2014, and October 31, 2015 the Trust paid PwC no other fees. There were no aggregate fees PwC billed to the Trust’s investment adviser and any entity controlling, controlled by, or under common control with the Trust’s investment adviser for any other services directly related to the operations and financial reporting of the Trust for the fiscal periods ended October 31, 2014, and October 31, 2015.
(e) The Trust’s Audit Committee Charter provides that the Audit Committee (comprised of the Independent Trustees of the Trust) is responsible for pre-approval of all auditing services performed for the Trust. The Audit Committee reports to the Board regarding its approval of the engagement of the auditor and the proposed fees for the engagement, and the majority of the Board (including the members of the Board who are Independent Trustees) must approve the auditor at an in-person meeting. The Audit Committee also is responsible for pre-approval (subject to the de minimis exception for non-audit services described in the Securities Exchange Act of 1934, as amended, and applicable rule thereunder and not expecting to exceed $5,000) of all non-auditing services performed for the Trust or for any service affiliate of the Trust. The Trust’s Audit Committee Charter also permits a designated member of the Audit Committee to pre-approve, between meetings, one or more non-audit service projects, subject to ratification by the Audit Committee at the next meeting of the Audit Committee. The Trust’s Audit Committee pre-approved all fees described above which PwC billed to the Trust.
(f) Less than 50% of the hours billed by PwC for auditing services to the Trust for the fiscal period ended October 31, 2015, were for work performed by persons other than full-time, permanent employees of PwC.
(g) There were no aggregate non-audit fees billed by PwC to the Trust and to the Trust’s investment adviser and any entity controlling, controlled by, or under common control with the Trust’s investment adviser for the fiscal periods ended October 31, 2014, and October 31, 2015.
(h) The Trust’s Audit Committee has considered the non-audit services provided to the Trust and the Trust’s investment adviser and any entity controlling, controlled by, or under common control with the Trust’s investment adviser as described above and determined that these services do not compromise PwC’s independence.
Item 5. Audit Committee of Listed Registrants
Not applicable to the Trust.
Item 6. Schedule of Investments
Included as part of report to shareholders under Item 1.
Item 7. Disclosure of Proxy Voting Policies and Procedures for Closed-End Management Investment Companies.
Not applicable to the Trust.
Item 8. Portfolio Managers of Closed-End Management Investment Companies
Not applicable to the Trust.
Item 9. Purchases of Equity Securities by Closed-End Management Investment Company and Affiliated Purchasers
Not applicable to the Trust.
Item 10. Submission of Matters to a Vote of Security Holders.
There have been no material changes to the Trust’s Nominating Committee Charter, which sets forth procedures by which shareholders may recommend nominees to the Board, since the Trust last provided disclosure in response to this item.
Item 11. Controls and Procedures
| | (a) | Based on an evaluation of the disclosure controls and procedures (as defined in Rule 30a-3(c) under the Investment Company Act of 1940, as amended), the Principal Executive Officer and Principal Financial Officer of the Trust have concluded that such disclosure controls and procedures are effective as of December 18, 2015. |
| | (b) | There was no change in the internal controls over financial reporting (as defined in Rule 30a-3(d) under the Investment Company Act of 1940, as amended) of the Trust that occurred during the second fiscal quarter of the period covered by this report that has materially affected or is reasonably likely to materially affect, its internal control over financial reporting. |
Item 12. Exhibits
(a)(1) Code of Ethics pursuant to Item 2 of Form N-CSR is filed and attached hereto as Exhibit 99.CODEETH.
(a)(2) The certifications required by Rule 30a-2(a) of the Investment Company Act of 1940, as amended, and Section 302 of the Sarbanes-Oxley Act of 2002 is filed and attached hereto as Exhibit 99.CERT.
(a)(3) Not applicable to the Trust.
(b) The certification required by Rule 30a-2(b) of the Investment Company Act of 1940, as amended, and Section 906 of the Sarbanes-Oxley Act of 2002 is filed and attached hereto as Exhibit 99.906CERT.
SIGNATURES
Pursuant to the requirements of the Securities Exchange Act of 1934 and the Investment Company Act of 1940, the Trust has duly caused this report to be signed on its behalf by the undersigned, thereunto duly authorized.
| | | | | | |
| | | | | EAGLE GROWTH & INCOME FUND |
Date: December 18, 2015 | | | | | | |
| | | |
| | | | | | /s/ Susan L. Walzer |
| | | | | | Susan L. Walzer |
| | | | | | Principal Executive Officer |
Pursuant to the requirements of the Securities Exchange Act of 1934 and the Investment Company Act of 1940, this report has been signed below by the following persons on behalf of the Trust and in the capacities and on the dates indicated.
| | | | | | |
| | | | | EAGLE GROWTH & INCOME FUND |
| | | |
Date: December 18, 2015 | | | | | | /s/ Susan L. Walzer |
| | | | | | Susan L. Walzer |
| | | | | | Principal Executive Officer |
| | | |
Date: December 18, 2015 | | | | | | /s/ Carolyn Gill |
| | | | | | Carolyn Gill |
| | | | | | Principal Financial Officer |