As filed with the Securities and Exchange Commission on May 20, 2016
UNITED STATES
SECURITIES AND EXCHANGE COMMISSION
Washington, D.C. 20549
FORM N-CSR
CERTIFIED SHAREHOLDER REPORT OF REGISTERED
MANAGEMENT INVESTMENT COMPANIES
Investment Company Act File Number 811-4786
Ariel Investment Trust
(Exact name of registrant as specified in charter)
200 East Randolph Street
Suite 2900
Chicago, Illinois, 60601
(Address of principal executive offices) (Zip code)
Mareile Cusack
200 East Randolph Street
Suite 2900
Chicago, Illinois 60601
(Name and address of agent for service)
with a copy to:
Arthur Don, Esq.
Greenberg Traurig, LLP
77 West Wacker Drive
Suite 3100
Chicago, IL 60601
Registrant's telephone number, including area code: (312) 726-0140
Date of fiscal year end: September 30, 2016
Date of reporting period: March 31, 2016
Item 1. Reports to Stockholders.
The following is a copy of the report transmitted to shareholders pursuant to Rule 30e-1 under the Investment Company Act of 1940 (the "Act") (17 CFR 270.30e-1)

The patient investor
| | | | | | |
| | | | | | |
| SEMI-ANNUAL REPORT: 03/31/16 |
| ● | Value | ● | Deep value | ● | Global |
| ● | Ariel Fund |
| ● | Ariel Appreciation Fund |
| ● | Ariel Focus Fund |
| ● | Ariel Discovery Fund |
| ● | Ariel International Fund |
| ● | Ariel Global Fund |
Slow and steady wins the race.
One of Ariel Investments’ guiding principles is to communicate openly with our shareholders so they may gain a clear understanding of our investment philosophy, portfolio decisions and results, as well as our opinions on the underlying market. In reviewing the materials contained in The Patient Investor, please consider the information provided on this page. While our investment decisions are rooted in detailed analysis, it is important to point out that actual results can differ significantly from those we seek. We candidly discuss a number of individual companies. Our opinions are current as of the date they were written but are subject to change. We want to remind investors that the information in this report is not sufficient on which to base an investment decision and should not be considered a recommendation to purchase or sell any particular security. Equity investments are affected by market conditions. The intrinsic value of the stocks in which the Funds invest may never be recognized by the broader market. Ariel Fund, Ariel Appreciation Fund, Ariel Focus Fund and Ariel Discovery Fund invest in micro, small and/or mid-cap companies. Investing in micro, small and mid-cap stocks is riskier and more volatile than investing in large cap stocks, in part because smaller companies may not have the scale, depth of resources and other assets of larger firms. Ariel Fund and Ariel Appreciation Fund often invest a significant portion of their assets in companies within the consumer discretionary and financial services sectors and their performance may suffer if these sectors underperform the overall stock market. Ariel Focus Fund invests primarily in equity securities of companies of any size in order to provide investors access to superior opportunities in companies of all market capitalizations. Ariel Focus Fund is a non-diversified fund in that it generally holds only 20-30 stocks and therefore may be more volatile than a more diversified investment. Ariel International Fund and Ariel Global Fund invest in foreign securities and may use currency derivatives and ETFs. Investments in foreign securities may underperform and may be more volatile than comparable U.S. stocks because of the risks involving foreign economies and markets, foreign political systems, foreign regulatory standards, foreign currencies and taxes. The use of currency derivatives and ETFs may increase investment losses and expenses and create more volatility. Investments in emerging markets present additional risks, such as difficulties selling on a timely basis and at an acceptable price. Performance data quoted represents past performance. Past performance does not guarantee future results. All performance assumes the reinvestment of dividends and capital gains. The investment return and principal value of an investment will fluctuate so that an investor’s shares, when redeemed, may be worth more or less than their original cost. Current performance may be lower or higher than the performance data quoted. Performance data current to the most recent month-end for the Funds may be obtained by visiting our website, arielinvestments.com. Investors should consider carefully the investment objectives, risks, and charges and expenses before investing. For a current summary prospectus or full prospectus which contains this and other information about the Funds offered by Ariel Investment Trust, call us at 800.292.7435 or visit our website, arielinvestments.com. Please read the summary prospectus or full prospectus carefully before investing. Distributed by Ariel Distributors, LLC, a wholly owned subsidiary of Ariel Investments, LLC. Ariel Investment Trust c/o U.S. Bancorp Fund Services, LLC P.O. Box 701 Milwaukee, WI 53201-0701 800.292.7435 • arielinvestments.com
• linkedin.com/company/ariel-investments
• twitter.com/ArielFunds
• facebook.com/ArielInvestments |
| | | |
| | Fund performance at a glance | AS OF 03/31/16 |
| | | |
| | | |
| | | | | | | | |
| | | | Annualized |
| | Quarter (%) | 1-year (%) | 3-year (%) | 5-year (%) | 10-year (%) | 20-year (%) | Since inception (%) |
| Small/mid cap value strategy | | | | | | | 11/06/86 |
| Ariel Fund–Investor Class | – 0.32 | –10.38 | + 9.85 | + 8.53 | + 5.75 | +10.26 | + 11.11 |
| Ariel Fund–Institutional Class | – 0.24 | –10.10 | + 10.19 | + 8.83 | + 5.90 | +10.34 | + 11.17 |
Russell 2500TM Value Index | + 3.33 | – 5.20 | + 7.15 | + 8.33 | + 5.80 | +10.07 | + 11.01 |
Russell 2000® Value Index | + 1.70 | – 7.72 | + 5.73 | + 6.66 | + 4.42 | + 9.12 | + 10.17 |
S&P 500® Index | + 1.35 | + 1.78 | + 11.82 | + 11.58 | + 7.01 | + 7.98 | + 9.99 |
| Mid cap value strategy | | | | | | | 12/01/89 |
| Ariel Appreciation Fund–Investor Class | + 1.09 | – 9.14 | + 9.06 | + 9.15 | + 7.48 | +10.62 | + 10.61 |
| Ariel Appreciation Fund–Institutional Class | + 1.20 | – 8.82 | + 9.43 | + 9.44 | + 7.62 | +10.70 | + 10.67 |
Russell Midcap® Value Index | + 3.92 | – 3.39 | + 9.88 | + 10.52 | + 7.23 | +10.50 | + 11.34 |
Russell Midcap® Index | + 2.24 | – 4.04 | + 10.45 | + 10.30 | + 7.45 | +10.02 | + 11.10 |
S&P 500® Index | + 1.35 | + 1.78 | + 11.82 | + 11.58 | + 7.01 | + 7.98 | + 9.27 |
| All cap value strategy | | | | | | | 06/30/05 |
| Ariel Focus Fund–Investor Class | + 1.62 | –12.08 | + 4.94 | + 5.89 | + 3.69 | – | + 4.09 |
| Ariel Focus Fund–Institutional Class | + 1.72 | –11.86 | + 5.21 | + 6.11 | + 3.80 | – | + 4.20 |
Russell 1000® Value Index | + 1.64 | – 1.54 | + 9.38 | + 10.25 | + 5.72 | – | + 6.37 |
S&P 500® Index | + 1.35 | + 1.78 | + 11.82 | + 11.58 | + 7.01 | – | + 7.47 |
| Small cap deep value strategy | | | | | | | 01/31/11 |
| Ariel Discovery Fund–Investor Class | + 2.20 | –21.90 | – 6.81 | – 1.51 | – | – | – 0.84 |
| Ariel Discovery Fund–Institutional Class | + 2.29 | –21.69 | – 6.58 | – 1.28 | – | – | – 0.61 |
Russell 2000® Value Index | + 1.70 | – 7.72 | + 5.73 | + 6.66 | – | – | + 7.76 |
S&P 500® Index | + 1.35 | + 1.78 | + 11.82 | + 11.58 | – | – | + 11.93 |
| International all cap strategy | | | | | | | 12/30/11 |
| Ariel International Fund–Investor Class | + 1.27 | – 0.04 | + 7.72 | – | – | – | + 7.40 |
| Ariel International Fund–Institutional Class | + 1.30 | + 0.18 | + 7.93 | – | – | – | + 7.64 |
| MSCI EAFE Index (net) | – 3.01 | – 8.27 | + 2.23 | – | – | – | + 6.71 |
| MSCI ACWI ex-US Index (net) | – 0.38 | – 9.19 | + 0.32 | – | – | – | + 4.73 |
| Global all cap strategy | | | | | | | 12/30/11 |
| Ariel Global Fund–Investor Class | + 2.41 | – 0.13 | + 8.57 | – | – | – | + 9.29 |
| Ariel Global Fund–Institutional Class | + 2.48 | + 0.08 | + 8.86 | – | – | – | + 9.57 |
| MSCI ACWI Index (net) | + 0.24 | – 4.34 | + 5.54 | – | – | – | + 9.20 |
The inception date for the Institutional Class shares of all Funds is December 30, 2011. Performance information for the Institutional Class prior to that date reflects the actual performance of a Fund’s Investor Class (and uses the actual expenses of the Fund’s Investor Class, for such period of time), without any adjustments. For any such period of time, the performance of a Fund’s Institutional Class would have been substantially similar to, yet higher than, the performance of its Investor Class, because the shares of both classes are invested in the same portfolio of securities, but the classes bear different expenses, which are primarily differences in distribution and service fees. Descriptions for the indexes can be found on page 65. Any extraordinary performance shown for short-term periods may not be sustainable and is not representative of the performance over longer periods. The minimum initial investment for Investor Class shares is $1,000; the minimum for Institutional Class shares is $1,000,000.
| | | |
| TURTLE TALK | |
| | |
| | | |
| | Portfolio manager viewpoints | |
| | | |
| | “In the global markets, a volatile environment provided a wonderful opportunity for us to apply our contrarian intrinsic value investing strategy. We currently believe international valuations are attractive and ideal for bottom-up stock pickers like ourselves. Sharp moves tend to mean big shifts in valuation, and on the downside that can create opportunities.” | |
| | | |
| | | -Rupal J. Bhansali, Chief Investment Officer, Ariel Global Equites | |
| | | |
| | Please turn to page 17 to read Rupal Bhansali’s full letter to shareholders on year-to-date performance drivers, stocks and sectors. | |
| | | |
| A born investor | |
| | Rupal J. Bhansali,Portfolio Manager, Ariel International Fund & Ariel Global Fund |
Coming from a long line of bankers and brokers, Rupal Bhansali grew up on stock stories instead of fairy tales. Eager to enter the world of finance, she learned accounting by the age of 16 and began working in the field right out of high school. By age 24, she had edited prospectuses, calculated residual values on lease portfolios and learned how to trade foreign exchange.
During her college days, Rupal was known for challenging conventional wisdom. To break the cyclical habit of students job-hunting upon graduation, she encouraged them to consider entrepreneurship as a path to success by launching a competition called “Mind Your Own Business”.
Rupal learned the meaning of volatility firsthand, when she came to the United States to pursue her MBA at the University of Rochester in Rochester, N.Y., in 1991. The Indian rupee had just devalued by a massive 40%, and stock markets tumbled worldwide due to a global recession. Fortunately, she had earned a Rotary Foundation Scholarship that was not subject to currency risk or equity market fluctuations, which meant she could still fund her education. That formative shock lesson continues to guide her risk management philosophy today.
To hear Rupal’s whole story, visit arielinvestments.com/bhansali.
UTILITY FUTILITY
| Performance data quoted represents past performance. Past performance does not guarantee future results. All performance assumes the reinvestment of dividends and capital gains and represents returns of the Investor Class shares. The investment return and principal value of an investment will fluctuate so that an investor’s shares, when redeemed, may be worth more or less than their original cost. Current performance may be lower or higher than the performance data quoted. Performance data current to the most recent month-end for Ariel Fund and Ariel Appreciation Fund may be obtained by visiting our website, arielinvestments.com. | |
DEAR FELLOW SHAREHOLDER:
Against the backdrop of an increasingly distant but still very relevant financial crisis, most investors have become accustomed to sharp downdrafts and steep recoveries. But even these days, it is rare to see a V-shaped market unfold in just one quarter. And yet, in the first six weeks of the year, stocks of all sizes and persuasions plummeted. And just as a bear market sentiment was taking root, they surged. After netting out some striking double-digit gains and losses, quarter-end results mask the extent of the volatility.
Amidst the frenzy, the smaller companies comprising Ariel Fund declined -0.32%, which fell short of the Russell 2000 Value Index’s +1.70% return but well below its primary Russell 2500 Value Index, which climbed +3.33%. And although Ariel Appreciation Fund managed to earn +1.09% during the first quarter, it underperformed the Russell Midcap Value Index as well as the Russell Midcap Index, which grew +3.92% and+2.24%, respectively.
Over the last three months Ariel Fund and Ariel Appreciation Fund have had similar performance experiences. Both benefited from select consumer discretionary names such as Mattel, Inc. (MAT) and certain producer durables holdings such as Kennametal Inc. (KMT). Separately, Ariel Fund’s sole, long-suffering energy holding, Contango Oil & Gas Co. (MCF) meaningfully recovered. Meanwhile, Ariel Appreciation Fund benefitted significantly from CBS Corp. (CBS) in the consumer discretionary sector. The greatest similarity, however, was both Funds were penalized for not owning utilities, which was far and away the best-performing sector over the three-month period—trouncing the other areas.
UTILITY FUTILITY?
There is little question that utilities provide much-needed products and services that make our daily lives possible. Electricity, water, gas, heat, telephones—all are considered basic necessities here in the U.S. When we turn on a faucet, flip a light switch, or adjust a thermometer, we expect it to work. And it is true, in most instances utility companies represent monopolies in their areas of service, which fends off competition completely. While many investors are attracted to their mostly-stable earnings and predictable dividends, American utility companies tend to lack the 10%-12% normalized growth rates we seek. Moreover, there is no such thing as branded electricity or trademarked natural gas. Not to mention, precisely because of the sheer magnitude of their importance, utilities are highly regulated—putting their rates and profits squarely under the control of government officials. If the aforementioned were not enough of an investment deterrent, it is worth noting that these businesses tend to be capital intensive with significant up-front and on-going costs often financed by debt.
Accordingly, in our more than three-decade history as professional investors, we have very rarely found attractive opportunities in the utilities sector. The economic shortcomings of these businesses ultimately come through in their market returns, as we show below in a look at the last 25 years. While utility gains of late underscore the truism that any stock or sector can have its “day in the sun,” the longer-term story is not so compelling. More specifically, risk-averse, yield-chasing investors piled headlong into the sector as soon as 2013 ended, and the numbers posted by both large- and small-cap utility issues are indeed quite stunning.
| 12/31/13–03/31/16 | | | | | | |
| | Cumulative return | Annualized return |
| Russell 2000 Value | – | 1.92 | % | – | 0.86 | % |
| Russell 2000 Value–Utilities | + | 29.66 | | + | 12.28 | |
| S&P 500 | + | 16.82 | | + | 7.15 | |
| S&P 500–Utilities | + | 41.83 | | + | 16.80 | |
Past performance does not guarantee future results.
As you can see below, the story was quite different for the first 22-plus years.
| 03/31/91–12/31/13 | | | | | | |
| | Cumulative return | Annualized return |
| Russell 2000 Value | + | 1226.84 | % | + | 12.03 | % |
| Russell 2000 Value–Utilities | + | 676.89 | | + | 9.43 | |
| S&P 500 | + | 687.50 | | + | 9.50 | |
| S&P 500–Utilities | + | 440.51 | | + | 7.70 | |
Past performance does not guarantee future results.
When considered together, the results of the last 25 years are meaningfully influenced by recent returns and thus more nuanced than one might surmise at a glance.
| 03/31/91–03/31/16 | | | | | | |
| | Cumulative return | Annualized return |
| Russell 2000 Value | + | 1203.95 | % | + | 10.81 | % |
| Russell 2000 Value–Utilities | + | 907.60 | | + | 9.67 | |
| S&P 500 | + | 819.92 | | + | 9.28 | |
| S&P 500–Utilities | + | 666.60 | | + | 8.49 | |
Past performance does not guarantee future results.
It reasonably follows, then, that our conscious decision to generally dodge utility stocks would boost our relative returns over the years. To show those results, we turn to our flagship mutual funds, Ariel Fund and Ariel Appreciation Fund, which have the best data over the very long term. Attribution analysis dating back to 1989 shows that by largely omitting the utilities sector, our flagship mutual fund Ariel Fund added +60.87%1 towards its outperformance of the primary Russell 2500 Value benchmark. In fact, for the 27-year period, our avoidance of utilities has contributed more than our ownership of any other sector. For the same period, the mid-cap Ariel Appreciation Fund has done even better. As a direct result of minimal investments in the sector, Ariel Appreciation Fund has contributed +88.13%1 towards the outperformance of its primary Russell Midcap Value Index. And, as for Ariel Fund, steering clear of the sector actually represents our number one sector contributor to returns over the period.
“Even these days, it is rare to see a V-shaped market unfold in just one quarter.”
Low bond yields have driven the surge in the popularity of the utility sector in recent years. As the Federal Reserve slowly but surely raises interest rates from its current rock-bottom level of 0.25% toward its historical average of 5.00%, income substitutes will organically experience downward pressure. Investors are likely to trade equity risk for the safety of U.S. Treasuries. As such, while utilities have done well in the recent race to rock-bottom interest rates, their role as an income producer will become less potent as interest rates rise. That should bode well for investors who avoid the area as we do, whether it is hot or not.
PORTFOLIO COMINGS AND GOINGS
In the first quarter of the year, we added two positions and eliminated three positions in Ariel Fund. A current holding in Ariel Appreciation Fund, we purchased premier trust bank, Northern Trust Corp. (NTRS) as its market capitalization fell within the range of our small/mid fund. We also bought shares of educational services provider DeVry Education Group Inc. (DV). Investor concerns surrounding weak demand and government regulation at DeVry University has cast a cloud over the entire company. We think it obscures the combined value of the growing health care and international schools, a cash-rich balance sheet and the option-like value of the business and technology schools. We are confident this cloud will eventually pass and the company’s true value will shine through. We sold our shares of long-term holding and saw chain manufacturer Blount Intl, Inc. (BLT) after it agreed to be acquired by American Securities and P2 Capital Partners at $10 per share. In addition, we eliminated our positions in Media General Inc. (MEG) and Newell Rubbermaid Inc. (NWL) in order to pursue more compelling opportunities. “While utilities have done well in the recent race to rock-bottom interest rates, their role as an income producer will become less potent as interest rates rise.”
In Ariel Appreciation Fund, we added one position and eliminated two positions in. Global middle-market investment bank Houlihan Lokey, Inc. (HLI), a new firm-wide holding, homes in on mid-cap transactions and provides first class restructuring services. We believe the mid-cap focus and strength of the restructuring segment provide the company with greater protection relative to competitors during periods of decline in the M&A cycle. We sold our shares of Coach, Inc. (COH) and Janus Capital Group Inc. (JNS) in order to pursue more compelling opportunities.
As always, we appreciate the opportunity to serve you and welcome any questions or comments you might have. You can also contact us directly at email@arielinvestments.com.
| | |
| Sincerely, | | |
| |  |
| John W. Rogers, Jr. | | Mellody Hobson |
| Chairman and CEO | | President |
| | | |
 EVALUATING RISK EVALUATING RISK | |
| | | |
| | We recently asked our portfolio managers what they thought were the most important factors to consider when evaluating risk. Here’s how Timothy R. Fidler, CFA, Co-Portfolio Manager of Ariel Appreciation Fund and Director of Research, responded: “I focus on evaluating the strength of a business’s franchise. In my view, stable high quality businesses exhibit lower risk, thus our research effort evaluates every company’s competitive advantages and points of differentiation. Additionally, balance sheet strength can serve to lower risk as financial distress can harm even the most competitively advantaged businesses.” | |
1 These returns represent the opportunity cost of the investment decisions in a portfolio relative to the overall benchmark. The subpar performance of utilities was largely avoided by the Funds and thus represented a relative gain to the Funds versus their benchmarks. | | | |
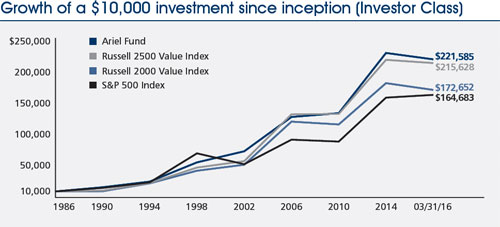
| Ariel Fund performance summary | INCEPTION: 11/06/86 |
| | | |
| | | |
| | | | | |
 | |  | |  |
| John W. Rogers, Jr. | | John P. Miller, cfa | | Kenneth E. Kuhrt, cpa |
| Lead portfolio | | Portfolio | | Portfolio |
| manager | | manager | | manager |
Composition of equity holdings (%) | | | | |
| | | Ariel
Fund† | Russell
2500
Value
Index | Russell
2000
Value
Index | S&P
500
Index |
| | Consumer discretionary | 29.99 | 9.88 | 10.26 | 14.25 |
| | Financial services | 29.56 | 39.07 | 43.08 | 17.70 |
| | Producer durables | 18.98 | 12.94 | 12.26 | 10.61 |
| | Health care | 8.60 | 4.27 | 4.14 | 14.22 |
| | Materials & processing | 5.50 | 6.63 | 4.66 | 3.02 |
| | Technology | 3.12 | 8.31 | 9.79 | 17.88 |
| | Consumer staples | 3.11 | 2.73 | 3.16 | 9.30 |
| | Energy | 1.14 | 5.28 | 3.46 | 6.79 |
| | Utilities | 0.00 | 10.89 | 9.20 | 6.23 |
† Represents percentage of total equity holdings in the portfolio. |
| Average annual total returns (%) as of 03/31/16 |
| | | | | | | | | Since |
| | | Quarter | 1-year | 3-year | 5-year | 10-year | 20-year | inception |
| | Ariel Fund–Investor Class | – | 0.32 | – | 10.38 | + | 9.85 | + | 8.53 | + | 5.75 | + | 10.26 | + | 11.11 |
| | Ariel Fund–Institutional Class + | – | 0.24 | – | 10.10 | + | 10.19 | + | 8.83 | + | 5.90 | + | 10.34 | + | 11.17 |
| | Russell 2500TM Value Index | + | 3.33 | – | 5.20 | + | 7.15 | + | 8.33 | + | 5.80 | + | 10.07 | + | 11.01 |
| | Russell 2000® Value Index | + | 1.70 | – | 7.72 | + | 5.73 | + | 6.66 | + | 4.42 | + | 9.12 | + | 10.17 |
| | S&P 500® Index | + | 1.35 | + | 1.78 | + | 11.82 | + | 11.58 | + | 7.01 | + | 7.98 | + | 9.99 |
Performance data quoted represents past performance and does not guarantee future results. All performance assumes the reinvestment of dividends and capital gains. The investment return and principal value of an investment will fluctuate so that an investor’s shares, when redeemed, may be worth more or less than their original cost. Current performance may be lower or higher than the performance data quoted. To access performance data current to the most recent month-end, visit arielinvestments.com. The minimum initial investment for Investor Class shares is $1,000; the minimum for Institutional Class shares is $1,000,000.
Expense ratio (as of 9/30/15) | |
| Investor Class | 1.02% |
| Institutional Class | 0.72% |
Top ten equity holdings (% of net assets) |
| 1. | Lazard Ltd | 4.6 |
| 2. | KKR & Co. L.P. | 4.3 |
| 3. | TEGNA, Inc. | 4.0 |
| 4. | Brady Corp. | 3.7 |
| 5. | Kennametal Inc. | 3.7 |
| 6. | Interpublic Group of Cos., Inc. | 3.3 |
| 7. | Meredith Corp. | 3.3 |
| 8. | JLL | 3.2 |
| 9. | Janus Capital Group Inc. | 3.2 |
| 10. | Royal Caribbean Cruises Ltd. | 3.2 |
+ The inception date for the Institutional Class shares is December 30, 2011. Performance information for the Institutional Class prior to that date reflects the actual performance of the Fund’s Investor Class (and uses the actual expenses of the Fund’s Investor Class, for such period of time), without any adjustments. For any such period of time, the performance of the Fund’s Institutional Class would have been substantially similar to, yet higher than, the performance of the Fund’s Investor Class, because the shares of both classes are invested in the same portfolio of securities, but the classes bear different expenses, which are primarily differences in distribution and service fees.
Notes: The graph does not reflect the deduction of taxes that a shareholder would pay on fund distributions or the redemption of fund shares. Total return does not reflect a maximum 4.75% sales load charged prior to 7/15/94. See index descriptions on page 65.
| | | |
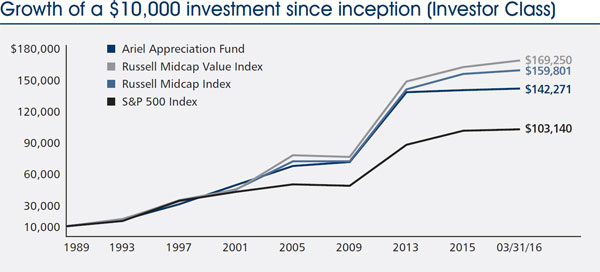
| | Ariel Appreciation Fund performance summary | INCEPTION: 12/01/89 |
| | | |
| | | |
| | | |
| | |  |
John W. Rogers, Jr. Co-portfolio
manager | | Timothy R. Fidler, cfa Co-portfolio
manager |
Composition of equity holdings (%) | |
| | | Ariel | Russell | | |
| | | Apprec- | Midcap | Russell | S&P |
| | | iation | Value | Midcap | 500 |
| | | Fund† | Index | Index | Index |
| | Financial services | 33.81 | 33.43 | 25.05 | 17.70 |
| | Consumer discretionary | 24.17 | 9.11 | 17.64 | 14.25 |
| | Health care | 16.97 | 5.64 | 8.61 | 14.22 |
| | Producer durables | 16.76 | 9.06 | 12.12 | 10.61 |
| | Consumer staples | 3.41 | 4.36 | 6.31 | 9.30 |
| | Technology | 2.64 | 8.17 | 11.10 | 17.88 |
| | Energy | 2.24 | 8.59 | 4.78 | 6.79 |
| | Materials & processing | 0.00 | 6.96 | 6.82 | 3.02 |
| | Utilities | 0.00 | 14.68 | 7.57 | 6.23 |
† Represents percentage of total equity holdings in the portfolio. |
Average annual total returns (%) as of 03/31/16 | | |
| | | | | | | | | Since |
| | | Quarter | 1-year | 3-year | 5-year | 10-year | 20-year | inception |
| | Ariel Appreciation Fund–Investor Class | + | 1.09 | – | 9.14 | + | 9.06 | + | 9.15 | + | 7.48 | + | 10.62 | + | 10.61 |
| | Ariel Appreciation Fund–Institutional Class + | + | 1.20 | – | 8.82 | + | 9.43 | + | 9.44 | + | 7.62 | + | 10.70 | + | 10.67 |
| | Russell Midcap® Value Index | + | 3.92 | – | 3.39 | + | 9.88 | + | 10.52 | + | 7.23 | + | 10.50 | + | 11.34 |
| | Russell Midcap® Index | + | 2.24 | – | 4.04 | + | 10.45 | + | 10.30 | + | 7.45 | + | 10.02 | + | 11.10 |
| | S&P 500® Index | + | 1.35 | + | 1.78 | + | 11.82 | + | 11.58 | + | 7.01 | + | 7.98 | + | 9.27 |
Performance data quoted represents past performance and does not guarantee future results. All performance assumes the reinvestment of dividends and capital gains. The investment return and principal value of an investment will fluctuate so that an investor’s shares, when redeemed, may be worth more or less than their original cost. Current performance may be lower or higher than the performance data quoted. To access performance data current to the most recent month-end, visit arielinvestments.com. The minimum initial investment for Investor Class shares is $1,000; the minimum for Institutional Class shares is $1,000,000.
Expense ratio (as of 9/30/15) | |
| Investor Class | 1.12% |
| Institutional Class | 0.79% |
Top ten equity holdings (% of net assets) |
| 1. | Zimmer Biomet Holdings, Inc. | 4.8 |
| 2. | AFLAC Inc. | 4.4 |
| 3. | Kennametal Inc. | 4.1 |
| 4. | Northern Trust Corp. | 4.1 |
| 5. | Stanley Black & Decker, Inc. | 4.0 |
| 6. | Laboratory Corp. of America Holdings | 4.0 |
| 7. | First American Financial Corp. | 3.9 |
| 8. | Omnicom Group Inc. | 3.9 |
| 9. | Interpublic Group of Cos., Inc. | 3.7 |
| 10. | Lazard Ltd | 3.6 |
+ The inception date for the Institutional Class shares is December 30, 2011. Performance information for the Institutional Class prior to that date reflects the actual performance of the Fund’s Investor Class (and uses the actual expenses of the Fund’s Investor Class, for such period of time), without any adjustments. For any such period of time, the performance of the Fund’s Institutional Class would have been substantially similar to, yet higher than, the performance of the Fund’s Investor Class, because the shares of both classes are invested in the same portfolio of securities, but the classes bear different expenses, which are primarily differences in distribution and service fees.
Notes: The graph does not reflect the deduction of taxes that a shareholder would pay on fund distributions or the redemption of fund shares. Total return does not reflect a maximum 4.75% sales load charged prior to 7/15/94. See index descriptions on page 65.
IS THE DOLLAR REALLY ALMIGHTY
| |
| Performance data quoted represents past performance. Past performance does not guarantee future results. All performance assumes the reinvestment of dividends and capital gains and represents returns of the Investor Class shares. The investment return and principal value of an investment will fluctuate so that an investor’s shares, when redeemed, may be worth more or less than their original cost. Current performance may be lower or higher than the performance data quoted. Performance data current to the most recent month-end for Ariel Focus Fund may be obtained by visiting our website, arielinvestments.com. |
DEAR FELLOW SHAREHOLDER:
Ariel Focus Fund returned +1.62% in the first quarter of 2016. It modestly lagged its primary benchmark the Russell 1000 Value Index, which gained +1.64%, as well as the S&P 500 Index, which increased +1.35%. In 2015, many of our worst-performing companies were commodity-related. Most of these turned positive in the first quarter, some dramatically so. Similarly, our home-furnishing retailers and sole for-profit education holding were oversold last year but recovered some of those losses in the first quarter. Our contrarian investments in “old tech” (companies like Western Union Co. (WU) and Oracle Corp. (ORCL)) boosted our performance in the quarter. Our only noteworthy disappointment was Hanger, Inc. (HNGR), which uncovered accounting irregularities and saw its shares delisted.
Past letters have focused on the woeful performance of companies with exposures to commodities such as oil and gas, copper and gold. Commodity returns have been so poor for so long that the shares of many quality commodity-related companies now trade well below the value of their assets and investments, according to our estimates. This quarter, the market finally began to recognize some of that value. Barrick Gold Corp. (ABX) saw its stock increase +84.28% in the quarter. Plus Kennametal Inc. (KMT), Exxon Mobil Corp. (XOM) and Apache Corp. (APA) all contributed to performance in the quarter.
I believe the market is finally acknowledging the risk of future inflation we have discussed frequently in prior letters. Recent government data shows that the core U.S. inflation rate is at or even exceeds the Fed’s 2% target. The anti-inflationary effects of high unemployment, a strong dollar and weak commodity prices are giving way to tighter job markets, a weaker dollar and a recovery in oil. I claim no particular skill in predicting short-term fluctuations in these macroeconomic inputs, of course. But the U.S. government has 19 trillion reasons to reduce the value of the U.S. dollar. $19 trillion is the current size of the U.S. Federal debt, and that figure does not include the value of debt owed by state and local governments. Inflation reduces the economic value of debt, a strong motivation for the government to take actions which increase inflation. In addition, more inflation should reduce the value of the dollar versus other currencies, improving the competitive position of U.S. manufacturers. I acknowledge inflation has taken longer to return than I expected. But I continue to believe increasing inflation (and a resulting increase in nominal interest rates) will be a dominant investment theme of the next three to five years.
Although the data shows increasing inflation, interest rates have stayed annoyingly low. “Annoyingly” because the investment thesis around many of our financial holdings is based on interest rates returning to their historic averages. Morgan Stanley (MS), Goldman Sachs Group, Inc. (GS), JPMorgan Chase & Co. (JPM), and Bank of New York Mellon Corp. (BK) will all generate higher profits when they are able to invest their capital in higher-earning fixed-income assets. All four of these companies saw their stocks decline in the quarter when interest rates did not increase, as we and many others had predicted.
Let me take a moment to focus on Morgan Stanley, whose shares fell -20.91% in the quarter to a breathtaking 30% below book value. For generations, bankers and traders competed to become partners at Morgan Stanley so they could have the right (!) to buy stock in the company at book value. At today’s stock price anyone can buy shares in Morgan Stanley below the price a partner once had to pay. As the graph below shows, since 1993 it has only traded at this current discount to book value on three occasions: in late 2008 during the Financial Crisis; in 2011 during the European sovereign debt crisis; and today.
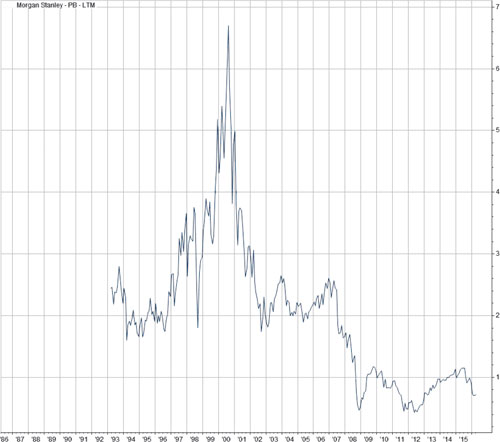
Past performance does not guarantee future results.
We sometimes hear a justification for Morgan Stanley’s low price-to-book: it reportedly has “anemic” returns on equity. In 2015 Morgan Stanley earned “only” 8.40% return on equity (ROE). Admittedly, this return is a far cry from 2006 when the company posted a 23% ROE. But is 8.40% really that bad today? Morgan Stanley’s assets and resulting book value consist almost entirely of stocks, bonds and other financial instruments. In 2015, the S&P 500 gained +1.38%. The broad bond market posted low single-digit returns. Commodities lost money. As such, if you owned a portfolio of financial assets last year, would you have been disappointed with an +8.40% return? I bet you would have been thrilled. If a closed-end mutual fund with a diversified portfolio of stocks and bonds returned +8.40% in 2015, would you think that fund should trade at a discount to the value of its holdings? No, you would probably be willing to pay a premium if you thought it could repeat that performance in the future. And we would argue Morgan Stanley’s 2015 earnings and resulting ROE are artificially and temporarily below normalized rates. When interest rates return to normal levels, we think Morgan Stanley will again be able to charge its wealth management clients fees on their cash holdings, after years of foregoing these high margin fees. A normal, positively-sloped yield curve will improve the profitability of Morgan Stanley’s beleaguered Fixed Income, Commodities and Currencies (“FICC”) group. We view the opportunity to purchase Morgan Stanley shares at a 30% discount to book value as a “fat pitch.”
“The anti-inflationary effects of high unemployment, a strong dollar, and weak commodity prices are giving way to tighter job markets, a weaker dollar and a recovery in oil.”
PORTFOLIO COMINGS AND GOINGS
In the first quarter we made significant progress in “working out” of some of our troubled holdings. We sold all of our shares in Apollo Education Group, Inc. (APOL) when the company negotiated a transaction to go private at $9.50 per share. The stock returned +12.13% in the quarter supporting our decision to hold our shares as “too cheap to sell” despite headwinds facing the for-profit education industry. We were wrong in viewing Washington D.C. political pressures as a temporary phenomenon. Likewise, we have worked down our position in troubled natural gas company Chesapeake Energy Corp. (CHK) to less than 1% of our holdings. As we write, Chesapeake has jumped more than +40% year-to-date. We would not expect to remain holders of Chesapeake at year end. In addition, we sold our positions in Baxter International Inc. (BAX) and Newell Rubbermaid Inc. (NWL) in order to pursue more compelling opportunities.
We added two new names to Ariel Focus Fund in the first quarter. We purchased our first shares in BorgWarner Inc. (BWA) in February after the company’s stock tumbled almost -50% on concerns about the auto supplier’s largest customer, Volkswagen. BorgWarner is a leading manufacturer of drivetrain and engine components and systems. We think the company will continue to benefit from increased demand for fuel-saving and emission-controlling technology that helps car manufacturers comply with increasing stringent regulations. We have followed BorgWarner closely for many years and consider it one of the highest quality companies in the industry. We initiated our position at approximately 10x our calculation of next year’s earnings, near a 10-year low for BorgWarner. To read more about BorgWarner and our investment thesis, see our company spotlight on page 21.
“Interest rates have stayed annoyingly low. ‘Annoyingly’ because the investment thesis around many of our financial holdings is based on interest rates returning to their historic averages.”
Finally, we initiated a new position in Zebra Technologies Corp. (ZBRA), the manufacturer of bar code printers and scanners used to track inventory and supplies. In 2014 Zebra purchased the bar code scanning business known as Motorola Solutions, Inc. (MSI). The company went from a printing scanner equipment manager to a systems designer able to deliver a complete solution to large retailers such as Wal-Mart Stores, Inc. (WMT) and Amazon.com, Inc. (AMZN). Zebra’s stock initially performed quite well after the acquisition, but was hit hard when costs of combining the two businesses exceeded management’s initial estimates. We purchased our first shares in Zebra at less than 10x our estimate of forward earnings, a very attractive price for a well-positioned supplier with good growth prospects both near and long term.
As always, we appreciate the opportunity to serve you and welcome any questions or comments you might have. You can also contact us directly at email@arielinvestments.com.
Sincerely,
Charles K. Bobrinskoy
Portfolio manager
| | | | |
| EVALUATING RISK | |
| | | | |
| | We recently asked our portfolio managers what they thought were the most important factors to consider when evaluating risk. | |
| | | |
| | Here’s how Charles K. Bobrinskoy, Portfolio Manager of Ariel Focus Fund, responded: | |
| | | |
| | “I believe that certainty of underlying asset value is the most important factor to consider when evaluating risk. In addition, management can make a decision that leads to permanent impairment of capital. Thus we focus on identifying companies with strong, properly incentivized leadership.” | |
| | | |
| | | |
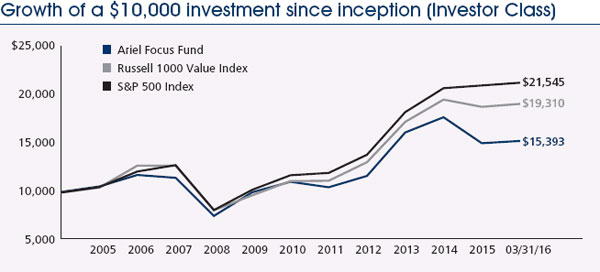
| | Ariel Focus Fund performance summary | INCEPTION: 06/30/05 |
| | | |
| | | |
| |
 |
Charles K. Bobrinskoy Portfolio manager |
| Composition of equity holdings (%) | | | |
| | | | | |
| | Financial services | 25.59 | 28.50 | 17.70 |
| | Technology | 16.60 | 11.10 | 17.88 |
| | Health care | 16.35 | 11.66 | 14.22 |
| | Producer durables | 14.98 | 10.26 | 10.61 |
| | Energy | 10.30 | 12.83 | 6.79 |
| | Consumer discretionary | 8.48 | 6.50 | 14.25 |
| | Materials & processing | 7.70 | 3.10 | 3.02 |
| | Consumer staples | 0.00 | 6.24 | 9.30 |
| | Utilities | 0.00 | 9.81 | 6.23 |
† Represents percentage of total equity holdings in the portfolio.
| Average annual total returns (%) as of 03/31/16 | | | |
| | | | | | | | Since |
| | | Quarter | 1-year | 3-year | 5-year | 10-year | inception |
| | Ariel Focus Fund–Investor Class | + 1.62 | – 12.08 | + 4.94 | + 5.89 | + 3.69 | + 4.09 |
| | Ariel Focus Fund–Institutional Class+ | + 1.72 | – 11.86 | + 5.21 | + 6.11 | + 3.80 | + 4.20 |
| | Russell 1000® Value Index | + 1.64 | – 1.54 | + 9.38 | +10.25 | + 5.72 | + 6.37 |
| | S&P 500® Index | + 1.35 | + 1.78 | +11.82 | +11.58 | + 7.01 | + 7.47 |
Performance data quoted represents past performance and does not guarantee future results. All performance assumes the reinvestment of dividends and capital gains. The investment return and principal value of an investment will fluctuate so that an investor’s shares, when redeemed, may be worth more or less than their original cost. Current performance may be lower or higher than the performance data quoted. To access performance data current to the most recent month-end, visit arielinvestments.com. The minimum initial investment for Investor Class shares is $1,000; the minimum for Institutional Class shares is $1,000,000.
Expense ratio (as of 9/30/15) 1 | | Net | | Gross |
| Investor Class | | 1.00% | | 1.37% |
| Institutional Class | | 0.75% | | 1.07% |
Top ten equity holdings (% of net assets) | |
| 1. | Western Union Co. | 5.7 |
| 2. | Oracle Corp. | 5.6 |
| 3. | Intl Business Machines Corp. | 5.6 |
| 4. | Stanley Black & Decker, Inc. | 5.5 |
| 5. | Lockheed Martin Corp. | 5.1 |
| 6. | Zimmer Biomet Holdings, Inc. | 4.5 |
| 7. | Laboratory Corp. of America Holdings | 4.4 |
| 8. | Exxon Mobil Corp. | 3.9 |
| 9. | Mosaic Co. | 3.9 |
| 10. | Barrick Gold Corp. | 3.8 |
+The inception date for the Institutional Class shares is December 30, 2011. Performance information for the Institutional Class prior to that date reflects the actual performance of the Fund’s Investor Class (and uses the actual expenses of the Fund’s Investor Class, for such period of time), without any adjustments. For any such period of time, the performance of the Fund’s Institutional Class would have been substantially similar to, yet higher than, the performance of the Fund’s Investor Class, because the shares of both classes are invested in the same portfolio of securities, but the classes bear different expenses, which are primarily differences in distribution and service fees.
1 Effective February 1, 2014, Ariel Investments, LLC, the Adviser, has contractually agreed to waive fees and reimburse expenses in order to limit Ariel Focus Fund’s total annual operating expenses to 1.00% of net assets for the Investor Class and 0.75% of net assets for the Institutional Class through the end of the fiscal year ending September 30, 2017. Through January 31, 2014, the Expense Cap was 1.25% for the Investor Class and 1.00% for the Institutional Class. Notes: The graph does not reflect the deduction of taxes that a shareholder would pay on fund distributions or the redemption of fund shares. See index descriptions on page 65.
ROSETTA STONE: A DIAMOND IN THE ROUGH
| Performance data quoted represents past performance. Past performance does not guarantee future results. All performance assumes the reinvestment of dividends and capital gains and represents returns of the Investor Class shares. The investment return and principal value of an investment will fluctuate so that an investor’s shares, when redeemed, may be worth more or less than their original cost. Current performance may be lower or higher than the performance data quoted. Performance data current to the most recent month-end for Ariel Discovery Fund may be obtained by visiting our website, arielinvestments.com. |
DEAR FELLOW SHAREHOLDER:
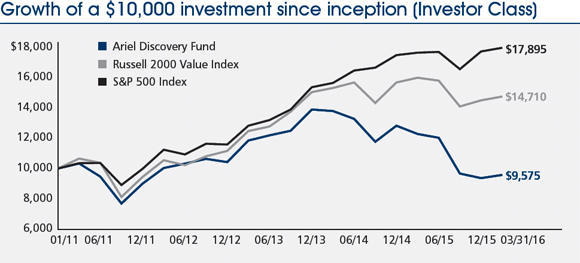
Average annual total returns as of 03/31/16
| | | | 1Q16 | | 1-year | | 3-year | | 5-year | | Since inception* |
| Ariel Discovery Fund | | | + 2.20 | % | | | – 21.90 | % | | | – 6.81 | % | | | – 1.51 | % | | | – 0.84 | % |
Russell 2000® Value Index | | | + 1.70 | | | | – 7.72 | | | | + 5.73 | | | | + 6.66 | | | | + 7.76 | |
S&P 500® Index | | | + 1.35 | | | | + 1.78 | | | | + 11.82 | | | | + 11.58 | | | | + 11.93 | |
| * | The inception date for Ariel Discovery Fund is 01/31/11. |
The first quarter of 2016 showed improved relative performance after a tough 2015. And, while it looks as if little occurred based on rather flat absolute returns, the quarter was anything but uneventful. By February 10th Ariel Discovery Fund was down nearly 14% year-to-date, but was generally in line with a broad-based market selloff. Then sentiment quickly turned, partly driven by a bounce in energy prices, and we participated in a sharp move off the bottom through quarter-end.
This early-year volatility provided some terrific buying opportunities in Ariel Discovery Fund. Several quality companies fell into our low price-to-book world, and we took advantage of the brief but intense move to add seven new names. They replaced holdings that were taken over, merged into another holding, had become even too small for us, or in one case where we had lost confidence. The seven new holdings were initially purchased at an average price-to-book ratio of .96x. Six of the seven have net cash positions. All seven have positive EBITDA, and six of the seven had positive GAAP earnings in 2015 and are expected to this year as well. The individual names are discussed at the end of the letter.
Top performers during the quarter included Contango Oil & Gas Co. (MCF), which surged +83.93% as energy prices recovered during the quarter. Real Industry Inc. (RELY), a new position, gained +45.00% since our initial purchase in February. Finally, ORBCOMM, Inc. (ORBC), one of our best performers last year after its successful satellite launch, continued its momentum with a gain of +39.92%. As one of our largest holdings, ORBCOMM was easily the biggest contributor to our year-to-date results.
On the downside were two very small holdings: Rentech, Inc. (RTK), down -36.93%, and Rubicon Technology, Inc. (RBCN), which lost -35.96%. In addition, Orion Energy Systems, Inc. (OESX) fell -35.94%.
12 ARIELINVESTMENTS.COM
IF WE COULD OWN JUST ONE STOCK, WHAT WOULD IT BE
Since 2011, we have been using our first quarter letter to respond to this question, as we believe a deep dive into our favorite stock at a given point in time effectively illustrates the characteristics we seek in our portfolio holdings.
As deep value investors, we look for underfollowed and misunderstood companies trading at prices we believe can help mitigate a permanent loss of capital. Specifically, we seek companies selling at deep discounts to their intrinsic worth that have fortress balance sheets and excess cash. We also want to be invested alongside talented and incentivized leadership, and we look to identify upside potential from underappreciated opportunities, overlooked assets, or preferably both.
Last years’ pick, RealNetworks, Inc. (RNWK), along with Cowen Group, Inc. (COWN), from 2014, continue to represent extraordinary value, and either could still qualify as a favorite holding. Right up with them, especially given its lackluster stock performance in the face of very positive fundamental developments, is language learning expert Rosetta Stone, Inc. (RST).
Rosetta Stone is different from previous favorites in that our thesis has changed over time. We are the largest shareholder, and we have supported management to make changes that we believe will ultimately benefit investors. One constant has been the remarkable effectiveness of Rosetta Stone’s immersive language software and the extraordinary value of its brand.
Based in Arlington, Virginia, Rosetta Stone has long been known for the yellow boxes at airport kiosks, book stores, and other locations promising to teach any of a multitude of languages. We initially bought the stock in December 2011 at just over $7.00 per share. At the time, we believed the company would ultimately make a successful transition in its consumer-based business to a digital delivery model; the company also held more than $5.00 per share in cash.
Our original thesis played out nicely for a time, as management did a good job of cutting costs and improving distribution. By mid-2013 the stock had traded as high as $18.30, and we had trimmed back our position as the stock approached fair value. Shortly thereafter the shares began a two-year decline, as a series of poor earnings reports combined with a perception that free language apps would destroy Rosetta’s value. From peak to trough the stock lost nearly 65% of its value, touching $6.17 this January. As natural contrarians, we have gradually added to our position over time. As of March 31, 2016, the stock traded at $6.71, or a market capitalization of $147 million.
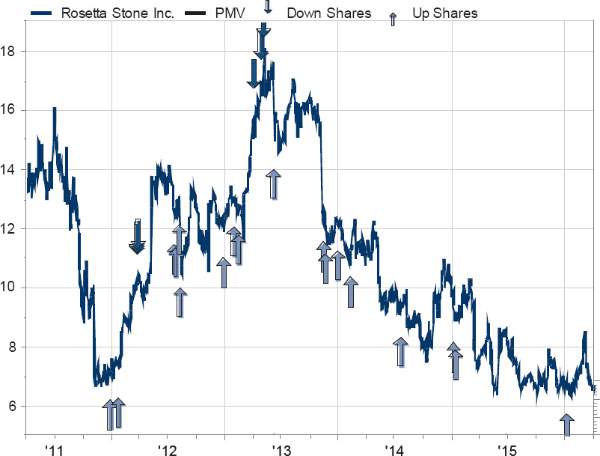
Light blue arrow = Ariel purchase Dark blue arrow = Ariel sale
Past performance does not guarantee future results.
During this period, our investment thesis changed from one dependent on the consumer business to an ultimately more powerful story built primarily on the institutional, or Enterprise & Education (E&E), business. Rosetta Stone was not a broken thesis. Instead, it evolved from a good thesis into an even better one.
Surely along the way there were poor results, an outcome of a management team attempting to build the consumer and enterprise businesses simultaneously. That ultimately meant overspending on a declining consumer business at the expense of the vast potential of the E&E franchise. A healthy dose of constructive activism, in our opinion, turned the tide.
Beginning in 2014, The D3 Family Funds and Osmium Partners, led by David Nierenberg and John Lewis, respectively, began to publicly voice their strong belief in the value of the company and their concern about its current direction and lack of focus. We had similar beliefs and privately expressed our concern to management and the board. With ownership of more than 30% of outstanding shares speaking independently—but with a common message—the board responded and the company made several significant changes:
800.292.7435 13
| • | A greatly improved Board of Directors. David Nierenberg joined, as did John Hass after an introduction by John Lewis. |
| • | A decision to focus the company on the E&E business and to vastly streamline the consumer side in pursuit of only serious learners. |
| • | John Hass appointed as Interim CEO in March 2015, and recently appointed as permanent CEO and Chair. |
| • | Engagement of renowned turnaround consultant Al Angrisani. |
The result of these moves and improved focus is a much better company that investors continue to ignore:
| • | $65 million in annual costs were taken out last year, and another $19 million are expected on an annualized basis. A leaner, more efficient company has emerged. |
| • | The decision to stop the bleeding on the consumer side may have been the single most important decision made by the board. Not only was the division in decline, the constant price cutting needed to entice the casual user was cannibalizing the institutional business. A powerful brand built over decades was in danger of becoming irrelevant. The contribution margin has more than doubled in a year to 25% in the fourth quarter. |
| • | Lexia Learning is now the crown jewel of Rosetta Stone. Purchased in 2013 for $22.5 million, this software focuses on first-language literacy, not learning additional languages. It has renewal rates of more than 90%. As a true Software as a Service (SaaS) business fulfilling a vital need to the nation’s schools, we believe it alone is worth more than the current RST enterprise value of just less than $100 million. Bookings of more than $30 million and a sustainable 30%+ growth rate should garner a price/ sales multiple of at least 3x and perhaps as much as 5x. |
| • | The institutional language business, under the leadership of Judy Verses, will soon launch its next-generation Language Learning Suite. Its core markets of enterprise and K12 digital learning are more than $1 billion in size. While it has struggled awaiting the launch of a cohesive platform, this is a solid business with high renewal rates. Even at only 1x revenue, it would be worth $70 million. |
| • | This collection of valuable assets is bolstered by a debt-free balance sheet with nearly $2 per share in cash. |
A sum-of-the parts valuation using what we believe to be very conservative multiples leads to a number of roughly twice the current price.
As John Lewis noted in a recent interview in Value Investor Insight, the market is clearly tired of this story1. The perception that Rosetta Stone is a broken consumer stock persists. But like Lewis, I find this to be one of my highest conviction holdings. The most likely scenario, in our opinion, is that the heavily incentivized leadership team will sell all or part of the company to one or more of several potential suitors. In particular, Lexia would be worth much more as part of a larger digital education company. Meanwhile, the foreign language businesses have tremendous franchise value. On the other hand, continued successful execution of the now highly-disciplined plan could lead to a fair value of 3-4 times the current price in as little as two years. We are enthusiastic owners, believing we stand to benefit from either outcome.
PORTFOLIO COMINGS AND GOINGS
As mentioned earlier, we took advantage of early-year market volatility to make some significant changes to the portfolio. The names eliminated included:
| • | Furmanite Corp. (FRM)– acquired by Team, Inc. (TISI), a current portfolio favorite. |
| • | CSW Industrials, Inc. (CSWI)– we believe the spinoff from Capital Southwest Corp. (CSWC) reached full value. |
| • | LeapFrog Enterprises, Inc. (LF)– agreed to be acquired by VTech for cash. |
| • | Broadwind Energy, Inc. (BWEN)– we had initiated a small position last year, but lost confidence in the company’s ability to avoid losses and protect its asset base. |
| • | Rentech, Inc., Rubicon Technology, Inc., Vical Inc. (VICL)– we believe each is deeply discounted, however, as discussed earlier, their very small market capitalizations and the opportunity to add the somewhat larger names below at similarly attractive valuations led us to eliminate these from this portfolio (note: the first two were still in the process of being sold at quarter-end, but are completed as of this writing). |
14 ARIELINVESTMENTS.COM
The new holdings, each of which we were very excited to add, are as follows:
| • | ArcBest Corp. (ARCB)– This well-managed freight transportation and logistics company trades below book value despite being solidly profitable. Macro-economic concerns provided us with an opportunity to purchase a company with potential to achieve higher returns as it grows its asset-light logistics business. |
| • | CRA International, Inc. (CRAI)– CRA International is a global consulting firm that offers litigation, regulatory, and financial consulting, as well as management consulting services. Trading below book value and with approximately 25% of the market cap in cash, we believe our investment has sizable downside protection. In addition, CRA International consistently generates cash and has solid long-term growth prospects. |
| • | Digi International Inc. (DGII)– Headquartered in Minnetonka, Minnesota, Digi International is a machine-to-machine (M2M) hardware provider in transition. The new management team is working strategically to reposition the company for sustainable long-term growth. DGII currently trades well below book value and has approximately 50% of its market cap in cash. |
| • | Movado Group Inc. (MOV)– Movado Group is a watch retailer and wholesaler with an international presence that operates through its iconic brands, along with six licensed brands. The company has a clean balance sheet with a sizable cash balance. Outstanding leadership has enabled the company to generate solid returns in a very challenging environment. Undemanding valuation multiples add to our enthusiasm. |
| • | Real Industry Inc.– Real Industry is a holding company based in Southern California backed by notable investors, including Sam Zell. With over $800 million in federal net operating losses (NOLs), management plans to acquire cash generating, stand-alone businesses that can utilize the NOL asset. Its first major purchase was Real Alloy, an aluminum recycling company. We believe the value of Real Alloy alone is more than the current market capitalization of Real Industry. With the value of the NOLs, we see an asymmetric risk/reward opportunity. |
| • | STRATTEC Security Corp. (STRT)– Headquartered in Milwaukee, STRATTEC Security designs, manufactures, and sells automotive access control products. The company has a clean balance sheet and trades near tangible book value. Additionally, advancement in automated cars should provide a tailwind, driving demand for STRATTEC products. |
| • | West Marine, Inc. (WMAR)– West Marine operates retail stores for boating supplies and accessories. It trades at a sizable discount to book value despite being profitable, and has a clean balance sheet with no debt and excess cash. West Marine is positioned to take advantage of an ongoing recovery in the boating industry. |
As always, we appreciate the opportunity to serve you and welcome any questions or comments you might have. You can also contact us directly at email@arielinvestments.com.
Sincerely,
David M. Maley
Lead portfolio manager
| | | | |
 | EVALUATING RISK | |
| | | | |
| | We recently asked our portfolio managers what they thought were the most important factors to consider when evaluating risk. | |
| | | |
| | Here’s how David M. Maley, Lead Portfolio Manager of Ariel Discovery Fund, responded: | |
| | | |
| | “One of the core beliefs that our Domestic Research Team shares is that certainty of underlying asset value is the most important factor to consider when evaluating risk. An additional consideration is that management can make a decision that leads to permanent impairment of capital. We therefore focus on identifying companies with strong, properly incentivized leadership.” | |
1 | “Investor Insight: Activism,” Value Investor Insight, March 31, 2016, 12-13. |
800.292.7435 15
| | | |
| | Ariel Discovery Fund performance summary | INCEPTION: 01/31/11 |
| | | |
| | | |
 |  |
| David M. Maley | Kenneth E. Kuhrt, cpa |
Lead portfolio
manager | Portfolio
manager |
Composition of equity holdings (%) | | | | | | | |
| | Ariel Discovery Fund† | Russell 2000 Value Index | | S&P 500 Index |
Consumer discretionary | 24.39 | | 10.26 | | | 14.25 | |
| Technology | 21.30 | | 9.79 | | | 17.88 | |
| Producer durables | 17.68 | | 12.26 | | | 10.61 | |
| Financial services | 13.66 | | 43.08 | | | 17.70 | |
| Utilities | 9.29 | | 9.20 | | | 6.23 | |
| Materials & processing | 5.83 | | 4.66 | | | 3.02 | |
| Energy | 5.77 | | 3.46 | | | 6.79 | |
| Health care | 2.08 | | 4.14 | | | 14.22 | |
| Consumer staples | 0.00 | | 3.16 | | | 9.30 | |
† Represents percentage of total equity holdings in the portfolio.
Average annual total returns (%) as of 03/31/16 |
| | | | | | Since |
| | Quarter | 1-year | 3-year | 5-year | inception |
Ariel Discovery Fund–Investor Class | + 2.20 | – 21.90 | – 6.81 | – 1.51 | – 0.84 |
Ariel Discovery Fund–Institutional Class+ | + 2.29 | – 21.69 | – 6.58 | – 1.28 | – 0.61 |
Russell 2000®Value Index | + 1.70 | – 7.72 | + 5.73 | + 6.66 | + 7.76 |
S&P 500® Index | + 1.35 | + 1.78 | + 11.82 | + 11.58 | + 11.93 |
Performance data quoted represents past performance and does not guarantee future results. All performance assumes the reinvestment of dividends and capital gains. The investment return and principal value of an investment will fluctuate so that an investor’s shares, when redeemed, may be worth more or less than their original cost. Current performance may be lower or higher than the performance data quoted. To access performance data current to the most recent month-end, visit arielinvestments.com. The minimum initial investment for Investor Class shares is $1,000; the minimum for Institutional Class shares is $1,000,000.
Expense ratio (as of 9/30/15) 1 | Net | Gross |
| Investor Class | 1.25% | 2.10% |
| Institutional Class | 1.00% | 1.29% |
Top ten equity holdings (% of net assets) |
| 1. | ORBCOMM, Inc. | 6.2 |
| 2. | Cowen Group, Inc. | 6.0 |
| 3. | Team, Inc. | 4.8 |
| 4. | Gaiam, Inc. | 4.6 |
| 5. | Rosetta Stone Inc. | 4.4 |
| 6. | RealNetworks, Inc. | 4.1 |
| 7. | SeaChange Intl, Inc. | 3.7 |
| 8. | Telenav Inc. | 3.5 |
| 9. | XO Group Inc. | 3.4 |
| 10. | Bristow Group Inc. | 3.3 |
+ The inception date for the Institutional Class shares is December 30, 2011. Performance information for the Institutional Class prior to that date reflects the actual performance of the Fund’s Investor Class (and uses the actual expenses of the Fund’s Investor Class, for such period of time), without any adjustments. For any such period of time, the performance of the Fund’s Institutional Class would have been substantially similar to, yet higher than, the performance of the Fund’s Investor Class, because the shares of both classes are invested in the same portfolio of securities, but the classes bear different expenses, which are primarily differences in distribution and service fees.
1 Effective February 1, 2014, Ariel Investments, LLC, the Adviser, has contractually agreed to waive fees and reimburse expenses in order to limit Ariel Discovery Fund’s total annual operating expenses to 1.25% of net assets for the Investor Class and 1.00% for the Institutional Class through the end of the fiscal year ending September 30, 2017. Through January 31, 2014, the Expense Cap was 1.50% for the Investor Class and 1.25% for the Institutional Class. Notes: The graph does not reflect the deduction of taxes that a shareholder would pay on fund distributions or the redemption of fund shares. See index descriptions on page 65.
EMBRACING VOLATILITY: OUR PHILOSOPHY IN ACTION
| Performance data quoted represents past performance. Past performance does not guarantee future results. All performance assumes the reinvestment of dividends and capital gains and represents returns of the Investor Class shares. The investment return and principal value of an investment will fluctuate so that an investor’s shares, when redeemed, may be worth more or less than their original cost. Current performance may be lower or higher than the performance data quoted. Performance data current to the most recent month-end for Ariel International Fund and Ariel Global Fund may be obtained by visiting our website, arielinvestments.com. |
DEAR FELLOW SHAREHOLDER:
Global equity markets followed a remarkably symmetrical v-shaped trajectory in the first quarter of 2016. The key indexes serving as benchmarks for our global portfolios were down double-digit percentages through mid-February, and regained most of the losses by quarter end.
As in 2015, our global portfolios had positive returns even though most of their benchmarks fell in the first quarter of 2016. Specifically, Ariel International Fund advanced +1.27%, topping the MSCI EAFE Index, which lost -3.01%, as well as the MSCI ACWI ex-US Index’s -0.38% drop. Meanwhile, Ariel Global Fund climbed +2.41%, as compared to the MSCI ACWI Index, which eked out a +0.24% gain.
As you will likely recall, our last quarterly letter addressed risk, stability and volatility. We noted that after the Great Financial Crisis of 2007-2009, investors sought “stable” stocks in the attempt to avoid harrowing losses like those from the crisis. Our key message from that letter was to be fearful when others are complacent—that is, to be vigilant when the crowd blithely assumes it can count on historical stability, volatility and risk profiles to remain fixed no matter the price.
In this letter we will discuss how that philosophy played out in the recent quarter—an environment that provided a wonderful opportunity to apply our strategy.
Specifically, when prices shift quickly and markedly, risks as well as opportunities appear. All else being equal, buying a volatile stock at a low price is better than buying a sedate stock at a high one. Indeed, far too many investors have so fully associated risk with volatility measurements—standard deviation, beta and so forth—that they have ignored price. In our view, the price you pay determines whether you are more exposed to risk or return. In other words, in equity investing you are ultimately paying for a share of a business’s profits. And future profits are never a sure thing. So the more you pay for supposedly stable earnings, the more exposed you are to risk—and the lower your likely returns.
We will use the current darlings of the world market, consumer staples stocks, as our example. Five years ago, the MSCI ACWI Index had a P/E ratio1 of 12.4x. Consumer staples stocks, however, sold at a premium, with a P/E ratio of 15.0x. Today, the index has a P/E ratio of 16.2x, which we would describe as toward the higher end of the normal range. Meanwhile, the consumer staples sector has a P/E ratio of 21.5x. Those embracing this love of consumer staples companies seem to believe they have a relatively predictable earnings pattern with a dearth of bad surprises; so they are worth a premium because they have low volatility. From our perspective, by contrast, when you pay $21.50 for each dollar of a consumer staples company’s present earnings, that’s a much higher price than the $16.20 you pay for a dollar of the broad market’s earnings. If those earnings fail to meet expectations, the price is likely to fall sharply—especially given that so many people are counting on those earnings to be on target.
Going into the quarter, we believed companies with relatively steady earnings were generally expensive—and therefore risky—while companies with more volatile earnings were more attractive. As the market sold off, investors fled to perceived safety, such as consumer staples fare. That meant we examined our portfolio and pared back on some of our more defensive names where the discount to our estimate of intrinsic value decreased. Specifically, we sold shares of tobacco-makers Philip Morris Intl, Inc. and Japan Tobacco Inc., utilities firms WEC Energy Group and Southern Co., and telecommunication and media firm Rogers Communications Inc.
Simultaneously, we added shares in our more volatile holdings where the discount to intrinsic value increased. In the broad technology and telecommunications area, we added to wireless expert Nokia Corp., integrated circuit-maker Dialog Semiconductor plc, and infotainment specialist Harman Intl Industries, Inc. We also bought more shares of French tire-maker Michelin (CDGE), whose stock trades in sympathy with the cyclical automobile industry. Finally, we increased our positions in energy companies EOG Resources Inc., Tenaris and Suncor Energy, Inc. as natural resources prices fluctuated considerably.
Clearly, this quarter’s activities represent a portfolio adjustment, not an overhaul. And when the market becomes especially erratic, adjustments are appropriate. In line with our patient investing philosophy, we would not generally endorse a wave of mass selling, a huge shift from one area to another, or any radical attempt to time the market. That said, to stand flat-footed when some stocks’ valuations rise and other shares plummet strikes us as risky in the first case and lethargic in the other. Just as importantly, the actions we took this quarter are not likely to show through in the coming days and weeks but rather in months or years. That is by no means to say they were not important: small shifts can boost returns substantially whether the market hits an air pocket or soars. We look forward to those results.
As always, we appreciate the opportunity to serve you and welcome any questions or comments you might have. You can also contact us directly at email@arielinvestments.com.
Sincerely,
Rupal J. Bhansali
Portfolio manager
| | | | |
| EVALUATING RISK | |
| | | | |
| | We recently asked our portfolio managers what they thought were the most important factors to consider when evaluating risk. | |
| | | |
| | Here’s how Rupal J. Bhansali, Portfolio Manager of Ariel International Fund and Ariel Global Fund, responded: | |
| | | |
| | “Both qualitative and quantitative factors should be considered when evaluating risk. Our qualitative risk assessment considers whether a company’s business model and strategy will stand the test of time, competitive threats, corporate governance matters, and capital allocation priorities. Quantitative risk factors incorporate an assessment of a company’s returns relative to its risk profile, balance sheet strength, and trading liquidity, among other factors.” | |
1 P/E, or price/earnings, is the ratio of a company’s share price to its per-share earnings.
Investing in equity stocks is risky and subject to the volatility of the markets. Bonds are fixed income securities in that at the time of the purchase of a bond, the amount of income and the timing of the payments are known. Risks of bonds include credit risk and interest rate risk, both of which may affect a bond’s investment value by resulting in lower bond prices or an eventual decrease in income. Treasury bonds are issued by the government of the United States. Payment of principal and interest is guaranteed by the full faith and credit of the U.S. government, and interest earned is exempt from state and local taxes.
| | | |
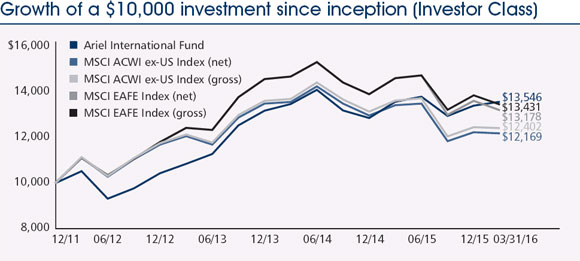
| Ariel International Fund performance summary | INCEPTION: 12/30/11 |
| | | |
| | | |
 | |
| Rupal J. Bhansali | |
| Portfolio manager | |
Composition of equity holdings* (%) | | | | | | |
| | | Ariel
International
Fund† | | MSCI
EAFE
Index | | MSCI
ACWI
ex-US
Index |
| | Information technology | 20.43 | | | 5.25 | | 8.35 |
| | Financials | 17.36 | | | 23.78 | | 25.79 |
| | Telecommunication services | 15.21 | | | 5.11 | | 5.34 |
| | Consumer staples | 13.43 | | | 12.66 | | 11.23 |
| | Health care | 12.15 | | | 11.47 | | 8.86 |
| | Consumer discretionary | 11.87 | | | 13.17 | | 11.99 |
| | Energy | 3.56 | | | 4.67 | | 6.38 |
| | Industrials | 3.00 | | | 13.29 | | 11.54 |
| | Utilities | 2.60 | | | 3.88 | | 3.58 |
| | Materials | 0.39 | | | 6.73 | | 6.94 |
| * | The sectors above are the Global Industry Classification Standard (“GICS”) sector classifications. GICS was developed by and is the exclusive property and a service mark of MSCI Inc. (“MSCI”) and Standard & Poor’s, a division of The McGraw-Hill Companies, Inc. (“S&P”) and is licensed for use by Ariel Investments, LLC. Neither MSCI, S&P nor any third party involved in making or compiling the GICS or any GICS classifications makes any express or implied warranties or representations with respect to such standard or classification (or the results to be obtained by the use thereof), and all such parties hereby expressly disclaim all warranties of originality, accuracy, completeness, merchantability and fitness for a particular purpose with respect to any of such standard or classification. Without limiting any of the foregoing, in no event shall MSCI, S&P, any of their affiliates or any third party involved in making or compiling the GICS or any GICS classifications have any liability for any direct, indirect, special, punitive, consequential or any other damages (including lost profits) even if notified of the possibility of such damages. |
Average annual total returns (%) as of 03/31/16 | | | | | | | | |
| | | Quarter | 1-year | 3-year | Since
inception |
| | Ariel International Fund–Investor Class | + | 1.27 | – | 0.04 | + | 7.72 | + | 7.40 |
| | Ariel International Fund–Institutional Class | + | 1.30 | + | 0.18 | + | 7.93 | + | 7.64 |
| | MSCI EAFE Index (gross) | – | 2.88 | – | 7.87 | + | 2.68 | + | 7.18 |
| | MSCI EAFE Index (net) | – | 3.01 | – | 8.27 | + | 2.23 | + | 6.71 |
| | MSCI ACWI ex-US Index (gross) | – | 0.26 | – | 8.78 | + | 0.76 | + | 5.19 |
| | MSCI ACWI ex-US Index (net) | – | 0.38 | – | 9.19 | + | 0.32 | + | 4.73 |
Performance data quoted represents past performance and does not guarantee future results. All performance assumes the reinvestment of dividends and capital gains. The investment return and principal value of an investment will fluctuate so that an investor’s shares, when redeemed, may be worth more or less than their original cost. Current performance may be lower or higher than the performance data quoted. To access performance data current to the most recent month-end, visit arielinvestments.com. The minimum initial investment for Investor Class shares is $1,000; the minimum for Institutional Class shares is $1,000,000.
Expense ratio (as of 9/30/15) 1 | | Net | | Gross |
| Investor Class | | 1.26% | | 3.49% |
| Institutional Class | | 1.01% | | 2.68% |
Top ten companies^ (% of net assets) | |
| | 1. | Deutsche Boerse AG | | 3.5 | | |
| | 2. | GlaxoSmithKline plc | | 3.2 | | |
| | 3. | China Mobile Ltd. | | 3.0 | | |
| | 4. | Roche Holding AG | | 3.0 | | |
| | 5. | Dialog Semiconductor plc | | 2.7 | | |
| | 6. | Ahold N.V. | | 2.7 | | |
| | 7. | Nokia Corp. | | 2.3 | | |
| | 8. | Reckitt Benckiser Group plc | | 2.2 | | |
| | 9. | Baidu, Inc. | | 2.0 | | |
| | 10. | Telefonica Deutschland GmbH & Co. | | 1.8 | | |
^For the purposes of determining the Fund’s top ten, securities of the same issuer are aggregated.
Country weightings† (%) | | | |
| | United Kingdom | | 18.07 | |
| | Germany | | 15.68 | |
| | Japan | | 15.22 | |
| | Switzerland | | 11.20 | |
| | China | | 9.91 | |
| | Netherlands | | 5.80 | |
| | France | | 5.14 | |
| | Finland | | 4.52 | |
| | United States | | 4.47 | |
| | Canada | | 2.58 | |
| | Spain | | 2.06 | |
| | Italy | | 1.35 | |
| | Ireland | | 0.90 | |
| | Hong Kong | | 0.73 | |
| | Luxembourg | | 0.62 | |
| | Israel | | 0.61 | |
| | Sweden | | 0.58 | |
| | Singapore | | 0.48 | |
| | United Arab Emirates | | 0.08 | |
1 | Effective February 1, 2014, Ariel Investments, LLC, the Adviser, has contractually agreed to waive fees and reimburse expenses in order to limit Ariel International Fund’s total annual operating expenses to 1.25% of net assets for the Investor Class and 1.00% for the Institutional Class through the end of the fiscal year ending September 30, 2017. For the year ended 9/30/15, the net expense ratios for both Classes of the Fund rounded above the expense caps due to interest expense which is excluded from the expense reimbursement. Through January 31, 2014, the Expense Cap was 1.40% for the Investor Class and 1.15% for the Institutional Class. |
| † | Sector and country weightings are calculated based on equity holdings in the Fund and exclude cash and ETFs in order to make a relevant comparison to the indexes. Notes: The graph does not reflect the deduction of taxes that a shareholder would pay on fund distributions or the redemption of fund shares. See index descriptions on page 65. |
| | | |
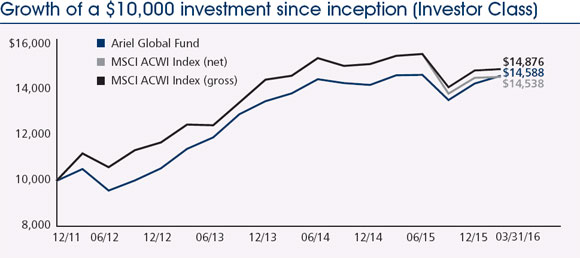
| | Ariel Global Fund performance summary | INCEPTION: 12/30/11 |
| | | |
| | | |
 | |
| Rupal J. Bhansali | |
| Portfolio manager | |
Composition of equity holdings* (%) | | | | | | |
| | | | Ariel
Global
Fund† | | MSCI
ACWI
Index |
| | Health care | | 24.77 | | | 11.72 | |
| | Information technology | | 21.20 | | | 15.01 | |
| | Telecommunication services | | 13.88 | | | 3.98 | |
| | Financials | | 13.19 | | | 20.38 | |
| | Consumer discretionary | | 12.53 | | | 12.91 | |
| | Utilities | | 4.99 | | | 3.47 | |
| | Consumer staples | | 4.68 | | | 10.67 | |
| | Energy | | 3.20 | | | 6.49 | |
| | Industrials | | 1.24 | | | 10.56 | |
| | Materials | | 0.32 | | | 4.81 | |
| * | The sectors above are the Global Industry Classification Standard (“GICS”) sector classifications. GICS was developed by and is the exclusive property and a service mark of MSCI Inc. (“MSCI”) and Standard & Poor’s, a division of The McGraw-Hill Companies, Inc. (“S&P”) and is licensed for use by Ariel Investments, LLC. Neither MSCI, S&P nor any third party involved in making or compiling the GICS or any GICS classifications makes any express or implied warranties or representations with respect to such standard or classification (or the results to be obtained by the use thereof), and all such parties hereby expressly disclaim all warranties of originality, accuracy, completeness, merchantability and fitness for a particular purpose with respect to any of such standard or classification. Without limiting any of the foregoing, in no event shall MSCI, S&P, any of their affiliates or any third party involved in making or compiling the GICS or any GICS classifications have any liability for any direct, indirect, special, punitive, consequential or any other damages (including lost profits) even if notified of the possibility of such damages. |
| | | | | | | | | | |
Average annual total returns (%) as of 03/31/16 |
| | | Quarter | 1-year | 3-year | Since
inception |
| | Ariel Global Fund–Investor Class | + | 2.41 | – | 0.13 | + | 8.57 | + | 9.29 |
| | Ariel Global Fund–Institutional Class | + | 2.48 | + | 0.08 | + | 8.86 | + | 9.57 |
| | MSCI ACWI Index (gross) | + | 0.38 | – | 3.81 | + | 6.10 | + | 9.79 |
| | MSCI ACWI Index (net) | + | 0.24 | – | 4.34 | + | 5.54 | + | 9.20 |
Performance data quoted represents past performance and does not guarantee future results. All performance assumes the reinvestment of dividends and capital gains. The investment return and principal value of an investment will fluctuate so that an investor’s shares, when redeemed, may be worth more or less than their original cost. Current performance may be lower or higher than the performance data quoted. To access performance data current to the most recent month-end, visit arielinvestments.com. The minimum initial investment for Investor Class shares is $1,000; the minimum for Institutional Class shares is $1,000,000.
Expense ratio (as of 9/30/15) 1 | | Net | | Gross |
| | Investor Class | | 1.25% | | 2.71% |
| | Institutional Class | | 1.00% | | 1.30% |
Top ten companies^ (% of net assets) |
| | 1. | Microsoft Corp. | | 6.4 | | |
| | 2. | Gilead Sciences, Inc. | | 6.3 | | |
| | 3. | Baidu, Inc. | | 5.5 | | |
| | 4. | GlaxoSmithKline plc | | 5.5 | | |
| | 5. | Roche Holding AG | | 5.0 | | |
| | 6. | China Mobile Ltd. | | 5.0 | | |
| | 7. | Johnson & Johnson | | 4.1 | | |
| | 8. | Southern Co. | | 3.9 | | |
| | 9. | Verizon Communications Inc. | | 3.8 | | |
| | 10. | Harman Intl Industries, Inc. | | 3.4 | | |
^For the purposes of determining the Fund’s top ten, securities of the same issuer are aggregated.
Country weightings† (%) | | | |
| | United States | | 47.07 | |
| | China | | 11.36 | |
| | United Kingdom | | 8.63 | |
| | Switzerland | | 7.52 | |
| | Germany | | 6.55 | |
| | Japan | | 5.90 | |
| | France | | 2.97 | |
| | Finland | | 2.63 | |
| | Netherlands | | 1.84 | |
| | Canada | | 1.37 | |
| | Chile | | 1.26 | |
| | Spain | | 0.98 | |
| | Brazil | | 0.66 | |
| | Singapore | | 0.30 | |
| | Hong Kong | | 0.28 | |
| | Mexico | | 0.24 | |
| | Israel | | 0.17 | |
| | Thailand | | 0.12 | |
| | Sweden | | 0.09 | |
| | Luxembourg | | 0.06 | |
1 | Effective February 1, 2014, Ariel Investments, LLC, the Adviser, has contractually agreed to waive fees and reimburse expenses in order to limit Ariel International Fund’s total annual operating expenses to 1.25% of net assets for the Investor Class and 1.00% for the Institutional Class through the end of the fiscal year ending September 30, 2017. Through January 31, 2014, the Expense Cap was 1.40% for the Investor Class and 1.15% for the Institutional Class. |
| † | Sector and country weightings are calculated based on equity holdings in the Fund and exclude cash and ETFs in order to make a relevant comparison to the indexes. |
| | Notes: The graph does not reflect the deduction of taxes that a shareholder would pay on fund distributions or the redemption of fund shares. See index descriptions on page 65. |
 | BorgWarner, Inc. (NYSE: BWA) 3850 Hamlin Road
Auburn Hills, MI 48326
248.754.9200 | borgwarner.com |
| |
BorgWarner makes highly-engineered systems and components, primarily for car and truck engines and drivetrains. Its engine group creates 70 percent of the company’s revenue with products such as turbochargers, engine timing systems and emissions systems. The rest of the sales come from drivetrain applications such as all-wheel-drive, dual clutch transmission and transmission components. The company was once a part of Borg-Warner Security, but was spun off as a stand-alone company in 1993. It employs approximately 19,700 people in 18 countries.
INCREASING REGULATORY PRESSURES ON AUTO MANUFACTURERS
Around the globe, car companies are facing continually increasing regulation around fuel economy and emissions. BorgWarner’s products help auto makers meet these regulations. For example, a BorgWarner turbocharger enables car makers to use a smaller engine. This turbo-charged engine gives the driver plenty of power when needed while using less fuel most of the time. We think BorgWarner’s ability to meet increasing regulatory demands will continue to be a positive tailwind for their products.
ELECTRIFICATION OF AUTOMOBILES
One of the biggest drivers of BorgWarner’s longer-term success is its ability to change its product offering to cover everything from gas and diesel engine parts to complete electric motors. BorgWarner leads the gas and diesel markets, and its turbocharger business for gas and diesel engines has approximately 25 percent market share. With the 2015 acquisition of Remy, the company has improved its positioning in hybrids and electrical vehicles—although continued innovation is necessary to make it the market leader. There is potential upside for BorgWarner in the shift to hybrids and plug-in vehicles, given the increased complexity of having both gas engine and electric motor components. Some estimate BorgWarner’s content per vehicle could be two or three times higher in hybrids and plug-ins when compared to current gas and diesel engines.
SOLID BALANCE SHEET AND CASH FLOW GENERATION
BorgWarner has traditionally maintained a stable balance sheet and continues to do so, even after the acquisition of Remy. Additionally, BorgWarner has been able to generate operating margins in the low double digits, which has generated consistent operating cash flow. This combination results in a stable capital base for future growth.
INTRIGUING VALUATION
As Wall Street continues to focus on the company’s current revenue mix, it underestimates its future position given the longer term shifts in market demand. Looking out a few years we believe the company is best positioned amongst its peers to benefit from the increasing regulations around fuel economy and emissions.
As of March 31, 2016, the shares closed at $38.40, a 20.33% discount to our current private market value of $48.20.
 | Landec Corporation (NASDAQ: LNDC) 3603 Haven Avenue
Menlo Park, CA 94025
650.306.1650 | landec.com |
| |
Based in Menlo Park, California, Landec is a polymer technology company, with primary applications in food packaging. Its main business is called Apio, which sells packaged produce, vegetable trays and prepared salads under the Eat Smart brand. The company’s other business is Lifecore Biomedical, a producer of hyaluronic acid (“HA”), which is used primarily in cataract surgery and joint therapy. Additionally, Landec owns a minority stake in Windset Farms, a hydroponic vegetable growing facility in Santa Maria, California. Combined, these assets are extremely valuable, but that value is being obscured in the near-term by, of all things, the weather.
WEATHER CREATES OPPORTUNITY
This year’s El Nino has matched the strongest in history, pressuring Landec’s core business on both the top and bottom line. Poor growing conditions in California and Florida have resulted in lower crop yields, which for Apio translate to higher sourcing costs and lost revenues. However, while investors look in the rearview and fret about the weather, the future looks bright. As expected, these adverse weather patterns have proven to be transitory - produce sourcing has already returned to historical norms. Looking over the next few years, the company’s higher-margin superfood salad business is expected to continue to grow at a double-digit pace, capitalizing on a rising preference for healthy eating.
UNDERAPPRECIATED ASSETS
Lifecore Biomedical and an ownership stake in Windset Farms are underappreciated for very different reasons. Investors have never fully understood how Lifecore fits with the core produce business. Indeed, there are no obvious synergies, but it is extremely valuable nonetheless. As an aging population increasingly requires treatment for afflictions such as cataracts and aching joints, this business is expected to experience double digit growth and generate attractive free cash flows. Additionally, a recent capacity expansion and a long history of handling highly-viscous fluid has opened up new opportunities in related services such as fermentation and aseptic filling. The Windset Farms investment is a more natural fit, but a recent delay in expansion plans and an upcoming change to fair value accounting requires investors to look past next year to see the growth potential.
A CAPITAL ALLOCATION STORY
Under the prior leadership of Gary Steele and now under new CEO Molly Hemmeter, Landec has proven to be an adept capital allocator. Six years after acquiring Lifecore, growth continues to exceed expectations, making the business a potentially attractive acquisition candidate for strategic suitors. Its Windset Farms investment has realized a 24% annual return since initial investment in February 2011. And, a more recent acquisition of GreenLine foods has added a valuable east coast presence. Today, Landec is prudently looking for yet another home run, something that complements its existing growth opportunities in the natural foods industry.
A LONG -TERM VIEW
We view these weather-related sourcing issues as a terrific buying opportunity for long-term investors. With a collection of underappreciated assets and a management team with a proven track record of astute capital allocation, Landec is a great example of what we look for in our deep value strategy.
As of March 31, 2016, shares traded at $10.50— a significant discount to our estimate of intrinsic value.
Expertise Applied | Answers Delivered | Littelfuse (NASDAQ: LFUS) 8755 West Higgins Road, Suite 500
Chicago, IL 60631
773.628.1000 | littelfuse.com |
| |
Chicago-based Littelfuse makes circuit protection devices for the electronics, electrical and automotive industries. When there is excessive current, its products break the electrical circuit in order to prevent further damage to higher-priced components. The company is also expanding into sensors, both through acquisition and organic growth. Although a small corporation, Littelfuse is a truly worldwide organization with manufacturing and sales around the globe.
DEMAND FOR INCREASINGLY COMPLEX PRODUCTS
Littelfuse continues to benefit from rising demand for product innovation as electronics and automobiles become increasingly complex. As most consumers know, electronics have become more intricate while simultaneously shrinking in size. That combination spurs a need for constant progress to meet the ever-increasing demands of customers. Meanwhile, Littelfuse can charge its customers higher prices over time for its more advanced products. Similarly, cars have more sensors all the time—providing a key growth area for the company. Innovations such as onboard computers, entertainment systems, and rearview cameras compound the intricacy of electrical systems while offering new applications for the company’s products. Finally, the significant growth in hybrid and electrical vehicles expands the number of components Littelfuse can provide for each car. These are all long-term trends we expect to grow far into the future.
ACQUISITION OF TE CONNECTIVITY CIRCUIT PROTECTION BUSINESS
On November 9, 2015, Littelfuse announced the acquisition of TE Connectivity’s circuit-protection business for $350 million in cash. This expansion provided Littelfuse with a larger portfolio of products and bridged product line gaps in battery protection and motor protection. The transaction also allows Littelfuse to build on its current relationships with global auto makers to cross-sell products. Finally, the acquisition increases Littelfuse’s presence in Japan, enabling it to better serve the major Japanese auto manufacturing industry.
IMPRESSIVE FREE CASH FLOW GENERATION
Given increasing demand for its products, as well as the high-return nature of its business, Littelfuse has historically guided free cash flow of 12% to 14% of its revenue. That level of free cash flow, combined with the low amount of capital needed to run the business, provides a wonderful investment opportunity.
LONG TERM OPPORTUNITY
The market continues to underestimate Littelfuse’s ability to grow revenue with its sustainable demand drivers. Meanwhile, the company has maintained a conservative balance sheet, which the market also overlooks. That combination makes Littelfuse the type of company we like to own for the long run as we see potential growth in the company’s intrinsic value.
As of March 31, 2016, the shares closed at $123.11, a 3.44% discount to our current private market value of $127.50.
| | | |
| | Ariel Fund statistical summary | (UNAUDITED) |
| | | |
| | | |
| | | | 52-week range | Earnings per share | P/E calendar | |
| Company | Ticker symbol | Price
03/31/16 | Low | High | 2014
actual
calendar | 2015
actual
calendar | Forward
12 months
estimate | 2014
actual
P/E | 2015
actual
P/E | Forward
12 months
P/E | Market
cap.
($MM) |
| Contango Oil & Gas Co. | MCF | 11.79 | 3.68 | 25.41 | (1.15) | (2.59) | (2.16) | NM | NM | NM | 229 |
| Bristow Group Inc. | BRS | 18.92 | 11.02 | 64.64 | 4.44 | 2.18 | 2.10 | 4.3 | 8.7 | 9.0 | 661 |
| MTS Systems Corp. | MTSC | 60.85 | 48.64 | 76.68 | 3.55 | 2.94 | 3.38 | 17.1 | 20.7 | 18.0 | 898 |
| International Speedway Corp. | ISCA | 36.91 | 28.96 | 38.27 | 1.45 | 1.54 | 1.63 | 25.5 | 24.0 | 22.6 | 986 |
| MSG Networks, Inc. | MSGN | 17.29 | 15.30 | 87.22 | N/A | 1.94 | 2.05 | N/A | 8.9 | 8.4 | 1,059 |
| DeVry Education Group Inc. | DV | 17.27 | 15.81 | 37.79 | 2.79 | 2.44 | 2.29 | 6.2 | 7.1 | 7.5 | 1,091 |
| Brady Corp. | BRC | 26.84 | 18.46 | 28.25 | 1.65 | 1.42 | 1.60 | 16.3 | 18.9 | 16.8 | 1,253 |
U.S. Silica Holdings, Inc. | SLCA | 22.72 | 13.48 | 40.17 | 2.23 | 0.22 | (0.42) | 10.2 | 103.3 | NM | 1,411 |
| Sotheby’s | BID | 26.73 | 18.86 | 47.28 | 2.05 | 2.60 | 1.60 | 13.0 | 10.3 | 16.7 | 1,634 |
| Anixter Intl Inc. | AXE | 52.11 | 37.61 | 78.68 | 5.91 | 5.29 | 4.82 | 8.8 | 9.9 | 10.8 | 1,718 |
| Gannett Co. Inc. | GCI | 15.14 | 10.75 | 17.91 | N/A | 1.69 | 1.62 | N/A | 9.0 | 9.3 | 1,764 |
| Kennametal Inc. | KMT | 22.49 | 15.11 | 39.91 | 2.74 | 2.26 | 1.33 | 8.2 | 10.0 | 16.9 | 1,792 |
| Meredith Corp. | MDP | 47.50 | 35.03 | 55.56 | 3.26 | 3.45 | 3.59 | 14.6 | 13.8 | 13.2 | 1,792 |
| Simpson Manufacturing Co., Inc. | SSD | 38.17 | 30.25 | 38.45 | 1.56 | 1.41 | 1.73 | 24.5 | 27.1 | 22.1 | 1,843 |
| Graham Holdings Co. | GHC | 480.00 | 425.14 | 1119.54 | 43.29 | 39.25 | 25.66 | 11.1 | 12.2 | 18.7 | 2,243 |
| Janus Capital Group Inc. | JNS | 14.63 | 11.07 | 18.98 | 0.84 | 0.96 | 0.94 | 17.4 | 15.2 | 15.6 | 2,717 |
| Littelfuse, Inc. | LFUS | 123.11 | 82.53 | 124.59 | 5.09 | 5.45 | 6.13 | 24.2 | 22.6 | 20.1 | 2,752 |
| Bio-Rad Laboratories, Inc. | BIO | 136.72 | 122.03 | 152.38 | 5.28 | 4.75 | 5.25 | 25.9 | 28.8 | 26.0 | 3,314 |
| Fair Isaac Corp. | FICO | 106.09 | 77.57 | 106.64 | 3.05 | 3.24 | 3.77 | 34.8 | 32.7 | 28.1 | 3,329 |
| The Madison Square Garden Co | MSG | 166.36 | 139.10 | 184.67 | N/A | 1.02 | 1.02 | N/A | 163.1 | 163.1 | 3,343 |
| Charles River Laboratories Intl, Inc. | CRL | 75.94 | 59.99 | 81.61 | 3.46 | 3.76 | 4.30 | 21.9 | 20.2 | 17.7 | 3,548 |
| Zebra Technologies Corp. | ZBRA | 69.00 | 52.14 | 119.47 | 3.61 | 4.78 | 5.58 | 19.1 | 14.4 | 12.4 | 3,598 |
| Dun & Bradstreet Corp. | DNB | 103.08 | 85.99 | 134.92 | 7.73 | 7.25 | 7.30 | 13.3 | 14.2 | 14.1 | 3,734 |
| First American Financial Corp. | FAF | 38.11 | 31.74 | 43.16 | 2.04 | 2.62 | 2.82 | 18.7 | 14.5 | 13.5 | 4,164 |
| Lazard Ltd | LAZ | 38.80 | 29.26 | 59.82 | 3.20 | 3.74 | 3.46 | 12.1 | 10.4 | 11.2 | 5,035 |
TEGNA, Inc. | TGNA | 23.46 | 21.11 | 38.48 | N/A | 1.78 | 2.57 | N/A | 13.2 | 9.1 | 5,129 |
| JLL | JLL | 117.32 | 96.67 | 179.97 | 8.84 | 10.28 | 10.06 | 13.3 | 11.4 | 11.7 | 5,289 |
KKR & Co. L.P. | KKR | 14.69 | 8.00 | 24.79 | 1.84 | 1.50 | 1.94 | 8.0 | 9.8 | 7.6 | 6,599 |
| Snap-on Inc. | SNA | 156.99 | 133.09 | 174.52 | 6.94 | 8.10 | 9.12 | 22.6 | 19.4 | 17.2 | 9,125 |
| Interpublic Group of Cos., Inc. | IPG | 22.95 | 18.16 | 23.80 | 1.07 | 1.25 | 1.42 | 21.4 | 18.4 | 16.2 | 9,229 |
| Western Union Co. | WU | 19.29 | 16.02 | 22.84 | 1.70 | 1.73 | 1.75 | 11.3 | 11.2 | 11.0 | 9,560 |
| CBRE Group, Inc. | CBG | 28.82 | 22.74 | 39.77 | 1.94 | 2.38 | 2.62 | 14.9 | 12.1 | 11.0 | 9,633 |
| Mattel, Inc. | MAT | 33.62 | 19.45 | 34.36 | 1.57 | 1.46 | 1.65 | 21.4 | 23.0 | 20.4 | 11,431 |
Laboratory Corp. of America Holdings | LH | 117.13 | 97.79 | 129.33 | 6.80 | 7.91 | 8.72 | 17.2 | 14.8 | 13.4 | 11,912 |
| Mohawk Industries, Inc. | MHK | 190.90 | 148.56 | 212.16 | 8.42 | 10.56 | 12.19 | 22.7 | 18.1 | 15.7 | 14,118 |
| Northern Trust Corp. | NTRS | 65.17 | 54.38 | 79.25 | 3.41 | 3.85 | 4.07 | 19.1 | 16.9 | 16.0 | 14,923 |
| J.M. Smucker Co. | SJM | 129.84 | 104.30 | 130.61 | 6.14 | 7.27 | 7.45 | 21.1 | 17.9 | 17.4 | 15,540 |
| Royal Caribbean Cruises Ltd. | RCL | 82.15 | 64.21 | 103.40 | 3.47 | 4.83 | 6.07 | 23.7 | 17.0 | 13.5 | 17,860 |
Note: Holdings are as of March 31, 2016. All earnings per share numbers are fully diluted and reflect the company’s cash earnings. Such numbers are from continuing operations and are adjusted for non-recurring items. All estimates of future earnings per share shown in this table are prepared by Ariel Investments research analysts as of March 31, 2016 and have not been updated to reflect any subsequent events. P/E ratios are based on earnings stated and March 31, 2016 stock price. NM=Not Meaningful.
| | | |
| | Ariel Appreciation Fund statistical summary | (UNAUDITED) |
| | | |
| | | |
| | | | 52-week range | Earnings per share | P/E calendar | |
| Company | Ticker
symbol | Price
03/31/16 | Low | High | 2014
actual
calendar | 2015
actual
calendar | Forward
12 months
estimate | 2014
actual
P/E | 2015
actual
P/E | Forward
12 months
P/E | Market
cap.
($MM) |
| Contango Oil & Gas Co. | MCF | 11.79 | 3.68 | 25.41 | (1.15) | (2.59) | (2.16) | NM | NM | NM | 229 |
Houlihan Lokey, Inc. | HLI | 24.90 | 18.22 | 26.75 | N/A | 1.27 | 1.75 | N/A | 19.6 | 14.2 | 301 |
| Bristow Group Inc. | BRS | 18.92 | 11.02 | 64.64 | 4.44 | 2.18 | 2.10 | 4.3 | 8.7 | 9.0 | 661 |
| International Speedway Corp. | ISCA | 36.91 | 28.96 | 38.27 | 1.45 | 1.54 | 1.63 | 25.5 | 24.0 | 22.6 | 986 |
| MSG Networks, Inc. | MSGN | 17.29 | 15.30 | 87.22 | N/A | 1.94 | 2.05 | N/A | 8.9 | 8.4 | 1,059 |
| Anixter Intl Inc. | AXE | 52.11 | 37.61 | 78.68 | 5.91 | 5.29 | 4.82 | 8.8 | 9.9 | 10.8 | 1,718 |
| Kennametal Inc. | KMT | 22.49 | 15.11 | 39.91 | 2.74 | 2.26 | 1.33 | 8.2 | 10.0 | 16.9 | 1,792 |
| Bio-Rad Laboratories, Inc. | BIO | 136.72 | 122.03 | 152.38 | 5.28 | 4.75 | 5.25 | 25.9 | 28.8 | 26.0 | 3,314 |
| The Madison Square Garden Co | MSG | 166.36 | 139.10 | 184.67 | N/A | 1.02 | 1.02 | N/A | 163.1 | 163.1 | 3,343 |
| First American Financial Corp. | FAF | 38.11 | 31.74 | 43.16 | 2.04 | 2.62 | 2.82 | 18.7 | 14.5 | 13.5 | 4,164 |
| Lazard Ltd | LAZ | 38.80 | 29.26 | 59.82 | 3.20 | 3.74 | 3.46 | 12.1 | 10.4 | 11.2 | 5,035 |
TEGNA, Inc. | TGNA | 23.46 | 21.11 | 38.48 | N/A | 1.78 | 2.57 | N/A | 13.2 | 9.1 | 5,129 |
| JLL | JLL | 117.32 | 96.67 | 179.97 | 8.84 | 10.28 | 10.06 | 13.3 | 11.4 | 11.7 | 5,289 |
KKR & Co. L.P. | KKR | 14.69 | 8.00 | 24.79 | 1.84 | 1.50 | 1.94 | 8.0 | 9.8 | 7.6 | 6,599 |
| Snap-on Inc. | SNA | 156.99 | 133.09 | 174.52 | 6.94 | 8.10 | 9.12 | 22.6 | 19.4 | 17.2 | 9,125 |
| Interpublic Group of Cos., Inc. | IPG | 22.95 | 18.16 | 23.80 | 1.07 | 1.25 | 1.42 | 21.4 | 18.4 | 16.2 | 9,229 |
| Tiffany & Co. | TIF | 73.38 | 59.73 | 96.43 | 4.20 | 4.27 | 3.77 | 17.5 | 17.2 | 19.5 | 9,249 |
| Western Union Co. | WU | 19.29 | 16.02 | 22.84 | 1.70 | 1.73 | 1.75 | 11.3 | 11.2 | 11.0 | 9,560 |
| CBRE Group, Inc. | CBG | 28.82 | 22.74 | 39.77 | 1.94 | 2.38 | 2.62 | 14.9 | 12.1 | 11.0 | 9,633 |
| Nordstrom, Inc. | JWN | 57.21 | 44.49 | 80.92 | 3.75 | 3.77 | 3.37 | 15.3 | 15.2 | 17.0 | 9,893 |
| Mattel, Inc. | MAT | 33.62 | 19.45 | 34.36 | 1.57 | 1.46 | 1.65 | 21.4 | 23.0 | 20.4 | 11,431 |
| National Oilwell Varco | NOV | 31.10 | 25.74 | 56.64 | 6.66 | 3.42 | 0.47 | 4.7 | 9.1 | 66.2 | 11,687 |
| Newell Rubbermaid Inc. | NWL | 44.29 | 33.26 | 50.90 | 2.00 | 2.54 | 2.57 | 22.1 | 17.4 | 17.2 | 11,873 |
Laboratory Corp. of America Holdings | LH | 117.13 | 97.79 | 129.33 | 6.80 | 7.91 | 8.72 | 17.2 | 14.8 | 13.4 | 11,912 |
| Viacom, Inc. | VIAB | 41.28 | 30.11 | 73.52 | 5.47 | 5.51 | 5.59 | 7.5 | 7.5 | 7.4 | 14,302 |
| Northern Trust Corp. | NTRS | 65.17 | 54.38 | 79.25 | 3.41 | 3.85 | 4.07 | 19.1 | 16.9 | 16.0 | 14,923 |
| J.M. Smucker Co. | SJM | 129.84 | 104.30 | 130.61 | 6.14 | 7.27 | 7.45 | 21.1 | 17.9 | 17.4 | 15,540 |
| St. Jude Medical, Inc. | STJ | 55.00 | 48.83 | 80.84 | 4.17 | 3.94 | 4.18 | 13.2 | 14.0 | 13.2 | 15,602 |
Stanley Black & Decker, Inc. | SWK | 105.21 | 88.72 | 111.18 | 6.41 | 6.55 | 6.77 | 16.4 | 16.1 | 15.5 | 15,771 |
Blackstone Group L.P. | BX | 28.05 | 22.31 | 44.43 | 3.76 | 1.82 | 3.14 | 7.5 | 15.4 | 8.9 | 15,854 |
| Willis Towers Watson plc | WLTW | 118.66 | 104.11 | 132.34 | 6.17 | 6.39 | 7.88 | 19.2 | 18.6 | 15.1 | 16,395 |
T. Rowe Price Group, Inc. | TROW | 73.46 | 63.57 | 83.52 | 4.55 | 4.63 | 4.69 | 16.1 | 15.9 | 15.7 | 18,190 |
| Omnicom Group Inc. | OMC | 83.23 | 64.12 | 84.23 | 4.43 | 4.67 | 5.05 | 18.8 | 17.8 | 16.5 | 19,941 |
| Progressive Corp. | PGR | 35.14 | 26.44 | 35.27 | 1.90 | 2.05 | 2.30 | 18.5 | 17.1 | 15.3 | 20,487 |
| Zimmer Biomet Holdings, Inc. | ZBH | 106.63 | 88.27 | 119.10 | 6.48 | 6.90 | 7.87 | 16.5 | 15.5 | 13.5 | 21,202 |
| Franklin Resources, Inc. | BEN | 39.05 | 31.00 | 52.76 | 3.69 | 3.16 | 2.70 | 10.6 | 12.4 | 14.5 | 23,143 |
| CBS Corp. | CBS | 55.09 | 38.51 | 63.95 | 3.00 | 3.34 | 3.99 | 18.4 | 16.5 | 13.8 | 23,238 |
| AFLAC Inc. | AFL | 63.14 | 51.41 | 66.53 | 6.19 | 6.08 | 6.36 | 10.2 | 10.4 | 9.9 | 26,458 |
| Illinois Tool Works Inc. | ITW | 102.44 | 78.79 | 102.98 | 5.09 | 5.82 | 5.91 | 20.1 | 17.6 | 17.3 | 36,966 |
| Thermo Fisher Scientific Inc. | TMO | 141.59 | 117.10 | 143.65 | 6.96 | 7.39 | 8.03 | 20.3 | 19.2 | 17.6 | 56,107 |
Note: Holdings are as of March 31, 2016. All earnings per share numbers are fully diluted and reflect the company’s cash earnings. Such numbers are from continuing operations and are adjusted for non-recurring items. All estimates of future earnings per share shown in this table are prepared by Ariel Investments research analysts as of March 31, 2016 and have not been updated to reflect any subsequent events. P/E ratios are based on earnings stated and March 31, 2016 stock price. NM=Not Meaningful.
| | | |
| | Ariel Fund schedule of investments | |
| | | |
| | | |
| Number of shares | | Common stocks—98.87% | | | Value | |
| | | | Consumer discretionary & services—29.65% | | | | |
| | 3,434,077 | | TEGNA, Inc. | | | $80,563,446 | |
| | 2,891,966 | | Interpublic Group of Cos., Inc. | | | 66,370,620 | |
| | 1,377,908 | | Meredith Corp. | | | 65,450,630 | |
| | 777,440 | | Royal Caribbean Cruises Ltd. | | | 63,866,696 | |
| | 315,304 | | Mohawk Industries, Inc.(a) | | | 60,191,534 | |
| | 1,630,502 | | International Speedway Corp., Class A | | | 60,181,829 | |
| | 1,517,300 | | Mattel, Inc. | | | 51,011,626 | |
| | 2,350,674 | | MSG Networks Inc.(a) | | | 40,643,153 | |
| | 192,424 | | Madison Square Garden Co., Class A(a) | | | 32,011,657 | |
| | 1,703,753 | | DeVry Education Group Inc. | | | 29,423,814 | |
| | 775,065 | | Sotheby’s(a) | | | 20,717,487 | |
| | 1,080,710 | | Gannett Co., Inc. | | | 16,361,949 | |
| | 19,883 | | Graham Holdings Co., Class B | | | 9,543,840 | |
| | | | | | | 596,338,281 | |
| | | | Consumer staples—3.07% | | | | |
| | 475,845 | | J.M. Smucker Co. | | | 61,783,715 | |
| | | | | | | | |
| | | | Energy—1.13% | | | | |
| | 1,928,817 | | Contango Oil & Gas Co.(a)(b) | | | 22,740,752 | |
| | | | | | | | |
| | | | Financial services—29.23% | | | | |
| | 2,376,403 | | Lazard Ltd., Class A | | | 92,204,436 | |
| | 5,931,039 | | KKR & Co. L.P. | | | 87,126,963 | |
| | 555,899 | | JLL | | | 65,218,071 | |
| | 4,434,616 | | Janus Capital Group Inc. | | | 64,878,432 | |
| | 561,678 | | Dun & Bradstreet Corp. | | | 57,897,768 | |
| | 1,503,188 | | First American Financial Corp. | | | 57,286,495 | |
| | 1,984,053 | | CBRE Group, Inc., Class A(a) | | | 57,180,407 | |
| | 697,700 | | Northern Trust Corp. | | | 45,469,109 | |
| | 2,310,754 | | Western Union Co. | | | 44,574,445 | |
| | 150,163 | | Fair Isaac Corp. | | | 15,930,793 | |
| | | | | | | 587,766,919 | |
| | | | Health care—8.50% | | | | |
| | 806,526 | | Charles River Laboratories Intl, Inc.(a) | | | 61,247,584 | |
| | 406,443 | | Bio-Rad Laboratories, Inc.(a) | | | 55,568,887 | |
| | 462,600 | | Laboratory Corp. of America Holdings(a) | | | 54,184,338 | |
| | | | | | | 171,000,809 | |
| | | | Materials & processing—5.44% | | | | |
| | 1,554,797 | | Simpson Manufacturing Co., Inc. | | | 59,346,602 | |
| | 2,206,161 | | U.S. Silica Holdings, Inc. | | | 50,123,978 | |
| | | | | | | 109,470,580 | |
| | Number of shares | | Common stocks—98.87% | | | Value | |
| | | | Producer durables—18.77% | | | | |
| | 2,780,662 | | Brady Corp., Class A | | | $74,632,968 | |
| | 3,279,341 | | Kennametal Inc. | | | 73,752,379 | |
| | 856,616 | | MTS Systems Corp.(b) | | | 52,125,084 | |
| | 2,683,655 | | Bristow Group Inc.(b) | | | 50,774,753 | |
| | 721,100 | | Zebra Technologies Corp.(a) | | | 49,755,900 | |
| | 328,166 | | Littelfuse, Inc. | | | 40,400,516 | |
| | 229,013 | | Snap-on Inc. | | | 35,952,751 | |
| | | | | | | 377,394,351 | |
| | | | Technology—3.08% | | | | |
| | 1,189,103 | | Anixter Intl Inc.(a) | | | 61,964,157 | |
| | | | Total common stocks (Cost $1,496,119,543) | | | 1,988,459,564 | |
| | | | | | | | |
| | Principal amount | | Repurchase agreement—0.60% | | | Value | |
| | $12,089,402 | | Fixed Income Clearing Corporation, 0.03%, dated 03/31/2016, due 04/01/2016, repurchase price $12,089,402, (collaterized by Federal Home Loan Bank, value $12,332,597, 5.50% due 07/15/2036) (Cost $12,089,402) | | | $12,089,402 | |
| | | | Total Investments—99.47% (Cost $1,508,208,945) | | | 2,000,548,966 | |
| | | | Other Assets less Liabilities—0.53% | | | 10,727,312 | |
| | | | Net Assets—100.00% | | | $2,011,276,278 | |
(a)Non-income producing.
(b)Affiliated company (See Note Three).
A category may contain multiple industries as defined by the Global Industry Classification Standards.
The accompanying notes are an integral part of the financial statements.
| | | |
| | Ariel Appreciation Fund schedule of investments | |
| | | |
| | | |
| | Number of shares | | Common stocks—97.81% | | | Value | |
| | | | Consumer discretionary & services—23.64% | | | | |
| | 810,000 | | Omnicom Group Inc. | | | $67,416,300 | |
| | 2,779,430 | | Interpublic Group of Cos., Inc. | | | 63,787,918 | |
| | 1,351,000 | | Viacom, Inc., Class B | | | 55,769,280 | |
| | 1,597,300 | | Mattel, Inc. | | | 53,701,226 | |
| | 855,800 | | CBS Corp., Class B | | | 47,146,022 | |
| | 694,500 | | Nordstrom, Inc. | | | 39,732,345 | |
| | 648,258 | | International Speedway Corp., Class A | | | 23,927,203 | |
| | 899,500 | | TEGNA, Inc. | | | 21,102,270 | |
| | 241,400 | | Tiffany & Co. | | | 17,713,932 | |
| | 195,000 | | Newell Rubbermaid Inc. | | | 8,636,550 | |
| | 474,800 | | MSG Networks Inc.(a) | | | 8,209,292 | |
| | 33,466 | | Madison Square Garden Co., Class A(a) | | | 5,567,403 | |
| | | | | | | 412,709,741 | |
| | | | Consumer staples—3.34% | | | | |
| | 449,075 | | J.M. Smucker Co. | | | 58,307,898 | |
| | | | | | | | |
| | | | Energy—2.20% | | | | |
| | 1,036,100 | | National Oilwell Varco | | | 32,222,710 | |
| | 519,982 | | Contango Oil & Gas Co.(a) | | | 6,130,588 | |
| | | | | | | 38,353,298 | |
| | | | Financial services—33.06% | | | | |
| | 1,231,900 | | AFLAC Inc. | | | 77,782,166 | |
| | 1,097,200 | | Northern Trust Corp. | | | 71,504,524 | |
| | 1,797,600 | | First American Financial Corp. | | | 68,506,536 | |
| | 1,626,820 | | Lazard Ltd., Class A | | | 63,120,616 | |
| | 2,884,600 | | Western Union Co. | | | 55,643,934 | |
| | 1,248,300 | | Franklin Resources, Inc. | | | 48,746,115 | |
| | 2,183,868 | | KKR & Co. L.P. | | | 32,081,021 | |
| | 911,400 | | Progressive Corp. | | | 32,026,596 | |
| | 271,600 | | JLL | | | 31,864,112 | |
| | 999,500 | | Blackstone Group L.P. | | | 28,035,975 | |
| | 213,300 | | Willis Towers Watson Pub Ltd Shs | | | 25,310,178 | |
| | 234,950 | | T. Rowe Price Group, Inc. | | | 17,259,427 | |
| | 533,030 | | Houlihan Lokey, Inc. | | | 13,272,447 | |
| | 423,250 | | CBRE Group, Inc., Class A(a) | | | 12,198,065 | |
| | | | | | | 577,351,712 | |
| | | | Health care—16.60% | | | | |
| | 785,300 | | Zimmer Biomet Holdings, Inc. | | | 83,736,539 | |
| | 594,500 | | Laboratory Corp. of America Holdings(a) | | | 69,633,785 | |
| | 1,135,100 | | St. Jude Medical, Inc. | | | 62,430,500 | |
| | 354,654 | | Thermo Fisher Scientific Inc. | | | 50,215,460 | |
| | 174,125 | | Bio-Rad Laboratories, Inc.(a) | | | 23,806,370 | |
| | | | | | | 289,822,654 | |
| | Number of shares | | Common stocks—97.81% | | | Value | |
| | | | Producer durables—16.39% | | | | |
| | 3,197,100 | | Kennametal Inc. | | | $71,902,779 | |
| | 667,299 | | Stanley Black & Decker, Inc. | | | 70,206,528 | |
| | 585,250 | | Illinois Tool Works Inc. | | | 59,953,010 | |
| | 2,426,964 | | Bristow Group Inc.(b) | | | 45,918,159 | |
| | 243,600 | | Snap-on Inc. | | | 38,242,764 | |
| | | | | | | 286,223,240 | |
| | | | Technology—2.58% | | | | |
| | 864,400 | | Anixter Intl Inc.(a) | | | 45,043,884 | |
| | | | Total common stocks (Cost $1,253,054,750) | | | 1,707,812,427 | |
| | | | | | | | |
| | Principal amount | | Repurchase agreement—1.70% | | | Value | |
| | $29,743,923 | | Fixed Income Clearing Corporation, 0.03%, dated 03/31/2016, due 04/01/2016, repurchase price $29,743,923, (collaterized by Federal Home Loan Mortgage Corp., value $30,340,144, 4.125%, due 10/11/2033) (Cost $29,743,923) | | | $29,743,923 | |
| | | | Total Investments—99.51% (Cost $1,282,798,673) | | | 1,737,556,350 | |
| | | | Other Assets less Liabilities—0.49% | | | 8,584,607 | |
| | | | Net Assets—100.00% | | | $1,746,140,957 | |
(a)Non-income producing.
(b)Affiliated company (See Note Three).
A category may contain multiple industries as defined by the Global Industry Classification Standards.
The accompanying notes are an integral part of the financial statements.
| | | |
| | Ariel Focus Fund schedule of investments | 03/31/16 (UNAUDITED) |
| | | |
| | | |
| | | | | | | | |
| Number of shares | | Common stocks—99.10% | | | Value | |
| | | | Consumer discretionary & services—8.41% | | | | |
| | 27,800 | | Bed Bath & Beyond Inc.(a) | | | $1,379,992 | |
| | 32,600 | | BorgWarner Inc. | | | 1,251,840 | |
| | 139,000 | | Pier 1 Imports, Inc. | | | 974,390 | |
| | | | | | | 3,606,222 | |
| | | | Energy—10.21% | | | | |
| | 20,200 | | Exxon Mobil Corp. | | | 1,688,518 | |
| | 48,600 | | National Oilwell Varco | | | 1,511,460 | |
| | 20,200 | | Apache Corp. | | | 985,962 | |
| | 47,700 | | Chesapeake Energy Corp.(a) | | | 196,524 | |
| | | | | | | 4,382,464 | |
| | | | Financial services—25.36% | | | | |
| | 127,400 | | Western Union Co. | | | 2,457,546 | |
| | 108,900 | | KKR & Co. L.P. | | | 1,599,741 | |
| | 9,800 | | Goldman Sachs Group, Inc. | | | 1,538,404 | |
| | 56,550 | | Morgan Stanley | | | 1,414,316 | |
| | 23,200 | | JPMorgan Chase & Co. | | | 1,373,904 | |
| | 36,800 | | Progressive Corp. | | | 1,293,152 | |
| | 32,700 | | Bank of New York Mellon Corp. | | | 1,204,341 | |
| | | | | | | 10,881,404 | |
| | | | Health care—16.20% | | | | |
| | 18,000 | | Zimmer Biomet Holdings, Inc. | | | 1,919,340 | |
| | 16,000 | | Laboratory Corp. of America Holdings(a) | | | 1,874,080 | |
| | 14,900 | | Johnson & Johnson | | | 1,612,180 | |
| | 20,000 | | St. Jude Medical, Inc. | | | 1,100,000 | |
| | 68,600 | | Hanger, Inc.(a) | | | 445,900 | |
| | | | | | | 6,951,500 | |
| | | | Materials & processing—7.63% | | | | |
| | 61,000 | | Mosaic Co. | | | 1,647,000 | |
| | 119,782 | | Barrick Gold Corp. | | | 1,626,639 | |
| | | | | | | 3,273,639 | |
| | | | Producer durables—14.84% | | | | |
| | 22,600 | | Stanley Black & Decker, Inc. | | | 2,377,746 | |
| | 9,900 | | Lockheed Martin Corp. | | | 2,192,850 | |
| | 51,100 | | Kennametal Inc. | | | 1,149,239 | |
| | 9,400 | | Zebra Technologies Corp.(a) | | | 648,600 | |
| | | | | | | 6,368,435 | |
| | | | Technology—16.45% | | | | |
| | 59,100 | | Oracle Corp. | | | 2,417,781 | |
| | 15,900 | | International Business Machines Corp. | | | 2,408,055 | |
| | 22,400 | | Microsoft Corp. | | | 1,237,152 | |
| | 19,100 | | Anixter Intl Inc.(a) | | | 995,301 | |
| | | | | | | 7,058,289 | |
| | | | Total common stocks (Cost $41,430,038) | | | 42,521,953 | |
| | | | | | | | |
| Principal amount | | Repurchase agreement—0.93% | | Value | |
| | | | | | | | |
| | $399,615 | | Fixed Income Clearing Corporation, 0.03%, dated 03/31/2016, due 04/01/2016, repurchase price $399,615, (collaterized by Federal Home Loan Bank, value $408,777, 5.50%, due 07/15/2036) (Cost $399,615) | | | $399,615 | |
| | | | Total Investments—100.03% (Cost $41,829,653) | | | 42,921,568 | |
| | | | Other Assets less Liabilities—(0.03)% | | | (13,068) | |
| | | | Net Assets—100.00% | | | $42,908,500 | |
(a)Non-income producing.
A category may contain multiple industries as defined by the Global Industry Classification Standards.
The accompanying notes are an integral part of the financial statements.
| | | |
| | Ariel Discovery Fund schedule of investments | 03/31/16 (UNAUDITED) |
| | | |
| | | |
| | | | | | | | |
| Number of shares | | Common stocks— 96.83% | | Value | |
| | | | Consumer discretionary & services—23.62% | | | | |
| | 236,100 | | Gaiam, Inc., Class A(a) | | | $1,511,040 | |
| | 214,974 | | Rosetta Stone Inc.(a) | | | 1,442,476 | |
| | 69,402 | | XO Group Inc.(a) | | | 1,113,902 | |
| | 169,157 | | Century Casinos, Inc.(a) | | | 1,042,007 | |
| | 39,900 | | Superior Industries Intl, Inc. | | | 880,992 | |
| | 177,500 | | Skullcandy Inc.(a) | | | 631,900 | |
| | 15,200 | | International Speedway Corp., Class A | | | 561,032 | |
| | 3,600 | | Strattec Security Corp. | | | 206,604 | |
| | 21,700 | | West Marine, Inc.(a) | | | 197,253 | |
| | 5,600 | | Movado Group Inc. | | | 154,168 | |
| | | | | | | 7,741,374 | |
| | | | Energy—5.58% | | | | |
| | 75,254 | | Contango Oil & Gas Co.(a) | | | 887,245 | |
| | 84,100 | | Gulf Island Fabrication, Inc. | | | 660,185 | |
| | 92,500 | | Mitcham Industries, Inc.(a) | | | 283,050 | |
| | | | | | | 1,830,480 | |
| | | | Financial services—13.22% | | | | |
| | 516,718 | | Cowen Group, Inc., Class A(a) | | | 1,968,696 | |
| | 21,800 | | First American Financial Corp. | | | 830,798 | |
| | 18,900 | | MB Financial, Inc. | | | 613,305 | |
| | 57,400 | | Real Industry Inc.(a) | | | 499,380 | |
| | 30,500 | | Capital Southwest Corp. | | | 423,035 | |
| | | | | | | 4,335,214 | |
| | | | Health care—2.01% | | | | |
| | 191,385 | | Kindred Biosciences, Inc.(a) | | | 660,278 | |
| | | | | | | | |
| | | | Materials & processing—5.65% | | | | |
| | 80,631 | | Landec Corp.(a) | | | 846,626 | |
| | 11,373 | | Simpson Manufacturing Co., Inc. | | | 434,107 | |
| | 288,191 | | Orion Energy Systems, Inc.(a) | | | 400,585 | |
| | 77,036 | | Rentech, Inc.(a) | | | 171,020 | |
| | | | | | | 1,852,338 | |
| | | | Producer durables—17.12% | | | | |
| | 52,099 | | Team, Inc.(a) | | | 1,582,768 | |
| | 56,600 | | Bristow Group Inc. | | | 1,070,872 | |
| | 81,400 | | Electro Rent Corp. | | | 753,764 | |
| | 183,525 | | Spartan Motors Inc. | | | 724,924 | |
| | 14,100 | | Brink’s Co. | | | 473,619 | |
| | 22,500 | | CRA International, Inc.(a) | | | 441,900 | |
| | 16,600 | | ArcBest Corp. | | | 358,394 | |
| | 124,902 | | Erickson Inc.(a) | | | 206,088 | |
| | | | | | | 5,612,329 | |
| | | | Technology—20.63% | | | | |
| | 330,500 | | RealNetworks, Inc.(a) | | | 1,341,830 | |
| | 221,800 | | SeaChange Intl, Inc.(a) | | | 1,224,336 | |
| | 193,040 | | Telenav Inc.(a) | | | 1,138,936 | |
| | 100,400 | | Brooks Automation, Inc. | | | 1,044,160 | |
| | 156,880 | | PCTEL, Inc. | | | 749,886 | |
| | 456,197 | | Imation Corp.(a) | | | 707,105 | |
| | 35,400 | | Electro Scientific Industries, Inc.(a) | | | 253,110 | |
| | 20,900 | | Digi International Inc.(a) | | | 197,087 | |
| | 144,313 | | Rubicon Technology, Inc.(a) | | | 105,349 | |
| | | | | | | 6,761,799 | |
| | | |
| | Ariel Discovery Fund schedule of investments (continued) | 03/31/16 (UNAUDITED) |
| | | |
| | | |
| | | | | | | | |
| Number of shares | | Common stocks— 96.83% | | Value | |
| | | | Utilities—9.00% | | | | |
| | 201,286 | | ORBCOMM, Inc.(a) | | | $2,039,027 | |
| | 1,716,312 | | Pendrell Corp.(a) | | | 909,645 | |
| | | | | | | 2,948,672 | |
| | | | Total common stocks (Cost $39,664,646) | | | 31,742,484 | |
| | | | | | | | |
| Principal amount | | Repurchase agreement—3.15% | | Value | |
| | $1,032,364 | | Fixed Income Clearing Corporation, 0.03%, dated 03/31/2016, due 04/01/2016, repurchase price $1,032,364, (collaterized by Federal Home Loan Bank, value $1,053,121, 5.50%, due 07/15/2036) (Cost $1,032,364) | | | $1,032,364 | |
| | | | Total Investments—99.98% (Cost $40,697,010) | | | 32,774,848 | |
| | | | Other Assets less Liabilities—0.02% | | | 7,104 | |
| | | | Net Assets—100.00% | | | $32,781,952 | |
(a)Non-income producing.
A category may contain multiple industries as defined by the Global Industry Classification Standards.
The accompanying notes are an integral part of the financial statements.
| | | |
| | Ariel International Fund schedule of investments | 03/31/16 (UNAUDITED) |
| | | |
| | | |
| Number of shares | | Common stocks— 51.73% | | Value | |
| | | | Canada—1.33% | | | | |
| | 20,675 | | Rogers Communications Inc. | | | $827,796 | |
| | 20,257 | | IGM Financial Inc. | | | 610,167 | |
| | 8,369 | | Suncor Energy, Inc. | | | 233,075 | |
| | | | | | | 1,671,038 | |
| | | | China—5.13% | | | | |
| | 13,403 | | Baidu, Inc. ADR(a) | | | 2,558,365 | |
| | 45,570 | | China Mobile Ltd. ADR | | | 2,526,856 | |
| | 109,000 | | China Mobile Ltd. | | | 1,214,023 | |
| | 162,000 | | Lenovo Group Ltd. | | | 126,553 | |
| | | | | | | 6,425,797 | |
| | | | Finland—2.34% | | | | |
| | 467,926 | | Nokia Corp. ADR | | | 2,765,443 | |
| | 28,466 | | Nokia Corp. | | | 169,245 | |
| | | | | | | 2,934,688 | |
| | | | France—2.66% | | | | |
| | 17,644 | | Michelin (CGDE) | | | 1,805,534 | |
| | 18,515 | | BNP Paribas SA | | | 931,847 | |
| | 1,961 | | L’Air Liquide SA | | | 220,665 | |
| | 1,875 | | Euler Hermes Group | | | 169,917 | |
| | 4,184 | | Eutelsat Communications | | | 135,164 | |
| | 1,327 | | Technip SA | | | 73,552 | |
| | | | | | | 3,336,679 | |
| | | | Germany—8.12% | | | | |
| | 51,211 | | Deutsche Boerse AG | | | 4,369,891 | |
| | 85,298 | | Dialog Semiconductor plc(a) | | | 3,375,282 | |
| | 417,720 | | Telefonica Deutschland GmbH & Co. | | | 2,263,015 | |
| | 4,813 | | Deutsche Post AG | | | 133,741 | |
| | 461 | | BASF SE | | | 34,779 | |
| | | | | | | 10,176,708 | |
| | | | Hong Kong—0.38% | | | | |
| | 803,321 | | Li & Fung Ltd. | | | 476,358 | |
| | | | | | | | |
| | | | Ireland—0.47% | | | | |
| | 6,800 | | Ryanair Holdings plc ADR(a) | | | 583,576 | |
| | | | | | | | |
| | | | Israel—0.31% | | | | |
| | 109,767 | | Bank Leumi Le-Israel BM(a) | | | 394,211 | |
| | | | | | | | |
| | | | Italy—0.70% | | | | |
| | 121,101 | | Snam SpA | | | 758,593 | |
| | 1,976 | | DiaSorin SpA | | | 114,111 | |
| | | | | | | 872,704 | |
| | | |
| | Ariel International Fund schedule of investments (continued) |
| | | |
| | | |
| Number of shares | | Common stocks— 51.73% | | Value | |
| | | | Japan—7.87% | | | | |
| | 14,200 | | Shimamura Co., Ltd. | | | $1,772,713 | |
| | 9,300 | | Nintendo Co., Ltd. | | | 1,322,138 | |
| | 8,700 | | Daito Trust Construction Co., Ltd. | | | 1,235,293 | |
| | 78,700 | | Nikon Corp. | | | 1,204,153 | |
| | 35,500 | | Canon Inc. | | | 1,058,266 | |
| | 19,900 | | Toyota Motor Corp. | | | 1,052,422 | |
| | 175,400 | | Anritsu Corp. | | | 964,704 | |
| | 12,700 | | Japan Tobacco Inc. | | | 529,237 | |
| | 17,201 | | Canon Inc. ADR | | | 512,934 | |
| | 1,677 | | Toyota Motor Corp. ADR | | | 178,299 | |
| | 2,400 | | Japan Exchange Group, Inc. | | | 36,764 | |
| | | | | | | 9,866,923 | |
| | | | Luxembourg—0.32% | | | | |
| | 2,624 | | RTL Group(b) | | | 222,267 | |
| | 6,309 | | Tenaris ADR | | | 156,211 | |
| | 268 | | RTL Group(c) | | | 22,658 | |
| | | | | | | 401,136 | |
| | | | Netherlands—3.00% | | | | |
| | 149,846 | | Ahold N.V. | | | 3,370,977 | |
| | 5,321 | | Gemalto N.V. | | | 393,378 | |
| | | | | | | 3,764,355 | |
| | | | Singapore—0.25% | | | | |
| | 22,100 | | United Overseas Bank Ltd. | | | 309,402 | |
| | | | | | | | |
| | | | Spain—1.06% | | | | |
| | 48,429 | | Endesa SA | | | 929,661 | |
| | 8,249 | | Tecnicas Reunidas SA | | | 232,082 | |
| | 41,425 | | Banco Popular Español SA | | | 107,803 | |
| | 6,448 | | Distribuidora Internacional | | | 33,502 | |
| | 7,075 | | Banco Santander SA(a) | | | 31,188 | |
| | | | | | | 1,334,236 | |
| | | | Sweden—0.30% | | | | |
| | 11,219 | | H&M Hennes & Mauritz AB, Class B | | | 374,093 | |
| | | | | | | | |
| | | | Switzerland—5.79% | | | | |
| | 15,083 | | Roche Holding AG | | | 3,712,907 | |
| | 4,027 | | Swisscom AG | | | 2,188,246 | |
| | 344 | | SGS SA | | | 726,960 | |
| | 21,915 | | UBS AG | | | 353,038 | |
| | 2,430 | | Nestle SA | | | 181,577 | |
| | 826 | | Novartis AG | | | 59,835 | |
| | 1,968 | | ABB Ltd. | | | 38,355 | |
| | | | | | | 7,260,918 | |
| | | | United Arab Emirates—0.04% | | | | |
| | 133,741 | | Dubai Financial Market | | | 49,520 | |
| Number of shares | | Common stocks— 51.73% | | Value | |
| | | | United Kingdom—9.05% | | | | |
| | 28,282 | | Reckitt Benckiser Group plc | | | $2,733,726 | |
| | 117,105 | | GlaxoSmithKline plc | | | 2,374,870 | |
| | 39,823 | | GlaxoSmithKline plc ADR | | | 1,614,823 | |
| | 207,033 | | HSBC Holdings plc | | | 1,290,206 | |
| | 7,697 | | British American Tobacco plc ADR | | | 899,856 | |
| | 102,462 | | British Telecom Group plc | | | 648,244 | |
| | 33,730 | | IMI plc | | | 461,436 | |
| | 10,585 | | Markit Ltd.(a) | | | 374,180 | |
| | 66,307 | | Countrywide plc | | | 367,220 | |
| | 10,311 | | HSBC Holdings plc ADR | | | 320,878 | |
| | 7,694 | | Diageo plc | | | 207,915 | |
| | 6,070 | | BT Group plc ADR | | | 194,726 | |
| | 16,787 | | IG Group Holdings plc | | | 192,882 | |
| | 319 | | Diageo plc ADR | | | 34,411 | |
| | | | | | | 11,715,373 | |
| | | | United States—2.61% | | | | |
| | 7,943 | | Core Laboratories N.V. | | | 892,873 | |
| | 9,965 | | EOG Resources Inc. | | | 723,260 | |
| | 7,346 | | Philip Morris Intl, Inc. | | | 720,716 | |
| | 5,082 | | Harman Intl Industries, Inc. | | | 452,501 | |
| | 1,747 | | AFLAC Inc. | | | 110,306 | |
| | | | | | | 2,899,656 | |
| | | | Total common stocks (Cost $63,630,868) | | | 64,847,371 | |
| | | | | | | | |
| Number of shares | | Investment companies—1.63% | | | Value | |
| | | | Exchange Traded Funds—1.63% | | | | |
| | 52,452 | | iShares MSCI Switzerland Cap ETF | | | $1,559,398 | |
| | 13,629 | | Vanguard MSCI EAFE ETF | | | 488,736 | |
| | | | | | | 2,048,134 | |
| | | | Total Investment companies (Cost $2,100,141) | | | 2,048,134 | |
| | | | | | | | |
| Principal amount | | Repurchase agreement—2.95% | | Value | |
| | $3,691,233 | | Fixed Income Clearing Corporation, 0.03%, dated 03/31/2016, due 04/01/2016, repurchase price | | | | |
| | | | $3,691,233, (collaterized by Federal Home Loan Bank., value $3,769,063, 5.50%, due 07/15/2036) | | | | |
| | | | (Cost $3,691,233) | | | $3,691,233 | |
| | | | Total Investments—(Cost $69,422,242) 56.31% | | | 70,586,738 | |
| | | | Cash, Foreign Currency, Other Assets less Liabilities—43.69% | | | 54,761,003 | |
| | | | Net Assets—100.00% | | | $125,347,741 | |
(a)Non-income producing.
(b)This security was purchased through more than one stock exchange and this line represents shares purchased through Xetra.
(c)This security was purchased through more than one stock exchange and this line represents shares purchased through Euronext Brussels.
ADR American Depositary Receipt
The accompanying notes are an integral part of the financial statements.
| | | |
| | Ariel Global Fund schedule of investments | |
| | | |
| | | |
| Number of shares | | Common stocks— 93.56% | | | Value | |
| | | | Brazil—0.61% | | | | |
| | 47,769 | | Itau Unibanco Holding SA ADR | | | $410,336 | |
| | | | | | | | |
| | | | Canada—1.28% | | | | |
| | 10,871 | | Rogers Communications Inc. | | | 435,259 | |
| | 10,216 | | IGM Financial Inc. | | | 307,719 | |
| | 4,149 | | Suncor Energy, Inc. | | | 115,549 | |
| | | | | | | 858,527 | |
| | | | | | | | |
| | | | Chile—1.17% | | | | |
| | 40,624 | | Banco Santander-Chile ADR | | | 786,074 | |
| | | | | | | | |
| | | | China—10.63% | | | | |
| | 19,280 | | Baidu, Inc. ADR(a) | | | 3,680,166 | |
| | 172,500 | | China Mobile Ltd. | | | 1,921,275 | |
| | 25,647 | | China Mobile Ltd. ADR | | | 1,422,126 | |
| | 108,000 | | Lenovo Group Ltd. | | | 84,369 | |
| | | | | | | 7,107,936 | |
| | | | | | | | |
| | | | Finland—2.46% | | | | |
| | 243,687 | | Nokia Corp. ADR | | | 1,440,190 | |
| | 34,994 | | Nokia Corp. | | | 208,058 | |
| | | | | | | 1,648,248 | |
| | | | | | | | |
| | | | France—2.78% | | | | |
| | 13,887 | | Michelin (CGDE) | | | 1,421,075 | |
| | 8,658 | | BNP Paribas SA | | | 435,751 | |
| | | | | | | 1,856,826 | |
| | | | | | | | |
| | | | Germany—6.13% | | | | |
| | 25,816 | | Deutsche Boerse AG | | | 2,202,908 | |
| | 26,081 | | Dialog Semiconductor plc(a) | | | 1,032,037 | |
| | 152,833 | | Telefonica Deutschland GmbH & Co. | | | 827,979 | |
| | 450 | | BASF SE(a) | | | 33,949 | |
| | | | | | | 4,096,873 | |
| | | | | | | | |
| | | | Hong Kong—0.27% | | | | |
| | 300,000 | | Li & Fung Ltd. | | | 177,896 | |
| | | | | | | | |
| | | | Israel—0.16% | | | | |
| | 29,464 | | Bank Leumi Le-Israel BM(a) | | | 105,815 | |
| | | | | | | | |
| | | | Japan—5.52% | | | | |
| | 46,300 | | Nikon Corp. | | | 708,415 | |
| | 4,200 | | Daito Trust Construction Co., Ltd. | | | 596,348 | |
| | 4,700 | | Shimamura Co., Ltd. | | | 586,743 | |
| | 9,500 | | Toyota Motor Corp. | | | 502,412 | |
| | 3,250 | | Nintendo Co., Ltd. | | | 462,037 | |
| | 14,300 | | Canon Inc. | | | 426,287 | |
| | 3,100 | | Japan Tobacco Inc. | | | 129,184 | |
| | 22,600 | | Anritsu Corp. | | | 124,301 | |
| | 1,155 | | Toyota Motor Corp. ADR | | | 122,800 | |
| | 2,100 | | Japan Exchange Group, Inc. | | | 32,168 | |
| | | | | | | 3,690,695 | |
| Number of shares | | Common stocks— 93.56% | | | Value | |
| | | | Luxembourg—0.05% | | | | |
| | 1,496 | | Tenaris ADR | | | $37,041 | |
| | | | | | | | |
| | | | Mexico—0.23% | | | | |
| | 16,777 | | Santander Mexico Financial Group ADR | | | 151,496 | |
| | | | | | | | |
| | | | Netherlands—1.72% | | | | |
| | 48,125 | | Ahold N.V. | | | 1,082,633 | |
| | 959 | | Gemalto N.V. | | | 70,898 | |
| | | | | | | 1,153,531 | |
| | | | Singapore—0.28% | | | | |
| | 13,200 | | United Overseas Bank Ltd. | | | 184,801 | |
| | | | | | | | |
| | | | Spain—0.92% | | | | |
| | 26,067 | | Endesa SA | | | 500,392 | |
| | 3,979 | | Tecnicas Reunidas SA | | | 111,948 | |
| | | | | | | 612,340 | |
| | | | | | | | |
| | | | Sweden—0.08% | | | | |
| | 1,596 | | H&M Hennes & Mauritz AB, Class B | | | 53,218 | |
| | | | | | | | |
| | | | Switzerland—7.04% | | | | |
| | 13,650 | | Roche Holding AG | | | 3,360,153 | |
| | 2,413 | | Swisscom AG | | | 1,311,209 | |
| | 17 | | SGS SA | | | 35,925 | |
| | | | | | | 4,707,287 | |
| | | | Thailand—0.12% | | | | |
| | 15,700 | | Kasikornbank PCL | | | 78,098 | |
| | | | | | | | |
| | | | United Kingdom—8.07% | | | | |
| | 50,512 | | GlaxoSmithKline plc ADR | | | 2,048,262 | |
| | 79,279 | | GlaxoSmithKline plc | | | 1,607,765 | |
| | 7,152 | | Reckitt Benckiser Group plc | | | 691,309 | |
| | 86,458 | | HSBC Holdings plc | | | 538,796 | |
| | 31,544 | | British Telecom Group plc | | | 199,569 | |
| | 5,694 | | HSBC Holdings plc ADR | | | 177,197 | |
| | 1,153 | | British American Tobacco plc | | | 67,730 | |
| | 2,475 | | Diageo plc | | | 66,882 | |
| | | | | | | 5,397,510 | |
| | | | |
| | Ariel Global Fund schedule of investments (continued) | 03/31/16 (UNAUDITED) | |
| | | | |
| | | | |
| Number of shares | | Common stocks— 93.56% | | | Value | |
| | | | United States—44.04% | | | | |
| | 77,226 | | Microsoft Corp. | | | $4,265,192 | |
| | 45,893 | | Gilead Sciences, Inc. | | | 4,215,731 | |
| | 25,065 | | Johnson & Johnson | | | 2,712,033 | |
| | 50,678 | | Southern Co. | | | 2,621,573 | |
| | 47,409 | | Verizon Communications Inc. | | | 2,563,879 | |
| | 25,239 | | Harman Intl Industries, Inc. | | | 2,247,281 | |
| | 66,691 | | Tumi Holdings Inc.(a) | | | 1,788,653 | |
| | 21,742 | | Quest Diagnostics Inc. | | | 1,553,466 | |
| | 15,563 | | American Express Co. | | | 955,568 | |
| | 8,367 | | Philip Morris Intl, Inc. | | | 820,886 | |
| | 6,247 | | Core Laboratories N.V. | | | 702,225 | |
| | 69,062 | | Ruckus Wireless, Inc.(a) | | | 677,498 | |
| | 15,316 | | U.S. Bancorp | | | 621,676 | |
| | 8,188 | | Schlumberger Ltd. | | | 603,865 | |
| | 3,362 | | Berkshire Hathaway Inc., Class B(a) | | | 477,001 | |
| | 115,294 | | Acacia Research Corp.(a) | | | 436,964 | |
| | 21,965 | | QLogic Corp.(a) | | | 295,210 | |
| | 3,599 | | EOG Resources Inc. | | | 261,215 | |
| | 2,844 | | Ansys, Inc.(a) | | | 254,424 | |
| | 5,783 | | Coach, Inc. | | | 231,841 | |
| | 7,777 | | EMC Corp. | | | 207,257 | |
| | 1,466 | | Praxair, Inc. | | | 167,784 | |
| | 1,665 | | Rockwell Collins, Inc. | | | 153,530 | |
| | 1,809 | | Occidental Petroleum Corp. | | | 123,790 | |
| | 1,001 | | The PNC Financial Service Group, Inc. | | | 84,655 | |
| | 463 | | Costco Wholesale Corp. | | | 72,960 | |
| | 1,294 | | Fastenal Co. | | | 63,406 | |
| | 221 | | W.W. Grainger Inc. | | | 51,588 | |
| | 714 | | AFLAC Inc. | | | 45,082 | |
| | 318 | | Pioneer Natural Resources Co. | | | 44,755 | |
| | 431 | | Union Pacific | | | 34,286 | |
| | 290 | | Accenture plc, Class A | | | 33,466 | |
| | 128 | | IntercontinentalExchange, Inc. | | | 30,098 | |
| | 524 | | Cullen/Frost Bankers, Inc. | | | 28,878 | |
| | | | | | | 29,447,716 | |
| | | | Total common stocks (Cost $57,048,246) | | | 62,562,264 | |
| | | | | | | | |
| Number of shares | | Investment companies—0.40% | | | Value | |
| | | | Exchange Traded Funds—0.40% | | | | |
| | 4,623 | | Vanguard Total World Stock Index Fund ETF | | | $266,701 | |
| | | | | | | | |
| | | | Total Investment companies (Cost $249,419) | | | 266,701 | |
| | | | | | | | |
| Principal amount | | Repurchase agreement—3.47% | | | Value | |
| | $2,319,961 | | Fixed Income Clearing Corporation, 0.03%, dated 03/31/2016, due 04/01/2016, repurchase price$2,319,961, (collaterized by Federal Home Loan Bank., value $2,369,521, 5.50%, due 07/15/2036) (Cost $2,319,961) | | | $2,319,961 | |
| | | | Total Investments—(Cost $59,617,626) 97.43% | | | 65,148,926 | |
| | | | Cash, Foreign Currency, Other Assets less Liabilities—2.57% | | | 1,715,518 | |
| | | | Net Assets—100.00% | | | $66,864,444 | |
(a)Non-income producing.
ADR American Depositary Receipt
The accompanying notes are an integral part of the financial statements.
| | | |
| | Statements of assets & liabilities | 03/31/16 (UNAUDITED) |
| | | |
| | | |
| | | | Ariel Fund | | | | Ariel Appreciation Fund | | | | Ariel Focus Fund | | | | Ariel Discovery Fund | |
| Assets: | | | | | | | | | | | | | | | | |
| | | | | | | | | | | | | | | | | |
| Investments in unaffiliated issuers, at value (cost $1,230,947,090, $1,119,701,417,$41,430,038 and $39,664,646, respectively) | | | $1,862,818,975 | | | | $1,661,894,268 | | | | $42,521,953 | | | | $31,742,484 | |
| | | | | | | | | | | | | | | | | |
| Investments in affiliated issuers, at value (cost $265,172,453, $133,353,333, respectively) | | | 125,640,589 | | | | 45,918,159 | | | | — | | | | — | |
| | | | | | | | | | | | | | | | | |
| Repurchase agreements, at value (cost $12,089,402,$29,743,923, $399,615 and $1,032,364, respectively) | | | 12,089,402 | | | | 29,743,923 | | | | 399,615 | | | | 1,032,364 | |
| | | | | | | | | | | | | | | | | |
| Receivable for fund shares sold | | | 2,071,561 | | | | 1,098,832 | | | | 4,286 | | | | 660 | |
| Receivable for securities sold | | | 12,273,824 | | | | 9,564,680 | | | | 105,906 | | | | 16,583 | |
| Dividends and interest receivable | | | 1,307,055 | | | | 3,020,873 | | | | 10,520 | | | | 18,578 | |
| Prepaid and other assets | | | 73,748 | | | | 55,515 | | | | 20,046 | | | | 23,307 | |
| Total assets | | | 2,016,275,154 | | | | 1,751,296,250 | | | | 43,062,326 | | | | 32,833,976 | |
| | | | | | | | | | | | | | | | | |
| Liabilities: | | | | | | | | | | | | | | | | |
| Payable for securities purchased | | | 2,751,490 | | | | 798,584 | | | | 100,881 | | | | — | |
| Payable for fund shares redeemed | | | 1,337,584 | | | | 3,594,267 | | | | 750 | | | | 8,537 | |
| Other liabilities | | | 909,802 | | | | 762,442 | | | | 52,195 | | | | 43,487 | |
| Total liabilities | | | 4,998,876 | | | | 5,155,293 | | | | 153,826 | | | | 52,024 | |
| Net assets | | | $2,011,276,278 | | | | $1,746,140,957 | | | | $42,908,500 | | | | $32,781,952 | |
| | | | | | | | | | | | | | | | | |
| Net assets consist of: | | | | | | | | | | | | | | | | |
| Paid-in capital | | | $1,489,973,325 | | | | $1,230,012,229 | | | | $42,185,216 | | | | $45,532,980 | |
| Undistributed net investment income (loss) | | | 14,252,805 | | | | 16,238,232 | | | | 183,715 | | | | (30,886 | ) |
| Accumulated net realized gain (loss) on investments | | | 14,710,127 | | | | 45,132,819 | | | | (552,346 | ) | | | (4,797,980 | ) |
| Net unrealized appreciation (depreciation) on investments | | | 492,340,021 | | | | 454,757,677 | | | | 1,091,915 | | | | (7,922,162 | ) |
| Total net assets | | | $2,011,276,278 | | | | $1,746,140,957 | | | | $42,908,500 | | | | $32,781,952 | |
| | | | | | | | | | | | | | | | | |
| Investor class shares: | | | | | | | | | | | | | | | | |
| Net assets | | | $1,497,121,944 | | | | $1,513,661,467 | | | | $32,463,713 | | | | $6,262,547 | |
| Shares outstanding (no par value, unlimited authorized) | | | 25,270,369 | | | | 33,212,692 | | | | 3,036,251 | | | | 748,644 | |
| Net asset value, offering and redemption price per share | | | $59.24 | | | | $45.57 | | | | $10.69 | | | | $8.37 | |
| | | | | | | | | | | | | | | | | |
| Institutional class shares: | | | | | | | | | | | | | | | | |
| Net assets | | | $514,154,334 | | | | $232,479,490 | | | | $10,444,787 | | | | $26,519,405 | |
| Shares outstanding (no par value, unlimited authorized) | | | 8,670,857 | | | | 5,093,875 | | | | 979,730 | | | | 3,128,099 | |
| Net asset value, offering and redemption price per share | | | $59.30 | | | | $45.64 | | | | $10.66 | | | | $8.48 | |
The accompanying notes are an integral part of the financial statements.
| | | |
| | Statements of assets & liabilities (continued) | 03/31/16 (UNAUDITED) |
| | | |
| | | |
| | | | Ariel International Fund | | | | Ariel Global Fund | |
| Assets: | | | | | | | | |
| Investments in unaffiliated issuers, at value (cost $65,731,009 and $57,297,665, respectively) | | | $66,895,505 | | | | $62,828,965 | |
| Repurchase agreements, at value (cost $3,691,233 and $2,319,961, respectively) | | | 3,691,233 | | | | 2,319,961 | |
| Foreign currencies (cost $423,435 and $1,750,676, respectively) | | | 424,575 | | | | 1,806,412 | |
| Cash | | | 4,174,449 | | | | — | |
| Dividends and interest receivable | | | 289,779 | | | | 194,543 | |
| Receivable for dividend reclaims | | | 50,455 | | | | 75,038 | |
| Receivable for fund shares sold | | | 50,369,068 | | | | 29,764 | |
| Receivable for securities and foreign currencies sold | | | 15,696 | | | | 80,048 | |
| Appreciation of forward currency contracts | | | 430,422 | | | | 134,711 | |
| Prepaid and other assets | | | 40,146 | | | | 31,769 | |
| Total assets | | | 126,381,328 | | | | 67,501,211 | |
| | | | | | | | | |
| Liabilities: | | | | | | | | |
| Payable for securities and foreign currencies purchased | | | 838,527 | | | | 428,210 | |
| Payable for fund shares redeemed | | | 73 | | | | — | |
| Depreciation of forward currency contracts | | | 142,057 | | | | 147,647 | |
| Other liabilities | | | 52,930 | | | | 60,910 | |
| Total liabilities | | | 1,033,587 | | | | 636,767 | |
| Net assets | | | $125,347,741 | | | | $66,864,444 | |
| | | | | | | | | |
| Net assets consist of: | | | | | | | | |
| Paid-in capital | | | $123,895,056 | | | | $61,157,947 | |
| Undistributed net investment income (loss) | | | 160,359 | | | | 207,221 | |
| Accumulated net realized gain (loss) on investments, foreign currencies and forward currency contracts | | | (161,597 | ) | | | (71,175 | ) |
| Net unrealized appreciation (depreciation) on: | | | | | | | | |
| Investments | | | 1,164,496 | | | | 5,531,300 | |
| Translation of assets and liabilities in foreign currencies | | | 1,062 | | | | 52,087 | |
| Forward currency contracts | | | 288,365 | | | | (12,936 | ) |
| Total net assets | | | $125,347,741 | | | | $66,864,444 | |
| | | | | | | | | |
| Investor class shares: | | | | | | | | |
| Net assets | | | $46,166,952 | | | | $7,899,011 | |
| Shares outstanding (no par value, unlimited authorized) | | | 3,629,899 | | | | 563,513 | |
| Net asset value, offering and redemption price per share | | | $12.72 | | | | $14.02 | |
| | | | | | | | | |
| Institutional class shares: | | | | | | | | |
| Net assets | | | $79,180,789 | | | | $58,965,433 | |
| Shares outstanding (no par value, unlimited authorized) | | | 6,334,044 | | | | 4,329,776 | |
| Net asset value, offering and redemption price per share | | | $12.50 | | | | $13.62 | |
The accompanying notes are an integral part of the financial statements.
| | | |
| | Statements of operations | SIX MONTHS ENDED 03/31/16 (UNAUDITED) |
| | | |
| | | |
| | | | Ariel Fund | | | | Ariel Appreciation Fund | | | | Ariel Focus Fund | | | | Ariel Discovery Fund | |
| Investment income: | | | | | | | | | | | | | | | | |
| Dividends | | | | | | | | | | | | | | | | |
| Unaffiliated issuers | | | $21,034,812 | | | | $26,160,482 | | | | $525,757 | (b) | | | $133,034 | |
| Affiliated issuers | | | 1,147,777 | (a) | | | 834,407 | (a) | | | — | | | | — | |
| Interest | | | 1,656 | | | | 1,001 | | | | 40 | | | | 73 | |
| Total investment income | | | 22,184,245 | | | | 26,995,890 | | | | 525,797 | | | | 133,107 | |
| | | | | | | | | | | | | | | | | |
| Expenses: | | | | | | | | | | | | | | | | |
| Management fees | | | 5,935,136 | | | | 6,046,899 | | | | 139,656 | | | | 125,473 | |
| Distribution fees (Investor Class) | | | 1,880,092 | | | | 1,916,512 | | | | 40,875 | | | | 7,123 | |
| Shareholder service fees | | | | | | | | | | | | | | | | |
| Investor Class | | | 890,875 | | | | 911,839 | | | | 10,929 | | | | 620 | |
| Institutional Class | | | 230,530 | | | | 53,034 | | | | 1,649 | | | | 11,595 | |
| Transfer agent fees and expenses | | | | | | | | | | | | | | | | |
| Investor Class | | | 293,344 | | | | 243,723 | | | | 30,326 | | | | 14,150 | |
| Institutional Class | | | 10,728 | | | | 11,520 | | | | 8,657 | | | | 9,268 | |
| Printing and postage expenses | | | | | | | | | | | | | | | | |
| Investor Class | | | 193,478 | | | | 176,147 | | | | 4,965 | | | | 1,966 | |
| Institutional Class | | | 22,429 | | | | 5,499 | | | | 915 | | | | 310 | |
| Trustees’ fees and expenses | | | 158,338 | | | | 138,276 | | | | 30,183 | | | | 28,904 | |
| Professional fees | | | 60,627 | | | | 54,597 | | | | 20,956 | | | | 21,501 | |
| Custody fees and expenses | | | 23,873 | | | | 20,030 | | | | 3,002 | | | | 5,496 | |
| Federal and state registration fees | | | 50,285 | | | | 29,383 | | | | 17,255 | | | | 18,968 | |
| Interest expense | | | — | | | | 286 | | | | 173 | | | | — | |
| Miscellaneous expenses | | | 76,419 | | | | 67,032 | | | | 5,070 | | | | 6,274 | |
| Total expenses before reimbursements | | | 9,826,154 | | | | 9,674,777 | | | | 314,611 | | | | 251,648 | |
| Expense reimbursements | | | — | | | | — | | | | (112,431 | ) | | | (87,655 | ) |
| Net expenses | | | 9,826,154 | | | | 9,674,777 | | | | 202,180 | | | | 163,993 | |
| Net investment income (loss) | | | 12,358,091 | | | | 17,321,113 | | | | 323,617 | | | | (30,886 | ) |
| | | | | | | | | | | | | | | | | |
| Realized and unrealized gain (loss): | | | | | | | | | | | | | | | | |
| Net realized gain (loss) on investments | | | | | | | | | | | | | | | | |
| Unaffiliated issuers | | | 79,196,420 | | | | 83,152,048 | | | | 431,735 | | | | (4,374,224 | ) |
| Affiliated issuers | | | — | (a) | | | — | (a) | | | — | | | | — | |
| Change in net unrealized appreciation (depreciation) on investments | | | | | | | | | | | | | | | | |
| Unaffiliated issuers | | | (12,966,059 | ) | | | 16,704,957 | | | | 783,891 | | | | 4,106,908 | |
| Affiliated issuers | | | 66,585,587 | | | | (16,023,939 | ) | | | — | | | | — | |
| Net gain (loss) on investments | | | 132,815,948 | | | | 83,833,066 | | | | 1,215,626 | | | | (267,316 | ) |
| Net increase (decrease) in net assets resulting from operations | | | $145,174,039 | | | | $101,154,179 | | | | $1,539,243 | | | | $(298,202 | ) |
(a)See Note Six for information on affiliated issuers.
(b)Net of $780 in foreign taxes withheld.
The accompanying notes are an integral part of the financial statements.
| | | |
| | Statements of operations (continued) | SIX MONTHS ENDED 03/31/16 (UNAUDITED) |
| | | |
| | | |
| | | | Ariel International Fund | | | | Ariel Global Fund | |
| Investment income: | | | | | | | | |
| Dividends | | | | | | | | |
| Unaffiliated issuers | | | $521,891 | (a) | | | $685,548 | (a) |
| Interest | | | 247 | | | | 248 | |
| Total investment income | | | 522,138 | | | | 685,796 | |
| | | | | | | | | |
| Expenses: | | | | | | | | |
| Management fees | | | 191,383 | | | | 253,620 | |
| Distribution fees (Investor Class) | | | 38,475 | | | | 8,725 | |
| Shareholder service fees | | | | | | | | |
| Investor Class | | | 8,897 | | | | 1,396 | |
| Institutional Class | | | 1,761 | | | | 10,971 | |
| Transfer agent fees and expenses | | | | | | | | |
| Investor Class | | | 14,676 | | | | 13,529 | |
| Institutional Class | | | 8,777 | | | | 8,656 | |
| Printing and postage expenses | | | | | | | | |
| Investor Class | | | 2,081 | | | | 2,021 | |
| Institutional Class | | | 186 | | | | 186 | |
| Trustees’ fees and expenses | | | 27,138 | | | | 29,749 | |
| Professional fees | | | 20,437 | | | | 22,788 | |
| Custody fees and expenses | | | 9,295 | | | | 12,004 | |
| Administration fees | | | 26,825 | | | | 26,825 | |
| Fund accounting fees | | | 23,291 | | | | 21,960 | |
| Federal and state registration fees | | | 17,616 | | | | 17,556 | |
| Interest expense | | | 349 | | | | 1,093 | |
| Miscellaneous expenses | | | 5,606 | | | | 6,699 | |
| Total expenses before reimbursements | | | 396,793 | | | | 437,778 | |
| Expense reimbursements | | | (118,727 | ) | | | (110,953 | ) |
| Net expenses | | | 278,066 | | | | 326,825 | |
| Net investment income | | | 244,072 | | | | 358,971 | |
| | | | | | | | | |
| Realized and unrealized gain (loss): | | | | | | | | |
| Net realized gain (loss) on: | | | | | | | | |
| Investments | | | (215,002 | ) | | | (132,079 | ) |
| Foreign currency translations | | | (58,429 | ) | | | 33,326 | |
| Forward currency contracts | | | 157,262 | | | | 78,260 | |
| Total | | | (116,169 | ) | | | (20,493 | ) |
| Change in net unrealized appreciation (depreciation) on: | | | | | | | | |
| Investments | | | 1,237,868 | | | | 4,307,715 | |
| Foreign currency translations | | | (1,260 | ) | | | 56,372 | |
| Forward currency contracts | | | 339,258 | | | | 42,481 | |
| Total | | | 1,575,866 | | | | 4,406,568 | |
| Net gain (loss) on investments | | | 1,459,697 | | | | 4,386,075 | |
| Net increase (decrease) in net assets resulting from operations | | | $1,703,769 | | | | $4,745,046 | |
(a)Net of $38,217 and $23,074 in foreign taxes withheld, respectively.
The accompanying notes are an integral part of the financial statements.
| | | |
| | Statements of changes in net assets | |
| | | |
| | | |
| | | | | | | | | | |
| | | Ariel Fund | | | Ariel Appreciation Fund |
| | | Six Months Ended | | | | | | | Six Months Ended | | | | |
| | | March 31, 2016 | | | Year Ended | | | | March 31, 2016 | | | Year Ended | |
| | | (Unaudited) | | | September 30, 2015 | | | | (Unaudited) | | | September 30, 2015 | |
| Operations: | | | | | | | | | | | | | |
| Net investment income (loss) | | $12,358,091 | | | $17,866,642 | | | | $17,321,113 | | | $20,080,679 | |
| Net realized gain (loss) on investments | | 79,196,420 | | | 279,416,969 | | | | 83,152,048 | | | 173,148,634 | |
| Change in net unrealized appreciation (depreciation) on investments | | 53,619,528 | | | (369,916,825 | ) | | | 681,018 | | | (258,092,734 | ) |
| Net increase (decrease) in net assets from operations | | 145,174,039 | | | (72,633,214 | ) | | | 101,154,179 | | | (64,863,421 | ) |
| | | | | | | | | | | | | | |
| Distributions to shareholders: | | | | | | | | | | | | | |
| Net investment income | | | | | | | | | | | | | |
| Investor Class | | (10,754,988 | ) | | (9,991,682 | ) | | | (17,090,416 | ) | | (12,975,423 | ) |
| Institutional Class | | (5,542,010 | ) | | (4,565,741 | ) | | | (3,428,879 | ) | | (1,997,000 | ) |
| Capital gains | | | | | | | | | | | | | |
| Investor Class | | (213,884,059 | ) | | (218,025,914 | ) | | | (157,811,879 | ) | | (192,280,387 | ) |
| Institutional Class | | (74,522,019 | ) | | (52,469,101 | ) | | | (19,534,087 | ) | | (19,253,268 | ) |
| Total distributions | | (304,703,076 | ) | | (285,052,438 | ) | | | (197,865,261 | ) | | (226,506,078 | ) |
| | | | | | | | | | | | | | |
| Share transactions: | | | | | | | | | | | | | |
| Shares issued | | | | | | | | | | | | | |
| Investor Class | | 76,691,114 | | | 362,867,652 | | | | 68,297,113 | | | 236,934,382 | |
| Institutional Class | | 25,888,828 | | | 374,354,633 | | | | 56,979,847 | | | 79,585,733 | |
| Shares issued in reinvestment of dividends and distributions | | | | | | | | | | | | | |
| Investor Class | | 219,814,850 | | | 222,753,416 | | | | 170,592,360 | | | 200,305,949 | |
| Institutional Class | | 80,060,597 | | | 57,031,676 | | | | 21,813,451 | | | 20,271,790 | |
| Shares redeemed | | | | | | | | | | | | | |
| Investor Class | | (176,323,718 | ) | | (577,044,021 | ) | | | (197,003,152 | ) | | (396,872,526 | ) |
| Institutional Class | | (66,793,421 | ) | | (221,046,008 | ) | | | (29,184,670 | ) | | (44,725,150 | ) |
| Net increase (decrease) from share transactions | | 159,338,250 | | | 218,917,348 | | | | 91,494,949 | | | 95,500,178 | |
| Total increase (decrease) in net assets | | (190,787 | ) | | (138,768,304 | ) | | | (5,216,133 | ) | | (195,869,321 | ) |
| | | | | | | | | | | | | | |
| Net assets: | | | | | | | | | | | | | |
| Beginning of year | | 2,011,467,065 | | | 2,150,235,369 | | | | 1,751,357,090 | | | 1,947,226,411 | |
| End of period | | $2,011,276,278 | | | $2,011,467,065 | | | | $1,746,140,957 | | | $1,751,357,090 | |
| Undistributed net investment income (loss) included in net assets at end of period | | $14,252,805 | | | $18,191,712 | | | | $16,238,232 | | | $19,436,414 | |
| | | | | | | | | | | | | | |
| Capital share transactions: | | | | | | | | | | | | | |
| Investor shares | | | | | | | | | | | | | |
| Shares sold | | 1,263,005 | | | 4,871,741 | | | | 1,489,753 | | | 4,328,562 | |
| Shares issued to holders in reinvestment of dividends | | 3,587,119 | | | 3,117,567 | | | | 3,605,383 | | | 3,759,118 | |
| Shares redeemed | | (2,959,847 | ) | | (7,961,074 | ) | | | (4,329,871 | ) | | (7,312,435 | ) |
| Net increase (decrease) | | 1,890,277 | | | 28,234 | | | | 765,265 | | | 775,245 | |
| | | | | | | | | | | | | | |
| Institutional shares | | | | | | | | | | | | | |
| Shares sold | | 426,466 | | | 5,113,496 | | | | 1,252,859 | | | 1,451,957 | |
| Shares issued to holders in reinvestment of dividends | | 1,303,317 | | | 795,751 | | | | 460,523 | | | 378,926 | |
| Shares redeemed | | (1,122,777 | ) | | (3,028,127 | ) | | | (637,919 | ) | | (830,083 | ) |
| Net increase (decrease) | | 607,006 | | | 2,881,120 | | | | 1,075,463 | | | 1,000,800 | |
The accompanying notes are an integral part of the financial statements.
| | | |
| | Statements of changes in net assets (continued) | |
| | | |
| | | |
| | | | | | | | | | |
| | | Ariel Focus Fund | | | Ariel Discovery Fund |
| | | Six Months Ended | | | | | | | Six Months Ended | | | | |
| | | March 31, 2016 | | | Year Ended | | | | March 31, 2016 | | | Year Ended | |
| | | (Unaudited) | | | September 30, 2015 | | | | (Unaudited) | | | September 30, 2015 | |
| Operations: | | | | | | | | | | | | | |
| Net investment income (loss) | | $323,617 | | | $588,222 | | | | $(30,886 | ) | | $(192,677 | ) |
| Net realized gain (loss) on investments | | 431,735 | | | 4,501,775 | | | | (4,374,224 | ) | | 2,921,401 | |
| Change in net unrealized appreciation (depreciation)on investments | | 783,891 | | | (12,497,190 | ) | | | 4,106,908 | | | (8,990,160 | ) |
| Net increase (decrease) in net assets from operations | | 1,539,243 | | | (7,407,193 | ) | | | (298,202 | ) | | (6,261,436 | ) |
| | | | | | | | | | | | | | |
| Distributions to shareholders: | | | | | | | | | | | | | |
| Net investment income | | | | | | | | | | | | | |
| Investor Class | | (401,524 | ) | | (403,404 | ) | | | — | | | — | |
| Institutional Class | | (175,566 | ) | | (136,885 | ) | | | — | | | — | |
| Capital gains | | | | | | | | | | | | | |
| Investor Class | | (3,802,984 | ) | | (5,136,235 | ) | | | (384,753 | ) | | (494,961 | ) |
| Institutional Class | | (1,167,998 | ) | | (1,205,972 | ) | | | (1,706,059 | ) | | (1,846,490 | ) |
| Total distributions | | (5,548,072 | ) | | (6,882,496 | ) | | | (2,090,812 | ) | | (2,341,451 | ) |
| | | | | | | | | | | | | | |
| Share transactions: | | | | | | | | | | | | | |
| Shares issued | | | | | | | | | | | | | |
| Investor Class | | 1,405,102 | | | 7,446,501 | | | | 1,140,932 | | | 1,617,271 | |
| Institutional Class | | 105,480 | | | 149,009 | | | | 622,669 | | | 3,713,192 | |
| Shares issued in reinvestment of dividends and distributions | | | | | | | | | | | | | |
| Investor Class | | 3,621,973 | | | 4,800,743 | | | | 382,050 | | | 485,212 | |
| Institutional Class | | 1,341,538 | | | 1,339,752 | | | | 1,706,060 | | | 1,846,490 | |
| Shares redeemed | | | | | | | | | | | | | |
| Investor Class | | (3,078,199 | ) | | (20,887,925 | ) | | | (863,966 | ) | | (4,684,689 | ) |
| Institutional Class | | (363,587 | ) | | (680,965 | ) | | | (315,419 | ) | | (8,117,031 | ) |
| Net increase (decrease) from share transactions | | 3,032,307 | | | (7,832,885 | ) | | | 2,672,326 | | | (5,139,555 | ) |
| Total increase (decrease) in net assets | | (976,522 | ) | | (22,122,574 | ) | | | 283,312 | | | (13,742,442 | ) |
| | | | | | | | | | | | | | |
| Net assets: | | | | | | | | | | | | | |
| Beginning of year | | 43,885,022 | | | 66,007,596 | | | | 32,498,640 | | | 46,241,082 | |
| End of period | | $42,908,500 | | | $43,885,022 | | | | $32,781,952 | | | $32,498,640 | |
| Undistributed net investment income (loss) included in net assets at end of period | | $183,715 | | | $437,188 | | | | $(30,886 | ) | | $— | |
| | | | | | | | | | | | | | |
| Capital share transactions: | | | | | | | | | | | | | |
| Investor shares | | | | | | | | | | | | | |
| Shares sold | | 128,810 | | | 532,475 | | | | 138,272 | | | 139,906 | |
| Shares issued to holders in reinvestment of dividends | | 326,427 | | | 340,544 | | | | 44,684 | | | 41,578 | |
| Shares redeemed | | (286,817 | ) | | (1,543,154 | ) | | | (105,383 | ) | | (396,400 | ) |
| Net increase (decrease) | | 168,420 | | | (670,135 | ) | | | 77,573 | | | (214,916 | ) |
| | | | | | | | | | | | | | |
| Institutional shares | | | | | | | | | | | | | |
| Shares sold | | 9,832 | | | 10,694 | | | | 72,694 | | | 342,262 | |
| Shares issued to holders in reinvestment of dividends | | 121,077 | | | 94,904 | | | | 197,005 | | | 156,748 | |
| Shares redeemed | | (33,848 | ) | | (49,255 | ) | | | (37,648 | ) | | (680,129 | ) |
| Net increase (decrease) | | 97,061 | | | 56,343 | | | | 232,051 | | | (181,119 | ) |
The accompanying notes are an integral part of the financial statements.
| | | | | | | | | | |
| | | Ariel International Fund | | | Ariel Global Fund |
| | | Six Months Ended | | | | | | Six Months Ended | | |
| | | March 31, 2016 | | | Year Ended | | | | March 31, 2016 | | Year Ended | |
| | | (Unaudited) | | | September 30, 2015 | | | | (Unaudited) | | September 30, 2015 | |
| Operations: | | | | | | | | | | | | | |
| Net investment income (loss) | | $244,072 | | | $242,342 | | | | $358,971 | | | $823,095 | |
| | | | | | | | | | | | | | |
| Net realized gain (loss) on investments and foreign currency | | (116,169 | ) | | (278,165 | ) | | | (20,493 | ) | | (56,724 | ) |
| | | | | | | | | | | | | | |
| Change in net unrealized appreciation (depreciation) on investments and foreign currency | | 1,575,866 | | | (735,095 | ) | | | 4,406,568 | | | (3,854,262 | ) |
| Net increase (decrease) in net assets from operations | | 1,703,769 | | | (770,918 | ) | | | 4,745,046 | | | (3,087,891 | ) |
| | | | | | | | | | | | | | |
| Distributions to shareholders: | | | | | | | | | | | | | |
| Net investment income | | | | | | | | | | | | | |
| Investor Class | | (60,860 | ) | | (51,220 | ) | | | (57,676 | ) | | — | |
| Institutional Class | | (36,774 | ) | | (160,003 | ) | | | (830,402 | ) | | (728,413 | ) |
| Capital gains | | | | | | | | | | | | | |
| Investor Class | | (10,016 | ) | | (125,440 | ) | | | — | | | (28,533 | ) |
| Institutional Class | | (4,359 | ) | | (221,181 | ) | | | — | | | (551,839 | ) |
| Total distributions | | (112,009 | ) | | (557,844 | ) | | | (888,078 | ) | | (1,308,785 | ) |
| | | | | | | | | | | | | | |
| Share transactions: | | | | | | | | | | | | | |
| Shares issued | | | | | | | | | | | | | |
| Investor Class | | 39,391,965 | | | 8,597,223 | | | | 1,794,356 | | | 4,233,566 | |
| Institutional Class | | 68,890,952 | | | 1,520,495 | | | | 3,390,316 | | | 1,323,358 | |
| Shares issued in reinvestment of dividends and distributions | | | | | | | | | | | | | |
| Investor Class | | 68,255 | | | 140,873 | | | | 49,300 | | | 17,785 | |
| Institutional Class | | 40,280 | | | 366,323 | | | | 825,218 | | | 1,271,708 | |
| Shares redeemed | | | | | | | | | | | | | |
| Investor Class | | (5,306,132 | ) | | (1,531,911 | ) | | | (475,004 | ) | | (541,673 | ) |
| Institutional Class | | (206,033 | ) | | (184,759 | ) | | | (674,570 | ) | | (562,837 | ) |
| Net increase (decrease) from share transactions | | 102,879,287 | | | 8,908,244 | | | | 4,909,616 | | | 5,741,907 | |
| Total increase (decrease) in net assets | | 104,471,047 | | | 7,579,482 | | | | 8,766,584 | | | 1,345,231 | |
| | | | | | | | | | | | | | |
| Net assets: | | | | | | | | | | | | | |
| Beginning of year | | 20,876,694 | | | 13,297,212 | | | | 58,097,860 | | | 56,752,629 | |
| End of period | | $125,347,741 | | | $20,876,694 | | | | $66,864,444 | | | $58,097,860 | |
| Undistributed net investment income (loss) included in net assets at end of period | | $160,359 | | | $13,921 | | | | $207,221 | | | $736,328 | |
| | | | | | | | | | | | | | |
| Capital share transactions: | | | | | | | | | | | | | |
| Investor shares | | | | | | | | | | | | | |
| Shares sold | | 3,130,793 | | | 661,312 | | | | 129,623 | | | 301,181 | |
| Shares issued to holders in reinvestment of dividends | | 5,369 | | | 11,371 | | | | 3,567 | | | 1,263 | |
| Shares redeemed | | (433,817 | ) | | (121,811 | ) | | | (34,642 | ) | | (39,169 | ) |
| Net increase (decrease) | | 2,702,345 | | | 550,872 | | | | 98,548 | | | 263,275 | |
| | | | | | | | | | | | | | |
| Institutional shares | | | | | | | | | | | | | |
| Shares sold | | 5,546,133 | | | 121,091 | | | | 257,075 | | | 98,900 | |
| Shares issued to holders in reinvestment of dividends | | 3,228 | | | 30,111 | | | | 61,492 | | | 93,004 | |
| Shares redeemed | | (16,899 | ) | | (14,782 | ) | | | (49,686 | ) | | (41,550 | ) |
| Net increase (decrease) | | 5,532,462 | | | 136,420 | | | | 268,881 | | | 150,354 | |
The accompanying notes are an integral part of the financial statements.
| | | |
| | Financial highlights For a share outstanding throughout each period | |
| | | |
| | | |
| | | | | | | | | | | | | | | | | | | |
| | | | | Year ended September 30 |
| | | | | | | | | | | | | | | | | | | |
Ariel Fund
(Investor Class) | | Six months
ended
March 31, 2016
(Unaudited) | | | 2015 | | | 2014 | | | 2013 | | | 2012 | | | 2011 | |
| Net asset value, beginning of period | | | $63.93 | | | | $75.33 | | | | $65.57 | | | | $49.67 | | | | $36.74 | | | | $42.78 | |
| Income from investment operations: | | | | | | | | | | | | | | | | | | | | | | | | |
| Net investment income | | | 0.27 | | | | 0.50 | | | | 0.67 | | | | 0.48 | | | | 0.29 | | | | 0.09 | |
| Net realized and unrealized gain (loss) on investments | | | 4.71 | | | | (2.07 | ) | | | 9.50 | | | | 15.91 | | | | 12.73 | | | | (6.13 | ) |
| Total from investment operations | | | 4.98 | | | | (1.57 | ) | | | 10.17 | | | | 16.39 | | | | 13.02 | | | | (6.04 | ) |
| | | | | | | | | | | | | | | | | | | | | | | | | |
| Distributions to shareholders: | | | | | | | | | | | | | | | | | | | | | | | | |
| Dividends from net investment income | | | (0.41 | ) | | | (0.40 | ) | | | (0.41 | ) | | | (0.49 | ) | | | (0.09 | ) | | | (0.00 | )(a) |
| Distributions from capital gains | | | (9.26 | ) | | | (9.43 | ) | | | — | | | | — | | | | — | | | | — | |
| Total distributions | | | (9.67 | ) | | | (9.83 | ) | | | (0.41 | ) | | | (0.49 | ) | | | (0.09 | ) | | | (0.00 | ) |
| Net asset value, end of period | | | $59.24 | | | | $63.93 | | | | $75.33 | | | | $65.57 | | | | $49.67 | | | | $36.74 | |
| Total return | | | 7.39 | %(b) | | | (3.40 | )% | | | 15.52 | % | | | 33.28 | % | | | 35.48 | % | | | (14.11 | )% |
| | | | | | | | | | | | | | | | | | | | | | | | | |
| Supplemental data and ratios: | | | | | | | | | | | | | | | | | | | | | | | | |
| Net assets, end of period, in thousands | | | $1,497,122 | | | | $1,494,724 | | | | $1,759,016 | | | | $1,787,490 | | | | $1,422,415 | | | | $1,350,852 | |
| Ratio of expenses to average net assets | | | 1.06 | %(c) | | | 1.02 | % | | | 1.03 | % | | | 1.03 | % | | | 1.06 | % | | | 1.04 | % |
| Ratio of net investment income to average net assets | | | 1.14 | %(c) | | | 0.67 | % | | | 0.88 | % | | | 0.83 | % | | | 0.56 | % | | | 0.16 | % |
| Portfolio turnover rate | | | 13 | %(b) | | | 25 | % | | | 29 | % | | | 30 | % | | | 27 | % | | | 29 | % |
| | | | | Year ended September 30 | |
Ariel Fund
(Institutional Class) | | Six months ended March 31, 2016 (Unaudited) | | | 2015 | | | 2014 | | | 2013 | | | December 30, 2011(d) to September 30, 2012 | | | | | |
| Net asset value, beginning of period | | | $64.08 | | | | $75.49 | | | | $65.70 | | | | $49.79 | | | | $42.97 | | | | | |
| Income from investment operations: | | | | | | | | | | | | | | | | | | | | | | | | |
| Net investment income | | | 0.40 | | | | 0.57 | | | | 0.81 | | | | 0.59 | | | | 0.36 | | | | | |
| Net realized and unrealized gain (loss)on investments | | | 4.71 | | | | (1.93 | ) | | | 9.60 | | | | 16.00 | | | | 6.46 | | | | | |
| Total from investment operations | | | 5.11 | | | | (1.36 | ) | | | 10.41 | | | | 16.59 | | | | 6.82 | | | | | |
| | | | | | | | | | | | | | | | | | | | | | | | | |
| Distributions to shareholders: | | | | | | | | | | | | | | | | | | | | | | | | |
| Dividends from net investment income | | | (0.63 | ) | | | (0.62 | ) | | | (0.62 | ) | | | (0.68 | ) | | | — | | | | | |
| Distributions from capital gains | | | (9.26 | ) | | | (9.43 | ) | | | — | | | | — | | | | — | | | | | |
| Total distributions | | | (9.89 | ) | | | (10.05 | ) | | | (0.62 | ) | | | (0.68 | ) | | | — | | | | | |
| | | | | | | | | | | | | | | | | | | | | | | | | |
| Net asset value, end of period | | | $59.30 | | | | $64.08 | | | | $75.49 | | | | $65.70 | | | | $49.79 | | | | | |
| Total return | | | 7.58 | %(b) | | | (3.11 | )% | | | 15.88 | % | | | 33.72 | % | | | 15.87 | %(b) | | | | |
| | | | | | | | | | | | | | | | | | | | | | | | | |
| Supplemental data and ratios: | | | | | | | | | | | | | | | | | | | | | | | | |
| Net assets, end of period, in thousands | | | $514,154 | | | | $516,743 | | | | $391,219 | | | | $365,694 | | | | $103,092 | | | | | |
| Ratio of expenses to average net assets | | | 0.73 | %(c) | | | 0.72 | % | | | 0.72 | % | | | 0.72 | % | | | 0.68 | %(c) | | | | |
| | | | | | | | | | | | | | | | | | | | | | | | | |
| Ratio of net investment income to average net assets | | | 1.47 | %(c) | | | 0.97 | % | | | 1.21 | % | | | 1.04 | % | | | 1.06 | %(c) | | | | |
| | | | | | | | | | | | | | | | | | | | | | | | | |
| Portfolio turnover rate | | | 13 | %(b) | | | 25 | % | | | 29 | % | | | 30 | % | | | 27 | %(b) | | | | |
(a)Amount is less than $(0.005).
(b)Not annualized.
(c)Annualized.
(d)Commencement of operations.
The accompanying notes are an integral part of the financial statements.
| | | | | Year ended September 30 |
| | | Six months | | | | | | | | | | | | | | | | |
| | | ended | | | | | | | | | | | | | | | | |
| Ariel Appreciation Fund | | March 31, 2016 | | | | | | | | | | | | | | | | |
| (Investor Class) | | (Unaudited) | | | 2015 | | | 2014 | | | 2013 | | | 2012 | | | 2011 | |
| Net asset value, beginning of period | | | $48.01 | | | | $56.12 | | | | $53.83 | | | | $45.13 | | | | $34.81 | | | | $37.79 | |
| Income from investment operations: | | | | | | | | | | | | | | | | | | | | | | | | |
| Net investment income | | | 0.42 | | | | 0.50 | | | | 0.43 | | | | 0.44 | | | | 0.35 | | | | 0.13 | |
| Net realized and unrealized gain (loss) on investments | | | 2.57 | | | | (2.08 | ) | | | 5.92 | | | | 13.08 | | | | 10.52 | | | | (3.10 | ) |
| Total from investment operations | | | 2.99 | | | | (1.58 | ) | | | 6.35 | | | | 13.52 | | | | 10.87 | | | | (2.97 | ) |
| | | | | | | | | | | | | | | | | | | | | | | | | |
| Distributions to shareholders: | | | | | | | | | | | | | | | | | | | | | | | | |
| Dividends from net investment income | | | (0.50 | ) | | | (0.37 | ) | | | (0.42 | ) | | | (0.33 | ) | | | (0.16 | ) | | | (0.01 | ) |
| Distributions from capital gains | | | (4.93 | ) | | | (6.16 | ) | | | (3.64 | ) | | | (4.49 | ) | | | (0.39 | ) | | | — | |
| Total distributions | | | (5.43 | ) | | | (6.53 | ) | | | (4.06 | ) | | | (4.82 | ) | | | (0.55 | ) | | | (0.01 | ) |
| Net asset value, end of period | | | $45.57 | | | | $48.01 | | | | $56.12 | | | | $53.83 | | | | $45.13 | | | | $34.81 | |
| Total return | | | 5.92 | %(a) | | | (3.89 | )% | | | 12.22 | % | | | 34.31 | % | | | 31.57 | % | | | (7.86 | )% |
| | | | | | | | | | | | | | | | | | | | | | | | | |
| Supplemental data and ratios: | | | | | | | | | | | | | | | | | | | | | | | | |
| Net assets, end of period, in thousands | | | $1,513,661 | | | | $1,557,796 | | | | $1,777,388 | | | | $1,758,277 | | | | $1,290,470 | | | | $1,143,406 | |
| Ratio of expenses to average net assets | | | 1.15 | %(b) | | | 1.12 | % | | | 1.12 | % | | | 1.13 | % | | | 1.17 | % | | | 1.15 | % |
| Ratio of net investment income to average net assets | | | 1.94 | %(b) | | | 0.95 | % | | | 0.79 | % | | | 1.00 | % | | | 0.79 | % | | | 0.30 | % |
| | | | | | | | | | | | | | | | | | | | | | | | | |
| Portfolio turnover rate | | | 9 | %(a) | | | 22 | % | | | 24 | % | | | 28 | % | | | 28 | % | | | 26 | % |
| | | | | Year ended September 30 | | | | | | | |
| | | Six months | | | | | | | | | | | | December 30, | | | | | |
| | | ended | | | | | | | | | | | | 2011(c) to | | | | | |
| Ariel Appreciation Fund | | March 31, 2016 | | | | | | | | | | | | September 30, | | | | | |
| (Institutional Class) | | (Unaudited) | | | 2015 | | | 2014 | | | 2013 | | | 2012 | | | | | |
| Net asset value, beginning of period | | | $48.17 | | | | $56.28 | | | | $53.95 | | | | $45.19 | | | | $38.70 | | | | | |
| Income from investment operations: | | | | | | | | | | | | | | | | | | | | | | | | |
| Net investment income | | | 0.43 | | | | 0.65 | | | | 0.60 | | | | 0.35 | | | | 0.32 | | | | | |
| Net realized and unrealized gain (loss)on investments | | | 2.66 | | | | (2.04 | ) | | | 5.96 | | | | 13.34 | | | | 6.17 | | | | | |
| Total from investment operations | | | 3.09 | | | | (1.39 | ) | | | 6.56 | | | | 13.69 | | | | 6.49 | | | | | |
| | | | | | | | | | | | | | | | | | | | | | | | | |
| Distributions to shareholders: | | | | | | | | | | | | | | | | | | | | | | | | |
| Dividends from net investment income | | | (0.69 | ) | | | (0.56 | ) | | | (0.59 | ) | | | (0.44 | ) | | | — | | | | | |
| Distributions from capital gains | | | (4.93 | ) | | | (6.16 | ) | | | (3.64 | ) | | | (4.49 | ) | | | — | | | | | |
| Total distributions | | | (5.62 | ) | | | (6.72 | ) | | | (4.23 | ) | | | (4.93 | ) | | | — | | | | | |
| Net asset value, end of period | | | $45.64 | | | | $48.17 | | | | $56.28 | | | | $53.95 | | | | $45.19 | | | | | |
| Total return | | | 6.12 | %(a) | | | (3.55 | )% | | | 12.59 | % | | | 34.76 | % | | 16.77 | %(a) | | | | |
| | | | | | | | | | | | | | | | | | | | | | | | | |
| Supplemental data and ratios: | | | | | | | | | | | | | | | | | | | | | | | | |
| Net assets, end of period, in thousands | | | $232,480 | | | | $193,561 | | | | $169,839 | | | | $118,732 | | | | $14,934 | | | | | |
| Ratio of expenses to average net assets | | | 0.80 | %(b) | | | 0.79 | % | | | 0.79 | % | | | 0.80 | % | | | 0.99 | %(b) | | | | |
| | | | | | | | | | | | | | | | | | | | | | | | | |
| Ratio of net investment income to average net assets | | | 2.32 | %(b) | | | 1.31 | % | | | 1.16 | % | | | 1.35 | % | | | 1.08 | %(b) | | | | |
| | | | | | | | | | | | | | | | | | | | | | | | | |
| Portfolio turnover rate | | | 9 | %(a) | | | 22 | % | | | 24 | % | | | 28 | % | | | 28 | %(a) | | | | |
(a)Not annualized.
(b)Annualized.
(c)Commencement of operations.
The accompanying notes are an integral part of the financial statements.
| | | |
| | Financial highlights For a share outstanding throughout each period (continued) | |
| | | |
| | | |
| | | | | | | | | | | | | | | | | | | | | | | | | |
| | | | | Year ended September 30 | |
| | | Six months | | | | | | | | | | | | | | | | | | | | | |
| | | ended | | | | | | | | | | | | | | | | | | | | | |
| Ariel Focus Fund | | March 31, 2016 | | | | | | | | | | | | | | | | | | | | | |
| (Investor Class) | | (Unaudited) | | | | 2015 | | | | 2014 | | | | 2013 | | | | 2012 | | | | 2011 | |
| Net asset value, beginning of period | | | $11.70 | | | | $15.12 | | | | $13.85 | | | | $10.95 | | | | $9.27 | | | | $9.49 | |
| Income from investment operations: | | | | | | | | | | | | | | | | | | | | | | | | |
| Net investment income | | | 0.07 | | | | 0.14 | | | | 0.11 | | | | 0.14 | | | | 0.10 | | | | 0.04 | |
| Net realized and unrealized gain (loss) on investments | | | 0.38 | | | | (1.99 | ) | | | 1.95 | | | | 2.89 | | | | 1.64 | | | | (0.23 | ) |
| Total from investment operations | | | 0.45 | | | | (1.85 | ) | | | 2.06 | | | | 3.03 | | | | 1.74 | | | | (0.19 | ) |
| | | | | | | | | | | | | | | | | | | | | | | | | |
| Distributions to shareholders: | | | | | | | | | | | | | | | | | | | | | | | | |
| Dividends from net investment income | | | (0.13 | ) | | | (0.11 | ) | | | (0.09 | ) | | | (0.13 | ) | | | (0.06 | ) | | | (0.03 | ) |
| Distributions from capital gains | | | (1.33 | ) | | | (1.46 | ) | | | (0.70 | ) | | | — | | | | — | | | | — | |
| Total distributions | | | (1.46 | ) | | | (1.57 | ) | | | (0.79 | ) | | | (0.13 | ) | | | (0.06 | ) | | | (0.03 | ) |
| Net asset value, end of period | | | $10.69 | | | | $11.70 | | | | $15.12 | | | | $13.85 | | | | $10.95 | | | | $9.27 | |
| Total return | | | 3.55 | %(a) | | | (13.98 | )% | | | 15.42 | % | | | 28.02 | % | | | 18.81 | % | | | (2.07 | )% |
| | | | | | | | | | | | | | | | | | | | | | | | | |
| Supplemental data and ratios: | | | | | | | | | | | | | | | | | | | | | | | | |
| Net assets, end of period, in thousands | | | $32,464 | | | | $33,553 | | | | $53,500 | | | | $43,925 | | | | $33,274 | | | | $42,547 | |
| Ratio of expenses to average net assets, including waivers | | | 1.00 | %(b) | | | 1.00 | % | | | 1.08 | % | | | 1.25 | % | | | 1.25 | % | | | 1.25 | % |
| Ratio of expenses to average net assets, excluding waivers | | | 1.54 | %(b) | | | 1.37 | % | | | 1.40 | % | | | 1.54 | % | | | 1.58 | % | | | 1.51 | % |
| Ratio of net investment income to average net assets, including waivers | | | 1.45 | %(b) | | | 0.89 | % | | | 0.78 | % | | | 1.19 | % | | | 0.88 | % | | | 0.37 | % |
| Ratio of net investment income to average net assets, excluding waivers | | | 0.91 | %(b) | | | 0.52 | % | | | 0.46 | % | | | 0.90 | % | | | 0.55 | % | | | 0.11 | % |
| Portfolio turnover rate | | | 11 | %(a) | | | 16 | % | | | 40 | % | | | 41 | % | | | 32 | % | | | 40 | % |
| | | | | | | | | | | | | | | | | | | | | |
| | | | | | | Year ended September 30 | | | | |
| | | Six months | | | | | | | | | | | | | | December 30, | |
| | | ended | | | | | | | | | | | | | | 2011(c) to | |
| Ariel Focus Fund | | March 31, 2016 | | | | | | | | | | | | | | September 30, | |
| (Institutional Class) | | (Unaudited) | | | | 2015 | | | 2014 | | | | 2013 | | | 2012 | |
| Net asset value, beginning of period | | | $11.71 | | | | $15.14 | | | | $13.87 | | | | $10.97 | | | | $9.82 | |
| Income from investment operations: | | | | | | | | | | | | | | | | | | | | |
| Net investment income | | | 0.08 | | | | 0.15 | | | | 0.15 | | | | 0.19 | | | | 0.10 | |
| Net realized and unrealized gain (loss) on investments | | | 0.38 | | | | (1.97 | ) | | | 1.96 | | | | 2.87 | | | | 1.05 | |
| Total from investment operations | | | 0.46 | | | | (1.82 | ) | | | 2.11 | | | | 3.06 | | | | 1.15 | |
| | | | | | | | | | | | | | | | | | | | | |
| Distributions to shareholders: | | | | | | | | | | | | | | | | | | | | |
| Dividends from net investment income | | | (0.18 | ) | | | (0.15 | ) | | | (0.14 | ) | | | (0.16 | ) | | | — | |
| Distributions from capital gains | | | (1.33 | ) | | | (1.46 | ) | | | (0.70 | ) | | | — | | | | — | |
| Total distributions | | | (1.51 | ) | | | (1.61 | ) | | | (0.84 | ) | | | (0.16 | ) | | | — | |
| Net asset value, end of period | | | $10.66 | | | | $11.71 | | | | $15.14 | | | | $13.87 | | | | $10.97 | |
| Total return | | | 3.65 | %(a) | | | (13.77 | )% | | | 15.74 | % | | | 28.36 | % | | | 11.71 | %(a) |
| | | | | | | | | | | | | | | | | | | | | |
| Supplemental data and ratios: | | | | | | | | | | | | | | | | | | | | |
| Net assets, end of period, in thousands | | | $10,445 | | | | $10,332 | | | | $12,507 | | | | $11,372 | | | | $10,470 | |
| Ratio of expenses to average net assets, including waivers | | | 0.75 | %(b) | | | 0.75 | % | | | 0.83 | % | | | 1.00 | % | | | 1.00 | %(b) |
| Ratio of expenses to average net assets, excluding waivers | | | 1.23 | %(b) | | | 1.07 | % | | | 1.06 | % | | | 1.19 | % | | | 1.29 | %(b) |
| Ratio of net investment income to average net assets, including waivers | | | 1.71 | %(b) | | | 1.15 | % | | | 1.02 | % | | | 1.46 | % | | | 1.15 | %(b) |
| Ratio of net investment income to average net assets, excluding waivers | | | 1.23 | %(b) | | | 0.84 | % | | | 0.79 | % | | | 1.27 | % | | | 0.86 | %(b) |
| Portfolio turnover rate | | | 11 | %(a) | | | 16 | % | | | 40 | % | | | 41 | % | | | 32 | %(a) |
(a)Not annualized.
(b)Annualized.
(c)Commencement of operations.
The accompanying notes are an integral part of the financial statements.
| | | | | | | | | | | | | | | |
| | | | | Year ended September 30 | | | | |
| | | Six months | | | | | | | | | | | January 31, | |
| | | ended | | | | | | | | | | | 2011(c) to | |
| Ariel Discovery Fund | | March 31, 2016 | | | | | | | | | | | September 30, | |
| (Investor Class) | | (Unaudited) | | | 2015 | | | 2014 | | | 2013 | | | 2012 | | | 2011 | |
| Net asset value, beginning of period | | | $9.03 | | | | $11.59 | | | | $12.47 | | | | $10.63 | | | | $7.71 | | | | $10.00 | |
| Income from investment operations: | | | | | | | | | | | | | | | | | | | | | | | | |
| Net investment loss | | | (0.01 | ) | | | (0.11 | ) | | | (0.10 | ) | | | (0.06 | ) | | | (0.08 | ) | | | (0.06 | ) |
| Net realized and unrealized gain (loss) on investments | | | 0.64 | | | | (1.79 | ) | | | (0.60 | ) | | | 1.90 | | | | 3.00 | | | | (2.23 | ) |
| Total from investment operations | | | 0.63 | | | | (1.90 | ) | | | (0.70 | ) | | | 1.84 | | | | 2.92 | | | | (2.29 | ) |
| | | | | | | | | | | | | | | | | | | | | | | | | |
| Distributions to shareholders: | | | | | | | | | | | | | | | | | | | | | | | | |
| Distributions from capital gains | | | (1.29 | ) | | | (0.66 | ) | | | (0.18 | ) | | | — | | | | — | | | | — | |
| Total distributions | | | (1.29 | ) | | | (0.66 | ) | | | (0.18 | ) | | | — | | | | — | | | | — | |
| Net asset value, end of period | | | $8.37 | | | | $9.03 | | | | $11.59 | | | | $12.47 | | | | $10.63 | | | | $7.71 | |
| Total return | | | (0.98 | )%(a) | | | (17.69 | )% | | | (5.80 | )% | | | 17.31 | % | | | 37.87 | % | | | (22.90 | )%(a) |
| | | | | | | | | | | | | | | | | | | | | | | | | |
| Supplemental data and ratios: | | | | | | | | | | | | | | | | | | | | | | | | |
| Net assets, end of period, in thousands | | | $6,263 | | | | $6,058 | | | | $10,272 | | | | $10,239 | | | | $4,240 | | | | $3,177 | |
| Ratio of expenses to average net assets, including waivers | | | 1.25 | %(b) | | | 1.25 | % | | | 1.33 | % | | | 1.50 | % | | | 1.50 | % | | | 1.50 | %(b) |
| Ratio of expenses to average net assets, excluding waivers | | | 2.15 | %(b) | | | 2.10 | % | | | 1.93 | % | | | 2.90 | % | | | 5.18 | % | | | 6.75 | %(b) |
| Ratio of net investment loss to average net assets, including waivers | | | (0.40 | )%(b) | | | (0.67 | )% | | | (0.79 | )% | | | (0.79 | )% | | | (0.92 | )% | | | (1.17 | )%(b) |
| Ratio of net investment loss to average net assets, excluding waivers | | | (1.30 | )%(b) | | | (1.52 | )% | | | (1.39 | )% | | | (2.19 | )% | | | (4.60 | )% | | | (6.42 | )%(b) |
| Portfolio turnover rate | | | 25 | %(a) | | | 29 | % | | | 36 | % | | | 31 | % | | | 33 | % | | | 18 | %(a) |
| | | | | | | | | | | | | | | | | | | | | |
| | | | | | | Year ended September 30 | | | | |
| | | Six months | | | | | | | | | | | | | | | December 30, | |
| | | ended | | | | | | | | | | | | | | | 2011(c) to | |
| Ariel Discovery Fund | | March 31, 2016 | | | | | | | | | | | | | | | September 30, | |
| (Institutional Class) | | (Unaudited) | | | | 2015 | | | | 2014 | | | | 2013 | | | 2012 | |
| Net asset value, beginning of period | | | $9.13 | | | | $11.69 | | | | $12.54 | | | | $10.66 | | | | $9.01 | |
| Income from investment operations: | | | | | | | | | | | | | | | | | | | | |
| Net investment loss | | | (0.01 | ) | | | (0.04 | ) | | | (0.06 | ) | | | (0.03 | ) | | | (0.05 | ) |
| Net realized and unrealized gain (loss) on investments | | | 0.65 | | | | (1.86 | ) | | | (0.61 | ) | | | 1.91 | | | | 1.70 | |
| Total from investment operations | | | 0.64 | | | | (1.90 | ) | | | (0.67 | ) | | | 1.88 | | | | 1.65 | |
| | | | | | | | | | | | | | | | | | | | | |
| Distributions to shareholders: | | | | | | | | | | | | | | | | | | | | |
| Distributions from capital gains | | | (1.29 | ) | | | (0.66 | ) | | | (0.18 | ) | | | — | | | | — | |
| Total distributions | | | (1.29 | ) | | | (0.66 | ) | | | (0.18 | ) | | | — | | | | — | |
| Net asset value, end of period | | | $8.48 | | | | $9.13 | | | | $11.69 | | | | $12.54 | | | | $10.66 | |
| Total return | | | (0.85 | )%(a) | | | (17.53 | )% | | | (5.52 | )% | | | 17.64 | % | | | 18.31 | %(a) |
| | | | | | | | | | | | | | | | | | | | | |
| Supplemental data and ratios: | | | | | | | | | | | | | | | | | | | | |
| Net assets, end of period, in thousands | | | $26,519 | | | | $26,441 | | | | $35,970 | | | | $27,096 | | | | $2,244 | |
| Ratio of expenses to average net assets, including waivers | | | 1.00 | %(b) | | | 1.00 | % | | | 1.07 | % | | | 1.25 | % | | | 1.25 | %(b) |
| Ratio of expenses to average net assets, excluding waivers | | | 1.48 | %(b) | | | 1.29 | % | | | 1.25 | % | | | 1.93 | % | | | 4.78 | %(b) |
| Ratio of net investment loss to average net assets, including waivers | | | (0.15 | )%(b) | | | (0.42 | )% | | | (0.53 | )% | | | (0.61 | )% | | | (0.75 | )%(b) |
| Ratio of net investment loss to average net assets, excluding waivers | | | (0.63 | )%(b) | | | (0.71 | )% | | | (0.71 | )% | | | (1.29 | )% | | | (4.28 | )%(b) |
| Portfolio turnover rate | | | 25 | %(a) | | | 29 | % | | | 36 | % | | | 31 | % | | | 33 | %(a) |
(a)Not annualized.
(b)Annualized.
(c)Commencement of operations.
The accompanying notes are an integral part of the financial statements.
| | | |
| | Financial highlights For a share outstanding throughout each period (continued) |
| | | |
| | | |
| | | | | | | | | | | | | | | | | | | | | |
| | | | | Year ended September 30 | | |
| | | | Six months | | | | | | | | | | | | | | | December 30, | |
| | | ended | | | | | | | | | | | | | | | | 2011(c) to | |
| Ariel International Fund | | March 31, 2016 | | | | | | | | | | | | | | | September 30, | |
| (Investor Class) | | (Unaudited) | | | | 2015 | | | | 2014 | | | | 2013 | | | | 2012 | |
| Net asset value, beginning of period | | | $12.17 | | | | $12.85 | | | | $12.38 | | | | $9.77 | | | | $10.00 | |
| Income from investment operations: | | | | | | | | | | | | | | | | | | | | |
| Net investment income (loss) | | | (0.01 | ) | | | 0.01 | | | | 0.22 | | | | 0.07 | | | | 0.16 | |
| Net realized and unrealized gain (loss) on investments | | | 0.59 | | | | (0.23 | ) | | | 0.41 | | | | 2.65 | | | | (0.39 | ) |
| Total from investment operations | | | 0.58 | | | | (0.22 | ) | | | 0.63 | | | | 2.72 | | | | (0.23 | ) |
| | | | | | | | | | | | | | | | | | | | | |
| Distributions to shareholders: | | | | | | | | | | | | | | | | | | | | |
| Dividends from net investment income | | | (0.01 | ) | | | (0.13 | ) | | | — | | | | (0.11 | ) | | | — | |
| Distributions from capital gains | | | (0.02 | ) | | | (0.33 | ) | | | (0.16 | ) | | | — | | | | — | |
| Total distributions | | | (0.03 | ) | | | (0.46 | ) | | | (0.16 | ) | | | (0.11 | ) | | | — | |
| Net asset value, end of period | | | $12.72 | | | | $12.17 | | | | $12.85 | | | | $12.38 | | | | $9.77 | |
| Total return | | | 4.73 | %(a) | | | (1.79 | )% | | | 5.22 | % | | | 28.11 | % | | | (2.30 | )%(a) |
| | | | | | | | | | | | | | | | | | | | | |
| Supplemental data and ratios: | | | | | | | | | | | | | | | | | | | | |
| Net assets, end of period, in thousands | | | $46,167 | | | | $11,290 | | | | $4,842 | | | | $2,260 | | | | $1,313 | |
| Ratio of expenses to average net assets, including waivers | | | 1.25 | %(b) | | | 1.26 | %(d) | | | 1.29 | % | | | 1.40 | % | | | 1.40 | %(b) |
| Ratio of expenses to average net assets, excluding waivers | | | 1.76 | %(b) | | | 3.49 | % | | | 4.24 | % | | | 9.36 | % | | | 17.00 | %(b) |
| Ratio of net investment income to average net assets, including waivers | | | 0.90 | %(b) | | | 1.39 | % | | | 2.13 | % | | | 0.98 | % | | | 2.93 | %(b) |
| Ratio of net investment income (loss) to average net assets, excluding waivers | | | 0.39 | %(b) | | | (0.84 | )% | | | (0.82 | )% | | | (6.98 | )% | | | (12.67 | )%(b) |
| Portfolio turnover rate | | | 13 | %(a) | | | 34 | % | | | 19 | % | | | 29 | % | | | 21 | %(a) |
| | | | | | | | | | | | | |
| | | | | Year ended September 30 | | | | |
| | | Six months | | | | | | | | | December 30, | |
| | | ended | | | | | | | | | | 2011(c) to | |
| Ariel International Fund | | March 31, 2016 | | | | | | | | | September 30, | |
| (Institutional Class) | | (Unaudited) | | | 2015 | | | 2014 | | | 2013 | | | | 2012 | |
| Net asset value, beginning of period | | | $11.96 | | | | $12.71 | | | | $12.26 | | | | $9.78 | | | | $10.00 | |
| Income from investment operations: | | | | | | | | | | | | | | | | | | | | |
| Net investment income | | | 0.05 | | | | 0.18 | | | | 0.29 | | | | 0.14 | | | | 0.11 | |
| Net realized and unrealized gain (loss) on investments | | | 0.53 | | | | (0.37 | ) | | | 0.38 | | | | 2.59 | | | | (0.33 | ) |
| Total from investment operations | | | 0.58 | | | | (0.19 | ) | | | 0.67 | | | | 2.73 | | | | (0.22 | ) |
| | | | | | | | | | | | | | | | | | | | | |
| Distributions to shareholders: | | | | | | | | | | | | | | | | | | | | |
| Dividends from net investment income | | | (0.01 | ) | | | (0.23 | ) | | | (0.06 | ) | | | (0.25 | ) | | | — | |
| Distributions from capital gains | | | (0.03 | ) | | | (0.33 | ) | | | (0.16 | ) | | | — | | | | — | |
| Total distributions | | | (0.04 | ) | | | (0.56 | ) | | | (0.22 | ) | | | (0.25 | ) | | | — | |
| Net asset value, end of period | | | $12.50 | | | | $11.96 | | | | $12.71 | | | | $12.26 | | | | $9.78 | |
| Total return | | | 4.79 | %(a) | | | (1.48 | )% | | | 5.48 | % | | | 28.42 | % | | | (2.20 | )%(a) |
| | | | | | | | | | | | | | | | | | | | | |
| Supplemental data and ratios: | | | | | | | | | | | | | | | | | | | | |
| Net assets, end of period, in thousands | | | $79,181 | | | | $9,587 | | | | $8,455 | | | | $4,129 | | | | $1,926 | |
| Ratio of expenses to average net assets, including waivers | | | 1.00 | %(b) | | | 1.01 | %(d) | | | 1.03 | % | | | 1.15 | % | | | 1.15 | %(b) |
| Ratio of expenses to average net assets, excluding waivers | | | 1.48 | %(b) | | | 2.68 | % | | | 3.17 | % | | | 6.53 | % | | | 15.70 | %(b) |
| Ratio of net investment income to average net assets, including waivers | | | 1.24 | %(b) | | | 1.69 | % | | | 2.49 | % | | | 1.09 | % | | | 3.41 | %(b) |
| Ratio of net investment income (loss) to average net assets, excluding waivers | | | 0.76 | %(b) | | | 0.02 | % | | | 0.35 | % | | | (4.29 | )% | | | (11.14 | )%(b) |
| Portfolio turnover rate | | | 13 | %(a) | | | 34 | % | | | 19 | % | | | 29 | % | | | 21 | %(a) |
(a)Not annualized.
(b)Annualized.
(c)Commencement of operations.
(d)These ratios round to 1.26% and 1.01% due to interest expense which is excluded from the expense waiver.
The accompanying notes are an integral part of the financial statements.
| | | | | | | | | | | |
| | | | | Year ended September 30 | | |
| | | | Six months | | | | | | | | | | | | | | | December 30, | |
| | | | ended | | | | | | | | | | | | | | | | 2011(c) to | |
| Ariel Global Fund | | March 31, 2016 | | | | | | | | | | | | | | | September 30, | |
| (Investor Class) | | | (Unaudited) | | | | 2015 | | | | 2014 | | | | 2013 | | | | 2012 | |
| Net asset value, beginning of period | | | $13.11 | | | | $13.96 | | | | $12.91 | | | | $10.02 | | | | $10.00 | |
| Income from investment operations: | | | | | | | | | | | | | | | | | | | | |
| Net investment income (loss) | | | (0.09 | ) | | | (0.07 | ) | | | 0.14 | | | | 0.02 | | | | 0.18 | |
| Net realized and unrealized gain (loss) on investments | | | 1.11 | | | | (0.64 | ) | | | 1.20 | | | | 2.87 | | | | (0.16 | ) |
| Total from investment operations | | | 1.02 | | | | (0.71 | ) | | | 1.34 | | | | 2.89 | | | | (0.02 | ) |
| | | | | | | | | | | | | | | | | | | | | |
| Distributions to shareholders: | | | | | | | | | | | | | | | | | | | | |
| Distributions from capital gains | | | (0.11 | ) | | | (0.14 | ) | | | (0.29 | ) | | | — | | | | — | |
| Total distributions | | | (0.11 | ) | | | (0.14 | ) | | | (0.29 | ) | | | — | | | | — | |
| Net asset value, end of period | | | $14.02 | | | | $13.11 | | | | $13.96 | | | | $12.91 | | | | $10.02 | |
| Total return | | | 7.80 | %(a) | | | (5.15 | )% | | | 10.52 | % | | | 28.84 | % | | | 0.20 | %(a) |
| | | | | | | | | | | | | | | | | | | | | |
| Supplemental data and ratios: | | | | | | | | | | | | | | | | | | | | |
| Net assets, end of period, in thousands | | | $7,899 | | | | $6,095 | | | | $2,816 | | | | $1,954 | | | | $992 | |
| Ratio of expenses to average net assets, including waivers | | | 1.25 | %(b) | | | 1.25 | % | | | 1.29 | % | | | 1.40 | % | | | 1.40 | %(b) |
| Ratio of expenses to average net assets, excluding waivers | | | 1.97 | %(b) | | | 2.71 | % | | | 3.70 | % | | | 5.37 | % | | | 12.33 | %(b) |
| Ratio of net investment income to average net assets, including waivers | | | 0.92 | %(b) | | | 1.30 | % | | | 1.56 | % | | | 0.81 | % | | | 2.67 | %(b) |
| Ratio of net investment income (loss) to average net assets, excluding waivers | | | 0.20 | %(b) | | | (0.16 | )% | | | (0.85 | )% | | | (3.16 | )% | | | (8.26 | )%(b) |
| Portfolio turnover rate | | | 12 | %(a) | | | 35 | % | | | 20 | % | | | 39 | % | | | 26 | %(a) |
| | | | | | | | | | | | | | | | | | | | | |
| | | | | | | | Year ended September 30 | | | | | |
| | | | Six months | | | | | | | | | | | | | | | December 30, | |
| | | | ended | | | | | | | | | | | | | | | | 2011(c) to | |
| Ariel Global Fund | | March 31, 2016 | | | | | | | | | | | | | | | September 30, | |
| (Institutional Class) | | | (Unaudited) | | | | 2015 | | | | 2014 | | | | 2013 | | | | 2012 | |
| Net asset value, beginning of period | | | $12.81 | | | | $13.79 | | | | $12.76 | | | | $10.04 | | | | $10.00 | |
| Income from investment operations: | | | | | | | | | | | | | | | | | | | | |
| Net investment income | | | 0.06 | | | | 0.18 | | | | 0.16 | | | | 0.08 | | | | 0.14 | |
| Net realized and unrealized gain (loss) on investments | | | 1.13 | | | | (0.84 | ) | | | 1.20 | | | | 2.81 | | | | (0.10 | ) |
| Total from investment operations | | | 1.19 | | | | (0.66 | ) | | | 1.36 | | | | 2.89 | | | | 0.04 | |
| | | | | | | | | | | | | | | | | | | | | |
| Distributions to shareholders: | | | | | | | | | | | | | | | | | | | | |
| Dividends from net investment income | | | (0.18 | ) | | | (0.18 | ) | | | (0.04 | ) | | | (0.17 | ) | | | — | |
| Distributions from capital gains | | | (0.20 | ) | | | (0.14 | ) | | | (0.29 | ) | | | — | | | | — | |
| Total distributions | | | (0.38 | ) | | | (0.32 | ) | | | (0.33 | ) | | | (0.17 | ) | | | — | |
| Net asset value, end of period | | | $13.62 | | | | $12.81 | | | | $13.79 | | | | $12.76 | | | | $10.04 | |
| Total return | | | 7.89 | %(a) | | | (4.88 | )% | | | 10.84 | % | | | 29.15 | % | | | 0.40 | %(a) |
| | | | | | | | | | | | | | | | | | | | | |
| Supplemental data and ratios: | | | | | | | | | | | | | | | | | | | | |
| Net assets, end of period, in thousands | | | $58,965 | | | | $52,002 | | | | $53,937 | | | | $25,975 | | | | $10,677 | |
| Ratio of expenses to average net assets, including waivers | | | 1.00 | %(b) | | | 1.00 | % | | | 1.04 | % | | | 1.15 | % | | | 1.15 | %(b) |
| Ratio of expenses to average net assets, excluding waivers | | | 1.31 | %(b) | | | 1.30 | % | | | 1.51 | % | | | 2.51 | % | | | 4.07 | %(b) |
| Ratio of net investment income to average net assets, including waivers | | | 1.16 | %(b) | | | 1.40 | % | | | 1.71 | % | | | 0.97 | % | | | 3.26 | %(b) |
| Ratio of net investment income (loss) to average net assets, excluding waivers | | | 0.85 | %(b) | | | 1.10 | % | | | 1.24 | % | | | (0.39 | )% | | | 0.34 | %(b) |
| Portfolio turnover rate | | | 12 | %(a) | | | 35 | % | | | 20 | % | | | 39 | % | | | 26 | %(a) |
(a)Not annualized.
(b)Annualized.
(c)Commencement of operations.
The accompanying notes are an integral part of the financial statements.
| | | | |
| | Notes to the financial statements | | |
| | | | |
| | | | |
NOTE ONE | ORGANIZATION
Ariel Investment Trust (the “Trust”) is a Massachusetts business trust registered under the Investment Company Act of 1940, as amended (the “1940 Act”), as an open-end management investment company. Ariel Fund, Ariel Appreciation Fund, Ariel Focus Fund, Ariel Discovery Fund, Ariel International Fund and Ariel Global Fund (the “Funds”) are series of the Trust. Ariel Focus Fund is a non-diversified Fund, all other Funds are diversified. The Funds issue two classes of shares: an Investor Class and an Institutional Class.
NOTE TWO | SIGNIFICANT ACCOUNTING POLICIES
The following is a summary of significant accounting policies consistently followed by the Funds in the preparation of their financial statements. The Funds are investment companies and follow accounting and reporting guidance in the Financial Accounting Standards Board (FASB) Accounting Standards Codification Topic 946 (ASC 946). The accompanying financial statements were prepared in accordance with accounting principles generally accepted in the United States of America (GAAP), including but not limited to ASC 946. GAAP requires management to make certain estimates and assumptions at the date of the financial statements. Actual results may differ from such estimates.
Securities valuation—Securities for which market quotations are readily available are valued at the last sale price on the national securities exchange on which such securities are primarily traded and, in the case of securities reported on the Nasdaq system, are valued based on the Nasdaq Official Closing Price. If a last sale price or a closing price is not reported, a security shall be valued using i) the closing price on another exchange on which the security traded (if such price is made available by the pricing vendor) or ii) securities for which reliable bid and ask quotations are available are valued at the mean between bid and ask prices.
Certain common stocks that trade on foreign exchanges are subject to valuation adjustments to account for the market movement between the close of a foreign market in which the security is traded and the close of the New York Stock Exchange. In the event the Funds become aware of a significant event that may materially affect the value of a security, a fair value of such security will be determined in accordance with procedures established by the Board of Trustees.
Debt securities having a maturity over 60 days are valued using evaluated prices or matrix pricing methods determined by a pricing service which take into consideration factors such as yield, maturity, ratings, and traded prices in identical or similar securities. Short-term debt obligations having a maturity of 60 days or less are valued at amortized cost, so long as it approximates fair value.
Securities and assets for which market quotations are not readily available are valued at fair value as determined in good faith by or under the direction of the Board of Trustees.
Securities transactions and investment income—Securities transactions are accounted for on a trade date basis. Realized gains and losses from securities transactions are recorded on the identified cost basis. Dividend income is recorded on the ex-dividend date and interest income is recognized on an accrual basis. Dividends from foreign securities are recorded on the ex-dividend date, or as soon as the information is available.
Subsequent events—In preparing these financial statements, the Trust has evaluated subsequent events after March 31, 2016 and there were no such events, other than the service provider conversion described in Note Eight, that would require adjustment to or additional disclosure in these financial statements.
Fair value measurements—Accounting Standards CodificationTM (ASC) 820-10 establishes a three-tier framework for measuring fair value based on a hierarchy of inputs. The hierarchy distinguishes between market data obtained from independent sources (observable inputs) and the Funds’ own market assumptions (unobservable inputs). These inputs are used in determining the value of the Funds’ investments and are summarized below:
Level 1 — quoted prices in active markets for identical securities
Level 2 — other significant observable inputs (including quoted prices for similar securities, “quoted” prices in inactive markets, dealer indications, and inputs corroborated by observable market data)
Level 3 — significant unobservable inputs (including the Funds’ own assumptions in determining the fair value of investments)
The inputs or methodology used for valuing securities are not necessarily an indication of the risk associated with investing in those securities.
The following tables summarize the inputs used as of March 31, 2016 in valuing the Funds’ investments carried at fair value:
| | | | | | | | | | | | | | | | | |
| | | Ariel
Fund | | | Ariel
Appreciation Fund | | | Ariel
Focus Fund | | | Ariel
Discovery Fund | |
| Level 1 | | | $1,988,459,564 | | | | $1,707,812,427 | | | | $42,521,953 | | | | $31,742,484 | |
| Level 2* | | | 12,089,402 | | | | 29,743,923 | | | | 399,615 | | | | 1,032,364 | |
| Level 3 | | | — | | | | — | | | | — | | | | — | |
| Fair value at 03/31/16 | | | $2,000,548,966 | | | | $1,737,556,350 | | | | $42,921,568 | | | | $32,774,848 | |
| | | | | | | | | | | | | | | | | |
| Ariel International Fund | | | Level 1 | | | | Level 2* | | | | Level 3 | | | | Total | |
| Common stocks | | | | | | | | | | | | | | | | |
| Consumer discretionary | | | $7,696,162 | | | | $— | | | | $— | | | | $7,696,162 | |
| Consumer staples | | | 8,711,917 | | | | — | | | | — | | | | 8,711,917 | |
| Energy | | | 2,311,053 | | | | — | | | | — | | | | 2,311,053 | |
| Financials | | | 11,254,713 | | | | — | | | | — | | | | 11,254,713 | |
| Health care | | | 7,876,547 | | | | — | | | | — | | | | 7,876,547 | |
| Industrials | | | 1,944,068 | | | | — | | | | — | | | | 1,944,068 | |
| Information technology | | | 13,246,307 | | | | — | | | | — | | | | 13,246,307 | |
| Materials | | | 255,444 | | | | — | | | | — | | | | 255,444 | |
| Telecommunication services | | | 9,862,906 | | | | — | | | | — | | | | 9,862,906 | |
| Utilities | | | 1,688,254 | | | | — | | | | — | | | | 1,688,254 | |
| Total common stocks | | | $64,847,371 | | | | — | | | | — | | | | $64,847,371 | |
| Exchange traded funds | | | 2,048,134 | | | | — | | | | — | | | | 2,048,134 | |
| Repurchase agreement | | | — | | | | 3,691,233 | | | | — | | | | 3,691,233 | |
| Total investments | | | $66,895,505 | | | | $3,691,233 | | | | — | | | | $70,586,738 | |
| Other financial instruments | | | | | | | | | | | | | | | | |
| Forward currency contractsˆ | | | $— | | | | $288,365 | | | | $— | | | | $288,365 | |
| | | | | | | | | | | | | | | | | |
| Ariel Global Fund | | | Level 1 | | | | Level 2* | | | | Level 3 | | | | Total | |
| Common stocks | | | | | | | | | | | | | | | | |
| Consumer discretionary | | | $7,840,333 | | | | $— | | | | $— | | | | $7,840,333 | |
| Consumer staples | | | 2,931,585 | | | | — | | | | — | | | | 2,931,585 | |
| Energy | | | 2,000,388 | | | | — | | | | — | | | | 2,000,388 | |
| Financials | | | 8,250,467 | | | | — | | | | — | | | | 8,250,467 | |
| Health care | | | 15,497,410 | | | | — | | | | — | | | | 15,497,410 | |
| Industrials | | | 775,699 | | | | — | | | | — | | | | 775,699 | |
| Information technology | | | 13,261,390 | | | | — | | | | — | | | | 13,261,390 | |
| Materials | | | 201,733 | | | | — | | | | — | | | | 201,733 | |
| Telecommunication services | | | 8,681,294 | | | | — | | | | — | | | | 8,681,294 | |
| Utilities | | | 3,121,965 | | | | — | | | | — | | | | 3,121,965 | |
| Total common stocks | | | $62,562,264 | | | | — | | | | — | | | | $62,562,264 | |
| Exchange traded funds | | | 266,701 | | | | — | | | | — | | | | 266,701 | |
| Repurchase agreement | | | — | | | | 2,319,961 | | | | — | | | | 2,319,961 | |
| Total investments | | | $62,828,965 | | | | $2,319,961 | | | | $— | | | | $65,148,926 | |
| Other financial instruments | | | | | | | | | | | | | | | | |
| Forward currency contractsˆ | | | $— | | | | $(12,936 | ) | | | $— | | | | $(12,936 | ) |
| | | | | | | | | | | | | | | | | |
There were no transfers between levels for the Ariel Fund, Ariel Appreciation Fund, Ariel Focus Fund, Ariel Discovery Fund, Ariel International Fund and Ariel Global Fund. Transfers between levels are recognized at the end of the reporting period.
* As of March 31, 2016, the only Level 2 investments held were repurchase agreements and forward currency contracts. See Schedule of Investments and Note Five.
ˆ Forward currency contracts derive their value from underlying exchange rates. These instruments are normally valued by pricing vendors using pricing models. The pricing models typically use inputs that are observed from active markets such as exchange rates. As such, forward currency contracts were categorized as Level 2. The forward currency contracts are reflected at the unrealized appreciation (depreciation) on the contract. See Note Five, Forward Currency Contracts.
| | | | |
| | Notes to the financial statements(continued) | | |
| | | | |
Offsetting assets and liabilities—The Funds are subject to various master netting agreements (“Master Netting Agreements”), which govern the terms of certain transactions with select counterparties. Master Netting Agreements seek to reduce the counterparty risk associated with relevant transactions by specifying credit protection mechanisms and providing standardization that seeks to improve legal certainty. The Master Netting Agreements allow the Funds to close out and net their total exposure to a counterparty in the event of a default by the other party or a termination event including, but not limited to, failure to pay or deliver or a breach of the terms of the agreement with respect to all the transactions governed under a single agreement with that counterparty. The Master Netting Agreements may also specify collateral posting arrangements at pre-arranged exposure levels. Under the Master Netting Agreements, collateral may be transferred if the total net exposure to certain transactions (net of existing collateral already in place) governed under the relevant Master Netting Agreement with a counterparty in a given account exceeds a specified threshold depending on the counterparty and the type of Master Netting Agreement. The Funds are not currently collateralizing their exposures under foreign exchange trades. The following is a summary of offsetting transactions as of March 31, 2016:
| | | | | | | | | | | | | | | | | | | | | | | | |
| | | | | | | | | | | | | | | | Gross amounts not offset in the
Statement of Assets & Liabilities | | | | | |
| | | Gross amounts of
recognized assets | | | Gross amounts
offset in the
Statement of
Assets & Liabilities | | | Net amounts
presented in the
Statement of
Assets & Liabilities | | | Financial
instruments | | | Collateral pledged
(received) | | Net amount | |
| Forward currency contracts | | | | | | | | | | | | | | | | | | | | | | | | |
| Ariel International Fund | | | 430,422 | | | | — | | | | 430,422 | | | | (142,057 | ) | | | — | | | | $288,365 | |
| Ariel Global Fund | | | 134,711 | | | | — | | | | 134,711 | | | | (147,647 | ) | | | — | | | | (12,936 | ) |
Foreign currency—Securities and other assets and liabilities denominated in foreign currencies are translated into U.S. dollars using exchange rates obtained from an independent third party. Net realized gains (losses) and Net unrealized appreciation (depreciation) on investments include the effects of changes in exchange rates on the underlying investments. Fluctuations in the value of other assets and liabilities resulting from changes in exchange rates are recorded as net unrealized appreciation (depreciation) on translation of assets and liabilities in foreign currencies until the assets or liabilities are settled in cash, at which time they are recorded as net realized gains (losses) on foreign currency translations.
Forward currency contracts—Ariel International Fund and Ariel Global Fund enter into forward currency contracts to provide the appropriate currency exposure related to protecting the value of securities and related receivables and payables against changes in foreign exchange rates. The primary risk associated with a Fund’s use of these contracts is that a counterparty will fail to fulfill its obligation to pay gains due to the Fund under the contracts. Counterparty risk is mitigated by entering into forward currency contracts only with highly rated counterparties. Forward currency contracts are “marked-to-market” daily and any resulting unrealized gains (losses) are recorded as net unrealized appreciation (depreciation) on forward currency contracts. The Funds record realized gains (losses) at the time the forward currency contract is settled or closed on the Statement of Operations as net realized gain (loss) on forward currency contracts.
Repurchase agreements—The Funds may enter into repurchase agreements with recognized financial institutions and in all instances hold underlying securities as collateral with a value at least equal to the total repurchase price such financial institutions have agreed to pay. At March 31, 2016, the Funds ongoing exposure to the economic return on repurchase agreements is shown on the Schedule of Investments.
Class and expense allocations—Each class of shares has equal rights as to assets and earnings, except that shareholders of each class bear certain class-specific expenses related to marketing and distribution and shareholder servicing and communication. Income, other non-class-specific expense, and realized and unrealized gains and losses on investments are allocated to each class of shares based on its relative net assets. Expenses that are not directly attributable to one or more Funds are allocated among applicable Funds on an equitable and consistent basis considering such things as the nature and type of expense and the relative net assets of the Funds.
Ariel Fund, Ariel Appreciation Fund, Ariel Focus Fund and Ariel Discovery Fund pay all operating expenses not expressly assumed by the Adviser, including custodial and transfer agency fees, federal and state securities registration fees, legal and audit fees, brokerage commissions, and other costs associated with the purchase and sale of portfolio securities. Ariel International Fund and Ariel Global Fund pay all operating expenses not expressly assumed by the Adviser, including custodial and transfer agency fees, fund administration, fund accounting, federal and state securities registration fees, legal and audit fees, and brokerage commissions and other costs associated with the purchase and sale of portfolio securities.
Distributions to shareholders—Dividends from net investment income and net realized capital gains, if any, are declared and paid at least annually and recorded on ex-dividend date.
Distributions to shareholders are determined in accordance with federal income tax regulations and may differ from net investment income and realized capital gains for financial reporting purposes. Reclassifications between net asset accounts are made at the end of the fiscal year for such differences that are permanent in nature. These differences are primarily due to distribution reclasses, net operating losses and foreign currency.
NOTE THREE | INVESTMENT TRANSACTIONS, DISTRIBUTIONS AND FEDERAL INCOME TAX MATTERS
Purchases and proceeds from sales of securities, excluding short-term investments and U.S. government securities, for the six months ended March 31, 2016 were as follows:
| | | | | | | | | | | | | | | | | | | |
| | | Ariel Fund | | | Ariel
Appreciation Fund | | | Ariel
Focus Fund | | | Ariel
Discovery Fund | | | Ariel
International Fund | | | Ariel
Global Fund | |
| Purchases | | | $260,836,914 | | | | $153,501,889 | | | | $4,862,194 | | | | $7,801,672 | | | | $52,792,392 | | | | $8,783,341 | |
| Sales | | | 404,606,744 | | | | 281,723,466 | | | | 6,827,378 | | | | 7,670,214 | | | | 5,931,452 | | | | 6,964,005 | |
Income Tax Matters—It is the Funds’ policy to comply with the requirements of the Internal Revenue Code applicable to regulated investment companies and to distribute substantially all taxable income to shareholders. The Funds file US federal income tax returns in addition to state and local tax returns that may be required. Management has analyzed the Funds’ tax positions taken for all open federal income tax years (September 30, 2012 – 2015), and has concluded that no provision for federal income tax is required in the financial statements.
The cost and unrealized appreciation and depreciation of securities on a federal income tax basis as of March 31, 2016 were as follows:
| | | | | | | | | | | | | | | | | | | |
| | | Ariel Fund | | | Ariel
Appreciation Fund | | | Ariel
Focus Fund | | | Ariel
Discovery Fund | | | Ariel
International Fund | | | Ariel
Global Fund | |
| Cost of investments | | | $1,550,762,914 | | | | $1,295,145,787 | | | | $42,639,233 | | | | $41,070,555 | | | | $69,544,885 | | | | $59,813,295 | |
| Gross unrealized appreciation | | | 736,475,634 | | | | 667,847,215 | | | | 8,974,945 | | | | 4,454,519 | | | | 4,117,963 | | | | 9,619,085 | |
| Gross unrealized depreciation | | | (286,689,581 | ) | | | (225,436,652 | ) | | | (8,692,610 | ) | | | (12,750,225 | ) | | | (3,076,109 | ) | | | (4,283,454 | ) |
| Net unrealized appreciation (depreciation) | | | $449,786,053 | | | | $442,410,563 | | | | $282,335 | | | | $(8,295,706 | ) | | | $1,041,854 | | | | $5,335,631 | |
The difference between book basis and tax basis unrealized appreciation and depreciation is attributable primarily to the deferral of losses on wash sales and partnership adjustments.
Tax adjustments are calculated annually. For interim periods, the Fund’s determine an estimate of tax cost adjustments based on a review of accounting reports for the interim period to identify changes from the adjustments calculated at the fiscal year end. For the previous fiscal year’s federal income tax information, please refer to the Notes to Financial Statements section in the Fund’s most recent annual report.
The tax character of distributions paid during the periods ended March 31, 2016 and September 30, 2015 was as follows:
| | Ariel Fund | | | Ariel Appreciation Fund | | | Ariel Focus Fund | |
| | | 3/31/16 | | | 9/30/15 | | | 3/31/16 | | | 9/30/15 | | | 3/31/16 | | | 9/30/15 | |
| Distributions from: | | | | | | | | | | | | | | | | | | |
| Ordinary income | | | $16,296,998 | | | | $34,143,344 | | | | $31,164,768 | | | | $54,262,132 | | | | $736,856 | | | | $1,911,066 | |
| Long-term capital gains | | | 288,406,078 | | | | 250,909,094 | | | | 166,700,493 | | | | 172,243,946 | | | | 4,811,216 | | | | 4,971,430 | |
| Total distributions | | | $304,703,076 | | | | $285,052,438 | | | | $197,865,261 | | | | $226,506,078 | | | | $5,548,072 | | | | $6,882,496 | |
| | | | | | | | | | | | | | | | | | | | | | | | | |
| | | Ariel Discovery Fund | | | | Ariel International Fund | | | | Ariel Global Fund | |
| | | 3/31/16 | | | 9/30/15 | | | 3/31/16 | | | 9/30/15 | | | 3/31/16 | | | 9/30/15 | |
| Distributions from: | | | | | | | | | | | | | | | | | | | | | | | | |
| Ordinary income | | | $15,925 | | | | $1,505,861 | | | | $97,634 | | | | $365,219 | | | | $888,078 | | | | $1,035,548 | |
| Long-term capital gains | | | 2,074,887 | | | | 835,590 | | | | 14,375 | | | | 192,625 | | | | — | | | | 273,237 | |
| Total distributions | | | $2,090,812 | | | | $2,341,451 | | | | $112,009 | | | | $557,844 | | | | $888,078 | | | | $1,308,785 | |
| | | |
| | Notes to the financial statements (continued) | |
| | | |
| | | |
NOTE FOUR | INVESTMENT ADVISORY AND OTHER TRANSACTIONS WITH RELATED PARTIES
Management fees—Ariel Investments, LLC (the “Adviser”) provides investment advisory and administrative services to Ariel Fund, Ariel Appreciation Fund, Ariel Focus Fund and Ariel Discovery Fund under an agreement (the “Management Agreement”). The Adviser provides investment advisory services to Ariel International Fund and Ariel Global Fund under an Advisory Agreement (collectively, the “Agreements”). Pursuant to the Agreements, the Adviser is paid a monthly fee on average daily net assets at the annual rates shown below:
| | | Ariel | | Ariel | | Ariel | | Ariel | | Ariel | | Ariel | |
| Management fees | | Fund | | Appreciation Fund | | Focus Fund | | Discovery Fund | | International Fund | | Global Fund | |
| Average daily net assets: | | | | | | | | | | | | | |
| First $500 million | | 0.65% | | 0.75% | | 0.65% | | 0.80% | | 0.80% | | 0.80% | |
| Next $500 million | | 0.60% | | 0.70% | | 0.60% | | 0.75% | | 0.80% | | 0.80% | |
| Over $1 billion | | 0.55% | | 0.65% | | 0.55% | | 0.70% | | 0.75% | | 0.75% | |
The Adviser has contractually agreed to reimburse the Funds to the extent their respective total annual operating expenses exceed certain limits as shown below:
| | | | | | | Ariel Focus Fund | | Ariel Discovery Fund |
| | | | | Ariel | | | | | | | | | | |
| | | Ariel Fund | | Appreciation Fund | | | | | | | | | | |
| | | Investor Class | | Investor Class | | Investor Class | | Institutional Class | | | Investor Class | | Institutional Class | |
| First $30 million* | | 1.50% | | 1.50% | | — | | — | | | — | | — | |
| Over $30 million* | | 1.00% | | 1.00% | | — | | — | | | — | | — | |
| On average daily net assets** | | — | | — | | 1.00% | | 0.75% | | | 1.25% | | 1.00% | |
| Waiver** | | — | | — | | 2017 | | 2017 | | | 2017 | | 2017 | |
| | | | | | | Ariel International Fund | | Ariel Global Fund |
| | | | | | | Investor Class | | Institutional Class | | | Investor Class | | Institutional Class | |
| On average daily net assets** | | | | | | 1.25% | | 1.00% | | | 1.25% | | 1.00% | |
| Waiver** | | | | | | 2017 | | 2017 | | | 2017 | | 2017 | |
* Exclusive of brokerage, interest, taxes, distribution plan expenses and extraordinary items.
** Through September 30 of the respective year. After these dates there is no assurance that such expenses will be limited. The Adviser has no right to recapture previously-waived fees.
Distribution fees—Ariel Distributors, LLC is the Funds’ distributor and principal underwriter (“the Distributor”). The Trust has adopted a plan of distribution under Rule 12b-1 of the 1940 Act applicable to the Investor Class of the Funds. Under the plan, 12b-1 distribution fees at an annual rate of 0.25% of average daily net assets are paid weekly to the Distributor for its services. For the six months ended March 31, 2016 distribution fee expenses were as follows:
| | | | | Ariel | | Ariel | | Ariel | | Ariel | | Ariel | |
| | Ariel Fund | | Appreciation Fund | | Focus Fund | | Discovery Fund | | International Fund | | Global Fund | |
| Paid to distributor | | $1,880,092 | | $1,916,512 | | $40,875 | | $7,123 | | $38,475 | | $8,725 | |
| Paid to broker/dealers | | 1,256,169 | | 1,352,766 | | 13,426 | | 2,058 | | 22,859 | | 3,961 | |
��
The remaining amounts were retained by the Distributor for its services, advertising, and other distribution expenses.
Trustees’ fees—Trustees’ fees and expenses represent only those expenses of disinterested (independent) trustees of the Funds.
NOTE FIVE | FORWARD CURRENCY CONTRACTS
At March 31, 2016, the open forward currency contracts are:
| | Contract | | | | | | | | | | | | | Unrealized | |
| | Settlement | | | | Currency to | | Amount to | | Currency to | | Amount to | | | appreciation | |
| | date | | Counterparty | | be received | | be received | | be delivered | | be delivered | | | (depreciation) | |
| | Ariel International Fund | | | | | | | | | | | | | | |
| | 04/11/2016 | | State Street Bank | | USD | | 262,674 | | CAD | | 371,306 | | | (23,228 | ) |
| | 04/11/2016 | | State Street Bank | | USD | | 522,689 | | CNH | | 3,547,749 | | | (26,018 | ) |
| | 04/11/2016 | | State Street Bank | | USD | | 711,082 | | CNH | | 4,827,889 | | | (35,616 | ) |
| | 04/11/2016 | | State Street Bank | | USD | | 401,552 | | CNH | | 2,708,389 | | | (17,336 | ) |
| | 04/11/2016 | | State Street Bank | | AUD | | 606,257 | | CHF | | 418,550 | | | 29,163 | |
| | 04/11/2016 | | State Street Bank | | EUR | | 238,412 | | CNH | | 1,773,874 | | | (3,005 | ) |
| | 04/11/2016 | | State Street Bank | | JPY | | 91,952,289 | | CNH | | 5,321,621 | | | (5,816 | ) |
| | 04/13/2016 | | State Street Bank | | AUD | | 980,018 | | USD | | 681,000 | | | 69,928 | |
| | 04/13/2016 | | State Street Bank | | SEK | | 4,291,036 | | USD | | 505,000 | | | 23,735 | |
| | 04/13/2016 | | State Street Bank | | NOK | | 1,402,662 | | USD | | 157,000 | | | 12,507 | |
| | 04/13/2016 | | State Street Bank | | JPY | | 109,314,012 | | USD | | 933,000 | | | 38,600 | |
| | 04/13/2016 | | State Street Bank | | SGD | | 193,010 | | USD | | 134,000 | | | 9,194 | |
| | 04/13/2016 | | State Street Bank | | EUR | | 95,414 | | USD | | 104,056 | | | 4,546 | |
| | 04/13/2016 | | State Street Bank | | USD | | 121,425 | | CNH | | 819,823 | | | (5,364 | ) |
| | 04/13/2016 | | State Street Bank | | AUD | | 383,373 | | CAD | | 379,000 | | | 1,928 | |
| | 04/13/2016 | | State Street Bank | | EUR | | 269,417 | | CNH | | 1,983,777 | | | (144 | ) |
| | 05/12/2016 | | State Street Bank | | SGD | | 143,468 | | USD | | 101,249 | | | 5,174 | |
| | 05/12/2016 | | State Street Bank | | SEK | | 3,411,250 | | USD | | 406,000 | | | 14,758 | |
| | 05/12/2016 | | State Street Bank | | JPY | | 50,043,327 | | USD | | 426,000 | | | 19,126 | |
| | 05/12/2016 | | State Street Bank | | AUD | | 1,481,863 | | USD | | 1,060,000 | | | 73,938 | |
| | 05/12/2016 | | State Street Bank | | SGD | | 245,086 | | USD | | 172,793 | | | 9,010 | |
| | 05/12/2016 | | State Street Bank | | AUD | | 353,220 | | CAD | | 348,000 | | | 2,325 | |
| | 05/16/2016 | | State Street Bank | | USD | | 200,019 | | CNH | | 1,348,407 | | | (8,243 | ) |
| | 05/20/2016 | | State Street Bank | | AUD | | 326,786 | | CAD | | 320,352 | | | 3,295 | |
| | 05/23/2016 | | State Street Bank | | JPY | | 67,225,277 | | USD | | 598,497 | | | (379 | ) |
| | 05/23/2016 | | State Street Bank | | SEK | | 1,175,866 | | USD | | 139,649 | | | 5,444 | |
| | 05/23/2016 | | State Street Bank | | AUD | | 248,630 | | USD | | 176,817 | | | 13,342 | |
| | 06/07/2016 | | State Street Bank | | EUR | | 493,366 | | USD | | 554,555 | | | 7,925 | |
| | 06/07/2016 | | State Street Bank | | AUD | | 525,236 | | USD | | 389,000 | | | 12,440 | |
| | 06/07/2016 | | State Street Bank | | JPY | | 79,954,010 | | USD | | 710,957 | | | 684 | |
| | 06/07/2016 | | State Street Bank | | SEK | | 1,078,358 | | USD | | 129,483 | | | 3,649 | |
| | 06/07/2016 | | State Street Bank | | SGD | | 122,542 | | USD | | 88,559 | | | 2,327 | |
| | 06/07/2016 | | State Street Bank | | USD | | 585,882 | | CNH | | 3,841,275 | | | (6,800 | ) |
| | 06/07/2016 | | State Street Bank | | AUD | | 377,228 | | CAD | | 374,000 | | | 331 | |
| | 06/07/2016 | | State Street Bank | | EUR | | 127,000 | | CAD | | 191,000 | | | (2,282 | ) |
| | 06/07/2016 | | UBS AG | | SEK | | 1,683,647 | | USD | | 198,107 | | | 9,752 | |
| | 06/07/2016 | | UBS AG | | SGD | | 137,754 | | USD | | 99,054 | | | 3,115 | |
| | 06/07/2016 | | UBS AG | | JPY | | 186,909,700 | | USD | | 1,650,892 | | | 12,722 | |
| | 06/07/2016 | | UBS AG | | GBP | | 933,044 | | USD | | 1,320,714 | | | 19,611 | |
| | 06/07/2016 | | UBS AG | | AUD | | 719,789 | | USD | | 528,286 | | | 21,852 | |
| | 06/07/2016 | | UBS AG | | USD | | 648,160 | | CNH | | 4,250,000 | | | (7,585 | ) |
| | 06/22/2016 | | UBS AG | | USD | | 217,962 | | CNH | | 1,415,442 | | | (240 | ) |
| | | | | | | | | | | | | | | $288,365 | |
| | | |
| | Notes to the financial statements (continued) | |
| | | |
| | | |
Contract
settlement
date | Counterparty | Currency to
be received | Amount to
be received | Currency to
be delivered | Amount to
be delivered | Unrealized
appreciation
(depreciation) |
| Ariel Global Fund | | | | | | |
| 04/11/2016 | State Street Bank | USD | 618,650 | CNH | 4,199,090 | (30,795) |
| 04/11/2016 | State Street Bank | USD | 600,826 | CNH | 4,079,307 | (30,093) |
| 04/11/2016 | State Street Bank | USD | 235,615 | CNH | 1,589,175 | (10,172) |
| 04/11/2016 | State Street Bank | EUR | 282,182 | CNH | 2,099,545 | (3,557) |
| 04/11/2016 | State Street Bank | JPY | 72,556,076 | CNH | 4,199,090 | (4,589) |
| 04/13/2016 | State Street Bank | USD | 909,010 | CHF | 904,938 | (32,480) |
| 04/13/2016 | State Street Bank | USD | 406,666 | CNH | 2,745,685 | (17,966) |
| 05/12/2016 | State Street Bank | CAD | 563,509 | CHF | 407,753 | 9,149 |
| 05/12/2016 | State Street Bank | AUD | 408,969 | CHF | 291,480 | 9,312 |
| 05/16/2016 | State Street Bank | USD | 431,364 | CNH | 2,908,000 | (17,778) |
| 05/16/2016 | State Street Bank | JPY | 76,767,785 | EUR | 588,039 | 12,931 |
| 05/16/2016 | State Street Bank | AUD | 389,043 | GBP | 190,026 | 24,688 |
| 05/16/2016 | State Street Bank | SEK | 2,274,871 | GBP | 185,007 | 14,884 |
| 05/16/2016 | State Street Bank | CAD | 630,980 | EUR | 410,487 | 18,181 |
| 05/16/2016 | State Street Bank | AUD | 1,188,662 | EUR | 761,513 | 41,797 |
| 05/16/2016 | State Street Bank | SEK | 1,762,365 | EUR | 187,988 | 3,228 |
| 06/07/2016 | State Street Bank | SGD | 127,259 | CHF | 89,985 | 541 |
| 06/22/2016 | UBS AG | USD | 197,687 | CNH | 1,283,780 | (217) |
| | | | | | | $(12,936) |
As reflected in the Statement of Operations, realized net gain (loss) and the change in net unrealized appreciation (depreciation) on forward currency contracts for the six months ended March 31, 2016 were:
| | Ariel International Fund | Ariel Global Fund |
| Net realized gain (loss) on forward currency contracts | $157,262 | $78,260 |
| Change in net unrealized appreciation (depreciation) on forward currency contracts | 339,258 | 42,481 |
For the six months ended March 31, 2016, the volume of the forward currency contracts is measured by the number of trades during the period and the average notional amount. The funds had 206 and 90 forward currency trades during the six months with an average notional value of $222,708 and $313,850 for the Ariel International Fund and Ariel Global Fund, respectively.
NOTE SIX | TRANSACTIONS WITH AFFILIATED COMPANIES
If a Fund’s holding represents ownership of 5% or more of the voting securities of a company, the company is deemed to be an affiliate as defined in the 1940 Act. The following transactions were made during the six months ended March 31, 2016, with affiliated companies:
| | Share activity | Six months ended March 31, 2016 |
| Security name | Balance
September 30,
2015 | Purchases | Sales | Balance
March 31,
2016 | Market value | | Dividends
credited to
income | | Amount of gain
(loss) realized on
sale of shares |
| Ariel Fund | | | | | | | | | |
| Bristow Group Inc. | 2,067,460 | 616,195 | — | 2,683,655 | $50,774,753 | | $890,792 | | $— |
| Contango Oil & Gas Co. | 1,928,817 | — | — | 1,928,817 | 22,740,752 | | — | | — |
| MTS Systems Corp. | 856,616 | — | — | 856,616 | 52,125,084 | | 256,985 | | — |
| | | | | | $125,640,589 | | $1,147,777 | | $— |
| Ariel Appreciation Fund | | | | | | | | | |
| Bristow Group, Inc. | 1,973,718 | 453,246 | — | 2,426,964 | $45,918,159 | | $834,407 | | $— |
NOTE SEVEN | LINE OF CREDIT
The Funds have a $125,000,000 Line of Credit (the “Line”), which is uncommitted, with State Street Bank and Trust Company. The Line is for temporary or emergency purposes such as to provide liquidity for shareholder redemptions. The Funds incur interest expense to the extent of amounts drawn (borrowed) under the Line. Interest is based on the minimum of the higher of the federal funds rate or the overnight LIBOR rate in effect at the time of borrowing, plus a margin of 1.25%.
For the six months ended March 31, 2016, the details of the borrowings were as follows:
| Fund | Average daily borrowings | Number of days outstanding | Weighted average annualized interest rate | |
| Ariel Appreciation Fund | 870,283 | 8 | 1.48% | |
| Ariel Focus Fund | 903,128 | 5 | 1.38% | |
NOTE EIGHT | SUBSEQUENT EVENT -SERVICE PROVIDER CONVERSION
Effective April 1, 2016 The Northern Trust Company (“Northern Trust”) provides fund administration and tax reporting services for the Funds in its role as sub-fund administrator engaged by the Adviser for Ariel Fund, Ariel Appreciation Fund, Ariel Focus Fund and Ariel Discovery Fund and as fund administrator engaged by the Trust for Ariel International Fund and Ariel Global Fund. Northern Trust also acts as the Funds’ accounting agent and custodian. U.S. Bancorp Fund Services, LLC continues to serve as the Funds’ transfer agent.
| | | |
| | Important supplemental information | |
| | | |
| | | |
PROXY VOTING POLICIES, PROCEDURES, AND RECORD
Both a description of the policies and procedures that the Funds’ investment adviser uses to determine how to vote proxies relating to portfolio securities and information regarding how the Funds voted proxies relating to portfolio securities during the most recent 12-month period ended June 30 are available upon request by calling 800-292-7435. Such information for the Ariel Investment Trust is also available on the Securities and Exchange Commission’s (“SEC”) web site at www.sec.gov.
SHAREHOLDER STATEMENTS AND REPORTS
The Funds attempt to reduce the volume of mail sent to shareholders by sending one copy of financial reports, prospectuses and other regulatory materials to two or more account holders who share the same address. We will send you a notice at least 60 days before sending only one copy of these documents we have if we have not received the shareholder’s written consent from you previously. Should you wish to receive individual copies of materials, please contact us at 800-292-7435. Once we have received your instructions, we will begin sending individual copies for each account within 30 days.
AVAILABILITY OF QUARTERLY PORTFOLIO SCHEDULE
The Funds file complete schedules of investments with the SEC for the quarters ended December 31 and June 30 of each fiscal year on Form N-Q which are available on the SEC’s website at www.sec.gov. Additionally, the Funds’ Form N-Q may be reviewed and copied at the SEC’s Public Reference Room in Washington, DC. For information on the Public Reference Room, call 800-SEC-0330.
All of the Funds’ quarterly reports contain a complete schedule of portfolio holdings. All quarterly reports are made available to shareholders on the Funds’ web site at www.arielinvestments.com. Shareholders also may obtain copies of shareholder reports upon request by calling 800-292-7435 or by writing to P.O. Box 701, Milwaukee, Wisconsin 53201-0701.
APPROVAL OF THE MANAGEMENT AGREEMENTS
Each year the Board of Trustees of the Trust (the “Board”), including a majority of the Trustees who are not “interested persons” of the Adviser or the Funds (“Independent Trustees”), is required by the 1940 Act to determine whether to continue each Fund’s management and advisory agreements with the Adviser (together the “Agreements”). At a meeting held in November 2015, the Board, including all of the Independent Trustees, upon recommendation of the Board’s Management Contracts Committee (the “Committee”), determined that the continuation of the agreement for each Fund was in the best interest of each Fund and its shareholders, and approved the continuation of the Agreements.
The Committee, which is comprised entirely of Independent Trustees and includes all Independent Trustees, leads the Board in its consideration of the Agreements. In evaluating the Agreements with respect to the Funds, both the Committee and the Board held meetings in November 2015 to review and evaluate materials provided by the Adviser in response to questions submitted by the Independent Trustees and counsel that is independent of the Adviser (“Independent Counsel”). At such meetings, the Committee received presentations from members of management at the Adviser and from the portfolio manager(s) of each Fund. In addition, the Committee members received a memorandum from Independent Counsel describing the factors they should consider in performing their review, supplemental materials from Broadridge, an independent provider of investment company data, utilizing Lipper data (the “Lipper Report”), and written material and presentations from the Adviser. During each of those meetings, the Committee was advised by, and met in executive session with, Independent Counsel. In connection with its deliberations, the Board also considered a broad range of information relevant to the annual contract review that is provided to the Board and its various standing committees at meetings throughout the year, including investment performance reports and related portfolio information for each Fund, as well as periodic reports on, among other matters, pricing and valuation; brokerage and execution; compliance; and shareholder and other services provided by the Adviser, its affiliates, and its service providers.
Nature, Extent and Quality of Services. The Committee considered the Adviser’s specific responsibilities in the day-to-day management of the Funds, taking into account information received at quarterly Board meetings related to the services rendered by the Adviser and the Trustees’ knowledge of the Adviser’s operations. In addition, the Committee considered the Adviser’s historical approach in managing the Funds; the consistency of the investment approach; the background, education and experience of the Adviser’s investment personnel; the nature and quality of the Adviser’s services, including, among other things, compliance matters, trading practices, broker approval and selection, shareholder communications, information technology, and cyber security protections; and the Adviser’s commitment to diversity and civic affairs. The Committee also considered whether the Funds had operated within their investment objectives, each Fund’s record of compliance with its investment restrictions and other regulatory requirements, and information regarding the structure of the Adviser’s compensation program for portfolio managers and certain other employees and the Adviser’s ability to attract and retain quality personnel. The Committee also considered the personal investments made by the Adviser’s personnel in the Funds, which aligns the interests of the Adviser and its personnel with those of the Funds’ shareholders.
Investment Performance. The Committee considered the investment performance of each Fund over time, including information provided in the Lipper Report, comparing each Fund’s performance with that of comparable funds selected by Broadridge (the “Peer Group” or “Lipper Peer Group”) as well as an analysis of Fund performance as compared to the performance of its benchmark over specific historical periods. Where applicable, the Committee considered one-, two-, three-, four-, five-, and ten-year periods as of September 30, 2015. In the case of those Funds that underperformed their Lipper Peer Group, the Board noted that performance, especially short-term performance, is only one of the factors that it deems relevant to its consideration of a Fund’s Agreements. The Committee considered the following with respect to the performance of each Fund:
Ariel Fund. Ariel Fund’s one-year period performance ranked in the fourth quintile, performance for the three- and four-year periods ranked in the top quintile and the five- and ten-year period performance ranked in the mid and fourth quintiles, respectively, as compared to its Lipper Peer Group.
Ariel Appreciation Fund. Performance for Ariel Appreciation Fund’s one- and two-year periods ranked in the fourth quintile, the four- and ten-year period performance ranked in the top decile and performance for the three- and five-year periods ranked in the second and third quintiles, respectively, as compared to the Fund’s Lipper Peer Group.
Ariel Focus Fund. Ariel Focus Fund’s performance ranked in the bottom quintile for all periods, as compared to its Lipper Peer Group.
Ariel Discovery Fund. The Committee considered that Ariel Discovery Fund had limited performance information due to its January 31, 2011 inception date and that Ariel Discovery Fund’s performance ranked in the bottom quintile for all applicable periods, as compared to the Fund’s Lipper Peer Group. The Committee discussed the small cap characterization of the Fund’s Lipper Peer Group and the related limitations in its ability to compare the Fund to such Peer Groups, due to its larger exposure in micro-cap stocks.
Ariel International Fund. The Committee considered that the Fund had limited performance information available due to its December 30, 2011 inception date and that Ariel International Fund’s one-, two- and three-year performance ranked in the top quintile, as compared to its Lipper Peer Group.
Ariel Global Fund. The Committee considered that the Fund had limited performance information available due to its December 30, 2011 inception date and that Ariel Global Fund was ranked in the top or the third quintile in all performance periods, as compared to its Lipper Peer Group.
Fees and Expenses. The Committee considered comparative fee and expense information for each Fund’s Peer Group, as selected and analyzed in the Lipper Report, which ranks the fund with the lowest fee at the top, the fund with the highest fee at the bottom and separates the Peer Group universe into five levels (“quintiles”), with the top being the first quintile. The Committee considered that the management fees for Ariel Fund ranked in the top quintile compared to the Lipper Peer Group and total expenses ranked in the second quintile. The management fees for Ariel Appreciation Fund’s Investor Class and Institutional Class ranked in the second and third quintiles, respectively. Total expenses for Ariel Appreciation Fund ranked in the fourth and mid quintiles for the Investor Class and Institutional Class, respectively. The Committee considered the historical expenses with respect to economies of scale and whether such benefits were being passed on to shareholders, such as through the use of breakpoints in the Adviser’s management fees. The Committee considered that Ariel Focus Fund, Ariel Discovery Fund, Ariel International Fund and Ariel Global Fund each had fee reimbursements and expense limitations in place. This resulted in each Fund having a net expense ratio that ranks in the first quintile for Ariel Focus Fund and Ariel Discovery Fund, the second and third quintiles for Ariel International Fund’s Investor Class and Institutional Class, respectively, and the second and first quintiles for Ariel Global Fund’s Investor Class and Institutional Class, respectively, as compared to their respective Lipper Peer Group. The Committee considered the impact of the Rule 12b-1 distribution services (“12b-1”) fees on the total expense ratio of the Investor Class of shares for all Funds and the resulting negative impact on the Funds’ total expense ratio when compared to funds in their respective Peer Groups that do not impose 12b-1 fees. The Committee considered the fees charged and services provided by Ariel to other types of clients and the rationale for any differences between those fees. The Committee also considered the revenue sharing payments made by the Adviser in the aggregate for 2014 and for the first six months of 2015.
Benefits, Profitability and Economies of Scale. The Committee considered the profitability to the Adviser from its relationship with each Fund, including the methodology by which that profitability analysis was calculated. The Committee also considered the fee reimbursements and expense limitations in place for Ariel Focus Fund, Ariel Discovery Fund, Ariel International Fund and Ariel Global Fund. The Committee considered the extent to which economies of scale may be realized as Funds increase in size and that the management fee schedules for each Fund contains breakpoints at different levels. The Committee considered the effective advisory fee rates for the Funds and whether the advisory fee schedules provide an appropriate sharing between the Funds and the Adviser of such economies of scale as may exist under the Agreements. The Committee considered information about the Funds’ soft dollar arrangements that benefit the Adviser, as well as the Adviser’s brokerage and trading practices. The Committee also considered ancillary benefits, including whether the Funds benefited from Mr. Rogers’ and Ms. Hobson’s high media profiles.
Approval. After full consideration of the above factors, as well as other factors that were instructive in evaluating the Agreements, the Board, including all of the Independent Trustees, concluded that continuation of each Fund’s Agreement was in the best interests of each Fund and its respective shareholders and the Board approved the continuation of each Fund’s Agreement. In reaching this determination, the Board considered that the nature, extent and quality of the services provided by the Adviser to each Fund were appropriate and consistent with the Fund’s Agreements; that Ariel Fund and Ariel Appreciation Fund showed strong long-term performance with some recent lower performance, Ariel International Fund and Ariel Global Fund showed strong performance, and Ariel Focus Fund and Ariel Discovery Fund both showed low performance, and the Adviser’s commitment to its stated investment strategy and identified circle of competency, and its calm, reasoned and long-term approach to investing; that the management fees paid by each Fund were reasonable in light of the services provided; that the breakpoints in the fee schedule for each Fund allow shareholders to benefit from potential economies of scale; that the profitability associated with the Adviser’s relationship with the Trust was within a reasonable range and was neither excessive nor so low that the Adviser could not be expected to continue to service the Funds effectively; and that the benefits accruing to the Adviser by virtue of its relationship with the Funds were reasonable in light of the costs of providing the investment management services and the benefits accruing to each Fund. The Board’s determinations were based upon a comprehensive consideration of all information provided to it, including both quantitative measures and qualitative factors, and were not the result of any single factor.
EXAMPLE
As a shareholder of the Funds, you incur ongoing costs, including management fees, distribution and service (12b-1) fees; and other Fund expenses. The Funds currently do not charge any transaction costs, such as sales charges (loads) on purchase payments, reinvested dividends or other distributions, redemption fees or exchange fees. The following example is intended to help you understand your ongoing costs (in dollars) of investing in each of the Funds and to compare these costs with the ongoing costs of investing in other mutual funds. Please note that IRA, 403(b) and Coverdell ESA account holders are charged an annual $15 recordkeeping fee or a one-time, lifetime $60 fee. If these fees were included in either the Actual Expense or Hypothetical Example below, your costs would be higher.
The example is based on an investment of $1,000 invested at the beginning of the period and held for the entire period of October 1, 2015- March 31, 2016.
ACTUAL EXPENSES
The first line of the table below for each Fund provides information about actual account values and actual expenses for that particular Fund. You may use the information in each of these lines, together with the amount you invested, to estimate the expenses that you paid over the period in each Fund. Simply divide your account value by $1,000 (for example, an $8,600 account value divided by $1,000=8.6), then multiply the result by the number in the first line under the heading, entitled “Expenses Paid During Period”, to estimate the expenses you paid on your account during this period in each Fund.
HYPOTHETICAL EXAMPLE FOR COMPARISON PURPOSES
The right portion of the table below for each Fund provides information about hypothetical account values and hypothetical expenses based on each Fund’s actual expense ratio and an assumed rate of return of 5% per year before expenses, which is not the actual return. The hypothetical account values and expenses may not be used to estimate the actual ending account balance or expenses you paid for the period. You may use this information to compare the ongoing costs of investing in each of the Funds to other funds. To do so, compare this 5% hypothetical example with the 5% hypothetical examples that appear in the shareholder reports of other funds.
Please note that the expenses shown in the table are meant to highlight only your ongoing costs in each of the Funds. Therefore, the right portion of the table for each Fund is useful in comparing ongoing costs only, and will not help you determine the relative total costs of owning different funds.
| | | | | Actual | | | Hypothetical
(5% return before expenses) | | | | |
Fund and return | | Beginning
account value
10/01/15 | | Ending
account value
03/31/16 | | Expenses
paid during
period* | | | Ending
account value
03/31/16 | | Expenses
paid during
period* | | | Annualized expense
ratio* | |
| | | | | | | | | | | | | | | | |
Ariel Fund Investor Class | | $1,000.00 | | $1,073.90 | | $5.50 | | | $1,019.70 | | $5.35 | | | 1.06% | |
| Institutional Class | | 1,000.00 | | 1,075.80 | | 3.79 | | | 1,021.35 | | 3.69 | | | 0.73% | |
| | | | | | | | | | | | | | | | |
Ariel Appreciation Fund Investor Class | | $1,000.00 | | $1,059.20 | | $5.92 | | | $1,019.25 | | $5.81 | | | 1.15% | |
| Institutional Class | | 1,000.00 | | 1,061.20 | | 4.12 | | | 1,021.00 | | 4.04 | | | 0.80% | |
| | | | | | | | | | | | | | | | |
Ariel Focus Fund Investor Class | | $1,000.00 | | $1,035.50 | | $5.09 | | | $1,020.00 | | $5.05 | | | 1.00% | |
| Institutional Class | | 1,000.00 | | 1,036.50 | | 3.82 | | | 1,021.25 | | 3.79 | | | 0.75% | |
| | | | | | | | | | | | | | | | |
Ariel Discovery Fund Investor Class | | $1,000.00 | | $990.20 | | $6.22 | | | $1,018.75 | | $6.31 | | | 1.25% | |
| Institutional Class | | 1,000.00 | | 991.50 | | 4.98 | | | 1,020.00 | | 5.05 | | | 1.00% | |
| | | | | | | | | | | | | | | | |
Ariel International Fund Investor Class | | $1,000.00 | | $1,047.30 | | $6.40 | | | $1,018.75 | | $6.31 | | | 1.25% | |
| Institutional Class | | 1,000.00 | | 1,047.90 | | 5.12 | | | 1,020.00 | | 5.05 | | | 1.00% | |
| | | | | | | | | | | | | | | | |
Ariel Global Fund Investor Class | | $1,000.00 | | $1,078.00 | | $6.49 | | | $1,018.75 | | $6.31 | | | 1.25% | |
| Institutional Class | | 1,000.00 | | 1,078.90 | | 5.20 | | | 1,020.00 | | 5.05 | | | 1.00% | |
*Expenses are equal to each Fund’s annualized expense ratio indicated above multiplied by the average account value over the period, multiplied by 183/366 to reflect the most recent fiscal half year.
| | Name and age | | Position(s) held with Fund | | Term of office and length of time served | | Principal occupation(s) during past 5 years | | Other directorships |
| | James W. Compton Age: 78 | | Trustee, Chairman of Governance Committee, Member of Management Contracts and Audit Committees | | Indefinite, until successor elected Trustee since 1997; Governance Committee Chair since 2015 | | Retired Executive Director, President and CEO, Chicago Urban League, 1972 to 2006 | | Seaway Bank and Trust Company, Commonwealth Edison Company |
| | William C. Dietrich Age: 66 | | Lead Independent Trustee, Member of Management Contracts and Audit Committees, Chairman of Executive Committee | | Indefinite, until successor elected Trustee since 1986; Lead Independent Trustee and Executive Committee Chair since 2014 | | Retired Executive Director, Shalem Institute for Spiritual Formation, Inc., 2006 to 2009 | | |
| | Mellody L. Hobson Age: 47 | | Chairman of the Board of Trustees and President, Member of Executive Committee | | Indefinite, until successor elected Trustee since 1993; President since 2002; Chairman since 2006 | | President, Ariel Investments since 2000 | | DreamWorks Animation SKG, Inc. (Chairman), The Estée Lauder Companies Inc., Starbucks Corporation |
| | Christopher G. Kennedy Age: 52 | | Trustee, Chairman of Audit Committee, Member of Management Contracts, Governance and Executive Committees | | Indefinite, until successor elected Trustee since 1995; Audit Committee Chair since 2014 | | Chairman, Joseph P. Kennedy Enterprises, Inc. since 2012; Founder and Chairman, Top Box Foods since 2012; Former President, Merchandise Mart Properties, Inc., 2000 to 2011; Executive Officer, Vornado Realty Trust, 2000 to 2011 | | Interface Inc.; Knoll, Inc. |
| | Merrillyn J. Kosier Age: 56 | | Trustee and Vice President | | Indefinite, until successor elected Trustee since 2003; Vice President since 1999 | | Executive Vice President, Ariel Investments since 1999; Chief Marketing Officer, Mutual Funds since 2007 | | |
| | Kim Y. Lew Age: 49 | | Trustee, Member of Management Contracts and Audit Committees | | Indefinite, until successor elected Trustee since 2014 | | Vice President and Chief Investment Officer, Carnegie Corporation of New York since 2016; Vice President and Co-Chief Investment Officer, Carnegie Corporation of New York, 2011 to 2015; Director of Investments, Carnegie Corporation of New York, 2007 to 2011 | | |
| | William M. Lewis, Jr. Age: 59 | | Trustee, Member of Management Contracts Committee | | Indefinite, until successor elected Trustee since 2007 | | Managing Director and Co-Chairman of Investment Banking, Lazard Ltd. since 2004 | | |
| | Stephen C. Mills Age: 56 | | Trustee, Member of Management Contracts Committee | | Indefinite, until successor elected Trustee since 2015 | | General Manager, New York Knickerbockers since 2013 | | |
| | John W. Rogers, Jr. Age: 58 | | Trustee | | Indefinite, until successor elected Trustee, 1986 to 1993 and since 2000 | | Founder, Chairman, CEO and Chief Investment Officer, Ariel Investments since 1983; Lead Portfolio Manager, Ariel Fund since 1986; Co-Portfolio Manager, Ariel Appreciation Fund since 2002 | | Exelon Corporation, McDonald’s Corporation |
| | James M. Williams Age: 68 | | Trustee, Chairman of Management Contracts Committee, Member of Governance Committee | | Indefinite, until successor elected Trustee since 2006; Management Committee Chair since 2007 | | Vice President and Chief Investment Officer, J. Paul Getty Trust since 2002 | | SEI Mutual Funds |
| | TRUSTEES EMERITUS (no Trustee duties nor responsibilities) |
| | Royce N. Flippin, Jr. | | |
| | John G. Guffey, Jr. | | |
| | H. Carl McCall | |
| | Bert N. Mitchell, CPA, Chairman | | |
Note: Number of portfolios in complex overseen by all Trustees is six. Address for all Trustees is 200 East Randolph Street, Suite 2900, Chicago, IL 60601-6505.
| | Name and age | | Position(s) held with Fund | | Term of office and length of time served | | Principal occupation(s) during past 5 years | | Other directorships |
| | Mareile B. Cusack Age: 57 | | Vice President, Anti-Money Laundering Officer and Secretary | | Indefinite, until successor elected Vice President since 2008; Anti-Money Laundering Officer since 2010; Secretary since 2014; Assistant Secretary, 2008 to 2014 | | Senior Vice President, Ariel Investments since 2012; Vice President, Ariel Investments, 2007-2012; General Counsel, Ariel Investments since 2008 | | |
| | Wendy D. Fox Age: 53 | | Chief Compliance Officer and Vice President | | Indefinite, until successor elected Chief Compliance Officer and Vice President since 2014 | | Chief Compliance Officer and Vice President, Ariel Investments, since 2004 | | |
| | Mellody L. Hobson Age: 47 | | Chairman of the Board of Trustees and President, Member of Executive Committee | | Indefinite, until successor elected Trustee since 1993; President since 2002; Chairman since 2006 | | President, Ariel Investments since 2000 | | DreamWorks Animation SKG, Inc. (Chairman), The Estée Lauder Companies Inc., Starbucks Corporation |
| | Merrillyn J. Kosier Age: 56 | | Trustee and Vice President | | Indefinite, until successor elected Trustee since 2003; Vice President since 1999 | | Executive Vice President, Ariel Investments since 1999; Chief Marketing Officer, Mutual Funds since 2007 | | |
| | James R. Rooney Age: 57 | | Chief Financial Officer, Vice President and Treasurer | | Indefinite, until successor elected Chief Financial Officer, Vice President and Treasurer since 2015 | | Vice President, Fund Administration, Ariel Investments, since 2015; Vice President, Shareholder Reporting, Fidelity Pricing & Cash Management Services, Fidelity Management, 2007 to 2015 | | |
The Statement of Additional Information (SAI) for Ariel Investment Trust includes additional information about the Funds’ Trustees and Officers. The SAI is available without charge by calling 800.292.7435 or logging on to our website, arielinvestments.com. Note: Number of portfolios in complex overseen by all Officers is six. Address for all officers is 200 East Randolph Street, Suite 2900, Chicago, IL 60601-6505.
The Russell 2500™ Value Index measures the performance of the small to mid-cap value segment of the U.S. equity universe. It includes those Russell 2500 companies with lower price-to-book ratios and lower forecasted growth values. This index pertains to Ariel Fund.
The Russell 2000® Value Index measures the performance of the small-cap value segment of the U.S. equity universe. It includes those Russell 2000 companies with lower price-to-book ratios and lower forecasted growth values. This index pertains to Ariel Fund and Ariel Discovery Fund.
The Russell Midcap® Index measures the performance of the mid-cap segment of the U.S. equity universe. The Russell Midcap Index is a subset of the Russell 1000® Index. It includes approximately 800 of the smallest securities based on a combination of their market cap and current index membership. This index pertains to Ariel Appreciation Fund.
The Russell Midcap® Value Index measures the performance of the mid-cap value segment of the U.S. equity universe. It includes those Russell Midcap Index companies with lower price-to-book ratios and lower forecasted growth values. This index pertains to Ariel Appreciation Fund.
The Russell 1000® Value Index measures the performance of the large-cap value segment of the U.S. equity universe. It includes those Russell 1000 companies with lower price-to-book ratios and lower expected growth values. This index pertains to Ariel Focus Fund.
The S&P 500® Index is the most widely accepted barometer of large cap U.S. equities. It includes 500 leading companies. This index pertains to Ariel Fund, Ariel Appreciation Fund, Ariel Focus Fund and Ariel Discovery Fund.
MSCI EAFE Index is an unmanaged, market-weighted index of companies in developed markets, excluding the U.S. and Canada. The MSCI EAFE Index net returns* reflect the reinvestment of income and other earnings, including the dividends net of the maximum withholding tax applicable to non-resident institutional investors that do not benefit from double taxation treaties. MSCI uses the maximum tax rate applicable to institutional investors, as determined by the companies’ country of incorporation. This index pertains to Ariel International Fund.
The MSCI ACWI (All Country World Index) ex-US Index is an unmanaged, market-weighted index of global developed and emerging markets, excluding the United States. The MSCI ACWI ex-US Index net returns* reflect the reinvestment of income and other earnings, including the dividends net of the maximum withholding tax applicable to non-resident institutional investors that do not benefit from double taxation treaties. MSCI uses the maximum tax rate applicable to institutional investors, as determined by the companies’ country of incorporation. This index pertains to Ariel International Fund.
MSCI ACWI (All Country World Index) Index is an unmanaged, market weighted index of global developed and emerging markets. The MSCI ACWI Index net returns* reflect the reinvestment of income and other earnings, including the dividends net of the maximum withholding tax applicable to non-resident institutional investors that do not benefit from double taxation treaties. MSCI uses the maximum tax rate applicable to institutional investors, as determined by the companies’ country of incorporation. This index pertains to Ariel Global Fund.
*Previously, Ariel International Fund and Ariel Global Fund compared their returns to their respective MSCI indices utilizing only gross returns of the indices. Gross returns reflect the reinvestment of income and other earnings, including the maximum possible dividends. Beginning with the Funds’ 9/30/15 annual report, both Funds began comparing their returns to the net returns of the indices because we believe the net returns serve as better comparisons. Net returns are calculated as described above for each of the MSCI indices. For a period of one year, both gross and net returns will be shown in quarterly reports.
Indexes are unmanaged. An investor cannot invest directly in an index.
Russell® is a trademark of Russell Investment Group, which is the source and owner of the Russell Indexes’ trademarks, service marks and copyrights.
MSCI makes no express or implied warranties or representations and shall have no liability whatsoever with respect to any MSCI data contained herein. The MSCI data may not be further redistributed or used to create indices or financial products. This report is not approved or produced by MSCI. Source: MSCI.
Ariel Investment Trust
c/o U.S. Bancorp Fund Services, LLC
P.O. Box 701
Milwaukee, WI 53201-0701
800.292.7435
● arielinvestments.com
● linkedin.com/company/ariel-investments
●twitter.com/ArielFunds
●facebook.com/ArielInvestments
What’s inside
| ● | Quarterly Update Read investment viewpoints, commentaries and outlooks from our portfolio managers. Find out which stocks or sectors contributed to performance. |
| ● | Seeing Stars Learn more about our Morningstar RatingTM for Ariel International Fund and Ariel Global Fund. Find out where Portfolio Manager Rupal Bhansali is finding values overseas. |
| ● | Utility Futility Find out why John Rogers and his fellow portfolio managers are not investing in utilities. |
| ● | Company Spotlights Read our investment thesis on BorgWarner, Landec and Littelfuse and learn why we believe these companies have intriguing valuations and long-term opportunities for growth. |
 Slow and steady wins the race. Slow and steady wins the race. |
The materials used to produce this report were sourced responsibly. The paper used along with the packaging are all recyclable. | TPI (145,000) ©05/16 AI–01 |
| | |
Item 2. Code of Ethics.
Not applicable. The information required by this Item is only required in an annual report on Form N-CSR.
Item 3. Audit Committee Financial Expert.
Not applicable. The information required by this Item is only required in an annual report on Form N-CSR.
Item 4. Principal Accountant Fees and Services.
Not applicable. The information required by this Item is only required in an annual report on Form N-CSR.
Item 5. Audit Committee of Listed Registrants.
Not applicable.
Item 6. Schedule of Investments.
| (a) | Included as part of the report to shareholders filed under Item 1 of this Form. |
Item 7. Disclosure of Proxy Voting Policies and Procedures for Closed-End Management Investment Companies.
Not applicable.
Item 8. Portfolio Managers of Closed-End Management Investment Companies.
Not applicable.
Item 9. Purchases of Equity Securities by Closed‑End Management Investment Company and Affiliated Purchasers.
Not applicable.
Item 10. Submission of Matters to a Vote of Security Holders.
There have been no changes to the procedures by which shareholders may recommend nominees to the registrant's Board of Trustees.
Item 11. Controls and Procedures.
| (a) | The registrant's certifying officers have reasonably designed such disclosure controls and procedures to ensure material information relating to the registrant is made known to them by others, particularly during the period in which this report is being prepared. The registrant's certifying officers have determined that the registrant's disclosure controls and procedures are effective based on their evaluation of these controls and procedures as of a date within 90 days prior to the filing date of this report. |
| (b) | There were no significant changes in the registrant's internal controls over financial reporting, or in other factors that could significantly affect these controls, that occurred during the registrant's first fiscal half-year, including any corrective actions with regard to significant deficiencies and material weaknesses. |
Item 12. Exhibits.
| (a) | (1) Code of Ethics – Not applicable. |
(a) (2) Certification for each principal executive and principal financial officer of the registrant as required by Rule 30a-2 under the Act (17 CFR 270.30a-2(a)) – Filed as an attachment to this filing.
(a) (3) Written solicitation to purchase securities under Rule 23c-1 – Not applicable.
| (b) | Certifications required by Rule 30a-2(b) under the Act (17 CFR 270.30a-2(b)), Rule 13a-14(b) or Rule 15d-14(b) under the Exchange Act (17 CFR 240.13a-14(b) or 240.15d-14(b)), and Section 1350 of Chapter 63 of Title 18 of the United States Code (18 U.S.C. 1350). A certification furnished pursuant to this paragraph will not be deemed "filed" for purposes of Section 18 of the Securities Exchange Act of 1934, as amended, or otherwise subject to the liability of that section. Such certification will not be deemed to be incorporated by reference into any filing under the Securities Act of 1933 or the Exchange Act, except to the extent that the registrant specifically incorporates it by reference – Filed as an attachment to this filing. |
SIGNATURES
Pursuant to the requirements of the Securities Exchange Act of 1934 and the Investment Company Act of 1940, the registrant has duly caused this report to be signed on its behalf by the undersigned, thereunto duly authorized.
Ariel Investment Trust
By: /s/ Mellody Hobson
Mellody Hobson
President and Principal Executive Officer
Date: May 18, 2016
Pursuant to the requirements of the Securities Exchange Act of 1934 and the Investment Company Act of 1940, this report has been signed below by the following persons on behalf of the registrant and in the capacities and on the dates indicated.
By: /s/ Mellody Hobson
Mellody Hobson
President and Principal Executive Officer
Date: May 18, 2016
By: /s/ James Rooney
James Rooney
Chief Financial Officer
Date: May 18, 2016