As filed with the Securities and Exchange Commission on May 21, 2015
UNITED STATES
SECURITIES AND EXCHANGE COMMISSION
Washington, D.C. 20549
FORM N-CSR
CERTIFIED SHAREHOLDER REPORT OF REGISTERED
MANAGEMENT INVESTMENT COMPANIES
Investment Company Act File Number 811-4786
Ariel Investment Trust
(Exact name of registrant as specified in charter)
200 East Randolph Street
Suite 2900
Chicago, Illinois, 60601
(Address of principal executive offices) (Zip code)
Mareile Cusack
200 East Randolph Street
Suite 2900
Chicago, Illinois 60601
(Name and address of agent for service)
with a copy to:
Arthur Don, Esq.
Greenberg Traurig, LLP
77 West Wacker Drive
Suite 3100
Chicago, IL 60601
Registrant's telephone number, including area code: (312) 726-0140
Date of fiscal year end: September 30, 2015
Date of reporting period: March 31, 2015
Item 1. Reports to Stockholders.
The following is a copy of the report transmitted to shareholders pursuant to Rule 30e-1 under the Investment Company Act of 1940 (17 CFR 270.30e-1).
The patient investor
| | | | | | |
| | | | | | |
| SEMI-ANNUAL REPORT: 03/31/15 |
| ● | Value | ● | Deep value | ● | Global |
| ● | Ariel Fund |
| ● | Ariel Appreciation Fund |
| ● | Ariel Focus Fund |
| ● | Ariel Discovery Fund |
| ● | Ariel International Fund |
| ● | |
Slow and steady wins the race.
One of Ariel Investments’ guiding principles is to communicate openly with our shareholders so they may gain a clear understanding of our investment philosophy, portfolio decisions and results, as well as our opinions on the underlying market. In reviewing the materials contained in The Patient Investor, please consider the information provided on this page. While our investment decisions are rooted in detailed analysis, it is important to point out that actual results can differ significantly from those we seek. We candidly discuss a number of individual companies. Our opinions are current as of the date they were written but are subject to change. We want to remind investors that the information in this report is not sufficient on which to base an investment decision and should not be considered a recommendation to purchase or sell any particular security. Equity investments are affected by market conditions. The intrinsic value of the stocks in which the Funds invest may never be recognized by the broader market. Ariel Fund, Ariel Appreciation Fund, Ariel Focus Fund and Ariel Discovery Fund invest in small and/or midsized companies. Investing in small and mid-cap stocks is riskier and more volatile than investing in large cap stocks, in part because smaller companies may not have the scale, depth of resources and other assets of larger firms. Ariel Fund and Ariel Appreciation Fund often invest a significant portion of their assets in companies within the consumer discretionary and financial services sectors and their performance may suffer if these sectors underperform the overall stock market. Ariel Focus Fund invests primarily in equity securities of companies of any size and is a non-diversified fund, which means its investments are concentrated in fewer stocks than diversified funds. Ariel Focus Fund generally holds 20-30 stocks and therefore may be more volatile than a more diversified investment. Ariel International Fund and Ariel Global Fund invest in foreign securities and may use currency derivatives and ETFs. Investments in foreign securities may underperform and may be more volatile than comparable U.S. stocks because of the risks involving foreign economies and markets, foreign political systems, foreign regulatory standards, foreign currencies and taxes. The use of currency derivatives and ETFs may increase investment losses and expenses and create more volatility. Investments in emerging and developing markets present additional risks, such as difficulties selling on a timely basis and at an acceptable price. Performance data quoted represents past performance. Past performance does not guarantee future results. All performance assumes the reinvestment of dividends and capital gains. The investment return and principal value of an investment will fluctuate so that an investor’s shares, when redeemed, may be worth more or less than their original cost. Current performance may be lower or higher than the performance data quoted. Performance data current to the most recent month-end for the Funds may be obtained by visiting our website, arielinvestments.com. Investors should consider carefully the investment objectives, risks, and charges and expenses before investing. For a current summary prospectus or full prospectus which contains this and other information about the Funds offered by Ariel Investment Trust, call us at 800.292.7435 or visit our website, arielinvestments.com. Please read the summary prospectus or full prospectus carefully before investing. Distributed by Ariel Distributors, LLC, a wholly owned subsidiary of Ariel Investments, LLC. Ariel Investment Trust c/o U.S. Bancorp Fund Services, LLC P.O. Box 701 Milwaukee, WI 53201-0701 800.292.7435 arielinvestments.com Follow us on Twitter @ArielFunds |
| | | |
| | Fund performance at a glance | AS OF 03/31/15 |
| | | |
| | | |
| | | | | | | | |
| | | | Annualized |
| | Quarter (%) | 1-year (%) | 3-year (%) | 5-year (%) | 10-year (%) | 20-year (%) | Since inception (%) |
| Small/mid cap value strategy | | | | | | | 11/06/86 |
| Ariel Fund–Investor Class | + 6.67 | +19.54 | + 21.60 | + 16.12 | + 7.89 | +11.68 | + 11.96 |
| Ariel Fund–Institutional Class | + 6.77 | +19.89 | + 21.99 | + 16.36 | + 8.00 | +11.74 | + 12.00 |
Russell 2500TM Value Index | + 3.02 | + 6.58 | + 16.29 | + 14.06 | + 8.46 | +11.72 | + 11.62 |
Russell 2000® Value Index | + 1.98 | + 4.43 | + 14.79 | + 12.54 | + 7.53 | +10.86 | + 10.86 |
S&P 500® Index | + 0.95 | +12.73 | + 16.11 | + 14.47 | + 8.01 | + 9.39 | + 10.29 |
| Mid cap value strategy | | | | | | | 12/01/89 |
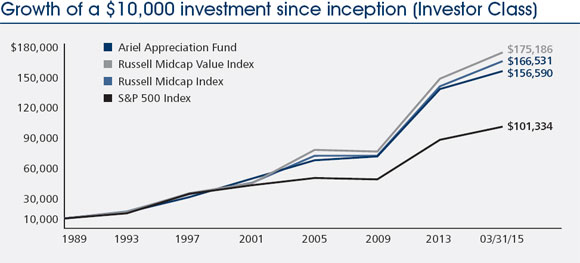
| Ariel Appreciation Fund–Investor Class | + 4.34 | +13.93 | + 19.21 | + 15.28 | + 9.32 | +12.15 | + 11.47 |
| Ariel Appreciation Fund–Institutional Class | + 4.41 | +14.32 | + 19.56 | + 15.51 | + 9.43 | +12.20 | + 11.52 |
Russell Midcap® Value Index | + 2.42 | +11.70 | + 18.60 | + 15.84 | + 9.61 | +12.13 | + 11.97 |
Russell Midcap® Index | + 3.95 | +13.68 | + 18.10 | + 16.16 | + 10.02 | +11.67 | + 11.74 |
S&P 500® Index | + 0.95 | +12.73 | + 16.11 | + 14.47 | + 8.01 | + 9.39 | + 9.57 |
| All cap value strategy | | | | | | | 06/30/05 |
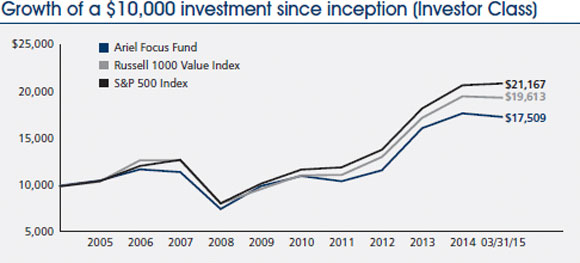
| Ariel Focus Fund–Investor Class | – 2.20 | + 5.28 | + 13.47 | + 10.77 | – | – | + 5.91 |
| Ariel Focus Fund–Institutional Class | – 2.13 | + 5.59 | + 13.75 | + 10.96 | – | – | + 6.00 |
Russell 1000® Value Index | – 0.72 | + 9.33 | + 16.44 | + 13.75 | – | – | + 7.22 |
S&P 500® Index | + 0.95 | +12.73 | + 16.11 | + 14.47 | – | – | + 8.07 |
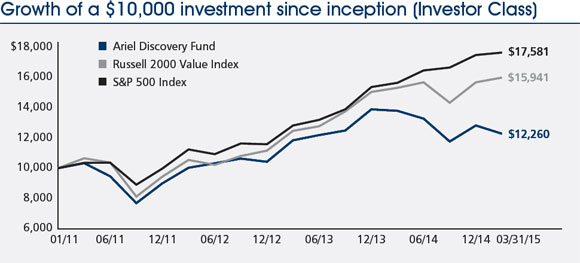
| Small cap deep value strategy | | | | | | | 01/31/11 |
| Ariel Discovery Fund–Investor Class | – 4.18 | –10.93 | + 6.92 | – | – | – | + 5.02 |
| Ariel Discovery Fund–Institutional Class | – 4.15 | –10.77 | + 7.17 | – | – | – | + 5.25 |
Russell 2000® Value Index | + 1.98 | + 4.43 | + 14.79 | – | – | – | + 11.86 |
S&P 500® Index | + 0.95 | +12.73 | + 16.11 | – | – | – | + 14.52 |
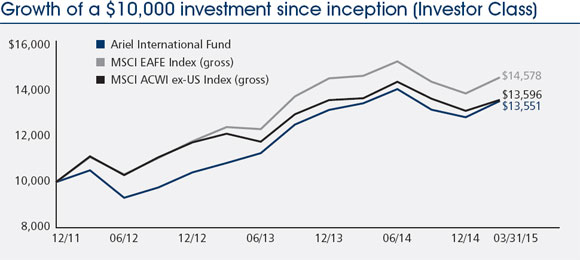
| International all cap strategy | | | | | | | 12/30/11 |
| Ariel International Fund–Investor Class | + 5.55 | + 0.78 | + 8.81 | – | – | – | + 9.79 |
| Ariel International Fund–Institutional Class | + 5.57 | + 0.99 | + 9.08 | – | – | – | + 10.05 |
MSCI EAFE® Index (gross) | + 5.00 | – 0.48 | + 9.52 | – | – | – | + 12.29 |
| MSCI ACWI ex-US Index (gross) | + 3.59 | – 0.57 | + 6.89 | – | – | – | + 9.91 |
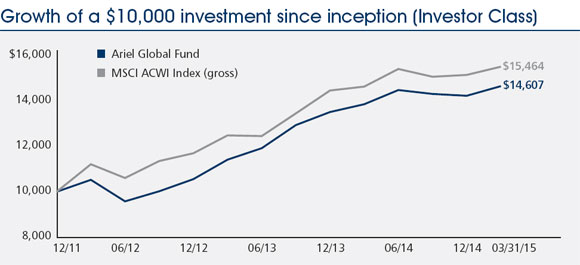
| Global all cap strategy | | | | | | | 12/30/11 |
| Ariel Global Fund–Investor Class | + 2.91 | + 5.71 | + 11.56 | – | – | – | + 12.36 |
| Ariel Global Fund–Institutional Class | + 2.98 | + 6.00 | + 11.86 | – | – | – | + 12.67 |
MSCI ACWISM Index (gross) | + 2.44 | + 5.97 | + 11.35 | – | – | – | + 14.35 |
The inception date for the Institutional Class shares of all Funds is December 30, 2011. Performance information for the Institutional Class prior to that date reflects the actual performance of a Fund’s Investor Class (and uses the actual expenses of the Fund’s Investor Class, for such period of time), without any adjustments. For any such period of time, the performance of a Fund’s Institutional Class would have been substantially similar to, yet higher than, the performance of its Investor Class, because the shares of both classes are invested in the same portfolio of securities, but the classes bear different expenses, which are primarily differences in distribution and service fees. Descriptions for the indexes can be found in the individual fund summaries in the report. Any extraordinary performance shown for short-term periods may not be sustainable and is not representative of the performance over longer periods. The minimum initial investment for Investor Class shares is $1,000; the minimum for Institutional Class shares is $1,000,000.
| | | |
| TURTLE TALK | |
| | |
| | | |
| | Inside this issue | |
| | | |
| | Ariel Investments Chairman and CEO John W. Rogers, Jr. was recently profiled in the April edition of Ticker Magazine. In the interview “Contrarian and Disciplined,” John discusses Ariel Fund’s investment style and how he finds opportunities in the market. “We look for companies that we can own for years, and we feel confident that they will still be leaders in their industries with high returns on capital, high profit margins and consistent growth rates.” | |
| | | -John W. Rogers, Jr., Chairman and CEO | |
| | | |
Ariel Fund tops its Morningstar category since the market bottom
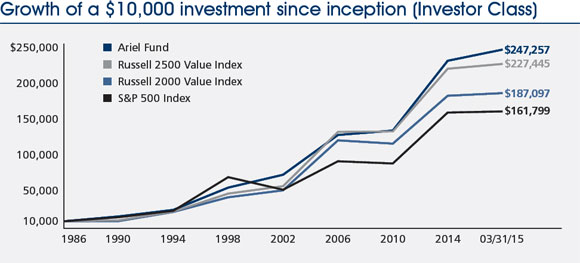
Six years ago, with panic at generational highs and expectations near all-time lows, the market bottomed on March 9, 2009. Given the extremely low valuations of stocks in early 2009, active managers had an opportunity to add value with savvy purchases and brave but rational conviction. Few managed the feat, as evidenced by results in Morningstar’s1 Mid-Cap Blend category, home to our flagship fund, Ariel Fund. In the six years from the March 9, 2009 market bottom through March 31, 2015, Ariel Fund ranked number one out of 259 funds in its category. While we are delighted with our performance since the market bottom, it is our current since inception ranking that matter most, number one out of 8 funds.
The key principle that underscores our work is our willingness to take a patient and long-term view. This patience has generated significant returns for our shareholders. For example, a $10,000 investment in Ariel Fund at its inception in 1986 is worth $247,257 today. This is nearly $20,000 higher than the Russell 2500 Value and over $85,000 higher than the S&P 500. While no one can guarantee future results, we remain committed to finding quality companies trading at attractive prices relative to their intrinsic value that can weather the storm.
We invite you to read the market commentary and the performance summary for Ariel Fund continuing on the pages that follow.
1 Performance data quoted represents past performance and does not guarantee future results. Performance shown assumes the reinvestment of dividends and capital gains, but it does not reflect the deduction of taxes that a shareholder would pay on fund distributions or the redemption of fund shares. The investment return and principal value of an investment will fluctuate so that an investor’s shares, when redeemed, may be worth more or less than their original cost. Current performance may be lower or higher than the performance data quoted. Performance data current to the most recent month-end for Ariel Fund may be obtained by visiting arielinvestments.com. Extraordinary performance for the short-term periods may not be sustainable and is not representative of the performance over longer periods. Morningstar, Inc. is a nationally recognized organization that reports performance and calculates rankings for mutual funds. Rankings are based on total returns. Morningstar ranks each fund relative to all funds in the same category. For the period ended March 31, 2015, the rankings of Ariel Fund for the 1-, 5-, 10-year, and since inception (November 6, 1986) periods were 4 out of 370 funds, 25 out of 268 funds, 118 out of 168 funds, and 1 out of 8 funds, respectively, among Morningstar Mid-Cap Blend funds. ©2015 Morningstar, Inc. All Rights Reserved. The information contained herein: (1) is proprietary to Morningstar and/or its content providers; (2) may not be copied or distributed; and (3) is not warranted to be accurate, complete or timely. Neither Morningstar nor its content providers are responsible for any damages or losses arising from any use of this information.

ACTIVELY PATIENT
| Performance data quoted represents past performance. Past performance does not guarantee future results. All performance assumes the reinvestment of dividends and capital gains and represents returns of the Investor Class shares. The investment return and principal value of an investment will fluctuate so that an investor’s shares, when redeemed, may be worth more or less than their original cost. Current performance may be lower or higher than the performance data quoted. Performance data current to the most recent month-end for Ariel Fund and Ariel Appreciation Fund may be obtained by visiting our website, arielinvestments.com. |
DEAR FELLOW SHAREHOLDER:
For the quarter ended March 31, 2015, Ariel Fund jumped +6.67% and finished ahead of the Russell 2500 Value Index’s +3.02% gain, as well as the +1.98% rise of the Russell 2000 Value Index. With producer durables representing the key soft spot in the portfolio, Ariel Fund was boosted by strong performance among our health-care and financial services names. Meanwhile, Ariel Appreciation Fund jumped +4.34%, ahead of the Russell Midcap Value Index’s +2.42% rise, as well as the +3.95% return of the Russell Midcap Index. For Ariel Appreciation, the strong performance of our financial services names was only marginally offset by weakness among our producer durable issues that had energy exposure. It is worth noting that the broad market, as measured by the Standard & Poor’s 500, weathered a volatile start of the year but ultimately managed to eke out a +0.95% three-month return. As Barron’s noted, “As the U.S. dollar continued to gain strength and the price of oil fell more than 10%…the index went negative in January before hitting a new high and then returning to the red in March.”1
ACTIVELY PATIENT
As most know, the debate about active versus passive (index) management is one that ebbs and flows. In recent years, passive investing has captured the lion’s share of investor attention—and assets—as some have become convinced that stock-pickers are a dying breed. We have been vocal in our unbridled support for true active management, and our results have certainly helped to reinforce our view. That said, when we speak of active management, we are most enthusiastic about the prospects of high-conviction managers who eschew following benchmarks in favor of optimizing returns. As we have been known to say, “The best way to beat a benchmark is not to follow it.” We know our views run counter to those who concern themselves with “tracking error,” which statistically shows how a manager’s performance diverges from a benchmark. In the case of tracking error, many believe less is more.
It is no secret: The academic community was skeptical of active management for a long time. Some professors concluded that active managers could not dependably outperform. While others acknowledged outperformance was possible, they concluded that identifying those who might do so in advance was quite difficult. We will be the first to admit how incredibly difficult it is to beat a benchmark over time. Over the last decade, K.J. Martijn Cremers, currently a professor of finance at the University of Notre Dame, working with various colleagues, has performed more in-depth studies of active management and in so doing, determined ways to predict which managers have a solid shot at beating passive benchmarks. Working with Antti Petajisto, then a professor of finance at the Yale School of Management, Cremers completed a paper in 2009 entitled, How Active Is Your Fund Manager? A New Measure That Predicts Performance. This groundbreaking measure known as “Active Share,” which quantifies how much a portfolio differs from a benchmark, proved to be simple and easy to understand. More specifically, a fund with 0% Active Share would be identical to the benchmark, while a fund with a 100% Active Share would have no overlapping exposure. The paper concluded that low Active Share portfolios, on average, were essentially destined to underperform, while high Active Share portfolios (of 80% or more) had a better shot at outperformance.
“We are most enthusiastic about the prospects of high-conviction managers who eschew following benchmarks in favor of optimizing returns.”
Cremers, now working with Ankur Pareek of Rutgers Business School, has a new paper, which is essentially a sequel to the first one, Patient Capital Outperformance: The Investment Skill of High Active Share Managers Who Trade Infrequently, a second draft of which was released last September. The very first line of this 72-page piece states that “among high Active Share portfolios—whose holdings differ substantially from the holdings of their benchmark—only those with patient investment strategies (i.e., with long stock holding durations of at least 2 years) outperform their benchmarks on average.”2 To paraphrase Jerry Maguire: They had us at hello! Before we read another line, we felt as if they could be talking about us. Then we came upon Panel A of Figure 3 and saw that our flagship Ariel Fund was one of just eight mutual funds used to illustrate the point after the authors studied “a large sample of actively managed all-equity U.S. retail mutual funds “ that have existed from 1995 through 2013, including “’dead,’ merged and delisted funds.” (They also analyzed the gross returns of institutional portfolios from 1986 through 2013. With the exception of slight performance differences related to gross and net returns, the conclusions drawn for mutual funds and institutional portfolios were largely the same.)
“High Active Share on its own is not enough to generate benchmark-beating results. Instead, the length of the holding period is the difference between success and mediocrity.”
Despite a dense paper complete with mathematical equations, their work can be boiled down to a few critical findings:
| | |
| ● | “A necessary condition for long-term outperformance is that the actively managed portfolio is substantially different than the benchmark.” |
| | |
| ● | “[A]mong high Active Share funds, patiently managed portfolios have been most likely to outperform. Patient funds are those which trade relatively infrequently, i.e., funds with long holding durations or low portfolio turnover.” |
| | |
| ● | “[F]unds with above 90% Active Share outperformed their benchmarks by about 1% a year, after fees were taken out.” |
After these facts were on the table, the paper goes into tremendous detail. More specifically, in order to prove their thesis, the authors work to disprove a number of binary points. For example, they demonstrate that high Active Share on its own is not enough to generate benchmark-beating results. Instead, the length of the holding period is the difference between success and mediocrity. On this point, they write, “We find no evidence that even the most active (i.e., high Active Share) mutual funds with short durations or frequent trading were able to outperform their benchmarks on average. Rather, we find that frequently trading mutual funds systematically underperformed their benchmarks, regardless of how different their holdings are relative to their benchmark.” The flip side is also true: A long holding period in and of itself does not drive outperformance. As the two professors note, “…the only portfolios with long Fund Duration that outperform are those that also contain high Active Share funds.”
Perhaps most interesting of all, once the authors moved passed the raw data analysis, they made two nuanced points that we would not normally associate with such a quantitative undertaking. First and foremost, they were perceptive in their view that to be a high Active Share/ low-turnover manager “requires a strong conviction on the part of the manager, as stock prices may initially move adversely before reversing any mispricing.” They also go on to say, “Similarly, it requires that investors are fairly patient in giving the manager time to see the strategy through, rather than evaluate the performance [after] relatively brief periods of time.” We live this day in and day out and wholeheartedly agree.
Additionally, the authors conclude, “The clear majority of the outperformance of the patient and active mutual fund managers seems due to their picking safe…, value…, and quality…stocks.” They underscore the thought by adding, “Our results thus suggest that Warren Buffett’s investment skill seems generally shared by mutual fund managers in the top Active Share and Fund Duration quintiles.” So there you have it: our strategy—value investing, with a long time horizon and more than 90% active share—and our hero—Warren Buffett—all in one academic paper about successful active management.
PORTFOLIO COMINGS AND GOINGS
During the quarter, we initiated one new position and eliminated two holdings in Ariel Fund. We added chainsaw chain maker Blount Intl, Inc. (BLT), a current holding in another of our portfolios. Blount produces saw chains, bars and sprockets, as well as outdoor equipment accessories and parts for the garden and landscape industry. It sells its products in more than 100 countries around the world. We sold our shares of City National Corp. (CYN) on the good news that it was being acquired by the Royal Bank of Canada (RY) for $5.4 billion, roughly half in cash and half in stock. We also sold our shares of Hospira, Inc. (HSP) when it entered a definitive merger agreement with Pfizer Inc., (PFE) an all-cash deal totaling about $17 billion.
In Ariel Appreciation Fund, we initiated one new position and eliminated two holdings during the quarter. We purchased shares in Anixter Intl Inc. (AXE), a current holding in some of our other portfolios. Anixter is a leading global supplier of communications and security products, electrical and electronic wire and cable, fasteners and other small components. Its innovative supply chain management services reduces the total cost of production and implementation for its customers. Ariel Appreciation Fund also exited City National Corp. and Hospira, Inc. due to their acquisitions.
As always, we appreciate the opportunity to serve you and welcome any questions or comments you might have. You can also contact us directly at email@arielinvestments.com.
| | | |
| Sincerely, | | |
| |  |
| John W. Rogers, Jr. | | Mellody Hobson |
| Chairman and CEO | | President |
| | |
 RESEARCH PROMOTIONS AND OTHER ARIEL NEWS RESEARCH PROMOTIONS AND OTHER ARIEL NEWS |
| | |
| | Recognizing and rewarding talent is the best way to keep great people engaged and inspired. To that end, we are delighted to announce promotions that reflect significant long-term contributions to Ariel. We invite you to read a special letter written by John W. Rogers, Jr. posted to arielinvestments.com. |
1 Michael Vallo, “Active Beats Passive in First Quarter,” Barron’s, April 6, 2015, L23.
2 Martijn Cremers and Ankur Pareek, Patient Capital Outperformance: The Investment Skill of High Active Share Managers Who Trade Infrequently, September 2014, 1.
| | | |
| | Ariel Fund performance summary | INCEPTION: 11/06/86 |
| | | |
| | | |
| | | | | |
 | |  | |  |
| John W. Rogers, Jr. | | John P. Miller, cfa | | Kenneth E. Kuhrt, cpa |
| Lead portfolio | | Portfolio | | Portfolio |
| manager | | manager | | manager |
Composition of equity holdings (%) | | | | |
| | | | | | |
| | | Ariel
Fund† | Russell
2500
Value
Index | Russell
2000
Value
Index | S&P
500
Index |
| | Financial services | | | | 17.93 |
| | Consumer discretionary | 27.73 | 12.57 | 12.51 | 14.19 |
| | Producer durables | 19.38 | 12.86 | 13.24 | 10.65 |
| | Health care | 8.74 | 6.68 | 5.92 | 14.87 |
| | Materials & processing | 5.29 | 6.51 | 5.79 | 3.50 |
| | | 3.84 | 1.95 | 2.41 | 8.52 |
| | Technology | 3.46 | 7.72 | 8.72 | 16.95 |
| | Energy | 1.84 | 3.77 | 3.02 | 8.07 |
| | Utilities | 0.00 | 9.10 | 7.66 | 5.32 |
† Sector weightings are calculated based on equity holdings in the Fund and exclude cash in order to make a relevant comparison to the indexes. |
Average annual total returns (%) as of 03/31/15 |
| | | | | | | | |
| | | Quarter | 1-year | 3-year | 5-year | 10-year | Since inception |
| | Ariel Fund–Investor Class | + | 6.67 | + 19.54 | + 21.60 | + 16.12 | + | 7.89 | + 11.96 |
| | Ariel Fund–Institutional Class+ | | 6.77 | + 19.89 | + 21.99 | + 16.36 | + | 8.00 | + 12.00 |
| | Russell 2500TM Value Index | + | 3.02 | + 6.58 | + 16.29 | + 14.06 | + | 8.46 | + 11.62 |
| | Russell 2000® Value Index | + | 1.98 | + 4.43 | + 14.79 | + 12.54 | + | 7.53 | + 10.86 |
| | S&P 500® Index | + | 0.95 | + 12.73 | + 16.11 | + 14.47 | + | 8.01 | + 10.29 |
Performance data quoted represents past performance and does not guarantee future results. All performance assumes the reinvestment of dividends and capital gains. The investment return and principal value of an investment will fluctuate so that an investor’s shares, when redeemed, may be worth more or less than their original cost. Current performance may be lower or higher than the performance data quoted. To access performance data current to the most recent month-end, visit arielinvestments.com. The minimum initial investment for Investor Class shares is $1,000; the minimum for Institutional Class shares is $1,000,000. |
Expense ratio (as of 09/30/14) | |
| Investor Class | 1.03% |
| Institutional Class | 0.72% |
Top ten equity holdings (% of net assets) |
| 1. | | 4.3 |
| 2. | | 3.4 |
| 3. | | 3.3 |
| 4. | International Speedway Corp. | 3.3 |
| 5. | | 3.3 |
| 6. | | 3.3 |
| 7. | | 3.2 |
| 8. | | 3.1 |
| 9. | | 3.1 |
| 10. | | 3.1 |
+The inception date for the Institutional Class shares is December 30, 2011. Performance information for the Institutional Class prior to that date reflects the actual performance of the Fund’s Investor Class (and uses the actual expenses of the Fund’s Investor Class, for such period of time), without any adjustments. For any such period of time, the performance of the Fund’s Institutional Class would have been substantially similar to, yet higher than, the performance of the Fund’s Investor Class, because the shares of both classes are invested in the same portfolio of securities, but the classes bear different expenses, which are primarily differences in distribution and service fees. Notes: The graph and performance table do not reflect the deduction of taxes that a shareholder would pay on fund distributions or the redemption of fund shares. The Russell 2500TM Value Index measures the performance of small to mid-cap value companies with lower price-to-book ratios and lower forecasted growth values. The Russell 2000® Value Index measures the performance of the small-cap value segment of the U.S. equity universe. It includes those Russell 2000 companies with lower price-to-book ratios and lower forecasted growth values. Russell® is a trademark of Russell Investment Group, which is the source and owner of the Russell Indexes’ trademarks, service marks and copyrights. The S&P 500® is a broad market-weighted index dominated by blue-chip stocks. All indexes are unmanaged, and an investor cannot invest directly in an index. Total return does not reflect a maximum 4.75% sales load charged prior to 7/15/94.
| | | |
| | Ariel Appreciation Fund performance summary | INCEPTION: 12/01/89 |
| | | |
| | | |
| | | |
 | |  |
John W. Rogers, Jr. Co-portfolio
manager | | Timothy R. Fidler, cfa Co-portfolio
manager |
Composition of equity holdings (%) | | | | |
| | | | | | |
| | | | | | S&P
500
Index |
| | Financial services | | | | 17.93 |
| | Consumer discretionary | 25.70 | 11.52 | 18.27 | 14.19 |
| | Producer durables | 19.35 | 8.81 | 11.96 | 10.65 |
| | Health care | 13.37 | 10.24 | 12.15 | 14.87 |
| | | 3.81 | 3.08 | 5.71 | 8.52 |
| | | 2.54 | 3.80 | 4.33 | 8.07 |
| | Technology | 1.32 | 8.87 | 11.75 | 16.95 |
| | Materials & processing | 0.00 | 7.35 | 6.68 | 3.50 |
| | Utilities | 0.00 | 12.02 | 6.10 | 5.32 |
† Sector weightings are calculated based on equity holdings in the Fund and exclude cash in order to make a relevant comparison to the indexes. |
Average annual total returns (%) as of 03/31/15 |
| | | | | | | | |
| | | Quarter | 1-year | 3-year | 5-year | 10-year | Since inception |
| | Ariel Appreciation Fund–Investor Class | + | 4.34 | + 13.93 | + 19.21 | + 15.28 | + | 9.32 | + 11.47 |
| | Ariel Appreciation Fund–Institutional Class+ | | 4.41 | + 14.32 | + 19.56 | + 15.51 | + | 9.43 | + 11.52 |
| | Russell Midcap® Value Index | + | 2.42 | + 11.70 | + 18.60 | + 15.84 | + | 9.61 | + 11.97 |
| | | + | 3.95 | + 13.68 | + 18.10 | + 16.16 | + | 10.02 | + 11.74 |
| | S&P 500® Index | + | 0.95 | + 12.73 | + 16.11 | + 14.47 | + | 8.01 | + 9.57 |
Performance data quoted represents past performance and does not guarantee future results. All performance assumes the reinvestment of dividends and capital gains. The investment return and principal value of an investment will fluctuate so that an investor’s shares, when redeemed, may be worth more or less than their original cost. Current performance may be lower or higher than the performance data quoted. To access performance data current to the most recent month-end, visit arielinvestments.com. The minimum initial investment for Investor Class shares is $1,000; the minimum for Institutional Class shares is $1,000,000. |
Expense ratio (as of 09/30/14) | |
| Investor Class | 1.12% |
| Institutional Class | 0.79% |
Top ten equity holdings (% of net assets) |
| 1. | Stanley Black & Decker, Inc. | 4.6 |
| 2. | | 4.6 |
| 3. | | 4.1 |
| 4. | First American Financial Corp. | 4.0 |
| 5. | | 3.8 |
| 6. | | 3.7 |
| 7. | | 3.7 |
| 8. | | 3.6 |
| 9. | Interpublic Group of Cos., Inc. | 3.6 |
| 10. | | 3.5 |
+The inception date for the Institutional Class shares is December 30, 2011. Performance information for the Institutional Class prior to that date reflects the actual performance of the Fund’s Investor Class (and uses the actual expenses of the Fund’s Investor Class, for such period of time), without any adjustments. For any such period of time, the performance of the Fund’s Institutional Class would have been substantially similar to, yet higher than, the performance of the Fund’s Investor Class, because the shares of both classes are invested in the same portfolio of securities, but the classes bear different expenses, which are primarily differences in distribution and service fees. Notes: The graph and performance table do not reflect the deduction of taxes that a shareholder would pay on fund distributions or the redemption of fund shares. The Russell Midcap® Value Index measures the performance of mid-cap value companies with lower price-to-book ratios and lower forecasted growth values. The Russell Midcap® Index measures the performance of mid-cap companies. Russell® is a trademark of Russell Investment Group, which is the source and owner of the Russell Indexes’ trademarks, service marks and copyrights. The S&P 500® is a broad market-weighted index dominated by blue-chip stocks. All indexes are unmanaged, and an investor cannot invest directly in an index. Total return does not reflect a maximum 4.75% sales load charged prior to 7/15/94.

LEVERAGE: A TAILWIND, UNTIL IT’S NOT
| |
| Performance data quoted represents past performance. Past performance does not guarantee future results. All performance assumes the reinvestment of dividends and capital gains and represents returns of the Investor Class shares. The investment return and principal value of an investment will fluctuate so that an investor’s shares, when redeemed, may be worth more or less than their original cost. Current performance may be lower or higher than the performance data quoted. Performance data current to the most recent month-end for Ariel Focus Fund may be obtained by visiting our website, arielinvestments.com. |
DEAR FELLOW SHAREHOLDER:
In the first quarter of 2015, Ariel Focus Fund trailed both its primary benchmark and the broad market, declining -2.20% versus a fall of -0.72% for the Russell 1000 Value Index and a rise of +0.95% for the S&P 500. Declining oil prices hurt the performance of many of our energy holdings, including National Oilwell Varco (NOV), which declined -23.01% in the quarter. It remains one of our favorite companies. Apollo Education Group, Inc. (APOL) continued to struggle in the first quarter, declining -44.53%. Fortunately, we had sold most of our position in Apollo. In hindsight, we should have sold it all. On the positive side, our largest position, Western Union Co. (WU), continues to see good stock and operating performance, increasing +17.12% in the quarter. In our view, Western Union remains a very inexpensive stock, trading at approximately 12x forward earnings. Equity analysts continue to underestimate the regulatory hurdles to using smartphones to transfer money across borders.
“Give me a long enough lever,” said Archimedes, “and I shall move the world.” In today’s investment climate, many companies and even entire asset classes have updated this saying to: “Give me enough debt leverage, and I shall move mediocre results into outperformance.” Last quarter, I discussed the disparate impact of falling interest rates on debt-laden versus strong balance sheet companies. Under the category of “no good deed goes unpunished,” I showed how, when interest rates fall, weak balance sheet companies with high levels of debt can see their stock prices increase much faster than the stock prices of strong balance sheet companies. In this letter, I will discuss how debt leverage can drive outperformance and underperformance, even holding interest rates constant. In my view, this power of leverage is not well understood, even by sophisticated investors. Alternative asset classes such as private equity, hedge funds and real estate in general employ much more leverage than long-only equity managers.
Full disclosure: I am not spending two quarterly letters on the topic of debt and leverage with purely altruistic motives. Ariel Focus Fund has a dog in this fight. The Fund invests in stocks with much stronger balance sheets than those in our primary benchmark. It had an average interest coverage ratio1 of 13.4x at quarter-end, compared with 6.3x for the Russell 1000 Value index and 9.0x for the S&P 500. It is my contention that these stronger, lower-leveraged balance sheets have been a recent headwind to our performance as interest rates have fallen. I expect this wind to shift if and when interest rates rise.
Suppose you serve on the investment committee of a local charity, perhaps your church, a hospital or your alma mater. You have just finished a year in which both markets and the economy were modestly up. Returns were nothing spectacular, but almost everyone has more money than they did the year before. At year-end, the professionals who manage money for your endowment present their results. One group has outperformed its benchmarks, showing strong absolute and relative returns. Another group showed positive returns but lagged its benchmark and the first group. In my opinion, this is the first question that should be asked: “How much leverage did the first (outperforming) group employ versus the second (underperforming)?” In my experience, that question almost never gets asked.
We’ll begin with an illustration based on an activist investor who recommends that a company “take advantage of its debt capacity” by paying a large special dividend of $9.5 billion to its shareholders and then financing that dividend with debt.
| Table 1: Financing a Special Dividend with Debt | | | | | | |
Dollars in millions, except per share | | Strong Balance Sheet Company A | | | Weak Balance Sheet Company B | |
| Total Debt | | | $500 | | | | $10,000 | |
| Borrowing Cost | | | 5.00% | | | | 8.00% | |
| Sales | | | $10,000 | | | | $10,000 | |
| Operating Margin | | | 20.00% | | | | 20.00% | |
| Operating Income | | | 2,000 | | | | 2,000 | |
| Interest Expense | | | 25 | | | | 800 | |
| Pretax Income | | | 1,975 | | | | 1,200 | |
| Taxes (35%) | | | 691 | | | | 420 | |
| Net Income | | | 1,284 | | | | 780 | |
| Shares Outstanding | | | 1,000 | | | | 1,000 | |
| EPS | | | $1.28 | | | | $0.78 | |
| P/E Multiple | | | 15.0 | | | | 15.0 | |
| Stock Price | | | $19.26 | | | | $11.70 | |
| | | | | | | $11.70 + $9.50 special dividend = $21.20 | |
Note: These examples are intended to show the potential general effect of interest rates on the stock price of a company with low debt versus a company with high debt. All information shown is hypothetical except for the stock price, which is purely a calculation of the earnings per share (EPS) multiplied by the price/earnings multiple (P/E multiple). Examples are illustrative only and are not indicative of any specific return an investor may receive from a particular investment. The underlying assumptions are not predictive of the effect of future interest rates on any particular company.
The new “restructured” company has exactly the same operating results as the old company: the same $10 billion in sales, the same 20% operating margin and the same operating income of $2 billion. But because the new leveraged company has a lot more debt than the old, it has a lot more interest expense—$800 million versus $25 million, in this illustration. As a result, net income will be lower, as will earnings per share. No surprises so far. But watch what happens to the stock price, assuming the same price/earnings (P/E) ratio: The stock price goes down by only $7.56, far less than the $9.50 dividend. New shareholders then have $9.50 in their pockets plus a stock trading at $11.70, for a total of $21.20. The activist has created an increase in shareholder value of almost 10% without improving the operating performance of the company—all through the power of leverage.
But the story doesn’t end there. Let’s assume we see modest economic growth (sales up by 5%), as well as modest increases in operating margins (from 20% to 21%). How do these companies perform? From an operating perspective, they are still identical. Both see operating income increase to $2.205 billion.
| Table 2: Operating Leverage | | | | | | | | | | | | |
Dollars in millions, except per share | | Strong Balance Sheet Company A | | | Weak Balance Sheet Company B | |
| Total Debt | | | $500 | | | | $500 | | | | $10,000 | | | | $10,000 | |
| Borrowing Cost | | | 5.00% | | | | 5.00% | | | | 8.00% | | | | 8.00% | |
| Sales | | | $10,000 | | | | $10,500 | | | | $10,000 | | | | $10,500 | |
| Operating Margin | | | 20.00% | | | | 21.00% | | | | 20.00% | | | | 21.00% | |
| Operating Income | | | 2,000 | | | | 2,205 | | | | 2,000 | | | | 2,205 | |
| Interest Expense | | | 25 | | | | 25 | | | | 800 | | | | 800 | |
| Net Income | | | 1,284 | | | | 1,417 | | | | 780 | | | | 913 | |
| EPS | | | $1.28 | | | | $1.42 | | | | $0.78 | | | | $0.91 | |
| P/E Multiple | | | 15.0 | | | | 15.0 | | | | 15.0 | | | | 15.0 | |
| Stock Price | | | $19.26 | | | | $21.26 | | | | $11.70 | | | | $13.70 | |
| Change in Stock Price | | | | | | | 10.38% | | | | | | | | 17.08% | |
Note: These examples are intended to show the potential general effect of interest rates on the stock price of a company with low debt versus a company with high debt. All information shown is hypothetical except for the stock price, which is purely a calculation of the earnings per share (EPS) multiplied by the price/earnings multiple (P/E multiple). Examples are illustrative only and are not indicative of any specific return an investor may receive from a particular investment. The underlying assumptions are not predictive of the effect of future interest rates on any particular company.
The shares of the highly leveraged company increase by more than 17%, while the shares of the strong balance sheet company grow by only 10%. Finally, consider the effect of declining interest rates, which I described in detail last quarter. So far, the examples used in this letter assume “normal” interest rates. To be specific, I have assumed a 10-year Treasury rate of 4.00% with a 1.00% incremental credit spread for a Strong Balance Sheet Company, resulting in a 5.00% borrowing cost, and a 4.00% increment credit spread for a Weak Balance Sheet Company, resulting in an 8.00% borrowing cost. But recently, interest rates have been anything but normal. Ten-year Treasury rates have dropped below 2%, near their lowest level in 140 years.
Now, let’s examine what happens to the stock prices of our two theoretical companies when we combine the operating leverage from Table 2 with lower borrowing costs.
Table 3: Lower Borrowing Costs | | | | | | | | | | | | |
Dollars in millions, except per share | | Strong Balance Sheet Company A | | | Weak Balance Sheet Company B | |
| Total Debt | | | $500 | | | | $500 | | | | $10,000 | | | | $10,000 | |
| Borrowing Cost | | | 5.00% | | | | 2.50% | | | | 8.00% | | | | 5.50% | |
| Sales | | | $10,000 | | | | $10,500 | | | | $10,000 | | | | $10,500 | |
| Operating Margin | | | 20.00% | | | | 21.00% | | | | 20.00% | | | | 21.00% | |
| Operating Income | | | 2,000 | | | | 2,205 | | | | 2,000 | | | | 2,205 | |
| Interest Expense | | | 25 | | | | 13 | | | | 800 | | | | 550 | |
| Net Income | | | 1,284 | | | | 1,425 | | | | 780 | | | | 1,075 | |
| EPS | | | $1.28 | | | | $1.43 | | | | $0.78 | | | | $1.08 | |
| P/E Multiple | | | 15.0 | | | | 17.0 | | | | 15.0 | | | | 17.0 | |
| Stock Price | | | $19.26 | | | | $24.23 | | | | $11.70 | | | | $18.29 | |
| Change in Stock Price | | | | | | | 25.81% | | | | | | | | 56.31% | |
Note: These examples are intended to show the potential general effect of interest rates on the stock price of a company with low debt versus a company with high debt. All information shown is hypothetical except for the stock price, which is purely a calculation of the earnings per share (EPS) multiplied by the price/earnings multiple (P/E multiple). Examples are illustrative only and are not indicative of any specific return an investor may receive from a particular investment. The underlying assumptions are not predictive of the effect of future interest rates on any particular company.
The combination of these effects (greater leverage to an improving economy and greater benefit from declining interest rates) produces more than 3,000 basis points of outperformance for the leveraged company versus the unleveraged company: a +56% return versus a roughly +26% return. (Note: I have increased the P/E ratio for both companies in the declining interest rate scenario. When interest rates fall, required returns fall, and investors will pay a higher price for a given stream of earnings—at least in theory.)
I contend that that this leverage effect explains relative returns of various investment asset classes. Private equity, leveraged buyouts and hedge funds employ far more debt leverage, on average, than long-only mutual funds. Real estate and many “hard asset” investment vehicles use leverage to improve returns above that of the underlying asset. Since 1981, interest rates have declined in a very steep, if bumpy, trajectory, providing a consistent tailwind to these leveraged asset classes and individual stocks. Which brings us back to Ariel Focus Fund. If the benefits of leverage are so powerful, why does Ariel Focus Fund insist on investing in stocks with significantly higher interest coverage than our benchmark and the S&P 500? In short, the answer is that all of the effects of leverage discussed in this letter work both ways. If the economy turns down, corporate profitability declines, P/E multiples contract and, most importantly, interest rates eventually head higher, then all of these effects should reverse, and unleveraged stocks and less-leveraged asset classes should outperform, as shown in Table 4.
Table 4: Higher Interest Rates | | | | | | | | | | | | |
Dollars in millions, except per share | | Strong Balance Sheet Company A | | | Weak Balance Sheet Company B | |
| Total Debt | | | $500 | | | | $500 | | | | $10,000 | | | | $10,000 | |
| Borrowing Cost | | | 2.50% | | | | 6.00% | | | | 5.50% | | | | 9.00% | |
| Sales | | | $10,500 | | | | $9,500 | | | | $10,500 | | | | $9,500 | |
| Operating Margin | | | 21.00% | | | | 19.00% | | | | 21.00% | | | | 19.00% | |
| Operating Income | | | 2,205 | | | | 1,805 | | | | 2,205 | | | | 1,805 | |
| Interest Expense | | | 13 | | | | 30 | | | | 550 | | | | 900 | |
| Net Income | | | 1,425 | | | | 1,154 | | | | 1,075 | | | | 588 | |
| EPS | | | $1.43 | | | | $1.15 | | | | $1.08 | | | | $0.59 | |
| P/E Multiple | | | 17.0 | | | | 14.0 | | | | 17.0 | | | | 14.0 | |
| Stock Price | | | $24.23 | | | | $16.15 | | | | $18.29 | | | | $8.24 | |
| Change in Stock Price | | | | | | | –33.33% | | | | | | | | –54.97% | |
Note: These examples are intended to show the potential general effect of interest rates on the stock price of a company with low debt versus a company with high debt. All information shown is hypothetical except for the stock price, which is purely a calculation of the earnings per share (EPS) multiplied by the price/earnings multiple (P/E multiple). Examples are illustrative only and are not indicative of any specific return an investor may receive from a particular investment. The underlying assumptions are not predictive of the effect of future interest rates on any particular company.
The outperformances of leveraged companies and asset classes have been relative headwinds for Ariel Focus Fund. I am managing the portfolio to benefit when and if those winds change direction.
PORTFOLIO COMINGS AND GOINGS
During the quarter, we initiated three new positions and exited three in Ariel Focus Fund. We purchased shares in Anixter Intl Inc. (AXE), a current holding in some of our other portfolios. Anixter is a leading global supplier of communications and security products, electrical and electronic wire and cable, fasteners, and other small components. We purchased Bio-Rad Laboratories, Inc. (BIO), also a current holding in some of our other portfolios. This company has remained at the center of scientific discovery for more than 50 years, manufacturing and distributing a broad range of products for the life science research and clinical diagnostic markets. We also bought shares of St. Jude Medical, Inc. (STJ), a current holding in our mid cap value portfolio. This company develops medical technology and services to treat cardiac, neurological and chronic pain patients worldwide. We sold International Game Technology (IGT), which is being acquired by GTECH SpA (GTKYY) for $6.4 billion. Lastly, we sold our shares in Target Corp. (TGT) and Snap-on Inc. (SNA) in order to pursue more compelling opportunities.
As always, we appreciate the opportunity to serve you and welcome any questions or comments you might have. You can also contact us directly at email@arielinvestments.com.
Sincerely,
Charles K. Bobrinskoy
Portfolio manager
| | |
| 1 | The interest coverage ratio shows how easily a company can pay interest on its debt. It divides a company’s earnings before interest and taxes (EBIT) by the company’s interest expenses. The lower the ratio, the higher the debt burden. |
| | This commentary contains the writer’s beliefs relating to future interest rates and the general effect of interest rates on companies with differing debt ratings. The underlying assumptions the writer uses are for illustration purposes only. The beliefs expressed are not predictive of future interest rates and are not representative of the effects of future interest rates on any particular company. |
| | A REIT (real estate investment trust) is a security that invests in real estate. REITs receive special tax considerations, have potentially high yields, and offer a liquid method of investing in real estate. Risks include interest rate and overdevelopment risk. Utility stocks are known as defensive stocks because they historically provide higher-than-average returns in a declining market. In addition, utility companies may return dividends that are likely to offset declines in the company’s stock prices. Risks of utility companies include the reduced potential for capital gain and the risk that the stocks may decline in value resulting in a loss. |
| | | |
| | Ariel Focus Fund performance summary | INCEPTION: 06/30/05 |
| | | |
| | | |
| |
 |
Charles K. Bobrinskoy Portfolio manager |
Composition of equity holdings (%) | | | |
| | | | | |
| | | | | |
| | | | | |
| | | 18.16 | | |
| | | 14.51 | 8.42 | |
| | | 14.29 | | |
| | | | | 8.07 |
| | | | 8.18 | |
| | Materials & processing | 6.28 | 3.30 | |
| | | 4.63 | 5.97 | |
| | | 0.00 | | |
† Sector weightings are calculated based on equity holdings in the Fund and exclude cash in order to make a relevant comparison to the indexes. |
Average annual total returns (%) as of 03/31/15 |
| | | | | | | |
| | | | 1-year | 3-year | | Since inception |
| | Ariel Focus Fund–Investor Class | | + 5.28 | + 13.47 | + | 10.77 | + 5.91 |
| | Ariel Focus Fund–Institutional Class+ | | + 5.59 | + 13.75 | + | 10.96 | + 6.00 |
| | Russell 1000® Value Index | | + 9.33 | + 16.44 | + | 13.75 | + 7.22 |
| | | + 0.95 | + 12.73 | + 16.11 | + | 14.47 | + 8.07 |
Performance data quoted represents past performance and does not guarantee future results. All performance assumes the reinvestment of dividends and capital gains. The investment return and principal value of an investment will fluctuate so that an investor’s shares, when redeemed, may be worth more or less than their original cost. Current performance may be lower or higher than the performance data quoted. To access performance data current to the most recent month-end, visit arielinvestments.com. The minimum initial investment for Investor Class shares is $1,000; the minimum for Institutional Class shares is $1,000,000. |
Expense ratio (as of 09/30/14)1 | | Net | | Gross | | Expense Cap |
| Investor Class | | 1.08% | | 1.40% | | 1.00% |
| Institutional Class | | 0.83% | | 1.06% | | 0.75% |
Top ten equity holdings (% of net assets) |
| 1. | Western Union Co. | 6.2 |
| 2. | Stanley Black & Decker, Inc. | 6.0 |
| 3. | Oracle Corp. | 5.2 |
| 4. | Lockheed Martin Corp. | 5.0 |
| 5. | International Business Machines Corp. | 4.6 |
| 6. | CVS Health Corp. | 4.6 |
| 7. | National Oilwell Varco | 4.3 |
| 8. | Mosaic Co. | 4.0 |
| 9. | Newell Rubbermaid Inc. | 3.9 |
| 10. | Exxon Mobil Corp. | 3.9 |
+The inception date for the Institutional Class shares is December 30, 2011. Performance information for the Institutional Class prior to that date reflects the actual performance of the Fund’s Investor Class (and uses the actual expenses of the Fund’s Investor Class, for such period of time), without any adjustments. For any such period of time, the performance of the Fund’s Institutional Class would have been substantially similar to, yet higher than, the performance of the Fund’s Investor Class, because the shares of both classes are invested in the same portfolio of securities, but the classes bear different expenses, which are primarily differences in distribution and service fees.
1 Effective February 1, 2014, Ariel Investments, LLC, the Adviser, has contractually agreed to waive fees and reimburse expenses (the “Expense Cap”) in order to limit Ariel Focus Fund’s total annual operating expenses to 1.00% of net assets for the Investor Class and 0.75% of net assets for the Institutional Class through the end of the fiscal year ending September 30, 2016. Through January 31, 2014, the Expense Cap was 1.25% for the Investor Class and 1.00% for the Institutional Class.
Notes: The graph and performance table do not reflect the deduction of taxes that a shareholder would pay on fund distributions or the redemption of fund shares. The Russell 1000® Value Index measures the performance of large-cap value companies with lower price-to-book ratios and lower expected growth values. Russell® is a trademark of Russell Investment Group, which is the source and owner of the Russell Indexes’ trademarks, service marks and copyrights. The S&P 500® is a broad market-weighted index dominated by blue-chip stocks. All indexes are unmanaged, and an investor cannot invest directly in an index.
HIDDEN IN PLAIN SIGHT
| Performance data quoted represents past performance. Past performance does not guarantee future results. All performance assumes the reinvestment of dividends and capital gains and represents returns of the Investor Class shares. The investment return and principal value of an investment will fluctuate so that an investor’s shares, when redeemed, may be worth more or less than their original cost. Current performance may be lower or higher than the performance data quoted. Performance data current to the most recent month-end for Ariel Discovery Fund may be obtained by visiting our website, arielinvestments.com. |
DEAR FELLOW SHAREHOLDER:
Our deep value portfolios had a difficult first quarter, as the market continued to give little credit for our generally cash-rich, low price-to-book holdings. The best-performing stocks in the period were high-octane, small-growth names, as evidenced by the +7.44% gain in the Russell 2500 Growth Index.
Despite the underperformance, however, we believe that, on average, our portfolio companies did quite well fundamentally. That is, business results were solid and in many cases improving. This led us to increase our estimates of fair value in most cases, thereby giving us even greater conviction in the attractiveness of our micro-cap and small cap deep value portfolios.
Average annual total returns as of 03/31/15
| | | | | | | | | | | | | | | | |
| | | Quarter | | 1-year | | 3-year | | | Since inception* | |
| Ariel Discovery Fund | | | | % | | | % | | + 6.92 | % | | | | % | |
Russell 2000® Value Index | | | | | | + 4.43 | | | + 14.79 | | | | + 11.86 | | |
S&P 500® Index | | | + 0.95 | | | + 12.73 | | | + 16.11 | | | | + 14.52 | | |
* The inception date for Ariel Discovery Fund is 01/31/11.
As long-term deep value investors, we know our style is often out of favor, and the prolonged disconnect can be frustrating. However, at many of our portfolio companies, significant changes have occurred, are in the process of happening or are extremely likely. Therefore, we believe that we may very well be at a fundamental inflection point.
A number of new CEOs for our holdings are making significant impact at their respective companies, usually after strong boards acted in shareholders’ interests to improve leadership. Activists have driven constructive change in other cases, most clearly at Rosetta Stone Inc. (RST), the well-known language and literacy company. Three new outside directors, a plan to focus on the rapidly growing educational and enterprise business, a new CEO, and engagement of an experienced turnaround consultant give us great confidence in improved results and an unlocking of significant value. And finally, there are situations where activist investors have launched proxy fights to replace ineffective board members and may successfully take control of underutilized assets.
Since its early 2011 inception and over the past three years, Ariel Discovery Fund’s returns are positive but well short of our benchmark. The difficult period after the fund’s launch, combined with the softness since year-end 2013 leaves our +5.02% return since inception behind the +11.86% gain in the Russell 2000 Value Index. Again, the relative weakness in the portfolio despite solid fundamentals leads us to believe our portfolio represents exceptional value at this point in time. Top performers during the quarter included Multi-Fineline Electronix, Inc. (MFLX), which gained +63.67% prior to our sale; Capital Southwest Corp. (CSWC), up +22.45%; and Telenav Inc. (TNAV), which rose +18.74%. On the downside, Erickson Inc. (EAC) fell by -48.20% as investors continued to punish the stock for a weak 2014. Orion Energy Systems, Inc. (OESX) dropped -42.91%, and Contango Oil & Gas Co. (MCF) lost -24.76% as low commodity prices continued to take a toll on energy stocks.
IF WE COULD OWN JUST ONE STOCK, WHAT WOULD IT BE?
A number of investment websites and magazines ask managers this question. Since 2011, we have been using our first-quarter letter to respond. While we would never recommend investing in only one stock, a detailed answer effectively illustrates the characteristics we seek in our portfolio holdings.
“As long-term deep value investors, we know our style is often out of favor, and the prolonged disconnect can be frustrating.”
As deep value investors, we look for underfollowed and misunderstood companies trading at prices that we believe provide a potential margin of safety* to buyers. Specifically, we refer to the difference between price and our significantly higher estimate of a company’s intrinsic value. We seek stocks that have value largely substantiated by tangible assets, with an emphasis on pristine balance sheets. We also want to be invested alongside talented and properly incentivized leadership, and we look to identify upside potential from underappreciated opportunities and/ or overlooked assets. This year, the company that best embodies these traits is RealNetworks, Inc. (RNWK).
“Putting a precise valuation on Rhapsody is difficult, but as RealNetworks’ stake is an investment requiring no ongoing capital, we believe any meaningful value is a windfall for shareowners.”
Based in Seattle, RealNetworks is best known for its RealPlayer media player software, which is downloaded onto millions of computers. The company invented the streaming media category in 1995 with the introduction of RealAudio. After trading at more than 50 times its current level during the Internet bubble, the company fell on hard times following the retirement of founder Rob Glaser. With a 36% ownership stake, he returned as interim CEO in 2012 and took on the role last year on a permanent basis. We are impressed with his reorganization and cost-cutting, along with the reinvigoration of RealNetworks’ product lines.
The company’s most important business is the RealPlayer Group. As sales of its legacy products have diminished, the company has developed RealPlayer Cloud, a cloud- and mobile-centric video storage and sharing platform. The service has grown from 500,000 to more than 10 million users in a year, and is approaching levels where we believe it will become a meaningful source of value for RealNetworks.
The other two businesses are Mobile Entertainment, a software as a service (SaaS) line that includes the LISTEN ringback app and Games, which holds both Zylom and the Slingo social casino brand, GameHouse. These two business lines have potential, especially because each has added strong leadership over the past year or two. Still, we ascribe only modest value to them in assessing RealNetworks’ intrinsic value.
With a current market capitalization of just more than $240 million, no debt and more than $160 million in cash, the market is currently ascribing very little value to the company’s business (based on a 3/31/15 share price of $6.73). Even assuming significant cash burn in the near future and applying a modest multiple to revenues, which we think should return to growth later this year, we come up with a valuation roughly 15% above current levels.
However, this valuation completely ignores an overlooked and potentially extremely valuable asset. Hidden in plain sight is RealNetworks’ 43% stake in privately held Rhapsody, the pioneer of the music streaming business. RealNetworks has made it clear it intends to monetize this investment. Carried on RealNetworks’ books at just $10 million, we believe that the 43% holding is worth at least $5.00 per share and could be worth multiples of that.
Although surpassed in size and notoriety by Spotify and Pandora, Rhapsody has found its footing and is growing rapidly. It reached 2.5 million paid subscribers by year-end 2014, up 60% year-over-year. Carrier partnerships such as UnRadio with T-Mobile are helping drive this subscriber growth. Through Napster, Rhapsody’s international brand, music is now available in more than 30 countries, up from only three countries just two years ago. A global partnership with Telefonica has shown significant growth, and the company has also expanded into auto partnerships. Finally, Rhapsody and Twitter, Inc. (TWTR) announced a partnership just weeks ago, giving Rhapsody access to a massive user base.
Putting a precise valuation on Rhapsody is difficult, but as RealNetworks’ stake is an investment requiring no ongoing capital, we believe any meaningful value is a windfall for shareowners, especially given that we estimate the rest of RealNetworks is worth more than the current quote.
Privately held Spotify can provide some clues based on reports of capital raised. With 15 million paid subscribers, it is six times the size of Rhapsody. Arguably, its acquisition costs have been much higher than Rhapsody’s, as much of Rhapsody’s success has come from carrier partnerships. Margin data is not available, but it is not unreasonable to assign similar multiples on a per-subscriber basis.
Reports are that Spotify is earning a value of nearly $600 per subscriber. At the high end, if Rhapsody reaches 3 million subscribers by mid-year, a 43% stake would be worth nearly $775 million, or more than $21.00 per share. While we use a heavily discounted version of that calculation to be conservative, we arrive at a sum-of-the parts valuation for RealNetworks of more than twice the current share price.
PORTFOLIO COMINGS AND GOINGS
There was one deletion from the Fund during the quarter. Multi-Fineline Electronix, Inc. (MFLX) was sold as it approached our estimate of fair value. We added one new position, SeaChange Int’l Inc. (SEAC), the market share leader in video on demand (VOD) software for cable and telecom companies. Trading at a very modest premium-to-book value, with nearly half of its market capitalization in cash, we believe the company’s growth potential from new software products is overlooked. Recently appointed CEO Jay Samit has a terrific reputation as a digital media innovator, and his shareholder-friendly compensation package adds to our confidence.
As always, we appreciate the opportunity to serve you and welcome any questions or comments you might have. You can also contact us directly at email@arielinvestments.com.
Sincerely,
David M. Maley
Lead portfolio manager
| | | | |
 | DAVID MALEY NAMED
MICROCAP SUPERSTAR | |
| | | | |
| | | In Dave Gentry’s new book, Microcap Superstars: The Movers and Shakers in Small Stocks and Big Money, Portfolio Manager David Maley is listed as a MicroCap Superstar among an elite group of investment professionals. To learn more about David’s strategy, visit arielinvestments.com. | |
* Attempting to purchase with a margin of safety on price cannot protect investors from the volatility associated with stocks, incorrect assumptions or estimations on our part, declining fundamentals or external forces.
| | | |
| | Ariel Discovery Fund performance summary | |
| | | |
| | | |
 |  |
| David M. Maley | |
Lead portfolio
manager | Portfolio
manager |
Composition of equity holdings (%) | | | | | | | |
| | | | | |
| | Ariel Discovery | Russell 2000 Value Index | | S&P 500 Index |
| Technology | | | 8.72 | | | | |
| Financial services | | | | | | | |
| | | | | | | |
| Utilities | | | | | | | |
| Materials & processing | | | | | | 3.50 | |
| Producer durables | 10.69 | | 13.24 | | | 10.65 | |
| | | | | | | |
| Health care | | | | | | | |
| Consumer staples | | | | | | 8.52 | |
† Sector weightings are calculated based on equity holdings in the Fund and exclude cash in order to make a relevant comparison to the indexes.
Average annual total returns (%) as of 03/31/15 |
| | | | | |
| | | | | Since |
| | Quarter | 1-year | 3-year | inception |
Ariel Discovery Fund–Investor Class | | | | |
Ariel Discovery Fund–Institutional Class+ | | | | |
Russell 2000® Value Index | + 1.98 | | | |
| + 0.95 | | | |
Performance data quoted represents past performance and does not guarantee future results. All performance assumes the reinvestment of dividends and capital gains. The investment return and principal value of an investment will fluctuate so that an investor’s shares, when redeemed, may be worth more or less than their original cost. Current performance may be lower or higher than the performance data quoted. To access performance data current to the most recent month-end, visit arielinvestments.com. The minimum initial investment for Investor Class shares is $1,000; the minimum for Institutional Class shares is $1,000,000.
Expense ratio (as of 09/30/14) 1 | Net | Gross | Expense Cap |
| Investor Class | 1.33% | 1.93% | 1.25% |
| Institutional Class | 1.07% | 1.25% | 1.00% |
Top ten equity holdings (% of net assets) |
| 1. | | |
| 2. | | |
| 3. | | |
| 4. | | |
| 5. | | |
| 6. | | |
| 7. | | |
| 8. | | |
| 9. | | |
| 10. | | |
+ The inception date for the Institutional Class shares is December 30, 2011. Performance information for the Institutional Class prior to that date reflects the actual performance of the Fund’s Investor Class (and uses the actual expenses of the Fund’s Investor Class, for such period of time), without any adjustments. For any such period of time, the performance of the Fund’s Institutional Class would have been substantially similar to, yet higher than, the performance of the Fund’s Investor Class, because the shares of both classes are invested in the same portfolio of securities, but the classes bear different expenses, which are primarily differences in distribution and service fees.
1 Effective February 1, 2014, Ariel Investments, LLC, the Adviser, has contractually agreed to waive fees and reimburse expenses (the “Expense Cap”) in order to limit Ariel Discovery Fund’s total annual operating expenses to 1.25% of net assets for the Investor Class and 1.00% for the Institutional Class through the end of the fiscal year ending September 30, 2016. Through January 31, 2014, the Expense Cap was 1.50% for the Investor Class and 1.25% for the Institutional Class.
Notes: The graph and performance table do not reflect the deduction of taxes that a shareholder would pay on fund distributions or the redemption of fund shares. The Russell 2000® Value Index measures the performance of the small-cap value segment of the U.S. equity universe. It includes those Russell 2000 companies with lower price-to-book ratios and lower forecasted growth values. Russell® is a trademark of Russell Investment Group, which is the source and owner of the Russell Indexes’ trademarks, service marks and copyrights. The S&P 500® is a broad market-weighted index dominated by blue-chip stocks. All indexes are unmanaged, and an investor cannot invest directly in an index.

THE INVESTING MARATHON
| Performance data quoted represents past performance. Past performance does not guarantee future results. All performance assumes the reinvestment of dividends and capital gains and represents returns of the Investor Class shares. The investment return and principal value of an investment will fluctuate so that an investor’s shares, when redeemed, may be worth more or less than their original cost. Current performance may be lower or higher than the performance data quoted. Performance data current to the most recent month-end for Ariel International Fund and Ariel Global Fund may be obtained by visiting our website, arielinvestments.com. |
DEAR FELLOW SHAREHOLDER:
International markets were up significantly in the first quarter of 2015, but performance in the U.S. market was more muted. Macroeconomic factors mainly drove the buoyant mood abroad. While the U.S. Federal Reserve has ended its quantitative easing (QE) program, the European Central Bank (ECB) just started one. This ECB action drove large moves in currency and equity markets, sending the Euro down -10% and Euro Stoxx 50 Index1 up +19% in local currency terms (although in U.S. dollars, the move was only +7%). The U.S. market was only up +1%, as a stronger dollar caused a weaker earnings outlook for America’s global firms.
Such an environment could have been a boon for a prognosticator who foresaw such forces. For instance, one could have concluded that QE would be the big factor in the first quarter of 2015 and surmised that it would drive European equities up—but not U.K. equities where the ECB stood by the sidelines—and then positioned the portfolio accordingly. We made no such macro calls, nor did we reposition our portfolios to benefit from such an environment. And yet, we outperformed. Specifically, Ariel International Fund gained +5.55%, topping the MSCI EAFE’s +5.00% gain and the MSCI ACWI ex-US Index’s +3.59% rise. Finally, Ariel Global Fund advanced +2.91%, outpacing the MSCI ACWI Index’s +2.44% return. To some, this may be a counterintuitive or unexpected outcome but not to us. We explore this below.
Many people often compare investing to a footrace; given our Aesop-inspired tortoise logo, we endorse the metaphor. That said, it is not perfect. First, race conditions are generally stable and, for big races, moderate. Second, in a footrace, the distance is clear. For instance, the Boston Marathon has a distance of 26.2 miles with slightly hilly terrain; the steepest grade (Heartbreak Hill) is about 3.3%. The weather changes yearly but is typically mild with temperatures in the upper 40s or lower 50s. The location does not shift from the Swiss Alps in January to the Sahara Desert in August, and it certainly does not change quickly from freezing to more than 100 degrees. Nobody cares who wins mile 3 or 10, and we doubt anybody strives to do so. It is the full 26.2 miles that matter.
When it comes to investing, some managers do try to compete in short-term cycles by positioning and repositioning the portfolio to suit the prevailing mood or momentum of the market. Put another way, they do focus on winning mile 3 or 10, often at the expense of winning the full 26.2 miles. We think it is very risky to attempt to predict the short-term environment and construct a portfolio to suit it. The market environment can shift from moderate to intense and from ebullient to harrowing in the space of weeks or even days, usually without notice, leaving such investors in the awkward position of chasing their own tails. Instead, we try to construct a portfolio in which superior bottom-up stock selection drives the performance. We believe while macro developments can create headwinds or tailwinds, and shift suddenly, a high-quality business drives its own destiny, especially over the long term. Indeed, many of our portfolio holdings recently showed this quality over the short term, enabling us to outperform for the quarter.
“In a marathon, nobody cares who wins mile 3 or 10, and we doubt anybody strives to do so. It is the full 26.2 miles that matter.”
Glaxo SmithKline plc, a U.K.-domiciled health-care company, was a key contributor, even though a weak Euro hurt its earnings. The same goes for another key contributor, Nintendo Co., Ltd., despite securing no benefit from the ECB’s actions. Simultaneously, our portfolio excluded important European exporters such as Volkswagen or BMW, which were key beneficiaries of a weak Euro; that detracted from performance. On balance, however, what we owned performed well enough to offset what we did not own.
We are not suggesting that superior stock-picking can always offset macro headwinds in the short run, but it often can. The past quarter was one such period. The difference between always and often is crucial, in our view. In the short run, a concentrated portfolio can perform idiosyncratically—sometimes performing well despite headwinds or performing poorly even with tailwinds. Given such varying outcomes, short-term performance, whether good or bad, is not a dependable measuring stick for the success of a strategy. For that, we believe one must examine the overall investment process and philosophy.
“Short-term performance, whether good or bad, is not a dependable measuring stick for the success of a strategy.”
As always, we appreciate the opportunity to serve you and welcome any questions or comments you might have. You can also contact us directly at email@arielinvestments.com.
Sincerely,
Rupal J. Bhansali
Portfolio manager
| | | | |
 | TURTLE TIME WITH RUPAL BHANSALI | |
| | | | |
| | “Our investment process is trying to solve for two objectives, not just one. Most investment disciplines are designed to achieve capital appreciation in equities. We try to shoot for capital appreciation, with a focus on risk management. All of these things have led to our 5-star rating from Morningstar for Ariel International Fund.” | |
| | | |
| | – Rupal J. Bhansali
CIO, International & Global Equities
Portfolio Manager | |
| | | |
| | Portfolio Manager Rupal J. Bhansali answers your questions in the latest edition of Turtle Time. We invite you to read the in-depth interview on arielinvestments.com/turtle-time-rupal in June. | |
Ariel International Fund’s Overall Morningstar RatingTM was five stars as of 4/30/15 among 310 Foreign Large Value Funds and is derived only from the three-year rating of five stars among 310 Foreign Large Value Funds. Ariel International Fund’s inception date is 12/30/11 and therefore it does not yet have performance or a rating for the five- and ten-year periods. Morningstar Rating is for the Investor share class only; the Institutional share class may have different performance characteristics. Past performance is no guarantee of future results.
For each fund with at least a three-year history, Morningstar calculates a Morningstar Rating™ based on a Morningstar Risk-Adjusted Return measure that accounts for variation in a fund’s monthly performance (including the effects of sales charges, loads and redemption fees), placing more emphasis on downward variations and rewarding consistent performance. These ratings change monthly. The top 10% of funds in an investment category receive five stars, the next 22.5% receive four stars, the next 35% receive three stars, the next 22.5% receive two stars, and the bottom 10% receive one star. The Overall Morningstar Rating for a fund is derived from a weighted average of the performance figures associated with its three-, five- and ten-year (if applicable) Morningstar Rating metrics. ©2015 Morningstar, Inc. All Rights Reserved. The information contained herein: (1) is proprietary to Morningstar and/or its content providers; (2) may not be copied or distributed; and (3) is not warranted to be accurate, complete or timely. Neither Morningstar nor its content providers are responsible for any damages or losses arising from any use of this information.
1 The EURO STOXX 50 is a stock index of Eurozone stocks designed by STOXX, an index provider owned by Deutsche Börse Group and SIX Group.
| | | |
| | Ariel International Fund performance summary | |
| | | |
| | | |
Rupal J. Bhansali
Portfolio manager
Composition of equity holdings* (%)
| | | | | | | | | | |
| | | | | | | | | MSCI |
| | | Ariel | | MSCI | | ACWI |
| | | International | | EAFE | | ex-US |
| | | Fund† | | Index | | Index |
| Information technology | | 20.41 | | | 4.91 | | | 7.67 | |
| Financials | | 18.15 | | | 26.01 | | | 27.34 | |
| Telecommunication services | | 14.92 | | | 4.70 | | | 5.10 | |
| Consumer staples | | 13.56 | | | 11.02 | | | 9.95 | |
| Consumer discretionary | | 13.06 | | | 13.12 | | | 11.83 | |
| Health care | | 10.46 | | | 11.43 | | | 9.14 | |
| Energy | | 5.10 | | | 5.11 | | | 6.89 | |
| Industrials | | 3.45 | | | 12.68 | | | 11.12 | |
| Utilities | | 0.53 | | | 3.58 | | | 3.38 | |
| Materials | | 0.36 | | | 7.46 | | | 7.57 | |
| † | Sector weightings are calculated based on equity holdings in the Fund and exclude cash in order to make a relevant comparison to the indexes. |
| * | The sectors above are the Global Industry Classification Standard (“GICS”) sector classifications. GICS was developed by and is the exclusive property and a service mark of MSCI Inc. (“MSCI”) and Standard & Poor’s, a division of The McGraw-Hill Companies, Inc. (“S&P”) and is licensed for use by Ariel Investments, LLC. Neither MSCI, S&P nor any third party involved in making or compiling the GICS or any GICS classifications makes any express or implied warranties or representations with respect to such standard or classification (or the results to be obtained by the use thereof), and all such parties hereby expressly disclaim all warranties of originality, accuracy, completeness, merchantability and fitness for a particular purpose with respect to any of such standard or classification. Without limiting any of the foregoing, in no event shall MSCI, S&P, any of their affiliates or any third party involved in making or compiling the GICS or any GICS classifications have any liability for any direct, indirect, special, punitive, consequential or any other damages (including lost profits) even if notified of the possibility of such damages. |
Average annual total returns (%) as of 03/31/15
| | | | | | | | | | |
| | | Quarter | 1-year | 3-year | Since inception |
| Ariel International Fund–Investor Class | | | | + 0.78 | | + 8.81 | | + 9.79 | |
| Ariel International Fund–Institutional Class | | + 5.57 | | + 0.99 | | + 9.08 | | + 10.05 | |
MSCI EAFE® Index (gross) | | + 5.00 | | | | + 9.52 | | + 12.29 | |
| MSCI ACWI ex-US Index (gross) | | + 3.59 | | – 0.57 | | + 6.89 | | + 9.91 | |
Performance data quoted represents past performance and does not guarantee future results. All performance assumes the reinvestment of dividends and capital gains. The investment return and principal value of an investment will fluctuate so that an investor’s shares, when redeemed, may be worth more or less than their original cost. Current performance may be lower or higher than the performance data quoted. To access performance data current to the most recent month-end, visit arielinvestments.com. The minimum initial investment for Investor Class shares is $1,000; the minimum for Institutional Class shares is $1,000,000.
| | | | |
Expense ratio (as of 09/30/14)1 | Net | Gross | Expense Cap |
| Investor Class | 1.29% | 4.24% | 1.25% |
| Institutional Class | 1.03% | 3.17% | 1.00% |
| | | | |
Top ten companies^ (% of net assets) |
| 1. | | Deutsche Boerse AG | 5.8 |
| 2. | | GlaxoSmithKline plc | 5.4 |
| 3. | | China Mobile Ltd. | 5.2 |
| 4. | | Ahold N.V. | 5.2 |
| 5. | | Roche Holding AG | 3.9 |
| 6. | | Dialog Semiconductor plc | 3.8 |
| 7. | | Nokia Corp. | 3.8 |
| 8. | | Reckitt Benckiser Group plc | 3.3 |
| 9. | | Swisscom AG | 3.2 |
| 10. | | Telefonica Deutschland GmbH & Co. | 3.1 |
^ For the purposes of determining the Fund’s top ten, securities of the same issuer are aggregated.
| Country weightings‡ (%) | | | | | | | | | |
| U.K. | 18.94 | | France | 4.79 | | Spain | 0.98 | | Luxembourg | 0.42 |
| Japan | 18.89 | | Finland | 4.38 | | Israel | 0.88 | | Macau | 0.17 |
| Germany | 15.16 | | U.S. | 4.08 | | Hong Kong | 0.66 | | Denmark | 0.09 |
| Switzerland | 9.41 | | Ireland | 2.93 | | Austria | 0.66 | | Portugal | 0.08 |
| China | 7.34 | | Italy | 1.97 | | Singapore | 0.54 | | | |
| Netherlands | 6.05 | | Canada | 1.06 | | Sweden | 0.52 | | | |
‡This list excludes ETFs.
| 1 | Effective February 1, 2014, Ariel Investments, LLC, the Adviser, has contractually agreed to waive fees and reimburse expenses (the “Expense Cap”) in order to limit Ariel International Fund’s total annual operating expenses to 1.25% of net assets for the Investor Class and 1.00% for the Institutional Class through the end of the fiscal year ending September 30, 2016. Through January 31, 2014, the Expense Cap was 1.40% for the Investor Class and 1.15% for the Institutional Class. Notes: The performance table does not reflect the deduction of taxes that a shareholder would pay on fund distributions or the redemption of fund shares. MSCI EAFE® Index is an unmanaged, market-weighted index of companies in developed markets, excluding the U.S. and Canada. MSCI EAFE Index (gross) returns reflect the reinvestment of income and other earnings, including the maximum possible dividends. The MSCI ACWI (All Country World Index) ex-US Index is an unmanaged, market-weighted index of global developed and emerging markets, excluding the United States. The MSCI ACWI ex US Index (gross) returns reflect the reinvestment of income and other earnings, including the maximum possible dividends. Source: MSCI. MSCI makes no express or implied warranties or representations and shall have no liability whatsoever with respect to any MSCI data contained herein. The MSCI data may not be further redistributed or used to create indices or financial products. This report is not approved or produced by MSCI. All indexes are unmanaged, and an investor cannot invest directly in an index. |
| | | |
| | Ariel Global Fund performance summary | |
| | | |
| | | |
Rupal J. Bhansali
Portfolio manager
Composition of equity holdings* (%)
| | | |
| | Ariel Global Fund† | MSCI ACWI Index |
| 21.75 | | 12.19 | |
| Information technology | 21.16 | | 13.92 | |
| Telecommunication services | 14.33 | | 3.65 | |
| Consumer discretionary | 13.70 | | 12.40 | |
| Financials | 12.94 | | 21.50 | |
| Consumer staples | 7.84 | | 9.67 | |
| Energy | 3.91 | | 7.51 | |
| Industrials | 2.56 | | 10.49 | |
| Utilities | 1.33 | | 3.18 | |
Materials | 0.48 | | 5.33 | |
† Sector weightings are calculated based on equity holdings in the Fund and exclude cash in order to make a relevant comparison to the indexes.* The sectors above are the Global Industry Classification Standard (“GICS”) sector classifications. GICS was developed by and is the exclusive property and a service mark of MSCI Inc. (“MSCI”) and Standard & Poor’s, a division of The McGraw-Hill Companies, Inc. (“S&P”) and is licensed for use by Ariel Investments, LLC. Neither MSCI, S&P nor any third party involved in making or compiling the GICS or any GICS classifications makes any express or implied warranties or representations with respect to such standard or classification (or the results to be obtained by the use thereof), and all such parties hereby expressly disclaim all warranties of originality, accuracy, completeness, merchantability and fitness for a particular purpose with respect to any of such standard or classification. Without limiting any of the foregoing, in no event shall MSCI, S&P, any of their affiliates or any third party involved in making or compiling the GICS or any GICS classifications have any liability for any direct, indirect, special, punitive, consequential or any other damages (including lost profits) even if notified of the possibility of such damages.
Average annual total returns (%) as of 03/31/15
| | | | | | | | | | | |
| | | | Quarter | | 1-year | | 3-year | | | Since inception |
Ariel Global Fund–Investor Class | | | + 2.91 | | | + 5.71 | | | + 11.56 | | | + 12.36 | |
Ariel Global Fund–Institutional Class | | | + 2.98 | | | + 6.00 | | | + 11.86 | | | + 12.67 | |
MSCI ACWISM Index (gross) | | | + 2.44 | | | + 5.97 | | | + 11.35 | | | + 14.35 | |
Performance data quoted represents past performance and does not guarantee future results. All performance assumes the reinvestment of dividends and capital gains. The investment return and principal value of an investment will fluctuate so that an investor’s shares, when redeemed, may be worth more or less than their original cost. Current performance may be lower or higher than the performance data quoted. To access performance data current to the most recent month-end, visit arielinvestments.com. The minimum initial investment for Investor Class shares is $1,000; the minimum for Institutional Class shares is $1,000,000.
Expense ratio (as of 09/30/14)1 | Net | Gross | Expense Cap |
| Investor Class | 1.29% | 3.70% | 1.25% |
| Institutional Class | 1.04% | 1.51% | 1.00% |
Top ten companies^ (% of net assets)
| 1. | | 5.5 |
| 2. | | 5.3 |
| 3. | | 5.1 |
| 4. | | 5.0 |
| 5. | Harman Intl. Industries, Inc. | 4.4 |
| 6. | | 3.9 |
| 7. | | 3.1 |
| 8. | | 3.1 |
| 9. | Verizon Communications, Inc. | 3.0 |
| 10. | | 2.8 |
^ For the purposes of determining the Fund’s top ten, securities of the same issuer are aggregated.
| Country weightings‡ (%) | | | | | | |
| U.S. | 49.80 | | Finland | 1.58 | | Hong Kong | 0.29 |
| China | 8.84 | | Chile | 1.40 | | Ireland | 0.23 |
| U.K. | 8.76 | | Canada | 0.79 | | Peru | 0.22 |
| Japan | 8.73 | | Brazil | 0.71 | | Israel | 0.17 |
| Germany | 6.09 | | Turkey | 0.55 | | Mexico | 0.11 |
| Switzerland | 5.54 | | Spain | 0.41 | | Macau | 0.08 |
| Netherlands | 2.79 | | Singapore | 0.35 | | | |
| France | 2.26 | | Italy | 0.30 | | | |
‡ This list excludes ETFs.
1 Effective February 1, 2014, Ariel Investments, LLC, the Adviser, has contractually agreed to waive fees and reimburse expenses (the “Expense Cap”) in order to limit Ariel Global Fund’s total annual operating expenses to 1.25% of net assets for the Investor Class and 1.00% for the Institutional Class through the end of the fiscal year ending September 30, 2016. Through January 31, 2014, the Expense Cap was 1.40% for the Investor Class and 1.15% for the Institutional Class. Notes: The performance table does not reflect the deduction of taxes that a shareholder would pay on fund distributions or the redemption of fund shares. MSCI ACWI (All Country World Index) IndexSM is an unmanaged, market weighted index of global developed and emerging markets. MSCI ACWI Index (gross) returns reflect the reinvestment of income and other earnings, including the maximum possible dividends. Source: MSCI. MSCI makes no express or implied warranties or representations and shall have no liability whatsoever with respect to any MSCI data contained herein. The MSCI data may not be further redistributed or used to create indices or financial products. This report is not approved or produced by MSCI. All indexes are unmanaged, and an investor cannot invest directly in an index.
 | Anixter Inc. (NYSE: AXE) 2301 Patriot Boulevard Glenview, IL 60023 224.521.8000 | anixter.com |
| | |
Anixter International Inc. is a leading distributor of wire and cable, as well as data center and security products. With a presence in more than 50 countries and the ability to deliver to 99% of the world’s major markets in less than 48 hours, the company sells 450,000 products to more than 100,000 customers. Anixter’s world-class logistics and inventory management offer customers dependable delivery of business-critical components wherever they do business. Led by Chairman Sam Zell and CEO Bob Eck, the company has a history of consistent cash flow generation and sizeable special dividends that have been a large component of shareholder returns.
BROADENING PRODUCT BASE
Originally built around selling wire, Anixter was founded on the principle of “buy by the mile, sell by the foot.” Although the company still sells wire and cable for industrial and manufacturing applications, its product offering has broadened to meet the needs of data center and enterprise customers. Over the past several years, the company has also grown into security equipment distribution. Anixter’s 3,000 technical specialists help customers choose the best product for an application, we believe while the company’s testing labs ensure that every product meets customers’ expectations.
Over the past five years, the company has grown its exposure to security products, while exiting less differentiated businesses. The most recent security acquisition, Tri-Ed (acquired in October 2014), is the company’s largest acquisition to date, expanding the company’s security product offering while introducing residential security exposure. In February 2014, Anixter announced that it had sold its Fasteners segment, a less differentiated and more competitive business. As a result of these two transactions, the company has a higher growth profile with a stronger economic moat. An economic moat is a perceived competitive advantage that acts as a barrier to entry for other companies in the same industry. This perceived advantage cannot protect investors from the volatility associated with stocks, incorrect assumptions or estimations, declining fundamentals or external forces.
COMPETITIVE ADVANTAGE
Anixter’s stock has fallen more than 25% over the past year, primarily driven by copper’s decline from more than $3.25 per pound last summer to less than $2.50 early this year. Historically, Anixter’s profits were closely tied to copper prices. When copper increased, the company was able to charge a higher markup and profits rose. But as the product mix shifted toward the data center and security markets, sales of the most copper-exposed products have declined to roughly 10% of sales. Investors failed to recognize this change in the company’s business and oversold the stock as a result. Longer term, the move in copper has not changed Anixter’s earnings potential, and as we see it, the company’s competitive advantage continues to grow.
At current levels, we believe the stock price undervalues the company’s normalized earnings power and growth potential. As of March 31, 2015, shares traded at $76.13, a 20% discount to our estimate of intrinsic value.
 | Hospira, Inc. (NYSE: HSP) 275 N. Field Drive Lake Forest, IL 60045 224.212.2000 | hospira.com |
| | |
Hospira, Inc. is a diversified health-care company that develops and manufactures generic and branded injectable and biosimilar pharmaceuticals, infusion pumps, and consumable IV sets. These products focus on increasing efficiency and safety for health-care providers and patients. In addition, biosimilar pharmaceuticals and generic injectables offer savings to insurers and patients in this increasingly cost-conscious health-care environment.
LONG -TERM FOCUS
We initiated a position in Hospira during 2008, when the company was underfollowed and poorly understood. We opportunistically built our position over the next 12 months. In 2011, the Food and Drug Administration (FDA) reinspected several Hospira facilities. The company was cited again for improper manufacturing processes. The stock dropped over 45% within an eight-month period. During this time, we approached hospitals and pharmacy workers, competitors, investors, pharmaceutical manufacturers, and distributors in order to reevaluate our previous research conclusions. We also analyzed historical timelines of other manufacturers with similar production issues and reprimands. After considering all potential outcomes, we significantly increased our position based upon our confidence the new management team would turn the company around.
WHAT OTHERS MISSED
As we reassessed the company, in the midst of the stock’s free fall, we uncovered an area—generic biotech drugs—that was underappreciated by investors due to short-term focus on quality issues. Biosimilar pharmaceuticals resemble already-approved biological medications. Since Hospira develops and manufacturers these pharmaceuticals internationally, investors were not seeing the potential market for these drugs in the United States. As with traditional pills, the goal of a generic biotech is lower costs with similar patient outcomes. We were confident these products would begin to enter the United States. Then, in March 2015, the FDA approved its first biosimilar.
NEW MANAGEMENT STRATEGY
Over the past few years, the FDA has reprimanded many manufacturers of injectables for poor manufacturing processes, and Hospira was among these. The company quickly took action by naming Mike Ball as the new Chief Executive Officer. His initial primary focus was to return the company to the high-level quality its customers had come to expect. To correct the issues, Hospira heavily invested in consultants, maintenance infrastructure and a new facility in India. While working closely with the FDA, earnings results abruptly decreased. Although the company is not out of the woods yet, it has made significant progress with quality enhancements. As a direct reflection of these improvements, Hospira’s profits and sales have begun to increase.
SLOW AND STEADY WINS THE RACE
Throughout the stock’s ups and downs over our 6-year holding time frame, we never lost our focus on Hospira’s long-term growth. When investors were fearful, we aggressively purchased more shares. In February 2015, our thesis was confirmed when Pfizer announced its acquisition of Hospira for $90 per share. Since the stock was trading close to deal price, we sold our position.
 | Viacom (NASDAQ: VIA.B) 1515 Broadway New York, NY 10036 212.258.6000 | viacom.com |
| | |
Viacom is a global entertainment content company operating a stable of highly valued cable networks that deliver high-quality music, comedy, and general entertainment for families and children. Viacom’s cable channels include, Nickelodeon (Nick Jr., TeenNick, Nicktoons, Nick at Nite), MTV, BET, Comedy Central, VH1, Spike, and TV Land, among others. Viacom also owns Paramount Pictures, a producer and distributor of filmed entertainment, with a library of more than 3,400 motion pictures, including Breakfast at Tiffany’s, It’s a Wonderful Life, as well as The Godfather, Indiana Jones, and the Star Trek series.
Over the last 12 months, Viacom shares have underperformed the S&P 500 due to struggles with declining ratings, primarily at its flagship Nickelodeon and MTV franchises. Additionally, the shares have been weighted down by fears of deteriorating economics, as media distribution becomes increasingly fragmented. In the most recent quarter, Viacom’s domestic advertising revenues fell 6% while overall advertising revenues increased 3%. According to one sell-side firm, Nickelodeon and MTV ratings were down more than 20%. Viacom has begun to reinvest aggressively in new programming to avoid further audience erosion. Moreover, in an effort to reach the approximate 10 million broadband-only households that do not subscribe to pay television, Viacom announced its Nickelodeon group would launch a subscription video service this spring. With audience fragmentation and technology disrupting the traditional media business model, we believe Viacom will be successful in its attempts to find new ways to monetize its viewing across various platforms.
A VALUABLE FRANCHISE
We recognize Viacom as an owner of a portfolio of valuable cable networks along with a leading movie production franchise. The company’s cable brands enjoy high market share in their categories among their target demographics. Recurring monthly affiliate fees from cable, satellite and telecom distributors offer investors stable and increasing revenue to complement Viacom’s more cyclical advertising revenues. Today, more than one third of Viacom’s revenues come from these recurring revenue streams.
CHANGING MEDIA CONSUMPTION PATTERNS
We acknowledge investor concerns regarding changing media consumption patterns and technology platforms on the cable business model. A change in cable provider structure to tiering or a la carte could reduce the number of subscribers at Viacom’s networks and its economics. Viacom CEO Philippe Dauman remains adamant about only supplying content to video streaming sites where the company is paid as much as with traditional distribution arrangements. We remain confident Viacom and several of its cable networks will remain dominant in their targeted demographic regardless of how consumers pay to view its popular content.
AGGRESSIVE RETURN OF CAPITAL
Viacom has been very aggressive in returning capital to its shareholders through share repurchases and dividends. Since fiscal year 2011, Viacom has spent slightly more than $14 billion to repurchase 236 million shares. During this period, Viacom’s total shares outstanding shrunk 33%. We expect Viacom will continue to aggressively reduce its float as the company believes its stock is significantly undervalued. We view the recent weakness in Viacom’s shares as an attractive buying opportunity for long-term, patient investors. At March 31, 2015, the shares traded at $68.30, or a 21% discount to our estimated private market value of $87.
| | | |
| | Ariel Fund statistical summary | (UNAUDITED) |
| | | |
| | | |
| | | | | | | | | | | | | | | | | | | |
| | | | | | 52-week range | Earnings per share | P/E calendar | |
| | | | | | | | 2013 | 2014 | 2015 | 2013 | 2014 | 2015 | Market |
| | Ticker | | Price | | | actual | actual | estimated | actual | actual | estimated | cap. |
| Company | symbol | | 03/31/15 | Low | High | calendar | calendar | calendar | P/E | P/E | P/E | ($MM) |
| Contango Oil & Gas Co. | MCF | | 22.00 | | 20.25 | 49.28 | | 2.56 | (1.15 | ) | (2.22) | 8.6 | | NM | NM | | 421 | |
| Blount Intl, Inc. | BLT | | 12.88 | | 10.84 | 17.97 | | 0.84 | 1.10 | | 1.07 | 15.3 | | 11.7 | 12.0 | | 630 | |
| International Speedway Corp. | ISCA | | 32.61 | | 28.09 | 35.32 | | 1.30 | 1.51 | | 1.41 | 25.1 | | 21.6 | 23.1 | | 868 | |
| MTS Systems Corp. | MTSC | | 75.65 | | 56.87 | 77.39 | | 3.83 | 3.55 | | 4.09 | 19.8 | | 21.3 | 18.5 | | 1,136 | |
| Brady Corp. | BRC | | 28.29 | | 20.98 | 30.86 | | 1.96 | 1.65 | | 1.87 | 14.4 | | 17.1 | 15.1 | | 1,351 | |
| Simpson Manufacturing Co., Inc. | SSD | | 37.37 | | 28.80 | 38.20 | | 1.17 | 1.47 | | 1.66 | 31.9 | | 25.4 | 22.5 | | 1,842 | |
| Bristow Group Inc. | BRS | | 54.45 | | 50.80 | 81.60 | | 3.78 | 4.44 | | 4.31 | 14.4 | | 12.3 | 12.6 | | 1,892 | |
| U.S. Silica Holdings, Inc. | SLCA | | 35.61 | | 22.71 | 73.43 | | 1.41 | 2.23 | | 2.04 | 25.3 | | 16.0 | 17.5 | | 1,900 | |
| Meredith Corp. | MDP | | 55.77 | | 41.95 | 57.22 | | 3.03 | 3.28 | | 3.50 | 18.4 | | 17.0 | 15.9 | | 2,077 | |
| Littelfuse, Inc. | LFUS | | 99.39 | | 78.68 | 103.08 | | 4.58 | 5.09 | | 5.27 | 21.7 | | 19.5 | 18.9 | | 2,262 | |
| Anixter Intl Inc. | AXE | | 76.13 | | 73.34 | 105.84 | | 6.25 | 6.09 | | 5.33 | 12.2 | | 12.5 | 14.3 | | 2,502 | |
| Kennametal Inc. | KMT | | 33.69 | | 27.63 | 49.24 | | 2.64 | 2.57 | | 2.03 | 12.8 | | 13.1 | 16.6 | | 2,667 | |
| Fair Isaac Corp. | FICO | | 88.72 | | 50.49 | 89.42 | | 2.90 | 3.10 | | 3.53 | 30.6 | | 28.6 | 25.1 | | 2,788 | |
| Sotheby’s | BID | | 42.26 | | 34.74 | 45.41 | | 1.88 | 2.05 | | 2.51 | 22.5 | | 20.6 | 16.8 | | 2,930 | |
| Janus Capital Group Inc. | JNS | | 17.19 | | 10.13 | 18.81 | | 0.71 | 0.84 | | 1.13 | 24.2 | | 20.5 | 15.2 | | 3,219 | |
| Bio-Rad Laboratories, Inc. | BIO | | 135.18 | | 102.71 | 137.23 | | 5.29 | 5.23 | | 5.73 | 25.6 | | 25.8 | 23.6 | | 3,242 | |
| Charles River Laboratories Intl, Inc. | CRL | | 79.29 | | 49.60 | 84.69 | | 2.93 | 3.46 | | 3.71 | 27.1 | | 22.9 | 21.4 | | 3,752 | |
| First American Financial Corp. | FAF | | 35.68 | | 25.45 | 37.75 | | 1.72 | 2.01 | | 2.50 | 20.7 | | 17.8 | 14.3 | | 3,846 | |
| Dun & Bradstreet Corp. | DNB | | 128.36 | | 98.01 | 137.25 | | 7.87 | 7.72 | | 7.78 | 16.3 | | 16.6 | 16.5 | | 4,625 | |
| Graham Holdings Co. | GHC | | 1,049.63 | | 645.93 | 1,098.94 | | 33.64 | 43.29 | | 45.95 | 31.2 | | 24.2 | 22.8 | | 5,095 | |
| Madison Square Garden Co. | MSG | | 84.65 | | 48.16 | 87.27 | | 1.73 | 1.40 | | 2.23 | 48.9 | | 60.5 | 38.0 | | 5,353 | |
| IDEX Corp. | IEX | | 75.83 | | 65.91 | 81.82 | | 3.43 | 3.78 | | 3.92 | 22.1 | | 20.1 | 19.3 | | 5,932 | |
| Lazard Ltd | LAZ | | 52.59 | | 43.12 | 55.50 | | 2.01 | 3.20 | | 3.53 | 26.2 | | 16.4 | 14.9 | | 6,824 | |
| JLL | JLL | | 170.40 | | 112.57 | 170.85 | | 6.45 | 8.84 | | 9.41 | 26.4 | | 19.3 | 18.1 | | 7,640 | |
| Gannett Co., Inc. | GCI | | 37.08 | | 25.53 | 37.29 | | 2.13 | 2.98 | | 2.89 | 17.4 | | 12.4 | 12.8 | | 8,447 | |
| Snap-on Inc. | SNA | | 147.06 | | 108.82 | 148.41 | | 5.88 | 6.94 | | 7.84 | 25.0 | | 21.2 | 18.8 | | 8,577 | |
| Interpublic Group of Cos., Inc. | IPG | | 22.12 | | 16.14 | 22.69 | | 0.88 | 1.07 | | 1.24 | 25.1 | | 20.7 | 17.8 | | 9,121 | |
| KKR & Co. L.P. | KKR | | 22.81 | | 18.84 | 25.58 | | 2.99 | 1.84 | | 2.50 | 7.6 | | 12.4 | 9.1 | | 9,889 | |
| Newell Rubbermaid Inc. | NWL | | 39.07 | | 28.27 | 40.37 | | 1.83 | 2.00 | | 2.20 | 21.3 | | 19.5 | 17.8 | | 10,490 | |
| Western Union Co. | WU | | 20.81 | | 14.60 | 20.87 | | 1.52 | 1.70 | | 1.72 | 13.7 | | 12.2 | 12.1 | | 10,851 | |
| Laboratory Corp. of America Holdings | LH | | 126.09 | | 95.12 | 131.19 | | 6.95 | 6.80 | | 7.61 | 18.1 | | 18.5 | 16.6 | | 12,647 | |
| CBRE Group, Inc. | CBG | | 38.71 | | 25.84 | 38.99 | | 1.59 | 1.94 | | 2.15 | 24.3 | | 20.0 | 18.0 | | 12,891 | |
| Mohawk Industries, Inc. | MHK | | 185.75 | | 120.37 | 188.29 | | 6.84 | 8.42 | | 9.87 | 27.2 | | 22.1 | 18.8 | | 13,561 | |
| J.M. Smucker Co. | SJM | | 115.73 | | 94.12 | 117.65 | | 6.18 | 6.14 | | 6.53 | 18.7 | | 18.8 | 17.7 | | 13,849 | |
| Royal Caribbean Cruises Ltd. | RCL | | 81.85 | | 49.65 | 85.56 | | 2.39 | 3.47 | | 4.64 | 34.2 | | 23.6 | 17.6 | | 17,998 | |
Note: Holdings are as of March 31, 2015. All earnings per share numbers are fully diluted and reflect the company’s cash earnings. Such numbers are from continuing operations and are adjusted for non-recurring items. All estimates of future earnings per share shown in this table are prepared by Ariel Investments research analysts as of March 31, 2015 and have not been updated to reflect any subsequent events. P/E ratios are based on earnings stated and March 31, 2015 stock price. NM=Not Meaningful.
| | | |
| | Ariel Appreciation Fund statistical summary | (UNAUDITED) |
| | | |
| | | |
| | | | | | | | | | | | | | |
| | | | | 52-week range | Earnings per share | P/E calendar | |
| | | | | | | 2013 | 2014 | 2015 | 2013 | 2014 | 2015 | Market |
| | Ticker | | Price | | | actual | actual | estimated | actual | actual | estimated | cap. |
| Company | symbol | | 03/31/15 | Low | High | calendar | calendar | calendar | P/E | P/E | P/E | ($MM) |
| Contango Oil & Gas Co. | MCF | | 22.00 | 20.25 | 49.28 | 3.79 | 2.17 | 1.68 | 5.8 | 10.1 | 13.1 | 421 | |
| International Speedway Corp. | ISCA | | 32.61 | 28.09 | 35.32 | 1.40 | 1.30 | 1.48 | 23.3 | 25.1 | 22.0 | 868 | |
| Bristow Group Inc. | BRS | | 54.45 | 50.80 | 81.60 | 1.73 | 3.85 | 4.96 | 31.5 | 14.1 | 11.0 | 1,892 | |
| Anixter Intl Inc. | AXE | | 76.13 | 73.34 | 105.84 | 5.32 | 6.25 | 6.45 | 14.3 | 12.2 | 11.8 | 2,502 | |
| Kennametal Inc. | KMT | | 33.69 | 27.63 | 49.24 | 3.30 | 2.64 | 2.87 | 10.2 | 12.8 | 11.7 | 2,667 | |
| Sotheby’s | BID | | 42.26 | 34.74 | 45.41 | 1.58 | 1.88 | 2.07 | 26.7 | 22.5 | 20.4 | 2,930 | |
| Janus Capital Group Inc. | JNS | | 17.19 | 10.13 | 18.81 | 0.65 | 0.71 | 0.84 | 26.4 | 24.2 | 20.5 | 3,219 | |
| Bio-Rad Laboratories, Inc. | BIO | | 135.18 | 102.71 | 137.23 | 7.05 | 5.29 | 5.10 | 19.2 | 25.6 | 26.5 | 3,242 | |
| First American Financial Corp. | FAF | | 35.68 | 25.45 | 37.75 | 2.46 | 1.72 | 1.93 | 14.5 | 20.7 | 18.5 | 3,846 | |
| Madison Square Garden Co. | MSG | | 84.65 | 48.16 | 87.27 | 1.72 | 1.73 | 1.90 | 49.2 | 48.9 | 44.6 | 5,353 | |
| Lazard Ltd | LAZ | | 52.59 | 43.12 | 55.50 | 1.44 | 2.01 | 2.95 | 36.5 | 26.2 | 17.8 | 6,824 | |
| JLL | JLL | | 170.40 | 112.57 | 170.85 | 5.61 | 6.45 | 8.21 | 30.4 | 26.4 | 20.8 | 7,640 | |
| Gannett Co., Inc. | GCI | | 37.08 | 25.53 | 37.29 | 2.43 | 2.13 | 2.83 | 15.3 | 17.4 | 13.1 | 8,447 | |
| Snap-on Inc. | SNA | | 147.06 | 108.82 | 148.41 | 5.13 | 5.88 | 6.94 | 28.7 | 25.0 | 21.2 | 8,577 | |
| Interpublic Group of Cos., Inc. | IPG | | 22.12 | 16.14 | 22.69 | 0.87 | 0.88 | 1.07 | 25.4 | 25.1 | 20.7 | 9,121 | |
| Towers Watson | TW | | 132.19 | 98.10 | 135.50 | 5.35 | 5.70 | 5.88 | 24.7 | 23.2 | 22.5 | 9,196 | |
| KKR & Co. L.P. | KKR | | 22.81 | 18.84 | 25.58 | 2.90 | 2.99 | 2.17 | 7.9 | 7.6 | 10.5 | 9,889 | |
| Newell Rubbermaid Inc. | NWL | | 39.07 | 28.27 | 40.37 | 1.70 | 1.83 | 2.01 | 23.0 | 21.3 | 19.4 | 10,490 | |
| Western Union Co. | WU | | 20.81 | 14.60 | 20.87 | 1.84 | 1.54 | 1.58 | 11.3 | 13.5 | 13.2 | 10,851 | |
| Tiffany & Co. | TIF | | 88.01 | 82.64 | 110.60 | 3.25 | 3.73 | 4.20 | 27.1 | 23.6 | 21.0 | 11,367 | |
| Coach, Inc. | COH | | 41.43 | 32.72 | 50.86 | 3.63 | 3.38 | 2.47 | 11.4 | 12.3 | 16.8 | 11,428 | |
| Laboratory Corp. of America Holdings | LH | | 126.09 | 95.12 | 131.19 | 7.38 | 6.95 | 6.80 | 17.1 | 18.1 | 18.5 | 12,647 | |
| CBRE Group, Inc. | CBG | | 38.71 | 25.84 | 38.99 | 1.38 | 1.59 | 1.92 | 28.1 | 24.3 | 20.2 | 12,891 | |
| J.M. Smucker Co. | SJM | | 115.73 | 94.12 | 117.65 | 5.72 | 6.18 | 6.21 | 20.2 | 18.7 | 18.6 | 13,849 | |
| Stanley Black & Decker, Inc. | SWK | | 95.36 | 75.90 | 100.44 | 5.38 | 5.81 | 6.33 | 17.7 | 16.4 | 15.1 | 14,615 | |
| Nordstrom, Inc. | JWN | | 80.32 | 59.97 | 83.16 | 3.61 | 3.71 | 3.79 | 22.2 | 21.6 | 21.2 | 15,293 | |
| Northern Trust Corp. | NTRS | | 69.65 | 58.30 | 72.72 | 2.86 | 3.04 | 3.25 | 24.4 | 22.9 | 21.4 | 16,272 | |
| St. Jude Medical, Inc. | STJ | | 65.40 | 54.80 | 71.90 | 3.65 | 3.96 | 4.20 | 17.9 | 16.5 | 15.6 | 18,320 | |
| Omnicom Group Inc. | OMC | | 77.98 | 64.03 | 80.98 | 3.76 | 4.09 | 4.43 | 20.7 | 19.1 | 17.6 | 19,239 | |
| Zimmer Holdings, Inc. | ZMH | | 117.52 | 90.48 | 121.84 | 5.67 | 6.26 | 6.59 | 20.7 | 18.8 | 17.8 | 19,979 | |
| National Oilwell Varco | NOV | | 49.99 | 46.08 | 86.55 | 5.83 | 5.35 | 6.10 | 8.6 | 9.3 | 8.2 | 20,493 | |
| Blackstone Group L.P. | BX | | 38.89 | 26.56 | 39.62 | 1.77 | 3.07 | 3.60 | 22.0 | 12.7 | 10.8 | 20,740 | |
| T. Rowe Price Group, Inc. | TROW | | 80.98 | 71.78 | 88.64 | 3.36 | 3.90 | 4.51 | 24.1 | 20.8 | 18.0 | 21,101 | |
| Viacom, Inc. | VIA.B | | 68.30 | 63.11 | 89.76 | 4.41 | 4.94 | 5.62 | 15.5 | 13.8 | 12.2 | 24,257 | |
| CBS Corp. | CBS | | 60.63 | 48.83 | 65.24 | 2.65 | 3.13 | 3.27 | 22.9 | 19.4 | 18.5 | 27,856 | |
| AFLAC Inc. | AFL | | 64.01 | 54.99 | 64.62 | 6.60 | 6.18 | 6.19 | 9.7 | 10.4 | 10.3 | 28,062 | |
| Franklin Resources, Inc. | BEN | | 51.32 | 49.12 | 59.43 | 3.09 | 3.50 | 3.82 | 16.6 | 14.7 | 13.4 | 31,912 | |
| Illinois Tool Works Inc. | ITW | | 97.14 | 79.06 | 100.14 | 3.76 | 4.12 | 5.04 | 25.8 | 23.6 | 19.3 | 36,265 | |
| Thermo Fisher Scientific Inc. | TMO | | 134.34 | 107.33 | 139.03 | 4.93 | 5.42 | 6.92 | 27.2 | 24.8 | 19.4 | 53,304 | |
Note: Holdings are as of March 31, 2015. All earnings per share numbers are fully diluted and reflect the company’s cash earnings. Such numbers are from continuing operations and are adjusted for non-recurring items. All estimates of future earnings per share shown in this table are prepared by Ariel Investments research analysts as of March 31, 2015 and have not been updated to reflect any subsequent events. P/E ratios are based on earnings stated and March 31, 2015 stock price.
| | | |
| | Ariel Focus Fund statistical summary | (UNAUDITED) |
| | | |
| | | |
| | | | | | | | | | | | | |
| | | | 52-week range | Earnings per share | P/E calendar | | |
| | | | | | 2013 | 2014 | 2015 | 2013 | 2014 | 2015 | Market | |
| | Ticker | Price | | | actual | actual | estimated | actual | actual | estimated | cap. | |
| Company | symbol | 03/31/15 | Low | High | calendar | calendar | calendar | P/E | P/E | P/E | ($MM) | |
| Hanger, Inc. | HGR | 22.69 | 18.25 | 35.41 | 1.94 | 2.08 | 1.75 | 11.7 | 10.9 | 13.0 | 801 | |
| Pier 1 Imports, Inc. | PIR | 13.98 | 11.38 | 19.39 | 1.20 | 1.01 | 1.00 | 11.7 | 13.8 | 14.0 | 1,258 | |
| Apollo Education Group, Inc. | APOL | 18.92 | 18.81 | 35.23 | 3.70 | 3.19 | 2.50 | 5.1 | 5.9 | 7.6 | 2,028 | |
| Anixter Intl Inc. | AXE | 76.13 | 73.34 | 105.84 | 5.32 | 6.25 | 6.45 | 14.3 | 12.2 | 11.8 | 2,502 | |
| Kennametal Inc. | KMT | 33.69 | 27.63 | 49.24 | 3.30 | 2.64 | 2.87 | 10.2 | 12.8 | 11.7 | 2,667 | |
| Bio-Rad Laboratories, Inc. | BIO | 135.18 | 102.71 | 137.23 | 7.05 | 5.29 | 5.10 | 19.2 | 25.6 | 26.5 | 3,242 | |
| Chesapeake Energy Corp. | CHK | 14.16 | 13.38 | 31.49 | 0.42 | 1.65 | 1.65 | 33.7 | 8.6 | 8.6 | 9,417 | |
| Newell Rubbermaid Inc. | NWL | 39.07 | 28.27 | 40.37 | 1.70 | 1.83 | 2.01 | 23.0 | 21.3 | 19.4 | 10,490 | |
| Western Union Co. | WU | 20.81 | 14.60 | 20.87 | 1.84 | 1.54 | 1.58 | 11.3 | 13.5 | 13.2 | 10,851 | |
| Laboratory Corp. of America Holdings | LH | 126.09 | 95.12 | 131.19 | 7.38 | 6.95 | 6.80 | 17.1 | 18.1 | 18.5 | 12,647 | |
| Barrick Gold Corp. | ABX | 10.96 | 10.04 | 19.49 | 3.82 | 2.51 | 0.65 | 2.9 | 4.4 | 16.9 | 12,765 | |
| Bed Bath & Beyond Inc. | BBBY | 76.78 | 54.96 | 79.64 | 4.56 | 4.79 | 5.06 | 16.8 | 16.0 | 15.2 | 13,343 | |
| Stanley Black & Decker, Inc. | SWK | 95.36 | 75.90 | 100.44 | 5.38 | 5.81 | 6.33 | 17.7 | 16.4 | 15.1 | 14,615 | |
| Mosaic Co. | MOS | 46.06 | 40.32 | 53.83 | 4.08 | 2.90 | 2.39 | 11.3 | 15.9 | 19.3 | 16,493 | |
| St. Jude Medical, Inc. | STJ | 65.40 | 54.80 | 71.90 | 3.65 | 3.96 | 4.20 | 17.9 | 16.5 | 15.6 | 18,320 | |
| Zimmer Holdings, Inc. | ZMH | 117.52 | 90.48 | 121.84 | 5.67 | 6.26 | 6.59 | 20.7 | 18.8 | 17.8 | 19,979 | |
| National Oilwell Varco | NOV | 49.99 | 46.08 | 86.55 | 5.83 | 5.35 | 6.10 | 8.6 | 9.3 | 8.2 | 20,493 | |
| Apache Corp. | APA | 60.33 | 54.34 | 104.57 | 9.62 | 8.20 | 5.75 | 6.3 | 7.4 | 10.5 | 22,734 | |
| Baxter Intl Inc. | BAX | 68.50 | 65.95 | 77.31 | 4.53 | 4.86 | 4.92 | 15.1 | 14.1 | 13.9 | 37,232 | |
| Bank of New York Mellon Corp. | BK | 40.24 | 32.66 | 41.79 | 2.03 | 2.24 | 2.40 | 19.8 | 18.0 | 16.8 | 44,853 | |
| Lockheed Martin Corp. | LMT | 202.96 | 153.54 | 207.06 | 10.06 | 10.64 | 10.35 | 20.2 | 19.1 | 19.6 | 64,193 | |
| Morgan Stanley | MS | 35.69 | 28.31 | 39.19 | 1.59 | 1.96 | 2.70 | 22.4 | 18.2 | 13.2 | 69,860 | |
| Goldman Sachs Group, Inc. | GS | 187.97 | 151.65 | 198.06 | 14.13 | 15.46 | 16.50 | 13.3 | 12.2 | 11.4 | 84,756 | |
| CVS Health Corp. | CVS | 103.21 | 72.37 | 105.46 | 3.43 | 4.00 | 4.51 | 30.1 | 25.8 | 22.9 | 117,171 | |
| International Business Machines Corp. | IBM | 160.50 | 149.52 | 199.21 | 15.25 | 16.28 | 16.15 | 10.5 | 9.9 | 9.9 | 158,093 | |
| Oracle Corp. | ORCL | 43.15 | 35.82 | 46.71 | 2.48 | 2.62 | 2.72 | 17.4 | 16.5 | 15.9 | 188,439 | |
| JPMorgan Chase & Co. | JPM | 60.58 | 52.97 | 63.49 | 5.20 | 4.35 | 5.50 | 11.7 | 13.9 | 11.0 | 225,861 | |
| Johnson & Johnson | JNJ | 100.60 | 95.10 | 109.49 | 5.31 | 5.84 | 6.29 | 18.9 | 17.2 | 16.0 | 279,724 | |
| Microsoft Corp. | MSFT | 40.66 | 38.51 | 50.05 | 2.70 | 2.63 | 2.71 | 15.1 | 15.5 | 15.0 | 329,834 | |
| Exxon Mobil Corp. | XOM | 85.00 | 82.68 | 104.76 | 8.10 | 7.50 | 7.27 | 10.5 | 11.3 | 11.7 | 356,549 | |
Note: Holdings are as of March 31, 2015. All earnings per share numbers are fully diluted and reflect the company’s cash earnings. Such numbers are from continuing operations and are adjusted for non-recurring items. All estimates of future earnings per share shown in this table are prepared by Ariel Investments research analysts as of March 31, 2015 and have not been updated to reflect any subsequent events. P/E ratios are based on earnings stated and March 31, 2015 stock price.
| | | | |
| | Ariel Fund schedule of investments | | |
| | | | |
| | | | |
| Number of shares | | Common stocks — 88.62% | | Value | |
| | | Consumer discretionary & services—24.57% | | | |
| 2,305,921 | | Gannett Co., Inc. | | | $85,503,551 | |
| 2,597,596 | | International Speedway Corp., Class A | | | 84,707,606 | |
| 3,415,066 | | Interpublic Group of Cos., Inc. | | | 75,541,260 | |
| 863,340 | | Royal Caribbean Cruises Ltd. | | | 70,664,379 | |
| 1,786,754 | | Newell Rubbermaid Inc. | | | 69,808,479 | |
| 366,304 | | Mohawk Industries, Inc.(a) | | | 68,040,968 | |
| 1,145,908 | | Meredith Corp. | | | 63,907,289 | |
| 577,274 | | Madison Square Garden Co., Class A(a) | | | 48,866,244 | |
| 1,076,165 | | Sotheby’s | | | 45,478,733 | |
| 19,883 | | Graham Holdings Co., Class B | | | 20,869,793 | |
| | | | | | 633,388,302 | |
| | | Consumer staples—3.41% | | | | |
| 758,445 | | J.M. Smucker Co. | | | 87,774,840 | |
| | | | | | | |
| | | Energy—1.63% | | | | |
| 1,909,817 | | Contango Oil & Gas Co(a)(b) | | | 42,015,974 | |
| | | | | | | |
| | | Financial services—26.34% | | | | |
| 2,128,603 | | Lazard Ltd, Class A | | | 111,943,232 | |
| 3,693,339 | | KKR & Co. L.P. | | | 84,245,063 | |
| 2,120,553 | | CBRE Group, Inc., Class A(a) | | | 82,086,607 | |
| 461,299 | | JLL | | | 78,605,350 | |
| 3,680,155 | | Western Union Co. | | | 76,584,026 | |
| 561,678 | | Dun & Bradstreet Corp. | | | 72,096,988 | |
| 1,986,288 | | First American Financial Corp. | | | 70,870,756 | |
| 3,351,416 | | Janus Capital Group Inc. | | | 57,610,841 | |
| 506,358 | | Fair Isaac Corp. | | | 44,924,082 | |
| | | | | | 678,966,945 | |
| | | Health care—7.75% | | | | |
| 549,100 | | Laboratory Corp. of America Holdings(a) | | | 69,236,019 | |
| 860,926 | | Charles River Laboratories Intl, Inc.(a) | | | 68,262,823 | |
| 460,583 | | Bio-Rad Laboratories, Inc., Class A(a) | | | 62,261,610 | |
| | | | | | 199,760,452 | |
| | | Materials & processing—4.69% | | | | |
| 1,785,997 | | Simpson Manufacturing Co., Inc. | | | 66,742,708 | |
| 1,522,082 | | U.S. Silica Holdings, Inc. | | | 54,201,340 | |
| | | | | | 120,944,048 | |
| | | | |
| | Ariel Fund schedule of investments (continued) | | |
| | | | |
| | | | |
| Number of shares | | Common stocks — 88.62% | | Value | |
| | | Producer durables—17.17% | | | |
| 2,510,041 | | Kennametal Inc. | | | $84,563,281 | |
| 2,797,362 | | Brady Corp., Class A | | | 79,137,371 | |
| 1,395,260 | | Bristow Group Inc. | | | 75,971,907 | |
| 792,516 | | MTS Systems Corp.(b) | | | 59,953,835 | |
| 3,951,626 | | Blount Intl, Inc.(a)(b) | | | 50,896,943 | |
| 335,613 | | Snap-on Inc. | | | 49,355,248 | |
| 362,266 | | Littelfuse, Inc. | | | 36,005,618 | |
| 89,576 | | IDEX Corp. | | | 6,792,548 | |
| | | | | | 442,676,751 | |
| | | Technology—3.06% | | | | |
| 1,037,403 | | Anixter Intl Inc.(a) | | | 78,977,490 | |
| | | | | | | |
| | | Total common stocks (Cost $1,342,757,550) | | | 2,284,504,802 | |
| | | | | | | |
| Principal amount | | Repurchase agreement —4.88% | | Value | |
| $125,838,754 | | Fixed Income Clearing Corporation, 0.00%, dated 03/31/2015, due 04/01/2015, repurchase price | | | | |
| | | $125,838,754, (collaterized by U.S. Treasury Note, value $123,381,844, 2.63%, due 11/15/2020; | | | | |
| | | U.S. Treasury Note, value $4,976,594, 1.75%, due 10/31/2020) (Cost $125,838,754) | | | $125,838,754 | |
| | | Total Investments—93.50% (Cost $1,468,596,304) | | | 2,410,343,556 | |
| | | Cash, Other Assets less Liabilities—6.50% | | | 167,608,197 | |
| | | Net Assets—100.00% | | | $2,577,951,753 | |
(a)Non-income producing.
(b)Affiliated company (See Note Six).
A category may contain multiple industries as defined by the Global Industry Classification Standards.
The accompanying notes are an integral part of the financial statements.
| | | | |
| | Ariel Appreciation Fund schedule of investments | | |
| | | | |
| | | | |
| Number of shares | | Common stocks — 95.25% | | Value | |
| | | Consumer discretionary & services—24.48% | | | |
| 3,422,230 | | Interpublic Group of Cos., Inc. | | | $75,699,728 | |
| 912,400 | | Omnicom Group Inc. | | | 71,148,952 | |
| 1,155,700 | | CBS Corp., Class B | | | 70,070,091 | |
| 1,577,656 | | International Speedway Corp., Class A | | | 51,447,362 | |
| 684,700 | | Viacom, Inc., Class B | | | 46,765,010 | |
| 528,600 | | Nordstrom, Inc. | | | 42,457,152 | |
| 988,700 | | Newell Rubbermaid Inc. | | | 38,628,509 | |
| 847,500 | | Gannett Co., Inc. | | | 31,425,300 | |
| 556,900 | | Sotheby’s | | | 23,534,594 | |
| 262,100 | | Madison Square Garden Co., Class A(a) | | | 22,186,765 | |
| 531,705 | | Coach, Inc. | | | 22,028,538 | |
| 241,400 | | Tiffany & Co. | | | 21,245,614 | |
| | | | | | 516,637,615 | |
| | | Consumer staples—3.63% | | | | |
| 662,275 | | J.M. Smucker Co. | | | 76,645,086 | |
| | | | | | | |
| | | Energy—2.42% | | | | |
| 762,400 | | National Oilwell Varco | | | 38,112,376 | |
| 586,482 | | Contango Oil & Gas Co.(a) | | | 12,902,604 | |
| | | | | | 51,014,980 | |
| | | Financial services—32.30% | | | | |
| 4,674,900 | | Western Union Co. | | | 97,284,669 | |
| 2,391,800 | | First American Financial Corp. | | | 85,339,424 | |
| 1,265,500 | | AFLAC Inc. | | | 81,004,655 | |
| 1,476,520 | | Lazard Ltd, Class A | | | 77,650,187 | |
| 1,025,500 | | Northern Trust Corp. | | | 71,426,075 | |
| 1,248,300 | | Franklin Resources, Inc. | | | 64,062,756 | |
| 366,400 | | JLL | | | 62,434,560 | |
| 901,200 | | Blackstone Group L.P. | | | 35,047,668 | |
| 1,516,168 | | KKR & Co. L.P. | | | 34,583,792 | |
| 790,150 | | CBRE Group, Inc., Class A(a) | | | 30,586,707 | |
| 311,500 | | T. Rowe Price Group, Inc. | | | 25,225,270 | |
| 1,002,942 | | Janus Capital Group Inc. | | | 17,240,573 | |
| | | | | | 681,886,336 | |
| | | Health care—12.73% | | | | |
| 664,200 | | Zimmer Holdings, Inc. | | | 78,056,784 | |
| 443,200 | | Laboratory Corp. of America Holdings(a) | | | 55,883,088 | |
| 817,300 | | St. Jude Medical, Inc. | | | 53,451,420 | |
| 389,754 | | Thermo Fisher Scientific Inc. | | | 52,359,552 | |
| 214,725 | | Bio-Rad Laboratories, Inc., Class A(a) | | | 29,026,526 | |
| | | | | | 268,777,370 | |
| | | | |
| | Ariel Appreciation Fund schedule of investments (continued) | | |
| | | | |
| | | | |
| Number of shares | | Common stocks — 95.25% | | Value | |
| | | Producer durables—18.43% | | | |
| 1,026,599 | | Stanley Black & Decker, Inc. | | | $97,896,481 | |
| 2,590,400 | | Kennametal Inc. | | | 87,270,576 | |
| 1,368,518 | | Bristow Group Inc. | | | 74,515,805 | |
| 610,950 | | Illinois Tool Works Inc. | | | 59,347,683 | |
| 332,100 | | Snap-on Inc. | | | 48,838,626 | |
| 160,500 | | Towers Watson, Class A | | | 21,215,693 | |
| | | | | | 389,084,864 | |
| | | Technology—1.26% | | | | |
| 349,500 | | Anixter Intl Inc.(a) | | | 26,607,435 | |
| | | | | | | |
| | | Total common stocks (Cost $1,185,627,262) | | | 2,010,653,686 | |
| | | | | | | |
| Principal amount | | Repurchase agreement — 4.72% | | Value | |
| $99,680,274 | | Fixed Income Clearing Corporation, 0.00%, dated 03/31/2015, due 04/01/2015, repurchase price | | | | |
| | | $99,680,274, (collaterized by U.S. Treasury Note, value $101,676,344, 1.75%, due 10/31/2020) | | | | |
| | | (Cost $99,680,274) | | | $99,680,274 | |
| | | Total Investments—99.97% (Cost $1,285,307,536) | | | 2,110,333,960 | |
| | | Other Assets less Liabilities—0.03% | | | 589,028 | |
| | | Net Assets—100.00% | | | $2,110,922,988 | |
(a) Non-income producing.
A category may contain multiple industries as defined by the Global Industry Classification Standards.
The accompanying notes are an integral part of the financial statements.
| | | |
| | Ariel Focus Fund schedule of investments | |
| | | |
| | | |
| Number of shares | | Common stocks —98.54% | | Value | |
| | | Consumer discretionary & services—11.79% | | | |
| 64,800 | | Newell Rubbermaid Inc. | | | $2,531,736 | |
| 30,000 | | Bed Bath & Beyond Inc.(a) | | | 2,303,250 | |
| 152,000 | | Pier 1 Imports, Inc. | | | 2,124,960 | |
| 38,500 | | Apollo Education Group, Inc., Class A(a) | | | 728,420 | |
| | | | | | 7,688,366 | |
| | | Consumer staples—4.56% | | | | |
| 28,800 | | CVS Health Corp. | | | 2,972,448 | |
| | | | | | | |
| | | Energy—11.82% | | | | |
| 56,000 | | National Oilwell Varco | | | 2,799,440 | |
| 29,700 | | Exxon Mobil Corp. | | | 2,524,500 | |
| 21,500 | | Apache Corp. | | | 1,297,095 | |
| 76,500 | | Chesapeake Energy Corp. | | | 1,083,240 | |
| | | | | | 7,704,275 | |
| | | Financial services—17.90% | | | | |
| 193,000 | | Western Union Co. | | | 4,016,330 | |
| 11,900 | | Goldman Sachs Group, Inc. | | | 2,236,843 | |
| 56,250 | | Morgan Stanley | | | 2,007,563 | |
| 29,000 | | JPMorgan Chase & Co. | | | 1,756,820 | |
| 41,100 | | Bank of New York Mellon Corp. | | | 1,653,864 | |
| | | | | | 11,671,420 | |
| | | Health care—17.89% | | | | |
| 19,800 | | Laboratory Corp. of America Holdings(a) | | | 2,496,582 | |
| 19,600 | | Zimmer Holdings, Inc. | | | 2,303,392 | |
| 21,900 | | Johnson & Johnson | | | 2,203,140 | |
| 72,300 | | Hanger, Inc.(a) | | | 1,640,487 | |
| 22,200 | | Baxter Intl Inc. | | | 1,520,700 | |
| 12,600 | | St. Jude Medical, Inc. | | | 824,040 | |
| 5,000 | | Bio-Rad Laboratories, Inc.(a) | | | 675,900 | |
| | | | | | 11,664,241 | |
| | | Materials & processing—6.19% | | | | |
| 57,300 | | Mosiac Co. | | | 2,639,238 | |
| 127,482 | | Barrick Gold Corp. | | | 1,397,203 | |
| | | | | | 4,036,441 | |
| | | Producer durables—14.09% | | | | |
| 40,700 | | Stanley Black & Decker, Inc. | | | 3,881,152 | |
| 16,100 | | Lockheed Martin Corp. | | | 3,267,656 | |
| 60,400 | | Kennametal Inc. | | | 2,034,876 | |
| | | | | | 9,183,684 | |
| | | Technology—14.30% | | | | |
| 78,000 | | Oracle Corp. | | | 3,365,700 | |
| 18,900 | | International Business Machines Corp. | | | 3,033,450 | |
| 39,600 | | Microsoft Corp. | | | 1,609,938 | |
| 17,200 | | Anixter Intl Inc.(a) | | | 1,309,436 | |
| | | | | | 9,318,524 | |
| | | Total common stocks (Cost $53,504,162) | | | 64,239,399 | |
| | | | | | | |
| Principal amount | | Repurchase agreement — 1.89% | | Value | |
| $1,235,666 | | Fixed Income Clearing Corporation, 0.00%, dated 03/31/2015, due 04/01/2015, repurchase price $1,235,666, | | | | |
| | | (collaterized by U.S. Treasury Note, value $1,263,250, 1.75%, due 10/31/2020) (Cost $1,235,666) | | | $1,235,666 | |
| | | Total Investments—100.43% (Cost $54,739,828) | | | 65,475,065 | |
| | | Liabilities less Other Assets—(0.43)% | | | (281,080 | ) |
| | | Net Assets — 100.00% | | | $65,193,985 | |
(a)Non-income producing.
A category may contain multiple industries as defined by the Global Industry Classification Standards.
The accompanying notes are an integral part of the financial statements.
| | | |
| | Ariel Discovery Fund schedule of investments | |
| | | |
| | | |
| Number of shares | | Common stocks — 98.70% | | Value | |
| | | Consumer discretionary & services—15.97% | | | |
| 277,000 | | Century Casinos, Inc.(a) | | | $1,509,650 | |
| 84,863 | | XO Group Inc.(a) | | | 1,499,529 | |
| 41,800 | | International Speedway Corp., Class A | | | 1,363,098 | |
| 177,955 | | Rosetta Stone Inc.(a) | | | 1,354,238 | |
| 39,900 | | Superior Industries Intl, Inc. | | | 755,307 | |
| | | | | | 6,481,822 | |
| | | Energy—7.22% | | | | |
| 75,254 | | Contango Oil & Gas Co.(a) | | | 1,655,588 | |
| 58,700 | | Gulf Island Fabrication, Inc. | | | 872,282 | |
| 87,700 | | Mitcham Industries, Inc.(a) | | | 403,420 | |
| | | | | | 2,931,290 | |
| | | Financial services—16.99% | | | | |
| 483,383 | | Cowen Group, Inc., Class A(a) | | | 2,513,592 | |
| 36,852 | | Capital Southwest Corp. | | | 1,710,670 | |
| 33,500 | | First American Financial Corp. | | | 1,195,280 | |
| 59,665 | | AV Homes, Inc.(a) | | | 952,253 | |
| 16,700 | | MB Financial, Inc. | | | 522,877 | |
| | | | | | 6,894,672 | |
| | | Health care—4.97% | | | | |
| 120,055 | | POZEN Inc.(a) | | | 926,825 | |
| 95,000 | | Kindred Biosciences, Inc.(a) | | | 678,300 | |
| 437,800 | | Vical Inc.(a) | | | 413,677 | |
| | | | | | 2,018,802 | |
| | | Materials & processing—10.69% | | | | |
| 1,336,494 | | Rentech, Inc.(a) | | | 1,496,873 | |
| 95,342 | | Landec Corp.(a) | | | 1,330,021 | |
| 268,391 | | Orion Energy Systems, Inc.(a) | | | 842,748 | |
| 17,973 | | Simpson Manufacturing Co., Inc. | | | 671,651 | |
| | | | | | 4,341,293 | |
| | | Producer durables—10.55% | | | | |
| 159,700 | | Furmanite Corp.(a) | | | 1,260,033 | |
| 224,425 | | Spartan Motors Inc. | | | 1,088,461 | |
| 20,539 | | Team, Inc.(a) | | | 800,610 | |
| 150,730 | | Erickson Inc.(a) | | | 651,154 | |
| 17,500 | | Brink’s Co. | | | 483,525 | |
| | | | | | 4,283,783 | |
| | | Technology—21.12% | | | | |
| 260,600 | | RealNetworks, Inc.(a) | | | 1,753,838 | |
| 350,900 | | Imation Corp.(a) | | | 1,414,127 | |
| 174,780 | | PCTEL, Inc. | | | 1,398,240 | |
| 253,500 | | Rubicon Technology, Inc.(a) | | | 998,790 | |
| 82,900 | | Brooks Automation, Inc. | | | 964,127 | |
| 96,115 | | Telenav Inc.(a) | | | 761,231 | |
| 93,540 | | Sigma Designs, Inc.(a) | | | 751,126 | |
| 67,500 | | SeaChange Intl, Inc.(a) | | | 529,875 | |
| | | | | | 8,571,354 | |
| Number of shares | | Common stocks — 98.70% | | Value | |
| | | Utilities—11.19% | | | |
| 416,912 | | ORBCOMM, Inc.(a) | | | $2,488,965 | |
| 1,578,912 | | Pendrell Corp.(a) | | | 2,052,586 | |
| | | | | | 4,541,551 | |
| | | Total common stocks (Cost $42,426,501) | | | 40,064,567 | |
| | | | | | | |
| Principal amount | | Repurchase agreement — 1.12% | | Value | |
| $456,019 | | Fixed Income Clearing Corporation, 0.00%, dated 03/31/2015, due 04/01/2015, repurchase price $456,019, | | | | |
| | | (collaterized by U.S. Treasury Note, value $468,625, 1.75%, due 10/31/2020) (Cost $456,019) | | | $456,019 | |
| | | Total Investments—99.82% (Cost $42,882,520) | | | 40,520,586 | |
| | | Other Assets less Liabilities—0.18% | | | 72,921 | |
| | | Net Assets — 100.00% | | | $40,593,507 | |
(a)Non-income producing.
A category may contain multiple industries as defined by the Global Industry Classification Standards.
The accompanying notes are an integral part of the financial statements.
| | | | |
| | Ariel International Fund schedule of investments | | |
| | | | |
| | | | | | |
| Number of shares | | Common stocks — 92.35% | | Value | |
| | | Austria—0.61% | | | |
| 1,910 | | Vienna Insurance Group | | | $84,614 | |
| | | | | | | |
| | | Canada—0.98% | | | | |
| 4,032 | | Rogers Communications Inc. | | | 134,978 | |
| | | | | | | |
| | | China—6.78% | | | | |
| 9,562 | | China Mobile Ltd. ADR | | | 621,817 | |
| 979 | | Baidu, Inc. ADR(a) | | | 204,024 | |
| 7,500 | | China Mobile Ltd. | | | 97,709 | |
| 10,000 | | Lenovo Group Ltd | | | 14,576 | |
| | | | | | 938,126 | |
| | | Denmark—0.08% | | | | |
| 278 | | Vestas Wind Systems AS | | | 11,518 | |
| | | | | | | |
| | | Finland—4.05% | | | | |
| 62,101 | | Nokia Corp. ADR | | | 470,726 | |
| 6,962 | | Nokia Corp. | | | 53,225 | |
| 1,216 | | Nokian Renkaat Corp. | | | 36,414 | |
| | | | | | 560,365 | |
| | | France—4.42% | | | | |
| 3,520 | | BNP Paribas SA | | | 214,111 | |
| 1,502 | | Michelin (CGDE) | | | 149,568 | |
| 1,707 | | Technip SA | | | 103,464 | |
| 2,002 | | Eutelsat Communications | | | 66,377 | |
| 360 | | L’Air Liquide SA | | | 46,373 | |
| 990 | | Societe Television Francaise 1 | | | 17,564 | |
| 134 | | Euler Hermes Group | | | 14,279 | |
| | | | | | 611,736 | |
| | | Germany—14.00% | | | | |
| 9,751 | | Deutsche Boerse AG | | | 797,471 | |
| 11,592 | | Dialog Semiconductor plc(a) | | | 524,311 | |
| 75,168 | | Telefonica Deutschland GmgH & Co. | | | 434,512 | |
| 1,907 | | SAP SE | | | 138,470 | |
| 941 | | Deutsche Post AG | | | 29,439 | |
| 156 | | Beiersdorf AG | | | 13,570 | |
| | | | | | 1,937,773 | |
| | | Hong Kong—0.61% | | | | |
| 20,585 | | Yue Yuen Industrial Holdings Ltd. | | | 73,151 | |
| 12,000 | | Li & Fung Ltd | | | 11,717 | |
| | | | | | 84,868 | |
| | | Ireland—2.71% | | | | |
| 5,613 | | Ryanair Holdings plc ADR(a) | | | 374,780 | |
| | | | | | | |
| | | Israel—0.81% | | | | |
| 25,196 | | Bank Leumi Le-Israel BM(a) | | | 93,520 | |
| 1,890 | | Mizrahi Tefahot Bank LTD(a) | | | 19,188 | |
| | | | | | 112,708 | |
| | | | | | |
| Number of shares | | Common stocks — 92.35% | | Value | |
| | | Italy—1.82% | | | |
| 30,109 | | Mediaset SpA | | | $137,722 | |
| 13,794 | | Snam SpA | | | 67,041 | |
| 1,062 | | DiaSorin SpA | | | 46,739 | |
| | | | | | 251,502 | |
| | | Japan—17.45% | | | | |
| 10,100 | | Canon Inc. | | | 357,734 | |
| 2,400 | | Nintendo Co., Ltd. | | | 353,692 | |
| 3,400 | | Shimamura Co., Ltd. | | | 315,237 | |
| 4,400 | | Toyota Motor Corp. | | | 307,543 | |
| 2,200 | | Daito Trust Construction Co., Ltd. | | | 246,258 | |
| 29,600 | | Anritsu Corp. | | | 207,065 | |
| 15,300 | | Nikon Corp. | | | 205,386 | |
| 4,200 | | Japan Tobacco Inc. | | | 133,090 | |
| 2,100 | | OBIC Co., Ltd. | | | 89,298 | |
| 1,700 | | Denso Corp. | | | 77,718 | |
| 900 | | Tokyo Electron Ltd. | | | 62,899 | |
| 4,000 | | Shizouka Bank Ltd. | | | 40,022 | |
| 532 | | Canon Inc. ADR | | | 18,817 | |
| | | | | | 2,414,759 | |
| | | Luxembourg—0.38% | | | | |
| 283 | | RTL Group(b) | | | 27,274 | |
| 268 | | RTL Group(c) | | | 25,779 | |
| | | | | | 53,053 | |
| | | Macau—0.16% | | | | |
| 10,000 | | Wynn Macau Ltd. | | | 21,696 | |
| | | | | | | |
| | | Netherlands—5.59% | | | | |
| 36,676 | | Ahold N.V. | | | 723,648 | |
| 629 | | Gemalto N.V. | | | 50,164 | |
| | | | | | 773,812 | |
| | | Portugal—0.07% | | | | |
| 790 | | Jeronimo Martins SGPS SA | | | 9,939 | |
| | | | | | | |
| | | Singapore—0.50% | | | | |
| 4,100 | | United Overseas Bank Ltd. | | | 68,714 | |
| | | | | | | |
| | | Spain—0.90% | | | | |
| 1,682 | | Tecnicas Reunidas SA | | | 70,715 | |
| 11,012 | | Banco Popular Español SA | | | 53,970 | |
| | | | | | 124,685 | |
| | | Sweden—0.48% | | | | |
| 1,629 | | H&M Hennes & Mauritz AB, Class B | | | 66,108 | |
| | | | |
| | Ariel International Fund schedule of investments (continued) | 03/31/15 (UNAUDITED) | |
| | | | |
| | | | | | |
| Number of shares | | Common stocks — 92.35% | | Value | |
| | | Switzerland—8.69% | | | |
| 1,942 | | Roche Holding AG | | | $535,759 | |
| 769 | | Swisscom AG | | | 446,697 | |
| 4,123 | | UBS Group | | | 77,725 | |
| 194 | | Zurich Insurance Group Ltd | | | 65,738 | |
| 71 | | Banque Cantonale Vaudoise | | | 40,768 | |
| 471 | | Nestle SA | | | 35,575 | |
| | | | | | 1,202,262 | |
| | | United Kingdom—17.49% | | | | |
| 13,249 | | GlaxoSmithKline plc ADR | | | 611,441 | |
| 5,278 | | Reckitt Benckiser Group plc | | | 454,104 | |
| 45,039 | | HSBC Holdings plc | | | 383,494 | |
| 4,675 | | Royal Dutch Shell plc ADR | | | 278,864 | |
| 6,200 | | GlaxoSmithKline plc | | | 142,187 | |
| 21,851 | | British Telecom Group plc | | | 141,972 | |
| 1,176 | | British American Tobacco plc ADR | | | 122,034 | |
| 2,045 | | Royal Dutch Shell plc, Class A | | | 60,914 | |
| 7,982 | | Countrywide plc | | | 60,860 | |
| 3,283 | | IG Group Holdings plc | | | 34,528 | |
| 4,643 | | Sage Group plc | | | 32,144 | |
| 454 | | BT Group plc ADR | | | 29,587 | |
| 1,344 | | IMI plc | | | 25,420 | |
| 568 | | HSBC Holdings plc ADR | | | 24,191 | |
| 680 | | Diageo plc | | | 18,757 | |
| | | | | | 2,420,497 | |
| | | United States—3.77% | | | | |
| 2,954 | | Philip Morris Intl, Inc. | | | 222,525 | |
| 1,312 | | Core Laboratories N.V. | | | 137,091 | |
| 974 | | Harman Intl Industries, Inc. | | | 130,156 | |
| 2,469 | | Ruckus Wireless, Inc.(a) | | | 31,776 | |
| | | | | | 521,548 | |
| | | Total common stocks (Cost $11,294,832) | | | 12,780,041 | |
| | | | | | | |
| Number of shares | | Investment companies—0.83% | | Value | |
| | | Exchange Traded Funds—0.83% | | | | |
| 2,896 | | Vanguard MSCI EAFE ETF | | | $115,348 | |
| | | Total investment companies (Cost $88,905) | | | $115,348 | |
| Principal amount | | Repurchase agreement — 1.94% | | Value | |
| $268,646 | | Fixed Income Clearing Corporation, 0.00%, dated 03/31/2015, due 04/01/2015, repurchase price $268,646, (collaterized by U.S. Treasury Note, value $275,063, 1.75%, due 10/31/2020) (Cost $268,646) | | | $268,646 | |
| | | Total Investments—95.12% (Cost $11,652,383) | | | 13,164,035 | |
| | | Cash, Other Assets less Liabilities—4.88% | | | 674,699 | |
| | | Net Assets—100.00% | | | $13,838,734 | |
(a)Non-income producing.
(b)This security was purchased through more than one stock exchange and this line represents shares purchased through Xetra.
(c) This security was purchased through more than one stock exchange and this line represents shares purchased through Euronext Brussels.
ADR American Depositary Receipt
The accompanying notes are an integral part of the financial statements.
| | | | |
| | Ariel Global Fund schedule of investments | 03/31/15 (UNAUDITED) | |
| | | | |
| | | | |
| | | | | | |
| Number of shares | | Common stocks — 92.00% | | Value | |
| | | Brazil—0.66% | | | |
| 19,451 | | Itau Unibanco Holding SA ADR | | | $215,128 | |
| 22,338 | | Souza Cruz SA | | | 177,777 | |
| | | | | | 392,905 | |
| | | Canada—0.73% | | | | |
| 12,977 | | Rogers Communications Inc. | | | 434,428 | |
| | | | | | | |
| | | Chile—1.28% | | | | |
| 35,471 | | Banco Santander-Chile ADR | | | 769,011 | |
| | | | | | | |
| | | China—8.14% | | | | |
| 160,000 | | China Mobile Ltd. | | | 2,084,449 | |
| 7,906 | | Baidu, Inc. ADR(a) | | | 1,647,610 | |
| 17,000 | | China Mobile Ltd. ADR | | | 1,105,510 | |
| 22,000 | | Lenovo Group Ltd | | | 32,066 | |
| | | | | | 4,869,635 | |
| | | Finland—1.46% | | | | |
| 72,459 | | Nokia Corp. ADR | | | 549,239 | |
| 34,994 | | Nokia Corp. | | | 267,530 | |
| 1,836 | | Nokian Renkaat Corp. | | | 54,980 | |
| | | | | | 871,749 | |
| | | France—2.08% | | | | |
| 4,849 | | Michelin (CGDE) | | | 482,858 | |
| 7,553 | | BNP Paribas SA | | | 459,426 | |
| 4,949 | | Technip SA | | | 299,968 | |
| | | | | | 1,242,252 | |
| | | Germany—5.60% | | | | |
| 22,764 | | Deutsche Boerse AG | | | 1,861,720 | |
| 152,833 | | Telefonica Deutschland GmgH | | | 883,458 | |
| 13,476 | | Dialog Semiconductor plc(a) | | | 609,525 | |
| | | | | | 3,354,703 | |
| | | Hong Kong—0.27% | | | | |
| 37,500 | | Yue Yuen Industrial Holdings Ltd. | | | 133,261 | |
| 30,000 | | Li & Fung Ltd | | | 29,293 | |
| | | | | | 162,554 | |
| | | Ireland—0.21% | | | | |
| 1,875 | | Ryanair Holdings plc ADR(a) | | | 125,194 | |
| | | | | | | |
| | | Israel—0.16% | | | | |
| 25,721 | | Bank Leumi Le-Israel BM(a) | | | 95,469 | |
| | | | | | | |
| | | Italy—0.27% | | | | |
| 35,638 | | Mediaset SpA | | | 163,012 | |
| | | | |
| | Ariel Global Fund schedule of investments (continued) | | |
| | | | |
| | | | | | |
| Number of shares | | Common stocks — 92.00% | | Value | |
| | | Japan—8.03% | | | |
| 5,050 | | Nintendo Co., Ltd. | | | $744,226 | |
| 18,600 | | Canon Inc. | | | 658,797 | |
| 6,700 | | Shimamura Co., Ltd. | | | 621,203 | |
| 5,400 | | Daito Trust Construction Co., Ltd. | | | 604,452 | |
| 44,400 | | Nikon Corp. | | | 596,023 | |
| 8,000 | | Toyota Motor Corp. | | | 559,170 | |
| 15,100 | | Japan Tobacco Inc. | | | 478,489 | |
| 1,155 | | Toyota Motor Corp. ADR | | | 161,573 | |
| 2,100 | | Tokyo Electron Ltd. | | | 146,765 | |
| 3,200 | | Denso Corp. | | | 146,293 | |
| 12,900 | | Anritsu Corp. | | | 90,241 | |
| | | | | | 4,807,232 | |
| | | Macau—0.07% | | | | |
| 19,600 | | Wynn Macau Ltd | | | 42,524 | |
| | | | | | | |
| | | Mexico—0.10% | | | | |
| 5,390 | | Santander Mexico Financial Group ADR | | | 58,859 | |
| | | | | | | |
| | | Netherlands—2.56% | | | | |
| 77,749 | | Ahold N.V. | | | 1,534,053 | |
| | | | | | | |
| | | Peru—0.20% | | | | |
| 861 | | Credicorp Ltd | | | 121,082 | |
| | | | | | | |
| | | Singapore—0.32% | | | | |
| 11,500 | | United Overseas Bank Ltd. | | | 192,735 | |
| | | | | | | |
| | | Spain—0.38% | | | | |
| 5,440 | | Tecnicas Reunidas SA | | | 228,710 | |
| | | | | | | |
| | | Switzerland—5.10% | | | | |
| 6,625 | | Roche Holding AG | | | 1,827,704 | |
| 2,107 | | Swisscom AG | | | 1,223,916 | |
| | | | | | 3,051,620 | |
| | | Turkey—0.51% | | | | |
| 14,755 | | Turkcell Iletisim Hizmetleri AS ADR | | | 192,258 | |
| 6,347 | | BIM Birlesik Magazalar AS | | | 112,587 | |
| | | | | | 304,845 | |
| | | United Kingdom—8.06% | | | | |
| 42,493 | | GlaxoSmithKline plc ADR | | | 1,961,052 | |
| 48,159 | | GlaxoSmithKline plc | | | 1,104,448 | |
| 68,951 | | HSBC Holdings plc | | | 587,098 | |
| 5,236 | | Reckitt Benckiser Group plc | | | 450,491 | |
| 7,237 | | Royal Dutch Shell plc ADR | | | 431,687 | |
| 27,462 | | British Telecom Group plc | | | 178,429 | |
| 2,549 | | HSBC Holdings plc ADR | | | 108,562 | |
| | | | | | 4,821,767 | |
| | | | | | |
| Number of shares | | Common stocks — 92.00% | | Value | |
| | | United States—45.81% | | | |
| 33,282 | | Gilead Sciences, Inc.(a) | | | $3,265,963 | |
| 73,101 | | Microsoft Corp. | | | 2,971,921 | |
| 19,692 | | Harman Intl Industries, Inc. | | | 2,631,442 | |
| 23,434 | | Johnson & Johnson | | | 2,357,460 | |
| 36,742 | | Verizon Communications Inc. | | | 1,786,763 | |
| 61,910 | | Tumi Holdings Inc.(a) | | | 1,514,319 | |
| 18,971 | | Quest Diagnostics Inc. | | | 1,457,921 | |
| 27,464 | | Broadcom Corp., Class A | | | 1,189,054 | |
| 91,109 | | Acacia Research Corp. | | | 974,866 | |
| 12,800 | | Philip Morris Intl, Inc. | | | 964,224 | |
| 63,521 | | QLogic Corp.(a) | | | 936,300 | |
| 20,607 | | U.S. Bancorp | | | 899,908 | |
| 60,289 | | Ruckus Wireless, Inc.(a) | | | 775,919 | |
| 16,509 | | Southern Co. | | | 731,019 | |
| 7,304 | | Schlumberger Ltd. | | | 609,446 | |
| 7,318 | | Wal-Mart Stores, Inc. | | | 601,906 | |
| 5,584 | | Core Laboratories N.V. | | | 583,472 | |
| 4,630 | | The PNC Financial Service Group, Inc. | | | 431,701 | |
| 2,926 | | Berkshire Hathaway Inc., Class B(a) | | | 422,280 | |
| 7,914 | | Coach, Inc. | | | 327,877 | |
| 12,804 | | EMC Corp. | | | 327,270 | |
| 6,272 | | Altera Corp. | | | 269,132 | |
| 2,178 | | Praxair, Inc. | | | 262,972 | |
| 2,482 | | Ansys, Inc.(a) | | | 218,888 | |
| 1,456 | | Rockwell Collins, Inc. | | | 140,577 | |
| 1,418 | | Accenture plc, Class A | | | 132,852 | |
| 1,009 | | CME Group Inc. | | | 95,562 | |
| 4,137 | | NVIDIA Corp. | | | 86,567 | |
| 492 | | Panera Bread Co.(a) | | | 78,718 | |
| 851 | | State Street Corp. | | | 62,574 | |
| 977 | | JPMorgan Chase & Co. | | | 59,187 | |
| 1,225 | | Expeditors Intl of Washington | | | 59,021 | |
| 458 | | M&T Bank Corp. | | | 58,166 | |
| 238 | | W.W. Grainger Inc. | | | 56,123 | |
| 1,334 | | Fastenal Co. | | | 55,274 | |
| 327 | | American Express Co. | | | 25,545 | |
| | | | | | 27,422,189 | |
| | | Total common stocks (Cost $47,745,032) | | | 55,066,528 | |
| | | | | | | |
| Number of shares | | Investment companies—0.96% | | Value | |
| | | Exchange Traded Funds—0.96% | | | | |
| 7,104 | | Vanguard FTSE Emerging Markets ETF | | | $290,340 | |
| 4,599 | | Vanguard Total World Stock Index Fund (ETF) | | | 283,252 | |
| | | | | | 573,592 | |
| | | Total investment companies (Cost $570,502) | | | 573,592 | |
| Principal amount | | Repurchase agreement — 4.67% | | Value | |
| $2,798,123 | | Fixed Income Clearing Corporation, 0.00%, dated 03/31/2015, due 04/01/2015, repurchase price $2,798,123, (collaterized by U.S. Treasury Note, value $2,857,594, 1.75%, due 10/31/2020) (Cost $2,798,123) | | | $2,798,123 | |
| | | Total Investments—97.63% (Cost $51,113,657) | | | 58,438,243 | |
| | | Cash, Other Assets less Liabilities—2.37% | | | 1,417,168 | |
| | | Net Assets—100.00% | | | $59,855,411 | |
(a)Non-income producing.
ADR American Depositary Receipt
The accompanying notes are an integral part of the financial statements.
| | | | |
| | Statements of assets & liabilities | | |
| | | | |
| | | | | | | | | | | | | |
| | | Ariel Fund | | | Ariel Appreciation Fund | | | Ariel Focus Fund | | | Ariel Discovery Fund | |
| Assets: | | | | | | | | | | | | |
| Investments in unaffiliated issuers, at value (cost $1,143,929,937, $1,185,627,262, $53,504,162 and $42,426,501, respectively) | | | $2,131,638,050 | | | | $2,010,653,686 | | | | $64,239,399 | | | | $40,064,567 | |
| | | | | | | | | | | | | | | | | |
Investments in affiliated issuers, at value (cost $198,827,613) | | | 152,866,752 | | | | — | | | | — | | | | — | |
| Repurchase agreements, at value (cost $125,838,754, $99,680,274, $1,235,666 and $456,019, respectively) | | | 125,838,754 | | | | 99,680,274 | | | | 1,235,666 | | | | 456,019 | |
| Cash | | | 162,440,907 | | | | — | | | | — | | | | — | |
| Receivable for fund shares sold | | | 7,342,321 | | | | 1,506,439 | | | | 52,132 | | | | 2,069 | |
| Receivable for securities sold | | | 1,340,059 | | | | — | | | | — | | | | 250,835 | |
| Dividends and interest receivable | | | 901,484 | | | | 2,377,526 | | | | 19,510 | | | | 9,698 | |
| Prepaid and other assets | | | 67,317 | | | | 45,573 | | | | 22,250 | | | | 27,340 | |
| Total assets | | | 2,582,435,644 | | | | 2,114,263,498 | | | | 65,568,957 | | | | 40,810,528 | |
| | | | | | | | | | | | | | | | | |
| Liabilities: | | | | | | | | | | | | | | | | |
| Payable for securities purchased | | | 602,521 | | | | — | | | | — | | | | — | |
| Payable for fund shares redeemed | | | 3,033,133 | | | | 2,554,438 | | | | 321,130 | | | | 169,443 | |
| Other liabilities | | | 848,237 | | | | 786,072 | | | | 53,842 | | | | 47,578 | |
| Total liabilities | | | 4,483,891 | | | | 3,340,510 | | | | 374,972 | | | | 217,021 | |
| Net assets | | | $2,577,951,753 | | | | $2,110,922,988 | | | | $65,193,985 | | | | $40,593,507 | |
| | | | | | | | | | | | | | | | | |
| Net assets consist of: | | | | | | | | | | | | | | | | |
| Paid-in capital | | | $1,484,704,685 | | | | $1,202,453,737 | | | | $52,217,302 | | | | $42,577,577 | |
| Undistributed net investment income (loss) | | | 8,668,854 | | | | 9,172,802 | | | | 153,478 | | | | (107,383 | ) |
| Accumulated net realized gain on investments | | | 142,830,962 | | | | 74,270,025 | | | | 2,087,968 | | | | 485,247 | |
| Net unrealized appreciation (depreciation) on investments | | | 941,747,252 | | | | 825,026,424 | | | | 10,735,237 | | | | (2,361,934 | ) |
| Total net assets | | | $2,577,951,753 | | | | $2,110,922,988 | | | | $65,193,985 | | | | $40,593,507 | |
| | | | | | | | | | | | | | | | | |
| Investor class shares: | | | | | | | | | | | | | | | | |
| Net assets | | | $1,942,822,719 | | | | $1,905,416,671 | | | | $52,862,107 | | | | $8,192,328 | |
| Shares outstanding (no par value, unlimited authorized) | | | 25,360,868 | | | | 34,045,758 | | | | 3,837,045 | | | | 715,636 | |
| Net asset value, offering and redemption price per share | | | $76.61 | | | | $55.97 | | | | $13.78 | | | | $11.45 | |
| | | | | | | | | | | | | | | | | |
| Institutional class shares: | | | | | | | | | | | | | | | | |
| Net assets | | | $635,129,034 | | | | $205,506,317 | | | | $12,331,878 | | | | $32,401,179 | |
| Shares outstanding (no par value, unlimited authorized) | | | 8,283,049 | | | | 3,665,982 | | | | 895,786 | | | | 2,802,190 | |
| Net asset value, offering and redemption price per share | | | $76.68 | | | | $56.06 | | | | $13.77 | | | | $11.56 | |
The accompanying notes are an integral part of the financial statements.
| | | | | | | |
| | | Ariel International Fund | | | Ariel Global Fund | |
| Assets: | | | | | | |
| | | | | | | |
| Investments in unaffiliated issuers, at value (cost $11,383,737 and $48,315,534, respectively) | | $12,895,389 | | | $55,640,120 | |
| | | | | | | |
| Repurchase agreements, at value (cost $268,646 and $2,798,123, respectively) | | 268,646 | | | 2,798,123 | |
| | | | | | | |
| Foreign currencies (cost $788,375 and $1,228,129, respectively) | | 765,460 | | | 1,229,477 | |
| | | | | | | |
| Dividends and interest receivable | | 46,358 | | | 139,844 | |
| Receivable for dividend reclaims | | 19,442 | | | 49,263 | |
| Receivable for fund shares sold | | 5,431 | | | 53,181 | |
| Receivable for securities and foreign currencies sold | | 21,855 | | | 131 | |
| Appreciation of forward currency contracts (see Note Five) | | 24,060 | | | 137,565 | |
| Prepaid and other assets | | 26,180 | | | 29,104 | |
| Total assets | | 14,072,821 | | | 60,076,808 | |
| | | | | | | |
| Liabilities: | | | | | | |
| Payable for securities and foreign currencies purchased | | 14,405 | | | 153,761 | |
| Depreciation of forward currency contracts (see Note Five) | | 22,079 | | | 14,779 | |
| Payable for fund shares redeemed | | 146,613 | | | — | |
| Other liabilities | | 50,990 | | | 52,857 | |
| Total liabilities | | 234,087 | | | 221,397 | |
| Net assets | | $13,838,734 | | | $59,855,411 | |
| | | | | | | |
| Net assets consist of: | | | | | | |
| Paid-in capital | | $12,800,670 | | | $53,513,044 | |
| Undistributed net investment income | | 74,623 | | | 181,204 | |
| Accumulated net realized loss on investments, foreign currencies and forward currency contracts | | (524,964 | ) | | (1,281,847 | ) |
Net unrealized appreciation (depreciation) on:
Investments | | 1,511,652 | | | 7,324,586 | |
| Translation of assets and liabilities in foreign currencies | | (25,228 | ) | | (4,362 | ) |
| Forward currency contracts | | 1,981 | | | 122,786 | |
| Total net assets | | $13,838,734 | | | $59,855,411 | |
| | | | | | | |
| Investor class shares: | | | | | | |
| Net assets | | $5,207,863 | | | $4,507,784 | |
| Shares outstanding (no par value, unlimited authorized) | | 408,519 | | | 318,551 | |
| Net asset value, offering and redemption price per share | | $12.75 | | | $14.15 | |
| | | | | | | |
| Institutional class shares: | | | | | | |
| Net assets | | $8,630,871 | | | $55,347,627 | |
| Shares outstanding (no par value, unlimited authorized) | | 689,900 | | | 4,008,964 | |
| Net asset value, offering and redemption price per share | | $12.51 | | | $13.81 | |
The accompanying notes are an integral part of the financial statements.
| | | | | | | | | | | | | |
| | | Ariel Fund | | | Ariel Appreciation Fund | | | Ariel Focus Fund | | | Ariel Discovery Fund | |
| Investment income: | | | | | | | | | | | | |
| Dividends | | | | | | | | | | | | |
| Unaffiliated issuers | | | $18,951,495 | | | | $20,850,395 | | | | $616,385 | (b) | | | $124,827 | |
| Affiliated issuers | | | 442,094 | (a) | | | — | | | | — | | | | — | |
| Total investment income | | | 19,393,589 | | | | 20,850,395 | | | | 616,385 | | | | 124,827 | |
| | | | | | | | | | | | | | | | | |
| Expenses: | | | | | | | | | | | | | | | | |
| Management fees | | | 6,796,582 | | | | 6,958,783 | | | | 212,949 | | | | 176,236 | |
| Distribution fees (Investor Class) | | | 2,269,774 | | | | 2,297,089 | | | | 66,116 | | | | 11,576 | |
| Shareholder service fees | | | | | | | | | | | | | | | | |
| Investor Class | | | 896,682 | | | | 952,538 | | | | 21,568 | | | | 13,110 | |
| Institutional Class | | | 189,780 | | | | 41,038 | | | | 1,912 | | | | 15,226 | |
| Transfer agent fees and expenses | | | | | | | | | | | | | | | | |
| Investor Class | | | 296,174 | | | | 258,300 | | | | 31,930 | | | | 13,652 | |
| Institutional Class | | | 9,914 | | | | 10,456 | | | | 8,006 | | | | 8,556 | |
| Printing and postage expenses | | | | | | | | | | | | | | | | |
| Investor Class | | | 238,582 | | | | 223,574 | | | | 9,650 | | | | 4,824 | |
| Institutional Class | | | 25,476 | | | | 5,370 | | | | 548 | | | | 1,730 | |
| Trustees’ fees and expenses | | | 135,130 | | | | 120,666 | | | | 22,022 | | | | 21,476 | |
| Professional fees | | | 53,230 | | | | 48,496 | | | | 19,018 | | | | 18,746 | |
| Custody fees and expenses | | | 22,854 | | | | 20,032 | | | | 2,286 | | | | 3,650 | |
| Federal and state registration fees | | | 43,208 | | | | 33,132 | | | | 17,200 | | | | 17,478 | |
| Interest expense | | | 109 | | | | — | | | | 47 | | | | 339 | |
| Miscellaneous expenses | | | 72,440 | | | | 63,854 | | | | 7,628 | | | | 5,724 | |
| Total expenses before reimbursements | | | 11,049,935 | | | | 11,033,328 | | | | 420,880 | | | | 312,323 | |
| Expense reimbursements | | | — | | | | — | | | | (109,007 | ) | | | (80,113 | ) |
| Net expenses | | | 11,049,935 | | | | 11,033,328 | | | | 311,873 | | | | 232,210 | |
| Net investment income (loss) | | | 8,343,654 | | | | 9,817,067 | | | | 304,512 | | | | (107,383 | ) |
| | | | | | | | | | | | | | | | | |
| Realized and unrealized gain: | | | | | | | | | | | | | | | | |
| Net realized gain on investments | | | | | | | | | | | | | | | | |
| Unaffiliated issuers | | | 198,328,278 | | | | 108,091,922 | | | | 2,602,842 | | | | 1,546,915 | |
| Affiliated issuers | | | — | (a) | | | — | | | | — | | | | — | |
| Change in net unrealized appreciation (depreciation) on investments | | | | | | | | | | | | | | | | |
| Unaffiliated issuers | | | 155,219,839 | | | | 112,857,031 | | | | (2,069,977 | ) | | | 676,976 | |
| Affiliated issuers | | | (22,109,905 | ) | | | — | | | | — | | | | — | |
| Net gain on investments | | | 331,438,212 | | | | 220,948,953 | | | | 532,865 | | | | 2,223,891 | |
| Net increase in net assets resulting from operations | | | $339,781,866 | | | | $230,766,020 | | | | $837,377 | | | | $2,116,508 | |
(a)See Note Six for information on affiliated issuers. |
(b)Net of $1,796 in foreign taxes withheld. |
| The accompanying notes are an integral part of the financial statements. |
| |
| 42 | ARIELINVESTMENTS.COM |
| | | | |
| | | SIX MONTHS ENDED 03/31/15 (UNAUDITED) | |
| | | | |
| | | | |
| | | | | | | |
| | | Ariel International Fund | | | Ariel Global Fund | |
| Investment income: | | | | | | |
| Dividends | | | | | | |
| Unaffiliated issuers | | $126,902 | (a) | | $517,504 | (a) |
| Total investment income | | 126,902 | | | 517,504 | |
| | | | | | | |
| Expenses: | | | | | | |
| Management fees | | 52,925 | | | 228,867 | |
| Distribution fees (Investor Class) | | 6,044 | | | 3,862 | |
| Shareholder service fees | | | | | | |
| Investor Class | | 13,288 | | | 12,012 | |
| Institutional Class | | 910 | | | 10,102 | |
| Transfer agent fees and expenses | | | | | | |
| Investor Class | | 12,278 | | | 12,094 | |
| Institutional Class | | 8,638 | | | 8,274 | |
| Printing and postage expenses | | | | | | |
| Investor Class | | 3,732 | | | 3,550 | |
| Institutional Class | | 1,366 | | | 1,002 | |
| Trustees’ fees and expenses | | 19,474 | | | 20,748 | |
| Professional fees | | 19,006 | | | 19,008 | |
| Custody fees and expenses | | 7,106 | | | 8,288 | |
| Administration fees | | 24,842 | | | 24,934 | |
| Fund accounting fees | | 22,266 | | | 22,086 | |
| Federal and state registration fees | | 17,116 | | | 17,204 | |
| Interest expense | | 318 | | | 755 | |
| Miscellaneous expenses | | 5,090 | | | 5,634 | |
| Total expenses before reimbursements | | 214,399 | | | 398,420 | |
| Expense reimbursements | | (141,881 | ) | | (107,719 | ) |
| Net expenses | | 72,518 | | | 290,701 | |
| Net investment income | | 54,384 | | | 226,803 | |
| | | | | | | |
| Realized and unrealized loss: | | | | | | |
| Net realized loss on: | | | | | | |
| Investments | | (280,140 | ) | | (940,555 | ) |
| Foreign currency translations | | (83,072 | ) | | (168,719 | ) |
| Forward currency contracts | | (160,204 | ) | | (137,447 | ) |
| Total | | (523,416 | ) | | (1,246,721 | ) |
| Change in net unrealized appreciation (depreciation) on: | | | | | | |
| Investments | | 864,785 | | | 2,341,367 | |
| Foreign currency translations | | (17,545 | ) | | 3,163 | |
| Forward currency contracts | | 28,013 | | | 80,335 | |
| Total | | 875,253 | | | 2,424,865 | |
| Net gain on investments | | 351,837 | | | 1,178,144 | |
| Net increase in net assets resulting from operations | | $406,221 | | | $1,404,947 | |
(a)Net of $9,893 and $24,365 in foreign taxes withheld, respectively. |
| The accompanying notes are an integral part of the financial statements. |
| |
| 800.292.7435 | 43 |
| | |
| | Statements of changes in net assets |
| | |
| | |
| | | | | | | | | | | | | |
| | | Ariel Fund | | | Ariel Appreciation Fund | |
| | | Six Months Ended March 31, 2015 (Unaudited) | | | Year Ended September 30, 2014 | | | Six Months Ended March 31, 2015 (Unaudited) | | Year Ended September 30, 2014 | |
| Operations: | | | | | | | | | | | | |
| Net investment income | | | | | $21,256,987 | | | $9,817,067 | | | $16,414,474 | |
| Net realized gain on investments and foreign currency translations | | 198,328,278 | | | 345,759,329 | | | 108,091,922 | | | 210,407,806 | |
| Change in net unrealized appreciation (depreciation)on investments and foreign currency translations | | 133,109,934 | | | (51,184,838 | ) | | 112,857,031 | | | 22,139 | |
| Net increase in net assets from operations | | 339,781,866 | | | 315,831,478 | | | 230,766,020 | | | 226,844,419 | |
| | | | | | | | | | | | | |
| Distributions to shareholders: | | | | | | | | | | | | |
| Net investment income | | | | | | | | | | | | |
| Investor Class | | (9,991,682 | ) | | (10,851,589 | ) | | (12,975,423 | ) | | (14,751,167 | ) |
| Institutional Class | | (4,565,741 | ) | | (4,607,417 | ) | | (1,997,000 | ) | | (1,572,228 | ) |
| Capital gains | | | | | | | | | | | | |
| Investor Class | | (218,025,914 | ) | | — | | | (192,280,387 | ) | | (118,921,348 | ) |
| Institutional Class | | (52,469,101 | ) | | — | | | (19,253,268 | ) | | (8,666,891 | ) |
| Total distributions | | (285,052,438 | ) | | (15,459,006 | ) | | (226,506,078 | ) | | (143,911,634 | ) |
| | | | | | | | | | | | | |
| Share transactions: | | | | | | | | | | | | |
| Shares issued | | | | | | | | | | | | |
| Investor Class | | 186,748,953 | | | 318,436,106 | | | 133,698,748 | | | 276,063,353 | |
| Institutional Class | | 247,290,596 | | | 229,450,739 | | | 37,510,791 | | | 66,585,579 | |
| Shares issued in reinvestment of dividends and distributions | | | | | | | | | | | | |
| Investor Class | | 222,753,416 | | | 10,618,853 | | | 200,305,949 | | | 130,740,322 | |
| Institutional Class | | 57,031,676 | | | 4,604,671 | | | 20,271,790 | | | 10,235,442 | |
| Shares redeemed | | | | | | | | | | | | |
| Investor Class | | (263,568,510 | ) | | (603,276,772 | ) | | (209,800,970 | ) | | (464,353,100 | ) |
| Institutional Class | | (77,269,175 | ) | | (263,154,871 | ) | | (22,549,673 | ) | | (31,986,635 | ) |
| Net increase (decrease) from share transactions | | 372,986,956 | | | (303,321,274 | ) | | 159,436,635 | | | (12,715,039 | ) |
| Total increase (decrease) in net assets | | 427,716,384 | | | (2,948,802 | ) | | 163,696,577 | | | 70,217,746 | |
| | | | | | | | | | | | | |
| Net assets: | | | | | | | | | | | | |
| Beginning of year | | 2,150,235,369 | | | 2,153,184,171 | | | 1,947,226,411 | | | 1,877,008,665 | |
| End of period | | $2,577,951,753 | | | | | | $2,110,922,988 | | | $1,947,226,411 | |
| Undistributed net investment income included in net assets at end of period | | $8,668,854 | | | $14,882,623 | | | $9,172,802 | | | $14,328,158 | |
| | | | | | | | | | | | | |
| Capital share transactions: | | | | | | | | | | | | |
| Investor shares | | | | | | | | | | | | |
| Shares sold | | 2,506,439 | | | 4,271,626 | | | 2,453,214 | | | 4,988,648 | |
| Shares issued to holders in reinvestment of dividends | | 3,117,566 | | | 144,415 | | | 3,759,118 | | | 2,441,961 | |
| Shares redeemed | | (3,614,995 | ) | | (8,325,017 | ) | | (3,838,756 | ) | | (8,424,192 | ) |
| Net increase (decrease) | | 2,009,010 | | | (3,908,976 | ) | | 2,373,576 | | | (993,583 | ) |
| Institutional shares | | | | | | | | | | | | |
| Shares sold | | 3,333,443 | | | 3,194,012 | | | 681,544 | | | 1,201,260 | |
| Shares issued to holders in reinvestment of dividends | | 795,751 | | | 62,631 | | | 378,926 | | | 190,346 | |
| Shares redeemed | | (1,028,876 | ) | | (3,640,163 | ) | | (412,100 | ) | | (574,780 | ) |
| Net increase (decrease) | | 3,100,318 | | | (383,520 | ) | | 648,370 | | | 816,826 | |
The accompanying notes are an integral part of the financial statements.
| | | | | | | | | | | | | |
| | Ariel Focus Fund | | | Ariel Discovery Fund | |
| | | Six Months Ended March 31, 2015 (Unaudited) | | Year Ended September 30, 2014 | | | Six Months Ended March 31, 2015 (Unaudited) | | Year Ended September 30, 2014 | |
| Operations: | | | | | | | | | | | | |
| Net investment income (loss) | | | | | $516,820 | | | $(107,383 | ) | | $(309,409 | ) |
Net realized gain on investments and foreign currency translations | | 2,602,842 | | | 6,657,134 | | | 1,546,915 | | | 1,840,036 | |
Change in net unrealized appreciation (depreciation) on investments and foreign currency translations | | (2,069,977 | ) | | 1,642,553 | | | 676,976 | | | (5,638,975 | ) |
| Net increase (decrease) in net assets from operations | | 837,377 | | | 8,816,507 | | | 2,116,508 | | | (4,108,348 | ) |
| | | | | | | | | | | | | |
| Distributions to shareholders: | | | | | | | | | | | | |
| Net investment income | | | | | | | | | | | | |
| Investor Class | | (403,404 | ) | | (294,442 | ) | | — | | | — | |
| Institutional Class | | (136,885 | ) | | (120,809 | ) | | — | | | — | |
| Capital gains | | | | | | | | | | | | |
| Investor Class | | (5,136,235 | ) | | (2,162,389 | ) | | (494,961 | ) | | (147,218 | ) |
| Institutional Class | | (1,205,972 | ) | | (589,253 | ) | | (1,846,490 | ) | | (446,951 | ) |
| Total distributions | | $(6,882,496 | ) | | $(3,166,893 | ) | | $(2,341,451 | ) | | $(594,169 | ) |
| | | | | | | | | | | | | |
| Share transactions: | | | | | | | | | | | | |
| Shares issued | | | | | | | | | | | | |
| Investor Class | | 4,529,407 | | | 16,051,424 | | | 1,199,707 | | | 4,006,796 | |
| Institutional Class | | 74,481 | | | 815,186 | | | 1,413,221 | | | 20,339,273 | |
Shares issued in reinvestment of dividends and distributions | | | | | | | | | | | | |
| Investor Class | | 4,800,743 | | | 2,139,910 | | | 485,212 | | | 145,169 | |
| Institutional Class | | 1,339,752 | | | 707,489 | | | 1,846,490 | | | 446,951 | |
| Shares redeemed | | | | | | | | | | | | |
| Investor Class | | (5,090,388 | ) | | (13,132,875 | ) | | (3,769,526 | ) | | (3,253,455 | ) |
| Institutional Class | | (422,487 | ) | | (1,519,712 | ) | | (6,597,736 | ) | | (8,076,188 | ) |
| Net increase (decrease) from share transactions | | 5,231,508 | | | 5,061,422 | | | (5,422,632 | ) | | 13,608,546 | |
| Total increase (decrease) in net assets | | (813,611 | ) | | 10,711,036 | | | (5,647,575 | ) | | 8,906,029 | |
| | | | | | | | | | | | | |
| Net assets: | | | | | | | | | | | | |
| Beginning of year | | 66,007,596 | | | 55,296,560 | | | 46,241,082 | | | 37,335,053 | |
| End of period | | | | | $66,007,596 | | | $40,593,507 | | | $46,241,082 | |
Undistributed net investment income (loss) included in net assets at end of period | | $153,478 | | | $389,255 | | | $(107,383 | ) | | $— | |
| | | | | | | | | | | | | |
| Capital share transactions: | | | | | | | | | | | | |
| Investor shares | | | | | | | | | | | | |
| Shares sold | | 317,917 | | | 1,120,567 | | | 101,680 | | | 306,814 | |
| Shares issued to holders in reinvestment of dividends | | 340,544 | | | 153,101 | | | 41,578 | | | 11,193 | |
| Shares redeemed | | (359,382 | ) | | (906,178 | ) | | (313,609 | ) | | (253,072 | ) |
| Net increase (decrease) | | 299,079 | | | 367,490 | | | (170,351 | ) | | 64,935 | |
| Institutional shares | | | | | | | | | | | | |
| Shares sold | | 5,193 | | | 56,737 | | | 118,632 | | | 1,527,516 | |
| Shares issued to holders in reinvestment of dividends | | 94,904 | | | 50,500 | | | 156,748 | | | 34,275 | |
| Shares redeemed | | (30,637 | ) | | (100,680 | ) | | (550,357 | ) | | (645,932 | ) |
| Net increase (decrease) | | 69,460 | | | 6,557 | | | (274,977 | ) | | 915,859 | |
The accompanying notes are an integral part of the financial statements.
| | |
| | Statements of changes in net assets (continued) |
| | |
| | |
| | | | | | | | | | | | | |
| | | Ariel International Fund | | | Ariel Global Fund | |
| | | Six Months Ended March 31, 2015 (Unaudited) | | Year Ended September 30, 2014 | | | Six Months Ended March 31, 2015 (Unaudited) | | Year Ended September 30, 2014 | |
| Operations: | | | | | | | | | | | | |
| Net investment income | | | | | $257,600 | | | $226,803 | | | $705,303 | |
| Net realized income (loss) on investments and foreign currency translations | | (523,416 | ) | | 368,909 | | | (1,246,721 | ) | | 799,140 | |
| Change in net unrealized appreciation (depreciation) on investments and foreign currency translations | | 875,253 | | | (386,480 | ) | | 2,424,865 | | | 1,954,904 | |
| Net increase in net assets from operations | | 406,221 | | | 240,029 | | | 1,404,947 | | | 3,459,347 | |
| | | | | | | | | | | | | |
| Distributions to shareholders: | | | | | | | | | | | | |
| Net investment income | | | | | | | | | | | | |
| Investor Class | | (51,220 | ) | | — | | | — | | | — | |
| Institutional Class | | (160,003 | ) | | (19,643 | ) | | (728,413 | ) | | (111,707 | ) |
| Capital gains | | | | | | | | | | | | |
| Investor Class | | (125,440 | ) | | (54,466 | ) | | (28,533 | ) | | (44,335 | ) |
| Institutional Class | | (221,181 | ) | | (56,777 | ) | | (551,839 | ) | | (664,135 | ) |
| Total distributions | | (557,844 | ) | | (130,886 | | | (1,308,785 | ) | | (820,177 | ) |
| | | | | | | | | | | | | |
| Share transactions: | | | | | | | | | | | | |
| Shares issued | | | | | | | | | | | | |
| Investor Class | | 904,342 | | | 3,823,489 | | | 1,991,485 | | | 1,214,914 | |
| Institutional Class | | 90,878 | | | 4,391,458 | | | 108,016 | | | 24,769,222 | |
| Shares issued in reinvestment of dividends and distributions | | | | | | | | | | | | |
| Investor Class | | 140,873 | | | 42,272 | | | 17,785 | | | 22,614 | |
| Institutional Class | | 366,323 | | | 70,701 | | | 1,271,708 | | | 767,187 | |
| Shares redeemed | | | | | | | | | | | | |
| Investor Class | | (649,788 | ) | | (1,356,437 | ) | | (348,125 | ) | | (553,655 | ) |
| Institutional Class | | (159,483 | ) | | (172,493 | ) | | (34,249 | ) | | (36,148 | ) |
| Net increase from share transactions | | 693,145 | | | 6,798,990 | | | 3,006,620 | | | 26,184,134 | |
| Total increase in net assets | | 541,522 | | | 6,908,133 | | | 3,102,782 | | | 28,823,304 | |
| | | | | | | | | | | | | |
| Net assets: | | | | | | | | | | | | |
| Beginning of year | | 13,297,212 | | | 6,389,079 | | | 56,752,629 | | | 27,929,325 | |
| End of period | | $13,838,734 | | | $13,297,212 | | | $59,855,411 | | | $56,752,629 | |
| Undistributed net investment income included in net assets at end of period | | $74,623 | | | $231,462 | | | $181,204 | | | $682,814 | |
| | | | | | | | | | | | | |
| Capital share transactions: | | | | | | | | | | | | |
| Investor shares | | | | | | | | | | | | |
| Shares sold | | 72,575 | | | 293,416 | | | 140,891 | | | 89,286 | |
| Shares issued to holders in reinvestment of dividends | | 11,371 | | | 3,368 | | | 1,263 | | | 1,734 | |
| Shares redeemed | | (52,109 | ) | | (102,673 | ) | | (25,293 | ) | | (40,732 | ) |
| Net increase | | 31,837 | | | 194,111 | | | 116,861 | | | 50,288 | |
| Institutional shares | | | | | | | | | | | | |
| Shares sold | | 7,447 | | | 336,142 | | | 7,921 | | | 1,818,325 | |
| Shares issued to holders in reinvestment of dividends | | 30,111 | | | 5,661 | | | 93,004 | | | 59,445 | |
| Shares redeemed | | (12,820 | ) | | (13,329 | ) | | (2,502 | ) | | (2,776 | ) |
| Net increase | | 24,738 | | | 328,474 | | | 98,423 | | | 1,874,994 | |
The accompanying notes are an integral part of the financial statements.
| | |
| | Financial highlights For a share outstanding throughout each period |
| | |
| | |
| | | | | | | | | | | | | | | | | | | | |
| | | | | | Year ended September 30 |
Ariel Fund (Investor Class) | | Six months ended March 31, 2015 (Unaudited) | | | 2014 | | | 2013 | | | 2012 | | | 2011 | | | 2010 | | |
| Net asset value, beginning of year | | $75.33 | | | $65.57 | | | $49.67 | | | $36.74 | | | $42.78 | | | $35.78 | | |
| Income from investment operations: | | | | | | | | | | | | | | | | | | | |
| Net investment income (loss) | | 0.19 | | | 0.67 | | | 0.48 | | | 0.29 | | | 0.09 | | | (0.07 | ) | |
| Net realized and unrealized gains | | | | | | | | | | | | | | | | | | | |
| (losses) on investments | | 10.92 | | | 9.50 | | | 15.91 | | | 12.73 | | | (6.13 | ) | | 7.08 | | |
| Total from investment operations | | 11.11 | | | 10.17 | | | 16.39 | | | 13.02 | | | (6.04 | ) | | 7.01 | | |
| | | | | | | | | | | | | | | | | | | | |
| Distributions to shareholders: | | | | | | | | | | | | | | | | | | | |
| Dividends from net investment income | | (0.40 | ) | | (0.41 | ) | | (0.49 | ) | | (0.09 | ) | | (0.00 | )(a) | | (0.01 | ) | |
| Distributions from capital gains | | (9.43 | ) | | — | | | — | | | — | | | — | | | — | | |
| Total distributions | | (9.83 | ) | | (0.41 | ) | | (0.49 | ) | | (0.09 | ) | | (0.00 | ) | | (0.01 | ) | |
| Net asset value, end of period | | $76.61 | | | $75.33 | | | $65.57 | | | $49.67 | | | $36.74 | | | $42.78 | | |
| Total return | | 15.76 | %(b) | | 15.52 | % | | 33.28 | % | | 35.48 | % | | (14.11 | )% | | 19.58 | % | |
| | | | | | | | | | | | | | | | | | | | |
| Supplemental data and ratios: | | | | | | | | | | | | | | | | | | | |
| Net assets, end of period, in thousands | | $1,942,823 | | | $1,759,016 | | | $1,787,490 | | | $1,422,415 | | | $1,350,852 | | | $1,953,134 | | |
| Ratio of expenses to average net assets | | 1.02 | %(c) | | 1.03 | % | | 1.03 | % | | 1.06 | % | | 1.04 | % | | 1.06 | % | |
| Ratio of net investment income (loss) | | | | | | | | | | | | | | | | | | | |
| to average net assets | | 0.64 | %(c) | | 0.88 | % | | 0.83 | % | | 0.56 | % | | 0.16 | % | | (0.16 | )% | |
| Portfolio turnover rate | | 14 | %(b) | | 29 | % | | 30 | % | | 27 | % | | 29 | % | | 40 | % | |
| | | | | | | | | | | | | | | | | | | | |
| | | | | | Year ended September 30 | | | | | | | | | | | |
Ariel Fund (Institutional Class) | | Six months ended March 31, 2015 (Unaudited) | | | 2014 | | | 2013 | | | December 30, 2011(d) to September 30, 2012 | | | | | | | | |
| Net asset value, beginning of year | | $75.49 | | | $65.70 | | | $49.79 | | | $42.97 | | | | | | | | |
| Income from investment operations: | | | | | | | | | | | | | | | | | | | |
| Net investment income | | 0.20 | | | 0.81 | | | 0.59 | | | 0.36 | | | | | | | | |
| Net realized and unrealized gains | | | | | | | | | | | | | | | | | | | |
| on investments | | 11.04 | | | 9.60 | | | 16.00 | | | 6.46 | | | | | | | | |
| Total from investment operations | | 11.24 | | | 10.41 | | | 16.59 | | | 6.82 | | | | | | | | |
| | | | | | | | | | | | | | | | | | | | |
| Distributions to shareholders: | | | | | | | | | | | | | | | | | | | |
| Dividends from net investment income | | (0.62 | ) | | (0.62 | ) | | (0.68 | ) | | — | | | | | | | | |
| Distributions from capital gains | | (9.43 | ) | | — | | | — | | | — | | | | | | | | |
| Total distributions | | (10.05 | ) | | (0.62 | ) | | (0.68 | ) | | 0.00 | | | | | | | | |
| Net asset value, end of period | | $76.68 | | | $75.49 | | | $65.70 | | | $49.79 | | | | | | | | |
| Total return | | 15.94 | %(b) | | 15.88 | % | | 33.72 | % | | 15.87 | %(b) | | | | | | | |
| | | | | | | | | | | | | | | | | | | | |
| Supplemental data and ratios: | | | | | | | | | | | | | | | | | | | |
| Net assets, end of period, in thousands | | $635,129 | | | $391,219 | | | $365,694 | | | $103,092 | | | | | | | | |
| Ratio of expenses to average net assets | | 0.70 | %(c) | | 0.72 | % | | 0.72 | % | | 0.68 | %(c) | | | | | | | |
| Ratio of net investment income | | | | | | | | | | | | | | | | | | | |
| to average net assets | | 0.97 | %(c) | | 1.21 | % | | 1.04 | % | | 1.06 | %(c) | | | | | | | |
| Portfolio turnover rate | | 14 | %(b) | | 29 | % | | 30 | % | | 27 | %(b) | | | | | | | |
(a)Amount is less than $(0.005).
(b)Not annualized.
(c)Annualized.
(d)Commencement of operations.
The accompanying notes are an integral part of the financial statements.
| | |
| | Financial highlights For a share outstanding throughout each period (continued) |
| | |
| | |
| | | | | | | | | | | | | | | | | | | | |
| | | | | | Year ended September 30 |
Ariel Appreciation Fund (Investor Class) | | Six months ended March 31, 2015 (Unaudited) | | | 2014 | | | 2013 | | | 2012 | | | 2011 | | | 2010 | | |
| Net asset value, beginning of year | | $56.12 | | | $53.83 | | | $45.13 | | | $34.81 | | | $37.79 | | | $32.16 | | |
| Income from investment operations: | | | | | | | | | | | | | | | | | | | |
| Net investment income (loss) | | 0.21 | | | 0.43 | | | 0.44 | | | 0.35 | | | 0.13 | | | (0.03 | ) | |
| Net realized and unrealized gains | | | | | | | | | | | | | | | | | | | |
| (losses) on investments | | 6.17 | | | 5.92 | | | 13.08 | | | 10.52 | | | (3.10 | ) | | 5.70 | | |
| Total from investment operations | | 6.38 | | | 6.35 | | | 13.52 | | | 10.87 | | | (2.97 | ) | | 5.67 | | |
| | | | | | | | | | | | | | | | | | | | |
| Distributions to shareholders: | | | | | | | | | | | | | | | | | | | |
| Dividends from net investment income | | (0.37 | ) | | (0.42 | ) | | (0.33 | ) | | (0.16 | ) | | (0.01 | ) | | (0.04 | ) | |
| Distributions from capital gains | | (6.16 | ) | | (3.64 | ) | | (4.49 | ) | | (0.39 | ) | | — | | | — | | |
| Total distributions | | (6.53 | ) | | (4.06 | ) | | (4.82 | ) | | (0.55 | ) | | (0.01 | ) | | (0.04 | ) | |
| Net asset value, end of period | | $55.97 | | | $56.12 | | | $53.83 | | | $45.13 | | | $34.81 | | | $37.79 | | |
| Total return | | 12.05 | %(a) | | 12.22 | % | | 34.31 | % | | 31.57 | % | | (7.86 | )% | | 17.64 | % | |
| | | | | | | | | | | | | | | | | | | | |
| Supplemental data and ratios: | | | | | | | | | | | | | | | | | | | |
| Net assets, end of period, in thousands | | $1,905,417 | | | $1,777,388 | | | $1,758,277 | | | $1,290,470 | | | $1,143,406 | | | $1,330,400 | | |
| Ratio of expenses to average net assets | | 1.12 | %(b) | | 1.12 | % | | 1.13 | % | | 1.17 | % | | 1.15 | % | | 1.18 | % | |
| Ratio of net investment income (loss) | | | | | | | | | | | | | | | | | | | |
| to average net assets | | 0.93 | %(b) | | 0.79 | % | | 1.00 | % | | 0.79 | % | | 0.30 | % | | (0.06 | )% | |
| Portfolio turnover rate | | 11 | %(a) | | 24 | % | | 28 | % | | 28 | % | | 26 | % | | 41 | % | |
| | | | | | | | | | | | | | | | | | | | |
| | | | | | Year ended September 30 | | | | | | | | | | | |
Ariel Appreciation Fund (Institutional Class) | | Six months ended March 31, 2015 (Unaudited) | | | 2014 | | | 2013 | | | December 30, 2011(c) to September 30, 2012 | | | | | | | | |
| Net asset value, beginning of year | | $56.28 | | | $53.95 | | | $45.19 | | | $38.70 | | | | | | | | |
| Income from investment operations: | | | | | | | | | | | | | | | | | | | |
| Net investment income | | 0.31 | | | 0.60 | | | 0.35 | | | 0.32 | | | | | | | | |
| Net realized and unrealized gains | | | | | | | | | | | | | | | | | | | |
| on investments | | 6.19 | | | 5.96 | | | 13.34 | | | 6.17 | | | | | | | | |
| Total from investment operations | | 6.50 | | | 6.56 | | | 13.69 | | | 6.49 | | | | | | | | |
| | | | | | | | | | | | | | | | | | | | |
| Distributions to shareholders: | | | | | | | | | | | | | | | | | | | |
| Dividends from net investment income | | (0.56 | ) | | (0.59 | ) | | (0.44 | ) | | — | | | | | | | | |
| Distributions from capital gains | | (6.16 | ) | | (3.64 | ) | | (4.49 | ) | | — | | | | | | | | |
| Total distributions | | (6.72 | ) | | (4.23 | ) | | (4.93 | ) | | — | | | | | | | | |
| Net asset value, end of period | | $56.06 | | | $56.28 | | | $53.95 | | | $45.19 | | | | | | | | |
| Total return | | 12.25 | %(a) | | 12.59 | % | | 34.76 | % | | 16.77 | %(a) | | | | | | | |
| | | | | | | | | | | | | | | | | | | | |
| Supplemental data and ratios: | | | | | | | | | | | | | | | | | | | |
| Net assets, end of period, in thousands | | $205,506 | | | $169,839 | | | $118,732 | | | $14,934 | | | | | | | | |
| Ratio of expenses to average net assets | | 0.78 | %(b) | | 0.79 | % | | 0.80 | % | | 0.99 | %(b) | | | | | | | |
| Ratio of net investment income | | | | | | | | | | | | | | | | | | | |
| to average net assets | | 1.31 | %(b) | | 1.16 | % | | 1.35 | % | | 1.08 | %(b) | | | | | | | |
| Portfolio turnover rate | | 11 | %(a) | | 24 | % | | 28 | % | | 28 | %(a) | | | | | | | |
(a)Not annualized.
(b)Annualized.
(c)Commencement of operations.
The accompanying notes are an integral part of the financial statements.
| | | | | | | | | | | | | | | | | | | |
| | | | | | Year ended September 30 | |
| | | Six months | | | | | | | | | | | | | | | | |
| | | ended | | | | | | | | | | | | | | | | |
| Ariel Focus Fund | | March 31, 2015 | | | | | | | | | | | | | | | | |
| (Investor Class) | | (Unaudited) | | | 2014 | | | 2013 | | | 2012 | | | 2011 | | | 2010 | |
| Net asset value, beginning of year | | | $15.12 | | | | $13.85 | | | | $10.95 | | | | $9.27 | | | | $9.49 | | | | $8.79 | |
| Income from investment operations: | | | | | | | | | | | | | | | | | | | | | | | | |
| Net investment income | | | 0.06 | | | | 0.11 | | | | 0.14 | | | | 0.10 | | | | 0.04 | | | | 0.04 | |
| Net realized and unrealized gains | | | | | | | | | | | | | | | | | | | | | | | | |
| (losses) on investments | | | 0.17 | | | | 1.95 | | | | 2.89 | | | | 1.64 | | | | (0.23 | ) | | | 0.70 | |
| Total from investment operations | | | 0.23 | | | | 2.06 | | | | 3.03 | | | | 1.74 | | | | (0.19 | ) | | | 0.74 | |
| Distributions to shareholders: | | | | | | | | | | | | | | | | | | | | | | | | |
| Dividends from net investment income | | | (0.11 | ) | | | (0.09 | ) | | | (0.13 | ) | | | (0.06 | ) | | | (0.03 | ) | | | (0.04 | ) |
| Distributions from capital gains | | | (1.46 | ) | | | (0.70 | ) | | | — | | | | — | | | | — | | | | — | |
| Total distributions | | | (1.57 | ) | | | (0.79 | ) | | | (0.13 | ) | | | (0.06 | ) | | | (0.03 | ) | | | (0.04 | ) |
| Net asset value, end of period | | | $13.78 | | | | $15.12 | | | | $13.85 | | | | $10.95 | | | | $9.27 | | | | $9.49 | |
| Total return | | | 1.31 | %(a) | | | 15.42 | % | | | 28.02 | % | | | 18.81 | % | | | (2.07 | )% | | | 8.37 | % |
| Supplemental data and ratios: | | | | | | | | | | | | | | | | | | | | | | | | |
| Net assets, end of period, in thousands | | | $52,862 | | | | $53,500 | | | | $43,925 | | | | $33,274 | | | | $42,547 | | | | $54,609 | |
| Ratio of expenses to average net assets, | | | | | | | | | | | | | | | | | | | | | | | | |
| including waivers | | | 1.00 | %(b) | | | 1.08 | % | | | 1.25 | % | | | 1.25 | % | | | 1.25 | % | | | 1.25 | % |
| Ratio of expenses to average net assets, | | | | | | | | | | | | | | | | | | | | | | | | |
| excluding waivers | | | 1.35 | %(b) | | | 1.40 | % | | | 1.54 | % | | | 1.58 | % | | | 1.51 | % | | | 1.58 | % |
| Ratio of net investment income to | | | | | | | | | | | | | | | | | | | | | | | | |
| average net assets, including waivers | | | 0.88 | %(b) | | | 0.78 | % | | | 1.19 | % | | | 0.88 | % | | | 0.37 | % | | | 0.36 | % |
| Ratio of net investment income to | | | | | | | | | | | | | | | | | | | | | | | | |
| average net assets, excluding waivers | | | 0.53 | %(b) | | | 0.46 | % | | | 0.90 | % | | | 0.55 | % | | | 0.11 | % | | | 0.03 | % |
| Portfolio turnover rate | | | 9 | %(a) | | | 40 | % | | | 41 | % | | | 32 | % | | | 40 | % | | | 52 | % |
| | | | | | | | | | | | | | | | | | | |
| | | | | | Year ended September 30 | | | | | | | | | | |
| | | Six months | | | | | | | | | December 30, | | | | | | | | | |
| | | ended | | | | | | | | | 2011(c) to | | | | | | | | | |
| Ariel Focus Fund | | March 31, 2015 | | | | | | | | | September 30, | | | | | | | | | |
| (Institutional Class) | | (Unaudited) | | | 2014 | | | 2013 | | | 2012 | | | | | | | | | |
| Net asset value, beginning of year | | | $15.14 | | | | $13.87 | | | | $10.97 | | | | $9.82 | | | | | | | | | |
| Income from investment operations: | | | | | | | | | | | | | | | | | | | | | | | | |
| Net investment income | | | 0.07 | | | | 0.15 | | | | 0.19 | | | | 0.10 | | | | | | | | | |
| Net realized and unrealized gains | | | | | | | | | | | | | | | | | | | | | | | | |
| on investments | | | 0.17 | | | | 1.96 | | | | 2.87 | | | | 1.05 | | | | | | | | | |
| Total from investment operations | | | 0.24 | | | | 2.11 | | | | 3.06 | | | | 1.15 | | | | | | | | | |
| Distributions to shareholders: | | | | | | | | | | | | | | | | | | | | | | | | |
| Dividends from net investment income | | | (0.15 | ) | | | (0.14 | ) | | | (0.16 | ) | | | — | | | | | | | | | |
| Distributions from capital gains | | | (1.46 | ) | | | (0.70 | ) | | | — | | | | — | | | | | | | | | |
| Total distributions | | | (1.61 | ) | | | (0.84 | ) | | | (0.16 | ) | | | — | | | | | | | | | |
| Net asset value, end of period | | | $13.77 | | | | $15.14 | | | | $13.87 | | | | $10.97 | | | | | | | | | |
| Total return | | | 1.40 | %(a) | | | 15.74 | % | | | 28.36 | % | | | 11.71 | %(a) | | | | | | | | |
| Supplemental data and ratios: | | | | | | | | | | | | | | | | | | | | | | | | |
| Net assets, end of period, in thousands | | | $12,332 | | | | $12,507 | | | | $11,372 | | | | $10,470 | | | | | | | | | |
| Ratio of expenses to average net assets, | | | | | | | | | | | | | | | | | | | | | | | | |
| including waivers | | | 0.75 | %(b) | | | 0.83 | % | | | 1.00 | % | | | 1.00 | %(b) | | | | | | | | |
| Ratio of expenses to average net assets, | | | | | | | | | | | | | | | | | | | | | | | | |
| excluding waivers | | | 1.02 | %(b) | | | 1.06 | % | | | 1.19 | % | | | 1.29 | %(b) | | | | | | | | |
| Ratio of net investment income to | | | | | | | | | | | | | | | | | | | | | | | | |
| average net assets, including waivers | | | 1.13 | %(b) | | | 1.02 | % | | | 1.46 | % | | | 1.15 | %(b) | | | | | | | | |
| Ratio of net investment income to | | | | | | | | | | | | | | | | | | | | | | | | |
| average net assets, excluding waivers | | | 0.86 | %(b) | | | 0.79 | % | | | 1.27 | % | | | 0.86 | %(b) | | | | | | | | |
| Portfolio turnover rate | | | 9 | %(a) | | | 40 | % | | | 41 | % | | | 32 | %(a) | | | | | | | | |
(a)Not annualized.
(b)Annualized.
(c)Commencement of operations.The accompanying notes are an integral part of the financial statements.
| | |
| | Financial highlights For a share outstanding throughout each period (continued) |
| | |
| | |
| | | | | | | | | | | | | | | | |
| | | | | | Year ended September 30 | | | | |
| | | Six months | | | | | | | | | | | | January 31, | |
| | | ended | | | | | | | | | | | | 2011(c) to | |
| Ariel Discovery Fund | | March 31, 2015 | | | | | | | | | | | | September 30, | |
| (Investor Class) | | (Unaudited) | | | 2014 | | | 2013 | | | 2012 | | | 2011 | |
| Net asset value, beginning of year | | | $11.59 | | | | $12.47 | | | | $10.63 | | | | $7.71 | | | | $10.00 | |
| Income from investment operations: | | | | | | | | | | | | | | | | | | | | |
| Net investment loss | | | (0.06 | ) | | | (0.10 | ) | | | (0.06 | ) | | | (0.08 | ) | | | (0.06 | ) |
| Net realized and unrealized gains (losses) on investments | | | 0.58 | | | | (0.60 | ) | | | 1.90 | | | | 3.00 | | | | (2.23 | ) |
| Total from investment operations | | | 0.52 | | | | (0.70 | ) | | | 1.84 | | | | 2.92 | | | | (2.29 | ) |
| Distributions to shareholders: | | | | | | | | | | | | | | | | | | | | |
| Distributions from capital gains | | | (0.66 | ) | | | (0.18 | ) | | | — | | | | — | | | | — | |
| Total distributions | | | (0.66 | ) | | | (0.18 | ) | | | — | | | | — | | | | — | |
| Net asset value, end of period | | | $11.45 | | | | $11.59 | | | | $12.47 | | | | $10.63 | | | | $7.71 | |
| Total return | | | 4.37 | %(a) | | | (5.80 | )% | | | 17.31 | % | | | 37.87 | % | | | (22.90 | )%(a) |
| Supplemental data and ratios: | | | | | | | | | | | | | | | | | | | | |
| Net assets, end of period, in thousands | | | $8,192 | | | | $10,272 | | | | $10,239 | | | | $4,240 | | | | $3,177 | |
| Ratio of expenses to average net assets, including waivers | | | 1.25 | %(b) | | | 1.33 | % | | | 1.50 | % | | | 1.50 | % | | | 1.50 | %(b) |
| Ratio of expenses to average net assets, excluding waivers | | | 2.04 | %(b) | | | 1.93 | % | | | 2.90 | % | | | 5.18 | % | | | 6.75 | %(b) |
| Ratio of net investment loss to average net assets, | | | | | | | | | | | | | | | | | | | | |
| including waivers | | | (0.69 | )%(b) | | | (0.79 | )% | | | (0.79 | )% | | | (0.92 | )% | | | (1.17 | )%(b) |
| Ratio of net investment loss to average net assets, | | | | | | | | | | | | | | | | | | | | |
| excluding waivers | | | (1.48 | )%(b) | | | (1.39 | )% | | | (2.19 | )% | | | (4.60 | )% | | | (6.42 | )%(b) |
| Portfolio turnover rate | | | 13 | %(a) | | | 36 | % | | | 31 | % | | | 33 | % | | | 18 | %(a) |
| | | | | | | | | | | | | | | | |
| | | | | | Year ended September 30 | | | | | | | |
| | | Six months | | | | | | | | | December 30, | | | | |
| | | ended | | | | | | | | | 2011(c) to | | | | |
| Ariel Discovery Fund | | March 31, 2015 | | | | | | | | | September 30, | | | | |
| (Institutional Class) | | (Unaudited) | | | 2014 | | | 2013 | | | 2012 | | | | |
| Net asset value, beginning of year | | | $11.69 | | | | $12.54 | | | | $10.66 | | | | $9.01 | | | | | |
| Income from investment operations: | | | | | | | | | | | | | | | | | | | | |
| Net investment loss | | | (0.02 | ) | | | (0.06 | ) | | | (0.03 | ) | | | (0.05 | ) | | | | |
| Net realized and unrealized gains (losses) on investments | | | 0.55 | | | | (0.61 | ) | | | 1.91 | | | | 1.70 | | | | | |
| Total from investment operations | | | 0.53 | | | | (0.67 | ) | | | 1.88 | | | | 1.65 | | | | | |
| Distributions to shareholders: | | | | | | | | | | | | | | | | | | | | |
| Distributions from capital gains | | | (0.66 | ) | | | (0.18 | ) | | | — | | | | — | | | | | |
| Total distributions | | | (0.66 | ) | | | (0.18 | ) | | | — | | | | — | | | | | |
| Net asset value, end of period | | | $11.56 | | | | $11.69 | | | | $12.54 | | | | $10.66 | | | | | |
| Total return | | | 4.42 | %(a) | | | (5.52 | )% | | | 17.64 | % | | | 18.31 | %(a) | | | | |
| Supplemental data and ratios: | | | | | | | | | | | | | | | | | | | | |
| Net assets, end of period, in thousands | | | $32,401 | | | | $35,970 | | | | $27,096 | | | | $2,244 | | | | | |
| Ratio of expenses to average net assets, including waivers | | | 1.00 | %(b) | | | 1.07 | % | | | 1.25 | % | | | 1.25 | %(b) | | | | |
| Ratio of expenses to average net assets, excluding waivers | | | 1.25 | %(b) | | | 1.25 | % | | | 1.93 | % | | | 4.78 | %(b) | | | | |
| Ratio of net investment loss to average net assets, | | | | | | | | | | | | | | | | | | | | |
| including waivers | | | (0.43 | )%(b) | | | (0.53 | )% | | | (0.61 | )% | | | (0.75 | )%(b) | | | | |
| Ratio of net investment loss to average net assets, | | | | | | | | | | | | | | | | | | | | |
| excluding waivers | | | (0.68 | )%(b) | | | (0.71 | )% | | | (1.29 | )% | | | (4.28 | )%(b) | | | | |
| Portfolio turnover rate | | | 13 | %(a) | | | 36 | % | | | 31 | % | | | 33 | %(a) | | | | |
(a)Not annualized.
(b)Annualized.
(c)Commencement of operations.The accompanying notes are an integral part of the financial statements.
| | | | | | | | | | | | | |
| | | | | | Year ended September 30 | | | | |
| | | Six months | | | | | | | | | December 30, | |
| | | ended | | | | | | | | | 2011(c) to | |
| Ariel International Fund | | March 31, 2015 | | | | | | | | | September 30, | |
| (Investor Class) | | (Unaudited) | | | 2014 | | | 2013 | | | 2012 | |
| Net asset value, beginning of year | | | $12.85 | | | | $12.38 | | | | $9.77 | | | | $10.00 | |
| Income from investment operations: | | | | | | | | | | | | | | | | |
| Net investment income | | | 0.02 | | | | 0.22 | | | | 0.07 | | | | 0.16 | |
| Net realized and unrealized gains (losses) on investments | | | 0.34 | | | | 0.41 | | | | 2.65 | | | | (0.39 | ) |
| Total from investment operations | | | 0.36 | | | | 0.63 | | | | 2.72 | | | | (0.23 | ) |
| | | | | | | | | | | | | | | | | |
| Distributions to shareholders: | | | | | | | | | | | | | | | | |
| Dividends from net investment income | | | (0.13 | ) | | | — | | | | (0.11 | ) | | | — | |
| Distributions from capital gains | | | (0.33 | ) | | | (0.16 | ) | | | — | | | | — | |
| Total distributions | | | (0.46 | ) | | | (0.16 | ) | | | (0.11 | ) | | | — | |
| Net asset value, end of period | | | $12.75 | | | | $12.85 | | | | $12.38 | | | | $9.77 | |
| Total return | | | 2.89 | %(a) | | | 5.22 | % | | | 28.11 | % | | | (2.30 | )%(a) |
| | | | | | | | | | | | | | | | | |
| Supplemental data and ratios: | | | | | | | | | | | | | | | | |
| Net assets, end of period, in thousands | | | $5,208 | | | | $4,842 | | | | $2,260 | | | | $1,313 | |
| Ratio of expenses to average net assets, including waivers | | | 1.25 | %(b) | | | 1.29 | % | | | 1.40 | % | | | 1.40 | %(b) |
| Ratio of expenses to average net assets, excluding waivers | | | 4.00 | %(b) | | | 4.24 | % | | | 9.36 | % | | | 17.00 | %(b) |
| Ratio of net investment income to average net assets, including waivers | | | 0.68 | %(b) | | | 2.13 | % | | | 0.98 | % | | | 2.93 | %(b) |
| Ratio of net investment loss to average net assets, excluding waivers | | | (2.07 | )%(b) | | | (0.82 | )% | | | (6.98 | )% | | | (12.67 | )%(b) |
| Portfolio turnover rate | | | 22 | %(a) | | | 19 | % | | | 29 | % | | | 21 | %(a) |
| | | | | | | | | | | | | | | | | |
| | | | | | | Year ended September 30 | | | | | |
| | | Six months | | | | | | | | | | | December 30, | |
| | | ended | | | | | | | | | | | 2011(c) to | |
| Ariel International Fund | | March 31, 2015 | | | | | | | | | | | September 30, | |
| (Institutional Class) | | (Unaudited) | | | | 2014 | | | | 2013 | | | | 2012 | |
| Net asset value, beginning of year | | | $12.71 | | | | $12.26 | | | | $9.78 | | | | $10.00 | |
| Income from investment operations: | | | | | | | | | | | | | | | | |
| Net investment income | | | 0.05 | | | | 0.29 | | | | 0.14 | | | | 0.11 | |
| Net realized and unrealized gains (losses) on investments | | | 0.31 | | | | 0.38 | | | | 2.59 | | | | (0.33 | ) |
| Total from investment operations | | | 0.36 | | | | 0.67 | | | | 2.73 | | | | (0.22 | ) |
| | | | | | | | | | | | | | | | | |
| Distributions to shareholders: | | | | | | | | | | | | | | | | |
| Dividends from net investment income | | | (0.23 | ) | | | (0.06 | ) | | | (0.25 | ) | | | — | |
| Distributions from capital gains | | | (0.33 | ) | | | (0.16 | ) | | | — | | | | — | |
| Total distributions | | | (0.56 | ) | | | (0.22 | ) | | | (0.25 | ) | | | — | |
| Net asset value, end of period | | | $12.51 | | | | $12.71 | | | | $12.26 | | | | $9.78 | |
| Total return | | | 3.05 | %(a) | | | 5.48 | % | | | 28.42 | % | | | (2.20 | )%(a) |
| | | | | | | | | | | | | | | | | |
| Supplemental data and ratios: | | | | | | | | | | | | | | | | |
| Net assets, end of period, in thousands | | | $8,631 | | | | $8,455 | | | | $4,129 | | | | $1,926 | |
| Ratio of expenses to average net assets, including waivers | | | 1.00 | %(b) | | | 1.03 | % | | | 1.15 | % | | | 1.15 | %(b) |
| Ratio of expenses to average net assets, excluding waivers | | | 2.80 | %(b) | | | 3.17 | % | | | 6.53 | % | | | 15.70 | %(b) |
| Ratio of net investment income to average net assets, including waivers | | | 0.91 | %(b) | | | 2.49 | % | | | 1.09 | % | | | 3.41 | %(b) |
| Ratio of net investment income (loss) to average net assets, excluding waivers | | | (0.89 | )%(b) | | | 0.35 | % | | | (4.29 | )% | | | (11.14 | )%(b) |
| Portfolio turnover rate | | | 22 | %(a) | | | 19 | % | | | 29 | % | | | 21 | %(a) |
(a)Not annualized.
(b)Annualized.
(c)Commencement of operations.
The accompanying notes are an integral part of the financial statements.
| | |
| | Financial highlights For a share outstanding throughout each period (continued) |
| | |
| | |
| | | | | | | | | | | | | |
| | | | | | Year ended September 30 | | | | |
| | | Six months | | | | | | | | | December 30, | |
| | | ended | | | | | | | | | 2011(c) to | |
| Ariel Global Fund | | March 31, 2015 | | | | | | | | | September 30, | |
| (Investor Class) | | (Unaudited) | | | 2014 | | | 2013 | | | 2012 | |
| Net asset value, beginning of year | | | $13.96 | | | | $12.91 | | | | $10.02 | | | | $10.00 | |
| Income from investment operations: | | | | | | | | | | | | | | | | |
| Net investment income (loss) | | | (0.09 | ) | | | 0.14 | | | | 0.02 | | | | 0.18 | |
| Net realized and unrealized gains (losses) on investments | | | 0.42 | | | | 1.20 | | | | 2.87 | | | | (0.16 | ) |
| Total from investment operations | | | 0.33 | | | | 1.34 | | | | 2.89 | | | | 0.02 | |
| | | | | | | | | | | | | | | | | |
| Distributions to shareholders: | | | | | | | | | | | | | | | | |
| Distributions from capital gains | | | (0.14 | ) | | | (0.29 | ) | | | — | | | | — | |
| Total distributions | | | (0.14 | ) | | | (0.29 | ) | | | — | | | | — | |
| Net asset value, end of period | | | $14.15 | | | | $13.96 | | | | $12.91 | | | | $10.02 | |
| Total return | | | 2.38 | %(a) | | | 10.52 | % | | | 28.84 | % | | | 0.20 | %(a) |
| | | | | | | | | | | | | | | | | |
| Supplemental data and ratios: | | | | | | | | | | | | | | | | |
| Net assets, end of period, in thousands | | | $4,508 | | | | $2,816 | | | | $1,954 | | | | $992 | |
| Ratio of expenses to average net assets, including waivers | | | 1.25 | %(b) | | | 1.29 | % | | | 1.40 | % | | | 1.40 | %(b) |
| Ratio of expenses to average net assets, excluding waivers | | | 3.26 | %(b) | | | 3.70 | % | | | 5.37 | % | | | 12.33 | %(b) |
| Ratio of net investment income to average net assets, including waivers | | | 0.64 | %(b) | | | 1.56 | % | | | 0.81 | % | | | 2.67 | %(b) |
| Ratio of net investment loss to average net assets, excluding waivers | | | (1.37 | )%(b) | | | (0.85 | )% | | | (3.16 | )% | | | (8.26 | )%(b) |
| Portfolio turnover rate | | | 19 | %(a) | | | 20 | % | | | 39 | % | | | 26 | %(a) |
| | | | | | | | | | | | | | | | | |
| | | | | | | Year ended September 30 | | | | | |
| | | Six months | | | | | | | | | | | December 30, | |
| | | ended | | | | | | | | | | | 2011(c) to | |
| Ariel Global Fund | | March 31, 2015 | | | | | | | | | | | September 30, | |
| (Institutional Class) | | (Unaudited) | | | | 2014 | | | | 2013 | | | | 2012 | |
| Net asset value, beginning of year | | | $13.79 | | | | $12.76 | | | | $10.04 | | | | $10.00 | |
| Income from investment operations: | | | | | | | | | | | | | | | | |
| Net investment income | | | 0.05 | | | | 0.16 | | | | 0.08 | | | | 0.14 | |
| Net realized and unrealized gains (losses) on investments | | | 0.29 | | | | 1.20 | | | | 2.81 | | | | (0.10 | ) |
| Total from investment operations | | | 0.34 | | | | 1.36 | | | | 2.89 | | | | 0.04 | |
| | | | | | | | | | | | | | | | | |
| Distributions to shareholders: | | | | | | | | | | | | | | | | |
| Dividends from net investment income | | | (0.18 | ) | | | (0.04 | ) | | | (0.17 | ) | | | — | |
| Distributions from capital gains | | | (0.14 | ) | | | (0.29 | ) | | | — | | | | — | |
| Total distributions | | | (0.32 | ) | | | (0.33 | ) | | | (0.17 | ) | | | — | |
| Net asset value, end of period | | | $13.81 | | | | $13.79 | | | | $12.76 | | | | $10.04 | |
| Total return | | | 2.54 | %(a) | | | 10.84 | % | | | 29.15 | % | | | 0.40 | %(a) |
| | | | | | | | | | | | | | | | | |
| Supplemental data and ratios: | | | | | | | | | | | | | | | | |
| Net assets, end of period, in thousands | | | $55,348 | | | | $53,937 | | | | $25,975 | | | | $10,677 | |
| Ratio of expenses to average net assets, including waivers | | | 1.00 | %(b) | | | 1.04 | % | | | 1.15 | % | | | 1.15 | %(b) |
| Ratio of expenses to average net assets, excluding waivers | | | 1.28 | %(b) | | | 1.51 | % | | | 2.51 | % | | | 4.07 | %(b) |
| Ratio of net investment income to average net assets, including waivers | | | 0.80 | %(b) | | | 1.71 | % | | | 0.97 | % | | | 3.26 | %(b) |
| Ratio of net investment income (loss) to average net assets, excluding waivers | | | 0.52 | %(b) | | | 1.24 | % | | | (0.39 | )% | | | 0.34 | %(b) |
| Portfolio turnover rate | | | 19 | %(a) | | | 20 | % | | | 39 | % | | | 26 | %(a) |
(a)Not annualized.
(b)Annualized.
(c)Commencement of operations.
The accompanying notes are an integral part of the financial statements.
| | | | |
| | Notes to the financial statements | | |
| | | | |
| | | | |
NOTE ONE | ORGANIZATION
Ariel Investment Trust (the “Trust”) is a Massachusetts business trust registered under the Investment Company Act of 1940, as amended (the “1940 Act”), as an open-end management investment company. Ariel Fund, Ariel Appreciation Fund, Ariel Focus Fund, Ariel Discovery Fund, Ariel International Fund and Ariel Global Fund (the “Funds”) are series of the Trust. Ariel Focus Fund is a non-diversified Fund, all other Funds are diversified. The Funds issue two classes of shares: an Investor Class and an Institutional Class.
NOTE TWO | SIGNIFICANT ACCOUNTING POLICIES
The following is a summary of significant accounting policies consistently followed by the Funds in the preparation of their financial statements. The financial statements have been prepared in accordance with accounting principles generally accepted in the United States, which require management to make certain estimates and assumptions at the date of the financial statements. Actual results may differ from such estimates.
Securities valuation—Securities for which market quotations are readily available are valued at the last sale price on the national securities exchange on which such securities are primarily traded and, in the case of securities reported on the Nasdaq system, are valued based on the Nasdaq Official Closing Price. If a closing price is not reported, a security shall be valued using i) the closing price on another exchange on which the security traded (if such price is made available by the pricing vendor) or ii) securities for which reliable bid and ask quotations are available are valued at the mean between bid and ask prices. Securities and assets for which market quotations are not readily available are valued at fair value as determined in good faith by or under the direction of the Board of Trustees.
Certain common stocks that trade on foreign exchanges are subject to valuation adjustments to account for the market movement between the close of a foreign market in which the security is traded and the close of the New York Stock Exchange. In the event the Funds become aware of a significant event that may materially affect the value of a security, a fair value of such security will be determined in accordance with procedures established by the Board of Trustees.
Debt securities having a maturity over 60 days are valued at the yield equivalent as obtained from a pricing source or one or more market makers for such securities. Short-term debt obligations having a maturity of 60 days or less are valued at amortized cost, so long as it approximates fair value. Securities and assets for which market quotations are not readily available are valued at fair value as determined in good faith by or under the direction of the Board of Trustees.
Securities transactions and investment income—Securities transactions are accounted for on a trade date basis. Realized gains and losses from securities transactions are recorded on the identified cost basis. Dividend income is recorded on the ex-dividend date and interest income is recognized on an accrual basis. Dividends from foreign securities are recorded on the ex-dividend date, or as soon as the information is available.
Subsequent events—In preparing these financial statements, the Trust has evaluated subsequent events after March 31, 2015 and there were no such events that would require adjustment to or additional disclosure in these financial statements.
Fair value measurements—Accounting Standards CodificationTM (ASC) 820-10 establishes a three-tier framework for measuring fair value based on a hierarchy of inputs. The hierarchy distinguishes between market data obtained from independent sources (observable inputs) and the Funds’ own market assumptions (unobservable inputs). These inputs are used in determining the value of the Funds’ investments and are summarized below:
Level 1 — quoted prices in active markets for identical securities
Level 2 — other significant observable inputs (including quoted prices for similar securities, “quoted” prices in inactive markets, dealer indications, and inputs corroborated by observable market data)
Level 3 — significant unobservable inputs (including the Funds’ own assumptions in determining the fair value of investments)
The Funds use valuation techniques to measure fair value that are consistent with the market approach and/or income approach, depending on the type of security and the particular circumstance. The market approach uses prices and other relevant information generated by market transactions involving identical or comparable securities. The income approach uses valuation techniques to discount estimated future cash flows to present value.
The inputs or methodology used for valuing securities are not necessarily an indication of the risk associated with investing in those securities.
| | | | |
| | Notes to the financial statements (continued) | | |
| | | | |
The following is a summary of the inputs used as of March 31, 2015 in valuing the Funds’ investments carried at fair value:
| | | Ariel | | | Ariel | | | Ariel | | | Ariel | |
| | | Fund | | | Appreciation Fund | | | Focus Fund | | | Discovery Fund | |
| Level 1 | | | $2,284,504,802 | | | | $2,010,653,686 | | | | $64,239,399 | | | | $40,064,567 | |
| Level 2* | | | 125,838,754 | | | | 99,680,274 | | | | 1,235,666 | | | | 456,019 | |
| Level 3 | | | — | | | | — | | | | — | | | | — | |
| Fair value at 03/31/15 | | | $2,410,343,556 | | | | $2,110,333,960 | | | | $65,475,065 | | | | $40,520,586 | |
* As of March 31, 2015, Level 2 investments held are repurchase agreements. See Schedule of Investments.
| Ariel International Fund | | Level 1 | | | Level 2 | | | Level 3 | | | Total | |
| Common stocks | | | | | | | | | | | | |
| Consumer discretionary | | | $1,669,412 | | | | $— | | | | $— | | | | $1,669,412 | |
| Consumer staples | | | 1,733,241 | | | | — | | | | — | | | | 1,733,241 | |
| Energy | | | 651,048 | | | | — | | | | — | | | | 651,048 | |
| Financials | | | 2,319,453 | | | | — | | | | — | | | | 2,319,453 | |
| Health care | | | 1,336,125 | | | | — | | | | — | | | | 1,336,125 | |
| Industrials | | | 441,156 | | | | — | | | | — | | | | 441,156 | |
| Information technology | | | 2,608,919 | | | | — | | | | — | | | | 2,608,919 | |
| Materials | | | 46,373 | | | | — | | | | — | | | | 46,373 | |
| Telecommunication services | | | 1,907,273 | | | | — | | | | — | | | | 1,907,273 | |
| Utilities | | | 67,041 | | | | — | | | | — | | | | 67,041 | |
| Total common stocks | | | $12,780,041 | | | | — | | | | — | | | | $12,780,041 | |
| Exchange traded funds | | | 115,348 | | | | — | | | | — | | | | 115,348 | |
| Repurchase agreement | | | — | | | | 268,646 | | | | — | | | | 268,646 | |
| Total investments | | | $12,895,389 | | | | $268,646 | | | | $— | | | | $13,164,035 | |
| Other Financial Instruments | | | | | | | | | | | | | | | | |
| Forward foreign currency contracts^ | | | $— | | | | $1,981 | | | | $— | | | | $1,981 | |
| Ariel Global Fund | | Level 1 | | | Level 2 | | | Level 3 | | | Total | |
| Common stocks | | | | | | | | | | | | |
| Consumer discretionary | | | $7,542,545 | | | | $— | | | | $— | | | | $7,542,545 | |
| Consumer staples | | | 4,319,527 | | | | — | | | | — | | | | 4,319,527 | |
| Energy | | | 2,153,283 | | | | — | | | | — | | | | 2,153,283 | |
| Financials | | | 7,128,467 | | | | — | | | | — | | | | 7,128,467 | |
| Health care | | | 11,974,549 | | | | — | | | | — | | | | 11,974,549 | |
| Industrials | | | 1,411,054 | | | | — | | | | — | | | | 1,411,054 | |
| Information technology | | | 11,653,902 | | | | — | | | | — | | | | 11,653,902 | |
| Materials | | | 262,972 | | | | — | | | | — | | | | 262,972 | |
| Telecommunication services | | | 7,889,210 | | | | — | | | | — | | | | 7,889,210 | |
| Utilities | | | 731,019 | | | | — | | | | — | | | | 731,019 | |
| Total common stocks | | | $55,066,528 | | | | — | | | | — | | | | $55,066,528 | |
| Exchange traded funds | | | 573,592 | | | | — | | | | — | | | | 573,592 | |
| Repurchase agreement | | | — | | | | 2,798,123 | | | | — | | | | 2,798,123 | |
| Total investments | | | $55,640,120 | | | | $2,798,123 | | | | $— | | | | $58,438,243 | |
| Other Financial Instruments | | | | | | | | | | | | | | | | |
| Forward foreign currency contracts^ | | | $— | | | | $122,786 | | | | $— | | | | $122,786 | |
There were no transfers between levels for the Ariel Fund, Ariel Appreciation Fund, Ariel Focus Fund, Ariel Discovery Fund, Ariel International Fund and Ariel Global Fund. Transfers between levels are recognized at the end of the reporting period.
^ Forward currency contracts derive their value from underlying exchange rates. These instruments are normally valued by pricing vendors using pricing models. The pricing models typically use inputs that are observed from active markets such as exchange rates. As such, forward currency contracts were categorized as Level 2. The forward currency contracts are reflected at the unrealized appreciation (depreciation) on the contract. See Note Five, Forward Currency Contracts.
Offsetting Assets and Liabilities—The Funds are subject to various master netting arrangements (“Master Netting Arrangements”), which govern the terms of certain transactions with select counterparties. Master Netting Arrangements seek to reduce the counterparty risk associated with relevant transactions by specifying credit protection mechanisms and providing standardization that seeks to improve legal certainty. The Master Netting Arrangements allow the Funds to close out and net their total exposure to a counterparty in the event of a default with respect to all the transactions governed under a single agreement with a counterparty. The Master Netting Arrangements may also specify collateral posting arrangements at pre-arranged exposure levels. Under the Master Netting Arrangements, collateral may be transferred if the total net exposure to certain transactions (net of existing collateral already in place) governed under the relevant Master Netting Arrangement with a counterparty in a given account exceeds a specified threshold depending on the counterparty and the type of Master Netting Arrangement. The Funds are not currently collateralizing their exposures under foreign exchange trades. The following is a summary of offsetting transactions as of March 31, 2015:
| | | | | | | | | | | | | | | | | | | |
| | | | | | | | | | | | Gross amounts not offset in the Statement of Assets & Liabilities | | | | |
| | | Gross amounts of recognized assets | | | Gross amounts offset in the Statement of Assets & Liabilities | | | Net amounts presented in the Statement of Assets & Liabilities | | | Financial instruments | | | Collateral pledged (received) | | | Net amount | |
| | | | | | | | | | | | | | | | | | | |
| Description | | | | | | | | | | | | | | | | | | |
| Repurchase agreements | | | | | | | | | | | | | | | | | | |
| Ariel Fund | | | $125,838,754 | | | | — | | | | $125,838,754 | | | | $125,838,754 | | | | $(125,838,754 | ) | | | — | |
| Ariel Appreciation Fund | | | 99,680,274 | | | | — | | | | 99,680,274 | | | | 99,680,274 | | | | (99,680,274 | ) | | | — | |
| Ariel Focus Fund | | | 1,235,666 | | | | — | | | | 1,235,666 | | | | 1,235,666 | | | | (1,235,666 | ) | | | — | |
| Ariel Discovery Fund | | | 456,019 | | | | — | | | | 456,019 | | | | 456,019 | | | | (456,019 | ) | | | — | |
| Ariel International Fund | | | 268,646 | | | | — | | | | 268,646 | | | | 268,646 | | | | (268,646 | ) | | | — | |
| Ariel Global Fund | | | 2,798,123 | | | | — | | | | 2,798,123 | | | | 2,798,123 | | | | (2,798,123 | ) | | | — | |
| | | | | | | | | | | | | | | | | | | | | | | | | |
| Forward currency contracts | | | | | | | | | | | | | | | | | | | | | | | | |
| Ariel International Fund | | | 24,060 | | | | — | | | | 24,060 | | | | (22,079 | ) | | | — | | | | $1,981 | |
| Ariel Global Fund | | | 137,565 | | | | — | | | | 137,565 | | | | (14,779 | ) | | | — | | | | 122,786 | |
Recent Accounting Pronouncement—In June 2014, the Financial Accounting Standard Board issued ASU No. 2014-11 “Repurchase-to-Maturity Transactions, Repurchase Financings, and Disclosures.” ASU No. 2014-11 makes limited changes to the accounting for repurchase agreements, clarifies when repurchase agreements and securities lending transactions should be accounted for as secured borrowings, and requires additional disclosures regarding these types of transactions. The guidance is effective for fiscal years beginning on or after December 15, 2014, and for interim periods within those fiscal years. Management is currently evaluating the impact these changes will have on the Funds’ financial statement disclosures.
Foreign Currency—Securities and other assets and liabilities denominated in foreign currencies are translated into U.S. dollars using exchange rates obtained from an independent third party. Realized gains (losses) and unrealized appreciation (depreciation) on securities include the effects of changes in security prices. Fluctuations in the value of other assets and liabilities resulting from changes in exchange rates are recorded as unrealized foreign currency gains (losses) until the assets or liabilities are settled in cash, at which time they are recorded as realized foreign currency gains (losses).
Forward Currency Contracts—Ariel International Fund and Ariel Global Fund enter into forward currency contracts to provide the appropriate currency exposure related to protecting the value of securities and related receivables and payables against changes in foreign exchange rates. The primary risk associated with a Fund’s use of these contracts is that a counterparty will fail to fulfill its obligation to pay gains due to the Fund under the contracts. Counterparty risk is mitigated by entering into forward currency contracts only with highly rated counterparties. Forward currency contracts are subject to the translations of foreign exchange rate fluctuations. Contracts are “marked-to-market” daily and any resulting unrealized gains (losses) are recorded as unrealized appreciation (depreciation) on foreign currency translations. The Funds record realized gains (losses) at the time the forward currency contract is settled or closed on the Statement of Operations as realized gain (loss) on foreign currency transactions.
Repurchase agreements—The Funds may enter into repurchase agreements with recognized financial institutions and in all instances hold underlying securities as collateral with a value at least equal to the total repurchase price such financial institutions have agreed to pay.
| | |
| | Notes to the financial statements (continued) |
| | |
| | |
Federal taxes—It is the Funds’ policy to comply with the requirements of the Internal Revenue Code applicable to regulated investment companies and to distribute substantially all taxable income to shareholders. Management has analyzed the Funds’ tax positions taken for all open federal income tax years (September 30, 2011 – 2014), and has concluded that no provision for federal income tax is required in the financial statements.
Class and expense allocations—Each class of shares has equal rights as to assets and earnings, except that shareholders of each class bear certain class-specific expenses related to marketing and distribution, shareholder servicing and shareholder reporting. Income, other non-class-specific expense, and gains and losses on investments are allocated to each class of shares based on its relative net assets. Expenses that are not directly attributable to one or more Funds are allocated among applicable Funds on an equitable and consistent basis considering such things as the nature and type of expense and the relative net assets of the Funds.
Ariel Fund, Ariel Appreciation Fund, Ariel Focus Fund and Ariel Discovery Fund pay all operating expenses not expressly assumed by the Adviser, including custodial and transfer agency fees, federal and state securities registration fees, legal and audit fees, and brokerage commissions and other costs associated with the purchase and sale of portfolio securities. The Ariel International Fund and Ariel Global Fund pay all operating expenses not expressly assumed by the Adviser, including custodial and transfer agency fees, fund administration, fund accounting, federal and state securities registration fees, legal and audit fees, and brokerage commissions and other costs associated with the purchase and sale of portfolio securities.
Distributions to shareholders—Dividends from net investment income and net realized capital gains, if any, are declared and paid at least annually and recorded on ex-dividend date.
Distributions to shareholders are determined in accordance with federal income tax regulations and may differ from net investment income and realized capital gains for financial reporting purposes. Reclassifications between net asset accounts are made at the end of the fiscal year for such differences that are permanent in nature.
NOTE THREE | INVESTMENT TRANSACTIONS, DISTRIBUTIONS AND FEDERAL INCOME TAX MATTERS
Purchases and proceeds from sales of securities, excluding short-term investments and U.S. government securities, for the six months ended March 31, 2015 were as follows:
| | | | | | | | | | | | | | | | | | | |
| | | | | | Ariel | | | Ariel | | | Ariel | | | Ariel | | | Ariel | |
| | | Ariel Fund | | | Appreciation Fund | | | Focus Fund | | | Discovery Fund | | | International Fund | | | Global Fund | |
| Purchases | | | $313,842,769 | | | | $217,379,940 | | | | $5,835,775 | | | | $5,578,024 | | | | $2,843,191 | | | | $10,807,466 | |
| Sales | | | 396,728,075 | | | | 270,163,235 | | | | 7,892,519 | | | | 13,329,361 | | | | 3,388,678 | | | | 10,584,566 | |
The cost and unrealized appreciation and depreciation of securities on a federal income tax basis at September 30, 2014 were as follows:
| | | | | | | | | | | | | | | | | | | |
| | | | | | Ariel | | | Ariel | | | Ariel | | | Ariel | | | Ariel | |
| | | Ariel Fund | | | Appreciation Fund | | | Focus Fund | | | Discovery Fund | | | International Fund | | | Global Fund | |
| Cost | | | $1,377,164,662 | | | | $1,247,289,615 | | | | $53,385,379 | | | | $48,848,451 | | | | $12,212,411 | | | | $50,595,418 | |
| | | 857,434,693 | | | | 748,755,286 | | | | 14,409,233 | | | | 3,387,494 | | | | 1,448,070 | | | | 7,506,148 | |
| | | (92,442,729 | ) | | | (57,398,978 | ) | | | (1,814,088 | ) | | | (6,643,934 | ) | | | (808,537 | ) | | | (2,561,165 | ) |
| Net unrealized appreciation (depreciation) | | | $764,991,964 | | | | $691,356,308 | | | | $12,595,145 | | | | $(3,256,440 | ) | | | $639,533 | | | | $4,944,983 | |
The difference between book basis and tax basis unrealized appreciation and depreciation is attributable primarily to the deferral of losses on wash sales and partnership adjustments.
At September 30, 2014, the Funds had no post-October capital loss deferrals and no post-December ordinary loss deferrals.
The tax character of distributions paid during the years ended September 30 was as follows:
| | | | | | | | | | | | | | | | | | | |
| | | Ariel Fund | | | Ariel Appreciation Fund | | | Ariel Focus Fund |
| | | | | | | | | | | | | | | | | | | |
| | | 2014 | | | 2013 | | | 2014 | | | 2013 | | | 2014 | | | 2013 | |
| Distributions from | | | | | | | | | | | | | | | | | | |
| Ordinary income | | | $15,459,006 | | | | $15,816,760 | | | | $55,982,799 | | | | $10,939,554 | | | | $415,251 | | | | $532,869 | |
| | | — | | | | — | | | | 87,928,835 | | | | 128,147,624 | | | | 2,751,642 | | | | — | |
| Total distributions | | | $15,459,006 | | | | $15,816,760 | | | | $143,911,634 | | | | $139,087,178 | | | | $3,166,893 | | | | $532,869 | |
| | | | | | | | | | | | | | | | | | | |
| | | Ariel Discovery Fund | | | Ariel International Fund | | | Ariel Global Fund | |
| | | 2014 | | | 2013 | | | 2014 | | | 2013 | | | 2014 | | | 2013 | |
| Distributions from | | | | | | | | | | | | | | | | | | |
| Ordinary income | | | $118,382 | | | | $— | | | | $98,327 | | | | $64,808 | | | | $340,986 | | | | $178,895 | |
| Long-term | | | | | | | | | | | | | | | | | | | | | | | | |
| capital gains | | | 475,787 | | | | — | | | | 32,559 | | | | — | | | | 479,191 | | | | — | |
| Total distributions | | | $594,169 | | | | $— | | | | $130,886 | | | | $64,808 | | | | $820,177 | | | | $178,895 | |
Under the Regulated Investment Company Modernization Act of 2010 (the “Act”), net capital losses arising in taxable years after December 22, 2010, may be carried forward indefinitely, and their character is retained as short-term and/or long-term losses. Previously, net capital losses were carried forward for up to eight years and treated as short-term losses. The Act requires that post-enactment net capital losses be used before pre-enactment net capital losses. At September 30, 2014, The Funds had no pre- or post-enactment net capital losses for federal income tax purposes.
NOTE FOUR | INVESTMENT ADVISORY AND OTHER TRANSACTIONS WITH RELATED PARTIES
Ariel Investments, LLC (the “Adviser”) provides investment advisory and administrative services to Ariel Fund, Ariel Appreciation Fund, Ariel Focus Fund and Ariel Discovery Fund under an agreement (the “Management Agreement”). The Adviser provides investment advisory services to Ariel International Fund and Ariel Global Fund under an Advisory Agreement (collectively, the “Agreements”). Pursuant to the Agreements, the Adviser is paid a monthly fee on average daily net assets at the annual rates shown below:
| | | Ariel | | | Ariel | | | Ariel | | | Ariel | | | Ariel | | | Ariel | |
| Management fees | | Fund | | | Appreciation Fund | | | Focus Fund | | | Discovery Fund | | | International Fund | | | Global Fund | |
| Average daily net assets: | | | | | | | | | | | | | | | | | | |
| First $500 million | | | 0.65 | % | | | 0.75 | % | | | 0.65 | % | | | 0.80 | % | | | 0.80 | % | | | 0.80 | % |
| Next $500 million | | | 0.60 | % | | | 0.70 | % | | | 0.60 | % | | | 0.75 | % | | | 0.80 | % | | | 0.80 | % |
| Over $1 billion | | | 0.55 | % | | | 0.65 | % | | | 0.55 | % | | | 0.70 | % | | | 0.75 | % | | | 0.75 | % |
The Adviser has contractually agreed to reimburse the Funds to the extent their respective total annual operating expenses exceed certain limits as shown below:
| | | | | | | | | | | | | | | | | | | |
| | | | | | Ariel | | | | | |
| | | Ariel Fund | | | Appreciation Fund | | | Ariel Focus Fund | | Ariel Discovery Fund | |
| | | Investor Class | | | Investor Class | | | Investor Class | | | Institutional Class | | | Investor Class | | | Institutional Class | |
| First $30 million* | | | 1.50 | % | | | 1.50 | % | | | — | | | | — | | | | — | | | | — | |
| Over $30 million* | | | 1.00 | % | | | 1.00 | % | | | — | | | | — | | | | — | | | | — | |
| On average daily net assets | | | — | | | | — | | | | 1.00 | % | | | 0.75 | % | | | 1.25 | % | | | 1.00 | % |
| Waiver** | | | — | | | | — | | | | 2016 | | | | 2016 | | | | 2016 | | | | 2016 | |
| | | | | | | | | | | | | |
| | | Ariel International Fund | Ariel Global Fund |
| | | Investor Class | | | Institutional Class | | | Investor Class | | | Institutional Class | |
| On average daily net assets** | | | 1.25 | % | | | 1.00 | % | | | 1.25 | % | | | 1.00 | % |
| Waiver** | | | 2016 | | | | 2016 | | | | 2016 | | | | 2016 | |
* Exclusive of brokerage, interest, taxes, distribution plan expenses and extraordinary items.
** Through September 30 of the respective year. After these dates there is no assurance that such expenses will be limited.
The Adviser has no right to recapture previously-waived fees.
| | |
| | Notes to the financial statements (continued) |
| | |
| | |
Ariel Distributors, LLC is the Funds’ distributor and principal underwriter (“the Distributor”). The Trust has adopted a plan of distribution under Rule 12b-1 of the 1940 Act applicable to the Investor Class of the Funds. Under the plan, 12b-1 distribution fees at an annual rate of 0.25% of average daily net assets are paid weekly to the Distributor for its services. For the six months ended March 31, 2015 distribution fee expenses were as follows:
| | | | | | | | | | | | | | | | | | | |
| | | Ariel Fund | | | | | | | | | | | | | | | | |
| Paid to distributor | | | $2,269,774 | | | | $2,297,089 | | | | $66,116 | | | | $11,576 | | | | $6,044 | | | | $3,862 | |
| Paid to broker/dealers | | | 1,758,352 | | | | 1,815,008 | | | | 41,829 | | | | 6,025 | | | | 3,417 | | | | 1,202 | |
The remaining amounts were retained by the Distributor for its services, advertising, and other distribution expenses.
Trustees’ fees and expenses represent only those expenses of disinterested (independent) trustees of the Funds.
NOTE FIVE | FORWARD CURRENCY CONTRACTS
At March 31, 2015, the open forward currency contracts (State Street Bank and Trust as counterparty) are:
| | | | | | | | | | | | |
| | | | | | | | | | | Unrealized | |
| | | Currency to | | Amount to | | Currency to | | Amount to | | appreciation | |
| Contract settlement date | | be received | | be received | | be delivered | | be delivered | | (depreciation) | |
| Ariel International Fund | | | | | | | | | | | |
| 05/18/2015 | | DKK | | 441,542 | | EUR | | 59,515 | | $(396) | |
| 05/18/2015 | | DKK | | 265,813 | | EUR | | 35,865 | | (277) | |
| 05/19/2015 | | JPY | | 9,917,147 | | CHF | | 77,583 | | 2,754 | |
| 05/19/2015 | | GBP | | 156,622 | | EUR | | 210,299 | | 5,995 | |
| 05/19/2015 | | CHF | | 62,815 | | EUR | | 58,940 | | 1,346 | |
| 05/19/2015 | | AUD | | 382,687 | | CHF | | 277,795 | | 4,296 | |
| 05/19/2015 | | SGD | | 154,346 | | EUR | | 99,549 | | 5,232 | |
| 05/19/2015 | | SEK | | 1,584,715 | | EUR | | 167,022 | | 4,437 | |
| 05/19/2015 | | DKK | | 630,242 | | EUR | | 84,647 | | (238) | |
| 05/19/2015 | | SEK | | 751,814 | | USD | | 90,314 | | (2,956) | |
| 05/19/2015 | | SGD | | 49,061 | | USD | | 36,125 | | (416) | |
| 05/19/2015 | | NOK | | 631,876 | | USD | | 83,876 | | (5,533) | |
| 05/19/2015 | | AUD | | 673,899 | | USD | | 524,166 | | (12,263) | |
| | | | | | | | | | | $1,981 | |
| Ariel Global Fund | | | | | | | | | | | |
| 05/18/2015 | | DKK | | 939,290 | | EUR | | 126,606 | | $(843) | |
| 05/19/2015 | | SEK | | 2,357,440 | | GBP | | 185,007 | | (426) | |
| 05/19/2015 | | SEK | | 618,007 | | CHF | | 69,440 | | 220 | |
| 05/19/2015 | | NOK | | 787,273 | | GBP | | 68,113 | | (3,397) | |
| 05/19/2015 | | CAD | | 541,783 | | CHF | | 407,753 | | 7,111 | |
| 05/19/2015 | | CAD | | 581,431 | | EUR | | 410,487 | | 17,127 | |
| 05/19/2015 | | AUD | | 754,502 | | EUR | | 513,739 | | 20,389 | |
| 05/19/2015 | | SEK | | 1,783,646 | | EUR | | 187,988 | | 4,994 | |
| 05/19/2015 | | AUD | | 1,083,558 | | CHF | | 786,562 | | 12,163 | |
| 05/19/2015 | | AUD | | 376,352 | | GBP | | 190,026 | | 4,087 | |
| 05/19/2015 | | AUD | | 188,934 | | EUR | | 129,768 | | 3,897 | |
| 05/19/2015 | | DKK | | 1,073,904 | | EUR | | 144,369 | | (550) | |
| 05/19/2015 | | GBP | | 68,113 | | NOK | | 800,112 | | 1,805 | |
| 05/19/2015 | | CHF | | 69,440 | | SEK | | 615,100 | | 118 | |
| 05/19/2015 | | CHF | | 786,562 | | AUD | | 1,058,634 | | 6,769 | |
| 05/19/2015 | | CAD | | 549,193 | | USD | | 442,903 | | (9,564) | |
| 05/19/2015 | | USD | | 324,734 | | JPY | | 38,683,489 | | 1,992 | |
| 05/19/2015 | | USD | | 282,097 | | EUR | | 246,950 | | 16,400 | |
| 05/19/2015 | | USD | | 686,962 | | GBP | | 447,784 | | 22,930 | |
| 05/19/2015 | | USD | | 405,887 | | CHF | | 378,800 | | 15,355 | |
| 05/19/2015 | | USD | | 240,007 | | JPY | | 28,502,278 | | 2,209 | |
| | | | | | | | | | | $122,786 | |
As reflected in the Statement of Operations, realized net gain (loss) and the change in net unrealized appreciation (depreciation) on forward currency contracts for the six months ended March 31, 2015 were:
| | | Ariel International Fund | | | Ariel Global Fund | |
| Realized net gain (loss) on forward currency contracts | | | $(160,204 | ) | | | $(137,447 | ) |
| Change in net unrealized appreciation (depreciation) on forward currency contracts | | | 28,013 | | | | 80,335 | |
For the six months ended March 31, 2015, the volume of the forward currency contracts is measured by the number of trades during the period and the average notional amount. The funds had 143 and 135 forward currency trades during the six months with an average notional value of $76,852 and $206,235 for the Ariel International Fund and Ariel Global Fund, respectively.
NOTE SIX | TRANSACTIONS WITH AFFILIATED COMPANIES
If a Fund’s holding represents ownership of 5% or more of the voting securities of a company, the company is deemed to be an affiliate as defined in the 1940 Act. Ariel Fund had the following transactions during the six months ended March 31, 2015, with affiliated companies:
| | | | | | | | | | | | | | | | |
| | | Share activity | | | Six months ended March 31, 2015 | |
| | | Balance | | | | | | | | | Balance | | | | | | Dividends | | | Amount of gain | |
| | | September 30, | | | | | | | | | March 31, | | | | | | credited to | | | (loss) realized on | |
| Security name | | 2014 | | | Purchases | | | Sales | | | 2015 | | | Market value | | | income | | | sale of shares | |
| Contango Oil & Gas Co. | | | 1,833,617 | | | | 76,200 | | | | — | | | | 1,909,817 | | | | $42,015,974 | | | | $— | | | | $— | |
| Blount International Inc. | | | — | | | | 3,951,626 | | | | — | | | | 3,951,626 | | | | 50,896,943 | | | | — | | | | — | |
| MTS Systems Corp. | | | 643,079 | | | | 149,437 | | | | — | | | | 792,516 | | | | 59,953,835 | | | | 442,094 | | | | — | |
| | | | | | | | | | | | | | | | | | | | $152,866,752 | | | | $442,094 | | | | $— | |
NOTE SEVEN | LINE OF CREDIT
The Funds have a $125,000,000 Line of Credit (the “Line”), which is uncommitted, with State Street Bank and Trust Company. The Line is for temporary or emergency purposes such as to provide liquidity for shareholder redemptions. The Funds incur interest expense to the extent of amounts drawn (borrowed) under the Line. Interest is based on the federal funds rate in effect at the time of borrowing, plus a margin of 0.50%.
For the six months ended March 31, 2015, the details of the borrowings were as follows:
| Fund | | Average daily borrowings | | | Number of days outstanding | | | Weighted average annualized interest rate | |
| Ariel Fund | | | $972,646 | | | | 3 | | | | 1.35 | % |
| Ariel Focus Fund | | | 311,834 | | | | 4 | | | | 1.35 | % |
| Ariel Discovery Fund | | | 907,348 | | | | 10 | | | | 1.35 | % |
| | |
| | Important supplemental information |
| | |
| | |
PROXY VOTING POLICIES, PROCEDURES, AND RECORD
Both a description of the policies and procedures that the Funds’ investment adviser uses to determine how to vote proxies relating to portfolio securities and information regarding how the Funds voted proxies relating to portfolio securities during the most recent 12-month period ended June 30 are available upon request by calling 800-292-7435. Such information for the Ariel Investment Trust is also available on the Securities and Exchange Commission’s (“SEC”) web site at www.sec.gov.
SHAREHOLDER STATEMENTS AND REPORTS
The Funds attempt to reduce the volume of mail sent to shareholders by sending one copy of financial reports, prospectuses and other regulatory materials to two or more account holders who share the same address. We will send you a notice at least 60 days before sending only one copy of these documents we have if we have not received the shareholder’s written consent from you previously. Should you wish to receive individual copies of materials, please contact us at 800-292-7435. Once we have received your instructions, we will begin sending individual copies for each account within 30 days.
AVAILABILITY OF QUARTERLY PORTFOLIO SCHEDULE
The Funds file complete schedules of investments with the SEC for the quarters ended December 31 and June 30 of each fiscal year on Form N-Q which are available on the SEC’s website at www.sec.gov. Additionally, the Funds’ Form N-Q may be reviewed and copied at the SEC’s Public Reference Room in Washington, DC. For information on the Public Reference Room, call 800-SEC-0330.
All of the Funds’ quarterly reports contain a complete schedule of portfolio holdings. All quarterly reports are made available to shareholders on the Funds’ web site at www.arielinvestments.com. Shareholders also may obtain copies of shareholder reports upon request by calling 800-292-7435 or by writing to P.O. Box 701, Milwaukee, Wisconsin 53201-0701.
APPROVAL OF THE MANAGEMENT AGREEMENTS
Each year the Board of Trustees of the Trust, including a majority of the Independent Trustees, is required by the 1940 Act to determine whether to continue each Fund’s management or advisory agreement with the Adviser (together the “Agreements”). Throughout the year, the Board meets in person and requests, receives and considers a broad range of materials and information that are relevant to the Trustees’ consideration of the Agreements. The Board’s Management Contracts Committee (the “Committee”), which is comprised entirely of Independent Trustees and includes all Independent Trustees, leads the Board in its consideration of the Agreements. Both the Committee and the Board held meetings in November 2014 to review and evaluate the materials provided by the Adviser to assist the Board, and in particular the Independent Trustees, in considering renewal of the Agreements. At such meetings the Committee received presentations from the Adviser and from the portfolio manager of each Fund, as well as a memorandum from their independent legal counsel and supplemental materials and presentations. During each of those meetings, the Committee was advised by, and met in executive sessions with, their independent legal counsel.
Nature, Extent and Quality of Services. The Committee considered the Adviser’s specific responsibilities in the day-to-day management of the Funds, taking into account information received at regular Board meetings throughout the year related to the services rendered by the Adviser and the Trustees’ knowledge of the Adviser’s operations. In addition, the Committee considered the Adviser’s historical approach in managing the Funds; its consistency of investment approach; the background, education and experience of the Adviser’s investment personnel; the nature and quality of the Adviser’s services, including, among other things, compliance matters, trading practices, brokerage selection, shareholder communications, and information technology; and the Adviser’s commitment to diversity and civic affairs. The Committee also reviewed whether the Funds had operated within their investment objectives and reviewed each Fund’s record of compliance with its investment restrictions and other regulatory requirements, and also considered information regarding the structure of the Adviser’s compensation program for portfolio managers and certain other employees and the Adviser’s ability to attract and retain quality personnel. The Committee also noted the personal investments made by the Adviser’s personnel in the Funds, which is designed to align the interests of the Adviser and its personnel with those of the Funds’ shareholders.
Investment Performance. The Committee considered the investment performance of each Fund over time, including comparative information provided by Lipper Inc., an independent data service provider (“Lipper”), comparing each Fund’s performance with that of comparable funds selected by Lipper (the “Peer Group”) as well as an analysis of Fund performance as compared to the performance of its benchmark over specific historical periods. The Committee discussed comparative data with respect to the performance of the Funds, the Funds’ respective Peer Groups and the Funds’ respective performance benchmarks. Where available the Committee considered one, two, three, four, five and ten year periods as of September 30, 2014.
Ariel Fund. The Committee discussed Ariel Fund’s performance, ranked in the top decile for the one, two and three year periods against its Lipper universe. The Committee also considered that Ariel Fund’s four year and five year periods had outperformed its Lipper universe median, while the ten year period underperformed against its Lipper universe median.
Ariel Appreciation Fund. The Committee discussed Ariel Appreciation Fund’s underperformance against its Lipper universe median for the past one year period. The Committee also noted that Ariel Appreciation Fund was ranked in the top decile for the two, three and five year periods against its Lipper universe, and outperformed its Lipper universe median for the four and ten year periods.
Ariel Focus Fund. The Committee discussed Ariel Focus Fund’s underperformance for the one, three, four and five year periods against its Lipper universe. The Committee also considered that Focus Fund was ranked in the top decile against its Lipper universe for the two year period.
Ariel Discovery Fund. The Committee discussed that Discovery Fund had limited performance information available due to a January 31, 2011 inception date. The Committee noted that the Fund’s performance for the one, two and three year periods underperformed against its Lipper universe median.
Ariel International Fund and Ariel Global Fund. The Committee discussed that both Funds had limited performance information available due to having a December 30, 2011 inception date. The Committee noted that each Fund’s one and two year performance periods outperformed against its Lipper universe.
The Committee met with the respective portfolio managers of the Funds prior to approval of the Agreements for a fulsome discussion of performance, volatility, market events, risk/reward trade off, and performance of high/low beta stocks in down markets. The Committee acknowledged the Adviser’s commitment to its stated investment strategy and identified circle of competency, and its calm, reasoned and long-term approach to investing.
Fees and Expenses. The Committee reviewed comparative fee and expense information for each Fund’s Peer Group, as selected and analyzed by Lipper. The Committee considered comparative total expense ratios, as well as each Fund’s management fee structure. The Committee observed that the Focus Fund, Discovery Fund, International Fund and Global Fund each had expense limitations in place. The Committee considered the expense ratio of each Fund and concluded that the expense ratios were reasonable and competitive with the expense ratios of each Fund’s Peer Group as determined by Lipper.
Benefits, Profitability and Economies of Scale. The Board discussed the Committee’s conclusion that Ariel’s profitability associated with its relationship with the Trust was within a reasonable range and was neither excessive nor so low that the Adviser could not be expected to continue to service the Funds effectively. The Committee reviewed the profitability to Ariel of its relationship with each Fund, including the methodology by which that profitability analysis was calculated, and also examined the fees charged by Ariel to other types of clients, as well as the basis for any differences between those fees. The Committee also noted that the Adviser was subsidizing the Ariel Focus Fund, Ariel Discovery Fund, Ariel International Fund and Ariel Global Fund. The Committee reviewed the extent to which economies of scale may be realized if the Funds increase in size. It was noted that the management fee schedules for all the Funds contain breakpoints at different levels, with the final breakpoint at $1 billion in assets. The Committee considered the effective advisory fees for the Funds and concluded that the advisory fee schedules provide an appropriate sharing between the Funds and the Adviser of such economies of scale as may exist under the Agreements and determined that no additional breakpoints, or adjustments to the existing breakpoints, were needed at the present time.
Approval. After full consideration of the above factors, as well as other factors that were instructive in evaluating the Agreements, the Board, including all of the Independent Trustees, concluded that continuation of each Fund’s Agreement was in the best interests of each Fund and its respective shareholders and the Board approved the continuation of each Fund’s Agreement. The Board’s determinations were based upon a comprehensive consideration of all information provided to it, including both quantitative measures and qualitative factors, and were not the result of any single factor.
EXAMPLE
As a shareholder of the Funds, you incur ongoing costs, including management fees, distribution and service (12b-1) fees; and other Fund expenses. The Funds currently do not charge any transaction costs, such as sales charges (loads) on purchase payments, reinvested dividends or other distributions, redemption fees or exchange fees. The following example is intended to help you understand your ongoing costs (in dollars) of investing in each of the Funds and to compare these costs with the ongoing costs of investing in other mutual funds. Please note that IRA, 403(b) and Coverdell ESA account holders are charged an annual $15 recordkeeping fee or a one-time, lifetime $60 fee. If these fees were included in either the Actual Expense or Hypothetical Example below, your costs would be higher.
The example is based on an investment of $1,000 invested at the beginning of the period and held for the entire period of October 1, 2014- March 31, 2015.
ACTUAL EXPENSES
The first line of the table below for each Fund provides information about actual account values and actual expenses for that particular Fund. You may use the information in each of these lines, together with the amount you invested, to estimate the expenses that you paid over the period in each Fund. Simply divide your account value by $1,000 (for example, an $8,600 account value divided by $1,000=8.6), then multiply the result by the number in the first line under the heading, entitled “Expenses Paid During Period”, to estimate the expenses you paid on your account during this period in each Fund.
HYPOTHETICAL EXAMPLE FOR COMPARISON PURPOSES
The right portion of the table below for each Fund provides information about hypothetical account values and hypothetical expenses based on each Fund’s actual expense ratio and an assumed rate of return of 5% per year before expenses, which is not the actual return. The hypothetical account values and expenses may not be used to estimate the actual ending account balance or expenses you paid for the period. You may use this information to compare the ongoing costs of investing in each of the Funds to other funds. To do so, compare this 5% hypothetical example with the 5% hypothetical examples that appear in the shareholder reports of other funds.
Please note that the expenses shown in the table are meant to highlight only your ongoing costs in each of the Funds. Therefore, the right portion of the table for each Fund is useful in comparing ongoing costs only, and will not help you determine the relative total costs of owning different funds.
| | | | | | | | | | | | | |
| | | | | Actual | | Hypothetical (5% return before expenses) | | |
| Fund and return | | Beginning account value 10/01/14 | | Ending account value 03/31/15 | | Expenses paid during period* | | Ending account value 03/31/15 | | Expenses paid during period* | | Annualized expense ratio* |
| Ariel Fund | | | | | | | | | | | | |
| Investor Class | | $1,000.00 | | $1,157.60 | | $5.49 | | $1,019.85 | | $5.14 | | 1.02% |
| Institutional Class | | 1,000.00 | | 1,159.40 | | 3.77 | | 1,021.44 | | 3.53 | | 0.70% |
| Ariel Appreciation Fund | | | | | | | | | | | | |
| Investor Class | | $1,000.00 | | $1,120.50 | | $5.92 | | $1,019.35 | | $5.64 | | 1.12% |
| Institutional Class | | 1,000.00 | | 1,122.50 | | 4.13 | | 1,021.04 | | 3.93 | | 0.78% |
| Ariel Focus Fund | | | | | | | | | | | | |
| Investor Class | | $1,000.00 | | $1,013.10 | | $5.02 | | $1,019.95 | | $5.04 | | 1.00% |
| Institutional Class | | 1,000.00 | | 1,014.00 | | 3.77 | | 1,021.19 | | 3.78 | | 0.75% |
| Ariel Discovery Fund | | | | | | | | | | | | |
| Investor Class | | $1,000.00 | | $1,043.70 | | $6.37 | | $1,018.70 | | $6.29 | | 1.25% |
| Institutional Class | | 1,000.00 | | 1,044.20 | | 5.10 | | 1,019.95 | | 5.04 | | 1.00% |
| Ariel International Fund | | | | | | | | | | | | |
| Investor Class | | $1,000.00 | | $1,028.90 | | $6.32 | | $1,018.70 | | $6.29 | | 1.25% |
| Institutional Class | | 1,000.00 | | 1,030.50 | | 5.06 | | 1,019.95 | | 5.04 | | 1.00% |
| Ariel Global Fund | | | | | | | | | | | | |
| Investor Class | | $1,000.00 | | $1,023.80 | | $6.31 | | $1,018.70 | | $6.29 | | 1.25% |
| Institutional Class | | 1,000.00 | | 1,025.40 | | 5.05 | | 1,019.95 | | 5.04 | | 1.00% |
*Expenses are equal to each Fund’s annualized expense ratio indicated above multiplied by the average account value over the period, multiplied by 182/365 to reflect the most recent fiscal half year.
| | | | | | | | | | |
| | Name and age | | Position(s) held with Fund | | Term of office and length of time served | | Principal occupation(s) during past 5 years | | Other directorships |
| | James W. Compton Age: 76 | | Trustee, Member of Management Contracts, Governance and Audit Committees | | Indefinite, until successor elected Trustee since 1997 | | Retired President and CEO, Chicago Urban League, 1972 to 2006 | | Seaway Bank and Trust Company, Commonwealth Edison Company |
| | William C. Dietrich Age: 65 | | Lead Independent Trustee, Member of Management Contracts and Audit Committees, Chairman of Executive Committee | | Indefinite, until successor elected Trustee since 1986; Lead Independent Trustee and Executive Committee Chair since 2014 | | Retired Executive Director, Shalem Institute for Spiritual Formation, Inc., 2006 to 2009 | | |
| | Mellody L. Hobson Age: 46 | | Chairman of the Board of Trustees and President, Member of Executive Committee | | Indefinite, until successor elected Trustee since 1993; President since 2002; Chairman since 2006 | | President, Ariel Investments since 2000 | | DreamWorks Animation SKG, Inc. (Chairman), The Estée Lauder Companies Inc., Starbucks Corporation |
| | Christopher G. Kennedy Age: 51 | | Trustee, Chairman of Audit Committee, Member of Management Contracts, Governance and Executive Committees | | Indefinite, until successor elected Trustee since 1995; Audit Committee Chair since 2014 | | Chairman, Joseph P. Kennedy Enterprises, Inc. since 2012; Founder and Chairman, Top Box Foods since 2012; Former President, Merchandise Mart Properties, Inc., 2000 to 2011; Executive Officer, Vornado Realty Trust, 2000 to 2011 | | Interface Inc. |
| | Merrillyn J. Kosier Age: 55 | | Trustee and Vice President | | Indefinite, until successor elected Trustee since 2003; Vice President since 1999 | | Executive Vice President, Ariel Investments since 1999; Chief Marketing Officer, Mutual Funds since 2007 | | |
| | Kim Y. Lew Age: 48 | | Trustee, Member of Management Contracts and Audit Committees | | Indefinite, until successor elected Trustee since 2014 | | Co-Chief Investment Officer, Carnegie Corporation since 2011; Director of Investments, 2007 to 2011 | | |
| | William M. Lewis, Jr. Age: 58 | | Trustee, Member of Management Contracts Committee | | Indefinite, until successor elected Trustee since 2007 | | Managing Director and Co-Chairman of Investment Banking, Lazard Ltd. since 2004 | | |
| | H. Carl McCall Age: 79 | | Trustee, Chairman of Governance Committee, Member of Management Contracts and Audit Committees | | Indefinite, until successor elected Trustee since 2006; Governance Committee Chair since 2006 | | Principal, Convent Capital, LLC since 2004 | | |
| | John W. Rogers, Jr. Age: 57 | | Trustee | | Indefinite, until successor elected Trustee, 1986 to 1993 and since 2000 | | Founder, Chairman, CEO and Chief Investment Officer, Ariel Investments since 1983; Lead Portfolio Manager, Ariel Fund since 1986; Co-Portfolio Manager, Ariel Appreciation Fund since 2002 | | Exelon Corporation, McDonald’s Corporation |
| | James M. Williams Age: 67 | | Trustee, Chairman of Management Contracts Committee, Member of Governance Committee | | Indefinite, until successor elected Trustee since 2006; Management Committee Chair since 2006 | | Vice President and Chief Investment Officer, J. Paul Getty Trust since 2002 | | SEI Mutual Funds |
| | | | | | | | | | |
TRUSTEES EMERITUS (no Trustee duties or responsibilities) |
| Royce N. Flippin, Jr. |
| John G. Guffey, Jr. |
| Bert N. Mitchell, CPA, Chairman |
Note: Number of portfolios in complex overseen by all Trustees is six. Address for all Trustees is 200 East Randolph Street, Suite 2900, Chicago, IL 60601.
| | | | | | | | | | |
| | Name and age | | Position(s) held with Fund | | Term of office and length of time served | | Principal occupation(s) during past 5 years | | Other directorships |
| | Mareile B. Cusack Age: 56 | | Vice President, Anti-Money Laundering Officer and Secretary | | Indefinite, until successor elected Vice President since 2008; Anti-Money Laundering Officer since 2010; Secretary since 2014; Assistant Secretary, 2008 to 2014 | | Senior Vice President, Ariel Investments since 2012; Vice President, Ariel Investments, 2007-2012; General Counsel, Ariel Investments since 2008 | | |
| | Wendy D. Fox Age: 52 | | Chief Compliance Officer and Vice President | | Indefinite, until successor elected Chief Compliance Officer and Vice President since 2014 | | Chief Compliance Officer and Vice President, Ariel Investments since 2004 | | |
| | Mellody L. Hobson Age: 46 | | Chairman of the Board of Trustees and President, Member of Executive Committee | | Indefinite, until successor elected Trustee since 1993; President since 2002; Chairman since 2006 | | President, Ariel Investments since 2000 | | DreamWorks Animation SKG, Inc. (Chairman), The Estée Lauder Companies Inc., Starbucks Corporation |
| | Merrillyn J. Kosier Age: 55 | | Trustee and Vice President | | Indefinite, until successor elected Trustee since 2003; Vice President since 1999 | | Executive Vice President, Ariel Investments since 1999; Chief Marketing Officer, Mutual Funds since 2007 | | |
| | Jeffrey H. Rapaport Age: 39 | | Chief Financial Officer, Vice President and Treasurer | | Indefinite, until successor elected Chief Financial Officer and Treasurer since 2014; Vice President since 2010; Assistant Treasurer, 2010 to 2014 | | Vice President, Fund Administration since 2010; Senior Fund Administration Analyst, Ariel Investments, 2007-2010 | | |
The Statement of Additional Information (SAI) for Ariel Investment Trust includes additional information about the Funds’ Trustees and Officers. The SAI is available without charge by calling 800.292.7435 or logging on to our website, arielinvestments.com. Note: Number of portfolios in complex overseen by all Officers is six. Address for all officers is 200 East Randolph Street, Suite 2900, Chicago, IL 60601.
Ariel Investment Trust
c/o U.S. Bancorp Fund Services, LLC
P.O. Box 701
Milwaukee, WI 53201-0701
800.292.7435
arielinvestments.com
Follow us on Twitter @ArielFunds
 | | The materials used to produce this report were sourced responsibly. | |
| | |
| | The paper used along with the packaging are all recyclable. |
| Slow and steady wins the race. | TPI (154,000) ©05/15 AI–01 |
Item 2. Code of Ethics.
Not applicable. The information required by this Item is only required in an annual report on Form N-CSR.
Item 3. Audit Committee Financial Expert.
Not applicable. The information required by this Item is only required in an annual report on Form N-CSR.
Item 4. Principal Accountant Fees and Services.
Not applicable. The information required by this Item is only required in an annual report on Form N-CSR.
Item 5. Audit Committee of Listed Registrants.
Not applicable.
Item 6. Schedule of Investments.
| (a) | Included as part of the report to shareholders filed under Item 1 of this Form. |
Item 7. Disclosure of Proxy Voting Policies and Procedures for Closed-End Management Investment Companies.
Not applicable.
Item 8. Portfolio Managers of Closed-End Management Investment Companies.
Not applicable.
Item 9. Purchases of Equity Securities by Closed-End Management Investment Company and Affiliated Purchasers.
Not applicable.
Item 10. Submission of Matters to a Vote of Security Holders.
There have been no changes to the procedures by which shareholders may recommend nominees to the registrant’s Board of Trustees.
Item 11. Controls and Procedures.
| (a) | The registrant’s certifying officers have reasonably designed such disclosure controls and procedures to ensure material information relating to the registrant is made known to them by others, particularly during the period in which this report is being prepared. The registrant’s certifying officers have determined that the registrant’s disclosure controls and procedures are effective based on their evaluation of these controls and procedures as of a date within 90 days prior to the filing date of this report. |
| (b) | There were no significant changes in the registrant's internal controls over financial reporting, or in other factors that could significantly affect these controls, that occurred during the registrant’s second fiscal half-year, including any corrective actions with regard to significant deficiencies and material weaknesses. |
Item 12. Exhibits.
| (a) | (1) Code of Ethics – Not applicable. |
(a) (2) Certification for each principal executive and principal financial officer of the registrant as required by Rule 30a-2 under the Act (17 CFR 270.30a-2(a)) – Filed as an attachment to this filing.
(a) (3) Written solicitation to purchase securities under Rule 23c-1 – Not applicable.
| (b) | Certifications required by Rule 30a-2(b) under the Act (17 CFR 270.30a-2(b)), Rule 13a-14(b) or Rule 15d-14(b) under the Exchange Act (17 CFR 240.13a-14(b) or 240.15d-14(b)), and Section 1350 of Chapter 63 of Title 18 of the United States Code (18 U.S.C. 1350). A certification furnished pursuant to this paragraph will not be deemed “filed” for purposes of Section 18 of the Securities Exchange Act of 1934, as amended, or otherwise subject to the liability of that section. Such certification will not be deemed to be incorporated by reference into any filing under the Securities Act of 1933 or the Exchange Act, except to the extent that the registrant specifically incorporates it by reference – Filed as an attachment to this filing. |
SIGNATURES
Pursuant to the requirements of the Securities Exchange Act of 1934 and the Investment Company Act of 1940, the registrant has duly caused this report to be signed on its behalf by the undersigned, thereunto duly authorized.
Ariel Investment Trust
By: /s/ Mellody Hobson
Mellody Hobson
President and Principal Executive Officer
Date: May 19, 2015
Pursuant to the requirements of the Securities Exchange Act of 1934 and the Investment Company Act of 1940, this report has been signed below by the following persons on behalf of the registrant and in the capacities and on the dates indicated.
By: /s/ Mellody Hobson
Mellody Hobson
President and Principal Executive Officer
Date: May 19, 2015
By: /s/ Jeffrey Rapaport
Jeffrey Rapaport
Treasurer and Chief Financial Officer