Washington, D.C. 20549
Arthur Don, Esq.
Item 1. Reports to Stockholders.
The patient investor
| | | | | | |
| | | | | | |
| SEMI-ANNUAL REPORT: 03/31/14 |
| ● | Value | ● | Deep value | ● | Global |
| ● | Ariel Fund |
| ● | Ariel Appreciation Fund |
| ● | Ariel Focus Fund |
| ● | Ariel Discovery Fund |
| ● | Ariel International Fund |
| ● | |
Slow and steady wins the race.
One of Ariel Investments’ guiding principles is to communicate openly with our shareholders so they may gain a clear understanding of our investment philosophy, portfolio decisions and results, as well as our opinions on the underlying market. In reviewing the materials contained in The Patient Investor, please consider the information provided on this page. While our investment decisions are rooted in detailed analysis, it is important to point out that actual results can differ significantly from those we seek. We candidly discuss a number of individual companies. Our opinions are current as of the date they were written but are subject to change. We want to remind investors that the information in this report is not sufficient on which to base an investment decision and should not be considered a recommendation to purchase or sell any particular security. Equity investments are affected by market conditions. The intrinsic value of the stocks in which the Funds invest may never be recognized by the broader market. Ariel Fund, Ariel Appreciation Fund, Ariel Focus Fund and Ariel Discovery Fund invest in small and/or midsized companies. Investing in small and mid-cap stocks is riskier and more volatile than investing in large cap stocks, in part because smaller companies may not have the scale, depth of resources and other assets of larger firms. Ariel Fund and Ariel Appreciation Fund often invest a significant portion of their assets in companies within the consumer discretionary and financial services sectors and their performance may suffer if these sectors underperform the overall stock market. Ariel Focus Fund invests primarily in equity securities of companies of any size and is a non-diversified fund, which means its investments are concentrated in fewer stocks than diversified funds. Ariel Focus Fund generally holds 25-30 stocks and therefore may be more volatile than a more diversified investment. Ariel International Fund and Ariel Global Fund invest in foreign securities and may use currency derivatives and ETFs. Investments in foreign securities may underperform and may be more volatile than comparable U.S. stocks because of the risks involving foreign economies and markets, foreign political systems, foreign regulatory standards, foreign currencies and taxes. The use of currency derivatives and ETFs may increase investment losses and expenses and create more volatility. Investments in emerging and developing markets present additional risks, such as difficulties selling on a timely basis and at an acceptable price. Performance data quoted represents past performance. Past performance does not guarantee future results. All performance assumes the reinvestment of dividends and capital gains. The investment return and principal value of an investment will fluctuate so that an investor’s shares, when redeemed, may be worth more or less than their original cost. Current performance may be lower or higher than the performance data quoted. Performance data current to the most recent month-end for the Funds may be obtained by visiting our website, arielinvestments.com. Investors should consider carefully the investment objectives, risks, and charges and expenses before investing. For a current summary prospectus or full prospectus which contains this and other information about the Funds offered by Ariel Investment Trust, call us at 800.292.7435 or visit our website, arielinvestments.com. Please read the summary prospectus or full prospectus carefully before investing. Distributed by Ariel Distributors, LLC, a wholly owned subsidiary of Ariel Investments, LLC. Ariel Investment Trust c/o U.S. Bancorp Fund Services, LLC P.O. Box 701 Milwaukee, WI 53201-0701 800.292.7435 toll-free arielinvestments.com Follow us on Twitter @ArielFunds |
| | | |
| | Fund performance at a glance | AS OF 03/31/14 |
| | | |
| | | |
| | | | | | | | |
| | | | Annualized |
| | Quarter | 1-year | 3-year | 5-year | 10-year | 20-year | Since inception |
| Small/mid cap value strategy | | | | | | | 11/06/86 |
| Ariel Fund–Investor Class | – 0.99% | + 23.74% | + 12.02% | + 30.25% | + 7.37% | + 11.04% | + 11.69% |
| Ariel Fund – Institutional Class | – 0.90 | + 24.13 | + 12.29 | + 30.45 | + 7.45 | + 11.08 | + 11.72 |
Russell 2500TM Value Index | + 3.52 | + 21.76 | + 13.88 | + 24.81 | + 9.01 | + 11.72 | + 11.81 |
Russell 2000® Value Index | + 1.78 | + 22.65 | + 12.74 | + 23.33 | + 8.07 | + 10.81 | + 11.10 |
S&P 500® Index | + 1.81 | + 21.86 | + 14.66 | + 21.16 | + 7.42 | + 9.53 | + 10.21 |
| Mid cap value strategy | | | | | | | 12/01/89 |
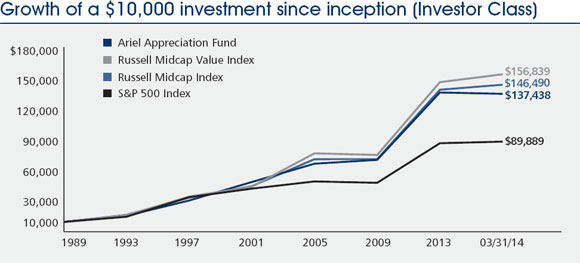
| Ariel Appreciation Fund–Investor Class | – 0.95% | + 25.33% | + 14.38% | + 28.77% | + 8.55% | + 11.59% | + 11.37% |
| Ariel Appreciation Fund – Institutional Class | – 0.86 | + 25.73 | + 14.63 | + 28.94 | + 8.62 | + 11.63 | + 11.40 |
Russell Midcap® Value Index | + 5.22 | + 22.95 | + 15.17 | + 26.35 | + 10.24 | + 12.09 | + 11.98 |
Russell Midcap® Index | + 3.53 | + 23.51 | + 14.39 | + 25.55 | + 10.05 | + 11.55 | + 11.66 |
S&P 500® Index | + 1.81 | + 21.86 | + 14.66 | + 21.16 | + 7.42 | + 9.53 | + 9.45 |
| All cap value strategy | | | | | | | 06/30/05 |
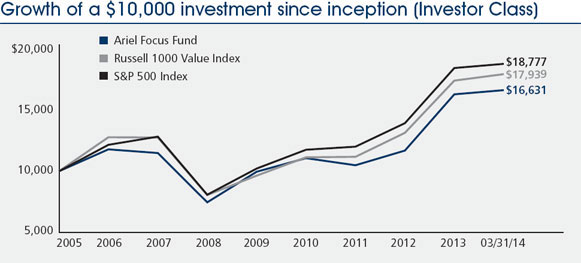
| Ariel Focus Fund–Investor Class | + 2.11% | + 24.86% | + 12.87% | + 21.34% | – | – | + 5.99% |
| Ariel Focus Fund – Institutional Class | + 2.11 | + 25.14 | + 13.07 | + 21.47 | – | – | + 6.05 |
Russell 1000® Value Index | + 3.02 | + 21.57 | + 14.80 | + 21.75 | – | – | + 6.98 |
S&P 500® Index | + 1.81 | + 21.86 | + 14.66 | + 21.16 | – | – | + 7.55 |
| Small cap deep value strategy | | | | | | | 01/31/11 |
| Ariel Discovery Fund–Investor Class | – 0.66% | + 16.35% | + 10.04% | – | – | – | + 10.63% |
| Ariel Discovery Fund– Institutional Class | – 0.51 | + 16.70 | + 10.31 | – | – | – | + 10.89 |
Russell 2000® Value Index | + 1.78 | + 22.65 | + 12.74 | – | – | – | + 14.32 |
S&P 500® Index | + 1.81 | + 21.86 | + 14.66 | – | – | – | + 15.09 |
| International all cap strategy | | | | | | | 12/30/11 |
| Ariel International Fund–Investor Class | + 2.18% | + 24.07% | – | – | – | – | + 14.05% |
| Ariel International Fund – Institutional Class | + 2.29 | + 24.26 | – | – | – | – | + 14.33 |
MSCI EAFE® Index | + 0.77 | + 18.06 | – | – | – | – | + 18.47 |
| Global all cap strategy | | | | | | | 12/30/11 |
| Ariel Global Fund–Investor Class | + 2.50% | + 21.21% | – | – | – | – | + 15.44% |
| Ariel Global Fund – Institutional Class | + 2.54 | + 21.62 | – | – | – | – | + 15.76 |
MSCI ACWISM Index | + 1.21 | + 17.17 | – | – | – | – | + 18.27 |
The inception date for the Institutional Class shares of all Funds is December 30, 2011. Performance information for the Institutional Class prior to that date reflects the actual performance of a Fund’s Investor Class (and uses the actual expenses of the Fund’s Investor Class, for such period of time), without any adjustments. For any such period of time, the performance of a Fund’s Institutional Class would have been substantially similar to, yet higher than, the performance of its Investor Class, because the shares of both classes are invested in the same portfolio of securities, but the classes bear different expenses, which are primarily differences in distribution and service fees. Descriptions for the indexes can be found in the individual fund summaries in the report. The extraordinary performance shown for the recent short-term periods may not be sustainable and is not representative of the performance over longer periods.
| | | |
| TURTLE TALK | |
| | |
| | | |
| | Portfolio manager viewpoints | |
| | | |
| | Chairman and CEO, John W. Rogers, Jr. and Vice Chairman and Director of Research, Charles K. Bobrinskoy recently participated in a webinar hosted by InvestmentNews and moderated by Conseulo Mack. In this webcast, John and Charlie discuss how investors can re-think standard sources of returns by challenging the categories of conventional investing using behavioral finance theories. To hear John and Charlie’s webcast on behavioral finance or to read John’s recent Forbes column on “Behavioral Bias”, please visit arielinvestments.com. | |
| | | |
Retirement do’s and don’t’s
Making sure you have enough saved to last throughout your retirement can be overwhelming. Use these friendly guidelines to keep yourself on track.
| | |
| DO |
| ● | Maximize your contributions. For 2014, you can contribute up to $5,500 ($6,500 if you’re age 50 or older) to your IRA and $17,500 to your 401k ($23,000 if you’re age 50 or older). |
| | |
| ● | Consider how much you’ll need in retirement. With medical advances, more Americans are expected to live healthier and long lives. |
| | |
| ● | Seize opportunities. When short-term fluctuations in the market occur, these can be opportunities to invest when stocks are selling at a discount. |
| | |
| DON’T |
| ● | Take an early distribution. If you’re not 59½ years old, you may be faced with both a 10% penalty and income taxes. |
| | |
| ● | Lose track of old retirement plans. If you change employers, think about moving your retirement plan(s) into a Rollover IRA so nothing gets lost in the shuffle. |
| | |
| ● | Invest in only your employer’s stock. Manage your overall risk with a well-diversified portfolio. |
For more information regarding your retirement options, call 800.292.7435.
Past performance does not guarantee future results. Investing involves risk, including the possible loss of principal. Consider your financial ability to continue to invest in both up and down markets. This information is not personalized investment or tax advice. Consult a licensed tax professional for tax ramifications.
MUCH ADO
Performance data quoted represents past performance. Past performance does not guarantee future results. All performance assumes the reinvestment of dividends and capital gains and represents returns of the Investor Class shares. The investment return and principal value of an investment will fluctuate so that an investor’s shares, when redeemed, may be worth more or less than their original cost. Current performance may be lower or higher than the performance data quoted. Performance data current to the most recent month-end for Ariel Fund and Ariel Appreciation Fund may be obtained by visiting our website, arielinvestments.com. The extraordinary performance shown for the recent short-term periods may not be sustainable and is not representative of the performance over longer periods. |
DEAR FELLOW SHAREHOLDER:
For the first quarter ended March 31, 2014, Ariel Fund fell –0.99% during a time when its primary benchmark, the Russell 2500 Value Index, gained +3.52% and the Russell 2000 Value Index rose +1.78%. Ariel Appreciation Fund’s –0.95% loss paled in comparison to the robust +5.22% gain for the Russell Midcap Value Index and +3.53% rise of the Russell Midcap Index. Keep in mind, 2013 was a strong performance year for our Funds before this reversal, which we discuss below in detail. Specifically, Ariel Fund surged +44.68%, topping the Russell 2500 Value Index’s +33.32% gain, and the Russell 2000 Value Index’s +34.52% rise. Meanwhile, Ariel Appreciation Fund leapt +46.21%, outdistancing the Russell Midcap Value Index’s +33.46% return and the Russell Midcap Index’s +34.76% move.
A Wall Street Journal headline characterized overall market returns as “A Restrained Start to 2014.”1 Our small losses accentuate this point. Not to mention, the striking similarity in the Funds’ returns underscores a style-driven result.
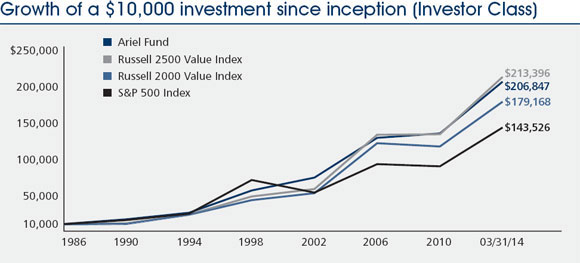
Before we drill down on the most recent quarter’s returns, we would be remiss if we failed to mention that, after the worst financial crisis since the Great Depression, the market hit bottom almost exactly five years ago. Since March 31, 2009, our flagship Ariel Fund ranked number one in the Morningstar Mid-Cap Blend category out of 311 funds that have been in existence over the 60-month period.* While we are pleased with this outcome, we are even more pleased Ariel Fund ranked number one in that same Morningstar database since the Fund’s inception on November 6, 1986—the longer time frame being more statistically significant as a measure of skill over luck. Also worth noting, only 11 Mid-Cap Blend funds have track records dating back as far.
* Past performance does not guarantee future results. For the period ended March 31, 2014, the rankings of Ariel Fund for the one-, five-, ten-year and since inception periods were 138 out of 390 funds, 1 out of 311 funds, 139 out of 192 funds and 1 out of 11 funds, respectively, among Morningstar Mid-Cap Blend funds. Morningstar, Inc. is a nationally recognized organization that reports performance and calculates rankings for mutual funds. Rankings are based on total returns. Morningstar ranks each fund relative to all funds in the same category.
MUCH ADO
According to Institutional Investor, “William Shakespeare’s Macbeth once observed that life is ‘full of sound and fury, signifying nothing.’”2 That’s how we feel about the first three months of 2014. More specifically, our post mortem on the quarter illustrates that most of our biggest winners last year were our biggest losers this year—and yet, there was little in the way of meaningful news to drive this outcome. For example, the top-10 performers in Ariel Fund in 2013 posted one-year gains ranging from Graham Holdings Co. (GHC), which surged +81.6%, on the high end to Lazard Ltd (LAZ), which gained +51.9%, on the low end. By contrast, the first quarter of 2014 exhibited a distinct reversal of fortune, whereby eight of those same top-10 performers experienced an average drop of –8.0% for the period, with losses ranging from –19.1% to –0.6%. The returns of Ariel Appreciation Fund’s holdings are similar. In 2013 its top stock, Towers Watson (TW), surged a whopping +127.0%. The tenth best performer, City National Corp. (CYN), racked up a +60.0% return. Meanwhile, seven of last year’s top-10 mid-cap performers have fallen on average –4.9% through March 31, with Towers Watson coming in at the bottom of the pack with a –10.6% first quarter loss.
Typically, underperformance results from deteriorating fundamentals, which often comes in the form of negative earnings revisions. As we look into 2014 and beyond, we are actually quite optimistic about our portfolios precisely because the reversal of some of our best performers is not supported by weakening fundamentals. For example, in Ariel Fund, Gannett Co., Inc. (GCI) had its earnings revised down just –1% during the quarter, yet the stock fell –6.7% over the period. Mohawk Industries, Inc. (MHK) experienced the same negligible revision, but its shares experienced an even worse outcome, dropping –8.7%. In Ariel Appreciation Fund, CBS Corp. (CBS) had no earnings revision at all, but the stock still fell –3.0%.
“…most of our biggest winners last year were our biggest losers this year—and yet, there was little in the way of meaningful news to drive this outcome.”
We will be the first to admit that all is not perfect in our portfolios; just like baseball batting averages, it never is. Take the worst revision among Ariel Fund’s top performers last year, Dun & Bradstreet Corp. (DNB). In 2013, DNB was up +56.1%. In the first quarter, consensus expectations for the company’s 2014 earnings were revised down –11.0%. The stock plummeted –19.1%, a painful outcome for sure. That said, we believe the new CEO’s cloud-based strategy, coupled with investment spending aimed at long-term growth should reward investors over time. Another stock that was problematic is slot machine manufacturer, International Game Technology (IGT), which fell –22.6% this year and is the worst-performing company in both funds. During a time of industry-wide compression, a bumpy acquisition integration, poor stock buy-back timing and eroding market share have led to a rough-and-tumble period for IGT. Despite these meaningful headwinds, we believe the business remains a good one, even as management’s recent actions have tried our patience.
“…we are actually quite optimistic about our portfolios precisely because the reversal of some of our best performers is not supported by weakening fundamentals.”
It is important to note that in keeping with our contrarian approach, we pared back our exposure to certain big winners as their stock prices soared in recent years. Mind you, when we sell after a stock runs hard, we do not sell haphazardly or automatically. Rather, we carefully examine our original thesis, thoroughly update our financial models based on new information and rigorously debate its future prospects. When we believe the gap between value and price has disappeared, we liquidate; when we think it has narrowed, we pare back. We have recently liquidated a few stocks and pared back on a larger number, but remain keen on the prospects of the great franchises we still own, many of which are moderately cheap rather than breathtaking bargains. Note, however, that we have added to other positions where we thought the difference between value and price had expanded or remained wide.
We will end this letter by comparing our own activities to what we think happened to some of our stocks during the quarter. When stocks we know well sell off on minor news (or no news!), we consider it a conundrum. As you know, we believe behavioral economics explains many market mysteries, so we offer a possible explanation for what we have described in detail above. One of the more arcane topics in behavioral finance is the disposition effect, first identified by Hersh Shefrin and Meir Statman in 1985. The disposition effect is the tendency for investors to sell rising securities too soon and to hold assets that fall too long. Those falling prey to this inclination often say they are “capturing profits” or “cashing in their chips,” which is fine if they are using careful analysis. Those simply selling based on price are ignoring half of the equation: value. Ultimately we think many investors who owned 2013’s hottest stocks simply sold, even when they lacked a truly solid rationale to do so. People tend to think of market returns in calendar years, so it makes sense that the disposition effect would kick in during the first quarter following a torrid market year such as 2013. We know of no other way to rigorously test our thesis, but we find it a reasonable explanation for actions that strike us as unwarranted.
���Ultimately we think many investors who owned 2013’s hottest stocks simply sold, even when they lacked a truly solid rationale to do so.”
PORTFOLIO COMINGS AND GOINGS
During the quarter we added two new positions to Ariel Fund. We purchased Bally Technologies Inc. (BYI) in our small/mid cap value fund. With an estimated $1.2 billion in fiscal year 2014 revenues, Bally Technologies has become one of the larger gaming equipment and systems companies in the world. At this time, we believe the investment community is too focused on what we consider to be short-term issues, such as disappointing attendance and play at regional casino operators. We are confident that Bally is poised to benefit from gaming growth, both domestically and internationally. We also added a previous Ariel holding, Laboratory Corp. of America Holdings (LH). LabCorp maintains a leading market position in an industry that continues to show promising growth potential due to technological advances, aging demographics, health-care cost containment, and preventative medicine. LabCorp maintains a solid balance sheet, generates a significant amount of free cash flow, and has been returning value to shareholders through share repurchases. The company operates with an experienced management team that is conservative yet willing to take slight risks in order to grow the business long-term. We did not eliminate any positions this quarter.
We also purchased LabCorp in Ariel Appreciation Fund and exited our position in Apollo Education Group, Inc. (APOL) in order to pursue more compelling opportunities.
As always, we appreciate the opportunity to serve you and welcome any questions or comments you might have. You can also contact us directly at email@arielinvestments.com.
| | | |
| Sincerely, | | |
| |  |
| John W. Rogers, Jr. | | Mellody Hobson |
| Chairman and CEO | | President |
| | | |
 MORNINGSTAR INVESTMENT CONFERENCE MORNINGSTAR INVESTMENT CONFERENCE | |
| | | |
| | John W. Rogers, Jr. will discuss wide moat investing at this year’s Morningstar Investment Conference in Chicago. If you have registered to attend, please join him on June 19 at 1:40pm and again at 2:40pm. Then stop by and meet John at the Ariel booth #322 from 3:30-4:30pm. We hope to see you there. | |
1 The Wall Street Journal, April 7, 2014, page R2.
2 Institutional Investor, December 2012/January 2013, page 78.
| | | |
| | Ariel Fund performance summary | INCEPTION: 11/06/86 |
| | | |
| | | |
| | | | | |
 | |  | |  |
| John W. Rogers, Jr. | | John P. Miller, cfa | | Kenneth E. Kuhrt, cpa |
| Lead portfolio | | Portfolio | | Portfolio |
| manager | | manager | | manager |
Composition of equity holdings (%) | | | | |
| | | | | | |
| | | Ariel
Fund† | Russell
2500
Value
Index | Russell
2000
Value
Index | S&P
500
Index |
| | Financial services | 31.60 | 37.99 | 39.65 | 17.85 |
| | Consumer discretionary | 30.60 | 10.90 | 10.39 | 13.81 |
| | Producer durables | 12.47 | 13.68 | 14.31 | 10.98 |
| | Health care | 10.18 | 5.00 | 4.83 | 13.20 |
| | Materials & processing | 6.48 | 6.53 | 5.40 | 3.93 |
| | | 3.17 | 1.54 | 2.11 | 8.49 |
| | Technology | 3.01 | 8.51 | 9.76 | 16.04 |
| | Energy | 2.49 | 6.84 | 6.69 | 10.18 |
| | Utilities | 0.00 | 9.01 | 6.86 | 5.52 |
† Sector weightings are calculated based on equity holdings in the Fund and exclude cash in order to make a relevant comparison to the indexes. |
Average annual total returns as of 03/31/14 |
| | | | | | | | | |
| | | Quarter | 1-year | 3-year | 5-year | 10-year | 20-year | Since inception |
| | Ariel Fund– Investor Class | – | 0.99% | + 23.74% | + 12.02% | + 30.25% | + | 7.37% | + | 11.04% | + 11.69% |
| | Ariel Fund– Institutional Class+ | | 0.90 | + 24.13 | + 12.29 | + 30.45 | + | 7.45 | + | 11.08 | + 11.72 |
| | Russell 2500TM Value Index | + | 3.52 | + 21.76 | + 13.88 | + 24.81 | + | 9.01 | + | 11.72 | + 11.81 |
| | Russell 2000® Value Index | + | 1.78 | + 22.65 | + 12.74 | + 23.33 | + | 8.07 | + | 10.81 | + 11.10 |
| | S&P 500® Index | + | 1.81 | + 21.86 | + 14.66 | + 21.16 | + | 7.42 | + | 9.53 | + 10.21 |
| Performance data quoted represents past performance and does not guarantee future results. All performance assumes the reinvestment of dividends and capital gains. The investment return and principal value of an investment will fluctuate so that an investor’s shares, when redeemed, may be worth more or less than their original cost. Current performance may be lower or higher than the performance data quoted. To access performance data current to the most recent month-end, visit arielinvestments.com. |
| Expense ratio (as of 09/30/13) | |
| Investor Class | 1.03% |
| Institutional Class | 0.72% |
Top ten equity holdings (% of net assets) |
| 1. | KKR & Co. L.P. | 3.9 |
| 2. | Lazard Ltd | 3.8 |
| 3. | | 3.8 |
| 4. | Royal Caribbean Cruises Ltd. | 3.7 |
| 5. | | 3.6 |
| 6. | U.S. Silica Holdings Inc. | 3.2 |
| 7. | | 3.1 |
| 8. | | 3.1 |
| 9. | | 3.1 |
| 10. | | 3.0 |
+The inception date for the Institutional Class shares is December 30, 2011. Performance information for the Institutional Class prior to that date reflects the actual performance of the Fund’s Investor Class (and uses the actual expenses of the Fund’s Investor Class, for such period of time), without any adjustments. For any such period of time, the performance of the Fund’s Institutional Class would have been substantially similar to, yet higher than, the performance of the Fund’s Investor Class, because the shares of both classes are invested in the same portfolio of securities, but the classes bear different expenses, which are primarily differences in distribution and service fees. Notes: The graph and performance table do not reflect the deduction of taxes that a shareholder would pay on fund distributions or the redemption of fund shares. The Russell 2500TM Value Index measures the performance of small to mid-cap value companies with lower price-to-book ratios and lower forecasted growth values. The Russell 2000® Value Index measures the performance of the small-cap value segment of the U.S. equity universe. It includes those Russell 2000 companies with lower price-to-book ratios and lower forecasted growth values. Russell® is a trademark of Russell Investment Group, which is the source and owner of the Russell Indexes’ trademarks, service marks and copyrights. The S&P 500® is a broad market-weighted index dominated by blue-chip stocks. All indexes are unmanaged, and an investor cannot invest directly in an index. Total return does not reflect a maximum 4.75% sales load charged prior to 7/15/94.
| | | |
| | Ariel Appreciation Fund performance summary | INCEPTION: 12/01/89 |
| | | |
| | | |
| | | |
 | |  |
John W. Rogers, Jr. Co-portfolio
manager | | Timothy R. Fidler, cfa Co-portfolio
manager |
Composition of equity holdings (%)
| | | | | | |
| | | Ariel Apprec- iation Fund† | Russell Midcap Value Index | Russell Midcap Index | S&P 500 Index |
| | Financial services | 36.98 | 32.57 | 21.39 | 17.85 |
| | Consumer discretionary | 29.52 | 9.39 | 18.18 | 13.81 |
| | Health care | 15.08 | 8.08 | 10.63 | 13.20 |
| | Producer durables | 14.03 | 12.29 | 13.11 | 10.98 |
| | Consumer staples | 2.98 | 2.90 | 5.53 | 8.49 |
| | Energy | 1.41 | 6.96 | 6.66 | 10.18 |
| | | 0.00 | 5.81 | 6.65 | 3.93 |
| | Technology | 0.00 | 9.24 | 11.38 | 16.04 |
| | Utilities | 0.00 | 12.77 | 6.47 | 5.52 |
† Sector weightings are calculated based on equity holdings in the Fund and exclude cash in order to make a relevant comparison to the indexes. |
Average annual total returns as of 03/31/14
| | | | | | | | | | | | | |
| | | Quarter | 1-year | 3-year | 5-year | 10-year | 20-year | Since inception |
| | Ariel Appreciation Fund– Investor Class | – | 0.95% | + 25.33% | + 14.38% | + 28.77% | + | 8.55% | + | 11.59% | + | 11.37% |
| | Ariel Appreciation Fund– Institutional Class+ | – | 0.86 | + 25.73 | + 14.63 | + 28.94 | + | 8.62 | + | 11.63 | + | 11.40 |
| | Russell Midcap® Value Index | + | 5.22 | + 22.95 | + 15.17 | + 26.35 | + | 10.24 | + | 12.09 | + | 11.98 |
| | Russell Midcap® Index | + | 3.53 | + 23.51 | + 14.39 | + 25.55 | + | 10.05 | + | 11.55 | + | 11.66 |
| | S&P 500® Index | + | 1.81 | + 21.86 | + 14.66 | + 21.16 | + | 7.42 | + | 9.53 | + | 9.45 |
| Performance data quoted represents past performance and does not guarantee future results. All performance assumes the reinvestment of dividends and capital gains. The investment return and principal value of an investment will fluctuate so that an investor’s shares, when redeemed, may be worth more or less than their original cost. Current performance may be lower or higher than the performance data quoted. To access performance data current to the most recent month-end, visit arielinvestments.com. |
| Expense ratio (as of 09/30/13) | |
| Investor Class | 1.13% |
| Institutional Class | 0.80% |
Top ten equity holdings (% of net assets)
| | 1. | Lazard Ltd | 4.5 |
| | 2. | | 4.4 |
| | 3. | First American Financial Corp. | 4.0 |
| | 4. | Stanley Black & Decker, Inc. | 3.5 |
| | 5. | | 3.5 |
| | 6. | Interpublic Group of Cos., Inc. | 3.3 |
| | 7. | | 3.3 |
| | 8. | International Game Technology | 3.2 |
| | 9. | | 3.2 |
| | 10. | AFLAC Inc. | 3.1 |
+The inception date for the Institutional Class shares is December 30, 2011. Performance information for the Institutional Class prior to that date reflects the actual performance of the Fund’s Investor Class (and uses the actual expenses of the Fund’s Investor Class, for such period of time), without any adjustments. For any such period of time, the performance of the Fund’s Institutional Class would have been substantially similar to, yet higher than, the performance of the Fund’s Investor Class, because the shares of both classes are invested in the same portfolio of securities, but the classes bear different expenses, which are primarily differences in distribution and service fees. Notes: The graph and performance table do not reflect the deduction of taxes that a shareholder would pay on fund distributions or the redemption of fund shares. The Russell Midcap® Value Index measures the performance of mid-cap value companies with lower price-to-book ratios and lower forecasted growth values. The Russell Midcap® Index measures the performance of mid-cap companies. Russell® is a trademark of Russell Investment Group, which is the source and owner of the Russell Indexes’ trademarks, service marks and copyrights. The S&P 500® is a broad market-weighted index dominated by blue-chip stocks. All indexes are unmanaged, and an investor cannot invest directly in an index. Total return does not reflect a maximum 4.75% sales load charged prior to 7/15/94.

INFLATION PREPARATION
| Performance data quoted represents past performance. Past performance does not guarantee future results. All performance assumes the reinvestment of dividends and capital gains and represents returns of the Investor Class shares. The investment return and principal value of an investment will fluctuate so that an investor’s shares, when redeemed, may be worth more or less than their original cost. Current performance may be lower or higher than the performance data quoted. Performance data current to the most recent month-end for Ariel Focus Fund may be obtained by visiting our website, arielinvestments.com. |
DEAR FELLOW SHAREHOLDER:
For the first quarter ending March 31, 2014, Ariel Focus Fund had mixed performance. Specifically, it increased +2.11%, slightly behind the Russell 1000 Value Index’s +3.02% gain but just ahead of the broad market as measured by the S&P 500 Index’s +1.81% return. Positive contributions came from a broad array of names, with seven stocks increasing more than +7%. Only two stocks declined by more than –7%, namely International Game Technology (IGT) and Goldman Sachs Group, Inc. (GS), both of which will be discussed in this letter.
FIRST QUARTER PERFORMANCE
One pleasant surprise during the quarter was the strong absolute performance of our five health-care names: Johnson & Johnson (JNJ), Zimmer Holdings, Inc. (ZMH), Hospira, Inc. (HSP), Baxter Intl Inc. (BAX), and our newest holding, Laboratory Corp. of America Holdings (LH). The stock prices of these holdings increased an average of +5.44% during the quarter. Counterintuitively, uncertainty surrounding the Affordable Care Act seems to have boosted profits. Health-care management teams assert (and our independent research confirms) that concerns about the new law drove more patients into hospitals in the fourth quarter. Usually uncertainty decreases activity, but not this time. The result was significantly improved health-care fundamentals, including more orthopedic procedures such as hip and knee replacements.
Speaking of health care, one new name was added to the portfolio during the quarter, Laboratory Corp. of America Holdings. LabCorp is an operator of independent clinical laboratories performing health-care testing. Its testing facilities are located outside hospitals and boast a much lower cost structure than an in-house lab. Our investment thesis is simple: An aging population will require more medical tests. Meanwhile, curtailing health-care costs will continue to be of increasing importance. Our opportunity came when the first draft of the annual “Doc Fix” legislation, the law that sets Medicare reimbursement rates, called for big cuts in independent lab fees. LabCorp’s stock got hit, and we initiated a position.
A few of our holdings struggled during the quarter. Investment bank Goldman Sachs slid –7.25% during the quarter, largely because it had to revise its plan to return capital to shareholders. The Federal Reserve has instituted stress tests that limit Goldman’s ability to return capital to shareholders. In early 2014, it became apparent that the Fed would become even more strict than previously anticipated. Also, gaming manufacturer International Game Technology fell –22.00% after a subpar earnings report. Its revenue and earnings per share (EPS) both slid below consensus estimates. Specifically, revenues were 2% lower than Wall Street expected, while the (adjusted) EPS of $0.25 did not meet the $0.30 forecast. The miss came from weak regional gaming trends and higher-than-expected operating expenses.
POSITIONING FOR INFLATION
Given the relatively uneventful nature of the first quarter, the rest of this letter will address a subtle change in outlook. A core strategy of Ariel Focus Fund is to buy what others are selling. If, as portfolio manager, I believe investors are overly concerned with a particular risk, I often invest in companies whose stocks have been excessively punished. But I also invest in companies that stand to benefit from a risk that seems to be underestimated. Right now, a key underappreciated risk is inflation.
“One pleasant surprise during the quarter was the strong absolute performance of our five health-care names.”
I realize there are few signs of inflation today. In fact, new Federal Reserve Chair Janet Yellen says she is concerned about the opposite problem, deflation, since wage rates do not seem to be rising. Additionally, the U.S. manufacturing system currently has a great deal of capacity. Since the financial crisis, the Consumer Price Index has averaged +2.13%, or only half the long-term average since 1970. Finally, perhaps the best argument against being worried about inflation is that 10-year Treasury yields of 2.72% are near historic lows. I cannot imagine bond investors accepting that coupon rate if they were expecting inflation to rear its ugly head.
When many fear rising inflation, companies that benefit from higher prices see their shares spike. Obviously, given low concern regarding inflation, that has not happened in this market and, in fact, such companies have languished. Oil and gas companies have underperformed the market over the last 12 months. Fertilizer companies are trading as much as 40% below their early 2011 levels. Finally, the price of gold has dropped from more than $1,900 per ounce in 2011 to approximately $1,300 today, causing gold mining stocks to suffer.
“(We) invest in companies that stand to benefit from a risk that seems to be underestimated. Right now, a key underappreciated risk is inflation.”
As portfolio manager of Ariel Focus Fund, why am I now worried about inflation when the typical investor shows no concern? I was raised in Hyde Park, on the South Side of Chicago, where Nobel Prize–winning economist Milton Friedman was quoted as saying, “Inflation is always and everywhere a monetary phenomenon.” At the University of Chicago, he taught his students that inflation comes from a significant increase in the money supply. Moreover, a significant increase in the money supply always leads to inflation. Recently we have witnessed an unprecedented increase in the money supply through $3 trillion of Federal Reserve Quantitative Easing. Therefore, according to Friedman, inflation is coming—it is simply a matter of time.
“It would be one thing if the United States was the only country to have inflationary policies, but easy money is a global phenomenon.”
It would be one thing if the United States was the only country to have inflationary policies, but easy money is a global phenomenon. We seem to be witnessing a global currency devaluation competition in which three of the world’s largest economies (the United States, China and Japan) are racing to see which country can devalue its currency the most quickly. The European Union, anxious to reduce unemployment by increasing exports, stands to finish just out of the medals in these liquidity Olympics.
As Warren Buffett has counseled, be fearful when others are greedy and greedy only when others are fearful. Today, market participants have little fear over inflation, which makes me especially nervous in light of the inflationary policies noted above. In contrast, I remain cautiously optimistic about the economy. The portfolio reflects these views. More than 20% of Ariel Focus Fund assets are invested in companies that I believe stand to benefit directly from inflation. That is, 16% of the portfolio is invested in natural resources exploration and services companies. Fertilizer company Mosaic Co. (MOS) represents 3% of the portfolios’ assets. The newest holding (purchased in April) is Barrick Gold Corp. (ABX), the largest gold mining company in the world. All of the aforementioned names are leading companies with strong balance sheets that stand to have reasonable fundamentals if inflation remains low; conversely, I think they will outperform if inflation spikes.
“We seem to be witnessing a global currency devaluation competition in which three of the world’s largest economies are racing to see which country can devalue its currency the most quickly.”
PORTFOLIO COMINGS AND GOINGS
During the quarter, we added two new positions and eliminated two in Ariel Focus Fund. As mentioned above, we purchased a previous Ariel holding, LabCorp. We also initiated a position in Telephone & Data Systems, Inc. (TDS), a telecom company. Telephone & Data Systems provides telephone and television service to approximately 5.9 million customers nationwide, using both wireless and landline connections. We exited both DeVry Inc. (DV) and First American Financial Corp. (FAF) in order to pursue more compelling opportunities.
We appreciate your consideration and the opportunity to serve you and welcome any questions or comments you might have. You can also contact us directly at email@arielinvestments.com.
| Sincerely, | |
 | |
| |
| Portfolio manager | |
| | | |
 TURTLE TIME WITH CHARLIE TURTLE TIME WITH CHARLIE | |
| | | |
| | Please join us on Tuesday, June 24, at 10am CST, as Charles K. Bobrinskoy responds to your investment questions in an hour-long Q&A session. Register now at arielinvestments.com/turtle-time. | |
| | | |
| | Ariel Focus Fund performance summary | |
| | | |
| | | |
Charles K. Bobrinskoy
Portfolio manager
Composition of equity holdings (%)
| | | | | | | |
| | | | | Russell | | |
| | | Ariel | | 1000 | | S&P |
| | | Focus | | Value | | 500 |
| | | Fund† | | Index | | Index |
| Energy | | | | | | |
| | | | | | |
| | | | | | |
| | | | | | |
| | | | | | |
| Technology | | 14.11 | | 8.48 | | 16.04 |
Consumer staples | | 4.15 | | 5.40 | | 8.49 |
| Materials & processing | | 3.23 | | 3.07 | | 3.93 |
| Utilities | | 1.68 | | 8.60 | | 5.52 |
† Sector weightings are calculated based on equity holdings in the Fund and exclude cash in order to make a relevant comparison to the indexes.
Average annual total returns as of 03/31/14
| | | | | | |
| | | | | | Since |
| | | 1-year | 3-year | 5-year | inception |
Ariel Focus Fund–Investor Class | + 2.11% | + 24.86% | + 12.87% | + 21.34% | + 5.99% |
Ariel Focus Fund–Institutional Class+ | + 2.11 | + 25.14 | + 13.07 | + 21.47 | + 6.05 |
Russell 1000® Value Index | + 3.02 | + 21.57 | + 14.80 | + 21.75 | + 6.98 |
| + 1.81 | + 21.86 | + 14.66 | + 21.16 | + 7.55 |
Performance data quoted represents past performance and does not guarantee future results. All performance assumes the reinvestment of dividends and capital gains. The investment return and principal value of an investment will fluctuate so that an investor’s shares, when redeemed, may be worth more or less than their original cost. Current performance may be lower or higher than the performance data quoted. To access performance data current to the most recent month-end, visit arielinvestments.com.
| | | |
| Expense ratio (as of 09/30/13)* | Investor Class | Institutional Class |
| Net | 1.25% | 1.00% |
| Gross | 1.54% | 1.19% |
Top ten equity holdings (% of net assets) |
| 1. | International Business Machines Corp. | |
| 2. | Microsoft Corp. | |
| 3. | Lockheed Martin Corp. | 5.2 |
| 4. | National Oilwell Varco | 5.0 |
| 5. | Western Union Co. | 4.8 |
| 6. | DIRECTV | 4.8 |
| 7. | Stanley Black & Decker, Inc. | 4.6 |
8. | Exxon Mobil Corp. | 4.3 |
| 9. | CVS Caremark Corp. | 4.0 |
| 10. | Johnson & Johnson | 3.7 |
+The inception date for the Institutional Class shares is December 30, 2011. Performance information for the Institutional Class prior to that date reflects the actual performance of the Fund’s Investor Class (and uses the actual expenses of the Fund’s Investor Class, for such period of time), without any adjustments. For any such period of time, the performance of the Fund’s Institutional Class would have been substantially similar to, yet higher than, the performance of the Fund’s Investor Class, because the shares of both classes are invested in the same portfolio of securities, but the classes bear different expenses, which are primarily differences in distribution and service fees.
*Effective February 1, 2014, Ariel Investments, LLC, the Adviser, has contractually agreed to waive fees and reimburse expenses in order to limit Ariel Focus Fund’s total annual operating expenses to 1.00% of net assets for the Investor Class and 0.75% of net assets for the Institutional Class through the end of the fiscal year ending September 30, 2016. Through January 31, 2014, the Expense Cap was 1.25% for the Investor Class and 1.00% for the Institutional Class.
Notes: The graph and performance table do not reflect the deduction of taxes that a shareholder would pay on fund distributions or the redemption of fund shares. The Russell 1000® Value Index measures the performance of large-cap value companies with lower price-to-book ratios and lower expected growth values. Russell® is a trademark of Russell Investment Group, which is the source and owner of the Russell Indexes’ trademarks, service marks and copyrights. The S&P 500® is a broad market-weighted index dominated by blue-chip stocks. All indexes are unmanaged, and an investor cannot invest directly in an index.
INCENTIVES DRIVE BEHAVIOR
| |
Performance data quoted represents past performance. Past performance does not guarantee future results. All performance assumes the reinvestment of dividends and capital gains and represents returns of the Investor Class shares. The investment return and principal value of an investment will fluctuate so that an investor’s shares, when redeemed, may be worth more or less than their original cost. Current performance may be lower or higher than the performance data quoted. Performance data current to the most recent month-end for Ariel Discovery Fund may be obtained by visiting our website, arielinvestments.com. |
DEAR FELLOW SHAREHOLDER:
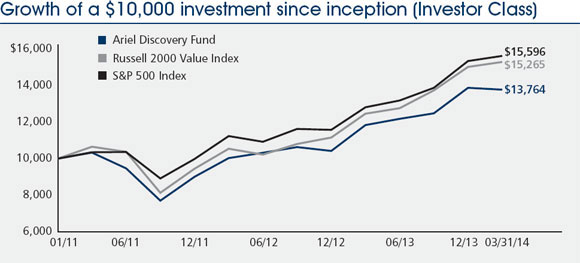
Ariel Discovery Fund essentially broke even in the first quarter of 2014, falling by -0.66% during a volatile period for U.S. equities. This result was 244 basis points behind that of our primary benchmark, the Russell 2000 Value Index, which gained +1.78%. That modest shortfall came roughly equally from the Energy and Producer Durables sectors, with no individual name having an outsized effect on performance in either direction.
Ariel Discovery Fund results ended December 31, 2014
| | | | | | | | | | | | | |
| | | | | | 1-year | | | 3-year | | | Since inception | |
| Ariel Discovery Fund | | - 0.66% | | | + 16.35% | | | + 10.04% | | | + 10.63% | |
Russell 2000® Value Index | | + 1.78 | | | + 22.65 | | | + 12.74 | | | + 14.32 | |
S&P 500® Index | | + 1.81 | | | + 21.86 | | | + 14.66 | | | + 15.09 | |
One point I would like to stress is that after 30 years in the business, I have come to understand that short-term results have almost no correlation with the value of the work done in that period. This is especially true, given that our expected holding period is minimally three to five years.
More importantly, the quality of work done by our team this quarter was the best ever. After such strong gains in 2013, I believed it critical to be even more on top of company fundamentals, and to re-double our communications with portfolio management teams. The number of in-person meetings this quarter was easily the highest in my career, and the rigorous debate among team members on existing and potential positions was the best yet. We expect this work to drive performance in the future.
During the quarter, the fund reached its three-year anniversary. The rocky start during the first few months of 2011 continues to weigh on our long-term relative results. Given our deep value strategy, which focuses on seeking a “margin of safety,”* we are not surprised to lag what has been a strong market with few exceptions since inception. We believe that the portfolio is well-positioned going forward, with a collection of attractive investments trading well below our average estimate of intrinsic value.
* Attempting to purchase with a margin of safety on price cannot protect investors from the volatility associated with stocks, incorrect assumptions or estimations on our part, declining fundamentals or external forces.
Top performers for the quarter included Imation Corp. (IMN), gaining +23.29%, Callaway Golf Co. (ELY), which returned +19.60% before our sale, and Emergent BioSolutions Inc. (EBS), up +19.14% before it was also sold. On the downside, XO Group Inc. (XOXO) lost -31.76%, Spartan Motors Inc. (SPAR) fell by -23.28%, and Mitcham Industries, Inc. (MIND) was down -21.29%.
IF WE COULD OWN JUST ONE STOCK, WHAT WOULD IT BE?
A number of investment websites and magazines ask managers this question. Since 2011, we have been using our first-quarter letter to respond, because while we would never invest that way, a detailed answer effectively illustrates the characteristics we seek in our portfolio holdings.
As deep value investors, we look for underfollowed and misunderstood companies trading at prices that have the potential to provide a “margin of safety” to buyers. We seek protection in asset values, with an emphasis on strong balance sheets. We also want to be invested alongside talented and properly incentivized leadership, and we look to identify upside potential from underappreciated opportunities. Today, the holding that best embodies these traits is Cowen Group, Inc. (COWN).
“…we seek companies with significant and widespread insider ownership, pay packages that reward long-term value creation, and talented managers and strong boards.”
First of all, we believe this company with roughly a $500 million market capitalization is clearly ignored and misunderstood. Followed by only two sell-side analysts, Cowen is commonly thought of as a troubled, sub-scale investment bank and broker dealer. However, Cowen Group was actually formed when Cowen Holdings, a boutique investment bank, was purchased by then privately held asset manager Ramius LLC in 2009. The Cowen brand remains, but top management comes primarily from Ramius. Founded in 1994, Ramius is a highly respected alternative asset manager with nearly $10 billion in assets under management and an outstanding long-term track record.
When we uncover a potential deep value investment, the first step in our research process is to examine the corporate governance and insider ownership profile. We obviously favor talented leadership, but we also believe that incentives drive behavior. Therefore, we seek companies with significant and widespread insider ownership, pay packages that reward long-term value creation, and talented managers and strong boards.
Cowen fits this bill as well as any company we own, with extraordinary leadership starting at the top from CEO Peter Cohen, who led Shearson Lehman from 1983 to 1990. He and his team collectively own roughly 15% of the company, clearly aligning their incentives with ours. Ramius Chair and Cowen Group Vice Chair Thomas Strauss rose to President of Salomon Brothers in 1986. Jeff Solomon, an original Ramius executive, is now leading Cowen & Co., the investment bank and brokerage arm, while Michael Singer joined in 2012 from Third Avenue Management to lead Ramius. This is a savvy team with decades of experience on both sides of the business. We have been extraordinarily impressed with them in our series of meetings and calls over the past few years, as well as by the actions they have taken to build the business to maximize shareholder value.
Two recent decisions highlight this astute decision-making. The first was last year’s acquisition of Dahlman Rose, which added highly respected energy and resource expertise to the research and investment banking teams of Cowen & Co. The second was the hiring of Jake Walthour as Vice Chairman of New Business and Product Development for Ramius. Part of Jake’s mandate is to find emerging, minority and women-owned alternative managers to add to Ramius’s platform. Many pension plans, particularly in the public sector, have the desire and even the mandate to identify emerging managers. Recent studies show that such managers in the alternative world outperform their more established peers1, yet they are often limited by their ability to create the infrastructure needed to win significant business. Ramius is unique among its peers in that its platform is built perfectly to work with small, talented managers, providing them with operational, legal and marketing expertise, while allowing them to focus on their investment disciplines. Although we have not modeled in any value for this Diversity and Emerging Fund Platform, it could provide a nice addition to assets under management over time.
The combination of the two entities created a firm that now has three profit centers: asset management, a research-driven investment bank and invested firm capital. Ramius’s business model is highly scalable; it could manage at least $20 billion on its current platform. With product lines such as US Small-Cap Activism, Global Long/Short Credit, Healthcare Royalties, and Real Estate and Alternative Solutions, Ramius has an attractive and diverse platform. A very significant portion of the firm’s highly liquid balance sheet is invested alongside clients; since 1999, Ramius has generated a roughly 15% return on equity on internal capital. And finally, Cowen & Co. looks to have executed an impressive turnaround under Jeff Solomon’s leadership and is well-positioned to serve active investment managers and growth companies with a vastly improved cost structure and complete product offering.
“…short-term results have almost no correlation with the value of the work done in that period.”
Finally, we see significant upside potential in Cowen Group stock. We believe that the broker-dealer’s troubles prior to and during the financial crisis, and the tough decisions necessary to turn it around, have caused investors to lose sight of the intrinsic value of the rest of company. We value Cowen Group on a sum-of-the-parts basis, using a percentage of assets under management for Ramius and a multiple of tangible book value for the broker-dealer. On top of that, there is a deferred tax asset potentially worth more than $100 million from net operating loss carryforwards. Even if we assume no value for the tax asset, we arrive at an intrinsic value well above current quotes. As we now believe the firm is poised for consistent profitability, the value of the business should become evident, and the tax asset should also start to be realized.
Therefore, we believe Cowen Group offers terrific upside potential and meaningful asset-based downside protection. So, if we could only own one stock, today it would be Cowen Group.
PORTFOLIO COMINGS AND GOINGS
We eliminated three holdings during the quarter. Callaway Golf, Tessera Technologies Inc. (TSRA), and Emergent BioSolutions were each sold as they essentially reached our estimates of fair value. We also added two new positions, thereby ending the first quarter with 36 companies in Ariel Discovery Fund’s portfolio:
Orion Energy Systems, Inc. (OESX) – Based in Manitowoc, Wisconsin, Orion is a company we have owned in our micro-cap strategy since 2009, and one that we had previously owned in Ariel Discovery Fund. Under the leadership of John Scribante, appointed CEO in 2012, this maker of energy-efficient lighting has made dramatic improvements in both its cost structure and product lineup. With a clean balance sheet, an underutilized plant providing a runway for growth and a new market in the form of LED lighting to pursue, we are very optimistic about Orion’s prospects.
Century Casinos, Inc. (CNTY) – Based in Colorado Springs, Century is a regional operator of domestic and international casinos. Trading just above its book value, Century has significant earnings potential from its operations in Poland and an under-construction racino (horse racing track/casino combination) with a prime location in Calgary. Co-CEOs who have worked together effectively for years and who each own more than 5% of the company add to our enthusiasm for this new holding.
We appreciate your consideration and the opportunity to serve you and welcome any questions or comments you might have. You can also contact us directly at email@arielinvestments.com.
Sincerely,
David M. Maley
Lead portfolio manager
1 Ramius; Barclays Hedge Fund Pulse, Affirmative Investing: Women and Minority Hedge Funds, June 2011; Rothstein Kass, Women in Alternative Investments, June 2013.
| | | |
| | Ariel Discovery Fund performance summary | |
| | | |
| | | |
 |  |
| David M. Maley | |
Lead portfolio
manager | Portfolio
manager |
Composition of equity holdings (%) | | | | | | | |
| | | | | |
| | Ariel Discovery | Russell 2000 Value Index | | S&P 500 Index |
| Technology | | | 9.76 | | | | |
| Financial services | | | | | | | |
| Producer durables | | | | | | | |
| | | | | | | |
| Energy | | | | | | | |
| Materials & processing | | | | | | 3.93 | �� |
| | | | | | | |
| Health care | | | | | | | |
| Consumer staples | 0.00 | | | | | 8.49 | |
† Sector weightings are calculated based on equity holdings in the Fund and exclude cash in order to make a relevant comparison to the indexes.
| Average annual total returns as of 03/31/14 |
| | | | | |
| | | | | Since |
| | Quarter | 1-year | 3-year | inception |
Ariel Discovery Fund– Investor Class | | | | |
Ariel Discovery Fund– Institutional Class+ | | | | |
Russell 2000® Value Index | + 1.78 | | | |
| + 1.81 | | | |
Performance data quoted represents past performance and does not guarantee future results. All performance assumes the reinvestment of dividends and capital gains. The investment return and principal value of an investment will fluctuate so that an investor’s shares, when redeemed, may be worth more or less than their original cost. Current performance may be lower or higher than the performance data quoted. To access performance data current to the most recent month-end, visit arielinvestments.com.
Expense ratio (as of 09/30/13)* | Investor Class | Institutional Class |
| Net | 1.50% | 1.25% |
| Gross | 2.90% | 1.93% |
Top ten equity holdings (% of net assets) |
| 1. | Contango Oil & Gas Co. | |
| 2. | | |
| 3. | | |
| 4. | First American Financial Corp. | |
| 5. | | |
| 6. | International Speedway Corp. | |
| 7. | | |
| 8. | | |
| 9. | | |
| 10. | | |
+The inception date for the Institutional Class shares is December 30, 2011. Performance information for the Institutional Class prior to that date reflects the actual performance of the Fund’s Investor Class (and uses the actual expenses of the Fund’s Investor Class, for such period of time), without any adjustments. For any such period of time, the performance of the Fund’s Institutional Class would have been substantially similar to, yet higher than, the performance of the Fund’s Investor Class, because the shares of both classes are invested in the same portfolio of securities, but the classes bear different expenses, which are primarily differences in distribution and service fees.
*Effective February 1, 2014, Ariel Investments, LLC, the Adviser, has contractually agreed to waive fees and reimburse expenses in order to limit Ariel Discovery Fund’s total annual operating expenses to 1.25% of net assets for the Investor Class and 1.00% for the Institutional Class through the end of the fiscal year ending September 30, 2016. Through January 31, 2014, the Expense Cap was 1.50% for the Investor Class and 1.25% for the Institutional Class.
Notes: The graph and performance table do not reflect the deduction of taxes that a shareholder would pay on fund distributions or the redemption of fund shares. The Russell 2000® Value Index measures the performance of the small-cap value segment of the U.S. equity universe. It includes those Russell 2000 companies with lower price-to-book ratios and lower forecasted growth values. Russell® is a trademark of Russell Investment Group, which is the source and owner of the Russell Indexes’ trademarks, service marks and copyrights. The S&P 500® is a broad market-weighted index dominated by blue-chip stocks. All indexes are unmanaged, and an investor cannot invest directly in an index.
TODAY’S BARGAINS: TRADITIONAL TECHNOLOGY
| |
Performance data quoted represents past performance. Past performance does not guarantee future results. All performance assumes the reinvestment of dividends and capital gains and represents returns of the Investor Class shares. The investment return and principal value of an investment will fluctuate so that an investor’s shares, when redeemed, may be worth more or less than their original cost. Current performance may be lower or higher than the performance data quoted. Performance data current to the most recent month-end for Ariel International Fund and Ariel Global Fund may be obtained by visiting our website, arielinvestments.com. |
DEAR FELLOW SHAREHOLDER:
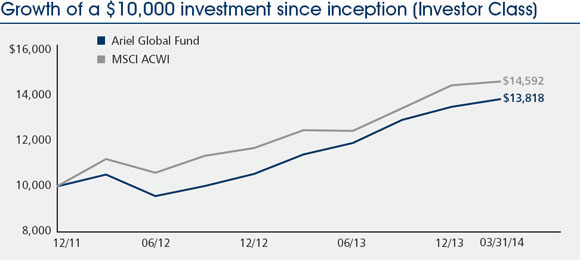
Global equity markets slowed down in the first quarter of 2014, which was of some relief to us. As you know, we are independent thinkers who focus intently on valuation, so when strong 2012 returns became an ebullient 2013 campaign, we became more skeptical looking forward. We welcomed the deceleration, during which the broad global indexes gained less than 2%. Our portfolios outperformed. Specifically, Ariel International Fund returned +2.18%, nicely ahead of the MSCI EAFE Index, which moved +0.77%, while Ariel Global Fund gained +2.50%, topping the MSCI ACWI Index, which went up +1.21%.
Since our international and global portfolios debuted at the end of December 2011, I have had the opportunity to present our investment process and philosophy to investors in great detail. Building a track record for the long run takes patience and discipline. Previously, we have emphasized our commitment to bottom-up stock-picking but have noted that bargains often cluster—sometimes by country, sometimes by sector, and in other various ways. For instance, in the second quarter of 2013, we wrote about our relatively heavy investments in Japan, and the next quarter, we wrote about health-care stocks. This quarter, we are writing about the technology area, in which we currently have a significant weighting.
In technology stocks, we are not making a sector bet. Rather, we perceive a valuation bifurcation within the sector that we believe has produced heavy risk in some stocks and opportunities in others. At first glance, one might think this stance runs parallel to the one in health-care stocks (which persists). While there are similarities, we think the differences are greater and more important.
One clear similarity between our tech and health-care holdings nicely illustrates our philosophy: Overall, our weightings are quite substantial when compared to the benchmarks. Unlike many practitioners, we do not start with an index’s sector weightings and adjust them up and down based on macroeconomic factors. Rather, we buy specific stocks within a sector to an appropriate investment level—on a risk/reward basis—and only constrain once the weighting becomes quite heavy. For example, our health-care weightings fall between 11% in the developed market portfolio and 21% in the global portfolio. The global portfolio weighting is 10 percentage points higher than the benchmark or roughly twice as high. Meanwhile, our technology weights fall between 15% in the developed markets portfolio and 21% in the global portfolio, where the weighting is 8 percentage points higher than the benchmark. Although the absolute weighting in technology stocks is lowest in the developed markets portfolio, our weighting is more than triple the index’s exposure of less than 5%. While some view such positions as risky on a relative performance basis, we view them as prudent on an absolute risk/reward investment basis.
“…we perceive a valuation bifurcation within the sector that we believe has produced heavy risk in some stocks and opportunities in others.”
Another parallel between the technology and health-care areas is their historical association with growth investing. Health-care stocks have generally, although not currently, had heavier weightings in growth indexes than in value benchmarks. This is even more true of technology stocks. Over long periods, investors have expected faster growth from tech firms than companies in other areas such as utilities, energy and financial services. While we do admire future growth, we do not think our style is “drifting” with these exposures, since we view every opportunity as a mix of current valuation and future expected growth. Sometimes an area with strong secular growth prospects appears cheap on a valuation basis, while other times it seems expensive relative to its likely future. In the case of the former, we are happy to invest a significant amount; that does not mean, however, that we have changed our stripes or adopted a new philosophy.
That statement brings us to the most significant difference between our current interest in technology and health care. As detailed six months ago, the market broadly concluded health-care companies were not growing as swiftly as they once did, causing valuations to fall across the sector. Something very different has happened in the technology sector. That is, expectations for certain technology companies are extremely high, while other technology companies reflect low growth assumptions. In other words, sometimes we find opportunities when investors give up on a broad area; other times, we find opportunities when the crowd gravitates toward one industry and ignores similar ones.
“…we view every opportunity as a mix of current valuation and future expected growth.”
The market’s current darlings are the recently public social media firms. To be sure, Facebook Inc., Twitter Inc., LinkedIn Corp., and Yelp Inc. have been as remarkable and game-changing as the Internet blue chips from years past: Amazon. com, Inc., eBay Inc., and Google Inc. are obvious examples. Investors, however, have historically shown a suspect ability to separate such long-term winners from those that fail to live up to expectations. Remember Pets.com, theglobe.com, Inc., and Webvan? They, too, once traded at sky-high valuations along with the eventual Internet blue chips but did not pan out.
“When we see valuations spike on exciting but unproven companies, we become nervous.”
When we see valuations spike on exciting but unproven companies, we become nervous. Because some of today’s favorites are not yet profitable, we will use an Enterprise Value/Sales ratio1 to sketch their valuations: LinkedIn trades at 15.6x; Facebook at 16.3x, Yelp at 19.3x, and Twitter at a remarkable 51.5x. Were a larger company to acquire one of these companies at the market price, it would pay, on average, $22 for every $1 of revenue the company produced over the last year. Again, that is not $22 per every $1 of profit, but for every dollar of revenue. True, it is possible that such companies will grow fast and far enough to justify current valuations. That said, at those valuations, the risk/ reward tradeoff more closely resembles speculation than it does prudent investing.
The good news is that within the same broad technology area, other companies are trading very cheaply on the same metrics. Moreover, these are not new, unproven companies. Rather, they are global titans with robust cash flows, diversified product offerings, and strong market positions—names such as Microsoft Corp., Nokia Corp. and Broadcom Corp. These are the types of companies that compose the significant technology weightings in our portfolios. The companies listed on the following page, the technology companies in our global portfolio, have an average enterprise value/sales ratio of just 2.6x. Based on this one metric, they would cost a hypothetical acquirer roughly one tenth as much as the popular social media companies mentioned on the previous page:
Ariel global technology holdings as of March 31, 2014
| | | |
| Company | EV/Sales | |
| Canon Inc. | 0.8x | | |
| Nokia Corp. | 1.0x | | |
| QLogic Corp. | 1.2x | | |
| NVIDIA Corp. | 1.3x | | |
| Nintendo Co., Ltd | 1.4x | | |
| Tokyo Electron Ltd. | 1.7x | | |
| Broadcom Corp. | 1.7x | | |
| Dialog Semiconductor plc | 1.7x | | |
| EMC Corp. | 2.1x | | |
| Global Payments Inc. | 2.3x | | |
| Microsoft Corp. | 3.0x | | |
| TIBCO Software Inc. | 3.1x | | |
| Ruckus Wireless, Inc. | 3.8x | | |
| Baidu, Inc. | 11.2x | | |
| Average | 2.6x | | |
As investors who consider both risk and reward in assembling a portfolio, we strongly favor these time-tested companies with strong business models, defensible market positions and relatively low valuations to today’s high flyers. Moreover, we believe the near frenzy around today’s social media darlings has helped make traditional technology companies seem less interesting and exciting—and cheap. To be clear, however, we are not simply making a “bet” on established technology companies and eschewing the new ones. Rather, within the cheaper end of the technology space, we have found a fairly large number of specific companies that are good risk/reward tradeoffs at current valuations.
As always, we appreciate the opportunity to serve you and welcome any questions or comments you might have. You can also contact us directly at email@arielinvestments.com.
Sincerely,
Rupal J. Bhansali
Portfolio manager
1The Enterprise Value/Sales valuation ratio compares a company’s overall enterprise value (equity plus debt) to its sales (or revenues). The metric is quite useful when assessing a company’s valuation in the event of an acquisition. In a takeover, the acquirer would need to not only purchase the equity but also cover the debt. Sales or revenues are often used when a company is young or unprofitable.
| | | |
| | Ariel International Fund performance summary | |
| | | |
| | | |
Rupal J. Bhansali
Portfolio manager
Composition of equity holdings1 (%)
| | | | |
| | Ariel International Fund† | | MSCI EAFE Index |
| 18.80 | | | 25.56 | |
| Information technology | 16.40 | | | 4.53 | |
| Consumer discretionary | 16.12 | | | 11.76 | |
| Consumer staples | 13.50 | | | 10.99 | |
| Health care | 11.54 | | | 10.44 | |
| Telecommunication services | 8.43 | | | 4.96 | |
| Energy | 6.78 | | | 6.90 | |
| Utilities | 3.84 | | | 3.76 | |
| 2.85 | | | 12.95 | |
| Materials | 1.74 | | | 8.14 | |
† Sector weightings are calculated based on equity holdings in the Fund and exclude cash in order to make a relevant comparison to the indexes.
1 The sectors above are the Global Industry Classification Standard (“GICS”) sector classifications. GICS was developed by and is the exclusive property and a service mark of MSCI Inc. (“MSCI”) and Standard & Poor’s, a division of The McGraw-Hill Companies, Inc. (“S&P”) and is licensed for use by Ariel Investments, LLC. Neither MSCI, S&P nor any third party involved in making or compiling the GICS or any GICS classifications makes any express or implied warranties or representations with respect to such standard or classification (or the results to be obtained by the use thereof), and all such parties hereby expressly disclaim all warranties of originality, accuracy, completeness, merchantability and fitness for a particular purpose with respect to any of such standard or classification. Without limiting any of the foregoing, in no event shall MSCI, S&P, any of their affiliates or any third party involved in making or compiling the GICS or any GICS classifications have any liability for any direct, indirect, special, punitive, consequential or any other damages (including lost profits) even if notified of the possibility of such damages.
Average annual total returns as of 03/31/14
| | | | | | | | |
| | | | Quarter | | 1-year | | Since inception |
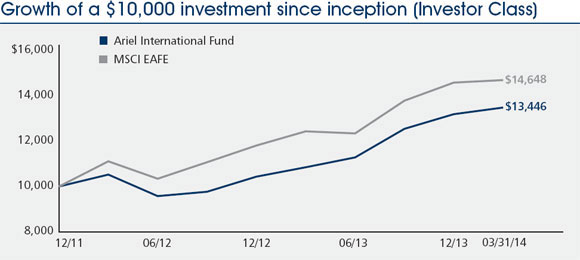
Ariel International Fund– Investor Class | | | + 2.18 | % | | + 24.07 | % | | + 14.05 | % |
Ariel International Fund– Institutional Class | | | + 2.29 | | | + 24.26 | | | + 14.33 | |
MSCI EAFE® Index | | | + 0.77 | | | + 18.06 | | | + 18.47 | |
Performance data quoted represents past performance and does not guarantee future results. All performance assumes the reinvestment of dividends and capital gains. The investment return and principal value of an investment will fluctuate so that an investor’s shares, when redeemed, may be worth more or less than their original cost. Current performance may be lower or higher than the performance data quoted. To access performance data current to the most recent month-end, visit arielinvestments.com.
Expense ratio (as of 09/30/13)* | Investor Class | Institutional Class |
| Net | 1.40% | 1.15% |
| Gross | 9.36% | 6.53% |
Top ten companies^ (% of net assets)
| 1. | | 4.9 |
| 2. | | 4.7 |
| 3. | | 4.6 |
| 4. | | 4.5 |
| 5. | | 3.6 |
| 6. | | 3.4 |
| 7. | | 3.2 |
| 8. | | 3.2 |
| 9. | | 3.1 |
| 10. | | 3.0 |
^For the purposes of determining the Fund’s top ten companies, securities of the same issuer are aggregated.
Country weightings (%)
| Japan | 18.43 | |
| U.K. | 18.18 | |
| Switzerland | 15.08 | |
| Germany | 9.25 | |
| 6.70 | |
| Netherlands | 5.27 | |
| 5.02 | |
| Italy | 5.00 | |
| U.S. | 3.72 | |
| Finland | 3.54 | |
| Ireland | 2.49 | |
| 1.45 | |
| 1.29 | |
| 1.08 | |
| 1.07 | |
| 0.76 | |
| 0.61 | |
| 0.41 | |
| 0.33 | |
| 0.17 | |
| Australia | 0.15 | |
*Effective February 1, 2014, Ariel Investments, LLC, the Adviser, has contractually agreed to waive fees and reimburse expenses in order to limit Ariel International Fund’s total annual operating expenses to 1.25% of net assets for the Investor Class and 1.00% for the Institutional Class through the end of the fiscal year ending September 30, 2016. Through January 31, 2014, the Expense Cap was 1.40% for the Investor Class and 1.15% for the Institutional Class.
Notes: The performance table does not reflect the deduction of taxes that a shareholder would pay on fund distributions or the redemption of fund shares. MSCI EAFE® Index is an unmanaged, market weighted index of companies in developed markets, excluding the U.S. and Canada. An investor cannot invest directly in an index.
| | | |
| | Ariel Global Fund performance summary | |
| | | |
| | | |
Rupal J. Bhansali
Portfolio manager
Composition of equity holdings1 (%)
| | | |
| | Ariel Global Fund† | MSCI ACWI Index |
| 21.72 | | 10.65 | |
| Information technology | 20.51 | | 12.67 | |
| Financials | 14.80 | | 21.53 | |
| Consumer discretionary | 12.82 | | 11.65 | |
| Consumer staples | 10.82 | | 9.69 | |
| Telecommunication services | 6.36 | | 3.90 | |
| Energy | 5.61 | | 9.66 | |
| Industrials | 3.69 | | 10.84 | |
| Materials | 1.92 | | 6.13 | |
| Utilities | 1.54 | | 3.29 | |
† Sector weightings are calculated based on equity holdings in the Fund and exclude cash in order to make a relevant comparison to the indexes.
1 The sectors above are the Global Industry Classification Standard (“GICS”) sector classifications. GICS was developed by and is the exclusive property and a service mark of MSCI Inc. (“MSCI”) and Standard & Poor’s, a division of The McGraw-Hill Companies, Inc. (“S&P”) and is licensed for use by Ariel Investments, LLC. Neither MSCI, S&P nor any third party involved in making or compiling the GICS or any GICS classifications makes any express or implied warranties or representations with respect to such standard or classification (or the results to be obtained by the use thereof), and all such parties hereby expressly disclaim all warranties of originality, accuracy, completeness, merchantability and fitness for a particular purpose with respect to any of such standard or classification. Without limiting any of the foregoing, in no event shall MSCI, S&P, any of their affiliates or any third party involved in making or compiling the GICS or any GICS classifications have any liability for any direct, indirect, special, punitive, consequential or any other damages (including lost profits) even if notified of the possibility of such damages.
Average annual total returns as of 03/31/14
| | | | | | | | |
| | | | Quarter | | 1-year | | Since inception |
Ariel Global Fund–Investor Class | | | + 2.50 | % | | + 21.21 | % | | + 15.44 | % |
Ariel Global Fund–Institutional Class | | | + 2.54 | | | + 21.62 | | | + 15.76 | |
MSCI ACWISM Index | | | + 1.21 | | | + 17.17 | | | + 18.27 | |
Performance data quoted represents past performance and does not guarantee future results. All performance assumes the reinvestment of dividends and capital gains. The investment return and principal value of an investment will fluctuate so that an investor’s shares, when redeemed, may be worth more or less than their original cost. Current performance may be lower or higher than the performance data quoted. To access performance data current to the most recent month-end, visit arielinvestments.com.
| Expense ratio (as of 09/30/13)* | Investor Class | Institutional Class |
| Net | 1.40% | 1.15% |
| Gross | 5.37% | 2.51% |
Top ten companies^ (% of net assets)
| 1. | | 5.4 |
| 2. | | 4.9 |
| 3. | | 4.8 |
| 4. | | 4.8 |
| 5. | Harman Intl Industries Inc. | 3.8 |
| 6. | | 3.5 |
| 7. | | 3.5 |
| 8. | | 3.4 |
| 9. | | 3.2 |
| 10. | | 2.9 |
^ For the purposes of determining the Fund’s top ten companies, securities of the same issuer are aggregated.
Country weightings (%)
| U.S. | 44.53 | |
| U.K. | 11.06 | |
| Switzerland | 9.62 | |
| 9.43 | |
| Germany | 4.99 | |
| China | 4.55 | |
| Netherlands | 3.68 | |
| France | 3.41 | |
| 1.77 | |
| 1.75 | |
| Italy | 1.54 | |
| Spain | 1.14 | |
| Hong Kong | 0.65 | |
| 0.54 | |
| 0.38 | |
| 0.33 | |
| Sweden | 0.25 | |
| 0.20 | |
| 0.18 | |
*Effective February 1, 2014, Ariel Investments, LLC, the Adviser, has contractually agreed to waive fees and reimburse expenses in order to limit Ariel Global Fund’s total annual operating expenses to 1.25% of net assets for the Investor Class and 1.00% for the Institutional Class through the end of the fiscal year ending September 30, 2016. Through January 31, 2014, the Expense Cap was 1.40% for the Investor Class and 1.15% for the Institutional Class.
Notes: The performance table does not reflect the deduction of taxes that a shareholder would pay on fund distributions or the redemption of fund shares. MSCI ACWI (All Country World Index) IndexSM is an unmanaged, market weighted index of global developed and emerging markets. An investor cannot invest directly in an index.
Coach, Inc. (NYSE: COH)
516 West 34th Street
New York, NY 10001
212.594.1850 | coach.com
Seventy-three years ago, Coach, Inc. (COH) began as a Manhattan-based family-operated producer of small handmade leather goods. It has since evolved into a leading, internationally-recognized, American designer of luxury leather bags, shoes, wallets and other accessories that are best known for their classic style, high quality, and excellent craftsmanship. Currently, Coach is undergoing a transformation from an international handbag and accessories brand into a global lifestyle brand, anchored in accessories—a brand that will encompass a full head-to-toe-expression of the Coach woman and man— which should invigorate the brand and bolster future sales.
PREMIUM LUXURY AT AFFORDABLE PRICES
Coach’s iconic horse-and-carriage logo is synonymous with premium luxury leather bags and accessories at affordable prices. The company practically created the aspirational luxury segment that is so attractive to designers today. The company has grown from a cottage-industry manufacturer of leather goods to a market share leader in women’s handbags and accessories. This differentiation has allowed Coach to generate best-in-class gross profit margins in excess of 70%.
CLOUDY OUTLOOK
Since reaching an all-time high in March 2012, Coach’s stock price has lost over 35% of its value. While the challenging macroeconomic backdrop has not helped, concerns surrounding the increasingly competitive environment, key management departures, and lifestyle brand transition have clouded the near-term outlook. Increased competition from the likes of Michael Kors has pressured Coach’s sales, and thereby eroded some of its market share lead. The recent departures of legendary CEO Lew Frankfort and Creative Director Reed Krakoff has given some investors pause, especially with the company in the midst of transition. The duo is often credited with transforming Coach into the globally-recognized $5 billion company it is today, and investors are uncertain whether new CEO Victor Luis and Creative Director Stuart Vevers can revitalize the brand.
STORIED HISTORY
We view Coach as an opportunity to own a world class brand whose future prospects have been obscured in the near-term. No stranger to competition, Coach has successfully thwarted competitive threats throughout its storied history. In the late 1990’s and early 2000’s, it prevailed as brands including Gucci, Kate Spade, and Nine West, attempted to infringe on its aspirational luxury turf. Nonetheless, Coach emerged the victor and we have no reason to believe that this time will be any different. While Messrs. Luis and Vevers have some big shoes to fill, they are more than capable of manning the ship in our view. Mr. Luis has spent the last eight years leading Coach’s Japan unit while more recently overseeing the company’s successful Chinese expansion—especially important, given Coach’s current international focus on China and beyond. Additionally, Mr. Luis will still have the counsel of Mr. Frankfort, who serves in an Executive Chairman capacity. Mr. Vevers’ experience is deeply rooted in luxury, with names such as Loewe, Louis Vuitton, Bottega Veneta, and Mulberry padding his resume. His new designs will not be available until the Fall of 2014, but the collection debuted to good reviews during NYC Fashion Week this past February.
ATTRACTIVE VALUATION
Coach’s business prospects are complemented by its strong, debt-free balance sheet. The company maintains a dividend payout ratio of over 30% and management repurchased $400 million worth of stock during its last fiscal year. Its lifestyle transformation will undoubtedly take some time to materialize, but we believe it presents a compelling opportunity for patient investors. As of March 31, 2014, shares traded at $49.66, a 25.4% discount to our private market value of $66.56.
Dun & Bradstreet Corp. (NYSE: DNB)
103 JFK Parkway
Short Hills, NJ 07078
973.921.5500 | dnb.com
Dun & Bradstreet Corp. (DNB) is the leading global provider of credit information and analytics to businesses. Over the past 173 years, the company has amassed one of the most comprehensive and trusted commercial databases in the world, containing more than 200 million business records. This is a quintessential wide moat* business—a market leading brand with an entrenched product that is highly scalable and nearly impossible to replicate. Over the past few years, however, the company has struggled to grow given its already dominant position and evolving customer demands. But, a new management team is reorienting the business for the next wave of long-term growth, while maintaining an excellent track record of returning cash to shareholders.
INVESTING FOR GROWTH
In recent years, there has been a rare disconnect between the global economic recovery and sluggish revenue growth at Dun & Bradstreet. Some of this was due to the high-class problem of trying to grow off of an already large base—the company has 70% market share in the U.S. The company was also too focused on harvesting renewals and cutting costs, rather than responding to current and potential customers’ desires for a more modern, more accessible and more customizable service offering. As a result, new CEO Bob Carrigan spent his first months on the job listening to customers and ultimately crafted a compelling strategic growth plan. The company is now laser-focused on driving top-line growth primarily through freeing its invaluable database asset and moving it to the cloud. For those focused on the near-term, this means an elevated cost structure and temporarily lower margins. But for the patient investor, this is a strategic investment that better positions the company for future growth.
MOVING TO THE CLOUD
Traditionally, the core Dun & Bradstreet offering has been very product focused—a commercial credit report generated on-site. The new plan is to better leverage the content behind that traditional product. By freeing up the content and moving it the cloud, not only can customers better access a more comprehensive and globally integrated database, but they can also fully customize and adapt the analytics around that content. It also means more Data-as-a-Service (DaaS) partnerships with leading players like Salesforce.com. Dun & Bradstreet’s existing partnership with Salesforce has resulted in higher sales productivity and reduced sales cycles for Salesforce customers. More importantly, it has generated thousands of new customers for Dun & Bradstreet.
REWARDING SHAREHOLDERS
What isn’t changing is the company’s excellent free cash flow generating characteristics coupled with a penchant for rewarding shareholders. Over the past three years alone, the company has generated nearly $1 billion in free cash flow and returned all of it to shareholders in the form of dividends and buybacks. While the stock price languished at levels below where it trades today, share count was reduced by over 20%. Moreover, rewarding shareholders is more than a near-term phenomenon; it is an entrenched philosophy. The total share count has been reduced by half over the last decade.
A WIDE MOAT BUSINESS
At current levels, investors are focused on a temporary reinvestment year, rather than the company’s long-term growth potential. When we look out over the horizon, we see the same wide moat business, but even better positioned for the next wave of growth in commercial credit analytics. As of March 31, 2014, Dun & Bradstreet shares traded at $99.35, a 7.2% discount to our private market value of $107.03.
* An economic moat is a perceived competitive advantage that acts as a barrier to entry for other companies in the same industry. This perceived advantage cannot protect investors from the volatility associated with stocks, incorrect assumptions or estimations, declining fundamentals or external forces. |
| 22 | ARIELINVESTMENTS.COM |
Imation Corp. (NYSE: IMN)
1 Imation Way
Oakdale, MN 55128
651.704.4000 | imation.com
Imation Corp. (IMN) is a data storage and security company in transition. Formed in 1996 through the spin-off of 3M’s data storage and imaging group, the company divested all of its non-storage businesses in the late 1990s. Today, its primary business is making and selling data storage media, including writeable CDs, DVDs and magnetic tape. As these products have become commoditized and pricing has deteriorated, revenue has declined sharply. In response, the management team has invested in areas where they see attractive growth opportunities, while divesting non-core assets and maximizing cash flow from the declining parts of the business.
SECURE AND SCALEABLE STORAGE PRODUCTS
Using the profits from the company’s declining storage media business, the company has built a portfolio of secure and scaleable storage products, which offer businesses affordable ways to store and protect their data. For example, the company’s encrypted flash drives enable customers to carry their data with them without compromising security. By targeting small- and medium-sized businesses, the company addresses an attractive niche that is underserved by larger competitors, such as HP or EMC.
ESTABLISHED REPUTATION
In early 2013, Imation supplemented its portfolio of differentiated storage solutions with the acquisition of Nexsan. With its long-term storage systems, Nexsan offers powerful data archive solutions without the significant upfront cost and ongoing maintenance required for enterprise-level systems. The company has established a reputation for solutions that can grow with an organization, enabling customers to expand without needing to completely replace the system. This flexibility, coupled with its affordable price point, makes it a perfect fit for Imation’s existing customer base.
ATTRACTIVE VALUATION
Although Imation’s secure and scaleable storage business is still small—representing less than a quarter of total revenue—its growth potential is currently being obscured by the company’s declining storage media. Because of investors’ focus on the steep declines in total revenue, the stock price reached a low of $3.51 early last year, trading at less than half of tangible book value and only slightly above the $2 per share in net cash the company held at that time.
In the past year, management has sold two small non-core businesses and a plot of land in California. It has also restructured its growing businesses under the leadership of Nexsan’s CEO, Philip Black, who has a strong track record. Although the stock has risen from its low, it still trades at just 1.1x tangible book value with $2.68 per share in net cash. As of March 31, 2014, shares traded at $5.77, a significant discount to our estimate of intrinsic value.
| | | |
| | Ariel Fund statistical summary | (UNAUDITED) |
| | | |
| | | |
| | | | | | | | | | | | | | | | | | | | | | | | |
| | | | | | 52-week range | Earnings per share | P/E calendar | |
| | Company | | Ticker symbol | Price 03/31/14 | Low | High | 2012 actual calendar | 2013 actual calendar | 2014 estimated calendar | 2012 actual P/E | 2013 actual P/E | 2014 estimated P/E | Market cap. ($MM) |
| | Symmetry Medical Inc. | | SMA | 10.06 | | 7.44 | | 12.83 | | 0.57 | | 0.34 | | 0.53 | | 17.6 | | 29.6 | | 19.0 | | 377 | |
| | International Speedway Corp. | | ISCA | 33.99 | | 29.30 | | 38.01 | | 1.40 | | 1.50 | | 1.68 | | 24.3 | | 22.7 | | 20.2 | | 902 | |
| | Contango Oil & Gas Co. | | MCF | 47.74 | | 33.22 | | 50.44 | | 3.79 | | 2.17 | | 3.37 | | 12.6 | | 22.0 | | 14.2 | | 925 | |
| | MTS Systems Corp. | | MTSC | 68.49 | | 53.80 | | 78.90 | | 3.77 | | 3.83 | | 3.99 | | 18.2 | | 17.9 | | 17.2 | | 1,047 | |
| | Brady Corp. | | BRC | 27.15 | | 24.75 | | 35.75 | | 2.38 | | 1.96 | | 1.88 | | 11.4 | | 13.9 | | 14.4 | | 1,320 | |
| | Interface, Inc. | | TILE | 20.55 | | 15.13 | | 22.46 | | 0.62 | | 0.67 | | 1.06 | | 33.1 | | 30.7 | | 19.4 | | 1,368 | |
| | Meredith Corp. | | MDP | 46.43 | | 36.06 | | 53.84 | | 2.87 | | 3.01 | | 3.29 | | 16.2 | | 15.5 | | 14.1 | | 1,689 | |
| | Simpson Manufacturing Co., Inc. | | SSD | 35.33 | | 27.49 | | 37.49 | | 1.01 | | 1.17 | | 1.51 | | 35.0 | | 30.2 | | 23.4 | | 1,728 | |
| | Fair Isaac Corp. | | FICO | 55.32 | | 41.33 | | 63.48 | | 2.78 | | 2.88 | | 3.21 | | 19.9 | | 19.2 | | 17.2 | | 1,931 | |
| | U.S. Silica Holdings Inc. | | SLCA | 38.17 | | 18.12 | | 38.23 | | 1.50 | | 1.67 | | 1.83 | | 25.4 | | 22.9 | | 20.9 | | 2,047 | |
| | Janus Capital Group Inc. | | JNS | 10.87 | | 7.86 | | 13.10 | | 0.65 | | 0.71 | | 0.77 | | 16.7 | | 15.3 | | 14.1 | | 2,075 | |
| | Littelfuse, Inc. | | LFUS | 93.64 | | 62.92 | | 97.54 | | 4.11 | | 4.58 | | 5.18 | | 22.8 | | 20.4 | | 18.1 | | 2,108 | |
| | Bally Technologies Inc. | | BYI | 66.27 | | 47.16 | | 82.67 | | 3.07 | | 3.99 | | 4.87 | | 21.6 | | 16.6 | | 13.6 | | 2,592 | |
| | DeVry Education Group Inc. | | DV | 42.39 | | 26.70 | | 42.87 | | 3.04 | | 2.59 | | 2.42 | | 13.9 | | 16.4 | | 17.5 | | 2,685 | |
| | Bristow Group Inc. | | BRS | 75.52 | | 59.21 | | 85.70 | | 1.73 | | 3.85 | | 4.58 | | 43.7 | | 19.6 | | 16.5 | | 2,739 | |
| | First American Financial Corp. | | FAF | 26.55 | | 20.39 | | 28.57 | | 2.46 | | 1.77 | | 1.85 | | 10.8 | | 15.0 | | 14.4 | | 2,824 | |
| | Charles River Laboratories Intl Inc. | | CRL | 60.34 | | 40.28 | | 62.50 | | 2.75 | | 2.93 | | 3.15 | | 21.9 | | 20.6 | | 19.2 | | 2,876 | |
| | Sotheby’s | | BID | 43.55 | | 32.95 | | 54.00 | | 1.58 | | 1.88 | | 2.33 | | 27.6 | | 23.2 | | 18.7 | | 3,006 | |
| | Bio-Rad Laboratories, Inc. | | BIO | 128.12 | | 110.02 | | 134.13 | | 7.05 | | 4.30 | | 6.50 | | 18.2 | | 29.8 | | 19.7 | | 3,037 | |
| | Anixter Intl Inc. | | AXE | 101.52 | | 64.94 | | 115.84 | | 5.32 | | 5.91 | | 6.76 | | 19.1 | | 17.2 | | 15.0 | | 3,305 | |
| | International Game Technology | | IGT | 14.06 | | 13.31 | | 21.20 | | 1.14 | | 1.26 | | 1.15 | | 12.4 | | 11.2 | | 12.2 | | 3,469 | |
| | Madison Square Garden Co. | | MSG | 56.78 | | 54.00 | | 63.44 | | 1.72 | | 1.93 | | 2.14 | | 33.0 | | 29.4 | | 26.5 | | 3,597 | |
| | Dun & Bradstreet Corp. | | DNB | 99.35 | | 81.87 | | 124.59 | | 7.18 | | 7.87 | | 7.54 | | 13.8 | | 12.6 | | 13.2 | | 3,677 | |
| | City National Corp. | | CYN | 78.72 | | 53.04 | | 81.34 | | 3.83 | | 3.99 | | 4.07 | | 20.6 | | 19.7 | | 19.3 | | 4,320 | |
| | Graham Holdings Co. | | GHC | 703.75 | | 427.33 | | 745.11 | | 25.02 | | 33.64 | | 35.27 | | 28.1 | | 20.9 | | 20.0 | | 4,376 | |
| | Jones Lang LaSalle Inc. | | JLL | 118.50 | | 80.86 | | 125.29 | | 5.61 | | 6.45 | | 7.57 | | 21.1 | | 18.4 | | 15.7 | | 5,273 | |
| | IDEX Corp. | | IEX | 72.89 | | 49.55 | | 79.27 | | 2.89 | | 3.43 | | 3.70 | | 25.2 | | 21.3 | | 19.7 | | 5,893 | |
| | Lazard Ltd | | LAZ | 47.09 | | 30.63 | | 48.70 | | 1.44 | | 2.01 | | 2.67 | | 32.7 | | 23.4 | | 17.6 | | 6,077 | |
| | Gannett Co., Inc. | | GCI | 27.60 | | 19.53 | | 30.43 | | 2.43 | | 2.13 | | 2.81 | | 11.4 | | 13.0 | | 9.8 | | 6,280 | |
| | Snap-on Inc. | | SNA | 113.48 | | 79.88 | | 115.51 | | 5.13 | | 5.88 | | 6.54 | | 22.1 | | 19.3 | | 17.4 | | 6,616 | |
| | KKR & Co. L.P. | | KKR | 22.84 | | 17.27 | | 26.50 | | 2.90 | | 3.02 | | 3.19 | | 7.9 | | 7.6 | | 7.2 | | 6,860 | |
| | Hospira, Inc. | | HSP | 43.25 | | 30.19 | | 45.24 | | 2.01 | | 2.10 | | 2.29 | | 21.5 | | 20.6 | | 18.9 | | 7,218 | |
| | Interpublic Group of Cos., Inc. | | IPG | 17.14 | | 12.76 | | 18.00 | | 0.87 | | 0.88 | | 1.06 | | 19.7 | | 19.5 | | 16.2 | | 7,268 | |
| | Newell Rubbermaid Inc. | | NWL | 29.90 | | 24.32 | | 32.54 | | 1.70 | | 1.83 | | 1.95 | | 17.6 | | 16.3 | | 15.3 | | 8,339 | |
| | Laboratory Corp. of America Holdings | | LH | 98.21 | | 87.01 | | 108.00 | | 7.38 | | 6.95 | | 6.94 | | 13.3 | | 14.1 | | 14.2 | | 8,377 | |
| | McCormick & Co., Inc. | | MKC | 71.74 | | 62.75 | | 75.26 | | 3.06 | | 3.13 | | 3.29 | | 23.4 | | 22.9 | | 21.8 | | 8,488 | |
| | Western Union Co. | | WU | 16.36 | | 14.24 | | 19.50 | | 1.85 | | 1.54 | | 1.55 | | 8.8 | | 10.6 | | 10.6 | | 8,964 | |
| | CBRE Group, Inc. | | CBG | 27.43 | | 20.59 | | 28.44 | | 1.38 | | 1.59 | | 1.83 | | 19.9 | | 17.3 | | 15.0 | | 9,106 | |
| | Mohawk Industries, Inc. | | MHK | 135.98 | | 103.74 | | 155.48 | | 4.48 | | 6.84 | | 8.68 | | 30.4 | | 19.9 | | 15.7 | | 9,886 | |
| | J.M. Smucker Co. | | SJM | 97.24 | | 87.10 | | 114.72 | | 5.78 | | 6.31 | | 6.50 | | 16.8 | | 15.4 | | 15.0 | | 10,083 | |
| | Nordstrom, Inc. | | JWN | 62.45 | | 54.33 | | 63.72 | | 3.61 | | 3.71 | | 4.04 | | 17.3 | | 16.8 | | 15.5 | | 11,846 | |
| | Royal Caribbean Cruises Ltd. | | RCL | 54.56 | | 31.35 | | 54.93 | | 1.84 | | 2.39 | | 3.37 | | 29.7 | | 22.8 | | 16.2 | | 12,069 | |
Note: Holdings are as of March 31, 2014. All earnings per share numbers are fully diluted and reflect the company’s cash earnings. Such numbers are from continuing operations and are adjusted for non-recurring items. All estimates of future earnings per share shown in this table are prepared by Ariel Investments research analysts as of March 31, 2014 and have not been updated to reflect any subsequent events. P/E ratios are based on earnings stated and March 31, 2014 stock price. |
| 24 | ARIELINVESTMENTS.COM |
| | | |
| | Ariel Appreciation Fund statistical summary | (UNAUDITED) |
| | | |
| | | |
| | | | | | | | | | | | | | | | | | | | | | | | |
| | | | | | 52-week range | Earnings per share | P/E calendar | |
| | Company | | Ticker symbol | Price 03/31/14 | Low | High | 2012 actual calendar | 2013 actual calendar | 2014 estimated calendar | 2012 actual P/E | 2013 actual P/E | 2014 estimated P/E | Market cap. ($MM) |
| | International Speedway Corp. | | ISCA | 33.99 | | 29.30 | | 38.01 | | 1.40 | | 1.50 | | 1.68 | | 24.3 | | 22.7 | | 20.2 | | 902 | |
| | Contango Oil & Gas Co. | | MCF | 47.74 | | 33.22 | | 50.44 | | 3.79 | | 2.17 | | 3.37 | | 12.6 | | 22.0 | | 14.2 | | 925 | |
| | Janus Capital Group Inc. | | JNS | 10.87 | | 7.86 | | 13.10 | | 0.65 | | 0.71 | | 0.77 | | 16.7 | | 15.3 | | 14.1 | | 2,075 | |
| | DeVry Education Group Inc. | | DV | 42.39 | | 26.70 | | 42.87 | | 3.04 | | 2.59 | | 2.42 | | 13.9 | | 16.4 | | 17.5 | | 2,685 | |
| | Bristow Group Inc. | | BRS | 75.52 | | 59.21 | | 85.70 | | 1.73 | | 3.85 | | 4.58 | | 43.7 | | 19.6 | | 16.5 | | 2,739 | |
| | First American Financial Corp. | | FAF | 26.55 | | 20.39 | | 28.57 | | 2.46 | | 1.77 | | 1.85 | | 10.8 | | 15.0 | | 14.4 | | 2,824 | |
| | Sotheby’s | | BID | 43.55 | | 32.95 | | 54.00 | | 1.58 | | 1.88 | | 2.33 | | 27.6 | | 23.2 | | 18.7 | | 3,006 | |
| | Bio-Rad Laboratories, Inc. | | BIO | 128.12 | | 110.02 | | 134.13 | | 7.05 | | 4.30 | | 6.50 | | 18.2 | | 29.8 | | 19.7 | | 3,037 | |
| | International Game Technology | | IGT | 14.06 | | 13.31 | | 21.20 | | 1.14 | | 1.26 | | 1.15 | | 12.4 | | 11.2 | | 12.2 | | 3,469 | |
| | Madison Square Garden Co. | | MSG | 56.78 | | 54.00 | | 63.44 | | 1.72 | | 1.93 | | 2.14 | | 33.0 | | 29.4 | | 26.5 | | 3,597 | |
| | City National Corp. | | CYN | 78.72 | | 53.04 | | 81.34 | | 3.83 | | 3.99 | | 4.07 | | 20.6 | | 19.7 | | 19.3 | | 4,320 | |
| | Jones Lang LaSalle Inc. | | JLL | 118.50 | | 80.86 | | 125.29 | | 5.61 | | 6.45 | | 7.57 | | 21.1 | | 18.4 | | 15.7 | | 5,273 | |
| | Lazard Ltd | | LAZ | 47.09 | | 30.63 | | 48.70 | | 1.44 | | 2.01 | | 2.67 | | 32.7 | | 23.4 | | 17.6 | | 6,077 | |
| | Gannett Co., Inc. | | GCI | 27.60 | | 19.53 | | 30.43 | | 2.43 | | 2.13 | | 2.81 | | 11.4 | | 13.0 | | 9.8 | | 6,280 | |
| | Snap-on Inc. | | SNA | 113.48 | | 79.88 | | 115.51 | | 5.13 | | 5.88 | | 6.54 | | 22.1 | | 19.3 | | 17.4 | | 6,616 | |
| | KKR & Co. L.P. | | KKR | 22.84 | | 17.27 | | 26.50 | | 2.90 | | 3.02 | | 3.19 | | 7.9 | | 7.6 | | 7.2 | | 6,860 | |
| | Hospira, Inc. | | HSP | 43.25 | | 30.19 | | 45.24 | | 2.01 | | 2.10 | | 2.29 | | 21.5 | | 20.6 | | 18.9 | | 7,218 | |
| | Interpublic Group of Cos., Inc. | | IPG | 17.14 | | 12.76 | | 18.00 | | 0.87 | | 0.88 | | 1.06 | | 19.7 | | 19.5 | | 16.2 | | 7,268 | |
| | Towers Watson | | TW | 114.05 | | 67.95 | | 131.73 | | 5.19 | | 5.55 | | 5.94 | | 22.0 | | 20.5 | | 19.2 | | 8,044 | |
| | Newell Rubbermaid Inc. | | NWL | 29.90 | | 24.32 | | 32.54 | | 1.70 | | 1.83 | | 1.95 | | 17.6 | | 16.3 | | 15.3 | | 8,339 | |
| | Laboratory Corp. of America Holdings | | LH | 98.21 | | 87.01 | | 108.00 | | 7.38 | | 6.95 | | 6.94 | | 13.3 | | 14.1 | | 14.2 | | 8,377 | |
| | Western Union Co. | | WU | 16.36 | | 14.24 | | 19.50 | | 1.85 | | 1.54 | | 1.55 | | 8.8 | | 10.6 | | 10.6 | | 8,964 | |
| | CBRE Group, Inc. | | CBG | 27.43 | | 20.59 | | 28.44 | | 1.38 | | 1.59 | | 1.83 | | 19.9 | | 17.3 | | 15.0 | | 9,106 | |
| | J.M. Smucker Co. | | SJM | 97.24 | | 87.10 | | 114.72 | | 5.78 | | 6.31 | | 6.50 | | 16.8 | | 15.4 | | 15.0 | | 10,083 | |
| | Tiffany & Co. | | TIF | 86.15 | | 68.27 | | 94.88 | | 3.25 | | 3.73 | | 4.07 | | 26.5 | | 23.1 | | 21.2 | | 11,031 | |
| | Nordstrom, Inc. | | JWN | 62.45 | | 54.33 | | 63.72 | | 3.61 | | 3.71 | | 4.04 | | 17.3 | | 16.8 | | 15.5 | | 11,846 | |
| | Stanley Black & Decker, Inc. | | SWK | 81.24 | | 73.77 | | 92.76 | | 5.38 | | 5.87 | | 5.48 | | 15.1 | | 13.8 | | 14.8 | | 12,652 | |
| | Coach, Inc. | | COH | 49.66 | | 44.31 | | 60.12 | | 3.63 | | 3.42 | | 3.38 | | 13.7 | | 14.5 | | 14.7 | | 13,785 | |
| | Northern Trust Corp. | | NTRS | 65.56 | | 51.90 | | 67.17 | | 2.86 | | 3.04 | | 3.36 | | 22.9 | | 21.6 | | 19.5 | | 15,558 | |
| | Zimmer Holdings, Inc. | | ZMH | 94.58 | | 72.31 | | 98.95 | | 5.67 | | 6.12 | | 6.60 | | 16.7 | | 15.5 | | 14.3 | | 15,942 | |
| | Blackstone Group L.P. | | BX | 33.25 | | 18.76 | | 35.39 | | 1.77 | | 3.07 | | 3.08 | | 18.8 | | 10.8 | | 10.8 | | 16,654 | |
| | St. Jude Medical, Inc. | | STJ | 65.39 | | 39.79 | | 68.79 | | 3.65 | | 3.95 | | 4.20 | | 17.9 | | 16.6 | | 15.6 | | 18,564 | |
| | Omnicom Group Inc. | | OMC | 72.60 | | 57.73 | | 76.87 | | 3.76 | | 4.09 | | 4.48 | | 19.3 | | 17.8 | | 16.2 | | 18,746 | |
| | T. Rowe Price Group, Inc. | | TROW | 82.35 | | 69.90 | | 84.41 | | 3.36 | | 3.90 | | 4.44 | | 24.5 | | 21.1 | | 18.5 | | 21,624 | |
| | AFLAC Inc. | | AFL | 63.04 | | 48.54 | | 67.62 | | 6.60 | | 6.18 | | 6.40 | | 9.6 | | 10.2 | | 9.9 | | 28,670 | |
| | Viacom, Inc. | | VIAB | 84.99 | | 60.82 | | 89.27 | | 4.41 | | 4.97 | | 5.75 | | 19.3 | | 17.1 | | 14.8 | | 32,892 | |
| | Franklin Resources, Inc. | | BEN | 54.18 | | 44.22 | | 58.87 | | 3.10 | | 3.52 | | 4.00 | | 17.5 | | 15.4 | | 13.6 | | 34,179 | |
| | CBS Corp. | | CBS | 61.80 | | 43.77 | | 68.10 | | 2.65 | | 3.12 | | 3.58 | | 23.3 | | 19.8 | | 17.3 | | 34,256 | |
| | Illinois Tool Works Inc. | | ITW | 81.33 | | 60.02 | | 84.32 | | 4.36 | | 4.02 | | 4.40 | | 18.7 | | 20.2 | | 18.5 | | 34,555 | |
| | Thermo Fisher Scientific Inc. | | TMO | 120.24 | | 75.00 | | 127.63 | | 4.93 | | 5.42 | | 6.85 | | 24.4 | | 22.2 | | 17.6 | | 47,109 | |
Note: Holdings are as of March 31, 2014. All earnings per share numbers are fully diluted and reflect the company’s cash earnings. Such numbers are from continuing operations and are adjusted for non-recurring items. All estimates of future earnings per share shown in this table are prepared by Ariel Investments research analysts as of March 31, 2014 and have not been updated to reflect any subsequent events. P/E ratios are based on earnings stated and March 31, 2014 stock price. |
| 800.292.7435 | 25 |
| | | |
| | Ariel Focus Fund statistical summary | (UNAUDITED) |
| | | |
| | | |
| | | | | | | | | | | | | | | | | | | | | | | | |
| | | | | | 52-week range | Earnings per share | P/E calendar | |
| | Company | | Ticker symbol | Price 03/31/14 | Low | High | 2012 actual calendar | 2013 actual calendar | 2014 estimated calendar | 2012 actual P/E | 2013 actual P/E | 2014 estimated P/E | Market cap. ($MM) |
| | Telephone & Data Systems, Inc. | | TDS | 26.21 | | 20.57 | | 31.52 | | 0.75 | | 1.29 | | (0.68 | ) | 34.9 | | 20.3 | | NM | | 2,663 | |
| | International Game Technology | | IGT | 14.06 | | 13.31 | | 21.20 | | 1.14 | | 1.26 | | 1.15 | | 12.4 | | 11.2 | | 12.2 | | 3,469 | |
| | Apollo Education Group, Inc. | | APOL | 34.24 | | 16.54 | | 35.92 | | 3.43 | | 2.88 | | 2.17 | | 10.0 | | 11.9 | | 15.8 | | 3,842 | |
| | Snap-on Inc. | | SNA | 113.48 | | 79.88 | | 115.51 | | 5.13 | | 5.88 | | 6.54 | | 22.1 | | 19.3 | | 17.4 | | 6,616 | |
| | Hospira, Inc. | | HSP | 43.25 | | 30.19 | | 45.24 | | 2.01 | | 2.10 | | 2.29 | | 21.5 | | 20.6 | | 18.9 | | 7,218 | |
| | Laboratory Corp. of America Holdings | | LH | 98.21 | | 87.01 | | 108.00 | | 7.38 | | 6.95 | | 6.94 | | 13.3 | | 14.1 | | 14.2 | | 8,377 | |
| | Western Union Co. | | WU | 16.36 | | 14.24 | | 19.50 | | 1.85 | | 1.54 | | 1.55 | | 8.8 | | 10.6 | | 10.6 | | 8,964 | |
| | Stanley Black & Decker, Inc. | | SWK | 81.24 | | 73.77 | | 92.76 | | 5.38 | | 5.87 | | 5.48 | | 15.1 | | 13.8 | | 14.8 | | 12,652 | |
| | Zimmer Holdings, Inc. | | ZMH | 94.58 | | 72.31 | | 98.95 | | 5.67 | | 6.12 | | 6.60 | | 16.7 | | 15.5 | | 14.3 | | 15,942 | |
| | Mosaic Co. | | MOS | 50.00 | | 39.75 | | 64.65 | | 4.08 | | 2.90 | | 2.85 | | 12.3 | | 17.2 | | 17.5 | | 17,009 | |
| | Chesapeake Energy Corp. | | CHK | 25.62 | | 18.21 | | 29.06 | | 0.42 | | 1.65 | | 1.80 | | 61.0 | | 15.5 | | 14.2 | | 17,012 | |
| | Omnicom Group Inc. | | OMC | 72.60 | | 57.73 | | 76.87 | | 3.76 | | 4.09 | | 4.48 | | 19.3 | | 17.8 | | 16.2 | | 18,746 | |
| | Apache Corp. | | APA | 82.95 | | 67.91 | | 94.84 | | 9.62 | | 8.20 | | 7.00 | | 8.6 | | 10.1 | | 11.9 | | 32,742 | |
| | National Oilwell Varco | | NOV | 77.87 | | 63.08 | | 84.71 | | 5.83 | | 5.35 | | 6.15 | | 13.4 | | 14.6 | | 12.7 | | 33,369 | |
| | Illinois Tool Works Inc. | | ITW | 81.33 | | 60.02 | | 84.32 | | 4.36 | | 4.02 | | 4.40 | | 18.7 | | 20.2 | | 18.5 | | 34,555 | |
| | Target Corp. | | TGT | 60.51 | | 54.66 | | 73.50 | | 4.37 | | 3.21 | | 4.00 | | 13.8 | | 18.9 | | 15.1 | | 38,313 | |
| | DIRECTV | | DTV | 76.42 | | 53.50 | | 80.77 | | 4.58 | | 5.17 | | 5.99 | | 16.7 | | 14.8 | | 12.8 | | 38,971 | |
| | Baxter Intl Inc. | | BAX | 73.58 | | 62.80 | | 75.68 | | 4.53 | | 4.67 | | 5.15 | | 16.2 | | 15.8 | | 14.3 | | 39,802 | |
| | Bank of New York Mellon Corp. | | BK | 35.29 | | 26.64 | | 35.88 | | 2.03 | | 2.24 | | 2.40 | | 17.4 | | 15.8 | | 14.7 | | 40,117 | |
| | Lockheed Martin Corp. | | LMT | 163.24 | | 94.00 | | 168.41 | | 10.06 | | 10.45 | | 10.56 | | 16.2 | | 15.6 | | 15.5 | | 52,117 | |
| | Morgan Stanley | | MS | 31.17 | | 20.16 | | 33.52 | | 1.59 | | 1.66 | | 2.50 | | 19.6 | | 18.8 | | 12.5 | | 61,582 | |
| | Goldman Sachs Group, Inc. | | GS | 163.85 | | 137.29 | | 181.13 | | 14.13 | | 15.46 | | 15.71 | | 11.6 | | 10.6 | | 10.4 | | 73,646 | |
| | CVS Caremark Corp. | | CVS | 74.86 | | 53.94 | | 76.36 | | 3.43 | | 4.00 | | 4.76 | | 21.8 | | 18.7 | | 15.7 | | 88,516 | |
| | Oracle Corp. | | ORCL | 40.91 | | 29.86 | | 41.43 | | 2.48 | | 2.63 | | 2.87 | | 16.5 | | 15.6 | | 14.3 | | 182,413 | |
| | International Business Machines Corp. | | IBM | 192.49 | | 172.19 | | 214.89 | | 15.25 | | 16.99 | | 18.00 | | 12.6 | | 11.3 | | 10.7 | | 200,448 | |
| | JPMorgan Chase & Co. | | JPM | 60.71 | | 46.05 | | 61.48 | | 5.20 | | 4.35 | | 5.56 | | 11.7 | | 14.0 | | 10.9 | | 229,898 | |
| | Johnson & Johnson | | JNJ | 98.23 | | 80.31 | | 98.60 | | 5.31 | | 5.86 | | 6.15 | | 18.5 | | 16.8 | | 16.0 | | 277,826 | |
| | Microsoft Corp. | | MSFT | 40.99 | | 28.11 | | 41.50 | | 2.70 | | 2.65 | | 2.78 | | 15.2 | | 15.5 | | 14.7 | | 340,247 | |
| | Exxon Mobil Corp. | | XOM | 97.68 | | 84.79 | | 101.74 | | 8.10 | | 7.50 | | 7.68 | | 12.1 | | 13.0 | | 12.7 | | 422,099 | |
Note: Holdings are as of March 31, 2014. All earnings per share numbers are fully diluted and reflect the company’s cash earnings. Such numbers are from continuing operations and are adjusted for non-recurring items. All estimates of future earnings per share shown in this table are prepared by Ariel Investments research analysts as of March 31, 2014 and have not been updated to reflect any subsequent events. P/E ratios are based on earnings stated and March 31, 2014 stock price. |
| 26 | ARIELINVESTMENTS.COM |
| | | | |
| | Ariel Fund schedule of investments | 03/31/14 (UNAUDITED) | |
| | | | |
| | | | |
| | | | | | |
| Number of shares | | Common stocks — 99.61% | | Value | |
| | | Consumer discretionary & services—30.48% | | | |
| | 1,629,440 | | Royal Caribbean Cruises Ltd. | | | $88,902,246 | |
| | 2,635,721 | | Gannett Co., Inc. | | | 72,745,900 | |
| | 4,949,345 | | International Game Technology | | | 69,587,791 | |
| | 1,988,496 | | International Speedway Corp., Class A | | | 67,588,979 | |
| | 3,921,666 | | Interpublic Group of Cos., Inc. | | | 67,217,355 | |
| | 1,396,908 | | Meredith Corp. | | | 64,858,438 | |
| | 423,404 | | Mohawk Industries, Inc.(a) | | | 57,574,476 | |
| | 819,700 | | Bally Technologies Inc.(a) | | | 54,321,519 | |
| | 1,786,754 | | Newell Rubbermaid Inc. | | | 53,423,945 | |
| | 47,082 | | Graham Holdings Co., Class B | | | 33,133,957 | |
| | 577,274 | | Madison Square Garden Co., Class A(a) | | | 32,777,618 | |
| | 701,090 | | DeVry Education Group Inc. | | | 29,719,205 | |
| | 556,765 | | Sotheby’s | | | 24,247,116 | |
| | 151,068 | | Nordstrom, Inc. | | | 9,434,197 | |
| | | | | | | 725,532,742 | |
| | | | Consumer staples—3.16% | | | | |
| | 639,445 | | J.M. Smucker Co. | | | 62,179,632 | |
| | 182,500 | | McCormick & Co., Inc. | | | 13,092,550 | |
| | | | | | | 75,272,182 | |
| | | | Energy—2.48% | | | | |
| | 1,235,343 | | Contango Oil & Gas Co.(a)(b) | | | 58,975,275 | |
| | | | | | | | |
| | | | Financial services—31.48% | | | | |
| | 4,103,459 | | KKR & Co. L.P. | | | 93,723,004 | |
| | 1,942,803 | | Lazard Ltd, Class A | | | 91,486,593 | |
| | 762,999 | | Jones Lang LaSalle Inc. | | | 90,415,381 | |
| | 3,143,653 | | CBRE Group, Inc., Class A(a) | | | 86,230,402 | |
| | 4,578,055 | | Western Union Co. | | | 74,896,980 | |
| | 6,295,716 | | Janus Capital Group Inc. | | | 68,434,433 | |
| | 2,443,588 | | First American Financial Corp. | | | 64,877,261 | |
| | 1,149,058 | | Fair Isaac Corp. | | | 63,565,889 | |
| | 611,578 | | Dun & Bradstreet Corp. | | | 60,760,274 | |
| | 697,860 | | City National Corp. | | | 54,935,539 | |
| | | | | | | 749,325,756 | |
| | | | Health care—10.14% | | | | |
| | 1,546,950 | | Hospira, Inc.(a) | | | 66,905,587 | |
| | 1,016,226 | | Charles River Laboratories Intl Inc.(a) | | | 61,319,077 | |
| | 363,783 | | Bio-Rad Laboratories, Inc., Class A(a) | | | 46,607,878 | |
| | 3,368,118 | | Symmetry Medical Inc.(a)(b) | | | 33,883,267 | |
| | 331,100 | | Laboratory Corp. of America Holdings.(a) | | | 32,517,331 | |
| | | | | | | 241,233,140 | |
| | | | Materials & processing—6.45% | | | | |
| | 2,004,194 | | U.S. Silica Holdings Inc. | | | 76,500,085 | |
| | 1,471,097 | | Simpson Manufacturing Co., Inc. | | | 51,973,857 | |
| | 1,218,076 | | Interface, Inc. | | | 25,031,462 | |
| | | | | | | 153,505,404 | |
| | | | |
| | Ariel Fund schedule of investments (continued) | 03/31/14 (UNAUDITED) | |
| | | | |
| | | | |
| | | | | | |
| Number of shares | | Common stocks — 99.61% | | Value | |
| | | Producer durables—12.42% | | | |
| | 973,341 | | Bristow Group Inc. | | | $73,506,712 | |
| | 2,203,829 | | Brady Corp., Class A | | | 59,833,957 | |
| | 500,713 | | Snap-on Inc. | | | 56,820,911 | |
| | 528,818 | | MTS Systems Corp. | | | 36,218,745 | |
| | 385,766 | | Littelfuse, Inc. | | | 36,123,128 | |
| | 455,676 | | IDEX Corp. | | | 33,214,224 | |
| | | | | | | 295,717,677 | |
| | | | Technology—3.00% | | | | |
| | 703,803 | | Anixter Intl Inc.(a) | | | 71,450,081 | |
| | | | Total common stocks (Cost $1,381,983,600) | | | 2,371,012,257 | |
| | | | | | |
| Principal amount | | Repurchase agreement — 0.66% | | Value | |
| | $15,719,183 | | Fixed Income Clearing Corporation, 0.00%, dated 03/31/2014, due 04/01/2014, repurchase price | | | |
| | | | $15,719,183, (collaterized by Federal National Mortgage Assoc., value $16,038,000, 1.02%, | | | |
| | | | due 10/17/2017) (Cost $15,719,183) | | | $15,719,183 | |
| | | | Total Investments—100.27% (Cost $1,397,702,783) | | | 2,386,731,440 | |
| | | | Liabilities less Other Assets—(0.27)% | | | (6,344,824 | ) |
| | | | Net Assets—100.00% | | | $2,380,386,616 | |
(a)Non-income producing.
(b)Affiliated company (See Note Six).
A category may contain multiple industries as defined by the Global Industry Classification Standards.
The accompanying notes are an integral part of the financial statements.
| | | | |
| | Ariel Appreciation Fund schedule of investments | 03/31/14 (UNAUDITED) | |
| | | | |
| | | | |
| | | | | | |
| Number of shares | | Common stocks — 97.08% | | Value | |
| | | Consumer discretionary & services—28.66% | | | |
| | 3,980,830 | | Interpublic Group of Cos., Inc. | | | $68,231,426 | |
| | 4,651,890 | | International Game Technology | | | 65,405,573 | |
| | 990,000 | | Nordstrom, Inc. | | | 61,825,500 | |
| | 802,600 | | Omnicom Group Inc. | | | 58,268,760 | |
| | 872,600 | | CBS Corp., Class B | | | 53,926,680 | |
| | 1,577,656 | | International Speedway Corp., Class A | | | 53,624,527 | |
| | 1,010,000 | | Coach, Inc. | | | 50,156,600 | |
| | 558,800 | | Viacom, Inc., Class B | | | 47,492,412 | |
| | 1,428,300 | | Gannett Co., Inc. | | | 39,421,080 | |
| | 988,700 | | Newell Rubbermaid Inc. | | | 29,562,130 | |
| | 457,400 | | Sotheby’s | | | 19,919,770 | |
| | 304,800 | | Madison Square Garden Co., Class A(a) | | | 17,306,544 | |
| | 262,635 | | DeVry Education Group Inc. | | | 11,133,098 | |
| | 112,800 | | Tiffany & Co. | | | 9,717,720 | |
| | | | | | | 585,991,820 | |
| | | | Consumer staples—2.90% | | | | |
| | 609,275 | | J.M. Smucker Co. | | | 59,245,901 | |
| | | | | | | | |
| | | | Energy—1.37% | | | | |
| | 586,482 | | Contango Oil & Gas Co.(a) | | | 27,998,651 | |
| | | | | | | | |
| | | | Financial services—35.89% | | | | |
| | 1,949,520 | | Lazard Ltd, Class A | | | 91,802,897 | |
| | 5,448,000 | | Western Union Co. | | | 89,129,280 | |
| | 3,081,600 | | First American Financial Corp. | | | 81,816,480 | |
| | 1,025,500 | | Northern Trust Corp. | | | 67,231,780 | |
| | 1,007,000 | | AFLAC Inc. | | | 63,481,280 | |
| | 1,155,700 | | Franklin Resources, Inc. | | | 62,615,826 | |
| | 521,800 | | Jones Lang LaSalle Inc. | | | 61,833,300 | |
| | 670,100 | | City National Corp. | | | 52,750,272 | |
| | 1,280,600 | | Blackstone Group L.P. | | | 42,579,950 | |
| | 3,480,675 | | Janus Capital Group Inc. | | | 37,834,937 | |
| | 1,460,568 | | KKR & Co. L.P. | | | 33,359,373 | |
| | 311,500 | | T. Rowe Price Group, Inc. | | | 25,652,025 | |
| | 871,050 | | CBRE Group, Inc., Class A(a) | | | 23,892,902 | |
| | | | | | | 733,980,302 | |
| | | | Health care—14.64% | | | | |
| | 1,506,300 | | Hospira, Inc.(a) | | | 65,147.475 | |
| | 960,500 | | St. Jude Medical, Inc. | | | 62,807,095 | |
| | 593,900 | | Zimmer Holdings, Inc. | | | 56,171,062 | |
| | 385,554 | | Thermo Fisher Scientific Inc. | | | 46,359,013 | |
| | 399,700 | | Laboratory Corp. of America Holdings(a) | | | 39,254,537 | |
| | 231,225 | | Bio-Rad Laboratories, Inc., Class A(a) | | | 29,624,547 | |
| | | | | | | 299,363,729 | |
| | | | |
| | Ariel Appreciation Fund schedule of investments (continued) | 03/31/14 (UNAUDITED) | |
| | | | |
| | | | |
| | | | | | |
| Number of shares | | Common stocks — 97.08% | | Value | |
| | | Producer durables—13.62% | | | |
| | 881,699 | | Stanley Black & Decker, Inc. | | | $71,629,227 | |
| | 939,018 | | Bristow Group Inc. | | | 70,914,639 | |
| | 735,250 | | Illinois Tool Works Inc. | | | 59,797,883 | |
| | 392,100 | | Snap-on Inc. | | | 44,495,508 | |
| | 277,500 | | Towers Watson, Class A | | | 31,648,875 | |
| | | | | | | 278,486,132 | |
| | | | Total common stocks (Cost $1,187,770,480) | | | 1,985,066,535 | |
| | | | | | |
| Principal amount | | Repurchase agreement — 3.77% | | Value | |
| | $77,053,212 | | Fixed Income Clearing Corporation, 0.00%, dated 03/31/2014, due 04/01/2014, repurchase price | | | |
| | | | $77,053,212, (collaterized by Federal National Mortgage Assoc., value $78,596,100, 0.875%, | | | |
| | | | due 08/28/2017) (Cost $77,053,212) | | | $77,053,212 | |
| | | | Total Investments—100.85% (Cost $1,264,823,692) | | | 2,062,119,747 | |
| | | | Liabilities less Other Assets—(0.85)% | | | (17,444,819 | ) |
| | | | Net Assets—100.00% | | | $2,044,674,928 | |
(a)Non-income producing.
A category may contain multiple industries as defined by the Global Industry Classification Standards.
The accompanying notes are an integral part of the financial statements.
| | | | |
| | Ariel Focus Fund schedule of investments | 03/31/14 (UNAUDITED) | |
| | | | |
| Number of shares | | Common stocks — 96.46% | | Value | |
| | | Consumer discretionary & services—15.14% | | | |
| 39,600 | | DIRECTV(a) | | $3,026,232 | |
| 37,600 | | Target Corp. | | 2,275,176 | |
| 116,100 | | International Game Technology | | 1,632,366 | |
| 38,500 | | Apollo Education Group, Inc., Class A(a) | | 1,318,240 | |
| 17,300 | | Omnicom Group Inc. | | 1,255,980 | |
| | | | | 9,507,994 | |
| | | Consumer staples—4.01% | | | |
| 33,600 | | CVS Caremark Corp. | | 2,515,296 | |
| | | | | | |
| | | Energy—15.23% | | | |
| 40,000 | | National Oilwell Varco | | 3,114,800 | |
| 27,700 | | Exxon Mobil Corp. | | 2,705,736 | |
| 76,500 | | Chesapeake Energy Corp. | | 1,959,930 | |
| 21,500 | | Apache Corp. | | 1,783,425 | |
| | | | | 9,563,891 | |
| | | Financial services—15.07% | | | |
| 185,300 | | Western Union Co. | | 3,031,508 | |
| 29,000 | | JPMorgan Chase & Co. | | 1,760,590 | |
| 56,250 | | Morgan Stanley | | 1,753,313 | |
| 9,800 | | Goldman Sachs Group, Inc. | | 1,605,730 | |
| 37,200 | | Bank of New York Mellon Corp. | | 1,312,788 | |
| | | | | 9,463,929 | |
| | | Health care—14.68% | | | |
| 23,700 | | Johnson & Johnson | | 2,328,051 | |
| 20,500 | | Laboratory Corp. of America Holdings(a) | | 2,013,305 | |
| 19,500 | | Zimmer Holdings, Inc. | | 1,844,310 | |
| 35,400 | | Hospira, Inc.(a) | | 1,531,050 | |
| 20,400 | | Baxter Intl Inc. | | 1,501,032 | |
| | | | | 9,217,748 | |
| | | Materials & processing—3.11% | | | |
| 39,100 | | Mosiac Co. | | 1,955,000 | |
| | | | | | |
| | | Producer durables—13.99% | | | |
| 20,100 | | Lockheed Martin Corp. | | 3,281,124 | |
| 35,400 | | Stanley Black & Decker, Inc. | | 2,875,896 | |
| 16,800 | | Illinois Tool Works Inc. | | 1,366,344 | |
| 11,100 | | Snap-on Inc. | | 1,259,628 | |
| | | | | 8,782,992 | |
| | | Technology—13.61% | | | |
| 17,200 | | International Business Machines Corp. | | 3,310,828 | |
| 80,700 | | Microsoft Corp. | | 3,307,893 | |
| 47,200 | | Oracle Corp. | | 1,930,952 | |
| | | | | 8,549,673 | |
| | | Utilities—1.62% | | | |
| 38,900 | | Telephone & Data Systems Inc. | | 1,019,569 | |
| | | Total common stocks (Cost $46,632,367) | | 60,576,092 | |
| | | | | | |
| Principal amount | | Repurchase agreement — 2.74% | | Value | |
| $1,718,349 | | Fixed Income Clearing Corporation, 0.00%, dated 03/31/2014, due 04/01/2014, repurchase price | | | |
| | | $1,718,349, (collaterized by Federal National Mortgage Assoc., value $1,757,250, 1.02%, due 10/17/2017) | | | |
| | | (Cost $1,718,349) | | | |
| | | | | $1,718,349 | |
| | | Total Investments—99.20% (Cost $48,350,716) | | 62,294,441 | |
| | | Other Assets less Liabilities—0.80% | | 503,447 | |
| | | Net Assets—100.00% | | $62,797,888 | |
| | | | | | |
(a)Non-income producing.
A category may contain multiple industries as defined by the Global Industry Classification Standards.
The accompanying notes are an integral part of the financial statements.
| | | | |
| | Ariel Discovery Fund schedule of investments | 03/31/14 (UNAUDITED) | |
| | | | |
| Number of shares | | Common stocks — 92.15% | | Value | |
| | | Consumer discretionary & services—12.28% | | | |
| 71,200 | | International Speedway Corp., Class A | | $2,420,088 | |
| 164,455 | | Rosetta Stone Inc.(a) | | 1,845,185 | |
| 124,800 | | XO Group Inc.(a) | | 1,265,472 | |
| 146,296 | | Century Casinos, Inc.(a) | | 1,048,942 | |
| 46,800 | | Superior Industries Intl Inc. | | 958,932 | |
| | | | | 7,538,619 | |
| | | Energy—10.75% | | | |
| 78,954 | | Contango Oil & Gas Co.(a) | | 3,769,264 | |
| 103,900 | | Mitcham Industries, Inc.(a) | | 1,448,366 | |
| 63,800 | | Gulf Island Fabrication, Inc. | | 1,378,718 | |
| | | | | 6,596,348 | |
| | | Financial services—14.62% | | | |
| 641,100 | | Cowen Group, Inc., Class A(a) | | 2,827,251 | |
| 103,800 | | First American Financial Corp. | | 2,755,890 | |
| 95,800 | | AV Homes, Inc.(a) | | 1,733,022 | |
| 25,900 | | Capital Southwest Corp. | | 899,248 | |
| 24,400 | | MB Financial, Inc. | | 755,424 | |
| | | | | 8,970,835 | |
| | | Health care—3.68% | | | |
| 212,100 | | POZEN Inc.(a) | | 1,696,800 | |
| 437,800 | | Vical Inc.(a) | | 564,762 | |
| | | | | 2,261,562 | |
| | | Materials & processing—10.08% | | | |
| 1,264,494 | | Rentech, Inc.(a) | | 2,402,539 | |
| 172,599 | | Landec Corp.(a) | | 1,926,205 | |
| 28,100 | | Simpson Manufacturing Co., Inc. | | 992,773 | |
| 119,091 | | Orion Energy Systems, Inc.(a) | | 863,410 | |
| | | | | 6,184,927 | |
| | | Producer durables—13.86% | | | |
| 135,230 | | Erickson Air-Crane, Inc.(a) | | 2,611,291 | |
| 34,939 | | Team, Inc.(a) | | 1,497,486 | |
| 285,825 | | Spartan Motors Inc. | | 1,469,141 | |
| 37,400 | | Brink’s Co. | | 1,067,770 | |
| 97,300 | | Furmanite Corp.(a) | | 955,486 | |
| 9,650 | | Littelfuse Inc. | | 903,626 | |
| | | | | 8,504,800 | |
| | | Technology—18.84% | | | |
| 368,800 | | Imation Corp.(a) | | 2,127,976 | |
| 181,180 | | PCTEL, Inc. | | 1,581,701 | |
| 76,300 | | Oplink Communications, Inc.(a) | | 1,370,348 | |
| 166,100 | | RealNetworks, Inc.(a) | | 1,259,038 | |
| 104,400 | | Brooks Automation, Inc. | | 1,141,092 | |
| 237,840 | | Sigma Designs, Inc.(a) | | 1,132,118 | |
| 169,100 | | FormFactor, Inc.(a) | | 1,080,549 | |
| 129,400 | | ARC Document Solutions Inc.(a) | | 962,736 | |
| 71,100 | | Multi-Fineline Electronix, Inc.(a) | | 910,080 | |
| | | | | 11,565,638 | |
| | | Utilities—8.04% | | | |
| 410,513 | | ORBCOMM Inc.(a) | | 2,812,014 | |
| 1,158,600 | | Pendrell Corp.(a) | | 2,120,238 | |
| | | | | 4,932,252 | |
| | | Total common stocks (Cost $50,728,608) | | 56,554,981 | |
| | | | | | |
| Principal amount | | Repurchase agreement — 4.79% | | Value | |
| $2,938,811 | | Fixed Income Clearing Corporation, 0.00%, dated 03/31/2014, due 04/01/2014, repurchase price | | | |
| | | $2,938,811, (collaterized by Federal National Mortgage Assoc., value $2,999,700, 1.02%, | | | |
| | | due 10/17/2017) (Cost $2,938,811) | | $2,938,811 | |
| | | Total Investments—96.94% (Cost $53,667,419) | | 59,493,792 | |
| | | Cash, Other Assets less Liabilities—3.06% | | 1,878,855 | |
| | | Net assets — 100.00% | | $61,372,647 | |
| | | | | | |
(a)Non-income producing.
A category may contain multiple industries as defined by the Global Industry Classification Standards.
The accompanying notes are an integral part of the financial statements.
| | | | |
| | Ariel International Fund schedule of investments | 03/31/14 (UNAUDITED) | |
| | | | |
| Number of shares | | Common stocks — 88.07% | | Value | |
| | | Australia—0.13% | | | |
| 3,262 | | AMP Ltd. | | $15,065 | |
| | | | | | |
| | | Austria—0.67% | | | |
| 1,589 | | Vienna Insurance Group | | 78,347 | |
| | | | | | |
| | | Canada—1.28% | | | |
| 279 | | Fairfax Financial Holdings Ltd. | | 121,140 | |
| 506 | | Tim Hortons Inc. | | 27,984 | |
| | | | | 149,124 | |
| | | China—4.42% | | | |
| 7,540 | | China Mobile Ltd. ADR | | 343,749 | |
| 887 | | Baidu, Inc. ADR(a) | | 135,161 | |
| 4,072 | | China Mobile Ltd. | | 37,274 | |
| | | | | 516,184 | |
| | | Czech Republic—0.15% | | | |
| 72 | | Komercni Banka AS | | 17,199 | |
| | | | | | |
| | | Finland—3.12% | | | |
| 42,532 | | Nokia Corp. ADR | | 312,185 | |
| 6,962 | | Nokia Corp. | | 51,697 | |
| | | | | 363,882 | |
| | | France—5.90% | | | |
| 9,739 | | Eutelsat Communications | | 330,727 | |
| 1,487 | | Technip SA | | 153,458 | |
| 1,536 | | BNP Paribas SA | | 118,479 | |
| 638 | | L’Air Liquide SA | | 86,417 | |
| | | | | 689,081 | |
| | | Germany—8.15% | | | |
| 6,665 | | Deutsche Boerse AG | | 530,446 | |
| 8,209 | | Dialog Semiconductor plc(a) | | 202,773 | |
| 22,629 | | Telefonica Deutschland Holding AG | | 180,378 | |
| 278 | | MTU Aero Engines AG | | 25,836 | |
| 319 | | Deutsche Post AG | | 11,853 | |
| | | | | 951,286 | |
| | | Hong Kong—0.94% | | | |
| 33,585 | | Yue Yuen Industrial | | 109,547 | |
| | | | | | |
| | | Ireland—2.19% | | | |
| 4,351 | | Ryanair Holdings plc ADR(a) | | 255,882 | |
| | | | | | |
| | | Italy—4.40% | | | |
| 67,455 | | Snam SpA | | 394,950 | |
| 14,298 | | Mediaset SpA | | 79,933 | |
| 919 | | DiaSorin SpA | | 39,438 | |
| | | | | 514,321 | |
| | | Japan—16.23% | | | |
| 3,200 | | Shimamura Co., Ltd. | | 276,859 | |
| 8,500 | | Canon Inc. | | 262,786 | |
| 4,100 | | Toyota Motor Corp. | | 231,426 | |
| 1,900 | | Nintendo Co., Ltd. | | 225,684 | |
| 3,300 | | Tokyo Electron Ltd. | | 202,224 | |
| 2,100 | | Daito Trust Construction Co., Ltd. | | 194,324 | |
| 3,600 | | Japan Tobacco Inc. | | 113,007 | |
| 900 | | Murata Manufacturing Co., Ltd. | | 84,886 | |
| 2,703 | | Canon Inc. ADR | | 83,955 | |
| 1,800 | | OBIC Co. Ltd. | | 56,852 | |
| 415 | | Toyota Motor Corp. ADR | | 46,854 | |
| 2,800 | | Nikon Corp. | | 45,086 | |
| 1,200 | | Chugai Pharmaceuticals Co., Ltd. | | 30,635 | |
| 900 | | JIN Co., Ltd. | | 26,900 | |
| 936 | | Nintendo Co., Ltd ADR | | 13,937 | |
| | | | | 1,895,415 | |
| | | Luxembourg—0.54% | | | |
| 548 | | RTL Group | | 62,782 | |
| | | | |
| | Ariel International Fund schedule of investments (continued) | 03/31/14 (UNAUDITED) | |
| | | | |
| Number of shares | | Common stocks — 88.07% | | Value | |
| | | Netherlands—4.64% | | | |
| 26,966 | | Ahold N.V. | | $541,643 | |
| | | | | | |
| | | Norway—0.29% | | | |
| 1,694 | | Gjensidige Forsikring ASA | | 34,458 | |
| | | | | | |
| | | Singapore—0.36% | | | |
| 2,000 | | United Overseas Bank Ltd. | | 34,422 | |
| 1,000 | | Oversea-Chinese Banking Corp. Ltd. | | 7,560 | |
| | | | | 41,982 | |
| | | Spain—1.14% | | | |
| 2,348 | | Tecnicas Reunidas SA(a) | | 132,640 | |
| | | | | | |
| | | Sweden—0.95% | | | |
| 1,438 | | H&M Hennes & Mauritz AB, Class B | | 61,321 | |
| 497 | | Autoliv Inc. | | 49,874 | |
| | | | | 111,195 | |
| | | Switzerland—13.28% | | | |
| 1,910 | | Roche Holding AG | | 572,535 | |
| 4,194 | | Nestle SA | | 315,718 | |
| 807 | | Zurich Insurance Group Ltd | | 247,746 | |
| 8,749 | | UBS AG | | 180,710 | |
| 288 | | Swisscom AG | | 176,895 | |
| 98 | | Banque Cantonale Vaudoise | | 57,145 | |
| | | | | 1,550,749 | |
| | | United Kingdom—16.01% | | �� | |
| 10,017 | | GlaxoSmithKline plc ADR | | 535,208 | |
| 75,957 | | Tesco plc | | 374,070 | |
| 28,130 | | HSBC Holdings plc | | 284,899 | |
| 3,317 | | Royal Dutch Shell plc ADR | | 242,340 | |
| 4,624 | | Royal Dutch Shell plc, Class A | | 168,902 | |
| 15,807 | | British Telecom Group plc | | 100,008 | |
| 2,178 | | Croda Intl plc | | 92,447 | |
| 454 | | BT Group plc ADR | | 28,988 | |
| 208 | | British American Tobacco plc ADR | | 23,177 | |
| 946 | | IG Group Holdings plc | | 9,896 | |
| 346 | | GlaxoSmithKline plc | | 9,180 | |
| | | | | 1,869,115 | |
| | | United States—3.28% | | | |
| 2,179 | | Harman Intl Industries Inc. | | 231,846 | |
| 3,373 | | Tumi Holdings Inc.(a) | | 76,331 | |
| 1,355 | | TIBCO Software Inc.(a) | | 27,534 | |
| 2,212 | | Ruckus Wireless, Inc.(a) | | 26,898 | |
| 248 | | Philip Morris Intl Inc. | | 20,304 | |
| | | | | 382,913 | |
| | | Total common stocks (Cost $8,964,015) | | 10,282,810 | |
| | | | | | |
| Number of shares | | Investment companies—1.85% | | Value | |
| | | Exchange Traded Funds—1.85% | | | |
| 2,896 | | Vanguard MSCI EAFE ETF | | $119,518 | |
| 1,636 | | Vanguard MSCI Pacific ETF | | 96,688 | |
| | | | | 216,206 | |
| | | Total investment companies (Cost $180,325) | | 216,206 | |
| | | | | | |
| Principal amount | | Repurchase agreement — 2.17% | | Value | |
| $252,790 | | Fixed Income Clearing Corporation, 0.00%, dated 03/31/2014, due 04/01/2014, repurchase price | | | |
| | | $252,790, (collaterized by Federal National Mortgage Assoc., value $262,350, 1.02%, due 10/17/2017) | | | |
| | | (Cost $252,790) | | $252,790 | |
| | | Total Investments ($9,397,130)—92.09% | | 10,751,806 | |
| | | Cash, Other Assets less Liabilities—7.91% | | 923,658 | |
| | | Net assets — 100.00% | | $11,675,464 | |
(a)Non-income producing.
ADR American Depositary Receipt
The accompanying notes are an integral part of the financial statements.
| | | | |
| | Ariel Global Fund schedule of investments | 03/31/14 (UNAUDITED) | |
| | | | |
| Number of shares | | Common stocks — 96.15% | | Value | |
| | | Brazil—0.32% | | | |
| 5,744 | | Telefonica Brasil SA ADR | | $122,003 | |
| | | | | | |
| | | Canada—1.71% | | | |
| 1,087 | | Fairfax Financial Holdings Ltd. | | 471,967 | |
| 4,979 | | Canadian Oil Sands | | 104,444 | |
| 1,370 | | Tim Hortons Inc. | | 75,768 | |
| | | | | 652,179 | |
| | | China—4.38% | | | |
| 17,000 | | China Mobile Ltd. ADR | | 775,030 | |
| 51,500 | | China Mobile Ltd. | | 471,411 | |
| 2,346 | | Baidu, Inc. ADR(a) | | 357,483 | |
| 2,163 | | Mindray Medical Intl Ltd. | | 69,995 | |
| | | | | 1,673,919 | |
| | | Czech Republic—0.17% | | | |
| 277 | | Komercni Banka AS | | 66,170 | |
| | | | | | |
| | | Finland—1.68% | | | |
| 52,134 | | Nokia Corp. ADR | | 382,664 | |
| 34,994 | | Nokia Corp. | | 259,849 | |
| | | | | 642,513 | |
| | | France—3.28% | | | |
| 17,742 | | Eutelsat Communications | | 602,502 | |
| 3,324 | | Technip SA | | 343,036 | |
| 4,013 | | BNP Paribas SA | | 309,541 | |
| | | | | 1,255,079 | |
| | | Germany—4.80% | | | |
| 16,501 | | Deutsche Boerse AG | | 1,313,262 | |
| 36,492 | | Telefonica Deutschland Holding AG | | 290,881 | |
| 9,322 | | Dialog Semiconductor plc(a) | | 230,265 | |
| | | | | 1,834,408 | |
| | | Hong Kong—0.63% | | | |
| 73,500 | | Yue Yuen Industrial | | 239,741 | |
| | | | | | |
| | | Ireland—0.37% | | | |
| 2,391 | | Ryanair Holdings plc ADR(a) | | 140,615 | |
| | | | | | |
| | | Italy—1.48% | | | |
| 96,592 | | Snam SpA | | 565,547 | |
| | | | | | |
| | | Japan—9.06% | | | |
| 6,900 | | Shimamura Co., Ltd. | | 596,977 | |
| 19,200 | | Canon Inc. | | 593,588 | |
| 8,500 | | Tokyo Electron Ltd. | | 520,879 | |
| 5,000 | | Daito Trust Construction Co., Ltd. | | 462,675 | |
| 3,750 | | Nintendo Co., Ltd. | | 445,429 | |
| 10,400 | | Japan Tobacco Inc. | | 326,464 | |
| 4,500 | | Toyota Motor Corp. | | 254,004 | |
| 1,155 | | Toyota Motor Corp. ADR | | 130,399 | |
| 4,600 | | Nikon Corp. | | 74,071 | |
| 1,957 | | Canon Inc. ADR | | 60,784 | |
| | | | | 3,465,270 | |
| | | Netherlands—3.54% | | | |
| 67,339 | | Ahold N.V. | | 1,352,580 | |
| | | | | | |
| | | Singapore—0.19% | | | |
| 3,000 | | United Overseas Bank Ltd. | | 51,634 | |
| 3,000 | | Oversea-Chinese Banking Corp. Ltd. | | 22,681 | |
| | | | | 74,315 | |
| | | Spain—1.09% | | | |
| 7,407 | | Tecnicas Reunidas SA(a) | | 418,425 | |
| | | | |
| | Ariel Global Fund schedule of investments (continued) | 03/31/14 (UNAUDITED) | |
| | | | |
| Number of shares | | Common stocks — 96.15% | | Value | |
| | | Sweden—0.23% | | | |
| 897 | | Autoliv Inc. | | $90,014 | |
| | | | | | |
| | | Switzerland—9.25% | | | |
| 6,106 | | Roche Holding AG | | 1,830,315 | |
| 2,084 | | Zurich Insurance Group Ltd | | 639,780 | |
| 745 | | Swisscom AG | | 457,593 | |
| 5,131 | | Nestle SA | | 386,254 | |
| 10,858 | | UBS AG | | 224,271 | |
| | | | | 3,538,213 | |
| | | Turkey—0.52% | | | |
| 4,388 | | BIM Birlesik Magazalar A.S. | | 98,846 | |
| 7,142 | | Turkcell Iletisim Hizmetleri AS ADR | | 98,345 | |
| | | | | 197,191 | |
| | | United Kingdom—10.63% | | | |
| 25,157 | | GlaxoSmithKline plc ADR | | 1,344,138 | |
| 178,299 | | Tesco plc | | 878,080 | |
| 9,627 | | Royal Dutch Shell plc ADR | | 703,349 | |
| 56,680 | | HSBC Holdings plc | | 574,051 | |
| 4,923 | | Royal Dutch Shell plc, Class A | | 179,824 | |
| 3,143 | | Croda Intl plc | | 133,407 | |
| 2,549 | | HSBC Holdings plc ADR | | 129,566 | |
| 19,686 | | British Telecom Group plc | | 124,550 | |
| | | | | 4,066,965 | |
| | | United States—42.82% | | | |
| 50,138 | | Microsoft Corp. | | 2,055,157 | |
| 19,009 | | Johnson & Johnson | | 1,867,254 | |
| 26,014 | | Gilead Sciences, Inc.(a) | | 1,843,352 | |
| 13,622 | | Harman Intl Industries Inc. | | 1,449,381 | |
| 19,036 | | Quest Diagnostics Inc. | | 1,102,565 | |
| 33,258 | | Broadcom Corp., Class A | | 1,046,962 | |
| 38,868 | | Tumi Holdings Inc.(a) | | 879,583 | |
| 56,747 | | Acacia Research Corporation | | 867,094 | |
| 14,256 | | U.S. Bancorp(a) | | 611,012 | |
| 4,382 | | Praxair, Inc. | | 573,911 | |
| 31,702 | | NVIDIA Corp. | | 567,783 | |
| 6,952 | | Wal-Mart Stores, Inc. | | 531,341 | |
| 4,945 | | Philip Morris Intl Inc. | | 404,847 | |
| 31,200 | | Ruckus Wireless, Inc.(a) | | 379,392 | |
| 6,492 | | Coach, Inc. | | 322,393 | |
| 3,203 | | The PNC Financial Service Group, Inc. | | 278,661 | |
| 2,681 | | Occidental Petroleum Corp. | | 255,472 | |
| 6,419 | | Expeditors Intl of Washington | | 254,385 | |
| 2,024 | | Berkshire Hathaway Inc., Class B(a) | | 252,939 | |
| 8,858 | | EMC Corp. | | 242,798 | |
| 16,192 | | QLogic Corp.(a) | | 206,448 | |
| 9,518 | | TIBCO Software Inc.(a) | | 193,406 | |
| 1,804 | | C.H. Robinson Worldwide, Inc. | | 94,512 | |
| 750 | | National Oilwell Varco | | 58,402 | |
| 283 | | M&T Bank Corp. | | 34,328 | |
| | | | | 16,373,378 | |
| | | Total common stocks (Cost $32,014,057) | | 36,768,525 | |
| | | | | | |
| Principal amount | | Repurchase agreement — 3.65% | | Value | |
| $1,395,904 | | Fixed Income Clearing Corporation, 0.00%, dated 03/31/2014, due 04/01/2014, repurchase price | | | |
| | | $1,395,904, (collaterized by Federal National Mortgage Assoc., value $1,425,600, 1.02%, | | | |
| | | due 10/17/2017) (Cost $1,395,904) | | $1,395,904 | |
| | | Total Investments (Cost $33,409,961)—99.80% | | 38,164,429 | |
| | | Cash, Other Assets less Liabilities—0.20% | | 76,308 | |
| | | Net assets — 100.00% | | $38,240,737 | |
(a)Non-income producing.
ADR American Depositary Receipt
The accompanying notes are an integral part of the financial statements.
| | | | |
| | Statements of assets & liabilities | 03/31/14 (UNAUDITED) | |
| | | | |
| | | Ariel Fund | | | Ariel Appreciation Fund | | | Ariel Focus Fund | | | Ariel Discovery Fund | |
| Assets: | | | | | | | | | | | | |
Investments in unaffiliated issuers, at value
(cost $1,285,660,528, $1,187,770,480, $46,632,367 and $50,728,608, respectively) | | $2,278,153,715 | | | $1,985,066,535 | | | $60,576,092 | | | $56,554,981 | |
| | | | | | | | | | | | | |
Investments in affiliated issuers, at value
(cost $96,323,072) | | 92,858,542 | | | — | | | — | | | — | |
| | | | | | | | | | | | | |
Repurchase agreements, at value
(cost $15,719,183, $77,053,212, $1,718,349 and $2,938,811, respectively) | | 15,719,183 | | | 77,053,212 | | | 1,718,349 | | | 2,938,811 | |
| | | | | | | | | | | | | |
| Cash | | — | | | — | | | — | | | 2,414,805 | |
| Receivable for fund shares sold | | 883,625 | | | 1,877,633 | | | 31,583 | | | 261,382 | |
| Receivable for securities sold | | 6,484,372 | | | — | | | 468,755 | | | 262,454 | |
| Dividends and interest receivable | | 1,292,097 | | | 2,651,187 | | | 38,767 | | | — | |
| Prepaid and other assets | | 101,634 | | | 92,489 | | | 21,512 | | | 24,154 | |
| Total assets | | 2,395,493,168 | | | 2,066,741,056 | | | 62,855,058 | | | 62,456,587 | |
| | | | | | | | | | | | | |
| Liabilities: | | | | | | | | | | | | |
| Payable for securities purchased | | 12,843,074 | | | — | | | — | | | 1,036,272 | |
| Payable for fund shares redeemed | | 1,533,472 | | | 21,442,352 | | | 9,839 | | | 14,534 | |
| Other liabilities | | 730,006 | | | 623,776 | | | 47,331 | | | 33,134 | |
| Total liabilities | | 15,106,552 | | | 22,066,128 | | | 57,170 | | | 1,083,940 | |
| Net assets | | $2,380,386,616 | | | $2,044,674,928 | | | $62,797,888 | | | $61,372,647 | |
| | | | | | | | | | | | | |
| Net assets consist of: | | | | | | | | | | | | |
| Paid-in capital | | $1,400,576,451 | | | $1,173,127,083 | | | $46,334,555 | | | $54,603,024 | |
| Undistributed net investment income (loss) | | 6,938,009 | | | 6,356,283 | | | 167,935 | | | (307,820) | |
| Accumulated net realized gain (loss) on investments | | (16,156,501) | | | 67,895,507 | | | 2,351,673 | | | 1,251,070 | |
| Net unrealized appreciation on investments | | 989,028,657 | | | 797,296,055 | | | 13,943,725 | | | 5,826,373 | |
| Total net assets | | $2,380,386,616 | | | $2,044,674,928 | | | $62,797,888 | | | $61,372,647 | |
| | | | | | | | | | | | | |
| Investor class shares: | | | | | | | | | | | | |
| Net assets | | $1,865,258,471 | | | $1,882,462,722 | | | $49,851,466 | | | $12,867,251 | |
| Shares outstanding (no par value, unlimited authorized) | | 25,568,726 | | | 34,106,223 | | | 3,427,004 | | | 947,339 | |
| Net asset value, offering and redemption price per share | | $72.95 | | | $55.19 | | | $14.55 | | | $13.58 | |
| | | | | | | | | | | | | |
| Institutional class shares: | | | | | | | | | | | | |
| Net assets | | $515,128,145 | | | $162,212,206 | | | $12,946,422 | | | $48,505,396 | |
| Shares outstanding (no par value, unlimited authorized) | | 7,056,915 | | | 2,935,431 | | | 890,259 | | | 3,546,630 | |
| Net asset value, offering and redemption price per share | | $73.00 | | | $55.26 | | | $14.54 | | | $13.68 | |
| The accompanying notes are an integral part of the financial statements. | |
| | |
| 800.292.7435 | 37 |
| | | | |
| | Statements of assets & liabilities (continued) | 03/31/14 (UNAUDITED) | |
| | | | |
| | | Ariel International Fund | | | Ariel Global Fund | |
| Assets: | | | | | | |
| Investments in unaffiliated issuers, at value (cost $9,144,340 and $32,014,057, respectively) | | $10,499,016 | | | $36,768,525 | |
| Repurchase agreements, at value (cost $252,790 and $1,395,904, respectively) | | 252,790 | | | 1,395,904 | |
| Foreign currencies (cost $839,345 and $43,078, respectively) | | 836,271 | | | 42,963 | |
| Dividends and interest receivable | | 68,623 | | | 181,541 | |
| Receivable for dividend reclaims | | 10,384 | | | 29,941 | |
| Receivable for fund shares sold | | 27,248 | | | 8,189 | |
| Receivable for securities and foreign currencies sold | | — | | | 88,224 | |
| Appreciation of forward currency contracts | | 25,058 | | | 42,171 | |
| Prepaid and other assets | | 24,241 | | | 26,384 | |
| Total assets | | 11,743,631 | | | 38,583,842 | |
| | | | | | | |
| Liabilities: | | | | | | |
| Payable for securities and foreign currencies purchased | | — | | | 261,372 | |
| Depreciation of forward currency contracts | | 4,125 | | | 26,001 | |
| Payable for fund shares redeemed | | 5,437 | | | 1,000 | |
| Other liabilities | | 58,605 | | | 54,732 | |
| Total liabilities | | 68,167 | | | 343,105 | |
| Net assets | | $11,675,464 | | | $38,240,737 | |
| | | | | | | |
| Net assets consist of: | | | | | | |
| Paid-in capital | | $10,152,794 | | | $33,128,843 | |
| Undistributed net investment income | | 51,702 | | | 266,149 | |
| Accumulated net realized gain on investments, foreign currencies and forward currency contracts | | 98,161 | | | 74,324 | |
| Net unrealized appreciation (depreciation) on: | | | | | | |
| Investments | | 1,354,676 | | | 4,754,468 | |
| Translation of assets and liabilities in foreign currencies | | (2,802) | | | 783 | |
| Forward currency contracts | | 20,933 | | | 16,170 | |
| Total net assets | | $11,675,464 | | | $38,240,737 | |
| | | | | | | |
| Investor class shares: | | | | | | |
| Net assets | | $4,778,646 | | | $2,515,669 | |
| Shares outstanding (no par value, unlimited authorized) | | 363,887 | | | 186,034 | |
| Net asset value, offering and redemption price per share | | $13.13 | | | $13.52 | |
| | | | | | | |
| Institutional class shares: | | | | | | |
| Net assets | | $6,896,818 | | | $35,725,068 | |
| Shares outstanding (no par value, unlimited authorized) | | 531,769 | | | 2,677,799 | |
| Net asset value, offering and redemption price per share | | $12.97 | | | $13.34 | |
| The accompanying notes are an integral part of the financial statements. |
| |
| 38 | ARIELINVESTMENTS.COM |
| | | | |
| | Statements of operations | SIX MONTHS ENDED 03/31/14 (UNAUDITED) | |
| | | | |
| | | | |
| | | | | | | | | | | | | |
| | | Ariel Fund | | | Ariel Appreciation Fund | | | Ariel Focus Fund | | | Ariel Discovery Fund | |
| Investment income: | | | | | | | | | | | | |
| Dividends | | | | | | | | | | | | |
| Unaffiliated issuers | | | $24,460,719 | | | | $19,361,497 | | | | $533,625 | | | | $115,338 | |
| Affiliated issuers | | | — | (a) | | | — | | | | — | | | | — | |
| Total investment income | | | 24,460,719 | | | | 19,361,497 | | | | 533,625 | | | | 115,338 | |
| | | | | | | | | | | | | | | | | |
| Expenses: | | | | | | | | | | | | | | | | |
| Management fees | | | 6,875,625 | | | | 6,929,483 | | | | 205,408 | | | | 233,205 | |
| Distribution fees (investor class) | | | 2,347,187 | | | | 2,341,864 | | | | 56,324 | | | | 14,541 | |
| Shareholder service fees | | | | | | | | | | | | | | | | |
| Investor Class | | | 951,972 | | | | 934,102 | | | | 20,270 | | | | 17,294 | |
| Institutional Class | | | 178,070 | | | | 32,558 | | | | 1,818 | | | | 10,402 | |
| Transfer agent fees and expenses | | | | | | | | | | | | | | | | |
| Investor Class | | | 300,664 | | | | 263,536 | | | | 31,850 | | | | 12,740 | |
| Institutional Class | | | 9,272 | | | | 9,636 | | | | 8,908 | | | | 8,906 | |
| Printing and postage expenses | | | | | | | | | | | | | | | | |
| Investor Class | | | 173,372 | | | | 151,008 | | | | 6,006 | | | | 1,288 | |
| Institutional Class | | | 10,190 | | | | 910 | | | | 368 | | | | 368 | |
| Trustees’ fees and expenses | | | 117,824 | | | | 101,464 | | | | 16,720 | | | | 14,090 | |
| Professional fees | | | 38,584 | | | | 34,216 | | | | 17,472 | | | | 18,456 | |
| Custody fees and expenses | | | 24,254 | | | | 19,908 | | | | 2,454 | | | | 4,996 | |
| Federal and state registration fees | | | 47,262 | | | | 38,924 | | | | 19,540 | | | | 18,556 | |
| Interest expense | | | 3,030 | | | | — | | | | 110 | | | | — | |
| Miscellaneous expenses | | | 71,040 | | | | 61,022 | | | | 6,636 | | | | 5,092 | |
| Total expenses before reimbursements | | | 11,148,346 | | | | 10,918,631 | | | | 393,884 | | | | 359,934 | |
| Expense reimbursements | | | — | | | | — | | | | (74,885 | ) | | | (53,887 | ) |
| Net expenses | | | 11,148,346 | | | | 10,918,631 | | | | 318,999 | | | | 306,047 | |
| Net investment income (loss) | | | 13,312,373 | | | | 8,442,866 | | | | 214,626 | | | | (190,709 | ) |
| | | | | | | | | | | | | | | | | |
| Realized and unrealized gain: | | | | | | | | | | | | | | | | |
| Net realized gain on investments | | | | | | | | | | | | | | | | |
| Unaffiliated issuers | | | 114,605,129 | | | | 100,593,703 | | | | 3,262,348 | | | | 1,384,367 | |
| Affiliated issuers | | | — | (a) | | | — | | | | — | | | | — | |
| Change in net unrealized appreciation on investments | | | | | | | | | | | | | | | | |
| Unaffiliated issuers | | | 110,656,479 | | | | 85,148,801 | | | | 2,781,064 | | | | 3,226,308 | |
| Affiliated issuers | | | 18,550,022 | | | | — | | | | — | | | | — | |
| Net gain on investments | | | 243,811,630 | | | | 185,742,504 | | | | 6,043,412 | | | | 4,610,675 | |
| Net increase in net assets resulting from operations | | | $257,124,003 | | | | $194,185,370 | | | | $6,258,038 | | | | $4,419,966 | |
(a)See Note Six for information on affiliated issuers.
The accompanying notes are an integral part of the financial statements.
| | | | |
| | Statements of operations (continued) | SIX MONTHS ENDED 03/31/14 (UNAUDITED) | |
| | | | |
| | | | |
| | | | | | | |
| | | Ariel International Fund | | | Ariel Global Fund | |
| Investment income: | | | | | | |
| Dividends | | | | | | |
| Unaffiliated issuers | | | $122,800 | (a) | | | $452,818 | (a) |
| Interest | | | 76 | | | | — | |
| Total investment income | | | 122,876 | | | | 452,818 | |
| | | | | | | | | |
| Expenses: | | | | | | | | |
| Management fees | | | 40,530 | | | | 159,454 | |
| Distribution fees (investor class) | | | 5,099 | | | | 2,719 | |
| Shareholder service fees | | | | | | | | |
| Investor Class | | | 11,830 | | | | 10,738 | |
| Institutional Class | | | 820 | | | | 4,140 | |
| Transfer agent fees and expenses | | | | | | | | |
| Investor Class | | | 9,186 | | | | 9,368 | |
| Institutional Class | | | 8,544 | | | | 8,362 | |
| Printing and postage expenses | | | | | | | | |
| Investor Class | | | 2,002 | | | | 2,364 | |
| Institutional Class | | | 1,366 | | | | 460 | |
| Trustees’ fees and expenses | | | 13,276 | | | | 14,182 | |
| Professional fees | | | 18,200 | | | | 18,200 | |
| Custody fees and expenses | | | 8,178 | | | | 10,706 | |
| Administration fees | | | 24,934 | | | | 28,084 | |
| Fund accounting fees | | | 20,020 | | | | 20,020 | |
| Federal and state registration fees | | | 16,918 | | | | 16,828 | |
| Miscellaneous expenses | | | 5,270 | | | | 5,544 | |
| Total expenses before reimbursements | | | 186,173 | | | | 311,169 | |
| Expense reimbursements | | | (133,190 | ) | | | (120,278 | ) |
| Net expenses | | | 52,983 | | | | 190,891 | |
| Net investment income | | | 69,893 | | | | 261,927 | |
| | | | | | | | | |
| Realized and unrealized gain (loss): | | | | | | | | |
| Net realized gain (loss) on: | | | | | | | | |
| Investments | | | 142,600 | | | | 516,324 | |
| Foreign currency transactions | | | (4,958 | ) | | | 3,476 | |
| Forward currency contracts | | | (7,698 | ) | | | (164,871 | ) |
| Total | | | 129,944 | | | | 354,929 | |
| Change in net unrealized appreciation (depreciation) on: | | | | | | | | |
| Investments | | | 365,662 | | | | 1,647,463 | |
| Foreign currency translations | | | (9,212 | ) | | | (874 | ) |
| Forward currency contracts | | | 16,725 | | | | 61,591 | |
| Total | | | 373,175 | | | | 1,708,180 | |
| Net gain on investments | | | 503,119 | | | | 2,063,109 | |
| Net increase in net assets resulting from operations | | | $573,012 | | | | $2,325,036 | |
(a)Net of $8,017 and $23,975 in foreign taxes witheld, respectively.
The accompanying notes are an integral part of the financial statements.
| | | |
| | Statements of changes in net assets | |
| | | |
| | | |
| | | | | | | | | | | | | |
| | | Ariel Fund | | | Ariel Appreciation Fund | |
| | | Six Months Ended March 31, 2014 (Unaudited) | | | Year Ended September 30, 2013 | | | Six Months Ended March 31, 2014 (Unaudited) | | | Year Ended September 30, 2013 | |
| Operations: | | | | | | | | | | | | |
| Net investment income | | | $13,312,373 | | | | $15,940,044 | | | | $8,442,866 | | | | $15,638,492 | |
Net realized gain on investments and foreign
currency transactions | | | 114,605,129 | | | | 122,385,862 | | | | 100,593,703 | | | | 130,435,078 | |
Change in net unrealized appreciation on
investments and foreign currency translations | | | 129,206,501 | | | | 385,860,689 | | | | 85,148,801 | | | | 303,858,363 | |
| Net increase in net assets from operations | | | 257,124,003 | | | | 524,186,595 | | | | 194,185,370 | | | | 449,931,933 | |
| | | | | | | | | | | | | | | | | |
| Distributions to shareholders: | | | | | | | | | | | | | | | | |
| Net investment income | | | | | | | | | | | | | | | | |
| Investor Class | | | (10,851,589 | ) | | | (13,897,254 | ) | | | (14,751,434 | ) | | | (9,935,949 | ) |
| Institutional Class | | | (4,607,417 | ) | | | (1,919,506 | ) | | | (1,572,228 | ) | | | (466,245 | ) |
| Capital gains | | | | | | | | | | | | | | | | |
| Investor Class | | | — | | | | — | | | | (118,923,496 | ) | | | (124,307,350 | ) |
| Institutional Class | | | — | | | | — | | | | (8,666,891 | ) | | | (4,377,634 | ) |
| Total distributions | | | (15,459,006 | ) | | | (15,816,760 | ) | | | (143,914,049 | ) | | | (139,087,178 | ) |
| | | | | | | | | | | | | | | | | |
| Share transactions: | | | | | | | | | | | | | | | | |
| Shares issued | | | | | | | | | | | | | | | | |
| Investor Class | | | 132,706,100 | | | | 359,508,970 | | | | 188,497,182 | | | | 343,272,599 | |
| Institutional Class | | | 189,880,818 | | | | 255,741,230 | | | | 44,726,350 | | | | 100,002,805 | |
Shares issued in reinvestment of dividends
and distributions | | | | | | | | | | | | | | | | |
| Investor Class | | | 10,618,853 | | | | 13,561,824 | | | | 130,740,322 | | | | 128,962,269 | |
| Institutional Class | | | 4,604,671 | | | | 1,916,647 | | | | 10,235,442 | | | | 4,841,384 | |
| Shares redeemed | | | | | | | | | | | | | | | | |
| Investor Class | | | (263,311,777 | ) | | | (447,133,981 | ) | | | (241,958,008 | ) | | | (301,678,641 | ) |
| Institutional Class | | | (88,961,217 | ) | | | (64,287,054 | ) | | | (14,846,346 | ) | | | (14,640,606 | ) |
| Net increase (decrease) from share transactions | | | (14,462,552 | ) | | | 119,307,636 | | | | 117,394,942 | | | | 260,759,810 | |
| Total increase in net assets | | | 227,202,445 | | | | 627,677,471 | | | | 167,666,263 | | | | 571,604,565 | |
| | | | | | | | | | | | | | | | | |
| Net assets: | | | | | | | | | | | | | | | | |
| Beginning of year | | | 2,153,184,171 | | | | 1,525,506,700 | | | | 1,877,008,665 | | | | 1,305,404,100 | |
| End of period | | | $2,380,386,616 | | | | $2,153,184,171 | | | | $2,044,674,928 | | | | $1,877,008,665 | |
Undistributed net investment income included
in net assets at end of period | | | $6,938,009 | | | | $9,084,642 | | | | $6,356,283 | | | | $14,237,079 | |
| | | | | | | | | | | | | | | | | |
| Capital share transactions: | | | | | | | | | | | | | | | | |
| Investor shares | | | | | | | | | | | | | | | | |
| Shares sold | | | 1,871,555 | | | | 6,354,966 | | | | 3,437,062 | | | | 7,195,510 | |
Shares issued to holders in reinvestment
of dividends | | | 144,415 | | | | 268,073 | | | | 2,441,961 | | | | 3,344,332 | |
| Shares redeemed | | | (3,708,078 | ) | | | (7,998,994 | ) | | | (4,438,565 | ) | | | (6,469,646 | ) |
| Net increase (decrease) | | | (1,692,108 | ) | | | (1,375,955 | ) | | | 1,440,458 | | | | 4,070,196 | |
| Institutional shares | | | | | | | | | | | | | | | | |
| Shares sold | | | 2,665,787 | | | | 4,511,389 | | | | 816,267 | | | | 2,051,810 | |
Shares issued to holders in reinvestment
of dividends | | | 62,632 | | | | 37,901 | | | | 190,346 | | | | 125,177 | |
| Shares redeemed | | | (1,237,755 | ) | | | (1,053,361 | ) | | | (271,968 | ) | | | (306,674 | ) |
| Net increase | | | 1,490,664 | | | | 3,495,929 | | | | 734,645 | | | | 1,870,313 | |
The accompanying notes are an integral part of the financial statements.
| | | |
| | Statements of changes in net assets (continued) | |
| | | |
| | | |
| | | | | | | | | | | | | | |
| | | Ariel Focus Fund | | | | Ariel Discovery Fund |
| | | Six Months Ended March 31, 2014 (Unaudited) | | | Year Ended September 30, 2013 | | | | Six Months Ended March 31, 2014 (Unaudited) | | | Year Ended September 30, 2013 | |
| Operations: | | | | | | | | | | | | | |
| Net investment income (loss) | | | $214,626 | | | | $595,389 | | | | | $(190,709 | ) | | | $(109,050 | ) |
Net realized gain on investments and foreign
currency translations | | | 3,262,348 | | | | 4,539,556 | | | | | 1,384,367 | | | | 523,977 | |
Change in net unrealized appreciation on
investments and foreign currency translations | | | 2,781,064 | | | | 6,608,928 | | | | | 3,226,308 | | | | 2,032,787 | |
| Net increase in net assets from operations | | | 6,258,038 | | | | 11,743,873 | | | | | 4,419,966 | | | | 2,447,714 | |
| | | | | | | | | | | | | | | | | | |
| Distributions to shareholders: | | | | | | | | | | | | | | | | | |
| Net investment income | | | | | | | | | | | | | | | | | |
| Investor Class | | | (294,442 | ) | | | (388,497 | ) | | | | — | | | | — | |
| Institutional Class | | | (120,809 | ) | | | (144,372 | ) | | | | — | | | | — | |
| Capital gains | | | | | | | | | | | | | | | | | |
| Investor Class | | | (2,162,389 | ) | | | — | | | | | (146,782 | ) | | | — | |
| Institutional Class | | | (589,253 | ) | | | — | | | | | (446,951 | ) | | | — | |
| Total distributions | | | (3,166,893 | ) | | | (532,869 | ) | | | | (593,733 | ) | | | — | |
| | | | | | | | | | | | | | | | | | |
| Share transactions: | | | | | | | | | | | | | | | | | |
| Shares issued | | | | | | | | | | | | | | | | | |
| Investor Class | | | 10,026,916 | | | | 7,822,581 | | | | | 2,597,022 | | | | 7,482,223 | |
| Institutional Class | | | 663,488 | | | | 274,193 | | | | | 18,383,601 | | | | 23,609,880 | |
Shares issued in reinvestment of dividends
and distributions | | | | | | | | | | | | | | | | | |
| Investor Class | | | 2,139,910 | | | | 329,876 | | | | | 145,169 | | | | — | |
| Institutional Class | | | 707,489 | | | | 141,445 | | | | | 446,951 | | | | — | |
| Shares redeemed | | | | | | | | | | | | | | | | | |
| Investor Class | | | (8,749,090 | ) | | | (6,175,087 | ) | | | | (1,049,691 | ) | | | (2,601,356 | ) |
| Institutional Class | | | (378,530 | ) | | | (2,051,820 | ) | | | | (311,691 | ) | | | (87,335 | ) |
| Net increase from share transactions | | | 4,410,183 | | | | 341,188 | | | | | 20,211,361 | | | | 28,403,412 | |
| Total increase in net assets | | | 7,501,328 | | | | 11,552,192 | | | | | 24,037,594 | | | | 30,851,126 | |
| | | | | | | | | | | | | | | | | | |
| Net assets: | | | | | | | | | | | | | | | | | |
| Beginning of year | | | 55,296,560 | | | | 43,744,368 | | | | | 37,335,053 | | | | 6,483,927 | |
| End of period | | | $62,797,888 | | | | $55,296,560 | | | | | $61,372,647 | | | | $37,335,053 | |
Undistributed net investment income (loss)
included in net assets at end of period | | | $167,935 | | | | $368,560 | | | | | $(307,820 | ) | | | $(117,111 | ) |
| | | | | | | | | | | | | | | | | | |
| Capital share transactions: | | | | | | | | | | | | | | | | | |
| Investor shares | | | | | | | | | | | | | | | | | |
| Shares sold | | | 723,729 | | | | 613,808 | | | | | 194,441 | | | | 647,875 | |
Shares issued to holders in reinvestment
of dividends | | | 153,101 | | | | 30,686 | | | | | 11,193 | | | | — | |
| Shares redeemed | | | (620,302 | ) | | | (512,745 | ) | | | | (79,347 | ) | | | (225,687 | ) |
| Net increase | | | 256,528 | | | | 131,749 | | | | | 126,287 | | | | 422,188 | |
| Institutional shares | | | | | | | | | | | | | | | | | |
| Shares sold | | | 46,565 | | | | 22,528 | | | | | 1,375,044 | | | | 1,958,061 | |
Shares issued to holders in reinvestment
of dividends | | | 50,500 | | | | 13,157 | | | | | 34,275 | | | | — | |
| Shares redeemed | | | (26,575 | ) | | | (170,276 | ) | | | | (23,997 | ) | | | (7,337 | ) |
| Net increase (decrease) | | | 70,490 | | | | (134,591 | ) | | | | 1,385,322 | | | | 1,950,724 | |
The accompanying notes are an integral part of the financial statements. |
| 42 | ARIELINVESTMENTS.COM |
| | | | | | | | | | | | | | |
| | | Ariel International Fund | | | Ariel Global Fund |
| | | Six Months Ended March 31, 2014 (Unaudited) | | | Year Ended September 30, 2013 | | | | Six Months Ended March 31, 2014 (Unaudited) | | | Year Ended September 30, 2013 | |
| Operations: | | | | | | | | | | | | | |
| Net investment income | | | $69,893 | | | | $44,689 | | | | | $261,927 | | | | $140,993 | |
Net realized income on investments and foreign
currency translations | | | 129,944 | | | | 76,030 | | | | | 354,929 | | | | 510,083 | |
Change in net unrealized appreciation on
investments and foreign currency translations | | | 373,175 | | | | 982,220 | | | | | 1,708,180 | | | | 3,145,583 | |
| Net increase in net assets from operations | | | 573,012 | | | | 1,102,939 | | | | | 2,325,036 | | | | 3,796,659 | |
| | | | | | | | | | | | | | | | | | |
| Distributions to shareholders: | | | | | | | | | | | | | | | | | |
| Net investment income | | | | | | | | | | | | | | | | | |
| Investor Class | | | — | | | | (15,673 | ) | | | | — | | | | — | |
| Institutional Class | | | (19,643 | ) | | | (49,135 | ) | | | | (111,707 | ) | | | (178,895 | ) |
| Capital gains | | | | | | | | | | | | | | | | | |
| Investor Class | | | (54,466 | ) | | | — | | | | | (44,335 | ) | | | — | |
| Institutional Class | | | (56,777 | ) | | | — | | | | | (664,135 | ) | | | — | |
| Total distributions | | | (130,886 | ) | | | (64,808 | ) | | | | (820,177 | ) | | | (178,895 | ) |
| | | | | | | | | | | | | | | | | | |
| Share transactions: | | | | | | | | | | | | | | | | | |
| Shares issued | | | | | | | | | | | | | | | | | |
| Investor Class | | | 2,683,225 | | | | 584,748 | | | | | 509,296 | | | | 4,331,957 | |
| Institutional Class | | | 2,513,135 | | | | 1,684,025 | | | | | 7,615,792 | | | | 11,936,499 | |
Shares issued in reinvestment of dividends
and distributions | | | | | | | | | | | | | | | | | |
| Investor Class | | | 42,271 | | | | 7,164 | | | | | 22,614 | | | | — | |
| Institutional Class | | | 70,701 | | | | 42,602 | | | | | 767,187 | | | | 174,482 | |
| Shares redeemed | | | | | | | | | | | | | | | | | |
| Investor Class | | | (391,513 | ) | | | (45,795 | ) | | | | (75,980 | ) | | | (3,700,060 | ) |
| Institutional Class | | | (73,560 | ) | | | (161,249 | ) | | | | (32,356 | ) | | | (100,495 | ) |
| Net increase from share transactions | | | 4,844,259 | | | | 2,111,495 | | | | | 8,806,553 | | | | 12,642,383 | |
| Total increase in net assets | | | 5,286,385 | | | | 3,149,626 | | | | | 10,311,412 | | | | 16,260,147 | |
| | | | | | | | | | | | | | | | | | |
| Net assets: | | | | | | | | | | | | | | | | | |
| Beginning of year | | | 6,389,079 | | | | 3,239,453 | | | | | 27,929,325 | | | | 11,669,178 | |
| End of period | | | $11,675,464 | | | | $6,389,079 | | | | | $38,240,737 | | | | $27,929,325 | |
Undistributed net investment income included
in net assets at end of period | | | $51,702 | | | | $1,452 | | | | | $266,149 | | | | $115,929 | |
| | | | | | | | | | | | | | | | | | |
| Capital share transactions: | | | | | | | | | | | | | | | | | |
| Investor shares | | | | | | | | | | | | | | | | | |
| Shares sold | | | 208,725 | | | | 51,714 | | | | | 38,715 | | | | 349,980 | |
Shares issued to holders in reinvestment
of dividends | | | 3,368 | | | | 696 | | | | | 1,734 | | | | — | |
| Shares redeemed | | | (30,777 | ) | | | (4,245 | ) | | | | (5,817 | ) | | | (297,535 | ) |
| Net increase | | | 181,316 | | | | 48,165 | | | | | 34,632 | | | | 52,445 | |
| Institutional shares | | | | | | | | | | | | | | | | | |
| Shares sold | | | 195,212 | | | | 151,490 | | | | | 585,307 | | | | 965,584 | |
Shares issued to holders in reinvestment
of dividends | | | 5,661 | | | | 4,189 | | | | | 59,445 | | | | 16,842 | |
| Shares redeemed | | | (5,792 | ) | | | (15,944 | ) | | | | (2,500 | ) | | | (10,062 | ) |
| Net increase | | | 195,081 | | | | 139,735 | | | | | 642,252 | | | | 972,364 | |
The accompanying notes are an integral part of the financial statements. | |
| 800.292.7435 | 43 |
| | | |
| | Financial highlights For a share outstanding throughout each period | |
| | | |
| | | |
| | | | | | Year ended September 30 |
| | | Six months | | | | | | | | | | | | | | | | |
| | | ended | | | | | | | | | | | | | | | | |
| | | March 31, 2014 | | | 2013 | | | 2012 | | | 2011 | | | 2010 | | | 2009 | |
| Ariel Fund (Investor Class) | | (Unaudited) | | | | | | | | | | | | | | | | |
| Net asset value, beginning of year | | | $65.57 | | | | $49.67 | | | | $36.74 | | | | $42.78 | | | | $35.78 | | | | $36.53 | |
| Income from investment operations: | | | | | | | | | | | | | | | | | | | | | | | | |
| Net investment income (loss) | | | 0.39 | | | | 0.48 | | | | 0.29 | | | | 0.09 | | | | (0.07 | ) | | | 0.13 | |
Net realized and unrealized gains
(losses) on investments | | | 7.40 | | | | 15.91 | | | | 12.73 | | | | (6.13 | ) | | | 7.08 | | | | (0.50 | ) |
| Total from investment operations | | | 7.79 | | | | 16.39 | | | | 13.02 | | | | (6.04 | ) | | | 7.01 | | | | (0.37 | ) |
| | | | | | | | | | | | | | | | | | | | | | | | | |
| Distributions to shareholders: | | | | | | | | | | | | | | | | | | | | | | | | |
| Dividends from net investment income | | | (0.41 | ) | | | (0.49 | ) | | | (0.09 | ) | | | (0.00 | )(a) | | | (0.01 | ) | | | (0.38 | ) |
| Total distributions | | | (0.41 | ) | | | (0.49 | ) | | | (0.09 | ) | | | (0.00 | ) | | | (0.01 | ) | | | (0.38 | ) |
| Net asset value, end of period | | | $72.95 | | | | $65.57 | | | | $49.67 | | | | $36.74 | | | | $42.78 | | | | $35.78 | |
| Total return | | | 11.87 | %(b) | | | 33.28 | % | | | 35.48 | % | | | (14.11 | )% | | | 19.58 | % | | | (0.36 | )% |
| | | | | | | | | | | | | | | | | | | | | | | | | |
| Supplemental data and ratios: | | | | | | | | | | | | | | | | | | | | | | | | |
| Net assets, end of period, in thousands | | | $1,865,259 | | | | $1,787,490 | | | | $1,422,415 | | | | $1,350,852 | | | | $1,953,134 | | | | $1,712,693 | |
| Ratio of expenses to average net assets | | | 1.01 | %(c) | | | 1.03 | % | | | 1.06 | % | | | 1.04 | % | | | 1.06 | % | | | 1.14 | % |
Ratio of net investment income (loss)
to average net assets | | | 1.05 | %(c) | | | 0.83 | % | | | 0.56 | % | | | 0.16 | % | | | (0.16 | )% | | | 0.14 | % |
| Portfolio turnover rate | | | 13 | %(b) | | | 30 | % | | | 27 | % | | | 29 | % | | | 40 | % | | | 45 | % |
| | | | | | | | | | | | | | | | | | | | | | | |
| | | Six months | | | | | | | December 30, | | | | | | | | | | | | | |
| | | ended | | | Year ended | | | 2011(d) to | | | | | | | | | | | | | |
| | | March 31, 2014 | | | September 30, | | | September 30, | | | | | | | | | | | | | |
| Ariel Fund (Institutional Class) | | (Unaudited) | | | | 2013 | | | | 2012 | | | | | | | | | | | | | |
| Net asset value, beginning of year | | | $65.70 | | | | $49.79 | | | | $42.97 | | | | | | | | | | | | | |
| Income from investment operations: | | | | | | | | | | | | | | | | | | | | | | | | |
| Net investment income | | | 0.40 | | | | 0.59 | | | | 0.36 | | | | | | | | | | | | | |
Net realized and unrealized gains
on investments | | | 7.52 | | | | 16.00 | | | | 6.46 | | | | | | | | | | | | | |
| Total from investment operations | | | 7.92 | | | | 16.59 | | | | 6.82 | | | | | | | | | | | | | |
| | | | | | | | | | | | | | | | | | | | | | | | | |
| Distributions to shareholders: | | | | | | | | | | | | | | | | | | | | | | | | |
| Dividends from net investment income | | | (0.62 | ) | | | (0.68 | ) | | | — | | | | | | | | | | | | | |
| Total distributions | | | (0.62 | ) | | | (0.68 | ) | | | — | | | | | | | | | | | | | |
| Net asset value, end of period | | | $73.00 | | | | $65.70 | | | | $49.79 | | | | | | | | | | | | | |
| Total return | | | 12.06 | %(b) | | | 33.72 | % | | | 15.87 | %(b) | | | | | | | | | |
| | | | | | | | | | | | | | | | | | | | | | | | | |
| Supplemental data and ratios: | | | | | | | | | | | | | | | | | | | | | | | | |
| Net assets, end of period, in thousands | | | $515,128 | | | | $365,694 | | | | $103,092 | | | | | | | | | | | | | |
| Ratio of expenses to average net assets | | | 0.69 | %(c) | | | 0.72 | % | | | 0.68 | %(c) | | | | | | | | | |
Ratio of net investment income to
average net assets | | | 1.41 | %(c) | | | 1.04 | % | | | 1.06 | %(c) | | | | | | | | | |
| Portfolio turnover rate | | | 13 | %(b) | | | 30 | % | | | 27 | %(b) | | | | | | | | | |
(a)Amount is less than $(0.005).
(b)Not annualized.
(c)Annualized.
(d)Commencement of operations.
The accompanying notes are an integral part of the financial statements. |
| 44 | ARIELINVESTMENTS.COM |
| | | | | Year ended September 30 |
| | | Six months | | | | | | | | | | | | | | | | |
| | | ended | | | | | | | | | | | | | | | | |
| Ariel Appreciation Fund | | March 31, 2014 | | | 2013 | | | 2012 | | | 2011 | | | 2010 | | | 2009 | |
| (Investor Class) | | (Unaudited) | | | | | | | | | | | | | | | | |
| Net asset value, beginning of year | | | $53.83 | | | | $45.13 | | | | $34.81 | | | | $37.79 | | | | $32.16 | | | | $36.39 | |
| Income from investment operations: | | | | | | | | | | | | | | | | | | | | | | | | |
| Net investment income (loss) | | | 0.20 | | | | 0.44 | | | | 0.35 | | | | 0.13 | | | | (0.03 | ) | | | 0.08 | |
Net realized and unrealized gains
(losses) on investments | | | 5.22 | | | | 13.08 | | | | 10.52 | | | | (3.10 | ) | | | 5.70 | | | | (1.02 | ) |
| Total from investment operations | | | 5.42 | | | | 13.52 | | | | 10.87 | | | | (2.97 | ) | | | 5.67 | | | | (0.94 | ) |
| | | | | | | | | | | | | | | | | | | | | | | | | |
| Distributions to shareholders: | | | | | | | | | | | | | | | | | | | | | | | | |
| Dividends from net investment income | | | (0.42 | ) | | | (0.33 | ) | | | (0.16 | ) | | | (0.01 | ) | | | (0.04 | ) | | | (0.18 | ) |
| Distributions from capital gains | | | (3.64 | ) | | | (4.49 | ) | | | (0.39 | ) | | | — | | | | — | | | | (3.11 | ) |
| Total distributions | | | (4.06 | ) | | | (4.82 | ) | | | (0.55 | ) | | | (0.01 | ) | | | (0.04 | ) | | | (3.29 | ) |
| Net asset value, end of period | | | $55.19 | | | | $53.83 | | | | $45.13 | | | | $34.81 | | | | $37.79 | | | | $32.16 | |
| Total return | | | 10.36 | %(a) | | | 34.31 | % | | | 31.57 | % | | | (7.86 | )% | | | 17.64 | % | | | 3.54 | % |
| | | | | | | | | | | | | | | | | | | | | | | | | |
| Supplemental data and ratios: | | | | | | | | | | | | | | | | | | | | | | | | |
| Net assets, end of period, in thousands | | | $1,882,463 | | | | $1,758,277 | | | | $1,290,470 | | | | $1,143,406 | | | | $1,330,400 | | | | $1,234,115 | |
| Ratio of expenses to average net assets | | | 1.11 | %(b) | | | 1.13 | % | | | 1.17 | % | | | 1.15 | % | | | 1.18 | % | | | 1.25 | % |
| Ratio of net investment income (loss) | | | | | | | | | | | | | | | | | | | | | | | | |
| to average net assets | | | 0.81 | %(b) | | | 1.00 | % | | | 0.79 | % | | | 0.30 | % | | | (0.06 | )% | | | 0.42 | % |
| Portfolio turnover rate | | | 13 | %(a) | | | 28 | % | | | 28 | % | | | 26 | % | | | 41 | % | | | 44 | % |
| | | | | | | | | | | | | | | | | | | | | | | |
| | | Six months | | | | | | | December 30, | | | | | | | | | | | | | |
| | | ended | | | Year ended | | | 2011(c) to | | | | | | | | | | | | | |
| Ariel Appreciation Fund | | March 31, 2014 | | | September 30, | | | September 30, | | | | | | | | | | | | | |
| (Institutional Class) | | (Unaudited) | | | | 2013 | | | | 2012 | | | | | | | | | | | | | |
| Net asset value, beginning of year | | | $53.95 | | | | $45.19 | | | | $38.70 | | | | | | | | | | | | | |
| Income from investment operations: | | | | | | | | | | | | | | | | | | | | | | | | |
| Net investment income | | | 0.29 | | | | 0.35 | | | | 0.32 | | | | | | | | | | | | | |
Net realized and unrealized gains
on investments | | | 5.25 | | | | 13.34 | | | | 6.17 | | | | | | | | | | | | | |
| Total from investment operations | | | 5.54 | | | | 13.69 | | | | 6.49 | | | | | | | | | | | | | |
| | | | | | | | | | | | | | | | | | | | | | | | | |
| Distributions to shareholders: | | | | | | | | | | | | | | | | | | | | | | | | |
| Dividends from net investment income | | | (0.59 | ) | | | (0.44 | ) | | | — | | | | | | | | | | | | | |
| Distributions from capital gains | | | (3.64 | ) | | | (4.49 | ) | | | — | | | | | | | | | | | | | |
| Total distributions | | | (4.23 | ) | | | (4.93 | ) | | | — | | | | | | | | | | | | | |
| Net asset value, end of period | | | $55.26 | | | | $53.95 | | | | $45.19 | | | | | | | | | | | | | |
| Total return | | | 10.55 | %(a) | | | 34.76 | % | | | 16.77 | %(a) | | | | | | | | | |
| | | | | | | | | | | | | | | | | | | | | | | | | |
| Supplemental data and ratios: | | | | | | | | | | | | | | | | | | | | | | | | |
| Net assets, end of period, in thousands | | | $162,212 | | | | $118,732 | | | | $14,934 | | | | | | | | | | | | | |
| Ratio of expenses to average net assets | | | 0.77 | %(b) | | | 0.80 | % | | | 0.99 | %(b) | | | | | | | | | |
Ratio of net investment income to
average net assets | | | 1.20 | %(b) | | | 1.35 | % | | | 1.08 | %(b) | | | | | | | | | |
| Portfolio turnover rate | | | 13 | %(a) | | | 28 | % | | | 28 | %(a) | | | | | | | | | |
(a)Not annualized.
(b)Annualized.
(c)Commencement of operations.
The accompanying notes are an integral part of the financial statements. | |
| 800.292.7435 | 45 |
| | | |
| | Financial highlights For a share outstanding throughout each period (continued) | |
| | | |
| | | |
| | | | | | Year ended September 30 | |
Ariel Focus Fund (Investor Class) | | Six months ended March 31, 2014 (Unaudited) | | | 2013 | | | 2012 | | | 2011 | | | 2010 | | | 2009 | |
| Net asset value, beginning of year | | | $13.85 | | | | $10.95 | | | | $9.27 | | | | $9.49 | | | | $8.79 | | | | $9.74 | |
| Income from investment operations: | | | | | | | | | | | | | | | | | | | | | | | | |
| Net investment income | | | 0.05 | | | | 0.14 | | | | 0.10 | | | | 0.04 | | | | 0.04 | | | | 0.05 | |
| Net realized and unrealized gains (losses) on investments | | | 1.45 | | | | 2.89 | | | | 1.64 | | | | (0.23 | ) | | | 0.70 | | | | (0.94 | ) |
| Total from investment operations | | | 1.50 | | | | 3.03 | | | | 1.74 | | | | (0.19 | ) | | | 0.74 | | | | (0.89 | ) |
| | | | | | | | | | | | | | | | | | | | | | | | | |
| Distributions to shareholders: | | | | | | | | | | | | | | | | | | | | | | | | |
| Dividends from net investment income | | | (0.10 | ) | | | (0.13 | ) | | | (0.06 | ) | | | (0.03 | ) | | | (0.04 | ) | | | (0.06 | ) |
| Distributions from capital gains | | | (0.70 | ) | | | — | | | | — | | | | — | | | | — | | | | — | |
| Total distributions | | | (0.80 | ) | | | (0.13 | ) | | | (0.06 | ) | | | (0.03 | ) | | | (0.04 | ) | | | (0.06 | ) |
| Net asset value, end of period | | | $14.55 | | | | $13.85 | | | | $10.95 | | | | $9.27 | | | | $9.49 | | | | $8.79 | |
| Total return | | | 11.07 | %(a) | | | 28.02 | % | | | 18.81 | % | | | (2.07 | )% | | | 8.37 | % | | | (9.02 | )% |
| | | | | | | | | | | | | | | | | | | | | | | | | |
| Supplemental data and ratios: | | | | | | | | | | | | | | | | | | | | | | | | |
| Net assets, end of period, in thousands | | | $49,852 | | | | $43,925 | | | | $33,274 | | | | $42,547 | | | | $54,609 | | | | $34,877 | |
Ratio of expenses to average net
assets, including waivers | | | 1.16 | %(b) | | | 1.25 | % | | | 1.25 | % | | | 1.25 | % | | | 1.25 | % | | | 1.25 | % |
Ratio of expenses to average net
assets, excluding waivers | | | 1.44 | %(b) | | | 1.54 | % | | | 1.58 | % | | | 1.51 | % | | | 1.58 | % | | | 1.87 | % |
Ratio of net investment income to
average net assets, including waivers | | | 0.70 | %(b) | | | 1.19 | % | | | 0.88 | % | | | 0.37 | % | | | 0.36 | % | | | 0.68 | % |
Ratio of net investment income to
average net assets, excluding waivers | | | 0.42 | %(b) | | | 0.90 | % | | | 0.55 | % | | | 0.11 | % | | | 0.03 | % | | | 0.06 | % |
| Portfolio turnover rate | | | 20 | %(a) | | | 41 | % | | | 32 | % | | | 40 | % | | | 52 | % | | | 42 | % |
| | | Six months | | | | | | December 30, | | | | | | | | | | |
| | | ended | | | Year ended | | | 2011(c) to | | | | | | | | | | |
| Ariel Focus Fund | | March 31, 2014 | | | September 30, | | | September 30, | | | | | | | | | | |
| (Institutional Class) | | (Unaudited) | | | 2013 | | | 2012 | | | | | | | | | | |
| Net asset value, beginning of year | | | $13.87 | | | | $10.97 | | | | $9.82 | | | | | | | | | | |
| Income from investment operations: | | | | | | | | | | | | | | | | | | | | | |
| Net investment income | | | 0.06 | | | | 0.19 | | | | 0.10 | | | | | | | | | | |
| Net realized and unrealized gains | | | | | | | | | | | | | | | | | | | | | |
| on investments | | | 1.45 | | | | 2.87 | | | | 1.05 | | | | | | | | | | |
| Total from investment operations | | | 1.51 | | | | 3.06 | | | | 1.15 | | | | | | | | | | |
| | | | | | | | | | | | | | | | | | | | | | |
| Distributions to shareholders: | | | | | | | | | | | | | | | | | | | | | |
| Dividends from net investment income | | | (0.14 | ) | | | (0.16 | ) | | | — | | | | | | | | | | |
| Dividends from capital gains | | | (0.70 | ) | | | — | | | | — | | | | | | | | | | |
| Total distributions | | | (0.84 | ) | | | (0.16 | ) | | | — | | | | | | | | | | |
| Net asset value, end of period | | | $14.54 | | | | $13.87 | | | | $10.97 | | | | | | | | | | | | | |
| Total return | | | 11.16 | %(a) | | | 28.36 | % | | | 11.71 | %(a) | | | | | | | | | | | | |
| | | | | | | | | | | | | | | | | | | | | | | | | |
| Supplemental data and ratios: | | | | | | | | | | | | | | | | | | | | | | | | |
| Net assets, end of period, in thousands | | | $12,946 | | | | $11,372 | | | | $10,470 | | | | | | | | | | | | | |
| Ratio of expenses to average net | | | | | | | | | | | | | | | | | | | | | | | | |
| assets, including waivers | | | 0.92 | %(b) | | | 1.00 | % | | | 1.00 | %(b) | | | | | | | | | | | | |
| Ratio of expenses to average net | | | | | | | | | | | | | | | | | | | | | | | | |
| assets, excluding waivers | | | 1.12 | %(b) | | | 1.19 | % | | | 1.29 | %(b) | | | | | | | | | | | | |
| Ratio of net investment income to | | | | | | | | | | | | | | | | | | | | | | | | |
| average net assets, including waivers | | | 0.93 | %(b) | | | 1.46 | % | | | 1.15 | %(b) | | | | | | | | | | | | |
| Ratio of net investment income to | | | | | | | | | | | | | | | | | | | | | | | | |
| average net assets, excluding waivers | | | 0.73 | %(b) | | | 1.27 | % | | | 0.86 | %(b) | | | | | | | | | | | | |
| Portfolio turnover rate | | | 20 | %(a) | | | 41 | % | | | 32 | %(a) | | | | | | | | | | | | |
(a) Not annualized.
(b) Annualized.
(c) Commencement of operations.
The accompanying notes are an integral part of the financial statements.
| | | | | | Year ended | | | | |
| | | Six months | | | | | | | | | January 31, | |
| | | ended | | | | | | | | | 2011(c) to | |
| Ariel Discovery Fund | | March 31, 2014 | | | | | | | | | September 30, | |
| (Investor Class) | | (Unaudited) | | | 2013 | | | 2012 | | | 2011 | |
| Net asset value, beginning of year | | | $12.47 | | | | $10.63 | | | | $7.71 | | | | $10.00 | |
| Income from investment operations: | | | | | | | | | | | | | | | | |
| Net investment loss | | | (0.05 | ) | | | (0.06 | ) | | | (0.08 | ) | | | (0.06 | ) |
| Net realized and unrealized gains (losses) on investments | | | 1.34 | | | | 1.90 | | | | 3.00 | | | | (2.23 | ) |
| Total from investment operations | | | 1.29 | | | | 1.84 | | | | 2.92 | | | | (2.29 | ) |
| | | | | | | | | | | | | | | | | |
| Distributions to shareholders: | | | | | | | | | | | | | | | | |
| Distributions from capital gains | | | (0.18 | ) | | | — | | | | — | | | | — | |
| Total distributions | | | (0.18 | ) | | | — | | | | — | | | | — | |
| Net asset value, end of period | | | $13.58 | | | | $12.47 | | | | $10.63 | | | | $7.71 | |
| Total return | | | 10.38 | %(a) | | | 17.31 | % | | | 37.87 | % | | | (22.90 | )%(a) |
| | | | | | | | | | | | | | | | | |
| Supplemental data and ratios: | | | | | | | | | | | | | | | | |
| Net assets, end of period, in thousands | | | $12,867 | | | | $10,239 | | | | $4,240 | | | | $3,177 | |
| Ratio of expenses to average net assets, including waivers | | | 1.41 | %(b) | | | 1.50 | % | | | 1.50 | % | | | 1.50 | %(b) |
| Ratio of expenses to average net assets, excluding waivers | | | 1.96 | %(b) | | | 2.90 | % | | | 5.18 | % | | | 6.75 | %(b) |
| Ratio of net investment loss to average net assets, including waivers | | | (0.96 | )%(b) | | | (0.79 | )% | | | (0.92 | )% | | | (1.17 | )%(b) |
| Ratio of net investment loss to average net assets, excluding waivers | | | (1.51 | )%(b) | | | (2.19 | )% | | | (4.60 | )% | | | (6.42 | )%(b) |
| Portfolio turnover rate | | | 15 | %(a) | | | 31 | % | | | 33 | % | | | 18 | %(a) |
| | | | | | | | | | | | | | | | | |
| | | Six months | | | | | | | December 30, | | | | | |
| | | ended | | | Year ended | | | 2011(c) to | | | | | |
| Ariel Discovery Fund | | March 31, 2014 | | | September 30, | | | September 30, | | | | | |
| (Institutional Class) | | (Unaudited) | | | | 2013 | | | | 2012 | | | | | |
| Net asset value, beginning of year | | | $12.54 | | | | $10.66 | | | | $9.01 | | | | | |
| Income from investment operations: | | | | | | | | | | | | | | | | |
| Net investment loss | | | (0.03 | ) | | | (0.03 | ) | | | (0.05 | ) | | | | |
| Net realized and unrealized gains on investments | | | 1.35 | | | | 1.91 | | | | 1.70 | | | | | |
| Total from investment operations | | | 1.32 | | | | 1.88 | | | | 1.65 | | | | | |
| | | | | | | | | | | | | | | | | |
| Distributions to shareholders: | | | | | | | | | | | | | | | | |
| Distributions from capital gains | | | (0.18 | ) | | | — | | | | — | | | | | |
| Total distributions | | | (0.18 | ) | | | — | | | | — | | | | | |
| Net asset value, end of period | | | $13.68 | | | | $12.54 | | | | $10.66 | | | | | |
| Total return | | | 10.56 | %(a) | | | 17.64 | % | | | 18.31 | %(a) | | | | |
| | | | | | | | | | | | | | | | | |
| Supplemental data and ratios: | | | | | | | | | | | | | | | | |
| Net assets, end of period, in thousands | | | $48,506 | | | | $27,096 | | | | $2,244 | | | | | |
| Ratio of expenses to average net assets, including waivers | | | 1.15 | %(b) | | | 1.25 | % | | | 1.25 | %(b) | | | | |
| Ratio of expenses to average net assets, excluding waivers | | | 1.27 | %(b) | | | 1.93 | % | | | 4.78 | %(b) | | | | |
| Ratio of net investment loss to average net assets, including waivers | | | (0.69 | )%(b) | | | (0.61 | )% | | | (0.75 | )%(b) | | | | |
| Ratio of net investment loss to average net assets, excluding waivers | | | (1.81 | )%(b) | | | (1.29 | )% | | | (4.28 | )%(b) | | | | |
| Portfolio turnover rate | | | 15 | %(a) | | | 31 | % | | | 33 | %(a) | | | | |
(a)Not annualized.
(b)Annualized.
(c)Commencement of operations.
The accompanying notes are an integral part of the financial statements. | |
| 800.292.7435 | 47 |
| | |
| | Financial highlights For a share outstanding throughout each period (continued) |
| | |
| | | Six months | | | | | | December 30, | |
| | | ended | | | Year ended | | | 2011(c) to | |
| Ariel International Fund | | March 31, 2014 | | | September 30, | | | September 30, | |
| (Investor Class) | | (Unaudited) | | | 2013 | | | 2012 | |
| Net asset value, beginning of year | | $12.38 | | | $9.77 | | | $10.00 | |
| Income from investment operations: | | | | | | | | | |
| Net investment income | | 0.03 | | | 0.07 | | | 0.16 | |
| Net realized and unrealized gains (losses) on investments | | 0.88 | | | 2.65 | | | (0.39 | ) |
| Total from investment operations | | 0.91 | | | 2.72 | | | (0.23 | ) |
| | | | | | | | | | |
| Distributions to shareholders: | | | | | | | | | |
| Dividends from net investment income | | — | | | (0.11 | ) | | — | |
| Distributions from capital gains | | (0.16 | ) | | — | | | — | |
| Total distributions | | (0.16 | ) | | (0.11 | ) | | — | |
| Net asset value, end of period | | $13.13 | | | $12.38 | | | $9.77 | |
| Total return | | 7.43 | %(a) | | 28.11 | % | | (2.30 | )%(a) |
| | | | | | | | | | |
| Supplemental data and ratios: | | | | | | | | | |
| Net assets, end of period, in thousands | | $4,778 | | | $2,260 | | | $1,313 | |
| Ratio of expenses to average net assets, including waivers | | 1.34 | %(b) | | 1.40 | % | | 1.40 | %(b) |
| Ratio of expenses to average net assets, excluding waivers | | 4.74 | %(b) | | 9.36 | % | | 17.00 | %(b) |
| Ratio of net investment income to average net assets, including waivers | | 1.32 | %(b) | | 0.98 | % | | 2.93 | %(b) |
| Ratio of net investment loss to average net assets, excluding waivers | | (2.08 | )%(b) | | (6.98 | )% | | (12.67 | )%(b) |
| Portfolio turnover rate | | 7 | %(a) | | 29 | % | | 21 | %(a) |
| | | | | | | | | | |
| | | Six months | | | | | | December 30, | |
| | | ended | | | Year ended | | | 2011(c) to | |
| Ariel International Fund | | March 31, 2014 | | | September 30, | | | September 30, | |
| (Institutional Class) | | (Unaudited) | | | 2013 | | | 2012 | |
| Net asset value, beginning of year | | $12.26 | | | $9.78 | | | $10.00 | |
| Income from investment operations: | | | | | | | | | |
| Net investment income | | 0.11 | | | 0.14 | | | 0.11 | |
| Net realized and unrealized gains (losses) on investments | | 0.82 | | | 2.59 | | | (0.33 | ) |
| Total from investment operations | | 0.93 | | | 2.73 | | | (0.22 | ) |
| | | | | | | | | | |
| Distributions to shareholders: | | | | | | | | | |
| Dividends from net investment income | | (0.06 | ) | | (0.25 | ) | | — | |
| Distributions from capital gains | | (0.16 | ) | | — | | | — | |
| Total distributions | | (0.22 | ) | | (0.25 | ) | | — | |
| Net asset value, end of period | | $12.97 | | | $12.26 | | | $9.78 | |
| Total return | | 7.64 | %(a) | | 28.42 | % | | (2.20 | )%(a) |
| | | | | | | | | | |
| Supplemental data and ratios: | | | | | | | | | |
| Net assets, end of period, in thousands | | $6,897 | | | $4,129 | | | $1,926 | |
| Ratio of expenses to average net assets, including waivers | | 1.09 | %(b) | | 1.15 | % | | 1.15 | %(b) |
| Ratio of expenses to average net assets, excluding waivers | | 3.83 | %(b) | | 6.53 | % | | 15.70 | %(b) |
| Ratio of net investment income to average net assets, including waivers | | 1.85 | %(b) | | 1.09 | % | | 3.41 | %(b) |
| Ratio of net investment loss to average net assets, excluding waivers | | (0.89 | )%(b) | | (4.29 | )% | | (11.14 | )%(b) |
| Portfolio turnover rate | | 7 | %(a) | | 29 | % | | 21 | %(a) |
(a)Not annualized. |
(b)Annualized. |
(c)Commencement of operations. |
| The accompanying notes are an integral part of the financial statements. |
| |
| | | Six months | | | | | | December 30, | |
| | | ended | | | Year ended | | | 2011(c) to | |
| Ariel Global Fund | | March 31, 2014 | | | September 30, | | | September 30, | |
| (Investor Class) | | (Unaudited) | | | 2013 | | | 2012 | |
| Net asset value, beginning of year | | $12.91 | | | $10.02 | | | $10.00 | |
| Income from investment operations: | | | | | | | | | |
| Net investment income | | 0.04 | | | 0.02 | | | 0.18 | |
| Net realized and unrealized gains (losses) on investments | | 0.86 | | | 2.87 | | | (0.16 | ) |
| Total from investment operations | | 0.90 | | | 2.89 | | | 0.02 | |
| | | | | | | | | | |
| Distributions to shareholders: | | | | | | | | | |
| Distributions from capital gains | | (0.29 | ) | | — | | | — | |
| Total distributions | | (0.29 | ) | | — | | | — | |
| Net asset value, end of period | | $13.52 | | | $12.91 | | | $10.02 | |
| Total return | | 7.03 | %(a) | | 28.84 | % | | 0.20 | %(a) |
| | | | | | | | | | |
| Supplemental data and ratios: | | | | | | | | | |
| Net assets, end of period, in thousands | | $2,516 | | | $1,954 | | | $992 | |
| Ratio of expenses to average net assets, including waivers | | 1.35 | %(b) | | 1.40 | % | | 1.40 | %(b) |
| Ratio of expenses to average net assets, excluding waivers | | 3.91 | %(b) | | 5.37 | % | | 12.33 | %(b) |
| Ratio of net investment income to average net assets, including waivers | | 1.31 | %(b) | | 0.81 | % | | 2.67 | %(b) |
| Ratio of net investment loss to average net assets, excluding waivers | | (1.25 | )%(b) | | (3.16 | )% | | (8.26 | )%(b) |
| Portfolio turnover rate | | 6 | %(a) | | 39 | % | | 26 | %(a) |
| | | | | | | | | | |
| | | Six months | | | | | | December 30, | |
| | | ended | | | Year ended | | | 2011(c) to | |
| Ariel Global Fund | | March 31, 2014 | | | September 30, | | | September 30, | |
| (Institutional Class) | | (Unaudited) | | | 2013 | | | 2012 | |
| Net asset value, beginning of year | | $12.76 | | | $10.04 | | | $10.00 | |
| Income from investment operations: | | | | | | | | | |
| Net investment income | | 0.08 | | | 0.08 | | | 0.14 | |
| Net realized and unrealized gains (losses) on investments | | 0.83 | | | 2.81 | | | (0.10 | ) |
| Total from investment operations | | 0.91 | | | 2.89 | | | 0.04 | |
| | | | | | | | | | |
| Distributions to shareholders: | | | | | | | | | |
| Dividends from net investment income | | (0.04 | ) | | (0.17 | ) | | — | |
| Distributions from capital gains | | (0.29 | ) | | — | | | — | |
| Total distributions | | (0.33 | ) | | (0.17 | ) | | — | |
| Net asset value, end of period | | $13.34 | | | $12.76 | | | $10.04 | |
| Total return | | 7.22 | %(a) | | 29.15 | % | | 0.40 | %(a) |
| | | | | | | | | | |
| Supplemental data and ratios: | | | | | | | | | |
| Net assets, end of period, in thousands | | $35,725 | | | $25,975 | | | $10,677 | |
| Ratio of expenses to average net assets, including waivers | | 1.10 | %(b) | | 1.15 | % | | 1.15 | %(b) |
| Ratio of expenses to average net assets, excluding waivers | | 1.67 | %(b) | | 2.51 | % | | 4.07 | %(b) |
| Ratio of net investment income to average net assets, including waivers | | 1.54 | %(b) | | 0.97 | % | | 3.26 | %(b) |
| Ratio of net investment income (loss) to average net assets, excluding waivers | | 0.97 | %(b) | | (0.39 | )% | | 0.34 | %(b) |
| Portfolio turnover rate | | 6 | %(a) | | 39 | % | | 26 | %(a) |
(a)Not annualized. | |
(b)Annualized. | |
(c)Commencement of operations. | |
| The accompanying notes are an integral part of the financial statements. | |
| | |
| | |
| | Notes to the financial statements |
| | |
| | |
NOTE ONE | ORGANIZATION
Ariel Investment Trust (the “Trust”) is a Massachusetts business trust registered under the Investment Company Act of 1940, as amended (the “1940 Act”), as an open-end management investment company. Ariel Fund, Ariel Appreciation Fund, Ariel Focus Fund, Ariel Discovery Fund, Ariel International Fund and Ariel Global Fund (the “Funds”) are series of the Trust. Ariel Focus Fund is a non-diversified Fund, all other Funds are diversified. The Funds issue two classes of shares: an Investor Class and an Institutional Class.
NOTE TWO | SIGNIFICANT ACCOUNTING POLICIES
The following is a summary of significant accounting policies consistently followed by the Funds in the preparation of their financial statements. The financial statements have been prepared in accordance with accounting principles generally accepted in the United States, which require management to make certain estimates and assumptions at the date of the financial statements. Actual results may differ from such estimates.
Securities valuation—Securities for which market quotations are readily available are valued at the last sale price on the national securities exchange on which such securities are primarily traded and, in the case of securities reported on the Nasdaq system, are valued based on the Nasdaq Official Closing Price. If a closing price is not reported, equity securities for which reliable bid and ask quotations are available are valued at the mean between bid and ask prices.
Certain common stocks that trade on foreign exchanges are subject to valuation adjustments to account for the market movement between the close of a foreign market in which the security is traded and the close of the New York Stock Exchange. These securities are valued by pricing vendors that consider the correlation patterns of price movements of the foreign security to the intraday trading in the U.S. markets.
Debt obligations having a maturity of 60 days or less are valued at amortized cost, which approximates market value. Securities and assets for which market quotations are not readily available are valued at fair value as determined in good faith by or under the direction of the Board of Trustees.
Securities transactions and investment income—Securities transactions are accounted for on a trade date basis. Realized gains and losses from securities transactions are recorded on the identified cost basis. Dividend income is recorded on the ex-dividend date and interest income is recognized on an accrual basis. Dividends from foreign securities are recorded on the ex-dividend date, or as soon as the information is available.
Fair value measurements—Accounting Standards CodificationTM (ASC) 820-10 establishes a three-tier framework for measuring fair value based on a hierarchy of inputs. The hierarchy distinguishes between market data obtained from independent sources (observable inputs) and the Funds’ own market assumptions (unobservable inputs). These inputs are used in determining the value of the Funds’ investments and are summarized below:
Level 1 — quoted prices in active markets for identical securities
Level 2 — other significant observable inputs (including quoted prices for similar securities, “quoted” prices in inactive markets, dealer indications, and inputs corroborated by observable market data)
Level 3 — significant unobservable inputs (including the Funds’ own assumptions in determining the fair value of investments)
The Funds use valuation techniques to measure fair value that are consistent with the market approach and/or income approach, depending on the type of security and the particular circumstance. The market approach uses prices and other relevant information generated by market transactions involving identical or comparable securities. The income approach uses valuation techniques to discount estimated future cash flows to present value.
The inputs or methodology used for valuing securities are not necessarily an indication of the risk associated with investing in those securities.
The following is a summary of the inputs used as of March 31, 2014 in valuing the Funds’ investments carried at fair value:
| | | Ariel Fund | | Ariel Appreciation Fund | | Ariel Focus Fund | | Ariel Discovery Fund | | Ariel International Fund | | Ariel Global Fund | |
| Level 1 | | $2,371,012,257 | | $1,985,066,535 | | $60,576,092 | | $56,554,981 | | $10,499,016 | | $36,768,525 | |
Level 2*+ | | 15,719,183 | | 77,053,212 | | 1,718,349 | | 2,938,811 | | 273,723 | | 1,412,074 | |
| Level 3 | | — | | — | | — | | — | | — | | — | |
| Fair value at 03/31/14 | | $2,386,731,440 | | $2,062,119,747 | | $62,294,441 | | $59,493,792 | | $10,772,739 | | $38,180,599 | |
| * | As of March 31, 2014, Level 2 investments held are repurchase agreements. See Schedule of Investments. |
| + | As of March 31, 2014, Level 2 investments held are forward currency contracts, which are reflected at the unrealized appreciation (depreciation) on the contract and repurchase agreements. See Note Five, Forward Currency Contracts. |
There were no transfers between levels for the Ariel Fund, Ariel Appreciation Fund, Ariel Focus Fund, Ariel Discovery Fund, Ariel International Fund and Ariel Global Fund. Transfers between levels are recognized at the end of the reporting period.
Forward currency contracts derive their value from underlying exchange rates. These instruments are normally valued by pricing vendors using pricing models. The pricing models typically use inputs that are observed from active markets such as exchange rates. As such, forward currency contracts were categorized as Level 2.
Offsetting assets and liabilities —In December 2011, the Financial Accounting Standards Board (“FASB”) issued Accounting Standards Update No. 2011-11 “Disclosures about Offsetting Assets and Liabilities” (“ASU 2011-11”). This disclosure requirement is intended to help investors and other financial statement users better assess the effect or potential effect of offsetting arrangements on a fund’s financial position. ASU 2011-11 requires entities to disclose both gross and net information about both instruments and transactions eligible for offset on the Statement of Assets and Liabilities, and disclose instruments and transactions subject to master netting or similar agreements. In addition, in January 2013, FASB issued Accounting Standards Update No. 2013-1 “Clarifying the Scope of Offsetting Assets and Liabilities” (“ASU 2013-1”), specifying exactly which transactions are subject to offsetting disclosures. The scope of the disclosure requirements is limited to derivative instruments, repurchase agreements and reverse repurchase agreements, and securities borrowing and securities lending transactions. ASU 2011-11 and ASU 2013-1 are effective for financial statements with fiscal years beginning on or after January 1, 2013, and interim periods within those fiscal years.
The Funds are subject to various master netting arrangements (“Master Netting Arrangements”), which govern the terms of certain transactions with select counterparties. Master Netting Arrangements seek to reduce the counterparty risk associated with relevant transactions by specifying credit protection mechanisms and providing standardization that seeks to improve legal certainty. The Master Netting Arrangements allow the Funds to close out and net their total exposure to a counterparty in the event of a default with respect to all the transactions governed under a single agreement with a counterparty. The Master Netting Arrangements may also specify collateral posting arrangements at prearranged exposure levels. Under the Master Netting Arrangements, collateral may be transferred if the total net exposure to certain transactions (net of existing collateral already in place) governed under the relevant Master Netting Arrangement with a counterparty in a given account exceeds a specified threshold depending on the counterparty and the type of Master Netting Arrangement. The Funds are not currently collateralizing their exposures under FX trades. The following is a summary of offsetting transactions as of March 31, 2014:
| | | | | | | | | Gross amounts not offset in the Statement of Assets & Liabilities | | | | |
| | | Gross amounts of recognized assets | | Gross amounts offset in the Statement of Assets & Liabilities | | Net amounts presented in the Statement of Assets & Liabilities | | Financial instruments | | Collateral pledged (received) | | | Net amount | |
| | | | | | | | | | | | | | | |
| Description | | | | | | | | | | | | | | |
| repurchase agreements | | | | | | | | | | | | | | |
| | | | | | | | | | | | | | | |
| Ariel Fund | | $15,719,183 | | — | | $15,719,183 | | $15,719,183 | | — | | | — | |
| Ariel Appreciation Fund | | 77,053,212 | | — | | 77,053,212 | | 77,053,212 | | — | | | — | |
| Ariel Focus Fund | | 1,718,349 | | — | | 1,718,349 | | 1,718,349 | | — | | | — | |
| Ariel Discovery Fund | | 2,938,811 | | — | | 2,938,811 | | 2,938,811 | | — | | | — | |
| Ariel International Fund | | 252,790 | | — | | 252,790 | | 252,790 | | — | | | — | |
| Ariel Global Fund | | 1,395,904 | | — | | 1,395,904 | | 1,395,904 | | — | | | — | |
| | | | | | | | | | | | | | | |
| Forward currency contracts | | | | | | | | | | | | | | |
| Ariel International Fund | | 25,058 | | — | | 25,058 | | (4,125) | | — | | | $20,933 | |
| Ariel Global Fund | | 42,171 | | — | | 42,171 | | (26,001) | | — | | | 16,170 | |
| | |
| | Notes to the financial statements (continued) |
| | |
| | |
Foreign currency—Securities and other assets and liabilities denominated in foreign currencies are translated into U.S. dollars using exchange rates obtained from an independent third party. Realized gains (losses) and unrealized appreciation (depreciation) on securities include the effects of changes in security prices. Fluctuations in the value of other assets and liabilities resulting from changes in exchange rates are recorded as unrealized foreign currency gains (losses) until the assets or liabilities are settled in cash, at which time they are recorded as realized foreign currency gains (losses).
Foreign currency contracts—Ariel International Fund and Ariel Global Fund enter into forward currency contracts to provide the appropriate currency exposure related to protecting the value of securities and related receivables and payables against changes in foreign exchange rates. The primary risk associated with a Fund’s use of these contracts is that a counterparty will fail to fulfill its obligation to pay gains due to the Fund under the contracts. Counterparty risk is mitigated by entering into forward currency contracts only with highly rated counterparties. Forward currency contracts are subject to the translations of foreign exchange rate fluctuations. Contracts are “marked-to-market” daily and any resulting unrealized gains (losses) are recorded as unrealized appreciation (depreciation) on foreign currency translations. The Funds record realized gains (losses) at the time the forward currency contract is settled or closed on the Statement of Operations as realized gain (loss) on foreign currency transactions.
Repurchase agreements—The Funds may enter into repurchase agreements with recognized financial institutions and in all instances hold underlying securities as collateral with a value at least equal to the total repurchase price such financial institutions have agreed to pay.
Federal taxes—It is the Funds’ policy to comply with the requirements of the Internal Revenue Code applicable to regulated investment companies and to distribute substantially all taxable income to shareholders. Management has analyzed the Funds’ tax positions taken for all open federal income tax years (September 30, 2010 – 2013), and has concluded that no provision for federal income tax is required in the financial statements.
Class and expense allocations—Each class of shares has equal rights as to assets and earnings, except that shareholders of each class bear certain class-specific expenses related to marketing and distribution, shareholder servicing and shareholder reporting. Income, other non-class-specific expense, and gains and losses on investments are allocated to each class of shares based on its relative net assets. Expenses that are not directly attributable to one or more Funds are allocated among applicable Funds on an equitable and consistent basis considering such things as the nature and type of expense and the relative net assets of the Funds.
Distributions to shareholders—Dividends from net investment income and net realized capital gains, if any, are declared and paid at least annually and recorded on ex-dividend date.
Distributions to shareholders are determined in accordance with federal income tax regulations and may differ from net investment income and realized capital gains for financial reporting purposes. Reclassifications between net asset accounts are made at the end of the fiscal year for such differences that are permanent in nature.
NOTE THREE | INVESTMENT TRANSACTIONS, DISTRIBUTIONS AND FEDERAL INCOME TAX MATTERS
Purchases and proceeds from sales of securities, excluding short-term investments and U.S. government securities, for the six months ended March 31, 2014 were as follows:
| | | Ariel | | Ariel | | Ariel | | Ariel | | Ariel | | Ariel | |
| | | Fund | | Appreciation Fund | | Focus Fund | | Discovery Fund | | International Fund | | Global Fund | |
| Purchases | | $303,439,832 | | $265,653,209 | | $13,986,576 | | $28,547,822 | | $5,002,700 | | $14,241,531 | |
| Sales | | 308,793,301 | | 249,878,340 | | 10,918,496 | | 6,917,574 | | 620,328 | | 2,003,489 | |
The cost and unrealized appreciation and depreciation of securities on a federal income tax basis at September 30, 2013 were as follows:
| | | | | | Ariel | | | Ariel | | | Ariel | | | Ariel | | | Ariel | |
| | | Ariel Fund | | | Appreciation Fund | | | Focus Fund | | | Discovery Fund | | | International Fund | | | Global Fund | |
| Cost | | $1,352,835,248 | | | $1,186,582,218 | | | $43,434,972 | | | $29,698,181 | | | $4,647,919 | | | $20,085,257 | |
| Unrealized appreciation | | $884,675,417 | | | $725,090,196 | | | $11,948,023 | | | $3,175,356 | | | $1,042,275 | | | $3,223,171 | |
| Unrealized depreciation | | (81,341,649 | ) | | (39,545,289 | ) | | (1,198,202 | ) | | (587,146 | ) | | (62,279 | ) | | (118,079 | ) |
| Net unrealized appreciation | | $803,333,768 | | | $685,544,907 | | | $10,749,821 | | | $2,588,210 | | | $979,996 | | | $3,105,092 | |
The difference between book basis and tax basis unrealized appreciation and depreciation is attributable primarily to the deferral of losses on wash sales and partnership adjustments.
At September 30, 2013, Ariel Discovery Fund had a post December ordinary loss deferral of $117,111.
Under the Regulated Investment Company Modernization Act of 2010 (the “Act”), net capital losses arising in taxable years after December 22, 2010, may be carried forward indefinitely, and their character is retained as short-term and/or long-term losses. Previously, net capital losses were carried forward for up to eight years and treated as short-term losses. The Act requires that post-enactment net capital losses be used before pre-enactment net capital losses. At September 30, 2013, Ariel Fund had pre-enactment net capital losses for federal income tax purposes of $75,651,758, expiring in the year 2018.
For the year ended September 30, 2013, the Ariel Fund had in-kind redemptions and in-kind contributions. The proceeds from in-kind redemptions were $112,642,360 and the net gain from such redemptions was $25,581,974. The gains from in-kind redemptions are not taxable to the Fund for federal income tax purposes. The in-kind contributions was $2,397,456, which the Fund recorded at fair market value.
NOTE FOUR | INVESTMENT ADVISORY AND OTHER TRANSACTIONS WITH RELATED PARTIES
Ariel Investments, LLC (the “Adviser”) provides investment advisory and administrative services to Ariel Fund, Ariel Appreciation Fund, Ariel Focus Fund and Ariel Discovery Fund under an agreement (the “Management Agreement”). The Adviser provides investment advisory services to Ariel International Fund and Ariel Global Fund under an Advisory Agreement (collectively, the “Agreements”).
Pursuant to the Agreements, the Adviser was paid a monthly fee, from October 1, 2013 to January 31, 2014, on average daily net assets at the annual rates shown below:
| Management fees | | Ariel | | Ariel | | Ariel | | Ariel | | Ariel | | Ariel | |
| | | Fund | | Appreciation Fund | | Focus Fund | | Discovery Fund | | International Fund | | Global Fund | |
| Average daily net assets: | | | | | | | | | | | | | |
| First $500 million | | 0.65% | | 0.75% | | 0.75% | | 1.00% | | 1.00% | | 1.00% | |
| Next $500 million | | 0.60% | | 0.70% | | 0.70% | | 0.95% | | 0.95% | | 0.95% | |
| Over $1 billion | | 0.55% | | 0.65% | | 0.65% | | 0.90% | | 0.90% | | 0.90% | |
The Adviser contractually agreed to reduce the fees paid by Ariel Focus Fund and Ariel Discovery Fund for its investment advisory and administrative services, and by Ariel International Fund and Ariel Global Fund for its investment advisory services. On February 1, 2014, the Adviser started to receive a monthly fee on average daily net assets at the annual rates shown below:
| Management fees | | Ariel | | Ariel | | Ariel | | Ariel | | Ariel | | Ariel | |
| | | Fund | | Appreciation Fund | | Focus Fund | | Discovery Fund | | International Fund | | Global Fund | |
| Average daily net assets: | | | | | | | | | | | | | |
| First $500 million | | 0.65% | | 0.75% | | 0.65% | | 0.80% | | 0.80% | | 0.80% | |
| Next $500 million | | 0.60% | | 0.70% | | 0.60% | | 0.75% | | 0.80% | | 0.80% | |
| Over $1 billion | | 0.55% | | 0.65% | | 0.55% | | 0.70% | | 0.75% | | 0.75% | |
The Adviser contractually agreed, from October 1, 2013 to January 31, 2014, to reimburse the Funds to the extent their respective total annual operating expenses exceed certain limits as shown below:
| | | | | | | | | | | | | | | |
| | | | | | | Ariel Focus Fund | | | Ariel Discovery Fund |
| | | | | Ariel | | | | | | | | | | |
| | | Ariel Fund | | Appreciation Fund | | | | | | | | | | |
| | | Investor Class | | Investor Class | | Investor Class | | Institutional Class | | | Investor Class | | Institutional Class | |
| First $30 million* | | 1.50% | | 1.50% | | — | | — | | | — | | — | |
| Over $30 million* | | 1.00% | | 1.00% | | — | | — | | | — | | — | |
| On average daily net assets** | | — | | — | | 1.25% | | 1.00% | | | 1.50% | | 1.25% | |
| | | | | | | | | | | |
| | | Ariel International Fund | | | Ariel Global Fund |
| | | Investor Class | | Institutional Class | | | Investor Class | | Institutional Class | |
| On average daily net assets** | | 1.40% | | 1.15% | | | 1.40% | | 1.15% | |
| * Exclusive of brokerage, interest, taxes, distribution plan expenses and extraordinary items. |
| ** For the current year through January 31, 2014. |
| | |
| | Notes to the financial statements (continued) |
| | |
| | |
| | | | | | | | | | | | | | | | | | | | | | |
| | | | Ariel Focus Fund | | | Ariel Discovery Fund | | | Ariel International Fund | | | Ariel Global Fund |
| | | | Investor | | Institutional | | | Investor | | Institutional | | | Investor | | Institutional | | | Investor | | Institutional | |
| | | | Class | | Class | | | Class | | Class | | | Class | | Class | | | Class | | Class | |
On average
daily net assets | | | 1.00% | | 0.75% | | | 1.25% | | 1.00% | | | 1.25% | | 1.00% | | | 1.25% | | 1.00% | |
| Waiver*** | | | 2016 | | 2016 | | | 2016 | | 2016 | | | 2016 | | 2016 | | | 2016 | | 2016 | |
The Ariel Fund and Ariel Appreciation Fund did not change their respective total annual operating expense limits.
*** Through September 30 of the respective year. After these dates, there is no assurance that such expenses will be limited.
The Adviser has no right to recapture previously-waived fees.
Ariel Distributors, LLC is the Funds’ distributor and principal underwriter (“the Distributor”). The Trust has adopted a plan of distribution under Rule 12b-1 of the 1940 Act applicable to the Investor Class of the Funds. Under the plan, 12b-1 distribution fees at an annual rate of 0.25% of average daily net assets are paid weekly to the Distributor for its services. For the six months ended March 31, 2014 distribution fee expenses were as follows:
| | | | | | | | | | | | | | |
| | | | | Ariel | | Ariel | | Ariel | | Ariel | | Ariel | |
| | | Ariel Fund | | Appreciation Fund | | Focus Fund | | Discovery Fund | | International Fund | | Global Fund | |
| Paid to distributor | | $2,347,187 | | $2,341,864 | | $56,324 | | $14,541 | | $5,099 | | $2,719 | |
| Paid to broker/dealers | | 1,899,369 | | 1,922,653 | | 33,307 | | 10,524 | | 2,453 | | 711 | |
The remaining amounts were retained by the Distributor for its services, advertising, and other distribution expenses.
Trustees’ fees and expenses represent only those expenses of disinterested (independent) trustees of the Funds.
NOTE FIVE | FORWARD CURRENCY CONTRACTS
At March 31, 2014, the open forward currency contracts (State Street Bank and Trust as counterparty) are:
| | | | | | | | | | | Unrealized | |
| | | Currency to | | Amount to | | Currency to | | Amount to | | appreciation | |
| Contract date | | be received | | be received | | be delivered | | be delivered | | (depreciation) | |
| Ariel International Fund | | | | | | | | | | | |
| 04/16/2014 | | EUR | | 48,367 | | CHF | | 59,737 | | $(949 | ) |
| 04/16/2014 | | AUD | | 10,269 | | JPY | | 951,040 | | 300 | |
| 04/16/2014 | | GBP | | 44,223 | | CHF | | 65,710 | | (618 | ) |
| 04/16/2014 | | GBP | | 9,144 | | CHF | | 13,588 | | (128 | ) |
| 04/16/2014 | | AUD | | 19,391 | | CHF | | 15,594 | | 324 | |
| 04/16/2014 | | AUD | | 46,561 | | CAD | | 44,832 | | 2,600 | |
| 04/16/2014 | | AUD | | 38,650 | | CAD | | 37,215 | | 2,158 | |
| 04/16/2014 | | AUD | | 66,328 | | USD | | 58,751 | | 2,702 | |
| 04/16/2014 | | GBP | | 35,903 | | USD | | 58,751 | | 1,099 | |
| 04/16/2014 | | SGD | | 46,096 | | USD | | 36,125 | | 520 | |
| 04/16/2014 | | SEK | | 585,976 | | USD | | 90,314 | | 202 | |
| 05/13/2014 | | SEK | | 101,802 | | EUR | | 11,567 | | (215 | ) |
| 05/13/2014 | | SEK | | 351,141 | | EUR | | 39,896 | | (740 | ) |
| 05/13/2014 | | SEK | | 102,292 | | EUR | | 11,622 | | (216 | ) |
| 05/13/2014 | | AUD | | 201,579 | | CHF | | 162,803 | | 2,204 | |
| 05/13/2014 | | JPY | | 6,355,227 | | USD | | 61,943 | | (357 | ) |
| 05/13/2014 | | AUD | | 265,617 | | USD | | 238,370 | | 7,272 | |
| 05/14/2014 | | SGD | | 53,216 | | EUR | | 30,906 | | (268 | ) |
| 06/18/2014 | | AUD | | 82,625 | | CAD | | 82,439 | | 1,789 | |
| 06/18/2014 | | SGD | | 25,433 | | EUR | | 14,458 | | 304 | |
| | | | | | | | | | | Unrealized | |
| | | Currency to | | Amount to | | Currency to | | Amount to | | appreciation | |
| Contract date | | be received | | be received | | be delivered | | be delivered | | (depreciation) | |
| Ariel International Fund | | | | | | | | | | | |
| 06/18/2014 | | AUD | | 82,625 | | CAD | | 82,439 | | $1,789 | |
| 06/18/2014 | | SGD | | 25,433 | | EUR | | 14,458 | | 304 | |
| 06/18/2014 | | AUD | | 125,483 | | CHF | | 99,398 | | 3,258 | |
| 06/18/2014 | | SEK | | 360,513 | | EUR | | 40,848 | | (634 | ) |
| 06/18/2014 | | SGD | | 27,659 | | USD | | 21,866 | | 123 | |
| 06/18/2014 | | GBP | | 12,157 | | USD | | 20,202 | | 55 | |
| 06/18/2014 | | GBP | | 32,899 | | USD | | 54,667 | | 148 | |
| | | | | | | | | | | $20,933 | |
| Ariel Global Fund | | | | | | | | | | | |
| 04/16/2014 | | MXN | | 2,194,077 | | EUR | | 121,282 | | $797 | |
| 04/16/2014 | | AUD | | 161,353 | | CHF | | 129,761 | | 2,699 | |
| 04/16/2014 | | AUD | | 65,466 | | EUR | | 42,635 | | 1,920 | |
| 04/16/2014 | | AUD | | 134,844 | | EUR | | 87,819 | | 3,954 | |
| 04/16/2014 | | SGD | | 115,889 | | CHF | | 82,667 | | (1,390 | ) |
| 04/16/2014 | | ZAR | | 1,301,516 | | GBP | | 72,045 | | 3,262 | |
| 04/16/2014 | | USD | | 90,946 | | JPY | | 9,508,848 | | (1,188 | ) |
| 04/16/2014 | | USD | | 121,490 | | GBP | | 74,244 | | (2,273 | ) |
| 04/16/2014 | | USD | | 123,398 | | CHF | | 112,056 | | (3,369 | ) |
| 04/16/2014 | | USD | | 333,081 | | EUR | | 246,950 | | (7,119 | ) |
| 04/23/2014 | | USD | | 112,680 | | CHF | | 102,317 | | (3,076 | ) |
| 05/13/2014 | | CAD | | 265,960 | | EUR | | 176,673 | | (3,031 | ) |
| 05/13/2014 | | SEK | | 774,746 | | EUR | | 88,025 | | (1,634 | ) |
| 05/13/2014 | | CAD | | 32,944 | | EUR | | 21,884 | | (375 | ) |
| 05/13/2014 | | AUD | | 185,571 | | EUR | | 122,280 | | 3,170 | |
| 05/13/2014 | | AUD | | 134,048 | | EUR | | 88,330 | | 2,290 | |
| 05/13/2014 | | AUD | | 176,198 | | CHF | | 142,121 | | 2,134 | |
| 06/18/2014 | | CAD | | 427,556 | | CHF | | 335,157 | | 6,696 | |
| 06/18/2014 | | AUD | | 267,636 | | EUR | | 172,675 | | 9,046 | |
| 06/18/2014 | | NOK | | 461,337 | | CHF | | 67,060 | | 915 | |
| 06/18/2014 | | SEK | | 890,527 | | EUR | | 99,963 | | (274 | ) |
| 06/18/2014 | | SGD | | 114,191 | | CHF | | 78,909 | | 1,469 | |
| 06/18/2014 | | SEK | | 504,029 | | CHF | | 69,440 | | (816 | ) |
| 06/18/2014 | | CAD | | 92,822 | | CHF | | 72,596 | | 1,642 | |
| 06/18/2014 | | USD | | 287,695 | | GBP | | 173,540 | | (1,456 | ) |
| 06/18/2014 | | USD | | 188,285 | | CHF | | 164,427 | | 2,177 | |
| | | | | | | | | | | $16,170 | |
| | | | |
| | Notes to the financial statements (continued) | 03/31/14 (UNAUDITED) | |
| | | | |
| | | | |
As reflected in the Statement of Operations, realized net gain (loss) and the change in net unrealized appreciation (depreciation) on forward currency contracts for the six months ended March 31, 2014 were:
| | | | | | |
| | | Ariel International Fund | | Ariel Global Fund | |
Realized net loss on forward currency contracts | | | ) | | ) |
| Change in net unrealized appreciation on forward currency contracts | | | | | |
For the six months ended March 31, 2014, the volume of the forward currency contracts is measured by the number of trades during the period and the average notional amount. The funds had 119 and 138 forward currency trades during the six months with an average notional value of $43,417 and $132,198 for the Ariel International Fund and Ariel Global Fund, respectively.
NOTE SIX | TRANSACTIONS WITH AFFILIATED COMPANIES
If a Fund’s holding represents ownership of 5% or more of the voting securities of a company, the company is deemed to be an affiliate as defined in the 1940 Act. Ariel Fund had the following transactions during the six months ended March 31, 2014, with affiliated companies:
| | | | | | | | | | | | | | | | | | |
| | | | | Six months ended March 31, 2014 | |
| | | Balance | | | | | | Balance | | | | | Dividends | | | Amount of gain | |
| | | September 30, | | | | | | | | | | | credited to | | | (loss) realized on | |
| Security name | | 2013 | | Purchases | | Sales | | | | Market value | | income | | | sale of shares | |
| | | | — | | — | | | | | | | $— | | | $— | |
| Symmetry Medical Inc. | | | | | | — | | | | | | | — | | | — | |
| | | | | | | | | | | | | | $— | | | | |
NOTE SEVEN | LINE OF CREDIT
The Funds have a $125,000,000 Line of Credit (the “Line”), which is uncommitted, with State Street Bank and Trust Company. The Line is for temporary or emergency purposes such as to provide liquidity for shareholder redemptions. The Funds incur interest expense to the extent of amounts drawn (borrowed) under the Line. Interest is based on the federal funds rate in effect at the time of borrowing, plus a margin.
For the six months ended March 31, 2014, the details of the borrowings were as follows:
| Fund | Average daily borrowings | Number of days outstanding | Weighted average annualized interest rate | |
| Ariel Fund | $27,136,407 | 3 | 1.34% | |
| Ariel Focus Fund | 588,372 | 5 | 1.34% | |
| | | | |
| | Important supplemental information | 03/31/14 (UNAUDITED) | |
| | | | |
PROXY VOTING POLICIES, PROCEDURES, AND RECORD
Both a description of the policies and procedures that the Funds’ investment adviser uses to determine how to vote proxies relating to portfolio securities and information regarding how the Funds voted proxies relating to portfolio securities during the most recent 12-month period ended June 30 are available upon request by calling 800-292-7435. Such information for the Ariel Investment Trust is also available on the Securities and Exchange Commission’s (“SEC”) web site at www.sec.gov.
SHAREHOLDER STATEMENTS AND REPORTS
The Funds attempt to reduce the volume of mail sent to shareholders by sending one copy of financial reports, prospectuses and other regulatory materials to two or more account holders who share the same address. We will send you a notice at least 60 days before sending only one copy of these documents we have if we have not received the shareholder’s written consent from you previously. Should you wish to receive individual copies of materials, please contact us at 800-292-7435. Once we have received your instructions, we will begin sending individual copies for each account within 30 days.
AVAILABILITY OF QUARTERLY PORTFOLIO SCHEDULE
The Funds file complete schedules of investments with the SEC for the quarters ended December 31 and June 30 of each fiscal year on Form N-Q which are available on the SEC’s website at www.sec.gov. Additionally, the Funds’ Form N-Q may be reviewed and copied at the SEC’s Public Reference Room in Washington, DC. For information on the Public Reference Room, call 800-SEC-0330.
All of the Funds’ quarterly reports contain a complete schedule of portfolio holdings. All quarterly reports are made available to shareholders on the Funds’ web site at www.arielinvestments.com. Shareholders also may obtain copies of shareholder reports upon request by calling 800-292-7435 or by writing to P.O. Box 701, Milwaukee, Wisconsin 53201-0701.
APPROVAL OF THE MANAGEMENT AGREEMENTS
Each year the Board of Trustees of the Trust, including a majority of the Independent Trustees, is required by the 1940 Act to determine whether to continue each Fund’s management or advisory agreement with the Adviser (together the “Agreements”). Throughout the year, the Board meets in person and requests, receives and considers a broad range of materials and information that are relevant to the Trustees’ consideration of the Agreements. The Board’s Management Contracts Committee (the “Committee”), which is comprised entirely of Independent Trustees and includes all Independent Trustees, leads the Board in its consideration of the Agreements. Both the Committee and the Board held meetings in November 2013 to review and evaluate the materials provided by the Adviser to assist the Board, and in particular the Independent Trustees, in considering renewal of the Agreements. The Committee also considered the Adviser’s proposal to lower the management fees and the contractual fee waivers for Focus Fund, Discovery Fund, International Fund and Global Fund, noting that the existing fees had been appropriately established and were reasonable. However, the Adviser was proposing a reduction to further enhance the Funds’ competitiveness in the market place. At such meetings the Committee received presentations from the Adviser and from the portfolio manager(s) of each Fund, as well as a memorandum from their independent legal counsel and supplemental materials and presentations. During each of those meetings, the Committee was advised by, and met in executive sessions with, independent legal counsel.
Nature, Extent and Quality of Services. The Board considered the Adviser’s specific responsibilities in the day-to-day management of the Funds, taking into account information received at regular meetings throughout the year related to the services rendered by the Adviser and their knowledge of the Adviser’s operations. In addition, the Board considered the Adviser’s historical approach in managing the Funds; its consistency of investment approach; the background, education and experience of the Adviser’s investment personnel; the nature and quality of the Adviser’s services, including, among other things, compliance matters, trading practices, brokerage selection, shareholder communications, and information technology; and the Adviser’s commitment to diversity and civic affairs. They also reviewed whether the Funds had operated within their investment objectives and reviewed each Fund’s record of compliance with its investment restrictions and other regulatory requirements. They also considered information regarding the structure of the Adviser’s compensation program for portfolio managers and certain other employees and the Adviser’s ability to attract and retain quality personnel. The Board noted they had good communication with the portfolio managers throughout the year. The Board also noted the personal investments made by the Adviser’s personnel in the Funds, which is designed to align the interests of the Adviser and its personnel with those of the Funds’ shareholders.
Investment Performance. The Committee considered the investment performance of each Fund over time, including comparative information provided by Lipper Inc., an independent data service provider (“Lipper”), comparing each Fund’s performance with that of comparable funds selected by Lipper (the “Peer Group”) as well as an analysis of Fund performance as compared to the performance of its benchmark over specific historical periods. The Committee discussed comparative data with respect to the performance of the Funds, the Funds’ respective Peer Groups and the Funds’ respective performance benchmarks. Where available the Committee considered one, two, three, four, five and ten year periods as of September 30, 2013.
| | | | |
| | Important supplemental information | 03/31/14 (UNAUDITED) | |
| | | | |
Ariel Fund. The Committee discussed Ariel Fund’s performance being ranked in the top decile for the one and two year periods against its Lipper universe. The Committee also considered that Ariel Fund’s four-year period had outperformed its Lipper universe median, while the three and ten year periods underperformed against its Lipper universe median.
Ariel Appreciation Fund. The Committee discussed Ariel Appreciation Fund’s performance, which ranked in the top decile against its Lipper universe for all the considered time periods.
Ariel Focus Fund. The Committee discussed Focus Fund’s performance which ranked in the top decile against its Lipper universe. The Committee also considered that Focus Fund underperformed against its Lipper universe for all other presented time periods. The Committee reviewed the performance consistency chart and risk analysis information for Focus Fund, which indicated comparably high volatility and low total return against its Lipper universe.
Ariel Discovery Fund. The Committee discussed that Discovery Fund only had limited performance information available due to a January 31, 2011 inception date. The Committee noted that the Fund’s performance for both the one and two year period underperformed against its Lipper universe median.
Ariel International Fund and Ariel Global Fund. The Committee discussed that both Funds only have limited performance information available due to having a December 30, 2011 inception date. The Committee noted that each Fund’s one year performance outperformed against its Lipper universe.
The Committee reported to the Board that it had discussed at some length the apparent volatility in the performance of the Funds. In that regard, the Committee had met with the respective portfolio managers of the Funds prior to approval of the Agreements for a fulsome discussion of performance, volatility, market events and their impact to the portfolios, risk/reward trade off, and performance of high/low beta stocks in down markets. The Committee noted that the investment team continues to seek to enhance its processes to minimize losses in the Funds’ portfolios and to seek to reduce the level of volatility of the Funds. The Committee acknowledged the Adviser’s commitment to its stated investment strategy and identified circle of competency, and its calm, reasoned and long-term approach to investing.
Fees and Expenses. The Committee reviewed comparative fee and expense information for each Fund’s Peer Group, as selected and analyzed by Lipper. The Committee considered comparative total expense ratios, as well as advisory fees, in assessing each Fund’s management fee structure. The Committee considered the expense ratio of each Fund and concluded that the Adviser’s new lower fee structure and proposed contractual fee waivers for Focus Fund, Discovery Fund, International Fund and Global Fund were reasonable and competitive; the expense ratios of Ariel Fund and Appreciation Fund, and the proposed lower expense ratios for the four other Funds, all compared favorably with the expense ratios of each Fund’s Peer Group as determined by Lipper.
Benefits, Profitability and Economies of Scale. The Board discussed the Committee’s conclusion that Ariel’s profitability associated with its relationship with the Trust was within a reasonable range and was neither excessive nor so low that the Adviser could not be expected to continue to service the Funds effectively. The Committee reviewed the profitability to Ariel of its relationship with each Fund, including the methodology by which that profitability analysis was calculated, and also examined the fees charged by Ariel to other types of clients, as well as the basis for any differences between those fees. The Committee also noted that the Adviser was heavily subsidizing the International Fund and Global Fund. The Committee reviewed the extent to which economies of scale may be realized if the Funds increase in size, including based on the proposed new management fees and expense waivers. It was noted that the management fee schedules for all the Funds contain breakpoints at different levels, with the final breakpoint at $1 billion in assets. The Committee considered the effective advisory fees for the Ariel Fund and Ariel Appreciation Fund and the proposed advisory fees for the Focus Fund, Discovery Fund, International Fund and Global Fund and concluded that the advisory fee schedules provided an appropriate sharing between the Funds and the Adviser of such economies of scale as may exist under the Agreements and determined that the breakpoints, proposed additional breakpoints, and the adjustments to the breakpoints were acceptable.
Approval. After full consideration of the above factors, as well as other factors that were instructive in evaluating the Agreements, the Board, including all of the Independent Trustees, concluded that continuation of each Fund’s Agreement was in the best interests of each Fund and its respective shareholders and the Board approved the continuation of each Fund’s Agreement. The Board’s determinations were based upon a comprehensive consideration of all information provided to it, including both quantitative measures and qualitative factors, and were not the result of any single factor.
EXAMPLE
As a shareholder of the Funds, you incur ongoing costs, including management fees, distribution and service (12b-1) fees; and other Fund expenses. The Funds currently do not charge any transaction costs, such as sales charges (loads) on purchase payments, reinvested dividends or other distributions, redemption fees or exchange fees. The following example is intended to help you understand your ongoing costs (in dollars) of investing in each of the Funds and to compare these costs with the ongoing costs of investing in other mutual funds. Please note that IRA, 403(b) and Coverdell ESA account holders are charged an annual $15 recordkeeping fee or a one-time, lifetime $60 fee. If these fees were included in either the Actual Expense or Hypothetical Example below, your costs would be higher.
The example is based on an investment of $1,000 invested at the beginning of the period and held for the entire period of October 1, 2013- March 31, 2014.
ACTUAL EXPENSES
The first line of the table below for each Fund provides information about actual account values and actual expenses for that particular Fund. You may use the information in each of these lines, together with the amount you invested, to estimate the expenses that you paid over the period in each Fund. Simply divide your account value by $1,000 (for example, an $8,600 account value divided by $1,000=8.6), then multiply the result by the number in the first line under the heading, entitled “Expenses Paid During Period”, to estimate the expenses you paid on your account during this period in each Fund.
HYPOTHETICAL EXAMPLE FOR COMPARISON PURPOSES
The right portion of the table below for each Fund provides information about hypothetical account values and hypothetical expenses based on each Fund’s actual expense ratio and an assumed rate of return of 5% per year before expenses, which is not the actual return. The hypothetical account values and expenses may not be used to estimate the actual ending account balance or expenses you paid for the period. You may use this information to compare the ongoing costs of investing in each of the Funds to other funds. To do so, compare this 5% hypothetical example with the 5% hypothetical examples that appear in the shareholder reports of other funds.
Please note that the expenses shown in the table are meant to highlight only your ongoing costs in each of the Funds. Therefore, the right portion of the table for each Fund is useful in comparing ongoing costs only, and will not help you determine the relative total costs of owning different funds.
| | | | Actual | | Hypothetical (5% return before expenses) | | | |
| Fund and return | Beginning account value 10/01/13 | | Ending account value 03/31/14 | Expenses paid during period* | | Ending account value 03/31/14 | Expenses paid during period* | | Annualized expense ratio* | |
| Ariel Fund | | | | | | | | | | |
| Investor Class | $1,000.00 | | $1,118.70 | $5.34 | | $1,019.90 | $5.09 | | 1.01% | |
| Institutional Class | 1,000.00 | | 1,120.60 | 3.65 | | 1,021.49 | 3.48 | | 0.69% | |
| Ariel Appreciation Fund | | | | | | | | | | |
| Investor Class | $1,000.00 | | $1,103.60 | $5.82 | | $1,019.40 | $5.59 | | 1.11% | |
| Institutional Class | 1,000.00 | | 1,105.50 | 4.04 | | 1,021.09 | 3.88 | | 0.77% | |
| Ariel Focus Fund | | | | | | | | | | |
| Investor Class | $1,000.00 | | $1,110.70 | $6.16 | | $1,019.10 | $5.89 | | 1.17% | |
| Institutional Class | 1,000.00 | | 1,111.60 | 4.84 | | 1,020.34 | 4.63 | | 0.92% | |
| Ariel Discovery Fund | | | | | | | | | | |
| Investor Class | $1,000.00 | | $1,103.80 | $7.40 | | $1,017.90 | $7.09 | | 1.41% | |
| Institutional Class | 1,000.00 | | 1,105.60 | 6.04 | | 1,019.20 | 5.79 | | 1.15% | |
| Ariel International Fund | | | | | | | | | | |
| Investor Class | $1,000.00 | | $1,074.30 | $6.98 | | $1,018.20 | $6.79 | | 1.35% | |
| Institutional Class | 1,000.00 | | 1,076.40 | 5.69 | | 1,019.45 | 5.54 | | 1.10% | |
| Ariel Global Fund | | | | | | | | | | |
| Investor Class | $1,000.00 | | $1,070.30 | $6.97 | | $1,018.20 | $6.79 | | 1.35% | |
| Institutional Class | 1,000.00 | | 1,072.20 | 5.68 | | 1,019.45 | 5.54 | | 1.10% | |
*Expenses are equal to each Fund’s annualized expense ratio indicated above multiplied by the average account value over the period, multiplied by 182/365 to reflect the most recent fiscal half year.
| | Name and age | | Position(s) held with Fund | | Term of office and length of time served | | Principal occupation(s) during past 5 years | | Other directorships |
| | James W. Compton Age: 75 | | Trustee, Member of Management Contracts, Governance and Audit Committees | | Indefinite, until successor elected
Trustee since 1997 | | Retired President and CEO, Chicago Urban League, 1972 to 2006 | | Seaway Bank and Trust Company, Commonwealth Edison Company |
| | William C. Dietrich Age: 64 | | Trustee, Chairman of Audit Committee, Member of Management Contracts and Executive Committees | | Indefinite, until successor elected
Trustee since 1986 | | Retired Executive Director, Shalem Institute for Spiritual Formation, Inc., 2006 to 2009 | | |
| | Royce N. Flippin, Jr. Age: 79 | | Lead Independent Trustee, Chairman of Executive Committee, Member of Management Contracts and Governance Committees | | Indefinite, until successor elected
Trustee since 1986;
Lead Independent Trustee since 2006 | | President, Flippin Associates since 1992 | | |
| | Mellody L. Hobson Age: 44 | | Chairman of the Board of Trustees and President, Member of Executive Committee | | Indefinite, until successor elected
Trustee since 1993;
President since 2002;
Chairman since 2006 | | President, Ariel Investments since 2000 | | DreamWorks Animation SKG, Inc. (Chairman), The Estée Lauder Companies Inc., Starbucks Corporation |
| | Christopher G. Kennedy Age: 50 | | Trustee, Member of Management Contracts, Audit and Governance Committees | | Indefinite, until successor elected
Trustee since 1995 | | Chairman, Joseph P. Kennedy Enterprises, Inc. since 2012; Founder and Chairman, Top Box Foods since 2012; Former President, Merchandise Mart Properties, Inc., 2000 to 2011; Executive Officer, Vornado Realty Trust, 2000 to 2011 | | Interface Inc. |
| | Merrillyn J. Kosier Age: 54 | | Trustee and Vice President | | Indefinite, until successor elected
Trustee since 2003;
Vice President since 1999 | | Executive Vice President, Ariel Investments since 1999; Chief Marketing Officer, Mutual Funds since 2007 | | |
| | William M. Lewis, Jr. Age: 57 | | Trustee, Member of Management Contracts Committee | | Indefinite, until successor elected
Trustee since 2007 | | Managing Director and Co-Chairman of Investment Banking, Lazard Ltd. since 2004 | | Darden Restaurants, Inc. |
| | H. Carl McCall Age: 78 | | Trustee, Chairman of Governance Committee, Member of Management Contracts and Audit Committees | | Indefinite, until successor elected
Trustee since 2006 | | Principal, Convent Capital, LLC since 2004 | | |
| | John W. Rogers, Jr. Age: 56 | | Trustee | | Indefinite, until successor elected
Trustee, 1986 to 1993 and since 2000 | | Founder, Chairman, CEO and Chief Investment Officer, Ariel Investments since 1983; Lead Portfolio Manager, Ariel Fund since 1986; Co-Portfolio Manager, Ariel Appreciation Fund since 2002 | | Exelon Corporation, McDonald’s Corporation |
| | James M. Williams Age: 66 | | Trustee, Chairman of Management Contracts Committee, Member of Governance Committee | | Indefinite, until successor elected
Trustee since 2006 | | Vice President and Chief Investment Officer, J. Paul Getty Trust since 2002 | | SEI Mutual Funds |
TRUSTEES EMERITUS (no Trustee duties or responsibilities) |
| |
| John G. Guffey, Jr. |
Bert N. Mitchell, CPA, Chairman |
Note: Number of portfolios in complex overseen by all Trustees is six. Address for all Trustees is 200 East Randolph Street, Suite 2900, Chicago, IL 60601.
| | Name and age | | Position(s) held with Fund | | Term of office and length of time served | | Principal occupation(s) during past 5 years | | Other directorships |
| | Mareile B. Cusack Age: 55 | | Vice President, Anti-Money Laundering Officer and Secretary | | Indefinite, until successor elected
Vice President since 2008; Anti-Money Laundering Officer since 2010; Secretary since 2014; Assistant Secretary, 2008 to 2014 | | Senior Vice President, Ariel Investments since 2012; Vice President, Ariel Investments, 2007-2012; General Counsel, Ariel Investments since 2008 | | |
| | Wendy D. Fox Age: 51 | | Chief Compliance Officer and Vice President | | Indefinite, until successor elected
Chief Compliance Officer and Vice President since 2014 | | Chief Compliance Officer and Vice President, Ariel Investments since 2004 | | |
| | Mellody L. Hobson Age: 44 | | Chairman of the Board of Trustees and President, Member of Executive Committee | | Indefinite, until successor elected
Trustee since 1993;
President since 2002;
Chairman since 2006 | | President, Ariel Investments since 2000 | | DreamWorks Animation SKG, Inc. (Chairman), The Estée Lauder Companies Inc., Starbucks Corporation |
| | Merrillyn J. Kosier Age: 54 | | Trustee and Vice President | | Indefinite, until successor elected
Trustee since 2003;
Vice President since 1999 | | Executive Vice President, Ariel Investments since 1999; Chief Marketing Officer, Mutual Funds since 2007 | | |
| | Jeffrey H. Rapaport Age: 38 | | Chief Financial Officer, Vice President and Treasurer | | Indefinite, until successor elected
Chief Financial Officer and Treasurer since 2014; Vice President since 2010; Assistant Treasurer, 2010 to 2014 | | Vice President, Fund Administration since 2010; Senior Fund Administration Analyst, Ariel Investments, 2007-2010 | | |
The Statement of Additional Information (SAI) for Ariel Investment Trust includes additional information about the Funds’ Trustees and Officers. The SAI is available without charge by calling 800.292.7435 or logging on to our website, arielinvestments.com. Note: Number of portfolios in complex overseen by all Officers is six. Address for all officers is 200 East Randolph Street, Suite 2900, Chicago, IL 60601.
Ariel Investment Trust
c/o U.S. Bancorp Fund Services, LLC
P.O. Box 701
Milwaukee, WI 53201-0701
800.292.7435 toll-free
arielinvestments.com
Follow us on Twitter @ArielFunds
 | Slow and steady wins the race. | TPI (160,000) ©05/14 AI–01 |
Item 2. Code of Ethics.
Not applicable. The information required by this Item is only required in an annual report on Form N-CSR.
Item 3. Audit Committee Financial Expert.
Not applicable. The information required by this Item is only required in an annual report on Form N-CSR.
Item 4. Principal Accountant Fees and Services.
Not applicable. The information required by this Item is only required in an annual report on Form N-CSR.
Item 5. Audit Committee of Listed Registrants.
Not applicable.
Item 6. Schedule of Investments.
(a) Included as part of the report to shareholders filed under Item 1 of this Form.
(b) Not applicable.
Item 7. Disclosure of Proxy Voting Policies and Procedures for Closed-End Management Investment Companies.
Not applicable.
Item 8. Portfolio Managers of Closed-End Management Investment Companies.
Not applicable.
Item 9. Purchases of Equity Securities by Closed-End Management Investment Company and Affiliated Purchasers.
Not applicable.
Item 10. Submission of Matters to a Vote of Security Holders.
There have been no changes to the procedures by which shareholders may recommend nominees to the registrant’s Board of Trustees.
Item 11. Controls and Procedures.
Item 12. Exhibits.
Pursuant to the requirements of the Securities Exchange Act of 1934 and the Investment Company Act of 1940, the registrant has duly caused this report to be signed on its behalf by the undersigned, thereunto duly authorized.
Pursuant to the requirements of the Securities Exchange Act of 1934 and the Investment Company Act of 1940, this report has been signed below by the following persons on behalf of the registrant and in the capacities and on the dates indicated.