As filed with the Securities and Exchange Commission on May 18, 2012
UNITED STATES
SECURITIES AND EXCHANGE COMMISSION
Washington, D.C. 20549
FORM N-CSR
CERTIFIED SHAREHOLDER REPORT OF REGISTERED
MANAGEMENT INVESTMENT COMPANIES
Investment Company Act File Number 811-4786
Ariel Investment Trust
(Exact name of registrant as specified in charter)
200 East Randolph Drive
Suite 2900
Chicago, Illinois, 60601
(Address of principal executive offices) (Zip code)
Mareile Cusack
200 East Randolph Drive
Suite 2900
Chicago, Illinois 60601
(Name and address of agent for service)
with a copy to:
Arthur Don, Esq.
Greenberg Traurig, LLP
77 West Wacker Drive
Suite 3100
Chicago, IL 60601
Registrant's telephone number, including area code: (312) 726-0140
Date of fiscal year end: September 30, 2012
Date of reporting period: March 31, 2012
Item 1. Reports to Stockholders.
The following is a copy of the report transmitted to shareholders pursuant to Rule 30e-1 under the Investment Company Act of 1940 (the “Act”) (17 CFR 270.30e-1)

| | One of Ariel Investments’ guiding principles is to communicate openly with our shareholders so they may gain a clear understanding of our investment philosophy, portfolio decisions and results, as well as our opinions on the underlying market. In reviewing the materials contained in The Patient Investor, please consider the information provided on this page. While our investment decisions are rooted in detailed analysis, it is important to point out that actual results can differ significantly from those we seek. We candidly discuss a number of individual companies. Our opinions are current as of the date they were written but are subject to change. We want to remind investors that the information in this report is not sufficient on which to base an investment decision and should not be considered a recommendation to purchase or sell any particular security. Ariel Fund, Ariel Appreciation Fund and Ariel Discovery Fund invest primarily in small and/or midsized companies. Investing in small and mid-cap stocks is riskier and more volatile than investing in large cap stocks, in part because smaller companies may not have the scale, depth of resources and other assets of larger firms. Ariel Fund and Ariel Appreciation Fund often invest a significant portion of their assets in companies within the consumer discretionary and financial services sectors and their performance may suffer if these sectors underperform the overall stock market. Ariel Focus Fund invests in large-capitalization stocks and is a non-diversified fund, which means its investments are concentrated in fewer names than diversified funds. Ariel Focus Fund generally holds 25-30 stocks and therefore may be more volatile than a more diversified investment. Equity investments are affected by market conditions. Ariel International Equity Fund and Ariel Global Equity Fund invest in foreign securities and may use currency derivatives and ETFs. Investments in foreign securities may underperform and may be more volatile than comparable U.S. stocks because of the risks involving foreign economies and markets, foreign political systems, foreign regulatory standards, foreign currencies and taxes. The use of currency derivatives and ETFs may increase investment losses and expenses and create more volatility. Investments in emerging and developing markets present additional risks, such as difficulties selling on a timely basis and at an acceptable price. The Ariel International Equity Fund and the Ariel Global Equity Fund are new with no operating history and there can be no assurance that they will grow to economically viable sizes. Investors should consider carefully the investment objectives, risks, and charges and expenses before investing. For a current summary prospectus or full prospectus which contains this and other information about the Funds offered by Ariel Investment Trust, call us at 800.292.7435 or visit our website, arielinvestments.com. Please read the summary prospectus or full prospectus carefully before investing. Distributed by Ariel Distributors, LLC, a wholly owned subsidiary of Ariel Investments, LLC. ARIEL INVESTMENT TRUST
c/o U.S. Bancorp Fund Services, LLC
P.O. Box 701
Milwaukee, WI 53201-0701
800.292.7435 | arielinvestments.com | |

Turtle Talk Lipper ranks Ariel Fund #1 in the mid-cap core category*
2012 is off to a great start with our domestic portfolios strongly outperforming their benchmarks, landing well within the top 10% of their Lipper categories. Following a very difficult investment environment that began in 2008, we are pleased that Ariel Fund ranks #1 out of 268 funds in the mid-cap core category for the three-year period ending March 31, 2012. During the same period, Lipper ranks Ariel Appreciation Fund #5 out of 620 funds in the multi-cap core category, and Ariel Focus Fund ranks #34 out of 469 in the large-cap value category. While these short-term returns are encouraging, as patient investors we continue to focus on the long term. Therefore, it is rewarding to see that since its inception through March 31, 2012, Ariel Fund ranks #3 out of just 10 mid-cap core funds. With only 10 funds with histories long enough to date back to Ariel Fund’s November 6, 1986 inception, our position within this group is certainly a testament to our patient approach to investing.
*Past performance is no guarantee of future results. Lipper, Inc. is a nationally recognized organization that reports performance and calculates rankings for mutual funds. Each fund is ranked within a universe of funds with similar investment objectives. Ranking is based on total returns. The rankings above are for the Investor Class shares of Ariel Fund, Ariel Appreciation Fund and Ariel Focus Fund.
| | Performance data quoted represents past performance. Past performance does not guarantee future results. All performance assumes the reinvestment of dividends and capital gains. The investment return and principal value of an investment will fluctuate so that an investor’s shares, when redeemed, may be worth more or less than their original cost. Current performance may be lower or higher than the performance data quoted. Performance data current to the most recent month-end for Ariel Fund and Ariel Appreciation Fund may be obtained by visiting arielinvestments.com. | |
Dear Fellow Shareholder: For the first quarter ended March 31, 2012, Ariel Fund (Investor Class) rose +14.57% versus +11.52% for the Russell 2500 Value Index, +11.59% for the Russell 2000 Value Index and +12.99% for the Russell 2500 Index. Ariel Appreciation Fund (Investor Class) surged 16.25% during the first quarter versus +11.41% for the Russell Midcap Value Index and +12.94% for the Russell Midcap Index. Across the board, stocks were strong as also evidenced by the broad market—the S&P 500 Index rose +12.59% during the three-month period. While some find the best first quarter in 14 years noteworthy, we are most struck by the fact that these returns come on the heels of an equally impressive fourth quarter when the S&P 500 Index jumped +11.82% and our own portfolios saw returns in the high teens.
Against this backdrop, the market has totally reversed course after the precipitous drop last Fall when fears of a double dip recession ensued following the U.S. debt downgrade and the 2.0 version of Europe’s sovereign debt crisis. As Barron’s wisely noted, “the first quarter’s resounding rally was really just a repudiation of last year’s recession fears…the 50 S&P 500 stocks that fared the worst in 2011 rebounded +23.8% in the first quarter, while the 50 that held up the best climbed just +10.5%…And the most heavily shorted posse jumped +18.1%, while the least-reviled group gained just +9.7%.”1 In Ariel Fund, our most downtrodden financial services names have morphed into our very best performers—not surprising since these high-quality gems were dramatically oversold six months ago. In Ariel Appreciation Fund, the health care and financial stocks that were indiscriminately punished are now leading the pack with stellar returns. And although consumer stocks were the top performers in the Russell 2000 Value and Russell 2500 Value indices and the second best performing group in the Russell Midcap Value Index during the first quarter, our consumer names were our weakest contributors—mostly because they held up better during last year’s market lows.
Triple Play
Recently, the Los Angeles Dodgers sold for an eye-popping $2 billion to a consortium including Magic Johnson. The final figure exceeded all expectations—more than double the price the Chicago Cubs fetched in 2009. At one point in time, that bid might have seemed like a huge stretch. But today it says a lot about the immense value of television rights. After all, the Dodgers auction came shortly after Matt Kemp appeared on the cover of Forbes in an article that connected his $160 million contract to a regional sports network deal likely to be worth $3.5 billion over 20 years. The relationship between money and sports has a storied history that is constantly shifting. Even though the business of sports inevitably attracts an abundance of attention given its larger-than-life athletes and wealthy owners, as value investors, we have been able to identify some unique investment opportunities (directly and indirectly related to sports) that play to our strengths and land squarely within our circle of competence.
| | | |
| The Patient Investor March 31, 2012 | 2 | Slow and Steady Wins the Race |
The key to our enthusiasm derives from the fact that sports sits in the sweet spot of technology, media and even real estate. While we have never professed any high-tech expertise, there is no question that recent breakthroughs have made sports more ubiquitous in the last few years. Television, cable and satellite mean more games are available than ever before. Not to mention, watching them in high definition (HD) vastly improves the product. At one time a simple score would suffice but with the proliferation of mobile devices like smart phones, tablets and laptops, devoted fans can now travel the world following their favorite teams live.
When we invest, we are constantly looking for businesses with wide moats that make it hard for new competition to break in. This is where we get excited since sports are somewhat insulated from the disruptive forces that have made some media cash cows less profitable. In television, the DVR has wreaked havoc on traditional advertising. Instead of watching commercial after commercial during our favorite shows, we fast forward through the ads with remote in hand. This phenomenon does not exist with sports because fans prefer to watch games live. Also, while many turn to the Internet to get free news and entertainment—people are willing to pay for sports. We buy pricey tickets to see games in person and are even willing to pay to watch athletes play on TV. For example, it is hard to see National Hockey League games without a pay television service. Similarly, with Monday Night Football on ESPN, viewers pay a charge on their cable or satellite TV bills. Escalating television sports contracts underscore this point. In December 2011, for instance, the National Football League signed a new 9-year deal with CBS Corp. (CBS), Fox and NBC that represents a 60% revenue increase over the current $4 billion annual take.
Herein lies the opportunity for our portfolios. As seasoned media investors, our deep knowledge of their revenue streams as well as their recent challenges puts us in a unique position to assess the opportunities at hand. This hard-learned media expertise has given us insight into the value of those assets that maintain or increase revenues in a world where the top line is often volatile and sometimes sliding. We are also employing the knowledge we have gained in real estate from companies such as Jones Lang LaSalle Inc. (JLL) and CBRE Group, Inc. (CBG). Real estate is an unusual asset because it can be tricky to estimate its current value, and also because savvy managers can wring far more value out of it than others can.
For all these reasons, we bought shares of one of the world’s most famous sports venues last year—Madison Square Garden Co. (MSG). One part of our attraction was the fact that so few realize that it recently became a publicly traded company. Having been spun off from Cablevision Systems Corp. (CVC) in 2010, MSG includes the Garden, two regional sports networks, as well as the New York Knicks, the New York Rangers, and a variety of other venues and businesses. One of the main overhangs on the stock is the admittedly huge cost related to a massive upgrade of Madison Square Garden itself. With estimates running as high as $1 billion, the market is skeptical, but a tour of the under-construction facilities more than convinced us the dollars represent money well spent. The facilities will be spectacular when all is said and done. We are further reassured about the expense when one considers that even in the worst economic downturn, fans continued to pay for premium tickets to live sporting events. Additionally, there is no better moat since the scale of the Garden simply cannot be duplicated in Manhattan today. Even though it gained nearly +20% in the past quarter, we think it still trades at a 21% discount to intrinsic value today.
3

CBS and Gannett Co., Inc. (GCI) represent more of a back-door sports play. CBS, a holding in Ariel Appreciation Fund, currently has five of the top-10 rated shows in the country, the most of any network—as well as a topnotch sports franchise. Among other offerings, it currently hosts the NFL, PGA golf, the NCAA basketball tournament, and SEC (Southeastern Conference) college football. Moreover, the network has successfully made itself synonymous with watching these premier events on television. Even though it has gained more than 25% in the last quarter, we estimate it still trades at a double-digit discount to intrinsic value. While many continue to think Gannett, a holding in Ariel Fund and Ariel Appreciation Fund, is limited to USA Today, it is truly a diversified media company. A few of us recently attended their analyst day, where their small-town papers got a lot of play because Americans love their small-town sports and read the local paper to get the best coverage of these events. Additionally, the company’s 23 television stations carry live sports.
As a forward-thinking company, Gannett is working hard to monetize other parts of the sports craze. For instance, it recently devoted a chunk of its free cash flow to buy BaseballHQ.com, a fantasy sports website. Gannett trades at just 7x consensus 2012 earnings, which we think remains quite a bargain.
For us, the sports theme feels like a triple-play: the trend is clear in the social and entertainment world, remains unappreciated—and thus undervalued—in the investing world, and falls right in the center of our circle of competence.
Portfolio comings and goings
We did not purchase any new holdings in Ariel Fund during the quarter, but we eliminated our position in Herman Miller, Inc. (MLHR) in order to pursue more compelling opportunities. In Ariel Appreciation Fund, we did not purchase any new holdings during the quarter, but we eliminated our position in Mattel, Inc. (MAT) in order to pursue more compelling opportunities.
We appreciate the opportunity to serve you and welcome your questions or comments. Feel free to contact us at email@arielinvestments.com. Lastly, we recently posted new videos to our website featuring our investment team and hope you enjoy them.
1 Barron’s, April 16, 2012, page 13.
| | | |
| arielinvestments.com | 4 | 800.292.7435 |
| | |
| Ariel Fund Performance Summary | Inception: November 6, 1986 |
| | ABOUT THE FUND |
| | The Fund pursues long-term capital appreciation by investing in small- to medium-sized companies. |
| | |
| | |
| | |
| | |
AVERAGE ANNUAL TOTAL RETURNS as of March 31, 2012 | |
| | | 1st Quarter | | 1 Year | | 3 Year | | 5 Year | | 10 Year | | 15 Year | | Life of Fund | |
| Ariel Fund | | | | | | | | | | | | | | | | | | | | | | |
| Investor Class | | | 14.57% | | | -6.56% | | | 35.58% | | | 0.46% | | | 5.00% | | | 8.93% | | | 10.87% | |
Institutional Class+ | | | 14.66% | | | -6.49% | | | 35.62% | | | 0.48% | | | 5.01% | | | 8.93% | | | 10.88% | |
Russell 2500TM Value Index | | | 11.52% | | | 0.09% | | | 27.09% | | | 1.00% | | | 7.46% | | | 9.46% | | | 11.08% | |
Russell 2000® Value Index* | | | 11.59% | | | -1.07% | | | 25.36% | | | 0.01% | | | 6.59% | | | 8.79% | | | 10.40% | |
Russell 2500TM Index | | | 12.99% | | | 1.33% | | | 28.42% | | | 3.03% | | | 7.49% | | | 8.94% | | | 10.44% | |
S&P 500® Index | | | 12.59% | | | 8.54% | | | 23.42% | | | 2.01% | | | 4.12% | | | 6.10% | | | 9.63% | |
Performance data quoted represents past performance and does not guarantee future results. The investment return and principal value of an investment will fluctuate so that an investor’s shares, when redeemed, may be worth more or less than their original cost. Current performance may be lower or higher than the performance data quoted. To access performance data current to the most recent month-end, visit arielinvestments.com.
*One of the Fund’s benchmarks has changed from the Russell 2500 Index to the Russell 2000 Value Index as the Adviser believes this new index is more indicative of the market capitalization and style profile of the Fund.
| COMPOSITION OF EQUITY HOLDINGS (%) |
| | | Russell | Russell | |
| | | 2500 | 2000 | S&P |
| | Ariel | Value | Value | 500 |
| | Fund† | Index | Index | Index |
| | | | | |
| Consumer discretionary | 35.95 | 13.66 | 12.48 | 12.73 |
| | | | | |
| Financial services | 29.98 | 34.54 | 37.55 | 16.08 |
| | | | | |
| Health care | 14.18 | 5.44 | 5.14 | 11.24 |
| | | | | |
| Producer durables | 7.30 | 13.96 | 14.56 | 10.89 |
| | | | | |
| Consumer staples | 4.92 | 2.93 | 2.83 | 9.44 |
| | | | | |
| Materials & processing | 4.51 | 7.06 | 7.02 | 3.82 |
| | | | | |
| Energy | 3.16 | 3.47 | 3.71 | 11.25 |
| | | | | |
| Technology | 0.00 | 8.51 | 9.70 | 18.48 |
| | | | | |
| Utilities | 0.00 | 10.42 | 7.01 | 6.08 |
| † | Sector weightings are calculated based on equity holdings in the Fund and exclude cash in order to make a relevant comparison to the indexes. |
| | | | | |
| Expense Ratio | | | | |
| Investor Class | | | 1.04 % |
| Institutional Class | | | 0.79 % |
| As of 9/30/11 (Investor Class). The expense ratio for the Institutional Class is based on estimated expenses for the current fiscal year. |
| | | | | | | | | | | | |
| TOP TEN EQUITY HOLDINGS | |
| | | | | | | | | | | | |
| 1 | Gannett Co., Inc. | | 4.0 | % | | 6 | | Jones Lang LaSalle Inc. | | 3.7 | % |
| 2 | Charles River Laboratories Intl Inc. | | 3.9 | % | | 7 | | Fair Isaac Corp. | | 3.7 | % |
| 3 | Janus Capital Group Inc. | | 3.9 | % | | 8 | | International Game Technology | | 3.6 | % |
| 4 | Interpublic Group of Cos., Inc. | | 3.8 | % | | 9 | | First American Financial Corp. | | 3.6 | % |
| 5 | Lazard Ltd | | 3.8 | % | | 10 | | Zimmer Holdings, Inc. | | 3.5 | % |
+The inception date for the Institutional Class shares is December 30, 2011. Performance information for the Institutional Class prior to that date reflects the actual performance of the Fund’s Investor Class (and uses the actual expenses of the Fund’s Investor Class, for such period of time), without any adjustments. For any such period of time, the performance of the Fund’s Institutional Class would have been substantially similar to, yet higher than, the performance of the Fund’s Investor Class, because the shares of both classes are invested in the same portfolio of securities, but the classes bear different expenses, which are primarily differences in distribution and service fees. Notes: The graph and performance table do not reflect the deduction of taxes that a shareholder would pay on fund distributions or the redemption of fund shares. The Russell 2500TM Value Index measures the performance of small to mid-cap value companies with lower price-to-book ratios and lower forecasted growth values. The Russell 2000® Value Index measures the performance of the small-cap value segment of the U.S. equity universe. It includes those Russell 2000 companies with lower price-to-book ratios and lower forecasted growth values. The Russell 2500TM Index measures the performance of small to mid-cap companies. The S&P 500® is a broad market-weighted index dominated by blue-chip stocks. All indexes are unmanaged, and an investor cannot invest directly in an index. Total return does not reflect a maximum 4.75% sales load charged prior to 7/15/94.
5
| | |
| Ariel Appreciation Fund Performance Summary | Inception: December 1, 1989 |
| | ABOUT THE FUND |
| | The Fund pursues long-term capital appreciation by investing in medium-sized companies. |
| | |
| | |
| | |
| | |
| | | | | | | | | | | | | | | | | | | | | | | |
AVERAGE ANNUAL TOTAL RETURNS as of March 31, 2012 | |
| | | 1st Quarter | | 1 Year | | 3 Year | | 5 Year | | 10 Year | | 15 Year | | Life of Fund | |
| Ariel Appreciation Fund | | | | | | | | | | | | | | | | | | | | | | |
| Investor Class | | | 16.25% | | | 0.66% | | | 33.54% | | | 3.78% | | | 5.53% | | | 9.85% | | | 10.47% | |
Institutional Class+ | | | 16.36% | | | 0.75% | | | 33.58% | | | 3.79% | | | 5.54% | | | 9.85% | | | 10.48% | |
Russell Midcap® Value Index | | | 11.41% | | | 2.28% | | | 29.18% | | | 1.26% | | | 8.02% | | | 9.58% | | | 11.10% | |
Russell Midcap® Index | | | 12.94% | | | 3.31% | | | 29.13% | | | 3.03% | | | 7.85% | | | 9.38% | | | 10.92% | |
S&P 500® Index | | | 12.59% | | | 8.54% | | | 23.42% | | | 2.01% | | | 4.12% | | | 6.10% | | | 8.72% | |
Performance data quoted represents past performance and does not guarantee future results. The investment return and principal value of an investment will fluctuate so that an investor’s shares, when redeemed, may be worth more or less than their original cost. Current performance may be lower or higher than the performance data quoted. To access performance data current to the most recent month-end, visit arielinvestments.com.
| COMPOSITION OF EQUITY HOLDINGS (%) | | |
| | | Russell | | |
| | Ariel | Midcap | Russell | S&P |
| | Appreciation | Value | Midcap | 500 |
| | Fund† | Index | Index | Index |
| | | | | |
| Consumer discretionary | 37.95 | 12.68 | 17.08 | 12.73 |
| | | | | |
| Financial services | 34.48 | 33.05 | 21.07 | 16.08 |
| | | | | |
| Health care | 13.66 | 6.13 | 9.05 | 11.24 |
| | | | | |
| Producer durables | 4.51 | 10.18 | 12.87 | 10.89 |
| | | | | |
| Technology | 3.99 | 6.91 | 11.72 | 18.48 |
| | | | | |
| Energy | 3.16 | 5.65 | 7.39 | 11.25 |
| | | | | |
| Consumer staples | 2.25 | 6.65 | 6.06 | 9.44 |
| | | | | |
| Materials & processing | 0.00 | 5.00 | 7.44 | 3.82 |
| | | | | |
| Utilities | 0.00 | 13.75 | 7.31 | 6.08 |
| † | Sector weightings are calculated based on equity holdings in the Fund and exclude cash in order to make a relevant comparison to the indexes. |
| | | | |
| Expense Ratio | | | | |
| Investor Class | | | 1.15 % |
| Institutional Class | | | 0.90 % |
| As of 9/30/11 (Investor Class). The expense ratio for the Institutional Class is based on estimated expenses for the current fiscal year. |
| TOP TEN EQUITY HOLDINGS | |
| | | | | | | | | | | | | |
| 1 | Northern Trust Corp. | | | 4.1 | % | | 6 | First American Financial Corp. | | | 3.6 | % |
| 2 | AFLAC Inc. | | | 4.0 | % | | 7 | Lazard Ltd | | | 3.6 | % |
| 3 | CBS Corp. | | | 4.0 | % | | 8 | Jones Lang LaSalle Inc. | | | 3.4 | % |
| 4 | Dell Inc. | | | 3.9 | % | | 9 | Thermo Fisher Scientific Inc. | | | 3.3 | % |
| 5 | Viacom, Inc. | | | 3.7 | % | | 10 | Interpublic Group of Cos., Inc. | | | 3.3 | % |
+The inception date for the Institutional Class shares is December 30, 2011. Performance information for the Institutional Class prior to that date reflects the actual performance of the Fund’s Investor Class (and uses the actual expenses of the Fund’s Investor Class, for such period of time), without any adjustments. For any such period of time, the performance of the Fund’s Institutional Class would have been substantially similar to, yet higher than, the performance of the Fund’s Investor Class, because the shares of both classes are invested in the same portfolio of securities, but the classes bear different expenses, which are primarily differences in distribution and service fees. Notes: The graph and performance table do not reflect the deduction of taxes that a shareholder would pay on fund distributions or the redemption of fund shares. The Russell Midcap® Value Index measures the performance of mid-cap value companies with lower price-to-book ratios and lower forecasted growth values. The Russell Midcap® Index measures the performance of mid-cap companies. The S&P 500® is a broad market-weighted index dominated by blue-chip stocks. All indexes are unmanaged, and an investor cannot invest directly in an index. Total return does not reflect a maximum 4.75% sales load charged prior to 7/15/94.
| arielinvestments.com | 6 | 800.292.7435 |
| | Performance data quoted represents past performance. Past performance does not guarantee future results. All performance assumes the reinvestment of dividends and capital gains. The investment return and principal value of an investment will fluctuate so that an investor’s shares, when redeemed, may be worth more or less than their original cost. Current performance may be lower or higher than the performance data quoted. Performance data current to the most recent month-end for Ariel Focus Fund may be obtained by visiting arielinvestments.com. | |
Dear Fellow Shareholder: Ariel Focus Fund posted strong results in the first quarter of 2012 on both an absolute and a relative basis. During the quarter ended March 31, 2012, Ariel Focus Fund (Investor Class) rose +14.26% versus an increase of +11.12% for its primary benchmark the Russell 1000 Value Index and +12.59% for the S&P 500 Index.
In this year’s first quarter, our large bank stocks performed particularly well, although over the full holding period for the portfolio they remain laggards. We have discussed in previous letters that certain financial stocks, in particular the investment banks, were trading at attractive valuations. Morgan Stanley (MS), Goldman, Sachs & Co. (GS), Citigroup Inc. (C) and JPMorgan Chase & Co. (JPM) all ended 2011 trading at discounts to their book values: in the extreme cases of Morgan Stanley and Citigroup, substantial discounts of more than 40%. During the first quarter, all four of these companies’ stock prices surged between +30% to +40%. The general explanation for the strong performance of financial services stocks so far this year has been the relatively benign developments around the European sovereign debt crisis. However, we believe strong negative sentiment around these companies provided an opportunity. The phrase “crowded trade” has been coined to describe situations where many institutional investors buy into the same investment thesis and purchase the same stocks. Late last year being bullish on the investment banks was just the opposite—a “lonely trade.”
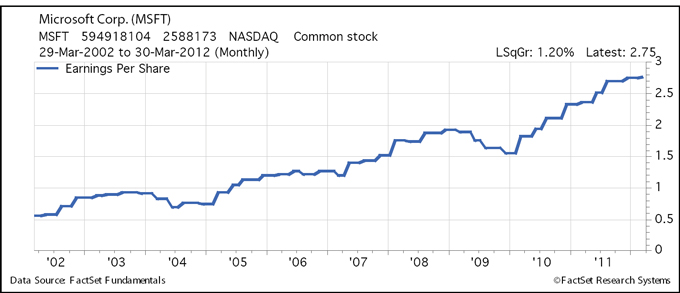
The second important theme that worked for us was our technology position. One way to describe our strategy in technology is “unloved tech.” We own several large technology companies with the following defining characteristics: they are highly profitable and growing, yet they trade at low multiples relative to their earnings. Microsoft Corp. (MSFT), our largest position at year end, rose +25% during the quarter. Microsoft continues to be a company and stock that many love to hate. The common perception is that the company has been ‘dead money’ with a bleak future to match its past stock performance. From our vantage point, the dead money perception works to our advantage as investors overlook the underlying growth of the business.
On the following page is a chart of Microsoft ’s earnings per share over the last 10 years, a period in which the company has faced tough competition from new form factors and technologies. Trailing 12-month EPS has grown from $0.53 in 2002 to $2.76 for the latest 12 months, a compound annual growth rate of approximately 18%. Taken as a whole, there has been nothing wrong with Microsoft ’s performance as a business over the last decade. The stock price went nowhere for much of the past 10 years because it was overvalued in our opinion. It was not overvalued when we bought it in Ariel Focus Fund in September 2010, and it is not overvalued today trading at nearly 11x our estimate of forward EPS of $2.86. Furthermore, when one adjusts for the more than $5.50 of net cash per share on the balance sheet, we believe the company is trading at roughly 9x forward earnings, well below the market multiple of over 12x.
7
Besides Microsoft, our other tech stocks also performed well in the quarter. Accenture plc (ACN), International Business Machines Corp. (IBM) and Dell Inc. (DELL) were up +21.17%, +13.91% and +13.43% respectively, all ahead of the market.
The area that hurt performance most during the quarter was for-profit education. Both Apollo Group, Inc. (APOL) and DeVry Inc. (DV) traded down sharply, -28.27% and -11.93%, respectively. A year ago, the industry was suffering from severe negative publicity arising from proposed new federal regulations and changes in methods that schools could use to measure their recruiters productivity. Coming into this year, we believed these companies had turned an important corner and would start showing increases in student enrollment.
Unfortunately, this expectation has not been met. Prolonged high unemployment combined with a sluggish economic recovery has potential students postponing decisions to attain post-secondary education. Both Apollo and DeVry reported a continued decline in student starts in the first quarter.
In addition, the operating leverage which works so well when enrollments are growing has the opposite effect when the number of students is declining. The modest additional cost of adding “a student to the back of a class room” materially boosts margins with each additional student but provides a major headwind to operating profitability when student counts fall.
The for-profit education industry has always been subject to cyclicality, both in terms of investor sentiment and actual operating results. However, the core positives for the business remain intact. The number of people attending college has grown steadily and will continue to do so. Non-traditional college students (e.g., working adults, members of the military returning to civilian life, etc.) are growing as a percentage of college students and for-profit schools have always enjoyed a high market share in this category. Finally, government support for state schools and community colleges will continue to be pressured resulting in higher tuition rates for the main for-profit competitors. These are highly profitable businesses that we believe will be larger five years from now than they are today. It may be bumpy between now and then, but we are in the business of being patient.
| | | |
| arielinvestments.com | 8 | 800.292.7435 |
Portfolio Comings and Goings
During the quarter, we initiated a new position in Snap-on Inc. (SNA). Snap-on is a leading manufacturer of tools and diagnostic equipment for independent car repair centers and mechanics. Snap-on has many of the attributes we look for in a company and a stock. First, it has a great brand and reputation with its customers producing a leading market share position. Second, it demonstrates positive industry growth characteristics as independent repair shops gain share from the increasing average life of cars. Finally, we prefer to buy stocks that temporarily trade at a sharp discount to intrinsic value due to bad short-term news.

In the case of Snap-on, the company was forced to bring its financing operations onto its own books when its finance partner had difficulties in 2009. As a result, Snap-on’s results have been affected by this new finance business. We have spent significant time with management and believe the finance operations are strong and do not represent a significant risk to shareholder value. We are very excited about Snap-on and believe it will be a “sneaky grower” over the next five to 10 years, posting better operating results than the market expects.
We exited our position in Carnival Corp. (CCL) during the quarter. We have held Carnival since 2005, the year we launched Ariel Focus Fund. Carnival undeniably remains the industry leader, but within a tightly focused portfolio such as this one, we believed other companies offered greater opportunities.
We appreciate the opportunity to serve you and welcome your questions or comments. Feel free to contact us at email@arielinvestments.com. Lastly, we recently posted new videos to our website featuring our investment team and hope you enjoy them.
9
| | |
| Ariel Focus Fund Performance Summary | Inception: June 30, 2005 |
| | ABOUT THE FUND |
| | The Fund pursues long-term capital appreciation by investing in medium-to large-sized companies. |
| | |
| | |
| | |
| | |
| | | | | | | | | | | | | | | | | |
AVERAGE ANNUAL TOTAL RETURNS as of March 31, 2012 | |
| | | | 1st Quarter | | | 1 Year | | | 3 Year | | | 5 Year | | | Life of Fund | |
| Ariel Focus Fund | | | | | | | | | | | | | | | | |
| Investor Class | | | 14.26% | | | 3.63% | | | 23.77% | | | 0.53% | | | 2.72% | |
Institutional Class+ | | | 14.36% | | | 3.72% | | | 23.80% | | | 0.55% | | | 2.73% | |
Russell 1000® Value Index | | | 11.12% | | | 4.79% | | | 22.82% | | | -0.81% | | | 3.36% | |
S&P 500® Index | | | 12.59% | | | 8.54% | | | 23.42% | | | 2.01% | | | 4.68% | |
Performance data quoted represents past performance and does not guarantee future results. The investment return and principal value of an investment will fluctuate so that an investor’s shares, when redeemed, may be worth more or less than their original cost. Current performance may be lower or higher than the performance data quoted. To access performance data current to the most recent month-end, visit arielinvestments.com.
| | | | |
| COMPOSITION OF EQUITY HOLDINGS (%) |
| | | Russell | |
| | Ariel | 1000 | S&P |
| | Focus | Value | 500 |
| | Fund† | Index | Index |
| | | | |
| Financial services | 29.08 | 27.73 | 16.08 |
| | | | |
| Consumer discretionary | 16.14 | 10.11 | 12.73 |
| | | | |
| Technology | 15.62 | 7.75 | 18.48 |
| | | | |
| Health care | 15.00 | 12.32 | 11.24 |
| | | | |
| Producer durables | 12.24 | 9.06 | 10.89 |
| | | | |
| Energy | 8.64 | 11.53 | 11.25 |
| | | | |
| Consumer staples | 3.28 | 7.33 | 9.44 |
| | | | |
| Materials & processing | 0.00 | 2.73 | 3.82 |
| | | | |
| Utilities | 0.00 | 11.45 | 6.08 |
| † | Sector weightings are calculated based on equity holdings in the Fund and exclude cash in order to make a relevant comparison to the indexes. |
| | | | | | | |
| Expense Ratio* | Investor Class | | Institutional Class |
| Net | | 1.25% | | | 1.00% | |
| Gross | | 1.51% | | | 1.26% | |
| As of 9/30/11 (Investor Class). The expense ratio for the Institutional Class is based on estimated expenses for the current fiscal year. |
| TOP TEN EQUITY HOLDINGS | |
| | | | | | | | | | | | | |
| 1 | Microsoft Corp. | | | 6.4 | % | | 6 | Exxon Mobil Corp. | | | 4.4 | % |
| 2 | Target Corp. | | | 5.7 | % | | 7 | Tyco Intl Ltd. | | | 4.4 | % |
| 3 | Dell Inc. | | | 5.5 | % | | 8 | Omnicom Group Inc. | | | 4.2 | % |
| 4 | Zimmer Holdings, Inc. | | | 4.7 | % | | 9 | Goldman, Sachs & Co. | | | 4.1 | % |
| 5 | Lockheed Martin Corp. | | | 4.5 | % | | 10 | Johnson & Johnson | | | 4.0 | % |
+ The inception date for the Institutional Class shares is December 30, 2011. Performance information for the Institutional Class prior to that date reflects the actual performance of the Fund’s Investor Class (and uses the actual expenses of the Fund’s Investor Class, for such period of time), without any adjustments. For any such period of time, the performance of the Fund’s Institutional Class would have been substantially similar to, yet higher than, the performance of the Fund’s Investor Class, because the shares of both classes are invested in the same portfolio of securities, but the classes bear different expenses, which are primarily differences in distribution and service fees.
*Ariel Investments, LLC, the Adviser, is contractually obligated to waive fees and reimburse expenses in order to limit Ariel Focus Fund’s total annual operating expenses to 1.25% of net assets for the Investor Class and 1.00% of net assets for the Institutional Class through the end of the fiscal year ending September 30, 2013.
Notes: The graph and performance table do not reflect the deduction of taxes that a shareholder would pay on fund distributions or the redemption of fund shares. The Russell 1000® Value Index measures the performance of large-cap value companies with lower price-to-book ratios and lower expected growth values. The S&P 500® is a broad market-weighted index dominated by blue-chip stocks. All indexes are unmanaged, and an investor cannot invest directly in an index. Ariel Focus Fund is a non-diversified fund and therefore may be subject to greater volatility than a more diversified investment.
| | | |
| arielinvestments.com | 10 | 800.292.7435 |
| | Performance data quoted represents past performance. Past performance does not guarantee future results. All performance assumes the reinvestment of dividends and capital gains. The investment return and principal value of an investment will fluctuate so that an investor’s shares, when redeemed, may be worth more or less than their original cost. Current performance may be lower or higher than the performance data quoted. Performance data current to the most recent month-end for Ariel Discovery Fund may be obtained by visiting arielinvestments.com. | |
Dear Fellow Shareholder: After a volatile 2011, U.S. stocks pulled out a strong and steady opening quarter of 2012, with the S&P 500 Index’s +12.59% return representing its best first quarter since 1998. Small-cap value stocks had similar gains, with the Russell 2000 Value Index gaining +11.59%. Our deep value portfolio did a bit better than we would expect in such a torrid market, with our gain of +11.32%—falling just slightly short of that benchmark.
Since inception on January 31, 2011 the Investor Class has an annual return of +0.26%, compared to +4.63% for the Russell 2000 Value Index and +10.50% for the S&P 500 Index. As discussed in earlier letters, we lagged the benchmark by some 5 percentage points during the first month of the fund’s existence, and have been working to overcome that deficit for the past year or so.
Our best performers during the quarter included AV Homes, Inc. (AVHI), formerly Avatar Holdings, returning +69.64% after a difficult 2011. Littelfuse, Inc. (LFUS), purchased in the fourth quarter of 2011, gained +46.38%, and Rosetta Stone Inc. (RST), also a late 2011 addition to the portfolio, was up +35.26%. On the downside were RadioShack Corp. (RSH), which lost -34.73%, Vical Inc. (VICL), down -22.90% after more than doubling in 2011, and Orion Energy Systems, Inc. (OESX), falling -19.32%.
If we could own just one stock, what would it be? A popular investment website asks managers this question, and our answer at this time last year was Force Protection, Inc. Since the company was acquired last fall by General Dynamics Corp. (GD), we thought this would be a good time to address this theme again. While we would of course never put all of our eggs in one basket, answering this question periodically is a great way to illustrate the characteristics we seek.
As deep value investors, we look for underfollowed and misunderstood companies trading at prices that provide a “margin of safety”1 to buyers. We seek protection in asset values, with an emphasis on cash-rich, debt-free balance sheets. We also strongly favor talented and properly incentivized leadership, and we look to identify upside potential from underappreciated opportunities. Today, the stock that best embodies the combination of these traits is Pervasive software Inc. (PVSW).
Based in Austin, Texas, Pervasive is a software company focused on data innovation. The company describes its business as “software to manage, integrate and analyze data, in the cloud or on-premises, throughout the entire data life cycle.” With the explosion of data across the globe, and the need for businesses to process and analyze this data in a cost-effective, timely manner, Pervasive software operates in a truly exciting place.
| | |
| 1 | Attempting to purchase with a margin of safety on price cannot protect investors from the volatility associated with stocks, incorrect assumptions or estimations on our part, declining fundamentals or external forces. |
11
We believe Pervasive’s stock currently represents an extraordinary investment opportunity with low downside risk. With a cash-rich balance sheet, a legacy database business generating significant cash, and growth opportunities in big data – one of the hottest areas in technology – we have made Pervasive one of our largest positions. Our confidence is further enhanced by the executive team of CEO John Farr and CTO Mike Hoskins, talented leaders who also are clearly motivated by their combined 16% ownership stake.
Founded in 1982 and public since 1997, Pervasive has established a solid presence with its embedded database product, PSQL. Used by tens of thousands of customers globally, the product is sold to independent software vendors (ISVs) that embed a relational database feature in their software products. A typical customer is The Sage Group plc (SGE.L), which provides business software to small and medium-sized businesses. This is a mature business line with little growth potential but one which produces significant and dependable cash for Pervasive and has led to 44 consecutive quarters of profitability.
Revenue from this legacy division has been consistently in the range of $26 million to $29 million per year, representing nearly 60% of the company’s current sales. The strong cash flow has allowed the company to repurchase shares opportunistically, invest heavily in R&D and generate consistent profitability. We calculate the legacy business combined with the company’s $41 million cash balance is worth at least the $97 million market capitalization of the entire company, which was trading at $5.99 per share as of March 31, 2012.
With Pervasive’s balance sheet and legacy business providing our desired “margin of safety,” we believe the remaining 40% of the company’s business provides enormous upside potential. We agree with John Farr’s assertion that software markets are going through “rapid and destructive change, brought on by the emergence and mainstreaming of cloud-based2 infrastructure and applications, and the explosion of data volumes (Big Data3).”
To capitalize on these trends, Pervasive has reinvested 25% of its annual revenues in R&D, well above industry norms. Pervasive Data Integrator is the largest product in Pervasive’s Data and Application Integration segment. This product has shown consistent growth, even during the financial crisis, and 70% of its revenues are now recurring, i.e., subscription4, support and maintenance. The Gartner Group has recognized Data Integrator in its “Visionary” quadrant for data integration tools. Pervasive DataProfiler and Pervasive Business XChange are related and successful products.
Cloud and big data innovation products are potentially the most exciting and underappreciated opportunities at Pervasive. Pervasive DataCloud is being employed by Intuit to integrate QuickBooks with Salesforce.com in a partnership with excellent potential. CTO Mike Hoskins has taken on the role of General Manager of Pervasive Big Data Products and Solutions, working to apply Pervasive DataRush to problems which are labeled “Extreme Information Management” by thought leaders such as Gartner and Forrester.
We believe that, due to its small size, investors are overlooking the value in these growth businesses—in our view assigning them no value. Current annual revenue run rates for the Integration and Innovation lines total roughly $20 million. The importance of cloud-based integration and big data capability has led to acquisitions, such as Dell Inc.’s (DELL) purchase of Boomi and the International Business Machines Corp. (IBM) acquisition of Cast Iron, at multiples of up to 10x revenue. Yet Pervasive’s current EV/Sales multiple is just 1.1x—a low figure even for the legacy embedded database. In our calculation of intrinsic value, we estimate the current share price fully values the legacy business plus the cash; if we apply a conservative multiple of 5x revenue on the growth businesses, that would lead to a share price above $12.00. In the intermediate term, we can envision an economically rational strategic takeout well above that level.
| | | |
| arielinvestments.com | 12 | 800.292.7435 |
Finally, a word about leadership, which is so crucial in our world. Management’s incentives, which we discussed at length in our fourth quarter 2011 letter, are completely aligned with shareholders. The management team owns 21% of the company and have modest salaries. CEO John Farr has a financial background, and in our multiple conversations, clearly demonstrated he grasps the importance of capital allocation. He has spent $45.1 million to repurchase roughly 10.3 million shares over the past six years, sharply reducing the share count while maintaining a large cash reserve. CTO Mike Hoskins is responsible for the innovation taking place at Pervasive and remains the company’s largest single shareholder. Management’s heavy equity ownership has been crucial in giving us the comfort needed to become major investors in Pervasive stock.
Portfolio Comings and Goings
We eliminated one holding during the quarter. InfoSpace, Inc. (INSP) was sold as the company approached our estimates of fair value after executing well on its long-term plan. We added two new positions during the quarter, thereby ending the first quarter with 35 companies in Ariel Discovery Fund:
Rentech, Inc. (RTK) — Rentech presents an unusual special situation opportunity. While cutting back drastically on its investment in its clean energy projects, the company recently spun off its hugely profitable nitrogen fertilizer facility in the form of a limited partnership. Rentech’s 60.9% remaining stake in publicly traded Rentech Nitrogen Partners alone is worth some $650 million, significantly more than the $475 million market value of Rentech Inc. On top of that, the company has nearly $140 million in net cash on its balance sheet – implying a negative value of more than $300 million for the legacy business.
Brink’s Co. (BCO) — Based in Richmond, Virginia, Brink’s has been held in other Ariel portfolios since 2009. The company is a global provider of secure transportation, cash logistics and other security-related services. Investors are focused on near-term challenges in the company’s U.S. and European operations, while in our opinion undervaluing the strength of the Brink’s brand as well as its robust emerging market opportunities.
We appreciate the opportunity to serve you and welcome your questions or comments. Feel free to contact us at email@arielinvestments.com. Lastly, we recently posted new videos to our website featuring our investment team and hope you enjoy them.

| | |
| 2 | PCMag.com defines cloud computing as “Using the Web server facilities of a provider on the Internet (the “cloud”) to run applications.” |
| | |
| 3 | PCMag.com defines Big Data as “the massive amounts of data that collect over time that are difficult to analyze and handle using common database management tools. Big data may be any type, such as business transactions, photos or surveillance videos. Scientific research data from logs and sensors can reach mammoth proportions over time, and big data also includes unstructured text posted on the Web, such as blogs and social media.” |
| | |
| 4 | Software as a Subscription, or SaaS, has become the most favorable model for delivering software to customers. Revenues are recognized periodically, leading to more stable and predictable streams. |
13
| | |
| Ariel Discovery Fund Performance Summary | Inception: January 31, 2011 |
| | ABOUT THE FUND |
| | The Fund pursues long-term capital appreciation and searches for a margin of safety1 by investing in small companies trading at significant discounts to their instrinsic values. |
| | |
| | |
| | |
| | |
AVERAGE ANNUAL TOTAL RETURNS as of March 31, 2012 | |
| | | 1st Quarter | | 1 Year | | Life of Fund | |
| Ariel Discovery Fund | | | | | | | | | | |
| Investor Class | | | 11.32% | | | -2.90% | | | 0.26% | |
Institutional Class+ | | | 11.54% | | | -2.71% | | | 0.43% | |
Russell 2000® Value Index | | | 11.59% | | | -1.07% | | | 4.63% | |
S&P 500® Index | | | 12.59% | | | 8.54% | | | 10.50% | |
Performance data quoted represents past performance and does not guarantee future results. The investment return and principal value of an investment will fluctuate so that an investor’s shares, when redeemed, may be worth more or less than their original cost. Current performance may be lower or higher than the performance data quoted. To access performance data current to the most recent month-end, visit arielinvestments.com.
| | | | |
| COMPOSITION OF EQUITY HOLDINGS (%) |
| | | Russell | |
| | Ariel | 2000 | S&P |
| | Discovery | Value | 500 |
| | Fund † | Index | Index |
| | | | |
| Financial services | 21.42 | 37.55 | 16.08 |
| | | | |
| Technology | 19.92 | 9.70 | 18.48 |
| | | | |
| Consumer discretionary | 19.69 | 12.48 | 12.73 |
| | | | |
| Producer durables | 13.55 | 14.56 | 10.89 |
| | | | |
| Materials & processing | 11.57 | 7.02 | 3.82 |
| | | | |
| Energy | 9.05 | 3.71 | 11.25 |
| | | | |
| Health care | 4.80 | 5.14 | 11.24 |
| | | | |
| Consumer staples | 0.00 | 2.83 | 9.44 |
| | | | |
| Utilities | 0.00 | 7.01 | 6.08 |
| † | Sector weightings are calculated based on equity holdings in the Fund and exclude cash in order to make a relevant comparison to the indexes. |
| | | | | | |
| Expense Ratio* | | Investor Class | | Institutional Class |
| Net | | 1.50% | | 1.25% | |
| Gross | | 6.75% | | 6.50% | |
| As of 9/30/11 (Investor Class). The expense ratio for the Institutional Class is based on estimated expenses for the current fiscal year. |
| | | | | | | | | | | | | |
| TOP TEN EQUITY HOLDINGS | |
| | | | | | | | | | | | | |
| 1 | Market Leader, Inc. | | | 5.9 | % | | 6 | Team, Inc. | | | 3.9 | % |
| 2 | First American Financial Corp. | | | 5.2 | % | | 7 | Contango Oil & Gas Co. | | | 3.7 | % |
| 3 | Mitcham Industries, Inc. | | | 5.0 | % | | 8 | Ballantyne Strong, Inc. | | | 3.7 | % |
| 4 | Madison Square Garden Co. | | | 4.7 | % | | 9 | Vical Inc. | | | 3.4 | % |
| 5 | Pervasive Software Inc. | | | 4.6 | % | | 10 | PCTEL, Inc. | | | 3.4 | % |
+ The inception date for the Institutional Class shares is December 30, 2011. Performance information for the Institutional Class prior to that date reflects the actual performance of the Fund’s Investor Class (and uses the actual expenses of the Fund’s Investor Class, for such period of time), without any adjustments. For any such period of time, the performance of the Fund’s Institutional Class would have been substantially similar to, yet higher than, the performance of the Fund’s Investor Class, because the shares of both classes are invested in the same portfolio of securities, but the classes bear different expenses, which are primarily differences in distribution and service fees.
1 Attempting to purchase with a margin of safety on price cannot protect investors from the volatility associated with stocks, incorrect assumptions or estimations on our part, declining fundamentals or external forces.
* Ariel Investments, LLC, the Adviser, is contractually obligated to waive fees or reimburse expenses in order to limit Ariel Discovery Fund’s total annual operating expenses to 1.50% of net assets for the Investor Class and 1.25% for the Institutional Class through the end of the fiscal year ending September 30, 2014.
Notes: The graph and performance table do not reflect the deduction of taxes that a shareholder would pay on fund distributions or the redemption of fund shares. The Russell 2000® Value Index measures the performance of the small-cap value segment of the U.S. equity universe. It includes those Russell 2000 companies with lower price-to-book ratios and lower forecasted growth values. The S&P 500® is a broad market-weighted index dominated by blue-chip stocks. All indexes are unmanaged, and an investor cannot invest directly in an index.
| | | |
| arielinvestments.com | 14 | 800.292.7435 |
| | Performance data quoted represents past performance. Past performance does not guarantee future results. All performance assumes the reinvestment of dividends and capital gains. The investment return and principal value of an investment will fluctuate so that an investor’s shares, when redeemed, may be worth more or less than their original cost. Current performance may be lower or higher than the performance data quoted. Performance data current to the most recent month-end for Ariel International Equity Fund and Ariel Global Equity Fund may be obtained by visiting arielinvestments.com. | |
Dear Fellow Shareholder: As I write this debut letter to introduce myself and our investment discipline to a new client base, it is an opportune moment to reflect on the 21 years I have spent honing my craft. It has been an unusual journey with unusual results.
I started out in the Eastern hemisphere covering emerging markets, then moved West to cover developed markets, while the world shifted in the opposite direction. I entered the profession at a time when merely having access to information was a source of alpha1. Today, given the proliferation of the Internet, I believe access to infinite information creates a huge amount of noise that actually detracts from alpha. In the first half of my career, investors fell in love with equities. In the latter half, they have wanted very little to do with them. In the early half, the U.S. was the favorite investment destination; in the latter half, everyone clamors to go overseas! So yes, much has changed and yet much remains unchanged.
My home is new but my investment discipline remains the same. At Ariel, I found a kindred spirit and an investment philosophy that resonated with my own. There is an additional benefit to the complementary nature of the relationship—I can lean on the domestic research team, and in turn they can lean on me for international perspectives. Recognizing that investors could benefit from not just broader research insights but broader product offerings as well, we launched two flagship funds–Ariel International Equity Fund and Ariel Global Equity Fund.
These funds are managed using an investment process custom-designed to achieve compelling absolute returns and superior relative returns over the long-term.
Unlike other disciplines that focus solely on “return management,” our process pays equal attention to “risk management.” Simply put, we pay attention to both capital appreciation and capital preservation. In practice this means we do not simply estimate a stock’s upside potential should everything go well, but we also carefully evaluate how much we stand to lose should things go wrong.
We simplify and focus. We find that the intrinsic quality of a business and the valuations we pay to own it are the most relevant factors in determining the risk and reward of the investment. As such, the bulk of our research is designed to understand these two components of the investment decision.
15
Lastly, we seek to optimize not maximize. Many managers buy stocks they think will go up the most; we instead seek to buy those that will post reasonable gains if all goes well but are unlikely to crater if things go wrong. In other words, the stocks in our portfolio are not the cheapest, the most popular or even the ones most likely to have the biggest gains—they are the ones, in our judgment, whose balance of risk and reward make them likely to withstand the test of time in different market environments—good and bad.
Finally, we are independent thinkers. We pick stocks, not styles. We buy and sell against the crowd, not with it. We own companies based on risk and reward, not their benchmark weights or geographies. We believe investing is more like Le Mans (endurance test) than a NASCAR race (speed test).
Performance Update
Globally, stocks rallied strongly in the first quarter of 2012, sending the MSCI EAFE and the MSCI ACWI Indices up +10.98% and +12.02%, respectively. Over the same time period, Ariel International Equity Fund (Investor Class) and Ariel Global Equity Fund (Investor Class) each gained +5.20%.
Underperformance in this sharp rally was predictable for several reasons. First and foremost, it was the portfolios’ first three months of existence, so we were still accumulating our full positions. Cash was significantly higher than it would be in almost any other environment. This especially hurt when markets jumped +2% on the day of the portfolio’s inception. We see this effect as a one-time occurrence. Also, our generally risk-averse, contrarian strategy tends to lag when the markets run hot. Finally, our portfolios had a lower relative weighting in financial services firms—a top-performing sector for the quarter.

While market participants displayed an ample risk appetite during the quarter, we remain risk-aware. We think significant economic and fiscal challenges are unresolved in both the public and private spheres. Our policy is to remain vigilant about such risks but to appreciate the opportunities they sometimes present for those building high-conviction portfolios designed to carefully balance risk and reward.
We appreciate the opportunity to serve you and welcome your questions or comments. Feel free to contact us at email@arielinvestments.com. Lastly, we recently posted new videos to our website featuring our investment team and hope you enjoy them.
| | |
| 1 | Alpha is a measure of performance on a risk-adjusted basis. Alpha takes the volatility of an investment and compares its risk-adjusted performance to a benchmark index. The excess return of the investment relative to the return of the benchmark index is an investment’s alpha. |
| arielinvestments.com | 16 | 800.292.7435 |
| | Rupal J. Bhansali Portfolio Manager Rupal is the portfolio manager for Ariel’s international and global strategies and oversees the entire research effort of these offerings. She joined Ariel after spending 10 years with MacKay Shields where she was senior managing director, portfolio manager and head of international equities. During her tenure, Rupal successfully managed both institutional and retail portfolios. Prior to joining MacKay Shields, Rupal was portfolio manager and co-head of international equities at Oppenheimer Capital where she co-managed international and global equity portfolios. She has also held various roles at other investment firms since she began her career in 1989, including Soros Fund Management. Fluent in several Indian languages including Hindi, Rupal earned a Bachelor of Commerce in accounting and finance, and a Master of Commerce in international finance and banking from the University of Mumbai, as well as an MBA in finance from the University of Rochester where she was a Rotary Foundation Scholar. | |
17
| Ariel International Equity Fund Performance Summary | Inception: December 30, 2011 |
 | | ABOUT THE FUND |
| | The Fund pursues long-term capital appreciation by investing primarily in companies outside the U.S. in developed international markets. |
| | |
| | |
| | |
| | |
AVERAGE ANNUAL TOTAL RETURNS as of March 31, 2012
| | 1st Quarter | Life of Fund |
| Ariel International Equity Fund | | |
| Investor Class | 5.20% | 5.20% |
| Institutional Class | 5.20% | 5.20% |
MSCI EAFE® Index | 10.98% | 10.98% |
Performance data quoted represents past performance and does not guarantee future results. The investment return and principal value of an investment will fluctuate so that an investor’s shares, when redeemed, may be worth more or less than their original cost. Current performance may be lower or higher than the performance data quoted. To access performance data current to the most recent month-end, visit arielinvestments.com.
| COMPOSITION OF EQUITY HOLDINGS (%) |
| | Ariel | |
| | International | MSCI |
| | Equity | EAFE |
| | Fund† | Index |
| | | |
| Financials | 22.25 | 22.61 |
| | | |
| Information technology | 19.36 | 4.83 |
| | | |
| Consumer staples | 15.66 | 11.22 |
| | | |
| Consumer discretionary | 13.36 | 10.83 |
| | | |
| Industrials | 9.20 | 12.72 |
| | | |
| Telecommunication services | 7.07 | 5.44 |
| | | |
| Health care | 6.88 | 9.32 |
| | | |
| Utilities | 3.86 | 4.33 |
| | | |
| Energy | 2.36 | 8.53 |
| | | |
| Materials | 0.00 | 10.18 |
| † | Sector weightings are calculated based on equity holdings in the Fund and exclude cash in order to make a relevant comparison to the indexes. |
| COUNTRY WEIGHTINGS (%) | |
| | |
| Japan | 24.96 |
| | |
| U.K. | 14.77 |
| | |
| Switzerland | 12.44 |
| | |
| Spain | 8.00 |
| | |
| France | 6.15 |
| | |
| Germany | 5.91 |
| | |
| Italy | 4.93 |
| | |
| Finland | 4.79 |
| | |
| Ireland | 4.77 |
| | |
| Canada | 4.31 |
| | |
| Netherlands | 4.25 |
| | |
| Belgium | 2.51 |
| | |
| Hong Kong | 1.60 |
| | |
| Norway | 0.61 |
| TOP TEN COMPANIES |
| 1 | Tesco plc | 4.9% |
| 2 | Roche Holding AG | 4.8% |
| 3 | Nokia Corp. | 3.9% |
| 4 | Ryanair Holdings plc | 3.9% |
| 5 | Nintendo Co., Ltd | 3.8% |
| 6 | NTT DOCOMO, Inc. | 3.7% |
| 7 | Koninklijke Ahold NV | 3.4% |
| 8 | Nestle SA | 3.3% |
| 9 | Bouygues SA | 3.3% |
| 10 | Deutsche Boerse AG | 3.1% |
| For the purpose of determining the Fund’s top ten companies, securities of the same issuer are aggregated. |
| Expense Ratio* | Investor Class | | Institutional Class |
| Net | 1.40% | | 1.15% |
| Gross | 2.49% | | 2.24% |
*Based on estimated expenses for the current year. Ariel Investments, LLC, the Adviser, is contractually obligated to waive fees or reimburse expenses in order to limit Ariel International Equity Fund’s total annual operating expenses to 1.40% of net assets for the Investor Class, and 1.15% of net assets for the Institutional Class, through the end of the fiscal year ending September 30, 2015.
Notes: The performance table does not reflect the deduction of taxes that a shareholder would pay on fund distributions or the redemption of fund shares. MSCI EAFE® Index is an unmanaged, market weighted index of companies in developed markets, excluding the U.S. and Canada.
| arielinvestments.com | 18 | 800.292.7435 |
| Ariel Global Equity Fund Performance Summary | Inception: December 30, 2011 |
| | ABOUT THE FUND |
| | The Fund pursues long-term capital appreciation by investing primarily in companies both within and outside the U.S., in countries with developed or emerging markets. |
| | |
| | |
| | |
| | |
AVERAGE ANNUAL TOTAL RETURNS as of March 31, 2012
| | 1st Quarter | Life of Fund |
| Ariel Global Equity Fund | | |
| Investor Class | 5.20% | 5.20% |
| Institutional Class | 5.30% | 5.30% |
MSCI AC World IndexSM | 12.02% | 12.02% |
Performance data quoted represents past performance and does not guarantee future results. The investment return and principal value of an investment will fluctuate so that an investor’s shares, when redeemed, may be worth more or less than their original cost. Current performance may be lower or higher than the performance data quoted. To access performance data current to the most recent month-end, visit arielinvestments.com.
| COMPOSITION OF EQUITY HOLDINGS (%) |
| | Ariel | |
| | Global | MSCI |
| | Equity | AC World |
| | Fund † | Index |
| | | |
| Information technology | 22.05 | 13.05 |
| | | |
| Financials | 18.04 | 19.52 |
| | | |
| Health care | 17.80 | 8.89 |
| | | |
| Consumer staples | 12.85 | 10.22 |
| | | |
| Consumer discretionary | 11.30 | 10.46 |
| | | |
| Industrials | 8.02 | 10.51 |
| | | |
| Telecommunication services | 5.43 | 4.45 |
| | | |
| Utilities | 2.71 | 3.65 |
| | | |
| Energy | 1.80 | 11.35 |
| | | |
| Materials | 0.00 | 7.90 |
| † | Sector weightings are calculated based on equity holdings in the Fund and exclude cash in order to make a relevant comparison to the indexes. |
| COUNTRY WEIGHTINGS (%) |
| | |
| U.S. | 25.59 |
| | |
| Japan | 18.21 |
| | |
| U.K. | 11.95 |
| | |
| Switzerland | 8.97 |
| | |
| Spain | 6.11 |
| | |
| France | 4.79 |
| | |
| Italy | 3.89 |
| | |
| Finland | 3.77 |
| | |
| Netherlands | 3.41 |
| | |
| Ireland | 3.37 |
| | |
| Germany | 3.33 |
| | |
| Canada | 2.93 |
| | |
| Belgium | 1.82 |
| | |
| Hong Kong | 1.47 |
| | |
| Norway | 0.39 |
| TOP TEN COMPANIES |
| 1 | Tesco plc | 4.8% |
| 2 | Roche Holding AG | 4.7% |
| 3 | Johnson & Johnson | 4.3% |
| 4 | Nokia Corp. | 3.1% |
| 5 | NTT DOCOMO, Inc. | 3.0% |
| 6 | Koninklijke Ahold NV | 2.8% |
| 7 | Bouygues SA | 2.8% |
| 8 | Ryanair Holdings plc | 2.8% |
| 9 | Deutsche Boerse AG | 2.7% |
| 10 | Nintendo Co., Ltd | 2.7% |
| For the purpose of determining the Fund’s top ten companies, securities of the same issuer are aggregated. |
| Expense Ratio* | Investor Class | Institutional Class |
| Net | 1.40% | 1.15% |
| Gross | 2.49% | 2.24% |
*Based on estimated expenses for the current year. Ariel Investments, LLC, the Adviser, is contractually obligated to waive fees or reimburse expenses in order to limit Ariel Global Equity Fund’s total annual operating expenses to 1.40% of net assets for the Investor Class, and 1.15% of net assets for the Institutional Class, through the end of the fiscal year ending September 30, 2015.
Notes: The performance table does not reflect the deduction of taxes that a shareholder would pay on fund distributions or the redemption of fund shares. MSCI ACWI (All Country World Index) IndexSM is an unmanaged, market weighted index of global developed and emerging markets.
19
Founded in 1889, First American Financial is a leading provider of title insurance and settlement services. The core title insurance business drives the majority of the company’s profits, providing essential policies in both the residential and commercial markets. Additionally, the company offers title plant management services, home warranty products, property and casualty insurance as well as trust and investment advisory services. With nearly 30% market share, the company has a distinct scale advantage in its network of offices and agencies and is poised to benefit from a housing market recovery. Yet investors remain fixated on the rearview mirror, paralyzed by the worst housing downturn in recent history.
Green Shoots Amidst the Wreckage
There is no denying that the recent housing downturn was severe. Mortgage originations plummeted, foreclosures spiked and refinancings remained elusive for all but for the most credit-worthy borrowers. In 2011, mortgage originations totaled just under $1.3 trillion, the lowest level in over a decade. Despite this reality, First American continues to weather the storm and remain profitable. Its high margin commercial business is thriving. Record low interest rates are driving periodic boosts in refinancing demand. More importantly, for the first time in a long while, the residential housing market is finally beginning to see some signs of stability.
A Lean, Mean, Centralized Machine
What investors are missing in this story is that once the residential housing market finally turns, First American is poised to emerge as a leaner, more efficient industry leader. Over the past few years, management has taken dramatic steps to enact permanent cost cuts to the tune of over $1 billion in annual savings. Claims centers have been reduced from 100 to 5. Accounting centers have been consolidated from 30 to just 3. And, regional managers have been cut from 16 to 3. Long gone are the days when every policy required onsite courthouse visits to inspect title. The new world in title insurance revolves around electronic data, automation and centralization and no one is better positioned than First American. Investors may worry that housing sales will never return to its peak levels, thus jeopardizing the future profitability of the company. But we take comfort that peak volumes are not necessary. In fact, with its cost-saving measures now implemented, First American can achieve prior peak operating margins on just half the number of real estate transactions required previously.
A Credit to Management
CEO Dennis Gilmore deserves credit for both the company’s success during the downturn as well as its current industry position. While competitors chose to either shift away from the title business or make short term staff reductions, Gilmore had the foresight to seize a rare opportunity to completely reshape the business. The company has over a $1.50 per share in excess cash, an efficient cost structure and a strong commercial business–all of which should help drive earnings per share this year to over $1.00.
A Long Term View
As long term investors, we believe the current housing market has created a tremendous opportunity to buy this rare diamond in the rough at a bargain price. Held in Ariel Fund, Ariel Appreciation Fund and Ariel Discovery Fund, First American Financial’s shares traded at $16.63 as of March 31, 2012, a 34% discount to our private market value of $25.21.
| arielinvestments.com | 20 | 800.292.7435 |
Snap-on is a leading manufacturer of tools and equipment as well as a provider of diagnostics, repair information and systems solutions for independent car repair centers. The company was founded in 1920 when Joseph Johnson and William Seidemann came up with the original idea of interchangeable sockets and wrench handles. The innovative spirit that characterized the company’s early beginnings along with a passion for producing high-quality products has led to the company’s dominant market position.
Franchisee Model
Snap-on uses a franchise structure in the sale and distribution of its products to vehicle repair centers. These franchisees carry their inventory in 4,800 customized vans and make weekly visits to customers and prospects. The vans usually sell products directly to the mechanics. The frequent interaction between the franchisee and mechanics has proven helpful in understanding their customers’ needs. Snap-on’s regular give-and-take with customers gives it an edge over other toolmakers.
Demand for New Tools
Demand for Snap-on tools is expected to grow due to multiple tailwinds. First, the company’s primary customers are independent automotive shops, which continue to gain share versus auto dealerships. This gain is the result of two major factors—an aging car fleet and higher labor costs per hour at dealerships. Older cars need more repairs after warranties expire, and the cheaper labor costs of independent shops have proven to be a solid alternative to returning to the dealer for the work. This trend should continue in the near term. Also, because independent shops work on a variety of vehicle brands, they often require multiple sets of tools. Finally, innovation in newer models can increase demand for new tools.
Financial Services Segment
In 2009, Snap-on ended its agreement with CIT Group to fund the assets of Snap-on Credit, a business that provides a broad range of financial services to the company’s franchisees and customers. Integrating the financial services business has created “lumpiness” in the company’s earnings, but this should stabilize once the transition is completed. We expect this segment to improve its profitability over the next few quarters and demonstrate the earnings power of the business.
Intriguing Valuation
The market is valuing the company as if it will no longer benefit from the aforementioned growth trends. Additionally, we believe the current market valuation reflects low expectations from the company’s financial services business. Overall, Snap-on stock is positioned to provide significant upside from current levels in the long run.
Held in Ariel Focus Fund, Snap-on’s shares traded at $60.97 as of March 31, 2012, a 32% discount to our steadily growing private market value of $89.16.
21
Symmetry Medical Inc. is a leading global source of innovative medical device solutions. The company supplies high-precision surgical instruments that focus on orthopedic applications like knee and hip reconstruction procedures. Symmetry also delivers a full line of cases and trays that are used in more than 25 different medical markets ranging from the orthopedics to the dental to the cardiovascular fields. The surgical instruments are typically combined into a case that is compatible with the specialized-sterilization procedures required between surgeries. Finally, the company has the ability to fully manufacture orthopedic implants from start to finish.
Growth in the Current Healthcare Cost Environment
We believe innovative, well-managed organizations can still thrive in this cost-conscious healthcare environment. First, Symmetry’s core products will benefit from the growth in orthopedic procedures due to aging global demographics. Second, the company directly benefits from new product launches by its core orthopedic partners. We believe innovative products that improve surgical outcomes, speed recovery times and decrease the probability of infection will continue to be highly desired. Third, as the restraints on healthcare costs impact medical device suppliers, they are re-engineering their business processes to focus on costs. One way to lower costs is to reduce the number of vendors manufacturing the company’s products, which results in more favorable pricing. At the same time, quality control cannot be sacrificed since recalls can be extremely costly. But Symmetry will benefit from vendor rationalization without jeopardizing its reputation for quality due to a strong track-record that is envied by its competitors. Finally, the company has a state-of-the-art facility in Malaysia that serves as a platform for expansion into overseas markets that are investing in better healthcare systems.
I Wish I Had It Done Sooner
Over the last three years, Symmetry has been under a cloud due to weak patient volume. The soft market is a consequence of higher insurance deductibles, higher co-payments and concerns about sick-time required for recuperation from surgery. Patients have not been willing to take extended sick-time for fear of losing their jobs in this high unemployment environment. We believe, as the economy continues to stabilize, those who have delayed orthopedic surgeries will return to the patient pool. In addition, as the economy recovers and unemployment declines, orthopedic surgery volumes should normalize. Although these procedures are considered elective, they are highly desired by the patient who wants to maintain an active lifestyle. After undergoing a hip or knee reconstruction procedure, doctors and family-members often hear “I wish I had it done sooner.”
On The Right Track
Symmetry Medical is under the new leadership of Tom Sullivan. Having joined the company in 2011, Sullivan brings a wealth of industry knowledge from his prior days at Johnson & Johnson. His previous roles enable him to understand what Symmetry’s customers need to navigate a changing healthcare environment. Under his leadership, we believe the company is focused on expanding its geographic footprint and product line. The company recently acquired an instrumentation business from Johnson & Johnson which added complimentary products to its portfolio. Although the company added debt to complete the acquisition, we remain confident management is laser-focused on right-sizing the balance sheet over the near-term. We believe the company is positioned for solid growth as the U.S. economy rebounds and the financial dynamics of the company improve. Held in Ariel Fund and Ariel Discovery Fund, Symmetry Medical’s shares traded at $7.07 as of March 31, 2012, a 54% discount to our PMV of $15.23.
| arielinvestments.com | 22 | 800.292.7435 |
| Ariel Fund Statistical Summary | (unaudited) |
| | | | 52-Week Range | | Earnings per Share | | P/E Calendar | | |
| | | | | | | 2010 | 2011 | 2012 | | 2010 | 2011 | 2012 | | Market |
| | Ticker | Price | | | | Actual | Actual | Estimated | | Actual | Actual | Estimated | | Cap. |
| Company | Symbol | 3/31/12 | Low | High | | Calendar | Calendar | Calendar | | P/E | P/E | P/E | | ($MM) |
| Symmetry Medical Inc. | SMA | 7.07 | 6.41 | 10.29 | | 0.47 | 0.35 | 0.69 | | 15.0 | 20.2 | 10.2 | | 252 |
| Contango Oil & Gas Co. | MCF | 58.91 | 51.54 | 69.75 | | 3.02 | 4.41 | 3.78 | | 19.5 | 13.4 | 15.6 | | 905 |
| Interface, Inc. | IFSIA | 13.95 | 9.75 | 20.48 | | 0.62 | 0.66 | 0.94 | | 22.5 | 21.1 | 14.8 | | 912 |
| Brink’s Co. | BCO | 23.87 | 21.53 | 34.46 | | 1.47 | 2.04 | 2.15 | | 16.2 | 11.7 | 11.1 | | 1,119 |
| Meredith Corp. | MDP | 32.46 | 21.10 | 36.10 | | 2.57 | 2.97 | 2.91 | | 12.6 | 10.9 | 11.2 | | 1,170 |
| Littelfuse, Inc. | LFUS | 62.70 | 36.65 | 66.38 | | 3.71 | 4.21 | 4.07 | | 16.9 | 14.9 | 15.4 | | 1,355 |
| Simpson Manufacturing Co., Inc. | SSD | 32.25 | 23.43 | 35.23 | | 1.03 | 1.17 | 1.53 | | 31.3 | 27.6 | 21.1 | | 1,558 |
| Fair Isaac Corp. | FICO | 43.90 | 20.05 | 44.35 | | 1.57 | 2.15 | 2.74 | | 28.0 | 20.4 | 16.0 | | 1,582 |
| Brady Corp. | BRC | 32.35 | 24.44 | 38.73 | | 2.26 | 2.54 | 2.68 | | 14.3 | 12.7 | 12.1 | | 1,583 |
| Janus Capital Group Inc. | JNS | 8.91 | 5.36 | 13.00 | | 0.91 | 0.85 | 0.83 | | 9.8 | 10.5 | 10.7 | | 1,679 |
| First American Financial Corp. | FAF | 16.63 | 10.51 | 16.96 | | 1.27 | 0.90 | 1.35 | | 13.1 | 18.5 | 12.3 | | 1,754 |
| Charles River Laboratories Intl Inc. | CRL | 36.09 | 25.52 | 42.84 | | 1.99 | 2.56 | 2.65 | | 18.1 | 14.1 | 13.6 | | 1,764 |
| Madison Square Garden Co. | MSG | 34.20 | 21.12 | 34.65 | | 1.23 | 1.15 | 1.41 | | 27.8 | 29.7 | 24.3 | | 2,128 |
| DeVry Inc. | DV | 33.87 | 32.73 | 66.85 | | 4.28 | 4.08 | 2.99 | | 7.9 | 8.3 | 11.3 | | 2,248 |
| Washington Post Co. | WPO | 373.57 | 308.50 | 454.97 | | 32.82 | 16.41 | 18.51 | | 11.4 | 22.8 | 20.2 | | 2,386 |
| Bio-Rad Laboratories, Inc. | BIO | 103.69 | 84.02 | 126.98 | | 6.56 | 7.19 | 7.09 | | 15.8 | 14.4 | 14.6 | | 2,389 |
| Sotheby’s | BID | 39.34 | 25.00 | 55.67 | | 2.46 | 2.40 | 2.79 | | 16.0 | 16.4 | 14.1 | | 2,662 |
| City National Corp. | CYN | 52.47 | 35.07 | 59.08 | | 2.36 | 3.26 | 3.53 | | 22.2 | 16.1 | 14.9 | | 2,792 |
| KKR & Co. L.P. | KKR | 14.83 | 8.95 | 19.16 | | 2.83 | 0.73 | 1.95 | | 5.2 | 20.3 | 7.6 | | 3,436 |
| IDEX Corp. | IEX | 42.13 | 29.29 | 47.50 | | 2.16 | 2.76 | 3.02 | | 19.5 | 15.3 | 14.0 | | 3,531 |
| Lazard Ltd | LAZ | 28.56 | 19.04 | 43.54 | | 2.06 | 1.68 | 1.56 | | 13.9 | 17.0 | 18.3 | | 3,631 |
| Gannett Co., Inc. | GCI | 15.33 | 8.28 | 16.26 | | 2.44 | 2.13 | 2.19 | | 6.3 | 7.2 | 7.0 | | 3,632 |
| Jones Lang LaSalle Inc. | JLL | 83.31 | 46.01 | 107.84 | | 3.96 | 4.99 | 5.81 | | 21.0 | 16.7 | 14.3 | | 3,634 |
| Dun & Bradstreet Corp. | DNB | 84.73 | 58.50 | 86.52 | | 5.20 | 5.60 | 6.31 | | 16.3 | 15.1 | 13.4 | | 4,054 |
| Mohawk Industries, Inc. | MHK | 66.51 | 39.93 | 68.86 | | 3.39 | 3.49 | 4.87 | | 19.6 | 19.1 | 13.7 | | 4,577 |
| Energizer Holdings, Inc. | ENR | 74.18 | 62.98 | 84.94 | | 5.35 | 5.38 | 6.36 | | 13.9 | 13.8 | 11.7 | | 4,892 |
| International Game Technology | IGT | 16.79 | 13.38 | 19.15 | | 0.98 | 1.12 | 1.18 | | 17.1 | 15.0 | 14.2 | | 4,995 |
| Interpublic Group of Cos., Inc. | IPG | 11.41 | 6.73 | 12.91 | | 0.47 | 0.77 | 0.82 | | 24.3 | 14.8 | 13.9 | | 5,090 |
| Newell Rubbermaid Inc. | NWL | 17.81 | 10.87 | 19.81 | | 1.50 | 1.64 | 1.67 | | 11.9 | 10.9 | 10.7 | | 5,167 |
| Hospira, Inc. | HSP | 37.39 | 26.92 | 59.20 | | 3.30 | 3.07 | 2.62 | | 11.3 | 12.2 | 14.3 | | 6,168 |
| Royal Caribbean Cruises Ltd. | RCL | 29.43 | 18.70 | 42.30 | | 2.43 | 2.80 | 2.32 | | 12.1 | 10.5 | 12.7 | | 6,401 |
| CBRE Group, Inc. | CBG | 19.96 | 12.30 | 29.88 | | 0.80 | 1.11 | 1.39 | | 25.0 | 18.0 | 14.4 | | 6,546 |
| McCormick & Co., Inc. | MKC | 54.43 | 43.36 | 54.63 | | 2.66 | 2.79 | 3.05 | | 20.5 | 19.5 | 17.8 | | 6,561 |
| J.M. Smucker Co. | SJM | 81.36 | 66.43 | 81.66 | | 5.17 | 5.21 | 5.59 | | 15.7 | 15.6 | 14.6 | | 9,114 |
| Zimmer Holdings, Inc. | ZMH | 64.28 | 47.00 | 69.93 | | 4.58 | 5.07 | 5.46 | | 14.0 | 12.7 | 11.8 | | 11,390 |
| Nordstrom, Inc. | JWN | 55.72 | 37.28 | 56.03 | | 2.75 | 3.14 | 3.44 | | 20.3 | 17.7 | 16.2 | | 11,586 |
| Stanley Black & Decker, Inc. | SWK | 76.96 | 47.07 | 81.90 | | 3.71 | 5.55 | 5.91 | | 20.7 | 13.9 | 13.0 | | 13,116 |
Note: Holdings are as of March 31, 2012. All earnings per share numbers are fully diluted and reflect the company’s cash earnings. Such numbers are from continuing operations and are adjusted for non-recurring items. All estimates of future earnings per share shown in this table are prepared by Ariel Investments research analysts as of March 31, 2012 and have not been updated to reflect any subsequent events. P/E ratios are based on earnings stated and March 31, 2012 stock price.
23
| Ariel Appreciation Fund Statistical Summary | (unaudited) |
| | | | 52-Week Range | | Earnings per Share | | P/E Calendar | | |
| | | | | | | 2010 | 2011 | 2012 | | 2010 | 2011 | 2012 | | Market |
| | Ticker | Price | | | | Actual | Actual | Estimated | | Actual | Actual | Estimated | | Cap. |
| Company | Symbol | 3/31/12 | Low | High | | Calendar | Calendar | Calendar | | P/E | P/E | P/E | | ($MM) |
| Janus Capital Group Inc. | JNS | 8.91 | 5.36 | 13.00 | | 0.91 | 0.85 | 0.83 | | 9.8 | 10.5 | 10.7 | | 1,679 |
| First American Financial Corp. | FAF | 16.63 | 10.51 | 16.96 | | 1.27 | 0.90 | 1.35 | | 13.1 | 18.5 | 12.3 | | 1,754 |
| Madison Square Garden Co. | MSG | 34.20 | 21.12 | 34.65 | | 1.23 | 1.15 | 1.41 | | 27.8 | 29.7 | 24.3 | | 2,128 |
| DeVry Inc. | DV | 33.87 | 32.73 | 66.85 | | 4.28 | 4.08 | 2.99 | | 7.9 | 8.3 | 11.3 | | 2,248 |
| Bio-Rad Laboratories, Inc. | BIO | 103.69 | 84.02 | 126.98 | | 6.56 | 7.19 | 7.09 | | 15.8 | 14.4 | 14.6 | | 2,389 |
| Sotheby’s | BID | 39.34 | 25.00 | 55.67 | | 2.46 | 2.40 | 2.79 | | 16.0 | 16.4 | 14.1 | | 2,662 |
| City National Corp. | CYN | 52.47 | 35.07 | 59.08 | | 2.36 | 3.26 | 3.53 | | 22.2 | 16.1 | 14.9 | | 2,792 |
| KKR & Co. L.P. | KKR | 14.83 | 8.95 | 19.16 | | 2.83 | 0.73 | 1.95 | | 5.2 | 20.3 | 7.6 | | 3,436 |
| Lazard Ltd | LAZ | 28.56 | 19.04 | 43.54 | | 2.06 | 1.68 | 1.56 | | 13.9 | 17.0 | 18.3 | | 3,631 |
| Gannett Co., Inc. | GCI | 15.33 | 8.28 | 16.26 | | 2.44 | 2.13 | 2.19 | | 6.3 | 7.2 | 7.0 | | 3,632 |
| Jones Lang LaSalle Inc. | JLL | 83.31 | 46.01 | 107.84 | | 3.96 | 4.99 | 5.81 | | 21.0 | 16.7 | 14.3 | | 3,634 |
| Mohawk Industries, Inc. | MHK | 66.51 | 39.93 | 68.86 | | 3.39 | 3.49 | 4.87 | | 19.6 | 19.1 | 13.7 | | 4,577 |
| International Game Technology | IGT | 16.79 | 13.38 | 19.15 | | 0.98 | 1.12 | 1.18 | | 17.1 | 15.0 | 14.2 | | 4,995 |
| Interpublic Group of Cos., Inc. | IPG | 11.41 | 6.73 | 12.91 | | 0.47 | 0.77 | 0.82 | | 24.3 | 14.8 | 13.9 | | 5,090 |
| Newell Rubbermaid Inc. | NWL | 17.81 | 10.87 | 19.81 | | 1.50 | 1.64 | 1.67 | | 11.9 | 10.9 | 10.7 | | 5,167 |
| Hospira, Inc. | HSP | 37.39 | 26.92 | 59.20 | | 3.30 | 3.07 | 2.62 | | 11.3 | 12.2 | 14.3 | | 6,168 |
| Blackstone Group L.P. | BX | 15.94 | 10.51 | 19.63 | | 1.26 | 1.25 | 1.75 | | 12.7 | 12.8 | 9.1 | | 6,342 |
| CBRE Group, Inc. | CBG | 19.96 | 12.30 | 29.88 | | 0.80 | 1.11 | 1.39 | | 25.0 | 18.0 | 14.4 | | 6,546 |
| J.M. Smucker Co. | SJM | 81.36 | 66.43 | 81.66 | | 5.17 | 5.21 | 5.59 | | 15.7 | 15.6 | 14.6 | | 9,114 |
| Zimmer Holdings, Inc. | ZMH | 64.28 | 47.00 | 69.93 | | 4.58 | 5.07 | 5.46 | | 14.0 | 12.7 | 11.8 | | 11,390 |
| Northern Trust Corp. | NTRS | 47.45 | 33.20 | 52.57 | | 2.74 | 2.50 | 2.98 | | 17.3 | 19.0 | 15.9 | | 11,446 |
| Nordstrom, Inc. | JWN | 55.72 | 37.28 | 56.03 | | 2.75 | 3.14 | 3.44 | | 20.3 | 17.7 | 16.2 | | 11,586 |
| Stanley Black & Decker, Inc. | SWK | 76.96 | 47.07 | 81.90 | | 3.71 | 5.55 | 5.91 | | 20.7 | 13.9 | 13.0 | | 13,116 |
| Omnicom Group Inc. | OMC | 50.65 | 35.27 | 51.38 | | 2.86 | 3.49 | 3.92 | | 17.7 | 14.5 | 12.9 | | 13,818 |
| St. Jude Medical, Inc. | STJ | 44.31 | 32.13 | 54.18 | | 3.19 | 3.39 | 3.67 | | 13.9 | 13.1 | 12.1 | | 13,895 |
| Chesapeake Energy Corp. | CHK | 23.17 | 20.41 | 35.75 | | 2.75 | 2.80 | 1.73 | | 8.4 | 8.3 | 13.4 | | 15,350 |
| T. Rowe Price Group, Inc. | TROW | 65.30 | 44.68 | 68.59 | | 2.53 | 2.92 | 3.33 | | 25.8 | 22.4 | 19.6 | | 16,567 |
| Carnival Corp. | CCL | 32.08 | 28.52 | 41.95 | | 2.55 | 2.36 | 1.79 | | 12.6 | 13.6 | 17.9 | | 19,128 |
| CBS Corp. | CBS | 33.91 | 17.99 | 33.94 | | 1.19 | 1.98 | 2.50 | | 28.5 | 17.1 | 13.6 | | 20,537 |
| Thermo Fisher Scientific Inc. | TMO | 56.38 | 43.06 | 65.86 | | 3.57 | 4.16 | 4.77 | | 15.8 | 13.6 | 11.8 | | 20,627 |
| AFLAC Inc. | AFL | 45.99 | 31.25 | 57.39 | | 5.53 | 6.33 | 6.60 | | 8.3 | 7.3 | 7.0 | | 21,485 |
| Viacom, Inc. | VIA.B | 47.46 | 35.13 | 52.67 | | 3.21 | 3.90 | 4.47 | | 14.8 | 12.2 | 10.6 | | 23,196 |
| Franklin Resources, Inc. | BEN | 124.03 | 87.71 | 137.56 | | 6.94 | 8.68 | 9.00 | | 17.9 | 14.3 | 13.8 | | 26,783 |
| Illinois Tool Works Inc. | ITW | 57.12 | 39.12 | 59.27 | | 3.29 | 4.04 | 4.47 | | 17.4 | 14.1 | 12.8 | | 27,505 |
| Dell Inc. | DELL | 16.60 | 13.29 | 18.36 | | 1.49 | 2.06 | 2.06 | | 11.1 | 8.1 | 8.1 | | 29,241 |
| Baxter Intl Inc. | BAX | 59.78 | 47.55 | 62.50 | | 4.10 | 4.41 | 4.71 | | 14.6 | 13.6 | 12.7 | | 33,257 |
| Accenture plc | ACN | 64.50 | 47.40 | 65.89 | | 2.91 | 3.55 | 3.94 | | 22.2 | 18.2 | 16.4 | | 41,567 |
Note: Holdings are as of March 31, 2012. All earnings per share numbers are fully diluted and reflect the company’s cash earnings. Such numbers are from continuing operations and are adjusted for non-recurring items. All estimates of future earnings per share shown in this table are prepared by Ariel Investments research analysts as of March 31, 2012 and have not been updated to reflect any subsequent events. P/E ratios are based on earnings stated and March 31, 2012 stock price.
| arielinvestments.com | 24 | 800.292.7435 |
| Ariel Focus Fund Statistical Summary | (unaudited) |
| | | | 52-Week Range | | Earnings per Share | | P/E Calendar | | |
| | | | | | | 2010 | 2011 | 2012 | | 2010 | 2011 | 2012 | | Market |
| | Ticker | Price | | | | Actual | Actual | Estimated | | Actual | Actual | Estimated | | Cap. |
| Company | Symbol | 3/31/12 | Low | High | | Calendar | Calendar | Calendar | | P/E | P/E | P/E | | ($MM) |
| DeVry Inc. | DV | 33.87 | 32.73 | 66.85 | | 4.28 | 4.08 | 2.99 | | 7.9 | 8.3 | 11.3 | | 2,248 |
| KKR & Co. L.P. | KKR | 14.83 | 8.95 | 19.16 | | 2.83 | 0.73 | 1.95 | | 5.2 | 20.3 | 7.6 | | 3,436 |
| Snap-on Inc. | SNA | 60.97 | 41.74 | 64.36 | | 3.19 | 4.71 | 5.02 | | 19.1 | 12.9 | 12.1 | | 3,552 |
| Apollo Group, Inc. | APOL | 38.64 | 37.08 | 58.29 | | 5.21 | 4.41 | 3.19 | | 7.4 | 8.8 | 12.1 | | 4,643 |
| Hospira, Inc. | HSP | 37.39 | 26.92 | 59.20 | | 3.30 | 3.07 | 2.62 | | 11.3 | 12.2 | 14.3 | | 6,168 |
| Zimmer Holdings, Inc. | ZMH | 64.28 | 47.00 | 69.93 | | 4.58 | 5.07 | 5.46 | | 14.0 | 12.7 | 11.8 | | 11,390 |
| Northern Trust Corp. | NTRS | 47.45 | 33.20 | 52.57 | | 2.74 | 2.50 | 2.98 | | 17.3 | 19.0 | 15.9 | | 11,446 |
| Omnicom Group Inc. | OMC | 50.65 | 35.27 | 51.38 | | 2.86 | 3.49 | 3.92 | | 17.7 | 14.5 | 12.9 | | 13,818 |
| Chesapeake Energy Corp. | CHK | 23.17 | 20.41 | 35.75 | | 2.75 | 2.80 | 1.73 | | 8.4 | 8.3 | 13.4 | | 15,350 |
| AFLAC Inc. | AFL | 45.99 | 31.25 | 57.39 | | 5.53 | 6.33 | 6.60 | | 8.3 | 7.3 | 7.0 | | 21,485 |
| Tyco Intl Ltd. | TYC | 56.18 | 37.39 | 56.66 | | 2.73 | 3.28 | 3.68 | | 20.6 | 17.1 | 15.3 | | 25,937 |
| Walgreen Co. | WAG | 33.49 | 30.34 | 45.34 | | 2.41 | 2.41 | 2.94 | | 13.9 | 13.9 | 11.4 | | 28,894 |
| Bank of New York Mellon Corp. | BK | 24.13 | 17.10 | 30.77 | | 2.12 | 2.03 | 2.22 | | 11.4 | 11.9 | 10.9 | | 29,072 |
| Lockheed Martin Corp. | LMT | 89.86 | 66.36 | 91.09 | | 7.37 | 9.12 | 9.74 | | 12.2 | 9.9 | 9.2 | | 29,214 |
| Dell Inc. | DELL | 16.60 | 13.29 | 18.36 | | 1.49 | 2.06 | 2.06 | | 11.1 | 8.1 | 8.1 | | 29,241 |
| Baxter Intl Inc. | BAX | 59.78 | 47.55 | 62.50 | | 4.10 | 4.41 | 4.71 | | 14.6 | 13.6 | 12.7 | | 33,257 |
| Morgan Stanley | MS | 19.64 | 11.58 | 28.24 | | 2.54 | 1.26 | 1.48 | | 7.7 | 15.6 | 13.3 | | 38,860 |
| Target Corp. | TGT | 58.27 | 45.28 | 58.95 | | 3.86 | 4.24 | 4.32 | | 15.1 | 13.7 | 13.5 | | 38,953 |
| Accenture plc | ACN | 64.50 | 47.40 | 65.89 | | 2.91 | 3.55 | 3.94 | | 22.2 | 18.2 | 16.4 | | 41,567 |
| Goldman, Sachs & Co. | GS | 124.37 | 84.27 | 164.40 | | 13.18 | 4.51 | 12.22 | | 9.4 | 27.6 | 10.2 | | 61,581 |
| Berkshire Hathaway Inc. | BRK.B | 81.15 | 65.35 | 84.44 | | 4.52 | 4.14 | 5.18 | | 18.0 | 19.6 | 15.7 | | 87,261 |
| Abbott Laboratories | ABT | 61.29 | 46.29 | 61.49 | | 4.85 | 5.35 | 5.71 | | 12.6 | 11.5 | 10.7 | | 96,370 |
| Citigroup Inc. | C | 36.55 | 21.40 | 46.90 | | 3.45 | 3.71 | 4.10 | | 10.6 | 9.9 | 8.9 | | 107,118 |
| JPMorgan Chase & Co. | JPM | 45.98 | 27.85 | 47.80 | | 3.96 | 4.48 | 4.92 | | 11.6 | 10.3 | 9.3 | | 175,522 |
| Johnson & Johnson | JNJ | 65.96 | 59.06 | 68.05 | | 4.94 | 5.19 | 5.38 | | 13.4 | 12.7 | 12.3 | | 181,082 |
| International Business Machines Corp. | IBM | 208.65 | 157.13 | 209.12 | | 11.81 | 13.45 | 15.08 | | 17.7 | 15.5 | 13.8 | | 241,755 |
| Microsoft Corp. | MSFT | 32.25 | 23.65 | 32.95 | | 2.40 | 2.68 | 2.87 | | 13.4 | 12.0 | 11.2 | | 270,644 |
| Exxon Mobil Corp. | XOM | 86.73 | 67.03 | 88.13 | | 5.96 | 8.42 | 8.18 | | 14.6 | 10.3 | 10.6 | | 408,778 |
Note: Holdings are as of March 31, 2012. All earnings per share numbers are fully diluted and reflect the company’s cash earnings. Such numbers are from continuing operations and are adjusted for non-recurring items. All estimates of future earnings per share shown in this table are prepared by Ariel Investments research analysts as of March 31, 2012 and have not been updated to reflect any subsequent events. P/E ratios are based on earnings stated and March 31, 2012 stock price.
25
| Ariel Fund Schedule of Investments | March 31, 2012 (unaudited) |
| Number of Shares | Common Stocks—99.71% | Market Value |
| | | | |
| | | Consumer discretionary & services—35.84% | |
| 4,274,139 | | Gannett Co., Inc. | $65,522,551 |
| 5,430,372 | | Interpublic Group of Cos., Inc. | 61,960,545 |
| 3,562,625 | | International Game Technology | 59,816,474 |
| 1,823,656 | | Royal Caribbean Cruises Ltd. | 53,670,196 |
| 2,865,657 | | Newell Rubbermaid Inc. | 51,037,351 |
| 739,348 | | Mohawk Industries, Inc.(a) | 49,174,035 |
| 1,445,690 | | DeVry Inc. | 48,965,520 |
| 559,595 | | Stanley Black & Decker, Inc. | 43,066,431 |
| 1,113,171 | | Meredith Corp. | 36,133,531 |
| 996,654 | | Madison Square Garden Co., Class A(a) | 34,085,567 |
| 89,000 | | Washington Post Co., Class B | 33,247,730 |
| 494,275 | | Nordstrom, Inc. | 27,541,003 |
| 633,667 | | Sotheby’s | 24,928,460 |
| | | | 589,149,394 |
| | | Consumer staples—4.90% | |
| 460,338 | | J.M. Smucker Co. | 37,453,100 |
| 449,525 | | McCormick & Co., Inc. | 24,467,646 |
| 252,054 | | Energizer Holdings, Inc.(a) | 18,697,366 |
| | | | 80,618,112 |
| | | Energy—3.15% | |
| 878,947 | | Contango Oil & Gas Co.(a) (b) | 51,778,768 |
| | | Financial services—29.90% | |
| 7,153,378 | | Janus Capital Group Inc. | 63,736,598 |
| 2,165,500 | | Lazard Ltd, Class A | 61,846,680 |
| 735,673 | | Jones Lang LaSalle Inc. | 61,288,918 |
| 1,373,800 | | Fair Isaac Corp. | 60,309,820 |
| 3,551,745 | | First American Financial Corp. | 59,065,519 |
| 634,100 | | Dun & Bradstreet Corp. | 53,727,293 |
| 2,681,757 | | CBRE Group, Inc.(a) | 53,527,870 |
| 3,186,945 | | KKR & Co. L.P. | 47,262,394 |
| 584,326 | | City National Corp. | 30,659,585 |
| | | | 491,424,677 |
| | | Health care—14.14% | |
| 1,793,875 | | Charles River Laboratories Intl Inc.(a) | 64,740,949 |
| 905,800 | | Zimmer Holdings, Inc. | 58,224,824 |
| 1,346,101 | | Hospira, Inc.(a) | 50,330,716 |
| 391,634 | | Bio-Rad Laboratories, Inc., Class A(a) | 40,608,529 |
| 2,618,600 | | Symmetry Medical Inc.(a) (b) | 18,513,502 |
| | | | 232,418,520 |
| | | Materials & processing—4.50% | |
| 1,253,300 | | Simpson Manufacturing Co., Inc. | 40,418,925 |
| 2,404,538 | | Interface, Inc., Class A | 33,543,305 |
| | | | 73,962,230 |
| | | Producer durables—7.28% | |
| 1,290,603 | | Brady Corp., Class A | 41,751,007 |
| 876,811 | | IDEX Corp. | 36,940,047 |
| 534,700 | | Littelfuse, Inc. | 33,525,690 |
| 310,525 | | Brink’s Co. | 7,412,232 |
| | | | 119,628,976 |
| | | Total common stocks (Cost $1,073,923,623) | 1,638,980,677 |
| | | | |
| Principal Amount | | Repurchase Agreement—1.97% | Market Value |
| | | | |
| $32,420,056 | | Fixed Income Clearing Corporation, 0.01%, dated 03/30/2012, due 04/02/2012, repurchase price $32,420,083, (collateralized by Federal Home Loan Bank, 0.36%, due 5/16/2013) (Cost $32,420,056) | $32,420,056 |
| | | Total Investments (Cost $1,106,343,679)—101.68% | 1,671,400,733 |
| | | Liabilities less Other Assets—(1.68%) | (27,708,686) |
| | | Net Assets—100.00% | $1,643,692,047 |
(a) Non-income producing. |
(b) Affiliated company (See Note Six). |
| |
| A category may contain multiple industries as defined by the Global Industry Classification Standards. |
| The accompanying notes are an integral part of the financial statements. |
| Semi-Annual Report | 26 | 800.292.7435 |
| Ariel Appreciation Fund Schedule of Investments | March 31, 2012 (unaudited) |
| Number of Shares | Common Stocks—99.16% | Market Value |
| | | | |
| | | Consumer discretionary & services—37.63% | |
| 1,659,400 | | CBS Corp., Class B | $56,270,254 |
| 1,098,500 | | Viacom, Inc., Class B | 52,134,810 |
| 4,008,930 | | Interpublic Group of Cos., Inc. | 45,741,892 |
| 686,775 | | Mohawk Industries, Inc.(a) | 45,677,405 |
| 1,321,850 | | Carnival Corp. | 42,404,948 |
| 836,100 | | Omnicom Group Inc. | 42,348,465 |
| 1,214,700 | | DeVry Inc. | 41,141,889 |
| 2,170,190 | | International Game Technology | 36,437,490 |
| 2,354,200 | | Gannett Co., Inc. | 36,089,886 |
| 989,700 | | Madison Square Garden, Co., Class A(a) | 33,847,740 |
| 416,299 | | Stanley Black & Decker, Inc. | 32,038,371 |
| 619,200 | | Sotheby’s | 24,359,328 |
| 374,500 | | Nordstrom, Inc. | 20,867,140 |
| 1,083,200 | | Newell Rubbermaid Inc. | 19,291,792 |
| | | | 528,651,410 |
| | | Consumer staples—2.23% | |
| 384,675 | | J.M. Smucker Co. | 31,297,158 |
| | | Energy—3.14% | |
| 1,902,700 | | Chesapeake Energy Corp. | 44,085,559 |
| | | Financial services—34.19% | |
| 1,204,800 | | Northern Trust Corp. | 57,167,760 |
| 1,228,200 | | AFLAC Inc. | 56,484,918 |
| 3,050,100 | | First American Financial Corp. | 50,723,163 |
| 1,769,620 | | Lazard Ltd, Class A | 50,540,347 |
| 570,900 | | Jones Lang LaSalle Inc. | 47,561,679 |
| 329,300 | | Franklin Resources, Inc. | 40,843,079 |
| 4,412,275 | | Janus Capital Group Inc. | 39,313,370 |
| 2,124,100 | | Blackstone Group L.P. | 33,858,154 |
| 2,246,455 | | KKR & Co. L.P. | 33,314,928 |
| 507,800 | | City National Corp. | 26,644,266 |
| 1,309,050 | | CBRE Group, Inc.(a) | 26,128,638 |
| 270,800 | | T. Rowe Price Group, Inc. | 17,683,240 |
| | | | 480,263,542 |
| | | Health care—13.55% | |
| 814,054 | | Thermo Fisher Scientific Inc. | 45,896,365 |
| 964,300 | | St. Jude Medical, Inc. | 42,728,133 |
| 646,200 | | Zimmer Holdings, Inc. | 41,537,736 |
| 652,100 | | Hospira, Inc.(a) | 24,382,019 |
| 201,625 | | Bio-Rad Laboratories, Inc., Class A(a) | 20,906,496 |
| 248,150 | | Baxter Intl Inc. | 14,834,407 |
| | | | 190,285,156 |
| | | Producer durables—4.47% | |
| 496,100 | | Accenture plc, Class A | 31,998,450 |
| 538,650 | | Illinois Tool Works Inc. | 30,767,688 |
| | | | 62,766,138 |
| | | Technology—3.95% | |
| 3,346,200 | | Dell Inc.(a) | 55,546,920 |
| | | Total common stocks (Cost $897,871,712) | 1,392,895,883 |
| | | | |
| Principal Amount | | Repurchase Agreement—0.69% | Market Value |
| | | | |
| $9,661,775 | | Fixed Income Clearing Corporation, 0.01%, dated 03/30/2012, due 04/02/2012, repurchase price $9,661,783, (collateralized by Federal Home Loan Bank, 0.36%, due 5/16/2013) (Cost $9,661,775) | $9,661,775 |
| | | Total Investments (Cost $907,533,487)—99.85% | 1,402,557,658 |
| | | Other Assets less Liabilities—0.15% | 2,121,974 |
| | | Net Assets—100.00% | $1,404,679,632 |
(a) Non-income producing.
A category may contain multiple industries as defined by the Global Industry Classification Standards.
The accompanying notes are an integral part of the financial statements.
| arielinvestments.com | 27 | Semi-Annual Report |
| Ariel Focus Fund Schedule of Investments | March 31, 2012 (unaudited) |
| Number of Shares | Common Stocks—97.29% | Market Value |
| | | | |
| | | Consumer discretionary & services—15.70% | |
| 46,400 | | Target Corp. | $2,703,728 |
| 39,000 | | Omnicom Group Inc. | 1,975,350 |
| 42,700 | | DeVry Inc. | 1,446,249 |
| 22,300 | | Apollo Group, Inc., Class A(a) | 861,672 |
| 7,700 | | Snap-on Inc. | 469,469 |
| | | | 7,456,468 |
| | | Consumer staples—3.19% | |
| 45,200 | | Walgreen Co. | 1,513,748 |
| | | | |
| | | Energy—8.41% | |
| 24,300 | | Exxon Mobil Corp. | 2,107,539 |
| 81,400 | | Chesapeake Energy Corp. | 1,886,038 |
| | | | 3,993,577 |
| | | Financial services—28.30% | |
| 15,600 | | Goldman, Sachs & Co. | 1,940,172 |
| 88,850 | | Morgan Stanley | 1,745,014 |
| 35,800 | | Northern Trust Corp. | 1,698,709 |
| 67,400 | | Bank of New York Mellon Corp. | 1,626,362 |
| 98,100 | | KKR & Co. L.P. | 1,454,823 |
| 29,900 | | JPMorgan Chase & Co. | 1,374,802 |
| 16,500 | | Berkshire Hathaway Inc., Class B(a) | 1,338,975 |
| 25,100 | | AFLAC Inc. | 1,154,349 |
| 30,150 | | Citigroup Inc. | 1,101,983 |
| | | | 13,435,189 |
| | | Health care—14.59% | |
| 34,700 | | Zimmer Holdings, Inc. | 2,230,516 |
| 28,600 | | Johnson & Johnson | 1,886,456 |
| 38,100 | | Hospira, Inc.(a) | 1,424,559 |
| 14,800 | | Baxter Intl Inc. | 884,744 |
| 8,200 | | Abbott Laboratories | 502,578 |
| | | | 6,928,853 |
| | | Producer durables—11.91% | |
| 24,000 | | Lockheed Martin Corp. | 2,156,640 |
| 36,875 | | Tyco Intl Ltd. | 2,071,638 |
| 22,100 | | Accenture plc, Class A | 1,425,450 |
| | | | 5,653,728 |
| | | Technology—15.19% | |
| 94,000 | | Microsoft Corp. | 3,031,500 |
| 157,700 | | Dell Inc.(a) | 2,617,820 |
| 7,500 | | International Business Machines Corp. | 1,564,875 |
| | | | 7,214,195 |
| | | Total common stocks (Cost $39,352,329) | 46,195,758 |
| | | | |
| Principal Amount | | Repurchase Agreement—2.57% | Market Value |
| | | | |
| $1,221,228 | | Fixed Income Clearing Corporation, 0.01%, dated 03/30/2012, due 04/02/2012, repurchase price $1,221,229, (collateralized by Federal Home Loan Bank, 0.36%, due 5/16/2013) (Cost $1,221,228) | $1,221,228 |
| | | Total Investments (Cost $40,573,557)—99.86% | 47,416,986 |
| | | Other Assets less Liabilities—0.14% | 67,495 |
| | | Net Assets—100.00% | $47,484,481 |
(a) Non-income producing.
A category may contain multiple industries as defined by the Global Industry Classification Standards.
The accompanying notes are an integral part of the financial statements.
| Semi-Annual Report | 28 | 800.292.7435 |
| Ariel Discovery Fund Schedule of Investments | March 31, 2012 (unaudited) |
| Number of Shares | Common Stocks—95.99% | Market Value |
| | | | |
| | | Consumer discretionary & services—18.90% | |
| 6,700 | | Madison Square Garden Co., Class A(a) | $229,140 |
| 5,600 | | International Speedway Corp., Class A | 155,400 |
| 15,900 | | XO Group Inc.(a) | 149,301 |
| 12,000 | | Callaway Golf Co. | 81,120 |
| 6,600 | | Rosetta Stone Inc.(a) | 68,112 |
| 16,100 | | Gaiam, Inc., Class A(a) | 64,078 |
| 3,500 | | JAKKS Pacific, Inc. | 61,075 |
| 9,400 | | RadioShack Corp. | 58,468 |
| 1,600 | | Shoe Carnival, Inc.(a) | 51,552 |
| | | | 918,246 |
| | | Energy—8.69% | |
| 10,800 | | Mitcham Industries, Inc.(a) | 242,568 |
| 3,050 | | Contango Oil & Gas Co.(a) | 179,676 |
| | | | 422,244 |
| | | Financial services—20.56% | |
| 78,100 | | Market Leader, Inc.(a) | 285,846 |
| 15,200 | | First American Financial Corp. | 252,775 |
| 11,600 | | AV Homes, Inc.(a) | 141,288 |
| 6,200 | | MB Financial, Inc. | 130,138 |
| 47,600 | | Cowen Group, Inc., Class A(a) | 128,996 |
| 5,200 | | Symetra Financial Corp. | 59,956 |
| | | | 998,999 |
| | | Health care—4.61% | |
| 49,000 | | Vical Inc.(a) | 166,600 |
| 8,100 | | Symmetry Medical Inc.(a) | 57,267 |
| | | | 223,867 |
| | | Materials & processing—11.11% | |
| 4,600 | | Simpson Manufacturing Co., Inc. | 148,350 |
| 61,000 | | Orion Energy Systems, Inc.(a) | 145,180 |
| 60,844 | | Rentech, Inc.(a) | 126,556 |
| 18,300 | | Landec Corp.(a) | 119,499 |
| | | | 539,585 |
| | | Producer durables—13.00% | |
| 6,200 | | Team, Inc.(a) | 191,890 |
| 33,600 | | Ballantyne Strong, Inc.(a) | 178,752 |
| 2,350 | | Littelfuse, Inc. | 147,345 |
| 3,700 | | Brink’s Co. | 88,319 |
| 6,300 | | Tecumseh Products Co., Class A(a) | 25,326 |
| | | | 631,632 |
| | | Technology—19.12% | |
| 37,100 | | Pervasive Software Inc.(a) | 222,229 |
| 24,980 | | PCTEL, Inc. | 166,117 |
| 26,900 | | American Reprographics Co.(a) | 144,991 |
| 21,000 | | Imation Corp.(a) | 129,990 |
| 3,700 | | Multi-Fineline Electronix, Inc.(a) | 101,565 |
| 5,300 | | Tessera Technologies, Inc. | 91,425 |
| 14,000 | | Sigma Designs, Inc.(a) | 72,520 |
| | | | 928,837 |
| | | Total common stocks (Cost $4,520,332) | 4,663,410 |
| | | | |
| Principal Amount | | Repurchase Agreement—2.71% | Market Value |
| | | | |
| $131,929 | | Fixed Income Clearing Corporation, 0.01%, dated 03/30/2012, due 04/02/2012, repurchase price $131,929, (collateralized by Federal Home Loan Bank, 0.36%, due 5/16/2013) (Cost $131,929) | $131,929 |
| | | Total Investments (Cost $4,652,261)—98.70% | 4,795,339 |
| | | Other Assets less Liabilities—1.30% | 63,127 |
| | | Net Assets—100.00% | $4,858,466 |
(a) Non-income producing
A category may contain multiple industries as defined by the Global Industry Classification Standards.
The accompanying notes are an integral part of the financial statements.
| arielinvestments.com | 29 | Semi-Annual Report |
| Ariel International Equity Fund Schedule of Investments | |
| Number of Shares | Common Stocks—80.76% | | Market Value |
| | | | | |
| | | Belgium—2.03% | | |
| 641 | | Mobistar SA(a) | | $31,931 |
| | | Canada—3.48% | | |
| 1,606 | | Great-West Lifeco Inc. | | 39,513 |
| 268 | | Power Financial Corp. | | 7,883 |
| 159 | | IGM Financial Inc. | | 7,404 |
| | | | | 54,800 |
| | | Finland—3.87% | | |
| 8,748 | | Nokia Corp. ADR(a) | | 48,027 |
| 2,383 | | Nokia Corp.(a) | | 12,973 |
| | | | | 61,000 |
| | | France—4.97% | | |
| 1,699 | | Bouygues SA(a) | | 51,959 |
| 476 | | BNP Paribas SA(a) | | 22,584 |
| 136 | | Ipsen SA(a) | | 3,718 |
| | | | | 78,261 |
| | | Germany—4.77% | | |
| 733 | | Deutsche Boerse AG(a) | | 49,350 |
| 100 | | Muenchener Rueckversicherungs-Ges. AG(a) | | 15,077 |
| 54 | | Allianz SE(a) | | 6,444 |
| 23 | | Siemens AG ADR | | 2,319 |
| 20 | | Siemens AG | | 2,016 |
| | | | | 75,206 |
| | | Hong Kong—1.29% | | |
| 10,118 | | Esprit Holdings Ltd. | | 20,326 |
| | | Ireland—3.85% | | |
| 1,674 | | Ryanair Holdings plc ADR(a) | | 60,733 |
| | | Italy—3.98% | | |
| 16,916 | | Mediaset SpA(a) | | 46,656 |
| 3,354 | | Snam SpA(a) | | 16,130 |
| | | | | 62,786 |
| | | Japan—20.16% | | |
| 400 | | Nintendo Co., Ltd | | 60,167 |
| 35 | | NTT DOCOMO, Inc. | | 58,101 |
| 600 | | Murata Manufacturing Co., Ltd. | | 35,556 |
| 600 | | Canon Inc.(a) | | 28,344 |
| 283 | | Toyota Motor Corp. ADR | | 24,570 |
| 600 | | Denso Corp. | | 20,043 |
| 412 | | Canon Inc. ADR(a) | | 19,636 |
| 200 | | Daito Trust Construction Co., Ltd. | | 17,953 |
| 55 | | Keyence Corp. | | 12,931 |
| 300 | | Nissin Foods Holdings Co., Ltd. | | 11,218 |
| 200 | | Sankyo Co., Ltd. | | 9,810 |
| 200 | | Toyota Motor Corp. | | 8,626 |
| 1 | | Japan Tobacco Inc. | | 5,630 |
| 500 | | Suruga Bank Ltd. | | 5,105 |
| | | | | 317,690 |
| Semi-Annual Report | 30 | 800.292.7435 |
| | March 31, 2012 (unaudited) |
| |
| Number of Shares | Common Stocks—80.76% | | Market Value |
| | | | | |
| | | Netherlands—3.43% | | |
| 3,903 | | Koninklijke Ahold NV(a) | | $54,085 |
| | | Norway—0.49% | | |
| 661 | | Gjensidige Forsikring ASA(a) | | 7,806 |
| | | Spain—6.46% | | |
| 6,986 | | Mediaset Espana Comunicacion SA(a) | | 40,065 |
| 1,713 | | Enagas SA(a) | | 32,967 |
| 2,344 | | Indra Sistemas SA(a) | | 28,723 |
| | | | | 101,755 |
| | | Switzerland—10.05% | | |
| 434 | | Roche Holding AG | | 75,530 |
| 827 | | Nestle SA(a) | | 52,037 |
| 1,603 | | UBS AG(a) | | 22,464 |
| 121 | | Actelion Ltd(a) | | 4,423 |
| 23 | | Straumann Holding AG(a) | | 3,914 |
| | | | | 158,368 |
| | | United Kingdom—11.93% | | |
| 14,468 | | Tesco plc(a) | | 76,367 |
| 20,695 | | Man Group plc(a) | | 44,621 |
| 715 | | Royal Dutch Shell plc | | 24,971 |
| 2,627 | | HSBC Holdings plc | | 23,312 |
| 540 | | Schroders plc | | 13,647 |
| 73 | | Royal Dutch Shell plc ADR | | 5,119 |
| | | | | 188,037 |
| | | | | |
| | | Total common stocks (Cost $1,207,296) | | 1,272,784 |
| | | | | |
| | | Total Investments (Cost $1,207,296)—80.76% | | 1,272,784 |
| | | Cash, Other Assets less Liabilities—19.24% | | 303,149 |
| | | Net Assets—100.00% | | $1,575,933 |
| ADR American Depositary Receipt |
(a) Non-income producing. |
| The accompanying notes are an integral part of the financial statements. |
| arielinvestments.com | 31 | Semi-Annual Report |
| Ariel Global Equity Fund Schedule of Investments |
| Number of Shares | Common Stocks—81.98% | | Market Value |
| | | | | |
| | | Belgium—1.49% | | |
| 503 | | Mobistar SA(a) | | $25,056 |
| | | | | |
| | | Canada—2.41% | | |
| 998 | | Great-West Lifeco Inc. | | 24,554 |
| 279 | | Power Financial Corp. | | 8,207 |
| 164 | | IGM Financial Inc. | | 7,637 |
| | | | | 40,398 |
| | | Finland—3.09% | | |
| 6,869 | | Nokia Corp. ADR(a) | | 37,711 |
| 2,622 | | Nokia Corp.(a) | | 14,275 |
| | | | | 51,986 |
| | | France—3.93% | | |
| 1,532 | | Bouygues SA(a) | | 46,851 |
| 356 | | BNP Paribas SA(a) | | 16,891 |
| 85 | | Ipsen SA(a) | | 2,324 |
| | | | | 66,066 |
| | | Germany—2.73% | | |
| 682 | | Deutsche Boerse AG(a) | | 45,916 |
| | | | | |
| | | Hong Kong—1.21% | | |
| 10,082 | | Esprit Holdings Ltd. | | 20,253 |
| | | | | |
| | | Ireland—2.76% | | |
| 1,279 | | Ryanair Holdings plc ADR(a) | | 46,402 |
| | | | | |
| | | Italy—3.19% | | |
| 14,986 | | Mediaset SpA(a) | | 41,333 |
| 2,544 | | Snam SpA(a) | | 12,235 |
| | | | | 53,568 |
| | | Japan—14.93% | | |
| 30 | | NTT DOCOMO, Inc. | | 49,801 |
| 300 | | Nintendo Co., Ltd | | 45,125 |
| 600 | | Canon Inc.(a) | | 28,344 |
| 400 | | Murata Manufacturing Co., Ltd. | | 23,704 |
| 200 | | Daito Trust Construction Co., Ltd. | | 17,953 |
| 500 | | Denso Corp. | | 16,703 |
| 342 | | Canon Inc. ADR(a) | | 16,300 |
| 153 | | Toyota Motor Corp. ADR | | 13,283 |
| 55 | | Keyence Corp. | | 12,931 |
| 300 | | Nissin Foods Holdings Co., Ltd. | | 11,218 |
| 1 | | Japan Tobacco Inc. | | 5,630 |
| 500 | | Suruga Bank Ltd. | | 5,105 |
| 100 | | Sankyo Co., Ltd. | | 4,905 |
| | | | | 251,002 |
| | | Netherlands—2.79% | | |
| 3,386 | | Koninklijke Ahold NV(a) | | 46,920 |
| | | | | |
| | | Norway—0.32% | | |
| 456 | | Gjensidige Forsikring ASA(a) | | 5,385 |
| | | | | |
| | | Spain—5.01% | | |
| 6,347 | | Mediaset Espana Comunicacion SA(a) | | 36,399 |
| 1,306 | | Enagas SA(a) | | 25,134 |
| 1,848 | | Indra Sistemas SA(a) | | 22,645 |
| | | | | 84,178 |
| Semi-Annual Report | 32 | 800.292.7435 |
| | March 31, 2012 (unaudited) |
| |
| Number of Shares | Common Stocks—81.98% | | Market Value |
| | | | | |
| | | Switzerland—7.35% | | |
| 455 | | Roche Holding AG | | $79,185 |
| 348 | | Nestle SA(a) | | 21,897 |
| 1,220 | | UBS AG(a) | | 17,096 |
| 102 | | Actelion Ltd(a) | | 3,729 |
| 10 | | Straumann Holding AG(a) | | 1,702 |
| | | | | 123,609 |
| | | United Kingdom—9.79% | | |
| 15,151 | | Tesco plc(a) | | 79,972 |
| 15,675 | | Man Group plc(a) | | 33,797 |
| 553 | | Royal Dutch Shell plc | | 19,314 |
| 538 | | Schroders plc | | 13,596 |
| 1,413 | | HSBC Holdings plc | | 12,539 |
| 77 | | Royal Dutch Shell plc ADR | | 5,400 |
| | | | | 164,618 |
| | | United States—20.98% | | |
| 1,100 | | Johnson & Johnson | | 72,556 |
| 706 | | Quest Diagnostics Inc. | | 43,172 |
| 719 | | Gilead Sciences, Inc.(a) | | 35,123 |
| 1,742 | | NVIDIA Corp.(a) | | 26,809 |
| 1,468 | | QLogic Corp.(a) | | 26,072 |
| 290 | | Berkshire Hathaway Inc., Class B(a) | | 23,534 |
| 1,389 | | H&R Block, Inc. | | 22,877 |
| 654 | | Microsoft Corp. | | 21,092 |
| 394 | | Plum Creek Timber Co. Inc. | | 16,375 |
| 187 | | Wal-Mart Stores, Inc. | | 11,444 |
| 282 | | Analog Devices, Inc. | | 11,393 |
| 600 | | Yahoo! Inc.(a) | | 9,132 |
| 213 | | Broadcom Corp. | | 8,371 |
| 200 | | Hospira, Inc.(a) | | 7,478 |
| 120 | | Fluor Corp. | | 7,205 |
| 135 | | Expeditors Intl of Washington(a) | | 6,279 |
| 100 | | General Electric Co.(a) | | 2,007 |
| 20 | | 3m Co(a) | | 1,784 |
| | | | | 352,703 |
| | | | | |
| | | Total common stocks (Cost $1,309,275) | | 1,378,060 |
| | | | | |
| | | Total Investments (Cost $1,309,275)—81.98% | | 1,378,060 |
| | | Cash, Other Assets less Liabilities—18.02% | | 302,985 |
| | | Net Assets—100.00% | | $1,681,045 |
| ADR American Depositary Receipt |
(a) Non-income producing. |
| The accompanying notes are an integral part of the financial statements. |
| arielinvestments.com | 33 | Semi-Annual Report |
| Statements of Assets & Liabilities |
| | | | | | | | |
| | Ariel Fund | | Ariel Appreciation Fund | | Ariel Focus Fund | | Ariel Discovery Fund |
| | | | | | | | |
| Assets: | | | | | | | |
| Investments in unaffiliated issuers, at value | | | | | | | |
| (cost $997,524,538, $897,871,712, | | | | | | | |
| $39,352,329 and $4,520,332, respectively) | $1,568,688,407 | | $1,392,895,883 | | $46,195,758 | | $4,663,410 |
| Investments in affiliated issuers, at value | | | | | | | |
| (cost $76,399,085) | 70,292,270 | | — | | — | | — |
| Repurchase agreements, at value | | | | | | | |
| (cost $32,420,056, $9,661,775, | | | | | | | |
| $1,221,228 and $131,929, respectively) | 32,420,056 | | 9,661,775 | | 1,221,228 | | 131,929 |
| Receivable for fund shares sold | 1,085,039 | | 854,912 | | 42,949 | | 2,684 |
| Receivable for securities sold | 19,753,708 | | — | | — | | 38,160 |
| Dividends and interest receivable | 1,543,426 | | 2,750,421 | | 32,929 | | 1,566 |
| Prepaid and other assets | 67,977 | | 52,805 | | 38,073 | | 43,479 |
| Total assets | 1,693,850,883 | | 1,406,215,796 | | 47,530,937 | | 4,881,228 |
| | | | | | | | |
| Liabilities: | | | | | | | |
| Payable for securities purchased | 2,298,604 | | — | | — | | 5,500 |
| Payable for fund shares redeemed | 46,997,007 | | 971,244 | | 7,844 | | 272 |
| Other liabilities | 863,225 | | 564,920 | | 38,612 | | 16,990 |
| Total liabilities | 50,158,836 | | 1,536,164 | | 46,456 | | 22,762 |
| Net assets | $1,643,692,047 | | $1,404,679,632 | | $47,484,481 | | $4,858,466 |
| | | | | | | | |
| Net assets consist of: | | | | | | | |
| Paid-in capital | $1,394,853,596 | | $891,884,841 | | $44,130,610 | | $4,716,028 |
| Accumulated undistributed net investment | | | | | | | |
| income (loss) | 4,016,033 | | 4,097,514 | | 85,841 | | (17,443) |
| Accumulated net realized gain (loss) on | | | | | | | |
| investment transactions | (320,234,635) | | 13,673,106 | | (3,575,399) | | 16,802 |
| Net unrealized appreciation on investments | 565,057,053 | | 495,024,171 | | 6,843,429 | | 143,079 |
| Total net assets | $1,643,692,047 | | $1,404,679,632 | | $47,484,481 | | $4,858,466 |
| | | | | | | | |
| Investor Class shares | | | | | | | |
| Net assets | $1,525,930,803 | | $1,395,256,320 | | $34,853,494 | | $2,827,093 |
| Shares outstanding (no par value) | 30,992,933 | | 31,009,997 | | 3,105,798 | | 281,754 |
| Net asset value, offering and redemption | | | | | | | |
| price per share | $49.23 | | $44.99 | | $11.22 | | $10.03 |
| | | | | | | | |
| Institutional Class shares | | | | | | | |
| Net assets | $117,761,244 | | $9,423,312 | | $12,630,987 | | $2,031,373 |
| Shares outstanding (no par value) | 2,389,986 | | 209,265 | | 1,124,725 | | 202,202 |
| Net asset value, offering and redemption | | | | | | | |
| price per share | $49.27 | | $45.03 | | $11.23 | | $10.05 |
The accompanying notes are an integral part of the financial statements.
| Semi-Annual Report | 34 | 800.292.7435 |
| | March 31, 2012 (unaudited) |
| |
| | | | | |
| | | Ariel International | | Ariel Global Equity |
| | | Equity Fund | | Fund |
| | | | | |
| Assets: | | | | |
| Investments in unaffiliated issuers, at value | | | | |
| (cost $1,207,296 and $1,309,275, respectively) | | $1,272,784 | | $1,378,060 |
| Foreign currencies (cost $280,502 and $53,967, respectively) | | 281,759 | | 54,600 |
| Cash | | 64,970 | | 279,061 |
| Dividends and interest receivable | | 3,924 | | 3,690 |
| Receivable for dividend reclaims | | 663 | | 686 |
| Receivable for fund shares sold | | 550 | | 550 |
| Appreciation of forward currency contracts | | - | | 47 |
| Prepaid and other assets | | 37,760 | | 37,759 |
| Total assets | | 1,662,410 | | 1,754,453 |
| | | | | |
| Liabilities: | | | | |
| Payable for securities and foreign currencies purchased | | 42,237 | | 27,911 |
| Depreciation of forward currency contracts | | 17 | | 345 |
| Other liabilities | | 44,223 | | 45,152 |
| Total liabilities | | 86,477 | | 73,408 |
| Net assets | | $1,575,933 | | $1,681,045 |
| | | | | |
| Net assets consist of: | | | | |
| Paid-in capital | | $1,503,819 | | $1,605,425 |
| Accumulated undistributed net investment income | | 3,244 | | 3,703 |
| Accumulated net realized gain | | 2,198 | | 2,775 |
| Net unrealized appreciation (depreciation) on: | | | | |
| Investments | | 65,488 | | 68,785 |
| Foreign currencies | | 1,201 | | 655 |
| Forward currency contracts | | (17) | | (298) |
| Total net assets | | $1,575,933 | | $1,681,045 |
| | | | | |
| Investor Class shares | | | | |
| Net assets | | $871,004 | | $932,130 |
| Shares outstanding (no par value) | | 82,822 | | 88,572 |
| Net asset value, offering and redemption price per share | | $10.52 | | $10.52 |
| | | | | |
| Institutional Class shares | | | | |
| Net assets | | $704,929 | | $748,915 |
| Shares outstanding (no par value) | | 66,981 | | 71,114 |
| Net asset value, offering and redemption price per share | | $10.52 | | $10.53 |
The accompanying notes are an integral part of the financial statements.
| arielinvestments.com | 35 | Semi-Annual Report |
| Statements of Operations | Six Months Ended March 31, 2012 (unaudited) |
| | | | | | | | |
| | Ariel Fund | | Ariel Appreciation Fund | | Ariel Focus Fund | | Ariel Discovery Fund |
| | | | | | | | |
| Investment income: | | | | | | | |
| Dividends | | | | | | | |
| Unaffiliated issuers | $12,186,633 | | $12,857,899 | | $464,102 | | $11,662 |
| Affiliated issuers | 174,558(a) | | — | | — | | — |
| Interest | 784 | | 494 | | 32 | | 7 |
| Total investment income | 12,361,975 | | 12,858,393 | | 464,134 | | 11,669 |
| | | | | | | | |
| Expenses: | | | | | | | |
| Management fees | 4,663,668 | | 4,592,961 | | 167,352 | | 20,162 |
| Distribution fees (Investor Class) | 1,905,840 | | 1,617,206 | | 49,882 | | 3,909 |
| Shareholder service fees | | | | | | | |
| Investor Class | 933,250 | | 703,600 | | 12,869 | | 459 |
| Institutional Class | 217 | | 155 | | 310 | | 31 |
| Transfer agent fees and expenses | | | | | | | |
| Investor Class | 340,144 | | 289,019 | | 31,557 | | 9,578 |
| Institutional Class | 248 | | 186 | | 651 | | 434 |
| Printing and postage expenses | | | | | | | |
| Investor Class | 211,906 | | 142,521 | | 8,136 | | 3,654 |
| Institutional Class | 186 | | 93 | | 217 | | 279 |
| Trustees’ fees and expenses | 134,400 | | 100,839 | | 26,040 | | 15,300 |
| Professional fees | 38,556 | | 34,266 | | 20,592 | | 19,851 |
| Custody fees and expenses | 19,878 | | 14,715 | | 2,106 | | 1,957 |
| Federal and state registration fees | 36,086 | | 38,155 | | 16,452 | | 13,754 |
| Interest expense | — | | — | | 90 | | — |
| Miscellaneous expenses | 78,390 | | 59,957 | | 8,070 | | 2,838 |
| Total expenses before reimbursements | 8,362,769 | | 7,593,673 | | 344,324 | | 92,206 |
| Expense reimbursements | — | | — | | (71,216) | | (63,094) |
| Net expenses | 8,362,769 | | 7,593,673 | | 273,108 | | 29,112 |
| Net investment income (loss) | 3,999,206 | | 5,264,720 | | 191,026 | | (17,443) |
| | | | | | | | |
| Realized and unrealized gain: | | | | | | | |
| Net realized gain on investments | | | | | | | |
| Unaffiliated issuers | 64,923,624 | | 64,014,591 | | 154,867 | | 16,802 |
| Affiliated issuers | 7,394,090(a) | | — | | — | | — |
| Change in net unrealized appreciation | | | | | | | |
| on investments | 370,784,746 | | 276,998,264 | | 8,388,368 | | 1,007,795 |
| Net gain on investments | 443,102,460 | | 341,012,855 | | 8,543,235 | | 1,024,597 |
| Net increase in net assets | | | | | | | |
| resulting from operations | $447,101,666 | | $346,277,575 | | $8,734,261 | | $1,007,154 |
(a) See Note Six for information on affiliated issuers. |
| The accompanying notes are an integral part of the financial statements. |
| Semi-Annual Report | 36 | 800.292.7435 |
| | December 30, 2011* to March 31, 2012 (unaudited) |
| |
| | | | | |
| | | Ariel International | | Ariel Global Equity |
| | | Equity Fund | | Fund |
| | | | | |
| Investment income: | | | | |
| Dividends | | | | |
| Unaffiliated issuers | | $7,837(a) | | $8,499(a) |
| Total investment income | | 7,837 | | 8,499 |
| | | | | |
| Expenses: | | | | |
| Management fees | | 3,544 | | 3,707 |
| Distribution fees (Investor Class) | | 518 | | 533 |
| Shareholder service fees | | | | |
| Investor Class | | 155 | | 155 |
| Institutional Class | | — | | — |
| Transfer agent fees and expenses | | | | |
| Investor Class | | 4,557 | | 4,557 |
| Institutional Class | | 5,022 | | 5,022 |
| Printing and postage expenses | | | | |
| Investor Class | | 960 | | 992 |
| Institutional Class | | 1,674 | | 1,643 |
| Trustees’ fees and expenses | | 9,858 | | 9,858 |
| Professional fees | | 10,540 | | 10,540 |
| Custody fees and expenses | | 5,662 | | 5,662 |
| Administration fees | | 12,741 | | 12,741 |
| Fund accounting fees | | 6,707 | | 7,637 |
| Federal and state registration fees | | 9,393 | | 9,393 |
| Miscellaneous expenses | | 1,364 | | 1,364 |
| Total expenses before reimbursements | | 72,695 | | 73,804 |
| Expense reimbursements | | (68,102) | | (69,008) |
| Net expenses | | 4,593 | | 4,796 |
| Net investment income | | 3,244 | | 3,703 |
| | | | | |
| Realized and unrealized gain: | | | | |
| Net realized gain on: | | | | |
| Investments | | 764 | | 2,335 |
| Foreign currencies | | 1,434 | | 440 |
| Total | | 2,198 | | 2,775 |
| Change in net unrealized appreciation (depreciation) on: | | | | |
| Investments | | 65,488 | | 68,785 |
| Foreign currencies | | 1,201 | | 655 |
| Forward currency contracts | | (17) | | (298) |
| Total | | 66,672 | | 69,142 |
| Net gain on investments | | 68,870 | | 71,917 |
| Net increase in net assets resulting from operations | | $72,114 | | $75,620 |
| *Commencement of operations. |
(a) Net of $859 and $791 in foreign taxes withheld, respectively. |
The accompanying notes are an integral part of the financial statements.
| arielinvestments.com | 37 | Semi-Annual Report |
| Statements of Changes in Net Assets |
| | | | |
| | Ariel Fund | | Ariel Appreciation Fund |
| | | | | | | | |
| | Six Months Ended | | Year Ended | | Six Months Ended | | Year Ended |
| | March 31, 2012 | | September 30, 2011 | | March 31, 2012 | | September 30, 2011 |
| | (unaudited) | | | | (unaudited) | | |
| | | | | | | | |
| | | | | | | | |
| Operations: | | | | | | | |
| Net investment income | $3,999,206 | | $3,403,938 | | $5,264,720 | | $4,327,042 |
| Net realized gain on investments and | | | | | | | |
| foreign currency translations | 72,317,714 | | 286,034,520 | | 64,014,591 | | 151,742,510 |
| Change in net unrealized appreciation (depreciation) | | | | | | | |
| on investments and foreign currency translations | 370,784,746 | | (493,701,099) | | 276,998,264 | | (240,952,711) |
| Net increase (decrease) in net assets from operations | 447,101,666 | | (204,262,641) | | 346,277,575 | | (84,883,159) |
| | | | | | | | |
| Distributions to shareholders: | | | | | | | |
| Net investment income | | | | | | | |
| Investor Class | (3,209,713) | | (181,815) | | (5,037,290) | | (456,958) |
| Capital gains | | | | | | | |
| Investor Class | — | | — | | (12,669,548) | | — |
| Total distributions | (3,209,713) | | (181,815) | | (17,706,838) | | (456,958) |
| | | | | | | | |
| Share transactions: | | | | | | | |
| Shares issued | | | | | | | |
| Investor Class | 107,096,125 | | 347,667,200 | | 79,255,105 | | 220,661,388 |
| Institutional Class | 117,257,158 | | — | | 8,487,130 | | — |
| Shares issued in reinvestment of | | | | | | | |
| dividends and distributions | | | | | | | |
| Investor Class | 3,126,505 | | 177,682 | | 17,189,462 | | 440,002 |
| Shares redeemed | | | | | | | |
| Investor Class | (375,895,401) | | (745,682,629) | | (172,101,733) | | (322,755,261) |
| Institutional Class | (2,635,828) | | — | | (127,190) | | — |
| Net decrease from share transactions | (151,051,441) | | (397,837,747) | | (67,297,226) | | (101,653,871) |
| Total increase (decrease) in net assets | 292,840,512 | | (602,282,203) | | 261,273,511 | | (186,993,988) |
| | | | | | | | |
| Net assets: | | | | | | | |
| Beginning of year | 1,350,851,535 | | 1,953,133,738 | | 1,143,406,121 | | 1,330,400,109 |
| End of period | $1,643,692,047 | | $1,350,851,535 | | $1,404,679,632 | | $1,143,406,121 |
| Undistributed net investment income included | | | | | | | |
| in net assets at end of period | $4,016,033 | | $3,226,540 | | $4,097,514 | | $3,870,084 |
| | | | | | | | |
| Capital share transactions: | | | | | | | |
| Investor shares | | | | | | | |
| Shares sold | 2,405,862 | | 7,209,068 | | 1,936,967 | | 5,206,549 |
| Shares issued to holders in reinvestment of dividends | 72,373 | | 3,637 | | 462,832 | | 10,331 |
| Shares redeemed | (8,254,462) | | (16,102,661) | | (4,239,190) | | (7,576,044) |
| Net decrease | (5,776,227) | | (8,889,956) | | (1,839,391) | | (2,359,164) |
| Institutional shares | | | | | | | |
| Shares sold | 2,445,162 | | — | | 212,124 | | — |
| Shares issued to holders in reinvestment of dividends | — | | — | | — | | — |
| Shares redeemed | (55,176) | | — | | (2,859) | | — |
| Net increase | 2,389,986 | | — | | 209,265 | | — |
| The accompanying notes are an integral part of the financial statements. |
| Semi-Annual Report | 38 | 800.292.7435 |
| | | | |
| | Ariel Focus Fund | | Ariel Discovery Fund |
| | | | | | | | |
| | Six Months Ended | | | | Six Months Ended | | January 31, 2011* |
| | March 31, 2012 | | Year Ended | | March 31, 2012 | | to |
| | (unaudited) | | September 30, 2011 | | (unaudited) | | September 30, 2011 |
| | | | | | | | |
| | | | | | | | |
| Operations: | | | | | | | |
| Net investment income (loss) | $191,026 | | $195,597 | | $(17,443) | | $(24,944) |
| Net realized gain on investments and | | | | | | | |
| foreign currency translations | 154,867 | | 1,944,544 | | 16,802 | | 14,479 |
| Change in net unrealized appreciation (depreciation) | | | | | | | |
| on investments and foreign currency translations | 8,388,368 | | (1,667,748) | | 1,007,795 | | (864,716) |
| Net increase (decrease) in net assets from operations | 8,734,261 | | 472,393 | | 1,007,154 | | (875,181) |
| | | | | | | | |
| Distributions to shareholders: | | | | | | | |
| Net investment income | | | | | | | |
| Investor Class | (251,088) | | (140,338) | | — | | — |
| Total distributions | (251,088) | | (140,338) | | — | | — |
| | | | | | | | |
| Share transactions: | | | | | | | |
| Shares issued | | | | | | | |
| Investor Cass | 2,903,592 | | 9,262,293 | | 996,090 | | 4,344,275 |
| Institutional Class | 12,109,033 | | — | | 1,852,239 | | — |
| Shares issued in reinvestment of | | | | | | | |
| dividends and distributions | | | | | | | |
| Investor Class | 216,920 | | 125,859 | | — | | — |
| Shares redeemed | | | | | | | |
| Investor Class | (18,267,240) | | (21,781,596) | | (2,169,149) | | (292,025) |
| Institutional Class | (508,451) | | — | | (4,937) | | — |
| Net increase (decrease) from share transactions | (3,546,146) | | (12,393,444) | | 674,243 | | 4,052,250 |
| Total increase (decrease) in net assets | 4,937,027 | | (12,061,389) | | 1,681,397 | | 3,177,069 |
| | | | | | | | |
| Net assets: | | | | | | | |
| Beginning of year | 42,547,454 | | 54,608,843 | | 3,177,069 | | — |
| End of period | $47,484,481 | | $42,547,454 | | $4,858,466 | | $3,177,069 |
| Undistributed net investment income (loss) included | | | | | | | |
| in net assets at end of period | $85,841 | | $145,903 | | $(17,443) | | $— |
| | | | | | | | |
| Capital share transactions: | | | | | | | |
| Investor shares | | | | | | | |
| Shares sold | 279,137 | | 876,263 | | 107,113 | | 442,258 |
| Shares issued to holders in reinvestment of dividends | 21,911 | | 12,032 | | — | | — |
| Shares redeemed | (1,784,232) | | (2,055,177) | | (237,473) | | (30,144) |
| Net increase (decrease) | (1,483,184) | | (1,166,882) | | (130,360) | | 412,114 |
| Institutional shares | | | | | | | |
| Shares sold | 1,173,054 | | — | | 202,713 | | — |
| Shares issued to holders in reinvestment of dividends | — | | — | | — | | — |
| Shares redeemed | (48,329) | | — | | (511) | | — |
| Net increase | 1,124,725 | | — | | 202,202 | | — |
| *Commencement of operations. |
| The accompanying notes are an integral part of the financial statements. |
| arielinvestments.com | 39 | Semi-Annual Report |
Statements of Changes in Net Assets (continued) |
| | | | | |
| | | Ariel International | | Ariel Global |
| | | Equity Fund | | Equity Fund |
| | | | | |
| | | | | |
| | | December 30, 2011* | | December 30, 2011* |
| | | to March 31, 2012 | | to March 31, 2012 |
| | | (unaudited) | | (unaudited) |
| | | | | |
| Operations: | | | | |
| Net investment income | | $3,244 | | $3,703 |
| Net realized gain on investments and | | | | |
| foreign currency translations | | 2,198 | | 2,775 |
| Change in net unrealized appreciation | | | | |
| on investments and foreign currency translations | | 66,672 | | 69,142 |
| Net increase in net assets from operations | | 72,114 | | 75,620 |
| | | | | |
| Share transactions: | | | | |
| Shares issued | | | | |
| Investor Class | | 856,969 | | 916,689 |
| Institutional Class | | 673,690 | | 715,607 |
| Shares redeemed | | | | |
| Investor Class | | (26,840) | | (26,871) |
| Net increase from share transactions | | 1,503,819 | | 1,605,425 |
| Total increase in net assets | | 1,575,933 | | 1,681,045 |
| | | | | |
| Net assets: | | | | |
| Beginning of year | | — | | — |
| End of period | | $1,575,933 | | $1,681,045 |
| Undistributed net investment income included | | | | |
| in net assets at end of period | | $3,244 | | $3,703 |
| | | | | |
| Capital share transactions: | | | | |
| Investor shares | | | | |
| Shares sold | | 85,398 | | 91,157 |
| Shares issued to holders in reinvestment of dividends | | — | | — |
| Shares redeemed | | (2,576) | | (2,585) |
| Net increase | | 82,822 | | 88,572 |
| Institutional shares | | | | |
| Shares sold | | 66,981 | | 71,114 |
| Shares issued to holders in reinvestment of dividends | | — | | — |
| Shares redeemed | | — | | — |
| Net increase | | 66,981 | | 71,114 |
| *Commencement of operations. |
| The accompanying notes are an integral part of the financial statements. |
| Semi-Annual Report | 40 | 800.292.7435 |
Financial Highlights For a share outstanding throughout each period |
| Ariel Fund (Investor Class) | | | Year Ended September 30 |
| | Six Months | | | | | | | | | | |
| | Ended | | | | | | | | | | |
| | March 31, 2012 | | 2011 | | 2010 | | 2009 | | 2008 | | 2007 |
| | (unaudited) | | | | | | | | | | |
| | | | | | | | | | | | |
| Net asset value, beginning of year | $36.74 | | $42.78 | | $35.78 | | $36.53 | | $54.60 | | $52.00 |
| Income from investment operations: | | | | | | | | | | | |
| Net investment income (loss) | 0.13 | | 0.09 | | (0.07) | | 0.13 | | 0.36 | | 0.03 |
| Net realized and unrealized gains | | | | | | | | | | | |
| (losses) on investments | 12.45 | | (6.13) | | 7.08 | | (0.50) | | (13.78) | | 5.97 |
| Total from investment operations | 12.58 | | (6.04) | | 7.01 | | (0.37) | | (13.42) | | 6.00 |
| | | | | | | | | | | | |
| Distributions to shareholders: | | | | | | | | | | | |
| Dividends from net investment income | (0.09) | | (0.00)(a) | | (0.01) | | (0.38) | | (0.15) | | — |
| Distributions from capital gains | — | | — | | — | | — | | (4.50) | | (3.40) |
| Total distributions | (0.09) | | (0.00) | | (0.01) | | (0.38) | | (4.65) | | (3.40) |
| Net asset value, end of period | $49.23 | | $36.74 | | $42.78 | | $35.78 | | $36.53 | | $54.60 |
| Total return | 34.28%(b) | | (14.11)% | | 19.58% | | (0.36)% | | (26.55)% | | 11.97% |
| | | | | | | | | | | | |
| Supplemental data and ratios: | | | | | | | | | | | |
| Net assets, end of period, in thousands | $1,525,931 | | $1,350,852 | | $1,953,134 | | $1,712,693 | | $1,845,578 | | $3,975,046 |
| Ratio of expenses to average net assets | 1.08%(c) | | 1.04% | | 1.06% | | 1.14% | | 1.07% | | 1.03% |
| Ratio of net investment income (loss) | | | | | | | | | | | |
| to average net assets | 0.50%(c) | | 0.16% | | (0.16)% | | 0.41% | | 0.76% | | 0.05% |
| Portfolio turnover rate | 13%(b) | | 29% | | 40% | | 45% | | 24% | | 25% |
| Ariel Fund (Institutional Class) | December 30, 2011(d) | |
| | to | |
| | March 31, 2012 | |
| | (unaudited) | |
| Net asset value, beginning of year | $42.97 | |
| Income from investment operations: | | |
| Net investment income | 0.09 | |
| Net realized and unrealized gains | | |
| on investments | 6.21 | |
| Total from investment operations | 6.30 | |
| | | |
| Net asset value, end of period | $49.27 | |
| Total return | 14.66% | (b) |
| | | |
| Supplemental data and ratios: | | |
| Net assets, end of period, in thousands | $117,761 | |
| Ratio of expenses to average net assets | 0.65% | (c) |
| Ratio of net investment income | | |
| to average net assets | 1.26% | (c) |
| Portfolio turnover rate | 13% | (b) |
(a) Amount is less than $(0.005). |
(b) Not annualized. |
(c) Annualized. |
(d) Commencement of operations. |
| The accompanying notes are an integral part of the financial statements. |
| arielinvestments.com | 41 | Semi-Annual Report |
Financial Highlights For a share outstanding throughout each period (continued) |
| Ariel Appreciation Fund (Investor Class) | | Year Ended September 30 |
| | Six Months | | | | | | | | | | |
| | Ended | | | | | | | | | | |
| | March 31, 2012 | | 2011 | | 2010 | | 2009 | | 2008 | | 2007 |
| | (unaudited) | | | | | | | | | | |
| Net asset value, beginning of year | $34.81 | | $37.79 | | $32.16 | | $36.39 | | $50.65 | | $48.46 |
| Income from investment operations: | | | | | | | | | | | |
| Net investment income (loss) | 0.17 | | 0.13 | | (0.03) | | 0.08 | | 0.17 | | 0.18 |
| Net realized and unrealized gains | | | | | | | | | | | |
| (losses) on investments | 10.56 | | (3.10) | | 5.70 | | (1.02) | | (9.74) | | 5.49 |
| Total from investment operations | 10.73 | | (2.97) | | 5.67 | | (0.94) | | (9.57) | | 5.67 |
| | | | | | | | | | | | |
| Distributions to shareholders: | | | | | | | | | | | |
| Dividends from net investment income | (0.16) | | (0.01) | | (0.04) | | (0.18) | | (0.23) | | (0.02) |
| Distributions from capital gains | (0.39) | | — | | — | | (3.11) | | (4.46) | | (3.46) |
| Total distributions | (0.55) | | (0.01) | | (0.04) | | (3.29) | | (4.69) | | (3.48) |
| Net asset value, end of period | $44.99 | | $34.81 | | $37.79 | | $32.16 | | $36.39 | | $50.65 |
| Total return | 31.17%(a) | | (7.86)% | | 17.64% | | 3.54% | | (20.49)% | | 12.09% |
| | | | | | | | | | | | |
| Supplemental data and ratios: | | | | | | | | | | | |
| Net assets, end of period, in thousands | $1,395,256 | | $1,143,406 | | $1,330,400 | | $1,234,115 | | $1,459,648 | | $2,452,674 |
| Ratio of expenses to average net assets | 1.17%(b) | | 1.15% | | 1.18% | | 1.25% | | 1.19% | | 1.12% |
| Ratio of net investment income (loss) | | | | | | | | | | | |
| to average net assets | 0.81%(b) | | 0.30% | | (0.06)% | | 0.42% | | 0.39% | | 0.33% |
| Portfolio turnover rate | 9%(a) | | 26% | | 41% | | 44% | | 26% | | 29% |
| | | |
| Ariel Appreciation Fund | December 30, 2011(c) | |
| (Institutional Class) | to | |
| | March 31, 2012 | |
| | (unaudited) | |
| Net asset value, beginning of year | $38.70 | |
| Income from investment operations: | | |
| Net investment income | 0.13 | |
| Net realized and unrealized gains | | |
| on investments | 6.20 | |
| Total from investment operations | 6.33 | |
| | | |
| Net asset value, end of period | $45.03 | |
| Total return | 16.36%(a) | |
| | | |
| Supplemental data and ratios: | | |
| Net assets, end of period, in thousands | $9,424 | |
| Ratio of expenses to average net assets | 0.77%(b) | |
| Ratio of net investment income | | |
| to average net assets | 1.31%(b) | |
| Portfolio turnover rate | 9%(a) | |
(a) Not annualized. |
(b) Annualized. |
(c) Commencement of operations. |
| The accompanying notes are an integral part of the financial statements. |
| Semi-Annual Report | 42 | 800.292.7435 |
| Ariel Focus Fund (Investor Class) | | | Year Ended September 30 |
| | Six Months | | | | | | | | | | |
| | Ended | | | | | | | | | | |
| | March 31, 2012 | | 2011 | | 2010 | | 2009 | | 2008 | | 2007 |
| | (unaudited) | | | | | | | | | | |
| Net asset value, beginning of year | $9.27 | | $9.49 | | $8.79 | | $9.74 | | $11.93 | | $10.69 |
| Income from investment operations: | | | | | | | | | | | |
| Net investment income | 0.05 | | 0.04 | | 0.04 | | 0.05 | | 0.04 | | 0.05 |
| Net realized and unrealized gains | | | | | | | | | | | |
| (losses) on investments | 1.96 | | (0.23) | | 0.70 | | (0.94) | | (1.92) | | 1.24 |
| Total from investment operations | 2.01 | | (0.19) | | 0.74 | | (0.89) | | (1.88) | | 1.29 |
| Distributions to shareholders: | | | | | | | | | | | |
| Dividends from net investment income | (0.06) | | (0.03) | | (0.04) | | (0.06) | | (0.04) | | (0.05) |
| Distributions from capital gains | — | | — | | — | | — | | (0.27) | | — |
| Total distributions | (0.06) | | (0.03) | | (0.04) | | (0.06) | | (0.31) | | (0.05) |
| Net asset value, end of period | $11.22 | | $9.27 | | $9.49 | | $8.79 | | $9.74 | | $11.93 |
| Total return | 21.74%(a) | | (2.07)% | | 8.37% | | (9.02)% | | (16.08)% | | 12.05% |
| Supplemental data and ratios: | | | | | | | | | | | |
| Net assets, end of period, in thousands | $34,853 | | $42,547 | | $54,609 | | $34,877 | | $37,871 | | $43,275 |
| Ratio of expenses to average net assets, | | | | | | | | | | | |
| including waivers | 1.25%(b) | | 1.25% | | 1.25% | | 1.25% | | 1.25% | | 1.25% |
| Ratio of expenses to average net assets, | | | | | | | | | | | |
| excluding waivers | 1.59%(b) | | 1.51% | | 1.58% | | 1.87% | | 1.61% | | 1.63% |
| Ratio of net investments income to | | | | | | | | | | | |
| average net assets, including waivers | 0.83%(b) | | 0.37% | | 0.36% | | 0.68% | | 0.37% | | 0.43% |
| Ratio of net investment income to | | | | | | | | | | | |
| average net assets, excluding waivers | 0.49%(b) | | 0.11% | | 0.03% | | 0.06% | | 0.00% | | 0.05% |
| Portfolio turnover rate | 13%(a) | | 40% | | 52% | | 42% | | 49% | | 28% |
| | | |
| Ariel Focus Fund (Institutional Class) | December 30, 2011(c) | |
| | to | |
| | March 31, 2012 | |
| | (unaudited) | |
| Net asset value, beginning of year | $9.82 | |
| Income from investment operations: | | |
| Net investment income | 0.02 | |
| Net realized and unrealized gains | | |
| on investments | 1.39 | |
| Total from investment operations | 1.41 | |
| Net asset value, end of period | $11.23 | |
| Total return | 14.36%(a) | |
| Supplemental data and ratios: | | |
| Net assets, end of period, in thousands | $12,631 | |
| Ratio of expenses to average net assets, | 1.00%(b) | |
| including waivers | | |
| Ratio of expenses to average net assets, | | |
| excluding waivers | 1.11%(b) | |
| Ratio of net investments income to | | |
| average net assets, including waivers | 1.05%(b) | |
| Ratio of net investment income | | |
| to average net assets, excluding waivers | 0.94%(b) | |
| Portfolio turnover rate | 13%(a) | |
(a) Not annualized. |
(b) Annualized. |
(c) Commencement of operations. |
| The accompanying notes are an integral part of the financial statements. |
| arielinvestments.com | 43 | Semi-Annual Report |
Financial Highlights For a share outstanding throughout each period (continued) |
| Ariel Discovery Fund (Investor Class) | | Six Months | | January 31, 2011(c) |
| | | Ended | | to |
| | | March 31, 2012 | | September 30, 2011 |
| | | (unaudited) | | |
| Net asset value, beginning of year | | $7.71 | | $10.00 |
| Income from investment operations: | | | | |
| Net investment loss | | (0.05) | | (0.06) |
| Net realized and unrealized gains (losses) on investments | | 2.37 | | (2.23) |
| Total from investment operations | | 2.32 | | (2.29) |
| | | | | |
| Net asset value, end of period | | $10.03 | | $7.71 |
| Total return | | 30.09%(a) | | (22.90)%(a) |
| | | | | |
| Supplemental data and ratios: | | | | |
| Net assets, end of period, in thousands | | $2,827 | | $3,177 |
| Ratio of expenses to average net assets, including waivers | | 1.50%(b) | | 1.50%(b) |
| Ratio of expenses to average net assets, excluding waivers | | 4.80%(b) | | 6.75%(b) |
| Ratio of net investment loss to average net assets, including waivers | | (0.87)%(b) | | (1.17)%(b) |
| Ratio of net investment loss to average net assets, excluding waivers | | (4.17)%(b) | | (6.42)%(b) |
| Portfolio turnover rate | | 20%(a) | | 18%(a) |
| Ariel Discovery Fund (Institutional Class) | December 30, 2011(c) | |
| | to | |
| | March 31, 2012 | |
| | (unaudited) | |
| Net asset value, beginning of year | $9.01 | |
| Income from investment operations: | | | |
| Net investment loss | (0.02) | |
| Net realized and unrealized gains on investments | 1.06 | |
| Total from investment operations | 1.04 | |
| | | | |
| Net asset value, end of period | $10.05 | |
| Total return | 11.54%(a) | |
| | | | |
| Supplemental data and ratios: | | | |
| Net assets, end of period, in thousands | $2,031 | |
| Ratio of expenses to average net assets, including waivers | 1.25%(b) | |
| Ratio of expenses to average net assets, excluding waivers | 3.80%(b) | |
| Ratio of net investment loss to average net assets, including waivers | (0.85)%(b) | |
| Ratio of net investment loss to average net assets, excluding waivers | (3.40)%(b) | |
| Portfolio turnover rate | 20%(a) | |
| | | | |
(a) Not annualized. | | | |
(b) Annualized. | | | |
(c) Commencement of operations. | | | |
| The accompanying notes are an integral part of the financial statements. | | | |
| Semi-Annual Report | 44 | 800.292.7435 |
| | | Ariel International Equity Fund | | Ariel Global Equity Fund |
| | | (Investor Class) | | (Investor Class) |
| | | December 30, 2011(c) to | | December 30, 2011(c) to |
| | | March 31, 2012 | | March 31, 2012 |
| | | (unaudited) | | (unaudited) |
| Net asset value, beginning of year | | $10.00 | | $10.00 |
| Income from investment operations: | | | | |
| Net investment income | | 0.02 | | 0.02 |
| Net realized and unrealized gains on investments | | 0.50 | | 0.50 |
| Total from investment operations | | 0.52 | | 0.52 |
| | | | | |
| Net asset value, end of period | | $10.52 | | $10.52 |
| Total return | | 5.20%(a) | | 5.20%(a) |
| | | | | |
| Supplemental data and ratios: | | | | |
| Net assets, end of period, in thousands | | $871 | | $932 |
| Ratio of expenses to average net assets, including waivers | | 1.40%(b) | | 1.40%(b) |
| Ratio of expenses to average net assets, excluding waivers | | 19.97%(b) | | 19.46%(b) |
| Ratio of net investment income to average net assets, including waivers | | 0.72%(b) | | 0.82%(b) |
| Ratio of net investment loss to average net assets, excluding waivers | | (17.85)%(b) | | (17.24)%(b) |
| Portfolio turnover rate | | 3%(a) | | 4%(a) |
| | | | | |
| | | Ariel International Equity Fund | | Ariel Global Equity Fund |
| | | (Institutional Class) | | (Institutional Class) |
| | | December 30, 2011(c) to | | December 30, 2011(c) to |
| | | March 31, 2012 | | March 31, 2012 |
| | | (unaudited) | | (unaudited) |
| Net asset value, beginning of year | | $10.00 | | $10.00 |
| Income from investment operations: | | | | |
| Net investment income | | 0.03 | | 0.03 |
| Net realized and unrealized gains on investments | | 0.49 | | 0.50 |
| Total from investment operations | | 0.52 | | 0.53 |
| | | | | |
| Net asset value, end of period | | $10.52 | | $10.53 |
| Total return | | 5.20%(a) | | 5.30%(a) |
| | | | | |
| Supplemental data and ratios: | | | | |
| Net assets, end of period, in thousands | | $705 | | $749 |
| Ratio of expenses to average net assets, including waivers | | 1.15%(b) | | 1.15%(b) |
| Ratio of expenses to average net assets, excluding waivers | | 21.29%(b) | | 20.52%(b) |
| Ratio of net investment income to average net assets, including waivers | | 1.20%(b) | | 1.24%(b) |
| Ratio of net investment loss to average net assets, excluding waivers | | (18.94)%(b) | | (18.13)%(b) |
| Portfolio turnover rate | | 3%(a) | | 4%(a) |
| | | | | |
(a) Not annualized. | | | | |
(b) Annualized. | | | | |
(c) Commencement of operations. | | | | |
| The accompanying notes are an integral part of the financial statements. | | | | |
| arielinvestments.com | 45 | Semi-Annual Report |
.
| Notes to the Financial Statements |
Note One | Organization
Ariel Investment Trust (the “Trust”) is a Massachusetts business trust registered under the Investment Company Act of 1940, as amended (the “1940 Act”), as an open-end management investment company. Ariel Fund, Ariel Appreciation Fund, Ariel Focus Fund, Ariel Discovery Fund, Ariel International Equity Fund and Ariel Global Equity Fund (the “Funds”) are series of the Trust. Ariel Focus Fund is a non-diversified Fund, all other Funds are diversified. The Funds issue two classes of shares: an Investor Class and an Institutional Class.
Note Two | Significant accounting policies
The following is a summary of significant accounting policies consistently followed by the Funds in the preparation of their financial statements. The financial statements have been prepared in accordance with accounting principles generally accepted in the United States, which require management to make certain estimates and assumptions at the date of the financial statements. Actual results may differ from such estimates.
Securities valuation— Securities for which market quotations are readily available are valued at the last sale price on the national securities exchange on which such securities are primarily traded and, in the case of securities reported on the Nasdaq system, are valued based on the Nasdaq Official Closing Price. If a closing price is not reported, equity securities for which reliable bid and ask quotations are available are valued at the mean between bid and ask prices.
Debt obligations having a maturity of 60 days or less are valued at amortized cost, which approximates market value. Securities and assets for which market quotations are not readily available are valued at fair value as determined in good faith by or under the direction of the Board of Trustees.
The Funds use independent pricing services to assist in pricing portfolio securities. Ariel International Equity Fund and Ariel Global Equity Fund use a third-party fair valuation vendor. The vendor provides fair value for foreign securities held by these Funds based on certain factors and methodologies (involving, generally, tracking valuation correlations between the U.S. market and each non-U.S. security).
Securities transactions and investment income— Securities transactions are accounted for on a trade date basis. Realized gains and losses from securities transactions are recorded on the identified cost basis. Dividend income is recorded on the ex-dividend date and interest income is recognized on an accrual basis. Premiums and discounts on securities purchased are amortized using the effective interest method.
Fair value measurements— Accounting Standards CodificationTM (ASC) 820-10 establishes a three-tier framework for measuring fair value based on a hierarchy of inputs. The hierarchy distinguishes between market data obtained from independent sources (observable inputs) and the Funds’ own market assumptions (unobservable inputs). These inputs are used in determining the value of the Funds’ investments and are summarized below:
Level 1 — quoted prices in active markets for identical securities
Level 2 — other significant observable inputs (including quoted prices for similar securities, “quoted” prices in inactive markets, dealer indications, and inputs corroborated by observable market data)
Level 3 — significant unobservable inputs (including the Funds’ own assumptions in determining the fair value of investments)
The Fund uses valuation techniques to measure fair value that are consistent with the market approach and/ or income approach, depending on the type of security and the particular circumstance. The market approach uses prices and other relevant information generated by market transactions involving identical or comparable securities. The income approach uses valuation techniques to discount estimated future cash flows to present value.
The inputs or methodology used for valuing securities are not necessarily an indication of the risk associated with investing in those securities.
The following is a summary of the inputs used as of March 31, 2012 in valuing the Funds’ investments carried at fair value:
| | | Ariel | Ariel | Ariel |
| | Ariel Fund | Appreciation | Focus | Discovery |
| | | Fund | Fund | Fund |
| Level 1 | $1,638,980,677 | $1,392,895,883 | $46,195,758 | $4,663,410 |
| Level 2* | 32,420,056 | 9,661,775 | 1,221,228 | 131,929 |
| Level 3 | — | — | — | — |
| Fair | | | | |
| Value at | | | | |
| 03/31/2012 | $1,671,400,733 | $1,402,557,658 | $47,416,986 | $4,795,339 |
*As of March 31, 2012, Level 2 securities held are repurchase agreements. See Schedule of Investments.
| Semi-Annual Report | 46 | 800.292.7435 |
| | March 31, 2012 (unaudited) |
| |
| | Ariel International | Ariel Global |
| | Equity Fund | Equity Fund |
| Level 1 | $1,272,784 | $1,378,060 |
| Level 2** | (17) | (298) |
| Level 3 | — | — |
| Fair Value | | |
| at 03/31/2012 | $1,272,767 | $1,377,762 |
| ** | As of March 31, 2012, Level 2 securities held are forward currency contracts, which are reflected at the unrealized depreciation on the contract. |
Forward currency contracts derive their value from underlying exchange rates. These instruments are normally valued by pricing vendors using pricing models. The pricing models typically use inputs that are observed from active markets such as exchange rates. As such, forward currency contracts were categorized as Level 2.
There were no significant transfers into or out of Level 1 and Level 2 fair value measurements during the reporting period, as compared to their classification from the most recent annual report.
The FASB issued amendments to ASC Topic 820 to establish common requirements for measuring fair value and for disclosing information about fair value measurements in accordance with GAAP and International Financial Reporting Standards (ASU No. 2011-04). Such amendments are effective for fiscal years beginning after December 15, 2011. Management is currently evaluating the impact these amendments may have on the Funds’ financial statements.
Foreign currency— Securities and other assets and liabilities denominated in foreign currencies are translated into U.S. dollars using exchange rates obtained from an independent third party. Realized gains (losses) and unrealized appreciation (depreciation) on securities include the effects of changes in security prices. Fluctuations in the value of other assets and liabilities resulting from changes in exchange rates are recorded as unrealized foreign currency gains (losses) until the assets or liabilities are settled in cash, at which time they are recorded as realized foreign currency gains (losses).
Europe risk— Ariel International Equity Fund and Ariel Global Equity Fund invest in securities issued by companies operating in Europe and therefore are subject to certain risks associated specifically with Europe. A significant number of countries in Europe are member states in the European Union, and the member states no longer control their own monetary policies. The recent rapid political and social changes throughout Europe make the extent and nature of future economic development in the region and their effect on securities issued by European companies impossible to predict.
Forward currency contracts— Ariel International Equity Fund and Ariel Global Equity Fund enter into forward currency contracts to provide the appropriate currency exposure related to protecting the value of securities and related receivables and payables against changes in foreign exchange rates. The primary risk associated with a Fund’s use of these contracts is that a counterparty will fail to fulfill its obligation to pay gains due to the Fund under the contracts. Counterparty risk is mitigated by entering into forward currency contracts only with highly rated counterparties. Forward currency contracts are subject to the translations of foreign exchange rate fluctuations. Contracts are “marked-to-market” daily and any resulting unrealized gains (losses) are recorded as unrealized appreciation (depreciation) on foreign currency translations. The Funds record realized gains (losses) at the time the forward currency contract is settled or closed on the Statement of Operations as realized gain (loss) on foreign currency transactions.
Repurchase agreements— The Funds may enter into repurchase agreements with recognized financial institutions and in all instances hold underlying securities as collateral with a value at least equal to the total repurchase price such financial institutions have agreed to pay.
Federal taxes— It is the Funds’ policy to comply with the requirements of the Internal Revenue Code applicable to regulated investment companies and to distribute substantially all taxable income to shareholders. Management has analyzed the Funds’ tax positions taken for all open federal income tax years (September 30, 2008 – 2011), and has concluded that no provision for federal income tax is required in the financial statements.
Class and expense allocations— Each class of shares has equal rights as to assets and earnings, except that shareholders of each class bear certain class-specific expenses related to marketing and distribution, shareholder servicing and shareholder reporting. Income, other non-class-specific expense, and gains and losses on investments are allocated to each class of shares based on its relative net assets. Expenses that are not directly attributable to one or more Funds are allocated among applicable Funds on an equitable and consistent basis considering such things as the nature and type of expense and the relative net assets of the Funds.
| arielinvestments.com | 47 | Semi-Annual Report |
Notes to the Financial Statements (continued) |
Distributions to shareholders— Dividends from net investment income and net realized capital gains, if any, are declared and paid at least annually and recorded on ex-dividend date.
Distributions to shareholders are determined in accordance with federal income tax regulations and may differ from net investment income and realized capital gains for financial reporting purposes. Reclassifications between net asset accounts are made at the end of the fiscal year for such differences that are permanent in nature.
Subsequent events— In preparing these financial statements, the Trust has evaluated subsequent events after March 31, 2012 and there were no such events that would require adjustment to or additional disclosure in these financial statements.
Note Three | Investment transactions, distributions and federal income tax matters
Purchases and proceeds from sales of securities, excluding short-term investments and U.S. government securities, for the six months ended March 31, 2012 (three months ended March 31, 2012 for Ariel International Equity Fund and Ariel Global Equity Fund) were as follows:
| | | Ariel Fund | | Ariel Appreciation Fund | | Ariel Focus Fund | | Ariel Discovery Fund | | Ariel International Equity Fund | | Ariel Global Equity Fund |
| Purchases | | $200,938,898 | | $117,833,519 | | $5,862,928 | | $1,292,936 | | $1,237,629 | | $1,344,970 |
| Sales | | 340,905,110 | | 197,000,398 | | 10,781,327 | | 777,644 | | 31,097 | | 38,030 |
The cost and unrealized appreciation and depreciation of securities on a federal income tax basis at September 30, 2011 were as follows:
| | | Ariel Fund | | Ariel Appreciation Fund | | Ariel Focus Fund | | Ariel Discovery Fund |
| Cost | | $1,225,084,952 | | $968,522,975 | | $45,050,854 | | $3,988,237 |
| | | | | | | | | |
| Unrealized appreciation | | $328,467,275 | | $319,628,593 | | $3,618,816 | | $20,491 |
| Unrealized depreciation | | (203,312,242) | | (145,069,166) | | (5,947,968) | | (885,207) |
| Net unrealized appreciation (depreciation) | | $125,155,033 | | $174,559,427 | | $(2,329,152) | | $(864,716) |
The difference between book basis and tax basis unrealized appreciation and depreciation is attributable primarily to the deferral of losses on wash sales and partnership adjustments.
As of September 30, 2011, Ariel Fund, Ariel Appreciation Fund, Ariel Focus Fund and Ariel Discovery Fund (where applicable) elected for federal income tax purposes to defer current year post October 31 losses as though the losses were incurred on the first day of the next fiscal year. Ariel Fund, Ariel Appreciation Fund, Ariel Focus Fund and Ariel Discovery Fund had no post-October losses.
At September 30, 2011, accumulated net realized capital loss carryovers, if any, and the year(s) in which the capital loss carryovers expire were:
| | | Ariel Fund | | Ariel Appreciation Fund | | Ariel Focus Fund | | Ariel Discovery Fund |
| Years of expiration: | | | | | | | | |
| 2018 | | $(323,418,254) | | — | | $(2,946,053) | | — |
As of September 30, 2011, Ariel International Equity Fund and Ariel Global Equity Fund had not commenced operations.
| Semi-Annual Report | 48 | 800.292.7435 |
| | March 31, 2012 (unaudited) |
| |
Note Four | Investment advisory and other transactions with related parties
Ariel Investments, LLC (the “Adviser”) provides investment advisory and administrative services to each Fund of the Trust under an agreement (the “Management Agreement”). Pursuant to the Management Agreement, the Adviser is paid a monthly fee on average daily net assets at the annual rates shown below:
| Management Fees | | Ariel Fund | | Ariel Appreciation Fund | | Ariel Focus Fund | | Ariel Discovery Fund | | Ariel International Equity Fund | | Ariel Global Equity Fund | |
| Average Daily Net Assets | | | | | | | | | | | | | |
| First $500 million | | 0.65% | | 0.75% | | 0.75% | | 1.00% | | 1.00% | | 1.00% | |
| Next $500 million | | 0.60% | | 0.70% | | 0.70% | | 0.95% | | 0.95% | | 0.95% | |
| Over $1 billion | | 0.55% | | 0.65% | | 0.65% | | 0.90% | | 0.90% | | 0.90% | |
The Adviser has contractually agreed to reimburse the Funds to the extent their respective total annual operating expenses exceed certain limits as shown below:
| | | Ariel Fund | | Ariel Appreciation Fund | | Ariel Focus Fund | | Ariel Discovery Fund | |
| | | Investor Class | | Investor Class | | Investor Class | | Institutional Class | | Investor Class | | Institutional Class | |
| First $30 million* | | 1.50% | | 1.50% | | — | | — | | — | | — | |
| Over $30 million* | | 1.00% | | 1.00% | | — | | — | | — | | — | |
| On average daily net assets | | — | | — | | 1.25% | | 1.00% | | 1.50% | | 1.25% | |
| Waiver** | | — | | — | | 2013 | | 2013 | | 2014 | | 2014 | |
| | | Ariel International Equity Fund | | Ariel Global Equity Fund | |
| | | Investor Class | | Institutional Class | | Investor Class | | Institutional Class | |
| First $30 million* | | — | | — | | — | | — | |
| Over $30 million* | | — | | — | | — | | — | |
| On average daily net assets | | 1.40% | | 1.15% | | 1.40% | | 1.15% | |
| Waiver** | | 2015 | | 2015 | | 2015 | | 2015 | |
*Exclusive of brokerage, interest, taxes, distribution plan expenses and extraordinary items
**Through September 30 of the respective year. After these dates, there is no assurance that such expenses will be limited.
Ariel Distributors, LLC is the Funds’ distributor and principal underwriter (“the Distributor”). The Trust has adopted a plan of distribution under Rule 12b-1 of the 1940 Act applicable to the Investor Class of the Funds. Under the plan, 12b-1 distribution fees up to an annual rate of 0.25% of average daily net assets are paid weekly to the Distributor for its services. For the six months ended March 31, 2012 (three months ended March 31, 2012 for Ariel International Equity Fund and Ariel Global Equity Fund) distribution fee expenses were as follows:
| | | Ariel Fund | | Ariel Appreciation Fund | | Ariel Focus Fund | | Ariel Discovery Fund | | Ariel International Equity Fund | | Ariel Global Equity Fund |
| | | | | | | | | | | | | |
| | | | | | | | | | | | | |
| Paid to distributor | | $1,905,840 | | $1,617,206 | | $49,882 | | $3,909 | | $518 | | $533 |
| Paid to broker/dealers | | 1,424,387 | | 1,276,521 | | 26,126 | | 1,579 | | 2 | | 7 |
The remaining amounts were retained by the Distributor for its services, advertising, and other distribution expenses.
Trustees’ fees and expenses represent only those expenses of disinterested (independent) trustees of the Funds.
| arielinvestments.com | 49 | Semi-Annual Report |
Notes to the Financial Statements (continued) | March 31, 2012 (unaudited) |
Note Five | Forward currency contracts
At March 31, 2012, the fair values of forward currency contracts were reflected in the Statement of Net Assets as follows:
| | Ariel International Equity Fund | Ariel Global Equity Fund | |
| Other assets | $— | | $47 | | |
| Liabilities | (17 | ) | (345 | ) | |
At March 31, 2012, the open forward currency contracts are:
Contract Settlement Date | | Currency to be Received | Amount to be Received | Currency to be Delivered | Amount to be Delivered | Unrealized Appreciation (Depreciation) |
| Ariel International Equity Fund | | | | | | | | | | | |
| 5/29/12 | | AUD | | 3,758 | | CAD | | 3,879 | | $(16 | ) |
| 5/29/12 | | GBP | | 4,909 | | EUR | | 5,885 | | (1 | ) |
| | | | | | | | | | | $(17 | ) |
| Ariel Global Equity Fund | | | | | | | | | | | |
| 4/23/12 | | USD | | 4,106 | | EUR | | 3,105 | | $(35 | ) |
| 5/29/12 | | USD | | 16,375 | | EUR | | 12,414 | | (186 | ) |
| 5/29/12 | | USD | | 16,380 | | JPY | | 1,351,240 | | 47 | |
| 6/19/12 | | USD | | 4,657 | | EUR | | 3,562 | | (95 | ) |
| 6/21/12 | | USD | | 4,095 | | EUR | | 3,091 | | (29 | ) |
| | | | | | | | | | | $(298 | ) |
As reflected in the Statement of Operations, realized net gain (loss) and the change in unrealized appreciation (depreciation) on forward currency contracts for the three months ended March 31, 2012 were:
| | Ariel International Equity Fund | Ariel Global Equity Fund |
| Realized Net Gain (Loss) on Derivatives | $— | | $— | |
| Change in Unrealized Appreciation (Depreciation) on Derivatives | (17 | ) | (298 | ) |
| The forward currency contracts held at March 31, 2012 are indicative of the contracts entered throughout the three month period from December 30, 2011 to March 31, 2012. |
| Note Six | Transactions with affiliated companies |
If a Fund’s holding represents ownership of 5% or more of the voting securities of a company, the company is deemed to be an affiliate as defined in the 1940 Act. Ariel Fund had the following transactions during the six months ended March 31, 2012, with affiliated companies:
| | | Share Activity | | Six Months Ended March 31, 2012 | |
| Security Name | | Balance September 30, 2011 | | Purchases | | Sales | | Balance March 31, 2012 | | Market Value | | Dividends Credited to Income | | Amount of Gain (Loss) Realized on Sale of Shares | |
| Interface, Inc.* | | 3,452,238 | | — | | 1,047,700 | | 2,404,538 | | $33,543,305 | | $112,876 | | $(257,531) | |
| Fair Isaac Corp.* | | 2,196,000 | | — | | 822,200 | | 1,373,800 | | 60,309,820 | | 61,682 | | 7,651,621 | |
| Symmetry Medical Inc. | | 2,474,200 | | 144,400 | | — | | 2,618,600 | | 18,513,502 | | — | | — | |
| Contango Oil & Gas Co. | | 535,771 | | 343,176 | | — | | 878,947 | | 51,778,768 | | — | | — | |
| | | | | | | | | | | $164,145,395 | | $174,558 | | $7,394,090 | |
| *No longer an affiliated company. |
| Note Seven | Line of credit |
The Funds have a $125,000,000 Line of Credit (the “Line”), which is uncommitted, with State Street Bank and Trust Company. The Line is for temporary or emergency purposes such as to provide liquidity for shareholder redemptions. The Funds incur interest expense to the extent of amounts drawn (borrowed) under the Line. Interest is based on the federal funds rate in effect at the time of borrowing, plus a margin: For the six months ended March 31, 2012, the details of the borrowings were as follows:
| Fund | | Average Daily Borrowings | | Number of Days Outstanding | | Weighted Average Annualized Interest Rate | |
| Ariel Focus Fund | | $6,380 | | 14 | | 1.40% | |
| Semi-Annual Report | 50 | 800.292.7435 |
| Fund Expense Example | (unaudited) |
Example
As a shareholder of the Funds, you incur ongoing costs, including management fees, distribution and service (12b-1) fees; and other Fund expenses. The Funds currently do not charge any transaction costs, such as sales charges (loads) on purchase payments, reinvested dividends or other distributions, redemption fees or exchange fees. The following example is intended to help you understand your ongoing costs (in dollars) of investing in each of the Funds and to compare these costs with the ongoing costs of investing in other mutual funds. Please note that IRA, 403(b) and Coverdell ESA account holders are charged an annual $15 recordkeeping fee or a one-time, lifetime $60 fee. If these fees were included in either the Actual Expense or Hypothetical Example below, your costs would be higher.
The example is based on an investment of $1,000 invested at the beginning of the period and held for the entire period of October 1, 2011-March 31, 2012.
Actual expenses
The first line of the table below for each Fund provides information about actual account values and actual expenses for that particular Fund. You may use the information in each of these lines, together with the amount you invested, to estimate the expenses that you paid over the period in each Fund. Simply divide your account value by $1,000 (for example, an $8,600 account value divided by $1,000=8.6), then multiply the result by the number in the first line under the heading, entitled “Expenses Paid During Period”, to estimate the expenses you paid on your account during this period in each Fund.
Hypothetical example for comparison purposes
The second line of the table below for each Fund provides information about hypothetical account values and hypothetical expenses based on each Fund’s actual expense ratio and an assumed rate of return of 5% per year before expenses, which is not the actual return. The hypothetical account values and expenses may not be used to estimate the actual ending account balance or expenses you paid for the period. You may use this information to compare the ongoing costs of investing in each of the Funds to other funds. To do so, compare this 5% hypothetical example with the 5% hypothetical examples that appear in the shareholder reports of other funds.
Please note that the expenses shown in the table are meant to highlight only your ongoing costs in each of the Funds. Therefore, the second line of the table for each Fund is useful in comparing ongoing costs only, and will not help you determine the relative total costs of owning different funds.
| | | | | Actual | | Hypothetical (5% return before expenses) | | | |
| Fund and Return | | Beginning Account Value 10/1/2011 | | Ending Account Value 3/31/2012 | | Expenses Paid During Period | | Ending Account Value 3/31/2012 | | Expenses Paid During Period | | Annualized Expense Ratio | |
| Ariel Fund | | | | | | | | | | | | | | | | | | | |
| Investor Class* | | $1,000.00 | | | $1,342.80 | | | $6.33 | | | $1,019.60 | | | $5.45 | | | 1.08% | | |
| Institutional Class** | | 1,000.00 | | | 1,146.60 | | | 1.77 | | | 1,021.75 | | | 3.29 | | | 0.65% | | |
| Ariel Appreciation Fund | | | | | | | | | | | | | | | | | | | |
| Investor Class* | | $1,000.00 | | | $1,311.70 | | | $6.76 | | | $1,019.15 | | | $5.91 | | | 1.17% | | |
| Institutional Class** | | 1,000.00 | | | 1,163.60 | | | 2.12 | | | 1,021.15 | | | 3.89 | | | 0.77% | | |
| Ariel Focus Fund | | | | | | | | | | | | | | | | | | | |
| Investor Class* | | $1,000.00 | | | $1,217.40 | | | $6.93 | | | $1,018.75 | | | $6.31 | | | 1.25% | | |
| Institutional Class** | | 1,000.00 | | | 1,143.60 | | | 2.72 | | | 1,020.00 | | | 5.05 | | | 1.00% | | |
| Ariel Discovery Fund | | | | | | | | | | | | | | | | | | | |
| Investor Class* | | $1,000.00 | | | $1,300.90 | | | $8.65 | | | $1,017.50 | | | $7.57 | | | 1.50% | | |
| Institutional Class** | | 1,000.00 | | | 1,115.40 | | | 3.36 | | | 1,018.75 | | | 6.31 | | | 1.25% | | |
| Ariel International Equity Fund | | | | | | | | | | | | | | | | | | | |
| Investor Class*** | | $1,000.00 | | | $1,052.00 | | | $3.65 | | | $1,018.00 | | | $7.06 | | | 1.40% | | |
| Institutional Class** | | 1,000.00 | | | 1,052.00 | | | 3.00 | | | 1,019.25 | | | 5.81 | | | 1.15% | | |
| Ariel Global Equity Fund | | | | | | | | | | | | | | | | | | | |
| Investor Class*** | | $1,000.00 | | | $1,052.00 | | | $3.65 | | | $1,018.00 | | | $7.06 | | | 1.40% | | |
| Institutional Class** | | 1,000.00 | | | 1,053.00 | | | 3.00 | | | 1,019.25 | | | 5.81 | | | 1.15% | | |
| * | Expenses are equal to each Fund’s annualized expense ratio indicated above multiplied by the average account value over the period, multiplied by 183/366 to reflect the most recent fiscal half year. |
| ** | Actual expenses are equal to the annualized expense ratio indicated above multiplied by the average account value over the period since inception, multiplied by 93/366 to reflect the period since the Institutional Class commenced on December 30, 2011. Hypothetical expenses are equal to the annualized expense ratio indicated above multiplied by the average account value over the period commencing December 30, 2011, multiplied by 183/366 to reflect information had the Institutional Class been in operation for the entire fiscal half year. |
| *** | Actual expenses are equal to the Fund’s annualized expense ratio indicated above multiplied by the average account value over the period since inception, multiplied by 93/366 to reflect the period since the Investor Class commenced operations December 30, 2011. Hypothetical expenses are equal to the Fund’s annualized expense ratio indicated above multiplied by the average account value over the period commencing December 30, 2011, multiplied by 183/366 to reflect information had the Investor Class been in operation for the entire fiscal half year. |
| arielinvestments.com | 51 | Semi-Annual Report |
| Important Supplemental Information |
Proxy Voting Policies, Procedures, and Record
Both a description of the policies and procedures that the Funds’ investment adviser uses to determine how to vote proxies relating to portfolio securities and information regarding how the Funds voted proxies relating to portfolio securities during the most recent 12-month period ended June 30 are available upon request by calling 800-292-7435. Such information for the Ariel Investment Trust is also available on the Securities and Exchange Commission’s (“SEC”) web site at www.sec.gov.
Shareholder Statements and Reports
The Funds attempt to reduce the volume of mail sent to shareholders by sending one copy of financial reports, prospectuses and other regulatory materials to two or more account holders who share the same address. We will send you a notice at least 60 days before sending only one copy of these documents we have if we have not received the shareholder’s written consent from you previously. Should you wish to receive individual copies of materials, please contact us at 800-292-7435. Once we have received your instructions, we will begin sending individual copies for each account within 30 days.
Availability of Quarterly Portfolio Schedule
The Funds file complete schedules of investments with the SEC for the quarters ended December 31 and June 30 of each fiscal year on Form N-Q which are available on the SEC’s website at www.sec.gov. Additionally, the Funds’ Form N-Q may be reviewed and copied at the SEC’s Public Reference Room in Washington, DC. For information on the Public Reference Room, call 800-SEC-0330.
All of the Funds’ quarterly reports contain a complete schedule of portfolio holdings. All quarterly reports are made available to shareholders on the Funds’ web site at www.arielinvestments. com. Shareholders also may obtain copies of shareholder reports upon request by calling 800-292-7435 or by writing to Ariel Investment Trust, c/o U.S. Bancorp Fund Services, LLC, P.O. Box 701, Milwaukee, Wisconsin 53201-0701.
Approval of the Management Agreements
Each year the Board of Trustees of the Trust, including a majority of the Independent Trustees, is required by the 1940 Act to determine whether to continue each Fund’s management agreement with the Adviser (each a “Management Agreement”). Throughout the year, the Board meets in person and requests, receives and considers a broad range of materials and information that are relevant to the Trustees’ consideration of the Management Agreements. The Board’s Management Contracts Committee (the “Committee”), which is comprised entirely of Independent Trustees, leads the Board in its consideration of the Management Agreements. Both the Committee and the Board held meetings in November 2011 to consider the Management Agreements, including a new management Agreement for two proposed new Funds, International Equity Fund and Global Equity Fund (the “International/Global Funds”). During each of those meetings, the Committee and the Independent Trustees were advised by, and met in executive sessions with, their independent legal counsel.
Nature, Extent and Quality of Services—The Trustees considered the Adviser’s specific responsibilities in the day-to-day management of the Funds, taking into account their knowledge of the Adviser’s operations. In addition, the Trustees considered the Adviser’s historical approach in managing the Funds; its consistency of investment approach; the background, education and experience of the Adviser’s investment personnel; the nature and quality of the Adviser’s services, including, among other things, compliance matters, trading practices, brokerage selection, shareholder communications, and information technology; and the Adviser’s commitment to diversity and civic affairs. They also reviewed whether the Funds had operated within their investment objectives and reviewed each Fund’s record of compliance with its investment restrictions and other regulatory requirements. They also considered information regarding the structure of the Adviser’s compensation program for portfolio managers and certain other employees and the Adviser’s ability to attract and retain quality personnel. The Independent Trustees noted they had good communication with the portfolio managers throughout the year. The Independent Trustees also noted the personal investments made by the Adviser’s personnel in the Funds, which is designed to align the interests of the Adviser and its personnel with those of the Funds’ shareholders.
Investment Performance—The Trustees considered the investment performance of each Fund over time, including comparative information provided by Lipper Inc., an independent data service provider (“Lipper”), comparing each Fund’s performance with that of comparable funds selected by Lipper (the “Peer Group”). The Trustees discussed comparative data with respect to the performance of the Funds, the Funds’ respective Peer Groups and the Funds’ respective performance benchmarks. The Trustees noted that during the last ten years, Ariel Fund’s performance ranked either in the first quintile or in the last quintile. Ariel Fund’s since inception performance was in the first quintile; however Ariel Fund’s 3-year total return dropped to the fourth quintile, and its 1-year, 5-year and 10-year returns dropped to the fifth quintile. They also noted the variation in Appreciation Fund’s performance, where it ranked in the top quintile for the 3-year and 5-year returns, the second quintile for the 10-year and since inception returns, and the fifth quintile for its 1-year performance. The Trustees noted that Focus Fund’s performance was more evenly distributed. Focus Fund ranked in the second quintile for its 1-year performance, in the third quintile for its 3-year and since inception performance, and in the top quintile for its 5-year performance. The Discovery Fund had less than 1 year of performance since its inception date was January 31, 2011. The Committee reported to the Board that it had discussed at some length the apparent volatility in the performance of the Funds. In that regard, the Committee had met with the respective portfolio managers of the Funds prior to approval of the Management Agreement for a fulsome discussion of performance and volatility. The investment team continues to seek to enhance its processes to minimize losses in the Funds’ portfolios and to seek to reduce the level of volatility of the Funds by researching and understanding behavioral finance, as well as strengthening the team’s skill sets and utilizing the longevity, experience and accumulated knowledge of company management. The Trustees acknowledged the Adviser’s commitment to its stated investment strategy and its approach of being patient investors, focused, independent, and innovative.
| Semi-Annual Report | 52 | 800.292.7435 |
| | March 31, 2012 (unaudited) |
| |
Fees and Expenses—The Trustees reviewed comparative fee and expense information for each Fund’s Peer Group, as selected and analyzed by Lipper. The Trustees considered comparative total expense ratios, as well as advisory fees, in assessing each Fund’s management fee structure. The Trustees considered the expense ratio of each Fund and concluded that the expense ratios were reasonable and competitive with the expense ratios of each Fund’s Peer Group as determined by Lipper.
Benefits, Profitability and Economies of Scale—The Trustees discussed the Committee’s conclusion that Ariel’s profitability associated with its relationship with each Fund was within a reasonable range and was neither excessive nor so low that the Adviser could not be expected to continue to service the Funds effectively. The Independent Trustees reviewed the profitability to Ariel of its relationship with each Fund, including the methodology by which that profitability analysis was calculated, and also examined the fees charged by Ariel to other types of clients, as well as the basis for any differences between those fees. The Independent Trustees discussed with representatives of the Adviser the financial condition of the Adviser and its long-term strategic planning. The Trustees reviewed the extent to which economies of scale may be realized if the Funds increase in size. It was noted that the management fee schedules for all the Funds contain breakpoints at different levels, with the final breakpoint at $1 billion in assets. The Trustees considered the effective advisory fees for the Funds and concluded that the advisory fee schedules provide an appropriate sharing between the Funds and the Adviser of such economies of scale as may exist under the Management Agreements and determined that no additional breakpoints, or adjustments to the existing breakpoints, were needed at the present time.
Consideration of International/Global Funds Advisory Agreement—The Trustees considered the specific advisory services proposed to be provided by the Adviser for the International/Global Funds, as well as the previous performance history, background, and investment experience of the portfolio manager who will have day-to-day management responsibilities, and the depth and qualifications of the analyst staff hired to date. The Trustees also considered the proposed fee schedules for the International/ Global Funds, noting that the proposed fees are the same as that charged to the Discovery Fund but higher than those charged to the other Ariel Funds. The Trustees concluded that such fees were reasonable and competitive given the increased level of attention and research required by the International/Global Funds, and were competitive with fees of comparable international and global funds. The Trustees considered the potential benefits to the Adviser through its management of the International/Global Funds and the potential benefit to the Funds from economies of scale that could be experienced through different breakpoints in the management fee schedule once the Funds become operational.
Approval—After full consideration of the above factors, as well as other factors that were instructive in evaluating the Management and Advisory Agreements, the Board, including all of the Independent Trustees, concluded that continuation of each Fund’s Management Agreement and the approval of the International/Global Fund’s initial Advisory Agreement was in the best interests of each Fund and its respective shareholders (or prospective shareholders in the case of the International/ Global Funds) and the Board approved the initial Advisory Agreement for the International/Global Funds and the continuation of each Fund’s agreement. The Board’s determinations were based upon a comprehensive consideration of all information provided to it, including both quantitative measures and qualitative factors, and were not the result of any single factor.
| arielinvestments.com | 53 | Semi-Annual Report |
| | | Position(s) held | | Term of office and length | | Principal occupation(s) | | |
| Name and age | | with Fund | | of time served | | during past 5 years | | Other directorships |
| James W. Compton | | Trustee, Member of | | Indefinite, until successor | | Retired President and CEO, | | Seaway Bank and Trust |
| Age: 73 | | Governance and Audit | | elected | | Chicago Urban League | | Company, Commonwealth |
| | | Committees | | | | (non-profit, civil rights and | | Edison Company |
| | | | | Served as a Trustee | | community-based organi- | | |
| | | | | since 1997 | | zation), 1972 to 2006 | | |
| | | | | | | | | |
| William C. Dietrich | | Trustee, Chairman of Audit | | Indefinite, until successor | | Former Executive Director, | | |
| Age: 62 | | Committee, Member of | | elected | | Shalem Institute for | | |
| | | Executive Committee | | | | Spiritual Formation, Inc. | | |
| | | | | Served as a Trustee | | (ecumenical educational | | |
| | | | | since 1986 | | institute) | | |
| | | | | | | | | |
| Royce N. Flippin, Jr. | | Lead Independent Trustee, | | Indefinite, until successor | | President, Flippin | | |
| Age: 77 | | Member of Management | | elected | | Associates (consulting | | |
| | | Contracts and Governance | | | | firm) since 1992 | | |
| | | Committees, Chairman of | | Served as a Trustee | | | | |
| | | Executive Committee | | since 1986 and Lead | | | | |
| | | | | Independent Trustee | | | | |
| | | | | since 2006 | | | | |
| | | | | | | | | |
| Mellody L. Hobson | | Chairman of the Board of | | Indefinite, until successor | | President, Ariel | | DreamWorks Animation |
| Age: 42 | | Trustees and President, | | elected | | Investments since 2000 | | SKG, Inc., The Estee |
| | | Member of Executive | | | | | | Lauder Companies Inc., |
| | | Committee | | Served as a Trustee since | | | | Groupon, Inc., Starbucks |
| | | | | 1993, President since 2002 | | | | Corporation, Sundance |
| | | | | and Chairman | | | | Institute, Chicago Public |
| | | | | since 2006. | | | | Education Fund, The Field |
| | | | | | | | | Museum, Investment |
| | | | | | | | | Company Institute (Board |
| | | | | | | | | of Governors), SEC Investor |
| | | | | | | | | Advisory Committee |
| | | | | | | | | |
| Christopher G. Kennedy | | Trustee, Member of | | Indefinite, until successor | | Chairman of the Board | | Interface Inc. |
| Age: 48 | | Audit and Governance | | elected | | of Trustees, University of | | |
| | | Committees | | | | Illinois, Chairman, | | |
| | | | | Served as a Trustee since | | Joseph P. Kennedy | | |
| | | | | 1995 | | Enterprise, Inc.; Former | | |
| | | | | | | President, Merchandise | | |
| | | | | | | Mart Properties, Inc., | | |
| | | | | | | 2000 to 2011 | | |
| arielinvestments.com | 54 | 800.292.7435 |
| | | Position(s) held | | Term of office and length | | Principal occupation(s) | | |
| Name and age | | with Fund | | of time served | | during past 5 years | | Other directorships |
| Merrillyn J. Kosier | | Trustee and Vice President | | Indefinite, until successor | | Executive Vice President, | | Loyola University Council |
| Age: 52 | | | | elected | | Ariel Investments since | | of Regents, Member of |
| | | | | | | 1999, Chief Marketing | | the Investment Policy |
| | | | | Served as a Trustee | | Officer, Mutual Funds since | | Committee and Board of |
| | | | | since 2003 and Vice | | 2007 | | Advisors for the Graduate |
| | | | | President since 1999 | | | | School of Business, Harris |
| | | | | | | | | Theater for Music and |
| | | | | | | | | Dance, Lupus Foundation |
| | | | | | | | | of America, Inc. |
| | | | | | | | | |
| William M. Lewis, Jr. | | Trustee, Member of | | Indefinite, until successor | | Managing Director | | Darden Restaurants, Inc. |
| Age: 55 | | Management Contracts | | elected | | and Co-Chairman of | | |
| | | Committee | | | | Investment Banking, Lazard | | |
| | | | | Served as a Trustee | | Ltd. since 2004 | | |
| | | | | since 2007 | | | | |
| | | | | | | | | |
| H. Carl McCall | | Trustee, Chairman of | | Indefinite, until successor | | Chairman, The State | | |
| Age: 76 | | Governance Committee, | | elected | | University of New York, | | |
| | | Member of Audit | | | | Principal, Convent Capital, | | |
| | | Committee | | Served as a Trustee | | LLC (financial advisory firm) | | |
| | | | | since 2006 | | 2004-2011 | | |
| | | | | | | | | |
| John W. Rogers, Jr. | | Trustee | | Indefinite, until | | Founder, Chairman, CEO | | Exelon Corporation, |
| Age: 54 | | | | successor elected | | and Chief Investment | | McDonald’s Corporation, |
| | | | | | | Officer, Ariel Investments, | | Chicago Urban League, |
| | | | | Served as a Trustee | | Lead Portfolio Manager, | | Trustee of the University |
| | | | | 1986 to 1993 and | | Ariel Fund & Ariel | | of Chicago, Economic |
| | | | | since 2000 | | Appreciation Fund | | Club of Chicago (Former |
| | | | | | | | | Chairman), Chair of the |
| | | | | | | | | President’s Advisory Council |
| | | | | | | | | on Financial Capability |
| | | | | | | | | |
| James M. Williams | | Trustee, Chairman of | | Indefinite, until successor | | Vice President and | | SEI Mutual Funds |
| Age: 64 | | Management Contracts | | elected | | Chief Investment Officer, | | |
| | | Committee | | | | J. Paul Getty Trust, since | | |
| | | | | Served as a Trustee | | 2002 | | |
| | | | | since 2006 | | | | |
| | | | | | | | | |
TRUSTEES EMERITUS
(no Trustee duties or responsibilities)
John G. Guffey, Jr.
Bert N. Mitchell, CPA, Chairman
Note: Number of portfolios in complex overseen by all Trustees is six. Address for all Trustees is 200 East Randolph Dr., Suite 2900, Chicago, IL 60601
55
| | | Position(s) held | | Term of office and length | | Principal occupation(s) | | Other directorships |
| Name and age | | with Fund | | of time served | | during past 5 years | | held by officer |
| | | | | | | | | |
| Mareile B. Cusack | | Vice President, Anti-Money | | Indefinite, until successor | | Vice President, Ariel | | Smart Museum of Art |
| Age: 53 | | Laundering Officer and | | elected | | Investments since 2007, | | (University of Chicago), |
| | | Assistant Secretary | | | | General Counsel since | | The Great Books |
| | | | | Served as Vice President | | October 2008; Vice | | Foundation |
| | | | | and Assistant Secretary | | President and Associate | | |
| | | | | since 2008 | | General Counsel, Chicago | | |
| | | | | | | Stock Exchange, Inc. 2007 | | |
| | | | | Served as Anti-Money | | and Chief Enforcement | | |
| | | | | Laudering Officer since | | Counsel, 2004 to 2007 | | |
| | | | | 2010 | | | | |
| | | | | | | | | |
| Mellody L. Hobson | | Chairman, President, Chief | | Indefinite, until successor | | President, Ariel | | DreamWorks Animation |
| Age: 42 | | Executive Officer and | | elected | | Investments, since 2000 | | SKG, Inc., The Estee Lauder |
| | | Principal Executive Officer | | | | | | Companies Inc., Groupon, |
| | | | | Served as a Trustee since | | | | Inc., Starbucks Corporation, |
| | | | | 1993, President since 2002 | | | | Sundance Institute, Chicago |
| | | | | and Chairman | | | | Public Education Fund, The |
| | | | | since 2006 | | | | Field Museum, Investment |
| | | | | | | | | Company Institute (Board |
| | | | | | | | | of Governors), SEC Investor |
| | | | | | | | | Advisory Committee |
| | | | | | | | | |
| Merrillyn J. Kosier | | Trustee and Vice President | | Indefinite, until successor | | Executive Vice President, | | Loyola University Council |
| Age: 52 | | | | elected | | Ariel Investments since | | of Regents, Member of |
| | | | | | | 1999, Chief Marketing | | the Investment Policy |
| | | | | Served as a Trustee since | | Officer, Mutual Funds since | | Committee and Board of |
| | | | | 2003 and Vice President | | 2007 | | Advisors for the Graduate |
| | | | | since 1999 | | | | School of Business, Harris |
| | | | | | | | | Theater for Music and |
| | | | | | | | | Dance, Lupus Foundation |
| | | | | | | | | of America, Inc. |
| | | | | | | | | |
| Jeffrey H. Rapaport | | Vice President and | | Served as Vice President | | Vice President, Fund | | |
| Age: 36 | | Assistant Treasurer | | and Assistant Treasurer | | Administration since 2010; | | |
| | | | | since 2010 | | Senior Fund Administration | | |
| | | | | | | Analyst, Ariel Investments, | | |
| | | | | | | 2007-2010; Fund | | |
| | | | | | | Administrator, Ariel | | |
| | | | | | | Investments, 2005-2007 | | |
| | | | | | | | | |
| Anita M. Zagrodnik, CPA | | Chief Financial Officer, | | Indefinite, until successor | | Senior Vice President, | | |
| Age: 52 | | Chief Compliance Officer, | | elected | | Fund Administration, | | |
| | | Vice President, Secretary | | | | Ariel Investments since | | |
| | | and Treasurer | | Served as Vice President | | 2010; Vice President, | | |
| | | | | since 2003, Chief Financial | | Fund Administration, Ariel | | |
| | | | | Officer and Treasurer since | | Investments, 2003-2010 | | |
| | | | | 2010, Chief Compliance | | | | |
| | | | | Officer, Ariel Investment Trust | | | | |
| | | | | since 2004, Secretary since | | | | |
| | | | | 2007, Assistant Secretary | | | | |
| | | | | from 2003-2007 | | | | |
The Statement of Additional Information (SAI) for Ariel Investment Trust includes additional information about the Funds’ Trustees and Officers. The SAI is available without charge by calling 800.292.7435 or logging on to our website, arielinvestments.com. Note: Number of portfolios in complex overseen by all Officers is six. Address for all officers is 200 East Randolph Dr., Suite 2900, Chicago, IL 60601.
| arielinvestments.com | 56 | 800.292.7435 |


Item 2. Code of Ethics.
Not applicable. The information required by this Item is only required in an annual report on Form N-CSR.
Item 3. Audit Committee Financial Expert.
Not applicable. The information required by this Item is only required in an annual report on Form N-CSR.
Item 4. Principal Accountant Fees and Services.
Not applicable. The information required by this Item is only required in an annual report on Form N-CSR.
Item 5. Audit Committee of Listed Registrants.
Not applicable.
Item 6. Schedule of Investments.
| (a) | Included as part of the report to shareholders filed under Item 1 of this Form. |
Item 7. Disclosure of Proxy Voting Policies and Procedures for Closed-End Management Investment Companies.
Not applicable.
Item 8. Portfolio Managers of Closed-End Management Investment Companies.
Not applicable.
Item 9. Purchases of Equity Securities by Closed-End Management Investment Company and Affiliated Purchasers.
Not applicable.
Item 10. Submission of Matters to a Vote of Security Holders.
There have been no changes to the procedures by which shareholders may recommend nominees to the registrant’s Board of Trustees.
Item 11. Controls and Procedures.
| (a) | The registrant’s certifying officers have reasonably designed such disclosure controls and procedures to ensure material information relating to the registrant is made known to them by others, particularly during the period in which this report is being prepared. The registrant’s certifying officers have determined that the registrant’s disclosure controls and procedures are effective based on their evaluation of these controls and procedures as of a date within 90 days prior to the filing date of this report. |
| (b) | There were no significant changes in the registrant's internal controls over financial reporting, or in other factors that could significantly affect these controls, that occurred during the registrant’s second fiscal half-year, including any corrective actions with regard to significant deficiencies and material weaknesses. |
Item 12. Exhibits.
| (a) | (1) Code of Ethics – Not applicable. |
(a) (2) Certification for each principal executive and principal financial officer of the registrant as required by Rule 30a-2 under the Act (17 CFR 270.30a-2(a)) – Filed as an attachment to this filing.
(a) (3) Written solicitation to purchase securities under Rule 23c-1 – Not applicable.
| (b) | Certifications required by Rule 30a-2(b) under the Act (17 CFR 270.30a-2(b)), Rule 13a-14(b) or Rule 15d-14(b) under the Exchange Act (17 CFR 240.13a-14(b) or 240.15d-14(b)), and Section 1350 of Chapter 63 of Title 18 of the United States Code (18 U.S.C. 1350). A certification furnished pursuant to this paragraph will not be deemed “filed” for purposes of Section 18 of the Securities Exchange Act of 1934, as amended, or otherwise subject to the liability of that section. Such certification will not be deemed to be incorporated by reference into any filing under the Securities Act of 1933 or the Exchange Act, except to the extent that the registrant specifically incorporates it by reference – Filed as an attachment to this filing. |
SIGNATURES
Pursuant to the requirements of the Securities Exchange Act of 1934 and the Investment Company Act of 1940, the registrant has duly caused this report to be signed on its behalf by the undersigned, thereunto duly authorized.
Ariel Investment Trust
By: /s/ Mellody Hobson
Mellody Hobson
President and Principal Executive Officer
Date: May 14, 2012
Pursuant to the requirements of the Securities Exchange Act of 1934 and the Investment Company Act of 1940, this report has been signed below by the following persons on behalf of the registrant and in the capacities and on the dates indicated.
By: /s/ Mellody Hobson
Mellody Hobson
President and Principal Executive Officer
Date: May 14, 2012
By: /s/ Anita Zagrodnik
Anita Zagrodnik
Treasurer and Chief Financial Officer
Date: May 14, 2012