UNITED STATES
SECURITIES AND EXCHANGE COMMISSION
Washington, D.C. 20549
FORM N-CSR
CERTIFIED SHAREHOLDER REPORT OF REGISTERED
MANAGEMENT INVESTMENT COMPANIES
Investment Company Act file number | 811-4786 |
|
Ariel Investment Trust |
(Exact name of registrant as specified in charter) |
|
200 East Randolph Drive Suite 2900 Chicago, Illinois | | 60601 |
(Address of principal executive offices) | | (Zip code) |
|
Mareile Cusack 200 East Randolph Drive Suite 2900 Chicago, Illinois 60601 |
(Name and address of agent for service) |
|
with a copy to: |
|
Arthur Don, Esq. Greenberg Traurig, LLP 77 West Wacker Drive Suite 3100 Chicago, IL 60601 |
|
Registrant’s telephone number, including area code: | (312) 726-0140 | |
|
Date of fiscal year end: | September 30, 2010 | |
|
Date of reporting period: | March 31, 2010 | |
| | | | | | | | |
Item 1. Reports to Stockholders.
The following is a copy of the report transmitted to shareholders pursuant to Rule 30e-1 under the Investment Company Act of 1940 (the “Act”) (17 CFR 270.30e-1).

One of Ariel Investments’ guiding principles is to communicate openly with our shareholders so they may gain a clear understanding of our investment philosophy, portfolio decisions and results, as well as our opinions on the underlying market. In reviewing the materials contained in The Patient Investor, please consider the information provided on this page. While our investment decisions are rooted in detailed analysis, it is important to point out that actual results can differ significantly from those we seek. We candidly discuss a number of individual companies.
Our opinions are current as of the date they were written but are subject to change. We want to remind investors that the information in The Patient Investor is not sufficient on which to base an investment decision and should not be considered a recommendation to purchase or sell any particular security. Ariel Fund and Ariel Appreciation Fund invest primarily in small and mid-sized companies. Investing in small and midcap stocks is riskier and more volatile than investing in large cap stocks, in part because smaller companies may not have the scale, depth of resources and other assets of larger firms. Additionally, Ariel Focus Fund invests in mid to large-cap stocks and is a non-diversified fund, which means its investments are concentrated in fewer names than diversified funds, such as Ariel Fund and Ariel Appreciation Fund. Ariel Focus Fund generally holds 20 stocks and therefore may be more volatile than a more diversified investment. Investing in equity stocks is risky and subject to the volatility of the markets.
Performance data quoted is past performance and does not guarantee future results. The performance stated in The Patient Investor assumes the reinvestment of dividends and capital gains. We caution shareholders that we can never predict or assure future returns on investments. The investment return and principal value of an investment with our Funds will fluctuate over time so that your shares, when redeemed, may be worth more or less than their original cost. Current performance may be lower or higher than the performance data quoted in this report. For the period ended March 31, 2010, the average annual total returns for the one-, five- and ten-year periods for Ariel Fund and Ariel Appreciation Fund were 112.31%, 0.25% and 8.66%; and 98.15%, 3.67% and 8.30%, respectively. For the period ended March 31, 2010, the average annual total returns of Ariel Focus Fund for the one-year and since inception (June 30, 2005) periods were 66.06% and 1.03%. To access our performance data current to the most recent month-end, visit our website, arielinvestments.com.
As of September 30, 2009, Ariel Fund and Ariel Appreciation Fund had annual expense ratios of 1.14% and 1.25%, respectively. As of September 30, 2009, Ariel Focus Fund had an annual net expense ratio of 1.25% and a gross expense ratio of 1.87%. The Fund’s adviser, Ariel Investments, LLC, is contractually obligated to waive fees or reimburse expenses in order to limit Ariel Focus Fund’s total annual operating expenses to 1.25% of net assets through the end of the fiscal year ending September 30, 2011. After that date, there is no assurance such expenses will be limited.
Investors should consider carefully the investment objectives, risks, and charges and expenses before investing. For a current summary prospectus or full prospectus which contains this and other information about the funds offered by Ariel Investment Trust, call us at 800.292.7435 or visit our website, arielinvestments.com. Please read the summary prospectus or full prospectus carefully before investing. Distributed by Ariel Distributors, LLC, a wholly-owned subsidiary of Ariel Investments, LLC.
ARIEL INVESTMENT TRUST
c/o U.S. Bancorp Fund Services, LLC
P.O. Box 701
Milwaukee, WI 53201-0701
800.292.7435 | arielinvestments.com

| WANT TO GET YOUR RETIREMENT SAVINGS BACK ON TRACK? |
INVEST IN AN ARIEL IRA TODAY! |
| |
| Ariel Investments has extended its offer to waive the custodial fee for both existing and new IRA shareholders through June 30th. |
| |
| To take advantage of this offer, invest or rollover: |
· | $1,000 in an Ariel IRA and we will waive your annual fee of $15 in 2010. |
· | $5,000 in an Ariel IRA and we will waive the lifetime fee of $60, so your custodial fees will be covered for the life of the account with Ariel. |
Turtle Talk with our Investment Specialists

I recently attended a graduation party for my niece who is heading off to college in September. It made me wonder if I’ll have enough money saved to send my infant daughter to college. Can Ariel help?
—Renee, Atlanta, GA
Khoa: Over the past ten years, the cost of tuition has risen nearly 5% per year beyond general inflation at public four-year colleges. While it is hard to predict the actual cost of college education several years from now, one thing we do know for sure is that it is important to start saving early—and even small amounts invested over time can be meaningful. For example, investing just $100 a month for 18 years will generate $48,000 to go towards your daughter’s college education expenses.*
Ariel Investments offers two types of accounts which can be used for saving for education: Coverdell Education Savings Accounts (“Coverdell ESA”) and Uniform Gifts or Transfers to Minor Act (“UGMA” and “UTMA”) accounts. Both ESAs and UGMA/UTMAs are custodial accounts, meaning the account is controlled by an adult (or custodian) until the child reaches age of majority— which varies by state, but is usually 18 to 21 years old.
· Coverdell ESA: ESAs are designed to specifically save for postsecondary educational expenses—including the cost of college or vocational school—and in some cases, will even cover some elementary and secondary school expenses. You can contribute up to $2,000 a year and withdrawals are tax free so long as they are used for qualified expenses (e.g., enrollment fees, tuition, cost of books, etc.).
· UGMA/UTMA: With an UTMA/UGMA account, there are no restrictions on how withdrawals can be used and there are no contribution limits. However, the income from the account is taxed at the minor’s income tax rate.
To learn more about effective ways to save for education with Ariel Investments, visit arielinvestments.com or call one of our Investment Specialists at 800.292.7435.
P.S. If you are looking to invest in a 529 plan offering one of our mutual funds, consider Illinois’ Bright Directions College Savings Program which includes Ariel Fund.
* This example assumes an annual return of 8% . It is illustrative only and is not indicative of any specific return you may receive from a particular investment. Please contact your tax advisor for specific tax information regarding ESAs UGMA/UTMA accounts and the rules for 529 plans in your state before making any investment. This is not a recommendation for any particular 529 plan or any other education savings account. Investors should consider carefully the investment objectives, risks, and charges and expenses of the Bright Directions College Savings Program. This and other information is contained in the Bright Directions’ plan disclosure document, which is available from your financial advisor. Please read the document carefully before investing. For more information about Bright Directions, visit brightdirections.com.

Dear Fellow Shareholder: For the three months ended March 31, 2010, the smaller companies comprising Ariel Fund had another strong quarter posting a +9.00% gain. This return was closely in line with the Russell 2500 Value Index which rose +9.57% as well as the Russell 2500 Index, which earned +9.21%. The mid-cap stocks comprising Ariel Appreciation Fund rose +7.19%, which was certainly gratifying on an absolute basis, but this return fell short of the Russell Midcap Value Index’s +9.61% jump as well as the Russell Midcap Index, which earned +8.67%. In the case of both Ariel portfolios, our consumer, financial and producer durable stocks did not perform as well as the value benchmarks’ during a quarter when there was largely an absence of news. As is often the case in an economic recovery, small- and mid-sized companies are leading the way. During the quarter, the large stocks of the S&P 500 Index returned +5.39%, which was more in-line with the typical stock mutual fund which Barron’s says “tacked on +5.68% in the first quarter.”1
The returns of the last quarter underscore a unique moment in stock market history—a remarkable rebound the like of which has not occurred since the Depression. Almost exactly a year ago we were at an inflection point. A stock market free-fall that cut broad market asset values in half and impaled smaller company stocks, including those of our portfolios, started to reverse itself. A year later, the S&P 500 Index has gained +49.77%, the Russell 2500 Value Index +67.17% and the Russell Midcap Value Index +72.41%. Our own recovery—built on our contrarian investing strategy—is the best we have had in 27 years of investing. More specifically, over the last 12 months, Ariel Fund has surged +112.31%, which mutual fund tracker Lipper Inc. ranks in the second percentile of its peers. Meanwhile, Ariel Appreciation Fund has gained +98.15% which lands the Fund in the first percentile of other Lipper-tracked funds with a similar strategy.1
Great Expectations
According to Barron’s, “The stock market is essentially an argument over the future.”2 To this point, the market’s dramatic ascent from last year’s gut- wrenching lows has led many to debate if public company shares have gone too far too fast. Recent
Lipper, Inc. is a nationally recognized organization that reports performance and calculates rankings for mutual funds based on total returns. The rankings quoted reflect the trailing 1-year ranking of Ariel Fund within its fund category. Lipper classifies Ariel Fund as a Mid-Cap Core Fund. For the period ended March 31, 2010, the rankings of Ariel Fund for the one-, five- and ten-year periods were in the 2nd percentile (7 out of 404 funds), 90th percentile (248 out of 275 funds) and 6th percentile (7 out of 123 funds) among Mid-Cap Core Funds. The rankings quoted reflect the trailing 1-year ranking of Ariel Appreciation Fund within its fund category. Lipper classifies Ariel Appreciation Fund as a Multi-Cap Core Fund. For the period ended March 31, 2010, the rankings of Ariel Appreciation Fund for the one-, five- and ten-year periods were in the 1st percentile (4 out of 805 funds), 22nd percentile (116 out of 539 funds) and 2nd percentile (3 out of 234 funds) among Multi-Cap Core Funds.
Performance data quoted is past performance and does not guarantee future results. We caution shareholders that we can never predict or assure future returns on investments. The investment return and principal value of an investment with our Funds will fluctuate over time so that your shares, when redeemed, may be worth more or less than their original cost. Current performance may be lower or higher than the performance data quoted in this report. To access our performance data current to the most recent month-end, visit our website, arielinvestments.com.
The Patient Investor March 31, 2010 | | Slow and Steady Wins the Race |
2
headlines tell the story with The New York Times asking, “Are We Flying Too High Again?” and Morningstar.com pondering, “The Recovery No One Wants to Believe In.”3 This skepticism is not surprising since behavioral finance reminds us to expect people to anchor in the past and to be slow to adapt to changing information. In contrast to some prevailing views, we think the economic recovery is real and this bull market has legs. As we wrote in our December 2009 letter, low Wall Street expectations anchored in 2008 crisis conditions as well as our unique, patient investing lens heighten our optimism. We are also encouraged by the number of new ideas populating our investment pipeline. Lastly and perhaps most importantly of all, we are enthusiastic about our prospects based on our belief that our battle-tested investment team is stronger than ever, precisely because of the financial crisis.

“The returns of the last quarter
underscore a unique moment in
stock market history—a remarkable
rebound the like of which has not
occurred since the Depression.”
Crisis Reveals
As many know, trial by fire is when you learn the most about others—be it a teammate, a spouse or a friend. Having watched a great deal of NCAA basketball in the last few weeks, we have come to liken our crisis revelations of the last two years to what one learns about athletes at crunch time. We would argue that as a hard-fought tournament unfolds and the inevitable ups and downs occur, a coach becomes more familiar with the strengths and weaknesses of the players than at any time during the regular season. He gains a good sense of who should take the shot with seconds on the clock; who should guard the toughest player on the opposing team; who is the least phased by jeering fans. While it was hard not to root for the underdogs from Butler University during the NCAA finals, Duke University confirmed why they win time and time again: the legendary Coach K, Mike Krzyzewski, brings confidence and calm to every game and has a formula for success based on study, accumulated knowledge and experience. Moreover, his players know their roles and get even better as the pressure builds. There is no scrambling.
“...we are enthusiastic about our
prospects based on our belief that
our battle-tested investment team
is stronger than ever, precisely
because of the financial crisis.”
As Martin Luther King, Jr. once wrote, “The ultimate measure of a man is not where he stands in moments of comfort and convenience, but where he stands at times of challenge and controversy.”4 To that point, as the market cratered, the economy froze and fear reigned, we were able to assess our own investment team more completely and holistically than ever before. During the ensuing moments of truth, those members of our investment committee with the keenest insights were able to determine how an unprecedented credit crunch would affect corporate balance sheets. Those with deep industry expertise could advocate for building larger positions at fire-sale prices while many professional investors were uncomfortable and waiting for the dust to settle. Those with the courage of their convictions could take a long-term view and ignore the short-term insanity. Those with vision could see what others did not see. Interestingly, like a team that excels during a full-court press, our skills were sharpened and our roles were even more clearly defined around individual areas of strength during what proved to be our playoffs. And while there have been a number of playoffs in our 27-year history—from the crash of ‘87 to 9/11—this was our toughest series yet.
3
In investing as in basketball, when success matters most, great teams harness individual strengths to win together. Although the crisis challenged us like nothing before, it has led our team to work even more effectively and productively, which should serve us well, come what may.
“In investing as in basketball,
when success matters most,
great teams harness individual
strengths to win together.”
Portfolio Comings and Goings
In the first quarter, we purchased Herman Miller, Inc. (MLHR) in Ariel Fund. Currently, the office furniture industry is facing declines because corporations have pulled back during the Great Recession. We believe Herman Miller is poised for the inevitable recovery, especially given the company’s new manufacturing efficiencies, diversified end-market strategy and the ability to pass through raw material costs through price increases. In addition to Herman Miller, we also bought shares of DeVry Inc. (DV) (See page 7 for a special feature on DeVry), a national for- profit education provider. We have owned it on and off from 1991 through 2007. The company specializes in career-oriented training in management, technology, health care and finance. The evidence shows DeVry graduates are able to get better jobs or expand their responsibilities. With unemployment hovering around 10%, we believe many people will go back to school to learn new skills and bolster existing knowledge which should continue to boost enrollment at DeVry.
In Ariel Appreciation Fund, we purchased Lazard Ltd (LAZ), a current holding in Ariel Fund, when the international financial advisory and asset management firm’s market capitalization rose to fit the parameters of this product. We did not exit any positions in either fund during the quarter.
As always, we appreciate the opportunity to serve you and welcome any questions or comments you might have. You can also contact us directly at email@arielinvestments.com.
Sincerely,

| 
|
| |
John W. Rogers, Jr. | Mellody Hobson |
Chairman and CEO | President |
1 Barron’s, April 12, 2010.
2 Barron’s, March 1, 2010.
3 The New York Times, April 9, 2010. Morningstar.com, March 30, 2010.
4 Martin Luther King, Jr., Strength to Love. (Minneapolis, MN: Fortress Press, 2010), p. 26.
arielinvestments.com | 800.292.7435 |
4
Ariel Fund Performance Summary | | Inception: November 6, 1986 |

ABOUT THE FUND
The no-load Ariel Fund pursues long-term capital appreciation by investing in undervalued companies that show strong potential for growth. The Fund primarily invests in companies with market capitalizations between $1 billion and $5 billion.
AVERAGE ANNUAL TOTAL RETURNS as of March 31, 2010
| | 1st Quarter | | 1 Year | | 3 Year | | 5 Year | | 10 Year | | Life of Fund | |
Ariel Fund | | 9.00 | % | 112.31 | % | -4.47 | % | 0.25 | % | 8.66 | % | 11.09 | % |
Russell 2500 Value Index | | 9.57 | % | 67.17 | % | -5.06 | % | 3.14 | % | 8.67 | % | 11.12 | % |
Russell 2500 Index | | 9.21 | % | 65.71 | % | -3.16 | % | 4.05 | % | 4.83 | % | 10.23 | % |
S&P 500 Index | | 5.39 | % | 49.77 | % | -4.17 | % | 1.92 | % | -0.65 | % | 9.36 | % |
Performance data quoted represents past performance and does not guarantee future results. The investment return and principal value of an investment will fluctuate so that an investor’s shares, when redeemed, may be worth more or less than their original cost. Current performance may be lower or higher than the performance data quoted. To access performance data current to the most recent month-end, visit our website, arielinvestments.com.
COMPOSITION OF EQUITY HOLDINGS
| | Ariel
Fund† | | Russell
2500
Value
Index | | Russell
2500
Index | | S&P
500
Index | |
Consumer discretionary & services | | 36.84 | % | 13.77 | % | 15.88 | % | 12.06 | % |
Financial services | | 30.35 | % | 31.67 | % | 22.00 | % | 17.37 | % |
Producer durables | | 12.50 | % | 11.87 | % | 13.35 | % | 10.75 | % |
Consumer staples | | 8.93 | % | 2.69 | % | 3.38 | % | 9.67 | % |
Health care | | 7.05 | % | 5.30 | % | 12.06 | % | 12.09 | % |
Materials & processing | | 2.32 | % | 10.14 | % | 7.94 | % | 3.82 | % |
Technology | | 2.01 | % | 8.03 | % | 13.26 | % | 17.21 | % |
Utilities | | 0.00 | % | 10.97 | % | 6.81 | % | 6.04 | % |
Energy | | 0.00 | % | 5.56 | % | 5.31 | % | 10.99 | % |
† Sector weightings are calculated based on equity holdings in the Fund and exclude cash in order to make a relevant comparison to the indexes.
Portfolio Composition
Equity | | 98.6 | % |
Cash, Other Assets & Liabilities | | 1.4 | % |
Expense Ratio
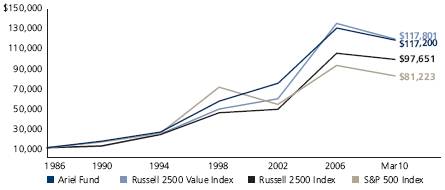
THE VALUE OF A $10,000 INVESTMENT IN ARIEL FUND
| TOP TEN EQUITY HOLDINGS | | | |
| | | | |
1 | Hewitt Associates, Inc.
Leading human resources outsourcing and consulting firm | | 4.2 | % |
| | | | |
2 | Gannett Co., Inc.
Largest U.S. newspaper company and publisher of USA Today | | 4.2 | % |
| | | | |
3 | Jones Lang LaSalle Inc.
Leading commercial real estate services firm | | 4.2 | % |
| | | | |
4 | Interpublic Group of Cos., Inc.
Global advertising and marketing services conglomerate | | 4.0 | % |
| | | | |
5 | CB Richard Ellis Group, Inc.
World’s largest commercial real estate services firm | | 3.9 | % |
| | | | |
6 | Hospira, Inc.
Diversified health care company | | 3.8 | % |
| | | | |
7 | Janus Capital Group Inc.
Investment management company | | 3.4 | % |
| | | | |
8 | CBS Corp.
Mass media company | | 3.3 | % |
| | | | |
9 | Lazard Ltd
International financial advisory and asset management firm | | 3.2 | % |
| | | | |
10 | Bio-Rad Laboratories, Inc.
Leading manufacturer of laboratory equipment and biological testing products | | 3.1 | % |
Note: The graph and performance table do not reflect the deduction of taxes that a shareholder would pay on fund distributions or the redemption of fund shares. The Russell 2500TM Value Index measures the performance of small to mid-cap value companies with lower price-to-book ratios and lower forecasted growth values. The Russell 2500TM Index measures the performance of small to mid-cap companies. The S&P 500 is a broad market-weighted index dominated by blue-chip stocks. All indexes are unmanaged, and an investor cannot invest directly in an index. Total return does not reflect a maximum 4.75% sales load charged prior to 7/15/94.
5
Ariel Fund Statistical Summary | (unaudited) |
| | | | | | 52-Week Range | | Earnings per Share | | P/E Calendar | | | |
Company | | Ticker
Symbol | | Price
3/31/10 | | Low | | High | | 2008
Actual
Calendar | | 2009
Actual
Calendar | | 2010
Estimated
Calendar | | 2008
Actual
P/E | | 2009
Actual
P/E | | 2010
Estimated
P/E | | Market
Cap.
($MM) | |
| | | | | | | | | | | | | | | | | | | | | | | |
Interface, Inc. | | IFSIA | | 11.58 | | 2.90 | | 11.90 | | 0.82 | | 0.28 | | 0.55 | | 14.1 | | 41.4 | | 21.1 | | 733 | |
Private Bancorp, Inc. | | PVTB | | 13.70 | | 8.33 | | 29.11 | | (3.11 | ) | (0.95 | ) | 0.25 | | NM | | NM | | 54.8 | | 929 | |
Herman Miller, Inc. | | MLHR | | 18.06 | | 10.21 | | 20.59 | | 2.59 | | 0.83 | | 1.00 | | 7.0 | | 21.8 | | 18.1 | | 1,010 | |
Fair Isaac Corp. | | FICO | | 25.34 | | 13.58 | | 27.00 | | 1.66 | | 1.34 | | 1.50 | | 15.3 | | 18.9 | | 16.9 | | 1,179 | |
Brink’s Co. | | BCO | | 28.23 | | 22.23 | | 31.28 | | 2.91 | | 1.76 | | 1.85 | | 9.7 | | 16.0 | | 15.3 | | 1,352 | |
Meredith Corp. | | MDP | | 34.41 | | 16.40 | | 35.08 | | 2.72 | | 1.78 | | 2.47 | | 12.7 | | 19.3 | | 13.9 | | 1,560 | |
Anixter Intl Inc. | | AXE | | 46.85 | | 29.04 | | 48.85 | | 5.80 | | (0.83 | ) | 3.00 | | 8.1 | | NM | | 15.6 | | 1,626 | |
Brady Corp. | | BRC | | 31.12 | | 17.02 | | 33.10 | | 2.22 | | 2.01 | | 2.15 | | 14.0 | | 15.5 | | 14.5 | | 1,631 | |
Sotheby’s | | BID | | 31.09 | | 8.54 | | 32.23 | | 0.51 | | 0.22 | | 1.05 | | 61.0 | | 141.3 | | 29.6 | | 2,088 | |
Janus Capital Group Inc. | | JNS | | 14.29 | | 6.12 | | 16.06 | | 0.86 | | 0.45 | | 0.78 | | 16.6 | | 31.8 | | 18.3 | | 2,601 | |
IDEX Corp. | | IEX | | 33.10 | | 19.67 | | 33.66 | | 1.67 | | 1.51 | | 1.85 | | 19.8 | | 21.9 | | 17.9 | | 2,680 | |
City National Corp. | | CYN | | 53.97 | | 31.02 | | 55.66 | | 2.11 | | 0.50 | | 1.50 | | 25.6 | | 107.9 | | 36.0 | | 2,781 | |
Bio-Rad Laboratories, Inc. | | BIO | | 103.52 | | 63.31 | | 104.44 | | 5.40 | | 6.09 | | 6.21 | | 19.2 | | 17.0 | | 16.7 | | 2,849 | |
Jones Lang LaSalle Inc. | | JLL | | 72.89 | | 22.24 | | 74.59 | | 3.24 | | 1.82 | | 3.02 | | 22.5 | | 40.0 | | 24.1 | | 3,050 | |
Lazard Ltd | | LAZ | | 35.70 | | 25.20 | | 44.62 | | 0.06 | | (1.68 | ) | 2.32 | | 595.0 | | NM | | 15.4 | | 3,081 | |
HCC Insurance Holdings, Inc. | | HCC | | 27.60 | | 23.02 | | 29.01 | | 2.81 | | 3.11 | | 3.00 | | 9.8 | | 8.9 | | 9.2 | | 3,148 | |
Constellation Brands, Inc. | | STZ | | 16.44 | | 10.72 | | 17.56 | | 1.68 | | 1.66 | | 1.75 | | 9.8 | | 9.9 | | 9.4 | | 3,648 | |
Markel Corp. | | MKL | | 374.66 | | 255.37 | | 379.05 | | 22.10 | | 20.52 | | 21.92 | | 17.0 | | 18.3 | | 17.1 | | 3,679 | |
Mohawk Industries, Inc. | | MHK | | 54.38 | | 28.98 | | 55.52 | | 4.42 | | 2.61 | | 3.89 | | 12.3 | | 20.8 | | 14.0 | | 3,724 | |
Hewitt Associates, Inc. | | HEW | | 39.78 | | 27.92 | | 43.85 | | 2.03 | | 2.81 | | 3.08 | | 19.6 | | 14.2 | | 12.9 | | 3,740 | |
Dun & Bradstreet Corp. | | DNB | | 74.42 | | 69.10 | | 84.95 | | 5.60 | | 5.99 | | 5.50 | | 13.3 | | 12.4 | | 13.5 | | 3,810 | |
Gannett Co., Inc. | | GCI | | 16.52 | | 2.10 | | 17.33 | | 3.16 | | 1.75 | | 2.11 | | 5.2 | | 9.4 | | 7.8 | | 3,918 | |
Interpublic Group of Cos., Inc. | | IPG | | 8.32 | | 4.03 | | 8.87 | | 0.52 | | 0.28 | | 0.44 | | 16.0 | | 29.7 | | 18.9 | | 4,044 | |
Newell Rubbermaid Inc. | | NWL | | 15.20 | | 6.20 | | 16.10 | | 1.24 | | 1.30 | | 1.54 | | 12.3 | | 11.7 | | 9.9 | | 4,223 | |
Energizer Holdings, Inc. | | ENR | | 62.76 | | 47.90 | | 69.11 | | 5.98 | | 5.12 | | 5.41 | | 10.5 | | 12.3 | | 11.6 | | 4,382 | |
Equifax Inc. | | EFX | | 35.80 | | 24.00 | | 36.63 | | 2.09 | | 1.83 | | 2.50 | | 17.1 | | 19.6 | | 14.3 | | 4,518 | |
Stanley Black & Decker, Inc. | | SWK | | 57.41 | | 28.32 | | 59.98 | | 3.41 | | 2.69 | | 2.96 | | 16.8 | | 21.3 | | 19.4 | | 4,620 | |
DeVry Inc. | | DV | | 65.20 | | 38.19 | | 68.42 | | 2.07 | | 3.00 | | 4.15 | | 31.5 | | 21.7 | | 15.7 | | 4,636 | |
McCormick & Co., Inc. | | MKC | | 38.36 | | 28.08 | | 39.71 | | 2.32 | | 2.36 | | 2.56 | | 16.5 | | 16.3 | | 15.0 | | 5,082 | |
CB Richard Ellis Group, Inc. | | CBG | | 15.85 | | 3.66 | | 16.22 | | 0.74 | | 0.18 | | 0.53 | | 21.4 | | 88.1 | | 29.9 | | 5,100 | |
International Game Technology | | IGT | | 18.45 | | 8.94 | | 23.30 | | 1.12 | | 0.91 | | 1.00 | | 16.5 | | 20.3 | | 18.5 | | 5,472 | |
Tiffany & Co. | | TIF | | 47.49 | | 20.78 | | 48.38 | | 1.74 | | 2.00 | | 2.60 | | 27.3 | | 23.7 | | 18.3 | | 5,999 | |
Royal Caribbean Cruises Ltd. | | RCL | | 32.99 | | 7.75 | | 33.93 | | 2.68 | | 0.71 | | 1.78 | | 12.3 | | 46.5 | | 18.5 | | 7,058 | |
J.M. Smucker Co. | | SJM | | 60.26 | | 36.60 | | 63.00 | | 3.48 | | 3.86 | | 4.42 | | 17.3 | | 15.6 | | 13.6 | | 7,178 | |
Nordstrom, Inc. | | JWN | | 40.85 | | 15.84 | | 42.20 | | 1.83 | | 1.90 | | 2.60 | | 22.3 | | 21.5 | | 15.7 | | 8,893 | |
Hospira, Inc. | | HSP | | 56.65 | | 29.86 | | 57.67 | | 2.53 | | 3.11 | | 3.40 | | 22.4 | | 18.2 | | 16.7 | | 9,262 | |
CBS Corp. | | CBS | | 13.94 | | 3.65 | | 14.95 | | 1.91 | | 0.65 | | 1.21 | | 7.3 | | 21.4 | | 11.5 | | 9,407 | |
Note: Holdings are as of March 31, 2010. All earnings per share numbers are fully diluted. Such numbers are from continuing operations and are adjusted for non-recurring items. All estimates of future earnings per share shown in this table are prepared by Ariel Investments research analysts as of March 31, 2010. P/E ratios are based on earnings stated and March 31, 2010 stock price. NM=Not Meaningful.
arielinvestments.com | 800.292.7435 |
6
Company Spotlight

| DeVry Inc. (NYSE: DV) |
3005 Highland Parkway |
Downers Grove, IL 60515 |
800.733.3879 |
devryinc.com |
Founded in Chicago in 1931, DeVry, held in Ariel Fund, has consistently delivered on its promise to provide strong, career-oriented educations to enrich its students’ job skills. Currently approximately 100,000 students attend its five separate colleges with training in technology, science, business, the arts and management. For instance, the Chamberlain School of Nursing helps fill the ever-expanding need for health care workers. Meanwhile, DeVry University’s technology curriculum teaches working adults to thrive in an increasingly complex information age. The company maintains a laser-like focus on its goal of improving lives through education.
Growth through Downturns
Adults return to DeVry during economic downturns to boost their skills. The Great Recession has been no exception; DeVry’s revenue is growing six to seven times faster than the overall economy. Meanwhile, the company is now benefitting from management’s past strategic moves. After the educational downturn in 2003, the company grew brick and mortar capacity, diversified by acquiring institutions with different specialties, and invested in online curriculums.
Customer Oriented
For-profit educators have long served non-traditional students better than public and private universities have. So while it is true DeVry’s core constituents are the working adults trying to expand on skills they already have, that is not the whole story. The company also developed an edge educating minority and immigrant students as well as those who are the first in their family to attend college. These groups are well- served: since 1975, 90 percent of DeVry’s graduates were active in their field within six months.
Growing Market
Currently more than 18 million students attend colleges and universities—one in three of them at community colleges. With most states suffering from declining revenues and increased operating expenses, it seems very likely that state legislatures will have to cut budgets broadly—and possibly deeply—at these schools. DeVry is a natural competitor to community colleges, and thus a probable beneficiary from this unfortunate situation.
Compelling Opportunity
Although DeVry competes against government-funded schools, its students still get much of their financing from the government. This has led Wall Street investors to fear any changes in Department of Education regulations. Recently investors have been concerned the “rules of the game” would be altered and hurt for-profit colleges. The market assumes any changes will slow the company down, but we disagree, believing DeVry will compete effectively because it provides a cost-effective service that people need.
Valuation
With its shares trading at 13x 2011 earnings estimates, our confidence that the market had become overly pessimistic regarding regulatory changes made us ready to pounce. As of March 31, 2010, shares traded at $65.20, a 23% discount to our private market value of $84.76.
7
Ariel Appreciation Fund Performance Summary | Inception: December 1, 1989 |

ABOUT THE FUND
The no-load Ariel Appreciation Fund pursues long-term capital appreciation by investing in undervalued companies that show strong potential for growth. The Fund primarily invests in companies with market capitalizations between $2.5 billion and $15 billion.
AVERAGE ANNUAL TOTAL RETURNS as of March 31, 2010
| | 1st Quarter | | 1 Year | | 3 Year | | 5 Year | | 10 Year | | Life of Fund | |
Ariel Appreciation Fund | | 7.19 | % | 98.15 | % | 0.05 | % | 3.67 | % | 8.30 | % | 10.55 | % |
Russell Midcap Value Index | | 9.61 | % | 72.41 | % | -5.22 | % | 3.71 | % | 8.46 | % | 11.03 | % |
Russell Midcap Index | | 8.67 | % | 67.71 | % | -3.30 | % | 4.20 | % | 4.84 | % | 10.68 | % |
S&P 500 Index | | 5.39 | % | 49.77 | % | -4.17 | % | 1.92 | % | -0.65 | % | 8.47 | % |
Performance data quoted represents past performance and does not guarantee future results. The investment return and principal value of an investment will fluctuate so that an investor’s shares, when redeemed, may be worth more or less than their original cost. Current performance may be lower or higher than the performance data quoted. To access performance data current to the most recent month-end, visit our website, arielinvestments.com.
COMPOSITION OF EQUITY HOLDINGS
| | Ariel
Appreciation
Fund† | | Russell
Midcap
Value
Index | | Russell
Midcap
Index | | S&P
500
Index | |
Consumer discretionary & services | | 33.16 | % | 13.81 | % | 16.46 | % | 12.06 | % |
Financial services | | 30.68 | % | 29.21 | % | 20.63 | % | 17.37 | % |
Health care | | 14.95 | % | 4.15 | % | 8.68 | % | 12.09 | % |
Consumer staples | | 8.75 | % | 6.35 | % | 6.09 | % | 9.67 | % |
Producer durables | | 8.66 | % | 11.00 | % | 13.31 | % | 10.75 | % |
Technology | | 3.80 | % | 5.78 | % | 12.04 | % | 17.21 | % |
Utilities | | 0.00 | % | 12.85 | % | 8.02 | % | 6.04 | % |
Materials & processing | | 0.00 | % | 8.58 | % | 7.61 | % | 3.82 | % |
Energy | | 0.00 | % | 8.27 | % | 7.15 | % | 10.99 | % |
† Sector weightings are calculated based on equity holdings in the Fund and exclude cash in order to make a relevant comparison to the indexes.
Portfolio Composition
Equity | | 99.3 | % |
Cash, Other Assets & Liabilities | | 0.7 | % |
Expense Ratio
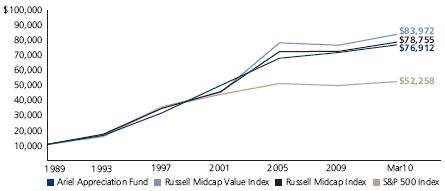
THE VALUE OF A $10,000 INVESTMENT IN ARIEL APPRECIATION FUND
| TOP TEN EQUITY HOLDINGS | | | |
| | | | |
1 | Gannett Co., Inc.
Largest U.S. newspaper company and publisher of USA Today | | 4.0 | % |
| | | | |
2 | Jones Lang LaSalle Inc.
Leading commercial real estate services firm | | 3.9 | % |
| | | | |
3 | Northern Trust Corp.
Premier trust bank focused on asset management, asset custodianship and private banking | | 3.7 | % |
| | | | |
4 | Viacom, Inc.
Cable network and film production company | | 3.7 | % |
| | | | |
5 | Accenture plc
Global management consultant specializing in technology and outsourcing | | 3.6 | % |
| | | | |
6 | Hewitt Associates, Inc.
Leading human resources outsourcing and consulting firm | | 3.6 | % |
| | | | |
7 | AFLAC Inc.
Leading provider of supplemental health and life insurance products in the U.S. and Japan | | 3.4 | % |
| | | | |
8 | Interpublic Group of Cos., Inc.
Global advertising and marketing services conglomerate | | 3.3 | % |
| | | | |
9 | CB Richard Ellis Group, Inc.
World’s largest commercial real estate services firm | | 3.2 | % |
| | | | |
10 | CBS Corp.
Mass media company | | 3.2 | % |
Note: The graph and performance table do not reflect the deduction of taxes that a shareholder would pay on fund distributions or the redemption of fund shares. The Russell Midcap® Value Index measures the performance of mid-cap value companies with lower price-to-book ratios and lower forecasted growth values. The Russell Midcap® Index measures the performance of mid-cap companies. The S&P 500 is a broad market-weighted index dominated by blue-chip stocks. All indexes are unmanaged, and an investor cannot invest directly in an index. Total return does not reflect a maximum 4.75% sales load charged prior to 7/15/94.
arielinvestments.com | 800.292.7435 |
8
Ariel Appreciation Fund Statistical Summary | (unaudited) |
| | | | | | 52-Week Range | | Earnings per Share | | P/E Calendar | | | |
| | | | | | | | | | 2008 | | 2009 | | 2010 | | 2008 | | 2009 | | 2010 | | Market | |
| | Ticker | | Price | | | | | | Actual | | Actual | | Estimated | | Actual | | Actual | | Estimated | | Cap. | |
Company | | Symbol | | 3/31/10 | | Low | | High | | Calendar | | Calendar | | Calendar | | P/E | | P/E | | P/E | | ($MM) | |
Anixter Intl Inc. | | AXE | | 46.85 | | 29.04 | | 48.85 | | 5.80 | | (0.83 | ) | 3.00 | | 8.1 | | NM | | 15.6 | | 1,626 | |
Sotheby’s | | BID | | 31.09 | | 8.54 | | 32.23 | | 0.51 | | 0.22 | | 1.05 | | 61.0 | | 141.3 | | 29.6 | | 2.088 | |
Janus Capital Group Inc. | | JNS | | 14.29 | | 6.12 | | 16.06 | | 0.86 | | 0.45 | | 0.78 | | 16.6 | | 31.8 | | 18.3 | | 2,601 | |
City National Corp. | | CYN | | 53.97 | | 31.02 | | 55.66 | | 2.11 | | 0.50 | | 1.50 | | 25.6 | | 107.9 | | 36.0 | | 2,781 | |
Bio-Rad Laboratories, Inc. | | BIO | | 103.52 | | 63.31 | | 104.44 | | 5.40 | | 6.09 | | 6.21 | | 19.2 | | 17.0 | | 16.7 | | 2,849 | |
Jones Lang LaSalle Inc. | | JLL | | 72.89 | | 22.24 | | 74.59 | | 3.24 | | 1.82 | | 3.02 | | 22.5 | | 40.0 | | 24.1 | | 3,050 | |
Lazard Ltd | | LAZ | | 35.70 | | 25.20 | | 44.62 | | 0.06 | | (1.68 | ) | 2.32 | | 595.0 | | NM | | 15.4 | | 3,081 | |
Constellation Brands, Inc. | | STZ | | 16.44 | | 10.72 | | 17.56 | | 1.68 | | 1.66 | | 1.75 | | 9.8 | | 9.9 | | 9.4 | | 3,648 | |
Markel Corp. | | MKL | | 374.66 | | 255.37 | | 379.05 | | 22.10 | | 20.52 | | 21.92 | | 17.0 | | 18.3 | | 17.1 | | 3,679 | |
Mohawk Industries, Inc. | | MHK | | 54.38 | | 28.98 | | 55.52 | | 4.42 | | 2.61 | | 3.89 | | 12.3 | | 20.8 | | 14.0 | | 3,724 | |
Hewitt Associates, Inc. | | HEW | | 39.78 | | 27.92 | | 43.85 | | 2.03 | | 2.81 | | 3.08 | | 19.6 | | 14.2 | | 12.9 | | 3,740 | |
Dun & Bradstreet Corp. | | DNB | | 74.42 | | 69.10 | | 84.95 | | 5.60 | | 5.99 | | 5.50 | | 13.3 | | 12.4 | | 13.5 | | 3,810 | |
Gannett Co., Inc. | | GCI | | 16.52 | | 2.10 | | 17.33 | | 3.16 | | 1.75 | | 2.11 | | 5.2 | | 9.4 | | 7.8 | | 3,918 | |
Interpublic Group of Cos., Inc. | | IPG | | 8.32 | | 4.03 | | 8.87 | | 0.52 | | 0.28 | | 0.44 | | 16.0 | | 29.7 | | 18.9 | | 4,044 | |
Energizer Holdings, Inc. | | ENR | | 62.76 | | 47.90 | | 69.11 | | 5.98 | | 5.12 | | 5.41 | | 10.5 | | 12.3 | | 11.6 | | 4,382 | |
Equifax Inc. | | EFX | | 35.80 | | 24.00 | | 36.63 | | 2.09 | | 1.83 | | 2.50 | | 17.1 | | 19.6 | | 14.3 | | 4,518 | |
Stanley Black & Decker, Inc. | | SWK | | 57.41 | | 28.32 | | 59.98 | | 3.41 | | 2.69 | | 2.96 | | 16.8 | | 21.3 | | 19.4 | | 4,620 | |
McCormick & Co., Inc. | | MKC | | 38.36 | | 28.08 | | 39.71 | | 2.32 | | 2.36 | | 2.56 | | 16.5 | | 16.3 | | 15.0 | | 5,082 | |
CB Richard Ellis Group, Inc. | | CBG | | 15.85 | | 3.66 | | 16.22 | | 0.74 | | 0.18 | | 0.53 | | 21.4 | | 88.1 | | 29.9 | | 5,100 | |
International Game Technology | | IGT | | 18.45 | | 8.94 | | 23.30 | | 1.12 | | 0.91 | | 1.00 | | 16.5 | | 20.3 | | 18.5 | | 5,472 | |
Tiffany & Co. | | TIF | | 47.49 | | 20.78 | | 48.38 | | 1.74 | | 2.00 | | 2.60 | | 27.3 | | 23.7 | | 18.3 | | 5,999 | |
J.M. Smucker Co. | | SJM | | 60.26 | | 36.60 | | 63.00 | | 3.48 | | 3.86 | | 4.42 | | 17.3 | | 15.6 | | 13.6 | | 7,178 | |
Laboratory Corp. of America | | LH | | 75.71 | | 57.08 | | 77.09 | | 4.99 | | 5.28 | | 5.83 | | 15.2 | | 14.3 | | 13.0 | | 7,972 | |
Nordstrom, Inc. | | JWN | | 40.85 | | 15.84 | | 42.20 | | 1.83 | | 1.90 | | 2.60 | | 22.3 | | 21.5 | | 15.7 | | 8,893 | |
Clorox Co. | | CLX | | 64.14 | | 50.31 | | 65.18 | | 3.37 | | 4.16 | | 4.49 | | 19.0 | | 15.4 | | 14.3 | | 8,995 | |
CBS Corp. | | CBS | | 13.94 | | 3.65 | | 14.95 | | 1.91 | | 0.65 | | 1.21 | | 7.3 | | 21.4 | | 11.5 | | 9,407 | |
Omnicom Group Inc. | | OMC | | 38.81 | | 23.00 | | 40.29 | | 3.17 | | 2.65 | | 2.78 | | 12.2 | | 14.6 | | 14.0 | | 11,969 | |
Zimmer Holdings, Inc. | | ZMH | | 59.20 | | 35.36 | | 64.77 | | 4.24 | | 4.13 | | 4.52 | | 14.0 | | 14.3 | | 13.1 | | 12,089 | |
St. Jude Medical, Inc. | | STJ | | 41.05 | | 31.66 | | 41.96 | | 2.41 | | 2.55 | | 2.92 | | 17.0 | | 16.1 | | 14.1 | | 13,322 | |
Northern Trust Corp. | | NTRS | | 55.26 | | 46.72 | | 66.08 | | 3.47 | | 3.16 | | 3.50 | | 15.9 | | 17.5 | | 15.8 | | 13,355 | |
T. Rowe Price Group, Inc. | | TROW | | 54.93 | | 27.42 | | 56.25 | | 1.82 | | 1.65 | | 2.59 | | 30.2 | | 33.3 | | 21.2 | | 14,212 | |
Viacom, Inc. | | VIA.B | | 34.38 | | 17.04 | | 34.78 | | 2.13 | | 2.43 | | 2.90 | | 16.1 | | 14.1 | | 11.9 | | 20,882 | |
Thermo Fisher Scientific Inc. | | TMO | | 51.44 | | 30.83 | | 52.39 | | 3.16 | | 3.05 | | 3.43 | | 16.3 | | 16.9 | | 15.0 | | 21,055 | |
Illinois Tool Works Inc. | | ITW | | 47.36 | | 29.69 | | 51.16 | | 3.08 | | 1.95 | | 2.77 | | 15.4 | | 24.3 | | 17.1 | | 23,791 | |
Franklin Resources, Inc. | | BEN | | 110.90 | | 51.33 | | 116.39 | | 5.97 | | 4.45 | | 6.40 | | 18.6 | | 24.9 | | 17.3 | | 25,308 | |
AFLAC Inc. | | AFL | | 54.29 | | 17.25 | | 55.20 | | 3.92 | | 4.85 | | 5.22 | | 13.8 | | 11.2 | | 10.4 | | 25,439 | |
Accenture plc | | ACN | | 41.95 | | 26.33 | | 43.89 | | 2.65 | | 2.79 | | 2.70 | | 15.8 | | 15.0 | | 15.5 | | 26,705 | |
Dell Inc. | | DELL | | 15.01 | | 9.22 | | 17.26 | | 1.35 | | 0.96 | | 1.25 | | 11.1 | | 15.6 | | 12.0 | | 29,394 | |
Carnival Corp. & plc | | CCL | | 38.88 | | 21.14 | | 39.35 | | 2.84 | | 2.24 | | 2.41 | | 13.7 | | 17.4 | | 16.1 | | 30,676 | |
Baxter Intl Inc. | | BAX | | 58.20 | | 45.46 | | 61.88 | | 3.45 | | 3.88 | | 4.33 | | 16.9 | | 15.0 | | 13.4 | | 34,977 | |
Note: Holdings are as of March 31, 2010. All earnings per share numbers are fully diluted. Such numbers are from continuing operations and are adjusted for non-recurring items. All estimates of future earnings per share shown in this table are prepared by Ariel Investments research analysts as of March 31, 2010. P/E ratios are based on earnings stated and March 31, 2010 stock price. NM=Not Meaningful.
9
Company Spotlight

| Mohawk Industries, Inc. (NYSE: MHK) |
160 South Industrial Boulevard |
Calhoun, GA 30701 |
800.241.4494 |
mohawkind.com |
Mohawk Industries, held in Ariel Fund and Ariel Appreciation Fund, is the leading manufacturer and distributor of floorcovering in the United States. Founded in 1878 as a carpet manufacturer, Mohawk is the oldest and largest company in the floorcovering industry—competing in all major categories including carpet, hardwood, laminate, and ceramic tile. The company markets and manufactures under a number of premier brand names such as Mohawk, Karastan, Lees, Dal-Tile, Unilin and American Olean.
A League of its Own
Mohawk maintains strong competitive advantages through an extensive distribution network of 300 locations, its own trucking fleet, low-cost manufacturing and brand recognition. Furthermore, the company has a strong commitment to its dealer relationships and premium service levels—both of which are critical in filling orders, ensuring prompt delivery, and achieving customer satisfaction.
Solid Strategic Acquirer
Over the years, Mohawk has completed several strategic acquisitions, rounding out its product portfolio. The company’s most recent acquisition, Columbia Wood, has provided the company with a proprietary hardwood product line. Even during the extreme downturn, management expanded the breadth of the hardwood product portfolio to raise prices and extend its distribution. Once the market rebounds, Mohawk’s hardwood division is poised to expand faster than the overall market due to the steps the company has taken during tough times.
An Industry in a Depression
During the Great Recession, the floorcovering industry did not face a recession—it faced a severe depression. This was the longest and deepest downturn lasting about three-and-a-half years and declining approximately 35%. In addition to the collapse of the housing market, the recession also slashed cash outlays for the residential replacement floorcovering business. Exacerbating this further was the capital freeze among corporate America on the commercial floorcovering business. We believe there is a shining silver lining for the floorcovering marketplace. Given the pullback in the market, we believe there is a huge amount of pent-up demand for floorcovering products. As existing home sales stabilize and improve, those neglected and foreclosed houses will require new floorcoverings. The typical homebuyer today is not as stretched for cash given the strict requirements by banks to have high credit scores, along with solid down payments. The purchasers today are in better shape financially than homebuyers during the bubble peak. Mohawk has a strong recurring replacement floor covering business which is more profitable than bulk purchases from home builders for new residences.
Slick Pricing
Another issue pressuring the stock is Mohawk’s exposure to raw material price increases (primarily petroleum-related products). Generally the industry has passed raw material price increases along to the end-consumer. During the Great Recession, however, the industry struggled to fully pass through price increases as the consumer shifted to the lower-priced products. In response, Mohawk has concentrated its research efforts in recycling, less expensive products, and non-nylon carpets.
As of March 31, 2010, Mohawk shares traded at $54.38, a 40% discount to our private market value of $89.98. We believe Wall Street does not fully appreciate the underlying pent-up demand within the floorcovering market and the operating margin expansion the company will exhibit as volumes increase.
arielinvestments.com | 800.292.7435 |
10

Dear Fellow Shareholder: In the first quarter of 2010 Ariel Focus Fund performed in line with the market, slightly underperforming the Russell 1000 Value Index and modestly outperforming the broad market as measured by the S&P 500 Index. For the quarter ended March 31, 2010, Ariel Focus Fund rose +5.43% versus +6.78% for the Russell 1000 Value Index, and +5.39% for the S&P 500 Index. For the last twelve months, the Fund gained +66.06% versus +53.56% for the Russell 1000 Value Index, and +49.77% for the S&P 500 Index.
Before taking a look at the stocks that helped and hurt performance in the quarter, we thought we would update our outlook for the rest of 2010 and for the market in general. You may recall our last letter called for “A Return to Normalcy” with outperformance coming primarily from superior stock selection rather than positioning for major market moves. In this type of market we expected broad equity returns in the high single or low double-digits rather than the +25% annual moves we have seen recently. We said we thought high-quality companies with steady earnings growth and robust cash flow offered the best risk/reward opportunity. Our portfolio at year-end reflected this quality bias with Johnson & Johnson (JNJ), Accenture plc (ACN), Omnicom Group Inc. (OMC) and Berkshire Hathaway Inc. (BRK.B) representing our four largest holdings.
At Ariel we do not profess to be able to predict short-term trends in the market; indeed, our forecast that higher-quality issues would outperform did not come true in the first quarter. Risk premiums continued to shrink in the quarter with lower-quality, higher- leveraged, deeper-cyclical companies on average outperforming higher-quality, less-leveraged, less-cyclical names. Overall equity returns in the quarter continued their recent trend of above-normal returns, reflecting the investment community’s continued appetite for risk. Of our four largest high-quality names, three (Johnson & Johnson, Omnicom and Accenture) underperformed the market. Only Berkshire Hathaway outperformed.
We continue to position Ariel Focus Fund to be heavily weighted toward higher-quality holdings. In short, we believe market participants are currently not being sufficiently compensated for taking risk. Usually there are trade-offs between quality, earnings growth, and valuation. As Milton Friedman would say, “There is no such thing as a free lunch.” But at quarter-end, Ariel Focus Fund had projected earnings growth estimates well above the broad market but traded at a forward PE multiple below the market. As of March 31, the forward PE for Ariel Focus Fund was 13.7x versus 14.4x for the S&P 500. Based on third-party (IBES) projected estimates, the stocks in our portfolio are growing
Performance data quoted represents past performance and does not guarantee future results. The investment return and principal value of an investment will fluctuate so that an investor’s shares, when redeemed, may be worth more or less than their original cost. Current performance may be lower or higher than the performance data quoted. To access performance data current to the most recent month –end, visit our website, arielinvestments.com.
11
earnings 20% faster than those in the S&P 500 over the next five years. And Ariel Focus Fund holds high-quality companies with much better balance sheet strength as measured by interest coverage (9.7x versus 6.8x). While there may be no free lunches, we think Ariel Focus Fund is currently buying sirloin steaks at hamburger prices.

“While there may be no
free lunches, we think
Ariel Focus Fund is
currently buying sirloin steaks
at hamburger prices.”
In the first quarter, Berkshire Hathaway was the second largest contributor to performance, with a gain of +23.66%. What has occurred with Berkshire over the last six months is a wonderful illustration of many of Ariel’s core value investing principles in action. In mid-2009, Berkshire was a company with sustainable competitive advantages trading at a discount to our calculation of intrinsic value. Berkshire’s competitive advantages include the world’s greatest investor at the helm and a reputation as the place to go when good companies need money in a hurry. In 2008-2009, Warren Buffett was offered the opportunity to make investments in Goldman Sachs Group, Inc. (GS), General Electric Co. (GE), and Tiffany & Co. (TIF), all on terms other institutional investors could only dream of. Those investments, along with the strong performance of Berkshire’s existing divisions such as GEICO and Gen Re, increased our calculation of the intrinsic value of Berkshire to about $3,674 per share1, 26% above our initial 2005 purchase price. But for most of 2009 Berkshire traded between $2,500 and $3,250, a substantial discount to Ariel’s calculation of private market value. The stock had traded poorly, in part, due to concerns over equity put options Buffett had sold in 2008 as well as credit default insurance Berkshire had written against certain municipal bonds.
A core goal of value investing is to buy companies at a discount to their intrinsic value without necessarily needing to identify the “catalyst” that will close this gap in the future. In fact, the absence of an identifiable catalyst is often necessary for a stock to trade at a discount. Investors focused on the short-term outlook may avoid a stock with long-term value if there is nothing in the near-term that will move a stock higher. At Ariel we are perfectly comfortable owning a great company like Berkshire at a discount, participating in the intrinsic growth of the business and waiting patiently for shorter-term clouds over the company to dissipate.
“...Berkshire Hathaway was the
second largest contributor to
performance, with a gain of
+23.66%. What has occurred with
Berkshire over the last six months
is a wonderful illustration of many
of Ariel’s core value investing
principles in action.”
In early 2010, Berkshire acquired railroad Burlington Northern Santa Fe Corporation. It was also added to the S&P 500 Index, which increased its share price. Additionally, Berkshire has enjoyed a recovery in the value of its large equity holdings as well as improved operating company performance, which contributed to the strong price movement. Considering that the shares trade near our calculation of intrinsic value and much of the “dry powder” of excess capital has been deployed in the recent correction, we sold half of our position in the quarter. We have a bias toward
arielinvestments.com | 800.292.7435 |
12
a complete exit in the near-term given our discipline of selling stocks trading above our estimate of private market value. We bought Berkshire for Ariel Focus Fund at an average cost of $2,911 because we thought it a great company trading at a discount to a carefully calculated intrinsic value. In the first quarter, we sold half of our shares when the valuation gap closed. We do not claim to be able to see the future. But we do believe if we purchase stocks at prices that incorporate a margin of safety; the market will eventually “weigh” the cash flows owned by the company and assign a price more consistent with their underlying values. That is value investing in a nutshell.
“A core goal of value investing
is to buy companies at a
discount to their intrinsic value
without necessarily needing to
identify the “catalyst” that will
close this gap in the future.”
Stocks having a negative effect on performance were generally less interesting than Berkshire, with no stock declining by more than
-6%. Many of our companies providing services to corporations underperformed modestly in the quarter. Hewitt Associates, Inc. (HEW) (see page 16 for a special feature on Hewitt) declined -5.9% and Omnicom declined -0.3%, both due to lack of investor enthusiasm with new estimates of 2010 profitability. In general, business services spending has earned its reputation as “late cycle”. Revenue for these companies has only met or even slightly missed expectations. Given the flood of negative headlines regarding Toyota Motor Corp. (TM), its worldwide recall and pending fines, it is actually encouraging that Toyota’s stock price declined only
-4.4% in the quarter.
Portfolio comings and goings
In the first quarter of 2010, we purchased Interpublic Group of Cos., Inc. (IPG), a current holding in Ariel Fund and Ariel Appreciation Fund. This advertising and marketing services firm rose to fit the parameters of this product and had a compelling valuation given its growth prospects in the recovery. Meanwhile, we exited Waste Management, Inc. (WM) during the quarter as the stock price approached our estimate of its private market value.
We appreciate your consideration and the opportunity to serve you and welcome any questions or comments you might have. You can also contact us directly at email@arielinvestments.com.
Sincerely, | | |

| | 
|
Charles K. Bobrinskoy | | Timothy Fidler |
Vice Chairman & Director of Research | | Senior Vice President, |
Co-Portfolio Manager | | Investment Committee |
| | Co-Portfolio Manager |
1 On January 20, 2010, Berkshire Hathaway Inc. shareholders approved a 50-for-1 split of its class B common stock. As of March 31, 2010 the stock traded at $81.27.
13
Ariel Focus Fund Performance Summary | Inception: June 30, 2005 |

ABOUT THE FUND
The no-load Ariel Focus Fund pursues long-term capital appreciation by investing in undervalued companies that show strong potential for growth. The Fund primarily invests in companies with market capitalizations in excess of $10 billion. Ariel Focus Fund is a non-diversified fund and holds approximately 20 securities.
AVERAGE ANNUAL TOTAL RETURNS as of March 31, 2010
| | 1st Quarter | | 1 Year | | 3 Year | | Life of Fund | |
Ariel Focus Fund | | 5.43 | % | 66.06 | % | -3.47 | % | 1.03 | % |
Russell 1000 Value Index | | 6.78 | % | 53.56 | % | -7.33 | % | 0.62 | % |
S&P 500 Index | | 5.39 | % | 49.77 | % | -4.17 | % | 1.58 | % |
Performance data quoted represents past performance and does not guarantee future results. The investment return and principal value of an investment will fluctuate so that an investor’s shares, when redeemed, may be worth more or less than their original cost. Current performance may be lower or higher than the performance data quoted. To access performance data current to the most recent month-end, visit our website, arielinvestments.com.
COMPOSITION OF EQUITY HOLDINGS
| | | | Russell | | | |
| | Ariel | | 1000 | | S&P | |
| | Focus | | Value | | 500 | |
| | Fund† | | Index | | Index | |
Consumer discretionary & services | | 25.97 | % | 11.07 | % | 12.06 | % |
Financial services | | 20.44 | % | 26.24 | % | 17.37 | % |
Producer durables | | 18.69 | % | 10.98 | % | 10.75 | % |
Health care | | 16.91 | % | 8.68 | % | 12.09 | % |
Technology | | 9.50 | % | 4.36 | % | 17.21 | % |
Energy | | 8.49 | % | 17.44 | % | 10.99 | % |
Utilities | | 0.00 | % | 11.42 | % | 6.04 | % |
Consumer staples | | 0.00 | % | 5.49 | % | 9.67 | % |
Materials & processing | | 0.00 | % | 4.31 | % | 3.82 | % |
† Sector weightings are calculated based on equity holdings in the Fund and exclude cash in order to make a relevant comparison to the indexes.
Portfolio Composition
Equity | | 96.9 | % |
Cash, Other Assets & Liabilities | | 3.1 | % |
Expense Ratio
THE VALUE OF A $10,000 INVESTMENT IN ARIEL FOCUS FUND

| TOP TEN EQUITY HOLDINGS | | | |
| | | | |
1 | Johnson & Johnson
Diversified health care and consumer products company | | 5.6 | % |
| | | | |
2 | Omnicom Group Inc.
Leading global advertising and marketing services company | | 5.2 | % |
| | | | |
3 | Accenture plc
Global management consultant specializing in technology and outsourcing | | 5.0 | % |
| | | | |
4 | Tyco Intl Ltd.
Diversified manufacturing conglomerate | | 4.8 | % |
| | | | |
5 | Apollo Group, Inc.
Nationwide private education provider specializing in online courses | | 4.8 | % |
| | | | |
6 | AFLAC Inc.
Leading provider of supplemental health and life insurance products in the U.S. and Japan | | 4.8 | % |
| | | | |
7 | International Business Machines Corp.
World’s top provider of computer products and services | | 4.7 | % |
| | | | |
8 | Dell Inc.
Global personal computer manufacturer and technology provider | | 4.5 | % |
| | | | |
9 | Morgan Stanley
Leading global financial services firm | | 4.5 | % |
| | | | |
10 | Walt Disney Co.
Global media and theme park company | | 4.4 | % |
*As of 9/30/09 Ariel Investments, LLC, the Adviser to the Funds, is contractually obligated to waive fees and reimburse expenses in order to limit Ariel Focus Fund’s total annual operating expenses to 1.25% of net assets through the end of the fiscal year ending September 30, 2011.
Note: The graph and performance table do not reflect the deduction of taxes that a shareholder would pay on fund distributions or the redemption of fund shares. The Russell 1000® Value Index measures the performance of large-cap value companies with lower price-to-book ratios and lower expected growth values. The S&P 500 is a broad market-weighted index dominated by blue-chip stocks. All indexes are unmanaged, and an investor cannot invest directly in an index. Ariel Focus Fund is a non-diversified fund and therefore may be subject to greater volatility than a more diversified investment.
arielinvestments.com | 800.292.7435 |
14
Ariel Focus Fund Statistical Summary | (unaudited) |
| | | | | | 52-Week Range | | Earnings per Share | | P/E Calendar | | | |
| | | | | | | | | | 2008 | | 2009 | | 2010 | | 2008 | | 2009 | | 2010 | | Market | |
| | Ticker | | Price | | | | | | Actual | | Actual | | Estimated | | Actual | | Actual | | Estimated | | Cap. | |
Company | | Symbol | | 3/31/10 | | Low | | High | | Calendar | | Calendar | | Calendar | | P/E | | P/E | | P/E | | ($MM) | |
Hewitt Associates, Inc. | | HEW | | 39.78 | | 27.92 | | 43.85 | | 2.03 | | 2.81 | | 3.08 | | 19.6 | | 14.2 | | 12.9 | | 3,740 | |
Interpublic Group of Cos., Inc. | | IPG | | 8.32 | | 4.03 | | 8.87 | | 0.52 | | 0.28 | | 0.44 | | 16.0 | | 29.7 | | 18.9 | | 4,044 | |
Apollo Group, Inc. | | APOL | | 61.29 | | 52.79 | | 81.20 | | 3.25 | | 4.51 | | 5.39 | | 18.9 | | 13.6 | | 11.4 | | 9,291 | |
Omnicom Group Inc. | | OMC | | 38.81 | | 23.00 | | 40.29 | | 3.17 | | 2.65 | | 2.78 | | 12.2 | | 14.6 | | 14.0 | | 11,969 | |
Tyco Intl Ltd. | | TYC | | 38.25 | | 18.70 | | 38.88 | | 2.97 | | 2.51 | | 2.62 | | 12.9 | | 15.2 | | 14.6 | | 18,174 | |
Hess Corp. | | HES | | 62.55 | | 46.33 | | 69.74 | | 7.28 | | 1.98 | | 4.05 | | 8.6 | | 31.6 | | 15.4 | | 20,468 | |
Covidien plc | | COV | | 50.28 | | 30.55 | | 52.40 | | 2.81 | | 3.20 | | 3.65 | | 17.9 | | 15.7 | | 13.8 | | 25,141 | |
AFLAC Inc. | | AFL | | 54.29 | | 17.25 | | 55.20 | | 3.92 | | 4.85 | | 5.22 | | 13.8 | | 11.2 | | 10.4 | | 25,439 | |
Accenture plc | | ACN | | 41.95 | | 26.33 | | 43.89 | | 2.65 | | 2.79 | | 2.70 | | 15.8 | | 15.0 | | 15.5 | | 26,705 | |
Dell Inc. | | DELL | | 15.01 | | 9.22 | | 17.26 | | 1.35 | | 0.96 | | 1.25 | | 11.1 | | 15.6 | | 12.0 | | 29,394 | |
Carnival Corp. & plc | | CCL | | 38.88 | | 21.14 | | 39.35 | | 2.84 | | 2.24 | | 2.41 | | 13.7 | | 17.4 | | 16.1 | | 30,676 | |
Lockheed Martin Corp. | | LMT | | 83.22 | | 65.21 | | 87.19 | | 7.96 | | 7.58 | | 7.41 | | 10.5 | | 11.0 | | 11.2 | | 31,041 | |
Baxter Intl Inc. | | BAX | | 58.20 | | 45.46 | | 61.88 | | 3.45 | | 3.88 | | 4.33 | | 16.9 | | 15.0 | | 13.4 | | 34,977 | |
Bank of New York Mellon Corp. | | BK | | 30.88 | | 23.75 | | 33.62 | | 1.22 | | (0.93 | ) | 2.40 | | 25.3 | | NM | | 12.9 | | 37,298 | |
Morgan Stanley | | MS | | 29.29 | | 20.69 | | 35.78 | | 3.51 | | (0.93 | ) | 2.84 | | 8.3 | | NM | | 10.3 | | 39,852 | |
Walt Disney Co. | | DIS | | 34.91 | | 17.82 | | 35.60 | | 2.10 | | 1.82 | | 2.11 | | 16.6 | | 19.2 | | 16.5 | | 65,488 | |
Merck & Co., Inc. | | MRK | | 37.35 | | 22.33 | | 41.56 | | 3.52 | | 3.34 | | 3.45 | | 10.6 | | 11.2 | | 10.8 | | 116,092 | |
Toyota Motor Corp. | | TM | | 80.42 | | 63.14 | | 91.97 | | 0.52 | | (5.95 | ) | 2.08 | | 154.7 | | NM | | 38.7 | | 126,099 | |
International Business Machines Corp. | | IBM | | 128.25 | | 94.85 | | 134.25 | | 8.89 | | 9.88 | | 11.05 | | 14.4 | | 13.0 | | 11.6 | | 167,409 | |
JPMorgan Chase & Co. | | JPM | | 44.75 | | 24.85 | | 47.47 | | 1.37 | | 2.24 | | 3.40 | | 32.7 | | 20.0 | | 13.2 | | 176,403 | |
Johnson & Johnson | | JNJ | | 65.20 | | 50.12 | | 65.95 | | 4.75 | | 4.81 | | 5.12 | | 13.7 | | 13.6 | | 12.7 | | 179,582 | |
Berkshire Hathaway Inc. | | BRK.B | | 81.27 | | 54.66 | | 83.57 | | 4.14 | | 3.46 | | 3.80 | | 19.6 | | 23.5 | | 21.4 | | 189,197 | |
Exxon Mobil Corp. | | XOM | | 66.98 | | 63.56 | | 76.54 | | 8.47 | | 3.95 | | 5.53 | | 7.9 | | 17.0 | | 12.1 | | 316,614 | |
Note: Holdings are as of March 31, 2010. All earnings per share numbers are fully diluted. Such numbers are from continuing operations and are adjusted for non-recurring items. All estimates of future earnings per share shown in this table are prepared by Ariel Investments research analysts as of March 31, 2010. P/E ratios are based on earnings stated and March 31, 2010 stock price. NM=Not Meaningful.
15
Company Spotlight

| Hewitt Associates (NYSE: HEW)
100 Half Day Road
Lincolnshire, IL 60069
847.295.5000
hewitt.com |
A Wonderful Franchise
Hewitt Associates, held in Ariel Fund, Ariel Appreciation Fund and Ariel Focus Fund, offers its clients a complete range of human capital management services, including: Human Resources (HR), Payroll, and Benefits Consulting & Outsourcing, Health Care, Retirement, and Financial Management Consulting, and Talent and Organizational Change Consulting. Hewitt’s competitive strength lies with its extensive experience in human resources and its blue chip client base. Currently more than half of the Fortune 500 companies are Hewitt clients and the company has retention rates of over 90% in its core benefits outsourcing business. Hewitt has a powerful brand and is a clear leader with scope and scale in the HR market. The company operates a growing business requiring low capital requirements, high operating margins and returns on invested capital as well as high client retention rates.
Hewitt continues to put up solid results in a difficult environment and is gaining increasing attention from the investment community now that the HR Business Process Outsourcing (BPO) segment has been stabilized. Hewitt is one the rare turnarounds that actually ‘turned’ and is demonstrating earnings growth and strong financial health in this toughest of periods. Furthermore, Hewitt is the type of investment Ariel thrives on: a conservatively, well-run company with an established world-class franchise and solid long-term growth prospects, available at very attractive valuation levels on both an absolute and relative basis.
Economic Sensitivity
As with almost every other company in this tough market, investors are highly focused on how Hewitt will perform in a recessionary environment. The headline here is that the company will exhibit modest cyclicality in revenues and profitability but is well-protected by strong free cash flow generation, a solid balance sheet and a high percentage of recurring revenue business.
The consulting business enjoys a largely recurring book of business from its pension and actuarial practice as well as a moderately stable project flow in other practice areas. The outsourcing business is directly affected by client employment levels, but although it is more cyclical than the other Hewitt units, we think the market is overly concerned. Benefit plan participant counts do not tightly match changes in overall employment, and we do not believe the employment outlook is as grim as analysts are anticipating over the next few years. One of our core tenets at Ariel is patience, and we intend to ride out the economic bumps as Hewitt has excellent growth potential once the economy has substantially recovered.
HR/BPO Contracts
Uncertainty around Hewitt’s HR BPO business has been a significant drag on the company’s share price over the past few years. Management has successfully stabilized the business; losses have fallen consistently, and the contract portfolio may even become profitable this year. Chief Executive Officer Russ Fradin has made the decision to narrow the types of HR BPO contracts that Hewitt is willing to pursue, while previous management focused on gaining market share.
Hewitt is now focused on HR BPO contracts that involve processes that offer one-to-many capabilities which drive scale in geographies the company knows well and require limited customization. What is most encouraging to us, however, is that while market opinion is focused on when the business achieves sustainable profitability, we believe investors are overlooking the potential for HR BPO to evolve into a growing, attractively profitable niche for Hewitt going forward.
As of March 31, 2010, shares traded at $39.78, a 29% discount to our steadily growing private market value of $56.28.
arielinvestments.com | | 800.292.7435 |
16
Ariel Fund Schedule of Investments | | March 31, 2010 (unaudited) |
Number of Shares | | Common Stocks—98.61% | | Cost | | Market Value | |
| | | | | | | |
| | Consumer discretionary & services—36.33% | | | | | |
5,130,200 | | CBS Corp., Class B | | $ | 24,505,203 | | $ | 71,514,988 | |
300,600 | | DeVry Inc. | | 17,738,885 | | 19,599,120 | |
5,471,339 | | Gannett Co., Inc. | | 13,461,475 | | 90,386,520 | |
3,303,625 | | International Game Technology | | 38,027,450 | | 60,951,881 | |
10,405,972 | | Interpublic Group of Cos., Inc.(a) | | 73,827,572 | | 86,577,687 | |
1,160,071 | | Meredith Corp. | | 24,852,975 | | 39,918,043 | |
1,112,148 | | Mohawk Industries, Inc.(a) | | 56,034,949 | | 60,478,608 | |
4,343,257 | | Newell Rubbermaid Inc. | | 83,215,102 | | 66,017,506 | |
1,418,075 | | Nordstrom, Inc. | | 20,132,272 | | 57,928,364 | |
2,004,356 | | Royal Caribbean Cruises Ltd.(a) | | 18,252,968 | | 66,123,704 | |
1,264,567 | | Sotheby’s | | 24,677,315 | | 39,315,388 | |
1,106,795 | | Stanley Black & Decker, Inc. | | 28,874,113 | | 63,541,101 | |
1,266,806 | | Tiffany & Co. | | 45,115,866 | | 60,160,617 | |
| | | | 468,716,145 | | 782,513,527 | |
| | Consumer staples—8.81% | | | | | |
2,181,738 | | Constellation Brands, Inc., Class A(a) | | 29,957,540 | | 35,867,773 | |
657,054 | | Energizer Holdings, Inc.(a) | | 16,529,522 | | 41,236,709 | |
1,033,238 | | J.M. Smucker Co. | | 36,511,651 | | 62,262,922 | |
1,313,325 | | McCormick & Co., Inc. | | 46,516,963 | | 50,379,147 | |
| | | | 129,515,676 | | 189,746,551 | |
| | Financial services—29.93% | | | | | |
5,292,457 | | CB Richard Ellis Group, Inc.(a) | | 29,043,371 | | 83,885,444 | |
964,326 | | City National Corp. | | 47,566,633 | | 52,044,674 | |
722,100 | | Dun & Bradstreet Corp. | . | 57,173,652 | | 53,738,682 | |
1,403,955 | | Equifax Inc. | | 48,536,697 | | 50,261,589 | |
972,600 | | Fair Isaac Corp. | | 20,548,195 | | 24,645,684 | |
1,794,065 | | HCC Insurance Holdings, Inc. | | 35,586,221 | | 49,516,194 | |
5,163,978 | | Janus Capital Group Inc. | | 45,288,053 | | 73,793,246 | |
1,232,073 | | Jones Lang LaSalle Inc. | | 18,949,825 | | 89,805,801 | |
1,938,400 | | Lazard Ltd, Class A | | 69,211,850 | | 69,200,880 | |
127,816 | | Markel Corp.(a) | | 30,017,212 | | 47,887,543 | |
3,647,457 | | PrivateBancorp, Inc.(b) | | 47,769,149 | | 49,970,161 | |
| | | | 449,690,858 | | 644,749,898 | |
| | Health care—6.95% | | | | | |
653,534 | | Bio-Rad Laboratories, Inc., Class A(a) | | 38,619,433 | | 67,653,840 | |
1,449,601 | | Hospira, Inc.(a) | | 50,879,418 | | 82,119,897 | |
| | | | 89,498,851 | | 149,773,737 | |
| | Materials & processing—2.29% | | | | | |
4,250,258 | | Interface, Inc., Class A(b) | | 42,423,952 | | 49,217,988 | |
| | | | | | | | | |
arielinvestments.com | | Semi-Annual Report |
17
Ariel Fund Schedule of Investments (continued) | | March 31, 2010 (unaudited) |
Number of Shares | | Common Stocks—98.61% | | Cost | | Market Value | |
| | | | | | | |
| | Producer durables—12.32% | | | | | |
1,648,603 | | Brady Corp., Class A | | $ | 23,936,272 | | $ | 51,304,525 | |
1,557,600 | | Brink’s Co. | | 38,884,487 | | 43,971,048 | |
1,970,590 | | Herman Miller, Inc. | | 34,594,947 | | 35,588,855 | |
2,289,113 | | Hewitt Associates, Inc., Class A(a) | | 62,451,405 | | 91,060,915 | |
1,315,811 | | IDEX Corp. | | 15,542,024 | | 43,553,344 | |
| | | | 175,409,135 | | 265,478,687 | |
| | Technology—1.98% | | | | | |
911,950 | | Anixter Intl Inc.(a) | | 20,242,635 | | 42,724,858 | |
| | | | | | | |
| | Total common stocks | | 1,375,497,252 | | 2,124,205,246 | |
| | | | | | | |
Principal Amount | | Repurchase Agreement—1.67% | | Cost | | Market Value | |
| | | | | | | | | | |
$ | 36,002,291 | | Fixed Income Clearing Corporation, 0.00%, dated 3/31/2010, due 4/1/2010, repurchase price $36,002,291, (collateralized by Federal Farm Credit Bank, 5.05%, due 9/9/2039, and Federal Home Loan Bank, 5.50%, due 7/15/2036, and Federal National Mortgage Assoc., 4.15% - 5.80%, due 12/17/2018 - 2/9/2026) | | $ | 36,002,291 | | $ | 36,002,291 | |
| | Total Investments—100.28% | | $ | 1,411,499,543 | | 2,160,207,537 | |
| | Liabilities less Other Assets��(0.28%) | | | | (6,060,544 | ) |
| | Net Assets—100.00% | | | | $ | 2,154,146,993 | |
(a) Non-income producing.
(b) Affiliated company (See Note Five).
A category may contain multiple industries as defined by the Global Industry Classification Standards.
The accompanying notes are an integral part of the financial statements.
Semi-Annual Report | | 800.292.7435 |
18
Ariel Appreciation Fund Schedule of Investments | | March 31, 2010 (unaudited) |
Number of Shares | | Common Stocks—99.32% | | Cost | | Market Value | |
| | | | | | | |
| | Consumer discretionary & services—32.93% | | | | | |
1,194,150 | | Carnival Corp. & plc | | $ | 34,487,581 | | $ | 46,428,552 | |
3,582,800 | | CBS Corp., Class B | | 24,487,329 | | 49,944,232 | |
3,747,000 | | Gannett Co., Inc. | | 8,270,245 | | 61,900,440 | |
2,023,500 | | International Game Technology | | 27,043,611 | | 37,333,575 | |
6,112,375 | | Interpublic Group of Cos., Inc.(a) | | 36,893,417 | | 50,854,960 | |
838,975 | | Mohawk Industries, Inc.(a) | | 38,084,790 | | 45,623,460 | |
667,500 | | Nordstrom, Inc. | | 8,374,245 | | 27,267,375 | |
1,205,900 | | Omnicom Group Inc. | | 36,525,508 | | 46,800,979 | |
494,800 | | Sotheby’s | | 9,412,000 | | 15,383,332 | |
663,199 | | Stanley Black & Decker, Inc. | | 14,108,688 | | 38,074,255 | |
773,100 | | Tiffany & Co. | | 25,369,849 | | 36,714,519 | |
1,686,500 | | Viacom, Inc.(a) | | 42,077,361 | | 57,981,870 | |
| | | | 305,134,624 | | 514,307,549 | |
| | Consumer staples—8.70% | | | | | |
322,047 | | Clorox Co. | | 14,119,343 | | 20,656,095 | |
1,695,500 | | Constellation Brands, Inc., Class A(a) | | 23,312,580 | | 27,874,020 | |
448,100 | | Energizer Holdings, Inc.(a) | | 21,561,708 | | 28,122,756 | |
532,675 | | J.M. Smucker Co. | | 27,256,513 | | 32,098,995 | |
704,725 | | McCormick & Co., Inc. | | 25,031,244 | | 27,033,251 | |
| | | | 111,281,388 | | 135,785,117 | |
| | Financial services—30.47% | | | | | |
981,000 | | AFLAC Inc. | | 21,343,572 | | 53,258,490 | |
3,173,750 | | CB Richard Ellis Group, Inc.(a) | | 11,953,634 | | 50,303,937 | |
626,700 | | City National Corp. | | 36,050,180 | | 33,822,999 | |
403,122 | | Dun & Bradstreet Corp. | | 19,517,536 | | 30,000,339 | |
682,400 | | Equifax Inc. | | 12,861,012 | | 24,429,920 | |
332,100 | | Franklin Resources, Inc. | | 10,904,455 | | 36,829,890 | |
3,244,075 | | Janus Capital Group Inc. | | 24,345,358 | | 46,357,832 | |
840,500 | | Jones Lang LaSalle Inc. | | 52,779,034 | | 61,264,045 | |
588,850 | | Lazard Ltd, Class A | | 22,025,040 | | 21,021,945 | |
74,800 | | Markel Corp.(a) | | 25,016,727 | | 28,024,568 | |
1,061,400 | | Northern Trust Corp. | | 42,639,405 | | 58,652,964 | |
579,900 | | T. Rowe Price Group, Inc. | | 12,554,880 | | 31,853,907 | |
| | | | 291,990,833 | | 475,820,836 | |
| | Health care—14.85% | | | | | |
629,050 | | Baxter Intl Inc. | | 18,985,460 | | 36,610,710 | |
280,525 | | Bio-Rad Laboratories, Inc., Class A(a) | | 19,179,773 | | 29,039,948 | |
471,000 | | Laboratory Corp. of America(a) | | 31,986,016 | | 35,659,410 | |
949,300 | | St. Jude Medical, Inc.(a) | | 35,511,568 | | 38,968,765 | |
851,854 | | Thermo Fisher Scientific Inc.(a) | | 17,046,087 | | 43,819,370 | |
807,300 | | Zimmer Holdings, Inc.(a) | | 37,117,537 | | 47,792,160 | |
| | | | 159,826,441 | | 231,890,363 | |
| | | | | | | | | |
arielinvestments.com | | Semi-Annual Report |
19
Ariel Appreciation Fund Schedule of Investments (continued) | | March 31, 2010 (unaudited) |
Number of Shares | | Common Stocks—99.32% | | Cost | | Market Value | |
| | | | | | | |
| | Producer durables—8.60% | | | | | |
1,354,100 | | Accenture plc, Class A | | $ | 25,609,266 | | $ | 56,804,495 | |
1,410,700 | | Hewitt Associates, Inc., Class A(a) | | 38,554,216 | | 56,117,646 | |
451,550 | | Illinois Tool Works Inc. | | 21,793,488 | | 21,385,408 | |
| | | | 85,956,970 | | 134,307,549 | |
| | Technology—3.77% | | | | | |
527,400 | | Anixter Intl Inc.(a) | | 31,724,407 | | 24,708,690 | |
2,279,800 | | Dell Inc.(a) | | 23,270,366 | | 34,219,798 | |
| | | | 54,994,773 | | 58,928,488 | |
| | | | | | | |
| | Total common stocks | | 1,009,185,029 | | 1,551,039,902 | |
| | | | | | | |
Principal Amount | | Repurchase Agreement—0.86% | | Cost | | Market Value | |
| | | | | | | |
$ | 13,463,000 | | Fixed Income Clearing Corporation, 0.00%, dated 3/31/2010, due 4/1/2010, repurchase price $13,463,000, (collateralized by Federal National Mortgage Assoc., 4.15%, due 12/17/2018) | | $ | 13,463,000 | | $ | 13,463,000 | |
| | Total Investments—100.18% | | $ | 1,022,648,029 | | 1,564,502,902 | |
| | Liabilities less Other Assets—(0.18%) | | | | (2,872,592 | ) |
| | Net Assets—100.00% | | | | $ | 1,561,630,310 | |
| | | | | | | | | | |
(a) Non-income producing.
A category may contain multiple industries as defined by the Global Industry Classification Standards.
The accompanying notes are an integral part of the financial statements.
Semi-Annual Report | 800.292.7435 |
20
Ariel Focus Fund Schedule of Investments | | March 31, 2010 (unaudited) |
Number of Shares | | Common Stocks—96.86% | | Cost | | Market Value | |
| | | | | | | |
| | Consumer discretionary & services—25.15% | | | | | |
32,000 | | Apollo Group, Inc.(a) | | $ | 2,019,175 | | $ | 1,961,280 | |
40,900 | | Carnival Corp. & plc | | 1,562,840 | | 1,590,192 | |
183,100 | | Interpublic Group of Cos., Inc.(a) | | 1,207,259 | | 1,523,392 | |
55,000 | | Omnicom Group Inc. | | 2,242,373 | | 2,134,550 | |
16,000 | | Toyota Motor Corp., ADR | | 1,380,901 | | 1,286,720 | |
51,900 | | Walt Disney Co. | | 1,393,306 | | 1,811,829 | |
| | | | 9,805,854 | | 10,307,963 | |
| | Energy—8.22% | | | | | |
26,300 | | Exxon Mobil Corp. | | 1,940,214 | | 1,761,574 | |
25,700 | | Hess Corp. | | 1,381,326 | | 1,607,535 | |
| | | | 3,321,540 | | 3,369,109 | |
| | Financial services—19.80% | | | | | |
36,100 | | AFLAC Inc. | | 1,428,472 | | 1,959,869 | |
58,200 | | Bank of New York Mellon Corp. | | 1,578,790 | | 1,797,216 | |
14,250 | | Berkshire Hathaway Inc., Class B(a) | | 829,587 | | 1,158,097 | |
29,900 | | JPMorgan Chase & Co. | | 1,186,580 | | 1,338,025 | |
63,450 | | Morgan Stanley | | 1,873,122 | | 1,858,451 | |
| | | | 6,896,551 | | 8,111,658 | |
| | Health care—16.38% | | | | | |
20,200 | | Baxter Intl Inc. | | 1,099,031 | | 1,175,640 | |
31,475 | | Covidien plc | | 1,110,016 | | 1,582,563 | |
35,000 | | Johnson & Johnson | | 2,106,310 | | 2,282,000 | |
44,800 | | Merck & Co., Inc. | | 1,209,311 | | 1,673,280 | |
| | | | 5,524,668 | | 6,713,483 | |
| | Producer durables—18.10% | | | | | |
48,700 | | Accenture plc, Class A | | 1,270,872 | | 2,042,965 | |
43,400 | | Hewitt Associates, Inc., Class A(a) | | 1,655,152 | | 1,726,452 | |
20,100 | | Lockheed Martin Corp. | | 1,500,245 | | 1,672,722 | |
51,675 | | Tyco Intl Ltd. | | 1,883,183 | | 1,976,569 | |
| | | | 6,309,452 | | 7,418,708 | |
| | Technology—9.21% | | | | | |
124,000 | | Dell Inc.(a) | | 2,403,457 | | 1,861,240 | |
14,900 | | International Business Machines Corp. | | 1,419,280 | | 1,910,925 | |
| | | | 3,822,737 | | 3,772,165 | |
| | | | | | | |
| | Total common stocks | | 35,680,802 | | 39,693,086 | |
| | | | | | | |
Principal Amount | | Repurchase Agreement—3.01% | | Cost | | Market Value | |
| | | | | | | |
$ | 1,232,113 | | Fixed Income Clearing Corporation, 0.00% dated 3/31/2010, due 4/1/2010, repurchase price $1,232,113, (collateralized by Federal National Mortgage Assoc., 4.15%, due 12/17/2018) | | $ | 1,232,113 | | $ | 1,232,113 | |
| | Total Investments—99.87% | | $ | 36,912,915 | | 40,925,199 | |
| | Other Assets less Liabilities—0.13% | | | | 54,745 | |
| | Net Assets—100.00% | | | | $ | 40,979,944 | |
| | | | | | | | | | |
(a) Non-income producing.
ADR stands for American Depositary Receipt.
A category may contain multiple industries as defined by the Global Industry Classification Standards.
The accompanying notes are an integral part of the financial statements.
arielinvestments.com | Semi-Annual Report |
21
Statements of Assets & Liabilities | March 31, 2010 (unaudited) |
| | Ariel Fund | | Ariel Appreciation Fund | | Ariel Focus Fund | |
Assets: | | | | | | | |
Investments in unaffiliated issuers, at value (cost $1,285,304,151, $1,009,185,029 and $35,680,802, respectively) | | $ | 2,025,017,097 | | $ | 1,551,039,902 | | $ | 39,693,086 | |
Investments in affiliated issuers, at value (cost $90,193,101) | | 99,188,149 | | — | | — | |
Repurchase agreements, at value (cost $36,002,291, $13,463,000 and $1,232,113, respectively) | | 36,002,291 | | 13,463,000 | | 1,232,113 | |
Receivable for fund shares sold | | 2,618,855 | | 1,551,166 | | 5,575 | |
Dividends and interest receivable | | 1,176,985 | | 1,557,469 | | 33,882 | |
Prepaid and other assets | | 132,123 | | 92,395 | | 20,451 | |
Total assets | | 2,164,135,500 | | 1,567,703,932 | | 40,985,107 | |
| | | | | | | |
Liabilities: | | | | | | | |
Payable for securities purchased | | 6,372,450 | | — | | — | |
Payable for fund shares redeemed | | 2,990,832 | | 5,545,270 | | 4,010 | |
Other liabilities | | 625,225 | | 528,352 | | 1,153 | |
Total liabilities | | 9,988,507 | | 6,073,622 | | 5,163 | |
Net assets | | $ | 2,154,146,993 | | $ | 1,561,630,310 | | $ | 40,979,944 | |
| | | | | | | |
Net assets consist of: | | | | | | | |
Paid-in capital | | $ | 2,157,081,496 | | $ | 1,261,869,542 | | $ | 43,524,403 | |
Undistributed net investment income (loss) | | (2,546,497 | ) | (1,318,345 | ) | 6,222 | |
Accumulated net realized loss on investment transactions | | (749,096,000 | ) | (240,775,760 | ) | (6,562,965 | ) |
Net unrealized appreciation on investments | | 748,707,994 | | 541,854,873 | | 4,012,284 | |
Total net assets | | $ | 2,154,146,993 | | $ | 1,561,630,310 | | $ | 40,979,944 | |
| | | | | | | |
Total net assets: | | $ | 2,154,146,993 | | $ | 1,561,630,310 | | $ | 40,979,944 | |
Shares outstanding (no par value) | | 51,256,395 | | 41,092,140 | | 4,133,375 | |
Net asset value, offering and redemption price per share | | $ | 42.03 | | $ | 38.00 | | $ | 9.91 | |
The accompanying notes are an integral part of the financial statements.
Semi-Annual Report | 800.292.7435 |
22
Statements of Operations | Six Months Ended March 31, 2010 (unaudited) |
| | Ariel Fund | | Ariel Appreciation Fund | | Ariel Focus Fund | |
Investment income: | | | | | | | |
Dividends | | | | | | | |
Unaffiliated issuers | | $ | 7,364,295 | | $ | 7,600,836 | | $ | 314,436 | (a) |
Affiliated issuers | | 92,121 | (b) | — | | — | |
Interest | | 1,448 | | 829 | | 37 | |
Total investment income | | 7,457,864 | | 7,601,665 | | 314,473 | |
| | | | | | | |
Expenses: | | | | | | | |
Management fees | | 5,506,387 | | 4,880,514 | | 140,584 | |
Distribution fees | | 2,332,916 | | 1,733,285 | | 46,862 | |
Shareholder service fees | | 1,071,864 | | 769,366 | | 8,737 | |
Transfer agent fees and expenses | | 427,909 | | 316,308 | | 30,177 | |
Printing and postage expenses | | 215,277 | | 159,321 | | 6,874 | |
Trustees’ fees and expenses | | 134,394 | | 106,322 | | 33,520 | |
Professional fees | | 42,349 | | 39,361 | | 21,743 | |
Custody fees and expenses | | 36,400 | | 27,300 | | 2,040 | |
Federal and state registration fees | | 29,400 | | 28,165 | | 12,220 | |
Miscellaneous expenses | | 72,093 | | 63,864 | | 5,091 | |
Total expenses before reimbursements | | 9,868,989 | | 8,123,806 | | 307,848 | |
Expense reimbursements | | — | | — | | (73,304 | ) |
Net expenses | | 9,868,989 | | 8,123,806 | | 234,544 | |
Net investment income (loss) | | (2,411,125 | ) | (522,141 | ) | 79,929 | |
| | | | | | | |
Realized and unrealized gain (loss): | | | | | | | |
Net realized gain (loss) on investments | | | | | | | |
Unaffiliated issuers | | 10,176,267 | | 21,149,748 | | 1,475,991 | |
Affiliated issuers | | (1,695,099 | ) | — | | — | |
Change in net unrealized appreciation on investments | | 301,965,361 | | 211,368,737 | | 3,082,056 | |
Net gain on investments | | 310,446,529 | | 232,518,485 | | 4,558,047 | |
Net increase in net assets resulting from operations | | $ | 308,035,404 | | $ | 231,996,344 | | $ | 4,637,976 | |
(a) Net of $388 in foreign tax withheld.
(b) See Note Five for information on affiliated issuers.
The accompanying notes are an integral part of the financial statements.
arielinvestments.com | Semi-Annual Report |
23
Statements of Changes in Net Assets
| | Ariel Fund | | Ariel Appreciation Fund | |
| | Six Months Ended | | | | Six Months Ended | | | |
| | March 31, 2010 | | Year Ended | | March 31, 2010 | | Year Ended | |
| | (unaudited) | | September 30, 2009 | | (unaudited) | | September 30, 2009 | |
| | | | | | | | | |
Operations: | | | | | | | | | |
Net investment income (loss) | | $ | (2,411,125 | ) | $ | 4,853,588 | | $ | (522,141 | ) | $ | 3,932,717 | |
Net realized gain (loss) on investments | | 8,481,168 | | (612,562,777 | ) | 21,149,748 | | (236,056,045 | ) |
Change in net unrealized appreciation on investments | | 301,965,361 | | 523,812,156 | | 211,368,737 | | 183,240,944 | |
Net increase (decrease) in net assets from operations | | 308,035,404 | | (83,897,033 | ) | 231,996,344 | | (48,882,384 | ) |
| | | | | | | | | |
Distributions to shareholders: | | | | | | | | | |
Net investment income | | (311,308 | ) | (17,409,181 | ) | (1,663,895 | ) | (7,803,099 | ) |
Capital gains | | — | | — | | — | | (117,944,550 | ) |
Total distributions | | (311,308 | ) | (17,409,181 | ) | (1,663,895 | ) | (125,747,649 | ) |
| | | | | | | | | |
Share transactions: | | | | | | | | | |
Shares issued | | 330,679,857 | | 393,496,595 | | 264,019,479 | | 174,717,931 | |
Shares issued in reinvestment of dividends and distributions | | 298,043 | | 16,584,356 | | 1,621,200 | | 120,824,738 | |
Shares redeemed | | (197,247,843 | ) | (441,660,068 | ) | (168,458,222 | ) | (346,445,707 | ) |
Net increase (decrease) from share transactions | | 133,730,057 | | (31,579,117 | ) | 97,182,457 | | (50,903,038 | ) |
Total increase (decrease) in net assets | | 441,454,153 | | (132,885,331 | ) | 327,514,906 | | (225,533,071 | ) |
| | | | | | | | | |
Net assets: | | | | | | | | | |
Beginning of year | | 1,712,692,840 | | 1,845,578,171 | | 1,234,115,404 | | 1,459,648,475 | |
End of period | | $ | 2,154,146,993 | | $ | 1,712,692,840 | | $ | 1,561,630,310 | | $ | 1,234,115,404 | |
| | | | | | | | | |
Undistributed net investment income (loss) included in net assets at end of period | | $ | (2,546,497 | ) | $ | 175,936 | | $ | (1,318,345 | ) | $ | 867,691 | |
| | | | | | | | | |
Capital share transactions: | | | | | | | | | |
Shares sold | | 8,603,848 | | 14,238,203 | | 7,510,021 | | 6,946,470 | |
Shares reinvested | | 7,646 | | 752,466 | | 45,197 | | 6,242,697 | |
Shares redeemed | | (5,226,079 | ) | (17,636,801 | ) | (4,842,071 | ) | (14,917,393 | ) |
Net increase (decrease) in shares outstanding | | 3,385,415 | | (2,646,132 | ) | 2,713,147 | | (1,728,226 | ) |
The accompanying notes are an integral part of the financial statements.
Semi-Annual Report | 800.292.7435 |
24
| | Ariel Focus Fund | |
| | Six Months Ended | | | |
| | March 31, 2010
(unaudited) | | Year Ended
September 30, 2009 | |
Operations: | | | | | |
Net investment income | | $ | 79,929 | | $ | 192,607 | |
Net realized gain (loss) on investments | | 1,475,991 | | (6,836,505 | ) |
Change in net unrealized appreciation on investments | | 3,082,056 | | 3,401,527 | |
Net increase (decrease) in net assets from operations | | 4,637,976 | | (3,242,371 | ) |
| | | | | |
Distributions to shareholders: | | | | | |
Net investment income | | (142,500 | ) | (212,065 | ) |
Capital gains | | — | | — | |
Total distributions | | (142,500 | ) | (212,065 | ) |
| | | | | |
Share transactions: | | | | | |
Shares issued | | 4,774,677 | | 6,591,335 | |
Shares issued in reinvestment of dividends and distributions | | 123,416 | | 182,172 | |
Shares redeemed | | (3,290,694 | ) | (6,313,181 | ) |
Net increase from share transactions | | 1,607,399 | | 460,326 | |
Total increase (decrease) in net assets | | 6,102,875 | | (2,994,110 | ) |
| | | | | |
Net assets: | | | | | |
Beginning of year | | 34,877,069 | | 37,871,179 | |
End of period | | $ | 40,979,944 | | $ | 34,877,069 | |
| | | | | |
Undistributed net investment income included in net assets at end of period | | $ | 6,222 | | $ | 68,793 | |
| | | | | |
Capital share transactions: | | | | | |
Shares sold | | 503,258 | | 938,099 | |
Shares reinvested | | 13,032 | | 26,829 | |
Shares redeemed | | (350,215 | ) | (885,667 | ) |
Net increase in shares outstanding | | 166,075 | | 79,261 | |
The accompanying notes are an integral part of the financial statements.
arielinvestments.com | Semi-Annual Report |
25
Financial Highlights For a share outstanding throughout each period
| | Year Ended September 30 | |
| | Six Months | | | | | | | | | | | |
| | Ended | | | | | | | | | | | |
| | March 31, 2010 | | | | | | | | | | | |
Ariel Fund | | (unaudited) | | 2009 | | 2008 | | 2007 | | 2006 | | 2005 | |
Net asset value, beginning of year | | $ | 35.78 | | $ | 36.53 | | $ | 54.60 | | $ | 52.00 | | $ | 54.55 | | $ | 50.62 | |
Income from investment operations: | | | | | | | | | | | | | |
Net investment income (loss) | | (0.05 | ) | 0.13 | | 0.36 | | 0.03 | | 0.09 | | 0.04 | |
Net realized and unrealized gains (losses) on investments | | 6.31 | | (0.50 | ) | (13.78 | ) | 5.97 | | 0.99 | | 5.70 | |
Total from investment operations | | 6.26 | | (0.37 | ) | (13.42 | ) | 6.00 | | 1.08 | | 5.74 | |
| | | | | | | | | | | | | |
Distributions to shareholders: | | | | | | | | | | | | | |
Dividends from net investment income | | (0.01 | ) | (0.38 | ) | (0.15 | ) | — | | (0.15 | ) | (0.02 | ) |
Distributions from capital gains | | — | | — | | (4.50 | ) | (3.40 | ) | (3.48 | ) | (1.79 | ) |
Total distributions | | (0.01 | ) | (0.38 | ) | (4.65 | ) | (3.40 | ) | (3.63 | ) | (1.81 | ) |
Net asset value, end of period | | $ | 42.03 | | $ | 35.78 | | $ | 36.53 | | $ | 54.60 | | $ | 52.00 | | $ | 54.55 | |
Total return | | 17.49 | %(a) | (0.36 | )% | (26.55 | )% | 11.97 | % | 2.16 | % | 11.54 | % |
| | | | | | | | | | | | | |
Supplemental data and ratios: | | | | | | | | | | | | | |
Net assets, end of period, in thousands | | $ | 2,154,147 | | $ | 1,712,693 | | $ | 1,845,578 | | $ | 3,975,046 | | $ | 4,280,965 | | $ | 5,017,851 | |
Ratio of expenses to average net assets | | 1.06 | %(b) | 1.14 | % | 1.07 | % | 1.03 | % | 1.07 | % | 1.03 | % |
Ratio of net investment income to average net assets | | (0.26 | )%(b) | 0.41 | % | 0.76 | % | 0.05 | % | 0.19 | % | 0.08 | % |
Portfolio turnover rate | | 15 | %(a) | 45 | % | 24 | % | 25 | % | 28 | % | 19 | % |
| | Year Ended September 30 | |
| | Six Months | | | | | | | | | | | |
| | Ended | | | | | | | | | | | |
| | March 31, 2010 | | | | | | | | | | | |
Ariel Appreciation Fund | | (unaudited) | | 2009 | | 2008 | | 2007 | | 2006 | | 2005 | |
| | | | | | | | | | | | | |
Net asset value, beginning of year | | $ | 32.16 | | $ | 36.39 | | $ | 50.65 | | $ | 48.46 | | $ | 48.32 | | $ | 44.62 | |
Income from investment operations: | | | | | | | | | | | | | |
Net investment income (loss) | | (0.01 | ) | 0.08 | | 0.17 | | 0.18 | | 0.12 | | 0.09 | |
Net realized and unrealized gains (losses) on investments | | 5.89 | | (1.02 | ) | (9.74 | ) | 5.49 | | 2.35 | | 4.86 | |
Total from investment operations | | 5.88 | | (0.94 | ) | (9.57 | ) | 5.67 | | 2.47 | | 4.95 | |
| | | | | | | | | | | | | |
Distributions to shareholders: | | | | | | | | | | | | | |
Dividends from net investment income | | (0.04 | ) | (0.18 | ) | (0.23 | ) | (0.02 | ) | (0.13 | ) | (0.05 | ) |
Distributions from capital gains | | — | | (3.11 | ) | (4.46 | ) | (3.46 | ) | (2.20 | ) | (1.20 | ) |
Total distributions | | (0.04 | ) | (3.29 | ) | (4.69 | ) | (3.48 | ) | (2.33 | ) | (1.25 | ) |
Net asset value, end of period | | $ | 38.00 | | $ | 32.16 | | $ | 36.39 | | $ | 50.65 | | $ | 48.46 | | $ | 48.32 | |
Total return | | 18.30 | %(a) | 3.54 | % | (20.49 | )% | 12.09 | % | 5.32 | % | 11.26 | % |
| | | | | | | | | | | | | |
Supplemental data and ratios: | | | | | | | | | | | | | |
Net assets, end of period, in thousands | | $ | 1,561,630 | | $ | 1,234,115 | | $ | 1,459,648 | | $ | 2,452,674 | | $ | 2,732,196 | | $ | 3,353,103 | |
Ratio of expenses to average net assets | | 1.17 | %(b) | 1.25 | % | 1.19 | % | 1.12 | % | 1.16 | % | 1.14 | % |
Ratio of net investment income to average net assets | | (0.08 | )%(b) | 0.42 | % | 0.39 | % | 0.33 | % | 0.27 | % | 0.17 | % |
Portfolio turnover rate | | 16 | %(a) | 44 | % | 26 | % | 29 | % | 25 | % | 25 | % |
(a) Not annualized.
(b) Annualized.
The accompanying notes are an integral part of the financial statements.
Semi-Annual Report | 800.292.7435 |
26
| | Year Ended September 30 | |
| | Six Months | | | | | | | | | | June 30, 2005(a) | |
| | Ended | | | | | | | | | | to | |
| | March 31, 2010 | | | | | | | | | | September 30, | |
Ariel Focus Fund | | (unaudited) | | 2009 | | 2008 | | 2007 | | 2006 | | 2005 | |
Net asset value, beginning of year | | $ | 8.79 | | $ | 9.74 | | $ | 11.93 | | $ | 10.69 | | $ | 10.23 | | $ | 10.00 | |
Income from investment operations: | | | | | | | | | | | | | |
Net investment income | | 0.02 | | 0.05 | | 0.04 | | 0.05 | | 0.04 | | 0.01 | |
Net realized and unrealized gains (losses) on investments | | 1.14 | | (0.94 | ) | (1.92 | ) | 1.24 | | 0.56 | | 0.22 | |
Total from investment operations | | 1.16 | | (0.89 | ) | (1.88 | ) | 1.29 | | 0.60 | | 0.23 | |
| | | | | | | | | | | | | |
Distributions to shareholders: | | | | | | | | | | | | | |
Dividends from net investment income | | (0.04 | ) | (0.06 | ) | (0.04 | ) | (0.05 | ) | (0.03 | ) | — | |
Distributions from capital gains | | — | | — | | (0.27 | ) | — | | 0.11 | | — | |
Total distributions | | (0.04 | ) | (0.06 | ) | (0.31 | ) | (0.05 | ) | (0.14 | ) | — | |
Net asset value, end of period | | $ | 9.91 | | $ | 8.79 | | $ | 9.74 | | $ | 11.93 | | $ | 10.69 | | $ | 10.23 | |
Total return | | 13.17 | %(b) | (9.02 | )% | (16.08 | )% | 12.05 | % | 6.00 | % | 2.30 | %(b) |
| | | | | | | | | | | | | |
Supplemental data and ratios: | | | | | | | | | | | | | |
Net assets, end of period, in thousands | | $ | 40,980 | | $ | 34,877 | | $ | 37,871 | | $ | 43,275 | | $ | 28,993 | | $ | 10,815 | |
Ratio of expenses to average net assets, including waivers | | 1.25 | %(c) | 1.25 | % | 1.25 | % | 1.25 | % | 1.25 | % | 1.25 | %(c) |
Ratio of expenses to average net assets, excluding waivers | | 1.64 | %(c) | 1.87 | % | 1.61 | % | 1.63 | % | 2.20 | % | 2.55 | %(c) |
Ratio of net investment income to average net assets, including waivers | | 0.43 | %(c) | 0.68 | % | 0.37 | % | 0.43 | % | 0.48 | % | 0.41 | %(c) |
Ratio of net investment income (loss) to average net assets, excluding waivers | | 0.04 | %(c) | 0.06 | % | 0.00 | % | 0.05 | % | (0.47 | )% | (0.89 | )%(c) |
Portfolio turnover rate | | 25 | %(b) | 42 | % | 49 | % | 28 | % | 29 | % | 15 | %(b) |
(a) Commencement of operations.
(b) Not annualized.
(c) Annualized.
The accompanying notes are an integral part of the financial statements.
arielinvestments.com | Semi-Annual Report |
27
Notes to the Financial Statements
Note One | Organization
Ariel Investment Trust (the “Trust”) is a Massachusetts business trust registered under the Investment Company Act of 1940, as amended (the “1940 Act”), as an open-end management investment company. Ariel Fund, Ariel Appreciation Fund and Ariel Focus Fund (the “Funds”) are series of the Trust. Ariel Fund and Ariel Appreciation Fund are diversified portfolios and Ariel Focus Fund is a non-diversified portfolio of the Trust.
Note Two | Significant accounting policies
The following is a summary of significant accounting policies consistently followed by the Funds in the preparation of their financial statements. The financial statements have been prepared in accordance with accounting principles generally accepted in the United States, which require management to make certain estimates and assumptions at the date of the financial statements. Actual results may differ from such estimates.
In the normal course of business, the Trust enters into contracts that contain a variety of representations and warranties that may provide certain indemnifications. The maximum exposure under these arrangements is unknown, as this would involve future claims that may be made against the Trust and/or its affiliates that have not yet occurred. Based on experience, however, the risk of loss is expected to be remote.
Fair Value Measurements— ASC 820-10 establishes a three-tier framework for measuring fair value based on a hierarchy of inputs. The hierarchy distinguishes between market data obtained from independent sources (observable inputs) and the Funds’ own market assumptions (unobservable inputs). These inputs are used in determining the value of the Funds’ investments and are summarized below:
Level 1 — quoted prices in active markets for identical securities
Level 2 — other significant observable inputs (including quoted prices for similar securities)
Level 3 — significant unobservable inputs (including the Funds’ own assumptions in determining the fair value of investments)
The inputs or methodology used for valuing securities are not necessarily an indication of the risk associated with investing in those securities.
The following is a summary of the inputs used as of March 31, 2010 in valuing the funds’ investments carried at market value:
| | Ariel Fund | | Ariel
Appreciation
Fund | | Ariel
Focus Fund | |
| | | | | | | |
Level 1 | | $ | 2,124,205,246 | | $ | 1,551,039,902 | | $ | 39,693,086 | |
Level 2 | | 36,002,291 | | 13,463,000 | | 1,232,113 | |
Level 3 | | — | | — | | — | |
Market Value at 03/31/2010 | | $ | 2,160,207,537 | | $ | 1,564,502,902 | | $ | 40,925,199 | |
As of March 31, 2010 all Level 2 securities held are repurchase agreements, see Schedule of Investments.
Investment valuation— Securities for which market quotations are readily available are valued at the last sale price on the national securities exchange on which such securities are primarily traded and, in the case of securities reported on the Nasdaq system, are valued based on the Nasdaq Official Closing Price. If a closing price is not reported, equity securities for which reliable bid and ask quotations are available are valued at the mean between bid and ask prices.
Debt obligations having a maturity of 60 days or less are valued at amortized cost, which approximates market value. Debt securities with maturities over 60 days are valued at the yield equivalent as obtained from a pricing service or one or more market makers for such securities. Securities and assets for which market quotations are not readily available are valued at fair value as determined in good faith by or under the direction of the Board of Trustees.
Foreign transactions— The books and records of the Funds are maintained in U.S. dollars and transactions denominated in foreign currencies are recorded in the Funds’ records at the rate prevailing when earned or recorded. Asset and liability accounts that are denominated in foreign currencies are adjusted to reflect current exchange rates. The effect of changes in foreign exchange rates on realized and unrealized security gains or losses is reflected as a component of such gains or losses. The Funds do not isolate that portion of the results of operations arising as a result of changes in the foreign exchange rates from the changes in market prices of the securities.
Repurchase agreements— The Funds may enter into repurchase agreements with recognized financial institutions and in all instances hold underlying securities as collateral with a value at least equal to the total repurchase price such financial institutions have agreed to pay.
Semi-Annual Report | 800.292.7435 |
28
March 31, 2010 (unaudited)
Federal taxes— It is the Funds’ policy to comply with the requirements of the Internal Revenue Code applicable to regulated investment companies and to distribute substantially all taxable income to shareholders. Accordingly, no provision for federal income or excise taxes has been made.
Management has reviewed the Funds’ tax positions for all tax periods open to examination by the applicable U.S. federal and state tax jurisdictions (tax years ended September 30, 2006-2009), in accordance with ASC 740-10, and no tax exposure reserve was required in the financial statements.
Securities transactions and investment income— Securities transactions are accounted for on a trade date basis. Realized gains and losses from securities transactions are recorded on the identified cost basis. Dividend income is recorded on the ex-dividend date and interest income is recognized on an accrual basis. Premiums and discounts on securities purchased are amortized using the effective interest method.
Expenses— The Funds contract and are charged for those expenses that are directly attributable to each Fund. Expenses that are not directly attributable to one or more Funds are allocated among applicable Funds on an equitable and consistent basis considering such things as the nature and type of expense and the relative net assets of the Funds. Various third party firms provide shareholder recordkeeping, communications and other services to beneficial owners of shares of the Funds. The fees incurred under these arrangements are reported as “Shareholder service fees” in the Statements of Operations.
Distributions to shareholders— Dividends from net investment income and net realized capital gains, if any, are declared and paid at least annually.
Distributions to shareholders are determined in accordance with federal income tax regulations and are recorded on the ex-dividend date. The character of distributions made during the year from net investment income or net realized capital gains may differ from the characterization for federal income tax purposes due to differences in the recognition of income, expense or gain items for financial statement and tax purposes. Where appropriate, reclassifications between net asset accounts are made at the end of the fiscal year for such differences that are permanent in nature.
Note Three | Investment transactions, distributions and federal income tax matters
Purchases and proceeds from sales of securities, excluding short-term investments and U.S. government securities, for the six months ended March 31, 2010 were as follows:
| | Ariel Fund | | Ariel Appreciation Fund | | Ariel Focus Fund | |
Purchases | | $ | 392,003,099 | | $ | 315,989,420 | | $ | 10,049,085 | |
Sales | | 281,490,877 | | 221,327,368 | | 9,302,471 | |
| | | | | | | | | | |
The cost and unrealized appreciation and depreciation of securities on a federal income tax basis at March 31, 2010 were as follows:
| | Ariel Fund | | Ariel Appreciation Fund | | Ariel Focus Fund | |
Cost | | $ | 1,441,192,824 | | $ | 1,057,878,695 | | $ | 35,935,937 | |
| | | | | | | |
Unrealized appreciation | | $ | 703,655,958 | | $ | 503,815,281 | | $ | 4,752,577 | |
Unrealized depreciation | | (20,643,536 | ) | (10,654,074 | ) | (995,428 | ) |
Net unrealized appreciation (depreciation) | | $ | 683,012,422 | | $ | 493,161,207 | | $ | 3,757,149 | |
The difference between book basis and tax basis unrealized appreciation and depreciation is attributable primarily to the deferral of losses on wash sales.
As of September 30, 2009, the Funds elected for federal income tax purposes to defer current year post October 31 losses as though the losses were incurred on the first day of the next fiscal year. Ariel Fund, Ariel Appreciation Fund and Ariel Focus Fund had post-October losses of $547,490,231, $208,524,045 and $6,464,484 respectively. At September 30, 2009, Ariel Fund and Ariel Focus Fund had available for federal income tax purposes a capital loss carryover of $(141,379,954) and $(1,162,700), respectively, expiring on September 30, 2017, which can be used to offset certain future realized capital gains.
arielinvestments.com | | Semi-Annual Report |
29
Notes to the Financial Statements (continued) | | March 31, 2010 (unaudited) |
Note Four | Investment advisory and other transactions with related parties
Ariel Investments, LLC (the “Adviser”) provides investment advisory and administrative services to each Fund of the Trust under an agreement (the “Management Agreement”). Pursuant to the Management Agreement, the Adviser is paid a monthly fee on average daily net assets at the annual rates shown below:
Management Fees | | Ariel Fund | | Ariel Appreciation Fund | | Ariel Focus Fund | |
Average Daily Net Assets | | | | | | | |
First $500 million | | 0.65 | % | 0.75 | % | 0.75 | % |
Next $500 million | | 0.60 | % | 0.70 | % | 0.70 | % |
Over $1 billion | | 0.55 | % | 0.65 | % | 0.65 | % |
The Adviser has contractually agreed to reimburse Ariel Fund and Ariel Appreciation Fund to the extent their respective total annual operating expenses (exclusive of brokerage, interest, taxes, distribution plan expenses and extraordinary items) exceed 1.50% of the first $30 million and 1.00% of their respective average daily net assets in excess of $30 million. The Adviser is contractually committed to waive fees or reimburse expenses in order to limit Ariel Focus Fund’s total annual operating expenses to 1.25% of its average daily net assets through September 30, 2011. After that date, there is no assurance that such expenses will be limited.
Ariel Distributors, LLC is the Funds’ distributor and principal underwriter (“the Distributor”). The Trust has adopted a plan of distribution under Rule 12b-1 of the 1940 Act applicable to the Funds. Under the plan, 12b-1 distribution fees up to an annual rate of 0.25% of average daily net assets are paid weekly to the Distributor for its services. Distribution fee expense totaled $2,332,916 for Ariel Fund, $1,733,285 for Ariel Appreciation Fund and $46,862 for Ariel Focus Fund during the six months ended March 31, 2010. These amounts were paid to the Distributor, which reallowed $1,801,389 for Ariel Fund, $1,341,278 for Ariel Appreciation Fund and $17,368 for Ariel Focus Fund to broker-dealers who distribute fund shares. The remaining amounts were retained by the Distributor for its services, advertising, and other distribution expenses.
Trustees’ fees and expenses represent only those expenses of disinterested (independent) trustees of the Funds.
Note Five | Transactions with affiliated companies
If a Fund’s holding represents ownership of 5% or more of the voting securities of a company, the company is deemed to be an affiliate as defined in the 1940 Act. Ariel Fund had the following transactions during the six months ended March 31, 2010, with affiliated companies:
| | Share Activity | | Six Months Ended March 31, 2010 | |
| | Balance | | | | | | | | | | Dividends | | Amount of Gain | |
| | September 30, | | | | | | Balance | | | | Credited to | | (Loss) Realized on | |
Security Name | | 2009 | | Purchases | | Sales | | March 31, 2010 | | Market Value | | Income | | Sale of Shares | |
Interface, Inc. | | 3,825,658 | | 424,600 | | — | | 4,250,258 | | $ | 49,217,988 | | $ | 20,190 | | $ | — | |
PrivateBancorp, Inc. | | 1,927,457 | | 1,865,400 | | 145,400 | | 3,647,457 | | 49,970,161 | | 71,931 | | (1,695,100 | ) |
| | | | | | | | | | $ | 99,188,149 | | $ | 92,121 | | $ | (1,695,100 | ) |
Note Six | Line of credit
The Funds have a $125,000,000 Line of Credit (the “Line”), which is uncommitted, with State Street Bank and Trust Company. The Line is for temporary or emergency purposes such as to provide liquidity for shareholder redemptions. The Funds incur interest expense to the extent of amounts drawn (borrowed) under the Line. Interest is based on the federal funds rate in effect at the time of borrowing, plus a margin.
For the six months ended March 31, 2010, the Funds did not borrow from the Line.
Semi-Annual Report | | 800.292.7435 |
30
Fund Expense Example | | (unaudited) |
Example
As a shareholder of the Funds, you incur ongoing costs, including management fees, distribution and service (12b-1) fees; and other Fund expenses. The Funds currently do not charge any transaction costs, such as sales charges (loads) on purchase payments, reinvested dividends or other distributions, redemption fees or exchange fees. The following example is intended to help you understand your ongoing costs (in dollars) of investing in each of the Funds and to compare these costs with the ongoing costs of investing in other mutual funds. Please note that IRA, 403(b) and Coverdell ESA account holders are charged an annual $15 recordkeeping fee or a one-time, lifetime $60 fee. If these fees were included in either the Actual Expense or Hypothetical Example below, your costs would be higher.
The example is based on an investment of $1,000 invested at the beginning of the period and held for the entire period of October 1, 2009-March 31, 2010.
Actual expenses
The first line of the table below for each Fund provides information about actual account values and actual expenses for that particular Fund. You may use the information in each of these lines, together with the amount you invested, to estimate the expenses that you paid over the period in each Fund. Simply divide your account value by $1,000 (for example, an $8,600 account value divided by $1,000 = 8.6), then multiply the result by the number in the first line under the heading, entitled Expenses Paid During Period, to estimate the expenses you paid on your account during this period in each Fund.
Hypothetical example for comparison purposes
The second line of the table below for each Fund provides information about hypothetical account values and hypothetical expenses based on each of the Fund’s actual expense ratio and an assumed rate of return of 5% per year before expenses, which is not the actual return. The hypothetical account values and expenses may not be used to estimate the actual ending account balance or expenses you paid for the period. You may use this information to compare the ongoing costs of investing in each of the Funds to other funds. To do so, compare this 5% hypothetical example with the 5% hypothetical examples that appear in the shareholder reports of other funds.
Please note that the expenses shown in the table are meant to highlight only your ongoing costs in each of the Funds. Therefore, the second line of the table for each Fund is useful in comparing ongoing costs only, and will not help you determine the relative total costs of owning different funds.
| | Beginning | | Ending | | Expenses | | | |
| | Account Value | | Account Value | | Paid During | | Annualized | |
Fund and Return | | October 1, 2009 | | March 31, 2010 | | Period* | | Expense Ratio* | |
Ariel Fund | | | | | | | | | |
Actual | | $ | 1,000.00 | | $ | 1,174.90 | | $ | 5.75 | | 1.06 | % |
Hypothetical (5% before expenses) | | 1,000.00 | | 1,019.65 | | 5.34 | | 1.06 | % |
| | | | | | | | | |
Ariel Appreciation Fund | | | | | | | | | |
Actual | | $ | 1,000.00 | | $ | 1,183.00 | | $ | 6.37 | | 1.17 | % |
Hypothetical (5% before expenses) | | 1,000.00 | | 1,019.10 | | 5.89 | | 1.17 | % |
| | | | | | | | | |
Ariel Focus Fund | | | | | | | | | |
Actual | | $ | 1,000.00 | | $ | 1,131.70 | | $ | 6.64 | | 1.25 | % |
Hypothetical (5% before expenses) | | 1,000.00 | | 1,018.70 | | 6.29 | | 1.25 | % |
* | | Expenses are equal to each Fund’s annualized expense ratio indicated above multiplied by the average account value over the period, multiplied by 182/365 to reflect the most recent fiscal half year. |
arielinvestments.com | | Semi-Annual Report |
31
Important Supplemental Information
Proxy Voting Policies, Procedures, and Record
Both a description of the policies and procedures that the Funds’ investment adviser uses to determine how to vote proxies relating to portfolio securities and information regarding how the Funds voted proxies relating to portfolio securities during the most recent 12-month period ended June 30 are available upon request by calling 800-292-7435. Such information for the Ariel Investment Trust is also available on the Securities and Exchange Commission’s (“SEC”) web site at www.sec.gov.
Shareholder Statements and Reports
The Funds attempt to reduce the volume of mail sent to shareholders by sending one copy of financial reports, prospectuses and other regulatory materials to two or more account holders who share the same address. Shareholders will be sent prior notice at least 60 days before only one copy of these documents is sent if the Funds have not received the shareholder’s written consent to do previously. A shareholder may request individual copies of materials, by calling 800-292-7435. It may take 30 days before individual copies for each account are sent pursuant to shareholder instruction.
Availability of Quarterly Portfolio Schedule
The Funds file complete schedules of investments with the SEC for the quarters ended December 31 and June 30 of each fiscal year on Form N-Q which are available on the SEC’s website at www.sec.gov. Additionally, the Funds’ Form N-Q may be reviewed and copied at the SEC’s Public Reference Room in Washington, DC. For information on the Public Reference Room, call 800-SEC-0330.
All Ariel Mutual Funds quarterly reports contain a complete schedule of portfolio holdings. All quarterly reports are made available to shareholders on the Funds’ web site at www.arielinvestments.com. Shareholders also may obtain copies of shareholder reports upon request by calling 800-292-7435 or by writing to P.O. Box 701, Milwaukee, Wisconsin 53201-0701.
Approval of the Management Agreements
Each year the Board of Trustees of the Trust, including a majority of the Independent Trustees, is required by the 1940 Act to determine whether to continue each Fund’s management agreement with the Adviser (each a “Management Agreement”). The Board requests, receives and considers a broad range of materials and information that are relevant to the Trustees’ consideration of the Management Agreements at Board meetings throughout the year and especially in connection with its annual review of those agreements. The Board’s Management Contracts Committee (the “Committee”), which is comprised entirely of Independent Trustees, leads the Board in its consideration of the Management Agreements. Both the Committee and the Board held meetings in the fall of 2009 to consider the Management Agreements. During each of those meetings, the Committee and the Independent Trustees were advised by, and met in executive sessions with, their independent legal counsel.
Nature, Extent and Quality of Services
The Trustees considered the nature and quality of the services provided by the Adviser, taking into account the knowledge gained from their successive meetings with the Adviser over a period of years. In addition, the Trustees considered the Adviser’s long-term historical approach in managing the Funds; its consistency of investment approach; the background and experience of the Adviser’s investment personnel responsible for managing the Funds; the Adviser’s performance as administrator of the Funds, including, among other things, in the areas of brokerage selection, trade execution, compliance, educational materials and other shareholder communications, information technology and business continuity; the Adviser’s commitment to diversity and civic affairs; and the favorable recognition of the Adviser and the Funds in the media and in industry publications. They also considered information regarding the structure of the Adviser’s compensation program for portfolio managers and certain other employees and the relationship of that compensation to the performance of the Funds and to the attraction and retention of quality personnel. The Independent Trustees also noted the personal investments that the Adviser’s personnel have made in the Funds, which is designed to align the interests of
Semi-Annual Report | | 800.292.7435 |
32
March 31, 2010 (unaudited)
the Adviser and its personnel with those of the Funds’ shareholders. The Trustees concluded that the nature, extent and the quality of the services provided by the Adviser was satisfactory.
Investment Performance
The Trustees considered the investment performance of each Fund over various periods of time, including comparative information provided by Lipper Inc., an independent data service provider (“Lipper”), comparing each Fund’s performance with that of comparable funds selected by Lipper (the “Peer Group”). The Trustees discussed comparative data provided by Lipper with respect to the performance of the Funds. The Trustees also considered the Funds’ respective Peer Groups and the Funds’ respective performance benchmarks. The Trustees took into account that the performance of each of the Funds, relative to their performance universe, was improving over the past year. The Committee had met with the respective portfolio managers of the Funds prior to approval of the Management Agreement for an in-depth discussion of performance. The Committee considered the portfolio managers belief that the Funds are positioned well for the market rebound, as recent performance indicated. The Trustees acknowledged the Adviser’s commitment to its stated investment strategy and commended its consistent approach of being patient investors, focused, independent, and innovative in thinking in navigating the recent market turmoil. The Trustees concluded that the investment performance of the Funds was satisfactory.
Fees and Expenses
The Trustees reviewed comparative fee and expense information for the Peer Group, as selected and analyzed by Lipper, for each of the Funds. The Trustees considered comparative total expense ratios, as well as advisory fees, in assessing each Fund’s management fee structure. The Trustees considered the expense ratio of each Fund and concluded that the ratios were reasonable and competitive with the expense ratios of each Fund’s Peer Group as determined by Lipper.
Benefits, Profitability and Economies of Scale
The Trustees discussed the Committee’s conclusion that Ariel’s profitability associated with its relationship with each Fund was within a reasonable range and was neither excessive nor so low that the Adviser could not be expected to continue to service the Funds effectively. The Independent Trustees reviewed the profitability to Ariel of its relationship with each Fund, including the methodology by which that profitability analysis was calculated, and also examined the fees charged by Ariel to other types of clients. The Independent Trustees discussed with representatives of the Adviser the financial condition of the Adviser and its long-term strategic planning. The Independent Trustees also reviewed the size and quality of the Adviser’s investment personnel, including their education and experience. The Independent Trustees noted they had good communication with the portfolio managers throughout the year. They also reviewed whether the Funds had operated within their investment objectives and reviewed each Fund’s record of compliance with its investment restrictions and other regulatory requirements. The Trustees reviewed the extent to which economies of scale may be realized if the Funds increase in size. It was noted that the management fee schedules for all three Funds contain breakpoints at different levels, with the final breakpoint at $I billion in assets. The Trustees considered the effective advisory fees for the Funds and concluded that the advisory fee schedules provide an appropriate sharing between the Funds and the Adviser of such economies of scale as may exist under the Management Agreements and determined that no additional breakpoints were needed at the present time.
Approval
After full consideration of the above factors, as well as other factors that were instructive in evaluating the Management Agreements, the Board, including all of the Independent Trustees, concluded that continuation of each Fund’s Management Agreement was in the best interests of the Fund and its shareholders and the Board approved the continuation of each of those agreements. The Board’s determinations were based upon a comprehensive consideration of all information provided to it, including both quantitative measures and qualitative factors, and were not the result of any single factor.
arielinvestments.com | | Semi-Annual Report |
33
Board of Trustees
| | Position(s) held | | Term of office and length | | Principal occupation(s) | | |
Name and age | | with Fund | | of time served | | during past 5 years | | Other directorships |
| | | | | | | | |
Mario L. Baeza, Esq.
Age: 59 | | Trustee, Member of Management Contracts and Governance Committees | | Indefinite, until successor elected
Served as a Trustee
since 1995 | | Chairman and CEO, The Baeza Group, LLC and Baeza & Co., LLC (Hispanic-owned investment firms) since 1995; Founder and Executive Chairman, V-Me Media, Inc. (media production and distribution company) since 2007 | | Air Products and Chemicals, Inc., Brown Shoe Company, Inc., Israel Discount Bank, UrbanAmerica LLC, Hispanic Federation Inc., NYC Latin Media and Entertainment Commission, Upper Manhattan Empowerment Zone |
| | | | | | | | |
James W. Compton
Age: 71 | | Trustee, Member of Governance and Audit Committees | | Indefinite, until successor elected
Served as a Trustee since 1997 | | Retired President and CEO, Chicago Urban League (non-profit, civil rights and community-based organization), 1978 to 2006 | | Seaway Bank and Trust Company, Commonwealth Edison Company, The Field Museum (Life Trustee), The Big Shoulders Fund, ETA Creative Arts Foundation, Inc. |
| | | | | | | | |
William C. Dietrich
Age: 60 | | Trustee, Chairman of Audit Committee, Member of Executive Committee | | Indefinite, until successor elected
Served as a Trustee since 1986 | | Former Executive Director, Shalem Institute for Spiritual Formation, Inc. (ecumenical educational institute), 2006-2009 (Co-Executive Director 2003-2006) | | |
| | | | | | | | |
Royce N. Flippin, Jr.
Age: 75 | | Lead Independent Trustee, Member of Management Contracts and Governance Committees, Chairman of Executive Committee | | Indefinite, until successor elected
Served as a Trustee since 1986 and Lead Independent Trustee since 2006 | | President, Flippin Associates (consulting firm) since 1992 | | Technical Career Institute, NYC, TerraCycle, Inc., Princeton Club of New York |
| | | | | | | | |
John G. Guffey, Jr.
Age: 61 | | Trustee, Member of Management Contracts and Audit Committees | | Indefinite, until successor elected
Served as a Trustee since 1986 | | President, Aurora Press, Inc. (publisher of trade paperback books) since 2003 | | Calvert Social Investment Foundation, Calvert Group of Funds, except for Calvert Variable Series |
| | | | | | | | |
Mellody L. Hobson
Age: 40 | | Chairman of the Board of Trustees and President, Member of Executive Committee | | Indefinite, until successor elected
Served as a Trustee since 1993, President since 2002 and Chairman since 2006. | | President, Ariel Investments since 2000 | | DreamWorks Animation SKG, Inc., The Estée Lauder Companies Inc., Starbucks Corporation, Sundance Institute, Chicago Public Education Fund, Chicago Public Library, The Field Museum, Investment Company Institute (Board of Governors) |
arielinvestments.com
34
| | Position(s) held | | Term of office and length | | Principal occupation(s) | | |
Name and age | | with Fund | | of time served | | during past 5 years | | Other directorships |
| | | | | | | | |
Christopher G. Kennedy
Age: 46 | | Trustee, Member of Audit and Governance Committees | | Indefinite, until successor elected
Served as a Trustee since 1995 | | President, Merchandise Mart Properties, Inc. (real estate management firm) since 2000; Executive Officer, Vornado Realty Trust (publicly traded real estate investment trust) since 2000 | | Interface Inc., Catholic Theological Union, University of Illinois (Chairman of the Board of Trustees) |
| | | | | | | | |
Merrillyn J. Kosier
Age: 50 | | Trustee and Vice President | | Indefinite, until successor elected
Served as a Trustee since 2003 and Vice President since 1999 | | Executive Vice President, Ariel Investments since 1999, Chief Marketing Officer, Mutual Funds since 2007 | | Loyola University Advisory Board and Council of Regents, Harris Theater for Music and Dance, Lupus Foundation of America, Inc. |
| | | | | | | | |
William M. Lewis, Jr.
Age: 53 | | Trustee, Member of Management Contracts Committee | | Indefinite, until successor elected
Served as a Trustee since 2007 | | Managing Director and Co-Chairman of Investment Banking, Lazard Ltd. since 2004; Managing Director and Co-Head of the Global Banking Department, Morgan Stanley, 1999 to 2004 | | Darden Restaurants, Inc., Phillips Academy, Central Park Conservancy, NCAA Leadership Advisory Board, Member of The Partnership for New York City |
| | | | | | | | |
H. Carl McCall
Age: 74 | | Trustee, Chairman of Governance Committee, Member of Audit Committee | | Indefinite, until successor elected
Served as a Trustee since 2006 | | Principal, Convent Capital, LLC (financial advisory firm) since 2004 | | |
| | | | | | | | |
John W. Rogers, Jr.
Age: 52 | | Trustee | | Indefinite, until successor elected
Served as a Trustee 1986 to 1993 and since 2000 | | Founder, Chairman, CEO and Chief Investment Officer, Ariel Investments, Lead Portfolio Manager, Ariel Fund & Ariel Appreciation Fund | | Aon Corporation, Exelon Corporation, McDonald’s Corporation, Chicago Urban League, John S. and James L. Knight Foundation, Economic Club of Chicago (Chairman) |
| | | | | | | | |
James M. Williams
Age: 62 | | Trustee, Chairman of Management Contracts Committee | | Indefinite, until successor elected
Served as a Trustee since 2006 | | Vice President and Chief Investment Officer, J. Paul Getty Trust, since 2002 | | SEI Mutual Funds |
CHAIRMAN EMERITUS
(has no trustee duties or responsibilities)
Bert N. Mitchell, CPA
Chairman and Chief Executive Officer, Mitchell & Titus, LLP
Note: Number of portfolios in complex overseen by all Trustees is three. Address for all Trustees is 200 East Randolph Dr., Suite 2900, Chicago, IL 60601
800.292.7435
35
Officers
| | Position(s) held | | Term of office and length | | Principal occupation(s) | | Other directorships |
Name and age | | with Fund | | of time served | | during past 5 years | | held by officer |
| | | | | | | | |
Mareile B. Cusack
Age: 51 | | Vice President,
Assistant Secretary | | Indefinite, until successor elected
Served as Vice President and Assistant Secretary since 2008 | | Vice President, Ariel Investments since 2007, General Counsel since October 2008; Vice President and Associate General Counsel, Chicago Stock Exchange, Inc. 2007 and Chief Enforcement Counsel, 2004 to 2007 | | International Visitors Center of Chicago |
| | | | | | | | |
Thomas E. Herman, CPA
Age: 48 | | Chief Financial Officer and Treasurer | | Indefinite, until successor elected
Served as Chief Financial Officer and Treasurer since 2005 | | Chief Financial Officer and Treasurer since 2006; Senior Vice President, Finance, 2005 to 2006; Vice President, Controller, 2004 to 2005, Ariel Investments; Regional Financial Manager, Otis Elevator Company, 1999 to 2004 | | Chicago Children’s Theatre |
| | | | | | | | |
Mellody L. Hobson
Age: 40 | | Chairman of the Board of Trustees and President; Member of Executive Committee | | Indefinite, until successor elected
Served as a Trustee since 1993, President since 2002 and Chairman since 2006 | | President, Ariel Investments, since 2000 | | DreamWorks Animation SKG, Inc., The Estée Lauder Companies Inc., Starbucks Corporation, Sundance Institute, Chicago Public Education Fund, Chicago Public Library, The Field Museum, Investment Company Institute (Board of Governors) |
| | | | | | | | |
Merrillyn J. Kosier
Age: 50 | | Trustee and Vice President | | Indefinite, until successor elected
Served as a Trustee since 2003 and Vice President since 1999 | | Executive Vice President, Ariel Investments since 1999, Chief Marketing Officer, Mutual Funds since 2007 | | Loyola University Advisory Board and Council of Regents, Harris Theater for Music and Dance, Lupus Foundation of America, Inc. |
| | | | | | | | |
Anita M. Zagrodnik
Age: 50 | | Vice President, Chief Compliance Officer, Secretary and Assistant Treasurer | | Indefinite, until successor elected
Served as Vice President and Assistant Treasurer since 2003; Chief Compliance Officer, Ariel Investment Trust since 2004, Secretary since 2007, Assistant Secretary from 2003-2007 | | Vice President, Fund Administration, Ariel Investments since 2003 | | |
The Statement of Additional Information (SAI) for Ariel Investment Trust includes additional information about the Funds’ Trustees and Officers. The SAI is available without charge by calling 800.292.7435 or logging on to our website, arielinvestments.com. Note: Number of portfolios in complex overseen by all Officers is three. Address for all Officers is 200 East Randolph Dr., Suite 2900, Chicago, IL 60601.
arielinvestments.com | | 800.292.7435 |
36

Slow and Steady Wins the Race
ARIEL INVESTMENT TRUST
c/o U.S. Bancorp Fund Services, LLC
P.O. Box 701
Milwaukee, WI 53201-0701
800.292.7435
arielinvestments.com
TPI ©4/10
Item 2. Code of Ethics.
Not applicable. The information required by this Item is only required in an annual report on Form N-CSR.
Item 3. Audit Committee Financial Expert.
Not applicable. The information required by this Item is only required in an annual report on Form N-CSR.
Item 4. Principal Accountant Fees and Services.
Not applicable. The information required by this Item is only required in an annual report on Form N-CSR.
Item 5. Audit Committee of Listed Registrants.
Not applicable.
Item 6. Schedule of Investments.
(a) Included as part of the report to shareholders filed under Item 1 of this Form.
(b) Not applicable.
Item 7. Disclosure of Proxy Voting Policies and Procedures for Closed-End Management Investment Companies.
Not applicable.
Item 8. Portfolio Managers of Closed-End Management Investment Companies.
Not applicable.
Item 9. Purchases of Equity Securities by Closed-End Management Investment Company and Affiliated Purchasers.
Not applicable.
Item 10. Submission of Matters to a Vote of Security Holders.
There have been no changes to the procedures by which shareholders may recommend nominees to the registrant’s Board of Trustees.
Item 11. Controls and Procedures.
(a) The registrant’s certifying officers have reasonably designed such disclosure controls and procedures to ensure material information relating to the registrant is made known to them by others, particularly during the period in which this report is being prepared. The registrant’s certifying officers have determined that the registrant’s disclosure controls and procedures are effective based on their evaluation of these controls and procedures as of a date within 90 days prior to the filing date of this report.
(b) There were no significant changes in the registrant’s internal controls over financial reporting, or in other factors that could significantly affect these controls, that occurred during the registrant’s second fiscal half-year, including any corrective actions with regard to significant deficiencies and material weaknesses.
Item 12. Exhibits.
(a)(1) Code of Ethics — Not applicable.
(a)(2) Certification for each principal executive and principal financial officer of the registrant as required by Rule 30a-2 under the Act (17 CFR 270.30a-2(a)) — Filed as an attachment to this filing.
(a)(3) Written solicitation to purchase securities under Rule 23c-1 — Not applicable.
(b) Certifications required by Rule 30a-2(b) under the Act (17 CFR 270.30a-2(b)), Rule 13a-14(b) or Rule 15d-14(b) under the Exchange Act (17 CFR 240.13a-14(b) or 240.15d-14(b)), and Section 1350 of Chapter 63 of Title 18 of the United States Code (18 U.S.C. 1350). A certification furnished pursuant to this paragraph will not be deemed “filed” for purposes of Section 18 of the Exchange Act (15 U.S.C. 78r), or otherwise subject to the liability of that section. Such certification will not be deemed to be incorporated by reference into any filing under the Securities Act of 1933 or the Exchange Act, except to the extent that the registrant specifically incorporates it by reference — Filed as an attachment to this filing.
SIGNATURES
Pursuant to the requirements of the Securities Exchange Act of 1934 and the Investment Company Act of 1940, the registrant has duly caused this report to be signed on its behalf by the undersigned, thereunto duly authorized.
Ariel Investment Trust | |
| |
By: | /s/ Mellody Hobson | |
| Mellody Hobson | |
| President and Principal Executive Officer | |
| | |
Date: | May 6, 2010 | |
Pursuant to the requirements of the Securities Exchange Act of 1934 and the Investment Company Act of 1940, this report has been signed below by the following persons on behalf of the registrant and in the capacities and on the dates indicated.
By: | /s/ Mellody Hobson | |
| Mellody Hobson | |
| President and Principal Executive Officer | |
| | |
Date: | May 6, 2010 | |
By: | /s/ Thomas Herman | |
| Thomas Herman | |
| Treasurer and Chief Financial Officer | |
| | |
Date: | May 6, 2010 | |