UNITED STATES
SECURITIES AND EXCHANGE COMMISSION
Washington, D.C. 20549
FORM N-CSR
CERTIFIED SHAREHOLDER REPORT OF REGISTERED
MANAGEMENT INVESTMENT COMPANIES
Investment Company Act file number | 811-4786 |
|
Ariel Investment Trust |
(Exact name of registrant as specified in charter) |
|
200 East Randolph Drive
Suite 2900
Chicago, Illinois | | 60601 |
(Address of principal executive offices) | | (Zip code) |
|
Sheldon R. Stein
200 East Randolph Drive
Suite 2900
Chicago, Illinois 60601 |
(Name and address of agent for service) |
|
with a copy to:
Arthur Don
Seyfarth Shaw LLP
131 South Dearborn Street
Suite 2400
Chicago, IL 60603 |
|
Registrant’s telephone number, including area code: | (312) 726-0140 | |
|
Date of fiscal year end: | September 30, 2007 | |
|
Date of reporting period: | March 31, 2008 | |
| | | | | | | |
Item 1. Reports to Stockholders.
The following is a copy of the report transmitted to shareholders pursuant to Rule 30e-1 under the Investment Company Act of 1940 (the “Act”) (17 CFR 270.30e-1).


One of Ariel’s guiding principles is to communicate openly with our shareholders so they may gain a clear understanding of our investment philosophy, portfolio decisions and results, as well as our opinions on the underlying market. In reviewing the materials contained in The Patient Investor and the Semi-Annual Report, please consider the information provided on this page. While our investment decisions are rooted in detailed analysis, it is important to point out that actual results can differ significantly from those we seek. We candidly discuss a number of individual companies. Our opinions are current as of the date they were written but are subject to change. We want to remind investors that the information in this report is not sufficient to base an investment decision and should not be considered a recommendation to purchase or sell any particular security.
The Funds invest primarily in small and mid-sized companies. Investing in small and mid-cap stocks is riskier and more volatile than investing in large cap stocks, in part because smaller companies may not have the scale, depth of resources and other assets of larger firms. Additionally, the Ariel Focus Fund is a non-diversified fund, which means its investments are concentrated in fewer names than diversified funds, such as Ariel Fund and Ariel Appreciation Fund. Ariel Focus Fund generally holds 20 stocks and therefore may be more volatile than a more diversified investment.
Performance data quoted is past performance and does not guarantee future results. The performance stated in this document assumes the reinvestment of dividends and capital gains. We caution shareholders that we can never predict or assure future returns on investments. The investment return and principal value of an investment with our Funds will fluctuate over time so that your shares, when redeemed, may be worth more or less than their original cost. Current performance may be lower or higher than the performance data quoted in this report. For the period ended March 31, 2008, the average annual total returns for the one-, five- and ten-year periods for Ariel Fund and Ariel Appreciation Fund were -16.03%, 9.94% and 7.22%; and -12.18%, 10.25% and 7.05%, respectively. For the period ended March 31, 2008, the average annual total returns of Ariel Focus Fund for the one-year and since inception (June 30, 2005) periods were -6.45% and 3.24%. To access our performance data current to the most recent month-end, visit our website, arielinvestments.com.
As of September 30, 2007, Ariel Fund and Ariel Appreciation Fund had annual expense ratios of 1.03% and 1.12%, respectively. As of September 30, 2007, Ariel Focus Fund had an annual net expense ratio of 1.25% and a gross expense ratio of 1.63%. The Fund’s adviser, Ariel Investments, LLC is contractually obligated to waive fees or reimburse expenses in order to limit Ariel Focus Fund’s total annual operating expenses to 1.25% of net assets through the end of the fiscal year ending September 30, 2009. After that date, there is no assurance such expenses will be limited.
Investors should consider carefully the investment objectives, risks, and charges and expenses before investing. For a current prospectus which contains this and other information about the funds offered by Ariel Investment Trust, call Ariel Distributors, LLC at 800.292.7435 or visit our website, arielinvestments.com. Please read the prospectus carefully before investing. ©2008 Ariel Distributors, LLC.
ARIEL INVESTMENT TRUST
c/o U.S. Bancorp Fund Services, LLC
P.O. Box 701
Milwaukee, WI 53201-0701
800.292.7435
arielinvestments.com

| | CONTENTS |
| | |
2 | | The Patient Investor |
| | |
6 | | Company Spotlights |
| | |
9 | | Statistical Summaries |
| | |
13 | | Semi-Annual Report |
Turtle Talk with our Investment Specialists

I recently got married and now I need to change the registration on my Ariel account to include my husband as a joint account holder. Additionally, we received monetary wedding gifts which I want to invest in this account. Can you help us? —Erin R., Frankfort, IL
Shanita: Congratulations on your wedding! This is a very exciting time in your life and we are delighted you are already thinking about your financial future.
To change your name on your Ariel Investments account, simply download and complete the Name Change Form which is available at arielinvestments.com and mail it back to us along with an official copy of your marriage certificate.
To add your husband to the account, simply send us a brief letter of instruction and include the following:
1. Your existing account number
2. Your husband’s name and Social Security Number
3. Your husband’s date of birth
Please make sure both you and your husband sign this letter and obtain a Signature Guarantee from your commercial bank, savings bank, credit union or broker-dealer.
Investing your monetary wedding gifts is a great way to begin saving together. It only takes a moment to purchase additional shares of Ariel Investments. Call us Monday through Friday, 8am-7pm CT at 800.292.7435, option 3, and an Investment Specialist will be happy to assist you. Best wishes on a happy and financially secure future!
Not Part of the Semi-Annual Report | 25 years of patient investing |

Dear Fellow Shareholder: The first quarter of 2008 easily qualifies as one of the most volatile periods in our 25 years of patient investing. With extreme daily and weekly moves, we witnessed days like January 23rd when the Dow had its second-biggest intraday point swing ever: a nearly 250-point rout morphed into a nearly 300-point rally by the end of the day. Against this tumultuous backdrop, the quarter ended with domestic and international stock markets down sharply across the board—small companies, large companies, value and growth strategies—nothing was spared. Perhaps the environment was best summed up in Fortune by one Wall Street executive who said, “If you are on a beach and a tsunami hits, you’ll drown whether you are a small child or an Olympic swimmer.”1
Our portfolios, which have typically weathered some terrible storms, also felt the brunt of the market’s tsunami and did not provide the downside protection that history has taught us to expect. Although Ariel Fund has outperformed in 70% of the 23 down quarters that have occurred since its 1986 inception, we did not manage to do so this quarter. In fact, the small-to-mid sized holdings comprising Ariel Fund fell -11.2% while the Russell 2500 Value Index lost -7.2% and the Russell 2500 Index gave back -9.4%. As a means of comparison, even the bell-weather Standard & Poor’s 500 dropped -9.4% for the quarter. Meanwhile, Ariel Appreciation Fund fell -9.2% which was a bit worse than the Russell Midcap Value Index which lost -8.6% and slightly better than the -10.0% return posted by the Russell Midcap Index.
Ariel Focus was the bright spot. Its -5.0% three month return outperformed the Russell 1000 Value Index which lost -8.7% as well as the Russell 1000 Index which dropped -9.5%.
As fiercely competitive as Olympic swimmers, we are naturally disappointed in Ariel and Ariel Appreciation’s relative results during a down quarter. Our shortfalls are directly tied to difficulties in our favored sectors, more specifically consumer and financials. We have also underperformed because of unprecedented strength in commodities, which helped some of the stocks we avoid and hurt some of the stocks we own.

“The first quarter of 2008
easily qualifies as one of the most
volatile periods in our 25 years
of patient investing.”
Dodging Damage
Recessionary fears and protracted subprime induced credit crisis have temporarily spooked investors away from the consumer and financial sectors—core areas where we have significant exposure, deep expertise and
800.292.7435 | arielinvestments.com |
2
strong long-term confidence. Since December 2006, these have been the market’s two worst performing sectors. During the first quarter of this year, financials continued their dismal run with results falling close to the very bottom of the pack across all benchmarks. Although a long-standing bias towards consistent and predictable industries has driven our excellent long-term results, these sector weightings have detracted from recent returns.
“The performance of our
financial stocks... provides a
meaningful reminder that
focus has real benefits.”
The performance of our financial stocks, however, provides a meaningful reminder that focus has real benefits. Although the punishment of the financials has been broad and unrelenting, we have avoided much of the pain by being knowledgeable and choosy. That is, while our 30%+ percentage weightings in financial issuers are similar to the benchmarks’, our performance has been anything but. For example, while the Russell 2500 Value’s financial holdings have plummeted -24.18% since the beginning of last year, Ariel Fund’s financial names are down just -5.02% over the same 15 month period. Similarly, Appreciation’s financial stake is down
- -5.89% since December 2006 while the financial holdings in the Russell Midcap Value Index have tumbled -24.66% over the same period.
Bubble Trouble
Beyond consumer and financials, nearly every nook and cranny of the stock market has taken a beating since the New Year began. And yet the boom and bust commodity sector that we consciously avoid continues to touch new highs. As The New York Times recently noted, “Commodity investors have had a much easier time this year than people who have endured the white-knuckle ride of the stock market.”2 Although the indices may get a boost from their commodity exposure, an ever escalating cost of goods is wreaking havoc on consumers while dampening corporate profits. Globally, commodities ranging from gold to dairy have been on a price trajectory not seen in decades, if ever. Case in point, according to the Wall Street Journal, “Since the start of 2007, wheat futures are up +69%, soybeans have risen +92%, corn is up +49% and rice is up +131% on the Chicago Board of Trade.”3 Sugar is up more than +40% since December alone. And as we write, oil has just topped another record high of $119 a barrel—up +1,000% in a decade. We have seen surges like these before: Internet stocks in the late 1990s, an escalation of housing prices for much of this decade. In other words, just like the aforementioned debacles, we see growing evidence of a commodity bubble. As any child knows all too well, bubbles are fun to watch, but they inevitably burst! The Kiplinger Letter seems to agree noting, “Another bubble will burst soon... Commodities are unsustainably high... way out of whack with supply/demand dynamics. And the day of reckoning is not far off.”4
Now the commodity bulls will argue that global demand, especially in China and India, is causing a secular change that has re-set commodity prices at a permanently high plateau. They say current prices are not only justified but only the beginning of a prolonged, upward march. Our bearish counterargument starts with a basic point, best made by another money manager, Howard Marks, who recently wrote, “...’it’s different this time.’ Those four little words are always heard when the market swings to dangerously high levels...it’s not just a sign of an absurd condition, it is a prerequisite.” Second, let’s look to history as a guide. In an insightful article entitled “Commodities Handle with Care,” Bernstein Wealth Management Research reported, “Over the last 50 years, commodity prices have grown at an average of +2.5% a year, well below the rate of inflation.”5 Contrast this long-term return with recent commodity gains and one has to consider a reversion to the mean. Lastly, let’s not forget the speculators and their hand in the price madness. While everything from weather to war to growing demand can cause commodities to be in short supply, speculators also play an important role in surging prices. For example,
Not Part of the Semi-annual Report | 25 years of patient investing |
3
The Wall Street Journal points out, “...investors have poured roughly $175 to $200 billion into commodity-linked index funds since 2001.”6 Barron’s goes even further saying, “more than half of all bullish bets on commodities have been made by speculators, both big and small... [These] speculators’ bullishness may be way overdone, in the process lifting prices far above fair value.”7
So what might burst this commodities bubble? For one, even the slightest slowdown in the small but rapidly growing Asian economies. As Professor Bob Aliber of University of Chicago notes, “The world is dominated by extrapolators, failed engineers that tend to straight line growth rates.” Next, given that money has chased commodities because nothing else has worked lately, a rally in domestic or international stocks could cause assets to flow out of commodities and thereby deflate prices. Of course, a confirmation that the U.S. economy is in a bona fide recession could do it. Consumers tend to pull back on such news and consumption falls. Indeed, we have already seen U.S. gas usage drop 2% since the beginning of the year. Two percent may not sound like much, but since the U.S. guzzles one quarter of the world’s oil, small changes make a big difference. Longer term, there is the all important profit motive whereby big price movements encourage new players and new inventions that change the whole game.

“...as patient investors we take a
contrary view and are encouraged
by the bevy of newfound
bargains coming to fore.”
Looking Forward
As James Stewart perfectly surmised in the April 2008 edition of SmartMoney magazine, “The mood is gloomy.” Indeed, smaller stocks have had three down quarters in a row for the first time since 1983, but as natural contrarians that leaves us feeling like the worst is behind us. Moreover, with obvious headwinds whip-sawing the market, a palpable undercurrent of fear, at times bordering on panic, has given way to some indiscriminate selling. While some might be unnerved by these price dislocations, as patient investors we take a contrary view and are encouraged by the bevy of newfound bargains coming to fore.
We appreciate the opportunity to serve you and welcome any questions or comments you might have. You can also contact us directly at email@arielinvestments.com.
Sincerely,

| 
|
| |
John W. Rogers, Jr. | Mellody Hobson |
Chairman and CEO | President |
1 | McLean, Bethany. “The Man Who Must Keep Goldman Growing.” Fortune. 5 Mar. 2008. |
2 | Schultz, Abby. “Demand May Give Commodities a Long-Run Edge.” New York Times. 6 Apr. 2008. |
3 | Davis, Ann. “Call Goes Out to Rein In Grain Speculators.” Wall Street Journal. 22 Apr. 2008: A4. |
4 | The Kiplinger Washington Editors Letter. 4 Apr. 2008. |
5 | Bernstein Global Wealth Management. Bernstein Wealth Management Research Report-Commodities: Handle With Care. Sept. 2006. |
6 | Davis, Ann. “Call Goes Out to Rein In Grain Speculators.” Wall Street Journal. 22 Apr. 2008: A4. |
7 | Epstein, Gene. “Commodities: Who’s Behind the Boom?” Barron’s. 31 Mar. 2008. |
800.292.7435 | arielinvestments.com |
4
Patient investing has
a new name:
Ariel Investments

2008 MARKS THE 25TH ANNIVERSARY of Ariel Capital Management. As we enthusiastically anticipate our second quarter century, we have decided to re-brand our firm as clearly and concisely as our time-tested investment strategy. So, rather than using two names—Ariel Mutual Funds, representing the no-load funds we manage, and Ariel Capital Management, representing the institutional money management side of our firm—both aspects of our business will simply be known as Ariel Investments.
While our name is changing, our slow and steady approach remains the same and we continue to serve individuals, institutions and advisors. Unlike Aesop’s timeless fable, we realize the investment race has no finish line and we will continue to work hard on your behalf.

Not Part of the Semi-annual Report | | 25 years of patient investing |
5
| Ariel Fund | Ariel Appreciation Fund | |
| |
Company Spotlight | Ariel Focus Fund |

| Tiffany & Co. (NYSE: TIF) |
727 Fifth Avenue |
NewYork, NY 10022 |
800.843.3269 |
www.tiffany.com |
A Charmed Reputation
Established in 1837 in New York as a stationery and fancy goods purveyor, Tiffany & Co. has transformed itself into an international fine jeweler and specialty retailer. Its offerings include an extensive selection of jewelry, timepieces, sterling silver, china, crystal, fragrances and luxury accessories. From the very beginning, the firm has set itself apart by its relentless commitment to quality, an eye for detail and an incredible track record of innovation. Founder Charles Tiffany masterminded the company’s iconic blue box and launched the first national retail catalogue. The company also played an essential role in the adoption of the metric carat as a standard weight for gems. Lastly, Tiffany established a policy of non-negotiable pricing and has only had two sales in its 171 year history.
Tiffany’s Timelessness
In our view, Tiffany represents the quintessential retailer. The company boasts a number of competitive strengths, most notably its coveted brand. As just one example, a Tiffany diamond connotes an image of flawlessness, beauty and good taste. Beyond its signature items, every detail right down to the Tiffany bow creates a memorable customer experience, and as a result, consumers are willing to pay premium pricing to attain the Tiffany name. Despite concerns over a possible recession and pull-back in consumer spending, we believe the company’s customer base is more resilient than the average consumer. Additionally, an expansive geographic footprint is another strategic advantage—insulating the firm from a weakening U.S. dollar. Ironically, our declining currency has worked to Tiffany’s benefit by attracting an increase in international buyers to the company’s flagship Fifth Avenue store.
Holiday Stress
Tiffany’s share price took a beating early this year due to lighter than expected holiday sales and trimmed 2008 earnings estimates. This news, coupled with recession fears and concerns over a luxury slowdown, caused Tiffany’s stock to drop 26% in January—what we considered an exaggerated punishment. We took advantage of the price dislocation and initiated a position for each of our funds.
A Classic Ariel Holding
We view Tiffany as the crown jewel in the retail space. In fact, it is a name we have owned before, first purchasing shares in 2002 when luxury brands fell out of favor in the wake of the tech wreck. As the economy rebounded, so did Tiffany’s stock price and our discipline led us to sell in August 2003. As patient investors, we are watchful for the right time to own our favorite names again, and January afforded us this opportunity.
As of March 31, 2008, the company traded at $41.84, a compelling 29% discount to our $59 estimate of private market value.
800.292.7435 | arielinvestments.com |
6
Company Spotlight | Ariel Fund | Ariel Appreciation Fund |

| CB Richard Ellis Group, Inc. (NYSE: CBG) |
11150 Santa Monica Boulevard, Suite 1600 |
Los Angeles, CA 90025 |
310.405.8900 |
www.cbre.com |
CB Richard Ellis Group, Inc. is a leading global provider of commercial real estate services with an extensive list of offerings, including tenant representation; property leasing and sales; commercial property and facility management; valuation; and real estate investment management. Notably, it is the largest industry player in terms of revenues. Last year alone, CB Richard Ellis was responsible for $264 billion in real estate transactions and managed nearly two billion square feet of property and corporate facilities worldwide.
Global Strength
The company benefits significantly from its respected brand name and global suite of services. CB Richard Ellis was recognized again this year in the BusinessWeek 50 as a best-in-class business. And, in the Lipsey Company’s annual survey of commercial real estate brands, CB Richard Ellis has held onto the top spot for seven consecutive years—since the award’s inception. The firm’s global footprint is another key strength. CB Richard Ellis is one of only three firms capable of managing multi-national real estate portfolios on a worldwide scale, creating an important moat around its business. Moreover, its sophisticated capabilities have attracted an impressive client list, including 88 of the Fortune 100 companies.
Current Challenges
Unfortunately, chaos in the U.S. housing and credit markets has created panic about the future of companies exposed to real estate. In many cases, investors are taking a “guilty until proven innocent” viewpoint. Undeniably, current softening in CB Richard Ellis’ sales and leasing business will impact its bottom line, yet we believe Wall Street is underestimating the company’s diversification efforts and long-term prospects. Strength in its international operations should offset some weakness in the U.S. market and we see a long runway for growth, particularly in the Asia Pacific region. We are also confident in the strength of the company’s outsourcing services and believe more and more companies will turn to CB Richard Ellis to oversee their large-scale real estate portfolios.
Volatility Creates Opportunity
In response to market fears, we believe the investment community has severely discounted the company’s shares. By mid-January, the stock price was slashed by more than half from its July high. As the saying goes, the early bird gets the worm—and we saw excessive punishment as an opportunity to buy a top-shelf brand at a terrific price point. We have followed the company closely for many years through our ownership of industry peer, Jones Lang LaSalle. From our due diligence, we have faith in the franchise and its experienced management team.
As of March 31, 2008, the company traded at $21.64, a 38% discount to our $35 estimate of intrinsic worth.
Not Part of the Semi-Annual Report | 25 years of patient investing |
7
Company Spotlight | Ariel Focus Fund |

| JPMorgan Chase & Co. (NYSE: JPM) |
270 Park Avenue |
New York, NY 10017 |
212.270.6000 |
www.jpmorgan.com |
A leading diversified financial services firm, JPMorgan Chase & Co. was formed by the consolidation of multiple premier industry players, including J.P. Morgan, Chase Manhattan and Bank One. With a legacy spanning more than 200 years, today, the bank operates globally across six lines of business: investment banking; credit cards; retail banking; commercial banking; wealth management; and treasury and security services. JPMorgan is a formidable leader in many of its businesses—notably, investment banking, loan syndication and high yield debt.
Competitive and Dynamic Leadership
In our view, the bank’s long history of excellence is embodied in Chairman and CEO Jamie Dimon, a tour de force on Wall Street known for his ability to cut costs while simultaneously growing the business. Prior to his current role at JP Morgan Chase, Dimon was CEO of Bank One and the chief architect in the merger with J.P. Morgan. Additionally, he has held senior leadership positions at Citigroup and Salomon Smith Barney. As CEO of JPMorgan Chase, Dimon has done an exceptional job recruiting experienced chief lieutenants, many of whom are considered future CEO candidates in their own right.
Balance Sheet Obsession
In our view, this leadership team is an important reason JPMorgan has outperformed its peers during the ongoing credit crisis. In fact, JPMorgan Chase has emerged relatively unscathed from the sub-prime debacle. While other financial services firms experienced enormous write-downs—from $37 billion to $30 billion—JPMorgan’s losses were significantly smaller at $5 billion. We believe this is a direct correlation to management’s uncompromising standards with respect to balance sheet oversight. Notably, the leadership team meets weekly and the first topic on the agenda is a review of risk in all forms. This storm may not be over and we continue to keep a watchful eye.
On Offense for Opportunity
Its fortress-like balance sheet enabled JPMorgan to acquire Bear Stearns when it faced bankruptcy this March. With excess capital, the bank was able to negotiate a strategic acquisition which includes an unprecedented $30 billion in backing from the Federal Reserve on Bear’s riskier assets. The acquisition not only provides JPMorgan with a prime broker to strengthen its position against other investment banks, but also comes with premier office space in the heart of Manhattan. In our view, not only has JPMorgan adeptly navigated the pitfalls of the credit crisis, but it is emerging an early winner.
As of March 31, 2008, the company traded at $42.95, a compelling 37% discount to our private market value estimate of $68.
800.292.7435 | arielinvestments.com |
8
Ariel Fund Statistical Summary (ARGFX) | (unaudited) |
| | | | | | 52-Week Range | | Earnings per Share | | P/E Calendar | | | |
| | | | | | | | | | 2006 | | 2007 | | 2008 | | 2006 | | 2007 | | 2008 | | Market | |
| | Ticker | | Price | | | | | | Actual | | Actual | | Estimated | | Actual | | Actual | | Estimated | | Cap. | |
Company | | Symbol | | 3/31/08 | | Low | | High | | Calendar | | Calendar | | Calendar | | P/E | | P/E | | P/E | | ($MM) | |
| | | | | | | | | | | | | | | | | | | | | | | |
BearingPoint, Inc. | | BE | | 1.68 | | 1.50 | | 8.00 | | (1.01 | ) | (1.65 | ) | (0.11 | ) | NM | | NM | | NM | | 361 | |
Lee Enterprises, Inc. | | LEE | | 10.01 | | 9.26 | | 30.92 | | 1.90 | | 2.38 | | 2.01 | | 5.3 | | 4.2 | | 5.0 | | 467 | |
ACCO Brands Corp. | | ABD | | 13.57 | | 12.40 | | 26.09 | | 1.00 | | 1.37 | | 1.41 | | 13.6 | | 9.9 | | 9.6 | | 734 | |
McClatchy Co. | | MNI | | 10.70 | | 8.33 | | 34.32 | | 3.13 | | 1.62 | | 1.16 | | 3.4 | | 6.6 | | 9.2 | | 879 | |
Herman Miller, Inc. | | MLHR | | 24.57 | | 23.07 | | 37.56 | | 1.71 | | 2.27 | | 2.29 | | 14.4 | | 10.8 | | 10.7 | | 1,499 | |
Steelcase Inc. | | SCS | | 11.06 | | 11.03 | | 20.72 | | 0.72 | | 0.99 | | 0.95 | | 15.5 | | 11.2 | | 11.6 | | 1,564 | |
Brady Corp. | | BRC | | 33.43 | | 28.00 | | 44.46 | | 2.18 | | 2.47 | | 2.71 | | 15.3 | | 13.5 | | 12.3 | | 1,824 | |
Assured Guaranty Ltd. | | AGO | | 23.74 | | 13.34 | | 31.99 | | 2.12 | | 2.57 | | 2.81 | | 11.2 | | 9.2 | | 8.4 | | 1,898 | |
Sotheby’s | | BID | | 28.91 | | 25.30 | | 61.40 | | 1.73 | | 3.25 | | 2.66 | | 16.7 | | 8.9 | | 10.9 | | 1,924 | |
Jones Lang LaSalle Inc. | | JLL | | 77.34 | | 56.68 | | 124.99 | | 5.16 | | 7.64 | | 6.90 | | 15.0 | | 10.1 | | 11.2 | | 2,069 | |
Anixter International Inc. | | AXE | | 64.04 | | 52.26 | | 88.40 | | 4.23 | | 5.81 | | 6.52 | | 15.1 | | 11.0 | | 9.8 | | 2,327 | |
City National Corp. | | CYN | | 49.46 | | 48.00 | | 78.54 | | 4.66 | | 4.52 | | 3.73 | | 10.6 | | 10.9 | | 13.3 | | 2,366 | |
Bio-Rad Laboratories, Inc. | | BIO | | 88.95 | | 67.53 | | 115.23 | | 3.65 | | 4.19 | | 4.60 | | 24.4 | | 21.2 | | 19.3 | | 2,391 | |
IDEX Corp. | | IEX | | 30.69 | | 25.77 | | 44.99 | | 1.65 | | 1.98 | | 2.20 | | 18.6 | | 15.5 | | 14.0 | | 2,504 | |
HCC Insurance Holdings, Inc. | | HCC | | 22.69 | | 21.26 | | 34.45 | | 2.93 | | 3.38 | | 2.94 | | 7.7 | | 6.7 | | 7.7 | | 2,611 | |
J.M. Smucker Co. | | SJM | | 50.61 | | 42.75 | | 64.32 | | 2.73 | | 3.11 | | 3.38 | | 18.5 | | 16.3 | | 15.0 | | 2,829 | |
USG Corp. | | USG | | 36.82 | | 29.71 | | 52.75 | | 8.85 | | 1.06 | | (0.08 | ) | 4.2 | | 34.7 | | NM | | 3,647 | |
Constellation Brands, Inc. | | STZ | | 17.67 | | 17.21 | | 26.46 | | 1.65 | | 1.50 | | 1.65 | | 10.7 | | 11.8 | | 10.7 | | 3,810 | |
Janus Capital Group Inc. | | JNS | | 23.27 | | 20.76 | | 37.08 | | 0.66 | | 1.10 | | 1.29 | | 35.3 | | 21.2 | | 18.0 | | 3,870 | |
Interpublic Group of Cos., Inc. | | IPG | | 8.41 | | 7.22 | | 13.69 | | (0.19 | ) | 0.26 | | 0.46 | | NM | | 32.3 | | 18.3 | | 3,964 | |
IMS Health Inc. | | RX | | 21.01 | | 20.01 | | 33.12 | | 1.47 | | 1.60 | | 1.77 | | 14.3 | | 13.1 | | 11.9 | | 4,018 | |
Hewitt Associates, Inc. | | HEW | | 39.77 | | 28.42 | | 40.39 | | (0.36 | ) | 1.71 | | 2.16 | | NM | | 23.3 | | 18.4 | | 4,096 | |
Black & Decker Corp. | | BDK | | 66.10 | | 61.71 | | 97.01 | | 6.55 | | 6.03 | | 5.85 | | 10.1 | | 11.0 | | 11.3 | | 4,159 | |
CB Richard Ellis Group, Inc. | | CBG | | 21.64 | | 15.23 | | 42.74 | | 1.46 | | 2.11 | | 1.92 | | 14.8 | | 10.3 | | 11.3 | | 4,363 | |
Markel Corp. | | MKL | | 439.97 | | 394.99 | | 554.95 | | 34.87 | | 36.76 | | 29.94 | | 12.6 | | 12.0 | | 14.7 | | 4,381 | |
Equifax Inc. | | EFX | | 34.48 | | 31.49 | | 46.30 | | 2.01 | | 2.58 | | 2.77 | | 17.2 | | 13.4 | | 12.4 | | 4,472 | |
Mohawk Industries, Inc. | | MHK | | 71.61 | | 63.00 | | 108.00 | | 7.32 | | 7.35 | | 6.85 | | 9.8 | | 9.7 | | 10.5 | | 4,895 | |
Energizer Holdings, Inc. | | ENR | | 90.48 | | 84.68 | | 119.60 | | 4.63 | | 5.74 | | 6.99 | | 19.5 | | 15.8 | | 12.9 | | 5,199 | |
Tiffany & Co. | | TIF | | 41.84 | | 32.84 | | 57.34 | | 1.80 | | 2.17 | | 2.64 | | 23.2 | | 19.3 | | 15.8 | | 5,303 | |
Newell Rubbermaid Inc. | | NWL | | 22.87 | | 21.24 | | 32.19 | | 1.88 | | 1.82 | | 2.00 | | 12.2 | | 12.6 | | 11.4 | | 6,328 | |
Gannett Co., Inc. | | GCI | | 29.05 | | 27.77 | | 61.68 | | 4.90 | | 4.56 | | 4.27 | | 5.9 | | 6.4 | | 6.8 | | 6,687 | |
Royal Caribbean Cruises Ltd. | | RCL | | 32.90 | | 30.22 | | 45.17 | | 2.95 | | 2.82 | | 3.19 | | 11.2 | | 11.7 | | 10.3 | | 6,991 | |
Pitney Bowes Inc. | | PBI | | 35.02 | | 32.64 | | 49.70 | | 2.69 | | 2.72 | | 2.85 | | 13.0 | | 12.9 | | 12.3 | | 7,512 | |
Note: Holdings are as of March 31, 2008. All earnings per share numbers are fully diluted. Such numbers are from continuing operations and are adjusted for non-recurring items. All estimates of future earnings per share shown in this table are prepared by Ariel Investments research analysts as of March 31, 2008 and have not been updated to reflect any subsequent events. P/E ratios are based on earnings stated and March 31, 2008 stock price. NM=Not Meaningful.
Not Part of the Semi-Annual Report | 25 years of patient investing |
9
Ariel Appreciation Fund Statistical Summary (CAAPX) | (unaudited) |
| | | | | | 52-Week Range | | Earnings per Share | | P/E Calendar | | | |
| | | | | | | | | | 2006 | | 2007 | | 2008 | | 2006 | | 2007 | | 2008 | | Market | |
| | Ticker | | Price | | | | | | Actual | | Actual | | Estimated | | Actual | | Actual | | Estimated | | Cap. | |
Company | | Symbol | | 3/31/08 | | Low | | High | | Calendar | | Calendar | | Calendar | | P/E | | P/E | | P/E | | ($MM) | |
| | | | | | | | | | | | | | | | | | | | | | | |
McClatchy Co. | | MNI | | 10.70 | | 8.33 | | 34.32 | | 3.13 | | 1.62 | | 1.16 | | 3.4 | | 6.6 | | 9.2 | | 879 | |
Sotheby’s | | BID | | 28.91 | | 25.30 | | 61.40 | | 1.73 | | 3.25 | | 2.66 | | 16.7 | | 8.9 | | 10.9 | | 1,924 | |
Jones Lang LaSalle Inc. | | JLL | | 77.34 | | 56.68 | | 124.99 | | 5.16 | | 7.64 | | 6.90 | | 15.0 | | 10.1 | | 11.2 | | 2,069 | |
Anixter International Inc. | | AXE | | 64.04 | | 52.26 | | 88.40 | | 4.23 | | 5.81 | | 6.52 | | 15.1 | | 11.0 | | 9.8 | | 2,327 | |
City National Corp. | | CYN | | 49.46 | | 48.00 | | 78.54 | | 4.66 | | 4.52 | | 3.73 | | 10.6 | | 10.9 | | 13.3 | | 2,366 | |
HCC Insurance Holdings, Inc. | | HCC | | 22.69 | | 21.26 | | 34.45 | | 2.93 | | 3.38 | | 2.94 | | 7.7 | | 6.7 | | 7.7 | | 2,611 | |
Constellation Brands, Inc. | | STZ | | 17.67 | | 17.21 | | 26.46 | | 1.65 | | 1.50 | | 1.65 | | 10.7 | | 11.8 | | 10.7 | | 3,810 | |
Janus Capital Group Inc. | | JNS | | 23.27 | | 20.76 | | 37.08 | | 0.66 | | 1.10 | | 1.29 | | 35.3 | | 21.2 | | 18.0 | | 3,870 | |
Interpublic Group of Cos., Inc. | | IPG | | 8.41 | | 7.22 | | 13.69 | | (0.19 | ) | 0.26 | | 0.46 | | NM | | 32.3 | | 18.3 | | 3,964 | |
IMS Health Inc. | | RX | | 21.01 | | 20.01 | | 33.12 | | 1.47 | | 1.60 | | 1.77 | | 14.3 | | 13.1 | | 11.9 | | 4,018 | |
Hewitt Associates, Inc. | | HEW | | 39.77 | | 28.42 | | 40.39 | | (0.36 | ) | 1.71 | | 2.16 | | NM | | 23.3 | | 18.4 | | 4,096 | |
Black & Decker Corp. | | BDK | | 66.10 | | 61.71 | | 97.01 | | 6.55 | | 6.03 | | 5.85 | | 10.1 | | 11.0 | | 11.3 | | 4,159 | |
CB Richard Ellis Group, Inc. | | CBG | | 21.64 | | 15.23 | | 42.74 | | 1.46 | | 2.11 | | 1.92 | | 14.8 | | 10.3 | | 11.3 | | 4,363 | |
Equifax Inc. | | EFX | | 34.48 | | 31.49 | | 46.30 | | 2.01 | | 2.58 | | 2.77 | | 17.2 | | 13.4 | | 12.4 | | 4,472 | |
Dun & Bradstreet Corp. | | DNB | | 81.38 | | 79.02 | | 108.45 | | 3.97 | | 4.70 | | 5.31 | | 20.5 | | 17.3 | | 15.3 | | 4,622 | |
Mohawk Industries, Inc. | | MHK | | 71.61 | | 63.00 | | 108.00 | | 7.32 | | 7.35 | | 6.85 | | 9.8 | | 9.7 | | 10.5 | | 4,895 | |
Energizer Holdings, Inc. | | ENR | | 90.48 | | 84.68 | | 119.60 | | 4.63 | | 5.74 | | 6.99 | | 19.5 | | 15.8 | | 12.9 | | 5,199 | |
Tiffany & Co. | | TIF | | 41.84 | | 32.84 | | 57.34 | | 1.80 | | 2.17 | | 2.64 | | 23.2 | | 19.3 | | 15.8 | | 5,303 | |
Gannett Co., Inc. | | GCI | | 29.05 | | 27.77 | | 61.68 | | 4.90 | | 4.56 | | 4.27 | | 5.9 | | 6.4 | | 6.8 | | 6,687 | |
Pitney Bowes Inc. | | PBI | | 35.02 | | 32.64 | | 49.70 | | 2.69 | | 2.72 | | 2.85 | | 13.0 | | 12.9 | | 12.3 | | 7,512 | |
Clorox Co. | | CLX | | 56.64 | | 55.37 | | 69.36 | | 3.12 | | 3.32 | | 3.49 | | 18.2 | | 17.1 | | 16.2 | | 7,865 | |
Moody’s Corp. | | MCO | | 34.83 | | 31.14 | | 73.69 | | 2.58 | | 2.58 | | 1.81 | | 13.5 | | 13.5 | | 19.2 | | 8,757 | |
T. Rowe Price Group, Inc. | | TROW | | 50.00 | | 43.00 | | 65.46 | | 1.90 | | 2.40 | | 2.49 | | 26.3 | | 20.8 | | 20.1 | | 13,230 | |
Omnicom Group Inc. | | OMC | | 44.18 | | 40.86 | | 55.45 | | 2.57 | | 2.95 | | 3.32 | | 17.2 | | 15.0 | | 13.3 | | 14,270 | |
Northern Trust Corp. | | NTRS | | 66.47 | | 58.73 | | 83.17 | | 3.00 | | 3.24 | | 4.19 | | 22.2 | | 20.5 | | 15.9 | | 14,632 | |
CBS Corp. | | CBS | | 22.08 | | 21.00 | | 35.75 | | 1.80 | | 1.98 | | 2.03 | | 12.3 | | 11.2 | | 10.9 | | 14,836 | |
Yum! Brands, Inc. | | YUM | | 37.21 | | 28.37 | | 40.60 | | 1.46 | | 1.70 | | 1.89 | | 25.5 | | 21.9 | | 19.7 | | 18,568 | |
Accenture Ltd | | ACN | | 35.17 | | 31.91 | | 44.03 | | 1.73 | | 2.17 | | 2.62 | | 20.3 | | 16.2 | | 13.4 | | 20,789 | |
Franklin Resources, Inc. | | BEN | | 96.99 | | 83.27 | | 145.59 | | 5.87 | | 7.15 | | 7.42 | | 16.5 | | 13.6 | | 13.1 | | 23,251 | |
Thermo Fisher Scientific Inc. | | TMO | | 56.84 | | 45.89 | | 62.02 | | 1.90 | | 2.65 | | 3.10 | | 29.9 | | 21.4 | | 18.3 | | 23,602 | |
Illinois Tool Works Inc. | | ITW | | 48.23 | | 45.02 | | 60.00 | | 3.01 | | 3.43 | | 3.64 | | 16.0 | | 14.1 | | 13.3 | | 25,567 | |
Aflac Inc. | | AFL | | 64.95 | | 46.57 | | 67.00 | | 2.85 | | 3.27 | | 3.85 | | 22.8 | | 19.9 | | 16.9 | | 31,600 | |
Carnival Corp. | | CCL | | 40.48 | | 36.10 | | 52.10 | | 2.79 | | 2.98 | | 3.09 | | 14.5 | | 13.6 | | 13.1 | | 31,817 | |
Baxter International Inc. | | BAX | | 57.82 | | 49.30 | | 65.20 | | 2.30 | | 2.86 | | 3.22 | | 25.1 | | 20.2 | | 18.0 | | 36,637 | |
Note: Holdings are as of March 31, 2008. All earnings per share numbers are fully diluted. Such numbers are from continuing operations and are adjusted for non-recurring items. All estimates of future earnings per share shown in this table are prepared by Ariel Investments research analysts as of March 31, 2008 and have not been updated to reflect any subsequent events. P/E ratios are based on earnings stated and March 31, 2008 stock price. NM=Not Meaningful.
800.292.7435 | arielinvestments.com |
10
Ariel Focus Fund Statistical Summary (ARFFX) | (unaudited) |
| | | | | | 52-Week Range | | Earnings per Share | | P/E Calendar | | | |
| | | | | | | | | | 2006 | | 2007 | | 2008 | | 2006 | | 2007 | | 2008 | | Market | |
| | Ticker | | Price | | | | | | Actual | | Actual | | Estimated | | Actual | | Actual | | Estimated | | Cap. | |
Company | | Symbol | | 3/31/08 | | Low | | High | | Calendar | | Calendar | | Calendar | | P/E | | P/E | | P/E | | ($MM) | |
| | | | | | | | | | | | | | | | | | | | | | | |
USG Corp. | | USG | | 36.82 | | 29.71 | | 52.75 | | 8.85 | | 1.06 | | (0.08 | ) | 4.2 | | 34.7 | | NM | | 3,647 | |
IMS Health Inc. | | RX | | 21.01 | | 20.01 | | 33.12 | | 1.47 | | 1.60 | | 1.77 | | 14.3 | | 13.1 | | 11.9 | | 4,018 | |
Hewitt Associates, Inc. | | HEW | | 39.77 | | 28.42 | | 40.39 | | (0.36 | ) | 1.71 | | 2.16 | | NM | | 23.3 | | 18.4 | | 4,096 | |
Black & Decker Corp. | | BDK | | 66.10 | | 61.71 | | 97.01 | | 6.55 | | 6.03 | | 5.85 | | 10.1 | | 11.0 | | 11.3 | | 4,159 | |
Tiffany & Co. | | TIF | | 41.84 | | 32.84 | | 57.34 | | 1.80 | | 2.17 | | 2.64 | | 23.2 | | 19.3 | | 15.8 | | 5,303 | |
Omnicom Group Inc. | | OMC | | 44.18 | | 40.86 | | 55.45 | | 2.57 | | 2.95 | | 3.32 | | 17.2 | | 15.0 | | 13.3 | | 14,270 | |
Accenture Ltd | | ACN | | 35.17 | | 31.91 | | 44.03 | | 1.73 | | 2.17 | | 2.62 | | 20.3 | | 16.2 | | 13.4 | | 20,789 | |
Tyco International Ltd.* | | TYC | | 44.05 | | 31.01 | | 137.92 | | NA | | 2.15 | | 2.84 | | NA | | 20.5 | | 15.5 | | 21,641 | |
Covidien Ltd. | | COV | | 44.25 | | 36.90 | | 49.70 | | 3.17 | | 2.70 | | 2.70 | | 14.0 | | 16.4 | | 16.4 | | 22,049 | |
Illinois Tool Works Inc. | | ITW | | 48.23 | | 45.02 | | 60.00 | | 3.01 | | 3.43 | | 3.64 | | 16.0 | | 14.1 | | 13.3 | | 25,567 | |
Aflac Inc. | | AFL | | 64.95 | | 46.57 | | 67.00 | | 2.85 | | 3.27 | | 3.85 | | 22.8 | | 19.9 | | 16.9 | | 31,600 | |
Carnival Corp. | | CCL | | 40.48 | | 36.10 | | 52.10 | | 2.79 | | 2.98 | | 3.09 | | 14.5 | | 13.6 | | 13.1 | | 31,817 | |
Lowe’s Cos., Inc. | | LOW | | 22.94 | | 19.94 | | 33.19 | | 1.99 | | 1.86 | | 1.59 | | 11.5 | | 12.3 | | 14.4 | | 33,447 | |
Dell Inc. | | DELL | | 19.92 | | 18.87 | | 30.77 | | 1.17 | | 1.30 | | 1.57 | | 17.0 | | 15.3 | | 12.7 | | 41,035 | |
Morgan Stanley | | MS | | 45.70 | | 33.56 | | 90.95 | | 7.09 | | 2.37 | | 5.33 | | 6.4 | | 19.3 | | 8.6 | | 50,512 | |
UBS AG | | UBS | | 28.80 | | 22.19 | | 66.26 | | 4.45 | | (3.23 | ) | (1.03 | ) | 6.5 | | NM | | NM | | 55,052 | |
Walt Disney Co. | | DIS | | 31.38 | | 26.30 | | 36.79 | | 1.69 | | 2.01 | | 2.30 | | 18.6 | | 15.6 | | 13.6 | | 60,595 | |
Citigroup Inc. | | C | | 21.42 | | 17.99 | | 55.55 | | 4.25 | | 0.72 | | 1.09 | | 5.0 | | 29.8 | | 19.7 | | 106,984 | |
JPMorgan Chase & Co. | | JPM | | 42.95 | | 36.01 | | 53.25 | | 3.86 | | 4.38 | | 3.47 | | 11.1 | | 9.8 | | 12.4 | | 144,630 | |
International Business Machines Corp. | | IBM | | 115.14 | | 93.57 | | 121.46 | | 6.23 | | 7.13 | | 8.25 | | 18.5 | | 16.1 | | 14.0 | | 159,496 | |
Toyota Motor Corp. | | TM | | 100.89 | | 91.21 | | 129.19 | | 8.17 | | 10.17 | | 10.30 | | 12.3 | | 9.9 | | 9.8 | | 160,651 | |
Johnson & Johnson | | JNJ | | 64.87 | | 59.72 | | 68.85 | | 3.76 | | 4.35 | | 4.65 | | 17.3 | | 14.9 | | 14.0 | | 184,245 | |
Berkshire Hathaway Inc. | | BRK.B | | 4,472.90 | | 3,538.00 | | 5,059.00 | | 199.86 | | 207.73 | | 202.85 | | 22.4 | | 21.5 | | 22.1 | | 206,503 | |
Note: Holdings are as of March 31, 2008. All earnings per share numbers are fully diluted. Such numbers are from continuing operations and are adjusted for non-recurring items. All estimates of future earnings per share shown in this table are prepared by Ariel Investments research analysts as of March 31, 2008 and have not been updated to reflect any subsequent events. P/E ratios are based on earnings stated and March 31, 2008 stock price. NM=Not Meaningful. NA=Not Applicable.
*On 7/2/07, Tyco International Ltd. divided into three companies (Tyco International, Tyco Electronics and Covidien Ltd.) and completed a 1-for-4 stock split. Therefore, 2006 earnings figures do not exist for the individual segments of the original company.
Not Part of the Semi-Annual Report | 25 years of patient investing |
11
Celebrating 25 years of
patient investing

AT ARIEL INVESTMENTS, WE HAVE LEARNED
that one of life’s greatest lessons also holds
true when investing: slow and steady wins the race.
Just like Aesop’s fabled Tortoise, the symbol
of our firm, we value patience and persistence over the
fleeting and the flashy. More than an adage,
patience sums up our way of evaluating companies,
making investment decisions and even
running our firm.


| | CONTENTS |
| | |
| | Ariel Fund |
16 | | Portfolio Management Discussion |
17 | | Performance Summary |
18 | | Schedule of Investments |
| | |
| | Ariel Appreciation Fund |
20 | | Portfolio Management Discussion |
21 | | Performance Summary |
22 | | Schedule of Investments |
| | |
| | Ariel Focus Fund |
24 | | Portfolio Management Discussion |
25 | | Performance Summary |
26 | | Schedule of Investments |
| | |
28 | | Statements of Assets & Liabilities |
| | |
29 | | Statements of Operations |
| | |
30 | | Statements of Changes in Net Assets |
| | |
32 | | Financial Highlights |
| | |
35 | | Notes to the Financial Statements |
| | |
38 | | Fund Expense Example |
| | |
39 | | Important Supplemental Information |
| | |
42 | | Board of Trustees |
| | |
44 | | Officers |
Ariel Fund Portfolio Management Discussion (ARGFX)

Fund Results
For the quarter ended March 31, 2008, Ariel Fund declined -11.21%. By comparison, the Russell 2500 Value Index retreated -7.22%, while the Russell 2500 Index gave back -9.37%. For the six months ended March 31, 2008, Ariel Fund posted a -17.18% return. Over the same timeframe, the Russell 2500 Value Index declined -13.69%, in line with the - -13.28% loss of the Russell 2500 Index.
Performance Drivers
Over the past six months, two primary factors significantly influenced Ariel Fund’s underperformance. First, we do not invest in energy stocks due to their connection to unpredictable commodities. The only sectors in the Russell 2500 Value Index to post gains during the period were energy-related. Second, investor pessimism was especially negative on the future of corporate spending. Noticeably, a number of our consumer names—like furniture manufacturers Herman Miller and Steelcase along with office products maker Acco Brands—sold off sharply during the period, although they did not report any significant bad news.
During the past two quarters, some of our stocks struggled. Technology consultant BearingPoint tumbled -58.5% largely on CEO Harry You’s December departure, marking the end of the firm’s attempts to shed underperforming businesses. Despite a changing of the guard, we remain convinced that the value of BearingPoint’s government business alone more than justifies its current stock price. Alcohol beverage distributor Constellation Brands shed -27.0%. Fear over consumer belt-tightening is the main cause for the stock’s swoon. From our vantage point, alcohol consumption tends to be fairly stable in all environments and we believe Constellation will benefit from wine’s increasing worldwide popularity.
Over the past six months, HR consulting firm Hewitt Associates rose +13.5%, demonstrating consistent performance since mid-2006. Moreover Hewitt’s first quarter 2008 earnings were almost 50% higher than Wall Street’s consensus estimate and in our view, the Street is not giving Hewitt full credit for its improving results. Commercial real estate firm CB Richard Ellis (featured on page 7) gained +7.9% during the period. In the fourth quarter of 2007, the stock sold off sharply as investors feared anything related to real estate was risky due to the housing crisis. In 2008, however, the market seems to be paying closer attention to the impressive fundamentals that the company continues to show.
Comings & Goings
During the quarter, we purchased shares of Gannett Co., Inc., the country’s largest newspaper company and publisher of USA TODAY. We also added Pitney Bowes Inc., a leading outsourcer of mailroom services along with Tiffany & Co. (featured on page 6). Conversely, we exited H&R Block after the company announced the sale of its mortgage servicing business, which caused a run up in the company’s stock price. We also parted with direct marketing company Harte-Hanks, Inc. on concerns it has lost its niche stronghold, as well as Invacare Corp. on our increased caution about changes in the home medical product industry.
The Patient Investor
Reflecting on the longer time horizon, Ariel Fund posted a +7.22% ten-year average annual total return, just shy of the Russell 2500 Value Index’s +7.86 rise and surpassing the +6.89% rise by the Russell 2500 Index over the same period. We believe the Fund’s long-term performance is driven by our disciplined investment approach, stock selection across industries in which Ariel has experience, and our commitment to investing in quality companies we believe are selling at excellent values.
arielinvestments.com
16
Ariel Fund Performance Summary | | Inception: November 6, 1986 |
ABOUT THE FUND
The no-load Ariel Fund pursues long-term capital appreciation by investing in undervalued companies that show strong potential for growth. The Fund primarily invests in companies with market capitalizations between $1 billion and $5 billion.
COMPOSITION OF EQUITY HOLDINGS
| | Ariel
Fund† | | Russell
2500
Value
Index | | Russell
2500
Index | | S&P
500
Index | |
Financial services | | 30.7 | % | 32.5 | % | 21.0 | % | 17.6 | % |
Consumer discretionary & services | | 28.1 | % | 10.8 | % | 16.2 | % | 11.1 | % |
Producer durables | | 10.3 | % | 5.2 | % | 7.6 | % | 5.0 | % |
Materials & processing | | 9.3 | % | 12.9 | % | 11.7 | % | 4.3 | % |
Consumer staples | | 7.8 | % | 3.6 | % | 2.5 | % | 8.6 | % |
Health care | | 7.7 | % | 4.6 | % | 11.0 | % | 12.0 | % |
Technology | | 6.1 | % | 7.5 | % | 11.2 | % | 13.3 | % |
Utilities | | 0.0 | % | 11.8 | % | 6.3 | % | 7.5 | % |
Other energy | | 0.0 | % | 5.8 | % | 7.3 | % | 5.5 | % |
Autos & transportation | | 0.0 | % | 3.7 | % | 4.0 | % | 2.6 | % |
Other | | 0.0 | % | 1.4 | % | 1.0 | % | 4.8 | % |
Integrated oils | | 0.0 | % | 0.0 | % | 0.1 | % | 7.7 | % |
† Sector weightings are calculated based on equity holdings in the Fund and exclude cash in order to make a relevant comparison to the indexes.
Portfolio Composition
Equity | | 98.2 | % |
Cash, Other Assets & Liabilities | | 1.8 | % |
Expense Ratio
AVERAGE ANNUAL TOTAL RETURNS as of March 31, 2008
| | 1st
Quarter | | 1
Year | | 3
Year | | 5
Year | | 10
Year | | Life
of Fund | |
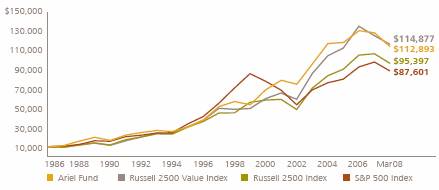
Ariel Fund | | -11.21 | % | -16.03 | % | -0.84 | % | 9.94 | % | 7.22 | % | 11.99 | % |
Russell 2500 Value Index | | -7.22 | % | -16.54 | % | 4.41 | % | 15.56 | % | 7.86 | % | 12.07 | % |
Russell 2500 Index | | -9.37 | % | -11.27 | % | 6.01 | % | 15.67 | % | 6.89 | % | 11.10 | % |
S&P 500 Index | | -9.44 | % | -5.08 | % | 5.85 | % | 11.32 | % | 3.50 | % | 10.66 | % |
Past performance does not guarantee future results.
THE VALUE OF A $10,000 INVESTMENT IN ARIEL FUND
| TOP TEN EQUITY HOLDINGS | | | |
| | | | |
1 | Markel Corp. | | 5.3 | % |
| Specialty insurance provider | | | |
| | | | |
2 | Hewitt Associates, Inc. | | 5.2 | % |
| Human resources outsourcing and consulting firm | | | |
| | | | |
3 | Anixter International Inc. | | 4.9 | % |
| Global distributor of communication products, wire, cable and fasteners | | | |
| | | | |
4 | J.M. Smucker Co. | | 4.3 | % |
| Manufacturer of fruit spreads, peanut butter and other food products | | | |
| | | | |
5 | Brady Corp. | | 4.2 | % |
| Global manufacturer of industrial identification and specialty coated products | | | |
| | | | |
6 | Jones Lang LaSalle Inc. | | 4.0 | % |
| Real estate services and money management firm | | | |
| | | | |
7 | Equifax Inc. | | 4.0 | % |
| Provider of consumer and commercial credit information | | | |
| | | | |
8 | Energizer Holdings, Inc. | | 3.9 | % |
| Consumer battery and razor manufacturer | | | |
| | | | |
9 | IDEX Corp. | | 3.9 | % |
| Industrial product manufacturer | | | |
| | | | |
10 | CB Richard Ellis Group, Inc. | | 3.8 | % |
| Global commercial real estate services company | | | |
Note: All performance assumes the reinvestment of dividends and capital gains. The graph and performance table do not reflect the deduction of taxes that a shareholder would pay on fund distributions or the redemption of fund shares. The Russell 2500® Value Index measures the performance of small and mid-sized, value-oriented companies with lower price-to-earnings ratios. The Russell 2500® Index measures the performance of small and mid-sized companies. The S&P 500 is a broad market-weighted index dominated by blue-chip stocks. All indexes are unmanaged, and an investor cannot invest directly in an index. Total return does
not reflect a maximum 4.75% sales load charged prior to 7/15/94.
800.292.7435
17
Ariel Fund Schedule of Investments
Number of Shares | | COMMON STOCKS—98.17% | | Cost | | Market Value | |
| | | | | | | |
| | Consumer Discretionary & Services—27.60% | | | | | |
1,500,475 | | Black & Decker Corp. | | $ | 121,537,818 | | $ | 99,181,397 | |
1,431,900 | | Gannett Co., Inc. | | 43,037,070 | | 41,596,695 | |
3,742,450 | | Hewitt Associates, Inc., Class A(a) | | 90,780,346 | | 148,837,236 | |
8,178,400 | | Interpublic Group of Cos., Inc.(a) | | 88,115,203 | | 68,780,344 | |
3,753,400 | | Lee Enterprises, Inc. | | 128,523,058 | | 37,571,534 | |
4,962,300 | | McClatchy Co., Class A | | 217,503,439 | | 53,096,610 | |
1,450,900 | | Mohawk Industries, Inc.(a) | | 103,061,829 | | 103,898,949 | |
3,516,300 | | Newell Rubbermaid Inc. | | 89,952,722 | | 80,417,781 | |
3,236,575 | | Royal Caribbean Cruises Ltd. | | 135,809,325 | | 106,483,318 | |
1,297,300 | | Tiffany & Co. | | 49,284,759 | | 54,279,032 | |
| | | | 1,067,605,569 | | 794,142,896 | |
| | Consumer Staples—7.68% | | | | | |
5,577,425 | | Constellation Brands, Inc.(a) | | 120,129,733 | | 98,553,100 | |
2,418,953 | | J.M. Smucker Co. | | 96,648,892 | | 122,423,211 | |
| | | | 216,778,625 | | 220,976,311 | |
| | Financial Services—30.14% | | | | | |
1,172,350 | | Assured Guaranty Ltd. | | 22,080,467 | | 27,831,589 | |
5,103,100 | | CB Richard Ellis Group, Inc.(a) | | 104,626,750 | | 110,431,084 | |
2,132,500 | | City National Corp. | | 154,868,542 | | 105,473,450 | |
3,330,000 | | Equifax Inc. | | 126,918,180 | | 114,818,400 | |
3,938,150 | | HCC Insurance Holdings, Inc. | | 68,404,887 | | 89,356,624 | |
4,085,600 | | Janus Capital Group Inc. | | 50,319,644 | | 95,071,912 | |
1,500,500 | | Jones Lang LaSalle Inc. | | 23,634,203 | | 116,048,670 | |
345,125 | | Markel Corp.(a) | | 73,225,835 | | 151,844,646 | |
1,957,400 | | Sotheby’s | | 66,436,739 | | 56,588,434 | |
| | | | 690,515,247 | | 867,464,809 | |
| | Health Care—7.56% | | | | | |
1,212,300 | | Bio-Rad Laboratories, Inc., Class A(a) | | 74,732,433 | | 107,834,085 | |
5,223,175 | | IMS Health Inc. | | 121,784,313 | | 109,738,907 | |
| | | | 196,516,746 | | 217,572,992 | |
| | Materials & Processing—9.15% | | | | | |
3,615,710 | | Brady Corp., Class A | | 69,842,870 | | 120,873,185 | |
1,253,250 | | Energizer Holdings, Inc.(a) | | 25,864,606 | | 113,394,060 | |
792,500 | | USG Corp.(a) | | 30,982,477 | | 29,179,850 | |
| | | | 126,689,953 | | 263,447,095 | |
| | Producer Durables—10.07% | | | | | |
3,408,000 | | ACCO Brands Corp.(a)(b) | | 76,759,532 | | 46,246,560 | |
1,836,750 | | Herman Miller, Inc. | | 33,636,406 | | 45,128,947 | |
3,661,000 | | IDEX Corp. | | 50,153,152 | | 112,356,090 | |
1,199,900 | | Pitney Bowes Inc. | | 42,186,050 | | 42,020,498 | |
3,988,575 | | Steelcase Inc., Class A | | 47,724,289 | | 44,113,640 | |
| | | | 250,459,429 | | 289,865,735 | |
| | | | | | | | | |
arielinvestments.com
18
March 31, 2008 (unaudited)
Number of Shares | | COMMON STOCKS—98.17% (cont’d) | | Cost | | Market Value | |
| | | | | | | |
| | Technology—5.97% | | | | | |
2,218,775 | | Anixter International Inc.(a)(b) | | $ | 58,438,417 | | $ | 142,090,351 | |
17,620,950 | | BearingPoint, Inc.(a)(b) | | 139,455,233 | | 29,603,196 | |
| | | | 197,893,650 | | 171,693,547 | |
| | | | | | | |
| | Total Common Stocks | | 2,746,459,219 | | 2,825,163,385 | |
| | | | | | | | | |
Principal Amount | | REPURCHASE AGREEMENT—2.11% | | Cost | | Market Value | |
| | | | | | | | | | |
$ | 60,810,118 | | Fixed Income Clearing Corporation, 1.40%, dated 3/31/2008, due 4/1/2008, repurchase price $60,812,482, (collateralized by Federal Home Loan Mortgage Corp., 3.625% due 9/15/2008) | | $ | 60,810,118 | | $ | 60,810,118 | |
| | Total Investments—100.28% | | $ | 2,807,269,337 | | 2,885,973,503 | |
| | Liabilities less Other Assets—(0.28%) | | | | (8,131,080 | ) |
| | NET ASSETS—100% | | | | $ | 2,877,842,423 | |
(a) | Non-income producing. |
(b) | Affiliated company (See Note Five). |
A category may contain multiple industries as defined by the Standard Industrial Classification system.
The accompanying notes are an integral part of the financial statements.
800.292.7435
19
Ariel Appreciation Fund Portfolio Management Discussion (CAAPX)

Fund Results
For the quarter ended March 31, 2008, Ariel Appreciation Fund declined -9.22% edging out the Russell Midcap benchmark’s -9.98% loss but trailing the Russell Midcap Value Index’s -8.64% posting. For the six month period ended March 31, 2008, Ariel Appreciation Fund retreated -14.59%. Its benchmarks fared a bit better—the Russell Midcap Value Index declined -14.09% and the Russell Midcap Index fell -13.17%.
Performance Drivers
Our six month performance was weighed down by a lack of energy-related holdings—the only sectors with positive returns in the Russell Midcap Value Index. There was also general pessimism toward consumer stocks. It is worth noting that solid stock selection was crucial for us, as our heaviest weightings were in two of the hardest hit sectors: consumer discretionary and financial services. The Fund’s holdings in these segments outperformed the Russell Midcap Value benchmark by roughly six percentage points in each sector.
Notably, shares of HR consulting firm Hewitt Associates were up +13.5% during the six month period. Performance has been solid since mid-2006, and the firm’s first quarter 2008 earnings were 50% higher than Wall Street’s consensus estimate. In our view, the Street has yet to fully appreciate the firm’s improving business fundamentals. Supplemental insurer Aflac Inc. gained +14.7% as investors flocked to the conservative financial firm which has a rock-solid balance sheet and highly transparent cash-flows. It also helps that Aflac’s extensive Japanese business counter-balanced weakness in the U.S. economy.
In this tough period, some stocks suffered. IMS Health, the leading pharmaceutical data provider lost -31.3%. Most of that slide occurred on the heels of a bleak third quarter 2007 earnings report. Margins fell, management lowered guidance and earnings disappointed the Street. We too were dissatisfied, but our analysis suggests the company’s business remains intact as drug firms simply need IMS data. USA TODAY publisher Gannett Co. slid -31.9%. The news about newspaper firms remains negative as ad revenues wane from competition of new media platforms and a softening economy. We believe content is king and creators of content will reap rewards on paper and over the Internet. Moreover, Gannett is one of only two publicly traded newspaper companies with an investment grade credit rating, meaning its financial strength is better than its peers.
Comings & Goings
During the quarter, we added fine jeweler Tiffany & Co. (featured on page 6) to the portfolio. Tiffany is a name Ariel admires and has held before. When weak 2007 holiday sales created what we viewed as a temporary price dislocation, we initiated a position once again. Conversely, we sold H&R Block on the announced sale of its mortgage servicing business, which consequently resulted in a run up of the company’s stock. We also parted with USG Corp., a dominant manufacturer of gypsum wallboard, on continued uncertainty regarding an end to the housing downturn.
The Patient Investor
Reflecting on the longer time horizon, Ariel Appreciation Fund posted a +7.05% ten-year average annual total return. By comparison, the Russell Midcap Value Index gained +8.16% and the Russell Midcap Index returned 7.65% over this time horizon. We believe the Fund’s long-term performance is driven by our disciplined investment approach, stock selection across industries in which Ariel has experience, and our commitment to investing in quality companies we believe are selling at excellent values.
arielinvestments.com
20
Ariel Appreciation Fund Performance Summary | | Inception: December 1, 1989 |
ABOUT THE FUND
The no-load Ariel Appreciation Fund pursues long-term capital appreciation by investing in undervalued companies that show strong potential for growth. The Fund primarily invests in companies with market capitalizations between $2.5 billion and $15 billion.
COMPOSITION OF EQUITY HOLDINGS
| | | | Russell | | | | | |
| | Ariel | | Midcap | | Russell | | S&P | |
| | Appreciation | | Value | | Midcap | | 500 | |
| | Fund† | | Index | | Index | | Index | |
Financial services | | 36.7 | % | 29.4 | % | 19.5 | % | 17.6 | % |
Consumer discretionary & services | | 34.3 | % | 9.9 | % | 15.0 | % | 11.1 | % |
Health care | | 11.1 | % | 1.8 | % | 7.4 | % | 12.0 | % |
Consumer staples | | 6.3 | % | 6.4 | % | 4.7 | % | 8.6 | % |
Producer durables | | 5.6 | % | 5.8 | % | 7.5 | % | 5.0 | % |
Materials & processing | | 3.0 | % | 9.6 | % | 9.4 | % | 4.3 | % |
Technology | | 3.0 | % | 5.9 | % | 10.2 | % | 13.3 | % |
Utilities | | 0.0 | % | 16.1 | % | 9.1 | % | 7.5 | % |
Other energy | | 0.0 | % | 6.1 | % | 10.3 | % | 5.5 | % |
Autos & transportation | | 0.0 | % | 3.9 | % | 3.8 | % | 2.6 | % |
Other | | 0.0 | % | 2.7 | % | 1.9 | % | 4.8 | % |
Integrated oils | | 0.0 | % | 2.5 | % | 1.1 | % | 7.7 | % |
† Sector weightings are calculated based on equity holdings in the Fund and exclude cash in order to make a relevant comparison to the indexes.
Portfolio Composition
Equity | | 99.7 | % |
Cash, Other Assets & Liabilities | | 0.3 | % |
Expense Ratio
AVERAGE ANNUAL TOTAL RETURNS as of March 31, 2008
| | 1st | | 1 | | 3 | | 5 | | 10 | | Life | |
| | Quarter | | Year | | Year | | Year | | Year | | of Fund | |
Ariel Appreciation Fund | | -9.22 | % | -12.18 | % | 1.65 | % | 10.25 | % | 7.05 | % | 10.97 | % |
Russell MidCap Value Index | | -8.64 | % | -14.12 | % | 6.56 | % | 16.77 | % | 8.16 | % | 12.35 | % |
Russell MidCap Index | | -9.98 | % | -8.92 | % | 7.36 | % | 16.31 | % | 7.65 | % | 11.95 | % |
S&P 500 Index | | -9.44 | % | -5.08 | % | 5.85 | % | 11.32 | % | 3.50 | % | 9.88 | % |
Past performance does not guarantee future results.
THE VALUE OF A $10,000 INVESTMENT IN ARIEL APPRECIATION FUND

| TOP TEN EQUITY HOLDINGS | | | |
| | | | |
1 | Accenture Ltd | | 4.8 | % |
| Global management consulting, technology services and outsourcing firm | | | |
| | | | |
2 | Thermo Fisher Scientific Inc. | | 3.9 | % |
| Distributor of scientific equipment and instruments | | | |
| | | | |
3 | Equifax Inc. | | 3.9 | % |
| Provider of consumer and commercial credit information | | | |
| | | | |
4 | CBS Corp. | | 3.8 | % |
| Mass media company | | | |
| | | | |
5 | Hewitt Associates, Inc. | | 3.8 | % |
| Human resources outsourcing and consulting firm | | | |
| | | | |
6 | Pitney Bowes Inc. | | 3.7 | % |
| Manufacturer of mailing equipment | | | |
| | | | |
7 | IMS Health Inc. | | 3.7 | % |
| Provider of health care data | | | |
| | | | |
8 | Baxter International Inc. | | 3.5 | % |
| Diversified health care manufacturer | | | |
| | | | |
9 | Northern Trust Corp. | | 3.5 | % |
| Global private wealth and institutional trust company | | | |
| | | | |
10 | Carnival Corp. | | 3.4 | % |
| Worldwide cruise company | | | |
Note: All performance assumes the reinvestment of dividends and capital gains. The graph and performance table do not reflect the deduction of taxes that a shareholder would pay on fund distributions or the redemption of fund shares. The Russell Midcap® Value Index measures the performance of mid-sized, value-oriented companies with lower price-to-earnings ratios. The Russell Midcap® Index measures the performance of mid-sized companies. The S&P 500 is a broad market-weighted index dominated by blue-chip stocks. All indexes are unmanaged, and an investor cannot invest directly in an index. Total return does not reflect a maximum 4.75% sales load charged prior to 7/15/94.
800.292.7435
21
Ariel Appreciation Fund Schedule of Investments
Number of Shares | | COMMON STOCKS—99.73% | | Cost | | Market Value | |
| | | | | | | |
| | Consumer Discretionary & Services—34.21% | | | | | |
2,474,600 | | Accenture Ltd, Class A | | $ | 37,718,556 | | $ | 87,031,682 | |
735,600 | | Black & Decker Corp. | | 27,179,544 | | 48,623,160 | |
1,517,550 | | Carnival Corp. | | 49,723,470 | | 61,430,424 | |
3,143,600 | | CBS Corp., Class B | | 77,462,472 | | 69,410,688 | |
1,935,750 | | Gannett Co., Inc. | | 109,108,067 | | 56,233,538 | |
1,728,100 | | Hewitt Associates, Inc., Class A(a) | | 47,443,870 | | 68,726,537 | |
4,373,475 | | Interpublic Group of Cos., Inc.(a) | | 36,241,351 | | 36,780,925 | |
2,211,000 | | McClatchy Co., Class A | | 98,174,435 | | 23,657,700 | |
675,400 | | Mohawk Industries, Inc.(a) | | 47,701,140 | | 48,365,394 | |
1,137,300 | | Omnicom Group Inc. | | 33,438,172 | | 50,245,914 | |
817,300 | | Tiffany & Co. | | 31,052,750 | | 34,195,832 | |
933,500 | | Yum! Brands, Inc. | | 10,416,470 | | 34,735,535 | |
| | | | 605,660,297 | | 619,437,329 | |
| | Consumer Staples—6.24% | | | | | |
951,672 | | Clorox Co. | | 37,327,203 | | 53,902,702 | |
3,341,200 | | Constellation Brands, Inc.(a) | | 70,862,041 | | 59,039,004 | |
| | | | 108,189,244 | | 112,941,706 | |
| | Financial Services—36.65% | | | | | |
345,400 | | Aß ac Inc. | | 15,462,034 | | 22,433,730 | |
2,766,075 | | CB Richard Ellis Group, Inc.(a) | | 69,023,447 | | 59,857,863 | |
1,204,200 | | City National Corp. | | 86,459,629 | | 59,559,732 | |
698,322 | | Dun & Bradstreet Corp. | | 17,041,841 | | 56,829,444 | |
2,024,000 | | Equifax Inc. | | 46,485,471 | | 69,787,520 | |
537,100 | | Franklin Resources, Inc. | | 20,777,883 | | 52,093,329 | |
1,464,700 | | HCC Insurance Holdings, Inc. | | 44,748,815 | | 33,234,043 | |
2,359,500 | | Janus Capital Group Inc. | | 27,432,245 | | 54,905,565 | |
789,400 | | Jones Lang LaSalle Inc. | | 68,978,776 | | 61,052,196 | |
1,276,800 | | Moody’s Corp. | | 55,578,218 | | 44,470,944 | |
944,000 | | Northern Trust Corp. | | 28,384,032 | | 62,747,680 | |
1,239,700 | | Sotheby’s | | 42,155,856 | | 35,839,727 | |
1,016,800 | | T. Rowe Price Group, Inc. | | 17,478,661 | | 50,840,000 | |
| | | | 540,006,908 | | 663,651,773 | |
| | Healthcare—11.09% | | | | | |
1,092,150 | | Baxter International Inc. | | 22,562,673 | | 63,148,113 | |
3,180,060 | | IMS Health Inc. | | 51,370,367 | | 66,813,061 | |
1,245,354 | | Thermo Fisher Scientific Inc.(a) | | 18,747,995 | | 70,785,921 | |
| | | | 92,681,035 | | 200,747,095 | |
| | Materials & Processing—2.98% | | | | | |
597,500 | | Energizer Holdings, Inc.(a) | | 47,817,008 | | 54,061,800 | |
| | | | | | | |
| | Producer Durables—5.57% | | | | | |
707,800 | | Illinois Tool Works Inc. | | 38,063,057 | | 34,137,194 | |
1,908,075 | | Pitney Bowes Inc. | | 68,185,224 | | 66,820,787 | |
| | | | 106,248,281 | | 100,957,981 | |
| | | | | | | | | |
arielinvestments.com
22
March 31, 2008 (unaudited)
Number of Shares | | COMMON STOCKS—99.73% (cont’d) | | Cost | | Market Value | |
| | | | | | | |
| | Technology—2.99% | | | | | |
844,900 | | Anixter International Inc.(a) | | $ | 53,531,300 | | $ | 54,107,396 | |
| | | | | | | |
| | Total Common Stocks | | 1,554,134,073 | | 1,805,905,080 | |
| | | | | | | | | |
Principal Amount | | REPURCHASE AGREEMENT—0.30% | | Cost | | Market Value | |
| | | | | | | |
$ | 5,467,186 | | Fixed Income Clearing Corporation, 1.40%, dated 3/31/2008, due 4/1/2008, repurchase price $5,467,399, (collateralized by Federal Home Loan Mortgage Corp., 3.625% due 9/15/2008) | | $ | 5,467,186 | | $ | 5,467,186 | |
| | Total Investments—100.03% | | $ | 1,559,601,259 | | 1,811,372,266 | |
| | Liabilities less Other Assets—(0.03%) | | | | (610,346 | ) |
| | NET ASSETS—100% | | | | $ | 1,810,761,920 | |
| | | | | | | | | | |
A category may contain multiple industries as defined by the Standard Industrial Classification system.
The accompanying notes are an integral part of the financial statements.
800.292.7435
23
Ariel Focus Fund Portfolio Management Discussion (ARFFX)

Fund Results
For the three months ended March 31, 2008, Ariel Focus Fund declined -5.01%, surpassing each of its benchmarks. The Russell 1000 Value Index retreated -8.72% and the Russell 1000 Index declined - -9.48%. During the quarter, the S&P 500 Index gave back -9.44%. For the six month period ended March 31, 2008, Ariel Focus Fund posted a -10.14% return, again, better than the -14.01% and
- -12.41% losses of the Russell 1000 Value and the Russell 1000 Indexes and ahead of the S&P 500 Index’s -12.46% decline.
Performance Drivers
Although never pleased when one of our mutual funds posts negative returns, we are satisfied that Ariel Focus Fund provided staunch downside protection compared to its benchmarks over the past two quarters. In some ways, the credit crisis was far more disruptive in the mid- and larger-cap universe than it was for smaller companies. Larger companies tend to invest in interconnected ways in securities related to the mortgages now defaulting, whereas smaller firms in general don’t have the same exposure to these types of complicated investments. A combination of a lighter weighting in the financial services sector than its primary benchmark—the Russell 1000 Value Benchmark—and generally good stock picking within this hard-hit arena drove most of the fund’s six-month outperformance.
The two best-performing stocks over this timeframe have a great deal in common. Insurance giant Berkshire Hathaway gained +13.2%, and supplemental health insurer Aflac Inc. climbed +14.7%. While Berkshire made headlines for starting up a bond insurer and acquiring 60% of conglomerate Marmon Group, Aflac had little surprising news. In both cases, we believe investors were seeking out conservative financial firms with strong balance sheets, steady cash flows and seasoned management—some of the key reasons we also admire these companies. Also notable, Aflac’s extensive Japanese business provided important diversification away from a weakening U.S. economy.
Unfortunately, the portfolio’s two worst performers also had multiple parallels which dragged down results. During the period, Citigroup fell -52.9% while Swiss banking giant UBS lost -45.9%. The credit crisis has been so broad and sweeping that it has been difficult for global financial firms such as Citigroup and UBS to emerge unscathed. Since the credit crisis began, Citigroup has had write-downs of $32 billion and UBS has taken a $37 billion hit. As a result, both have sought out multi-billion dollar capital infusions. Despite negative news, we remain confident in the long-term prospects of Citigroup and UBS. First, we believe most of the bad news is out and reflected in the stock prices, and at this point we see additional downside risk as minimal. Second, and even more important, we are confident that both Citigroup and UBS will survive and recover. Each has sizeable assets, established global brands and wide- ranging diversification.
Comings & Goings
During the quarter, we initiated a position in fine jeweler Tiffany & Co. (featured on page 6), as well as media and entertainment icon Walt Disney Co. after its stock traded down on falling consumer confidence and lower discretionary spending. We sold our stake in Home Depot and bought Lowe’s Cos., Inc., another home improvement retailer with higher margins and what we believe offers shareholders a brighter long-term outlook. Additionally, we sold our stake in Constellation Brands, a leading producer and distributor of alcohol beverages, to pursue other investment ideas, although we continue to hold Constellation in Ariel Fund and Ariel Appreciation Fund. Finally, we parted with tax preparation giant H&R Block after management announced the sale of its mortgage business, resulting in a nice run up in its stock price.
arielinvestments.com
24
Ariel Focus Fund Performance Summary | | Inception: June 30, 2005 |
ABOUT THE FUND
The no-load Ariel Focus Fund pursues long-term capital appreciation by investing in undervalued companies that show strong potential for growth. The Fund primarily invests in companies with market capitalizations in excess of $10 billion. Ariel Focus Fund is a non-diversified fund and generally will hold 20 securities.
COMPOSITION OF EQUITY HOLDINGS |
| | | | Russell | | | | | |
| | Ariel | | 1000 | | Russell | | S&P | |
| | Focus | | Value | | 1000 | | 500 | |
| | Fund† | | Index | | Index | | Index | |
Consumer discretionary & services | | 30.3 | % | 7.0 | % | 11.8 | % | 11.1 | % |
Financial services | | 17.9 | % | 28.0 | % | 17.8 | % | 17.6 | % |
Health care | | 15.2 | % | 7.6 | % | 11.8 | % | 12.0 | % |
Technology | | 12.2 | % | 3.4 | % | 12.9 | % | 13.3 | % |
Other | | 11.2 | % | 6.6 | % | 4.5 | % | 4.8 | % |
Autos & transportation | | 6.9 | % | 1.6 | % | 2.5 | % | 2.6 | % |
Producer durables | | 3.2 | % | 3.2 | % | 5.2 | % | 5.0 | % |
Materials & processing | | 3.1 | % | 5.4 | % | 5.2 | % | 4.3 | % |
Utilities | | 0.0 | % | 13.1 | % | 7.4 | % | 7.5 | % |
Integrated oils | | 0.0 | % | 12.9 | % | 6.9 | % | 7.7 | % |
Consumer staples | | 0.0 | % | 7.1 | % | 7.9 | % | 8.6 | % |
Other energy | | 0.0 | % | 3.9 | % | 6.0 | % | 5.5 | % |
† Sector weightings are calculated based on equity holdings in the Fund and exclude cash in order to make a relevant comparison to the indexes.
Portfolio Composition | | | |
| | | |
Equity | | 97.3 | % |
Cash, Other Assets & Liabilities | | 2.7 | % |
| | | |
Expense Ratio | | | |
| | | |
Net | | 1.25 | %* |
Gross | | 1.63 | %* |
*As of 9/30/07 Ariel Investments, the Adviser to the Funds, is contractually obligated to waive fees and reimburse expenses in order to limit Ariel Focus Fund’s total annual operating expenses to 1.25% of net assets through the end of the fiscal year ending September 30, 2009. After that date, there is no assurance that such expenses will be limited.
AVERAGE ANNUAL TOTAL RETURNS as of March 31, 2008
| | 1st | | 1 | | Life | |
| | Quarter | | Year | | of Fund | |
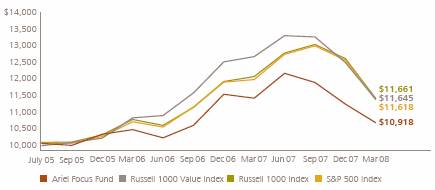
Ariel Focus Fund | | -5.01 | % | -6.45 | % | 3.24 | % |
Russell 1000 Value Index | | -8.72 | % | -9.99 | % | 5.68 | % |
Russell 1000 index | | -9.48 | % | -5.40 | % | 5.73 | % |
S&P 500 Index | | -9.44 | % | -5.08 | % | 5.59 | % |
Past performance does not guarantee future results.
THE VALUE OF A $10,000 INVESTMENT IN ARIEL FOCUS FUND
| | TOP TEN EQUITY HOLDINGS | | |
| | | | |
1 | | Berkshire Hathaway Inc. | | 7.4% |
| | Global insurance and investment firm | | |
| | | | |
2 | | International Business Machines Corp. | | 7.2% |
| | Worldwide provider of computer products and services | | |
| | | | |
3 | | Toyota Motor Corp. | | 6.7% |
| | Global auto manufacturer | | |
| | | | |
4 | | IMS Health Inc. | | 5.2% |
| | Provider of health care data | | |
| | | | |
5 | | Johnson & Johnson | | 5.1% |
| | Diversified health care and consumer products company | | |
| | | | |
6 | | Accenture Ltd | | 4.8% |
| | Global management consulting, technology services and outsourcing firm | | |
| | | | |
7 | | Dell Inc. | | 4.7% |
| | Global computer and technology provider | | |
| | | | |
8 | | JPMorgan Chase & Co. | | 4.4% |
| | Global financial services firm | | |
| | | | |
9 | | Aflac Inc. | | 4.4% |
| | Global insurance provider | | |
| | | | |
10 | | Covidien Ltd. | | 4.4% |
| | Global healthcare products company | | |
Note: All performance assumes the reinvestment of dividends and capital gains. The graph and performance table do not reflect the deduction of taxes that a shareholder would pay on fund distributions or the redemption of fund shares. The Russell 1000® Value Index measures the performance of large-sized, value-oriented companies with lower price-to-earnings ratios. The Russell 1000® Index measures the performance of large-sized companies. The S&P 500 is a broad market-weighted index dominated by blue-chip stocks. All indexes are unmanaged, and an investor cannot invest directly in an index. Ariel Focus Fund is a non-diversified fund and therefore may be subject to greater volatility than a more diversified investment.
800.292.7435
25
Ariel Focus Fund Schedule of Investments
Number of Shares | | COMMON STOCKS—97.32% | | Cost | | Market Value | |
| | | | | | | |
| | Autos & Transportation—6.71% | | | | | |
26,900 | | Toyota Motor Corp., ADR | | $ | 2,793,369 | | $ | 2,713,941 | |
| | | | | | | |
| | Consumer Discretionary & Services—29.55% | | | | | |
55,000 | | Accenture Ltd, Class A | | 1,554,494 | | 1,934,350 | |
21,500 | | Black & Decker Corp. | | 1,838,786 | | 1,421,150 | |
43,800 | | Carnival Corp. | | 2,106,185 | | 1,773,024 | |
36,500 | | Hewitt Associates, Inc., Class A(a) | | 931,694 | | 1,451,605 | |
53,200 | | Lowe’s Cos., Inc. | | 1,305,723 | | 1,220,408 | |
37,400 | | Omnicom Group Inc. | | 1,733,937 | | 1,652,332 | |
30,900 | | Tiffany & Co. | | 1,137,950 | | 1,292,856 | |
38,700 | | Walt Disney Co. | | 1,081,589 | | 1,214,406 | |
| | | | 11,690,358 | | 11,960,131 | |
| | Financial Services—17.41% | | | | | |
27,500 | | Aflac Inc. | | 1,236,588 | | 1,786,125 | |
53,700 | | Citigroup Inc. | | 2,271,066 | | 1,150,254 | |
41,600 | | JPMorgan Chase & Co. | | 1,745,710 | | 1,786,720 | |
25,400 | | Morgan Stanley | | 1,255,628 | | 1,160,780 | |
40,400 | | UBS AG | | 2,427,899 | | 1,163,520 | |
| | | | 8,936,891 | | 7,047,399 | |
| | Health Care—14.77% | | | | | |
40,275 | | Covidien Ltd. | | 1,492,310 | | 1,782,168 | |
100,500 | | IMS Health Inc. | | 2,388,710 | | 2,111,505 | |
32,100 | | Johnson & Johnson | | 2,013,337 | | 2,082,327 | |
| | | | 5,894,357 | | 5,976,000 | |
| | Materials & Processing—2.98% | | | | | |
32,800 | | USG Corp.(a) | | 1,498,433 | | 1,207,696 | |
| | | | | | | |
| | Other—10.87% | | | | | |
671 | | Berkshire Hathaway Inc., Class B (a) | | 2,178,823 | | 3,001,316 | |
31,775 | | Tyco International Ltd. | | 1,316,147 | | 1,399,689 | |
| | | | 3,494,970 | | 4,401,005 | |
| | Producer Durables—3.16% | | | | | |
26,500 | | Illinois Tool Works Inc. | | 1,394,764 | | 1,278,095 | |
| | | | | | | | | |
arielinvestments.com
26
March 31, 2008 (unaudited)
Number of Shares | | COMMON STOCKS—97.32% | | Cost | | Market Value | |
| | | | | | | |
| | Technology—11.87% | | | | | |
95,000 | | Dell Inc.(a) | | $ | 2,305,224 | | $ | 1,892,400 | |
25,300 | | International Business Machines Corp. | | 2,048,580 | | 2,913,042 | |
| | | | 4,353,804 | | 4,805,442 | |
| | Total Common Stocks | | 40,056,946 | | 39,389,709 | |
| | | | | | | |
Principal Amount | | REPURCHASE AGREEMENT—2.51% | | Cost | | Market Value | |
$ | 1,015,344 | | Fixed Income Clearing Corporation, 1.40%, dated 3/31/2008, due 4/1/2008, repurchase price $1.015,383, (collateralized by Federal Home Loan Mortgage Corp., 3.625% due 9/15/2008) | | $ | 1,015,344 | | $ | 1,015,344 | |
| | Total Investments—99.83% | | $ | 41,072,290 | | 40,405,053 | |
| | Other Assets less Liabilities—0.17% | | | | 66,940 | |
| | NET ASSETS—100% | | | | $ | 40,471,993 | |
| | | | | | | | | | |
A category may contain multiple industries as defined by the Standard Industrial Classification system.
The accompanying notes are an integral part of the financial statements.
800.292.7435
27
Statements of Assets & Liabilities | March 31, 2008 (unaudited) |
| | Ariel
Fund | | Ariel
Appreciation
Fund | | Ariel
Focus
Fund | |
Assets: | | | | | | | |
Investments in unaffiliated issuers, at value
(cost $2,471,806,037, $1,554,134,073 and $40,056,946, respectively) | | $ | 2,607,223,278 | | $ | 1,805,905,080 | | $ | 39,389,709 | |
Investments in affiliated issuers, at value
(cost $274,653,182) | | 217,940,107 | | — | | — | |
Repurchase agreements, at value
(cost $60,810,118, $5,467,186 and $1,015,344, respectively) | | 60,810,118 | | 5,467,186 | | 1,015,344 | |
Receivable for fund shares sold | | 2,069,969 | | 1,441,832 | | 109,181 | |
Receivable for securities sold | | 6,751,341 | | — | | — | |
Dividends and interest receivable | | 3,374,061 | | 3,314,663 | | 39,569 | |
Prepaid and other assets | | 79,887 | | 43,433 | | 12,676 | |
Total assets | | 2,898,248,761 | | 1,816,172,194 | | 40,566,479 | |
| | | | | | | |
Liabilities: | | | | | | | |
Payable for securities purchased | | 4,152,835 | | — | | — | |
Payable for fund shares redeemed | | 14,092,859 | | 4,119,801 | | 84,408 | |
Other liabilities | | 2,160,644 | | 1,290,473 | | 10,078 | |
Total liabilities | | 20,406,338 | | 5,410,274 | | 94,486 | |
Net Assets | | $ | 2,877,842,423 | | $ | 1,810,761,920 | | $ | 40,471,993 | |
| | | | | | | |
Net Assets Consist of: | | | | | | | |
Paid-in capital | | $ | 2,795,551,239 | | $ | 1,455,673,957 | | $ | 41,384,718 | |
Undistributed net investment income | | 9,593 | | 1,100,164 | | 26,677 | |
Accumulated net realized gain (loss) on investment transactions | | 3,577,425 | | 102,216,792 | | (272,165 | ) |
Net unrealized appreciation (depreciation) on investments | | 78,704,166 | | 251,771,007 | | (667,237 | ) |
Total net assets | | $ | 2,877,842,423 | | $ | 1,810,761,920 | | $ | 40,471,993 | |
| | | | | | | |
Total net assets | | $ | 2,877,842,423 | | $ | 1,810,761,920 | | $ | 40,471,993 | |
| | | | | | | |
Shares outstanding (no par value) | | 69,873,117 | | 46,322,941 | | 3,880,226 | |
| | | | | | | |
Net asset value, offering and redemption price per share | | $ | 41.19 | | $ | 39.09 | | $ | 10.43 | |
The accompanying notes are an integral part of the financial statements.
arielinvestments.com
28
Statement of Operations | Six Months Ended March 31, 2008 (unaudited) |
| | Ariel
Fund | | Ariel
Appreciation
Fund | | Ariel
Focus
Fund | |
Investment Income: | | | | | | | |
Dividends | | | | | | | |
Unaffiliated Issuers | | $ | 25,766,385 | | $ | 16,369,511 | | $ | 326,523 | (a) |
Affiliated Issuers | | 1,344,071 | (b) | — | | — | |
Interest | | 273,758 | | 75,056 | | 23,200 | |
Total investment income | | 27,384,214 | | 16,444,567 | | 349,723 | |
| | | | | | | |
Expenses: | | | | | | | |
Management fees | | 9,621,300 | | 7,243,291 | | 156,363 | |
Distribution fees | | 4,202,864 | | 2,641,650 | | 52,121 | |
Shareholder service fees | | 2,730,034 | | 1,440,468 | | 11,561 | |
Transfer agent fees and expenses | | 716,629 | | 489,224 | | 28,438 | |
Printing and postage expenses | | 449,659 | | 306,883 | | 5,486 | |
Trustees’ fees and expenses | | 151,965 | | 109,958 | | 32,580 | |
Custody fees and expenses | | 175,671 | | 316,441 | | 1,269 | |
Professional fees | | 82,165 | | 62,632 | | 21,601 | |
Federal and state registration fees | | 29,078 | | 21,576 | | 10,502 | |
Miscellaneous expenses | | 91,668 | | 60,820 | | 3,605 | |
Total expenses before reimbursements | | 18,251,033 | | 12,692,943 | | 323,526 | |
Expense reimbursements | | — | | — | | (62,863 | ) |
Net expenses | | 18,251,033 | | 12,692,943 | | 260,663 | |
Net investment income | | 9,133,181 | | 3,751,624 | | 89,060 | |
| | | | | | | |
Realized and unrealized gain (loss): | | | | | | | |
Net realized gain (loss) on investments and foreign currency translations | | | | | | | |
Unaffiliated Issuers | | (36,588,225 | ) | 131,395,690 | | (210,210 | ) |
Affiliated Issuers | | 49,822,313 | | — | | — | |
Change in net unrealized depreciation on investments and foreign currency translations | | (658,678,413 | ) | (469,289,536 | ) | (4,412,262 | ) |
Net loss on investments | | (645,444,325 | ) | (337,893,846 | ) | (4,662,472 | ) |
Net decrease in net assets resulting from operations | | $ | (636,311,144 | ) | $ | (334,142,222 | ) | $ | (4,533,412 | ) |
(a) | Net of $1,912 in foreign tax withheld. |
(b) | See Note Five for information on affiliated issuers. |
The accompanying notes are an integral part of the financial statements.
800.292.7435
29
Statements of Changes in Net Assets
| | Ariel Fund | | Ariel Appreciation Fund | |
| | Six Months Ended
March 31, 2008
(unaudited) | | Year Ended
September 30, 2007 | | Six Months Ended
March 31, 2008
(unaudited) | | Year Ended
September 30, 2007 | |
Operations: | | | | | | | | | |
Net investment income | | $ | 9,133,181 | | $ | 1,891,797 | | $ | 3,751,624 | | $ | 8,834,075 | |
Net realized gain on investments and foreign currency translations | | 13,234,088 | | 314,487,706 | | 131,395,690 | | 185,959,112 | |
Change in net unrealized appreciation/
depreciation on investments and foreign currency translations | | (658,678,413 | ) | 161,698,054 | | (469,289,536 | ) | 125,580,243 | |
Net increase (decrease) in net assets from operations | | (636,311,144 | ) | 478,077,557 | | (334,142,222 | ) | 320,373,430 | |
| | | | | | | | | |
Distributions to shareholders: | | | | | | | | | |
Net investment income | | (11,015,385 | ) | — | | (11,483,580 | ) | (1,232,376 | ) |
Capital gains | | (318,392,871 | ) | (269,304,352 | ) | (209,771,457 | ) | (189,484,532 | ) |
Total distributions | | (329,408,256 | ) | (269,304,352 | ) | (221,255,037 | ) | (190,716,908 | ) |
| | | | | | | | | |
Share transactions: | | | | | | | | | |
Shares sold | | 309,392,246 | | 698,765,802 | | 121,306,930 | | 367,297,911 | |
Shares issued to holders in reinvestment of dividends | | 283,871,455 | | 236,050,404 | | 212,808,158 | | 183,697,049 | |
Shares redeemed | | (724,748,168 | ) | (1,449,508,007 | ) | (420,630,156 | ) | (960,173,632 | ) |
Net decrease from share transactions | | (131,484,467 | ) | (514,691,801 | ) | (86,515,068 | ) | (409,178,672 | ) |
| | | | | | | | | |
Total decrease in net assets | | (1,097,203,867 | ) | (305,918,596 | ) | (641,912,327 | ) | (279,522,150 | ) |
| | | | | | | | | |
Net Assets: | | | | | | | | | |
Beginning of year | | 3,975,046,290 | | 4,280,964,886 | | 2,452,674,247 | | 2,732,196,397 | |
End of period | | $ | 2,877,842,423 | | $ | 3,975,046,290 | | $ | 1,810,761,920 | | $ | 2,452,674,247 | |
Undistributed net investment income included in net assets at end of period | | $ | 9,593 | | $ | 1,891,797 | | $ | 1,100,164 | | $ | 8,832,848 | |
| | | | | | | | | |
Capital share transactions: | | | | | | | | | |
Shares sold | | 6,842,888 | | 12,774,043 | | 2,792,779 | | 7,312,403 | |
Shares reinvested | | 5,953,093 | | 4,608,559 | | 4,821,806 | | 3,820,391 | |
Shares redeemed | | (15,720,556 | ) | (26,914,002 | ) | (9,711,336 | ) | (19,096,650 | ) |
Net decrease in shares outstanding | | (2,924,575 | ) | (9,531,400 | ) | (2,096,751 | ) | (7,963,856 | ) |
The accompanying notes are an integral part of the financial statements.
arielinvestments.com
30
March 31, 2008 (unaudited)
| | Ariel Focus Fund | |
| | Six Months Ended
March 31, 2008
(unaudited) | | Year Ended
September 30, 2007 | |
Operations: | | | | | |
Net investment income | | $ | 89,060 | | $ | 164,678 | |
Net realized gain (loss) on investments and foreign currency translations | | (210,210 | ) | 950,199 | |
Change in net unrealized appreciation/depreciation on investments and foreign currency translations | | (4,412,262 | ) | 2,626,393 | |
Net increase (decrease) in net assets from operations | | (4,533,412 | ) | 3,741,270 | |
| | | | | |
Distributions to shareholders: | | | | | |
Net investment income | | (157,966 | ) | (137,420 | ) |
Capital gains | | (971,843 | ) | — | |
Total distributions | | (1,129,809 | ) | (137,420 | ) |
| | | | | |
Share transactions: | | | | | |
Shares sold | | 5,559,026 | | 13,692,371 | |
Shares issued to holders in reinvestment of dividends | | 973,907 | | 134,532 | |
Shares redeemed | | (3,672,466 | ) | (3,149,419 | ) |
Net increase from share transactions | | 2,860,467 | | 10,677,484 | |
| | | | | |
Total increase (decrease) in net assets | | (2,802,754 | ) | 14,281,334 | |
| | | | | |
Net Assets: | | | | | |
Beginning of year | | 43,274,747 | | 28,993,413 | |
End of period | | $ | 40,471,993 | | $ | 43,274,747 | |
Undistributed net investment income included in net assets at end of period | | $ | 26,677 | | $ | 95,583 | |
| | | | | |
Capital share transactions: | | | | | |
Shares sold | | 505,438 | | 1,173,710 | |
Shares reinvested | | 87,771 | | 11,588 | |
Shares redeemed | | (339,919 | ) | (270,256 | ) |
Net increase from shares outstanding | | 253,290 | | 915,042 | |
The accompanying notes are an integral part of the financial statements.
800.292.7435
31
Financial Highlights For a share outstanding throughout each period
| | Six Months
Ended
March 31, 2008 | | Year Ended September 30 | |
Ariel Fund | | (unaudited) | | 2007 | | 2006 | | 2005 | | 2004 | | 2003 | |
Net asset value, beginning of year | | $ | 54.60 | | $ | 52.00 | | $ | 54.55 | | $ | 50.62 | | $ | 40.84 | | $ | 35.18 | |
Income from investment operations: | | | | | | | | | | | | | |
Net investment income (loss) | | 0.12 | | 0.03 | | 0.09 | | 0.04 | | 0.02 | | (0.02 | ) |
Net realized and unrealized gains (losses) on investments | | (8.88 | ) | 5.97 | | 0.99 | | 5.70 | | 9.76 | | 6.20 | |
Total from investment operations | | (8.76 | ) | 6.00 | | 1.08 | | 5.74 | | 9.78 | | 6.18 | |
| | | | | | | | | | | | | |
Distributions to shareholders: | | | | | | | | | | | | | |
Dividends from net investment income | | (0.15 | ) | — | | (0.15 | ) | (0.02 | ) | — | | — | |
Distributions from capital gains | | (4.50 | ) | (3.40 | ) | (3.48 | ) | (1.79 | ) | — | | (0.52 | ) |
Total distributions | | (4.65 | ) | (3.40 | ) | (3.63 | ) | (1.81 | ) | — | | (0.52 | ) |
Net asset value, end of period | | $ | 41.19 | | $ | 54.60 | | $ | 52.00 | | $ | 54.55 | | $ | 50.62 | | $ | 40.84 | |
Total return | | (17.18 | )%(a) | 11.97 | % | 2.16 | % | 11.54 | % | 23.95 | % | 17.82 | % |
Supplemental data and ratios: | | | | | | | | | | | | | |
Net assets, end of period, in thousands | | $ | 2,877,842 | | $ | 3,975,046 | | $ | 4,280,965 | | $ | 5,017,851 | | $ | 3,387,346 | | $ | 2,007,868 | |
Ratio of expenses to average net assets | | 1.09 | %(b) | 1.03 | % | 1.07 | % | 1.03 | % | 1.07 | % | 1.10 | % |
Ratio of net investment income (loss) to average net assets | | 0.54 | %(b) | 0.05 | % | 0.19 | % | 0.08 | % | 0.06 | % | (0.05 | )% |
Portfolio turnover rate | | 10 | %(a) | 25 | % | 28 | % | 19 | % | 16 | % | 4 | % |
(a) | Not annualized. |
(b) | Annualized. |
The accompanying notes are an integral part of the financial statements.
arielinvestments.com
32
March 31, 2008 (unaudited)
| | Six Months
Ended
March 31, 2008 | | Year Ended September 30 | |
Ariel Appreciation Fund | | (unaudited) | | 2007 | | 2006 | | 2005 | | 2004 | | 2003 | |
Net asset value, beginning of year | | $ | 50.65 | | $ | 48.46 | | $ | 48.32 | | $ | 44.62 | | $ | 38.99 | | $ | 31.49 | |
Income from investment operations: | | | | | | | | | | | | | |
Net investment income (loss) | | 0.07 | | 0.18 | | 0.12 | | 0.09 | | 0.01 | | (0.02 | ) |
Net realized and unrealized gains (losses) on investments | | (6.94 | ) | 5.49 | | 2.35 | | 4.86 | | 5.62 | | 7.64 | |
Total from investment operations | | (6.87 | ) | 5.67 | | 2.47 | | 4.95 | | 5.63 | | 7.62 | |
| | | | | | | | | | | | | |
Distributions to shareholders: | | | | | | | | | | | | | |
Dividends from net investment income | | (0.23 | ) | (0.02 | ) | (0.13 | ) | (0.05 | ) | — | | — | |
Distributions from capital gains | | (4.46 | ) | (3.46 | ) | (2.20 | ) | (1.20 | ) | — | | (0.12 | ) |
Total distributions | | (4.69 | ) | (3.48 | ) | (2.33 | ) | (1.25 | ) | — | | (0.12 | ) |
Net asset value, end of period | | $ | 39.09 | | $ | 50.65 | | $ | 48.46 | | $ | 48.32 | | $ | 44.62 | | $ | 38.99 | |
Total return | | (14.59 | )%(a) | 12.09 | % | 5.32 | % | 11.26 | % | 14.44 | % | 24.29 | % |
Supplemental data and ratios: | | | | | | | | | | | | | |
Net assets, end of period, in thousands | | $ | 1,810,762 | | $ | 2,452,674 | | $ | 2,732,196 | | $ | 3,353,103 | | $ | 2,919,117 | | $ | 2,064,883 | |
Ratio of expenses to average net assets, including reimbursements | | 1.20 | %(b) | 1.12 | % | 1.16 | % | 1.14 | % | 1.15 | %(c) | 1.20 | % |
Ratio of net investment income (loss) to average net assets | | 0.36 | %(b) | 0.33 | % | 0.27 | % | 0.17 | % | 0.01 | % | (0.06 | )% |
Portfolio turnover rate | | 14 | %(a) | 29 | % | 25 | % | 25 | % | 19 | % | 32 | % |
(a) | Not annualized. |
(b) | Annualized. |
(c) | Ratio of expenses to average net assets, excluding reimbursements, was 1.16% in 2004. |
The accompanying notes are an integral part of the financial statements.
800.292.7435
33
Financial Highlights (continued) | March 31, 2008 (unaudited) |
| | Six Months
Ended
March 31, 2008 | | Year Ended September 30 | | June 30, 2005(a)
to September | |
Ariel Focus Fund | | (unaudited) | | 2007 | | 2006 | | 30, 2005 | |
Net asset value, beginning of year | | $ | 11.93 | | $ | 10.69 | | $ | 10.23 | | $ | 10.00 | |
Income from investment operations: | | | | | | | | | |
Net investment income | | 0.02 | | 0.05 | | 0.04 | | 0.01 | |
Net realized and unrealized gains (losses) on investments | | (1.21 | ) | 1.24 | | 0.56 | | 0.22 | |
Total from investment operations | | (1.19 | ) | 1.29 | | 0.60 | | 0.23 | |
| | | | | | | | | |
Distributions to shareholders: | | | | | | | | | |
Dividends from net investment income | | (0.04 | ) | (0.05 | ) | (0.03 | ) | — | |
Distributions from capital gains | | (0.27 | ) | — | | (0.11 | ) | — | |
Total distributions | | (0.31 | ) | (0.05 | ) | (0.14 | ) | — | |
Net asset value, end of period | | $ | 10.43 | | $ | 11.93 | | $ | 10.69 | | $ | 10.23 | |
Total return | | (10.14 | )%(b) | 12.05 | % | 6.00 | % | 2.30 | %(b) |
Supplemental data and ratios: | | | | | | | | | |
Net assets, end of period, in thousands | | $ | 40,472 | | $ | 43,275 | | $ | 28,993 | | $ | 10,815 | % |
Ratio of expenses to average net assets, including waivers | | 1.25 | %(c) | 1.25 | % | 1.25 | % | 1.25 | %(c) |
Ratio of expenses to average net assets, excluding waivers | | 1.55 | %(c) | 1.63 | % | 2.20 | % | 2.55 | %(c) |
Ratio of net investment income to average net assets, including waivers | | 0.43 | %(c) | 0.43 | % | 0.48 | % | 0.41 | %(c) |
Ratio of net investment income (loss) to average net assets, excluding waivers | | 0.13 | %(c) | 0.05 | % | (0.47 | )% | (0.89 | )%(c) |
Portfolio turnover rate | | 22 | %(b) | 28 | % | 29 | % | 15 | %(b) |
(a) | Commencement of operations. |
(b) | Not annualized. |
(c) | Annualized. |
The accompanying notes are an integral part of the financial statements.
arielinvestments.com
34
Notes to the Financial Statements | | March 31, 2008 (unaudited) |
Note One | Organization
Ariel Investment Trust (the “Trust”) is a Massachusetts business trust registered under the Investment Company Act of 1940, as amended (the “1940 Act”), as an open-end management investment company. Ariel Fund, Ariel Appreciation Fund and Ariel Focus Fund (the “Funds”) are series of the Trust. Ariel Fund and Ariel Appreciation Fund are diversified portfolios and Ariel Focus Fund is a non-diversified portfolio of the Trust.
Note Two | Significant accounting policies
The following is a summary of significant accounting policies consistently followed by the Funds in the preparation of their financial statements. The financial statements have been prepared in accordance with accounting principles generally accepted in the United States, which require management to make certain estimates and assumptions at the date of the financial statements. Actual results may differ from such estimates.
In the normal course of business, the Trust enters into contracts that contain a variety of representations and warranties that may provide certain indemnifications. The maximum exposure under these arrangements is unknown, as this would involve future claims that may be made against the Trust and/or its affiliates that have not yet occurred. Based on experience, however, the risk of loss is expected to be remote.
In September 2006, FASB issued Statement of Financial Accounting Standards No. 157, Fair Value Measurements (“FAS 157”), which is effective for fiscal years beginning after November 15, 2007. FAS 157 defines fair value, establishes a framework for measuring fair value and expands financial statement disclosures about fair value measurements. Management is currently evaluating the impact of adopting FAS 157.
Investment valuation — Securities for which market quotations are readily available are valued at the last sale price on the national securities exchange on which such securities are primarily traded and, in the case of securities reported on the Nasdaq system, are valued based on the Nasdaq Official Closing Price. If a closing price is not reported, equity securities for which reliable bid and ask quotations are available are valued at the mean between bid and ask prices.
Debt obligations having a maturity of 60 days or less are valued at amortized cost, which approximates market value. Debt securities with maturities over 60 days are valued at the yield equivalent as obtained from a pricing service or one or more market makers for such securities. Securities and assets for which market quotations are not readily available are valued at fair value as determined in good faith by or under the direction of the Board of Trustees.
Foreign transactions — The books and records of the Funds are maintained in U.S. dollars and transactions denominated in foreign currencies are recorded in the Funds’ records at the rate prevailing when earned or recorded. Asset and liability accounts that are denominated in foreign currencies are adjusted to reflect current exchange rates. The effect of changes in foreign exchange rates on realized and unrealized security gains or losses is reflected as a component of such gains or losses. The Funds do not isolate that portion of the results of operations arising as a result of changes in the foreign exchange rates from the changes in market prices of the securities.
Repurchase agreements — The Funds may enter into repurchase agreements with recognized financial institutions and in all instances hold underlying securities as collateral with a value at least equal to the total repurchase price such financial institutions have agreed to pay.
Federal taxes — It is the Funds’ policy to comply with the requirements of the Internal Revenue Code applicable to regulated investment companies and to distribute substantially all taxable income to shareholders. Accordingly, no provision for federal income or excise taxes has been made.
800.292.7435
35
Notes to the Financial Statements (continued)
Securities transactions and investment income — Securities transactions are accounted for on a trade date basis. Realized gains and losses from securities transactions are recorded on the identified cost basis. Dividend income is recorded on the ex-dividend date and interest income is recognized on an accrual basis. Premiums and discounts on securities purchased are amortized using the effective interest method.
Expenses — The Funds contract and are charged for those expenses that are directly attributable to each Fund. Expenses that are not directly attributable to one or more Funds are allocated among applicable Funds on an equitable and consistent basis considering such things as the nature and type of expense and the relative net assets of the Funds. Various third party firms provide shareholder recordkeeping, communications and other services to beneficial owners of shares of the Funds. The fees incurred under these arrangements are reported as “Shareholder service fees” in the Statements of Operations.
Distributions to shareholders — Dividends from net investment income and net realized capital gains, if any, are declared and paid at least annually.
Distributions to shareholders are determined in accordance with federal income tax regulations and are recorded on the ex-dividend date. The character of distributions made during the year from net investment income or net realized capital gains may differ from the characterization for federal income tax purposes due to differences in the recognition of income, expense or gain items for financial statement and tax purposes. Where appropriate, reclassifications between net asset accounts are made at the end of the fiscal year for such differences that are permanent in nature
Note Three | Investment transactions, distributions and federal income tax matters
Purchases and proceeds from sales of securities, excluding short-term investments and U.S. government securities, for the six months ended March 31, 2008 were as follows:
| | Ariel Fund | | Ariel Appreciation Fund | | Ariel Focus Fund | |
Purchases | | $ | 349,449,666 | | $ | 299,624,277 | | $ | 10,663,328 | |
Sales | | 818,907,124 | | 600,095,486 | | 8,909,479 | |
| | | | | | | | | | |
Note Four | Investment advisory and other transactions with related parties
Ariel Investments, LLC (the “Adviser”) provides investment advisory and administrative services to each Fund of the Trust under an agreement (the “Management Agreement”). Pursuant to the Management Agreement, the Adviser is paid a monthly fee on average daily net assets at the annual rates shown below:
Management Fees | | Ariel Fund | | Ariel Appreciation Fund | | Ariel Focus Fund | |
Average Daily Net Assets | | | | | | | |
First $500 million | | 0.65 | % | 0.75 | % | 0.75 | % |
Next $500 million | | 0.60 | % | 0.70 | % | 0.70 | % |
Over $1 billion | | 0.55 | % | 0.65 | % | 0.65 | % |
arielinvestments.com
36
March 31, 2008 (unaudited)
The Adviser has contractually agreed to reimburse Ariel Fund and Ariel Appreciation Fund to the extent their respective total annual operating expenses (exclusive of brokerage, interest, taxes, distribution plan expenses and extraordinary items) exceed 1.50% of the first $30 million and 1.00% of their respective average daily net assets in excess of $30 million. The Adviser is contractually committed to waive fees or reimburse expenses in order to limit Ariel Focus Fund’s total annual operating expenses to 1.25% of its average daily net assets through September 30, 2009. After that date, there is no assurance that such expenses will be limited.
Ariel Distributors, LLC is the Funds’ distributor and principal underwriter (“the Distributor”). The Trust has adopted a plan of distribution under Rule 12b-1 of the 1940 Act applicable to the Funds. Under the plan, 12b-1 distribution fees up to an annual rate of 0.25% of average daily net assets are paid weekly to the Distributor for its services. Distribution fee expenses totaled $4,202,864 for Ariel Fund, $2,641,650 for Ariel Appreciation Fund and $52,121 for Ariel Focus Fund during the six months ended March 31, 2008. These amounts were paid to the Distributor, which reallowed $3,180,516 for Ariel Fund, $2,057,801 for Ariel Appreciation Fund and $20,007 for Ariel Focus Fund to broker dealers who distribute fund shares. The remaining amounts were retained by the Distributor for its services, advertising, and other distribution expenses.
Trustees’ fees and expenses represent only those expenses of disinterested (independent) trustees of the Funds.
Note Five | Transactions with affiliated companies
If a Fund’s holding represents ownership of 5% or more of the voting securities of a company, the company is deemed to be an affiliate as defined in the 1940 Act. Ariel Fund had the following transactions during the six months ended March 31, 2008 with affiliated companies:
| | Share Activity | | Six Months Ended March 31, 2008 | |
| | | | | | | | | | | | | | Amount of Gain | |
| | Balance | | | | | | Balance | | Balance | | Dividends | | (Loss) Realized | |
| | September 30, | | | | | | March 31, | | March 31, | | Credited to | | on Sale of | |
Security Name | | 2007 | | Purchases | | Sales | | 2008 | | 2008 | | Income | | Shares | |
| | | | | | | | | | | | | | | |
ACCO Brands Corp. | | 3,380,000 | | 28,000 | | — | | 3,408,000 | | $ | 46,246,560 | | $ | — | | $ | — | |
Anixter International Inc. | | 2,218,775 | | — | | — | | 2,218,775 | | 142,090,351 | | — | | — | |
Assured Guaranty Ltd.* | | 5,440,950 | | 440,400 | | 4,709,000 | | 1,172,350 | | * | | 332,459 | | 3,856,949 | |
BearingPoint, Inc. | | 17,554,450 | | 66,500 | | — | | 17,620,950 | | 29,603,196 | | — | | — | |
Hewitt Associates, Inc.* | | 6,660,350 | | — | | 2,917,900 | | 3,742,450 | | * | | — | | 29,846,646 | |
IDEX Corp.* | | 4,562,700 | | — | | 901,700 | | 3,661,000 | | * | | 1,011,612 | | 16,118,718 | |
| | | | | | | | | | $ | 217,940,107 | | $ | 1,344,071 | | $ | 49,822,313 | |
*No longer an affiliated company as of March 31, 2008.
Hewitt Associates provides record-keeping services for employer-sponsored plans invested in the Funds and receives shareholder service fees accordingly. An affiliate of Hewitt Associates, Hewitt Financial Services distributes Fund shares and receives 12b-1 fees from Ariel Distributors, LLC.
800.292.7435
37
Fund Expense Example | | (unaudited) |
Example
As a shareholder of the Funds, you incur ongoing costs, including management fees, distribution and service (12b-1) fees; and other Fund expenses. The Funds currently do not charge any transaction costs, such as sales charges (loads) on purchase payments, reinvested dividends or other distributions, redemption fees or exchange fees. The following example is intended to help you understand your ongoing costs (in dollars) of investing in each of the Funds and to compare these costs with the ongoing costs of investing in other mutual funds. Please note that IRA, 403(b) and Coverdell ESA account holders are charged an annual $15 recordkeeping fee or a one-time, lifetime $60 fee. If these fees were included in either the Actual Expense or Hypothetical Example below, your costs would be higher.
The example is based on an investment of $1,000 invested at the beginning of the period and held for the entire period of October 1, 2007 to March 31, 2008.
Actual expenses
The first line of the table below for each Fund provides information about actual account values and actual expenses for that particular Fund. You may use the information in each of these lines, together with the amount you invested, to estimate the expenses that you paid over the period in each Fund. Simply divide your account value by $1,000 (for example, an $8,600 account value divided by $1,000=8.6), then multiply the result by the number in the first line under the heading, entitled Expenses Paid During Period, to estimate the expenses you paid on your account during this period in each Fund.
Hypothetical example for comparison purposes
The second line of the table below for each Fund provides information about hypothetical account values and hypothetical expenses based on each of the Fund’s actual expense ratio and an assumed rate of return of 5% per year before expenses, which is not the actual return. The hypothetical account values and expenses may not be used to estimate the actual ending account balance or expenses you paid for the period. You may use this information to compare the ongoing costs of investing in each of the Funds to other funds. To do so, compare this 5% hypothetical example with the 5% hypothetical examples that appear in the shareholder reports of other funds.
Please note that the expenses shown in the table are meant to highlight only your ongoing costs in each of the Funds. Therefore, the second line of the table for each Fund is useful in comparing ongoing costs only, and will not help you determine the relative total costs of owning different funds.
| | Beginning
Account Value | | Ending
Account Value | | Expenses
Paid During | | Annualized | |
Fund and Return | | October 1, 2007 | | March 31, 2008 | | Period* | | Expense Ratio* | |
| | | | | | | | | |
Ariel Fund | | | | | | | | | |
Actual | | $ | 1,000.00 | | $ | 828.20 | | $ | 4.98 | | 1.09 | % |
Hypothetical (5% before expenses) | | 1,000.00 | | 1,019.55 | | 5.50 | | 1.09 | % |
| | | | | | | | | |
Ariel Appreciation Fund | | | | | | | | | |
Actual | | $ | 1,000.00 | | $ | 854.10 | | $ | 5.56 | | 1.20 | % |
Hypothetical (5% before expenses) | | 1,000.00 | | 1,019.00 | | 6.06 | | 1.20 | % |
| | | | | | | | | |
Ariel Focus Fund | | | | | | | | | |
Actual | | $ | 1,000.00 | | $ | 898.60 | | $ | 5.93 | | 1.25 | % |
Hypothetical (5% before expenses) | | 1,000.00 | | 1,081.75 | | 6.31 | | 1.25 | % |
* | Expenses are equal to each Fund’s annualized expense ratio indicated above multiplied by the average account value over the period, multiplied by 183/366 to reflect the most recent fiscal half year. |
arielinvestments.com
38
Important Supplemental Information | | March 31, 2008 (unaudited) |
Proxy Voting Policies, Procedures, and Record
Both a description of the policies and procedures that the Funds used to determine how to vote proxies relating to portfolio securities and information regarding how the Funds voted proxies relating to portfolio securities during the most recent 12-month period ended June 30 are available upon request by calling us at 800.292.7435. Such information for the Funds is also available on the Securities and Exchange Commission’s (“SEC”) website at www.sec.gov.
Shareholder Statements and Reports
When we send financial reports, prospectuses and other regulatory materials to shareholders, we attempt to reduce the volume of mail you receive by sending one copy of these documents to two or more account holders who share the same address. We will send you a notice at least 60 days before sending only one copy of these documents if we have not received written consent from you previously. Should you wish to receive individual copies of materials, please contact us at 800.292.7435 Once we have received your instructions, we will begin sending individual copies for each account within 30 days.
Availability of Quarterly Portfolio Schedule
The Funds file complete schedules of investments with the SEC for the quarters ended December 31 and June 30 of each fiscal year on Form N-Q which are available on the SEC’s website at www.sec.gov. Additionally, the Funds’ Form N-Q may be reviewed and copied at the SEC’s Public Reference Room in Washington, DC. For information on the Public Reference Room, call 800.SEC.0330.
All Ariel quarterly reports contain a complete schedule of portfolio holdings. All quarterly reports are made available to shareholders on our website at arielinvestments.com. Shareholders also may obtain copies of shareholder reports upon request by contacting us directly at 800.292.7435 or by writing to us at P.O. Box 701, Milwaukee, Wisconsin 53201-0701.
Approval of the Management Agreements
Each year the Board of Trustees of the Trust, including a majority of the independent Trustees, is required by the Investment Company Act of 1940 (the “1940 Act”) to determine whether to continue each Fund’s management agreement with the Adviser (each a “Management Agreement”). The Board requests, receives and considers a broad range of materials and information that are relevant to the Trustees’ consideration of the Management Agreements, at Board meetings throughout the year and especially in connection with its annual review of those agreements. The Board’s Management Contracts Committee (the “Committee”), which is comprised entirely of Trustees who are not “interested persons” of the Funds, as defined in the 1940 Act (“Independent Trustees”), leads the Board in its consideration of the Management Agreements.
Both the Committee and the Board held meetings in the fall of 2007 to consider the Management Agreements. During each of those meetings, the Committee and the Independent Trustees were advised by, and met in executive sessions with, their independent legal counsel. The Committee and the Board considered, among other things: (i) the nature, quality and extent of the Adviser’s services; (ii) the investment performance of each Fund, as well as performance information for comparable funds; (iii) the fees and other expenses paid by each Fund, as well as expense information for comparable funds; (iv) arrangements for the distribution of the Funds’ shares; (v) the allocation of the Funds’ brokerage and use of soft commission dollars; (vi) the profitability to the Adviser of its relationship with each Fund; (vii) whether economies of scale may be realized as each Fund grows and whether the management fee rates provide for a sharing with the Fund of economies of scale; and (viii) other benefits to the Adviser from its relationship with the Funds.
At a meeting held on November 15, 2007, the Board, including a majority of the Independent Trustees, upon recommendation of the Committee, determined that the continuation of the Management Agreement for each Fund was in the best interests of the Fund and its shareholders, and approved the continuation of each Management Agreement. The Board’s determinations were based upon a comprehensive consideration of all information provided to it, including both quantitative measures and qualitative factors, and were not the result of any single factor.
800.292.7435
39
Important Supplemental Information (continued)
Nature, Quality and Extent of Services.
The Trustees considered the nature, quality and extent of the services provided by the Adviser, taking into account the knowledge gained from their successive meetings with the Adviser over a period of years. In addition, the Trustees considered the Adviser’s long-term history of care and conscientiousness in the management of the Funds; its consistency of investment approach; the background and experience of the Adviser’s investment personnel responsible for managing the Funds; the Adviser’s performance as administrator of the Funds, including, among other things, in the areas of brokerage selection, trade execution, compliance, educational materials and other shareholder communications, information technology and business continuity; the Adviser’s commitment to diversity and civic affairs; and the favorable recognition of the Adviser and the Funds in the media and in industry publications. They also considered information regarding the structure of the Adviser’s compensation program for portfolio managers and certain other employees and the relationship of that compensation to the performance of the Funds and to the attraction and retention of quality personnel. The Independent Trustees also noted the significant personal investments that the Adviser’s personnel have made in the Funds, which further aligns the interests of the Adviser and its personnel with those of the Funds’ shareholders. The Board concluded that the nature, quality and extent of the services provided by the Adviser to each Fund were appropriate and consistent with the Fund’s Management Agreement and that each Fund was likely to benefit from a continuation of the services provided under its Management Agreement.
Investment Performance. The Trustees considered the investment performance of each Fund over various periods of time, including comparative information provided by Lipper Inc., an independent data service provider (“Lipper”), comparing each Fund’s performance with that of comparable funds selected by Lipper (the “Performance Universe”). The Trustees also considered each Fund’s performance relative to that of its benchmark and other comparative data provided by Lipper, including total returns, volatility and performance consistency, placing greater emphasis on longer-term periods. The Trustees noted that the performance of both Ariel Fund and Ariel Appreciation Fund over ten years and over a full investment cycle compared favorably to that of its Performance Universe, although its shorter-term performance was relatively weak. However, the shorter-term underperformance of those Funds and of Ariel Focus Fund (which commenced operations in June 2005) was consistent with the investment strategy and approach for the Funds that the Adviser had articulated to the Trustees and shareholders, recognizing that the Adviser has underweighted or avoided certain sectors that have performed better in more recent periods. Additionally, the Trustees found that the risk profile of each Fund is lower than that of its peer group. Consequently, each Fund’s performance may be expected to lag that of the peer group during rising stock markets but to exceed that of the group during declining markets.
Costs of Services Provided and Profits Realized by the Adviser. Using information provided by Lipper, the Trustees evaluated each Fund’s management fee compared to the management fees paid by other mutual funds similar in investment strategy, asset size and character (“the Expense Group”) and each Fund’s expense ratio compared to the expense ratios of the Expense Group. The Trustees noted that the rates of management fees paid by each Fund compare favorably to the median fee rates for the Fund’s Expense Group. The Trustees also reviewed the Adviser’s advisory fees for its institutional separate accounts and for its subadvised funds (for which the Adviser provides portfolio management services only). They noted that, although the Adviser tends to charge higher rates of fees to the Funds than to those other clients, the differences in large part reflect the Adviser’s significantly greater level of responsibilities and broader scope of services regarding the Funds, and the more extensive regulatory obligations and risks associated with managing the Funds. The Trustees also considered the Adviser’s costs in serving as each Fund’s investment adviser and administrator, including costs associated with technology, infrastructure and compliance necessary to manage the Funds effectively. The Trustees reviewed the Adviser’s methodology for allocating costs among its lines of business and among
arielinvestments.com
40
March 31, 2008 (unaudited)
the Funds. Finally, the Trustees reviewed the Adviser’s financial condition and the pre-tax profits realized by the Adviser from its relationship with each Fund. Based on the materials provided to them, the Trustees concluded that the management fees paid by each Fund to the Adviser were reasonable in relation to the nature and quality of the services provided and that the fees charged to the Fund were neither excessive nor so low that the Adviser could not be expected to continue to effectively service the Fund. They also observed that the Adviser’s profitability regarding each of Ariel Fund and Ariel Appreciation Fund was within an acceptable range, while the Adviser was currently subsidizing the Focus Fund due to its small asset size. The Board determined that the total expenses of each Fund, including the management fees, as a percentage of net assets were reasonable in relation to the expense ratios of comparable mutual funds.
Economies of Scale. The Trustees considered the extent to which economies of scale were being realized or would be realized by the Funds as their assets increase. They noted that the fee schedule in the Management Agreement for each Fund provides breakpoints that decrease the rate of fee at various asset levels as net assets increase and that both Ariel Fund and Ariel Appreciation Fund have net assets that have allowed them to realize lower fee rates.
The Trustees concluded that the advisory fee schedules provide an appropriate sharing between the Funds and the Adviser of such economies of scale as may exist in the management of the Funds at current asset levels, and determined that no additional breakpoints were needed at the present time.
Other Benefits to the Adviser. The Trustees also reviewed the other benefits that the Adviser and its affiliated distributor receive from their relationship with the Funds. They noted that the distributor’s expenses in distributing shares of the Funds exceed the distributor’s revenues for providing distribution services. The Trustees also considered the Adviser’s use of a portion of the commissions paid by the Funds and other clients of the Adviser on their portfolio brokerage transactions to obtain research products and services and concluded that the Adviser’s use of commission dollars to purchase research products and services was consistent with regulatory requirements and beneficial to the Funds.
After full consideration of the above factors, as well as other factors that were instructive in evaluating the Management Agreements, the Board, including a majority of the Independent Trustees, concluded that continuation of each Fund’s Management Agreement was in the best interests of the Fund and its shareholders and the Board approved the continuation of each of those agreements.
800.292.7435
41
Board of Trustees
Name and age | | Position(s) held
with Fund | | Term of office and length
of time served | | Principal occupation(s)
during past 5 years | | Other directorships |
| | | | | | | | |
Mario L. Baeza, Esq.
Age: 57 | | Trustee, Member of Management Contracts and Governance Committees | | Indefinite, until successor
elected Served as a Trustee
since 1995 | | Chairman and CEO, The Baeza Group, LLC and Baeza & Co., LLC (Hispanic-owned investment firms) since 1995; Founder and Executive Chairman, V-Me Media, Inc. (Spanish-language television network) since 2007. Chairman, TCW/ Latin America Partners, LLC (private equity capital firm), 1996–2006 (CEO 1996–2003) | | Air Products and Chemicals, Inc., Brown Shoe Company, Inc., Israel Discount Bank, UrbanAmerica LLC, Hispanic Federation Inc., NYC Latin Media and Entertainment Commission, Upper Manhattan Empowerment Zone |
| | | | | | | | |
James W. Compton
Age: 69 | | Trustee, Chairman of Governance Committee, Member of Audit Committee | | Indefinite, until successor
elected Served as a Trustee
since 1997 | | Retired President and CEO, Chicago Urban League (non-profit, civil rights and community-based organization), 1978 to 2006 | | Seaway National Bank of Chicago, Commonwealth Edison Company, The Field Museum, DePaul University, The Big Shoulders Fund |
| | | | | | | | |
William C. Dietrich
Age: 58 | | Trustee, Chairman of Audit Committee, Member of Executive Committee | | Indefinite, until successor
elected Served as a Trustee
since 1986 | | Executive Director, Shalem Institute for Spiritual Formation, Inc. (ecumenical educational institute), since 2001 (Co-Executive Director 2001–2006) | | Scottish Widows Investment Partnership Trust, Global Emerging Markets Fund |
| | | | | | | | |
Royce N. Flippin, Jr.
Age: 73 | | Lead Independent Trustee, Member of Management Contracts and Governance Committees, Chairman of Executive Committee | | Indefinite, until successor
elected Served as a Trustee
since 1986 and Lead
Independent Trustee
since 2006 | | President, Flippin Associates (consulting firm) since 1992 | | Technical Career Institute, NYC, TerraCycle, Inc., Independent Directors Council of the Investment Company Institute, Princeton Club of New York |
| | | | | | | | |
John G. Guffey, Jr.
Age: 59 | | Trustee, Member of Management Contracts and Audit Committees | | Indefinite, until successor
elected Served as a Trustee
since 1986 | | President, Aurora Press, Inc. (publisher of trade paperback books) since 2003; Treasurer and Director, Silby, Guffey and Co., Inc. (venture capital firm), 1988 to 2003 | | Calvert Social Investment Foundation, Calvert Group of Funds, except for Calvert Variable Series |
| | | | | | | | |
Mellody L. Hobson
Age: 38 | | Chairman of the Board of Trustees and President, Member of Executive Committee | | Indefinite, until successor
elected Served as a Trustee since
1993, President since 2002 and Chairman since 2006. | | President, Ariel Investments since 2000 | | DreamWorks Animation SKG, Inc., The Estée Lauder Companies Inc., Starbucks Corporation, Sundance Institute, Chicago Public Education Fund, Chicago Public Library, The Field Museum, Investment Company Institute (Board of Governors) |
arielinvestments.com
42
Name and age | | Position(s) held
with Fund | | Term of office and length
of time served | | Principal occupation(s)
during past 5 years | | Other directorships |
| | | | | | | | |
Christopher G. Kennedy
Age: 44 | | Trustee, Member of Audit and Governance Committees | | Indefinite, until successor
elected Served as a Trustee
since 1995 | | President, Merchandise Mart Properties, Inc. (real estate management firm) since 2000; Executive Officer, Vornado Realty Trust (publicly traded real estate investment trust) since 2000 | | Interface Inc., Rehabilitation Institute of Chicago, Catholic Theological Union |
| | | | | | | | |
Merrillyn J. Kosier
Age: 48 | | Trustee and Vice President | | Indefinite, until successor
elected Served as a Trustee
since 2003 and Vice
President since 1999 | | Executive Vice President, Ariel Investments since 1999, Chief Marketing Officer, Mutual Funds since 2007 | | Loyola University Advisory Board and Council of Regents, Chair of Mutual Fund Education Alliance, Harris Theater for Music and Dance, Lupus Foundation of America, Inc. |
| | | | | | | | |
William M. Lewis, Jr.
Age: 51 | | Trustee, Member of Management Contracts Committee | | Indefinite, until successor
elected Served as a Trustee
since 2007 | | Managing Director and Co-Chairman of Investment Banking, Lazard Ltd. since 2004; Managing Director and Co-Head of the Global Banking Department, Morgan Stanley, 1999 to 2004 | | Freddie Mac, Darden Restaurants, Inc., NAACP Legal Defense Fund, Phillips Academy, The Cancer Research Institute, Carnegie Endowment for International Peace |
| | | | | | | | |
H. Carl McCall
Age: 72 | | Trustee, Member of Audit and Governance Committees | | Indefinite, until successor
elected Served as a Trustee
since 2006 | | Principal, Convent Capital, LLC (financial advisory firm) since 2004; Comptroller of the State of New York, 1993 to 2002 | | Tyco International Ltd. |
| | | | | | | | |
John W. Rogers, Jr.
Age: 50 | | Trustee | | Indefinite, until successor
elected Served as a Trustee
1986 to 1993 and
since 2000 | | Founder, Chairman, CEO and Chief Investment Officer, Ariel Investments, Lead Portfolio Manager, Ariel Fund & Ariel Appreciation Fund | | Aon Corporation, Exelon Corporation, McDonald’s Corporation, Chicago Urban League, John S. and James L. Knight Foundation |
| | | | | | | | |
James M. Williams
Age: 60 | | Trustee, Chairman of Management Contracts Committee | | Indefinite, until successor
elected Served as a Trustee
since 2006 | | Vice President and Chief Investment Officer, J. Paul Getty Trust, since 2002; President, Harbor Capital Advisors and Harbor Mutual Funds, 2000 to 2002 | | SEI Mutual Funds |
| | | | | | | | |
CHAIRMAN EMERITUS
Bert N. Mitchell, CPA
Age: 69 | | Chairman Emeritus of the Board of Trustees (has no trustee duties or responsibilities) | | Served as a Trustee
from 1986 to 2006 and
Independent Chairman
from 1995 to 2006 | | Chairman and CEO, Mitchell & Titus, LLP (certified public accounting firm) since 1974 | | Seedco (Structured Employment Economic Development Corporation) |
Note: Number of portfolios in complex overseen by all Trustees is three. Address for all Trustees is 200 East Randolph Dr., Suite 2900, Chicago, IL 60601
800.292.7435
43
Officers
Name and age | | Position(s) held
with Fund | | Term of office and length
of time served | | Principal occupation(s)
during past 5 years | | Other directorships
held by officer |
| | | | | | | | |
Thomas E. Herman, CPA
Age: 46 | | Chief Financial Officer and Treasurer | | Indefinite, until successor elected Served as Chief Financial
Officer and Treasurer
since 2005 | | Chief Financial Officer and Treasurer since 2006; Senior Vice President, Finance, 2005 to 2006; Vice President, Controller, 2004 to 2005, Ariel Investments; Regional Financial Manager, Otis Elevator Company, 1999 to 2004 | | Chicago Children’s Theatre, Community Health Charities of Illinois |
| | | | | | | | |
Mellody L. Hobson
Age: 38 | | Chairman of the Board of Trustees and President; Member of Executive Committee | | Indefinite, until successor
elected
Served as a Trustee since
1993, President since 2002
and Chairman
since 2006 | | President, Ariel Investments, since 2000 | | DreamWorks Animation SKG, Inc., The Estée Lauder Companies Inc., Starbucks Corporation, Sundance Institute, Chicago Public Education Fund, Chicago Public Library, The Field Museum, Investment Company Institute (Board of Governors) |
| | | | | | | | |
Merrillyn J. Kosier
Age: 48 | | Trustee and Vice President | | Indefinite, until successor
elected Served as a Trustee since
2003 and Vice President
since 1999 | | Executive Vice President, Ariel Investments since 1999, Chief Marketing Officer, Mutual Funds since 2007 | | Loyola University Advisory Board and Council of Regents, Chair of Mutual Fund Education Alliance, Harris Theater for Music and Dance, Lupus Foundation of America, Inc. |
| | | | | | | | |
Sheldon R. Stein
Age: 79 | | Vice President, Assistant Secretary | | Indefinite, until successor
elected Served as Vice President
since 2002 and Assistant
Secretary since 2007 | | Vice President, General Counsel, Ariel Investments since 2001; Of Counsel, D’Ancona & Pflaum LLC and Seyfarth Shaw LLP, as successor thereto, since 2001 | | Great Books Foundation. |
| | | | | | | | |
Anita M. Zagrodnik
Age: 48 | | Vice President, Chief Compliance Officer, Secretary and Assistant Treasurer | | Indefinite, until successor
elected Served as Vice President,
Assistant Secretary and
Assistant Treasurer since
2003; Chief Compliance
Officer, Ariel Investment
Trust since 2004, Secretary
since 2007 | | Vice President, Fund Administration, Ariel Investments since 2003; Principal, ideassociates, LLC (financial services consulting firm), 1999 to 2003 | | |
The Statement of Additional Information (SAI) for Ariel Investment Trust includes additional information about the Funds’ Trustees and Officers. The SAI is available without charge by calling 800.292.7435 or logging on to our website, arielinvestments.com. Note: Number of portfolios in complex overseen by all Officers is three. Address for all officers is 200 East Randolph Dr., Suite 2900, Chicago, IL 60601.
arielinvestments.com
44
THE TORTOISE
AND
THE HARE

One day a fleet-footed Hare was making fun of
a rather plodding Tortoise. The Hare was surprised
when the Tortoise laughed back. “Speedy you may be,”
said the Tortoise, “But I challenge you to a race
and I bet that I win.”
“Oh, for goodness’ sake,” said the Hare,
“It will be no contest at all. In fact, I will dance
rings around you all the way.”
When the time came, both started off together.
The Hare sped off from the start. In fact, he ran
so quickly that he soon left the Tortoise far behind.
He turned circles and flips as he raced ahead,
keen and proud of his speed and nimbleness.
Once the Hare reached the middle of the course,
he was so far ahead, he decided to take a nap.
While the Hare slept, the Tortoise plodded on and
on, straight toward the finish line. Slowly, steadily, the
Tortoise kept focused on his goal. When the Hare awoke
from his nap, he was surprised that the Tortoise was
nowhere in sight. Racing to the finish line with all his
proud speed, he saw that it was too late. The Tortoise
was waiting there for him, a smile on his face.
–Aesop
Celebrating 25 years of patient investing
ARIEL INVESTMENT TRUST
c/o U.S. Bancorp Fund Services, LLC
P.O. Box 701
Milwaukee, WI 53201-0701
800.292.7435
arielinvestments.com
TPI ©4/08
Item 2. Code of Ethics.
Not applicable. The information required by this Item is only required in an annual report on Form N-CSR.
Item 3. Audit Committee Financial Expert.
Not applicable. The information required by this Item is only required in an annual report on Form N-CSR.
Item 4. Principal Accountant Fees and Services.
Not applicable. The information required by this Item is only required in an annual report on Form N-CSR.
Item 5. Audit Committee of Listed Registrants.
Not applicable.
Item 6. Schedule of Investments.
Included as part of the report to shareholders filed under Item 1 of this Form.
Item 7. Disclosure of Proxy Voting Policies and Procedures for Closed-End Management Investment Companies.
Not applicable.
Item 8. Portfolio Managers of Closed-End Management Investment Companies.
Not applicable.
Item 9. Purchases of Equity Securities by Closed-End Management Investment Company and Affiliated Purchasers.
Not applicable.
Item 10. Submission of Matters to a Vote of Security Holders.
There have been no changes to the procedures by which shareholders may recommend nominees to the registrant’s Board of Trustees.
Item 11. Controls and Procedures.
(a) The registrant’s certifying officers have reasonably designed such disclosure controls and procedures to ensure material information relating to the registrant is made known to them by others, particularly
during the period in which this report is being prepared. The registrant’s certifying officers have determined that the registrant’s disclosure controls and procedures are effective based on their evaluation of these controls and procedures as of a date within 90 days prior to the filing date of this report.
(b) There were no significant changes in the registrant’s internal controls over financial reporting, or in other factors that could significantly affect these controls, that occurred during the registrant’s second fiscal half-year, including any corrective actions with regard to significant deficiencies and material weaknesses.
Item 12. Exhibits.
(a)(1) Code of Ethics – Not applicable.
(a)(2) Certification for each principal executive and principal financial officer of the registrant as required by Rule 30a-2 under the Act (17 CFR 270.30a-2(a)) – Filed as an attachment to this filing.
(a)(3) Written solicitation to purchase securities under Rule 23c-1 – Not applicable.
(b) Certifications required by Rule 30a-2(b) under the Act (17 CFR 270.30a-2(b)), Rule 13a-14(b) or Rule 15d-14(b) under the Exchange Act (17 CFR 240.13a-14(b) or 240.15d-14(b)), and Section 1350 of Chapter 63 of Title 18 of the United States Code (18 U.S.C. 1350). A certification furnished pursuant to this paragraph will not be deemed “filed” for purposes of Section 18 of the Exchange Act (15 U.S.C. 78r), or otherwise subject to the liability of that section. Such certification will not be deemed to be incorporated by reference into any filing under the Securities Act of 1933 or the Exchange Act, except to the extent that the registrant specifically incorporates it by reference – Filed as an attachment to this filing.
SIGNATURES
Pursuant to the requirements of the Securities Exchange Act of 1934 and the Investment Company Act of 1940, the registrant has duly caused this report to be signed on its behalf by the undersigned, thereunto duly authorized.
Ariel Investment Trust
By: | | /s/ Mellody L. Hobson | |
| | Mellody L. Hobson |
| | President and Principal Executive Officer |
| | |
Date: | | May 9, 2008 | |
| | | | |
Pursuant to the requirements of the Securities Exchange Act of 1934 and the Investment Company Act of 1940, this report has been signed below by the following persons on behalf of the registrant and in the capacities and on the dates indicated.
By: | | /s/ Mellody L. Hobson | |
| | Mellody L. Hobson |
| | President and Principal Executive Officer |
| | |
Date: | | May 9, 2008 | |
| | | | |
By: | | /s/ Thomas Herman | |
| | Thomas Herman |
| | Vice President and Principal Financial Officer |
| | |
Date: | | May 9, 2008 | |
| | | | |
