UNITED STATES
SECURITIES AND EXCHANGE COMMISSION
Washington, D.C. 20549
FORM N-CSR
CERTIFIED SHAREHOLDER REPORT OF REGISTERED
MANAGEMENT INVESTMENT COMPANIES
Investment Company Act file number | 811-4786 |
|
Ariel Investment Trust |
(Exact name of registrant as specified in charter) |
|
200 East Randolph Drive
Suite 2900
Chicago, Illinois | | 60601 |
(Address of principal executive offices) | | (Zip code) |
|
Sheldon R. Stein or Erik D. Ojala
200 East Randolph Drive
Suite 2900
Chicago, Illinois 60601 |
(Name and address of agent for service) |
|
with a copy to:
Arthur Don
Seyfarth Shaw LLP
131 South Dearborn Street
Suite 2400
Chicago, IL 60603 |
|
Registrant’s telephone number, including area code: | (312) 726-0140 | |
|
Date of fiscal year end: | September 30 | |
|
Date of reporting period: | March 31, 2007 | |
| | | | | | | | |
Item 1. Reports to Stockholders.
The following is a copy of the report transmitted to shareholders pursuant to Rule 30e-1 under the Investment Company Act of 1940 (the “Act”) (17 CFR 270.30e-1)


Investing in small and mid-cap stocks is more risky and more volatile than investing in large cap stocks. For the period ended March 31, 2007, the average annual total returns of Ariel Fund and Ariel Appreciation Fund for the one-, five- and ten-year periods were +6.09%, +9.75% and +13.42%; and +11.01%, +7.32% and +13.01%, respectively. For the period ended March 31, 2007, the average annual total returns of Ariel Focus Fund for the one-year and since inception (June 30, 2005) periods were +8.96% and +9.21%. All performance assumes reinvestment of dividends and capital gains. Performance data quoted represents past performance. Past performance does not guarantee future results. The investment return and principal value of an investment will fluctuate so that an investor’s shares, when redeemed, may be worth more or less than their original cost. Current performance may be lower or higher than the performance data quoted. Performance data current to the most recent month-end may be obtained by visiting our web site, arielmutualfunds.com. Ariel Focus Fund is a non-diversified fund and therefore may be subject to greater volatility than a more diversified investment. The performance of Ariel Focus Fund may differ from that of Ariel Fund and Ariel Appreciation Fund due to its status as a non-diversified fund and different portfolio managers.
This report candidly discusses a number of individual companies. Our opinions are current as of the date of this report but are subject to change. The information provided in this report is not reasonably sufficient upon which to base an investment decision and should not be considered a recommendation to purchase or sell a particular security.
For a current prospectus which includes the investment objectives, risks, management fees, charges and expenses as well as other information, call 800-292-7435. Please read the prospectus and consider this information carefully before investing. ©2007, Ariel Distributors, LLC.
Ariel Investment Trust
P.O. Box 219121
Kansas City, Missouri 64121-9121
800-292-7435
arielmutualfunds.com
Table of Contents

Turtle Talk with our Investment Specialists

I recently received my tax refund of $1,600. This year, my New Year’s resolution is to save more, so I put it in my Ariel IRA instead of spending it like I usually do. I’d like to maximize my IRA contribution, but right now I don’t have another $2,400 to reach the $4,000 limit for 2007. Any suggestions?
-Chris R., Evanston, IL
Stephanie: It can be hard to save with so many day-to-day responsibilities, but with compounding, even just a few extra dollars can really add up. Personally, I’m a big fan of automatic investment programs because you can put your savings on autopilot, making it easier to stick to your goals.
With this type of program, you designate a specific dollar amount you want automatically withdrawn from either a paycheck or bank account. You have up until April 15, 2008 to make your 2007 IRA contribution. So, if you start in May and contribute $200 a month through next April, you'll reach your goal. If this seems like a stretch, you can start with as little as $50 each month. Then down the road, you can increase the amount at any time. To enroll in this convenient plan, log onto arielmutualfunds.com.*
As a shareholder services representative, I am excited to introduce a new feature on our web site. In early May, Ariel is updating the account login feature so that you can access your Ariel account with a username you create instead of your Social Security number. We are adding this function based on shareholder feedback and our commitment to providing the best possible security features for investors. For more information, visit arielmutualfunds.com/username/ or call us at 800.292.7435, option 4.
* | Please note, if your banking information is not already on file with Ariel, you will need to complete and mail in our banking instructions and automatic investment form. You can access this form on arielmutualfunds.com. |


MARCH 31, 2007 | | SLOW AND STEADY WINS THE RACE |
“ ...our conservative, high quality holdings with their strong financial shells should provide needed protection as lower quality, cyclical issues descend from their lofty heights.”
Dear Fellow Shareholder: Lower-quality cyclical and commodity issues had a surprising comeback during the quarter ended March 31, 2007. Surprising because after a prolonged and remarkable ascent built on feeble fundamentals, these unlikely stock market darlings had finally begun to experience some comeuppance last fall after the Federal Reserve Board stopped raising interest rates in a clear nod to a slowing economy. But it seems the New Year brought with it a hearty appetite for risk perhaps best summed up by a recent Wall Street Journal headline which declared, “Investors Regain Their Risk Hunger.” As The Journal put it, “Investors aren’t just dipping their toes in the water. They’re diving in head first, making high-stakes bets on everything...”
Much to our delight, Ariel Fund was able to overcome these headwinds and beat both of its benchmarks during the quarter. More specifically, the portfolio’s +3.9% gain outpaced the +3.1% return posted by the Russell 2500 Value Index as well as the +3.6% advance of the Russell 2500 Index. The Fund’s results are noteworthy because low-quality rallies generally do not offer ideal market conditions for our kind of stocks. But one by-product of current investor bias is that both financial and strategic buyers, with more cash on hand then ever, have begun to re-focus on some of the wonderful, branded businesses that have largely been ignored. Accordingly, three names in Ariel Fund announced transactions during the quarter: Investors Financial Services Corp. is being bought by State Street Corp. at a +38% premium, while ServiceMaster Co. and Tribune Co. are both being taken private. Shares of ServiceMaster are up +29.3% since the company announced it would explore strategic alternatives last fall. And although we believe the famed real estate investor, Sam Zell, is getting Tribune for a bargain in buying the company for less than our private market value estimate, his $34 price is still at a +25.5% premium to the stock’s 2006 low when we were actively acquiring more shares.
Although Ariel Appreciation Fund’s first quarter performance was also helped by the ServiceMaster and Tribune transactions, as well as the continued re-bound of other contrarian picks, our gains fell short of the ever skyrocketing mid-cap indices propelled to new heights by lower quality holdings producing what we now fear to be “bubble-like” returns. Finance theory says investors should be rewarded for accepting additional risk. As such, small caps should outperform mid-caps, which should outpace large caps over time. Conversely, during those periods when a more conservative approach is being rewarded, one would expect less risky large caps to outperform their higher octane small cap siblings—with
ARIELMUTUALFUNDS.COM
2
mid-cap performance somewhere in between. And yet, in keeping with the last five years, the first quarter advances of the Russell Midcap Value Index and the Russell Midcap Index continue to defy logic—having trounced both the Russell 2000 Value Index as well as the Russell 1000 Value Index as shown in the following chart. In fact, according to Lipper data, the Russell Midcap Value Index outperformed 89% of all domestic managers for the quarter and 98% of that same group over the last five-years. This, too, is noteworthy since a benchmark is expected to fall in the middle of the pack. As Smart Money columnist, James B. Stewart, recently explained in the April 2007 issue, “[The] whole point [of index funds] is to be ‘average,’ nothing more and nothing less.” Against this unusual backdrop, Ariel Appreciation Fund’s +1.9% return outpaced the broader market, but could not catch the Russell Midcap Value Index which surged +4.9% or the Russell Midcap Index’s +4.4% jump.
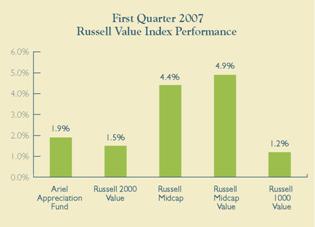
Not surprisingly, with low quality companies’ stellar rise, the conservative brands Ariel Focus Fund favors sat out this rally. Additionally, a few names in our concentrated portfolio struggled, weighing down results over the quarter. As such, Ariel Focus Fund returned -1.0%, trailing its benchmarks, which were up only slightly. Specifically, the S&P 500 Index gained +0.6%, while
the Russell 1000 Value Index and Russell 1000 Index both rose +1.2%.
Where has all the value gone?
Value is expensive. All of the signs are there. One would think that as value managers we would relish this period. But we don’t because the category is now picked over— making value’s seven-year run feel more like one encore too many at a concert with our favorite band. Barron’s Alan Abelson agrees and recently commented, “Stocks are anything but cheap [and] forces are making it
tougher to find, well, good value in these value days.”

“ …the category is now picked over—
making value’s seven-year run feel
more like one encore too many at a
concert with our favorite band.”

According to an updated white paper entitled “Has Growth Become Value—Reprise” by Dennis J. Trittin of the Frank Russell Company, “Value has outpaced Growth by +15.0% on an annualized basis...since the June 30, 2000 Growth stock peak.” Moreover, “not only is the magnitude of this style advantage to Value unprecedented since the inception of the Russell indexes, but also the duration is the longest on record.” In fact, although hard to imagine when one recalls those heady dot com days, he writes, “...the Value move in the ‘post-Bubble’ market has now overwhelmed the Growth rally in the speculative period that preceded it!”
It is not surprising then that the money has flowed hand over fist into the value style, making for a self-fulfilling prophesy that has less and less to do with the fundamentals of the underlying companies. For example, for the three years through 2000 when growth stocks were on fire, mid-cap value mutual funds experienced $6.9 billion in net redemptions. Large cap value had it even worse—
NOT PART OF THE SEMI-ANNUAL REPORT
3
$64 billion of the category’s assets ran for the door. All of these dollars and then some rushed to large cap growth funds which were inundated with $222 billion in net new assets. As you may recall, during this period, the Standard & Poor’s 500 Index garnered the highest “A” rating from The Wall Street Journal for its 1-, 3- and 5-year results placing it in the top 10% of all managers. Fast forward to today and one sees a striking contrast for the three years ending 2006. Mid-cap value took in $33 billion in new assets. Large cap value did even better with $76 billion in new flows. Meanwhile, large cap growth experienced $32 billion in redemptions.* As such, it is not hard to comprehend why Trittin believes “...market valuations have again become historically compressed...making growth companies... cheaper than normal and value companies ...more expensive than normal.” In further explaining value’s richness, he surmises that “during extended profit recoveries, investors often pay ‘growth stock multiples’ for what are ultimately shown to be cyclicals.”
“...we are convinced current
conditions are precarious, the
pendulum has just swung too far,
and some valuation ‘normalcy’ will
re-emerge as the economy slows.”
Against this backdrop, we are convinced current conditions are precarious—the pendulum has just swung too far—and some valuation ‘normalcy’ will re-emerge as the economy slows. Although market declines are never fun, we are comforted in knowing our conservative, high quality holdings with their strong financial shells should provide needed protection as lower quality, cyclical issues descend from their lofty heights. The reason being, our names generally have low expectations built into their prices and therefore have less far to fall in tough times. As such, we remain confident that when the inevitable correction does occur (this bull turns 5 years old this fall!), more bargains will be at hand.
Farewell to a good friend
Franklin Morton, a 15-year Ariel veteran, recently announced he plans to retire on June 1, 2007. Franklin has served as a long-time member of the Investment Committee with a specialty in the consumer products and financial services arenas. He has been a wonderful and valued member of Ariel’s team—always willing to go above and beyond to get any job done for our clients and shareholders. We sincerely appreciate all that he has done to help us get where we are today, and we wish him all the very best in the years to come.
As always, we appreciate the opportunity to serve you and welcome any questions or comments that you might have. You can contact us directly at email@arielmutualfunds.com.
Sincerely,

| | 
|
| | |
| | |
John W. Rogers, Jr. | | Mellody Hobson |
Chairman and CEO | | President |

* According to Strategic Insight
800-292-7435
4
Company Spotlight | | [Ariel Fund] |

Investors Financial Services Corp. (NASDAQ: IFIN)
200 Clarendon Street
Boston, MA 02116
617-937-6700
www.ibtco.com
Investors Financial Services Corp. is the holding company for Investors Bank & Trust—a global provider of administrative and back-office services for asset managers such as mutual fund complexes, investment advisors, hedge funds, banks and insurance companies. More specifically, the company assists its clients with global custody, multi-currency accounting, fund administration, securities lending and other value-added services.
Admirable Franchise
Prior to initiating our purchase in July 2005, Ariel’s investment team had tracked the firm for a number of years, admiring its quality franchise, unique business niche and obsession for customer service. Unlike its larger competitors, Investors Financial targets smaller asset managers, which creates an important competitive advantage. By providing world-class customer service, the company has successfully grown along with its clients, today servicing over $2.3 trillion in assets. Particularly noteworthy is the fact that Investors Financial has been rated #1 in client service for four years by Global Investor—a tribute to management’s laser-like focus on accuracy and high-touch service. Of additional significance is the firm’s early advocacy of Exchange Traded Funds (ETFs), a rapidly-growing segment in the investment arena. In 2001, the company inked a deal with Barclays Global Investors which has emerged as the largest ETF manager, creating an important partnership for Investors Financial.
Buying Opportunity
We saw a wonderful buying opportunity in 2005, when two issues dragged down the company’s stock price. First, the Barclay’s contract was coming up for renewal. Wall Street worried Investors Financial was overly concentrated in one client and pondered doomsday scenarios over the loss of a major account. Second, the investment community was pessimistic over an inverted yield curve and its potential impact on the company. Historically, Investors Financial boosted profits by investing clients’ cash at higher long-term maturities. As the gap between long-term and short-term yields narrowed, a nice profit stream for the company weakened.
Slow and Steady
As the company was encountering these headwinds, Ariel initiated its position. Our investment team had conducted years of extensive due diligence on the firm’s fundamentals as well as deep quantitative analysis on the impact of the changing yield curve and the possible loss of the Barclay’s account. Additionally, we leveraged our network of peers and even other Investors Financial clients to verify the strength of its business. Our analysis dismissed Wall Street concerns as overblown and confirmed our thesis that this quality company was selling at a bargain. As such, we built the bulk of our position in 2005. We were pleasantly surprised when State Street Corporation announced in February its intention to acquire the company at a premium of 38%. On the good news of the merger, we sold our shares in March and the merger is expected to close this July.
NOT PART OF THE SEMI-ANNUAL REPORT
5
Company Spotlight | | [Ariel Fund] |
| | [Ariel Appreciation Fund] |

Mohawk Industries, Inc. (NYSE: MHK)
160 South Industrial Boulevard
Calhoun, GA 30701
706-629-7721
www.mohawkind.com
Founded in 1878 as a carpet manufacturer, Mohawk Industries is the oldest and largest company in its industry—and today competes across all major flooring categories including carpet, rugs, hardwood, laminate, ceramic tile, stone and vinyl flooring. The company markets and manufactures products to both residential and commercial customers under a number of well-known brands such as Mohawk, Aladdin, Ralph Lauren, Custom Weave, Karastan, Lees, Dal-Tile and American Olean.
Magic Carpet Ride
Beyond an impressive stable of brands, the company boasts a number of competitive advantages. Specifically, Mohawk sets itself apart from its peers through a relentless commitment to dealer relationships and premium servicing—both of which are critical in terms of filling orders, ensuring prompt delivery, achieving customer satisfaction and cultivating repeat business. Additionally, the company maintains an extensive distribution network of more than 300 locations and has its own trucking fleet.
Over the years, management has made several well-calculated acquisitions, providing complementary product offerings for customers. For example, its 2005 purchase of Unilin added an important proprietary product line to Mohawk’s portfolio, laminates. As Mohawk has folded Unilin into its distribution channel and extended this line across the pricing spectrum, the Unilin name has gained greater strength and appeal among retailers, increasing Mohawk’s revenues by 15%.
Current Headwinds
Unfortunately, over the past several months, the flooring industry has suffered from softness in new residential construction and replacement sales. As expected, Mohawk’s stock price has declined in sympathy. In our opinion, investors have exaggerated new construction’s impact on Mohawk, when in fact, the company has a robust commercial construction exposure which remains strong and helps offset some of the weakness in residential construction. Another stumbling block has been rising raw material prices—particularly petroleum, a key flooring component—which has pressured Mohawk’s earnings downward.
Looking Ahead
We believe these issues are temporary tough spots and that investor concerns are inflated. The industry historically has passed raw material increases to consumers and we see no reason why Mohawk will not be able to continue this trend. Furthermore, we expect its replacement business to regain momentum as buyers who postponed a new home consider smaller home improvements. We also believe Mohawk’s strong long-term track record dating back nearly 130 years speaks for itself. The company has a deep bench of management talent with significant industry expertise, and we have every confidence Mohawk will weather the current storm.
As of March 31, 2007, shares traded at $82.05, a 31% discount to our $119 estimate of private market value.
ARIELMUTUALFUNDS.COM
6
Company Spotlight | | [Ariel Focus Fund] |

Johnson & Johnson (NYSE: JNJ)
One Johnson & Johnson Plaza
New Brunswick, NJ 08933
732-524-0400
www.jnj.com
Johnson & Johnson is one of the largest and most diversified consumer health care companies in the world. Its more than 200 operating companies develop a broad spectrum of products spanning baby care, first aid, pharmaceuticals, medical devices and diagnostics to products relating to family planning, dermatology and feminine hygiene.
Industry Pioneers
With over 54,000 U.S. and international patents, Johnson & Johnson has a formidable track record of innovation with breakthroughs like baby powder, the first antiseptic surgical dressings and the Pap smear. In fact, Johnson’s Baby Powder was introduced in 1893 and over a century later, remains a favorite brand. Other popular household names from Johnson & Johnson include Band-Aid, Neutrogena, Tylenol, Visine, Benadryl and Reach, just to name a few. This level of brand strength is a significant advantage and hard to match. Additionally, Johnson & Johnson’s financial flexibility allows the company to explore revolutionary product ideas and take risks with research and development dollars. Equally important, Johnson & Johnson’s premier reputation as an iconic health care
company is invaluable to attracting and retaining world-class scientists and management talent.
Strategic Growth
Led by Chairman and CEO William Weldon, leadership continues to enhance its market strength through a number of strategic acquisitions. Most recently, the company purchased Pfizer Consumer Healthcare creating new market opportunities with consumer health care brands like Listerine, Rogaine and Sudafed. For example, the addition of Listerine more than triples Johnson & Johnson’s oral health franchise. Management also has made important acquisitions in its Medical Devices & Diagnostics division strengthening its therapies and product pipeline.
Current Pressures Create a Bargain
Lately, the blue-chip company’s stock has been pressured by a few product challenges. Specifically, investors fret over select pharmaceuticals losing patent protection in the next three years and the resulting increase in generic competition. Additionally, Johnson & Johnson’s stock slid further after controversial studies led to negative headlines regarding its heart stents, which are tiny wires used to open heart arteries. As one of the biggest players in the health care industry, Johnson & Johnson is a natural lightening rod for negative press. However, we have watched the company skillfully navigate past challenges and expect leadership to address current concerns with the same level of success.
In our view, short-term setbacks made this high-quality, blue-chip company an incredibly attractive value. In fact, Johnson & Johnson is selling at one of the lowest multiples in years. As such, we initiated our position in February and remain confident in the firm’s reputation, highly demanded products, diversification and enormous free cash flow. As of March 31, 2007, the company traded at $60.26, a 43% discount to our $105 value of intrinsic worth.
NOT PART OF THE SEMI-ANNUAL REPORT
7
Ariel Fund Statistical Summary (ARGFX)
| | | | | | 52-Week Range | | Earnings Per Share | | P/E Calendar | | | |
| | | | | | | | | | 2005 | | 2006 | | 2007 | | 2005 | | 2006 | | 2007 | | Market | |
| | Ticker | | Price | | | | | | Actual | | Actual | | Estimated | | Actual | | Actual | | Estimated | | Cap. | |
Company | | Symbol | | 3/31/07 | | Low | | High | | Calendar | | Calendar | | Calendar | | P/E | | P/E | | P/E | | ($MM) | |
| | | | | | | | | | | | | | | | | | | | | | | |
Invacare Corp. | | IVC | | 17.44 | | 17.24 | | 31.38 | | 1.86 | | 1.45 | | 1.42 | | 9.4 | | 12.0 | | 12.3 | | 558 | |
ACCO Brands Corp. | | ABD | | 24.09 | | 17.95 | | 27.45 | | 1.03 | | 1.00 | | 1.51 | | 23.4 | | 24.1 | | 16.0 | | 1,295 | |
Chittenden Corp. | | CHZ | | 30.19 | | 24.60 | | 31.96 | | 1.77 | | 1.83 | | 1.97 | | 17.1 | | 16.5 | | 15.3 | | 1,369 | |
Lee Enterprises, Inc. | | LEE | | 30.05 | | 22.98 | | 35.65 | | 2.11 | | 1.90 | | 2.72 | | 14.2 | | 15.8 | | 11.0 | | 1,384 | |
BearingPoint, Inc. | | BE | | 7.66 | | 7.33 | | 9.59 | | 0.17 | | (0.03 | )(e) | 0.32 | | 45.1 | | NM | | 23.9 | | 1,544 | |
Brady Corp. | | BRC | | 31.20 | | 30.85 | | 42.79 | | 1.85 | | 2.08 | | 2.33 | | 16.9 | | 15.0 | | 13.4 | | 1,683 | |
Assured Guaranty Ltd. | | AGO | | 27.32 | | 23.50 | | 28.40 | | 2.61 | | 2.12 | | 2.32 | | 10.5 | | 12.9 | | 11.8 | | 1,845 | |
Bio-Rad Laboratories, Inc. | | BIO | | 69.84 | | 60.91 | | 88.54 | | 3.51 | | 3.65 | | 3.27 | | 19.9 | | 19.1 | | 21.4 | | 1,851 | |
Harte-Hanks, Inc. | | HHS | | 27.59 | | 22.35 | | 28.78 | | 1.34 | | 1.39 | | 1.51 | | 20.6 | | 19.8 | | 18.3 | | 2,075 | |
Herman Miller, Inc. | | MLHR | | 33.49 | | 25.77 | | 40.79 | | 1.27 | | 1.76 | | 2.20 | | 26.4 | | 19.0 | | 15.2 | | 2,155 | |
McClatchy Co. | | MNI | | 31.61 | | 31.25 | | 50.64 | | 3.44 | | 3.13 | | 2.55 | | 9.2 | | 10.1 | | 12.4 | | 2,589 | |
Anixter International Inc. | | AXE | | 65.94 | | 44.42 | | 67.44 | | 2.43 | | 4.23 | | 4.98 | | 27.1 | | 15.6 | | 13.2 | | 2,605 | |
IDEX Corp. | | IEX | | 50.88 | | 39.00 | | 53.48 | | 2.09 | | 2.48 | | 2.98 | | 24.3 | | 20.5 | | 17.1 | | 2,732 | |
Career Education Corp. | | CECO | | 30.50 | | 17.60 | | 42.59 | | 2.32 | | 1.55 | | 1.36 | | 13.1 | | 19.7 | | 22.4 | | 2,934 | |
Steelcase Inc. | | SCS | | 19.89 | | 13.22 | | 20.54 | | 0.45 | | 0.72 | | 1.03 | | 44.2 | | 27.8 | | 19.3 | | 2,953 | |
J.M. Smucker Co. | | SJM | | 53.32 | | 38.75 | | 53.99 | | 2.55 | | 2.73 | | 3.16 | | 20.9 | | 19.5 | | 16.9 | | 3,027 | |
Hewitt Associates, Inc. | | HEW | | 29.23 | | 19.01 | | 30.77 | | 1.29 | | (0.47 | ) | 1.44 | | 22.7 | | NM | | 20.3 | | 3,242 | |
Jones Lang LaSalle Inc. | | JLL | | 104.28 | | 70.55 | | 110.02 | | 3.12 | | 5.16 | | 5.23 | | 33.4 | | 20.2 | | 19.9 | | 3,321 | |
HCC Insurance Holdings, Inc. | | HCC | | 30.80 | | 28.51 | | 35.15 | | 1.76 | | 2.93 | | 3.21 | | 17.5 | | 10.5 | | 9.6 | | 3,441 | |
City National Corp. | | CYN | | 73.60 | | 60.02 | | 78.25 | | 4.60 | | 4.66 | | 4.85 | | 16.0 | | 15.8 | | 15.2 | | 3,524 | |
Janus Capital Group Inc. | | JNS | | 20.91 | | 15.50 | | 24.20 | | 0.52 | | 0.66 | | 0.99 | | 40.2 | | 31.7 | | 21.1 | | 4,046 | |
USG Corp. | | USG | | 46.68 | | 43.68 | | 94.24 | | 6.67 | | 8.81 | | 3.87 | | 7.0 | | 5.3 | | 12.1 | | 4,195 | |
ServiceMaster Co. | | SVM | | 15.39 | | 9.66 | | 15.42 | | 0.64 | | 0.64 | | 0.69 | | 24.0 | | 24.0 | | 22.3 | | 4,490 | |
Equifax Inc. | | EFX | | 36.45 | | 30.15 | | 42.00 | | 1.79 | | 2.01 | | 2.23 | | 20.4 | | 18.1 | | 16.3 | | 4,545 | |
Energizer Holdings, Inc. | | ENR | | 85.33 | | 49.19 | | 88.34 | | 4.07 | | 4.53 | | 5.21 | | 21.0 | | 18.8 | | 16.4 | | 4,789 | |
Markel Corp. | | MKL | | 484.83 | | 325.00 | | 505.89 | | 12.57 | | 34.87 | | 34.05 | | 38.6 | | 13.9 | | 14.2 | | 4,845 | |
Constellation Brands, Inc. | | STZ | | 21.18 | | 18.83 | | 29.17 | | 1.55 | | 1.65 | | 1.45 | | 13.7 | | 12.8 | | 14.6 | | 4,949 | |
A.G. Edwards, Inc. | | AGE | | 69.18 | | 47.77 | | 70.10 | | 3.06 | | 3.02 | | 4.62 | | 22.6 | | 22.9 | | 15.0 | | 5,210 | |
Black & Decker Corp. | | BDK | | 81.62 | | 66.04 | | 94.90 | | 6.90 | | 6.55 | | 6.50 | | 11.8 | | 12.5 | | 12.6 | | 5,447 | |
800-292-7435
8
(Unaudited)
| | | | | | 52-Week Range | | Earnings Per Share | | P/E Calendar | | | |
| | | | | | | | | | 2005 | | 2006 | | 2007 | | 2005 | | 2006 | | 2007 | | Market | |
| | Ticker | | Price | | | | | | Actual | | Actual | | Estimated | | Actual | | Actual | | Estimated | | Cap. | |
Company | | Symbol | | 3/31/07 | | Low | | High | | Calendar | | Calendar | | Calendar | | P/E | | P/E | | P/E | | ($MM) | |
| | | | | | | | | | | | | | | | | | | | | | | |
Mohawk Industries, Inc. | | MHK | | 82.05 | | 62.80 | | 94.35 | | 5.78 | | 7.32 | | 7.68 | | 14.2 | | 11.2 | | 10.7 | | 5,560 | |
Interpublic Group of Cos., Inc. | | IPG | | 12.31 | | 7.79 | | 13.94 | | (0.69 | ) | (0.19 | ) | 0.28 | | NM | | NM | | 44.0 | | 5,768 | |
IMS Health Inc. | | RX | | 29.66 | | 25.68 | | 30.13 | | 1.42 | | 1.47 | | 1.64 | | 20.9 | | 20.2 | | 18.1 | | 5,952 | |
H&R Block, Inc. | | HRB | | 21.04 | | 18.31 | | 24.95 | | 1.71 | | 1.32 | | 1.60 | | 12.3 | | 15.9 | | 13.2 | | 6,792 | |
Tribune Co. | | TRB | | 32.11 | | 27.09 | | 34.28 | | 2.08 | | 2.04 | | 2.02 | | 15.4 | | 15.7 | | 15.9 | | 7,681 | |
Note: All earnings per share numbers are fully diluted. Such numbers are from continuing operations and are adjusted for non-recurring items. All estimates of future earnings per share shown in this table are prepared by Ariel Capital Management, LLC research analysts as of March 31, 2007 and have not been updated to reflect any subsequent events. P/E ratios are based on earnings stated and March 31, 2007 stock price. NM=Not Meaningful.
(e) Ariel Capital Management, LLC estimates are used for companies that had not reported 2006 earnings by 3/31/07.
NOT PART OF THE SEMI-ANNUAL REPORT
9
Ariel Appreciation Fund Statistical Summary (CAAPX) | (Unaudited) |
| | | | | | 52-Week Range | | Earnings Per Share | | P/E Calendar | | | |
| | | | | | | | | | 2005 | | 2006 | | 2007 | | 2005 | | 2006 | | 2007 | | Market | |
| | Ticker | | Price | | | | | | Actual | | Actual | | Estimated | | Actual | | Actual | | Estimated | | Cap. | |
Company | | Symbol | | 3/31/07 | | Low | | High | | Calendar | | Calendar | | Calendar | | P/E | | P/E | | P/E | | ($MM) | |
| | | | | | | | | | | | | | | | | | | | | | | |
Harte-Hanks, Inc. | | HHS | | 27.59 | | 22.35 | | 28.78 | | 1.34 | | 1.39 | | 1.51 | | 20.6 | | 19.8 | | 18.3 | | 2,075 | |
McClatchy Co. | | MNI | | 31.61 | | 31.25 | | 50.64 | | 3.44 | | 3.13 | | 2.55 | | 9.2 | | 10.1 | | 12.4 | | 2,589 | |
Anixter International Inc. | | AXE | | 65.94 | | 44.42 | | 67.44 | | 2.43 | | 4.23 | | 4.98 | | 27.1 | | 15.6 | | 13.2 | | 2,605 | |
Career Education Corp. | | CECO | | 30.50 | | 17.60 | | 42.59 | | 2.32 | | 1.55 | | 1.36 | | 13.1 | | 19.7 | | 22.4 | | 2,934 | |
Hewitt Associates, Inc. | | HEW | | 29.23 | | 19.01 | | 30.77 | | 1.29 | | (0.47 | ) | 1.44 | | 22.7 | | NM | | 20.3 | | 3,242 | |
HCC Insurance Holdings, Inc. | | HCC | | 30.80 | | 28.51 | | 35.15 | | 1.76 | | 2.93 | | 3.21 | | 17.5 | | 10.5 | | 9.6 | | 3,441 | |
City National Corp. | | CYN | | 73.60 | | 60.02 | | 78.25 | | 4.60 | | 4.66 | | 4.85 | | 16.0 | | 15.8 | | 15.2 | | 3,524 | |
Janus Capital Group Inc. | | JNS | | 20.91 | | 15.50 | | 24.20 | | 0.52 | | 0.66 | | 0.99 | | 40.2 | | 31.7 | | 21.1 | | 4,046 | |
USG Corp. | | USG | | 46.68 | | 43.68 | | 94.24 | | 6.67 | | 8.81 | | 3.87 | | 7.0 | | 5.3 | | 12.1 | | 4,195 | |
Equifax Inc. | | EFX | | 36.45 | | 30.15 | | 42.00 | | 1.79 | | 2.01 | | 2.23 | | 20.4 | | 18.1 | | 16.3 | | 4,545 | |
Energizer Holdings, Inc. | | ENR | | 85.33 | | 49.19 | | 88.34 | | 4.07 | | 4.53 | | 5.21 | | 21.0 | | 18.8 | | 16.4 | | 4,789 | |
Constellation Brands, Inc. | | STZ | | 21.18 | | 18.83 | | 29.17 | | 1.55 | | 1.65 | | 1.45 | | 13.7 | | 12.8 | | 14.6 | | 4,949 | |
Black & Decker Corp. | | BDK | | 81.62 | | 66.04 | | 94.90 | | 6.90 | | 6.55 | | 6.50 | | 11.8 | | 12.5 | | 12.6 | | 5,447 | |
Dun & Bradstreet Corp. | | DNB | | 91.20 | | 65.03 | | 91.72 | | 3.47 | | 3.97 | | 4.60 | | 26.3 | | 23.0 | | 19.8 | | 5,481 | |
Mohawk Industries, Inc. | | MHK | | 82.05 | | 62.80 | | 94.35 | | 5.78 | | 7.32 | | 7.68 | | 14.2 | | 11.2 | | 10.7 | | 5,560 | |
Interpublic Group of Cos., Inc. | | IPG | | 12.31 | | 7.79 | | 13.94 | | (0.69 | ) | (0.19 | ) | 0.28 | | NM | | NM | | 44.0 | | 5,768 | |
IMS Health Inc. | | RX | | 29.66 | | 25.68 | | 30.13 | | 1.42 | | 1.47 | | 1.64 | | 20.9 | | 20.2 | | 18.1 | | 5,952 | |
H&R Block, Inc. | | HRB | | 21.04 | | 18.31 | | 24.95 | | 1.71 | | 1.32 | | 1.60 | | 12.3 | | 15.9 | | 13.2 | | 6,792 | |
Tribune Co. | | TRB | | 32.11 | | 27.09 | | 34.28 | | 2.08 | | 2.04 | | 2.02 | | 15.4 | | 15.7 | | 15.9 | | 7,681 | |
Clorox Co. | | CLX | | 63.69 | | 56.17 | | 67.50 | | 2.72 | | 3.16 | | 3.47 | | 23.4 | | 20.2 | | 18.4 | | 9,633 | |
Pitney Bowes Inc. | | PBI | | 45.39 | | 40.18 | | 48.95 | | 2.46 | | 2.69 | | 2.97 | | 18.5 | | 16.9 | | 15.3 | | 10,014 | |
Mattel, Inc. | | MAT | | 27.57 | | 15.81 | | 29.00 | | 1.20 | | 1.41 | | 1.54 | | 23.0 | | 19.6 | | 17.9 | | 10,595 | |
T. Rowe Price Group, Inc. | | TROW | | 47.19 | | 34.87 | | 50.30 | | 1.58 | | 1.90 | | 2.38 | | 29.9 | | 24.8 | | 19.8 | | 12,503 | |
Northern Trust Corp. | | NTRS | | 60.14 | | 51.52 | | 63.49 | | 2.64 | | 3.00 | | 3.41 | | 22.8 | | 20.0 | | 17.6 | | 13,153 | |
Gannett Co., Inc. | | GCI | | 56.29 | | 51.65 | | 63.50 | | 4.99 | | 4.90 | | 4.80 | | 11.3 | | 11.5 | | 11.7 | | 13,214 | |
YUM! Brands, Inc. | | YUM | | 57.76 | | 44.21 | | 63.68 | | 2.63 | | 2.92 | | 3.26 | | 22.0 | | 19.8 | | 17.7 | | 15,306 | |
Omnicom Group Inc. | | OMC | | 102.38 | | 81.84 | | 106.90 | | 4.36 | | 4.99 | | 5.68 | | 23.5 | | 20.5 | | 18.0 | | 17,233 | |
Thermo Fisher Scientific Inc. | | TMO | | 46.75 | | 33.85 | | 49.90 | | 1.54 | | 1.82 | | 2.43 | | 30.4 | | 25.7 | | 19.2 | | 19,476 | |
Accenture Ltd | | ACN | | 38.54 | | 25.68 | | 39.25 | | 1.50 | | 1.71 | | 2.05 | | 25.7 | | 22.5 | | 18.8 | | 22,681 | |
Aflac Inc. | | AFL | | 47.06 | | 41.63 | | 49.37 | | 2.53 | | 2.85 | | 3.28 | | 18.6 | | 16.5 | | 14.3 | | 23,179 | |
CBS Corp. | | CBS | | 30.59 | | 23.97 | | 32.27 | | 1.59 | | 1.80 | | 1.87 | | 19.2 | | 17.0 | | 16.4 | | 23,505 | |
Franklin Resources, Inc. | | BEN | | 120.83 | | 80.16 | | 126.71 | | 4.47 | | 4.64 | | 6.59 | | 27.0 | | 26.0 | | 18.3 | | 30,637 | |
Baxter International Inc. | | BAX | | 52.67 | | 36.00 | | 53.53 | | 1.99 | | 2.30 | | 2.62 | | 26.5 | | 22.9 | | 20.1 | | 34,261 | |
Carnival Corp. | | CCL | | 46.86 | | 36.40 | | 52.73 | | 2.75 | | 2.79 | | 3.07 | | 17.0 | | 16.8 | | 15.3 | | 37,254 | |
Note: All earnings per share numbers are fully diluted. Such numbers are from continuing operations and are adjusted for non-recurring items. All estimates of future earnings per share shown in this table are prepared by Ariel Capital Management, LLC research analysts as of March 31, 2007 and have not been updated to reflect any subsequent events. P/E ratios are based on earnings stated and March 31, 2007 stock price. NM=Not Meaningful.
ARIELMUTUALFUNDS.COM
10
Ariel Focus Fund Statistical Summary (ARFFX) | | (Unaudited) |
| | | | | | 52-Week Range | | Earnings Per Share | | P/E Calendar | | | |
| | | | | | | | | | 2005 | | 2006 | | 2007 | | 2005 | | 2006 | | 2007 | | Market | |
| | Ticker | | Price | | | | | | Actual | | Actual | | Estimated | | Actual | | Actual | | Estimated | | Cap. | |
Company | | Symbol | | 3/31/07 | | Low | | High | | Calendar | | Calendar | | Calendar | | P/E | | P/E | | P/E | | ($MM) | |
| | | | | | | | | | | | | | | | | | | | | | | |
Hewitt Associates, Inc. | | HEW | | 29.23 | | 19.01 | | 30.77 | | 1.29 | | (0.47 | ) | 1.44 | | 22.7 | | NM | | 20.3 | | 3,242 | |
Constellation Brands, Inc. | | STZ | | 21.18 | | 18.83 | | 29.17 | | 1.55 | | 1.65 | | 1.45 | | 13.7 | | 12.8 | | 14.6 | | 4,949 | |
Black & Decker Corp. | | BDK | | 81.62 | | 66.04 | | 94.90 | | 6.90 | | 6.55 | | 6.50 | | 11.8 | | 12.5 | | 12.6 | | 5,447 | |
IMS Health Inc. | | RX | | 29.66 | | 25.68 | | 30.13 | | 1.42 | | 1.47 | | 1.64 | | 20.9 | | 20.2 | | 18.1 | | 5,952 | |
H&R Block, Inc. | | HRB | | 21.04 | | 18.31 | | 24.95 | | 1.71 | | 1.32 | | 1.60 | | 12.3 | | 15.9 | | 13.2 | | 6,792 | |
Omnicom Group Inc. | | OMC | | 102.38 | | 81.84 | | 106.90 | | 4.36 | | 4.99 | | 5.68 | | 23.5 | | 20.5 | | 18.0 | | 17,233 | |
Accenture Ltd | | ACN | | 38.54 | | 25.68 | | 39.25 | | 1.50 | | 1.71 | | 2.05 | | 25.7 | | 22.5 | | 18.8 | | 22,681 | |
Aflac Inc. | | AFL | | 47.06 | | 41.63 | | 49.37 | | 2.53 | | 2.85 | | 3.28 | | 18.6 | | 16.5 | | 14.3 | | 23,179 | |
Carnival Corp. | | CCL | | 46.86 | | 36.40 | | 52.73 | | 2.75 | | 2.79 | | 3.07 | | 17.0 | | 16.8 | | 15.3 | | 37,254 | |
Dell Inc. | | DELL | | 23.21 | | 18.95 | | 30.44 | | 1.29 | | 1.18 | (e) | 1.20 | | 18.0 | | 19.7 | | 19.3 | | 52,919 | |
Tyco International Ltd. | | TYC | | 31.55 | | 24.97 | | 33.29 | | 1.83 | | 1.88 | | 2.05 | | 17.2 | | 16.8 | | 15.4 | | 62,339 | |
Home Depot, Inc. | | HD | | 36.74 | | 32.85 | | 42.94 | | 2.58 | | 2.78 | | 2.68 | | 14.2 | | 13.2 | | 13.7 | | 72,378 | |
Morgan Stanley | | MS | | 78.76 | | 54.52 | | 84.66 | | 5.63 | | 7.50 | | 8.05 | | 14.0 | | 10.5 | | 9.8 | | 83,615 | |
International Business Machines Corp. | | IBM | | 94.26 | | 72.73 | | 100.90 | | 5.34 | | 6.06 | | 6.82 | | 17.7 | | 15.6 | | 13.8 | | 142,001 | |
JPMorgan Chase & Co. | | JPM | | 48.38 | | 39.33 | | 51.95 | | 2.95 | | 4.04 | | 4.16 | | 16.4 | | 12.0 | | 11.6 | | 167,476 | |
Berkshire Hathaway Inc. | | BRK.B | | 3,640.00 | | 2,839.00 | | 3,825.00 | | 185.00 | | 199.86 | | 196.41 | | 19.7 | | 18.2 | | 18.5 | | 168,172 | |
Johnson & Johnson | | JNJ | | 60.26 | | 57.32 | | 69.41 | | 3.39 | | 3.76 | | 4.13 | | 17.8 | | 16.0 | | 14.6 | | 174,346 | |
Pfizer Inc | | PFE | | 25.26 | | 22.16 | | 28.60 | | 2.03 | | 2.08 | | 2.14 | | 12.4 | | 12.1 | | 11.8 | | 179,952 | |
Toyota Motor Corp. | | TM | | 128.16 | | 94.52 | | 138.00 | | 6.91 | | 8.31 | | 9.04 | | 18.5 | | 15.4 | | 14.2 | | 206,086 | |
Citigroup Inc. | | C | | 51.34 | | 46.22 | | 57.00 | | 3.96 | | 4.25 | | 4.58 | | 13.0 | | 12.1 | | 11.2 | | 252,182 | |
Note: All earnings per share numbers are fully diluted. Such numbers are from continuing operations and are adjusted for non-recurring items. All estimates of future earnings per share shown in this table are prepared by Ariel Capital Management, LLC research analysts as of March 31, 2007 and have not been updated to reflect any subsequent events. P/E ratios are based on earnings stated and March 31, 2007 stock price. NM=Not Meaningful.
(e) Ariel Capital Management, LLC estimates are used for companies that had not reported 2006 earnings by 3/31/07.
NOT PART OF THE SEMI-ANNUAL REPORT
11
A history of patient investing
At Ariel, patience serves as the core of our corporate philosophy. We believe that the most successful investors proceed, not by sudden leaps and bounds, but by the steady, painstaking work of research, stock selection and investment monitoring. More than an adage, patience sums up our way of evaluating companies, making investment decisions and even running our firm.

Semi-annual Report
March 31, 2007 (Unaudited)
Ariel Fund
Ariel Appreciation Fund
Ariel Focus Fund
Investing in small and mid-cap stocks is more risky and more volatile than investing in large cap stocks. For the period ended March 31, 2007, the average annual total returns of Ariel Fund and Ariel Appreciation Fund for the one-, five- and ten-year periods were +6.09%, +9.75% and +13.42%; and +11.01%, +7.32% and +13.01%, respectively. For the period ended March 31, 2007, the average annual total returns of Ariel Focus Fund for the one-year and since inception (June 30, 2005) periods were +8.96% and +9.21%. All performance assumes reinvestment of dividends and capital gains. Performance data quoted represents past performance. Past performance does not guarantee future results. The investment return and principal value of an investment will fluctuate so that an investor’s shares, when redeemed, may be worth more or less than their original cost. Current performance may be lower or higher than the performance data quoted. Performance data current to the most recent month-end may be obtained by visiting our web site, arielmutualfunds.com. Ariel Focus Fund is a non-diversified fund and therefore may be subject to greater volatility than a more diversified investment. The performance of Ariel Focus Fund may differ from that of Ariel Fund and Ariel Appreciation Fund due to its status as a non-diversified fund and different portfolio managers.
This report candidly discusses a number of individual companies. Our opinions are current as of the date of this report but are subject to change. The information provided in this report is not reasonably sufficient upon which to base an investment decision and should not be considered a recommendation to purchase or sell a particular security.
For a current prospectus which includes the investment objectives, risks, management fees, charges and expenses as well as other information, call 800-292-7435. Please read the prospectus and consider this information carefully before investing. ©2007, Ariel Distributors, LLC.
Ariel Investment Trust
P.O. Box 219121
Kansas City, Missouri 64121-9121
800-292-7435
arielmutualfunds.com
Table of Contents
Ariel Fund | | |
Portfolio Management Discussion | | 16 |
Performance Summary | | 17 |
Schedule of Investments | | 18 |
| | |
Ariel Appreciation Fund | | |
Portfolio Management Discussion | | 20 |
Performance Summary | | 21 |
Schedule of Investments | | 22 |
| | |
Ariel Focus Fund | | |
Portfolio Management Discussion | | 24 |
Performance Summary | | 25 |
Schedule of Investments | | 26 |
| | |
Statements of Assets & Liabilities | | 27 |
| | |
Statements of Operations | | 28 |
| | |
Statements of Changes in Net Assets | | 29 |
| | |
Financial Highlights | | 31 |
| | |
Notes to the Financial Statements | | 33 |
| | |
Fund Expense Example | | 36 |
| | |
Important Supplemental Information | | 37 |
| | |
Board of Trustees | | 40 |
| | |
Officers | | 42 |
Ariel Fund Portfolio Management Discussion | | ARGFX |

Fund Results
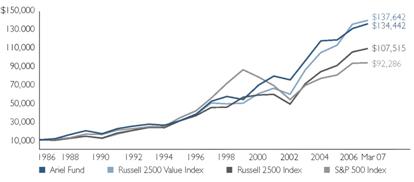
During the first three months of 2007, Ariel Fund rose +3.94%, surpassing its benchmarks. By comparison, the Russell 2500 Value Index rose +3.08% while the Russell 2500 Index gained +3.55%. For the six-month period ended March 31, 2007, Ariel Fund rose a solid +10.44%, but trailed the +12.51% and +12.56% advances of the Russell 2500 Value and the Russell 2500 Indices, respectively.
Performance Drivers
After closing 2006 short of its benchmarks, we were pleased to see Ariel Fund pull ahead in the first quarter of the New Year. The value conscious portfolio’s advance is particularly noteworthy given a rising market when lower-quality cyclical issues typically outperform the conservative, defensive stocks Ariel favors. As patient investors with a consistent approach—the stocks impacting the Fund’s quarterly and six-month periods were similar.
Specifically, Ariel Fund’s results were lifted by transactions involving Investors Financial Services Corp. and ServiceMaster Co. During the quarter, Investors Financial (featured on page 5) soared +37% on the news State Street Corp. will acquire it. Additionally, ServiceMaster jumped +18% this quarter on news it will go private. Conversely, McClatchy Co. tumbled almost -27% over the three-month period on sluggish advertising and pessimism toward newspaper stocks. Yet, we remain confident in McClatchy’s management and the company’s attractive valuation. Industrial product manufacturer, Brady Corp. also suffered, tumbling -16% over the quarter. It fell on an earnings disappointment and softening demand for its labels by cell phone and disk drive manufacturers. We view these challenges as surmountable short-term setbacks.
Also noteworthy, was the April announcement that long-time holding, Tribune Co. will go private in an employee stock ownership plan backed by contrarian business maverick, Sam Zell. The takeout price was $34 per share.
From our vantage, the bull’s incredible run is showing signs of age. The market stumbled unexpectedly in February, sending a shockwave through global markets. Additionally, the economy is slowing with GDP clocking a mere 2.5% and corporate earnings pulling back to 7.3% from previous double-digit growth. Furthermore, a weakening U.S. housing market is likely to crimp consumer spending habits. As such, we continue to favor quality companies with strong brands that provide predictable, consistent returns. Although our conservative bias may sacrifice some short-term gains, we believe our patient approach and long-term focus provide shareholder value over the long-haul.
Comings & Goings
During the quarter, we purchased Constellation Brands, Inc., a producer and marketer of beverage alcohol brands; USG Corp., a leader in North America’s building materials industry and Equifax Inc., a provider of credit information. Conversely, we exited three financial holdings. We sold Sky Financial Group, Inc. and Investors Financial on the good news of their pending acquisitions. We also parted with TD Banknorth Inc. when majority owner, Toronto Dominion, announced it will purchase the company’s remaining shares.
The Patient Investor
Reflecting on the longer time horizon, Ariel Fund posted a +13.42% ten-year average annual total return, in line with the Russell 2500 Value Index’s +13.95% rise and ahead of the +12.03% gain by the Russell 2500 Index over the same period. We believe the Fund’s long-term performance is driven by our disciplined investment approach, stock selection across industries in which Ariel has experience and our commitment to investing in quality companies we believe are selling at excellent values.
800-292-7435
16
Ariel Fund Performance Summary | | Inception: November 6, 1986 |
About the Fund
The no-load Ariel Fund pursues long-term capital appreciation by investing in undervalued companies that show strong potential for growth. The Fund primarily invests in companies with market capitalizations between $1 billion and $5 billion.
Composition of Equity Holdings
| | | | Russell | | | | | |
| | | | 2500 | | Russell | | S&P | |
| | Ariel | | Value | | 2500 | | 500 | |
| | Fund† | | Index | | Index | | Index | |
Financial Services | | 33.1 | % | 32.8 | % | 23.5 | % | 22.6 | % |
Consumer Discretionary & Services | | 29.6 | % | 15.0 | % | 18.3 | % | 12.3 | % |
Producer Durables | | 10.7 | % | 5.7 | % | 7.2 | % | 4.3 | % |
Materials & Processing | | 8.9 | % | 11.1 | % | 10.2 | % | 3.6 | % |
Technology | | 6.8 | % | 7.6 | % | 10.8 | % | 12.5 | % |
Health Care | | 6.5 | % | 3.9 | % | 10.5 | % | 12.1 | % |
Consumer Staples | | 4.4 | % | 3.9 | % | 2.6 | % | 7.4 | % |
Utilities | | 0.0 | % | 11.5 | % | 6.8 | % | 8.3 | % |
Other Energy | | 0.0 | % | 3.9 | % | 5.3 | % | 3.6 | % |
Autos & Transportation | | 0.0 | % | 3.6 | % | 3.8 | % | 2.4 | % |
Other | | 0.0 | % | 1.0 | % | 0.9 | % | 4.6 | % |
Integrated Oils | | 0.0 | % | 0.1 | % | 0.1 | % | 6.3 | % |
† Sector weightings are calculated based on equity holdings in the Fund and exclude cash in order to make a relevant comparison to the indexes.
Portfolio Composition | | | |
| | | |
Equity | | 97.9 | % |
Cash & Other | | 2.1 | % |
| | | |
Expense Ratio | | | |
| | | |
As of 9/30/06 | | 1.07 | % |
Average Annual Total Returns as of March 31, 2007
| | 1st Quarter | | 1 Year | | 3 Year | | 5 Year | | 10 Year | | Life of Fund | |
| | | | | | | | | | | | | |
Ariel Fund | | 3.94 | % | 6.09 | % | 9.77 | % | 9.75 | % | 13.42 | % | 13.59 | % |
| | | | | | | | | | | | | |
Russell 2500 Value Index | | 3.08 | % | 12.15 | % | 15.19 | % | 14.33 | % | 13.95 | % | 13.70 | % |
| | | | | | | | | | | | | |
Russell 2500 Index | | 3.55 | % | 8.23 | % | 13.26 | % | 12.15 | % | 12.03 | % | 12.33 | % |
| | | | | | | | | | | | | |
S&P 500 Index | | 0.64 | % | 11.83 | % | 10.04 | % | 6.27 | % | 8.20 | % | 11.49 | % |
Past performance does not guarantee future results.
The Value of a $10,000 Investment in Ariel Fund
| | Top Ten Equity Holdings | | | |
1 | | Hewitt Associates, Inc. | | 5.3 | % |
| | Human resources outsourcing and consulting firm | | | |
| | | | | |
2 | | Markel Corp. | | 5.2 | % |
| | Specialty insurance provider | | | |
| | | | | |
3 | | Energizer Holdings, Inc. | | 4.8 | % |
| | Consumer battery and razor manufacturer | | | |
| | | | | |
4 | | Janus Capital Group Inc. | | 4.4 | % |
| | Mutual fund manager | | | |
| | | | | |
5 | | IDEX Corp. | | 3.9 | % |
| | Industrial product manufacturer | | | |
| | | | | |
6 | | Jones Lang LaSalle Inc. | | 3.8 | % |
| | Real estate services and money management firm | | | |
| | | | | |
7 | | Mohawk Industries, Inc. | | 3.8 | % |
| | Manufacturer and distributor of floor coverings | | | |
| | | | | |
8 | | Tribune Co. | | 3.7 | % |
| | Publishing and broadcasting company | | | |
| | | | | |
9 | | HCC Insurance Holdings, Inc. | | 3.6 | % |
| | Global provider of specialized property and casualty insurance | | | |
| | | | | |
10 | | Anixter International Inc. | | 3.6 | % |
| | Global distributor of communication products, wire, cable and fasteners | | | |
Note: All performance assumes the reinvestment of dividends and capital gains. The graph and performance table do not reflect the deduction of taxes that a shareholder would pay on fund distributions or the redemption of fund shares. The Russell 2500® Value Index measures the performance of small and mid-sized, value-oriented companies with lower price-to-earnings ratios. The Russell 2500® Index measures the performance of small and mid-sized companies. The S&P 500 is a broad market-weighted index dominated by blue-chip stocks. All indexes are unmanaged, and an investor cannot invest directly in an index. Total return does not reflect a maximum 4.75% sales load charged prior to 7/15/94.
MARCH 31, 2007 SEMI-ANNUAL REPORT
17
Ariel Fund Schedule of Investments | |
Number of Shares | | COMMON STOCKS—97.86% | | Cost | | Market Value | |
| | | | | | | |
| | Consumer Discretionary & Services—28.96% | | | | | |
1,465,500 | | Black & Decker Corp. | | $ | 118,566,967 | | $ | 119,614,110 | |
2,433,650 | | Career Education Corp. * | | 73,461,595 | | 74,226,325 | |
3,812,500 | | Harte-Hanks, Inc. †† | | 92,171,127 | | 105,186,875 | |
7,496,050 | | Hewitt Associates, Inc., Class A *†† | | 192,863,559 | | 219,109,541 | |
7,406,800 | | Interpublic Group of Cos., Inc. * | | 81,206,219 | | 91,177,708 | |
3,658,900 | | Lee Enterprises, Inc. | | 126,721,405 | | 109,949,945 | |
3,190,100 | | McClatchy Co., Class A | | 171,045,441 | | 100,839,061 | |
1,905,700 | | Mohawk Industries, Inc. * | | 136,902,456 | | 156,362,685 | |
4,065,825 | | ServiceMaster Co. | | 43,508,502 | | 62,573,047 | |
4,711,500 | | Tribune Co. | | 132,358,461 | | 151,286,265 | |
| | | | 1,168,805,732 | | 1,190,325,562 | |
| | | | | | | |
| | Consumer Staples—4.27% | | | | | |
2,192,000 | | Constellation Brands, Inc. * | | 43,724,682 | | 46,426,560 | |
2,418,953 | | J.M. Smucker Co. | | 96,648,892 | | 128,978,574 | |
| | | | 140,373,574 | | 175,405,134 | |
| | | | | | | |
| | Financial Services—32.36% | | | | | |
1,982,100 | | A. G. Edwards, Inc. | | 69,247,985 | | 137,121,678 | |
3,962,450 | | Assured Guaranty Ltd. †† | | 81,579,508 | | 108,254,134 | |
2,173,750 | | Chittenden Corp. | | 60,176,026 | | 65,625,512 | |
1,566,400 | | City National Corp. | | 111,549,007 | | 115,287,040 | |
2,216,300 | | Equifax Inc. | | 82,387,086 | | 80,784,135 | |
5,924,600 | | H&R Block, Inc. | | 136,158,665 | | 124,653,584 | |
4,805,400 | | HCC Insurance Holdings, Inc. | | 89,202,304 | | 148,006,320 | |
8,632,900 | | Janus Capital Group Inc. | | 120,517,774 | | 180,513,939 | |
1,500,500 | | Jones Lang LaSalle Inc. | | 23,634,203 | | 156,472,140 | |
440,925 | | Markel Corp. * | | 102,045,666 | | 213,773,668 | |
| | | | 876,498,224 | | 1,330,492,150 | |
| | | | | | | |
| | Health Care—6.35% | | | | | |
1,085,500 | | Bio-Rad Laboratories, Inc., Class A * | | 64,939,669 | | 75,811,320 | |
4,915,575 | | IMS Health Inc. | | 114,603,686 | | 145,795,954 | |
2,268,875 | | Invacare Corp. †† | | 76,822,858 | | 39,569,180 | |
| | | | 256,366,213 | | 261,176,454 | |
| | | | | | | |
| | Materials & Processing—8.71% | | | | | |
3,268,610 | | Brady Corp., Class A | | 56,916,465 | | 101,980,632 | |
2,305,050 | | Energizer Holdings, Inc. * | | 76,476,687 | | 196,689,916 | |
1,275,100 | | USG Corp. * | | 62,585,663 | | 59,521,668 | |
| | | | 195,978,815 | | 358,192,216 | |
| | | | | | | | | |
ARIELMUTUALFUNDS.COM
18
March 31, 2007 (Unaudited)
Number of Shares | | COMMON STOCKS—97.86% (cont’d) | | Cost | | Market Value | |
| | | | | | | |
| | Producer Durables—10.51% | | | | | |
3,264,900 | | ACCO Brands Corp. *†† | | $ | 73,169,018 | | $ | 78,651,441 | |
2,566,100 | | Herman Miller, Inc. | | 50,873,913 | | 85,938,689 | |
3,151,450 | | IDEX Corp. †† | | 68,473,088 | | 160,345,776 | |
5,389,475 | | Steelcase Inc., Class A | | 67,272,241 | | 107,196,658 | |
| | | | 259,788,260 | | 432,132,564 | |
| | | | | | | |
| | Technology—6.70% | | | | | |
2,218,775 | | Anixter International Inc. *†† | | 58,438,417 | | 146,306,024 | |
16,828,050 | | BearingPoint, Inc. *†† | | 133,685,901 | | 128,902,863 | |
| | | | 192,124,318 | | 275,208,887 | |
| | | | | | | |
| | Total Common Stocks | | 3,089,935,136 | | 4,022,932,967 | |
| | | | | | | |
Principal Amount | | REPURCHASE AGREEMENT—3.99% | | Cost | | Market Value | |
| | | | | | | |
$ | 164,017,539 | | Fixed Income Clearing Corporation, 4.50%, dated 3/30/2007, | | | | | |
| | due 4/2/2007, repurchase price $164,079,046, | | | | | |
| | (collateralized by U.S. Treasury Note, 4.625%, | | | | | |
| | due 3/31/2008) | | 164,017,539 | | 164,017,539 | |
| | Total Investments—101.85% | | $ | 3,253,952,675 | | 4,186,950,506 | |
| | Liabilities less Other Assets—(1.85%) | | | | (75,905,673 | ) |
| | NET ASSETS—100.00% | | | | $ | 4,111,044,833 | |
| | | | | | | | | | |
* | Non-income producing. |
†† | Affiliated company (See Note Five). |
| A category may contain multiple industries as defined by the Standard Industrial Classification system. |
| The accompanying notes are an integral part of the financial statements. |
MARCH 31, 2007 SEMI-ANNUAL REPORT
19
Ariel Appreciation Fund Portfolio Management Discussion | | CAAPX |

Fund Results
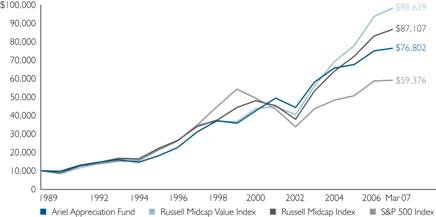
During the quarter ended March 31, 2007, Ariel Appreciation Fund rose +1.92% trailing the +4.86% gain by the Russell Midcap Value Index and the +4.38% increase by the Russell Midcap Index. For the six-month period, the Fund posted a solid +9.02%, still behind the +13.77% and +12.38% advances of the Russell Midcap Value and Russell Midcap Indices.
Performance Drivers
During the quarter and the six-month period ended March 31, 2007, low quality stocks continued their stellar rise, fueling the Russell Midcap Value Index’s bubble-like performance. In fact, the Russell Midcap Value Index bested 89% of all domestic managers last quarter and 98% over the five-year period (universe rankings provided by Lipper). Against this unusual backdrop, Ariel Appreciation Fund’s return surpassed the broader market, but could not keep up with runaway returns of its benchmarks.
As patient investors with a consistent approach—the stocks impacting the portfolio were similar for the quarter and six-month periods. Notably, a few of our underdogs continued their rebounds. Career Education Corp. climbed +23% during the quarter as its regulatory outlook improved, allowing management to move forward with two campus expansions. Additionally, our conviction in ServiceMaster Co. was rewarded. ServiceMaster surged almost +18% this quarter on news it will go private. Conversely, some of our contrarian plays have not panned out yet. Specifically, McClatchy Co. tumbled almost -27% over the quarter on sluggish advertising sales and general pessimism toward newspaper stocks. Yet, we remain confident in McClatchy management and the company’s attractive valuation. H&R Block, Inc. also struggled, falling -8% over the quarter on concerns over its mortgage business and association with the sub-prime meltdown. We believe H&R Block’s iconic tax franchise continues to operate well, and that on its own is worth more than the current stock price.
Also noteworthy, was the April announcement that long-time holding, Tribune Co. will go private in an employee stock ownership plan backed by contrarian business maverick, Sam Zell. The takeout price was $34 per share.
While investors try to catch the last few waves of this remarkable ride, history has shown that eventually there will be a return to normalcy. Knowing the market moves through peaks and troughs, we consistently favor quality companies with strong brand franchises and predictable, stable returns. Although our conservative bias may appear to sacrifice some short-term gains, we believe our patient approach and long-term focus provide shareholder value over the long-haul.
Comings & Goings
During the quarter, we purchased six names: Anixter International Inc., a leading distributor of communication products and wiring systems; Constellation Brands, Inc., a producer and marketer of beverage alcohol brands; Energizer Holdings, Inc., a battery and razor manufacturer; HCC Insurance Holdings, Inc., a specialty insurer; Hewitt Associates, Inc., a leading human resources outsourcer and USG Corp., a leader in North America’s building materials industry. Conversely, we exited Realogy Corp. and ServiceMaster on the good news each will go private. We also parted with TD Banknorth Inc. when its majority owner, Toronto Dominion, announced its purchase of the company’s remaining shares.
The Patient Investor
Reflecting on the longer time horizon, the Fund posted a solid +13.01% ten-year average annual total return while the Russell Midcap Value Index and the Russell Midcap Index gained +14.00% and +12.71%, respectively. We believe the portfolio’s long-term performance is driven by our disciplined investment approach, stock selection across industries in which Ariel has experience and commitment to investing in quality companies we believe are selling at excellent values.
800-292-7435
20
Ariel Appreciation Fund Performance Summary | | Inception: December 1, 1989 |
About the Fund
The no-load Ariel Appreciation Fund pursues long-term capital appreciation by investing in undervalued companies that show strong potential for growth. The Fund primarily invests in companies with market capitalizations between $2.5 billion and $15 billion.
Composition of Equity Holdings
| | | | Russell | | | | | |
| | Ariel | | Midcap | | Russell | | S&P | |
| | Appreciation | | Value | | Midcap | | 500 | |
| | Fund† | | Index | | Index | | Index | |
Consumer Discretionary & Services | | 47.7 | % | 11.3 | % | 18.2 | % | 12.3 | % |
Financial Services | | 29.5 | % | 31.2 | % | 21.1 | % | 22.6 | % |
Health Care | | 10.5 | % | 2.6 | % | 8.9 | % | 12.1 | % |
Producer Durables | | 4.4 | % | 4.4 | % | 6.3 | % | 4.3 | % |
Materials & Processing | | 3.5 | % | 8.9 | % | 8.2 | % | 3.6 | % |
Consumer Staples | | 3.4 | % | 7.1 | % | 5.0 | % | 7.4 | % |
Technology | | 1.0 | % | 5.6 | % | 9.6 | % | 12.5 | % |
Utilities | | 0.0 | % | 17.7 | % | 10.1 | % | 8.3 | % |
Other Energy | | 0.0 | % | 4.3 | % | 6.2 | % | 3.6 | % |
Autos & Transportation | | 0.0 | % | 3.8 | % | 4.1 | % | 2.4 | % |
Other | | 0.0 | % | 1.9 | % | 1.6 | % | 4.6 | % |
Integrated Oils | | 0.0 | % | 1.3 | % | 0.6 | % | 6.3 | % |
† Sector weightings are calculated based on equity holdings in the Fund and exclude cash in order to make a relevant comparison to the indexes.
Portfolio Composition
Equity | | 98.8 | % |
Cash & Other | | 1.2 | % |
Expense Ratio
Average Annual Total Returns as of March 31, 2007
| | 1st Quarter | | 1 Year | | 3 Year | | 5 Year | | 10 Year | | Life of Fund | |
Ariel Appreciation Fund | | 1.92 | % | 11.01 | % | 8.27 | % | 7.32 | % | 13.01 | % | 12.48 | % |
Russell Midcap Value Index | | 4.86 | % | 17.13 | % | 18.58 | % | 15.22 | % | 14.00 | % | 14.11 | % |
Russell Midcap Index | | 4.38 | % | 11.79 | % | 15.72 | % | 12.91 | % | 12.71 | % | 13.29 | % |
S&P 500 Index | | 0.64 | % | 11.83 | % | 10.04 | % | 6.27 | % | 8.20 | % | 10.82 | % |
Past performance does not guarantee future results.
The Value of a $10,000 Investment in Ariel Appreciation Fund
| | Top Ten Equity Holdings | | | |
| | | | | |
1 | | Accenture Ltd | | 5.3 | % |
| | Global management consulting, technology services and outsourcing firm | | | |
| | | | | |
2 | | Tribune Co. | | 4.8 | % |
| | Publishing and broadcasting company | | | |
| | | | | |
3 | | Carnival Corp. | | 4.6 | % |
| | Worldwide cruise company | | | |
| | | | | |
4 | | Northern Trust Corp. | | 4.5 | % |
| | Personal and institutional trust company | | | |
| | | | | |
5 | | Pitney Bowes Inc. | | 4.3 | % |
| | Manufacturer of mailing equipment | | | |
| | | | | |
6 | | Mohawk Industries, Inc. | | 4.1 | % |
| | Manufacturer and distributor of floor coverings | | | |
| | | | | |
7 | | CBS Corp. | | 3.9 | % |
| | Mass media company | | | |
| | | | | |
8 | | Baxter International Inc. | | 3.8 | % |
| | Diversified health care manufacturer | | | |
| | | | | |
9 | | Gannett Co., Inc. | | 3.7 | % |
| | Diversified news and information company | | | |
| | | | | |
10 | | Janus Capital Group Inc. | | 3.4 | % |
| | Mutual fund manager | | | |
Note: All performance assumes the reinvestment of dividends and capital gains. The graph and performance table do not reflect the deduction of taxes that a shareholder would pay on fund distributions or the redemption of fund shares. The Russell Midcap® Value Index measures the performance of mid-sized, value-oriented companies with lower price-to-earnings ratios. The Russell Midcap® Index measures the performance of mid-sized companies. The S&P 500 is a broad market-weighted index dominated by blue-chip stocks. All indexes are unmanaged, and an investor cannot invest directly in an index. Total return does not reflect a maximum 4.75% sales load charged prior to 7/15/94.
MARCH 31, 2007 SEMI-ANNUAL REPORT
21
Ariel Appreciation Fund Schedule of Investments
Number of Shares | | COMMON STOCKS—98.77% | | Cost | | Market Value | |
| | | | | | | |
| | Consumer Discretionary & Services—47.11% | | | | | |
3,685,000 | | Accenture Ltd, Class A | | $ | 56,325,881 | | $ | 142,019,900 | |
1,102,300 | | Black & Decker Corp. | | 46,231,739 | | 89,969,726 | |
1,331,050 | | Career Education Corp. * | | 36,683,514 | | 40,597,025 | |
2,661,450 | | Carnival Corp. | | 104,482,844 | | 124,715,547 | |
3,418,600 | | CBS Corp., Class B | | 85,442,944 | | 104,574,974 | |
1,772,750 | | Gannett Co., Inc. | | 102,063,515 | | 99,788,097 | |
1,772,875 | | Harte-Hanks, Inc. | | 26,291,077 | | 48,913,621 | |
1,352,500 | | Hewitt Associates, Inc., Class A * | | 36,159,113 | | 39,533,575 | |
4,321,925 | | Interpublic Group of Cos., Inc. * | | 38,395,852 | | 53,202,897 | |
1,900,900 | | Mattel, Inc. | | 30,848,996 | | 52,407,813 | |
1,844,100 | | McClatchy Co., Class A | | 89,246,726 | | 58,292,001 | |
1,337,400 | | Mohawk Industries, Inc. * | | 99,343,670 | | 109,733,670 | |
879,100 | | Omnicom Group Inc. | | 56,838,256 | | 90,002,258 | |
4,046,450 | | Tribune Co. | | 155,544,548 | | 129,931,510 | |
1,467,300 | | YUM! Brands, Inc. | | 34,541,737 | | 84,751,248 | |
| | | | 998,440,412 | | 1,268,433,862 | |
| | Consumer Staples—3.32% | | | | | |
931,472 | | Clorox Co. | | 35,804,496 | | 59,325,452 | |
1,424,100 | | Constellation Brands, Inc. * | | 28,408,226 | | 30,162,438 | |
| | | | 64,212,722 | | 89,487,890 | |
| | Financial Services—29.15% | | | | | |
1,365,200 | | Aflac Inc. | | 61,815,706 | | 64,246,312 | |
1,030,000 | | City National Corp. | | 73,176,054 | | 75,808,000 | |
726,822 | | Dun & Bradstreet Corp. | | 18,040,486 | | 66,286,166 | |
1,888,800 | | Equifax Inc. | | 41,321,942 | | 68,846,760 | |
687,600 | | Franklin Resources, Inc. | | 24,818,844 | | 83,082,708 | |
3,839,500 | | H&R Block, Inc. | | 91,850,040 | | 80,783,080 | |
1,746,700 | | HCC Insurance Holdings, Inc. | | 53,848,775 | | 53,798,360 | |
4,412,800 | | Janus Capital Group Inc. | | 55,412,068 | | 92,271,648 | |
1,997,800 | | Northern Trust Corp. | | 65,826,514 | | 120,147,692 | |
1,684,800 | | T. Rowe Price Group, Inc. | | 30,041,105 | | 79,505,712 | |
| | | | 516,151,534 | | 784,776,438 | |
| | Health Care—10.33% | | | | | |
1,949,350 | | Baxter International Inc. | | 42,861,921 | | 102,672,264 | |
3,105,060 | | IMS Health Inc. | | 49,619,587 | | 92,096,080 | |
1,781,954 | | Thermo Fisher Scientific Inc. * | | 28,662,350 | | 83,306,350 | |
| | | | 121,143,858 | | 278,074,694 | |
| | Materials & Processing—3.49% | | | | | |
648,300 | | Energizer Holdings, Inc. * | | 52,145,998 | | 55,319,439 | |
829,600 | | USG Corp. * | | 40,660,906 | | 38,725,728 | |
| | | | 92,806,904 | | 94,045,167 | |
| | | | | | | | | |
ARIELMUTUALFUNDS.COM
22
March 31, 2007 (Unaudited)
Number of Shares | | COMMON STOCKS—98.77% (cont’d) | | Cost | | Market Value | |
| | | | | | | |
| | Producer Durables—4.34% | | | | | |
2,574,375 | | Pitney Bowes Inc. | | $ | 95,880,248 | | $ | 116,850,881 | |
| | | | | | | |
| | Technology—1.03% | | | | | |
418,100 | | Anixter International Inc. * | | 25,786,923 | | 27,569,514 | |
| | | | | | | |
| | Total Common Stocks | | 1,914,422,601 | | 2,659,238,446 | |
| | | | | | | |
Principal Amount | | REPURCHASE AGREEMENT—1.81% | | Cost | | Market Value | |
| | | | | | | |
$ | 48,551,719 | | Fixed Income Clearing Corporation, 4.50%, dated 3/30/2007, due 4/2/2007, repurchase price $48,569,926, (collateralized by U.S. Treasury Bond, 8.875%, due 2/15/2019) | | 48,551,719 | | 48,551,719 | |
| | Total Investments—100.58% | | $ | 1,962,974,320 | | 2,707,790,165 | |
| | Liabilities less Other Assets—(0.58%) | | | | (15,491,874 | ) |
| | NET ASSETS—100.00% | | | | $ | 2,692,298,291 | |
| | | | | | | | | | |
* Non-income producing.
A category may contain multiple industries as defined by the Standard Industrial Classification system.
The accompanying notes are an integral part of the financial statements.
MARCH 31, 2007 SEMI-ANNUAL REPORT
23
Ariel Focus Fund Portfolio Management Discussion | | ARFFX |

Fund Results
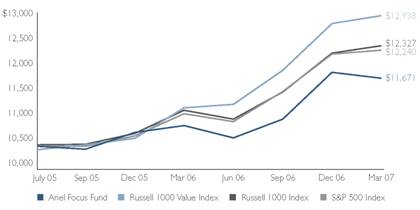
Ariel Focus Fund dipped -1.04% during the first quarter of 2007. By comparison, the Russell 1000 Value Index gained +1.24%, the Russell 1000 Index inched up +1.21% while the broader market as measured by the S&P 500 Index was up only a nominal +0.64%. For the six months ended March 31, 2007, Ariel Focus Fund increased a solid +7.63%, slightly ahead of the S&P 500’s rise of +7.38%. By comparison, over the same six-month period, the Russell 1000 Value and Russell 1000 Indices rose +9.34% and +8.25%, respectively.
Performance Drivers
During the quarter and the six-month period ended March 31, 2007, low quality stocks continued their stellar rise. The conservative brands that Ariel favors largely sat out this rally as investors chased performance. Compounding our avoidance of low-quality, a few names in our concentrated portfolio struggled, weighing down overall performance for the three- and six-month periods.
On a positive note, our conviction in Hewitt Associates, Inc. was rewarded this quarter. Hewitt rose almost +14% on improved earnings, management’s stock repurchase plans and stabilization in its Human Resources Business Processing Outsourcing segment. Unfortunately, some gains were given back on struggle stories like H&R Block, Inc. which fell -8%, on investor skittishness regarding a softening housing market and worry over rippling effects of a sub-prime meltdown. Wall Street further penalized the stock when mortgage lenders, HSBC and New Century Financial, experienced very large and public losses. Yet, H&R Block’s core business, its iconic tax franchise, continues to operate well. We believe the tax business alone is worth more than the current stock price.
Over the six month period, Accenture rose almost +23% on strong organic growth in its consulting and outsourcing businesses combined with management’s buyback of over a billion dollars worth of outstanding shares. A significant percentage of these gains were offset by poor performance of a few holdings. For example, pharmaceutical giant, Pfizer Inc, fell -9%, largely on its suspension of all Phase 3 torcetrapib trials because of safety concerns over the cholesterol drug. Despite this disappointment, we remain confident in Pfizer’s robust pipeline of early stage drugs, its track record of innovation and management’s continued commitment to cut costs and reallocate capital wisely.
This historic market rally now stands at four years, five months and counting. While investors try to catch the last few waves of this remarkable ride, history has shown that eventually there will be a return to normalcy. In fact, we see signs of challenges ahead. Specifically, the economy is slowing with GDP clocking a mere 2.5% and corporate earnings pulling back to 7.3% from previous double-digit growth. Furthermore, a weakening U.S. housing market is likely to crimp the spending habits of U.S. consumers. As such, we favor quality companies with strong brand franchises that provide relatively predictable, consistent returns. Although our conservative bias may appear to sacrifice some short-term gains, we believe our patient approach and long-term focus provide shareholder value over the long-haul.
Comings & Goings
During the quarter, we added two holdings to the portfolio. We purchased shares of consumer health care manufacturer, Johnson & Johnson, whose stable of brands includes popular names like Band-Aid, Tylenol, Reach and Listerine. Additionally, we added Constellation Brands, Inc., a leading producer and marketer of beverage alcohol brands. Conversely, we sold our position in Gannett Co., Inc. to pursue other opportunities.
800-292-7435
24
Ariel Focus Fund Performance Summary | | Inception: June 30, 2005 |
About the Fund
The no-load Ariel Focus Fund pursues long-term capital appreciation by investing in undervalued companies that show strong potential for growth. The Fund primarily invests in companies with market capitalizations in excess of $10 billion. Ariel Focus Fund is a non-diversified fund and generally will hold 20 securities.
Composition of Equity Holdings
| | | | Russell | | | | | |
| | Ariel | | 1000 | | Russell | | S&P | |
| | Focus | | Value | | 1000 | | 500 | |
| | Fund† | | Index | | Index | | Index | |
Consumer Discretionary & Services | | 26.2 | % | 7.5 | % | 13.3 | % | 12.3 | % |
Financial Services | | 23.2 | % | 35.3 | % | 22.7 | % | 22.6 | % |
Other | | 14.7 | % | 3.6 | % | 3.9 | % | 4.6 | % |
Technology | | 12.6 | % | 3.6 | % | 12.3 | % | 12.5 | % |
Health Care | | 11.9 | % | 6.7 | % | 12.3 | % | 12.1 | % |
Autos & Transportation | | 6.5 | % | 1.6 | % | 2.4 | % | 2.4 | % |
Consumer Staples | | 4.9 | % | 7.0 | % | 7.0 | % | 7.4 | % |
Utilities | | 0.0 | % | 14.0 | % | 8.3 | % | 8.3 | % |
Integrated Oils | | 0.0 | % | 11.1 | % | 5.7 | % | 6.3 | % |
Materials & Processing | | 0.0 | % | 4.6 | % | 4.3 | % | 3.6 | % |
Other Energy | | 0.0 | % | 2.9 | % | 3.3 | % | 3.6 | % |
Producer Durables | | 0.0 | % | 2.0 | % | 4.6 | % | 4.3 | % |
† Sector weightings are calculated based on equity holdings in the Fund and exclude cash in order to make a relevant comparison to the indexes.
Portfolio Composition
Equity | | 95.3 | % |
Cash & Other | | 4.7 | % |
Expense Ratio
* As of 9/30/06
Ariel Capital Management, LLC, the Adviser to the Ariel Mutual Funds, is contractually obligated to waive fees and reimburse expenses in order to limit Ariel Focus Fund’s total annual operating expenses to 1.25% of net assets through the end of the fiscal year ending September 30, 2008. After that date, there is no assurance that such expenses will be limited.
Average Annual Total Returns as of March 31, 2007
| | 1st Quarter | | 1 Year | | Life of Fund | |
Ariel Focus Fund | | -1.04 | % | 8.96 | % | 9.21 | % |
Russell 1000 Value Index | | 1.24 | % | 16.83 | % | 15.82 | % |
Russell 1000 Index | | 1.21 | % | 11.84 | % | 12.67 | % |
S&P 500 Index | | 0.64 | % | 11.83 | % | 12.22 | % |
Past performance does not guarantee future results.
The Value of a $10,000 Investment in Ariel Focus Fund
| | Top Ten Equity Holdings | | | |
| | | | | |
1 | | Berkshire Hathaway Inc. | | 7.6 | % |
| | Insurance and investment firm | | | |
| | | | | |
2 | | International Business Machines Corp. | | 6.8 | % |
| | Worldwide provider of computer products and services | | | |
| | | | | |
3 | | Tyco International Ltd. | | 6.4 | % |
| | Manufacturing conglomerate | | | |
| | | | | |
4 | | H&R Block, Inc. | | 6.3 | % |
| | Tax, investment and mortgage services provider | | | |
| | | | | |
5 | | Toyota Motor Corp. | | 6.2 | % |
| | Global auto manufacturer | | | |
| | | | | |
6 | | Dell Inc. | | 5.2 | % |
| | Global computer and technology provider | | | |
| | | | | |
7 | | Carnival Corp. | | 4.8 | % |
| | Worldwide cruise company | | | |
| | | | | |
8 | | Hewitt Associates, Inc. | | 4.7 | % |
| | Human resources outsourcing and consulting firm | | | |
| | | | | |
9 | | Black & Decker Corp. | | 4.7 | % |
| | Manufacturer of power tools and accessories | | | |
| | | | | |
10 | | Constellation Brands, Inc. | | 4.6 | % |
| | Leading producer of alcohol brands | | | |
Note: All performance assumes the reinvestment of dividends and capital gains. The graph and performance table do not reflect the deduction of taxes that a shareholder would pay on fund distributions or the redemption of fund shares. The Russell 1000® Value Index measures the performance of large-sized, value-oriented companies with lower price-to-earnings ratios. The Russell 1000® Index measures the performance of large-sized companies. The S&P 500 is a broad market-weighted index dominated by blue-chip stocks. All indexes are unmanaged, and an investor cannot invest directly in an index. Ariel Focus Fund is a non-diversified fund and therefore may be subject to greater volatility than a more diversified investment. The performance of Ariel Focus Fund may differ from that of Ariel Fund and Ariel Appreciation Fund due to its status as a non-diversified fund and different portfolio managers.
MARCH 31, 2007 SEMI-ANNUAL REPORT
25
Ariel Focus Fund Schedule of Investments | | March 31, 2007 (Unaudited) |
Number of Shares | | COMMON STOCKS—95.28% | | Cost | | Market Value | |
| | | | | | | |
| | Autos & Transportation—6.24% | | | | | |
18,100 | | Toyota Motor Corp., ADR | | $ | 1,760,280 | | $ | 2,319,696 | |
| | | | | | | |
| | Consumer Discretionary & Services—24.97% | | | | | |
42,700 | | Accenture Ltd, Class A | | 1,073,642 | | 1,645,658 | |
21,500 | | Black & Decker Corp. | | 1,859,011 | | 1,754,830 | |
38,300 | | Carnival Corp. | | 1,854,480 | | 1,794,738 | |
60,200 | | Hewitt Associates, Inc., Class A * | | 1,526,283 | | 1,759,646 | |
43,100 | | Home Depot, Inc. | | 1,663,536 | | 1,583,494 | |
7,300 | | Omnicom Group Inc. | | 588,398 | | 747,374 | |
| | | | 8,565,350 | | 9,285,740 | |
| | Consumer Staples—4.65% | | | | | |
81,600 | | Constellation Brands, Inc.* | | 1,615,657 | | 1,728,288 | |
| | Financial Services—22.13% | | | | | |
32,500 | | Aflac Inc. | | 1,466,383 | | 1,529,450 | |
31,000 | | Citigroup Inc. | | 1,490,585 | | 1,591,540 | |
110,800 | | H&R Block, Inc. | | 2,641,490 | | 2,331,232 | |
35,000 | | JPMorgan Chase & Co. | | 1,449,606 | | 1,693,300 | |
13,800 | | Morgan Stanley | | 768,771 | | 1,086,888 | |
| | | | 7,816,835 | | 8,232,410 | |
| | Health Care—11.31% | | | | | |
47,900 | | IMS Health Inc. | | 1,182,080 | | 1,420,714 | |
27,900 | | Johnson & Johnson | | 1,742,847 | | 1,681,254 | |
43,700 | | Pfizer Inc | | 1,098,927 | | 1,103,862 | |
| | | | 4,023,854 | | 4,205,830 | |
| | Other—14.02% | | | | | |
781 | | Berkshire Hathaway Inc., Class B * | | 2,435,851 | | 2,842,840 | |
75,200 | | Tyco International Ltd. | | 2,002,640 | | 2,372,560 | |
| | | | 4,438,491 | | 5,215,400 | |
| | Technology—11.96% | | | | | |
82,800 | | Dell Inc. * | | 2,015,985 | | 1,921,788 | |
26,800 | | International Business Machines Corp. | | 2,194,320 | | 2,526,168 | |
| | | | 4,210,305 | | 4,447,956 | |
| | | | | | | |
| | Total Common Stocks | | 32,430,772 | | 35,435,320 | |
| | | | | | | |
Principal Amount | | REPURCHASE AGREEMENTS—4.67% | | Cost | | Market Value | |
| | | | | | | |
$ | 1,671,004 | | Fixed Income Clearing Corporation, 4.50%, dated 3/30/2007, due 4/2/2007, repurchase price $1,671,630, (collateralized by U.S. Treasury Bond, 8.875%, due 2/15/2019) | | $ | 1,671,004 | | $ | 1,671,004 | |
67,227 | | State Street Corporation, 4.30%, dated 3/30/2007, due 4/2/2007, repurchase price $67,251, (collateralized by U.S. Treasury Bond, 6.00%, due 2/15/2026) | | 67,227 | | 67,227 | |
| | Total Repurchase Agreements | | 1,738,231 | | 1,738,231 | |
| | Total Investments—99.95% | | $ | 34,169,003 | | 37,173,551 | |
| | Other Assets Less Liabilities—0.05% | | | | 20,353 | |
| | NET ASSETS—100.00% | | | | $ | 37,193,904 | |
| | | | | | | | | | |
* Non-income producing.
A category may contain multiple industries as defined by the Standard Industrial Classification system.
The accompanying notes are an integral part of the financial statements.
ARIELMUTUALFUNDS.COM
26
Statements of Assets & Liabilities | | March 31, 2007 (Unaudited) |
| | | | Ariel | | Ariel | |
| | Ariel | | Appreciation | | Focus | |
| | Fund | | Fund | | Fund | |
Assets: | | | | | | | |
Investments in unaffiliated issuers, at value
(cost $2,312,731,660, $1,914,422,601 and $32,430,772, respectively) | | $ | 3,036,607,133 | | $ | 2,659,238,446 | | $ | 35,435,320 | |
Investments in affiliated issuers, at value
(cost $777,203,476) | | 986,325,834 | | — | | — | |
Repurchase agreements, at value
(cost $164,017,539, $48,551,719 and $1,738,231, respectively) | | 164,017,539 | | 48,551,719 | | 1,738,231 | |
Receivable for fund shares sold | | 52,087,108 | | 1,871,877 | | 56,039 | |
Dividends and interest receivable | | 3,934,491 | | 3,746,507 | | 30,130 | |
Prepaid and other assets | | 92,080 | | 51,373 | | 11,763 | |
Total assets | | 4,243,064,185 | | 2,713,459,922 | | 37,271,483 | |
Liabilities: | | | | | | | |
Payable for securities purchased | | 28,376,675 | | 14,991,017 | | — | |
Payable for fund shares redeemed | | 101,023,488 | | 4,425,598 | | 29,898 | |
Other liabilities | | 2,619,189 | | 1,745,016 | | 47,681 | |
Total liabilities | | 132,019,352 | | 21,161,631 | | 77,579 | |
Net Assets | | $ | 4,111,044,833 | | $ | 2,692,298,291 | | $ | 37,193,904 | |
| | | | | | | |
Net Assets Consist of: | | | | | | | |
Paid-in capital | | $ | 3,122,103,050 | | $ | 1,863,361,496 | | $ | 33,965,878 | |
Undistributed net investment income | | 1,906,675 | | 7,109,126 | | 30,837 | |
Accumulated net realized gain on investment transactions | | 54,037,276 | | 77,011,824 | | 192,641 | |
Net unrealized appreciation on investments | | 932,997,832 | | 744,815,845 | | 3,004,548 | |
Total net assets | | $ | 4,111,044,833 | | $ | 2,692,298,291 | | $ | 37,193,904 | |
| | | | | | | |
Total net assets | | $ | 4,111,044,833 | | $ | 2,692,298,291 | | $ | 37,193,904 | |
| | | | | | | |
Shares outstanding (no par value) | | 76,347,613 | | 54,657,247 | | 3,246,057 | |
| | | | | | | |
Net asset value, offering and redemption price per share | | $ | 53.85 | | $ | 49.26 | | $ | 11.46 | |
The accompanying notes are an integral part of the financial statements.
MARCH 31, 2007 SEMI-ANNUAL REPORT
27
Statements of Operations | | Six Months Ended March 31, 2007 (Unaudited) |
| | | | Ariel | | Ariel | |
| | Ariel | | Appreciation | | Focus | |
| | Fund | | Fund | | Fund | |
Investment Income: | | | | | | | |
Dividends | | | | | | | |
Unaffiliated Issuers | | $ | 18,023,258 | | $ | 22,140,931 | | $ | 273,407 | (a) |
Affiliated Issuers | | 3,951,397 | (b) | | | | |
Interest | | 1,764,949 | | 525,309 | | 41,364 | |
Total investment income | | 23,739,604 | | 22,666,240 | | 314,771 | |
| | | | | | | |
Expenses: | | | | | | | |
Management fees | | 11,959,977 | | 9,336,703 | | 128,903 | |
Distribution fees | | 5,266,366 | | 3,447,204 | | 42,968 | |
Shareholder service fees | | 2,925,119 | | 1,662,656 | | 34,844 | |
Transfer agent fees and expenses | | 706,896 | | 480,867 | | 33,631 | |
Printing and postage expenses | | 577,082 | | 353,221 | | 2,444 | |
Trustees’ fees and expenses | | 149,384 | | 104,657 | | 28,683 | |
Custody fees and expenses | | 71,145 | | 48,107 | | 1,673 | |
Professional fees | | 46,403 | | 39,511 | | 18,228 | |
Federal and state registration fees | | 43,366 | | 23,394 | | 12,050 | |
Miscellaneous expenses | | 87,191 | | 59,567 | | 2,579 | |
Total expenses before reimbursements | | 21,832,929 | | 15,555,887 | | 306,003 | |
Expense reimbursements | | — | | — | | (91,164 | ) |
Net expenses | | 21,832,929 | | 15,555,887 | | 214,839 | |
Net investment income | | 1,906,675 | | 7,110,353 | | 99,932 | |
| | | | | | | |
Realized and unrealized gain (loss): | | | | | | | |
Net realized gain (loss) on investments and foreign currency translations | | | | | | | |
Unaffiliated Issuers | | (14,885,068 | ) | 82,379,105 | | 232,952 | |
Affiliated Issuers | | 74,673,842 | | — | | — | |
Change in net unrealized appreciation/depreciation on investments and foreign currency translations | | 357,313,307 | | 149,335,545 | | 1,885,916 | |
Net gain on investments | | 417,102,081 | | 231,714,650 | | 2,118,868 | |
Net increase in net assets resulting from operations | | $ | 419,008,756 | | $ | 238,825,003 | | $ | 2,218,800 | |
(a) Net of $913 in foreign tax withheld.
(b) See Note Five for information on affiliated issuers.
The accompanying notes are an integral part of the financial statements.
800-292-7435
28
Statements of Changes in Net Assets
| | Ariel Fund | | Ariel Appreciation Fund | |
| | Six Months Ended | | | | Six Months Ended | | | |
| | March 31, 2007 | | Year Ended | | March 31, 2007 | | Year Ended | |
| | (Unaudited) | | September 30, 2006 | | (Unaudited) | | September 30, 2006 | |
Operations: | | | | | | | | | |
Net investment income | | $ | 1,906,675 | | $ | 9,003,567 | | $ | 7,110,353 | | $ | 8,162,163 | |
Net realized gain on investments and foreign currency translations | | 59,788,774 | | 272,196,400 | | 82,379,105 | | 206,501,395 | |
Change in net unrealized appreciation/depreciation on investments and foreign currency translations | | 357,313,307 | | (192,737,113 | ) | 149,335,545 | | (63,685,778 | ) |
Net increase in net assets from operations | | 419,008,756 | | 88,462,854 | | 238,825,003 | | 150,977,780 | |
| | | | | | | | | |
Distribution to shareholders: | | | | | | | | | |
Net investment income | | — | | (14,001,396 | ) | (1,232,376 | ) | (9,404,820 | ) |
Capital gains | | (269,304,352 | ) | (314,776,554 | ) | (189,484,532 | ) | (150,977,922 | ) |
Total distributions | | (269,304,352 | ) | (328,777,950 | ) | (190,716,908 | ) | (160,382,742 | ) |
| | | | | | | | | |
Share transactions: | | | | | | | | | |
Shares sold | | 354,199,108 | | 818,400,432 | | 222,153,385 | | 452,970,351 | |
Shares issued to holders in reinvestment of dividends | | 236,050,404 | | 293,315,056 | | 183,697,049 | | 153,913,503 | |
Shares redeemed | | (909,873,969 | ) | (1,608,286,625 | ) | (493,856,635 | ) | (1,218,385,890 | ) |
Net decrease from share transactions | | (319,624,457 | ) | (496,571,137 | ) | (88,006,201 | ) | (611,502,036 | ) |
Total decrease in net assets | | (169,920,053 | ) | (736,886,233 | ) | (39,898,106 | ) | (620,906,998 | ) |
| | | | | | | | | |
Net Assets: | | | | | | | | | |
Beginning of year | | 4,280,964,886 | | 5,017,851,119 | | 2,732,196,397 | | 3,353,103,395 | |
End of period | | $ | 4,111,044,833 | | $ | 4,280,964,886 | | $ | 2,692,298,291 | | $ | 2,732,196,397 | |
Undistributed net investment income included in net assets at end of period | | $ | 1,906,675 | | $ | — | | $ | 7,109,126 | | $ | 1,231,149 | |
| | | | | | | | | |
Capital share transactions: | | | | | | | | | |
Shares sold | | 6,680,562 | | 15,720,931 | | 4,509,940 | | 9,615,344 | |
Shares reinvested | | 4,608,559 | | 5,774,276 | | 3,820,391 | | 3,300,423 | |
Shares redeemed | | (17,270,600 | ) | (31,152,007 | ) | (10,056,633 | ) | (25,929,064 | ) |
Net decrease in shares outstanding | | (5,981,479 | ) | (9,656,800 | ) | (1,726,302 | ) | (13,013,297 | ) |
The accompanying notes are an integral part of the financial statements.
MARCH 31, 2007 SEMI-ANNUAL REPORT
29
Statements of Changes in Net Assets (continued) | | March 31, 2007 (Unaudited) |
| | Ariel Focus Fund | |
| | Six Months Ended | | | |
| | March 31, 2007 | | Year Ended | |
| | (Unaudited) | | September 30, 2006 | |
Operations: | | | | | |
Net investment income | | $ | 99,932 | | $ | 89,135 | |
Net realized gain (loss) on investments and foreign currency translations | | 232,952 | | (4,019 | ) |
Change in net unrealized appreciation/depreciation on investments and foreign currency translations | | 1,885,916 | | 1,024,114 | |
Net increase in net assets from operations | | 2,218,800 | | 1,109,230 | |
| | | | | |
Distributions to shareholders: | | | | | |
Net investment income | | (137,420 | ) | (37,431 | ) |
Capital gains | | — | | (125,877 | ) |
Total distributions | | (137,420 | ) | (163,308 | ) |
| | | | | |
Share transactions: | | | | | |
Shares sold | | 7,575,812 | | 17,864,409 | |
Shares issued to holders in reinvestment of dividends | | 134,532 | | 106,400 | |
Shares redeemed | | (1,591,233 | ) | (738,373 | ) |
Net increase from share transactions | | 6,119,111 | | 17,232,436 | |
| | | | | |
Total increase in net assets | | 8,200,491 | | 18,178,358 | |
| | | | | |
Net Assets: | | | | | |
Beginning of year | | 28,993,413 | | 10,815,055 | |
End of period | | $ | 37,193,904 | | $ | 28,993,413 | |
Undistributed net investment income included in net assets at end of period | | $ | 30,837 | | $ | 68,325 | |
| | | | | |
Capital share transactions: | | | | | |
Shares sold | | 661,806 | | 1,716,461 | |
Shares reinvested | | 11,588 | | 10,314 | |
Shares redeemed | | (139,231 | ) | (72,000 | ) |
Net decrease in shares outstanding | | 534,163 | | 1,654,775 | |
The accompanying notes are an integral part of the financial statements.
ARIELMUTUALFUNDS.COM
30
Financial Highlights | | March 31, 2007 (Unaudited) |
For a share outstanding throughout each period | | |
| | ARIEL FUND | |
| | Six Months Ended March 31, | | Year Ended September 30 | |
| | 2007 (Unaudited) | | 2006 | | 2005 | | 2004 | | 2003 | | 2002 | |
| | | | | | | | | | | | | |
Net asset value, beginning of year | | $ | 52.00 | | $ | 54.55 | | $ | 50.62 | | $ | 40.84 | | $ | 35.18 | | $ | 33.58 | |
Income from investment operations: | | | | | | | | | | | | | |
Net investment income (loss) | | 0.02 | | 0.09 | | 0.04 | | 0.02 | | (0.02 | ) | (0.05 | ) |
Net realized and unrealized gains on investments | | 5.23 | | 0.99 | | 5.70 | | 9.76 | | 6.20 | | 2.29 | |
Total from investment operations | | 5.25 | | 1.08 | | 5.74 | | 9.78 | | 6.18 | | 2.24 | |
Distributions to shareholders: | | | | | | | | | | | | | |
Dividends from net investment income | | — | | (0.15 | ) | (0.02 | ) | — | | — | | (0.11 | ) |
Distributions from capital gains | | (3.40 | ) | (3.48 | ) | (1.79 | ) | — | | (0.52 | ) | (0.53 | ) |
Total distributions | | (3.40 | ) | (3.63 | ) | (1.81 | ) | — | | (0.52 | ) | (0.64 | ) |
Net asset value, end of period | | $ | 53.85 | | $ | 52.00 | | $ | 54.55 | | $ | 50.62 | | $ | 40.84 | | $ | 35.18 | |
Total return | | 10.44 | %(a) | 2.16 | % | 11.54 | % | 23.95 | % | 17.82 | % | 6.62 | % |
Supplemental data and ratios: | | | | | | | | | | | | | |
Net assets, end of period, in thousands | | $ | 4,111,045 | | $ | 4,280,965 | | $ | 5,017,851 | | $ | 3,387,346 | | $ | 2,007,868 | | $ | 1,140,501 | |
Ratio of expenses to average net assets | | 1.04 | %(b) | 1.07 | % | 1.03 | % | 1.07 | % | 1.10 | % | 1.19 | % |
Ratio of net investment income (loss) to average net assets | | 0.09 | %(b) | 0.19 | % | 0.08 | % | 0.06 | % | (0.05 | )% | (0.12 | )% |
Portfolio turnover rate | | 8 | %(a) | 28 | % | 19 | % | 16 | % | 4 | % | 6 | % |
| | ARIEL APPRECIATION FUND | |
| | Six Months Ended March 31, | | Year Ended September 30 | |
| | 2007 (Unaudited) | | 2006 | | 2005 | | 2004 | | 2003 | | 2002 | |
| | | | | | | | | | | | | |
Net asset value, beginning of year | | $ | 48.46 | | $ | 48.32 | | $ | 44.62 | | $ | 38.99 | | $ | 31.49 | | $ | 32.40 | |
Income from investment operations: | | | | | | | | | | | | | |
Net investment income (loss) | | 0.13 | | 0.12 | | 0.09 | | 0.01 | | (0.02 | ) | (0.02 | ) |
Net realized and unrealized gains (losses) on investments | | 4.15 | | 2.35 | | 4.86 | | 5.62 | | 7.64 | | (0.12 | ) |
Total from investment operations | | 4.28 | | 2.47 | | 4.95 | | 5.63 | | 7.62 | | (0.14 | ) |
Distributions to shareholders: | | | | | | | | | | | | | |
Dividends from net investment income | | (0.02 | ) | (0.13 | ) | (0.05 | ) | — | | — | | (0.06 | ) |
Distributions from capital gains | | (3.46 | ) | (2.20 | ) | (1.20 | ) | — | | (0.12 | ) | (0.71 | ) |
Total distributions | | (3.48 | ) | (2.33 | ) | (1.25 | ) | — | | (0.12 | ) | (0.77 | ) |
Net asset value, end of period | | $ | 49.26 | | $ | 48.46 | | $ | 48.32 | | $ | 44.62 | | $ | 38.99 | | $ | 31.49 | |
Total return | | 9.02 | %(a) | 5.32 | % | 11.26 | % | 14.44 | % | 24.29 | % | (0.73 | )% |
Supplemental data and ratios: | | | | | | | | | | | | | |
Net assets, end of period, in thousands | | $ | 2,692,298 | | $ | 2,732,196 | | $ | 3,353,103 | | $ | 2,919,117 | | $ | 2,064,883 | | $ | 1,274,543 | |
Ratio of expenses to average net assets, including reimbursements | | 1.13 | %(b) | 1.16 | % | 1.14 | % | 1.15 | %(c) | 1.20 | % | 1.26 | % |
Ratio of net investment income (loss) to average net assets | | 0.52 | %(b) | 0.27 | % | 0.17 | % | 0.01 | % | (0.06 | )% | (0.06 | )% |
Portfolio turnover rate | | 13 | %(a) | 25 | % | 25 | % | 19 | % | 32 | % | 13 | % |
(a) Not annualized.
(b) Annualized.
(c) Ratio of expenses to average net assets, excluding reimbursements, was 1.16% in 2004.
The accompanying notes are an integral part of the financial statements.
MARCH 31, 2007 SEMI-ANNUAL REPORT
31
Financial Highlights (continued) | | |
| | ARIEL FOCUS FUND | |
| | Six Months Ended March 31, | | Year Ended | | June 30, 2005(a) to | |
| | 2007 (Unaudited) | | September 30, 2006 | | September 30, 2005 | |
| | | | | | | |
Net asset value, beginning of year | | $ | 10.69 | | $ | 10.23 | | $ | 10.00 | |
Income from investment operations: | | | | | | | |
Net investment income | | 0.03 | | 0.04 | | 0.01 | |
Net realized and unrealized gains on investments | | 0.79 | | 0.56 | | 0.22 | |
Total from investment operations | | 0.82 | | 0.60 | | 0.23 | |
Distributions to shareholders: | | | | | | | |
Dividends from net investment income | | (0.05 | ) | (0.03 | ) | — | |
Distributions from capital gains | | — | | (0.11 | ) | — | |
Total distributions | | (0.05 | ) | (0.14 | ) | — | |
Net asset value, end of period | | $ | 11.46 | | $ | 10.69 | | $ | 10.23 | |
Total return | | 7.63 | %(b) | 6.00 | % | 2.30 | %(b) |
Supplemental data and ratios: | | | | | | | |
Net assets, end of period, in thousands | | $ | 37,194 | | $ | 28,993 | | $ | 10,815 | |
Ratio of expenses to average net assets, including waivers | | 1.25 | %(c) | 1.25 | % | 1.25 | %(c) |
Ratio of expenses to average net assets, excluding waivers | | 1.78 | %(c) | 2.20 | % | 2.55 | %(c) |
Ratio of net investment income to average net assets, including waivers | | 0.58 | %(c) | 0.48 | % | 0.41 | %(c) |
Ratio of net investment income (loss) to average net assets, excluding waivers | | 0.05 | %(c) | (0.47 | )% | (0.89 | )%(c) |
Portfolio turnover rate | | 19 | %(b) | 29 | % | 15 | %(b) |
(a) Commencement of operations.
(b) Not annualized.
(c) Annualized.
The accompanying notes are an integral part of the financial statements.
800-292-7435
32
Notes to the Financial Statements | | March 31, 2007 (Unaudited) |
Note One | Organization
Ariel Investment Trust (the “Trust”) is a Massachusetts business trust registered under the Investment Company Act of 1940, as amended (the “1940 Act”), as an open-end management investment company. Ariel Fund, Ariel Appreciation Fund and Ariel Focus Fund (the “Funds”) are series of the Trust. Ariel Fund and Ariel Appreciation Fund are diversified portfolios and Ariel Focus Fund is a non-diversified portfolio of the Trust.
Note Two | Significant Accounting Policies
The following is a summary of significant accounting policies consistently followed by the Funds in the preparation of their financial statements. The financial statements have been prepared in accordance with accounting principles generally accepted in the United States, which require management to make certain estimates and assumptions at the date of the financial statements. Actual results may differ from such estimates.
In the normal course of business, the Trust enters into contracts that contain a variety of representations and warranties that may provide certain indemnifications. The maximum exposure under these arrangements is unknown, as this would involve future claims that may be made against the Trust and/or its affiliates that have not yet occurred. Based on experience, however, the risk of loss is expected to be remote.
The Financial Accounting Standards Board (“FASB”) issued Interpretation No. 48, Accounting for Uncertainty in Income Taxes – an Interpretation of FASB Statement No. 109 (“FIN 48”). FIN 48 addresses the accounting for uncertainty in income taxes. FASB issued Statement of Financial Accounting Standards No. 157, Fair Value Measurements (“FAS 157”), in September 2006, which is effective for fiscal years beginning after November 15, 2007. FAS 157 defines fair value, establishes a framework for measuring fair value and expands financial statement disclosures about fair value measurements. Management is currently evaluating the impact of adopting FIN 48 and FAS 157.
Investment Valuation – Securities for which market quotations are readily available are valued at the last sale price on the national securities exchange on which such securities are primarily traded and, in the case of securities reported on the Nasdaq system, are valued based on the Nasdaq Official Closing Price. If a closing price is not reported, equity securities for which reliable bid and ask quotations are available are valued at the mean between bid and ask prices.
Debt obligations having a maturity of 60 days or less are valued at amortized cost, which approximates market value. Debt securities with maturities over 60 days are valued at the yield equivalent as obtained from a pricing service or one or more market makers for such securities. Securities and assets for which market quotations are not readily available are valued at fair value as determined
in good faith by or under the direction of the Board of Trustees.
Foreign Transactions – The books and records of the Funds are maintained in U.S. dollars and transactions denominated in foreign currencies are recorded in the Funds’ records at the rate prevailing when earned or recorded. Asset and liability accounts that are denominated in foreign currencies are adjusted to reflect current exchange rates. The effect of changes in foreign exchange rates on realized and unrealized security gains or losses is reflected as a component of such gains or losses. The Funds do not isolate that portion of the results of operations arising as a result of changes in the foreign exchange rates from the changes in market prices of the securities.
Repurchase Agreements – The Funds may enter into repurchase agreements with recognized financial institutions and in all instances hold underlying securities as collateral with a value at least equal to the total repurchase price such financial institutions have agreed to pay.
Federal Taxes – It is the Funds’ policy to comply with the requirements of the Internal Revenue Code applicable to regulated investment companies and to distribute substantially all taxable income to shareholders.
MARCH 31, 2007 SEMI-ANNUAL REPORT
33
Notes to the Financial Statements (continued)
Accordingly, no provision for federal income or excise taxes has been made.
Securities Transactions and Investment Income – Securities transactions are accounted for on a trade date basis. Realized gains and losses from securities transactions are recorded on the identified cost basis. Dividend income is recorded on the ex-dividend date and interest income is recognized on an accrual basis. Premiums and discounts on securities purchased are amortized using the effective interest method.
Expenses – The Funds contract and are charged for those expenses that are directly attributable to each Fund. Expenses that are not directly attributable to one or more Funds are allocated among applicable Funds on an equitable and consistent basis considering such things as the nature and type of expense and the relative net assets of the Funds. Various third party firms provide shareholder recordkeeping, communications and other services to beneficial owners of shares of the Funds. The fees incurred under these arrangements are reported as “Shareholder service fees” in the Statements of Operations.
Distributions to Shareholders – Dividends from net investment income and net realized capital gains, if any, are declared and paid at least annually.
Distributions to shareholders are determined in accordance with federal income tax regulations and are recorded on the ex-dividend date. The character of distributions made during the year from net investment income or net realized capital gains may differ from the characterization for federal income tax purposes due to differences in the recognition of income, expense or gain items for financial statement and tax purposes. Where appropriate, reclassifications between net asset accounts are made at the end of the fiscal year for such differences that are permanent in nature.
Note Three | Investment Transactions, Distributions and Federal Income Tax Matters
Purchases and proceeds from sales of securities, excluding short-term investments and U.S. government securities, for the six months ended March 31, 2007 were as follows:
| | Ariel Fund | | Ariel Appreciation Fund | | Ariel Focus Fund | |
| | | | | | | |
Purchases | | $ | 329,376,236 | | $ | 365,891,266 | | $ | 10,705,287 | |
Sales | | 1,002,183,561 | | 627,684,716 | | 6,196,815 | |
| | | | | | | | | | |
Note Four | Investment Advisory and Other Transactions with Related Parties
Ariel Capital Management, LLC (the “Adviser”) provides investment advisory and administrative services to each Fund of the Trust under an agreement (the “Management Agreement”). Pursuant to the Management Agreement, the Adviser is paid a monthly fee on average daily net assets at the annual rates shown below:
Management Fees | | Ariel Fund | | Ariel Appreciation Fund | | Ariel Focus Fund | |
| | | | | | | |
Average Daily Net Assets | | | | | | | |
First $500 million | | 0.65 | % | 0.75 | % | 0.75 | % |
Next $500 million | | 0.60 | % | 0.70 | % | 0.70 | % |
Over $1 billion | | 0.55 | % | 0.65 | % | 0.65 | % |
The Adviser has contractually agreed to reimburse Ariel Fund and Ariel Appreciation Fund to the extent their respective total annual operating expenses (exclusive of brokerage, interest, taxes, distribution plan expenses and extraordinary items) exceed 1.50% of the first $30 million and 1.00% of their respective average daily net assets in excess of $30 million. The Adviser is contractually committed to waive fees or reimburse expenses in order to limit Ariel Focus Fund’s total annual operating expenses to 1.25% of its average daily net assets through September 30, 2008. After that date, there is no assurance that such expenses will be limited.
ARIELMUTUALFUNDS.COM
34
March 31, 2007 (Unaudited)
Ariel Distributors, LLC is the Funds’ distributor and principal underwriter (“the Distributor”). The Trust has adopted a plan of distribution under Rule 12b-1 of the 1940 Act applicable to the Funds. Under the plan, 12b-1 distribution fees up to an annual rate of 0.25% of average daily net assets are paid weekly to the Distributor for its services. Distribution fee expense totaled $5,266,366 for Ariel Fund, $3,447,204 for Ariel Appreciation Fund and $42,968 for Ariel Focus Fund during the six months ended March 31, 2007. These amounts were paid to the Distributor, which reallowed $3,872,277 for Ariel Fund, $2,684,567 for Ariel Appreciation Fund and $13,455 for Ariel Focus Fund to broker-dealers who distribute fund shares. The remaining amounts were retained by the Distributor for its services, advertising, and other distribution expenses.
Trustees’ fees and expenses represent only those expenses of disinterested (independent) trustees of the Funds.
Note Five | Transactions with Affiliated Companies
If a Fund’s holding represents ownership of 5% or more of the voting securities of a company, the company is deemed to be an affiliate as defined in the 1940 Act. Ariel Fund had the following transactions during the six months ended March 31, 2007 with affiliated companies:
| | Share Activity | | Six Months Ended March 31, 2007 | |
| | | | | | | | | | | | | | Amount of | |
| | | | | | | | | | | | | | Gain (Loss) | |
| | | | | | | | | | | | | | Realized on | |
| | Balance | | | | | | Balance | | Value at | | Dividends Credited | | Sale of | |
Security Name | | September 30, 2006 | | Purchases | | Sales | | March 31, 2007 | | March 31, 2007 | | to Income | | Shares | |
| | | | | | | | | | | | | | | |
ACCO Brands Corp. | | 3,014,900 | | 250,000 | | — | | 3,264,900 | | $ | 78,651,441 | | $ | — | | $ | — | |
Anixter International Inc. | | 2,205,850 | | 232,425 | | 219,500 | | 2,218,775 | | 146,306,024 | | — | | 5,856,503 | |
Assured Guaranty Ltd. | | 4,835,250 | | — | | 872,800 | | 3,962,450 | | 108,254,134 | | 312,416 | | 1,813,347 | |
BearingPoint, Inc. | | 16,828,050 | | — | | — | | 16,828,050 | | 128,902,863 | | — | | — | |
Career Education Corp.** | | 5,772,150 | | — | | 3,338,500 | | 2,433,650 | | ** | | — | | (38,441,612 | ) |
Chittenden Corp.** | | 2,440,750 | | — | | 267,000 | | 2,173,750 | | ** | | 922,900 | | (176,725 | ) |
Harte-Hanks, Inc.* | | 3,053,200 | | 759,300 | | — | | 3,812,500 | | 105,186,875 | | 430,201 | | — | |
Herman Miller, Inc.** | | 3,478,900 | | — | | 912,800 | | 2,566,100 | | ** | | 410,576 | | 7,391,498 | |
Hewitt Associates, Inc. | | 7,496,050 | | — | | — | | 7,496,050 | | 219,109,541 | | — | | — | |
IDEX Corp. | | 3,151,450 | | — | | — | | 3,151,450 | | 160,345,776 | | 945,435 | | — | |
Invacare Corp. | | 2,961,275 | | — | | 692,400 | | 2,268,875 | | 39,569,180 | | 65,377 | | (15,348,016 | ) |
Investors Financial Services Corp.** | | 3,705,400 | | — | | 3,705,400 | | — | | — | | 176,007 | | 90,613,949 | |
Jones Lang LaSalle Inc.** | | 2,058,300 | | — | | 557,800 | | 1,500,500 | | ** | | 688,485 | | 43,726,342 | |
Markel Corp.** | | 517,625 | | — | | 76,700 | | 440,925 | | ** | | — | | 7,484,990 | |
Valassis Communications, Inc.** | | 2,399,150 | | — | | 2,399,150 | | — | | — | | — | | (28,246,434 | ) |
| | | | | | | | | | $ | 986,325,834 | | $ | 3,951,397 | | $ | 74,673,842 | |
* Became an affiliated company during the six months ended March 31, 2007.
** No longer an affiliated company as of March 31, 2007.
Hewitt Associates provides record-keeping services for employer-sponsored plans invested in the Funds and receives shareholder service fees accordingly. An affiliate of Hewitt Associates, Hewitt Financial Services distributes Fund shares and receives 12b-1 fees from Ariel Distributors, LLC.
MARCH 31, 2007 SEMI-ANNUAL REPORT
35
Fund Expense Example | | (Unaudited) |
Example
As a shareholder of the Ariel Mutual Funds, you incur ongoing costs, including management fees, distribution and service (12b-1) fees; and other Fund expenses. The Ariel Mutual Funds currently do not charge any transaction costs, such as sales charges (loads) on purchase payments, reinvested dividends, or other distributions; redemption fees; or exchange fees. The following example is intended to help you understand your ongoing costs (in dollars) of investing in each of the Ariel Mutual Funds and to compare these costs with the ongoing costs of investing in other mutual funds. Please note that IRA, 403(b) and Coverdell ESA account holders are charged an annual $15 recordkeeping fee or a one-time, lifetime $60 fee. If these fees were included, in either the Actual Expense or Hypothetical Example below, your costs would be higher.
The example is based on an investment of $1,000 invested at the beginning of the period and held for the entire period of October 1, 2006 to March 31, 2007.
Actual Expenses
The first line of the table below for each Fund provides information about actual account values and actual expenses for that particular Fund. You may use the information in each of these lines, together with the amount you invested, to estimate the expenses that you paid over the period in each Fund. Simply divide your account value by $1,000 (for example, an $8,600 account value divided by $1,000=8.6), then multiply the result by the number in the first line under the heading entitled, Expenses Paid During Period, to estimate the expenses you paid on your account during this period in each Fund.
Hypothetical Example for Comparison Purposes
The second line of the table below for each Fund provides information about hypothetical account values and hypothetical expenses based on each of the Ariel Mutual Funds’ actual expense ratios and an assumed rate of return of 5% per year before expenses, which is not the actual return. The hypothetical account values and expenses may not be used to estimate the actual ending account balance or expenses you paid for the period. You may use this information to compare the ongoing costs of investing in each of the Ariel Mutual Funds and other funds. To do so, compare this 5% hypothetical example with the 5% hypothetical examples that appear in the shareholder reports of other funds.
Please note that the expenses shown in the table are meant to highlight only your ongoing costs in each of the Ariel Mutual Funds. Therefore, the second line of the table for each Fund is useful in comparing ongoing costs only, and will not help you determine the relative total costs of owning different funds.
| | Beginning | | Ending | | Expenses | | Annualized | |
| | Account Value | | Account Value | | Paid During | | Expense | |
Fund and Return | | October 1, 2006 | | March 31, 2007 | | Period* | | Ratio* | |
| | | | | | | | | |
Ariel Fund | | | | | | | | | |
Actual | | $ | 1,000.00 | | $ | 1,104.40 | | $ | 5.46 | | 1.04 | % |
Hypothetical (5% before expenses) | | $ | 1,000.00 | | $ | 1,019.75 | | $ | 5.24 | | 1.04 | % |
| | | | | | | | | |
| | | | | | | | | |
Ariel Appreciation Fund | | | | | | | | | |
Actual | | $ | 1,000.00 | | $ | 1,090.20 | | $ | 5.89 | | 1.13 | % |
Hypothetical (5% before expenses) | | $ | 1,000.00 | | $ | 1,019.30 | | $ | 5.69 | | 1.13 | % |
| | | | | | | | | |
| | | | | | | | | |
Ariel Focus Fund | | | | | | | | | |
Actual | | $ | 1,000.00 | | $ | 1,076.30 | | $ | 6.47 | | 1.25 | % |
Hypothetical (5% before expenses) | | $ | 1,000.00 | | $ | 1,018.70 | | $ | 6.29 | | 1.25 | % |
* Expenses are equal to each Fund’s annualized expense ratio indicated above multiplied by the average account value over the period, multiplied by 182/365 to reflect the most recent fiscal half year.
800-292-7435
36
Important Supplemental Information
Proxy Voting Policies, Procedures, and Record
Both a description of the policies and procedures that the Funds used to determine how to vote proxies relating to portfolio securities and information regarding how the Funds voted proxies relating to portfolio securities during the most recent 12-month period ended June 30 are available upon request by calling us at 800-292-7435. Such information for the Ariel Mutual Funds is also available on the Securities and Exchange Commission’s (“SEC”) web site at www.sec.gov.
Shareholder Statements and Reports
When we send financial reports, prospectuses and other regulatory materials to shareholders, we attempt to reduce the volume of mail you receive by sending one copy of these documents to two or more account holders who share the same address. We will send you a notice at least 60 days before sending only one copy of these documents if we have not received written consent from you previously. Should you wish to receive individual copies of materials, please contact us at 800-292-7435. Once we have received your instructions, we will begin sending individual copies for each account within 30 days.
Availability of Quarterly Portfolio Schedule
The Funds file complete schedules of investments with the SEC for the quarters ended December 31 and June 30 of each fiscal year on Form N-Q which are available on the SEC’s website at www.sec.gov. Additionally, the Funds’ Form N-Q may be reviewed and copied at the SEC’s Public Reference Room in Washington, DC. For information on the Public Reference Room, call 800-SEC-0330.
All Ariel Mutual Funds quarterly reports contain a complete schedule of portfolio holdings. All quarterly reports are made available to shareholders on our web site at arielmutualfunds.com. Shareholders also may obtain copies of shareholder reports upon request by contacting us directly at 800-292-7435 or by writing to us at P.O. Box 219121, Kansas City, Missouri 64121-9121.
Approval of the Management Agreements
Each year the Board of Trustees of the Trust, including a majority of the independent Trustees, is required to determine whether to continue each Fund’s management agreement with the Adviser (each a “Management Agreement”). The Investment Company Act of 1940, as amended (the “1940 Act”), requires that the Board request and evaluate, and that the Adviser provide, such information as may reasonably be necessary, to evaluate the terms of the Management Agreements. The Board requests and receives a broad range of materials and information, both throughout the year and especially in connection with its annual review of the Management Agreements.
The Board’s Management Contracts Committee (the “Committee”) leads the Board in its consideration of the Management Agreements. The Committee is comprised entirely of Trustees who are not “interested persons” of the Funds, as defined in the 1940 Act (“Independent Trustees”). Both the Committee and the Board held meetings in November 2006 to consider the Management Agreements. During each of those meetings, the Committee and the Independent Trustees were advised by, and met in executive sessions with, independent legal counsel as well as counsel to the Funds. In addition, matters bearing on the Management Agreements are considered at most, if not all, of the Board meetings.
In those meetings the Committee and the Board considered, among other things: (i) the nature, quality and extent of the Adviser’s services including the resources devoted to and the record of compliance with the Funds’ investment policies and restrictions and regulatory requirements; (ii) the investment performance of each Fund, as well as performance information for comparable funds; (iii) the fees and other expenses paid by each Fund, as well as expense information for comparable funds; (iv) arrangements in respect of the distribution of the Funds’ shares; (v) the allocation of the Funds’ brokerage and use of soft commission dollars; (vi) the profitability to the Adviser of its relationship with
MARCH 31, 2007 SEMI-ANNUAL REPORT
37
Important Supplemental Information (continued)
each Fund; (vii) whether economies of scale may be realized as each Fund grows and whether applicable management fee rates provide for a sharing with the Fund of economies of scale; and (viii) other benefits to the Adviser from its relationship with the Funds.
At a meeting held on November 16, 2006, the Board, including a majority of the Independent Trustees, determined that the continuation of the Management Agreement for each Fund was in the best interests of the Fund and its shareholders, and the Board, upon recommendation of the Committee, approved continuation of each Management Agreement. The Board’s determinations were based upon a comprehensive consideration of all information provided to it and were not the result of any single factor. The Board noted the importance of both quantitative measures and qualitative factors that are important in assessing whether the Funds’ shareholders have been, or are likely to be, well served by continuation of the Management Agreements.
Nature, Quality and Extent of Services. The Trustees considered the nature, quality and extent of the services provided by the Adviser, taking into account the knowledge gained from their repeated meetings with the Adviser over a period of years. In addition, the Trustees considered the Adviser’s long-term history of care and conscientiousness in the management of the Funds; its consistency of investment approach; the background and experience of the Adviser’s investment personnel responsible for managing the Funds; the Adviser’s performance as administrator of the Funds, including, among other things, in the areas of brokerage selection, trade execution, compliance, educational materials and other shareholder communications; the Adviser’s commitment to diversity and civic affairs; and the favorable recognition of the Adviser and the Funds in the media and in industry publications. The Trustees confirmed that the Funds had operated within their investment objectives and reviewed each Fund’s record of compliance with its investment restrictions. The Independent Trustees also noted the significant personal investments that the Adviser’s personnel have made
in the Funds, which further aligns the interests of the Adviser and its personnel with those of the Funds’ shareholders. The Board concluded that the nature, quality and extent of the services provided by the Adviser to each Fund were appropriate and consistent with the Fund’s Management Agreement and that each Fund was likely to benefit from a continuation of the services provided under its Management Agreement.
Investment Performance. The Trustees considered the investment performance of each Fund over various periods of time, including comparative information provided by Lipper Inc., an independent data service provider (“Lipper”), comparing each Fund’s performance with that of comparable funds selected by Lipper (the “Performance Universe”). The Trustees also considered each Fund’s performance relative to that of its benchmark and other comparative data provided by Lipper, including total returns, volatility and performance consistency, placing greater emphasis on longer-term periods. The Trustees noted that the performance of each of Ariel Fund and Ariel Appreciation Fund over longer periods was strong relative to that of its Performance Universe, although its shorter-term performance was relatively weak. The shorter-term underperformance was consistent with the investment strategy for the Funds that had been articulated to the Trustees and shareholders. Ariel Focus Fund commenced operations on June 30, 2005 and, therefore, its performance history is limited. The Trustees concluded that each Fund’s performance supported continuation of each of the Management Agreements.
Costs of Services Provided and Profits Realized by the Adviser. Using information provided by Lipper, the Trustees evaluated each Fund’s management fee compared to the management fees for other mutual funds similar in investment strategy, asset size and character (the “Expense Group”) and each Fund’s expense ratio compared to the expense ratios of the Expense Group. The Trustees noted that the rates of management fees paid by each Fund compare favorably with the rates of
ARIELMUTUALFUNDS.COM
38
March 31, 2007 (Unaudited)
fees paid by other funds in the relevant Expense Group. The Trustees also reviewed the Adviser’s advisory fees for its institutional separate accounts and for its subadvised funds (for which the Adviser provides portfolio management services only). They noted that, although the Adviser tends to charge the Funds higher rates of fees than the fees it charges those other clients, the differences reflect the Adviser’s significantly greater level of responsibilities and broader scope of services regarding the Funds, and the more extensive regulatory obligations and risks associated with managing the Funds.
The Trustees also considered the Adviser’s costs in serving as each Fund’s investment adviser and administrator, including costs associated with technology, infrastructure and compliance necessary to manage the Funds effectively. The Trustees reviewed the Adviser’s methodology for allocating costs among its lines of business and among the Funds. They also considered information regarding the structure of the Adviser’s compensation program for portfolio managers and certain other employees and the relationship of that compensation to the attraction and retention of quality personnel. Finally, the Trustees reviewed the Adviser’s financial condition and the pre-tax profits realized by the Adviser from its relationship with each Fund. Based on the materials provided to them, the Trustees concluded that the management fees paid by each Fund to the Adviser were reasonable in relation to the nature and quality of the services provided and found that the fees charged to the Funds were neither excessive nor so low that the Adviser could not be expected to continue to effectively service each Fund. It was observed that the profitability of Ariel Fund and Ariel Appreciation Fund were each within an acceptable range, while the Adviser was currently subsidizing Ariel Focus Fund due to its small asset size. The Board determined that the total expenses of each Fund, including the management fees, as a percentage of net assets were reasonable in relation to the expense ratios of comparable mutual funds.
Economies of Scale. The Trustees considered the extent to which economies of scale were being realized or would be realized by the Funds as their assets increase. They noted that the fee schedule in the Management Agreement for each Fund provides breakpoints that decrease the rate of fee as net assets increase and that both Ariel Fund and Ariel Appreciation Fund have net assets that have allowed them to realize lower fee rates. They also noted that, according to information provided by Lipper for each Fund, even if the Fund’s net assets should increase significantly, the Fund’s effective rate of management fee should be at or below the median fee rate paid by other funds in the Expense Group at those asset levels. The Trustees concluded that the advisory fee schedules represent an appropriate sharing between the Funds and the Adviser of such economies of scale as may exist in the management of the Funds at current asset levels, and determined that no additional breakpoints were needed at the present time.
Other Benefits to the Adviser. The Trustees also reviewed the other benefits that the Adviser and its affiliated distributor receive from their relationship with the Funds. They noted that the distributor’s expenses in distributing shares of the Funds exceed the distributor’s revenues for providing distribution services. The Trustees also considered the Adviser’s use of a portion of the commissions paid by the Funds and other clients of the Adviser on their portfolio brokerage transactions to obtain research products and services and concluded that the Adviser’s use of soft commission dollars to obtain research products and services was consistent with regulatory requirements and beneficial to the Funds.
After full consideration of the above factors, as well as other factors that were instructive in evaluating the Management Agreements, the Board, including a majority of the Independent Trustees, concluded that continuation of each Fund’s Management Agreement was in the best interests of the Fund and its shareholders and the Board approved the continuation of each of those agreements.
MARCH 31, 2007 SEMI-ANNUAL REPORT
39
Board of Trustees
| | | | Term of Office and Length | | Principal Occupation(s) | | Other Directorships Held |
Name and Age | | Position(s) Held with Fund | | of Time Served | | During Past 5 Years | | by Trustee |
| | | | | | | | |
Mario L. Baeza, Esq. Age: 56 | | Trustee, Member of Management Contracts and Governance Committees | | Indefinite, until successor elected
Served as a Trustee since 1995 | | Chairman and CEO, The Baeza Group, LLC and Baeza & Co., LLC (Hispanic-owned investment firms) since 1995; Founder and Executive Chairman, V-Me Media, Inc. (Spanish-language television network) since 2007. Chairman, TCW/Latin, America Partners, LLC (private equity capital firm), 1996-2006 (CEO1996-2003) | | Air Products and Chemicals, Inc., Tommy Hilfiger Corp., Israel Discount Bank, Urban America LLC, Channel Thirteen/WNET, Hispanic Federation Inc., Americas for the United Nations Population Fund, NYC Latin Media and Entertainment Commission, Upper Manhattan Empowerment Zone |
| | | | | | | | |
James W. Compton Age: 68 | | Trustee, Chairman of Governance Committee, Member of Audit Committee | | Indefinite, until successor elected
Served as a Trustee since 1997 | | Retired President and CEO, Chicago Urban League (non-profit, civil rights and community-based organization),1978 to 2006 | | Seaway National Bank of Chicago, Commonwealth Edison Company, The Field Museum, DePaul University, The Big Shoulders Fund |
| | | | | | | | |
William C. Dietrich Age: 57 | | Trustee, Chairman of Audit Committee, Member of Executive Committee | | Indefinite, until successor elected
Served as a Trustee since 1986 | | Executive Director, Shalem Institute for Spiritual Formation, Inc. (ecumenical educational institute), since 2001; Independent financial consultant, 2000 to 2001 | | Scottish Widows Investment Partnership Trust, Global Emerging Markets Fund |
| | | | | | | | |
Royce N. Flippin, Jr. Age: 72 | | Lead Independent Trustee, Member of Management Contracts and Governance Committees, Chairman of Executive Committee | | Indefinite, until successor elected
Served as a Trustee since 1986 and Lead Independent Trustee since 2006 | | President, Flippin Associates (consulting firm) since 1992 | | EVCI Career Colleges Holding Corp., TerraCycle, Inc., Princeton Club of New York |
| | | | | | | | |
John G. Guffey, Jr. Age: 58 | | Trustee, Chairman of Management Contracts Committee, Member of Audit Committee | | Indefinite, until successor elected
Served as a Trustee since 1986 | | President, Aurora Press, Inc. (publisher of trade paperback books) since 2003; Treasurer and Director, Silby, Guffey and Co., Inc. (venture capital firm), 1988 to 2003 | | Calvert Social Investment Foundation, Calvert Group of Funds, except for Calvert Variable Series |
| | | | | | | | |
Mellody L. Hobson Age: 37 | | Chairman of the Board of Trustees and President, Member of Executive Committee | | Indefinite, until successor elected
Served as a Trustee since 1993, President since 2002 and Chairman since 2006 | | President, Ariel Capital Management, LLC since 2000 | | DreamWorks Animation SKG, Inc., The Estée Lauder Companies Inc., Starbucks Corporation, Sundance Institute, Chicago Public Education Fund, Chicago Public Library, The Field Museum, Investment Company Institute (Board of Governors) |
ARIELMUTUALFUNDS.COM
40
| | | | Term of Office and Length | | Principal Occupation(s) | | Other Directorships Held |
Name and Age | | Position(s) Held with Fund | | of Time Served | | During Past 5 Years | | by Trustee |
| | | | | | | | |
Christopher G. Kennedy Age: 43 | | Trustee, Member of Audit Committee | | Indefinite, until successor elected
Served as a Trustee since 1995 | | President, Merchandise Mart Properties, Inc. (real estate management firm) since 2000; Executive Officer, Vornado Realty Trust (publicly traded real estate investment trust) since 2000 | | Interface Inc., Rehabilitation Institute of Chicago, Catholic Theological Union |
| | | | | | | | |
Merrillyn J. Kosier Age: 47 | | Trustee and Vice President | | Indefinite, until successor elected
Served as a Trustee since 2003 and Vice President since 1999 | | Executive Vice President and Director of Mutual Fund Marketing and Investor Services, Ariel Capital Management, LLC since 1999 | | Loyola University Chicago Advisory Board, Mutual Fund Education Alliance, Harris Theater for Music and Dance |
| | | | | | | | |
H. Carl McCall Age: 71 | | Trustee, Member of Governance Committee | | Indefinite, until successor elected
Served as a Trustee since 2006 | | Principal, Convent Capital, LLC (financial advisory firm) since 2004; Comptroller of the State of New York, 1993 to 2002 | | Tyco International Ltd., New Plan Excel Realty Trust, Inc. |
| | | | | | | | |
John W. Rogers, Jr. Age: 49 | | Trustee | | Indefinite, until successor elected
Served as a Trustee 1986-1993 and since 2000 | | Founder, Chairman, Chief Executive Officer and Chief Investment Officer, Ariel Capital Management, LLC; Lead Portfolio Manager, Ariel Fund and Ariel Appreciation Fund | | Aon Corporation, Exelon Corporation, McDonald’s Corporation, Chicago Urban League, John S. and James L. Knight Foundation |
| | | | | | | | |
James M. Williams Age: 59 | | Trustee, Member of Management Contracts Committee | | Indefinite, until successor elected
Served as a Trustee since 2006 | | Vice President and Chief Investment Officer, J. Paul Getty Trust, since 2002; President, Harbor Capital Advisors and Harbor Mutual Funds, 2000 to 2002 | | SEI Mutual Funds |
| | | | | | | | |
CHAIRMAN EMERITUS | | | | | | | | |
| | | | | | | | |
Bert N. Mitchell, CPA Age: 68 | | Chairman Emeritus of the Board of Trustees (has no trustee duties or responsibilities) | | Served as a Trustee from 1986-2006 and Independent Chairman from 1995-2006 | | Chairman and CEO, Mitchell & Titus, LLP (certified public accounting firm) since 1974 | | SEEDCO (Structured Employment Economic Development Corporation) |
Note: Number of portfolios in complex overseen by all Trustees is three. Address for all Trustees is 200 East Randolph Dr., Suite 2900, Chicago, IL 60601
MARCH 31, 2007 SEMI-ANNUAL REPORT
41
Officers
| | | | Term of Office and Length | | Principal Occupation(s) | | Other Directorships Held |
Name and Age | | Position(s) Held with Fund | | of Time Served | | During Past 5 Years | | by Trustee |
| | | | | | | | |
Thomas E. Herman, CPA Age: 45 | | Chief Financial Officer and Treasurer | | Indefinite, until successor elected
Served as Chief Financial Officer and Treasurer since 2005 | | Chief Financial Officer since 2006; Senior Vice President, Finance, Ariel Capital Management, LLC, 2005 to 2006; Vice President, Controller, 2004 to 2005; Regional Financial Manager, Otis Elevator Company, 1999 to 2004 | | Chicago Children’s Theatre |
| | | | | | | | |
Mellody L. Hobson Age: 37 | | Chairman of the Board of Trustees and President; Member of Executive Committee | | Indefinite, until successor elected
Served as a Trustee since 1993, President since 2002 and Chairman since 2006 | | President, Ariel Capital Management, LLC since 2000 | | DreamWorks Animation SKG, Inc., The Estée Lauder Companies Inc., Starbucks Corporation, Sundance Institute, Chicago Public Education Fund, Chicago Public Library, The Field Museum, Investment Company Institute (Board of Governors) |
| | | | | | | | |
Merrillyn J. Kosier Age: 47 | | Trustee and Vice President | | Indefinite, until successor elected
Served as a Trustee since 2003 and Vice President since 1999 | | Executive Vice President and Director of Mutual Fund Marketing and Investor Services, Ariel Capital Management, LLC since 1999 | | Loyola University Chicago Advisory Board, Mutual Fund Education Alliance, Harris Theater for Music and Dance |
| | | | | | | | |
Erik D. Ojala Age: 32 | | Vice President and Secretary | | Indefinite, until successor elected
Served as Vice President since 2003 and Secretary since 2004 | | Vice President, Assistant General Counsel, Ariel Capital Management, LLC since 2003; Corporate Secretary, since 2006 (Compliance Officer, Ariel Capital Management, LLC, 2003 to 2004); Attorney, D’Ancona & Pflaum LLC and Seyfarth Shaw LLP, as successor thereto, 2000 to 2003 | | Auxiliary Board of Directors, Midtown Educational Foundation |
| | | | | | | | |
Sheldon R. Stein Age: 78 | | Vice President | | Indefinite, until successor elected
Served as Vice President since 2002 | | Vice President, General Counsel, Ariel Capital Management, LLC since 2001; Of Counsel, D’Ancona & Pflaum LLC and Seyfarth Shaw LLP, as successor there-to, since 2001 | | |
| | | | | | | | |
Anita M. Zagrodnik Age: 47 | | Vice President, Chief Compliance Officer, Assistant Secretary and Assistant Treasurer | | Indefinite, until successor elected
Served as Vice President, Assistant Secretary and Assistant Treasurer since 2003; Chief Compliance Officer since 2004 | | Vice President, Fund Administration, Ariel Capital Management, LLC since 2003; Principal, ideassociates, LLC (financial services consulting firm),1999 to 2003 | | |
Note: Number of portfolios in complex overseen by all Officers is three. Address for all Officers is 200 East Randolph Dr., Suite 2900, Chicago, IL 60601 The Ariel Mutual Funds’ Statement of Additional Information (SAI) includes additional information about the Funds’ Trustees and Officers. The SAI is available without charge by calling 800-292-7435 or logging on to our web site, arielmutualfunds.com.
800-292-7435
42
The Tortoise and the Hare
One day a fleet-footed Hare was making fun of a rather plodding Tortoise.
The Hare was surprised when the Tortoise laughed back.
“Speedy you may be,” said the Tortoise,
“But I challenge you to a race and I bet that I win.”
“Oh, for goodness’ sake,” said the Hare,
“It will be no contest at all.
In fact, I will dance rings around you all the way.”
When the time came, both started off together.
The Hare sped off from the start.
In fact, he ran so quickly that he soon left the Tortoise far behind.
He turned circles and flips as he raced ahead,
keen and proud of his speed and nimbleness.
Once the Hare reached the middle of the course,
he was so far ahead, he decided to take a nap.
While the Hare slept, the Tortoise plodded on
and on, straight toward the finish line.
Slowly, steadily, the Tortoise kept focused on his goal.
When the Hare awoke from his nap,
he was surprised that the Tortoise was nowhere in sight.
Racing to the finish line with all his proud speed,
he saw that it was too late.
The Tortoise was waiting there for him, a smile on his face.
–Aesop

Slow and Steady Wins the Race

Ariel Investment Trust |
P.O. Box 219121 |
Kensas City, Missouri 64121-9121 |
800-292-7435 |
arielmutualfunds.com | TPI 05/07 |
Item 2. Code of Ethics.
Not applicable. The information required by this Item is only required in an annual report on Form N-CSR.
Item 3. Audit Committee Financial Expert.
Not applicable. The information required by this Item is only required in an annual report on Form N-CSR.
Item 4. Principal Accountant Fees and Services.
Not applicable. The information required by this Item is only required in an annual report on Form N-CSR.
Item 5. Audit Committee of Listed Registrants.
Not applicable.
Item 6. Schedule of Investments.
Included as part of the report to shareholders filed under Item 1 of this Form.
Item 7. Disclosure of Proxy Voting Policies and Procedures for Closed-End Management Investment Companies.
Not applicable.
Item 8. Portfolio Managers of Closed-End Management Investment Companies.
Not applicable.
Item 9. Purchases of Equity Securities by Closed-End Management Investment Company and Affiliated Purchasers.
Not applicable.
Item 10. Submission of Matters to a Vote of Security Holders.
There have been no changes to the procedures by which shareholders may recommend nominees to the registrant’s Board of Trustees.
Item 11. Controls and Procedures.
(a) The registrant’s certifying officers have reasonably designed such disclosure controls and procedures to ensure material information relating to the registrant is made known to them by others, particularly
during the period in which this report is being prepared. The registrant’s certifying officers have determined that the registrant’s disclosure controls and procedures are effective based on their evaluation of these controls and procedures as of a date within 90 days prior to the filing date of this report.
(b) There were no significant changes in the registrant’s internal controls over financial reporting, or in other factors that could significantly affect these controls, that occurred during the registrant’s second fiscal half-year, including any corrective actions with regard to significant deficiencies and material weaknesses.
Item 12. Exhibits.
(a)(1) Code of Ethics – Not applicable.
(a)(2) Certification for each principal executive and principal financial officer of the registrant as required by Rule 30a-2 under the Act (17 CFR 270.30a-2(a)) – Filed as an attachment to this filing.
(a)(3) Written solicitation to purchase securities under Rule 23c-1 – Not applicable.
(b) Certifications required by Rule 30a-2(b) under the Act (17 CFR 270.30a-2(b)), Rule 13a-14(b) or Rule 15d-14(b) under the Exchange Act (17 CFR 240.13a-14(b) or 240.15d-14(b)), and Section 1350 of Chapter 63 of Title 18 of the United States Code (18 U.S.C. 1350). A certification furnished pursuant to this paragraph will not be deemed “filed” for purposes of Section 18 of the Exchange Act (15 U.S.C. 78r), or otherwise subject to the liability of that section. Such certification will not be deemed to be incorporated by reference into any filing under the Securities Act of 1933 or the Exchange Act, except to the extent that the registrant specifically incorporates it by reference – Filed as an attachment to this filing.
SIGNATURES
Pursuant to the requirements of the Securities Exchange Act of 1934 and the Investment Company Act of 1940, the registrant has duly caused this report to be signed on its behalf by the undersigned, thereunto duly authorized.
Ariel Investment Trust
By: | | /s/ Mellody L. Hobson | |
| Mellody L. Hobson |
| President and Principal Executive Officer |
| |
Date: | | May 10, 2007 | |
| | | | |
Pursuant to the requirements of the Securities Exchange Act of 1934 and the Investment Company Act of 1940, this report has been signed below by the following persons on behalf of the registrant and in the capacities and on the dates indicated.
By: | | /s/ Mellody L. Hobson | |
| Mellody L. Hobson |
| President and Principal Executive Officer |
| |
Date: | | May 10, 2007 | |
| |
| |
By: | | /s/ Thomas Herman | |
| Thomas Herman |
| Vice President and Principal Financial Officer |
| |
Date: | | May 10, 2007 | |
| | | | |