UNITED STATES
SECURITIES AND EXCHANGE COMMISSION
WASHINGTON, D.C. 20549
FORM 10-K
(Mark One)
| | x | ANNUAL REPORT PURSUANT TO SECTION 13 OR 15(D) OF THE SECURITIES EXCHANGE ACT OF 1934 |
For the fiscal year ended February 2, 2008
OR
| | ¨ | TRANSITION REPORT PURSUANT TO SECTION 13 OR 15(D) OF THE SECURITIES EXCHANGE ACT OF 1934 |
For the transition period from to .
Commission file number 0-14970
COST PLUS, INC.
(Exact name of registrant as specified in its charter)
| | |
| California | | 94-1067973 |
(State or other jurisdiction of incorporation or organization) | | (I.R.S. Employer Identification No.) |
| |
200 4th Street Oakland, California | | 94607 |
| (Address of principal executive offices) | | (Zip Code) |
Registrant’s telephone number, including area code(510) 893-7300
Securities registered pursuant to Section 12(b) of the Act:
| | |
Title of each class | | Name of each exchange on which registered |
Common Stock, $0.01 par value | | The NASDAQ Stock Market LLC |
| | (NASDAQ Global Select) |
Securities registered pursuant to Section 12(g) of the Act:
Preferred Share Purchase Rights
Indicate by check mark if the registrant is a well-known seasoned issuer, as defined in Rule 405 of the Securities Act. Yes ¨ No x
Indicate by check mark if the registrant is not required to file reports pursuant to Section 13 or Section 15(d) of the Act. Yes ¨ No x
Indicate by check mark whether the registrant (1) has filed all reports required to be filed by Section 13 or 15(d) of the Securities Exchange Act of 1934 during the preceding 12 months (or for such shorter period that the registrant was required to file such reports), and (2) has been subject to such filing requirements for the past 90 days. Yes x No ¨
Indicate by check mark if disclosure of delinquent filers pursuant to Item 405 of Regulation S-K is not contained herein, and will not be contained, to the best of registrant’s knowledge, in definitive proxy or information statements incorporated by reference in Part III of this Form 10-K or any amendment to this Form 10-K. ¨
Indicate by check mark whether the registrant is a large accelerated filer, an accelerated filer, a non-accelerated filer or a small reporting company. See definitions of “large accelerated filer,” “accelerated filer” and “small reporting company” in Rule 12b-2 of the Exchange Act.
| | |
| Large accelerated filer ¨ | | Accelerated filer x |
| Non-accelerated filer ¨(Do not check if a smaller reporting company) | | Smaller reporting company ¨ |
Indicate by check mark whether the registrant is a shell company (as defined in Rule 12b-2 of the Exchange Act). Yes ¨ No x
The aggregate market value of voting stock held by non-affiliates of the registrant based upon the closing sale price of the common stock on August 3, 2007, the last business day of the registrant’s most recently completed second fiscal quarter, was approximately $129.4 million as reported for such date on the Nasdaq Global Select Market. As of April 14, 2008, 22,087,113 shares of Common Stock, $.01 par value, were outstanding.
DOCUMENTS INCORPORATED BY REFERENCE
Portions of the Registrant’s Proxy Statement for the Annual Meeting of Shareholders to be held June 19, 2008 (“Proxy Statement”) are incorporated by reference into Part III of this Annual Report on Form 10-K to the extent stated herein. Except with respect to information specifically incorporated herein by reference, the Proxy Statement is not deemed to be filed as part hereof.
COST PLUS, INC.
TABLE OF CONTENTS
2007 FORM 10-K
Some of the statements under the sections entitled “Business”, “Management’s Discussion and Analysis of Financial Condition and Results of Operations,” and “Risk Factors,” and elsewhere in this Annual Report on Form 10-K contain forward-looking statements, which reflect Cost Plus, Inc.’s (the “Company”) current beliefs and estimates with respect to future events and the Company’s future financial performance, business, operations and competitive position. Forward looking statements may be identified by use of the words “may,” “should,” “expects,” “anticipates,” “estimates,” “believes,” “looking ahead,” “forecast,” “projects,” “continues,” “intends,” “likely,” “plans” and similar expressions. The forward-looking statements involve known and unknown risks and uncertainties which may cause the Company’s actual results or performance to differ materially from those expressed in such forward-looking statements due to a number of factors including those set forth in Risk Factors in this Form 10-K and in documents which are incorporated by reference herein. The Company may from time to time make additional written and oral forward-looking statements, including statements contained in the Company’s filings with the Securities and Exchange Commission. You should not place undue reliance on our forward-looking statements, as they are not guarantees of future results, levels of activity or performance and represent the Company’s expectations only as of the date they are made. The Company does not undertake any obligation to update any forward-looking statement that may be made from time to time by or on behalf of the Company.
PART I
The Company
Cost Plus, Inc. and its subsidiaries (“Cost Plus World Market,” or “the Company”) is a leading specialty retailer of casual home furnishings and entertaining products in the United States. Cost Plus, Inc. was organized as a California corporation in November 1946 and opened its first retail store in 1958 in San Francisco, California. As of February 2, 2008, the Company operated 298 stores under the name “World Market,” “Cost Plus World Market,” “Cost Plus Imports” and “World Market Stores” in 34 states. Cost Plus World Market’s business strategy is to differentiate itself by offering a large and ever-changing selection of unique products, many of which are imported, at value prices in an exciting shopping environment. Many of Cost Plus World Market’s products are proprietary or private label, often incorporating the Company’s own designs, “World Market” brand name, quality standards and specifications and typically are not available at department stores or other specialty retailers.
Cost Plus World Market’s expansion strategy is to open stores primarily in metropolitan and suburban markets that can support multiple stores and enable the Company to achieve advertising, distribution and operating efficiencies. The Company may also enter mid-sized markets that can support one or two stores that the Company believes can meet its profitability criteria. The Company’s stores are located predominantly in high traffic metropolitan and suburban locales, often near major malls. In the fiscal year ended February 2, 2008, the Company opened a total of 15 new stores, including 12 in the existing markets of Palm Dessert, CA; Boise, ID; Phoenix, AZ; Reno, NV; Salt Lake City, UT; Albuquerque, NM; Dallas Ft. Worth and San Antonio, TX; Omaha, NE; Milwaukee, WI; Orlando, FL; Chicago, IL; and three in the new markets of Bozeman, MT; Amarillo, TX and Myrtle Beach, SC. In addition to opening 15 new stores in fiscal 2007, the Company also closed four stores. In fiscal 2008, the Company intends to open stores in existing states in order to reinforce its brand and to maximize the effectiveness of its advertising budget.
On January 21, 2008, the Board of Directors of Cost Plus, Inc. (the “Company”), approved a plan for the Company to exit eight underperforming media markets while closing 18 of its existing stores during fiscal 2008, of which 13 will be considered discontinued operations. In addition, the Board of Directors approved a plan to reduce the Company’s corporate workforce by approximately 10%. The Company is taking these actions to reduce costs, to enable it to increase its brand presence in better performing markets, and to help position the Company to return to sustainable profitability and future long-term growth. Cost Plus World Market’s current focus is to reconnect with its loyal customer base and reinforce its value pricing strategy.
1
The Company’s website address iswww.worldmarket.com. The Company has made available through its Internet website, free of charge, its Annual Report on Form 10-K, Quarterly Reports on Form 10-Q, Current Reports on Form 8-K, Definitive Proxy Statement and Section 16 filings and amendments to those reports filed or furnished pursuant to Section 13(a) or 15(d) of the Securities Exchange Act of 1934, as amended (“Exchange Act”), as soon as reasonably practicable after such materials are electronically filed with, or furnished to, the SEC.
Merchandising
Cost Plus World Market’s merchandising strategy is to offer customers a broad selection of distinctive items related to the theme of casual home furnishing and entertaining.
Products. The Company believes its distinctive and unique merchandise and shopping environment differentiates it from other retailers. Many of Cost Plus World Market’s products are proprietary or private label. The “World Market” brand name or other brand names exclusive to the Company often incorporate the Company’s own designs, and have quality standards and specifications typically not available at department stores or other specialty retailers. In addition to strengthening the stores’ product offering, proprietary and private label goods typically offer higher gross margins and stronger consumer values than branded goods. A significant portion of Cost Plus World Market’s products are made abroad in over 50 countries and many of these goods are handcrafted by local artisans. The Company’s product offering is designed to provide solutions to customers’ casual living and home entertaining needs. The offerings include home decorating items such as furniture, rugs, pillows, bath linens, lamps, window coverings, frames, and baskets. Cost Plus World Market’s furniture products include ready-to-assemble living and dining room pieces, unusual handcrafted case goods and occasional pieces, as well as outdoor furniture made from a variety of materials such as rattan, hardwood and wrought iron. The Company also sells a number of tabletop and kitchen items including glassware, ceramics, textiles and cooking utensils. Kitchen products include an assortment of products organized around a variety of themes such as baking, food preparation, barbecue and international dining.
Cost Plus World Market offers a number of gift and decorative accessories, including collectibles, candles, framed art, and holiday and other seasonal items. The Company’s offering also includes a unique assortment of jewelry, fashion accessories and personal care items. Because many of the gift, jewelry and collectible items come from around the world, they contribute to the exotic atmosphere of the stores. The Company’s business is highly seasonal, reflecting the general pattern associated with the retail industry of peak sales and earnings during the fourth quarter holiday season.
Cost Plus World Market also offers its customers a wide selection of gourmet foods and beverages, including wine, microbrewed and imported beer, coffee, tea and bottled water. The wine assortment offers a number of moderately priced premium wines, including a variety of well recognized labels, as well as wines not readily available at neighborhood wine or grocery stores that have been privately bottled and imported from around the world. State regulations may limit or restrict the Company’s ability to sell alcoholic beverages. Consumable products, particularly beverages, generally have lower margins than the Company’s average. Gourmet foods include packaged products from around the world and seasonal items that relate to “traditional” holidays and customs. Packaged snacks, candy and pasta are often displayed in open barrels and crates. Food items typically have a shelf life of six months or longer.
The Company classifies sales into the home furnishings and consumables product lines with sales as a percentage of total sales for the prior three fiscal years for these categories as follows:
| | | | | | | | | |
| | | Fiscal Year Ended | |
| | | February 2,
2008 | | | February 3,
2007 | | | January 28,
2006 | |
Home Furnishings | | 61 | % | | 61 | % | | 61 | % |
Consumables | | 39 | % | | 39 | % | | 39 | % |
2
The Company replaces or updates many of the items in its merchandise assortment on a regular basis in order to encourage repeat shopping and to promote a sense of discovery. The Company marks down retail prices of items that do not meet its turnover expectations.
Format and Presentation. The Company’s stores are designed to evoke the feeling of a “world marketplace” through colorful and creative visual displays and merchandise presentations, including goods in open barrels and crates, groupings of related products in distinct “shops” within the store and in-store activities such as food and coffee tastings and wine tasting in some states. The Company believes that its “world marketplace” effect provides customers with a fun shopping experience and encourages browsing throughout the store.
The average selling space of a Cost Plus World Market store is approximately 15,700 square feet, which allows flexibility for merchandise displays, product adjacencies and directed traffic patterns. Complementary products are positioned in proximity to one another and cross merchandising themes are used in merchandise displays to tie different product offerings together. The floor plan allows the customer to see virtually all of the different product areas in a Cost Plus World Market store from the store center where four zones, with bulk displays highlighting sharply priced items, lead the customer into different product areas. The Company has a seasonal shop, usually located in the heart of the store, which features seasonal products and themes, such as the holiday shop, harvest and outdoor. Store signage, including permanent as well as promotional signs, is developed by the Company’s in-house graphic design department. End caps, bulk stacks and free standing displays are changed frequently. Approximately 3,000 square feet of back office and stock space are included in the total square footage at a store, which averages about 18,700 square feet per store.
The Cost Plus World Market store format is also designed to reinforce the Company’s value image through exposed ceilings, concrete floors, simple wooden fixtures and open or bulk presentations of merchandise. The Company displays most of its inventory on the selling floor and makes effective use of vertical space, such as a display of chairs arranged on a wall and rugs hanging vertically from fixtures.
The Company believes that its customers usually visit a Cost Plus World Market store as a destination with a specific purchase in mind. The Company makes use of frequent receipts of products, seasonal themes and products, and consumable products to encourage frequent return visits by its customers. The Company also believes that once in the store, its customers often spend additional time shopping and browsing, which results in customers purchasing more items than they originally intended.
Pricing. Cost Plus World Market offers quality products at competitive prices. The Company complements its everyday low price strategy with selected product promotions and opportunistic buys, enabling the Company to pass on additional savings to the customer. The Company routinely shops a variety of retailers to ensure that its products are competitively priced.
Planning and Buying. Cost Plus World Market effectively manages a large number of products by utilizing centralized merchandise planning, tracking and replenishment systems. The Company regularly monitors merchandise activity at the item level through its management information systems to identify and respond to product trends. The Company maintains its own central buying staff that is responsible for establishing the assortment of inventory within its merchandise classifications each season, including integrating current trends or themes identified by the Company into its different product categories. The Company attempts to moderate the risk associated with merchandise purchasing by testing selected new products in a limited number of stores. The Company’s long-standing relationships with overseas suppliers, its international buying agency network and its knowledge of the import process facilitate the planning and buying process. The buyers work closely with suppliers to develop unique products that will meet customers’ expectations for quality and value.
Advertising
The Company’s marketing program is a multimedia strategy utilizing print, electronic and non-traditional media, including weekly newspaper circulars, daily newspaper advertisements, direct mail, radio, e-mail correspondence and online search functionality. Each medium is used to highlight product offerings and
3
communicate promotional activity. In addition, the Company uses a series of advertising elements and store-based event activity to highlight grand openings of new stores. This activity is directed to be both specific to each store opening and to the general market in which the new store is located.
The Company offers selected products on its website atwww.worldmarket.com which provides customers with purchase options and product information for items sold in stores. The Company’s website is designed to leverage a multi-channel philosophy, giving customers an additional touch point with its merchandise and marketing and to increase traffic at its stores.
Product Sourcing and Distribution
The Company purchases most of its inventory centrally, which allows the Company to take advantage of volume purchase discounts and improve controls over inventory and product mix. The Company purchases its merchandise from approximately 2,000 suppliers, one of which represented approximately 10% and another which represented approximately 12% of total purchases in the fiscal year ended February 2, 2008. A significant portion of Cost Plus World Market’s products are made abroad in over 50 countries in Europe, North and South America, Asia, Africa and Australia. The Company has established a well developed overseas sourcing network and enjoys long standing relationships with many of its vendors. As is customary in the industry, the Company does not have long-term contracts with any suppliers. The Company’s buyers often work with suppliers to produce unique products exclusive to Cost Plus World Market. The Company believes that, although there could be delays in changing suppliers, alternate sources of merchandise for core product categories are available at comparable prices. Cost Plus World Market typically purchases overseas products on either a free-on-board or ex-works basis, and the Company’s insurance on such goods commences at the time it takes ownership. The Company also purchases a number of domestic products, especially in the gourmet food and beverage area. Due to state regulations, wine and beer are purchased from local distributors, with purchasing primarily controlled by the corporate buying office.
The Company currently services its stores from its distribution centers located in Stockton, California (“California”) and Windsor, Virginia (“Virginia”). Domestically sourced merchandise is usually delivered to the distribution centers by common carrier or by Company trucks.
Management Information Systems
Each of the Company’s stores is linked to the Cost Plus World Market headquarters in Oakland, California through a point-of-sale system and frame relay data network that interfaces with an IBM AS/400 computer. The Company’s information systems keep records, which are updated daily, of each merchandise item sold in each store, as well as financial, sales and inventory information. The point-of-sale system also has scanning, “price look-up” and on-line credit/debit card approval capabilities, all of which improve transaction accuracy, speed checkout time and increase overall store efficiency. The Company continually upgrades its in-store information systems to improve information flow to store management and enhance other in-store administration capabilities.
Purchasing operations are facilitated by the use of computerized merchandise information systems that allow the Company to analyze product sell-through and assist the buyers in making merchandise decisions. The Company’s central replenishment system includes SKU and store-specific “model stock” logic that enables the Company to maintain adequate stock levels on basic goods in each location.
The Company uses several other management information and control systems to direct its operations and finances. These computerized systems are designed to ensure the integrity of the Company’s inventory, allow the merchandising staff to reprice merchandise, process payroll, pay bills, control cash, maintain fixed assets and track promotions throughout all of the Company’s stores. The Company’s distribution operations use systems to receive, locate, pick and ship inventory to stores. The Company believes that these systems allow for higher operating efficiency and improve profitability.
4
Additional systems also enable the Company to produce the periodic financial reports necessary for developing budgets and monitoring individual store and consolidated Company performance.
Competition
The markets served by Cost Plus World Market are highly competitive. The Company competes against a diverse group of retailers ranging from specialty stores to department stores and discounters. The Company’s product offerings compete with such retailers as Bed Bath & Beyond, Target, Linens n’ Things, Crate & Barrel, Pottery Barn, Michaels Stores, Pier 1 Imports, Trader Joe’s and Williams-Sonoma. Most specialty retailers tend to have higher prices and a narrower assortment of products and department stores typically have higher prices than Cost Plus World Market for similar merchandise. Discounters may have lower prices than Cost Plus World Market, but the product assortment is generally more limited. The Company competes with these and other retailers for customers principally on the basis of price, assortment of products, brand name recognition, suitable retail locations and qualified management personnel.
Employees
As of February 2, 2008, the Company had 2,719 full-time and 3,986 part-time employees. Of these, 5,897 were employed in the Company’s stores, and approximately 808 were employed in the distribution centers and corporate office. The Company regularly supplements its work force with temporary staff, especially in the fourth fiscal quarter of each year to service increased customer traffic during the peak Holiday season. Employees in 11 stores in Northern California are covered by a collective bargaining agreement that expires on May 31, 2008. The Company believes that it enjoys good relationships with its employees.
Trademarks
The Company regards its trademarks and service marks as having significant value and as being important to its marketing efforts. The Company has registered its “Aaku,” “Asian Passage,” “Atacama with logo” and “Atacama” logo, “Castello Del Lago,” “Cost Plus,” “Cost Plus World Market,” “Crandall Brooks,” “Credo,” “Crossroads,” “Donaletta with logo,” “Electric Reindeer” and “Electric Reindeer” logo, “Marche du Monde with logo” and “Marche du Monde” logo, “Market Classics,” “Maui Morning,” “Mercado Del Mundo,” “Praline Perk,” “Seacliff” and “Seacliff” logo, “Soiree,” “Texas Turtle,” “Villa Vitale,” and “World Market” marks with the United States Patent and Trademark Office on the Principal register. The company has pending applications to register its “Cabulous,” “Chardonyeah!,” “Tales of the Sip,” “The Big Sipper,” “There with logo,” and “Zinfatuation” with the United States Patent and Trademark Office. In Canada, the Company has registered its “Cost Plus” mark and has applied to register its “Cost Plus World Market” and “World Market” marks. In the European Union, the Company has registered its “World Market” and logo mark. In Mexico, the Company has registered its “Mercado Del Mundo” and “World Market” marks. The Company’s policy is to pursue prompt and broad registration of its marks and to vigorously oppose infringement of its marks.
The following information describes certain significant risks and uncertainties inherent in our business. You should carefully consider these risks and uncertainties, together with the other information contained in this Annual Report on Form 10-K and in the Company’s other public filings. If any of such risks and uncertainties materialize, the Company’s business, financial condition or operating results could differ materially from the plans, projections and other forward-looking statements included in the section titled “Management’s Discussion and Analysis of Financial Condition and Results of Operations” and elsewhere in this report and in the Company’s other public filings. In addition, if any of the following risks and uncertainties, or if any other disclosed risks and uncertainties, actually occurs, the Company’s business, financial condition or operating results could be harmed substantially, which could cause the market price of our stock to decline, perhaps significantly.
5
We face significant competition in our industry.
The markets that we serve are very competitive. We compete against a diverse group of retailers ranging from specialty stores to department stores and discounters. Our product offerings compete with such retailers as Bed Bath & Beyond, Target, Linens n’ Things, Crate & Barrel, Pottery Barn, Michaels Stores, Pier 1 Imports, Trader Joe’s and Williams-Sonoma. We compete with these and other retailers for customers, suitable retail locations and qualified management personnel. Some of our competitors have greater resources, more customers, and greater brand recognition. They may secure better terms from vendors, adopt more aggressive pricing, and devote more resources to technology, distribution, and marketing. Competitive pressures or other factors could cause us to lose market share, which may require us to lower prices, increase marketing and advertising expenditures, or increase the use of discounting or promotional campaigns, each of which would adversely affect our margins and could result in a decrease in our operating results and profitability.
Our business is highly seasonal, and our operating results fluctuate significantly from quarter to quarter.
Our business is highly seasonal, reflecting the general pattern associated with the retail industry of peak sales and earnings during the Holiday season. Due to the importance of the Holiday selling season, the fourth quarter of each fiscal year has historically contributed, and we expect will continue to contribute, a large percentage of our net sales and much of our net income for the entire fiscal year. Any factors that have a negative effect on our business during the Holiday selling season in any year, including unfavorable economic conditions, would materially and adversely affect our financial condition and results of operations. We generally experience lower sales and earnings during the first three quarters and, as is typical in the retail industry, may incur losses in these quarters. The results of our operations for these interim periods are not necessarily indicative of the results for our full fiscal year.
We also must make decisions regarding merchandise well in advance of the season in which it will be sold. If the demand for our merchandise is significantly different than we have projected, it would harm our business and operating results, either as a result of lost sales due to insufficient inventory or lower gross margin due to the need to mark down excess inventory.
Our quarterly operating results may also fluctuate based on such factors as:
| | • | | delays in the flow of merchandise to our stores; |
| | • | | the number and timing of new store openings and related store pre-opening expenses; |
| | • | | the amount of sales contributed by new and existing stores; |
| | • | | the mix of products sold; |
| | • | | the timing and level of markdowns; |
| | • | | store closings or relocations; |
| | • | | changes in fuel and other shipping costs; |
| | • | | general economic conditions; |
| | • | | foreign exchange rates; |
| | • | | labor market fluctuations; |
| | • | | the impact of terrorist activities; |
| | • | | our ability to acquire merchandise and manage inventory levels; |
| | • | | our ability to retain and increase sales to existing customers, attract new customers, and satisfy our customers’ demands; |
6
| | • | | changes in accounting rules and regulations; and |
| | • | | unseasonable weather conditions. |
These fluctuations may also cause a decline in the market price of our common stock.
Our success depends to a significant extent upon the overall level of consumer spending.
As a retail business our success depends to a significant extent upon the overall level of consumer spending. Among the factors that affect consumer spending are the general state of the economy, credit and financial markets, the level of consumer debt, prevailing interest rates and consumer confidence in future economic conditions. A substantial number of our stores are located in the western United States, especially in California. Lower levels of consumer spending in this region could have a material adverse affect on our financial condition and results of operations. Reduced consumer confidence and spending may result in reduced demand for our merchandise, may limit our ability to increase prices and may require us to incur higher selling and promotional expenses, which in turn would harm our business and operating results.
The occurrence or the threat of international conflicts or terrorist activities could harm our business and result in business interruptions.
A significant portion of the merchandise that we sell is purchased in other countries and must be shipped to the United States, transported from the port of entry to our distribution centers in California or Virginia and distributed to our stores from the distribution centers. The precise timing and coordination of these activities is crucial to our business. The occurrence or threat of international conflicts or terrorist activities and the responses to those developments, for example, the temporary shutdown of a port that we use, could have a significant impact upon our business, our personnel and facilities, our customers and suppliers, the retail and financial markets and general economic conditions.
Our business and operating results are sensitive to changes in energy and transportation costs.
We incur significant costs for the transportation of goods from foreign ports to our distribution centers and stores and for utility services in our stores, distribution centers and corporate offices. We continually negotiate pricing for certain transportation contracts and, in a period of rising fuel costs such as we have recently experienced, we expect that our vendors for these services will increase their rates to compensate for the higher energy costs. We may not be able to pass a portion of these increased costs on to our customers and remain competitively priced.
We must continue to increase sales from existing stores and open new stores to carry out our growth strategy.
Our ability to increase our sales and earnings depends in part on our ability to continue to open new stores and to operate these stores on a profitable basis. Our continued growth also depends on our ability to increase sales in our existing stores. We opened a net of 11 stores in fiscal 2007 and presently plan on closing 18 stores and opening 17 new stores in fiscal 2008. In fiscal 2008, the Company plans to focus on opening stores in existing markets. When we open additional stores in existing markets, it can result in lower sales from existing stores in that market. The success of our planned store openings will depend upon many factors, including the following:
| | • | | our ability to identify suitable markets for expansion, |
| | • | | the selection, availability and leasing of suitable sites on acceptable terms, |
| | • | | the hiring, training and retention of qualified management and other store personnel, |
| | • | | satisfaction of regulatory requirements in new markets, including alcoholic beverage regulations, |
7
| | • | | control of costs associated with entering new markets, including advertising and distribution costs; and |
| | • | | our ability to maintain adequate systems, controls and procedures, including product distribution facilities, store management, financial controls and information systems. |
We cannot assure that we will be able to achieve our planned store openings, integrate new stores effectively into our existing operations or operate our new stores profitably.
Our operating results will be harmed if we are unable to improve our comparable store sales.
Our success depends, in part, upon our ability to improve sales at our existing stores. Our comparable store sales, which are defined as sales by stores that have completed 14 full fiscal months of sales, fluctuate from year to year. Fiscal 2006 was 53 weeks; therefore, to ensure a meaningful comparison, comparable store sales for fiscal 2006 were measured on a 53-week basis. In all other years presented, comparable store sales were measured on a 52-week basis. In fiscal 2007, comparable store sales decreased by 5.4% from fiscal 2006. Various factors affect comparable store sales, including:
| | • | | the general retail sales environment, |
| | • | | our ability to source and distribute products efficiently, |
| | • | | changes in our merchandise mix, |
| | • | | current economic conditions, |
| | • | | the timing of release of new merchandise and promotional events, |
| | • | | the success of marketing programs, and |
These factors and others may cause our comparable store sales to differ significantly from prior periods and from expectations. If we fail to meet the comparable store sales expectations of investors and security analysts in one or more future periods, the price of our common stock could decline.
We face a number of risks because we import much of our merchandise.
We import a significant amount of our merchandise from over 50 countries and numerous suppliers. We have no long-term contracts with our suppliers but instead rely on long-term relationships that we have established with many of these suppliers. Our future success will depend to a significant extent on our ability to maintain our relationships with our suppliers or to develop new ones. As an importer, our business is subject to the risks generally associated with doing business abroad such as the following:
| | • | | foreign governmental regulations, |
| | • | | freight cost increases, |
| | • | | changes in political or economic conditions in countries from which we purchase products, and |
| | • | | the effect of trade regulation by the United States, including quotas, duties and taxes and other charges or restrictions on imported merchandise. |
If these factors or others made the conduct of business in particular countries undesirable or impractical or if additional quotas, duties taxes or other charges or restrictions were imposed by the United States on the importation of our products, our business and operating results would be harmed.
8
Interruption of the supply chain and/or ability to obtain products from suppliers.
The products we sell are procured from a wide variety of domestic and foreign suppliers and are distributed to our stores through distribution facilities in Stockton, California and Windsor, Virginia, as well as direct store delivery. Any significant interruption in our ability to source the products and the efficiency of distributing such products to our stores, would harm our business and operating results.
We may not be able to forecast customer preferences accurately in our merchandise selections.
Our success depends in part on our ability to anticipate the tastes of our customers and to provide merchandise that appeals to their preferences. Our strategy requires our merchandising staff to introduce products from around the world that meet current customer preferences and that are affordable, distinctive in quality and design and that are not widely available from other retailers. Many of our products require long order lead times. In addition, a large percentage of our merchandise changes regularly. Our failure to anticipate, identify or react appropriately to changes in consumer trends could cause excess inventories and higher markdowns or a shortage of products and could harm our business and operating results.
We rely on various key management personnel to ensure our success.
Our success will continue to depend on our key management personnel. The loss of the services of one or more of these executive officers or other key employees could harm our business and operating results. We do not maintain any key man life insurance policies.
We have significant indebtedness.
We have significant debt and may incur substantial additional debt in the future. A significant portion of our future cash flow from operating activities is likely to remain dedicated to the payment of interest and the repayment of principal on our indebtedness. There is no guarantee that we will be able to meet our debt service obligations. If we are unable to generate sufficient cash flow or obtain funds for required payments, or if we fail to comply with our debt covenants, we would be in default and the lenders would have the right to accelerate full payment of the loans. In such event, we might not have sufficient cash resources to repay the lenders and we might not be able to refinance our debt on terms acceptable to us, or at all. Our indebtedness could limit our ability to obtain additional financing for working capital, capital expenditures, debt service requirements, acquisitions or other purposes in the future, as needed; to plan for, or react to, changes in our business and competition; and to react in the event of an economic downturn.
Our common stock may be subject to substantial price and volume fluctuations.
The market price of our common stock is affected by factors such as fluctuations in our operating results, a downturn in the retail industry, changes in interest rates, changes in financial estimates by us or securities analysts and recommendations by securities analysts regarding our company, other retail companies or the retail industry in general, and general market and economic conditions. In addition, the stock market can experience price and volume fluctuations that are unrelated to the operating performance of particular companies.
Impact of natural disasters.
The occurrence of one or more natural disasters, including earthquakes (particularly in California where our Stockton distribution center is located and approximately 28.5 percent of our sales were generated in fiscal 2007) could result in the disruption in the supply of our products and distribution of products to our stores, damage to and the temporary closure of one or more stores and interruption in our labor staffing. These, and other potential outcomes of a natural disaster, could materially and adversely affect our results of operations.
9
We may be subject to significant liability should the consumption of any of our products cause injury, illness or death.
Our business is subject to product recalls in the event of contamination, product tampering, mislabeling or damage to our products. We cannot assure you that product-liability claims will not be asserted against us or that we will not be obligated to recall our products in the future. A product-liability judgment against us or a product recall could have a material adverse effect on our business, financial condition or results of operations.
Our business is subject to risks associated with fluctuations in the values of foreign currencies against the United States dollar.
We have significant purchase obligations with suppliers outside of the United States. During fiscal 2007, approximately 3.7% of these purchases were settled in currencies other than the United States dollar, compared to approximately 3.0% of purchases in fiscal 2006. Fluctuations in the rates of exchange between the dollar and other currencies could harm our operating results. We have not hedged our currency risk in the past and do not currently anticipate doing so in the future.
Provisions in our charter documents as well as our shareholders’ rights plan could prevent or delay a change in control of our Company and may reduce the market price of our common stock.
Certain provisions of our articles of incorporation and bylaws may have the effect of making it more difficult for a third party to acquire, or may discourage a third party from attempting to acquire, control of the Company. Such provisions could limit the price that certain investors might be willing to pay in the future for shares of our common stock. Certain of these provisions allow us to issue preferred stock without any vote or further action by the shareholders. In addition, the right to cumulate votes in the election of directors has been eliminated. These provisions may make it more difficult for shareholders to take certain corporate actions and could have the effect of delaying or preventing a change in control of the Company. In addition, our board of directors has adopted a preferred share purchase rights agreement. Pursuant to the rights agreement, our board of directors declared a dividend of one right to purchase one one-thousandth share of our Series A Participating Preferred Stock for each outstanding share of our common stock. These rights could have the effect of delaying, deferring or preventing a change of control of our Company, discouraging a proxy contest or making more difficult the acquisition of a substantial block of our common stock. The rights agreement could also limit the price that investors might be willing to pay in the future for our common stock.
Lawsuits and other claims against our Company may adversely affect our operating results.
We are involved in litigation, claims and assessments incidental to our business, the disposition of which is not expected to have a material effect on our financial position or results of operations. It is possible, however, that future results of operations for any particular quarterly or annual period could be materially affected by changes in our assumptions related to these matters. We accrue our best estimate of the probable cost for the resolution of claims. When appropriate, such estimates are developed in consultation with outside counsel handling the matters and are based upon a combination of litigation and settlement strategies. To the extent additional information arises or our strategies change, it is possible that our best estimate of our probable liability may change.
Changes to estimates related to the Company’s property and equipment, or operating results that are lower than its current estimates at certain store locations, may cause the Company to incur impairment charges on certain long-lived assets.
The Company makes certain estimates and projections with regards to individual store operations in connection with its impairment analyses for long-lived assets in accordance with SFAS No. 144, “Accounting for the Impairment or Disposal of Long-Lived Assets.” An impairment charge is required when the carrying value of the asset exceeds the estimated fair value or undiscounted future cash flows of the asset. The projection of future cash flows used in this analysis requires the use of judgment and a number of estimates and projections of future
10
operating results. If actual results differ from the Company’s estimates, additional charges for asset impairments may be required in the future. If impairment charges are significant, the Company’s results of operations could be adversely affected.
If we fail to maintain an effective system of internal control, we may not be able to accurately report our financial results. As a result, current and potential stockholders could lose confidence in our financial reporting, which could harm our business and the market price of our stock.
Effective internal control is necessary for us to provide reliable financial reports. If we cannot provide reliable financial reports, our business and operating results could be harmed.
| ITEM 1B. | UNRESOLVED STAFF COMMENTS |
Not Applicable.
As of April 14, 2008, the Company operated 305 stores in 34 states. The average selling space of a Cost Plus World Market store was approximately 15,700 square feet. The total average square footage of a Cost Plus World Market store was approximately 18,700 square feet, including a back stock room and office space. The table below summarizes the distribution of stores by state:
| | | | | | | | | | | | | | |
Alabama | | 5 | | Idaho | | 2 | | Minnesota | | 7 | | Oregon | | 7 |
Arizona | | 13 | | Illinois | | 19 | | Mississippi | | 1 | | South Carolina | | 7 |
California | | 73 | | Indiana | | 2 | | Missouri | | 6 | | South Dakota | | 1 |
(Northern California | | 31) | | Iowa | | 1 | | Montana | | 2 | | Tennessee | | 7 |
(Southern California | | 42) | | Kansas | | 2 | | Nebraska | | 3 | | Texas | | 33 |
Colorado | | 7 | | Kentucky | | 2 | | Nevada | | 5 | | Utah | | 2 |
Delaware | | 1 | | Louisiana | | 6 | | New Mexico | | 3 | | Virginia | | 10 |
Florida | | 15 | | Maryland | | 3 | | North Carolina | | 12 | | Washington | | 11 |
Georgia | | 8 | | Michigan | | 11 | | Ohio | | 13 | | Wisconsin | | 5 |
The Company leases land and buildings for 299 stores (of which 11 are capital leases) and leases land and owns the buildings for six stores. The Company currently leases its executive headquarters in Oakland, CA pursuant to a lease that expires in October 2008.
The Company currently leases a distribution center of approximately 1,000,000 square feet in Stockton, CA on 55 acres of land. The distribution center has two separate but adjacent facilities, one of which is used primarily for furniture distribution and the other is primarily used for general merchandise distribution. The California distribution center is the Company’s primary distribution center for its stores in the western United States. The Company owned the property prior to leasing it. The initial term of the building lease expires April 30, 2026. The company has two options to renew for five year terms each and one option to renew for a term of four years. The Company accounted for the sale and leaseback of the property as a financing whereby the net book value of the asset remains on the Company’s consolidated balance sheet.
The Company currently leases a distribution center of approximately 1,000,000 square feet in Windsor, VA on 82 acres of land. The Company owned the property prior to leasing it. The initial term of the lease expires December 21, 2026. The Company has the option to renew for four consecutive terms of five years each. The Company accounted for the sale and leaseback of the property as a financing whereby the net book value of the asset remains on the Company’s consolidated balance sheet.
The Company believes its current distribution facilities are adequate to meet its needs and will be able to accommodate future store growth.
11
The Company is not a party to any pending legal proceeding other than claims and litigation that arise in the ordinary course of business. Based on currently available information, management does not believe that the ultimate outcome of any unresolved matters, individually or in the aggregate, is likely to have a material adverse effect on the Company’s financial position or results of operations. However, litigation is subject to inherent uncertainties, and management’s view of these matters may change in the future. Were an unfavorable outcome to occur, there exists the possibility of a material adverse impact on the Company’s financial position and results of operations for the period in which the unfavorable outcome occurs, which may extend into future periods.
| ITEM 4. | SUBMISSION OF MATTERS TO A VOTE OF SECURITY HOLDERS |
None.
12
EXECUTIVE OFFICERS OF THE REGISTRANT
The executive officers of the Company are as follows:
| | | | |
Name | | Age | | Position |
Barry J. Feld | | 51 | | Chief Executive Officer, President and Director |
Michael J. Allen | | 53 | | Executive Vice President, Store Operations |
Joan S. Fujii | | 61 | | Executive Vice President, Human Resources |
Jane L. Baughman | | 41 | | Executive Vice President and Chief Financial Officer |
Rayford K. Whitley | | 44 | | Senior Vice President, Supply Chain |
George K. Whitney | | 54 | | Senior Vice President, Merchandising |
Jeffrey A. Turner | | 45 | | Senior Vice President, Chief Information Officer |
Carrie F. Crooker | | 48 | | Senior Vice President, Store Operations |
Mr. Feld was appointed Chief Executive Officer and President of Cost Plus, Inc. in October 2005. From August 1999 until October 2005, Mr. Feld was President, Chief Executive Officer and Chairman of the Board of Directors of PCA International, Inc., the largest North American operator of portrait studios focused on serving the discount retail market. From November 1998 to June 1999, Mr. Feld was President and Chief Operating Officer of Vista Eyecare, Inc., a specialty eyecare retailer. He joined Vista Eyecare as a result of its acquisition of New West Eyeworks, Inc., where he had been serving as President and a director since May 1991 and as Chief Executive Officer and a Director since February 1994. From 1987 to May 1991, Mr. Feld was with Frame-n-Lens Optical, Inc., where he served as its president prior to joining New West. Prior to that, he served in various senior management positions at Pearle Health Services for 10 years and, for a number of years, he served as an acquisition and turnaround specialist for optical retail groups acquired by Pearle. PCA International filed for protection under Chapter 11 of the federal Bankruptcy Code in August 2006.
Mr. Allen joined the Company in December 1988 as a Regional Manager, later was promoted to Director of Store Operations and in 1998 became Vice President, Real Estate and Store Development. In March 2002, Mr. Allen was promoted to Senior Vice President, Store Operations. In November 2004, Mr. Allen was promoted to Executive Vice President, Store Operations with responsibility for Store Operations, Development and Real Estate. Prior to coming to Cost Plus World Market, he was a District Manager for Liquor Barn, a discount beverage retailer, from 1986 to 1988. From 1981 to 1985, he was a store manager for Safeway Corporation, a food grocery chain.
Ms. Fujii was named the Company’s Executive Vice President, Human Resources in July 2005. Ms. Fujii joined the Company in May 1991 and served as Senior Vice President, Human Resources from February 1998 to May 2005. From October 1994 to February 1998, Ms. Fujii served as Vice President, Human Resources. From May 1991 to October 1994, Ms. Fujii served as the Company’s Director of Human Resources. From September 1975 to May 1991, she was employed by Macy’s California in various operations and human resources management positions, ultimately serving as Vice President, Human Resources at Macy’s Union Square store in San Francisco.
Ms. Baughman was named the Company’s Executive Vice President, Chief Financial Officer in August 2007. Ms. Baughman joined the Company in February 1996 as Manager of Merchandise Planning. She was promoted to Director of Financial Planning in June 1999 and then to Vice President of Financial Planning, Treasurer and Corporate Secretary in August 2001. In October 2006, she was promoted to Senior Vice President of Financial Operations. Prior to joining the Company, Ms. Baughman served in various financial positions for The Nature Company and The Gap, Inc., and in investment banking as a financial analyst for Dillon Read & Co., Inc.
Mr. Whitley joined the Company in November 2005 as Senior Vice President, Supply Chain. He is responsible for global logistics, distribution, merchandise planning & allocation, business intelligence, supply
13
chain operations, and our E-commerce business. Prior to joining Cost Plus World Market, Mr. Whitley served from August 2001 to October 2005 in a variety of roles at Williams-Sonoma, Inc. culminating in the position of Vice President, Supply Chain Optimization & Store Operations. Prior to this Mr. Whitley worked for Gap, Inc., Coopers & Lybrand LLP, and Ernst & Young LLP.
Mr. Whitney joined the Company in December 2006 as Senior Vice President of Merchandising, bringing 29 years of retail and wholesale merchandising, as well as product development experience. He held a number of senior level buying and store merchandising positions with Macy’s West, including Vice President, Divisional Merchandising Manager for The Cellar (housewares and food) from 1990 to 1995. After 17 years at Macy’s, Mr. Whitney went on to a variety of entrepreneurial retail and wholesale ventures, including Vice President of Merchandising for the Discovery Channel retail venture. From 1999 to 2002 Mr. Whitney held the position of Vice President, General Merchandise Manager for Home Style with the television retailer, QVC, Inc. During 2002 Mr. Whitney relocated to Hong Kong, where he was the founder and Managing Director of a product development trading company subsidiary for Thomas Pacconi Classics International Ltd., a major home products supplier. Upon returning to the U.S. during 2004, he served as Vice President for Replication Services for CAV Distributing Corp., a privately held DVD manufacturer, licensor and distributor.
Mr. Turner joined the Company in September 2007 as Senior Vice President and Chief Information Officer bringing 24 years of information technology experience, as well as 16 years of retail systems experience. Prior to joining Cost Plus World Market, Mr. Turner served as the Senior Vice President and Chief Information Officer for Restoration Hardware from June 2004 to September 2007. Mr. Turner also held senior level information technology positions at Levi Strauss & Co. and Gap Inc. from 1991 to 2004. He served as the Vice President, Global and North America Development at Levi Strauss & Co. from August 2001 to February 2004, and he served from September 1991 to July 2001 in a variety of roles at Gap Inc. culminating in the position of Vice President, Global Store Technology. Mr. Turner began his career in management consulting with Arthur Andersen in July 1984.
Ms. Crooker joined the Company in March 2003 as the Regional Director for the Western Region. In January of 2005 she was promoted to Vice President of Store Operations and, ultimately, assumed responsibility for both the Eastern and Western Regions in the company. In August of 2007 she was promoted to Senior Vice President of Store Operations. Prior to coming to Cost Plus World Market, Ms. Crooker worked for Target Corporation for 16 years in a variety of Store Operations roles. These roles included Target’s expansion into central and northern California in the late 1980’s. Ms. Crooker has been focused on field operations during her career and her roles at Target included, but were not exclusive to, Store Team Leader and District Team Leader.
14
PART II
| ITEM 5. | MARKET FOR REGISTRANT’S COMMON EQUITY, RELATED STOCKHOLDER MATTERS AND ISSUER PURCHASES OF EQUITY SECURITIES |
Market Information
The Company’s common stock is currently traded on the over-the-counter market and is quoted on the Nasdaq Stock Market under the symbol “CPWM.” The following table sets forth the high and low closing sales prices, for the periods indicated, as reported by the Nasdaq National Market.
Fiscal Year Ended February 2, 2008
| | | | | | |
| | | Price Range |
| | | High | | Low |
First Quarter | | $ | 11.20 | | $ | 8.80 |
Second Quarter | | | 9.74 | | | 5.86 |
Third Quarter | | | 5.70 | | | 2.89 |
Fourth Quarter | | | 5.81 | | | 2.97 |
Fiscal Year Ended February 3, 2007
| | | | | | |
| | | Price Range |
| | | High | | Low |
First Quarter | | $ | 20.18 | | $ | 16.21 |
Second Quarter | | | 17.38 | | | 13.26 |
Third Quarter | | | 13.51 | | | 9.36 |
Fourth Quarter | | | 14.18 | | | 9.64 |
As of March 27, 2008, the Company had 49 shareholders of record, excluding shareholders whose stock is held by brokers and other institutions on behalf of the shareholders. The Company estimated it had approximately 5,300 shareholders in total as of the same date.
Dividend Policy
To date, the Company has paid no cash dividends on its common stock, and the Company has no current intentions to do so. Certain provisions of the Company’s loan agreements restrict the ability of the Company to pay dividends.
Purchases of Equity Securities by the Issuer and Affiliated Purchasers
In March 2003, the Company announced a stock repurchase program that was approved by its Board of Directors to repurchase up to 500,000 shares of its common stock. The Company repurchased 425,500 shares in fiscal 2004 under the program. On November 18, 2004, the Company’s Board of Directors authorized the repurchase of an additional 1,000,000 shares creating a total of 1,074,500 shares available for repurchase under the program. There were no shares repurchased under the program during fiscal 2007, 2006 or fiscal 2005. The program does not require the Company to repurchase any common stock and may be discontinued at any time.
Securities Authorized for Issuance Under Equity Compensation Plans
Information regarding the securities authorized for issuance under the Company’s equity compensation plans is incorporated by reference from our proxy statement to be filed for our 2008 Annual Meeting of Shareholders. See Item 12 of this Form 10-K.
15
PERFORMANCE GRAPH
The following graph shows a comparison of cumulative total return for our common stock, the Nasdaq National Market—U.S. Index and the Nasdaq CRSP Retail Group Index from January 31, 2003 through the fiscal year ended February 2, 2008. In preparing the graph it was assumed that: (i) $100 was invested on January 31, 2003 in our common stock at $23.60 per share (adjusted for stock splits), the Nasdaq National Market—U.S. Index and the Nasdaq CRSP Retail Group Index; and (ii) all dividends were reinvested.
Notwithstanding anything to the contrary set forth in any of our previous filings under the Securities Act of 1933 or the Securities Exchange Act of 1934 that might incorporate future filings, including this proxy statement, in whole or in part, the following performance graph shall neither be incorporated by reference into any such filings nor be incorporated by reference into any future filings.
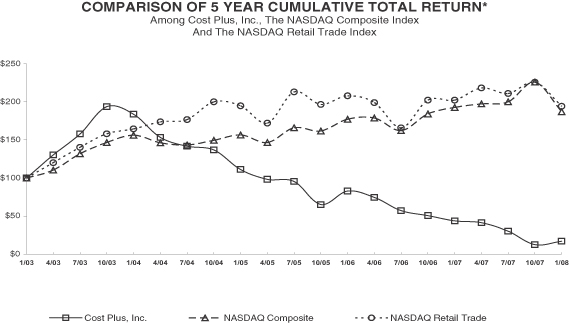
| | * | $100 invested on 1/31/03 in stock or index-including reinvestment of dividends. Fiscal year ending February 2, 2008. |
16
| ITEM 6. | SELECTED FINANCIAL DATA |
Five Year Summary of Selected Financial Data
| | | | | | | | | | | | | | | | | | | | |
(In thousands, except per share amounts
and selected operating data) | | Fiscal Year1 | |
| | 2007 | | | 2006 | | | 2005 | | | 2004 | | | 2003 | |
Statement of Operations Data: | | | | | | | | | | | | | | | | | | | | |
Net sales | | $ | 1,023,897 | | | $ | 1,040,309 | | | $ | 970,441 | | | $ | 908,560 | | | $ | 801,566 | |
Cost of sales and occupancy | | | 736,596 | | | | 739,257 | | | | 649,041 | | | | 601,732 | | | | 520,109 | |
| | | | | | | | | | | | | | | | | | | | |
Gross profit | | | 287,301 | | | | 301,052 | | | | 321,400 | | | | 306,828 | | | | 281,457 | |
Selling, general and administrative expenses | | | 329,690 | | | | 318,477 | | | | 281,719 | | | | 251,223 | | | | 220,288 | |
Store preopening expenses | | | 3,443 | | | | 5,650 | | | | 8,186 | | | | 7,552 | | | | 6,845 | |
Impairment of goodwill | | | — | | | | 4,178 | | | | — | | | | — | | | | — | |
| | | | | | | | | | | | | | | | | | | | |
Income (loss) from operations | | | (45,832 | ) | | | (27,253 | ) | | | 31,495 | | | | 48,053 | | | | 54,324 | |
Net interest expense | | | 11,613 | | | | 7,126 | | | | 5,143 | | | | 2,983 | | | | 3,285 | |
| | | | | | | | | | | | | | | | | | | | |
Income (loss) before income taxes | | | (57,445 | ) | | | (34,379 | ) | | | 26,352 | | | | 45,070 | | | | 51,039 | |
Income tax (benefit) expense | | | (1,945 | ) | | | (11,843 | ) | | | 9,763 | | | | 16,891 | | | | 18,352 | |
| | | | | | | | | | | | | | | | | | | | |
Net income (loss) | | $ | (55,500 | ) | | $ | (22,536 | ) | | $ | 16,589 | | | $ | 28,179 | | | $ | 32,687 | |
| | | | | | | | | | | | | | | | | | | | |
Net income (loss) per share—basic | | $ | (2.51 | ) | | $ | (1.02 | ) | | $ | 0.75 | | | $ | 1.29 | | | $ | 1.51 | |
Net income (loss) per share—diluted | | $ | (2.51 | ) | | $ | (1.02 | ) | | $ | 0.75 | | | $ | 1.26 | | | $ | 1.46 | |
Weighted average shares Outstanding—basic | | | 22,086 | | | | 22,068 | | | | 22,004 | | | | 21,840 | | | | 21,624 | |
Weighted average shares outstanding—diluted | | | 22,086 | | | | 22,068 | | | | 22,100 | | | | 22,323 | | | | 22,349 | |
| | | | | | | | | | | | | | | | | | | | |
Selected Operating Data: | | | | | | | | | | | | | | | | | | | | |
Percent of net sales: | | | | | | | | | | | | | | | | | | | | |
Gross profit | | | 28.1 | % | | | 28.9 | % | | | 33.1 | % | | | 33.8 | % | | | 35.1 | % |
Selling, general and administrative expenses | | | 32.2 | % | | | 30.6 | % | | | 29.0 | % | | | 27.7 | % | | | 27.5 | % |
Income (loss) from operations | | | (4.5 | )% | | | (2.6 | )% | | | 3.2 | % | | | 5.3 | % | | | 6.7 | % |
Number of stores: | | | | | | | | | | | | | | | | | | | | |
Opened during period | | | 15 | | | | 24 | | | | 35 | | | | 34 | | | | 31 | |
Closed during period | | | 4 | | | | 4 | | | | 5 | | | | 1 | | | | 2 | |
Open at end of period | | | 298 | | | | 287 | | | | 267 | | | | 237 | | | | 204 | |
Average sales per selling square foot2 | | $ | 223 | | | $ | 237 | | | $ | 247 | | | $ | 260 | | | $ | 267 | |
Comparable store sales increase (decrease)3 | | | (5.4 | )% | | | (3.3 | )% | | | (2.6 | )% | | | 0.9 | % | | | 2.7 | % |
| | | | | | | | | | | | | | | | | | | | |
Balance Sheet Data (at period end): | | | | | | | | | | | | | | | | | | | | |
Working capital | | $ | 161,129 | | | $ | 198,749 | | | $ | 188,463 | | | $ | 193,406 | | | $ | 183,644 | |
Total assets | | | 553,747 | | | | 569,546 | | | | 529,571 | | | | 492,203 | | | | 433,041 | |
Long-term debt and capital lease obligations, less current portion | | | 122,769 | | | | 121,567 | | | | 62,319 | | | | 50,591 | | | | 36,167 | |
Total shareholders’ equity | | | 237,519 | | | | 291,459 | | | | 310,395 | | | | 287,481 | | | | 262,718 | |
Current ratio | | | 2.03 | | | | 2.73 | | | | 2.60 | | | | 2.62 | | | | 2.77 | |
Debt to equity ratio | | | 60.2 | % | | | 42.4 | % | | | 22.3 | % | | | 18.9 | % | | | 14.5 | % |
| | | | | | | | | | | | | | | | | | | | |
| 1. | The Company’s fiscal year end is the Saturday closest to the end of January. Fiscal 2006 was 53 weeks and ended on February 3, 2007. All other fiscal years presented consisted of 52 weeks. |
| 2. | Calculated using net sales for stores open during the entire period divided by the selling square feet of such stores. |
| 3. | A store is included in comparable store sales the first day of the fiscal month beginning with the fourteenth full fiscal month of sales. Comparable store sales for fiscal 2006 were measured on a 53-week basis. In all other years presented, comparable store sales were measured on a 52-week basis. |
17
| ITEM 7. | MANAGEMENT’S DISCUSSION AND ANALYSIS OF FINANCIAL CONDITION AND RESULTS OF OPERATION |
The following discussion and analysis of results of operations, financial condition, liquidity and capital resources should be read in conjunction with the accompanying audited consolidated financial statements and notes thereto that are included elsewhere in this Form 10-K. The fiscal year ended February 2, 2008 (fiscal 2007) included 52 weeks, fiscal year ended February 3, 2007 (fiscal 2006) included 53 weeks, and the fiscal year ended January 28, 2006 (fiscal 2005) included 52 weeks.
Overview
Cost Plus, Inc is a leading specialty retailer of casual home furnishings and entertaining products. As of February 2, 2008, the Company operated 298 stores in 34 states. The stores feature an ever-changing selection of casual home furnishings, housewares, gifts, decorative accessories, gourmet foods and beverages offered at competitive prices and imported from more than 50 countries. Many items are unique and exclusive to Cost Plus World Market. The value, breadth and continual refreshment of products invites customers to come back throughout a lifetime of changing home furnishings and entertaining needs.
In fiscal 2007, the Company continued to experience a declining same store sales trend but believes the fundamentals of the business have been restored and its turnaround efforts have taken hold. This is evidenced by continuing improvement in buyer margin, inventory turn, customer count and average ticket metrics. The Company has taken actions to exit underperforming media markets in order to increase its brand presence in better performing markets. On January 21, 2008, the Board of Directors of Cost Plus, Inc. approved a plan for the Company to exit eight underperforming media markets while closing 18 of its existing stores during fiscal 2008, of which 13 will be considered discontinued operations.
Net sales for the fifty-two week fiscal year 2007 decreased 1.6% to $1.02 billion from $1.04 billion for the fifty-three week fiscal year 2006 while comparable store sales for the year decreased 5.4% compared to a 3.3% decrease in fiscal 2006.
Net loss in fiscal 2007 was $55.5 million, or $2.51 per diluted share, versus a net loss in fiscal 2006 of $22.5 million, or $1.02 per diluted share. Fiscal 2007 results include a non-cash charge of $20.1 million, or $0.91 per diluted share, for a deferred tax asset valuation allowance and a $2.3 million, or $0.06 per diluted share, non-cash impairment charge to write-down property and equipment related to the store closures that will occur in fiscal 2008 from exiting the eight underperforming media markets. Fiscal 2006 results included a markdown charge of $3.7 million, or $0.17 per diluted share taken in the second quarter to clear discontinued merchandise and also included significant additional markdowns related to promotional activities to clear seasonal merchandise in the second half of the year. The net loss in fiscal 2006 also included a non-cash impairment charge of $4.2 million, or $0.17 per diluted share, for the write-down of goodwill.
The Company opened 15 new stores and closed four during fiscal 2007 to end the year with 298 stores. The Company expects to close 18 stores and to open 17 new stores in fiscal 2008.
Fiscal 2007 (52 weeks) Compared to Fiscal 2006 (53 weeks)
Net SalesNet sales consist almost entirely of retail sales, but also include direct-to-consumer sales and shipping revenue. Net sales decreased $16.4 million, or 1.6%, to $1.02 billion in the fifty-two week fiscal 2007 from $1.04 billion in the fifty-three week fiscal 2006. The decrease in net sales was attributable to a decrease in comparable store sales. Comparable store sales decreased 5.4% compared to a decrease of 3.3% in 2006. Comparable store sales decreased primarily as a result of decreased customer traffic, partially offset by an increase in average transaction size. As of February 2, 2008, the calculation of comparable store sales included a
18
base of 282 stores. A store is generally included as comparable at the beginning of the fourteenth month after its grand opening. As of February 2, 2008, the Company operated 298 stores compared to 287 stores as of February 3, 2007. Consistent with the National Retail Federation reporting calendar, fiscal 2007 was a fifty-two week year for the Company compared to a fifty-three week year in fiscal 2006.
The Company classifies its sales into the home furnishings and consumables product lines. Home furnishings were 61% of sales and consumables were 39% of sales in 2007 and 2006.
Cost of Sales and Occupancy Cost of sales and occupancy, which consists of costs to acquire merchandise inventory, costs of freight and distribution, as well as certain facility costs, decreased $2.7 million, or 0.4%, to $736.6 million in 2007 compared to $739.3 million in 2006. As a percentage of net sales, total cost of sales and occupancy increased 80 basis points to 71.9% in 2007 from 71.1% in 2006. The 80 basis point increase was due to an increase in occupancy costs of 70 basis points primarily from decreased leverage on sales as a result of lower comparable store sales and an increase in cost of goods sold of 10 basis points primarily related to higher distribution costs.
Selling, General and Administrative (“SG&A”) Expenses SG&A expenses increased $11.2 million, or 3.5%, to $329.7 million in 2007 compared to $318.5 million in 2006. As a percentage of net sales, SG&A expenses for 2007 increased 160 basis points to 32.2% in 2007 from 30.6% in 2006. This was primarily due to decreased leverage on sales as a result of lower comparable store sales as well as higher store payroll expenses and higher depreciation expenses. Advertising expense for the year was approximately flat to last year both in dollars and as a percentage of sales. In fiscal 2007, the Company recorded a $2.3 million non-cash impairment charge to write-down property and equipment related to the store closures that will occur in fiscal 2008.
Store Preopening Expenses Store preopening expenses, which include rent expense incurred prior to opening as well as grand opening advertising and preopening merchandise setup expenses, were $3.4 million in 2007 compared to $5.7 million in 2006. The Company opened 15 stores in 2007 compared to 24 stores in 2006. Per store average preopening expense was flat compared to last year. Rent expense included in store preopening expenses was approximately $0.5 million in 2007 versus $1.1 million in 2006. Store preopening expenses vary depending on the amount of time between the possession date and the store opening, the particular store site and whether it is located in a new or existing market.
Net Interest Expense Net interest expense, which includes interest on capital leases and debt, net of interest earned on investments, was $11.6 million in 2007 compared to $7.1 million in 2006. The increase in net interest expense was primarily due to additional long-term debt related to the Virginia and California distribution center sale-leaseback transactions, the California distribution center expansion, and higher seasonal borrowings under the Company’s revolving line of credit. Excluded from net interest expense was interest capitalized primarily related to distribution center projects totaling $825,000 and $729,000 for fiscal years 2007 and 2006, respectively.
Income Taxes The Company’s effective tax rate before valuation allowance was a benefit of 38.3% in 2007 and a benefit of 34.4% in 2006. The increase in the tax benefit (before valuation allowance) was primarily due to an impairment write-down of non-deductible goodwill in fiscal year 2006. After considering the valuation allowance of $20.1 million recorded in 2007, the Company’s effective tax rate is 3.4%. For fiscal 2007, the Company had net deferred tax assets of $1.9 million, of which $8.6 million was included in other assets and $6.7 million was included in other current liabilities on the Company’s consolidated balance sheet. For fiscal 2006, the Company had a net deferred tax asset of $5.3 million, of which $14.9 million was included in other assets and $9.6 million was included in other current liabilities on the Company’s consolidated balance sheet. For fiscal 2008, the Company expects that the effective tax rate after valuation allowance will be consistent with the fiscal 2007 effective tax rate.
19
Fiscal 2006 (53 weeks) Compared to Fiscal 2005 (52 weeks)
Net Sales Net sales consist almost entirely of retail sales but also include direct-to-consumer sales and shipping revenue. Net sales increased $69.9 million, or 7.2%, to $1.04 billion in 2006 from $970.4 million in 2005. The increase in net sales was attributable to an increase in new store sales partially offset by a decrease in comparable store sales. Comparable store sales decreased 3.3%, or $32.1 million, in 2006 compared to a decrease of 2.6%, or $22.4 million, in 2005. Comparable store sales decreased primarily as a result of decreased customer traffic and a decrease in average transaction size. The decrease in average transaction size was primarily due to heavy discounting and a focus on providing more value-oriented products. As of February 3, 2007, the calculation of comparable store sales included a base of 260 stores. A store is generally included as comparable at the beginning of the fourteenth month after its grand opening. New store sales increased $102.0 million, primarily driven by new store openings. As of February 3, 2007, the Company operated 287 stores compared to 267 stores as of January 28, 2006. Consistent with the National Retail Federation reporting calendar fiscal 2006 was a fifty-three week year for the Company compared to a fifty-two week year in fiscal 2005.
The Company classifies its sales into the home furnishings and consumables product lines. Home furnishings were 61% of sales and consumables were 39% of sales in 2006 and 2005.
Cost of Sales and Occupancy Cost of sales and occupancy, which consists of costs to acquire merchandise inventory, costs of freight and distribution, as well as certain facility costs, increased $90.2 million, or 13.9%, to $739.3 million in 2006 compared to $649.0 million in 2005. As a percentage of net sales, total cost of sales and occupancy increased 420 basis points to 71.1% in 2006 from 66.9% in 2005. The 420 basis point increase was due to an increase in cost of goods sold of 350 basis points and an increase in occupancy costs of 70 basis points. The increase in cost of sales as a percentage of net sales was primarily attributable to significant markdowns the Company recorded in the second quarter to clear discontinued merchandise and additional markdowns taken throughout the year on primarily seasonal merchandise. Higher distribution center costs and freight costs also contributed to the increase. The 70 basis point increase in occupancy costs was primarily due to decreased leverage on sales as a result of lower comparable store sales in 2006 and higher average occupancy costs for newer stores.
Selling, General and Administrative (“SG&A”) Expenses SG&A expenses increased $36.8 million, or 13.0%, to $318.5 million in 2006 compared to $281.7 million in 2005. As a percentage of net sales, SG&A expenses for 2006 increased 160 basis points to 30.6% in 2006 from 29.0% in 2005. This was primarily due to an increase in payroll and benefits costs of 80 basis points and an increase in advertising expense of 30 basis points. The increase in store payroll and advertising as a percentage of net sales was primarily due to decreased leverage on sales as a result of lower comparable store sales in fiscal 2006. The increase also included 30 basis points from the recording of share-based compensation due to the adoption of Statement of Financial Accounting Standards (“SFAS”) No. 123(R), “Share-Based Payment,” (“SFAS 123(R)”) at the beginning of fiscal 2006.
Store Preopening Expenses Store preopening expenses, which include rent expense incurred prior to opening as well as grand opening advertising and preopening merchandise setup expenses, were $5.7 million in 2006 compared to $8.2 million in 2005. The Company opened 24 stores in 2006 compared to 35 stores in 2005. Per store average preopening expense was flat compared to last year. Rent expense included in store preopening expenses was approximately $1.1 million in 2006 versus $1.6 million in 2005. Store preopening expenses vary depending on the amount of time between the possession date and the store opening, the particular store site and whether it is located in a new or existing market.
Impairment of Goodwill In fiscal 2006, the Company recorded a $4.2 million non-cash charge as a result of the impairment to goodwill. Based upon its annual goodwill impairment test performed in the fourth quarter of 2006, the Company reduced all of the goodwill attributed to the acquisition of Cost Plus, Inc. by BC Investments, Inc. in November of 1987. The impairment has been included as a separate line item before “income from operations” in accordance with SFAS No. 142, “Goodwill and Other Intangible Assets.”
20
Net Interest Expense Net interest expense, which includes interest on capital leases and debt, net of interest earned on investments, was $7.1 million in 2006 compared to $5.1 million in 2005. The increase in net interest expense was primarily due to additional long-term debt related to the sale-leaseback of the California distribution center and higher average net borrowings under the Company’s revolving line of credit. Excluded from net interest expense was interest capitalized primarily related to distribution center projects totaling $729,000 and $434,000 for fiscal years 2006 and 2005, respectively.
Income Taxes The Company’s effective tax rate was a benefit of 34.4% in 2006 and a rate of 37.0% in 2005. The decrease in the tax rate was primarily due to the adoption of SFAS 123(R), “Share-Based Payment,” and an impairment write down of non-deductible goodwill.
Liquidity and Capital Resources
The Company’s cash and cash equivalents balance at the end of fiscal 2007 was $3.3 million compared to $12.7 million at the end of fiscal 2006. The Company’s primary uses for cash are to fund operating expenses, inventory requirements and new store expansion. Historically, the Company has financed its operations primarily from internally generated funds and seasonal borrowings under a revolving credit facility. The Company believes that the combination of its cash and cash equivalents, internally generated funds and available borrowings will be sufficient to finance its working capital and other capital projects for at least the next twelve months.
Distribution Center Activities On April 7, 2006, the Company entered into a sale-leaseback transaction with Inland Real Estate Acquisitions, Inc., a third party real estate investment trust (“Inland-A”). In connection with the transaction, the Company sold its Stockton, California distribution center property to Inland-A for net proceeds of $29.8 million. The property sold consisted of a 500,000 square foot building located on approximately 55 acres. At the closing on April 7, 2006, the Company entered into a lease agreement and a subground lease agreement with Inland-A to lease the property back. The Company used a portion of the proceeds from the sale of the property to retire $18.2 million of long-term debt related to the Company’s purchase of the property, and the remaining proceeds were used for other business purposes. The Company accounted for the transaction as a financing whereby the net book value of the asset remains on the Company’s consolidated balance sheet. The Company also recorded a financing obligation in the amount of approximately $29.8 million, which is being amortized over the 34-year period of the lease (including option periods) and approximates the discounted value of minimum lease payments under the leases. Monthly lease payments are accounted for as principal and interest payments (at an approximate annual rate of 7.2%) on the recorded obligation. On July 31, 2007, the Company entered into a new lease agreement, as described below, and as a result approximately $4.0 million of outstanding long-term debt was transferred to the new lease agreement and is being amortized thereunder. As of February 2, 2008, the balance of the financing obligation was $25.2 million and was included on the Company’s condensed consolidated balance sheet as long-term debt.
On July 31, 2007, the Company entered into a sale-leaseback transaction with Inland Western Stockton Airport Way II, L.L.C., a third party real estate investment company (“Inland-B”), in which the Company sold its newly constructed distribution facility in Stockton, California for proceeds of $34.3 million. At the closing on July 31, 2007, the Company entered into a lease agreement with Inland-B (“new lease agreement”) to lease the property back. In addition, the new lease agreement terminated and replaced the existing subground lease agreement which had an outstanding long-term debt balance of approximately $4.0 million. The Company used the proceeds from the sale to pay-off long-term debt associated with the construction of the distribution facility. The Company accounted for the transaction as a financing whereby the net book value of the asset remains on the Company’s condensed consolidated balance sheet. The Company also recorded a financing obligation in the amount of approximately $34.3 million, which is being amortized over the 32-year and nine-month period of the lease (including option periods) and approximates the discounted value of minimum lease payments under the lease. Monthly lease payments are accounted for as principal and interest payments (at an approximate annual rate of 8.4%) on the recorded obligation. As of February 2, 2008, the balance of the financing obligation was approximately $38.0 million and was included on the Company’s condensed consolidated balance sheet as long-term debt.
21
On December 21, 2006, the Company entered into a sale-leaseback transaction with Inland-A, in which the Company sold its Windsor, Virginia distribution center property to Inland-A for net proceeds of $52.3 million. The property sold consisted of a 1,000,000 square foot building located on approximately 82 acres. At the closing on December 21, 2006, the Company entered into a lease agreement with Inland-A to lease the property back. The Company used a portion of the net proceeds from the sale to pay-off the long-term debt of $34.1 million related to the Company’s purchase of the property, and used the remaining proceeds for other business purposes. The Company accounted for the transaction as a financing whereby the net book value of the asset remains on the Company’s condensed consolidated balance sheet. The Company also recorded a financing obligation in the amount of approximately $52.3 million, which is being amortized over the 40 year period of the lease (including option periods) and approximates the discounted value of minimum lease payments under the lease. Monthly lease payments are accounted for as principal and interest payments (at an approximate annual rate of 8.5%) on the recorded obligation. As of February 2, 2008, the balance of the financing obligation was $52.0 million and was included on the Company’s condensed consolidated balance sheet as long-term debt.
Cash Flows From Operating ActivitiesNet cash provided by operating activities totaled $5.0 million for fiscal 2007 versus net cash used in operating activities of $19.4 million in fiscal 2006. The increase in net cash provided by operations was primarily due to an increase in accounts payable reflecting the effect of better terms with vendors and timing factors, the add-back of a $20.1 million non-cash charge for a valuation allowance on the deferred tax assets, as well as less cash used for the payment of income taxes and a decrease in other assets. This was partially offset by a higher net loss.
Net cash used in operating activities totaled $19.4 million for fiscal 2006, versus net cash provided by operating activities of $44.2 million in fiscal 2005. The decrease in net cash provided by operations was primarily due to the net loss of $22.5 million in fiscal 2006 versus net income of $16.6 million in fiscal 2005. The decrease was also due to an increase in other assets related to an income tax receivable of $11.0 million due to the Company’s net loss for the year and higher inventory growth.
Cash Flows From Investing Activities Net cash used in investing activities totaled $33.1 million in fiscal 2007, a decrease of $30.7 million from fiscal 2006 due to decreased capital expenditures. In fiscal 2007, the Company spent $10.7 million on the expansion of the California distribution facility versus $36.8 million in fiscal 2006 and only opened 15 new stores compared to 24 new stores last year. The Company received net proceeds from the sale of property and equipment of $36,000 in fiscal 2007 compared to $3.7 million in fiscal 2006.
Net cash used in investing activities totaled $63.8 million in fiscal 2006, a decrease of $2.1 million from fiscal 2005. In fiscal 2006, the Company’s capital expenditures were $67.5 million compared to $66.0 million in fiscal 2005. The Company spent $36.8 million in fiscal 2006 on the expansion of the California distribution facility versus $33.0 million in fiscal 2005 on the purchase and renovation of the California distribution facility. The Company received net proceeds from the sale of property and equipment of $3.7 million in fiscal 2006 compared to $0.1 million in fiscal 2005.
The Company estimates that fiscal 2008 capital expenditures will approximate $14.8 million; including approximately $5.7 million for new stores, $3.8 million for management information systems and distribution center projects, and $5.3 million allocated to investments in existing stores and various other corporate projects.
Cash Flows From Financing Activities Net cash provided by financing activities was $18.7 million for fiscal 2007 compared to $55.5 million in fiscal 2006. The Company had net borrowings from its revolving credit line of $18.1 million in fiscal 2007 compared to no net borrowings last year. In fiscal 2007, proceeds from long-term debt were $39.6 million related to the sale-leaseback of its newly constructed general merchandise distribution facility in Stockton, California, compared to proceeds from long-term debt last year of $112.6 million related to the sale-leasebacks of the furniture distribution facility in Stockton, California and the Virginia distribution center as well as proceeds from long-term debt related to the aforementioned construction project.
22
The Company used a portion of the net proceeds from the sale of its newly constructed California distribution facility to pay-down $36.0 million in long-term debt during fiscal 2007. Principal payments on long-term debt were $597,000 compared to $3.4 million last year. In 2007, the Company received $16,000 from the issuance of common stock in connection with the exercise of employee stock options compared to $207,000 in fiscal 2006.
Net cash provided by financing activities was $55.5 million for fiscal 2006 compared to $19.2 million in fiscal 2005. The company incurred $82.1 million in long-term debt in fiscal 2006 related to the sale-leaseback of the California and Virginia distribution centers versus $20.0 million of long-term debt in fiscal 2005 for the purchase of the California distribution facility. In turn, the Company used a portion of the proceeds from the sale of its distribution centers to retire $52.3 million of existing long-term debt. During fiscal 2006, the Company began construction of a 500,000 square foot general merchandise distribution facility in Stockton, California that resulted in long-term debt of $30.5 million. In 2006, the Company received $207,000 from the issuance of common stock in connection with the exercise of employee stock options compared to $4.5 million in fiscal 2005.
Revolving lines of CreditOn June 25, 2007, the Company entered into a secured five-year revolving credit agreement (the “Credit Agreement”) with a group of banks that terminated and replaced its existing five-year line of credit agreement and its existing 18-month revolving credit facility. The Credit Agreement allows for cash borrowings and letters of credit under a secured revolving credit facility of up to $200.0 million. The amount available for borrowing at any time will be limited by a stated percentage of the aggregate amount of the liquidated value of eligible inventory and the face amount of eligible credit card receivables. The Credit Agreement includes three options to increase the size of the revolving credit facility by up to $50.0 million in the aggregate. All borrowings and letters of credit under the Credit Agreement are collateralized by all assets presently owned and hereafter-acquired by the Company. Interest will be paid in arrears monthly, quarterly, or over the applicable interest period as selected by the Company, with the entire balance payable on June 25, 2012. Borrowings pursuant to the revolving credit facility will bear interest, at the Company’s election, at a rate equal to either (i) the higher of Bank of America’s prime rate or the federal funds effective rate plus an applicable margin; or (ii) the LIBOR rate plus an applicable margin. The applicable margin is based on the Company’s Average Excess Availability, as defined in the Credit Agreement. In addition, the Company will pay a commitment fee on the unused portion of the amount available for borrowing as described in the Credit Agreement. The Credit Agreement includes limitations on the ability of the Company to, among other things, incur debt, grant liens, make investments, enter into mergers and acquisitions, pay dividends, repurchase its outstanding common stock, change its business, enter into transactions with affiliates, and dispose of assets. The events of default under the Credit Agreement include, among others, payment defaults, cross defaults with certain other indebtedness, breaches of covenants, loss of collateral, judgments, changes in control, and bankruptcy events. In the event of a default, the Credit Agreement requires the Company to pay incremental interest at the rate of 2.0% and the lenders may, among other remedies, foreclose on the security (which could include the sale of the Company’s inventory), eliminate their commitments to make credit available, declare due all unpaid principal amounts outstanding, and require cash collateral for any letter of credit obligations. In addition, in the event of a default or if the Company’s Average Excess Availability is 15% or less of the borrowing capacity under the revolving credit facility, the Company will be subject to additional restrictions, including specific restrictions with respect to its cash management procedures.
The Company intends to use the proceeds from the Credit Agreement for working capital, issuance of commercial and standby letters of credit, capital expenditures, and other general corporate purposes. The Company believes that borrowings on the Credit Agreement will be paid down within twelve months. As of February 2, 2008, the Company was in compliance with its loan covenant requirements, had $18.1 million in borrowings and $12.9 million in outstanding letters of credit, and had credit available under the Credit Agreement of $158.5 million.
23
Contractual Obligations and Commercial Commitments The following table provides summary information concerning the Company’s future contractual obligations and commercial commitments as of February 2, 2008:
| | | | | | | | | | | | | | | |
Contractual Obligations (in millions)4 | | Less than
1 year | | 1-3 years | | 4-5 Years | | After
5 Years | | Total Amount
Committed |
Operating leases | | $ | 83.4 | | $ | 235.0 | | $ | 115.0 | | $ | 115.4 | | $ | 548.8 |
Capital leases (principal and interest) | | | 2.6 | | | 5.0 | | | 2.6 | | | 8.5 | | | 18.7 |
Long-term debt | | | 0.8 | | | 2.6 | | | 1.9 | | | 109.9 | | | 115.2 |
Merchandise letters of credit | | | 5.9 | | | — | | | — | | | — | | | 5.9 |
Loan Outstanding | | | 18.1 | | | — | | | — | | | — | | | 18.1 |
Standby letters of credit | | | 7.0 | | | — | | | — | | | — | | | 7.0 |
Purchase obligations1 | | | 129.5 | | | — | | | — | | | — | | | 129.5 |
Severance payments2 | | | 0.8 | | | — | | | — | | | — | | | 0.8 |
Interest3 | | | 8.3 | | | 25.1 | | | 17.2 | | | 219.3 | | | 269.9 |
| | | | | | | | | | | | | | | |
Total | | $ | 256.4 | | $ | 267.7 | | $ | 136.7 | | $ | 453.1 | | $ | 1,113.9 |
| | | | | | | | | | | | | | | |
| 1. | As of February 2, 2008, the Company had approximately $129.5 million of outstanding purchase orders, which were primarily related to merchandise inventory. Such purchase orders are generally cancelable at the discretion of the Company until the order has been shipped. The table above excludes certain immaterial executory contracts for goods and services that tend to be recurring in nature and similar in amount year over year. |
| 2. | Payable to the Company’s former CFO and various individuals impacted by the corporate workforce reduction. |
| 3. | Represents interest expected to be paid on our deferred financing obligations related to the distribution centers. |
| 4. | This table excludes $2.2 million of liabilities for uncertain tax positions under FIN 48, as we are not able to reasonably estimate when cash payments for these liabilities will occur. This amount, however, has been recorded as a liability in the accompanying Consolidated Balance Sheet as of February 2, 2008. |
Off Balance Sheet Arrangements
Other than the operating leases and letters of credit discussed above, the Company has no financial arrangements involving special-purpose entities or lease agreements, commonly described as synthetic leases, or any off-balance sheet arrangements that have a material current effect, or that are reasonably likely to have a material future effect, on the Company’s financial condition, revenues or expenses, results of operations, liquidity, capital expenditures or capital resources.
Impact of New Accounting Standards
In September 2006, the Financial Accounting Standards Board (“FASB”) issued SFAS No. 157, “Fair Value Measurement.” SFAS No. 157 clarifies the definition of fair value, establishes a framework for measuring fair value in generally accepted accounting principles, and expands disclosures about fair value measurements. This Statement does not require any new fair value measurements. SFAS No. 157 is effective for fiscal years beginning after November 15, 2007 and interim periods within those fiscal years. The Company is currently assessing the impact of SFAS No. 157 on its financial statements.
In February 2007, the FASB issued SFAS No. 159, “The Fair Value Option for Financial Assets and Financial Liabilities—Including an amendment of FASB Statement No. 115.” SFAS No. 159 permits all entities to choose to measure eligible items at fair value at specific election dates. This statement does not require any new fair value measurements. SFAS No. 159 is effective for fiscal years beginning after November 15, 2007 and
24
interim periods within those fiscal years. The Company is currently assessing the impact of SFAS No. 159 on its financial statements.
Inflation
The Company does not believe that inflation has had a material effect on its financial condition and results of operations during the past three fiscal years. However, there can be no assurance that the Company’s business will not be affected by inflation in the future.
Quarterly Results and Seasonality
The following tables set forth the Company’s unaudited quarterly operating results for the eight most recent quarterly periods.
| | | | | | | | | | | | | | | | |
| | | Fiscal Quarters Ended | |
(In thousands, except per share data and number of stores) | | May 5,
2007 | | | August 4,
2007 | | | November 3,
2007 | | | February 2,
20081,2,3 | |
Net sales | | $ | 207,947 | | | $ | 215,185 | | | $ | 220,581 | | | $ | 380,184 | |
Gross profit | | | 57,977 | | | | 52,234 | | | | 61,895 | | | | 115,195 | |
Net loss | | | (11,113 | ) | | | (17,985 | ) | | | (13,944 | ) | | | (12,458 | ) |
Net loss per weighted average share | | | | | | | | | | | | | | | | |
Basic | | $ | (0.50 | ) | | $ | (0.81 | ) | | $ | (0.63 | ) | | $ | (0.56 | ) |
Diluted | | $ | (0.50 | ) | | $ | (0.81 | ) | | $ | (0.63 | ) | | $ | (0.56 | ) |
Number of stores open at end of period | | | 292 | | | | 296 | | | | 297 | | | | 298 | |
| |
| | | Fiscal Quarters Ended | |
(In thousands, except per share data and number of stores) | | April 29,
2006 | | | July 29,
2006 | | | October 28,
2006 | | | February 3,
2007¹ | |
Net sales | | $ | 212,964 | | | $ | 215,275 | | | $ | 215,405 | | | $ | 396,665 | |
Gross profit | | | 65,382 | | | | 53,669 | | | | 65,320 | | | | 116,681 | |
Net income (loss) | | | (3,537 | ) | | | (14,205 | ) | | | (12,244 | ) | | | 7,450 | |
Net income (loss) per weighted average share | | | | | | | | | | | | | | | | |
Basic | | $ | (0.16 | ) | | $ | (0.64 | ) | | $ | (0.55 | ) | | $ | 0.34 | |
Diluted | | $ | (0.16 | ) | | $ | (0.64 | ) | | $ | (0.55 | ) | | $ | 0.34 | |
Number of stores open at end of period | | | 272 | | | | 274 | | | | 283 | | | | 287 | |
| 1. | The three months ended February 2, 2008 was a thirteen-week period as compared to the three months ended February 3, 2007 which was a fourteen-week period. |
| 2. | The three months ended February 2, 2008 included a $2.3 million non-cash impairment charge to write-down property and equipment for the stores planned to close in fiscal 2008. |
| 3. | The three months ended February 2, 2008 included a $20.1 million non-cash charge for a deferred tax asset valuation allowance. |
The Company’s business is highly seasonal, reflecting the general pattern associated with the retail industry of peak sales and earnings during the fourth quarter (Holiday) season. Due to the importance of the Holiday selling season, the fourth quarter of each fiscal year has historically contributed, and the Company expects it will continue to contribute, a disproportionate percentage of the Company’s net sales and most of its net income, if any, for the entire fiscal year. Any factors negatively affecting the Company during the Holiday selling season in any year, including unfavorable economic conditions, could have a material adverse effect on the Company’s financial condition and results of operations. The Company generally experiences lower sales and earnings during the first three quarters and, as is typical in the retail industry, may incur losses in these quarters. The results of operations for these interim periods are not necessarily indicative of the results for a full fiscal year. In addition, the Company makes decisions regarding merchandise well in advance of the season in which it will be
25
sold. Significant deviations from projected demand for products could have a material adverse effect on the Company’s financial condition and results of operations, either by lost gross sales due to insufficient inventory or lost gross margin due to the need to mark down excess inventory.
The Company’s quarterly results of operations may also fluctuate based upon such factors as delays in the flow of merchandise, the ability to realize the expected operational and cost efficiencies from its distribution centers, the number and timing of store openings and related store preopening expenses, the amount of net sales contributed by new and existing stores, the mix of products sold, the timing and level of markdowns, store closings or relocations, competitive factors, changes in fuel and other shipping costs, general economic conditions, geopolitical conditions, fluctuations in the value of the U.S. dollar against foreign currencies, labor market fluctuations, changes in accounting rules and regulations and unseasonable weather conditions.
Critical Accounting Policies and Estimates
Cost Plus, Inc.’s and its subsidiaries’ discussion and analysis of its financial condition and results of operations are based upon the Company’s consolidated financial statements, which have been prepared in accordance with accounting principles generally accepted in the United States of America. The preparation of these financial statements requires the Company to make estimates and judgments that affect the reported amounts of assets, liabilities, revenues and expenses and related disclosure of contingent assets and liabilities. Estimates and assumptions include, but are not limited to, inventory values, fixed asset lives, intangible asset values, deferred income taxes, self-insurance reserves and the impact of contingencies and litigation. The Company bases its estimates on historical experience and various other assumptions that are believed to be reasonable under the circumstances, the results of which form the basis for making judgments about the carrying values of assets and liabilities that are not readily apparent from other sources. Actual results may differ from those estimates under different assumptions or conditions. The Company has also chosen certain accounting policies when options are available, including the retail inventory method of accounting for inventories and, prior to fiscal 2006, the intrinsic value method to account for common stock options. These accounting policies are applied consistently for all years presented except for the adoption of SFAS 123R as of January 29, 2006. Operating results would be affected if other alternatives were used. Information about the impact on operating results by using Accounting Principles Board Opinion No. 25, “Accounting for Stock Issued to Employees,” as it relates to fiscal 2005, is included in Note 1 to the consolidated financial statements.
Although not all inclusive, the Company believes that the following represent the more critical estimates and assumptions used in the preparation of the consolidated financial statements.
Revenue Recognition The Company recognizes revenue from the sale of merchandise either at the point of sale in its stores or at the time of receipt by the customer for merchandise purchased from its website. Revenue from sales of gift cards is deferred until redemption or until the likelihood of redemption by the customer is remote (gift card breakage). Income from gift card breakage is recorded as a reduction to selling, general and administrative expenses. Shipping and handling fees charged to customers are recognized as revenue at the time the merchandise is delivered to the customer. The Company’s revenues are reported net of discounts and returns, including an allowance for estimated returns. The allowance for sales returns is based on historical experience and was approximately $0.4 million at the end of fiscal 2007 and fiscal 2006, and $0.3 million at the end of fiscal 2005.
Inventory Inventories are stated at the lower of cost or market with cost determined under the retail inventory method (“RIM”), in which the valuation of inventories at cost and gross margins are calculated by applying a cost-to-retail ratio to the retail value of inventories. RIM is an averaging method that is widely used in the retail industry due to its practicality. The Company’s use of the RIM results in valuing inventories at lower of cost or market as markdowns are currently taken as a reduction of the retail value of inventories. Inherent in the RIM calculation are certain significant management judgments and estimates including, among others, merchandise markon, markdowns and shrinkage, which impact the ending inventory valuation at cost as well as
26
gross margin. The Company’s RIM utilizes multiple departments in which fairly homogeneous classes of merchandise inventories having similar gross margins are grouped. Management believes that the Company’s RIM provides an inventory valuation that reasonably approximates cost and results in carrying inventory at the lower of cost or market. Inventory costs also include certain buying and distribution costs related to the procurement, processing and transportation of merchandise.
Other Accounting Estimates Estimates inherent in the preparation of the Company’s financial statements include those associated with the evaluation of the recoverability of deferred tax assets, the adequacy of tax contingencies, the impairment of goodwill and long-lived assets and those estimates used in the determination of liabilities related to litigation, claims and assessments.
The Company assesses the likelihood that deferred tax assets will be realized in the future and records a valuation allowance, if necessary, to reduce deferred tax assets to the amount that it believes is more likely than not to be realized. In evaluating our ability to recover our deferred tax assets we consider all available positive and negative evidence, including scheduled reversals of deferred tax liabilities, projected future taxable income, tax planning strategies, and recent financial operations. During fiscal 2007, the Company recorded a valuation allowance of $20.1 million on its deferred tax assets. This is a non-cash charge that management felt was appropriate to record as the cumulative losses in recent years and the store closure activities met the prescribed criteria for taking an allowance under FASB Statement No. 109, “Accounting for Income Taxes,” (“SFAS 109”). The Company’s effective tax rate may be materially impacted by changes in the estimated level of earnings and changes in the deferred tax valuation allowance.
The Company recognizes tax liabilities in accordance with FASB Interpretation No. 148, “Accounting For Uncertainty in Income Taxes,” (“FIN 48”) and we adjust these liabilities when our judgment changes as a result of the evaluation of new information not previously available. Due to the complexity of some of these uncertainties, the ultimate resolution may result in a payment that is materially different from our current estimate of the tax liabilities. These differences will be reflected as increases or decreases to income tax expense in the period in which they are determined.
The Company reviews long-lived assets and intangible assets with finite useful lives for impairment at least annually or whenever events or changes in circumstances indicate that their carrying values may not be recoverable. Using its best estimates based on reasonable assumptions and projections, the Company records an impairment loss to write such assets down to their estimated fair values if the carrying values of the assets exceed their related undiscounted expected future cash flows. Store-specific long-lived assets and intangible assets with finite lives are evaluated along with the stores in their respective media market, which is the lowest level at which individual cash flows can be identified. Corporate assets or other long-lived assets that are not store specific are evaluated at a consolidated entity level. Based on the impairment tests performed, there was no impairment of long-lived and intangible assets with finite lives in fiscal 2006 or 2005. However, the Company recorded a $2.3 million non-cash impairment charge in fiscal 2007 to write-down property and equipment for the store closures that will occur in fiscal 2008 related to exiting the eight underperforming media markets.
The Company is involved in litigation, claims and assessments incidental to its business, the disposition of which is not expected to have a material effect on the Company’s financial position or results of operations. It is possible, however, that future results of operations for any particular quarterly or annual period could be materially affected by changes in the Company’s assumptions related to these matters. The Company accrues its best estimate of the probable cost for the resolution of claims. When appropriate, such estimates are developed in consultation with outside counsel handling the matters and are based upon a combination of litigation and settlement strategies. To the extent additional information arises or the Company’s strategies change, it is possible that the Company’s best estimate of its probable liability may change.
27
| ITEM 7A. | QUANTITATIVE AND QUALITATIVE DISCLOSURES ABOUT MARKET RISK |
The Company is exposed to financial market risks, which include changes in U.S. interest rates and foreign exchange rates. The Company does not engage in financial transactions for trading or speculative purposes.
Interest Rate Risk The interest payable on the Company’s bank line of credit is based on a variable interest rate and therefore is affected by changes in market interest rates. In addition, the Company has fixed and variable income investments classified as cash and cash equivalents which are also affected by changes in market interest rates. If interest rates on existing variable rate debt were to rise 56 basis points (a 10% change from the Company’s borrowing rate as of February 2, 2008), the Company’s results of operations and cash flows would not be materially affected.
Foreign Currency Risks The majority of purchase obligations outside of the United States of America into which the Company enters are settled in U.S. dollars; therefore, the Company has only minimal exposure to foreign currency exchange risks. The cost of products purchased in international markets can be affected by changes in foreign currency exchange rates and significant exchange rate changes could have a material impact on future product costs. The extent to which an increase in costs from foreign currency exchange rate changes will be able to be recovered in higher prices charged to customers is uncertain. The Company does not currently hedge against foreign currency risks.
28
| ITEM 8. | FINANCIAL STATEMENTS AND SUPPLEMENTARY DATA |
INDEX TO CONSOLIDATED FINANCIAL STATEMENTS
29
REPORT OF INDEPENDENT REGISTERED PUBLIC ACCOUNTING FIRM
To the Board of Directors and Shareholders of Cost Plus, Inc.:
We have audited the accompanying consolidated balance sheets of Cost Plus, Inc. and subsidiaries (the “Company”) as of February 2, 2008 and February 3, 2007, and the related consolidated statements of income, shareholders’ equity, and cash flows for each of the three years in the period ended February 2, 2008. These financial statements are the responsibility of the Company’s management. Our responsibility is to express an opinion on these financial statements based on our audits.
We conducted our audits in accordance with the standards of the Public Company Accounting Oversight Board (United States). Those standards require that we plan and perform the audit to obtain reasonable assurance about whether the financial statements are free of material misstatement. An audit includes examining, on a test basis, evidence supporting the amounts and disclosures in the financial statements. An audit also includes assessing the accounting principles used and significant estimates made by management, as well as evaluating the overall financial statement presentation. We believe that our audits provide a reasonable basis for our opinion.
In our opinion, such consolidated financial statements present fairly, in all material respects, the financial position of Cost Plus, Inc. and subsidiaries as of February 2, 2008 and February 3, 2007, and the results of their operations and their cash flows for each of the three years in the period ended February 2, 2008, in conformity with accounting principles generally accepted in the United States of America.
As discussed in Notes 1 and 6 to the consolidated financial statements, the Company adopted Financial Accounting Standards Board Interpretation No. 48,Accounting for Uncertainty in Income Taxes - an interpretation of FASB Statement No.109, effective February 4, 2007. As discussed in Notes 1 and 7 to the consolidated financial statements, the Company adopted Statement of Financial Accounting Standards No. 123(R),Share-Based Payment, effective January 29, 2006.
We have also audited, in accordance with the standards of the Public Company Accounting Oversight Board (United States), the Company’s internal control over financial reporting as of February 2, 2008, based on the criteria established inInternal Control—Integrated Framework issued by the Committee of Sponsoring Organizations of the Treadway Commission, and our report dated April 17, 2008, expressed an unqualified opinion on the Company’s internal control over financial reporting.
/s/ DELOITTE & TOUCHE LLP
San Francisco, California
April 17, 2008
30
REPORT OF INDEPENDENT REGISTERED PUBLIC ACCOUNTING FIRM ON INTERNAL CONTROL OVER FINANCIAL REPORTING
To the Board of Directors and Shareholders of Cost Plus, Inc.:
We have audited the internal control over financial reporting of Cost Plus, Inc. and subsidiaries (the “Company”) as of February 2, 2008, based on criteria established inInternal Control—Integrated Framework issued by the Committee of Sponsoring Organizations of the Treadway Commission. The Company’s management is responsible for maintaining effective internal control over financial reporting and for its assessment of the effectiveness of internal control over financial reporting, included in the accompanyingManagement’s Report on Internal Control Over Financial Reporting. Our responsibility is to express an opinion on the Company’s internal control over financial reporting based on our audit.
We conducted our audit in accordance with the standards of the Public Company Accounting Oversight Board (United States). Those standards require that we plan and perform the audit to obtain reasonable assurance about whether effective internal control over financial reporting was maintained in all material respects. Our audit included obtaining an understanding of internal control over financial reporting, assessing the risk that a material weakness exists, testing and evaluating the design and operating effectiveness of internal control based on that risk, and performing such other procedures as we considered necessary in the circumstances. We believe that our audit provides a reasonable basis for our opinion.
A company’s internal control over financial reporting is a process designed by, or under the supervision of, the company’s principal executive and principal financial officers, or persons performing similar functions, and effected by the company’s board of directors, management, and other personnel to provide reasonable assurance regarding the reliability of financial reporting and the preparation of financial statements for external purposes in accordance with generally accepted accounting principles. A company’s internal control over financial reporting includes those policies and procedures that (1) pertain to the maintenance of records that, in reasonable detail, accurately and fairly reflect the transactions and dispositions of the assets of the company; (2) provide reasonable assurance that transactions are recorded as necessary to permit preparation of financial statements in accordance with generally accepted accounting principles, and that receipts and expenditures of the company are being made only in accordance with authorizations of management and directors of the company; and (3) provide reasonable assurance regarding prevention or timely detection of unauthorized acquisition, use, or disposition of the company’s assets that could have a material effect on the financial statements.
Because of the inherent limitations of internal control over financial reporting, including the possibility of collusion or improper management override of controls, material misstatements due to error or fraud may not be prevented or detected on a timely basis. Also, projections of any evaluation of the effectiveness of the internal control over financial reporting to future periods are subject to the risk that the controls may become inadequate because of changes in conditions, or that the degree of compliance with the policies or procedures may deteriorate.
In our opinion, the Company maintained, in all material respects, effective internal control over financial reporting as of February 2, 2008, based on the criteria established inInternal Control—Integrated Framework issued by the Committee of Sponsoring Organizations of the Treadway Commission.
We have also audited, in accordance with the standards of the Public Company Accounting Oversight Board (United States), the consolidated financial statements as of and for the year ended February 2, 2008 of the Company, and our report dated April 17, 2008, expressed an unqualified opinion on those financial statements and includes an explanatory paragraph relating to the adoption of new accounting standards.
/s/ DELOITTE & TOUCHE LLP
San Francisco, California
April 17, 2008
31
Consolidated Balance Sheets
| | | | | | |
(In thousands, except share amounts) | | February 2,
2008 | | February 3,
2007 |
ASSETS | | | | | | |
Current assets: | | | | | | |
Cash and cash equivalents | | $ | 3,283 | | $ | 12,697 |
Merchandise inventories, net | | | 272,855 | | | 264,056 |
Other current assets | | | 41,593 | | | 36,722 |
| | | | | | |
Total current assets | | | 317,731 | | | 313,475 |
Property and equipment, net | | | 221,700 | | | 232,459 |
Other assets, net | | | 14,316 | | | 23,612 |
| | | | | | |
Total assets | | $ | 553,747 | | $ | 569,546 |
| | | | | | |
LIABILITIES AND SHAREHOLDERS’ EQUITY | | | | | | |
Current liabilities: | | | | | | |
Accounts payable | | $ | 93,845 | | $ | 69,925 |
Accrued compensation | | | 12,232 | | | 10,922 |
Revolving line of credit | | | 18,060 | | | — |
Current portion of long-term debt | | | 775 | | | 541 |
Other current liabilities | | | 31,690 | | | 33,338 |
| | | | | | |
Total current liabilities | | | 156,602 | | | 114,726 |
Capital lease obligations | | | 8,358 | | | 9,911 |
Long-term debt | | | 114,411 | | | 111,656 |
Other long-term obligations | | | 36,857 | | | 41,794 |
Commitments and contingencies (See Note 9) | | | | | | |
Shareholders’ equity: | | | | | | |
Preferred stock, $.01 par value: 5,000,000 shares authorized; none issued and outstanding | | | — | | | — |
Common stock, $.01 par value: 67,500,000 shares authorized; issued and outstanding 22,087,113and 22,084,239 shares | | | 221 | | | 220 |
Additional paid-in capital | | | 168,793 | | | 167,019 |
Retained earnings | | | 68,505 | | | 124,220 |
| | | | | | |
Total shareholders’ equity | | | 237,519 | | | 291,459 |
| | | | | | |
Total liabilities and shareholders’ equity | | $ | 553,747 | | $ | 569,546 |
| | | | | | |
See notes to consolidated financial statements.
32
Consolidated Statements of Operations
| | | | | | | | | | | |
| | | Fiscal Year Ended |
(In thousands, except per share amounts) | | February 2,
2008 | | | February 3,
2007 | | | January 28,
2006 |
Net sales | | $ | 1,023,897 | | | $ | 1,040,309 | | | $ | 970,441 |
Cost of sales and occupancy | | | 736,596 | | | | 739,257 | | | | 649,041 |
| | | | | | | | | | | |
Gross profit | | | 287,301 | | | | 301,052 | | | | 321,400 |
Selling, general and administrative expenses | | | 329,690 | | | | 318,477 | | | | 281,719 |
Store preopening expenses | | | 3,443 | | | | 5,650 | | | | 8,186 |
Impairment of goodwill | | | — | | | | 4,178 | | | | — |
| | | | | | | | | | | |
Income (loss) from operations | | | (45,832 | ) | | | (27,253 | ) | | | 31,495 |
Net interest expense | | | 11,613 | | | | 7,126 | | | | 5,143 |
| | | | | | | | | | | |
Income (loss) before income taxes | | | (57,445 | ) | | | (34,379 | ) | | | 26,352 |
Income tax provision (benefit) | | | (1,945 | ) | | | (11,843 | ) | | | 9,763 |
| | | | | | | | | | | |
Net income (loss) | | $ | (55,500 | ) | | $ | (22,536 | ) | | $ | 16,589 |
| | | | | | | | | | | |
Net income (loss) per weighted average share | | | | | | | | | | | |
Basic | | $ | (2.51 | ) | | $ | (1.02 | ) | | $ | 0.75 |
Diluted | | $ | (2.51 | ) | | $ | (1.02 | ) | | $ | 0.75 |
| | | | | | | | | | | |
Weighted average common and common equivalent shares outstanding | | | | | | | | | | | |
Basic | | | 22,086 | | | | 22,068 | | | | 22,004 |
Diluted | | | 22,086 | | | | 22,068 | | | | 22,100 |
| | | | | | | | | | | |
See notes to consolidated financial statements.
33
Consolidated Statements of Shareholders’ Equity
| | | | | | | | | | | | | | | | | | | | | | | | |
(In thousands, except shares) | | Common Stock | | Additional
Paid-in
Capital | | Retained
Earnings | | | Accumulated
Other
Comprehensive
Loss | | | Total
Shareholders’
Equity | | | Comprehensive
Income | |
| | Shares | | Amount | | | | | |
Balance at January 29, 2005 | | 21,832,559 | | | 218 | | | 158,183 | | | 130,167 | | | | (1,087 | ) | | | 287,481 | | | $ | 27,092 | |
| | | | | | | | | | | | | | | | | | | | | | | | |
Common stock issued under Employee Stock Purchase Plan | | 12,065 | | | — | | | 267 | | | | | | | | | | | 267 | | | | | |
Exercise of common stock options | | 216,164 | | | 2 | | | 4,182 | | | | | | | | | | | 4,184 | | | | | |
Share-based compensation expense from the acceleration of employee stock options | | | | | | | | 630 | | | | | | | | | | | 630 | | | | | |
Tax effect of disqualifying common stock dispositions | | | | | | | | 309 | | | | | | | | | | | 309 | | | | | |
Net income | | | | | | | | | | | 16,589 | | | | | | | | 16,589 | | | $ | 16,589 | |
Other comprehensive income, net of related tax effect | | | | | | | | | | | | | | | 935 | | | | 935 | | | | 935 | |
| | | | | | | | | | | | | | | | | | | | | | | | |
Balance at January 28, 2006 | | 22,060,788 | | | 220 | | | 163,571 | | | 146,756 | | | | (152 | ) | | | 310,395 | | | $ | 17,524 | |
| | | | | | | | | | | | | | | | | | | | | | | | |
Exercise of common stock options | | 23,451 | | | — | | | 207 | | | | | | | | | | | 207 | | | | | |
Share-based compensation | | | | | | | | 3,230 | | | | | | | | | | | 3,230 | | | | | |
Tax effect of disqualifying common stock dispositions | | | | | | | | 11 | | | | | | | | | | | 11 | | | | | |
Net loss | | | | | | | | | | | (22,536 | ) | | | | | | | (22,536 | ) | | $ | (22,536 | ) |
Other comprehensive income, net of related tax effect | | | | | | | | | | | | | | | 152 | | | | 152 | | | | 152 | |
| | | | | | | | | | | | | | | | | | | | | | | | |
Balance at February 3, 2007 | | 22,084,239 | | | 220 | | | 167,019 | | | 124,220 | | | | — | | | | 291,459 | | | $ | (22,384 | ) |
| | | | | | | | | | | | | | | | | | | | | | | | |
Exercise of common stock options | | 2,874 | | | 1 | | | 16 | | | | | | | | | | | 17 | | | | | |
Share-based compensation | | | | | | | | 1,755 | | | | | | | | | | | 1,755 | | | | | |
Tax effect of disqualifying common stock dispositions | | | | | | | | 3 | | | | | | | | | | | 3 | | | | | |
Net loss | | | | | | | | | | | (55,500 | ) | | | | | | | (55,500 | ) | | $ | (55,500 | ) |
Cumulative effect of accounting change (Note 1) | | | | | | | | | | | (215 | ) | | | — | | | | (215 | ) | | | | |
| | | | | | | | | | | | | | | | | | | | | | | | |
Balance at February 2, 2008 | | 22,087,113 | | $ | 221 | | $ | 168,793 | | $ | 68,505 | | | $ | — | | | $ | 237,519 | | | $ | (55,500 | ) |
| | | | | | | | | | | | | | | | | | | | | | | | |
See notes to consolidated financial statements.
34
Consolidated Statements of Cash Flows
| | | | | | | | | | | | |
| | | Fiscal Year Ended | |
(In thousands) | | February 2,
2008 | | | February 3,
2007 | | | January 28,
2006 | |
Cash Flows From Operating Activities: | | | | | | | | | | | | |
Net income (loss) | | $ | (55,500 | ) | | $ | (22,536 | ) | | $ | 16,589 | |
Adjustments to reconcile net income (loss) to net cash provided by (used in) operating activities: | | | | | | | | | | | | |
Depreciation and amortization | | | 36,612 | | | | 33,513 | | | | 28,659 | |
Deferred income taxes | | | (9,020 | ) | | | (4,432 | ) | | | (3,402 | ) |
Tax effect of disqualifying common stock dispositions | | | 3 | | | | 11 | | | | 309 | |
Share-based compensation expense | | | 1,755 | | | | 3,230 | | | | 630 | |
Loss on asset disposal | | | 92 | | | | 540 | | | | 587 | |
Impairment loss on goodwill | | | — | | | | 4,178 | | | | — | |
Valuation allowance on deferred tax asset | | | 20,092 | | | | — | | | | — | |
Impairment of property and equipment | | | 2,251 | | | | — | | | | — | |
Changes in assets and liabilities: | | | | | | | | | | | | |
Merchandise inventories | | | (8,799 | ) | | | (13,645 | ) | | | (188 | ) |
Other assets | | | (7,551 | ) | | | (22,649 | ) | | | 3,776 | |
Accounts payable | | | 29,026 | | | | 6,152 | | | | (11,562 | ) |
Income taxes payable | | | (72 | ) | | | (6,908 | ) | | | (1,450 | ) |
Other liabilities | | | (3,903 | ) | | | 3,119 | | | | 10,250 | |
| | | | | | | | | | | | |
Net cash provided by (used in) operating activities | | | 4,986 | | | | (19,427 | ) | | | 44,198 | |
| | | | | | | | | | | | |
Cash Flows From Investing Activities: | | | | | | | | | | | | |
Purchases of property and equipment | | | (33,097 | ) | | | (67,476 | ) | | | (66,033 | ) |
Proceeds from sale of property and equipment | | | 36 | | | | 3,710 | | | | 129 | |
| | | | | | | | | | | | |
Net cash used in investing activities | | | (33,061 | ) | | | (63,766 | ) | | | (65,904 | ) |
| | | | | | | | | | | | |
Cash Flows From Financing Activities: | | | | | | | | | | | | |
Net borrowings under revolving line of credit | | | 18,060 | | | | — | | | | — | |
Proceeds from long-term debt | | | 39,586 | | | | 112,554 | | | | 20,000 | |
Pay-down of long-term debt | | | (36,000 | ) | | | (52,278 | ) | | | — | |
Principal payments on long-term debt | | | (597 | ) | | | (3,396 | ) | | | (3,813 | ) |
Debt issuance costs | | | (781 | ) | | | — | | | | — | |
Principal payments on capital lease obligations | | | (1,623 | ) | | | (1,579 | ) | | | (1,467 | ) |
Proceeds from the issuance of common stock | | | 16 | | | | 207 | | | | 4,450 | |
| | | | | | | | | | | | |
Net cash provided by financing activities | | | 18,661 | | | | 55,508 | | | | 19,170 | |
| | | | | | | | | | | | |
Net decrease in cash and cash equivalents | | | (9,414 | ) | | | (27,685 | ) | | | (2,536 | ) |
| | | | | | | | | | | | |
Cash and Cash Equivalents: | | | | | | | | | | | | |
Beginning of period | | | 12,697 | | | | 40,382 | | | | 42,918 | |
| | | | | | | | | | | | |
End of period | | $ | 3,283 | | | $ | 12,697 | | | $ | 40,382 | |
| | | | | | | | | | | | |
Supplemental Disclosures of Cash Flow Information: | | | | | | | | | | | | |
Cash paid for interest | | $ | 11,595 | | | $ | 7,383 | | | $ | 5,437 | |
| | | | | | | | | | | | |
Cash paid (received) for income taxes | | $ | (2,304 | ) | | $ | 10,605 | | | $ | 14,353 | |
| | | | | | | | | | | | |
Non-Cash Financing and Investing: | | | | | | | | | | | | |
Termination of capital leases: | | | | | | | | | | | | |
Reduction in capital lease obligations | | $ | — | | | $ | 816 | | | $ | — | |
Reduction in capital lease assets | | $ | — | | | $ | 564 | | | $ | — | |
| | | | | | | | | | | | |
See notes to consolidated financial statements.
35
Notes to Consolidated Financial Statements
Note 1. Summary of Business and Significant Accounting Policies
Business Cost Plus, Inc. and its subsidiaries (“Cost Plus World Market” or “the Company”) is a specialty retailer of casual home living and entertaining products. At February 2, 2008, the Company operated 298 stores in 34 states under the names “World Market,” “Cost Plus World Market,” “Cost Plus Imports,” and “World Market Stores.” The Company’s product offerings are designed to provide solutions to customers’ casual home furnishing and home entertaining needs. The offerings include home decorating items such as furniture and rugs, as well as a variety of tabletop and kitchen products. Cost Plus World Market stores also offer a number of gift and decorative accessories including collectibles, cards, wrapping paper and other seasonal items. In addition, Cost Plus World Market offers its customers a wide selection of gourmet foods and beverages, including wine, micro-brewed and imported beer, coffee and tea. The Company accounts for its operations as one operating segment.
Fiscal Year The Company’s fiscal year end is the Saturday closest to the end of January. The current and prior fiscal years ended February 2, 2008 (fiscal 2007), February 3, 2007 (fiscal 2006) and January 28, 2006 (fiscal 2005). The fiscal year ended February 3, 2007 (fiscal 2006) contained 53 weeks. All other fiscal years presented consist of 52 weeks.
Principles of Consolidation The consolidated financial statements include the accounts of Cost Plus, Inc. and its subsidiaries. Intercompany balances and transactions are eliminated in consolidation.
Accounting Estimates The preparation of financial statements in conformity with accounting principles generally accepted in the United States of America requires management to make estimates and assumptions that affect the reported amounts of assets and liabilities, including disclosures of contingent assets and liabilities, as of the date of the financial statements, as well as the reported amounts of revenues and expenses during the reporting period. Actual results could differ from those estimates.
The Company’s significant accounting judgments and estimates affect the valuation of inventories, depreciable lives and impairments of long-lived assets, accrued liabilities, deferred taxes, self-insurance reserves and allowances for sales returns.
Estimated Fair Value of Financial Instruments The carrying value of cash and cash equivalents, accounts receivable, accounts payable and unrealized gains and losses on interest rate swaps approximate their estimated fair value.
Cash Equivalents The Company considers all highly liquid investments with original maturities of 90 days or less as cash equivalents.
Inventories Inventories are stated at lower of cost or market under the retail inventory method (“RIM”), in which the valuation of inventories at cost and gross margins are calculated by applying a cost-to-retail ratio to the retail value of inventories. Cost includes certain buying and distribution costs related to the procurement, processing and transportation of merchandise. Management believes that the Company’s RIM provides an inventory valuation which reasonably approximates cost and results in carrying inventory at the lower of cost or market.
Property and Equipment Buildings, furniture, fixtures and equipment are stated at cost and are depreciated using the straight-line method over the following estimated useful lives:
| | |
Buildings | | 40 years |
Store fixtures and equipment | | 3-10 years |
Leasehold improvements | | Lesser of life of the asset or lease term |
Computer equipment and software | | 3-10 years |
36
Capital LeasesProperty subject to a non-cancelable lease that meets the criteria of a capital lease is capitalized as an asset in property and equipment and is amortized on a straight-line basis over the lease term.
Other Assets Other assets include deferred compensation plan assets, lease rights and interests, deferred taxes and other intangibles. Lease rights and interests are amortized on a straight-line basis over their related lease terms.
Impairment of Long-Lived and Intangible Assets The Company reviews long-lived assets and intangible assets with finite useful lives for impairment at least annually or whenever events or changes in circumstances indicate that their carrying values may not be recoverable. Using its best estimates based on reasonable assumptions and projections, the Company records an impairment loss to write such assets down to their estimated fair values if the carrying values of the assets exceed their related undiscounted expected future cash flows. Store-specific long-lived assets and intangible assets with finite lives are evaluated along with the stores in their respective media market, which is the lowest level at which individual cash flows can be identified. Corporate assets or other long-lived assets that are not store specific are evaluated at a consolidated entity level. There was no impairment of long-lived and intangible assets with finite lives in fiscal 2006 or 2005. However, the Company recorded a $2.3 million non-cash impairment charge in fiscal 2007 to write-down affected property and equipment for the store closures that will occur in fiscal 2008 related to exiting eight underperforming media markets. At February 2, 2008, the gross carrying value of intangible assets subject to amortization was $1.6 million with accumulated amortization of $1 million. Amortization expense related to these assets, primarily lease rights, totaled approximately $48,000 in fiscal 2007, $52,000 in fiscal 2006, and $136,000 in fiscal 2005. The Company expects amortization expense for the existing intangible assets will be approximately $45,000 for fiscal 2008, and approximately $37,000, $37,000, $37,000 and $36,000 for fiscal 2009, 2010, 2011 and 2012, respectively.
Insurance The Company is self-insured for workers’ compensation, general liability costs, and certain health insurance plans with per occurrence and aggregate limits on losses. The Company maintains a comprehensive property insurance policy. The self-insurance liability recorded in the financial statements is based on claims filed and an estimate of claims incurred but not yet reported. The following sets forth the significant insurance coverage by major category:
Workers’ compensation and general liability insurance: The Company retains losses on individual claims up to a maximum of $300,000 for both workers compensation and general liability insurance. The Company has a combined workers compensation and general liability insurance aggregate of $9.0 million.
Property insurance: The Company maintains a $250,000 deductible for each submitted claim.
Health insurance: The Company has a stop loss provision per claim of $300,000, and an aggregate of $15.5 million.
Deferred Rent Certain of the Company’s operating leases contain predetermined fixed escalations of minimum rentals during the initial term. For these leases, the Company recognizes the related rental expense on a straight-line basis over the life of the lease from the date the Company takes possession of the facility and records the difference between amounts charged to operations and amounts paid as deferred rent. As part of its lease agreements, the Company may receive certain lease incentives, primarily tenant improvement allowances. These allowances are also deferred and are amortized as a reduction of rent expense on a straight-line basis over the life of the lease. The cumulative net excess of recorded rent expense over lease payments made in the amount of $35.3 million and $38.5 million is reflected in other long-term obligations on the consolidated balance sheets as of February 2, 2008 and February 3, 2007, respectively.
Share-Based CompensationAs of February 2, 2008, the Company had stock options and awards outstanding under three share-based compensation plans, which are described more fully in Note 7. Prior to January 29, 2006, the Company accounted for those plans under the recognition and measurement provisions of
37
APB Opinion No. 25, “Accounting for Stock Issued to Employees,” and related Interpretations, as permitted by Statement of Financial Accounting Standards (“SFAS”) No. 123, “Accounting for Stock-Based Compensation.” Effective January 29, 2006, the Company adopted the fair value recognition provisions of Statement of Financial Accounting Standard (“SFAS”) No. 123 (revised 2004), “Share-Based Payment” (“SFAS 123(R)”), using the modified-prospective-transition method. Under that transition method, compensation cost recognized during the period includes: (a) compensation cost for all share-based payments granted prior to, but not yet vested as of January 29, 2006, based on the grant date fair value estimated in accordance with the original provisions of SFAS 123, and (b) compensation cost for all share-based payments granted subsequent to January 29, 2006, based on the grant-date fair value estimated in accordance with the provisions of SFAS 123(R). Results for prior periods have not been restated.
Prior to the adoption of SFAS 123(R), the Company presented all benefits of tax deductions resulting from the exercise of share-based payment awards as operating cash flows in its statements of cash flows. SFAS 123(R) requires the benefits of tax deductions in excess of the compensation cost recognized for those stock awards (excess tax benefits) to be classified as financing cash flows. In fiscal 2007, the Company had no excess tax benefits required to be reported as a financing cash flow.
Share-based compensation expense recognized during the period is based on the value of the portion of share-based payment awards that is ultimately expected to vest. In accordance with SFAS 123(R), compensation expense for all share-based payment awards granted prior to January 29, 2006 will continue to be recognized based on the multiple option approach (accelerated method) and compensation expense for all share-based payment awards granted subsequent to January 28, 2006 will be recognized using the straight-line method. SFAS 123(R) requires forfeitures to be estimated at the time of grant and revised, if necessary, in subsequent periods if actual forfeitures differ from those estimates.
The Company recognized share-based compensation expense of $1.8 million in fiscal 2007 compared to $3.2 million in fiscal 2006. Share-based compensation expense is included as a component of selling, general and administrative expenses. At year end, there was $3.2 million of total unrecognized compensation cost related to nonvested share-based payments that is expected to be recognized over a weighted-average period of approximately 1.3 years.
Had share-based employee compensation expense been determined based upon the fair values at the grant dates for awards under the Company’s stock plans in accordance with SFAS 123 for fiscal 2005, the Company’s pro forma net income, and basic and diluted net income per common share would have been as follows:
| | | | |
(In thousands, except per share data) | | Fiscal Year Ended
January 28, 2006 | |
Net income, as reported | | $ | 16,589 | |
Add: Share-based compensation expense included in reported net income, net of related tax effect | | | 381 | |
Deduct: Total share-based compensation expense determined under fair value based method for all awards, net of related tax effect | | | (4,485 | ) |
| | | | |
Pro forma net income | | $ | 12,485 | |
| | | | |
Basic net income per weighted average share: | | | | |
As reported | | $ | 0.75 | |
Pro forma | | $ | 0.57 | |
Diluted net income per weighted average share: | | | | |
As reported | | $ | 0.75 | |
Pro forma | | $ | 0.56 | |
Pro forma disclosures for fiscal 2007 and 2006 are not presented because employee stock options were accounted for using SFAS 123(R)’s fair-value method for all of fiscal 2007 and 2006.
38
The following table presents the weighted average assumptions used in the option pricing model for the stock options granted during fiscal 2007, 2006, and 2005:
| | | | | | | | | |
| | | Fiscal Year Ended | |
| | | February 2,
2008 | | | February 3,
2007 | | | January 28,
2006 | |
| | | | | | | | | (Pro forma) | |
Expected dividend rate | | — | | | — | | | — | |
Volatility | | 41.0 | % | | 45.1 | % | | 47.9 | % |
Risk-free interest rate | | 4.5 | % | | 4.4 | % | | 4.1 | % |
Expected lives (years) | | 4.8 | | | 4.8 | | | 4.2 | |
The fair value of each option grant was estimated using the Black-Scholes option-pricing model, which was also used for the Company’s pro forma disclosure required under SFAS 123. The Company used its historical stock price volatility for a period approximating the expected life as the basis for its expected volatility assumption consistent with SFAS 123(R) and Staff Accounting Bulletin (“SAB”) No. 107. The expected life of stock options represents the weighted-average period the stock options are expected to remain outstanding. The Company has elected to follow the guidance of SAB 107 and adopt the simplified method in determining expected life for its stock option awards. The expected dividend yield assumption is based on the Company’s history of zero dividend payouts and the expectation that no dividends will be paid in the foreseeable future. The risk-free interest rate is based on the implied yield available on U.S. Treasury zero-coupon issues with a term equivalent to the expected life of the stock option.
Revenue Recognition The Company recognizes revenue from the sale of merchandise either at the point of sale in its stores or at the time of receipt by the customer for merchandise purchased from its website. Revenue from sales of gift cards is deferred until redemption or until the likelihood of redemption by the customer is remote (gift card breakage). Income from gift card breakage is recorded as a reduction to selling, general, and administrative expenses. Shipping and handling fees charged to the customers are recognized as revenue at the time the merchandise is delivered to the customer. The Company’s revenues are reported net of discounts and returns, including an allowance for estimated returns. The allowance for sales returns is based on historical experience and was approximately $0.4 million at the end of fiscal 2007 and 2006, and $0.3 million at the end of fiscal 2005.
Cost of Sales and Occupancy Cost of sales includes costs to acquire merchandise inventory and costs of freight and distribution. The costs of maintaining warehouse facilities including depreciation, rent, utilities and certain indirect costs such as product purchasing activities and logistics are also charged to cost of sales. Occupancy costs include rent expense under store lease agreements, utility costs, common area maintenance costs charged to the Company by landlords and property taxes.
Vendor Credits and Rebates The Company’s policy is to recognize vendor credits and rebates in accordance with the provisions of the Emerging Issues Task Force Issue No. 02-16, “Accounting by a Customer (Including a Reseller ) for Certain Consideration Received from a Vendor.” Markdown allowances are recognized as a credit to cost of sales upon the later of sale of the individual units or receipt of the markdown allowance. Once granted, the Company recognizes volume rebates ratably over the period rebates are earned unless they are not reasonably estimable, in which case they are recognized when the milestones are achieved. Only when achievement of the rebate appears probable does the Company recognize the credit over the milestone period. The rebates are recognized as a credit to cost of sales. Allowances from vendors for items such as defective merchandise and shipping delays are recognized as a credit to cost of sales as the related specific merchandise is sold.
Selling, General and Administrative Expenses Selling, general and administrative expenses include costs related to functions such as advertising, store operations expenses, corporate management, marketing, administration, legal and accounting, among others. Such costs include compensation, insurance costs,
39
employment taxes, credit card fees, management information systems operating costs, telephone and other communication charges, travel related expenses, professional and other consulting fees and utilities, among other costs.
Advertising Expense Advertising costs, which include newspaper, radio, and other media advertising, are expensed as incurred or at the point of first broadcast or distribution. For fiscal 2007, 2006 and 2005, advertising costs were $63.9 million, $64.0 million and $56.7 million, respectively.
Store Preopening Expenses Store preopening expenses include rent expense incurred prior to opening as well as grand opening advertising, labor, travel and hiring expenses and are expensed as incurred.
Concentration of Credit Risk Financial instruments, which potentially subject the Company to concentration of credit risk, consist principally of cash and cash equivalents. The Company places its cash and cash equivalents with high quality financial institutions. At times, such balances may be in excess of FDIC insurance limits.
Income TaxesIncome taxes are accounted for using an asset and liability approach that requires recognition of deferred tax assets and liabilities for the expected future tax consequences of events that have been recognized in the Company’s consolidated financial statements or tax returns. For fiscal 2007, the Company had net deferred tax assets of $1.9 million, of which $8.6 million was included in other assets and $6.7 million was included in other current liabilities on the Company’s consolidated balance sheet. For fiscal 2006, the Company had a net deferred tax asset of $5.3 million, of which $14.9 million was included in other assets and $9.6 million was included in other current liabilities on the Company’s consolidated balance sheet.
The Company adopted the provisions of FASB Interpretation No. 48, “Accounting for Uncertainty in Income Taxes,” (FIN 48) on February 4, 2007, which clarifies the accounting for uncertainty in income tax positions. FIN 48 requires that a company recognize in its consolidated financial statements the impact of a tax position that is more likely than not to be sustained upon examination based on the technical merits of the position. In accordance with FIN 48, the Company recognized a cumulative-effect adjustment of $215,000 as an increase to its liability for unrecognized tax benefits, interest, and penalties and a reduction of the February 4, 2007 balance of retained earnings. See Note 6 to the financial statements for further disclosure.
Comprehensive Income Comprehensive income consists of net income and unrealized gains and losses on interest rate swaps. The Company accounts for its interest rate swaps as cash flow hedges in accordance with SFAS No. 133, “Accounting for Derivative Instruments and Hedging Activity.”
Net Income per Share SFAS No. 128, “Earnings Per Share,” requires earnings per share (“EPS”) to be computed and reported as both basic EPS and diluted EPS. Basic EPS is computed by dividing net income by the weighted average number of common shares outstanding for the period. Diluted EPS is computed by dividing net income by the weighted average number of common shares and dilutive common stock equivalents outstanding during the period. Diluted EPS reflects the potential dilution that could occur if options to purchase common stock were exercised into common stock.
The following is a reconciliation of the weighted average number of shares used in the Company’s basic and diluted per share computations:
| | | | | | |
| | | Fiscal Year Ended |
(In thousands) | | February 2,
2008 | | February 3,
2007 | | January 28,
2006 |
Basic shares | | 22,086 | | 22,068 | | 22,004 |
Effect of dilutive stock options | | — | | — | | 96 |
| | | | | | |
Diluted shares | | 22,086 | | 22,068 | | 22,100 |
| | | | | | |
40
Certain options to purchase common stock were outstanding but were not included in the computation of diluted earnings per share because the effect would be anti-dilutive. For the fiscal years ended February 2, 2008, February 3, 2007, and January 28, 2006 there were anti-dilutive options of 2,258,303; 2,178,962 and 1,395,699 respectively.
New Accounting PronouncementsIn September 2006, the Financial Accounting Standards Board (“FASB”) issued SFAS No. 157, “Fair Value Measurement.” SFAS No. 157 clarifies the definition of fair value, establishes a framework for measuring fair value in generally accepted accounting principles, and expands disclosures about fair value measurements. This Statement does not require any new fair value measurements. SFAS No. 157 is effective for fiscal years beginning after November 15, 2007 and interim periods within those fiscal years. The Company is currently assessing the impact of SFAS No. 157 on its financial statements.
In February 2007, the FASB issued SFAS No. 159, “The Fair Value Option for Financial Assets and Financial Liabilities – Including an amendment of FASB Statement No. 115.” SFAS No. 159 permits all entities to choose to measure eligible items at fair value at specific election dates. This statement does not require any new fair value measurements. SFAS No. 159 is effective for fiscal years beginning after November 15, 2007 and interim periods within those fiscal years. The Company is currently assessing the impact of SFAS No. 159 on its financial statements.
Note 2. Property and Equipment
Property and equipment consist of the following:
| | | | | | | | |
(In thousands) | | February 2,
2008 | | | February 3,
2007 | |
Building and leasehold improvements | | $ | 114,514 | | | $ | 149,112 | |
Facilities and land subject to sale and leaseback | | | 117,830 | | | | 79,430 | |
Furniture, fixtures, equipment and software | | | 153,371 | | | | 136,255 | |
Facilities under capital leases | | | 22,610 | | | | 27,594 | |
| | | | | | | | |
Total | | | 408,325 | | | | 392,391 | |
Less accumulated depreciation and amortization | | | (186,625 | ) | | | (159,932 | ) |
| | | | | | | | |
Property and equipment, net | | $ | 221,700 | | | $ | 232,459 | |
| | | | | | | | |
Note 3. Other Assets
Other assets consist of the following:
| | | | | | | | |
(In thousands) | | February 2,
2008 | | | February 3,
2007 | |
Deferred income taxes | | $ | 8,641 | | | $ | 14,932 | |
Lease rights and interests | | | 1,556 | | | | 3,011 | |
Other intangibles | | | 1,933 | | | | 2,073 | |
Deferred compensation plan assets | | | — | | | | 3,062 | |
Prepaid rent | | | 2,581 | | | | 2,581 | |
Other | | | 2,941 | | | | 2,710 | |
| | | | | | | | |
Total | | | 17,652 | | | | 28,369 | |
Less accumulated amortization | | | (3,336 | ) | | | (4,757 | ) |
| | | | | | | | |
Other assets, net | | $ | 14,316 | | | $ | 23,612 | |
| | | | | | | | |
41
Note 4. Leases
The Company leases certain properties consisting of retail stores, distribution centers, corporate offices and equipment. Store leases typically contain initial terms and provisions for two to three renewal options of five to ten years each. The retail stores, distribution centers and corporate office leases generally provide that the Company assumes the maintenance and all or a portion of the property tax obligations on the leased property. Certain store leases also require contingent rent based on store revenues.
The minimum rental payments required under capital leases (with interest rates ranging from 3.2% to 12.7%) and non-cancelable operating leases with a remaining lease term in excess of one year at February 2, 2008 are as follows:
| | | | | | | | | | |
(In thousands) | | Capital Leases | | | Operating Leases | | Total1 |
Fiscal year: | | | | | | | | | | |
2008 | | $ | 2,561 | | | $ | 83,380 | | $ | 85,941 |
2009 | | | 2,190 | | | | 82,255 | | | 84,445 |
2010 | | | 1,410 | | | | 78,400 | | | 79,810 |
2011 | | | 1,410 | | | | 74,308 | | | 75,718 |
2012 | | | 1,381 | | | | 61,743 | | | 63,124 |
Thereafter through the year 2040 | | | 9,722 | | | | 168,730 | | | 178,452 |
| | | | | | | | | | |
Minimum lease commitments | | | 18,674 | | | $ | 548,816 | | $ | 567,490 |
| | | | | | | | | | |
Less amount representing interest | | | (8,793 | ) | | | | | | |
| | | | | | | | | | |
Present value of capital lease obligations | | | 9,881 | | | | | | | |
Less current portion | | | (1,523 | ) | | | | | | |
| | | | | | | | | | |
Long-term portion | | $ | 8,358 | | | | | | | |
| | | | | | | | | | |
| 1. | This table does not include the financing obligations for the California or Virginia distribution centers. See Note 5 for more information. |
Interest expense related to capital leases was $1.1 million, $1.3 million, and $1.5 million for fiscal 2007, 2006, and 2005, respectively.
Minimum and contingent rental expense under operating and capital leases and sublease rental income is as follows:
| | | | | | | | | | | | |
| | | Fiscal Year Ended | |
(In thousands) | | February 2,
2008 | | | February 3,
2007 | | | January 28,
2006 | |
Operating leases: | | | | | | | | | | | | |
Minimum rental expense | | $ | 86,190 | | | $ | 80,384 | | | $ | 70,566 | |
Contingent rental expense | | | 87 | | | | 656 | | | | 757 | |
Less sublease rental income | | | (347 | ) | | | (551 | ) | | | (506 | ) |
| | | | | | | | | | | | |
Total | | $ | 85,930 | | | $ | 80,489 | | | $ | 70,817 | |
| | | | | | | | | | | | |
Capital leases—contingent rental expense | | $ | 1,626 | | | $ | 1,688 | | | $ | 1,466 | |
| | | | | | | | | | | | |
Total minimum rental income to be received from non-cancelable sublease agreements through 2012 is approximately $1.0 million as of February 2, 2008.
42
Note 5. Long-term Debt and Revolving Lines of Credit
The Company’s long-term debt balance as of February 2, 2008 and February 3, 2007 is summarized as follows:
| | | | | | | | |
(In thousands) | | February 2,
2008 | | | February 3,
2007 | |
Obligation under sale and leaseback: | | | | | | | | |
California distribution centers | | $ | 63,173 | | | $ | 29,448 | |
Virginia distribution center | | | 52,013 | | | | 52,249 | |
Line of Credit for California distribution center construction | | | — | | | | 30,500 | |
| | | | | | | | |
Total long-term debt | | | 115,186 | | | | 112,197 | |
| | | | | | | | |
Less current portion | | | (775 | ) | | | (541 | ) |
| | | | | | | | |
Long-term debt, net | | $ | 114,411 | | | $ | 111,656 | |
| | | | | | | | |
Total long-term debt matures as follows:
| | | |
(In thousands) | | Long-term
Debt |
Fiscal year: | | | |
2008 | | $ | 775 |
2009 | | | 823 |
2010 | | | 875 |
2011 | | | 886 |
2012 | | | 930 |
Thereafter through the year 2046 | | | 110,897 |
| | | |
Total long-term debt | | $ | 115,186 |
| | | |
On April 7, 2006, the Company entered into a sale-leaseback transaction with Inland Real Estate Acquisitions, Inc., a third party real estate investment trust (“Inland-A”). In connection with the transaction, the Company sold its Stockton, California distribution center property to Inland-A for net proceeds of $29.8 million. The property sold consisted of a 500,000 square foot building located on approximately 55 acres. At the closing on April 7, 2006, the Company entered into a lease agreement and a subground lease agreement with Inland-A to lease the property back. The Company used a portion of the proceeds from the sale of the property to retire $18.2 million of long-term debt related to the Company’s purchase of the property, and the remaining proceeds were used for other business purposes. The Company accounted for the transaction as a financing whereby the net book value of the asset remains on the Company’s consolidated balance sheet. The Company also recorded a financing obligation in the amount of approximately $29.8 million, which is being amortized over the 34-year period of the lease (including option periods) and approximates the discounted value of minimum lease payments under the leases. Monthly lease payments are accounted for as principal and interest payments (at an approximate annual rate of 7.2%) on the recorded obligation. On July 31, 2007, the Company entered into a new lease agreement, as described below, and as a result approximately $4.0 million of outstanding long-term debt was transferred to the new lease agreement and is being amortized thereunder. As of February 2, 2008, the balance of the financing obligation was $25.2 million and was included on the Company’s condensed consolidated balance sheet as long-term debt.
On July 31, 2007, the Company entered into a sale-leaseback transaction with Inland Western Stockton Airport Way II, L.L.C., a third party real estate investment company (“Inland-B”), in which the Company sold its newly constructed distribution facility in Stockton, California for proceeds of $34.3 million. At the closing on July 31, 2007, the Company entered into a lease agreement with Inland-B (“new lease agreement”) to lease the property back. In addition, the new lease agreement terminated and replaced the existing subground lease agreement which had an outstanding long-term debt balance of approximately $4.0 million. The Company used the proceeds from the sale to pay-off long-term debt associated with the construction of the distribution facility. The Company accounted for the transaction as a financing whereby the net book value of the asset remains on the Company’s condensed consolidated balance sheet. The Company also recorded a financing obligation in the amount of approximately
43
$34.3 million, which is being amortized over the 32-year and nine month period of the lease (including option periods) and approximates the discounted value of minimum lease payments under the lease. Monthly lease payments are accounted for as principal and interest payments (at an approximate annual rate of 8.4%) on the recorded obligation. As of February 2, 2008, the balance of the financing obligation was approximately $38.0 million and was included on the Company’s condensed consolidated balance sheet as long-term debt.
On December 21, 2006, the Company entered into a sale-leaseback transaction with Inland-A, in which the Company sold its Windsor, Virginia distribution center property to Inland-A for net proceeds of $52.3 million. The property sold consisted of a 1,000,000 square foot building located on approximately 82 acres. At the closing on December 21, 2006, the Company entered into a lease agreement with Inland-A to lease the property back. The Company used a portion of the net proceeds from the sale to pay-off the long-term debt of $34.1 million related to the Company’s purchase of the property, and used the remaining proceeds for other business purposes. The Company accounted for the transaction as a financing whereby the net book value of the asset remains on the Company’s condensed consolidated balance sheet. The Company also recorded a financing obligation in the amount of approximately $52.3 million, which is being amortized over the 40 year period of the lease (including option periods) and approximates the discounted value of minimum lease payments under the lease. Monthly lease payments are accounted for as principal and interest payments (at an approximate annual rate of 8.5%) on the recorded obligation. As of February 2, 2008, the balance of the financing obligation was $52.0 million and was included on the Company’s condensed consolidated balance sheet as long-term debt.
On June 25, 2007, the Company entered into a secured five-year revolving credit agreement (the “Credit Agreement”) with a group of banks that terminated and replaced its existing five-year line of credit agreement and its existing 18-month revolving credit facility. The Credit Agreement allows for cash borrowings and letters of credit under a secured revolving credit facility of up to $200.0 million. The amount available for borrowing at any time will be limited by a stated percentage of the aggregate amount of the liquidated value of eligible inventory and the face amount of eligible credit card receivables. The Credit Agreement includes three options to increase the size of the revolving credit facility by up to $50.0 million in the aggregate. All borrowings and letters of credit under the Credit Agreement are collateralized by all assets presently owned and hereafter-acquired by the Company. Interest will be paid in arrears monthly, quarterly, or over the applicable interest period as selected by the Company, with the entire balance payable on June 25, 2012. Borrowings pursuant to the revolving credit facility will bear interest, at the Company’s election, at a rate equal to either (i) the higher of Bank of America’s prime rate or the federal funds effective rate plus an applicable margin; or (ii) the LIBOR rate plus an applicable margin. The applicable margin is based on the Company’s Average Excess Availability, as defined in the Credit Agreement. In addition, the Company will pay a commitment fee on the unused portion of the amount available for borrowing as described in the Credit Agreement. The Credit Agreement includes limitations on the ability of the Company to, among other things, incur debt, grant liens, make investments, enter into mergers and acquisitions, pay dividends, repurchase its outstanding common stock, change its business, enter into transactions with affiliates, and dispose of assets. The events of default under the Credit Agreement include, among others, payment defaults, cross defaults with certain other indebtedness, breaches of covenants, loss of collateral, judgments, changes in control, and bankruptcy events. In the event of a default, the Credit Agreement requires the Company to pay incremental interest at the rate of 2.0% and the lenders may, among other remedies, foreclose on the security (which could include the sale of the Company’s inventory), eliminate their commitments to make credit available, declare due all unpaid principal amounts outstanding, and require cash collateral for any letter of credit obligations. In addition, in the event of a default or if the Company’s Average Excess Availability is 15% or less of the borrowing capacity under the revolving credit facility, the Company will be subject to additional restrictions, including specific restrictions with respect to its cash management procedures.
The Company intends to use the proceeds from the Credit Agreement for working capital, issuance of commercial and standby letters of credit, capital expenditures, and other general corporate purposes. As of February 2, 2008, the Company was in compliance with its loan covenant requirements, had $18.1 million in borrowings and $12.9 million in outstanding letters of credit, and had credit available under the Credit Agreement of $158.5 million.
44
Note 6. Income Taxes
The provision (benefit) for income taxes consists of the following:
| | | | | | | | | | | | |
| | | Fiscal Year Ended | |
(In thousands) | | February 2,
2008 | | | February 3,
2007 | | | January 28,
2006 | |
Current: | | | | | | | | | | | | |
Federal | | $ | (8,341 | ) | | $ | (7,396 | ) | | $ | 11,939 | |
State | | | 422 | | | | 84 | | | | 1,273 | |
| | | | | | | | | | | | |
Total current | | | (7,919 | ) | | | (7,312 | ) | | | 13,212 | |
Deferred: | | | | | | | | | | | | |
Federal | | | (3,905 | ) | | | (2,538 | ) | | | (1,859 | ) |
State | | | 9,879 | | | | (1,993 | ) | | | (1,590 | ) |
| | | | | | | | | | | | |
Total deferred | | | 5,974 | | | | (4,531 | ) | | | (3,449 | ) |
| | | | | | | | | | | | |
Provision (benefit) for income taxes | | $ | (1,945 | ) | | $ | (11,843 | ) | | $ | 9,763 | |
| | | | | | | | | | | | |
The differences between the U.S. federal statutory tax rate and the Company’s effective tax rate are as follows:
| | | | | | | | | |
| | | Fiscal Year Ended | |
| | | February 2,
2008 | | | February 3,
2007 | | | January 28,
2006 | |
U.S. federal statutory tax rate | | (35.0 | )% | | (35.0 | )% | | 35.0 | % |
State income taxes (net of U.S. federal income tax benefit) | | (2.4 | ) | | (1.4 | ) | | 2.8 | |
Benefit of wage and other tax credits | | (0.6 | ) | | (2.1 | ) | | (3.3 | ) |
Non-deductible expenses | | 0.3 | | | 0.9 | | | 0.8 | |
Goodwill impairment | | — | | | 3.6 | | | — | |
Other | | (0.6 | ) | | (0.4 | ) | | 1.7 | |
Valuation allowance | | 34.9 | | | — | | | — | |
| | | | | | | | | |
Effective income tax rate | | (3.4 | )% | | (34.4 | )% | | 37.0 | % |
| | | | | | | | | |
Significant components of the Company’s deferred tax assets and liabilities are as follows:
| | | | | | | | | | | | | |
| | | Fiscal Year Ended |
| | | February 2, 2008 | | February 3, 2007 |
| | | Deferred
Tax Assets | | | Deferred
Tax Liabilities | | Deferred
Tax Assets | | Deferred
Tax Liabilities |
| | | | |
Capitalized inventory costs | | $ | — | | | $ | 8,549 | | $ | — | | $ | 10,529 |
Trade discounts | | | — | | | | 536 | | | — | | | 826 |
Prepaid expenses | | | — | | | | 769 | | | — | | | 1,010 |
Deferred rent | | | 15,100 | | | | — | | | 16,011 | | | — |
Capital leases and facilities and land subject to sale and leaseback | | | 48,669 | | | | — | | | 526 | | | — |
Lease rights | | | — | | | | 234 | | | — | | | 254 |
Depreciation | | | — | | | | 47,548 | | | — | | | 9,037 |
Deferred compensation | | | (1 | ) | | | — | | | 1,272 | | | — |
Credit and net operating loss carryforwards | | | 16,293 | | | | — | | | 9,357 | | | — |
Deductible reserves and other | | | 4,412 | | | | — | | | 3,696 | | | — |
State taxes | | | — | | | | 4,783 | | | — | | | 3,866 |
| | | | | | | | | | | | | |
Subtotal | | | 84,473 | | | | 62,419 | | | 30,862 | | | 25,522 |
Valuation allowance | | | (20,092 | ) | | | — | | | — | | | — |
| | | | | | | | | | | | | |
Total | | $ | 64,381 | | | $ | 62,419 | | $ | 30,862 | | $ | 25,522 |
| | | | | | | | | | | | | |
45
At February 2, 2008, the Company had California state enterprise zone credit carryforwards of $8.2 million which have no expiration date but require taxable income in the enterprise zone to be realizable. The Company also had a federal net operating loss carryforward of $5.0 million which expire in 20 years as well as state net operating loss carryforwards of $2.4 million that will expire in 3 to 15 years, and $0.5 million which will expire in 15 to 20 years.
Significant management judgment is required to determine the provision for income taxes, deferred tax assets and liabilities and any valuation allowance to be recorded against deferred tax assets. Management evaluates all available evidence to determine whether it is more likely than not that some portion or all of the deferred tax assets will not be realized. A valuation allowance is established to reduce the deferred tax assets to the amounts expected to be realized. In fiscal year 2007, the Company established a valuation allowance of $20.1 million against its deferred tax assets for net state deferred assets as well as federal net operating loss carryforwards and stock option deferred assets. The valuation allowance is subject to adjustment based on the Company’s assessment of its future taxable income and may be wholly or partially reversed in future years.
The Company adopted the provisions of FASB Interpretation No. 48, “Accounting for Uncertainty in Income Taxes,” (FIN 48) on February 4, 2007. In accordance with FIN 48, the Company recognized a cumulative-effect adjustment of $215,000 as an increase to its liability for unrecognized tax benefits, interest, and penalties and a reduction of the February 4, 2007 balance of retained earnings. A reconciliation of the beginning and ending amount of unrecognized tax benefits is as follows:
| | | | |
Unrecognized tax benefits balance at February 4, 2007 | | $ | 3,043 | |
Gross increases for tax positions of prior years | | | 657 | |
Gross decreases for tax positions of prior years | | | (1,428 | ) |
Settlements | | | (183 | ) |
Lapse of statute of limitations | | | (65 | ) |
Unrecognized tax benefits at February 2, 2008 | | $ | 2,024 | |
At February 2, 2008, the Company had $2.0 million in unrecognized tax benefits, the recognition of which would have an impact of $555,000 on the Company’s income tax provision. At February 2, 2008, it is reasonably possible that the total amounts of unrecognized tax benefits could decrease by $908,000 within the next twelve months due to the expiration of statutes of limitation.
The Company recognizes accrued interest and penalties related to unrecognized tax benefits in income tax expense. At February 2, 2008, the Company had accrued $420,000 and $15,000 and at February 4, 2007, the Company had accrued $268,000 and $115,000 for the potential payment of interest and penalties, respectively.
As of February 2, 2008, the Company is subject to U.S. Federal income tax examinations for the tax years 2004 and forward, and is subject to state and local income tax examinations for the tax years 2001 and forward.
Note 7. Equity and Stock Compensation Plans
Shareholder Rights Plan Each outstanding share of common stock has a Preferred Share Purchase Right (expiring on June 30, 2008) that is exercisable only upon the occurrence of certain change in control events.
Options As of February 2, 2008 the Company had options outstanding under three stock option plans; the 1995 Stock Option Plan (“1995 Plan”), the 2004 Stock Plan (“2004 Plan”), and the 1996 Director Stock Option Plan (“Director Option Plan”).
The 1995 Plan permitted the granting of options to employees and directors to purchase, at fair market value as of the date of grant, up to 5,968,006 shares of common stock, less the aggregate number of shares related to options granted and outstanding under the 1994 Plan (821,120 shares). Options are exercisable over ten years and
46
vest as determined by the Board of Directors, generally over three or four years. A 900,000 increase in the number of shares of common stock reserved for issuance was approved by the Board of Directors and shareholders in 2002 and is included in the share count above. The 1995 Plan was terminated in November 2005.
The 2004 Plan was approved by the Board of Directors and shareholders in fiscal 2004 and was last amended by the shareholders in June 2006. The 2004 Stock Plan permits the granting of up to 2,800,000 shares, which includes 900,000 new shares, 100,000 shares transferred from the 1995 plan, an additional 800,000 shares transferred from the 1995 plan subject to outstanding options that expired without being exercised, and 1,000,000 shares approved by both the Board of Directors and shareholders in 2006. Under the 2004 Plan, incentive stock options must be granted at fair market value as of the grant date and non-statutory options may be granted at 25% to 100% of the fair market value on the grant date. The term of the options granted under the 2004 Plan and the date when the options become exercisable is determined by the Board of Directors. However, in no event will a stock option granted under the 2004 Plan be exercised more than ten years after the date of grant. The 2004 Plan also includes the ability to grant restricted stock, stock appreciation rights, performance shares, and deferred stock units.
The Director Option Plan was approved by the Board of Directors and shareholders in fiscal 1996, and was last amended by the shareholders in June 2006. The 1996 Director Option Plan permits the granting of options for up to 703,675 shares of common stock to non-employee directors at fair market value as of the date of grant. Options are exercisable over a maximum term of ten years and vest as determined by the Board of Directors, generally over four years. The number of shares of common stock reserved for issuance under the Director Option Plan increased by 150,000 in 2002, 100,000 in 2004, and 200,000 in 2006. All increases were approved by the Board of Directors and shareholders and are included in the share count above.
As of February 2, 2008 there were 1,769,590 shares of commons stock available for future grant under the Company’s stock plans.
A summary of activity under the Company’s option plans is set forth below:
| | | | | | | | | | | |
| | | Options | | | Weighted
Average
Exercise Price
Per Share | | Weighted
Average
Remaining
Contractual
Term | | Aggregate
Intrinsic Value
(In thousands) |
Outstanding, January 29, 2005 | | 1,908,752 | | | $ | 26.51 | | | | | |
Granted (Weighted average fair value per share granted of $9.81) | | 692,500 | | | | 23.30 | | | | | |
Exercised | | (216,164 | ) | | | 19.36 | | | | | |
Cancelled or expired | | (472,184 | ) | | | 30.27 | | | | | |
| | | | | | | | | | | |
Outstanding, January 28, 2006 | | 1,912,904 | | | $ | 25.24 | | | | | |
Granted (Weighted average fair value per share granted of $8.44) | | 563,000 | | | | 18.53 | | | | | |
Exercised | | (23,451 | ) | | | 9.04 | | | | | |
Cancelled or expired | | (273,491 | ) | | | 26.77 | | | | | |
| | | | | | | | | | | |
Outstanding, February 3, 2007 | | 2,178,962 | | | $ | 23.49 | | | | | |
Granted (Weighted average fair value per share granted of $3.54) | | 463,000 | | | | 8.52 | | | | | |
Exercised | | (2,250 | ) | | | 7.00 | | | | | |
Cancelled or expired | | (381,409 | ) | | | 20.40 | | | | | |
| | | | | | | | | | | |
Outstanding, February 2, 2008 | | 2,258,303 | | | $ | 20.96 | | 4.8 | | $ | — |
| | | | | | | | | | | |
Vested or expected to vest, February 2, 2008 | | 1,972,309 | | | $ | 22.11 | | 4.7 | | $ | — |
Exercisable, February 2, 2008 | | 1,314,362 | | | $ | 24.89 | | 4.2 | | $ | — |
47
The aggregate intrinsic value in the table above is the difference between the market value of the Company’s common stock on the last day of business for the period indicated and the exercise price. Cash received as a result of stock options exercised in fiscal 2007 was $15,750, and the actual tax benefit realized for tax deductions from stock options exercised totaled $3,000. The total intrinsic value of stock options exercised in fiscal 2007 was $8,400.
During fiscal 2007, the Company granted performance share awards (“Performance Shares”) to certain key employees under its 2004 Stock Plan. Performance Shares entitle the holder to receive a number of shares of Cost Plus, Inc. common stock within a specified range of shares at the end of the vesting period. Performance Shares are earned using a non-discretionary formula that is based on the Company achieving certain thresholds of comparable store sales growth and income from operations during the performance period. The fair value of performance shares are measured on the grant date and recognized in earnings over the requisite service period in accordance with SFAS 123(R).
The following table summarizes Performance Share activity during fiscal 2007, with the shares granted representing the maximum number of shares that could be achieved:
| | | | | | |
| | | Shares | | | Weighted
Average Grant
Date Fair Value
Per Share |
Outstanding at February 3, 2007 | | — | | | $ | — |
Granted | | 97,000 | | | | 9.38 |
Vested | | — | | | | — |
Forfeited | | (97,000 | ) | | | 9.38 |
| | | | | | |
Outstanding at February 2, 2008 | | — | | | $ | — |
| | | | | | |
The following table summarizes information about the weighted average remaining contractual life (in years) and the weighted average exercise prices for stock options both outstanding and exercisable as of February 2, 2008:
| | | | | | | | | | | | |
| | | Options Outstanding | | Options Exercisable |
Actual Range of Exercise Prices | | Number
Outstanding | | Remaining
Life (Yrs.) | | Weighted
Average
Exercise Price | | Number
of Shares | | Weighted
Average
Exercise Price |
$ 3.00 – $ 4.00 | | 10,000 | | 6.6 | | $ | 3.71 | | — | | $ | — |
4.01 – 5.00 | | 66,000 | | 6.6 | | | 4.21 | | — | | | — |
8.00 – 10.00 | | 365,500 | | 6.3 | | | 9.38 | | — | | | — |
10.01 – 15.00 | | 48,604 | | 4.3 | | | 12.88 | | 21,604 | | | 13.33 |
15.01 – 25.00 | | 1,151,283 | | 4.3 | | | 20.01 | | 818,908 | | | 20.87 |
25.01 – 38.50 | | 616,916 | | 4.7 | | | 32.28 | | 473,850 | | | 32.36 |
| | | | | | | | | | | | |
$ 3.00 – $38.50 | | 2,258,303 | | 4.8 | | $ | 20.96 | | 1,314,362 | | $ | 24.89 |
| | | | | | | | | | | | |
Note 8. Employee Benefit Plans
The Company has a 401(k) plan for employees who meet certain service and age requirements. Participants may contribute the lesser of 60% of their annual base salary or $15,500, and participants age 50 or older may contribute an additional catch-up deferral amount of up to $5,000 per year. Effective March 1, 2006, the Company matched 100% of employee contributions up to the first 3% of base salary and matched 50% of employee contributions in excess of 3% of base salary up to a maximum of 5% of base salary. On March 1, 2006 the Company revised its plan so that all unvested and current contributions made on behalf of the employee were immediately 100% vested. The Company contributed approximately $1,591,000 in fiscal 2007, $1,485,000 in
48
fiscal 2006 and $625,000 in fiscal 2005. In fiscal 2005, the Company matched 50% of the first 4% of base salary that the employee contributed to the 401(k) plan and contributions made on behalf of the employee vested evenly over five years.
In addition, a non-qualified deferred compensation plan was available to certain employees whose benefits were limited under Section 401(k) of the U.S. Internal Revenue Service Code. There were no compensation deferrals for fiscal 2007, compared with deferrals of $64,000 for fiscal 2006 and $510,000 for fiscal 2005. The Company terminated its deferred compensation plan on March 1, 2006. In the first quarter of fiscal 2007, each deferred compensation plan participant received a lump sum distribution of the full value of their respective account.
Note 9. Commitments and Contingencies
The Company is involved in litigation, claims and assessments incidental to its business, the disposition of which is not expected to have a material effect on the Company’s financial position or results of operations. It is possible, however, that future results of operations for any particular quarterly or annual period could be materially affected by changes in the Company’s assumptions related to these matters. The Company accrues its best estimate of the probable cost for the resolution of claims. When appropriate, such estimates are developed in consultation with outside counsel handling these matters and are based upon a combination of litigation and settlement strategies. To the extent additional information arises or the Company’s strategies change, it is possible that the Company’s best estimate of its probable liability in these matters may change.
Note 10. Quarterly Information (unaudited)
The following tables set forth the Company’s unaudited quarterly operating results for the eight most recent quarterly periods.
| | | | | | | | | | | | | | | | |
| | | Fiscal Quarters Ended | |
(In thousands, except per share data) | | May 5,
2007 | | | August 4,
2007 | | | November 3,
2007 | | | February 2,
20081,2,3 | |
Net sales | | $ | 207,947 | | | $ | 215,185 | | | $ | 220,581 | | | $ | 380,184 | |
Gross profit | | | 57,977 | | | | 52,234 | | | | 61,895 | | | | 115,195 | |
Net loss | | | (11,113 | ) | | | (17,985 | ) | | | (13,944 | ) | | | (12,458 | ) |
Net loss per weighted average share | | | | | | | | | | | | | | | | |
Basic | | $ | (0.50 | ) | | $ | (0.81 | ) | | $ | (0.63 | ) | | $ | (0.56 | ) |
Diluted | | $ | (0.50 | ) | | $ | (0.81 | ) | | $ | (0.63 | ) | | $ | (0.56 | ) |
| |
| | | Fiscal Quarters Ended | |
(In thousands, except per share data) | | April 29,
2006 | | | July 29,
2006 | | | October 28,
2006 | | | February 3,
20071 | |
Net sales | | $ | 212,964 | | | $ | 215,275 | | | $ | 215,405 | | | $ | 396,665 | |
Gross profit | | | 65,382 | | | | 53,669 | | | | 65,320 | | | | 116,681 | |
Net income (loss) | | | (3,537 | ) | | | (14,205 | ) | | | (12,244 | ) | | | 7,450 | |
Net income (loss) per weighted average share | | | | | | | | | | | | | | | | |
Basic | | $ | (0.16 | ) | | $ | (0.64 | ) | | $ | (0.55 | ) | | $ | 0.34 | |
Diluted | | $ | (0.16 | ) | | $ | (0.64 | ) | | $ | (0.55 | ) | | $ | 0.34 | |
| 1. | The three months ended February 2, 2008 was a thirteen-week period as compared to the three months ended February 3, 2007 which was a fourteen-week period. |
| 2. | The three months ended February 2, 2008 included a $2.3 million non-cash impairment charge to write-down property and equipment for the stores planned to close in fiscal 2008. |
| 3. | The three months ended February 2, 2008 included a $20.1 million non-cash charge for a deferred tax asset valuation allowance. |
49
| ITEM 9. | CHANGES IN AND DISAGREEMENTS WITH ACCOUNTANTS ON ACCOUNTING AND FINANCIAL DISCLOSURE |
None.
| ITEM 9A. | CONTROLS AND PROCEDURES |
Evaluation of Disclosure Controls and Procedures
Our management, with the participation of our Chief Executive Officer and Chief Financial Officer evaluated the effectiveness of the design and operation of our disclosure controls and procedures, as defined in Rules 13a-15(e) and 15d-15(e) of the Securities Exchange Act of 1934 (the “Exchange Act”) as of the end of the period covered by this report. Based on this evaluation, the Company’s principal executive officer and its principal financial officer have concluded that its disclosure controls and procedures are effective to ensure that information it is required to disclose in reports that it files or submits under the Securities Exchange Act of 1934 is accumulated and communicated to its management, including its principal executive and principal financial officers, as appropriate to allow timely decisions regarding required disclosure, and that such information is recorded, processed, summarized and reported within the time periods specified in the Securities and Exchange Commission rules and forms.
Changes in Internal Control Over Financial Reporting
There was no change in the Company’s internal control over financial reporting that occurred during the quarter ended February 2, 2008 that has materially affected, or is reasonably likely to materially affect, the Company’s internal control over financial reporting.
MANAGEMENT’S REPORT ON INTERNAL CONTROL OVER FINANCIAL REPORTING
Our management is responsible for establishing and maintaining adequate internal control over financial reporting as defined in Rules 13a-15(f) and 15d-15(f) of the Securities and Exchange Act of 1934. The Company’s internal control over financial reporting is designed to provide reasonable assurance regarding the reliability of financial reporting and the preparation of financial statements for external reporting purposes in accordance with generally accepted accounting principles. The Company’s internal control over financial reporting includes those policies and procedures that (i) pertain to the maintenance of records that in reasonable detail accurately and fairly reflect the transactions and dispositions of the assets of the company; (ii) provide reasonable assurance that transactions are recorded as necessary to permit preparation of financial statements in accordance with generally accepted accounting principles, and that receipts and expenditures of the company are being made only in accordance with authorizations of management and directors of the company; and (iii) provide reasonable assurance regarding prevention or timely detection of unauthorized acquisition, use, or disposition of the company’s assets that could have a material effect on the financial statements.
Our management conducted an evaluation of the effectiveness of its internal control over financial reporting based on the framework inInternal Control—Integrated Framework issued by the Committee of Sponsoring Organizations of the Treadway Commission. A system of internal control over financial reporting has inherent limitations and may not prevent or detect misstatements. Further, projections of any evaluation of effectiveness to future periods are subject to the risk that controls may become inadequate due to changes in conditions and that the degree of compliance with policies or procedures may change over time. Based on this evaluation, our management concluded that the Company’s internal control over financial reporting was effective as of February 2, 2008.
Our independent registered public accounting firm, Deloitte and Touche LLP, has issued a report on our internal control over financial reporting. The report is included on page 31 in item 8 of this Annual Report on Form 10-K.
| ITEM 9B. | OTHER INFORMATION |
None
50
PART III
Information called for by Part III (Items 10, 11, 12, 13 and 14) of this report on Form 10-K has been omitted as the Company intends to file with the Securities and Exchange Commission not later than June 1, 2008 a definitive Proxy Statement pursuant to Regulation 14A promulgated under the Securities Exchange Act of 1934. Such information will be set forth in such Proxy Statement and is incorporated herein by reference.
| ITEM 10. | DIRECTORS, EXECUTIVE OFFICERS AND CORPORATE GOVERNANCE |
Information regarding (i) the Company’s directors, (ii) compliance with Section 16(a) of the Securities Exchange Act of 1934, as amended, as well as (iii) any material changes to procedures by which security holders may recommend nominees to the Company’s board of directors, standing audit committee and audit committee financial expert are incorporated herein by reference to the sections entitled “Proposal One: Election of Directors,” “Section 16(a) Beneficial Ownership Reporting Compliance,” and “Corporate Governance,” respectively, in our Proxy Statement for the Company’s 2008 Annual Meeting of Shareholders. The information required by this item concerning executive officers is incorporated herein by reference to the section entitled “Executive Officers of the Registrant” at the end of Part I of this report.
The Company has adopted aCode of Ethics for Principal Executive and Senior Financial Officers, which is listed as an exhibit to this report on Form 10-K. The policy applies to the Company’s Chief Executive Officer and the Chief Financial Officer.
| ITEM 11. | EXECUTIVE COMPENSATION |
The information required by this item is incorporated herein by reference to the sections entitled “Compensation Discussion and Analysis and Executive Compensation,” “Compensation Tables,” “Compensation Committee Report,” “Compensation Committee Interlocks and Insider Participation,” and “Corporate Governance—Director Compensation,” each of which is in the Proxy Statement for the Company’s 2008 Annual Meeting of Shareholders.
51
| ITEM 12. | SECURITY OWNERSHIP OF CERTAIN BENEFICIAL OWNERS AND MANAGEMENT AND RELATED STOCKHOLDER MATTERS |
The information required by this item is incorporated herein by reference to the sections entitled “Compensation Tables” and “Security Ownership of Certain Beneficial Owners and Management in the Proxy Statement for the Company’s 2008 Annual Meeting of Shareholders.
The following table sets forth information as of February 2, 2008 about our common stock that may be issuable upon the exercise of options and rights granted to employees, consultants and members of our Board of Directors under all existing equity compensation plans.
| | | | | | | |
| | | (a)
Number of securities
to be issued upon exercise
of outstanding options,
warrants and rights | | (b)
Weighted-average
exercise price of
outstanding options,
warrants and rights | | (c)
Number of securities
remaining available for
future issuance under
equity compensation plans
(excluding securities
reflected in column (a)) |
Equity compensation plans approved by shareholders | | | | | | | |
1995 Stock Option Plan(1) | | 760,687 | | $ | 26.67 | | — |
1996 Director Option Plan | | 398,491 | | | 23.45 | | 165,715 |
2004 Stock Plan | | 1,099,125 | | | 16.10 | | 1,603,875 |
Equity compensation plans not approved by shareholders | | — | | | — | | — |
Total | | 2,258,303 | | $ | 20.96 | | 1,769,590 |
| (1) | The 1995 Stock Option Plan was replaced by the 2004 Stock Plan in July 2005. 100,000 remaining shares available for grant under the 1995 Stock Option Plan were transferred to the 2004 Stock Plan and the 1995 Stock Option Plan was terminated for any new grants. Up to 800,000 shares subject to outstanding options under the 1995 Stock Option Plan may be transferred to the 2004 Stock Plan if they expire without being exercised and as of February 2, 2008 the Company had transferred all 800,000 shares. |
| ITEM 13. | CERTAIN RELATIONSHIPS AND RELATED TRANSACTIONS, AND DIRECTOR INDEPENDENCE |
Certain information required by this item is incorporated herein by reference to the section entitled “Certain Relationships and Related Transactions” and “Corporate Governance—Director Compensation” in the Proxy Statement for the Company’s 2008 Annual Meeting of Shareholders.
| ITEM 14. | PRINCIPAL ACCOUNTING FEES AND SERVICES |
The information required by this item is incorporated herein by reference to the section in Proposal Two entitled “Audit and Related Fees for Fiscal Years 2007 and 2006” in the Proxy Statement for the Company’s 2008 Annual Meeting of Shareholders.
52
PART IV
| ITEM 15. | EXHIBITS, FINANCIAL STATEMENT SCHEDULES |
| | (a)1. | Financial Statements: See “Index to Consolidated Financial Statements” in Part II, Item 8 on page 29 of this Form 10-K. |
| | 2. | Financial Statement Schedules: |
Financial statement schedules of Cost Plus, Inc. have been omitted from Item 15 because they are not applicable or the information is included in the financial statements or notes thereto.
| | |
Exhibit No. | | Description of Exhibits |
| 3.1 | | Amended and Restated Articles of Incorporation as filed with the California Secretary of State on April 1, 1996, incorporated by reference to Exhibit 3.1 to the Form 10-K filed for the year ended February 1, 1997. |
| |
| 3.1.1 | | Certificate of Amendment of Restated Articles of Incorporation as filed with the California Secretary of State on February 25, 1999, incorporated by reference to Exhibit 3.1 to the Form 10-Q filed for the quarter ended May 1, 1999. |
| |
| 3.1.2 | | Certificate of Amendment of Restated Articles of Incorporation as filed with the California Secretary of State on September 24, 1999, incorporated by reference to Exhibit 3.1.2 of the Form 10-K filed for the year ended January 29, 2000. |
| |
| 3.2 | | Certificate of Determination as filed with California Secretary of State on July 27, 1998, incorporated by reference to Exhibit 3.2 to the Form 10-K filed for the year ended January 30, 1999. |
| |
| 3.3 | | Amended and Restated By-laws dated November 15, 2007, incorporated by reference to Exhibit 3.3 to the Form 8-K filed November 21, 2007. |
| |
| 4.0 | | Preferred Shares Rights Agreement, dated June 30, 1998, between Cost Plus, Inc. and BankBoston, N.A., including the Certificate of Determination, the form of Rights Certificate and the Summary of Rights, incorporated by reference to Exhibit 1 to the Form 8-A filed on July 27, 1998. |
| |
| 4.1 | | Amendment to Preferred Shares Rights Agreement, dated June 2, 2003, between Cost Plus, Inc. and EquiServe Trust Company, N.A, incorporated by reference to Exhibit 4.3 to the Form 8-A/A filed on July 11, 2003. |
| |
| 10.1 | | Form of Indemnification Agreement, as amended and restated, between the Company and each of its directors and officers, incorporated by reference to Exhibit 10.1 to the Form 10-Q filed for the quarter ended July 29, 2006. |
| |
| 10.2 | | Lease Agreement, dated August 27, 1991, as amended, between the Company and The Stockton Port District for certain warehouses for storage and distribution located in Stockton, California and extension thereto dated February 21, 1996, incorporated by reference to Exhibit 10.6 to the Registration Statement on Form S-1 effective April 3, 1996. |
| |
| 10.2.1 | | Letters dated December 3, 2004 and December 9, 2004 extending the Lease Agreement, dated August 27, 1991, as amended, between the Company and The Stockton Port District for certain warehouses for storage and distribution located in Stockton, California and extension thereto dated February 21, 1996, incorporated by reference to Exhibit 10.2.1 to the Form 10-K filed for the year ended January 28, 2006. |
| |
| 10.3 | | Lease agreement between the Company and Square I, LLC for certain Corporate office space located in Oakland, California, incorporated by reference to Exhibit 10.1 to the Form 10-Q filed for the quarter ended October 31, 1998. |
53
| | |
Exhibit No. | | Description of Exhibits |
| 10.4 | | Credit Agreement dated June 25, 2007 between Cost Plus, Inc. and its wholly owned subsidiaries Cost Plus of Texas, Inc., Cost Plus of Idaho, Inc., and Cost Plus Management Services, Inc., and Bank of America, N.A., as administrative agent, collateral agent, swing line lender, and L/C issuer, incorporated by reference to Exhibit 10.3.1 of the Form 10-Q filed for the quarter ended August 4, 2007. |
| |
| 10.4.1 | | Security Agreement dated June 25, 2007 between Cost Plus, Inc. and its wholly owned subsidiaries Cost Plus of Texas, Inc., Cost Plus of Idaho, Inc., and Cost Plus Management Services, Inc., and Bank of America, N.A., as collateral agent, incorporated by reference to Exhibit 10.3.2 of the Form 10-Q filed for the quarter ended August 4, 2007. |
| |
| 10.4.2 | | Intellectual Property Security Agreement dated June 25, 2007 between Cost Plus, Inc. and its wholly owned subsidiaries Cost Plus of Texas, Inc., Cost Plus of Idaho, Inc., and Cost Plus Management Services, Inc., and Bank of America, N.A., as a collateral agent, incorporated by reference to Exhibit 10.3.3 of the Form 10-Q filed for the quarter ended August 4, 2007. |
| |
| 10.4.3 | | Pledge Agreement dated June 25, 2007 between Cost Plus, Inc. and Bank of America, N.A., as collateral agent, incorporated by reference to Exhibit 10.3.4 of the Form 10-Q filed for the quarter ended August 4, 2007. |
| |
| 10.5 | | Purchase and Sale Agreement between Cost Plus, Inc. and Inland Real Estate Acquisitions, Inc., as purchaser, incorporated by reference to Exhibit 10.2 of the Form 10-Q filed for the quarter ended April 29, 2006. |
| |
| 10.5.1 | | Lease Agreement between Cost Plus, Inc., as lessee, and Inland Western Stockton Airport Way, L.L.C. (“First Landlord”), as lessor, dated as of April 7, 2006, incorporated by reference to Exhibit 10.2.1 of the Form 10-Q filed for the quarter ended April 29, 2006. |
| |
| 10.5.2 | | Subground Lease Agreement between Cost Plus, Inc., as lessee, and Western Stockton Ground Tenant, L.L.C. (“Second Landlord”), as lessor, dated as of April 7, 2006, incorporated by reference to Exhibit 10.2.2 of the Form 10-Q filed for the quarter ended April 29, 2006. |
| |
| 10.5.3 | | Lease agreement between Cost Plus, Inc., as lessee, and Inland Western Stockton Airport Way II, LLC., as lessor, dated as of July 31, 2007, incorporated by reference to Exhibit 10.1 of the Form 10-Q filed for the quarter ended August 4, 2007. |
| |
| 10.6 | | Purchase and Sale Agreement and Joint Escrow Instructions dated October 26, 2006 between Cost Plus, Inc. and Inland Real Estate Acquisitions, Inc., as purchaser, incorporated by reference to Exhibit 10.1 of the Form 10-Q filed on October 28, 2006. |
| |
| 10.6.1 | | Lease Agreement between Cost Plus, Inc., as lessee, and Inland RI Holding, LLC, Bruning Holding, LLC, JM 55th Holding LLC, 55th Holding LLC, Rockford Bruning Holding, LLC, Commons Holding, LLC, Deer Park Holding, LLC, BA WR Holding, LLC, Hartland Holding, LLC, as lessor, dated as of December 21, 2006, incorporated by reference to Exhibit 10.7.1 of the Form 10-K filed for the year ended February 3, 2007 |
| |
| 10.7¨ | | 1995 Stock Option Plan, as amended, incorporated by reference to Exhibit 10.1 of the Form 10-Q filed for the quarter ended August 3, 2002. |
| |
| 10.7.1¨ | | Form of Stock Option Agreement, 1995 Stock Option Plan, incorporated by reference to Exhibit 10.4 to the Form 10-K filed for the year ended February 1, 1997. |
| |
| 10.8¨ | | Cost Plus, Inc. 1996 Director Option Plan as amended June 22, 2006, incorporated by reference to Exhibit 10.2 to the Form 10-Q filed for quarter ended July 29, 2006. |
| |
| 10.8.1¨ | | Form of Stock Option Agreement, 1996 Director Option Plan used for grants prior to fiscal 2008, incorporated by reference to Exhibit 10.4 to the Form 10-Q filed for the quarter ended July 31, 1999. |
54
| | |
Exhibit No. | | Description of Exhibits |
| 10.8.2¨ | | Form of Stock Option Agreement, 1996 Director Option Plan used for grants beginning in fiscal 2008. |
| |
| 10.9¨ | | Cost Plus, Inc. 2004 Stock Plan, as amended June 22, 2006, incorporated by reference to Exhibit 10.3 to the Form 10-Q filed for quarter ended July 29, 2006. |
| |
| 10.9.1¨ | | Form of Option Agreement, 2004 Stock Plan used for grants prior to fiscal 2008, incorporated by reference to Exhibit 10.2 of the Form 8-K filed on November 23, 2004. |
| |
| 10.9.2¨ | | Form of Option Agreement, 2004 Stock Plan used for grants beginning in fiscal 2008. |
| |
| 10.10¨ | | Form of Notice of Grant of Performance Shares and Performance Share Agreement under the 2004 Stock Plan, incorporated by reference to Exhibit 10.1 of the Form 8-K filed on April 21, 2006. |
| |
| 10.11¨ | | Amended and Restated Employment Agreement, dated March 12, 2008, between Cost Plus, Inc. and Barry J. Feld. |
| |
| 10.12¨ | | Fifth Amended and Restated Employment Severance Agreement dated May 25, 2007, between Cost Plus, Inc. and Joan S. Fujii, incorporated by reference to Exhibit 10.6 of the Form 10-Q filed for the quarter ended May 5, 2007. |
| |
| 10.13¨ | | Fifth Amended and Restated Employment Severance Agreement dated May 25, 2007, between Cost Plus, Inc. and Michael J. Allen, incorporated by reference to Exhibit 10.5 of the Form 10-Q filed for the quarter ended May 5, 2007. |
| |
| 10.14¨ | | Employment Severance Agreement dated April 17, 2006, between Cost Plus, Inc. and Frank Castiglione, incorporated by reference to Exhibit 10.7 to the Form 10-Q filed for the quarter ended April 29, 2006. |
| |
| 10.15¨ | | Amended and Restated Employment Severance Agreement dated May 25, 2007, between Cost Plus, Inc. and Rayford K. Whitley, incorporated by reference to Exhibit 10.4 to the Form 10-Q filed for the quarter ended May 5, 2007. |
| |
| 10.16¨ | | Amended and Restated Employment Severance Agreement dated May 25, 2007, between Cost Plus, Inc. and Thomas D. Willardson, incorporated by reference to Exhibit 10.2 to the Form 10-Q filed for the quarter ended May 5, 2007. |
| |
| 10.17¨ | | Fourth Amended and Restated Employment Severance Agreement dated September 10, 2007, between Cost Plus, Inc. and Jane L. Baughman, incorporated by reference to Exhibit 10.1 to the Form 8-K filed on September 11, 2007. |
| |
| 10.18¨ | | Amended and Restated Employment Severance Agreement dated May 25, 2007, between Cost Plus, Inc. and George Whitney, incorporated by reference to Exhibit 10.7 to the Form 10-Q filed for the quarter ended May 5, 2007. |
| |
| 10.19¨ | | Fiscal 2008 Management Incentive Plan. |
| |
| 10.20¨ | | Employment Severance Agreement dated September 27, 2007 between Cost Plus, Inc. and Timothy Lester, incorporated by reference to Exhibit 10.2 of the Form 10-Q filed for the quarter ended November 3, 2007. |
| |
| 10.21¨ | | Employment Severance Agreement dated September 28, 2007 between Cost Plus, Inc. and Jeffrey Turner, incorporated by reference to Exhibit 10.3 of the Form 10-Q filed for the quarter ended November 3, 2007. |
| |
| 14 | | Code of Business Conduct and Ethics, incorporated by reference to Exhibit 14 of the Form 10-K filed for the year ended January 29, 2005. |
55
| | |
Exhibit No. | | Description of Exhibits |
| 14.1 | | Code of Ethics for Principal Executive and Senior Financial Officers, incorporated by reference to Exhibit 14 of the Form 10-K/A filed for the year ended January 29, 2005. |
| 21 | | List of Subsidiaries of the Company, incorporated by reference to Exhibit 21 of the Form 10-K filed for the year ended February 3, 2007. |
| |
| 23 | | Consent of Independent Registered Public Accounting Firm. |
| |
| 31.1 | | Certification of the Chief Executive Officer of the Registration pursuant to 18 U.S.C. Section 1350, as adopted pursuant to Section 302 of the Sarbanes-Oxley Act of 2002. |
| |
| 31.2 | | Certification of the Chief Financial Officer of the Registration pursuant to 18 U.S.C. Section 1350, as adopted pursuant to Section 302 of the Sarbanes-Oxley Act of 2002. |
| |
| 32.1 | | Certification of the Chief Executive Officer and Chief Financial Officer of the Registration pursuant to 18 U.S.C. Section 1350, as adopted pursuant to Section 906 of the Sarbanes-Oxley Act of 2002. |
| ¨ | Management compensation plan or arrangement. |
56
SIGNATURES
Pursuant to the requirements of Section 13 or 15(d) of the Securities Exchange Act of 1934, the registrant has duly caused this report to be signed on its behalf by the undersigned, thereunto duly authorized.
| | | | | | |
| | | | COST PLUS, INC. |
| | | |
| Date: April 17, 2008 | | | | By: | | /S/ BARRY J. FELD |
| | | | | | Barry J. Feld |
| | | | | | Chief Executive Officer and President |
Pursuant to the requirements of the Securities Exchange Act of 1934, this report has been signed below by the following persons on behalf of the registrant and in the capacities and on the dates indicated.
| | | | |
Signature | | Title | | Date |
| | |
/S/ BARRY J. FELD Barry J. Feld | | Director, Chief Executive Officer and President
(Principal Executive Officer) | | April 17, 2008 |
| | |
/S/ JANE L. BAUGHMAN Jane L. Baughman | | Executive Vice President, Chief Financial Officer
(Principal Financial Officer) | | April 17, 2008 |
| | |
/S/ TIMOTHY W. LESTER Timothy W. Lester | | Vice President, Controller
(Principal Accounting Officer) | | April 17, 2008 |
| | |
/S/ JOSEPH H. COULOMBE Joseph H. Coulombe | | Director | | April 17, 2008 |
| | |
/S/ CHRISTOPHER V. DODDS Christopher V. Dodds | | Director | | April 17, 2008 |
| | |
/S/ CLIFFORD J. EINSTEIN Clifford J. Einstein | | Director | | April 17, 2008 |
| | |
/S/ DANNY W. GURR Danny W. Gurr | | Director | | April 17, 2008 |
| | |
/S/ KIM D. ROBBINS Kim D. Robbins | | Director | | April 17, 2008 |
| | |
/S/ FREDRIC M. ROBERTS Fredric M. Roberts | | Director, Chairman of the Board | | April 17, 2008 |
57