UNITED STATES
SECURITIES AND EXCHANGE COMMISSION
Washington, D.C. 20549
FORM N-CSR
CERTIFIED SHAREHOLDER REPORT OF REGISTERED MANAGEMENT
INVESTMENT COMPANIES
Investment Company Act file number | 811- 04813 |
| |
| Dreyfus Investment Funds | |
| (Exact name of Registrant as specified in charter) | |
| | |
| c/o The Dreyfus Corporation 200 Park Avenue New York, New York 10166 | |
| (Address of principal executive offices) (Zip code) | |
| | |
| Bennett MacDougall, Esq. 200 Park Avenue New York, New York 10166 | |
| (Name and address of agent for service) | |
|
Registrant's telephone number, including area code: | (212) 922-6000 |
| |
Date of fiscal year end: | 9/30 | |
Date of reporting period: | 9/30/15 | |
| | | | | | | |
The following N-CSR relates only to the Registrant’s series listed below and does not affect the other series of the Registrant, which have a different fiscal year end and, therefore, different N-CSR reporting requirements. Separate N-CSR Forms will be filed for those series, as appropriate.
-Dreyfus Diversified Emerging Markets Fund
-Dreyfus/Newton International Equity Fund
-Dreyfus Tax Sensitive Total Return Bond Fund
-Dreyfus/The Boston Company Small Cap Growth Fund
-Dreyfus/The Boston Company Small Cap Value Fund
-Dreyfus/The Boston Company Small/Mid Cap Growth Fund
FORM N-CSR
Item 1. Reports to Stockholders.
Dreyfus Diversified Emerging Markets Fund
| | | |

| | ANNUAL REPORT
September 30, 2015 |
| |
Save time. Save paper. View your next shareholder report online as soon as it’s available. Log into www.dreyfus.com and sign up for Dreyfus eCommunications. It’s simple and only takes a few minutes. |
| |
The views expressed in this report reflect those of the portfolio manager only through the end of the period covered and do not necessarily represent the views of Dreyfus or any other person in the Dreyfus organization. Any such views are subject to change at any time based upon market or other conditions and Dreyfus disclaims any responsibility to update such views. These views may not be relied on as investment advice and, because investment decisions for a Dreyfus fund are based on numerous factors, may not be relied on as an indication of trading intent on behalf of any Dreyfus fund. |
| |
Not FDIC-Insured • Not Bank-Guaranteed • May Lose Value |
Contents
THE FUND
FOR MORE INFORMATION
Back Cover
| | | | |
| |
Dreyfus Diversified Emerging Markets Fund
| | The Fund |
A LETTER FROM THE PRESIDENT
Dear Shareholder:
We are pleased to present this annual report for Dreyfus Diversified Emerging Markets Fund, covering the 12-month period from October 1, 2014, through September 30, 2015. For information about how the fund performed during the reporting period, as well as general market perspectives, we provide a Discussion of Fund Performance on the pages that follow.
Financial markets proved volatile over the reporting period. For much of the year, a recovering U.S. economy enabled stocks to advance, but those gains were erased during the third quarter of 2015 when economic concerns in China, falling commodity prices, and a stronger U.S. dollar sparked sharp corrections in equity markets throughout the world. The emerging markets were especially hard hit. U.S. bonds generally fared better, rallying in late 2014 before reversing course in the spring as the domestic economy strengthened. Global economic instability sparked a renewed rally among U.S. government securities toward the reporting period’s end, but corporate-backed and inflation-linked securities lost value.
We expect market volatility to persist over the near term as investors vacillate between hopes that current turmoil represents a healthy correction and fears that further disappointments could trigger a full-blown bear market. Our investment strategists and portfolio managers are monitoring developments carefully, keeping a close watch on Chinese fiscal and monetary policy, expectations of higher short-term interest rates in the United States, liquidity factors affecting various asset classes, and other developments that could influence investor sentiment. Over the longer term, we remain confident that markets are likely to stabilize as the world adjusts to slower Chinese economic growth, abundant energy resources, and the eventual normalization of U.S. monetary policy. In our view, investors will continue to be well served under these circumstances by a long-term perspective and a disciplined investment approach.
Thank you for your continued confidence and support.
Sincerely,

J. Charles Cardona
President
The Dreyfus Corporation
October 15, 2015
2
DISCUSSION OF FUND PERFORMANCE
For the period of October 1, 2014, through September 30, 2015, as provided by Elizabeth Slover, Michelle Y. Chan, CFA, Gaurav Patankar, William S. Cazalet, CAIA, Ronald P. Gala, CFA, and Peter D. Goslin, CFA, Portfolio Managers
Fund and Market Performance Overview
For the 12-month period ended September 30, 2015, Dreyfus Diversified Emerging Markets Fund’s Class A shares produced a total return of -18.00%, Class C shares returned –18.44%, Class I shares returned -17.44%, and Class Y shares returned -17.44%.1 In comparison, the fund’s benchmark, the Morgan Stanley Capital International Emerging Markets Index (the “MSCI EM Index”), produced a total return of -19.28% for the same period.2
Emerging-markets equities fell sharply amid volatile trading in response to a variety of economic and geopolitical concerns. Above-average results from three of the fund’s underlying strategies enabled it to outperform the benchmark.
The Fund’s Investment Approach
The fund seeks long-term capital growth. To pursue its goal, the fund invests at least 80% of its assets in equity securities (or other instruments with similar economic characteristics) of companies located, organized or with a majority of assets or business in countries considered to be emerging markets, including other investment companies that invest in such securities.
The fund uses a “manager of managers” approach by selecting one or more experienced investment managers to serve as subadvisers to the fund. The fund also uses a “fund of funds” approach by investing in one or more underlying funds. The fund currently allocates its assets among emerging market equity strategies employed by The Boston Company Asset Management, LLC (the TBCAM Strategy) and Mellon Capital Management Corporation (the Mellon Capital Strategy), each an affiliate of Dreyfus, and two affiliated underlying funds, Dreyfus Global Emerging Markets Fund (the Newton Fund), which is sub-advised by Newton Capital Management Limited, an affiliate of Dreyfus, and Dreyfus Strategic Beta Emerging Markets Equity Fund, added in early September 2015, which is sub-advised by Mellon Capital Management Corporations (the Mellon Capital Fund).
Global Economic Trends Undermined Emerging Markets
Emerging market equities proved highly volatile during the reporting period, with the MSCI EM Index rising and falling several times before moving sharply lower over the summer of 2015 amid renewed worries regarding slowing economic growth in China. Declining prices of petroleum and other commodities particularly undermined stock prices in materials-producing nations. Geopolitical developments caused further market deterioration in countries such as Russia, which saw Western sanctions imposed in response to its involvement with conflict in Ukraine; and in Brazil, where high-profile corporate and government scandals undermined investor sentiment. Furthermore, most emerging market currencies weakened significantly against the U.S. dollar, putting added pressure on the value of foreign currency-denominated investments for U.S. residents.
3
DISCUSSION OF FUND PERFORMANCE (continued)
Underlying Strategies Cushioned Market Weakness
Although we are never satisfied with negative absolute returns, particularly of the magnitude seen over the reporting period, we nonetheless are pleased that the TBCAM Strategy, the Mellon Capital Strategy, and the Newton Fund each produced higher returns than the MSCI EM Index during a highly challenging time for emerging-market equities. The Dreyfus Strategic Beta EM fund modestly underperformed for the month of September 2015.
Results from the TBCAM Strategy were buoyed by underweighted exposure to some of the weaker individual markets, particularly those, such as Malaysia, that are struggling with heavy debt loads and others, such as Mexico, where investor expectations seem unrealistically high. Instead, TBCAM focused on attractive intrinsic values, which led to relatively successful positions in Chinese automotive companies, industrial companies and state-owned banks. The Strategy’s fundamental approach further benefited from underweighted exposure to hard-hit metals-and-mining companies, energy producers, and semiconductor manufacturers. Conversely, overweighted exposure to India weighed on the Strategy’s relative performance.
The Mellon Capital Strategy’s quantitative stock selection process proved effective during the reporting period, as relative results were buoyed by individual holdings such as Korean cosmetics maker Amorepacific, electronics producer Pegatron in Taiwan, and China Merchant’s Bank. Relative performance was strongest in the energy and financials sectors, while telecommunications services and utilities holdings generally lagged market averages. From a country perspective, the Strategy fared well in Taiwan but encountered shortfalls in India and South Africa.
The Newton Fund also outperformed market averages over the reporting period. In China, the Fund benefited from a preference for U.S.-listed ADRs of structural growth companies over H-shares of banks, heavy industrials and property companies. A focus on India and the Philippines also proved beneficial, as did underweighted exposure to Brazil. Overweighted exposure to and successful stock selection in the consumer discretionary, consumer staples and materials sectors bolstered relative performance, but disappointing stock selections in the information technology and industrials sectors weighed to a degree on relative results.
Selectivity Is Key to Investment Success
Although market conditions in developing nations have remained volatile in the aggregate due to ongoing economic uncertainty, we believe that individual countries, market sectors and companies offer differentiated prospects for active portfolio managers. All of the fund’s underlying strategies have continued to find ample opportunities across a variety of individual markets. Moreover, in our analysis, recent market weakness may provide attractive opportunities to purchase at attractive values the stocks of high-quality companies with structural tailwinds, strong business fundamentals, and favorable growth prospects.
October 15, 2015
Equity funds are subject generally to market, market sector, market liquidity, issuer, and investment style risks, among other factors, to varying degrees, all of which are more fully described in the fund’s prospectus.
The fund’s performance will be influenced by political, social, and economic factors affecting investments in foreign companies. These special risks include exposure to currency fluctuations, less liquidity, less developed or less efficient trading markets, lack of comprehensive company information, political instability, and differing auditing and legal standards. Investments in foreign currencies are subject to the risk that those currencies will decline in value relative to the U.S. dollar, or, in the case of hedged positions, that the U.S. dollar will decline relative to the currency being hedged.
4
Emerging markets tend to be more volatile than the markets of more mature economies, and generally have less diverse and less mature economic structures and less stable political systems than those of developed countries.
The ability of the fund to achieve its investment goal depends, in part, on the ability of Dreyfus to allocate effectively the fund’s assets among investment strategies, subadvisers, and underlying funds. There can be no assurance that the actual allocations will be effective in achieving the fund’s investment goal or that an investment strategy, subadviser, or underlying fund will achieve its particular investment objective.
Each subadviser makes investment decisions independently, and it is possible that the investment styles of the subadvisers may not complement one another. As a result, the fund’s exposure to a given stock, industry, sector, market capitalization, geographic area, or investment style could unintentionally be greater or smaller than it would have been if the fund had a single adviser or investment strategy.
The risks of investing in other investment companies, including ETFs, typically reflect the risks associated with the types of instruments in which the investment companies and ETFs invest. When the fund or an underlying fund invests in another investment company or ETF, shareholders of the fund will bear indirectly their proportionate share of the expenses of the other investment company or ETF (including management fees) in addition to the expenses of the fund. ETFs are exchange-traded investment companies that are, in many cases, designed to provide investment results corresponding to an index. The value of the underlying securities can fluctuate in response to activities of individual companies or in response to general market and/or economic conditions.
1 Total return includes reinvestment of dividends and any capital gains paid, and does not take into consideration the maximum initial sales charge in the case of Class A shares, or the applicable contingent deferred sales charge imposed on redemptions in the case of Class C shares. Had these charges been reflected, returns would have been lower. Past performance is no guarantee of future results. Share price and investment return fluctuate such that upon redemption, fund shares may be worth more or less than their original cost. The fund’s returns reflect the absorption of certain fund expenses by The Dreyfus Corporation pursuant to an agreement in effect through February 1, 2017, at which time it may be extended, terminated, or modified. Had these expenses not been absorbed, the fund’s returns would have been lower.
The fund changed its investment strategy on January 31, 2014. Prior to that date, the fund invested in individual securities using a bottom-up investment approach which emphasized individual stock selection through the use of proprietary computer models and fundamental analysis. The fund did not use a “manager of managers” or “fund of funds” approach. Different investment strategies may lead to different performance results. The fund’s performance for periods prior to January 31, 2014, reflects the investment strategy in effect prior to that date.
2 SOURCE: LIPPER INC. – Reflects reinvestment of net dividends and, where applicable, capital gain distributions. The Morgan Stanley Capital International (MSCI) Emerging Markets Index is a free float-adjusted market capitalization weighted index that is designed to measure the equity performance in global emerging markets. The index consists of select designated MSCI emerging market national indices. MSCI Indices reflect investable opportunities for global investors by taking into account local market restrictions on share ownership by foreigners. Investors cannot invest directly in any index.
5
FUND PERFORMANCE
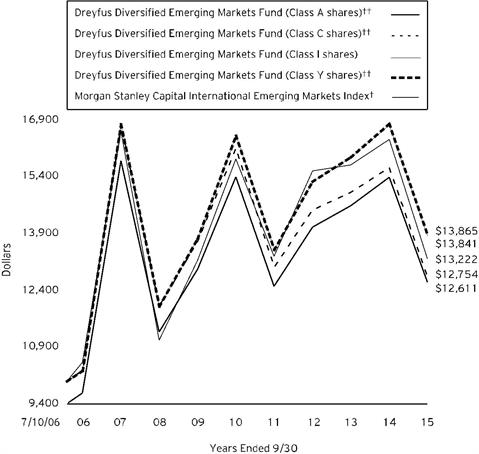 Comparison of change in value of $10,000 investment in Dreyfus Diversified Emerging Markets Fund Class A shares, Class C shares, Class I shares and Class Y shares and the Morgan Stanley Capital International Emerging Markets Index
† Source: Lipper Inc.
†† The total return figures presented for Class A and Class C shares of the fund reflect the performance of the fund’s Class I shares for the period prior to 3/31/09 (the inception date for Class A and Class C shares), adjusted to reflect the applicable sales load for Class A shares.
The total return figures presented for Class Y shares of the fund reflect the performance of the fund’s Class I shares for the period prior to 1/31/14 (the inception date for Class Y shares).
Past performance is not predictive of future performance.
The above graph compares a $10,000 investment made in each of the Class A, Class C, Class I and Class Y shares of Dreyfus Diversified Emerging Markets Fund on 7/10/06 (inception date) to a $10,000 investment made in the Morgan Stanley Capital International Emerging Markets Index (the “Index”) on that date. All dividends and capital gain distributions are reinvested.
The fund’s performance shown in the line graph above takes into account the maximum initial sales charge on Class A shares and all other applicable fees and expenses on all classes. The Index is a free float-adjusted market capitalization weighted index that is designed to measure the equity performance in global emerging markets. Unlike a mutual fund, the Index is not subject to charges, fees and other expenses. Investors cannot invest directly in any index. These factors can contribute to the Index potentially outperforming the fund. Further information relating to fund performance, including expense reimbursements, if applicable, is contained in the Financial Highlights section of the prospectus and elsewhere in this report.
6
| | | | | | | |
Average Annual Total Returns as of 9/30/15 | | |
| Inception | 1 Year | 5 Years | | From |
Date | Inception |
Class A shares | | | | |
with maximum sales charge (5.75%) | 3/31/09 | -22.71% | -5.04% | | 2.55% | †† |
without sales charge | 3/31/09 | -18.00% | -3.91% | | 3.21% | †† |
Class C shares | | | | |
with applicable redemption charge † | 3/31/09 | -19.25% | -4.61% | | 2.67% | †† |
without redemption | 3/31/09 | -18.44% | -4.61% | | 2.67% | †† |
Class I shares | 7/10/06 | -17.44% | -3.43% | | 3.59% | |
Class Y shares | 1/31/14 | -17.44% | -3.40% | †† | 3.61% | †† |
Morgan Stanley Capital International | | | | |
Emerging Markets Index | 6/30/06 | -19.28% | -3.58% | | 3.07% | ††† |
Past performance is not predictive of future performance. The fund’s performance shown in the graph and table does not reflect the deduction of taxes that a shareholder would pay on fund distributions or the redemption of fund shares. In addition to the performance of Class A shares shown with and without a maximum sales charge, the fund’s performance shown in the table takes into account all other applicable fees and expenses on all classes.
† The maximum contingent deferred sales charge for Class C shares is 1% for shares redeemed within one year of the date of purchase.
†† The total return performance figures presented for Class A and Class C shares of the fund reflect the performance of the fund’s Class I shares for the period prior to 3/31/09 (the inception date for Class A and Class C shares), adjusted to reflect the applicable sales load for Class A shares.
The total return performance figures presented for Class Y shares of the fund reflect the performance of the fund’s Class I shares for the period prior to 1/31/14 (the inception date for Class Y shares).
††† The Index date is based on the life of Class I shares. For comparative purposes, the value of the Index as of the month end 6/30/06 is used as the beginning value on 7/10/06 (the inception date for Class I shares).
7
UNDERSTANDING YOUR FUND’S EXPENSES (Unaudited)
As a mutual fund investor, you pay ongoing expenses, such as management fees and other expenses. Using the information below, you can estimate how these expenses affect your investment and compare them with the expenses of other funds. You also may pay one-time transaction expenses, including sales charges (loads) and redemption fees, which are not shown in this section and would have resulted in higher total expenses. For more information, see your fund’s prospectus or talk to your financial adviser.
Review your fund’s expenses
The table below shows the expenses you would have paid on a $1,000 investment in Dreyfus Diversified Emerging Markets Fund from April 1, 2015 to September 30, 2015. It also shows how much a $1,000 investment would be worth at the close of the period, assuming actual returns and expenses.
| | | | | | | | | | | | |
Expenses and Value of a $1,000 Investment | | |
assuming actual returns for the six months ended September 30, 2015 |
| | | | | | | | |
| | | | Class A | Class C | Class I | Class Y |
Expenses paid per $1,000† | | $6.36 | | $9.49 | | $4.57 | | $4.29 |
Ending value (after expenses) | | $839.20 | | $837.10 | | $841.50 | | $841.70 |
COMPARING YOUR FUND’S EXPENSES
WITH THOSE OF OTHER FUNDS (Unaudited)
Using the SEC’s method to compare expenses
The Securities and Exchange Commission (SEC) has established guidelines to help investors assess fund expenses. Per these guidelines, the table below shows your fund’s expenses based on a $1,000 investment, assuming a hypothetical 5% annualized return. You can use this information to compare the ongoing expenses (but not transaction expenses or total cost) of investing in the fund with those of other funds. All mutual fund shareholder reports will provide this information to help you make this comparison. Please note that you cannot use this information to estimate your actual ending account balance and expenses paid during the period.
| | | | | | | | | | | | |
Expenses and Value of a $1,000 Investment | | |
assuming a hypothetical 5% annualized return for the six months ended September 30, 2015 |
| | | | | | | | |
| | | | Class A | Class C | Class I | Class Y |
Expenses paid per $1,000† | | $6.98 | | $10.40 | | $5.01 | | $4.71 |
Ending value (after expenses) | | $1,018.15 | | $1,014.74 | | $1,020.10 | | $1,020.41 |
† Expenses are equal to the fund’s annualized expense ratio of 1.38% for Class A, 2.06% for Class C, .99% for Class I and .93% for Class Y, multiplied by the average account value over the period, multiplied by 183/365 (to reflect the one-half year period).
8
STATEMENT OF INVESTMENTS
September 30, 2015
| | | | | | |
Common Stocks - 54.4% | | Shares | | Value ($) | |
Brazil - 1.5% | | | | | |
AMBEV | | 48,700 | | 238,556 | |
Banco Bradesco | | 12,100 | | 72,090 | |
Banco do Brasil | | 4,900 | | 18,787 | |
BM&FBovespa | | 179,800 | | 502,506 | |
BR Malls Participacoes | | 4,200 | | 11,081 | |
BRF | | 16,400 | | 292,011 | |
Cia de Saneamento Basico do Estado de Sao Paulo | | 89,000 | | 355,596 | |
EDP - Energias do Brasil | | 109,100 | | 315,921 | |
Grupo BTG Pactual | | 58,600 | | 389,780 | |
JBS | | 125,000 | | 529,701 | |
M Dias Branco | | 900 | | 13,190 | |
| | | | | 2,739,219 | |
Chile - .4% | | | | | |
Cia Cervecerias Unidas | | 4,334 | | 47,805 | |
Enersis | | 226,838 | | 57,033 | |
ENTEL Chile | | 60,724 | | 571,614 | |
| | | | | 676,452 | |
China - 11.8% | | | | | |
Air China, Cl. H | | 142,000 | | 113,142 | |
Anhui Conch Cement, Cl. H | | 76,500 | | 226,512 | |
ANTA Sports Products | | 323,000 | | 841,012 | |
Bank of China, Cl. H | | 1,190,000 | | 515,079 | |
Beijing Capital International Airport, Cl. H | | 950,000 | | 886,994 | |
Belle International Holdings | | 291,000 | | 254,140 | |
China Construction Bank, Cl. H | | 3,258,000 | | 2,182,362 | |
China Galaxy Securities | | 53,000 | | 37,580 | |
China International Marine Containers Group, Cl. H | | 69,200 | | 122,252 | |
China Life Insurance, Cl. H | | 330,000 | | 1,151,896 | |
China Longyuan Power Group, Cl. H | | 593,000 | | 640,954 | |
China Merchants Bank, Cl. H | | 134,500 | | 327,718 | |
China National Building Material, Cl. H | | 220,000 | | 127,647 | |
China Shenhua Energy, Cl. H | | 37,500 | | 57,687 | |
China Southern Airlines Company, Cl. H | | 568,000 | | 417,535 | |
China Vanke, Cl. H | | 17,000 | | 36,496 | |
Chongqing Changan Automobile, Cl. B | | 105,356 | | 178,807 | |
Chongqing Rural Commercial Bank, Cl. H | | 583,000 | | 331,567 | |
CNOOC | | 1,031,000 | | 1,065,864 | |
Country Garden Holdings | | 46,000 | | 16,681 | |
9
STATEMENT OF INVESTMENTS (continued)
| | | | | | |
Common Stocks - 54.4% (continued) | | Shares | | Value ($) | |
China - 11.8% (continued) | | | | | |
Evergrande Real Estate Group | | 62,000 | | 35,431 | |
Fosun International | | 162,000 | | 280,220 | |
Geely Automobile Holdings | | 565,000 | | 272,437 | |
GF Securities | | 261,400 | a | 477,307 | |
Huaneng Power International, Cl. H | | 448,000 | | 486,104 | |
Huatai Securities | | 136,400 | a,b | 272,313 | |
Industrial & Commercial Bank of China, Cl. H | | 3,367,000 | | 1,952,048 | |
Jiangsu Expressway, Cl. H | | 126,000 | | 161,546 | |
Lenovo Group | | 620,000 | | 526,441 | |
Longfor Properties | | 11,500 | | 14,564 | |
PetroChina, Cl. H | | 82,000 | | 57,132 | |
PICC Property & Casualty, Cl. H | | 624,000 | | 1,223,574 | |
Ping An Insurance Group Company of China, Cl. H | | 161,500 | | 805,013 | |
Shanghai Pharmaceuticals Holding, Cl. H | | 394,300 | | 829,741 | |
Sihuan Pharmaceutical Holdings Group | | 690,000 | c | 273,781 | |
Sino-Ocean Land Holdings | | 35,500 | | 19,525 | |
Sinopharm Group, Cl. H | | 30,400 | | 106,932 | |
Tencent Holdings | | 219,900 | | 3,698,396 | |
Vipshop Holdings, ADR | | 17,837 | a | 299,662 | |
WuXi PharmaTech, ADR | | 10,534 | a | 455,174 | |
Zhejiang Expressway, Cl. H | | 304,000 | | 332,088 | |
| | | | | 22,111,354 | |
Czech Republic - .3% | | | | | |
Komercni banka | | 2,300 | | 498,934 | |
Hong Kong - 2.5% | | | | | |
China Everbright | | 132,000 | | 303,891 | |
China Mobile | | 194,000 | | 2,315,409 | |
China Overseas Land & Investment | | 46,000 | | 140,382 | |
China Resources Cement Holdings | | 448,000 | | 205,144 | |
China Resources Land | | 176,000 | | 416,188 | |
COSCO Pacific | | 371,056 | c | 469,256 | |
PAX Global Technology | | 434,000 | | 454,584 | |
Shimao Property Holdings | | 15,500 | | 23,481 | |
Sino Biopharmaceutical | | 368,000 | | 458,156 | �� |
| | | | | 4,786,491 | |
Hungary - .6% | | | | | |
OTP Bank | | 22,625 | | 436,542 | |
Richter Gedeon | | 38,043 | | 604,983 | |
| | | | | 1,041,525 | |
10
| | | | | | |
Common Stocks - 54.4% (continued) | | Shares | | Value ($) | |
India - 6.7% | | | | | |
Ambuja Cements | | 37,800 | | 118,790 | |
Bank of India | | 440,500 | | 914,420 | |
Bharat Petroleum | | 33,256 | | 424,893 | |
Bharti Infratel | | 125,704 | | 675,873 | |
DCB Bank | | 184,907 | a | 401,524 | |
Dr. Reddy's Laboratories | | 7,867 | | 479,490 | |
HCL Technologies | | 76,016 | | 1,116,966 | |
ICICI Bank | | 159,839 | | 661,138 | |
Idea Cellular | | 181,402 | | 413,821 | |
Infosys | | 19,963 | | 347,064 | |
IRB Infrastructure Developers | | 153,396 | | 557,395 | |
ITC | | 108,751 | | 546,772 | |
JSW Steel | | 9,303 | | 126,445 | |
Lupin | | 14,200 | | 440,661 | |
Mahindra & Mahindra | | 25,950 | | 499,496 | |
Max India | | 64,250 | | 489,333 | |
Power Finance | | 100,543 | | 353,528 | |
Praj Industries | | 328,449 | | 408,060 | |
Redington India | | 233,883 | | 388,284 | |
Rural Electrification | | 117,811 | | 493,453 | |
State Bank of India | | 257,535 | | 934,381 | |
Tata Consultancy Services | | 1,158 | | 45,710 | |
Tata Motors | | 135,028 | a | 616,286 | |
UPL | | 150,161 | | 1,051,885 | |
Vedanta | | 35,122 | | 45,000 | |
| | | | | 12,550,668 | |
Indonesia - .5% | | | | | |
Bank Mandiri | | 269,100 | | 146,005 | |
Bank Negara Indonesia | | 1,270,100 | | 359,792 | |
Bank Rakyat Indonesia | | 613,300 | | 364,293 | |
United Tractors | | 115,900 | | 138,946 | |
| | | | | 1,009,036 | |
Malaysia - .5% | | | | | |
Astro Malaysia Holdings | | 173,400 | | 111,350 | |
British American Tobacco Malaysia | | 12,200 | | 167,670 | |
DiGi.Com | | 319,300 | | 403,185 | |
Hong Leong Financial Group | | 15,300 | | 48,791 | |
Telekom Malaysia | | 161,900 | | 246,571 | |
| | | | | 977,567 | |
11
STATEMENT OF INVESTMENTS (continued)
| | | | | | |
Common Stocks - 54.4% (continued) | | Shares | | Value ($) | |
Mexico - 2.3% | | | | | |
Alfa, Cl. A | | 306,300 | | 595,753 | |
America Movil, Ser. L | | 401,000 | | 333,279 | |
Arca Continental | | 162,800 | | 916,809 | |
Controladora Vuela Compania de Aviacion, ADR | | 58,135 | a | 867,374 | |
Fibra Uno Administracion | | 19,200 | | 39,650 | |
Gruma, Cl. B | | 36,900 | | 507,501 | |
Grupo Aeroportuario del Pacifico, Cl. B | | 29,400 | | 255,654 | |
Grupo Financiero Inbursa, Ser. O | | 111,300 | | 229,975 | |
OHL Mexico | | 125,800 | a | 162,227 | |
PLA Administradora Industrial | | 234,800 | a | 428,351 | |
| | | | | 4,336,573 | |
Peru - .2% | | | | | |
Credicorp | | 4,130 | | 439,267 | |
Philippines - .7% | | | | | |
Ayala Land | | 836,100 | | 610,087 | |
Globe Telecom | | 8,885 | | 448,337 | |
SM Prime Holdings | | 68,000 | | 30,124 | |
Universal Robina | | 79,540 | | 327,385 | |
| | | | | 1,415,933 | |
Poland - 1.0% | | | | | |
Bank Millennium | | 79,003 | a | 122,473 | |
KGHM Polska Miedz | | 5,826 | | 125,988 | |
Orange Polska | | 87,599 | | 167,801 | |
Polski Koncern Naftowy Orlen | | 21,175 | | 369,512 | |
Polskie Gornictwo Naftowe i Gazownictwo | | 205,386 | | 352,870 | |
Powszechna Kasa Oszczednosci Bank Polski | | 93,139 | a | 722,732 | |
| | | | | 1,861,376 | |
Russia - 2.0% | | | | | |
Gazprom, ADR | | 110,813 | | 447,283 | |
Lukoil, ADR | | 28,140 | | 957,695 | |
MMC Norilsk Nickel, ADR | | 40,778 | | 585,980 | |
Rosneft, GDR | | 139,366 | | 515,754 | |
Sberbank of Russia, ADR | | 168,690 | | 834,757 | |
Severstal, GDR | | 7,979 | | 84,676 | |
Sistema, GDR | | 9,057 | | 62,467 | |
Tatneft, ADR | | 12,447 | | 349,004 | |
| | | | | 3,837,616 | |
South Africa - 3.2% | | | | | |
Barclays Africa Group | | 51,559 | | 634,525 | |
Barloworld | | 18,103 | | 98,698 | |
12
| | | | | | |
Common Stocks - 54.4% (continued) | | Shares | | Value ($) | |
South Africa - 3.2% (continued) | | | | | |
Clicks Group | | 69,045 | | 447,780 | |
Coronation Fund Managers | | 46,700 | | 220,570 | |
FirstRand | | 110,243 | | 391,887 | |
Growthpoint Properties | | 25,090 | | 46,488 | |
Kumba Iron Ore | | 23,560 | | 134,002 | |
Liberty Holdings | | 24,813 | | 226,363 | |
Mediclinic International | | 106,952 | | 853,756 | |
Mondi | | 24,070 | | 505,182 | |
MTN Group | | 49,875 | | 642,099 | |
Redefine Properties | | 30,173 | | 25,516 | |
Resilient Property Income Fund | | 3,309 | | 27,755 | |
SPAR Group | | 10,200 | | 136,333 | |
Steinhoff International Holdings | | 63,300 | | 388,988 | |
Telkom | | 69,773 | | 335,382 | |
Truworths International | | 35,800 | | 220,100 | |
Woolworths Holdings | | 90,646 | | 634,467 | |
| | | | | 5,969,891 | |
South Korea - 8.7% | | | | | |
BGF Retail | | 1,400 | | 239,691 | |
BNK Financial Group | | 38,238 | | 443,719 | |
CJ | | 1,045 | | 232,103 | |
Coway | | 11,416 | | 809,009 | |
DGB Financial Group | | 8,819 | | 78,423 | |
Dongbu Insurance | | 2,696 | | 139,468 | |
E-Mart | | 3,021 | | 588,266 | |
Hanwha | | 2,800 | | 92,316 | |
Hyosung | | 3,619 | | 346,044 | |
Hyundai Development Co-Engineering & Construction | | 4,600 | | 212,937 | |
Industrial Bank of Korea | | 30,106 | | 346,896 | |
Kangwon Land | | 14,974 | | 531,179 | |
KB Financial Group | | 22,851 | | 678,320 | |
Korea Electric Power | | 17,919 | | 737,695 | |
Korea Investment Holdings | | 362 | | 18,587 | |
KT&G | | 6,246 | | 588,882 | |
LG Chem | | 2,166 | | 526,309 | |
LG Display | | 18,164 | | 346,105 | |
LG Household & Health Care | | 901 | | 650,861 | |
Lotte Chemical | | 4,468 | | 1,026,287 | |
Lotte Shopping | | 2,165 | | 524,840 | |
13
STATEMENT OF INVESTMENTS (continued)
| | | | | | |
Common Stocks - 54.4% (continued) | | Shares | | Value ($) | |
South Korea - 8.7% (continued) | | | | | |
Mirae Asset Securities | | 6,390 | | 151,675 | |
NCSoft | | 673 | | 107,914 | |
Samsung Electronics | | 4,241 | | 4,078,556 | |
Samsung Fire & Marine Insurance | | 2,416 | | 566,942 | |
Shinsegae | | 1,383 | | 276,686 | |
SK Hynix | | 23,296 | | 665,738 | |
SK Telecom | | 2,476 | | 548,427 | |
S-Oil | | 13,562 | | 723,114 | |
| | | | | 16,276,989 | |
Taiwan - 5.3% | | | | | |
Advanced Semiconductor Engineering | | 721,000 | | 788,727 | |
Cathay Financial Holding | | 492,000 | | 673,177 | |
Chailease Holding | | 78,688 | | 123,433 | |
China Development Financial Holding | | 2,899,000 | | 781,169 | |
Compal Electronics | | 529,000 | | 300,824 | |
CTBC Financial Holding | | 895,873 | | 462,114 | |
E.Sun Financial Holding | | 240,298 | | 141,446 | |
Far EasTone Telecommunications | | 180,000 | | 388,514 | |
Foxconn Technology | | 79,770 | | 230,345 | |
Hon Hai Precision Industry | | 373,228 | | 976,257 | |
Innolux | | 546,000 | | 171,320 | |
Largan Precision | | 9,000 | | 706,555 | |
Mega Financial Holding | | 737,000 | | 511,466 | |
Nan Ya Plastics | | 192,000 | | 325,651 | |
Pegatron | | 445,000 | | 1,095,937 | |
Pou Chen | | 218,000 | | 329,212 | |
Ruentex Industries | | 84,000 | | 149,176 | |
SinoPac Financial Holdings | | 797,434 | | 250,562 | |
Taiwan Semiconductor Manufacturing | | 309,000 | | 1,233,066 | |
Zhen Ding Technology Holding | | 132,000 | | 380,024 | |
| | | | | 10,018,975 | |
Thailand - 1.5% | | | | | |
Advanced Info Service, NVDR | | 60,600 | | 377,868 | |
PTT | | 81,300 | | 539,681 | |
PTT Exploration & Production, NVDR | | 67,400 | | 130,637 | |
PTT Global Chemical, NVDR | | 268,400 | | 398,830 | |
Siam Cement, NVDR | | 5,050 | | 64,687 | |
Thai Beverage | | 1,123,000 | | 542,374 | |
Thai Oil | | 263,800 | | 384,650 | |
14
| | | | | | |
Common Stocks - 54.4% (continued) | | Shares | | Value ($) | |
Thailand - 1.5% (continued) | | | | | |
Thai Union Group, NVDR | | 712,700 | | 362,250 | |
| | | | | 2,800,977 | |
Turkey - 1.8% | | | | | |
Emlak Konut Gayrimenkul Yatirim Ortakligi | | 431,125 | | 357,778 | |
Eregli Demir ve Celik Fabrikalari | | 276,652 | | 341,296 | |
TAV Havalimananlari Holdings | | 50,203 | | 394,397 | |
Tofas Turk Otomobil Fabrikasi | | 29,814 | | 177,253 | |
Tupras Turkiye Petrol Rafinerileri | | 43,012 | a | 1,053,563 | |
Turk Hava Yollari | | 160,843 | a | 424,041 | |
Turkiye Halk Bankasi | | 119,654 | | 399,638 | |
Turkiye Is Bankasi, Cl. C | | 156,376 | | 243,552 | |
| | | | | 3,391,518 | |
United Arab Emirates - .7% | | | | | |
Abu Dhabi Commercial Bank | | 91,571 | | 190,835 | |
Dubai Islamic Bank | | 236,847 | | 434,139 | |
Emaar Properties | | 361,369 | | 636,434 | |
First Gulf Bank | | 33,478 | | 127,278 | |
| | | | | 1,388,686 | |
United States - 2.2% | | | | | |
iShares China Large-Cap ETF | | 22,626 | | 802,544 | |
iShares MSCI Brazil Capped ETF | | 34,738 | | 762,499 | |
iShares MSCI Indonesia ETF | | 45,844 | | 810,980 | |
iShares MSCI Mexico Capped ETF | | 17,741 | | 914,726 | |
Market Vectors Russia ETF | | 55,568 | | 872,418 | |
| | | | | 4,163,167 | |
Total Common Stocks (cost $114,369,346) | | | | 102,292,214 | |
Preferred Stocks - 1.3% | | | | | |
Brazil - 1.2% | | | | | |
AES Tiete | | 9,800 | | 34,780 | |
Banco Bradesco | | 46,620 | | 251,886 | |
Banco do Estado do Rio Grande do Sul, Cl. B | | 133,200 | | 187,478 | |
Cia Energetica de Minas Gerais | | 121,300 | | 213,870 | |
Cia Energetica de Sao Paulo, Cl. B | | 33,800 | | 129,675 | |
Cia Paranaense de Energia, Cl. B | | 16,400 | | 135,022 | |
Itau Unibanco Holding | | 73,990 | | 494,760 | |
Suzano Papel e Celulose, Cl. A | | 74,800 | | 363,953 | |
Telefonica Brasil | | 36,900 | | 341,310 | |
| | | | | 2,152,734 | |
Chile - .0% | | | | | |
Sociedad Quimica y Minera de Chile, Cl. B | | 5,220 | | 75,746 | |
15
STATEMENT OF INVESTMENTS (continued)
| | | | | | |
Preferred Stocks - 1.3% (continued) | | Shares | | Value ($) | |
Colombia - .1% | | | | | |
Banco Davivienda | | 7,437 | | 57,756 | |
Grupo Aval Acciones y Valores | | 190,623 | | 72,538 | |
| | | | | 130,294 | |
South Korea - .0% | | | | | |
Samsung Electronics | | 93 | | 72,463 | |
Total Preferred Stocks (cost $4,245,891) | | | | 2,431,237 | |
Rights - .0% | | Number of Rights | | Value ($) | |
China - .0% | | | | | |
Fosun International | | 18,144 | a | 0 | |
South Korea - .0% | | | | | |
Mirae Asset Securities | | 5,567 | a | 24,821 | |
Total Rights (cost $35,222) | | | | 24,821 | |
Other Investment - 42.2% | | Shares | | Value ($) | |
Registered Investment Company - 42.2% | | | | | |
Dreyfus Global Emerging Markets Fund, Cl. Y | | 5,310,332 | d | 63,777,089 | |
Dreyfus Strategic Beta Emerging Markets Fund, Cl. Y | | 1,591,548 | e | 15,406,187 | |
| | | | | 79,183,276 | |
Total Other Investment (cost $86,448,841) | | | | | |
Total Investments (cost $205,099,300) | | 97.9% | | 183,931,548 | |
Cash and Receivables (Net) | | 2.1% | | 4,011,645 | |
Net Assets | | 100.0% | | 187,943,193 | |
ADR—American Depository Receipt
ETF—Exchange-Traded Fund
GDR—Global Depository Receipt
NVDR—Non-Voting Depository Receipt
a Non-income producing security.
b Security exempt from registration pursuant to Rule 144A under the Securities Act of 1933. This security may be resold in transactions exempt from registration, normally to qualified institutional buyers. At September 30, 2015, this security was valued at $272,313, or 0.1% of net assets.
c The valuation of these securities has been determined in good faith by management under the direction of the Board of Trustees. At September 30, 2015, the value of these securities amounted to $743,037 or 0.4% of net assets.
d The fund's investment in the Dreyfus Global Emerging Markets Fund represents 34.0% of the fund's total investments. The Dreyfus Global Emerging Markets Fund seeks to provide long-term capital appreciation.
e The fund's investment in the Dreyfus Strategic Beta Emerging Markets Fund represents 8.2% of the fund's total investments. Dreyfus Strategic Beta Emerging Markets Fund seeks to provide long-term capital appreciation.
16
| | |
Portfolio Summary (Unaudited) † | Value (%) |
Mutual Fund: Foreign | 42.2 |
Financials | 16.6 |
Information Technology | 9.3 |
Telecommunication Services | 4.4 |
Energy | 4.3 |
Consumer Discretionary | 3.8 |
Consumer Staples | 3.8 |
Industrials | 3.8 |
Materials | 3.4 |
Health Care | 2.4 |
Exchange-Traded Funds | 2.2 |
Utilities | 1.7 |
| | 97.9 |
†Based on net assets.
See notes to financial statements.
17
STATEMENT OF ASSETS AND LIABILITIES
September 30, 2015
| | | | | | | |
| | | Cost | | Value | |
Assets ($): | | | | |
Investments in securities—See Statement of Investments: | | | | | |
Unaffiliated issuers | | 118,650,459 | | 104,748,272 | |
Affiliated issuers | | 86,448,841 | | 79,183,276 | |
Cash | | | | | 2,995,396 | |
Cash denominated in foreign currency | | | 1,244,666 | | 1,239,962 | |
Receivable for investment securities sold | | | | | 543,765 | |
Receivable for shares of Beneficial Interest subscribed | | | | | 509,843 | |
Dividends receivable | | | | | 231,021 | |
Unrealized appreciation on forward foreign
currency exchange contracts—Note 4 | | | | | 641 | |
Prepaid expenses | | | | | 27,385 | |
| | | | | 189,479,561 | |
Liabilities ($): | | | | |
Due to The Dreyfus Corporation and affiliates—Note 3(c) | | | | | 188,596 | |
Payable for investment securities purchased | | | | | 841,489 | |
Payable for shares of Beneficial Interest redeemed | | | | | 464,704 | |
Accrued expenses | | | | | 41,579 | |
| | | | | 1,536,368 | |
Net Assets ($) | | | 187,943,193 | |
Composition of Net Assets ($): | | | | |
Paid-in capital | | | | | 220,158,240 | |
Accumulated undistributed investment income—net | | | | | 939,779 | |
Accumulated net realized gain (loss) on investments | | | | | (11,956,624) | |
Accumulated net unrealized appreciation (depreciation)
on investments and foreign currency transactions | | | | | (21,198,202) | |
Net Assets ($) | | | 187,943,193 | |
| | | | | | |
Net Asset Value Per Share | Class A | Class C | Class I | Class Y | |
Net Assets ($) | 1,153,287 | 291,487 | 2,839,658 | 183,658,761 | |
Shares Outstanding | 66,947 | 17,663 | 165,509 | 10,688,768 | |
Net Asset Value Per Share ($) | 17.23 | 16.50 | 17.16 | 17.18 | |
See notes to financial statements.
18
STATEMENT OF OPERATIONS
Year Ended September 30, 2015
| | | | | | | |
| | | | | | |
| | | | | | |
Investment Income ($): | | | | |
Income: | | | | |
Cash dividends (net of $384,252 foreign taxes withheld at source): | | | | |
Unaffiliated issuers | | | 3,321,678 | |
Affiliated issuers | | | 205,369 | |
Total Income | | | 3,527,047 | |
Expenses: | | | | |
Investment advisory fee—Note 3(a) | | | 1,366,262 | |
Custodian fees—Note 3(c) | | | 176,312 | |
Administration fee—Note 3(a) | | | 112,938 | |
Registration fees | | | 60,977 | |
Professional fees | | | 42,673 | |
Prospectus and shareholders’ reports | | | 19,920 | |
Trustees' fees and expenses—Note 3(d) | | | 12,758 | |
Shareholder servicing costs—Note 3(c) | | | 4,707 | |
Loan commitment fees—Note 2 | | | 2,024 | |
Distribution fees—Note 3(b) | | | 1,259 | |
Miscellaneous | | | 58,037 | |
Total Expenses | | | 1,857,867 | |
Less—reduction in fees due to earnings credits—Note 3(c) | | | (3) | |
Net Expenses | | | 1,857,864 | |
Investment Income—Net | | | 1,669,183 | |
Realized and Unrealized Gain (Loss) on Investments—Note 4 ($): | | |
Net realized gain (loss) on investments and foreign currency transactions: | | |
Unaffiliated issuers | | | (10,543,706) | |
Affiliated issuers | | | (890,949) | |
Net realized gain (loss) on forward foreign currency exchange contracts | (95,621) | |
Capital gain distributions from affiliated issuers | | | 526,094 | |
Net Realized Gain (Loss) | | | (11,004,182) | |
Net unrealized appreciation (depreciation) on investments
and foreign currency transactions: | | | | |
Unaffiliated issuers | | | (16,796,845) | |
Affiliated issuers | | | (12,942,351) | |
Net unrealized appreciation (depreciation) on
forward foreign currency exchange contracts | | | 4,373 | |
Net Unrealized Appreciation (Depreciation) | | | (29,734,823) | |
Net Realized and Unrealized Gain (Loss) on Investments | | | (40,739,005) | |
Net (Decrease) in Net Assets Resulting from Operations | | (39,069,822) | |
See notes to financial statements.
19
STATEMENT OF CHANGES IN NET ASSETS
| | | | | | | | | | |
| | | | | | | | | | |
| | | | Year Ended September 30, |
| | | | 2015 | | | | 2014 | a |
Operations ($): | | | | | | | | |
Investment income—net | | | 1,669,183 | | | | 984,444 | |
Net realized gain (loss) on investments | | (11,004,182) | | | | 1,584,567 | |
Net unrealized appreciation (depreciation)
on investments | | (29,734,823) | | | | 8,125,999 | |
Net Increase (Decrease) in Net Assets
Resulting from Operations | (39,069,822) | | | | 10,695,010 | |
Dividends to Shareholders from ($): | | | | | | | | |
Investment income—net: | | | | | | | | |
Class A | | | (1,232) | | | | (1,321) | |
Class I | | | (16,426) | | | | (38,708) | |
Class Y | | | (1,538,438) | | | | - | |
Net realized gain on investments: | | | | | | | | |
Class A | | | (1,947) | | | | - | |
Class C | | | (673) | | | | - | |
Class I | | | (18,839) | | | | - | |
Class Y | | | (1,764,369) | | | | - | |
Total Dividends | | | (3,341,924) | | | | (40,029) | |
Beneficial Interest Transactions ($): | | | | | | | | |
Net proceeds from shares sold: | | | | | | | | |
Class A | | | 1,342,600 | | | | 129,686 | |
Class C | | | 296,721 | | | | 84,928 | |
Class I | | | 4,261,358 | | | | 1,802,991 | |
Class Y | | | 110,725,943 | | | | 186,859,039 | |
Dividends reinvested: | | | | | | | | |
Class A | | | 3,179 | | | | 1,321 | |
Class C | | | 673 | | | | - | |
Class I | | | 27,489 | | | | 7,090 | |
Class Y | | | 1,232,674 | | | | - | |
Cost of shares redeemed: | | | | | | | | |
Class A | | | (183,344) | | | | (53,303) | |
Class C | | | (10,139) | | | | (95,379) | |
Class I | | | (1,781,281) | | | | (4,484,417) | |
Class Y | | | (74,465,022) | | | | (9,568,065) | |
Increase (Decrease) in Net Assets
from Beneficial Interest Transactions | 41,450,851 | | | | 174,683,891 | |
Total Increase (Decrease) in Net Assets | (960,895) | | | | 185,338,872 | |
Net Assets ($): | | | | | | | | |
Beginning of Period | | | 188,904,088 | | | | 3,565,216 | |
End of Period | | | 187,943,193 | | | | 188,904,088 | |
Undistributed investment income—net | 939,779 | | | | 573,672 | |
20
| | | | | | | | | | |
| | | | | | | | | | |
| | | | Year Ended September 30, |
| | | | 2015 | | | | 2014 | a |
Capital Share Transactions: | | | | | | | | |
Class A | | | | | | | | |
Shares sold | | | 66,158 | | | | 5,929 | |
Shares issued for dividends reinvested | | | 157 | | | | 64 | |
Shares redeemed | | | (9,169) | | | | (2,515) | |
Net Increase (Decrease) in Shares Outstanding | 57,146 | | | | 3,478 | |
Class C | | | | | | | | |
Shares sold | | | 14,765 | | | | 4,201 | |
Shares issued for dividends reinvested | | | 35 | | | | - | |
Shares redeemed | | | (492) | | | | (4,703) | |
Net Increase (Decrease) in Shares Outstanding | 14,308 | | | | (502) | |
Class Ib | | | | | | | | |
Shares sold | | | 218,705 | | | | 90,912 | |
Shares issued for dividends reinvested | | | 1,371 | | | | 350 | |
Shares redeemed | | | (89,902) | | | | (220,231) | |
Net Increase (Decrease) in Shares Outstanding | 130,174 | | | | (128,969) | |
Class Yb | | | | | | | | |
Shares sold | | | 5,632,680 | | | | 9,318,728 | |
Shares issued for dividends reinvested | | | 61,388 | | | | - | |
Shares redeemed | | | (3,865,948) | | | | (458,080) | |
Net Increase (Decrease) in Shares Outstanding | 1,828,120 | | | | 8,860,648 | |
a Effective January 31, 2014, the fund commenced offering Class Y shares. | |
b During the period ended September 30, 2014, 12,340 Class I shares representing $272,093 were exchanged for 12,317 Class Y shares. | |
See notes to financial statements.
21
FINANCIAL HIGHLIGHTS
The following tables describe the performance for each share class for the fiscal periods indicated. All information (except portfolio turnover rate) reflects financial results for a single fund share. Total return shows how much your investment in the fund would have increased (or decreased) during each period, assuming you had reinvested all dividends and distributions. These figures have been derived from the fund’s financial statements.
| | | | | | | | | |
| | | | | |
| | Year Ended September 30, |
Class A Shares | 2015 | | 2014 | | 2013 | 2012 | 2011 |
Per Share Data ($): | | | | | | |
Net asset value, beginning of period | 21.34 | | 20.58 | | 19.78 | 21.86 | 26.99 |
Investment Operations: | | | | | | |
Investment income—neta | .09 | | .05 | | .23 | .07 | .09 |
Net realized and unrealized gain (loss) on investments | (3.88) | | .98 | | .57 | 2.15 | (5.14) |
Total from Investment Operations | (3.79) | | 1.03 | | .80 | 2.22 | (5.05) |
Distributions: | | | | | | |
Dividends from investment income—net | (.13) | | (.28) | | – | (.08) | (.08) |
Dividends from net realized gain on investments | (.20) | | — | | — | (4.22) | — |
Total Distributions | (.33) | | (.28) | | — | (4.30) | (.08) |
Proceeds from redemption feesb | .01 | | .01 | | — | — | — |
Net asset value, end of period | 17.23 | | 21.34 | | 20.58 | 19.78 | 21.86 |
Total Return (%)c | (18.00) | | 5.14 | | 3.99 | 12.48 | (18.77) |
Ratios/Supplemental Data (%): | | | | | |
Ratio of total expenses to average net assets | 1.42 | d | 4.80 | d | 6.20 | 5.55 | 3.66 |
Ratio of net expenses to average net assets | 1.42 | d | 1.60 | d | 1.60 | 2.25 | 2.25 |
Ratio of net investment income to average net assets | .47 | d | .22 | d | 1.10 | .36 | .30 |
Portfolio Turnover Rate | 78.32 | | 128.76 | | 67.74 | 70.79 | 75.59 |
Net Assets, end of period ($ x 1,000) | 1,153 | | 209 | | 130 | 107 | 158 |
a Based on average shares outstanding.
b See Note 3(e).
c Exclusive of sales charge.
d Amount does not include the expenses of the underlying funds.
See notes to financial statements.
22
| | | | | | | | | |
| | | | | |
| | Year Ended September 30, |
Class C Shares | 2015 | | 2014 | | 2013 | 2012 | 2011 |
Per Share Data ($): | | | | | | |
Net asset value, beginning of period | 20.44 | | 19.60 | | 18.98 | 21.23 | 26.36 |
Investment Operations: | | | | | | |
Investment income (loss)—neta | .04 | | (.16) | | .04 | (.14) | (.16) |
Net realized and unrealized gain (loss) on investments | (3.79) | | .99 | | .58 | 2.14 | (4.97) |
Total from Investment Operations | (3.75) | | .83 | | .62 | 2.00 | (5.13) |
Distributions: | | | | | | |
Dividends from investment income—net | — | | — | | — | (.03) | — |
Dividends from net realized gain on investments | (.20) | | — | | — | (4.22) | — |
Total Distributions | (.20) | | — | | — | (4.25) | — |
Proceeds from redemption feesb | .01 | | .01 | | — | — | — |
Net asset value, end of period | 16.50 | | 20.44 | | 19.60 | 18.98 | 21.23 |
Total Return (%)c | (18.44) | | 4.34 | | 3.21 | 11.63 | (19.43) |
Ratios/Supplemental Data (%): | | | | | |
Ratio of total expenses to average net assets | 2.08 | d | 6.10 | d | 6.62 | 5.79 | 3.92 |
Ratio of net expenses to average net assets | 2.08 | d | 2.35 | d | 2.35 | 3.00 | 3.00 |
Ratio of net investment income (loss) to average net assets | .22 | d | (.77) | d | .22 | (.69) | (.58) |
Portfolio Turnover Rate | 78.32 | | 128.76 | | 67.74 | 70.79 | 75.59 |
Net Assets, end of period ($ x 1,000) | 291 | | 69 | | 76 | 91 | 157 |
a Based on average shares outstanding.
b See Note 3(e).
c Exclusive of sales charge.
d Amount does not include the expenses of the underlying funds.
See notes to financial statements.
23
FINANCIAL HIGHLIGHTS (continued)
| | | | | | | | | | | |
| | | | | |
| | Year Ended September 30, |
Class I Shares | 2015 | | 2014 | | 2013 | 2012 | 2011 | |
Per Share Data ($): | | | | | | | |
Net asset value, beginning of period | 21.16 | | 20.45 | | 19.60 | 21.82 | 26.79 | |
Investment Operations: | | | | | | | |
Investment income (loss)—neta | .16 | | (.30) | | .26 | .24 | .25 | |
Net realized and unrealized gain (loss) on investments | (3.79) | | 1.34 | | .59 | 2.10 | (5.11) | |
Total from Investment Operations | (3.63) | | 1.04 | | .85 | 2.34 | (4.86) | |
Distributions: | | | | | | | |
Dividends from investment income—net | (.18) | | (.34) | | — | (.34) | (.11) | |
Dividends from net realized gain on investments | (.20) | | — | | — | (4.22) | — | |
Total Distributions | (.38) | | (.34) | | — | (4.56) | (.11) | |
Proceeds from redemption feesb | .01 | | .01 | | — | — | — | |
Net asset value, end of period | 17.16 | | 21.16 | | 20.45 | 19.60 | 21.82 | |
Total Return (%) | (17.44) | | 5.32 | | 4.23 | 13.36 | (18.27) | |
Ratios/Supplemental Data (%): | | | | | | |
Ratio of total expenses to average net assets | .99 | c | 3.57 | c | 5.39 | 4.66 | 2.83 | |
Ratio of net expenses to average net assets | .99 | c | 1.35 | c | 1.35 | 1.50 | 1.50 | |
Ratio of net investment income (loss) to average net assets | .83 | c | (.63) | c | 1.27 | 1.19 | .90 | |
Portfolio Turnover Rate | 78.32 | | 128.76 | | 67.74 | 70.79 | 75.59 | |
Net Assets, end of period ($ x 1,000) | 2,840 | | 748 | | 3,359 | 4,291 | 8,090 | |
a Based on average shares outstanding.
b See Note 3(e).
c Amount does not include the expenses of the underlying funds.
See notes to financial statements.
24
| | | | |
| | | |
| | Year Ended September 30, | |
Class Y Shares | 2015 | 2014 | a |
Per Share Data ($): | | | |
Net asset value, beginning of period | 21.20 | 19.03 | |
Investment Operations: | | | |
Investment income—netb | .17 | .14 | |
Net realized and unrealized gain (loss) on investments | (3.82) | 2.02 | |
Total from Investment Operations | (3.65) | 2.16 | |
Distributions: | | | |
Dividends from investment income—net | (.18) | — | |
Dividends from net realized gain on investments | (.20) | — | |
Total Distributions | (.38) | — | |
Proceeds from redemption feesc | .01 | .01 | |
Net asset value, end of period | 17.18 | 21.20 | |
Total Return (%) | (17.44) | 11.40 | d |
Ratios/Supplemental Data (%): | | | |
Ratio of total expenses to average net assetse | .93 | 1.29 | f |
Ratio of net expenses to average net assetse | .93 | 1.29 | f |
Ratio of net investment income to average net assetse | .84 | 1.03 | f |
Portfolio Turnover Rate | 78.32 | 128.76 | |
Net Assets, end of period ($ x 1,000) | 183,659 | 187,879 | |
a From the close of business on January 31, 2014 (commencement of initial offering) to September 30, 2014.
b Based on average shares outstanding.
c See Note 3(e).
d Not annualized.
e Amount does not include the expenses of the underlying funds.
f Annualized.
See notes to financial statements.
25
NOTES TO FINANCIAL STATEMENTS
NOTE 1—Significant Accounting Policies:
Dreyfus Diversified Emerging Markets Fund (the “fund”) is a separate diversified series of Dreyfus Investment Funds (the “Trust”), which is registered under the Investment Company Act of 1940, as amended (the “Act”), as an open-end management investment company and operates as a series company currently offering seven series, including the fund. The fund’s investment objective is to seek long-term growth of capital. The Dreyfus Corporation (the “Manager” or “Dreyfus”), a wholly-owned subsidiary of The Bank of New York Mellon Corporation (“BNY Mellon”), serves as the fund’s investment adviser. Mellon Capital Management Corporation (“Mellon Capital”) and The Boston Company Asset Management, LLC (“TBCAM”), each a wholly-owned subsidiary of BNY Mellon and an affiliate of Dreyfus, serve as the fund’s sub-investment advisers.
MBSC Securities Corporation (the “Distributor”), a wholly-owned subsidiary of Dreyfus, is the distributor of the fund’s shares. The fund is authorized to issue an unlimited number of $.001 par value shares of Beneficial Interest in each of the following classes of shares: Class A, Class C, Class I and Class Y. Class A and Class C shares are sold primarily to retail investors through financial intermediaries and bear Distribution and/or Shareholder Services Plan fees. Class A shares generally are subject to a sales charge imposed at the time of purchase. Class C shares are subject to a contingent deferred sales charge (“CDSC”) imposed on Class C shares redeemed within one year of purchase. Class I shares are sold primarily to bank trust departments and other financial service providers (including The Bank of New York Mellon, a subsidiary of BNY Mellon and an affiliate of Dreyfus, and its affiliates), acting on behalf of customers having a qualified trust or an investment account or relationship at such institution, and bear no Distribution or Shareholder Services Plan fees. Class Y shares are sold at net asset value per share generally to institutional investors, and bear no Distribution or Shareholder Services Plan fees. Class I and Class Y shares are offered without a front-end sales charge or CDSC. Other differences between the classes include the services offered to and the expenses borne by each class, the allocation of certain transfer agency costs, and certain voting rights. Income, expenses (other than expenses attributable to a specific class), and realized and unrealized gains or losses on investments are allocated to each class of shares based on its relative net assets.
26
The Trust accounts separately for the assets, liabilities and operations of each series. Expenses directly attributable to each series are charged to that series’ operations; expenses which are applicable to all series are allocated among them on a pro rata basis.
The Financial Accounting Standards Board (“FASB”) Accounting Standards Codification (“ASC”) is the exclusive reference of authoritative U.S. generally accepted accounting principles (“GAAP”) recognized by the FASB to be applied by nongovernmental entities. Rules and interpretive releases of the Securities and Exchange Commission (“SEC”) under authority of federal laws are also sources of authoritative GAAP for SEC registrants. The fund’s financial statements are prepared in accordance with GAAP, which may require the use of management estimates and assumptions. Actual results could differ from those estimates.
(a) Portfolio valuation: The fair value of a financial instrument is the amount that would be received to sell an asset or paid to transfer a liability in an orderly transaction between market participants at the measurement date (i.e., the exit price). GAAP establishes a fair value hierarchy that prioritizes the inputs of valuation techniques used to measure fair value. This hierarchy gives the highest priority to unadjusted quoted prices in active markets for identical assets or liabilities (Level 1 measurements) and the lowest priority to unobservable inputs (Level 3 measurements).
Additionally, GAAP provides guidance on determining whether the volume and activity in a market has decreased significantly and whether such a decrease in activity results in transactions that are not orderly. GAAP requires enhanced disclosures around valuation inputs and techniques used during annual and interim periods.
Various inputs are used in determining the value of the fund’s investments relating to fair value measurements. These inputs are summarized in the three broad levels listed below:
Level 1—unadjusted quoted prices in active markets for identical investments.
Level 2—other significant observable inputs (including quoted prices for similar investments, interest rates, prepayment speeds, credit risk, etc.).
Level 3—significant unobservable inputs (including the fund’s own assumptions in determining the fair value of investments).
The inputs or methodology used for valuing securities are not necessarily an indication of the risk associated with investing in those securities.
27
NOTES TO FINANCIAL STATEMENTS (continued)
Changes in valuation techniques may result in transfers in or out of an assigned level within the disclosure hierarchy. Valuation techniques used to value the fund’s investments are as follows:
Investments in securities are valued at the last sales price on the securities exchange or national securities market on which such securities are primarily traded. Securities listed on the National Market System for which market quotations are available are valued at the official closing price or, if there is no official closing price that day, at the last sales price. For open short positions, asked prices are used for valuation purposes. Bid price is used when no asked price is available. Registered investment companies that are not traded on an exchange are valued at their net asset value. All of the preceding securities are generally categorized within Level 1 of the fair value hierarchy.
Securities not listed on an exchange or the national securities market, or securities for which there were no transactions, are valued at the average of the most recent bid and asked prices. These securities are generally categorized within Level 2 of the fair value hierarchy.
Fair valuing of securities may be determined with the assistance of a pricing service using calculations based on indices of domestic securities and other appropriate indicators, such as prices of relevant ADRs and financial futures. Utilizing these techniques may result in transfers between Level 1 and Level 2 of the fair value hierarchy.
When market quotations or official closing prices are not readily available, or are determined not to reflect accurately fair value, such as when the value of a security has been significantly affected by events after the close of the exchange or market on which the security is principally traded (for example, a foreign exchange or market), but before the fund calculates its net asset value, the fund may value these investments at fair value as determined in accordance with the procedures approved by the Trust’s Board of Trustees (the “Board”). Certain factors may be considered when fair valuing investments such as: fundamental analytical data, the nature and duration of restrictions on disposition, an evaluation of the forces that influence the market in which the securities are purchased and sold, and public trading in similar securities of the issuer or comparable issuers. These securities are either categorized within Level 2 or 3 of the fair value hierarchy depending on the relevant inputs used.
For restricted securities where observable inputs are limited, assumptions about market activity and risk are used and are generally categorized within Level 3 of the fair value hierarchy.
28
Investments denominated in foreign currencies are translated to U.S. dollars at the prevailing rates of exchange.
Forward foreign currency exchange contracts (“forward contracts”) are valued at the forward rate and are generally categorized within Level 2 of the fair value hierarchy.
The following is a summary of the inputs used as of September 30, 2015 in valuing the fund’s investments:
| | | | | | |
Assets ($) | Level 1 Unadjusted Quoted Prices | Level 2 - Other Significant Observable Inputs | | Level 3 Significant Unobservable Inputs | Total |
Investments in Securities: | | | |
Equity Securities - Foreign Common Stocks† | 2,647,457 | 94,738,553 | †† | 743,037 | 98,129,047 |
Equity Securities - Foreign Preferred Stocks† | — | 2,431,237 | †† | — | 2,431,237 |
Exchange-Traded Funds | 4,163,167 | - | | — | 4,163,167 |
Mutual Funds | 79,183,276 | - | | — | 79,183,276 |
Rights† | — | 24,821 | †† | — | 24,821 |
Other Financial Instruments: | | | |
Forward Foreign Currency Exchange Contracts††† | — | 641 | | — | 641 |
† See Statement of Investments for additional detailed categorizations.
†† Securities classified within Level 2 at period end as the values were determined pursuant to the fund’s fair valuation procedures. See note above for additional information.
††† Amount shown represents unrealized appreciation at period end.
At September 30, 2014, no exchange traded foreign equity securities were classified within Level 2 of the fair value hierarchy.
The following is a reconciliation of Level 3 assets for which significant unobservable inputs were used to determine the fair value:
29
NOTES TO FINANCIAL STATEMENTS (continued)
| | |
| Equity Securities - Foreign Common Stocks ($) |
Balance as of 9/30/2014 | — |
Realized gain (loss) | — |
Change in unrealized appreciation (depreciation) | (137,832) |
Purchases | — |
Sales | — |
Transfer into Level 3† | 880,869 |
Transfer out of Level 3 | — |
Balance as of 9/30/2015 | 743,037 |
The amount of total gains (losses) for the period included in earnings attributable to the change in unrealized gains (losses) relating to investments still held at 9/30/2015 | (137,832) |
† Transfers into or out of Level 3 represent the value at the date of transfer. The transfer into Level 3 for the current period was due to the extended trading halt of foreign common stocks.
(b) Foreign currency transactions: The fund does not isolate that portion of the results of operations resulting from changes in foreign exchange rates on investments from the fluctuations arising from changes in the market prices of securities held. Such fluctuations are included with the net realized and unrealized gain or loss on investments.
Net realized foreign exchange gains or losses arise from sales of foreign currencies, currency gains or losses realized on securities transactions between trade and settlement date, and the difference between the amounts of dividends, interest and foreign withholding taxes recorded on the fund’s books and the U.S. dollar equivalent of the amounts actually received or paid. Net unrealized foreign exchange gains and losses arise from changes in the value of assets and liabilities other than investments resulting from changes in exchange rates. Foreign currency gains and losses on foreign currency transactions are also included with net realized and unrealized gain or loss on investments.
(c) Securities transactions and investment income: Securities transactions are recorded on a trade date basis. Realized gains and losses from securities transactions are recorded on the identified cost basis. Dividend income is recognized on the ex-dividend date and interest income, including, where applicable, accretion of discount and amortization of premium on investments, is recognized on the accrual basis.
(d) Affiliated issuers: Investments in other investment companies advised by Dreyfus are defined as “affiliated” under the Act. Investments in affiliated investment companies during the period ended September 30, 2015 were as follows:
30
| | | | | | |
Affiliated Investment Company | Value 9/30/2014 ($) | Purchases ($) | † | Sales ($) | Net Realized Gain (Loss) ($) |
Dreyfus Global Emerging Markets Fund, Cl. Y | 64,803,821 | 21,675,144 | | 9,168,292 | (892,117) |
Dreyfus Strategic Beta Emerging Markets Fund, Cl. Y | — | 16,089,587 | | 383,684 | 1,168 |
Total | 64,803,821 | 37,764,731 | | 9,551,976 | (890,949) |
| | | | | |
| | | | |
Affiliated Investment Company | Change in Net Unrealized Appreciation (Depreciation) ($) | Value 9/30/2015 ($) | Net Assets (%) | Dividends/ Distributions ($) |
Dreyfus Global Emerging Markets Fund, Cl. Y | (12,641,467) | 63,777,089 | 34.0 | 731,463 |
Dreyfus Strategic Beta Emerging Markets Fund, Cl. Y | (300,884) | 15,406,187 | 8.2 | — |
Total | (12,942,351) | 79,183,276 | 42.2 | 731,463 |
† Includes reinvested dividends/distributions.
(e) Risk: Investing in foreign markets may involve special risks and considerations not typically associated with investing in the U.S. These risks include revaluation of currencies, high rates of inflation, repatriation restrictions on income and capital, and adverse political and economic developments. Moreover, securities issued in these markets may be less liquid, subject to government ownership controls and delayed settlements, and their prices may be more volatile than those of comparable securities in the U.S.
(f) Dividends to shareholders: Dividends are recorded on the ex-dividend date. Dividends from investment income-net and dividends from net realized capital gains, if any, are normally declared and paid annually, but the fund may make distributions on a more frequent basis to comply with the distribution requirements of the Internal Revenue Code of 1986, as amended (the “Code”). To the extent that net realized capital gains can be offset by capital loss carryovers, it is the policy of the fund not to distribute such gains. Income and capital gain distributions are determined in accordance with income tax regulations, which may differ from GAAP.
(g) Federal income taxes: It is the policy of the fund to continue to qualify as a regulated investment company, if such qualification is in the best interests of its shareholders, by complying with the applicable provisions of the Code, and to make distributions of taxable income sufficient to relieve it from substantially all federal income and excise taxes.
31
NOTES TO FINANCIAL STATEMENTS (continued)
As of and during the period ended September 30, 2015, the fund did not have any liabilities for any uncertain tax positions. The fund recognizes interest and penalties, if any, related to uncertain tax positions as income tax expense in the Statement of Operations. During the period ended September 30, 2015, the fund did not incur any interest or penalties.
Each tax year in the four-year period ended September 30, 2015 remains subject to examination by the Internal Revenue Service and state taxing authorities.
At September 30, 2015, the components of accumulated earnings on a tax basis were as follows: undistributed ordinary income $959,398 and unrealized depreciation $23,871,378. In addition, the fund had $9,303,067 of capital losses realized after October 31, 2014, which were deferred for tax purposes to the first day of the following fiscal year.
The tax character of distributions paid to shareholders during the fiscal periods ended September 30, 2015 and September 30, 2014 were as follows: ordinary income $3,181,778 and $40,029, and long term capital gains $160,146 and $0, respectively.
During the period ended September 30, 2015, as a result of permanent book to tax differences, primarily due to the tax treatment for foreign currency gains and losses, passive foreign investment companies, foreign capital gain taxes, short-term capital gains distributions from regulated investment company holdings and dividend reclassification, the fund increased accumulated undistributed investment income-net by $253,020 and decreased accumulated net realized gain (loss) on investments by the same amount. Net assets and net asset value per share were not affected by this reclassification.
NOTE 2—Bank Lines of Credit:
The fund participates with other Dreyfus-managed funds in a $430 million unsecured credit facility led by Citibank, N.A. and a $300 million unsecured credit facility provided by The Bank of New York Mellon (each, a “Facility”), each to be utilized primarily for temporary or emergency purposes, including the financing of redemptions. Prior to October 8, 2014, the unsecured credit facility with Citibank, N.A. was $265 million. In connection therewith, the fund has agreed to pay its pro rata portion of commitment fees for each Facility. Interest is charged to the fund based on rates determined pursuant to the terms of the respective Facility at the time of borrowing. During the period ended September 30, 2015, the fund did not borrow under the Facilities.
32
NOTE 3—Investment Advisory Fee, Sub-Investment Advisory Fee, Administration Fee and Other Transactions with Affiliates:
(a) Pursuant to an investment advisory agreement with Dreyfus, the fund has agreed to pay an investment advisory fee at the annual rate of 1.10% of the value of the fund’s average daily net assets other than assets allocated to investments in other investment companies (other underlying funds, which may consist of affiliated funds, mutual funds and exchange traded funds) and is payable monthly. Dreyfus had contractually agreed, from October 1, 2014 through October 31, 2014 to waive receipt of its fees and/or assume the expenses of the fund so that the direct expenses of the fund (excluding Rule 12b-1 Distribution Plan fees, Shareholder Services Plan fees, taxes, interest expense, brokerage commissions, commitment fees on borrowings, acquired fund fees and expenses of the underlying fund and extraordinary expenses) did not exceed 1.35% of the fund’s average daily net assets. Dreyfus has also contractually agreed, from November 1, 2014 through February 1, 2016, to waive receipt of its fees and/or assume the direct expenses of the fund, so that the expenses of Class A, C, I and Y shares (excluding certain expenses as described above) do not exceed 1.35%, 1.35%, 1.35% and 1.30% of the value of the respective class’ average daily net assets. During the period ended September 30, 2015, there was no reduction in expenses pursuant to the undertaking.
Pursuant to separate sub-investment advisory agreements between Dreyfus, TBCAM and Mellon Capital, each serves as the fund’s sub-investment adviser responsible for the day-to–day management of a portion of the fund’s portfolio. Dreyfus pays each sub-investment adviser a monthly fee at an annual percentage of the value of the fund’s average daily net assets. Dreyfus has obtained an exemptive order from the SEC (the “Order”), upon which the fund may rely, to use a manager of managers approach that permits Dreyfus, subject to certain conditions and approval by the Board, to enter into and materially amend sub-investment advisory agreements with one or more sub-investment advisers who are either unaffiliated with Dreyfus or are wholly-owned subsidiaries (as defined under the Act) of Dreyfus’ ultimate parent company, BNY Mellon, without obtaining shareholder approval. The Order also allows the fund to disclose the sub-investment advisory fee paid by Dreyfus to any unaffiliated sub-investment adviser in the aggregate with other unaffiliated sub-investment advisers in documents filed with the SEC and provided to shareholders. In addition, pursuant to the Order, it is not necessary to disclose the sub-investment advisory fee payable by Dreyfus separately to a sub-investment adviser that is a wholly-owned subsidiary of BNY Mellon in documents filed with the SEC and provided to shareholders; such fees
33
NOTES TO FINANCIAL STATEMENTS (continued)
are to be aggregated with fees payable to Dreyfus. Dreyfus has ultimate responsibility (subject to oversight by the Board) to supervise any sub-investment adviser and recommend the hiring, termination, and replacement of any sub-investment adviser to the Board.
The fund has a Fund Accounting and Administrative Services Agreement (the “Administration Agreement”) with Dreyfus, whereby Dreyfus performs administrative, accounting and recordkeeping services for the fund. The fund has agreed to compensate Dreyfus for providing accounting and recordkeeping services, administration, compliance monitoring, regulatory and shareholder reporting, as well as related facilities, equipment and clerical help. The fee is based on the fund’s average daily net assets and computed at the following annual rates: .10% of the first $500 million, .065% of the next $500 million and .02% in excess of $1 billion.
In addition, after applying any expense limitations or fee waivers that reduce the fees paid to Dreyfus for this service, Dreyfus has contractually agreed in writing to waive any remaining fees for this service to the extent that they exceed both Dreyfus’ costs in providing these services and a reasonable allocation of the costs incurred by Dreyfus and its affiliates related to the support and oversight of these services. The fund also reimburses Dreyfus for the out-of-pocket expenses incurred in performing this service for the fund. Pursuant to the Administration Agreement, the fund was charged $112,938 during the period ended September 30, 2015.
During the period ended September 30, 2015, the Distributor retained $228 from commissions earned on sales of the fund's Class A shares.
(b) Under the Distribution Plan adopted pursuant to Rule 12b-1 under the Act, Class C shares pay the Distributor for distributing its shares at an annual rate of .75% of the value of its average daily net assets. During the period ended September 30, 2015, Class C shares were charged $1,259 pursuant to the Distribution Plan.
(c) Under the Shareholder Services Plan, Class A and Class C shares pay the Distributor at an annual rate of .25% of the value of their average daily net assets for the provision of certain services. The services provided may include personal services relating to shareholder accounts, such as answering shareholder inquiries regarding the fund and providing reports and other information, and services related to the maintenance of shareholder accounts. The Distributor may make payments to Service Agents (securities dealers, financial institutions or other industry professionals) with respect to these services. The Distributor determines the amounts to be paid to Service Agents. During the period ended
34
September 30, 2015, Class A and Class C shares were charged $1,103 and $419, respectively, pursuant to the Shareholder Services Plan.
Under its terms, the Distribution Plan and Shareholder Services Plan shall remain in effect from year to year, provided such continuance is approved annually by a vote of a majority of those Trustees who are not “interested persons” of the Trust and who have no direct or indirect financial interest in the operation of or in any agreement related to the Distribution Plan or Shareholder Services Plan.
The fund has arrangements with the transfer agent and the custodian whereby the fund may receive earnings credits when positive cash balances are maintained, which are used to offset transfer agency and custody fees. For financial reporting purposes, the fund includes net earnings credits as an expense offset in the Statement of Operations.
The fund compensates Dreyfus Transfer, Inc., a wholly-owned subsidiary of Dreyfus, under a transfer agency agreement for providing transfer agency and cash management services for the fund. The majority of transfer agency fees are comprised of amounts paid on a per account basis, while cash management fees are related to fund subscriptions and redemptions. During the period ended September 30, 2015, the fund was charged $2,135 for transfer agency services and $80 for cash management services. These fees are included in Shareholder servicing costs in the Statement of Operations. Cash management fees were partially offset by earnings credits of $3.
The fund compensates The Bank of New York Mellon under a custody agreement for providing custodial services for the fund. These fees are determined based on net assets, geographic region and transaction activity. During the period ended September 30, 2015, the fund was charged $176,312 pursuant to the custody agreement.
During the period ended September 30, 2015, the fund was charged $11,078 for services performed by the Chief Compliance Officer and his staff.
The components of “Due to The Dreyfus Corporation and affiliates” in the Statement of Assets and Liabilities consist of: investment advisory fees $97,384, administration fees $9,456, Distribution Plan fees $180, Shareholder Services Plan fees $288, custodian fees $78,119, Chief Compliance Officer fees $2,606 and transfer agency fees $563.
(d) Each Board member also serves as a Board member of other funds within the Dreyfus complex. Annual retainer fees and attendance fees are allocated to each fund based on net assets.
35
NOTES TO FINANCIAL STATEMENTS (continued)
(e) A 2% redemption fee is charged and retained by the fund on certain shares redeemed within sixty days following the date of issuance subject to certain exceptions, including redemptions made through use of the fund’s exchange privilege. During the period ended September 30, 2015, redemption fees charged and retained by the fund amounted to $73,018.
NOTE 4—Securities Transactions:
The aggregate amount of purchases and sales of investment securities, excluding short-term securities and forward contracts, during the period ended September 30, 2015, amounted to $190,629,385 and $152,700,857, respectively.
Derivatives: A derivative is a financial instrument whose performance is derived from the performance of another asset. The fund enters into International Swaps and Derivatives Association, Inc. Master Agreements or similar agreements (collectively, “Master Agreements”) with its over-the-counter (“OTC”) derivative contract counterparties in order to, among other things, reduce its credit risk to counterparties. Master Agreements include provisions for general obligations, representations, collateral and events of default or termination. Under a Master Agreement, the fund may offset with the counterparty certain derivative financial instrument’s payables and/or receivables with collateral held and/or posted and create one single net payment in the event of default or termination.
Each type of derivative instrument that was held by the fund during the period ended September 30, 2015 is discussed below.
Forward Foreign Currency Exchange Contracts: The fund enters into forward contracts in order to hedge its exposure to changes in foreign currency exchange rates on its foreign portfolio holdings, to settle foreign currency transactions or as a part of its investment strategy. When executing forward contracts, the fund is obligated to buy or sell a foreign currency at a specified rate on a certain date in the future. With respect to sales of forward contracts, the fund incurs a loss if the value of the contract increases between the date the forward contract is opened and the date the forward contract is closed. The fund realizes a gain if the value of the contract decreases between those dates. With respect to purchases of forward contracts, the fund incurs a loss if the value of the contract decreases between the date the forward contract is opened and the date the forward contract is closed. The fund realizes a gain if the value of the contract increases between those dates. Any realized or unrealized gains or losses which occurred during the period are reflected in the Statement of Operations. The fund is exposed to foreign currency risk as a result of
36
changes in value of underlying financial instruments. The fund is also exposed to credit risk associated with counterparty nonperformance on these forward contracts, which is generally limited to the unrealized gain on each open contract. This risk may be mitigated by Master Agreements, if any, between the fund and the counterparty and the posting of collateral, if any, by the counterparty to the fund to cover the fund’s exposure to the counterparty. The following summarizes open forward contracts at September 30, 2015:
| | | | | | | | | |
Forward Foreign Currency Exchange Contracts | Foreign Currency
Amounts | Cost ($) | Value ($) | Unrealized Appreciation ($) | |
Purchases: | | | | | |
Northern Trust Bank | | | | |
Turkish Lira, | | | | |
Expiring | | | | |
10/1/2015 | 1,211,986 | 399,969 | 400,610 | 641 | |
Gross Unrealized Appreciation | | | | 641 | |
The provisions of ASC Topic 210 “Disclosures about Offsetting Assets and Liabilities” require disclosure on the offsetting of financial assets and liabilities. These disclosures are required for certain investments, including derivative financial instruments subject to Master Agreements which are eligible for offsetting in the Statement of Assets and Liabilities and require the fund to disclose both gross and net information with respect to such investments. For financial reporting purposes, the fund does not offset derivative assets and derivative liabilities that are subject to Master Agreements in the Statement of Assets and Liabilities.
At September 30, 2015, derivative assets and liabilities (by type) on a gross basis are as follows:
| | | | | | |
Derivative Financial Instruments: | | Assets ($) | | Liabilities ($) | |
Forward contracts | | 641 | | - | |
Total gross amount of derivative | | | | | |
assets and liabilities in the | | | | | |
Statement of Assets and Liabilities | | 641 | | - | |
Derivatives not subject to | | | | | |
Master Agreements | | - | | - | |
Total gross amount of assets | | | | | |
and liabilities subject to | | | | | |
Master Agreements | | 641 | | - | |
37
NOTES TO FINANCIAL STATEMENTS (continued)
The following table presents derivative assets net of amounts available for offsetting under Master Agreements and net of related collateral received or pledged, if any, as of September 30, 2015:
| | | | | | | |
| | | | Financial | | | |
| | | | Instruments | | | |
| | | | and Derivatives | | | |
| | Gross Amount of | | Available | Collateral | | Net Amount of |
Counterparty | Assets ($) | 1 | for Offset ($) | Received ($) | | Assets ($) |
Northern Trust Bank | 641 | | - | - | | 641 |
| | | | | | | |
| | | | | | | |
1 Absent a default event or early termination, OTC derivative assets and liabilities are presented
at gross amounts and are not offset in the Statement of Assets and Liabilities. |
The following summarizes the average market value of derivatives outstanding during the period ended September 30, 2015:
| | | | | |
| | | | | Average Market Value ($) |
Forward contracts | | | | 485,589 |
At September 30, 2015, the cost of investments for federal income tax purposes was $207,772,476; accordingly, accumulated net unrealized depreciation on investments was $23,840,928, consisting of $4,192,216 gross unrealized appreciation and $28,033,144 gross unrealized depreciation.
38
REPORT OF INDEPENDENT REGISTERED
PUBLIC ACCOUNTING FIRM
The Board of Trustees and Shareholders of
Dreyfus Investment Funds
We have audited the accompanying statement of assets and liabilities of Dreyfus Diversified Emerging Markets Fund (the “Fund”), a series of Dreyfus Investment Funds, including the statement of investments, as of September 30, 2015, and the related statement of operations for the year then ended, the statements of changes in net assets for each of the years in the two-year period then ended, and the financial highlights for each of the years or period in the five-year period then ended. These financial statements and financial highlights are the responsibility of the Fund’s management. Our responsibility is to express an opinion on these financial statements and financial highlights based on our audits.
We conducted our audits in accordance with the standards of the Public Company Accounting Oversight Board (United States). Those standards require that we plan and perform the audit to obtain reasonable assurance about whether the financial statements and financial highlights are free of material misstatement. An audit includes examining, on a test basis, evidence supporting the amounts and disclosures in the financial statements. Our procedures included confirmation of securities owned as of September 30, 2015, by correspondence with the custodian and brokers or by other appropriate auditing procedures. An audit also includes assessing the accounting principles used and significant estimates made by management, as well as evaluating the overall financial statement presentation. We believe that our audits provide a reasonable basis for our opinion.
In our opinion, the financial statements and financial highlights referred to above present fairly, in all material respects, the financial position of Dreyfus Diversified Emerging Markets Fund as of September 30, 2015, the results of its operations for the year then ended, the changes in its net assets for each of the years in the two-year period then ended, and the financial highlights for each of the years or period in the five-year period then ended, in conformity with U.S. generally accepted accounting principles.

New York, New York
November 25, 2015
39
IMPORTANT TAX INFORMATION (Unaudited)
For federal tax purposes, the fund elects to provide each shareholder with their portion of the fund's income sourced from foreign countries and taxes paid from foreign countries. The fund reports the maximum amount allowable but not less than $3,694,873 as income sourced from foreign countries for the fiscal year ended September 30, 2015 in accordance with Section 853(c)(2) of the Internal Revenue Code and also the fund reports the maximum amount allowable but not less than $526,513 as taxes paid from foreign countries for the fiscal year ended September 30, 2015 in accordance with Section 853(a) of the Internal Revenue Code. Where required by federal tax law rules, shareholders will receive notification of their proportionate share of foreign sourced income and foreign taxes paid for the 2015 calendar year with Form 1099-DIV which will be mailed in early 2016. Also the fund reports the maximum amount allowable, but not less than $1,856,646 as ordinary income dividends paid during the fiscal year ended September 30, 2015 as qualified dividend income in accordance with Section 854(b)(1)(B) of the Internal Revenue Code. The fund reports the maximum amount allowable but not less than $.0186 per share as a long-term capital gain dividend in accordance with Section 852(b)(3)(C) of the Internal Revenue Code. The fund reports the maximum amount allowable but not less than $.1821 per share as a short-term capital gain dividend in accordance with Sections 871(k)(2) and 881(e) of the Internal Revenue Code.
40
BOARD MEMBERS INFORMATION (Unaudited)
INDEPENDENT BOARD MEMBERS
Joseph S. DiMartino (71)
Chairman of the Board (2008)
Principal Occupation During Past 5 Years:
· Corporate Director and Trustee (1995-present)
Other Public Company Board Memberships During Past 5 Years:
· CBIZ (formerly, Century Business Services, Inc.), a provider of outsourcing functions for small and medium size companies, Director (1997-present)
· The Newark Group, a provider of a national market of paper recovery facilities, paperboard mills and paperboard converting plants, Director (2000-2010)
No. of Portfolios for which Board Member Serves: 142
———————
Francine J. Bovich (64)
Board Member (2011)
Principal Occupation During Past 5 Years:
· Trustee, The Bradley Trusts, private trust funds (2011-present)
· Managing Director, Morgan Stanley Investment Management (1993-2010)
Other Public Company Board Memberships During Past 5 Years:
· Annaly Capital Management, Inc., Board Member (May 2014-present)
No. of Portfolios for which Board Member Serves: 80
———————
Kenneth A. Himmel (69)
Board Member (2008)
Principal Occupation During Past 5 Years:
· Managing Partner, Gulf Related, an international real estate development company (2010-present)
· President and CEO, Related Urban Development, a real estate development company (1996-present)
· President and CEO, Himmel & Company, a real estate development company (1980-present)
· CEO, American Food Management, a restaurant company (1983-present)
No. of Portfolios for which Board Member Serves: 30
———————
41
BOARD MEMBERS INFORMATION (Unaudited) (continued)
INDEPENDENT BOARD MEMBERS (continued)
Stephen J. Lockwood (68)
Board Member (2008)
Principal Occupation During Past 5 Years:
· Chairman of the Board, Stephen J. Lockwood and Company LLC, a real estate investment company (2000-present)
No. of Portfolios for which Board Member Serves: 30
———————
Roslyn M. Watson (65)
Board Member (2008)
Principal Occupation During Past 5 Years:
· Principal, Watson Ventures, Inc., a real estate investment company (1993-present)
No. of Portfolios for which Board Member Serves: 66
———————
Benaree Pratt Wiley (69)
Board Member (2008)
Principal Occupation During Past 5 Years:
· Principal, The Wiley Group, a firm specializing in strategy and business development (2005-present)
Other Public Company Board Memberships During Past 5 Years:
· CBIZ (formerly, Century Business Services, Inc.), a provider of outsourcing functions for small and medium size companies, Director (2008-present)
No. of Portfolios for which Board Member Serves: 66
———————
Once elected all Board Members serve for an indefinite term, but achieve Emeritus status upon reaching age 80. The address of the Board Members and Officers is c/o The Dreyfus Corporation, 200 Park Avenue, New York, New York 10166. Additional information about the Board Members is available in the fund’s Statement of Additional Information which can be obtained from Dreyfus free of charge by calling this toll free number: 1-800-DREYFUS.
James M. Fitzgibbons, Emeritus Board Member
J. Tomlinson Fort, Emeritus Board Member
42
OFFICERS OF THE FUND (Unaudited)
BRADLEY J. SKAPYAK, President since January 2010.
Chief Operating Officer and a director of the Manager since June 2009, Chairman of Dreyfus Transfer, Inc., an affiliate of the Manager and the transfer agent of the funds, since May 2011 and Executive Vice President of the Distributor since June 2007. From April 2003 to June 2009, Mr. Skapyak was the head of the Investment Accounting and Support Department of the Manager. He is an officer of 68 investment companies (comprised of 142 portfolios) managed by the Manager. He is 56 years old and has been an employee of the Manager since February 1988.
BENNETT A. MACDOUGALL, Chief Legal Officer since October 2015
Chief Legal Officer of the Manager since June 2015; from June 2005 to June 2015, Director and Associate General Counsel of Deutsche Bank – Asset & Wealth Management Division, and Chief Legal Officer of Deutsche Investment Management Americas Inc. He is an officer of 69 investment companies (comprised of 167 portfolios) managed by the Manager. He is 44 years old and has been an employee of the Manager since June 2015.
JANETTE E. FARRAGHER, Vice President and Secretary since December 2011.
Assistant General Counsel of BNY Mellon, and an officer of 69 investment companies (comprised of 167 portfolios) managed by the Manager. She is 52 years old and has been an employee of the Manager since February 1984.
JAMES BITETTO, Vice President and Assistant Secretary since December 2008.
Managing Counsel of BNY Mellon and Secretary of the Manager, and an officer of 69 investment companies (comprised of 167 portfolios) managed by the Manager. He is 49 years old and has been an employee of the Manager since December 1996.
JONI LACKS CHARATAN, Vice President and Assistant Secretary since December 2008.
Managing Counsel of BNY Mellon, and an officer of 69 investment companies (comprised of 167 portfolios) managed by the Manager. She is 59 years old and has been an employee of the Manager since October 1988.
JOSEPH M. CHIOFFI, Vice President and Assistant Secretary since December 2008.
Managing Counsel of BNY Mellon, and an officer of 69 investment companies (comprised of 167 portfolios) managed by the Manager. He is 53 years old and has been an employee of the Manager since June 2000.
JOHN B. HAMMALIAN, Vice President and Assistant Secretary since December 2008.
Senior Managing Counsel of BNY Mellon, and an officer of 69 investment companies (comprised of 167 portfolios) managed by the Manager. He is 52 years old and has been an employee of the Manager since February 1991.
MAUREEN E. KANE, Vice President and Assistant Secretary since April 2015.
Managing Counsel of BNY Mellon since July 2014; from October 2004 until July 2014, General Counsel, and from May 2009 until July 2014, Chief Compliance Officer of Century Capital Management. She is an officer of 69 investment companies (comprised of 167 portfolios) managed by the Manager. She is 53 years old and has been an employee of the Manager since July 2014.
SARAH S. KELLEHER, Vice President and Assistant Secretary since April 2014.
Senior Counsel of BNY Mellon, and an officer of 69 investment companies (comprised of 167 portfolios) managed by the Manager; from August 2005 to March 2013, Associate General Counsel of Third Avenue Management. She is 40 years old and has been an employee of the Manager since March 2013.
JEFF PRUSNOFSKY, Vice President and Assistant Secretary since December 2008.
Senior Managing Counsel of BNY Mellon, and an officer of 69 investment companies (comprised of 167 portfolios) managed by the Manager. He is 50 years old and has been an employee of the Manager since October 1990.
JAMES WINDELS, Treasurer since December 2008.
Director – Mutual Fund Accounting of the Manager, and an officer of 69 investment companies (comprised of 167 portfolios) managed by the Manager. He is 57 years old and has been an employee of the Manager since April 1985.
43
OFFICERS OF THE FUND (Unaudited) (continued)
RICHARD CASSARO, Assistant Treasurer since December 2008.
Senior Accounting Manager – Money Market and Municipal Bond Funds of the Manager, and an officer of 69 investment companies (comprised of 167 portfolios) managed by the Manager. He is 56 years old and has been an employee of the Manager since September 1982.
GAVIN C. REILLY, Assistant Treasurer since December 2005.
Tax Manager of the Investment Accounting and Support Department of the Manager, and an officer of 69 investment companies (comprised of 167 portfolios) managed by the Manager. He is 47 years old and has been an employee of the Manager since April 1991.
ROBERT S. ROBOL, Assistant Treasurer since December 2008.
Senior Accounting Manager – Fixed Income Funds of the Manager, and an officer of 69 investment companies (comprised of 167 portfolios) managed by the Manager. He is 51 years old and has been an employee of the Manager since October 1988.
ROBERT SALVIOLO, Assistant Treasurer since December 2008.
Senior Accounting Manager – Equity Funds of the Manager, and an officer of 69 investment companies (comprised of 167 portfolios) managed by the Manager. He is 48 years old and has been an employee of the Manager since June 1989.
ROBERT SVAGNA, Assistant Treasurer since December 2008.
Senior Accounting Manager – Equity Funds of the Manager, and an officer of 69 investment companies (comprised of 167 portfolios) managed by the Manager. He is 48 years old and has been an employee of the Manager since November 1990.
JOSEPH W. CONNOLLY, Chief Compliance Officer since December 2008.
Chief Compliance Officer of the Manager and The Dreyfus Family of Funds (69 investment companies, comprised of 167 portfolios). He is 58 years old and has served in various capacities with the Manager since 1980, including manager of the firm’s Fund Accounting Department from 1997 through October 2001.
44
NOTES
45
Dreyfus Diversified Emerging Markets Fund
200 Park Avenue
New York, NY 10166
Manager
The Dreyfus Corporation
200 Park Avenue
New York, NY 10166
Sub-Investment Adviser
Mellon Capital Management Corporation
50 Fremont Street, Suite 3900
San Francisco, CA 94105
The Boston Company Asset Management, LLC
BNY Mellon Center One Boston Place
Boston, MA 02108
Custodian
The Bank of New York Mellon
225 Liberty Street
New York, NY 10286
Transfer Agent &
Dividend Disbursing Agent
Dreyfus Transfer, Inc.
200 Park Avenue
New York, NY 10166
Distributor
MBSC Securities Corporation
200 Park Avenue
New York, NY 10166
| | |
Ticker Symbols: | Class A: DBEAX Class C: DBECX Class I: SBCEX Class Y: SBYEX |
Telephone Call your financial representative or 1-800-DREYFUS
Mail The Dreyfus Family of Funds, 144 Glenn Curtiss Boulevard, Uniondale, NY 11556-0144
E-mail Send your request to info@dreyfus.com
Internet Information can be viewed online or downloaded at www.dreyfus.com
The fund files its complete schedule of portfolio holdings with the Securities and Exchange Commission (“SEC”) for the first and third quarters of each fiscal year on Form N-Q. The fund’s Forms N-Q are available on the SEC’s website at www.sec.gov and may be reviewed and copied at the SEC’s Public Reference Room in Washington, DC. (phone 1-800-SEC-0330 for information).
A description of the policies and procedures that the fund uses to determine how to vote proxies relating to portfolio securities and information regarding how the fund voted these proxies for the most recent 12-month period ended June 30 is available at www.dreyfus.com and on the SEC’s website at www.sec.gov and without charge, upon request, by calling 1-800-DREYFUS.
| | |
© 2015 MBSC Securities Corporation
6919AR0915 | 
|
Dreyfus/Newton International Equity Fund
| | | |

| | ANNUAL REPORT
September 30, 2015 |
| |
Save time. Save paper. View your next shareholder report online as soon as it’s available. Log into www.dreyfus.com and sign up for Dreyfus eCommunications. It’s simple and only takes a few minutes. |
| |
The views expressed in this report reflect those of the portfolio manager only through the end of the period covered and do not necessarily represent the views of Dreyfus or any other person in the Dreyfus organization. Any such views are subject to change at any time based upon market or other conditions and Dreyfus disclaims any responsibility to update such views. These views may not be relied on as investment advice and, because investment decisions for a Dreyfus fund are based on numerous factors, may not be relied on as an indication of trading intent on behalf of any Dreyfus fund. |
| |
Not FDIC-Insured • Not Bank-Guaranteed • May Lose Value |
Contents
THE FUND
FOR MORE INFORMATION
Back Cover
| | | | |
| |
Dreyfus/Newton International Equity Fund
| | The Fund |
A LETTER FROM THE PRESIDENT
Dear Shareholder:
We are pleased to present this annual report for Dreyfus/Newton International Equity Fund, covering the 12-month period from October 1, 2014, through September 30, 2015. For information about how the fund performed during the reporting period, as well as general market perspectives, we provide a Discussion of Fund Performance on the pages that follow.
Financial markets proved volatile over the reporting period. For much of the year, a recovering U.S. economy enabled stocks to advance, but those gains were erased during the third quarter of 2015 when economic concerns in China, falling commodity prices, and a stronger U.S. dollar sparked sharp corrections in equity markets throughout the world. The emerging markets were especially hard hit. U.S. bonds generally fared better, rallying in late 2014 before reversing course in the spring as the domestic economy strengthened. Global economic instability sparked a renewed rally among U.S. government securities toward the reporting period’s end, but corporate-backed and inflation-linked securities lost value.
We expect market volatility to persist over the near term as investors vacillate between hopes that current turmoil represents a healthy correction and fears that further disappointments could trigger a full-blown bear market. Our investment strategists and portfolio managers are monitoring developments carefully, keeping a close watch on Chinese fiscal and monetary policy, expectations of higher short-term interest rates in the United States, liquidity factors affecting various asset classes, and other developments that could influence investor sentiment. Over the longer term, we remain confident that markets are likely to stabilize as the world adjusts to slower Chinese economic growth, abundant energy resources, and the eventual normalization of U.S. monetary policy. In our view, investors will continue to be well served under these circumstances by a long-term perspective and a disciplined investment approach.
Thank you for your continued confidence and support.
Sincerely,

J. Charles Cardona
President
The Dreyfus Corporation
October 15, 2015
2
DISCUSSION OF FUND PERFORMANCE
For the period of October 1, 2014, through September 30, 2015, as provided by Paul Markham, Lead Portfolio Manager of Newton Capital Management Limited, Sub-Investment Adviser
Fund and Market Performance Overview
For the 12-month period ended September 30, 2015, Dreyfus/Newton International Equity Fund’s Class A shares produced a total return of -5.58%, Class C shares returned -6.39%, Class I shares returned -5.37%, and Class Y shares returned -5.32%.1 In comparison, the fund’s benchmark, the Morgan Stanley Capital International Europe, Australasia, Far East Index (“MSCI EAFE Index”), produced a total return of -8.66% for the same period.2
Developed equity markets lost ground during the reporting period amid heightened volatility stemming from global economic instability. The fund outperformed its benchmark, mainly due to strong contributions from consumer discretionary stocks and the Eurozone.
The Fund’s Investment Approach
The fund normally invests at least 80% of its assets in common stocks, securities convertible into common stocks of foreign companies, and in depositary receipts evidencing ownership in such securities. The process of selecting investments begins with Newton’s core list of global investment themes. These themes are based on observable economic, industrial, or social trends (typically global) that Newton believes will positively or negatively affect certain sectors or industries. The list of themes is discussed and updated on a regular basis. For instance, Newton’s Debt Burden theme asserts that excessive debt is weighing on economic activity, and that the way in which deleveraging occurs is critical to the outlook for economics and financial markets. Elsewhere, Newton’s Net Effects theme focuses upon the opportunities and risks inherent in the growth of information technology networks around the world.
International Equities Declined amid Volatility
Despite lackluster global macroeconomic data, monetary intervention by central banks helped push stock prices higher over the reporting period’s first half. A ramped-up quantitative easing program from the Bank of Japan in late October 2014 and new stimulative measures from the European Central Bank in January 2015 helped the MSCI EAFE Index rally from previous weakness.
In mid-May 2015, rebounding oil prices stoked inflation fears, and international stocks retreated, on average. This pattern continued throughout June, with international equities coming under particular pressure when Greece’s debt crisis intensified. Over the summer, disappointing economic data and dramatic stock market declines in China further eroded investor sentiment, and these fears were exacerbated in August when policymakers devalued the Chinese renminbi. Consequently, international equities fell into negative territory, led lower by Asian and emerging markets.
Fund Strategies Helped Cushion Market’s Decline
Our theme-driven investment process proved especially effective in the consumer discretionary sector, where successful stock selections included Japanese discount retailer Don Quijote Holdings, Chinese furniture manufacturer Man Wah Holdings, and Japanese
3
DISCUSSION OF FUND PERFORMANCE (continued)
restaurant chain Skylark. The fund also fared well due to underweighted exposure to and strong stock selections in the materials sector, as U.K.-based building materials company CRH ranked as one of the fund’s top-performing stocks and the fund avoided weakness in mining companies BHP Billiton and Glencore. In the industrials sector, Japan Airlines and Italian toll-road operator Atlantia added value. Underweighted exposure to the hard-hit energy sector also supported relative results.
On a geographic level, the Eurozone generated a significant portion of the fund’s outperformance over the reporting period. Stock selections in Germany, Italy, and the Netherlands produced favorable relative results. For example, German property developer LEG Immobilien’s generous dividend yield attracted investor attention early in the reporting period, and the company gained additional value after receiving a takeover bid. The fund’s underweighted position in the Asia Pacific ex-Japan region also proved beneficial, as did strong stock selections such as Hong Kong-listed insurer AIA Group and Chinese footwear retailer Belle International Holdings.
On a more negative note, holdings such as Softbank Group and TeliaSonera in the telecommunications services sector weighed on relative results, more than offsetting the positive effects of an overweighted sector position. Likewise, the benefits of overweighted exposure to the health care sector were undermined by detrimental stock selections, such as Topcon and Sanofi. From a country allocation perspective, our stock selection strategies in Brazil and the Philippines generally detracted from relative performance.
At times during the reporting period, the fund employed forward contracts to hedge its exposure to certain foreign currencies.
A Cautious and Selective Approach
Despite central banks’ aggressively accommodative monetary policies, we have seen a palpable loss of momentum in global economic activity. Given the structural challenges of ever-larger debt burdens, evidence of a shift from globalization to protectionism, and generally unpromising demographics, the global economy appears more fragile than policymakers suggest.
Consequently, we have maintained a focus on businesses with structural tailwinds-such as strong balance sheets, pricing power, and cost flexibility-at a price that affords some margin of safety. In broad terms, our approach continues to emphasize the importance of being highly selective, of thoroughly understanding the constituents of portfolios, and, most importantly, of knowing why we hold them.
October 15, 2015
Please note, the position in any security highlighted with italicized typeface was sold during the reporting period.
Equity funds are subject generally to market, market sector, market liquidity, issuer, and investment style risks, among other factors, to varying degrees, all of which are more fully described in the fund’s prospectus.
Investing internationally involves special risks, including changes in currency exchange rates, political, economic and social instability, a lack of comprehensive company information, differing auditing and legal standards, and less market liquidity.
The use of derivatives involves risks different from, or possibly greater than, the risks associated with investing directly in the underlying assets. Derivatives can be highly volatile, illiquid, and difficult to value, and there is the risk that changes in the value of a derivative held by the fund will not correlate with the underlying instruments or the fund’s other investments.
1 Total return includes reinvestment of dividends and any capital gains paid, and does not take into consideration the maximum initial sales charge in the case of Class A shares, or the applicable contingent deferred sales charge imposed on redemptions in the case of Class C shares. Had these charges been reflected, returns would have been lower. Past performance is no guarantee of future
4
results. Share price, yield, and investment return fluctuate such that upon redemption, fund shares may be worth more or less than their original cost.
2 SOURCE: LIPPER INC. — Reflects reinvestment of net dividends and, where applicable, capital gain distributions. The Morgan Stanley Capital International Europe, Australasia, Far East (MSCI EAFE) Index is an unmanaged index composed of a sample of companies representative of the market structure of European and Pacific Basin countries. The Index does not take into account fees and expenses to which the fund is subject. Investors cannot invest directly in any index.
5
FUND PERFORMANCE
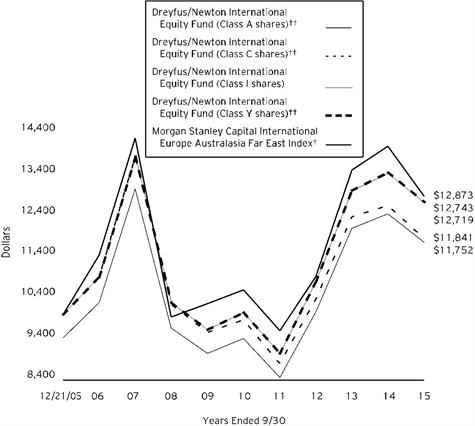
Comparison of change in value of $10,000 investment in Dreyfus/Newton International Equity Fund Class A shares, Class C shares, Class I shares and Class Y shares and the Morgan Stanley Capital International Europe Australasia Far East Index
† Source: Lipper Inc.
†† The total return figures presented for Class A and Class C shares of the fund reflect the performance of the fund’s Class I shares for the period prior to 3/31/08 (the inception date for Class A and Class C shares), adjusted to reflect the applicable sales load for Class A shares.
The total return figures presented for Class Y shares of the fund reflect the performance of the fund’s Class I shares for the period prior to 7/1/13 (the inception date for Class Y shares).
Past performance is not predictive of future performance.
The above graph compares a $10,000 investment made in each of the Class A, Class C, Class I and Class Y shares of Dreyfus/Newton International Equity Fund on 12/21/05 (inception date) to a $10,000 investment made in the Morgan Stanley Capital International Europe Australasia Far East Index (the “Index”) on that date. All dividends and capital gain distributions are reinvested.
The fund’s performance shown in the line graph above takes into account the maximum initial sales charge on Class A shares and all other applicable fees and expenses on all classes. The Index is an unmanaged index composed of a sample of companies representative of the market structure of European and Pacific Basin countries. Unlike a mutual fund, the Index is not subject to charges, fees and other expenses. Investors cannot invest directly in any index. These factors can contribute to the Index potentially outperforming the fund. Further information relating to fund performance, including expense reimbursements, if applicable, is contained in the Financial Highlights section of the prospectus and elsewhere in this report.
6
| | | | | |
Average Annual Total Returns as of 9/30/15 |
| | Inception | | | From |
| Date | 1 Year | 5 Years | Inception |
Class A shares | | | | |
with maximum sales charge (5.75%) | 3/31/08 | -11.03% | 3.32% | 1.66%†† |
without sales charge | 3/31/08 | -5.58% | 4.54% | 2.28%†† |
Class C shares | | | | |
with applicable redemption charge† | 3/31/08 | -7.29% | 3.72% | 1.74%†† |
without redemption | 3/31/08 | -6.39% | 3.72% | 1.74%†† |
Class I shares | 12/21/05 | -5.37% | 4.84% | 2.49% |
Class Y shares | 7/1/13 | -5.32% | 4.88%†† | 2.51%†† |
Morgan Stanley Capital International | | | | |
Europe Australasia Far East Index | 12/31/05 | -8.66% | 3.98% | 2.62%††† |
Past performance is not predictive of future performance. The fund’s performance shown in the graph and table does not reflect the deduction of taxes that a shareholder would pay on fund distributions or the redemption of fund shares. In addition to the performance of Class A shares shown with and without a maximum sales charge, the fund’s performance shown in the table takes into account all other applicable fees and expenses on all classes.
† The maximum contingent deferred sales charge for Class C shares is 1% for shares redeemed within one year of the date of purchase.
†† The total return performance figures presented for Class A and Class C shares of the fund reflect the performance of the fund’s Class I shares for the period prior to 3/31/08 (the inception date for Class A and Class C shares), adjusted to reflect the applicable sales load for Class A shares.
The total return performance figures presented for Class Y shares of the fund reflect the performance of the fund’s Class I shares for the period prior to 7/1/13 (the inception date for Class Y shares).
††† The Index date is based on the life of Class I shares. For comparative purposes, the value of the Index as of the month end 12/31/05 is used as the beginning value on 12/21/05 (the inception date for Class I shares).
7
UNDERSTANDING YOUR FUND’S EXPENSES (Unaudited)
As a mutual fund investor, you pay ongoing expenses, such as management fees and other expenses. Using the information below, you can estimate how these expenses affect your investment and compare them with the expenses of other funds. You also may pay one-time transaction expenses, including sales charges (loads) and redemption fees, which are not shown in this section and would have resulted in higher total expenses. For more information, see your fund’s prospectus or talk to your financial adviser.
Review your fund’s expenses
The table below shows the expenses you would have paid on a $1,000 investment in Dreyfus/Newton International Equity Fund from April 1, 2015 to September 30, 2015. It also shows how much a $1,000 investment would be worth at the close of the period, assuming actual returns and expenses.
| | | | | | | | | |
Expenses and Value of a $1,000 Investment | | |
assuming actual returns for the six months ended September 30, 2015 |
| | | | | | | | |
| | | | Class A | Class C | Class I | Class Y |
Expenses paid per $1,000† | $ 5.87 | $ 9.51 | $ 4.29 | $ 4.24 |
Ending value (after expenses) | $919.60 | $916.00 | $920.90 | $921.00 |
COMPARING YOUR FUND’S EXPENSES
WITH THOSE OF OTHER FUNDS (Unaudited)
Using the SEC’s method to compare expenses
The Securities and Exchange Commission (SEC) has established guidelines to help investors assess fund expenses. Per these guidelines, the table below shows your fund’s expenses based on a $1,000 investment, assuming a hypothetical 5% annualized return. You can use this information to compare the ongoing expenses (but not transaction expenses or total cost) of investing in the fund with those of other funds. All mutual fund shareholder reports will provide this information to help you make this comparison. Please note that you cannot use this information to estimate your actual ending account balance and expenses paid during the period.
| | | | | | | | |
Expenses and Value of a $1,000 Investment | | |
assuming a hypothetical 5% annualized return for the six months ended September 30, 2015 |
| | | | | | | | |
| | | | Class A | Class C | Class I | Class Y |
Expenses paid per $1,000† | $ 6.17 | $ 10.00 | $ 4.51 | $ 4.46 |
Ending value (after expenses) | $1,018.95 | $1,015.14 | $1,020.61 | $1,020.66 |
† Expenses are equal to the fund's annualized expense ratio of 1.22% for Class A, 1.98% for Class C, .89% for Class I and .88% for Class Y, multiplied by the average account value over the period, multiplied by 183/365 (to reflect the one-half year period).
8
STATEMENT OF INVESTMENTS
September 30, 2015
| | | | | | | | | |
Common Stocks - 96.4% | | Shares | | Value ($) | |
Australia - .6% | | | | | |
Dexus Property Group | | 1,227,364 | | 6,171,143 | |
Belgium - 1.7% | | | | | |
Anheuser-Busch InBev | | 151,320 | | 16,072,403 | |
Brazil - .1% | | | | | |
International Meal Company Alimentacao, Cl. A | | 547,388 | a | 650,321 | |
China - 1.1% | | | | | |
China Biologic Products | | 118,814 | a | 10,671,873 | |
France - 5.1% | | | | | |
Air Liquide | | 141,916 | | 16,816,936 | |
Sanofi | | 174,767 | | 16,649,383 | |
Vivendi | | 623,947 | | 14,771,993 | |
| | | | | 48,238,312 | |
Georgia - .5% | | | | | |
TBC Bank, GDR | | 512,646 | a | 4,716,343 | |
Germany - 13.3% | | | | | |
Bayer | | 124,261 | | 15,881,669 | |
Brenntag | | 301,894 | | 16,246,753 | |
Commerzbank | | 1,339,955 | a | 14,104,603 | |
Hella KGaA Hueck & Co | | 230,429 | | 8,326,580 | |
Infineon Technologies | | 1,631,725 | | 18,337,580 | |
LEG Immobilien | | 346,205 | a | 28,543,543 | |
SAP | | 152,195 | | 9,846,522 | |
Telefonica Deutschland Holding | | 2,407,644 | | 14,694,075 | |
| | | | | 125,981,325 | |
Hong Kong - 2.8% | | | | | |
AIA Group | | 3,057,512 | | 15,919,071 | |
Man Wah Holdings | | 10,943,000 | | 10,748,659 | |
| | | | | 26,667,730 | |
India - 1.1% | | | | | |
HDFC Bank, ADR | | 170,407 | | 10,410,164 | |
Ireland - 1.9% | | | | | |
CRH | | 663,663 | | 17,534,820 | |
Italy - 2.8% | | | | | |
Atlantia | | 587,649 | | 16,453,291 | |
Pirelli & C. | | 604,268 | | 10,112,350 | |
| | | | | 26,565,641 | |
Japan - 25.8% | | | | | |
Don Quijote Holdings | | 672,400 | | 25,442,306 | |
9
STATEMENT OF INVESTMENTS (continued)
| | | | | | | | | | | |
Common Stocks - 96.4% (continued) | | Shares | | Value ($) | |
Japan - 25.8% (continued) | | | | | |
FANUC | | 72,100 | | 11,115,599 | |
Japan Airlines | | 552,286 | | 19,496,994 | |
Japan Tobacco | | 671,000 | | 20,873,351 | |
LIXIL Group | | 392,000 | | 7,972,530 | |
M3 | | 375,700 | | 7,495,038 | |
NGK Spark Plug | | 437,000 | | 10,034,801 | |
Nomura Holdings | | 1,917,500 | | 11,125,758 | |
Recruit Holdings | | 398,771 | | 11,995,328 | |
Sawai Pharmaceutical | | 121,600 | | 7,102,328 | |
Skylark | | 1,169,900 | | 15,270,331 | |
SoftBank | | 359,500 | | 16,540,741 | |
Stanley Electric | | 400,600 | | 8,024,748 | |
Sugi Holdings | | 321,600 | | 14,489,777 | |
Suntory Beverage & Food | | 323,600 | | 12,453,224 | |
TechnoPro Holdings | | 371,300 | | 9,879,710 | |
Tokyo Electron | | 34,600 | | 1,635,413 | |
TOPCON | | 546,800 | | 7,149,639 | |
Toyota Motor | | 443,900 | | 26,107,687 | |
| | | | | 244,205,303 | |
Mexico - .5% | | | | | |
Grupo Financiero Santander Mexico, Cl. B, ADR | | 592,065 | | 4,345,757 | |
Netherlands - 3.8% | | | | | |
RELX | | 938,250 | | 15,318,489 | |
Wolters Kluwer | | 658,565 | | 20,304,932 | |
| | | | | 35,623,421 | |
Norway - 1.0% | | | | | |
DNB | | 718,353 | | 9,361,564 | |
Philippines - .5% | | | | | |
Energy Development | | 41,894,600 | | 4,951,705 | |
Portugal - .6% | | | | | |
Galp Energia | | 608,194 | | 6,000,014 | |
Switzerland - 12.8% | | | | | |
Actelion | | 77,330 | a | 9,836,959 | |
Credit Suisse Group | | 882,674 | a | 21,235,101 | |
Nestle | | 343,124 | | 25,839,468 | |
Novartis | | 271,558 | | 25,014,497 | |
Roche Holding | | 77,458 | | 20,476,333 | |
Zurich Insurance Group | | 76,440 | a | 18,805,797 | |
| | | | | 121,208,155 | |
10
| | | | | | | | | | | | | | |
Common Stocks - 96.4% (continued) | | Shares | | Value ($) | |
United Kingdom - 20.4% | | | | | |
Associated British Foods | | 318,975 | | 16,165,954 | |
Barclays | | 6,816,152 | | 25,199,597 | |
British American Tobacco | | 341,343 | | 18,864,822 | |
Centrica | | 4,558,376 | | 15,840,240 | |
Dixons Carphone | | 1,532,520 | | 9,862,292 | |
GlaxoSmithKline | | 785,282 | | 15,053,588 | |
Just Eat | | 2,128,297 | a | 13,238,552 | |
Merlin Entertainments | | 1,496,722 | b | 8,431,702 | |
Next | | 107,882 | | 12,451,033 | |
Prudential | | 898,412 | | 18,992,874 | |
Vodafone Group | | 7,484,339 | | 23,665,699 | |
Wolseley | | 268,524 | | 15,708,407 | |
| | | | | 193,474,760 | |
Total Common Stocks (cost $860,226,850) | | | | 912,850,754 | |
Other Investments - 4.9% | | | | | |
Registered Investment Company; | | | | | |
Dreyfus Institutional Preferred Plus Money Market Fund | | 45,994,333 | c | 45,994,333 | |
(cost $45,994,333) | | | | | |
Total Investments (cost $906,221,183) | | 101.3% | | 958,845,087 | |
Liabilities, Less Cash and Receivables | | (1.3%) | | (11,893,746) | |
Net Assets | | 100.0% | | 946,951,341 | |
ADR—American Depository Receipt
GDR—Global Depository Receipt
a Non-income producing security.
b Security exempt from registration pursuant to Rule 144A under the Securities Act of 1933. This security may be resold in transactions exempt from registration, normally to qualified institutional buyers. At September 30, 2015, this security was valued at $8,431,702 or .9% of net assets.
c Investment in affiliated money market mutual fund.
11
STATEMENT OF INVESTMENTS (continued)
| | |
Portfolio Summary (Unaudited) † | Value (%) |
Consumer Discretionary | 21.2 |
Financials | 20.0 |
Health Care | 14.3 |
Consumer Staples | 13.2 |
Industrials | 11.3 |
Telecommunication Services | 5.8 |
Money Market Investment | 4.9 |
Information Technology | 4.2 |
Materials | 3.6 |
Utilities | 2.2 |
Energy | .6 |
| | 101.3 |
†Based on net assets.
See notes to financial statements.
12
STATEMENT OF ASSETS AND LIABILITIES
September 30, 2015
| | | | | | | |
| | | Cost | | Value | |
Assets ($): | | | | |
Investments in securities—See Statement of Investments: | | | | | |
Unaffiliated issuers | | 860,226,850 | | 912,850,754 | |
Affiliated issuers | | 45,994,333 | | 45,994,333 | |
Cash | | | | | 2,374,234 | |
Cash denominated in foreign currency | | | 306,537 | | 305,993 | |
Receivable for investment securities sold | | | | | 12,661,662 | |
Dividends receivable | | | | | 3,051,094 | |
Receivable for shares of Beneficial Interest subscribed | | | | | 2,132,087 | |
Unrealized appreciation on forward foreign
currency exchange contracts—Note 4 | | | | | 21,167 | |
Prepaid expenses | | | | | 27,906 | |
| | | | | 979,419,230 | |
Liabilities ($): | | | | |
Due to The Dreyfus Corporation and affiliates—Note 3(c) | | | | | 792,123 | |
Payable for investment securities purchased | | | | | 30,969,829 | |
Payable for shares of Beneficial Interest redeemed | | | | | 614,218 | |
Unrealized depreciation on forward foreign
currency exchange contracts—Note 4 | | | | | 13,485 | |
Accrued expenses | | | | | 78,234 | |
| | | | | 32,467,889 | |
Net Assets ($) | | | 946,951,341 | |
Composition of Net Assets ($): | | | | |
Paid-in capital | | | | | 917,528,796 | |
Accumulated undistributed investment income—net | | | | | 9,763,942 | |
Accumulated net realized gain (loss) on investments | | | | | (32,970,745) | |
Accumulated net unrealized appreciation (depreciation)
on investments and foreign currency transactions | | | | | 52,629,348 | |
Net Assets ($) | | | 946,951,341 | |
| | | | | | |
Net Asset Value Per Share | Class A | Class C | Class I | Class Y | |
Net Assets ($) | 6,965,112 | 1,417,229 | 43,538,477 | 895,030,523 | |
Shares Outstanding | 375,778 | 78,295 | 2,366,966 | 48,879,419 | |
Net Asset Value Per Share ($) | 18.54 | 18.10 | 18.39 | 18.31 | |
See notes to financial statements.
13
STATEMENT OF OPERATIONS
Year Ended September 30, 2015
| | | | | | | |
| | | | | | |
| | | | | | |
Investment Income ($): | | | | |
Income: | | | | |
Cash dividends (net of $1,647,396 foreign taxes withheld at source): | | | | |
Unaffiliated issuers | | | 18,972,911 | |
Affiliated issuers | | | 22,352 | |
Total Income | | | 18,995,263 | |
Expenses: | | | | |
Investment advisory fee—Note 3(a) | | | 6,883,311 | |
Custodian fees—Note 3(c) | | | 294,955 | |
Administration fee—Note 3(a) | | | 186,930 | |
Registration fees | | | 76,084 | |
Professional fees | | | 56,578 | |
Trustees' fees and expenses—Note 3(d) | | | 53,054 | |
Shareholder servicing costs—Note 3(c) | | | 22,442 | |
Distribution fees—Note 3(b) | | | 8,945 | |
Loan commitment fees—Note 2 | | | 8,703 | |
Prospectus and shareholders’ reports | | | 7,878 | |
Interest expense—Note 2 | | | 2,268 | |
Miscellaneous | | | 51,576 | |
Total Expenses | | | 7,652,724 | |
Less—reduction in fees due to earnings credits—Note 3(c) | | | (5) | |
Net Expenses | | | 7,652,719 | |
Investment Income—Net | | | 11,342,544 | |
Realized and Unrealized Gain (Loss) on Investments—Note 4 ($): | | |
Net realized gain (loss) on investments and foreign currency transactions | (26,776,004) | |
Net realized gain (loss) on forward foreign currency exchange contracts | 5,950,082 | |
Net Realized Gain (Loss) | | | (20,825,922) | |
Net unrealized appreciation (depreciation) on investments
and foreign currency transactions | | | (46,003,743) | |
Net unrealized appreciation (depreciation) on
forward foreign currency exchange contracts | | | (3,952,907) | |
Net Unrealized Appreciation (Depreciation) | | | (49,956,650) | |
Net Realized and Unrealized Gain (Loss) on Investments | | | (70,782,572) | |
Net (Decrease) in Net Assets Resulting from Operations | | (59,440,028) | |
See notes to financial statements.
14
STATEMENT OF CHANGES IN NET ASSETS
| | | | | | | | | | |
| | | | | | | | | | |
| | | | Year Ended September 30, |
| | | | 2015 | | | | 2014 | |
Operations ($): | | | | | | | | |
Investment income—net | | | 11,342,544 | | | | 17,247,820 | |
Net realized gain (loss) on investments | | (20,825,922) | | | | 23,673,501 | |
Net unrealized appreciation (depreciation)
on investments | | (49,956,650) | | | | (20,186,096) | |
Net Increase (Decrease) in Net Assets
Resulting from Operations | (59,440,028) | | | | 20,735,225 | |
Dividends to Shareholders from ($): | | | | | | | | |
Investment income—net: | | | | | | | | |
Class A | | | (45,244) | | | | (142,170) | |
Class C | | | (19,617) | | | | (13,199) | |
Class I | | | (826,604) | | | | (9,907,582) | |
Class Y | | | (24,124,094) | | | | (20) | |
Net realized gain on investments: | | | | | | | | |
Class A | | | (41,568) | | | | - | |
Class C | | | (18,505) | | �� | | - | |
Class I | | | (540,048) | | | | - | |
Class Y | | | (13,319,218) | | | | - | |
Total Dividends | | | (38,934,898) | | | | (10,062,971) | |
Beneficial Interest Transactions ($): | | | | | | | | |
Net proceeds from shares sold: | | | | | | | | |
Class A | | | 6,034,240 | | | | 1,547,595 | |
Class C | | | 730,359 | | | | 393,985 | |
Class I | | | 35,984,384 | | | | 262,132,680 | |
Class Y | | | 319,351,626 | | | | 806,497,402 | |
Dividends reinvested: | | | | | | | | |
Class A | | | 84,769 | | | | 141,362 | |
Class C | | | 38,122 | | | | 13,199 | |
Class I | | | 1,248,485 | | | | 4,475,491 | |
Class Y | | | 19,737,631 | | | | - | |
Cost of shares redeemed: | | | | | | | | |
Class A | | | (786,295) | | | | (8,997,862) | |
Class C | | | (436,089) | | | | (142,573) | |
Class I | | | (18,271,886) | | | | (802,856,212) | |
Class Y | | | (114,873,841) | | | | (23,042,278) | |
Increase (Decrease) in Net Assets
from Beneficial Interest Transactions | 248,841,505 | | | | 240,162,789 | |
Total Increase (Decrease) in Net Assets | 150,466,579 | | | | 250,835,043 | |
Net Assets ($): | | | | | | | | |
Beginning of Period | | | 796,484,762 | | | | 545,649,719 | |
End of Period | | | 946,951,341 | | | | 796,484,762 | |
Undistributed investment income—net | 9,763,942 | | | | 17,969,957 | |
15
STATEMENT OF CHANGES IN NET ASSETS (continued)
| | | | | | | | | | |
| | | | Year Ended September 30, |
| | | | 2015 | | | | 2014 | |
Capital Share Transactions: | | | | | | | | |
Class A | | | | | | | | |
Shares sold | | | 297,171 | | | | 75,834 | |
Shares issued for dividends reinvested | | | 4,536 | | | | 7,216 | |
Shares redeemed | | | (39,761) | | | | (435,987) | |
Net Increase (Decrease) in Shares Outstanding | 261,946 | | | | (352,937) | |
Class C | | | | | | | | |
Shares sold | | | 36,131 | | | | 19,615 | |
Shares issued for dividends reinvested | | | 2,073 | | | | 680 | |
Shares redeemed | | | (22,382) | | | | (7,038) | |
Net Increase (Decrease) in Shares Outstanding | 15,822 | | | | 13,257 | |
Class Ia | | | | | | | | |
Shares sold | | | 1,796,337 | | | | 12,979,452 | |
Shares issued for dividends reinvested | | | 67,340 | | | | 229,512 | |
Shares redeemed | | | (943,910) | | | | (38,385,605) | |
Net Increase (Decrease) in Shares Outstanding | 919,767 | | | | (25,176,641) | |
Class Ya | | | | | | | | |
Shares sold | | | 16,257,122 | | | | 38,558,130 | |
Shares issued for dividends reinvested | | | 1,070,951 | | | | - | |
Shares redeemed | | | (5,902,266) | | | | (1,104,571) | |
Net Increase (Decrease) in Shares Outstanding | 11,425,807 | | | | 37,453,559 | |
a During the period ended September 30, 2014, 35,884,139 Class I shares representing $751,546,493 were exchanged for 35,901,286 Class Y shares. | |
See notes to financial statements.
16
FINANCIAL HIGHLIGHTS
The following tables describe the performance for each share class for the fiscal periods indicated. All information (except portfolio turnover rate) reflects financial results for a single fund share. Total return shows how much your investment in the fund would have increased (or decreased) during each period, assuming you had reinvested all dividends and distributions. These figures have been derived from the fund’s financial statements.
| | | | | | | |
| | | | |
| | Year Ended September 30, |
Class A Shares | | 2015 | 2014 | 2013 | 2012 | 2011 |
Per Share Data ($): | | | | | | |
Net asset value, beginning of period | | 20.41 | 20.15 | 16.96 | 14.74 | 16.80 |
Investment Operations: | | | | | | |
Investment income—neta | | .19 | .47 | .21 | .18 | .19 |
Net realized and unrealized
gain (loss) on investments | | (1.33) | .10 | 3.19 | 2.52 | (1.82) |
Total from Investment Operations | | (1.14) | .57 | 3.40 | 2.70 | (1.63) |
Distributions: | | | | | | |
Dividends from investment income—net | | (.38) | (.31) | (.21) | (.23) | (.17) |
Dividends from net realized
gain on investments | | (.35) | - | - | (.25) | (.26) |
Total Distributions | | (.73) | (.31) | (.21) | (.48) | (.43) |
Net asset value, end of period | | 18.54 | 20.41 | 20.15 | 16.96 | 14.74 |
Total Return (%)b | | (5.58) | 2.88 | 20.24 | 18.92 | (10.10) |
Ratios/Supplemental Data (%): | | | | | | |
Ratio of total expenses to average net assets | | 1.19 | 1.30 | 1.34 | 1.32 | 1.32 |
Ratio of net expenses to average net assets | | 1.19 | 1.30 | 1.34 | 1.32 | 1.32 |
Ratio of net investment income
to average net assets | | .97 | 2.22 | 1.11 | 1.14 | 1.06 |
Portfolio Turnover Rate | | 36.37 | 39.45 | 55.27 | 57.88 | 63.28 |
Net Assets, end of period ($ x 1,000) | | 6,965 | 2,324 | 9,404 | 7,300 | 9,766 |
a Based on average shares outstanding.
b Exclusive of sales charge.
See notes to financial statements.
17
FINANCIAL HIGHLIGHTS (continued)
| | | | | | | |
| | | | |
| | Year Ended September 30, |
Class C Shares | | 2015 | 2014 | 2013 | 2012 | 2011 |
Per Share Data ($): | | | | | | |
Net asset value, beginning of period | | 20.10 | 19.90 | 16.70 | 14.54 | 16.59 |
Investment Operations: | | | | | | |
Investment income—neta | | .02 | .29 | .05 | .07 | .05 |
Net realized and unrealized
gain (loss) on investments | | (1.30) | .14 | 3.17 | 2.47 | (1.79) |
Total from Investment Operations | | (1.28) | .43 | 3.22 | 2.54 | (1.74) |
Distributions: | | | | | | |
Dividends from investment income—net | | (.37) | (.23) | (.02) | (.13) | (.05) |
Dividends from net realized
gain on investments | | (.35) | - | - | (.25) | (.26) |
Total Distributions | | (.72) | (.23) | (.02) | (.38) | (.31) |
Net asset value, end of period | | 18.10 | 20.10 | 19.90 | 16.70 | 14.54 |
Total Return (%)b | | (6.39) | 2.18 | 19.31 | 17.92 | (10.79) |
Ratios/Supplemental Data (%): | | | | | | |
Ratio of total expenses to average net assets | | 2.01 | 2.04 | 2.13 | 2.16 | 2.07 |
Ratio of net expenses to average net assets | | 2.01 | 2.04 | 2.13 | 2.16 | 2.07 |
Ratio of net investment income
to average net assets | | .10 | 1.43 | .28 | .42 | .31 |
Portfolio Turnover Rate | | 36.37 | 39.45 | 55.27 | 57.88 | 63.28 |
Net Assets, end of period ($ x 1,000) | | 1,417 | 1,256 | 979 | 722 | 924 |
a Based on average shares outstanding.
b Exclusive of sales charge.
See notes to financial statements.
18
| | | | | | | | | | |
| | | | | | | |
| | Year Ended September 30, |
Class I Shares | | 2015 | 2014 | 2013 | 2012 | 2011 |
Per Share Data ($): | | | | | | |
Net asset value, beginning of period | | 20.37 | 20.10 | 16.92 | 14.77 | 16.84 |
Investment Operations: | | | | | | |
Investment income—neta | | .26 | .61 | .26 | .24 | .26 |
Net realized and unrealized
gain (loss) on investments | | (1.35) | .03 | 3.18 | 2.49 | (1.86) |
Total from Investment Operations | | (1.09) | .64 | 3.44 | 2.73 | (1.60) |
Distributions: | | | | | | |
Dividends from investment income—net | | (.54) | (.37) | (.26) | (.33) | (.21) |
Dividends from net realized
gain on investments | | (.35) | - | - | (.25) | (.26) |
Total Distributions | | (.89) | (.37) | (.26) | (.58) | (.47) |
Net asset value, end of period | | 18.39 | 20.37 | 20.10 | 16.92 | 14.77 |
Total Return (%) | | (5.37) | 3.25 | 20.62 | 19.27 | (9.90) |
Ratios/Supplemental Data (%): | | | | | | |
Ratio of total expenses to average net assets | | .90 | .96 | 1.01 | 1.04 | 1.05 |
Ratio of net expenses to average net assets | | .90 | .96 | 1.01 | 1.04 | 1.05 |
Ratio of net investment income
to average net assets | | 1.32 | 2.95 | 1.42 | 1.54 | 1.48 |
Portfolio Turnover Rate | | 36.37 | 39.45 | 55.27 | 57.88 | 63.28 |
Net Assets, end of period ($ x 1,000) | | 43,538 | 29,479 | 535,265 | 430,297 | 484,349 |
a Based on average shares outstanding.
See notes to financial statements.
19
FINANCIAL HIGHLIGHTS (continued)
| | | | | | | | | | |
| | | | | | | |
| | Year Ended September 30, |
Class Y Shares | | | | 2015 | 2014 | 2013a |
Per Share Data ($): | | | | | | |
Net asset value, beginning of period | | | | 20.38 | 20.11 | 18.74 |
Investment Operations: | | | | | | |
Investment income—netb | | | | .26 | .22 | .06 |
Net realized and unrealized
gain (loss) on investments | | | | (1.34) | .43 | 1.31 |
Total from Investment Operations | | | | (1.08) | .65 | 1.37 |
Distributions: | | | | | | |
Dividends from investment income—net | | | | (.64) | (.38) | - |
Dividends from net realized
gain on investments | | | | (.35) | - | - |
Total Distributions | | | | (.99) | (.38) | - |
Net asset value, end of period | | | | 18.31 | 20.38 | 20.11 |
Total Return (%) | | | | (5.32) | 3.33 | 6.29c |
Ratios/Supplemental Data (%): | | | | | | |
Ratio of total expenses to average net assets | | | | .89 | .91 | .94d |
Ratio of net expenses to average net assets | | | | .89 | .91 | .94d |
Ratio of net investment income
to average net assets | | | | 1.32 | 1.10 | 1.19d |
Portfolio Turnover Rate | | | | 36.37 | 39.45 | 55.27 |
Net Assets, end of period ($ x 1,000) | | | | 895,031 | 763,426 | 1 |
a From July 1, 2013, (commencement of initial offering) to September 30, 2013.
b Based on average shares outstanding.
c Not annualized.
d Annualized.
See notes to financial statements.
20
NOTES TO FINANCIAL STATEMENTS
NOTE 1—Significant Accounting Policies:
Dreyfus/Newton International Equity Fund (the “fund”) is a separate diversified series of Dreyfus Investment Funds (the “Trust”), which is registered under the Investment Company Act of 1940, as amended (the “Act”), as an open-end management investment company and operates as a series company currently offering seven series, including the fund. The fund’s investment objective is to seek long-term growth of capital. The Dreyfus Corporation (the “Manager” or “Dreyfus”), a wholly-owned subsidiary of The Bank of New York Mellon Corporation (“BNY Mellon”), serves as the fund’s investment adviser. Newton Capital Management Limited (“Newton”), serves as the fund’s sub-investment adviser.
MBSC Securities Corporation (the “Distributor”), a wholly-owned subsidiary of Dreyfus, is the distributor of the fund’s shares. The fund is authorized to issue an unlimited number of $.001 par value shares of Beneficial Interest in each of the following classes of shares: Class A, Class C, Class I and Class Y. Class A and Class C shares are sold primarily to retail investors through financial intermediaries and bear Distribution and/or Shareholder Services Plan fees. Class A shares generally are subject to a sales charge imposed at the time of purchase. Class C shares are subject to a contingent deferred sales charge (“CDSC”) imposed on Class C shares redeemed within one year of purchase. Class I shares are sold primarily to bank trust departments and other financial service providers (including The Bank of New York Mellon, a subsidiary of BNY Mellon and an affiliate of Dreyfus, and its affiliates), acting on behalf of customers having a qualified trust or an investment account or relationship at such institution, and bear no Distribution or Shareholder Services Plan fees. Class Y shares are sold at net asset value per share generally to institutional investors, and bear no Distribution or Shareholder Services Plan fees. Class I and Class Y shares are offered without a front-end sales charge or CDSC. Other differences between the classes include the services offered to and the expenses borne by each class, the allocation of certain transfer agency costs, and certain voting rights. Income, expenses (other than expenses attributable to a specific class), and realized and unrealized gains or losses on investments are allocated to each class of shares based on its relative net assets.
The Trust accounts separately for the assets, liabilities and operations of each series. Expenses directly attributable to each series are charged to that
21
NOTES TO FINANCIAL STATEMENTS (continued)
series’ operations; expenses which are applicable to all series are allocated among them on a pro rata basis.
The Financial Accounting Standards Board (“FASB”) Accounting Standards Codification (“ASC”) is the exclusive reference of authoritative U.S. generally accepted accounting principles (“GAAP”) recognized by the FASB to be applied by nongovernmental entities. Rules and interpretive releases of the Securities and Exchange Commission (“SEC”) under authority of federal laws are also sources of authoritative GAAP for SEC registrants. The fund’s financial statements are prepared in accordance with GAAP, which may require the use of management estimates and assumptions. Actual results could differ from those estimates.
(a) Portfolio valuation: The fair value of a financial instrument is the amount that would be received to sell an asset or paid to transfer a liability in an orderly transaction between market participants at the measurement date (i.e., the exit price). GAAP establishes a fair value hierarchy that prioritizes the inputs of valuation techniques used to measure fair value. This hierarchy gives the highest priority to unadjusted quoted prices in active markets for identical assets or liabilities (Level 1 measurements) and the lowest priority to unobservable inputs (Level 3 measurements).
Additionally, GAAP provides guidance on determining whether the volume and activity in a market has decreased significantly and whether such a decrease in activity results in transactions that are not orderly. GAAP requires enhanced disclosures around valuation inputs and techniques used during annual and interim periods.
Various inputs are used in determining the value of the fund’s investments relating to fair value measurements. These inputs are summarized in the three broad levels listed below:
Level 1—unadjusted quoted prices in active markets for identical investments.
Level 2—other significant observable inputs (including quoted prices for similar investments, interest rates, prepayment speeds, credit risk, etc.).
Level 3—significant unobservable inputs (including the fund’s own assumptions in determining the fair value of investments).
The inputs or methodology used for valuing securities are not necessarily an indication of the risk associated with investing in those securities.
22
Changes in valuation techniques may result in transfers in or out of an assigned level within the disclosure hierarchy. Valuation techniques used to value the fund’s investments are as follows:
Investments in securities are valued at the last sales price on the securities exchange or national securities market on which such securities are primarily traded. Securities listed on the National Market System for which market quotations are available are valued at the official closing price or, if there is no official closing price that day, at the last sales price. For open short positions, asked prices are used for valuation purposes. Bid price is used when no asked price is available. Registered investment companies that are not traded on an exchange are valued at their net asset value. All of the preceding securities are generally categorized within Level 1 of the fair value hierarchy.
Securities not listed on an exchange or the national securities market, or securities for which there were no transactions, are valued at the average of the most recent bid and asked prices. These securities are generally categorized within Level 2 of the fair value hierarchy.
Fair valuing of securities may be determined with the assistance of a pricing service using calculations based on indices of domestic securities and other appropriate indicators, such as prices of relevant ADRs and financial futures. Utilizing these techniques may result in transfers between Level 1 and Level 2 of the fair value hierarchy.
When market quotations or official closing prices are not readily available, or are determined not to reflect accurately fair value, such as when the value of a security has been significantly affected by events after the close of the exchange or market on which the security is principally traded (for example, a foreign exchange or market), but before the fund calculates its net asset value, the fund may value these investments at fair value as determined in accordance with the procedures approved by the Trust's Board of Trustees (the “Board”). Certain factors may be considered when fair valuing investments such as: fundamental analytical data, the nature and duration of restrictions on disposition, an evaluation of the forces that influence the market in which the securities are purchased and sold, and public trading in similar securities of the issuer or comparable issuers. These securities are either categorized within Level 2 or 3 of the fair value hierarchy depending on the relevant inputs used.
For restricted securities where observable inputs are limited, assumptions about market activity and risk are used and are generally categorized within Level 3 of the fair value hierarchy.
23
NOTES TO FINANCIAL STATEMENTS (continued)
Investments denominated in foreign currencies are translated to U.S. dollars at the prevailing rates of exchange.
Forward foreign currency exchange contracts ("forward contracts") are valued at the forward rate and are generally categorized within Level 2 of the fair value hierarchy.
The following is a summary of the inputs used as of September 30, 2015 in valuing the fund’s investments:
| | | | | | |
| | Level 1 - Unadjusted Quoted Prices | Level 2 - Other Significant Observable Inputs | | Level 3 -Significant Unobservable Inputs | Total |
Assets ($) | | | | |
Investments in Securities: | | | | |
Equity Securities - Domestic Common Stocks† | 30,144,137 | - | | - | 30,144,137 |
Equity Securities - Foreign Common Stocks† | - | 882,706,617 | †† | - | 882,706,617 |
Mutual Funds | 45,994,333 | - | | - | 45,994,333 |
Other Financial Instruments: | | | | | |
Forward Foreign Currency Exchange Contracts††† | - | 21,167 | | - | 21,167 |
Liabilities ($) | | | | | |
Other Financial Instruments: | | | | | |
Forward Foreign Currency Exchange Contracts††† | - | (13,485) | | - | (13,485) |
† See Statement of Investments for additional detailed categorizations.
†† Securities classified within Level 2 at period end as the values were determined pursuant to the fund's fair valuation procedures. See note above for additional information.
††† Amount shown represents unrealized appreciation (depreciation) at period end.
At September 30, 2014, $5,632,642 of exchange traded foreign equity securities were classified within Level 2 of the fair value hierarchy pursuant to the fund’s fair valuation procedures.
24
(b) Foreign currency transactions: The fund does not isolate that portion of the results of operations resulting from changes in foreign exchange rates on investments from the fluctuations arising from changes in the market prices of securities held. Such fluctuations are included with the net realized and unrealized gain or loss on investments.
Net realized foreign exchange gains or losses arise from sales of foreign currencies, currency gains or losses realized on securities transactions between trade and settlement date, and the difference between the amounts of dividends, interest and foreign withholding taxes recorded on the fund’s books and the U.S. dollar equivalent of the amounts actually received or paid. Net unrealized foreign exchange gains and losses arise from changes in the value of assets and liabilities other than investments resulting from changes in exchange rates. Foreign currency gains and losses on foreign currency transactions are also included with net realized and unrealized gain or loss on investments.
(c) Securities transactions and investment income: Securities transactions are recorded on a trade date basis. Realized gains and losses from securities transactions are recorded on the identified cost basis. Dividend income is recognized on the ex-dividend date and interest income, including, where applicable, accretion of discount and amortization of premium on investments, is recognized on the accrual basis.
(d) Affiliated issuers: Investments in other investment companies advised by Dreyfus are defined as “affiliated” under the Act. Investments in affiliated investment companies during the period ended September 30, 2015 were as follows:
| | | | | | |
Affiliated Investment Company | Value 9/30/2014 ($) | Purchases ($) | Sales ($) | Value 9/30/2015 ($) | Net Assets (%) |
Dreyfus Institutional Preferred Plus Money Market Fund | 9,880,074 | 371,174,894 | 335,060,635 | 45,994,333 | 4.9 |
(e) Risk: Investing in foreign markets may involve special risks and considerations not typically associated with investing in the U.S. These risks include revaluation of currencies, high rates of inflation, repatriation restrictions on income and capital, and adverse political and economic developments. Moreover, securities issued in these markets may be less liquid, subject to government ownership controls and delayed settlements,
25
NOTES TO FINANCIAL STATEMENTS (continued)
and their prices may be more volatile than those of comparable securities in the U.S.
(f) Dividends to shareholders: Dividends are recorded on the ex-dividend date. Dividends from investment income-net and dividends from net realized capital gains, if any, are normally declared and paid annually, but the fund may make distributions on a more frequent basis to comply with the distribution requirements of the Internal Revenue Code of 1986, as amended (the “Code”). To the extent that net realized capital gains can be offset by capital loss carryovers, it is the policy of the fund not to distribute such gains. Income and capital gain distributions are determined in accordance with income tax regulations, which may differ from GAAP.
(g) Federal income taxes: It is the policy of the fund to continue to qualify as a regulated investment company, if such qualification is in the best interests of its shareholders, by complying with the applicable provisions of the Code, and to make distributions of taxable income sufficient to relieve it from substantially all federal income and excise taxes.
As of and during the period ended September 30, 2015, the fund did not have any liabilities for any uncertain tax positions. The fund recognizes interest and penalties, if any, related to uncertain tax positions as income tax expense in the Statement of Operations. During the period ended September 30, 2015, the fund did not incur any interest or penalties.
Each tax year in the four-year period ended September 30, 2015 remains subject to examination by the Internal Revenue Service and state taxing authorities.
At September 30, 2015, the components of accumulated earnings on a tax basis were as follows: undistributed ordinary income $9,752,210, accumulated capital losses $25,245,083 and unrealized appreciation $44,915,418.
Under the Regulated Investment Company Modernization Act of 2010, the fund is permitted to carry forward capital losses for an unlimited period. Furthermore, capital loss carryovers retain their character as either short-term or long-term capital losses.
The accumulated capital loss carryover is available for federal income tax purposes to be applied against future net realized capital gains, if any, realized subsequent to September 30, 2015. The fund has $14,560,632 of short-term capital losses and $10,684,451 of long-term capital losses which can be carried forward for an unlimited period.
The tax character of distributions paid to shareholders during the fiscal periods ended September 30, 2015 and September 30, 2014 were as
26
follows: ordinary income $27,721,796 and $10,062,971, and long-term capital gains $11,213,102 and $0, respectively.
During the period ended September 30, 2015, as a result of permanent book to tax differences, primarily due to the tax treatment for foreign currency gains and losses and dividend reclassification, the fund increased accumulated undistributed investment income-net by $5,467,000 and decreased accumulated net realized gain (loss) on investments by the same amount. Net assets and net asset value per share were not affected by this reclassification.
NOTE 2—Bank Lines of Credit:
The fund participates with other Dreyfus-managed funds in a $430 million unsecured credit facility led by Citibank, N.A. and a $300 million unsecured credit facility provided by The Bank of New York Mellon (each, a “Facility”), each to be utilized primarily for temporary or emergency purposes, including the financing of redemptions. Prior to October 8, 2014, the unsecured credit facility with Citibank, N.A. was $265 million. In connection therewith, the fund has agreed to pay its pro rata portion of commitment fees for each Facility. Interest is charged to the fund based on rates determined pursuant to the terms of the respective Facility at the time of borrowing.
The average amount of borrowings outstanding under the Facilities during the period ended September 30, 2015, was approximately $215,600 with a related weighted average annualized interest rate of 1.05%.
NOTE 3—Investment Advisory Fee, Sub-Investment Advisory Fee, Administration Fee and Other Transactions with Affiliates:
(a) Pursuant to a investment advisory agreement with Dreyfus, the investment advisory fee is computed at the annual rate of .80% of the value of the fund's average daily net assets and is payable monthly.
Pursuant to a sub-investment advisory agreement between Dreyfus and Newton, Dreyfus pays Newton a monthly fee at an annual percentage rate of the value of the fund’s average daily net assets.
The fund has a Fund Accounting and Administrative Services Agreement (the “Administration Agreement”) with Dreyfus, whereby Dreyfus performs administrative, accounting and recordkeeping services for the fund. The fund has agreed to compensate Dreyfus for providing accounting and recordkeeping services, administration, compliance monitoring, regulatory and shareholder reporting, as well as related facilities, equipment and clerical help. The fee is based on the fund’s average daily net assets and computed at the following annual rates: .10%
27
NOTES TO FINANCIAL STATEMENTS (continued)
of the first $500 million, .065% of the next $500 million and .02% in excess of $1 billion.
In addition, after applying any expense limitations or fee waivers that reduce the fees paid to Dreyfus for this service, Dreyfus has contractually agreed in writing to waive any remaining fees for this service to the extent that they exceed both Dreyfus’ costs in providing these services and a reasonable allocation of the costs incurred by Dreyfus and its affiliates related to the support and oversight of these services. The fund also reimburses Dreyfus for the out-of-pocket expenses incurred in performing this service for the fund. Pursuant to the Administration Agreement, the fund was charged $186,930 during the period ended September 30, 2015.
During the period ended September 30, 2015, the Distributor retained $158 from commissions earned on sales of the fund's Class A shares.
(b) Under the Distribution Plan adopted pursuant to Rule 12b-1 under the Act, Class C shares pay the Distributor for distributing its shares at an annual rate of .75% of the value of its average daily net assets. During the period ended September 30, 2015, Class C shares were charged $8,945 pursuant to the Distribution Plan.
(c) Under the Shareholder Services Plan, Class A and Class C shares pay the Distributor at an annual rate of .25% of the value of their average daily net assets for the provision of certain services. The services provided may include personal services relating to shareholder accounts, such as answering shareholder inquiries regarding the fund and providing reports and other information, and services related to the maintenance of shareholder accounts. The Distributor may make payments to Service Agents (securities dealers, financial institutions or other industry professionals) with respect to these services. The Distributor determines the amounts to be paid to Service Agents. During the period ended September 30, 2015, Class A and Class C shares were charged $10,565 and $2,982, respectively, pursuant to the Shareholder Services Plan.
Under its terms, the Distribution Plan and Shareholder Services Plan shall remain in effect from year to year, provided such continuance is approved annually by a vote of a majority of those Trustees who are not “interested persons” of the Trust and who have no direct or indirect financial interest in the operation of or in any agreement related to the Distribution Plan or Shareholder Services Plan.
The fund has arrangements with the transfer agent and the custodian whereby the fund may receive earnings credits when positive cash balances are maintained, which are used to offset transfer agency and custody fees.
28
For financial reporting purposes, the fund includes net earnings credits as an expense offset in the Statement of Operations.
The fund compensates Dreyfus Transfer, Inc., a wholly-owned subsidiary of Dreyfus, under a transfer agency agreement for providing transfer agency and cash management services for the fund. The majority of transfer agency fees are comprised of amounts paid on a per account basis, while cash management fees are related to fund subscriptions and redemptions. During the period ended September 30, 2015, the fund was charged $3,518 for transfer agency services and $114 for cash management services. These fees are included in Shareholder servicing costs in the Statement of Operations. Cash management fees were partially offset by earnings credits of $5.
The fund compensates The Bank of New York Mellon under a custody agreement for providing custodial services for the fund. These fees are determined based on net assets, geographic region and transaction activity. During the period ended September 30, 2015, the fund was charged $294,955 pursuant to the custody agreement.
During the period ended September 30, 2015, the fund was charged $11,078 for services performed by the Chief Compliance Officer and his staff.
The components of “Due to The Dreyfus Corporation and affiliates” in the Statement of Assets and Liabilities consist of: investment advisory fees $620,295, administration fees $16,123, Distribution Plan fees $887, Shareholder Services Plan fees $1,734, custodian fees $147,939, Chief Compliance Officer fees $2,606 and transfer agency fees $2,539.
(d) Each Board member also serves as a Board member of other funds within the Dreyfus complex. Annual retainer fees and attendance fees are allocated to each fund based on net assets.
NOTE 4—Securities Transactions:
The aggregate amount of purchases and sales of investment securities, excluding short-term securities and forward contracts, during the period ended September 30, 2015, amounted to $502,648,102 and $304,054,213, respectively.
Derivatives: A derivative is a financial instrument whose performance is derived from the performance of another asset. The fund enters into International Swaps and Derivatives Association, Inc. Master Agreements or similar agreements (collectively, “Master Agreements”) with its over-the-counter (“OTC”) derivative contract counterparties in order to, among other things, reduce its credit risk to counterparties. Master Agreements
29
NOTES TO FINANCIAL STATEMENTS (continued)
include provisions for general obligations, representations, collateral and events of default or termination. Under a Master Agreement, the fund may offset with the counterparty certain derivative financial instrument’s payables and/or receivables with collateral held and/or posted and create one single net payment in the event of default or termination.
Each type of derivative instrument that was held by the fund during the period ended September 30, 2015 is discussed below.
Forward Foreign Currency Exchange Contracts: The fund enters into forward contracts in order to hedge its exposure to changes in foreign currency exchange rates on its foreign portfolio holdings, to settle foreign currency transactions or as a part of its investment strategy. When executing forward contracts, the fund is obligated to buy or sell a foreign currency at a specified rate on a certain date in the future. With respect to sales of forward contracts, the fund incurs a loss if the value of the contract increases between the date the forward contract is opened and the date the forward contract is closed. The fund realizes a gain if the value of the contract decreases between those dates. With respect to purchases of forward contracts, the fund incurs a loss if the value of the contract decreases between the date the forward contract is opened and the date the forward contract is closed. The fund realizes a gain if the value of the contract increases between those dates. Any realized or unrealized gains or losses which occurred during the period are reflected in the Statement of Operations. The fund is exposed to foreign currency risk as a result of changes in value of underlying financial instruments. The fund is also exposed to credit risk associated with counterparty nonperformance on these forward contracts, which is generally limited to the unrealized gain on each open contract. This risk may be mitigated by Master Agreements, if any, between the fund and the counterparty and the posting of collateral, if any, by the counterparty to the fund to cover the fund’s exposure to the counterparty. The following summarizes open forward contracts at September 30, 2015:
| | | | | | | | | |
Forward Foreign Currency Exchange Contracts | Foreign Currency
Amounts | Cost ($) | Value ($) | Unrealized Appreciation (Depreciation)($) | |
Purchases: | | | | | |
JP Morgan Chase Bank | | | | |
British Pound, | | | | |
Expiring | | | | |
10/2/2015 | 5,870,314 | 8,880,612 | 8,880,288 | (324) | |
30
| | | | | | | | | |
Forward Foreign Currency Exchange Contracts | Foreign Currency
Amounts | Cost ($) | Value ($) | Unrealized Appreciation (Depreciation)($) | |
Purchases: | | | | | |
Royal Bank of Scotland | | | | |
British Pound, | | | | |
Expiring | | | | |
10/1/2015 | 240,126 | 363,618 | 363,250 | (368) | |
UBS | | | | |
Euro, | | | | |
Expiring | | | | |
10/2/2015 | 9,050,300 | 10,105,384 | 10,112,858 | 7,474 | |
Norwegian Krone, | | | | |
Expiring | | | | |
10/2/2015 | 3,810,133 | 446,549 | 447,556 | 1,007 | |
Swiss Franc, | | | | |
Expiring | | | | |
10/2/2015 | 5,588,004 | 5,722,013 | 5,733,638 | 11,625 | |
Sales: | | Proceeds ($) | | | |
JP Morgan Chase Bank | | | | |
Japanese Yen, | | | | |
Expiring | | | | |
10/1/2015 | 8,353,800 | 69,590 | 69,636 | (46) | |
10/2/2015 | 346,378,912 | 2,888,394 | 2,887,333 | 1,061 | |
Royal Bank of Scotland | | | | |
Japanese Yen, | | | | |
Expiring | | | | |
10/5/2015 | 682,883,257 | 5,679,607 | 5,692,354 | (12,747) | |
Gross Unrealized Appreciation | | | | 21,167 | |
Gross Unrealized Depreciation | | | | (13,485) | |
The provisions of ASC Topic 210 “Disclosures about Offsetting Assets and Liabilities” require disclosure on the offsetting of financial assets and liabilities. These disclosures are required for certain investments, including derivative financial instruments subject to Master Agreements which are eligible for offsetting in the Statement of Assets and Liabilities and require the fund to disclose both gross and net information with respect to such investments. For financial reporting purposes, the fund does not offset
31
NOTES TO FINANCIAL STATEMENTS (continued)
derivative assets and derivative liabilities that are subject to Master Agreements in the Statement of Assets and Liabilities.
At September 30, 2015, derivative assets and liabilities (by type) on a gross basis are as follows:
| | | | | | |
Derivative Financial Instruments: | | Assets ($) | | Liabilities ($) | |
Forward contracts | | 21,167 | | (13,485) | |
Total gross amount of derivative | | | | | |
assets and liabilities in the | | | | | |
Statement of Assets and Liabilities | | 21,167 | | (13,485) | |
Derivatives not subject to | | | | | |
Master Agreements | | - | | - | |
Total gross amount of assets | | | | | |
and liabilities subject to | | | | | |
Master Agreements | | 21,167 | | (13,485) | |
The following tables present derivative assets and liabilities net of amounts available for offsetting under Master Agreements and net of related collateral received or pledged, if any, as of September 30, 2015:
| | | | | | | |
| | | | Financial | | | |
| | | | Instruments | | | |
| | | | and Derivatives | | | |
| | Gross Amount of | | Available | Collateral | | Net Amount of |
Counterparty | Assets ($) | 1 | for Offset ($) | Received ($) | | Assets ($) |
JP Morgan
Chase Bank | 1,061 | | (370) | - | | 691 |
UBS | 20,106 | | - | - | | 20,106 |
Total | 21,167 | | (370) | - | | 20,797 |
| | | | | | | |
| | | | Financial | | | |
| | | | Instruments | | | |
| | | | and Derivatives | | | |
| | Gross Amount of | | Available | Collateral | | Net Amount of |
Counterparty | Liabilities ($) | 1 | for Offset ($) | Pledged ($) | | Liabilities ($) |
JP Morgan
Chase Bank | (370) | | 370 | - | | - |
Royal Bank
of Scotland | (13,115) | | - | - | | (13,115) |
Total | (13,485) | | 370 | - | | (13,115) |
| | | | | | | |
1 Absent a default event or early termination, OTC derivative assets and liabilities are
presented at gross amounts and are not offset in the Statement of Assets and Liabilities. |
The following summarizes the average market value of derivatives outstanding during the period ended September 30, 2015:
| | | | | | |
| | | | | Average Market Value ($) |
Forward contracts | | | | 48,136,600 |
32
At September 30, 2015, the cost of investments for federal income tax purposes was $913,946,845; accordingly, accumulated net unrealized appreciation on investments was $44,898,242, consisting of $113,032,533 gross unrealized appreciation and $68,134,291 gross unrealized depreciation.
33
REPORT OF INDEPENDENT REGISTERED
PUBLIC ACCOUNTING FIRM
The Board of Trustees and Shareholders of
Dreyfus Investment Funds
We have audited the accompanying statement of assets and liabilities of Dreyfus/Newton International Equity Fund (the “Fund”), a series of Dreyfus Investment Funds, including the statement of investments, as of September 30, 2015, and the related statement of operations for the year then ended, the statements of changes in net assets for each of the years in the two-year period then ended, and the financial highlights for each of the years or period in the five-year period then ended. These financial statements and financial highlights are the responsibility of the Fund’s management. Our responsibility is to express an opinion on these financial statements and financial highlights based on our audits.
We conducted our audits in accordance with the standards of the Public Company Accounting Oversight Board (United States). Those standards require that we plan and perform the audit to obtain reasonable assurance about whether the financial statements and financial highlights are free of material misstatement. An audit includes examining, on a test basis, evidence supporting the amounts and disclosures in the financial statements. Our procedures included confirmation of securities owned as of September 30, 2015, by correspondence with the custodian and brokers or by other appropriate auditing procedures. An audit also includes assessing the accounting principles used and significant estimates made by management, as well as evaluating the overall financial statement presentation. We believe that our audits provide a reasonable basis for our opinion.
In our opinion, the financial statements and financial highlights referred to above present fairly, in all material respects, the financial position of Dreyfus/Newton International Equity Fund as of September 30, 2015, the results of its operations for the year then ended, the changes in its net assets for each of the years in the two-year period then ended, and the financial highlights for each of the years or period in the five-year period then ended, in conformity with U.S. generally accepted accounting principles.

New York, New York
November 25, 2015
34
IMPORTANT TAX INFORMATION (Unaudited)
For federal tax purposes, the fund elects to provide each shareholder with their portion of the fund's income sourced from foreign countries and taxes paid from foreign countries. The fund reports the maximum amount allowable but not less than $20,630,599 as income sourced from foreign countries for the fiscal year ended September 30, 2015 in accordance with Section 853(c)(2) of the Internal Revenue Code and also the fund reports the maximum amount allowable but not less than $1,575,205 as taxes paid from foreign countries for the fiscal year ended September 30, 2015 in accordance with Section 853(a) of the Internal Revenue Code. Where required by federal tax rules, shareholders will receive notification of their proportionate share of foreign sourced income and foreign taxes paid for the 2015 calendar year with Form 1099-DIV which will be mailed in early 2016. Also the fund reports the maximum amount allowable, but not less than $27,009,621 as ordinary income dividends paid during the fiscal year ended September 30, 2015 as qualified dividend income in accordance with Section 854(b)(1)(B) of the Internal Revenue Code. The fund reports the maximum amount allowable but not less than $.2843 per share as a capital gain dividend in accordance with Section 852(b)(3)(C) of the Internal Revenue Code. The fund reports the maximum amount allowable but not less than $.0685 per share as a short-term capital gain dividend in accordance with Sections 871(k)(2) and 881(e) of the Internal Revenue Code.
35
BOARD MEMBERS INFORMATION (Unaudited)
INDEPENDENT BOARD MEMBERS
Joseph S. DiMartino (71)
Chairman of the Board (2008)
Principal Occupation During Past 5 Years:
· Corporate Director and Trustee (1995-present)
Other Public Company Board Memberships During Past 5 Years:
· CBIZ (formerly, Century Business Services, Inc.), a provider of outsourcing functions for small and medium size companies, Director (1997-present)
· The Newark Group, a provider of a national market of paper recovery facilities, paperboard mills and paperboard converting plants, Director (2000-2010)
No. of Portfolios for which Board Member Serves: 142
———————
Francine J. Bovich (64)
Board Member (2011)
Principal Occupation During Past 5 Years:
· Trustee, The Bradley Trusts, private trust funds (2011-present)
· Managing Director, Morgan Stanley Investment Management (1993-2010)
Other Public Company Board Memberships During Past 5 Years:
· Annaly Capital Management, Inc., Board Member (May 2014-present)
No. of Portfolios for which Board Member Serves: 80
———————
Kenneth A. Himmel (69)
Board Member (2008)
Principal Occupation During Past 5 Years:
· Managing Partner, Gulf Related, an international real estate development company (2010-present)
· President and CEO, Related Urban Development, a real estate development company (1996-present)
· President and CEO, Himmel & Company, a real estate development company (1980-present)
· CEO, American Food Management, a restaurant company (1983-present)
No. of Portfolios for which Board Member Serves: 30
———————
36
Stephen J. Lockwood (68)
Board Member (2008)
Principal Occupation During Past 5 Years:
· Chairman of the Board, Stephen J. Lockwood and Company LLC, a real estate investment company (2000-present)
No. of Portfolios for which Board Member Serves: 30
———————
Roslyn M. Watson (65)
Board Member (2008)
Principal Occupation During Past 5 Years:
· Principal, Watson Ventures, Inc., a real estate investment company (1993-present)
No. of Portfolios for which Board Member Serves: 66
———————
Benaree Pratt Wiley (69)
Board Member (2008)
Principal Occupation During Past 5 Years:
· Principal, The Wiley Group, a firm specializing in strategy and business development (2005-present)
Other Public Company Board Memberships During Past 5 Years:
· CBIZ (formerly, Century Business Services, Inc.), a provider of outsourcing functions for small and medium size companies, Director (2008-present)
No. of Portfolios for which Board Member Serves: 66
———————
Once elected all Board Members serve for an indefinite term, but achieve Emeritus status upon reaching age 80. The address of the Board Members and Officers is c/o The Dreyfus Corporation, 200 Park Avenue, New York, New York 10166. Additional information about the Board Members is available in the fund's Statement of Additional Information which can be obtained from Dreyfus free of charge by calling this toll free number: 1-800-DREYFUS.
James M. Fitzgibbons, Emeritus Board Member
37
OFFICERS OF THE FUND (Unaudited)
BRADLEY J. SKAPYAK, President since January 2010.
Chief Operating Officer and a director of the Manager since June 2009, Chairman of Dreyfus Transfer, Inc., an affiliate of the Manager and the transfer agent of the funds, since May 2011 and Executive Vice President of the Distributor since June 2007. From April 2003 to June 2009, Mr. Skapyak was the head of the Investment Accounting and Support Department of the Manager. He is an officer of 68 investment companies (comprised of 142 portfolios) managed by the Manager. He is 56 years old and has been an employee of the Manager since February 1988.
BENNETT A. MACDOUGALL, Chief Legal Officer since October 2015
Chief Legal Officer of the Manager since June 2015; from June 2005 to June 2015, Director and Associate General Counsel of Deutsche Bank – Asset & Wealth Management Division, and Chief Legal Officer of Deutsche Investment Management Americas Inc. He is an officer of 69 investment companies (comprised of 167 portfolios) managed by the Manager. He is 44 years old and has been an employee of the Manager since June 2015.
JANETTE E. FARRAGHER, Vice President and Secretary since December 2011.
Assistant General Counsel of BNY Mellon, and an officer of 69 investment companies (comprised of 167 portfolios) managed by the Manager. She is 52 years old and has been an employee of the Manager since February 1984.
JAMES BITETTO, Vice President and Assistant Secretary since December 2008.
Managing Counsel of BNY Mellon and Secretary of the Manager, and an officer of 69 investment companies (comprised of 167 portfolios) managed by the Manager. He is 49 years old and has been an employee of the Manager since December 1996.
JONI LACKS CHARATAN, Vice President and Assistant Secretary since December 2008.
Managing Counsel of BNY Mellon, and an officer of 69 investment companies (comprised of 167 portfolios) managed by the Manager. She is 59 years old and has been an employee of the Manager since October 1988.
JOSEPH M. CHIOFFI, Vice President and Assistant Secretary since December 2008.
Managing Counsel of BNY Mellon, and an officer of 69 investment companies (comprised of 167 portfolios) managed by the Manager. He is 53 years old and has been an employee of the Manager since June 2000.
JOHN B. HAMMALIAN, Vice President and Assistant Secretary since December 2008.
Senior Managing Counsel of BNY Mellon, and an officer of 69 investment companies (comprised of 167 portfolios) managed by the Manager. He is 52 years old and has been an employee of the Manager since February 1991.
MAUREEN E. KANE, Vice President and Assistant Secretary since April 2015.
Managing Counsel of BNY Mellon since July 2014; from October 2004 until July 2014, General Counsel, and from May 2009 until July 2014, Chief Compliance Officer of Century Capital Management. She is an officer of 69 investment companies (comprised of 167 portfolios) managed by the Manager. She is 53 years old and has been an employee of the Manager since July 2014.
SARAH S. KELLEHER, Vice President and Assistant Secretary since April 2014.
Senior Counsel of BNY Mellon, and an officer of 69 investment companies (comprised of 167 portfolios) managed by the Manager; from August 2005 to March 2013, Associate General Counsel of Third Avenue Management. She is 40 years old and has been an employee of the Manager since March 2013.
JEFF PRUSNOFSKY, Vice President and Assistant Secretary since December 2008.
Senior Managing Counsel of BNY Mellon, and an officer of 69 investment companies (comprised of 167 portfolios) managed by the Manager. He is 50 years old and has been an employee of the Manager since October 1990.
JAMES WINDELS, Treasurer since December 2008.
Director – Mutual Fund Accounting of the Manager, and an officer of 69 investment companies (comprised of 167 portfolios) managed by the Manager. He is 57 years old and has been an employee of the Manager since April 1985.
38
RICHARD CASSARO, Assistant Treasurer since December 2008.
Senior Accounting Manager – Money Market and Municipal Bond Funds of the Manager, and an officer of 69 investment companies (comprised of 167 portfolios) managed by the Manager. He is 56 years old and has been an employee of the Manager since September 1982.
GAVIN C. REILLY, Assistant Treasurer since December 2008.
Tax Manager of the Investment Accounting and Support Department of the Manager, and an officer of 69 investment companies (comprised of 167 portfolios) managed by the Manager. He is 47 years old and has been an employee of the Manager since April 1991.
ROBERT S. ROBOL, Assistant Treasurer since December 2008.
Senior Accounting Manager – Fixed Income Funds of the Manager, and an officer of 69 investment companies (comprised of 167 portfolios) managed by the Manager. He is 51 years old and has been an employee of the Manager since October 1988.
ROBERT SALVIOLO, Assistant Treasurer since December 2008.
Senior Accounting Manager – Equity Funds of the Manager, and an officer of 69 investment companies (comprised of 167 portfolios) managed by the Manager. He is 48 years old and has been an employee of the Manager since June 1989.
ROBERT SVAGNA, Assistant Treasurer since December 2008.
Senior Accounting Manager – Equity Funds of the Manager, and an officer of 69 investment companies (comprised of 167 portfolios) managed by the Manager. He is 48 years old and has been an employee of the Manager since November 1990.
JOSEPH W. CONNOLLY, Chief Compliance Officer since December 2008.
Chief Compliance Officer of the Manager and The Dreyfus Family of Funds (69 investment companies, comprised of 167 portfolios). He is 58 years old and has served in various capacities with the Manager since 1980, including manager of the firm’s Fund Accounting Department from 1997 through October 2001.
39
NOTES
40
NOTES
41
Dreyfus/Newton International Equity Fund
200 Park Avenue
New York, NY 10166
Manager
The Dreyfus Corporation
200 Park Avenue
New York, NY 10166
Sub-Investment Adviser
Newton Capital
Management Limited
160 Queen Victoria Street
London, EC4V, 4LA, UK
Custodian
The Bank of New York Mellon
225 Liberty Street
New York, NY 10286
Transfer Agent &
Dividend Disbursing Agent
Dreyfus Transfer, Inc.
200 Park Avenue
New York, NY 10166
Distributor
MBSC Securities Corporation
200 Park Avenue
New York, NY 10166
| | |
Ticker Symbols: | Class A: NIEAX Class C: NIECX Class I: SNIEX Class Y: NIEYX |
Telephone Call your financial representative or 1-800-DREYFUS
Mail The Dreyfus Family of Funds, 144 Glenn Curtiss Boulevard, Uniondale, NY 11556-0144
E-mail Send your request to info@dreyfus.com
Internet Information can be viewed online or downloaded at www.dreyfus.com
The fund files its complete schedule of portfolio holdings with the Securities and Exchange Commission (“SEC”) for the first and third quarters of each fiscal year on Form N-Q. The fund’s Forms N-Q are available on the SEC’s website at www.sec.gov and may be reviewed and copied at the SEC’s Public Reference Room in Washington, DC. (phone 1-800-SEC-0330 for information).
A description of the policies and procedures that the fund uses to determine how to vote proxies relating to portfolio securities and information regarding how the fund voted these proxies for the most recent 12-month period ended June 30 is available at www.dreyfus.com and on the SEC’s website at www.sec.gov and without charge, upon request, by calling 1-800-DREYFUS.
| | |
© 2015 MBSC Securities Corporation
6916AR0915 | 
|
Dreyfus Tax Sensitive Total Return Bond Fund
| | | |

| | ANNUAL REPORT
September 30, 2015 |
| |
The views expressed in this report reflect those of the portfolio manager only through the end of the period covered and do not necessarily represent the views of Dreyfus or any other person in the Dreyfus organization. Any such views are subject to change at any time based upon market or other conditions and Dreyfus disclaims any responsibility to update such views. These views may not be relied on as investment advice and, because investment decisions for a Dreyfus fund are based on numerous factors, may not be relied on as an indication of trading intent on behalf of any Dreyfus fund. |
| |
Not FDIC-Insured • Not Bank-Guaranteed • May Lose Value |
Contents
THE FUND
FOR MORE INFORMATION
Back Cover
| | | | |
| |
Dreyfus Tax Sensitive Total Return Bond Fund
| | The Fund |
A LETTER FROM THE PRESIDENT
Dear Shareholder:
We are pleased to present this annual report for Dreyfus Tax Sensitive Total Return Bond Fund, covering the 12-month period from October 1, 2014, through September 30, 2015. For information about how the fund performed during the reporting period, as well as general market perspectives, we provide a Discussion of Fund Performance on the pages that follow.
Financial markets proved volatile over the reporting period. For much of the year, a recovering U.S. economy enabled stocks to advance, but those gains were erased during the third quarter of 2015 when economic concerns in China, falling commodity prices, and a stronger U.S. dollar sparked sharp corrections in equity markets throughout the world. The emerging markets were especially hard hit. U.S. bonds generally fared better, rallying in late 2014 before reversing course in the spring as the domestic economy strengthened. Global economic instability sparked a renewed rally among U.S. government securities toward the reporting period’s end, but corporate-backed and inflation-linked securities lost value.
We expect market volatility to persist over the near term as investors vacillate between hopes that current turmoil represents a healthy correction and fears that further disappointments could trigger a full-blown bear market. Our investment strategists and portfolio managers are monitoring developments carefully, keeping a close watch on Chinese fiscal and monetary policy, expectations of higher short-term interest rates in the United States, liquidity factors affecting various asset classes, and other developments that could influence investor sentiment. Over the longer term, we remain confident that markets are likely to stabilize as the world adjusts to slower Chinese economic growth, abundant energy resources, and the eventual normalization of U.S. monetary policy. In our view, investors will continue to be well served under these circumstances by a long-term perspective and a disciplined investment approach.
Thank you for your continued confidence and support.
Sincerely,

J. Charles Cardona
President
The Dreyfus Corporation
October 15, 2015
2
DISCUSSION OF FUND PERFORMANCE
For the period of October 1, 2014, through September 30, 2015, as provided by Christine L. Todd, Thomas Casey, Daniel Rabasco, and Jeffrey Burger, Portfolio Managers
Fund and Market Performance Overview
For the 12-month period ended September 30, 2015, Dreyfus Tax Sensitive Total Return Bond Fund’s Class A shares produced a total return of 2.38%, Class C shares returned 1.58%, Class I shares returned 2.63%, and Class Y shares returned 2.59%.1 In comparison, the fund’s benchmark, the Barclays 3-, 5-, 7-, 10-Year Municipal Bond Index, provided a total return of 2.31% for the same period.2
Municipal bonds generally produced positive returns, as declines triggered by rising long-term interest rates during the spring of 2015 were more than offset by rallies early and late in the reporting period. The fund’s performance for the period was mainly due to a relatively long average duration and an emphasis on revenue-backed bonds.
The Fund’s Investment Approach
The fund seeks high after-tax total return. To pursue its goal, the fund normally invests at least 80% of its net assets, plus any borrowings for investment purposes, in bonds. The fund normally invests at least 65% of its net assets in municipal bonds that provide income exempt from federal personal income tax. The fund may invest up to 35% of its net assets in taxable bonds. The fund invests principally in bonds rated investment grade at the time of purchase or, if unrated, determined to be of comparable quality.3 The fund may invest up to 25% of its assets in bonds rated below investment grade.
We seek relative value opportunities among municipal bonds and invest selectively in taxable securities with the potential to enhance after-tax total return and/or reduce volatility. We use a combination of fundamental credit analysis and macroeconomic and quantitative inputs to identify undervalued sectors and securities, and we select municipal bonds using fundamental credit analysis to estimate the relative value and attractiveness of various sectors and securities and to exploit pricing inefficiencies.
Fluctuating Interest Rates Sparked Market Volatility
Over the final months of 2014, global investors seeking more competitive yields than were available in overseas markets flocked to higher yielding investments in the United States, and the resulting supply-and-demand imbalance put downward pressure on U.S. bond yields. This trend began to reverse in early 2015, when longer term interest rates drifted higher amid stronger-than-expected employment data and investor concerns that the Federal Reserve would pursue a tightening in monetary policy. Renewed concerns about sluggish global economic growth and benign inflation however pushed bond yields lower and prices higher over the summer months.
The national municipal bond market encountered a lower degree of volatility compared to other markets. Fairly balanced supply-and-demand dynamics contributed to greater relative stability. After a limited supply of newly issued bonds during 2014, issuance volumes climbed somewhat during 2015 as issuers rushed to refinance existing debt and issue new bonds before expected increases in interest rates. Demand for municipal bonds remained strong and steady as investors sought competitive after-tax yields.
3
DISCUSSION OF FUND PERFORMANCE (continued)
Many states and local municipalities have seen tax revenues climb beyond pre-recession levels, and isolated pockets of weak credit conditions in Illinois, New Jersey, and Puerto Rico did not have a systemic impact on the national market.
Intermediate-Term Revenue Bonds Buoyed Relative Results
Our duration management strategy proved effective over the reporting period: a relatively long average duration and a focus on bonds with 10- to 12-year maturities boosted the fund’s participation in market rallies. Our sector allocation strategy also worked well when intermediate-term revenue bonds outperformed comparable general obligation and escrowed bonds. The fund achieved particularly favorable results through revenue bonds backed by hospitals, airports, transportation facilities, education institutions, industrial development projects, and the states’ settlement of litigation with U.S. tobacco companies. The fund further benefited from underweighted positions in some of the market’s weaker segments, most notably Puerto Rico bonds that were hurt by the U.S. territory’s deteriorating fiscal condition.
On the other hand, the fund’s relative results were constrained to a degree by higher quality bonds backed by revenues from essential municipal services. Although the fund’s allocation to taxable bonds proved modestly supportive overall, investment-grade and high yield corporate bonds exhibited weakness amid heightened market volatility over the summer of 2015.
A Constructive Investment Posture
We expect market volatility to persist over the near term in anticipation of higher short-term interest rates, but we remain optimistic about the market’s longer term prospects in a growing U.S. economy. We will take advantage of bouts of market volatility to purchase creditworthy securities at attractive prices. We will maintain the fund’s focus on intermediate-term, revenue-backed municipal bonds, particularly those with “A” credit ratings. The Fund will also invest in taxable bonds opportunistically with the goal to enhance after-tax total return.
October 15, 2015
Bond funds are subject generally to interest rate, credit, liquidity, and market risks, to varying degrees, all of which are more fully described in the fund’s prospectus. Generally, all other factors being equal, bond prices are inversely related to interest-rate changes, and rate increases can cause price declines.
The use of derivatives involves risks different from, or possibly greater than, the risks associated with investing directly in the underlying assets. Derivatives can be highly volatile, illiquid, and difficult to value, and there is the risk that changes in the value of a derivative held by the fund will not correlate with the underlying instruments of the fund’s other investments.
1Total return includes reinvestment of dividends and any capital gains paid, and does not take into consideration the maximum initial sales charge in the case of Class A shares or the applicable contingent deferred sales charge imposed on redemptions in the case of Class C shares. Had these charges been reflected, returns would have been lower. Neither Class I nor Class Y shares are subject to any initial or deferred sales charge. Past performance is no guarantee of future results. Share price, yield, and investment return fluctuate such that upon redemption, fund shares may be worth more or less than their original cost. Dividends paid by the fund will be exempt from federal income tax to the extent such dividends are derived from interest paid on principal obligations. The fund also may invest a portion of its assets in securities that generate income that is not exempt from federal or state income tax. Income may be subject to state and local taxes, and some income may be subject to the federal alternative minimum tax (AMT) for certain investors. Capital gains, if any, are taxable. Return figures provided reflect the absorption of certain fund expenses by The Dreyfus Corporation, pursuant to an agreement in effect through February 1, 2017, at which time it may be extended, modified, or terminated. Had these expenses not been absorbed, the fund’s returns would have been lower.
4
2Source: Lipper Inc. — The Barclays 3-, 5-, 7-, 10-Year Municipal Bond Index is composed of an equal-weighted composite of the 3-Year, 5-Year, 7-Year and 10- Year Barclays Municipal Bond indices. Reflects investments of dividends and, where applicable, capital gain distributions. Investors cannot invest directly in any index.
3The fund may continue to own investment-grade bonds (at the time of purchase), which are subsequently downgraded to below investment grade.
5
FUND PERFORMANCE
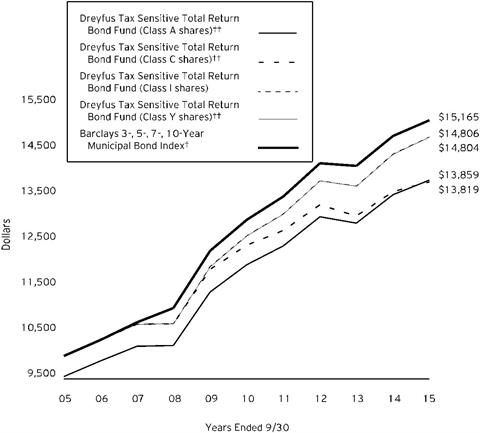
Comparison of change in value of $10,000 investment in Dreyfus Tax Sensitive Total Return Bond Fund Class A shares, Class C shares, Class I shares and Class Y shares and the Barclays 3-, 5-, 7-, 10-Year Municipal Bond Index
† Source: Lipper Inc.
†† The total return figures presented for Class A and Class C shares of the fund reflect the performance of the fund’s Class I shares for the period prior to 3/31/09 (the inception date for Class A and Class C shares), not reflecting the applicable sales charges for Class A shares.
The total return figures presented for Class Y shares of the fund reflect the performance of the fund’s Class I shares for the period prior to 7/1/13 (the inception date for Class Y shares).
Past performance is not predictive of future performance.
The above graph compares a $10,000 investment made in each of the Class A, Class C, Class I and Class Y shares of Dreyfus Tax Sensitive Total Return Fund on 9/30/05 to a $10,000 investment made in the Barclays 3-, 5-, 7-, 10-Year Municipal Bond Index (the “Index”) on that date. All dividends and capital gain distributions are reinvested.
The fund’s performance shown in the line graph above takes into account the maximum initial sales charge on Class A shares and all other applicable fees and expenses on all classes. The Index is an equal-weighted composite of the Barclays 3-Year, 5-Year, 7-Year, and 10-Year Municipal Bond indices, each of which is a broad measure of the performance of investment grade, fixed-rate municipal bonds. Unlike a mutual fund, the Index is not subject to charges, fees and other expenses. Investors cannot invest directly in any index. These factors can contribute to the Index potentially outperforming the fund. Further information relating to fund performance, including expense reimbursements, if applicable, is contained in the Financial Highlights section of the prospectus and elsewhere in this report.
6
| | | | | | | | |
Average Annual Total Returns as of 9/30/15 |
| Inception | 1 Year | 5 Years | | 10 Years | |
Date |
Class A shares | | | | |
with maximum sales charge (4.5%) | 3/31/09 | -2.23% | 1.97% | | 3.32% | †† |
without sales charge | 3/31/09 | 2.38% | 2.91% | | 3.79% | †† |
Class C shares | | | | |
with applicable redemption charge † | 3/31/09 | 0.59% | 2.14% | | 3.29% | †† |
without redemption | 3/31/09 | 1.58% | 2.14% | | 3.29% | †† |
Class I shares | 11/2/92 | 2.63% | 3.22% | | 4.00% | |
Class Y shares | 7/1/13 | 2.59% | 3.22% | †† | 4.00% | †† |
Barclay 3-, 5-, 7-, 10-Year | | | | |
Municipal Bond Index | | 2.31% | 3.15% | | 4.25% | |
Past performance is not predictive of future performance. The fund’s performance shown in the graph and table does not reflect the deduction of taxes that a shareholder would pay on fund distributions or the redemption of fund shares. In addition to the performance of Class A shares shown with and without a maximum sales charge, the fund’s performance shown in the table takes into account all other applicable fees and expenses on all classes.
† The maximum contingent deferred sales charge for Class C shares is 1% for shares redeemed within one year of the date of purchase.
†† The total return performance figures presented for Class A and Class C shares of the fund reflect the performance of the fund’s Class I shares for the period prior to 3/31/09 (the inception date for Class A and Class C shares), not reflecting the applicable sales charges for Class A shares.
The total return performance figures presented for Class Y shares of the fund reflect the performance of the fund’s Class I shares for the period prior to 7/1/13 (the inception date for Class Y shares).
7
UNDERSTANDING YOUR FUND’S EXPENSES (Unaudited)
As a mutual fund investor, you pay ongoing expenses, such as management fees and other expenses. Using the information below, you can estimate how these expenses affect your investment and compare them with the expenses of other funds. You also may pay one-time transaction expenses, including sales charges (loads) and redemption fees, which are not shown in this section and would have resulted in higher total expenses. For more information, see your fund’s prospectus or talk to your financial adviser.
Review your fund’s expenses
The table below shows the expenses you would have paid on a $1,000 investment in Dreyfus Tax Sensitive Total Return Bond Fund from April 1, 2015 to September 30, 2015. It also shows how much a $1,000 investment would be worth at the close of the period, assuming actual returns and expenses.
| | | | | | | | | | | | |
Expenses and Value of a $1,000 Investment | | |
assuming actual returns for the six months ended September 30, 2015 |
| | | | | | | | |
| | | | Class A | Class C | Class I | Class Y |
Expenses paid per $1,000† | | $3.52 | | $7..27 | | $2.26 | | $2.26 |
Ending value (after expenses) | | $1,004.60 | | $1,001.00 | | $1,005.80 | | $1,005.80 |
COMPARING YOUR FUND’S EXPENSES
WITH THOSE OF OTHER FUNDS (Unaudited)
Using the SEC’s method to compare expenses
The Securities and Exchange Commission (SEC) has established guidelines to help investors assess fund expenses. Per these guidelines, the table below shows your fund’s expenses based on a $1,000 investment, assuming a hypothetical 5% annualized return. You can use this information to compare the ongoing expenses (but not transaction expenses or total cost) of investing in the fund with those of other funds. All mutual fund shareholder reports will provide this information to help you make this comparison. Please note that you cannot use this information to estimate your actual ending account balance and expenses paid during the period.
| | | | | | | | | | | | |
Expenses and Value of a $1,000 Investment | | |
assuming a hypothetical 5% annualized return for the six months ended September 30, 2015 |
| | | | | | | | |
| | | | Class A | Class C | Class I | Class Y |
Expenses paid per $1,000† | | $3.55 | | $7.33 | | $2.28 | | 2.28 |
Ending value (after expenses) | | $1,021.56 | | $1,017.80 | | $1,022.81 | | $1,022.81 |
† Expenses are equal to the fund’s annualized expense ratio of .70% for Class A, 1.45% for Class C and .45% for Class I and .45% for Class Y, multiplied by the average account value over the period, multiplied by 183/365 (to reflect the one-half year period).
8
STATEMENT OF INVESTMENTS
September 30, 2015
| | | | | | | | | | | | |
Bonds and Notes - 7.9% | | Coupon
Rate (%) | | Maturity
Date | | Principal
Amount ($) | | Value ($) | |
Asset-Backed Certificates - .8% | |
Carrington Mortgage Loan Trust, | | | | | | | | | | | |
Ser. 2006-NC5, Cl. A2 | | | | 0.30 | | 1/25/37 | | 601,665 | a | 439,766 | |
OneMain Financial Issuance Trust, | | | | | | | | | | | |
Ser. 2014-1A, Cl. B | | | | 3.24 | | 6/18/24 | | 1,180,000 | b | 1,188,115 | |
| | | 1,627,881 | |
Asset-Backed Ctfs./Auto Receivables - 2.1% | |
Capital Auto Receivables Asset Trust, | | | | | | | | | | | |
Ser. 2014-2, Cl. D | | | | 2.81 | | 8/20/19 | | 240,000 | | 243,348 | |
DT Auto Owner Trust, | | | | | | | | | | | |
Ser. 2014-2A, Cl. D | | | | 3.68 | | 4/15/21 | | 1,500,000 | b | 1,505,271 | |
DT Auto Owner Trust, | | | | | | | | | | | |
Ser. 2014-3A, Cl. D | | | | 4.47 | | 11/15/21 | | 2,345,000 | b | 2,396,017 | |
| | | 4,144,636 | |
Commercial Mortgage Pass-Through Ctfs. - .6% | |
Wachovia Bank Commercial Mortgage Trust, | | | | | | | | | | | |
Ser. 2006-C24, Cl. AJ | | | | 5.66 | | 3/15/45 | | 1,250,000 | a | 1,255,693 | |
Consumer Discretionary - .5% | |
Neiman Marcus Group, | | | | | | | | | | | |
Gtd. Notes | | | | 8.00 | | 10/15/21 | | 875,000 | b | 905,625 | |
Energy - .4% | |
Carrizo Oil & Gas, | | | | | | | | | | | |
Gtd. Notes | | | | 6.25 | | 4/15/23 | | 950,000 | | 831,915 | |
Financials - 1.1% | |
Denali Borrower, | | | | | | | | | | | |
Sr. Scd. Notes | | | | 5.63 | | 10/15/20 | | 800,000 | b | 833,600 | |
Hub Holdings, | | | | | | | | | | | |
Sr. Unscd. Notes | | | | 8.13 | | 7/15/19 | | 750,000 | b | 727,500 | |
HUB International, | | | | | | | | | | | |
Sr. Unscd. Notes | | | | 7.88 | | 10/1/21 | | 750,000 | b | 718,125 | |
| | | 2,279,225 | |
Health Care - .4% | |
Dignity Health, | | | | | | | | | | | |
Unscd. Bonds | | | | 2.64 | | 11/1/19 | | 760,000 | | 775,755 | |
Telecommunications - 2.0% | |
Altice, | | | | | | | | | | | |
Gtd. Notes | | | | 7.75 | | 5/15/22 | | 800,000 | b | 730,000 | |
Digicel, | | | | | | | | | | | |
Sr. Unscd. Notes | | | | 6.00 | | 4/15/21 | | 925,000 | b | 848,688 | |
Frontier Communications, | | | | | | | | | | | |
Sr. Unscd. Notes | | | | 8.88 | | 9/15/20 | | 960,000 | b | 943,200 | |
Intelsat Jackson Holdings, | | | | | | | | | | | |
Gtd. Notes | | | | 7.25 | | 4/1/19 | | 750,000 | | 705,938 | |
T-Mobile USA, | | | | | | | | | | | |
Gtd. Bonds | | | | 6.13 | | 1/15/22 | | 750,000 | | 725,625 | |
| | | 3,953,451 | |
Total Bonds and Notes
(cost $16,297,010) | | 15,774,181 | |
9
STATEMENT OF INVESTMENTS (continued)
| | | | | | | | | | | | |
Long-Term Municipal Investments - 91.1% | | Coupon
Rate (%) | | Maturity
Date | | Principal
Amount ($) | | Value ($) | |
Alabama - 1.3% | |
Alabama Public School and College Authority, | | | | | | | | | | | |
Capital Improvement Revenue | | | | 5.00 | | 1/1/19 | | 1,000,000 | | 1,128,030 | |
Alabama Public School and College Authority, | | | | | | | | | | | |
Capital Improvement Revenue | | | | 5.00 | | 1/1/26 | | 1,250,000 | | 1,519,462 | |
| | | 2,647,492 | |
Arizona - .2% | |
Phoenix Industrial Development Authority, | | | | | | | | | | | |
Education Facility Revenue (Legacy Traditional Schools Projects) | | | | 3.00 | | 7/1/20 | | 500,000 | b | 489,910 | |
Arkansas - 1.1% | |
Arkansas Development Finance Authority, | | | | | | | | | | | |
HR (Washington Regional Medical Center) | | | | 5.00 | | 2/1/25 | | 1,835,000 | | 2,130,050 | |
California - 8.7% | |
California, | | | | | | | | | | | |
Economic Recovery Bonds (Escrowed to Maturity) | | | | 5.00 | | 7/1/18 | | 1,160,000 | | 1,294,560 | |
California, | | | | | | | | | | | |
Economic Recovery Bonds (Escrowed to Maturity) | | | | 5.00 | | 7/1/18 | | 340,000 | | 379,440 | |
California, | | | | | | | | | | | |
GO (Various Purpose) | | | | 5.00 | | 9/1/22 | | 1,000,000 | | 1,207,530 | |
California Health Facilities Financing Authority, | | | | | | | | | | | |
Revenue (Sutter Health) | | | | 5.00 | | 8/15/18 | | 1,030,000 | | 1,152,632 | |
California State Public Works Board, | | | | | | | | | | | |
LR (Judicial Council of California) (New Stockton Courthouse) | | | | 5.00 | | 10/1/26 | | 1,000,000 | | 1,198,640 | |
California State University Trustees, | | | | | | | | | | | |
Systemwide Revenue | | | | 5.00 | | 11/1/22 | | 1,000,000 | | 1,197,900 | |
Golden State Tobacco Securitization Corporation, | | | | | | | | | | | |
Enhanced Tobacco Settlement Asset-Backed Bonds (Insured; AMBAC) | | | | 4.60 | | 6/1/23 | | 750,000 | | 809,370 | |
Jurupa Public Financing Authority, | | | | | | | | | | | |
Special Tax Revenue | | | | 5.00 | | 9/1/29 | | 1,060,000 | | 1,206,132 | |
Los Angeles Community Facilities District Number 4, | | | | | | | | | | | |
Special Tax Revenue (Playa Vista-Phase 1) | | | | 5.00 | | 9/1/28 | | 1,000,000 | | 1,144,240 | |
Los Angeles Department of Water and Power, | | | | | | | | | | | |
Power System Revenue | | | | 5.00 | | 7/1/23 | | 1,000,000 | | 1,223,300 | |
Sacramento County, | | | | | | | | | | | |
Airport System Senior Revenue | | | | 5.00 | | 7/1/22 | | 1,275,000 | | 1,415,760 | |
Southern California Public Power Authority, | | | | | | | | | | | |
Revenue (Canyon Power Project) | | | | 5.00 | | 7/1/22 | | 2,000,000 | | 2,293,540 | |
Southern California Public Power Authority, | | | | | | | | | | | |
Revenue (Windy Point/Windy Flats Project) | | | | 5.00 | | 7/1/23 | | 1,000,000 | | 1,168,230 | |
Stockton Unified School District, | | | | | | | | | | | |
10
| | | | | | | | | | | | | |
Long-Term Municipal Investments - 91.1% (continued) | | Coupon
Rate (%) | | Maturity
Date | | Principal
Amount ($) | | Value ($) | |
California - 8.7% (continued) | |
GO (Insured; Assured Guaranty Municipal Corp.) | | | | 4.00 | | 7/1/16 | | 500,000 | | 514,245 | |
Tuolumne Wind Project Authority, | | | | | | | | | | | |
Revenue (Tuolumne Company Project) | | | | 5.00 | | 1/1/18 | | 1,000,000 | | 1,092,390 | |
| | | 17,297,909 | |
Colorado - .4% | |
City and County of Denver, | | | | | | | | | | | |
Airport System Subordinate Revenue | | | | 5.00 | | 11/15/22 | | 720,000 | | 844,625 | |
Connecticut - .6% | |
Connecticut, | | | | | | | | | | | |
Special Tax Obligation Revenue (Transportation Infrastructure Purposes) | | | | 5.00 | | 9/1/33 | | 1,000,000 | | 1,142,020 | |
District of Columbia - 2.4% | |
Georgetown University, | | | | | | | | | | | |
GO (Insured; National Public Finance Guarantee Corp.) | | | | 0.34 | | 4/1/29 | | 4,000,000 | a | 3,680,000 | |
Metropolitan Washington Airports Authority, | | | | | | | | | | | |
Airport System Revenue | | | | 5.00 | | 10/1/24 | | 1,000,000 | | 1,174,360 | |
| | | 4,854,360 | |
Florida - 11.2% | |
Citizens Property Insurance Corporation, | | | | | | | | | | | |
Coastal Account Senior Secured Revenue | | | | 5.00 | | 6/1/25 | | 3,000,000 | | 3,576,570 | |
Citizens Property Insurance Corporation, | | | | | | | | | | | |
Personal Lines Account/Commercial Lines Account Senior Secured Revenue | | | | 5.00 | | 6/1/20 | | 1,500,000 | | 1,719,810 | |
Florida Department of Transportation, | | | | | | | | | | | |
Turnpike Revenue | | | | 5.00 | | 7/1/25 | | 1,000,000 | | 1,191,880 | |
Jacksonville, | | | | | | | | | | | |
Special Revenue | | | | 5.00 | | 10/1/27 | | 1,000,000 | | 1,181,200 | |
Lakeland, | | | | | | | | | | | |
Energy System Revenue (Insured; Assured Guaranty Municipal Corp.) | | | | 5.00 | | 10/1/17 | | 1,000,000 | | 1,085,680 | |
Lee County, | | | | | | | | | | | |
Transportation Facilities Revenue (Insured; Assured Guaranty Municipal Corp.) | | | | 5.00 | | 10/1/25 | | 1,000,000 | | 1,197,530 | |
Miami-Dade County, | | | | | | | | | | | |
Aviation Revenue (Miami International Airport) | | | | 5.25 | | 10/1/23 | | 1,000,000 | | 1,156,050 | |
Miami-Dade County, | | | | | | | | | | | |
Seaport Revenue | | | | 5.00 | | 10/1/22 | | 2,000,000 | | 2,345,660 | |
Miami-Dade County School Board, | | | | | | | | | | | |
COP | | | | 5.00 | | 5/1/26 | | 1,500,000 | | 1,774,845 | |
Orlando-Orange County Expressway Authority, | | | | | | | | | | | |
Revenue (Insured; Assured Guaranty Municipal Corp.) | | | | 5.00 | | 7/1/18 | | 1,000,000 | | 1,112,080 | |
Palm Beach County School Board, | | | | | | | | | | | |
COP (Master Lease Purchase Agreement with Palm Beach School Board Leasing Corporation) | | | | 5.00 | | 8/1/21 | | 1,845,000 | | 2,169,462 | |
South Miami Health Facilities Authority, | | | | | | | | | | | |
11
STATEMENT OF INVESTMENTS (continued)
| | | | | | | | | | | | | |
Long-Term Municipal Investments - 91.1% (continued) | | Coupon
Rate (%) | | Maturity
Date | | Principal
Amount ($) | | Value ($) | |
Florida - 11.2% (continued) | |
HR (Baptist Health South Florida Obligated Group) | | | | 5.00 | | 8/15/18 | | 750,000 | | 810,233 | |
Tampa, | | | | | | | | | | | |
Capital Improvement Cigarette Tax Allocation Revenue (H. Lee Moffitt Cancer Center Project) | | | | 5.00 | | 9/1/23 | | 500,000 | | 579,765 | |
Tampa, | | | | | | | | | | | |
Health System Revenue (BayCare Health System Issue) | | | | 5.00 | | 11/15/18 | | 1,000,000 | | 1,120,620 | |
Village Community Development District Number 7, | | | | | | | | | | | |
Special Assessment Revenue | | | | 3.00 | | 5/1/19 | | 650,000 | | 675,643 | |
Village Community Development District Number 7, | | | | | | | | | | | |
Special Assessment Revenue | | | | 3.00 | | 5/1/20 | | 600,000 | | 624,132 | |
| | | 22,321,160 | |
Georgia - 3.2% | |
Atlanta, | | | | | | | | | | | |
Airport General Revenue | | | | 5.00 | | 1/1/22 | | 1,000,000 | | 1,148,850 | |
Atlanta Development Authority, | | | | | | | | | | | |
Senior Lien Revenue (New Downtown Atlanta Stadium Project) | | | | 5.00 | | 7/1/29 | | 1,000,000 | | 1,164,300 | |
DeKalb County, | | | | | | | | | | | |
Water and Sewerage Revenue | | | | 5.00 | | 10/1/21 | | 2,380,000 | | 2,811,875 | |
Municipal Electric Authority of Georgia, | | | | | | | | | | | |
GO (Project One Subordinated Bonds) | | | | 5.00 | | 1/1/21 | | 1,000,000 | | 1,167,870 | |
| | | 6,292,895 | |
Illinois - 6.4% | |
Chicago, | | | | | | | | | | | |
Customer Facility Charge Senior Lien Revenue (Chicago O'Hare International Airport) | | | | 5.25 | | 1/1/24 | | 1,500,000 | | 1,731,120 | |
Chicago, | | | | | | | | | | | |
General Airport Third Lien Revenue (Chicago O'Hare International Airport) (Insured; Assured Guaranty Municipal Corp.) | | | | 5.00 | | 1/1/20 | | 1,000,000 | | 1,086,060 | |
Chicago, | | | | | | | | | | | |
GO (Neighborhoods Alive 21 Program) | | | | 5.00 | | 1/1/20 | | 1,000,000 | | 1,020,250 | |
Chicago, | | | | | | | | | | | |
Second Lien Water Revenue | | | | 5.00 | | 11/1/26 | | 1,000,000 | | 1,100,850 | |
Chicago Park District, | | | | | | | | | | | |
Limited Tax GO | | | | 5.00 | | 1/1/28 | | 2,500,000 | | 2,723,625 | |
Illinois Finance Authority, | | | | | | | | | | | |
Revenue (Rush University Medical Center Obligated Group) | | | | 5.00 | | 11/15/26 | | 1,000,000 | | 1,175,700 | |
Metropolitan Pier and Exposition Authority, | | | | | | | | | | | |
Revenue (McCormick Place Expansion Project) | | | | 5.00 | | 12/15/28 | | 1,235,000 | | 1,359,068 | |
Northern Illinois University Board of Trustees, | | | | | | | | | | | |
Auxiliary Facilities System Revenue (Insured; Assured Guaranty Municipal Corp.) | | | | 5.00 | | 4/1/17 | | 1,500,000 | | 1,580,385 | |
12
| | | | | | | | | | | | | |
Long-Term Municipal Investments - 91.1% (continued) | | Coupon
Rate (%) | | Maturity
Date | | Principal
Amount ($) | | Value ($) | |
Illinois - 6.4% (continued) | |
Railsplitter Tobacco Settlement Authority, | | | | | | | | | | | |
Tobacco Settlement Revenue | | | | 5.00 | | 6/1/17 | | 1,000,000 | | 1,065,870 | |
| | | 12,842,928 | |
Indiana - .7% | |
Knox County, | | | | | | | | | | | |
EDR (Good Samaritan Hospital Project) | | | | 5.00 | | 4/1/23 | | 1,300,000 | | 1,464,242 | |
Kansas - 1.5% | |
Kansas Department of Transportation, | | | | | | | | | | | |
Highway Revenue | | | | 5.00 | | 9/1/18 | | 1,415,000 | | 1,587,432 | |
Kansas Development Finance Authority, | | | | | | | | | | | |
Revolving Funds Revenue (Kansas Department of Health and Environment) | | | | 5.00 | | 3/1/21 | | 1,150,000 | | 1,332,562 | |
| | | 2,919,994 | |
Kentucky - .6% | |
Louisville and Jefferson County Metropolitan Sewer District, | | | | | | | | | | | |
Sewer and Drainage System Revenue | | | | 5.00 | | 5/15/23 | | 1,000,000 | | 1,189,330 | |
Louisiana - 1.2% | |
Louisiana, | | | | | | | | | | | |
State Highway Improvement Revenue | | | | 5.00 | | 6/15/25 | | 1,000,000 | | 1,218,840 | |
Tobacco Settlement Financing Corporation of Louisiana, | | | | | | | | | | | |
Tobacco Settlement Asset-Backed Bonds | | | | 5.00 | | 5/15/20 | | 1,000,000 | | 1,129,370 | |
| | | 2,348,210 | |
Maryland - .6% | |
Maryland Economic Development Corporation, | | | | | | | | | | | |
EDR (Transportation Facilities Project) | | | | 5.13 | | 6/1/20 | | 1,000,000 | | 1,093,730 | |
Michigan - 3.7% | |
Detroit, | | | | | | | | | | | |
Sewage Disposal System Senior Lien Revenue (Insured; Assured Guaranty Municipal Corp.) | | | | 5.25 | | 7/1/19 | | 1,000,000 | | 1,129,670 | |
Michigan Finance Authority, | | | | | | | | | | | |
HR (Beaumont Health Credit Group) | | | | 5.00 | | 8/1/25 | | 1,000,000 | | 1,162,130 | |
Michigan Finance Authority, | | | | | | | | | | | |
Local Government Loan Program Revenue (Detroit Water and Sewerage Department, Sewage Disposal System Revenue Senior Lien Local Project Bonds) (Insured; Assured Guaranty Municipal Corp.) | | | | 5.00 | | 7/1/30 | | 1,000,000 | | 1,126,650 | |
Michigan Finance Authority, | | | | | | | | | | | |
Local Government Loan Program Revenue (School District of the City of Detroit State Qualified Unlimited Tax GO Local Project Bonds) | | | | 5.00 | | 5/1/20 | | 1,125,000 | | 1,285,999 | |
Michigan Finance Authority, | | | | | | | | | | | |
Unemployment Obligation Assessment Revenue | | | | 5.00 | | 7/1/21 | | 1,500,000 | | 1,664,520 | |
13
STATEMENT OF INVESTMENTS (continued)
| | | | | | | | | | | | | |
Long-Term Municipal Investments - 91.1% (continued) | | Coupon
Rate (%) | | Maturity
Date | | Principal
Amount ($) | | Value ($) | |
Michigan - 3.7% (continued) | |
Wayne County Airport Authority, | | | | | | | | | | | |
Airport Revenue (Detroit Metropolitan Wayne County Airport) | | | | 5.00 | | 12/1/16 | | 1,000,000 | | 1,045,570 | |
| | | 7,414,539 | |
Minnesota - 1.2% | |
Saint Paul Housing and Redevelopment Authority, | | | | | | | | | | | |
Hospital Facility Revenue (HealthEast Care System Project) | | | | 5.00 | | 11/15/21 | | 1,000,000 | | 1,113,200 | |
Western Minnesota Municipal Power Agency, | | | | | | | | | | | |
Power Supply Revenue | | | | 5.00 | | 1/1/29 | | 1,120,000 | | 1,311,195 | |
| | | 2,424,395 | |
Missouri - 3.0% | |
Missouri Development Finance Board, | | | | | | | | | | | |
Infrastructure Facilities Revenue (Branson Landing Project) | | | | 5.00 | | 6/1/23 | | 1,000,000 | | 1,172,580 | |
Missouri Development Finance Board, | | | | | | | | | | | |
Infrastructure Facilities Revenue (Branson Landing Project) | | | | 5.00 | | 6/1/28 | | 1,000,000 | | 1,127,070 | |
Missouri Joint Municipal Electric Utility Commission, | | | | | | | | | | | |
Power Project Revenue (Prairie State Project) | | | | 5.00 | | 12/1/29 | | 3,120,000 | | 3,628,872 | |
| | | 5,928,522 | |
Nebraska - .6% | |
Nebraska Public Power District, | | | | | | | | | | | |
General Revenue | | | | 5.00 | | 1/1/30 | | 1,000,000 | | 1,168,430 | |
New Jersey - 5.1% | |
New Jersey Economic Development Authority, | | | | | | | | | | | |
Cigarette Tax Revenue | | | | 5.00 | | 6/15/18 | | 1,250,000 | | 1,342,200 | |
New Jersey Economic Development Authority, | | | | | | | | | | | |
School Facilities Construction Revenue | | | | 5.00 | | 6/15/26 | | 1,845,000 | | 1,944,076 | |
New Jersey Economic Development Authority, | | | | | | | | | | | |
Water Facilities Revenue (New Jersey - American Water Company, Inc. Project) | | | | 5.10 | | 6/1/23 | | 1,000,000 | | 1,114,360 | |
New Jersey Educational Facilities Authority, | | | | | | | | | | | |
Revenue (Rowan University Issue) | | | | 5.00 | | 7/1/18 | | 1,225,000 | | 1,347,145 | |
New Jersey Health Care Facilities Financing Authority, | | | | | | | | | | | |
Revenue (Virtua Health Issue) | | | | 5.00 | | 7/1/25 | | 1,000,000 | | 1,165,890 | |
New Jersey Higher Education Student Assistance Authority, | | | | | | | | | | | |
Senior Student Loan Revenue | | | | 5.00 | | 12/1/18 | | 1,000,000 | | 1,094,930 | |
New Jersey Higher Education Student Assistance Authority, | | | | | | | | | | | |
Senior Student Loan Revenue | | | | 5.00 | | 12/1/24 | | 1,000,000 | | 1,132,660 | |
Tobacco Settlement Financing Corporation of New Jersey, | | | | | | | | | | | |
Tobacco Settlement Asset-Backed Bonds | | | | 4.50 | | 6/1/23 | | 1,000,000 | | 1,005,630 | |
| | | 10,146,891 | |
14
| | | | | | | | | | | | | |
Long-Term Municipal Investments - 91.1% (continued) | | Coupon
Rate (%) | | Maturity
Date | | Principal
Amount ($) | | Value ($) | |
New Mexico - 1.0% | |
New Mexico Municipal Energy Acquisition Authority, | | | | | | | | | | | |
Gas Supply Revenue | | | | 0.88 | | 8/1/19 | | 1,000,000 | a | 999,730 | |
New Mexico Municipal Energy Acquisition Authority, | | | | | | | | | | | |
Gas Supply Revenue (SBPA; Royal Bank of Canada) | | | | 0.78 | | 2/1/19 | | 1,000,000 | a | 997,430 | |
| | | 1,997,160 | |
New York - 8.9% | |
Metropolitan Transportation Authority, | | | | | | | | | | | |
Dedicated Tax Fund Revenue | | | | 5.00 | | 11/15/24 | | 2,000,000 | | 2,421,160 | |
Metropolitan Transportation Authority, | | | | | | | | | | | |
Transportation Revenue | | | | 5.00 | | 11/15/26 | | 1,205,000 | | 1,427,262 | |
New York City, | | | | | | | | | | | |
GO | | | | 5.00 | | 8/1/21 | | 2,000,000 | | 2,279,020 | |
New York City, | | | | | | | | | | | |
GO | | | | 5.00 | | 3/1/25 | | 1,000,000 | | 1,208,590 | |
New York City Health and Hospitals Corporation, | | | | | | | | | | | |
Health System Revenue | | | | 5.00 | | 2/15/19 | | 1,000,000 | | 1,125,750 | |
New York City Transitional Finance Authority, | | | | | | | | | | | |
Future Tax Secured Subordinate Revenue | | | | 5.00 | | 11/1/18 | | 1,000,000 | | 1,125,190 | |
Onondaga Civic Development Corporation, | | | | | | | | | | | |
Revenue (Saint Joseph's Hospital Health Center Project) | | | | 5.00 | | 7/1/25 | | 1,000,000 | | 1,077,630 | |
Port Authority of New York and New Jersey, | | | | | | | | | | | |
(Consolidated Bonds, 185th Series) | | | | 5.00 | | 9/1/30 | | 1,000,000 | | 1,137,860 | |
Triborough Bridge and Tunnel Authority, | | | | | | | | | | | |
General Revenue (MTA Bridges and Tunnels) | | | | 0.48 | | 12/3/19 | | 3,500,000 | a | 3,460,450 | |
Triborough Bridge and Tunnel Authority, | | | | | | | | | | | |
General Revenue (MTA Bridges and Tunnels) | | | | 5.00 | | 11/15/24 | | 2,150,000 | | 2,593,351 | |
| | | 17,856,263 | |
North Carolina - 1.0% | |
North Carolina Medical Care Commission, | | | | | | | | | | | |
Health Care Facilities First Mortgage Revenue (Pennybryn at Maryfield) | | | | 5.00 | | 10/1/19 | | 1,875,000 | | 2,030,906 | |
Ohio - 1.9% | |
Ohio Higher Educational Facility Commission, | | | | | | | | | | | |
Higher Educational Facility Revenue (Case Western Reserve University Project) | | | | 5.00 | | 12/1/23 | | 1,500,000 | | 1,810,980 | |
Southeastern Ohio Port Authority, | | | | | | | | | | | |
Hospital Facilities Improvement Revenue (Memorial Health System Obligated Group Project) | | | | 5.50 | | 12/1/29 | | 820,000 | | 886,756 | |
University of Toledo, | | | | | | | | | | | |
General Receipts Bonds | | | | 5.00 | | 6/1/17 | | 1,050,000 | | 1,123,122 | |
| | | 3,820,858 | |
15
STATEMENT OF INVESTMENTS (continued)
| | | | | | | | | | | | | |
Long-Term Municipal Investments - 91.1% (continued) | | Coupon
Rate (%) | | Maturity
Date | | Principal
Amount ($) | | Value ($) | |
Pennsylvania - 1.1% | |
Pennsylvania Intergovernmental Cooperation Authority, | | | | | | | | | | | |
Special Tax Revenue (City of Philadelphia Funding Program) | | | | 5.00 | | 6/15/17 | | 1,000,000 | | 1,075,370 | |
Philadelphia, | | | | | | | | | | | |
Gas Works Revenue | | | | 5.00 | | 8/1/21 | | 1,000,000 | | 1,164,060 | |
| | | 2,239,430 | |
Rhode Island - 1.5% | |
Rhode Island Health and Educational Building Corporation, | | | | | | | | | | | |
Higher Education Facilities Revenue (Brown University Issue) | | | | 5.00 | | 9/1/21 | | 700,000 | | 835,632 | |
Tobacco Settlement Financing Corporation of Rhode Island, | | | | | | | | | | | |
Tobacco Settlement Asset-Backed Bonds | | | | 5.00 | | 6/1/26 | | 1,000,000 | | 1,140,170 | |
Tobacco Settlement Financing Corporation of Rhode Island, | | | | | | | | | | | |
Tobacco Settlement Asset-Backed Bonds | | | | 5.00 | | 6/1/35 | | 1,000,000 | | 1,062,980 | |
| | | 3,038,782 | |
South Carolina - .6% | |
South Carolina Public Service Authority, | | | | | | | | | | | |
Revenue Obligations (Santee Cooper) | | | | 5.00 | | 12/1/21 | | 1,000,000 | | 1,184,580 | |
South Dakota - 1.3% | |
South Dakota Conservancy District, | | | | | | | | | | | |
Revenue (State Revolving Fund Program) | | | | 5.00 | | 8/1/17 | | 2,370,000 | | 2,565,098 | |
Tennessee - .6% | |
Metropolitan Government of Nashville and Davidson County, | | | | | | | | | | | |
GO | | | | 5.00 | | 7/1/22 | | 1,000,000 | | 1,206,490 | |
Texas - 13.8% | |
Arlington Independent School District, | | | | | | | | | | | |
Unlimited Tax School Building Bonds (Permanent School Fund Guarantee Program) | | | | 5.00 | | 2/15/27 | | 1,400,000 | | 1,647,254 | |
Corpus Christi, | | | | | | | | | | | |
Utility System Junior Lien Revenue (Insured; Assured Guaranty Municipal Corp.) | | | | 5.00 | | 7/15/23 | | 1,725,000 | | 2,038,001 | |
Harris County-Houston Sports Authority, | | | | | | | | | | | |
Senior Lien Revenue | | | | 5.00 | | 11/15/29 | | 750,000 | | 858,630 | |
Houston, | | | | | | | | | | | |
Airport System Special Facilities Revenue (United Airlines, Inc. Terminal E Project) | | | | 4.75 | | 7/1/24 | | 1,000,000 | | 1,081,420 | |
Houston, | | | | | | | | | | | |
Airport System Subordinate Lien Revenue (Insured; XLCA) | | | | 0.39 | | 7/1/32 | | 2,725,000 | a | 2,530,844 | |
Houston, | | | | | | | | | | | |
Combined Utility System First Lien Revenue | | | | 5.00 | | 11/15/18 | | 1,355,000 | | 1,525,920 | |
Houston, | | | | | | | | | | | |
16
| | | | | | | | | | | | | |
Long-Term Municipal Investments - 91.1% (continued) | | Coupon
Rate (%) | | Maturity
Date | | Principal
Amount ($) | | Value ($) | |
Texas - 13.8% (continued) | |
Combined Utility System First Lien Revenue | | | | 0.92 | | 5/1/20 | | 2,500,000 | a | 2,488,900 | |
Houston, | | | | | | | | | | | |
Public Improvement GO | | | | 5.00 | | 3/1/24 | | 2,000,000 | | 2,443,160 | |
Houston Convention and Entertainment Facilities Department, | | | | | | | | | | | |
Hotel Occupancy Tax and Special Revenue | | | | 5.00 | | 9/1/20 | | 1,000,000 | | 1,155,750 | |
Love Field Airport Modernization Corporation, | | | | | | | | | | | |
General Airport Revenue | | | | 5.00 | | 11/1/27 | | 1,850,000 | | 2,181,964 | |
North Texas Tollway Authority, | | | | | | | | | | | |
First Tier System Revenue | | | | 5.00 | | 1/1/22 | | 1,000,000 | | 1,182,570 | |
North Texas Tollway Authority, | | | | | | | | | | | |
Second Tier System Revenue | | | | 5.00 | | 1/1/21 | | 2,000,000 | | 2,311,740 | |
Sam Rayburn Municipal Power Agency, | | | | | | | | | | | |
Power Supply System Revenue | | | | 5.00 | | 10/1/20 | | 1,210,000 | | 1,395,069 | |
Texas, | | | | | | | | | | | |
GO (College Student Loan) | | | | 5.00 | | 8/1/17 | | 1,000,000 | | 1,081,970 | |
Texas Municipal Power Agency, | | | | | | | | | | | |
Revenue (Insured; National Public Finance Guarantee Corp.) (Escrowed to Maturity) | | | | 0.00 | | 9/1/16 | | 10,000 | c | 9,971 | |
Trinity River Authority of Texas, | | | | | | | | | | | |
Revenue (Tarrant County Water Project) | | | | 5.00 | | 2/1/23 | | 1,940,000 | | 2,323,616 | |
West Travis County Public Utility Agency, | | | | | | | | | | | |
Revenue | | | | 5.00 | | 8/15/23 | | 1,140,000 | | 1,301,857 | |
| | | 27,558,636 | |
Virginia - 1.4% | |
Virginia College Building Authority, | | | | | | | | | | | |
Educational Facilities Revenue (Marymount University Project) | | | | 5.00 | | 7/1/19 | | 425,000 | b | 462,387 | |
Virginia Public School Authority, | | | | | | | | | | | |
School Financing Bonds | | | | 5.00 | | 8/1/24 | | 2,000,000 | | 2,393,300 | |
| | | 2,855,687 | |
Washington - 2.0% | |
Port of Seattle, | | | | | | | | | | | |
Intermediate Lien Revenue | | | | 5.00 | | 4/1/25 | | 3,340,000 | | 3,896,644 | |
West Virginia - .6% | |
West Virginia University Board of Governors, | | | | | | | | | | | |
University Improvement Revenue (West Virginia University Projects) | | | | 5.00 | | 10/1/17 | | 1,135,000 | | 1,232,962 | |
Wisconsin - 1.7% | |
Public Finance Authority of Wisconsin, | | | | | | | | | | | |
Senior Living Revenue (Rose Villa Project) | | | | 4.25 | | 11/15/20 | | 1,000,000 | | 1,001,620 | |
Wisconsin Health and Educational Facilities Authority, | | | | | | | | | | | |
Health Facilities Revenue (UnityPoint Health) | | | | 5.00 | | 12/1/23 | | 1,000,000 | | 1,198,980 | |
17
STATEMENT OF INVESTMENTS (continued)
| | | | | | | | | | | | | | |
Long-Term Municipal Investments - 91.1% (continued) | | Coupon
Rate (%) | | Maturity
Date | | Principal
Amount ($) | | Value ($) | |
Wisconsin - 1.7% (continued) | |
Wisconsin Health and Educational Facilities Authority, | | | | | | | | | | | |
Revenue (ProHealth Care, Inc. Obligated Group) | | | | 5.00 | | 8/15/33 | | 1,000,000 | | 1,108,320 | |
| | | 3,308,920 | |
Total Long-Term Municipal Investments
(cost $175,324,011) | | 181,754,048 | |
Total Investments (cost $191,621,021) | | 99.0% | | 197,528,229 | |
Cash and Receivables (Net) | | 1.0% | | 2,062,650 | |
Net Assets | | 100.0% | | 199,590,879 | |
a Variable rate security--interest rate subject to periodic change.
b Securities exempt from registration pursuant to Rule 144A under the Securities Act of 1933. These securities may be resold in transactions exempt from registration, normally to qualified institutional buyers. At September 30, 2015, these securities were valued at $11,748,438 or 5.9% of net assets.
c Security issued with a zero coupon. Income is recognized through the accretion of discount.
18
| | |
Portfolio Summary (Unaudited) † | Value (%) |
Transportation Services | 21.8 |
Utility-Electric | 11.2 |
Health Care | 10.6 |
Education | 10.1 |
Utility-Water and Sewer | 9.8 |
Special Tax | 6.4 |
City | 4.5 |
Asset-Backed Ctfs./Auto Recievables | 2.1 |
Asset-Backed/Tobacco | 2.0 |
Telecommunications | 2.0 |
Lease | 1.7 |
State/Territory | 1.2 |
Financial | 1.1 |
Asset-Backed Certificates | .8 |
Prerefunded | .8 |
Housing | .7 |
Commercial Mortagage | .6 |
County | .6 |
Industrial | .6 |
Consumer Discretionary | .5 |
Energy | .4 |
Other | 9.5 |
| | 99.0 |
†Based on net assets.
See notes to financial statements.
19
| | | | |
| |
Summary of Abbreviations |
| |
ABAG | Association of Bay Area
Governments | ACA | American Capital Access |
AGC | ACE Guaranty Corporation | AGIC | Asset Guaranty Insurance Company |
AMBAC | American Municipal Bond
Assurance Corporation | ARRN | Adjustable Rate
Receipt Notes |
BAN | Bond Anticipation Notes | BPA | Bond Purchase Agreement |
CIFG | CDC Ixis Financial Guaranty | COP | Certificate of Participation |
CP | Commercial Paper | DRIVERS | Derivative Inverse
Tax-Exempt Receipts |
EDR | Economic Development
Revenue | EIR | Environmental Improvement
Revenue |
FGIC | Financial Guaranty
Insurance Company | FHA | Federal Housing Administration |
FHLB | Federal Home
Loan Bank | FHLMC | Federal Home Loan Mortgage
Corporation |
FNMA | Federal National
Mortgage Association | GAN | Grant Anticipation Notes |
GIC | Guaranteed Investment
Contract | GNMA | Government National Mortgage
Association |
GO | General Obligation | HR | Hospital Revenue |
IDB | Industrial Development Board | IDC | Industrial Development Corporation |
IDR | Industrial Development
Revenue | LIFERS | Long Inverse Floating
Exempt Receipts |
LOC | Letter of Credit | LOR | Limited Obligation Revenue |
LR | Lease Revenue | MERLOTS | Municipal Exempt Receipts
Liquidity Option Tender |
MFHR | Multi-Family Housing Revenue | MFMR | Multi-Family Mortgage Revenue |
PCR | Pollution Control Revenue | PILOT | Payment in Lieu of Taxes |
P-FLOATS | Puttable Floating Option
Tax-Exempt Receipts | PUTTERS | Puttable Tax-Exempt Receipts |
RAC | Revenue Anticipation Certificates | RAN | Revenue Anticipation Notes |
RAW | Revenue Anticipation Warrants | RIB | Residual Interest Bonds |
ROCS | Reset Options Certificates | RRR | Resources Recovery Revenue |
SAAN | State Aid Anticipation Notes | SBPA | Standby Bond Purchase Agreement |
SFHR | Single Family Housing Revenue | SFMR | Single Family Mortgage Revenue |
SONYMA | State of New York
Mortgage Agency | SPEARS | Short Puttable Exempt
Adjustable Receipts |
SWDR | Solid Waste Disposal Revenue | TAN | Tax Anticipation Notes |
TAW | Tax Anticipation Warrants | TRAN | Tax and Revenue Anticipation Notes |
XLCA | XL Capital Assurance | | |
See notes to financial statements.
20
STATEMENT OF ASSETS AND LIABILITIES
September 30, 2015
| | | | | | | |
| | | Cost | | Value | |
Assets ($): | | | | |
Investments in securities—See Statement of Investments | | 191,621,021 | | 197,528,229 | |
Cash | | | | | 311,761 | |
Interest receivable | | | | | 2,268,662 | |
Receivable for investment securities sold | | | | | 1,767,500 | |
Prepaid expenses | | | | | 28,184 | |
| | | | | 201,904,336 | |
Liabilities ($): | | | | |
Due to The Dreyfus Corporation and affiliates—Note 3(c) | | | | | 71,648 | |
Payable for investment securities purchased | | | | | 1,830,247 | |
Payable for shares of Beneficial Interest redeemed | | | | | 356,496 | |
Accrued expenses | | | | | 55,066 | |
| | | | | 2,313,457 | |
Net Assets ($) | | | 199,590,879 | |
Composition of Net Assets ($): | | | | |
Paid-in capital | | | | | 192,809,495 | |
Accumulated undistributed investment income—net | | | | | 602 | |
Accumulated net realized gain (loss) on investments | | | | | 873,574 | |
Accumulated net unrealized appreciation (depreciation)
on investments | | | | | 5,907,208 | |
Net Assets ($) | | | 199,590,879 | |
| | | | | | |
Net Asset Value Per Share | Class A | Class C | Class I | Class Y | |
Net Assets ($) | 6,318,595 | 744,023 | 191,558,491 | 969,770 | |
Shares Outstanding | 274,777 | 32,347 | 8,326,791 | 42,160 | |
Net Asset Value Per Share ($) | 23.00 | 23.00 | 23.01 | 23.00 | |
See notes to financial statements.
21
STATEMENT OF OPERATIONS
Year Ended September 30, 2015
| | | | | | | |
| | | | | | |
| | | | | | |
Investment Income ($): | | | | |
Interest Income | | | 5,302,382 | |
Expenses: | | | | |
Investment advisory fee—Note 3(a) | | | 722,463 | |
Administration fee—Note 3(a) | | | 108,387 | |
Registration fees | | | 59,721 | |
Professional fees | | | 44,345 | |
Shareholder servicing costs—Note 3(c) | | | 39,971 | |
Prospectus and shareholders’ reports | | | 32,795 | |
Custodian fees—Note 3(c) | | | 14,605 | |
Trustees' fees and expenses—Note 3(d) | | | 11,918 | |
Distribution fees—Note 3(b) | | | 7,011 | |
Loan commitment fees—Note 2 | | | 2,170 | |
Miscellaneous | | | 42,291 | |
Total Expenses | | | 1,085,677 | |
Less—reduction in expenses due to undertaking—Note 3(a) | | | (244,459) | |
Less—reduction in fees due to earnings credits—Note 3(c) | | | (18) | |
Net Expenses | | | 841,200 | |
Investment Income—Net | | | 4,461,182 | |
Realized and Unrealized Gain (Loss) on Investments—Note 4 ($): | | |
Net realized gain (loss) on investments and foreign currency transactions | 872,217 | |
Net realized gain (loss) on forward foreign currency exchange contracts | 671,988 | |
Net Realized Gain (Loss) | | | 1,544,205 | |
Net unrealized appreciation (depreciation) on investments | | | (1,629,971) | |
Net Realized and Unrealized Gain (Loss) on Investments | | | (85,766) | |
Net Increase in Net Assets Resulting from Operations | | 4,375,416 | |
See notes to financial statements.
22
STATEMENT OF CHANGES IN NET ASSETS
| | | | | | | | | | |
| | | | | | | | | | |
| | | | Year Ended September 30, |
| | | | 2015 | | | | 2014 | |
Operations ($): | | | | | | | | |
Investment income—net | | | 4,461,182 | | | | 3,553,171 | |
Net realized gain (loss) on investments | | 1,544,205 | | | | 549,300 | |
Net unrealized appreciation (depreciation)
on investments | | (1,629,971) | | | | 3,170,912 | |
Net Increase (Decrease) in Net Assets
Resulting from Operations | 4,375,416 | | | | 7,273,383 | |
Dividends to Shareholders from ($): | | | | | | | | |
Investment income—net: | | | | | | | | |
Class A | | | (149,596) | | | | (132,161) | |
Class C | | | (13,923) | | | | (20,494) | |
Class I | | | (4,251,640) | | | | (3,380,066) | |
Class Y | | | (27,544) | | | | (4,424) | |
Net realized gain on investments: | | | | | | | | |
Class A | | | (52,563) | | | | - | |
Class C | | | (8,122) | | | | - | |
Class I | | | (1,149,150) | | | | - | |
Class Y | | | (9,154) | | | | - | |
Total Dividends | | | (5,661,692) | | | | (3,537,145) | |
Beneficial Interest Transactions ($): | | | | | | | | |
Net proceeds from shares sold: | | | | | | | | |
Class A | | | 1,661,571 | | | | 1,665,136 | |
Class C | | | 143,478 | | | | 68,355 | |
Class I | | | 75,643,160 | | | | 80,162,182 | |
Class Y | | | 276,000 | | | | 1,017,447 | |
Dividends reinvested: | | | | | | | | |
Class A | | | 192,778 | | | | 125,735 | |
Class C | | | 22,016 | | | | 20,208 | |
Class I | | | 4,381,986 | | | | 2,764,779 | |
Class Y | | | 30,960 | | | | 3,142 | |
Cost of shares redeemed: | | | | | | | | |
Class A | | | (1,657,191) | | | | (2,677,697) | |
Class C | | | (414,752) | | | | (955,844) | |
Class I | | | (32,741,225) | | | | (64,499,441) | |
Class Y | | | (355,287) | | | | - | |
Increase (Decrease) in Net Assets
from Beneficial Interest Transactions | 47,183,494 | | | | 17,694,002 | |
Total Increase (Decrease) in Net Assets | 45,897,218 | | | | 21,430,240 | |
Net Assets ($): | | | | | | | | |
Beginning of Period | | | 153,693,661 | | | | 132,263,421 | |
End of Period | | | 199,590,879 | | | | 153,693,661 | |
Undistributed investment income—net | 602 | | | | 1,984 | |
23
STATEMENT OF CHANGES IN NET ASSETS (continued)
| | | | | | | | | | |
| | | | | | | | | | |
| | | | Year Ended September 30, |
| | | | 2015 | | | | 2014 | |
Capital Share Transactions: | | | | | | | | |
Class A | | | | | | | | |
Shares sold | | | 71,706 | | | | 72,867 | |
Shares issued for dividends reinvested | | | 8,360 | | | | 5,490 | |
Shares redeemed | | | (71,950) | | | | (117,866) | |
Net Increase (Decrease) in Shares Outstanding | 8,116 | | | | (39,509) | |
Class C | | | | | | | | |
Shares sold | | | 6,212 | | | | 3,000 | |
Shares issued for dividends reinvested | | | 954 | | | | 883 | |
Shares redeemed | | | (18,055) | | | | (41,761) | |
Net Increase (Decrease) in Shares Outstanding | (10,889) | | | | (37,878) | |
Class Ia | | | | | | | | |
Shares sold | | | 3,273,865 | | | | 3,523,025 | |
Shares issued for dividends reinvested | | | 190,044 | | | | 120,645 | |
Shares redeemed | | | (1,419,091) | | | | (2,834,303) | |
Net Increase (Decrease) in Shares Outstanding | 2,044,818 | | | | 809,367 | |
Class Ya | | | | | | | | |
Shares sold | | | 11,876 | | | | 44,122 | |
Shares issued for dividends reinvested | | | 1,342 | | | | 136 | |
Shares redeemed | | | (15,360) | | | | - | |
Net Increase (Decrease) in Shares Outstanding | (2,142) | | | | 44,258 | |
a During the period ended September 30, 2014, 31,115 Class I shares representing $716,584 were exchanged for 31,115 Class Y shares. | |
See notes to financial statements.
24
FINANCIAL HIGHLIGHTS
The following tables describe the performance for each share class for the fiscal periods indicated. All information (except portfolio turnover rate) reflects financial results for a single fund share. Total return shows how much your investment in the fund would have increased (or decreased) during each period, assuming you had reinvested all dividends and distributions. These figures have been derived from the fund’s financial statements.
| | | | | | | |
| | | | | |
| | Year Ended September 30, |
Class A Shares | | 2015 | 2014 | 2013 | 2012 | 2011 |
Per Share Data ($): | | | | | | |
Net asset value, beginning of period | 23.15 | 22.56 | 23.44 | 23.05 | 22.95 |
Investment Operations: | | | | | | |
Investment income—neta | .52 | .49 | .51 | .53 | .61 |
Net realized and unrealized gain (loss) on investments | .02 | .59 | (.76) | .64 | .14 |
Total from Investment Operations | .54 | 1.08 | (.25) | 1.17 | .75 |
Distributions: | | | | | | |
Dividends from Investment income—net | (.51) | (.49) | (.51) | (.52) | (.62) |
Dividends from net realized gain on investments | (.18) | — | (.12) | (.26) | (.03) |
Total Distributions | (.69) | (.49) | (.63) | (.78) | (.65) |
Net asset value, end of period | 23.00 | 23.15 | 22.56 | 23.44 | 23.05 |
Total Return (%)b | 2.38 | 4.84 | (1.10) | 5.19 | 3.38 |
Ratios/Supplemental Data (%): | | | | | |
Ratio of total expenses to average net assets | .89 | .95 | .89 | .90 | .98 |
Ratio of net expenses to average net assets | | .70 | .70 | .70 | .80 | .80 |
Ratio of net investment income to average net assets | 2.24 | 2.15 | 2.20 | 2.25 | 2.72 |
Portfolio Turnover Rate | 29.93 | 26.01 | 35.03 | 21.97 | 27.67 |
Net Assets, end of period ($ x 1,000) | 6,319 | 6,173 | 6,908 | 6,639 | 4,760 |
a Based on average shares outstanding.
b Exclusive of sales charge.
See notes to financial statements.
25
FINANCIAL HIGHLIGHTS (continued)
| | | | | | | |
| | | | | |
| | Year Ended September 30, |
Class C Shares | | 2015 | 2014 | 2013 | 2012 | 2011 |
Per Share Data ($): | | | | | | |
Net asset value, beginning of period | 23.16 | 22.57 | 23.45 | 23.05 | 22.95 |
Investment Operations: | | | | | | |
Investment income—neta | .35 | .32 | .33 | .35 | .45 |
Net realized and unrealized gain (loss) on investments | .01 | .59 | (.75) | .66 | .13 |
Total from Investment Operations | .36 | .91 | (.42) | 1.01 | .58 |
Distributions: | | | | | | |
Dividends from investment income—net | (.34) | (.32) | (.34) | (.35) | (.45) |
Dividends from net realized gain on investments | (.18) | — | (.12) | (.26) | (.03) |
Total Distributions | (.52) | (.32) | (.46) | (.61) | (.48) |
Net asset value, end of period | 23.00 | 23.16 | 22.57 | 23.45 | 23.05 |
Total Return (%)b | 1.58 | 4.07 | (1.80) | 4.39 | 2.60 |
Ratios/Supplemental Data (%): | | | | | |
Ratio of total expenses to average net assets | 1.69 | 1.75 | 1.65 | 1.67 | 1.73 |
Ratio of net expenses to average net assets | 1.45 | 1.45 | 1.45 | 1.55 | 1.55 |
Ratio of net investment income to average net assets | 1.49 | 1.40 | 1.45 | 1.48 | 1.99 |
Portfolio Turnover Rate | 29.93 | 26.01 | 35.03 | 21.97 | 27.67 |
Net Assets, end of period ($ x 1,000) | 744 | 1,001 | 1,831 | 2,045 | 719 |
a Based on average shares outstanding.
b Exclusive of sales charge.
See notes to financial statements.
26
| | | | | | | | | |
| | | | | |
| | Year Ended September 30, |
Class I Shares | | 2015 | 2014 | 2013 | 2012 | 2011 | |
Per Share Data ($): | | | | | | | |
Net asset value, beginning of period | 23.16 | 22.57 | 23.45 | 23.06 | 22.95 | |
Investment Operations: | | | | | | | |
Investment income—neta | .57 | .55 | .57 | .60 | .70 | |
Net realized and unrealized gain (loss) on investments | .03 | .59 | (.76) | .65 | .14 | |
Total from Investment Operations | .60 | 1.14 | (.19) | 1.25 | .84 | |
Distributions: | | | | | | | |
Dividends from Investment income—net | (.57) | (.55) | (.57) | (.60) | (.70) | |
Dividends from net realized gain on investments | (.18) | — | (.12) | (.26) | (.03) | |
Total Distributions | (.75) | (.55) | (.69) | (.86) | (.73) | |
Net asset value, end of period | 23.01 | 23.16 | 22.57 | 23.45 | 23.06 | |
Total Return (%) | 2.63 | 5.11 | (.85) | 5.54 | 3.79 | |
Ratios/Supplemental Data (%): | | | | | | |
Ratio of total expenses to average net assets | .58 | .68 | .61 | .61 | .63 | |
Ratio of net expenses to average net assets | .45 | .45 | .45 | .45 | .45 | |
Ratio of net investment income to average net assets | 2.48 | 2.40 | 2.45 | 2.61 | 3.10 | |
Portfolio Turnover Rate | 29.93 | 26.01 | 35.03 | 21.97 | 27.67 | |
Net Assets, end of period ($ x 1,000) | 191,558 | 145,493 | 123,524 | 128,217 | 128,398 | |
a Based on average shares outstanding.
See notes to financial statements.
27
FINANCIAL HIGHLIGHTS (continued)
| | | | | | | | |
| | | | |
| | Year Ended September 30, |
Class Y Shares | 2015 | 2014 | 2013 | a |
Per Share Data ($): | | | | |
Net asset value, beginning of period | 23.16 | 22.57 | 22.60 | |
Investment Operations: | | | | |
Investment income—netb | .57 | .47 | .14 | |
Net realized and unrealized gain (loss) on investments | .02 | .68 | (.03) | |
Total from Investment Operations | .59 | 1.15 | .11 | |
Distributions: | | | | |
Dividends from Investment income—net | (.57) | (.56) | (.14) | |
Dividends from net realized gain on investments | (.18) | — | — | |
Total Distributions | (.75) | (.56) | (.14) | |
Net asset value, end of period | 23.00 | 23.16 | 22.57 | |
Total Return (%) | 2.59 | 5.13 | .50 | c |
Ratios/Supplemental Data (%): | | | | |
Ratio of total expenses to average net assets | .59 | .66 | .58 | d |
Ratio of net expenses to average net assets | .45 | .45 | .45 | d |
Ratio of net investment income to average net assets | 2.48 | 2.40 | 2.57 | d |
Portfolio Turnover Rate | 29.93 | 26.01 | 35.03 | |
Net Assets, end of period ($ x 1,000) | 970 | 1,026 | 1 | |
a From July 1, 2013 (commencement of initial offering) to September 30, 2013.
b Based on average shares outstanding.
c Not annualized.
d Annualized.
See notes to financial statements.
28
NOTES TO FINANCIAL STATEMENTS
NOTE 1—Significant Accounting Policies:
Dreyfus Tax Sensitive Total Return Bond Fund (the “fund”) is a separate non-diversified series of Dreyfus Investment Funds (the “Trust”), (the “Company”), which is registered under the Investment Company Act of 1940, as amended (the “Act”), as an open-end management investment company and operates as a series company currently offering seven series, including the fund. The fund’s investment objective is to seek a high after-tax total return. The Dreyfus Corporation (the “Manager” or “Dreyfus”), a wholly-owned subsidiary of The Bank of New York Mellon Corporation (“BNY Mellon”), serves as the fund’s investment adviser. Standish Mellon Asset Management Company LLC (“Standish”), a wholly-owned subsidiary of BNY Mellon and an affiliate of Dreyfus, serves as the fund’s sub-investment adviser.
MBSC Securities Corporation (the “Distributor”), a wholly-owned subsidiary of Dreyfus, is the distributor of the fund’s shares. The fund is authorized to issue an unlimited number of $.001 par value shares of Beneficial Interest in each of the following classes of shares: Class A, Class C, Class I and Class Y. Class A and Class C shares are sold primarily to retail investors through financial intermediaries and bear Distribution and/or Shareholder Services Plan fees. Class A shares generally are subject to a sales charge imposed at the time of purchase. Class C shares are subject to a contingent deferred sales charge (“CDSC”) imposed on Class C shares redeemed within one year of purchase. Class I shares are sold primarily to bank trust departments and other financial service providers (including The Bank of New York Mellon, a subsidiary of BNY Mellon and an affiliate of Dreyfus, and its affiliates), acting on behalf of customers having a qualified trust or an investment account or relationship at such institution, and bear no Distribution or Shareholder Services Plan fees. Class Y shares are sold at net asset value per share generally to institutional investors, and bear no Distribution or Shareholder Services Plan fees. Class I and Class Y shares are offered without a front-end sales charge or CDSC. Other differences between the classes include the services offered to and the expenses borne by each class, the allocation of certain transfer agency costs, and certain voting rights. Income, expenses (other than expenses attributable to a specific class), and realized and unrealized gains or losses on investments are allocated to each class of shares based on its relative net assets.
The Trust accounts separately for the assets, liabilities and operations of each series. Expenses directly attributable to each series are charged to that
29
NOTES TO FINANCIAL STATEMENTS (continued)
series’ operations; expenses which are applicable to all series are allocated among them on a pro rata basis.
The Financial Accounting Standards Board (“FASB”) Accounting Standards Codification (“ASC”) is the exclusive reference of authoritative U.S. generally accepted accounting principles (“GAAP”) recognized by the FASB to be applied by nongovernmental entities. Rules and interpretive releases of the Securities and Exchange Commission (“SEC”) under authority of federal laws are also sources of authoritative GAAP for SEC registrants. The fund’s financial statements are prepared in accordance with GAAP, which may require the use of management estimates and assumptions. Actual results could differ from those estimates.
(a) Portfolio valuation: The fair value of a financial instrument is the amount that would be received to sell an asset or paid to transfer a liability in an orderly transaction between market participants at the measurement date (i.e., the exit price). GAAP establishes a fair value hierarchy that prioritizes the inputs of valuation techniques used to measure fair value. This hierarchy gives the highest priority to unadjusted quoted prices in active markets for identical assets or liabilities (Level 1 measurements) and the lowest priority to unobservable inputs (Level 3 measurements).
Additionally, GAAP provides guidance on determining whether the volume and activity in a market has decreased significantly and whether such a decrease in activity results in transactions that are not orderly. GAAP requires enhanced disclosures around valuation inputs and techniques used during annual and interim periods.
Various inputs are used in determining the value of the fund’s investments relating to fair value measurements. These inputs are summarized in the three broad levels listed below:
Level 1—unadjusted quoted prices in active markets for identical investments.
Level 2—other significant observable inputs (including quoted prices for similar investments, interest rates, prepayment speeds, credit risk, etc.).
Level 3—significant unobservable inputs (including the fund’s own assumptions in determining the fair value of investments).
The inputs or methodology used for valuing securities are not necessarily an indication of the risk associated with investing in those securities.
30
Changes in valuation techniques may result in transfers in or out of an assigned level within the disclosure hierarchy. Valuation techniques used to value the fund’s investments are as follows:
Registered investment companies that are not traded on an exchange are valued at their net asset value and are generally categorized within Level 1 of the fair value hierarchy.
Investments in securities, excluding short-term investments (other than U.S. Treasury Bills), are valued each business day by an independent pricing service (the “Service”) approved by the Trust’s Board of Trustees. Investments for which quoted bid prices are readily available and are representative of the bid side of the market in the judgment of the Service are valued at the mean between the quoted bid prices (as obtained by the Service from dealers in such securities) and asked prices (as calculated by the Service based upon its evaluation of the market for such securities). Other investments (which constitute a majority of the portfolio securities) are valued as determined by the Service, based on methods which include consideration of the following: yields or prices of securities of comparable quality, coupon, maturity and type; indications as to values from dealers; and general market conditions. These securities are generally categorized within Level 2 of the fair value hierarchy.
The Service’s procedures are reviewed by Dreyfus under the general supervision of the Board.
When market quotations or official closing prices are not readily available, or are determined not to reflect accurately fair value, such as when the value of a security has been significantly affected by events after the close of the exchange or market on which the security is principally traded (for example, a foreign exchange or market), but before the fund calculates its net asset value, the fund may value these investments at fair value as determined in accordance with the procedures approved by the Board. Certain factors may be considered when fair valuing investments such as: fundamental analytical data, the nature and duration of restrictions on disposition, an evaluation of the forces that influence the market in which the securities are purchased and sold, and public trading in similar securities of the issuer or comparable issuers. These securities are either categorized within Level 2 or 3 of the fair value hierarchy depending on the relevant inputs used.
For restricted securities where observable inputs are limited, assumptions about market activity and risk are used and are generally categorized within Level 3 of the fair value hierarchy.
31
NOTES TO FINANCIAL STATEMENTS (continued)
Investments denominated in foreign currencies are translated to U.S. dollars at the prevailing rates of exchange.
Forward foreign currency exchange contracts (“forward contracts”) are valued at the forward rate and are generally categorized within Level 2 of the fair value hierarchy.
The following is a summary of the inputs used as of September 30, 2015 in valuing the fund’s investments:
| | | | | |
Assets ($) | Level 1 Unadjusted Quoted Prices | Level 2 - Other Significant Observable Inputs | Level 3 Significant Unobservable Inputs | Total |
Investments in Securities: |
Asset-Backed | — | 5,772,517 | - | 5,772,517 |
Commercial Mortgage-Backed | — | 1,255,693 | - | 1,255,693 |
Corporate Bonds† | — | 8,745,971 | - | 8,745,971 |
Municipal Bonds† | — | 181,754,048 | - | 181,754,048 |
† See Statement of Investments for additional detailed categorizations.
At September 30, 2015, there were no transfers between Level 1 and Level 2 of the fair value hierarchy.
(b) Foreign currency transactions: The fund does not isolate that portion of the results of operations resulting from changes in foreign exchange rates on investments from the fluctuations arising from changes in the market prices of securities held. Such fluctuations are included with the net realized and unrealized gain or loss on investments.
Net realized foreign exchange gains or losses arise from sales of foreign currencies, currency gains or losses realized on securities transactions between trade and settlement date, and the difference between the amounts of dividends, interest and foreign withholding taxes recorded on the fund’s books and the U.S. dollar equivalent of the amounts actually received or paid. Net unrealized foreign exchange gains and losses arise from changes in the value of assets and liabilities other than investments resulting from changes in exchange rates. Foreign currency gains and losses on foreign currency transactions are also included with net realized and unrealized gain or loss on investments.
(c) Securities transactions and investment income: Securities transactions are recorded on a trade date basis. Realized gains and losses from securities transactions are recorded on the identified cost basis. Interest income, adjusted for accretion of discount and amortization of premium on investments, is earned from settlement date and recognized
32
on the accrual basis. Securities purchased or sold on a when issued or delayed delivery basis may be settled a month or more after the trade date.
(d) Risk: The fund invests primarily in debt securities. Failure of an issuer of the debt securities to make timely interest or principal payments, or a decline or the perception of a decline in the credit quality of a debt security, can cause the debt security’s price to fall, potentially lowering the fund’s share price. In addition, the value of debt securities may decline due to general market conditions that are not specifically related to a particular issuer, such as real or perceived adverse economic conditions, changes in outlook for corporate earnings, changes in interest or currency rates or adverse investor sentiment. They may also decline because of factors that affect a particular industry.
(e) Dividends to shareholders: It is the policy of the fund to declare dividends daily from investment income-net. Such dividends are paid monthly. Dividends from net realized capital gains, if any, are normally declared and paid annually, but the fund may make distributions on a more frequent basis to comply with the distribution requirements of the Internal Revenue Code of 1986, as amended (the “Code”). To the extent that net realized capital gains can be offset by capital loss carryovers, it is the policy of the fund not to distribute such gains. Income and capital gain distributions are determined in accordance with income tax regulations, which may differ from GAAP.
(f) Federal income taxes: It is the policy of the fund to continue to qualify as a regulated investment company, which can distribute tax-exempt dividends, by complying with the applicable provisions of the Code, and to make distributions of income and net realized capital gain sufficient to relieve it from substantially all federal income and excise taxes.
As of and during the period ended September 30, 2015, the fund did not have any liabilities for any uncertain tax positions. The fund recognizes interest and penalties, if any, related to uncertain tax positions as income tax expense in the Statement of Operations. During the period ended September 30, 2015, the fund did not incur any interest or penalties.
Each tax year in the four-year period ended September 30, 2015 remains subject to examination by the Internal Revenue Service and state taxing authorities.
At September 30, 2015, the components of accumulated earnings on a tax basis were as follows: undistributed tax-exempt income $9,543, undistributed ordinary income $528,598, undistributed capital gains $339,686 and unrealized appreciation $5,912,498.
33
NOTES TO FINANCIAL STATEMENTS (continued)
The tax character of distributions paid to shareholders during the fiscal periods ended September 30, 2015 and September 30, 2014 were as follows: tax-exempt income $3,740,024 and $3,424,477, ordinary income $990,581 and $112,668, and long-term capital gains $931,087 and $0, respectively.
During the period ended September 30, 2015, as a result of permanent book to tax differences, primarily due to the tax treatment for amortization adjustments and paydown gains and losses, the fund decreased accumulated undistributed investment income-net by $19,861, increased accumulated net realized gain (loss) on investments by $16,878 and increased paid-in capital by $2,983. Net assets and net asset value per share were not affected by this reclassification.
NOTE 2—Bank Lines of Credit:
The fund participates with other Dreyfus-managed funds in a $430 million unsecured credit facility led by Citibank, N.A. and a $300 million unsecured credit facility provided by The Bank of New York Mellon (each, a “Facility”), each to be utilized primarily for temporary or emergency purposes, including the financing of redemptions. Prior to October 8, 2014, the unsecured credit facility with Citibank, N.A. was $265 million. In connection therewith, the fund has agreed to pay its pro rata portion of commitment fees for each Facility. Interest is charged to the fund based on rates determined pursuant to the terms of the respective Facility at the time of borrowing. During the period ended September 30, 2015, the fund did not borrow under the Facilities.
NOTE 3—Investment Advisory Fee, Administration Fee and Other Transactions with Affiliates:
(a) Pursuant to an investment advisory agreement with Dreyfus, the fund has agreed to pay an investment advisory fee at the annual rate of .40% of the value of the fund’s average daily net assets and is payable monthly. Dreyfus has contractually agreed, from October 1, 2015 through February 1, 2016, to waive receipt of its fees and assume the direct expenses of the fund so that the expenses of none of the classes (excluding Rule 12b-1 Distribution Plan fees, Shareholder Services Plan fees, taxes, interest expense, brokerage commissions, commitment fees on borrowings and extraordinary expenses) exceed .45% of the value of the fund’s average daily net assets. The reduction in expenses, pursuant to the undertaking, amounted to $244,459 during the year ended September 30, 2015.
Pursuant to a sub-investment advisory agreement between Dreyfus and Standish, Standish serves as the fund’s sub-investment adviser responsible for the day-to–day management of the fund’s portfolio. Dreyfus pays the
34
sub-investment adviser a monthly fee at an annual percentage of the value of the fund’s average daily net asset. Dreyfus has obtained an exemptive order from the SEC (the “Order”), upon which the fund may rely, to use a manager of managers approach that permits Dreyfus, subject to certain conditions and approval by the Board, to enter into and materially amend sub-investment advisory agreements with one or more sub-investment advisers who are either unaffiliated with Dreyfus or are wholly-owned subsidiaries (as defined under the Act) of Dreyfus’ ultimate parent company, BNY Mellon, without obtaining shareholder approval. The Order also allows the fund to disclose the sub-investment advisory fee paid by Dreyfus to any unaffiliated sub-investment adviser in the aggregate with other unaffiliated sub-investment advisers in documents filed with the SEC and provided to shareholders. In addition, pursuant to the Order, it is not necessary to disclose the sub-investment advisory fee payable by Dreyfus separately to a sub-investment adviser that is a wholly-owned subsidiary of BNY Mellon in documents filed with the SEC and provided to shareholders; such fees are to be aggregated with fees payable to Dreyfus. Dreyfus has ultimate responsibility (subject to oversight by the Board) to supervise any sub-investment adviser and recommend the hiring, termination, and replacement of any sub-investment adviser to the Board.
The fund has a Fund Accounting and Administrative Services Agreement (the “Administration Agreement”) with Dreyfus, whereby Dreyfus performs administrative, accounting and recordkeeping services for the fund. The fund has agreed to compensate Dreyfus for providing accounting and recordkeeping services, administration, compliance monitoring, regulatory and shareholder reporting, as well as related facilities, equipment and clerical help. The fee is based on the fund’s average daily net assets and computed at the following annual rates: .06% of the first $500 million, .04% of the next $500 million and .02% in excess of $1 billion.
In addition, after applying any expense limitations or fee waivers that reduce the fees paid to Dreyfus for this service, Dreyfus has contractually agreed in writing to waive any remaining fees for this service to the extent that they exceed both Dreyfus’ costs in providing these services and a reasonable allocation of the costs incurred by Dreyfus and its affiliates related to the support and oversight of these services. The fund also reimburses Dreyfus for the out-of-pocket expenses incurred in performing this service for the fund. Pursuant to the Administration Agreement, the fund was charged $108,387 during the period ended September 30, 2015.
(b) Under the Distribution Plan adopted pursuant to Rule 12b-1 under the Act, Class C shares pay the Distributor for distributing its shares at an
35
NOTES TO FINANCIAL STATEMENTS (continued)
annual rate of .75% of the value of its average daily net assets. During the period ended September 30, 2015, Class C shares were charged $7,011 pursuant to the Distribution Plan.
(c) Under the Shareholder Services Plan, Class A and Class C shares pay the Distributor at an annual rate of .25% of the value of their average daily net assets for the provision of certain services. The services provided may include personal services relating to shareholder accounts, such as answering shareholder inquiries regarding the fund and providing reports and other information, and services related to the maintenance of shareholder accounts. The Distributor may make payments to Service Agents (securities dealers, financial institutions or other industry professionals) with respect to these services. The Distributor determines the amounts to be paid to Service Agents. During the period ended September 30, 2015, Class A and Class C shares were charged $16,800 and $2,337, respectively, pursuant to the Shareholder Services Plan.
Under its terms, the Distribution Plan and Shareholder Services Plan shall remain in effect from year to year, provided such continuance is approved annually by a vote of a majority of those Trustees who are not “interested persons” of the Trust and who have no direct or indirect financial interest in the operation of or in any agreement related to the Distribution Plan or Shareholder Services Plan.
The fund has arrangements with the transfer agent and the custodian whereby the fund may receive earnings credits when positive cash balances are maintained, which are used to offset transfer agency and custody fees. For financial reporting purposes, the fund includes net earnings credits as an expense offset in the Statement of Operations.
The fund compensates Dreyfus Transfer, Inc., a wholly-owned subsidiary of Dreyfus, under a transfer agency agreement for providing transfer agency and cash management services for the fund. The majority of transfer agency fees are comprised of amounts paid on a per account basis, while cash management fees are related to fund subscriptions and redemptions. During the period ended September 30, 2015, the fund was charged $9,030 for transfer agency services and $431 for cash management services. These fees are included in Shareholder servicing costs in the Statement of Operations. Cash management fees were partially offset by earnings credits of $18.
The fund compensates The Bank of New York Mellon under a custody agreement for providing custodial services for the fund. These fees are determined based on net assets, geographic region and transaction activity.
36
During the period ended September 30, 2015, the fund was charged $14,605 pursuant to the custody agreement.
During the period ended September 30, 2015, the fund was charged $11,078 for services performed by the Chief Compliance Officer and his staff.
The components of “Due to The Dreyfus Corporation and affiliates” in the Statement of Assets and Liabilities consist of: investment advisory fees $65,578, administration fees $9,837, Distribution Plan fees $459, Shareholder Services Plan fees $1,441, custodian fees $6,990, Chief Compliance Officer fees $2,606 and transfer agency fees $1,566, which are offset against an expense reimbursement currently in effect in the amount of $16,829.
(d) Each Board member also serves as a Board member of other funds within the Dreyfus complex. Annual retainer fees and attendance fees are allocated to each fund based on net assets.
NOTE 4—Securities Transactions:
The aggregate amount of purchases and sales (including paydowns) of investment securities, excluding short-term securities and forward contracts, during the period ended September 30, 2015, amounted to $102,489,331 and $52,377,334, respectively.
Derivatives: A derivative is a financial instrument whose performance is derived from the performance of another asset. The fund enters into International Swaps and Derivatives Association, Inc. Master Agreements or similar agreements (collectively, “Master Agreements”) with its over-the-counter (“OTC”) derivative contract counterparties in order to, among other things, reduce its credit risk to counterparties. Master Agreements include provisions for general obligations, representations, collateral and events of default or termination. Under a Master Agreement, the fund may offset with the counterparty certain derivative financial instrument’s payables and/or receivables with collateral held and/or posted and create one single net payment in the event of default or termination.
Each type of derivative instrument that was held by the fund during the period ended September 30, 2015 is discussed below.
Forward Foreign Currency Exchange Contracts: The fund enters into forward contracts in order to hedge its exposure to changes in foreign currency exchange rates on its foreign portfolio holdings, to settle foreign currency transactions or as a part of its investment strategy. When executing forward contracts, the fund is obligated to buy or sell a foreign
37
NOTES TO FINANCIAL STATEMENTS (continued)
currency at a specified rate on a certain date in the future. With respect to sales of forward contracts, the fund incurs a loss if the value of the contract increases between the date the forward contract is opened and the date the forward contract is closed. The fund realizes a gain if the value of the contract decreases between those dates. With respect to purchases of forward contracts, the fund incurs a loss if the value of the contract decreases between the date the forward contract is opened and the date the forward contract is closed. The fund realizes a gain if the value of the contract increases between those dates. Any realized or unrealized gains or losses which occurred during the period are reflected in the Statement of Operations. The fund is exposed to foreign currency risk as a result of changes in value of underlying financial instruments. The fund is also exposed to credit risk associated with counterparty nonperformance on these forward contracts, which is generally limited to the unrealized gain on each open contract. This risk may be mitigated by Master Agreements, if any, between the fund and the counterparty and the posting of collateral, if any, by the counterparty to the fund to cover the fund’s exposure to the counterparty. At September 30, 2015, there were no forward contracts outstanding.
The following summarizes the average market value of derivatives outstanding during the period ended September 30, 2015:
| | | | | |
| | | | | Average Market Value ($) |
Forward contracts | | | | 9,391,043 |
At September 30, 2015, the cost of investments for federal income tax purposes was $191,615,731; accordingly, accumulated net unrealized appreciation on investments was $5,912,498, consisting of $6,856,072 gross unrealized appreciation and $943,574 gross unrealized depreciation.
38
REPORT OF INDEPENDENT REGISTERED
PUBLIC ACCOUNTING FIRM
The Board of Trustees and Shareholders of
Dreyfus Investment Funds
We have audited the accompanying statement of assets and liabilities of Dreyfus Tax Sensitive Total Return Bond Fund. (the “Fund”), a series of Dreyfus Investment Funds, including the statement of investments, as of September 30, 2015, and the related statement of operations for the year then ended, the statements of changes in net assets for each of the years in the two-year period then ended, and the financial highlights for each of the years or period in the five-year period then ended. These financial statements and financial highlights are the responsibility of the Fund’s management. Our responsibility is to express an opinion on these financial statements and financial highlights based on our audits.
We conducted our audits in accordance with the standards of the Public Company Accounting Oversight Board (United States). Those standards require that we plan and perform the audit to obtain reasonable assurance about whether the financial statements and financial highlights are free of material misstatement. An audit includes examining, on a test basis, evidence supporting the amounts and disclosures in the financial statements. Our procedures included confirmation of securities owned as of September 30, 2015, by correspondence with the custodian and brokers or by other appropriate auditing procedures. An audit also includes assessing the accounting principles used and significant estimates made by management, as well as evaluating the overall financial statement presentation. We believe that our audits provide a reasonable basis for our opinion.
In our opinion, the financial statements and financial highlights referred to above present fairly, in all material respects, the financial position of Dreyfus Tax Sensitive Total Return Bond Fund as of September 30, 2015, the results of its operations for the year then ended, the changes in its net assets for each of the years in the two-year period then ended, and the financial highlights for each of the years or periods in the five-year period then ended, in conformity with U.S. generally accepted accounting principles.

New York, New York
November 25, 2015
39
IMPORTANT TAX INFORMATION (Unaudited)
In accordance with federal tax law, the fund hereby reports all the dividends paid from investment income-net during its fiscal year ended September 30, 2015 as “exempt-interest dividends” (not generally subject to regular federal income tax), except $702,679 that is being reported as an ordinary income distribution for reporting purposes. Where required by federal tax law rules, shareholders will receive notification of their portion of the fund’s taxable ordinary dividends (if any), capital gains distributions (if any) and tax-exempt dividends paid for the 2015 calendar year on Form 1099-DIV, which will be mailed in early 2016. The fund reports the maximum amount allowable but not less than $.1368 per share as a capital gain dividend in accordance with Section 852(b)(3)(C) of the Internal Revenue Code. The fund reports the maximum amount allowable but not less than $.0423 per share as a short-term capital gain dividend in accordance with Sections 871(k)(2) and 881(e) of the Internal Revenue Code.
40
BOARD MEMBERS INFORMATION (Unaudited)
INDEPENDENT BOARD MEMBERS
Joseph S. DiMartino (71)
Chairman of the Board (2008)
Principal Occupation During Past 5 Years:
· Corporate Director and Trustee (1995-present)
Other Public Company Board Memberships During Past 5 Years:
· CBIZ (formerly, Century Business Services, Inc.), a provider of outsourcing functions for small and medium size companies, Director (1997-present)
· The Newark Group, a provider of a national market of paper recovery facilities, paperboard mills and paperboard converting plants, Director (2000-2010)
No. of Portfolios for which Board Member Serves: 142
———————
Francine J. Bovich (64)
Board Member (2011)
Principal Occupation During Past 5 Years:
· Trustee, The Bradley Trusts, private trust funds (2011-present)
· Managing Director, Morgan Stanley Investment Management (1993-2010)
Other Public Company Board Memberships During Past 5 Years:
· Annaly Capital Management, Inc., Board Member (May 2014-present)
No. of Portfolios for which Board Member Serves: 80
———————
Kenneth A. Himmel (69)
Board Member (2008)
Principal Occupation During Past 5 Years:
· Managing Partner, Gulf Related, an international real estate development company (2010-present)
· President and CEO, Related Urban Development, a real estate development company (1996-present)
· President and CEO, Himmel & Company, a real estate development company (1980-present)
· CEO, American Food Management, a restaurant company (1983-present)
No. of Portfolios for which Board Member Serves: 30
———————
41
BOARD MEMBERS INFORMATION (Unaudited) (continued)
INDEPENDENT BOARD MEMBERS (continued)
Stephen J. Lockwood (68)
Board Member (2008)
Principal Occupation During Past 5 Years:
· Chairman of the Board, Stephen J. Lockwood and Company LLC, a real estate investment company (2000-present)
No. of Portfolios for which Board Member Serves: 30
———————
Roslyn M. Watson (65)
Board Member (2008)
Principal Occupation During Past 5 Years:
· Principal, Watson Ventures, Inc., a real estate investment company (1993-present)
No. of Portfolios for which Board Member Serves: 66
———————
Benaree Pratt Wiley (69)
Board Member (2008)
Principal Occupation During Past 5 Years:
· Principal, The Wiley Group, a firm specializing in strategy and business development (2005-present)
Other Public Company Board Memberships During Past 5 Years:
· CBIZ (formerly, Century Business Services, Inc.), a provider of outsourcing functions for small and medium size companies, Director (2008-present)
No. of Portfolios for which Board Member Serves: 66
———————
Once elected all Board Members serve for an indefinite term, but achieve Emeritus status upon reaching age 80. The address of the Board Members and Officers is c/o The Dreyfus Corporation, 200 Park Avenue, New York, New York 10166. Additional information about the Board Members is available in the fund's Statement of Additional Information which can be obtained from Dreyfus free of charge by calling this toll free number: 1-800-DREYFUS.
James M. Fitzgibbons, Emeritus Board Member
42
OFFICERS OF THE FUND (Unaudited)
BRADLEY J. SKAPYAK, President since January 2010.
Chief Operating Officer and a director of the Manager since June 2009, Chairman of Dreyfus Transfer, Inc., an affiliate of the Manager and the transfer agent of the funds, since May 2011 and Executive Vice President of the Distributor since June 2007. From April 2003 to June 2009, Mr. Skapyak was the head of the Investment Accounting and Support Department of the Manager. He is an officer of 68 investment companies (comprised of 142 portfolios) managed by the Manager. He is 56 years old and has been an employee of the Manager since February 1988.
BENNETT A. MACDOUGALL, Chief Legal Officer since October 2015
Chief Legal Officer of the Manager since June 2015; from June 2005 to June 2015, Director and Associate General Counsel of Deutsche Bank – Asset & Wealth Management Division, and Chief Legal Officer of Deutsche Investment Management Americas Inc. He is an officer of 69 investment companies (comprised of 167 portfolios) managed by the Manager. He is 44 years old and has been an employee of the Manager since June 2015.
JANETTE E. FARRAGHER, Vice President and Secretary since December 2011.
Assistant General Counsel of BNY Mellon, and an officer of 69 investment companies (comprised of 167 portfolios) managed by the Manager. She is 52 years old and has been an employee of the Manager since February 1984.
JAMES BITETTO, Vice President and Assistant Secretary since December 2008.
Managing Counsel of BNY Mellon and Secretary of the Manager, and an officer of 69 investment companies (comprised of 167 portfolios) managed by the Manager. He is 49 years old and has been an employee of the Manager since December 1996.
JONI LACKS CHARATAN, Vice President and Assistant Secretary since December 2008.
Managing Counsel of BNY Mellon, and an officer of 69 investment companies (comprised of 167 portfolios) managed by the Manager. She is 59 years old and has been an employee of the Manager since October 1988.
JOSEPH M. CHIOFFI, Vice President and Assistant Secretary since December 2008.
Managing Counsel of BNY Mellon, and an officer of 69 investment companies (comprised of 167 portfolios) managed by the Manager. He is 53 years old and has been an employee of the Manager since June 2000.
JOHN B. HAMMALIAN, Vice President and Assistant Secretary since December 2008.
Senior Managing Counsel of BNY Mellon, and an officer of 69 investment companies (comprised of 167 portfolios) managed by the Manager. He is 52 years old and has been an employee of the Manager since February 1991.
MAUREEN E. KANE, Vice President and Assistant Secretary since April 2015.
Managing Counsel of BNY Mellon since July 2014; from October 2004 until July 2014, General Counsel, and from May 2009 until July 2014, Chief Compliance Officer of Century Capital Management. She is an officer of 69 investment companies (comprised of 167 portfolios) managed by the Manager. She is 53 years old and has been an employee of the Manager since July 2014.
SARAH S. KELLEHER, Vice President and Assistant Secretary since April 2014.
Senior Counsel of BNY Mellon, and an officer of 69 investment companies (comprised of 167 portfolios) managed by the Manager; from August 2005 to March 2013, Associate General Counsel of Third Avenue Management. She is 40 years old and has been an employee of the Manager since March 2013.
JEFF PRUSNOFSKY, Vice President and Assistant Secretary since December 2008.
Senior Managing Counsel of BNY Mellon, and an officer of 69 investment companies (comprised of 167 portfolios) managed by the Manager. He is 50 years old and has been an employee of the Manager since October 1990.
JAMES WINDELS, Treasurer since December 2008.
Director – Mutual Fund Accounting of the Manager, and an officer of 69 investment companies (comprised of 167 portfolios) managed by the Manager. He is 57 years old and has been an employee of the Manager since April 1985.
43
OFFICERS OF THE FUND (Unaudited) (continued)
RICHARD CASSARO, Assistant Treasurer since December 2008.
Senior Accounting Manager – Money Market and Municipal Bond Funds of the Manager, and an officer of 69 investment companies (comprised of 167 portfolios) managed by the Manager. He is 56 years old and has been an employee of the Manager since September 1982.
GAVIN C. REILLY, Assistant Treasurer since December 2008.
Tax Manager of the Investment Accounting and Support Department of the Manager, and an officer of 69 investment companies (comprised of 167 portfolios) managed by the Manager. He is 47 years old and has been an employee of the Manager since April 1991.
ROBERT S. ROBOL, Assistant Treasurer since December 2008.
Senior Accounting Manager – Fixed Income Funds of the Manager, and an officer of 69 investment companies (comprised of 167 portfolios) managed by the Manager. He is 51 years old and has been an employee of the Manager since October 1988.
ROBERT SALVIOLO, Assistant Treasurer since December 2008.
Senior Accounting Manager – Equity Funds of the Manager, and an officer of 69 investment companies (comprised of 167 portfolios) managed by the Manager. He is 48 years old and has been an employee of the Manager since June 1989.
ROBERT SVAGNA, Assistant Treasurer since December 2008.
Senior Accounting Manager – Equity Funds of the Manager, and an officer of 69 investment companies (comprised of 167 portfolios) managed by the Manager. He is 48 years old and has been an employee of the Manager since November 1990.
JOSEPH W. CONNOLLY, Chief Compliance Officer since December 2008.
Chief Compliance Officer of the Manager and The Dreyfus Family of Funds (69 investment companies, comprised of 167 portfolios). He is 58 years old and has served in various capacities with the Manager since 1980, including manager of the firm’s Fund Accounting Department from 1997 through October 2001.
44
NOTES
45
Dreyfus Tax Sensitive Total Return Bond Fund
200 Park Avenue
New York, NY 10166
Manager
The Dreyfus Corporation
200 Park Avenue
New York, NY 10166
Sub-Investment Adviser
Standish Mellon Asset Management Company LLC
BNY Mellon Center
201 Washington Street
Suite 2900
Boston, MA 02108-4408
Custodian
The Bank of New York Mellon
225 Liberty Street
New York, NY 10286
Transfer Agent &
Dividend Disbursing Agent
Dreyfus Transfer, Inc.
200 Park Avenue
New York, NY 10166
Distributor
MBSC Securities Corporation
200 Park Avenue
New York, NY 10166
| | |
Ticker Symbols: | Class A: DSDAX Class C: DSDCX Class I: SDITX Class Y: SDYTX |
Telephone Call your financial representative or 1-800-DREYFUS
Mail The Dreyfus Family of Funds, 144 Glenn Curtiss Boulevard, Uniondale, NY 11556-0144
E-mail Send your request to info@dreyfus.com
Internet Information can be viewed online or downloaded at www.dreyfus.com
The fund files its complete schedule of portfolio holdings with the Securities and Exchange Commission (“SEC”) for the first and third quarters of each fiscal year on Form N-Q. The fund’s Forms N-Q are available on the SEC’s website at www.sec.gov and may be reviewed and copied at the SEC’s Public Reference Room in Washington, DC. (phone 1-800-SEC-0330 for information).
A description of the policies and procedures that the fund uses to determine how to vote proxies relating to portfolio securities and information regarding how the fund voted these proxies for the most recent 12-month period ended June 30 is available at www.dreyfus.com and on the SEC’s website at www.sec.gov and without charge, upon request, by calling 1-800-DREYFUS.
| | |
© 2015 MBSC Securities Corporation
6935AR0915 | 
|
Dreyfus/The Boston Company Small Cap Growth Fund
| | | |

| | ANNUAL REPORT
September 30, 2015 |
| |
Save time. Save paper. View your next shareholder report online as soon as it’s available. Log into www.dreyfus.com and sign up for Dreyfus eCommunications. It’s simple and only takes a few minutes. |
| |
The views expressed in this report reflect those of the portfolio manager only through the end of the period covered and do not necessarily represent the views of Dreyfus or any other person in the Dreyfus organization. Any such views are subject to change at any time based upon market or other conditions and Dreyfus disclaims any responsibility to update such views. These views may not be relied on as investment advice and, because investment decisions for a Dreyfus fund are based on numerous factors, may not be relied on as an indication of trading intent on behalf of any Dreyfus fund. |
| |
Not FDIC-Insured • Not Bank-Guaranteed • May Lose Value |
Contents
THE FUND
FOR MORE INFORMATION
Back Cover
| | | | |
| |
Dreyfus/The Boston Company Small Cap Growth Fund
| | The Fund |
A LETTER FROM THE PRESIDENT
Dear Shareholder:
We are pleased to present this annual report for Dreyfus/The Boston Company Small Cap Growth Fund, covering the 12-month period from October 1, 2014, through September 30, 2015. For information about how the fund performed during the reporting period, as well as general market perspectives, we provide a Discussion of Fund Performance on the pages that follow.
Financial markets proved volatile over the reporting period. For much of the year, a recovering U.S. economy enabled stocks to advance, but those gains were erased during the third quarter of 2015 when economic concerns in China, falling commodity prices, and a stronger U.S. dollar sparked sharp corrections in equity markets throughout the world. The emerging markets were especially hard hit. U.S. bonds generally fared better, rallying in late 2014 before reversing course in the spring as the domestic economy strengthened. Global economic instability sparked a renewed rally among U.S. government securities toward the reporting period’s end, but corporate-backed and inflation-linked securities lost value.
We expect market volatility to persist over the near term as investors vacillate between hopes that current turmoil represents a healthy correction and fears that further disappointments could trigger a full-blown bear market. Our investment strategists and portfolio managers are monitoring developments carefully, keeping a close watch on Chinese fiscal and monetary policy, expectations of higher short-term interest rates in the United States, liquidity factors affecting various asset classes, and other developments that could influence investor sentiment. Over the longer term, we remain confident that markets are likely to stabilize as the world adjusts to slower Chinese economic growth, abundant energy resources, and the eventual normalization of U.S. monetary policy. In our view, investors will continue to be well served under these circumstances by a long-term perspective and a disciplined investment approach.
Thank you for your continued confidence and support.
Sincerely,

J. Charles Cardona
President
The Dreyfus Corporation
October 15, 2015
2
DISCUSSION OF FUND PERFORMANCE
For the period of October 1, 2014, through September 30, 2015, as provided by Todd W. Wakefield, CFA, and Robert C. Zeuthen, CFA, Primary Portfolio Managers
Fund and Market Performance Overview
For the 12-month period ended September 30, 2015, Dreyfus/The Boston Company Small Cap Growth Fund’s Class I shares produced a total return of 6.50%, and Class Y shares returned 6.56%.1 In comparison, the fund’s benchmark, the Russell 2000® Growth Index (the “Index”), produced a total return of 4.04% for the same period.2
Moderate stock market gains in a recovering U.S. economy over much of the reporting period were partly offset by subsequent declines triggered by global economic concerns. The fund outperformed its benchmark, mainly due to successful security selections in the information technology, industrials, and energy sectors.
The Fund’s Investment Approach
The fund seeks long-term growth of capital. To pursue its goal, the fund normally invests at least 80% of its net assets in equity securities of small-cap U.S. companies with total market capitalizations equal to or less than that of the largest company in the Index. When choosing stocks, we seek to identify high-quality, small-cap companies that are experiencing or are expected to experience rapid current or expected earnings or revenue growth. We employ fundamental research to identify companies with attractive characteristics, such as strong business and competitive positions, solid cash flows and balance sheets, high-quality management and high sustainable growth. We also may invest in companies that our research indicates will experience accelerating revenues and expanding operating margins.
Global Economic Concerns Sparked Market Volatility
Modestly positive results from the Russell 2000® Growth Index over the full reporting period masked elevated levels of short-term market volatility across all capitalization ranges. October 2014 began in the midst of a market downturn, but U.S. employment gains, better consumer confidence, and improved business sentiment prompted a quick market recovery. Consequently, some broad market indices climbed to record highs through the end of February 2015. The rally paused in March amid sluggish U.S. economic growth stemming from severe winter weather and an appreciating U.S. dollar. However, the domestic economy regained traction in the spring, and stocks advanced until economic uncertainty in Greece and China again sent U.S. stock prices lower over the summer.
In this tumultuous environment, small-cap stocks generally produced higher returns than their large- and midcap counterparts, and growth-oriented stocks outperformed more value-oriented companies, on average.
Technology Stocks Drove Fund Performance
The fund successfully navigated turmoil in a number of market sectors over the reporting period, enabling it to post higher overall returns than the benchmark. The fund achieved particularly robust relative results in the information technology sector. Remote access specialist LogMeIn reported better-than-expected earnings amid robust customer demand.
3
DISCUSSION OF FUND PERFORMANCE (continued)
Enterprise software producer SS&C Technologies Holdings posted strong results over several consecutive quarters and acquired a company with complementary products and markets. Transportation management software maker Fleetmatics Group successfully launched a new product and achieved better-than-expected results across its various business units. Marketing software developer HubSpot captured greater market share while posting improved revenues, earnings, and cash flow.
In the industrials sector, relative performance was bolstered by heating and air conditioning systems provider Comfort Systems USA and kitchen cabinets supplier American Woodmark, both of which benefited from greater construction activity in the recovering U.S. economy. The fund held underweighted exposure to the hard hit energy sector and avoided the area’s worst performers, helping to cushion the adverse impact of plummeting oil-and-gas prices over the reporting period.
The fund achieved more disappointing results in the health care sector. Medical devices maker Spectranetics announced sluggish sales of single-use medical devices used in minimally invasive heart procedures. The acquisition of an early-stage company by heart pumps manufacturer Heartware International was received skeptically by investors. The fund did not participate in robust gains posted by glucose monitoring systems specialist Dexcom, which gained value for the benchmark over the reporting period. In the materials sector, oilfield products supplier Flotek Industries struggled with waning demand for the chemicals used in hydraulic fracturing. Finally, in the consumer staples sector, United Natural Foods encountered pricing pressures from rivals seeking to capture market share.
Selectively Positioned for Continued U.S. Economic Growth
Despite ongoing turmoil in overseas markets, the U.S. economy has continued to grow. At the same time, we have been encouraged by positive investor sentiment surrounding U.S.-centric small-cap companies that have been relatively insulated from international economic instability.
However, in our judgment, selectivity is likely to be key to investment performance over the months ahead, and we have intensified our focus on companies with strong underlying growth prospects. The fund ended the reporting period with an overweighted position in the industrials sector, and we have continued to identify attractive individual opportunities in the information technology sector. While the fund held underweighted exposure to the health care sector overall, we have nonetheless found an ample number of companies meeting our investment criteria in the biotechnology and pharmaceutical industries.
October 15, 2015
Please note, the position in any security highlighted with italicized typeface was sold during the reporting period.
Equity funds are subject generally to market, market sector, market liquidity, issuer, and investment style risks, among other factors, to varying degrees, all of which are more fully described in the fund’s prospectus.
The prices of small company stocks tend to be more volatile than the prices of large company stocks, mainly because these companies have less established and more volatile earnings histories. They also tend to be less liquid than larger company stocks.
1 Total return includes reinvestment of dividends and any capital gains paid. Past performance is no guarantee of future results. Share price and investment return fluctuate such that upon redemption, fund shares may be worth more or less than their original cost. The fund’s returns reflect the absorption of certain expenses by The Dreyfus Corporation pursuant to an agreement in effect through February 1, 2017. Had these expenses not been absorbed, returns would have been lower.
4
2 SOURCE: LIPPER INC. — Reflects the reinvestment of dividends and, where applicable, capital gain distributions. The Russell 2000 Growth Index is an unmanaged index, which measures the performance of those Russell 2000 companies with higher price-to-book ratios and higher forecasted growth values. Investors cannot invest directly in any index.
5
FUND PERFORMANCE
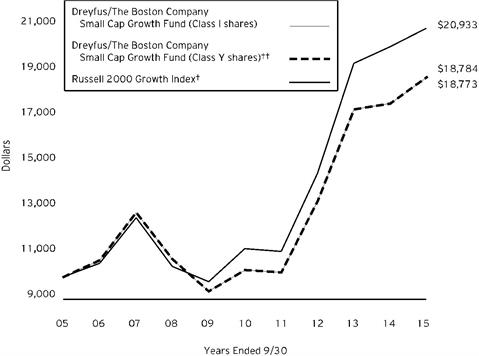
Comparison of change in value of $10,000 investment in Dreyfus/The Boston Company Small Cap Growth Fund Class I shares and Class Y shares and the Russell 2000 Growth Index
| | | | | | | |
Average Annual Total Returns as of 9/30/15 | |
| | | | | |
| Inception
Date | 1 Year | 5 Years | | 10 Years | |
Class I shares | 12/23/96 | 6.50% | 12.76% | | 6.50% | |
Class Y shares | 7/1/13 | 6.56% | 12.77% | ††† | 6.51% | ††† |
Russell 2000 Growth Index | | 4.04% | 13.26% | | 7.67% | |
† Source: Lipper Inc.
†† The total return figures presented for Class Y shares of the fund reflect the performance of the fund’s Class I shares for the period prior to 7/1/13 (the inception date for Class Y shares).
Past performance is not predictive of future performance. The fund’s performance shown in the graph and table does not reflect the deduction of taxes that a shareholder would pay on fund distributions or the redemption of fund shares.
The above graph compares a $10,000 investment made in each of the Class I and Class Y shares of Dreyfus/The Boston Company Small Cap Growth Fund on 9/30/05 to a $10,000 investment made in the Russell 2000 Growth Index (the “Index”) on that date. All dividends and capital gain distributions are reinvested.
The fund’s performance shown in the line graph above takes into account all applicable fees and expenses. The Index is an unmanaged index that measures the performance of those Russell 2000 companies (the 2,000 smallest companies in the Russell 3000 Index) with higher price-to-book ratios and higher forecasted growth values. Unlike a mutual fund, the Index is not subject to charges, fees and other expenses. Investors cannot invest directly in any index. These factors can contribute to the Index potentially outperforming the fund. Further information relating to fund performance, including expense reimbursements, if applicable, is contained in the Financial Highlights section of the prospectus and elsewhere in this report.
††† The total return performance figures presented for Class Y shares of the fund reflect the performance of the fund’s Class I shares for the period prior to 7/1/13 (the inception date for Class Y shares).
6
UNDERSTANDING YOUR FUND’S EXPENSES (Unaudited)
As a mutual fund investor, you pay ongoing expenses, such as management fees and other expenses. Using the information below, you can estimate how these expenses affect your investment and compare them with the expenses of other funds. You also may pay one-time transaction expenses, including sales charges (loads) and redemption fees, which are not shown in this section and would have resulted in higher total expenses. For more information, see your fund’s prospectus or talk to your financial adviser.
Review your fund’s expenses
The table below shows the expenses you would have paid on a $1,000 investment in Dreyfus/The Boston Company Small Cap Growth Fund from April 1, 2015 to September 30, 2015. It also shows how much a $1,000 investment would be worth at the close of the period, assuming actual returns and expenses.
| | | | | | |
Expenses and Value of a $1,000 Investment | | |
assuming actual returns for the six months ended September 30, 2015 | |
| | | | Class I | Class Y |
Expenses paid per $1,000† | | $ 4.52 | $ 4.28 |
Ending value (after expenses) | | $ 896.70 | $ 897.00 |
COMPARING YOUR FUND’S EXPENSES
WITH THOSE OF OTHER FUNDS (Unaudited)
Using the SEC’s method to compare expenses
The Securities and Exchange Commission (SEC) has established guidelines to help investors assess fund expenses. Per these guidelines, the table below shows your fund’s expenses based on a $1,000 investment, assuming a hypothetical 5% annualized return. You can use this information to compare the ongoing expenses (but not transaction expenses or total cost) of investing in the fund with those of other funds. All mutual fund shareholder reports will provide this information to help you make this comparison. Please note that you cannot use this information to estimate your actual ending account balance and expenses paid during the period.
| | | | | | |
Expenses and Value of a $1,000 Investment | | |
assuming a hypothetical 5% return for the six months ended September 30, 2015 | |
| | | | Class I | Class Y |
Expenses paid per $1,000† | | $ 4.81 | $ 4.56 |
Ending value (after expenses) | | $ 1,020.31 | $1,020.56 |
† Expenses are equal to the fund’s annualized expense ratio of .95% for Class I and .90% for Class Y, multiplied by the average account value over the period, multiplied by 183/365 (to reflect the one-half year period).
7
STATEMENT OF INVESTMENTS
September 30, 2015
| | | | | | | | | |
Common Stocks - 103.5% | | Shares | | Value ($) | |
Automobiles & Components - 1.8% | | | | | |
Motorcar Parts of America | | 12,991 | a | 407,138 | |
Banks - 3.7% | | | | | |
ConnectOne Bancorp | | 13,782 | | 265,993 | |
National Bank Holdings, Cl. A | | 16,372 | | 336,117 | |
PrivateBancorp | | 6,841 | | 262,216 | |
| | | | | 864,326 | |
Capital Goods - 12.3% | | | | | |
Altra Industrial Motion | | 14,616 | | 337,922 | |
American Woodmark | | 3,725 | a | 241,641 | |
Beacon Roofing Supply | | 15,497 | a | 503,498 | |
Comfort Systems USA | | 9,880 | | 269,329 | |
EMCOR Group | | 7,338 | | 324,706 | |
Milacron Holdings | | 11,870 | | 208,319 | |
PGT | | 27,528 | a | 338,044 | |
Trex | | 7,600 | a | 253,308 | |
Watsco | | 3,092 | | 366,340 | |
| | | | | 2,843,107 | |
Commercial & Professional Services - 8.1% | | | | | |
Advisory Board | | 10,289 | a | 468,561 | |
CEB | | 6,040 | | 412,774 | |
Kforce Inc | | 10,526 | | 276,623 | |
Knoll | | 18,383 | | 404,058 | |
TrueBlue | | 13,589 | a | 305,345 | |
| | | | | 1,867,361 | |
Consumer Durables & Apparel - 5.0% | | | | | |
Malibu Boats, Cl. A | | 18,314 | a | 256,030 | |
Oxford Industries | | 3,186 | | 235,382 | |
Steven Madden | | 10,780 | a | 394,764 | |
Wolverine World Wide | | 13,110 | | 283,700 | |
| | | | | 1,169,876 | |
Consumer Services - 2.7% | | | | | |
2U | | 7,717 | a,b | 277,040 | |
Red Robin Gourmet Burgers | | 4,628 | a | 350,525 | |
| | | | | 627,565 | |
Exchange-Traded Funds - 3.7% | | | | | |
iShares Russell 2000 Growth ETF | | 6,378 | b | 854,461 | |
Food, Beverage & Tobacco - 2.5% | | | | | |
Snyder's-Lance | | 11,395 | | 384,353 | |
8
| | | | | | | | | | | |
Common Stocks - 103.5% (continued) | | Shares | | Value ($) | |
Food, Beverage & Tobacco - 2.5% (continued) | | | | | |
WhiteWave Foods | | 4,754 | a | 190,873 | |
| | | | | 575,226 | |
Health Care Equipment & Services - 10.6% | | | | | |
Align Technology | | 4,143 | a | 235,157 | |
Endologix | | 22,417 | a | 274,832 | |
Globus Medical, Cl. A | | 14,907 | a,b | 307,979 | |
HealthStream | | 9,225 | a | 201,197 | |
HeartWare International | | 2,664 | a,b | 139,354 | |
LDR Holding | | 9,999 | a,b | 345,265 | |
Medidata Solutions | | 6,875 | a | 289,506 | |
NxStage Medical Inc | | 19,859 | a | 313,176 | |
WellCare Health Plans | | 3,915 | a | 337,395 | |
| | | | | 2,443,861 | |
Household & Personal Products - 1.9% | | | | | |
Inter Parfums | | 17,877 | | 443,528 | |
Media - 3.2% | | | | | |
IMAX | | 10,869 | a | 367,264 | |
Lions Gate Entertainment | | 9,995 | b | 367,816 | |
| | | | | 735,080 | |
Pharmaceuticals, Biotechnology & Life Sciences - 13.6% | | | | | |
ACADIA Pharmaceuticals | | 11,100 | a,b | 367,077 | |
Cepheid | | 7,853 | a | 354,956 | |
Foamix Pharmaceuticals | | 37,791 | | 277,008 | |
Ligand Pharmaceuticals | | 5,455 | a,b | 467,221 | |
Otonomy | | 10,606 | a | 188,893 | |
Paratek Pharmaceuticals | | 9,604 | b | 182,476 | |
Pfenex | | 22,777 | a | 341,883 | |
Retrophin | | 12,898 | a | 261,313 | |
Tokai Pharmaceuticals | | 30,975 | b | 320,591 | |
ZS Pharma | | 5,854 | a | 384,374 | |
| | | | | 3,145,792 | |
Real Estate - 1.5% | | | | | |
Physicians Realty Trust | | 22,550 | c | 340,279 | |
Retailing - 7.2% | | | | | |
American Eagle Outfitters | | 21,025 | b | 328,621 | |
Core-Mark Holding | | 6,600 | | 431,970 | |
Kirkland's | | 20,774 | | 447,472 | |
Restoration Hardware Holdings | | 4,868 | a,b | 454,233 | |
| | | | | 1,662,296 | |
9
STATEMENT OF INVESTMENTS (continued)
| | | | | | | | | | | | | | |
Common Stocks - 103.5% (continued) | | Shares | | Value ($) | |
Semiconductors & Semiconductor Equipment - 7.1% | | | | | |
Inphi | | 17,284 | a | 415,507 | |
Integrated Device Technology | | 18,665 | a | 378,899 | |
MaxLinear, Cl. A | | 38,879 | a | 483,655 | |
Mellanox Technologies | | 9,377 | a | 354,357 | |
| | | | | 1,632,418 | |
Software & Services - 14.1% | | | | | |
AVG Technologies | | 18,820 | a | 409,335 | |
comScore | | 5,472 | a,b | 252,533 | |
Fleetmatics Group | | 6,067 | a | 297,829 | |
HubSpot | | 6,470 | b | 300,014 | |
LogMeIn | | 8,065 | a | 549,710 | |
Mentor Graphics | | 21,853 | | 538,239 | |
Proofpoint | | 4,639 | a,b | 279,824 | |
SS&C Technologies Holdings | | 5,579 | | 390,753 | |
Synchronoss Technologies | | 7,714 | a,b | 253,019 | |
| | | | | 3,271,256 | |
Technology Hardware & Equipment - 3.1% | | | | | |
Ciena | | 17,724 | a,b | 367,241 | |
Infinera | | 17,870 | a,b | 349,537 | |
| | | | | 716,778 | |
Transportation - 1.4% | | | | | |
Forward Air | | 7,763 | | 322,087 | |
Total Common Stocks (cost $22,130,812) | | | | 23,922,435 | |
Other Investments - 1.3% | | | | | |
Registered Investment Company; | | | | | |
Dreyfus Institutional Preferred Plus Money Market Fund | | 306,707 | d | 306,707 | |
(cost $306,707) | | | | | |
Investment of Cash Collateral for Securities Loaned - 7.6% | | | | | |
Registered Investment Company; | | | | | |
Dreyfus Institutional Cash Advantage Fund | | 1,743,152 | d | 1,743,152 | |
(cost $1,743,152) | | | | | |
Total Investments (cost $24,180,671) | | 112.4% | | 25,972,294 | |
Liabilities, Less Cash and Receivables | | (12.4%) | | (2,857,799) | |
Net Assets | | 100.0% | | 23,114,495 | |
ETF—Exchange-Traded Fund
a Non-income producing security.
b Security, or portion thereof, on loan. At September 30, 2015, the value of the fund's securities on loan was $5,651,365 and the value of the collateral held by the fund was $5,640,542, consisting of cash collateral of $1,743,152 and U.S. Government & Agency securities valued at $3,897,390.
c Investment in real estate investment trust.
d Investment in affiliated money market mutual fund.
10
| | |
Portfolio Summary (Unaudited) † | Value (%) |
Software & Services | 14.1 |
Pharmaceuticals, Biotechnology & Life Sciences | 13.6 |
Capital Goods | 12.3 |
Health Care Equipment & Services | 10.6 |
Money Market Investments | 8.9 |
Commercial & Professional Services | 8.1 |
Retailing | 7.2 |
Semiconductors & Semiconductor Equipment | 7.1 |
Consumer Durables & Apparel | 5.0 |
Banks | 3.7 |
Exchange-Traded Funds | 3.7 |
Media | 3.2 |
Technology Hardware & Equipment | 3.1 |
Consumer Services | 2.7 |
Food, Beverage & Tobacco | 2.5 |
Household & Personal Products | 1.9 |
Automobiles & Components | 1.8 |
Real Estate | 1.5 |
Transportation | 1.4 |
| | 112.4 |
†Based on net assets.
See notes to financial statements.
11
STATEMENT OF ASSETS AND LIABILITIES
September 30, 2015
| | | | | | | |
| | | Cost | | Value | |
Assets ($): | | | | |
Investments in securities—See Statement of Investments
(including securities on loan, valued at $5,651,365)—Note 1(b): | | | | | |
Unaffiliated issuers | | 22,130,812 | | 23,922,435 | |
Affiliated issuers | | 2,049,859 | | 2,049,859 | |
Cash | | | | | 4,523 | |
Receivable for investment securities sold | | | | | 676,667 | |
Dividends and securities lending income receivable | | | | | 9,613 | |
Prepaid expenses | | | | | 17,184 | |
| | | | | 26,680,281 | |
Liabilities ($): | | | | |
Due to The Dreyfus Corporation and affiliates—Note 3(b) | | | | | 27,649 | |
Liability for securities on loan—Note 1(b) | | | | | 1,743,152 | |
Payable for shares of Beneficial Interest redeemed | | | | | 1,253,640 | |
Payable for investment securities purchased | | | | | 493,555 | |
Accrued expenses | | | | | 47,790 | |
| | | | | 3,565,786 | |
Net Assets ($) | | | 23,114,495 | |
Composition of Net Assets ($): | | | | |
Paid-in capital | | | | | 14,507,822 | |
Accumulated net realized gain (loss) on investments | | | | | 6,815,050 | |
Accumulated net unrealized appreciation (depreciation)
on investments | | | | | 1,791,623 | |
Net Assets ($) | | | 23,114,495 | |
| | | | |
Net Asset Value Per Share | Class I | Class Y | |
Net Assets ($) | 23,033,518 | 80,977 | |
Shares Outstanding | 655,074 | 2,302 | |
Net Asset Value Per Share ($) | 35.16 | 35.18 | |
See notes to financial statements.
12
STATEMENT OF OPERATIONS
Year Ended September 30, 2015
| | | | | | | |
| | | | | | |
| | | | | | |
Investment Income ($): | | | | |
Income: | | | | |
Cash dividends (net of $1,194 foreign taxes withheld at source): | | | | |
Unaffiliated issuers | | | 148,213 | |
Affiliated issuers | | | 504 | |
Income from securities lending—Note 1(b) | | | 23,875 | |
Total Income | | | 172,592 | |
Expenses: | | | | |
Investment advisory fee—Note 3(a) | | | 254,131 | |
Professional fees | | | 51,350 | |
Registration fees | | | 31,747 | |
Custodian fees—Note 3(b) | | | 30,730 | |
Shareholder servicing costs—Note 3(b) | | | 25,909 | |
Administration fee—Note 3(a) | | | 19,060 | |
Prospectus and shareholders’ reports | | | 9,559 | |
Trustees' fees and expenses—Note 3(c) | | | 1,383 | |
Interest expense—Note 2 | | | 614 | |
Loan commitment fees—Note 2 | | | 261 | |
Miscellaneous | | | 19,332 | |
Total Expenses | | | 444,076 | |
Less—reduction in expenses due to undertaking—Note 3(a) | | | (141,433) | |
Less—reduction in fees due to earnings credits—Note 3(b) | | | (36) | |
Net Expenses | | | 302,607 | |
Investment (Loss)—Net | | | (130,015) | |
Realized and Unrealized Gain (Loss) on Investments—Note 4 ($): | | |
Net realized gain (loss) on investments | 7,277,238 | |
Net unrealized appreciation (depreciation) on investments | | | (4,051,822) | |
Net Realized and Unrealized Gain (Loss) on Investments | | | 3,225,416 | |
Net Increase in Net Assets Resulting from Operations | | 3,095,401 | |
See notes to financial statements.
13
STATEMENT OF CHANGES IN NET ASSETS
| | | | | | | | | | |
| | | | | | | | | | |
| | | | Year Ended September 30, |
| | | | 2015 | | | | 2014 | |
Operations ($): | | | | | | | | |
Investment (loss)—net | | | (130,015) | | | | (351,066) | |
Net realized gain (loss) on investments | | 7,277,238 | | | | 27,905,318 | |
Net unrealized appreciation (depreciation)
on investments | | (4,051,822) | | | | (22,841,870) | |
Net Increase (Decrease) in Net Assets
Resulting from Operations | 3,095,401 | | | | 4,712,382 | |
Dividends to Shareholders from ($): | | | | | | | | |
Net realized gain on investments: | | | | | | | | |
Class I | | | (16,086,915) | | | | (27,698,814) | |
Class Y | | | (48,130) | | | | (309) | |
Total Dividends | | | (16,135,045) | | | | (27,699,123) | |
Beneficial Interest Transactions ($): | | | | | | | | |
Net proceeds from shares sold: | | | | | | | | |
Class I | | | 9,459,524 | | | | 3,063,509 | |
Class Y | | | - | | | | 158,032 | |
Dividends reinvested: | | | | | | | | |
Class I | | | 6,200,108 | | | | 14,378,737 | |
Cost of shares redeemed: | | | | | | | | |
Class I | | | (25,914,730) | | | | (49,211,819) | |
Class Y | | | (36,954) | | | | - | |
Increase (Decrease) in Net Assets
from Beneficial Interest Transactions | (10,292,052) | | | | (31,611,541) | |
Total Increase (Decrease) in Net Assets | (23,331,696) | | | | (54,598,282) | |
Net Assets ($): | | | | | | | | |
Beginning of Period | | | 46,446,191 | | | | 101,044,473 | |
End of Period | | | 23,114,495 | | | | 46,446,191 | |
Capital Share Transactions (Shares): | | | | | | | | |
Class Ia | | | | | | | | |
Shares sold | | | 227,097 | | | | 47,416 | |
Shares issued for dividends reinvested | | | 177,348 | | | | 263,733 | |
Shares redeemed | | | (626,690) | | | | (860,430) | |
Net Increase (Decrease) in Shares Outstanding | (222,245) | | | | (549,281) | |
Class Ya | | | | | | | | |
Shares sold | | | - | | | | 2,936 | |
Shares redeemed | | | (650) | | | | - | |
Net Increase (Decrease) in Shares Outstanding | (650) | | | | 2,936 | |
a During the period ended September 30, 2014, 2,936 Class I shares representing $158,032 were exchanged for 2,936 Class Y shares. | |
See notes to financial statements.
14
FINANCIAL HIGHLIGHTS
The following tables describe the performance for each share class for the fiscal periods indicated. All information (except portfolio turnover rate) reflects financial results for a single fund share. Total return shows how much your investment in the fund would have increased (or decreased) during each period, assuming you had reinvested all dividends and distributions. These figures have been derived from the fund’s financial statements.
| | | | | | | | | |
| | | | | |
| | Year Ended September 30, |
Class I Shares | | 2015 | 2014 | 2013 | 2012 | 2011 | |
Per Share Data ($): | | | | | | | |
Net asset value, beginning of period | 52.76 | 70.83 | 60.57 | 47.21 | 47.68 | |
Investment Operations: | | | | | | | |
Investment (loss)—neta | (.17) | (.30) | (.13) | (.16) | (.18) | |
Net realized and unrealized gain (loss) on investments | 3.48 | 1.98 | 16.26 | 14.57 | (.29) | |
Total from Investment Operations | 3.31 | 1.68 | 16.13 | 14.41 | (.47) | |
Distributions: | | | | | | | |
Dividends from net realized gain on investments | (20.91) | (19.75) | (5.87) | (1.05) | - | |
Net asset value, end of period | 35.16 | 52.76 | 70.83 | 60.57 | 47.21 | |
Total Return (%) | 6.50 | 1.46 | 30.20 | 30.86 | (.99) | |
Ratios/Supplemental Data (%): | | | | | | |
Ratio of total expenses to average net assets | 1.40 | 1.15 | 1.04 | 1.02 | .97 | |
Ratio of net expenses to average net assets | .95 | .95 | .98 | .96 | .96 | |
Ratio of net investment (loss) to average net assets | (.41) | (.52) | (.22) | (.29) | (.33) | |
Portfolio Turnover Rate | 169.20 | 138.15 | 121.73 | 154.49 | 176.06 | |
Net Assets, end of period ($ x 1,000) | 23,034 | 46,290 | 101,043 | 133,692 | 142,906 | |
a Based on average shares outstanding.
See notes to financial statements.
15
FINANCIAL HIGHLIGHTS (continued)
| | | | | | | | |
| | | | |
| | Year Ended September 30, |
Class Y Shares | 2015 | 2014 | 2013 | a |
Per Share Data ($): | | | | |
Net asset value, beginning of period | 52.76 | 70.83 | 64.04 | |
Investment Operations: | | | | |
Investment (loss)—netb | (.15) | (.19) | (.10) | |
Net realized and unrealized gain (loss) on investments | 3.48 | 1.87 | 6.89 | |
Total from Investment Operations | 3.33 | 1.68 | 6.79 | |
Distributions: | | | | |
Dividends from net realized gain on investments | (20.91) | (19.75) | — | |
Net asset value, end of period | 35.18 | 52.76 | 70.83 | |
Total Return (%) | 6.56 | 1.48 | 10.59 | c |
Ratios/Supplemental Data (%): | | | | |
Ratio of total expenses to average net assets | 1.40 | 1.11 | 1.07 | d |
Ratio of net expenses to average net assets | .90 | .95 | .95 | d |
Ratio of net investment (loss) to average net assets | (.35) | (.38) | (.57) | d |
Portfolio Turnover Rate | 169.20 | 138.15 | 121.73 | |
Net Assets, end of period ($ x 1,000) | 81 | 156 | 1 | |
a From July 1, 2013 (commencement of initial offering) to September 30, 2013.
b Based on average shares outstanding.
c Not annualized.
d Annualized.
See notes to financial statements.
16
NOTES TO FINANCIAL STATEMENTS
NOTE 1—Significant Accounting Policies:
Dreyfus/The Boston Company Small Cap Growth Fund (the “fund”) is a separate diversified series of Dreyfus Investment Funds (the “Trust”), which is registered under the Investment Company Act of 1940, as amended (the “Act”), as an open-end management investment company and operates as a series company currently offering seven series, including the fund. The fund’s investment objective is to seek long-term growth of capital. The Dreyfus Corporation (the “Manager” or “Dreyfus”), a wholly-owned subsidiary of The Bank of New York Mellon Corporation (“BNY Mellon”), serves as the fund’s investment adviser.
MBSC Securities Corporation (the “Distributor”), a wholly-owned subsidiary of Dreyfus, is the distributor of the fund’s shares. The fund is authorized to issue an unlimited number of $.001 par value shares of Beneficial Interest in each of the following classes of shares: Class I and Class Y. Class I shares are sold primarily to bank trust departments and other financial service providers (including The Bank of New York Mellon, a subsidiary of BNY Mellon and an affiliate of Dreyfus, and its affiliates), acting on behalf of customers having a qualified trust or an investment account or relationship at such institution, and bear no Distribution or Shareholder Services Plan fees. Class Y shares are sold at net asset value per share generally to institutional investors, and bear no Distribution or Shareholder Services Plan fees. Class I and Class Y shares are offered without a front-end sales charge or contingent deferred sales charge. Other differences between the classes include the services offered to and the expenses borne by each class, the allocation of certain transfer agency costs, and certain voting rights. Income, expenses (other than expenses attributable to a specific class), and realized and unrealized gains or losses on investments are allocated to each class of shares based on its relative net assets.
The Trust accounts separately for the assets, liabilities and operations of each series. Expenses directly attributable to each series are charged to that series’ operations; expenses which are applicable to all series are allocated among them on a pro rata basis.
The Financial Accounting Standards Board (“FASB”) Accounting Standards Codification (“ASC”) is the exclusive reference of authoritative U.S. generally accepted accounting principles (“GAAP”) recognized by the FASB to be applied by nongovernmental entities. Rules and interpretive releases of the Securities and Exchange Commission (“SEC”) under authority of federal laws are also sources of authoritative GAAP for SEC
17
NOTES TO FINANCIAL STATEMENTS (continued)
registrants. The fund’s financial statements are prepared in accordance with GAAP, which may require the use of management estimates and assumptions. Actual results could differ from those estimates.
(a) Portfolio valuation: The fair value of a financial instrument is the amount that would be received to sell an asset or paid to transfer a liability in an orderly transaction between market participants at the measurement date (i.e., the exit price). GAAP establishes a fair value hierarchy that prioritizes the inputs of valuation techniques used to measure fair value. This hierarchy gives the highest priority to unadjusted quoted prices in active markets for identical assets or liabilities (Level 1 measurements) and the lowest priority to unobservable inputs (Level 3 measurements).
Additionally, GAAP provides guidance on determining whether the volume and activity in a market has decreased significantly and whether such a decrease in activity results in transactions that are not orderly. GAAP requires enhanced disclosures around valuation inputs and techniques used during annual and interim periods.
Various inputs are used in determining the value of the fund’s investments relating to fair value measurements. These inputs are summarized in the three broad levels listed below:
Level 1—unadjusted quoted prices in active markets for identical investments.
Level 2—other significant observable inputs (including quoted prices for similar investments, interest rates, prepayment speeds, credit risk, etc.).
Level 3—significant unobservable inputs (including the fund’s own assumptions in determining the fair value of investments).
The inputs or methodology used for valuing securities are not necessarily an indication of the risk associated with investing in those securities.
Changes in valuation techniques may result in transfers in or out of an assigned level within the disclosure hierarchy. Valuation techniques used to value the fund’s investments are as follows:
Investments in securities are valued at the last sales price on the securities exchange or national securities market on which such securities are primarily traded. Securities listed on the National Market System for which market quotations are available are valued at the official closing price or, if there is no official closing price that day, at the last sales price. For open short positions, asked prices are used for valuation purposes. Bid price is used when no asked price is available. Registered investment companies
18
that are not traded on an exchange are valued at their net asset value. All of the preceding securities are generally categorized within Level 1 of the fair value hierarchy.
Securities not listed on an exchange or the national securities market, or securities for which there were no transactions, are valued at the average of the most recent bid and asked prices. These securities are generally categorized within Level 2 of the fair value hierarchy.
Fair valuing of securities may be determined with the assistance of a pricing service using calculations based on indices of domestic securities and other appropriate indicators, such as prices of relevant American Depository Receipts and financial futures. Utilizing these techniques may result in transfers between Level 1 and Level 2 of the fair value hierarchy.
When market quotations or official closing prices are not readily available, or are determined not to reflect accurately fair value, such as when the value of a security has been significantly affected by events after the close of the exchange or market on which the security is principally traded (for example, a foreign exchange or market), but before the fund calculates its net asset value, the fund may value these investments at fair value as determined in accordance with the procedures approved by the Trust’s Board of Trustees (the “Board”). Certain factors may be considered when fair valuing investments such as: fundamental analytical data, the nature and duration of restrictions on disposition, an evaluation of the forces that influence the market in which the securities are purchased and sold, and public trading in similar securities of the issuer or comparable issuers. These securities are either categorized within Level 2 or 3 of the fair value hierarchy depending on the relevant inputs used.
For restricted securities where observable inputs are limited, assumptions about market activity and risk are used and are generally categorized within Level 3 of the fair value hierarchy.
The following is a summary of the inputs used as of September 30, 2015 in valuing the fund’s investments:
19
NOTES TO FINANCIAL STATEMENTS (continued)
| | | | | |
| | Level 1 - Unadjusted Quoted Prices | Level 2 - Other Significant Observable Inputs | Level 3 -Significant Unobservable Inputs | Total |
Assets ($) | | | | |
Investments in Securities: | | |
Equity Securities—Domestic Common Stocks† | 21,716,538 | - | - | 21,716,538 |
Equity Securities—Foreign Common Stocks† | 1,351,436 | - | - | 1,351,436 |
Exchange—Traded Funds | 854,461 | - | - | 854,461 |
Mutual Funds | 2,049,859 | - | - | 2,049,859 |
† See Statement of Investments for additional detailed categorizations.
At September 30, 2015, there were no transfers between Level 1 and Level 2 of the fair value hierarchy.
(b) Securities transactions and investment income: Securities transactions are recorded on a trade date basis. Realized gains and losses from securities transactions are recorded on the identified cost basis. Dividend income is recognized on the ex-dividend date and interest income, including, where applicable, accretion of discount and amortization of premium on investments, is recognized on the accrual basis.
Pursuant to a securities lending agreement with The Bank of New York Mellon, the fund may lend securities to qualified institutions. It is the fund’s policy that, at origination, all loans are secured by collateral of at least 102% of the value of U.S. securities loaned and 105% of the value of foreign securities loaned. Collateral equivalent to at least 100% of the market value of securities on loan is maintained at all times. At September 30, 2015, the value of the collateral was 99.8% of the market value of the securities on loan. On a daily basis, the collateral held by the fund is monitored to ensure that its value is at least 100% of the market value of the securities on loan. Collateral is either in the form of cash, which can be invested in certain money market mutual funds managed by Dreyfus, or U.S. Government and Agency securities. The fund is entitled to receive all dividends, interest and distributions on securities loaned, in addition to income earned as a result of the lending transaction. Should a borrower fail to return the securities in a timely manner, The Bank of New York Mellon is required to replace the securities for the benefit of the fund or credit the fund with the market value of the unreturned securities and is subrogated to the fund’s rights against the borrower and the collateral. During the
20
period ended September 30, 2015, The Bank of New York Mellon earned $5,458 from lending portfolio securities, pursuant to the securities lending agreement.
(c) Affiliated issuers: Investments in other investment companies advised by Dreyfus are defined as “affiliated” under the Act. Investments in affiliated investment companies during the period ended September 30, 2015 were as follows:
| | | | | | |
Affiliated Investment Company | Value 9/30/2014 ($) | Purchases ($) | Sales ($) | Value 9/30/2015 ($) | Net Assets (%) |
Dreyfus Institutional Preferred Plus Money Market Fund | 845,754 | 34,174,859 | 34,713,906 | 306,707 | 1.3 |
Dreyfus Institutional Cash Advantage Fund | 6,881,565 | 46,089,474 | 51,227,887 | 1,743,152 | 7.6 |
Total | 7,727,319 | 80,264,333 | 85,941,793 | 2,049,859 | 8.9 |
(d) Dividends to shareholders: Dividends are recorded on the ex-dividend date. Dividends from investment income-net and dividends from net realized capital gains, if any, are normally declared and paid annually, but the fund may make distributions on a more frequent basis to comply with the distribution requirements of the Internal Revenue Code of 1986, as amended (the “Code”). To the extent that net realized capital gains can be offset by capital loss carryovers, it is the policy of the fund not to distribute such gains. Income and capital gain distributions are determined in accordance with income tax regulations, which may differ from GAAP.
(e) Federal income taxes: It is the policy of the fund to continue to qualify as a regulated investment company, if such qualification is in the best interests of its shareholders, by complying with the applicable provisions of the Code, and to make distributions of taxable income sufficient to relieve it from substantially all federal income and excise taxes.
As of and during the period ended September 30, 2015, the fund did not have any liabilities for any uncertain tax positions. The fund recognizes interest and penalties, if any, related to uncertain tax positions as income tax expense in the Statement of Operations. During the period ended September 30, 2015, the fund did not incur any interest or penalties.
21
NOTES TO FINANCIAL STATEMENTS (continued)
Each tax year in the four-year period ended September 30, 2015 remains subject to examination by the Internal Revenue Service and state taxing authorities.
At September 30, 2015, the components of accumulated earnings on a tax basis were as follows: undistributed ordinary income $750,271, undistributed capital gains $6,287,603 and unrealized appreciation $1,568,799.
The tax character of distributions paid to shareholders during the fiscal periods ended September 30, 2015 and September 30, 2014 were as follows: ordinary income $4,521,973 and $4,850,061, and long-term capital gains $11,613,072 and $22,849,062, respectively.
During the period ended September 30, 2015, as a result of permanent book to tax differences, primarily due to the tax treatment for net operating expenses and treating a portion of the proceeds from redemptions as a distribution for tax purposes, the fund increased accumulated undistributed investment income-net by $130,015, decreased accumulated net realized gain (loss) on investments by $7,963,378 and increased paid-in capital by $7,833,363. Net assets and net asset value per share were not affected by this reclassification.
NOTE 2—Bank Lines of Credit:
The fund participates with other Dreyfus-managed funds in a $430 million unsecured credit facility led by Citibank, N.A. and a $300 million unsecured credit facility provided by The Bank of New York Mellon (each, a “Facility”), each to be utilized primarily for temporary or emergency purposes, including the financing of redemptions. Prior to October 8, 2014, the unsecured credit facility with Citibank, N.A. was $265 million. In connection therewith, the fund has agreed to pay its pro rata portion of commitment fees for each Facility. Interest is charged to the fund based on rates determined pursuant to the terms of the respective Facility at the time of borrowing.
The average amount of borrowings outstanding under the Facilities during the period ended September 30, 2015 was approximately $55,900 with a related weighted average annualized interest rate of 1.10%.
NOTE 3—Investment Advisory Fee, Administration Fee and Other Transactions with Affiliates:
(a) Pursuant to an investment advisory agreement with Dreyfus, the investment advisory fee is computed at the annual rate of .80% of the value of the fund’s average daily net assets and is payable monthly. Dreyfus had contractually agreed, from October 1, 2014 through October 31, 2014,
22
to waive receipt of its fees and/or assume the expenses of the fund, so that the direct annual fund’s operating expenses (excluding taxes, interest expense, brokerage commissions, commitment fees on borrowings and extraordinary expenses) did not exceed .95% of the value of the fund’s average daily net assets. Dreyfus has contractually agreed, from November 1, 2014 through February 1, 2016, to waive receipt of its fees and/or assume the direct expenses of the fund so that the expenses of Class I and Y shares (excluding certain expenses as described above) do not exceed .95% and .90% of the value of the respective class’ average daily net assets. The reduction in expenses, pursuant to the undertaking, amounted to $141,433 during the period ended September 30, 2015.
The fund has a Fund Accounting and Administrative Services Agreement (the “Administration Agreement”) with Dreyfus, whereby Dreyfus performs administrative, accounting and recordkeeping services for the fund. The fund has agreed to compensate Dreyfus for providing accounting and recordkeeping services, administration, compliance monitoring, regulatory and shareholder reporting, as well as related facilities, equipment and clerical help. The fee is based on the fund’s average daily net assets and computed at the following annual rates: .06% of the first $500 million, .04% of the next $500 million and .02% in excess of $1 billion.
In addition, after applying any expense limitations or fee waivers that reduce the fees paid to Dreyfus for this service, Dreyfus has contractually agreed in writing to waive any remaining fees for this service to the extent that they exceed both Dreyfus’ costs in providing these services and a reasonable allocation of the costs incurred by Dreyfus and its affiliates related to the support and oversight of these services. The fund also reimburses Dreyfus for the out-of-pocket expenses incurred in performing this service for the fund. Pursuant to the Administration Agreement, the fund was charged $19,060 during the period ended September 30, 2015.
(b)The fund has arrangements with the transfer agent and the custodian whereby the fund may receive earnings credits when positive cash balances are maintained, which are used to offset transfer agency and custody fees. For financial reporting purposes, the fund includes net earnings credits as an expense offset in the Statement of Operations.
The fund compensates Dreyfus Transfer, Inc., a wholly-owned subsidiary of Dreyfus, under a transfer agency agreement for providing transfer agency and cash management services for the fund. The majority of transfer agency fees are comprised of amounts paid on a per account basis, while cash management fees are related to fund subscriptions and redemptions. During the period ended September 30, 2015, the fund was
23
NOTES TO FINANCIAL STATEMENTS (continued)
charged $20,594 for transfer agency services and $891 for cash management services. These fees are included in Shareholder servicing costs in the Statement of Operations. Cash management fees were partially offset by earnings credits of $36.
The fund compensates The Bank of New York Mellon under a custody agreement for providing custodial services for the fund. These fees are determined based on net assets, geographic region and transaction activity. During the period ended September 30, 2015, the fund was charged $30,730 pursuant to the custody agreement.
During the period ended September 30, 2015, the fund was charged $11,078 for services performed by the Chief Compliance Officer and his staff.
The components of “Due to The Dreyfus Corporation and affiliates” in the Statement of Assets and Liabilities consist of: investment advisory fees $17,014, custodian fees $13,000, Chief Compliance Officer fees $2,606, administration fees $1,276 and transfer agency fees $2,591, which are offset against an expense reimbursement currently in effect in the amount of $8,838.
(c) Each Board member also serves as a Board member of other funds within the Dreyfus complex. Annual retainer fees and attendance fees are allocated to each fund based on net assets.
NOTE 4—Securities Transactions:
The aggregate amount of purchases and sales of investment securities, excluding short-term securities, during the period ended September 30, 2015, amounted to $54,111,097 and $79,128,033, respectively.
At September 30, 2015, the cost of investments for federal income tax purposes was $24,403,495; accordingly, accumulated net unrealized appreciation on investments was $1,568,799, consisting of $3,470,359 gross unrealized appreciation and $1,901,560 gross unrealized depreciation.
24
REPORT OF INDEPENDENT REGISTERED
PUBLIC ACCOUNTING FIRM
The Board of Trustees and Shareholders of
Dreyfus Investment Funds
We have audited the accompanying statement of assets and liabilities of Dreyfus/The Boston Company Small Cap Growth Fund (the “Fund”), a series of Dreyfus Investment Funds, including the statement of investments, as of September 30, 2015, and the related statement of operations for the year then ended, the statements of changes in net assets for each of the years in the two-year period then ended, and the financial highlights for each of the years or period in the five-year period then ended. These financial statements and financial highlights are the responsibility of the Fund’s management. Our responsibility is to express an opinion on these financial statements and financial highlights based on our audits.
We conducted our audits in accordance with the standards of the Public Company Accounting Oversight Board (United States). Those standards require that we plan and perform the audit to obtain reasonable assurance about whether the financial statements and financial highlights are free of material misstatement. An audit includes examining, on a test basis, evidence supporting the amounts and disclosures in the financial statements. Our procedures included confirmation of securities owned as of September 30, 2015, by correspondence with the custodian and brokers or by other appropriate auditing procedures. An audit also includes assessing the accounting principles used and significant estimates made by management, as well as evaluating the overall financial statement presentation. We believe that our audits provide a reasonable basis for our opinion.
In our opinion, the financial statements and financial highlights referred to above present fairly, in all material respects, the financial position of Dreyfus/The Boston Company Small Cap Growth Fund as of September 30, 2015, the results of its operations for the year then ended, the changes in its net assets for each of the years in the two-year period then ended, and the financial highlights for each of the years or period in the five-year period then ended, in conformity with U.S. generally accepted accounting principles.

New York, New York
November 25, 2015
25
IMPORTANT TAX INFORMATION (Unaudited)
For federal tax purposes, the fund reports the maximum amount allowable, but not less than $735 as ordinary income dividends paid during the year ended September 30, 2015 as qualified dividend income in accordance with Section 854(b)(1)(B) of the Internal Revenue Code. Also, the fund reports the maximum amount allowable but not less than 4.06% of ordinary income dividends paid during the year ended September 30, 2015 as eligible for the corporate dividends received deduction provided under Section 243 of the Internal Revenue Code in accordance with Section 854(b)(1)(A) of the Internal Revenue Code. Shareholders will receive notification in early 2016 of the percentage applicable to the preparation of their 2015 income tax returns. The fund reports the maximum amount allowable but not less than $15.0506 per share as a capital gain dividend in accordance with Section 852(b)(3)(C) of the Internal Revenue Code. The fund reports the maximum amount allowable but not less than $5.8605 per share as a short-term capital gain dividend in accordance with Sections 871(k)(2) and 881(e) of the Internal Revenue Code.
26
BOARD MEMBERS INFORMATION (Unaudited)
INDEPENDENT BOARD MEMBERS
Joseph S. DiMartino (71)
Chairman of the Board (2008)
Principal Occupation During Past 5 Years:
· Corporate Director and Trustee (1995-present)
Other Public Company Board Memberships During Past 5 Years:
· CBIZ (formerly, Century Business Services, Inc.), a provider of outsourcing functions for small and medium size companies, Director (1997-present)
· The Newark Group, a provider of a national market of paper recovery facilities, paperboard mills and paperboard converting plants, Director (2000-2010)
No. of Portfolios for which Board Member Serves: 142
———————
Francine J. Bovich (64)
Board Member (2011)
Principal Occupation During Past 5 Years:
· Trustee, The Bradley Trusts, private trust funds (2011-present)
· Managing Director, Morgan Stanley Investment Management (1993-2010)
Other Public Company Board Memberships During Past 5 Years:
· Annaly Capital Management, Inc., Board Member (May 2014-present)
No. of Portfolios for which Board Member Serves: 80
———————
Kenneth A. Himmel (69)
Board Member (2008)
Principal Occupation During Past 5 Years:
· Managing Partner, Gulf Related, an international real estate development company (2010-present)
· President and CEO, Related Urban Development, a real estate development company (1996-present)
· President and CEO, Himmel & Company, a real estate development company (1980-present)
· CEO, American Food Management, a restaurant company (1983-present)
No. of Portfolios for which Board Member Serves: 30
———————
27
BOARD MEMBERS INFORMATION (Unaudited) (continued)
INDEPENDENT BOARD MEMBERS (continued)
Stephen J. Lockwood (68)
Board Member (2008)
Principal Occupation During Past 5 Years:
· Chairman of the Board, Stephen J. Lockwood and Company LLC, a real estate investment company (2000-present)
No. of Portfolios for which Board Member Serves: 30
———————
Roslyn M. Watson (65)
Board Member (2008)
Principal Occupation During Past 5 Years:
· Principal, Watson Ventures, Inc., a real estate investment company (1993-present)
No. of Portfolios for which Board Member Serves: 66
———————
Benaree Pratt Wiley (69)
Board Member (2008)
Principal Occupation During Past 5 Years:
· Principal, The Wiley Group, a firm specializing in strategy and business development (2005-present)
Other Public Company Board Memberships During Past 5 Years:
· CBIZ (formerly, Century Business Services, Inc.), a provider of outsourcing functions for small and medium size companies, Director (2008-present)
No. of Portfolios for which Board Member Serves: 66
———————
Once elected all Board Members serve for an indefinite term, but achieve Emeritus status upon reaching age 80. The address of the Board Members and Officers is c/o The Dreyfus Corporation, 200 Park Avenue, New York, New York 10166. Additional information about the Board Members is available in the fund's Statement of Additional Information which can be obtained from Dreyfus free of charge by calling this toll free number: 1-800-DREYFUS.
James M. Fitzgibbons, Emeritus Board Member
28
OFFICERS OF THE FUND (Unaudited)
BRADLEY J. SKAPYAK, President since January 2010.
Chief Operating Officer and a director of the Manager since June 2009, Chairman of Dreyfus Transfer, Inc., an affiliate of the Manager and the transfer agent of the funds, since May 2011 and Executive Vice President of the Distributor since June 2007. From April 2003 to June 2009, Mr. Skapyak was the head of the Investment Accounting and Support Department of the Manager. He is an officer of 68 investment companies (comprised of 142 portfolios) managed by the Manager. He is 56 years old and has been an employee of the Manager since February 1988.
BENNETT A. MACDOUGALL, Chief Legal Officer since October 2015
Chief Legal Officer of the Manager since June 2015; from June 2005 to June 2015, Director and Associate General Counsel of Deutsche Bank – Asset & Wealth Management Division, and Chief Legal Officer of Deutsche Investment Management Americas Inc. He is an officer of 69 investment companies (comprised of 167 portfolios) managed by the Manager. He is 44 years old and has been an employee of the Manager since June 2015.
JANETTE E. FARRAGHER, Vice President and Secretary since December 2011.
Assistant General Counsel of BNY Mellon, and an officer of 69 investment companies (comprised of 167 portfolios) managed by the Manager. She is 52 years old and has been an employee of the Manager since February 1984.
JAMES BITETTO, Vice President and Assistant Secretary since December 2008.
Managing Counsel of BNY Mellon and Secretary of the Manager, and an officer of 69 investment companies (comprised of 167 portfolios) managed by the Manager. He is 49 years old and has been an employee of the Manager since December 1996.
JONI LACKS CHARATAN, Vice President and Assistant Secretary since December 2008.
Managing Counsel of BNY Mellon, and an officer of 69 investment companies (comprised of 167 portfolios) managed by the Manager. She is 59 years old and has been an employee of the Manager since October 1988.
JOSEPH M. CHIOFFI, Vice President and Assistant Secretary since December 2008.
Managing Counsel of BNY Mellon, and an officer of 69 investment companies (comprised of 167 portfolios) managed by the Manager. He is 53 years old and has been an employee of the Manager since June 2000.
JOHN B. HAMMALIAN, Vice President and Assistant Secretary since December 2008.
Senior Managing Counsel of BNY Mellon, and an officer of 69 investment companies (comprised of 167 portfolios) managed by the Manager. He is 52 years old and has been an employee of the Manager since February 1991.
MAUREEN E. KANE, Vice President and Assistant Secretary since April 2015.
Managing Counsel of BNY Mellon since July 2014; from October 2004 until July 2014, General Counsel, and from May 2009 until July 2014, Chief Compliance Officer of Century Capital Management. She is an officer of 69 investment companies (comprised of 167 portfolios) managed by the Manager. She is 53 years old and has been an employee of the Manager since July 2014.
SARAH S. KELLEHER, Vice President and Assistant Secretary since April 2014.
Senior Counsel of BNY Mellon, and an officer of 69 investment companies (comprised of 167 portfolios) managed by the Manager; from August 2005 to March 2013, Associate General Counsel of Third Avenue Management. She is 40 years old and has been an employee of the Manager since March 2013.
JEFF PRUSNOFSKY, Vice President and Assistant Secretary since December 2008.
Senior Managing Counsel of BNY Mellon, and an officer of 69 investment companies (comprised of 167 portfolios) managed by the Manager. He is 50 years old and has been an employee of the Manager since October 1990.
JAMES WINDELS, Treasurer since December 2008.
Director – Mutual Fund Accounting of the Manager, and an officer of 69 investment companies (comprised of 167 portfolios) managed by the Manager. He is 57 years old and has been an employee of the Manager since April 1985.
29
OFFICERS OF THE FUND (Unaudited) (continued)
RICHARD CASSARO, Assistant Treasurer since December 2008.
Senior Accounting Manager – Money Market and Municipal Bond Funds of the Manager, and an officer of 69 investment companies (comprised of 167 portfolios) managed by the Manager. He is 56 years old and has been an employee of the Manager since September 1982.
GAVIN C. REILLY, Assistant Treasurer since December 2008.
Tax Manager of the Investment Accounting and Support Department of the Manager, and an officer of 69 investment companies (comprised of 167 portfolios) managed by the Manager. He is 47 years old and has been an employee of the Manager since April 1991.
ROBERT S. ROBOL, Assistant Treasurer since December 2008.
Senior Accounting Manager – Fixed Income Funds of the Manager, and an officer of 69 investment companies (comprised of 167 portfolios) managed by the Manager. He is 51 years old and has been an employee of the Manager since October 1988.
ROBERT SALVIOLO, Assistant Treasurer since December 2008.
Senior Accounting Manager – Equity Funds of the Manager, and an officer of 69 investment companies (comprised of 167 portfolios) managed by the Manager. He is 48 years old and has been an employee of the Manager since June 1989.
ROBERT SVAGNA, Assistant Treasurer since December 2008.
Senior Accounting Manager – Equity Funds of the Manager, and an officer of 69 investment companies (comprised of 167 portfolios) managed by the Manager. He is 48 years old and has been an employee of the Manager since November 1990.
JOSEPH W. CONNOLLY, Chief Compliance Officer since December 2008.
Chief Compliance Officer of the Manager and The Dreyfus Family of Funds (69 investment companies, comprised of 167 portfolios). He is 58 years old and has served in various capacities with the Manager since 1980, including manager of the firm’s Fund Accounting Department from 1997 through October 2001.
30
NOTES
31
NOTES
32
NOTES
33
Dreyfus/The Boston Company Small Cap Growth Fund
200 Park Avenue
New York, NY 10166
Manager
The Dreyfus Corporation
200 Park Avenue
New York, NY 10166
Custodian
The Bank of New York Mellon
225 Liberty Street
New York, NY 10286
Transfer Agent &
Dividend Disbursing Agent
Dreyfus Transfer, Inc.
200 Park Avenue
New York, NY 10166
Distributor
MBSC Securities Corporation
200 Park Avenue
New York, NY 10166
| | |
Ticker Symbols: | Class I: SSETX Class Y: SSYGX |
Telephone Call your financial representative or 1-800-DREYFUS
Mail The Dreyfus Family of Funds, 144 Glenn Curtiss Boulevard, Uniondale, NY 11556-0144
E-mail Send your request to info@dreyfus.com
Internet Information can be viewed online or downloaded at www.dreyfus.com
The fund files its complete schedule of portfolio holdings with the Securities and Exchange Commission (“SEC”) for the first and third quarters of each fiscal year on Form N-Q. The fund’s Forms N-Q are available on the SEC’s website at www.sec.gov and may be reviewed and copied at the SEC’s Public Reference Room in Washington, DC. (phone 1-800-SEC-0330 for information).
A description of the policies and procedures that the fund uses to determine how to vote proxies relating to portfolio securities and information regarding how the fund voted these proxies for the most recent 12-month period ended June 30 is available at www.dreyfus.com and on the SEC’s website at www.sec.gov and without charge, upon request, by calling 1-800-DREYFUS.
| | |
© 2015 MBSC Securities Corporation
6941AR0915 | 
|
Dreyfus/The Boston Company Small Cap Value Fund
| | | |
| | ANNUAL REPORT
September 30, 2015 |
| |
Save time. Save paper. View your next shareholder report online as soon as it’s available. Log into www.dreyfus.com and sign up for Dreyfus eCommunications. It’s simple and only takes a few minutes. |
| |
The views expressed in this report reflect those of the portfolio manager only through the end of the period covered and do not necessarily represent the views of Dreyfus or any other person in the Dreyfus organization. Any such views are subject to change at any time based upon market or other conditions and Dreyfus disclaims any responsibility to update such views. These views may not be relied on as investment advice and, because investment decisions for a Dreyfus fund are based on numerous factors, may not be relied on as an indication of trading intent on behalf of any Dreyfus fund. |
| |
Not FDIC-Insured • Not Bank-Guaranteed • May Lose Value |
Contents
THE FUND
FOR MORE INFORMATION
Back Cover
| | | | |
| |
Dreyfus/The Boston Company Small Cap Value Fund
| | The Fund |
A LETTER FROM THE PRESIDENT
Dear Shareholder:
We are pleased to present this annual report for Dreyfus/The Boston Company Small Cap Value Fund, covering the 12-month period from October 1, 2014, through September 30, 2015. For information about how the fund performed during the reporting period, as well as general market perspectives, we provide a Discussion of Fund Performance on the pages that follow.
Financial markets proved volatile over the reporting period. For much of the year, a recovering U.S. economy enabled stocks to advance, but those gains were erased during the third quarter of 2015 when economic concerns in China, falling commodity prices, and a stronger U.S. dollar sparked sharp corrections in equity markets throughout the world. The emerging markets were especially hard hit. U.S. bonds generally fared better, rallying in late 2014 before reversing course in the spring as the domestic economy strengthened. Global economic instability sparked a renewed rally among U.S. government securities toward the reporting period’s end, but corporate-backed and inflation-linked securities lost value.
We expect market volatility to persist over the near term as investors vacillate between hopes that current turmoil represents a healthy correction and fears that further disappointments could trigger a full-blown bear market. Our investment strategists and portfolio managers are monitoring developments carefully, keeping a close watch on Chinese fiscal and monetary policy, expectations of higher short-term interest rates in the United States, liquidity factors affecting various asset classes, and other developments that could influence investor sentiment. Over the longer term, we remain confident that markets are likely to stabilize as the world adjusts to slower Chinese economic growth, abundant energy resources, and the eventual normalization of U.S. monetary policy. In our view, investors will continue to be well served under these circumstances by a long-term perspective and a disciplined investment approach.
Thank you for your continued confidence and support.
Sincerely,

J. Charles Cardona
President
The Dreyfus Corporation
October 15, 2015
2
DISCUSSION OF FUND PERFORMANCE
For the period of October 1, 2014, through September 30, 2015, as provided by Joseph M. Corrado, CFA, and Stephanie K. Brandaleone, CFA, Portfolio Managers
Fund and Market Performance Overview
For the 12-month period ended September 30, 2015, Dreyfus/The Boston Company Small Cap Value Fund produced a total return of -2.05%.1 In comparison, the fund’s benchmark, the Russell 2000® Value Index (the “Index”), produced a total return of -1.60% for the same period.2
Stocks proved volatile over the reporting period amid shifting economic sentiment. The fund lagged its benchmark primarily due to shortfalls in the materials and health care sectors.
The Fund’s Investment Approach
The fund seeks long-term growth of capital. To pursue its goal, the fund normally invests at least 80% of its net assets in equity securities of small-cap U.S. companies with market capitalizations that are equal to or less than the total market capitalization of the largest company in the Index. We use fundamental research and qualitative analysis to select stocks and look for companies with strong competitive positions, high-quality management, and financial strength. We use a consistent three-step fundamental research process to evaluate the stocks, consisting of valuation, which is to identify small-cap companies that are considered to be attractively priced relative to their earnings potential; fundamentals, which is to verify the strength of the underlying business position; and catalyst, which is to identify a specific event that has the potential to cause the stocks to appreciate in value.
Global Economic Concerns Sparked Market Volatility
Modestly negative results from the Russell 2000® Value Index over the full reporting period masked elevated levels of short-term market volatility. October 2014 began in the midst of a market downturn, but U.S. employment gains, better consumer confidence, and improved business sentiment prompted a quick market recovery. Consequently, some broad market indices climbed to record highs through the end of February 2015. The rally paused in March amid sluggish U.S. economic growth stemming from severe winter weather and an appreciating U.S. dollar. However, the domestic economy regained traction in the spring, and stocks advanced until economic uncertainty in Greece and China again sent U.S. stock prices lower over the summer.
Fund Strategies Produced Mixed Results
The fund’s relative performance over the reporting period was dampened by a handful of disappointing security selections. In the hard hit materials sector, falling commodity and energy prices presented challenges for holdings such as steelmaker TimkenSteel, specialty metals producer Carpenter Technology, and oilfield products supplier Flotek Industries, where earnings suffered amid slowing demand from oil drillers. Likewise, mining firm Allied Nevada Gold was hurt by lower gold prices. In the health care sector, medical services and products provider Hanger struggled with accounting issues that prevented the company from filing with the SEC, and medical insurance benefit cost containment specialist HMS Holding unexpectedly lost a major government contract to a competitor. Results were also undermined by oil well servicing contractor Key Energy Services, which experienced problems
3
DISCUSSION OF FUND PERFORMANCE (continued)
in its Mexico operations, and independent energy producer Bill Barrett Corp., which was hurt by declining oil and gas prices.
The fund achieved better relative results in several other market segments. Returns from the consumer discretionary sector were buoyed by specialty retailers: Office Depot gained substantial value after receiving a takeover offer from rival Staples, and apparel seller Express encountered robust demand for new product lines. In addition, investors responded positively to the addition of activist shareholders to the board of automotive service company Pep Boys-Manny, Moe & Jack, and media conglomerate E.W. Scripps advanced after merging with Journal Communications and announcing that it would spin off some of its divisions into a new company.
In the industrials sector, a number of holdings benefited from greater U.S. residential and commercial construction activity, including carpet tiles maker Interface, furnishings manufacturer Knoll, office furniture provider Steelcase, and HVAC products supplier Comfort Systems USA. Finally, strong performers in the consumer staples sector included convenience store operator Casey’s General Stores, which reported higher earnings and improved same-store sales stemming from increased customer traffic and lower food preparation costs.
A Constructive Investment Posture
As we enter the close of the year, volatility will likely continue to impact equities as they try to find more solid footing. Above all, it is important to remember that fundamentals for both U.S. companies and the overall U.S. economy remain solid. Despite this, investors continue to grapple with concerns over global growth, especially regarding China and Europe, as well as escalating geo-political risks (such as Syria, Ukraine, and Iran) and importantly, the highly anticipated but yet-to-materialize Federal Reserve interest rate hike. The lack of clarity on those fronts continues to keep the markets off-balance. Despite this, our research driven process has led us to a number of areas in the market that are well positioned to experience positive tailwinds looking forward. While volatility is likely to persist throughout the remainder of the year, we believe that equities should be supported by positive seasonal influences, relatively healthier economic conditions, and solid corporate underpinnings.
Within this environment, we continue to find attractive opportunities in the Consumer Discretionary, Industrials and Health Care sectors, which are emphasized in the portfolio with overweight positions versus the Index. Conversely, we have maintained underweight exposure to the REITs and Insurance segments, where we have found fewer opportunities meeting our investment criteria.
October 15, 2015
Please note, the position in any security highlighted with italicized typeface was sold during the reporting period.
Equity funds are subject generally to market, market sector, market liquidity, issuer, and investment style risks, among other factors, to varying degrees, all of which are more fully described in the fund’s prospectus.
Small companies carry additional risks because their earnings and revenues tend to be less predictable and their share prices more volatile than those of larger, more established companies. The shares of smaller companies tend to trade less frequently than those of larger, more established companies, which can adversely affect the pricing of these securities and the fund’s ability to sell these securities.
1 Total return includes reinvestment of dividends and any capital gains paid. Past performance is no guarantee of future results. Share price and investment return fluctuate such that upon redemption, fund shares may be worth more or less than their original cost.
4
2 SOURCE: LIPPER INC. — Reflects the reinvestment of dividends and, where applicable, capital gain distributions. The Russell 2000 Value Index is an unmanaged index, which measures the performance of those Russell 2000 companies with lower price-to-book ratios and lower forecasted growth values. Investors cannot invest directly in any index.
5
FUND PERFORMANCE
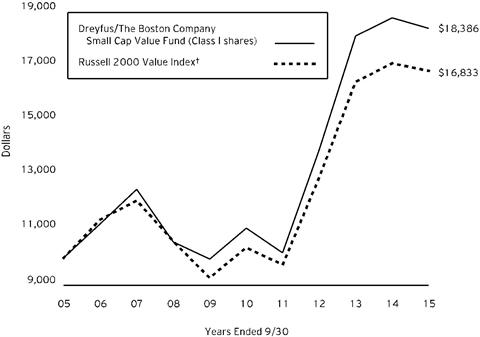
Comparison of change in value of $10,000 investment in Dreyfus/The Boston Company Small Cap Value Fund Class I shares and the Russell 2000 Value Index
| | | | |
Average Annual Total Returns as of 9/30/15 | |
| | | | |
| 1 Year | 5 Years | 10 Years |
Class I shares | -2.05% | 10.65% | 6.28% |
Russell 2000 Value Index | -1.60% | 10.17% | 5.35% |
† Source: Lipper Inc.
Past performance is not predictive of future performance. The fund’s performance shown in the graph and table does not reflect the deduction of taxes that a shareholder would pay on fund distributions or the redemption of fund shares.
The above graph compares a $10,000 investment made in Class I shares of Dreyfus/The Boston Company Small Cap Value Fund on 9/30/05 to a $10,000 investment made in the Russell 2000 Value Index (the “Index”) on that date. All dividends and capital gain distributions are reinvested.
The fund’s performance shown in the line graph above takes into account all applicable fees and expenses. The Index is an unmanaged index, which measures the performance of those Russell 2000 companies (the 2,000 smallest companies in the Russell 3000 Index) with lower price-to-book ratios and lower forecasted growth values. Unlike a mutual fund, the Index is not subject to charges, fees and other expenses. Investors cannot invest directly in any index. These factors can contribute to the Index potentially outperforming the fund. Further information relating to fund performance, including expense reimbursements, if applicable, is contained in the Financial Highlights section of the prospectus and elsewhere in this report.
6
UNDERSTANDING YOUR FUND’S EXPENSES (Unaudited)
As a mutual fund investor, you pay ongoing expenses, such as management fees and other expenses. Using the information below, you can estimate how these expenses affect your investment and compare them with the expenses of other funds. You also may pay one-time transaction expenses, including sales charges (loads) and redemption fees, which are not shown in this section and would have resulted in higher total expenses. For more information, see your fund’s prospectus or talk to your financial adviser.
Review your fund’s expenses
The table below shows the expenses you would have paid on a $1,000 investment in Dreyfus/The Boston Company Small Cap Value Fund from April 1, 2015 to September 30, 2015. It also shows how much a $1,000 investment would be worth at the close of the period, assuming actual returns and expenses.
| | | | | | | | | |
Expenses and Value of a $1,000 Investment |
assuming actual returns for the six months ended September 30, 2015 | | |
| | | | | | | | | |
Expenses paid per $1,000† | | | $ 4.66 | | | |
Ending value (after expenses) | | | $ 898.50 | | | |
COMPARING YOUR FUND’S EXPENSES
WITH THOSE OF OTHER FUNDS (Unaudited)
Using the SEC’s method to compare expenses
The Securities and Exchange Commission (SEC) has established guidelines to help investors assess fund expenses. Per these guidelines, the table below shows your fund’s expenses based on a $1,000 investment, assuming a hypothetical 5% annualized return. You can use this information to compare the ongoing expenses (but not transaction expenses or total cost) of investing in the fund with those of other funds. All mutual fund shareholder reports will provide this information to help you make this comparison. Please note that you cannot use this information to estimate your actual ending account balance and expenses paid during the period.
| | | | | | | | | |
Expenses and Value of a $1,000 Investment |
assuming a hypothetical 5% annualized return for the six months ended September 30, 2015 |
| | | | | | | | | |
Expenses paid per $1,000† | | | $ 4.96 | | | |
Ending value (after expenses) | | | $ 1,020.16 | | | |
† Expenses are equal to the fund’s annualized expense ratio of .98%, multiplied by the average account value over the period, multiplied by 183/365 (to reflect the one-half year period).
7
STATEMENT OF INVESTMENTS
September 30, 2015
| | | | | | | | | |
Common Stocks - 99.4% | | Shares | | Value ($) | |
Automobiles & Components - .9% | | | | | |
Thor Industries | | 42,651 | | 2,209,322 | |
Banks - 18.9% | | | | | |
Bank of Hawaii | | 50,732 | a | 3,220,975 | |
Boston Private Financial Holdings | | 140,775 | | 1,647,067 | |
Brookline Bancorp | | 151,420 | | 1,535,399 | |
Bryn Mawr Bank | | 21,063 | | 654,427 | |
Capital Bank Financial, Cl. A | | 28,469 | b | 860,618 | |
Cardinal Financial | | 66,880 | | 1,538,909 | |
Central Pacific Financial | | 66,628 | | 1,397,189 | |
CoBiz Financial | | 114,663 | | 1,491,766 | |
Columbia Banking System | | 70,311 | | 2,194,406 | |
CVB Financial | | 54,936 | | 917,431 | |
FCB Financial Holdings, Cl. A | | 28,723 | b | 936,944 | |
First Horizon National | | 344,281 | a | 4,881,905 | |
First Midwest Bancorp | | 126,273 | | 2,214,828 | |
Prosperity Bancshares | | 30,407 | | 1,493,288 | |
Seacoast Banking Corp. of Florida | | 85,444 | b | 1,254,318 | |
Synovus Financial | | 229,350 | | 6,788,760 | |
UMB Financial | | 56,327 | a | 2,861,975 | |
United Community Banks | | 112,562 | | 2,300,767 | |
Valley National Bancorp | | 314,275 | | 3,092,466 | |
Washington Trust Bancorp | | 29,981 | | 1,152,769 | |
Webster Financial | | 117,155 | | 4,174,233 | |
Wintrust Financial | | 30,907 | | 1,651,361 | |
| | | | | 48,261,801 | |
Capital Goods - 7.4% | | | | | |
AeroVironment | | 76,504 | b | 1,533,140 | |
American Woodmark | | 16,798 | b | 1,089,686 | |
Apogee Enterprises | | 26,649 | | 1,189,878 | |
Astec Industries | | 52,671 | | 1,765,005 | |
Chart Industries | | 49,103 | b | 943,269 | |
Comfort Systems USA | | 47,500 | | 1,294,850 | |
EMCOR Group | | 53,037 | | 2,346,887 | |
FreightCar America | | 52,261 | | 896,799 | |
Granite Construction | | 60,713 | | 1,801,355 | |
Great Lakes Dredge and Dock | | 75,740 | b | 381,730 | |
Lindsay | | 27,448 | a | 1,860,700 | |
Mueller Industries | | 21,044 | | 622,482 | |
8
| | | | | | | | | | | |
Common Stocks - 99.4% (continued) | | Shares | | Value ($) | |
Capital Goods - 7.4% (continued) | | | | | |
Raven Industries | | 62,884 | | 1,065,884 | |
Simpson Manufacturing | | 62,195 | | 2,082,911 | |
| | | | | 18,874,576 | |
Commercial & Professional Services - 6.4% | | | | | |
Advisory Board | | 47,099 | b | 2,144,888 | |
FTI Consulting | | 61,979 | b | 2,572,748 | |
Interface | | 106,893 | | 2,398,679 | |
Knoll | | 84,106 | | 1,848,650 | |
Korn/Ferry International | | 77,297 | | 2,556,212 | |
McGrath RentCorp | | 57,136 | | 1,524,960 | |
Steelcase, Cl. A | | 115,834 | | 2,132,504 | |
TrueBlue | | 54,942 | b | 1,234,547 | |
| | | | | 16,413,188 | |
Consumer Durables & Apparel - 5.6% | | | | | |
Cavco Industries | | 19,535 | b | 1,330,138 | |
Deckers Outdoor | | 26,485 | b | 1,537,719 | |
Ethan Allen Interiors | | 73,498 | | 1,941,082 | |
iRobot | | 50,109 | a,b | 1,460,176 | |
Oxford Industries | | 21,226 | | 1,568,177 | |
TopBuild | | 24,953 | b | 772,794 | |
Universal Electronics | | 29,295 | b | 1,231,269 | |
Vera Bradley | | 86,066 | a,b | 1,085,292 | |
WCI Communities | | 78,122 | b | 1,767,901 | |
William Lyon Homes, Cl. A | | 76,018 | b | 1,565,971 | |
| | | | | 14,260,519 | |
Consumer Services - 2.4% | | | | | |
Belmond, Cl. A | | 173,203 | b | 1,751,082 | |
Capella Education | | 19,222 | | 951,873 | |
Cheesecake Factory | | 61,707 | | 3,329,710 | |
| | | | | 6,032,665 | |
Diversified Financials - .9% | | | | | |
Cohen & Steers | | 37,289 | | 1,023,583 | |
Piper Jaffray | | 37,008 | b | 1,338,579 | |
| | | | | 2,362,162 | |
Energy - 4.8% | | | | | |
Energen | | 35,489 | | 1,769,482 | |
Geospace Technologies | | 61,040 | b | 842,962 | |
Gulf Island Fabrication | | 42,164 | | 443,987 | |
Natural Gas Services Group | | 48,973 | b | 945,179 | |
Oil States International | | 75,183 | b | 1,964,532 | |
9
STATEMENT OF INVESTMENTS (continued)
| | | | | | | | | | | |
Common Stocks - 99.4% (continued) | | Shares | | Value ($) | |
Energy - 4.8% (continued) | | | | | |
Patterson-UTI Energy | | 140,004 | | 1,839,653 | |
PDC Energy | | 17,849 | a,b | 946,175 | |
RPC | | 168,485 | a | 1,491,092 | |
Synergy Resources | | 193,053 | b | 1,891,919 | |
| | | | | 12,134,981 | |
Exchange-Traded Funds - .6% | | | | | |
iShares Russell 2000 Value ETF | | 16,935 | | 1,525,843 | |
Food & Staples Retailing - 3.7% | | | | | |
Casey's General Stores | | 50,031 | | 5,149,191 | |
Fresh Market | | 78,348 | b | 1,769,881 | |
United Natural Foods | | 50,070 | a,b | 2,428,896 | |
| | | | | 9,347,968 | |
Food, Beverage & Tobacco - .5% | | | | | |
Fresh Del Monte Produce | | 34,535 | | 1,364,478 | |
Health Care Equipment & Services - 6.4% | | | | | |
Air Methods | | 62,935 | a,b | 2,145,454 | |
Computer Programs & Systems | | 12,731 | | 536,357 | |
Globus Medical, Cl. A | | 94,209 | b | 1,946,358 | |
Hanger | | 27,740 | b | 378,374 | |
Invacare | | 49,359 | | 714,225 | |
LifePoint Health | | 48,648 | b | 3,449,143 | |
Meridian Bioscience | | 79,755 | | 1,363,810 | |
Natus Medical | | 13,194 | b | 520,503 | |
Omnicell | | 56,244 | b | 1,749,188 | |
WellCare Health Plans | | 40,697 | b | 3,507,267 | |
| | | | | 16,310,679 | |
Insurance - 1.8% | | | | | |
First American Financial | | 39,335 | | 1,536,818 | |
RLI | | 30,850 | | 1,651,400 | |
Safety Insurance Group | | 26,899 | | 1,456,581 | |
| | | | | 4,644,799 | |
Materials - 3.2% | | | | | |
Calgon Carbon | | 57,826 | | 900,929 | |
Carpenter Technology | | 37,229 | | 1,108,307 | |
Haynes International | | 28,093 | | 1,063,039 | |
Intrepid Potash | | 91,741 | b | 508,245 | |
Louisiana-Pacific | | 127,466 | a,b | 1,815,116 | |
Stillwater Mining | | 179,131 | b | 1,850,423 | |
TimkenSteel | | 82,201 | | 831,874 | |
| | | | | 8,077,933 | |
10
| | | | | | | | | | | |
Common Stocks - 99.4% (continued) | | Shares | | Value ($) | |
Media - 3.6% | | | | | |
E.W. Scripps, Cl. A | | 195,524 | | 3,454,909 | |
Morningstar | | 9,023 | | 724,186 | |
New York Times, Cl. A | | 206,614 | | 2,440,111 | |
Time | | 133,327 | | 2,539,879 | |
| | | | | 9,159,085 | |
Real Estate - 6.6% | | | | | |
American Assets Trust | | 51,723 | c | 2,113,402 | |
CyrusOne | | 72,508 | c | 2,368,111 | |
Education Realty Trust | | 30,765 | a | 1,013,707 | |
EPR Properties | | 49,877 | c | 2,572,157 | |
Healthcare Trust of America, Cl. A | | 113,334 | | 2,777,816 | |
Kite Realty Group Trust | | 106,402 | | 2,533,432 | |
Pebblebrook Hotel Trust | | 27,661 | a,c | 980,582 | |
Physicians Realty Trust | | 82,143 | c | 1,239,538 | |
RLJ Lodging Trust | | 45,558 | c | 1,151,251 | |
| | | | | 16,749,996 | |
Retailing - 6.8% | | | | | |
American Eagle Outfitters | | 167,092 | a | 2,611,648 | |
Express | | 132,166 | b | 2,361,806 | |
Finish Line, Cl. A | | 60,445 | | 1,166,589 | |
Guess? | | 102,941 | a | 2,198,820 | |
Haverty Furniture | | 43,428 | | 1,019,689 | |
PEP Boys-Manny Moe & Jack | | 122,026 | b | 1,487,497 | |
The Children's Place | | 34,984 | | 2,017,527 | |
Urban Outfitters | | 51,240 | b | 1,505,431 | |
Vitamin Shoppe | | 63,975 | b | 2,088,144 | |
Zumiez | | 49,125 | b | 767,824 | |
| | | | | 17,224,975 | |
Semiconductors & Semiconductor Equipment - 3.2% | | | | | |
Brooks Automation | | 157,697 | | 1,846,632 | |
Inphi | | 54,536 | b | 1,311,045 | |
MKS Instruments | | 54,258 | | 1,819,271 | |
Nanometrics | | 65,041 | b | 789,598 | |
Teradyne | | 138,753 | | 2,498,942 | |
| | | | | 8,265,488 | |
Software & Services - 4.5% | | | | | |
Acxiom | | 96,147 | b | 1,899,865 | |
Constant Contact | | 45,968 | b | 1,114,265 | |
CSG Systems International | | 64,035 | | 1,972,278 | |
Mentor Graphics | | 124,106 | | 3,056,731 | |
11
STATEMENT OF INVESTMENTS (continued)
| | | | | | | | | |
|
Common Stocks - 99.4% (continued) | | Shares | | Value ($) | |
Software & Services - 4.5% (continued) | | | | | |
Monotype Imaging Holdings | | 49,999 | | 1,090,978 | |
Synchronoss Technologies | | 35,540 | b | 1,165,712 | |
TiVo | | 144,619 | b | 1,252,401 | |
| | | | | 11,552,230 | |
Technology Hardware & Equipment - 4.1% | | | | | |
DTS | | 25,237 | b | 673,828 | |
Electronics For Imaging | | 46,811 | b | 2,025,980 | |
FARO Technologies | | 30,702 | b | 1,074,570 | |
IPG Photonics | | 8,690 | b | 660,179 | |
Ixia | | 44,787 | b | 648,964 | |
Littelfuse | | 23,544 | | 2,146,036 | |
ScanSource | | 34,998 | b | 1,241,029 | |
Tech Data | | 15,019 | b | 1,028,802 | |
Vishay Intertechnology | | 103,404 | | 1,001,985 | |
| | | | | 10,501,373 | |
Transportation - .4% | | | | | |
Marten Transport | | 64,068 | | 1,035,979 | |
Utilities - 6.7% | | | | | |
California Water Service Group | | 73,849 | | 1,633,540 | |
Chesapeake Utilities | | 34,745 | | 1,844,265 | |
Hawaiian Electric Industries | | 82,132 | | 2,356,367 | |
MDU Resources Group | | 122,247 | | 2,102,648 | |
NorthWestern | | 52,077 | | 2,803,305 | |
Piedmont Natural Gas | | 77,079 | | 3,088,556 | |
Portland General Electric | | 91,073 | | 3,366,969 | |
| | | | | 17,195,650 | |
Total Common Stocks (cost $230,761,306) | | | | 253,505,690 | |
Other Investments - 1.6% | | | | | |
Registered Investment Company; | | | | | |
Dreyfus Institutional Preferred Plus Money Market Fund | | 4,093,323 | d | 4,093,323 | |
(cost $4,093,323) | | | | | |
Investment of Cash Collateral for Securities Loaned - 3.4% | | | | | |
Registered Investment Company; | | | | | |
Dreyfus Institutional Cash Advantage Fund | | 8,516,377 | d | 8,516,377 | |
(cost $8,516,377) | | | | | |
Total Investments (cost $243,371,006) | | 104.4% | | 266,115,390 | |
Liabilities, Less Cash and Receivables | | (4.4%) | | (11,096,502) | |
Net Assets | | 100.0% | | 255,018,888 | |
ETF—Exchange-Traded Fund
12
a Security, or portion thereof, on loan. At September 30, 2015, the value of the fund's securities on loan was $19,349,734 and the value of the collateral held by the fund was $19,708,171 consisting of cash collateral of $8,516,377 and U.S. Government & Agency securities valued at $11,191,794.
b Non-income producing security.
c Investment in real estate investment trust.
d Investment in affiliated money market mutual fund.
| | |
Portfolio Summary (Unaudited) † | Value (%) |
Banks | 18.9 |
Capital Goods | 7.4 |
Retailing | 6.8 |
Utilities | 6.7 |
Real Estate | 6.6 |
Commercial & Professional Services | 6.4 |
Health Care Equipment & Services | 6.4 |
Consumer Durables & Apparel | 5.6 |
Money Market Investments | 5.0 |
Energy | 4.8 |
Software & Services | 4.5 |
Technology Hardware & Equipment | 4.1 |
Food & Staples Retailing | 3.7 |
Media | 3.6 |
Materials | 3.2 |
Semiconductors & Semiconductor Equipment | 3.2 |
Consumer Services | 2.4 |
Insurance | 1.8 |
Automobiles & Components | .9 |
Diversified Financials | .9 |
Exchange-Traded Funds | .6 |
Food, Beverage & Tobacco | .5 |
Transportation | .4 |
| | 104.4 |
†Based on net assets.
See notes to financial statements.
13
STATEMENT OF ASSETS AND LIABILITIES
September 30, 2015
| | | | | | | | | |
| | | Cost | | Value | |
Assets ($): | | | | |
Investments in securities—See Statement of Investments
(including securities on loan, valued at $19,349,734)—Note 1(b): | | | | |
Unaffiliated issuers | | 230,761,306 | | 253,505,690 | |
Affiliated issuers | | 12,609,700 | | 12,609,700 | |
Cash | | | | | 113,052 | |
Receivable for investment securities sold | | | | | 2,262,569 | |
Dividends and securities lending income receivable | | | | | 367,687 | |
Prepaid expenses | | | | | 9,554 | |
| | | | | 268,868,252 | |
Liabilities ($): | | | | |
Due to The Dreyfus Corporation and affiliates—Note 3(b) | | | | | 214,063 | |
Liability for securities on loan—Note 1(b) | | | | | 8,516,377 | |
Payable for investment securities purchased | | | | | 5,026,501 | |
Payable for shares of Beneficial Interest redeemed | | | | | 27,263 | |
Accrued expenses | | | | | 65,160 | |
| | | | | 13,849,364 | |
Net Assets ($) | | | 255,018,888 | |
Composition of Net Assets ($): | | | | |
Paid-in capital | | | | | 215,695,472 | |
Accumulated undistributed investment income—net | | | | | 1,519,285 | |
Accumulated net realized gain (loss) on investments | | | | | 15,059,747 | |
Accumulated net unrealized appreciation (depreciation)
on investments | | | | | 22,744,384 | |
Net Assets ($) | | | 255,018,888 | |
Shares Outstanding | | |
(unlimited number of $.001 par value shares of Beneficial Interest authorized) | | 11,616,638 | |
Net Asset Value Per Share ($) | | 21.95 | |
See notes to financial statements.
14
STATEMENT OF OPERATIONS
Year Ended September 30, 2015
| | | | | | | |
| | | | | | |
| | | | | | |
Investment Income ($): | | | | |
Income: | | | | |
Cash dividends (net of $259 foreign taxes withheld at source): | | | | |
Unaffiliated issuers | | | 4,683,213 | |
Affiliated issuers | | | 3,562 | |
Income from securities lending—Note 1(b) | | | 101,530 | |
Total Income | | | 4,788,305 | |
Expenses: | | | | |
Investment advisory fee—Note 3(a) | | | 2,404,673 | |
Shareholder servicing costs—Note 3(b) | | | 172,612 | |
Administration fee—Note 3(a) | | | 149,758 | |
Custodian fees—Note 3(b) | | | 55,663 | |
Professional fees | | | 47,537 | |
Registration fees | | | 25,870 | |
Prospectus and shareholders’ reports | | | 21,633 | |
Trustees' fees and expenses—Note 3(c) | | | 17,667 | |
Loan commitment fees—Note 2 | | | 2,521 | |
Interest expense—Note 2 | | | 1,091 | |
Miscellaneous | | | 21,460 | |
Total Expenses | | | 2,920,485 | |
Less—reduction in fees due to earnings credits—Note 3(b) | | | (6) | |
Net Expenses | | | 2,920,479 | |
Investment Income—Net | | | 1,867,826 | |
Realized and Unrealized Gain (Loss) on Investments—Note 4 ($): | | |
Net realized gain (loss) on investments | 16,979,535 | |
Net unrealized appreciation (depreciation) on investments | | | (21,216,304) | |
Net Realized and Unrealized Gain (Loss) on Investments | | | (4,236,769) | |
Net (Decrease) in Net Assets Resulting from Operations | | (2,368,943) | |
See notes to financial statements.
15
STATEMENT OF CHANGES IN NET ASSETS
| | | | | | | | | | |
| | | | | | | | | | |
| | | | Year Ended September 30, |
| | | | 2015 | | | | 2014 | |
Operations ($): | | | | | | | | |
Investment income—net | | | 1,867,826 | | | | 1,308,141 | |
Net realized gain (loss) on investments | | 16,979,535 | | | | 67,923,008 | |
Net unrealized appreciation (depreciation)
on investments | | (21,216,304) | | | | (53,436,247) | |
Net Increase (Decrease) in Net Assets
Resulting from Operations | (2,368,943) | | | | 15,794,902 | |
Dividends to Shareholders from ($): | | | | | | | | |
Investment income—net | | | (1,400,392) | | | | (1,005,685) | |
Net realized gain on investments | | | (60,861,664) | | | | (62,752,734) | |
Total Dividends | | | (62,262,056) | | | | (63,758,419) | |
Beneficial Interest Transactions ($): | | | | | | | | |
Net proceeds from shares sold | | | 21,295,604 | | | | 23,641,959 | |
Dividends reinvested | | | 61,197,899 | | | | 62,714,198 | |
Cost of shares redeemed | | | (81,219,703) | | | | (105,762,725) | |
Increase (Decrease) in Net Assets
from Beneficial Interest Transactions | 1,273,800 | | | | (19,406,568) | |
Total Increase (Decrease) in Net Assets | (63,357,199) | | | | (67,370,085) | |
Net Assets ($): | | | | | | | | |
Beginning of Period | | | 318,376,087 | | | | 385,746,172 | |
End of Period | | | 255,018,888 | | | | 318,376,087 | |
Undistributed investment income—net | 1,519,285 | | | | 1,378,066 | |
Capital Share Transactions (Shares): | | | | | | | | |
Shares sold | | | 861,137 | | | | 777,169 | |
Shares issued for dividends reinvested | | | 2,685,296 | | | | 2,192,804 | |
Shares redeemed | | | (3,214,581) | | | | (3,460,611) | |
Net Increase (Decrease) in Shares Outstanding | 331,852 | | | | (490,638) | |
See notes to financial statements.
16
FINANCIAL HIGHLIGHTS
The following table describes the performance for the fiscal periods indicated. Total return shows how much your investment in the fund would have increased (or decreased) during each period, assuming you had reinvested all dividends and distributions. These figures have been derived from the fund’s financial statements.
| | | | | | | |
| | | | | |
| | Year Ended September 30, |
| | | 2015 | 2014 | 2013 | 2012 | 2011 |
Per Share Data ($): | | | | | | |
Net asset value, beginning of period | 28.21 | 32.76 | 25.65 | 18.81 | 20.57 |
Investment Operations: | | | | | | |
Investment income—neta | .15 | .11 | .26 | .14 | .13 |
Net realized and unrealized gain (loss) on investments | (.51) | 1.15 | 7.29 | 6.79 | (1.79) |
Total from Investment Operations | (.36) | 1.26 | 7.55 | 6.93 | (1.66) |
Distributions: | | | | | | |
Dividends from investment income—net | | (.13) | (.09) | (.22) | (.09) | (.10) |
Dividends from net realized gain on investments | (5.77) | (5.72) | (.22) | - | - |
Total Distributions | (5.90) | (5.81) | (.44) | (.09) | (.10) |
Net asset value, end of period | 21.95 | 28.21 | 32.76 | 25.65 | 18.81 |
Total Return (%) | (2.05) | 3.62 | 29.92 | 36.95 | (8.14) |
Ratios/Supplemental Data (%): | | | | | |
Ratio of total expenses to average net assets | .97 | .96 | .99 | .98 | .96 |
Ratio of net expenses to average net assets | | .97 | .96 | .99 | .98 | .96 |
Ratio of net investment income to average net assets | .62 | .37 | .90 | .59 | .57 |
Portfolio Turnover Rate | 76.23 | 68.43 | 76.63 | 88.54 | 66.51 |
Net Assets, end of period ($ x 1,000) | 255,019 | 318,376 | 385,746 | 457,180 | 372,176 |
a Based on average shares outstanding.
See notes to financial statements.
17
NOTES TO FINANCIAL STATEMENTS
NOTE 1—Significant Accounting Policies:
Dreyfus/The Boston Company Small Cap Value Fund (the “fund”) is a separate diversified series of Dreyfus Investment Funds (the “Trust”), which is registered under the Investment Company Act of 1940, as amended (the “Act”), as an open-end management investment company and operates as a series company currently offering seven series, including the fund. The fund’s investment objective is to seek long-term growth of capital. The Dreyfus Corporation (the “Manager” or “Dreyfus”), a wholly-owned subsidiary of The Bank of New York Mellon Corporation (“BNY Mellon”), serves as the fund’s investment adviser. MBSC Securities Corporation (the “Distributor”), a wholly-owned subsidiary of Dreyfus, is the distributor of the fund’s shares.
Class I shares are sold primarily to bank trust departments and other financial service providers (including The Bank of New York Mellon, a subsidiary of BNY Mellon and an affiliate of Dreyfus, and its affiliates), acting on behalf of customers having a qualified trust or an investment account or relationship at such institution, and bear no Distribution or Shareholder Service Plan fees. Class I shares are offered without a front-end sales charge or a contingent deferred sales charge.
The Trust accounts separately for the assets, liabilities and operations of each series. Expenses directly attributable to each series are charged to that series’ operations; expenses which are applicable to all series are allocated among them on a pro rata basis.
The Financial Accounting Standards Board (“FASB”) Accounting Standards Codification (“ASC”) is the exclusive reference of authoritative U.S. generally accepted accounting principles (“GAAP”) recognized by the FASB to be applied by nongovernmental entities. Rules and interpretive releases of the Securities and Exchange Commission (“SEC”) under authority of federal laws are also sources of authoritative GAAP for SEC registrants. The fund’s financial statements are prepared in accordance with GAAP, which may require the use of management estimates and assumptions. Actual results could differ from those estimates.
(a) Portfolio valuation: The fair value of a financial instrument is the amount that would be received to sell an asset or paid to transfer a liability in an orderly transaction between market participants at the measurement date (i.e., the exit price). GAAP establishes a fair value hierarchy that prioritizes the inputs of valuation techniques used to measure fair value. This hierarchy gives the highest priority to unadjusted quoted prices in
18
active markets for identical assets or liabilities (Level 1 measurements) and the lowest priority to unobservable inputs (Level 3 measurements).
Additionally, GAAP provides guidance on determining whether the volume and activity in a market has decreased significantly and whether such a decrease in activity results in transactions that are not orderly. GAAP requires enhanced disclosures around valuation inputs and techniques used during annual and interim periods.
Various inputs are used in determining the value of the fund’s investments relating to fair value measurements. These inputs are summarized in the three broad levels listed below:
Level 1—unadjusted quoted prices in active markets for identical investments.
Level 2—other significant observable inputs (including quoted prices for similar investments, interest rates, prepayment speeds, credit risk, etc.).
Level 3—significant unobservable inputs (including the fund’s own assumptions in determining the fair value of investments).
The inputs or methodology used for valuing securities are not necessarily an indication of the risk associated with investing in those securities.
Changes in valuation techniques may result in transfers in or out of an assigned level within the disclosure hierarchy. Valuation techniques used to value the fund’s investments are as follows:
Investments in securities are valued at the last sales price on the securities exchange or national securities market on which such securities are primarily traded. Securities listed on the National Market System for which market quotations are available are valued at the official closing price or, if there is no official closing price that day, at the last sales price. For open short positions, asked prices are used for valuation purposes. Bid price is used when no asked price is available. Registered investment companies that are not traded on an exchange are valued at their net asset value. All of the preceding securities are generally categorized within Level 1 of the fair value hierarchy.
Securities not listed on an exchange or the national securities market, or securities for which there were no transactions, are valued at the average of the most recent bid and asked prices. These securities are generally categorized within Level 2 of the fair value hierarchy.
Fair valuing of securities may be determined with the assistance of a pricing service using calculations based on indices of domestic securities
19
NOTES TO FINANCIAL STATEMENTS (continued)
and other appropriate indicators, such as prices of relevant American Depository Receipts and financial futures. Utilizing these techniques may result in transfers between Level 1 and Level 2 of the fair value hierarchy.
When market quotations or official closing prices are not readily available, or are determined not to reflect accurately fair value, such as when the value of a security has been significantly affected by events after the close of the exchange or market on which the security is principally traded (for example, a foreign exchange or market), but before the fund calculates its net asset value, the fund may value these investments at fair value as determined in accordance with the procedures approved by the Trust’s Board of Trustees (the “Board”). Certain factors may be considered when fair valuing investments such as: fundamental analytical data, the nature and duration of restrictions on disposition, an evaluation of the forces that influence the market in which the securities are purchased and sold, and public trading in similar securities of the issuer or comparable issuers. These securities are either categorized within Level 2 or 3 of the fair value hierarchy depending on the relevant inputs used.
For restricted securities where observable inputs are limited, assumptions about market activity and risk are used and are generally categorized within Level 3 of the fair value hierarchy.
The following is a summary of the inputs used as of September 30, 2015 in valuing the fund’s investments:
| | | | | |
| | Level 1 - Unadjusted Quoted Prices | Level 2 - Other Significant Observable Inputs | Level 3 -Significant Unobservable Inputs | Total |
Assets ($) | | | | |
Investments in Securities: | | |
Equity Securities—Domestic Common Stocks† | 250,228,765 | - | - | 250,228,765 |
Equity Securities—Foreign Common Stocks† | 1,751,082 | - | - | 1,751,082 |
Exchange—Traded Funds | 1,525,843 | - | - | 1,525,843 |
Mutual Funds | 12,609,700 | - | - | 12,609,700 |
† See Statement of Investments for additional detailed categorizations.
At September 30, 2015, there were no transfers between Level 1 and Level 2 of the fair value hierarchy.
20
(b) Securities transactions and investment income: Securities transactions are recorded on a trade date basis. Realized gains and losses from securities transactions are recorded on the identified cost basis. Dividend income is recognized on the ex-dividend date and interest income, including, where applicable, accretion of discount and amortization of premium on investments, is recognized on the accrual basis.
Pursuant to a securities lending agreement with The Bank of New York Mellon, the fund may lend securities to qualified institutions. It is the fund’s policy that, at origination, all loans are secured by collateral of at least 102% of the value of U.S. securities loaned and 105% of the value of foreign securities loaned. Collateral equivalent to at least 100% of the market value of securities on loan is maintained at all times. Collateral is either in the form of cash, which can be invested in certain money market mutual funds managed by Dreyfus, or U.S. Government and Agency securities. The fund is entitled to receive all dividends, interest and distributions on securities loaned, in addition to income earned as a result of the lending transaction. Should a borrower fail to return the securities in a timely manner, The Bank of New York Mellon is required to replace the securities for the benefit of the fund or credit the fund with the market value of the unreturned securities and is subrogated to the fund’s rights against the borrower and the collateral. During the period ended September 30, 2015, The Bank of New York Mellon earned $28,465 from lending portfolio securities, pursuant to the securities lending agreement.
(c) Affiliated issuers: Investments in other investment companies advised by Dreyfus are defined as “affiliated” under the Act. Investments in affiliated investment companies during the period ended September 30, 2015 were as follows:
| | | | | | |
Affiliated Investment Company | Value 9/30/2014 ($) | Purchases ($) | Sales ($) | Value 9/30/2015 ($) | Net Assets (%) |
Dreyfus Institutional Preferred Plus Money Market Fund | 4,863,755 | 95,469,787 | 96,240,219 | 4,093,323 | 1.6 |
Dreyfus Institutional Cash Advantage Fund | - | 161,027,020 | 152,510,643 | 8,516,377 | 3.4 |
Total | 4,863,755 | 256,496,807 | 248,750,862 | 12,609,700 | 5.0 |
21
NOTES TO FINANCIAL STATEMENTS (continued)
(d) Dividends to shareholders: Dividends are recorded on the ex-dividend date. Dividends from investment income-net and dividends from net realized capital gains, if any, are normally declared and paid annually, but the fund may make distributions on a more frequent basis to comply with the distribution requirements of the Internal Revenue Code of 1986, as amended (the “Code”). To the extent that net realized capital gains can be offset by capital loss carryovers, it is the policy of the fund not to distribute such gains. Income and capital gain distributions are determined in accordance with income tax regulations, which may differ from GAAP.
(e) Federal income taxes: It is the policy of the fund to continue to qualify as a regulated investment company, if such qualification is in the best interests of its shareholders, by complying with the applicable provisions of the Code, and to make distributions of taxable income sufficient to relieve it from substantially all federal income and excise taxes.
As of and during the period ended September 30, 2015, the fund did not have any liabilities for any uncertain tax positions. The fund recognizes interest and penalties, if any, related to uncertain tax positions as income tax expense in the Statement of Operations. During the period ended September 30, 2015, the fund did not incur any interest or penalties.
Each tax year in the four-year period ended September 30, 2015 remains subject to examination by the Internal Revenue Service and state taxing authorities.
At September 30, 2015, the components of accumulated earnings on a tax basis were as follows: undistributed ordinary income $1,426,710, undistributed capital gains $17,976,075 and unrealized appreciation $19,920,631.
The tax character of distributions paid to shareholders during the fiscal periods ended September 30, 2015 and September 30, 2014 were as follows: ordinary income $9,741,539 and $23,808,510, and long-term capital gains $52,520,517 and $39,949,909, respectively.
During the period ended September 30, 2015, as a result of permanent book to tax differences, primarily due to the tax treatment for real estate investment trusts and dividend reclassification, the fund decreased accumulated undistributed investment income-net by $326,215 and increased accumulated net realized gain (loss) on investments by the same amount. Net assets and net asset value per share were not affected by this reclassification.
22
NOTE 2—Bank Lines of Credit:
The fund participates with other Dreyfus-managed funds in a $430 million unsecured credit facility led by Citibank, N.A. and a $300 million unsecured credit facility provided by The Bank of New York Mellon (each, a “Facility”), each to be utilized primarily for temporary or emergency purposes, including the financing of redemptions. Prior to October 8, 2014, the unsecured credit facility with Citibank, N.A. was $265 million. In connection therewith, the fund has agreed to pay its pro rata portion of commitment fees for each Facility. Interest is charged to the fund based on rates determined pursuant to the terms of the respective Facility at the time of borrowing.
The average amount of borrowings outstanding under the Facilities during the period ended September 30, 2015 was approximately $99,500 with a related weighted average annualized interest rate of 1.10%.
NOTE 3—Investment Advisory Fee, Administration Fee and Other Transactions with Affiliates:
(a) Pursuant to an investment advisory agreement with Dreyfus, the investment advisory fee is computed at the annual rate of .80% of the value of the fund’s average daily net assets and is payable monthly.
The fund has a Fund Accounting and Administrative Services Agreement (the “Administration Agreement”) with Dreyfus, whereby Dreyfus performs administrative, accounting and recordkeeping services for the fund. The fund has agreed to compensate Dreyfus for providing accounting and recordkeeping services, administration, compliance monitoring, regulatory and shareholder reporting, as well as related facilities, equipment and clerical help. The fee is based on the fund’s average daily net assets and computed at the following annual rates: .06% of the first $500 million, .04% of the next $500 million and .02% in excess of $1 billion.
In addition, after applying any expense limitations or fee waivers that reduce the fees paid to Dreyfus for this service, Dreyfus has contractually agreed in writing to waive any remaining fees for this service to the extent that they exceed both Dreyfus’ costs in providing these services and a reasonable allocation of the costs incurred by Dreyfus and its affiliates related to the support and oversight of these services. The fund also reimburses Dreyfus for the out-of-pocket expenses incurred in performing this service for the fund. Pursuant to the Administration Agreement, the fund was charged $149,758 during the period ended September 30, 2015.
23
NOTES TO FINANCIAL STATEMENTS (continued)
(b)The fund has arrangements with the transfer agent and the custodian whereby the fund may receive earnings credits when positive cash balances are maintained, which are used to offset transfer agency and custody fees. For financial reporting purposes, the fund includes net earnings credits as an expense offset in the Statement of Operations.
The fund compensates Dreyfus Transfer, Inc., a wholly-owned subsidiary of Dreyfus, under a transfer agency agreement for providing transfer agency and cash management services for the fund. The majority of transfer agency fees are comprised of amounts paid on a per account basis, while cash management fees are related to fund subscriptions and redemptions. During the period ended September 30, 2015, the fund was charged $4,266 for transfer agency services and $120 for cash management services. These fees are included in Shareholder servicing costs in the Statement of Operations. Cash management fees were partially offset by earnings credits of $6.
The fund compensates The Bank of New York Mellon under a custody agreement for providing custodial services for the fund. These fees are determined based on net assets, geographic region and transaction activity. During the period ended September 30, 2015, the fund was charged $55,663 pursuant to the custody agreement.
During the period ended September 30, 2015, the fund was charged $11,078 for services performed by the Chief Compliance Officer and his staff.
The components of “Due to The Dreyfus Corporation and affiliates” in the Statement of Assets and Liabilities consist of: investment advisory fees $173,367, custodian fees $25,025, Chief Compliance Officer fees $2,606, administration fees $12,318 and transfer agency fees $747.
(c) Each Board member also serves as a Board member of other funds within the Dreyfus complex. Annual retainer fees and attendance fees are allocated to each fund based on net assets.
NOTE 4—Securities Transactions:
The aggregate amount of purchases and sales of investment securities, excluding short-term securities, during the period ended September 30, 2015, amounted to $226,409,400 and $285,684,730, respectively.
At September 30, 2015, the cost of investments for federal income tax purposes was $246,194,759; accordingly, accumulated net unrealized appreciation on investments was $19,920,631, consisting of $45,038,479 gross unrealized appreciation and $25,117,848 gross unrealized depreciation.
24
REPORT OF INDEPENDENT REGISTERED
PUBLIC ACCOUNTING FIRM
The Board of Trustees and Shareholders of
Dreyfus Investment Funds
We have audited the accompanying statement of assets and liabilities of Dreyfus/The Boston Company Small Cap Value Fund (the “Fund”), a series of Dreyfus Investment Funds, including the statement of investments, as of September 30, 2015, and the related statement of operations for the year then ended, the statements of changes in net assets for each of the years in the two-year period then ended, and the financial highlights for each of the years in the five-year period then ended. These financial statements and financial highlights are the responsibility of the Fund’s management. Our responsibility is to express an opinion on these financial statements and financial highlights based on our audits.
We conducted our audits in accordance with the standards of the Public Company Accounting Oversight Board (United States). Those standards require that we plan and perform the audit to obtain reasonable assurance about whether the financial statements and financial highlights are free of material misstatement. An audit includes examining, on a test basis, evidence supporting the amounts and disclosures in the financial statements. Our procedures included confirmation of securities owned as of September 30, 2015, by correspondence with the custodian and brokers or by other appropriate auditing procedures. An audit also includes assessing the accounting principles used and significant estimates made by management, as well as evaluating the overall financial statement presentation. We believe that our audits provide a reasonable basis for our opinion.
In our opinion, the financial statements and financial highlights referred to above present fairly, in all material respects, the financial position of Dreyfus/The Boston Company Small Cap Value Fund as of September 30, 2015, the results of its operations for the year then ended, the changes in its net assets for each of the years in the two-year period then ended, and the financial highlights for each of the years in the five-year period then ended, in conformity with U.S. generally accepted accounting principles.

New York, New York
November 25, 2015
25
IMPORTANT TAX INFORMATION (Unaudited)
For federal tax purposes, the fund reports the maximum amount allowable, but not less than $2,555,914 as ordinary income dividends paid during the year ended September 30, 2015 as qualified dividend income in accordance with Section 854(b)(1)(B) of the Internal Revenue Code. Also, the fund reports the maximum amount allowable but not less than 38.91% of ordinary income dividends paid during the year ended September 30, 2015 as eligible for the corporate dividends received deduction provided under Section 243 of the Internal Revenue Code in accordance with Section 854(b)(1)(A) of the Internal Revenue Code. Shareholders will receive notification in early 2016 of the percentage applicable to the preparation of their 2015 income tax returns. The fund reports the maximum amount allowable but not less than $4.9768 per share as a capital gain dividend in accordance with Section 852(b)(3)(C) of the Internal Revenue Code. The fund reports the maximum amount allowable but not less than $.7904 per share as a short-term capital gain dividend in accordance with Sections 871(k)(2) and 881(e) of the Internal Revenue Code.
26
BOARD MEMBERS INFORMATION (Unaudited)
INDEPENDENT BOARD MEMBERS
Joseph S. DiMartino (71)
Chairman of the Board (2008)
Principal Occupation During Past 5 Years:
· Corporate Director and Trustee (1995-present)
Other Public Company Board Memberships During Past 5 Years:
· CBIZ (formerly, Century Business Services, Inc.), a provider of outsourcing functions for small and medium size companies, Director (1997-present)
· The Newark Group, a provider of a national market of paper recovery facilities, paperboard mills and paperboard converting plants, Director (2000-2010)
No. of Portfolios for which Board Member Serves: 142
———————
Francine J. Bovich (64)
Board Member (2011)
Principal Occupation During Past 5 Years:
· Trustee, The Bradley Trusts, private trust funds (2011-present)
· Managing Director, Morgan Stanley Investment Management (1993-2010)
Other Public Company Board Memberships During Past 5 Years:
· Annaly Capital Management, Inc., Board Member (May 2014-present)
No. of Portfolios for which Board Member Serves: 80
———————
Kenneth A. Himmel (69)
Board Member (2008)
Principal Occupation During Past 5 Years:
· Managing Partner, Gulf Related, an international real estate development company (2010-present)
· President and CEO, Related Urban Development, a real estate development company (1996-present)
· President and CEO, Himmel & Company, a real estate development company (1980-present)
· CEO, American Food Management, a restaurant company (1983-present)
No. of Portfolios for which Board Member Serves: 30
———————
27
BOARD MEMBERS INFORMATION (Unaudited) (continued)
INDEPENDENT BOARD MEMBERS (continued)
Stephen J. Lockwood (68)
Board Member (2008)
Principal Occupation During Past 5 Years:
· Chairman of the Board, Stephen J. Lockwood and Company LLC, a real estate investment company (2000-present)
No. of Portfolios for which Board Member Serves: 30
———————
Roslyn M. Watson (65)
Board Member (2008)
Principal Occupation During Past 5 Years:
· Principal, Watson Ventures, Inc., a real estate investment company (1993-present)
No. of Portfolios for which Board Member Serves: 66
———————
Benaree Pratt Wiley (69)
Board Member (2008)
Principal Occupation During Past 5 Years:
· Principal, The Wiley Group, a firm specializing in strategy and business development (2005-present)
Other Public Company Board Memberships During Past 5 Years:
· CBIZ (formerly, Century Business Services, Inc.), a provider of outsourcing functions for small and medium size companies, Director (2008-present)
No. of Portfolios for which Board Member Serves: 66
———————
Once elected all Board Members serve for an indefinite term, but achieve Emeritus status upon reaching age 80. The address of the Board Members and Officers is c/o The Dreyfus Corporation, 200 Park Avenue, New York, New York 10166. Additional information about the Board Members is available in the fund's Statement of Additional Information which can be obtained from Dreyfus free of charge by calling this toll free number: 1-800-DREYFUS.
James M. Fitzgibbons, Emeritus Board Member
28
OFFICERS OF THE FUND (Unaudited)
BRADLEY J. SKAPYAK, President since January 2010.
Chief Operating Officer and a director of the Manager since June 2009, Chairman of Dreyfus Transfer, Inc., an affiliate of the Manager and the transfer agent of the funds, since May 2011 and Executive Vice President of the Distributor since June 2007. From April 2003 to June 2009, Mr. Skapyak was the head of the Investment Accounting and Support Department of the Manager. He is an officer of 68 investment companies (comprised of 142 portfolios) managed by the Manager. He is 56 years old and has been an employee of the Manager since February 1988.
BENNETT A. MACDOUGALL, Chief Legal Officer since October 2015
Chief Legal Officer of the Manager since June 2015; from June 2005 to June 2015, Director and Associate General Counsel of Deutsche Bank – Asset & Wealth Management Division, and Chief Legal Officer of Deutsche Investment Management Americas Inc. He is an officer of 69 investment companies (comprised of 167 portfolios) managed by the Manager. He is 44 years old and has been an employee of the Manager since June 2015.
JANETTE E. FARRAGHER, Vice President and Secretary since December 2011.
Assistant General Counsel of BNY Mellon, and an officer of 69 investment companies (comprised of 167 portfolios) managed by the Manager. She is 52 years old and has been an employee of the Manager since February 1984.
JAMES BITETTO, Vice President and Assistant Secretary since December 2008.
Managing Counsel of BNY Mellon and Secretary of the Manager, and an officer of 69 investment companies (comprised of 167 portfolios) managed by the Manager. He is 49 years old and has been an employee of the Manager since December 1996.
JONI LACKS CHARATAN, Vice President and Assistant Secretary since December 2008.
Managing Counsel of BNY Mellon, and an officer of 69 investment companies (comprised of 167 portfolios) managed by the Manager. She is 59 years old and has been an employee of the Manager since October 1988.
JOSEPH M. CHIOFFI, Vice President and Assistant Secretary since December 2008.
Managing Counsel of BNY Mellon, and an officer of 69 investment companies (comprised of 167 portfolios) managed by the Manager. He is 53 years old and has been an employee of the Manager since June 2000.
JOHN B. HAMMALIAN, Vice President and Assistant Secretary since December 2008.
Senior Managing Counsel of BNY Mellon, and an officer of 69 investment companies (comprised of 167 portfolios) managed by the Manager. He is 52 years old and has been an employee of the Manager since February 1991.
MAUREEN E. KANE, Vice President and Assistant Secretary since April 2015.
Managing Counsel of BNY Mellon since July 2014; from October 2004 until July 2014, General Counsel, and from May 2009 until July 2014, Chief Compliance Officer of Century Capital Management. She is an officer of 69 investment companies (comprised of 167 portfolios) managed by the Manager. She is 53 years old and has been an employee of the Manager since July 2014.
SARAH S. KELLEHER, Vice President and Assistant Secretary since April 2014.
Senior Counsel of BNY Mellon, and an officer of 69 investment companies (comprised of 167 portfolios) managed by the Manager; from August 2005 to March 2013, Associate General Counsel of Third Avenue Management. She is 40 years old and has been an employee of the Manager since March 2013.
JEFF PRUSNOFSKY, Vice President and Assistant Secretary since December 2008.
Senior Managing Counsel of BNY Mellon, and an officer of 69 investment companies (comprised of 167 portfolios) managed by the Manager. He is 50 years old and has been an employee of the Manager since October 1990.
JAMES WINDELS, Treasurer since December 2008.
Director – Mutual Fund Accounting of the Manager, and an officer of 69 investment companies (comprised of 167 portfolios) managed by the Manager. He is 57 years old and has been an employee of the Manager since April 1985.
29
OFFICERS OF THE FUND (Unaudited) (continued)
RICHARD CASSARO, Assistant Treasurer since December 2008.
Senior Accounting Manager – Money Market and Municipal Bond Funds of the Manager, and an officer of 69 investment companies (comprised of 167 portfolios) managed by the Manager. He is 56 years old and has been an employee of the Manager since September 1982.
GAVIN C. REILLY, Assistant Treasurer since December 2008.
Tax Manager of the Investment Accounting and Support Department of the Manager, and an officer of 69 investment companies (comprised of 167 portfolios) managed by the Manager. He is 47 years old and has been an employee of the Manager since April 1991.
ROBERT S. ROBOL, Assistant Treasurer since December 2008.
Senior Accounting Manager – Fixed Income Funds of the Manager, and an officer of 69 investment companies (comprised of 167 portfolios) managed by the Manager. He is 51 years old and has been an employee of the Manager since October 1988.
ROBERT SALVIOLO, Assistant Treasurer since December 2008.
Senior Accounting Manager – Equity Funds of the Manager, and an officer of 69 investment companies (comprised of 167 portfolios) managed by the Manager. He is 48 years old and has been an employee of the Manager since June 1989.
ROBERT SVAGNA, Assistant Treasurer since December 2008.
Senior Accounting Manager – Equity Funds of the Manager, and an officer of 69 investment companies (comprised of 167 portfolios) managed by the Manager. He is 48 years old and has been an employee of the Manager since November 1990.
JOSEPH W. CONNOLLY, Chief Compliance Officer since December 2008.
Chief Compliance Officer of the Manager and The Dreyfus Family of Funds (69 investment companies, comprised of 167 portfolios). He is 58 years old and has served in various capacities with the Manager since 1980, including manager of the firm’s Fund Accounting Department from 1997 through October 2001.
30
NOTES
31
NOTES
32
NOTES
33
Dreyfus/The Boston Company Small Cap Value Fund
200 Park Avenue
New York, NY 10166
Manager
The Dreyfus Corporation
200 Park Avenue
New York, NY 10166
Custodian
The Bank of New York Mellon
225 Liberty Street
New York, NY 10286
Transfer Agent &
Dividend Disbursing Agent
Dreyfus Transfer, Inc.
200 Park Avenue
New York, NY 10166
Distributor
MBSC Securities Corporation
200 Park Avenue
New York, NY 10166
Telephone Call your financial representative or 1-800-DREYFUS
Mail The Dreyfus Family of Funds, 144 Glenn Curtiss Boulevard, Uniondale, NY 11556-0144
E-mail Send your request to info@dreyfus.com
Internet Information can be viewed online or downloaded at www.dreyfus.com
The fund files its complete schedule of portfolio holdings with the Securities and Exchange Commission (“SEC”) for the first and third quarters of each fiscal year on Form N-Q. The fund’s Forms N-Q are available on the SEC’s website at www.sec.gov and may be reviewed and copied at the SEC’s Public Reference Room in Washington, DC. (phone 1-800-SEC-0330 for information).
A description of the policies and procedures that the fund uses to determine how to vote proxies relating to portfolio securities and information regarding how the fund voted these proxies for the most recent 12-month period ended June 30 is available at www.dreyfus.com and on the SEC’s website at www.sec.gov and without charge, upon request, by calling 1-800-DREYFUS.
| | |
© 2015 MBSC Securities Corporation
6944AR0915 | 
|
Dreyfus/The Boston Company Small/Mid Cap Growth Fund
| | | |

| | ANNUAL REPORT
September 30, 2015 |
| |
Save time. Save paper. View your next shareholder report online as soon as it’s available. Log into www.dreyfus.com and sign up for Dreyfus eCommunications. It’s simple and only takes a few minutes. |
| |
The views expressed in this report reflect those of the portfolio manager only through the end of the period covered and do not necessarily represent the views of Dreyfus or any other person in the Dreyfus organization. Any such views are subject to change at any time based upon market or other conditions and Dreyfus disclaims any responsibility to update such views. These views may not be relied on as investment advice and, because investment decisions for a Dreyfus fund are based on numerous factors, may not be relied on as an indication of trading intent on behalf of any Dreyfus fund. |
| |
Not FDIC-Insured • Not Bank-Guaranteed • May Lose Value |
Contents
THE FUND
FOR MORE INFORMATION
Back Cover
| | | | |
| |
Dreyfus/The Boston Company Small/Mid Cap Growth Fund
| | The Fund |
A LETTER FROM THE PRESIDENT
Dear Shareholder:
We are pleased to present this annual report for Dreyfus/The Boston Company Small/Mid Cap Growth Fund, covering the 12-month period from October 1, 2014, through September 30, 2015. For information about how the fund performed during the reporting period, as well as general market perspectives, we provide a Discussion of Fund Performance on the pages that follow.
Financial markets proved volatile over the reporting period. For much of the year, a recovering U.S. economy enabled stocks to advance, but those gains were erased during the third quarter of 2015 when economic concerns in China, falling commodity prices, and a stronger U.S. dollar sparked sharp corrections in equity markets throughout the world. The emerging markets were especially hard hit. U.S. bonds generally fared better, rallying in late 2014 before reversing course in the spring as the domestic economy strengthened. Global economic instability sparked a renewed rally among U.S. government securities toward the reporting period’s end, but corporate-backed and inflation-linked securities lost value.
We expect market volatility to persist over the near term as investors vacillate between hopes that current turmoil represents a healthy correction and fears that further disappointments could trigger a full-blown bear market. Our investment strategists and portfolio managers are monitoring developments carefully, keeping a close watch on Chinese fiscal and monetary policy, expectations of higher short-term interest rates in the United States, liquidity factors affecting various asset classes, and other developments that could influence investor sentiment. Over the longer term, we remain confident that markets are likely to stabilize as the world adjusts to slower Chinese economic growth, abundant energy resources, and the eventual normalization of U.S. monetary policy. In our view, investors will continue to be well served under these circumstances by a long-term perspective and a disciplined investment approach.
Thank you for your continued confidence and support.
Sincerely,

J. Charles Cardona
President
The Dreyfus Corporation
October 15, 2015
2
DISCUSSION OF FUND PERFORMANCE
For the period of October 1, 2014, through September 30, 2015, as provided by Todd W. Wakefield, CFA, and Robert C. Zeuthen, CFA, Primary Portfolio Managers
Fund and Market Performance Overview
For the 12-month period ended September 30, 2015, Dreyfus/The Boston Company Small/Mid Cap Growth Fund’s Class A shares produced a total return of -0.42%, Class C shares returned -1.18%, Class I shares returned -0.17%, and Class Y shares returned -0.05%.1 In comparison, the fund’s benchmark, the Russell 2500® Growth Index (the “Index”), produced a total return of 3.35% for the same period.2
Moderate stock market gains in a recovering U.S. economy over much of the reporting period were offset by subsequent declines triggered by global economic concerns. The fund lagged its benchmark due to shortfalls in the health care, industrials, and consumer-related sectors.
The Fund’s Investment Approach
The fund seeks long-term growth of capital. To pursue its goal, the fund normally invests at least 80% of its net assets in equity securities of small-cap and midcap U.S. companies with market capitalizations equal to or less than the total market capitalization of the largest company in the Index. When choosing stocks, we seek to identify high-quality small-cap and mid-cap companies with rapid current or expected earnings or revenue growth. We employ fundamental research to identify companies with attractive characteristics, such as strong business and competitive positions, solid cash flows and balance sheets, high-quality management and high sustainable growth. We also may invest in companies that our research indicates will experience accelerating revenues and expanding operating margins.
Global Economic Concerns Sparked Market Volatility
Generally flat to modestly positive results from broad market indices over the full reporting period masked elevated levels of short-term market volatility. October 2014 began in the midst of a market downturn, but U.S. employment gains and better consumer and business confidence prompted a quick market recovery. Consequently, some broad market indices climbed to record highs through the end of February 2015. The rally paused in March amid sluggish U.S. economic growth stemming from severe winter weather and an appreciating U.S. dollar. However, the domestic economy regained traction in the spring, and stocks advanced until economic uncertainty in Greece and China again sent U.S. stock prices lower over the summer.
Fund Strategies Produced Mixed Results
Although the fund successfully navigated turbulence in a number of market sectors over the reporting period, its performance compared to the benchmark was undercut by shortfalls in a handful of industry groups. Most notably, relative performance in the health care sector suffered amid volatility among pharmaceutical developers. Salix Pharmaceuticals was hurt by a scandal surrounding inventory accounting issues, prompting its elimination from the portfolio. Tetraphase Pharmaceuticals received disappointing results from clinical trials of a promising new drug. Pacira Pharmaceuticals was a great performer, but fundamentals slowed and we exited the position. Horizon Pharmaceutical lost value after the pharmaceutical industry
3
DISCUSSION OF FUND PERFORMANCE (continued)
came under scrutiny over pricing and marketing practices. Among health care service providers, assisted living facilities operator Brookdale Senior Living had trouble integrating a recent acquisition.
In the industrials sector, results were dampened by transportation providers. Spirit Airlines reported weak quarterly results due to weather disruptions and competitive pressures, and tank barge specialist Kirby Corp. was hurt by waning demand from domestic oil producers. Meanwhile, equipment rental company United Rentals and contracting services provider Quanta Services were hindered by weakness among customers in the energy industry. Relative performance in the consumer discretionary sector was undercut by several retailers: Deckers Outdoor struggled with high inventories of unsold footwear, investors reacted skeptically to management changes at Vitamin Shoppe, and Urban Outfitters continued to see weakness in its flagship brand despite more positive results from other business units. Finally, in the consumer staples sector, United Natural Foods encountered pricing pressures from rivals seeking to capture market share.
The fund achieved better results in the information technology sector, driven by better-than-expected earnings from remote access specialist LogMeIn, enterprise software producer SS&C Technologies Holdings, transportation management software maker Fleetmatics Group, network security provider Palo Alto Networks, and digital optical networking solutions provider Infinera. Results in the financials sector were bolstered by Wintrust Financial, which achieved strong loan growth, and CBOE Holdings, which benefited from rising trading volumes. Finally, in the materials sector, greater U.S. infrastructure development activity helped domestically-focused aggregates producer Vulcan Materials buoy relative performance.
Selectively Positioned for Continued U.S. Economic Growth
Despite ongoing turmoil in overseas markets, the U.S. economy has continued to grow. At the same time, we have been encouraged by positive investor sentiment surrounding small- and midcap companies with U.S.-centric business models that have been relatively insulated from international economic instability.
However, in our judgment, selectivity is likely to be key to investment performance over the months ahead, and we have intensified our focus on companies with strong underlying growth prospects. The fund ended the reporting period with overweighted positions in the information technology, industrials, and consumer-related sectors, but we have identified fewer opportunities meeting our investment criteria in the health care sector.
October 15, 2015
Please note, the position in any security highlighted with italicized typeface was sold during the reporting period.
Equity funds are subject generally to market, market sector, market liquidity, issuer, and investment style risks, among other factors, to varying degrees, all of which are more fully described in the fund’s prospectus.
Small and midsize companies carry additional risks because their earnings and revenues tend to be less predictable, and their share prices more volatile, than those of larger more established companies.
1 Total return includes reinvestment of dividends and any capital gains paid, and does not take into consideration the maximum initial sales charge in the case of Class A shares, or the applicable contingent deferred sales charge imposed on redemptions in the case of Class C shares. Had these charges been reflected, returns would have been lower. Past performance is no guarantee of future results. Share price and investment return fluctuate such that upon redemption, fund shares may be worth more or less than their original cost.
2 SOURCE: LIPPER INC. — The Russell 2500 Growth Index is an unmanaged index that measures the performance of those Russell 2500 companies (the 2,500 smallest companies in the Russell 3000 Index, which is composed of the 3,000 largest U.S.
4
companies based on total market capitalization) with higher price-to-book ratios and higher forecasted growth values. The total return figure cited for this index assumes change in security prices and reinvestment of dividends, but does not reflect the costs of managing a mutual fund. Investors cannot invest directly in any index.
5
FUND PERFORMANCE
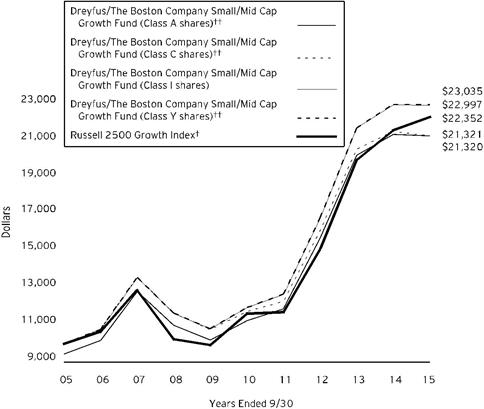
Comparison of change in value of $10,000 investment in Dreyfus / The Boston Company Small / Mid Cap Growth Fund Class A shares, Class C shares, Class I shares and Class Y shares and the Russell 2500 Growth Index
† Source: Lipper Inc.
†† The total return figures presented for Class A and Class C shares of the fund reflect the performance of the fund’s Class I shares for the period prior to 3/31/09 (the inception date for Class A and Class C shares), adjusted to reflect the applicable sales load for Class A shares.
The total return figures presented for Class Y shares of the fund reflect the performance of the fund’s Class I shares for the period prior to 7/1/13 (the inception date for Class Y shares).
Past performance is not predictive of future performance.
The above graph compares a $10,000 investment made in each of the Class A, Class C, Class I and Class Y shares of Dreyfus/The Boston Company Small/Mid Cap Growth Fund on 9/30/05 to a $10,000 investment made in the Russell 2500 Growth Index (the “Index”) on that date. All dividends and capital gain distributions are reinvested.
The fund’s performance shown in the line graph above takes into account the maximum initial sales charge on Class A shares and all other applicable fees and expenses on all classes. The Index is an unmanaged index that measures the performance of those Russell 2500 companies in the Russell 3000 Index with higher price-to-book ratios and higher forecasted growth values. Unlike a mutual fund, the Index is not subject to charges, fees and other expenses. Investors cannot invest directly in any index. These factors can contribute to the Index potentially outperforming the fund. Further information relating to fund performance, including expense reimbursements, if applicable, is contained in the Financial Highlights section of the prospectus and elsewhere in this report.
6
| | | | | |
Average Annual Total Returns as of 9/30/15 |
| | | | | |
| Inception Date | 1 Year | 5 Years | 10 Years |
Class A shares | | | | |
with maximum sales charge (5.75%) | 3/31/09 | -6.16% | 12.27% | 7.87%†† |
without sales charge | 3/31/09 | -0.42% | 13.61% | 8.50%†† |
Class C shares | | | | |
with applicable redemption charge† | 3/31/09 | -2.06% | 12.65% | 7.86%†† |
without redemption | 3/31/09 | -1.18% | 12.65% | 7.86%†† |
Class I shares | 1/1/88 | -0.17% | 13.93% | 8.68% |
Class Y shares | 7/1/13 | -0.05% | 13.97%†† | 8.70%†† |
Russell 2500 Growth Index | | 3.35% | 13.93% | 8.38% |
Past performance is not predictive of future performance. The fund’s performance shown in the graph and table does not reflect the deduction of taxes that a shareholder would pay on fund distributions or the redemption of fund shares. In addition to the performance of Class A shares shown with and without a maximum sales charge, the fund’s performance shown in the table takes into account all other applicable fees and expenses on all classes.
† The maximum contingent deferred sales charge for Class C shares is 1% for shares redeemed within one year of the date of purchase.
†† The total return performance figures presented for Class A and Class C shares of the fund reflect the performance of the fund’s Class I shares for the period prior to 3/31/09 (the inception date for Class A and Class C shares), adjusted to reflect the applicable sales load for Class A shares.
The total return performance figures presented for Class Y shares of the fund reflect the performance of the fund’s Class I shares for the period prior to 7/1/13 (the inception date for Class Y shares).
7
UNDERSTANDING YOUR FUND’S EXPENSES (Unaudited)
As a mutual fund investor, you pay ongoing expenses, such as management fees and other expenses. Using the information below, you can estimate how these expenses affect your investment and compare them with the expenses of other funds. You also may pay one-time transaction expenses, including sales charges (loads) and redemption fees, which are not shown in this section and would have resulted in higher total expenses. For more information, see your fund’s prospectus or talk to your financial adviser.
Review your fund’s expenses
The table below shows the expenses you would have paid on a $1,000 investment in Dreyfus/The Boston Company Small/Mid Cap Growth Fund from April 1, 2015 to September 30, 2015. It also shows how much a $1,000 investment would be worth at the close of the period, assuming actual returns and expenses.
| | | | | | | | | |
Expenses and Value of a $1,000 Investment | | |
assuming actual returns for the six months ended September 30, 2015 |
| | | | | | | | |
| | | | Class A | Class C | Class I | Class Y |
Expenses paid per $1,000† | $ 4.78 | $ 8.36 | $ 3.69 | $ 3.17 |
Ending value (after expenses) | $888.30 | $885.10 | $889.50 | $889.70 |
COMPARING YOUR FUND’S EXPENSES
WITH THOSE OF OTHER FUNDS (Unaudited)
Using the SEC’s method to compare expenses
The Securities and Exchange Commission (SEC) has established guidelines to help investors assess fund expenses. Per these guidelines, the table below shows your fund’s expenses based on a $1,000 investment, assuming a hypothetical 5% annualized return. You can use this information to compare the ongoing expenses (but not transaction expenses or total cost) of investing in the fund with those of other funds. All mutual fund shareholder reports will provide this information to help you make this comparison. Please note that you cannot use this information to estimate your actual ending account balance and expenses paid during the period.
| | | | | | | | |
Expenses and Value of a $1,000 Investment | | |
assuming a hypothetical 5% annualized return for the six months ended September 30, 2015 |
| | | | | | | | |
| | | | Class A | Class C | Class I | Class Y |
Expenses paid per $1,000† | $ 5.11 | $ 8.95 | $ 3.95 | $ 3.40 |
Ending value (after expenses) | $1,020.00 | $1,016.19 | $1,021.16 | $1,021.71 |
† Expenses are equal to the fund's annualized expense ratio of 1.01% for Class A, 1.77% for Class C, .78% for Class I and .67% for Class Y, multiplied by the average account value over the period, multiplied by 183/365 (to reflect the one-half year period).
8
STATEMENT OF INVESTMENTS
September 30, 2015
| | | | | | |
Common Stocks - 97.1% | | Shares | | Value ($) | |
Automobiles & Components - 3.0% | | | | | |
Dorman Products | | 286,890 | a,b | 14,599,832 | |
Gentex | | 721,991 | | 11,190,861 | |
| | | | | 25,790,693 | |
Banks - 4.0% | | | | | |
SVB Financial Group | | 92,270 | b | 10,660,876 | |
Webster Financial | | 327,825 | | 11,680,405 | |
Wintrust Financial | | 237,918 | | 12,711,959 | |
| | | | | 35,053,240 | |
Capital Goods - 13.0% | | | | | |
A.O. Smith | | 173,959 | | 11,340,387 | |
Allegion | | 121,094 | | 6,982,280 | |
Beacon Roofing Supply | | 436,639 | b | 14,186,401 | |
BWX Technologies | | 287,316 | | 7,573,650 | |
Carlisle | | 140,497 | | 12,276,628 | |
EMCOR Group | | 346,198 | | 15,319,261 | |
Nordson | | 153,627 | | 9,669,283 | |
Sensata Technologies Holding | | 149,608 | b | 6,633,619 | |
Snap-on | | 104,981 | | 15,845,832 | |
Watsco | | 117,312 | | 13,899,126 | |
| | | | | 113,726,467 | |
Commercial & Professional Services - 3.2% | | | | | |
Advisory Board | | 346,533 | b | 15,781,113 | |
CEB | | 171,915 | | 11,748,671 | |
| | | | | 27,529,784 | |
Consumer Durables & Apparel - 8.8% | | | | | |
Jarden | | 214,310 | b | 10,475,473 | |
Kate Spade & Co. | | 607,290 | b | 11,605,312 | |
Polaris Industries | | 72,891 | | 8,737,444 | |
PVH | | 132,566 | | 13,513,778 | |
Steven Madden | | 303,745 | b | 11,123,142 | |
TopBuild | | 365,559 | b | 11,321,362 | |
Wolverine World Wide | | 456,100 | | 9,870,004 | |
| | | | | 76,646,515 | |
Consumer Services - 1.7% | | | | | |
Panera Bread, Cl. A | | 74,888 | a,b | 14,484,088 | |
Diversified Financials - 1.9% | | | | | |
CBOE Holdings | | 249,577 | | 16,741,625 | |
9
STATEMENT OF INVESTMENTS (continued)
| | | | | | |
Common Stocks - 97.1% (continued) | | Shares | | Value ($) | |
Energy - .8% | | | | | |
Energen | | 137,707 | | 6,866,071 | |
Exchange-Traded Funds - 3.5% | | | | | |
iShares Russell 2000 Growth ETF | | 229,581 | a | 30,756,967 | |
Food, Beverage & Tobacco - 1.4% | | | | | |
WhiteWave Foods | | 299,370 | b | 12,019,706 | |
Health Care Equipment & Services - 9.8% | | | | | |
Acadia Healthcare | | 122,759 | b | 8,135,239 | |
Align Technology | | 282,776 | b | 16,050,366 | |
athenahealth | | 96,970 | a,b | 12,930,950 | |
Brookdale Senior Living | | 446,682 | b | 10,255,819 | |
Cooper | | 95,284 | | 14,183,976 | |
Endologix | | 561,644 | b | 6,885,755 | |
Medidata Solutions | | 251,118 | b | 10,574,579 | |
WellCare Health Plans | | 78,135 | b | 6,733,674 | |
| | | | | 85,750,358 | |
Materials - 3.9% | | | | | |
Bemis | | 380,794 | | 15,068,019 | |
Headwaters | | 386,209 | b | 7,260,729 | |
Scotts Miracle-Gro, Cl. A | | 189,148 | | 11,503,981 | |
| | | | | 33,832,729 | |
Media - 3.1% | | | | | |
IMAX | | 444,456 | b | 15,018,168 | |
Lions Gate Entertainment | | 324,005 | a | 11,923,384 | |
| | | | | 26,941,552 | |
Pharmaceuticals, Biotechnology & Life Sciences - 5.9% | | | | | |
ACADIA Pharmaceuticals | | 323,963 | a,b | 10,713,456 | |
Alkermes | | 147,786 | b | 8,670,605 | |
Cepheid | | 186,210 | b | 8,416,692 | |
Jazz Pharmaceuticals | | 71,701 | b | 9,522,610 | |
Ligand Pharmaceuticals | | 162,069 | a,b | 13,881,210 | |
| | | | | 51,204,573 | |
Real Estate - 3.7% | | | | | |
CBRE Group, Cl. A | | 324,150 | b | 10,372,800 | |
Extra Space Storage | | 124,920 | c | 9,638,827 | |
Realogy Holdings | | 321,640 | b | 12,103,313 | |
| | | | | 32,114,940 | |
Retailing - 6.6% | | | | | |
HSN | | 190,302 | | 10,892,886 | |
LKQ | | 523,751 | b | 14,853,578 | |
Murphy USA | | 165,925 | b | 9,117,579 | |
10
| | | | | | |
Common Stocks - 97.1% (continued) | | Shares | | Value ($) | |
Retailing - 6.6% (continued) | | | | | |
Ulta Salon Cosmetics & Fragrance | | 56,986 | b | 9,308,663 | |
Williams-Sonoma | | 180,931 | | 13,814,082 | |
| | | | | 57,986,788 | |
Semiconductors & Semiconductor Equipment - 2.9% | | | | | |
Integrated Device Technology | | 629,770 | b | 12,784,331 | |
Mellanox Technologies | | 339,208 | b | 12,818,670 | |
| | | | | 25,603,001 | |
Software & Services - 14.8% | | | | | |
Akamai Technologies | | 172,167 | b | 11,889,853 | |
ANSYS | | 82,063 | b | 7,233,033 | |
Black Knight Financial Services Inc | | 312,160 | | 10,160,808 | |
Booz Allen Hamilton Holdings | | 413,072 | | 10,826,617 | |
comScore | | 192,076 | a,b | 8,864,307 | |
Fleetmatics Group | | 151,187 | a,b | 7,421,770 | |
HomeAway | | 466,689 | b | 12,385,926 | |
LogMeIn | | 210,668 | b | 14,359,131 | |
Proofpoint | | 121,165 | a,b | 7,308,673 | |
SS&C Technologies Holdings | | 159,876 | | 11,197,715 | |
Synchronoss Technologies | | 271,085 | a,b | 8,891,588 | |
Synopsys | | 407,959 | b | 18,839,547 | |
| | | | | 129,378,968 | |
Technology Hardware & Equipment - 3.8% | | | | | |
Ciena | | 392,107 | b | 8,124,457 | |
Infinera | | 585,005 | a,b | 11,442,698 | |
IPG Photonics | | 78,354 | a,b | 5,952,553 | |
Palo Alto Networks | | 41,977 | b | 7,220,044 | |
| | | | | 32,739,752 | |
Transportation - 1.3% | | | | | |
Hub Group, Cl. A | | 311,879 | b | 11,355,514 | |
Total Common Stocks (cost $786,577,248) | | | | 846,523,331 | |
Other Investments - 3.7% | | | | | |
Registered Investment Company; | | | | | |
Dreyfus Institutional Preferred Plus Money Market Fund | | 32,019,545 | d | 32,019,545 | |
(cost $32,019,545) | | | | | |
11
STATEMENT OF INVESTMENTS (continued)
| | | | | | |
Investment of Cash Collateral for Securities Loaned - 5.4% | | Shares | | Value ($) | |
Registered Investment Company; | | | | | |
Dreyfus Institutional Cash Advantage Fund | | 46,796,134 | d | 46,796,134 | |
(cost $46,796,134) | | | | | |
Total Investments (cost $865,392,927) | | 106.2% | | 925,339,010 | |
Liabilities, Less Cash and Receivables | | (6.2%) | | (53,808,802) | |
Net Assets | | 100.0% | | 871,530,208 | |
ETF—Exchange-Traded Fund
a Security, or portion thereof, on loan. At September 30, 2015, the value of the fund's securities on loan was $87,685,370 and the value of the collateral held by the fund was $86,808,224, consisting of cash collateral of $46,796,134 and U.S. Government & Agency securities valued at $40,012,090.
b Non-income producing security.
c Investment in real estate investment trust.
d Investment in affiliated money market mutual fund.
| | |
Portfolio Summary (Unaudited) † | Value (%) |
Software & Services | 14.8 |
Capital Goods | 13.0 |
Health Care Equipment & Services | 9.8 |
Money Market Investments | 9.1 |
Consumer Durables & Apparel | 8.8 |
Retailing | 6.6 |
Pharmaceuticals, Biotechnology & Life Sciences | 5.9 |
Banks | 4.0 |
Materials | 3.9 |
Technology Hardware & Equipment | 3.8 |
Real Estate | 3.7 |
Exchange-Traded Funds | 3.5 |
Commercial & Professional Services | 3.2 |
Media | 3.1 |
Automobiles & Components | 3.0 |
Semiconductors & Semiconductor Equipment | 2.9 |
Diversified Financials | 1.9 |
Consumer Services | 1.7 |
Food, Beverage & Tobacco | 1.4 |
Transportation | 1.3 |
Energy | .8 |
| | 106.2 |
†Based on net assets.
See notes to financial statements.
12
STATEMENT OF ASSETS AND LIABILITIES
September 30, 2015
| | | | | | | |
| | | Cost | | Value | |
Assets ($): | | | | |
Investments in securities—See Statement of Investments
(including securities on loan, valued at $87,685,370)—Note 1(b): | | | | | |
Unaffiliated issuers | | 786,577,248 | | 846,523,331 | |
Affiliated issuers | | 78,815,679 | | 78,815,679 | |
Cash | | | | | 57,258 | |
Receivable for investment securities sold | | | | | 19,966,278 | |
Receivable for shares of Beneficial Interest subscribed | | | | | 227,980 | |
Dividends, interest and securities lending income receivable | | | | | 139,690 | |
Prepaid expenses | | | | | 35,863 | |
| | | | | 945,766,079 | |
Liabilities ($): | | | | |
Due to The Dreyfus Corporation and affiliates—Note 3(c) | | | | | 593,389 | |
Liability for securities on loan—Note 1(b) | | | | | 46,796,134 | |
Payable for investment securities purchased | | | | | 26,339,956 | |
Payable for shares of Beneficial Interest redeemed | | | | | 297,122 | |
Accrued expenses | | | | | 209,270 | |
| | | | | 74,235,871 | |
Net Assets ($) | | | 871,530,208 | |
Composition of Net Assets ($): | | | | |
Paid-in capital | | | | | 770,965,347 | |
Accumulated investment (loss)—net | | | | | (1,834,965) | |
Accumulated net realized gain (loss) on investments | | | | | 42,453,743 | |
Accumulated net unrealized appreciation (depreciation)
on investments | | | | | 59,946,083 | |
Net Assets ($) | | | 871,530,208 | |
| | | | | | |
Net Asset Value Per Share | Class A | Class C | Class I | Class Y | |
Net Assets ($) | 219,184,966 | 34,554,224 | 512,830,183 | 104,960,835 | |
Shares Outstanding | 13,846,343 | 2,359,744 | 31,699,218 | 6,473,981 | |
Net Asset Value Per Share ($) | 15.83 | 14.64 | 16.18 | 16.21 | |
See notes to financial statements.
13
STATEMENT OF OPERATIONS
Year Ended September 30, 2015
| | | | | | | |
| | | | | | |
| | | | | | |
Investment Income ($): | | | | |
Income: | | | | |
Interest | | | 1,327 | |
Cash dividends (net of $15,234 foreign taxes withheld at source): | | | | |
Unaffiliated issuers | | | 5,393,626 | |
Affiliated issuers | | | 21,443 | |
Income from securities lending—Note 1(b) | | | 335,050 | |
Total Income | | | 5,751,446 | |
Expenses: | | | | |
Investment advisory fee—Note 3(a) | | | 5,710,723 | |
Shareholder servicing costs—Note 3(c) | | | 1,635,237 | |
Distribution fees—Note 3(b) | | | 265,137 | |
Prospectus and shareholders’ reports | | | 232,656 | |
Administration fee—Note 3(a) | | | 149,757 | |
Custodian fees—Note 3(c) | | | 89,120 | |
Registration fees | | | 81,370 | |
Trustees' fees and expenses—Note 3(d) | | | 71,929 | |
Professional fees | | | 57,362 | |
Interest expense—Note 2 | | | 11,532 | |
Loan commitment fees—Note 2 | | | 9,950 | |
Miscellaneous | | | 29,925 | |
Total Expenses | | | 8,344,698 | |
Less—reduction in fees due to earnings credits—Note 3(c) | | | (257) | |
Net Expenses | | | 8,344,441 | |
Investment (Loss)—Net | | | (2,592,995) | |
Realized and Unrealized Gain (Loss) on Investments—Note 4 ($): | | |
Net realized gain (loss) on investments | 57,336,005 | |
Net unrealized appreciation (depreciation) on investments | | | (55,352,998) | |
Net Realized and Unrealized Gain (Loss) on Investments | | | 1,983,007 | |
Net (Decrease) in Net Assets Resulting from Operations | | (609,988) | |
See notes to financial statements.
14
STATEMENT OF CHANGES IN NET ASSETS
| | | | | | | | | | |
| | | | | | | | | | |
| | | | Year Ended September 30, |
| | | | 2015 | | | | 2014 | |
Operations ($): | | | | | | | | |
Investment (loss)—net | | | (2,592,995) | | | | (2,955,479) | |
Net realized gain (loss) on investments | | 57,336,005 | | | | 112,428,209 | |
Net unrealized appreciation (depreciation)
on investments | | (55,352,998) | | | | (64,422,589) | |
Net Increase (Decrease) in Net Assets
Resulting from Operations | (609,988) | | | | 45,050,141 | |
Dividends to Shareholders from ($): | | | | | | | | |
Net realized gain on investments: | | | | | | | | |
Class A | | | (23,322,566) | | | | (22,918,565) | |
Class C | | | (3,481,028) | | | | (1,334,731) | |
Class I | | | (58,554,617) | | | | (68,005,735) | |
Class Y | | | (9,955,724) | | | | (122) | |
Total Dividends | | | (95,313,935) | | | | (92,259,153) | |
Beneficial Interest Transactions ($): | | | | | | | | |
Net proceeds from shares sold: | | | | | | | | |
Class A | | | 42,910,573 | | | | 77,706,564 | |
Class C | | | 11,464,914 | | | | 26,705,891 | |
Class I | | | 178,504,282 | | | | 233,650,640 | |
Class Y | | | 22,023,769 | | | | 120,463,624 | |
Dividends reinvested: | | | | | | | | |
Class A | | | 22,529,055 | | | | 22,257,399 | |
Class C | | | 3,465,315 | | | | 1,312,211 | |
Class I | | | 48,779,707 | | | | 57,620,214 | |
Class Y | | | 9,955,724 | | | | - | |
Cost of shares redeemed: | | | | | | | | |
Class A | | | (48,241,421) | | | | (56,417,187) | |
Class C | | | (7,415,176) | | | | (2,572,766) | |
Class I | | | (262,766,990) | | | | (258,869,361) | |
Class Y | | | (17,346,252) | | | | (17,223,963) | |
Increase (Decrease) in Net Assets
from Beneficial Interest Transactions | 3,863,500 | | | | 204,633,266 | |
Total Increase (Decrease) in Net Assets | (92,060,423) | | | | 157,424,254 | |
Net Assets ($): | | | | | | | | |
Beginning of Period | | | 963,590,631 | | | | 806,166,377 | |
End of Period | | | 871,530,208 | | | | 963,590,631 | |
Accumulated investment (loss)—net | (1,834,965) | | | | - | |
15
STATEMENT OF CHANGES IN NET ASSETS (continued)
| | | | | | | | | | |
| | | | Year Ended September 30, |
| | | | 2015 | | | | 2014 | |
Capital Share Transactions: | | | | | | | | |
Class A | | | | | | | | |
Shares sold | | | 2,450,759 | | | | 4,314,496 | |
Shares issued for dividends reinvested | | | 1,371,214 | | | | 1,296,296 | |
Shares redeemed | | | (2,749,859) | | | | (3,151,684) | |
Net Increase (Decrease) in Shares Outstanding | 1,072,114 | | | | 2,459,108 | |
Class C | | | | | | | | |
Shares sold | | | 702,848 | | | | 1,571,228 | |
Shares issued for dividends reinvested | | | 226,639 | | | | 80,851 | |
Shares redeemed | | | (459,878) | | | | (153,217) | |
Net Increase (Decrease) in Shares Outstanding | 469,609 | | | | 1,498,862 | |
Class Ia | | | | | | | | |
Shares sold | | | 9,989,602 | | | | 12,766,341 | |
Shares issued for dividends reinvested | | | 2,910,484 | | | | 3,303,911 | |
Shares redeemed | | | (14,943,120) | | | | (14,192,319) | |
Net Increase (Decrease) in Shares Outstanding | (2,043,034) | | | | 1,877,933 | |
Class Ya | | | | | | | | |
Shares sold | | | 1,227,841 | | | | 6,564,764 | |
Shares issued for dividends reinvested | | | 593,309 | | | | - | |
Shares redeemed | | | (960,971) | | | | (951,020) | |
Net Increase (Decrease) in Shares Outstanding | 860,179 | | | | 5,613,744 | |
a During the period ended September 30, 2014, 245,559 Class I shares representing $4,385,685 were exchanged for 245,422 Class Y shares. | |
See notes to financial statements.
16
FINANCIAL HIGHLIGHTS
The following tables describe the performance for each share class for the fiscal periods indicated. All information (except portfolio turnover rate) reflects financial results for a single fund share. Total return shows how much your investment in the fund would have increased (or decreased) during each period, assuming you had reinvested all dividends and distributions. These figures have been derived from the fund’s financial statements.
| | | | | | | |
| | | | |
| | Year Ended September 30, |
Class A Shares | | 2015 | 2014 | 2013 | 2012 | 2011 |
Per Share Data ($): | | | | | | |
Net asset value, beginning of period | | 17.65 | 18.76 | 15.82 | 12.95 | 12.26 |
Investment Operations: | | | | | | |
Investment (loss)—neta | | (.07) | (.09) | (.06) | (.06) | (.06) |
Net realized and unrealized
gain (loss) on investments | | .06 | 1.08 | 4.20 | 4.08 | .75 |
Total from Investment Operations | | (.01) | .99 | 4.14 | 4.02 | .69 |
Distributions: | | | | | | |
Dividends from net realized
gain on investments | | (1.81) | (2.10) | (1.20) | (1.15) | - |
Net asset value, end of period | | 15.83 | 17.65 | 18.76 | 15.82 | 12.95 |
Total Return (%)b | | (.42) | 5.59 | 28.73 | 32.36 | 5.63 |
Ratios/Supplemental Data (%): | | | | | | |
Ratio of total expenses to average net assets | | 1.03 | 1.04 | 1.02 | 1.08 | 1.09 |
Ratio of net expenses to average net assets | | 1.03 | 1.04 | 1.02 | 1.08 | 1.09 |
Ratio of net investment (loss)
to average net assets | | (.42) | (.48) | (.34) | (.37) | (.45) |
Portfolio Turnover Rate | | 144.39 | 139.37 | 124.25 | 153.75 | 180.82 |
Net Assets, end of period ($ x 1,000) | | 219,185 | 225,427 | 193,470 | 135,904 | 107,696 |
a Based on average shares outstanding.
b Exclusive of sales charge.
See notes to financial statements.
17
FINANCIAL HIGHLIGHTS (continued)
| | | | | | | |
| | | | |
| | Year Ended September 30, |
Class C Shares | | 2015 | 2014 | 2013 | 2012 | 2011 |
Per Share Data ($): | | | | | | |
Net asset value, beginning of period | | 16.58 | 17.87 | 15.26 | 12.63 | 12.06 |
Investment Operations: | | | | | | |
Investment (loss)—neta | | (.20) | (.22) | (.20) | (.18) | (.18) |
Net realized and unrealized
gain (loss) on investments | | .07 | 1.03 | 4.01 | 3.96 | .75 |
Total from Investment Operations | | (.13) | .81 | 3.81 | 3.78 | .57 |
Distributions: | | | | | | |
Dividends from net realized
gain on investments | | (1.81) | (2.10) | (1.20) | (1.15) | - |
Net asset value, end of period | | 14.64 | 16.58 | 17.87 | 15.26 | 12.63 |
Total Return (%)b | | (1.18) | 4.72 | 27.54 | 31.21 | 4.73 |
Ratios/Supplemental Data (%): | | | | | | |
Ratio of total expenses to average net assets | | 1.81 | 1.83 | 1.92 | 1.97 | 1.95 |
Ratio of net expenses to average net assets | | 1.81 | 1.83 | 1.92 | 1.97 | 1.95 |
Ratio of net investment (loss)
to average net assets | | (1.21) | (1.26) | (1.29) | (1.24) | (1.31) |
Portfolio Turnover Rate | | 144.39 | 139.37 | 124.25 | 153.75 | 180.82 |
Net Assets, end of period ($ x 1,000) | | 34,554 | 31,329 | 6,991 | 1,893 | 1,124 |
a Based on average shares outstanding.
b Exclusive of sales charge.
See notes to financial statements.
18
| | | | | | | | | | |
| | | | | | | |
| | Year Ended September 30, |
Class I Shares | | 2015 | 2014 | 2013 | 2012 | 2011 |
Per Share Data ($): | | | | | | |
Net asset value, beginning of period | | 17.96 | 19.01 | 15.98 | 13.03 | 12.29 |
Investment Operations: | | | | | | |
Investment (loss)—neta | | (.03) | (.04) | (.01) | (.01) | (.02) |
Net realized and unrealized
gain (loss) on investments | | .06 | 1.09 | 4.24 | 4.11 | .76 |
Total from Investment Operations | | .03 | 1.05 | 4.23 | 4.10 | .74 |
Distributions: | | | | | | |
Dividends from net realized
gain on investments | | (1.81) | (2.10) | (1.20) | (1.15) | - |
Net asset value, end of period | | 16.18 | 17.96 | 19.01 | 15.98 | 13.03 |
Total Return (%) | | (.17) | 5.85 | 29.03 | 32.81 | 6.02 |
Ratios/Supplemental Data (%): | | | | | | |
Ratio of total expenses to average net assets | | .79 | .80 | .75 | .78 | .77 |
Ratio of net expenses to average net assets | | .79 | .80 | .75 | .78 | .77 |
Ratio of net investment (loss)
to average net assets | | (.19) | (.24) | (.06) | (.07) | (.14) |
Portfolio Turnover Rate | | 144.39 | 139.37 | 124.25 | 153.75 | 180.82 |
Net Assets, end of period ($ x 1,000) | | 512,830 | 605,932 | 605,704 | 513,947 | 341,406 |
a Based on average shares outstanding.
See notes to financial statements.
19
FINANCIAL HIGHLIGHTS (continued)
| | | | | | | | | | |
| | | | | | | |
| | Year Ended September 30, |
Class Y Shares | | | | 2015 | 2014 | 2013a |
Per Share Data ($): | | | | | | |
Net asset value, beginning of period | | | | 17.97 | 19.01 | 17.16 |
Investment Operations: | | | | | | |
Investment (loss)—netb | | | | (.01) | (.03) | (.01) |
Net realized and unrealized
gain (loss) on investments | | | | .06 | 1.09 | 1.86 |
Total from Investment Operations | | | | .05 | 1.06 | 1.85 |
Distributions: | | | | | | |
Dividends from net realized
gain on investments | | | | (1.81) | (2.10) | - |
Net asset value, end of period | | | | 16.21 | 17.97 | 19.01 |
Total Return (%) | | | | (.05) | 5.90 | 10.78c |
Ratios/Supplemental Data (%): | | | | | | |
Ratio of total expenses to average net assets | | | | .68 | .72 | .72d |
Ratio of net expenses to average net assets | | | | .68 | .72 | .72d |
Ratio of net investment (loss)
to average net assets | | | | (.07) | (.15) | (.26)d |
Portfolio Turnover Rate | | | | 144.39 | 139.37 | 124.25 |
Net Assets, end of period ($ x 1,000) | | | | 104,961 | 100,902 | 1 |
a From July 1, 2013, (commencement of initial offering) to September 30, 2013.
b Based on average shares outstanding.
c Not annualized.
d Annualized.
See notes to financial statements.
20
NOTES TO FINANCIAL STATEMENTS
NOTE 1—Significant Accounting Policies:
Dreyfus/The Boston Company Small/Mid Cap Growth Fund (the “fund”) is a separate non-diversified series of Dreyfus Investment Funds (the “Trust”), which is registered under the Investment Company Act of 1940, as amended (the “Act”), as an open-end management investment company and operates as a series company currently offering seven series, including the fund. The fund’s investment objective is to seek long-term growth of capital. The Dreyfus Corporation (the “Manager” or “Dreyfus”), a wholly-owned subsidiary of The Bank of New York Mellon Corporation (“BNY Mellon”), serves as the fund’s investment adviser. The Boston Company Asset Management, LLC (“TBCAM”), a wholly-owned subsidiary of BNY Mellon and an affiliate of Dreyfus, serves as the fund’s sub-investment adviser.
MBSC Securities Corporation (the “Distributor”), a wholly-owned subsidiary of Dreyfus, is the distributor of the fund’s shares. The fund is authorized to issue an unlimited number of $.001 par value shares of Beneficial Interest in each of the following classes of shares: Class A, Class C, Class I and Class Y. Class A and Class C shares are sold primarily to retail investors through financial intermediaries and bear Distribution and/or Shareholder Services Plan fees. Class A shares generally are subject to a sales charge imposed at the time of purchase. Class C shares are subject to a contingent deferred sales charge (“CDSC”) imposed on Class C shares redeemed within one year of purchase. Class I shares are sold primarily to bank trust departments and other financial service providers (including The Bank of New York Mellon, a subsidiary of BNY Mellon and an affiliate of Dreyfus, and its affiliates), acting on behalf of customers having a qualified trust or an investment account or relationship at such institution, and bear no Distribution or Shareholder Services Plan fees. Class Y shares are sold at net asset value per share generally to institutional investors, and bear no Distribution or Shareholder Services Plan fees. Class I and Class Y shares are offered without a front-end sales charge or CDSC. Other differences between the classes include the services offered to and the expenses borne by each class, the allocation of certain transfer agency costs, and certain voting rights. Income, expenses (other than expenses attributable to a specific class), and realized and unrealized gains or losses on investments are allocated to each class of shares based on its relative net assets.
The Trust accounts separately for the assets, liabilities and operations of each series. Expenses directly attributable to each series are charged to that
21
NOTES TO FINANCIAL STATEMENTS (continued)
series’ operations; expenses which are applicable to all series are allocated among them on a pro rata basis.
The Financial Accounting Standards Board (“FASB”) Accounting Standards Codification (“ASC”) is the exclusive reference of authoritative U.S. generally accepted accounting principles (“GAAP”) recognized by the FASB to be applied by nongovernmental entities. Rules and interpretive releases of the Securities and Exchange Commission (“SEC”) under authority of federal laws are also sources of authoritative GAAP for SEC registrants. The fund’s financial statements are prepared in accordance with GAAP, which may require the use of management estimates and assumptions. Actual results could differ from those estimates.
(a) Portfolio valuation: The fair value of a financial instrument is the amount that would be received to sell an asset or paid to transfer a liability in an orderly transaction between market participants at the measurement date (i.e., the exit price). GAAP establishes a fair value hierarchy that prioritizes the inputs of valuation techniques used to measure fair value. This hierarchy gives the highest priority to unadjusted quoted prices in active markets for identical assets or liabilities (Level 1 measurements) and the lowest priority to unobservable inputs (Level 3 measurements).
Additionally, GAAP provides guidance on determining whether the volume and activity in a market has decreased significantly and whether such a decrease in activity results in transactions that are not orderly. GAAP requires enhanced disclosures around valuation inputs and techniques used during annual and interim periods.
Various inputs are used in determining the value of the fund’s investments relating to fair value measurements. These inputs are summarized in the three broad levels listed below:
Level 1—unadjusted quoted prices in active markets for identical investments.
Level 2—other significant observable inputs (including quoted prices for similar investments, interest rates, prepayment speeds, credit risk, etc.).
Level 3—significant unobservable inputs (including the fund’s own assumptions in determining the fair value of investments).
The inputs or methodology used for valuing securities are not necessarily an indication of the risk associated with investing in those securities.
22
Changes in valuation techniques may result in transfers in or out of an assigned level within the disclosure hierarchy. Valuation techniques used to value the fund’s investments are as follows:
Investments in securities are valued at the last sales price on the securities exchange or national securities market on which such securities are primarily traded. Securities listed on the National Market System for which market quotations are available are valued at the official closing price or, if there is no official closing price that day, at the last sales price. For open short positions, asked prices are used for valuation purposes. Bid price is used when no asked price is available. Registered investment companies that are not traded on an exchange are valued at their net asset value. All of the preceding securities are generally categorized within Level 1 of the fair value hierarchy.
Securities not listed on an exchange or the national securities market, or securities for which there were no transactions, are valued at the average of the most recent bid and asked prices. These securities are generally categorized within Level 2 of the fair value hierarchy.
Fair valuing of securities may be determined with the assistance of a pricing service using calculations based on indices of domestic securities and other appropriate indicators, such as prices of relevant American Depository Receipts and financial futures. Utilizing these techniques may result in transfers between Level 1 and Level 2 of the fair value hierarchy.
When market quotations or official closing prices are not readily available, or are determined not to reflect accurately fair value, such as when the value of a security has been significantly affected by events after the close of the exchange or market on which the security is principally traded (for example, a foreign exchange or market), but before the fund calculates its net asset value, the fund may value these investments at fair value as determined in accordance with the procedures approved by the Trust's Board of Trustees (the “Board”). Certain factors may be considered when fair valuing investments such as: fundamental analytical data, the nature and duration of restrictions on disposition, an evaluation of the forces that influence the market in which the securities are purchased and sold, and public trading in similar securities of the issuer or comparable issuers. These securities are either categorized within Level 2 or 3 of the fair value hierarchy depending on the relevant inputs used.
For restricted securities where observable inputs are limited, assumptions about market activity and risk are used and are generally categorized within Level 3 of the fair value hierarchy.
23
NOTES TO FINANCIAL STATEMENTS (continued)
The following is a summary of the inputs used as of September 30, 2015 in valuing the fund’s investments:
| | | | | |
| | Level 1 - Unadjusted Quoted Prices | Level 2 - Other Significant Observable Inputs | Level 3 -Significant Unobservable Inputs | Total |
Assets ($) | | | |
Investments in Securities: | | | |
Equity Securities - Domestic Common Stocks† | 793,326,426 | - | - | 793,326,426 |
Equity Securities - Foreign Common Stocks† | 22,439,938 | - | - | 22,439,938 |
Exchange-Traded Funds | 30,756,967 | - | - | 30,756,967 |
Mutual Funds | 78,815,679 | - | - | 78,815,679 |
† See Statement of Investments for additional detailed categorizations.
At September 30, 2015, there were no transfers between Level 1 and Level 2 of the fair value hierarchy.
(b) Securities transactions and investment income: Securities transactions are recorded on a trade date basis. Realized gains and losses from securities transactions are recorded on the identified cost basis. Dividend income is recognized on the ex-dividend date and interest income, including, where applicable, accretion of discount and amortization of premium on investments, is recognized on the accrual basis.
Pursuant to a securities lending agreement with The Bank of New York Mellon, the fund may lend securities to qualified institutions. It is the fund’s policy that, at origination, all loans are secured by collateral of at least 102% of the value of U.S. securities loaned and 105% of the value of foreign securities loaned. Collateral equivalent to at least 100% of the market value of securities on loan is maintained at all times. At September 30, 2015, the value of the collateral was 99% of the market value of the securities on loan. On a daily basis, the collateral held by the fund is monitored to ensure that its value is at least 100% of the market value of the securities on loan. Collateral is either in the form of cash, which can be invested in certain money market mutual funds managed by Dreyfus, or
24
U.S. Government and Agency securities. The fund is entitled to receive all dividends, interest and distributions on securities loaned, in addition to income earned as a result of the lending transaction. Should a borrower fail to return the securities in a timely manner, The Bank of New York Mellon is required to replace the securities for the benefit of the fund or credit the fund with the market value of the unreturned securities and is subrogated to the fund’s rights against the borrower and the collateral. During the period ended September 30, 2015, The Bank of New York Mellon earned $76,171 from lending portfolio securities, pursuant to the securities lending agreement.
(c) Affiliated issuers: Investments in other investment companies advised by Dreyfus are defined as “affiliated” under the Act. Investments in affiliated investment companies during the period ended September 30, 2015 were as follows:
| | | | | | |
Affiliated Investment Company | Value
9/30/2014 ($) | Purchases ($) | Sales ($) | Value
9/30/2015 ($) | Net
Assets (%) |
Dreyfus Institutional Preferred Plus Money Market Fund | 18,843,868 | 437,473,919 | 424,298,242 | 32,019,545 | 3.7 |
Dreyfus Institutional Cash Advantage Fund | 74,662,549 | 707,350,493 | 735,216,908 | 46,796,134 | 5.4 |
Total | 93,506,417 | 1,144,824,412 | 1,159,515,150 | 78,815,679 | 9.1 |
(d) Dividends to shareholders: Dividends are recorded on the ex-dividend date. Dividends from investment income-net and dividends from net realized capital gains, if any, are normally declared and paid annually, but the fund may make distributions on a more frequent basis to comply with the distribution requirements of the Internal Revenue Code of 1986, as amended (the “Code”). To the extent that net realized capital gains can be offset by capital loss carryovers, it is the policy of the fund not to distribute such gains. Income and capital gain distributions are determined in accordance with income tax regulations, which may differ from GAAP.
(e) Federal income taxes: It is the policy of the fund to continue to qualify as a regulated investment company, if such qualification is in the best interests of its shareholders, by complying with the applicable provisions of the Code, and to make distributions of taxable income sufficient to relieve it from substantially all federal income and excise taxes.
As of and during the period ended September 30, 2015, the fund did not have any liabilities for any uncertain tax positions. The fund recognizes interest and penalties, if any, related to uncertain tax positions as income
25
NOTES TO FINANCIAL STATEMENTS (continued)
tax expense in the Statement of Operations. During the period ended September 30, 2015, the fund did not incur any interest or penalties.
Each tax year in the four-year period ended September 30, 2015 remains subject to examination by the Internal Revenue Service and state taxing authorities.
At September 30, 2015, the components of accumulated earnings on a tax basis were as follows: undistributed capital gains $55,258,913, accumulated capital losses $7,044,438 and unrealized appreciation $54,185,351. In addition, the fund deferred for tax purposes late year ordinary losses of $1,834,965 to the first day of the following fiscal year.
Under the Regulated Investment Company Modernization Act of 2010 (the “2010 Act”), the fund is permitted to carry forward capital losses incurred in taxable years beginning after December 22, 2010 (“post-enactment losses”) for an unlimited period. Furthermore, post-enactment capital loss carryovers retain their character as either short-term or long-term capital losses rather than short-term as they were under previous statute. The 2010 Act requires post-enactment losses to be utilized before the utilization of losses incurred in taxable years prior to the effective date of the 2010 Act (“pre-enactment losses”). As a result of this ordering rule, pre-enactment losses may be more likely to expire unused.
The accumulated capital loss carryover is available for federal income tax purposes to be applied against future net realized capital gains, if any, realized subsequent to September 30, 2015. As a result of the fund’s April 29, 2010 merger with Dreyfus Discovery Fund, capital losses of $7,044,438 are available to offset future gains, if any. Based on certain provisions in the Code, the amount of losses which can be utilized in subsequent years is subject to an annual limitation. This acquired capital loss will expire in fiscal year 2016.
The tax character of distributions paid to shareholders during the fiscal periods ended September 30, 2015 and September 30, 2014 were as follows: ordinary income $18,412,406 and $22,995,578, and long-term capital gains $76,901,529 and $69,263,575, respectively.
During the period ended September 30, 2015, as a result of permanent book to tax differences, primarily due to the tax treatment for net operating losses, the fund increased accumulated undistributed investment income-net by $758,030 and decreased paid-in capital by the same amount. Net assets and net asset value per share were not affected by this reclassification.
26
NOTE 2—Bank Lines of Credit:
The fund participates with other Dreyfus-managed funds in a $430 million unsecured credit facility led by Citibank, N.A. and a $300 million unsecured credit facility provided by The Bank of New York Mellon (each, a “Facility”), each to be utilized primarily for temporary or emergency purposes, including the financing of redemptions. Prior to October 8, 2014, the unsecured credit facility with Citibank, N.A. was $265 million. In connection therewith, the fund has agreed to pay its pro rata portion of commitment fees for each Facility. Interest is charged to the fund based on rates determined pursuant to the terms of the respective Facility at the time of borrowing.
The average amount of borrowings outstanding under the Facilities during the period ended September 30, 2015, was approximately $1,047,700 with a related weighted average annualized interest rate of 1.10%.
NOTE 3—Investment Advisory Fee, Sub-Investment Advisory Fee, Administration Fee and Other Transactions with Affiliates:
(a) Pursuant to an investment advisory agreement with Dreyfus, the investment advisory fee is computed at the annual rate of .60% of the value of the fund's average daily net assets and is payable monthly.
Pursuant to a sub-investment advisory agreement between Dreyfus and TBCAM, TBCAM serves as the fund’s sub-investment adviser responsible for the day-to–day management of the fund’s portfolio. Dreyfus pays TBCAM a monthly fee at an annual percentage of the value of the fund’s average daily net assets. Dreyfus has obtained an exemptive order from the SEC (the “Order”), upon which the fund may rely, to use a manager of managers approach that permits Dreyfus, subject to certain conditions and approval by the Board, to enter into and materially amend sub-investment advisory agreements with one or more sub-investment advisers who are either unaffiliated with Dreyfus or are wholly-owned subsidiaries (as defined under the Act) of Dreyfus’ ultimate parent company, BNY Mellon, without obtaining shareholder approval. The Order also allows the fund to disclose the sub-investment advisory fee paid by Dreyfus to any unaffiliated sub-investment adviser in the aggregate with other unaffiliated sub-investment advisers in documents filed with the SEC and provided to shareholders. In addition, pursuant to the Order, it is not necessary to disclose the sub-investment advisory fee payable by Dreyfus separately to a sub-investment adviser that is a wholly-owned subsidiary of BNY Mellon in documents filed with the SEC and provided to shareholders; such fees are to be aggregated with fees payable to Dreyfus. Dreyfus has ultimate responsibility (subject to oversight by the Board) to supervise any sub-
27
NOTES TO FINANCIAL STATEMENTS (continued)
investment adviser and recommend the hiring, termination, and replacement of any sub-investment adviser to the Board.
The fund has a Fund Accounting and Administrative Services Agreement (the “Administration Agreement”) with Dreyfus, whereby Dreyfus performs administrative, accounting and recordkeeping services for the fund. The fund has agreed to compensate Dreyfus for providing accounting and recordkeeping services, administration, compliance monitoring, regulatory and shareholder reporting, as well as related facilities, equipment and clerical help. The fee is based on the fund’s average daily net assets and computed at the following annual rates: .06% of the first $500 million, .04% of the next $500 million and .02% in excess of $1 billion.
In addition, after applying any expense limitations or fee waivers that reduce the fees paid to Dreyfus for this service, Dreyfus has contractually agreed in writing to waive any remaining fees for this service to the extent that they exceed both Dreyfus’ costs in providing these services and a reasonable allocation of the costs incurred by Dreyfus and its affiliates related to the support and oversight of these services. The fund also reimburses Dreyfus for the out-of-pocket expenses incurred in performing this service for the fund. Pursuant to the Administration Agreement, the fund was charged $149,757 during the period ended September 30, 2015.
During the period ended September 30, 2015, the Distributor retained $13,253 from commissions earned on sales of the fund's Class A shares and $10,301 from CDSCs on redemptions of the fund's Class C shares.
(b) Under the Distribution Plan adopted pursuant to Rule 12b-1 under the Act, Class C shares pay the Distributor for distributing its shares at an annual rate of .75% of the value of its average daily net assets. During the period ended September 30, 2015, Class C shares were charged $265,137 pursuant to the Distribution Plan.
(c) Under the Shareholder Services Plan, Class A and Class C shares pay the Distributor at an annual rate of .25% of the value of their average daily net assets for the provision of certain services. The services provided may include personal services relating to shareholder accounts, such as answering shareholder inquiries regarding the fund and providing reports and other information, and services related to the maintenance of shareholder accounts. The Distributor may make payments to Service Agents (securities dealers, financial institutions or other industry professionals) with respect to these services. The Distributor determines the amounts to be paid to Service Agents. During the period ended
28
September 30, 2015, Class A and Class C shares were charged $599,862 and $88,379, respectively, pursuant to the Shareholder Services Plan.
Under its terms, the Distribution Plan and Shareholder Services Plan shall remain in effect from year to year, provided such continuance is approved annually by a vote of a majority of those Trustees who are not “interested persons” of the Trust and who have no direct or indirect financial interest in the operation of or in any agreement related to the Distribution Plan or Shareholder Services Plan.
The fund has arrangements with the transfer agent and the custodian whereby the fund may receive earnings credits when positive cash balances are maintained, which are used to offset transfer agency and custody fees. For financial reporting purposes, the fund includes net earnings credits as an expense offset in the Statement of Operations.
The fund compensates Dreyfus Transfer, Inc., a wholly-owned subsidiary of Dreyfus, under a transfer agency agreement for providing transfer agency and cash management services for the fund. The majority of transfer agency fees are comprised of amounts paid on a per account basis, while cash management fees are related to fund subscriptions and redemptions. During the period ended September 30, 2015, the fund was charged $94,105 for transfer agency services and $6,207 for cash management services. These fees are included in Shareholder servicing costs in the Statement of Operations. Cash management fees were partially offset by earnings credits of $257.
The fund compensates The Bank of New York Mellon under a custody agreement for providing custodial services for the fund. These fees are determined based on net assets, geographic region and transaction activity. During the period ended September 30, 2015, the fund was charged $89,120 pursuant to the custody agreement.
During the period ended September 30, 2015, the fund was charged $11,078 for services performed by the Chief Compliance Officer and his staff.
The components of “Due to The Dreyfus Corporation and affiliates” in the Statement of Assets and Liabilities consist of: investment advisory fees $446,267, administration fees $12,308, Distribution Plan fees $22,172, Shareholder Services Plan fees $54,164, custodian fees $34,804, Chief Compliance Officer fees $2,606 and transfer agency fees $21,068.
(d) Each Board member also serves as a Board member of other funds within the Dreyfus complex. Annual retainer fees and attendance fees are allocated to each fund based on net assets.
29
NOTES TO FINANCIAL STATEMENTS (continued)
NOTE 4—Securities Transactions:
The aggregate amount of purchases and sales of investment securities, excluding short-term securities, during the period ended September 30, 2015, amounted to $1,339,659,188 and $1,436,532,320, respectively.
At September 30, 2015, the cost of investments for federal income tax purposes was $871,153,659; accordingly, accumulated net unrealized appreciation on investments was $54,185,351, consisting of $102,688,421 gross unrealized appreciation and $48,503,070 gross unrealized depreciation.
30
REPORT OF INDEPENDENT REGISTERED
PUBLIC ACCOUNTING FIRM
The Board of Trustees and Shareholders of
Dreyfus Investment Funds
We have audited the accompanying statement of assets and liabilities of Dreyfus/The Boston Company Small/Mid Cap Growth Fund (the “Fund”), a series of Dreyfus Investment Funds, including the statement of investments, as of September 30, 2015, and the related statement of operations for the year then ended, the statements of changes in net assets for each of the years in the two-year period then ended, and the financial highlights for each of the years or period in the five-year period then ended. These financial statements and financial highlights are the responsibility of the Fund’s management. Our responsibility is to express an opinion on these financial statements and financial highlights based on our audits.
We conducted our audits in accordance with the standards of the Public Company Accounting Oversight Board (United States). Those standards require that we plan and perform the audit to obtain reasonable assurance about whether the financial statements and financial highlights are free of material misstatement. An audit includes examining, on a test basis, evidence supporting the amounts and disclosures in the financial statements. Our procedures included confirmation of securities owned as of September 30, 2015, by correspondence with the custodian and brokers or by other appropriate auditing procedures. An audit also includes assessing the accounting principles used and significant estimates made by management, as well as evaluating the overall financial statement presentation. We believe that our audits provide a reasonable basis for our opinion.
In our opinion, the financial statements and financial highlights referred to above present fairly, in all material respects, the financial position of Dreyfus/ The Boston Company Small/Mid Cap Growth Fund as of September 30, 2015, the results of its operations for the year then ended, the changes in its net assets for each of the years in the two-year period then ended, and the financial highlights for each of the years or period in the five-year period then ended, in conformity with U.S. generally accepted accounting principles.

New York, New York
November 25, 2015
31
IMPORTANT TAX INFORMATION (Unaudited)
For federal tax purposes, the fund reports the maximum amount allowable, but not less than $3,847,940 as ordinary income dividends paid during the year ended September 30, 2015 as qualified dividend income in accordance with Section 854(b)(1)(B) of the Internal Revenue Code. Also, the fund reports the maximum amount allowable but not less than 20.98% of ordinary income dividends paid during the year ended September 30, 2015 as eligible for the corporate dividends received deduction provided under Section 243 of the Internal Revenue Code in accordance with Section 854(b)(1)(A) of the Internal Revenue Code. Shareholders will receive notification in early 2016 of the percentage applicable to the preparation of their 2015 income tax returns. The fund reports the maximum amount allowable but not less than $1.4622 per share as a capital gain dividend in accordance with Section 852(b)(3)(C) of the Internal Revenue Code. The fund reports the maximum amount allowable but not less than $.3501 per share as a short-term capital gain dividend in accordance with Sections 871(k)(2) and 881(e) of the Internal Revenue Code.
32
BOARD MEMBERS INFORMATION (Unaudited)
INDEPENDENT BOARD MEMBERS
Joseph S. DiMartino (71)
Chairman of the Board (2008)
Principal Occupation During Past 5 Years:
· Corporate Director and Trustee (1995-present)
Other Public Company Board Memberships During Past 5 Years:
· CBIZ (formerly, Century Business Services, Inc.), a provider of outsourcing functions for small and medium size companies, Director (1997-present)
· The Newark Group, a provider of a national market of paper recovery facilities, paperboard mills and paperboard converting plants, Director (2000-2010)
No. of Portfolios for which Board Member Serves: 142
———————
Francine J. Bovich (64)
Board Member (2011)
Principal Occupation During Past 5 Years:
· Trustee, The Bradley Trusts, private trust funds (2011-present)
· Managing Director, Morgan Stanley Investment Management (1993-2010)
Other Public Company Board Memberships During Past 5 Years:
· Annaly Capital Management, Inc., Board Member (May 2014-present)
No. of Portfolios for which Board Member Serves: 80
———————
Kenneth A. Himmel (69)
Board Member (2008)
Principal Occupation During Past 5 Years:
· Managing Partner, Gulf Related, an international real estate development company (2010-present)
· President and CEO, Related Urban Development, a real estate development company (1996-present)
· President and CEO, Himmel & Company, a real estate development company (1980-present)
· CEO, American Food Management, a restaurant company (1983-present)
No. of Portfolios for which Board Member Serves: 30
———————
33
BOARD MEMBERS INFORMATION (Unaudited) (continued)
INDEPENDENT BOARD MEMBERS (continued)
Stephen J. Lockwood (68)
Board Member (2008)
Principal Occupation During Past 5 Years:
· Chairman of the Board, Stephen J. Lockwood and Company LLC, a real estate investment company (2000-present)
No. of Portfolios for which Board Member Serves: 30
———————
Roslyn M. Watson (65)
Board Member (2008)
Principal Occupation During Past 5 Years:
· Principal, Watson Ventures, Inc., a real estate investment company (1993-present)
No. of Portfolios for which Board Member Serves: 66
———————
Benaree Pratt Wiley (69)
Board Member (2008)
Principal Occupation During Past 5 Years:
· Principal, The Wiley Group, a firm specializing in strategy and business development (2005-present)
Other Public Company Board Memberships During Past 5 Years:
· CBIZ (formerly, Century Business Services, Inc.), a provider of outsourcing functions for small and medium size companies, Director (2008-present)
No. of Portfolios for which Board Member Serves: 66
———————
Once elected all Board Members serve for an indefinite term, but achieve Emeritus status upon reaching age 80. The address of the Board Members and Officers is c/o The Dreyfus Corporation, 200 Park Avenue, New York, New York 10166. Additional information about the Board Members is available in the fund's Statement of Additional Information which can be obtained from Dreyfus free of charge by calling this toll free number: 1-800-DREYFUS.
James M. Fitzgibbons, Emeritus Board Member
34
OFFICERS OF THE FUND (Unaudited)
BRADLEY J. SKAPYAK, President since January 2010.
Chief Operating Officer and a director of the Manager since June 2009, Chairman of Dreyfus Transfer, Inc., an affiliate of the Manager and the transfer agent of the funds, since May 2011 and Executive Vice President of the Distributor since June 2007. From April 2003 to June 2009, Mr. Skapyak was the head of the Investment Accounting and Support Department of the Manager. He is an officer of 68 investment companies (comprised of 142 portfolios) managed by the Manager. He is 56 years old and has been an employee of the Manager since February 1988.
BENNETT A. MACDOUGALL, Chief Legal Officer since October 2015
Chief Legal Officer of the Manager since June 2015; from June 2005 to June 2015, Director and Associate General Counsel of Deutsche Bank – Asset & Wealth Management Division, and Chief Legal Officer of Deutsche Investment Management Americas Inc. He is an officer of 69 investment companies (comprised of 167 portfolios) managed by the Manager. He is 44 years old and has been an employee of the Manager since June 2015.
JANETTE E. FARRAGHER, Vice President and Secretary since December 2011.
Assistant General Counsel of BNY Mellon, and an officer of 69 investment companies (comprised of 167 portfolios) managed by the Manager. She is 52 years old and has been an employee of the Manager since February 1984.
JAMES BITETTO, Vice President and Assistant Secretary since December 2008.
Managing Counsel of BNY Mellon and Secretary of the Manager, and an officer of 69 investment companies (comprised of 167 portfolios) managed by the Manager. He is 49 years old and has been an employee of the Manager since December 1996.
JONI LACKS CHARATAN, Vice President and Assistant Secretary since December 2008.
Managing Counsel of BNY Mellon, and an officer of 69 investment companies (comprised of 167 portfolios) managed by the Manager. She is 59 years old and has been an employee of the Manager since October 1988.
JOSEPH M. CHIOFFI, Vice President and Assistant Secretary since December 2008.
Managing Counsel of BNY Mellon, and an officer of 69 investment companies (comprised of 167 portfolios) managed by the Manager. He is 53 years old and has been an employee of the Manager since June 2000.
JOHN B. HAMMALIAN, Vice President and Assistant Secretary since December 2008.
Senior Managing Counsel of BNY Mellon, and an officer of 69 investment companies (comprised of 167 portfolios) managed by the Manager. He is 52 years old and has been an employee of the Manager since February 1991.
MAUREEN E. KANE, Vice President and Assistant Secretary since April 2015.
Managing Counsel of BNY Mellon since July 2014; from October 2004 until July 2014, General Counsel, and from May 2009 until July 2014, Chief Compliance Officer of Century Capital Management. She is an officer of 69 investment companies (comprised of 167 portfolios) managed by the Manager. She is 53 years old and has been an employee of the Manager since July 2014.
SARAH S. KELLEHER, Vice President and Assistant Secretary since April 2014.
Senior Counsel of BNY Mellon, and an officer of 69 investment companies (comprised of 167 portfolios) managed by the Manager; from August 2005 to March 2013, Associate General Counsel of Third Avenue Management. She is 40 years old and has been an employee of the Manager since March 2013.
JEFF PRUSNOFSKY, Vice President and Assistant Secretary since December 2008.
Senior Managing Counsel of BNY Mellon, and an officer of 69 investment companies (comprised of 167 portfolios) managed by the Manager. He is 50 years old and has been an employee of the Manager since October 1990.
JAMES WINDELS, Treasurer since December 2008.
Director – Mutual Fund Accounting of the Manager, and an officer of 69 investment companies (comprised of 167 portfolios) managed by the Manager. He is 57 years old and has been an employee of the Manager since April 1985.
35
OFFICERS OF THE FUND (Unaudited) (continued)
RICHARD CASSARO, Assistant Treasurer since December 2008.
Senior Accounting Manager – Money Market and Municipal Bond Funds of the Manager, and an officer of 69 investment companies (comprised of 167 portfolios) managed by the Manager. He is 56 years old and has been an employee of the Manager since September 1982.
GAVIN C. REILLY, Assistant Treasurer since December 2008.
Tax Manager of the Investment Accounting and Support Department of the Manager, and an officer of 69 investment companies (comprised of 167 portfolios) managed by the Manager. He is 47 years old and has been an employee of the Manager since April 1991.
ROBERT S. ROBOL, Assistant Treasurer since December 2008.
Senior Accounting Manager – Fixed Income Funds of the Manager, and an officer of 69 investment companies (comprised of 167 portfolios) managed by the Manager. He is 51 years old and has been an employee of the Manager since October 1988.
ROBERT SALVIOLO, Assistant Treasurer since December 2008.
Senior Accounting Manager – Equity Funds of the Manager, and an officer of 69 investment companies (comprised of 167 portfolios) managed by the Manager. He is 48 years old and has been an employee of the Manager since June 1989.
ROBERT SVAGNA, Assistant Treasurer since December 2008.
Senior Accounting Manager – Equity Funds of the Manager, and an officer of 69 investment companies (comprised of 167 portfolios) managed by the Manager. He is 48 years old and has been an employee of the Manager since November 1990.
JOSEPH W. CONNOLLY, Chief Compliance Officer since December 2008.
Chief Compliance Officer of the Manager and The Dreyfus Family of Funds (69 investment companies, comprised of 167 portfolios). He is 58 years old and has served in various capacities with the Manager since 1980, including manager of the firm’s Fund Accounting Department from 1997 through October 2001.
36
NOTES
37
Dreyfus/The Boston Company Small/Mid Cap Growth Fund
200 Park Avenue
New York, NY 10166
Manager
The Dreyfus Corporation
200 Park Avenue
New York, NY 10166
Sub-Investment Adviser
The Boston Company Asset
Management LLC
BNY Mellon Center
One Boston Place
Boston, MA 02108
Custodian
The Bank of New York Mellon
225 Liberty Street
New York, NY 10286
Transfer Agent &
Dividend Disbursing Agent
Dreyfus Transfer, Inc.
200 Park Avenue
New York, NY 10166
Distributor
MBSC Securities Corporation
200 Park Avenue
New York, NY 10166
| | |
Ticker Symbols: | Class A: DBMAX Class C: DBMCX Class I: SDSCX Class Y: DBMYX |
Telephone Call your financial representative or 1-800-DREYFUS
Mail The Dreyfus Family of Funds, 144 Glenn Curtiss Boulevard, Uniondale, NY 11556-0144
E-mail Send your request to info@dreyfus.com
Internet Information can be viewed online or downloaded at www.dreyfus.com
The fund files its complete schedule of portfolio holdings with the Securities and Exchange Commission (“SEC”) for the first and third quarters of each fiscal year on Form N-Q. The fund’s Forms N-Q are available on the SEC’s website at www.sec.gov and may be reviewed and copied at the SEC’s Public Reference Room in Washington, DC. (phone 1-800-SEC-0330 for information).
A description of the policies and procedures that the fund uses to determine how to vote proxies relating to portfolio securities and information regarding how the fund voted these proxies for the most recent 12-month period ended June 30 is available at www.dreyfus.com and on the SEC’s website at www.sec.gov and without charge, upon request, by calling 1-800-DREYFUS.
| | |
© 2015 MBSC Securities Corporation
6921AR0915 | 
|
Item 2. Code of Ethics.
The Registrant has adopted a code of ethics that applies to the Registrant's principal executive officer, principal financial officer, principal accounting officer or controller, or persons performing similar functions. There have been no amendments to, or waivers in connection with, the Code of Ethics during the period covered by this Report.
Item 3. Audit Committee Financial Expert.
The Registrant's Board has determined that Joseph S. DiMartino, a member of the Audit Committee of the Board, is an audit committee financial expert as defined by the Securities and Exchange Commission (the "SEC"). Mr. DiMartino is "independent" as defined by the SEC for purposes of audit committee financial expert determinations.
Item 4. Principal Accountant Fees and Services.
(a) Audit Fees. The aggregate fees billed for each of the last two fiscal years (the "Reporting Periods") for professional services rendered by the Registrant's principal accountant (the "Auditor") for the audit of the Registrant's annual financial statements or services that are normally provided by the Auditor in connection with the statutory and regulatory filings or engagements for the Reporting Periods, were $159,060 in 2014 and $162,900 in 2015.
(b) Audit-Related Fees. The aggregate fees billed in the Reporting Periods for assurance and related services by the Auditor that are reasonably related to the performance of the audit of the Registrant's financial statements and are not reported under paragraph (a) of this Item 4 were $28,190 in 2014 and $28,840 in 2015. These services consisted of one or more of the following: (i) agreed upon procedures related to compliance with Internal Revenue Code section 817(h), (ii) security counts required by Rule 17f-2 under the Investment Company Act of 1940, as amended, (iii) advisory services as to the accounting or disclosure treatment of Registrant transactions or events and (iv) advisory services to the accounting or disclosure treatment of the actual or potential impact to the Registrant of final or proposed rules, standards or interpretations by the Securities and Exchange Commission, the Financial Accounting Standards Boards or other regulatory or standard-setting bodies.
The aggregate fees billed in the Reporting Periods for non-audit assurance and related services by the Auditor to the Registrant's investment adviser (not including any sub-investment adviser whose role is primarily portfolio management and is subcontracted with or overseen by another investment adviser), and any entity controlling, controlled by or under common control with the investment adviser that provides ongoing services to the Registrant ("Service Affiliates"), that were reasonably related to the performance of the annual audit of the Service Affiliate, which required pre-approval by the Audit Committee were $0 in 2014 and $0 in 2015.
(c) Tax Fees. The aggregate fees billed in the Reporting Periods for professional services rendered by the Auditor for tax compliance, tax advice, and tax planning ("Tax Services") were $15,880 in 2014 and $16,210 in 2015. These services consisted of: (i) review or preparation of U.S. federal, state, local and excise tax returns; (ii) U.S. federal, state and local tax planning, advice and assistance regarding statutory, regulatory or administrative developments; (iii) tax advice regarding tax qualification matters and/or treatment of various financial instruments held or proposed to be acquired or held, and (iv) determination of Passive Foreign Investment Companies. The aggregate fees billed in the Reporting Periods for Tax Services by the Auditor to Service Affiliates, which required pre-approval by the Audit Committee were $0 in 2014 and $0 in 2015.
(d) All Other Fees. The aggregate fees billed in the Reporting Periods for products and services provided by the Auditor, other than the services reported in paragraphs (a) through (c) of this Item, were $0 in 2014 and $0 in 2015.
The aggregate fees billed in the Reporting Periods for Non-Audit Services by the Auditor to Service Affiliates, other than the services reported in paragraphs (b) through (c) of this Item, which required pre-approval by the Audit Committee, were $0 in 2014 and $0 in 2015.
(e)(1) Audit Committee Pre-Approval Policies and Procedures. The Registrant's Audit Committee has established policies and procedures (the "Policy") for pre-approval (within specified fee limits) of the Auditor's engagements for non-audit services to the Registrant and Service Affiliates without specific case-by-case consideration. The pre-approved services in the Policy can include pre-approved audit services, pre-approved audit-related services, pre-approved tax services and pre-approved all other services. Pre-approval considerations include whether the proposed services are compatible with maintaining the Auditor's independence. Pre-approvals pursuant to the Policy are considered annually.
(e)(2) Note: None of the services described in paragraphs (b) through (d) of this Item 4 were approved by the Audit Committee pursuant to paragraph (c)(7)(i)(C) of Rule 2-01 of Regulation S-X.
(f) None of the hours expended on the principal accountant's engagement to audit the registrant's financial statements for the most recent fiscal year were attributed to work performed by persons other than the principal account's full-time, permanent employees.
Non-Audit Fees. The aggregate non-audit fees billed by the Auditor for services rendered to the Registrant, and rendered to Service Affiliates, for the Reporting Periods were $15,840,989 in 2014 and $14,297,338 in 2015.
Auditor Independence. The Registrant's Audit Committee has considered whether the provision of non-audit services that were rendered to Service Affiliates, which were not pre-approved (not requiring pre-approval), is compatible with maintaining the Auditor's independence.
Item 5. Audit Committee of Listed Registrants.
Not applicable.
Item 6. Investments.
(a) Not applicable.
Item 7. Disclosure of Proxy Voting Policies and Procedures for Closed-End Management Investment Companies.
Not applicable.
Item 8. Portfolio Managers of Closed-End Management Investment Companies.
Not applicable.
Item 9. Purchases of Equity Securities by Closed-End Management Investment Companies and Affiliated Purchasers.
Not applicable.
Item 10. Submission of Matters to a Vote of Security Holders.
There have been no material changes to the procedures applicable to Item 10.
Item 11. Controls and Procedures.
(a) The Registrant's principal executive and principal financial officers have concluded, based on their evaluation of the Registrant's disclosure controls and procedures as of a date within 90 days of the filing date of this report, that the Registrant's disclosure controls and procedures are reasonably designed to ensure that information required to be disclosed by the Registrant on Form N-CSR is recorded, processed, summarized and reported within the required time periods and that information required to be disclosed by the Registrant in the reports that it files or submits on Form N-CSR is accumulated and communicated to the Registrant's management, including its principal executive and principal financial officers, as appropriate to allow timely decisions regarding required disclosure.
(b) There were no changes to the Registrant's internal control over financial reporting that occurred during the second fiscal quarter of the period covered by this report that have materially affected, or are reasonably likely to materially affect, the Registrant's internal control over financial reporting.
Item 12. Exhibits.
(a)(1) Code of ethics referred to in Item 2.
(a)(2) Certifications of principal executive and principal financial officers as required by Rule 30a-2(a) under the Investment Company Act of 1940.
(a)(3) Not applicable.
(b) Certification of principal executive and principal financial officers as required by Rule 30a-2(b) under the Investment Company Act of 1940.
SIGNATURES
Pursuant to the requirements of the Securities Exchange Act of 1934 and the Investment Company Act of 1940, the Registrant has duly caused this Report to be signed on its behalf by the undersigned, thereunto duly authorized.
Dreyfus Investment Funds
By: /s/ Bradley J. Skapyak
Bradley J. Skapyak,
President
Date: November 23, 2015
Pursuant to the requirements of the Securities Exchange Act of 1934 and the Investment Company Act of 1940, this Report has been signed below by the following persons on behalf of the Registrant and in the capacities and on the dates indicated.
By: /s/ Bradley J. Skapyak
Bradley J. Skapyak,
President
Date: November 23, 2015
By: /s/ James Windels
James Windels,
Treasurer
Date: November 23, 2015
EXHIBIT INDEX
(a)(1) Code of ethics referred to in Item 2.
(a)(2) Certifications of principal executive and principal financial officers as required by Rule 30a-2(a) under the Investment Company Act of 1940. (EX-99.CERT)
(b) Certification of principal executive and principal financial officers as required by Rule 30a-2(b) under the Investment Company Act of 1940. (EX-99.906CERT)