UNITED STATES
SECURITIES AND EXCHANGE COMMISSION
Washington, D.C. 20549
FORM N-CSR
CERTIFIED SHAREHOLDER REPORT OF REGISTERED MANAGEMENT
INVESTMENT COMPANIES
Investment Company Act file number | 811-04813 | |||||
|
| |||||
| Dreyfus Investment Funds |
| ||||
| (Exact name of Registrant as specified in charter) |
| ||||
|
|
| ||||
|
c/o The Dreyfus Corporation 200 Park Avenue New York, New York 10166 |
| ||||
| (Address of principal executive offices) (Zip code) |
| ||||
|
|
| ||||
| John Pak, Esq. 200 Park Avenue New York, New York 10166 |
| ||||
| (Name and address of agent for service) |
| ||||
| ||||||
Registrant's telephone number, including area code: | (212) 922-6000 | |||||
|
| |||||
Date of fiscal year end:
| 9/30 |
| ||||
Date of reporting period: | 9/30/14 |
| ||||
The following N-CSR relates only to the Registrant’s series listed below and does not affect the other series of the Registrant, which have a different fiscal year end and, therefore, different N-CSR reporting requirements. Separate N-CSR Forms will be filed for those series, as appropriate.
-Dreyfus Diversified Emerging Markets Fund
-Dreyfus/The Boston Company Small Cap Growth Fund
-Dreyfus/The Boston Company Small Cap Value Fund
-Dreyfus/The Boston Company Small/Mid Cap Growth Fund
-Dreyfus Tax Sensitive Total Return Bond Fund
-Dreyfus/Newton International Equity Fund
Dreyfus
Diversified Emerging
Markets Fund
ANNUAL REPORT September 30, 2014
The views expressed in this report reflect those of the portfolio manager only through the end of the period covered and do not necessarily represent the views of Dreyfus or any other person in the Dreyfus organization. Any such views are subject to change at any time based upon market or other conditions and Dreyfus disclaims any responsibility to update such views.These views may not be relied on as investment advice and, because investment decisions for a Dreyfus fund are based on numerous factors, may not be relied on as an indication of trading intent on behalf of any Dreyfus fund.
Not FDIC-Insured • Not Bank-Guaranteed • May Lose Value
Contents | |
THE FUND | |
| 2 | A Letter from the President |
| 3 | Discussion of Fund Performance |
| 6 | Fund Performance |
| 8 | Understanding Your Fund’s Expenses |
| 8 | Comparing Your Fund’s Expenses With Those of Other Funds |
| 9 | Statement of Investments |
| 19 | Statement of Assets and Liabilities |
| 20 | Statement of Operations |
| 21 | Statement of Changes in Net Assets |
| 23 | Financial Highlights |
| 27 | Notes to Financial Statements |
| 43 | Report of Independent Registered Public Accounting Firm |
| 44 | Important Tax Information |
| 45 | Board Members Information |
| 47 | Officers of the Fund |
FOR MORE INFORMATION | |
Back Cover |
Dreyfus
Diversified Emerging
Markets Fund
The Fund
A LETTER FROM THE PRESIDENT
Dear Shareholder:
This annual report for Dreyfus Diversified Emerging Markets Fund covers the 12-month period from October 1, 2013, through September 30, 2014. For information about how the fund performed during the reporting period, as well as general market perspectives, we provide a Discussion of Fund Performance on the pages that follow.
For the 12-month reporting period overall, international stock prices advanced modestly as investors generally responded positively to more accommodative monetary policies throughout much of the world. However, the overall market’s entire advance was achieved during the first half of the reporting period.The second half saw mildly negative returns, on average, due to renewed concerns regarding geopolitical tensions and persistently sluggish growth in Europe and the emerging markets.
Some forces appear likely to support international stock prices over the foreseeable future; low inflation has enabled the European Central Bank to reduce short-term interest rates further, China’s economic slowdown appears increasingly unlikely to devolve into a more severe financial crisis, and India’s stock market has surged in anticipation of a more business-friendly government.Yet, some countries are faring better economically than others and monetary policies have begun to diverge, affecting currency exchange rates and capital flows. Consequently, selectivity and a long-term perspective seem poised to become more important determinants of investment success.As always, we urge you to talk regularly with your financial advisor to assess the potential impact of these and other developments on your investments.
Thank you for your continued confidence and support.

J. Charles Cardona
President
The Dreyfus Corporation
October 15, 2014
2
DISCUSSION OF FUND PERFORMANCE
For the period of October 1, 2013, through September 30, 2014, as provided by Elizabeth Slover; MichelleY. Chan, CFA; Gaurav Patankar;Warren Chiang, CFA; Ronald P. Gala, CFA; Peter D. Goslin, CFA; Robert Marshall-Lee; and Sophia Whitbread, CFA, Portfolio Managers
Fund and Market Performance Overview
For the 12-month period ended September 30, 2014, Dreyfus Diversified Emerging Markets Fund’s Class A shares produced a total return of 5.14%, Class C shares returned 4.34%, and Class I shares returned 5.32%. From its inception on January 31, 2014, through September 30, 2014, the fund’s Class Y shares returned 11.40%.1 In comparison, the fund’s benchmark, the Morgan Stanley Capital International Emerging Markets Index (the “MSCI EM Index”), produced a total return of 4.30% for the 12-month reporting period.2
Emerging-markets equities gained value over the reporting period despite bouts of heightened market volatility stemming from economic and geopolitical concerns. The fund outperformed its benchmark, largely due to strong stock selections and country allocations by its three underlying strategies.
The Fund’s Investment Approach
The fund seeks long-term capital growth.To pursue its goal, the fund invests at least 80% of its assets in equity securities (or other instruments with similar economic characteristics) of companies located, organized, or with a majority of assets or business, in countries considered to be emerging markets including other investment companies that invest in such securities.
From the start of the reporting period through January 31, 2014, the fund employed a “bottom-up” investment approach, which emphasized individual stock selection.As of January 31, 2014, the fund uses a “manager of managers” approach by selecting one or more experienced investment managers to serve as subadvisers to the fund. The fund also uses a “fund of funds” approach by investing in one or more underlying funds.The fund currently allocates its assets among emerging market equity strategies employed by The Boston Company Asset Management, LLC (the TBCAM Strategy) and Mellon Capital Management Corporation (the Mellon Capital Strategy), each an
The Fund 3
DISCUSSION OF FUND PERFORMANCE (continued)
affiliate of Dreyfus, and one affiliated underlying fund, Dreyfus Global Emerging Markets Fund (the Newton Fund), which is sub-advised by Newton Capital Management Limited, an affiliate of Dreyfus.
Moderate Gains Under Volatile Market Conditions
The emerging markets produced mixed results amid heightened volatility as investors reacted to various economic and geopolitical developments. On the positive side, Indian stocks posted solid increases amid a strengthening currency, improving trade balances, and the election of new, pro-business government leadership. Most other Asian emerging markets produced more modest gains, with China continuing to exhibit slowing, though stabilizing, economic growth. On the other hand, Eastern European markets were negatively affected by intensifying geopolitical tensions surrounding Russia and Ukraine, while Latin America remained vulnerable to national fiscal difficulties and weakening demand from China for commodities.
Underlying Strategies Produced Strong Relative Results
Both of the fund’s underlying subadvisers and its one underlying fund outperformed the MSCI EM Index since the fund changed its approach and structure on January 31, 2014. The TBCAM Strategy benefited from overweighted exposure to India and the Philippines, which ranked as two of the benchmark’s better performing countries. Positive results from these positions more than offset relative weakness from underweighted exposure to Russia, Mexico, and South Africa.The Mellon Cap Strategy achieved strong contributions from a number of individual companies, including Indian diversified financial services firm Reliance Capital, South Korean cosmetics maker AMOREPACIFIC Group, and South Korean electrical equipment producer LG Display. Disappointments for the Mellon Cap Strategy included Thailand’s PTT Global Chemical and Brazil’s Itau Unibanco Holding. Finally, the Newton Fund’s stock selection strategy identified a number of winners in China, India, South Korea, and the Philippines, more than balancing lagging results in Hong Kong.
Positioned for Continued Recovery
Underlying fundamentals appear to be improving and valuations have become more attractive in the emerging markets.The fund’s portfolio managers have positioned their respective portfolios to benefit from government leadership changes and economic reforms currently taking place in several countries. However, some regions and industry
4
groups seem to be better positioned for these developments than others, and the fund’s portfolio managers expect to maintain a highly selective approach to choosing individual investments.
October 15, 2014
Equity funds are subject generally to market, market sector, market liquidity, issuer, and investment style risks, among other factors, to varying degrees, all of which are more fully described in the fund’s prospectus.
The fund’s performance will be influenced by political, social, and economic factors affecting investments in foreign companies.These special risks include exposure to currency fluctuations, less liquidity, less developed or less efficient trading markets, lack of comprehensive company information, political instability, and differing auditing and legal standards. Investments in foreign currencies are subject to the risk that those currencies will decline in value relative to the U.S. dollar, or, in the case of hedged positions, that the U.S. dollar will decline relative to the currency being hedged. Emerging markets tend to be more volatile than the markets of more mature economies, and generally have less diverse and less mature economic structures and less stable political systems than those of developed countries.
The ability of the fund to achieve its investment goal depends, in part, on the ability of Dreyfus to allocate effectively the fund’s assets among investment strategies, subadvisers and underlying funds.There can be no assurance that the actual allocations will be effective in achieving the fund’s investment goal or that an investment strategy, subadviser, or underlying fund will achieve its particular investment objective.
Each subadviser makes investment decisions independently, and it is possible that the investment styles of the subadvisers may not complement one another. As a result, the fund’s exposure to a given stock, industry, sector, market capitalization, geographic area or investment style could unintentionally be greater or smaller than it would have been if the fund had a single adviser or investment strategy.
The risks of investing in other investment companies, including ETFs, typically reflect the risks associated with the types of instruments in which the investment companies and ETFs invest.When the fund or an underlying fund invests in another investment company or ETF, shareholders of the fund will bear indirectly their proportionate share of the expenses of the other investment company or ETF (including management fees) in addition to the expenses of the fund. ETFs are exchange-traded investment companies that are, in many cases, designed to provide investment results corresponding to an index.The value of the underlying securities can fluctuate in response to activities of individual companies or in response to general market and/or economic conditions.
| 1 Total return includes reinvestment of dividends and any capital gains paid, and does not take into consideration the |
| maximum initial sales charge in the case of Class A shares, or the applicable contingent deferred sales charge imposed on |
| redemptions in the case of Class C shares. Had these charges been reflected, returns would have been lower. Past |
| performance is no guarantee of future results. Share price and investment return fluctuate such that upon redemption, fund |
| shares may be worth more or less than their original cost.The fund’s returns reflect the absorption of certain fund expenses |
| by The Dreyfus Corporation pursuant to an agreement in effect through February 1, 2016, at which time it may be |
| extended, terminated, or modified. Had these expenses not been absorbed, the fund’s returns would have been lower. |
| The fund changed its investment strategy on January 31, 2014. Prior to that date, the fund invested in individual |
| securities using a bottom-up investment approach which emphasized individual stock selection through the use of |
| proprietary computer models and fundamental analysis.The fund did not use a “manager of managers” or “fund of |
| funds” approach. Different investment strategies may lead to different performance results.The fund’s performance for |
| periods prior to January 31, 2014, reflects the investment strategy in effect prior to that date. |
| 2 SOURCE: LIPPER INC. – Reflects reinvestment of net dividends and, where applicable, capital gain distributions. |
| The Morgan Stanley Capital International (MSCI) Emerging Markets Index is a free float-adjusted market |
| capitalization weighted index that is designed to measure the equity performance in global emerging markets.The |
| index consists of select designated MSCI emerging market national indices. MSCI Indices reflect investable |
| opportunities for global investors by taking into account local market restrictions on share ownership by foreigners. |
| Investors cannot invest directly in any index. |
The Fund 5
FUND PERFORMANCE
| † | Source: Lipper Inc. |
| †† | The total return figures presented for Class A and Class C shares of the fund reflect the performance of the fund’s |
| Class I shares for the period prior to 3/31/09 (the inception date for Class A and Class C shares), adjusted to | |
| reflect the applicable sales load for Class A shares. | |
| The total return figures presented for ClassY shares of the fund reflect the performance of the fund’s Class I shares for | |
| the period prior to 1/31/14 (the inception date for ClassY shares). |
Past performance is not predictive of future performance.
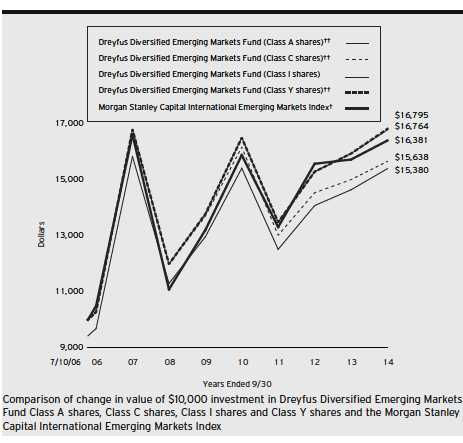
On January 31, 2014, the fund changed its name from “Dreyfus/The Boston Company Emerging Markets Core Equity Fund” to “Dreyfus Diversified Emerging Markets Fund” and the fund’s investment strategy changed.
On November 21, 2013, the Board authorized the fund to offer Class Y shares, as a new class of shares, to certain investors, including certain institutional investors. On January 31, 2014, Class Y shares were offered at net asset value and are not subject to certain fees, including Distribution Plan and Shareholder Services Plan fees.
The above graph compares a $10,000 investment made in each of the Class A, Class C, Class I and Class Y shares of Dreyfus Diversified Emerging Markets Fund on 7/10/06 (inception date) to a $10,000 investment made in the Morgan Stanley Capital International Emerging Markets Index (the “Index”) on that date. All dividends and capital gain distributions are reinvested.
The fund’s performance shown in the line graph above takes into account the maximum initial sales charge on Class A shares and all other applicable fees and expenses on all classes.The Index is a free float-adjusted market capitalization weighted index that is designed to measure the equity performance in global emerging markets. Unlike a mutual fund, the Index is not subject to charges, fees and other expenses. Investors cannot invest directly in any index.These factors can contribute to the Index potentially outperforming the fund. Further information relating to fund performance, including expense reimbursements, if applicable, is contained in the Financial Highlights section of the prospectus and elsewhere in this report.
6
| Average Annual Total Returns as of 9/30/14 | |||||||
| Inception | From | ||||||
| Date | 1 Year | 5 Years | Inception | ||||
| Class A shares | |||||||
| with maximum sales charge (5.75%) | 3/31/09 | –0.88 | % | 2.27 | % | 5.38 | %†† |
| without sales charge | 3/31/09 | 5.14 | % | 3.49 | % | 6.14 | %†† |
| Class C shares | |||||||
| with applicable redemption charge † | 3/31/09 | 3.34 | % | 2.70 | % | 5.59 | %†† |
| without redemption | 3/31/09 | 4.34 | % | 2.70 | % | 5.59 | %†† |
| Class I shares | 7/10/06 | 5.32 | % | 4.02 | % | 6.49 | % |
| Class Y shares | 1/31/14 | 5.52 | %†† | 4.06 | %†† | 6.51 | %†† |
| Morgan Stanley Capital International | 6/30/06 | ||||||
| Emerging Markets Index | 4.30 | % | 4.42 | % | 6.16 | %††† | |
Past performance is not predictive of future performance.The fund’s performance shown in the graph and table does not reflect the deduction of taxes that a shareholder would pay on fund distributions or the redemption of fund shares. In addition to the performance of Class A shares shown with and without a maximum sales charge, the fund’s performance shown in the table takes into account all other applicable fees and expenses on all classes.
| † | The maximum contingent deferred sales charge for Class C shares is 1% for shares redeemed within one year of the |
| date of purchase. | |
| †† | The total return performance figures presented for Class A and Class C shares of the fund reflect the performance of |
| the fund’s Class I shares for the period prior to 3/31/09 (the inception date for Class A and Class C shares), | |
| adjusted to reflect the applicable sales load for Class A shares. | |
| The total return performance figures presented for ClassY shares of the fund reflect the performance of the fund’s | |
| Class I shares for the period prior to 1/31/14 (the inception date for ClassY shares). | |
| ††† | The Index date is based on the life of Class I shares. For comparative purposes, the value of the Index as of the |
| month end 6/30/06 is used as the beginning value on 7/10/06 (the inception date for Class I shares). |
The Fund 7
UNDERSTANDING YOUR FUND’S EXPENSES (Unaudited)
As a mutual fund investor, you pay ongoing expenses, such as management fees and other expenses. Using the information below, you can estimate how these expenses affect your investment and compare them with the expenses of other funds.You also may pay one-time transaction expenses, including sales charges (loads) and redemption fees, which are not shown in this section and would have resulted in higher total expenses. For more information, see your fund’s prospectus or talk to your financial adviser.
Review your fund’s expenses
The table below shows the expenses you would have paid on a $1,000 investment in Dreyfus Diversified Emerging Markets Fund from April 1, 2014 to September 30, 2014. It also shows how much a $1,000 investment would be worth at the close of the period, assuming actual returns and expenses.
Expenses and Value of a $1,000 Investment
assuming actual returns for the six months ended September 30, 2014
| Class A | Class C | Class I | Class Y | |||||
| Expenses paid per $1,000† | $ | 8.19 | $ | 12.01 | $ | 6.92 | $ | 6.56 |
| Ending value (after expenses) | $ | 1,042.00 | $ | 1,038.10 | $ | 1,043.40 | $ | 1,044.30 |
COMPARING YOUR FUND’S EXPENSES
WITH THOSE OF OTHER FUNDS (Unaudited)
Using the SEC’s method to compare expenses
The Securities and Exchange Commission (SEC) has established guidelines to help investors assess fund expenses. Per these guidelines, the table below shows your fund’s expenses based on a $1,000 investment, assuming a hypothetical 5% annualized return. You can use this information to compare the ongoing expenses (but not transaction expenses or total cost) of investing in the fund with those of other funds. All mutual fund shareholder reports will provide this information to help you make this comparison. Please note that you cannot use this information to estimate your actual ending account balance and expenses paid during the period.
Expenses and Value of a $1,000 Investment
assuming a hypothetical 5% annualized return for the six months ended September 30, 2014
| Class A | Class C | Class I | Class Y | |||||
| Expenses paid per $1,000† | $ | 8.09 | $ | 11.86 | $ | 6.83 | $ | 6.48 |
| Ending value (after expenses) | $ | 1,017.05 | $ | 1,013.29 | $ | 1,018.30 | $ | 1,018.65 |
| † Expenses are equal to the fund’s annualized expense ratio of 1.60% for Class A, 2.35% for Class C, 1.35% for |
| Class I and 1.28% for ClassY, multiplied by the average account value over the period, multiplied by 183/365 (to |
| reflect the one-half year period). |
8
| STATEMENT OF INVESTMENTS |
| September 30, 2014 |
| Common Stocks—60.3% | Shares | Value ($) | |
| Brazil—3.0% | |||
| Banco do Brasil | 38,900 | 402,071 | |
| BM&FBovespa | 88,700 | 405,496 | |
| BR Malls Participacoes | 5,500 | 43,434 | |
| Brasil Insurance Participacoes e Administracao | 116,900 | 382,065 | |
| Cia de Saneamento Basico do Estado de Sao Paulo | 43,600 | 352,327 | |
| EcoRodovias Infraestrutura e Logistrica | 49,200 | 242,407 | |
| Embraer, ADR | 10,315 | 404,554 | |
| Gol Linhas Aereas Inteligentes, ADR | 80,930 | 389,273 | |
| Grupo BTG Pactual | 23,900 | 314,891 | |
| JBS | 171,400 | 640,715 | |
| Kroton Educational | 153,900 | 967,003 | |
| M Dias Branco | 1,200 | 47,858 | |
| Multiplus | 23,400 | 282,205 | |
| Porto Seguro | 15,000 | 174,099 | |
| Qualicorp | 46,100 | a | 456,150 |
| Ultrapar Participacoes | 4,700 | 99,482 | |
| 5,604,030 | |||
| British Virgin Islands—.1% | |||
| Atlas Mara Co-Nvest | 24,400 | 239,120 | |
| Chile—.6% | |||
| Cia Cervecerias Unidas | 18,297 | 200,352 | |
| Enersis | 1,295,250 | 409,898 | |
| ENTEL Chile | 46,130 | 522,636 | |
| 1,132,886 | |||
| China—12.8% | |||
| Agile Property Holdings | 32,000 | 19,658 | |
| Agricultural Bank of China, Cl. H | 1,018,000 | 450,996 | |
| Alibaba Group Holding, ADR | 8,113 | 720,840 | |
| Anhui Conch Cement, Cl. H | 100,000 | 319,388 | |
| ANTA Sports Products | 259,000 | 527,683 | |
| Bank of China, Cl. H | 1,567,000 | 702,288 | |
| Beijing Capital International Airport, Cl. H | 86,000 | 65,789 | |
| China BlueChemical, Cl. H | 170,000 | 73,781 | |
| China Cinda Asset Management, Cl. H | 884,000 | 389,355 | |
| China CITIC Bank, Cl. H | 785,000 | 476,165 |
The Fund 9
STATEMENT OF INVESTMENTS (continued)
| Common Stocks (continued) | Shares | Value ($) | |
| China (continued) | |||
| China Communications Construction, Cl. H | 555,000 | 400,265 | |
| China Construction Bank, Cl. H | 3,646,000 | 2,554,362 | |
| China Life Insurance, Cl. H | 348,000 | 965,814 | |
| China Merchants Bank, Cl. H | 354,500 | 606,291 | |
| China Minsheng Banking, Cl. H | 483,800 | 442,376 | |
| China National Building Material, Cl. H | 60,000 | 54,399 | |
| China Oilfield Services, Cl. H | 156,000 | 411,856 | |
| China Petroleum & Chemical, Cl. H | 998,000 | 873,990 | |
| China Railway Construction, Cl. H | 51,500 | 46,825 | |
| China Shenhua Energy, Cl. H | 280,500 | 782,092 | |
| China Telecom, Cl. H | 958,000 | 587,272 | |
| CNOOC | 785,000 | 1,346,606 | |
| Country Garden Holdings | 60,000 | 22,640 | |
| CSR, Cl. H | 708,000 | 622,760 | |
| Evergrande Real Estate Group | 82,000 | 30,836 | |
| Geely Automobile Holdings | 530,000 | 221,833 | |
| Great Wall Motor, Cl. H | 182,000 | 706,684 | |
| Huaneng Power International, Cl. H | 468,000 | 511,103 | |
| Industrial & Commercial Bank of China, Cl. H | 656,000 | 408,899 | |
| Jiangsu Expressway, Cl. H | 166,000 | 175,089 | |
| Lenovo Group | 568,000 | 845,616 | |
| Longfor Properties | 15,000 | 17,154 | |
| New China Life Insurance, Cl. H | 36,500 | 127,153 | |
| PetroChina, Cl. H | 368,000 | 471,561 | |
| PICC Property & Casualty, Cl. H | 262,000 | 464,287 | |
| Ping An Insurance Group Company of China, Cl. H | 59,000 | 442,983 | |
| Shanghai Electric Group | 532,000 | 282,962 | |
| Shanghai Pharmaceuticals Holding, Cl. H | 177,200 | 433,139 | |
| Sihuan Pharmaceutical Holdings Group | 690,000 | 517,177 | |
| Sino-Ocean Land Holdings | 46,500 | 24,493 | |
| Sinopharm Group, Cl. H | 186,000 | 680,296 | |
| Tencent Holdings | 206,900 | 3,077,581 | |
| Vipshop Holdings, ADS | 1,520 | a | 287,295 |
| Weichai Power, Cl. H | 80,000 | 288,995 | |
| WuXi PharmaTech, ADR | 7,560 | a | 264,751 |
10
| Common Stocks (continued) | Shares | Value ($) | |
| China (continued) | |||
| Zhejiang Expressway, Cl. H | 192,000 | 195,095 | |
| Zhuzhou CSR Times Electric, Cl. H | 75,000 | 289,767 | |
| 24,228,240 | |||
| Colombia—.2% | |||
| Cemex Latam Holdings | 20,600 | a | 183,112 |
| Ecopetrol | 66,358 | 103,715 | |
| 286,827 | |||
| Czech Republic—.3% | |||
| Komercni Banka | 2,620 | 623,404 | |
| Greece—.3% | |||
| Alpha Bank | 753,970 | a | 584,716 |
| Hong Kong—2.0% | |||
| China Mobile | 49,500 | 572,146 | |
| China Overseas Land & Investment | 198,000 | 509,481 | |
| China Resources Cement Holdings | 696,000 | 476,857 | |
| China Resources Land | 34,000 | 70,059 | |
| China Resources Power Holdings | 220,000 | 593,572 | |
| China Unicom Hong Kong | 496,000 | 740,980 | |
| COSCO Pacific | 324,000 | 429,783 | |
| Orient Overseas International | 76,000 | 420,871 | |
| Shimao Property Holdings | 20,500 | 41,502 | |
| 3,855,251 | |||
| Hungary—.2% | |||
| OTP Bank | 26,310 | 447,006 | |
| India—6.4% | |||
| Bank of Baroda | 44,590 | 651,450 | |
| Bharat Petroleum | 11,800 | 125,222 | |
| Cairn India | 74,892 | 378,159 | |
| Coal India | 67,150 | 371,141 | |
| DCB Bank | 114,670 | a | 149,422 |
| Grasim Industries | 9,730 | 551,777 | |
| HCL Technologies | 1,201 | 32,469 | |
| HeidelbergCement India | 133,740 | a | 174,583 |
| Hindalco Industries | 143,550 | 364,337 | |
| Idea Cellular | 271,320 | 714,713 |
The Fund 11
STATEMENT OF INVESTMENTS (continued)
| Common Stocks (continued) | Shares | Value ($) |
| India (continued) | ||
| IDFC | 55,180 | 119,815 |
| Ion Exchange (India) | 37,007 | 118,156 |
| IRB Infrastructure Developers | 41,520 | 143,042 |
| ITC | 94,140 | 555,143 |
| JM Financial | 318,690 | 198,962 |
| Just Dial | 14,950 | 386,234 |
| LIC Housing Finance | 87,374 | 435,777 |
| Magma Fincorp | 62,299 | 112,941 |
| Max India | 33,250 | 163,202 |
| NHPC | 291,120 | 91,682 |
| NTPC | 159,160 | 357,969 |
| Oil & Natural Gas | 117,530 | 753,078 |
| Power Finance | 159,922 | 587,134 |
| Reliance Capital | 63,093 | 445,140 |
| Reliance Industries | 37,690 | 567,145 |
| Rural Electrification | 36,626 | 142,270 |
| State Bank of India | 10,614 | 396,948 |
| Tata Consultancy Services | 1,500 | 66,441 |
| Tata Motors | 137,471 | 1,093,783 |
| Tata Steel | 70,854 | 513,659 |
| Tech Mahindra | 12,070 | 466,178 |
| Tribhovandas Bhimji Zaveri | 44,282 | 112,014 |
| Tube Investments of India | 35,470 | 174,737 |
| Unichem Laboratories | 85,240 | 306,469 |
| UPL | 66,410 | 360,931 |
| 12,182,123 | ||
| Indonesia—1.3% | ||
| Bank Mandiri | 351,200 | 290,385 |
| Bank Negara Indonesia Persero | 2,182,500 | 989,603 |
| Bank Rakyat Indonesia Persero | 870,400 | 744,680 |
| Indocement Tunggal Prakarsa | 204,400 | 361,495 |
| 2,386,163 | ||
| Malaysia—1.1% | ||
| British American Tobacco Malaysia | 14,800 | 318,061 |
| DiGi.Com | 151,300 | 269,808 |
| Hong Leong Financial Group | 24,400 | 130,907 |
12
| Common Stocks (continued) | Shares | Value ($) | |
| Malaysia (continued) | |||
| IJM | 260,300 | 513,379 | |
| Malayan Banking | 59,500 | 180,649 | |
| Telekom Malaysia | 161,900 | 325,725 | |
| Tenaga Nasional | 98,200 | 370,589 | |
| 2,109,118 | |||
| Mexico—3.0% | |||
| America Movil, Ser. L | 576,700 | 726,967 | |
| Arca Continental | 161,200 | 1,106,634 | |
| Coca-Cola Femsa, Ser. L | 5,400 | 54,448 | |
| Controladora Vuela Compania de Aviacion, ADR | 55,040 | 477,747 | |
| Fibra Uno Administracion | 25,100 | 82,567 | |
| Gruma, Cl. B | 62,700 | a | 671,327 |
| Grupo Aeroportuario del Pacifico, Cl. B | 70,400 | 474,488 | |
| Grupo Financiero Banorte, Cl. O | 83,900 | 537,302 | |
| Grupo Financiero Inbursa, Cl. O | 180,500 | 516,079 | |
| Hoteles City Express | 66,700 | a | 122,519 |
| OHL Mexico | 155,300 | a | 421,480 |
| Qualitas Controladora | 43,600 | 116,868 | |
| TF Administradora Industrial | 187,500 | a | 413,099 |
| 5,721,525 | |||
| Philippines—1.0% | |||
| Ayala Land | 724,700 | 564,387 | |
| Metropolitan Bank & Trust | 291,918 | 564,614 | |
| SM Prime Holdings | 89,300 | 34,783 | |
| Universal Robina | 196,310 | 818,004 | |
| 1,981,788 | |||
| Poland—.9% | |||
| Orange Polska | 163,609 | 575,749 | |
| PGE | 95,102 | 602,404 | |
| Powszechny Zaklad Ubezpieczen | 3,586 | 521,563 | |
| 1,699,716 | |||
| Russia—2.7% | |||
| Gazprom, ADR | 110,116 | 775,217 | |
| Lukoil, ADR | 6,136 | 312,936 | |
| Magnit, GDR | 11,370 | 656,731 | |
| MMC Norilsk Nickel, ADR | 28,770 | 536,561 |
The Fund 13
STATEMENT OF INVESTMENTS (continued)
| Common Stocks (continued) | Shares | Value ($) | |
| Russia (continued) | |||
| Rosneft, GDR | 136,292 | 794,173 | |
| Sberbank of Russia, ADR | 63,717 | 504,639 | |
| Sberbank of Russia, ADR | 101,010 | a | 799,999 |
| Severstal, GDR | 10,469 | 104,481 | |
| Sistema, GDR | 12,207 | 84,228 | |
| Tatneft, ADR | 14,825 | 523,471 | |
| 5,092,436 | |||
| South Africa—2.9% | |||
| African Rainbow Minerals | 6,515 | 82,734 | |
| Barloworld | 23,636 | 193,776 | |
| FirstRand | 141,177 | 538,294 | |
| Growthpoint Properties | 32,864 | 71,771 | |
| Imperial Holdings | 25,470 | 392,680 | |
| Kumba Iron Ore | 3,836 | 90,617 | |
| Liberty Holdings | 15,375 | 167,912 | |
| Mediclinic International | 127,964 | 1,043,311 | |
| MTN Group | 60,420 | 1,276,222 | |
| Redefine Properties | 39,233 | 33,799 | |
| RMB Holdings | 64,237 | 322,815 | |
| Sasol | 13,430 | 730,078 | |
| Steinhoff International Holdings | 11,534 | 55,284 | |
| Vodacom Group | 35,650 | 410,760 | |
| Woolworths Holdings | 20,047 | 124,215 | |
| 5,534,268 | |||
| South Korea—8.5% | |||
| AMOREPACIFIC Group | 658 | 728,929 | |
| BS Financial Group | 3,708 | 59,384 | |
| CJ | 1,500 | 247,335 | |
| Coway | 12,086 | 965,505 | |
| DGB Financial Group | 11,620 | 184,995 | |
| Dongbu Insurance | 8,174 | 460,889 | |
| E-Mart | 2,672 | 583,649 | |
| Halla Visteon Climate Control | 5,072 | 246,090 | |
| Hana Financial Group | 18,045 | 658,358 | |
| Hankook Tire | 12,130 | 591,988 | |
| Hanwha | 22,700 | 633,513 |
14
| Common Stocks (continued) | Shares | Value ($) | |
| South Korea (continued) | |||
| Hanwha Life Insurance | 16,172 | 108,810 | |
| Hyundai Engineering & Construction | 10,751 | 614,343 | |
| Hyundai Mobis | 509 | 123,964 | |
| Hyundai Steel | 34 | 2,391 | |
| Hyundai Wia | 2,435 | 496,115 | |
| Industrial Bank of Korea | 39,572 | 598,127 | |
| KB Financial Group | 19,790 | 722,961 | |
| Kia Motors | 11,653 | 593,003 | |
| Korea Investment Holdings | 483 | 25,357 | |
| Korea Zinc | 318 | 117,527 | |
| LG Display | 37,322 | a | 1,202,510 |
| LG Electronics | 7,800 | 485,629 | |
| Lotte Shopping | 1,345 | 402,767 | |
| Mirae Asset Securities | 2,900 | 122,293 | |
| Samsung Electronics | 2,017 | 2,263,092 | |
| Samsung Fire & Marine Insurance | 3,970 | 1,062,805 | |
| SK Hynix | 21,306 | a | 943,905 |
| SK Networks | 18,818 | a | 189,027 |
| SK Telecom | 1,930 | 530,396 | |
| 15,965,657 | |||
| Taiwan—7.0% | |||
| Advanced Semiconductor Engineering | 551,000 | 641,214 | |
| Asustek Computer | 12,000 | 114,400 | |
| Catcher Technology | 115,000 | 1,066,093 | |
| Chailease Holding | 167,700 | 407,404 | |
| Compal Electronics | 657,000 | 491,354 | |
| CTBC Financial Holding | 455,000 | 305,881 | |
| Delta Electronics | 90,000 | 568,057 | |
| E.Sun Financial Holding | 1,063,788 | 645,208 | |
| Hon Hai Precision Industry | 199,360 | 629,154 | |
| Inotera Memories | 235,000 | a | 349,184 |
| Kinsus Interconnect Technology | 144,000 | 534,920 | |
| Largan Precision | 5,000 | 358,323 | |
| Lite-On Technology | 69,330 | 99,940 | |
| Mega Financial Holding | 540,000 | 442,907 | |
| Pegatron | 265,000 | 487,845 |
The Fund 15
STATEMENT OF INVESTMENTS (continued)
| Common Stocks (continued) | Shares | Value ($) |
| Taiwan (continued) | ||
| Pou Chen | 284,000 | 315,561 |
| Radiant Opto-Electronics | 26,000 | 102,993 |
| Realtek Semiconductor | 129,000 | 457,996 |
| Ruentex Industries | 155,000 | 344,960 |
| SinoPac Financial Holdings | 532,834 | 228,587 |
| Taishin Financial Holding | 648,606 | 303,839 |
| Taiwan Cement | 427,000 | 635,878 |
| Taiwan Semiconductor Manufacturing | 456,000 | 1,798,846 |
| Taiwan Semiconductor Manufacturing, ADR | 72,610 | 1,465,270 |
| Zhen Ding Technology Holding | 136,000 | 393,879 |
| 13,189,693 | ||
| Thailand—1.9% | ||
| Jasmine International | 2,612,800 | 539,885 |
| PTT | 47,600 | 528,481 |
| PTT Exploration & Production, NVDR | 88,900 | 438,674 |
| PTT Global Chemical | 368,043 | 692,386 |
| PTT Global Chemical, NVDR | 348,400 | 655,433 |
| Siam Cement, NVDR | 23,500 | 326,137 |
| Thai Beverage | 639,000 | 383,190 |
| 3,564,186 | ||
| Turkey—1.1% | ||
| Emlak Konut | ||
| Gayrimenkul Yatirim Ortakligi | 327,859 | 342,757 |
| Eregli Demir ve Celik Fabrikalari | 329,223 | 611,721 |
| Tofas Turk Otomobil Fabrikasi | 39,300 | 220,966 |
| Turkiye Halk Bankasi | 68,810 | 414,090 |
| Turkiye Is Bankasi, Cl. C | 205,636 | 457,059 |
| 2,046,593 | ||
| United Kingdom—.2% | ||
| Standard Chartered | 15,480 | 286,211 |
| United States—2.8% | ||
| Global X MSCI Colombia ETF | 22,600 | 412,902 |
| iShares Global Materials ETF | 8,470 | 507,268 |
| iShares MSCI Indonesia ETF | 21,690 | 590,402 |
| iShares MSCI Philippines ETF | 21,420 | 815,245 |
| Ishares MSCI Poland Capped ETF | 20,930 | 594,412 |
16
| Common Stocks (continued) | Shares | Value ($) | |
| United States (continued) | |||
| iShares MSCI South Korea Capped ETF | 19,330 | 1,169,658 | |
| Market Vectors Russia ETF | 12,880 | 288,126 | |
| Market Vectors Vietnam ETF | 13,410 | 293,679 | |
| Vanguard FTSE Emerging Markets ETF | 13,210 | 550,989 | |
| 5,222,681 | |||
| Total Common Stocks | |||
| (cost $111,283,565) | 113,983,638 | ||
| Preferred Stocks—4.1% | |||
| Brazil—4.0% | |||
| AES Tiete | 21,200 | 186,645 | |
| Banco do Estado do Rio Grande do Sul, Cl. B | 83,900 | 503,863 | |
| Bradespar | 44,800 | 327,981 | |
| Braskem, Cl. A | 58,600 | 387,834 | |
| Cia Brasileira de Distribuicao (Grupo Pao de Acucar) | 29,800 | 1,300,840 | |
| Cia Energetica de Minas Gerais | 71,100 | 435,416 | |
| Cia Energetica de Sao Paulo, Cl. B | 36,500 | 390,387 | |
| Cia Paranaense de Energia, Cl. B | 21,400 | 291,482 | |
| Itau Unibanco Holding | 103,470 | 1,431,735 | |
| Metalurgica Gerdau | 47,100 | 272,277 | |
| Petroleo Brasileiro | 146,200 | 1,080,485 | |
| Suzano Papel e Celulose, Cl. A | 123,800 | 497,678 | |
| Telefonica Brasil | 21,400 | 423,148 | |
| 7,529,771 | |||
| Chile—.0% | |||
| Sociedad Quimica y Minera de Chile, Cl. B | 13 | 337 | |
| Colombia—.1% | |||
| Grupo Aval Acciones y Valores | 248,613 | 170,653 | |
| Total Preferred Stocks | |||
| (cost $7,511,845) | 7,700,761 | ||
| Number of | |||
| Rights—.0% | Rights | Value ($) | |
| China | |||
| Agile Property Holdings | |||
| (cost $1,072) | 6,400 | a | 635 |
The Fund 17
STATEMENT OF INVESTMENTS (continued)
| Other Investment—34.3%† | Shares | Value ($) | |
| Registered Investment Company; | |||
| Dreyfus Global Emerging Markets Fund, Cl. Y | |||
| (cost $59,127,036) | 4,420,452 | b | 64,803,821 |
| Total Investments (cost $177,923,518) | 98.7 | % | 186,488,855 |
| Cash and Receivables (Net) | 1.3 | % | 2,415,233 |
| Net Assets | 100.0 | % | 188,904,088 |
| † The fund’s investment in the Dreyfus Emerging Markets Fund represents 34.3% of the fund’s total investments.The |
| Dreyfus Global Emerging Markets Fund seeks to provide capital appreciation. |
ADR—American Depository Receipts
ADS—American Depository Shares
ETF—Exchange-Traded Fund
GDR—Global Depository Receipts
NVDR—Non-Voting Depository Receipts
| a | Non-income producing security. |
| b | Investment in affiliated mutual fund. |
| Portfolio Summary (Unaudited)†† | |||
| Value (%) | Value (%) | ||
| Mutual Funds: Foreign | 34.3 | Consumer Staples | 4.3 |
| Financial | 17.9 | Industrial | 4.0 |
| Information Technology | 10.3 | Exchange-Traded Funds | 2.8 |
| Energy | 6.1 | Utilities | 2.4 |
| Consumer Discretionary | 5.2 | Health Care | 2.0 |
| Materials | 5.0 | ||
| Telecommunication Services | 4.4 | 98.7 | |
| †† Based on net assets. | |||
| See notes to financial statements. | |||
18
STATEMENT OF ASSETS AND LIABILITIES
September 30, 2014
| Cost | Value | |||
| Assets ($): | ||||
| Investments in securities—See Statement of Investments: | ||||
| Unaffiliated issuers | 118,796,482 | 121,685,034 | ||
| Affiliated issuers | 59,127,036 | 64,803,821 | ||
| Cash | 1,307,736 | |||
| Cash denominated in foreign currencies | 1,867,475 | 1,844,982 | ||
| Receivable for shares of Beneficial Interest subscribed | 225,559 | |||
| Receivable for investment securities sold | 188,371 | |||
| Dividends receivable | 180,394 | |||
| Unrealized appreciation on forward foreign | ||||
| currency exchange contracts—Note 4 | 272 | |||
| Prepaid expenses | 21,714 | |||
| 190,257,883 | ||||
| Liabilities ($): | ||||
| Due to The Dreyfus Corporation and affiliates—Note 3(c) | 252,721 | |||
| Payable for investment securities purchased | 908,428 | |||
| Payable for shares of Beneficial Interest redeemed | 124,724 | |||
| Unrealized depreciation on forward foreign | ||||
| currency exchange contracts—Note 4 | 4,004 | |||
| Accrued expenses | 63,918 | |||
| 1,353,795 | ||||
| Net Assets ($) | 188,904,088 | |||
| Composition of Net Assets ($): | ||||
| Paid-in capital | 178,707,389 | |||
| Accumulated undistributed investment income—net | 573,672 | |||
| Accumulated net realized gain (loss) on investments | 1,086,406 | |||
| Accumulated net unrealized appreciation (depreciation) | ||||
| on investments and foreign currency transactions | 8,536,621 | |||
| Net Assets ($) | 188,904,088 | |||
| Net Asset Value Per Share | ||||
| Class A | Class C | Class I | Class Y | |
| Net Assets ($) | 209,155 | 68,571 | 747,752 | 187,878,610 |
| Shares Outstanding | 9,801 | 3,355 | 35,335 | 8,860,648 |
| Net Asset Value Per Share ($) | 21.34 | 20.44 | 21.16 | 21.20 |
| See notes to financial statements. | ||||
The Fund 19
| STATEMENT OF OPERATIONS | ||
| Year Ended September 30, 2014 | ||
| Investment Income ($): | ||
| Income: | ||
| Cash dividends (net of $289,352 foreign taxes withheld at source): | ||
| Unaffiliated issuers | 2,294,888 | |
| Affiliated issuers | 4 | |
| Total Income | 2,294,892 | |
| Expenses: | ||
| Investment advisory fee—Note 3(a) | 706,726 | |
| Custodian fees—Note 3(c) | 311,432 | |
| Professional fees | 164,774 | |
| Registration fees | 75,293 | |
| Administration fees—Note 3(a) | 64,242 | |
| Prospectus and shareholders' reports | 20,144 | |
| Trustees' fees and expenses—Note 3(d) | 8,244 | |
| Shareholder servicing costs—Note 3(c) | 2,176 | |
| Loan commitment fees—Note 2 | 1,387 | |
| Distribution fees—Note 3(b) | 465 | |
| Miscellaneous | 41,419 | |
| Total Expenses | 1,396,302 | |
| Less—reduction in expenses due to undertaking—Note 3(a) | (85,851 | ) |
| Less—reduction in fees due to earnings credits—Note 3(c) | (3 | ) |
| Net Expenses | 1,310,448 | |
| Investment Income—Net | 984,444 | |
| Realized and Unrealized Gain (Loss) on Investments—Note 4 ($): | ||
| Net realized gain (loss) on investments and foreign currency transactions: | ||
| Unaffiliated issuers | 1,644,670 | |
| Affiliated issuers | (5,312 | ) |
| Net realized gain (loss) on forward foreign currency exchange contracts | (54,791 | ) |
| Net Realized Gain (Loss) | 1,584,567 | |
| Net unrealized appreciation (depreciation) on | ||
| investments and foreign currency transactions: | ||
| Unaffiliated issuers | 2,452,946 | |
| Affiliated issuers | 5,676,785 | |
| Net unrealized appreciation (depreciation) on | ||
| forward foreign currency exchange contracts | (3,732 | ) |
| Net Unrealized Appreciation (Depreciation) | 8,125,999 | |
| Net Realized and Unrealized Gain (Loss) on Investments | 9,710,566 | |
| Net Increase in Net Assets Resulting from Operations | 10,695,010 | |
| See notes to financial statements. | ||
20
STATEMENT OF CHANGES IN NET ASSETS
| Year Ended September 30, | ||||
| 2014 | a | 2013 | ||
| Operations ($): | ||||
| Investment income—net | 984,444 | 54,479 | ||
| Net realized gain (loss) on investments | 1,584,567 | 280,434 | ||
| Net unrealized appreciation | ||||
| (depreciation) on investments | 8,125,999 | (195,305 | ) | |
| Net Increase (Decrease) in Net Assets | ||||
| Resulting from Operations | 10,695,010 | 139,608 | ||
| Dividends to Shareholders from ($): | ||||
| Investment income—net: | ||||
| Class A | (1,321 | ) | — | |
| Class I | (38,708 | ) | — | |
| Total Dividends | (40,029 | ) | — | |
| Beneficial Interest Transactions ($): | ||||
| Net proceeds from shares sold: | ||||
| Class A | 129,686 | 58,085 | ||
| Class C | 84,928 | 5,942 | ||
| Class I | 1,802,991 | 8,530 | ||
| Class Y | 186,859,039 | — | ||
| Dividends reinvested: | ||||
| Class A | 1,321 | — | ||
| Class I | 7,090 | — | ||
| Cost of shares redeemed: | ||||
| Class A | (53,303 | ) | (36,590 | ) |
| Class C | (95,379 | ) | (26,219 | ) |
| Class I | (4,484,417 | ) | (1,074,296 | ) |
| Class Y | (9,568,065 | ) | — | |
| Increase (Decrease) in Net Assets from | ||||
| Beneficial Interest Transactions | 174,683,891 | (1,064,548 | ) | |
| Total Increase (Decrease) in Net Assets | 185,338,872 | (924,940 | ) | |
| Net Assets ($): | ||||
| Beginning of Period | 3,565,216 | 4,490,156 | ||
| End of Period | 188,904,088 | 3,565,216 | ||
| Undistributed investment income—net | 573,672 | 38,332 | ||
The Fund 21
STATEMENT OF CHANGES IN NET ASSETS (continued)
| Year Ended September 30, | ||||
| 2014 | a | 2013 | ||
| Capital Share Transactions: | ||||
| Class Ab | ||||
| Shares sold | 5,929 | 2,745 | ||
| Shares issued for dividends reinvested | 64 | — | ||
| Shares redeemed | (2,515 | ) | (1,856 | ) |
| Net Increase (Decrease) in Shares Outstanding | 3,478 | 889 | ||
| Class Cb | ||||
| Shares sold | 4,201 | 309 | ||
| Shares redeemed | (4,703 | ) | (1,258 | ) |
| Net Increase (Decrease) in Shares Outstanding | (502 | ) | (949 | ) |
| Class Ic | ||||
| Shares sold | 90,912 | 398 | ||
| Shares issued for dividends reinvested | 350 | — | ||
| Shares redeemed | (220,231 | ) | (55,065 | ) |
| Net Increase (Decrease) in Shares Outstanding | (128,969 | ) | (54,667 | ) |
| Class Yc | ||||
| Shares sold | 9,318,728 | — | ||
| Shares redeemed | (458,080 | ) | — | |
| Net Increase (Decrease) in Shares Outstanding | 8,860,648 | — | ||
| a Effective January 31, 2014, the fund commenced offering ClassY shares. |
| b During the period ended September 30, 2013, 1,256 Class C shares representing $26,182 were exchanged for |
| 1,200 Class A shares. |
| c During the period ended September 30, 2014, 12,340 Class I shares representing $272,093 were exchanged for |
| 12,317 ClassY shares. |
See notes to financial statements.
22
FINANCIAL HIGHLIGHTS
The following tables describe the performance for each share class for the fiscal periods indicated. All information (except portfolio turnover rate) reflects financial results for a single fund share.Total return shows how much your investment in the fund would have increased (or decreased) during each period, assuming you had reinvested all dividends and distributions.These figures have been derived from the fund’s financial statements.
| Year Ended September 30, | ||||||||
| Class A Shares | 2014 | 2013 | 2012 | 2011 | 2010 | |||
| Per Share Data ($): | ||||||||
| Net asset value, beginning of period | 20.58 | 19.78 | 21.86 | 26.99 | 22.70 | |||
| Investment Operations: | ||||||||
| Investment income—neta | .05 | .23 | .07 | .09 | .17 | |||
| Net realized and unrealized | ||||||||
| gain (loss) on investments | .98 | .57 | 2.15 | (5.14 | ) | 4.12 | ||
| Total from Investment Operations | 1.03 | .80 | 2.22 | (5.05 | ) | 4.29 | ||
| Distributions: | ||||||||
| Dividends from investment income—net | (.28 | ) | — | (.08 | ) | (.08 | ) | — |
| Dividends from net realized | ||||||||
| gain on investments | — | — | (4.22 | ) | — | — | ||
| Total Distributions | (.28 | ) | — | (4.30 | ) | (.08 | ) | — |
| Proceeds from redemption feesb | .01 | — | — | — | — | |||
| Net asset value, end of period | 21.34 | 20.58 | 19.78 | 21.86 | 26.99 | |||
| Total Return (%)c | 5.14 | 3.99 | 12.48 | (18.77 | ) | 18.85 | ||
| Ratios/Supplemental Data (%): | ||||||||
| Ratio of total expenses | ||||||||
| to average net assets | 4.80 | d | 6.20 | 5.55 | 3.66 | 3.69 | ||
| Ratio of net expenses | ||||||||
| to average net assets | 1.60 | d | 1.60 | 2.25 | 2.25 | 2.25 | ||
| Ratio of net investment income | ||||||||
| to average net assets | .22 | d | 1.10 | .36 | .30 | .71 | ||
| Portfolio Turnover Rate | 128.76 | 67.74 | 70.79 | 75.59 | 102.30 | |||
| Net Assets, end of period ($ x 1,000) | 209 | 130 | 107 | 158 | 152 | |||
| a | Based on average shares outstanding. |
| b | See Note 3(e). |
| c | Exclusive of sales charge. |
| d | Amount does not include the expenses of the underlying fund. |
See notes to financial statements.
The Fund 23
FINANCIAL HIGHLIGHTS (continued)
| Year Ended September 30, | |||||||||
| Class C Shares | 2014 | 2013 | 2012 | 2011 | 2010 | ||||
| Per Share Data ($): | |||||||||
| Net asset value, beginning of period | 19.60 | 18.98 | 21.23 | 26.36 | 22.62 | ||||
| Investment Operations: | |||||||||
| Investment income (loss)—neta | (.16 | ) | .04 | (.14 | ) | (.16 | ) | (.13 | ) |
| Net realized and unrealized | |||||||||
| gain (loss) on investments | .99 | .58 | 2.14 | (4.97 | ) | 4.17 | |||
| Total from Investment Operations | .83 | .62 | 2.00 | (5.13 | ) | 4.04 | |||
| Distributions: | |||||||||
| Dividends from investment income—net | — | — | (.03 | ) | — | (.30 | ) | ||
| Dividends from net realized | |||||||||
| gain on investments | — | — | (4.22 | ) | — | — | |||
| Total Distributions | — | — | (4.25 | ) | — | (.30 | ) | ||
| Proceeds from redemption feesb | .01 | — | — | — | — | ||||
| Net asset value, end of period | 20.44 | 19.60 | 18.98 | 21.23 | 26.36 | ||||
| Total Return (%)c | 4.34 | 3.21 | 11.63 | (19.43 | ) | 17.95 | |||
| Ratios/Supplemental Data (%): | |||||||||
| Ratio of total expenses | |||||||||
| to average net assets | 6.10 | d | 6.62 | 5.79 | 3.92 | 4.18 | |||
| Ratio of net expenses | |||||||||
| to average net assets | 2.35 | d | 2.35 | 3.00 | 3.00 | 3.00 | |||
| Ratio of net investment income | |||||||||
| (loss) to average net assets | (.77 | )d | .22 | (.69 | ) | (.58 | ) | (.57 | ) |
| Portfolio Turnover Rate | 128.76 | 67.74 | 70.79 | 75.59 | 102.30 | ||||
| Net Assets, end of period ($ x 1,000) | 69 | 76 | 91 | 157 | 258 | ||||
| a | Based on average shares outstanding. |
| b | See Note 3(e). |
| c | Exclusive of sales charge. |
| d | Amount does not include the expenses of the underlying fund. |
See notes to financial statements.
24
| Year Ended September 30, | |||||||||
| Class I Shares | 2014 | 2013 | 2012 | 2011 | 2010 | ||||
| Per Share Data ($): | |||||||||
| Net asset value, beginning of period | 20.45 | 19.60 | 21.82 | 26.79 | 22.67 | ||||
| Investment Operations: | |||||||||
| Investment income (loss)—neta | (.30 | ) | .26 | .24 | .25 | .18 | |||
| Net realized and unrealized | |||||||||
| gain (loss) on investments | 1.34 | .59 | 2.10 | (5.11 | ) | 4.26 | |||
| Total from Investment Operations | 1.04 | .85 | 2.34 | (4.86 | ) | 4.44 | |||
| Distributions: | |||||||||
| Dividends from investment income—net | (.34 | ) | — | (.34 | ) | (.11 | ) | (.32 | ) |
| Dividends from net realized | |||||||||
| gain on investments | — | — | (4.22 | ) | — | — | |||
| Total Distributions | (.34 | ) | — | (4.56 | ) | (.11 | ) | (.32 | ) |
| Proceeds from redemption feesb | .01 | — | — | — | — | ||||
| Net asset value, end of period | 21.16 | 20.45 | 19.60 | 21.82 | 26.79 | ||||
| Total Return (%) | 5.32 | 4.23 | 13.36 | (18.27 | ) | 19.73 | |||
| Ratios/Supplemental Data (%): | |||||||||
| Ratio of total expenses | |||||||||
| to average net assets | 3.57 | c | 5.39 | 4.66 | 2.83 | 3.07 | |||
| Ratio of net expenses | |||||||||
| to average net assets | 1.35 | c | 1.35 | 1.50 | 1.50 | 1.50 | |||
| Ratio of net investment income | |||||||||
| (loss) to average net assets | (.63 | )c | 1.27 | 1.19 | .90 | .75 | |||
| Portfolio Turnover Rate | 128.76 | 67.74 | 70.79 | 75.59 | 102.30 | ||||
| Net Assets, end of period ($ x 1,000) | 748 | 3,359 | 4,291 | 8,090 | 15,978 | ||||
| a | Based on average shares outstanding. |
| b | See Note 3(e). |
| c | Amount does not include the expenses of the underlying fund. |
See notes to financial statements.
The Fund 25
FINANCIAL HIGHLIGHTS (continued)
| Year Ended | |
| Class Y Shares | September 30, 2014a |
| Per Share Data ($): | |
| Net asset value, beginning of period | 19.03 |
| Investment Operations: | |
| Investment income—netb | .14 |
| Net realized and unrealized | |
| gain (loss) on investments | 2.02 |
| Total from Investment Operations | 2.16 |
| Proceeds from redemption feesc | .01 |
| Net asset value, end of period | 21.20 |
| Total Return (%)d | 11.40 |
| Ratios/Supplemental Data (%): | |
| Ratio of total expenses to average net assetse,f | 1.29 |
| Ratio of net expenses to average net assetse,f | 1.29 |
| Ratio of net investment income | |
| to average net assetse,f | 1.03 |
| Portfolio Turnover Rate | 128.76 |
| Net Assets, end of period ($ x 1,000) | 187,879 |
| a From the close of business on January 31, 2014 (commencement of initial offering) to September 30, 2014. |
| b Based on average shares outstanding. |
| c See Note 3(e). |
| d Not annualized. |
| e Annualized. |
| f Amount does not include the expenses of the underlying fund. |
See notes to financial statements.
26
NOTES TO FINANCIAL STATEMENTS
NOTE 1—Significant Accounting Policies:
Dreyfus Diversified Emerging Markets Fund (the “fund”) is a separate diversified series of Dreyfus Investment Funds (the “Trust”), which is registered under the Investment Company Act of 1940, as amended (the “Act”), as an open-end management investment company and operates as a series company currently offering seven series, including the fund.The fund’s investment objective is to seek long-term growth of capital. The Dreyfus Corporation (the “Manager” or “Dreyfus”), a wholly-owned subsidiary of The Bank of New York Mellon Corporation (“BNY Mellon”), serves as the fund’s investment adviser.
At a meeting held on October 30-31, 2013, the Trust’s Board of Trustees (the “Board”) approved The Boston Company Asset Management, LLC (“TBCAM”) and Mellon Capital Management Corporation (“Mellon Capital”), each an affiliate of Dreyfus, to serve as the fund’s new sub-investment advisers, effective on January 31, 2014 (the “Effective Date”).
The Board also approved, as of the Effective Date, proposals to change the name of the fund from “Dreyfus/The Boston Company Emerging Markets Core Equity Fund” to “Dreyfus Diversified Emerging Markets Fund” and the fund uses a “fund of funds” approach by investing in one or more underlying funds.
At a meeting held on November 21, 2013, the Board approved, effective January 31, 2014, for the fund to offer Class Y shares.
MBSC Securities Corporation (the “Distributor”), a wholly-owned subsidiary of Dreyfus, is the distributor of the fund’s shares.The fund is authorized to issue an unlimited number of $.001 par value shares of Beneficial Interest in each of the following classes of shares: Class A, Class C, Class I and Class Y. Class A and Class C shares are sold primarily to
The Fund 27
NOTES TO FINANCIAL STATEMENTS (continued)
retail investors through financial intermediaries and bear Distribution and/or Shareholder Services Plan fees. Class A shares generally are subject to a sales charge imposed at the time of purchase. Class C shares are subject to a contingent deferred sales charge (“CDSC”) imposed on Class C shares redeemed within one year of purchase. Class I shares are sold primarily to bank trust departments and other financial service providers (including The Bank of New York Mellon, a subsidiary of BNY Mellon and an affiliate of Dreyfus, and its affiliates), acting on behalf of customers having a qualified trust or an investment account or relationship at such institution, and bear no Distribution or Shareholder Services Plan fees. Class Y shares are sold at net asset value per share generally to institutional investors and bear no Distribution or Shareholder Services Plan fees. Class I and Class Y shares are offered without a front-end sales charge or CDSC. Other differences between the classes include the services offered to and the expenses borne by each class, the allocation of certain transfer agency costs, and certain voting rights. Income, expenses (other than expenses attributable to a specific class), and realized and unrealized gains or losses on investments are allocated to each class of shares based on its relative net assets.
The Trust accounts separately for the assets, liabilities and operations of each series. Expenses directly attributable to each series are charged to that series’ operations; expenses which are applicable to all series are allocated among them on a pro rata basis.
The Financial Accounting Standards Board (“FASB”) Accounting Standards Codification (“ASC”) is the exclusive reference of authoritative U.S. generally accepted accounting principles (“GAAP”) recognized by the FASB to be applied by nongovernmental entities. Rules and interpretive releases of the Securities and Exchange Commission (“SEC”) under authority of federal laws are also sources of authoritative GAAP for SEC registrants. The fund’s financial statements are prepared in accordance with GAAP, which may require the use of management estimates and assumptions. Actual results could differ from those estimates.
28
(a) Portfolio valuation: The fair value of a financial instrument is the amount that would be received to sell an asset or paid to transfer a liability in an orderly transaction between market participants at the measurement date (i.e., the exit price). GAAP establishes a fair value hierarchy that prioritizes the inputs of valuation techniques used to measure fair value. This hierarchy gives the highest priority to unadjusted quoted prices in active markets for identical assets or liabilities (Level 1 measurements) and the lowest priority to unobservable inputs (Level 3 measurements).
Additionally, GAAP provides guidance on determining whether the volume and activity in a market has decreased significantly and whether such a decrease in activity results in transactions that are not orderly. GAAP requires enhanced disclosures around valuation inputs and techniques used during annual and interim periods.
Various inputs are used in determining the value of the fund’s investments relating to fair value measurements.These inputs are summarized in the three broad levels listed below:
Level 1—unadjusted quoted prices in active markets for identical investments.
Level 2—other significant observable inputs (including quoted prices for similar investments, interest rates, prepayment speeds, credit risk, etc.).
Level 3—significant unobservable inputs (including the fund’s own assumptions in determining the fair value of investments).
The inputs or methodology used for valuing securities are not necessarily an indication of the risk associated with investing in those securities.
Changes in valuation techniques may result in transfers in or out of an assigned level within the disclosure hierarchy. Valuation techniques used to value the fund’s investments are as follows:
The Fund 29
NOTES TO FINANCIAL STATEMENTS (continued)
Investments in securities are valued at the last sales price on the securities exchange or national securities market on which such securities are primarily traded. Securities listed on the National Market System for which market quotations are available are valued at the official closing price or, if there is no official closing price that day, at the last sales price. Securities not listed on an exchange or the national securities market, or securities for which there were no transactions, are valued at the average of the most recent bid and asked prices, except for open short positions, where the asked price is used for valuation purposes. Bid price is used when no asked price is available. Registered investment companies that are not traded on an exchange are valued at their net asset value. All of the preceding securities are categorized within Level 1 of the fair value hierarchy.
Fair valuing of securities may be determined with the assistance of a pricing service using calculations based on indices of domestic securities and other appropriate indicators, such as prices of relevant ADRs and financial futures. Utilizing these techniques may result in transfers between Level 1 and Level 2 of the fair value hierarchy.
When market quotations or official closing prices are not readily available, or are determined not to reflect accurately fair value, such as when the value of a security has been significantly affected by events after the close of the exchange or market on which the security is principally traded (for example, a foreign exchange or market), but before the fund calculates its net asset value, the fund may value these investments at fair value as determined in accordance with the procedures approved by the Board. Certain factors may be considered when fair valuing investments such as: fundamental analytical data, the nature and duration of restrictions on disposition, an evaluation of the forces that influence the market in which the securities are purchased and sold, and public trading in similar securities of the issuer or comparable issuers. These securities are either categorized within Level 2 or 3 of the fair value hierarchy depending on the relevant inputs used.
For restricted securities where observable inputs are limited, assumptions about market activity and risk are used and are generally categorized within Level 3 of the fair value hierarchy.
30
Investments denominated in foreign currencies are translated to U.S. dollars at the prevailing rates of exchange.
Forward foreign currency exchange contracts (“forward contracts”) are valued at the forward rate and are generally categorized within Level 2 of the fair value hierarchy.
The following is a summary of the inputs used as of September 30, 2014 in valuing the fund’s investments:
| Level 2—Other | Level 3— | |||||
| Level 1— | Significant | Significant | ||||
| Unadjusted | Observable | Unobservable | ||||
| Quoted Prices | Inputs | Inputs | Total | |||
| Assets ($) | ||||||
| Investments in Securities: | ||||||
| Equity Securities— | ||||||
| Foreign | ||||||
| Common Stocks† | 108,760,957 | — | — | 108,760,957 | ||
| Equity Securities— | ||||||
| Foreign | ||||||
| Preferred Stocks† | 7,700,761 | — | — | 7,700,761 | ||
| Exchange-Traded | ||||||
| Funds | 5,222,681 | — | — | 5,222,681 | ||
| Mutual Funds | 64,803,821 | — | — | 64,803,821 | ||
| Rights† | 635 | — | — | 635 | ||
| Other Financial | ||||||
| Instruments: | ||||||
| Forward Foreign | ||||||
| Currency Exchange | ||||||
| Contracts†† | — | 272 | — | 272 | ||
| Liabilities ($) | ||||||
| Other Financial | ||||||
| Instruments: | ||||||
| Forward Foreign | ||||||
| Currency Exchange | ||||||
| Contracts†† | — | (4,004 | ) | — | (4,004 | ) |
| † | See Statement of Investments for additional detailed categorizations. |
| †† | Amount shown represents unrealized appreciation (depreciation) at period end. |
At September 30, 2013, $2,904,942 of exchange traded foreign equity securities were classified within Level 2 of the fair value hierarchy pursuant to the fund's fair valuation procedures.
The Fund 31
NOTES TO FINANCIAL STATEMENTS (continued)
(b) Foreign currency transactions: The fund does not isolate that portion of the results of operations resulting from changes in foreign exchange rates on investments from the fluctuations arising from changes in the market prices of securities held. Such fluctuations are included with the net realized and unrealized gain or loss on investments.
Net realized foreign exchange gains or losses arise from sales of foreign currencies, currency gains or losses realized on securities transactions between trade and settlement date, and the difference between the amounts of dividends, interest and foreign withholding taxes recorded on the fund’s books and the U.S. dollar equivalent of the amounts actually received or paid. Net unrealized foreign exchange gains and losses arise from changes in the value of assets and liabilities other than investments resulting from changes in exchange rates. Foreign currency gains and losses on foreign currency transactions are also included with net realized and unrealized gain or loss on investments.
(c) Securities transactions and investment income: Securities transactions are recorded on a trade date basis. Realized gains and losses from securities transactions are recorded on the identified cost basis. Dividend income is recognized on the ex-dividend date and interest income, including, where applicable, accretion of discount and amortization of premium on investments, is recognized on the accrual basis.
(d) Affiliated issuers: Investments in other investment companies advised by Dreyfus are defined as “affiliated” under the Act. Investments in affiliated investment companies during the period ended September 30, 2014 were as follows:
| Affiliated | ||||||
| Investment | Value | Net Realized | ||||
| Company | 9/30/2013 ($) | Purchases ($)† | Sales ($) | Gain (Loss) ($) | ||
| Dreyfus | ||||||
| Institutional | ||||||
| Preferred | ||||||
| Plus Money | ||||||
| Market | ||||||
| Fund | 15,470 | 380,632 | 396,102 | — | ||
| Dreyfus | ||||||
| Global Emerging | ||||||
| Markets Fund, Cl. Y | — | 59,261,837 | 129,489 | (5,312 | ) | |
| Total | 15,470 | 59,642,469 | 525,591 | (5,312 | ) |
32
| Change in Net | |||||
| Affiliated | Unrealized | ||||
| Investment | Appreciation | Value | Net | Dividends/ | |
| Company | (Depreciation) ($) | 9/30/2014 | ($) | Assets (%) | Distributions ($) |
| Dreyfus | |||||
| Institutional | |||||
| Preferred | |||||
| Plus Money | |||||
| Market Fund | — | — | — | — | |
| Dreyfus | |||||
| Global Emerging | |||||
| Markets Fund, Cl. Y | 5,676,785 | 64,803,821 | 34.3 | — | |
| Total | 5,676,785 | 64,803,821 | 34.3 | — |
| † | Includes reinvested dividends/distributions. |
(e) Risk: Investing in foreign markets may involve special risks and considerations not typically associated with investing in the U.S.These risks include revaluation of currencies, high rates of inflation, repatriation restrictions on income and capital, and adverse political and economic developments. Moreover, securities issued in these markets may be less liquid, subject to government ownership controls and delayed settlements, and their prices may be more volatile than those of comparable securities in the U.S.
(f) Dividends to shareholders: Dividends are recorded on the ex-dividend date. Dividends from investment income-net and dividends from net realized capital gains, if any, are normally declared and paid annually, but the fund may make distributions on a more frequent basis to comply with the distribution requirements of the Internal Revenue Code of 1986, as amended (the “Code”). To the extent that net realized capital gains can be offset by capital loss carryovers, it is the policy of the fund not to distribute such gains. Income and capital gain distributions are determined in accordance with income tax regulations, which may differ from GAAP.
(g) Federal income taxes: It is the policy of the fund to continue to qualify as a regulated investment company, if such qualification is in the best interests of its shareholders, by complying with the applicable provisions of the Code, and to make distributions of taxable income sufficient to relieve it from substantially all federal income and excise taxes.
The Fund 33
NOTES TO FINANCIAL STATEMENTS (continued)
As of and during the period ended September 30, 2014, the fund did not have any liabilities for any uncertain tax positions. The fund recognizes interest and penalties, if any, related to uncertain tax positions as income tax expense in the Statement of Operations. During the period ended September 30, 2014, the fund did not incur any interest or penalties.
Each tax year in the four-year period ended September 30, 2014 remains subject to examination by the Internal Revenue Service and state taxing authorities.
At September 30, 2014, the components of accumulated earnings on a tax basis were as follows: undistributed ordinary income $2,159,688, undistributed capital gains $94,616 and unrealized appreciation $7,942,395.
The tax character of distributions paid to shareholders during the fiscal periods ended September 30, 2014 and September 30, 2013 were as follows: ordinary income $40,029 and $0, respectively.
During the period ended September 30, 2014, as a result of permanent book to tax differences, primarily due to the tax treatment for foreign currency gains and losses, passive foreign investment companies and foreign capital gain taxes, the fund decreased accumulated undistributed investment income-net by $409,075 and increased accumulated net realized gain (loss) on investments by the same amount. Net assets and net asset value per share were not affected by this reclassification.
NOTE 2—Bank Lines of Credit:
The fund participates with other Dreyfus-managed funds in a $265 million unsecured credit facility led by Citibank, N.A. and a $300 million unsecured credit facility provided by The Bank of New York Mellon (each, a “Facility”), each to be utilized primarily for temporary or emergency purposes, including the financing of redemptions. Prior to October 9, 2013, the unsecured credit facility with Citibank, N.A. was $210 million. In connection therewith, the fund has agreed to pay its pro rata portion of commitment fees for each Facility. Interest is charged to
34
the fund based on rates determined pursuant to the terms of the respective Facility at the time of borrowing. During the period ended September 30, 2014, the fund did not borrow under the Facilities.
NOTE 3—Investment Advisory Fee, Sub-Investment Advisory Fee, Administration Fee and Other Transactions with Affiliates:
(a) Pursuant to an investment advisory agreement with Dreyfus, the fund has agreed to pay an investment advisory fee at the annual rate of 1.10% of the value of the fund’s average daily net assets other than assets allocated to investments in other investment companies (other underlying funds, which may consist of affiliated funds, mutual funds and exchange traded funds) and is payable monthly. Dreyfus had contractually agreed, from October 1, 2013 through October 31, 2014 for Class A, Class C and Class I shares and from January 31, 2014 through October 31, 2014 for Class Y shares, to waive receipt of its fees and/or assume the expenses of the fund so that the direct expenses of the fund (excluding Rule 12b-1 Distribution Plan fees, Shareholder Services Plan fees, taxes, interest expense, brokerage commissions, commitment fees on borrowings, acquired fund fees and expenses of the underlying fund and extraordinary expenses) do not exceed 1.35% of the fund’s average daily net assets. Dreyfus has also contractually agreed, from November 1, 2014 through February 1, 2016, to waive receipt of its fees and/or assume the direct expenses of the fund, so that the expenses of Class A, C, I and Y shares (excluding certain expenses as described above) do not exceed 1.35%, 1.35%, 1.35% and 1.30% of the value of the respective class’ average daily net assets. The reduction in expenses, pursuant to the undertaking, amounted to $85,851 during the period ended September 30, 2014.
Pursuant to separate sub-investment advisory agreements between Dreyfus, TBCAM and Mellon Capital, each serves as the fund’s subad-visers responsible for the day to day management of a portion of the fund’s portfolio. Dreyfus pays each sub-investment advisor a monthly fee at an annual percentage of the value of the fund’s average daily net assets. Dreyfus has obtained an exemptive order from the SEC, upon which the
The Fund 35
NOTES TO FINANCIAL STATEMENTS (continued)
fund may rely, to use a manager of managers approach that permits Dreyfus, subject to certain conditions and approval by the Board, to enter into and materially amend sub-investment advisory agreements with one or more subadvisers who are either unaffiliated with Dreyfus or are wholly-owned subsidiaries (as defined under the Act) of Dreyfus’ ultimate parent company, BNY Mellon, without obtaining shareholder approval.The order also relieves the fund from disclosing the sub-investment advisory fee paid by Dreyfus to an unaffiliated subadviser in documents filed with the SEC and provided to shareholders. In addition, pursuant to the order, it is not necessary to disclose the sub-investment advisory fee payable by Dreyfus separately to a subadviser that is a wholly-owned subsidiary of BNY Mellon in documents filed with the SEC and provided to shareholders; such fees are to be aggregated with fees payable to Dreyfus. Dreyfus has ultimate responsibility (subject to oversight by the Board) to supervise any subadviser and recommend the hiring, termination, and replacement of any subadviser to the Board.
The fund has an Accounting and Administration Agreement (the “Administration Agreement”) with Dreyfus, whereby Dreyfus performs administrative, accounting and recordkeeping services for the fund. The fund has agreed to compensate Dreyfus for providing accounting services, administration, compliance monitoring, regulatory and shareholder reporting, as well as related facilities, equipment and clerical help.The fee is based on the fund’s average daily net assets and computed at the following annual rates: .10% of the first $500 million, .065% of the next $500 million and .02% in excess of $1 billion.
In addition, after applying any expense limitations or fee waivers that reduce the fees paid to Dreyfus for this service, Dreyfus has contractually agreed in writing to waive any remaining fees for this service to the extent that they exceed both Dreyfus’ costs in providing these services and a reasonable allocation of the costs incurred by Dreyfus and its affiliates related to the support and oversight of these services. The fund also reimburses Dreyfus for the out-of-pocket expenses incurred in performing this service for the fund. Pursuant to the Administration Agreement, the fund was charged $64,242 during the period ended September 30, 2014.
36
During the period ended September 30, 2014, the Distributor retained $70 from commissions earned on sales of the fund’s Class A shares.
(b) Under the Distribution Plan adopted pursuant to Rule 12b-1 under the Act, Class C shares pay the Distributor for distributing its shares at an annual rate of .75% of the value of its average daily net assets. During the period ended September 30, 2014, Class C shares were charged $465 pursuant to the Distribution Plan.
(c) Under the Shareholder Services Plan, Class A and Class C shares pay the Distributor at the annual rate of .25% of the value of their average daily net assets for the provision of certain services.The services provided may include personal services relating to shareholder accounts, such as answering shareholder inquiries regarding the fund and providing reports and other information, and services related to the maintenance of shareholder accounts.The Distributor may make payments to Service Agents (securities dealers, financial institutions or other industry professionals) with respect to these services.The Distributor determines the amounts to be paid to Service Agents. During the period ended September 30, 2014, Class A and Class C shares were charged $317 and $155, respectively, pursuant to the Shareholder Services Plan.
Under its terms, the Distribution Plan and Shareholder Services Plan shall remain in effect from year to year, provided such continuance is approved annually by a vote of a majority of those Trustees who are not “interested persons” of the Trust and who have no direct or indirect financial interest in the operation of or in any agreement related to the Distribution Plan or Shareholder Services Plan.
The fund has arrangements with the transfer agent and the custodian whereby the fund may receive earnings credits when positive cash balances are maintained, which are used to offset transfer agency and custody fees. For financial reporting purposes, the fund includes net earnings credits as an expense offset in the Statement of Operations.
The fund compensates Dreyfus Transfer, Inc., a wholly-owned subsidiary of Dreyfus, under a transfer agency agreement for providing transfer
The Fund 37
NOTES TO FINANCIAL STATEMENTS (continued)
agency and cash management services for the fund. The majority of transfer agency fees are comprised of amounts paid on a per account basis, while cash management fees are related to fund subscriptions and redemptions. During the period ended September 30, 2014, the fund was charged $1,167 for transfer agency services and $39 for cash management services.These fees are included in Shareholder servicing costs in the Statement of Operations. Cash management fees were partially offset by earnings credits of $3.
The fund compensates The Bank of NewYork Mellon under a custody agreement for providing custodial services for the fund. These fees are determined based on net assets, geographic region and transaction activity. During the period ended September 30, 2014, the fund was charged $311,432 pursuant to the custody agreement.
During the period ended September 30, 2014, the fund was charged $8,107 for services performed by the Chief Compliance Officer and his staff.
The components of “Due to The Dreyfus Corporation and affiliates” in the Statement of Assets and Liabilities consist of: investment advisory fees $112,348, Distribution Plan fees $39, Shareholder Services Plan fees $57, custodian fees $128,276, Chief Compliance Officer fees $1,730, administration fees $10,207 and transfer agency fees $263, which are offset against an expense reimbursement currently in effect in the amount of $199.
(d) Each Board member also serves as a Board member of other funds within the Dreyfus complex. Annual retainer fees and attendance fees are allocated to each fund based on net assets.
(e) A 2% redemption fee is charged and retained by the fund on certain shares redeemed within sixty days following the date of issuance subject to certain exceptions, including redemptions made through use of the fund’s exchange privilege. During the period ended September 30, 2014, redemption fees charged and retained by the fund amounted to $85,971.
38
NOTE 4—Securities Transactions:
The aggregate amount of purchases and sales of investment securities, excluding short-term securities and forward contracts, during the period ended September 30, 2014, amounted to $296,551,014 and $123,802,265, respectively.
Derivatives: A derivative is a financial instrument whose performance is derived from the performance of another asset. Each type of derivative instrument that was held by the fund during the period ended September 30, 2014 is discussed below.
Master Netting Arrangements: The fund enters into International Swaps and Derivatives Association, Inc. Master Agreements or similar agreements (collectively,“Master Agreements”) with its over-the counter (“OTC”) derivative contract counterparties in order to, among other things, reduce its credit risk to counterparties. Master Agreements include provisions for general obligations, representations, collateral and events of default or termination. Under a Master Agreement, the fund may offset with the counterparty certain derivative financial instrument’s payables and/or receivables with collateral held and/or posted and create one single net payment in the event of default or termination.
Forward Foreign Currency Exchange Contracts: The fund enters into forward contracts in order to hedge its exposure to changes in foreign currency exchange rates on its foreign portfolio holdings, to settle foreign currency transactions or as a part of its investment strategy.When executing forward contracts, the fund is obligated to buy or sell a foreign currency at a specified rate on a certain date in the future.With respect to sales of forward contracts, the fund incurs a loss if the value of the contract increases between the date the forward contract is opened and the date the forward contract is closed. The fund realizes a gain if the value of the contract decreases between those dates. With respect to purchases of forward contracts, the fund incurs a loss if the value of the contract decreases between the date the forward contract is opened and
The Fund 39
NOTES TO FINANCIAL STATEMENTS (continued)
the date the forward contract is closed. The fund realizes a gain if the value of the contract increases between those dates. Any realized or unrealized gains or losses which occurred during the period are reflected in the Statement of Operations.The fund is exposed to foreign currency risk as a result of changes in value of underlying financial instruments. The fund is also exposed to credit risk associated with counterparty nonperformance on these forward contracts, which is generally limited to the unrealized gain on each open contract. The risk is mitigated by Master Agreements between the fund and the counterparty.The following summarizes open forward contracts at September 30, 2014:
| Foreign | Unrealized | |||||
| Forward Foreign Currency | Currency | Appreciation | ||||
| Exchange Contracts | Amounts | Cost ($) | Value ($) | (Depreciation) ($) | ||
| Purchases: | ||||||
| Mexican New Peso, | ||||||
| Expiring: | ||||||
| 10/1/2014 a | 763,998 | 56,613 | 56,885 | 272 | ||
| 10/2/2014 b | 973,704 | 72,502 | 72,500 | (2 | ) | |
| South African Rand, | ||||||
| Expiring | ||||||
| 10/1/2014 c | 3,304,417 | 296,866 | 292,873 | (3,993 | ) | |
| Sales: | Proceeds ($) | |||||
| Hong Kong Dollar, | ||||||
| Expiring | ||||||
| 10/3/2014 c | 1,617 | 208 | 208 | — | ||
| South African Rand, | ||||||
| Expiring | �� | |||||
| 10/1/2014 d | 191,105 | 16,929 | 16,938 | (9 | ) | |
| Gross Unrealized | ||||||
| Appreciation | 272 | |||||
| Gross Unrealized | ||||||
| Depreciation | (4,004 | ) |
Counterparties:
| a | JP Morgan Chase Bank |
| b | Goldman Sachs International |
| c | Deutsche Bank |
| d | UBS |
40
The provisions of ASC Topic 210 “Disclosures about Offsetting Assets and Liabilities” require disclosure on the offsetting of financial assets and liabilities. These disclosures are required for certain investments, including derivative financial instruments subject to Master Agreements which are eligible for offsetting the Statement of Assets and Liabilities and require the fund to disclose both gross and net information with respect to such investments. For financial reporting purposes, the fund does not offset derivative assets and derivative liabilities that are subject to Master Agreements in the Statement of Asset and Liabilities.
At September 30, 2014, derivative assets and liabilities (by type) on a gross basis are as follows:
| Derivative Financial Instruments: | Assets ($) | Liabilities ($) | |
| Forward contracts | 272 | (4,004 | ) |
| Total gross amount of derivative | |||
| assets and liabilities in the | |||
| Statement of Assets and Liabilities | 272 | (4,004 | ) |
| Derivatives not subject to | |||
| Master Agreements | — | — | |
| Total gross amount of assets and | |||
| liabilities subject to Master Agreements | 272 | (4,004 | ) |
The following tables present derivative assets and liabilities net of amounts available for offsetting under Master Agreements and net of related collateral received or pledged, if any, as of September 30, 2014:
| Financial | ||||
| Instruments | ||||
| and | ||||
| Derivatives | ||||
| Gross Amount of | Available | Collateral | Net Amount | |
| Counterparty | Assets ($)1 | for Offset ($) | Received ($)2 | of Assets ($) |
| JP Morgan Chase Bank | 272 | — | — | 272 |
| Total | 272 | — | — | 272 |
The Fund 41
NOTES TO FINANCIAL STATEMENTS (continued)
| Financial | ||||||
| Instruments | ||||||
| and | ||||||
| Derivatives | ||||||
| Gross Amount of | Available | Collateral | Net Amount | |||
| Counterparties | Liabilities ($)1 | for Offset ($) | Pledged ($)2 | of Liabilities ($) | ||
| Deutsche Bank | (3,993 | ) | — | — | (3,993 | ) |
| Goldman Sachs | ||||||
| International | (2 | ) | — | — | (2 | ) |
| UBS | (9 | ) | — | — | (9 | ) |
| Total | (4,004 | ) | — | — | (4,004 | ) |
| 1 | Absent a default event or early termination, OTC derivative assets and liabilities are presented at |
| gross amounts and are not offset in the Statement of Assets and Liabilities. | |
| 2 | In some instances, the actual collateral received and/or pledged may be more than the amount |
| shown due to overcollateralization. |
The following summarizes the average market value of derivatives outstanding during the period ended September 30, 2014:
| Average Market Value ($) | |
| Forward contracts | 381,511 |
At September 30, 2014, the cost of investments for federal income tax purposes was $178,521,737; accordingly, accumulated net unrealized appreciation on investments was $7,967,118, consisting of $13,518,716 gross unrealized appreciation and $5,551,598 gross unrealized depreciation.
42
| REPORT OF INDEPENDENT REGISTERED |
| PUBLIC ACCOUNTING FIRM |
The Board of Trustees and Shareholders Dreyfus Investment Funds
We have audited the accompanying statement of assets and liabilities of Dreyfus Diversified Emerging Markets Fund (the “Fund”) (formerly known as Dreyfus/The Boston Company Emerging Markets Core Equity Fund), a series of Dreyfus Investment Funds, including the statement of investments, as of September 30, 2014, and the related statement of operations for the year then ended, the statements of changes in net assets for each of the years in the two-year period then ended, and the financial highlights for each of the years or periods in the five-year period then ended. These financial statements and financial highlights are the responsibility of the Fund’s management. Our responsibility is to express an opinion on these financial statements and financial highlights based on our audits.
We conducted our audits in accordance with the standards of the Public Company Accounting Oversight Board (United States). Those standards require that we plan and perform the audit to obtain reasonable assurance about whether the financial statements and financial highlights are free of material misstatement. An audit includes examining, on a test basis, evidence supporting the amounts and disclosures in the financial statements. Our procedures included confirmation of securities owned as of September 30, 2014, by correspondence with the custodian and brokers or by other appropriate auditing procedures. An audit also includes assessing the accounting principles used and significant estimates made by management, as well as evaluating the overall financial statement presentation. We believe that our audits provide a reasonable basis for our opinion.
In our opinion, the financial statements and financial highlights referred to above present fairly, in all material respects, the financial position of Dreyfus Diversified Emerging Markets Fund as of September 30, 2014, the results of its operations for the year then ended, the changes in its net assets for each of the years in the two-year period then ended, and the financial highlights for each of the years or periods in the five-year period then ended, in conformity with U.S. generally accepted accounting principles.

New York, New York
November 26, 2014
The Fund 43
IMPORTANT TAX INFORMATION (Unaudited)
For federal tax purposes, the fund elects to provide each shareholder with their portion of the fund's income sourced from foreign countries and taxes paid from foreign countries. The fund reports the maximum amount allowable but not less than $2,555,877 as income sourced from foreign countries for the fiscal year ended September 30, 2014 in accordance with Section 853(c)(2) of the Internal Revenue Code. Also, the fund reports the maximum amount allowable but not less than $429,571 as taxes paid from foreign countries for the fiscal year ended September 30, 2014 in accordance with Section 853(a) of the Internal Revenue Code. Where required by federal tax law rules, shareholders will receive notification of their proportionate share of foreign sourced income and foreign taxes paid for the 2014 calendar year with Form 1099-DIV which will be mailed in early 2015. Also, the fund reports the maximum amount allowable, but not less than $40,029 as ordinary income dividends paid during the fiscal year ended September 30, 2014 as qualified dividend income in accordance with Section 854(b)(1)(B) of the Internal Revenue Code.
44
| BOARD MEMBERS INFORMATION (Unaudited) |
| INDEPENDENT BOARD MEMBERS |
| Joseph S. DiMartino (70) |
| Chairman of the Board (2008) |
| Principal Occupation During Past 5Years: |
| • Corporate Director and Trustee (1995-present) |
| Other Public Company Board Memberships During Past 5Years: |
| • CBIZ (formerly, Century Business Services, Inc.), a provider of outsourcing functions for small |
| and medium size companies, Director (1997-present) |
| • The Newark Group, a provider of a national market of paper recovery facilities, paperboard |
| mills and paperboard converting plants, Director (2000-2010) |
| • Sunair Services Corporation, a provider of certain outdoor-related services to homes and busi- |
| nesses, Director (2005-2009) |
| No. of Portfolios for which Board Member Serves: 145 |
| ——————— |
| Francine J. Bovich (63) |
| Board Member (2011) |
| Principal Occupation During Past 5Years: |
| • Trustee,The Bradley Trusts, private trust funds (2011-present) |
| • Managing Director, Morgan Stanley Investment Management (1993-2010) |
| Other Public Company Board Membership During Past 5Years: |
| • Annaly Capital Management, Inc., Board Member (May 2014-present) |
| No. of Portfolios for which Board Member Serves: 45 |
| ——————— |
| Kenneth A. Himmel (68) |
| Board Member (2008) |
| Principal Occupation During Past 5Years: |
| • President and CEO, Related Urban Development, a real estate development company (1996-present) |
| • President and CEO, Himmel & Company, a real estate development company (1980- present) |
| • CEO,American Food Management, a restaurant company (1983-present) |
| No. of Portfolios for which Board Member Serves: 31 |
The Fund 45
| BOARD MEMBERS INFORMATION (Unaudited) (continued) |
| INDEPENDENT BOARD MEMBERS (continued) |
| Stephen J. Lockwood (67) |
| Board Member (2008) |
| Principal Occupation During Past 5Years: |
| • Chairman of the Board, Stephen J. Lockwood and Company LLC, a real estate investment |
| company (2000-present) |
| No. of Portfolios for which Board Member Serves: 31 |
| ——————— |
| Roslyn M. Watson (64) |
| Board Member (2008) |
| Principal Occupation During Past 5Years: |
| • Principal,Watson Ventures, Inc., a real estate investment company (1993-present) |
| No. of Portfolios for which Board Member Serves: 67 |
| ——————— |
| Benaree Pratt Wiley (68) |
| Board Member (2008) |
| Principal Occupation During Past 5Years: |
| • Principal,TheWiley Group, a firm specializing in strategy and business development (2005-present) |
| Other Public Company Board Membership During Past 5Years: |
| • CBIZ (formerly, Century Business Services, Inc.), a provider of outsourcing functions for small |
| and medium size companies, Director (2008-present) |
| No. of Portfolios for which Board Member Serves: 69 |
| ——————— |
| Once elected all Board Members serve for an indefinite term, but achieve Emeritus status upon reaching age 80.The |
| address of the Board Members and Officers is c/o The Dreyfus Corporation, 200 Park Avenue, NewYork, NewYork |
| 10166.Additional information about the Board Members is available in the fund’s Statement of Additional Information |
| which can be obtained from Dreyfus free of charge by calling this toll free number: 1-800-DREYFUS. |
| James M. Fitzgibbons, Emeritus Board Member |
| J.Tomlinson Fort, Emeritus Board Member |
46
OFFICERS OF THE FUND (Unaudited)
BRADLEY J. SKAPYAK, President since January 2010.
Chief Operating Officer and a director of the Manager since June 2009, Chairman of Dreyfus Transfer, Inc., an affiliate of the Manager and the transfer agent of the funds, since May 2011 and Executive Vice President of the Distributor since June 2007. From April 2003 to June 2009, Mr. Skapyak was the head of the Investment Accounting and Support Department of the Manager. He is an officer of 69 investment companies (comprised of 145 portfolios) managed by the Manager. He is 55 years old and has been an employee of the Manager since February 1988.
JOHN PAK, Chief Legal Officer since March 2013.
Deputy General Counsel, Investment Management, of BNY Mellon since August 2014; Chief Legal Officer of the Manager since August 2012; from March 2005 to July 2012, Managing Director of Deutsche Bank, Deputy Global Head of Deutsche Asset Management Legal and Regional Head of Deutsche Asset Management Americas Legal. He is an officer of 70 investment companies (comprised of 170 portfolios) managed by the Manager. He is 46 years old and has been an employee of the Manager since August 2012.
JANETTE E. FARRAGHER, Vice President and Secretary since December 2011.
Assistant General Counsel of BNY Mellon, and an officer of 70 investment companies (comprised of 170 portfolios) managed by the Manager. She is 51 years old and has been an employee of the Manager since February 1984.
KIESHA ASTWOOD, Vice President and Assistant Secretary since January 2010.
Counsel of BNY Mellon, and an officer of 70 investment companies (comprised of 170 portfolios) managed by the Manager. She is 41 years old and has been an employee of the Manager since July 1995.
JAMES BITETTO, Vice President and Assistant Secretary since December 2008.
Managing Counsel of BNY Mellon and Secretary of the Manager, and an officer of 70 investment companies (comprised of 170 portfolios) managed by the Manager. He is 48 years old and has been an employee of the Manager since December 1996.
JONI LACKS CHARATAN, Vice President and Assistant Secretary since December 2008.
Managing Counsel of BNY Mellon, and an officer of 70 investment companies (comprised of 170 portfolios) managed by the Manager. She is 58 years old and has been an employee of the Manager since October 1988.
JOSEPH M. CHIOFFI, Vice President and Assistant Secretary since December 2008.
Managing Counsel of BNY Mellon, and an officer of 70 investment companies (comprised of 170 portfolios) managed by the Manager. He is 52 years old and has been an employee of the Manager since June 2000.
JOHN B. HAMMALIAN, Vice President and Assistant Secretary since December 2008.
Senior Managing Counsel of BNY Mellon, and an officer of 70 investment companies (comprised of 170 portfolios) managed by the Manager. He is 51 years old and has been an employee of the Manager since February 1991.
SARAH S. KELLEHER, Vice President and Assistant Secretary since April 2014.
Senior Counsel of BNY Mellon, and an officer of 70 investment companies (comprised of 170 portfolios) managed by the Manager; from August 2005 to March 2013, Associate General Counsel of Third Avenue Management. She is 38 years old and has been an employee of the Manager since March 2013.
The Fund 47
OFFICERS OF THE FUND (Unaudited) (continued)
JEFF PRUSNOFSKY, Vice President and Assistant Secretary since December 2008.
Senior Managing Counsel of BNY Mellon, and an officer of 70 investment companies (comprised of 170 portfolios) managed by the Manager. He is 49 years old and has been an employee of the Manager since October 1990.
JAMES WINDELS, Treasurer since December 2008.
Director – Mutual Fund Accounting of the Manager, and an officer of 70 investment companies (comprised of 170 portfolios) managed by the Manager. He is 56 years old and has been an employee of the Manager since April 1985.
RICHARD CASSARO, Assistant Treasurer since December 2008.
Senior Accounting Manager – Money Market and Municipal Bond Funds of the Manager, and an officer of 70 investment companies (comprised of 170 portfolios) managed by the Manager. He is 55 years old and has been an employee of the Manager since September 1982.
GAVIN C. REILLY, Assistant Treasurer since December 2008.
Tax Manager of the Investment Accounting and Support Department of the Manager, and an officer of 70 investment companies (comprised of 170 portfolios) managed by the Manager. He is 46 years old and has been an employee of the Manager since April 1991.
ROBERT S. ROBOL, Assistant Treasurer since December 2008.
Senior Accounting Manager – Fixed Income Funds of the Manager, and an officer of 70 investment companies (comprised of 170 portfolios) managed by the Manager. He is 50 years old and has been an employee of the Manager since October 1988.
ROBERT SALVIOLO, Assistant Treasurer since December 2008.
Senior Accounting Manager – Equity Funds of the Manager, and an officer of 70 investment companies (comprised of 170 portfolios) managed by the Manager. He is 47 years old and has been an employee of the Manager since June 1989.
ROBERT SVAGNA, Assistant Treasurer since December 2008.
Senior Accounting Manager – Equity Funds of the Manager, and an officer of 70 investment companies (comprised of 170 portfolios) managed by the Manager. He is 47 years old and has been an employee of the Manager since November 1990.
JOSEPH W. CONNOLLY, Chief Compliance Officer since December 2008.
Chief Compliance Officer of the Manager and The Dreyfus Family of Funds (70 investment companies, comprised of 170 portfolios). He is 57 years old and has served in various capacities with the Manager since 1980, including manager of the firm’s Fund Accounting Department from 1997 through October 2001.
MATTHEW D. CONNOLLY, Anti-Money Laundering Compliance Officer since April 2012.
Anti-Money Laundering Compliance Officer of the Distributor since October 2011; from March 2010 to September 2011, Global Head, KYC Reviews and Director of UBS Investment Bank; until March 2010, AML Compliance Officer and Senior Vice President of Citi Global Wealth Management. He is an officer of 65 investment companies (comprised of 165 portfolios) managed by the Manager. He is 42 years old and has been an employee of the Distributor since October 2011.
48
For More Information
Telephone Call your financial representative or 1-800-DREYFUS
Mail The Dreyfus Family of Funds, 144 Glenn Curtiss Boulevard, Uniondale, NY 11556-0144
The fund files its complete schedule of portfolio holdings with the Securities and Exchange Commission (“SEC”) for the first and third quarters of each fiscal year on Form N-Q. The fund’s Forms N-Q are available on the SEC’s website at http://www.sec.gov and may be reviewed and copied at the SEC’s Public Reference Room in Washington, DC. Information on the operation of the Public Reference Room may be obtained by calling 1-800-SEC-0330.
| Dreyfus/The Boston |
| Company Small Cap |
| Growth Fund |
ANNUAL REPORT September 30, 2014
Save time. Save paper. View your next shareholder report online as soon as it’s available. Log into www.dreyfus.com and sign up for Dreyfus eCommunications. It’s simple and only takes a few minutes.
The views expressed in this report reflect those of the portfolio manager only through the end of the period covered and do not necessarily represent the views of Dreyfus or any other person in the Dreyfus organization. Any such views are subject to change at any time based upon market or other conditions and Dreyfus disclaims any responsibility to update such views.These views may not be relied on as investment advice and, because investment decisions for a Dreyfus fund are based on numerous factors, may not be relied on as an indication of trading intent on behalf of any Dreyfus fund.
| Not FDIC-Insured • Not Bank-Guaranteed • May Lose Value |
Contents | |
THE FUND | |
| 2 | A Letter from the President |
| 3 | Discussion of Fund Performance |
| 6 | Fund Performance |
| 7 | Understanding Your Fund’s Expenses |
| 7 | Comparing Your Fund’s Expenses With Those of Other Funds |
| 8 | Statement of Investments |
| 13 | Statement of Assets and Liabilities |
| 14 | Statement of Operations |
| 15 | Statement of Changes in Net Assets |
| 16 | Financial Highlights |
| 18 | Notes to Financial Statements |
| 28 | Report of Independent Registered Public Accounting Firm |
| 29 | Important Tax Information |
| 30 | Board Members Information |
| 32 | Officers of the Fund |
FOR MORE INFORMATION | |
Back Cover |
Dreyfus/The Boston
Company Small Cap
Growth Fund
The Fund
A LETTER FROM THE PRESIDENT
Dear Shareholder:
This annual report for Dreyfus/The Boston Company Small Cap Growth Fund covers the 12-month period from October 1, 2013, through September 30, 2014. For information about how the fund performed during the reporting period, as well as general market perspectives, we provide a Discussion of Fund Performance on the pages that follow.
Despite occasional bouts of heightened volatility, U.S. stocks gained ground steadily over the reporting period as the domestic economy rebounded. As a result, most broad measures of equity market performance established a series of new record highs. Smaller and more economically sensitive stocks generally fared well over the reporting period’s first half, but larger, better established companies rallied more strongly over the second half.
We remain cautiously optimistic regarding the U.S. stock market’s prospects. We currently expect the economy to continue to accelerate as several longstanding drags, including tight fiscal policies and private sector deleveraging, fade from the scene. Of course, a number of risks remain, including the possibilities of higher interest rates and intensifying geopolitical turmoil. As always, we encourage you to discuss our observations with your financial adviser to assess their potential impact on your investments.
Thank you for your continued confidence and support.

J. Charles Cardona
President
The Dreyfus Corporation
October 15, 2014
2
DISCUSSION OF FUND PERFORMANCE
For the period of October 1, 2013, through September 30, 2014, as provided by Todd W. Wakefield, CFA, and Robert C. Zeuthen, CFA, Primary Portfolio Managers
Fund and Market Performance Overview
For the 12-month period ended September 30, 2014, Dreyfus/The Boston Company Small Cap Growth Fund’s Class I shares produced a total return of 1.46%, and Class Y shares returned 1.48%.1 In comparison, the fund’s benchmark, the Russell 2000® Growth Index (the “Index”), produced a total return of 3.79% for the same period.2
Despite bouts of heightened volatility, small-cap stocks gained a degree of value during the reporting period in an environment of improving economic growth. The fund lagged the Index, mainly due to shortfalls in the information technology and energy sectors.
The Fund’s Investment Approach
The fund seeks long-term growth of capital. To pursue its goal, the fund normally invests at least 80% of its net assets in equity securities of small-cap U.S. companies with total market capitalizations equal to or less than that of the largest company in the Index. When choosing stocks, we seek to identify high-quality, small-cap companies that are experiencing or are expected to experience rapid current or expected earnings or revenue growth. We employ fundamental research to identify companies with attractive characteristics, such as strong business and competitive positions, solid cash flows and balance sheets, high-quality management and high sustainable growth.We also may invest in companies that our research indicates will experience accelerating revenues and expanding operating margins.
Small-Cap Stocks Advanced in Volatile Market
Stocks generally gained value over the fall of 2013 in response to encouraging economic data, enabling several broad measures of U.S. stock market performance to end the year near record highs. The market relinquished some of its gains in January 2014 amid concerns regarding economic slowdowns in the emerging markets, but stocks rebounded in February when those worries proved to be
The Fund 3
DISCUSSION OF FUND PERFORMANCE (continued)
overblown.Another bout of weakness in the spring signaled a shift in market leadership from more aggressive growth stocks to their better established, value-oriented counterparts. Over the summer, however, positive economic data broadly drove stocks to new record highs. Small-cap stocks gave up a significant portion of their earlier gains in September, when concerns regarding geopolitical tensions and the possibility of higher U.S. interest rates weighed on smaller companies.
While large-, mid-, and small-cap stocks produced positive absolute returns in this environment, the shift in market leadership to more conservative companies caused small-cap stocks to trail their larger counterparts by a wide margin for the reporting period overall. Growth stocks more modestly trailed their value-oriented counterparts.
Technology, Energy Holdings Dampened Fund Results
The fund’s relative performance over the reporting period was undermined to a degree by disappointing stock selections in the information technology sector. Most notably, software developers Infoblox, BroadSoft, Gigamon, and CommVault Systems were hurt when capital spending by corporate customers did not increase as expected. Shares of technology services provider MAXIMUS were under pressure as management indirectly talked down 2015 earnings expectations, spooking the market. Semiconductor manufacturers Silicon Laboratories and Power Integrations reported disappointing results with concerns over visibility. In the energy sector, Natural Gas Services Group was hurt by falling gas prices despite strong execution of its business plan, and seismic data specialist Geospace Technologies missed earning targets when sales of a new product fell short of forecasts.
The fund achieved better relative results in the health care sector, where a number of innovative pharmaceutical developers and biotechnology firms fared well. Salix Pharmaceuticals more than doubled in value amid takeover speculation and strong results in clinical trials for a new gastrointestinal drug. Biodelivery Sciences International advanced after releasing positive news surrounding a new painkiller addiction treatment. Investors also looked forward to new products from medical devices maker LDR Holding and life sciences company WuXi PharmaTech. Biopharmaceutical services provider PAREXEL International posted better-than-expected earnings, and medical technology company athenahealth benefited from the U.S. health system’s migration to digital records.
4
In the materials sector, we successfully avoided some of the harder hit companies in a struggling industry group. Instead, we focused on better performers such as aluminum producer Constellium and chemicals maker Flotek Industries, which serve vibrant niche markets. Winners in the consumer staples sector included food producer WhiteWave Foods, which beat earnings expectation over several quarters, and private label grocery distributor TreeHouse Foods, which encountered robust demand for its products.
Continuing to Find Attractive Growth Opportunities
We recently have been encouraged by improved U.S. economic activity, which should be good for small-cap growth stocks. However, geopolitical conflicts have persisted and interest rates may rise, suggesting that selectivity is likely to become more critical to investment success. Our security selection process has identified an ample number of opportunities meeting our criteria in the health care sector, but relatively few in the consumer discretionary and materials sectors.
October 15, 2014
Please note, the position in any security highlighted with italicized typeface was sold during the reporting period. Equity funds are subject generally to market, market sector, market liquidity, issuer, and investment style risks, among other factors, to varying degrees, all of which are more fully described in the fund’s prospectus.
The prices of small company stocks tend to be more volatile than the prices of large company stocks, mainly because these companies have less established and more volatile earnings histories.They also tend to be less liquid than larger company stocks.
| 1 Total return includes reinvestment of dividends and any capital gains paid. Past performance is no guarantee of future |
| results. Share price and investment return fluctuate such that upon redemption, fund shares may be worth more or less |
| than their original cost.The fund’s returns reflect the absorption of certain expenses by The Dreyfus Corporation |
| pursuant to an agreement in effect through February 1, 2016. Had these expenses not been absorbed, returns would |
| have been lower. |
| 2 SOURCE: LIPPER INC. — Reflects the reinvestment of dividends and, where applicable, capital gain |
| distributions.The Russell 2000 Growth Index is an unmanaged index, which measures the performance of those |
| Russell 2000 companies with higher price-to-book ratios and higher forecasted growth values. Investors cannot invest |
| directly in any index. |
The Fund 5
FUND PERFORMANCE
| Average Annual Total Returns as of 9/30/14 | |||||||
| Inception | |||||||
| Date | 1 Year | 5 Years | 10 Years | ||||
| Class I shares | 12/23/96 | 1.46 | % | 13.48 | % | 7.96 | % |
| Class Y shares | 7/1/13 | 1.48 | % | 13.48 | %††† | 7.96 | %††† |
| Russell 2000 Growth Index | 3.79 | % | 15.51 | % | 9.03 | % | |
| † | Source: Lipper Inc. |
| †† | The total return figures presented for ClassY shares of the fund reflect the performance of the fund’s Class I shares |
| for the period prior to 7/1/13 (the inception date for ClassY shares). |
Past performance is not predictive of future performance.The fund’s performance shown in the graph and table does not reflect the deduction of taxes that a shareholder would pay on fund distributions or the redemption of fund shares. The above graph compares a $10,000 investment made in each of the Class I and Class Y shares of Dreyfus/The Boston Company Small Cap Growth Fund on 9/30/04 to a $10,000 investment made in the Russell 2000 Growth Index (the “Index”) on that date. All dividends and capital gain distributions are reinvested.
The fund’s performance shown in the line graph above takes into account all applicable fees and expenses.The Index is an unmanaged index that measures the performance of those Russell 2000 companies (the 2,000 smallest companies in the Russell 3000 Index) with higher price-to-book ratios and higher forecasted growth values. Unlike a mutual fund, the Index is not subject to charges, fees and other expenses. Investors cannot invest directly in any index.These factors can contribute to the Index potentially outperforming the fund. Further information relating to fund performance, including expense reimbursements, if applicable, is contained in the Financial Highlights section of the prospectus and elsewhere in this report.
| ††† | The total return performance figures presented for ClassY shares of the fund reflect the performance of the fund’s |
| Class I shares for the period prior to 7/1/13 (the inception date for ClassY shares). |
6
UNDERSTANDING YOUR FUND’S EXPENSES (Unaudited)
As a mutual fund investor, you pay ongoing expenses, such as management fees and other expenses. Using the information below, you can estimate how these expenses affect your investment and compare them with the expenses of other funds.You also may pay one-time transaction expenses, including sales charges (loads) and redemption fees, which are not shown in this section and would have resulted in higher total expenses. For more information, see your fund’s prospectus or talk to your financial adviser.
Review your fund’s expenses
The table below shows the expenses you would have paid on a $1,000 investment in Dreyfus/The Boston Company Small Cap Growth Fund from April 1, 2014 to September 30, 2014. It also shows how much a $1,000 investment would be worth at the close of the period, assuming actual returns and expenses.
Expenses and Value of a $1,000 Investment
assuming actual returns for the six months ended September 30, 2014
| Class I | Class Y | |||
| Expenses paid per $1,000† | $ | 4.57 | $ | 4.57 |
| Ending value (after expenses) | $ | 919.00 | $ | 919.00 |
COMPARING YOUR FUND’S EXPENSES
WITH THOSE OF OTHER FUNDS (Unaudited)
Using the SEC’s method to compare expenses
The Securities and Exchange Commission (SEC) has established guidelines to help investors assess fund expenses. Per these guidelines, the table below shows your fund’s expenses based on a $1,000 investment, assuming a hypothetical 5% annualized return. You can use this information to compare the ongoing expenses (but not transaction expenses or total cost) of investing in the fund with those of other funds. All mutual fund shareholder reports will provide this information to help you make this comparison. Please note that you cannot use this information to estimate your actual ending account balance and expenses paid during the period.
Expenses and Value of a $1,000 Investment
assuming a hypothetical 5% annualized return for the six months ended September 30, 2014
| Class I | Class Y | |||
| Expenses paid per $1,000† | $ | 4.81 | $ | 4.81 |
| Ending value (after expenses) | $ | 1,020.31 | $ | 1,020.31 |
| † Expenses are equal to the fund’s annualized expense ratio of .95% for Class I and .95% for ClassY, multiplied by |
| the average account value over the period, multiplied by 183/365 (to reflect the one-half year period). |
The Fund 7
| STATEMENT OF INVESTMENTS |
| May 31, 2013 |
| Common Stocks—98.6% | Shares | Value ($) | |
| Automobiles & Components—1.1% | |||
| Motorcar Parts of America | 6,330 | a | 172,239 |
| Tenneco | 6,620 | a | 346,292 |
| 518,531 | |||
| Banks—4.6% | |||
| Boston Private Financial Holdings | 50,660 | 627,677 | |
| National Bank Holdings, Cl. A | 18,735 | 358,213 | |
| PrivateBancorp | 20,440 | 611,360 | |
| Prosperity Bancshares | 9,740 | 556,836 | |
| 2,154,086 | |||
| Capital Goods—10.1% | |||
| Apogee Enterprises | 13,820 | 550,036 | |
| Comfort Systems USA | 22,420 | 303,791 | |
| Crane | 4,956 | 313,269 | |
| DXP Enterprises | 8,097 | a | 596,587 |
| Hexcel | 14,230 | a | 564,931 |
| Primoris Services | 21,750 | 583,770 | |
| Sun Hydraulics | 12,040 | 452,584 | |
| Trex | 16,080 | a | 555,886 |
| Watsco | 9,120 | 785,962 | |
| 4,706,816 | |||
| Commercial & Professional Services—2.5% | |||
| Advisory Board | 15,284 | a | 712,082 |
| On Assignment | 1,480 | a | 39,738 |
| TrueBlue | 16,740 | a | 422,852 |
| 1,174,672 | |||
| Consumer Durables & Apparel—2.7% | |||
| Malibu Boats, Cl. A | 18,340 | 339,657 | |
| Steven Madden | 10,720 | a | 345,506 |
| Wolverine World Wide | 23,130 | b | 579,638 |
| 1,264,801 | |||
| Consumer Services—.9% | |||
| Del Frisco’s Restaurant Group | 22,170 | a | 424,334 |
| Energy—5.2% | |||
| Forum Energy Technologies | 20,950 | a | 641,279 |
| Natural Gas Services Group | 13,060 | a | 314,354 |
8
| Common Stocks (continued) | Shares | Value ($) | |
| Energy (continued) | |||
| Navigator Holdings | 16,544 | a | 460,420 |
| PDC Energy | 9,590 | a | 482,281 |
| RSP Permian | 19,850 | 507,366 | |
| 2,405,700 | |||
| Exchange-Traded Funds—1.9% | |||
| iShares Russell 2000 Growth ETF | 6,830 | b | 885,783 |
| Food & Staples Retailing—1.3% | |||
| United Natural Foods | 9,950 | a | 611,527 |
| Food, Beverage & Tobacco—2.3% | |||
| TreeHouse Foods | 6,590 | a | 530,495 |
| WhiteWave Foods | 14,930 | a | 542,407 |
| 1,072,902 | |||
| Health Care Equipment & | |||
| Services—9.2% | |||
| Align Technology | 13,500 | a | 697,680 |
| athenahealth | 3,230 | a | 425,359 |
| Endologix | 32,810 | a | 347,786 |
| Globus Medical, Cl. A | 19,400 | a | 381,598 |
| HealthStream | 20,800 | a | 499,408 |
| HeartWare International | 3,260 | a | 253,074 |
| Insulet | 13,570 | a | 500,054 |
| LDR Holding | 15,173 | 472,335 | |
| Spectranetics | 25,550 | a | 678,863 |
| 4,256,157 | |||
| Household & Personal Products—1.0% | |||
| Inter Parfums | 17,080 | 469,700 | |
| Materials—3.2% | |||
| Chemtura | 20,200 | a | 471,266 |
| Constellium, Cl. A | 13,590 | a | 334,450 |
| Scotts Miracle-Gro, Cl. A | 7,920 | 435,600 | |
| Trecora Resources | 18,400 | a | 227,792 |
| 1,469,108 | |||
| Media—3.3% | |||
| IMAX | 27,900 | a,b | 766,134 |
| Lions Gate Entertainment | 17,180 | b | 566,425 |
The Fund 9
STATEMENT OF INVESTMENTS (continued)
| Common Stocks (continued) | Shares | Value ($) | |
| Media (continued) | |||
| Media General | 15,670 | a,b | 205,434 |
| 1,537,993 | |||
| Pharmaceuticals, Biotech & Life Sciences—15.9% | |||
| ACADIA Pharmaceuticals | 21,150 | a,b | 523,674 |
| Anacor Pharmaceuticals | 37,740 | a,b | 923,498 |
| Auspex Pharmaceuticals | 7,730 | 198,429 | |
| BioDelivery Sciences International | 54,540 | a | 932,089 |
| Celldex Therapeutics | 32,910 | a,b | 426,514 |
| Cepheid | 15,300 | a,b | 673,659 |
| KYTHERA Biopharmaceuticals | 17,190 | a,b | 563,144 |
| Nektar Therapeutics | 56,480 | a | 681,714 |
| NPS Pharmaceuticals | 21,379 | a | 555,854 |
| PAREXEL International | 9,310 | a | 587,368 |
| Vanda Pharmaceuticals | 41,770 | a,b | 433,573 |
| WuXi PharmaTech, ADR | 24,510 | a | 858,340 |
| 7,357,856 | |||
| Real Estate—1.0% | |||
| RE/MAX Holdings, Cl. A | 15,950 | 474,193 | |
| Retailing—5.2% | |||
| Core-Mark Holding Company | 8,880 | 470,995 | |
| Kirkland’s | 26,420 | a | 425,626 |
| Restoration Hardware Holdings | 6,190 | a,b | 492,414 |
| Shutterfly | 9,759 | a | 475,654 |
| Vitamin Shoppe | 12,390 | a | 549,992 |
| 2,414,681 | |||
| Semiconductors & Semiconductor | |||
| Equipment—5.5% | |||
| Inphi | 32,770 | a | 471,233 |
| Mellanox Technologies | 16,670 | a | 747,983 |
| Photronics | 44,070 | a | 354,763 |
| Power Integrations | 10,730 | 578,454 | |
| Xcerra | 39,740 | a | 389,055 |
| 2,541,488 |
10
| Common Stocks (continued) | Shares | Value ($) | |
| Software & Services—10.3% | |||
| Barracuda Networks | 13,900 | 356,535 | |
| comScore | 15,640 | a | 569,452 |
| FleetMatics Group | 15,680 | a,b | 478,240 |
| LogMeIn | 16,250 | a | 748,637 |
| MAXIMUS | 14,930 | 599,141 | |
| Mentor Graphics | 33,850 | 693,756 | |
| Proofpoint | 13,930 | a | 517,360 |
| Q2 Holdings | 16,847 | b | 235,858 |
| SS&C Technologies Holdings | 13,650 | a | 599,098 |
| 4,798,077 | |||
| Technology Hardware & | |||
| Equipment—6.8% | |||
| Aruba Networks | 33,749 | a | 728,303 |
| Coherent | 7,860 | a | 482,368 |
| Infinera | 44,590 | a,b | 475,775 |
| Littelfuse | 5,320 | 453,158 | |
| RADWARE | 27,410 | a | 484,061 |
| Sonus Networks | 148,660 | a | 508,417 |
| 3,132,082 | |||
| Transportation—4.6% | |||
| Forward Air | 13,200 | 591,756 | |
| Hub Group, Cl. A | 13,810 | a | 559,719 |
| Saia | 7,410 | a | 367,240 |
| Spirit Airlines | 8,640 | a | 597,370 |
| 2,116,085 | |||
| Total Common Stocks | |||
| (cost $39,943,127) | 45,786,572 | ||
| Other Investment—1.8% | |||
| Registered Investment Company; | |||
| Dreyfus Institutional Preferred | |||
| Plus Money Market Fund | |||
| (cost $845,754) | 845,754 | c | 845,754 |
The Fund 11
STATEMENT OF INVESTMENTS (continued)
| Investment of Cash Collateral | ||||
| for Securities Loaned—14.8% | Shares | Value ($) | ||
| Registered Investment Company; | ||||
| Dreyfus Institutional Cash Advantage Fund | ||||
| (cost $6,881,565) | 6,881,565 | c | 6,881,565 | |
| Total Investments (cost $47,670,446) | 115.2 | % | 53,513,891 | |
| Liabilities, Less Cash and Receivables | (15.2 | %) | (7,067,700 | ) |
| Net Assets | 100.0 | % | 46,446,191 |
ADR—American Depository Receipts
ETF—Exchange-Traded Funds
| a Non-income producing security. |
| b Security, or portion thereof, on loan.At September 30, 2014, the value of the fund’s securities on loan was |
| $6,577,391 and the value of the collateral held by the fund was $6,881,565. |
| c Investment in affiliated money market mutual fund. |
| Portfolio Summary (Unaudited)† | |||
| Value (%) | Value (%) | ||
| Money Market Investments | 16.6 | Media | 3.3 |
| Pharmaceuticals, | Materials | 3.2 | |
| Biotech & Life Sciences | 15.9 | Consumer Durables & Apparel | 2.7 |
| Software & Services | 10.3 | Commercial & Professional Services | 2.5 |
| Capital Goods | 10.1 | Food, Beverage & Tobacco | 2.3 |
| Health Care Equipment & Services | 9.2 | Exchange-Traded Funds | 1.9 |
| Technology Hardware & Equipment | 6.8 | Food & Staples Retailing | 1.3 |
| Semiconductors & | Automobiles & Components | 1.1 | |
| Semiconductor Equipment | 5.5 | Household & Personal Products | 1.0 |
| Energy | 5.2 | Real Estate | 1.0 |
| Retailing | 5.2 | Consumer Services | .9 |
| Banks | 4.6 | ||
| Transportation | 4.6 | 115.2 | |
| † Based on net assets. | |||
| See notes to financial statements. | |||
12
| STATEMENT OF ASSETS AND LIABILITIES |
| September 30, 2014 |
| Cost | Value | |
| Assets ($): | ||
| Investments in securities—See Statement of Investments (including | ||
| securities on loan, valued at $6,577,391)—Note 1(b): | ||
| Unaffiliated issuers | 39,943,127 | 45,786,572 |
| Affiliated issuers | 7,727,319 | 7,727,319 |
| Receivable for investment securities sold | 631,508 | |
| Dividends and securities lending income receivable | 11,053 | |
| Prepaid expenses | 11,683 | |
| 54,168,135 | ||
| Liabilities ($): | ||
| Due to The Dreyfus Corporation and affiliates—Note 3(b) | 42,940 | |
| Cash overdraft due to Custodian | 3,305 | |
| Liability for securities on loan—Note 1(b) | 6,881,565 | |
| Payable for investment securities purchased | 731,796 | |
| Payable for shares of Beneficial Interest redeemed | 17,353 | |
| Accrued expenses | 44,985 | |
| 7,721,944 | ||
| Net Assets ($) | 46,446,191 | |
| Composition of Net Assets ($): | ||
| Paid-in capital | 16,966,511 | |
| Accumulated net realized gain (loss) on investments | 23,636,235 | |
| Accumulated net unrealized appreciation | ||
| (depreciation) on investments | 5,843,445 | |
| Net Assets ($) | 46,446,191 | |
| Net Asset Value Per Share | ||
| Class I | Class Y | |
| Net Assets ($) | 46,290,434 | 155,757 |
| Shares Outstanding | 877,319 | 2,952 |
| Net Asset Value Per Share ($) | 52.76 | 52.76 |
| See notes to financial statements. | ||
The Fund 13
| STATEMENT OF OPERATIONS | ||
| Year Ended September 30, 2014 | ||
| Investment Income ($): | ||
| Income: | ||
| Cash dividends (net of $619 foreign taxes withheld at source): | ||
| Unaffiliated issuers | 253,936 | |
| Affiliated issuers | 1,012 | |
| Income from securities lending—Note 1(b) | 39,231 | |
| Total Income | 294,179 | |
| Expenses: | ||
| Investment advisory fee—Note 3(a) | 542,378 | |
| Professional fees | 48,838 | |
| Administration fees—Note 3(a) | 40,678 | |
| Shareholder servicing costs—Note 3(b) | 39,186 | |
| Registration fees | 36,857 | |
| Custodian fees—Note 3(b) | 29,262 | |
| Prospectus and shareholders’ reports | 15,563 | |
| Trustees’ fees and expenses—Note 3(c) | 4,746 | |
| Loan commitment fees—Note 2 | 900 | |
| Interest expense—Note 2 | 270 | |
| Miscellaneous | 19,137 | |
| Total Expenses | 777,815 | |
| Less—reduction in expenses due to undertaking—Note 3(a) | (132,485 | ) |
| Less—reduction in fees due to earnings credits—Note 3(b) | (85 | ) |
| Net Expenses | 645,245 | |
| Investment (Loss)—Net | (351,066 | ) |
| Realized and Unrealized Gain (Loss) on Investments—Note 4 ($): | ||
| Net realized gain (loss) on investments | 27,905,318 | |
| Net unrealized appreciation (depreciation) on investments | (22,841,870 | ) |
| Net Realized and Unrealized Gain (Loss) on Investments | 5,063,448 | |
| Net Increase in Net Assets Resulting from Operations | 4,712,382 | |
| See notes to financial statements. | ||
14
STATEMENT OF CHANGES IN NET ASSETS
| Year Ended September 30, | ||||
| 2014 | 2013 | a | ||
| Operations ($): | ||||
| Investment (loss)—net | (351,066 | ) | (251,275 | ) |
| Net realized gain (loss) on investments | 27,905,318 | 25,579,315 | ||
| Net unrealized appreciation | ||||
| (depreciation) on investments | (22,841,870 | ) | 3,939,088 | |
| Net Increase (Decrease) in Net Assets | ||||
| Resulting from Operations | 4,712,382 | 29,267,128 | ||
| Dividends to Shareholders from ($): | ||||
| Net realized gain on investments: | ||||
| Class I | (27,698,814 | ) | (12,618,690 | ) |
| Class Y | (309 | ) | — | |
| Total Dividends | (27,699,123 | ) | (12,618,690 | ) |
| Beneficial Interest Transactions ($): | ||||
| Net proceeds from shares sold: | ||||
| Class I | 3,063,509 | 6,120,054 | ||
| Class Y | 158,032 | 1,000 | ||
| Dividends reinvested: | ||||
| Class I | 14,378,737 | 7,458,872 | ||
| Cost of shares redeemed: | ||||
| Class I | (49,211,819 | ) | (62,875,666 | ) |
| Increase (Decrease) in Net Assets from | ||||
| Beneficial Interest Transactions | (31,611,541 | ) | (49,295,740 | ) |
| Total Increase (Decrease) in Net Assets | (54,598,282 | ) | (32,647,302 | ) |
| Net Assets ($): | ||||
| Beginning of Period | 101,044,473 | 133,691,775 | ||
| End of Period | 46,446,191 | 101,044,473 | ||
| Undistributed investment income–net | — | 6,997 | ||
| Capital Share Transactions (Shares): | ||||
| Class Ib | ||||
| Shares sold | 47,416 | 100,619 | ||
| Shares issued for dividends reinvested | 263,733 | 143,993 | ||
| Shares redeemed | (860,430 | ) | (1,025,281 | ) |
| Net Increase (Decrease) in Shares Outstanding | (549,281 | ) | (780,669 | ) |
| Class Yb | ||||
| Shares sold | 2,936 | 15.615 | ||
| a Effective July 1, 2013, the fund commenced offering ClassY shares. |
| b During the period ended September 30, 2014, 2,936 Class I shares representing $158,032 were exchanged for |
| 2,936 ClassY shares. |
See notes to financial statements.
The Fund 15
FINANCIAL HIGHLIGHTS
The following tables describe the performance for each share class for the fiscal periods indicated. All information (except portfolio turnover rate) reflects financial results for a single fund share.Total return shows how much your investment in the fund would have increased (or decreased) during each period, assuming you had reinvested all dividends and distributions.These figures have been derived from the fund’s financial statements.
| Year Ended September 30, | ||||||||||
| Class I Shares | 2014 | 2013 | 2012 | 2011 | 2010 | |||||
| Per Share Data ($): | ||||||||||
| Net asset value, beginning of period | 70.83 | 60.57 | 47.21 | 47.68 | 43.36 | |||||
| Investment Operations: | ||||||||||
| Investment (loss)—neta | (.30 | ) | (.13 | ) | (.16 | ) | (.18 | ) | (.13 | ) |
| Net realized and unrealized | ||||||||||
| gain (loss) on investments | 1.98 | 16.26 | 14.57 | (.29 | ) | 4.45 | ||||
| Total from Investment Operations | 1.68 | 16.13 | 14.41 | (.47 | ) | 4.32 | ||||
| Distributions: | ||||||||||
| Dividends from net realized | ||||||||||
| gain on investments | (19.75 | ) | (5.87 | ) | (1.05 | ) | — | — | ||
| Net asset value, end of period | 52.76 | 70.83 | 60.57 | 47.21 | 47.68 | |||||
| Total Return (%) | 1.46 | 30.20 | 30.86 | (.99 | ) | 9.96 | ||||
| Ratios/Supplemental Data (%): | ||||||||||
| Ratio of total expenses | ||||||||||
| to average net assets | 1.15 | 1.04 | 1.02 | .97 | .94 | |||||
| Ratio of net expenses | ||||||||||
| to average net assets | .95 | .98 | .96 | .96 | .94 | |||||
| Ratio of net investment (loss) | ||||||||||
| to average net assets | (.52 | ) | (.22 | ) | (.29 | ) | (.33 | ) | (.29 | ) |
| Portfolio Turnover Rate | 138.15 | 121.73 | 154.49 | 176.06 | 181.09 | |||||
| Net Assets, end of period ($ x 1,000) | 46,290 | 101,043 | 133,692 | 142,906 | 219,144 | |||||
| a Based on average shares outstanding. | ||||||||||
| See notes to financial statements. | ||||||||||
16
| Year Ended September 30, | ||||
| Class Y Shares | 2014 | 2013 | a | |
| Per Share Data ($): | ||||
| Net asset value, beginning of period | 70.83 | 64.04 | ||
| Investment Operations: | ||||
| Investment (loss)—netb | (.19 | ) | (.10 | ) |
| Net realized and unrealized | ||||
| gain (loss) on investments | 1.87 | 6.89 | ||
| Total from Investment Operations | 1.68 | 6.79 | ||
| Distributions: | ||||
| Dividends from net realized | ||||
| gain on investments | (19.75 | ) | — | |
| Net asset value, end of period | 52.76 | 70.83 | ||
| Total Return (%) | 1.48 | 10.59 | c | |
| Ratios/Supplemental Data (%): | ||||
| Ratio of total expenses to average net assets | 1.11 | 1.07 | d | |
| Ratio of net expenses to average net assets | .95 | .95 | d | |
| Ratio of net investment (loss) | ||||
| to average net assets | (.38 | ) | (.57 | )d |
| Portfolio Turnover Rate | 138.15 | 121.73 | ||
| Net Assets, end of period ($ x 1,000) | 156 | 1 | ||
| a | From July 1, 2013 (commencement of initial offering) to September 30, 2013. |
| b | Based on average shares outstanding. |
| c | Not annualized. |
| d | Annualized. |
See notes to financial statements.
The Fund 17
NOTES TO FINANCIAL STATEMENTS
NOTE 1—Significant Accounting Policies:
Dreyfus/The Boston Company Small Cap Growth Fund (the “fund”) is a separate diversified series of Dreyfus Investment Funds (the “Trust”), which is registered under the Investment Company Act of 1940, as amended (the “Act”), as an open-end management investment company and operates as a series company currently offering seven series, including the fund.The fund’s investment objective is to seek long-term growth of capital. The Dreyfus Corporation (the “Manager” or “Dreyfus”), a wholly-owned subsidiary of The Bank of New York Mellon Corporation (“BNY Mellon”), serves as the fund’s investment adviser.
MBSC Securities Corporation (the “Distributor”), a wholly-owned subsidiary of the Manager, is the distributor of the fund’s shares. The fund is authorized to issue an unlimited number of $.001 par value shares of Beneficial Interest in each of the following classes of shares: Class I and Class Y. Class I shares are sold primarily to bank trust departments and other financial service providers (including The Bank of New York Mellon, a subsidiary of BNY Mellon and an affiliate of Dreyfus, and its affiliates), acting on behalf of customers having a qualified trust or an investment account or relationship at such institution, and bear no Distribution or Shareholder Services Plan fees. Class Y shares are sold at net asset value per share generally to institutional investors, and bear no Distribution or Shareholder Services Plan fees. Class I and Class Y shares are offered without a front-end sales charge or a contingent deferred sales charge. Other differences between the classes include the services offered to and the expenses borne by each class, the allocation of certain transfer agency costs, and certain voting rights. Income, expenses (other than expenses attributable to a specific class), and realized and unrealized gains or losses on investments are allocated to each class of shares based on its relative net assets.
The Trust accounts separately for the assets, liabilities and operations of each series. Expenses directly attributable to each series are charged to that series’ operations; expenses which are applicable to all series are allocated among them on a pro rata basis.
18
The Financial Accounting Standards Board (“FASB”) Accounting Standards Codification (“ASC”) is the exclusive reference of authoritative U.S. generally accepted accounting principles (“GAAP”) recognized by the FASB to be applied by nongovernmental entities. Rules and interpretive releases of the Securities and Exchange Commission (“SEC”) under authority of federal laws are also sources of authoritative GAAP for SEC registrants. The fund’s financial statements are prepared in accordance with GAAP, which may require the use of management estimates and assumptions. Actual results could differ from those estimates.
(a) Portfolio valuation: The fair value of a financial instrument is the amount that would be received to sell an asset or paid to transfer a liability in an orderly transaction between market participants at the measurement date (i.e., the exit price). GAAP establishes a fair value hierarchy that prioritizes the inputs of valuation techniques used to measure fair value. This hierarchy gives the highest priority to unadjusted quoted prices in active markets for identical assets or liabilities (Level 1 measurements) and the lowest priority to unobservable inputs (Level 3 measurements).
Additionally, GAAP provides guidance on determining whether the volume and activity in a market has decreased significantly and whether such a decrease in activity results in transactions that are not orderly. GAAP requires enhanced disclosures around valuation inputs and techniques used during annual and interim periods.
Various inputs are used in determining the value of the fund’s investments relating to fair value measurements.These inputs are summarized in the three broad levels listed below:
Level 1—unadjusted quoted prices in active markets for identical investments.
Level 2—other significant observable inputs (including quoted prices for similar investments, interest rates, prepayment speeds, credit risk, etc.).
Level 3—significant unobservable inputs (including the fund’s own assumptions in determining the fair value of investments).
The Fund 19
NOTES TO FINANCIAL STATEMENTS (continued)
The inputs or methodology used for valuing securities are not necessarily an indication of the risk associated with investing in those securities.
Changes in valuation techniques may result in transfers in or out of an assigned level within the disclosure hierarchy. Valuation techniques used to value the fund’s investments are as follows:
Investments in securities are valued at the last sales price on the securities exchange or national securities market on which such securities are primarily traded. Securities listed on the National Market System for which market quotations are available are valued at the official closing price or, if there is no official closing price that day, at the last sales price. Securities not listed on an exchange or the national securities market, or securities for which there were no transactions, are valued at the average of the most recent bid and asked prices, except for open short positions, where the asked price is used for valuation purposes. Bid price is used when no asked price is available. Registered investment companies that are not traded on an exchange are valued at their net asset value. All of the preceding securities are generally categorized within Level 1 of the fair value hierarchy.
Fair valuing of securities may be determined with the assistance of a pricing service using calculations based on indices of domestic securities and other appropriate indicators, such as prices of relevant ADRs and financial futures. Utilizing these techniques may result in transfers between Level 1 and Level 2 of the fair value hierarchy.
When market quotations or official closing prices are not readily available, or are determined not to reflect accurately fair value, such as when the value of a security has been significantly affected by events after the close of the exchange or market on which the security is principally traded (for example, a foreign exchange or market), but before the fund calculates its net asset value, the fund may value these investments at fair value as determined in accordance with the procedures approved by the Trust’s Board of Trustees (the “Board”). Certain factors may be considered when fair valuing investments such as: fundamental analytical data,
20
the nature and duration of restrictions on disposition, an evaluation of the forces that influence the market in which the securities are purchased and sold, and public trading in similar securities of the issuer or comparable issuers.These securities are either categorized within Level 2 or 3 of the fair value hierarchy depending on the relevant inputs used.
For restricted securities where observable inputs are limited, assumptions about market activity and risk are used and are generally categorized within Level 3 of the fair value hierarchy.
The following is a summary of the inputs used as of September 30, 2014 in valuing the fund's investments:
| Level 2—Other | Level 3— | |||
| Level 1— | Significant | Significant | ||
| Unadjusted | Observable | Unobservable | ||
| Quoted Prices | Inputs | Inputs | Total | |
| Assets ($) | ||||
| Investments in Securities: | ||||
| Equity Securities— | ||||
| Domestic | ||||
| Common Stocks† | 41,519,144 | — | — | 41,519,144 |
| Equity Securities— | ||||
| Foreign | ||||
| Common Stocks† | 3,381,645 | — | — | 3,381,645 |
| Exchange-Traded | ||||
| Funds | 885,783 | — | — | 885,783 |
| Mutual Funds | 7,727,319 | — | — | 7,727,319 |
| † See Statement of Investments for additional detailed categorizations. | ||||
At September 30, 2014, there were no transfers between Level 1 and Level 2 of the fair value hierarchy.
(b) Securities transactions and investment income: Securities transactions are recorded on a trade date basis. Realized gains and losses from securities transactions are recorded on the identified cost basis. Dividend income is recognized on the ex-dividend date and interest income, including, where applicable, accretion of discount and amortization of premium on investments, is recognized on the accrual basis.
The Fund 21
NOTES TO FINANCIAL STATEMENTS (continued)
Pursuant to a securities lending agreement with The Bank of New York Mellon, the fund may lend securities to qualified institutions. It is the fund’s policy that, at origination, all loans are secured by collateral of at least 102% of the value of U.S. securities loaned and 105% of the value of foreign securities loaned. Collateral equivalent to at least 100% of the market value of securities on loan is maintained at all times. Collateral is either in the form of cash, which can be invested in certain money market mutual funds managed by the Manager or U.S. Government and Agency securities.The fund is entitled to receive all dividends, interest and distributions on securities loaned, in addition to income earned as a result of the lending transaction. Should a borrower fail to return the securities in a timely manner, The Bank of New York Mellon is required to replace the securities for the benefit of the fund or credit the fund with the market value of the unreturned securities and is subrogated to the fund’s rights against the borrower and the collateral. During the period ended September 30, 2014,The Bank of NewYork Mellon earned $9,810 from lending portfolio securities, pursuant to the securities lending agreement.
(c) Affiliated issuers: Investments in other investment companies advised by Dreyfus are defined as “affiliated” under the Act. Investments in affiliated investment companies during the period ended September 30, 2014 were as follows:
| Affiliated | |||||
| Investment | Value | Value | Net | ||
| Company | 9/30/2013 ($) | Purchases ($) | Sales ($) | 9/30/2014 ($) | Assets (%) |
| Dreyfus | |||||
| Institutional | |||||
| Preferred | |||||
| Plus Money | |||||
| Market Fund | 2,948,535 | 33,356,408 | 35,459,189 | 845,754 | 1.8 |
| Dreyfus | |||||
| Institutional | |||||
| Cash Advantage | |||||
| Fund | 6,506,553 | 62,307,693 | 61,932,681 | 6,881,565 | 14.8 |
| Total | 9,455,088 | 95,664,101 | 97,391,870 | 7,727,319 | 16.6 |
22
(d) Dividends to shareholders: Dividends are recorded on the ex-dividend date. Dividends from investment income-net and dividends from net realized capital gains, if any, are normally declared and paid annually, but the fund may make distributions on a more frequent basis to comply with the distribution requirements of the Internal Revenue Code of 1986, as amended (the “Code”). To the extent that net realized capital gains can be offset by capital loss carryovers, it is the policy of the fund not to distribute such gains. Income and capital gain distributions are determined in accordance with income tax regulations, which may differ from GAAP.
(e) Federal income taxes: It is the policy of the fund to continue to qualify as a regulated investment company, if such qualification is in the best interests of its shareholders, by complying with the applicable provisions of the Code, and to make distributions of taxable income sufficient to relieve it from substantially all federal income and excise taxes.
As of and during the period ended September 30, 2014, the fund did not have any liabilities for any uncertain tax positions. The fund recognizes interest and penalties, if any, related to uncertain tax positions as income tax expense in the Statement of Operations. During the period ended September 30, 2014, the fund did not incur any interest or penalties.
Each tax year in the four-year period ended September 30, 2014 remains subject to examination by the Internal Revenue Service and state taxing authorities.
At September 30, 2014, the components of accumulated earnings on a tax basis were as follows: undistributed ordinary income $4,521,238, undistributed capital gains $19,445,919 and unrealized appreciation $5,512,523.
The Fund 23
NOTES TO FINANCIAL STATEMENTS (continued)
The tax character of distributions paid to shareholders during the fiscal periods ended September 30, 2014 and September 30, 2013 were as follows: ordinary income $4,850,061 and $0, and long-term capital gains $22,849,062 and $12,618,690, respectively.
During the period ended September 30, 2014, as a result of permanent book to tax differences, primarily due to the tax treatment for net operating losses and real estate investment trusts, the fund increased accumulated undistributed investment income-net by $344,069 and decreased accumulated net realized gain (loss) on investments by the same amount. Net assets and net asset value per share were not affected by this reclassification.
NOTE 2—Bank Lines of Credit:
The fund participates with other Dreyfus-managed funds in a $265 million unsecured credit facility led by Citibank, N.A. and a $300 million unsecured credit facility provided by The Bank of New York Mellon (each, a “Facility”), each to be utilized primarily for temporary or emergency purposes, including the financing of redemptions. Prior to October 9, 2013, the unsecured credit facility with Citibank, N.A. was $210 million. In connection therewith, the fund has agreed to pay its pro rata portion of commitment fees for each Facility. Interest is charged to the fund based on rates determined pursuant to the terms of the respective Facility at the time of borrowing.
The average amount of borrowings outstanding under the Facilities during the period ended September 30, 2014 was approximately $24,700 with a related weighted average annualized interest rate of 1.10%.
NOTE 3—Investment Advisory Fee, Administration Fee and Other Transactions with Affiliates:
(a) Pursuant to an investment advisory agreement with the Manager, the investment advisory fee is computed at the annual rate of .80% of the value of the fund’s average daily net assets and is payable monthly. The Manager had contractually agreed, from October 1, 2013 through
24
October 31, 2014, to waive receipt of its fees and/or assume the expenses of the fund, so that the direct annual fund’s operating expenses (excluding taxes, interest expense, brokerage commissions, commitment fees on borrowings and extraordinary expenses) did not exceed .95% of the value of the fund’s average daily net assets.The Manager has also contractually agreed, from November 1, 2014 through February 1, 2016, to waive receipt of its fees and/or assume the direct expenses of the fund, so that the expenses of Class I andY shares (excluding certain expenses as described above) do not exceed .95% and .90% of the value of the respective class’ average daily net assets. The reduction in expenses, pursuant to the undertaking, amounted to $132,485 during the period ended September 30, 2014.
The fund has an Accounting and Administration Agreement (the “Administration Agreement”) with Dreyfus, whereby Dreyfus performs administrative and accounting services for the fund.The fund has agreed to compensate Dreyfus for providing accounting services, administration, compliance monitoring, regulatory and shareholder reporting, as well as related facilities and equipment.The fee is based on the fund’s average daily net assets and computed at the following annual rates: .06% of the first $500 million, .04% of the next $500 million and .02% in excess of $1 billion.
In addition, after applying any expense limitations or fee waivers that reduce the fees paid to Dreyfus for this service, Dreyfus has contractually agreed in writing to waive any remaining fees for this service to the extent that they exceed both Dreyfus’ costs in providing these services and a reasonable allocation of the costs incurred by Dreyfus and its affiliates related to the support and oversight of these services. The fund also reimburses Dreyfus for the out-of-pocket expenses incurred in performing this service for the fund. Pursuant to the Administration Agreement, the fund was charged $40,678 during the period ended September 30, 2014.
The Fund 25
NOTES TO FINANCIAL STATEMENTS (continued)
(b) The fund has arrangements with the transfer agent and the custodian whereby the fund may receive earnings credits when positive cash balances are maintained, which are used to offset transfer agency and custody fees. For financial reporting purposes, the fund includes net earnings credits as an expense offset in the Statement of Operations.
The fund compensates Dreyfus Transfer, Inc., a wholly-owned subsidiary of the Manager, under a transfer agency agreement for providing transfer agency and cash management services for the fund. The majority of transfer agency fees are comprised of amounts paid on a per account basis, while cash management fees are related to fund subscriptions and redemptions. During the period ended September 30, 2014, the fund was charged $50,390 for transfer agency services and $1,226 for cash management services. These fees are included in Shareholder servicing costs in the Statement of Operations. Cash management fees were partially offset by earnings credits of $85.
The fund compensates The Bank of NewYork Mellon under a custody agreement for providing custodial services for the fund.These fees are determined based on net assets, geographic region and transaction activity. During the period ended September 30, 2014, the fund was charged $29,262 pursuant to the custody agreement.
During the period ended September 30, 2014, the fund was charged $8,107 for services performed by the Chief Compliance Officer and his staff.
The components of “Due to The Dreyfus Corporation and affiliates” in the Statement of Assets and Liabilities consist of: investment advisory fees $31,892, custodian fees $10,410, Chief Compliance Officer fees $1,730, administration fees $2,392 and transfer agency fees $3,034, which are offset against an expense reimbursement currently in effect in the amount of $6,518.
26
(c) Each Board member also serves as a Board member of other funds within the Dreyfus complex. Annual retainer fees and attendance fees are allocated to each fund based on net assets.
NOTE 4—Securities Transactions:
The aggregate amount of purchases and sales of investment securities, excluding short-term securities, during the period ended September 30, 2014, amounted to $95,070,704 and $155,744,183, respectively.
At September 30, 2014, the cost of investments for federal income tax purposes was $48,001,368; accordingly, accumulated net unrealized appreciation on investments was $5,512,523, consisting of $7,552,618 gross unrealized appreciation and $2,040,095 gross unrealized depreciation.
The Fund 27
REPORT OF INDEPENDENT REGISTERED
PUBLIC ACCOUNTING FIRM
The Board of Trustees and Shareholders Dreyfus Investment Funds
We have audited the accompanying statement of assets and liabilities of Dreyfus/The Boston Company Small Cap Growth Fund (the “Fund”), a series of Dreyfus Investment Funds, Inc., including the statement of investments, as of September 30, 2014, and the related statement of operations for the year then ended, the statements of changes in net assets for each of the years in the two-year periods then ended, and the financial highlights for each of the years or period in the five-year period then ended.These financial statements and financial highlights are the responsibility of the Fund’s management. Our responsibility is to express an opinion on these financial statements and financial highlights based on our audits.
We conducted our audits in accordance with the standards of the Public Company Accounting Oversight Board (United States).Those standards require that we plan and perform the audit to obtain reasonable assurance about whether the financial statements and financial highlights are free of material misstatement. An audit includes examining, on a test basis, evidence supporting the amounts and disclosures in the financial statements. Our procedures included confirmation of securities owned as of September 30, 2014, by correspondence with the custodian and brokers or by other appropriate auditing procedures. An audit also includes assessing the accounting principles used and significant estimates made by management, as well as evaluating the overall financial statement presentation. We believe that our audits provide a reasonable basis for our opinion.
In our opinion, the financial statements and financial highlights referred to above present fairly, in all material respects, the financial position of Dreyfus/The Boston Company Small Cap Growth Fund as of September 30, 2014, the results of its operations for the year then ended, the changes in its net assets for each of the years in the two-year periods then ended, and the financial highlights for each of the years or period in the five-year period then ended, in conformity with U.S. generally accepted accounting principles.

New York, New York
November 26, 2014
28
IMPORTANT TAX INFORMATION (Unaudited)
For federal tax purposes, the fund reports the maximum amount allowable, but not less than $770,784 as ordinary income dividends paid during the year ended September 30, 2014 as qualified dividend income in accordance with Section 854(b)(1)(B) of the Internal Revenue Code. Also, the fund reports the maximum amount allowable but not less than 14.55% of ordinary income dividends paid during the year ended September 30, 2014 as eligible for the corporate dividends received deduction provided under Section 243 of the Internal Revenue Code in accordance with Section 854(b)(1)(A) of the Internal Revenue Code. Shareholders will receive notification in early 2015 of the percentage applicable to the preparation of their 2014 income tax returns. The fund reports the maximum amount allowable but not less than $16.2900 per share as a capital gain dividend in accordance with Section 852(b)(3)(C) of the Internal Revenue Code.The fund reports the maximum amount allowable but not less than $3.4578 per share as a short-term capital gain dividend in accordance with Sections 871(k)(2) and 881(e) of the Internal Revenue Code.
The Fund 29
| BOARD MEMBERS INFORMATION (Unaudited) |
| INDEPENDENT BOARD MEMBERS |
| Joseph S. DiMartino (70) |
| Chairman of the Board (2008) |
| Principal Occupation During Past 5Years: |
| • Corporate Director and Trustee (1995-present) |
| Other Public Company Board Memberships During Past 5Years: |
| • CBIZ (formerly, Century Business Services, Inc.), a provider of outsourcing functions for small |
| and medium size companies, Director (1997-present) |
| • The Newark Group, a provider of a national market of paper recovery facilities, paperboard |
| mills and paperboard converting plants, Director (2000-2010) |
| • Sunair Services Corporation, a provider of certain outdoor-related services to homes and |
| businesses, Director (2005-2009) |
| No. of Portfolios for which Board Member Serves: 145 |
| ——————— |
| Francine J. Bovich (63) |
| Board Member (2011) |
| Principal Occupation During Past 5Years: |
| • Trustee,The Bradley Trusts, private trust funds (2011-present) |
| • Managing Director, Morgan Stanley Investment Management (1993-2010) |
| Other Public Company Board Membership During Past 5Years: |
| • Annaly Capital Management, Inc., Board Member (May 2014-present) |
| No. of Portfolios for which Board Member Serves: 45 |
| ——————— |
| Kenneth A. Himmel (68) |
| Board Member (2008) |
| Principal Occupation During Past 5Years: |
| • President and CEO, Related Urban Development, a real estate development company (1996-present) |
| • President and CEO, Himmel & Company, a real estate development company (1980-present) |
| • CEO,American Food Management, a restaurant company (1983-present) |
| No. of Portfolios for which Board Member Serves: 31 |
30
| Stephen J. Lockwood (67) |
| Board Member (2008) |
| Principal Occupation During Past 5Years: |
| • Chairman of the Board, Stephen J. Lockwood and Company LLC, a real estate |
| investment company (2000-present) |
| No. of Portfolios for which Board Member Serves: 31 |
| ——————— |
| Roslyn M. Watson (64) |
| Board Member (2008) |
| Principal Occupation During Past 5Years: |
| • Principal,Watson Ventures, Inc., a real estate investment company (1993-present) |
| No. of Portfolios for which Board Member Serves: 67 |
| ——————— |
| Benaree Pratt Wiley (68) |
| Board Member (2008) |
| Principal Occupation During Past 5Years: |
| • Principal,TheWiley Group, a firm specializing in strategy and business development (2005-present) |
| Other Public Company Board Membership During Past 5Years: |
| • CBIZ (formerly, Century Business Services, Inc.), a provider of outsourcing functions for small |
| and medium size companies, Director (2008-present) |
| No. of Portfolios for which Board Member Serves: 69 |
| ——————— |
| Once elected all Board Members serve for an indefinite term, but achieve Emeritus status upon reaching age 80.The |
| address of the Board Members and Officers is c/o The Dreyfus Corporation, 200 Park Avenue, NewYork, NewYork |
| 10166.Additional information about the Board Members is available in the fund’s Statement of Additional Information |
| which can be obtained from Dreyfus free of charge by calling this toll free number: 1-800-DREYFUS. |
| James M. Fitzgibbons, Emeritus Board Member |
The Fund 31
OFFICERS OF THE FUND (Unaudited)
BRADLEY J. SKAPYAK, President since January 2010.
Chief Operating Officer and a director of the Manager since June 2009, Chairman of Dreyfus Transfer, Inc., an affiliate of the Manager and the transfer agent of the funds, since May 2011 and Executive Vice President of the Distributor since June 2007. From April 2003 to June 2009, Mr. Skapyak was the head of the Investment Accounting and Support Department of the Manager. He is an officer of 69 investment companies (comprised of 145 portfolios) managed by the Manager. He is 55 years old and has been an employee of the Manager since February 1988.
JOHN PAK, Chief Legal Officer since March 2013.
Deputy General Counsel, Investment Management, of BNY Mellon since August 2014; Chief Legal Officer of the Manager since August 2012; from March 2005 to July 2012, Managing Director of Deutsche Bank, Deputy Global Head of Deutsche Asset Management Legal and Regional Head of Deutsche Asset Management Americas Legal. He is an officer of 70 investment companies (comprised of 170 portfolios) managed by the Manager. He is 46 years old and has been an employee of the Manager since August 2012.
JANETTE E. FARRAGHER, Vice President and Secretary since December 2011.
Assistant General Counsel of BNY Mellon, and an officer of 70 investment companies (comprised of 170 portfolios) managed by the Manager. She is 51 years old and has been an employee of the Manager since February 1984.
KIESHA ASTWOOD, Vice President and Assistant Secretary since January 2010.
Counsel of BNY Mellon, and an officer of 70 investment companies (comprised of 170 portfolios) managed by the Manager. She is 41 years old and has been an employee of the Manager since July 1995.
JAMES BITETTO, Vice President and Assistant Secretary since December 2008.
Managing Counsel of BNY Mellon and Secretary of the Manager, and an officer of 70 investment companies (comprised of 170 portfolios) managed by the Manager. He is 48 years old and has been an employee of the Manager since December 1996.
JONI LACKS CHARATAN, Vice President and Assistant Secretary since December 2008.
Managing Counsel of BNY Mellon, and an officer of 70 investment companies (comprised of 170 portfolios) managed by the Manager. She is 58 years old and has been an employee of the Manager since October 1988.
JOSEPH M. CHIOFFI, Vice President and Assistant Secretary since December 2008.
Managing Counsel of BNY Mellon, and an officer of 70 investment companies (comprised of 170 portfolios) managed by the Manager. He is 52 years old and has been an employee of the Manager since June 2000.
JOHN B. HAMMALIAN, Vice President and Assistant Secretary since December 2008.
Senior Managing Counsel of BNY Mellon, and an officer of 70 investment companies (comprised of 170 portfolios) managed by the Manager. He is 51 years old and has been an employee of the Manager since February 1991.
SARAH S. KELLEHER, Vice President and Assistant Secretary since April 2014.
Senior Counsel of BNY Mellon, and an officer of 70 investment companies (comprised of 170 portfolios) managed by the Manager; from August 2005 to March 2013, Associate General Counsel of Third Avenue Management. She is 38 years old and has been an employee of the Manager since March 2013.
32
JEFF PRUSNOFSKY, Vice President and Assistant Secretary since December 2008.
Senior Managing Counsel of BNY Mellon, and an officer of 70 investment companies (comprised of 170 portfolios) managed by the Manager. He is 49 years old and has been an employee of the Manager since October 1990.
JAMES WINDELS, Treasurer since December 2008.
Director – Mutual Fund Accounting of the Manager, and an officer of 70 investment companies (comprised of 170 portfolios) managed by the Manager. He is 56 years old and has been an employee of the Manager since April 1985.
RICHARD CASSARO, Assistant Treasurer since December 2008.
Senior Accounting Manager – Money Market and Municipal Bond Funds of the Manager, and an officer of 70 investment companies (comprised of 170 portfolios) managed by the Manager. He is 55 years old and has been an employee of the Manager since September 1982.
GAVIN C. REILLY, Assistant Treasurer since December 2008.
Tax Manager of the Investment Accounting and Support Department of the Manager, and an officer of 70 investment companies (comprised of 170 portfolios) managed by the Manager. He is 46 years old and has been an employee of the Manager since April 1991.
ROBERT S. ROBOL, Assistant Treasurer since December 2008.
Senior Accounting Manager – Fixed Income Funds of the Manager, and an officer of 70 investment companies (comprised of 170 portfolios) managed by the Manager. He is 50 years old and has been an employee of the Manager since October 1988.
ROBERT SALVIOLO, Assistant Treasurer since December 2008.
Senior Accounting Manager – Equity Funds of the Manager, and an officer of 70 investment companies (comprised of 170 portfolios) managed by the Manager. He is 47 years old and has been an employee of the Manager since June 1989.
ROBERT SVAGNA, Assistant Treasurer since December 2008.
Senior Accounting Manager – Equity Funds of the Manager, and an officer of 70 investment companies (comprised of 170 portfolios) managed by the Manager. He is 47 years old and has been an employee of the Manager since November 1990.
JOSEPH W. CONNOLLY, Chief Compliance Officer since December 2008.
Chief Compliance Officer of the Manager and The Dreyfus Family of Funds (70 investment companies, comprised of 170 portfolios). He is 57 years old and has served in various capacities with the Manager since 1980, including manager of the firm’s Fund Accounting Department from 1997 through October 2001.
MATTHEW D. CONNOLLY, Anti-Money Laundering Compliance Officer since April 2012.
Anti-Money Laundering Compliance Officer of the Distributor since October 2011; from March 2010 to September 2011, Global Head, KYC Reviews and Director of UBS Investment Bank; until March 2010, AML Compliance Officer and Senior Vice President of Citi Global Wealth Management. He is an officer of 65 investment companies (comprised of 165 portfolios) managed by the Manager. He is 42 years old and has been an employee of the Distributor since October 2011.
The Fund 33
For More Information
Telephone 1-800-DREYFUS
Mail The Dreyfus Family of Funds, 144 Glenn Curtiss Boulevard, Uniondale, NY 11556-0144 E-mail Send your request to info@dreyfus.com Internet Information can be viewed online or downloaded at: http://www.dreyfus.com
The fund files its complete schedule of portfolio holdings with the Securities and Exchange Commission (“SEC”) for the first and third quarters of each fiscal year on Form N-Q. The fund’s Forms N-Q are available on the SEC’s website at http://www.sec.gov and may be reviewed and copied at the SEC’s Public Reference Room in Washington, DC. Information on the operation of the Public Reference Room may be obtained by calling 1-800-SEC-0330.
| Dreyfus/The Boston |
| Company Small Cap |
| Value Fund |
ANNUAL REPORT September 30, 2014
Save time. Save paper. View your next shareholder report online as soon as it’s available. Log into www.dreyfus.com and sign up for Dreyfus eCommunications. It’s simple and only takes a few minutes.
The views expressed in this report reflect those of the portfolio manager only through the end of the period covered and do not necessarily represent the views of Dreyfus or any other person in the Dreyfus organization. Any such views are subject to change at any time based upon market or other conditions and Dreyfus disclaims any responsibility to update such views.These views may not be relied on as investment advice and, because investment decisions for a Dreyfus fund are based on numerous factors, may not be relied on as an indication of trading intent on behalf of any Dreyfus fund.
| Not FDIC-Insured • Not Bank-Guaranteed • May Lose Value |
Contents | |
THE FUND | |
| 2 | A Letter from the President |
| 3 | Discussion of Fund Performance |
| 6 | Fund Performance |
| 7 | Understanding Your Fund’s Expenses |
| 7 | Comparing Your Fund’s Expenses With Those of Other Funds |
| 8 | Statement of Investments |
| 14 | Statement of Assets and Liabilities |
| 15 | Statement of Operations |
| 16 | Statement of Changes in Net Assets |
| 17 | Financial Highlights |
| 18 | Notes to Financial Statements |
| 27 | Report of Independent Registered Public Accounting Firm |
| 28 | Important Tax Information |
| 29 | Board Members Information |
| 31 | Officers of the Fund |
FOR MORE INFORMATION | |
Back Cover |
Dreyfus/The Boston
Company Small Cap
Value Fund
The Fund
A LETTER FROM THE PRESIDENT
Dear Shareholder:
This annual report for Dreyfus/The Boston Company Small CapValue Fund covers the 12-month period from October 1, 2013, through September 30, 2014. For information about how the fund performed during the reporting period, as well as general market perspectives, we provide a Discussion of Fund Performance on the pages that follow.
Despite occasional bouts of heightened volatility, U.S. stocks gained ground steadily over the reporting period as the domestic economy rebounded. As a result, most broad measures of equity market performance established a series of new record highs. Smaller and more economically sensitive stocks generally fared well over the reporting period’s first half, but larger, better established companies rallied more strongly over the second half.
We remain cautiously optimistic regarding the U.S. stock market’s prospects. We currently expect the economy to continue to accelerate as several longstanding drags, including tight fiscal policies and private sector deleveraging, fade from the scene. Of course, a number of risks remain, including the possibilities of higher interest rates and intensifying geopolitical turmoil. As always, we encourage you to discuss our observations with your financial adviser to assess their potential impact on your investments.
Thank you for your continued confidence and support.

J. Charles Cardona
President
The Dreyfus Corporation
October 15, 2014
2
DISCUSSION OF FUND PERFORMANCE
For the period of October 1, 2013, through September 30, 2014, as provided by Joseph M. Corrado, CFA, and Stephanie K. Brandaleone, CFA, Portfolio Managers
Fund and Market Performance Overview
For the 12-month period ended September 30, 2014, Dreyfus/The Boston Company Small Cap Value Fund produced a total return of 3.62%.1 In comparison, the fund’s benchmark, the Russell 2000®Value Index (the “Index”), produced a total return of 4.13% for the same period.2
Despite bouts of heightened volatility, small-cap value stocks gained a degree of value during the reporting period in an environment of improving U.S. economic growth. The fund lagged the Index, mainly due to shortfalls in the energy and consumer discretionary sectors.
The Fund’s Investment Approach
The fund seeks long-term growth of capital. To pursue its goal, the fund normally invests at least 80% of its net assets in equity securities of small-cap U.S. companies with market capitalizations that are equal to or less than the total market capitalization of the largest company in the Index. We use fundamental research and qualitative analysis to select stocks and look for companies with strong competitive positions, high-quality management, and financial strength. We use a consistent three-step fundamental research process to evaluate the stocks, consisting of valuation, which is to identify small-cap companies that are considered to be attractively priced relative to their earnings potential; fundamentals, which is to verify the strength of the underlying business position; and catalyst, which is to identify a specific event that has the potential to cause the stocks to appreciate in value.
Small-Cap Stocks Advanced in Volatile Market
Stocks generally rallied over the fall of 2013 in response to encouraging economic data, enabling several broad measures of U.S. stock market performance to end the year near record highs.The market relinquished some of its gains in January 2014 amid concerns regarding economic slowdowns in the emerging markets, but stocks rebounded in February when those worries proved to be overblown. Another bout of weakness in
The Fund 3
DISCUSSION OF FUND PERFORMANCE (continued)
the spring signaled a shift in market leadership from more aggressive growth stocks to their better established, value-oriented counterparts. However, positive economic data subsequently drove stocks to new record highs. Small-cap stocks gave up a significant portion of their earlier gains in July and September, when concerns regarding geopolitical tensions, deteriorating European economic conditions, and the possibility of higher U.S. interest rates weighed on smaller companies.
While stocks across all capitalization ranges produced positive absolute returns in this environment, the shift in market leadership to more conservative companies caused small-cap stocks to trail their larger counterparts by a wide margin for the reporting period overall.Value stocks modestly outperformed their growth-oriented counterparts.
Energy, Consumer Discretionary Holdings Dampened Results
The fund’s relative performance over the reporting period was hindered by disappointing stock selection in the energy sector. Most notably, onshore well servicer Key Energy Services experienced weakness in international markets, most notably Mexico. Seismic equipment provider Geospace Technologies suffered declining order volumes, and oil services company Helix Energy Solutions Group was hurt by reduced demand stemming from a weaker offshore drilling environment. In the consumer discretionary sector, macroeconomic challenges and elevated expenses prompted apparel retailer Express to reduce the earnings guidance it provides to analysts. Car care provider Pep Boys-Manny, Moe & Jack announced weaker-than-expected quarterly results due to pricing pressures in the tires segment. Automobile components supplier Dana Holding missed earnings targets as a result of weaker sales of commercial vehicles.
The fund achieved better relative results in the information technology sector, where network services provider NetScout Systems released a series of strong quarterly financial results, security intelligence specialist Verint Systems enhanced its online capabilities through a strategic acquisition, and digital marketing firm Conversant agreed to be acquired at a significant premium to its stock price at the time. Among health care companies, medical equipment maker Natus Medical boosted sales, expanded profit margins, and issued an encouraging forecast. Health care services provider Centene posted strong earnings and announced a large, new contract to serve Medicaid patients. Hospitals operator LifePoint Hospitals saw profits increase as a result of the Affordable Care Act.The fund also fared well in the industrials sector,
4
as transportation services companies Landstar System and FreightCar America benefited from rising demand and positive pricing trends in the trucking and railroad industries, respectively.
Continuing to Find Attractive Value Opportunities
Investors remain focused on the potential timing of the Federal Reserve’s interest rate hikes and geopolitical headline risks surrounding the Russia/Ukraine conflict and turmoil in the Middle East. In addition, uncertainty pertaining to Chinese growth and the outlook for the Eurozone continue to raise concerns. Despite these challenges, the U.S. economy remains well positioned to benefit from key drivers including a recovery in consumer and business spending, while the corporate earnings backdrop remains solid. Overall, we believe a healthier U.S. economy, strong corporate underpinnings, and secular tailwinds will remain supportive of U.S. equities and we remain focused on the strategy’s disciplined, research-driven investment approach.
Within this environment, we are finding attractive opportunities in the Consumer Discretionary, Industrials, and Health Care sectors and those areas are emphasized in the portfolio with overweight positions versus the index. Conversely, we have maintained underweight exposure to REITs and Insurance as we have found fewer opportunities meeting our investment criteria within these segments.
October 15, 2014
Please note, the position in any security highlighted with italicized typeface was sold during the reporting period. Equity funds are subject generally to market, market sector, market liquidity, issuer, and investment style risks, among other factors, to varying degrees, all of which are more fully described in the fund’s prospectus.
Small companies carry additional risks because their earnings and revenues tend to be less predictable, and their share prices more volatile than those of larger, more established companies.The shares of smaller companies tend to trade less frequently than those of larger, more established companies, which can adversely affect the pricing of these securities and the fund’s ability to sell these securities.
| 1 Total return includes reinvestment of dividends and any capital gains paid. Past performance is no guarantee of future |
| results. Share price and investment return fluctuate such that upon redemption, fund shares may be worth more or less |
| than their original cost. |
| 2 SOURCE: LIPPER INC. — Reflects the reinvestment of dividends and, where applicable, capital gain |
| distributions.The Russell 2000 Value Index is an unmanaged index, which measures the performance of those |
| Russell 2000 companies with lower price-to-book ratios and lower forecasted growth values. Investors cannot invest |
| directly in any index. |
The Fund 5
FUND PERFORMANCE
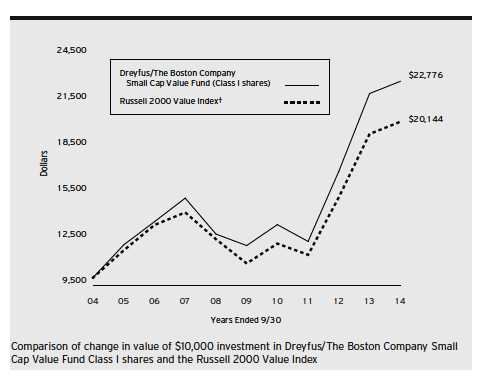
| Average Annual Total Returns as of 9/30/14 | ||||||
| 1 Year | 5 Years | 10 Years | ||||
| Class I shares | 3.62 | % | 13.51 | % | 8.58 | % |
| Russell 2000 Value Index | 4.13 | % | 13.02 | % | 7.25 | % |
| † Source: Lipper Inc. |
| Past performance is not predictive of future performance.The fund’s performance shown in the graph and table does not |
| reflect the deduction of taxes that a shareholder would pay on fund distributions or the redemption of fund shares. |
| The above graph compares a $10,000 investment made in Class I shares of Dreyfus/The Boston Company Small Cap |
| Value Fund on 9/30/04 to a $10,000 investment made in the Russell 2000 Value Index (the “Index”) on that date. |
| All dividends and capital gain distributions are reinvested. |
| The fund’s performance shown in the line graph above takes into account all applicable fees and expenses. The Index is |
| an unmanaged index, which measures the performance of those Russell 2000 companies (the 2,000 smallest companies |
| in the Russell 3000 Index) with lower price-to-book ratios and lower forecasted growth values. Unlike a mutual fund, |
| the Index is not subject to charges, fees and other expenses. Investors cannot invest directly in any index. These factors |
| can contribute to the Index potentially outperforming the fund. Further information relating to fund performance, |
| including expense reimbursements, if applicable, is contained in the Financial Highlights section of the prospectus and |
| elsewhere in this report. |
6
UNDERSTANDING YOUR FUND’S EXPENSES (Unaudited)
As a mutual fund investor, you pay ongoing expenses, such as management fees and other expenses. Using the information below, you can estimate how these expenses affect your investment and compare them with the expenses of other funds.You also may pay one-time transaction expenses, including sales charges (loads) and redemption fees, which are not shown in this section and would have resulted in higher total expenses. For more information, see your fund’s prospectus or talk to your financial adviser.
Review your fund’s expenses
The table below shows the expenses you would have paid on a $1,000 investment in Dreyfus/The Boston Company Small CapValue Fund from April 1, 2014 to September 30, 2014. It also shows how much a $1,000 investment would be worth at the close of the period, assuming actual returns and expenses.
Expenses and Value of a $1,000 Investment
assuming actual returns for the six months ended September 30, 2014
| Expenses paid per $1,000† | $ | 4.61 |
| Ending value (after expenses) | $ | 934.10 |
COMPARING YOUR FUND’S EXPENSES
WITH THOSE OF OTHER FUNDS (Unaudited)
Using the SEC’s method to compare expenses
The Securities and Exchange Commission (SEC) has established guidelines to help investors assess fund expenses. Per these guidelines, the table below shows your fund’s expenses based on a $1,000 investment, assuming a hypothetical 5% annualized return. You can use this information to compare the ongoing expenses (but not transaction expenses or total cost) of investing in the fund with those of other funds. All mutual fund shareholder reports will provide this information to help you make this comparison. Please note that you cannot use this information to estimate your actual ending account balance and expenses paid during the period.
Expenses and Value of a $1,000 Investment
assuming a hypothetical 5% annualized return for the six months ended September 30, 2014
| Expenses paid per $1,000† | $ | 4.81 |
| Ending value (after expenses) | $ | 1,020.31 |
| † Expenses are equal to the fund’s annualized expense ratio of .95% for Class I, multiplied by the average account value |
| over the period, multiplied by 183/365 (to reflect the one-half year period). |
The Fund 7
| STATEMENT OF INVESTMENTS |
| September 30, 2014 |
| Common Stocks—99.6% | Shares | Value ($) | |
| Automobiles & Components—1.6% | |||
| Tenneco | 52,860 | a | 2,765,107 |
| Thor Industries | 45,914 | 2,364,571 | |
| 5,129,678 | |||
| Banks—15.0% | |||
| Boston Private Financial Holdings | 293,180 | 3,632,500 | |
| Brookline Bancorp | 195,760 | 1,673,748 | |
| Cardinal Financial | 95,419 | 1,628,802 | |
| CoBiz Financial | 150,220 | 1,679,460 | |
| Columbia Banking System | 89,490 | 2,220,247 | |
| CVB Financial | 219,783 | 3,153,886 | |
| First Horizon National | 340,050 | 4,175,814 | |
| First Midwest Bancorp | 177,390 | 2,854,205 | |
| Hancock Holding | 125,887 | 4,034,678 | |
| Square 1 Financial, Cl. A | 8,192 | 157,532 | |
| Synovus Financial | 270,938 | 6,404,974 | |
| UMB Financial | 56,130 | 3,061,892 | |
| United Community Banks | 184,610 | 3,038,681 | |
| Valley National Bancorp | 254,700 | 2,468,043 | |
| Washington Trust Bancorp | 35,630 | 1,175,434 | |
| Webster Financial | 101,630 | 2,961,498 | |
| Wintrust Financial | 80,080 | 3,577,174 | |
| 47,898,568 | |||
| Capital Goods—10.0% | |||
| Aerovironment | 94,110 | a | 2,829,888 |
| American Woodmark | 58,770 | a | 2,166,262 |
| Apogee Enterprises | 71,340 | 2,839,332 | |
| Armstrong World Industries | 40,210 | a | 2,251,760 |
| Astec Industries | 52,610 | 1,918,687 | |
| Chart Industries | 30,140 | a | 1,842,458 |
| Comfort Systems USA | 121,130 | 1,641,312 | |
| FreightCar America | 60,746 | 2,022,842 | |
| Global Power Equipment Group | 44,940 | 669,606 | |
| Granite Construction | 55,720 | 1,772,453 | |
| Great Lakes Dredge and Dock | 250,450 | a | 1,547,781 |
| Lindsay | 30,180 | 2,255,955 |
8
| Common Stocks (continued) | Shares | Value ($) | |
| Capital Goods (continued) | |||
| Mueller Industries | 76,200 | 2,174,748 | |
| Powell Industries | 26,170 | 1,069,306 | |
| Regal-Beloit | 47,690 | 3,064,083 | |
| Taser International | 107,720 | a | 1,663,197 |
| 31,729,670 | |||
| Commercial & Professional Services—5.2% | |||
| Herman Miller | 61,640 | 1,839,954 | |
| Interface | 159,280 | 2,570,779 | |
| Knoll | 118,720 | 2,055,043 | |
| Korn/Ferry International | 95,720 | a | 2,383,428 |
| McGrath RentCorp | 62,180 | 2,126,556 | |
| Steelcase, Cl. A | 164,250 | 2,659,207 | |
| TrueBlue | 110,930 | a | 2,802,092 |
| 16,437,059 | |||
| Consumer Durables & Apparel—4.3% | |||
| Cavco Industries | 23,622 | a | 1,606,296 |
| Ethan Allen Interiors | 109,900 | 2,505,720 | |
| Oxford Industries | 41,680 | 2,542,063 | |
| Standard Pacific | 308,600 | a | 2,311,414 |
| Taylor Morrison Home, Cl. A | 102,570 | a | 1,663,685 |
| Universal Electronics | 26,240 | a | 1,295,469 |
| Vera Bradley | 85,670 | a | 1,771,656 |
| 13,696,303 | |||
| Consumer Services—2.3% | |||
| Belmond, Cl. A | 214,750 | a | 2,503,985 |
| Capella Education | 18,110 | 1,133,686 | |
| Cheesecake Factory | 70,170 | 3,192,735 | |
| Multimedia Games Holding Company | 11,610 | a | 418,076 |
| 7,248,482 | |||
| Diversified Financials—.9% | |||
| Piper Jaffray | 53,520 | a | 2,795,885 |
| Energy—6.5% | |||
| Bill Barrett | 126,750 | a | 2,793,570 |
| Cloud Peak Energy | 47,570 | a | 600,333 |
| Geospace Technologies | 60,580 | a | 2,129,387 |
The Fund 9
STATEMENT OF INVESTMENTS (continued)
| Common Stocks (continued) | Shares | Value ($) | |
| Energy (continued) | |||
| Gulf Island Fabrication | 51,860 | 891,992 | |
| Key Energy Services | 548,070 | a | 2,652,659 |
| McDermott International | 353,230 | a | 2,020,476 |
| Natural Gas Services Group | 42,730 | a | 1,028,511 |
| Oil States International | 58,020 | a | 3,591,438 |
| PDC Energy | 47,250 | a | 2,376,202 |
| Synergy Resources | 208,890 | a | 2,546,369 |
| 20,630,937 | |||
| Exchange-Traded Funds—.3% | |||
| iShares Russell 2000 Value ETF | 10,210 | 955,248 | |
| Food & Staples Retailing—1.9% | |||
| Casey’s General Stores | 61,833 | 4,433,426 | |
| Fresh Market | 46,540 | a | 1,625,642 |
| 6,059,068 | |||
| Food, Beverage & Tobacco—1.3% | |||
| Dean Foods | 188,565 | 2,498,486 | |
| Fresh Del Monte Produce | 54,870 | 1,750,353 | |
| 4,248,839 | |||
| Health Care Equipment & Services—8.0% | |||
| Air Methods | 70,140 | a | 3,896,277 |
| Centene | 43,529 | a | 3,600,284 |
| Computer Programs & Systems | 36,860 | 2,119,081 | |
| Globus Medical, Cl. A | 49,130 | a | 966,387 |
| Hanger | 91,270 | a | 1,872,860 |
| HealthSouth | 91,760 | 3,385,944 | |
| LifePoint Hospitals | 37,390 | a | 2,587,014 |
| Natus Medical | 75,290 | a | 2,221,808 |
| Omnicell | 85,250 | a | 2,329,882 |
| Select Medical Holdings | 77,650 | 934,130 | |
| WellCare Health Plans | 25,980 | a | 1,567,633 |
| 25,481,300 | |||
| Household & Personal Products—.4% | |||
| Elizabeth Arden | 72,750 | a | 1,217,835 |
| Insurance—.6% | |||
| Safety Insurance Group | 34,880 | 1,880,381 |
10
| Common Stocks (continued) | Shares | Value ($) | |
| Materials—5.6% | |||
| Allied Nevada Gold | 615,010 | a | 2,035,683 |
| Carpenter Technology | 66,470 | 3,001,120 | |
| Cytec Industries | 68,440 | 3,236,528 | |
| Haynes International | 34,560 | 1,589,414 | |
| Intrepid Potash | 84,690 | a | 1,308,461 |
| Louisiana-Pacific | 90,090 | a | 1,224,323 |
| Schnitzer Steel Industries, Cl. A | 35,000 | 841,750 | |
| Stillwater Mining | 137,710 | a | 2,069,781 |
| TimkenSteel | 51,060 | 2,373,779 | |
| 17,680,839 | |||
| Media—3.0% | |||
| DreamWorks Animation SKG, Cl. A | 82,110 | a | 2,239,140 |
| E.W. Scripps, Cl. A | 209,980 | a | 3,424,774 |
| New York Times, Cl. A | 347,390 | 3,897,716 | |
| 9,561,630 | |||
| Real Estate—7.0% | |||
| Acadia Realty Trust | 105,250 | b | 2,902,795 |
| American Assets Trust | 69,650 | b | 2,296,361 |
| Corporate Office Properties Trust | 92,110 | b | 2,369,069 |
| CyrusOne | 89,230 | 2,145,089 | |
| EPR Properties | 47,730 | b | 2,418,956 |
| Getty Realty | 79,740 | b | 1,355,580 |
| Healthcare Trust of America, Cl. A | 304,310 | 3,529,996 | |
| Pebblebrook Hotel Trust | 68,340 | b | 2,551,816 |
| Summit Hotel Properties | 113,610 | b | 1,224,716 |
| Urstadt Biddle Properties, Cl. A | 72,004 | b | 1,461,681 |
| 22,256,059 | |||
| Retailing—5.8% | |||
| American Eagle Outfitters | 322,360 | 4,680,667 | |
| Express | 184,494 | a | 2,879,951 |
| Office Depot | 499,286 | a | 2,566,330 |
| PEP Boys-Manny Moe & Jack | 218,210 | a | 1,944,251 |
| The Children’s Place | 72,970 | 3,477,750 | |
| Zumiez | 100,390 | a | 2,820,959 |
| 18,369,908 |
The Fund 11
STATEMENT OF INVESTMENTS (continued)
| Common Stocks (continued) | Shares | Value ($) | |
| Semiconductors & Semiconductor | |||
| Equipment—3.0% | |||
| Brooks Automation | 280,050 | 2,943,325 | |
| MKS Instruments | 59,310 | 1,979,768 | |
| Nanometrics | 69,844 | a | 1,054,644 |
| Teradyne | 180,810 | 3,505,906 | |
| 9,483,643 | |||
| Software & Services—5.9% | |||
| Acxiom | 19,130 | a | 316,602 |
| Advent Software | 58,150 | 1,835,214 | |
| Conversant | 33,070 | a | 1,132,648 |
| CoreLogic | 174,040 | a | 4,711,263 |
| CSG Systems International | 107,310 | 2,820,107 | |
| Mentor Graphics | 92,730 | 1,900,501 | |
| Monotype Imaging Holdings | 113,060 | 3,201,859 | |
| NetScout Systems | 65,520 | a | 3,000,816 |
| 18,919,010 | |||
| Technology Hardware & Equipment—4.0% | |||
| FARO Technologies | 33,320 | a | 1,690,990 |
| FEI | 24,640 | 1,858,349 | |
| Lexmark International, Cl. A | 68,980 | 2,931,650 | |
| Universal Display | 67,720 | a | 2,210,381 |
| Vishay Intertechnology | 287,660 | 4,110,661 | |
| 12,802,031 | |||
| Transportation—2.0% | |||
| Con-way | 74,141 | 3,521,697 | |
| Landstar System | 40,440 | 2,919,364 | |
| 6,441,061 | |||
| Utilities—5.0% | |||
| Chesapeake Utilities | 55,845 | 2,326,503 | |
| El Paso Electric | 74,930 | 2,738,692 | |
| Hawaiian Electric Industries | 201,560 | 5,351,418 | |
| NorthWestern | 54,700 | 2,481,192 | |
| Portland General Electric | 99,519 | 3,196,550 | |
| 16,094,355 | |||
| Total Common Stocks | |||
| (cost $273,057,101) | 317,017,789 |
12
| Other Investment–1.5% | Shares | Value ($) | ||
| Registered Investment Company; | ||||
| Dreyfus Institutional Preferred | ||||
| Plus Money Market Fund | ||||
| (cost $4,863,755) | 4,863,755 | c | 4,863,755 | |
| Total Investments (cost $277,920,856) | 101.1 | % | 321,881,544 | |
| Liabilities, Less Cash and Receivables | (1.1 | %) | (3,505,457 | ) |
| Net Assets | 100.0 | % | 318,376,087 | |
| ETF—Exchange-Traded Fund | ||||
| a Non-income producing security. | ||||
| b Investment in real estate investment trust. | ||||
| c Investment in affiliated money market mutual fund. | ||||
| Portfolio Summary (Unaudited)† | |||
| Value (%) | Value (%) | ||
| Banks | 15.0 | Semiconductors & Semiconductor | |
| Capital Goods | 10.0 | Equipment | 3.0 |
| Health Care Equipment & Services | 8.0 | Consumer Services | 2.3 |
| Real Estate | 7.0 | Transportation | 2.0 |
| Energy | 6.5 | Food & Staples Retailing | 1.9 |
| Software & Services | 5.9 | Automobiles & Components | 1.6 |
| Retailing | 5.8 | Money Market Investment | 1.5 |
| Materials | 5.6 | Food, Beverage & Tobacco | 1.3 |
| Commercial & Professional Services | 5.2 | Diversified Financials | .9 |
| Utilities | 5.0 | Insurance | .6 |
| Consumer Durables & Apparel | 4.3 | Household & Personal Products | .4 |
| Technology Hardware & Equipment | 4.0 | Exchange-Traded Funds | .3 |
| Media | 3.0 | 101.1 | |
| † Based on net assets. | |||
| See notes to financial statements. | |||
The Fund 13
| STATEMENT OF ASSETS AND LIABILITIES |
| September 30, 2014 |
| Cost | Value | |
| Assets ($): | ||
| Investments in securities—See Statement of Investments: | ||
| Unaffiliated issuers | 273,057,101 | 317,017,789 |
| Affiliated issuers | 4,863,755 | 4,863,755 |
| Cash | 94,650 | |
| Receivable for investment securities sold | 1,436,056 | |
| Dividends and securities lending income receivable | 427,338 | |
| Prepaid expenses | 10,340 | |
| 323,849,928 | ||
| Liabilities ($): | ||
| Due to The Dreyfus Corporation and affiliates—Note 3(b) | 258,509 | |
| Payable for investment securities purchased | 5,073,856 | |
| Payable for shares of Beneficial Interest redeemed | 68,476 | |
| Accrued expenses | 73,000 | |
| 5,473,841 | ||
| Net Assets ($) | 318,376,087 | |
| Composition of Net Assets ($): | ||
| Paid-in capital | 214,421,672 | |
| Accumulated undistributed investment income—net | 1,378,066 | |
| Accumulated net realized gain (loss) on investments | 58,615,661 | |
| Accumulated net unrealized appreciation | ||
| (depreciation) on investments | 43,960,688 | |
| Net Assets ($) | 318,376,087 | |
| Class I Shares Outstanding | ||
| (unlimited number of $.001 par value shares of Beneficial Interest authorized) | 11,284,786 | |
| Net Asset Value, offering and redemption price per share ($) | 28.21 | |
| See notes to financial statements. | ||
14
| STATEMENT OF OPERATIONS | ||
| Year Ended September 30, 2014 | ||
| Investment Income ($): | ||
| Income: | ||
| Cash dividends (net of $1,373 foreign taxes withheld at source): | ||
| Unaffiliated issuers | 4,586,422 | |
| Affiliated issuers | 2,726 | |
| Income from securities lending—Note 1(b) | 143,537 | |
| Total Income | 4,732,685 | |
| Expenses: | ||
| Investment advisory fee—Note 3(a) | 2,846,019 | |
| Shareholder servicing costs—Note 3(b) | 239,748 | |
| Administration fees—Note 3(a) | 144,224 | |
| Custodian fees—Note 3(b) | 57,669 | |
| Professional fees | 39,681 | |
| Prospectus and shareholders’ reports | 25,642 | |
| Registration fees | 22,922 | |
| Trustees’ fees and expenses—Note 3(c) | 21,626 | |
| Loan commitment fees—Note 2 | 3,500 | |
| Interest expense—Note 2 | 2,867 | |
| Miscellaneous | 20,655 | |
| Total Expenses | 3,424,553 | |
| Less—reduction in fees due to earnings credits—Note 3(b) | (9 | ) |
| Net Expenses | 3,424,544 | |
| Investment Income—Net | 1,308,141 | |
| Realized and Unrealized Gain (Loss) on Investments—Note 4 ($): | ||
| Net realized gain (loss) on investments | 67,923,008 | |
| Net unrealized appreciation (depreciation) on investments | (53,436,247 | ) |
| Net Realized and Unrealized Gain (Loss) on Investments | 14,486,761 | |
| Net Increase in Net Assets Resulting from Operations | 15,794,902 | |
| See notes to financial statements. | ||
The Fund 15
STATEMENT OF CHANGES IN NET ASSETS
| Year Ended September 30, | ||||
| 2014 | 2013 | |||
| Operations ($): | ||||
| Investment income—net | 1,308,141 | 3,921,209 | ||
| Net realized gain (loss) on investments | 67,923,008 | 54,164,714 | ||
| Net unrealized appreciation | ||||
| (depreciation) on investments | (53,436,247 | ) | 53,938,616 | |
| Net Increase (Decrease) in Net Assets | ||||
| Resulting from Operations | 15,794,902 | 112,024,539 | ||
| Dividends to Shareholders from ($): | ||||
| Investment income—net | (1,005,685 | ) | (3,800,963 | ) |
| Net realized gain on investments | (62,752,734 | ) | (3,803,209 | ) |
| Total Dividends | (63,758,419 | ) | (7,604,172 | ) |
| Beneficial Interest Transactions ($): | ||||
| Net proceeds from shares sold | 23,641,959 | 50,443,835 | ||
| Dividends reinvested | 62,714,198 | 7,356,146 | ||
| Cost of shares redeemed | (105,762,725 | ) | (233,654,485 | ) |
| Increase (Decrease) in Net Assets from | ||||
| Beneficial Interest Transactions | (19,406,568 | ) | (175,854,504 | ) |
| Total Increase (Decrease) in Net Assets | (67,370,085 | ) | (71,434,137 | ) |
| Net Assets ($): | ||||
| Beginning of Period | 385,746,172 | 457,180,309 | ||
| End of Period | 318,376,087 | 385,746,172 | ||
| Undistributed investment income—net | 1,378,066 | 1,389,835 | ||
| Capital Share Transactions (Shares): | ||||
| Shares sold | 777,169 | 1,770,305 | ||
| Shares issued for dividends reinvested | 2,192,804 | 289,490 | ||
| Shares redeemed | (3,460,611 | ) | (8,107,284 | ) |
| Net Increase (Decrease) in Shares Outstanding | (490,638 | ) | (6,047,489 | ) |
| See notes to financial statements. | ||||
16
FINANCIAL HIGHLIGHTS
The following table describes the performance for the fiscal periods indicated. Total return shows how much your investment in the fund would have increased (or decreased) during each period, assuming you had reinvested all dividends and distributions.These figures have been derived from the fund’s financial statements.
| Year Ended September 30, | ||||||||||
| Class I Shares | 2014 | 2013 | 2012 | 2011 | 2010 | |||||
| Per Share Data ($): | ||||||||||
| Net asset value, beginning of period | 32.76 | 25.65 | 18.81 | 20.57 | 18.54 | |||||
| Investment Operations: | ||||||||||
| Investment income—neta | .11 | .26 | .14 | .13 | .10 | |||||
| Net realized and unrealized | ||||||||||
| gain (loss) on investments | 1.15 | 7.29 | 6.79 | (1.79 | ) | 1.99 | ||||
| Total from Investment Operations | 1.26 | 7.55 | 6.93 | (1.66 | ) | 2.09 | ||||
| Distributions: | ||||||||||
| Dividends from investment income—net | (.09 | ) | (.22 | ) | (.09 | ) | (.10 | ) | (.06 | ) |
| Dividends from net realized | ||||||||||
| gain on investments | (5.72 | ) | (.22 | ) | — | — | — | |||
| Total Distributions | (5.81 | ) | (.44 | ) | (.09 | ) | (.10 | ) | (.06 | ) |
| Net asset value, end of period | 28.21 | 32.76 | 25.65 | 18.81 | 20.57 | |||||
| Total Return (%) | 3.62 | 29.92 | 36.95 | (8.14 | ) | 11.27 | ||||
| Ratios/Supplemental Data (%): | ||||||||||
| Ratio of total expenses | ||||||||||
| to average net assets | .96 | .99 | .98 | .96 | .93 | |||||
| Ratio of net expenses | ||||||||||
| to average net assets | .96 | .99 | .98 | .96 | .93 | |||||
| Ratio of net investment income | ||||||||||
| to average net assets | .37 | .90 | .59 | .57 | .52 | |||||
| Portfolio Turnover Rate | 68.43 | 76.63 | 88.54 | 66.51 | 79.47 | |||||
| Net Assets, end of period ($ x 1,000) | 318,376 | 385,746 | 457,180 | 372,176 | 492,393 | |||||
| a Based on average shares outstanding. | ||||||||||
| See notes to financial statements. | ||||||||||
The Fund 17
NOTES TO FINANCIAL STATEMENTS
NOTE 1—Significant Accounting Policies:
Dreyfus/The Boston Company Small Cap Value Fund (the “fund”) is a separate diversified series of Dreyfus Investment Funds (the “Trust”), which is registered under the Investment Company Act of 1940, as amended (the “Act”), as an open-end management investment company and operates as a series company currently offering seven series, including the fund. The fund’s investment objective is to seek long-term growth of capital. The Dreyfus Corporation (the “Manager” or “Dreyfus”), a wholly-owned subsidiary of The Bank of New York Mellon Corporation (“BNY Mellon”), serves as the fund’s investment adviser. MBSC Securities Corporation (the “Distributor”), a wholly-owned subsidiary of the Manager, is the distributor of the fund’s shares.
Class I shares are sold primarily to bank trust departments and other financial service providers (including The Bank of New York Mellon, a subsidiary of BNY Mellon and an affiliate of Dreyfus, and its affiliates), acting on behalf of customers having a qualified trust or an investment account or relationship at such institution, and bear no Distribution or Shareholder Service Plan fees. Class I shares are offered without a front-end sales charge or a contingent deferred sales charge.
The Trust accounts separately for the assets, liabilities and operations of each series. Expenses directly attributable to each series are charged to that series’ operations; expenses which are applicable to all series are allocated among them on a pro rata basis.
The Financial Accounting Standards Board (“FASB”) Accounting Standards Codification (“ASC”) is the exclusive reference of authoritative U.S. generally accepted accounting principles (“GAAP”) recognized by the FASB to be applied by nongovernmental entities. Rules and interpretive releases of the Securities and Exchange Commission (“SEC”) under authority of federal laws are also sources of authoritative GAAP for SEC registrants. The fund’s financial statements are prepared in accordance with GAAP, which may require the use of management estimates and assumptions. Actual results could differ from those estimates.
18
(a) Portfolio valuation: The fair value of a financial instrument is the amount that would be received to sell an asset or paid to transfer a liability in an orderly transaction between market participants at the measurement date (i.e., the exit price). GAAP establishes a fair value hierarchy that prioritizes the inputs of valuation techniques used to measure fair value. This hierarchy gives the highest priority to unadjusted quoted prices in active markets for identical assets or liabilities (Level 1 measurements) and the lowest priority to unobservable inputs (Level 3 measurements).
Additionally, GAAP provides guidance on determining whether the volume and activity in a market has decreased significantly and whether such a decrease in activity results in transactions that are not orderly. GAAP requires enhanced disclosures around valuation inputs and techniques used during annual and interim periods.
Various inputs are used in determining the value of the fund’s investments relating to fair value measurements.These inputs are summarized in the three broad levels listed below:
Level 1—unadjusted quoted prices in active markets for identical investments.
Level 2—other significant observable inputs (including quoted prices for similar investments, interest rates, prepayment speeds, credit risk, etc.).
Level 3—significant unobservable inputs (including the fund’s own assumptions in determining the fair value of investments).
The inputs or methodology used for valuing securities are not necessarily an indication of the risk associated with investing in those securities.
Changes in valuation techniques may result in transfers in or out of an assigned level within the disclosure hierarchy. Valuation techniques used to value the fund’s investments are as follows:
The Fund 19
NOTES TO FINANCIAL STATEMENTS (continued)
Investments in securities are valued at the last sales price on the securities exchange or national securities market on which such securities are primarily traded. Securities listed on the National Market System for which market quotations are available are valued at the official closing price or, if there is no official closing price that day, at the last sales price. Securities not listed on an exchange or the national securities market, or securities for which there were no transactions, are valued at the average of the most recent bid and asked prices, except for open short positions, where the asked price is used for valuation purposes. Bid price is used when no asked price is available. Registered investment companies that are not traded on an exchange are valued at their net asset value.All of the preceding securities are generally categorized within Level 1 of the fair value hierarchy.
Fair valuing of securities may be determined with the assistance of a pricing service using calculations based on indices of domestic securities and other appropriate indicators, such as prices of relevant American Depository Receipts and financial futures. Utilizing these techniques may result in transfers between Level 1 and Level 2 of the fair value hierarchy.
When market quotations or official closing prices are not readily available, or are determined not to reflect accurately fair value, such as when the value of a security has been significantly affected by events after the close of the exchange or market on which the security is principally traded (for example, a foreign exchange or market), but before the fund calculates its net asset value, the fund may value these investments at fair value as determined in accordance with the procedures approved by the Trust’s Board of Trustees (the “Board”). Certain factors may be considered when fair valuing investments such as: fundamental analytical data, the nature and duration of restrictions on disposition, an evaluation of the forces that influence the market in which the securities are purchased and sold, and public trading in similar securities of the issuer or comparable issuers.These securities are either categorized within Level 2 or 3 of the fair value hierarchy depending on the relevant inputs used.
20
For restricted securities where observable inputs are limited, assumptions about market activity and risk are used and are generally categorized within Level 3 of the fair value hierarchy.
The following is a summary of the inputs used as of September 30, 2014 in valuing the fund's investments:
| Level 2—Other | Level 3— | |||
| Level 1— | Significant | Significant | ||
| Unadjusted | Observable | Unobservable | ||
| Quoted Prices | Inputs | Inputs | Total | |
| Assets ($) | ||||
| Investments in Securities: | ||||
| Equity Securities— | ||||
| Domestic | ||||
| Common Stocks† | 313,558,556 | — | — | 313,558,556 |
| Equity Securities— | ||||
| Foreign | ||||
| Common Stocks† | 2,503,985 | — | — | 2,503,985 |
| Exchange- | ||||
| Traded Funds | 955,248 | — | — | 955,248 |
| Mutual Funds | 4,863,755 | — | — | 4,863,755 |
| † See Statement of Investments for additional detailed categorizations. | ||||
At September 30, 2014, there were no transfers between Level 1 and Level 2 of the fair value hierarchy.
(b) Securities transactions and investment income: Securities transactions are recorded on a trade date basis. Realized gains and losses from securities transactions are recorded on the identified cost basis. Dividend income is recognized on the ex-dividend date and interest income, including, where applicable, accretion of discount and amortization of premium on investments, is recognized on the accrual basis.
Pursuant to a securities lending agreement with The Bank of New York Mellon, the fund may lend securities to qualified institutions. It is the fund’s policy that, at origination, all loans are secured by collateral of at least 102% of the value of U.S. securities loaned and 105% of the value of foreign securities loaned. Collateral equivalent to at least
The Fund 21
NOTES TO FINANCIAL STATEMENTS (continued)
100% of the market value of securities on loan is maintained at all times. Collateral is either in the form of cash, which can be invested in certain money market mutual funds managed by the Manager or U.S. Government and Agency securities.The fund is entitled to receive all dividends, interest and distributions on securities loaned, in addition to income earned as a result of the lending transaction. Should a borrower fail to return the securities in a timely manner, The Bank of New York Mellon is required to replace the securities for the benefit of the fund or credit the fund with the market value of the unreturned securities and is subrogated to the fund’s rights against the borrower and the collateral. During the period ended September 30, 2014,The Bank of New York Mellon earned $35,884 from lending portfolio securities, pursuant to the securities lending agreement.
(c) Affiliated issuers: Investments in other investment companies advised by Dreyfus are defined as “affiliated” under the Act. Investments in affiliated investment companies during the period ended September 30, 2014 were as follows:
| Affiliated | |||||
| Investment | Value | Value | Net | ||
| Company | 9/30/2013 ($) | Purchases ($) | Sales ($) | 9/30/2014 ($) | Assets (%) |
| Dreyfus | |||||
| Institutional | |||||
| Preferred | |||||
| Plus Money | |||||
| Market | |||||
| Fund | 2,887,568 | 110,955,622 | 108,979,435 | 4,863,755 | 1.5 |
| Dreyfus | |||||
| Institutional | |||||
| Cash | |||||
| Advantage | |||||
| Fund | 22,653,083 | 123,900,739 | 146,553,822 | — | — |
| Total | 25,540,651 | 234,856,361 | 255,533,257 | 4,863,755 | 1.5 |
(d) Dividends to shareholders: Dividends are recorded on the ex-dividend date. Dividends from investment income-net and dividends from net realized capital gains, if any, are normally declared and paid annually, but the fund may make distributions on a more frequent basis to comply with the distribution requirements of the Internal Revenue Code of 1986, as amended (the “Code”).To the extent that net realized
22
capital gains can be offset by capital loss carryovers, it is the policy of the fund not to distribute such gains. Income and capital gain distributions are determined in accordance with income tax regulations, which may differ from GAAP.
(e) Federal income taxes: It is the policy of the fund to continue to qualify as a regulated investment company, if such qualification is in the best interests of its shareholders, by complying with the applicable provisions of the Code, and to make distributions of taxable income sufficient to relieve it from substantially all federal income and excise taxes.
As of and during the period ended September 30, 2014, the fund did not have any liabilities for any uncertain tax positions. The fund recognizes interest and penalties, if any, related to uncertain tax positions as income tax expense in the Statement of Operations. During the period ended September 30, 2014, the fund did not incur any interest or penalties.
Each tax year in the four-year period ended September 30, 2014 remains subject to examination by the Internal Revenue Service and state taxing authorities.
At September 30, 2014, the components of accumulated earnings on a tax basis were as follows: undistributed ordinary income $9,593,000, undistributed capital gains $52,519,449 and unrealized appreciation $41,841,966.
The tax character of distributions paid to shareholders during the fiscal periods ended September 30, 2014 and September 30, 2013 were as follows: ordinary income $23,808,510 and $3,868,537, and long-term capital gains $39,949,909 and $3,735,635, respectively.
During the period ended September 30, 2014, as a result of permanent book to tax differences, primarily due to the tax treatment for real estate investment trusts, the fund decreased accumulated undistributed investment income-net by $314,225 and increased accumulated net realized gain (loss) on investments by the same amount. Net assets and net asset value per share were not affected by this reclassification.
The Fund 23
NOTES TO FINANCIAL STATEMENTS (continued)
NOTE 2—Bank Lines of Credit:
The fund participates with other Dreyfus-managed funds in a $265 million unsecured credit facility led by Citibank, N.A. and a $300 million unsecured credit facility provided by The Bank of New York Mellon (each, a “Facility”), each to be utilized primarily for temporary or emergency purposes, including the financing of redemptions. Prior to October 9, 2013, the unsecured credit facility with Citibank, N.A. was $210 million. In connection therewith, the fund has agreed to pay its pro rata portion of commitment fees for each Facility. Interest is charged to the fund based on rates determined pursuant to the terms of the respective Facility at the time of borrowing.
The average amount of borrowings outstanding under the Facilities during the period ended September 30, 2014 was approximately $260,300 with a related weighted average annualized interest rate of 1.10%.
NOTE 3—Investment Advisory Fee, Administration Fee and Other Transactions with Affiliates:
(a) Pursuant to an investment advisory agreement with the Manager, the investment advisory fee is computed at the annual rate of .80% of the value of the fund’s average daily net assets and is payable monthly.
The fund has an Accounting and Administration Agreement (the “Administration Agreement”) with Dreyfus, whereby Dreyfus performs administrative and accounting services for the fund. The fund has agreed to compensate Dreyfus for providing accounting services, administration, compliance monitoring, regulatory and shareholder reporting, as well as related facilities and equipment. The fee is based on the fund’s average daily net assets and computed at the following annual rates: .06% of the first $500 million, .04% of the next $500 million and .02% in excess of $1 billion.
In addition, after applying any expense limitations or fee waivers that reduce the fees paid to Dreyfus for this service, Dreyfus has contractually agreed in writing to waive any remaining fees for this service to
24
the extent that they exceed both Dreyfus’ costs in providing these services and a reasonable allocation of the costs incurred by Dreyfus and its affiliates related to the support and oversight of these services. The fund also reimburses Dreyfus for the out-of-pocket expenses incurred in performing this service for the fund. Pursuant to the Administration Agreement, the fund was charged $144,224 during the period ended September 30, 2014.
(b) The fund has arrangements with the transfer agent and the custodian whereby the fund may receive earnings credits when positive cash balances are maintained, which are used to offset transfer agency and custody fees. For financial reporting purposes, the fund includes net earnings credits as an expense offset in the Statement of Operations.
The fund compensates Dreyfus Transfer, Inc., a wholly-owned subsidiary of the Manager, under a transfer agency agreement for providing transfer agency and cash management services for the fund. The majority of transfer agency fees are comprised of amounts paid on a per account basis, while cash management fees are related to fund subscriptions and redemptions. During the period ended September 30, 2014, the fund was charged $8,675 for transfer agency services and $130 for cash management services. These fees are included in Shareholder servicing costs in the Statement of Operations. Cash management fees were partially offset by earnings credits of $9.
The fund compensates The Bank of New York Mellon under a custody agreement for providing custodial services for the fund. These fees are determined based on net assets, geographic region and transaction activity. During the period ended September 30, 2014, the fund was charged $57,669 pursuant to the custody agreement.
During the period ended September 30, 2014, the fund was charged $8,107 for services performed by the Chief Compliance Officer and his staff.
The Fund 25
NOTES TO FINANCIAL STATEMENTS (continued)
The components of “Due to The Dreyfus Corporation and affiliates” in the Statement of Assets and Liabilities consist of: investment advisory fees $219,416, custodian fees $23,815, Chief Compliance Officer fees $1,730, administration fees $12,564 and transfer agency fees $984.
(c) Each Board member also serves as a Board member of other funds within the Dreyfus complex. Annual retainer fees and attendance fees are allocated to each fund based on net assets.
NOTE 4—Securities Transactions:
The aggregate amount of purchases and sales of investment securities, excluding short-term securities, during the period ended September 30, 2014, amounted to $241,497,933 and $323,765,869, respectively.
At September 30, 2014, the cost of investments for federal income tax purposes was $280,039,578; accordingly, accumulated net unrealized appreciation on investments was $41,841,966, consisting of $58,611,898 gross unrealized appreciation and $16,769,932 gross unrealized depreciation.
26
| REPORT OF INDEPENDENT REGISTERED |
| PUBLIC ACCOUNTING FIRM |
The Board of Trustees and Shareholders Dreyfus Investment Funds
We have audited the accompanying statement of assets and liabilities of Dreyfus/The Boston Company Small Cap Value Fund (the “Fund”), a series of Dreyfus Investment Funds, including the statement of investments, as of September 30, 2014, and the related statement of operations for the year then ended, the statements of changes in net assets for each of the years in the two-year period then ended, and the financial highlights for each of the years in the five-year period then ended. These financial statements and financial highlights are the responsibility of the Fund’s management. Our responsibility is to express an opinion on these financial statements and financial highlights based on our audits.
We conducted our audits in accordance with the standards of the Public Company Accounting Oversight Board (United States). Those standards require that we plan and perform the audit to obtain reasonable assurance about whether the financial statements and financial highlights are free of material misstatement. An audit includes examining, on a test basis, evidence supporting the amounts and disclosures in the financial statements. Our procedures included confirmation of securities owned as of September 30, 2014, by correspondence with the custodian and brokers or by other appropriate auditing procedures. An audit also includes assessing the accounting principles used and significant estimates made by management, as well as evaluating the overall financial statement presentation.We believe that our audits provide a reasonable basis for our opinion.
In our opinion, the financial statements and financial highlights referred to above present fairly, in all material respects, the financial position of Dreyfus/The Boston Company Small Cap Value Fund as of September 30, 2014, the results of its operations for the year then ended, the changes in its net assets for each of the years in the two-year period then ended, and the financial highlights for each of the years in the five-year period then ended, in conformity with U.S. generally accepted accounting principles.

New York, New York
November 26, 2014
The Fund 27
IMPORTANT TAX INFORMATION (Unaudited)
For federal tax purposes, the fund reports the maximum amount allowable, but not less than $4,299,265 as ordinary income dividends paid during the year ended September 30, 2014 as qualified dividend income in accordance with Section 854(b)(1)(B) of the Internal Revenue Code. Also, the fund reports the maximum amount allowable but not less than 27.95% of ordinary income dividends paid during the year ended September 30, 2014 as eligible for the corporate dividends received deduction provided under Section 243 of the Internal Revenue Code in accordance with Section 854(b)(1)(A) of the Internal Revenue Code. Shareholders will receive notification in early 2015 of the percentage applicable to the preparation of their 2014 income tax returns.The fund reports the maximum amount allowable but not less than $3.6427 per share as a capital gain dividend in accordance with Section 852(b)(3)(C) of the Internal Revenue Code.The fund reports the maximum amount allowable but not less than $2.0792 per share as a short-term capital gain dividend in accordance with Sections 871(k)(2) and 881(e) of the Internal Revenue Code.
28
BOARD MEMBERS INFORMATION (Unaudited)
INDEPENDENT BOARD MEMBERS
| Joseph S. DiMartino (70) |
| Chairman of the Board (2008) |
| Principal Occupation During Past 5Years: |
| • Corporate Director and Trustee (1995-present) |
| Other Public Company Board Memberships During Past 5Years: |
| • CBIZ (formerly, Century Business Services, Inc.), a provider of outsourcing functions for small |
| and medium size companies, Director (1997-present) |
| • The Newark Group, a provider of a national market of paper recovery facilities, paperboard |
| mills and paperboard converting plants, Director (2000-2010) |
| • Sunair Services Corporation, a provider of certain outdoor-related services to homes and |
| businesses, Director (2005-2009) |
| No. of Portfolios for which Board Member Serves: 145 |
| ——————— |
| Francine J. Bovich (63) |
| Board Member (2011) |
| Principal Occupation During Past 5Years: |
| • Trustee,The Bradley Trusts, private trust funds (2011-present) |
| • Managing Director, Morgan Stanley Investment Management (1993-2010) |
| Other Public Company Board Membership During Past 5Years: |
| • Annaly Capital Management, Inc., Board Member (May 2014-present) |
| No. of Portfolios for which Board Member Serves: 45 |
| ——————— |
| Kenneth A. Himmel (68) |
| Board Member (2008) |
| Principal Occupation During Past 5Years: |
| • President and CEO, Related Urban Development, a real estate development company |
| (1996-present) |
| • President and CEO, Himmel & Company, a real estate development company (1980-present) |
| • CEO,American Food Management, a restaurant company (1983-present) |
| No. of Portfolios for which Board Member Serves: 31 |
The Fund 29
| BOARD MEMBERS INFORMATION (Unaudited) (continued) |
| INDEPENDENT BOARD MEMBERS (continued) |
| Stephen J. Lockwood (67) |
| Board Member (2008) |
| Principal Occupation During Past 5Years: |
| • Chairman of the Board, Stephen J. Lockwood and Company LLC, a real estate investment |
| company (2000-present) |
| No. of Portfolios for which Board Member Serves: 31 |
| ——————— |
| Roslyn M. Watson (64) |
| Board Member (2008) |
| Principal Occupation During Past 5Years: |
| • Principal,Watson Ventures, Inc., a real estate investment company (1993-present) |
| No. of Portfolios for which Board Member Serves: 67 |
| ——————— |
| Benaree Pratt Wiley (68) |
| Board Member (2008) |
| Principal Occupation During Past 5Years: |
| • Principal,TheWiley Group, a firm specializing in strategy and business development (2005-present) |
| Other Public Company Board Membership During Past 5Years: |
| • CBIZ (formerly, Century Business Services, Inc.), a provider of outsourcing functions for small |
| and medium size companies, Director (2008-present) |
| No. of Portfolios for which Board Member Serves: 69 |
| ——————— |
| Once elected all Board Members serve for an indefinite term, but achieve Emeritus status upon reaching age 80.The |
| address of the Board Members and Officers is c/o The Dreyfus Corporation, 200 Park Avenue, NewYork, NewYork |
| 10166.Additional information about the Board Members is available in the fund’s Statement of Additional Information |
| which can be obtained from Dreyfus free of charge by calling this toll free number: 1-800-DREYFUS. |
| James M. Fitzgibbons, Emeritus Board Member |
30
OFFICERS OF THE FUND (Unaudited)
BRADLEY J. SKAPYAK, President since January 2010.
Chief Operating Officer and a director of the Manager since June 2009, Chairman of Dreyfus Transfer, Inc., an affiliate of the Manager and the transfer agent of the funds, since May 2011 and Executive Vice President of the Distributor since June 2007. From April 2003 to June 2009, Mr. Skapyak was the head of the Investment Accounting and Support Department of the Manager. He is an officer of 69 investment companies (comprised of 145 portfolios) managed by the Manager. He is 55 years old and has been an employee of the Manager since February 1988.
JOHN PAK, Chief Legal Officer since March 2013.
Deputy General Counsel, Investment Management, of BNY Mellon since August 2014; Chief Legal Officer of the Manager since August 2012; from March 2005 to July 2012, Managing Director of Deutsche Bank, Deputy Global Head of Deutsche Asset Management Legal and Regional Head of Deutsche Asset Management Americas Legal. He is an officer of 70 investment companies (comprised of 170 portfolios) managed by the Manager. He is 46 years old and has been an employee of the Manager since August 2012.
JANETTE E. FARRAGHER, Vice President and Secretary since December 2011.
Assistant General Counsel of BNY Mellon, and an officer of 70 investment companies (comprised of 170 portfolios) managed by the Manager. She is 51 years old and has been an employee of the Manager since February 1984.
KIESHA ASTWOOD, Vice President and Assistant Secretary since January 2010.
Counsel of BNY Mellon, and an officer of 70 investment companies (comprised of 170 portfolios) managed by the Manager. She is 41 years old and has been an employee of the Manager since July 1995.
JAMES BITETTO, Vice President and Assistant Secretary since December 2008.
Managing Counsel of BNY Mellon and Secretary of the Manager, and an officer of 70 investment companies (comprised of 170 portfolios) managed by the Manager. He is 48 years old and has been an employee of the Manager since December 1996.
JONI LACKS CHARATAN, Vice President and Assistant Secretary since December 2008.
Managing Counsel of BNY Mellon, and an officer of 70 investment companies (comprised of 170 portfolios) managed by the Manager. She is 58 years old and has been an employee of the Manager since October 1988.
JOSEPH M. CHIOFFI, Vice President and Assistant Secretary since December 2008.
Managing Counsel of BNY Mellon, and an officer of 70 investment companies (comprised of 170 portfolios) managed by the Manager. He is 52 years old and has been an employee of the Manager since June 2000.
JOHN B. HAMMALIAN, Vice President and Assistant Secretary since December 2008.
Senior Managing Counsel of BNY Mellon, and an officer of 70 investment companies (comprised of 170 portfolios) managed by the Manager. He is 51 years old and has been an employee of the Manager since February 1991.
SARAH S. KELLEHER, Vice President and Assistant Secretary since April 2014.
Senior Counsel of BNY Mellon, and an officer of 70 investment companies (comprised of 170 portfolios) managed by the Manager; from August 2005 to March 2013, Associate General Counsel of Third Avenue Management. She is 38 years old and has been an employee of the Manager since March 2013.
The Fund 31
OFFICERS OF THE FUND (Unaudited) (continued)
JEFF PRUSNOFSKY, Vice President and Assistant Secretary since December 2008.
Senior Managing Counsel of BNY Mellon, and an officer of 70 investment companies (comprised of 170 portfolios) managed by the Manager. He is 49 years old and has been an employee of the Manager since October 1990.
JAMES WINDELS, Treasurer since December 2008.
Director – Mutual Fund Accounting of the Manager, and an officer of 70 investment companies (comprised of 170 portfolios) managed by the Manager. He is 56 years old and has been an employee of the Manager since April 1985.
RICHARD CASSARO, Assistant Treasurer since December 2008.
Senior Accounting Manager – Money Market and Municipal Bond Funds of the Manager, and an officer of 70 investment companies (comprised of 170 portfolios) managed by the Manager. He is 55 years old and has been an employee of the Manager since September 1982.
GAVIN C. REILLY, Assistant Treasurer since December 2008.
Tax Manager of the Investment Accounting and Support Department of the Manager, and an officer of 70 investment companies (comprised of 170 portfolios) managed by the Manager. He is 46 years old and has been an employee of the Manager since April 1991.
ROBERT S. ROBOL, Assistant Treasurer since December 2008.
Senior Accounting Manager – Fixed Income Funds of the Manager, and an officer of 70 investment companies (comprised of 170 portfolios) managed by the Manager. He is 50 years old and has been an employee of the Manager since October 1988.
ROBERT SALVIOLO, Assistant Treasurer since December 2008.
Senior Accounting Manager – Equity Funds of the Manager, and an officer of 70 investment companies (comprised of 170 portfolios) managed by the Manager. He is 47 years old and has been an employee of the Manager since June 1989.
ROBERT SVAGNA, Assistant Treasurer since December 2008.
Senior Accounting Manager – Equity Funds of the Manager, and an officer of 70 investment companies (comprised of 170 portfolios) managed by the Manager. He is 47 years old and has been an employee of the Manager since November 1990.
JOSEPH W. CONNOLLY, Chief Compliance Officer since December 2008.
Chief Compliance Officer of the Manager and The Dreyfus Family of Funds (70 investment companies, comprised of 170 portfolios).
He is 57 years old and has served in various capacities with the Manager since 1980, including manager of the firm’s Fund Accounting Department from 1997 through October 2001.
MATTHEW D. CONNOLLY, Anti-Money Laundering Compliance Officer since April 2012.
Anti-Money Laundering Compliance Officer of the Distributor since October 2011; from March 2010 to September 2011, Global Head, KYC Reviews and Director of UBS Investment Bank; until March 2010, AML Compliance Officer and Senior Vice President of Citi Global Wealth Management. He is an officer of 65 investment companies (comprised of 165 portfolios) managed by the Manager. He is 42 years old and has been an employee of the Distributor since October 2011.
32
For More Information
Telephone 1-800-DREYFUS
Mail The Dreyfus Family of Funds, 144 Glenn Curtiss Boulevard, Uniondale, NY 11556-0144 E-mail Send your request to info@dreyfus.com Internet Information can be viewed online or downloaded at: http://www.dreyfus.com
The fund files its complete schedule of portfolio holdings with the Securities and Exchange Commission (“SEC”) for the first and third quarters of each fiscal year on Form N-Q. The fund’s Forms N-Q are available on the SEC’s website at http://www.sec.gov and may be reviewed and copied at the SEC’s Public Reference Room in Washington, DC. Information on the operation of the Public Reference Room may be obtained by calling 1-800-SEC-0330.
| Dreyfus/The Boston |
| Company Small/Mid Cap |
| Growth Fund |
ANNUAL REPORT September 30, 2014
Save time. Save paper. View your next shareholder report online as soon as it’s available. Log into www.dreyfus.com and sign up for Dreyfus eCommunications. It’s simple and only takes a few minutes.
The views expressed in this report reflect those of the portfolio manager only through the end of the period covered and do not necessarily represent the views of Dreyfus or any other person in the Dreyfus organization. Any such views are subject to change at any time based upon market or other conditions and Dreyfus disclaims any responsibility to update such views.These views may not be relied on as investment advice and, because investment decisions for a Dreyfus fund are based on numerous factors, may not be relied on as an indication of trading intent on behalf of any Dreyfus fund.
| Not FDIC-Insured • Not Bank-Guaranteed • May Lose Value |
Contents | |
THE FUND | |
| 2 | A Letter from the President |
| 3 | Discussion of Fund Performance |
| 6 | Fund Performance |
| 8 | Understanding Your Fund’s Expenses |
| 8 | Comparing Your Fund’s Expenses With Those of Other Funds |
| 9 | Statement of Investments |
| 14 | Statement of Assets and Liabilities |
| 15 | Statement of Operations |
| 16 | Statement of Changes in Net Assets |
| 18 | Financial Highlights |
| 22 | Notes to Financial Statements |
| 34 | Report of Independent Registered Public Accounting Firm |
| 35 | Important Tax Information |
| 36 | Board Members Information |
| 38 | Officers of the Fund |
FOR MORE INFORMATION | |
Back Cover |
Dreyfus/The Boston
Company Small/Mid Cap
Growth Fund
The Fund
A LETTER FROM THE PRESIDENT
Dear Shareholder:
This annual report for Dreyfus/The Boston Company Small/Mid Cap Growth Fund covers the 12-month period from October 1, 2013, through September 30, 2014. For information about how the fund performed during the reporting period, as well as general market perspectives, we provide a Discussion of Fund Performance on the pages that follow.
Despite occasional bouts of heightened volatility, U.S. stocks gained ground steadily over the reporting period as the domestic economy rebounded. As a result, most broad measures of equity market performance established a series of new record highs. Smaller and more economically sensitive stocks generally fared well over the reporting period’s first half, but larger, better established companies rallied more strongly over the second half.
We remain cautiously optimistic regarding the U.S. stock market’s prospects. We currently expect the economy to continue to accelerate as several longstanding drags, including tight fiscal policies and private sector deleveraging, fade from the scene. Of course, a number of risks remain, including the possibilities of higher interest rates and intensifying geopolitical turmoil. As always, we encourage you to discuss our observations with your financial adviser to assess their potential impact on your investments.
Thank you for your continued confidence and support.

J. Charles Cardona
President
The Dreyfus Corporation
October 15, 2014
2
DISCUSSION OF FUND PERFORMANCE
For the period of October 1, 2013, through September 30, 2014, as provided by Todd W. Wakefield, CFA, and Robert C. Zeuthen, CFA, Primary Portfolio Managers
Fund and Market Performance Overview
For the 12-month period ended September 30, 2014, Dreyfus/The Boston Company Small/Mid Cap Growth Fund’s Class A shares produced a total return of 5.59%, Class C shares returned 4.72%, Class I shares returned 5.85%, and Class Y shares returned 5.90%.1 In comparison, the fund’s benchmark, the Russell 2500® Growth Index (the “Index”), produced a total return of 8.05% for the same period.2
Despite bouts of volatility, small- and midcap stocks gained some value during the reporting period in an environment of improving U.S. economic growth.The fund lagged its benchmark, mainly due to shortfalls in the information technology and industrials sectors.
The Fund’s Investment Approach
The fund seeks long-term growth of capital. To pursue its goal, the fund normally invests at least 80% of its net assets in equity securities of small-cap and midcap U.S. companies with market capitalizations equal to or less than the total market capitalization of the largest company in the Index.When choosing stocks, we seek to identify high-quality small-cap and midcap companies with rapid current or expected earnings or revenue growth.We employ fundamental research to identify companies with attractive characteristics, such as strong business and competitive positions, solid cash flows and balance sheets, high-quality management and high sustainable growth. We also may invest in companies that our research indicates will experience accelerating revenues and expanding operating margins.
Stocks Advanced in Volatile Market
Stocks gained value over the fall of 2013 in response to encouraging economic data, enabling several broad measures of U.S. stock market performance to end the year near record highs. The market relinquished some of its gains in January 2014 amid concerns regarding economic slowdowns in the emerging markets, but stocks rebounded in February when those worries proved to be overblown. Another bout
The Fund 3
DISCUSSION OF FUND PERFORMANCE (continued)
of volatility in the spring signaled a shift in market leadership from more aggressive growth stocks to their better established, value-oriented counterparts. Over the summer, positive economic data broadly drove stocks to new record highs, but small and midcap stocks gave up a significant portion of their earlier gains in late September due to renewed concerns regarding geopolitical tensions, economic weakness in Europe, and the possibility of higher U.S. interest rates.
While stocks of all capitalization ranges produced positive returns, the shift in market leadership to more conservative companies caused small-cap stocks to trail large-cap stocks by a wide margin for the reporting period overall. Midcap stocks lagged somewhat more mildly.
Technology, Industrials Holdings Dampened Fund Results
The fund’s relative performance over the reporting period was undermined by disappointing stock selections in the information technology sector. Most notably, software developers Infoblox, BroadSoft, CommVault Systems, and Informatica were hurt when capital spending by corporate customers did not increase as expected. Shares of technology services provider Maximus were under pressure as management indirectly talked down 2015 earnings expectations, spooking the market. In the industrials sector, professional services provider On Assignment reduced its earnings outlook amid softer-than-expected industry conditions. Corporate Executive Board lost value when investors grew concerned about its valuation, margin pressures, and the impact of recent acquisitions.Transportation services company JB Hunt Transport Services encountered earnings uncertainty surrounding their intermodal and dedicated business in an otherwise favorable environment for domestic logistics companies.
The fund achieved better relative results in the health care sector, where Salix Pharmaceuticals more than doubled in value amid takeover speculation and strong clinical trial results for a new gastrointestinal treatment. Pacira Pharmaceuticals announced regulatory pre-approval for expanded use of an anesthetic drug. Biopharmaceutical services provider PAREXEL International exceeded earnings expectations, and medical technology company athenahealth benefited from the U.S. health system’s migration to digital records.
In the financials sector, real estate manager CBRE Group posted higher revenues and earnings, and investment manager Waddell & Reed Financial reported a robust increase
4
in assets under management. Among consumer discretionary companies, vacation rentals marketplace HomeAway attracted new customers, while bedding maker Tempur Sealy International posted strong sales of its differentiated products. Positive new product introductions led to stronger sales of recreation vehicles for Polaris Industries. Beauty services and products provider Ulta Salon, Cosmetics & Fragrance achieved rising same-store sales, and household products seller Williams-Sonoma benefited from synergies between its online and physical stores. Finally, in the consumer staples sector, food producer WhiteWave Foods beat earnings expectation over several quarters, and private label distributor TreeHouse Foods saw robust demand for its products.
Continuing to Find Attractive Growth Opportunities
We recently have been encouraged by improved U.S. economic activity, which should be good for small- and midcap growth stocks. However, geopolitical conflicts have persisted and interest rates may rise, suggesting that selectivity is likely to become more critical to investment success. Our security selection process has identified an ample number of opportunities meeting our criteria in the health care and consumer discretionary sectors, but fewer in the financials sector.
October 15, 2014
Please note, the position in any security highlighted with italicized typeface was sold during the reporting period. Equity funds are subject generally to market, market sector, market liquidity, issuer, and investment style risks, among other factors, to varying degrees, all of which are more fully described in the fund’s prospectus.
Small and midsize companies carry additional risks because their earnings and revenues tend to be less predictable, and their share prices more volatile, than those of larger more established companies.
| 1 Total return includes reinvestment of dividends and any capital gains paid, and does not take into consideration the |
| maximum initial sales charge in the case of Class A shares, or the applicable contingent deferred sales charge imposed |
| on redemptions in the case of Class C shares. Had these charges been reflected, returns would have been lower. Past |
| performance is no guarantee of future results. Share price and investment return fluctuate such that upon redemption, |
| fund shares may be worth more or less than their original cost. |
| 2 SOURCE: LIPPER INC. — The Russell 2500 Growth Index is an unmanaged index that measures the |
| performance of those Russell 2500 companies (the 2,500 smallest companies in the Russell 3000 Index, which is |
| composed of the 3,000 largest U.S. companies based on total market capitalization) with higher price-to-book ratios |
| and higher forecasted growth values. The total return figure cited for this index assumes change in security prices and |
| reinvestment of dividends, but does not reflect the costs of managing a mutual fund. Investors cannot invest directly |
| in any index. |
The Fund 5
FUND PERFORMANCE
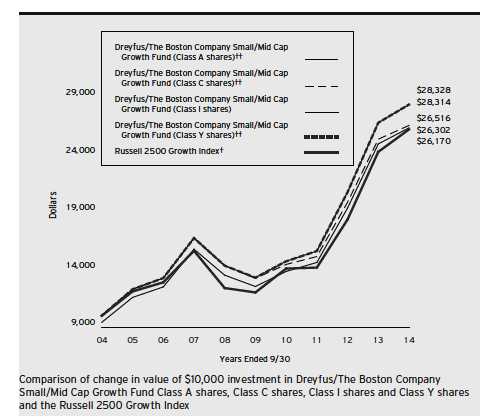
| † | Source: Lipper Inc. |
| †† | The total return figures presented for Class A and Class C shares of the fund reflect the performance of the fund’s |
| Class I shares for the period prior to 3/31/09 (the inception date for Class A and Class C shares), adjusted to | |
| reflect the applicable sales load for Class A shares. | |
| The total return figures presented for ClassY shares of the fund reflect the performance of the fund’s Class I shares for | |
| the period prior to 7/1/13 (the inception date for ClassY shares). |
Past performance is not predictive of future performance.
The above graph compares a $10,000 investment made in each of the Class A, Class C, Class I and Class Y shares of Dreyfus/The Boston Company Small/Mid Cap Growth Fund on 9/30/04 to a $10,000 investment made in the Russell 2500 Growth Index (the “Index”) on that date. All dividends and capital gain distributions are reinvested. The fund’s performance shown in the line graph above takes into account the maximum initial sales charge on Class A shares and all other applicable fees and expenses on all classes.The Index is an unmanaged index that measures the performance of those Russell 2500 companies in the Russell 3000 Index with higher price-to-book ratios and higher forecasted growth values. Unlike a mutual fund, the Index is not subject to charges, fees and other expenses. Investors cannot invest directly in any index.These factors can contribute to the Index potentially outperforming the fund. Further information relating to fund performance, including expense reimbursements, if applicable, is contained in the Financial Highlights section of the prospectus and elsewhere in this report.
6
| Average Annual Total Returns as of 9/30/14 | |||||||
| Inception | |||||||
| Date | 1 Year | 5 Years | 10 Years | ||||
| Class A shares | |||||||
| with maximum sales charge (5.75%) | 3/31/09 | –0.46 | % | 14.61 | % | 10.15 | %†† |
| without sales charge | 3/31/09 | 5.59 | % | 15.99 | % | 10.81 | %†† |
| Class C shares | |||||||
| with applicable redemption charge † | 3/31/09 | 3.79 | % | 14.90 | % | 10.24 | %†† |
| without redemption | 3/31/09 | 4.72 | % | 14.90 | % | 10.24 | %†† |
| Class I shares | 1/1/88 | 5.85 | % | 16.32 | % | 10.97 | % |
| Class Y shares | 7/1/13 | 5.90 | % | 16.33 | %†† | 10.97 | %†† |
| Russell 2500 Growth Index | 8.05 | % | 16.85 | % | 10.10 | % | |
Past performance is not predictive of future performance.The fund’s performance shown in the graph and table does not reflect the deduction of taxes that a shareholder would pay on fund distributions or the redemption of fund shares. In addition to the performance of Class A shares shown with and without a maximum sales charge, the fund’s performance shown in the table takes into account all other applicable fees and expenses on all classes.
| † | The maximum contingent deferred sales charge for Class C shares is 1% for shares redeemed within one year of the |
| date of purchase. | |
| †† | The total return performance figures presented for Class A and Class C shares of the fund reflect the performance of |
| the fund’s Class I shares for the period prior to 3/31/09 (the inception date for Class A and Class C shares), | |
| adjusted to reflect the applicable sales load for Class A shares. | |
| The total return performance figures presented for ClassY shares of the fund reflect the performance of the fund’s | |
| Class I shares for the period prior to 7/1/13 (the inception date for ClassY shares). |
The Fund 7
UNDERSTANDING YOUR FUND’S EXPENSES (Unaudited)
As a mutual fund investor, you pay ongoing expenses, such as management fees and other expenses. Using the information below, you can estimate how these expenses affect your investment and compare them with the expenses of other funds.You also may pay one-time transaction expenses, including sales charges (loads) and redemption fees, which are not shown in this section and would have resulted in higher total expenses. For more information, see your fund’s prospectus or talk to your financial adviser.
Review your fund’s expenses
The table below shows the expenses you would have paid on a $1,000 investment in Dreyfus/The Boston Company Small/Mid Cap Growth Fund from April 1, 2014 to September 30, 2014. It also shows how much a $1,000 investment would be worth at the close of the period, assuming actual returns and expenses.
Expenses and Value of a $1,000 Investment
assuming actual returns for the six months ended September 30, 2014
| Class A | Class C | Class I | Class Y | |||||
| Expenses paid per $1,000† | $ | 5.22 | $ | 9.02 | $ | 4.03 | $ | 3.48 |
| Ending value (after expenses) | $ | 982.20 | $ | 977.60 | $ | 983.00 | $ | 983.00 |
COMPARING YOUR FUND’S EXPENSES
WITH THOSE OF OTHER FUNDS (Unaudited)
Using the SEC’s method to compare expenses
The Securities and Exchange Commission (SEC) has established guidelines to help investors assess fund expenses. Per these guidelines, the table below shows your fund’s expenses based on a $1,000 investment, assuming a hypothetical 5% annualized return. You can use this information to compare the ongoing expenses (but not transaction expenses or total cost) of investing in the fund with those of other funds. All mutual fund shareholder reports will provide this information to help you make this comparison. Please note that you cannot use this information to estimate your actual ending account balance and expenses paid during the period.
Expenses and Value of a $1,000 Investment
assuming a hypothetical 5% annualized return for the six months ended September 30, 2014
| Class A | Class C | Class I | Class Y | |||||
| Expenses paid per $1,000† | $ | 5.32 | $ | 9.20 | $ | 4.10 | $ | 3.55 |
| Ending value (after expenses) | $ | 1,019.80 | $ | 1,015.94 | $ | 1,021.01 | $ | 1,021.56 |
| † Expenses are equal to the fund’s annualized expense ratio of 1.05% for Class A, 1.82% for Class C, .81% for |
| Class I and .70% for ClassY, multiplied by the average account value over the period, multiplied by 183/365 (to |
| reflect the one-half year period). |
8
| STATEMENT OF INVESTMENTS |
| September 30, 2014 |
| Common Stocks—97.7% | Shares | Value ($) | |
| Automobiles & Components—.7% | |||
| Tenneco | 136,550 | a | 7,142,931 |
| Banks—1.3% | |||
| Prosperity Bancshares | 225,290 | 12,879,829 | |
| Capital Goods—11.6% | |||
| Chart Industries | 50,170 | a | 3,066,892 |
| Crane | 131,050 | 8,283,671 | |
| Donaldson | 237,860 | 9,664,252 | |
| Hexcel | 291,050 | a | 11,554,685 |
| ITT | 207,660 | 9,332,240 | |
| MRC Global | 354,100 | a | 8,257,612 |
| Quanta Services | 348,840 | a | 12,659,404 |
| Sensata Technologies Holding | 268,980 | a | 11,977,679 |
| Trinity Industries | 153,560 | b | 7,174,323 |
| United Rentals | 153,570 | a | 17,061,627 |
| Watsco | 146,630 | 12,636,573 | |
| 111,668,958 | |||
| Commercial & Professional Services—2.8% | |||
| Corporate Executive Board | 128,142 | 7,697,490 | |
| On Assignment | 24,250 | a | 651,113 |
| Towers Watson & Co., Cl. A | 66,901 | 6,656,650 | |
| Waste Connections | 250,850 | 12,171,242 | |
| 27,176,495 | |||
| Consumer Durables & Apparel—7.2% | |||
| Deckers Outdoor | 175,600 | a | 17,064,808 |
| Jarden | 212,710 | a | 12,785,998 |
| Polaris Industries | 92,960 | 13,924,478 | |
| PVH | 77,520 | 9,391,548 | |
| Steven Madden | 216,180 | a | 6,967,481 |
| Wolverine World Wide | 364,280 | b | 9,128,857 |
| 69,263,170 |
The Fund 9
STATEMENT OF INVESTMENTS (continued)
| Common Stocks (continued) | Shares | Value ($) | |
| Consumer Services—.7% | |||
| Cheesecake Factory | 153,730 | 6,994,715 | |
| Energy—3.9% | |||
| Exterran Holdings | 274,110 | 12,145,814 | |
| Laredo Petroleum | 367,540 | a | 8,236,571 |
| Oasis Petroleum | 177,960 | a | 7,440,508 |
| Oil States International | 155,960 | a | 9,653,924 |
| 37,476,817 | |||
| Exchange-Traded Funds—5.2% | |||
| iShares Russell 2000 ETF | 44,000 | 4,811,400 | |
| iShares Russell 2000 Growth ETF | 351,720 | b | 45,614,567 |
| 50,425,967 | |||
| Food & Staples Retailing—1.2% | |||
| United Natural Foods | 181,787 | a | 11,172,629 |
| Food, Beverage & Tobacco—2.2% | |||
| TreeHouse Foods | 126,104 | a | 10,151,372 |
| WhiteWave Foods | 297,390 | a | 10,804,179 |
| 20,955,551 | |||
| Health Care Equipment & Services—10.1% | |||
| Acadia Healthcare | 215,730 | a | 10,462,905 |
| Align Technology | 268,180 | a | 13,859,542 |
| athenahealth | 70,616 | a,b | 9,299,421 |
| Brookdale Senior Living | 359,620 | a | 11,586,956 |
| Catamaran | 357,724 | a | 15,078,067 |
| Cooper | 46,630 | 7,262,622 | |
| Endologix | 674,470 | a | 7,149,382 |
| MEDNAX | 209,200 | a | 11,468,344 |
| Universal Health Services, Cl. B | 110,390 | 11,535,755 | |
| 97,702,994 | |||
| Materials—5.1% | |||
| Airgas | 134,270 | 14,856,975 | |
| Constellium, Cl. A | 280,170 | a | 6,894,984 |
| Reliance Steel & Aluminum | 104,470 | 7,145,748 | |
| Scotts Miracle-Gro, Cl. A | 192,110 | 10,566,050 | |
| Vulcan Materials | 160,620 | 9,674,143 | |
| 49,137,900 |
10
| Common Stocks (continued) | Shares | Value ($) | |
| Media—3.8% | |||
| IMAX | 431,190 | a,b | 11,840,477 |
| Interpublic Group of Companies | 670,420 | 12,282,094 | |
| Lions Gate Entertainment | 374,675 | b | 12,353,035 |
| 36,475,606 | |||
| Pharmaceuticals, Biotech & | |||
| Life Sciences—12.0% | |||
| ACADIA Pharmaceuticals | 628,310 | a,b | 15,556,956 |
| Alkermes | 219,130 | a | 9,394,103 |
| Anacor Pharmaceuticals | 238,040 | a | 5,824,839 |
| Celldex Therapeutics | 593,690 | a,b | 7,694,222 |
| Cepheid | 210,380 | a | 9,263,031 |
| Intercept Pharmaceuticals | 32,630 | a | 7,723,195 |
| Jazz Pharmaceuticals | 88,060 | a | 14,138,914 |
| Nektar Therapeutics | 859,274 | a | 10,371,437 |
| NPS Pharmaceuticals | 378,980 | a | 9,853,480 |
| PAREXEL International | 154,100 | a | 9,722,169 |
| Salix Pharmaceuticals | 98,120 | a | 15,330,269 |
| 114,872,615 | |||
| Real Estate—1.0% | |||
| CBRE Group, Cl. A | 331,330 | a | 9,853,754 |
| Retailing—5.9% | |||
| HomeAway | 294,500 | a | 10,454,750 |
| HSN | 166,450 | 10,215,036 | |
| LKQ | 500,800 | a | 13,316,272 |
| Ulta Salon, Cosmetics & Fragrance | 83,550 | a | 9,873,104 |
| Williams-Sonoma | 188,320 | 12,536,462 | |
| 56,395,624 | |||
| Semiconductors & Semiconductor | |||
| Equipment—2.3% | |||
| Mellanox Technologies | 282,050 | a | 12,655,583 |
| Microchip Technology | 204,370 | b | 9,652,395 |
| 22,307,978 | |||
| Software & Services—11.4% | |||
| Akamai Technologies | 159,380 | a | 9,530,924 |
| ANSYS | 127,910 | a | 9,678,950 |
The Fund 11
STATEMENT OF INVESTMENTS (continued)
| Common Stocks (continued) | Shares | Value ($) | |
| Software & Services (continued) | |||
| Concur Technologies | 106,460 | a | 13,501,257 |
| FleetMatics Group | 311,950 | a,b | 9,514,475 |
| LogMeIn | 266,370 | a,b | 12,271,666 |
| MAXIMUS | 296,920 | 11,915,400 | |
| Proofpoint | 281,520 | a | 10,455,653 |
| SS&C Technologies Holdings | 272,180 | a | 11,945,980 |
| Synopsys | 539,410 | a | 21,411,880 |
| 110,226,185 | |||
| Technology Hardware & Equipment—6.0% | |||
| CommScope Holding | 300,760 | a | 7,191,172 |
| F5 Networks | 106,060 | a | 12,593,564 |
| IPG Photonics | 140,890 | a,b | 9,690,414 |
| National Instruments | 231,570 | 7,162,460 | |
| Palo Alto Networks | 104,560 | a | 10,257,336 |
| Stratasys | 92,550 | a,b | 11,178,189 |
| 58,073,135 | |||
| Telecommunication Services—.6% | |||
| tw telecom | 138,780 | a | 5,774,636 |
| Transportation—2.7% | |||
| J.B. Hunt Transport Services | 66,490 | 4,923,585 | |
| Kirby | 81,490 | a | 9,603,597 |
| Spirit Airlines | 163,970 | a | 11,336,886 |
| 25,864,068 | |||
| Total Common Stocks | |||
| (cost $826,542,476) | 941,841,557 | ||
| Other Investment—2.0% | |||
| Registered Investment Company; | |||
| Dreyfus Institutional Preferred | |||
| Plus Money Market Fund | |||
| (cost $18,843,868) | 18,843,868 | c | 18,843,868 |
12
| Investment of Cash Collateral | ||||
| for Securities Loaned—7.7% | Shares | Value ($) | ||
| Registered Investment Company; | ||||
| Dreyfus Institutional Cash Advantage Fund | ||||
| (cost $74,662,549) | 74,662,549 | c | 74,662,549 | |
| Total Investments (cost $920,048,893) | 107.4 | % | 1,035,347,974 | |
| Liabilities, Less Cash and Receivables | (7.4 | %) | (71,757,343 | ) |
| Net Assets | 100.0 | % | 963,590,631 |
ETF—Exchange-Traded Fund
| a Non-income producing security. |
| b Security, or portion thereof, on loan.At September 30, 2014 the value of the fund’s securities on loan was |
| $70,681,117 and the value of the collateral held by the fund was $75,007,046, consisting of cash collateral of |
| $74,662,549 and U.S. Government & Agency securities valued at $344,497. |
| c Investment in affiliated money market mutual fund. |
| Portfolio Summary (Unaudited)† | |||
| Value (%) | Value (%) | ||
| Pharmaceuticals, | Commercial & Professional Services | 2.8 | |
| Biotech & Life Sciences | 12.0 | Transportation | 2.7 |
| Capital Goods | 11.6 | Semiconductors & | |
| Software & Services | 11.4 | Semiconductor Equipment | 2.3 |
| Health Care Equipment & Services | 10.1 | Food, Beverage & Tobacco | 2.2 |
| Money Market Investments | 9.7 | Banks | 1.3 |
| Consumer Durables & Apparel | 7.2 | Food & Staples Retailing | 1.2 |
| Technology Hardware & Equipment | 6.0 | Real Estate | 1.0 |
| Retailing | 5.9 | Automobiles & Components | .7 |
| Exchange-Traded Funds | 5.2 | Consumer Services | .7 |
| Materials | 5.1 | Telecommunication Services | .6 |
| Energy | 3.9 | ||
| Media | 3.8 | 107.4 | |
| † Based on net assets. | |||
| See notes to financial statements. | |||
The Fund 13
| STATEMENT OF ASSETS AND LIABILITIES |
| September 30, 2014 |
| Cost | Value | |||
| Assets ($): | ||||
| Investments in securities—See Statement of Investments (including | ||||
| securities on loan, valued at $70,681,117)—Note 1(b): | ||||
| Unaffiliated issuers | 826,542,476 | 941,841,557 | ||
| Affiliated issuers | 93,506,417 | 93,506,417 | ||
| Cash | 527,853 | |||
| Receivable for investment securities sold | 23,199,414 | |||
| Receivable for shares of Beneficial Interest subscribed | 613,273 | |||
| Dividends and securities lending income receivable | 165,157 | |||
| Prepaid expenses | 194,507 | |||
| 1,060,048,178 | ||||
| Liabilities ($): | ||||
| Due to The Dreyfus Corporation and affiliates—Note 3(c) | 635,059 | |||
| Liability for securities on loan—Note 1(b) | 74,662,549 | |||
| Payable for investment securities purchased | 20,041,810 | |||
| Payable for shares of Beneficial Interest redeemed | 929,877 | |||
| Accrued expenses | 188,252 | |||
| 96,457,547 | ||||
| Net Assets ($) | 963,590,631 | |||
| Composition of Net Assets ($): | ||||
| Paid-in capital | 767,859,877 | |||
| Accumulated net realized gain (loss) on investments | 80,431,673 | |||
| Accumulated net unrealized appreciation | ||||
| (depreciation) on investments | 115,299,081 | |||
| Net Assets ($) | 963,590,631 | |||
| Net Asset Value Per Share | ||||
| Class A | Class C | Class I | Class Y | |
| Net Assets ($) | 225,427,408 | 31,329,139 | 605,932,468 | 100,901,616 |
| Shares Outstanding | 12,774,229 | 1,890,135 | 33,742,252 | 5,613,802 |
| Net Asset Value Per Share ($) | 17.65 | 16.58 | 17.96 | 17.97 |
| See notes to financial statements. | ||||
14
| STATEMENT OF OPERATIONS | ||
| Year Ended September 30, 2014 | ||
| Investment Income ($): | ||
| Income: | ||
| Cash dividends (net of $13,020 foreign taxes withheld at source): | ||
| Unaffiliated issuers | 4,867,811 | |
| Affiliated issuers | 15,856 | |
| Income from securities lending—Note 1(b) | 371,325 | |
| Total Income | 5,254,992 | |
| Expenses: | ||
| Investment advisory fee—Note 3(a) | 5,626,471 | |
| Shareholder servicing costs—Note 3(c) | 1,599,313 | |
| Prospectus and shareholders’ reports | 258,957 | |
| Distribution fees—Note 3(b) | 166,249 | |
| Administration fee—Note 3(a) | 144,224 | |
| Professional fees | 114,118 | |
| Registration fees | 109,475 | |
| Custodian fees—Note 3(c) | 83,572 | |
| Trustees’ fees and expenses—Note 3(d) | 66,479 | |
| Loan commitment fees—Note 2 | 8,410 | |
| Interest expense—Note 2 | 1,945 | |
| Miscellaneous | 31,691 | |
| Total Expenses | 8,210,904 | |
| Less—reduction in fees due to earnings credits—Note 3(c) | (433 | ) |
| Net Expenses | 8,210,471 | |
| Investment (Loss)—Net | (2,955,479 | ) |
| Realized and Unrealized Gain (Loss) on Investments—Note 4 ($): | ||
| Net realized gain (loss) on investments | 112,428,209 | |
| Net unrealized appreciation (depreciation) on investments | (64,422,589 | ) |
| Net Realized and Unrealized Gain (Loss) on Investments | 48,005,620 | |
| Net Increase in Net Assets Resulting from Operations | 45,050,141 | |
| See notes to financial statements. | ||
The Fund 15
STATEMENT OF CHANGES IN NET ASSETS
| Year Ended September 30, | ||||
| 2014 | 2013 | a | ||
| Operations ($): | ||||
| Investment (loss)—net | (2,955,479 | ) | (910,979 | ) |
| Net realized gain (loss) on investments | 112,428,209 | 105,195,638 | ||
| Net unrealized appreciation | ||||
| (depreciation) on investments | (64,422,589 | ) | 80,229,259 | |
| Net Increase (Decrease) in Net Assets | ||||
| Resulting from Operations | 45,050,141 | 184,513,918 | ||
| Dividends to Shareholders from ($): | ||||
| Net realized gain on investments: | ||||
| Class A | (22,918,565 | ) | (10,591,811 | ) |
| Class C | (1,334,731 | ) | (165,811 | ) |
| Class I | (68,005,735 | ) | (39,569,772 | ) |
| Class Y | (122 | ) | — | |
| Total Dividends | (92,259,153 | ) | (50,327,394 | ) |
| Beneficial Interest Transactions ($): | ||||
| Net proceeds from shares sold: | ||||
| Class A | 77,706,564 | 35,575,263 | ||
| Class C | 26,705,891 | 5,126,829 | ||
| Class I | 233,650,640 | 167,413,489 | ||
| Class Y | 120,463,624 | 1,000 | ||
| Dividends reinvested: | ||||
| Class A | 22,257,399 | 10,214,754 | ||
| Class C | 1,312,211 | 149,491 | ||
| Class I | 57,620,214 | 33,795,640 | ||
| Cost of shares redeemed: | ||||
| Class A | (56,417,187 | ) | (19,101,349 | ) |
| Class C | (2,572,766 | ) | (911,306 | ) |
| Class I | (258,869,361 | ) | (212,027,715 | )b |
| Class Y | (17,223,963 | ) | — | |
| Increase (Decrease) in Net Assets from | ||||
| Beneficial Interest Transactions | 204,633,266 | 20,236,096 | ||
| Total Increase (Decrease) in Net Assets | 157,424,254 | 154,422,620 | ||
| Net Assets ($): | ||||
| Beginning of Period | 806,166,377 | 651,743,757 | ||
| End of Period | 963,590,631 | 806,166,377 | ||
| Undistributed investment income—net | — | 2,180 | ||
16
| Year Ended September 30, | ||||
| 2014 | 2013 | a | ||
| Capital Share Transactions: | ||||
| Class Ac | ||||
| Shares sold | 4,314,496 | 2,197,409 | ||
| Shares issued for dividends reinvested | 1,296,296 | 729,625 | ||
| Shares redeemed | (3,151,684 | ) | (1,202,638 | ) |
| Net Increase (Decrease) in Shares Outstanding | 2,459,108 | 1,724,396 | ||
| Class Cc | ||||
| Shares sold | 1,571,228 | 315,189 | ||
| Shares issued for dividends reinvested | 80,851 | 11,123 | ||
| Shares redeemed | (153,217 | ) | (59,075 | ) |
| Net Increase (Decrease) in Shares Outstanding | 1,498,862 | 267,237 | ||
| Class Id | ||||
| Shares sold | 12,766,341 | 10,187,123 | ||
| Shares issued for dividends reinvested | 3,303,911 | 2,386,698 | ||
| Shares redeemed | (14,192,319 | ) | (12,878,782 | ) |
| Net Increase (Decrease) in Shares Outstanding | 1,877,933 | (304,961 | ) | |
| Class Yd | ||||
| Shares sold | 6,564,764 | 58.28 | ||
| Shares redeemed | (951,020 | ) | — | |
| Net Increase (Decrease) in Shares Outstanding | 5,613,744 | 58.28 | ||
| a Effective July 1, 2013, the fund commenced offering ClassY shares. |
| b Includes redemption-in-kind amounting to $71,300,269. |
| c During the period ended September 30, 2013, 6,859 Class C shares representing $110,285 were exchanged for |
| 6,557 Class A shares. |
| d During the period ended September 30, 2014, 245,559 Class I shares representing $4,385,685 were exchanged |
| for 245,422 ClassY shares. |
See notes to financial statements.
The Fund 17
FINANCIAL HIGHLIGHTS
The following tables describe the performance for each share class for the fiscal periods indicated. All information (except portfolio turnover rate) reflects financial results for a single fund share.Total return shows how much your investment in the fund would have increased (or decreased) during each period, assuming you had reinvested all dividends and distributions.These figures have been derived from the fund’s financial statements.
| Year Ended September 30, | ||||||||||
| Class A Shares | 2014 | 2013 | 2012 | 2011 | 2010 | |||||
| Per Share Data ($): | ||||||||||
| Net asset value, beginning of period | 18.76 | 15.82 | 12.95 | 12.26 | 11.10 | |||||
| Investment Operations: | ||||||||||
| Investment (loss)—neta | (.09 | ) | (.06 | ) | (.06 | ) | (.06 | ) | (.04 | ) |
| Net realized and unrealized | ||||||||||
| gain (loss) on investments | 1.08 | 4.20 | 4.08 | .75 | 1.20 | |||||
| Total from Investment Operations | .99 | 4.14 | 4.02 | .69 | 1.16 | |||||
| Distributions: | ||||||||||
| Dividends from net realized | ||||||||||
| gain on investments | (2.10 | ) | (1.20 | ) | (1.15 | ) | — | — | ||
| Net asset value, end of period | 17.65 | 18.76 | 15.82 | 12.95 | 12.26 | |||||
| Total Return (%)b | 5.59 | 28.73 | 32.36 | 5.63 | 10.45 | |||||
| Ratios/Supplemental Data (%): | ||||||||||
| Ratio of total expenses | ||||||||||
| to average net assets | 1.04 | 1.02 | 1.08 | 1.09 | 1.12 | |||||
| Ratio of net expenses | ||||||||||
| to average net assets | 1.04 | 1.02 | 1.08 | 1.09 | 1.12 | |||||
| Ratio of net investment (loss) | ||||||||||
| to average net assets | (.48 | ) | (.34 | ) | (.37 | ) | (.45 | ) | (.35 | ) |
| Portfolio Turnover Rate | 139.37 | 124.25 | 153.75 | 180.82 | 191.46 | |||||
| Net Assets, end of period ($ x 1,000) | 225,427 | 193,470 | 135,904 | 107,696 | 107,796 | |||||
| a | Based on average shares outstanding. |
| b | Exclusive of sales charge. |
See notes to financial statements.
18
| Year Ended September 30, | ||||||||||
| Class C Shares | 2014 | 2013 | 2012 | 2011 | 2010 | |||||
| Per Share Data ($): | ||||||||||
| Net asset value, beginning of period | 17.87 | 15.26 | 12.63 | 12.06 | 11.05 | |||||
| Investment Operations: | ||||||||||
| Investment (loss)—neta | (.22 | ) | (.20 | ) | (.18 | ) | (.18 | ) | (.13 | ) |
| Net realized and unrealized | ||||||||||
| gain (loss) on investments | 1.03 | 4.01 | 3.96 | .75 | 1.14 | |||||
| Total from Investment Operations | .81 | 3.81 | 3.78 | .57 | 1.01 | |||||
| Distributions: | ||||||||||
| Dividends from net realized | ||||||||||
| gain on investments | (2.10 | ) | (1.20 | ) | (1.15 | ) | — | — | ||
| Net asset value, end of period | 16.58 | 17.87 | 15.26 | 12.63 | 12.06 | |||||
| Total Return (%)b | 4.72 | 27.54 | 31.21 | 4.73 | 9.14 | |||||
| Ratios/Supplemental Data (%): | ||||||||||
| Ratio of total expenses | ||||||||||
| to average net assets | 1.83 | 1.92 | 1.97 | 1.95 | 1.99 | |||||
| Ratio of net expenses | ||||||||||
| to average net assets | 1.83 | 1.92 | 1.97 | 1.95 | 1.99 | |||||
| Ratio of net investment (loss) | ||||||||||
| to average net assets | (1.26 | ) | (1.29 | ) | (1.24 | ) | (1.31 | ) | (1.21 | ) |
| Portfolio Turnover Rate | 139.37 | 124.25 | 153.75 | 180.82 | 191.46 | |||||
| Net Assets, end of period ($ x 1,000) | 31,329 | 6,991 | 1,893 | 1,124 | 1,091 | |||||
| a | Based on average shares outstanding. |
| b | Exclusive of sales charge. |
See notes to financial statements.
The Fund 19
FINANCIAL HIGHLIGHTS (continued)
| Year Ended September 30, | ||||||||||
| Class I Shares | 2014 | 2013 | 2012 | 2011 | 2010 | |||||
| Per Share Data ($): | ||||||||||
| Net asset value, beginning of period | 19.01 | 15.98 | 13.03 | 12.29 | 11.10 | |||||
| Investment Operations: | ||||||||||
| Investment (loss)—neta | (.04 | ) | (.01 | ) | (.01 | ) | (.02 | ) | (.01 | ) |
| Net realized and unrealized | ||||||||||
| gain (loss) on investments | 1.09 | 4.24 | 4.11 | .76 | 1.20 | |||||
| Total from Investment Operations | 1.05 | 4.23 | 4.10 | .74 | 1.19 | |||||
| Distributions: | ||||||||||
| Dividends from net realized | ||||||||||
| gain on investments | (2.10 | ) | (1.20 | ) | (1.15 | ) | — | — | ||
| Net asset value, end of period | 17.96 | 19.01 | 15.98 | 13.03 | 12.29 | |||||
| Total Return (%) | 5.85 | 29.03 | 32.81 | 6.02 | 10.72 | |||||
| Ratios/Supplemental Data (%): | ||||||||||
| Ratio of total expenses | ||||||||||
| to average net assets | .80 | .75 | .78 | .77 | .81 | |||||
| Ratio of net expenses | ||||||||||
| to average net assets | .80 | .75 | .78 | .77 | .81 | |||||
| Ratio of net investment (loss) | ||||||||||
| to average net assets | (.24 | ) | (.06 | ) | (.07 | ) | (.14 | ) | (.05 | ) |
| Portfolio Turnover Rate | 139.37 | 124.25 | 153.75 | 180.82 | 191.46 | |||||
| Net Assets, end of period ($ x 1,000) | 605,932 | 605,704 | 513,947 | 341,406 | 293,126 | |||||
| a Based on average shares outstanding. | ||||||||||
| See notes to financial statements. | ||||||||||
20
| Year Ended September 30, | ||||
| Class Y Shares | 2014 | 2013 | a | |
| Per Share Data ($): | ||||
| Net asset value, beginning of period | 19.01 | 17.16 | ||
| Investment Operations: | ||||
| Investment (loss)—netb | (.03 | ) | (.01 | ) |
| Net realized and unrealized | ||||
| gain (loss) on investments | 1.09 | 1.86 | ||
| Total from Investment Operations | 1.06 | 1.85 | ||
| Distributions: | ||||
| Dividends from net realized | ||||
| gain on investments | (2.10 | ) | — | |
| Net asset value, end of period | 17.97 | 19.01 | ||
| Total Return (%) | 5.90 | 10.78 | c | |
| Ratios/Supplemental Data (%): | ||||
| Ratio of total expenses to average net assets | .72 | .72 | d | |
| Ratio of net expenses to average net assets | .72 | .72 | d | |
| Ratio of net investment (loss) | ||||
| to average net assets | (.15 | ) | (.26 | )d |
| Portfolio Turnover Rate | 139.37 | 124.25 | ||
| Net Assets, end of period ($ x 1,000) | 100,902 | 1 | ||
| a | From July 1, 2013 (commencement of initial offering) to September 30, 2013. |
| b | Based on average shares outstanding. |
| c | Not annualized. |
| d | Annualized. |
See notes to financial statements.
The Fund 21
NOTES TO FINANCIAL STATEMENTS
NOTE 1—Significant Accounting Policies:
Dreyfus/The Boston Company Small/Mid Cap Growth Fund (the “fund”) is a separate non-diversified series of Dreyfus Investment Funds (the “Trust”), which is registered under the Investment Company Act of 1940, as amended (the “Act”), as an open-end management investment company and operates as a series company currently offering seven series, including the fund. The fund’s investment objective is to seek long-term growth of capital. The Dreyfus Corporation (the “Manager” or “Dreyfus”), a wholly-owned subsidiary of The Bank of New York Mellon Corporation (“BNY Mellon”), serves as the fund’s investment adviser. At a meeting held on October 30-31, 2013, the Trust’s Board of Trustees (the “Board”) approved, effective May 1, 2014 (the “Effective Date”) for The Boston Company Asset Management, LLC (“TBCAM”), an affiliate of Dreyfus, to serve as the fund’s sub-investment advisor.
The Board also approved, as of the Effective Date, a proposal to change the fund’s subclassification from a “diversified” fund to a “non-diversified” fund.
MBSC Securities Corporation (the “Distributor”), a wholly-owned subsidiary of Dreyfus, is the distributor of the fund’s shares.The fund is authorized to issue an unlimited number of $.001 par value shares of Beneficial Interest in each of the following classes of shares: Class A, Class C, Class I and ClassY. Class A and Class C shares are sold primarily to retail investors through financial intermediaries and bear Distribution and/or Shareholder Services Plan fees. Class A shares generally are subject to a sales charge imposed at the time of purchase. Class C shares are subject to a contingent deferred sales charge (“CDSC”) imposed on Class C shares redeemed within one year of purchase. Class I shares are sold primarily to bank trust departments and other financial service providers (including The Bank of New York Mellon, a subsidiary of BNY Mellon and an affiliate of Dreyfus, and its affiliates), acting on behalf of customers having a qualified trust or an investment account or relationship at such institution, and bear no Distribution or
22
Shareholder Services Plan fees. Class Y shares are sold at net asset value per share generally to institutional investors, and bear no Distribution or Shareholder Services Plan fees. Class I and Class Y shares are offered without a front-end sales charge or CDSC. Other differences between the classes include the services offered to and the expenses borne by each class, the allocation of certain transfer agency costs, and certain voting rights. Income, expenses (other than expenses attributable to a specific class), and realized and unrealized gains or losses on investments are allocated to each class of shares based on its relative net assets.
The Trust accounts separately for the assets, liabilities and operations of each series. Expenses directly attributable to each series are charged to that series’ operations; expenses which are applicable to all series are allocated among them on a pro rata basis.
The Financial Accounting Standards Board (“FASB”) Accounting Standards Codification (“ASC”) is the exclusive reference of authoritative U.S. generally accepted accounting principles (“GAAP”) recognized by the FASB to be applied by nongovernmental entities. Rules and interpretive releases of the Securities and Exchange Commission (“SEC”) under authority of federal laws are also sources of authoritative GAAP for SEC registrants. The fund’s financial statements are prepared in accordance with GAAP, which may require the use of management estimates and assumptions. Actual results could differ from those estimates.
(a) Portfolio valuation: The fair value of a financial instrument is the amount that would be received to sell an asset or paid to transfer a liability in an orderly transaction between market participants at the measurement date (i.e., the exit price). GAAP establishes a fair value hierarchy that prioritizes the inputs of valuation techniques used to measure fair value. This hierarchy gives the highest priority to unadjusted quoted prices in active markets for identical assets or liabilities (Level 1 measurements) and the lowest priority to unobservable inputs (Level 3 measurements).
The Fund 23
NOTES TO FINANCIAL STATEMENTS (continued)
Additionally, GAAP provides guidance on determining whether the volume and activity in a market has decreased significantly and whether such a decrease in activity results in transactions that are not orderly. GAAP requires enhanced disclosures around valuation inputs and techniques used during annual and interim periods.
Various inputs are used in determining the value of the fund’s investments relating to fair value measurements.These inputs are summarized in the three broad levels listed below:
Level 1—unadjusted quoted prices in active markets for identical investments.
Level 2—other significant observable inputs (including quoted prices for similar investments, interest rates, prepayment speeds, credit risk, etc.).
Level 3—significant unobservable inputs (including the fund’s own assumptions in determining the fair value of investments).
The inputs or methodology used for valuing securities are not necessarily an indication of the risk associated with investing in those securities.
Changes in valuation techniques may result in transfers in or out of an assigned level within the disclosure hierarchy. Valuation techniques used to value the fund’s investments are as follows:
Investments in securities are valued at the last sales price on the securities exchange or national securities market on which such securities are primarily traded. Securities listed on the National Market System for which market quotations are available are valued at the official closing price or, if there is no official closing price that day, at the last sales price. Securities not listed on an exchange or the national securities market, or securities for which there were no transactions, are valued at the average of the most recent bid and asked prices, except for open short positions, where the asked price is used for valuation purposes. Bid price is used when no asked price is available. Registered investment companies that are not traded on an exchange are valued at their net asset value.All of the preceding securities are generally categorized within Level 1 of the fair value hierarchy.
24
Fair valuing of securities may be determined with the assistance of a pricing service using calculations based on indices of domestic securities and other appropriate indicators, such as prices of relevant American Depository Receipts and financial futures. Utilizing these techniques may result in transfers between Level 1 and Level 2 of the fair value hierarchy.
When market quotations or official closing prices are not readily available, or are determined not to reflect accurately fair value, such as when the value of a security has been significantly affected by events after the close of the exchange or market on which the security is principally traded (for example, a foreign exchange or market), but before the fund calculates its net asset value, the fund may value these investments at fair value as determined in accordance with the procedures approved by the Board. Certain factors may be considered when fair valuing investments such as: fundamental analytical data, the nature and duration of restrictions on disposition, an evaluation of the forces that influence the market in which the securities are purchased and sold, and public trading in similar securities of the issuer or comparable issuers. These securities are either categorized within Level 2 or 3 of the fair value hierarchy depending on the relevant inputs used.
For restricted securities where observable inputs are limited, assumptions about market activity and risk are used and are generally categorized within Level 3 of the fair value hierarchy.
The following is a summary of the inputs used as of September 30, 2014 in valuing the fund’s investments:
| Level 2—Other | Level 3— | |||
| Level 1— | Significant | Significant | ||
| Unadjusted | Observable | Unobservable | ||
| Quoted Prices | Inputs | Inputs | Total | |
| Assets ($) | ||||
| Investments in Securities: | ||||
| Equity Securities— | ||||
| Domestic | ||||
| Common Stocks† | 863,165,654 | — | — | 863,165,654 |
The Fund 25
NOTES TO FINANCIAL STATEMENTS (continued)
| Level 2—Other | Level 3— | |||
| Level 1— | Significant | Significant | ||
| Unadjusted | Observable | Unobservable | ||
| Quoted Prices | Inputs | Inputs | Total | |
| Assets ($) (continued) | ||||
| Investments in Securities | ||||
| (continued): | ||||
| Equity Securities— | ||||
| Foreign | ||||
| Common Stocks† | 28,249,936 | — | — | 28,249,936 |
| Exchange-Traded | ||||
| Funds | 50,425,967 | — | — | 50,425,967 |
| Mutual Funds | 93,506,417 | — | — | 93,506,417 |
| † See Statement of Investments for additional detailed categorizations. | ||||
At September 30, 2014, there were no transfers between Level 1 and Level 2 of the fair value hierarchy.
(b) Securities transactions and investment income: Securities transactions are recorded on a trade date basis. Realized gains and losses from securities transactions are recorded on the identified cost basis. Dividend income is recognized on the ex-dividend date and interest income, including, where applicable, accretion of discount and amortization of premium on investments, is recognized on the accrual basis.
Pursuant to a securities lending agreement with The Bank of New York Mellon, the fund may lend securities to qualified institutions. It is the fund’s policy that, at origination, all loans are secured by collateral of at least 102% of the value of U.S. securities loaned and 105% of the value of foreign securities loaned. Collateral equivalent to at least 100% of the market value of securities on loan is maintained at all times. Collateral is either in the form of cash, which can be invested in certain money market mutual funds managed by Dreyfus or U.S. Government and Agency securities.The fund is entitled to receive all dividends, interest and distributions on securities loaned, in addition to income earned as a result of the lending transaction. Should a borrower fail to return the securities in a timely manner, The Bank of
26
New York Mellon is required to replace the securities for the benefit of the fund or credit the fund with the market value of the unreturned securities and is subrogated to the fund’s rights against the borrower and the collateral. During the period ended September 30, 2014,The Bank of New York Mellon earned $88,185 from lending portfolio securities, pursuant to the securities lending agreement.
(c) Affiliated issuers: Investments in other investment companies advised by Dreyfus are defined as “affiliated” under the Act. Investments in affiliated investment companies during the period ended September 30, 2014 were as follows:
| Affiliated | ||||||
| Investment | Value | Value | Net | |||
| Company | 9/30/2013 ($) | Purchases ($) | Sales ($) | 9/30/2014 ($) | Assets (%) | |
| Dreyfus | ||||||
| Institutional | ||||||
| Preferred | ||||||
| Plus Money | ||||||
| Market | ||||||
| Fund | 28,903,661 | 443,467,638 | 453,527,431 | 18,843,868 | 2.0 | |
| Dreyfus | ||||||
| Institutional | ||||||
| Cash | ||||||
| Advantage | ||||||
| Fund | 54,771,773 | 671,283,570 | 651,392,794 | 74,662,549 | 7.7 | |
| Total | 83,675,434 | 1,114,751,208 | 1,104,920,225 | 93,506,417 | 9.7 | |
(d) Dividends to shareholders: Dividends are recorded on the ex-dividend date. Dividends from investment income-net and dividends from net realized capital gains, if any, are normally declared and paid annually, but the fund may make distributions on a more frequent basis to comply with the distribution requirements of the Internal Revenue Code of 1986, as amended (the “Code”).To the extent that net realized capital gains can be offset by capital loss carryovers, it is the policy of the fund not to distribute such gains. Income and capital gain distributions are determined in accordance with income tax regulations, which may differ from GAAP.
The Fund 27
NOTES TO FINANCIAL STATEMENTS (continued)
(e) Federal income taxes: It is the policy of the fund to continue to qualify as a regulated investment company, if such qualification is in the best interests of its shareholders, by complying with the applicable provisions of the Code, and to make distributions of taxable income sufficient to relieve it from substantially all federal income and excise taxes.
As of and during the period ended September 30, 2014, the fund did not have any liabilities for any uncertain tax positions. The fund recognizes interest and penalties, if any, related to uncertain tax positions as income tax expense in the Statement of Operations. During the period ended September 30, 2014, the fund did not incur any interest or penalties.
Each tax year in the four-year period ended September 30, 2014 remains subject to examination by the Internal Revenue Service and state taxing authorities.
At September 30, 2014, the components of accumulated earnings on a tax basis were as follows: undistributed ordinary income $18,412,406, undistributed capital gains $76,900,782, accumulated capital losses $11,998,619 and unrealized appreciation $112,416,185.
Under the Regulated Investment Company Modernization Act of 2010 (the “2010 Act”), the fund is permitted to carry forward capital losses incurred in taxable years beginning after December 22, 2010 (“post-enactment losses”) for an unlimited period. Furthermore, post-enactment capital loss carryovers retain their character as either short-term or long-term capital losses rather than short-term as they were under previous statute.The 2010 Act requires post-enactment losses to be utilized before the utilization of losses incurred in taxable years prior to the effective date of the 2010 Act (“pre-enactment losses”).As a result of this ordering rule, pre-enactment losses may be more likely to expire unused.
The accumulated capital loss carryover is available for federal income tax purposes to be applied against future net realized capital gains, if any, realized subsequent to September 30, 2014. As a result of the fund’s
28
April 29, 2010 merger with Dreyfus Discovery Fund, capital losses of $11,998,619 are available to offset future gains, if any. Based on certain provisions in the Code, the amount of losses which can be utilized in subsequent years is subject to an annual limitation.This acquired capital loss will expire in fiscal year 2016.
The tax character of distributions paid to shareholders during the fiscal periods ended September 30, 2014 and September 30, 2013 were as follows: ordinary income $22,995,578 and $16,761,795, and long-term capital gains $69,263,575 and $33,565,599, respectively.
During the period ended September 30, 2014, as a result of permanent book to tax differences, primarily due to the tax treatment for net operating losses and real estate investment trusts, the fund increased accumulated undistributed investment income-net by $2,953,299, decreased accumulated net realized gain (loss) on investments by $2,950,013 and decreased paid-in capital by $3,286. Net assets and net asset value per share were not affected by this reclassification.
NOTE 2—Bank Lines of Credit:
The fund participates with other Dreyfus-managed funds in a $265 million unsecured credit facility led by Citibank, N.A. and a $300 million unsecured credit facility provided by The Bank of New York Mellon (each, a “Facility”), each to be utilized primarily for temporary or emergency purposes, including the financing of redemptions. Prior to October 9, 2013, the unsecured credit facility with Citibank, N.A. was $210 million. In connection therewith, the fund has agreed to pay its pro rata portion of commitment fees for each Facility. Interest is charged to the fund based on rates determined pursuant to the terms of the respective Facility at the time of borrowing.
The average amount of borrowings outstanding under the Facilities during the period ended September 30, 2014 was approximately $179,200 with a related weighted average annualized interest rate of 1.09%.
The Fund 29
NOTES TO FINANCIAL STATEMENTS (continued)
NOTE 3—Investment Advisory Fee, Sub-Investment Advisory fee, Administration Fee and Other Transactions with Affiliates:
(a) Pursuant to an investment advisory agreement with the Manager, the investment advisory fee is computed at the annual rate of .60% of the value of the fund’s average daily net assets and is payable monthly.
Pursuant to Sub-Investment Advisory Agreement between Dreyfus and TBCAM, TBCAM serves as the fund’s sub adviser responsible for the day-to–day management of a portion of the fund’s portfolio. Dreyfus pays TBCAM a monthly fee at an annual percentage of the value of the fund’s average daily net assets. Dreyfus has obtained an exemptive order from the SEC, upon which the fund may rely, to use a manager of managers approach that permits Dreyfus, subject to certain conditions and approval by the Board, to enter into and materially amend sub-investment advisory agreements with one or more subadvisers who are either unaffiliated with Dreyfus or are wholly-owned subsidiaries (as defined under the Act) of Dreyfus’ ultimate parent company, BNY Mellon, without obtaining shareholder approval.The order also relieves the fund from disclosing the sub-investment advisory fee paid by Dreyfus to an unaffiliated subadviser in documents filed with the SEC and provided to shareholders. In addition, pursuant to the order, it is not necessary to disclose the sub-investment advisory fee payable by Dreyfus separately to a subadviser that is a wholly-owned subsidiary of BNY Mellon in documents filed with the SEC and provided to shareholders; such fees are to be aggregated with fees payable to Dreyfus. Dreyfus has ultimate responsibility (subject to oversight by the Board) to supervise any sub-adviser and recommend the hiring, termination, and replacement of any subadviser to the Board.
The fund has an Accounting and Administration Agreement (the “Administration Agreement”) with Dreyfus, whereby Dreyfus performs administrative and accounting services for the fund. The fund has agreed to compensate Dreyfus for providing accounting services, administration, compliance monitoring, regulatory and shareholder
30
reporting, as well as for related facilities and equipment. The fee is based on the fund’s average daily net assets and computed at the following annual rates: .06% of the first $500 million, .04% of the next $500 million and .02% in excess of $1 billion.
In addition, after applying any expense limitations or fee waivers that reduce the fees paid to Dreyfus for this service, Dreyfus has contractually agreed in writing to waive any remaining fees for this service to the extent that they exceed both Dreyfus’ costs in providing these services and a reasonable allocation of the costs incurred by Dreyfus and its affiliates related to the support and oversight of these services. The fund also reimburses Dreyfus for the out-of-pocket expenses incurred in performing this service for the fund. Pursuant to the Administration Agreement, the fund was charged $144,224 during the period ended September 30, 2014.
During the period ended September 30, 2014, the Distributor retained $48,105 from commissions earned on sales of the fund’s Class A shares and $4,450 from CDSCs on redemptions of the fund’s Class C shares.
(b) Under the Distribution Plan adopted pursuant to Rule 12b-1 under the Act, Class C shares pay the Distributor for distributing its shares at an annual rate of .75% of the value of its average daily net assets. During the period ended September 30, 2104, Class C shares were charged $166,249 pursuant to the Distribution Plan.
(c) Under the Shareholder Services Plan, Class A and Class C shares pay the Distributor at an annual rate of .25% of their average daily net assets for the provision of certain services.The services provided may include personal services relating to shareholder accounts, such as answering shareholder inquiries regarding the fund and providing reports and other information, and services related to the maintenance of shareholder accounts.The Distributor may make payments to Service Agents (securities dealers, financial institutions or other industry professionals) with respect to these services.The Distributor determines the amounts
The Fund 31
NOTES TO FINANCIAL STATEMENTS (continued)
to be paid to Service Agents. During the period ended September 30, 2014, Class A and Class C shares were charged $568,182 and $55,416, respectively, pursuant to the Shareholder Services Plan.
Under its terms, the Distribution Plan and Shareholder Services Plan shall remain in effect from year to year, provided such continuance is approved annually by a vote of a majority of those Trustees who are not “interested persons” of the Trust and who have no direct or indirect financial interest in the operation of or in any agreement related to the Distribution Plan or Shareholder Services Plan.
The fund has arrangements with the transfer agent and the custodian whereby the fund may receive earnings credits when positive cash balances are maintained, which are used to offset transfer agency and custody fees. For financial reporting purposes, the fund includes net earnings credits as an expense offset in the Statement of Operations.
The fund compensates Dreyfus Transfer, Inc., a wholly-owned subsidiary of Dreyfus, under a transfer agency agreement for providing transfer agency and cash management services for the fund.The majority of transfer agency fees are comprised of amounts paid on a per account basis, while cash management fees are related to fund subscriptions and redemptions. During the period ended September 30, 2014, the fund was charged $111,845 for transfer agency services and $6,301 for cash management services. These fees are included in Shareholder servicing costs in the Statement of Operations. Cash management fees were partially offset by earnings credits of $433.
The fund compensates The Bank of NewYork Mellon under a custody agreement for providing custodial services for the fund.These fees are determined based on net assets, geographic region and transaction activity. During the period ended September 30, 2014, the fund was charged $83,572 pursuant to the custody agreement.
32
During the period ended September 30, 2014, the fund was charged $8,107 for services performed by the Chief Compliance Officer and his staff.
The components of “Due to The Dreyfus Corporation and affiliates” in the Statement of Assets and Liabilities consist of: investment advisory fees $490,724, Distribution Plan fees $19,725, Shareholder Services Plan fees $54,516, custodian fees $32,512, Chief Compliance Officer fees $1,730, administration fees $11,828 and transfer agency fees $24,024.
(d) Each Board member also serves as a Board member of other funds within the Dreyfus complex. Annual retainer fees and attendance fees are allocated to each fund based on net assets.
NOTE 4—Securities Transactions:
The aggregate amount of purchases and sales of investment securities, excluding short-term securities, during the period ended September 30, 2014, amounted to $1,394,536,304 and $1,275,129,816, respectively.
At September 30, 2014, the cost of investments for federal income tax purposes was $922,931,789; accordingly, accumulated net unrealized appreciation on investments was $112,416,185, consisting of $138,528,286 gross unrealized appreciation and $26,112,101 gross unrealized depreciation.
The Fund 33
| REPORT OF INDEPENDENT REGISTERED |
| PUBLIC ACCOUNTING FIRM |
The Board of Trustees and Shareholders Dreyfus Investment Funds
We have audited the accompanying statement of assets and liabilities of Dreyfus/The Boston Company Small/Mid Cap Growth Fund (the “Fund”), a series of Dreyfus Investment Funds, including the statement of investments, as of September 30, 2014, and the related statement of operations for the year then ended, the statements of changes in net assets for each of the years in the two-year period then ended, and the financial highlights for each of the years or periods in the five-year period then ended.These financial statements and financial highlights are the responsibility of the Fund’s management. Our responsibility is to express an opinion on these financial statements and financial highlights based on our audits.
We conducted our audits in accordance with the standards of the Public Company Accounting Oversight Board (United States). Those standards require that we plan and perform the audit to obtain reasonable assurance about whether the financial statements and financial highlights are free of material misstatement. An audit includes examining, on a test basis, evidence supporting the amounts and disclosures in the financial statements. Our procedures included confirmation of securities owned as of September 30, 2014, by correspondence with the custodian and brokers or by other appropriate auditing procedures. An audit also includes assessing the accounting principles used and significant estimates made by management, as well as evaluating the overall financial statement presentation. We believe that our audits provide a reasonable basis for our opinion.
In our opinion, the financial statements and financial highlights referred to above present fairly, in all material respects, the financial position of Dreyfus/The Boston Company Small/Mid Cap Growth Fund as of September 30, 2014, the results of its operations for the year then ended, the changes in its net assets for each of the years in the two-year period then ended, and the financial highlights for each of the years or periods in the five-year period then ended, in conformity with U.S. generally accepted accounting principles.

New York, New York
November 26, 2014
34
IMPORTANT TAX INFORMATION (Unaudited)
For federal tax purposes, the fund reports the maximum amount allowable, but not less than $3,631,393 as ordinary income dividends paid during the year ended September 30, 2014 as qualified dividend income in accordance with Section 854(b)(1)(B) of the Internal Revenue Code. Also, the fund reports the maximum amount allowable but not less than 18.16% of ordinary income dividends paid during the year ended September 30, 2014 as eligible for the corporate dividends received deduction provided under Section 243 of the Internal Revenue Code in accordance with Section 854(b)(1)(A) of the Internal Revenue Code. Shareholders will receive notification in early 2015 of the percentage applicable to the preparation of their 2014 income tax returns.The fund reports the maximum amount allowable but not less than $1.5762 per share as a capital gain dividend in accordance with Section 852(b)(3)(C) of the Internal Revenue Code. The fund reports the maximum amount allowable but not less than $.5233 per share as a short-term capital gain dividend in accordance with Sections 871(k)(2) and 881(e) of the Internal Revenue Code.
The Fund 35
| BOARD MEMBERS INFORMATION (Unaudited) |
| INDEPENDENT BOARD MEMBERS |
| Joseph S. DiMartino (70) |
| Chairman of the Board (2008) |
| Principal Occupation During Past 5Years: |
| • Corporate Director and Trustee (1995-present) |
| Other Public Company Board Memberships During Past 5Years: |
| • CBIZ (formerly, Century Business Services, Inc.), a provider of outsourcing functions for small |
| and medium size companies, Director (1997-present) |
| • The Newark Group, a provider of a national market of paper recovery facilities, paperboard |
| mills and paperboard converting plants, Director (2000-2010) |
| • Sunair Services Corporation, a provider of certain outdoor-related services to homes and |
| businesses, Director (2005-2009) |
| No. of Portfolios for which Board Member Serves: 145 |
| ——————— |
| Francine J. Bovich (63) |
| Board Member (2011) |
| Principal Occupation During Past 5Years: |
| • Trustee,The Bradley Trusts, private trust funds (2011-present) |
| • Managing Director, Morgan Stanley Investment Management (1993-2010) |
| Other Public Company Board Membership During Past 5Years: |
| • Annaly Capital Management, Inc., Board Member (May 2014-present) |
| No. of Portfolios for which Board Member Serves: 45 |
| ——————— |
| Kenneth A. Himmel (68) |
| Board Member (2008) |
| Principal Occupation During Past 5Years: |
| • President and CEO, Related Urban Development, a real estate development company (1996-present) |
| • President and CEO, Himmel & Company, a real estate development company (1980-present) |
| • CEO,American Food Management, a restaurant company (1983-present) |
| No. of Portfolios for which Board Member Serves: 31 |
36
| Stephen J. Lockwood (67) |
| Board Member (2008) |
| Principal Occupation During Past 5Years: |
| • Chairman of the Board, Stephen J. Lockwood and Company LLC, a real estate investment |
| company (2000-present) |
| No. of Portfolios for which Board Member Serves: 31 |
| ——————— |
| Roslyn M. Watson (64) |
| Board Member (2008) |
| Principal Occupation During Past 5Years: |
| • Principal,Watson Ventures, Inc., a real estate investment company (1993-present) |
| No. of Portfolios for which Board Member Serves: 67 |
| ——————— |
| Benaree Pratt Wiley (68) |
| Board Member (2008) |
| Principal Occupation During Past 5Years: |
| • Principal,TheWiley Group, a firm specializing in strategy and business development (2005-present) |
| Other Public Company Board Membership During Past 5Years: |
| • CBIZ (formerly, Century Business Services, Inc.), a provider of outsourcing functions for small |
| and medium size companies, Director (2008-present) |
| No. of Portfolios for which Board Member Serves: 69 |
| ——————— |
| Once elected all Board Members serve for an indefinite term, but achieve Emeritus status upon reaching age 80.The |
| address of the Board Members and Officers is c/o The Dreyfus Corporation, 200 Park Avenue, NewYork, NewYork |
| 10166.Additional information about the Board Members is available in the fund’s Statement of Additional Information |
| which can be obtained from Dreyfus free of charge by calling this toll free number: 1-800-DREYFUS. |
| James M. Fitzgibbons, Emeritus Board Member |
The Fund 37
OFFICERS OF THE FUND (Unaudited)
BRADLEY J. SKAPYAK, President since January 2010.
Chief Operating Officer and a director of the Manager since June 2009, Chairman of Dreyfus Transfer, Inc., an affiliate of the Manager and the transfer agent of the funds, since May 2011 and Executive Vice President of the Distributor since June 2007. From April 2003 to June 2009, Mr. Skapyak was the head of the Investment Accounting and Support Department of the Manager. He is an officer of 69 investment companies (comprised of 145 portfolios) managed by the Manager. He is 55 years old and has been an employee of the Manager since February 1988.
JOHN PAK, Chief Legal Officer since March 2013.
Deputy General Counsel, Investment Management, of BNY Mellon since August 2014; Chief Legal Officer of the Manager since August 2012; from March 2005 to July 2012, Managing Director of Deutsche Bank, Deputy Global Head of Deutsche Asset Management Legal and Regional Head of Deutsche Asset Management Americas Legal. He is an officer of 70 investment companies (comprised of 170 portfolios) managed by the Manager. He is 46 years old and has been an employee of the Manager since August 2012.
JANETTE E. FARRAGHER, Vice President and Secretary since December 2011.
Assistant General Counsel of BNY Mellon, and an officer of 70 investment companies (comprised of 170 portfolios) managed by the Manager. She is 51 years old and has been an employee of the Manager since February 1984.
KIESHA ASTWOOD, Vice President and Assistant Secretary since January 2010.
Counsel of BNY Mellon, and an officer of 70 investment companies (comprised of 170 portfolios) managed by the Manager. She is 41 years old and has been an employee of the Manager since July 1995.
JAMES BITETTO, Vice President and Assistant Secretary since December 2008.
Managing Counsel of BNY Mellon and Secretary of the Manager, and an officer of 70 investment companies (comprised of 170 portfolios) managed by the Manager. He is 48 years old and has been an employee of the Manager since December 1996.
JONI LACKS CHARATAN, Vice President and Assistant Secretary since December 2008.
Managing Counsel of BNY Mellon, and an officer of 70 investment companies (comprised of 170 portfolios) managed by the Manager. She is 58 years old and has been an employee of the Manager since October 1988.
JOSEPH M. CHIOFFI, Vice President and Assistant Secretary since December 2008.
Managing Counsel of BNY Mellon, and an officer of 70 investment companies (comprised of 170 portfolios) managed by the Manager. He is 52 years old and has been an employee of the Manager since June 2000.
JOHN B. HAMMALIAN, Vice President and Assistant Secretary since December 2008.
Senior Managing Counsel of BNY Mellon, and an officer of 70 investment companies (comprised of 170 portfolios) managed by the Manager. He is 51 years old and has been an employee of the Manager since February 1991.
SARAH S. KELLEHER, Vice President and Assistant Secretary since April 2014.
Senior Counsel of BNY Mellon, and an officer of 70 investment companies (comprised of 170 portfolios) managed by the Manager; from August 2005 to March 2013, Associate General Counsel of Third Avenue Management. She is 38 years old and has been an employee of the Manager since March 2013.
38
JEFF PRUSNOFSKY, Vice President and Assistant Secretary since December 2008.
Senior Managing Counsel of BNY Mellon, and an officer of 70 investment companies (comprised of 170 portfolios) managed by the Manager. He is 49 years old and has been an employee of the Manager since October 1990.
JAMES WINDELS, Treasurer since December 2008.
Director – Mutual Fund Accounting of the Manager, and an officer of 70 investment companies (comprised of 170 portfolios) managed by the Manager. He is 56 years old and has been an employee of the Manager since April 1985.
RICHARD CASSARO, Assistant Treasurer since December 2008.
Senior Accounting Manager – Money Market and Municipal Bond Funds of the Manager, and an officer of 70 investment companies (comprised of 170 portfolios) managed by the Manager. He is 55 years old and has been an employee of the Manager since September 1982.
GAVIN C. REILLY, Assistant Treasurer since December 2008.
Tax Manager of the Investment Accounting and Support Department of the Manager, and an officer of 70 investment companies (comprised of 170 portfolios) managed by the Manager. He is 46 years old and has been an employee of the Manager since April 1991.
ROBERT S. ROBOL, Assistant Treasurer since December 2008.
Senior Accounting Manager – Fixed Income Funds of the Manager, and an officer of 70 investment companies (comprised of 170 portfolios) managed by the Manager. He is 50 years old and has been an employee of the Manager since October 1988.
ROBERT SALVIOLO, Assistant Treasurer since December 2008.
Senior Accounting Manager – Equity Funds of the Manager, and an officer of 70 investment companies (comprised of 170 portfolios) managed by the Manager. He is 47 years old and has been an employee of the Manager since June 1989.
ROBERT SVAGNA, Assistant Treasurer since December 2008.
Senior Accounting Manager – Equity Funds of the Manager, and an officer of 70 investment companies (comprised of 170 portfolios) managed by the Manager. He is 47 years old and has been an employee of the Manager since November 1990.
JOSEPH W. CONNOLLY, Chief Compliance Officer since December 2008.
Chief Compliance Officer of the Manager and The Dreyfus Family of Funds (70 investment companies, comprised of 170 portfolios). He is 57 years old and has served in various capacities with the Manager since 1980, including manager of the firm’s Fund Accounting Department from 1997 through October 2001.
MATTHEW D. CONNOLLY, Anti-Money Laundering Compliance Officer since April 2012.
Anti-Money Laundering Compliance Officer of the Distributor since October 2011; from March 2010 to September 2011, Global Head, KYC Reviews and Director of UBS Investment Bank; until March 2010, AML Compliance Officer and Senior Vice President of Citi Global Wealth Management. He is an officer of 65 investment companies (comprised of 165 portfolios) managed by the Manager. He is 42 years old and has been an employee of the Distributor since October 2011.
The Fund 39
NOTES
For More Information
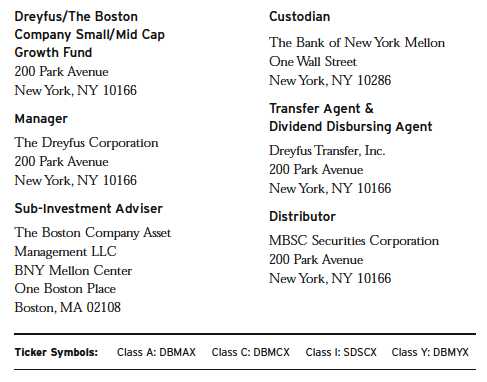
| Telephone Call your financial representative or 1-800-DREYFUS |
| Mail The Dreyfus Family of Funds, 144 Glenn Curtiss Boulevard, Uniondale, NY 11556-0144 |
The fund files its complete schedule of portfolio holdings with the Securities and Exchange Commission (“SEC”) for the first and third quarters of each fiscal year on Form N-Q. The fund’s Forms N-Q are available on the SEC’s website at http://www.sec.gov and may be reviewed and copied at the SEC’s Public Reference Room in Washington, DC. Information on the operation of the Public Reference Room may be obtained by calling 1-800-SEC-0330.
| Dreyfus |
| Tax Sensitive |
| Total Return Bond Fund |
ANNUAL REPORT September 30, 2014
The views expressed in this report reflect those of the portfolio manager only through the end of the period covered and do not necessarily represent the views of Dreyfus or any other person in the Dreyfus organization. Any such views are subject to change at any time based upon market or other conditions and Dreyfus disclaims any responsibility to update such views.These views may not be relied on as investment advice and, because investment decisions for a Dreyfus fund are based on numerous factors, may not be relied on as an indication of trading intent on behalf of any Dreyfus fund.
| Not FDIC-Insured • Not Bank-Guaranteed • May Lose Value |
Contents | |
THE FUND | |
| 2 | A Letter from the President |
| 3 | Discussion of Fund Performance |
| 6 | Fund Performance |
| 8 | Understanding Your Fund’s Expenses |
| 8 | Comparing Your Fund’s Expenses With Those of Other Funds |
| 9 | Statement of Investments |
| 21 | Statement of Assets and Liabilities |
| 22 | Statement of Operations |
| 23 | Statement of Changes in Net Assets |
| 25 | Financial Highlights |
| 29 | Notes to Financial Statements |
| 40 | Report of Independent Registered Public Accounting Firm |
| 41 | Important Tax Information |
| 42 | Board Members Information |
| 44 | Officers of the Fund |
FOR MORE INFORMATION | |
Back Cover |
Dreyfus
Tax Sensitive
Total Return Bond Fund
The Fund
A LETTER FROM THE PRESIDENT
Dear Shareholder:
This annual report for Dreyfus Tax Sensitive Total Return Bond Fund covers the 12-month period from October 1, 2013, through September 30, 2014. For information about how the fund performed during the reporting period, as well as general market perspectives, we provide a Discussion of Fund Performance on the pages that follow.
Municipal bonds generally gained ground for the reporting period overall despite bouts of heightened volatility during the final months of 2013, when a more moderately accommodative monetary policy and accelerating economic growth caused long-term interest rates to rise. Long-term interest rates moderated early in 2014 due to geopolitical and economic concerns, driving prices of long-term securities higher, and favorable supply-and-demand dynamics helped keep yields low when economic growth resumed. Meanwhile, improving economic fundamentals enabled many states and municipalities to shore up their fiscal conditions.
While we remain cautiously optimistic regarding the municipal bond market’s prospects, we believe that selectivity is likely to become more important to investment success. Long-term rates could rise if, as we anticipate, the economy continues to accelerate and inflationary pressures rise. On the other hand, intensifying geopolitical turmoil and other factors could dampen the adverse effects of a stronger domestic economic recovery, and rising investor demand for tax-advantaged investments may continue to support municipal bond prices. As always, we encourage you to discuss our observations with your financial adviser to assess their potential impact on your investments.
Thank you for your continued confidence and support.

J. Charles Cardona
President
The Dreyfus Corporation
October 15, 2014
2
DISCUSSION OF FUND PERFORMANCE
For the period of October 1, 2013, through September 30, 2014, as provided by Christine L.Todd,Thomas Casey, Daniel Rabasco and Jeffrey Burger, Portfolio Managers
Fund and Market Performance Overview
For the 12-month period ended September 30, 2014, Dreyfus Tax Sensitive Total Return Bond Fund’s Class A shares produced a total return of 4.84%, Class C shares returned 4.07%, Class I shares returned 5.11%, and Class Y shares returned 5.13%.1 In comparison, the fund’s benchmark, the Barclays 3-, 5-, 7-, 10-Year Municipal Bond Index (the “Index”), provided a total return of 4.62% for the same period.2
Municipal bonds rallied over the reporting period when long-term interest rates moderated, supply-and-demand dynamics proved favorable, and credit conditions improved. The fund’s results were roughly in line with its benchmark, as strong results from lower rated revenue-backed bonds were balanced by more modest returns from higher quality securities.
Effective February 21, 2014 (the “Effective Date”), the fund changed its name, investment objective, investment strategy, and certain fundamental investment policies, and Jeffrey Burger and Daniel Rabasco became portfolio managers.
The Fund’s Investment Approach
As of the Effective Date, the fund seeks high after-tax total return.To pursue its goal, the fund normally invests at least 80% of its net assets, plus any borrowings for investment purposes, in bonds.The fund normally invests at least 65% of its net assets in municipal bonds that provide income exempt from federal personal income tax. The fund may invest up to 35% of its net assets in taxable bonds. The fund invests principally in bonds rated investment grade at the time of purchase or, if unrated, determined to be of comparable quality.3 The fund may invest up to 25% of its assets in bonds rated below investment grade.
We seek relative value opportunities among municipal bonds and invest selectively in taxable securities with the potential to enhance after-tax total return and/or reduce volatility. We use a combination of fundamental credit analysis and macroeconomic and quantitative inputs to identify undervalued sectors and securities, and we select municipal bonds using fundamental credit analysis to estimate the relative value and attractiveness of various sectors and securities and to exploit pricing inefficiencies.
The Fund 3
DISCUSSION OF FUND PERFORMANCE (continued)
Economic and Technical Forces Buoyed Municipal Bonds
Fixed-income securities struggled over the fall of 2013 amid accelerating economic growth and the Federal Reserve Board’s plans to back away from its quantitative easing program. By the end of the year, long-term interest rates had climbed above 3% for the first time in more than two years, and bond prices fell. However, rates subsequently moderated, and bonds rebounded when harsh winter weather contributed to an economic contraction during the first quarter of 2014.
The economic recovery got back on track in the spring, but favorable supply-and-demand dynamics kept municipal rates low. Limited refinancing activity produced a reduced supply of newly issued securities over the first nine months of 2014, while demand intensified from investors seeking higher after-tax income. Consequently, municipal bonds produced highly competitive total returns, with longer term and lower rated securities faring particularly well.
The economic rebound resulted in better underlying credit conditions for many municipal issuers.Tax revenues increased, helping most states achieve budget surpluses. Isolated fiscal problems in Detroit and Puerto Rico were notable exceptions to the recovering credit environment.
Revenue Bonds Bolstered Relative Performance
The fund participated fully in the bond markets’ rallies during the reporting period. Performance was especially buoyed by revenue-backed municipal bonds with lower credit ratings, including securities issued on behalf of hospitals, airports, industrial development projects, and the states’ settlement of litigation with U.S. tobacco companies. Conversely, the fund benefited from underweighted exposure to general obligation bonds and high-quality escrowed bonds. Relatively light holdings of Puerto Rico securities also aided relative results.
Increased exposure to taxable bonds also bolstered relative performance during the reporting period, as we added to positions in high yield corporate securities, commercial mortgage-backed securities, and asset-backed securities backed by automobile loans.
Finally, a long average duration enabled the fund to benefit more fully from falling long-term interest rates.
4
These successful strategies were offset to a degree by lagging results from higher quality holdings, such as municipal bonds backed by water-and-sewer facilities, special tax districts, and educational institutions.
Adapting to a Changing Market Environment
The U.S. economic recovery has gained momentum, but disappointing global growth recently drove bond yields lower when investors flocked to traditional safe havens such as U.S. Treasury securities. In addition, technical factors have remained favorable. Nonetheless, we recognize that yield differences have narrowed substantially along the market’s credit-quality spectrum, and valuations of lower rated securities have become richer.Therefore, we have adopted a somewhat less constructive investment posture, including a greater emphasis on higher rated municipal bonds. We also intend to continue to look for opportunities to add to the fund’s holdings of taxable securities in order to diversify the portfolio more broadly and support competitive levels of current income.
October 15, 2014
Bond funds are subject generally to interest rate, credit, liquidity, and market risks, to varying degrees, all of which are more fully described in the fund’s prospectus. Generally, all other factors being equal, bond prices are inversely related to interest-rate changes, and rate increases can cause price declines.
The use of derivatives involves risks different from, or possibly greater than, the risks associated with investing directly in the underlying assets. Derivatives can be highly volatile, illiquid, and difficult to value, and there is the risk that changes in the value of a derivative held by the fund will not correlate with the underlying instruments of the fund’s other investments.
| 1 Total return includes reinvestment of dividends and any capital gains paid, and does not take into consideration the |
| maximum initial sales charge in the case of Class A shares or the applicable contingent deferred sales charge imposed |
| on redemptions in the case of Class C shares. Had these charges been reflected, returns would have been lower. |
| Neither Class I nor ClassY shares are subject to any initial or deferred sales charge. Past performance is no guarantee |
| of future results. Share price, yield, and investment return fluctuate such that upon redemption, fund shares may be |
| worth more or less than their original cost. Income may be subject to state and local taxes, and some income may be |
| subject to the federal alternative minimum tax (AMT) for certain investors. Capital gains, if any, are taxable. Return |
| figures provided reflect the absorption of certain fund expenses by The Dreyfus Corporation, pursuant to an agreement |
| in effect through February 1, 2016, at which time it may be extended, modified or terminated. Had these expenses |
| not been absorbed, the fund’s returns would have been lower. |
| 2 Source: Lipper Inc. |
| 3 The fund may continue to own investment-grade bonds (at the time of purchase), which are subsequently downgraded |
| to below investment grade. |
The Fund 5
FUND PERFORMANCE
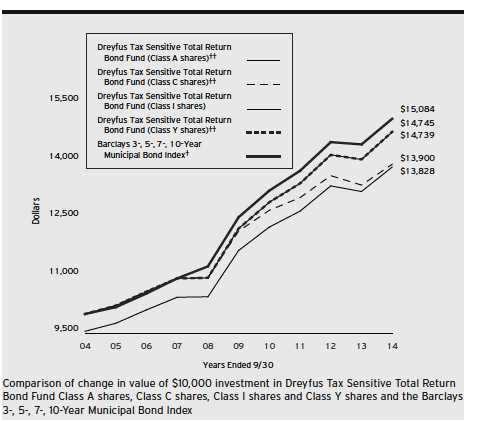
| † | Source: Lipper Inc. |
| †† | The total return figures presented for Class A and Class C shares of the fund reflect the performance of the fund’s |
| Class I shares for the period prior to 3/31/09 (the inception date for Class A and Class C shares), not reflecting the | |
| applicable sales charges for Class A shares. | |
| The total return figures presented for ClassY shares of the fund reflect the performance of the fund’s Class I shares for | |
| the period prior to 7/1/13 (the inception date for ClassY shares). |
Past performance is not predictive of future performance.
The above graph compares a $10,000 investment made in each of the Class A, Class C, Class I and Class Y shares of Dreyfus Tax Sensitive Total Return Bond Fund on 9/30/04 to a $10,000 investment made in the Barclays 3-, 5-, 7-, 10-Year Municipal Bond Index (the “Index”) on that date. All dividends and capital gain distributions are reinvested. On February 21, 2014, the fund changed its name from “Dreyfus/Standish Intermediate Tax Exempt Bond Fund” to “Dreyfus Tax Sensitive Total Return Bond Fund” and the fund’s investment strategy changed.
The fund’s performance shown in the line graph above takes into account the maximum initial sales charge on Class A shares and all other applicable fees and expenses on all classes.The Index is an equal-weighted composite of the Barclays 3-Year, 5-Year, 7-Year, and 10-Year Municipal Bond indices, each of which is a broad measure of the performance of investment grade, fixed-rate municipal bonds. Unlike a mutual fund, the Index is not subject to charges, fees and other expenses. Investors cannot invest directly in any index.These factors can contribute to the Index potentially outperforming the fund. Further information relating to fund performance, including expense reimbursements, if applicable, is contained in the Financial Highlights section of the prospectus and elsewhere in this report.
6
| Average Annual Total Returns as of 9/30/14 | |||||||
| Inception | |||||||
| Date | 1 Year | 5 Years | 10 years | ||||
| Class A shares | |||||||
| with maximum sales charge (4.5%) | 3/31/09 | 0.14 | % | 2.53 | % | 3.29 | %†† |
| without sales charge | 3/31/09 | 4.84 | % | 3.48 | % | 3.77 | %†† |
| Class C shares | |||||||
| with applicable redemption charge † | 3/31/09 | 3.07 | % | 2.71 | % | 3.35 | %†† |
| without redemption | 3/31/09 | 4.07 | % | 2.71 | % | 3.35 | %†† |
| Class I shares | 11/2/92 | 5.11 | % | 3.81 | % | 3.96 | % |
| Class Y shares | 5.13 | % | 3.82 | %†† | 3.96 | %†† | |
| Barclays 3-, 5-, 7-, 10-Year | |||||||
| Municipal Bond Index | 7/1/13 | 4.62 | % | 3.80 | % | 4.20 | % |
Past performance is not predictive of future performance.The fund’s performance shown in the graph and table does not reflect the deduction of taxes that a shareholder would pay on fund distributions or the redemption of fund shares. In addition to the performance of Class A shares shown with and without a maximum sales charge, the fund’s performance shown in the table takes into account all other applicable fees and expenses on all classes.
| † | The maximum contingent deferred sales charge for Class C shares is 1% for shares redeemed within one year of the |
| date of purchase. | |
| †† | The total return performance figures presented for Class A and Class C shares of the fund reflect the performance of |
| the fund’s Class I shares for the period prior to 3/31/09 (the inception date for Class A and Class C shares), not | |
| reflecting the applicable sales charges for Class A shares. | |
| The total return performance figures presented for ClassY shares of the fund reflect the performance of the fund’s | |
| Class I shares for the period prior to 7/1/13 (the inception date for ClassY shares). |
The Fund 7
UNDERSTANDING YOUR FUND’S EXPENSES (Unaudited)
As a mutual fund investor, you pay ongoing expenses, such as management fees and other expenses. Using the information below, you can estimate how these expenses affect your investment and compare them with the expenses of other funds.You also may pay one-time transaction expenses, including sales charges (loads) and redemption fees, which are not shown in this section and would have resulted in higher total expenses. For more information, see your fund’s prospectus or talk to your financial adviser.
Review your fund’s expenses
The table below shows the expenses you would have paid on a $1,000 investment in Dreyfus Tax Sensitive Total Return Bond Fund from April 1, 2014 to September 30, 2014. It also shows how much a $1,000 investment would be worth at the close of the period, assuming actual returns and expenses.
Expenses and Value of a $1,000 Investment
assuming actual returns for the six months ended September 30, 2014
| Class A | Class C | Class I | Class Y | |||||
| Expenses paid per $1,000† | $ | 3.56 | $ | 7.36 | $ | 2.29 | $ | 2.29 |
| Ending value (after expenses) | $ | 1,027.40 | $ | 1,024.00 | $ | 1,028.70 | $ | 1,028.70 |
COMPARING YOUR FUND’S EXPENSES
WITH THOSE OF OTHER FUNDS (Unaudited)
Using the SEC’s method to compare expenses
The Securities and Exchange Commission (SEC) has established guidelines to help investors assess fund expenses. Per these guidelines, the table below shows your fund’s expenses based on a $1,000 investment, assuming a hypothetical 5% annualized return. You can use this information to compare the ongoing expenses (but not transaction expenses or total cost) of investing in the fund with those of other funds. All mutual fund shareholder reports will provide this information to help you make this comparison. Please note that you cannot use this information to estimate your actual ending account balance and expenses paid during the period.
Expenses and Value of a $1,000 Investment
assuming a hypothetical 5% annualized return for the six months ended September 30, 2014
| Class A | Class C | Class I | Class Y | |||||
| Expenses paid per $1,000† | $ | 3.55 | $ | 7.33 | $ | 2.28 | $ | 2.28 |
| Ending value (after expenses) | $ | 1,021.56 | $ | 1,017.80 | $ | 1,022.81 | $ | 1,022.81 |
| † Expenses are equal to the fund’s annualized expense ratio of .70% for Class A, 1.45% for Class C, .45% for |
| Class I and .45% for ClassY, multiplied by the average account value over the period, multiplied by 183/365 (to |
| reflect the one-half year period). |
8
| STATEMENT OF INVESTMENTS |
| September 30, 2014 |
| Coupon | Maturity | Principal | |||
| Bonds and Notes—3.7% | Rate (%) | Date | Amount ($) | Value ($) | |
| Asset-Backed Certificates—.8% | |||||
| OneMain Financial Issuance Trust, | |||||
| Ser. 2014-A1, Cl. B | 3.24 | 6/18/24 | 1,180,000 | a | 1,181,982 |
| Asset-Backed Ctfs./ | |||||
| Auto Receivables—1.6% | |||||
| American Credit Acceptance | |||||
| Receivables, Ser. 2014-2, Cl. B | 2.26 | 3/10/20 | 725,000 | a | 725,203 |
| Capital Auto Receivables Asset | |||||
| Trust, Ser. 2014-2, Cl. D | 2.81 | 8/20/19 | 240,000 | 238,759 | |
| DT Auto Owner Trust, | |||||
| Ser. 2014-2A, Cl. D | 3.68 | 4/15/21 | 1,500,000 | a | 1,494,309 |
| Commercial Mortgage | |||||
| Pass Though Ctfs.—.8% | |||||
| Wachovia Bank Commercial Mortgage | |||||
| Trust, Ser. 2006-C24, Cl. AJ | 5.66 | 3/15/45 | 1,250,000 | b | 1,271,136 |
| Financial—.5% | |||||
| Hockey Merger Sub 2, | |||||
| Sr. Unscd. Notes | 7.88 | 10/1/21 | 750,000 | a | 771,563 |
| Total Bonds and Notes | |||||
| (cost $5,734,719) | 5,682,952 | ||||
| Long-Term Municipal | |||||
| Investments—94.1% | |||||
| Alabama—2.5% | |||||
| Alabama Public School and | |||||
| College Authority, Capital | |||||
| Improvement Revenue | 5.00 | 1/1/19 | 1,000,000 | 1,164,080 | |
| Alabama Public School and | |||||
| College Authority, Capital | |||||
| Improvement Revenue | 5.00 | 1/1/26 | 1,250,000 | 1,526,800 | |
| Birmingham Water Works Board, | |||||
| Water Revenue (Assured | |||||
| Guaranty Municipal Corp.) | 5.00 | 1/1/17 | 1,000,000 | 1,096,290 | |
| Arizona—.1% | |||||
| Pima County Industrial Development | |||||
| Authority, Education Revenue | |||||
| (American Charter Schools | |||||
| Foundation Project) | 5.13 | 7/1/15 | 190,000 | 190,549 | |
The Fund 9
STATEMENT OF INVESTMENTS (continued)
| Long-Term Municipal | Coupon | Maturity | Principal | |
| Investments (continued) | Rate (%) | Date | Amount ($) | Value ($) |
| California—14.5% | ||||
| California, | ||||
| Economic Recovery Bonds | 5.00 | 7/1/18 | 1,500,000 | 1,736,955 |
| California, | ||||
| GO (Insured; AMBAC) | 6.00 | 2/1/17 | 1,000,000 | 1,129,400 |
| California, | ||||
| GO (Various Purpose) | 5.00 | 9/1/22 | 1,000,000 | 1,211,760 |
| California Health Facilities | ||||
| Financing Authority, Revenue | ||||
| (Sutter Health) | 5.00 | 8/15/18 | 1,030,000 | 1,191,226 |
| California Housing Finance Agency, | ||||
| Home Mortgage Revenue | ||||
| (Insured; Assured Guaranty | ||||
| Municipal Corp.) | 5.13 | 8/1/18 | 1,250,000 | 1,288,500 |
| California State Public Works | ||||
| Board, LR (Judicial | ||||
| Council of California) | ||||
| (New Stockton Courthouse) | 5.00 | 10/1/26 | 1,000,000 | 1,202,870 |
| California State Public Works | ||||
| Board, LR (Judicial Council of | ||||
| California) (Various Judicial | ||||
| Council Projects) | 5.00 | 12/1/17 | 1,015,000 | 1,151,548 |
| California State University | ||||
| Trustees, Systemwide Revenue | 5.00 | 11/1/22 | 1,000,000 | 1,209,380 |
| Golden State Tobacco | ||||
| Securitization Corporation, | ||||
| Enhanced Tobacco Settlement | ||||
| Asset-Backed Bonds | ||||
| (Insured; AMBAC) | 4.60 | 6/1/23 | 750,000 | 812,407 |
| Jurupa Public Financing Authority, | ||||
| Special Tax Revenue | 5.00 | 9/1/29 | 1,060,000 | 1,209,916 |
| Los Angeles Community | ||||
| Facilities District Number 4, | ||||
| Special Tax Revenue | ||||
| (Playa Vista-Phase 1) | 5.00 | 9/1/28 | 1,000,000 | 1,162,550 |
| Los Angeles Department of | ||||
| Water and Power, | ||||
| Power System Revenue | 5.00 | 7/1/20 | 1,000,000 | 1,203,520 |
10
| Long-Term Municipal | Coupon | Maturity | Principal | |
| Investments (continued) | Rate (%) | Date | Amount ($) | Value ($) |
| California (continued) | ||||
| Los Angeles Department of Water | ||||
| and Power, Power System Revenue | 5.00 | 7/1/23 | 1,000,000 | 1,233,460 |
| Sacramento County, | ||||
| Airport System Senior Revenue | 5.00 | 7/1/22 | 1,275,000 | 1,458,765 |
| Southern California Public Power | ||||
| Authority, Revenue (Canyon | ||||
| Power Project) | 5.00 | 7/1/22 | 2,000,000 | 2,322,080 |
| Southern California Public Power | ||||
| Authority, Revenue (Windy | ||||
| Point/Windy Flats Project) | 5.00 | 7/1/23 | 1,000,000 | 1,193,730 |
| Stockton Unified School District, | ||||
| GO (Insured; Assured Guaranty | ||||
| Municipal Corp.) | 4.00 | 7/1/16 | 500,000 | 531,090 |
| Tuolumne Wind Project Authority, | ||||
| Revenue (Tuolumne | ||||
| Company Project) | 5.00 | 1/1/18 | 1,000,000 | 1,129,920 |
| Colorado—.6% | ||||
| City and County of Denver, | ||||
| Airport System | ||||
| Subordinate Revenue | 5.00 | 11/15/22 | 720,000 | 850,162 |
| District of Columbia—.8% | ||||
| Metropolitan Washington Airports | ||||
| Authority, Airport System Revenue | 5.00 | 10/1/24 | 1,000,000 | 1,179,660 |
| Florida—9.0% | ||||
| Citizens Property Insurance | ||||
| Corporation, Personal Lines | ||||
| Account/Commercial Lines | ||||
| Account Senior Secured Revenue | 5.00 | 6/1/20 | 1,500,000 | 1,756,470 |
| Florida Department of | ||||
| Transportation, Turnpike Revenue | 5.00 | 7/1/25 | 1,000,000 | 1,198,900 |
| Lakeland, | ||||
| Energy System Revenue | ||||
| (Insured; Assured Guaranty | ||||
| Municipal Corp.) | 5.00 | 10/1/17 | 1,000,000 | 1,124,200 |
| Miami-Dade County, Aviation Revenue | ||||
| (Miami International Airport) | 5.25 | 10/1/23 | 1,000,000 | 1,179,250 |
The Fund 11
STATEMENT OF INVESTMENTS (continued)
| Long-Term Municipal | Coupon | Maturity | Principal | |
| Investments (continued) | Rate (%) | Date | Amount ($) | Value ($) |
| Florida (continued) | ||||
| Miami-Dade County, | ||||
| Seaport Revenue | 5.00 | 10/1/22 | 2,000,000 | 2,337,320 |
| Miami-Dade County, | ||||
| Water and Sewer System Revenue | ||||
| (Insured; Assured Guaranty | ||||
| Municipal Corp.) | 5.25 | 10/1/19 | 2,000,000 | 2,367,560 |
| Orlando Utilities Commission, | ||||
| Utility System Revenue | 5.00 | 10/1/14 | 100,000 | 100,014 |
| Orlando-Orange County Expressway | ||||
| Authority, Revenue (Insured; | ||||
| Assured Guaranty Municipal Corp.) | 5.00 | 7/1/18 | 1,000,000 | 1,149,150 |
| South Miami Health Facilities | ||||
| Authority, HR (Baptist Health | ||||
| South Florida Obligated Group) | 5.00 | 8/15/18 | 750,000 | 839,183 |
| Tampa, | ||||
| Capital Improvement Cigarette | ||||
| Tax Allocation Revenue (H. Lee | ||||
| Moffitt Cancer Center Project) | 5.00 | 9/1/23 | 500,000 | 579,495 |
| Tampa, | ||||
| Health System Revenue (BayCare | ||||
| Health System Issue) | 5.00 | 11/15/18 | 1,000,000 | 1,155,870 |
| Georgia—5.1% | ||||
| Atlanta, | ||||
| Airport General Revenue | 5.00 | 1/1/22 | 1,000,000 | 1,158,590 |
| Atlanta, | ||||
| Water and Wastewater Revenue | 6.00 | 11/1/20 | 1,000,000 | 1,229,990 |
| DeKalb County, | ||||
| Water and Sewerage Revenue | 5.00 | 10/1/21 | 2,380,000 | 2,835,413 |
| Georgia State Road and Tollway | ||||
| Authority, Guaranteed Revenue | 5.00 | 3/1/19 | 1,175,000 | 1,375,796 |
| Municipal Electric Authority of | ||||
| Georgia, GO (Project One | ||||
| Subordinated Bonds) | 5.00 | 1/1/21 | 1,000,000 | 1,184,840 |
| Illinois—7.0% | ||||
| Chicago, | ||||
| Customer Facility Charge | ||||
| Senior Lien Revenue (Chicago | ||||
| O’Hare International Airport) | 5.25 | 1/1/24 | 1,500,000 | 1,734,945 |
12
| Long-Term Municipal | Coupon | Maturity | Principal | |
| Investments (continued) | Rate (%) | Date | Amount ($) | Value ($) |
| IIllinois (continued) | ||||
| Chicago, | ||||
| General Airport Third Lien | ||||
| Revenue (Chicago O’Hare | ||||
| International Airport) | ||||
| (Insured; Assured Guaranty | ||||
| Municipal Corp.) | 5.00 | 1/1/20 | 1,000,000 | 1,125,120 |
| Chicago, | ||||
| Second Lien Water Revenue | 5.00 | 11/1/26 | 1,000,000 | 1,162,200 |
| Chicago Park District, | ||||
| Limited Tax GO | 5.00 | 1/1/28 | 2,500,000 | 2,850,300 |
| Cook County Community High School | ||||
| District Number 219, GO School | ||||
| Bonds (Insured; FGIC) | ||||
| (Escrowed to Maturity) | 7.88 | 12/1/14 | 100,000 | 101,317 |
| llinois Finance Authority, | ||||
| Revenue (DePaul University) | 5.00 | 10/1/16 | 1,000,000 | 1,043,720 |
| Northern Illinois University Board | ||||
| of Trustees, Auxiliary | ||||
| Facilities System Revenue | ||||
| (Insured; Assured Guaranty | ||||
| Municipal Corp.) | 5.00 | 4/1/17 | 1,500,000 | 1,633,335 |
| Railsplitter Tobacco Settlement | ||||
| Authority, Tobacco | ||||
| Settlement Revenue | 5.00 | 6/1/17 | 1,000,000 | 1,102,350 |
| Indiana—2.1% | ||||
| Indianapolis Local Public | ||||
| Improvement Bond | ||||
| Bank, Revenue | 5.00 | 6/1/17 | 1,625,000 | 1,809,844 |
| Knox County, | ||||
| EDR (Good Samaritan | ||||
| Hospital Project) | 5.00 | 4/1/23 | 1,300,000 | 1,456,390 |
| Kansas—2.0% | ||||
| Kansas Department of | ||||
| Transportation, Highway Revenue | 5.00 | 9/1/18 | 1,415,000 | 1,641,145 |
| Kansas Development Finance | ||||
| Authority, Revolving Funds | ||||
| Revenue (Kansas Department of | ||||
| Health and Environment) | 5.00 | 3/1/21 | 1,150,000 | 1,354,206 |
The Fund 13
STATEMENT OF INVESTMENTS (continued)
| Long-Term Municipal | Coupon | Maturity | Principal | |
| Investments (continued) | Rate (%) | Date | Amount ($) | Value ($) |
| Kentucky—.8% | ||||
| Louisville and Jefferson County | ||||
| Metropolitan Sewer District, Sewer | ||||
| and Drainage System Revenue | 5.00 | 5/15/23 | 1,000,000 | 1,188,180 |
| Louisiana—1.5% | ||||
| Louisiana, | ||||
| State Highway | ||||
| Improvement Revenue | 5.00 | 6/15/25 | 1,000,000 | 1,218,450 |
| Tobacco Settlement Financing | ||||
| Corporation of Louisiana, | ||||
| Tobacco Settlement | ||||
| Asset-Backed Bonds | 5.00 | 5/15/20 | 1,000,000 | 1,143,200 |
| Maryland—.7% | ||||
| Maryland Economic Development | ||||
| Corporation, EDR (Transportation | ||||
| Facilities Project) | 5.13 | 6/1/20 | 1,000,000 | 1,102,860 |
| Michigan—3.3% | ||||
| Detroit, | ||||
| Sewage Disposal System Senior | ||||
| Lien Revenue (Insured; Assured | ||||
| Guaranty Municipal Corp.) | 5.25 | 7/1/19 | 1,000,000 | 1,156,700 |
| Michigan Finance Authority, | ||||
| Local Government Loan Program | ||||
| Revenue (Detroit Water and | ||||
| Sewerage Department, Sewage | ||||
| Disposal System Revenue Senior | ||||
| Lien Local Project Bonds) | ||||
| (Insured; Assured Guaranty | ||||
| Municipal Corp.) | 5.00 | 7/1/30 | 1,000,000 | 1,104,270 |
| Michigan Finance Authority, | ||||
| Unemployment Obligation | ||||
| Assessment Revenue | 5.00 | 7/1/21 | 1,500,000 | 1,715,610 |
| Wayne County Airport Authority, | ||||
| Airport Revenue (Detroit | ||||
| Metropolitan Wayne | ||||
| County Airport) | 5.00 | 12/1/16 | 1,000,000 | 1,090,930 |
| Minnesota—.9% | ||||
| Western Minnesota Municipal Power | ||||
| Agency, Power Supply Revenue | 5.00 | 1/1/29 | 1,120,000 | 1,330,123 |
14
| Long-Term Municipal | Coupon | Maturity | Principal | ||
| Investments (continued) | Rate (%) | Date | Amount ($) | Value ($) | |
| New Jersey—3.8% | |||||
| New Jersey Economic Development | |||||
| Authority, Water Facilities | |||||
| Revenue (New Jersey—American | |||||
| Water Company, Inc. Project) | 5.10 | 6/1/23 | 1,000,000 | 1,126,890 | |
| New Jersey Educational Facilities | |||||
| Authority, Revenue (Rowan | |||||
| University Issue) | 5.00 | 7/1/18 | 1,225,000 | 1,391,183 | |
| New Jersey Health Care Facilities | |||||
| Financing Authority, Revenue | |||||
| (Virtua Health Issue) | 5.00 | 7/1/25 | 1,000,000 | 1,186,280 | |
| New Jersey Higher Education | |||||
| Student Assistance Authority, | |||||
| Senior Student Loan Revenue | 5.00 | 12/1/18 | 1,000,000 | 1,137,220 | |
| Tobacco Settlement Financing | |||||
| Corporation of New Jersey, | |||||
| Tobacco Settlement | |||||
| Asset-Backed Bonds | 4.50 | 6/1/23 | 1,000,000 | 990,250 | |
| New Mexico—.7% | |||||
| New Mexico Municipal Energy | |||||
| Acquisition Authority, Gas | |||||
| Supply Revenue | 0.85 | 8/1/19 | 1,000,000 | b | 1,006,760 |
| New York—10.5% | |||||
| Metropolitan Transportation | |||||
| Authority, Dedicated Tax | |||||
| Fund Revenue | 5.00 | 11/15/24 | 2,000,000 | 2,418,800 | |
| Metropolitan Transportation | |||||
| Authority, Transportation Revenue | 5.00 | 11/15/26 | 1,205,000 | 1,428,130 | |
| New York City, | |||||
| GO | 5.00 | 8/1/21 | 2,000,000 | 2,343,940 | |
| New York City, | |||||
| GO | 5.00 | 3/1/25 | 1,000,000 | 1,202,770 | |
| New York City Health and | |||||
| Hospitals Corporation, | |||||
| Health System Revenue | 5.00 | 2/15/19 | 1,000,000 | 1,153,630 | |
| New York City Transitional Finance | |||||
| Authority, Future Tax Secured | |||||
| Subordinate Revenue | 5.00 | 11/1/18 | 1,000,000 | 1,162,270 |
The Fund 15
STATEMENT OF INVESTMENTS (continued)
| Long-Term Municipal | Coupon | Maturity | Principal | ||
| Investments (continued) | Rate (%) | Date | Amount ($) | Value ($) | |
| New York (continued) | |||||
| New York State Urban Development | |||||
| Corporation, State Personal Income | |||||
| Tax Revenue (General Purpose) | 5.00 | 3/15/19 | 1,475,000 | 1,723,803 | |
| Onondaga Civic Development | |||||
| Corporation, Revenue (Saint | |||||
| Joseph’s Hospital Health | |||||
| Center Project) | 5.00 | 7/1/25 | 1,000,000 | 1,056,130 | |
| Port Authority of New York and New | |||||
| Jersey (Consolidated Bonds, | |||||
| 185th Series) | 5.00 | 9/1/30 | 1,000,000 | 1,145,070 | |
| Triborough Bridge and Tunnel | |||||
| Authority, General Revenue | |||||
| (MTA Bridges and Tunnels) | 5.00 | 11/15/24 | 2,150,000 | 2,569,594 | |
| North Carolina—.6% | |||||
| Wake County Industrial Facilities | |||||
| and Pollution Control Financing | |||||
| Authority, PCR (Carolina Power | |||||
| and Light Company Project) | |||||
| (Insured; AMBAC) | 0.09 | 10/1/22 | 1,000,000 | b | 936,250 |
| Ohio—1.9% | |||||
| Ohio Higher Educational Facility | |||||
| Commission, Higher Educational | |||||
| Facility Revenue (Case Western | |||||
| Reserve University Project) | 5.00 | 12/1/23 | 1,500,000 | 1,808,370 | |
| University of Toledo, | |||||
| General Receipts Bonds | 5.00 | 6/1/17 | 1,050,000 | 1,164,219 | |
| Pennsylvania—2.1% | |||||
| Pennsylvania Economic | |||||
| Development Financing | |||||
| Authority, Unemployment | |||||
| Compensation Revenue | 5.00 | 7/1/22 | 2,000,000 | 2,152,580 | |
| Pennsylvania Intergovernmental | |||||
| Cooperation Authority, Special | |||||
| Tax Revenue (City of Philadelphia | |||||
| Funding Program) | 5.00 | 6/15/17 | 1,000,000 | 1,117,010 | |
| Rhode Island—.6% | |||||
| Rhode Island Health and | |||||
| Educational Building | |||||
| Corporation, Higher Education | |||||
| Facilities Revenue (Brown | |||||
| University Issue) | 5.00 | 9/1/21 | 700,000 | 849,415 |
16
| Long-Term Municipal | Coupon | Maturity | Principal | ||
| Investments (continued) | Rate (%) | Date | Amount ($) | Value ($) | |
| South Dakota—1.7% | |||||
| South Dakota Conservancy District, | |||||
| Revenue (State Revolving | |||||
| Fund Program) | 5.00 | 8/1/17 | 2,370,000 | 2,666,937 | |
| Tennessee—1.9% | |||||
| Chattanooga-Hamilton County | |||||
| Hospital Authority, HR | |||||
| (Erlanger Medical Center) | |||||
| (Insured; National Public | |||||
| Finance Guarantee Corp.) | 0.39 | 10/1/27 | 2,000,000 | b | 1,755,000 |
| Metropolitan Government of | |||||
| Nashville and Davidson | |||||
| County, GO | 5.00 | 7/1/22 | 1,000,000 | 1,212,060 | |
| Texas—14.1% | |||||
| Arlington Independent School | |||||
| District, Unlimited Tax School | |||||
| Building Bonds (Permament | |||||
| School Fund Guarantee Program) | 5.00 | 2/15/27 | 1,400,000 | 1,658,454 | |
| Corpus Christi, | |||||
| Utility System Junior Lien | |||||
| Revenue (Insured; Assured | |||||
| Guaranty Municipal Corp.) | 5.00 | 7/15/23 | 1,725,000 | 2,038,191 | |
| Houston, | |||||
| Airport System Special | |||||
| Facilities Revenue (United | |||||
| Airlines, Inc. Terminal E Project) | 4.75 | 7/1/24 | 1,000,000 | 1,048,810 | |
| Houston, | |||||
| Combined Utility System First | |||||
| Lien Revenue | 5.00 | 11/15/18 | 1,355,000 | 1,574,225 | |
| Houston, | |||||
| Public Improvement GO | 5.00 | 3/1/24 | 2,000,000 | 2,451,500 | |
| Houston Convention and | |||||
| Entertainment Facilities | |||||
| Department, Hotel Occupancy | |||||
| Tax and Special Revenue | 5.00 | 9/1/20 | 1,000,000 | 1,178,570 | |
| Sam Rayburn Municipal Power | |||||
| Agency, Power Supply | |||||
| System Revenue | 5.00 | 10/1/20 | 1,210,000 | 1,408,779 | |
| Socorro Independent School | |||||
| District, Unlimited Tax Bonds | |||||
| (Permament School Fund | |||||
| Guarantee Program) | 5.00 | 8/15/26 | 3,525,000 | 4,310,088 |
The Fund 17
STATEMENT OF INVESTMENTS (continued)
| Long-Term Municipal | Coupon | Maturity | Principal | ||
| Investments (continued) | Rate (%) | Date | Amount ($) | Value ($) | |
| Texas (continued) | |||||
| Stafford Economic Development | |||||
| Corporation, Sales Tax Revenue | |||||
| (Insured; National Public | |||||
| Finance Guarantee Corp.) | |||||
| (Escrowed to Maturity) | 6.00 | 9/1/15 | 270,000 | 284,459 | |
| Tarrant Regional Water District, | |||||
| Water Transmission Facilities | |||||
| Contract Revenue (City of | |||||
| Dallas Project) | 5.00 | 9/1/18 | 1,000,000 | 1,158,280 | |
| Texas, | |||||
| GO (College Student Loan) | 5.00 | 8/1/17 | 1,000,000 | 1,122,980 | |
| Texas Municipal Power Agency, | |||||
| Revenue (Insured; National | |||||
| Public Finance Guarantee | |||||
| Corp.) (Escrowed to Maturity) | 0.00 | 9/1/16 | 10,000 | c | 9,938 |
| Texas Transportation Commission, | |||||
| State Highway Fund | |||||
| First Tier Revenue | 5.00 | 4/1/20 | 1,905,000 | 2,107,806 | |
| West Travis County Public Utility | |||||
| Agency, Revenue | 5.00 | 8/15/23 | 1,140,000 | 1,306,497 | |
| Virginia—1.6% | |||||
| Virginia Public School Authority, | |||||
| School Financing Bonds | 5.00 | 8/1/24 | 2,000,000 | 2,388,020 | |
| Washington—1.1% | |||||
| Energy Northwest, | |||||
| Electric Revenue (Columbia | |||||
| Generating Station) | 5.00 | 7/1/19 | 1,500,000 | 1,761,390 | |
| West Virginia—.8% | |||||
| West Virginia University Board of | |||||
| Governors, University | |||||
| Improvement Revenue (West | |||||
| Virginia University Projects) | 5.00 | 10/1/17 | 1,135,000 | 1,279,576 | |
| Wisconsin—1.4% | |||||
| Public Finance Authority of | |||||
| Wisconsin, Senior Living | |||||
| Revenue (Rose Villa Project) | 4.25 | 11/15/20 | 1,000,000 | 1,007,130 | |
| Wisconsin Health and Educational | |||||
| Facilities Authority, Health Facilities | |||||
| Revenue (UnityPoint Health) | 5.00 | 12/1/23 | 1,000,000 | 1,190,220 |
18
| Long-Term Municipal | Coupon | Maturity | Principal | ||
| Investments (continued) | Rate (%) | Date | Amount ($) | Value ($) | |
| Wyoming—.4% | |||||
| Wyoming Community Development | |||||
| Authority, Housing Revenue | 5.50 | 12/1/17 | 535,000 | 560,322 | |
| Total Long-Term Municipal Investments | |||||
| (cost $136,984,704) | 144,573,650 | ||||
| Total Investments (cost $142,719,423) | 97.8 | % | 150,256,602 | ||
| Cash and Receivables (Net) | 2.2 | % | 3,437,059 | ||
| Net Assets | 100.0 | % | 153,693,661 | ||
| a Securities exempt from registration pursuant to Rule 144A under the Securities Act of 1933.These securities may be |
| resold in transactions exempt from registration, normally to qualified institutional buyers.At September 30, 2014, |
| these securities were valued at $4,173,057 or 2.7% of net assets. |
| b Variable rate security—interest rate subject to periodic change. |
| c Security issued with a zero coupon. Income is recognized through the accretion of discount. |
| Portfolio Summary (Unaudited)† | |||
| Value (%) | Value (%) | ||
| Transportation Services | 19.0 | Asset-Backed Certificates | .8 |
| Utility-Water and Sewer | 15.2 | Commercial Mortagage-Backed | .8 |
| Utility-Electric | 9.7 | County | .8 |
| Education | 8.4 | Industrial | .8 |
| Health Care | 8.2 | Asset-Backed/Municipals | .6 |
| City | 8.1 | Pollution Control | .6 |
| Special Tax | 7.9 | Financial | .5 |
| State/Territory | 3.4 | Prerefunded | .2 |
| Asset-Backed Ctfs./Auto Recievables | 1.6 | Other | 8.5 |
| Lease | 1.5 | ||
| Housing | 1.2 | 97.8 | |
| † | Based on net assets. |
The Fund 19
STATEMENT OF INVESTMENTS (continued)
| Summary of Abbreviations | |||
| ABAG | Association of Bay Area | ACA | American Capital Access |
| Governments | |||
| AGC | ACE Guaranty Corporation | AGIC | Asset Guaranty Insurance Company |
| AMBAC | American Municipal Bond | ARRN | Adjustable Rate |
| Assurance Corporation | Receipt Notes | ||
| BAN | Bond Anticipation Notes | BPA | Bond Purchase Agreement |
| CIFG | CDC Ixis Financial Guaranty | COP | Certificate of Participation |
| CP | Commercial Paper | DRIVERS | Derivative Inverse |
| Tax-Exempt Receipts | |||
| EDR | Economic Development | EIR | Environmental Improvement |
| Revenue | Revenue | ||
| FGIC | Financial Guaranty | FHA | Federal Housing |
| Insurance Company | Administration | ||
| FHLB | Federal Home | FHLMC | Federal Home Loan Mortgage |
| Loan Bank | Corporation | ||
| FNMA | Federal National | GAN | Grant Anticipation Notes |
| Mortgage Association | |||
| GIC | Guaranteed Investment | GNMA | Government National Mortgage |
| Contract | Association | ||
| GO | General Obligation | HR | Hospital Revenue |
| IDB | Industrial Development Board | IDC | Industrial Development Corporation |
| IDR | Industrial Development | LIFERS | Long Inverse Floating |
| Revenue | Exempt Receipts | ||
| LOC | Letter of Credit | LOR | Limited Obligation Revenue |
| LR | Lease Revenue | MERLOTS | Municipal Exempt Receipts |
| Liquidity Option Tender | |||
| MFHR | Multi-Family Housing Revenue | MFMR | Multi-Family Mortgage Revenue |
| PCR | Pollution Control Revenue | PILOT | Payment in Lieu of Taxes |
| P-FLOATS | Puttable Floating Option | PUTTERS | Puttable Tax-Exempt Receipts |
| Tax-Exempt Receipts | |||
| RAC | Revenue Anticipation Certificates | RAN | Revenue Anticipation Notes |
| RAW | Revenue Anticipation Warrants | RIB | Residual Interest Bonds |
| ROCS | Reset Options Certificates | RRR | Resources Recovery Revenue |
| SAAN | State Aid Anticipation Notes | SBPA | Standby Bond Purchase Agreement |
| SFHR | Single Family Housing Revenue | SFMR | Single Family Mortgage Revenue |
| SONYMA | State of New York | SPEARS | Short Puttable Exempt |
| Mortgage Agency | Adjustable Receipts | ||
| SWDR | Solid Waste Disposal Revenue | TAN | Tax Anticipation Notes |
| TAW | Tax Anticipation Warrants | TRAN | Tax and Revenue Anticipation Notes |
| XLCA | XL Capital Assurance | ||
| See notes to financial statements. | |||
20
| STATEMENT OF ASSETS AND LIABILITIES |
| September 30, 2014 |
| Cost | Value | |||
| Assets ($): | ||||
| Investments in securities—See Statement of Investments | 142,719,423 | 150,256,602 | ||
| Cash | 1,797,413 | |||
| Interest receivable | 1,740,373 | |||
| Receivable for shares of Beneficial Interest subscribed | 89,512 | |||
| Prepaid expenses | 39,298 | |||
| 153,923,198 | ||||
| Liabilities ($): | ||||
| Due to The Dreyfus Corporation and affiliates—Note 3(c) | 32,889 | |||
| Payable for shares of Beneficial Interest redeemed | 144,597 | |||
| Accrued expenses | 52,051 | |||
| 229,537 | ||||
| Net Assets ($) | 153,693,661 | |||
| Composition of Net Assets ($): | ||||
| Paid-in capital | 145,623,018 | |||
| Accumulated undistributed investment income—net | 1,984 | |||
| Accumulated net realized gain (loss) on investments | 531,480 | |||
| Accumulated net unrealized appreciation | ||||
| depreciation) on investments | 7,537,179 | |||
| Net Assets ($) | 153,693,661 | |||
| Net Asset Value Per Share | ||||
| Class A | Class C | Class I | Class Y | |
| Net Assets ($) | 6,173,308 | 1,001,274 | 145,493,176 | 1,025,903 |
| Shares Outstanding | 266,661 | 43,236 | 6,281,973 | 44,302 |
| Net Asset Value Per Share ($) | 23.15 | 23.16 | 23.16 | 23.16 |
| See notes to financial statements. | ||||
The Fund 21
| STATEMENT OF OPERATIONS | ||
| Year Ended September 30, 2014 | ||
| Investment Income ($): | ||
| Interest Income | 4,254,648 | |
| Expenses: | ||
| Investment advisory fee—Note 3(a) | 596,886 | |
| Professional fees | 132,115 | |
| Administration fee—Note 3(a) | 89,533 | |
| Registration fees | 64,377 | |
| Shareholder servicing costs—Note 3(c) | 60,392 | |
| Prospectus and shareholders’ reports | 25,715 | |
| Trustees’ fees and expenses—Note 3(d) | 11,473 | |
| Distribution fees—Note 3(b) | 10,978 | |
| Custodian fees—Note 3(c) | 9,887 | |
| Loan commitment fees—Note 2 | 1,617 | |
| Miscellaneous | 42,274 | |
| Total Expenses | 1,045,247 | |
| Less—reduction in expenses due to undertaking—Note 3(a) | (343,749 | ) |
| Less—reduction in fees due to earnings credits—Note 3(c) | (21 | ) |
| Net Expenses | 701,477 | |
| Investment Income—Net | 3,553,171 | |
| Realized and Unrealized Gain (Loss) on Investments—Note 4 ($): | ||
| Net realized gain (loss) on investments | 549,300 | |
| Net unrealized appreciation (depreciation) on investments | 3,170,912 | |
| Net Realized and Unrealized Gain (Loss) on Investments | 3,720,212 | |
| Net Increase in Net Assets Resulting from Operations | 7,273,383 | |
| See notes to financial statements. | ||
22
STATEMENT OF CHANGES IN NET ASSETS
| Year Ended September 30, | ||||
| 2014 | 2013 | a | ||
| Operations ($): | ||||
| Investment income—net | 3,553,171 | 3,299,250 | ||
| Net realized gain (loss) on investments | 549,300 | (43,405 | ) | |
| Net unrealized appreciation | ||||
| (depreciation) on investments | 3,170,912 | (4,388,106 | ) | |
| Net Increase (Decrease) in Net Assets | ||||
| Resulting from Operations | 7,273,383 | (1,132,261 | ) | |
| Dividends to Shareholders from ($): | ||||
| Investment income—net: | ||||
| Class A | (132,161 | ) | (145,558 | ) |
| Class C | (20,494 | ) | (28,239 | ) |
| Class I | (3,380,066 | ) | (3,139,673 | ) |
| Class Y | (4,424 | ) | (6 | ) |
| Net realized gain on investments: | ||||
| Class A | — | (34,521 | ) | |
| Class C | — | (11,026 | ) | |
| Class I | — | (667,647 | ) | |
| Total Dividends | (3,537,145 | ) | (4,026,670 | ) |
| Beneficial Interest Transactions ($): | ||||
| Net proceeds from shares sold: | ||||
| Class A | 1,665,136 | 3,511,221 | ||
| Class C | 68,355 | 717,609 | ||
| Class I | 80,162,182 | 36,460,867 | ||
| Class Y | 1,017,447 | 1,000 | ||
| Dividends reinvested: | ||||
| Class A | 125,735 | 170,617 | ||
| Class C | 20,208 | 38,746 | ||
| Class I | 2,764,779 | 3,459,905 | ||
| Class Y | 3,142 | — | ||
| Cost of shares redeemed: | ||||
| Class A | (2,677,697 | ) | (3,175,829 | ) |
| Class C | (955,844 | ) | (901,716 | ) |
| Class I | (64,499,441 | ) | (39,761,232 | ) |
| Increase (Decrease) in Net Assets from | ||||
| Beneficial Interest Transactions | 17,694,002 | 521,188 | ||
| Total Increase (Decrease) in Net Assets | 21,430,240 | (4,637,743 | ) | |
| Net Assets ($): | ||||
| Beginning of Period | 132,263,421 | 136,901,164 | ||
| End of Period | 153,693,661 | 132,263,421 | ||
| Undistributed investment income—net | 1,984 | — | ||
The Fund 23
STATEMENT OF CHANGES IN NET ASSETS (continued)
| Year Ended September 30, | ||||
| 2014 | 2013 | a | ||
| Capital Share Transactions: | ||||
| Class Ab | ||||
| Shares sold | 72,867 | 152,431 | ||
| Shares issued for dividends reinvested | 5,490 | 7,391 | ||
| Shares redeemed | (117,866 | ) | (136,871 | ) |
| Net Increase (Decrease) in Shares Outstanding | (39,509 | ) | 22,951 | |
| Class Cb | ||||
| Shares sold | 3,000 | 31,424 | ||
| Shares issued for dividends reinvested | 883 | 1,674 | ||
| Shares redeemed | (41,761 | ) | (39,187 | ) |
| Net Increase (Decrease) in Shares Outstanding | (37,878 | ) | (6,089 | ) |
| Class Ic | ||||
| Shares sold | 3,523,025 | 1,581,246 | ||
| Shares issued for dividends reinvested | 120,645 | 149,780 | ||
| Shares redeemed | (2,834,303 | ) | (1,725,344 | ) |
| Net Increase (Decrease) in Shares Outstanding | 809,367 | 5,682 | ||
| Class Yc | ||||
| Shares sold | 44,122 | 44.25 | ||
| Shares issued for dividends reinvested | 136 | — | ||
| Net Increase (Decrease) in Shares Outstanding | 44,258 | 44.25 | ||
| a Effective July 1, 2013, the fund commenced offering ClassY shares. |
| b During the period ended September 30, 2013, 2,712 Class C shares representing $63,079 were exchanged for |
| 2,714 Class A shares. |
| c During the period ended September 30, 2014, 31,115 Class I shares representing $716,584 were exchanged for |
| 31,115 ClassY shares. |
See notes to financial statements.
24
FINANCIAL HIGHLIGHTS
The following tables describe the performance for each share class for the fiscal periods indicated. All information (except portfolio turnover rate) reflects financial results for a single fund share.Total return shows how much your investment in the fund would have increased (or decreased) during each period, assuming you had reinvested all dividends and distributions.These figures have been derived from the fund’s financial statements.
| Year Ended September 30, | ||||||||||
| Class A Shares | 2014 | 2013 | 2012 | 2011 | 2010 | |||||
| Per Share Data ($): | ||||||||||
| Net asset value, beginning of period | 22.56 | 23.44 | 23.05 | 22.95 | 22.45 | |||||
| Investment Operations: | ||||||||||
| Investment income—neta | .49 | .51 | .53 | .61 | .61 | |||||
| Net realized and unrealized | ||||||||||
| gain (loss) on investments | .59 | (.76 | ) | .64 | .14 | .54 | ||||
| Total from Investment Operations | 1.08 | (.25 | ) | 1.17 | .75 | 1.15 | ||||
| Distributions: | ||||||||||
| Dividends from investment income—net | (.49 | ) | (.51 | ) | (.52 | ) | (.62 | ) | (.65 | ) |
| Dividends from net realized | ||||||||||
| gain on investments | — | (.12 | ) | (.26 | ) | (.03 | ) | — | ||
| Total Distributions | (.49 | ) | (.63 | ) | (.78 | ) | (.65 | ) | (.65 | ) |
| Net asset value, end of period | 23.15 | 22.56 | 23.44 | 23.05 | 22.95 | |||||
| Total Return (%)b | 4.84 | (1.10 | ) | 5.19 | 3.38 | 5.24 | ||||
| Ratios/Supplemental Data (%): | ||||||||||
| Ratio of total expenses | ||||||||||
| to average net assets | .95 | .89 | .90 | .98 | .96 | |||||
| Ratio of net expenses | ||||||||||
| to average net assets | .70 | .70 | .80 | .80 | .80 | |||||
| Ratio of net investment income | ||||||||||
| to average net assets | 2.15 | 2.20 | 2.25 | 2.72 | 2.80 | |||||
| Portfolio Turnover Rate | 26.01 | 35.03 | 21.97 | 27.67 | 32.07 | |||||
| Net Assets, end of period ($ x 1,000) | 6,173 | 6,908 | 6,639 | 4,760 | 1,665 | |||||
| a | Based on average shares outstanding. |
| b | Exclusive of sales charge. |
See notes to financial statements.
The Fund 25
FINANCIAL HIGHLIGHTS (continued)
| Year Ended September 30, | ||||||||||
| Class C Shares | 2014 | 2013 | 2012 | 2011 | 2010 | |||||
| Per Share Data ($): | ||||||||||
| Net asset value, beginning of period | 22.57 | 23.45 | 23.05 | 22.95 | 22.45 | |||||
| Investment Operations: | ||||||||||
| Investment income-neta | .32 | .33 | .35 | .45 | .40 | |||||
| Net realized and unrealized | ||||||||||
| gain (loss) on investments | .59 | (.75 | ) | .66 | .13 | .59 | ||||
| Total from Investment Operations | .91 | (.42 | ) | 1.01 | .58 | .99 | ||||
| Distributions: | ||||||||||
| Dividends from investment income—net | (.32 | ) | (.34 | ) | (.35 | ) | (.45 | ) | (.49 | ) |
| Dividends from net realized | ||||||||||
| gain on investments | — | (.12 | ) | (.26 | ) | (.03 | ) | — | ||
| Total Distributions | (.32 | ) | (.46 | ) | (.61 | ) | (.48 | ) | (.49 | ) |
| Net asset value, end of period | 23.16 | 22.57 | 23.45 | 23.05 | 22.95 | |||||
| Total Return (%)b | 4.07 | (1.80 | ) | 4.39 | 2.60 | 4.46 | ||||
| Ratios/Supplemental Data (%): | ||||||||||
| Ratio of total expenses | ||||||||||
| to average net assets | 1.75 | 1.65 | 1.67 | 1.73 | 1.74 | |||||
| Ratio of net expenses | ||||||||||
| to average net assets | 1.45 | 1.45 | 1.55 | 1.55 | 1.55 | |||||
| Ratio of net investment income | ||||||||||
| to average net assets | 1.40 | 1.45 | 1.48 | 1.99 | 1.94 | |||||
| Portfolio Turnover Rate | 26.01 | 35.03 | 21.97 | 27.67 | 32.07 | |||||
| Net Assets, end of period ($ x 1,000) | 1,001 | 1,831 | 2,045 | 719 | 480 | |||||
| a | Based on average shares outstanding. |
| b | Exclusive of sales charge. |
See notes to financial statements.
26
| Year Ended September 30, | ||||||||||
| Class I Shares | 2014 | 2013 | 2012 | 2011 | 2010 | |||||
| Per Share Data ($): | ||||||||||
| Net asset value, beginning of period | 22.57 | 23.45 | 23.06 | 22.95 | 22.45 | |||||
| Investment Operations: | ||||||||||
| Investment income—neta | .55 | .57 | .60 | .70 | .73 | |||||
| Net realized and unrealized | ||||||||||
| gain (loss) on investments | .59 | (.76 | ) | .65 | .14 | .50 | ||||
| Total from Investment Operations | 1.14 | (.19 | ) | 1.25 | .84 | 1.23 | ||||
| Distributions: | ||||||||||
| Dividends from investment income—net | (.55 | ) | (.57 | ) | (.60 | ) | (.70 | ) | (.73 | ) |
| Dividends from net realized | ||||||||||
| gain on investments | — | (.12 | ) | (.26 | ) | (.03 | ) | — | ||
| Total Distributions | (.55 | ) | (.69 | ) | (.86 | ) | (.73 | ) | (.73 | ) |
| Net asset value, end of period | 23.16 | 22.57 | 23.45 | 23.06 | 22.95 | |||||
| Total Return (%) | 5.11 | (.85 | ) | 5.54 | 3.79 | 5.61 | ||||
| Ratios/Supplemental Data (%): | ||||||||||
| Ratio of total expenses | ||||||||||
| to average net assets | .68 | .61 | .61 | .63 | .64 | |||||
| Ratio of net expenses | ||||||||||
| to average net assets | .45 | .45 | .45 | .45 | .45 | |||||
| Ratio of net investment income | ||||||||||
| to average net assets | 2.40 | 2.45 | 2.61 | 3.10 | 3.26 | |||||
| Portfolio Turnover Rate | 26.01 | 35.03 | 21.97 | 27.67 | 32.07 | |||||
| Net Assets, end of period ($ x 1,000) | 145,493 | 123,524 | 128,217 | 128,398 | 109,470 | |||||
| a Based on average shares outstanding. | ||||||||||
| See notes to financial statements. | ||||||||||
The Fund 27
FINANCIAL HIGHLIGHTS (continued)
| Year Ended September 30, | ||||
| Class Y Shares | 2014 | 2013 | a | |
| Per Share Data ($): | ||||
| Net asset value, beginning of period | 22.57 | 22.60 | ||
| Investment Operations: | ||||
| Investment income—netb | .47 | .14 | ||
| Net realized and unrealized | ||||
| gain (loss) on investments | .68 | (.03 | ) | |
| Total from Investment Operations | 1.15 | .11 | ||
| Distributions: | ||||
| Dividends from investment income—net | (.56 | ) | (.14 | ) |
| Net asset value, end of period | 23.16 | 22.57 | ||
| Total Return (%) | 5.13 | .50 | c | |
| Ratios/Supplemental Data (%): | ||||
| Ratio of total expenses to average net assets | .66 | .58 | d | |
| Ratio of net expenses to average net assets | .45 | .45 | d | |
| Ratio of net investment income | ||||
| to average net assets | 2.40 | 2.57 | d | |
| Portfolio Turnover Rate | 26.01 | 35.03 | ||
| Net Assets, end of period ($ x 1,000) | 1,026 | 1 | ||
| a | From July 1, 2013 (commencement of initial offering) to September 30, 2013. |
| b | Based on average shares outstanding. |
| c | Not annualized. |
| d | Annualized. |
See notes to financial statements.
28
NOTES TO FINANCIAL STATEMENTS
NOTE 1—Significant Accounting Policies:
Dreyfus Tax Sensitive Total Return Bond Fund (the “fund”) is a separate non-diversified series of Dreyfus Investment Funds (the “Trust”), which is registered under the Investment Company Act of 1940, as amended (the “Act”), as an open-end management investment company and operates as a series company currently offering seven series, including the fund. The fund’s investment objective is to seek a high after-tax total return. Prior to February 21, 2014, the fund’s investment objective was to seek a high level of interest income exempt from federal income tax, while preserving shareholders’ capital. The Dreyfus Corporation (the “Manager” or “Dreyfus”), a wholly-owned subsidiary of The Bank of New York Mellon Corporation (“BNY Mellon”), serves as the fund’s investment adviser. Standish Mellon Asset Management Company LLC (“Standish”), an affiliate of Dreyfus, serves as the fund’s sub-investment adviser. At a meeting held on October 30-31, 2013, the Trust’s Board of Trustees (the “Board “) approved a new sub-investment advisory agreement with Standish, which became effective on February 21, 2014 (the “Effective Date”).
The Board also approved, as of the Effective Date, a proposal to change the name of the fund from “Dreyfus/Standish Intermediate Tax Exempt Bond Fund” to “Dreyfus Tax Sensitive Total Return Bond Fund”.
MBSC Securities Corporation (the “Distributor”), a wholly-owned subsidiary of Dreyfus, is the distributor of the fund’s shares. The fund is authorized to issue an unlimited number of $.001 par value shares of Beneficial Interest in each of the following classes of shares: Class A, Class C, Class I and Class Y. Class A and Class C shares are sold primarily to retail investors through financial intermediaries and bear Distribution and/or Shareholder Service Plan fees. Class A shares generally are subject to a sales charge imposed at the time of purchase. Class C shares are subject to a contingent deferred sales charge (“CDSC”) imposed on Class C shares redeemed within one year of purchase. Class I shares are sold primarily to bank trust departments
The Fund 29
NOTES TO FINANCIAL STATEMENTS (continued)
and other financial service providers (including The Bank of NewYork Mellon, a subsidiary of BNY Mellon and an affiliate of Dreyfus, and its affiliates), acting on behalf of customers having a qualified trust or an investment account or relationship at such institution, and bear no Distribution or Shareholder Services Plan fees. Class Y shares are sold at net asset value per share generally to institutional investors, and bear no Distribution or Shareholder Services Plan fees. Class I and Class Y shares are offered without a front-end sales charge or CDSC. Other differences between the classes include the services offered to and the expenses borne by each class, the allocation of certain transfer agency costs, and certain voting rights. Income, expenses (other than expenses attributable to a specific class), and realized and unrealized gains or losses on investments are allocated to each class of shares based on its relative net assets.
The Trust accounts separately for the assets, liabilities and operations of each series. Expenses directly attributable to each series are charged to that series’ operations; expenses which are applicable to all series are allocated among them on a pro rata basis.
The Financial Accounting Standards Board (“FASB”) Accounting Standards Codification (“ASC”) is the exclusive reference of authoritative U.S. generally accepted accounting principles (“GAAP”) recognized by the FASB to be applied by nongovernmental entities. Rules and interpretive releases of the Securities and Exchange Commission (“SEC”) under authority of federal laws are also sources of authoritative GAAP for SEC registrants. The fund’s financial statements are prepared in accordance with GAAP, which may require the use of management estimates and assumptions. Actual results could differ from those estimates.
(a) Portfolio valuation: The fair value of a financial instrument is the amount that would be received to sell an asset or paid to transfer a liability in an orderly transaction between market participants at the measurement date (i.e., the exit price). GAAP establishes a fair value hierarchy that prioritizes the inputs of valuation techniques used to
30
measure fair value. This hierarchy gives the highest priority to unadjusted quoted prices in active markets for identical assets or liabilities (Level 1 measurements) and the lowest priority to unobservable inputs (Level 3 measurements).
Additionally, GAAP provides guidance on determining whether the volume and activity in a market has decreased significantly and whether such a decrease in activity results in transactions that are not orderly. GAAP requires enhanced disclosures around valuation inputs and techniques used during annual and interim periods.
Various inputs are used in determining the value of the fund’s investments relating to fair value measurements.These inputs are summarized in the three broad levels listed below:
Level 1—unadjusted quoted prices in active markets for identical investments.
Level 2—other significant observable inputs (including quoted prices for similar investments, interest rates, prepayment speeds, credit risk, etc.).
Level 3—significant unobservable inputs (including the fund’s own assumptions in determining the fair value of investments).
The inputs or methodology used for valuing securities are not necessarily an indication of the risk associated with investing in those securities.
Changes in valuation techniques may result in transfers in or out of an assigned level within the disclosure hierarchy. Valuation techniques used to value the fund’s investments are as follows:
Registered investment companies that are not traded on an exchange are valued at their net asset value and are generally categorized within Level 1 of the fair value hierarchy.
Investments in securities, excluding short-term investments (other than U.S. Treasury Bills), are valued each business day by an independent pricing service (the “Service”) approved by the Board.
The Fund 31
NOTES TO FINANCIAL STATEMENTS (continued)
Investments for which quoted bid prices are readily available and are representative of the bid side of the market in the judgment of the Service are valued at the mean between the quoted bid prices (as obtained by the Service from dealers in such securities) and asked prices (as calculated by the Service based upon its evaluation of the market for such securities). Other investments (which constitute a majority of the portfolio securities) are valued as determined by the Service, based on methods which include consideration of the following: yields or prices of securities of comparable quality, coupon, maturity and type; indications as to values from dealers; and general market conditions.These securities are generally categorized within Level 2 of the fair value hierarchy.
The Service’s procedures are reviewed by Dreyfus under the general supervision of the Board.
When market quotations or official closing prices are not readily available, or are determined not to reflect accurately fair value, such as when the value of a security has been significantly affected by events after the close of the exchange or market on which the security is principally traded (for example, a foreign exchange or market), but before the fund calculates its net asset value, the fund may value these investments at fair value as determined in accordance with the procedures approved by the Board. Certain factors may be considered when fair valuing investments such as: fundamental analytical data, the nature and duration of restrictions on disposition, an evaluation of the forces that influence the market in which the securities are purchased and sold, and public trading in similar securities of the issuer or comparable issuers. These securities are either categorized within Level 2 or 3 of the fair value hierarchy depending on the relevant inputs used.
For restricted securities where observable inputs are limited, assumptions about market activity and risk are used and are generally categorized within Level 3 of the fair value hierarchy.
32
The following is a summary of the inputs used as of September 30, 2014 in valuing the fund’s investments:
| Level 2—Other | Level 3— | |||
| Level 1— | Significant | Significant | ||
| Unadjusted | Observable | Unobservable | ||
| Quoted Prices | Inputs | Inputs | Total | |
| Assets ($) | ||||
| Investments in Securities: | ||||
| Asset-Backed | — | 3,640,253 | — | 3,640,253 |
| Commercial | ||||
| Mortgage-Backed | — | 1,271,136 | — | 1,271,136 |
| Corporate Bonds† | — | 771,563 | — | 771,563 |
| Municipal Bonds† | — | 144,573,650 | — | 144,573,650 |
| † See Statement of Investments for additional detailed categorizations. | ||||
At September 30, 2014, there were no transfers between Level 1 and Level 2 of the fair value hierarchy.
(b) Securities transactions and investment income: Securities transactions are recorded on a trade date basis. Realized gains and losses from securities transactions are recorded on the identified cost basis. Interest income, adjusted for accretion of discount and amortization of premium on investments, is earned from settlement date and recognized on the accrual basis. Securities purchased or sold on a when issued or delayed delivery basis may be settled a month or more after the trade date.
(c) Risk: The fund invests in debt securities. Failure of an issuer of the debt securities to make timely interest or principal payments, or a decline or the perception of a decline in the credit quality of a debt security, can cause the debt security’s price to fall, potentially lowering the fund’s share price. In addition, the value of debt securities may decline due to general market conditions that are not specifically related to a particular issuer, such as real or perceived adverse economic conditions, changes in outlook for corporate earnings, changes
The Fund 33
NOTES TO FINANCIAL STATEMENTS (continued)
in interest or currency rates or adverse investor sentiment. They may also decline because of factors that affect a particular industry.
(d) Dividends to shareholders: It is the policy of the fund to declare dividends daily from investment income-net. Such dividends are paid monthly. Dividends from net realized capital gains, if any, are normally declared and paid annually, but the fund may make distributions on a more frequent basis to comply with the distribution requirements of the Internal Revenue Code of 1986, as amended (the “Code”).To the extent that net realized capital gains can be offset by capital loss carryovers, it is the policy of the fund not to distribute such gains. Income and capital gain distributions are determined in accordance with income tax regulations, which may differ from GAAP.
(e) Federal income taxes: It is the policy of the fund to continue to qualify as a regulated investment company, which can distribute tax-exempt dividends, by complying with the applicable provisions of the Code, and to make distributions of taxable and tax-exempt income and net realized capital gain sufficient to relieve it from substantially all federal income and excise taxes.
As of and during the period ended September 30, 2014, the fund did not have any liabilities for any uncertain tax positions. The fund recognizes interest and penalties, if any, related to uncertain tax positions as income tax expense in the Statement of Operations. During the period ended September 30, 2014, the fund did not incur any interest or penalties.
Each tax year in the four-year period ended September 30, 2014 remains subject to examination by the Internal Revenue Service and state taxing authorities.
At September 30, 2014, the components of accumulated earnings on a tax basis were as follows: undistributed tax-exempt income $7,943, undistributed ordinary income $230,906, undistributed capital gains $283,530 and unrealized appreciation $7,554,223.
34
The tax character of distributions paid to shareholders during the fiscal periods September 30, 2014 and September 30, 2013 were as follows: tax-exempt income $3,424,477 and $3,313,701, ordinary income $112,668 and $208,429 and long-term capital gains $0 and $504,540, respectively.
During the period ended September 30, 2014, as a result of permanent book to tax differences, primarily due to the tax treatment for amortization adjustments, the fund decreased accumulated undistributed investment income-net by $14,042, increased accumulated net realized gain (loss) on investments by $12,945 and increased paid-in capital by $1,097. Net assets and net asset value per share were not affected by this reclassification.
NOTE 2—Bank Lines of Credit:
The fund participates with other Dreyfus-managed funds in a $265 million unsecured credit facility led by Citibank, N.A. and a $300 million unsecured credit facility provided by The Bank of New York Mellon (each, a “Facility”), each to be utilized primarily for temporary or emergency purposes, including the financing of redemptions. Prior to October 9, 2013, the unsecured credit facility with Citibank, N.A. was $210 million. In connection therewith, the fund has agreed to pay its pro rata portion of commitment fees for each Facility. Interest is charged to the fund based on rates determined pursuant to the terms of the respective Facility at the time of borrowing. During the period ended September 30, 2014, the fund did not borrow under the Facilities.
NOTE 3—Investment Advisory Fee, Sub-Investment Advisory Fee, Adminstration Fee and Other Transactions with Affiliates:
(a) Pursuant to an investment advisory agreement with Dreyfus, the investment advisory fee is computed at the annual rate of .40% of the value of the fund’s average daily net assets and is payable monthly. Dreyfus has contractually agreed, from October 1, 2013 through
| The Fund | 35 |
NOTES TO FINANCIAL STATEMENTS (continued)
February 1, 2016, to waive receipt of its fees and/or assume the direct expenses of the fund so that the expenses of none of the classes (excluding Rule 12b-1 Distribution Plan fees, Shareholder Services Plan fees, taxes, interest expense, brokerage commissions, commitment fees on borrowings and extraordinary expenses) exceed .45% of the value of the fund’s average daily net assets.The reduction in expenses, pursuant to the undertaking, amounted to $343,749 during the year ended September 30, 2014.
Pursuant to separate Sub-Investment Advisory Agreements between Dreyfus and Standish, Standish serves as the fund’s sub-adviser responsible for the day-to–day management of a portion of the fund’s portfolio, Dreyfus pays each sub-Investment advisor a monthly fee at an annual percentage of the value of the fund’s average daily net assets. Dreyfus has obtained an exemptive order from the SEC, upon which the fund may rely, to use a manager of managers approach that permits Dreyfus, subject to certain conditions and approval by the Board, to enter into and materially amend sub-investment advisory agreements with one or more subadvisers who are either unaffiliated with Dreyfus or are wholly-owned subsidiaries (as defined under the Act) of Dreyfus’ ultimate parent company, BNY Mellon, without obtaining shareholder approval.The order also relieves the fund from disclosing the sub-investment advisory fee paid by Dreyfus to an unaffiliated subadviser in documents filed with the SEC and provided to shareholders. In addition, pursuant to the order, it is not necessary to disclose the sub-investment advisory fee payable by Dreyfus separately to a subadviser that is a wholly-owned subsidiary of BNY Mellon in documents filed with the SEC and provided to shareholders; such fees are to be aggregated with fees payable to Dreyfus. Dreyfus has ultimate responsibility (subject to oversight by the Board) to supervise any subadviser and recommend the hiring, termination, and replacement of any subadviser to the Board.
The fund has an Accounting and Administration Agreement (the “Administration Agreement”) with Dreyfus, whereby Dreyfus performs administrative and accounting services for the fund.The fund has agreed to compensate Dreyfus for providing accounting services,
36
administration, compliance monitoring, regulatory and shareholder reporting, as well as for related facilities and equipment.The fee is based on the fund’s average daily net assets and computed at the following annual rates: .06% of the first $500 million, .04% of the next $500 million and .02% in excess of $1 billion.
In addition, after applying any expense limitations or fee waivers that reduce the fees paid to Dreyfus for this service, Dreyfus has contractually agreed in writing to waive any remaining fees for this service to the extent that they exceed both Dreyfus’ costs in providing these services and a reasonable allocation of the costs incurred by Dreyfus and its affiliates related to the support and oversight of these services. The fund also reimburses Dreyfus for the out-of-pocket expenses incurred in performing this service for the fund. Pursuant to the Administration Agreement, the fund was charged $89,533 during the period ended September 30, 2014.
During the period ended September 30, 2014, the Distributor retained $25 from commissions earned on sales of the fund’s Class A shares and $43 from CDSCs on redemptions of the fund’s Class C shares.
(b) Under the Distribution Plan adopted pursuant to Rule 12b-1 under the Act, Class C shares pay the Distributor for distributing its shares at an annual rate of .75% of the value of its average daily net assets. During the period ended September 30, 2014, Class C shares were charged $10,978 pursuant to the Distribution Plan.
(c) Under the Shareholder Services Plan, Class A and Class C shares pay the Distributor at the annual rate of .25% of the value of their average daily net assets for the provision of certain services. The services provided may include personal services relating to shareholder accounts, such as answering shareholder inquiries regarding the fund and providing reports and other information, and services related to the maintenance of shareholder accounts. The Distributor may make payments to Service Agents (securities dealers, financial institutions or other industry professionals) with respect to these services. The Distributor determines the
The Fund 37
NOTES TO FINANCIAL STATEMENTS (continued)
amounts to be paid to Service Agents. During the period ended September 30, 2014, Class A and Class C shares were charged $15,343 and $3,659, respectively, pursuant to the Shareholder Services Plan.
Under its terms, the Distribution Plan and Shareholder Services Plan shall remain in effect from year to year, provided such continuance is approved annually by a vote of a majority of those Trustees who are not “interested persons” of the Trust and who have no direct or indirect financial interest in the operation of or in any agreement related to the Distribution Plan or Shareholder Services Plan.
The fund has arrangements with the transfer agent and the custodian whereby the fund may receive earnings credits when positive cash balances are maintained, which are used to offset transfer agency and custody fees. For financial reporting purposes, the fund includes net earnings credits as an expense offset in the Statement of Operations.
The fund compensates Dreyfus Transfer, Inc., a wholly-owned subsidiary of Dreyfus, under a transfer agency agreement for providing transfer agency and cash management services for the fund. The majority of transfer agency fees are comprised of amounts paid on a per account basis, while cash management fees are related to fund subscriptions and redemptions. During the period ended September 30, 2014, the fund was charged $7,148 for transfer agency services and $310 for cash management services.These fees are included in Shareholder servicing costs in the Statement of Operations. Cash management fees were partially offset by earnings credits of $21.
The fund compensates The Bank of NewYork Mellon under a custody agreement for providing custodial services for the fund.These fees are determined based on net assets, geographic region and transaction activity. During the period ended September 30, 2014, the fund was charged $9,887 pursuant to the custody agreement.
38
During the period ended September 30, 2014, the fund was charged $8,107 for services performed by the Chief Compliance Officer and his staff.
The components of “Due to The Dreyfus Corporation and affiliates” in the Statement of Assets and Liabilities consist of: investment advisory fees $50,241, administration fees $7,536, Distribution Plan fees $632, Shareholder Services Plan fees $1,467, custodian fees $3,988, Chief Compliance Officer fees $1,730 and transfer agency fees $1,287, which are offset against an expense reimbursement currently in effect in the amount of $33,992.
(d) Each Board member also serves as a Board member of other funds within the Dreyfus complex. Annual retainer fees and attendance fees are allocated to each fund based on net assets.
NOTE 4—Securities Transactions:
The aggregate amount of purchases and sales (including paydowns) of investment securities, excluding short-term securities, during the period ended September 30, 2014, amounted to $56,967,003 and $36,872,660, respectively.
At September 30, 2014, the cost of investments for federal income tax purposes was $142,702,379; accordingly, accumulated net unrealized appreciation on investments was $7,554,223, consisting of $7,574,359 gross unrealized appreciation and $20,136 gross unrealized depreciation.
The Fund 39
| REPORT OF INDEPENDENT REGISTERED |
| PUBLIC ACCOUNTING FIRM |
The Board of Trustees and Shareholders Dreyfus Investment Funds
We have audited the accompanying statement of assets and liabilities of Dreyfus Tax Sensitive Total Return Bond Fund (the “Fund”) (formerly known as Dreyfus/Standish Intermediate Tax Exempt Bond Fund), a series of Dreyfus Investment Funds, including the statement of investments, as of September 30, 2014, and the related statement of operations for the year then ended, the statements of changes in net assets for each of the years in the two-year period then ended, and the financial highlights for each of the years or periods in the five-year period then ended. These financial statements and financial highlights are the responsibility of the Fund’s management. Our responsibility is to express an opinion on these financial statements and financial highlights based on our audits.
We conducted our audits in accordance with the standards of the Public Company Accounting Oversight Board (United States).Those standards require that we plan and perform the audit to obtain reasonable assurance about whether the financial statements and financial highlights are free of material misstatement. An audit includes examining, on a test basis, evidence supporting the amounts and disclosures in the financial statements. Our procedures included confirmation of securities owned as of September 30, 2014, by correspondence with the custodian and brokers or by other appropriate auditing procedures. An audit also includes assessing the accounting principles used and significant estimates made by management, as well as evaluating the overall financial statement presentation. We believe that our audits provide a reasonable basis for our opinion.
In our opinion, the financial statements and financial highlights referred to above present fairly, in all material respects, the financial position of Dreyfus Tax Sensitive Total Return Bond Fund as of September 30, 2014, the results of its operations for the year then ended, the changes in its net assets for each of the years in the two-year period then ended, and the financial highlights for each of the years or periods in the five-year period then ended, in conformity with U.S. generally accepted accounting principles.

New York, New York
November 26, 2014
40
IMPORTANT TAX INFORMATION (Unaudited)
In accordance with federal tax law, the fund hereby reports all the dividends paid from investment income-net during its fiscal year ended September 30, 2014 as “exempt-interest dividends” (not generally subject to regular federal income tax), except $112,668 that is being reported as an ordinary income distribution for reportig purposes. Where required by federal tax law rules, shareholders will receive notification of their portion of the fund’s taxable ordinary dividends (if any), capital gains distributions (if any) and tax-exempt dividends paid for the 2014 calendar year on Form 1099-DIV, which will be mailed in early 2015.
The Fund 41
| BOARD MEMBERS INFORMATION (Unaudited) |
| INDEPENDENT BOARD MEMBERS |
| Joseph S. DiMartino (70) |
| Chairman of the Board (2008) |
| Principal Occupation During Past 5Years: |
| • Corporate Director and Trustee (1995-present) |
| Other Public Company Board Memberships During Past 5Years: |
| • CBIZ (formerly, Century Business Services, Inc.), a provider of outsourcing functions for small |
| and medium size companies, Director (1997-present) |
| • The Newark Group, a provider of a national market of paper recovery facilities, paperboard |
| mills and paperboard converting plants, Director (2000-2010) |
| • Sunair Services Corporation, a provider of certain outdoor-related services to homes and |
| businesses, Director (2005-2009) |
| No. of Portfolios for which Board Member Serves: 145 |
| ——————— |
| Francine J. Bovich (63) |
| Board Member (2011) |
| Principal Occupation During Past 5Years: |
| • Trustee,The Bradley Trusts, private trust funds (2011-present) |
| • Managing Director, Morgan Stanley Investment Management (1993-2010) |
| Other Public Company Board Membership During Past 5Years: |
| • Annaly Capital Management, Inc., Board Member (May 2014-present) |
| No. of Portfolios for which Board Member Serves: 45 |
| ——————— |
| Kenneth A. Himmel (68) |
| Board Member (2008) |
| Principal Occupation During Past 5Years: |
| • President and CEO, Related Urban Development, a real estate development company (1996-present) |
| • President and CEO, Himmel & Company, a real estate development company (1980- present) |
| • CEO,American Food Management, a restaurant company (1983-present) |
| No. of Portfolios for which Board Member Serves: 31 |
42
| Stephen J. Lockwood (67) |
| Board Member (2008) |
| Principal Occupation During Past 5Years: |
| • Chairman of the Board, Stephen J. Lockwood and Company LLC, a real estate investment |
| company (2000-present) |
| No. of Portfolios for which Board Member Serves: 31 |
| ——————— |
| Roslyn M. Watson (64) |
| Board Member (2008) |
| Principal Occupation During Past 5Years: |
| • Principal,Watson Ventures, Inc., a real estate investment company (1993-present) |
| No. of Portfolios for which Board Member Serves: 67 |
| ——————— |
| Benaree Pratt Wiley (68) |
| Board Member (2008) |
| Principal Occupation During Past 5Years: |
| • Principal,TheWiley Group, a firm specializing in strategy and business development (2005-present) |
| Other Public Company Board Membership During Past 5Years: |
| • CBIZ (formerly, Century Business Services, Inc.), a provider of outsourcing functions for small |
| and medium size companies, Director (2008-present) |
| No. of Portfolios for which Board Member Serves: 69 |
| ——————— |
| Once elected all Board Members serve for an indefinite term, but achieve Emeritus status upon reaching age 80.The |
| address of the Board Members and Officers is c/o The Dreyfus Corporation, 200 Park Avenue, NewYork, NewYork |
| 10166.Additional information about the Board Members is available in the fund’s Statement of Additional Information |
| which can be obtained from Dreyfus free of charge by calling this toll free number: 1-800-DREYFUS. |
| James M. Fitzgibbons, Emeritus Board Member |
The Fund 43
OFFICERS OF THE FUND (Unaudited)
BRADLEY J. SKAPYAK, President since January 2010.
Chief Operating Officer and a director of the Manager since June 2009, Chairman of Dreyfus Transfer, Inc., an affiliate of the Manager and the transfer agent of the funds, since May 2011 and Executive Vice President of the Distributor since June 2007. From April 2003 to June 2009, Mr. Skapyak was the head of the Investment Accounting and Support Department of the Manager. He is an officer of 69 investment companies (comprised of 145 portfolios) managed by the Manager. He is 55 years old and has been an employee of the Manager since February 1988.
JOHN PAK, Chief Legal Officer since March 2013.
Deputy General Counsel, Investment Management, of BNY Mellon since August 2014; Chief Legal Officer of the Manager since August 2012; from March 2005 to July 2012, Managing Director of Deutsche Bank, Deputy Global Head of Deutsche Asset Management Legal and Regional Head of Deutsche Asset Management Americas Legal. He is an officer of 70 investment companies (comprised of 170 portfolios) managed by the Manager. He is 46 years old and has been an employee of the Manager since August 2012.
JANETTE E. FARRAGHER, Vice President and Secretary since December 2011.
Assistant General Counsel of BNY Mellon, and an officer of 70 investment companies (comprised of 170 portfolios) managed by the Manager. She is 51 years old and has been an employee of the Manager since February 1984.
KIESHA ASTWOOD, Vice President and Assistant Secretary since January 2010.
Counsel of BNY Mellon, and an officer of 70 investment companies (comprised of 170 portfolios) managed by the Manager. She is 41 years old and has been an employee of the Manager since July 1995.
JAMES BITETTO, Vice President and Assistant Secretary since December 2008.
Managing Counsel of BNY Mellon and Secretary of the Manager, and an officer of 70 investment companies (comprised of 170 portfolios) managed by the Manager. He is 48 years old and has been an employee of the Manager since December 1996.
JONI LACKS CHARATAN, Vice President and Assistant Secretary since December 2008.
Managing Counsel of BNY Mellon, and an officer of 70 investment companies (comprised of 170 portfolios) managed by the Manager. She is 58 years old and has been an employee of the Manager since October 1988.
JOSEPH M. CHIOFFI, Vice President and Assistant Secretary since December 2008.
Managing Counsel of BNY Mellon, and an officer of 70 investment companies (comprised of 170 portfolios) managed by the Manager. He is 52 years old and has been an employee of the Manager since June 2000.
JOHN B. HAMMALIAN, Vice President and Assistant Secretary since December 2008.
Senior Managing Counsel of BNY Mellon, and an officer of 70 investment companies (comprised of 170 portfolios) managed by the Manager. He is 51 years old and has been an employee of the Manager since February 1991.
SARAH S. KELLEHER, Vice President and Assistant Secretary since April 2014.
Senior Counsel of BNY Mellon, and an officer of 70 investment companies (comprised of 170 portfolios) managed by the Manager; from August 2005 to March 2013, Associate General Counsel of Third Avenue Management. She is 38 years old and has been an employee of the Manager since March 2013.
44
JEFF PRUSNOFSKY, Vice President and Assistant Secretary since December 2008.
Senior Managing Counsel of BNY Mellon, and an officer of 70 investment companies (comprised of 170 portfolios) managed by the Manager. He is 49 years old and has been an employee of the Manager since October 1990.
JAMES WINDELS, Treasurer since December 2008.
Director – Mutual Fund Accounting of the Manager, and an officer of 70 investment companies (comprised of 170 portfolios) managed by the Manager. He is 56 years old and has been an employee of the Manager since April 1985.
RICHARD CASSARO, Assistant Treasurer since December 2008.
Senior Accounting Manager – Money Market and Municipal Bond Funds of the Manager, and an officer of 70 investment companies (comprised of 170 portfolios) managed by the Manager. He is 55 years old and has been an employee of the Manager since September 1982.
GAVIN C. REILLY, Assistant Treasurer since December 2008.
Tax Manager of the Investment Accounting and Support Department of the Manager, and an officer of 70 investment companies (comprised of 170 portfolios) managed by the Manager. He is 46 years old and has been an employee of the Manager since April 1991.
ROBERT S. ROBOL, Assistant Treasurer since December 2008.
Senior Accounting Manager – Fixed Income Funds of the Manager, and an officer of 70 investment companies (comprised of 170 portfolios) managed by the Manager. He is 50 years old and has been an employee of the Manager since October 1988.
ROBERT SALVIOLO, Assistant Treasurer since December 2008.
Senior Accounting Manager – Equity Funds of the Manager, and an officer of 70 investment companies (comprised of 170 portfolios) managed by the Manager. He is 47 years old and has been an employee of the Manager since June 1989.
ROBERT SVAGNA, Assistant Treasurer since December 2008.
Senior Accounting Manager – Equity Funds of the Manager, and an officer of 70 investment companies (comprised of 170 portfolios) managed by the Manager. He is 47 years old and has been an employee of the Manager since November 1990.
JOSEPH W. CONNOLLY, Chief Compliance Officer since December 2008.
Chief Compliance Officer of the Manager and The Dreyfus Family of Funds (70 investment companies, comprised of 170 portfolios). He is 57 years old and has served in various capacities with the Manager since 1980, including manager of the firm’s Fund Accounting Department from 1997 through October 2001.
MATTHEW D. CONNOLLY, Anti-Money Laundering Compliance Officer since April 2012.
Anti-Money Laundering Compliance Officer of the Distributor since October 2011; from March 2010 to September 2011, Global Head, KYC Reviews and Director of UBS Investment Bank; until March 2010, AML Compliance Officer and Senior Vice President of Citi Global Wealth Management. He is an officer of 65 investment companies (comprised of 165 portfolios) managed by the Manager. He is 42 years old and has been an employee of the Distributor since October 2011.
The Fund 45
For More Information
Telephone Call your Financial Representative or 1-800-DREYFUS
Mail The Dreyfus Family of Funds, 144 Glenn Curtiss Boulevard, Uniondale, NY 11556-0144 E-mail Send your request to info@dreyfus.com Internet Information can be viewed online or downloaded at: http://www.dreyfus.com
The fund files its complete schedule of portfolio holdings with the Securities and Exchange Commission (“SEC”) for the first and third quarters of each fiscal year on Form N-Q. The fund’s Forms N-Q are available on the SEC’s website at http://www.sec.gov and may be reviewed and copied at the SEC’s Public Reference Room in Washington, DC. Information on the operation of the Public Reference Room may be obtained by calling 1-800-SEC-0330.
Information regarding how the fund voted proxies relating to portfolio securities for the most recent 12-month period ended June 30 is available on the SEC’s website at http://www.sec.gov and without charge, upon request, by calling 1-800-DREYFUS.

Dreyfus/Newton
International Equity Fund
ANNUAL REPORT September 30, 2014
Save time. Save paper. View your next shareholder report online as soon as it’s available. Log into www.dreyfus.com and sign up for Dreyfus eCommunications. It’s simple and only takes a few minutes.
The views expressed in this report reflect those of the portfolio manager only through the end of the period covered and do not necessarily represent the views of Dreyfus or any other person in the Dreyfus organization. Any such views are subject to change at any time based upon market or other conditions and Dreyfus disclaims any responsibility to update such views.These views may not be relied on as investment advice and, because investment decisions for a Dreyfus fund are based on numerous factors, may not be relied on as an indication of trading intent on behalf of any Dreyfus fund.
| Not FDIC-Insured • Not Bank-Guaranteed • May Lose Value |
Contents | |
THE FUND | |
| 2 | A Letter from the President |
| 3 | Discussion of Fund Performance |
| 6 | Fund Performance |
| 8 | Understanding Your Fund’s Expenses |
| 8 | Comparing Your Fund’s Expenses With Those of Other Funds |
| 9 | Statement of Investments |
| 13 | Statement of Assets and Liabilities |
| 14 | Statement of Operations |
| 15 | Statement of Changes in Net Assets |
| 17 | Financial Highlights |
| 21 | Notes to Financial Statements |
| 36 | Report of Independent Registered Public Accounting Firm |
| 37 | Important Tax Information |
| 38 | Board Members Information |
| 40 | Officers of the Fund |
FOR MORE INFORMATION | |
Back Cover |
Dreyfus/Newton
International Equity Fund
The Fund
A LETTER FROM THE PRESIDENT
Dear Shareholder:
This annual report for Dreyfus/Newton International Equity Fund covers the 12-month period from October 1, 2013, through September 30, 2014. For information about how the fund performed during the reporting period, as well as general market perspectives, we provide a Discussion of Fund Performance on the pages that follow.
For the 12-month reporting period overall, international stock prices advanced modestly as investors generally responded positively to more accommodative monetary policies throughout much of the world. However, the overall market’s entire advance was achieved during the first half of the reporting period. The second half saw mildly negative returns, on average, due to renewed concerns regarding geopolitical tensions and persistently sluggish growth in Europe and the emerging markets.
Some forces appear likely to support international stock prices over the foreseeable future; low inflation has enabled the European Central Bank to reduce short-term interest rates further, China’s economic slowdown appears increasingly unlikely to devolve into a more severe financial crisis, and India’s stock market has surged in anticipation of a more business-friendly government.Yet, some countries are faring better economically than others and monetary policies have begun to diverge, affecting currency exchange rates and capital flows. Consequently, selectivity and a long-term perspective seem poised to become more important determinants of investment success.As always, we urge you to talk regularly with your financial advisor to assess the potential impact of these and other developments on your investments.
Thank you for your continued confidence and support.

J. Charles Cardona
President
The Dreyfus Corporation
October 15, 2014
2
DISCUSSION OF FUND PERFORMANCE
For the period of October 1, 2013, through September 30, 2014, as provided by Paul Markham, Lead Portfolio Manager of Newton Capital Management Limited, Sub-Investment Adviser
Fund and Market Performance Overview
For the 12-month period ended September 30, 2014, Dreyfus/Newton International Equity Fund’s Class A shares produced a total return of 2.88%, Class C shares returned 2.18%, Class I shares returned 3.25%, and Class Y shares returned 3.33%.1 In comparison, the fund’s benchmark, the Morgan Stanley Capital International Europe, Australasia, Far East Index (“MSCI EAFE Index”), produced a total return of 4.25% for the same period.2
International equity markets advanced early in the reporting period amid signs of improving global business prospects, but renewed economic concerns later sparked broad-based declines.The fund lagged its benchmark, mainly due to disappointments in the telecommunications services, financials, consumer discretionary, and information technology sectors.
The Fund’s Investment Approach
The fund normally invests at least 80% of its assets in common stocks, securities convertible into common stocks of foreign companies, and in depositary receipts evidencing ownership in such securities.The process of selecting investments begins with Newton’s core list of global investment themes. These themes are based on observable economic, industrial, or social trends (typically global) that Newton believes will positively or negatively affect certain sectors or industries. The list of themes is discussed and updated on a regular basis. For instance, Newton’s Debt Burden theme asserts that excessive debt is weighing on economic activity, and that the way in which deleveraging occurs is critical to the outlook for economics and financial markets. Elsewhere, Newton’s Net Effects theme focuses upon the opportunities and risks inherent in the growth of information technology networks around the world.
International Markets Advanced Despite Volatility
European stock markets climbed during the first eight months of the reporting period as economic growth appeared to pick up in some countries, such as
The Fund 3
DISCUSSION OF FUND PERFORMANCE (continued)
Germany, and signs of recovery emerged in some of the region’s more troubled economies, including Italy and Spain. Investors also responded positively to an unexpected reduction in short-term interest rates by the European Central Bank. However, many European stocks came under pressure over the summer due to disappointing GDP growth rates, deflation fears, and worries about geopolitical instability in Ukraine and the Middle East. Although European markets gave up a significant portion of their earlier gains between June and September, the region ended the reporting period with moderate gains overall.
Developed markets in Asia generated more modest returns, on average.The Japanese stock market struggled with stalling economic growth and the fading benefits of aggressively stimulative monetary and fiscal policies. Hong Kong and Australian stocks were hampered by slowing economic growth and sluggish demand for commodities in China.
Stock Selection Strategy Dampened Relative Results
The fund participated in much of the international equity markets’ gains, but its relative performance was constrained by the telecommunications services sector, where U.K.-based Vodafone Group and Philippine Long Distance Telecom lagged market averages. In the consumer discretionary area, Japanese holdings Toyota Motor and discount retailer Don Quijote lost ground, while Japan’s Nomura Holdings and Germany’s Commerzbank disappointed among financials stocks. Results from the information technology sector were hurt by U.K. microchip manufacturer Imagination Technologies Group after U.S. semiconductor giant Intel decided to sell its stake in the company.
The fund achieved better relative results in the energy sector, where our Energy Economy theme led to overweighted positions in France’s Total and the Netherlands’ Royal Dutch Shell.The consumer staples sector also fared well due to gains posted by Associated British Foods, as its Primark clothing division continued to perform well. Lack of exposure to U.K. retailer Tesco supported relative results, as did underweight exposure to materials stocks, particularly metals-and-mining companies. Finally, an overweighted allocation to the health care sector included investments in strong performers such as Japanese optical equipment manufacturer TOPCON and Swiss biopharmaceutical developer Actelion. These companies were part of our Healthy Demand theme, which points to stronger consumer demand for healthcare stemming
4
from expanding incomes and changing lifestyles in the developing world, as well as aging populations and budget constraints in the more mature economies.
Maintaining Investment Discipline
Economic struggles in Europe and Japan, together with the end of quantitative easing in the United States, could spark greater uncertainty and volatility in global financial markets. In our view, changing global conditions are likely to produce greater differentiation in the performance of regional markets, industry groups, and individual securities. We think it is important to retain investment discipline in this more challenging environment and to focus on companies that are allocating shareholder capital correctly. We have identified an ample number of companies meeting our criteria in Japan, Switzerland, the Philippines, China, and Norway, but relatively few in Australia, Spain, France, and the United Kingdom. From an industry group perspective, the fund has maintained overweighted exposure to health care companies, retailers, and telecommunications service providers and underweighted positions among materials producers, banks, and manufacturers of capital goods.
October 15, 2014
Please note, the position in any security highlighted with italicized typeface was sold during the reporting period. Equity funds are subject generally to market, market sector, market liquidity, issuer and investment style risks, among other factors, to varying degrees, all of which are more fully described in the fund’s prospectus.
Investing internationally involves special risks, including changes in currency exchange rates, political, economic and social instability, a lack of comprehensive company information, differing auditing and legal standards and less market liquidity. The use of derivatives involves risks different from, or possibly greater than, the risks associated with investing directly in the underlying assets. Derivatives can be highly volatile, illiquid, and difficult to value and there is the risk that changes in the value of a derivative held by the fund will not correlate with the underlying instruments or the fund’s other investments.
| 1 Total return includes reinvestment of dividends and any capital gains paid, and does not take into consideration the |
| maximum initial sales charge in the case of Class A shares, or the applicable contingent deferred sales charge imposed |
| on redemptions in the case of Class C shares. Had these charges been reflected, returns would have been lower. Past |
| performance is no guarantee of future results. Share price, yield and investment return fluctuate such that upon |
| redemption, fund shares may be worth more or less than their original cost. |
| 2 SOURCE: LIPPER INC. — Reflects reinvestment of net dividends and, where applicable, capital gain |
| distributions.The Morgan Stanley Capital International Europe,Australasia, Far East (MSCI EAFE) Index is an |
| unmanaged index composed of a sample of companies representative of the market structure of European and Pacific |
| Basin countries.The Index does not take into account fees and expenses to which the fund is subject. Investors cannot |
| invest directly in any index. |
The Fund 5
FUND PERFORMANCE
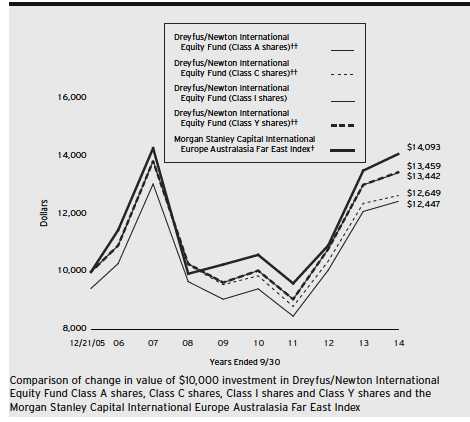
| † | Source: Lipper Inc. |
| †† | The total return figures presented for Class A and Class C shares of the fund reflect the performance of the fund’s |
| Class I shares for the period prior to 3/31/08 (the inception date for Class A and Class C shares), adjusted to | |
| reflect the applicable sales load for Class A shares. | |
| The total return figures presented for ClassY shares of the fund reflect the performance of the fund’s Class I shares for | |
| the period prior to 7/1/13 (the inception date for ClassY shares). |
Past performance is not predictive of future performance.
The above graph compares a $10,000 investment made in each of the Class A, Class C, Class I and Class Y shares of Dreyfus/Newton International Equity Fund on 12/21/05 (inception date) to a $10,000 investment made in the Morgan Stanley Capital International Europe Australasia Far East Index (the “Index”) on that date. All dividends and capital gain distributions are reinvested.
The fund’s performance shown in the line graph above takes into account the maximum initial sales charge on Class A shares and all other applicable fees and expenses on all classes.The Index is an unmanaged index composed of a sample of companies representative of the market structure of European and Pacific Basin countries. Unlike a mutual fund, the Index is not subject to charges, fees and other expenses. Investors cannot invest directly in any index.These factors can contribute to the Index potentially outperforming the fund. Further information relating to fund performance, including expense reimbursements, if applicable, is contained in the Financial Highlights section of the prospectus and elsewhere in this report.
6
| Average Annual Total Returns as of 9/30/14 | |||||||
| Inception | From | ||||||
| Date | 1 Year | 5 Years | Inception | ||||
| Class A shares | |||||||
| with maximum sales charge (5.75%) | 3/31/08 | –3.04 | % | 5.33 | % | 2.52 | %†† |
| without sales charge | 3/31/08 | 2.88 | % | 6.58 | % | 3.22 | %†† |
| Class C shares | |||||||
| with applicable redemption charge † | 3/31/08 | 1.18 | % | 5.77 | % | 2.71 | %†† |
| without redemption | 3/31/08 | 2.18 | % | 5.77 | % | 2.71 | %†† |
| Class I shares | 12/21/05 | 3.25 | % | 6.90 | % | 3.43 | % |
| Class Y shares | 7/1/13 | 3.33 | % | 6.93 | %†† | 3.44 | %†† |
| Morgan Stanley Capital International | |||||||
| Europe Australasia Far East Index | 12/31/05 | 4.25 | % | 6.56 | % | 6.32 | %††† |
Past performance is not predictive of future performance.The fund’s performance shown in the graph and table does not reflect the deduction of taxes that a shareholder would pay on fund distributions or the redemption of fund shares. In addition to the performance of Class A shares shown with and without a maximum sales charge, the fund’s performance shown in the table takes into account all other applicable fees and expenses on all classes.
| † | The maximum contingent deferred sales charge for Class C shares is 1% for shares redeemed within one year of the |
| date of purchase. | |
| †† | The total return performance figures presented for Class A and Class C shares of the fund reflect the performance of |
| the fund’s Class I shares for the period prior to 3/31/08 (the inception date for Class A and Class C shares), | |
| adjusted to reflect the applicable sales load for Class A shares. | |
| The total return performance figures presented for ClassY shares of the fund reflect the performance of the fund’s | |
| Class I shares for the period prior to 7/1/13 (the inception date for ClassY shares). | |
| ††† The Index date is based on the life of Class I shares. For comparative purposes, the value of the Index as of the | |
| month end 12/31/05 is used as the beginning value on 12/21/05 (the inception date for Class I shares). | |
The Fund 7
UNDERSTANDING YOUR FUND’S EXPENSES (Unaudited)
As a mutual fund investor, you pay ongoing expenses, such as management fees and other expenses. Using the information below, you can estimate how these expenses affect your investment and compare them with the expenses of other funds.You also may pay one-time transaction expenses, including sales charges (loads) and redemption fees, which are not shown in this section and would have resulted in higher total expenses. For more information, see your fund’s prospectus or talk to your financial adviser.
Review your fund’s expenses
The table below shows the expenses you would have paid on a $1,000 investment in Dreyfus/Newton International Equity Fund from April 1, 2014 to September 30, 2014. It also shows how much a $1,000 investment would be worth at the close of the period, assuming actual returns and expenses.
Expenses and Value of a $1,000 Investment
assuming actual returns for the six months ended September 30, 2014
| Class A | Class C | Class I | Class Y | |||||
| Expenses paid per $1,000† | $ | 6.54 | $ | 10.24 | $ | 4.48 | $ | 4.58 |
| Ending value (after expenses) | $ | 1,005.90 | $ | 1,003.00 | $ | 1,007.40 | $ | 1,008.40 |
COMPARING YOUR FUND’S EXPENSES
WITH THOSE OF OTHER FUNDS (Unaudited)
Using the SEC’s method to compare expenses
The Securities and Exchange Commission (SEC) has established guidelines to help investors assess fund expenses. Per these guidelines, the table below shows your fund’s expenses based on a $1,000 investment, assuming a hypothetical 5% annualized return. You can use this information to compare the ongoing expenses (but not transaction expenses or total cost) of investing in the fund with those of other funds. All mutual fund shareholder reports will provide this information to help you make this comparison. Please note that you cannot use this information to estimate your actual ending account balance and expenses paid during the period.
Expenses and Value of a $1,000 Investment
assuming a hypothetical 5% annualized return for the six months ended September 30, 2014
| Class A | Class C | Class I | Class Y | |||||
| Expenses paid per $1,000† | $ | 6.58 | $ | 10.30 | $ | 4.51 | $ | 4.61 |
| Ending value (after expenses) | $ | 1,018.55 | $ | 1,014.84 | $ | 1,020.61 | $ | 1,020.51 |
| Expenses are equal to the fund’s annualized expense ratio of 1.30% for Class A, 2.04% for Class C, .89% for |
| Class I and .91% for ClassY, multiplied by the average account value over the period, multiplied by 183/365 (to |
| reflect the one-half year period). |
8
| STATEMENT OF INVESTMENTS |
| September 30, 2014 |
| Common Stocks—99.0% | Shares | Value ($) | |
| Australia—.9% | |||
| Dexus Property Group | 7,340,223 | 7,133,668 | |
| Belgium—1.1% | |||
| Anheuser-Busch InBev | 77,789 | 8,657,960 | |
| Brazil—.5% | |||
| International Meal Company Holdings | 555,431 | 4,039,086 | |
| China—.4% | |||
| Sun Art Retail Group | 2,715,500 | 3,070,515 | |
| Finland—1.6% | |||
| Nokia | 1,471,772 | 12,557,084 | |
| France—7.5% | |||
| Air Liquide | 111,836 | 13,641,017 | |
| Sanofi | 168,130 | 19,018,760 | |
| Total | 300,683 | 19,539,667 | |
| Vivendi | 306,036 | 7,390,661 | |
| 59,590,105 | |||
| Germany—8.8% | |||
| Bayer | 91,490 | 12,815,279 | |
| Brenntag | 224,163 | 11,016,612 | |
| Commerzbank | 585,350 | a | 8,753,671 |
| Gerry Weber International | 178,685 | 7,056,176 | |
| LEG Immobilien | 274,528 | a | 19,025,869 |
| SAP | 160,963 | 11,608,739 | |
| 70,276,346 | |||
| Hong Kong—4.5% | |||
| AIA Group | 2,338,112 | 12,089,763 | |
| Belle International Holdings | 5,185,255 | 5,829,768 | |
| Jardine Matheson Holdings | 146,800 | 8,749,280 | |
| Man Wah Holdings | 6,056,500 | 8,907,478 | |
| 35,576,289 | |||
| Ireland—1.0% | |||
| CRH | 342,518 | 7,829,300 | |
| Israel—.9% | |||
| Bank Hapoalim | 1,330,508 | 7,503,401 | |
| Italy—1.4% | |||
| Pirelli & C | 784,316 | 10,857,367 |
Th eFund 9
STATEMENT OF INVESTMENTS (continued)
| Common Stocks (continued) | Shares | Value ($) | |
| Japan—28.2% | |||
| Don Quijote Holdings | 255,400 | 14,647,513 | |
| FANUC | 55,700 | 10,060,789 | |
| Japan Airlines | 325,586 | 8,905,931 | |
| Japan Display | 445,400 | 2,148,316 | |
| Japan Tobacco | 519,100 | 16,882,878 | |
| Lawson | 153,900 | 10,762,827 | |
| LIXIL Group | 497,900 | 10,636,697 | |
| M3 | 375,300 | 6,022,594 | |
| Makita | 193,000 | 10,910,417 | |
| Mitsubishi UFJ Financial Group | 2,162,700 | 12,229,829 | |
| NGK Spark Plug | 264,000 | 7,762,936 | |
| Nissan Motor | 1,078,900 | 10,516,016 | |
| Nomura Holdings | 2,162,900 | 12,893,586 | |
| Sawai Pharmaceutical | 121,300 | 6,978,828 | |
| Skylark | 514,800 | b | 5,632,642 |
| SoftBank | 250,700 | 17,575,859 | |
| Sugi Holdings | 320,500 | 13,457,055 | |
| Suntory Beverage & Food | 182,900 | 6,487,176 | |
| Tokyo Electron | 156,300 | 10,201,007 | |
| TOPCON | 439,100 | 9,993,103 | |
| Toyota Motor | 339,300 | 19,994,492 | |
| 224,700,491 | |||
| Mexico—.8% | |||
| Grupo Financiero Santander Mexico, Cl. B, ADR | 468,352 | 6,336,803 | |
| Netherlands—2.7% | |||
| Reed Elsevier | 354,087 | 8,036,759 | |
| Wolters Kluwer | 502,600 | 13,407,237 | |
| 21,443,996 | |||
| Norway—2.1% | |||
| DNB | 908,115 | 17,003,967 | |
| Philippines—2.1% | |||
| Energy Development | 48,195,900 | 8,688,203 |
10
| Common Stocks (continued) | Shares | Value ($) | |
| Philippines (continued) | |||
| LT Group | 24,416,300 | 8,509,185 | |
| 17,197,388 | |||
| Portugal—.9% | |||
| Galp Energia | 442,914 | 7,199,807 | |
| Russia—.7% | |||
| TBC Bank, GDR | 373,333 | 5,935,995 | |
| Sweden—1.4% | |||
| TeliaSonera | 1,664,557 | 11,515,339 | |
| Switzerland—12.3% | |||
| Actelion | 56,313 | a | 6,624,018 |
| Credit Suisse Group | 444,049 | a | 12,311,697 |
| Nestle | 295,624 | 21,752,997 | |
| Novartis | 197,763 | 18,674,279 | |
| Roche Holding | 72,858 | 21,604,797 | |
| Zurich Insurance Group | 56,304 | a | 16,796,249 |
| 97,764,037 | |||
| United Kingdom—19.2% | |||
| Associated British Foods | 191,287 | 8,307,658 | |
| Barclays | 3,535,546 | 13,036,556 | |
| British American Tobacco | 164,552 | 9,288,645 | |
| Centrica | 2,813,637 | 14,039,677 | |
| GlaxoSmithKline | 611,644 | 14,010,748 | |
| Imagination Technologies Group | 1,061,847 | a | 3,244,843 |
| Just Eat | 1,006,415 | 4,813,041 | |
| Merlin Entertainments | 1,284,919 | c | 7,311,446 |
| Prudential | 1,015,176 | 22,645,411 | |
| Royal Dutch Shell, Cl. B | 761,195 | 30,072,663 | |
| Vodafone Group | 5,550,507 | 18,392,213 | |
| Wolseley | 142,418 | 7,485,112 | |
| 152,648,013 | |||
| Total Common Stocks | |||
| (cost $690,099,726) | 788,836,957 |
The Fund 11
STATEMENT OF INVESTMENTS (continued)
| Other Investment—1.3% | Shares | Value ($) | ||
| Registered Investment Company; | ||||
| Dreyfus Institutional Preferred | ||||
| Plus Money Market Fund | ||||
| (cost $9,880,074) | 9,880,074 | d | 9,880,074 | |
| Total Investments (cost $699,979,800) | 100.3 | % | 798,717,031 | |
| Liabilities, Less Cash and Receivables | (.3 | %) | (2,232,269 | ) |
| Net Assets | 100.0 | % | 796,484,762 |
ADR—American Depository Receipts
GDR—Global Depository Receipts
| a Non-income producing security. |
| b The valuation of this security has been determined in good faith by management under the direction of the Board of |
| Trustees.At September 30, 2014, the value of this security amounted to $5,632,642 or .7% of net assets. |
| c Security exempt from registration pursuant to Rule 144A under the Securities Act of 1933.This security may be |
| resold in transactions exempt from registration, normally to qualified institutional buyers.At September 30, 2014, |
| this security was valued at $7,311,446 or 0.9% of net assets. |
| d Investment in affiliated money market mutual fund. |
| Portfolio Summary (Unaudited)† | |||
| Value (%) | Value (%) | ||
| Financial | 22.9 | Telecommunication Services | 6.9 |
| Consumer Discretionary | 16.6 | Information Technology | 4.7 |
| Health Care | 14.5 | Utilities | 2.8 |
| Consumer Staples | 13.1 | Materials | 2.7 |
| Industrial | 7.7 | Money Market Investment | 1.3 |
| Energy | 7.1 | 100.3 | |
| † Based on net assets. | |||
| See notes to financial statements. | |||
12
| STATEMENT OF ASSETS AND LIABILITIES |
| September 30, 2014 |
| Cost | Value | |||
| Assets ($): | ||||
| Investments in securities—See Statement of Investments: | ||||
| Unaffiliated issuers | 690,099,726 | 788,836,957 | ||
| Affiliated issuers | 9,880,074 | 9,880,074 | ||
| Cash | 735,501 | |||
| Cash denominated in foreign currencies | 383,952 | 382,602 | ||
| Dividends receivable | 3,266,495 | |||
| Receivable for investment securities sold | 990,970 | |||
| Receivable for shares of Beneficial Interest subscribed | 369,139 | |||
| Unrealized appreciation on forward foreign | ||||
| currency exchange contracts—Note 4 | 6,004,374 | |||
| Prepaid expenses | 14,778 | |||
| 810,480,890 | ||||
| Liabilities ($): | ||||
| Due to The Dreyfus Corporation and affiliates—Note 3(c) | 698,627 | |||
| Payable for investment securities purchased | 11,126,714 | |||
| Unrealized depreciation on forward foreign | ||||
| currency exchange contracts—Note 4 | 2,043,785 | |||
| Payable for shares of Beneficial Interest redeemed | 55,017 | |||
| Accrued expenses | 71,985 | |||
| 13,996,128 | ||||
| Net Assets ($) | 796,484,762 | |||
| Composition of Net Assets ($): | ||||
| Paid-in capital | 668,687,291 | |||
| Accumulated undistributed investment income—net | 17,969,957 | |||
| Accumulated net realized gain (loss) on investments | 7,241,516 | |||
| Accumulated net unrealized appreciation (depreciation) | ||||
| on investments and foreign currency transactions | 102,585,998 | |||
| Net Assets ($) | 796,484,762 | |||
| Net Asset Value Per Share | ||||
| Class A | Class C | Class I | Class Y | |
| Net Assets ($) | 2,323,855 | 1,255,882 | 29,479,434 | 763,425,591 |
| Shares Outstanding | 113,832 | 62,473 | 1,447,199 | 37,453,612 |
| Net Asset Value Per Share ($) | 20.41 | 20.10 | 20.37 | 20.38 |
| See notes to financial statements. | ||||
The Fund 13
| STATEMENT OF OPERATIONS | ||
| Year Ended September 30, 2014 | ||
| Investment Income ($): | ||
| Income: | ||
| Cash dividends (net of $1,688,087 foreign taxes withheld of source): | ||
| Unaffiliated issuers | 23,779,242 | |
| Affiliated issuers | 13,418 | |
| Income from securities lending—Note 1(c) | 11,716 | |
| Total Income | 23,804,376 | |
| Expenses: | ||
| Investment advisory fee—Note 3(a) | 5,513,477 | |
| Shareholder servicing costs—Note 3(c) | 324,593 | |
| Custodian fees—Note 3(c) | 253,895 | |
| Administration fees— Note 3(a) | 181,861 | |
| Registration fees | 82,216 | |
| Professional fees | 72,609 | |
| Trustees’ fees and expenses—Note 3(d) | 53,539 | |
| Prospectus and shareholders’ reports | 13,292 | |
| Distribution fees—Note 3(b) | 9,347 | |
| Loan commitment fees—Note 2 | 5,588 | |
| Interest expense—Note 2 | 277 | |
| Miscellaneous | 45,868 | |
| Total Expenses | 6,556,562 | |
| Less—reduction in fees due to earnings credits—Note 3(c) | (6 | ) |
| Net Expenses | 6,556,556 | |
| Investment Income—Net | 17,247,820 | |
| Realized and Unrealized Gain (Loss) on Investments—Note 4 ($): | ||
| Net realized gain (loss) on investments and foreign currency transactions | 24,120,467 | |
| Net realized gain (loss) on forward foreign currency exchange contracts | (446,966 | ) |
| Net Realized Gain (Loss) | 23,673,501 | |
| Net unrealized appreciation (depreciation) on | ||
| investments and foreign currency transactions | (24,728,307 | ) |
| Net unrealized appreciation (depreciation) on | ||
| forward foreign currency exchange contracts | 4,542,211 | |
| Net Unrealized Appreciation (Depreciation) | (20,186,096 | ) |
| Net Realized and Unrealized Gain (Loss) on Investments | 3,487,405 | |
| Net Increase in Net Assets Resulting from Operations | 20,735,225 | |
| See notes to financial statements. | ||
14
STATEMENT OF CHANGES IN NET ASSETS
| Year Ended September 30, | ||||
| 2014 | 2013 | a | ||
| Operations ($): | ||||
| Investment income—net | 17,247,820 | 6,725,897 | ||
| Net realized gain (loss) on investments | 23,673,501 | 32,104,423 | ||
| Net unrealized appreciation | ||||
| (depreciation) on investments | (20,186,096 | ) | 49,773,557 | |
| Net Increase (Decrease) in Net Assets | ||||
| Resulting from Operations | 20,735,225 | 88,603,877 | ||
| Dividends to Shareholders from ($): | ||||
| Investment income—net: | ||||
| Class A | (142,170 | ) | (88,183 | ) |
| Class C | (13,199 | ) | (880 | ) |
| Class I | (9,907,582 | ) | (6,512,959 | ) |
| Class Y | (20 | ) | — | |
| Total Dividends | (10,062,971 | ) | (6,602,022 | ) |
| Beneficial Interest Transactions ($): | ||||
| Net proceeds from shares sold: | ||||
| Class A | 1,547,595 | 2,287,145 | ||
| Class C | 393,985 | 223,635 | ||
| Class I | 262,132,680 | 109,529,721 | ||
| Class Y | 806,497,402 | 1,000 | ||
| Dividends reinvested: | ||||
| Class A | 141,362 | 87,532 | ||
| Class C | 13,199 | 880 | ||
| Class I | 4,475,491 | 2,853,477 | ||
| Cost of shares redeemed: | ||||
| Class A | (8,997,862 | ) | (1,685,573 | ) |
| Class C | (142,573 | ) | (101,618 | ) |
| Class I | (802,856,212 | ) | (87,866,516 | ) |
| Class Y | (23,042,278 | ) | — | |
| Increase (Decrease) in Net Assets | ||||
| from Beneficial Interest Transactions | 240,162,789 | 25,329,683 | ||
| Total Increase (Decrease) in Net Assets | 250,835,043 | 107,331,538 | ||
| Net Assets ($): | ||||
| Beginning of Period | 545,649,719 | 438,318,181 | ||
| End of Period | 796,484,762 | 545,649,719 | ||
| Undistributed investment income—net | 17,969,957 | 10,097,149 | ||
The Fund 15
STATEMENT OF CHANGES IN NET ASSETS (continued)
| Year Ended September 30, | ||||
| 2014 | 2013 | a | ||
| Capital Share Transactions: | ||||
| Class A | ||||
| Shares sold | 75,834 | 122,017 | ||
| Shares issued for dividends reinvested | 7,216 | 5,089 | ||
| Shares redeemed | (435,987 | ) | (90,839 | ) |
| Net Increase (Decrease) in Shares Outstanding | (352,937 | ) | 36,267 | |
| Class C | ||||
| Shares sold | 19,615 | 11,768 | ||
| Shares issued for dividends reinvested | 680 | 52 | ||
| Shares redeemed | (7,038 | ) | (5,821 | ) |
| Net Increase (Decrease) in Shares Outstanding | 13,257 | 5,999 | ||
| Class Ib | ||||
| Shares sold | 12,979,452 | 5,861,410 | ||
| Shares issued for dividends reinvested | 229,512 | 166,675 | ||
| Shares redeemed | (38,385,605 | ) | (4,836,153 | ) |
| Net Increase (Decrease) in Shares Outstanding | (25,176,641 | ) | 1,191,932 | |
| Class Yb | ||||
| Shares sold | 38,558,130 | 52.85 | ||
| Shares redeemed | (1,104,571 | ) | — | |
| Net Increase (Decrease) in Shares Outstanding | 37,453,559 | 52.85 | ||
| a Effective July 1, 2013, the fund commenced offering ClassY shares. |
| b During the period ended September 30, 2014, 35,884,139 Class I shares representing $751,546,493 were |
| exchanged for 35,901,286 ClassY shares. |
See notes to financial statements.
16
FINANCIAL HIGHLIGHTS
The following tables describe the performance for each share class for the fiscal periods indicated. All information (except portfolio turnover rate) reflects financial results for a single fund share.Total return shows how much your investment in the fund would have increased (or decreased) during each period, assuming you had reinvested all dividends and distributions.These figures have been derived from the fund’s financial statements.
| Year Ended September 30, | ||||||||||
| Class A Shares | 2014 | 2013 | 2012 | 2011 | 2010 | |||||
| Per Share Data ($): | ||||||||||
| Net asset value, beginning of period | 20.15 | 16.96 | 14.74 | 16.80 | 16.27 | |||||
| Investment Operations: | ||||||||||
| Investment income—neta | .47 | .21 | .18 | .19 | .21 | |||||
| Net realized and unrealized | ||||||||||
| gain (loss) on investments | .10 | 3.19 | 2.52 | (1.82 | ) | .44 | ||||
| Total from Investment Operations | .57 | 3.40 | 2.70 | (1.63 | ) | .65 | ||||
| Distributions: | ||||||||||
| Dividends from investment income—net | (.31 | ) | (.21 | ) | (.23 | ) | (.17 | ) | (.12 | ) |
| Dividends from net realized | ||||||||||
| gain on investments | — | — | (.25 | ) | (.26 | ) | — | |||
| Total Distributions | (.31 | ) | (.21 | ) | (.48 | ) | (.43 | ) | (.12 | ) |
| Net asset value, end of period | 20.41 | 20.15 | 16.96 | 14.74 | 16.80 | |||||
| Total Return (%)b | 2.88 | 20.24 | 18.92 | (10.10 | ) | 3.99 | ||||
| Ratios/Supplemental Data (%): | ||||||||||
| Ratio of total expenses | ||||||||||
| to average net assets | 1.30 | 1.34 | 1.32 | 1.32 | 1.32 | |||||
| Ratio of net expenses | ||||||||||
| to average net assets | 1.30 | 1.34 | 1.32 | 1.32 | 1.32 | |||||
| Ratio of net investment income | ||||||||||
| to average net assets | 2.22 | 1.11 | 1.14 | 1.06 | 1.29 | |||||
| Portfolio Turnover Rate | 39.45 | 55.27 | 57.88 | 63.28 | 64.45 | |||||
| Net Assets, end of period ($ x 1,000) | 2,324 | 9,404 | 7,300 | 9,766 | 18,901 | |||||
| a | Based on average shares outstanding. |
| b | Exclusive of sales charge. |
See notes to financial statements.
The Fund 17
FINANCIAL HIGHLIGHTS (continued)
| Year Ended September 30, | ||||||||||
| Class C Shares | 2014 | 2013 | 2012 | 2011 | 2010 | |||||
| Per Share Data ($): | ||||||||||
| Net asset value, beginning of period | 19.90 | 16.70 | 14.54 | 16.59 | 16.17 | |||||
| Investment Operations: | ||||||||||
| Investment income—neta | .29 | .05 | .07 | .05 | .08 | |||||
| Net realized and unrealized | ||||||||||
| gain (loss) on investments | .14 | 3.17 | 2.47 | (1.79 | ) | .45 | ||||
| Total from Investment Operations | .43 | 3.22 | 2.54 | (1.74 | ) | .53 | ||||
| Distributions: | ||||||||||
| Dividends from investment income—net | (.23 | ) | (.02 | ) | (.13 | ) | (.05 | ) | (.11 | ) |
| Dividends from net realized | ||||||||||
| gain on investments | — | — | (.25 | ) | (.26 | ) | — | |||
| Total Distributions | (.23 | ) | (.02 | ) | (.38 | ) | (.31 | ) | (.11 | ) |
| Net asset value, end of period | 20.10 | 19.90 | 16.70 | 14.54 | 16.59 | |||||
| Total Return (%)b | 2.18 | 19.31 | 17.92 | (10.79 | ) | 3.20 | ||||
| Ratios/Supplemental Data (%): | ||||||||||
| Ratio of total expenses | ||||||||||
| to average net assets | 2.04 | 2.13 | 2.16 | 2.07 | 2.11 | |||||
| Ratio of net expenses | ||||||||||
| to average net assets | 2.04 | 2.13 | 2.16 | 2.07 | 2.11 | |||||
| Ratio of net investment income | ||||||||||
| to average net assets | 1.43 | .28 | .42 | .31 | .52 | |||||
| Portfolio Turnover Rate | 39.45 | 55.27 | 57.88 | 63.28 | 64.45 | |||||
| Net Assets, end of period ($ x 1,000) | 1,256 | 979 | 722 | 924 | 1,345 | |||||
| a | Based on average shares outstanding. |
| b | Exclusive of sales charge. |
See notes to financial statements.
18
| Year Ended September 30, | ||||||||||
| Class I Shares | 2014 | 2013 | 2012 | 2011 | 2010 | |||||
| Per Share Data ($): | ||||||||||
| Net asset value, beginning of period | 20.10 | 16.92 | 14.77 | 16.84 | 16.27 | |||||
| Investment Operations: | ||||||||||
| Investment income—neta | .61 | .26 | .24 | .26 | .25 | |||||
| Net realized and unrealized | ||||||||||
| gain (loss) on investments | .03 | 3.18 | 2.49 | (1.86 | ) | .45 | ||||
| Total from Investment Operations | .64 | 3.44 | 2.73 | (1.60 | ) | .70 | ||||
| Distributions: | ||||||||||
| Dividends from investment income—net | (.37 | ) | (.26 | ) | (.33 | ) | (.21 | ) | (.13 | ) |
| Dividends from net realized | ||||||||||
| gain on investments | — | — | (.25 | ) | (.26 | ) | — | |||
| Total Distributions | (.37 | ) | (.26 | ) | (.58 | ) | (.47 | ) | (.13 | ) |
| Net asset value, end of period | 20.37 | 20.10 | 16.92 | 14.77 | 16.84 | |||||
| Total Return (%) | 3.25 | 20.62 | 19.27 | (9.90 | ) | 4.31 | ||||
| Ratios/Supplemental Data (%): | ||||||||||
| Ratio of total expenses | ||||||||||
| to average net assets | .96 | 1.01 | 1.04 | 1.05 | 1.07 | |||||
| Ratio of net expenses | ||||||||||
| to average net assets | .96 | 1.01 | 1.04 | 1.05 | 1.07 | |||||
| Ratio of net investment income | ||||||||||
| to average net assets | 2.95 | 1.42 | 1.54 | 1.48 | 1.57 | |||||
| Portfolio Turnover Rate | 39.45 | 55.27 | 57.88 | 63.28 | 64.45 | |||||
| Net Assets, end of period ($ x 1,000) | 29,479 | 535,265 | 430,297 | 484,349 | 500,811 | |||||
| a Based on average shares outstanding. | ||||||||||
| See notes to financial statements. | ||||||||||
The Fund 19
FINANCIAL HIGHLIGHTS (continued)
| Year Ended September 30, | ||||
| Class Y Shares | 2014 | 2013 | a | |
| Per Share Data ($): | ||||
| Net asset value, beginning of period | 20.11 | 18.74 | ||
| Investment Operations: | ||||
| Investment income—netb | .22 | .06 | ||
| Net realized and unrealized | ||||
| gain (loss) on investments | .43 | 1.31 | ||
| Total from Investment Operations | .65 | 1.37 | ||
| Distributions: | ||||
| Dividends from investment income—net | (.38 | ) | — | |
| Net asset value, end of period | 20.38 | 20.11 | ||
| Total Return (%) | 3.33 | 6.29 | c | |
| Ratios/Supplemental Data (%): | ||||
| Ratio of total expenses to average net assets | .91 | .94 | d | |
| Ratio of net expenses to average net assets | .91 | .94 | d | |
| Ratio of net investment income | ||||
| to average net assets | 1.10 | 1.19 | d | |
| Portfolio Turnover Rate | 39.45 | 55.27 | ||
| Net Assets, end of period ($ x 1,000) | 763,426 | 1 | ||
| a | From July 1, 2013, (commencement of initial offering) to September 30, 2013. |
| b | Based on average shares outstanding. |
| c | Not annualized. |
| d | Annualized. |
See notes to financial statements.
20
NOTES TO FINANCIAL STATEMENTS
NOTE 1—Significant Accounting Policies:
Dreyfus/Newton International Equity Fund (the “fund”) is a separate diversified series of Dreyfus Investment Funds (the “Trust”), which is registered under the Investment Company Act of 1940, as amended (the “Act”), as an open-end management investment company and operates as a series company currently offering seven series, including the fund.The fund’s investment objective is to seek long-term growth of capital. The Dreyfus Corporation (the “Manager” or “Dreyfus”), a wholly-owned subsidiary of The Bank of New York Mellon Corporation (“BNY Mellon”), serves as the fund’s investment adviser. Newton Capital Management Limited (“Newton”), serves as the fund’s sub-investment adviser.
MBSC Securities Corporation (the “Distributor”), a wholly-owned subsidiary of Dreyfus, is the distributor of the fund’s shares. The fund is authorized to issue an unlimited number of $.001 par value shares of Beneficial Interest in each of the following classes of shares: Class A, Class C, Class I and Class Y. Class A and Class C shares are sold primarily to retail investors through financial intermediaries and bear Distribution and/or Shareholder Services Plan fees. Class A shares generally are subject to a sales charge imposed at the time of purchase. Class C shares are subject to a contingent deferred sales charge (“CDSC”) imposed on Class C shares redeemed within one year of purchase. Class I shares are sold primarily to bank trust departments and other financial service providers (including The Bank of NewYork Mellon, a subsidiary of BNY Mellon and an affiliate of Dreyfus, and its affiliates), acting on behalf of customers having a qualified trust or an investment account or relationship at such institution, and bear no Distribution or Shareholder Services Plan fees. Class Y shares are sold at net asset value per share generally to institutional investors, and bear no Distribution or Shareholder Services Plan fees. Class I and Class Y shares are offered without a front-end sales charge or CDSC. Other
The Fund 21
NOTES TO FINANCIAL STATEMENTS (continued)
differences between the classes include the services offered to and the expenses borne by each class, the allocation of certain transfer agency costs, and certain voting rights. Income, expenses (other than expenses attributable to a specific class), and realized and unrealized gains or losses on investments are allocated to each class of shares based on its relative net assets.
The Trust accounts separately for the assets, liabilities and operations of each series. Expenses directly attributable to each series are charged to that series’ operations; expenses which are applicable to all series are allocated among them on a pro rata basis.
The Financial Accounting Standards Board (“FASB”) Accounting Standards Codification (“ASC”) is the exclusive reference of authoritative U.S. generally accepted accounting principles (“GAAP”) recognized by the FASB to be applied by nongovernmental entities. Rules and interpretive releases of the Securities and Exchange Commission (“SEC”) under authority of federal laws are also sources of authoritative GAAP for SEC registrants. The fund’s financial statements are prepared in accordance with GAAP, which may require the use of management estimates and assumptions. Actual results could differ from those estimates.
(a) Portfolio valuation: The fair value of a financial instrument is the amount that would be received to sell an asset or paid to transfer a liability in an orderly transaction between market participants at the measurement date (i.e., the exit price). GAAP establishes a fair value hierarchy that prioritizes the inputs of valuation techniques used to measure fair value. This hierarchy gives the highest priority to unadjusted quoted prices in active markets for identical assets or liabilities (Level 1 measurements) and the lowest priority to unobservable inputs (Level 3 measurements).
Additionally, GAAP provides guidance on determining whether the volume and activity in a market has decreased significantly and whether such a decrease in activity results in transactions that are not orderly. GAAP requires enhanced disclosures around valuation inputs and techniques used during annual and interim periods.
22
Various inputs are used in determining the value of the fund’s investments relating to fair value measurements.These inputs are summarized in the three broad levels listed below:
Level 1—unadjusted quoted prices in active markets for identical investments.
Level 2—other significant observable inputs (including quoted prices for similar investments, interest rates, prepayment speeds, credit risk, etc.).
Level 3—significant unobservable inputs (including the fund’s own assumptions in determining the fair value of investments).
The inputs or methodology used for valuing securities are not necessarily an indication of the risk associated with investing in those securities.
Changes in valuation techniques may result in transfers in or out of an assigned level within the disclosure hierarchy. Valuation techniques used to value the fund’s investments are as follows:
Investments in securities are valued at the last sales price on the securities exchange or national securities market on which such securities are primarily traded. Securities listed on the National Market System for which market quotations are available are valued at the official closing price or, if there is no official closing price that day, at the last sales price. Securities not listed on an exchange or the national securities market, or securities for which there were no transactions, are valued at the average of the most recent bid and asked prices, except for open short positions, where the asked price is used for valuation purposes. Bid price is used when no asked price is available. Registered investment companies that are not traded on an exchange are valued at their net asset value.All of the preceding securities are generally categorized within Level 1 of the fair value hierarchy.
Fair valuing of securities may be determined with the assistance of a pricing service using calculations based on indices of domestic securities and other appropriate indicators, such as prices of relevant ADRs
The Fund 23
NOTES TO FINANCIAL STATEMENTS (continued)
and financial futures. Utilizing these techniques may result in transfers between Level 1 and Level 2 of the fair value hierarchy.
When market quotations or official closing prices are not readily available, or are determined not to reflect accurately fair value, such as when the value of a security has been significantly affected by events after the close of the exchange or market on which the security is principally traded (for example, a foreign exchange or market), but before the fund calculates its net asset value, the fund may value these investments at fair value as determined in accordance with the procedures approved by the Trust’s Board of Trustees (the “Board”). Certain factors may be considered when fair valuing investments such as: fundamental analytical data, the nature and duration of restrictions on disposition, an evaluation of the forces that influence the market in which the securities are purchased and sold, and public trading in similar securities of the issuer or comparable issuers.These securities are either categorized within Level 2 or 3 of the fair value hierarchy depending on the relevant inputs used.
For restricted securities where observable inputs are limited, assumptions about market activity and risk are used and are generally categorized within Level 3 of the fair value hierarchy.
Investments denominated in foreign currencies are translated to U.S. dollars at the prevailing rates of exchange.
Forward foreign currency exchange contracts (“forward contracts”) are valued at the forward rate and are generally categorized within Level 2 of the fair value hierarchy.
The following is a summary of the inputs used as of September 30, 2014 in valuing the fund’s investments:
| Level 2—Other | Level 3— | |||
| Level 1— | Significant | Significant | ||
| Unadjusted | Observable | Unobservable | ||
| Quoted Prices | Inputs | Inputs | Total | |
| Assets ($) | ||||
| Investments in Securities: | ||||
| Equity Securities— | ||||
| Foreign | ||||
| Common Stocks† | 783,204,315 | 5,632,642 | — | 788,836,957 |
24
| Level 2—Other | Level 3— | ||||
| Level 1— | Significant | Significant | |||
| Unadjusted | Observable | Unobservable | |||
| Quoted Prices | Inputs | Inputs | Total | ||
| Assets ($) (continued) | |||||
| Investments in | |||||
| Securities (continued): | |||||
| Mutual Funds | 9,880,074 | — | — | 9,880,074 | |
| Other Financial | |||||
| Instruments: | |||||
| Forward Foreign | |||||
| Currency Exchange | |||||
| Contracts†† | — | 6,004,374 | — | 6,004,374 | |
| Liabilities ($) | |||||
| Other Financial | |||||
| Instruments: | |||||
| Forward Foreign | |||||
| Currency Exchange | |||||
| Contracts†† | — | (2,043,785) | — | (2,043,785 | ) |
| † | See Statement of Investments for additional detailed categorizations. |
| †† | Amount shown represents unrealized appreciation (depreciation) at period end. |
At September 30, 2013, $522,098,678 of exchange traded foreign equity securities were classified within Level 2 of the fair value hierarchy pursuant to the fund's fair valuation procedures.
(b) Foreign currency transactions: The fund does not isolate that portion of the results of operations resulting from changes in foreign exchange rates on investments from the fluctuations arising from changes in the market prices of securities held. Such fluctuations are included with the net realized and unrealized gain or loss on investments.
Net realized foreign exchange gains or losses arise from sales of foreign currencies, currency gains or losses realized on securities transactions between trade and settlement date, and the difference between the amounts of dividends, interest and foreign withholding taxes recorded on the fund’s books and the U.S. dollar equivalent of the amounts actually received or paid. Net unrealized foreign exchange gains and losses arise from changes in the value of assets and liabilities other than investments
The Fund 25
NOTES TO FINANCIAL STATEMENTS (continued)
resulting from changes in exchange rates. Foreign currency gains and losses on foreign currency transactions are also included with net realized and unrealized gain or loss on investments.
(c) Securities transactions and investment income: Securities transactions are recorded on a trade date basis. Realized gains and losses from securities transactions are recorded on the identified cost basis. Dividend income is recognized on the ex-dividend date and interest income, including, where applicable, accretion of discount and amortization of premium on investments, is recognized on the accrual basis.
Pursuant to a securities lending agreement with The Bank of New York Mellon, the fund may lend securities to qualified institutions. It is the fund’s policy that, at origination, all loans are secured by collateral of at least 102% of the value of U.S. securities loaned and 105% of the value of foreign securities loaned. Collateral equivalent to at least 100% of the market value of securities on loan is maintained at all times. Collateral is either in the form of cash, which can be invested in certain money market mutual funds managed by Dreyfus or U.S. Government and Agency securities. The fund is entitled to receive all dividends, interest and distributions on securities loaned, in addition to income earned as a result of the lending transaction. Should a borrower fail to return the securities in a timely manner,The Bank of NewYork Mellon is required to replace the securities for the benefit of the fund or credit the fund with the market value of the unreturned securities and is subrogated to the fund’s rights against the borrower and the collateral. During the period ended September 30, 2014,The Bank of New York Mellon earned $2,322 from lending portfolio securities, pursuant to the securities lending agreement.
(d) Affiliated issuers: Investments in other investment companies advised by Dreyfus are defined as “affiliated” under the Act. Investments
26
in affiliated investment companies during the period ended September 30, 2014 were as follows:
| Affiliated | |||||
| Investment | Value | Value | Net | ||
| Company | 9/30/2013 ($) | Purchases ($) | Sales ($) | 9/30/2014 ($) | Assets (%) |
| Dreyfus | |||||
| Institutional | |||||
| Preferred | |||||
| Plus Money | |||||
| Market | |||||
| Fund | 10,666,351 | 305,550,662 | 306,336,939 | 9,880,074 | 1.3 |
| Dreyfus | |||||
| Institutional | |||||
| Cash | |||||
| Advantage | |||||
| Fund | — | 9,322,774 | 9,322,774 | — | — |
| 10,666,351 | 314,873,436 | 315,659,713 | 9,880,074 | 1.3 |
(e) Risk: Investing in foreign markets may involve special risks and considerations not typically associated with investing in the U.S.These risks include revaluation of currencies, high rates of inflation, repatriation restrictions on income and capital, and adverse political and economic developments. Moreover, securities issued in these markets may be less liquid, subject to government ownership controls and delayed settlements, and their prices may be more volatile than those of comparable securities in the U.S.
(f) Dividends to shareholders: Dividends are recorded on the ex-dividend date. Dividends from investment income-net and dividends from net realized capital gains, if any, are normally declared and paid annually, but the fund may make distributions on a more frequent basis to comply with the distribution requirements of the Internal Revenue Code of 1986, as amended (the “Code”).To the extent that net realized capital gains can be offset by capital loss carryovers, it is the policy of the
The Fund 27
NOTES TO FINANCIAL STATEMENTS (continued)
fund not to distribute such gains. Income and capital gain distributions are determined in accordance with income tax regulations, which may differ from GAAP.
(g) Federal income taxes: It is the policy of the fund to continue to qualify as a regulated investment company, if such qualification is in the best interests of its shareholders, by complying with the applicable provisions of the Code, and to make distributions of taxable income sufficient to relieve it from substantially all federal income and excise taxes.
As of and during the period ended September 30, 2014, the fund did not have any liabilities for any uncertain tax positions. The fund recognizes interest and penalties, if any, related to uncertain tax positions as income tax expense in the Statement of Operations. During the period ended September 30, 2014, the fund did not incur any interest or penalties.
Each tax year in the four-year period ended September 30, 2014 remains subject to examination by the Internal Revenue Service and state taxing authorities.
At September 30, 2014, the components of accumulated earnings on a tax basis were as follows: undistributed ordinary income $24,686,557, undistributed capital gains $11,213,102 and unrealized appreciation $91,897,812.
The tax character of distributions paid to shareholders during the fiscal periods ended September 30, 2014 and September 30, 2013 were as follows: ordinary income $10,062,971 and $6,602,022, respectively.
During the period ended September 30, 2014, as a result of permanent book to tax differences, primarily due to the tax treatment for foreign currency gains and losses and passive foreign investment companies, the fund increased accumulated undistributed investment income-net by $687,959 and decreased accumulated net realized gain (loss) on investments by the same amount. Net assets and net asset value per share were not affected by this reclassification.
28
NOTE 2—Bank Lines of Credit:
The fund participates with other Dreyfus-managed funds in a $265 million unsecured credit facility led by Citibank, N.A. and a $300 million unsecured credit facility provided by The Bank of New York Mellon (each, a “Facility”), each to be utilized primarily for temporary or emergency purposes, including the financing of redemptions. Prior to October 9, 2013, the unsecured credit facility with Citibank, N.A. was $210 million. In connection therewith, the fund has agreed to pay its pro rata portion of commitment fees for each Facility. Interest is charged to the fund based on rates determined pursuant to the terms of the respective Facility at the time of borrowing.
The average amount of borrowings outstanding under the Facilities during the period ended September 30, 2014 was approximately $25,500 with a related weighted average annualized interest rate of 1.09%.
NOTE 3—Investment Advisory Fee, Sub-Investment Advisory Fee, Administration Fee and Other Transactions with Affiliates:
(a) Pursuant to an investment advisory agreement with Dreyfus, the investment advisory fee is computed at the annual rate of .80% of the value of the fund’s average daily net assets and is payable monthly.
Pursuant to a sub-investment advisory agreement between Dreyfus and Newton, Dreyfus pays Newton a monthly fee at an annual percentage rate of the value of the fund’s average daily net assets.
The fund has an Accounting and Administration Agreement (the “Administration Agreement”) with Dreyfus, whereby Dreyfus performs administrative and accounting services for the fund. The fund has agreed to compensate Dreyfus for providing accounting services, administration, compliance monitoring, regulatory and shareholder reporting, as well as related facilities and equipment. The fee is based
The Fund 29
NOTES TO FINANCIAL STATEMENTS (continued)
on the fund’s average daily net assets and computed at the following annual rates: .10% of the first $500 million, .065% of the next $500 million and .02% in excess of $1 billion.
In addition, after applying any expense limitations or fee waivers that reduce the fees paid to Dreyfus for this service, Dreyfus has contractually agreed in writing to waive any remaining fees for this service to the extent that they exceed both Dreyfus’ costs in providing these services and a reasonable allocation of the costs incurred by Dreyfus and its affiliates related to the support and oversight of these services. The fund also reimburses Dreyfus for the out-of-pocket expenses incurred in performing this service for the fund. Pursuant to the Administration Agreement, the fund was charged $181,861 during the period ended September 30, 2014.
(b) Under the Distribution Plan adopted pursuant to Rule 12b-1 under the Act, Class C shares pay the Distributor for distributing its shares at an annual rate of .75% of the value of its average daily net assets. During the period ended September 30, 2014, Class C shares were charged $9,347 pursuant to the Distribution Plan.
(c) Under the Shareholder Services Plan, Class A and Class C shares pay the Distributor at an annual rate of .25% of the value of their average daily net assets for the provision of certain services.The services provided may include personal services relating to shareholder accounts, such as answering shareholder inquiries regarding the fund and providing reports and other information, and services related to the maintenance of shareholder accounts.The Distributor may make payments to Service Agents (securities dealers, financial institutions or other industry professionals) with respect to these services.The Distributor determines the amounts to be paid to Service Agents. During the period ended September 30, 2014, Class A and Class C shares were charged $22,103 and $3,115, respectively, pursuant to the Shareholder Services Plan.
Under its terms, the Distribution Plan and Shareholder Services Plan shall remain in effect from year to year, provided such continuance is approved annually by a vote of a majority of those Trustees who are
30
not “interested persons” of the Trust and who have no direct or indirect financial interest in the operation of or in any agreement related to the Distribution Plan or Shareholder Services Plan.
The fund has arrangements with the transfer agent and the custodian whereby the fund may receive earnings credits when positive cash balances are maintained, which are used to offset transfer agency and custody fees. For financial reporting purposes, the fund includes net earnings credits as an expense offset in the Statement of Operations.
The fund compensates Dreyfus Transfer, Inc., a wholly-owned subsidiary of Dreyfus, under a transfer agency agreement for providing transfer agency and cash management services for the fund. The majority of transfer agency fees are comprised of amounts paid on a per account basis, while cash management fees are related to fund subscriptions and redemptions. During the period ended September 30, 2014, the fund was charged $3,188 for transfer agency services and $92 for cash management services.These fees are included in Shareholder servicing costs in the Statement of Operations. Cash management fees were partially offset by earnings credits of $6.
The fund compensates The Bank of NewYork Mellon under a custody agreement for providing custodial services for the fund.These fees are determined based on net assets, geographic region and transaction activity. During the period ended September 30, 2014, the fund was charged $253,895 pursuant to the custody agreement.
During the period ended September 30, 2014, the fund was charged $8,107 for services performed by the Chief Compliance Officer and his staff.
The components of “Due to The Dreyfus Corporation and affiliates” in the Statement of Assets and Liabilities consist of: investment advisory fees $529,693, administration fees $15,162, Distribution Plan fees $793, Shareholder Services Plan fees $874, custodian fees $106,836, Chief Compliance Officer fees $1,730 and transfer agency fees $43,539.
The Fund 31
NOTES TO FINANCIAL STATEMENTS (continued)
(d) Each Board member also serves as a Board member of other funds within the Dreyfus complex. Annual retainer fees and attendance fees are allocated to each fund based on net assets.
NOTE 4—Securities Transactions:
The aggregate amount of purchases and sales of investment securities, excluding short-term securities and forward contracts, during the period ended September 30, 2014, amounted to $527,008,068 and $264,576,810, respectively.
Derivatives: A derivative is a financial instrument whose performance is derived from the performance of another asset. Each type of derivative instrument that was held by the fund during the period ended September 30, 2014 is discussed below.
Master Netting Arrangements: The fund enters into International Swaps and Derivatives Association, Inc. Master Agreements or similar agreements (collectively, “Master Agreements”) with its over-the counter (“OTC”) derivative contract counterparties in order to, among other things, reduce its credit risk to counterparties. Master Agreements include provisions for general obligations, representations, collateral and events of default or termination. Under a Master Agreement, the fund may offset with the counterparty certain derivative financial instrument’s payables and/or receivables with collateral held and/or posted and create one single net payment in the event of default or termination.
Forward Foreign Currency Exchange Contracts: The fund enters into forward contracts in order to hedge its exposure to changes in foreign currency exchange rates on its foreign portfolio holdings, to settle foreign currency transactions or as a part of its investment strategy. When executing forward contracts, the fund is obligated to buy or sell a foreign currency at a specified rate on a certain date in the future. With respect to sales of forward contracts, the fund incurs a loss if the value of the contract increases between the date the forward contract is opened and the date the forward contract is closed.The fund realizes a gain if the value of the contract decreases between those dates. With
32
respect to purchases of forward contracts, the fund incurs a loss if the value of the contract decreases between the date the forward contract is opened and the date the forward contract is closed.The fund realizes a gain if the value of the contract increases between those dates. Any realized or unrealized gains or losses which occurred during the period are reflected in the Statement of Operations. The fund is exposed to foreign currency risk as a result of changes in value of underlying financial instruments.The fund is also exposed to credit risk associated with counterparty nonperformance on these forward contracts, which is generally limited to the unrealized gain on each open contract. This risk is mitigated by Master Agreements between the fund and the counterparty. The following summarizes open forward contracts at September 30, 2014:
| Foreign | Unrealized | ||||||
| Forward Foreign Currency | Currency | Appreciation | |||||
| Exchange Contracts | Amounts | Cost ($) | Value ($) (Depreciation) ($) | ||||
| Purchases: | |||||||
| Japanese Yen, | |||||||
| Expiring | |||||||
| 10/15/2014 a | 1,464,865,000 | 14,346,650 | 13,357,788 | (988,862 | ) | ||
| Swedish Krona, | |||||||
| Expiring | |||||||
| 10/15/2014 b | 96,790,565 | 14,467,406 | 13,412,483 | (1,054,923 | ) | ||
| Sales: | Proceeds ($) | ||||||
| Japanese Yen, | |||||||
| Expiring: | |||||||
| 10/2/2014 b | 108,684,688 | 994,639 | 990,971 | 3,668 | |||
| 10/15/2014 b | 4,394,594,000 | 43,364,472 | 40,073,354 | 3,291,118 | |||
| 10/15/2014 c | 3,274,434,000 | 31,854,392 | 29,858,857 | 1,995,535 | |||
| Swedish Krona, | |||||||
| Expiring | |||||||
| 10/15/2014 a | 98,379,005 | 14,346,650 | 13,632,597 | 714,053 | |||
| Gross Unrealized | |||||||
| Appreciation | 6,004,374 | ||||||
| Gross Unrealized | |||||||
| Depreciation | (2,043,785 | ) | |||||
Counterparties:
| a | JP Morgan Chase Bank |
| b | UBS |
| c | Royal Bank of Scotland |
The Fund 33
NOTES TO FINANCIAL STATEMENTS (continued)
The provisions of ASC Topic 210 “Disclosures about Offsetting Assets and Liabilities” require disclosure on the offsetting of financial assets and liabilities. These disclosures are required for certain investments, including derivative financial instruments subject to Master Agreements which are eligible for offsetting in the Statement of Assets and Liabilities and require the fund to disclose both gross and net information with respect to such investments. For financial reporting purposes, the fund does not offset derivative assets and derivative liabilities that are subject to Master Agreements in the Statement of Assets and Liabilities.
At September 30, 2014, derivative assets and liabilities (by type) on a gross basis are as follows:
| Derivative Financial Instruments: | Assets ($) | Liabilities ($) | |
| Forward contracts | 6,004,374 | (2,043,785 | ) |
| Total gross amount of derivative | |||
| assets and liabilities in the | |||
| Statement of Assets and Liabilities | 6,004,374 | (2,043,785 | ) |
| Derivatives not subject to | |||
| Master Agreements | — | — | |
| Total gross amount of assets | |||
| and liabilities subject to | |||
| Master Agreements | 6,004,374 | (2,043,785 | ) |
The following tables present derivative assets and liabilities net of amounts available for offsetting under Master Agreements and net of related collateral received or pledged, if any, as of September 30, 2014:
| Financial | |||||
| Instruments | |||||
| and | |||||
| Derivatives | |||||
| Gross Amount of | Available | Collateral | Net Amount | ||
| Counterparties | Assets ($)1 | for Offset ($) | Received ($) | of Assets ($) | |
| JP Morgan Chase Bank | 714,053 | (714,053 | ) | — | — |
| Royal Bank of Scotland | 1,995,535 | — | — | 1,995,535 | |
| UBS | 3,294,786 | (1,054,923 | ) | — | 2,239,863 |
| Total | 6,004,374 | (1,768,976 | ) | — | 4,235,398 |
34
| Financial | ||||||
| Instruments | ||||||
| and | ||||||
| Derivatives | ||||||
| Gross Amount of | Available | Collateral | Net Amount | |||
| Counterparties | Liabilities ($)1 | for Offset ($) | Pledged ($) | of Liabilities ($) | ||
| JP Morgan Chase Bank | (988,862 | ) | 714,053 | — | (274,809 | ) |
| UBS | (1,054,923 | ) | 1,054,923 | — | — | |
| Total | (2,043,785 | ) | 1,768,976 | — | (274,809 | ) |
| 1 | Absent a default event or early termination, OTC derivative assets and liabilities are presented at |
| gross amounts and are not offset in the Statement of Assets and Liabilities. |
The following summarizes the average market value of derivatives outstanding during the period ended September 30, 2014:
| Average Market Value ($) | |
| Forward contracts | 51,274,919 |
At September 30, 2014, the cost of investments for federal income tax purposes was $706,707,396; accordingly, accumulated net unrealized appreciation on investments was $92,009,635, consisting of $128,738,655 gross unrealized appreciation and $36,729,020 gross unrealized depreciation.
The Fund 35
| REPORT OF INDEPENDENT REGISTERED |
| PUBLIC ACCOUNTING FIRM |
The Board of Trustees and Shareholders Dreyfus Investment Funds
We have audited the accompanying statement of assets and liabilities of Dreyfus/Newton International Equity Fund (the “Fund”), a series of Dreyfus Investment Funds, including the statement of investments, as of September 30, 2014, and the related statement of operations for the year then ended, the statements of changes in net assets for each of the years in the two-year period then ended, and the financial highlights for each of the years or periods in the five-year period then ended.These financial statements and financial highlights are the responsibility of the Fund’s management. Our responsibility is to express an opinion on these financial statements and financial highlights based on our audits.
We conducted our audits in accordance with the standards of the Public Company Accounting Oversight Board (United States). Those standards require that we plan and perform the audit to obtain reasonable assurance about whether the financial statements and financial highlights are free of material misstatement. An audit includes examining, on a test basis, evidence supporting the amounts and disclosures in the financial statements. Our procedures included confirmation of securities owned as of September 30, 2014, by correspondence with the custodian and brokers or by other appropriate auditing procedures. An audit also includes assessing the accounting principles used and significant estimates made by management, as well as evaluating the overall financial statement presentation. We believe that our audits provide a reasonable basis for our opinion.
In our opinion, the financial statements and financial highlights referred to above present fairly, in all material respects, the financial position of Dreyfus/Newton International Equity Fund as of September 30, 2014, the results of its operations for the year then ended, the changes in its net assets for each of the years in the two-year period then ended, and the financial highlights for each of the years or periods in the five-year period then ended, in conformity with U.S. generally accepted accounting principles.

New York, New York
November 26, 2014
36
IMPORTANT TAX INFORMATION (Unaudited)
For federal tax purposes, the fund elects to provide each shareholder with their portion of the fund’s income sourced from foreign countries and taxes paid from foreign countries. The fund reports the maximum amount allowable but not less than $25,499,722 as income sourced from foreign countries for the fiscal year ended September 30, 2014 in accordance with Section 853(c)(2) of the Internal Revenue Code and also the fund reports the maximum amount allowable but not less than $1,606,598 as taxes paid from foreign countires for the fiscal year ended September 30, 2014 in accordance with Section 853(a) of the Internal Revenue Code. Where required by federal tax rules, shareholders will receive notification of their proportionate share of foreign sourced income and foreign taxes paid for the 2014 calendar year with Form 1099-DIV which will be mailed in early 2015. Also the fund reports the maximum amount allowable, but not less than $10,062,971 as ordinary income dividends paid during the fiscal year ended September 30, 2014 as qualified dividend income in accordance with Section 854(b)(1)(B) of the Internal Revenue Code.
The Fund 37
| BOARD MEMBERS INFORMATION (Unaudited) |
| INDEPENDENT BOARD MEMBERS |
| Joseph S. DiMartino (70) |
| Chairman of the Board (2008) |
| Principal Occupation During Past 5Years: |
| • Corporate Director and Trustee (1995-present) |
| Other Public Company Board Memberships During Past 5Years: |
| • CBIZ (formerly, Century Business Services, Inc.), a provider of outsourcing functions for small |
| and medium size companies, Director (1997-present) |
| • The Newark Group, a provider of a national market of paper recovery facilities, paperboard |
| mills and paperboard converting plants, Director (2000-2010) |
| • Sunair Services Corporation, a provider of certain outdoor-related services to homes and |
| businesses, Director (2005-2009) |
| No. of Portfolios for which Board Member Serves: 145 |
| ——————— |
| Francine J. Bovich (63) |
| Board Member (2011) |
| Principal Occupation During Past 5Years: |
| • Trustee,The Bradley Trusts, private trust funds (2011-present) |
| • Managing Director, Morgan Stanley Investment Management (1993-2010) |
| Other Public Company Board Membership During Past 5Years: |
| • Annaly Capital Management, Inc., Board Member (May 2014-present) |
| No. of Portfolios for which Board Member Serves: 45 |
| ——————— |
| Kenneth A. Himmel (68) |
| Board Member (2008) |
| Principal Occupation During Past 5Years: |
| • President and CEO, Related Urban Development, a real estate development company (1996-present) |
| • President and CEO, Himmel & Company, a real estate development company (1980-present) |
| • CEO,American Food Management, a restaurant company (1983-present) |
| No. of Portfolios for which Board Member Serves: 31 |
| ——————— |
| Stephen J. Lockwood (67) |
| Board Member (2008) |
| Principal Occupation During Past 5Years: |
| • Chairman of the Board, Stephen J. Lockwood and Company LLC, a real estate investment |
| company (2000-present) |
| No. of Portfolios for which Board Member Serves: 31 |
38
| Roslyn M. Watson (64) |
| Board Member (2008) |
| Principal Occupation During Past 5Years: |
| • Principal,Watson Ventures, Inc., a real estate investment company (1993-present) |
| No. of Portfolios for which Board Member Serves: 67 |
| ——————— |
| Benaree Pratt Wiley (68) |
| Board Member (2008) |
| Principal Occupation During Past 5Years: |
| • Principal,TheWiley Group, a firm specializing in strategy and business development (2005-present) |
| Other Public Company Board Membership During Past 5Years: |
| • CBIZ (formerly, Century Business Services, Inc.), a provider of outsourcing functions for small |
| and medium size companies, Director (2008-present) |
| No. of Portfolios for which Board Member Serves: 69 |
| ——————— |
Once elected all Board Members serve for an indefinite term, but achieve Emeritus status upon reaching age 80.The address of the Board Members and Officers is c/o The Dreyfus Corporation, 200 Park Avenue, New York, New York 10166. Additional information about the Board Members is available in the fund’s Statement of Additional Information which can be obtained from Dreyfus free of charge by calling this toll free number: 1-800-DREYFUS.
James M. Fitzgibbons, Emeritus Board Member
The Fund 39
OFFICERS OF THE FUND (Unaudited)
BRADLEY J. SKAPYAK, President since January 2010.
Chief Operating Officer and a director of the Manager since June 2009, Chairman of Dreyfus Transfer, Inc., an affiliate of the Manager and the transfer agent of the funds, since May 2011 and Executive Vice President of the Distributor since June 2007. From April 2003 to June 2009, Mr. Skapyak was the head of the Investment Accounting and Support Department of the Manager. He is an officer of 69 investment companies (comprised of 145 portfolios) managed by the Manager. He is 55 years old and has been an employee of the Manager since February 1988.
JOHN PAK, Chief Legal Officer since March 2013.
Deputy General Counsel, Investment Management, of BNY Mellon since August 2014; Chief Legal Officer of the Manager since August 2012; from March 2005 to July 2012, Managing Director of Deutsche Bank, Deputy Global Head of Deutsche Asset Management Legal and Regional Head of Deutsche Asset Management Americas Legal. He is an officer of 70 investment companies (comprised of 170 portfolios) managed by the Manager. He is 46 years old and has been an employee of the Manager since August 2012.
JANETTE E. FARRAGHER, Vice President and Secretary since December 2011.
Assistant General Counsel of BNY Mellon, and an officer of 70 investment companies (comprised of 170 portfolios) managed by the Manager. She is 51 years old and has been an employee of the Manager since February 1984.
KIESHA ASTWOOD, Vice President and Assistant Secretary since January 2010.
Counsel of BNY Mellon, and an officer of 70 investment companies (comprised of 170 portfolios) managed by the Manager. She is 41 years old and has been an employee of the Manager since July 1995.
JAMES BITETTO, Vice President and Assistant Secretary since December 2008.
Managing Counsel of BNY Mellon and Secretary of the Manager, and an officer of 70 investment companies (comprised of 170 portfolios) managed by the Manager. He is 48 years old and has been an employee of the Manager since December 1996.
JONI LACKS CHARATAN, Vice President and Assistant Secretary since December 2008.
Managing Counsel of BNY Mellon, and an officer of 70 investment companies (comprised of 170 portfolios) managed by the Manager. She is 58 years old and has been an employee of the Manager since October 1988.
JOSEPH M. CHIOFFI, Vice President and Assistant Secretary since December 2008.
Managing Counsel of BNY Mellon, and an officer of 70 investment companies (comprised of 170 portfolios) managed by the Manager. He is 52 years old and has been an employee of the Manager since June 2000.
JOHN B. HAMMALIAN, Vice President and Assistant Secretary since December 2008.
Senior Managing Counsel of BNY Mellon, and an officer of 70 investment companies (comprised of 170 portfolios) managed by the Manager. He is 51 years old and has been an employee of the Manager since February 1991.
SARAH S. KELLEHER, Vice President and Assistant Secretary since April 2014.
Senior Counsel of BNY Mellon, and an officer of 70 investment companies (comprised of 170 portfolios) managed by the Manager; from August 2005 to March 2013, Associate General Counsel of Third Avenue Management. She is 38 years old and has been an employee of the Manager since March 2013.
40
JEFF PRUSNOFSKY, Vice President and Assistant Secretary since December 2008.
Senior Managing Counsel of BNY Mellon, and an officer of 70 investment companies (comprised of 170 portfolios) managed by the Manager. He is 49 years old and has been an employee of the Manager since October 1990.
JAMES WINDELS, Treasurer since December 2008.
Director – Mutual Fund Accounting of the Manager, and an officer of 70 investment companies (comprised of 170 portfolios) managed by the Manager. He is 56 years old and has been an employee of the Manager since April 1985.
RICHARD CASSARO, Assistant Treasurer since December 2008.
Senior Accounting Manager – Money Market and Municipal Bond Funds of the Manager, and an officer of 70 investment companies (comprised of 170 portfolios) managed by the Manager. He is 55 years old and has been an employee of the Manager since September 1982.
GAVIN C. REILLY, Assistant Treasurer since December 2008.
Tax Manager of the Investment Accounting and Support Department of the Manager, and an officer of 70 investment companies (comprised of 170 portfolios) managed by the Manager. He is 46 years old and has been an employee of the Manager since April 1991.
ROBERT S. ROBOL, Assistant Treasurer since December 2008.
Senior Accounting Manager – Fixed Income Funds of the Manager, and an officer of 70 investment companies (comprised of 170 portfolios) managed by the Manager. He is 50 years old and has been an employee of the Manager since October 1988.
ROBERT SALVIOLO, Assistant Treasurer since December 2008.
Senior Accounting Manager – Equity Funds of the Manager, and an officer of 70 investment companies (comprised of 170 portfolios) managed by the Manager. He is 47 years old and has been an employee of the Manager since June 1989.
ROBERT SVAGNA, Assistant Treasurer since December 2008.
Senior Accounting Manager – Equity Funds of the Manager, and an officer of 70 investment companies (comprised of 170 portfolios) managed by the Manager. He is 47 years old and has been an employee of the Manager since November 1990.
JOSEPH W. CONNOLLY, Chief Compliance Officer since December 2008.
Chief Compliance Officer of the Manager and The Dreyfus Family of Funds (70 investment companies, comprised of 170 portfolios). He is 57 years old and has served in various capacities with the Manager since 1980, including manager of the firm’s Fund Accounting Department from 1997 through October 2001.
MATTHEW D. CONNOLLY, Anti-Money Laundering Compliance Officer since April 2012.
Anti-Money Laundering Compliance Officer of the Distributor since October 2011; from March 2010 to September 2011, Global Head, KYC Reviews and Director of UBS Investment Bank; until March 2010, AML Compliance Officer and Senior Vice President of Citi Global Wealth Management. He is an officer of 65 investment companies (comprised of 165 portfolios) managed by the Manager. He is 42 years old and has been an employee of the Distributor since October 2011.
The Fund 41
For More Information
Telephone Call your financial representative or 1-800-DREYFUS
Mail The Dreyfus Family of Funds, 144 Glenn Curtiss Boulevard, Uniondale, NY 11556-0144
The fund files its complete schedule of portfolio holdings with the Securities and Exchange Commission (“SEC”) for the first and third quarters of each fiscal year on Form N-Q. The fund’s Forms N-Q are available on the SEC’s website at http://www.sec.gov and may be reviewed and copied at the SEC’s Public Reference Room in Washington, DC. Information on the operation of the Public Reference Room may be obtained by calling 1-800-SEC-0330.
Item 2. Code of Ethics.
The Registrant has adopted a code of ethics that applies to the Registrant's principal executive officer, principal financial officer, principal accounting officer or controller, or persons performing similar functions. There have been no amendments to, or waivers in connection with, the Code of Ethics during the period covered by this Report.
Item 3. Audit Committee Financial Expert.
The Registrant's Board has determined that Joseph S. DiMartino, a member of the Audit Committee of the Board, is an audit committee financial expert as defined by the Securities and Exchange Commission (the "SEC"). Mr. DiMartino is "independent" as defined by the SEC for purposes of audit committee financial expert determinations.
Item 4. Principal Accountant Fees and Services.
(a) Audit Fees. The aggregate fees billed for each of the last two fiscal years (the "Reporting Periods") for professional services rendered by the Registrant's principal accountant (the "Auditor") for the audit of the Registrant's annual financial statements or services that are normally provided by the Auditor in connection with the statutory and regulatory filings or engagements for the Reporting Periods, were $155,995 in 2013 and $159,060 in 2014.
(b) Audit-Related Fees. The aggregate fees billed in the Reporting Periods for assurance and related services by the Auditor that are reasonably related to the performance of the audit of the Registrant's financial statements and are not reported under paragraph (a) of this Item 4 were $26,820 in 2013 and $28,190 in 2014. These services consisted of one or more of the following: (i) agreed upon procedures related to compliance with Internal Revenue Code section 817(h), (ii) security counts required by Rule 17f-2 under the Investment Company Act of 1940, as amended, (iii) advisory services as to the accounting or disclosure treatment of Registrant transactions or events and (iv) advisory services to the accounting or disclosure treatment of the actual or potential impact to the Registrant of final or proposed rules, standards or interpretations by the Securities and Exchange Commission, the Financial Accounting Standards Boards or other regulatory or standard-setting bodies.
The aggregate fees billed in the Reporting Periods for non-audit assurance and related services by the Auditor to the Registrant's investment adviser (not including any sub-investment adviser whose role is primarily portfolio management and is subcontracted with or overseen by another investment adviser), and any entity controlling, controlled by or under common control with the investment adviser that provides ongoing services to the Registrant ("Service Affiliates"), that were reasonably related to the performance of the annual audit of the Service Affiliate, which required pre-approval by the Audit Committee were $0 in 2013 and $0 in 2014.
(c) Tax Fees. The aggregate fees billed in the Reporting Periods for professional services rendered by the Auditor for tax compliance, tax advice, and tax planning ("Tax Services") were $15,580 in 2013 and $15,880 in 2014. These services consisted of the review or preparation of U.S. federal, state, local and excise tax returns. The aggregate fees billed in the Reporting Periods for Tax Services by the Auditor to Service Affiliates, which required pre-approval by the Audit Committee were $0 in 2013 and $0 in 2014.
(d) All Other Fees. The aggregate fees billed in the Reporting Periods for products and services provided by the Auditor, other than the services reported in paragraphs (a) through (c) of this Item, were $0 in 2013 and $0 in 2014.
The aggregate fees billed in the Reporting Periods for Non-Audit Services by the Auditor to Service Affiliates, other than the services reported in paragraphs (b) through (c) of this Item, which required pre-approval by the Audit Committee, were $0 in 2013 and $0 in 2014.
(e)(1) Audit Committee Pre-Approval Policies and Procedures. The Registrant's Audit Committee has established policies and procedures (the "Policy") for pre-approval (within specified fee limits) of the Auditor's engagements for non-audit services to the Registrant and Service Affiliates without specific case-by-case consideration. The pre-approved services in the Policy can include pre-approved audit services, pre-approved audit-related services, pre-approved tax services and pre-approved all other services. Pre-approval considerations include whether the proposed services are compatible with maintaining the Auditor's independence. Pre-approvals pursuant to the Policy are considered annually.
(e)(2) Note: None of the services described in paragraphs (b) through (d) of this Item 4 were approved by the Audit Committee pursuant to paragraph (c)(7)(i)(C) of Rule 2-01 of Regulation S-X.
(f) None of the hours expended on the principal accountant's engagement to audit the registrant's financial statements for the most recent fiscal year were attributed to work performed by persons other than the principal account's full-time, permanent employees.
Non-Audit Fees. The aggregate non-audit fees billed by the Auditor for services rendered to the Registrant, and rendered to Service Affiliates, for the Reporting Periods were $13,874,191 in 2013 and $15,840,989 in 2014.
Auditor Independence. The Registrant's Audit Committee has considered whether the provision of non-audit services that were rendered to Service Affiliates, which were not pre-approved (not requiring pre-approval), is compatible with maintaining the Auditor's independence.
Item 5. Audit Committee of Listed Registrants.
Not applicable.
Item 6. Investments.
(a) Not applicable.
Item 7. Disclosure of Proxy Voting Policies and Procedures for Closed-End Management Investment Companies.
Not applicable.
Item 8. Portfolio Managers of Closed-End Management Investment Companies.
Not applicable.
Item 9. Purchases of Equity Securities by Closed-End Management Investment Companies and Affiliated Purchasers.
Not applicable.
Item 10. Submission of Matters to a Vote of Security Holders.
There have been no material changes to the procedures applicable to Item 10.
Item 11. Controls and Procedures.
(a) The Registrant's principal executive and principal financial officers have concluded, based on their evaluation of the Registrant's disclosure controls and procedures as of a date within 90 days of the filing date of this report, that the Registrant's disclosure controls and procedures are reasonably designed to ensure that information required to be disclosed by the Registrant on Form N-CSR is recorded, processed, summarized and reported within the required time periods and that information required to be disclosed by the Registrant in the reports that it files or submits on Form N-CSR is accumulated and communicated to the Registrant's management, including its principal executive and principal financial officers, as appropriate to allow timely decisions regarding required disclosure.
(b) There were no changes to the Registrant's internal control over financial reporting that occurred during the second fiscal quarter of the period covered by this report that have materially affected, or are reasonably likely to materially affect, the Registrant's internal control over financial reporting.
Item 12. Exhibits.
(a)(1) Code of ethics referred to in Item 2.
(a)(2) Certifications of principal executive and principal financial officers as required by Rule 30a-2(a) under the Investment Company Act of 1940.
(a)(3) Not applicable.
(b) Certification of principal executive and principal financial officers as required by Rule 30a-2(b) under the Investment Company Act of 1940.
SIGNATURES
Pursuant to the requirements of the Securities Exchange Act of 1934 and the Investment Company Act of 1940, the Registrant has duly caused this Report to be signed on its behalf by the undersigned, thereunto duly authorized.
Dreyfus Investment Funds
By: /s/Bradley J. Skapyak_
Bradley J. Skapyak,
President
Date: November 17, 2014
Pursuant to the requirements of the Securities Exchange Act of 1934 and the Investment Company Act of 1940, this Report has been signed below by the following persons on behalf of the Registrant and in the capacities and on the dates indicated.
By: /s/Bradley J. Skapyak_
Bradley J. Skapyak,
President
Date: November 17, 2014
By: /s/James Windels___
James Windels,
Treasurer
Date: November 17, 2014
EXHIBIT INDEX
(a)(1) Code of ethics referred to in Item 2.
(a)(2) Certifications of principal executive and principal financial officers as required by Rule 30a-2(a) under the Investment Company Act of 1940. (EX-99.CERT)
(b) Certification of principal executive and principal financial officers as required by Rule 30a-2(b) under the Investment Company Act of 1940. (EX-99.906CERT)