UNITED STATES
SECURITIES AND EXCHANGE COMMISSION
Washington, D.C. 20549
FORM N-CSR
CERTIFIED SHAREHOLDER REPORT OF REGISTERED MANAGEMENT
INVESTMENT COMPANIES
Investment Company Act file number | 811- 04813 | |||||
|
| |||||
| Dreyfus Investment Funds |
| ||||
| (Exact name of Registrant as specified in charter) |
| ||||
|
|
| ||||
|
c/o The Dreyfus Corporation 200 Park Avenue New York, New York 10166 |
| ||||
| (Address of principal executive offices) (Zip code) |
| ||||
|
|
| ||||
| Janette E. Farragher, Esq. 200 Park Avenue New York, New York 10166 |
| ||||
| (Name and address of agent for service) |
| ||||
| ||||||
Registrant's telephone number, including area code: | (212) 922-6000 | |||||
|
| |||||
Date of fiscal year end:
| 12/31 |
| ||||
Date of reporting period: | 12/31/12 |
| ||||
The following N-CSR relates only to the Registrant’s series listed below and does not affect the other series of the Registrant, which have a different fiscal year end and, therefore, different N-CSR reporting requirements. Separate N-CSR Forms will be filed for those series, as appropriate.
Dreyfus/Standish Fixed Income Fund
Dreyfus/Standish Global Fixed Income Fund
Dreyfus/Standish International Fixed Income Fund
Dreyfus/Standish
Fixed Income Fund
ANNUAL REPORT December 31, 2012
The views expressed in this report reflect those of the portfolio manager only through the end of the period covered and do not necessarily represent the views of Dreyfus or any other person in the Dreyfus organization. Any such views are subject to change at any time based upon market or other conditions and Dreyfus disclaims any responsibility to update such views.These views may not be relied on as investment advice and, because investment decisions for a Dreyfus fund are based on numerous factors, may not be relied on as an indication of trading intent on behalf of any Dreyfus fund.
| Not FDIC-Insured • Not Bank-Guaranteed • May Lose Value |
Contents | |
THE FUND | |
| 2 | A Letter from the President |
| 3 | Discussion of Fund Performance |
| 6 | Fund Performance |
| 7 | Understanding Your Fund’s Expenses |
| 7 | Comparing Your Fund’s Expenses With Those of Other Funds |
| 8 | Statement of Investments |
| 20 | Statement of Financial Futures |
| 21 | Statement of Assets and Liabilities |
| 22 | Statement of Operations |
| 23 | Statement of Changes in Net Assets |
| 24 | Financial Highlights |
| 25 | Notes to Financial Statements |
| 45 | Report of Independent Registered Public Accounting Firm |
| 46 | Important Tax Information |
| 47 | Board Members Information |
| 49 | Officers of the Fund |
FOR MORE INFORMATION | |
Back Cover |
Dreyfus/Standish
Fixed Income Fund
The Fund
A LETTER FROM THE PRESIDENT
Dear Shareholder:
We are pleased to present this annual report for Dreyfus/Standish Fixed Income Fund, covering the 12-month period from January 1, 2012, through December 31, 2012. For information about how the fund performed during the reporting period, as well as general market perspectives, we provide a Discussion of Fund Performance on the pages that follow.
The search for higher yields amid historically low interest rates proved to be a major force in the performance of U.S. and global bond markets in 2012, even as the Federal Reserve Board and other central banks pumped liquidity into their financial systems. More specifically, low rates on U.S.Treasury securities drove investors to riskier market sectors, helping to support prices among corporate-backed securities, asset-backed securities, commercial mortgage-backed securities, and emerging-markets bonds. In addition, higher yielding bond market sectors were buoyed by gradually recovering U.S. and global economies as domestic employment trends improved, Europe avoided a collapse of its common currency, and China engineered an economic soft landing.
We currently expect the U.S. and global economies to be modestly stronger in 2013, especially during the second half of the year.The U.S. economy seems likely to benefit from greater certainty regarding U.S. tax and fiscal policies, the resumption of postponed spending by businesses, and a continued housing recovery. We encourage you to discuss the implications of our economic analysis with your financial advisor, who can help you align your investments with the year’s challenges and opportunities.
Thank you for your continued confidence and support.
Sincerely,

J. Charles Cardona
President
The Dreyfus Corporation
January 15, 2013
2
DISCUSSION OF FUND PERFORMANCE
For the period of January 1, 2012, through December 31, 2012, as provided by David Bowser, CFA, Portfolio Manager
Fund and Market Performance Overview
For the 12-month period ended December 31, 2012, Dreyfus/Standish Fixed Income Fund’s Class I shares achieved a total return of 7.58%.1 The Barclays U.S. Aggregate Bond Index (the “Index”), the fund’s benchmark, achieved a total return of 4.22% for the same period.2
With interest rates anchored by the Federal Reserve Board’s (the “Fed”) historically low target for the overnight federal funds rate, income-oriented investors sought higher yields from riskier market sectors.The fund produced higher returns than its benchmark, primarily due to its emphasis on better performing corporate bonds, asset-backed securities and commercial mortgage-backed securities.
The Fund’s Investment Approach
The fund seeks to achieve a high level of current income, consistent with conserving principal and liquidity, and secondarily seeks capital appreciation when changes in interest rates and economic conditions indicate that capital appreciation may be available without significant risk to principal.To achieve this, the fund invests, under normal circumstances, at least 80% of net assets in fixed-income securities issued by U.S. and foreign governments and companies.
The fund invests primarily in investment-grade securities, but may invest up to 15% of assets in below investment-grade securities, sometimes referred to as junk bonds. The fund will not invest in securities rated lower than B at the time of purchase. In this instance, we will attempt to select fixed-income securities that have the potential to be upgraded.
Accommodative Monetary Policy Kept Rates Low
The year 2012 began in the midst of rebounding financial markets as concerns eased regarding U.S. employment trends, an intensifying European financial crisis, and an economic slowdown in China. Indeed, improving U.S. economic data, quantitative
| The Fund | 3 |
DISCUSSION OF FUND PERFORMANCE (continued)
easing by Europe’s policymakers, and less restrictive monetary and fiscal policies in key emerging markets boosted economic sentiment early in the year, prompting many investors to turn away from traditional safe havens and toward riskier assets.
While yields of U.S. government securities typically would be expected to rise under these conditions, they remained low due to accommodative monetary policy initiatives from central banks worldwide, including the Fed’s OperationTwist, which sought to reduce long-term interest rates through sales of short-term U.S.Treasury securities and purchases of long-term bonds. Meanwhile, an improving business environment buoyed prices of corporate- and asset-backed securities, reducing yield differences along the market’s credit-quality spectrum.
The U.S. labor market’s rebound slowed in the spring when employment gains proved more anemic than expected, austerity measures in Europe encountered resistance, and China’s economy remained sluggish. These headwinds sparked a renewed flight to perceived safe havens, sending yields of U.S. government securities to multi-year lows, while riskier bonds gave back some of their previous gains.
Global and domestic economic data improved over the summer, but the Fed announced in September that it would take additional steps to stimulate employment growth through a new, open-ended round of quantitative easing involving purchases of up to $40 billion of mortgage-backed securities per month.This program supported bond prices through the reporting period’s end, and it helped mitigate the potentially negative impact of concerns regarding automatic tax hikes and spending cuts scheduled for the start of 2013.
Security Selection Strategy Produced Positive Results
The fund’s relative performance was bolstered by overweighted exposure to higher yielding market sectors.Among corporate bonds, the fund achieved particularly robust results from the financials sector as well as bonds with ratings at the bottom of the investment-grade range.The fund also received relatively robust results from high yield corporate bonds, which are not represented in the Index, and from overweighted positions in asset-backed securities and commercial mortgage-backed securities. Although residential mortgage-backed securities lagged market averages due to rising prepayment risks, the fund benefited from its emphasis on lower coupon mortgages that are less likely to be refinanced.
4
Our interest rate strategies produced more muted results. A modestly short average duration had relatively little impact on performance in 2012, but our decision to maintain underweighted exposure to shorter term bonds helped the fund participate more fully in gains stemming from falling long-term rates.The fund suffered relatively few disappointments during the year, with the exception of a brief investment in the spring in Treasury Inflation Protected Securities.
The fund successfully employed futures contracts to manage interest rate strategies and currency forward contracts to protect against unexpected changes in currency exchange rates.
NOTE
Effective January 18, 2013, Dreyfus/Standish Fixed Income Fund merged into of Dreyfus Intermediate Term Income Fund (“Acquiring Fund”).The merger provided for the transfer of the Dreyfus/Standish Fixed Income Fund’s assets to the Acquiring Fund in a tax-free exchange for corresponding shares of the Acquiring Fund.
January 15, 2013
Bond funds are subject generally to interest rate, credit, liquidity and market risks, to varying degrees, all of which are more fully described in the fund’s prospectus. Generally, all other factors being equal, bond prices are inversely related to interest-rate changes, and rate increases can cause price declines.
Foreign bonds are subject to special risks including exposure to currency fluctuations, changing political and economic conditions, and potentially less liquidity.The fixed income securities of issuers located in emerging markets can be more volatile and less liquid than those of issuers in more mature economies.
High yield bonds are subject to increased credit risk and are considered speculative in terms of the issuer’s perceived ability to continue making interest payments on a timely basis and to repay principal upon maturity.
| 1 Total return includes reinvestment of dividends and any capital gains paid. Past performance is no guarantee of future |
| results. Share price, yield and investment return fluctuate such that upon redemption fund shares may be worth more |
| or less than their original cost. |
| 2 SOURCE: LIPPER INC. — Reflects reinvestment of dividends and, where applicable, capital gain distributions. |
| The Barclays U.S.Aggregate Bond Index is a widely accepted, unmanaged total return index of corporate, U.S. |
| government and U.S. government agency debt instruments, mortgage-backed securities and asset-backed securities with |
| an average maturity of 1-10 years.The Index does not include fees and expenses to which the fund is subject. |
| Investors cannot invest directly in any index. |
| The Fund | 5 |
FUND PERFORMANCE
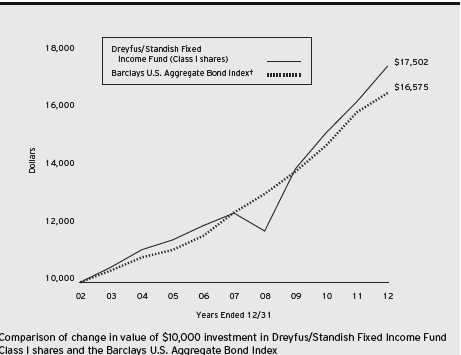
| Average Annual Total Returns as of 12/31/12 | ||||||
| 1 Year | 5 Years | 10 Years | ||||
| Class I shares | 7.58 | % | 7.14 | % | 5.76 | % |
| Barclays U.S. Aggregate Bond Index | 4.22 | % | 5.95 | % | 5.18 | % |
† Source: Lipper Inc.
Past performance is not predictive of future performance.The fund’s performance shown in the graph and table does not reflect the deduction of taxes that a shareholder would pay on fund distributions or the redemption of fund shares.
The above graph compares a $10,000 investment made in Class I shares of Dreyfus/Standish Fixed Income Fund on 12/31/02 to a $10,000 investment made in the Barclays U.S.Aggregate Bond Index (the “Index”) on that date.All dividends and capital gain distributions are reinvested.
The fund’s performance shown in the line graph above takes into account all applicable fees and expenses.The Index is a widely accepted, unmanaged total return index of corporate, U.S. government and U.S. government agency debt instruments, mortgage-backed securities and asset-backed securities with an average maturity of 1-10 years. Unlike a mutual fund, the Index is not subject to charges, fees and other expenses. Investors cannot invest directly in any index. These factors can contribute to the Index potentially outperforming the fund. Further information relating to fund performance, including expense reimbursements, if applicable, is contained in the Financial Highlights section of the prospectus and elsewhere in this report.
6
UNDERSTANDING YOUR FUND’S EXPENSES (Unaudited)
As a mutual fund investor, you pay ongoing expenses, such as management fees and other expenses. Using the information below, you can estimate how these expenses affect your investment and compare them with the expenses of other funds.You also may pay one-time transaction expenses, including sales charges (loads) and redemption fees, which are not shown in this section and would have resulted in higher total expenses. For more information, see your fund’s prospectus or talk to your financial adviser.
Review your fund’s expenses
The table below shows the expenses you would have paid on a $1,000 investment in Dreyfus/Standish Fixed Income Fund from July 1, 2012 to December 31, 2012. It also shows how much a $1,000 investment would be worth at the close of the period, assuming actual returns and expenses.
Expenses and Value of a $1,000 Investment
assuming actual returns for the six months ended December 31, 2012
| Expenses paid per $1,000† | $ | 3.18 |
| Ending value (after expenses) | $ | 1,041.80 |
COMPARING YOUR FUND’S EXPENSES
WITH THOSE OF OTHER FUNDS (Unaudited)
Using the SEC’s method to compare expenses
The Securities and Exchange Commission (SEC) has established guidelines to help investors assess fund expenses. Per these guidelines, the table below shows your fund’s expenses based on a $1,000 investment, assuming a hypothetical 5% annualized return. You can use this information to compare the ongoing expenses (but not transaction expenses or total cost) of investing in the fund with those of other funds.All mutual fund shareholder reports will provide this information to help you make this comparison. Please note that you cannot use this information to estimate your actual ending account balance and expenses paid during the period.
Expenses and Value of a $1,000 Investment
assuming a hypothetical 5% annualized return for the six months ended December 31, 2012
| Expenses paid per $1,000† | $ | 3.15 |
| Ending value (after expenses) | $ | 1,022.02 |
| † Expenses are equal to the fund’s annualized expense ratio of .62% for Class I, multiplied by the average account value |
| over the period, multiplied by 184/366 (to reflect the one-half year period). |
| The Fund | 7 |
STATEMENT OF INVESTMENTS
December 31, 2012
| Coupon | Maturity | Principal | |||
| Bonds and Notes—119.5% | Rate (%) | Date | Amount ($)a | Value ($) | |
| Asset-Backed Ctfs./ | |||||
| Auto Receivables—5.5% | |||||
| AmeriCredit Automobile Receivables | |||||
| Trust, Ser. 2012-5, Cl. D | 2.35 | 12/10/18 | 290,000 | 290,034 | |
| AmeriCredit Automobile Receivables | |||||
| Trust, Ser. 2012-1, Cl. C | 2.67 | 1/8/18 | 390,000 | 401,401 | |
| AmeriCredit Automobile Receivables | |||||
| Trust, Ser. 2012-1, Cl. D | 4.72 | 3/8/18 | 1,365,000 | 1,472,660 | |
| AmeriCredit Automobile Receivables | |||||
| Trust, Ser. 2011-5, Cl. D | 5.05 | 12/8/17 | 1,095,000 | 1,185,080 | |
| CarMax Auto Owner Trust, | |||||
| Ser. 2010-1, Cl. B | 3.75 | 12/15/15 | 200,000 | 207,117 | |
| CarMax Auto Owner Trust, | |||||
| Ser. 2010-2, Cl. B | 3.96 | 6/15/16 | 140,000 | 146,403 | |
| Santander Drive Auto Receivables | |||||
| Trust, Ser. 2010-2, Cl. B | 2.24 | 12/15/14 | 280,000 | 281,753 | |
| Santander Drive Auto Receivables | |||||
| Trust, Ser. 2012-6, Cl. D | 2.52 | 9/17/18 | 535,000 | 535,195 | |
| Santander Drive Auto Receivables | |||||
| Trust, Ser. 2010-B, Cl. C | 3.02 | 10/17/16 | 835,000 | b | 850,683 |
| Santander Drive Auto Receivables | |||||
| Trust, Ser. 2010-3, Cl. C | 3.06 | 11/15/17 | 405,000 | 418,450 | |
| Santander Drive Auto Receivables | |||||
| Trust, Ser. 2011-1, Cl. C | 3.11 | 5/16/16 | 1,065,000 | 1,097,110 | |
| Santander Drive Auto Receivables | |||||
| Trust, Ser. 2012-2, Cl. C | 3.20 | 2/15/18 | 540,000 | 557,590 | |
| Santander Drive Auto Receivables | |||||
| Trust, Ser. 2012-3, Cl. D | 3.64 | 5/15/18 | 710,000 | 738,380 | |
| Santander Drive Auto Receivables | |||||
| Trust, Ser. 2012-1, Cl. C | 3.78 | 11/15/17 | 230,000 | 240,615 | |
| Santander Drive Auto Receivables | |||||
| Trust, Ser. 2011-3, Cl. D | 4.23 | 5/15/17 | 450,000 | 474,431 | |
| Santander Drive Auto Receivables | |||||
| Trust, Ser. 2011-4, Cl. D | 4.74 | 9/15/17 | 540,000 | 574,216 | |
| 9,471,118 | |||||
| Commercial Mortgage | |||||
| Pass-Through Ctfs.—4.8% | |||||
| American Tower Trust, | |||||
| Ser. 2007-1A, Cl. D | 5.96 | 4/15/37 | 630,000 | b | 644,713 |
| American Tower Trust, | |||||
| Ser. 2007-1A, Cl. F | 6.64 | 4/15/37 | 1,280,000 | b | 1,309,480 |
8
| Coupon | Maturity | Principal | |||
| Bonds and Notes (continued) | Rate (%) | Date | Amount ($)a | Value ($) | |
| Commercial Mortgage | |||||
| Pass-Through Ctfs. (continued) | |||||
| Citigroup Commercial Mortgage | |||||
| Trust, Ser. 2012-GC8, Cl. A4 | 3.02 | 9/10/45 | 735,000 | 775,629 | |
| Credit Suisse First Boston | |||||
| Mortgage Securities, | |||||
| Ser. 2005-C4, Cl. AAB | 5.07 | 8/15/38 | 102,324 | c | 102,533 |
| GS Mortgage Securities Corporation | |||||
| II, Ser. 2007-EOP, Cl. B | 1.73 | 3/6/20 | 2,965,000 | b,c | 2,971,037 |
| GS Mortgage Securities Corporation | |||||
| II, Ser. 2007-EOP, Cl. E | 2.48 | 3/6/20 | 1,120,000 | b,c | 1,123,523 |
| GS Mortgage Securities Corporation | |||||
| II, Ser. 2007-EOP, Cl. K | 4.80 | 3/6/20 | 650,000 | b,c | 654,527 |
| JP Morgan Chase Commercial | |||||
| Mortgage Securities, | |||||
| Ser. 2007-CB20, Cl. AM | 5.88 | 2/12/51 | 560,000 | c | 652,605 |
| Wachovia Bank Commercial | |||||
| Mortgage Trust, | |||||
| Ser. 2005-C16, Cl. A2 | 4.38 | 10/15/41 | 50,028 | 50,009 | |
| 8,284,056 | |||||
| Consumer Discretionary—4.1% | |||||
| Ameristar Casinos, | |||||
| Gtd. Notes | 7.50 | 4/15/21 | 390,000 | 424,612 | |
| AutoZone, | |||||
| Sr. Unscd. Notes | 3.70 | 4/15/22 | 435,000 | 458,195 | |
| Cablevision Systems, | |||||
| Sr. Unscd. Notes | 7.75 | 4/15/18 | 400,000 | 447,000 | |
| Cox Communications, | |||||
| Sr. Unscd. Notes | 6.25 | 6/1/18 | 575,000 | b | 703,330 |
| CVS Pass-Through Trust, | |||||
| Pass Thru Certificates Notes | 8.35 | 7/10/31 | 1,067,745 | b | 1,476,213 |
| Dish DBS, | |||||
| Gtd. Notes | 5.88 | 7/15/22 | 430,000 | 464,400 | |
| Hanesbrands, | |||||
| Gtd. Notes | 6.38 | 12/15/20 | 420,000 | 464,100 | |
| NBCUniversal Media, | |||||
| Sr. Unscd. Notes | 4.38 | 4/1/21 | 305,000 | 343,220 | |
| Pearson Dollar Finance Two, | |||||
| Gtd. Notes | 6.25 | 5/6/18 | 150,000 | b | 181,608 |
| Staples, | |||||
| Sr. Unscd. Notes | 9.75 | 1/15/14 | 330,000 | 358,865 | |
| The Fund | 9 |
STATEMENT OF INVESTMENTS (continued)
| Coupon | Maturity | Principal | |||
| Bonds and Notes (continued) | Rate (%) | Date | Amount ($)a | Value ($) | |
| Consumer Discretionary (continued) | |||||
| TCI Communications, | |||||
| Sr. Unscd. Debs | 7.88 | 2/15/26 | 355,000 | 500,101 | |
| Time Warner, | |||||
| Gtd. Debs | 6.10 | 7/15/40 | 220,000 | 267,329 | |
| Time Warner, | |||||
| Gtd. Notes | 3.40 | 6/15/22 | 440,000 | 459,883 | |
| Unitymedia Hessen, | |||||
| Sr. Scd. Notes | 5.50 | 1/15/23 | 455,000 | b | 472,062 |
| 7,020,918 | |||||
| Consumer Staples—1.1% | |||||
| Mondelez International, | |||||
| Sr. Unscd. Notes | 6.88 | 2/1/38 | 325,000 | 450,826 | |
| Pernod-Ricard, | |||||
| Sr. Unscd. Notes | 4.25 | 7/15/22 | 530,000 | b | 583,602 |
| SABMiller Holdings, | |||||
| Gtd. Notes | 3.75 | 1/15/22 | 530,000 | b | 573,413 |
| Walgreen, | |||||
| Sr. Unscd. Notes | 1.00 | 3/13/15 | 300,000 | 300,415 | |
| 1,908,256 | |||||
| Energy—4.1% | |||||
| Anadarko Petroleum, | |||||
| Sr. Unscd. Notes | 6.38 | 9/15/17 | 985,000 | 1,177,799 | |
| CNOOC Finance (2012), | |||||
| Gtd. Notes | 3.88 | 5/2/22 | 440,000 | b | 468,497 |
| Continental Resources, | |||||
| Gtd. Notes | 5.00 | 9/15/22 | 465,000 | 503,362 | |
| Enterprise Products Operating, | |||||
| Gtd. Notes | 4.45 | 2/15/43 | 205,000 | 208,420 | |
| Enterprise Products Operating, | |||||
| Gtd. Notes | 5.95 | 2/1/41 | 520,000 | 630,119 | |
| Hess, | |||||
| Sr. Unscd. Notes | 5.60 | 2/15/41 | 310,000 | 368,029 | |
| Kinder Morgan Energy Partners, | |||||
| Sr. Unscd. Notes | 6.55 | 9/15/40 | 605,000 | 760,883 | |
| MEG Energy, | |||||
| Gtd. Notes | 6.38 | 1/30/23 | 425,000 | b | 445,187 |
| Pemex Project Funding Master | |||||
| Trust, Gtd. Bonds | 6.63 | 6/15/35 | 610,000 | 777,750 | |
10
| Coupon | Maturity | Principal | |||
| Bonds and Notes (continued) | Rate (%) | Date | Amount ($)a | Value ($) | |
| Energy (continued) | |||||
| Petrobras International Finance, | |||||
| Gtd. Notes | 5.38 | 1/27/21 | 305,000 | 344,900 | |
| Petrobras International Finance, | |||||
| Gtd. Notes | 6.75 | 1/27/41 | 260,000 | 330,743 | |
| Transocean, | |||||
| Gtd. Notes | 2.50 | 10/15/17 | 330,000 | 333,846 | |
| Unit, | |||||
| Gtd. Notes | 6.63 | 5/15/21 | 440,000 | b | 453,750 |
| Williams Partners, | |||||
| Sr. Unscd. Notes | 3.35 | 8/15/22 | 235,000 | 239,436 | |
| Williams Partners, | |||||
| Sr. Unscd. Notes | 6.30 | 4/15/40 | 125,000 | 153,365 | |
| 7,196,086 | |||||
| Financial—18.4% | |||||
| AIG SunAmerica Global Financing X, | |||||
| Sr. Scd. Notes | 6.90 | 3/15/32 | 190,000 | b | 252,849 |
| Ally Financial, | |||||
| Gtd. Notes | 4.63 | 6/26/15 | 650,000 | 678,006 | |
| Ally Financial, | |||||
| Gtd. Notes | 5.50 | 2/15/17 | 1,090,000 | 1,171,418 | |
| American International Group, | |||||
| Sr. Unscd. Notes | 6.40 | 12/15/20 | 675,000 | 838,889 | |
| Ameriprise Financial, | |||||
| Jr. Sub. Notes | 7.52 | 6/1/66 | 610,000 | c | 672,525 |
| AON, | |||||
| Gtd. Notes | 3.50 | 9/30/15 | 460,000 | 484,792 | |
| Bangkok Bank, | |||||
| Sr. Unscd. Notes | 3.88 | 9/27/22 | 400,000 | b | 414,400 |
| Bank of America, | |||||
| Sr. Unscd. Notes | 5.00 | 5/13/21 | 1,225,000 | 1,400,952 | |
| Bank of America, | |||||
| Sr. Unscd. Notes | 5.63 | 7/1/20 | 150,000 | 178,122 | |
| Bank of America, | |||||
| Sr. Unscd. Notes | 5.70 | 1/24/22 | 805,000 | 969,815 | |
| BBVA US Senior, | |||||
| Gtd. Notes | 4.66 | 10/9/15 | 465,000 | 477,081 | |
| Cincinnati Financial, | |||||
| Sr. Unscd. Notes | 6.13 | 11/1/34 | 563,000 | 649,065 | |
| The Fund | 11 |
STATEMENT OF INVESTMENTS (continued)
| Coupon | Maturity | Principal | |||
| Bonds and Notes (continued) | Rate (%) | Date | Amount ($)a | Value ($) | |
| Financial (continued) | |||||
| CIT Group, | |||||
| Sr. Unscd. Notes | 5.00 | 5/15/17 | 485,000 | 516,525 | |
| CIT Group, | |||||
| Sr. Unscd. Notes | 5.00 | 8/15/22 | 230,000 | 246,416 | |
| Citigroup, | |||||
| Sr. Unscd. Notes | 4.50 | 1/14/22 | 285,000 | 318,573 | |
| Citigroup, | |||||
| Sr. Unscd. Notes | 5.38 | 8/9/20 | 900,000 | 1,062,294 | |
| Citigroup, | |||||
| Sr. Unscd. Notes | 5.88 | 1/30/42 | 250,000 | 309,724 | |
| DDR, | |||||
| Sr. Unscd. Notes | 4.75 | 4/15/18 | 545,000 | 604,721 | |
| Discover Financial Services, | |||||
| Sr. Unscd. Notes | 5.20 | 4/27/22 | 998,000 | 1,138,573 | |
| Duke Realty, | |||||
| Sr. Unscd. Notes | 8.25 | 8/15/19 | 430,000 | 550,531 | |
| EPR Properties, | |||||
| Gtd. Notes | 5.75 | 8/15/22 | 465,000 | 483,034 | |
| ERAC USA Finance, | |||||
| Gtd. Notes | 6.38 | 10/15/17 | 460,000 | b | 556,941 |
| Ford Motor Credit, | |||||
| Sr. Unscd. Notes | 4.21 | 4/15/16 | 660,000 | 704,508 | |
| Ford Motor Credit, | |||||
| Sr. Unscd. Notes | 5.00 | 5/15/18 | 1,075,000 | 1,188,881 | |
| General Electric Capital, | |||||
| Sr. Unscd. Notes | 2.30 | 4/27/17 | 675,000 | 700,614 | |
| General Electric Capital, | |||||
| Sr. Unscd. Notes | 6.88 | 1/10/39 | 520,000 | 709,313 | |
| Goldman Sachs Group, | |||||
| Sr. Unscd. Notes | 5.25 | 7/27/21 | 560,000 | 639,506 | |
| Goldman Sachs Group, | |||||
| Sr. Unscd. Notes | 5.75 | 1/24/22 | 195,000 | 230,949 | |
| Harley-Davidson Funding, | |||||
| Gtd. Notes | 5.75 | 12/15/14 | 815,000 | b | 890,466 |
| Hartford Financial | |||||
| Services Group, | |||||
| Sr. Unscd. Notes | 5.13 | 4/15/22 | 645,000 | 745,635 | |
| Health Care REIT, | |||||
| Sr. Unscd. Notes | 5.13 | 3/15/43 | 535,000 | 515,421 | |
12
| Coupon | Maturity | Principal | |||
| Bonds and Notes (continued) | Rate (%) | Date | Amount ($)a | Value ($) | |
| Financial (continued) | |||||
| HSBC Holdings, | |||||
| Sr. Unscd. Notes | 4.00 | 3/30/22 | 625,000 | 685,624 | |
| Hyundai Capital Services, | |||||
| Sr. Unscd. Notes | 4.38 | 7/27/16 | 400,000 | b | 430,523 |
| International Lease Finance, | |||||
| Sr. Unscd. Notes | 5.75 | 5/15/16 | 425,000 | 450,113 | |
| International Lease Finance, | |||||
| Sr. Unscd. Notes | 6.63 | 11/15/13 | 565,000 | 589,012 | |
| Intesa Sanpaolo, | |||||
| Sr. Unscd. Notes | 6.50 | 2/24/21 | 550,000 | b | 580,455 |
| JPMorgan Chase & Co., | |||||
| Sr. Unscd. Notes | 4.35 | 8/15/21 | 590,000 | 660,959 | |
| Liberty Mutual Group, | |||||
| Gtd. Notes | 6.50 | 5/1/42 | 195,000 | b | 220,147 |
| Metlife, | |||||
| Sr. Unscd. Notes, Ser. A | 6.82 | 8/15/18 | 550,000 | 693,711 | |
| Morgan Stanley, | |||||
| Sr. Unscd. Notes | 5.50 | 7/28/21 | 455,000 | 517,492 | |
| Morgan Stanley, | |||||
| Sr. Unscd. Notes | 5.55 | 4/27/17 | 840,000 | 932,155 | |
| Prudential Financial, | |||||
| Jr. Sub. Notes | 5.88 | 9/15/42 | 580,000 | c | 611,175 |
| Prudential Financial, | |||||
| Notes | 5.38 | 6/21/20 | 540,000 | 632,265 | |
| Rabobank Nederland, | |||||
| Bank Gtd. Notes | 3.95 | 11/9/22 | 495,000 | 507,928 | |
| Regency Centers, | |||||
| Gtd. Notes | 5.25 | 8/1/15 | 187,000 | 204,038 | |
| Royal Bank of Scotland, | |||||
| Sub. Notes | 9.50 | 3/16/22 | 785,000 | c | 925,813 |
| Royal Bank of Scotland Group, | |||||
| Sr. Unscd. Notes | 2.55 | 9/18/15 | 505,000 | 517,160 | |
| Santander US Debt, | |||||
| Bank Gtd. Notes | 3.72 | 1/20/15 | 900,000 | b | 904,528 |
| WEA Finance, | |||||
| Gtd. Notes | 7.13 | 4/15/18 | 305,000 | b | 376,248 |
| WEA Finance, | |||||
| Gtd. Notes | 7.50 | 6/2/14 | 245,000 | b | 266,658 |
| The Fund | 13 |
STATEMENT OF INVESTMENTS (continued)
| Coupon | Maturity | Principal | ||||
| Bonds and Notes (continued) | Rate (%) | Date | Amount ($)a | Value ($) | ||
| Financial (continued) | ||||||
| Willis North America, | ||||||
| Gtd. Notes | 6.20 | 3/28/17 | 810,000 | 923,035 | ||
| 31,929,578 | ||||||
| Foreign/Governmental—9.2% | ||||||
| Corporacion Andina De Formento, | ||||||
| Sr. Unscd. Notes | 3.75 | 1/15/16 | 590,000 | 625,580 | ||
| Indonesia Eximbank, | ||||||
| Sr. Unscd. Notes | 3.75 | 4/26/17 | 415,000 | d | 439,699 | |
| Irish Government, | ||||||
| Unscd. Bonds | EUR | 5.50 | 10/18/17 | 610,000 | 885,488 | |
| Italian Government, | ||||||
| Unscd. Bonds | EUR | 4.75 | 6/1/17 | 2,560,000 | 3,600,747 | |
| Italian Government, | ||||||
| Unscd. Bonds | EUR | 5.50 | 9/1/22 | 645,000 | 924,191 | |
| Korea Finance, | ||||||
| Sr. Unscd. Notes | 2.25 | 8/7/17 | 620,000 | 629,244 | ||
| Petroleos Mexicanos, | ||||||
| Gtd. Notes | 4.88 | 1/24/22 | 300,000 | 339,300 | ||
| Portuguese Government, | ||||||
| Sr. Unscd. Bonds | EUR | 4.45 | 6/15/18 | 655,000 | 804,853 | |
| Province of Quebec Canada, | ||||||
| Unscd. Notes | 4.60 | 5/26/15 | 585,000 | 642,465 | ||
| Republic of Korea, | ||||||
| Sr. Unscd. Notes | 7.13 | 4/16/19 | 360,000 | 468,224 | ||
| Slovenian Government, | ||||||
| Sr. Unscd. Notes | 5.50 | 10/26/22 | 1,315,000 | b | 1,384,037 | |
| South African Government, | ||||||
| Bonds, Ser. R209 | ZAR | 6.25 | 3/31/36 | 9,580,000 | 918,391 | |
| Spanish Government, | ||||||
| Sr. Unscd. Bonds | EUR | 5.50 | 7/30/17 | 3,115,000 | 4,360,013 | |
| 16,022,232 | ||||||
| Health Care—.5% | ||||||
| DaVita HealthCare Partners, | ||||||
| Gtd. Notes | 5.75 | 8/15/22 | 85,000 | 89,994 | ||
14
| Coupon | Maturity | Principal | ||||
| Bonds and Notes (continued) | Rate (%) | Date | Amount ($)a | Value ($) | ||
| Health Care (continued) | ||||||
| Watson Pharmaceuticals, | ||||||
| Sr. Unscd. Notes | 4.63 | 10/1/42 | 225,000 | 235,208 | ||
| WellPoint, | ||||||
| Sr. Unscd. Notes | 1.25 | 9/10/15 | 585,000 | 590,015 | ||
| 915,217 | ||||||
| Industrial—.8% | ||||||
| Techem, | ||||||
| Sr. Scd. Notes | EUR | 6.13 | 10/1/19 | 340,000 | b | 483,567 |
| Waste Management, | ||||||
| Gtd. Notes | 7.00 | 7/15/28 | 261,000 | 354,632 | ||
| Xerox, | ||||||
| Sr. Unscd. Notes | 5.63 | 12/15/19 | 485,000 | 542,659 | ||
| 1,380,858 | ||||||
| Information Technology—.1% | ||||||
| Hewlett-Packard, | ||||||
| Sr. Unscd. Notes | 4.30 | 6/1/21 | 160,000 | 158,758 | ||
| Materials—2.1% | ||||||
| ArcelorMittal, | ||||||
| Sr. Unscd. Notes | 6.75 | 2/25/22 | 445,000 | c | 467,832 | |
| Ardagh Packaging Finance, | ||||||
| Sr. Scd. Notes | 7.38 | 10/15/17 | 450,000 | b | 491,062 | |
| Dow Chemical, | ||||||
| Sr. Unscd. Notes | 4.13 | 11/15/21 | 475,000 | 521,325 | ||
| Sealed Air, | ||||||
| Sr. Unscd. Notes | 6.50 | 12/1/20 | 175,000 | b | 189,875 | |
| Smurfit Kappa Acquisitions, | ||||||
| Sr. Scd. Notes | 4.88 | 9/15/18 | 200,000 | b | 205,000 | |
| Smurfit Kappa Acquisitions, | ||||||
| Sr. Scd. Notes | EUR | 5.13 | 9/15/18 | 200,000 | b | 279,435 |
| Teck Resources, | ||||||
| Gtd. Notes | 6.25 | 7/15/41 | 410,000 | 484,008 | ||
| Vale, | ||||||
| Sr. Unscd. Notes | 5.63 | 9/11/42 | 415,000 | 452,599 | ||
| The Fund | 15 |
STATEMENT OF INVESTMENTS (continued)
| Coupon | Maturity | Principal | |||||
| Bonds and Notes (continued) | Rate (%) | Date | Amount ($)a | Value ($) | |||
| Materials (continued) | |||||||
| Vale Overseas, | |||||||
| Gtd. Notes | 4.38 | 1/11/22 | 525,000 | 563,066 | |||
| 3,654,202 | |||||||
| Municipal Bonds—1.0% | |||||||
| California, | |||||||
| GO (Build America Bonds) | 7.30 | 10/1/39 | 610,000 | 845,887 | |||
| New York City, | |||||||
| GO (Build America Bonds) | 5.99 | 12/1/36 | 630,000 | 799,980 | |||
| 1,645,867 | |||||||
| Residential Mortgage | |||||||
| Pass-Through Ctfs.—.1% | |||||||
| Credit Suisse First Boston Mortgage | |||||||
| Securities, Ser. 2004-7, Cl. 6A1 | 5.25 | 10/25/19 | 241,730 | 245,748 | |||
| Telecommunications—.6% | |||||||
| Cellco Partnership/Verizon | |||||||
| Wireless Capital, Sr. Unscd. Notes | 8.50 | 11/15/18 | 135,000 | 185,947 | |||
| Telecom Italia Capital, | |||||||
| Gtd. Notes | 7.18 | 6/18/19 | 150,000 | 174,825 | |||
| Telefonica Emisiones, | |||||||
| Gtd. Notes | 5.46 | 2/16/21 | 675,000 | 721,406 | |||
| 1,082,178 | |||||||
| U.S. Government Agencies—3.9% | |||||||
| Federal National Mortgage | |||||||
| Association, Notes | 1.55 | 10/29/19 | 1,675,000 | e | 1,677,332 | ||
| Federal National Mortgage | |||||||
| Association, Notes | 1.55 | 10/29/19 | 1,720,000 | e | 1,720,064 | ||
| Federal National Mortgage | |||||||
| Association, Notes | 1.70 | 10/4/19 | 1,740,000 | e | 1,743,781 | ||
| Federal National Mortgage | |||||||
| Association, Notes | 1.70 | 11/13/19 | 1,675,000 | e | 1,679,449 | ||
| 6,820,626 | |||||||
| U.S. Government Agencies/ | |||||||
| Mortgage-Backed—25.5% | |||||||
| Federal Home Loan Mortgage Corp.: | |||||||
| 4.00% | 7,135,000 | e,f | 7,618,842 | ||||
| 5.00%, 1/1/40—9/1/40 | 1,113,247 | e | 1,241,990 | ||||
| 5.50%, 5/1/40 | 85,421 | e | 92,398 | ||||
| 7.00%, 11/1/31 | 103,510 | e | 122,041 | ||||
16
| Coupon | Maturity | Principal | |||||
| Bonds and Notes (continued) | Rate (%) | Date | Amount ($)a | Value ($) | |||
| U.S. Government Agencies/ | |||||||
| Mortgage-Backed (continued) | |||||||
| Federal National Mortgage Association: | |||||||
| 2.50% | 935,000 | e,f | 977,952 | ||||
| 3.00% | 10,305,000 | e,f | 10,800,928 | ||||
| 3.50% | 14,090,000 | e,f | 15,026,214 | ||||
| 5.00% | 3,675,000 | e,f | 3,981,059 | ||||
| 4.50%, 11/1/14 | 1,815 | e | 1,954 | ||||
| 5.00%, 1/1/19—9/1/40 | 655,599 | e | 725,644 | ||||
| 5.50%, 2/1/33—7/1/40 | 2,883,504 | e | 3,194,860 | ||||
| 6.00%, 1/1/38 | 445,893 | e | 488,238 | ||||
| 7.00%, 11/1/31—6/1/32 | 15,168 | e | 17,464 | ||||
| 7.50%, 2/1/29—11/1/29 | 2,952 | e | 3,533 | ||||
| Government National | |||||||
| Mortgage Association I: | |||||||
| 6.50%, 7/15/32 | 2,078 | 2,470 | |||||
| 8.00%, 5/15/26 | 1,839 | 2,134 | |||||
| 44,297,721 | |||||||
| U.S. Government Securities—36.3% | |||||||
| U.S. Treasury Bonds: | |||||||
| 3.88%, 8/15/40 | 4,765,000 | d | 5,727,678 | ||||
| 4.63%, 2/15/40 | 160,000 | d | 216,200 | ||||
| 6.13%, 11/15/27 | 1,050,000 | 1,560,070 | |||||
| U.S. Treasury Notes: | |||||||
| 0.13%, 7/31/14 | 5,055,000 | d | 5,047,301 | ||||
| 0.63%, 1/31/13 | 26,325,000 | d | 26,339,400 | ||||
| 1.38%, 1/15/13 | 4,135,000 | 4,137,423 | |||||
| 1.75%, 5/31/16 | 8,150,000 | 8,514,843 | |||||
| 2.38%, 7/31/17 | 8,375,000 | d | 9,032,571 | ||||
| 3.88%, 2/15/13 | 2,480,000 | 2,491,626 | |||||
| 63,067,112 | |||||||
| Utilities—1.4% | |||||||
| Calpine, | |||||||
| Sr. Scd. Notes | 7.88 | 1/15/23 | 100,000 | b | 113,500 | ||
| Enel Finance International, | |||||||
| Gtd. Bonds | 6.25 | 9/15/17 | 775,000 | b | 862,446 | ||
| Exelon Generation, | |||||||
| Sr. Unscd. Notes | 6.25 | 10/1/39 | 355,000 | 414,255 | |||
| Nisource Finance, | |||||||
| Gtd. Notes | 4.45 | 12/1/21 | 555,000 | 608,839 | |||
| The Fund | 17 |
STATEMENT OF INVESTMENTS (continued)
| Coupon | Maturity | Principal | |||
| Bonds and Notes (continued) | Rate (%) | Date | Amount ($)a | Value ($) | |
| Utilities (continued) | |||||
| Sempra Energy, | |||||
| Sr. Unscd. Notes | 6.50 | 6/1/16 | 340,000 | 398,911 | |
| 2,397,951 | |||||
| Total Bonds and Notes | |||||
| (cost $200,622,243) | 207,498,482 | ||||
| Preferred Stocks—.6% | Shares | Value ($) | |||
| Financial | |||||
| General Electric Capital, | |||||
| Non-Cum, Perpetual, Ser. B, $6.25 | |||||
| (cost $900,000) | 9,000 | c | 984,331 | ||
| Face Amount | |||||
| Covered by | |||||
| Options Purchased—.1% | Contracts ($) | Value ($) | |||
| Call Options—.0% | |||||
| 10-Year USD LIBOR-BBA, | |||||
| February 2013 @ $1.75 | 4,195,000 | g | 22,295 | ||
| Put Options—.1% | |||||
| 10-Year USD LIBOR-BBA, | |||||
| February 2013 @ $1.75 | 4,195,000 | g | 69,781 | ||
| Total Options Purchased | |||||
| (cost $107,811) | 92,076 | ||||
| Principal | |||||
| Short-Term Investments—.2% | Amount ($) | Value ($) | |||
| U.S. Treasury Bills; | |||||
| 0.08%, 2/7/13 | |||||
| (cost $424,963) | 425,000 | h | 424,988 | ||
| Other Investment—1.0% | Shares | Value ($) | |||
| Registered Investment Company; | |||||
| Dreyfus Institutional Preferred | |||||
| Plus Money Market Fund | |||||
| (cost $1,677,096) | 1,677,096 | i | 1,677,096 | ||
18
| Investment of Cash Collateral | ||||
| for Securities Loaned—.2% | Shares | Value ($) | ||
| Registered Investment Company; | ||||
| Dreyfus Institutional Cash | ||||
| Advantage Fund | ||||
| (cost $449,813) | 449,813 | i | 449,813 | |
| Total Investments (cost $204,181,926) | 121.6 | % | 211,126,786 | |
| Liabilities, Less Cash and Receivables | (21.6 | %) | (37,484,322 | ) |
| Net Assets | 100.0 | % | 173,642,464 | |
BBA—British Bankers Association
GO—General Obligation
LIBOR—London Interbank Offered Rate
REIT—Real Estate Investment Trust
USD—U.S. Dollar
| a Principal amount stated in U.S. Dollars unless otherwise noted. |
| EUR—Euro |
| ZAR—South African Rand |
| b Securities exempt from registration pursuant to Rule 144A under the Securities Act of 1933.These securities may be |
| resold in transactions exempt from registration, normally to qualified institutional buyers.At December 31, 2012, |
| these securities were valued at $21,813,762 or 12.6% of net assets. |
| c Variable rate security—interest rate subject to periodic change. |
| d Security, or portion thereof, on loan.At December 31, 2012, the value of the fund’s securities on loan was |
| $21,641,204 and the value of the collateral held by the fund was $22,265,848, consisting of cash collateral of |
| $449,813 and U.S. Government and Agency securities valued at $21,816,035. |
| e The Federal Housing Finance Agency (“FHFA”) placed Federal Home Loan Mortgage Corporation and Federal |
| National Mortgage Association into conservatorship with FHFA as the conservator.As such, the FHFA oversees the |
| continuing affairs of these companies. |
| f Purchased on a forward commitment basis. |
| g Non-income producing security. |
| h Held by or on behalf of a counterparty for open financial futures positions. |
| i Investment in affiliated money market mutual fund. |
| Portfolio Summary (Unaudited)† | |||
| Value (%) | Value (%) | ||
| U.S. Government & Agencies | 65.7 | Municipal Bonds | 1.0 |
| Corporate Bonds | 33.2 | Preferred Stocks | .6 |
| Asset/Mortgage-Backed | 10.4 | Option Purchased | .1 |
| Foreign/Governmental | 9.2 | ||
| Short-Term/Money Market Investments | 1.4 | 121.6 | |
| † Based on net assets. | |||
| See notes to financial statements. | |||
| The Fund | 19 |
| STATEMENT OF FINANCIAL FUTURES |
| December 31, 2012 |
| Unrealized | ||||||
| Market Value | Appreciation/ | |||||
| Covered by | (Depreciation) | |||||
| Contracts | Contracts ($) | Expiration | at 12/31/2012 | ($) | ||
| Financial Futures Long | ||||||
| Long Gilt | 28 | 5,409,055 | March 2013 | (11,322 | ) | |
| Financial Futures Short | ||||||
| Euro-Bund | 28 | (5,382,682 | ) | March 2013 | (38,293 | ) |
| U.S. Treasury 10 Year Notes | 138 | (18,323,813 | ) | March 2013 | 83,884 | |
| Gross Unrealized Appreciation | 83,884 | |||||
| Gross Unrealized Depreciation | (49,615 | ) | ||||
| See notes to financial statements. | ||||||
20
STATEMENT OF ASSETS AND LIABILITIES
December 31, 2012
| Cost | Value | ||
| Assets ($): | |||
| Investments in securities—See Statement of Investments (including | |||
| securities on loan, valued at $21,641,204)—Note 1(c): | |||
| Unaffiliated issuers | 202,055,017 | 208,999,877 | |
| Affiliated issuers | 2,126,909 | 2,126,909 | |
| Cash | 62,184 | ||
| Cash denominated in foreign currencies | 152,116 | 152,464 | |
| Dividends, interest and securities lending income receivable | 1,399,002 | ||
| Receivable for futures variation margin—Note 4 | 21,449 | ||
| Unrealized appreciation on forward foreign | |||
| currency exchange contracts—Note 4 | 16,921 | ||
| Prepaid expenses | 12,002 | ||
| 212,790,808 | |||
| Liabilities ($): | |||
| Due to The Dreyfus Corporation and affiliates—Note 3(c) | 76,056 | ||
| Due to Administrator—Note 3(a) | 8,809 | ||
| Payable for open mortgage dollar roll transactions—Note 4 | 32,847,977 | ||
| Payable for investment securities purchased | 5,548,980 | ||
| Liability for securities on loan—Note 1(c) | 449,813 | ||
| Unrealized depreciation on forward foreign | |||
| currency exchange contracts—Note 4 | 126,348 | ||
| Payable for shares of Beneficial Interest redeemed | 22,951 | ||
| Accrued expenses | 67,410 | ||
| 39,148,344 | |||
| Net Assets ($) | 173,642,464 | ||
| Composition of Net Assets ($): | |||
| Paid-in capital | 166,373,802 | ||
| Accumulated undistributed investment income—net | 847,987 | ||
| Accumulated net realized gain (loss) on investments | (452,223 | ) | |
| Accumulated net unrealized appreciation (depreciation) on | |||
| investments, options transactions and foreign currency transactions | |||
| (including $34,269 net unrealized appreciation on financial futures) | 6,872,898 | ||
| Net Assets ($) | 173,642,464 | ||
| Class I Shares Outstanding | |||
| (unlimited number of $.001 par value shares of Beneficial Interest authorized) | 7,683,733 | ||
| Net Asset Value, offering and redemption price per share ($) | 22.60 | ||
| See notes to financial statements. | |||
| The Fund | 21 |
STATEMENT OF OPERATIONS
Year Ended December 31, 2012
| Investment Income ($): | ||
| Income: | ||
| Interest | 5,112,008 | |
| Income from securities lending—Note 1(c) | 23,565 | |
| Dividends: | ||
| Unaffiliated issuers | 21,562 | |
| Affiliated issuers | 4,003 | |
| Total Income | 5,161,138 | |
| Expenses: | ||
| Investment advisory fee—Note 3(a) | 778,161 | |
| Administration fee—Note 3(a) | 116,724 | |
| Professional fees | 81,899 | |
| Shareholder servicing costs—Note 3(c) | 42,036 | |
| Administrative service fees—Note 3(b) | 28,934 | |
| Custodian fees—Note 3(c) | 26,224 | |
| Registration fees | 23,029 | |
| Prospectus and shareholders’ reports | 21,042 | |
| Trustees’ fees and expenses—Note 3(d) | 17,228 | |
| Loan commitment fees—Note 2 | 1,686 | |
| Miscellaneous | 45,541 | |
| Total Expenses | 1,182,504 | |
| Less—reduction in fees due to earnings credits—Note 3(c) | (8 | ) |
| Net Expenses | 1,182,496 | |
| Investment Income—Net | 3,978,642 | |
| Realized and Unrealized Gain (Loss) on Investments—Note 4 ($): | ||
| Net realized gain (loss) on investments and foreign currency transactions | 9,118,849 | |
| Net realized gain (loss) on options transactions | 58,507 | |
| Net realized gain (loss) on financial futures | (207,018 | ) |
| Net realized gain (loss) on swap transactions | (54,535 | ) |
| Net realized gain (loss) on forward foreign currency exchange contracts | 146,331 | |
| Net Realized Gain (Loss) | 9,062,134 | |
| Net unrealized appreciation (depreciation) on | ||
| investments and foreign currency transactions | 1,130,121 | |
| net unrealized appreciation (depreciation) on options transactions | (18,921 | ) |
| Net unrealized appreciation (depreciation) on financial futures | 46,482 | |
| Net unrealized appreciation (depreciation) on | ||
| forward foreign currency exchange contracts | (109,427 | ) |
| Net Unrealized Appreciation (Depreciation) | 1,048,255 | |
| Net Realized and Unrealized Gain (Loss) on Investments | 10,110,389 | |
| Net Increase in Net Assets Resulting from Operations | 14,089,031 | |
| See notes to financial statements. | ||
22
STATEMENT OF CHANGES IN NET ASSETS
| Year Ended December 31, | ||||
| 2012 | 2011 | |||
| Operations ($): | ||||
| Investment income—net | 3,978,642 | 6,337,662 | ||
| Net realized gain (loss) on investments | 9,062,134 | 11,007,171 | ||
| Net unrealized appreciation | ||||
| (depreciation) on investments | 1,048,255 | (1,671,087 | ) | |
| Net Increase (Decrease) in Net Assets | ||||
| Resulting from Operations | 14,089,031 | 15,673,746 | ||
| Dividends to Shareholders from ($): | ||||
| Investment income—net | (4,437,089 | ) | (6,666,113 | ) |
| Beneficial Interest Transactions ($): | ||||
| Net proceeds from shares sold | 17,830,355 | 44,852,359 | ||
| Dividends reinvested | 3,735,110 | 6,083,801 | ||
| Cost of shares redeemed | (69,291,395 | ) | (89,960,363 | ) |
| Increase (Decrease) in Net Assets from | ||||
| Beneficial Interest Transactions | (47,725,930 | ) | (39,024,203 | ) |
| Total Increase (Decrease) in Net Assets | (38,073,988 | ) | (30,016,570 | ) |
| Net Assets ($): | ||||
| Beginning of Period | 211,716,452 | 241,733,022 | ||
| End of Period | 173,642,464 | 211,716,452 | ||
| Undistributed investment income—net | 847,987 | 843,233 | ||
| Capital Share Transactions (Shares): | ||||
| Shares sold | 811,305 | 2,113,586 | ||
| Shares issued for dividends reinvested | 168,521 | 288,276 | ||
| Shares redeemed | (3,133,837 | ) | (4,234,315 | ) |
| Net Increase (Decrease) in Shares Outstanding | (2,154,011 | ) | (1,832,453 | ) |
| See notes to financial statements. | ||||
| The Fund | 23 |
FINANCIAL HIGHLIGHTS
The following table describes the performance for the fiscal periods indicated. Total return shows how much your investment in the fund would have increased (or decreased) during each period, assuming you had reinvested all dividends and distributions.These figures have been derived from the fund’s financial statements.
| Year Ended December 31, | ||||||||||
| 2012 | 2011 | 2010 | 2009 | a | 2008 | |||||
| Per Share Data ($): | ||||||||||
| Net asset value, beginning of period | 21.52 | 20.71 | 19.79 | 17.52 | 19.31 | |||||
| Investment Operations: | ||||||||||
| Investment income—netb | .45 | .59 | .77 | .85 | .88 | |||||
| Net realized and unrealized | ||||||||||
| gain (loss) on investments | 1.17 | .86 | .99 | 2.29 | (1.81 | ) | ||||
| Total from Investment Operations | 1.62 | 1.45 | 1.76 | 3.14 | (.93 | ) | ||||
| Distributions: | ||||||||||
| Dividends from investment income—net | (.54 | ) | (.64 | ) | (.84 | ) | (.87 | ) | (.86 | ) |
| Net asset value, end of period | 22.60 | 21.52 | 20.71 | 19.79 | 17.52 | |||||
| Total Return (%) | 7.58 | 7.10 | 8.99 | 18.32 | (5.00 | ) | ||||
| Ratios/Supplemental Data (%): | ||||||||||
| Ratio of total expenses | ||||||||||
| to average net assets | .61 | .56 | .54 | .60 | .52 | |||||
| Ratio of net expenses | ||||||||||
| to average net assets | .61 | .55 | .50 | .50 | .50 | |||||
| Ratio of net investment income | ||||||||||
| to average net assets | 2.05 | 2.79 | 3.74 | 4.62 | 4.72 | |||||
| Portfolio Turnover Ratec | 467.10 | 400.34 | 328.76 | 361.73 | 443 | |||||
| Net Assets, end of period ($ x 1,000) | 173,642 | 211,716 | 241,733 | 245,169 | 310,742 | |||||
| a Effective September 1, 2009, the fund’s shares were redesignated as Class I shares. |
| b Based on average shares outstanding at each month end. |
| c The portfolio turnover rates excluding mortgage dollar roll transactions for the periods ended December 31, 2012, |
| 2011, 2010, 2009 and 2008 were 223.05%, 281.77%, 130.16%, 93.83% and 72%, respectively. |
See notes to financial statements.
24
NOTES TO FINANCIAL STATEMENTS
NOTE 1—Significant Accounting Policies:
Dreyfus/Standish Fixed Income Fund (the “fund”) is a separate diversified series of Dreyfus Investment Funds (the “Trust”), which is registered under the Investment Company Act of 1940, as amended (the “Act”), as an open-end management investment company and operates as a series company offering eleven series, including the fund. The fund’s investment objective is to achieve a high level of current incomes consistent with conserving principal liquidity.The Dreyfus Corporation (the “Manager” or “Dreyfus”), a wholly-owned subsidiary of The Bank of NewYork Mellon Corporation (“BNY Mellon”), serves as the fund’s investment adviser. MBSC Securities Corporation (the “Distributor”), a wholly-owned subsidiary of the Manager, is the distributor of the fund’s shares.
Class I shares are sold primarily to bank trust departments and other financial service providers, (including The Bank of NewYork Mellon, a subsidiary of BNY Mellon and an affiliate of Dreyfus, and its affiliates), acting on behalf of customers having a qualified trust or an investment account or relationship at such institution and bear no Distribution or Shareholder Services Plan fees. Class I shares are offered without a front end sales charge or contingent deferred sales charge.
The Trust accounts separately for the assets, liabilities and operations of each series. Expenses directly attributable to each series are charged to that series’ operations; expenses which are applicable to all series are allocated among them on a pro rata basis.
The Financial Accounting Standards Board (“FASB”) Accounting Standards Codification is the exclusive reference of authoritative U.S. generally accepted accounting principles (“GAAP”) recognized by the FASB to be applied by nongovernmental entities. Rules and interpretive releases of the Securities and Exchange Commission (“SEC”) under authority of federal laws are also sources of authoritative GAAP for SEC registrants. The fund’s financial statements are prepared in accordance with GAAP, which may require the use of management estimates and assumptions.Actual results could differ from those estimates.
| The Fund | 25 |
NOTES TO FINANCIAL STATEMENTS (continued)
(a) Portfolio valuation: The fair value of a financial instrument is the amount that would be received to sell an asset or paid to transfer a liability in an orderly transaction between market participants at the measurement date (i.e., the exit price). GAAP establishes a fair value hierarchy that prioritizes the inputs of valuation techniques used to measure fair value.This hierarchy gives the highest priority to unadjusted quoted prices in active markets for identical assets or liabilities (Level 1 measurements) and the lowest priority to unobservable inputs (Level 3 measurements).
Additionally, GAAP provides guidance on determining whether the volume and activity in a market has decreased significantly and whether such a decrease in activity results in transactions that are not orderly. GAAP requires enhanced disclosures around valuation inputs and techniques used during annual and interim periods.
Various inputs are used in determining the value of the fund’s investments relating to fair value measurements.These inputs are summarized in the three broad levels listed below:
Level 1—unadjusted quoted prices in active markets for identical investments.
Level 2—other significant observable inputs (including quoted prices for similar investments, interest rates, prepayment speeds, credit risk, etc.).
Level 3—significant unobservable inputs (including the fund’s own assumptions in determining the fair value of investments).
The inputs or methodology used for valuing securities are not necessarily an indication of the risk associated with investing in those securities.
Changes in valuation techniques may result in transfers in or out of an assigned level within the disclosure hierarchy. Valuation techniques used to value the fund’s investments are as follows:
Registered investment companies that are not traded on an exchange are valued at their net asset value and are categorized within Level 1 of the fair value hierarchy.
26
Investments in securities, excluding short-term investments (other than U.S.Treasury Bills), financial futures, options, swaps and forward foreign currency exchange contracts (“forward contracts”) are valued each business day by an independent pricing service (the “Service”) approved by the Trust’s Board of Trustees (the “Board”). Investments for which quoted bid prices are readily available and are representative of the bid side of the market in the judgment of the Service are valued at the mean between the quoted bid prices (as obtained by the Service from dealers in such securities) and asked prices (as calculated by the Service based upon its evaluation of the market for such securities). Other investments (which constitute a majority of the portfolio securities) are valued as determined by the Service, based on methods which include consideration of the following: yields or prices of securities of comparable quality, coupon, maturity and type; indications as to values from dealers; and general market conditions.These securities are generally categorized within Level 2 of the fair value hierarchy.
U.S. Treasury Bills are valued at the mean price between quoted bid prices and asked prices by the Service. These securities are generally categorized within Level 2 of the fair value hierarchy
The Service’s procedures are reviewed by Dreyfus under the general supervision of the Board.
When market quotations or official closing prices are not readily available, or are determined not to reflect accurately fair value, such as when the value of a security has been significantly affected by events after the close of the exchange or market on which the security is principally traded (for example, a foreign exchange or market), but before the fund calculates its net asset value, the fund may value these investments at fair value as determined in accordance with the procedures approved by the Board. Certain factors may be considered when fair valuing investments such as: fundamental analytical data, the nature and duration of restrictions on disposition, an evaluation of the forces that influence the market in which the securities are purchased and sold, and public trading in similar securities of the issuer or comparable
| The Fund | 27 |
NOTES TO FINANCIAL STATEMENTS (continued)
issuers. These securities are either categorized within Level 2 or 3 depending on the relevant inputs used.
For restricted securities where observable inputs are limited, assumptions about market activity and risk are used and are categorized within Level 3 of the fair value hierarchy.
Investments denominated in foreign currencies are translated to U.S. dollars at the prevailing rates of exchange.
Financial futures and options, which are traded on an exchange, are valued at the last sales price on the securities exchange on which such securities are primarily traded or at the last sales price on the national securities market on each business day. These securities are generally categorized within Level 1 of the fair value hierarchy. Options traded over-the-counter are valued at the mean between the bid and asked price.These securities are generally categorized within Level 2 of the fair value hierarchy. Investments in swap transactions are valued each business day by the Service. Swaps are valued by the Service by using a swap pricing model which incorporates among other factors, default probabilities, recovery rates, credit curves of the underlying issuer and swap spreads on interest rates. These securities are generally categorized within Level 2 of the fair value hierarchy. Forward contracts are valued at the forward rate. These securities are generally categorized within Level 2 of the fair value hierarchy.
The following is a summary of the inputs used as of December 31, 2012 in valuing the fund’s investments:
| Level 2—Other | Level 3— | |||
| Level 1— | Significant | Significant | ||
| Unadjusted | Observable | Unobservable | ||
| Quoted Prices | Inputs | Inputs | Total | |
| Assets ($) | ||||
| Investments in Securities: | ||||
| Asset-Backed | — | 9,471,118 | — | 9,471,118 |
| Commercial | ||||
| Mortgage-Backed | — | 8,284,056 | — | 8,284,056 |
| Corporate Bonds† | — | 57,644,002 | — | 57,644,002 |
| Foreign Government | — | 16,022,232 | — | 16,022,232 |
| Municipal Bonds | — | 1,645,867 | — | 1,645,867 |
28
| Level 2—Other | Level 3— | ||||||
| Level 1— | Significant | Significant | |||||
| Unadjusted | Observable | Unobservable | |||||
| Quoted Prices | Inputs | Inputs | Total | ||||
| Assets ($) (continued) | |||||||
| Mutual Funds | 2,126,909 | — | — | 2,126,909 | |||
| Preferred Stocks† | — | 984,331 | — | 984,331 | |||
| Residential | |||||||
| Mortgage-Backed | — | 245,748 | — | 245,748 | |||
| U.S. Government | |||||||
| Agencies/ | |||||||
| Mortgage-Backed | — | 51,118,347 | — | 51,118,347 | |||
| U.S. Treasury | — | 63,492,100 | — | 63,492,100 | |||
| Other Financial | |||||||
| Instruments: | |||||||
| Financial Futures†† | 83,884 | — | — | 83,884 | |||
| Forward Foreign | |||||||
| Currency Exchange | |||||||
| Contracts†† | — | 16,921 | — | 16,921 | |||
| Options Purchased | — | 92,076 | — | 92,076 | |||
| Liabilities ($) | |||||||
| Other Financial | |||||||
| Instruments: | |||||||
| Financial Futures†† | (49,615 | ) | — | — | (49,615 | ) | |
| Forward Foreign | |||||||
| Currency Exchange | |||||||
| Contracts†† | — | (126,348 | ) | — | (126,348 | ) |
| † | See Statement of Investments for additional detailed categorizations. |
| †† | Amount shown represents unrealized appreciation (depreciation) at period end. |
At December 31, 2012, there were no transfers between Level 1 and Level 2 of the fair value hierarchy.
(b) Foreign currency transactions: The fund does not isolate that portion of the results of operations resulting from changes in foreign exchange rates on investments from the fluctuations arising from changes in market prices of securities held. Such fluctuations are included with the net realized and unrealized gain or loss on investments.
Net realized foreign exchange gains or losses arise from sales of foreign currencies, currency gains or losses realized on securities transactions between trade and settlement date, and the difference between the
| The Fund | 29 |
NOTES TO FINANCIAL STATEMENTS (continued)
amounts of dividends, interest and foreign withholding taxes recorded on the fund’s books and the U.S. dollar equivalent of the amounts actually received or paid. Net unrealized foreign exchange gains and losses arise from changes in the value of assets and liabilities other than investments resulting from changes in exchange rates. Foreign currency gains and losses on investments are also included with net realized and unrealized gain or loss on investments.
(c) Securities transactions and investment income: Securities transactions are recorded on a trade date basis. Realized gains and losses from securities transactions are recorded on the identified cost basis. Dividend income is recognized on the ex-dividend date and interest income, including, where applicable, accretion of discount and amortization of premium on investments, is recognized on the accrual basis.
Pursuant to a securities lending agreement with The Bank of New York Mellon, the fund may lend securities to qualified institutions. It is the fund’s policy that, at origination, all loans are secured by collateral of at least 102% of the value of U.S. securities loaned and 105% of the value of foreign securities loaned. Collateral equivalent to at least 100% of the market value of securities on loan is maintained at all times. Collateral is either in the form of cash, which can be invested in certain money market mutual funds managed by the Manager, U.S. Government and Agency securities or letters of credit. The fund is entitled to receive all income on securities loaned, in addition to income earned as a result of the lending transaction. Although each security loaned is fully collateralized, the fund bears the risk of delay in recovery of, or loss of rights in, the securities loaned should a borrower fail to return the securities in a timely manner. During the period ended December 31, 2012, The Bank of New York Mellon earned $12,689 from lending portfolio securities, pursuant to the securities lending agreement.
30
(d) Affiliated issuers: Investments in other investment companies advised by Dreyfus are defined as “affiliated” in the Act. Investments in affiliated investment companies for the period ended December 31, 2012 were as follows:
| Affiliated | ||||||
| Investment | Value | Value | Net | |||
| Company | 12/31/2011 | ($) | Purchases ($) | Sales ($) | 12/31/2012 ($) | Assets (%) |
| Dreyfus | ||||||
| Institutional | ||||||
| Preferred | ||||||
| Plus Money | ||||||
| Market | ||||||
| Fund | 3,759,606 | 97,289,787 | 99,372,297 | 1,677,096 | 1.0 | |
| Dreyfus | ||||||
| Institutional | ||||||
| Cash | ||||||
| Advantage | ||||||
| Fund | 10,733,429 | 16,461,539 | 26,745,155 | 449,813 | .2 | |
| Total | 14,493,035 | 113,751,326 | 126,117,452 | 2,126,909 | 1.2 |
(e) Risk: The fund invests primarily in debt securities. Failure of an issuer of the debt securities to make timely interest or principal payments, or a decline or the perception of a decline in the credit quality of a debt security, can cause the debt security’s price to fall, potentially lowering the fund’s share price. In addition, the value of debt securities may decline due to general market conditions that are not specifically related to a particular issuer, such as real or perceived adverse economic conditions, changes in outlook for corporate earnings, changes in interest or currency rates or adverse investor sentiment. They may also decline because of factors that affect a particular industry.
(f) Dividends to shareholders: Dividends are recorded on the ex-dividend date. Dividends from investment income-net are normally declared and paid quarterly. Dividends from net realized capital gains, if any, are normally declared and paid annually, but the fund may make
| The Fund | 31 |
NOTES TO FINANCIAL STATEMENTS (continued)
distributions on a more frequent basis to comply with the distribution requirements of the Internal Revenue Code of 1986, as amended (the “Code”).To the extent that net realized capital gains can be offset by capital loss carryovers, it is the policy of the fund not to distribute such gains. Income and capital gain distributions are determined in accordance with income tax regulations, which may differ from GAAP.
(g) Federal income taxes: It is the policy of the fund to continue to qualify as a regulated investment company, if such qualification is in the best interests of its shareholders, by complying with the applicable provisions of the Code, and to make distributions of taxable income sufficient to relieve it from substantially all federal income and excise taxes.
As of and during the period ended December 31, 2012, the fund did not have any liabilities for any uncertain tax positions.The fund recognizes interest and penalties, if any, related to uncertain tax positions as income tax expense in the Statement of Operations. During the period, the fund did not incur any interest or penalties.
Each of the tax years in the four-year period ended December 31, 2012 remains subject to examination by the Internal Revenue Service and state taxing authorities.
At December 31, 2012, the components of accumulated earnings on a tax basis were as follows: undistributed ordinary income $897,827, accumulated capital losses $418,512 and unrealized appreciation $6,789,347.
Under the Regulated Investment Company Modernization Act of 2010 (the “2010 Act”), the fund is permitted to carry forward capital losses incurred in taxable years beginning after December 22, 2010 (“post-enactment losses”) for an unlimited period. Furthermore, post-enactment capital loss carryovers retain their character as either short-term or long-term capital losses rather than short-term as they were under previous statute.The 2010 Act requires post-enactment losses to be utilized before the utilization of losses incurred in taxable years prior to the effective date of the 2010 Act (“pre-enactment losses”).As
32
a result of this ordering rule, pre-enactment losses may be more likely to expire unused.
The accumulated capital loss carryover is available for federal income tax purposes to be applied against future net realized capital gains, if any, realized subsequent to December 31, 2012. If not applied, the carryover expires in fiscal year 2017.
The tax character of distributions paid to shareholders during the fiscal periods ended December 31, 2012 and December 31, 2011 were as follows: ordinary income $4,437,089 and $6,666,113, respectively.
During the period ended December 31, 2012, as a result of permanent book to tax differences, primarily due to the tax treatment for pay-down gains and losses on mortgage-backed securities, amortization of premiums, consent fees and foreign currency transactions, the fund increased accumulated undistributed investment income-net by $463,201 and decreased accumulated net realized gain (loss) on investments by the same amount. Net assets and net asset value per share were not affected by this reclassification.
(h) New Accounting Pronouncements: In April 2011, FASB issued Accounting Standards Update No. 2011-03 “Transfers and Servicing (Topic 860) Reconsideration of Effective Control for Repurchase Agreements” (“ASU 2011-03”) which relates to the accounting for repurchase agreements and similar agreements including mortgage dollar rolls, that both entitle and obligate a transferor to repurchase or redeem financial assets before their maturity.ASU 2011-03 modifies the criteria for determining effective control of transferred assets and as a result certain agreements may now be accounted for as secured borrowings.ASU 2011-03 was effective for new transfers and existing transactions that were modified in the first interim or annual period beginning on or after December 15, 2011. The new disclosures have been implemented and there was no change in accounting for the fund. Management has determined that the fund has not entered into transactions that can be deemed “secured borrowings” as defined by ASU 2011-03.
| The Fund | 33 |
NOTES TO FINANCIAL STATEMENTS (continued)
In December 2011, FASB issued Accounting Standards Update No. 2011-11 “Disclosures about Offsetting Assets and Liabilities” (“ASU 2011-11”). These disclosure requirements are intended to help investors and other financial statement users to better assess the effect or potential effect of offsetting arrangements on a company’s financial position.They also improve transparency in the reporting of how companies mitigate credit risk, including disclosure of related collateral pledged or received. In addition, ASU 2011-11 facilitates comparison between those entities that prepare their financial statements on the basis of GAAP and those entities that prepare their financial statements on the basis of International Financial Reporting Standards (“IFRS”). ASU 2011-11 requires entities to: disclose both gross and net information about both instruments and transactions eligible for offset in the financial statements; and disclose instruments and transactions subject to an agreement similar to a master netting agreement. ASU 2011-11 is effective for fiscal years beginning on or after January 1, 2013, and interim periods within those annual periods.At this time, management is evaluating the implications of ASU 2011-11 and its impact on the fund’s financial statement disclosures.
NOTE 2—Bank Lines of Credit:
The fund participates with other Dreyfus-managed funds in a $210 million unsecured credit facility led by Citibank, N.A. and a $300 million unsecured credit facility provided by The Bank of New York Mellon (each, a “Facility”), each to be utilized primarily for temporary or emergency purposes, including the financing of redemptions. Prior to October 10, 2012, the unsecured credit facility with Citibank, N.A. was $225 million. In connection therewith, the fund has agreed to pay its pro rata portion of commitment fees for each Facility. Interest is charged to the fund based on rates determined pursuant to the terms of the respective Facility at the time of borrowing. During the period ended December 31, 2012, the fund did not borrow under the Facilities.
34
NOTE 3—Investment Advisory Fee and Other Transactions With Affiliates:
(a) Pursuant to an investment advisory agreement with the Manager, the investment advisory fee is based on the value of the fund’s average daily net assets and is computed at the following annual rates: .40% of the first $250 million; .35% of the next $250 million and .30% in excess of $500 million.
The fund has an Accounting and Administration Agreement (the “Administration Agreement”) with Dreyfus, whereby Dreyfus performs administrative and accounting services for the fund. The fund has agreed to compensate Dreyfus for providing accounting services, administration, compliance monitoring, regulatory and shareholder reporting, as well as related facilities and equipment.The fee is based on the fund’s average daily net assets and computed at the following annual rates: .06% of the first $500 million, .04% of the next $500 million and .02% in excess of $1 billion.
In addition, after applying any expense limitations or fee waivers that reduce the fees paid to Dreyfus for this service, Dreyfus has contractually agreed in writing to waive any remaining fees for this service to the extent that they exceed both Dreyfus’ costs in providing these services and a reasonable allocation of the costs incurred by Dreyfus and its affiliates related to the support and oversight of these services.The fund also reimburses Dreyfus for the out-of-pocket expenses incurred in performing this service for the fund. Pursuant to the Administration Agreement, the fund was charged $116,724 during the period December 31, 2012.
(b) The fund pays administrative service fees. These fees are paid to affiliated or unaffiliated retirement plans, omnibus accounts and platform administrators and other entities (“Plan Administrators”) that provide record keeping and/or other administrative support services to
| The Fund | 35 |
NOTES TO FINANCIAL STATEMENTS (continued)
accounts, retirement plans and their participants. As compensation for such services, the fund pays each Plan Administrators an administrative service fee an amount of up to .15% (on an annualized basis) of the fund’s average daily net assets attributable to fund shares that are held in accounts serviced by such Plan Administrators. During the period ended December 31, 2012, the fund were charged $28,934 for administrative service fees. The fund’s adviser or its affiliates may pay additional compensation from their own resources to Plan Administrators and other entities for administrative services, as well as for marketing or other distribution related services.These payments may provide an incentive for these entities to actively promote the fund or cooperate with the Distributor’s promotional efforts.
(c) The fund has arrangements with the transfer agent and the custodian whereby the fund may receive earnings credits when positive cash balances are maintained, which are used to offset transfer agency and custody fees. For financial reporting purposes, the fund includes net earnings credits as an expense offset in the Statement of Operations.
The fund compensates Dreyfus Transfer, Inc., a wholly-owned subsidiary of the Manager, under a transfer agency agreement for providing transfer agency services for the fund and, since May 29, 2012, cash management services related to fund subscriptions and redemptions. During the period ended December 31, 2012, the fund was charged $1,896 for transfer agency services and $39 for cash management services. Cash management fees were partially offset by earnings credits of $4. These fees are included in Shareholder servicing costs in the Statement of Operations.
The fund compensates The Bank of New York Mellon under a custody agreement for providing custodial services for the fund. During the period ended December 31, 2012, the fund was charged $26,224 pursuant to the custody agreement.
Prior to May 29, 2012, the fund compensated The Bank of NewYork Mellon under a cash management agreement for performing cash
36
management services related to fund subscriptions and redemptions. During the period ended December 31, 2012, the fund was charged $100 pursuant to the cash management agreement, which is included in Shareholder servicing costs in the Statement of Operations. These fees were partially offset by earnings credits of $4.
During the period ended December 31, 2012, the fund was charged $8,783 for services performed by the Chief Compliance Officer and his staff.
The components of “Due to The Dreyfus Corporation and affiliates” in the Statement of Assets and Liabilities consist of: investment advisory fees $58,725, custodian fees $12,820, Chief Compliance Officer fees $3,981 and transfer agency fees $530.
(d) Each Board member also serves as a Board member of other funds within the Dreyfus complex. Annual retainer fees and attendance fees are allocated to each fund based on net assets.
NOTE 4—Securities Transactions:
The aggregate amount of purchases and sales (including paydowns) of investment securities, excluding short-term securities, financial futures, forward contracts, options transactions and swap transactions, during the period ended December 31, 2012, amounted to $1,107,994,148 and $1,168,958,545, respectively, of which $578,907,214 in purchases and $579,897,477 in sales were from mortgage dollar roll transactions.
Mortgage Dollar Rolls: A mortgage dollar roll transaction involves a sale by the fund of mortgage related securities that it holds with an agreement by the fund to repurchase similar securities at an agreed upon price and date.The securities purchased will bear the same interest rate as those sold, but generally will be collateralized by pools of mortgages with different prepayment histories than those securities sold.The fund accounts for mortgage dollar rolls as purchases and sales transactions.
| The Fund | 37 |
NOTES TO FINANCIAL STATEMENTS (continued)
Derivatives: A derivative is a financial instrument whose performance is derived from the performance of another asset. Each type of derivative instrument that was held by the fund during the period ended December 31, 2012 is discussed below.
The following tables show the fund’s exposure to different types of market risk as it relates to the Statement of Assets and Liabilities and the Statement of Operations, respectively.
Fair value of derivative instruments as of December 31, 2012 is shown below:
| Derivative | Derivative | |||
| Assets ($) | Liabilities ($) | |||
| Interest rate risk1,2 | 175,960 | Interest rate risk1 | (49,615 | ) |
| Foreign exchange risk3 | 16,921 | Foreign exchange risk4 | (126,348 | ) |
| Gross fair value of | ||||
| derivatives contracts | 192,881 | (175,963 | ) |
Statement of Assets and Liabilities location:
| 1 | Includes cumulative appreciation (depreciation) on financial futures as reported in the Statement of |
| Financial Futures, but only the unpaid variation margin is reported in the Statement of Assets | |
| and Liabilities. | |
| 2 | Options purchased are included in Investments in securities—Unaffiliated issuers, at value. |
| 3 | Unrealized appreciation on forward foreign currency exchange contracts. |
| 4 | Unrealized depreciation on forward foreign currency exchange contracts. |
The effect of derivative instruments in the Statement of Operations during the period ended December 31, 2012 is shown below:
| Amount of realized gain or (loss) on derivatives recognized in income ($) | ||||||||
| Financial | Options | Forward | Swap | |||||
| Underlying risk | Futures5 | Transactions6 | Contracts7 | Transactions8 | Total | |||
| Interest rate | (207,018 | ) | 58,507 | — | (54,535 | ) | (203,046 | ) |
| Foreign | ||||||||
| exchange | — | — | 146,331 | — | 146,331 | |||
| Total | (207,018 | ) | 58,507 | 146,331 | (54,535 | ) | (56,715 | ) |
38
| Change in unrealized appreciation or (depreciation) on derivatives recognized in income ($) | |||||||
| Financial | Options | Forward | |||||
| Underlying risk | Futures9 | Transactions10 | Contracts11 | Total | |||
| Interest rate | 46,482 | (18,921 | ) | — | 27,561 | ||
| Foreign exchange | — | — | (109,427 | ) | (109,427 | ) | |
| Total | 46,482 | (18,921 | ) | (109,427 | ) | (81,866 | ) |
Statement of Operations location:
| 5 | Net realized gain (loss) on financial futures. |
| 6 | Net realized gain (loss) on options transactions. |
| 7 | Net realized gain (loss) on forward foreign currency exchange contracts. |
| 8 | Net realized gain (loss) on swap transactions. |
| 9 | Net unrealized appreciation (depreciation) on financial futures. |
| 10 Net unrealized appreciation (depreciation) on options transactions. | |
| 11 Net unrealized appreciation (depreciation) on forward foreign currency exchange contracts. | |
Financial Futures: In the normal course of pursuing its investment objective, the fund is exposed to market risk, including interest rate risk as a result of changes in value of underlying financial instruments.The fund invests in financial futures in order to manage its exposure to or protect against changes in the market.A financial futures contract represents a commitment for the future purchase or a sale of an asset at a specified date. Upon entering into such contracts, these investments require initial margin deposits with a counterparty, which consist of cash or cash equivalents.The amount of these deposits is determined by the exchange or Board of Trade on which the contract is traded and is subject to change.Accordingly, variation margin payments are received or made to reflect daily unrealized gains or losses which are recorded in the Statement of Operations.When the contracts are closed, the fund recognizes a realized gain or loss which is reflected in the Statement of Operations.There is minimal counterparty credit risk to the fund with financial futures since they are exchange traded, and the exchange’s clearinghouse guarantees the financial futures against default. Financial
| The Fund | 39 |
NOTES TO FINANCIAL STATEMENTS (continued)
futures open at December 31, 2012 are set forth in the Statement of Financial Futures.
Options Transactions:The fund purchases and writes (sells) put and call options to hedge against changes in interest rates or as a substitute for an investment.The fund is subject to market risk and interest rate risk in the course of pursuing its investment objectives through its investments in options contracts.A call option gives the purchaser of the option the right (but not the obligation) to buy, and obligates the writer to sell, the underlying security or securities at the exercise price at any time during the option period, or at a specified date. Conversely, a put option gives the purchaser of the option the right (but not the obligation) to sell, and obligates the writer to buy the underlying security or securities at the exercise price at any time during the option period, or at a specified date.
As a writer of call options, the fund receives a premium at the outset and then bears the market risk of unfavorable changes in the price of the financial instrument underlying the option. Generally, the fund realizes a gain, to the extent of the premium, if the price of the underlying financial instrument decreases between the date the option is written and the date on which the option is terminated. Generally, the fund incurs a loss if the price of the financial instrument increases between those dates.
As a writer of put options, the fund receives a premium at the outset and then bears the market risk of unfavorable changes in the price of the financial instrument underlying the option. Generally, the fund realizes a gain, to the extent of the premium, if the price of the underlying financial instrument increases between the date the option is written and the date on which the option is terminated. Generally, the fund incurs a loss if the price of the financial instrument decreases between those dates.
As a writer of an option, the fund has no control over whether the underlying securities may be sold (call) or purchased (put) and as a result bears the market risk of an unfavorable change in the price of the security underlying the written option.There is a risk of loss from
40
a change in value of such options which may exceed the related premiums received. The Statement of Operations reflects the following: any unrealized gains or losses which occurred during the period as well as any realized gains or losses which occurred upon the expiration or closing of the option transaction.
The following summarizes the fund’s call/put options written during the period ended December 31, 2012:
| Face Amount | Options Terminated | |||
| Covered by | Premiums | Net Realized | ||
| Option Written: | Contracts ($) | Received ($) | Cost ($) | Gain ($) |
| Contracts outstanding | ||||
| December 31, 2011 | 6,115,000 | 86,284 | ||
| Contracts terminated: | ||||
| Contracts closed | 6,115,000 | 86,284 | 79,965 | 6,319 |
| Contracts Outstanding | ||||
| December 31, 2012 | — | — | ||
Forward Foreign Currency Exchange Contracts: The fund enters into forward contracts in order to hedge its exposure to changes in foreign currency exchange rates on its foreign portfolio holdings, to settle foreign currency transactions or as a part of its investment strategy. When executing forward contracts, the fund is obligated to buy or sell a foreign currency at a specified rate on a certain date in the future. With respect to sales of forward contracts, the fund incurs a loss if the value of the contract increases between the date the forward contract is opened and the date the forward contract is closed.The fund realizes a gain if the value of the contract decreases between those dates.With respect to purchases of forward contracts, the fund incurs a loss if the value of the contract decreases between the date the forward contract is opened and the date the forward contract is closed.The fund realizes a gain if the value of the contract increases between those dates. Any realized or unrealized gains or losses which occurred during the period are reflected in the Statement of Operations. The fund is exposed to foreign currency risk as a result of changes in value of underlying financial instruments.The fund is also exposed to credit risk associated with counterparty nonperformance on these forward contracts, which
| The Fund | 41 |
NOTES TO FINANCIAL STATEMENTS (continued)
is typically limited to the unrealized gain on each open contract.The following summarizes open forward contracts at December 31, 2012:
| Forward Foreign | |||||
| Currency | Foreign | Unrealized | |||
| Exchange | Currency | Appreciation | |||
| Contracts | Amounts | Cost ($) | Value ($) (Depreciation) ($) | ||
| Purchases: | |||||
| Mexcian New Peso, | |||||
| Expiring | |||||
| 1/29/2013a | 22,840,000 | 1,787,881 | 1,762,002 | (25,879 | ) |
| South African Rand, | |||||
| Expiring | |||||
| 1/29/2013a | 7,520,000 | 866,359 | 883,280 | 16,921 | |
| Sales: | Proceeds ($) | ||||
| Euro, | |||||
| Expiring | |||||
| 1/29/2013b | 8,520,000 | 11,148,437 | 11,248,906 | (100,469 | ) |
| Gross Unrealized | |||||
| Appreciation | 16,921 | ||||
| Gross Unrealized | |||||
| Depreciation | (126,348 | ) | |||
Counterparties:
| a | JPMorgan Chase & Co. |
| b | Morgan Stanley |
Swap Transactions: The fund enters into swap agreements to exchange the interest rate on, or return generated by, one nominal instrument for the return generated by another nominal instrument. The fund enters into these agreements to hedge certain market or interest rate risks, to manage the interest rate sensitivity (sometimes called duration) of fixed income securities, to provide a substitute for purchasing or selling particular securities or to increase potential returns.
The fund accrues for the interim payments on swap contracts on a daily basis, with the net amount recorded within unrealized appreciation (depreciation) on swap contracts in the Statement of Assets and Liabilities. Once the interim payments are settled in cash, the net amount is recorded as a realized gain (loss) on swaps, in addition to realized gain (loss) recorded upon the termination of swap contracts in the Statement of Operations. Upfront payments made and/or received by the fund, are recorded as an asset and/or liability in the Statement
42
of Assets and Liabilities and are recorded as a realized gain or loss ratably over the contract’s term/event with the exception of forward starting interest rate swaps which are recorded as realized gains or losses on the termination date. Fluctuations in the value of swap contracts are recorded for financial statement purposes as unrealized appreciation or depreciation on swap transactions.
Interest Rate Swaps: Interest rate swaps involve the exchange of commitments to pay and receive interest based on a notional principal amount.The fund may elect to pay a fixed rate and receive a floating rate, or receive a fixed rate and pay a floating rate on a notional principal amount. The net interest received or paid on interest rate swap agreements is included within realized gain (loss) on swap contracts in the Statement of Operations. Interest rate swap agreements are subject to general market risk, liquidity risk, counterparty risk and interest rate risk. For financial reporting purposes, forward rate agreements are classified as interest rate swaps. At December 31, 2012, there were no interest rate swap agreements outstanding.
The following summarizes the average market value of derivatives outstanding during the period ended December 31, 2012:
| Average Market Value ($) | |
| Interest rate financial futures | 11,156,102 |
| Interest rate options contracts | 32,286 |
| Forward contracts | 6,393,853 |
The following summarizes the average notional value of swap contracts outstanding during the period ended December 31, 2012:
| Average Notional Value ($) | |
| Interest rate swap contracts | 1,936,154 |
At December 31, 2012, the cost of investments for federal income tax purposes was $204,252,807; accordingly, accumulated net unrealized appreciation on investments was $6,873,979, consisting of $7,272,355 gross unrealized appreciation and $398,376 gross unrealized depreciation.
| The Fund | 43 |
NOTES TO FINANCIAL STATEMENTS (continued)
NOTE 5—Plan of Reorganization:
On July 25-26, 2012, the Board approved an agreement and Plan of Reorganization between the Trust, on behalf of the fund, and Dreyfus Investment Grade Funds, Inc. on behalf of Dreyfus Intermediate Term Income Fund, (the “Acquiring Fund”).The merger was approved by the shareholders of the fund at a meeting held on November 15, 2012 and the merger occurred on January 18, 2013. The merger provided for the fund to transfer all of its assets, subject to its liabilities, to the Acquiring Fund, in exchange for a number of Class I shares of the Acquiring Fund of equal value to the assets less liabilities of the fund. The Acquiring Fund’s Class I shares were distributed to the fund’s shareholders on a pro rata basis in liquidation of the fund. The fund was closed to new investors on August 27, 2012.
44
REPORT OF INDEPENDENT REGISTERED
PUBLIC ACCOUNTING FIRM
The Board of Trustees and Shareholders of Dreyfus/Standish Fixed Income Fund
We have audited the accompanying statement of assets and liabilities of Dreyfus/Standish Fixed Income Fund (the “Fund”), a series of Dreyfus Investment Funds, including the statements of investments and financial futures as of December 31, 2012, and the related statement of operations for the year then ended, the statement of changes in net assets for each of the years in the two-year period then ended, and the financial highlights for each of the years in the four-year period then ended. These financial statements and financial highlights are the responsibility of the Fund’s management. Our responsibility is to express an opinion on these financial statements and financial highlights based on our audits. The financial highlights for the year ended December 31, 2008 were audited by other independent registered public accountants whose report thereon, dated February 27, 2009, expressed an unqualified opinion on those financial highlights.
We conducted our audits in accordance with the standards of the Public Company Accounting Oversight Board (United States).Those standards require that we plan and perform the audit to obtain reasonable assurance about whether the financial statements and financial highlights are free of material misstatement. An audit includes examining, on a test basis, evidence supporting the amounts and disclosures in the financial statements. Our procedures included confirmation of securities owned as of December 31, 2012, by correspondence with the custodian and brokers or by other appropriate auditing procedures where replies from brokers were not received.An audit also includes assessing the accounting principles used and significant estimates made by management, as well as evaluating the overall financial statement presentation.We believe that our audits provide a reasonable basis for our opinion.
In our opinion, the financial statements and financial highlights referred to above present fairly, in all material respects, the financial position of Dreyfus/Standish Fixed Income Fund as of December 31, 2012, the results of its operations for the year then ended, the changes in its net assets for each of the years in the two-year period then ended, and the financial highlights for each of the years in the four-year period then ended, in conformity with U.S. generally accepted accounting principles.

New York, New York
February 28, 2013
| The Fund | 45 |
IMPORTANT TAX INFORMATION (Unaudited)
For federal tax purposes the fund reports the maximum amount allowable but not less than 92.37% as interest-related dividends in accordance with Sections 871(k)(1) and 881(e) of the Internal Revenue Code.
46
BOARD MEMBERS INFORMATION (Unaudited)
| The Fund | 47 |
BOARD MEMBERS INFORMATION (Unaudited) (continued)
48
OFFICERS OF THE FUND (Unaudited)
BRADLEY J. SKAPYAK, President since January 2010.
Chief Operating Officer and a director of the Manager since June 2009; from April 2003 to June 2009, Mr. Skapyak was the head of the Investment Accounting and Support Department of the Manager. He is an officer of 69 investment companies (comprised of 150 portfolios) managed by the Manager. He is 54 years old and has been an employee of the Manager since February 1988.
JANETTE E. FARRAGHER, Vice President and Secretary since December 2011.
Assistant General Counsel of BNY Mellon, and an officer of 70 investment companies (comprised of 177 portfolios) managed by the Manager. She is 50 years old and has been an employee of the Manager since February 1984.
KIESHA ASTWOOD, Vice President and Assistant Secretary since January 2010.
Counsel of BNY Mellon, and an officer of 70 investment companies (comprised of 177 portfolios) managed by the Manager. She is 39 years old and has been an employee of the Manager since July 1995.
JAMES BITETTO, Vice President and Assistant Secretary since December 2008.
Senior Counsel of BNY Mellon and Secretary of the Manager, and an officer of 70 investment companies (comprised of 177 portfolios) managed by the Manager. He is 46 years old and has been an employee of the Manager since December 1996.
JONI LACKS CHARATAN, Vice President and Assistant Secretary since December 2008.
Senior Counsel of BNY Mellon, and an officer of 70 investment companies (comprised of 177 portfolios) managed by the Manager. She is 57 years old and has been an employee of the Manager since October 1988.
JOSEPH M. CHIOFFI, Vice President and Assistant Secretary since December 2008.
Senior Counsel of BNY Mellon, and an officer of 70 investment companies (comprised of 177 portfolios) managed by the Manager. He is 51 years old and has been an employee of the Manager since June 2000.
JOHN B. HAMMALIAN, Vice President and Assistant Secretary since December 2008.
Senior Managing Counsel of BNY Mellon, and an officer of 70 investment companies (comprised of 177 portfolios) managed by the Manager. He is 49 years old and has been an employee of the Manager since February 1991.
ROBERT R. MULLERY, Vice President and Assistant Secretary since December 2008.
Managing Counsel of BNY Mellon, and an officer of 70 investment companies (comprised of 177 portfolios) managed by the Manager. He is 60 years old and has been an employee of the Manager since May 1986.
JEFF PRUSNOFSKY, Vice President and Assistant Secretary since December 2008.
Senior Managing Counsel of BNY Mellon, and an officer of 70 investment companies (comprised of 177 portfolios) managed by the Manager. He is 47 years old and has been an employee of the Manager since October 1990.
JAMES WINDELS, Treasurer since December 2008.
Director – Mutual Fund Accounting of the Manager, and an officer of 70 investment companies (comprised of 177 portfolios) managed by the Manager. He is 54 years old and has been an employee of the Manager since April 1985.
| The Fund | 49 |
OFFICERS OF THE FUND (Unaudited) (continued)
RICHARD CASSARO, Assistant Treasurer since December 2008.
Senior Accounting Manager – Money Market and Municipal Bond Funds of the Manager, and an officer of 70 investment companies (comprised of 177 portfolios) managed by the Manager. He is 53 years old and has been an employee of the Manager since September 1982.
GAVIN C. REILLY, Assistant Treasurer since December 2008.
Tax Manager of the Investment Accounting and Support Department of the Manager, and an officer of 70 investment companies (comprised of 177 portfolios) managed by the Manager. He is 44 years old and has been an employee of the Manager since April 1991.
ROBERT S. ROBOL, Assistant Treasurer since December 2008.
Senior Accounting Manager – Fixed Income Funds of the Manager, and an officer of 70 investment companies (comprised of 177 portfolios) managed by the Manager. He is 48 years old and has been an employee of the Manager since October 1988.
ROBERT SALVIOLO, Assistant Treasurer since December 2008.
Senior Accounting Manager – Equity Funds of the Manager, and an officer of 70 investment companies (comprised of 177 portfolios) managed by the Manager. He is 45 years old and has been an employee of the Manager since June 1989.
ROBERT SVAGNA, Assistant Treasurer since December 2008.
Senior Accounting Manager – Equity Funds of the Manager, and an officer of 70 investment companies (comprised of 177 portfolios) managed by the Manager. He is 45 years old and has been an employee of the Manager since November 1990.
JOSEPH W. CONNOLLY, Chief Compliance Officer since December 2008.
Chief Compliance Officer of the Manager and The Dreyfus Family of Funds (70 investment companies, comprised of 177 portfolios).
He is 55 years old and has served in various capacities with the Manager since 1980, including manager of the firm’s Fund Accounting Department from 1997 through October 2001.
MATTHEW D. CONNOLLY, Anti-Money Laundering Compliance Officer since April 2012.
Anti-Money Laundering Compliance Officer of the Distributor since October 2011; from March 2010 to September 2011, Global Head, KYC Reviews and Director, UBS Investment Bank; until March 2010,AML Compliance Officer and Senior Vice President, Citi Global Wealth Management. He is an officer of 66 investment companies (comprised of 173 portfolios) managed by the Manager. He is 40 years old and has been an employee of the Distributor since October 2011.
50
NOTES
For More Information
Ticker Symbol: SDFIX
Telephone Call your Financial Representative or 1-800-DREYFUS
Mail The Dreyfus Family of Funds, 144 Glenn Curtiss Boulevard, Uniondale, NY 11556-0144 E-mail Send your request to info@dreyfus.com Internet Information can be viewed online or downloaded at: http://www.dreyfus.com
The fund files its complete schedule of portfolio holdings with the Securities and Exchange Commission (“SEC”) for the first and third quarters of each fiscal year on Form N-Q. The fund’s Forms N-Q are available on the SEC’s website at http://www.sec.gov and may be reviewed and copied at the SEC’s Public Reference Room in Washington, DC. Information on the operation of the Public Reference Room may be obtained by calling 1-800-SEC-0330.
A description of the policies and procedures that the fund uses to determine how to vote proxies relating to portfolio securities, and information regarding how the fund voted these proxies for the most recent 12-month period ended June 30 is available at http://www.dreyfus.com and on the SEC’s website at http://www.sec.gov. The description of the policies and procedures is also available without charge, upon request, by calling 1-800-DREYFUS.

| Dreyfus/Standish |
| Global Fixed |
| Income Fund |
ANNUAL REPORT December 31, 2012
The views expressed in this report reflect those of the portfolio manager only through the end of the period covered and do not necessarily represent the views of Dreyfus or any other person in the Dreyfus organization. Any such views are subject to change at any time based upon market or other conditions and Dreyfus disclaims any responsibility to update such views.These views may not be relied on as investment advice and, because investment decisions for a Dreyfus fund are based on numerous factors, may not be relied on as an indication of trading intent on behalf of any Dreyfus fund.
| Not FDIC-Insured • Not Bank-Guaranteed • May Lose Value |
Contents | |
THE FUND | |
| 2 | A Letter from the President |
| 3 | Discussion of Fund Performance |
| 6 | Fund Performance |
| 8 | Understanding Your Fund’s Expenses |
| 8 | Comparing Your Fund’s Expenses With Those of Other Funds |
| 9 | Statement of Investments |
| 25 | Statement of Financial Futures |
| 26 | Statement of Assets and Liabilities |
| 27 | Statement of Operations |
| 28 | Statement of Changes in Net Assets |
| 30 | Financial Highlights |
| 33 | Notes to Financial Statements |
| 58 | Report of Independent Registered Public Accounting Firm |
| 59 | Important Tax Information |
| 60 | Board Members Information |
| 62 | Officers of the Fund |
FOR MORE INFORMATION | |
Back Cover |
Dreyfus/Standish
Global Fixed
Income Fund
The Fund
A LETTER FROM THE PRESIDENT
Dear Shareholder:
We are pleased to present this annual report for Dreyfus/Standish Global Fixed Income Fund, covering the 12-month period from January 1, 2012, through December 31, 2012. For information about how the fund performed during the reporting period, as well as general market perspectives, we provide a Discussion of Fund Performance on the pages that follow.
The search for higher yields amid historically low interest rates proved to be a major force in the performance of U.S. and global bond markets in 2012, even as the Federal Reserve Board and other central banks pumped liquidity into their financial systems. More specifically, low rates on U.S.Treasury securities drove investors to riskier market sectors, helping to support prices among corporate-backed securities, asset-backed securities, commercial mortgage-backed securities, and emerging-markets bonds. In addition, higher yielding bond market sectors were buoyed by gradually recovering U.S. and global economies as domestic employment trends improved, Europe avoided a collapse of its common currency, and China engineered an economic soft landing.
We currently expect the U.S. and global economies to be modestly stronger in 2013, especially during the second half of the year.The U.S. economy seems likely to benefit from greater certainty regarding U.S. tax and fiscal policies, the resumption of postponed spending by businesses, and a continued housing recovery.We encourage you to discuss the implications of our economic analysis with your financial advisor, who can help you align your investments with the year’s challenges and opportunities.
Thank you for your continued confidence and support.
Sincerely,
J. Charles Cardona
President
The Dreyfus Corporation
January 15, 2013
2
DISCUSSION OF FUND PERFORMANCE
For the period of January 1, 2012, through December 31, 2012, as provided by David Leduc, CFA, and Brendan Murphy, CFA, Portfolio Managers
Fund and Market Performance Overview
For the 12-month period ended December 31, 2012, Dreyfus/Standish Global Fixed Income Fund’s Class A shares achieved a total return of 9.26%, Class C shares returned 8.42% and Class I shares returned 9.55%.1 In comparison, the Barclays Global Aggregate Index (Hedged) (the “Index”), the fund’s benchmark, achieved a total return of 5.72% for the same period.2
Aggressively accommodative monetary policies generally supported global bond prices during 2012. The fund outperformed its benchmark, mainly due to strong security selections among U.S. investment-grade corporate bonds and European sovereign bonds.
The Fund’s Investment Approach
The fund seeks to maximize total return while realizing a market level of income, consistent with preserving principal and liquidity, by normally investing at least 80% of its net assets in fixed income securities.The fund also normally invests at least 65% of its assets in non-U.S. dollar-denominated fixed-income securities of governments and companies located in various countries, including emerging markets.The fund generally invests in eight or more countries, but always invests in at least three countries, one of which may be the United States. The fund’s investments may include bonds, notes, mortgage-related securities, asset-backed securities, convertible securities, eurodollar and Yankee dollar instruments, preferred stock and money market instruments. To protect the U.S. dollar value of the fund’s assets, we hedge most, but not necessarily all, of the portfolio’s foreign currency exposure.
The portfolio managers focus on identifying undervalued government bond markets, currencies, sectors and securities and de-emphasize the use of interest rate forecasting. The portfolio managers look for fixed income securities with the most potential for added value, such as those involving the potential for credit upgrades, unique structural characteristics or innovative features.The portfolio managers select securities for the
| The Fund | 3 |
DISCUSSION OF FUND PERFORMANCE (continued)
fund’s portfolio by using fundamental economic research and quantitative analysis and focusing on sectors and individual securities that appear to be relatively undervalued and actively trading among sectors.
Economic Developments Supported Higher Yielding Bonds
Market rallies in early 2012 were driven by positive macroeconomic developments in the United States, Europe, and China. Most notably, employment gains helped bolster the U.S. economy, and a quantitative easing program appeared to forestall a more severe banking crisis in Europe. Consequently, higher yielding securities rallied as investors turned toward riskier market sectors expected to benefit from improved economic conditions.
The global recovery seemed to falter in the spring, when U.S. employment gains moderated, austerity programs in Europe encountered resistance, and China’s economy remained sluggish.These headwinds erased some of the markets’ previous gains, and yields of sovereign debt securities from fiscally healthy nations plunged in a renewed flight to quality. Fortunately, better economic data over the summer and fall—and the announcement of new policy initiatives by several central banks—cheered investors, enabling global bond markets to end the year with attractive returns, on average.
Security Selections Boosted Fund Results
In this environment, our security selection process scored successes among European sovereign bonds, including securities from Italy, Slovakia, and Ireland, and the fund generally avoided weakness in Spain early in 2012. In the United States, the fund benefited from overweighted exposure to investment-grade corporate bonds, particularly in the industrials and financials sectors.
The fund’s asset allocation strategy proved effective, as we favored investment-grade and high yield corporate securities. Underweighted positions in traditionally defensive securities, such as U.S. Treasuries and German bunds, also supported relative performance. Successful currency strategies included overweighted exposure to the Mexican peso and Brazilian real, and underweighted exposure to the Japanese yen and New Zealand dollar. The fund’s country allocation strategy also added value through relatively light positions in Japan and overweighted exposure to emerging-markets bonds denominated in local currencies.
On the other hand, our interest rate strategies detracted mildly from the fund’s relative results, mainly due to a modestly short duration posture at times during the year.
4
We employed currency forwards and options to help implement the fund’s currency allocation strategy, interest rate futures and swaps to establish its interest rate strategies, and interest rate options and futures to manage the risks of interest rate volatility.
Finding Relative Values in International Markets
We have been encouraged by positive economic news in many markets, and we expect accommodative monetary policies to boost global growth further in 2013. Moreover, low interest rates in many parts of the world appear likely to support demand for global bonds, but yield differences have narrowed across the market’s credit-quality spectrum.Therefore, the fund ended 2012 with a mild focus on markets where we believe valuations are relatively attractive, including some of the peripheral nations of Europe.We also have placed greater emphasis on countries where interest rates appear likely to fall, and we have maintained a relatively short duration to guard against the risks of rising rates in some markets.
January 15, 2013
Bond funds are subject generally to interest rate, credit, liquidity and market risks, to varying degrees, all of which are more fully described in the fund’s prospectus. Generally, all other factors being equal, bond prices are inversely related to interest-rate changes, and rate increases can cause price declines.
Foreign bonds are subject to special risks including exposure to currency fluctuations, changing political and economic conditions, and potentially less liquidity.The fixed income securities of issuers located in emerging markets can be more volatile and less liquid than those of issuers in more mature economies.
Investments in foreign currencies are subject to the risk that those currencies will decline in value relative to the U.S. dollar, or, in the case of hedged positions, that the U.S. dollar will decline relative to the currency being hedged. Currency rates in foreign countries may fluctuate significantly over short periods of time.A decline in the value of foreign currencies relative to the U.S. dollar will reduce the value of securities held by the fund and denominated in those currencies.
High yield bonds are subject to increased credit risk and are considered speculative in terms of the issuer’s perceived ability to continue making interest payments on a timely basis and to repay principal upon maturity.
The fund may use derivative instruments, such as options, futures and options on futures, forward contracts, swaps (including credit default swaps on corporate bonds and asset-backed securities), options on swaps and other credit derivatives.A small investment in derivatives could have a potentially large impact on the fund’s performance.The use of derivatives involves risks different from, or possibly greater than, the risks associated with investing directly in the underlying assets.
| 1 Total return includes reinvestment of dividends and any capital gains paid and does not take into consideration the |
| maximum initial sales charge in the case of Class A shares or the applicable contingent deferred sales charge imposed on |
| redemptions in the case of Class C shares. Had these charges been reflected, returns would have been lower. Class I shares |
| are not subject to any initial or deferred sales charge. Past performance is no guarantee of future results. Share price and |
| investment return fluctuate such that upon redemption, fund shares may be worth more or less than their original cost. |
| 2 SOURCE: FACTSET — Reflects reinvestment of dividends and, where applicable, capital gain distributions.The |
| Barclays Global Aggregate (Hedged) Index provides a broad-based measure of the global investment-grade fixed |
| income markets.The three major components of this index are the U.S.Aggregate, the Pan-European Aggregate, and |
| the Asian-Pacific Aggregate Indices.The index also includes Eurodollar and Euro-Yen corporate bonds, Canadian |
| Government securities, and USD investment-grade 144A securities. Index returns do not reflect fees and expenses |
| associated with operating a mutual fund. Investors cannot invest directly in any index. |
| The Fund | 5 |
FUND PERFORMANCE
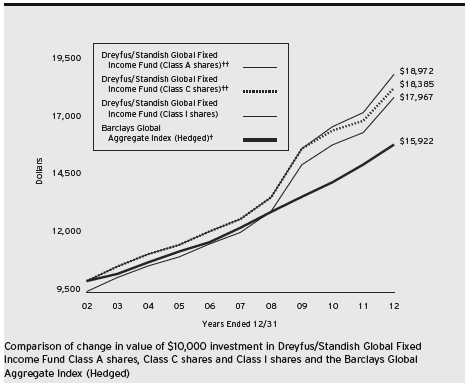
| † | Source: FactSet |
| †† | The total return figures presented for Class A and Class C shares of the fund reflect the performance of the fund’s |
| Class I shares for the period prior to 12/2/09 (the inception date for Class A and Class C shares), adjusted to | |
| reflect the applicable sales load for each share class. | |
| Past performance is not predictive of future performance. | |
| The above graph compares a $10,000 investment made in each of the Class A, Class C and Class I shares of | |
| Dreyfus/Standish Global Fixed Income Fund on 12/31/02 to a $10,000 investment made in the Barclays Global | |
| Aggregate Index (Hedged) (the “Index”) on that date.All dividends and capital gain distributions are reinvested. | |
| The fund’s performance shown in the line graph above takes into account the maximum initial sales charge on Class A | |
| shares and all other applicable fees and expenses on all classes.The Index provides a broad-based measure of the global | |
| investment-grade fixed income markets.The three major components of this index are the U.S.Aggregate, the Pan- | |
| European Aggregate, and the Asian-Pacific Aggregate Indices.The Index also includes Eurodollar and Euro-Yen corporate | |
| bonds, Canadian government securities, and USD investment grade 144A securities. Unlike a mutual fund, the Index is | |
| not subject to charges, fees and other expenses. Investors cannot invest directly in any index.These factors can contribute | |
| to the Index potentially outperforming the fund. Further information relating to fund performance, including expense | |
| reimbursements, if applicable, is contained in the Financial Highlights section of the prospectus and elsewhere in this report. | |
6
| Average Annual Total Returns as of 12/31/12 | |||||||
| Inception | |||||||
| Date | 1 Year | 5 Years | 10 Years | ||||
| Class A shares | |||||||
| with maximum sales charge (4.5%) | 12/2/09 | 4.33 | % | 7.22 | %†† | 6.03 | %†† |
| without sales charge | 12/2/09 | 9.26 | % | 8.21 | %†† | 6.53 | %†† |
| Class C shares | |||||||
| with applicable redemption charge † | 12/2/09 | 7.42 | % | 7.70 | %†† | 6.28 | %†† |
| without redemption | 12/2/09 | 8.42 | % | 7.70 | %†† | 6.28 | %†† |
| Class I shares | 1/1/94 | 9.55 | % | 8.38 | % | 6.61 | % |
| Barclays Global | |||||||
| Aggregate Index (Hedged) | 5.72 | % | 5.28 | % | 4.76 | % | |
Past performance is not predictive of future performance.The fund’s performance shown in the graph and table does not reflect the deduction of taxes that a shareholder would pay on fund distributions or the redemption of fund shares.
| † | The maximum contingent deferred sales charge for Class C shares is 1% for shares redeemed within one year of the |
| date of purchase. | |
| †† | The total return performance figures presented for Class A and Class C shares of the fund reflect the performance of |
| the fund’s Class I shares for the period prior to 12/2/09 (the inception date for Class A and Class C shares), | |
| adjusted to reflect the applicable sales load for each share class. |
| The Fund | 7 |
UNDERSTANDING YOUR FUND’S EXPENSES (Unaudited)
As a mutual fund investor, you pay ongoing expenses, such as management fees and other expenses. Using the information below, you can estimate how these expenses affect your investment and compare them with the expenses of other funds.You also may pay one-time transaction expenses, including sales charges (loads) and redemption fees, which are not shown in this section and would have resulted in higher total expenses. For more information, see your fund’s prospectus or talk to your financial adviser.
Review your fund’s expenses
The table below shows the expenses you would have paid on a $1,000 investment in Dreyfus/Standish Global Fixed Income Fund from July 1, 2012 to December 31, 2012. It also shows how much a $1,000 investment would be worth at the close of the period, assuming actual returns and expenses.
Expenses and Value of a $1,000 Investment
assuming actual returns for the six months ended December 31, 2012
| Class A | Class C | Class I | ||||
| Expenses paid per $1,000† | $ | 4.75 | $ | 8.55 | $ | 3.15 |
| Ending value (after expenses) | $ | 1,053.80 | $ | 1,049.90 | $ | 1,055.30 |
COMPARING YOUR FUND’S EXPENSES
WITH THOSE OF OTHER FUNDS (Unaudited)
Using the SEC’s method to compare expenses
The Securities and Exchange Commission (SEC) has established guidelines to help investors assess fund expenses. Per these guidelines, the table below shows your fund’s expenses based on a $1,000 investment, assuming a hypothetical 5% annualized return. You can use this information to compare the ongoing expenses (but not transaction expenses or total cost) of investing in the fund with those of other funds.All mutual fund shareholder reports will provide this information to help you make this comparison. Please note that you cannot use this information to estimate your actual ending account balance and expenses paid during the period.
Expenses and Value of a $1,000 Investment
assuming a hypothetical 5% annualized return for the six months ended December 31, 2012
| Class A | Class C | Class I | ||||
| Expenses paid per $1,000† | $ | 4.67 | $ | 8.42 | $ | 3.10 |
| Ending value (after expenses) | $ | 1,020.51 | $ | 1,016.79 | $ | 1,022.07 |
| † Expenses are equal to the fund’s annualized expense ratio of .92% for Class A, 1.66% for Class C and .61% |
| for Class I, multiplied by the average account value over the period, multiplied by 184/366 (to reflect the one-half |
| year period). |
8
STATEMENT OF INVESTMENTS
December 31, 2012
| Coupon | Maturity | Principal | ||||
| Bonds and Notes—93.3% | Rate (%) | Date | Amount ($)a | Value ($) | ||
| Australia—1.5% | ||||||
| FMG Resources (August 2006), | ||||||
| Gtd. Notes | 6.38 | 2/1/16 | 470,000 | b,c | 488,800 | |
| Queensland Treasury, | ||||||
| Gov’t Gtd. Bonds, Ser. 13G | AUD | 6.00 | 8/14/13 | 800,000 | 847,295 | |
| Queensland Treasury, | ||||||
| Gov’t Gtd. Notes, Ser. 15 | AUD | 6.00 | 10/14/15 | 1,250,000 | 1,400,824 | |
| Queensland Treasury, | ||||||
| Gov’t Gtd. Notes, Ser. 21 | AUD | 6.00 | 6/14/21 | 900,000 | 1,080,493 | |
| SMART Trust, | ||||||
| Ser. 2011-1USA, Cl. A3B | 1.06 | 10/14/14 | 650,583 | c,d | 652,085 | |
| 4,469,497 | ||||||
| Austria—.9% | ||||||
| Austrian Government, | ||||||
| Sr. Unscd. Notes | EUR | 3.15 | 6/20/44 | 1,865,000 | c | 2,764,695 |
| Belgium—1.3% | ||||||
| Belgium Government, | ||||||
| Bonds, Ser. 50 | EUR | 4.00 | 3/28/13 | 1,265,000 | 1,683,846 | |
| Belgium Government, | ||||||
| Sr. Unscd. Notes, Ser. 65 | EUR | 4.25 | 9/28/22 | 1,270,000 | 2,003,217 | |
| 3,687,063 | ||||||
| Brazil—.9% | ||||||
| Brazil Notas do | ||||||
| Tesouro Nacional, | ||||||
| Bonds, Ser. B | BRL | 6.00 | 8/15/14 | 900,000 | e | 1,069,919 |
| Petrobras | ||||||
| International Finance, | ||||||
| Gtd. Notes | EUR | 5.88 | 3/7/22 | 435,000 | 681,370 | |
| QGOG Constellation, | ||||||
| Gtd. Notes | 6.25 | 11/9/19 | 800,000 | b,c | 836,000 | |
| 2,587,289 | ||||||
| Canada—5.2% | ||||||
| Bombardier, | ||||||
| Sr. Unscd. Notes | EUR | 6.13 | 5/15/21 | 410,000 | c | 583,124 |
| Canadian Capital Auto | ||||||
| Receivables Asset Trust, | ||||||
| Ser. 2012-1A, Cl. A2 | CAD | 2.03 | 8/17/15 | 500,000 | c | 504,454 |
| Canadian Capital Auto | ||||||
| Receivables Asset Trust, | ||||||
| Ser. 2012-1A, Cl. A3 | CAD | 2.38 | 4/17/17 | 1,620,000 | c | 1,649,511 |
| The Fund | 9 |
STATEMENT OF INVESTMENTS (continued)
| Coupon | Maturity | Principal | ||||
| Bonds and Notes (continued) | Rate (%) | Date | Amount ($)a | Value ($) | ||
| Canada (continued) | ||||||
| Canadian Capital Auto | ||||||
| Receivables Asset Trust, | ||||||
| Ser. 2011-1A, Cl. A2 | CAD | 2.63 | 8/17/14 | 1,420,942 | c | 1,434,685 |
| Canadian Government, | ||||||
| Bonds, Ser. VW17 | CAD | 8.00 | 6/1/27 | 1,400,000 | 2,432,695 | |
| CIT Canada Equipment | ||||||
| Receivables Trust, | ||||||
| Ser. 2012-1A, Cl. A2 | CAD | 2.11 | 12/20/16 | 1,325,000 | c | 1,333,381 |
| CNH Capital Canada | ||||||
| Receivables Trust, | ||||||
| Ser. 2011-1A, Cl. A2 | CAD | 2.34 | 7/17/17 | 1,695,000 | c | 1,718,908 |
| Ford Auto Securitization Trust, | ||||||
| Ser. 2011-R3A, Cl. A2 | CAD | 1.96 | 7/15/15 | 733,881 | c | 740,211 |
| Ford Auto Securitization Trust, | ||||||
| Ser. 2012-R1, Cl. A2 | CAD | 2.02 | 3/15/16 | 1,200,000 | 1,211,232 | |
| Ford Auto Securitization Trust, | ||||||
| Ser. 2011-R1A, Cl. A2 | CAD | 2.43 | 11/15/14 | 594,853 | c | 600,456 |
| Ford Auto Securitization Trust, | ||||||
| Ser. 2010-R3A, Cl. A3 | CAD | 2.71 | 9/15/15 | 325,000 | c | 330,799 |
| MEG Energy, | ||||||
| Gtd. Notes | 6.38 | 1/30/23 | 600,000 | c | 628,500 | |
| Province of British Columbia, | ||||||
| Sr. Unscd. Bonds | CAD | 2.70 | 12/18/22 | 650,000 | 656,077 | |
| Rogers Communications, | ||||||
| Gtd. Notes | CAD | 6.56 | 3/22/41 | 600,000 | 759,099 | |
| Videotron, | ||||||
| Gtd. Notes | 5.00 | 7/15/22 | 595,000 | 626,981 | ||
| 15,210,113 | ||||||
| Chile—1.7% | ||||||
| Banco Santander Chile, | ||||||
| Sr. Unscd. Notes | 3.88 | 9/20/22 | 445,000 | c | 457,300 | |
| Cencosud, | ||||||
| Gtd. Notes | 4.88 | 1/20/23 | 500,000 | c | 513,971 | |
| Chilean Government, | ||||||
| Sr. Unscd. Notes | CLP | 5.50 | 8/5/20 | 944,000,000 | 2,208,418 | |
| CODELCO, | ||||||
| Sr. Unscd. Notes | 3.88 | 11/3/21 | 540,000 | c | 591,101 | |
| Empresa Nacional de Petroleo, | ||||||
| Sr. Unscd. Notes | 4.75 | 12/6/21 | 555,000 | c | 597,526 | |
��
10
| Coupon | Maturity | Principal | ||||
| Bonds and Notes (continued) | Rate (%) | Date | Amount ($)a | Value ($) | ||
| Chile (continued) | ||||||
| Telefonica Chile, | ||||||
| Sr. Unscd. Notes | 3.88 | 10/12/22 | 570,000 | c | 571,858 | |
| 4,940,174 | ||||||
| China—.2% | ||||||
| Baidu, | ||||||
| Sr. Unscd. Notes | 3.50 | 11/28/22 | 540,000 | 544,215 | ||
| Colombia—.2% | ||||||
| Bancolombia, | ||||||
| Sub. Notes | 5.13 | 9/11/22 | 485,000 | 506,825 | ||
| France—3.9% | ||||||
| AXA, | ||||||
| Jr. Sub. Notes | EUR | 5.78 | 7/29/49 | 1,050,000 | d | 1,368,185 |
| AXA, | ||||||
| Jr. Sub. Notes | EUR | 6.21 | 10/29/49 | 215,000 | d | 278,400 |
| BNP Paribas, | ||||||
| Sr. Unscd. Notes | 2.38 | 9/14/17 | 2,115,000 | 2,147,721 | ||
| French Government, | ||||||
| Bonds | EUR | 4.50 | 4/25/41 | 2,025,000 | 3,452,660 | |
| GDF Suez, | ||||||
| Sr. Unscd. Notes | 1.63 | 10/10/17 | 560,000 | c | 560,508 | |
| Pernod-Ricard, | ||||||
| Sr. Unscd. Bonds | EUR | 5.00 | 3/15/17 | 200,000 | 302,504 | |
| Pernod-Ricard, | ||||||
| Sr. Unscd. Bonds | 5.75 | 4/7/21 | 500,000 | c | 599,074 | |
| Societe Generale, | ||||||
| Gtd. Notes | 2.75 | 10/12/17 | 2,630,000 | 2,678,279 | ||
| 11,387,331 | ||||||
| Germany—2.0% | ||||||
| Allianz, | ||||||
| Sub. Notes | EUR | 5.63 | 10/17/42 | 1,000,000 | d | 1,495,601 |
| Conti-Gummi Finance, | ||||||
| Sr. Scd. Bonds | EUR | 7.13 | 10/15/18 | 600,000 | c | 848,305 |
| German Government, | ||||||
| Bonds | EUR | 3.25 | 7/4/42 | 870,000 | 1,432,622 | |
| Globaldrive, | ||||||
| Ser. 2011-AA, Cl. A | EUR | 0.86 | 4/20/19 | 682,756 | c,d | 906,917 |
| KFW, | ||||||
| Gov’t Gtd. Bonds | 3.50 | 3/10/14 | 125,000 | 129,703 | ||
| The Fund | 11 |
STATEMENT OF INVESTMENTS (continued)
| Coupon | Maturity | Principal | ||||
| Bonds and Notes (continued) | Rate (%) | Date | Amount ($)a | Value ($) | ||
| Germany (continued) | ||||||
| Techem, | ||||||
| Sr. Scd. Notes | EUR | 6.13 | 10/1/19 | 400,000 | b,c | 568,902 |
| Unitymedia Hessen, | ||||||
| Sr. Scd. Notes | EUR | 7.50 | 3/15/19 | 380,000 | c | 550,488 |
| 5,932,538 | ||||||
| Iceland—.4% | ||||||
| Iceland Government, | ||||||
| Unscd. Notes | 4.88 | 6/16/16 | 1,235,000 | 1,299,624 | ||
| Ireland—1.7% | ||||||
| Ardagh Packaging Finance, | ||||||
| Sr. Scd. Notes | EUR | 7.38 | 10/15/17 | 250,000 | 360,843 | |
| Bank of Ireland, | ||||||
| Gov’t Gtd. Notes | EUR | 4.00 | 1/28/15 | 2,150,000 | 2,908,857 | |
| Irish Government, | ||||||
| Unscd. Bonds | EUR | 5.50 | 10/18/17 | 500,000 | 725,810 | |
| Smurfit Kappa Acquisitions, | ||||||
| Sr. Scd. Notes | EUR | 5.13 | 9/15/18 | 260,000 | c | 363,266 |
| Smurfit Kappa Acquistions, | ||||||
| Sr. Scd. Notes | EUR | 7.75 | 11/15/19 | 380,000 | b,c | 557,260 |
| 4,916,036 | ||||||
| Italy—6.1% | ||||||
| Enel, | ||||||
| Sr. Unscd. Bonds | EUR | 4.88 | 2/20/18 | 915,000 | b | 1,287,259 |
| Enel Finance International, | ||||||
| Gtd. Notes | 5.70 | 1/15/13 | 295,000 | c | 295,188 | |
| Intesa Sanpaolo, | ||||||
| Sr. Unscd. Notes | EUR | 4.13 | 9/19/16 | 300,000 | 414,167 | |
| Intesa Sanpaolo, | ||||||
| Sr. Unscd. Notes | EUR | 5.00 | 2/28/17 | 1,200,000 | 1,714,093 | |
| Italian Government, | ||||||
| Unscd. Bonds | EUR | 4.75 | 6/1/17 | 6,700,000 | 9,423,829 | |
| Italian Government, | ||||||
| Unscd. Bonds | EUR | 4.75 | 9/1/21 | 915,000 | 1,261,144 | |
| Italian Government, | ||||||
| Unscd. Bonds | EUR | 5.50 | 9/1/22 | 980,000 | 1,404,197 | |
| Telecom Italia, | ||||||
| Sr. Unscd. Notes | GBP | 7.38 | 12/15/17 | 750,000 | 1,381,777 | |
| Telecom Italia Capital, | ||||||
| Gtd. Notes | 5.25 | 10/1/15 | 200,000 | 213,300 | ||
12
| Coupon | Maturity | Principal | ||||
| Bonds and Notes (continued) | Rate (%) | Date | Amount ($)a | Value ($) | ||
| Italy (continued) | ||||||
| Telecom Italia Capital, | ||||||
| Gtd. Notes | 7.18 | 6/18/19 | 325,000 | 378,788 | ||
| 17,773,742 | ||||||
| Japan—8.6% | ||||||
| Development Bank of Japan, | ||||||
| Gov’t Gtd. Notes | JPY | 1.05 | 6/20/23 | 27,000,000 | 317,162 | |
| Japanese Government, | ||||||
| Sr. Unscd. Bonds, Ser. 8 | JPY | 1.00 | 6/10/16 | 130,000,000 | f | 1,596,553 |
| Japanese Government, | ||||||
| Sr. Unscd. Bonds, Ser. 11 | JPY | 1.70 | 6/20/33 | 334,150,000 | 3,811,593 | |
| Japanese Government, | ||||||
| Sr. Unscd. Bonds, Ser. 79 | JPY | 2.00 | 6/20/25 | 120,850,000 | 1,546,849 | |
| Japanese Government, | ||||||
| Sr. Unscd. Bonds, Ser. 106 | JPY | 2.20 | 9/20/28 | 601,500,000 | 7,701,915 | |
| Japanese Government, | ||||||
| Sr. Unscd. Bonds, Ser. 288 | JPY | 1.70 | 9/20/17 | 539,500,000 | 6,675,415 | |
| Japanese Government, | ||||||
| Sr. Unscd. Bonds, Ser. 310 | JPY | 1.00 | 9/20/20 | 302,850,000 | 3,627,747 | |
| 25,277,234 | ||||||
| Kazakhstan—.6% | ||||||
| Development Bank of Kazakhstan, | ||||||
| Sr. Unscd. Notes | 4.13 | 12/10/22 | 620,000 | c | 627,750 | |
| Kazakhstan Temir Zholy Finance, | ||||||
| Gtd. Notes | 6.95 | 7/10/42 | 850,000 | c | 1,071,000 | |
| 1,698,750 | ||||||
| Mexico—.8% | ||||||
| Comision Federal de Electricidad, | ||||||
| Sr. Unscd. Notes | 5.75 | 2/14/42 | 550,000 | c | 628,375 | |
| Mexican Government, | ||||||
| Bonds, Ser. M 30 | MXN | 8.50 | 11/18/38 | 12,680,000 | 1,244,527 | |
| Mexichem, | ||||||
| Sr. Unscd. Notes | 4.88 | 9/19/22 | 345,000 | c | 372,600 | |
| Southern Copper, | ||||||
| Sr. Unscd. Notes | 3.50 | 11/8/22 | 210,000 | 215,509 | ||
| 2,461,011 | ||||||
| Mongolia—.2% | ||||||
| Mongolian Government, | ||||||
| Sr. Unscd. Notes | 4.13 | 1/5/18 | 530,000 | c | 526,025 | |
| The Fund | 13 |
STATEMENT OF INVESTMENTS (continued)
| Coupon | Maturity | Principal | ||||
| Bonds and Notes (continued) | Rate (%) | Date | Amount ($)a | Value ($) | ||
| Netherlands—3.1% | ||||||
| ABN AMRO Bank, | ||||||
| Sr. Unscd. Notes | 4.25 | 2/2/17 | 1,100,000 | c | 1,202,536 | |
| BMW Finance, | ||||||
| Gtd. Notes | EUR | 3.88 | 1/18/17 | 140,000 | 205,563 | |
| E.ON International Finance, | ||||||
| Gtd. Notes | EUR | 4.88 | 1/28/14 | 100,000 | 138,076 | |
| E.ON International Finance, | ||||||
| Gtd. Notes | EUR | 5.50 | 10/2/17 | 150,000 | 236,751 | |
| ELM, | ||||||
| Jr. Sub. Notes | EUR | 5.25 | 5/29/49 | 1,050,000 | d | 1,426,114 |
| Heineken, | ||||||
| Sr. Notes | 0.80 | 10/1/15 | 875,000 | c | 877,230 | |
| Iberdrola International, | ||||||
| Gtd. Notes | EUR | 4.50 | 9/21/17 | 300,000 | 432,277 | |
| ING Bank, | ||||||
| Covered Notes | EUR | 3.63 | 8/31/21 | 305,000 | 463,510 | |
| Rabobank Nederland, | ||||||
| Sr. Unscd. Notes | EUR | 3.88 | 4/20/16 | 775,000 | 1,119,677 | |
| Rabobank Nederland, | ||||||
| Sub. Notes | EUR | 3.75 | 11/9/20 | 125,000 | 176,653 | |
| Repsol International Finance, | ||||||
| Gtd. Notes | EUR | 4.38 | 2/20/18 | 500,000 | 710,073 | |
| Repsol International Finance, | ||||||
| Gtd. Notes | EUR | 4.88 | 2/19/19 | 500,000 | 726,423 | |
| RWE Finance, | ||||||
| Gtd. Notes | EUR | 6.63 | 1/31/19 | 100,000 | 170,681 | |
| UPCB Finance VI, | ||||||
| Sr. Scd. Notes | 6.88 | 1/15/22 | 530,000 | c | 576,375 | |
| Ziggo Bond, | ||||||
| Gtd. Notes | EUR | 8.00 | 5/15/18 | 390,000 | c | 568,836 |
| 9,030,775 | ||||||
| New Zealand—2.2% | ||||||
| New Zealand Government, | ||||||
| Sr. Unscd. Bonds, Ser. 1217 | NZD | 6.00 | 12/15/17 | 7,000,000 | 6,605,535 | |
| Norway—.9% | ||||||
| DNB Boligkreditt, | ||||||
| Covered Bonds | 2.10 | 10/14/16 | 795,000 | c | 824,856 | |
| Norwegian Government, | ||||||
| Bonds, Ser. 474 | NOK | 3.75 | 5/25/21 | 4,300,000 | 884,364 | |
14
| Coupon | Maturity | Principal | ||||
| Bonds and Notes (continued) | Rate (%) | Date | Amount ($)a | Value ($) | ||
| Norway (continued) | ||||||
| Statoil, | ||||||
| Gtd. Notes | 4.25 | 11/23/41 | 740,000 | 799,566 | ||
| 2,508,786 | ||||||
| Peru—.4% | ||||||
| BBVA Banco Continental, | ||||||
| Sr. Unscd. Notes | 5.00 | 8/26/22 | 90,000 | c | 96,300 | |
| Corp Financiera | ||||||
| de Desarrollo, | ||||||
| Sr. Unscd. Notes | 4.75 | 2/8/22 | 360,000 | c | 396,900 | |
| Peruvian Government, | ||||||
| Sr. Unscd. Notes | PEN | 6.95 | 8/12/31 | 1,580,000 | c | 780,189 |
| 1,273,389 | ||||||
| Philippines—.1% | ||||||
| Philippine Government, | ||||||
| Sr. Unscd. Notes | PHP | 4.95 | 1/15/21 | 8,000,000 | 215,542 | |
| Poland—.4% | ||||||
| Polish Government, | ||||||
| Sr. Unscd. Notes | 5.00 | 3/23/22 | 1,015,000 | 1,201,253 | ||
| Slovokia—2.7% | ||||||
| Slovakian Government, | ||||||
| Bonds, Ser. 213 | EUR | 3.50 | 2/24/16 | 1,550,000 | b | 2,219,430 |
| Slovakian Government, | ||||||
| Bonds, Ser. 214 | EUR | 4.00 | 4/27/20 | 155,000 | 231,309 | |
| Slovakian Government, | ||||||
| Sr. Unsub. Notes | EUR | 4.00 | 3/26/21 | 1,420,000 | b | 2,136,260 |
| Slovakian Government, | ||||||
| Sr. Unscd. Notes | EUR | 4.38 | 1/21/15 | 900,000 | b | 1,282,167 |
| Slovakian Government, | ||||||
| Sr. Unscd. Notes | 4.38 | 5/21/22 | 1,970,000 | c | 2,155,810 | |
| 8,024,976 | ||||||
| Slovenia—.6% | ||||||
| Slovenian Government, | ||||||
| Sr. Unscd. Notes | 5.50 | 10/26/22 | 1,575,000 | c | 1,657,688 | |
| South Africa—2.1% | ||||||
| South African Government, | ||||||
| Bonds, Ser. R209 | ZAR | 6.25 | 3/31/36 | 28,525,000 | 2,734,561 | |
| South African Government, | ||||||
| Bonds, Ser. R213 | ZAR | 7.00 | 2/28/31 | 26,650,000 | 2,918,089 | |
| The Fund | 15 |
STATEMENT OF INVESTMENTS (continued)
| Coupon | Maturity | Principal | ||||
| Bonds and Notes (continued) | Rate (%) | Date | Amount ($)a | Value ($) | ||
| South Africa (continued) | ||||||
| Transnet SOC, | ||||||
| Sr. Unscd. Notes | 4.00 | 7/26/22 | 525,000 | c | 529,594 | |
| 6,182,244 | ||||||
| South Korea—.5% | ||||||
| Export-Import Bank of Korea, | ||||||
| Sr. Unscd. Notes | EUR | 5.75 | 5/22/13 | 110,000 | 148,244 | |
| Korea Finance, | ||||||
| Sr. Unscd. Notes | 2.25 | 8/7/17 | 1,245,000 | 1,263,563 | ||
| 1,411,807 | ||||||
| Spain—5.1% | ||||||
| Banco Santander, | ||||||
| Covered Bonds | EUR | 4.63 | 1/20/16 | 1,600,000 | 2,230,629 | |
| BBVA Senior Finance, | ||||||
| Gtd. Notes | EUR | 4.38 | 9/21/15 | 1,100,000 | 1,489,154 | |
| BBVA US Senior, | ||||||
| Gtd. Notes | 4.66 | 10/9/15 | 1,400,000 | 1,436,372 | ||
| Iberdrola Finanzas, | ||||||
| Gtd. Notes | EUR | 3.50 | 10/13/16 | 1,200,000 | 1,660,719 | |
| Santander International Debt, | ||||||
| Gtd. Notes | EUR | 4.00 | 3/27/17 | 1,600,000 | 2,164,055 | |
| Spanish Government, | ||||||
| Sr. Unsub. Bonds | EUR | 5.85 | 1/31/22 | 2,880,000 | 3,972,355 | |
| Telefonica Emisiones, | ||||||
| Gtd. Notes | GBP | 5.38 | 2/2/18 | 985,000 | 1,690,197 | |
| Telefonica Emisiones, | ||||||
| Gtd. Notes | 5.46 | 2/16/21 | 410,000 | 438,188 | ||
| 15,081,669 | ||||||
| Supranational—.4% | ||||||
| Corporacion Andina de Fomento, | ||||||
| Sr. Unscd. Notes | 3.75 | 1/15/16 | 660,000 | 699,801 | ||
| Eurasian Development Bank, | ||||||
| Sr. Unscd. Notes | 4.77 | 9/20/22 | 510,000 | c | 529,890 | |
| 1,229,691 | ||||||
| Sweden—.7% | ||||||
| Nordea Bank, | ||||||
| Sr. Unscd. Notes | 2.13 | 1/14/14 | 795,000 | c | 802,811 | |
| Swedish Government, | ||||||
| Bonds, Ser. 3102 | SEK | 4.00 | 12/1/20 | 4,500,000 | g | 1,168,595 |
| 1,971,406 | ||||||
16
| Coupon | Maturity | Principal | ||||
| Bonds and Notes (continued) | Rate (%) | Date | Amount ($)a | Value ($) | ||
| Switzerland—.4% | ||||||
| Credit Suisse, | ||||||
| Covered Notes | EUR | 2.13 | 1/18/17 | 800,000 | 1,119,048 | |
| Thailand—.2% | ||||||
| Bangkok Bank, | ||||||
| Sr. Unscd. Notes | 2.75 | 3/27/18 | 585,000 | c | 594,586 | |
| Turkey—1.1% | ||||||
| Export Credit Bank of Turkey, | ||||||
| Sr. Unscd. Notes | 5.88 | 4/24/19 | 200,000 | 228,300 | ||
| Turkish Government, | ||||||
| Bonds | TRY | 3.00 | 2/23/22 | 4,250,000 | h | 2,901,369 |
| 3,129,669 | ||||||
| United Kingdom—11.9% | ||||||
| Abbey National | ||||||
| Treasury Services, | ||||||
| Covered Bonds | EUR | 3.63 | 9/8/17 | 800,000 | 1,160,687 | |
| Arcelormittal, | ||||||
| Sr. Unscd. Bonds | 9.85 | 6/1/19 | 1,195,000 | d | 1,434,983 | |
| ArcelorMittal, | ||||||
| Sr. Unscd. Notes | EUR | 4.63 | 11/17/17 | 245,000 | b,d | 349,035 |
| ArcelorMittal, | ||||||
| Sr. Unscd. Notes | 6.25 | 2/25/22 | 530,000 | b,d | 557,193 | |
| Barclays Bank, | ||||||
| Covered Notes | EUR | 2.13 | 9/8/15 | 440,000 | 597,830 | |
| BP Capital Markets, | ||||||
| Gtd. Notes | 2.25 | 11/1/16 | 255,000 | 265,541 | ||
| E-Carat, | ||||||
| Ser. 2012-1, Cl. A | GBP | 1.30 | 6/18/20 | 600,000 | 975,893 | |
| GlaxoSmithKline Capital, | ||||||
| Gtd. Notes | 0.75 | 5/8/15 | 1,080,000 | 1,085,905 | ||
| Gracechurch Card Funding, | ||||||
| Ser. 2012-1A, Cl. A2 | EUR | 0.91 | 2/15/17 | 1,400,000 | c,d | 1,867,287 |
| HSBC Holdings, | ||||||
| Sub. Notes | EUR | 6.25 | 3/19/18 | 100,000 | 158,618 | |
| Ineos Finance, | ||||||
| Sr. Scd. Notes | 7.50 | 5/1/20 | 450,000 | c | 473,625 | |
| Lloyds TSB Bank, | ||||||
| Covered Notes | EUR | 3.38 | 3/17/16 | 600,000 | 842,473 | |
| Lloyds TSB Bank, | ||||||
| Covered Bonds | EUR | 4.00 | 9/29/21 | 200,000 | 310,082 | |
| The Fund | 17 |
STATEMENT OF INVESTMENTS (continued)
| Coupon | Maturity | Principal | ||||
| Bonds and Notes (continued) | Rate (%) | Date | Amount ($)a | Value ($) | ||
| United Kingdom (continued) | ||||||
| Lloyds TSB Bank, | ||||||
| Sr. Unscd. Notes | EUR | 5.38 | 9/3/19 | 450,000 | b | 723,647 |
| National Grid, | ||||||
| Sr. Unscd. Notes | 6.30 | 8/1/16 | 75,000 | 87,092 | ||
| Paragon Mortgages, | ||||||
| Ser. 14A, Cl. A2C | 0.51 | 9/15/39 | 1,239,432 | c,d | 1,096,228 | |
| Reed Elsevier Investment, | ||||||
| Gtd. Notes | GBP | 7.00 | 12/11/17 | 100,000 | 198,140 | |
| Royal Bank of Scotland, | ||||||
| Covered Notes | EUR | 3.00 | 9/8/16 | 280,000 | 393,353 | |
| Royal Bank of Scotland, | ||||||
| Covered Notes | EUR | 3.88 | 10/19/21 | 600,000 | 920,218 | |
| Royal Bank of Scotland, | ||||||
| Gtd. Notes | 5.63 | 8/24/20 | 405,000 | 470,939 | ||
| Royal Bank of Scotland, | ||||||
| Sr. Unscd. Notes | EUR | 5.75 | 5/21/14 | 205,000 | 288,257 | |
| Royal Bank of Scotland, | ||||||
| Sub. Notes | 9.50 | 3/16/22 | 535,000 | d | 630,968 | |
| Sasol Financing International, | ||||||
| Gtd. Notes | 4.50 | 11/14/22 | 725,000 | 731,344 | ||
| United Kingdom Gilt, | ||||||
| Bonds | GBP | 2.25 | 3/7/14 | 1,110,000 | 1,843,999 | |
| United Kingdom Gilt, | ||||||
| Bonds | GBP | 4.25 | 9/7/39 | 2,170,000 | 4,306,614 | |
| United Kingdom Gilt, | ||||||
| Bonds | GBP | 4.25 | 12/7/40 | 560,000 | 1,112,720 | |
| United Kingdom Gilt, | ||||||
| Bonds | GBP | 4.75 | 12/7/30 | 165,000 | 351,584 | |
| United Kingdom Gilt, | ||||||
| Bonds, Ser. 3MO | GBP | 1.25 | 11/22/17 | 1,225,000 | i | 2,882,538 |
| United Kingdom Gilt, | ||||||
| Bonds, Ser. 3MO | GBP | 1.88 | 11/22/22 | 1,850,000 | i | 4,596,158 |
| United Kingdom Gilt, | ||||||
| Unscd. Bonds | GBP | 3.75 | 9/7/21 | 2,260,000 | 4,313,539 | |
| 35,026,490 | ||||||
18
| Coupon | Maturity | Principal | ||||
| Bonds and Notes (continued) | Rate (%) | Date | Amount ($)a | Value ($) | ||
| United States—23.8% | ||||||
| AbbVie, | ||||||
| Gtd. Notes | 1.75 | 11/6/17 | 1,400,000 | c | 1,416,867 | |
| Ally Auto Receivables Trust, | ||||||
| Ser. 2010-1, Cl. A3 | 1.45 | 5/15/14 | 15,294 | 15,307 | ||
| Ally Financial, | ||||||
| Gtd. Notes | 4.50 | 2/11/14 | 170,000 | 175,312 | ||
| Ally Financial, | ||||||
| Gtd. Notes | 5.50 | 2/15/17 | 840,000 | 902,744 | ||
| Ally Master Owner Trust, | ||||||
| Ser. 2011-5, Cl. A | 0.86 | 6/15/15 | 945,000 | d | 946,417 | |
| American International Group, | ||||||
| Sr. Unscd. Notes | 4.88 | 6/1/22 | 580,000 | 663,412 | ||
| Anadarko Petroleum, | ||||||
| Sr. Unscd. Notes | 6.38 | 9/15/17 | 235,000 | 280,998 | ||
| ARL First, | ||||||
| Ser. 2012-1A, Cl. A1 | 1.96 | 12/15/42 | 700,000 | c,d | 707,875 | |
| Bank of America, | ||||||
| Sr. Unscd. Notes | 3.88 | 3/22/17 | 1,035,000 | 1,123,577 | ||
| BMW US Capital, | ||||||
| Gtd. Notes | EUR | 5.00 | 5/28/15 | 200,000 | 290,243 | |
| Capital One Financial, | ||||||
| Sr. Unscd. Notes | 1.00 | 11/6/15 | 980,000 | 977,372 | ||
| Chrysler Financial Auto | ||||||
| Securitization Trust, | ||||||
| Ser. 2010-A, Cl. D | 3.52 | 8/8/16 | 630,000 | 632,517 | ||
| CIT Group, | ||||||
| Sr. Unscd. Notes | 4.25 | 8/15/17 | 465,000 | 481,009 | ||
| CIT Group, | ||||||
| Sr. Unscd. Notes | 5.00 | 5/15/17 | 520,000 | 553,800 | ||
| Citigroup, | ||||||
| Sr. Unscd. Notes | 2.65 | 3/2/15 | 1,060,000 | 1,092,126 | ||
| Comcast, | ||||||
| Gtd. Notes | 5.90 | 3/15/16 | 150,000 | 172,468 | ||
| CVS Pass-Through Trust, | ||||||
| Pass Thru Notes | 5.77 | 1/10/33 | 143,136 | c | 169,302 | |
| The Fund | 19 |
STATEMENT OF INVESTMENTS (continued)
| Coupon | Maturity | Principal | |||||
| Bonds and Notes (continued) | Rate (%) | Date | Amount ($)a | Value ($) | |||
| United States (continued) | |||||||
| DaVita HealthCare Partners, | |||||||
| Gtd. Notes | 5.75 | 8/15/22 | 120,000 | 127,050 | |||
| EQT, | |||||||
| Sr. Unscd. Notes | 8.13 | 6/1/19 | 135,000 | 167,323 | |||
| Exelon Generation, | |||||||
| Sr. Unscd Notes | 4.25 | 6/15/22 | 1,300,000 | c | 1,354,348 | ||
| Express Scripts Holding, | |||||||
| Gtd. Notes | 2.10 | 2/12/15 | 540,000 | c | 550,358 | ||
| Federal Home Loan | 3.00 | 9/1/42 | — | 3,940,378 | j | 4,132,159 | |
| Mortgage Corp. | 10/1/42 | ||||||
| Federal National | |||||||
| Mortgage Association | 3.00 | 10/1/42 | 2,188,824 | j | 2,296,488 | ||
| Federal National | 3.50 | 10/1/41 | — | 9,340,085 | j | 10,083,991 | |
| Mortgage Association | 6/1/42 | ||||||
| Ford Motor Credit, | |||||||
| Sr. Unscd. Notes | 3.00 | 6/12/17 | 500,000 | 514,246 | |||
| Ford Motor Credit, | |||||||
| Sr. Unscd. Notes | 3.88 | 1/15/15 | 720,000 | 751,215 | |||
| General Electric Capital, | |||||||
| Sub. Notes | 5.30 | 2/11/21 | 300,000 | 348,820 | |||
| Holcim US Finance Sarl & Cie, | |||||||
| Gtd. Notes | 6.00 | 12/30/19 | 605,000 | c | 687,203 | ||
| HSBC USA, | |||||||
| Sr. Unscd. Notes | 2.38 | 2/13/15 | 1,200,000 | 1,234,988 | |||
| Hyundai Capital America, | |||||||
| Gtd. Notes | 4.00 | 6/8/17 | 475,000 | c | 513,174 | ||
| JPMorgan Chase Bank, | |||||||
| Sub. Notes | EUR | 4.38 | 11/30/21 | 900,000 | b,d | 1,260,328 | |
| JPMorgan Chase Commercial | |||||||
| Mortgage Securities, | |||||||
| Ser. 2007-CB20, Cl. AM | 5.88 | 2/12/51 | 525,000 | d | 611,818 | ||
| Kinder Morgan Energy Partners, | |||||||
| Sr. Unscd. Notes | 6.85 | 2/15/20 | 165,000 | 208,194 | |||
| Lamar Media, | |||||||
| Gtd. Notes | 5.88 | 2/1/22 | 350,000 | 381,500 | |||
| Levi Strauss & Co., | |||||||
| Sr. Unscd. Notes | EUR | 7.75 | 5/15/18 | 130,000 | 185,322 | ||
20
| Coupon | Maturity | Principal | |||
| Bonds and Notes (continued) | Rate (%) | Date | Amount ($)a | Value ($) | |
| United States (continued) | |||||
| LyondellBasell Industries, | |||||
| Sr. Unscd. Notes | 5.00 | 4/15/19 | 375,000 | 416,250 | |
| MetLife Institutional Funding II, | |||||
| Scd. Notes | 1.25 | 4/4/14 | 1,075,000 | c,d | 1,084,472 |
| MGM Resorts International, | |||||
| Gtd. Notes | 7.75 | 3/15/22 | 540,000 | 580,500 | |
| NBCUniversal Media, | |||||
| Sr. Unscd. Notes | 4.38 | 4/1/21 | 95,000 | 106,904 | |
| News America, | |||||
| Gtd. Notes | 6.90 | 3/1/19 | 355,000 | 445,485 | |
| Peabody Energy, | |||||
| Gtd. Notes | 6.00 | 11/15/18 | 505,000 | 539,088 | |
| Peabody Energy, | |||||
| Gtd. Notes | 6.25 | 11/15/21 | 240,000 | 256,200 | |
| PepsiCo, | |||||
| Sr. Unscd. Notes | 0.80 | 8/25/14 | 650,000 | 653,658 | |
| Philip Morris International, | |||||
| Sr. Unscd. Notes | 5.65 | 5/16/18 | 125,000 | 151,728 | |
| Philip Morris International, | |||||
| Sr. Unscd. Notes | 6.88 | 3/17/14 | 135,000 | 145,405 | |
| Plains All American Pipeline, | |||||
| Sr. Unscd. Notes | 5.00 | 2/1/21 | 135,000 | 156,642 | |
| Plains All American Pipeline, | |||||
| Sr. Unscd. Notes | 8.75 | 5/1/19 | 65,000 | 88,541 | |
| Prudential Financial, | |||||
| Notes | 5.38 | 6/21/20 | 200,000 | 234,172 | |
| Puget Energy, | |||||
| Sr. Scd. Notes | 6.00 | 9/1/21 | 170,000 | 187,791 | |
| Santander Drive Auto | |||||
| Receivables Trust, | |||||
| Ser. 2012-1, Cl. B | 2.72 | 5/15/16 | 365,000 | 374,469 | |
| Sealed Air, | |||||
| Sr. Unscd. Notes | 6.50 | 12/1/20 | 250,000 | b,c | 271,250 |
| Sempra Energy, | |||||
| Sr. Unscd. Notes | 1.07 | 3/15/14 | 770,000 | d | 774,270 |
| SLM, | |||||
| Sr. Unscd. Notes | 7.25 | 1/25/22 | 730,000 | 808,475 | |
| The Fund | 21 |
STATEMENT OF INVESTMENTS (continued)
| Coupon | Maturity | Principal | |||
| Bonds and Notes (continued) | Rate (%) | Date | Amount ($)a | Value ($) | |
| United States (continued) | |||||
| SLM Student Loan Trust, | |||||
| Ser. 2011-B, Cl. A1 | 1.06 | 12/16/24 | 766,639 | c,d | 768,584 |
| Structured Asset | |||||
| Securities Corporation, | |||||
| Ser. 2006-AM1, Cl. A4 | 0.37 | 4/25/36 | 838,762 | d | 735,685 |
| U.S. Treasury Bonds | 3.00 | 5/15/42 | 4,100,000 | 4,177,515 | |
| U.S. Treasury Inflation | |||||
| Protected Securities | 2.00 | 1/15/14 | 3,104,737 | b,k | 3,205,399 |
| U.S. Treasury Inflation | |||||
| Protected Securities | 2.13 | 1/15/19 | 8,209,864 | b,k | 9,975,625 |
| U.S. Treasury Notes | 1.50 | 8/31/18 | 3,785,000 | 3,919,545 | |
| Unit, | |||||
| Gtd. Notes | 6.63 | 5/15/21 | 605,000 | c | 623,906 |
| Ventas Realty, | |||||
| Gtd. Notes | 4.25 | 3/1/22 | 245,000 | 260,292 | |
| Watson Pharmaceuticals, | |||||
| Sr. Unscd. Notes | 3.25 | 10/1/22 | 310,000 | 317,108 | |
| Wells Fargo & Co. | |||||
| Sr. Unscd. Notes | 2.63 | 12/15/16 | 910,000 | 961,287 | |
| WM Wrigley Jr., | |||||
| Sr. Scd. Notes | 3.70 | 6/30/14 | 380,000 | c | 393,452 |
| Xerox, | |||||
| Sr. Unscd. Notes | 1.13 | 5/16/14 | 190,000 | d | 189,667 |
| ZFS Finance (USA) Trust V, | |||||
| Jr. Sub. Cap. Secs | 6.50 | 5/9/67 | 1,000,000 | c,d | 1,071,250 |
| 69,884,486 | |||||
| Venezuela—.4% | |||||
| Petroleos de Venezuela, | |||||
| Gtd. Notes | 8.50 | 11/2/17 | 1,100,000 | 1,089,000 | |
| Zambia—.1% | |||||
| Zambian Government, | |||||
| Unscd. Bonds | 5.38 | 9/20/22 | 220,000 | c | 220,000 |
| Total Bonds And Notes | |||||
| (cost $262,780,693) | 273,440,202 | ||||
22
| Face Amount | |||
| Covered by | |||
| Options Purchased—.3% | Contracts ($) | Value ($) | |
| Call Options—.1% | |||
| Australian Dollar, | |||
| February 2013 @ $1.01 | 5,600,000 | l | 16,531 |
| South Korean Won, | |||
| March 2013 @ $1,100 | 5,800,000 | l | 18,867 |
| Euro, | |||
| June 2013 @ $1.31 | 7,300,000 | l | 144,774 |
| 10-Year USD LIBOR-BBA, | |||
| June 2023 @ $1.89 | 14,500,000 | l | 205,808 |
| 385,980 | |||
| Put Options—.2% | |||
| Euro, | |||
| June 2013 @ $1.31 | 7,300,000 | l | 208,773 |
| 10-Year USD LIBOR-BBA, | |||
| June 2023 @ $1.89 | 14,500,000 | l | 317,541 |
| 526,314 | |||
| Total Options Purchased | |||
| (cost $991,615) | 912,294 | ||
| Principal | |||
| Short-Term Investments—2.8% | Amount ($) | Value ($) | |
| U.S. Treasury Bills: | |||
| 0.08%, 1/10/13 | 5,010,000 | 5,009,970 | |
| 0.12%, 2/7/13 | 3,180,000 | m | 3,179,911 |
| Total Short-Term Investments | |||
| (cost $8,189,511) | 8,189,881 | ||
| Other Investment—.9% | Shares | Value ($) | |
| Registered | |||
| Investment Company; | |||
| Dreyfus | |||
| Institutional Preferred | |||
| Plus Money Market Fund | |||
| (cost $2,573,602) | 2,573,602 | n | 2,573,602 |
| The Fund | 23 |
STATEMENT OF INVESTMENTS (continued)
| Investment of Cash Collateral | ||||
| for Securities Loaned—2.9% | Shares | Value ($) | ||
| Registered Investment Company; | ||||
| Dreyfus Institutional Cash Advantage Fund | ||||
| (cost $8,649,087) | 8,649,087 | n | 8,649,087 | |
| Total Investments (cost $283,184,508) | 100.2 | % | 293,765,066 | |
| Liabilities, Less Cash and Receivables | (.2 | %) | (624,746 | ) |
| Net Assets | 100.0 | % | 293,140,320 |
| BBA—British Bankers Association | |
| LIBOR—London Interbank Offered Rate | |
| USD—U.S. Dollar | |
| a | Principal amount stated in U.S. Dollars unless otherwise noted. |
| AUD—Australian Dollar | |
| BRL—Brazilian Real | |
| CAD—Canadian Dollar | |
| CLP—Chilean Peso | |
| EUR—Euro | |
| GBP—British Pound | |
| JPY—JapaneseYen | |
| MXN—Mexican New Peso | |
| NOK—Norwegian Krone | |
| NZD—New Zealand Dollar | |
| PEN—Peruvian Nuevo Sol | |
| PHP—Philippine Peso | |
| SEK—Swedish Krona | |
| TRY—Turkish Lira | |
| ZAR—South African Rand | |
| b | Security, or portion thereof, on loan.At December 31, 2012, the value of the fund’s securities on loan was |
| $17,078,324 and the value of the collateral held by the fund was $17,778,438, consisting of cash collateral of | |
| $8,649,087 and U.S Government and Agency securities valued at $9,129,351. | |
| c | Securities exempt from registration pursuant to Rule 144A under the Securities Act of 1933.These securities may be |
| resold in transactions exempt from registration, normally to qualified institutional buyers.At December 31, 2012, | |
| these securities were valued at $50,335,805 or 17.2% of net assets. | |
| d | Variable rate security—interest rate subject to periodic change. |
| e | Principal amount for accrual purposes is periodically adjusted based on changes in the Brazilian Consumer Price Index. |
| f | Principal amount for accrual purposes is periodically adjusted based on changes in the Japanese Consumer Price Index. |
| g | Principal amount for accrual purposes is periodically adjusted based on changes in the Swedish Consumer Price Index. |
| h | Principal amount for accrual purposes is periodically adjusted based on changes in the Turkish Consumer Price Index. |
| i | Principal amount for accrual purposes is periodically adjusted based on changes in the British Consumer Price Index. |
| j | The Federal Housing Finance Agency (“FHFA”) placed Federal Home Loan Mortgage Corporation and Federal |
| National Mortgage Association into conservatorship with FHFA as the conservator.As such, the FHFA oversees the | |
| continuing affairs of these companies. | |
| k | Principal amount for accrual purposes is periodically adjusted based on changes in the Consumer Price Index. |
| l | Non-income producing security. |
| m | Held by or on behalf of a counterparty for open financial futures positions. |
| n | Investment in affiliated money market mutual fund. |
| Portfolio Summary (Unaudited)† | |||
| Value (%) | Value (%) | ||
| Foreign/Governmental | 42.1 | Asset/Commerical/ | |
| Corporate Bonds | 31.5 | Residential Mortgage-Backed | 6.8 |
| U.S. Government/Agencies | 12.9 | Short-Term/Money Market Investments | 6.6 |
| Options Purchased | .3 | ||
| 100.2 | |||
| † Based on net assets. | |||
| See notes to financial statements. | |||
24
STATEMENT OF FINANCIAL FUTURES
December 31, 2012
| Unrealized | ||||||
| Market Value | Appreciation | |||||
| Covered by | (Depreciation) | |||||
| Contracts | Contracts ($) | Expiration | at 12/31/2012 | ($) | ||
| Financial Futures Long | ||||||
| U.S. Treasury Ultra 30 Year Bonds | 11 | 1,788,531 | March 2013 | (36,324 | ) | |
| Long Gilt | 67 | 12,943,095 | March 2013 | 29,610 | ||
| Financial Futures Short | ||||||
| Euro-Bobl | 63 | (10,629,171 | ) | March 2013 | (71,960 | ) |
| Euro-Bund | 66 | (12,687,751 | ) | March 2013 | (104,606 | ) |
| Euro-Schatz | 68 | (9,950,475 | ) | March 2013 | (12,633 | ) |
| U.S. Treasury 10 Year Notes | 60 | (7,966,875 | ) | March 2013 | (9,155 | ) |
| Gross Unrealized Appreciation | 29,610 | |||||
| Gross Unrealized Depreciation | (234,678 | ) | ||||
| See notes to financial statements. | ||||||
| The Fund | 25 |
STATEMENT OF ASSETS AND LIABILITIES
December 31, 2012
| Cost | Value | |||
| Assets ($): | ||||
| Investments in securities—See Statement of Investments (including | ||||
| securities on loan, valued at $17,078,324)—Note 1(c): | ||||
| Unaffiliated issuers | 271,961,819 | 282,542,377 | ||
| Affiliated issuers | 11,222,689 | 11,222,689 | ||
| Cash | 425,503 | |||
| Cash denominated in foreign currencies | 4,057,546 | 4,062,238 | ||
| Receivable for investment securities sold | 14,049,054 | |||
| Dividends, interest and securities lending income receivable | 2,941,125 | |||
| Unrealized appreciation on forward foreign | ||||
| currency exchange contracts—Note 4 | 1,920,737 | |||
| Receivable for shares of Beneficial Interest subscribed | 1,106,826 | |||
| Unrealized appreciation on swap contracts—Note 4 | 453,232 | |||
| Prepaid expenses | 25,340 | |||
| 318,749,121 | ||||
| Liabilities ($): | ||||
| Due to The Dreyfus Corporation and affiliates—Note 3(d) | 158,403 | |||
| Due to Administrator—Note 3(a) | 15,921 | |||
| Payable for open mortgage dollar roll transactions—Note 4 | 10,986,956 | |||
| Liability for securities on loan—Note 1(c) | 8,649,087 | |||
| Payable for investment securities purchased | 3,210,392 | |||
| Payable for shares of Beneficial Interest redeemed | 1,361,674 | |||
| Unrealized depreciation on forward foreign | ||||
| currency exchange contracts—Note 4 | 1,048,913 | |||
| Unrealized depreciation on swap contracts—Note 4 | 84,195 | |||
| Payable for futures variation margin—Note 4 | 7,247 | |||
| Distributions payable | 5,785 | |||
| Accrued expenses | 80,228 | |||
| 25,608,801 | ||||
| Net Assets ($) | 293,140,320 | |||
| Composition of Net Assets ($): | ||||
| Paid-in capital | 282,285,027 | |||
| Accumulated distribution in excess of investment income—net | (1,688,095 | ) | ||
| Accumulated net realized gain (loss) on investments | 889,648 | |||
| Accumulated net unrealized appreciation (depreciation) on | ||||
| investments, options transactions, swap transactions and | ||||
| foreign currency transactions [including ($205,068) net | ||||
| unrealized (depreciation) on financial futures] | 11,653,740 | |||
| Net Assets ($) | 293,140,320 | |||
| Net Asset Value Per Share | ||||
| Class A | Class C | Class I | ||
| Net Assets ($) | 75,834,164 | 16,612,614 | 200,693,542 | |
| Shares Outstanding | 3,475,456 | 764,067 | 9,184,320 | |
| Net Asset Value Per Share ($) | 21.82 | 21.74 | 21.85 | |
| See notes to financial statements. | ||||
26
STATEMENT OF OPERATIONS
Year Ended December 31, 2012
| Investment Income ($): | ||
| Income: | ||
| Interest | 7,101,822 | |
| Income from securities lending—Note 1(c) | 18,539 | |
| Dividends; | ||
| Affiliated issuers | 7,870 | |
| Total Income | 7,128,231 | |
| Expenses: | ||
| Investment advisory fee—Note 3(a) | 975,728 | |
| Shareholder servicing costs—Note 3(d) | 327,793 | |
| Administration fee—Note 3(a) | 181,635 | |
| Distribution fees—Note 3(c) | 101,147 | |
| Professional fees | 67,326 | |
| Registration fees | 46,705 | |
| Custodian fees—Note 3(d) | 43,436 | |
| Prospectus and shareholders’ reports | 35,882 | |
| Trustees’ fees and expenses—Note 3(e) | 17,980 | |
| Administrative service fees—Note 3(b) | 11,609 | |
| Loan commitment fees—Note 2 | 2,205 | |
| Miscellaneous | 57,571 | |
| Total Expenses | 1,869,017 | |
| Less—reduction in fees due to earnings credits—Note 3(d) | (69 | ) |
| Net Expenses | 1,868,948 | |
| Investment Income—Net | 5,259,283 | |
| Realized and Unrealized Gain (Loss) on Investments—Note 4 ($): | ||
| Net realized gain (loss) on investments and foreign currency transactions | 10,056,924 | |
| Net realized gain (loss) on options transactions | 65,759 | |
| Net realized gain (loss) on financial futures | (1,234,534 | ) |
| Net realized gain (loss) on swap transactions | 29,089 | |
| Net realized gain (loss) on forward foreign currency exchange contracts | 43,997 | |
| Net Realized Gain (Loss) | 8,961,235 | |
| Net unrealized appreciation (depreciation) on | ||
| investments and foreign currency transactions | 6,224,438 | |
| Net unrealized appreciation (depreciation) on options transactions | (79,321 | ) |
| Net unrealized appreciation (depreciation) on financial futures | (7,137 | ) |
| Net unrealized appreciation (depreciation) on swap transactions | 286,577 | |
| Net unrealized appreciation (depreciation) on | ||
| forward foreign currency exchange contracts | 1,401,653 | |
| Net Unrealized Appreciation (Depreciation) | 7,826,210 | |
| Net Realized and Unrealized Gain (Loss) on Investments | 16,787,445 | |
| Net Increase in Net Assets Resulting from Operations | 22,046,728 |
See notes to financial statements.
| The Fund | 27 |
STATEMENT OF CHANGES IN NET ASSETS
| Year Ended December 31, | ||||
| 2012 | 2011 | |||
| Operations ($): | ||||
| Investment income—net | 5,259,283 | 4,121,340 | ||
| Net realized gain (loss) on investments | 8,961,235 | (75,498 | ) | |
| Net unrealized appreciation | ||||
| (depreciation) on investments | 7,826,210 | 1,893,547 | ||
| Net Increase (Decrease) in Net Assets | ||||
| Resulting from Operations | 22,046,728 | 5,939,389 | ||
| Dividends to Shareholders from ($): | ||||
| Investment income—net: | ||||
| Class A Shares | (1,184,277 | ) | (1,699,732 | ) |
| Class C Shares | (158,879 | ) | (306,004 | ) |
| Class I Shares | (3,623,174 | ) | (5,381,475 | ) |
| Net realized gain on investments: | ||||
| Class A Shares | (1,561,860 | ) | (3,861 | ) |
| Class C Shares | (343,963 | ) | (667 | ) |
| Class I Shares | (4,134,508 | ) | (11,739 | ) |
| Total Dividends | (11,006,661 | ) | (7,403,478 | ) |
| Beneficial Interest Transactions ($): | ||||
| Net proceeds from shares sold: | ||||
| Class A Shares | 40,020,503 | 30,956,514 | ||
| Class C Shares | 6,674,327 | 6,932,896 | ||
| Class I Shares | 76,140,895 | 74,675,907 | ||
| Dividends reinvested: | ||||
| Class A Shares | 2,722,931 | 1,683,367 | ||
| Class C Shares | 496,249 | 303,637 | ||
| Class I Shares | 7,235,059 | 3,837,389 | ||
| Cost of shares redeemed: | ||||
| Class A Shares | (18,231,493 | ) | (13,698,964 | ) |
| Class C Shares | (1,926,424 | ) | (1,538,906 | ) |
| Class I Shares | (30,846,236 | ) | (32,635,132 | ) |
| Increase (Decrease) in Net Assets from | ||||
| Beneficial Interest Transactions | 82,285,811 | 70,516,708 | ||
| Total Increase (Decrease) in Net Assets | 93,325,878 | 69,052,619 | ||
| Net Assets ($): | ||||
| Beginning of Period | 199,814,442 | 130,761,823 | ||
| End of Period | 293,140,320 | 199,814,442 | ||
| Distributions in excess of | ||||
| investment income—net | (1,688,095 | ) | (2,681,932 | ) |
28
| Year Ended December 31, | ||||
| 2012 | 2011 | |||
| Capital Share Transactions: | ||||
| Class A | ||||
| Shares sold | 1,856,321 | 1,474,689 | ||
| Shares issued for dividends reinvested | 124,983 | 80,939 | ||
| Shares redeemed | (844,462 | ) | (651,716 | ) |
| Net Increase (Decrease) in Shares Outstanding | 1,136,842 | 903,912 | ||
| Class C | ||||
| Shares sold | 309,946 | 330,903 | ||
| Shares issued for dividends reinvested | 22,815 | 14,659 | ||
| Shares redeemed | (89,826 | ) | (73,569 | ) |
| Net Increase (Decrease) in Shares Outstanding | 242,935 | 271,993 | ||
| Class I | ||||
| Shares sold | 3,509,137 | 3,546,669 | ||
| Shares issued for dividends reinvested | 331,676 | 184,228 | ||
| Shares redeemed | (1,422,591 | ) | (1,550,933 | ) |
| Net Increase (Decrease) in Shares Outstanding | 2,418,222 | 2,179,964 | ||
| See notes to financial statements. | ||||
| The Fund | 29 |
FINANCIAL HIGHLIGHTS
The following tables describe the performance for each share class for the fiscal periods indicated.All information (except portfolio turnover rate) reflects financial results for a single fund share.Total return shows how much your investment in the fund would have increased (or decreased) during each period, assuming you had reinvested all dividends and distributions.These figures have been derived from the fund’s financial statements.
| Year Ended December 31, | ||||||||
| Class A Shares | 2012 | 2011 | 2010 | 2009 | a | |||
| Per Share Data ($): | ||||||||
| Net asset value, beginning of period | 20.74 | 20.84 | 20.73 | 20.92 | ||||
| Investment Operations: | ||||||||
| Investment income—netb | .43 | .48 | .59 | .08 | ||||
| Net realized and unrealized | ||||||||
| gain (loss) on investments | 1.48 | .21 | .60 | (.07 | ) | |||
| Total from Investment Operations | 1.91 | .69 | 1.19 | .01 | ||||
| Distributions: | ||||||||
| Dividends from investment income—net | (.37 | ) | (.79 | ) | (1.08 | ) | (.20 | ) |
| Dividends from net realized | ||||||||
| gain on investments | (.46 | ) | (.00 | )c | — | — | ||
| Total Distributions | (.83 | ) | (.79 | ) | (1.08 | ) | (.20 | ) |
| Net asset value, end of period | 21.82 | 20.74 | 20.84 | 20.73 | ||||
| Total Return (%)d | 9.26 | 3.36 | 5.77 | .03 | e | |||
| Ratios/Supplemental Data (%): | ||||||||
| Ratio of total expenses to average net assets | .93 | 1.00 | 1.08 | .98 | f | |||
| Ratio of net expenses to average net assets | .93 | .98 | .90 | .90 | f | |||
| Ratio of net investment income | ||||||||
| to average net assets | 1.99 | 2.26 | 2.86 | 4.40 | f | |||
| Portfolio Turnover Rateg | 245.46 | 267.08 | 210.75 | 131.97 | ||||
| Net Assets, end of period ($ x 1,000) | 75,834 | 48,509 | 29,900 | 10 | ||||
| a From December 2, 2009 (commencement of initial offering) to December 31, 2009. |
| b Based on average shares outstanding at each month end. |
| c Amount represents less than $.01 per share. |
| d Exclusive of sales charge. |
| e Not annualized. |
| f Annualized. |
| g The portfolio turnover rates excluding mortgage dollar roll transactions for the periods ended December 31, 2012, |
| 2011, 2010 and 2009 were 197.97%, 247.48%, 206.04% and 111.36%, respectively. |
See notes to financial statements.
30
| Year Ended December 31, | ||||||||
| Class C Shares | 2012 | 2011 | 2010 | 2009 | a | |||
| Per Share Data ($): | ||||||||
| Net asset value, beginning of period | 20.68 | 20.79 | 20.73 | 20.92 | ||||
| Investment Operations:�� | ||||||||
| Investment income—netb | .27 | .31 | .42 | .06 | ||||
| Net realized and unrealized | ||||||||
| gain (loss) on investments | 1.47 | .23 | .60 | (.07 | ) | |||
| Total from Investment Operations | 1.74 | .54 | 1.02 | (.01 | ) | |||
| Distributions: | ||||||||
| Dividends from investment income—net | (.22 | ) | (.65 | ) | (.96 | ) | (.18 | ) |
| Dividends from net realized | ||||||||
| gain on investments | (.46 | ) | (.00 | )c | — | — | ||
| Total Distributions | (.68 | ) | (.65 | ) | (.96 | ) | (.18 | ) |
| Net asset value, end of period | 21.74 | 20.68 | 20.79 | 20.73 | ||||
| Total Return (%)d | 8.42 | 2.56 | 5.01 | (.03 | )e | |||
| Ratios/Supplemental Data (%): | ||||||||
| Ratio of total expenses to average net assets | 1.68 | 1.76 | 1.87 | 1.73 | f | |||
| Ratio of net expenses to average net assets | 1.68 | 1.73 | 1.65 | 1.65 | f | |||
| Ratio of net investment income | ||||||||
| to average net assets | 1.24 | 1.47 | 2.12 | 3.65 | f | |||
| Portfolio Turnover Rateg | 245.46 | 267.08 | 210.75 | 131.97 | ||||
| Net Assets, end of period ($ x 1,000) | 16,613 | 10,778 | 5,181 | 10 | ||||
| a From December 2, 2009 (commencement of initial offering) to December 31, 2009. |
| b Based on average shares outstanding at each month end. |
| c Amount represents less than $.01 per share. |
| d Exclusive of sales charge. |
| e Not annualized. |
| f Annualized. |
| g The portfolio turnover rates excluding mortgage dollar roll transactions for the periods ended December 31, 2012, |
| 2011, 2010 and 2009 were 197.97%, 247.48%, 206.04% and 111.36%, respectively. |
See notes to financial statements.
| The Fund | 31 |
FINANCIAL HIGHLIGHTS (continued)
| Year Ended December 31, | ||||||||||
| Class I Shares | 2012 | 2011 | 2010 | 2009 | a | 2008 | ||||
| Per Share Data ($): | ||||||||||
| Net asset value, beginning of period | 20.77 | 20.86 | 20.72 | 18.53 | 18.73 | |||||
| Investment Operations: | ||||||||||
| Investment income—netb | .50 | .54 | .75 | .91 | .86 | |||||
| Net realized and unrealized | ||||||||||
| gain (loss) on investments | 1.47 | .23 | .49 | 1.90 | .53 | |||||
| Total from Investment Operations | 1.97 | .77 | 1.24 | 2.81 | 1.39 | |||||
| Distributions: | ||||||||||
| Dividends from investment income—net | (.43 | ) | (.86 | ) | (1.10 | ) | (.62 | ) | (1.59 | ) |
| Dividends from net realized | ||||||||||
| gain on investments | (.46 | ) | (.00 | )c | — | — | — | |||
| Total Distributions | (.89 | ) | (.86 | ) | (1.10 | ) | (.62 | ) | (1.59 | ) |
| Net asset value, end of period | 21.85 | 20.77 | 20.86 | 20.72 | 18.53 | |||||
| Total Return (%) | 9.55 | 3.72 | 6.02 | 15.48 | 7.50 | |||||
| Ratios/Supplemental Data (%): | ||||||||||
| Ratio of total expenses | ||||||||||
| to average net assets | .63 | .67 | .78 | .92 | 1.02 | |||||
| Ratio of net expenses | ||||||||||
| to average net assets | .63 | .66 | .65 | .65 | .65 | |||||
| Ratio of net investment income | ||||||||||
| to average net assets | 2.29 | 2.58 | 3.50 | 4.62 | 4.52 | |||||
| Portfolio Turnover Rated | 245.46 | 267.08 | 210.75 | 131.97 | 190 | |||||
| Net Assets, end of period ($ x 1,000) | 200,694 | 140,527 | 95,681 | 72,910 | 43,409 | |||||
| a The fund commenced offering three classes of shares on December 2, 2009. Effective September 1, 2009, the existing |
| shares were redesignated as Class I shares. |
| b Based on average shares outstanding at each month end. |
| c Amount represents less than $.01 per share. |
| d The portfolio turnover rates excluding mortgage dollar roll transactions for the periods ended December 31, 2012, |
| 2011, 2010, 2009 and 2008 were 197.97%, 247.48%, 206.04%, 111.36% and 116%, respectively. |
See notes to financial statements.
32
NOTES TO FINANCIAL STATEMENTS
NOTE 1—Significant Accounting Policies:
Dreyfus/Standish Global Fixed Income Fund (the “fund”) is a separate non-diversified series of Dreyfus Investment Funds (the “Trust”), which is registered under the Investment Company Act of 1940, as amended (the “Act”), as an open-end management investment company and operates as a series company offering eleven series, including the fund. The fund’s investment objective seeks to maximize total return while realizing a market level of income, consistent with preserving principal and liquidity.The Dreyfus Corporation (the “Manager” or “Dreyfus”), a wholly-owned subsidiary of The Bank of New York Mellon Corporation (“BNY Mellon”), serves as the fund’s investment adviser.
MBSC Securities Corporation (the “Distributor”), a wholly-owned subsidiary of the Manager, is the distributor of the fund’s shares.The fund is authorized to issue an unlimited number of $.001 par value shares of Beneficial Interest in each of the following classes of shares: Class A, Class C and Class I. Class A and Class C shares are sold primarily to retail investors through financial intermediaries and bear a distribution fee and/or shareholder services fee. Class A shares are subject to a sale charge imposed at the time of purchase. Class C shares are subject to a contingent deferred sales charge (“CDSC”) imposed on Class C shares redeemed within one year of purchase. Class I shares are sold primarily to bank trust departments and other financial service providers (including The Bank of New York Mellon, a subsidiary of BNY Mellon and an affiliate of Dreyfus, and its affiliates), acting on behalf of customers having a qualified trust or an investment account or relationship at such institution, and bear no Distribution or Shareholder Services Plan fees. Class I shares are offered without a front-end sales charge or CDSC. Other differences between the classes
| The Fund | 33 |
NOTES TO FINANCIAL STATEMENTS (continued)
include the services offered to and the expenses borne by each class, the allocation of certain transfer agency costs and certain voting rights. Income, expenses (other than expenses attributable to a specific class), and realized and unrealized gains or losses on investments are allocated to each class of shares based on its relative net assets.
The Trust accounts separately for the assets, liabilities and operations of each series. Expenses directly attributable to each series are charged to that series’ operations; expenses which are applicable to all series are allocated among them on a pro rata basis.
The Financial Accounting Standards Board (“FASB”) Accounting Standards Codification is the exclusive reference of authoritative U.S. generally accepted accounting principles (“GAAP”) recognized by the FASB to be applied by nongovernmental entities. Rules and interpretive releases of the Securities and Exchange Commission (“SEC”) under authority of federal laws are also sources of authoritative GAAP for SEC registrants. The fund’s financial statements are prepared in accordance with GAAP, which may require the use of management estimates and assumptions.Actual results could differ from those estimates.
(a) Portfolio valuation: The fair value of a financial instrument is the amount that would be received to sell an asset or paid to transfer a liability in an orderly transaction between market participants at the measurement date (i.e., the exit price). GAAP establishes a fair value hierarchy that prioritizes the inputs of valuation techniques used to measure fair value.This hierarchy gives the highest priority to unadjusted quoted prices in active markets for identical assets or liabilities (Level 1 measurements) and the lowest priority to unobservable inputs (Level 3 measurements).
Additionally, GAAP provides guidance on determining whether the volume and activity in a market has decreased significantly and whether such a decrease in activity results in transactions that are not orderly. GAAP requires enhanced disclosures around valuation inputs and techniques used during annual and interim periods.
34
Various inputs are used in determining the value of the fund’s investments relating to fair value measurements.These inputs are summarized in the three broad levels listed below:
Level 1—unadjusted quoted prices in active markets for identical investments.
Level 2—other significant observable inputs (including quoted prices for similar investments, interest rates, prepayment speeds, credit risk, etc.).
Level 3—significant unobservable inputs (including the fund’s own assumptions in determining the fair value of investments).
The inputs or methodology used for valuing securities are not necessarily an indication of the risk associated with investing in those securities.
Changes in valuation techniques may result in transfers in or out of an assigned level within the disclosure hierarchy. Valuation techniques used to value the fund’s investments are as follows:
Registered investment companies that are not traded on an exchange are valued at their net asset value and are categorized within Level 1 of the fair value hierarchy.
Investments in securities, excluding short-term investments (other than U.S.Treasury Bills), financial futures, options, swaps and forward foreign currency exchange contracts (“forward contracts”) are valued each business day by an independent pricing service (the “Service”) approved by the Trust’s Board of Trustees (the “Board”). Investments for which quoted bid prices are readily available and are representative of the bid side of the market in the judgment of the Service are valued at the mean between the quoted bid prices (as obtained by the Service from dealers in such securities) and asked prices (as calculated by the Service based upon its evaluation of the market for such securities). Other investments (which constitute a majority of the portfolio securities) are valued as determined by the Service, based on methods which include consideration of the following: yields or prices of secu-
| The Fund | 35 |
NOTES TO FINANCIAL STATEMENTS (continued)
rities of comparable quality, coupon, maturity and type; indications as to values from dealers; and general market conditions.These securities are generally categorized within Level 2 of the fair value hierarchy.
U.S. Treasury Bills are valued at the mean price between quoted bid prices and asked prices by the Service. These securities are generally categorized within Level 2 of the fair value hierarchy.
The Service’s procedures are reviewed by Dreyfus under the general supervision of the Board.
When market quotations or official closing prices are not readily available, or are determined not to reflect accurately fair value, such as when the value of a security has been significantly affected by events after the close of the exchange or market on which the security is principally traded (for example, a foreign exchange or market), but before the fund calculates its net asset value, the fund may value these investments at fair value as determined in accordance with the procedures approved by the Board. Certain factors may be considered when fair valuing investments such as: fundamental analytical data, the nature and duration of restrictions on disposition, an evaluation of the forces that influence the market in which the securities are purchased and sold, and public trading in similar securities of the issuer or comparable issuers. These securities are either categorized within Level 2 or 3 depending on the relevant inputs used.
For restricted securities where observable inputs are limited, assumptions about market activity and risk are used and are categorized within Level 3 of the fair value hierarchy.
Investments denominated in foreign currencies are translated to U.S. dollars at the prevailing rates of exchange.
Financial futures and options, which are traded on an exchange, are valued at the last sales price on the securities exchange on which such securities are primarily traded or at the last sales price on the national securities market on each business day. These securities are generally categorized within Level 1 of the fair value hierarchy. Options traded
36
over-the-counter are valued at the mean between the bid and asked price.These securities are generally categorized within Level 2 of the fair value hierarchy. Investments in swap transactions are valued each business day by the Service. Swaps are valued by the Service by using a swap pricing model which incorporates among other factors, default probabilities, recovery rates, credit curves of the underlying issuer and swap spreads on interest rates. These securities are generally categorized within Level 2 of the fair value hierarchy. Forward contracts are valued at the forward rate. These securities are generally categorized within Level 2 of the fair value hierarchy.
The following is a summary of the inputs used as of December 31, 2012 in valuing the fund’s investments:
| Level 2—Other | Level 3— | |||
| Level 1— | Significant | Significant | ||
| Unadjusted | Observable | Unobservable | ||
| Quoted Prices | Inputs | Inputs | Total | |
| Assets ($) | ||||
| Investments in Securities: | ||||
| Asset-Backed | — | 18,106,673 | — | 18,106,673 |
| Commercial | ||||
| Mortgage-Backed | — | 611,818 | — | 611,818 |
| Corporate Bonds† | — | 92,417,195 | — | 92,417,195 |
| Foreign Government | — | 123,417,566 | — | 123,417,566 |
| Mutual Funds | 11,222,689 | — | — | 11,222,689 |
| Residential | ||||
| Mortgage-Backed | — | 1,096,228 | — | 1,096,228 |
| U.S. Government | ||||
| Agencies/ | ||||
| Mortgage-Backed | — | 16,512,638 | — | 16,512,638 |
| U.S. Treasury | — | 29,467,965 | — | 29,467,965 |
| Other Financial | ||||
| Instruments: | ||||
| Financial Futures†† | 29,610 | — | — | 29,610 |
| Forward Foreign | ||||
| Currency Exchange | ||||
| Contracts†† | — | 1,920,737 | — | 1,920,737 |
| Options Purchased | — | 912,294 | — | 912,294 |
| Swaps†† | — | 453,232 | — | 453,232 |
| The Fund | 37 |
NOTES TO FINANCIAL STATEMENTS (continued)
| Level 2—Other | Level 3— | ||||||
| Level 1— | Significant | Significant | |||||
| Unadjusted | Observable | Unobservable | |||||
| Quoted Prices | Inputs | Inputs | Total | ||||
| Liabilities ($) | |||||||
| Other Financial | |||||||
| Instruments: | |||||||
| Financial Futures†† | (234,678 | ) | — | — | (234,678 | ) | |
| Forward Foreign | |||||||
| Currency Exchange | |||||||
| Contracts†† | — | (1,048,913 | ) | — | (1,048,913 | ) | |
| Swaps†† | — | (84,195 | ) | — | (84,195 | ) |
| † | See Statement of Investments for additional detailed categorizations. |
| †† | Amount shown represents unrealized appreciation (depreciation) at period end. |
At December 31, 2012, there were no transfers between Level 1 and Level 2 of the fair value hierarchy.
(b) Foreign currency transactions: The fund does not isolate that portion of the results of operations resulting from changes in foreign exchange rates on investments from the fluctuations arising from changes in the market prices of securities held. Such fluctuations are included with the net realized and unrealized gain or loss on investments.
Net realized foreign exchange gains or losses arise from sales of foreign currencies, currency gains or losses realized on securities transactions between trade and settlement date, and the difference between the amounts of dividends, interest and foreign withholding taxes recorded on the fund’s books and the U.S. dollar equivalent of the amounts actually received or paid. Net unrealized foreign exchange gains and losses arise from changes in the value of assets and liabilities other than investments resulting from changes in exchange rates. Foreign currency gains and losses on investments are also included with net realized and unrealized gain or loss on investments.
(c) Securities transactions and investment income: Securities transactions are recorded on a trade date basis. Realized gains and losses from securities transactions are recorded on the identified cost basis. Dividend income is recognized on the ex-dividend date and interest income, including, where applicable, accretion of discount and amortization of premium on investments, is recognized on the accrual basis.
38
Pursuant to a securities lending agreement with The Bank of New York Mellon, the fund may lend securities to qualified institutions. It is the fund’s policy that, at origination, all loans are secured by collateral of at least 102% of the value of U.S. securities loaned and 105% of the value of foreign securities loaned. Collateral equivalent to at least 100% of the market value of securities on loan is maintained at all times. Collateral is either in the form of cash, which can be invested in certain money market mutual funds managed by the Manager, U.S. Government and Agency securities or letters of credit. The fund is entitled to receive all income on securities loaned, in addition to income earned as a result of the lending transaction. Although each security loaned is fully collateralized, the fund bears the risk of delay in recovery of, or loss of rights in, the securities loaned should a borrower fail to return the securities in a timely manner. During the period ended December 31, 2012, The Bank of New York Mellon earned $9,983 from lending portfolio securities, pursuant to the securities lending agreement.
(d) Affiliated issuers: Investments in other investment companies advised by Dreyfus are defined as “affiliated” in the Act. Investments in affiliated investment companies for the period ended December 31, 2012 were as follows:
| Affiliated | |||||||
| Investment | Value | Value | Net | ||||
| Company | 12/31/2011 | ($) | Purchases ($) | Sales ($) | 12/31/2012 | ($) | Assets (%) |
| Dreyfus | |||||||
| Institutional | |||||||
| Preferred | |||||||
| Plus Money | |||||||
| Market | |||||||
| Fund | 7,435,735 | 188,921,767 | 193,783,900 | 2,573,602 | .9 | ||
| Dreyfus | |||||||
| Institutional | |||||||
| Cash | |||||||
| Advantage | |||||||
| Fund | 2,038,000 | 41,170,018 | 34,558,931 | 8,649,087 | 2.9 | ||
| Total | 9,473,735 | 230,091,785 | 228,342,831 | 11,222,689 | 3.8 |
| The Fund | 39 |
NOTES TO FINANCIAL STATEMENTS (continued)
(e) Risk: The fund invests primarily in debt securities. Failure of an issuer of the debt securities to make timely interest or principal payments, or a decline or the perception of a decline in the credit quality of a debt security, can cause the debt security’s price to fall, potentially lowering the fund’s share price. In addition, the value of debt securities may decline due to general market conditions that are not specifically related to a particular issuer, such as real or perceived adverse economic conditions, changes in outlook for corporate earnings, changes in interest or currency rates or adverse investor sentiment. They may also decline because of factors that affect a particular industry or country.
Investing in foreign markets may involve special risks and considerations not typically associated with investing in the U.S. These risks include revaluation of currencies, high rates of inflation, repatriation restrictions on income and capital, and adverse political and economic developments. Moreover, securities issued in these markets may be less liquid, subject to government ownership controls and delayed settlements, and their prices may be more volatile than those of comparable securities in the U.S.
(f) Dividends to shareholders: Dividends are recorded on the ex-dividend date. Dividends from investment income-net are normally declared and paid quarterly. Dividends from net realized capital gains, if any, are normally declared and paid annually, but the fund may make distributions on a more frequent basis to comply with the distribution requirements of the Internal Revenue Code of 1986, as amended (the “Code”).To the extent that net realized capital gains can be offset by capital loss carryovers, it is the policy of the fund not to distribute such gains. Income and capital gain distributions are determined in accordance with income tax regulations, which may differ from GAAP.
(g) Federal income taxes: It is the policy of the fund to continue to qualify as a regulated investment company, if such qualification is in the best interests of its shareholders, by complying with the applicable provisions of the Code, and to make distributions of taxable income sufficient to relieve it from substantially all federal income and excise taxes.
40
As of and during the period ended December 31, 2012, the fund did not have any liabilities for any uncertain tax positions.The fund recognizes interest and penalties, if any, related to uncertain tax positions as income tax expense in the Statement of Operations. During the period, the fund did not incur any interest or penalties.
Each of the tax years in the four-year period ended December 31, 2012 remains subject to examination by the Internal Revenue Service and state taxing authorities.
At December 31, 2012, the components of accumulated earnings on a tax basis were as follows: undistributed ordinary income $2,265,596 and unrealized appreciation $8,712,808. In addition, the fund had $123,111 of capital losses realized after October 31, 2012, which were deferred for tax purposes to the first day of the following fiscal year.
The tax character of distributions paid to shareholders during the fiscal periods ended December 31, 2012 and December 31, 2011 were as follows: ordinary income $10,547,494 and $7,387,445 and long-term capital gains $459,167 and $16,033, respectively.
During the period ended December 31, 2012, as a result of permanent book to tax differences, primarily due to the tax treatment for pay-downs gains and losses on mortgage-backed securities, foreign currency transactions, amortization of premiums, swap periodic payments and consent fees, the fund increased accumulated undistributed investment income-net by $700,884 and decreased accumulated net realized gain (loss) on investments by the same amount. Net assets and net asset value per share were not affected by this reclassification.
(h) New Accounting Pronouncements: In April 2011, FASB issued Accounting Standards Update No. 2011-03 “Transfers and Servicing (Topic 860) Reconsideration of Effective Control for Repurchase Agreements” (“ASU 2011-03”) which relates to the accounting for repurchase agreements and similar agreements including mortgage
| The Fund | 41 |
NOTES TO FINANCIAL STATEMENTS (continued)
dollar rolls, that both entitle and obligate a transferor to repurchase or redeem financial assets before their maturity. ASU 2011-03 modifies the criteria for determining effective control of transferred assets and as a result certain agreements may now be accounted for as secured borrowings.ASU 2011-03 was effective for new transfers and existing transactions that were modified in the first interim or annual period beginning on or after December 15, 2011. The new disclosures have been implemented and there was no change in accounting for the fund. Management has determined that the fund has not entered into transactions that can be deemed “secured borrowings” as defined by ASU 2011-03.
In December 2011, FASB issued Accounting Standards Update No. 2011-11 “Disclosures about Offsetting Assets and Liabilities” (“ASU 2011-11”). These disclosure requirements are intended to help investors and other financial statement users to better assess the effect or potential effect of offsetting arrangements on a company’s financial position.They also improve transparency in the reporting of how companies mitigate credit risk, including disclosure of related collateral pledged or received. In addition, ASU 2011-11 facilitates comparison between those entities that prepare their financial statements on the basis of GAAP and those entities that prepare their financial statements on the basis of International Financial Reporting Standards (“IFRS”). ASU 2011-11 requires entities to: disclose both gross and net information about both instruments and transactions eligible for offset in the financial statements; and disclose instruments and transactions subject to an agreement similar to a master netting agreement. ASU 2011-11 is effective for fiscal years beginning on or after January 1, 2013, and interim periods within those annual periods.At this time, management is evaluating the implications of ASU 2011-11 and its impact on the fund’s financial statement disclosures.
42
NOTE 2—Bank Lines of Credit:
The fund participates with other Dreyfus-managed funds in a $210 million unsecured credit facility led by Citibank, N.A. and a $300 million unsecured credit facility provided by The Bank of New York Mellon (each, a “Facility”), each to be utilized primarily for temporary or emergency purposes, including the financing of redemptions. Prior to October 10, 2012, the unsecured credit facility with Citibank, N.A. was $225 million. In connection therewith, the fund has agreed to pay its pro rata portion of commitment fees for each Facility. Interest is charged to the fund based on rates determined pursuant to the terms of the respective Facility at the time of borrowing. During the period ended December 31, 2012, the fund did not borrow under the Facilities.
NOTE 3—Investment Advisory Fee and Other Transactions With Affiliates:
(a) Pursuant to an investment advisory agreement with the Manager, the investment advisory fee is computed at the annual rate of .40% of the value of the fund’s average daily net assets and is payable monthly.
The fund has an Accounting and Administration Agreement (the “Administration Agreement”) with Dreyfus, whereby Dreyfus performs administrative and accounting services for the fund. The fund has agreed to compensate Dreyfus for providing accounting services, administration, compliance monitoring, regulatory and shareholder reporting, as well as related facilities and equipment.The fee is based on the fund’s average daily net assets and computed at the following annual rates: .10% of the first $500 million, .065% of the next $500 million and .02% in excess of $1 billion.
In addition, after applying any expense limitations or fee waivers that reduce the fees paid to Dreyfus for this service, Dreyfus has contractually
| The Fund | 43 |
NOTES TO FINANCIAL STATEMENTS (continued)
agreed in writing to waive any remaining fees for this service to the extent that they exceed both Dreyfus’ costs in providing these services and a reasonable allocation of the costs incurred by Dreyfus and its affiliates related to the support and oversight of these services.The fund also reimburses Dreyfus for the out-of-pocket expenses incurred in performing this service for the fund. Pursuant to Administration Agreement, the fund was charged $181,635 during the period December 31, 2012.
During the period ended December 31, 2012, the Distributor retained $2,567 from commissions earned on sales of the fund’s Class A shares and $825 from CDSCs on redemptions of the fund’s Class C shares.
(b) The fund pays administrative service fees for Class I shares.These fees are paid to affiliated or unaffiliated retirement plans, omnibus accounts and platform administrators and other entities (“Plan Administrators”) that provide record keeping and/or other administrative support services to accounts, retirement plans and their participants.As compensation for such services, Class I shares pay each Plan Administrator an administrative service fee an amount of up to .15% (on an annualized basis) of the average daily net assets attributable to Class I shares that are held in accounts serviced by such Plan Administrators. During the period ended December 31, 2012, Class I shares were charged $11,609 for administrative service fees. The fund’s adviser or its affiliates may pay additional compensation from their own resources to Plan Administrators and other entities for administrative services, as well as for marketing or other distribution-related services.These payments may provide an incentive for these entities to actively promote the fund or cooperate with the Distributor’s promotional efforts.
(c) Under the Distribution Plan adopted pursuant to Rule 12b-1 under the Act, Class C shares pay the Distributor for distributing its shares at an annual rate of .75% of the value of the average daily net assets of Class C shares. During the period ended December 31, 2012, Class C shares were charged $101,147 pursuant to the Distribution Plan.
44
(d) Under the Shareholder Services Plan, Class A and Class C shares pay the Distributor at an annual rate of .25% of the value of their average daily net assets for the provision of certain services.The services provided may include personal services relating to shareholder accounts, such as answering shareholder inquiries regarding the fund and providing reports and other information, and services related to the maintenance of shareholder accounts.The Distributor may make payments to Service Agents (securities dealers, financial institutions or other industry professionals) with respect to these services. The Distributor determines the amounts to be paid to Service Agents. During the period ended December 31, 2012, Class A and Class C shares were charged $157,172 and $33,716, respectively, pursuant to the Shareholder Services Plan.
Under its terms, the Distribution Plan and Shareholder Services Plan shall remain in effect from year to year, provided such continuance is approved annually by a vote of a majority of those Trustees who are not “interested persons” of the Trust and who have no direct or indirect financial interest in the operation of or in any agreement related to the Distribution Plan or Shareholder Services Plan.
The fund has arrangements with the transfer agent and the custodian whereby the fund may receive earnings credits when positive cash balances are maintained, which are used to offset transfer agency and custody fees. For financial reporting purposes, the fund includes net earnings credits as an expense offset in the Statement of Operations.
The fund compensates Dreyfus Transfer, Inc., a wholly-owned subsidiary of the Manager, under a transfer agency agreement for providing transfer agency services for the fund and, since May 29, 2012, cash management services related to fund subscriptions and redemptions. During the period ended December 31, 2012, the fund was charged $12,804 for transfer agency services and $391 for cash management services. Cash management fees were partially offset by earnings credits of $46.These fees are included in Shareholder servicing costs in the Statement of Operations.
| The Fund | 45 |
NOTES TO FINANCIAL STATEMENTS (continued)
The fund compensates The Bank of New York Mellon under a custody agreement for providing custodial services for the fund. During the period ended December 31, 2012, the fund was charged $43,436 pursuant to the custody agreement.
Prior to May 29, 2012, the fund compensated The Bank of NewYork Mellon under a cash management agreement for performing cash management services related to fund subscriptions and redemptions. During the period ended December 31, 2012, the fund was charged $665 pursuant to the cash management agreement, which is included in Shareholder servicing costs in the Statement of Operations. These fees were partially offset by earnings credits of $23.
During the period ended December 31, 2012, the fund was charged $8,783 for services performed by the Chief Compliance Officer and his staff.
The components of “Due to The Dreyfus Corporation and affiliates” in the Statement of Assets and Liabilities consist of: investment advisory fees $99,027, Distribution Plan fee $10,425, Shareholder Services Plan fees $19,394, custodian fees $21,055, Chief Compliance Officer fees $3,981 and transfer agency fees $4,521.
(e) Each Board member also serves as a Board member of other funds within the Dreyfus complex. Annual retainer fees and attendance fees are allocated to each fund based on net assets.
NOTE 4—Securities Transactions:
The aggregate amount of purchases and sales (including paydowns) of investment securities, excluding short-term securities, financial futures, forward contracts, options transactions and swap transactions, during the period ended December 31, 2012, amounted to $637,908,425 and $568,374,761, respectively, of which $109,676,454 in purchases and $109,962,373 in sales were from mortgage dollar roll transactions.
46
Mortgage Dollar Rolls: A mortgage dollar roll transaction involves a sale by the fund of mortgage related securities that it holds with an agreement by the fund to repurchase similar securities at an agreed upon price and date.The securities purchased will bear the same interest rate as those sold, but generally will be collateralized by pools of mortgages with different prepayment histories than those securities sold.The fund accounts for mortgage dollar rolls as purchases and sales transactions.
Derivatives: A derivative is a financial instrument whose performance is derived from the performance of another asset. Each type of derivative instrument that was held by the fund during the period ended December 31, 2012 is discussed below.
The following tables show the fund’s exposure to different types of market risk as it relates to the Statement of Assets and Liabilities and the Statement of Operations, respectively.
Fair value of derivative instruments as of December 31, 2012 is shown below:
| Derivative | Derivative | |||
| Assets ($) | Liabilities ($) | |||
| Interest rate risk1,2,3 | 1,006,191 | Interest rate risk1,4 | (278,001 | ) |
| Foreign exchange risk2,5 | 2,309,682 | Foreign exchange risk6 | (1,048,913 | ) |
| Credit risk | — | Credit risk4 | (40,872 | ) |
| Gross fair value of | ||||
| derivatives contracts | 3,315,873 | (1,367,786 | ) |
Statement of Assets and Liabilities location:
| 1 | Includes cumulative appreciation (depreciation) on financial futures as reported in the Statement of |
| Financial Futures, but only the unpaid variation margin is reported in the Statement of Assets | |
| and Liabilities. | |
| 2 | Options purchased are included in Investments in securities–Unaffiliated issuers, at value. |
| 3 | Unrealized appreciation on swap contracts. |
| 4 | Unrealized depreciation on swap contracts. |
| 5 | Unrealized appreciation on forward foreign currency exchange contracts. |
| 6 | Unrealized depreciation on forward foreign currency exchange contracts. |
| The Fund | 47 |
NOTES TO FINANCIAL STATEMENTS (continued)
The effect of derivative instruments in the Statement of Operations during the period ended December 31, 2012 is shown below:
| Amount of realized gain or (loss) on derivatives recognized in income ($) | ||||||||
| Financial | Options | Forward | Swap | |||||
| Underlying risk | Futures7 | Transactions8 | Contracts9 | Transactions10 | Total | |||
| Interest rate | (1,234,534 | ) | 65,759 | — | 41,534 | (1,127,241 | ) | |
| Foreign | ||||||||
| exchange | — | — | 43,997 | — | 43,997 | |||
| Credit | — | — | — | (12,445 | ) | (12,445 | ) | |
| Total | (1,234,534 | ) | 65,759 | 43,997 | 29,089 | (1,095,689 | ) | |
| Change in unrealized appreciation or (depreciation) on derivatives recognized in income ($) | |||||||||
| Financial | Options | Forward | Swap | ||||||
| Underlying risk | Futures11 | Transactions12 | Contracts13 | Transactions14 | Total | ||||
| Interest rate | (7,137 | ) | (17,501 | ) | — | 327,449 | 302,811 | ||
| Foreign | |||||||||
| exchange | — | (61,820 | ) | 1,401,653 | — | 1,339,833 | |||
| Credit | — | — | — | (40,872 | ) | (40,872 | ) | ||
| Total | (7,137 | ) | (79,321 | ) | 1,401,653 | 286,577 | 1,601,772 | ||
Statement of Operations location:
| 7 | Net realized gain (loss) on financial futures. |
| 8 | Net realized gain (loss) on options transactions. |
| 9 | Net realized gain (loss) on forward foreign currency exchange contracts. |
| 10 Net realized gain (loss) on swap transactions. | |
| 11 Net unrealized appreciation (depreciation) on financial futures. | |
| 12 Net unrealized appreciation (depreciation) on options transactions. | |
| 13 Net unrealized appreciation (depreciation) on forward foreign currency exchange contracts. | |
| 14 Net unrealized appreciation (depreciation) on swap transactions. | |
Financial Futures: In the normal course of pursuing its investment objective, the fund is exposed to market risk, including interest rate risk as a result of changes in value of underlying financial instruments.The fund invests in financial futures in order to manage its exposure to or protect against changes in the market.A financial futures contract represents a commitment for the future purchase or a sale of an asset at a specified date. Upon entering into such contracts, these investments require initial margin deposits with a counterparty, which consist of cash or cash equivalents.The amount of these deposits is determined by the exchange or Board of Trade on which the contract is traded and is subject to change.Accordingly, variation margin payments are received
48
or made to reflect daily unrealized gains or losses which are recorded in the Statement of Operations.When the contracts are closed, the fund recognizes a realized gain or loss which is reflected in the Statement of Operations.There is minimal counterparty credit risk to the fund with financial futures since they are exchange traded, and the exchange’s clearinghouse guarantees the financial futures against default. Financial futures open at December 31, 2012 are set forth in the Statement of Financial Futures.
Options Transactions: The fund purchases and writes (sells) put and call options to hedge against changes in interest rates and foreign currencies or as a substitute for an investment.The fund is subject to market risk, interest rate risk and currency risk in the course of pursuing its investment objectives through its investments in options contracts.A call option gives the purchaser of the option the right (but not the obligation) to buy, and obligates the writer to sell, the underlying security or securities at the exercise price at any time during the option period, or at a specified date. Conversely, a put option gives the purchaser of the option the right (but not the obligation) to sell, and obligates the writer to buy the underlying security or securities at the exercise price at any time during the option period, or at a specified date.
As a writer of call options, the fund receives a premium at the outset and then bears the market risk of unfavorable changes in the price of the financial instrument underlying the option. Generally, the fund realizes a gain, to the extent of the premium, if the price of the underlying financial instrument decreases between the date the option is written and the date on which the option is terminated. Generally, the fund incurs a loss if the price of the financial instrument increases between those dates.
As a writer of put options, the fund receives a premium at the outset and then bears the market risk of unfavorable changes in the price of the financial instrument underlying the option. Generally, the fund realizes a gain, to the extent of the premium, if the price of the under-
| The Fund | 49 |
NOTES TO FINANCIAL STATEMENTS (continued)
lying financial instrument increases between the date the option is written and the date on which the option is terminated. Generally, the fund incurs a loss if the price of the financial instrument decreases between those dates.
As a writer of an option, the fund has no control over whether the underlying securities may be sold (call) or purchased (put) and as a result bears the market risk of an unfavorable change in the price of the security underlying the written option.There is a risk of loss from a change in value of such options which may exceed the related premiums received. The Statement of Operations reflects the following: any unrealized gains or losses which occurred during the period as well as any realized gains or losses which occurred upon the expiration or closing of the option transaction:
The following summarizes the fund’s call/put options written during the period ended December 31, 2012:
| Face Amount | Options Terminated | |||
| Covered by | Premiums | Net Realized | ||
| Options Written: | Contracts ($) | Received ($) | Cost ($) | Gain ($) |
| Contracts outstanding | ||||
| December 31, 2011 | — | — | ||
| Contracts written | 282,000 | 78,749 | ||
| Contracts terminated: | ||||
| Contracts closed | 282,000 | 78,749 | 19,035 | 59,714 |
| Contracts outstanding | ||||
| December 31, 2012 | — | — | ||
Forward Foreign Currency Exchange Contracts: The fund enters into forward contracts in order to hedge its exposure to changes in foreign currency exchange rates on its foreign portfolio holdings, to settle foreign currency transactions or as a part of its investment strategy. When executing forward contracts, the fund is obligated to buy or sell a foreign currency at a specified rate on a certain date in the future. With respect to sales of forward contracts, the fund incurs a loss if the value of the contract increases between the date the forward contract
50
is opened and the date the forward contract is closed.The fund realizes a gain if the value of the contract decreases between those dates.With respect to purchases of forward contracts, the fund incurs a loss if the value of the contract decreases between the date the forward contract is opened and the date the forward contract is closed.The fund realizes a gain if the value of the contract increases between those dates. Any realized or unrealized gains or losses which occurred during the period are reflected in the Statement of Operations. The fund is exposed to foreign currency risk as a result of changes in value of underlying financial instruments.The fund is also exposed to credit risk associated with counterparty nonperformance on these forward contracts, which is typically limited to the unrealized gain on each open contract.The following summarizes open forward contracts at December 31, 2012:
| Foreign | Unrealized | |||||
| Forward Foreign Currency | Currency | Appreciation | ||||
| Exchange Contracts | Amounts | Cost ($) | Value ($) (Depreciation) ($) | |||
| Purchases: | ||||||
| Brazilian Real, | ||||||
| Expiring: | ||||||
| 1/3/2013 a | 5,850,000 | 2,773,169 | 2,855,828 | 82,659 | ||
| 2/4/2013 b | 9,460,000 | 4,487,453 | 4,598,278 | 110,825 | ||
| Euro, | ||||||
| Expiring | ||||||
| 1/2/2013 c | 18,200 | 24,051 | 24,023 | (28 | ) | |
| Mexican New Peso, | ||||||
| Expiring | ||||||
| 1/29/2013 d | 58,140,000 | 4,551,112 | 4,485,236 | (65,876 | ) | |
| Singapore Dollar, | ||||||
| Expiring | ||||||
| 1/29/2013 a | 3,090,000 | 2,534,440 | 2,529,393 | (5,047 | ) | |
| Sales: | Proceeds ($) | |||||
| Australian Dollar, | ||||||
| Expiring | ||||||
| 1/29/2013 a | 3,235,000 | 3,409,124 | 3,351,699 | 57,425 | ||
| Brazilian Real, | ||||||
| Expiring | ||||||
| 1/3/2013 a | 5,850,000 | 2,862,736 | 2,855,828 | 6,908 | ||
| The Fund | 51 |
NOTES TO FINANCIAL STATEMENTS (continued)
| Foreign | Unrealized | |||||
| Forward Foreign Currency | Currency | Appreciation | ||||
| Exchange Contracts | Amounts | Proceeds ($) | Value ($) (Depreciation) ($) | |||
| Sales (continued): | ||||||
| British Pound, | ||||||
| Expiring: | ||||||
| 1/29/2013 a | 2,745,000 | 4,435,468 | 4,458,718 | (23,250 | ) | |
| 1/29/2013 e | 2,950,000 | 4,757,730 | 4,791,700 | (33,970 | ) | |
| 1/29/2013 f | 5,120,000 | 8,275,610 | 8,316,443 | (40,833 | ) | |
| 1/29/2013 g | 4,070,000 | 6,579,969 | 6,610,922 | (30,953 | ) | |
| Canadian Dollar, | ||||||
| Expiring | ||||||
| 1/29/2013 f | 13,715,000 | 13,946,867 | 13,779,380 | 167,487 | ||
| Chilean Peso, | ||||||
| Expiring | ||||||
| 1/29/2013 h | 1,033,830,000 | 2,168,495 | 2,150,279 | 18,216 | ||
| Euro, | ||||||
| Expiring: | ||||||
| 1/29/2013 a | 8,910,000 | 11,668,090 | 11,763,821 | (95,731 | ) | |
| 1/29/2013 b | 8,900,000 | 11,645,668 | 11,750,618 | (104,950 | ) | |
| 1/29/2013 c | 5,990,000 | 7,826,300 | 7,908,562 | (82,262 | ) | |
| 1/29/2013 e | 8,380,000 | 10,949,470 | 11,064,065 | (114,595 | ) | |
| 1/29/2013 f | 8,620,000 | 11,291,941 | 11,380,936 | (88,995 | ) | |
| 1/29/2013 g | 10,090,000 | 13,211,644 | 13,321,768 | (110,124 | ) | |
| 1/29/2013 i | 8,320,000 | 10,865,367 | 10,984,848 | (119,481 | ) | |
| Japanese Yen, | ||||||
| Expiring: | ||||||
| 1/29/2013 e | 615,790,000 | 7,366,285 | 7,109,625 | 256,660 | ||
| 1/29/2013 f | 522,650,000 | 6,284,117 | 6,034,275 | 249,842 | ||
| 1/29/2013 g | 517,560,000 | 6,233,410 | 5,975,508 | 257,902 | ||
| 1/29/2013 h | 356,160,000 | 4,288,929 | 4,112,058 | 176,871 | ||
| 1/29/2013 i | 447,578,000 | 5,386,386 | 5,167,528 | 218,858 | ||
| 1/29/2013 j | 473,365,000 | 5,699,176 | 5,465,253 | 233,923 | ||
| New Zealand Dollar, | ||||||
| Expiring | ||||||
| 1/29/2013 a | 8,000,000 | 6,668,704 | 6,598,379 | 70,325 | ||
| Norwegian Krone, | ||||||
| Expiring | ||||||
| 1/29/2013 b | 4,430,000 | 787,843 | 796,187 | (8,344 | ) | |
| Peruvian Nuevo Sol, | ||||||
| Expiring | ||||||
| 1/29/2013 k | 1,570,000 | 610,954 | 613,919 | (2,965 | ) | |
| South African Rand, | ||||||
| Expiring | ||||||
| 1/29/2013 f | 48,530,000 | 5,590,172 | 5,700,214 | (110,042 | ) | |
| Swedish Krona, | ||||||
| Expiring | ||||||
| 1/29/2013 b | 9,010,000 | 1,373,009 | 1,384,476 | (11,467 | ) | |
52
| Foreign | Unrealized | ||||
| Forward Foreign Currency | Currency | Appreciation | |||
| Exchange Contracts | Amounts | Proceeds ($) | Value ($) (Depreciation) ($) | ||
| Sales (continued): | |||||
| Turkish Lira, | |||||
| Expiring | |||||
| 1/29/2013d | 5,300,000 | 2,971,351 | 2,958,515 | 12,836 | |
| Gross Unrealized | |||||
| Appreciation | 1,920,737 | ||||
| Gross Unrealized | |||||
| Depreciation | (1,048,913 | ) | |||
| Counterparties: | |
| a | Goldman Sachs |
| b | Morgan Stanley |
| c | Royal Bank of Scotland |
| d | JP Morgan Chase & Co. |
| e | Commonwealth Bank of Australia |
| f | Credit Suisse First Boston |
| g | Deutsche Bank |
| h | Barclays Bank |
| i | UBS |
| j | Bank of America |
| k | Citigroup |
Swap Transactions:The fund enters into swap agreements to exchange the interest rate on, or return generated by, one nominal instrument for the return generated by another nominal instrument.The fund enters into these agreements to hedge certain market or interest rate risks, to manage the interest rate sensitivity (sometimes called duration) of fixed income securities, to provide a substitute for purchasing or selling particular securities or to increase potential returns.
The fund accrues for the interim payments on swap contracts on a daily basis, with the net amount recorded within unrealized appreciation (depreciation) on swap contracts in the Statement of Assets and Liabilities. Once the interim payments are settled in cash, the net amount is recorded as a realized gain (loss) on swaps, in addition to realized gain (loss) recorded upon the termination of swap contracts in the Statement of Operations. Upfront payments made and/or received
| The Fund | 53 |
NOTES TO FINANCIAL STATEMENTS (continued)
by the fund, are recorded as an asset and/or liability in the Statement of Assets and Liabilities and are recorded as a realized gain or loss ratably over the contract’s term/event with the exception of forward starting interest rate swaps which are recorded as realized gains or losses on the termination date. Fluctuations in the value of swap contracts are recorded for financial statement purposes as unrealized appreciation or depreciation on swap transactions.
Interest Rate Swaps: Interest rate swaps involve the exchange of commitments to pay and receive interest based on a notional principal amount.The fund may elect to pay a fixed rate and receive a floating rate, or receive a fixed rate and pay a floating rate on a notional principal amount. The net interest received or paid on interest rate swap agreements is included within realized gain (loss) on swap contracts in the Statement of Operations. Interest rate swap agreements are subject to general market risk, liquidity risk, counterparty risk and interest rate risk.
The fund’s maximum risk of loss from counterparty credit risk is the discounted value of the cash flows to be received from the counterparty over the contract’s remaining life, to the extent that the amount is positive. This risk is mitigated by having a master netting arrangement between the fund and the counterparty and by the posting of collateral by the counterparty to the fund to cover the fund’s exposure to the counterparty.The following summarizes open interest rate swaps entered into by the fund at December 31, 2012:
| Unrealized | ||||||
| Notional | Reference | (Pay)/Receive | Appreciation | |||
| Amount ($) | Entity/Currency | Counterparty | Fixed Rate (%) | Expiration (Depreciation) ($) | ||
| 5,900,000 | USD—6 Month | |||||
| Libor | JP Morgan | (1.76) | 11/8/2022 | (2,167 | ) | |
| 16,100,000 | USD—6 Month | |||||
| Libor | Citibank | (0.84) | 11/8/2022 | (41,156 | ) | |
| 6,500,000 | EUR—1 Year | |||||
| Libor | JP Morgan | 1.91) | 11/4/2016 | 453,232 | ||
| Gross Unrealized | ||||||
| Appreciation | 453,232 | |||||
| Gross Unrealized | ||||||
| Depreciation | (43,323 | ) | ||||
54
Credit Default Swaps: Credit default swaps involve commitments to pay a fixed interest rate in exchange for payment if a credit event affecting a third party (the referenced company, obligation or index) occurs. Credit events may include a failure to pay interest or principal, bankruptcy, or restructuring.The fund enters into these agreements to manage its exposure to the market or certain sectors of the market, to reduce its risk exposure to defaults of corporate and sovereign issuers, or to create exposure to corporate or sovereign issuers to which it is not otherwise exposed. For those credit default swaps in which the fund is paying a fixed rate, the fund is buying credit protection on the instrument. In the event of a credit event, the fund would receive the full notional amount for the reference obligation. For those credit default swaps in which the fund is receiving a fixed rate, the fund is selling credit protection on the underlying instrument.The maximum payouts for these contracts are limited to the notional amount of each swap. Credit default swaps may involve greater risks than if the fund had invested in the reference obligation directly and are subject to general market risk, liquidity risk, counterparty risk and credit risk.
The maximum potential amount of future payments (undiscounted) that a fund as a seller of protection could be required to make under a credit default swap agreement would be an amount equal to the notional amount of the agreement which may exceed the amount of unrealized appreciation or depreciation reflected in the Statement of Assets and Liabilities. Notional amounts of all credit default swap agreements are disclosed in the following chart, which summarizes open credit default swaps on index issues entered into by the fund. These potential amounts would be partially offset by any recovery values of the respective referenced obligations, underlying securities comprising the referenced index, upfront payments received upon entering into the agreement, or net amounts received from the settlement of buy protection credit default swap agreements entered into by the fund for the
| The Fund | 55 |
NOTES TO FINANCIAL STATEMENTS (continued)
same referenced entity or entities. The following summarizes open credit default swaps entered into by the fund at December 31, 2012:
| Reference | Notional | (Pay) Receive | Implied Credit | Market | Unrealized | ||||
| Obligation | Amount ($)2 | Fixed Rate (%) | Spread (%)3 | Value ($) (Depreciation) ($) | |||||
| Purchase | |||||||||
| Contracts:1 | |||||||||
| Dow Jones | |||||||||
| CDX.NA.HY.19 | |||||||||
| Index | |||||||||
| 12/20/2017† | 5,600,000 | a | (5.00 | ) | 4.87 | (40,872 | ) | (40,872 | ) |
| † | Expiration Date |
| Conterparty: | |
| a | JP Morgan Chase & Co. |
| 1 | If the fund is a buyer of protection and a credit event occurs, as defined under the terms of the swap |
| agreement, the fund will either (i) receive from the seller of protection an amount equal to the | |
| notional amount of the swap and deliver the reference obligation or (ii) receive a net settlement | |
| amount in the form of cash or securities equal to the notional amount of the swap less the recovery | |
| value of the reference obligation. | |
| 2 | The maximum potential amount the fund could be required to pay as a seller of credit protection |
| or receive as a buyer of credit protection if a credit event occurs as defined under the terms of the | |
| swap agreement. | |
| 3 | Implied credit spreads, represented in absolute terms, utilized in determining the market value as of |
| the period end serve as an indicator of the current status of the payment/performance risk and | |
| represent the likelihood of risk of default for the credit derivative.The credit spread of a particular | |
| referenced entity reflects the cost of buying/selling protection and may include upfront payments | |
| required to be made to enter into the agreement.Wider credit spreads represent a deterioration of | |
| the referenced entity’s credit soundness and a greater likelihood of risk of default or other credit | |
| event occurring as defined under the terms of the agreement.A credit spread identified as | |
| “Defaulted” indicates a credit event has occurred for the referenced entity. | |
GAAP requires disclosure for (i) the nature and terms of the credit derivative, reasons for entering into the credit derivative, the events or circumstances that would require the seller to perform under the credit derivative, and the current status of the payment/performance risk of the credit derivative, (ii) the maximum potential amount of future payments (undiscounted) the seller could be required to make under the credit derivative, (iii) the fair value of the credit derivative, and (iv) the nature of any recourse provisions and assets held either as collateral or by third parties.All required disclosures have been made and are incorporated within the current period as part of the Notes to the Statement of Investments and disclosures within this Note:
56
The following summarizes the average market value of derivatives outstanding during the period ended December 31, 2012:
| Average Market Value ($) | |
| Interest rate financial futures | 57,222,466 |
| Interest rate options contracts | 43,986 |
| Foreign currency options contracts | 32,081 |
| Forward contracts | 143,703,197 |
The following summarizes the average notional value of swap contracts outstanding during the period ended December 31, 2012:
| Average Notional Value ($) | |
| Interest rate swap contracts | 11,776,567 |
| Credit default swap contracts | 430,769 |
At December 31, 2012, the cost of investments for federal income tax purposes was $283,278,842; accordingly, accumulated net unrealized appreciation on investments was $10,486,224, consisting of $12,593,125 gross unrealized appreciation and $2,106,901 gross unrealized depreciation.
Note 5—Plan of Reorganization:
On July 25-26, 2012, the Board, on behalf of both the fund and Dreyfus/Standish International Fixed Income Fund (the “Acquired Fund”), approved a Plan of Reorganization.The merger was approved by the shareholders of the Acquired Fund at a meeting held on November 15, 2012 and the merger occurred on January 25, 2013.The merger provided for the Acquired Fund to transfer all of its assets, subject to its liabilities, to the fund in exchange for a number of Class I shares of the fund of equal value to the assets less liabilities of the Acquired Fund.The fund’s Class I shares were distributed to the Acquired Fund’s shareholders on a pro rata basis in liquidation of the Acquired Fund.
| The Fund | 57 |
REPORT OF INDEPENDENT REGISTERED
PUBLIC ACCOUNTING FIRM
The Board of Trustees and Shareholders of Dreyfus/Standish Global Fixed Income Fund
We have audited the accompanying statement of assets and liabilities of Dreyfus/Standish Global Fixed Income Fund (the “Fund”), a series of Dreyfus Investment Funds, including the statements of investments and financial futures as of December 31, 2012, and the related statement of operations for the year then ended, the statements of changes in net assets for each of the years in the two-year period then ended, and the financial highlights for each of the years in the four-year period then ended.These financial statements and financial highlights are the responsibility of the Fund’s management. Our responsibility is to express an opinion on these financial statements and financial highlights based on our audits. The financial highlights for the year ended December 31, 2008 were audited by other independent registered public accountants whose report thereon, dated February 27, 2009, expressed an unqualified opinion on those financial highlights.
We conducted our audits in accordance with the standards of the Public Company Accounting Oversight Board (United States).Those standards require that we plan and perform the audit to obtain reasonable assurance about whether the financial statements and financial highlights are free of material misstatement. An audit includes examining, on a test basis, evidence supporting the amounts and disclosures in the financial statements. Our procedures included confirmation of securities owned as of December 31, 2012, by correspondence with the custodian and brokers or by other appropriate auditing procedures where replies from brokers were not received.An audit also includes assessing the accounting principles used and significant estimates made by management, as well as evaluating the overall financial statement presentation.We believe that our audits provide a reasonable basis for our opinion.
In our opinion, the financial statements and financial highlights referred to above present fairly, in all material respects, the financial position of Dreyfus/Standish Global Fixed Income Fund as of December 31, 2012, and the results of its operations for the year then ended, the changes in its net assets for each of the years in the two-year period then ended, and the financial highlights for each of the years in the four-year period ended December 31, 2012 in conformity with U.S. generally accepted accounting principles.

New York, New York
February 28, 2013
58
IMPORTANT TAX INFORMATION (Unaudited)
For federal tax purposes, the fund reports the maximum amount allowable but not less than 29.84% as interest-related dividends in accordance with Sections 871(k)(1) and 881(e) of the Internal Revenue Code. Also, the fund reports the maximum amount allowable but not less than $.0351 per share as a capital gain dividend in accordance with Section 852(b)(3)(C) of the Internal Revenue Code. Also, the fund reports the maximum amount allowable but not less than $.4261 as a short-term capital gain dividend paid on December 28, 2012 in accordance with Sections 871(k)(2) and 881(e) of the Internal Revenue Code.
| The Fund | 59 |
BOARD MEMBERS INFORMATION (Unaudited)
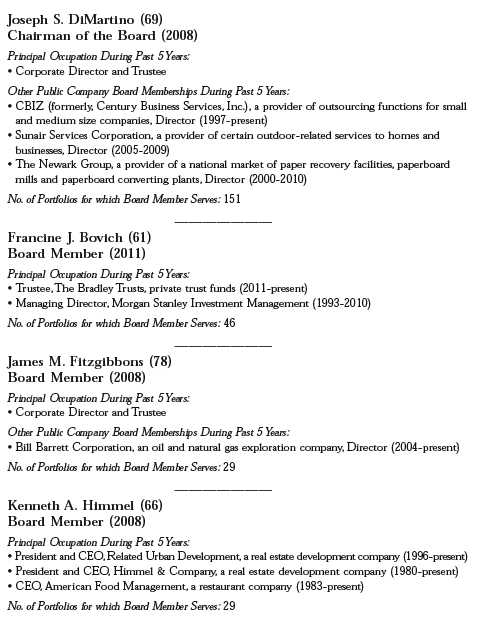
60
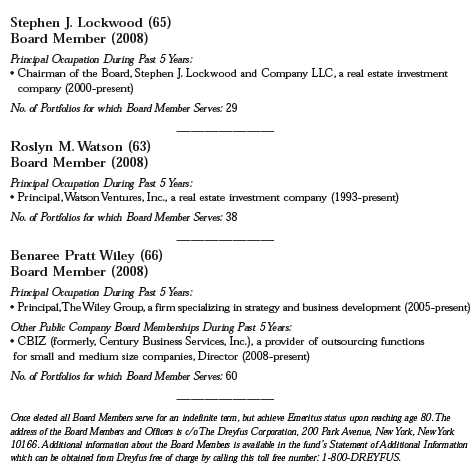
| The Fund | 61 |
OFFICERS OF THE FUND (Unaudited)
BRADLEY J. SKAPYAK, President since January 2010.
Chief Operating Officer and a director of the Manager since June 2009; from April 2003 to June 2009, Mr. Skapyak was the head of the Investment Accounting and Support Department of the Manager. He is an officer of 69 investment companies (comprised of 150 portfolios) managed by the Manager. He is 54 years old and has been an employee of the Manager since February 1988.
JANETTE E. FARRAGHER, Vice President and Secretary since December 2011.
Assistant General Counsel of BNY Mellon, and an officer of 70 investment companies (comprised of 177 portfolios) managed by the Manager. She is 50 years old and has been an employee of the Manager since February 1984.
KIESHA ASTWOOD, Vice President and Assistant Secretary since January 2010.
Counsel of BNY Mellon, and an officer of 70 investment companies (comprised of 177 portfolios) managed by the Manager. She is 39 years old and has been an employee of the Manager since July 1995.
JAMES BITETTO, Vice President and Assistant Secretary since December 2008.
Senior Counsel of BNY Mellon and Secretary of the Manager, and an officer of 70 investment companies (comprised of 177 portfolios) managed by the Manager. He is 46 years old and has been an employee of the Manager since December 1996.
JONI LACKS CHARATAN, Vice President and Assistant Secretary since December 2008.
Senior Counsel of BNY Mellon, and an officer of 70 investment companies (comprised of 177 portfolios) managed by the Manager. She is 57 years old and has been an employee of the Manager since October 1988.
JOSEPH M. CHIOFFI, Vice President and Assistant Secretary since December 2008.
Senior Counsel of BNY Mellon, and an officer of 70 investment companies (comprised of 177 portfolios) managed by the Manager. He is 51 years old and has been an employee of the Manager since June 2000.
JOHN B. HAMMALIAN, Vice President and Assistant Secretary since December 2008.
Senior Managing Counsel of BNY Mellon, and an officer of 70 investment companies (comprised of 177 portfolios) managed by the Manager. He is 49 years old and has been an employee of the Manager since February 1991.
ROBERT R. MULLERY, Vice President and Assistant Secretary since December 2008.
Managing Counsel of BNY Mellon, and an officer of 70 investment companies (comprised of 177 portfolios) managed by the Manager. He is 60 years old and has been an employee of the Manager since May 1986.
JEFF PRUSNOFSKY, Vice President and Assistant Secretary since December 2008.
Senior Managing Counsel of BNY Mellon, and an officer of 70 investment companies (comprised of 177 portfolios) managed by the Manager. He is 47 years old and has been an employee of the Manager since October 1990.
JAMES WINDELS, Treasurer since December 2008.
Director – Mutual Fund Accounting of the Manager, and an officer of 70 investment companies (comprised of 177 portfolios) managed by the Manager. He is 54 years old and has been an employee of the Manager since April 1985.
62
RICHARD CASSARO, Assistant Treasurer since December 2008.
Senior Accounting Manager – Money Market and Municipal Bond Funds of the Manager, and an officer of 70 investment companies (comprised of 177 portfolios) managed by the Manager. He is 53 years old and has been an employee of the Manager since September 1982.
GAVIN C. REILLY, Assistant Treasurer since December 2008.
Tax Manager of the Investment Accounting and Support Department of the Manager, and an officer of 70 investment companies (comprised of 177 portfolios) managed by the Manager. He is 44 years old and has been an employee of the Manager since April 1991.
ROBERT S. ROBOL, Assistant Treasurer since December 2008.
Senior Accounting Manager – Fixed Income Funds of the Manager, and an officer of 70 investment companies (comprised of 177 portfolios) managed by the Manager. He is 48 years old and has been an employee of the Manager since October 1988.
ROBERT SALVIOLO, Assistant Treasurer since December 2008.
Senior Accounting Manager – Equity Funds of the Manager, and an officer of 70 investment companies (comprised of 177 portfolios) managed by the Manager. He is 45 years old and has been an employee of the Manager since June 1989.
ROBERT SVAGNA, Assistant Treasurer since December 2008.
Senior Accounting Manager – Equity Funds of the Manager, and an officer of 70 investment companies (comprised of 177 portfolios) managed by the Manager. He is 45 years old and has been an employee of the Manager since November 1990.
JOSEPH W. CONNOLLY, Chief Compliance Officer since December 2008.
Chief Compliance Officer of the Manager and The Dreyfus Family of Funds (70 investment companies, comprised of 177 portfolios). He is 55 years old and has served in various capacities with the Manager since 1980, including manager of the firm’s Fund Accounting Department from 1997 through October 2001.
MATTHEW D. CONNOLLY, Anti-Money Laundering Compliance Officer since April 2012.
Anti-Money Laundering Compliance Officer of the Distributor since October 2011; from March 2010 to September 2011, Global Head, KYC Reviews and Director, UBS Investment Bank; until March 2010,AML Compliance Officer and Senior Vice President, Citi Global Wealth Management. He is an officer of 66 investment companies (comprised of 173 portfolios) managed by the Manager. He is 40 years old and has been an employee of the Distributor since October 2011.
| The Fund | 63 |
NOTES
For More Information
| Telephone Call your Financial Representative or 1-800-DREYFUS |
| Mail The Dreyfus Family of Funds, 144 Glenn Curtiss Boulevard, Uniondale, NY 11556-0144 |
| E-mail Send your request to info@dreyfus.com |
| Internet Information can be viewed online or downloaded at: http://www.dreyfus.com |
Dreyfus/Standish
International Fixed
Income Fund
ANNUAL REPORT December 31, 2012
The views expressed in this report reflect those of the portfolio manager only through the end of the period covered and do not necessarily represent the views of Dreyfus or any other person in the Dreyfus organization. Any such views are subject to change at any time based upon market or other conditions and Dreyfus disclaims any responsibility to update such views.These views may not be relied on as investment advice and, because investment decisions for a Dreyfus fund are based on numerous factors, may not be relied on as an indication of trading intent on behalf of any Dreyfus fund.
| Not FDIC-Insured • Not Bank-Guaranteed • May Lose Value |
Contents | |
THE FUND | |
| 2 | A Letter from the President |
| 3 | Discussion of Fund Performance |
| 6 | Fund Performance |
| 7 | Understanding Your Fund’s Expenses |
| 7 | Comparing Your Fund’s Expenses With Those of Other Funds |
| 8 | Statement of Investments |
| 22 | Statement of Financial Futures |
| 23 | Statement of Assets and Liabilities |
| 24 | Statement of Operations |
| 25 | Statement of Changes in Net Assets |
| 26 | Financial Highlights |
| 27 | Notes to Financial Statements |
| 49 | Report of Independent Registered Public Accounting Firm |
| 50 | Important Tax Information |
| 51 | Board Members Information |
| 53 | Officers of the Fund |
FOR MORE INFORMATION | |
Back Cover |
Dreyfus/Standish
International Fixed
Income Fund
The Fund
A LETTER FROM THE PRESIDENT
Dear Shareholder:
We are pleased to present this annual report for Dreyfus/Standish International Fixed Income Fund, covering the 12-month period from January 1, 2012, through December 31, 2012. For information about how the fund performed during the reporting period, as well as general market perspectives, we provide a Discussion of Fund Performance on the pages that follow.
The search for higher yields amid historically low interest rates proved to be a major force in the performance of U.S. and global bond markets in 2012, even as the Federal Reserve Board and other central banks pumped liquidity into their financial systems More specifically, low rates on U.S.Treasury securities drove investors to riskier market sectors, helping to support prices among corporate-backed securities, asset-backed securities, commercial mortgage-backed securities, and emerging-markets bonds. In addition, higher yielding bond market sectors were buoyed by gradually recovering U.S. and global economies as domestic employment trends improved, Europe avoided a collapse of its common currency, and China engineered an economic soft landing.
We currently expect the U.S. and global economies to be modestly stronger in 2013, especially during the second half of the year.The U.S. economy seems likely to benefit from greater certainty regarding U.S. tax and fiscal policies, the resumption of postponed spending by businesses, and a continued housing recovery.We encourage you to discuss the implications of our economic analysis with your financial advisor, who can help you align your investments with the year’s challenges and opportunities.
Thank you for your continued confidence and support.
Sincerely,

J. Charles Cardona
President
The Dreyfus Corporation
January 15, 2013
2
DISCUSSION OF FUND PERFORMANCE
For the period of January 1, 2012, through December 31, 2012, as provided by David Leduc, CFA, and Brendan Murphy, CFA, Portfolio Managers
Fund and Market Performance Overview
For the 12-month period ended December 31, 2012, Dreyfus/Standish International Fixed Income Fund’s Class I shares achieved a total return of 10.41%.1 In comparison, the Barclays Global Aggregate ex-U.S. Index (Hedged) (the “Index”), the fund’s benchmark, achieved a total return of 6.46% for the same period.2
Aggressively accommodative monetary policies generally supported international bond prices during 2012.The fund outperformed its benchmark, mainly due to strong security selections among U.S. investment-grade corporate bonds and European sovereign bonds.
At a Special Meeting of shareholders of the fund held on November 15, 2012, shareholders of the fund approved a Plan of Reorganization providing for the transfer of the fund’s assets to Dreyfus/Standish Global Fixed Income Fund (the “Acquiring Fund”) effective on or about January 25, 2013. Class I shares of the Acquiring Fund will be distributed to fund shareholders and the fund will be terminated.
The Fund’s Investment Approach
The fund seeks to maximize total return while realizing a market level of income, consistent with preserving principal and liquidity, by normally investing at least 80% of its net assets in fixed income securities.The fund also normally invests at least 65% of its assets in non-U.S. dollar-denominated fixed-income securities of foreign governments and companies located in various countries, including emerging markets. The fund always invests in at least five countries other than the United States. The fund’s investment may include bonds, notes, mortgage-related securities, asset-backed securities, convertible securities, eurodollar andYankee dollar instruments, preferred stock and money market instruments. To protect the U.S. dollar value of the fund’s assets, we hedge most, but not necessarily all, of the portfolio’s foreign currency exposure.
The portfolio managers focus on identifying undervalued government bond markets, currencies, sectors and securities. The portfolio managers look for fixed income securities with the most potential for added value, such as those involving the potential for credit upgrades, unique structural characteristics or innovative features. The
| The Fund | 3 |
DISCUSSION OF FUND PERFORMANCE (continued)
portfolio managers select securities for the fund’s portfolio by using fundamental economic research and quantitative analysis and focusing on sectors and individual securities that appear to be relatively undervalued and actively trading among sectors.
Economic Developments Supported Higher Yielding Bonds
The year 2012 began in the midst of market rallies driven by positive macroeconomic developments in the United States, Europe, and China. Most notably, employment gains helped bolster the U.S. economy, and a quantitative easing program appeared to forestall a more severe banking crisis in Europe.These developments supported a sustained rally among higher yielding securities as investors turned toward riskier market sectors expected to benefit from better economic conditions.
The global recovery seemed to falter in the spring, when U.S. employment gains moderated, proposed austerity programs in Europe encountered resistance, and China’s economy remained sluggish. These headwinds erased many of the gains previously posted by higher yielding bonds, and yields of sovereign debt securities from fiscally healthy nations plunged in a renewed flight to quality. Fortunately, more encouraging economic data over the summer and fall—and the announcement of new policy initiatives by several central banks—cheered investors, enabling global bond markets to end the year with attractive returns, on average.
Security Selections Boosted Fund Results
In this environment, our security selection process scored successes among European sovereign bonds, including debt securities from Italy, Slovakia, and Ireland.The fund generally avoided weakness in Spain early in 2012, and we gradually adopted a more constructive posture in European credit markets. In the United States, the fund benefited from overweighted exposure to investment-grade corporate bonds, particularly in the industrials and financials sectors.
The fund’s asset allocation strategy proved effective, as we favored investment-grade and high yield corporate securities. Underweighted positions in traditionally defensive securities, such as U.S. Treasuries and German bunds, also supported relative performance. Successful currency strategies included overweighted exposure to the Mexican peso and Brazilian real, and underweighted exposure to the Japanese yen and New Zealand dollar.The fund’s country allocation strategy also added value through relatively light positions in Japan and overweighted exposure to emerging-markets bonds denominated in local currencies.
4
On the other hand, our interest rate strategies detracted mildly from the fund’s relative results, mainly due to a modestly short duration posture at times during the year.
We employed currency forwards and options to help implement the fund’s currency allocation strategy, interest rate futures and swaps to establish its interest rate strategies, and interest rate options and futures to manage the risks of interest rate volatility.
Finding Relative Values in International Markets
We have been encouraged by positive economic news in many markets, and we expect accommodative monetary policies to boost global growth further in 2013. Moreover, low interest rates in many parts of the world appear likely to support demand for international bonds, but yield differences have narrowed across the market’s credit-quality spectrum.Therefore, the fund ended 2012 with a mild focus on markets where we believe valuations are relatively attractive, including some of the peripheral nations of Europe. We also have placed greater emphasis on countries where interest rates appear likely to fall, and we have maintained a relatively short duration to guard against the risks of rising rates in some markets.
January 15, 2013
Foreign bonds are subject to special risks including exposure to currency fluctuations, changing political and economic conditions, and potentially less liquidity.The fixed income securities of issuers located in emerging markets can be more volatile and less liquid than those of issuers in more mature economies.
Investments in foreign currencies are subject to the risk that those currencies will decline in value relative to the U.S. dollar, or, in the case of hedged positions, that the U.S. dollar will decline relative to the currency being hedged. Currency rates in foreign countries may fluctuate significantly over short periods of time.A decline in the value of foreign currencies relative to the U.S. dollar will reduce the value of securities held by the fund and denominated in those currencies. Bond funds are subject generally to interest rate, credit, liquidity and market risks, to varying degrees, all of which are more fully described in the fund’s prospectus. Generally, all other factors being equal, bond prices are inversely related to interest-rate changes, and rate increases can cause price declines.
High yield bonds are subject to increased credit risk and are considered speculative in terms of the issuer’s perceived ability to continue making interest payments on a timely basis and to repay principal upon maturity.
The fund may use derivative instruments, such as options, futures and options on futures, forward contracts, swaps (including credit default swaps on corporate bonds and asset-backed securities), options on swaps and other credit derivatives.A small investment in derivatives could have a potentially large impact on the fund’s performance.The use of derivatives involves risks different from, or possibly greater than, the risks associated with investing directly in the underlying assets.
| 1 Total return includes reinvestment of dividends and any capital gains paid. Past performance is no guarantee of future |
| results. Share price and investment return fluctuate such that upon redemption, fund shares may be worth more or less |
| than their original cost. |
| 2 SOURCE: FACTSET — Reflects reinvestment of dividends and, where applicable, capital gain distributions. The |
| Barclays Global Aggregate ex-U.S. Index (Hedged) is designed to measure the performance of global investment- |
| grade, fixed-rate debt markets, excluding the United States, hedged into U. S. dollars. Investors cannot invest directly |
| in any index. |
| The Fund | 5 |
FUND PERFORMANCE
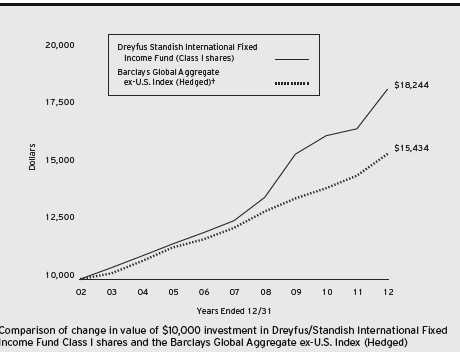
| Average Annual Total Returns as of 12/31/12 | ||||||
| 1 Year | 5 Years | 10 Years | ||||
| Class I shares | 10.41 | % | 7.80 | % | 6.20 | % |
| Barclays Global Aggregate | ||||||
| ex-U.S. Index (Hedged) | 6.46 | % | 4.77 | % | 4.44 | % |
† Source: FactSet
Past performance is not predictive of future performance.The fund’s performance shown in the graph and table does not reflect the deduction of taxes that a shareholder would pay on fund distributions or the redemption of fund shares. The above graph compares a $10,000 investment made in Class I shares of Dreyfus/Standish International Fixed Income Fund on 12/31/02 to a $10,000 investment made in the Barclays Global Aggregate ex-U.S. Index (Hedged) (the “Index”) on that date.All dividends and capital gain distributions are reinvested.
The fund’s performance shown in the line graph takes into account all applicable fees and expenses.The Index is designed to measure the performance of global investment-grade, fixed-rate debt markets, excluding the United States, hedged into U.S. dollars. Unlike a mutual fund, the Index is not subject to charges, fees and other expenses. Investors cannot invest directly in any index.These factors can contribute to the Index potentially outperforming the fund. Further information relating to fund performance, including expense reimbursements, if applicable, is contained in the Financial Highlights section of the prospectus and elsewhere in this report.
6
UNDERSTANDING YOUR FUND’S EXPENSES (Unaudited)
As a mutual fund investor, you pay ongoing expenses, such as management fees and other expenses. Using the information below, you can estimate how these expenses affect your investment and compare them with the expenses of other funds.You also may pay one-time transaction expenses, including sales charges (loads) and redemption fees, which are not shown in this section and would have resulted in higher total expenses. For more information, see your fund’s prospectus or talk to your financial adviser.
Review your fund’s expenses
The table below shows the expenses you would have paid on a $1,000 investment in Dreyfus/Standish International Fixed Income Fund from July 1, 2012 to December 31, 2012. It also shows how much a $1,000 investment would be worth at the close of the period, assuming actual returns and expenses.
Expenses and Value of a $1,000 Investment
assuming actual returns for the six months ended December 31, 2012
| Expenses paid per $1,000† | $ | 4.87 |
| Ending value (after expenses) | $ | 1,060.70 |
COMPARING YOUR FUND’S EXPENSES
WITH THOSE OF OTHER FUNDS (Unaudited)
Using the SEC’s method to compare expenses
The Securities and Exchange Commission (SEC) has established guidelines to help investors assess fund expenses. Per these guidelines, the table below shows your fund’s expenses based on a $1,000 investment, assuming a hypothetical 5% annualized return. You can use this information to compare the ongoing expenses (but not transaction expenses or total cost) of investing in the fund with those of other funds.All mutual fund shareholder reports will provide this information to help you make this comparison. Please note that you cannot use this information to estimate your actual ending account balance and expenses paid during the period.
Expenses and Value of a $1,000 Investment
assuming a hypothetical 5% annualized return for the six months ended December 31, 2012
| Expenses paid per $1,000† | $ | 4.77 |
| Ending value (after expenses) | $ | 1,020.41 |
† Expenses are equal to the fund’s annualized expense ratio of .94% for Class I, multiplied by the average account
value over the period, multiplied by 184/366 (to reflect the one-half year period).
| The Fund | 7 |
STATEMENT OF INVESTMENTS
December 31, 2012
| Coupon | Maturity | Principal | ||||
| Bonds and Notes—97.7% | Rate (%) | Date | Amount ($)a | Value ($) | ||
| Australia—2.8% | ||||||
| FMG Resources (August 2006), | ||||||
| Gtd. Notes | 6.38 | 2/1/16 | 215,000 | b | 223,600 | |
| Queensland Treasury, | ||||||
| Gov’t Gtd. Bonds, Ser. 13G | AUD | 6.00 | 8/14/13 | 860,000 | 910,842 | |
| Queensland Treasury, | ||||||
| Gov’t Gtd. Notes, Ser. 15 | AUD | 6.00 | 10/14/15 | 575,000 | 644,379 | |
| Queensland Treasury, | ||||||
| Gov’t Gtd. Notes, Ser. 21 | AUD | 6.00 | 6/14/21 | 780,000 | 936,428 | |
| SMART Trust, | ||||||
| Ser. 2011-1USA, Cl. A3B | 1.06 | 10/14/14 | 260,233 | b,c | 260,834 | |
| 2,976,083 | ||||||
| Austria—1.1% | ||||||
| Austrian Government, | ||||||
| Sr. Unscd. Bonds | EUR | 3.90 | 7/15/20 | 750,000 | b | 1,172,121 |
| Belgium—1.7% | ||||||
| Anheuser-Busch InBev, | ||||||
| Gtd. Notes | GBP | 9.75 | 7/30/24 | 130,000 | 339,908 | |
| Belgium Government, | ||||||
| Sr. Unscd. Notes, Ser. 65 | EUR | 4.25 | 9/28/22 | 920,000 | 1,451,149 | |
| 1,791,057 | ||||||
| Brazil—1.5% | ||||||
| Brazil Notas do | ||||||
| Tesouro Nacional, | ||||||
| Bonds, Ser. B | BRL | 6.00 | 8/15/14 | 750,000 | d | 891,599 |
| Petrobras | ||||||
| International Finance, | ||||||
| Gtd. Notes | EUR | 5.88 | 3/7/22 | 190,000 | 297,610 | |
| QGOG Constellation, | ||||||
| Gtd. Notes | 6.25 | 11/9/19 | 330,000 | b | 344,850 | |
| 1,534,059 | ||||||
| Canada—6.9% | ||||||
| Bombardier, | ||||||
| Sr. Unscd. Notes | EUR | 6.13 | 5/15/21 | 185,000 | b | 263,117 |
| Canadian Capital Auto | ||||||
| Receivables Asset Trust, | ||||||
| Ser. 2012-1A, Cl. A2 | CAD | 2.03 | 8/17/15 | 200,000 | b | 201,781 |
| Canadian Capital Auto | ||||||
| Receivables Asset Trust, | ||||||
| Ser. 2012-1A, Cl. A3 | CAD | 2.38 | 4/17/17 | 725,000 | b | 738,207 |
8
| Coupon | Maturity | Principal | ||||
| Bonds and Notes (continued) | Rate (%) | Date | Amount ($)a | Value ($) | ||
| Canada (continued) | ||||||
| Canadian Capital Auto | ||||||
| Receivables Asset Trust, | ||||||
| Ser. 2011-1A, Cl. A2 | CAD | 2.63 | 8/17/14 | 627,726 | b | 633,796 |
| CIT Canada Equipment | ||||||
| Receivables Trust, | ||||||
| Ser. 2012-1A, Cl. A2 | CAD | 2.11 | 12/20/16 | 555,000 | b | 558,511 |
| CNH Capital Canada | ||||||
| Receivables Trust, | ||||||
| Ser. 2011-1A, Cl. A2 | CAD | 2.34 | 7/17/17 | 755,000 | b | 765,649 |
| Ford Auto Securitization Trust, | ||||||
| Ser. 2011-R3A, Cl. A2 | CAD | 1.96 | 7/15/15 | 403,634 | b | 407,116 |
| Ford Auto Securitization Trust, | ||||||
| Ser. 2012-R1, Cl. A2 | CAD | 2.02 | 3/15/16 | 550,000 | 555,148 | |
| Ford Auto Securitization Trust, | ||||||
| Ser. 2011-R1A, Cl. A2 | CAD | 2.43 | 11/15/14 | 297,426 | b | 300,228 |
| Ford Auto Securitization Trust, | ||||||
| Ser. 2010-R3A, Cl. A3 | CAD | 2.71 | 9/15/15 | 150,000 | b | 152,677 |
| MEG Energy, | ||||||
| Gtd. Notes | 6.38 | 1/30/23 | 260,000 | b | 272,350 | |
| Province of British Columbia, | ||||||
| Sr. Unscd. Bonds | CAD | 2.70 | 12/18/22 | 450,000 | 454,207 | |
| Province of Ontario Canada, | ||||||
| Bonds | CAD | 4.40 | 3/8/16 | 1,200,000 | 1,312,026 | |
| Rogers Communications, | ||||||
| Gtd. Notes | CAD | 6.56 | 3/22/41 | 340,000 | 430,156 | |
| Videotron, | ||||||
| Gtd. Notes | 5.00 | 7/15/22 | 270,000 | 284,513 | ||
| 7,329,482 | ||||||
| Chile—2.3% | ||||||
| Banco Santander Chile, | ||||||
| Sr. Unscd. Notes | 3.88 | 9/20/22 | 195,000 | b | 200,390 | |
| Cencosud, | ||||||
| Gtd. Notes | 4.88 | 1/20/23 | 200,000 | b | 205,588 | |
| Chilean Government, | ||||||
| Sr. Unscd. Notes | CLP | 5.50 | 8/5/20 | 541,000,000 | 1,265,629 | |
| CODELCO, | ||||||
| Sr. Unscd. Notes | 3.88 | 11/3/21 | 240,000 | b | 262,711 | |
| Empresa Nacional de Petroleo, | ||||||
| Sr. Unscd. Notes | 4.75 | 12/6/21 | 245,000 | b | 263,773 | |
| The Fund | 9 |
STATEMENT OF INVESTMENTS (continued)
| Coupon | Maturity | Principal | ||||
| Bonds and Notes (continued) | Rate (%) | Date | Amount ($)a | Value ($) | ||
| Chile (continued) | ||||||
| Telefonica Chile, | ||||||
| Sr. Unscd. Notes | 3.88 | 10/12/22 | 250,000 | b | 250,815 | |
| 2,448,906 | ||||||
| China—.2% | ||||||
| Baidu, | ||||||
| Sr. Unscd. Notes | 3.50 | 11/28/22 | 210,000 | 211,639 | ||
| Colombia—.2% | ||||||
| Bancolombia, | ||||||
| Sub. Notes | 5.13 | 9/11/22 | 210,000 | 219,450 | ||
| Denmark—.8% | ||||||
| Denmark Government, | ||||||
| Bonds | DKK | 0.10 | 11/15/23 | 4,355,000 | e | 835,793 |
| France—5.0% | ||||||
| AXA, | ||||||
| Jr. Sub. Notes | EUR | 5.78 | 7/29/49 | 450,000 | c | 586,365 |
| AXA, | ||||||
| Jr. Sub. Notes | EUR | 6.21 | 10/29/49 | 95,000 | c | 123,014 |
| BNP Paribas, | ||||||
| Sr. Unscd. Notes | 2.38 | 9/14/17 | 915,000 | 929,156 | ||
| French Government, | ||||||
| Bonds | EUR | 4.50 | 4/25/41 | 1,255,000 | 2,139,797 | |
| GDF Suez, | ||||||
| Sr. Unscd. Notes | 1.63 | 10/10/17 | 245,000 | b | 245,222 | |
| Pernod-Ricard, | ||||||
| Sr. Unscd. Bonds | EUR | 5.00 | 3/15/17 | 100,000 | 151,252 | |
| Societe Generale, | ||||||
| Gtd. Notes | 2.75 | 10/12/17 | 1,130,000 | 1,150,743 | ||
| 5,325,549 | ||||||
| Germany—1.7% | ||||||
| Allianz, | ||||||
| Sub. Notes | EUR | 5.63 | 10/17/42 | 400,000 | c | 598,240 |
| Conti-Gummi Finance, | ||||||
| Sr. Scd. Bonds | EUR | 7.13 | 10/15/18 | 250,000 | b | 353,460 |
| Daimler, | ||||||
| Sr. Unscd. Notes | EUR | 4.63 | 9/2/14 | 150,000 | 210,886 | |
| German Government, | ||||||
| Bonds | EUR | 3.25 | 7/4/42 | 135,000 | 222,303 | |
| Techem, | ||||||
| Sr. Scd. Notes | EUR | 6.13 | 10/1/19 | 100,000 | b | 142,225 |
10
| Coupon | Maturity | Principal | ||||
| Bonds and Notes (continued) | Rate (%) | Date | Amount ($)a | Value ($) | ||
| Germany (continued) | ||||||
| Unitymedia Hessen, | ||||||
| Sr. Scd. Notes | EUR | 7.50 | 3/15/19 | 175,000 | b | 253,514 |
| 1,780,628 | ||||||
| Iceland—.5% | ||||||
| Iceland Government, | ||||||
| Unscd. Notes | 4.88 | 6/16/16 | 525,000 | 552,472 | ||
| Ireland—2.1% | ||||||
| Ardagh Packaging Finance, | ||||||
| Sr. Scd. Notes | EUR | 7.38 | 10/15/17 | 105,000 | 151,554 | |
| Bank of Ireland, | ||||||
| Gov’t Gtd. Notes | EUR | 4.00 | 1/28/15 | 910,000 | 1,231,191 | |
| Irish Government, | ||||||
| Unscd. Bonds | EUR | 5.50 | 10/18/17 | 275,000 | 399,195 | |
| Smurfit Kappa Acquisitions, | ||||||
| Sr. Scd. Notes | EUR | 5.13 | 9/15/18 | 100,000 | b | 139,718 |
| Smurfit Kappa Acquistions, | ||||||
| Sr. Scd. Notes | EUR | 7.75 | 11/15/19 | 175,000 | b | 256,633 |
| 2,178,291 | ||||||
| Italy—8.9% | ||||||
| Enel Finance International, | ||||||
| Gtd. Notes | 5.13 | 10/7/19 | 155,000 | b | 164,048 | |
| Intesa Sanpaolo, | ||||||
| Sr. Unscd. Notes | EUR | 4.13 | 9/19/16 | 100,000 | 138,056 | |
| Intesa Sanpaolo, | ||||||
| Sr. Unscd. Notes | EUR | 5.00 | 2/28/17 | 500,000 | 714,205 | |
| Italian Government, | ||||||
| Bonds | EUR | 5.00 | 9/1/40 | 195,000 | 257,901 | |
| Italian Government, | ||||||
| Unscd. Bonds | EUR | 4.75 | 6/1/17 | 4,525,000 | 6,364,601 | |
| Italian Government, | ||||||
| Unscd. Bonds | EUR | 5.50 | 9/1/22 | 620,000 | 888,369 | |
| Telecom Italia, | ||||||
| Sr. Unscd. Notes | GBP | 7.38 | 12/15/17 | 350,000 | 644,829 | |
| Telecom Italia Capital, | ||||||
| Gtd. Notes | 7.18 | 6/18/19 | 190,000 | 221,445 | ||
| 9,393,454 | ||||||
| Japan—5.4% | ||||||
| Development Bank of Japan, | ||||||
| Gov’t Gtd. Notes | JPY | 1.05 | 6/20/23 | 11,000,000 | 129,214 | |
| The Fund | 11 |
STATEMENT OF INVESTMENTS (continued)
| Coupon | Maturity | Principal | ||||
| Bonds and Notes (continued) | Rate (%) | Date | Amount ($)a | Value ($) | ||
| Japan (continued) | ||||||
| Development Bank of Japan, | ||||||
| Gov’t. Gtd. Bonds | JPY | 1.70 | 9/20/22 | 263,000,000 | 3,298,290 | |
| Japanese Government, | ||||||
| Sr. Unscd. Bonds, Ser. 8 | JPY | 1.00 | 6/10/16 | 93,000,000 | f | 1,142,150 |
| Japanese Government, | ||||||
| Sr. Unscd. Bonds, Ser. 11 | JPY | 1.70 | 6/20/33 | 79,750,000 | 909,695 | |
| Japanese Government, | ||||||
| Sr. Unscd. Bonds, Ser. 106 | JPY | 2.20 | 9/20/28 | 16,200,000 | 207,433 | |
| 5,686,782 | ||||||
| Kazakhstan—.6% | ||||||
| Development Bank of Kazakhstan, | ||||||
| Sr. Unscd. Notes | 4.13 | 12/10/22 | 240,000 | b | 243,000 | |
| Kazakhstan Temir Zholy Finance, | ||||||
| Gtd. Notes | 6.95 | 7/10/42 | 350,000 | b | 441,000 | |
| 684,000 | ||||||
| Mexico—1.5% | ||||||
| Comision Federal de Electricidad, | ||||||
| Sr. Unscd. Notes | 5.75 | 2/14/42 | 360,000 | b | 411,300 | |
| Mexican Government, | ||||||
| Bonds, Ser. M 30 | MXN | 8.50 | 11/18/38 | 9,090,000 | 892,173 | |
| Mexichem, | ||||||
| Sr. Unscd. Notes | 4.88 | 9/19/22 | 200,000 | b | 216,000 | |
| Southern Copper, | ||||||
| Sr. Unscd. Notes | 3.50 | 11/8/22 | 85,000 | 87,230 | ||
| 1,606,703 | ||||||
| Mongolia—.2% | ||||||
| Mongolian Government, | ||||||
| Sr. Unscd. Notes | 4.13 | 1/5/18 | 200,000 | b | 198,500 | |
| Netherlands—4.2% | ||||||
| ABN AMRO Bank, | ||||||
| Sr. Unscd. Notes | 4.25 | 2/2/17 | 500,000 | b | 546,608 | |
| E.ON International Finance, | ||||||
| Gtd. Notes | EUR | 5.50 | 10/2/17 | 175,000 | 276,210 | |
| ELM, | ||||||
| Jr. Sub. Notes | EUR | 5.25 | 5/29/49 | 450,000 | c | 611,192 |
| Elsevier Finance, | ||||||
| Sr. Unscd. Notes | EUR | 6.50 | 4/2/13 | 150,000 | 200,939 | |
| Heineken, | ||||||
| Sr. Notes | 0.80 | 10/1/15 | 375,000 | b | 375,956 | |
12
| Coupon | Maturity | Principal | ||||
| Bonds and Notes (continued) | Rate (%) | Date | Amount ($)a | Value ($) | ||
| Netherlands (continued) | ||||||
| Iberdrola International, | ||||||
| Gtd. Notes | EUR | 4.50 | 9/21/17 | 100,000 | 144,092 | |
| ING Bank, | ||||||
| Covered Notes | EUR | 3.63 | 8/31/21 | 170,000 | 258,350 | |
| Rabobank Nederland, | ||||||
| Sr. Unscd. Notes | EUR | 3.88 | 4/20/16 | 350,000 | 505,660 | |
| Rabobank Nederland, | ||||||
| Sub. Notes | EUR | 3.75 | 11/9/20 | 50,000 | 70,661 | |
| Repsol International Finance, | ||||||
| Gtd. Notes | EUR | 4.38 | 2/20/18 | 200,000 | 284,029 | |
| Repsol International Finance, | ||||||
| Gtd. Notes | EUR | 4.88 | 2/19/19 | 200,000 | 290,569 | |
| RWE Finance, | ||||||
| Gtd. Notes | EUR | 6.63 | 1/31/19 | 150,000 | 256,022 | |
| UPCB Finance VI, | ||||||
| Sr. Scd. Notes | 6.88 | 1/15/22 | 300,000 | b | 326,250 | |
| Ziggo Bond, | ||||||
| Gtd. Notes | EUR | 8.00 | 5/15/18 | 180,000 | b | 262,540 |
| 4,409,078 | ||||||
| New Zealand—2.3% | ||||||
| New Zealand Government, | ||||||
| Sr. Unscd. Bonds, | ||||||
| Ser. 1217 | NZD | 6.00 | 12/15/17 | 2,550,000 | 2,406,302 | |
| Norway—1.3% | ||||||
| DNB Boligkreditt, | ||||||
| Covered Bonds | EUR | 3.38 | 1/20/17 | 590,000 | 860,834 | |
| Norwegian Government, | ||||||
| Bonds, Ser. 474 | NOK | 3.75 | 5/25/21 | 900,000 | 185,100 | |
| Statoil, | ||||||
| Gtd. Notes | 4.25 | 11/23/41 | 350,000 | 378,173 | ||
| 1,424,107 | ||||||
| Peru—.6% | ||||||
| BBVA Banco Continental, | ||||||
| Sr. Unscd. Notes | 5.00 | 8/26/22 | 40,000 | b | 42,800 | |
| Corp Financiera de Desarrollo, | ||||||
| Sr. Unscd. Notes | 4.75 | 2/8/22 | 200,000 | b | 220,500 | |
| Peruvian Government, | ||||||
| Sr. Unscd. Notes | PEN | 6.95 | 8/12/31 | 710,000 | b | 350,591 |
| 613,891 | ||||||
| The Fund | 13 |
STATEMENT OF INVESTMENTS (continued)
| Coupon | Maturity | Principal | ||||
| Bonds and Notes (continued) | Rate (%) | Date | Amount ($)a | Value ($) | ||
| Philippines—.2% | ||||||
| Philippine Government, | ||||||
| Sr. Unscd. Notes | PHP | 4.95 | 1/15/21 | 7,000,000 | 188,599 | |
| Poland—.5% | ||||||
| Polish Government, | ||||||
| Sr. Unscd. Notes | 5.00 | 3/23/22 | 480,000 | 568,080 | ||
| Slovakia—3.4% | ||||||
| Slovakian Government, | ||||||
| Bonds, Ser. 213 | EUR | 3.50 | 2/24/16 | 700,000 | 1,002,323 | |
| Slovakian Government, | ||||||
| Bonds, Ser. 214 | EUR | 4.00 | 4/27/20 | 65,000 | 97,001 | |
| Slovakian Government, | ||||||
| Sr. Unsub. Notes | EUR | 4.00 | 3/26/21 | 720,000 | 1,083,174 | |
| Slovakian Government, | ||||||
| Sr. Unscd. Notes | EUR | 4.38 | 1/21/15 | 405,000 | 576,975 | |
| Slovakian Government, | ||||||
| Sr. Unscd. Notes | 4.38 | 5/21/22 | 775,000 | b | 848,098 | |
| 3,607,571 | ||||||
| Slovenia—.7% | ||||||
| Slovenian Government, | ||||||
| Sr. Unscd. Notes | 5.50 | 10/26/22 | 675,000 | b | 710,438 | |
| South Africa—2.3% | ||||||
| South African Government, | ||||||
| Bonds, Ser. R209 | ZAR | 6.25 | 3/31/36 | 14,930,000 | 1,431,271 | |
| South African Government, | ||||||
| Bonds, Ser. R213 | ZAR | 7.00 | 2/28/31 | 7,130,000 | 780,712 | |
| Transnet SOC, | ||||||
| Sr. Unscd. Notes | 4.00 | 7/26/22 | 225,000 | b | 226,969 | |
| 2,438,952 | ||||||
| South Korea—.7% | ||||||
| Export-Import Bank of Korea, | ||||||
| Sr. Unscd. Notes | EUR | 5.75 | 5/22/13 | 155,000 | 208,890 | |
| Korea Finance, | ||||||
| Sr. Unscd. Notes | 2.25 | 8/7/17 | 535,000 | 542,977 | ||
| 751,867 | ||||||
| Spain—8.5% | ||||||
| Banco Santander, | ||||||
| Covered Bonds | EUR | 4.63 | 1/20/16 | 700,000 | 975,900 | |
| BBVA Senior Finance, | ||||||
| Gtd. Notes | EUR | 4.38 | 9/21/15 | 400,000 | 541,511 | |
14
| Coupon | Maturity | Principal | ||||
| Bonds and Notes (continued) | Rate (%) | Date | Amount ($)a | Value ($) | ||
| Spain (continued) | ||||||
| BBVA US Senior, | ||||||
| Gtd. Notes | 4.66 | 10/9/15 | 610,000 | 625,848 | ||
| Iberdrola Finanzas, | ||||||
| Gtd. Notes | EUR | 3.50 | 10/13/16 | 500,000 | 691,966 | |
| Santander International Debt, | ||||||
| Gtd. Notes | EUR | 4.00 | 3/27/17 | 700,000 | 946,774 | |
| Spanish Government, | ||||||
| Sr. Unsub. Bonds | EUR | 4.70 | 7/30/41 | 250,000 | 282,808 | |
| Spanish Government, | ||||||
| Sr. Unsub. Bonds | EUR | 5.85 | 1/31/22 | 1,100,000 | 1,517,219 | |
| Spanish Government, | ||||||
| Unscd. Bonds | EUR | 3.40 | 4/30/14 | 1,825,000 | 2,438,167 | |
| Telefonica Emisiones, | ||||||
| Gtd. Notes | GBP | 5.38 | 2/2/18 | 530,000 | 909,446 | |
| 8,929,639 | ||||||
| Supranational—1.1% | ||||||
| Corporacion Andina de Fomento, | ||||||
| Sr. Unscd. Notes | 3.75 | 1/15/16 | 260,000 | 275,679 | ||
| Eurasian Development Bank, | ||||||
| Sr. Unscd. Notes | 4.77 | 9/20/22 | 215,000 | b | 223,385 | |
| European Investment Bank, | ||||||
| Sr. Unscd. Notes | JPY | 1.90 | 1/26/26 | 58,000,000 | 702,269 | |
| 1,201,333 | ||||||
| Sweden—2.1% | ||||||
| Swedish Government, | ||||||
| Bonds, Ser. 3105 | SEK | 3.50 | 12/1/15 | 8,000,000 | g | 1,670,568 |
| Swedish Government, | ||||||
| Bonds, Ser. 3102 | SEK | 4.00 | 12/1/20 | 2,000,000 | g | 519,376 |
| 2,189,944 | ||||||
| Switzerland—.7% | ||||||
| Credit Suisse, | ||||||
| Covered Notes | EUR | 2.13 | 1/18/17 | 500,000 | 699,405 | |
| Thailand—.2% | ||||||
| Bangkok Bank, | ||||||
| Sr. Unscd. Notes | 2.75 | 3/27/18 | 245,000 | b | 249,015 | |
| Turkey—1.2% | ||||||
| Turkish Government, | ||||||
| Bonds | TRY | 3.00 | 2/23/22 | 1,780,000 | h | 1,215,162 |
| The Fund | 15 |
STATEMENT OF INVESTMENTS (continued)
| Coupon | Maturity | Principal | ||||
| Bonds and Notes (continued) | Rate (%) | Date | Amount ($)a | Value ($) | ||
| United Kingdom—11.8% | ||||||
| Abbey National | ||||||
| Treasury Services, | ||||||
| Covered Bonds | EUR | 3.63 | 9/8/17 | 350,000 | 507,801 | |
| ArcelorMittal, | ||||||
| Sr. Unscd. Bonds | 10.35 | 6/1/19 | 500,000 | c | 600,412 | |
| ArcelorMittal, | ||||||
| Sr. Unsub. Notes | EUR | 5.88 | 11/17/17 | 105,000 | c | 149,586 |
| ArcelorMittal, | ||||||
| Sr. Unscd. Notes | 6.75 | 2/25/22 | 230,000 | c | 241,801 | |
| Barclays Bank, | ||||||
| Covered Notes | EUR | 2.13 | 9/8/15 | 350,000 | 475,546 | |
| BP Capital Markets, | ||||||
| Gtd. Notes | 2.25 | 11/1/16 | 120,000 | 124,961 | ||
| E-Carat, | ||||||
| Ser. 2012-1, Cl. A | GBP | 1.30 | 6/18/20 | 225,000 | 365,960 | |
| GlaxoSmithKline Capital, | ||||||
| Gtd. Notes | 0.75 | 5/8/15 | 485,000 | 487,652 | ||
| Gracechurch Card Funding, | ||||||
| Ser. 2012-1A, Cl. A2 | EUR | 0.91 | 2/15/17 | 320,000 | b,c | 426,808 |
| HSBC Holdings, | ||||||
| Sub. Notes | EUR | 6.25 | 3/19/18 | 50,000 | 79,309 | |
| Ineos Finance, | ||||||
| Sr. Scd. Notes | 7.50 | 5/1/20 | 200,000 | b | 210,500 | |
| Lloyds TSB Bank, | ||||||
| Covered Bonds | EUR | 4.00 | 9/29/21 | 200,000 | 310,082 | |
| Lloyds TSB Bank, | ||||||
| Covered Notes | EUR | 3.38 | 3/17/16 | 300,000 | 421,237 | |
| National Grid, | ||||||
| Sr. Unscd. Notes | EUR | 5.00 | 7/2/18 | 175,000 | 275,275 | |
| Paragon Mortgages, | ||||||
| Ser. 14A, Cl. A2C | 0.51 | 9/15/39 | 574,709 | b,c | 508,307 | |
| Royal Bank of Scotland, | ||||||
| Covered Notes | EUR | 3.00 | 9/8/16 | 265,000 | 372,280 | |
| Royal Bank of Scotland, | ||||||
| Covered Notes | EUR | 3.88 | 10/19/21 | 400,000 | 613,479 | |
| Royal Bank of Scotland, | ||||||
| Sr. Unscd. Notes | EUR | 4.75 | 5/18/16 | 150,000 | 220,411 | |
| Royal Bank of Scotland, | ||||||
| Sub. Notes | 9.50 | 3/16/22 | 235,000 | c | 277,154 | |
16
| Coupon | Maturity | Principal | ||||
| Bonds and Notes (continued) | Rate (%) | Date | Amount ($)a | Value ($) | ||
| United Kingdom (continued) | ||||||
| Sasol Financing International, | ||||||
| Gtd. Notes | 4.50 | 11/14/22 | 300,000 | 302,625 | ||
| United Kingdom Gilt, | ||||||
| Bonds | GBP | 4.25 | 9/7/39 | 505,000 | 1,002,230 | |
| United Kingdom Gilt, | ||||||
| Bonds | GBP | 4.25 | 12/7/40 | 1,535,000 | 3,050,044 | |
| United Kingdom Gilt, | ||||||
| Bonds, Ser. 3MO | GBP | 1.88 | 11/22/22 | 575,000 | i | 1,428,536 |
| 12,451,996 | ||||||
| United States—12.1% | ||||||
| AbbVie, | ||||||
| Gtd. Notes | 1.75 | 11/6/17 | 575,000 | b | 581,928 | |
| Ally Auto Receivables Trust, | ||||||
| Ser. 2010-1, Cl. A3 | 1.45 | 5/15/14 | 18,823 | 18,839 | ||
| Ally Financial, | ||||||
| Gtd. Notes | 4.50 | 2/11/14 | 100,000 | 103,125 | ||
| Ally Financial, | ||||||
| Gtd. Notes | 5.50 | 2/15/17 | 360,000 | 386,890 | ||
| Ally Master Owner Trust, | ||||||
| Ser. 2011-5, Cl. A | 0.86 | 6/15/15 | 450,000 | c | 450,675 | |
| American International Group, | ||||||
| Sr. Unscd. Notes | 4.88 | 6/1/22 | 245,000 | 280,234 | ||
| Anadarko Petroleum, | ||||||
| Sr. Unscd. Notes | 6.38 | 9/15/17 | 180,000 | 215,232 | ||
| ARL First, | ||||||
| Ser. 2012-1A, Cl. A1 | 1.96 | 12/15/42 | 275,000 | b,c | 278,094 | |
| Bank of America, | ||||||
| Sr. Unscd. Notes | 3.88 | 3/22/17 | 460,000 | 499,368 | ||
| BMW US Capital, | ||||||
| Gtd. Notes | EUR | 5.00 | 5/28/15 | 165,000 | 239,450 | |
| Capital One Financial, | ||||||
| Sr. Unscd. Notes | 1.00 | 11/6/15 | 400,000 | 398,927 | ||
| Chrysler Financial Auto | ||||||
| Securitization Trust, | ||||||
| Ser. 2010-A, Cl. D | 3.52 | 8/8/16 | 220,000 | 220,879 | ||
| CIT Group, | ||||||
| Sr. Unscd. Notes | 4.25 | 8/15/17 | 200,000 | 206,886 | ||
| CIT Group, | ||||||
| Sr. Unscd. Notes | 5.00 | 5/15/17 | 235,000 | 250,275 | ||
| The Fund | 17 |
STATEMENT OF INVESTMENTS (continued)
| Coupon | Maturity | Principal | ||||
| Bonds and Notes (continued) | Rate (%) | Date | Amount ($)a | Value ($) | ||
| United States (continued) | ||||||
| Citigroup, | ||||||
| Sr. Unscd. Notes | 2.65 | 3/2/15 | 485,000 | 499,699 | ||
| Comcast, | ||||||
| Gtd. Notes | 5.90 | 3/15/16 | 50,000 | 57,489 | ||
| CVS Pass-Through Trust, | ||||||
| Pass Thru Notes | 5.77 | 1/10/33 | 209,932 | b | 248,309 | |
| DaVita HealthCare Partners, | ||||||
| Gtd. Notes | 5.75 | 8/15/22 | 50,000 | 52,938 | ||
| Exelon Generation, | ||||||
| Sr. Unscd Notes | 4.25 | 6/15/22 | 550,000 | b | 572,993 | |
| Express Scripts Holding | ||||||
| Gtd. Notes | 2.10 | 2/12/15 | 245,000 | b | 249,699 | |
| Ford Motor Credit, | ||||||
| Sr. Unscd. Notes | 3.00 | 6/12/17 | 220,000 | 226,268 | ||
| Ford Motor Credit, | ||||||
| Sr. Unscd. Notes | 3.88 | 1/15/15 | 280,000 | 292,139 | ||
| General Electric Capital, | ||||||
| Sub. Notes | 5.30 | 2/11/21 | 150,000 | 174,410 | ||
| Holcim US Finance Sarl & Cie, | ||||||
| Gtd. Notes | 6.00 | 12/30/19 | 265,000 | b | 301,006 | |
| Hyundai Capital America, | ||||||
| Gtd. Notes | 4.00 | 6/8/17 | 220,000 | b | 237,681 | |
| JPMorgan Chase Bank, | ||||||
| Sub. Notes | EUR | 4.38 | 11/30/21 | 300,000 | c | 420,109 |
| JPMorgan | ||||||
| Chase Commercial | ||||||
| Mortgage Securities, | ||||||
| Ser. 2007-CB20, Cl. AM | 5.88 | 2/12/51 | 235,000 | c | 273,861 | |
| Lamar Media, | ||||||
| Gtd. Notes | 5.88 | 2/1/22 | 155,000 | 168,950 | ||
| Levi Strauss & Co., | ||||||
| Sr. Unscd. Notes | EUR | 7.75 | 5/15/18 | 75,000 | 106,917 | |
| LyondellBasell Industries, | ||||||
| Sr. Unscd. Notes | 5.00 | 4/15/19 | 250,000 | 277,500 | ||
| Metropolitan Life | ||||||
| Global Funding I, | ||||||
| Sr. Scd. Notes | 2.00 | 1/9/15 | 265,000 | b | 272,285 | |
18
| Coupon | Maturity | Principal | ||||
| Bonds and Notes (continued) | Rate (%) | Date | Amount ($)a | Value ($) | ||
| United States (continued) | ||||||
| MGM Resorts International, | ||||||
| Gtd. Notes | 7.75 | 3/15/22 | 245,000 | 263,375 | ||
| NBCUniversal Media, | ||||||
| Sr. Unscd. Notes | 4.38 | 4/1/21 | 55,000 | 61,892 | ||
| Peabody Energy, | ||||||
| Gtd. Notes | 6.00 | 11/15/18 | 240,000 | 256,200 | ||
| Peabody Energy, | ||||||
| Gtd. Notes | 6.25 | 11/15/21 | 115,000 | 122,763 | ||
| PepsiCo, | ||||||
| Sr. Unscd. Notes | 0.80 | 8/25/14 | 300,000 | 301,688 | ||
| Plains All American Pipeline, | ||||||
| Sr. Unscd. Notes | 5.00 | 2/1/21 | 275,000 | 319,086 | ||
| Prudential Financial, | ||||||
| Notes | 5.38 | 6/21/20 | 100,000 | 117,086 | ||
| Puget Energy, | ||||||
| Sr. Scd. Notes | 6.00 | 9/1/21 | 100,000 | 110,465 | ||
| Santander Drive Auto | ||||||
| Receivables Trust, | ||||||
| Ser. 2012-1, Cl. B | 2.72 | 5/15/16 | 170,000 | 174,410 | ||
| Sealed Air, | ||||||
| Sr. Unscd. Notes | 6.50 | 12/1/20 | 100,000 | b | 108,500 | |
| SLM, | ||||||
| Sr. Unscd. Notes | 7.25 | 1/25/22 | 330,000 | 365,475 | ||
| Structured Asset | ||||||
| Securities Corporation, | ||||||
| Ser. 2006-AM1, Cl. A4 | 0.37 | 4/25/36 | 309,697 | c | 271,637 | |
| Unit, | ||||||
| Gtd. Notes | 6.63 | 5/15/21 | 255,000 | b | 262,969 | |
| Ventas Realty, | ||||||
| Gtd. Notes | 4.25 | 3/1/22 | 110,000 | 116,866 | ||
| Watson Pharmaceuticals, | ||||||
| Sr. Unscd. Notes | 3.25 | 10/1/22 | 140,000 | 143,210 | ||
| Wells Fargo & Co. | ||||||
| Sr. Unscd. Notes | 2.63 | 12/15/16 | 420,000 | 443,671 | ||
| WM Covered Bond Program, | ||||||
| Covered Notes | EUR | 4.00 | 11/26/16 | 285,000 | 419,578 | |
| The Fund | 19 |
STATEMENT OF INVESTMENTS (continued)
| Coupon | Maturity | Principal | |||||
| Bonds and Notes (continued) | Rate (%) | Date | Amount ($)a | Value ($) | |||
| United States (continued) | |||||||
| WM Wrigley Jr., | |||||||
| Sr. Scd. Notes | 3.70 | 6/30/14 | 170,000 | b | 176,018 | ||
| Xerox, | |||||||
| Sr. Unscd. Notes | 1.13 | 5/16/14 | 125,000 | c | 124,781 | ||
| 12,722,725 | |||||||
| Venezuela—.4% | |||||||
| Petroleos de Venezuela, | |||||||
| Gtd. Notes | 8.50 | 11/2/17 | 450,000 | 445,500 | |||
| Total Bonds And Notes | |||||||
| (cost $95,851,258) | 103,148,573 | ||||||
| Face Amount | |||||||
| Covered by | |||||||
| Options Purchased—.3% | Contracts ($) | Value ($) | |||||
| Call Options—.1% | |||||||
| Australian Dollar, | |||||||
| February 2013 @ $1.01 | 2,300,000 | j | 6,789 | ||||
| South Korean Won, | |||||||
| March 2013 @ $1,100 | 2,200,000 | j | 7,157 | ||||
| Euro, | |||||||
| June 2013 @ $1.31 | 2,700,000 | j | 53,546 | ||||
| 10-Year USD LIBOR-BBA, | |||||||
| June 2023 @ $1.89 | 5,400,000 | j | 76,646 | ||||
| 144,138 | |||||||
| Put Options—.2% | |||||||
| Euro, | |||||||
| June 2013 @ $1.31 | 2,700,000 | j | 77,217 | ||||
| 10-Year USD LIBOR-BBA, | |||||||
| June 2023 @ $1.89 | 5,400,000 | j | 118,257 | ||||
| 195,474 | |||||||
| Total Options Purchased | |||||||
| (cost $371,033) | 339,612 | ||||||
| Principal | |||||||
| Short-Term Investments—2.7% | Amount ($) | Value ($) | |||||
| U.S. Treasury Bills; | |||||||
| 0.12%, 2/7/13 | |||||||
| (cost $2,854,633) | 2,855,000 | k | 2,854,920 | ||||
20
| Other Investment—.3% | Shares | Value ($) | ||
| Registered Investment Company; | ||||
| Dreyfus Institutional Preferred Plus Money Market Fund | ||||
| (cost $349,796) | 349,796 | l | 349,796 | |
| Total Investments (cost $99,426,720) | 101.0 | % | 106,692,901 | |
| Liabilities, Less Cash and Receivables | (1.0 | %) | (1,029,691 | ) |
| Net Assets | 100.0 | % | 105,663,210 | |
| BBA—British Bankers Association |
| LIBOR—London Interbank Offered Rate |
| USD—U.S. Dollar |
| a Principal amount stated in U.S. Dollars unless otherwise noted. |
| AUD—Australian Dollar |
| BRL—Brazilian Real |
| CAD—Canadian Dollar |
| CLP—Chilean Peso |
| DKK—Danish Krone |
| EUR—Euro |
| GBP—British Pound |
| JPY—JapaneseYen |
| MXN—Mexican New Peso |
| NOK—Norwegian Krone |
| NZD—New Zealand Dollar |
| PEN—Peruvian Nuevo Sol |
| PHP—Philippine Peso |
| SEK—Swedish Krona |
| TRY—Turkish Lira |
| ZAR—South African Rand |
| b Securities exempt from registration pursuant to Rule 144A under the Securities Act of 1933.These securities may be |
| resold in transactions exempt from registration, normally to qualified institutional buyers.At December 31, 2012, |
| these securities were valued at $19,360,981 or 18.3% of net assets. |
| c Variable rate security—interest rate subject to periodic change. |
| d Principal amount for accrual purposes is periodically adjusted based on changes in the Brazilian Consumer Price Index. |
| e Principal amount for accrual purposes is periodically adjusted based on changes in the Danish Consumer Price Index. |
| f Principal amount for accrual purposes is periodically adjusted based on changes in the Japanese Consumer Price Index. |
| g Principal amount for accrual purposes is periodically adjusted based on changes in the Swedish Consumer Price Index. |
| h Principal amount for accrual purposes is periodically adjusted based on changes in the Turkish Consumer Price Index. |
| i Principal amount for accrual purposes is periodically adjusted based on changes in the British Consumer Price Index. |
| j Non-income producing security. |
| k Held by or on behalf of a counterparty for open financial futures positions. |
| l Investment in affiliated money market mutual fund. |
| Portfolio Summary (Unaudited)† | |||
| Value (%) | Value (%) | ||
| Foreign/Governmental | 52.1 | Short-Term/Money Market Investment | 3.0 |
| Corporate Bonds | 38.4 | Options Purchased | .3 |
| Asset/Commerical/ | |||
| Residential Mortgage-Backed | 7.2 | 101.0 | |
| † Based on net assets. |
| See notes to financial statements. |
| The Fund | 21 |
STATEMENT OF FINANCIAL FUTURES
December 31, 2012
| Unrealized | ||||||
| Market Value | Appreciation | |||||
| Covered by | (Depreciation) | |||||
| Contracts | Contracts ($) | Expiration | at 12/31/2012 | ($) | ||
| Financial Futures Long | ||||||
| Canadian 10 Year Bonds | 19 | 2,588,982 | March 2013 | (2,147 | ) | |
| Euro-Bund | 1 | 192,239 | March 2013 | 1,596 | ||
| Japanese 10 Year Bonds | 12 | 19,897,270 | March 2013 | (101,893 | ) | |
| Long Gilt | 41 | 7,920,402 | March 2013 | 31,224 | ||
| U.S. Treasury 5 Year Notes | 22 | 2,737,075 | March 2013 | 5,959 | ||
| Financial Futures Short | ||||||
| Euro-Bobl | 4 | (674,868 | ) | March 2013 | (4,347 | ) |
| Euro-Schatz | 30 | (4,389,916 | ) | March 2013 | (5,574 | ) |
| U.S. Treasury 2 Year Notes | 22 | (4,850,313 | ) | March 2013 | (1,038 | ) |
| U.S. Treasury 10 Year Notes | 60 | (7,966,875 | ) | March 2013 | 24,376 | |
| U.S. Treasury 30 Year Bonds | 11 | (1,622,500 | ) | March 2013 | 27,655 | |
| Gross Unrealized Appreciation | 90,810 | |||||
| Gross Unrealized Depreciation | (114,999 | ) | ||||
| See notes to financial statements. | ||||||
22
STATEMENT OF ASSETS AND LIABILITIES
December 31, 2012
| Cost | Value | ||
| Assets ($): | |||
| Investments in securities—See Statement of Investments—Note 1(c): | |||
| Unaffiliated issuers | 99,076,924 | 106,343,105 | |
| Affiliated issuers | 349,796 | 349,796 | |
| Cash | 34,057 | ||
| Cash denominated in foreign currencies | 831,162 | 830,232 | |
| Dividends and interest receivable | 1,285,173 | ||
| Unrealized appreciation on forward foreign | |||
| currency exchange contracts—Note 4 | 620,316 | ||
| Unrealized appreciation on swap contracts—Note 4 | 216,157 | ||
| Receivable for investment securities sold | 136,663 | ||
| Receivable for shares of Beneficial Interest subscribed | 36,615 | ||
| Receivable for futures variation margin—Note 4 | 14,143 | ||
| Prepaid expenses | 28,802 | ||
| 109,895,059 | |||
| Liabilities ($): | |||
| Due to The Dreyfus Corporation and affiliates—Note 3(c) | 52,852 | ||
| Due to Administrator—Note 3(a) | 9,211 | ||
| Payable for shares of Beneficial Interest redeemed | 2,675,892 | ||
| Unrealized depreciation on forward foreign | |||
| currency exchange contracts—Note 4 | 502,221 | ||
| Unrealized depreciation on swap contracts—Note 4 | 450,750 | ||
| Payable for investment securities purchased | 369,471 | ||
| Accrued expenses | 171,452 | ||
| 4,231,849 | |||
| Net Assets ($) | 105,663,210 | ||
| Composition of Net Assets ($): | |||
| Paid-in capital | 96,949,335 | ||
| Accumulated distribution in excess of investment income—net | (761,094 | ) | |
| Accumulated net realized gain (loss) on investments | 2,330,055 | ||
| Accumulated net unrealized appreciation (depreciation) on | |||
| investments, options transactions, swap transactions | |||
| and foreign currency transactions [including ($24,189) | |||
| net unrealized (depreciation) on financial futures] | 7,144,914 | ||
| Net Assets ($) | 105,663,210 | ||
| Class I Shares Outstanding | |||
| (unlimited number of $.001 par value shares of Beneficial Interest authorized) | 5,099,990 | ||
| Net Asset Value, offering and redemption price per share ($) | 20.72 | ||
See notes to financial statements.
| The Fund | 23 |
STATEMENT OF OPERATIONS
Year Ended December 31, 2012
| Investment Income ($): | ||
| Income: | ||
| Interest | 3,406,666 | |
| Dividends; | ||
| Affiliated issuers | 2,496 | |
| Total Income | 3,409,162 | |
| Expenses: | ||
| Investment advisory fee—Note 3(a) | 416,283 | |
| Professional fees | 154,651 | |
| Administration fee—Note 3(a) | 104,071 | |
| Shareholder servicing costs—Note 3(c) | 74,360 | |
| Prospectus and shareholders’ reports | 34,495 | |
| Custodian fees—Note 3(c) | 24,947 | |
| Registration fees | 20,163 | |
| Trustees’ fees and expenses—Note 3(d) | 7,543 | |
| Administrative service fees—Note 3(b) | 1,079 | |
| Loan commitment fees—Note 2 | 863 | |
| Interest expense—Note 2 | 320 | |
| Miscellaneous | 61,262 | |
| Total Expenses | 900,037 | |
| Less—reduction in fees due to earnings credits—Note 3(c) | (15 | ) |
| Net Expenses | 900,022 | |
| Investment Income—Net | 2,509,140 | |
| Realized and Unrealized Gain (Loss) on Investments—Note 4 ($): | ||
| Net realized gain (loss) on investments and foreign currency transactions | 3,972,785 | |
| Net realized gain (loss) on financial futures | (33,216 | ) |
| Net realized gain (loss) on options transactions | 27,050 | |
| Net realized gain (loss) on swap transactions | (61,697 | ) |
| Net realized gain (loss) on forward foreign currency exchange contracts | (490,588 | ) |
| Net Realized Gain (Loss) | 3,414,334 | |
| Net unrealized appreciation (depreciation) on | ||
| investments and foreign currency transactions | 3,755,983 | |
| Net unrealized appreciation (depreciation) on financial futures | 43,510 | |
| Net unrealized appreciation (depreciation) on options transactions | (31,421 | ) |
| Net unrealized appreciation (depreciation) on swap transactions | 87,832 | |
| Net unrealized appreciation (depreciation) on | ||
| forward foreign currency exchange contracts | 483,268 | |
| Net Unrealized Appreciation (Depreciation) | 4,339,172 | |
| Net Realized and Unrealized Gain (Loss) on Investments | 7,753,506 | |
| Net Increase in Net Assets Resulting from Operations | 10,262,646 | |
| See notes to financial statements. | ||
24
STATEMENT OF CHANGES IN NET ASSETS
| Year Ended December 31, | ||||
| 2012 | 2011 | |||
| Operations ($): | ||||
| Investment income—net | 2,509,140 | 2,856,718 | ||
| Net realized gain (loss) on investments | 3,414,334 | (1,055,377 | ) | |
| Net unrealized appreciation | ||||
| (depreciation) on investments | 4,339,172 | 30,095 | ||
| Net Increase (Decrease) in Net Assets | ||||
| Resulting from Operations | 10,262,646 | 1,831,436 | ||
| Dividends to Shareholders from ($): | ||||
| Investment income—net | (3,307,871 | ) | (4,918,206 | ) |
| Net realized gain on investments | — | (425,653 | ) | |
| Total Dividends | (3,307,871 | ) | (5,343,859 | ) |
| Beneficial Interest Transactions ($): | ||||
| Net proceeds from shares sold | 38,297,493 | 41,684,329 | ||
| Dividends reinvested | 3,192,267 | 5,121,013 | ||
| Cost of shares redeemed | (34,359,038 | ) | (57,681,797 | ) |
| Increase (Decrease) in Net Assets from | ||||
| Beneficial Interest Transactions | 7,130,722 | (10,876,455 | ) | |
| Total Increase (Decrease) in Net Assets | 14,085,497 | (14,388,878 | ) | |
| Net Assets ($): | ||||
| Beginning of Period | 91,577,713 | 105,966,591 | ||
| End of Period | 105,663,210 | 91,577,713 | ||
| Undistributed (distributions in excess of) | ||||
| investment income—net | (761,094 | ) | 223,854 | |
| Capital Share Transactions (Shares): | ||||
| Shares sold | 1,923,246 | 2,106,059 | ||
| Shares issued for dividends reinvested | 160,205 | 262,141 | ||
| Shares redeemed | (1,705,827 | ) | (2,930,480 | ) |
| Net Increase (Decrease) in Shares Outstanding | 377,624 | (562,280 | ) | |
| See notes to financial statements. | ||||
| The Fund | 25 |
FINANCIAL HIGHLIGHTS
The following table describes the performance for the fiscal periods indicated. Total return shows how much your investment in the fund would have increased (or decreased) during each period, assuming you had reinvested all dividends and distributions.These figures have been derived from the fund’s financial statements.
| Year Ended December 31, | ||||||||||
| Class I Shares | 2012 | 2011 | 2010 | 2009 | a | 2008 | ||||
| Per Share Data ($): | ||||||||||
| Net asset value, beginning of period | 19.39 | 20.05 | 19.94 | 18.95 | 18.57 | |||||
| Investment Operations: | ||||||||||
| Investment income—netb | .49 | .56 | .71 | .74 | .72 | |||||
| Net realized and unrealized | ||||||||||
| gain (loss) on investments | 1.49 | (.19 | ) | .30 | 1.72 | .75 | ||||
| Total from Investment Operations | 1.98 | .37 | 1.01 | 2.46 | 1.47 | |||||
| Distributions: | ||||||||||
| Dividends from investment income—net | (.65 | ) | (.95 | ) | (.90 | ) | (1.47 | ) | (1.09 | ) |
| Dividends from net realized | ||||||||||
| gain on investments | — | (.08 | ) | — | — | — | ||||
| Total Distributions | (.65 | ) | (1.03 | ) | (.90 | ) | (1.47 | ) | (1.09 | ) |
| Net asset value, end of period | 20.72 | 19.39 | 20.05 | 19.94 | 18.95 | |||||
| Total Return (%) | 10.41 | 1.88 | 5.15 | 13.86 | 8.08 | |||||
| Ratios/Supplemental Data (%): | ||||||||||
| Ratio of total expenses | ||||||||||
| to average net assets | .86 | .76 | .72 | .87 | .80 | |||||
| Ratio of net expenses | ||||||||||
| to average net assets | .86 | .76 | .72 | .80 | .78 | |||||
| Ratio of net investment income | ||||||||||
| to average net assets | 2.41 | 2.82 | 3.49 | 3.88 | 3.84 | |||||
| Portfolio Turnover Rate | 183.62 | 218.72 | 210.34 | 120.50 | 158 | c | ||||
| Net Assets, end of period ($ x 1,000) | 105,663 | 91,578 | 105,967 | 92,171 | 60,945 | |||||
| a Effective September 1, 2009, the fund’s shares were redesignated as Class I shares. |
| b Based on average shares outstanding at each month end. |
| c The portfolio turnover rate excluding mortgage dollar roll transactions for the period ended December 31, 2008 |
| was 144%. |
See notes to financial statements.
26
NOTES TO FINANCIAL STATEMENTS
NOTE 1—Significant Accounting Policies:
Dreyfus/Standish International Fixed Income Fund (the “fund”) is a separate non-diversified series of Dreyfus Investment Funds (the “Trust”), which is registered under the Investment Company Act of 1940, as amended (the “Act”), as an open-end management investment company and operates as a series company offering eleven series, including the fund. The fund’s investment objective seeks to maximize total return while realizing a market level of income, consistent with preserving principal and liquidity.The Dreyfus Corporation (the “Manager” or “Dreyfus”), a wholly-owned subsidiary of The Bank of New York Mellon Corporation (“BNY Mellon”), serves as the fund’s investment adviser. MBSC Securities Corporation (the “Distributor”), a wholly-owned subsidiary of the Manager, is the distributor of the fund’s shares.
Class I shares are sold primarily to bank trust departments and other financial service providers, (including The Bank of NewYork Mellon, a subsidiary of BNY Mellon and an affiliate of Dreyfus, and its affiliates), acting on behalf of customers having a qualified trust or an investment account or relationship at such institution and bear no distribution or service fees. Class I shares are offered without a front end sales charge or contingent deferred sales charge.
The Trust accounts separately for the assets, liabilities and operations of each series. Expenses directly attributable to each series are charged to that series’ operations; expenses which are applicable to all series are allocated among them on a pro rata basis.
The Financial Accounting Standards Board (“FASB”) Accounting Standards Codification is the exclusive reference of authoritative U.S. generally accepted accounting principles (“GAAP”) recognized by the FASB to be applied by nongovernmental entities. Rules and interpretive releases of the Securities and Exchange Commission (“SEC”) under authority of federal laws are also sources of authoritative GAAP for SEC registrants. The fund’s financial statements are prepared in accordance with GAAP, which may require the use of management estimates and assumptions.Actual results could differ from those estimates.
| The Fund | 27 |
NOTES TO FINANCIAL STATEMENTS (continued)
(a) Portfolio valuation: The fair value of a financial instrument is the amount that would be received to sell an asset or paid to transfer a liability in an orderly transaction between market participants at the measurement date (i.e., the exit price). GAAP establishes a fair value hierarchy that prioritizes the inputs of valuation techniques used to measure fair value.This hierarchy gives the highest priority to unadjusted quoted prices in active markets for identical assets or liabilities (Level 1 measurements) and the lowest priority to unobservable inputs (Level 3 measurements).
Additionally, GAAP provides guidance on determining whether the volume and activity in a market has decreased significantly and whether such a decrease in activity results in transactions that are not orderly. GAAP requires enhanced disclosures around valuation inputs and techniques used during annual and interim periods.
Various inputs are used in determining the value of the fund’s investments relating to fair value measurements.These inputs are summarized in the three broad levels listed below:
Level 1—unadjusted quoted prices in active markets for identical investments.
Level 2—other significant observable inputs (including quoted prices for similar investments, interest rates, prepayment speeds, credit risk, etc.).
Level 3—significant unobservable inputs (including the fund’s own assumptions in determining the fair value of investments).
The inputs or methodology used for valuing securities are not necessarily an indication of the risk associated with investing in those securities.
Changes in valuation techniques may result in transfers in or out of an assigned level within the disclosure hierarchy. Valuation techniques used to value the fund’s investments are as follows:
Registered investment companies that are not traded on an exchange are valued at their net asset value and are categorized within Level 1 of the fair value hierarchy.
28
Investments in securities, excluding short-term investments (other than U.S.Treasury Bills), financial futures, options, swaps and forward foreign currency exchange contracts (“forward contracts”) are valued each business day by an independent pricing service (the “Service”) approved by the Trust’s Board of Trustees (the “Board”). Investments for which quoted bid prices are readily available and are representative of the bid side of the market in the judgment of the Service are valued at the mean between the quoted bid prices (as obtained by the Service from dealers in such securities) and asked prices (as calculated by the Service based upon its evaluation of the market for such securities). Other investments (which constitute a majority of the portfolio securities) are valued as determined by the Service, based on methods which include consideration of the following: yields or prices of securities of comparable quality, coupon, maturity and type; indications as to values from dealers; and general market conditions.These securities are generally categorized within Level 2 of the fair value hierarchy.
U.S. Treasury Bills are valued at the mean price between quoted bid prices and asked prices by the Service. These securities are generally categorized within Level 2 of the fair value hierarchy.
The Service’s procedures are reviewed by Dreyfus under the general supervision of the Board.
When market quotations or official closing prices are not readily available, or are determined not to reflect accurately fair value, such as when the value of a security has been significantly affected by events after the close of the exchange or market on which the security is principally traded (for example, a foreign exchange or market), but before the fund calculates its net asset value, the fund may value these investments at fair value as determined in accordance with the procedures approved by the Board. Certain factors may be considered when fair valuing investments such as: fundamental analytical data, the nature and duration of restrictions on disposition, an evaluation of the forces that influence the market in which the securities are purchased and
| The Fund | 29 |
NOTES TO FINANCIAL STATEMENTS (continued)
sold, and public trading in similar securities of the issuer or comparable issuers. These securities are either categorized within Level 2 or 3 depending on the relevant inputs used.
For restricted securities where observable inputs are limited, assumptions about market activity and risk are used and are categorized within Level 3 of the fair value hierarchy.
Investments denominated in foreign currencies are translated to U.S. dollars at the prevailing rates of exchange.
Financial futures and options, which are traded on an exchange, are valued at the last sales price on the securities exchange on which such securities are primarily traded or at the last sales price on the national securities market on each business day. These securities are generally categorized within Level 1 of the fair value hierarchy. Options traded over-the-counter are valued at the mean between the bid and asked price.These securities are generally categorized within Level 2 of the fair value hierarchy. Investments in swap transactions are valued each business day by the Service. Swaps are valued by the Service by using a swap pricing model which incorporates among other factors, default probabilities, recovery rates, credit curves of the underlying issuer and swap spreads on interest rates. These securities are generally categorized within Level 2 of the fair value hierarchy. Forward contracts are valued at the forward rate. These securities are generally categorized within Level 2 of the fair value hierarchy.
The following is a summary of the inputs used as of December 31, 2012 in valuing the fund’s investments:
| Level 2—Other | Level 3— | |||
| Level 1— | Significant | Significant | ||
| Unadjusted | Observable | Unobservable | ||
| Quoted Prices | Inputs | Inputs | Total | |
| Assets ($) | ||||
| Investments in Securities: | ||||
| Asset-Backed | — | 6,781,249 | — | 6,781,249 |
| Commercial | ||||
| Mortgage-Backed | — | 273,861 | — | 273,861 |
| Corporate Bonds† | — | 40,551,936 | — | 40,551,936 |
| Foreign Government | — | 55,033,220 | — | 55,033,220 |
30
| Level 2—Other | Level 3— | ||||||
| Level 1— | Significant | Significant | |||||
| Unadjusted | Observable | Unobservable | |||||
| Quoted Prices | Inputs | Inputs | Total | ||||
| Assets ($) (continued) | |||||||
| Mutual Funds | 349,796 | — | — | 349,796 | |||
| Residential | |||||||
| Mortgage-Backed | — | 508,307 | — | 508,307 | |||
| U.S. Treasury | — | 2,854,920 | — | 2,854,920 | |||
| Other Financial | |||||||
| Instruments: | |||||||
| Financial Futures†† | 90,810 | — | — | 90,810 | |||
| Forward Foreign | |||||||
| Currency Exchange | |||||||
| Contracts†† | — | 620,316 | — | 620,316 | |||
| Options Purchased | — | 339,612 | — | 339,612 | |||
| Swaps†† | — | 216,157 | — | 216,157 | |||
| Liabilities ($) | |||||||
| Other Financial | |||||||
| Instruments: | |||||||
| Financial Futures†† | (114,999 | ) | — | — | (114,999 | ) | |
| Forward Foreign | |||||||
| Currency Exchange | |||||||
| Contracts†† | — | (502,221 | ) | — | (502,221 | ) | |
| Swaps†† | — | (450,750 | ) | — | (450,750 | ) |
| † | See Statement of Investments for additional detailed categorizations. |
| †† | Amount shown represents unrealized appreciation (depreciation) at period end. |
At December 31, 2012, there were no transfers between Level 1 and Level 2 of the fair value hierarchy.
(b) Foreign currency transactions: The fund does not isolate that portion of the results of operations resulting from changes in foreign exchange rates on investments from the fluctuations arising from changes in the market prices of securities held. Such fluctuations are included with the net realized and unrealized gain or loss on investments.
Net realized foreign exchange gains or losses arise from sales of foreign currencies, currency gains or losses realized on securities transactions between trade and settlement date, and the difference between the amounts of dividends, interest and foreign withholding taxes recorded
| The Fund | 31 |
NOTES TO FINANCIAL STATEMENTS (continued)
on the fund’s books and the U.S. dollar equivalent of the amounts actually received or paid. Net unrealized foreign exchange gains and losses arise from changes in the value of assets and liabilities other than investments resulting from changes in exchange rates. Foreign currency gains and losses on investments are also included with net realized and unrealized gain or loss on investments.
(c) Securities transactions and investment income: Securities transactions are recorded on a trade date basis. Realized gains and losses from securities transactions are recorded on the identified cost basis. Dividend income is recognized on the ex-dividend date and interest income, including, where applicable, accretion of discount and amortization of premium on investments, is recognized on the accrual basis.
(d) Affiliated issuers: Investments in other investment companies advised by Dreyfus are defined as “affiliated” in the Act. Investments in affiliated investment companies for the period ended December 31, 2012 were as follows:
| Affiliated | |||||||
| Investment | Value | Value | Net | ||||
| Company | 12/31/2011 | ($) | Purchases ($) | Sales ($) | 12/31/2012 | ($) | Assets (%) |
| Dreyfus | |||||||
| Institutional | |||||||
| Preferred | |||||||
| Plus Money | |||||||
| Market Fund | 6,104,207 | 72,769,152 | 78,523,563 | 349,796 | .3 |
(e) Risk: The fund invests primarily in debt securities. Failure of an issuer of the debt securities to make timely interest or principal payments, or a decline or the perception of a decline in the credit quality of a debt security, can cause the debt security’s price to fall, potentially lowering the fund’s share price. In addition, the value of debt securities may decline due to general market conditions that are not specifically related to a particular issuer, such as real or perceived adverse economic conditions, changes in outlook for corporate earnings, changes in interest or currency rates or adverse investor sentiment. They may also decline because of factors that affect a particular industry or country.
32
Investing in foreign markets may involve special risks and considerations not typically associated with investing in the U.S. These risks include revaluation of currencies, high rates of inflation, repatriation restrictions on income and capital, and adverse political and economic developments. Moreover, securities issued in these markets may be less liquid, subject to government ownership controls and delayed settlements, and their prices may be more volatile than those of comparable securities in the U.S.
(f) Dividends to shareholders: Dividends are recorded on the ex-dividend date. Dividends from investment income-net are normally declared and paid quarterly. Dividends from net realized capital gains, if any, are normally declared and paid annually, but the fund may make distributions on a more frequent basis to comply with the distribution requirements of the Internal Revenue Code of 1986, as amended (the “Code”).To the extent that net realized capital gains can be offset by capital loss carryovers, it is the policy of the fund not to distribute such gains. Income and capital gain distributions are determined in accordance with income tax regulations, which may differ from GAAP.
(g) Federal income taxes: It is the policy of the fund to continue to qualify as a regulated investment company, if such qualification is in the best interests of its shareholders, by complying with the applicable provisions of the Code, and to make distributions of taxable income sufficient to relieve it from substantially all federal income and excise taxes.
As of and during the period ended December 31, 2012, the fund did not have any liabilities for any uncertain tax positions.The fund recognizes interest and penalties, if any, related to uncertain tax positions as income tax expense in the Statement of Operations. During the period, the fund did not incur any interest or penalties.
Each of the tax years in the four-year period ended December 31, 2012 remains subject to examination by the Internal Revenue Service and state taxing authorities.
| The Fund | 33 |
NOTES TO FINANCIAL STATEMENTS (continued)
At December 31, 2012, the components of accumulated earnings on a tax basis were as follows: undistributed ordinary income $2,620,185, undistributed capital gains $222,511 and unrealized appreciation $5,871,179.
The tax character of distributions paid to shareholders during the fiscal periods ended December 31, 2012 and December 31, 2011 were as follows: ordinary income $3,307,871 and $4,918,313 and long-term capital gains $0 and $425,546, respectively.
During the period ended December 31, 2012, as a result of permanent book to tax differences, primarily due to the tax treatment for pay-down gains and losses on mortgage-backed securities, foreign currency transactions, amortization of premiums, swap periodic payments and consent fees, the fund decreased accumulated undistributed investment income-net by $186,217 and increased accumulated net realized gain (loss) on investments by the same amount. Net assets and net asset value per share were not affected by this reclassification.
(h) New Accounting Pronouncement: In December 2011, FASB issued Accounting Standards Update No. 2011-11 “Disclosures about Offsetting Assets and Liabilities” (“ASU 2011-11”). These disclosure requirements are intended to help investors and other financial statement users to better assess the effect or potential effect of offsetting arrangements on a company’s financial position.They also improve transparency in the reporting of how companies mitigate credit risk, including disclosure of related collateral pledged or received. In addition,ASU 2011-11 facilitates comparison between those entities that prepare their financial statements on the basis of GAAP and those entities that prepare their financial statements on the basis of International Financial Reporting Standards (“IFRS”). ASU 2011-11 requires entities to: disclose both gross and net information about both instruments and transactions eligible for offset in the financial statements; and disclose instruments and transactions subject to an agreement similar to a master netting agreement. ASU 2011-11 is effective for fiscal years beginning on or after January 1, 2013, and interim periods within those annual periods.At this
34
time, management is evaluating the implications of ASU 2011-11 and its impact on the fund’s financial statement disclosures.
NOTE 2—Bank Lines of Credit:
The fund participates with other Dreyfus-managed funds in a $210 million unsecured credit facility led by Citibank, N.A. and a $300 million unsecured credit facility provided by The Bank of New York Mellon (each, a “Facility”), each to be utilized primarily for temporary or emergency purposes, including the financing of redemptions. Prior to October 10, 2012, the unsecured credit facility with Citibank, N.A. was $225 million. In connection therewith, the fund has agreed to pay its pro rata portion of commitment fees for each Facility. Interest is charged to the fund based on rates determined pursuant to the terms of the respective Facility at the time of borrowing.
The average amount of borrowings outstanding under the Facilities during the period ended December 31, 2012, was approximately $27,600 with a related weighted average annualized interest rate of 1.16%.
NOTE 3—Investment Advisory Fee and Other Transactions With Affiliates:
(a) Pursuant to an investment advisory agreement with the Manager, the investment advisory fee is computed at the annual rate of .40% of the value of the fund’s average daily net assets and is payable monthly.
The fund has an Accounting and Administration Agreement (the “Administration Agreement”) with Dreyfus, whereby Dreyfus performs administrative and accounting services for the fund. The fund has agreed to compensate Dreyfus for providing accounting services, administration, compliance monitoring, regulatory and shareholder reporting, as well as related facilities equipment.The fee is based on the fund’s average daily net assets and computed at the following annual rates: .10% of the first $500 million, .065% of the next $500 million and .02% in excess of $1 billion.
| The Fund | 35 |
NOTES TO FINANCIAL STATEMENTS (continued)
In addition, after applying any expense limitations or fee waivers that reduce the fees paid to Dreyfus for this service, Dreyfus has contractually agreed in writing to waive any remaining fees for this service to the extent that they exceed both Dreyfus’ costs in providing these services and a reasonable allocation of the costs incurred by Dreyfus and its affiliates related to the support and oversight of these services.The fund also reimburses Dreyfus for the out-of-pocket expenses incurred in performing this service for the fund. Pursuant to Administration Agreement, the fund was charged $104,071 during the period December 31, 2012.
(b) The fund pays administrative service fees. These fees are paid to affiliated or unaffiliated retirement plans, omnibus accounts and platform administrators and other entities (“Plan Administrators”) that provide record keeping and/or other administrative support services to accounts, retirement plans and their participants. As compensation for such services, the fund pays each Plan Administrator an administrative service fee an amount of up to .15% (on an annualized basis) of the fund’s average daily net assets attributable to fund shares that are held in accounts serviced by such Plan Administrators. During the period ended December 31, 2012, the fund was charged $1,079 for administrative service fees.The fund’s adviser or its affiliates may pay additional compensation from their own resources to Plan Administrators and other entities for administrative services, as well as for marketing or other distribution related services. These payments may provide an incentive for these entities to actively promote the fund or cooperate with the Distributor’s promotional efforts.
(c) The fund has arrangements with the transfer agent and the custodian whereby the fund may receive earnings credits when positive cash balances are maintained, which are used to offset transfer agency and custody fees. For financial reporting purposes, the fund includes net earnings credits as an expense offset in the Statement of Operations.
The fund compensates Dreyfus Transfer, Inc., a wholly-owned subsidiary of the Manager, under a transfer agency agreement for providing transfer agency services for the fund and, since May 29, 2012, cash management services related to fund subscriptions and redemptions.
36
During the period ended December 31, 2012, the fund was charged $3,989 for transfer agency services and $65 for cash management services. Cash management fees were partially offset by earnings credits of $8.These fees are included in Shareholder servicing costs in the Statement of Operations.
The fund compensates The Bank of New York Mellon under a custody agreement for providing custodial services for the fund. During the period ended December 31, 2012, the fund was charged $24,947 pursuant to the custody agreement.
Prior to May 29, 2012, the fund compensated The Bank of NewYork Mellon under a cash management agreement for performing cash management services related to fund subscriptions and redemptions. During the period ended December 31, 2012, the fund was charged $185 pursuant to the cash management agreement, which is included in Shareholder servicing costs in the Statement of Operations. These fees were partially offset by earnings credits of $7.
During the period ended December 31, 2012, the fund was charged $8,783 for services performed by the Chief Compliance Officer and his staff.
The components of “Due to The Dreyfus Corporation and affiliates” in the Statement of Assets and Liabilities consist of: investment advisory fees $36,843, custodian fees $11,000, Chief Compliance Officer fees $3,981 and transfer agency fees $1,028.
(d) Each Board member also serves as a Board member of other funds within the Dreyfus complex. Annual retainer fees and attendance fees are allocated to each fund based on net assets.
NOTE 4—Securities Transactions:
The aggregate amount of purchases and sales (including paydowns) of investment securities, excluding short-term securities, forward contracts, financial futures, options transactions and swap transactions, during the period ended December 31, 2012, amounted to $191,358,071 and $181,532,140, respectively.
| The Fund | 37 |
NOTES TO FINANCIAL STATEMENTS (continued)
Derivatives: A derivative is a financial instrument whose performance is derived from the performance of another asset. Each type of derivative instrument that was held by the fund during the period ended December 31, 2012 is discussed below.
The following tables show the fund’s exposure to different types of market risk as it relates to the Statement of Assets and Liabilities and the Statement of Operations, respectively.
Fair value of derivative instruments as of December 31, 2012 is shown below:
| Derivative | Derivative | |||
| Assets ($) | Liabilities ($) | |||
| Interest rate risk1,2,3 | 501,870 | Interest rate risk1,4 | (550,422 | ) |
| Foreign exchange risk2,5 | 765,025 | Foreign exchange risk6 | (502,221 | ) |
| Credit risk | — | Credit risk4 | (15,327 | ) |
| Gross fair value of | ||||
| derivatives contracts | 1,266,895 | (1,067,970 | ) |
Statement of Assets and Liabilities location:
| 1 | Includes cumulative appreciation (depreciation) on financial futures as reported in the Statement of |
| Financial Futures, but only the unpaid variation margin is reported in the Statement of Assets | |
| and Liabilities. | |
| 2 | Options purchased are included in Investments in securities—Unaffiliated issuers, at value. |
| 3 | Unrealized appreciation on swap contracts. |
| 4 | Unrealized depreciation on swap contracts. |
| 5 | Unrealized appreciation on forward foreign currency exchange contracts. |
| 6 | Unrealized depreciation on forward foreign currency exchange contracts. |
The effect of derivative instruments in the Statement of Operations during the period ended December 31, 2012 is shown below:
| Amount of realized gain or (loss) on derivatives recognized in income ($) | |||||||||
| Financial | Options | Forward | Swap | ||||||
| Underlying risk | Futures7 | Transactions8 | Contracts9 | Transactions10 | Total | ||||
| Interest rate | (33,216 | ) | 27,050 | — | (57,030 | ) | (63,196 | ) | |
| Foreign exchange | — | — | (490,588 | ) | — | (490,588 | ) | ||
| Credit | — | — | — | (4,667 | ) | (4,667 | ) | ||
| Total | (33,216 | ) | 27,050 | (490,588 | ) | (61,697 | ) | (558,451 | ) |
38
| Change in unrealized appreciation or (depreciation) on derivatives recognized in income ($) | ||||||||
| Financial | Options | Forward | Swap | |||||
| Underlying risk | Futures11 | Transactions12 | Contracts13 | Transactions14 | Total | |||
| Interest rate | 43,510 | (6,518 | ) | — | 103,159 | 140,151 | ||
| Foreign exchange | — | (24,903 | ) | 483,268 | — | 458,365 | ||
| Credit | — | — | — | (15,327 | ) | (15,327 | ) | |
| Total | 43,510 | (31,421 | ) | 483,268 | 87,832 | 583,189 | ||
Statement of Operations location:
| 7 | Net realized gain (loss) on financial futures. |
| 8 | Net realized gain (loss) on options transactions. |
| 9 | Net realized gain (loss) on forward foreign currency exchange contracts. |
| 10 Net realized gain (loss) on swap transactions. | |
| 11 Net unrealized appreciation (depreciation) on financial futures. | |
| 12 Net unrealized appreciation (depreciation) on options transactions. | |
| 13 Net unrealized appreciation (depreciation) on forward foreign currency exchange contracts. | |
| 14 Net unrealized appreciation (depreciation) on swap transactions. | |
Financial Futures: In the normal course of pursuing its investment objective, the fund is exposed to market risk, including interest rate risk, as a result of changes in value of underlying financial instruments.The fund invests in financial futures in order to manage its exposure to or protect against changes in the market. A financial futures represents a commitment for the future purchase or a sale of an asset at a specified date. Upon entering into such contracts, these investments require initial margin deposits with a counterparty, which consist of cash or cash equivalents. The amount of these deposits is determined by the exchange or Board of Trade on which the contract is traded and is subject to change. Accordingly, variation margin payments are received or made to reflect daily unrealized gains or losses which are recorded in the Statement of Operations.When the contracts are closed, the fund recognizes a realized gain or loss.There is minimal counterparty credit risk to the fund with financial futures since they are exchange traded, and the exchange’s clearinghouse guarantees the financial futures against default. Financial futures open at December 31, 2012 are set forth in the Statement of Financial Futures.
| The Fund | 39 |
NOTES TO FINANCIAL STATEMENTS (continued)
Options Transactions: The fund purchases and writes (sells) put and call options to hedge against changes in interest rates and foreign currencies, or as a substitute for an investment.The fund is subject to interest rate risk and currency risk in the course of pursuing its investment objectives through its investments in options contracts. A call option gives the purchaser of the option the right (but not the obligation) to buy, and obligates the writer to sell, the underlying security or securities at the exercise price at any time during the option period, or at a specified date. Conversely, a put option gives the purchaser of the option the right (but not the obligation) to sell, and obligates the writer to buy the underlying security or securities at the exercise price at any time during the option period, or at a specified date.
As a writer of call options, the fund receives a premium at the outset and then bears the market risk of unfavorable changes in the price of the financial instrument underlying the option. Generally, the fund realizes a gain, to the extent of the premium, if the price of the underlying financial instrument decreases between the date the option is written and the date on which the option is terminated. Generally, the fund incurs a loss if the price of the financial instrument increases between those dates.
As a writer of put options, the fund receives a premium at the outset and then bears the market risk of unfavorable changes in the price of the financial instrument underlying the option. Generally, the fund realizes a gain, to the extent of the premium, if the price of the underlying financial instrument increases between the date the option is written and the date on which the option is terminated. Generally, the fund incurs a loss if the price of the financial instrument decreases between those dates.
As a writer of an option, the fund has no control over whether the underlying securities may be sold (call) or purchased (put) and as a result bears the market risk of an unfavorable change in the price of the security underlying the written option.There is a risk of loss from a change in value of such options which may exceed the related pre-
40
miums received. The Statement of Operations reflects the following: any unrealized gains or losses which occurred during the period as well as any realized gains or losses which occurred upon the expiration or closing of the option transaction:
The following summarizes the fund’s call/put options written during the period ended December 31, 2012:
| Face Amount | Options Terminated | |||
| Covered by | Premiums | Net Realized | ||
| Options Written: | Contracts ($) | Received ($) | Cost ($) | Gain ($) |
| Contracts outstanding | ||||
| December 31, 2011 | — | — | ||
| Contracts written | 116,000 | 32,393 | ||
| Contracts terminated: | ||||
| Contracts closed | 116,000 | 32,393 | 7,830 | 24,563 |
| Contracts outstanding | ||||
| December 31, 2012 | — | — | ||
Forward Foreign Currency Exchange Contracts: The fund enters into forward contracts in order to hedge its exposure to changes in foreign currency exchange rates on its foreign portfolio holdings, to settle foreign currency transactions or as a part of its investment strategy. When executing forward contracts, the fund is obligated to buy or sell a foreign currency at a specified rate on a certain date in the future. With respect to sales of forward contracts, the fund incurs a loss if the value of the contract increases between the date the forward contract is opened and the date the forward contract is closed.The fund realizes a gain if the value of the contract decreases between those dates.With respect to purchases of forward contracts, the fund incurs a loss if the value of the contract decreases between the date the forward contract is opened and the date the forward contract is closed.The fund realizes a gain if the value of the contract increases between those dates. Any realized or unrealized gains or losses which occurred during the period are reflected in the Statement of Operations. The fund is exposed to foreign currency risk as a result of changes in value of underlying financial instruments.The fund is also exposed to credit risk associated with counterparty nonperformance on these forward contracts, which
| The Fund | 41 |
NOTES TO FINANCIAL STATEMENTS (continued)
is typically limited to the unrealized gain on each open contract.The following summarizes open forward contracts at December 31, 2012:
| Foreign | Unrealized | |||||
| Forward Foreign Currency | Currency | Appreciation | ||||
| Exchange Contracts | Amounts | Cost ($) | Value ($) (Depreciation) ($) | |||
| Purchases: | ||||||
| Brazilian Real, | ||||||
| Expiring: | ||||||
| 1/3/2013 a | 2,170,000 | 1,028,680 | 1,059,341 | 30,661 | ||
| 2/4/2013 b | 2,635,000 | 1,249,941 | 1,280,810 | 30,869 | ||
| Japanese Yen, | ||||||
| Expiring | ||||||
| 1/7/2013 c | 19,806,367 | 230,172 | 228,619 | (1,553 | ) | |
| Mexican New Peso, | ||||||
| Expiring | ||||||
| 1/29/2013 d | 14,110,000 | 1,104,510 | 1,088,522 | (15,988 | ) | |
| Singapore Dollar, | ||||||
| Expiring | ||||||
| 1/29/2013 a | 1,280,000 | 1,049,865 | 1,047,774 | (2,091 | ) | |
| Sales: | Proceeds ($) | |||||
| Australian Dollar, | ||||||
| Expiring | ||||||
| 1/29/2013 a | 2,435,000 | 2,566,064 | 2,522,840 | 43,224 | ||
| Brazilian Real, | ||||||
| Expiring | ||||||
| 1/3/2013 a | 2,170,000 | 1,061,904 | 1,059,341 | 2,563 | ||
| British Pound, | ||||||
| Expiring: | ||||||
| 1/29/2013 a | 1,280,000 | 2,068,966 | 2,079,111 | (10,145 | ) | |
| 1/29/2013 e | 925,000 | 1,491,831 | 1,502,482 | (10,651 | ) | |
| 1/29/2013 f | 1,290,000 | 2,085,066 | 2,095,354 | (10,288 | ) | |
| 1/29/2013 g | 1,330,000 | 2,150,211 | 2,160,326 | (10,115 | ) | |
| Canadian Dollar, | ||||||
| Expiring | ||||||
| 1/29/2013 f | 6,745,000 | 6,859,031 | 6,776,662 | 82,369 | ||
| Chilean Peso, | ||||||
| Expiring | ||||||
| 1/29/2013 h | 595,890,000 | 1,249,900 | 1,239,401 | 10,499 | ||
| Danish Krone, | ||||||
| Expiring | ||||||
| 1/29/2013 b | 4,710,000 | 826,249 | 833,660 | (7,411 | ) | |
| Euro, | ||||||
| Expiring: | ||||||
| 1/2/2013 i | 2,470 | 3,264 | 3,260 | 4 | ||
| 1/29/2013 a | 4,755,000 | 6,226,910 | 6,277,999 | (51,089 | ) | |
| 1/29/2013 b | 3,210,000 | 4,200,291 | 4,238,144 | (37,853 | ) | |
| 1/29/2013 c | 5,445,000 | 7,105,888 | 7,189,001 | (83,113 | ) | |
| 1/29/2013 e | 2,990,000 | 3,909,755 | 3,947,679 | (37,924 | ) | |
| 1/29/2013 f | 4,420,000 | 5,790,067 | 5,835,700 | (45,633 | ) | |
| 1/29/2013 g | 5,350,000 | 7,005,183 | 7,063,574 | (58,391 | ) | |
| 1/29/2013 j | 3,960,000 | 5,173,780 | 5,228,365 | (54,585 | ) | |
42
| Foreign | Unrealized | |||||
| Forward Foreign Currency | Currency | Appreciation | ||||
| Exchange Contracts | Amounts | Proceeds ($) | Value ($) (Depreciation) ($) | |||
| Sales (continued): | ||||||
| Japanese Yen, | ||||||
| Expiring: | ||||||
| 1/29/2013 c | 117,230,000 | 1,402,658 | 1,353,483 | 49,175 | ||
| 1/29/2013 e | 153,530,000 | 1,833,090 | 1,772,586 | 60,504 | ||
| 1/29/2013 f | 145,075,000 | 1,744,319 | 1,674,969 | 69,350 | ||
| 1/29/2013 g | 145,045,000 | 1,746,899 | 1,674,622 | 72,277 | ||
| 1/29/2013 h | 103,960,000 | 1,251,901 | 1,200,274 | 51,627 | ||
| 1/29/2013 i | 174,475,000 | 2,100,628 | 2,014,407 | 86,221 | ||
| New Zealand Dollar, | ||||||
| Expiring | ||||||
| 1/29/2013 a | 2,920,000 | 2,434,077 | 2,408,408 | 25,669 | ||
| Norwegian Krone, | ||||||
| Expiring | ||||||
| 1/29/2013 b | 840,000 | 149,388 | 150,970 | (1,582 | ) | |
| Peruvian Nuevo Sol, | ||||||
| Expiring | ||||||
| 1/29/2013 k | 710,000 | 276,291 | 277,632 | (1,341 | ) | |
| South African Rand, | ||||||
| Expiring | ||||||
| 1/29/2013 f | 19,320,000 | 2,225,522 | 2,269,280 | (43,758 | ) | |
| Swedish Krona, | ||||||
| Expiring | ||||||
| 1/29/2013 b | 14,700,000 | 2,240,092 | 2,258,802 | (18,710 | ) | |
| Turkish Lira, | ||||||
| Expiring | ||||||
| 1/29/2013 d | 2,190,000 | 1,227,785 | 1,222,481 | 5,304 | ||
| Gross Unrealized | ||||||
| Appreciation | 620,316 | |||||
| Gross Unrealized | ||||||
| Depreciation | (502,221 | ) | ||||
| Counterparties: | |
| a | Goldman Sachs |
| b | Morgan Stanley |
| c | UBS |
| d | JP Morgan Chase & Co. |
| e | Commonwealth Bank of Australia |
| f | Credit Suisse First Boston |
| g | Deutsche Bank |
| h | Barclays Bank |
| i | Bank of America |
| j | Royal Bank of Scotland |
| k | Citigroup |
| The Fund | 43 |
NOTES TO FINANCIAL STATEMENTS (continued)
Swap Transactions:The fund enters into swap agreements to exchange the interest rate on, or return generated by, one nominal instrument for the return generated by another nominal instrument.The fund enters into these agreements to hedge certain market or interest rate risks, to manage the interest rate sensitivity (sometimes called duration) of fixed income securities, to provide a substitute for purchasing or selling particular securities or to increase potential returns.
The fund accrues for the interim payments on swap contracts on a daily basis, with the net amount recorded within unrealized appreciation (depreciation) on swap contracts in the Statement of Assets and Liabilities. Once the interim payments are settled in cash, the net amount is recorded as a realized gain (loss) on swaps, in addition to realized gain (loss) recorded upon the termination of swap contracts in the Statement of Operations. Upfront payments made and/or received by the fund, are recorded as an asset and/or liability in the Statement of Assets and Liabilities and are recorded as a realized gain or loss ratably over the contract’s term/event with the exception of forward starting interest rate swaps which are recorded as realized gains or losses on the termination date. Fluctuations in the value of swap contracts are recorded for financial statement purposes as unrealized appreciation or depreciation on swap transactions.
Interest Rate Swaps: Interest rate swaps involve the exchange of commitments to pay and receive interest based on a notional principal amount. The fund may elect to pay a fixed rate and receive a floating rate, or receive a fixed rate and pay a floating rate on a notional principal amount.The net interest received or paid on interest rate swap agreements is included within realized gain (loss) on swap contracts in the Statement of Operations. Interest rate swap agreements are subject to general market risk, liquidity risk, counterparty risk and interest rate risk.
The fund’s maximum risk of loss from counterparty credit risk is the discounted value of the cash flows to be received from the counterparty over the contract’s remaining life, to the extent that the amount is positive. This risk is mitigated by having a master netting arrangement
44
between the fund and the counterparty and by the posting of collateral by the counterparty to the fund to cover the fund’s exposure to the counterparty. The following summarizes open interest rate swaps entered into by the fund at December 31, 2012:
| Unrealized | |||||||
| Notional | Reference | (Pay)/Receive | Appreciation | ||||
| Amount ($) | Entity/Currency | Counterparty | Fixed Rate (%) | Expiration (Depreciation) ($) | |||
| 2,410,000 | USD—6 Month | ||||||
| Libor | Citibank | (3.68 | ) | 5/5/2020 | (413,053 | ) | |
| 10,100,000 | USD—6 Month | ||||||
| Libor | JP Morgan | (1.76 | ) | 11/8/2022 | (3,709 | ) | |
| 7,300,000 | USD—6 Month | ||||||
| Libor | Citibank | (0.84 | ) | 11/8/2022 | (18,661 | ) | |
| 3,100,000 | EUR—1 Year | ||||||
| Libor | JP Morgan | 1.91 | 11/4/2016 | 216,157 | |||
| Gross Unrealized | |||||||
| Appreciation | 216,157 | ||||||
| Gross Unrealized | |||||||
| Depreciation | (435,423 | ) | |||||
Credit Default Swaps: Credit default swaps involve commitments to pay a fixed interest rate in exchange for payment if a credit event affecting a third party (the referenced company, obligation or index) occurs. Credit events may include a failure to pay interest or principal, bankruptcy, or restructuring.The fund enters into these agreements to manage its exposure to the market or certain sectors of the market, to reduce its risk exposure to defaults of corporate and sovereign issuers, or to create exposure to corporate or sovereign issuers to which it is not otherwise exposed. For those credit default swaps in which the fund is paying a fixed rate, the fund is buying credit protection on the instrument. In the event of a credit event, the fund would receive the full notional amount for the reference obligation. For those credit default swaps in which the fund is receiving a fixed rate, the fund is selling credit protection on the underlying instrument.The maximum payouts for these contracts are limited to the notional amount of each swap. Credit default swaps may involve greater risks than if the fund had invested in the reference obligation directly and are subject to general market risk, liquidity risk, counterparty risk and credit risk.
| The Fund | 45 |
NOTES TO FINANCIAL STATEMENTS (continued)
The maximum potential amount of future payments (undiscounted) that a fund as a seller of protection could be required to make under a credit default swap agreement would be an amount equal to the notional amount of the agreement which may exceed the amount of unrealized appreciation or depreciation reflected in the Statement of Assets and Liabilities. Notional amounts of all credit default swap agreements are disclosed in the following chart, which summarizes open credit default swaps on index issues entered into by the fund. These potential amounts would be partially offset by any recovery values of the respective referenced obligations, underlying securities comprising the referenced index, upfront payments received upon entering into the agreement, or net amounts received from the settlement of buy protection credit default swap agreements entered into by the fund for the same referenced entity or entities. The following summarizes open credit default swaps entered into by the fund at December 31, 2012:
| Upfront | ||||||
| (Pay) | Implied | Premiums | ||||
| Reference | Notional | Receive | Credit | Market | Received | Unrealized |
| Obligation | Amount ($)2 | Fixed Rate (%) | Spread (%)3 | Value ($) | (Paid) ($) | (Depreciation) ($) |
| Purchase Contract:1 | ||||||
| Dow Jones | ||||||
| CDX.NA.HY.19 | ||||||
| Index | ||||||
| 12/20/2017 † | 2,100,000a | (5.00) | 4.87 | (15,326.99) | — | (15,327 |
| † | Expiration Date |
| Counterparty: | |
| a | JP Morgan |
| 1 | If the fund is a buyer of protection and a credit event occurs, as defined under the terms of the |
| swap agreement, the fund will either (i) receive from the seller of protection an amount equal to the | |
| notional amount of the swap and deliver the reference obligation or (ii) receive a settlement amount | |
| in the form of cash or securities equal to the notional amount of the swap less the recovery value of | |
| the reference obligation. | |
| 2 | The maximum potential amount the fund could be required to pay as a seller of credit protection |
| or receive as a buyer of credit protection if a credit event occurs as defined under the terms of the | |
| swap agreement. | |
| 3 | Implied credit spreads, represented in absolute terms, utilized in determining the market value as of |
| the period end serve as an indicator of the current status of the payment/performance risk and | |
| represent the likelihood of risk of default for the credit derivative.The credit spread of a particular | |
| referenced entity reflects the cost of buying/selling protection and may include upfront payments | |
| required to be made to enter into the agreement.Wider credit spreads represent a deterioration of | |
| the referenced entity’s credit soundness and a greater likelihood of risk of default or other credit | |
| event occurring as defined under the terms of the agreement.A credit spread identified as Defaulted | |
| indicates a credit event has occurred for the referenced entity. | |
46
GAAP requires disclosure for (i) the nature and terms of the credit derivative, reasons for entering into the credit derivative, the events or circumstances that would require the seller to perform under the credit derivative, and the current status of the payment/performance risk of the credit derivative, (ii) the maximum potential amount of future payments (undiscounted) the seller could be required to make under the credit derivative, (iii) the fair value of the credit derivative, and (iv) the nature of any recourse provisions and assets held either as collateral or by third parties.All required disclosures have been made and are incorporated within the current period as part of the Notes to the Statement of Investments and disclosures within this Note:
The following summarizes the average market value of derivatives outstanding during the period ended December 31, 2012:
| Average Market Value ($) | |
| Interest rate futures contracts | 48,417,399 |
| Interest rate options contracts | 16,526 |
| Foreign currency options contracts | 12,020 |
| Forward contracts | 79,320,255 |
The following summarizes the average notional value of swap contracts outstanding during the period ended December 31, 2012:
| Average Notional Value ($) | |
| Interest rate swap contracts | 9,089,239 |
| Credit default swap contracts | 161,538 |
At December 31, 2012, the cost of investments for federal income tax purposes was $99,511,790; accordingly, accumulated net unrealized appreciation on investments was $7,181,111, consisting of $7,531,370 gross unrealized appreciation and $350,259 gross unrealized depreciation.
NOTE 5—Plan of Reorganization:
On July 25-26, 2012, the Board, on behalf of both the fund and Dreyfus/Standish Global Fixed Income Fund (the “Acquiring Fund”), approved a Plan of Reorganization.The merger was approved by the
| The Fund | 47 |
NOTES TO FINANCIAL STATEMENTS (continued)
shareholders of the fund at a meeting held on November 15, 2012 and the merger occurred on January 25, 2013.The merger provided for the fund to transfer all of its assets, subject to its liabilities, to the Acquiring Fund in exchange for a number of Class I shares of the Acquiring Fund of equal value to the assets less liabilities of the fund. The Acquiring Fund’s Class I shares were distributed to the fund’s shareholders on a pro rata basis in liquidation of the fund.The fund was closed to new investors on August 27, 2012.
48
REPORT OF INDEPENDENT REGISTERED
PUBLIC ACCOUNTING FIRM
The Board of Trustees and Shareholders of Dreyfus/Standish International Fixed Income Fund
We have audited the accompanying statement of assets and liabilities of Dreyfus/Standish International Fixed Income Fund (the “Fund”), a series of Dreyfus Investment Funds, including the statements of investments and financial futures as of December 31, 2012, and the related statement of operations for the year then ended, the statement of changes in net assets for each of the years in the two-year period then ended, and the financial highlights for each of the years in the four-year period then ended.These financial statements and financial highlights are the responsibility of the Fund’s management. Our responsibility is to express an opinion on these financial statements and financial highlights based on our audits. The financial highlights for year ended December 31, 2008 were audited by other independent registered public accountants whose report thereon, dated February 27, 2009, expressed an unqualified opinion on those financial highlights.
We conducted our audits in accordance with the standards of the Public Company Accounting Oversight Board (United States).Those standards require that we plan and perform the audit to obtain reasonable assurance about whether the financial statements and financial highlights are free of material misstatement. An audit includes examining, on a test basis, evidence supporting the amounts and disclosures in the financial statements. Our procedures included confirmation of securities owned as of December 31, 2012, by correspondence with the custodian and brokers or by other appropriate auditing procedures where replies from brokers were not received.An audit also includes assessing the accounting principles used and significant estimates made by management, as well as evaluating the overall financial statement presentation.We believe that our audits provide a reasonable basis for our opinion.
In our opinion, the financial statements and financial highlights referred to above present fairly, in all material respects, the financial position of Dreyfus/Standish International Fixed Income Fund as of December 31, 2012, the results of its operations for the year then ended, the changes in its net assets for each of the years in the two-year period then ended, and the financial highlights for each of the years in the four-year period then ended, in conformity with U.S. generally accepted accounting principles.
![]()
New York, New York
February 28, 2013
| The Fund | 49 |
IMPORTANT TAX INFORMATION (Unaudited)
For federal tax purposes, the fund reports the maximum amount allowable but not less than 11.17% as interest-related dividends in accordance with Sections 871(k)(1) and 881(e) of the Internal Revenue Code.
50
BOARD MEMBERS INFORMATION (Unaudited)
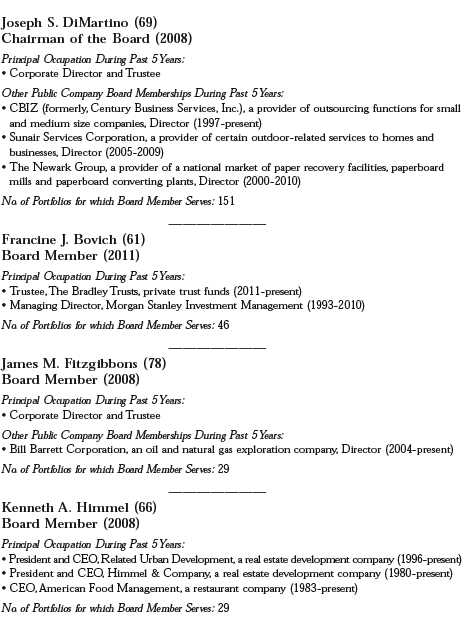
| The Fund | 51 |
BOARD MEMBERS INFORMATION (Unaudited) (continued)
52
OFFICERS OF THE FUND (Unaudited)
BRADLEY J. SKAPYAK, President since January 2010.
Chief Operating Officer and a director of the Manager since June 2009; from April 2003 to June 2009, Mr. Skapyak was the head of the Investment Accounting and Support Department of the Manager. He is an officer of 69 investment companies (comprised of 150 portfolios) managed by the Manager. He is 54 years old and has been an employee of the Manager since February 1988.
JANETTE E. FARRAGHER, Vice President and Secretary since December 2011.
Assistant General Counsel of BNY Mellon, and an officer of 70 investment companies (comprised of 177 portfolios) managed by the Manager. She is 50 years old and has been an employee of the Manager since February 1984.
KIESHA ASTWOOD, Vice President and Assistant Secretary since January 2010.
Counsel of BNY Mellon, and an officer of 70 investment companies (comprised of 177 portfolios) managed by the Manager. She is 39 years old and has been an employee of the Manager since July 1995.
JAMES BITETTO, Vice President and Assistant Secretary since December 2008.
Senior Counsel of BNY Mellon and Secretary of the Manager, and an officer of 70 investment companies (comprised of 177 portfolios) managed by the Manager. He is 46 years old and has been an employee of the Manager since December 1996.
JONI LACKS CHARATAN, Vice President and Assistant Secretary since December 2008.
Senior Counsel of BNY Mellon, and an officer of 70 investment companies (comprised of 177 portfolios) managed by the Manager. She is 57 years old and has been an employee of the Manager since October 1988.
JOSEPH M. CHIOFFI, Vice President and Assistant Secretary since December 2008.
Senior Counsel of BNY Mellon, and an officer of 70 investment companies (comprised of 177 portfolios) managed by the Manager. He is 51 years old and has been an employee of the Manager since June 2000.
JOHN B. HAMMALIAN, Vice President and Assistant Secretary since December 2008.
Senior Managing Counsel of BNY Mellon, and an officer of 70 investment companies (comprised of 177 portfolios) managed by the Manager. He is 49 years old and has been an employee of the Manager since February 1991.
ROBERT R. MULLERY, Vice President and Assistant Secretary since December 2008.
Managing Counsel of BNY Mellon, and an officer of 70 investment companies (comprised of 177 portfolios) managed by the Manager. He is 60 years old and has been an employee of the Manager since May 1986.
JEFF PRUSNOFSKY, Vice President and Assistant Secretary since December 2008.
Senior Managing Counsel of BNY Mellon, and an officer of 70 investment companies (comprised of 177 portfolios) managed by the Manager. He is 47 years old and has been an employee of the Manager since October 1990.
JAMES WINDELS, Treasurer since December 2008.
Director – Mutual Fund Accounting of the Manager, and an officer of 70 investment companies (comprised of 177 portfolios) managed by the Manager. He is 54 years old and has been an employee of the Manager since April 1985.
| The Fund | 53 |
OFFICERS OF THE FUND (Unaudited) (continued)
RICHARD CASSARO, Assistant Treasurer since December 2008.
Senior Accounting Manager – Money Market and Municipal Bond Funds of the Manager, and an officer of 70 investment companies (comprised of 177 portfolios) managed by the Manager. He is 53 years old and has been an employee of the Manager since September 1982.
GAVIN C. REILLY, Assistant Treasurer since December 2008.
Tax Manager of the Investment Accounting and Support Department of the Manager, and an officer of 70 investment companies (comprised of 177 portfolios) managed by the Manager. He is 44 years old and has been an employee of the Manager since April 1991.
ROBERT S. ROBOL, Assistant Treasurer since December 2008.
Senior Accounting Manager – Fixed Income Funds of the Manager, and an officer of 70 investment companies (comprised of 177 portfolios) managed by the Manager. He is 48 years old and has been an employee of the Manager since October 1988.
ROBERT SALVIOLO, Assistant Treasurer since December 2008.
Senior Accounting Manager – Equity Funds of the Manager, and an officer of 70 investment companies (comprised of 177 portfolios) managed by the Manager. He is 45 years old and has been an employee of the Manager since June 1989.
ROBERT SVAGNA, Assistant Treasurer since December 2008.
Senior Accounting Manager – Equity Funds of the Manager, and an officer of 70 investment companies (comprised of 177 portfolios) managed by the Manager. He is 45 years old and has been an employee of the Manager since November 1990.
JOSEPH W. CONNOLLY, Chief Compliance Officer since December 2008.
Chief Compliance Officer of the Manager and The Dreyfus Family of Funds (70 investment companies, comprised of 177 portfolios). He is 55 years old and has served in various capacities with the Manager since 1980, including manager of the firm’s Fund Accounting Department from 1997 through October 2001.
MATTHEW D. CONNOLLY, Anti-Money Laundering Compliance Officer since April 2012.
Anti-Money Laundering Compliance Officer of the Distributor since October 2011; from March 2010 to September 2011, Global Head, KYC Reviews and Director, UBS Investment Bank; until March 2010,AML Compliance Officer and Senior Vice President, Citi Global Wealth Management. He is an officer of 66 investment companies (comprised of 173 portfolios) managed by the Manager. He is 40 years old and has been an employee of the Distributor since October 2011.
54
NOTES
For More Information
| Ticker Symbol: Class I: SDIFX |
| Telephone Call your Financial Representative or 1-800-DREYFUS |
| Mail The Dreyfus Family of Funds, 144 Glenn Curtiss Boulevard, Uniondale, NY 11556-0144 |
| E-mail Send your request to info@dreyfus.com |
| Internet Information can be viewed online or downloaded at: http://www.dreyfus.com |
Item 2. Code of Ethics.
The Registrant has adopted a code of ethics that applies to the Registrant's principal executive officer, principal financial officer, principal accounting officer or controller, or persons performing similar functions. There have been no amendments to, or waivers in connection with, the Code of Ethics during the period covered by this Report.
Item 3. Audit Committee Financial Expert.
The Registrant's Board has determined that Joseph S. DiMartino, a member of the Audit Committee of the Board, is an audit committee financial expert as defined by the Securities and Exchange Commission (the "SEC"). Mr. DiMartino is "independent" as defined by the SEC for purposes of audit committee financial expert determinations.
Item 4. Principal Accountant Fees and Services.
(a) Audit Fees. The aggregate fees billed for each of the last two fiscal years (the "Reporting Periods") for professional services rendered by the Registrant's principal accountant (the "Auditor") for the audit of the Registrant's annual financial statements or services that are normally provided by the Auditor in connection with the statutory and regulatory filings or engagements for the Reporting Periods, were $103,210 in 2011 and $106,300 in 2012.
(b) Audit-Related Fees. The aggregate fees billed in the Reporting Periods for assurance and related services by the Auditor that are reasonably related to the performance of the audit of the Registrant's financial statements and are not reported under paragraph (a) of this Item 4 were $13,170 in 2011 and $13,560 in 2012. These services consisted of one or more of the following: (i) agreed upon procedures related to compliance with Internal Revenue Code section 817(h), (ii) security counts required by Rule 17f-2 under the Investment Company Act of 1940, as amended, (iii) advisory services as to the accounting or disclosure treatment of Registrant transactions or events and (iv) advisory services to the accounting or disclosure treatment of the actual or potential impact to the Registrant of final or proposed rules, standards or interpretations by the Securities and Exchange Commission, the Financial Accounting Standards Boards or other regulatory or standard-setting bodies.
The aggregate fees billed in the Reporting Periods for non-audit assurance and related services by the Auditor to the Registrant's investment adviser (not including any sub-investment adviser whose role is primarily portfolio management and is subcontracted with or overseen by another investment adviser), and any entity controlling, controlled by or under common control with the investment adviser that provides ongoing services to the Registrant ("Service Affiliates"), that were reasonably related to the performance of the annual audit of the Service Affiliate, which required pre-approval by the Audit Committee were $0 in 2011 and $0 in 2012.
(c) Tax Fees. The aggregate fees billed in the Reporting Periods for professional services rendered by the Auditor for tax compliance, tax advice, and tax planning ("Tax Services") were $7,650 in 2011and $7,890 in 2012. These services consisted of review or preparation of U.S. federal, state, local and excise tax returns. The aggregate fees billed in the Reporting Periods for Tax Services by the Auditor to Service Affiliates, which required pre-approval by the Audit Committee were $0 in 2011 and $0 in 2012.
(d) All Other Fees. The aggregate fees billed in the Reporting Periods for products and services provided by the Auditor, other than the services reported in paragraphs (a) through (c) of this Item, were $0 in 2011 and $0 in 2012.
The aggregate fees billed in the Reporting Periods for Non-Audit Services by the Auditor to Service Affiliates, other than the services reported in paragraphs (b) through (c) of this Item, which required pre-approval by the Audit Committee, were $0 in 2011 and $0 in 2012.
(e)(1) Audit Committee Pre-Approval Policies and Procedures. The Registrant's Audit Committee has established policies and procedures (the "Policy") for pre-approval (within specified fee limits) of the Auditor's engagements for non-audit services to the Registrant and Service Affiliates without specific case-by-case consideration. The pre-approved services in the Policy can include pre-approved audit services, pre-approved audit-related services, pre-approved tax services and pre-approved all other services. Pre-approval considerations include whether the proposed services are compatible with maintaining the Auditor's independence. Pre-approvals pursuant to the Policy are considered annually.
(e)(2) Note: None of the services described in paragraphs (b) through (d) of this Item 4 were approved by the Audit Committee pursuant to paragraph (c)(7)(i)(C) of Rule 2-01 of Regulation S-X.
(f) None of the hours expended on the principal accountant's engagement to audit the registrant's financial statements for the most recent fiscal year were attributed to work performed by persons other than the principal account's full-time, permanent employees.
Non-Audit Fees. The aggregate non-audit fees billed by the Auditor for services rendered to the Registrant, and rendered to Service Affiliates, for the Reporting Periods were $12,255,249 in 2011 and $12,372,510 in 2012.
Auditor Independence. The Registrant's Audit Committee has considered whether the provision of non-audit services that were rendered to Service Affiliates, which were not pre-approved (not requiring pre-approval), is compatible with maintaining the Auditor's independence.
Item 5. Audit Committee of Listed Registrants.
Not applicable.
Item 6. Investments.
(a) Not applicable.
Item 7. Disclosure of Proxy Voting Policies and Procedures for Closed-End Management Investment Companies.
Not applicable.
Item 8. Portfolio Managers of Closed-End Management Investment Companies.
Not applicable.
Item 9. Purchases of Equity Securities by Closed-End Management Investment Companies and Affiliated Purchasers.
Not applicable.
Item 10. Submission of Matters to a Vote of Security Holders.
There have been no material changes to the procedures applicable to Item 10.
Item 11. Controls and Procedures.
(a) The Registrant's principal executive and principal financial officers have concluded, based on their evaluation of the Registrant's disclosure controls and procedures as of a date within 90 days of the filing date of this report, that the Registrant's disclosure controls and procedures are reasonably designed to ensure that information required to be disclosed by the Registrant on Form N-CSR is recorded, processed, summarized and reported within the required time periods and that information required to be disclosed by the Registrant in the reports that it files or submits on Form N-CSR is accumulated and communicated to the Registrant's management, including its principal executive and principal financial officers, as appropriate to allow timely decisions regarding required disclosure.
(b) There were no changes to the Registrant's internal control over financial reporting that occurred during the second fiscal quarter of the period covered by this report that have materially affected, or are reasonably likely to materially affect, the Registrant's internal control over financial reporting.
Item 12. Exhibits.
(a)(1) Code of ethics referred to in Item 2.
(a)(2) Certifications of principal executive and principal financial officers as required by Rule 30a-2(a) under the Investment Company Act of 1940.
(a)(3) Not applicable.
(b) Certification of principal executive and principal financial officers as required by Rule 30a-2(b) under the Investment Company Act of 1940.
SIGNATURES
Pursuant to the requirements of the Securities Exchange Act of 1934 and the Investment Company Act of 1940, the Registrant has duly caused this Report to be signed on its behalf by the undersigned, thereunto duly authorized.
Dreyfus Investment Funds
By: /s/ Bradley J. Skapyak | |
Bradley J. Skapyak, President
| |
Date: | February 26, 2013 |
| |
Pursuant to the requirements of the Securities Exchange Act of 1934 and the Investment Company Act of 1940, this Report has been signed below by the following persons on behalf of the Registrant and in the capacities and on the dates indicated. | |
| |
By: /s/ Bradley J. Skapyak | |
Bradley J. Skapyak, President
| |
Date: | February 26, 2013 |
| |
By: /s/ James Windels | |
James Windels, Treasurer
| |
Date: | February 26, 2013 |
| |
EXHIBIT INDEX
(a)(1) Code of ethics referred to in Item 2.
(a)(2) Certifications of principal executive and principal financial officers as required by Rule 30a-2(a) under the Investment Company Act of 1940. (EX-99.CERT)
(b) Certification of principal executive and principal financial officers as required by Rule 30a-2(b) under the Investment Company Act of 1940. (EX-99.906CERT)