UNITED STATES
SECURITIES AND EXCHANGE COMMISSION
Washington, D.C. 20549
FORM N-CSR
CERTIFIED SHAREHOLDER REPORT OF REGISTERED MANAGEMENT
INVESTMENT COMPANIES
Investment Company Act file number | 811-04813 | |||||
|
| |||||
| Dreyfus Investment Funds |
| ||||
| (Exact name of Registrant as specified in charter) |
| ||||
|
|
| ||||
|
c/o The Dreyfus Corporation 200 Park Avenue New York, New York 10166 |
| ||||
| (Address of principal executive offices) (Zip code) |
| ||||
|
|
| ||||
| Janette Farragher, Esq. 200 Park Avenue New York, New York 10166 |
| ||||
| (Name and address of agent for service) |
| ||||
| ||||||
Registrant's telephone number, including area code: | (212) 922-6000 | |||||
|
| |||||
Date of fiscal year end:
| 12/31 |
| ||||
Date of reporting period: | 12/31/11 |
| ||||
The following N-CSR relates only to the Registrant’s series listed below and does not affect the other series of the Registrant, which have a different fiscal year end and, therefore, different N-CSR reporting requirements. Separate N-CSR Forms will be filed for those series, as appropriate.
Dreyfus/Standish Fixed Income Fund
Dreyfus/Standish Global Fixed Income Fund
Dreyfus/Standish International Fixed Income Fund
| Dreyfus/Standish |
| Fixed Income Fund |
ANNUAL REPORT December 31, 2011
The views expressed in this report reflect those of the portfolio manager only through the end of the period covered and do not necessarily represent the views of Dreyfus or any other person in the Dreyfus organization. Any such views are subject to change at any time based upon market or other conditions and Dreyfus disclaims any responsibility to update such views.These views may not be relied on as investment advice and, because investment decisions for a Dreyfus fund are based on numerous factors, may not be relied on as an indication of trading intent on behalf of any Dreyfus fund.
| Not FDIC-Insured • Not Bank-Guaranteed • May Lose Value |
Contents | |
THE FUND | |
| 2 | A Letter from the Chairman and CEO |
| 3 | Discussion of Fund Performance |
| 6 | Fund Performance |
| 7 | Understanding Your Fund’s Expenses |
| 7 | Comparing Your Fund’s Expenses With Those of Other Funds |
| 8 | Statement of Investments |
| 20 | Statement of Financial Futures |
| 20 | Statement of Options Written |
| 21 | Statement of Assets and Liabilities |
| 22 | Statement of Operations |
| 23 | Statement of Changes in Net Assets |
| 24 | Financial Highlights |
| 25 | Notes to Financial Statements |
| 44 | Report of Independent Registered Public Accounting Firm |
| 45 | Important Tax Information |
| 46 | Board Members Information |
| 48 | Officers of the Fund |
FOR MORE INFORMATION | |
Back Cover |
Dreyfus/Standish
Fixed Income Fund
The Fund

A LETTER FROM THE CHAIRMAN AND CEO
Dear Shareholder:
We are pleased to present this annual report for Dreyfus/Standish Fixed Income Fund, covering the 12-month period from January 1, 2011, through December 31, 2011. For information about how the fund performed during the reporting period, as well as general market perspectives, we provide a Discussion of Fund Performance on the pages that follow.
U.S. bond markets in 2011 were primarily driven by a “flight to quality” in which investors fled riskier assets due to adverse macroeconomic developments ranging from natural disasters in Japan to an unprecedented downgrade of long-term U.S. debt securities and the resurgence of a sovereign debt crisis in Europe. Ironically, despite the rating downgrade, long-term U.S.Treasury securities ended the year with double-digit total returns as investors flocked to traditional safe havens. Corporate-backed bonds also fared well, but to a lesser degree thanTreasuries, as investors sought competitive yields in a low interest-rate environment.
Our economic forecast calls for a mild acceleration of the U.S. recovery as the domestic banking system regains strength, credit conditions loosen and housing markets begin a long-awaited convalescence. In addition, we believe that long-term fundamentals currently appear to favor U.S. non-financial corporate credit, as well as emerging-markets local currency-denominated debt. Of course, we encourage you to talk with your financial adviser to help ensure that your investment objectives are properly aligned with your risk tolerance in pursuing potential market opportunities in 2012.
Thank you for your continued confidence and support.

Jonathan R. Baum
Chairman and Chief Executive Officer
The Dreyfus Corporation
January 17, 2012
2

DISCUSSION OF FUND PERFORMANCE
For the period of January 1, 2011, through December 31, 2011, as provided by David Bowser, CFA, and Peter Vaream, Portfolio Managers
Fund and Market Performance Overview
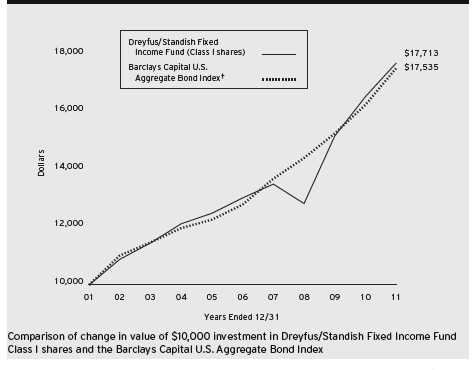
For the 12-month period ended December 31, 2011, Dreyfus/Standish Fixed Income Fund’s Class I shares achieved a total return of 7.10%.1 In comparison, the Barclays Capital U.S. Aggregate Bond Index (the “Index”), the fund’s benchmark, achieved a total return of 7.84% for the same period.2
U.S. government securities rallied strongly over much of 2011 when economic uncertainty intensified amid a subpar U.S. economic recovery and a sovereign debt crisis in Europe, sparking a flight to traditional safe havens among investors. In contrast, higher yielding sectors of the bond market produced more modest returns. The fund produced a lower return than its benchmark, primarily due to allocations to higher yielding bonds and a relatively short average duration at times during the year.
The Fund’s Investment Approach
The fund seeks to achieve a high level of current income, consistent with conserving principal and liquidity, and secondarily seeks capital appreciation when changes in interest rates and economic conditions indicate that capital appreciation may be available without significant risk to principal. To achieve this, the fund invests, under normal circumstances, at least 80% of net assets in fixed-income securities issued by U.S. and foreign governments and companies.
The fund invests primarily in investment-grade securities, but may invest up to 15% of assets in below investment-grade securities, sometimes referred to as junk bonds. The fund will not invest in securities rated lower than B at the time of purchase. In this instance, we will attempt to select fixed-income securities that have the potential to be upgraded.
Government Securities Rallied Amid Economic Uncertainty
Improvements in U.S. economic data supported prices of higher yielding bonds at the start of 2011, but investor confidence deteriorated in the spring when Greece appeared headed for default on its sovereign debt
| The Fund | 3 |
DISCUSSION OF FUND PERFORMANCE (continued)
and the crisis spread to other European nations. In addition, U.S. economic data proved more disappointing than expected, and investors reacted cautiously to a contentious political debate regarding U.S. government spending and borrowing.These developments sparked a shift away from riskier assets and toward traditional safe havens, causing U.S. government bond prices to rise and yields to fall. Market volatility proved especially severe in August and September after a major credit-rating agency reduced its assessment of long-term U.S. government debt. Ironically, U.S. government bonds gained considerable value during the ensuing flight to quality. In contrast, investment-grade and high yield corporate bonds suffered declines, erasing their earlier gains.
Economic data and investor confidence seemed to improve from October through December, when it became more apparent that the subpar U.S. economic expansion remained intact and the European Union seemed to make some progress in addressing the region’s problems. As a result, U.S. government securities gave back some of their previous gains. Corporate-backed securities rallied to a degree over the final months of the reporting period, enabling them to end the year with positive total returns, on average.
Constructive Investment Posture Dampened Relative Results
The fund’s results compared to the benchmark were undermined by our expectations of a more robust U.S. economy, which led us to establish overweighted positions in riskier market sectors, including high yield securities and dollar-denominated bonds issued by governments in the emerging markets. These securities generally lagged the strong returns provided by long-term U.S. government securities during the flight to quality. In addition, we had set the fund’s average duration in a position we considered slightly shorter than market averages in anticipation of potentially higher interest rates. However, this strategy prevented the fund from participating more fully in the remarkable gains of U.S. Treasury securities and, to a lesser extent, U.S. government agency securities.
The fund achieved better results from commercial mortgage-backed securities and asset-backed securities, which fared quite well during 2011. The fund also benefited from our security selection strategy among residential mortgage-backed securities, which favored higher coupon mortgages in an environment where prepayment activity remained low due to depressed home prices and tight lending standards.
4
Positioned for a Slow-Growth Environment
We currently expect the U.S. economic recovery to persist, but at a more sluggish pace than historical norms, as the concerns that weighed on investor sentiment in 2011 may be slow to recede. Nonetheless, we have maintained a mild emphasis on higher yielding securities, particularly residential mortgage-backed securities that are likely to benefit from the Federal Reserve Board’s efforts to stimulate the U.S. economy.We also have favored commercial mortgages, asset-backed securities and corporate credits that have little exposure to Europe’s troubles.The fund’s high yield holdings are concentrated among shorter-term securities toward the upper end of the sector’s credit-quality spectrum. In our view, these are prudent strategies until the economic outlook becomes clearer.
January 17, 2012
| Bond funds are subject generally to interest rate, credit, liquidity and market risks, to varying | |
| degrees, all of which are more fully described in the fund’s prospectus. Generally, all other factors | |
| being equal, bond prices are inversely related to interest-rate changes, and rate increases can cause | |
| price declines. | |
| Foreign bonds are subject to special risks including exposure to currency fluctuations, changing | |
| political and economic conditions, and potentially less liquidity.The fixed income securities of | |
| issuers located in emerging markets can be more volatile and less liquid than those of issuers in | |
| more mature economies. | |
| High yield bonds are subject to increased credit risk and are considered speculative in terms of the | |
| issuer’s perceived ability to continue making interest payments on a timely basis and to repay | |
| principal upon maturity. | |
| Investments in foreign currencies are subject to the risk that those currencies will decline in value | |
| relative to the U.S. dollar, or, in the case of hedged positions, that the U.S. dollar will decline | |
| relative to the currency being hedged. Each of these risks could increase the fund’s volatility. | |
| The fund may use derivative instruments, such as options, futures and options on futures, forward | |
| contracts, swaps (including credit default swaps on corporate bonds and asset-backed securities), | |
| options on swaps and other credit derivatives.A small investment in derivatives could have a | |
| potentially large impact on the fund’s performance. | |
| 1 | Total return includes reinvestment of dividends and any capital gains paid. Past performance is no |
| guarantee of future results. Share price, yield and investment return fluctuate such that upon | |
| redemption fund shares may be worth more or less than their original cost. Return figure provided | |
| reflects the absorption of certain fund expenses by The Dreyfus Corporation pursuant to a | |
| voluntary undertaking in effect has been terminated since the end of the reporting period. Had | |
| these expenses not been absorbed, the fund’s return would have been lower. | |
| 2 | SOURCE: LIPPER INC. — Reflects reinvestment of dividends and, where applicable, capital |
| gain distributions.The Barclays Capital U.S.Aggregate Bond (Hedged) Index is a widely | |
| accepted, unmanaged total return index of corporate, U.S. government and U.S. government | |
| agency debt instruments, mortgage-backed securities and asset-backed securities with an average | |
| maturity of 1-10 years.The Index does not include fees and expenses to which the fund is | |
| subject. Investors cannot invest directly in any index. |
| The Fund | 5 |
FUND PERFORMANCE
| Average Annual Total Returns as of 12/31/11 | ||||||
| 1Year | 5 Years | 10 Years | ||||
| Class I shares | 7.10% | 6.34% | 5.88% | |||
| Barclays Capital U.S. Aggregate Bond Index | 7.84% | 6.50% | 5.78% | |||
| † Source: Lipper Inc. |
| Past performance is not predictive of future performance.The fund’s performance shown in the graph and table does not |
| reflect the deduction of taxes that a shareholder would pay on fund distributions or the redemption of fund shares. |
| The above graph compares a $10,000 investment made in Class I shares of Dreyfus/Standish Fixed Income Fund on |
| 12/31/01 to a $10,000 investment made in the Barclays Capital U.S.Aggregate Bond Index (the “Index”) on that |
| date.All dividends and capital gain distributions are reinvested. |
| The fund’s performance shown in the line graph above takes into account all applicable fees and expenses.The Index is a |
| widely accepted, unmanaged total return index of corporate, U.S. government and U.S. government agency debt |
| instruments, mortgage-backed securities and asset-backed securities with an average maturity of 1-10 years. Unlike a |
| mutual fund, the Index is not subject to charges, fees and other expenses. Investors cannot invest directly in any index. |
| These factors can contribute to the Index potentially outperforming the fund. Further information relating to fund |
| performance, including expense reimbursements, if applicable, is contained in the Financial Highlights section of the |
| prospectus and elsewhere in this report. |
6
UNDERSTANDING YOUR FUND’S EXPENSES (Unaudited)
As a mutual fund investor, you pay ongoing expenses, such as management fees and other expenses. Using the information below, you can estimate how these expenses affect your investment and compare them with the expenses of other funds.You also may pay one-time transaction expenses, including sales charges (loads) and redemption fees, which are not shown in this section and would have resulted in higher total expenses. For more information, see your fund’s prospectus or talk to your financial adviser.
Review your fund’s expenses
The table below shows the expenses you would have paid on a $1,000 investment in Dreyfus/Standish Fixed Income Fund from July 1, 2011 to December 31, 2011. It also shows how much a $1,000 investment would be worth at the close of the period, assuming actual returns and expenses.
Expenses and Value of a $1,000 Investment
assuming actual returns for the six months ended December 31, 2011
| Expenses paid per $1,000† | $2.67 | |
| Ending value (after expenses) | $1,038.80 |
COMPARING YOUR FUND’S EXPENSES
WITH THOSE OF OTHER FUNDS (Unaudited)
Using the SEC’s method to compare expenses
The Securities and Exchange Commission (SEC) has established guidelines to help investors assess fund expenses. Per these guidelines, the table below shows your fund’s expenses based on a $1,000 investment, assuming a hypothetical 5% annualized return. You can use this information to compare the ongoing expenses (but not transaction expenses or total cost) of investing in the fund with those of other funds.All mutual fund shareholder reports will provide this information to help you make this comparison. Please note that you cannot use this information to estimate your actual ending account balance and expenses paid during the period.
Expenses and Value of a $1,000 Investment
assuming a hypothetical 5% annualized return for the six months ended December 31, 2011
| Expenses paid per $1,000† | $2.65 | |
| Ending value (after expenses) | $1,022.58 |
| † Expenses are equal to the fund’s annualized expense ratio of .52% for Class I, multiplied by the average account |
| value over the period, multiplied by 184/365 (to reflect the one-half year period). |
| The Fund | 7 |
| STATEMENT OF INVESTMENTS |
| December 31, 2011 |
| Coupon | Maturity | Principal | |||
| Bonds and Notes—122.9% | Rate (%) | Date | Amount ($)a | Value ($) | |
| Asset-Backed Certificates—.5% | |||||
| Santander Drive Auto Receivables | |||||
| Trust, Ser. 2011-1, Cl. C | 3.11 | 5/16/16 | 1,065,000 | 1,050,549 | |
| Asset-Backed Ctfs./ | |||||
| Auto Receivables—3.2% | |||||
| Americredit Automobile Receivables | |||||
| Trust, Ser. 2011-5, Cl. D | 5.05 | 12/8/17 | 1,095,000 | 1,101,298 | |
| Americredit Automobile Receivables | |||||
| Trust, Ser. 2010-1, Cl. C | 5.19 | 8/17/15 | 280,000 | 289,871 | |
| Americredit Prime Automobile | |||||
| Receivable, Ser. 2007-1, Cl. E | 6.96 | 3/8/16 | 894,110 | b | 895,095 |
| Carmax Auto Owner Trust, | |||||
| Ser. 2010-1, Cl. B | 3.75 | 12/15/15 | 200,000 | 205,992 | |
| Carmax Auto Owner Trust, | |||||
| Ser. 2010-2, Cl. B | 3.96 | 6/15/16 | 140,000 | 145,617 | |
| Chrysler Financial Auto | |||||
| Securitization Trust, | |||||
| Ser. 2010-A, Cl. C | 2.00 | 1/8/14 | 465,000 | 465,309 | |
| Ford Credit Floorplan Master Owner | |||||
| Trust, Ser. 2011-1, Cl. A2 | 0.88 | 2/15/16 | 425,000 | c | 424,769 |
| Franklin Auto Trust, | |||||
| Ser. 2008-A, Cl. B | 6.10 | 5/20/16 | 569,055 | b | 572,041 |
| JPMorgan Auto Receivables Trust, | |||||
| Ser. 2008-A, Cl. CFTS | 5.22 | 7/15/15 | 250,826 | b | 248,856 |
| Santander Drive Auto Receivables | |||||
| Trust, Ser. 2010-2, Cl. B | 2.24 | 12/15/14 | 280,000 | 279,363 | |
| Santander Drive Auto Receivables | |||||
| Trust, Ser. 2010-B, Cl. C | 3.02 | 10/17/16 | 835,000 | b | 827,125 |
| Santander Drive Auto Receivables | |||||
| Trust, Ser. 2010-3, Cl. C | 3.06 | 11/15/17 | 405,000 | 405,024 | |
| Smart Trust, | |||||
| Ser. 2011-1USA, Cl. A3B | 1.13 | 10/14/14 | 825,000 | b,c | 823,777 |
| 6,684,137 | |||||
| Asset-Backed Ctfs./Credit Cards—.5% | |||||
| Citibank Omni Master Trust, | |||||
| Ser. 2009-A14A, Cl. A14 | 3.03 | 8/15/18 | 1,000,000 | b,c | 1,049,719 |
| Asset-Backed Ctfs./ | |||||
| Home Equity Loans—.3% | |||||
| Bayview Financial Acquisition | |||||
| Trust, Ser. 2005-B, Cl. 1A6 | 5.21 | 4/28/39 | 116,492 | c | 111,453 |
8
| Coupon | Maturity | Principal | |||
| Bonds and Notes (continued) | Rate (%) | Date | Amount ($)a | Value ($) | |
| Asset-Backed Ctfs./ | |||||
| Home Equity Loans (continued) | |||||
| Carrington Mortgage Loan Trust, | |||||
| Ser. 2005-NC5, Cl. A2 | 0.61 | 10/25/35 | 253,932 | c | 234,047 |
| Citicorp Residential Mortgage | |||||
| Securities, Ser. 2006-1, Cl. A3 | 5.71 | 7/25/36 | 135,215 | c | 135,469 |
| Citicorp Residential Mortgage | |||||
| Securities, Ser. 2007-2, Cl. A2 | 5.98 | 6/25/37 | 103,596 | c | 103,703 |
| First Franklin Mortgage Loan Asset | |||||
| Backed Certificates, | |||||
| Ser. 2005-FF2, Cl. M1 | 0.69 | 3/25/35 | 66,125 | c | 65,805 |
| JP Morgan Mortgage Acquisition, | |||||
| Ser. 2006-CH2, Cl. AV2 | 0.34 | 10/25/36 | 19,405 | c | 19,249 |
| 669,726 | |||||
| Asset-Backed Ctfs./ | |||||
| Manufactured Housing—.5% | |||||
| Vanderbilt Mortgage Finance, | |||||
| Ser. 1999-A, Cl. 1A6 | 6.75 | 3/7/29 | 1,030,000 | c | 1,029,203 |
| Auto Loan—.4% | |||||
| Ford Motor Credit, | |||||
| Sr. Unscd. Notes | 5.00 | 5/15/18 | 780,000 | 783,973 | |
| Banks—3.4% | |||||
| Bank of America, | |||||
| Sr. Unscd. Notes, Ser. 1 | 3.75 | 7/12/16 | 400,000 | 370,745 | |
| Bank of America, | |||||
| Sr. Unscd. Notes | 5.00 | 5/13/21 | 1,225,000 | 1,117,800 | |
| Citigroup, | |||||
| Sr. Unscd. Notes | 4.50 | 1/14/22 | 505,000 | 486,788 | |
| Citigroup, | |||||
| Sr. Unscd. Notes | 5.38 | 8/9/20 | 520,000 | 535,618 | |
| Citigroup, | |||||
| Sr. Unscd. Notes | 5.50 | 4/11/13 | 1,040,000 | 1,062,084 | |
| Goldman Sachs Group, | |||||
| Sr. Unscd. Notes | 5.25 | 7/27/21 | 560,000 | 547,315 | |
| JPMorgan Chase & Co., | |||||
| Sr. Unscd. Notes | 6.00 | 1/15/18 | 425,000 | 474,770 | |
| JPMorgan Chase Bank, | |||||
| Sr. Unscd. Notes | 4.35 | 8/15/21 | 1,340,000 | 1,355,919 | |
| Morgan Stanley, | |||||
| Sr. Unscd. Notes | 5.50 | 7/28/21 | 435,000 | 402,944 | |
| The Fund | 9 |
STATEMENT OF INVESTMENTS (continued)
| Coupon | Maturity | Principal | |||
| Bonds and Notes (continued) | Rate (%) | Date | Amount ($)a | Value ($) | |
| Banks (continued) | |||||
| Morgan Stanley, | |||||
| Sr. Unscd. Notes | 5.55 | 4/27/17 | 840,000 | 811,359 | |
| 7,165,342 | |||||
| Commercial Mortgage | |||||
| Pass-Through Ctfs.—4.5% | |||||
| American Tower Trust, | |||||
| Ser. 2007-1A, Cl. D | 5.96 | 4/15/37 | 630,000 | b | 669,326 |
| American Tower Trust, | |||||
| Ser. 2007-1A, Cl. F | 6.64 | 4/15/37 | 1,280,000 | b | 1,363,467 |
| Bear Stearns Commercial Mortgage | |||||
| Securities, Ser. 2003-T12, Cl. A3 | 4.24 | 8/13/39 | 525,477 | c | 529,168 |
| CS First Boston Mortgage | |||||
| Securities, Ser. 2005-C4, Cl. AAB | 5.07 | 8/15/38 | 681,310 | c | 693,882 |
| Extended Stay America Trust, | |||||
| Ser. 2010-ESHA, Cl. A | 2.95 | 11/5/27 | 308,692 | b | 310,236 |
| GS Mortgage Securities Corporation | |||||
| II, Ser. 2007-EOP, Cl. B | 1.84 | 3/6/20 | 2,965,000 | b,c | 2,887,477 |
| GS Mortgage Securities Corporation | |||||
| II, Ser. 2007-EOP, Cl. E | 2.67 | 3/6/20 | 1,120,000 | b,c | 1,085,111 |
| GS Mortgage Securities Corporation | |||||
| II, Ser. 2007-EOP, Cl. K | 5.33 | 3/6/20 | 650,000 | b,c | 639,574 |
| JP Morgan Chase Commercial | |||||
| Mortgage Securities, | |||||
| Ser. 2011-C3, Cl. A4 | 4.72 | 2/15/46 | 1,185,000 | b | 1,307,070 |
| Merrill Lynch Mortgage Trust, | |||||
| Ser. 2005-LC1, Cl. A2 | 5.20 | 1/12/44 | 97,851 | c | 97,808 |
| Wachovia Bank Commercial Mortgage | |||||
| Trust, Ser. 2005-C16, Cl. A2 | 4.38 | 10/15/41 | 62,870 | 62,835 | |
| 9,645,954 | |||||
| Diversified Financial Services—4.6% | |||||
| American Express, | |||||
| Sr. Unscd. Notes | 7.25 | 5/20/14 | 240,000 | 268,175 | |
| Ameriprise Financial, | |||||
| Jr. Sub. Notes | 7.52 | 6/1/66 | 610,000 | c | 619,150 |
| Discover Financial Services, | |||||
| Sr. Unscd. Notes | 10.25 | 7/15/19 | 998,000 | 1,218,184 | |
| ERAC USA Finance, | |||||
| Gtd. Notes | 6.38 | 10/15/17 | 460,000 | b | 532,208 |
10
| Coupon | Maturity | Principal | |||
| Bonds and Notes (continued) | Rate (%) | Date | Amount ($)a | Value ($) | |
| Diversified Financial | |||||
| Services (continued) | |||||
| FUEL Trust, | |||||
| Scd. Notes | 4.21 | 4/15/16 | 660,000 | b | 666,250 |
| General Electric Capital, | |||||
| Sr. Unscd. Notes | 1.01 | 4/7/14 | 930,000 | c | 909,546 |
| General Electric Capital, | |||||
| Sr. Unscd. Notes | 4.38 | 9/21/15 | 360,000 | 387,593 | |
| General Electric Capital, | |||||
| Sr. Unscd. Notes | 6.88 | 1/10/39 | 965,000 | 1,159,989 | |
| Harley-Davidson Funding, | |||||
| Gtd. Notes | 5.75 | 12/15/14 | 1,145,000 | b | 1,236,961 |
| Hyundai Capital Services, | |||||
| Sr. Unscd. Notes | 4.38 | 7/27/16 | 400,000 | b | 408,363 |
| International Lease Finance, | |||||
| Sr. Unscd. Notes | 6.63 | 11/15/13 | 565,000 | e | 565,000 |
| Invesco, | |||||
| Gtd. Notes | 5.38 | 2/27/13 | 595,000 | 618,574 | |
| Merrill Lynch & Co., | |||||
| Sub. Notes | 5.70 | 5/2/17 | 1,205,000 | 1,107,894 | |
| 9,697,887 | |||||
| Electric Utilities—1.6% | |||||
| AES, | |||||
| Sr. Unscd. Notes | 8.00 | 10/15/17 | 490,000 | 541,450 | |
| Exelon Generation, | |||||
| Sr. Unscd. Notes | 5.20 | 10/1/19 | 660,000 | 726,170 | |
| National Grid, | |||||
| Sr. Unscd. Notes | 6.30 | 8/1/16 | 548,000 | 629,480 | |
| Nevada Power, | |||||
| Mortgage Notes | 6.50 | 8/1/18 | 240,000 | 289,812 | |
| Nisource Finance, | |||||
| Sr. Unscd. Notes | 4.45 | 12/1/21 | 555,000 | 568,221 | |
| Sempra Energy, | |||||
| Sr. Unscd. Notes | 6.50 | 6/1/16 | 565,000 | 659,715 | |
| 3,414,848 | |||||
| Environmental Control—.4% | |||||
| Waste Management, | |||||
| Sr. Unscd. Notes | 7.00 | 7/15/28 | 596,000 | 749,238 | |
| The Fund | 11 |
STATEMENT OF INVESTMENTS (continued)
| Coupon | Maturity | Principal | ||||
| Bonds and Notes (continued) | Rate (%) | Date | Amount ($)a | Value ($) | ||
| Food & Beverages—.2% | ||||||
| Kraft Foods, | ||||||
| Sr. Unscd. Notes | 6.88 | 2/1/38 | 325,000 | 431,849 | ||
| Foreign/Governmental—2.8% | ||||||
| Corp Andina De Formento, | ||||||
| Sr. Unscd. Notes | 3.75 | 1/15/16 | 590,000 | 602,041 | ||
| Mexican Government, | ||||||
| Bonds | MXN | 6.50 | 6/10/21 | 59,545,000 | 4,282,165 | |
| Province of Quebec Canada, | ||||||
| Unscd. Notes | 4.60 | 5/26/15 | 585,000 | e | 651,517 | |
| Republic of Korea, | ||||||
| Sr. Unscd. Notes | 7.13 | 4/16/19 | 360,000 | 450,993 | ||
| 5,986,716 | ||||||
| Health Care—1.4% | ||||||
| Amgen, | ||||||
| Sr. Unscd. Notes | 3.88 | 11/15/21 | 850,000 | 859,497 | ||
| Aristotle Holding, | ||||||
| Gtd. Notes | 4.75 | 11/15/21 | 570,000 | b | 590,979 | |
| Biomet, | ||||||
| Gtd. Notes | 10.00 | 10/15/17 | 390,000 | 423,150 | ||
| Gilead Sciences, | ||||||
| Sr. Unscd. Notes | 4.40 | 12/1/21 | 465,000 | 493,263 | ||
| HCA, | ||||||
| Notes | 6.25 | 2/15/13 | 550,000 | 563,750 | ||
| 2,930,639 | ||||||
| Materials—2.2% | ||||||
| Dow Chemical, | ||||||
| Sr. Unscd. Notes | 4.13 | 11/15/21 | 1,260,000 | 1,294,965 | ||
| Dow Chemical, | ||||||
| Sr. Unscd. Notes | 5.25 | 11/15/41 | 420,000 | 443,476 | ||
| Ecolab, | ||||||
| Sr. Unscd. Notes | 4.35 | 12/8/21 | 210,000 | 224,711 | ||
| Freeport-McMoRan Copper & Gold, | ||||||
| Sr. Unscd. Notes | 8.38 | 4/1/17 | 590,000 | 627,539 | ||
| Georgia-Pacific, | ||||||
| Gtd. Notes | 8.25 | 5/1/16 | 485,000 | b | 538,987 | |
| Holcim US Finance Sarl & Cie, | ||||||
| Gtd. Notes | 6.00 | 12/30/19 | 490,000 | b | 505,728 | |
| Peabody Energy, | ||||||
| Sr. Notes | 6.25 | 11/15/21 | 475,000 | b | 494,000 | |
12
| Coupon | Maturity | Principal | |||
| Bonds and Notes (continued) | Rate (%) | Date | Amount ($)a | Value ($) | |
| Materials (continued) | |||||
| Teck Resources, | |||||
| Gtd. Notes | 6.25 | 7/15/41 | 410,000 | 475,355 | |
| 4,604,761 | |||||
| Media—2.9% | |||||
| Cox Communications, | |||||
| Sr. Unscd. Notes | 6.25 | 6/1/18 | 575,000 | b | 670,502 |
| DirecTV Holdings, | |||||
| Gtd. Notes | 6.00 | 8/15/40 | 80,000 | 87,581 | |
| Dish DBS, | |||||
| Gtd. Notes | 6.75 | 6/1/21 | 295,000 | 319,337 | |
| Dish DBS, | |||||
| Gtd. Notes | 7.13 | 2/1/16 | 230,000 | 248,975 | |
| NBC Universal Media, | |||||
| Sr. Unscd. Notes | 4.38 | 4/1/21 | 600,000 | 634,414 | |
| NBC Universal Media, | |||||
| Sr. Unscd. Notes | 5.15 | 4/30/20 | 635,000 | 708,203 | |
| News America, | |||||
| Gtd. Notes | 6.15 | 3/1/37 | 720,000 | 789,659 | |
| News America, | |||||
| Gtd. Notes | 6.90 | 8/15/39 | 545,000 | 632,095 | |
| Pearson Dollar Finance Two, | |||||
| Gtd. Notes | 6.25 | 5/6/18 | 150,000 | b | 174,436 |
| TCI Communications, | |||||
| Sr. Unscd. Debs | 7.88 | 2/15/26 | 355,000 | 471,263 | |
| Time Warner, | |||||
| Gtd. Debs | 6.10 | 7/15/40 | 220,000 | 258,855 | |
| Time Warner, | |||||
| Gtd. Debs | 6.20 | 3/15/40 | 370,000 | 437,397 | |
| Time Warner Cable, | |||||
| Gtd. Notes | 5.50 | 9/1/41 | 535,000 | 565,894 | |
| Time Warner Cable, | |||||
| Gtd. Notes | 6.75 | 7/1/18 | 205,000 | 243,809 | |
| 6,242,420 | |||||
| Multi-Line Insurance—.4% | |||||
| American International Group, | |||||
| Sr. Unscd. Notes | 3.65 | 1/15/14 | 185,000 | e | 179,763 |
| American International Group, | |||||
| Sr. Unscd. Notes | 6.40 | 12/15/20 | 675,000 | 682,380 | |
| 862,143 | |||||
| The Fund | 13 |
STATEMENT OF INVESTMENTS (continued)
| Coupon | Maturity | Principal | ||
| Bonds and Notes (continued) | Rate (%) | Date | Amount ($)a | Value ($) |
| Municipal Bonds—.9% | ||||
| California, | ||||
| GO (Build America Bonds) | 7.30 | 10/1/39 | 610,000 | 721,892 |
| Illinois, | ||||
| GO | 4.42 | 1/1/15 | 350,000 | 363,303 |
| New York City, | ||||
| GO (Build America Bonds) | 5.99 | 12/1/36 | 630,000 | 754,249 |
| 1,839,444 | ||||
| Office And Business Equipment—.3% | ||||
| Xerox, | ||||
| Sr. Unscd. Notes | 5.50 | 5/15/12 | 235,000 | 238,918 |
| Xerox, | ||||
| Sr. Unscd. Notes | 5.65 | 5/15/13 | 335,000 | 351,798 |
| 590,716 | ||||
| Oil & Gas—2.4% | ||||
| Anadarko Petroleum, | ||||
| Sr. Unscd. Notes | 6.38 | 9/15/17 | 985,000 | 1,143,135 |
| Chesapeake Energy, | ||||
| Gtd. Notes | 6.63 | 8/15/20 | 760,000 | 818,900 |
| EQT, | ||||
| Sr. Unscd. Notes | 8.13 | 6/1/19 | 550,000 | 646,054 |
| Hess, | ||||
| Sr. Unscd. Notes | 5.60 | 2/15/41 | 310,000 | 347,663 |
| Pemex Project Funding Master | ||||
| Trust, Gtd. Bonds | 6.63 | 6/15/35 | 610,000 | 697,687 |
| Petrobras International Finance, | ||||
| Gtd. Notes | 5.38 | 1/27/21 | 305,000 | 321,958 |
| Petrobras International Finance, | ||||
| Gtd. Notes | 6.75 | 1/27/41 | 260,000 | 300,075 |
| Petro-Canada, | ||||
| Sr. Unscd. Notes | 6.80 | 5/15/38 | 210,000 | 272,087 |
| Valero Energy, | ||||
| Gtd. Notes | 6.13 | 2/1/20 | 500,000 | 557,060 |
| 5,104,619 | ||||
| Paper & Paper Related—.3% | ||||
| International Paper, | ||||
| Sr. Unscd. Notes | 4.75 | 2/15/22 | 500,000 | 532,526 |
14
| Coupon | Maturity | Principal | ||
| Bonds and Notes (continued) | Rate (%) | Date | Amount ($)a | Value ($) |
| Pipelines—1.7% | ||||
| El Paso, | ||||
| Sr. Unscd. Notes | 7.25 | 6/1/18 | 500,000 | 549,949 |
| Enterprise Products Operating, | ||||
| Gtd. Notes | 5.95 | 2/1/41 | 905,000 | 1,018,079 |
| Kinder Morgan Energy Partners, | ||||
| Sr. Unscd. Notes | 6.55 | 9/15/40 | 605,000 | 680,052 |
| Plains All American Pipeline, | ||||
| Gtd. Notes | 5.00 | 2/1/21 | 550,000 | 606,995 |
| Plains All American Pipeline, | ||||
| Gtd. Notes | 5.75 | 1/15/20 | 610,000 | 681,897 |
| 3,536,972 | ||||
| Property & Casualty Insurance—2.8% | ||||
| AON, | ||||
| Sr. Unscd. Notes | 3.50 | 9/30/15 | 460,000 | 472,446 |
| Cincinnati Financial, | ||||
| Sr. Unscd. Notes | 6.13 | 11/1/34 | 563,000 | 561,980 |
| Cincinnati Financial, | ||||
| Sr. Unscd. Debs | 6.92 | 5/15/28 | 789,000 | 863,139 |
| MetLife, | ||||
| Sr. Unscd. Notes | 5.00 | 6/15/15 | 235,000 | 256,211 |
| Principal Financial Group, | ||||
| Gtd. Notes | 8.88 | 5/15/19 | 575,000 | 716,910 |
| Prudential Financial, | ||||
| Sr. Unscd. Notes | 5.38 | 6/21/20 | 1,040,000 | 1,114,941 |
| Willis North America, | ||||
| Gtd. Notes | 6.20 | 3/28/17 | 810,000 | 891,608 |
| Willis North America, | ||||
| Gtd. Notes | 7.00 | 9/29/19 | 910,000 | 1,014,514 |
| 5,891,749 | ||||
| Real Estate—2.0% | ||||
| DDR, | ||||
| Sr. Unscd. Notes | 4.75 | 4/15/18 | 545,000 | 522,156 |
| Duke Realty, | ||||
| Sr. Unscd. Notes | 6.75 | 3/15/20 | 55,000 | 60,441 |
| Duke Realty, | ||||
| Sr. Unscd. Notes | 8.25 | 8/15/19 | 510,000 | 600,133 |
| The Fund | 15 |
STATEMENT OF INVESTMENTS (continued)
| Coupon | Maturity | Principal | |||
| Bonds and Notes (continued) | Rate (%) | Date | Amount ($)a | Value ($) | |
| Real Estate (continued) | |||||
| Federal Realty Investment Trust, | |||||
| Sr. Unscd. Notes | 6.00 | 7/15/12 | 380,000 | 386,649 | |
| Mack-Cali Realty, | |||||
| Sr. Unscd. Notes | 5.13 | 1/15/15 | 196,000 | 205,754 | |
| Mack-Cali Realty, | |||||
| Sr. Unscd. Notes | 5.25 | 1/15/12 | 340,000 | 340,256 | |
| Regency Centers, | |||||
| Gtd. Notes | 5.25 | 8/1/15 | 187,000 | 199,438 | |
| Regency Centers, | |||||
| Gtd. Notes | 5.88 | 6/15/17 | 330,000 | 359,790 | |
| Simon Property Group, | |||||
| Sr. Unscd. Notes | 6.75 | 2/1/40 | 745,000 | 976,224 | |
| WEA Finance, | |||||
| Gtd. Notes | 7.13 | 4/15/18 | 445,000 | b | 497,979 |
| WEA Finance, | |||||
| Gtd. Notes | 7.50 | 6/2/14 | 245,000 | b | 268,728 |
| 4,417,548 | |||||
| Residential Mortgage | |||||
| Pass-Through Ctfs.—.8% | |||||
| Banc of America Mortgage | |||||
| Securities, Ser. 2005-2, Cl. 2A1 | 5.00 | 3/25/20 | 307,017 | 307,394 | |
| Countrywide Alternative Loan | |||||
| Trust, Ser. 2004-16CB, Cl. 2A2 | 5.00 | 8/25/19 | 901,483 | 912,862 | |
| CS First Boston Mortgage | |||||
| Securities, Ser. 2004-7, Cl. 6A1 | 5.25 | 10/25/19 | 366,972 | 370,976 | |
| 1,591,232 | |||||
| Retail—1.7% | |||||
| Autozone, | |||||
| Sr. Unscd. Notes | 5.75 | 1/15/15 | 560,000 | 620,351 | |
| CVS Pass-Through Trust, | |||||
| Pass Thru Certificates Notes | 8.35 | 7/10/31 | 1,411,677 | b | 1,732,205 |
| Home Depot, | |||||
| Sr. Unscd. Notes | 5.95 | 4/1/41 | 415,000 | 537,523 | |
| Staples, | |||||
| Gtd. Notes | 9.75 | 1/15/14 | 570,000 | 652,085 | |
| 3,542,164 | |||||
| Telecommunications—.8% | |||||
| Cellco Partnership/Verizon | |||||
| Wireless Capital, Sr. Unscd. Notes | 5.55 | 2/1/14 | 565,000 | 614,154 | |
16
| Coupon | Maturity | Principal | ||||
| Bonds and Notes (continued) | Rate (%) | Date | Amount ($)a | Value ($) | ||
| Telecommunications (continued) | ||||||
| Verizon Communications, | ||||||
| Sr. Unscd. Notes | 3.50 | 11/1/21 | 395,000 | 412,098 | ||
| Verizon Communications, | ||||||
| Sr. Unscd. Notes | 4.75 | 11/1/41 | 350,000 | 378,229 | ||
| Verizon Communications, | ||||||
| Sr. Unscd. Notes | 7.35 | 4/1/39 | 280,000 | 392,814 | ||
| 1,797,295 | ||||||
| Tobacco—.9% | ||||||
| Altria Group, | ||||||
| Gtd. Notes | 10.20 | 2/6/39 | 1,185,000 | 1,849,602 | ||
| Transportation-Rail—.2% | ||||||
| CSX, | ||||||
| Sr. Unscd. Notes | 4.75 | 5/30/42 | 510,000 | 528,368 | ||
| U.S. Government Agencies/ | ||||||
| Mortgage-Backed—34.4% | ||||||
| Federal Home Loan Mortgage Corp.: | ||||||
| 4.00% | 10,325,000f,g | 10,831,570 | ||||
| 5.00%, 1/1/40—9/1/40 | 1,525,918f | 1,663,837 | ||||
| 5.50%, 1/1/34—9/1/40 | 1,137,754f | 1,242,092 | ||||
| 7.00%, 11/1/31 | 116,640f | 134,013 | ||||
| Federal National Mortgage Association: | ||||||
| 3.50% | 1,090,000f,g | 1,121,338 | ||||
| 4.00% | 17,925,000f,g | 18,835,255 | ||||
| 4.50% | 835,000f,g | 888,753 | ||||
| 5.00% | 10,235,000f,g | 11,051,300 | ||||
| 5.50% | 10,350,000f,g | 11,234,780 | ||||
| 6.00% | 4,750,000f,g | 5,230,939 | ||||
| 4.50%, 11/1/14 | 3,856f | 4,113 | ||||
| 5.00%, 1/1/19—9/1/40 | 798,723f | 870,181 | ||||
| 5.50%, 2/1/33—8/1/40 | 6,040,934f | 6,631,366 | ||||
| 6.00%, 1/1/38 | 837,066f | 925,699 | ||||
| 7.00%, 11/1/31—6/1/32 | 16,361f | 18,985 | ||||
| 7.50%, 2/1/29—11/1/29 | 3,389f | 3,981 | ||||
| Government National | ||||||
| Mortgage Association I: | ||||||
| 4.00% | 2,115,000g | 2,262,719 | ||||
| 6.00%, 1/15/32 | 1,420 | 1,616 | ||||
| 6.50%, 7/15/32 | 2,147 | 2,490 | ||||
| 8.00%, 5/15/26 | 1,945 | 2,241 | ||||
| 72,957,268 | ||||||
| The Fund | 17 |
STATEMENT OF INVESTMENTS (continued)
| Principal | ||||
| Bonds and Notes (continued) | Amount ($)a | Value ($) | ||
| U.S. Government Securities—43.9% | ||||
| U.S. Treasury Bonds: | ||||
| 3.88%, 8/15/40 | 4,915,000 | e | 5,892,623 | |
| 6.13%, 11/15/27 | 445,000 | 661,451 | ||
| U.S. Treasury Notes: | ||||
| 1.00%, 4/30/12 | 6,875,000 | e | 6,897,557 | |
| 1.13%, 1/15/12 | 29,770,000 | e | 29,785,123 | |
| 1.38%, 9/15/12 | 18,725,000 | e | 18,892,514 | |
| 1.75%, 4/15/13 | 625,000 | e | 637,500 | |
| 2.13%, 5/31/15 | 12,870,000 | e | 13,588,918 | |
| 3.63%, 5/15/13 | 15,940,000 | e | 16,682,214 | |
| 93,037,900 | ||||
| Total Bonds and Notes | ||||
| (cost $254,381,364) | 260,216,507 | |||
| Face Amount | ||||
| Covered by | ||||
| Options Purchased—.0% | Contracts ($) | Value ($) | ||
| Call Options; | ||||
| 5-Year USD LIBOR-BBA, | ||||
| February 2012 @ $1.43 | ||||
| (cost $86,284) | 11,660,000 | h | 111,429 | |
| Principal | ||||
| Short-Term Investments—3.4% | Amount ($) | Value ($) | ||
| U.S. Treasury Bills: | ||||
| 0.03%, 1/12/12 | 7,105,000 | 7,104,979 | ||
| 0.02%, 5/17/12 | 40,000 | d | 39,995 | |
| Total Short-Term Investments | ||||
| (cost $7,145,061) | 7,144,974 | |||
| Other Investment—1.8% | Shares | Value ($) | ||
| Registered Investment Company; | ||||
| Dreyfus Institutional Preferred | ||||
| Plus Money Market Fund | ||||
| (cost $3,759,606) | 3,759,606 | i | 3,759,606 | |
18
| Investment of Cash Collateral | ||||
| for Securities Loaned—5.1% | Shares | Value ($) | ||
| Registered Investment Company; | ||||
| Dreyfus Institutional Cash Advantage Fund | ||||
| (cost $10,733,429) | 10,733,429i | 10,733,429 | ||
| Total Investments (cost $276,105,744) | 133.2% | 281,965,945 | ||
| Liabilities, Less Cash and Receivables | (33.2%) | (70,249,493) | ||
| Net Assets | 100.0% | 211,716,452 | ||
| BBA—British Bankers Association |
| LIBOR—London Interbank Offered Rate |
| USD—U.S. Dollar |
| a Principal amount stated in U.S. Dollars unless otherwise noted. |
| MXN—Mexican New Peso |
| b Securities exempt from registration under Rule 144A of the Securities Act of 1933.These securities may be resold in |
| transactions exempt from registration, normally to qualified institutional buyers.At December 31, 2011, these |
| securities were valued at $20,996,200 or 9.9% of net assets. |
| c Variable rate security—interest rate subject to periodic change. |
| d Held by a broker as collateral for open financial futures positions. |
| e Security, or portion thereof, on loan.At December 31, 2011, the value of the fund’s securities on loan was |
| $35,044,502 and the market value of the collateral held by the fund was $35,951,807, consisting of cash collateral |
| of $10,733,429 and U.S. Government securities valued at $25,218,378. |
| f The Federal Housing Finance Agency (“FHFA”) placed Federal Home Loan Mortgage Corporation and Federal |
| National Mortgage Association into conservatorship with FHFA as the conservator.As such, the FHFA oversees the |
| continuing affairs of these companies. |
| g Purchased on a forward commitment basis. |
| h Non-income producing security. |
| i Investment in affiliated money market mutual fund. |
| Portfolio Summary (Unaudited)† | |||
| Value (%) | Value (%) | ||
| U.S. Government & Agencies | 78.3 | Foreign/Governmental | 2.8 |
| Corporate Bonds | 30.6 | Municipal Bonds | .9 |
| Asset/Mortgage-Backed | 10.3 | Options Purchased | .0 |
| Short-Term/ | |||
| Money Market Investments | 10.3 | 133.2 | |
| † Based on net assets. | |||
| See notes to financial statements. | |||
| The Fund | 19 |
| STATEMENT OF FINANCIAL FUTURES |
| December 31, 2011 |
| Market Value | Unrealized | |||||
| Covered by | (Depreciation) | |||||
| Contracts | Contracts ($) | Expiration | at 12/31/2011 | ($) | ||
| Financial Futures Short | ||||||
| U.S. Treasury 10 Year Notes | 20 | (2,622,500 | ) | March 2012 | (12,213 | ) |
| See notes to financial statements. | ||||||
| STATEMENT OF OPTIONS WRITTEN |
| December 31, 2011 |
| Face Amount | ||||
| Covered by | ||||
| Contracts ($) | Value ($) | |||
| Call Options: | ||||
| 10-Year USD LIBOR-BBA, | ||||
| February 2012 @ $2.15 | ||||
| (premiums received $86,284) | 6,115,000 | a | (108,243 | ) |
| BBA—British Bankers Association |
| LIBOR—London Interbank Offered Rate |
| USD—U.S. Dollar |
| a Non-income producing security. |
| See notes to financial statements. |
20
| STATEMENT OF ASSETS AND LIABILITIES |
| December 31, 2011 |
| Cost | Value | ||
| Assets ($): | |||
| Investments in securities—See Statement of Investments (including | |||
| securities on loan, valued at $35,044,502)—Note 1(c): | |||
| Unaffiliated issuers | 261,612,709 | 267,472,910 | |
| Affiliated issuers | 14,493,035 | 14,493,035 | |
| Cash | 39,791 | ||
| Cash denominated in foreign currencies | 141,573 | 140,219 | |
| Dividends, interest and securities lending income receivable | 1,588,345 | ||
| Prepaid expenses | 8,563 | ||
| 283,742,863 | |||
| Liabilities ($): | |||
| Due to The Dreyfus Corporation and affiliates—Note 3(c) | 95,234 | ||
| Due to Administrator—Note 3(a) | 11,169 | ||
| Payable for investment securities purchased | 60,991,085 | ||
| Liability for securities on loan—Note 1(c) | 10,733,429 | ||
| Outstanding options written, at value (premiums received | |||
| $86,284)—See Statement of Options Written—Note 4 | 108,243 | ||
| Payable for shares of Beneficial Interest redeemed | 42,514 | ||
| Payable for futures variation margin—Note 4 | 5,625 | ||
| Accrued expenses | 39,112 | ||
| 72,026,411 | |||
| Net Assets ($) | 211,716,452 | ||
| Composition of Net Assets ($): | |||
| Paid-in capital | 214,099,732 | ||
| Accumulated undistributed investment income—net | 843,233 | ||
| Accumulated net realized gain (loss) on investments | (9,051,156) | ||
| Accumulated net unrealized appreciation (depreciation) on | |||
| investments [including ($12,213) net unrealized | |||
| (depreciation) on financial futures] | 5,824,643 | ||
| Net Assets ($) | 211,716,452 | ||
| Class I Shares Outstanding | |||
| (unlimited number of $.001 par value shares of Beneficial Interest authorized) | 9,837,744 | ||
| Net Asset Value, offering and redemption price per share ($) | 21.52 | ||
| See notes to financial statements. | |||
| The Fund | 21 |
| STATEMENT OF OPERATIONS |
| Year Ended December 31, 2011 |
| Investment Income ($): | ||
| Income: | ||
| Interest | 7,563,236 | |
| Dividends; | ||
| Affiliated issuers | 4,697 | |
| Income from securities lending—Note 1(c) | 13,125 | |
| Total Income | 7,581,058 | |
| Expenses: | ||
| Investment advisory fee—Note 3(a) | 909,886 | |
| Administration fees—Note 3(a) | 89,041 | |
| Professional fees | 62,545 | |
| Custodian fees—Note 3(c) | 50,842 | |
| Registration fees | 25,985 | |
| Shareholder servicing costs—Note 3(c) | 25,398 | |
| Administrative service fees—Note 3(b) | 19,251 | |
| Accounting and administration fees—Note 3(a) | 15,000 | |
| Prospectus and shareholders’ reports | 11,235 | |
| Trustees’ fees and expenses—Note 3(d) | 9,901 | |
| Loan commitment fees—Note 2 | 3,787 | |
| Miscellaneous | 59,386 | |
| Total Expenses | 1,282,257 | |
| Less—reduction in investment advisory fee | ||
| due to undertaking—Note 3(a) | (38,850) | |
| Less—reduction in fees due to earnings credits—Note 3(c) | (11) | |
| Net Expenses | 1,243,396 | |
| Investment Income—Net | 6,337,662 | |
| Realized and Unrealized Gain (Loss) on Investments—Note 4 ($): | ||
| Net realized gain (loss) on investments and foreign currency transactions | 11,257,762 | |
| Net realized gain (loss) on options transactions | 99,058 | |
| Net realized gain (loss) on financial futures | (568,721) | |
| Net realized gain (loss) on forward foreign currency exchange contracts | 219,072 | |
| Net Realized Gain (Loss) | 11,007,171 | |
| Net unrealized appreciation (depreciation) on | ||
| investments and foreign currency transactions | (1,298,848) | |
| Net unrealized appreciation (depreciation) on options transactions | (29,445) | |
| Net unrealized appreciation (depreciation) on financial futures | (354,472) | |
| Net unrealized appreciation (depreciation) on | ||
| forward foreign currency exchange contracts | 11,678 | |
| Net Unrealized Appreciation (Depreciation) | (1,671,087) | |
| Net Realized and Unrealized Gain (Loss) on Investments | 9,336,084 | |
| Net Increase in Net Assets Resulting from Operations | 15,673,746 | |
| See notes to financial statements. | ||
22
STATEMENT OF CHANGES IN NET ASSETS
| Year Ended December 31, | ||||
| 2011 | 2010 | |||
| Operations ($): | ||||
| Investment income—net | 6,337,662 | 9,477,254 | ||
| Net realized gain (loss) on investments | 11,007,171 | 9,430,732 | ||
| Net unrealized appreciation | ||||
| (depreciation) on investments | (1,671,087) | 2,969,578 | ||
| Net Increase (Decrease) in Net Assets | ||||
| Resulting from Operations | 15,673,746 | 21,877,564 | ||
| Dividends to Shareholders from ($): | ||||
| Investment income—net | (6,666,113) | (10,023,757) | ||
| Beneficial Interest Transactions ($): | ||||
| Net proceeds from shares sold | 44,852,359 | 50,296,437 | ||
| Dividends reinvested | 6,083,801 | 8,875,032 | ||
| Cost of shares redeemed | (89,960,363) | (74,461,285) | ||
| Increase (Decrease) in Net Assets from | ||||
| Beneficial Interest Transactions | (39,024,203) | (15,289,816) | ||
| Total Increase (Decrease) in Net Assets | (30,016,570) | (3,436,009) | ||
| Net Assets ($): | ||||
| Beginning of Period | 241,733,022 | 245,169,031 | ||
| End of Period | 211,716,452 | 241,733,022 | ||
| Undistributed investment income—net | 843,233 | 1,057,913 | ||
| Capital Share Transactions (Shares): | ||||
| Shares sold | 2,113,586 | 2,434,833 | ||
| Shares issued for dividends reinvested | 288,276 | 430,086 | ||
| Shares redeemed | (4,234,315) | (3,582,058) | ||
| Net Increase (Decrease) in Shares Outstanding | (1,832,453) | (717,139) | ||
| See notes to financial statements. | ||||
| The Fund | 23 |
FINANCIAL HIGHLIGHTS
The following table describes the performance for the fiscal periods indicated. Total return shows how much your investment in the fund would have increased (or decreased) during each period, assuming you had reinvested all dividends and distributions.These figures have been derived from the fund’s financial statements.
| Year Ended December 31, | ||||||||||
| Class I Shares | 2011 | 2010 | 2009a | 2008 | 2007 | |||||
| Per Share Data ($): | ||||||||||
| Net asset value, beginning of period | 20.71 | 19.79 | 17.52 | 19.31 | 19.61 | |||||
| Investment Operations: | ||||||||||
| Investment income—netb | .59 | .77 | .85 | .88 | .96 | |||||
| Net realized and unrealized | ||||||||||
| gain (loss) on investments | .86 | .99 | 2.29 | (1.81) | (.26) | |||||
| Total from Investment Operations | 1.45 | 1.76 | 3.14 | (.93) | .70 | |||||
| Distributions: | ||||||||||
| Dividends from investment income—net | (.64) | (.84) | (.87) | (.86) | (1.00) | |||||
| Net asset value, end of period | 21.52 | 20.71 | 19.79 | 17.52 | 19.31 | |||||
| Total Return (%) | 7.10 | 8.99 | 18.32 | (5.00) | 3.64 | |||||
| Ratios/Supplemental Data (%): | ||||||||||
| Ratio of total expenses | ||||||||||
| to average net assets | .56 | .54 | .60 | .52 | .51c | |||||
| Ratio of net expenses | ||||||||||
| to average net assets | .55 | .50 | .50 | .50 | .50 | |||||
| Ratio of net investment income | ||||||||||
| to average net assets | 2.79 | 3.74 | 4.62 | 4.72 | 4.93 | |||||
| Portfolio Turnover Rated | 400.34 | 328.76 | 361.73 | 443 | 430e | |||||
| Net Assets, end of period ($ x 1,000) | 211,716 | 241,733 | 245,169 | 310,742 | 565,572 | |||||
| a Effective September 1, 2009, the fund’s shares were redesignated as Class I shares. |
| b Based on average shares outstanding at each month end. |
| c Includes the fund’s share of the The Standish Mellon Fixed Income Portfolio’s (the Portfolio) allocated expenses. |
| d The portfolio turnover rates excluding mortgage dollar roll transactions for the periods ended December 31, 2011, |
| 2010, 2009, 2008 and 2007 were 281.77%, 130.16%, 93.83%, 72% and 166% , respectively. |
| e On October 25, 2007, the fund, which owned 100% of the Portfolio on such date, withdrew entirely from the |
| Portfolio and received the Portfolio’s securties and cash in exchange for its interest in the Portfolio. Effective October |
| 26, 2007, the fund began investing directly in the securities in which the Portfolio had invested. Portfolio turnover |
| represents activity of both the fund and the Portfolio for the year 2007. |
See notes to financial statements.
24
NOTES TO FINANCIAL STATEMENTS
NOTE 1—Significant Accounting Policies:
Dreyfus/Standish Fixed Income Fund (the “fund”) is a separate diversified series of Dreyfus Investment Funds (the “Trust”), which is registered under the Investment Company Act of 1940, as amended (the “Act”), as an open-end management investment company and operates as a series company offering eleven series, including the fund. The fund’s investment objective is to achieve a high level of current incomes consistent with conserving principal liquidity. The Dreyfus Corporation (the “Manager” or “Dreyfus”), a wholly-owned subsidiary of The Bank of New York Mellon Corporation (“BNY Mellon”), serves as the fund’s investment adviser. MBSC Securities Corporation (the “Distributor”), a wholly-owned subsidiary of the Manager, is the distributor of the fund’s shares.
Class I shares are sold primarily to bank trust departments and other financial service providers, (including The Bank of NewYork Mellon, a subsidiary of BNY Mellon and an affiliate of Dreyfus), acting on behalf of customers having a qualified trust or an investment account or relationship at such institution and bear no distribution or service fees. Class I shares are offered without a front end sales charge or contingent deferred sales charge.
The Trust accounts separately for the assets, liabilities and operations of each series. Expenses directly attributable to each series are charged to that series’ operations; expenses which are applicable to all series are allocated among them on a pro rata basis.
The Financial Accounting Standards Board (“FASB”) Accounting Standards Codification (“ASC”) is the exclusive reference of authoritative U.S. generally accepted accounting principles (“GAAP”) recognized by the FASB to be applied by nongovernmental entities. Rules and interpretive releases of the Securities and Exchange Commission (“SEC”) under authority of federal laws are also sources of authoritative GAAP for SEC registrants. The fund’s financial statements are prepared in accordance with GAAP, which may require the use of management estimates and assumptions.Actual results could differ from those estimates.
| The Fund | 25 |
NOTES TO FINANCIAL STATEMENTS (continued)
(a) Portfolio valuation: The fair value of a financial instrument is the amount that would be received to sell an asset or paid to transfer a liability in an orderly transaction between market participants at the measurement date (i.e. the exit price). GAAP establishes a fair value hierarchy that prioritizes the inputs of valuation techniques used to measure fair value.This hierarchy gives the highest priority to unadjusted quoted prices in active markets for identical assets or liabilities (Level 1 measurements) and the lowest priority to unobservable inputs (Level 3 measurements).
Additionally, GAAP provides guidance on determining whether the volume and activity in a market has decreased significantly and whether such a decrease in activity results in transactions that are not orderly. GAAP requires enhanced disclosures around valuation inputs and techniques used during annual and interim periods.
Various inputs are used in determining the value of the fund’s investments relating to fair value measurements.These inputs are summarized in the three broad levels listed below:
Level 1—unadjusted quoted prices in active markets for identical investments.
Level 2—other significant observable inputs (including quoted prices for similar investments, interest rates, prepayment speeds, credit risk, etc.).
Level 3—significant unobservable inputs (including the fund’s own assumptions in determining the fair value of investments).
The inputs or methodology used for valuing securities are not necessarily an indication of the risk associated with investing in those securities.
Changes in valuation techniques may result in transfers in or out of an assigned level within the disclosure hierarchy. Valuation techniques used to value the fund’s investments are as follows:
Registered investment companies that are not traded on an exchange are valued at their net asset value and are categorized within Level 1 of the fair value hierarchy.
26
Investments in securities excluding short-term investments (other than U.S.Treasury Bills), financial futures, options and forward foreign currency exchange contracts (“forward contracts”) are valued each business day by an independent pricing service (the “Service”) approved by the Board of Trustees. Investments for which quoted bid prices are readily available and are representative of the bid side of the market in the judgment of the Service are valued at the mean between the quoted bid prices (as obtained by the Service from dealers in such securities) and asked prices (as calculated by the Service based upon its evaluation of the market for such securities). Other investments (which constitute a majority of the portfolio securities) are valued as determined by the Service, based on methods which include consideration of: yields or prices of securities of comparable quality, coupon, maturity and type; indications as to values from dealers; and general market conditions. These securities are generally categorized within Level 2 of the fair value hierarchy.
U.S. Treasury Bills are valued at the mean price between quoted bid prices and asked prices by the Service. These securities are generally categorized within Level 2 of the fair value hierarchy.
The Service’s procedures are reviewed by Dreyfus under the general supervision of the Board of Trustees.
When market quotations or official closing prices are not readily available, or are determined not to reflect accurately fair value, such as when the value of a security has been significantly affected by events after the close of the exchange or market on which the security is principally traded (for example, a foreign exchange or market), but before the fund calculates its net asset value, the fund may value these investments at fair value as determined in accordance with the procedures approved by the Board of Trustees. Certain factors may be considered when fair valuing investments such as: fundamental analytical data, the nature and duration of restrictions on disposition, an evaluation of the forces that influence the market in which the securities are purchased and sold, and public
| The Fund | 27 |
NOTES TO FINANCIAL STATEMENTS (continued)
trading in similar securities of the issuer or comparable issuers. These securities are either categorized as Level 2 or 3 depending on the relevant inputs used.
For restricted securities where observable inputs are limited, assumptions about market activity and risk are used and are categorized within Level 3 of the fair value hierarchy.
Financial futures and options, which are traded on an exchange, are valued at the last sales price on the securities exchange on which such securities are primarily traded or at the last sales price on the national securities market on each business day. These securities are generally categorized within Level 1 of the fair value hierarchy. Options traded over-the-counter are valued at the mean between the bid and asked price.These securities are generally categorized within Level 2 of the fair value hierarchy. Investments denominated in foreign currencies are translated to U.S. dollars at the prevailing rates of exchange. Forward contracts are valued at the forward rate.These securities are generally categorized within Level 2 of the fair value hierarchy.
The following is a summary of the inputs used as of December 31, 2011 in valuing the fund’s investments:
| Level 2—Other | Level 3— | |||
| Level 1— | Significant | Significant | ||
| Unadjusted | Observable | Unobservable | ||
| Quoted Prices | Inputs | Inputs | Total | |
| Assets ($) | ||||
| Investments in Securities: | ||||
| Asset-Backed | — | 10,483,334 | — | 10,483,334 |
| Commercial | ||||
| Mortgage-Backed | — | 9,645,954 | — | 9,645,954 |
| Corporate Bonds† | — | 64,674,659 | — | 64,674,659 |
| Foreign Government | — | 5,986,716 | — | 5,986,716 |
| Municipal Bonds | — | 1,839,444 | — | 1,839,444 |
| Mutual Funds | 14,493,035 | — | — | 14,493,035 |
| Residential | ||||
| Mortgage-Backed | — | 1,591,232 | — | 1,591,232 |
28
| Level 2—Other | Level 3— | ||||||
| Level 1— | Significant | Significant | |||||
| Unadjusted | Observable | Unobservable | |||||
| Quoted Prices | Inputs | Inputs | Total | ||||
| Assets ($) (continued) | |||||||
| U.S. Government | |||||||
| Agencies/ | |||||||
| Mortgage-Backed | — | 72,957,268 | — | 72,957,268 | |||
| U.S. Treasury | — | 100,182,874 | — | 100,182,874 | |||
| Other Financial | |||||||
| Instruments: | |||||||
| Options Purchased | — | 111,429 | — | 111,429 | |||
| Liabilities ($) | |||||||
| Other Financial | |||||||
| Instruments: | |||||||
| Futures†† | (12,213 | ) | — | — | (12,213 | ) | |
| Options Written | — | (108,243 | ) | — | (108,243 | ) |
| † | See Statement of Investments for additional detailed categorizations. |
| †† | Amount shown represents unrealized (depreciation) at period end. |
In May 2011, FASB issued Accounting Standards Update (“ASU”) No. 2011-04 “Amendments to Achieve Common Fair Value Measurement and Disclosure Requirements in GAAP and International Financial Reporting Standards (“IFRS”)” (“ASU 2011-04”). ASU 2011-04 includes common requirements for measurement of and disclosure about fair value between GAAP and IFRS. ASU 2011-04 will require reporting entities to disclose the following information for fair value measurements categorized within Level 3 of the fair value hierarchy: quantitative information about the unobservable inputs used in the fair value measurement, the valuation processes used by the reporting entity and a narrative description of the sensitivity of the fair value measurement to changes in unobservable inputs and the interrelationships between those unobservable inputs. In addition, ASU 2011-04 will require reporting entities to make disclosures about amounts and reasons for all transfers in and out of Level 1 and Level 2 fair value measurements.The new and revised disclosures are effective for interim
| The Fund | 29 |
NOTES TO FINANCIAL STATEMENTS (continued)
and annual reporting periods beginning after December 15, 2011. At this time, management is evaluating the implications of ASU 2011-04 and its impact on the financial statements.
(b) Foreign currency transactions: The fund does not isolate that portion of the results of operations resulting from changes in foreign exchange rates on investments from the fluctuations arising from changes in market prices of securities held. Such fluctuations are included with the net realized and unrealized gain or loss on investments.
Net realized foreign exchange gains or losses arise from sales of foreign currencies, currency gains or losses realized on securities transactions between trade and settlement date, and the difference between the amounts of dividends, interest and foreign withholding taxes recorded on the fund’s books and the U.S. dollar equivalent of the amounts actually received or paid. Net unrealized foreign exchange gains and losses arise from changes in the value of assets and liabilities other than investments resulting from changes in exchange rates. Foreign currency gains and losses on investments are included with net realized and unrealized gain or loss on investments.
(c) Securities transactions and investment income: Securities transactions are recorded on a trade date basis. Realized gains and losses from securities transactions are recorded on the identified cost basis. Dividend income is recognized on the ex-dividend date and interest income, including, where applicable, accretion of discount and amortization of premium on investments, is recognized on the accrual basis.
Investing in foreign markets may involve special risks and considerations not typically associated with investing in the U.S. These risks include revaluation of currencies, high rates of inflation, repatriation restrictions on income and capital, and adverse political and economic developments. Moreover, securities issued in these markets may be less liquid, subject to government ownership controls and delayed settlements, and their prices may be more volatile than those of comparable securities in the U.S.
30
Pursuant to a securities lending agreement withThe Bank of NewYork Mellon, the fund may lend securities to qualified institutions. It is the fund’s policy that, at origination, all loans are secured by collateral of at least 102% of the value of U.S. securities loaned and 105% of the value of foreign securities loaned. Collateral equivalent to at least 100% of the market value of securities on loan is maintained at all times. Collateral is either in the form of cash, which can be invested in certain money market mutual funds managed by the Manager, U.S. Government and Agency securities or letters of credit.The fund is entitled to receive all income on securities loaned, in addition to income earned as a result of the lending transaction.Although each security loaned is fully collateralized, the fund bears the risk of delay in recovery of, or loss of rights in, the securities loaned should a borrower fail to return the securities in a timely manner. During the period ended December 31, 2011,The Bank of NewYork Mellon earned $7,067 from lending portfolio securities, pursuant to the securities lending agreement.
(d) Affiliated issuers: Investments in other investment companies advised by Dreyfus are defined as “affiliated” in the Act.
The fund may invest in shares of certain affiliated investment companies also advised or managed by Dreyfus. Investments in affiliated investment companies for the period ended December 31, 2011 were as follows:
| Affiliated | |||||||
| Investment | Value | Value | Net | ||||
| Company | 12/31/2010 | ($) | Purchases ($) | Sales ($) | 12/31/2011 | ($) | Assets (%) |
| Dreyfus | |||||||
| Institutional | |||||||
| Preferred | |||||||
| Plus Money | |||||||
| Market | |||||||
| Fund | 8,529,422 | 208,575,215 | 213,345,031 | 3,759,606 | 1.8 | ||
| Dreyfus | |||||||
| Institutional | |||||||
| Cash | |||||||
| Advantage | |||||||
| Fund | 3,318,329 | 41,730,506 | 34,315,406 | 10,733,429 | 5.1 | ||
| Total | 11,847,751 | 250,305,721 | 247,660,437 | 14,493,035 | 6.9 |
| The Fund | 31 |
NOTES TO FINANCIAL STATEMENTS (continued)
(e) Concentration of Risk: The fund invests primarily in debt securities. Failure of an issuer of the debt securities to make timely interest or principal payments, or a decline or the perception of a decline in the credit quality of a debt security, can cause the debt security’s price to fall, potentially lowering the fund’s share price. In addition, the value of debt securities may decline due to general market conditions that are not specifically related to a particular company, such as real or perceived adverse economic conditions, changes in outlook for corporate earnings, changes in interest or currency rates or adverse investor sentiment.They may also decline because of factors that affect a particular industry or country.
(f) Dividends to shareholders: Dividends are recorded on the ex-dividend date. Dividends from investment income-net are declared and paid quarterly. Dividends from net realized capital gains, if any, are normally declared and paid annually, but the fund may make distributions on a more frequent basis to comply with the distribution requirements of the Internal Revenue Code of 1986, as amended (the “Code”).To the extent that net realized capital gains can be offset by capital loss carryovers, it is the policy of the fund not to distribute such gains. Income and capital gain distributions are determined in accordance with income tax regulations, which may differ from GAAP.
(g) Federal income taxes: It is the policy of the fund to continue to qualify as a regulated investment company, if such qualification is in the best interests of its shareholders, by complying with the applicable provisions of the Code, and to make distributions of taxable income sufficient to relieve it from substantially all federal income and excise taxes.
As of and during the period ended December 31, 2011, the fund did not have any liabilities for any uncertain tax positions.The fund recognizes interest and penalties, if any, related to uncertain tax positions as income tax expense in the Statement of Operations. During the period, the fund did not incur any interest or penalties.
Each of the tax years in the four-year period ended December 31, 2011 remains subject to examination by the Internal Revenue Service and state taxing authorities.
32
At December 31, 2011, the components of accumulated earnings on a tax basis were as follows: undistributed ordinary income $843,233, accumulated capital losses $8,520,833 and unrealized appreciation $5,332,315. In addition, the fund had $37,995 of capital losses realized after October 31, 2011, which were deferred for tax purposes to the first day of the following fiscal year.
Under the Regulated Investment Company Modernization Act of 2010 (the “2010 Act”), the fund will be permitted to carry forward capital losses incurred in taxable years beginning after December 22, 2010 (“post-enactment losses”) for an unlimited period. Furthermore, post-enactment capital loss carryovers will retain their character as either short-term or long-term capital losses rather than short-term as they were under previous statute. The 2010 Act requires post-enactment losses to be utilized before the utilization of losses incurred in taxable years prior to the effective date of the 2010 Act (“pre-enactment losses”). As a result of this ordering rule, pre-enactment losses may be more likely to expire unused.
The accumulated capital loss carryover is available for federal income tax purposes to be applied against future net securities profits, if any, realized subsequent to December 31, 2011. If not applied, the carryover expires in fiscal 2017.
The tax character of distributions paid to shareholders during the fiscal periods ended December 31, 2011 and December 31, 2010 were as follows: ordinary income $6,666,113 and $10,023,757, respectively.
During the period ended December 31, 2011, as a result of permanent book to tax differences, primarily due to the tax treatment for paydown gains and losses on mortgage-backed securities, amortization of premiums, consent feees and foreign currency transactions, the fund increased accumulated undistributed investment income-net by $113,771 and decreased accumulated net realized gain (loss) on investments by the same amount. Net assets and net asset value per share were not affected by this reclassification.
| The Fund | 33 |
NOTES TO FINANCIAL STATEMENTS (continued)
(h) New Accounting Pronouncement: In April 2011, FASB issued ASU No. 2011-03“Transfers and Servicing (Topic 860) Reconsideration of Effective Control for Repurchase Agreements (“ASU 2011-03”) which relates to the accounting for repurchase agreements and similar agreements including mortgage dollar rolls, that both entitle and obligate a transferor to repurchase or redeem financial assets before their maturity. ASU 2011-03 modifies the criteria for determining effective control of transferred assets and as a result certain agreements may now be accounted for as secured borrowings.ASU 2011-03 is effective prospectively for new transfers and existing transactions that are modified in the first interim or annual period beginning on or after December 15, 2011. Management is currently evaluating the implications of this change and its impact on the financial statements.
NOTE 2—Bank Lines of Credit:
The fund participates with other Dreyfus-managed funds in a $225 million unsecured credit facility led by Citibank, N.A. and a $300 million unsecured credit facility provided by The Bank of New York Mellon (each, a “Facility”), each to be utilized primarily for temporary or emergency purposes, including the financing of redemptions. In connection therewith, the fund has agreed to pay its pro rata portion of commitment fees for each Facility. Interest is charged to the fund based on rates determined pursuant to the terms of the respective Facility at the time of borrowing. During the period ended December 31, 2011, the fund did not borrow under the Facilities.
NOTE 3—Investment Advisory Fee and Other Transactions With Affiliates:
(a) Pursuant to an investment advisory agreement with the Manager, the investment advisory fee is based on the value of the fund’s average daily net assets and is computed at the following annual rates: .40% of the first $250 million; .35% of the next $250 million and .30% in excess of $500 million. The Manager had undertaken from January 1, 2011 through May 1, 2011 to reduce the investment advisory fee paid by the fund, to the extent that the fund’s aggregate annual expenses (exclusive
34
of taxes, brokerage fees, interest on borrowings, commitment fees and extraordinary expenses) did not exceed an annual rate of .50% of the value of the fund’s average daily net assets.The reduction in investment advisory fee, pursuant to the undertaking, amounted to $38,850 during the period ended December 31, 2011.
From January 1, 2011 through April 30, 2011,The Trust had an agreement with The Bank of New York Mellon, pursuant to which The Bank of NewYork Mellon provided administration and fund accounting services for the fund. For these services, the fund paid The Bank of New York Mellon a fixed fee plus asset and transaction based fees, as well as out-of-pocket expenses. Pursuant to this agreement, the fund was charged $15,000 during the period January 1, 2011 through April 30, 2011 for administration and fund accounting services.
At Board Meetings of the Trust held on February 15-16, 2011, the Board of Trustees of the Trust terminated the agreement with The Bank of New York Mellon and, on behalf of the Trust, entered into a Fund Accounting and Administration Agreement (the “Administration Agreement”) with Dreyfus, effective May 1, 2011, whereby Dreyfus performs administrative, accounting and recordkeeping services for the fund. The fund has agreed to compensate Dreyfus for providing accounting services, administration, compliance monitoring, regulatory and shareholder reporting, as well as related facilities, equipment and clerical help.The fee is based on the fund’s average daily net assets and computed at the following annual rates: .06% of the first $500 million, .04% of the next $500 million and .02% in excess of $1 billion.
In addition, after applying any expense limitations or fee waivers that reduce the fees paid to Dreyfus for this service, Dreyfus has contractually agreed in writing to waive any remaining fees for this service to the extent that they exceed both Dreyfus’ costs in providing these services and a reasonable allocation of the costs incurred by Dreyfus and its affiliates related to the support and oversight of these services.The fund also reimburses Dreyfus for the out-of-pocket expenses Dreyfus incurs
| The Fund | 35 |
NOTES TO FINANCIAL STATEMENTS (continued)
in performing this service for the fund. Pursuant to the Administration Agreement, the fund was charged $89,041 during the period May 1, 2011 through December 31, 2011.
(b) The fund may pay administrative service fees.These fees are paid to affiliated or unaffiliated retirement plans, omnibus accounts and platform administrators and other entities (“Plan Administrators”) that provide record keeping and/or other administrative support services to accounts, retirement plans and their participants. As compensation for such services, the fund may pay each Plan Administrator an administrative service fee in an amount of up to .15% (on an annualized basis) of the fund’s average daily net assets attributable to fund shares that are held in accounts serviced by such Plan Administrator. During the period ended December 31, 2011, the fund was charged $19,251.The fund’s adviser or its affiliates may pay additional compensation from their own resources to Plan Administrators and other entities for administrative services, as well as in consideration of marketing or other distribution related services. These payments may provide an incentive for these entities to actively promote the fund or cooperate with the distributor’s promotional efforts.
(c) The fund compensates Dreyfus Transfer, Inc., a wholly-owned subsidiary of the Manager under a transfer agency agreement for providing personnel and facilities to perform transfer agency services for the fund. During the period ended December 31, 2011, the fund was charged $2,975 pursuant to the transfer agency agreement, which is included in Shareholder servicing costs in the Statement of Operations.
The fund has arrangements with the custodian and cash management bank whereby the fund may receive earnings credits when positive cash balances are maintained, which are used to offset custody and cash management fees. For financial reporting purposes, the fund includes net earnings credits as an expense offset in the Statement of Operations.
The fund compensates The Bank of New York Mellon under cash management agreements for performing cash management services related to fund subscriptions and redemptions. During the period
36
ended December 31, 2011, the fund was charged $397 pursuant to the cash management agreements, which is included in Shareholder servicing costs in the Statement of Operations.These fees were partially offset by earnings credits of $11.
The fund also compensates The Bank of New York Mellon under a custody agreement for providing custodial services for the fund. During the period ended December 31, 2011, the fund was charged $50,842 pursuant to the custody agreement.
During the period ended December 31, 2011, the fund was charged $6,402 for services performed by the Chief Compliance Officer.
The components of “Due to The Dreyfus Corporation and affiliates” in the Statement of Assets and Liabilities consist of: investment advisory fees $74,458, custodian fees $15,041, chief compliance officer fees $5,295 and transfer agency per account fees $440.
(e) Prior to January 1, 2012, each Trustee who is not an “interested person” of the Trust (as defined in the Act) received $60,000 per annum, plus $7,000 per joint Board meeting of the Trust, The Dreyfus/Laurel Funds, Inc., The Dreyfus/Laurel Funds Trust, The Dreyfus/Laurel Tax-Free Municipal Funds and Dreyfus Funds, Inc. (collectively, the “Board Group Open-End Funds”) attended, $2,500 for separate in-person committee meetings attended which were not held in conjunction with a regularly scheduled Board meeting and $2,000 for Board meetings and separate committee meetings attended that were conducted by telephone. The Board Group Open-End Funds also reimbursed each Trustee who is not an “interested person” of the Trust (as defined in the Act) for travel and out-of-pocket expenses. With respect to Board meetings, the Chair of the Board received an additional 25% of such compensation (with the exception of reimbursable amounts).The Chair of each of the Board’s committees, unless the Chair also served as Chair of the Board, received $1,350 per applicable committee meeting. In the event that there was an in-person joint committee meeting or a joint telephone meeting of
| The Fund | 37 |
NOTES TO FINANCIAL STATEMENTS (continued)
the Board Group Open-End Funds and Dreyfus HighYield Strategies Fund (“DHF”), $2,500 was allocated between the Board Group Open-End Funds and DHF.
Effective January 1, 2012, the Board Group Open-End Funds and DHF (collectively, the “Board Group Funds”) will pay each Trustee their respective allocated portions of an annual retainer of $85,000 and a fee of $10,000 for each regularly scheduled Board meeting attended ($75,000 and $8,000, respectively, in the aggregate, prior to January 1, 2012).With respect to the annual retainer and Board meetings of the Board Group Funds, the Chair of the Board will receive an additional 25% of such compensation (with the exception of reimbursable amounts). Each Trustee will receive $2,500 for any separate in-person committee meetings attended, which are not held in conjunction with a regularly scheduled Board meeting, such amount to be allocated among the Board Group Funds, as applicable. In the event that there is a joint telephone meeting of the Board Group Funds, a fee of $2,000 will be allocated among the applicable Board Group Funds, accordingly (prior to January 1, 2012, the fee allocated was $2,500 if the meeting included DHF).The Chair of each of the Board’s committees, unless the Chair also serves as Chair of the Board, will receive $1,500 per applicable committee meeting. Each Emeritus Trustee is entitled to receive an annual retainer of one-half the amount paid as a retainer at the time the Trustee became Emeritus and a per meeting attended fee of one-half the amount paid to Trustees.The Board Group Funds also reimburse each Independent Trustee and Emeritus Trustees for travel and out-of-pocket expenses.
These fees and expenses are charged and allocated to each series based on net assets.
NOTE 4—Securities Transactions:
The aggregate amount of purchases and sales (including paydowns) of investment securities, excluding short-term securities, financial futures, forward contracts and options transactions, during the period ended
38
December 31, 2011, amounted to $1,042,990,699 and $1,063,698,972, respectively, of which $308,898,861 in purchases and $309,685,964 in sales were from mortgage dollar roll transactions.
Mortgage Dollar Rolls: A mortgage dollar roll transaction involves a sale by the fund of mortgage related securities that it holds with an agreement by the fund to repurchase similar securities at an agreed upon price and date.The securities purchased will bear the same interest rate as those sold, but generally will be collateralized by pools of mortgages with different prepayment histories than those securities sold.
The following tables show the fund’s exposure to different types of market risk as it relates to the Statement of Assets and Liabilities and the Statement of Operations, respectively.
Fair value of derivative instruments as of December 31, 2011 is shown below:
| Derivative | Derivative | |||
| Assets ($) | Liabilities ($) | |||
| Interest rate risk1 | 111,429 | Interest rate risk2,3 | (120,456) | |
| Gross fair value of | ||||
| derivatives contracts | 111,429 | (120,456) | ||
| Statement of Assets and Liabilities location: | |
| 1 | Options purchased are included in Investments in securities of Unaffiliated issuers at market value |
| 2 | Includes cumulative appreciation (depreciation) on futures contracts as reported in the Statement |
| Financial Futures, but only the unpaid variation margin is reported in the Statement of Assets | |
| and Liabilities. | |
| 3 | Outstanding options written, at value. |
The effect of derivative instruments in the Statement of Operations during the period ended December 31, 2011 is shown below:
| Amount of realized gain or (loss) on derivatives recognized in income ($) | |||||||
| Forward | |||||||
| Underlying risk | Futures4 | Options5 | Contracts6 | Total | |||
| Interest rate | (568,721) | 179,745 | — | (388,976) | |||
| Foreign exchange | — | (80,687) | 219,072 | 138,385 | |||
| Total | (568,721) | 99,058 | 219,072 | (250,591) | |||
| The Fund | 39 |
NOTES TO FINANCIAL STATEMENTS (continued)
| Change in unrealized appreciation or (depreciation) on derivatives recognized in income ($) | |||||||
| Forward | |||||||
| Underlying risk | Futures7 | Options8 | Contracts9 | Total | |||
| Interest rate | (354,472) | (116,011) | — | (470,483) | |||
| Foreign exchange | — | 86,566 | 11,678 | 98,244 | |||
| Total | (354,472) | (29,445) | 11,678 | (372,239) | |||
| Statement of Operations location: | |
| 4 | Net realized gain (loss) on financial futures. |
| 5 | Net realized gain (loss) on options transactions. |
| 6 | Net realized gain (loss) on forward foreign currency exchange contracts. |
| 7 | Net unrealized appreciation (depreciation) on financial futures. |
| 8 | Net unrealized appreciation (depreciation) on options transactions. |
| 9 | Net unrealized appreciation (depreciation) on forward foreign currency exchange contracts. |
Futures Contracts: In the normal course of pursuing its investment objective, the fund is exposed to market risk, including interest rate risk, as a result of changes in value of underlying financial instruments.The fund invests in financial futures contracts in order to manage its exposure to or protect against changes in the market.A futures contract represents a commitment for the future purchase or a sale of an asset at a specified date. Upon entering into such contracts, these investments require initial margin deposits with a broker, which consist of cash or cash equivalents. The amount of these deposits is determined by the exchange or Board of Trade on which the contract is traded and is subject to change. Accordingly, variation margin payments are received or made to reflect daily unrealized gains or losses which are recorded in the Statement of Operations. Futures contracts are valued daily at the last sales price established by the Board of Trade or exchange upon which they are traded. When the contracts are closed, the fund recognizes a realized gain or loss. There is minimal counterparty credit risk to the fund with futures since futures are exchange traded, and the exchange’s clearinghouse guarantees the futures against default. Contracts open at December 31, 2011 are set forth in the Statement of Financial Futures.
Options: The fund purchases and writes (sells) put and call options to hedge against changes in interest rates and foreign currencies, or as a substitute for an investment. The fund is subject to interest rate and currency risk in the course of pursuing its investment objectives
40
through its investments in options contracts. A call option gives the purchaser of the option the right (but not the obligation) to buy, and obligates the writer to sell, the underlying security or securities at the exercise price at any time during the option period, or at a specified date. Conversely, a put option gives the purchaser of the option the right (but not the obligation) to sell, and obligates the writer to buy the underlying security or securities at the exercise price at any time during the option period, or at a specified date.
As a writer of call options, the fund receives a premium at the outset and then bears the market risk of unfavorable changes in the price of the financial instrument underlying the option. Generally, the fund realizes a gain, to the extent of the premium, if the price of the underlying financial instrument decreases between the date the option is written and the date on which the option is terminated. Generally, the fund incurs a loss, if the price of the financial instrument increases between those dates.
As a writer of put options, the fund receives a premium at the outset and then bears the market risk of unfavorable changes in the price of the financial instrument underlying the option. Generally, the fund realizes a gain, to the extent of the premium, if the price of the underlying financial instrument increases between the date the option is written and the date on which the option is terminated. Generally, the fund incurs a loss, if the price of the financial instrument decreases between those dates.
As a writer of an option, the fund has no control over whether the underlying securities may be sold (call) or purchased (put) and as a result bears the market risk of an unfavorable change in the price of the security underlying the written option.There is a risk of loss from a change in value of such options which may exceed the related premiums received. One risk of holding a put or a call option is that if the option is not sold or exercised prior to its expiration, it becomes worthless. However, this risk is limited to the premium paid by the fund. Upon the expiration or closing of the option transaction, a gain or loss is reported in the Statement of Operations.
| The Fund | 41 |
NOTES TO FINANCIAL STATEMENTS (continued)
The following summarizes the fund’s call/put options written during the period ended December 31, 2011:
| Face Amount | Options Terminated | ||||
| Covered by | Premiums | Net Realized | |||
| Options Written: | Contracts ($) | Received ($) | Cost ($) Gain (Loss) ($) | ||
| Contracts outstanding | |||||
| December 31, 2010 | 24,880,000 | 280,792 | |||
| Contracts written | 93,215,000 | 595,473 | |||
| Contracts terminated: | |||||
| Contracts closed | 82,200,000 | 554,607 | 610,072 | (55,465 | ) |
| Contracts expired | 29,780,000 | 235,374 | — | 235,374 | |
| Total contracts | |||||
| terminated | 111,980,000 | 789,981 | 610,072 | 179,909 | |
| Contracts outstanding | |||||
| December 31, 2011 | 6,115,000 | 86,284 | |||
Forward Foreign Currency Exchange Contracts: The fund enters into forward contracts in order to hedge its exposure to changes in foreign currency exchange rates on its foreign portfolio holdings, to settle foreign currency transactions or as a part of its investment strategy. When executing forward contracts, the fund is obligated to buy or sell a foreign currency at a specified rate on a certain date in the future. With respect to sales of forward contracts, the fund incurs a loss if the value of the contract increases between the date the forward contract is opened and the date the forward contract is closed.The fund realizes a gain if the value of the contract decreases between those dates. With respect to purchases of forward contracts, the fund incurs a loss if the value of the contract decreases between the date the forward contract is opened and the date the forward contract is closed.The fund realizes a gain if the value of the contract increases between those dates. Any realized gain or loss which occurred during the period is reflected in the Statement of Operations.The fund is exposed to foreign currency
42
risk as a result of changes in value of underlying financial instruments. The fund is also exposed to credit risk associated with counterparty nonperformance on these forward contracts, which is typically limited to the unrealized gain on each open contract. At December 31, 2011, there were no forward contracts outstanding.
The following summarizes the average market value of derivatives outstanding during the period ended December 31, 2011:
| Average Market Value ($) | |
| Interest rate futures contracts | 7,620,523 |
| Interest rate options contracts | 52,988 |
| Foreign currency options contracts | 17,793 |
| Forward contracts | 5,375,889 |
At December 31, 2011, the cost of investments for federal income tax purposes was $276,181,026; accordingly, accumulated net unrealized appreciation on investments was $5,784,919, consisting of $6,537,209 gross unrealized appreciation and $752,290 gross unrealized depreciation.
NOTE 5—Other Matters:
At the October 27, 2011 Board meeting, the Board of the Trust elected Ms. Bovich as a Trustee of the Trust, subject to shareholder approval. A proxy statement was mailed on December 1, 2011 to shareholders of record as of the close of business on November 1, 2011, asking shareholders to consider Ms. Bovich's election at a special meeting of shareholders held on Wednesday, February 8, 2012. At this meeting, Ms. Bovich was elected by the shareholders to serve as a Trustee of the Trust.
| The Fund | 43 |
| REPORT OF INDEPENDENT REGISTERED |
| PUBLIC ACCOUNTING FIRM |
The Board of Trustees and Shareholders of Dreyfus/Standish Fixed Income Fund
We have audited the accompanying statement of assets and liabilities of Dreyfus/Standish Fixed Income Fund (the “Fund”), a series of Dreyfus Investment Funds, including the statements of investments, financial futures and options written, as of December 31, 2011, the related statement of operations for the year then ended, and the statement of changes in net assets for each of the years in the two-year period then ended and financial highlights for each of the years in the three-year period then ended.These financial statements and financial highlights are the responsibility of the Fund’s management. Our responsibility is to express an opinion on these financial statements and financial highlights based on our audits.The financial highlights for each of the years in the two-year period ended December 31, 2008 were audited by other independent registered public accountants whose report thereon, dated February 27, 2009, expressed an unqualified opinion on those financial highlights.
We conducted our audits in accordance with the standards of the Public Company Accounting Oversight Board (United States).Those standards require that we plan and perform the audit to obtain reasonable assurance about whether the financial statements and financial highlights are free of material misstatement. An audit includes examining, on a test basis, evidence supporting the amounts and disclosures in the financial statements. Our procedures included confirmation of securities owned as of December 31, 2011, by correspondence with the custodian and brokers or by other appropriate auditing procedures where replies from brokers were not received.An audit also includes assessing the accounting principles used and significant estimates made by management, as well as evaluating the overall financial statement presentation.We believe that our audits provide a reasonable basis for our opinion.
In our opinion, the financial statements and financial highlights referred to above present fairly, in all material respects, the financial position of Dreyfus/Standish Fixed Income Fund as of December 31, 2011, the results of its operations for the year then ended, and the changes in its net assets for each of the years in the two-year period then ended and financial highlights for each of the years in the three-year period then ended, in conformity with U.S. generally accepted accounting principles.

New York, New York
February 24, 2012
44
IMPORTANT TAX INFORMATION (Unaudited)
For federal tax purposes the fund reports the maximum amount allowable but not less than 97.59% as interest-related dividends in accordance with Sections 871(k)(1) and 881(e) of the Internal Revenue Code.
| The Fund | 45 |
BOARD MEMBERS INFORMATION (Unaudited)
| Joseph S. DiMartino (68) |
| Chairman of the Board (2008) |
| Principal Occupation During Past 5Years: |
| • Corporate Director and Trustee |
| Other Public Company Board Memberships During Past 5Years: |
| • CBIZ (formerly, Century Business Services, Inc.), a provider of outsourcing functions for small |
| and medium size companies, Director (1997-present) |
| • Sunair Services Corporation, a provider of certain outdoor-related services to homes and |
| businesses, Director (2005-2009) |
| • The Newark Group, a provider of a national market of paper recovery facilities, paperboard |
| mills and paperboard converting plants, Director (2000-2010) |
| No. of Portfolios for which Board Member Serves: 164 |
| ——————— |
| Francine J. Bovich (60)† |
| Board Member (2011) |
| Principal Occupation During Past 5Years: |
| • Trustee,The Bradley Trusts, private trust funds (2011-Present) |
| • Managing Director, Morgan Stanley Investment Management (1993-2010) |
| No. of Portfolios for which Board Member Serves: 13 |
| ——————— |
| James M. Fitzgibbons (77) |
| Board Member (2008) |
| Principal Occupation During Past 5Years: |
| • Corporate Director and Trustee |
| Other Public Company Board Memberships During Past 5Years: |
| • Bill Barrett Corporation, an oil and natural gas exploration company, Director (2004-present) |
| No. of Portfolios for which Board Member Serves: 31 |
| ——————— |
| Kenneth A. Himmel (65) |
| Board Member (2008) |
| Principal Occupation During Past 5Years: |
| • President and CEO, Related Urban Development, a real estate development company (1996-present) |
| • President and CEO, Himmel & Company, a real estate development company (1980-present) |
| • CEO,American Food Management, a restaurant company (1983-present) |
| No. of Portfolios for which Board Member Serves: 31 |
46
| Stephen J. Lockwood (64) |
| Board Member (2008) |
| Principal Occupation During Past 5Years: |
| • Chairman of the Board, Stephen J. Lockwood and Company LLC, a real estate investment |
| company (2000-present) |
| No. of Portfolios for which Board Member Serves: 31 |
| ——————— |
| Roslyn M. Watson (61) |
| Board Member (2008) |
| Principal Occupation During Past 5Years: |
| • Principal,Watson Ventures, Inc., a real estate investment company (1993-present) |
| No. of Portfolios for which Board Member Serves: 41 |
| ——————— |
| Benaree Pratt Wiley (65) |
| Board Member (2008) |
| Principal Occupation During Past 5Years: |
| • Principal,TheWiley Group, a firm specializing in strategy and business development (2005-present) |
| Other Public Company Board Memberships During Past 5Years: |
| • CBIZ (formerly, Century Business Services, Inc.), a provider of outsourcing functions for small |
| and medium size companies, Director (2008-present) |
| No. of Portfolios for which Board Member Serves: 66 |
| ——————— |
† Ms. Bovich was elected as a Trustee of the Trust, effective October 27, 2011. See Note 5.
Once elected all Board Members serve for an indefinite term, but achieve Emeritus status upon reaching age 80.The address of the Board Members and Officers is in c/o The Dreyfus Corporation, 200 Park Avenue, NewYork, NewYork 10166.Additional information about the Board Members is available in the fund’s Statement of Additional Information which can be obtained from Dreyfus free of charge by calling this toll free number: 1-800-DREYFUS.
| The Fund | 47 |
OFFICERS OF THE FUND (Unaudited)
BRADLEY J. SKAPYAK, President since January 2010.
Chief Operating Officer and a director of the Manager since June 2009. From April 2003 to June 2009, Mr. Skapyak was the head of the Investment Accounting and Support Department of the Manager. He is an officer of 75 investment companies (comprised of 163 portfolios) managed by the Manager. He is 53 years old and has been an employee of the Manager since February 1988.
JANETTE E. FARRAGHER, Vice President and Secretary since December 2011.
Assistant General Counsel of BNY Mellon, and an officer of 76 investment companies (comprised of 189 portfolios) managed by the Manager. She is 49 years old and has been an employee of the Manager since February 1984.
KIESHA ASTWOOD, Vice President and Assistant Secretary since January 2010.
Counsel of BNY Mellon, and an officer of 76 investment companies (comprised of 189 portfolios) managed by the Manager. She is 38 years old and has been an employee of the Manager since July 1995.
JAMES BITETTO, Vice President and Assistant Secretary since December 2008.
Senior Counsel of BNY Mellon and Secretary of the Manager, and an officer of 76 investment companies (comprised of 189 portfolios) managed by the Manager. He is 45 years old and has been an employee of the Manager since December 1996.
JONI LACKS CHARATAN, Vice President and Assistant Secretary since December 2008.
Senior Counsel of BNY Mellon, and an officer of 76 investment companies (comprised of 189 portfolios) managed by the Manager. She is 56 years old and has been an employee of the Manager since October 1988.
JOSEPH M. CHIOFFI, Vice President and Assistant Secretary since December 2008
Senior Counsel of BNY Mellon, and an officer of 76 investment companies (comprised of 189 portfolios) managed by the Manager. He is 50 years old and has been an employee of the Manager since June 2000.
KATHLEEN DENICHOLAS, Vice President and Assistant Secretary since January 2010.
Managing Counsel of BNY Mellon, and an officer of 76 investment companies (comprised of 189 portfolios) managed by the Manager. She is 37 years old and has been an employee of the Manager since February 2001.
JOHN B. HAMMALIAN, Vice President and Assistant Secretary since December 2008.
Senior Managing Counsel of BNY Mellon, and an officer of 76 investment companies (comprised of 189 portfolios) managed by the Manager. He is 48 years old and has been an employee of the Manager since February 1991.
M. CRISTINA MEISER, Vice President and Assistant Secretary since January 2010.
Senior Counsel of BNY Mellon, and an officer of 76 investment companies (comprised of 189 portfolios) managed by the Manager. She is 41 years old and has been an employee of the Manager since August 2001.
ROBERT R. MULLERY, Vice President and Assistant Secretary since December 2008.
Managing Counsel of BNY Mellon, and an officer of 76 investment companies (comprised of 189 portfolios) managed by the Manager. He is 59 years old and has been an employee of the Manager since May 1986.
48
JEFF PRUSNOFSKY, Vice President and Assistant Secretary since December 2008.
Senior Managing Counsel of BNY Mellon, and an officer of 76 investment companies (comprised of 189 portfolios) managed by the Manager. He is 46 years old and has been an employee of the Manager since October 1990.
JAMES WINDELS, Treasurer since December 2008.
Director – Mutual Fund Accounting of the Manager, and an officer of 76 investment companies (comprised of 189 portfolios) managed by the Manager. He is 53 years old and has been an employee of the Manager since April 1985.
RICHARD CASSARO, Assistant Treasurer since December 2008.
Senior Accounting Manager – Money Market and Municipal Bond Funds of the Manager, and an officer of 76 investment companies (comprised of 189 portfolios) managed by the Manager. He is 52 years old and has been an employee of the Manager since September 1982.
GAVIN C. REILLY, Assistant Treasurer since December 2008.
Tax Manager of the Investment Accounting and Support Department of the Manager, and an officer of 76 investment companies (comprised of 189 portfolios) managed by the Manager. He is 43 years old and has been an employee of the Manager since April 1991.
ROBERT S. ROBOL, Assistant Treasurer since December 2008.
Senior Accounting Manager – Fixed Income Funds of the Manager, and an officer of 76 investment companies (comprised of 189 portfolios) managed by the Manager. He is 47 years old and has been an employee of the Manager since October 1988.
ROBERT SALVIOLO, Assistant Treasurer since December 2008.
Senior Accounting Manager – Equity Funds of the Manager, and an officer of 76 investment companies (comprised of 189 portfolios) managed by the Manager. He is 44 years old and has been an employee of the Manager since June 1989.
ROBERT SVAGNA, Assistant Treasurer since December 2008.
Senior Accounting Manager – Equity Funds of the Manager, and an officer of 76 investment companies (comprised of 189 portfolios) managed by the Manager. He is 44 years old and has been an employee of the Manager since November 1990.
JOSEPH W. CONNOLLY, Chief Compliance Officer since December 2008.
Chief Compliance Officer of the Manager and The Dreyfus Family of Funds (76 investment companies, comprised of 189 portfolios). From November 2001 through March 2004, Mr. Connolly was first Vice-President, Mutual Fund Servicing for Mellon Global Securities Services. In that capacity, Mr. Connolly was responsible for managing Mellon’s Custody, Fund Accounting and Fund Administration services to third-party mutual fund clients. He is 54 years old and has served in various capacities with the Manager since 1980, including manager of the firm’s Fund Accounting Department from 1997 through October 2001.
STEPHEN J. STOREN, Anti-Money Laundering Compliance Officer since May 2011.
Chief Compliance Officer of the Distributor, and the Anti-Money Laundering Compliance Officer of 72 investment companies (comprised of 185 portfolios) managed by the Manager. He is 57 years old and has been an employee of the Distributor since October 1999.
| The Fund | 49 |
For More Information
| Ticker Symbol: SDFIX |
| Telephone Call your Financial Representative or 1-800-DREYFUS |
| Mail The Dreyfus Family of Funds, 144 Glenn Curtiss Boulevard, Uniondale, NY 11556-0144 |
| E-mail Send your request to info@dreyfus.com |
| Internet Information can be viewed online or downloaded at: http://www.dreyfus.com |
The fund files its complete schedule of portfolio holdings with the Securities and Exchange Commission (“SEC”) for the first and third quarters of each fiscal year on Form N-Q. The fund’s Forms N-Q are available on the SEC’s website at http://www.sec.gov and may be reviewed and copied at the SEC’s Public Reference Room in Washington, DC. Information on the operation of the Public Reference Room may be obtained by calling 1-800-SEC-0330.
A description of the policies and procedures that the fund uses to determine how to vote proxies relating to portfolio securities, and information regarding how the fund voted these proxies for the most recent 12-month period ended June 30 is available at http://www.dreyfus.com and on the SEC’s website at http://www.sec.gov. The description of the policies and procedures is also available without charge, upon request, by calling 1-800-DREYFUS.

| Dreyfus/Standish |
| Global Fixed |
| Income Fund |
ANNUAL REPORT December 31, 2011
The views expressed in this report reflect those of the portfolio manager only through the end of the period covered and do not necessarily represent the views of Dreyfus or any other person in the Dreyfus organization. Any such views are subject to change at any time based upon market or other conditions and Dreyfus disclaims any responsibility to update such views.These views may not be relied on as investment advice and, because investment decisions for a Dreyfus fund are based on numerous factors, may not be relied on as an indication of trading intent on behalf of any Dreyfus fund.
| Not FDIC-Insured • Not Bank-Guaranteed • May Lose Value |
Contents | |
THE FUND | |
| 2 | A Letter from the Chairman and CEO |
| 3 | Discussion of Fund Performance |
| 6 | Fund Performance |
| 8 | Understanding Your Fund’s Expenses |
| 8 | Comparing Your Fund’s Expenses With Those of Other Funds |
| 9 | Statement of Investments |
| 21 | Statement of Financial Futures |
| 22 | Statement of Assets and Liabilities |
| 23 | Statement of Operations |
| 24 | Statement of Changes in Net Assets |
| 26 | Financial Highlights |
| 29 | Notes to Financial Statements |
| 54 | Report of Independent Registered Public Accounting Firm |
| 55 | Important Tax Information |
| 56 | Board Members Information |
| 58 | Officers of the Fund |
FOR MORE INFORMATION | |
Back Cover |
Dreyfus/Standish
Global Fixed
Income Fund
The Fund

A LETTER FROM THE CHAIRMAN AND CEO
Dear Shareholder:
We are pleased to present this annual report for Dreyfus/Standish Global Fixed Income Fund, covering the 12-month period from January 1, 2011, through December 31, 2011. For information about how the fund performed during the reporting period, as well as general market perspectives, we provide a Discussion of Fund Performance on the pages that follow.
U.S. bond markets in 2011 were primarily driven by a “flight to quality” in which investors fled riskier assets due to adverse macroeconomic developments ranging from natural disasters in Japan to an unprecedented downgrade of long-term U.S. debt securities and the resurgence of a sovereign debt crisis in Europe. Ironically, despite the rating downgrade, long-term U.S.Treasury securities ended the year with double-digit total returns as investors flocked to traditional safe havens. Corporate-backed bonds also fared well, but to a lesser degree than Treasuries, as investors sought competitive yields in a low interest-rate environment.
Our economic forecast calls for a mild acceleration of the U.S. recovery as the domestic banking system regains strength, credit conditions loosen and housing markets begin a long-awaited convalescence. In addition, we believe that long-term fundamentals currently appear to favor U.S. non-financial corporate credit, as well as emerging-markets local currency-denominated debt. Of course, we encourage you to talk with your financial adviser to help ensure that your investment objectives are properly aligned with your risk tolerance in pursuing potential market opportunities in 2012.
Thank you for your continued confidence and support.

Jonathan R. Baum
Chairman and Chief Executive Officer
The Dreyfus Corporation
January 17, 2012
2

DISCUSSION OF FUND PERFORMANCE
For the period of January 1, 2011, through December 31, 2011, as provided by David Leduc, CFA and Brendan Murphy, CFA, Portfolio Managers
Fund and Market Performance Overview
For the 12-month period ended December 31, 2011, Dreyfus/Standish Global Fixed Income Fund’s Class A shares achieved a total return of 3.36%, Class C shares returned 2.56% and Class I shares returned 3.72%.1 In comparison, the Barclays Capital Global Aggregate Index (Hedged) (the “Index”), the fund’s benchmark, achieved a total return of 5.40% for the same period.2 Global bond markets proved volatile during 2011 as investors responded to several adverse macroeconomic developments, but a rally late in the year enabled the Index to end the year in positive territory. The fund produced lower returns than its benchmark, primarily due to shortfalls in our currency allocation and security selection strategies.
The Fund’s Investment Approach
The fund seeks to maximize total return while realizing a market level of income, consistent with preserving principal and liquidity, by normally investing at least 80% of its net assets in fixed income securities.The fund also normally invests at least 65% of its assets in non-U.S. dollar-denominated fixed-income securities of governments and companies located in various countries, including emerging markets.The fund generally invests in eight or more countries, but always invests in at least three countries, one of which may be the United States. The fund’s investments may include bonds, notes, mortgage-related securities, asset-backed securities, convertible securities, eurodollar andYankee dollar instruments, preferred stock and money market instruments.To protect the U.S. dollar value of the fund’s assets, we hedge most, but not necessarily all, of the portfolio’s foreign currency exposure.
The portfolio managers focus on identifying undervalued government bond markets, currencies, sectors and securities and de-emphasize the use of interest rate forecasting.The portfolio managers look for fixed income securities with the most potential for added value, such as those involving the potential for credit upgrades, unique structural characteristics or
| The Fund | 3 |
DISCUSSION OF FUND PERFORMANCE (continued)
innovative features.The portfolio managers select securities for the fund’s portfolio by using fundamental economic research and quantitative analysis and focusing on sectors and individual securities that appear to be relatively undervalued and actively trading among sectors.
Global Economic Developments Roiled Bond Markets
Global bond markets fared well over the first half of the year amid several unexpected economic shocks, including political unrest in the Middle East, natural disasters in Japan and a sovereign debt crisis in Europe. However, investor confidence in sovereign bonds later crumbled as the debt crisis spread to other parts of Europe, interest rates in China climbed and a contentious political debate intensified in the United States regarding government spending and borrowing. The Index fell particularly sharply between September and October, when fears of global market instability mounted. In this turbulent environment, investors favored perceived safe havens, such as gold and U.S.Treasury securities.
The downward trend resumed in November amid an apparent lack of progress toward solving Europe’s problems.Although market volatility remained high in December, global fixed-income markets regained some of the ground they had lost earlier, ending the year with positive total returns, on average.
Currency and Duration Strategies Hurt Fund Performance
The fund benefited early in the reporting period from overweighted exposure to investment-grade corporate bonds, commercial mortgage-backed securities and residential mortgage-backed securities. However, these positions later lost value, particularly in peripheral European markets such as Spain and Italy, which were hit hard by the region’s debt crisis. In addition, the fund’s relatively short average duration prevented it from participating fully in the rally among U.S. Treasury securities over the first half of the year, and our currency allocation strategy dampened relative performance when the euro and other European currencies weakened against the U.S. dollar.
As economic conditions deteriorated, we adjusted the fund’s composition to reduce credit risks, which positioned the fund relatively well for the market downturn in the early fall. Changes included a reduction in corporate bonds and underweighted exposure to the peripheral nations of Europe. Instead, we favored sovereign bonds that we believed would hold up well in the uncertain economy, such as securities issued by the
4
United Kingdom, Sweden and Canada.We increased the fund’s holdings of corporate-backed bonds late in the year, but credits with BBB ratings lagged market averages.
Maintaining a Cautious Investment Posture
Although we currently expect the global economic recovery to persist, a number of headwinds appear likely to keep growth at subpar levels and interest rates low.Therefore, we have maintained an emphasis on higher-quality securities, such as newly issued investment-grade corporate bonds from industrial companies outside of Europe.As of year-end, the fund’s currency positions included underweighted exposure to Europe and an emphasis on Canada and Mexico, whose currencies tend to correlate strongly with the U.S. dollar. We have set the fund’s average duration in a range that is roughly in line with industry averages, reflecting richer valuations among U.S.Treasuries and other sovereign bonds.
January 17, 2012
| Bond funds are subject generally to interest rate, credit, liquidity and market risks, to varying | |
| degrees, all of which are more fully described in the fund’s prospectus. Generally, all other factors | |
| being equal, bond prices are inversely related to interest-rate changes, and rate increases can cause | |
| price declines. | |
| Foreign bonds are subject to special risks including exposure to currency fluctuations, changing | |
| political and economic conditions, and potentially less liquidity.The fixed income securities of | |
| issuers located in emerging markets can be more volatile and less liquid than those of issuers in | |
| more mature economies. | |
| Investments in foreign currencies are subject to the risk that those currencies will decline in value | |
| relative to the U.S. dollar, or, in the case of hedged positions, that the U.S. dollar will decline | |
| relative to the currency being hedged. Currency rates in foreign countries may fluctuate significantly | |
| over short periods of time.A decline in the value of foreign currencies relative to the U.S. dollar | |
| will reduce the value of securities held by the fund and denominated in those currencies. | |
| High yield bonds are subject to increased credit risk and are considered speculative in terms of the | |
| issuer’s perceived ability to continue making interest payments on a timely basis and to repay | |
| principal upon maturity. | |
| The fund may use derivative instruments, such as options, futures and options on futures, forward | |
| contracts, swaps (including credit default swaps on corporate bonds and asset-backed securities), | |
| options on swaps and other credit derivatives.A small investment in derivatives could have a | |
| potentially large impact on the fund’s performance.The use of derivatives involves risks different | |
| from, or possibly greater than, the risks associated with investing directly in the underlying assets. | |
| 1 | Total return includes reinvestment of dividends and any capital gains paid. Past performance is no |
| guarantee of future results. Share price and investment return fluctuate such that upon redemption | |
| fund shares may be worth more or less than their original cost. | |
| 2 | SOURCE: FACTSET — Reflects reinvestment of dividends and, where applicable, capital gain |
| distributions.The Barclays Capital Global Aggregate (Hedged) Index provides a broad-based | |
| measure of the global investment-grade fixed income markets.The three major components of this | |
| index are the U.S.Aggregate, the Pan-European Aggregate, and the Asian-Pacific Aggregate | |
| Indices.The index also includes Eurodollar and Euro-Yen corporate bonds, Canadian Government | |
| securities, and USD investment-grade 144A securities. Index returns do not reflect fees and | |
| expenses associated with operating a mutual fund. Investors cannot invest directly in any index. |
| The Fund | 5 |
FUND PERFORMANCE
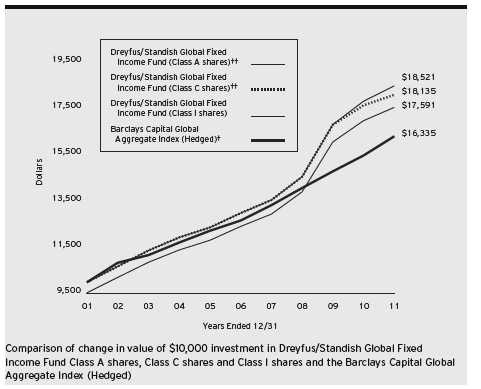
| † | Source: FactSet |
| †† | The total return figures presented for Class A and Class C shares of the fund reflect the performance of the fund’s |
| Class I shares for the period prior to 12/2/09 (the inception date for Class A and Class C shares respectively), | |
| adjusted to reflect the applicable sales load for each share class. | |
| Past performance is not predictive of future performance. | |
| The above graph compares a $10,000 investment made in each of the Class A, Class C and Class I shares of | |
| Dreyfus/Standish Global Fixed Income Fund on 12/31/01 to a $10,000 investment made in the Barclays Capital | |
| Global Aggregate Index (Hedged) (the “Index”) on that date.All dividends and capital gain distributions are reinvested. | |
| The fund’s performance shown in the line graph above takes into account the maximum initial sales charge on Class A | |
| shares and all other applicable fees and expenses on all classes. The Index provides a broad-based measure of the global | |
| investment-grade fixed income markets. The three major components of this index are the U. S. Aggregate, the Pan- | |
| European Aggregate, and the Asian-Pacific Aggregate Indices. The Index also includes Eurodollar and Euro-Yen | |
| corporate bonds, Canadian government securities, and USD investment grade 144A securities. Unlike a mutual fund, | |
| the Index is not subject to charges, fees and other expenses. Investors cannot invest directly in any index. These factors | |
| can contribute to the Index potentially outperforming the fund. Further information relating to fund performance, | |
| including expense reimbursements, if applicable, is contained in the Financial Highlights section of the prospectus and | |
| elsewhere in this report. | |
6
| Average Annual Total Returns as of 12/31/11 | |||||||
| Inception | |||||||
| Date | 1Year | 5 Years | 10 Years | ||||
| Class A shares | |||||||
| with maximum sales charge (4.5%) | 12/2/09 | –1.28% | 6.22%†† | 5.81%†† | |||
| without sales charge | 12/2/09 | 3.36% | 7.21%†† | 6.30%†† | |||
| Class C shares | |||||||
| with applicable redemption charge † | 12/2/09 | 1.57% | 6.87%†† | 6.13%†† | |||
| without redemption | 12/2/09 | 2.56% | 6.87%†† | 6.13%†† | |||
| Class I shares | 1/1/94 | 3.72% | 7.32% | 6.36% | |||
| Barclays Capital Global | |||||||
| Aggregate Index (Hedged) | 5.40% | 5.20% | 5.03% | ||||
Past performance is not predictive of future performance.The fund’s performance shown in the graph and table does not reflect the deduction of taxes that a shareholder would pay on fund distributions or the redemption of fund shares.
| † | The maximum contingent deferred sales charge for Class C shares is 1% for shares redeemed within one year of the |
| date of purchase. | |
| †† | The total return performance figures presented for Class A and Class C shares of the fund reflect the performance of |
| the fund’s Class I shares for the period prior to 12/2/09 (the inception date for Class A and Class C shares | |
| respectively), adjusted to reflect the applicable sales load for each share class. |
| The Fund | 7 |
UNDERSTANDING YOUR FUND’S EXPENSES (Unaudited)
As a mutual fund investor, you pay ongoing expenses, such as management fees and other expenses. Using the information below, you can estimate how these expenses affect your investment and compare them with the expenses of other funds.You also may pay one-time transaction expenses, including sales charges (loads) and redemption fees, which are not shown in this section and would have resulted in higher total expenses. For more information, see your fund’s prospectus or talk to your financial adviser.
Review your fund’s expenses
The table below shows the expenses you would have paid on a $1,000 investment in Dreyfus/Standish Global Fixed Income Fund from July 1, 2011 to December 31, 2011. It also shows how much a $1,000 investment would be worth at the close of the period, assuming actual returns and expenses.
Expenses and Value of a $1,000 Investment
assuming actual returns for the six months ended December 31, 2011
| Class A | Class C | Class I | ||||
| Expenses paid per $1,000† | $7.15 | $12.65 | $4.60 | |||
| Ending value (after expenses) | $1,027.50 | $1,023.90 | $1,029.70 |
COMPARING YOUR FUND’S EXPENSES
WITH THOSE OF OTHER FUNDS (Unaudited)
Using the SEC’s method to compare expenses
The Securities and Exchange Commission (SEC) has established guidelines to help investors assess fund expenses. Per these guidelines, the table below shows your fund’s expenses based on a $1,000 investment, assuming a hypothetical 5% annualized return. You can use this information to compare the ongoing expenses (but not transaction expenses or total cost) of investing in the fund with those of other funds.All mutual fund shareholder reports will provide this information to help you make this comparison. Please note that you cannot use this information to estimate your actual ending account balance and expenses paid during the period.
Expenses and Value of a $1,000 Investment
assuming a hypothetical 5% annualized return for the six months ended December 31, 2011
| Class A | Class C | Class I | ||||
| Expenses paid per $1,000† | $7.12 | $12.58 | $4.58 | |||
| Ending value (after expenses) | $1,018.15 | $1,012.70 | $1,020.67 |
| † Expenses are equal to the fund’s annualized expense ratio of 1.40% for Class A, 2.48% for Class C and .90% |
| for Class I, multiplied by the average account value over the period, multiplied by 184/365 (to reflect the one-half |
| year period). |
8
| STATEMENT OF INVESTMENTS |
| December 31, 2011 |
| Coupon | Maturity | Principal | ||||
| Bonds and Notes—94.2% | Rate (%) | Date | Amount ($)a | Value ($) | ||
| Australia—1.5% | ||||||
| Australian Government, | ||||||
| Sr. Unscd. Bonds, Ser. 124 | AUD | 5.75 | 5/15/21 | 855,000 | 1,017,805 | |
| Queensland Treasury, | ||||||
| Gov’t Gtd. Bonds, Ser. 13G | AUD | 6.00 | 8/14/13 | 800,000 | 841,721 | |
| SMART Trust, | ||||||
| Ser. 2011-1USA, Cl. A3B | 1.13 | 10/14/14 | 1,100,000 | b,c | 1,098,369 | |
| 2,957,895 | ||||||
| Bermuda—.2% | ||||||
| Weatherford International, | ||||||
| Gtd. Notes | 6.75 | 9/15/40 | 350,000 | 398,379 | ||
| Brazil—1.9% | ||||||
| Brazilian Government, | ||||||
| Notes, Ser. F | BRL | 10.00 | 1/1/12 | 2,200,000 | 1,179,761 | |
| Federal Republic of Brazil, | ||||||
| Sr. Unscd. Bonds | 5.63 | 1/7/41 | 565,000 | 658,225 | ||
| Petrobras | ||||||
| International Finance, | ||||||
| Gtd. Notes | EUR | 5.88 | 3/7/22 | 800,000 | 1,051,094 | |
| Vale Overseas, | ||||||
| Gtd. Notes | 4.63 | 9/15/20 | 345,000 | 358,491 | ||
| Vale Overseas, | ||||||
| Gtd. Notes | 6.25 | 1/23/17 | 500,000 | 565,958 | ||
| 3,813,529 | ||||||
| Canada—5.0% | ||||||
| Canadian Government, | ||||||
| Bonds | CAD | 4.00 | 6/1/16 | 2,700,000 | 2,963,573 | |
| Canadian Government, | ||||||
| Bonds, Ser. A55 | CAD | 8.00 | 6/1/23 | 1,450,000 | 2,276,646 | |
| Canadian Government, | ||||||
| Bonds, Ser. VW17 | CAD | 8.00 | 6/1/27 | 340,000 | 581,569 | |
| CNH Capital Canada | ||||||
| Receivables Trust, | ||||||
| Ser. 2011-1A, Cl. A2 | CAD | 2.34 | 7/17/17 | 875,000 | c | 863,236 |
| Ford Auto | ||||||
| Securitization Trust, | ||||||
| Ser. 2011-R3A, Cl. A2 | CAD | 1.96 | 7/15/15 | 800,000 | c | 785,457 |
| Rogers Communications, | ||||||
| Gtd. Notes | CAD | 6.56 | 3/22/41 | 600,000 | 670,539 | |
| The Fund | 9 |
STATEMENT OF INVESTMENTS (continued)
| Coupon | Maturity | Principal | ||||
| Bonds and Notes (continued) | Rate (%) | Date | Amount ($)a | Value ($) | ||
| Canada (continued) | ||||||
| Royal Bank of Canada, | ||||||
| Sr. Unscd. Notes | 1.45 | 10/30/14 | 745,000 | 749,384 | ||
| Teck Resources, | ||||||
| Sr. Scd. Notes | 10.75 | 5/15/19 | 330,000 | 403,135 | ||
| Toronto-Dominion Bank, | ||||||
| Sr. Unscd. Notes | 2.38 | 10/19/16 | 615,000 | 626,525 | ||
| 9,920,064 | ||||||
| Chile—2.0% | ||||||
| Chilean Government, | ||||||
| Sr. Unscd. Notes | CLP | 5.50 | 8/5/20 | 944,000,000 | 1,903,446 | |
| Codelco, | ||||||
| Sr. Unscd. Notes | 3.88 | 11/3/21 | 1,340,000 | c | 1,371,032 | |
| Empresa Nacional de Petroleos, | ||||||
| Notes | 4.75 | 12/6/21 | 755,000 | c | 753,731 | |
| 4,028,209 | ||||||
| France—1.4% | ||||||
| BNP Paribas Home Loan, | ||||||
| Covered Bonds | EUR | 2.25 | 10/1/12 | 800,000 | 1,037,452 | |
| Pernod-Ricard, | ||||||
| Sr. Unscd. Bonds | EUR | 5.00 | 3/15/17 | 300,000 | 406,775 | |
| Pernod-Ricard, | ||||||
| Sr. Unscd. Bonds | 5.75 | 4/7/21 | 750,000 | c | 847,696 | |
| Pernod-Ricard, | ||||||
| Sr. Unscd. Notes | EUR | 7.00 | 1/15/15 | 100,000 | 142,434 | |
| RCI Banque, | ||||||
| Sr. Unscd. Notes | 2.26 | 4/11/14 | 395,000 | b,c | 376,689 | |
| 2,811,046 | ||||||
| Germany—6.5% | ||||||
| German Government, | ||||||
| Bonds | EUR | 3.25 | 7/4/42 | 1,430,000 | 2,195,872 | |
| German Government, | ||||||
| Bonds, Ser. 2004 | EUR | 4.25 | 7/4/14 | 6,560,000 | 9,340,161 | |
| Globaldrive, | ||||||
| Ser. 2011-AA, Cl. A | EUR | 1.89 | 4/20/19 | 951,293 | b,c | 1,231,105 |
| KFW, | ||||||
| Gov’t Gtd. Bonds | 3.50 | 3/10/14 | 125,000 | 132,034 | ||
| 12,899,172 | ||||||
10
| Coupon | Maturity | Principal | ||||
| Bonds and Notes (continued) | Rate (%) | Date | Amount ($)a | Value ($) | ||
| Japan—14.6% | ||||||
| Development Bank of Japan, | ||||||
| Gov’t Gtd. Notes | JPY | 1.05 | 6/20/23 | 27,000,000 | 343,150 | |
| Japanese Government, | ||||||
| Sr. Unscd. Bonds, Ser. 252 | JPY | 1.00 | 6/20/13 | 345,000,000 | 4,539,500 | |
| Japanese Government, | ||||||
| Sr. Unscd. Bonds, Ser. 8 | JPY | 1.00 | 6/10/16 | 130,000,000 | d | 1,724,354 |
| Japanese Government, | ||||||
| Sr. Unscd. Bonds, Ser. 310 | JPY | 1.00 | 9/20/20 | 440,000,000 | 5,796,601 | |
| Japanese Government, | ||||||
| Sr. Unscd. Bonds, Ser. 288 | JPY | 1.70 | 9/20/17 | 628,450,000 | 8,750,691 | |
| Japanese Government, | ||||||
| Sr. Unscd. Bonds, Ser. 11 | JPY | 1.70 | 6/20/33 | 595,150,000 | 7,637,993 | |
| Japanese Government, | ||||||
| Sr. Unscd. Bonds, | ||||||
| Ser. 106 | JPY | 2.20 | 9/20/28 | 28,300,000 | 399,700 | |
| 29,191,989 | ||||||
| Luxembourg—.5% | ||||||
| Enel Finance International, | ||||||
| Gtd. Notes | 5.70 | 1/15/13 | 295,000 | c | 296,186 | |
| Holcim US Finance Sarl & Cie, | ||||||
| Gtd. Notes | 6.00 | 12/30/19 | 435,000 | c | 448,962 | |
| Telecom Italia Capital, | ||||||
| Gtd. Notes | 7.18 | 6/18/19 | 325,000 | 304,987 | ||
| 1,050,135 | ||||||
| Mexico—.6% | ||||||
| Mexican Government, | ||||||
| Bonds, Ser. M 30 | MXN | 8.50 | 11/18/38 | 5,380,000 | 418,034 | |
| Petroleos Mexicanos, | ||||||
| Gtd. Notes | 6.50 | 6/2/41 | 740,000 | c | 836,200 | |
| 1,254,234 | ||||||
| Netherlands—2.9% | ||||||
| BMW Finance, | ||||||
| Gtd. Notes | EUR | 3.88 | 1/18/17 | 140,000 | 191,513 | |
| E.ON International Finance, | ||||||
| Gtd. Notes | EUR | 4.88 | 1/28/14 | 100,000 | 138,068 | |
| E.ON International Finance, | ||||||
| Gtd. Notes | EUR | 5.50 | 10/2/17 | 150,000 | 223,963 | |
| The Fund | 11 |
STATEMENT OF INVESTMENTS (continued)
| Coupon | Maturity | Principal | ||||
| Bonds and Notes (continued) | Rate (%) | Date | Amount ($)a | Value ($) | ||
| Netherlands (continued) | ||||||
| ING Bank, | ||||||
| Covered Notes | EUR | 3.63 | 8/31/21 | 305,000 | 407,334 | |
| Netherlands Government, | ||||||
| Bonds | EUR | 3.25 | 7/15/15 | 2,080,000 | 2,906,344 | |
| Netherlands Government, | ||||||
| Bonds | EUR | 4.00 | 7/15/18 | 1,105,000 | 1,621,625 | |
| RWE Finance, | ||||||
| Gtd. Notes | EUR | 6.63 | 1/31/19 | 100,000 | 157,801 | |
| Storm, | ||||||
| Ser. 2005, Cl. A | EUR | 1.62 | 5/26/47 | 120,536 | b | 155,462 |
| 5,802,110 | ||||||
| Norway—1.3% | ||||||
| DNB Boligkreditt, | ||||||
| Covered Bonds | 2.10 | 10/14/16 | 795,000 | c | 789,697 | |
| Norwegian Government, | ||||||
| Bonds, Ser. 474 | NOK | 3.75 | 5/25/21 | 4,300,000 | 798,457 | |
| Statoil, | ||||||
| Gtd. Notes | 4.25 | 11/23/41 | 740,000 | 776,178 | ||
| Yara International, | ||||||
| Sr. Unscd. Notes | 7.88 | 6/11/19 | 150,000 | c | 184,373 | |
| 2,548,705 | ||||||
| Philippines—.1% | ||||||
| Philippine Government, | ||||||
| Sr. Unscd. Notes | PHP | 4.95 | 1/15/21 | 8,000,000 | 185,625 | |
| Poland—.6% | ||||||
| Polish Government, | ||||||
| Sr. Unscd. Notes | 5.00 | 3/23/22 | 1,255,000 | 1,265,981 | ||
| Qatar—.8% | ||||||
| Qatar Goverment, | ||||||
| Sr. Unscd. Notes | 3.13 | 1/20/17 | 1,580,000 | c | 1,597,696 | |
| Saudi Arabia—.4% | ||||||
| Abu Dhabi National Energy, | ||||||
| Sr. Unscd. Notes | 4.13 | 3/13/17 | 200,000 | c,e | 201,750 | |
| Abu Dhabi National Energy, | ||||||
| Sr. Unscd. Notes | 5.88 | 12/13/21 | 550,000 | c | 574,750 | |
| 776,500 | ||||||
12
| Coupon | Maturity | Principal | ||||
| Bonds and Notes (continued) | Rate (%) | Date | Amount ($)a | Value ($) | ||
| South Africa—.2% | ||||||
| South African Government, | ||||||
| Bonds, Ser. R209 | ZAR | 6.25 | 3/31/36 | 4,890,000 | 448,260 | |
| South Korea—.1% | ||||||
| Export-Import | ||||||
| Bank of Korea, | ||||||
| Sr. Unscd. Notes | EUR | 5.75 | 5/22/13 | 110,000 | 147,492 | |
| Spain—.2% | ||||||
| Telefonica Emisiones, | ||||||
| Gtd. Notes | 5.46 | 2/16/21 | 410,000 | 391,938 | ||
| Supranational—.3% | ||||||
| Corp Andina De Formento, | ||||||
| Sr. Unscd. Notes | 3.75 | 1/15/16 | 660,000 | 673,469 | ||
| Sweden—4.0% | ||||||
| Nordea Bank, | ||||||
| Sr. Unscd. Notes | 2.13 | 1/14/14 | 795,000 | c | 780,075 | |
| Swedish Government, | ||||||
| Bonds, Ser. 1052 | SEK | 4.25 | 3/12/19 | 4,270,000 | 739,480 | |
| Swedish Government, | ||||||
| Bonds, Ser. 1041 | SEK | 6.75 | 5/5/14 | 39,000,000 | e | 6,434,670 |
| 7,954,225 | ||||||
| United Kingdom—12.8% | ||||||
| Arran Residential | ||||||
| Mortgages Funding, | ||||||
| Ser. 2011-1A, Cl. A1B | EUR | 2.66 | 11/19/47 | 715,434 | b,c | 925,002 |
| Barclays Bank, | ||||||
| Covered Notes | EUR | 2.13 | 9/8/15 | 440,000 | 565,664 | |
| Barclays Bank, | ||||||
| Covered Notes | EUR | 4.00 | 10/7/19 | 800,000 | 1,076,668 | |
| BP Capital Markets, | ||||||
| Gtd. Notes | 2.25 | 11/1/16 | 255,000 | 256,919 | ||
| BP Capital Markets, | ||||||
| Gtd. Notes | 3.56 | 11/1/21 | 1,410,000 | 1,470,973 | ||
| Fosse Master Issuer, | ||||||
| Ser. 2011-1A, Cl. A4 | EUR | 2.87 | 10/18/54 | 1,980,000 | b,c | 2,553,425 |
| Holmes Master Issuer, | ||||||
| Ser. 2011-3A, Cl. A3 | EUR | 2.98 | 10/15/54 | 870,000 | b,c | 1,118,676 |
| The Fund | 13 |
STATEMENT OF INVESTMENTS (continued)
| Coupon | Maturity | Principal | ||||
| Bonds and Notes (continued) | Rate (%) | Date | Amount ($)a | Value ($) | ||
| United Kingdom (continued) | ||||||
| Lloyds TSB Bank, | ||||||
| Covered Notes | EUR | 3.38 | 3/17/16 | 600,000 | 787,164 | |
| Lloyds TSB Bank, | ||||||
| Covered Bonds | EUR | 4.00 | 9/29/21 | 200,000 | 257,942 | |
| Lloyds TSB Bank, | ||||||
| Sr. Unscd. Notes | EUR | 5.38 | 9/3/19 | 450,000 | 563,651 | |
| National Grid, | ||||||
| Sr. Unscd. Notes | 6.30 | 8/1/16 | 75,000 | 86,151 | ||
| Paragon Mortgages, | ||||||
| Ser. 14A, Cl. A2C | 0.65 | 9/15/39 | 1,275,433 | b,c | 943,950 | |
| Reed Elsevier Investment, | ||||||
| Gtd. Notes | GBP | 7.00 | 12/11/17 | 100,000 | 185,794 | |
| Royal Bank of Scotland, | ||||||
| Covered Notes | EUR | 3.00 | 9/8/16 | 280,000 | 361,420 | |
| Royal Bank of Scotland, | ||||||
| Covered Notes | EUR | 3.88 | 10/19/21 | 600,000 | 764,394 | |
| Royal Bank of Scotland, | ||||||
| Gtd. Notes | 5.63 | 8/24/20 | 405,000 | 389,098 | ||
| Royal Bank of Scotland, | ||||||
| Sr. Unscd. Notes | EUR | 5.75 | 5/21/14 | 205,000 | 265,978 | |
| Silverstone Master Issuer, | ||||||
| Ser. 2011-1A, Cl. 1A | 1.96 | 1/21/55 | 895,000 | b,c | 893,358 | |
| United Kingdom Gilt, | ||||||
| Bonds | GBP | 4.25 | 9/7/39 | 2,055,000 | 3,933,848 | |
| United Kingdom Gilt, | ||||||
| Bonds | GBP | 4.25 | 12/7/40 | 1,290,000 | 2,471,873 | |
| United Kingdom Gilt, | ||||||
| Bonds | GBP | 8.00 | 6/7/21 | 1,080,000 | 2,571,523 | |
| United Kingdom Gilt, | ||||||
| Bonds | GBP | 8.75 | 8/25/17 | 1,415,000 | 3,119,155 | |
| 25,562,626 | ||||||
| United States—36.3% | ||||||
| Ally Auto Receivables Trust, | ||||||
| Ser. 2010-1, Cl. A3 | 1.45 | 5/15/14 | 169,625 | 170,383 | ||
| Ally Financial, | ||||||
| Gtd. Notes | 4.50 | 2/11/14 | 170,000 | 164,475 | ||
| Ally Master Owner Trust, | ||||||
| Ser. 2011-5, Cl. A | 0.93 | 6/15/15 | 945,000 | b | 945,339 | |
14
| Coupon | Maturity | Principal | ||||
| Bonds and Notes (continued) | Rate (%) | Date | Amount ($)a | Value ($) | ||
| United States (continued) | ||||||
| Altria Group, | ||||||
| Gtd. Notes | 4.75 | 5/5/21 | 575,000 | 634,303 | ||
| Altria Group, | ||||||
| Gtd. Notes | 10.20 | 2/6/39 | 65,000 | 101,455 | ||
| Anadarko Petroleum, | ||||||
| Unscd. Notes | 6.20 | 3/15/40 | 190,000 | 212,191 | ||
| Anadarko Petroleum, | ||||||
| Sr. Unscd. Notes | 6.38 | 9/15/17 | 235,000 | 272,728 | ||
| Anheuser-Busch InBev Worldwide, | ||||||
| Gtd. Notes | 4.38 | 2/15/21 | 685,000 | 764,928 | ||
| Anheuser-Busch Inbev Worldwide, | ||||||
| Gtd. Notes | 6.38 | 1/15/40 | 250,000 | 344,819 | ||
| Anheuser-Busch InBev Worldwide, | ||||||
| Gtd. Notes | 8.20 | 1/15/39 | 215,000 | 340,139 | ||
| Arkle Master Issuer, | ||||||
| Ser. 2010-2A, Cl. 1A1 | 1.87 | 5/17/60 | 1,315,000 | b,c | 1,312,857 | |
| Autozone, | ||||||
| Sr. Unscd. Notes | 4.00 | 11/15/20 | 425,000 | 436,228 | ||
| BMW US Capital, | ||||||
| Gtd. Notes | EUR | 5.00 | 5/28/15 | 200,000 | 283,010 | |
| Burlington | ||||||
| North Santa Fe, | ||||||
| Sr. Unscd. Debs | 5.05 | 3/1/41 | 150,000 | 167,007 | ||
| Cargill, | ||||||
| Sr. Unscd. Notes | 3.25 | 11/15/21 | 625,000 | c | 630,349 | |
| Chrysler Financial Auto | ||||||
| Securitization Trust, | ||||||
| Ser. 2010-A, Cl. D | 3.52 | 8/8/16 | 630,000 | 636,165 | ||
| Citigroup, | ||||||
| Sr. Unscd. Notes | EUR | 7.38 | 6/16/14 | 250,000 | 345,826 | |
| CNA Financial, | ||||||
| Sr. Unscd. Notes | 5.75 | 8/15/21 | 325,000 | 332,248 | ||
| Comcast, | ||||||
| Gtd. Notes | 5.90 | 3/15/16 | 150,000 | 171,851 | ||
| CVS Pass-Through Trust, | ||||||
| Pass Thru Certificates | 5.77 | 1/10/33 | 415,966 | c | 426,456 | |
| CVS Pass-Through Trust, | ||||||
| Pass Thru Certificates | 6.04 | 12/10/28 | 348,775 | 363,942 | ||
| The Fund | 15 |
STATEMENT OF INVESTMENTS (continued)
| Coupon | Maturity | Principal | ||||
| Bonds and Notes (continued) | Rate (%) | Date | Amount ($)a | Value ($) | ||
| United States (continued) | ||||||
| DIRECTV Holdings, | ||||||
| Gtd. Notes | 5.00 | 3/1/21 | 600,000 | 643,317 | ||
| Ecolab, | ||||||
| Sr. Unscd. Notes | 5.50 | 12/8/41 | 195,000 | 216,920 | ||
| Enterprise Products Operating, | ||||||
| Gtd. Notes | 6.13 | 10/15/39 | 325,000 | 364,292 | ||
| EQT, | ||||||
| Sr. Unscd. Notes | 8.13 | 6/1/19 | 135,000 | 158,577 | ||
| Federal National | 12/1/40— | |||||
| Mortgage Association | 4.00 | 8/1/41 | 8,210,217 | g | 8,655,041 | |
| Federal National | ||||||
| Mortgage Association | 3.50 | 1/1/40 | 2,895,000 | f,g | 2,978,231 | |
| Federal National | ||||||
| Mortgage Association | 4.00 | 1/1/39 | 6,215,000 | f,g | 6,530,606 | |
| Ford Motor Credit, | ||||||
| Sr. Unscd. Notes | 3.88 | 1/15/15 | 1,010,000 | 1,006,944 | ||
| Ford Motor Credit, | ||||||
| Sr. Unscd. Notes | 6.63 | 8/15/17 | 240,000 | 261,562 | ||
| Freeport-McMoRan Copper & Gold, | ||||||
| Sr. Unscd. Notes | 8.38 | 4/1/17 | 279,000 | 296,752 | ||
| General Electric Capital, | ||||||
| Sr. Unscd. Notes | 4.63 | 1/7/21 | 205,000 | 213,069 | ||
| General Electric Capital, | ||||||
| Sub. Notes | 5.30 | 2/11/21 | 300,000 | 321,267 | ||
| General Electric Capital, | ||||||
| Sr. Unscd. Notes | 6.88 | 1/10/39 | 165,000 | 198,340 | ||
| Gilead Sciences, | ||||||
| Sr. Unscd. Notes | 3.05 | 12/1/16 | 620,000 | 635,282 | ||
| Goldman Sachs Group, | ||||||
| Sr. Unscd. Notes | 6.00 | 6/15/20 | 380,000 | 389,899 | ||
| Goodyear Tire & Rubber, | ||||||
| Gtd. Notes | 10.50 | 5/15/16 | 155,000 | 171,662 | ||
| Gracechurch Mortgage Funding PLC, | ||||||
| Ser. 2007-1A, Cl. 3A1 | 0.56 | 11/20/56 | 462,464 | b,c | 460,745 | |
16
| Coupon | Maturity | Principal | ||||
| Bonds and Notes (continued) | Rate (%) | Date | Amount ($)a | Value ($) | ||
| United States (continued) | ||||||
| Gracechurch Mortgage Funding PLC, | ||||||
| Ser. 2011-1A, Cl. 2A1 | 2.03 | 11/20/56 | 2,000,000 | b,c | 2,001,150 | |
| Hartford Financial Services Group, | ||||||
| Sr. Unscd. Notes | 5.50 | 3/30/20 | 175,000 | 177,904 | ||
| Holmes Master Issuer, | ||||||
| Ser. 2010-1A, Cl. A2 | 1.80 | 10/15/54 | 1,190,000 | b,c | 1,188,050 | |
| Hyundai Capital America, | ||||||
| Gtd. Notes | 4.00 | 6/8/17 | 475,000 | c | 470,579 | |
| International Paper, | ||||||
| Sr. Unscd. Notes | 4.75 | 2/15/22 | 380,000 | 404,720 | ||
| JPMorgan Chase Bank, | ||||||
| Sr. Unscd. Notes | 4.35 | 8/15/21 | 1,355,000 | 1,371,097 | ||
| JPMorgan Chase Bank NA, | ||||||
| Sub. Notes | EUR | 4.38 | 11/30/21 | 450,000 | b | 486,511 |
| Kinder Morgan Energy Partners, | ||||||
| Sr. Unscd. Notes | 6.85 | 2/15/20 | 165,000 | 194,321 | ||
| Kraft Foods, | ||||||
| Sr. Unscd. Notes | 5.38 | 2/10/20 | 1,260,000 | 1,456,284 | ||
| Levi Strauss & Co., | ||||||
| Sr. Unscd. Notes | EUR | 7.75 | 5/15/18 | 130,000 | 155,213 | |
| Macy’s Retail Holdings, | ||||||
| Gtd. Notes | 6.38 | 3/15/37 | 610,000 | 711,015 | ||
| Marathon Petroleum, | ||||||
| Sr. Uncd. Notes | 5.13 | 3/1/21 | 380,000 | 397,701 | ||
| MetLife Institutional Funding II, | ||||||
| Scd. Notes | 1.27 | 4/4/14 | 1,075,000 | b,c | 1,073,331 | |
| Morgan Stanley, | ||||||
| Sr. Unscd. Notes | 5.50 | 7/24/20 | 425,000 | 387,062 | ||
| NBC Universal Media, | ||||||
| Sr. Unscd. Notes | 4.38 | 4/1/21 | 95,000 | 100,449 | ||
| NBC Universal Media, | ||||||
| Sr. Unscd. Notes | 5.15 | 4/30/20 | 385,000 | 429,383 | ||
| NBC Universal Media, | ||||||
| Sr. Unscd. Notes | 6.40 | 4/30/40 | 245,000 | 302,293 | ||
| The Fund | 17 |
STATEMENT OF INVESTMENTS (continued)
| Coupon | Maturity | Principal | |||
| Bonds and Notes (continued) | Rate (%) | Date | Amount ($)a | Value ($) | |
| United States (continued) | |||||
| News America, | |||||
| Gtd. Notes | 6.90 | 3/1/19 | 355,000 | 417,833 | |
| Peabody Energy, | |||||
| Gtd. Notes | 6.00 | 11/15/18 | 505,000 | c | 517,625 |
| Peabody Energy, | |||||
| Gtd. Notes | 6.25 | 11/15/21 | 240,000 | c | 249,600 |
| Pepsico, | |||||
| Sr. Unscd. Notes | 0.80 | 8/25/14 | 650,000 | 649,880 | |
| Philip Morris International, | |||||
| Sr. Unscd. Notes | 2.90 | 11/15/21 | 1,140,000 | 1,164,773 | |
| Philip Morris International, | |||||
| Sr. Unscd. Notes | 5.65 | 5/16/18 | 125,000 | 148,055 | |
| Philip Morris International, | |||||
| Sr. Unscd. Notes | 6.88 | 3/17/14 | 135,000 | 151,959 | |
| Plains All American Pipeline, | |||||
| Gtd. Notes | 4.25 | 9/1/12 | 300,000 | 306,069 | |
| Plains All American Pipeline, | |||||
| Gtd. Notes | 5.00 | 2/1/21 | 135,000 | 148,990 | |
| Plains All American Pipeline, | |||||
| Gtd. Notes | 8.75 | 5/1/19 | 65,000 | 83,155 | |
| Prudential Financial, | |||||
| Sr. Unscd. Notes | 4.50 | 11/15/20 | 650,000 | 654,792 | |
| Prudential Financial, | |||||
| Sr. Unscd. Notes | 5.38 | 6/21/20 | 200,000 | 214,412 | |
| Puget Energy, | |||||
| Sr. Scd. Notes | 6.00 | 9/1/21 | 170,000 | 176,224 | |
| Reed Elsevier Capital, | |||||
| Gtd. Notes | 8.63 | 1/15/19 | 110,000 | 137,478 | |
| Sempra Energy, | |||||
| Sr. Unscd. Notes | 1.31 | 3/15/14 | 770,000 | b | 767,387 |
| SLM Student Loan Trust, | |||||
| Ser. 2011-B, Cl. A1 | 1.13 | 12/16/24 | 937,830 | b,c | 926,462 |
| Time Warner, | |||||
| Gtd. Debs | 5.38 | 10/15/41 | 320,000 | 347,956 | |
18
| Coupon | Maturity | Principal | |||||
| Bonds and Notes (continued) | Rate (%) | Date | Amount ($)a | Value ($) | |||
| United States (continued) | |||||||
| Time Warner Cable, | |||||||
| Gtd. Notes | 4.00 | 9/1/21 | 300,000 | 304,123 | |||
| U.S. Treasury Bonds | 3.75 | 8/15/41 | 690,000 | e | 811,613 | ||
| U.S. Treasury Bonds | 5.38 | 2/15/31 | 675,000 | 962,192 | |||
| U.S. Treasury Notes | 2.63 | 4/30/16 | 16,200,000 | e | 17,530,182 | ||
| Verizon Communications, | |||||||
| Sr. Unscd. Notes | 4.75 | 11/1/41 | 535,000 | 578,150 | |||
| Wells Fargo Bank & Co. | |||||||
| Sr. Unscd. Notes | 2.63 | 12/15/16 | 910,000 | 910,494 | |||
| WM Wrigley Jr., | |||||||
| Sr. Scd. Notes | 3.70 | 6/30/14 | 380,000 | c | 391,986 | ||
| Xerox, | |||||||
| Sr. Unscd. Notes | 1.28 | 5/16/14 | 190,000 | b | 187,340 | ||
| 72,604,998 | |||||||
| Total Bonds And Notes | |||||||
| (cost $183,761,775) | 188,284,277 | ||||||
| Short-Term Investments—5.8% | |||||||
| U.S. Treasury Bills: | |||||||
| 0.00%, 2/2/12 | 1,920,000h | 1,919,983 | |||||
| 0.00%, 3/8/12 | 15,000 | h | 14,999 | ||||
| 0.01%, 3/29/12 | 9,505,000 | 9,504,601 | |||||
| 0.02%, 5/17/12 | 50,000 | h | 49,994 | ||||
| Total Short-Term Investments | |||||||
| (cost $11,489,876) | 11,489,577 | ||||||
| Other Investment—3.7% | Shares | Value ($) | |||||
| Registered Investment Company; | |||||||
| Dreyfus | |||||||
| Institutional Preferred | |||||||
| Plus Money Market Fund | |||||||
| (cost $7,435,735) | 7,435,735i | 7,435,735 | |||||
| The Fund | 19 |
STATEMENT OF INVESTMENTS (continued)
| Investment of Cash Collateral | ||||
| for Securities Loaned—1.0% | Shares | Value ($) | ||
| Registered Investment Company; | ||||
| Dreyfus Institutional Cash Advantage Fund | ||||
| (cost $2,038,000) | 2,038,000i | 2,038,000 | ||
| Total Investments (cost $204,725,386) | 104.7% | 209,247,589 | ||
| Liabilities, Less Cash and Receivables | (4.7%) | (9,433,147) | ||
| Net Assets | 100.0% | 199,814,442 | ||
| a Principal amount stated in U.S. Dollars unless otherwise noted. |
| AUD—Australian Dollar |
| BRL—Brazilian Real |
| CAD—Canadian Dollar |
| CLP—Chilean Peso |
| EUR—Euro |
| GBP—British Pound |
| JPY—JapaneseYen |
| MXN—Mexican New Peso |
| NOK—Norwegian Krone |
| PHP—Philippine Peso |
| SEK—Swedish Krona |
| ZAR—South African Rand |
| b Variable rate security—interest rate subject to periodic change. |
| c Securities exempt from registration under Rule 144A of the Securities Act of 1933.These securities may be resold in |
| transactions exempt from registration, normally to qualified institutional buyers.At December 31, 2011, these |
| securities were valued at $29,120,605 or 14.6% of net assets. |
| d Principal amount for accrual purposes is periodically adjusted based on changes in the Japanese Consumer Price Index. |
| e Security, or portion thereof, on loan.At December 31, 2011, the value of the fund’s securities on loan was |
| $15,951,573 and the value of the collateral held by the fund was $16,467,838, consisting of cash collateral of |
| $2,038,000 and U.S Government & Agency securities valued at $14,429,838. |
| f Purchased on a forward commitment basis. |
| g The Federal Housing Finance Agency (“FHFA”) placed Federal Home Loan Mortgage Corporation and Federal |
| National Mortgage Association into conservatorship with FHFA as the conservator.As such, the FHFA oversees the |
| continuing affairs of these companies. |
| h Held by a broker as collateral for open financial futures positions. |
| i Investment in affiliated money market mutual fund. |
| Portfolio Summary (Unaudited)† | |||
| Value (%) | Value (%) | ||
| Foreign/Governmental | 40.8 | Short-Term/ | |
| Corporate Bonds | 25.5 | Money Market Investments | 10.5 |
| U.S. Government/Agencies | 18.8 | Asset/Residential Mortgage-Backed | 9.1 |
| 104.7 | |||
| † Based on net assets. | |||
| See notes to financial statements. | |||
20
STATEMENT OF FINANCIAL FUTURES
December 31, 2011
| Unrealized | ||||||
| Market Value | Appreciation | |||||
| Covered by | (Depreciation) | |||||
| Contracts | Contracts ($) | Expiration | at 12/31/2011($) | |||
| Financial Futures Short | ||||||
| Euro-Bobl | 45 | (7,286,546) | March 2012 | (107,266) | ||
| U.S. Treasury 2 Year Notes | 72 | (15,879,375) | March 2012 | (5,718) | ||
| U.S. Treasury 10 Year Notes | 93 | (12,194,625) | March 2012 | (161,708) | ||
| Financial Futures Long | ||||||
| Canadian 10 Year Bonds | 16 | 2,102,026 | March 2012 | 38,330 | ||
| Japanese 10 Year Bonds | 2 | 3,700,403 | March 2012 | 38,431 | ||
| Gross Unrealized Appreciation | 76,761 | |||||
| Gross Unrealized Depreciation | (274,692) | |||||
| See notes to financial statements. | ||||||
| The Fund | 21 |
| STATEMENT OF ASSETS AND LIABILITIES |
| December 31, 2011 |
| Cost | Value | |||
| Assets ($): | ||||
| Investments in securities—See Statement of Investments (including | ||||
| securities on loan, valued at $15,951,573)—Note 1(c): | ||||
| Unaffiliated issuers | 195,251,651 | 199,773,854 | ||
| Affiliated issuers | 9,473,735 | 9,473,735 | ||
| Cash | 183,738 | |||
| Cash denominated in foreign currencies | 252,393 | 252,171 | ||
| Receivable for shares of Beneficial Interest subscribed | 2,144,475 | |||
| Dividends, interest and securities lending income receivable | 1,711,795 | |||
| Receivable for investment securities sold | 431,474 | |||
| Unrealized appreciation on forward foreign | ||||
| currency exchange contracts—Note 4 | 265,769 | |||
| Unrealized appreciation on swap contracts—Note 4 | 82,460 | |||
| Prepaid expenses | 25,634 | |||
| 214,345,105 | ||||
| Liabilities ($): | ||||
| Due to The Dreyfus Corporation and affiliates—Note 3(d) | 112,179 | |||
| Due to Administrator—Note 3(b) | 14,884 | |||
| Payable for investment securities purchased | 11,108,346 | |||
| Liability for securities on loan—Note 1(c) | 2,038,000 | |||
| Unrealized depreciation on forward foreign | ||||
| currency exchange contracts—Note 4 | 795,598 | |||
| Payable for shares of Beneficial Interest redeemed | 379,831 | |||
| Payable for futures variation margin—Note 4 | 35,885 | |||
| Accrued expenses | 45,940 | |||
| 14,530,663 | ||||
| Net Assets ($) | 199,814,442 | |||
| Composition of Net Assets ($): | ||||
| Paid-in capital | 199,999,216 | |||
| Accumulated distributions in excess of investment income—net | (2,681,932) | |||
| Accumulated net realized gain (loss) on investments | (1,330,372) | |||
| Accumulated net unrealized appreciation (depreciation) on investments, | ||||
| swap transactions and foreign currency transactions [including | ||||
| ($197,931) net unrealized (depreciation) on financial futures] | 3,827,530 | |||
| Net Assets ($) | 199,814,442 | |||
| Net Asset Value Per Share | ||||
| Class A | Class C | Class I | ||
| Net Assets ($) | 48,509,106 | 10,778,047 | 140,527,289 | |
| Shares Outstanding | 2,338,614 | 521,132 | 6,766,098 | |
| Net Asset Value Per Share ($) | 20.74 | 20.68 | 20.77 | |
| See notes to financial statements. | ||||
22
| STATEMENT OF OPERATIONS |
| Year Ended December 31, 2011 |
| Investment Income ($): | ||
| Income: | ||
| Interest (net of $3,411 foreign taxes withheld at source): | 5,433,462 | |
| Income from securities lending—Note 1(c) | 6,275 | |
| Dividends; | ||
| Affiliated issuers | 6,195 | |
| Total Income | 5,445,932 | |
| Expenses: | ||
| Investment advisory fee—Note 3(a) | 673,511 | |
| Shareholder servicing costs—Note 3(d) | 212,522 | |
| Administration fees—Note 3(a) | 118,300 | |
| Custodian fees—Note 3(d) | 67,708 | |
| Distribution fees—Note 3(c) | 59,377 | |
| Professional fees | 56,901 | |
| Registration fees | 45,494 | |
| Prospectus and shareholders’ reports | 24,105 | |
| Accounting and administration fees—Note 3(a) | 24,000 | |
| Trustees’ fees and expenses—Note 3(e) | 10,699 | |
| Administrative service fees—Note 3(b) | 7,124 | |
| Loan commitment fees—Note 2 | 2,511 | |
| Interest expense—Note 2 | 155 | |
| Miscellaneous | 51,761 | |
| Total Expenses | 1,354,168 | |
| Less—reduction in investment advisory fee due to undertaking—Note 3(a) | (29,547) | |
| Less—reduction in fees due to earnings credits—Note 3(d) | (29) | |
| Net Expenses | 1,324,592 | |
| Investment Income—Net | 4,121,340 | |
| Realized and Unrealized Gain (Loss) on Investments—Note 4 ($): | ||
| Net realized gain (loss) on investments and foreign currency transactions | 1,967,315 | |
| Net realized gain (loss) on options transactions | (101,217) | |
| Net realized gain (loss) on financial futures | (1,736,826) | |
| Net realized gain (loss) on swap transactions | (17,860) | |
| Net realized gain (loss) on forward foreign currency exchange contracts | (186,910) | |
| Net Realized Gain (Loss) | (75,498) | |
| Net unrealized appreciation (depreciation) on | ||
| investments and foreign currency transactions | 1,751,674 | |
| Net unrealized appreciation (depreciation) on options transactions | 15,612 | |
| Net unrealized appreciation (depreciation) on financial futures | (242,542) | |
| Net unrealized appreciation (depreciation) on swap transactions | 126,372 | |
| Net unrealized appreciation (depreciation) on | ||
| forward foreign currency exchange contracts | 242,431 | |
| Net Unrealized Appreciation (Depreciation) | 1,893,547 | |
| Net Realized and Unrealized Gain (Loss) on Investments | 1,818,049 | |
| Net Increase in Net Assets Resulting from Operations | 5,939,389 | |
See notes to financial statements.
| The Fund | 23 |
STATEMENT OF CHANGES IN NET ASSETS
| Year Ended December 31, | ||||
| 2011 | 2010 | |||
| Operations ($): | ||||
| Investment income—net | 4,121,340 | 3,446,960 | ||
| Net realized gain (loss) on investments | (75,498) | 4,891,542 | ||
| Net unrealized appreciation | ||||
| (depreciation) on investments | 1,893,547 | (3,724,627) | ||
| Net Increase (Decrease) in Net Assets | ||||
| Resulting from Operations | 5,939,389 | 4,613,875 | ||
| Dividends to Shareholders from ($): | ||||
| Investment income—net: | ||||
| Class A Shares | (1,699,732) | (957,250) | ||
| Class C Shares | (306,004) | (149,989) | ||
| Class I Shares | (5,381,475) | (4,781,480) | ||
| Net realized gain on investments: | ||||
| Class A Shares | (3,861) | — | ||
| Class C Shares | (667) | — | ||
| Class I Shares | (11,739) | — | ||
| Total Dividends | (7,403,478) | (5,888,719) | ||
| Beneficial Interest Transactions ($): | ||||
| Net proceeds from shares sold: | ||||
| Class A Shares | 30,956,514 | 32,628,652 | ||
| Class C Shares | 6,932,896 | 5,376,167 | ||
| Class I Shares | 74,675,907 | 54,692,976 | ||
| Dividends reinvested: | ||||
| Class A Shares | 1,683,367 | 948,045 | ||
| Class C Shares | 303,637 | 148,159 | ||
| Class I Shares | 3,837,389 | 4,383,251 | ||
| Cost of shares redeemed: | ||||
| Class A Shares | (13,698,964) | (2,686,498) | ||
| Class C Shares | (1,538,906) | (173,066) | ||
| Class I Shares | (32,635,132) | (36,210,753) | ||
| Increase (Decrease) in Net Assets from | ||||
| Beneficial Interest Transactions | 70,516,708 | 59,106,933 | ||
| Total Increase (Decrease) in Net Assets | 69,052,619 | 57,832,089 | ||
| Net Assets ($): | ||||
| Beginning of Period | 130,761,823 | 72,929,734 | ||
| End of Period | 199,814,442 | 130,761,823 | ||
| Undistributed (distribution in excess of) | ||||
| investment income—net | (2,681,932) | (554,103) | ||
24
| Year Ended December 31, | ||||
| 2011 | 2010 | |||
| Capital Share Transactions: | ||||
| Class A | ||||
| Shares sold | 1,474,689 | 1,512,906 | ||
| Shares issued for dividends reinvested | 80,939 | 45,424 | ||
| Shares redeemed | (651,716) | (124,106) | ||
| Net Increase (Decrease) in Shares Outstanding | 903,912 | 1,434,224 | ||
| Class C | ||||
| Shares sold | 330,903 | 249,611 | ||
| Shares issued for dividends reinvested | 14,659 | 7,122 | ||
| Shares redeemed | (73,569) | (8,072) | ||
| Net Increase (Decrease) in Shares Outstanding | 271,993 | 248,661 | ||
| Class I | ||||
| Shares sold | 3,546,669 | 2,548,923 | ||
| Shares issued for dividends reinvested | 184,228 | 208,835 | ||
| Shares redeemed | (1,550,933) | (1,689,639) | ||
| Net Increase (Decrease) in Shares Outstanding | 2,179,964 | 1,068,119 | ||
| See notes to financial statements. | ||||
| The Fund | 25 |
FINANCIAL HIGHLIGHTS
The following tables describe the performance for each share class for the fiscal periods indicated.All information (except portfolio turnover rate) reflects financial results for a single fund share.Total return shows how much your investment in the fund would have increased (or decreased) during each period, assuming you had reinvested all dividends and distributions.These figures have been derived from the fund’s financial statements.
| Year Ended December 31, | ||||||
| Class A Shares | 2011 | 2010 | 2009a | |||
| Per Share Data ($): | ||||||
| Net asset value, beginning of period | 20.84 | 20.73 | 20.92 | |||
| Investment Operations: | ||||||
| Investment income—netb | .48 | .59 | .08 | |||
| Net realized and unrealized | ||||||
| gain (loss) on investments | .21 | .60 | (.07) | |||
| Total from Investment Operations | .69 | 1.19 | .01 | |||
| Distributions: | ||||||
| Dividends from investment income—net | (.79) | (1.08) | (.20) | |||
| Dividends from net realized gain on investments | (.00)c | — | — | |||
| Total Distributions | (.79) | (1.08) | (.20) | |||
| Net asset value, end of period | 20.74 | 20.84 | 20.73 | |||
| Total Return (%)d | 3.36 | 5.77 | .03e | |||
| Ratios/Supplemental Data (%): | ||||||
| Ratio of total expenses to average net assets | 1.00 | 1.08 | .98f | |||
| Ratio of net expenses to average net assets | .98 | .90 | .90f | |||
| Ratio of net investment income | ||||||
| to average net assets | 2.26 | 2.86 | 4.40f | |||
| Portfolio Turnover Rate | 267.08g | 210.75g | 131.97g | |||
| Net Assets, end of period ($ x 1,000) | 48,509 | 29,900 | 10 | |||
| a | From December 2, 2009 (commencement of initial offering of this class) to December 31, 2009. |
| b | Based on average shares outstanding at each month end. |
| c | Amount represents less than $.01 per share. |
| d | Exclusive of sales charge. |
| e | Not annualized. |
| f | Annualized. |
| g | The portfolio turnover rates excluding mortgage dollar roll transactions for the periods ended December 31, 2011, |
| 2010 and 2009 were 247.48%, 206.04% and 111.36%, respectively. | |
| See notes to financial statements. | |
26
| Year Ended December 31, | ||||||
| Class C Shares | 2011 | 2010 | 2009a | |||
| Per Share Data ($): | ||||||
| Net asset value, beginning of period | 20.79 | 20.73 | 20.92 | |||
| Investment Operations: | ||||||
| Investment income—netb | .31 | .42 | .06 | |||
| Net realized and unrealized | ||||||
| gain (loss) on investments | .23 | .60 | (.07) | |||
| Total from Investment Operations | .54 | 1.02 | (.01) | |||
| Distributions: | ||||||
| Dividends from investment income—net | (.65) | (.96) | (.18) | |||
| Dividends from net realized gain on investments | (.00)c | — | — | |||
| Total Distributions | (.65) | (.96) | (.18) | |||
| Net asset value, end of period | 20.68 | 20.79 | 20.73 | |||
| Total Return (%)d | 2.56 | 5.01 | (.03)e | |||
| Ratios/Supplemental Data (%): | ||||||
| Ratio of total expenses to average net assets | 1.76 | 1.87 | 1.73f | |||
| Ratio of net expenses to average net assets | 1.73 | 1.65 | 1.65f | |||
| Ratio of net investment income | ||||||
| to average net assets | 1.47 | 2.12 | 3.65f | |||
| Portfolio Turnover Rate | 267.08g | 210.75g | 131.97g | |||
| Net Assets, end of period ($ x 1,000) | 10,778 | 5,181 | 10 | |||
| a | From December 2, 2009 (commencement of initial offering of this class) to December 31, 2009. |
| b | Based on average shares outstanding at each month end. |
| c | Amount represents less than $.01 per share. |
| d | Exclusive of sales charge. |
| e | Not annualized. |
| f | Annualized. |
| g | The portfolio turnover rates excluding mortgage dollar transactions for the periods ended December 31, 2011, 2010 |
| and 2009 were 247.48%, 206.04% and 111.36%, respectively. | |
| See notes to financial statements. | |
| The Fund | 27 |
FINANCIAL HIGHLIGHTS (continued)
| Year Ended December 31, | ||||||||||
| Class I Shares | 2011 | 2010 | 2009a | 2008 | 2007 | |||||
| Per Share Data ($): | ||||||||||
| Net asset value, beginning of period | 20.86 | 20.72 | 18.53 | 18.73 | 18.60 | |||||
| Investment Operations: | ||||||||||
| Investment income—netb | .54 | .75 | .91 | .86 | .85 | |||||
| Net realized and unrealized | ||||||||||
| gain (loss) on investments | .23 | .49 | 1.90 | .53 | (.06)c | |||||
| Total from Investment Operations | .77 | 1.24 | 2.81 | 1.39 | .79 | |||||
| Distributions: | ||||||||||
| Dividends from investment income—net | (.86) | (1.10) | (.62) | (1.59) | (.66) | |||||
| Dividends from net realized | ||||||||||
| gain on investments | (.00)d | — | — | — | — | |||||
| Total Distributions | (.86) | (1.10) | (.62) | (1.59) | (.66) | |||||
| Net asset value, end of period | 20.77 | 20.86 | 20.72 | 18.53 | 18.73 | |||||
| Total Return (%) | 3.72 | 6.02 | 15.48 | 7.50 | 4.30 | |||||
| Ratios/Supplemental Data (%): | ||||||||||
| Ratio of total expenses | ||||||||||
| to average net assets | .67 | .78 | .92 | 1.02 | .91 | |||||
| Ratio of net expenses | ||||||||||
| to average net assets | .66 | .65 | .65 | .65 | .65e | |||||
| Ratio of net investment income | ||||||||||
| to average net assets | 2.58 | 3.50 | 4.62 | 4.52 | 4.54 | |||||
| Portfolio Turnover Rate | 267.08f 210.75f 131.97f | 190f | 274f,g | |||||||
| Net Assets, end of period ($ x 1,000) | 140,527 | 95,681 | 72,910 | 43,409 | 40,833 | |||||
| a | The fund commenced offering three classes of shares on December 2, 2009. Effective September 1, 2009, the existing |
| shares were redesignated as Class I shares. | |
| b | Based on average shares outstanding at each month end. |
| c | Amount includes litigation proceeds received by the fund of $.01 for the year ended December 31, 2007. |
| d | Amount represents less than $.01 per share. |
| e | Includes the fund’s share of The Standish Mellon Global Fixed Income Portfolio’s (the “Portfolio”) allocated expenses. |
| f | The portfolio turnover rates excluding mortgage dollar roll transactions for the periods ended December 31, 2011, |
| 2010, 2009, 2008 and 2007 were 247.48%, 206.04%, 111.36%, 116% and 128%, respectively. | |
| g | On October 25, 2007, the fund, which owned 100% of the Portfolio on such date, withdrew entirely from the |
| Portfolio and received the Portfolio’s securties and cash in exchange for its interest in the Portfolio. Effective October 26, | |
| 2007, the fund began investing directly in the securities in which the Portfolio had invested. Portfolio turnover represents | |
| activity of both the fund and the Portfolio for 2007. | |
| See notes to financial statements. | |
28
NOTES TO FINANCIAL STATEMENTS
NOTE 1—Significant Accounting Policies:
Dreyfus/Standish Global Fixed Income Fund (the “fund”) is a separate non-diversified series of Dreyfus Investment Funds (the “Trust”), which is registered under the Investment Company Act of 1940, as amended (the “Act”), as an open-end management investment company and operates as a series company offering eleven series, including the fund. The fund’s investment objective seeks to maximize total return while realizing a market level of income, consistent with the preservation of capital and the maintenance of liquidity. The Dreyfus Corporation (the “Manager” or “Dreyfus”), a wholly-owned subsidiary of The Bank of New York Mellon Corporation (“BNY Mellon”), serves as the fund’s investment adviser.
MBSC Securities Corporation (the “Distributor”), a wholly-owned subsidiary of the Manager, is the distributor of the fund’s shares. The fund is authorized to issue an unlimited number of $.001 par value shares of Beneficial Interest in each of the following classes of shares: Class A, Class C and Class I. Class A and Class C shares are sold primarily to retail investors through financial intermediaries and bear a distribution fee and/or shareholder services fee. Class A shares are subject to a sale charge imposed at the time of purchase. Class C shares are subject to a contingent deferred sales charge (“CDSC”) imposed on Class C shares redeemed within one year of purchase. Class I shares are sold primarily to bank trust departments and other financial service providers (including The Bank of NewYork Mellon, a subsidiary of BNY Mellon and an affiliate of Dreyfus), acting on behalf of customers having a qualified trust or an investment account or relationship at such institution, and bear no distribution or shareholder services fees. Class I shares are offered without a front-end sales charge or CDSC. Other differences between the classes include the services offered to and the expenses borne by each class, the allocation of certain transfer agency costs and
| The Fund | 29 |
NOTES TO FINANCIAL STATEMENTS (continued)
certain voting rights. Income, expenses (other than expenses attributable to a specific class), and realized and unrealized gains or losses on investments are allocated to each class of shares based on its relative net assets.
The Trust accounts separately for the assets, liabilities and operations of each series. Expenses directly attributable to each series are charged to that series’ operations; expenses which are applicable to all series are allocated among them on a pro rata basis.
The Financial Accounting Standards Board (“FASB”) Accounting Standards Codification (“ASC”) is the exclusive reference of authoritative U.S. generally accepted accounting principles (“GAAP”) recognized by the FASB to be applied by nongovernmental entities. Rules and interpretive releases of the Securities and Exchange Commission (“SEC”) under authority of federal laws are also sources of authoritative GAAP for SEC registrants. The fund’s financial statements are prepared in accordance with GAAP, which may require the use of management estimates and assumptions.Actual results could differ from those estimates.
(a) Portfolio valuation: The fair value of a financial instrument is the amount that would be received to sell an asset or paid to transfer a liability in an orderly transaction between market participants at the measurement date (i.e. the exit price). GAAP establishes a fair value hierarchy that prioritizes the inputs of valuation techniques used to measure fair value.This hierarchy gives the highest priority to unadjusted quoted prices in active markets for identical assets or liabilities (Level 1 measurements) and the lowest priority to unobservable inputs (Level 3 measurements).
Additionally, GAAP provides guidance on determining whether the volume and activity in a market has decreased significantly and whether such a decrease in activity results in transactions that are not orderly. GAAP requires enhanced disclosures around valuation inputs and techniques used during annual and interim periods.
30
Various inputs are used in determining the value of the fund’s investments relating to fair value measurements.These inputs are summarized in the three broad levels listed below:
Level 1—unadjusted quoted prices in active markets for identical investments.
Level 2—other significant observable inputs (including quoted prices for similar investments, interest rates, prepayment speeds, credit risk, etc.).
Level 3—significant unobservable inputs (including the fund’s own assumptions in determining the fair value of investments).
The inputs or methodology used for valuing securities are not necessarily an indication of the risk associated with investing in those securities.
Changes in valuation techniques may result in transfers in or out of an assigned level within the disclosure hierarchy. Valuation techniques used to value the fund’s investments are as follows:
Registered investment companies that are not traded on an exchange are valued at their net asset value and are categorized within Level 1 of the fair value hierarchy.
Investments in securities excluding short-term investments (other than U.S.Treasury Bills), financial futures, options, swaps and forward foreign currency exchange contracts (“forward contracts”) are valued each business day by an independent pricing service (the “Service”) approved by the Board of Trustees. Investments for which quoted bid prices are readily available and are representative of the bid side of the market in the judgment of the Service are valued at the mean between the quoted bid prices (as obtained by the Service from dealers in such securities) and asked prices (as calculated by the Service based upon its evaluation of the market for such securities). Other investments (which constitute a majority of the portfolio securities) are valued as determined by the
| The Fund | 31 |
NOTES TO FINANCIAL STATEMENTS (continued)
Service, based on methods which include consideration of: yields or prices of securities of comparable quality, coupon, maturity and type; indications as to values from dealers; and general market conditions. These securities are generally categorized within Level 2 of the fair value hierarchy.
U.S. Treasury Bills are valued at the mean price between quoted bid prices and asked prices by the Service. These securities are generally categorized within Level 2 of the fair value hierarchy.
The Service’s procedures are reviewed by Dreyfus under the general supervision of the Board of Trustees.
When market quotations or official closing prices are not readily available, or are determined not to reflect accurately fair value, such as when the value of a security has been significantly affected by events after the close of the exchange or market on which the security is principally traded (for example, a foreign exchange or market), but before the fund calculates its net asset value, the fund may value these investments at fair value as determined in accordance with the procedures approved by the Board of Trustees. Certain factors may be considered when fair valuing investments such as: fundamental analytical data, the nature and duration of restrictions on disposition, an evaluation of the forces that influence the market in which the securities are purchased and sold, and public trading in similar securities of the issuer or comparable issuers. These securities are either categorized as Level 2 or 3 depending on the relevant inputs used.
For restricted securities where observable inputs are limited, assumptions about market activity and risk are used and are categorized within Level 3 of the fair value hierarchy.
Financial futures and options, which are traded on an exchange, are valued at the last sales price on the securities exchange on which such securities are primarily traded or at the last sales price on the national securities market on each business day. These securities are generally categorized within Level 1 of the fair value hierarchy. Options traded over-the-counter are valued at the mean between the bid and asked
32
price.These securities are generally categorized within Level 2 of the fair value hierarchy. Investments in swap transactions are valued each business day by the Service. Swaps are valued by the Service by using a swap pricing model which incorporates among other factors, default probabilities, recovery rates, credit curves of the underlying issuer and swap spreads on interest rates.These securities are generally categorized within Level 2 of the fair value hierarchy. Investments denominated in foreign currencies are translated to U.S. dollars at the prevailing rates of exchange. Forward contracts are valued at the forward rate.These securities are generally categorized within Level 2 of the fair value hierarchy.
The following is a summary of the inputs used as of December 31, 2011 in valuing the fund’s investments:
| Level 2—Other | Level 3— | |||
| Level 1— | Significant | Significant | ||
| Unadjusted | Observable | Unobservable | ||
| Quoted Prices | Inputs | Inputs | Total | |
| Assets ($) | ||||
| Investments in Securities: | ||||
| Asset-Backed | — | 5,425,411 | — | 5,425,411 |
| Commercial | ||||
| Mortgage-Backed | — | 2,256,807 | — | 2,256,807 |
| Corporate Bonds† | — | 51,138,379 | — | 51,138,379 |
| Foreign Government | — | 81,468,842 | — | 81,468,842 |
| Mutual Funds | 9,473,735 | — | — | 9,473,735 |
| Residential | ||||
| Mortgage-Backed | — | 10,526,973 | — | 10,526,973 |
| U.S. Government | ||||
| Agencies/ | ||||
| Mortgage-Backed | — | 18,163,878 | — | 18,163,878 |
| U.S. Treasury | — | 30,793,564 | — | 30,793,564 |
| Other Financial | ||||
| Instruments: | ||||
| Forward Foreign | ||||
| Currency Exchange | ||||
| Contracts†† | — | 265,769 | — | 265,769 |
| Futures†† | 76,761 | — | — | 76,761 |
| Swaps†† | — | 82,460 | — | 82,460 |
| The Fund | 33 |
NOTES TO FINANCIAL STATEMENTS (continued)
| Level 2—Other | Level 3— | ||||||
| Level 1— | Significant | Significant | |||||
| Unadjusted | Observable | Unobservable | |||||
| Quoted Prices | Inputs | Inputs | Total | ||||
| Liabilities ($) | |||||||
| Other Financial | |||||||
| Instruments: | |||||||
| Forward Foreign | |||||||
| Currency Exchange | |||||||
| Contracts†† | — | (795,598) | — | (795,598) | |||
| Futures†† | (274,692) | — | — | (274,692) | |||
| † | See Statement of Investments for additional detailed categorizations. |
| †† | Amount shown represents unrealized appreciation (depreciation) at period end. |
In May 2011, FASB issued Accounting Standards Update (“ASU”) No. 2011-04 “Amendments to Achieve Common FairValue Measurement and Disclosure Requirements in GAAP and International Financial Reporting Standards (“IFRS”)” (“ASU 2011-04”). ASU 2011-04 includes common requirements for measurement of and disclosure about fair value between GAAP and IFRS. ASU 2011-04 will require reporting entities to disclose the following information for fair value measurements categorized within Level 3 of the fair value hierarchy: quantitative information about the unobservable inputs used in the fair value measurement, the valuation processes used by the reporting entity and a narrative description of the sensitivity of the fair value measurement to changes in unobservable inputs and the interrelationships between those unobservable inputs. In addition, ASU 2011-04 will require reporting entities to make disclosures about amounts and reasons for all transfers in and out of Level 1 and Level 2 fair value measurements.The new and revised disclosures are effective for interim and annual reporting periods beginning after December 15, 2011. At this time, management is evaluating the implications of ASU 2011-04 and its impact on the financial statements.
(b) Foreign currency transactions: The fund does not isolate that portion of the results of operations resulting from changes in foreign exchange rates on investments from the fluctuations arising from changes
34
in market prices of securities held. Such fluctuations are included with the net realized and unrealized gain or loss on investments.
Net realized foreign exchange gains or losses arise from sales of foreign currencies, currency gains or losses realized on securities transactions between trade and settlement date, and the difference between the amounts of dividends, interest and foreign withholding taxes recorded on the fund’s books and the U.S. dollar equivalent of the amounts actually received or paid. Net unrealized foreign exchange gains and losses arise from changes in the value of assets and liabilities other than investments resulting from changes in exchange rates. Foreign currency gains and losses on investments are included with net realized and unrealized gain or loss on investments.
(c) Securities transactions and investment income: Securities transactions are recorded on a trade date basis. Realized gains and losses from securities transactions are recorded on the identified cost basis. Dividend income is recognized on the ex-dividend date and interest income, including, where applicable, accretion of discount and amortization of premium on investments, is recognized on the accrual basis.
Investing in foreign markets may involve special risks and considerations not typically associated with investing in the U.S. These risks include revaluation of currencies, high rates of inflation, repatriation restrictions on income and capital, and adverse political and economic developments. Moreover, securities issued in these markets may be less liquid, subject to government ownership controls and delayed settlements, and their prices may be more volatile than those of comparable securities in the U.S.
Pursuant to a securities lending agreement with The Bank of NewYork Mellon, the fund may lend securities to qualified institutions. It is the fund’s policy that, at origination, all loans are secured by collateral of at least 102% of the value of U.S. securities loaned and 105% of the value of foreign securities loaned. Collateral equivalent to at least 100% of the
| The Fund | 35 |
NOTES TO FINANCIAL STATEMENTS (continued)
market value of securities on loan is maintained at all times. Collateral is either in the form of cash, which can be invested in certain money market mutual funds managed by the Manager, U.S. Government and Agency securities or letters of credit.The fund is entitled to receive all income on securities loaned, in addition to income earned as a result of the lending transaction. Although each security loaned is fully collateralized, the fund bears the risk of delay in recovery of, or loss of rights in, the securities loaned should a borrower fail to return the securities in a timely manner. During the period ended December 31, 2011,The Bank of New York Mellon earned $3,379 from lending portfolio securities, pursuant to the securities lending agreement.
(d) Affiliated issuers: Investments in other investment companies advised by Dreyfus are defined as “affiliated” in the Act.
The fund may invest in shares of certain affiliated investment companies also advised or managed by Dreyfus. Investments in affiliated investment companies for the period ended December 31, 2011 were as follows:
| Affiliated | |||||
| Investment | Value | Value | Net | ||
| Company | 12/31/2010 ($) | Purchases ($) | Sales ($) | 12/31/2011 ($) | Assets (%) |
| Dreyfus | |||||
| Institutional | |||||
| Preferred | |||||
| Plus Money | |||||
| Market | |||||
| Fund | 3,691,799 | 202,523,078 | 198,779,142 | 7,435,735 | 3.7 |
| Dreyfus | |||||
| Institutional | |||||
| Cash | |||||
| Advantage | |||||
| Fund | 1,383,790 | 27,468,959 | 26,814,749 | 2,038,000 | 1.0 |
| Total | 5,075,589 | 229,992,037 | 225,593,891 | 9,473,735 | 4.7 |
(e) Concentration of Risk: The fund invests primarily in debt securities. Failure of an issuer of the debt securities to make timely interest or principal payments, or a decline or the perception of a decline in the credit quality of a debt security, can cause the debt security’s price
36
to fall, potentially lowering the fund’s share price. In addition, the value of debt securities may decline due to general market conditions that are not specifically related to a particular issuer, such as real or perceived adverse economic conditions, changes in outlook for corporate earnings, changes in interest or currency rates or adverse investor sentiment.They may also decline because of factors that affect a particular industry or country.
(f) Dividends to shareholders: Dividends are recorded on the ex-dividend date. Dividends from investment income-net are declared and paid quarterly. Dividends from net realized capital gains, if any, are normally declared and paid annually, but the fund may make distributions on a more frequent basis to comply with the distribution requirements of the Internal Revenue Code of 1986, as amended (the “Code”).To the extent that net realized capital gains can be offset by capital loss carryovers, it is the policy of the fund not to distribute such gains. Income and capital gain distributions are determined in accordance with income tax regulations, which may differ from GAAP.
(g) Federal income taxes: It is the policy of the fund to continue to qualify as a regulated investment company, if such qualification is in the best interests of its shareholders, by complying with the applicable provisions of the Code, and to make distributions of taxable income sufficient to relieve it from substantially all federal income and excise taxes.
As of and during the period ended December 31, 2011, the fund did not have any liabilities for any uncertain tax positions.The fund recognizes interest and penalties, if any, related to uncertain tax positions as income tax expense in the Statement of Operations. During the period, the fund did not incur any interest or penalties.
Each of the tax years in the four-year period ended December 31, 2011 remains subject to examination by the Internal Revenue Service and state taxing authorities.
| The Fund | 37 |
NOTES TO FINANCIAL STATEMENTS (continued)
At December 31, 2011, the components of accumulated earnings on a tax basis were as follows: undistributed ordinary income $320,450, accumulated capital losses $651,181 and unrealized appreciation $145,957.
Under the Regulated Investment Company Modernization Act of 2010 (the “2010 Act”), the fund will be permitted to carry forward capital losses incurred in taxable years beginning after December 22, 2010 (“post-enactment losses”) for an unlimited period. Furthermore, post-enactment capital loss carryovers will retain their character as either short-term or long-term capital losses rather than short-term as they were under previous statute. The 2010 Act requires post-enactment losses to be utilized before the utilization of losses incurred in taxable years prior to the effective date of the 2010 Act (“pre-enactment losses”). As a result of this ordering rule, pre-enactment losses may be more likely to expire unused.
The accumulated capital loss carryover is available for federal income tax purposes to be applied against future net securities profits, if any, realized subsequent to December 31, 2011.The fund has $651,181 of post-enactment short-term capital losses that can be carried forward for an unlimited period.
The tax character of distributions paid to shareholders during the fiscal periods ended December 31, 2011 and December 31, 2010 were as follows: ordinary income $7,387,445 and $5,888,719 and long-term capital gains $16,033 and $0, respectively.
During the period ended December 31, 2011, as a result of permanent book to tax differences, primarily due to the tax treatment for pay-downs gains and losses on mortgage-backed securities, foreign currency transactions, amortization of premiums, swap periodic payments and dividend reclassification, the fund increased accumulated undistributed investment income-net by $1,138,042 and decreased accumulated net realized gain (loss) on investments by the same amount. Net assets and net asset value per share were not affected by this reclassification.
(h) New Accounting Pronouncement: In April 2011, FASB issued ASU No. 2011-03 “Transfers and Servicing (Topic 860) Reconsideration
38
of Effective Control for Repurchase Agreements (“ASU 2011-03”) which relates to the accounting for repurchase agreements and similar agreements including mortgage dollar rolls, that both entitle and obligate a transferor to repurchase or redeem financial assets before their maturity. ASU 2011-03 modifies the criteria for determining effective control of transferred assets and as a result certain agreements may now be accounted for as secured borrowings.ASU 2011-03 is effective prospectively for new transfers and existing transactions that are modified in the first interim or annual period beginning on or after December 15, 2011. Management is currently evaluating the implications of this change and its impact on the financial statements.
NOTE 2—Bank Lines of Credit:
The fund participates with other Dreyfus-managed funds in a $225 million unsecured credit facility led by Citibank, N.A. and a $300 million unsecured credit facility provided by The Bank of New York Mellon (each, a “Facility”), each to be utilized primarily for temporary or emergency purposes, including the financing of redemptions. In connection therewith, the fund has agreed to pay its pro rata portion of commitment fees for each Facility. Interest is charged to the fund based on rates determined pursuant to the terms of the respective Facility at the time of borrowing.
The average amount of borrowings outstanding under the Facilities during the period ended December 31, 2011, was approximately $11,200 with a related weighted average annualized interest rate of 1.38%.
NOTE 3—Investment Advisory Fee and Other Transactions With Affiliates:
(a) Pursuant to an investment advisory agreement with the Manager, the investment advisory fee is computed at the annual rate of .40% of the value of the fund’s average daily net assets and is payable monthly. The Manager had undertaken from January 1, 2011 through May 1, 2011 to reduce the investment advisory fee paid by the fund, to the
| The Fund | 39 |
NOTES TO FINANCIAL STATEMENTS (continued)
extent that the fund’s aggregate annual expenses, (exclusive of taxes, brokerage fees, Rule 12b-1 distribution plan fees, shareholder services plan fees, interest expense, commitment fees on borrowings and extraordinary expenses), do not exceed an annual rate of .65% of the value of the fund’s average daily net assets. The reduction in investment advisory fee, pursuant to the undertaking, amounted to $29,547 during the year ended December 31, 2011.
From January 1, 2011 through April 30, 2011,The Trust had an agreement withThe Bank of NewYork Mellon, pursuant to whichThe Bank of NewYork Mellon provided administration and fund accounting services for the fund. For these services, the fund paid The Bank of New York Mellon a fixed fee plus asset and transaction based fees, as well as out-of-pocket expenses. Pursuant to this agreement, the fund was charged $24,000 during the period January 1, 2011 through April 30, 2011 for administration and fund accounting services.
At Board Meetings of the Trust held on February 15-16, 2011, the Board of Trustees of the Trust terminated the agreement with The Bank of New York Mellon and, on behalf of the Trust, entered into a Fund Accounting and Administration Agreement (the “Administration Agreement”) with Dreyfus, effective May 1, 2011, whereby Dreyfus performs administrative, accounting and recordkeeping services for the fund. The fund has agreed to compensate Dreyfus for providing accounting services, administration, compliance monitoring, regulatory and shareholder reporting, as well as related facilities, equipment and clerical help.The fee is based on the fund’s average daily net assets and computed at the following annual rates: .10% of the first $500 million, .065% of the next $500 million and .02% in excess of $1 billion.
In addition, after applying any expense limitations or fee waivers that reduce the fees paid to Dreyfus for this service, Dreyfus has contractually agreed in writing to waive any remaining fees for this service to the extent that they exceed both Dreyfus’ costs in providing these services
40
and a reasonable allocation of the costs incurred by Dreyfus and its affiliates related to the support and oversight of these services.The fund also reimburses Dreyfus for the out-of-pocket expenses Dreyfus incurs in performing this service for the fund. Pursuant to the Administration Agreement, the fund was charged $118,300 during the period May 1, 2011 through December 31, 2011.
During the period ended December 31, 2011, the Distributor retained $5,262 from commissions earned on sales of the fund’s Class A shares and $1,954 from CDSCs on redemptions of the fund’s Class C shares.
(b)The fund pays administrative service fees for Class I shares.These fees are paid to affiliated or unaffiliated retirement plans, omnibus accounts and platform administrators and other entities (“Plan Administrators”) that provide record keeping and/or other administrative support services to accounts, retirement plans and their participants.As compensation for such services, Class I shares pay each Plan Administrator an administrative service fee in an amount of up to .15% (on an annualized basis) of their average daily net assets attributable to Class I shares that are held in accounts serviced by such Plan Administrator. During the period ended December 31, 2011, Class I shares was charged $7,124.The fund’s adviser or its affiliates may pay additional compensation from their own resources to Plan Administrators and other entities for administrative services, as well as in consideration of marketing or other distribution-related services. These payments may provide an incentive for these entities to actively promote the fund or cooperate with the distributor’s promotional efforts.
(c) Under the Distribution Plan (the “Plan”) adopted pursuant to Rule 12b-1 under the Act, Class C shares pay the Distributor for distributing its shares at an annual rate of .75% of the value of the average daily net assets of Class C shares. During the period ended December 31, 2011, Class C shares were charged $59,377 pursuant to the Plan.
| The Fund | 41 |
NOTES TO FINANCIAL STATEMENTS (continued)
(d) Under the Shareholder Services Plan, Class A and Class C shares pay the Distributor at an annual rate of .25% of the value of their average daily net assets for the provision of certain services.The services provided may include personal services relating to shareholder accounts, such as answering shareholder inquiries regarding the fund and providing reports and other information, and services related to the maintenance of shareholder accounts.The Distributor may make payments to Service Agents (a securities dealer, financial institution or other industry professional) in respect of these services. The Distributor determines the amounts to be paid to Service Agents. During the period ended December 31, 2011, Class A and Class C shares were charged $102,413 and $19,792, respectively, pursuant to the Shareholder Services Plan.
Under its terms, the Plan and Shareholder Services Plan shall remain in effect from year to year, provided such continuance is approved annually by a vote of a majority of those Trustees who are not “interested persons” of theTrust and who have no direct or indirect financial interest in the operation of or in any agreement related to the Plan or Shareholder Services Plan.
The fund compensates Dreyfus Transfer, Inc., a wholly-owned subsidiary of the Manager, under a transfer agency agreement for providing personnel and facilities to perform transfer agency services for the fund. During the period ended December 31, 2011, the fund was charged $1,827 pursuant to the transfer agency agreement, which is included in Shareholder servicing costs in the Statement of Operations.
The fund has arrangements with the custodian and cash management bank whereby the fund may receive earnings credits when positive cash balances are maintained, which are used to offset custody and cash management fees. For financial reporting purposes, the fund includes net earnings credits as an expense offset in the Statement of Operations.
The fund compensates The Bank of New York Mellon under cash management agreements for performing cash management services related to fund subscriptions and redemptions. During the period
42
ended December 31, 2011, the fund was charged $1,100 pursuant to the cash management agreements, which is included in Shareholder servicing costs in the Statement of Operations.These fees were partially offset by earnings credits of $29.
The fund also compensates The Bank of New York Mellon under a custody agreement for providing custodial services for the fund. During the period ended December 31, 2011, the fund was charged $67,708 pursuant to the custody agreement.
During the period ended December 31, 2011, the fund was charged $6,402 for services performed by the Chief Compliance Officer.
The components of “Due to The Dreyfus Corporation and affiliates” in the Statement of Assets and Liabilities consist of: investment advisory fees $66,547, Rule 12b-1 distribution plan fees $6,632, shareholder services plan fees $12,248, custodian fees $19,630, chief compliance officer fees $5,295 and transfer agency per account fees $1,827.
(e) Prior to January 1, 2012, each Trustee who is not an “interested person” of theTrust (as defined in the Act) received $60,000 per annum, plus $7,000 per joint Board meeting of the Trust,The Dreyfus/Laurel Funds, Inc., The Dreyfus/Laurel Funds Trust, The Dreyfus/Laurel Tax-Free Municipal Funds and Dreyfus Funds, Inc. (collectively, the “Board Group Open-End Funds”) attended, $2,500 for separate in-person committee meetings attended which were not held in conjunction with a regularly scheduled Board meeting and $2,000 for Board meetings and separate committee meetings attended that were conducted by telephone. The Board Group Open-End Funds also reimbursed each Trustee who is not an “interested person” of the Trust (as defined in the Act) for travel and out-of-pocket expenses.With respect to Board meetings, the Chair of the Board received an additional 25% of such compensation (with the exception of reimbursable amounts).The Chair of each of the Board’s committees, unless the Chair also served as Chair of the Board, received
| The Fund | 43 |
NOTES TO FINANCIAL STATEMENTS (continued)
$1,350 per applicable committee meeting. In the event that there was an in-person joint committee meeting or a joint telephone meeting of the Board Group Open-End Funds and Dreyfus High Yield Strategies Fund (“DHF”), $2,500 was allocated between the Board Group Open-End Funds and DHF.
Effective January 1, 2012, the Board Group Open-End Funds and DHF (collectively, the “Board Group Funds”) will pay each Trustee their respective allocated portions of an annual retainer of $85,000 and a fee of $10,000 for each regularly scheduled Board meeting attended ($75,000 and $8,000, respectively, in the aggregate, prior to January 1, 2012). With respect to the annual retainer and Board meetings of the Board Group Funds, the Chair of the Board will receive an additional 25% of such compensation (with the exception of reimbursable amounts). Each Trustee will receive $2,500 for any separate in-person committee meetings attended, which are not held in conjunction with a regularly scheduled Board meeting, such amount to be allocated among the Board Group Funds, as applicable. In the event that there is a joint telephone meeting of the Board Group Funds, a fee of $2,000 will be allocated among the applicable Board Group Funds, accordingly (prior to January 1, 2012, the fee allocated was $2,500 if the meeting included DHF). The Chair of each of the Board’s committees, unless the Chair also serves as Chair of the Board, will receive $1,500 per applicable committee meeting. Each Emeritus Trustee is entitled to receive an annual retainer of one-half the amount paid as a retainer at the time theTrustee became Emeritus and a per meeting attended fee of one-half the amount paid to Trustees. The Board Group Funds also reimburse each Independent Trustee and Emeritus Trustees for travel and out-of-pocket expenses. These fees and expenses are charged and allocated to each series based on net assets.
44
NOTE 4—Securities Transactions:
The aggregate amount of purchases and sales (including paydowns) of investment securities, excluding short-term securities, forward contracts, financial futures, options transactions and swap transactions, during the period ended December 31, 2011, amounted to $483,203,299 and $425,587,503, respectively, of which $31,150,898 in purchases and $31,231,982 in sales were from mortgage dollar roll transactions.
Mortgage Dollar Rolls: A mortgage dollar roll transaction involves a sale by the fund of mortgage related securities that it holds with an agreement by the fund to repurchase similar securities at an agreed upon price and date.The securities purchased will bear the same interest rate as those sold, but generally will be collateralized by pools of mortgages with different prepayment histories than those securities sold.
The following tables show the fund’s exposure to different types of market risk as it relates to the Statement of Assets and Liabilities and the Statement of Operations, respectively.
Fair value of derivative instruments as of December 31, 2011 is shown below:
| Derivative | Derivative | |||
| Assets ($) | Liabilities ($) | |||
| Interest rate risk1,2 | 159,221 | Interest rate risk1 | (274,692) | |
| Foreign exchange risk3 | 265,769 | Foreign exchange risk4 | (795,598) | |
| Gross fair value of | ||||
| derivatives contracts | 424,990 | (1,070,290) | ||
| Statement of Assets and Liabilities location: | |
| 1 | Includes cumulative appreciation (depreciation) on futures contracts as reported in the Statement of |
| Financial Futures, but only the unpaid variation margin is reported in the Statement of Assets | |
| and Liabilities. | |
| 2 | Unrealized appreciation on swap contracts. |
| 3 | Unrealized appreciation on forward foreign currency exchange contracts. |
| 4 | Unrealized depreciation on forward foreign currency exchange contracts. |
| The Fund | 45 |
NOTES TO FINANCIAL STATEMENTS (continued)
The effect of derivative instruments in the Statement of Operations during the period ended December 31, 2011 is shown below:
| Amount of realized gain or (loss) on derivatives recognized in income ($) | ||||||||||
| Forward | ||||||||||
| Underlying risk | Futures5 | Options6 | Contracts7 | Swaps8 | Total | |||||
| Interest rate | (1,736,826) | — | — | 114,220 | (1,622,606) | |||||
| Foreign exchange | — | (101,217) | (186,910) | — | (288,127) | |||||
| Credit | — | — | — | (132,080) | (132,080) | |||||
| Total | (1,736,826) | (101,217) | (186,910) | (17,860) | (2,042,813) | |||||
| Change in unrealized appreciation or (depreciation) on derivatives recognized in income ($) | ||||||||
| Forward | ||||||||
| Underlying risk | Futures9 | Options10 | Contracts11 | Swaps12 | Total | |||
| Interest rate | (242,542) | (75,077) | — | 126,372 | (191,247) | |||
| Foreign exchange | — | 90,689 | 242,431 | — | 333,120 | |||
| Total | (242,542) | 15,612 | 242,431 | 126,372 | 141,873 | |||
| Statement of Operations location: | |
| 5 | Net realized gain (loss) on financial futures. |
| 6 | Net realized gain (loss) on options transactions. |
| 7 | Net realized gain (loss) on forward foreign currency exchange contracts. |
| 8 | Net realized gain (loss) on swap transactions. |
| 9 | Net unrealized appreciation (depreciation) on financial futures. |
| 10 Net unrealized appreciation (depreciation) on options transactions. | |
| 11 Net unrealized appreciation (depreciation) on forward foreign currency exchange contracts. | |
| 12 Net unrealized appreciation (depreciation) on swap transactions. | |
Futures Contracts: In the normal course of pursuing its investment objective, the fund is exposed to market risk, including interest rate risk as a result of changes in value of underlying financial instruments.The fund invests in financial futures contracts in order to manage its exposure to or protect against changes in the market.A futures contract represents a commitment for the future purchase or a sale of an asset at a specified date. Upon entering into such contracts, these investments require initial margin deposits with a broker, which consist of cash or cash equivalents. The amount of these deposits is determined by the exchange or Board of Trade on which the contract is traded and is subject to change. Accordingly, variation margin payments are received or made to reflect daily unrealized gains or losses which are recorded in the Statement of Operations. Futures contracts are valued daily at the last sales price estab-
46
lished by the Board of Trade or exchange upon which they are traded. When the contracts are closed, the fund recognizes a realized gain or loss.There is minimal counterparty credit risk to the fund with futures since futures are exchange traded, and the exchange’s clearinghouse guarantees the futures against default. Contracts open at December 31, 2011 are set forth in the Statement of Financial Futures.
Options: The fund purchases and writes (sells) put and call options to hedge against changes in interest rates, foreign currencies, or as a substitute for an investment.The fund is subject to interest rate risk and currency risk in the course of pursuing its investment objectives through its investments in options contracts. A call option gives the purchaser of the option the right (but not the obligation) to buy, and obligates the writer to sell, the underlying security or securities at the exercise price at any time during the option period, or at a specified date. Conversely, a put option gives the purchaser of the option the right (but not the obligation) to sell, and obligates the writer to buy the underlying security or securities at the exercise price at any time during the option period, or at a specified date.
As a writer of call options, the fund receives a premium at the outset and then bears the market risk of unfavorable changes in the price of the financial instrument underlying the option. Generally, the fund realizes a gain, to the extent of the premium, if the price of the underlying financial instrument decreases between the date the option is written and the date on which the option is terminated. Generally, the fund incurs a loss, if the price of the financial instrument increases between those dates.
As a writer of put options, the fund receives a premium at the outset and then bears the market risk of unfavorable changes in the price of the financial instrument underlying the option. Generally, the fund realizes a gain, to the extent of the premium, if the price of the underlying financial instrument increases between the date the option is written and the date on which the option is terminated. Generally, the fund incurs a loss, if the price of the financial instrument decreases between those dates.
| The Fund | 47 |
NOTES TO FINANCIAL STATEMENTS (continued)
As a writer of an option, the fund has no control over whether the underlying securities may be sold (call) or purchased (put) and as a result bears the market risk of an unfavorable change in the price of the security underlying the written option.There is a risk of loss from a change in value of such options which may exceed the related premiums received. One risk of holding a put or a call option is that if the option is not sold or exercised prior to its expiration, it becomes worthless. However, this risk is limited to the premium paid by the fund. Upon the expiration or closing of the option transaction, a gain or loss is reported in the Statement of Operations.
The following summarizes the fund’s call/put options written during the period ended December 31, 2011:
| Face Amount | Options Terminated | |||
| Covered by | Premiums | Net Realized | ||
| Options Written: | Contracts ($) | Received ($) | Cost ($) | Gain ($) |
| Contracts outstanding | ||||
| December 31, 2010 | 3,000,000 | 45,000 | ||
| Contracts terminated; | ||||
| Contracts expired | 3,000,000 | 45,000 | — | 45,000 |
| Contracts outstanding | ||||
| December 31, 2011 | — | — | ||
Forward Foreign Currency Exchange Contracts: The fund enters into forward contracts in order to hedge its exposure to changes in foreign currency exchange rates on its foreign portfolio holdings, to settle foreign currency transactions or as a part of its investment strategy. When executing forward contracts, the fund is obligated to buy or sell a foreign currency at a specified rate on a certain date in the future. With respect to sales of forward contracts, the fund incurs a loss if the value of the contract increases between the date the forward contract is opened and the date the forward contract is closed.The fund realizes a gain if the value of the contract decreases between those dates.With respect to purchases of forward contracts, the fund incurs a loss if the value of the contract decreases between the date the forward contract is opened and the date the forward contract is closed.The fund realizes
48
a gain if the value of the contract increases between those dates. Any realized gain or loss which occurred during the period is reflected in the Statement of Operations.The fund is exposed to foreign currency risk as a result of changes in value of underlying financial instruments. The fund is also exposed to credit risk associated with counterparty nonperformance on these forward contracts, which is typically limited to the unrealized gain on each open contract.The following summarizes open forward contracts at December 31, 2011:
| Forward Foreign | ||||||||
| Currency | Number | Foreign | Unrealized | |||||
| Exchange | of | Currency | Appreciation | |||||
| Contracts | Contracts | Amounts | Cost ($) | Value ($) (Depreciation) ($) | ||||
| Purchases: | ||||||||
| Canadian Dollar, | ||||||||
| Expiring: | ||||||||
| 1/3/2012a | 1 | 1,679,195 | 1,639,624 | 1,648,289 | 8,665 | |||
| 1/31/2012a | 1 | 1,470,000 | 1,412,348 | 1,441,875 | 29,527 | |||
| Euro, | ||||||||
| Expiring | ||||||||
| 1/31/2012b | 1 | 1,130,000 | 1,470,514 | 1,462,830 | (7,684 | ) | ||
| Mexican New Peso, | ||||||||
| Expiring | ||||||||
| 1/31/2012c | 1 | 71,640,000 | 5,124,463 | 5,119,027 | (5,436 | ) | ||
| Sales: | Proceeds ($) | |||||||
| Australian Dollar, | ||||||||
| Expiring: | ||||||||
| 1/31/2012a | 1 | 62,000 | 61,163 | 63,164 | (2,001 | ) | ||
| 1/31/2012d | 1 | 1,850,000 | 1,826,598 | 1,884,724 | (58,126 | ) | ||
| Brazilian Real, | ||||||||
| Expiring | ||||||||
| 1/31/2012e | 1 | 2,240,000 | 1,183,870 | 1,191,196 | (7,326 | ) | ||
| British Pound, | ||||||||
| Expiring: | ||||||||
| 1/31/2012f | 1 | 3,200,000 | 4,940,320 | 4,968,080 | (27,760 | ) | ||
| 1/31/2012a | 1 | 2,310,000 | 3,568,719 | 3,586,333 | (17,614 | ) | ||
| 1/31/2012g | 1 | 2,840,000 | 4,383,313 | 4,409,171 | (25,858 | ) | ||
| 1/31/2012d | 1 | 575,000 | 889,059 | 892,702 | (3,643 | ) | ||
| 1/31/2012h | 1 | 1,360,000 | 2,096,936 | 2,111,434 | (14,498 | ) | ||
| Chilean Peso, | ||||||||
| Expiring | ||||||||
| 1/31/2012i | 1 | 1,033,830,000 | 1,973,674 | 1,980,459 | (6,785 | ) | ||
| The Fund | 49 |
NOTES TO FINANCIAL STATEMENTS (continued)
| Forward Foreign | ||||||||
| Currency | Number | Foreign | Unrealized | |||||
| Exchange | of | Currency | Appreciation | |||||
| Contracts | Contracts | Amounts | Proceeds ($) | Value ($) (Depreciation) ($) | ||||
| Sales (continued): | ||||||||
| Euro, | ||||||||
| Expiring: | ||||||||
| 1/31/2012f | 1 | 4,940,000 | 6,412,120 | 6,395,026 | 17,094 | |||
| 1/31/2012a | 1 | 5,830,000 | 7,576,668 | 7,547,167 | 29,501 | |||
| 1/31/2012j | 1 | 8,400,000 | 10,925,628 | 10,874,134 | 51,494 | |||
| 1/31/2012d | 1 | 8,660,000 | 11,264,625 | 11,210,714 | 53,911 | |||
| 1/31/2012e | 1 | 1,110,000 | 1,442,824 | 1,436,939 | 5,885 | |||
| 1/31/2012h | 1 | 160,000 | 208,905 | 207,126 | 1,779 | |||
| Hungarian Forint, | ||||||||
| Expiring | ||||||||
| 1/31/2012j | 1 | 438,200,000 | 1,862,620 | 1,794,707 | 67,913 | |||
| Japanese Yen, | ||||||||
| Expiring: | ||||||||
| 1/31/2012f | 1 | 443,140,000 | 5,682,739 | 5,760,204 | (77,465) | |||
| 1/31/2012g | 1 | 671,510,000 | 8,612,415 | 8,728,697 | (116,282) | |||
| 1/31/2012i | 1 | 542,475,000 | 6,957,127 | 7,051,421 | (94,294) | |||
| 1/31/2012b | 1 | 266,938,000 | 3,425,312 | 3,469,823 | (44,511) | |||
| 1/31/2012h | 1 | 323,430,000 | 4,146,432 | 4,204,141 | (57,709) | |||
| Norwegian Krone, | ||||||||
| Expiring | ||||||||
| 1/31/2012e | 1 | 4,430,000 | 738,688 | 739,867 | (1,179) | |||
| South African Rand, | ||||||||
| Expiring | ||||||||
| 1/31/2012a | 1 | 3,820,000 | 450,743 | 470,544 | (19,801) | |||
| Swedish Krona, | ||||||||
| Expiring: | ||||||||
| 1/31/2012f | 1 | 45,480,000 | 6,473,376 | 6,597,097 | (123,721) | |||
| 1/31/2012e | 1 | 5,070,000 | 722,727 | 735,429 | (12,702) | |||
| Swiss Franc, | ||||||||
| Expiring | ||||||||
| 1/31/2012e | 1 | 5,390,000 | 5,670,479 | 5,741,682 | (71,203) | |||
| Gross Unrealized | ||||||||
| Appreciation | 265,769 | |||||||
| Gross Unrealized | ||||||||
| Depreciation | (795,598) | |||||||
| Counterparties: | |
| a | Credit Suisse First Boston |
| b | UBS |
| c | JPMorgan Chase & Co. |
| d | Goldman Sachs |
| e | Morgan Stanley |
| f | Deutsche Bank |
| g | Barclays Capital |
| h | Commonwealth Bank of Australia |
| i | Merrill Lynch |
| j | Royal Bank of Scotland |
50
Swaps:The fund enters into swap agreements to exchange the interest rate on, or return generated by, one nominal instrument for the return generated by another nominal instrument.The fund enters into these agreements to hedge certain market or interest rate risks, to manage the interest rate sensitivity (sometimes called duration) of fixed income securities, to provide a substitute for purchasing or selling particular securities or to increase potential returns.
The fund accrues for the interim payments on swap contracts on a daily basis, with the net amount recorded within unrealized appreciation (depreciation) on swap contracts in the Statement of Assets and Liabilities. Once the interim payments are settled in cash, the net amount is recorded as realized gain (loss) on swaps, in addition to realized gain (loss) recorded upon the termination of swaps contracts in the Statement of Operations. Upfront payments made and/or received by the fund, are recorded as an asset and/or liability in the Statement of Assets and Liabilities and are recorded as a realized gain or loss ratably over the contract’s term/event with the exception of forward starting interest rate swaps which are recorded as realized gains or losses on the termination date. Fluctuations in the value of swap contracts are recorded for financial statement purposes as unrealized appreciation or depreciation on swap transactions.
Interest Rate Swaps: Interest rate swaps involve the exchange of commitments to pay and receive interest based on a notional principal amount.The fund enters into these agreements for a variety of reasons, including to hedge certain market or interest rate risks, to manage the interest rate sensitivity (sometimes called duration) of fixed income securities, to provide a substitute for purchasing or selling particular securities or to increase potential returns.The fund may elect to pay a fixed rate and receive a floating rate, or receive a fixed rate and pay a floating rate on a notional principal amount.The net interest received or paid on interest rate swap agreements is included within unrealized appreciation (depreciation) on swap contracts in the Statement of Assets and Liabilities. Interest rate swaps are valued daily and the change, if any,
| The Fund | 51 |
NOTES TO FINANCIAL STATEMENTS (continued)
is recorded as an unrealized gain or loss in the Statement of Operations. When a swap contract is terminated early, the fund records a realized gain or loss equal to the difference between the current realized value and the expected cash flows.
The fund’s maximum risk of loss from counterparty credit risk is the discounted net value of the cash flows to be received from the counter-party over the contract’s remaining life, to the extent that the amount is positive.This risk is mitigated by having a master netting arrangement between the fund and the counterparty and by the posting of collateral by the counterparty to the fund to cover the fund’s exposure to the counterparty.The following summarizes open interest rate swaps entered into by the fund at December 31, 2011:
| Notional | Reference | (Pay) Receive | Unrealized | |
| Amount ($) | Entity/Currency | Counterparty | Fixed Rate (%) Expiration | Appreciation ($) |
| 6,500,000 | EUR—1 Year | |||
| Libor | JP Morgan | 1.91 11/4/2016 | 82,460 | |
Credit Default Swaps: Credit default swaps involve commitments to pay a fixed interest rate in exchange for payment if a credit event affecting a third party (the referenced company, obligation or index) occurs. Credit events may include a failure to pay interest or principal, bankruptcy, or restructuring.The fund enters into these agreements to manage its exposure to the market or certain sectors of the market, to reduce its risk exposure to defaults of corporate and sovereign issuers, or to create exposure to corporate or sovereign issuers to which it is not otherwise exposed. For those credit default swaps in which the fund is paying a fixed rate, the fund is buying credit protection on the instrument. In the event of a credit event, the fund would receive the full notional amount for the reference obligation. For those credit default swaps in which the fund is receiving a fixed rate, the fund is selling credit protection on the underlying instrument.The maximum payouts for these contracts are limited to the notional amount of each swap. Credit default swaps may involve greater risks than if the fund had invested in the reference obligation
52
directly and are subject to general market risk, liquidity risk, counter-party risk and credit risk. At December 31, 2011, there were no credit default swap agreements outstanding.
The following summarizes the average market value of derivatives outstanding during the period ended December 31, 2011:
| Average Market Value ($) | |
| Interest rate futures contracts | 41,718,215 |
| Interest rate options contracts | 9,027 |
| Foreign currency options contracts | 11,971 |
| Forward contracts | 103,537,141 |
The following summarizes the average notional value of swap contracts outstanding during the period ended December 31, 2011:
| Average Notional Value ($) | |
| Interest rate swap contracts | 5,091,001 |
| Credit default swap contracts | 1,980,000 |
At December 31, 2011, the cost of investments for federal income tax purposes was $204,924,753; accordingly, accumulated net unrealized appreciation on investments was $4,322,836, consisting of $7,535,466 gross unrealized appreciation and $3,212,630 gross unrealized depreciation.
NOTE 5—Other Matters:
At the October 27, 2011 Board meeting, the Board of the Trust elected Ms. Bovich as a Trustee of the Trust, subject to shareholder approval. A proxy statement was mailed on December 1, 2011 to shareholders of record as of the close of business on November 1, 2011, asking shareholders to consider Ms. Bovich’s election at a special meeting of shareholders held on Wednesday, February 8, 2012. At this meeting, Ms. Bovich was elected by the shareholders to serve as a Trustee of the Trust.
| The Fund | 53 |
| REPORT OF INDEPENDENT REGISTERED |
| PUBLIC ACCOUNTING FIRM |
The Board of Trustees and Shareholders of Dreyfus/Standish Global Fixed Income Fund
We have audited the accompanying statement of assets and liabilities of Dreyfus/Standish Global Fixed Income Fund (the “Fund”), a series of Dreyfus Investment Funds, including the statements of investments and financial futures, as of December 31, 2011, the related statement of operations for the year then ended, and the statements of changes in net assets for each of the years in the two-year period then ended and financial highlights for each of the years in the three-year period ended December 31, 2011. These financial statements and financial highlights are the responsibility of the Fund’s management. Our responsibility is to express an opinion on these financial statements and financial highlights based on our audits.The financial highlights for each of the years in the two-year period ended December 31, 2008 were audited by other independent registered public accountants whose report thereon, dated February 27, 2009, expressed an unqualified opinion on those financial highlights.
We conducted our audits in accordance with the standards of the Public Company Accounting Oversight Board (United States).Those standards require that we plan and perform the audit to obtain reasonable assurance about whether the financial statements and financial highlights are free of material misstatement. An audit includes examining, on a test basis, evidence supporting the amounts and disclosures in the financial statements. Our procedures included confirmation of securities owned as of December 31, 2011, by correspondence with the custodian and brokers or by other appropriate auditing procedures where replies from brokers were not received.An audit also includes assessing the accounting principles used and significant estimates made by management, as well as evaluating the overall financial statement presentation.We believe that our audits provide a reasonable basis for our opinion.
In our opinion, the financial statements and financial highlights referred to above present fairly, in all material respects, the financial position of Dreyfus/Standish Global Fixed Income Fund as of December 31, 2011, and the results of its operations for the year then ended, and the changes in its net assets for each of the years in the two-year period then ended and financial highlights for each of the years in the three-year period ended December 31, 2011 in conformity with U.S. generally accepted accounting principles.

New York, New York
February 24, 2012
54
IMPORTANT TAX INFORMATION (Unaudited)
For federal tax purposes the fund reports the maximum amount allowable but not less than 27.85% as interest-related dividends in accordance with Sections 871(k)(1) and 881(e) of the Internal Revenue Code.Also, the fund reports the maximum amount allowable but not less than $.0021 per share as a capital gain dividend paid on March 31, 2011 in accordance with Section 852(b)(3)(C) of the Internal Revenue Code.
| The Fund | 55 |
BOARD MEMBERS INFORMATION (Unaudited)
| Joseph S. DiMartino (68) |
| Chairman of the Board (2008) |
| Principal Occupation During Past 5Years: |
| • Corporate Director and Trustee |
| Other Public Company Board Memberships During Past 5Years: |
| • CBIZ (formerly, Century Business Services, Inc.), a provider of outsourcing functions for small |
| and medium size companies, Director (1997-present) |
| • Sunair Services Corporation, a provider of certain outdoor-related services to homes and |
| businesses, Director (2005-2009) |
| • The Newark Group, a provider of a national market of paper recovery facilities, paperboard |
| mills and paperboard converting plants, Director (2000-2010) |
| No. of Portfolios for which Board Member Serves: 164 |
| ——————— |
| Francine J. Bovich (60)† |
| Board Member (2011) |
| Principal Occupation During Past 5Years: |
| • Trustee,The Bradley Trusts, private trust funds (2011-Present) |
| • Managing Director, Morgan Stanley Investment Management (1993-2010) |
| No. of Portfolios for which Board Member Serves: 13 |
| ——————— |
| James M. Fitzgibbons (77) |
| Board Member (2008) |
| Principal Occupation During Past 5Years: |
| • Corporate Director and Trustee |
| Other Public Company Board Memberships During Past 5Years: |
| • Bill Barrett Corporation, an oil and natural gas exploration company, Director (2004-present) |
| No. of Portfolios for which Board Member Serves: 31 |
| ——————— |
| Kenneth A. Himmel (65) |
| Board Member (2008) |
| Principal Occupation During Past 5Years: |
| • President and CEO, Related Urban Development, a real estate development company (1996-present) |
| • President and CEO, Himmel & Company, a real estate development company (1980-present) |
| • CEO,American Food Management, a restaurant company (1983-present) |
| No. of Portfolios for which Board Member Serves: 31 |
56
| Stephen J. Lockwood (64) |
| Board Member (2008) |
| Principal Occupation During Past 5Years: |
| • Chairman of the Board, Stephen J. Lockwood and Company LLC, a real estate investment |
| company (2000-present) |
| No. of Portfolios for which Board Member Serves: 31 |
| ——————— |
| Roslyn M. Watson (62) |
| Board Member (2008) |
| Principal Occupation During Past 5Years: |
| • Principal,Watson Ventures, Inc., a real estate investment company (1993-present) |
| No. of Portfolios for which Board Member Serves: 41 |
| ——————— |
| Benaree Pratt Wiley (65) |
| Board Member (2008) |
| Principal Occupation During Past 5Years: |
| • Principal,TheWiley Group, a firm specializing in strategy and business development (2005-present) |
| Other Public Company Board Memberships During Past 5Years: |
| • CBIZ (formerly, Century Business Services, Inc.), a provider of outsourcing functions for small |
| and medium size companies, Director (2008-present) |
| No. of Portfolios for which Board Member Serves: 66 |
| ——————— |
| † Ms. Bovich was elected as a Trustee of the Trust, effective October 27, 2011. See Note 5. |
| Once elected all Board Members serve for an indefinite term, but achieve Emeritus status upon reaching age 80.The |
| address of the Board Members and Officers is in c/o The Dreyfus Corporation, 200 Park Avenue, NewYork, NewYork |
| 10166.Additional information about the Board Members is available in the fund’s Statement of Additional Information |
| which can be obtained from Dreyfus free of charge by calling this toll free number: 1-800-DREYFUS. |
| The Fund | 57 |
OFFICERS OF THE FUND (Unaudited)
BRADLEY J. SKAPYAK, President since January 2010.
Chief Operating Officer and a director of the Manager since June 2009. From April 2003 to June 2009, Mr. Skapyak was the head of the Investment Accounting and Support Department of the Manager. He is an officer of 75 investment companies (comprised of 163 portfolios) managed by the Manager. He is 53 years old and has been an employee of the Manager since February 1988.
JANETTE E. FARRAGHER, Vice President and Secretary since December 2011.
Assistant General Counsel of BNY Mellon, and an officer of 76 investment companies (comprised of 189 portfolios) managed by the Manager. She is 49 years old and has been an employee of the Manager since February 1984.
KIESHA ASTWOOD, Vice President and Assistant Secretary since January 2010.
Counsel of BNY Mellon, and an officer of 76 investment companies (comprised of 189 portfolios) managed by the Manager. She is 38 years old and has been an employee of the Manager since July 1995.
JAMES BITETTO, Vice President and Assistant Secretary since December 2008.
Senior Counsel of BNY Mellon and Secretary of the Manager, and an officer of 76 investment companies (comprised of 189 portfolios) managed by the Manager. He is 45 years old and has been an employee of the Manager since December 1996.
JONI LACKS CHARATAN, Vice President and Assistant Secretary since December 2008.
Senior Counsel of BNY Mellon, and an officer of 76 investment companies (comprised of 189 portfolios) managed by the Manager. She is 56 years old and has been an employee of the Manager since October 1988.
JOSEPH M. CHIOFFI, Vice President and Assistant Secretary since December 2008.
Senior Counsel of BNY Mellon, and an officer of 76 investment companies (comprised of 189 portfolios) managed by the Manager. He is 50 years old and has been an employee of the Manager since June 2000.
KATHLEEN DENICHOLAS, Vice President and Assistant Secretary since January 2010.
Managing Counsel of BNY Mellon, and an officer of 76 investment companies (comprised of 189 portfolios) managed by the Manager. She is 37 years old and has been an employee of the Manager since February 2001.
JOHN B. HAMMALIAN, Vice President and Assistant Secretary since December 2008.
Senior Managing Counsel of BNY Mellon, and an officer of 76 investment companies (comprised of 189 portfolios) managed by the Manager. He is 48 years old and has been an employee of the Manager since February 1991.
M. CRISTINA MEISER, Vice President and Assistant Secretary since January 2010.
Senior Counsel of BNY Mellon, and an officer of 76 investment companies (comprised of 189 portfolios) managed by the Manager. She is 41 years old and has been an employee of the Manager since August 2001.
ROBERT R. MULLERY, Vice President and Assistant Secretary since December 2008.
Managing Counsel of BNY Mellon, and an officer of 76 investment companies (comprised of 189 portfolios) managed by the Manager. He is 59 years old and has been an employee of the Manager since May 1986.
58
JEFF PRUSNOFSKY, Vice President and Assistant Secretary since December 2008.
Senior Managing Counsel of BNY Mellon, and an officer of 76 investment companies (comprised of 189 portfolios) managed by the Manager. He is 46 years old and has been an employee of the Manager since October 1990.
JAMES WINDELS, Treasurer since December 2008.
Director – Mutual Fund Accounting of the Manager, and an officer of 76 investment companies (comprised of 189 portfolios) managed by the Manager. He is 53 years old and has been an employee of the Manager since April 1985.
RICHARD CASSARO, Assistant Treasurer since December 2008.
Senior Accounting Manager – Money Market and Municipal Bond Funds of the Manager, and an officer of 76 investment companies (comprised of 189 portfolios) managed by the Manager. He is 52 years old and has been an employee of the Manager since September 1982.
GAVIN C. REILLY, Assistant Treasurer since December 2008.
Tax Manager of the Investment Accounting and Support Department of the Manager, and an officer of 76 investment companies (comprised of 189 portfolios) managed by the Manager. He is 43 years old and has been an employee of the Manager since April 1991.
ROBERT S. ROBOL, Assistant Treasurer since December 2008.
Senior Accounting Manager ñ Fixed Income Funds of the Manager, and an officer of 76 investment companies (comprised of 189 portfolios) managed by the Manager. He is 47 years old and has been an employee of the Manager since October 1988.
ROBERT SALVIOLO, Assistant Treasurer since December 2008.
Senior Accounting Manager ñ Equity Funds of the Manager, and an officer of 76 investment companies (comprised of 189 portfolios) managed by the Manager. He is 44 years old and has been an employee of the Manager since June 1989.
ROBERT SVAGNA, Assistant Treasurer since December 2008.
Senior Accounting Manager ñ Equity Funds of the Manager, and an officer of 76 investment companies (comprised of 189 portfolios) managed by the Manager. He is 44 years old and has been an employee of the Manager since November 1990.
JOSEPH W. CONNOLLY, Chief Compliance Officer since December 2008.
Chief Compliance Officer of the Manager and The Dreyfus Family of Funds (76 investment companies, comprised of 189 portfolios). From November 2001 through March 2004, Mr. Connolly was first Vice-President, Mutual Fund Servicing for Mellon Global Securities Services. In that capacity, Mr. Connolly was responsible for managing Mellonís Custody, Fund Accounting and Fund Administration services to third-party mutual fund clients. He is 54 years old and has served in various capacities with the Manager since 1980, including manager of the firmís Fund Accounting Department from 1997 through October 2001.
STEPHEN J. STOREN, Anti-Money Laundering Compliance Officer since May 2011.
Chief Compliance Officer of the Distributor, and the Anti-Money Laundering Compliance Officer of 72 investment companies (comprised of 185 portfolios) managed by the Manager. He is 57 years old and has been an employee of the Distributor since October 1999.
| The Fund | 59 |
NOTES
For More Information
The fund files its complete schedule of portfolio holdings with the Securities and Exchange Commission (“SEC”) for the first and third quarters of each fiscal year on Form N-Q. The fund’s Forms N-Q are available on the SEC’s website at http://www.sec.gov and may be reviewed and copied at the SEC’s Public Reference Room in Washington, DC. Information on the operation of the Public Reference Room may be obtained by calling 1-800-SEC-0330.
| Telephone Call your Financial Representative or 1-800-DREYFUS |
| Mail The Dreyfus Family of Funds, 144 Glenn Curtiss Boulevard, Uniondale, NY 11556-0144 |
| E-mail Send your request to info@dreyfus.com |
| Internet Information can be viewed online or downloaded at: http://www.dreyfus.com |
| Dreyfus/Standish |
| International Fixed |
| Income Fund |
ANNUAL REPORT December 31, 2011
The views expressed in this report reflect those of the portfolio manager only through the end of the period covered and do not necessarily represent the views of Dreyfus or any other person in the Dreyfus organization. Any such views are subject to change at any time based upon market or other conditions and Dreyfus disclaims any responsibility to update such views.These views may not be relied on as investment advice and, because investment decisions for a Dreyfus fund are based on numerous factors, may not be relied on as an indication of trading intent on behalf of any Dreyfus fund.
| Not FDIC-Insured • Not Bank-Guaranteed • May Lose Value |
Contents | |
THE FUND | |
| 2 | A Letter from the Chairman and CEO |
| 3 | Discussion of Fund Performance |
| 6 | Fund Performance |
| 7 | Understanding Your Fund’s Expenses |
| 7 | Comparing Your Fund’s Expenses With Those of Other Funds |
| 8 | Statement of Investments |
| 18 | Statement of Financial Futures |
| 19 | Statement of Assets and Liabilities |
| 20 | Statement of Operations |
| 21 | Statement of Changes in Net Assets |
| 22 | Financial Highlights |
| 23 | Notes to Financial Statements |
| 46 | Report of Independent Registered Public Accounting Firm |
| 47 | Important Tax Information |
| 48 | Board Members Information |
| 50 | Officers of the Fund |
FOR MORE INFORMATION | |
Back Cover |
Dreyfus/Standish
International Fixed
Income Fund
The Fund

A LETTER FROM THE CHAIRMAN AND CEO
Dear Shareholder:
We are pleased to present this annual report for Dreyfus/Standish International Fixed Income Fund, covering the 12-month period from January 1, 2011, through December 31, 2011. For information about how the fund performed during the reporting period, as well as general market perspectives, we provide a Discussion of Fund Performance on the pages that follow.
U.S. bond markets in 2011 were primarily driven by a “flight to quality” in which investors fled riskier assets due to adverse macroeconomic developments ranging from natural disasters in Japan to an unprecedented downgrade of long-term U.S. debt securities and the resurgence of a sovereign debt crisis in Europe. Ironically, despite the rating downgrade, long-term U.S. Treasury securities ended the year with double-digit total returns as investors flocked to traditional safe havens. Corporate-backed bonds also fared well, but to a lesser degree than Treasuries, as investors sought competitive yields in a low interest-rate environment.
Our economic forecast calls for a mild acceleration of the U.S. recovery as the domestic banking system regains strength, credit conditions loosen and housing markets begin a long-awaited convalescence. In addition, we believe that long-term fundamentals currently appear to favor U.S. non-financial corporate credit, as well as emerging-markets local currency-denominated debt. Of course, we encourage you to talk with your financial adviser to help ensure that your investment objectives are properly aligned with your risk tolerance in pursuing potential market opportunities in 2012.
Thank you for your continued confidence and support.
Jonathan R. Baum
Chairman and Chief Executive Officer
The Dreyfus Corporation
January 17, 2012
2

DISCUSSION OF FUND PERFORMANCE
For the period of January 1, 2011, through December 31, 2011, as provided by David Leduc, CFA, and Brendan Murphy, CFA, Portfolio Managers
Fund and Market Performance Overview
For the 12-month period ended December 31, 2011, Dreyfus/Standish International Fixed Income Fund’s Class I shares achieved a total return of 1.88%.1 In comparison, the Barclays Capital Global Aggregate ex-U.S. Index (Hedged) (the “Index”), the fund’s benchmark, achieved a total return of 3.94% for the same period.2 International bond markets proved volatile during 2011 as investors responded to several adverse macroeconomic developments, but a rally late in the year enabled the Index to end the year in positive territory. The fund produced a lower return than its benchmark, primarily due to shortfalls in our currency allocation and security selection strategies.
The Fund’s Investment Approach
The fund seeks to maximize total return while realizing a market level of income, consistent with preserving principal and liquidity, by normally investing at least 80% of its net assets in fixed income securities.The fund also normally invests at least 65% of its assets in non-U.S. dollar-denominated fixed-income securities of foreign governments and companies located in various countries, including emerging markets. The fund always invests in at least five countries other than the United States.The fund’s investment may include bonds, notes, mortgage-related securities, asset-backed securities, convertible securities, eurodollar and Yankee dollar instruments, preferred stock and money market instruments. To protect the U.S. dollar value of the fund’s assets, we hedge most, but not necessarily all, of the portfolio’s foreign currency exposure.
The portfolio managers focus on identifying undervalued government bond markets, currencies, sectors and securities.The portfolio managers look for fixed income securities with the most potential for added value, such as those involving the potential for credit upgrades, unique structural characteristics or innovative features.The portfolio managers select securities for the fund’s portfolio by using fundamental economic research and quantitative analysis and focusing on sectors and individual securities that appear to be relatively undervalued and actively trading among sectors.
| The Fund | 3 |
DISCUSSION OF FUND PERFORMANCE (continued)
Global Economic Developments Roiled Bond Markets
International bond markets gained value over the first half of the year amid several unexpected shocks to the global economy, including unprecedented political unrest in the Middle East, natural and nuclear disasters in Japan and a growing sovereign debt crisis in Europe. However, investor confidence in sovereign bonds later crumbled as the debt crisis spread to other members of the European Union, interest rates in China climbed as part of the nation’s inflation-fighting efforts and a contentious political debate intensified in the United States regarding government spending and borrowing. The Index fell particularly sharply from mid-September to mid-October, when fears of global market instability mounted. In this turbulent environment, investors favored perceived safe havens, such as gold and U.S.Treasury securities.
Although market conditions soon stabilized, the downward trend resumed in November as global economic conditions improved. Although market volatility remained high in December, global fixed-income markets regained some of the ground they had lost earlier, ending the year with modestly positive total returns, on average.
Currency and Duration Strategies Hurt Fund Performance
The fund benefited early in the reporting period from overweighted exposure to higher yielding market sectors, including investment-grade corporate bonds, commercial mortgage-backed securities and residential mortgage-backed securities. However, these positions later lost value, particularly in peripheral European markets, such as Spain and Italy, which were hit hard by the region’s debt crisis. In addition, the fund’s relatively short average duration prevented it from participating fully in the sovereign debt markets’ gains over the first half of the year, and our currency allocation strategy dampened relative performance when the euro and other European currencies weakened against the U.S. dollar.
As economic conditions deteriorated, we adjusted the fund’s composition to reduce credit risks, which positioned the fund relatively well for the market downturn in the early fall. Changes included a reduction in corporate bonds and underweighted exposure to the peripheral nations of Europe. Instead, we favored sovereign bonds that we believed would hold up well in the uncertain economy, such as securities issued by the United Kingdom, Sweden and Canada.We increased the fund’s holdings of corporate-backed bonds late in the year, but credits with BBB ratings lagged market averages.
4
Maintaining a Cautious Investment Posture
Although we currently expect the global economic recovery to persist, a number of headwinds appear likely to keep growth at subpar levels and interest rates low.Therefore, we have maintained an emphasis on higher-quality securities, such as newly issued investment-grade corporate bonds from industrial companies outside of Europe. As of year-end, the fund’s currency positions included underweighted exposure to Europe and an emphasis on Canada and Mexico, whose currencies tend to correlate strongly with the U.S. dollar.We have set the fund’s average duration in a range that is roughly in line with industry averages, reflecting richer valuations among sovereign bonds.
January 17, 2012
| Foreign bonds are subject to special risks including exposure to currency fluctuations, changing | |
| political and economic conditions, and potentially less liquidity.The fixed income securities of | |
| issuers located in emerging markets can be more volatile and less liquid than those of issuers in | |
| more mature economies. | |
| Investments in foreign currencies are subject to the risk that those currencies will decline in value | |
| relative to the U.S. dollar, or, in the case of hedged positions, that the U.S. dollar will decline | |
| relative to the currency being hedged. Currency rates in foreign countries may fluctuate significantly | |
| over short periods of time.A decline in the value of foreign currencies relative to the U.S. dollar | |
| will reduce the value of securities held by the fund and denominated in those currencies. | |
| Bond funds are subject generally to interest rate, credit, liquidity and market risks, to varying degrees, | |
| all of which are more fully described in the fund’s prospectus. Generally, all other factors being equal, | |
| bond prices are inversely related to interest-rate changes, and rate increases can cause price declines. | |
| High yield bonds are subject to increased credit risk and are considered speculative in terms of the | |
| issuer’s perceived ability to continue making interest payments on a timely basis and to repay | |
| principal upon maturity. | |
| The fund may use derivative instruments, such as options, futures and options on futures, forward | |
| contracts, swaps (including credit default swaps on corporate bonds and asset-backed securities), | |
| options on swaps and other credit derivatives.A small investment in derivatives could have a | |
| potentially large impact on the fund’s performance.The use of derivatives involves risks different | |
| from, or possibly greater than, the risks associated with investing directly in the underlying assets. | |
| 1 | Total return includes reinvestment of dividends and any capital gains paid. Past performance is no |
| guarantee of future results. Share price and investment return fluctuate such that upon redemption | |
| fund shares may be worth more or less than their original cost. | |
| 2 | SOURCE: FACTSET — Reflects reinvestment of dividends and, where applicable, capital gain |
| distributions.The Barclays Capital Global Aggregate ex-U.S. Index (Hedged) is designed to | |
| measure the performance of global investment-grade, fixed-rate debt markets, excluding the United | |
| States, hedged into U.S. dollars. Investors cannot invest directly in any index. |
| The Fund | 5 |
FUND PERFORMANCE
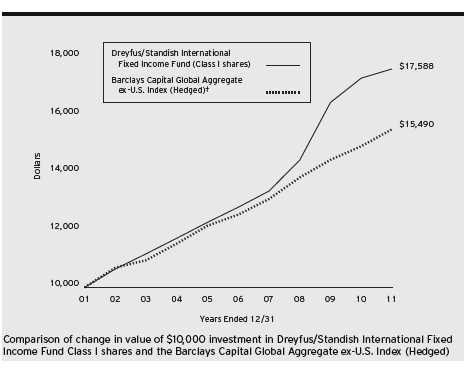
| Average Annual Total Returns as of 12/31/11 | ||||||
| 1Year | 5 Years | 10 Years | ||||
| Class I shares | 1.88% | 6.59% | 5.81% | |||
| Barclays Capital Global Aggregate | ||||||
| ex-U.S. Index (Hedged) | 3.94% | 4.33% | 4.47% | |||
| † Source: FactSet |
| Past performance is not predictive of future performance.The fund’s performance shown in the graph and table does not |
| reflect the deduction of taxes that a shareholder would pay on fund distributions or the redemption of fund shares. |
| The above graph compares a $10,000 investment made in Class I shares of Dreyfus/Standish International Fixed |
| Income Fund on 12/31/01 to a $10,000 investment made in the Barclays Capital Global Aggregate ex-U.S. Index |
| (Hedged) (the “Index”) on that date.All dividends and capital gain distributions are reinvested. |
| The fund’s performance shown in the line graph takes into account all applicable fees and expenses.The Index is designed |
| to measure the performance of global investment-grade, fixed-rate debt markets, excluding the United States, hedged into |
| U.S. dollars. Unlike a mutual fund, the Index is not subject to charges, fees and other expenses. Investors cannot invest |
| directly in any index.These factors can contribute to the Index potentially outperforming the fund. Further information |
| relating to fund performance, including expense reimbursements, if applicable, is contained in the Financial Highlights |
| section of the prospectus and elsewhere in this report. |
6
UNDERSTANDING YOUR FUND’S EXPENSES (Unaudited)
As a mutual fund investor, you pay ongoing expenses, such as management fees and other expenses. Using the information below, you can estimate how these expenses affect your investment and compare them with the expenses of other funds.You also may pay one-time transaction expenses, including sales charges (loads) and redemption fees, which are not shown in this section and would have resulted in higher total expenses. For more information, see your fund’s prospectus or talk to your financial adviser.
Review your fund’s expenses
The table below shows the expenses you would have paid on a $1,000 investment in Dreyfus/Standish International Fixed Income Fund from July 1, 2011 to December 31, 2011. It also shows how much a $1,000 investment would be worth at the close of the period, assuming actual returns and expenses.
Expenses and Value of a $1,000 Investment
assuming actual returns for the six months ended December 31, 2011
| Expenses paid per $1,000† | $3.72 | |
| Ending value (after expenses) | $1,019.40 |
COMPARING YOUR FUND’S EXPENSES
WITH THOSE OF OTHER FUNDS (Unaudited)
Using the SEC’s method to compare expenses
The Securities and Exchange Commission (SEC) has established guidelines to help investors assess fund expenses. Per these guidelines, the table below shows your fund’s expenses based on a $1,000 investment, assuming a hypothetical 5% annualized return. You can use this information to compare the ongoing expenses (but not transaction expenses or total cost) of investing in the fund with those of other funds.All mutual fund shareholder reports will provide this information to help you make this comparison. Please note that you cannot use this information to estimate your actual ending account balance and expenses paid during the period.
Expenses and Value of a $1,000 Investment
assuming a hypothetical 5% annualized return for the six months ended December 31, 2011
| Expenses paid per $1,000† | $3.72 | |
| Ending value (after expenses) | $1,021.53 |
| † Expenses are equal to the fund’s annualized expense ratio of .73% for Class I, multiplied by the average account |
| value over the period, multiplied by 184/365 (to reflect the one-half year period). |
| The Fund | 7 |
| STATEMENT OF INVESTMENTS |
| December 31, 2011 |
| Coupon | Maturity | Principal | ||||
| Bonds and Notes—93.5% | Rate (%) | Date | Amount ($)a | Value ($) | ||
| Australia—2.4% | ||||||
| Australian Government, | ||||||
| Sr. Unscd. Bonds, Ser. 124 | AUD | 5.75 | 5/15/21 | 725,000 | 863,051 | |
| Queensland Treasury, | ||||||
| Gov’t Gtd. Bonds, Ser. 13G | AUD | 6.00 | 8/14/13 | 860,000 | 904,850 | |
| SMART Trust, | ||||||
| Ser. 2011-1USA, Cl. A3B | 1.13 | 10/14/14 | 440,000 | b,c | 439,348 | |
| 2,207,249 | ||||||
| Belgium—.3% | ||||||
| Anheuser-Busch InBev, | ||||||
| Gtd. Notes | GBP | 9.75 | 7/30/24 | 130,000 | 312,400 | |
| Bermuda—.1% | ||||||
| Weatherford International, | ||||||
| Gtd. Notes | 6.75 | 9/15/40 | 100,000 | 113,823 | ||
| Brazil—2.5% | ||||||
| Brazilian Government, | ||||||
| Notes, Ser. F | BRL | 10.00 | 1/1/12 | 1,900,000 | 1,018,885 | |
| Federal Republic of Brazil, | ||||||
| Sr. Unscd. Bonds | 5.63 | 1/7/41 | 270,000 | 314,550 | ||
| Petrobras | ||||||
| International Finance, | ||||||
| Gtd. Notes | EUR | 5.88 | 3/7/22 | 370,000 | 486,131 | |
| Vale Overseas, | ||||||
| Gtd. Notes | 4.63 | 9/15/20 | 260,000 | 270,167 | ||
| Vale Overseas, | ||||||
| Gtd. Notes | 6.25 | 1/23/17 | 150,000 | 169,788 | ||
| 2,259,521 | ||||||
| Canada—6.2% | ||||||
| Canadian Government, | ||||||
| Bonds | CAD | 4.00 | 6/1/16 | 1,560,000 | 1,712,287 | |
| Canadian Government, | ||||||
| Bonds, Ser. A55 | CAD | 8.00 | 6/1/23 | 135,000 | 211,964 | |
| Canadian Government, | ||||||
| Bonds, Ser. VW17 | CAD | 8.00 | 6/1/27 | 815,000 | 1,394,056 | |
| CNH Capital Canada | ||||||
| Receivables Trust, | ||||||
| Ser. 2011-1A, Cl. A2 | CAD | 2.34 | 7/17/17 | 415,000 | b | 409,420 |
| Ford Auto Securitization Trust, | ||||||
| Ser. 2011-R3A, Cl. A2 | CAD | 1.96 | 7/15/15 | 440,000 | b | 432,001 |
8
| Coupon | Maturity | Principal | ||||
| Bonds and Notes (continued) | Rate (%) | Date | Amount ($)a | Value ($) | ||
| Canada (continued) | ||||||
| Ford Auto | ||||||
| Securitization Trust, | ||||||
| Ser. 2011-R1A, Cl. A2 | CAD | 2.43 | 11/15/14 | 300,000 | b | 296,157 |
| Rogers Communications, | ||||||
| Gtd. Notes | CAD | 6.56 | 3/22/41 | 340,000 | 379,972 | |
| Royal Bank of Canada, | ||||||
| Sr. Unscd. Notes | 1.45 | 10/30/14 | 355,000 | 357,089 | ||
| Teck Resources, | ||||||
| Sr. Scd. Notes | 10.75 | 5/15/19 | 185,000 | 226,000 | ||
| Toronto-Dominion Bank, | ||||||
| Sr. Unscd. Notes | 2.38 | 10/19/16 | 255,000 | 259,779 | ||
| 5,678,725 | ||||||
| Chile—2.3% | ||||||
| Chilean Government, | ||||||
| Sr. Unscd. Notes | CLP | 5.50 | 8/5/20 | 541,000,000 | 1,090,852 | |
| Codelco, | ||||||
| Sr. Unscd. Notes | 3.88 | 11/3/21 | 640,000 | b | 654,821 | |
| Empresa Nacional de Petroleos, | ||||||
| Notes | 4.75 | 12/6/21 | 345,000 | b | 344,420 | |
| 2,090,093 | ||||||
| France—3.0% | ||||||
| BNP Paribas Home Loan, | ||||||
| Covered Bonds | EUR | 2.25 | 10/1/12 | 350,000 | 453,885 | |
| French Government, | ||||||
| Bonds | EUR | 5.00 | 10/25/16 | 945,000 | 1,387,463 | |
| Pernod-Ricard, | ||||||
| Sr. Unscd. Bonds | EUR | 5.00 | 3/15/17 | 100,000 | 135,592 | |
| Pernod-Ricard, | ||||||
| Sr. Unscd. Bonds | 5.75 | 4/7/21 | 320,000 | b | 361,684 | |
| Pernod-Ricard, | ||||||
| Sr. Unscd. Notes | EUR | 7.00 | 1/15/15 | 100,000 | 142,434 | |
| RCI Banque, | ||||||
| Sr. Unscd. Notes | 2.26 | 4/11/14 | 260,000 | b,c | 247,947 | |
| 2,729,005 | ||||||
| Germany—6.0% | ||||||
| Daimler, | ||||||
| Sr. Unscd. Notes | EUR | 4.63 | 9/2/14 | 150,000 | 207,063 | |
| The Fund | 9 |
STATEMENT OF INVESTMENTS (continued)
| Coupon | Maturity | Principal | ||||
| Bonds and Notes (continued) | Rate (%) | Date | Amount ($)a | Value ($) | ||
| Germany (continued) | ||||||
| German Government, | ||||||
| Bonds | EUR | 2.50 | 1/4/21 | 390,000 | 538,944 | |
| German Government, | ||||||
| Bonds | EUR | 3.25 | 7/4/42 | 1,360,000 | 2,088,382 | |
| German Government, | ||||||
| Bonds | EUR | 4.25 | 7/4/14 | 1,865,000 | 2,655,396 | |
| 5,489,785 | ||||||
| Italy—5.8% | ||||||
| Italian Government, | ||||||
| Bonds | EUR | 3.50 | 6/1/14 | 1,460,000 | 1,811,615 | |
| Italian Government, | ||||||
| Bonds | EUR | 3.75 | 8/1/15 | 2,855,000 | 3,476,390 | |
| 5,288,005 | ||||||
| Japan—20.1% | ||||||
| Development Bank of Japan, | ||||||
| Gov’t Gtd. Notes | JPY | 1.05 | 6/20/23 | 11,000,000 | 139,802 | |
| Development Bank of Japan, | ||||||
| Gov’t. Gtd. Bonds | JPY | 1.70 | 9/20/22 | 263,000,000 | 3,596,464 | |
| Japanese Government, | ||||||
| Sr. Unscd. Bonds, Ser. 252 | JPY | 1.00 | 6/20/13 | 85,000,000 | 1,118,427 | |
| Japanese Government, | ||||||
| Sr. Unscd. Bonds, Ser. 8 | JPY | 1.00 | 6/10/16 | 93,000,000 | d | 1,233,576 |
| Japanese Government, | ||||||
| Sr. Unscd. Bonds, Ser. 310 | JPY | 1.00 | 9/20/20 | 484,400,000 | 6,381,531 | |
| Japanese Government, | ||||||
| Sr. Unscd. Bonds, Ser. 275 | JPY | 1.40 | 12/20/15 | 65,000,000 | 881,717 | |
| Japanese Government, | ||||||
| Sr. Unscd. Bonds, Ser. 288 | JPY | 1.70 | 9/20/17 | 78,450,000 | 1,092,357 | |
| Japanese Government, | ||||||
| Sr. Unscd. Bonds, Ser. 11 | JPY | 1.70 | 6/20/33 | 288,200,000 | 3,698,680 | |
| Japanese Government, | ||||||
| Sr. Unscd. Bonds, Ser. 106 | JPY | 2.20 | 9/20/28 | 17,300,000 | 244,339 | |
| 18,386,893 | ||||||
| Luxembourg—.6% | ||||||
| Enel Finance International, | ||||||
| Gtd. Notes | 5.13 | 10/7/19 | 155,000 | b | 138,684 | |
| Holcim US Finance Sarl & Cie, | ||||||
| Gtd. Notes | 6.00 | 12/30/19 | 220,000 | b | 227,061 | |
10
| Coupon | Maturity | Principal | ||||
| Bonds and Notes (continued) | Rate (%) | Date | Amount ($)a | Value ($) | ||
| Luxembourg (continued) | ||||||
| Telecom Italia Capital, | ||||||
| Gtd. Notes | 7.18 | 6/18/19 | 190,000 | 178,300 | ||
| 544,045 | ||||||
| Mexico—.9% | ||||||
| Mexican Government, | ||||||
| Bonds, Ser. M 30 | MXN | 8.50 | 11/18/38 | 5,890,000 | 457,662 | |
| Petroleos Mexicanos, | ||||||
| Gtd. Notes | 6.50 | 6/2/41 | 305,000 | b | 344,650 | |
| 802,312 | ||||||
| Netherlands—4.2% | ||||||
| E.ON International Finance, | ||||||
| Gtd. Notes | EUR | 5.50 | 10/2/17 | 175,000 | 261,291 | |
| Elsevier Finance, | ||||||
| Gtd. Notes | EUR | 6.50 | 4/2/13 | 150,000 | 204,611 | |
| ING Bank, | ||||||
| Covered Notes | EUR | 3.63 | 8/31/21 | 170,000 | 227,039 | |
| Netherlands Government, | ||||||
| Bonds | EUR | 3.25 | 7/15/21 | 870,000 | 1,226,169 | |
| Netherlands Government, | ||||||
| Bonds | EUR | 4.00 | 7/15/18 | 1,030,000 | 1,511,560 | |
| RWE Finance, | ||||||
| Gtd. Notes | EUR | 6.63 | 1/31/19 | 150,000 | 236,701 | |
| Storm, | ||||||
| Ser. 2005, Cl. A | EUR | 1.58 | 5/26/47 | 120,536 | c | 155,462 |
| 3,822,833 | ||||||
| Norway—1.4% | ||||||
| DnB NOR | ||||||
| Boligkreditt, | ||||||
| Covered Bonds | EUR | 3.38 | 1/20/17 | 590,000 | 801,027 | |
| Norwegian Government, | ||||||
| Bonds, Ser. 474 | NOK | 3.75 | 5/25/21 | 900,000 | 167,119 | |
| Statoil, | ||||||
| Gtd. Notes | 4.25 | 11/23/41 | 350,000 | 367,111 | ||
| 1,335,257 | ||||||
| Philippines—.2% | ||||||
| Philippine Government, | ||||||
| Sr. Unscd. Notes | PHP | 4.95 | 1/15/21 | 7,000,000 | 162,422 | |
| The Fund | 11 |
STATEMENT OF INVESTMENTS (continued)
| Coupon | Maturity | Principal | ||||
| Bonds and Notes (continued) | Rate (%) | Date | Amount ($)a | Value ($) | ||
| Poland—.6% | ||||||
| Republic of Poland, | ||||||
| Sr. Unscd. Notes | 5.00 | 3/23/22 | 600,000 | 605,250 | ||
| Qatar—.8% | ||||||
| Qatar Government, | ||||||
| Sr. Unscd. Notes | 3.13 | 1/20/17 | 715,000 | b | 723,008 | |
| Saudi Arabia—.3% | ||||||
| Abu Dhabi National Energy, | ||||||
| Sr. Unscd. Notes | 5.88 | 12/13/21 | 250,000 | b | 261,250 | |
| South Africa—.5% | ||||||
| South African Government, | ||||||
| Bonds, Ser. R209 | ZAR | 6.25 | 3/31/36 | 5,145,000 | 471,635 | |
| South Korea—.2% | ||||||
| Export-Import Bank of Korea, | ||||||
| Sr. Unscd. Notes | EUR | 5.75 | 5/22/13 | 155,000 | 207,830 | |
| Supranational—1.1% | ||||||
| Corp Andina De Formento, | ||||||
| Sr. Unscd. Notes | 3.75 | 1/15/16 | 260,000 | 265,306 | ||
| European Investment Bank, | ||||||
| Sr. Unscd. Notes | JPY | 1.90 | 1/26/26 | 58,000,000 | 736,159 | |
| 1,001,465 | ||||||
| Sweden—5.3% | ||||||
| Swedish Government, | ||||||
| Bonds, Ser. 1050 | SEK | 3.00 | 7/12/16 | 6,475,000 | 1,021,431 | |
| Swedish Government, | ||||||
| Bonds, Ser. 1052 | SEK | 4.25 | 3/12/19 | 1,745,000 | 302,199 | |
| Swedish Government, | ||||||
| Bonds, Ser. 1041 | SEK | 6.75 | 5/5/14 | 21,400,000 | 3,530,819 | |
| 4,854,449 | ||||||
| United Kingdom—15.3% | ||||||
| Arkle Master Issuer, | ||||||
| Ser. 2010-2A, Cl. 2A | EUR | 2.96 | 8/17/15 | 400,000 | b,c | 515,874 |
| Arran Residential | ||||||
| Mortgages Funding, | ||||||
| Ser. 2011-1A, Cl. A1B | EUR | 2.66 | 11/19/47 | 462,928 | b,c | 598,530 |
| Barclays Bank, | ||||||
| Covered Notes | EUR | 2.13 | 9/8/15 | 250,000 | 321,400 | |
| Barclays Bank, | ||||||
| Covered Notes | EUR | 4.00 | 10/7/19 | 250,000 | 336,459 | |
12
| Coupon | Maturity | Principal | ||||
| Bonds and Notes (continued) | Rate (%) | Date | Amount ($)a | Value ($) | ||
| United Kingdom (continued) | ||||||
| BP Capital Markets, | ||||||
| Gtd. Notes | 2.25 | 11/1/16 | 120,000 | 120,903 | ||
| BP Capital Markets, | ||||||
| Gtd. Notes | 3.56 | 11/1/21 | 310,000 | 323,405 | ||
| Fosse Master Issuer, | ||||||
| Ser. 2011-1A, Cl. A4 | EUR | 2.87 | 10/18/54 | 650,000 | b,c | 838,246 |
| Holmes Master Issuer, | ||||||
| Ser. 2011-3A, Cl. A3 | EUR | 2.98 | 10/15/54 | 415,000 | b,c | 533,621 |
| Lloyds TSB Bank, | ||||||
| Covered Notes | EUR | 3.38 | 3/17/16 | 300,000 | 393,582 | |
| Lloyds TSB Bank, | ||||||
| Covered Bonds | EUR | 4.00 | 9/29/21 | 200,000 | 257,942 | |
| National Grid, | ||||||
| Sr. Unscd. Notes | EUR | 5.00 | 7/2/18 | 175,000 | 251,972 | |
| Paragon Mortgages, | ||||||
| Ser. 14A, Cl. A2C | 0.65 | 9/15/39 | 591,402 | b,c | 437,698 | |
| Royal Bank of Scotland, | ||||||
| Covered Notes | EUR | 3.00 | 9/8/16 | 265,000 | 342,058 | |
| Royal Bank of Scotland, | ||||||
| Covered Notes | EUR | 3.88 | 10/19/21 | 400,000 | 509,596 | |
| Royal Bank of Scotland, | ||||||
| Sr. Unscd. Notes | EUR | 4.75 | 5/18/16 | 150,000 | 184,884 | |
| United Kingdom Gilt, | ||||||
| Bonds | GBP | 4.25 | 9/7/39 | 1,650,000 | 3,158,564 | |
| United Kingdom Gilt, | ||||||
| Bonds | GBP | 4.25 | 12/7/40 | 590,000 | 1,130,547 | |
| United Kingdom Gilt, | ||||||
| Bonds | GBP | 8.00 | 6/7/21 | 630,000 | 1,500,055 | |
| United Kingdom Gilt, | ||||||
| Bonds | GBP | 8.75 | 8/25/17 | 1,025,000 | 2,259,459 | |
| 14,014,795 | ||||||
| United States—13.4% | ||||||
| Ally Auto Receivables Trust, | ||||||
| Ser. 2010-1, Cl. A3 | 1.45 | 5/15/14 | 208,769 | 209,702 | ||
| Ally Financial, | ||||||
| Gtd. Notes | 4.50 | 2/11/14 | 100,000 | 96,750 | ||
| Ally Master Owner Trust, | ||||||
| Ser. 2011-5, Cl. A | 0.93 | 6/15/15 | 450,000 | c | 450,161 | |
| The Fund | 13 |
STATEMENT OF INVESTMENTS (continued)
| Coupon | Maturity | Principal | ||||
| Bonds and Notes (continued) | Rate (%) | Date | Amount ($)a | Value ($) | ||
| United States (continued) | ||||||
| Altria Group, | ||||||
| Gtd. Notes | 10.20 | 2/6/39 | 25,000 | 39,021 | ||
| Anadarko Petroleum, | ||||||
| Sr. Unscd. Notes | 6.38 | 9/15/17 | 180,000 | 208,898 | ||
| Anheuser-Busch InBev Worldwide, | ||||||
| Gtd. Notes | 4.38 | 2/15/21 | 195,000 | 217,753 | ||
| Anheuser-Busch Inbev Worldwide, | ||||||
| Gtd. Notes | 6.38 | 1/15/40 | 100,000 | 137,928 | ||
| Arkle Master Issuer, | ||||||
| Ser. 2010-2A, Cl. 1A1 | 1.87 | 5/17/60 | 295,000 | b,c | 294,519 | |
| BMW US Capital, | ||||||
| Gtd. Notes | EUR | 5.00 | 5/28/15 | 165,000 | 233,483 | |
| Burlington North Santa Fe, | ||||||
| Sr. Unscd. Debs | 5.05 | 3/1/41 | 100,000 | 111,338 | ||
| Cargill, | ||||||
| Sr. Unscd. Notes | 3.25 | 11/15/21 | 295,000 | b | 297,525 | |
| Chrysler Financial Auto | ||||||
| Securitization Trust, | ||||||
| Ser. 2010-A, Cl. D | 3.52 | 8/8/16 | 220,000 | 222,153 | ||
| CNA Financial, | ||||||
| Sr. Unscd. Notes | 5.75 | 8/15/21 | 260,000 | 265,799 | ||
| Comcast, | ||||||
| Gtd. Notes | 5.90 | 3/15/16 | 50,000 | 57,284 | ||
| CVS Pass-Through Trust, | ||||||
| Gtd. Notes | 5.77 | 1/10/33 | 293,623 | b | 301,028 | |
| Directv Holdings, | ||||||
| Gtd. Notes | 5.00 | 3/1/21 | 300,000 | 321,658 | ||
| Ecolab, | ||||||
| Sr. Unscd. Notes | 5.50 | 12/8/41 | 90,000 | 100,117 | ||
| Enterprise Products Operating, | ||||||
| Gtd. Notes | 6.13 | 10/15/39 | 190,000 | 212,970 | ||
| Ford Motor Credit, | ||||||
| Sr. Unscd. Notes | 3.88 | 1/15/15 | 480,000 | 478,548 | ||
| Ford Motor Credit, | ||||||
| Sr. Unscd. Notes | 6.63 | 8/15/17 | 145,000 | 158,027 | ||
| Freeport-McMoRan Copper & Gold, | ||||||
| Sr. Unscd. Notes | 8.38 | 4/1/17 | 250,000 | 265,907 | ||
| General Electric Capital, | ||||||
| Sub. Notes | 5.30 | 2/11/21 | 150,000 | 160,634 | ||
14
| Coupon | Maturity | Principal | ||||
| Bonds and Notes (continued) | Rate (%) | Date | Amount ($)a | Value ($) | ||
| United States (continued) | ||||||
| General Electric Capital, | ||||||
| Sr. Unscd. Notes | 6.88 | 1/10/39 | 80,000 | 96,165 | ||
| Gilead Sciences, | ||||||
| Sr. Unscd. Notes | 3.05 | 12/1/16 | 285,000 | 292,025 | ||
| Goodyear Tire & Rubber, | ||||||
| Sr. Unscd. Notes | 10.50 | 5/15/16 | 91,000 | 100,783 | ||
| Gracechurch Mortgage Funding LLC, | ||||||
| Ser. 2007-1A, Cl. 3A1 | 0.56 | 11/20/56 | 496,721 | b,c | 494,874 | |
| Gracechurch Mortgage Funding LLC, | ||||||
| Ser. 2011-1A, Cl. 2A1 | 2.03 | 11/20/56 | 950,000 | b,c | 950,546 | |
| Hartford Financial Services Group, | ||||||
| Sr. Unscd. Notes | 5.50 | 3/30/20 | 115,000 | 116,908 | ||
| Holmes Master Issuer, | ||||||
| Ser. 2010-1A, Cl. A2 | 1.80 | 10/15/54 | 265,000 | b,c | 264,566 | |
| Hyundai Capital America, | ||||||
| Gtd. Notes | 4.00 | 6/8/17 | 220,000 | b | 217,952 | |
| International Paper, | ||||||
| Sr. Unscd. Notes | 4.75 | 2/15/22 | 90,000 | 95,855 | ||
| JPMorgan Chase Bank, | ||||||
| Sr. Unscd. Notes | 4.35 | 8/15/21 | 265,000 | 268,148 | ||
| JPMorgan Chase Bank NA, | ||||||
| Sub. Notes | EUR | 4.38 | 11/30/21 | 150,000 | c | 162,170 |
| Kraft Foods, | ||||||
| Sr. Unscd. Notes | 5.38 | 2/10/20 | 380,000 | 439,197 | ||
| Levi Strauss & Co., | ||||||
| Sr. Unscd. Notes | EUR | 7.75 | 5/15/18 | 75,000 | 89,546 | |
| Macy’s Retail Holdings, | ||||||
| Gtd. Notes | 6.38 | 3/15/37 | 245,000 | 285,571 | ||
| Morgan Stanley, | ||||||
| Sr. Unscd. Notes | 5.50 | 7/28/21 | 270,000 | 250,103 | ||
| NBC Universal Media, | ||||||
| Sr. Unscd. Notes | 4.38 | 4/1/21 | 55,000 | 58,155 | ||
| Peabody Energy, | ||||||
| Gtd. Notes | 6.00 | 11/15/18 | 240,000 | b | 246,000 | |
| Peabody Energy, | ||||||
| Gtd. Notes | 6.25 | 11/15/21 | 115,000 | b | 119,600 | |
| Pepsico, | ||||||
| Sr. Unscd. Notes | 0.80 | 8/25/14 | 300,000 | 299,945 | ||
| The Fund | 15 |
STATEMENT OF INVESTMENTS (continued)
| Coupon | Maturity | Principal | |||||
| Bonds and Notes (continued) | Rate (%) | Date | Amount ($)a | Value ($) | |||
| United States (continued) | |||||||
| Philip Morris International, | |||||||
| Sr. Unscd. Notes | 2.90 | 11/15/21 | 440,000 | 449,562 | |||
| Plains All American Pipeline, | |||||||
| Gtd. Notes | 5.00 | 2/1/21 | 275,000 | 303,498 | |||
| Prudential Financial, | |||||||
| Sr. Unscd. Notes | 5.38 | 6/21/20 | 100,000 | 107,206 | |||
| Puget Energy, | |||||||
| Sr. Scd. Notes | 6.00 | 9/1/21 | 100,000 | 103,661 | |||
| Time Warner, | |||||||
| Gtd. Notes | 5.38 | 10/15/41 | 125,000 | 135,920 | |||
| Time Warner Cable, | |||||||
| Gtd. Notes | 4.00 | 9/1/21 | 150,000 | 152,062 | |||
| Verizon Communications, | |||||||
| Sr. Unscd. Notes | 4.75 | 11/1/41 | 255,000 | 275,567 | |||
| Wells Fargo Bank & Co. | |||||||
| Sr. Unscd. Notes | 2.63 | 12/15/16 | 420,000 | 420,228 | |||
| WM Covered Bond Program, | |||||||
| Covered Notes | EUR | 4.00 | 9/27/16 | 285,000 | 387,017 | ||
| WM Wrigley Jr., | |||||||
| Sr. Scd. Notes | 3.70 | 6/30/14 | 170,000 | b | 175,362 | ||
| Xerox, | |||||||
| Sr. Unscd. Notes | 1.28 | 5/16/14 | 125,000 | c | 123,250 | ||
| 12,322,645 | |||||||
| Total Bonds And Notes | |||||||
| (cost $82,104,800) | 85,684,695 | ||||||
| Short-Term Investments—1.7% | |||||||
| U.S. Treasury Bills: | |||||||
| 0.00%, 2/2/12 | 1,430,000e | 1,429,987 | |||||
| 0.03%, 5/17/12 | 100,000 | 99,988 | |||||
| Total Short-Term Investments | |||||||
| (cost $1,529,988) | 1,529,975 | ||||||
16
| Other Investment—6.7% | Shares | Value ($) | ||
| Registered Investment Company; | ||||
| Dreyfus Institutional Preferred | ||||
| Plus Money Market Fund | ||||
| (cost $6,104,207) | 6,104,207f | 6,104,207 | ||
| Total Investments (cost $89,738,995) | 101.9 | 93,318,877 | ||
| Liabilities, Less Cash and Receivables | (1.9%) | (1,741,164) | ||
| Net Assets | 100.0% | 91,577,713 | ||
| a Principal amount stated in U.S. Dollars unless otherwise noted. |
| AUD—Australian Dollar |
| BRL—Brazilian Real |
| CAD—Canadian Dollar |
| CLP—Chilean Peso |
| EUR—Euro |
| GBP—British Pound |
| JPY—JapaneseYen |
| MXN—Mexican New Peso |
| NOK—Norwegian Krone |
| PHP—Philippine Peso |
| SEK—Swedish Krona |
| ZAR—South African Rand |
| b Securities exempt from registration under Rule 144A of the Securities Act of 1933.These securities may be resold in |
| transactions exempt from registration, normally to qualified institutional buyers.At December 31, 2011, these |
| securities were valued at $11,166,392 or 12.2% of net assets. |
| c Variable rate security—interest rate subject to periodic change. |
| d Principal amount for accrual purposes is periodically adjusted based on changes in the Japanese Consumer Price Index. |
| e Held by a broker as a collateral for open financial futures positions. |
| f Investment in affiliated money market mutual fund. |
| Portfolio Summary (Unaudited)† | |||
| Value (%) | Value (%) | ||
| Foreign/Governmental | 62.3 | Asset/Residential | |
| Corporate Bonds | 23.0 | Mortgage-Backed | 8.2 |
| Short-Term/ | |||
| Money Market Investments | 8.4 | 101.9 | |
| † Based on net assets. | |||
| See notes to financial statements. | |||
| The Fund | 17 |
| STATEMENT OF FINANCIAL FUTURES |
| December 31, 2011 |
| Unrealized | ||||||
| Market Value | Appreciation | |||||
| Covered by | (Depreciation) | |||||
| Contracts | Contracts ($) | Expiration | at 12/31/2011($) | |||
| Financial Futures Long | ||||||
| Canadian 10 Year Bonds | 13 | 1,707,897 | March 2012 | 30,915 | ||
| Euro-Bond | 8 | 1,439,617 | March 2012 | 40,010 | ||
| Euro-Schatz | 22 | 3,141,759 | March 2012 | 9,446 | ||
| Japanese 10 Year Bonds | 3 | 5,550,604 | March 2012 | 57,646 | ||
| Financial Futures Short | ||||||
| Euro-Bobl | 21 | (3,400,388) | March 2012 | (50,058) | ||
| U.S. Treasury 2 Year Notes | 46 | (10,145,156) | March 2012 | (3,653) | ||
| U.S. Treasury 10 Year Notes | 49 | (6,425,125) | March 2012 | (82,400) | ||
| U.S. Treasury 30 Year Bond | 8 | (1,158,500) | March 2012 | (27,823) | ||
| U.S. Treasury Ultra | ||||||
| Long Term Bonds | 9 | (1,441,688) | March 2012 | (41,782) | ||
| Gross Unrealized Appreciation | 138,017 | |||||
| Gross Unrealized Depreciation | (205,716) | |||||
| See notes to financial statements. | ||||||
18
| STATEMENT OF ASSETS AND LIABILITIES |
| December 31, 2011 |
| Cost | Value | ||
| Assets ($): | |||
| Investments in securities—See Statement of Investments—Note 1(c): | |||
| Unaffiliated issuers | 83,634,788 | 87,214,670 | |
| Affiliated issuers | 6,104,207 | 6,104,207 | |
| Cash | 238,452 | ||
| Cash denominated in foreign currencies | 119,675 | 119,640 | |
| Dividends and interest receivable | 969,495 | ||
| Receivable for shares of Beneficial Interest subscribed | 416,709 | ||
| Receivable for investment securities sold | 210,454 | ||
| Unrealized appreciation on forward foreign | |||
| currency exchange contracts—Note 4 | 157,579 | ||
| Unrealized appreciation on swap contracts—Note 4 | 39,327 | ||
| Prepaid expenses | 12,670 | ||
| 95,483,203 | |||
| Liabilities ($): | |||
| Due to The Dreyfus Corporation and affiliates—Note 3(c) | 51,252 | ||
| Due to Administrator—Note 3(b) | 7,563 | ||
| Cash overdraft due to Custodian | 2,750,137 | ||
| Unrealized depreciation on forward foreign | |||
| currency exchange contracts—Note 4 | 522,752 | ||
| Unrealized depreciation on swap contracts—Note 4 | 361,752 | ||
| Payable for shares of Beneficial Interest redeemed | 156,758 | ||
| Payable for futures variation margin—Note 4 | 21,827 | ||
| Accrued expenses | 33,449 | ||
| 3,905,490 | |||
| Net Assets ($) | 91,577,713 | ||
| Composition of Net Assets ($): | |||
| Paid-in capital | 89,818,613 | ||
| Accumulated undistributed investment income—net | 223,854 | ||
| Accumulated net realized gain (loss) on investments | (1,270,496) | ||
| Accumulated net unrealized appreciation (depreciation) on investments, | |||
| swap transactions and foreign currency transactions [including | |||
| ($67,699) net realized (depreciation) on financial futures] | 2,805,742 | ||
| Net Assets ($) | 91,577,713 | ||
| Class I Shares Outstanding | |||
| (unlimited number of $.001 par value shares of Beneficial interest authorized) | 4,722,366 | ||
| Net Asset Value, offering and redemption price per share ($) | 19.39 | ||
| See notes to financial statements. | |||
| The Fund | 19 |
| STATEMENT OF OPERATIONS |
| Year Ended December 31, 2011 |
| Investment Income ($): | ||
| Income: | ||
| Interest (net of $5,558 foreign taxes withheld at souce) | 3,617,656 | |
| Dividends; | ||
| Affiliated issuers | 2,564 | |
| Income from securities lending—Note 1(c) | 2,199 | |
| Total Income | 3,622,419 | |
| Expenses: | ||
| Investment advisory fee—Note 3(a) | 404,972 | |
| Administration fees—Note 3(a) | 66,640 | |
| Shareholder servicing costs—Note 3(c) | 61,861 | |
| Custodian fees—Note 3(c) | 59,385 | |
| Auditing fees | 47,396 | |
| Registration fees | 21,691 | |
| Accounting and administration fees—Note 3(a) | 20,000 | |
| Prospectus and shareholders' reports | 18,392 | |
| Legal fees | 7,967 | |
| Trustees' fees and expenses—Note 3(d) | 7,127 | |
| Administrative service fees—Note 3(b) | 1,831 | |
| Loan commitment fees—Note 2 | 1,707 | |
| Interest expense—Note 2 | 528 | |
| Miscellaneous | 46,222 | |
| Total Expenses | 765,719 | |
| Less—reduction in fees due to earnings credits—Note 3(c) | (18) | |
| Net Expenses | 765,701 | |
| Investment Income—Net | 2,856,718 | |
| Realized and Unrealized Gain (Loss) on Investments—Note 4 ($): | ||
| Net realized gain (loss) on investments and foreign currency transactions | 1,478,117 | |
| Net realized gain (loss) on options transactions | (96,066) | |
| Net realized gain (loss) on financial futures | (1,421,486) | |
| Net realized gain (loss) on swap transactions | (374,915) | |
| Net realized gain (loss) on forward foreign currency exchange contracts | (641,027) | |
| Net Realized Gain (Loss) | (1,055,377) | |
| Net unrealized appreciation (depreciation) on | ||
| investments and foreign currency transactions | 76,304 | |
| Net unrealized appreciation (depreciation) on options transactions | (1,019) | |
| Net unrealized appreciation (depreciation) on financial futures | (87,522) | |
| Net unrealized appreciation (depreciation) on swap transactions | (361,759) | |
| Net unrealized appreciation (depreciation) on | ||
| forward foreign currency exchange contracts | 404,091 | |
| Net Unrealized Appreciation (Depreciation) | 30,095 | |
| Net Realized and Unrealized Gain (Loss) on Investments | (1,025,282) | |
| Net Increase in Net Assets Resulting from Operations | 1,831,436 | |
| See notes to financial statements. | ||
20
STATEMENT OF CHANGES IN NET ASSETS
| Year Ended December 31, | ||||
| 2011 | 2010 | |||
| Operations ($): | ||||
| Investment income—net | 2,856,718 | 3,638,647 | ||
| Net realized gain (loss) on investments | (1,055,377) | 4,906,493 | ||
| Net unrealized appreciation | ||||
| (depreciation) on investments | 30,095 | (3,559,895) | ||
| Net Increase (Decrease) in Net Assets | ||||
| Resulting from Operations | 1,831,436 | 4,985,245 | ||
| Dividends to Shareholders from ($): | ||||
| Investment income—net | (4,918,206) | (4,592,306) | ||
| Net realized gain on investments | (425,653) | — | ||
| Total Dividends | (5,343,859) | (4,592,306) | ||
| Beneficial Interest Transactions ($): | ||||
| Net proceeds from shares sold | 41,684,329 | 56,009,166 | ||
| Dividends reinvested | 5,121,013 | 4,432,118 | ||
| Cost of shares redeemed | (57,681,797) | (47,038,194) | ||
| Increase (Decrease) in Net Assets from | ||||
| Capital Beneficial Interest Transactions | (10,876,455) | 13,403,090 | ||
| Total Increase (Decrease) in Net Assets | (14,388,878) | 13,796,029 | ||
| Net Assets ($): | ||||
| Beginning of Period | 105,966,591 | 92,170,562 | ||
| End of Period | 91,577,713 | 105,966,591 | ||
| Undistributed investment income—net | 223,854 | 2,276,042 | ||
| Capital Share Transactions (Shares): | ||||
| Shares sold | 2,106,059 | 2,769,012 | ||
| Shares issued for dividends reinvested | 262,141 | 221,726 | ||
| Shares redeemed | (2,930,480) | (2,328,518) | ||
| Net Increase (Decrease) in Shares Outstanding | (562,280) | 662,220 | ||
| See notes to financial statements. | ||||
| The Fund | 21 |
FINANCIAL HIGHLIGHTS
The following table describes the performance for the fiscal periods indicated. Total return shows how much your investment in the fund would have increased (or decreased) during each period, assuming you had reinvested all dividends and distributions.These figures have been derived from the fund’s financial statements.
| Year Ended December 31, | ||||||||||
| Class I Shares | 2011 | 2010 | 2009a | 2008 | 2007 | |||||
| Per Share Data ($): | ||||||||||
| Net asset value, beginning of period | 20.05 | 19.94 | 18.95 | 18.57 | 18.14 | |||||
| Investment Operations: | ||||||||||
| Investment income—netb | .56 | .71 | .74 | .72 | .69 | |||||
| Net realized and unrealized | ||||||||||
| gain (loss) on investments | (.19) | .30 | 1.72 | .75 | .10 | |||||
| Total from Investment Operations | .37 | 1.01 | 2.46 | 1.47 | .79 | |||||
| Distributions: | ||||||||||
| Dividends from investment income—net | (.95) | (.90) | (1.47) | (1.09) | (.36) | |||||
| Dividends from net realized | ||||||||||
| gain on investments | (.08) | — | — | — | — | |||||
| Total Distributions | (1.03) | (.90) | (1.47) | (1.09) | (.36) | |||||
| Net asset value, end of period | 19.39 | 20.05 | 19.94 | 18.95 | 18.57 | |||||
| Total Return (%) | 1.88 | 5.15 | 13.86 | 8.08 | 4.35 | |||||
| Ratios/Supplemental Data (%): | ||||||||||
| Ratio of total expenses | ||||||||||
| to average net assets | .76 | .72 | .87 | .80 | .70 | |||||
| Ratio of net expenses | ||||||||||
| to average net assets | .76 | .72 | .80 | .78 | .70 | |||||
| Ratio of net investment income | ||||||||||
| to average net assets | 2.82 | 3.49 | 3.88 | 3.84 | 3.73 | |||||
| Portfolio Turnover Rate | 218.72 | 210.34 | 120.50 | 158c | 168c | |||||
| Net Assets, end of period ($ x 1,000) | 91,578 | 105,967 | 92,171 | 60,945 | 99,877 | |||||
| a Effective September 1, 2009, the fund’s shares were redesignated as Class I shares. |
| b Based on average shares outstanding at each month end. |
| c The portfolio turnover rates excluding mortgage dollar roll transactions for the periods ended December 31, 2008 and |
| 2007 were 144% and 140%, respectively. |
See notes to financial statements.
22
NOTES TO FINANCIAL STATEMENTS
NOTE 1—Significant Accounting Policies:
Dreyfus/Standish International Fixed Income Fund (the “fund”) is a separate diversified series of Dreyfus Investment Funds (the “Trust”), which is registered under the Investment Company Act of 1940, as amended (the “Act”), as an open-end management investment company and operates as a series company offering eleven series, including the fund. The fund’s investment objective seeks to maximize total return while realizing a market level of income, consistent with the preservation of capital and the maintenance of liquidity. The Dreyfus Corporation (the “Manager” or “Dreyfus”), a wholly-owned subsidiary of The Bank of New York Mellon Corporation (“BNY Mellon”), serves as the fund’s investment adviser. MBSC Securities Corporation (the “Distributor”), a wholly-owned subsidiary of the Manager, is the distributor of the fund’s shares.
Class I shares are sold primarily to bank trust departments and other financial service providers, (including The Bank of NewYork Mellon, a subsidiary of BNY Mellon and an affiliate of Dreyfus), acting on behalf of customers having a qualified trust or an investment account or relationship at such institution and bear no distribution or service fees. Class I shares are offered without a front end sales charge or contingent deferred sales charge.
TheTrust accounts separately for the assets, liabilities and operations of each series. Expenses directly attributable to each series are charged to that series’ operations; expenses which are applicable to all series are allocated among them on a pro rata basis.
The Financial Accounting Standards Board (“FASB”) Accounting Standards Codification (“ASC”) is the exclusive reference of authoritative U.S. generally accepted accounting principles (“GAAP”) recognized by the FASB to be applied by nongovernmental entities. Rules and interpretive releases of the Securities and Exchange Commission (“SEC”)
| The Fund | 23 |
NOTES TO FINANCIAL STATEMENTS (continued)
under authority of federal laws are also sources of authoritative GAAP for SEC registrants. The fund’s financial statements are prepared in accordance with GAAP, which may require the use of management estimates and assumptions.Actual results could differ from those estimates.
(a) Portfolio valuation: The fair value of a financial instrument is the amount that would be received to sell an asset or paid to transfer a liability in an orderly transaction between market participants at the measurement date (i.e. the exit price). GAAP establishes a fair value hierarchy that prioritizes the inputs of valuation techniques used to measure fair value.This hierarchy gives the highest priority to unadjusted quoted prices in active markets for identical assets or liabilities (Level 1 measurements) and the lowest priority to unobservable inputs (Level 3 measurements).
Additionally, GAAP provides guidance on determining whether the volume and activity in a market has decreased significantly and whether such a decrease in activity results in transactions that are not orderly. GAAP requires enhanced disclosures around valuation inputs and techniques used during annual and interim periods.
Various inputs are used in determining the value of the fund’s investments relating to fair value measurements.These inputs are summarized in the three broad levels listed below:
Level 1—unadjusted quoted prices in active markets for identical investments.
Level 2—other significant observable inputs (including quoted prices for similar investments, interest rates, prepayment speeds, credit risk, etc.).
Level 3—significant unobservable inputs (including the fund’s own assumptions in determining the fair value of investments).
The inputs or methodology used for valuing securities are not necessarily an indication of the risk associated with investing in those securities.
24
Changes in valuation techniques may result in transfers in or out of an assigned level within the disclosure hierarchy. Valuation techniques used to value the fund’s investments are as follows:
Registered investment companies that are not traded on an exchange are valued at their net asset value and are categorized within Level 1 of the fair value hierarchy.
Investments in securities excluding short-term investments (other than U.S.Treasury Bills), financial futures, options, swaps and forward foreign currency exchange contracts (“forward contracts”) are valued each business day by an independent pricing service (the “Service”) approved by the Board of Trustees. Investments for which quoted bid prices are readily available and are representative of the bid side of the market in the judgment of the Service are valued at the mean between the quoted bid prices (as obtained by the Service from dealers in such securities) and asked prices (as calculated by the Service based upon its evaluation of the market for such securities). Other investments (which constitute a majority of the portfolio securities) are valued as determined by the Service, based on methods which include consideration of: yields or prices of securities of comparable quality, coupon, maturity and type; indications as to values from dealers; and general market conditions.These securities are generally categorized within Level 2 of the fair value hierarchy.
U.S. Treasury Bills are valued at the mean price between quoted bid prices and asked prices by the Service. These securities are generally categorized within Level 2 of the fair value hierarchy.
The Service’s procedures are reviewed by Dreyfus under the general supervision of the Board of Trustees.
When market quotations or official closing prices are not readily available, or are determined not to reflect accurately fair value, such as when the value of a security has been significantly affected by events
| The Fund | 25 |
NOTES TO FINANCIAL STATEMENTS (continued)
after the close of the exchange or market on which the security is principally traded (for example, a foreign exchange or market), but before the fund calculates its net asset value, the fund may value these investments at fair value as determined in accordance with the procedures approved by the Board of Trustees. Certain factors may be considered when fair valuing investments such as: fundamental analytical data, the nature and duration of restrictions on disposition, an evaluation of the forces that influence the market in which the securities are purchased and sold, and public trading in similar securities of the issuer or comparable issuers. These securities are either categorized as Level 2 or 3 depending on the relevant inputs used.
For restricted securities where observable inputs are limited, assumptions about market activity and risk are used and are categorized within Level 3 of the fair value hierarchy.
Financial futures and options, which are traded on an exchange, are valued at the last sales price on the securities exchange on which such securities are primarily traded or at the last sales price on the national securities market on each business day.These securities are generally categorized within Level 1 of the fair value hierarchy. Options traded over-the-counter are valued at the mean between the bid and asked price.These securities are generally categorized within Level 2 of the fair value hierarchy. Investments in swap transactions are valued each business day by the Service. Swaps are valued by the Service by using a swap pricing model which incorporates among other factors, default probabilities, recovery rates, credit curves of the underlying issuer and swap spreads on interest rates.These securities are generally categorized within Level 2 of the fair value hierarchy. Investments denominated in foreign currencies are translated to U.S. dollars at the prevailing rates of exchange. Forward contracts are valued at the forward rate.These securities are generally categorized within Level 2 of the fair value hierarchy.
26
The following is a summary of the inputs used as of December 31, 2011 in valuing the fund’s investments:
| Level 2—Other | Level 3— | ||||||
| Level 1— | Significant | Significant | |||||
| Unadjusted | Observable | Unobservable | |||||
| Quoted Prices | Inputs | Inputs | Total | ||||
| Assets ($) | |||||||
| Investments in Securities: | |||||||
| Asset-Backed | — | 2,458,942 | — | 2,458,942 | |||
| Commercial | |||||||
| Mortgage-Backed | — | 2,442,203 | — | 2,442,203 | |||
| Corporate Bonds† | — | 21,056,875 | — | 21,056,875 | |||
| Foreign Government | — | 57,084,942 | — | 57,084,942 | |||
| Mutual Funds | 6,104,207 | — | — | 6,104,207 | |||
| Residential | |||||||
| Mortgage-Backed | — | 2,641,733 | — | 2,641,733 | |||
| U.S. Treasury | — | 1,529,975 | — | 1,529,975 | |||
| Other Financial | |||||||
| Instruments: | |||||||
| Forward Foreign | |||||||
| Currency Exchange | |||||||
| Contracts†† | — | 157,579 | — | 157,579 | |||
| Futures†† | 138,017 | — | — | 138,017 | |||
| Swaps†† | — | 39,327 | — | 39,327 | |||
| Liabilities ($) | |||||||
| Other Financial | |||||||
| Instruments: | |||||||
| Forward Foreign | |||||||
| Currency Exchange | |||||||
| Contracts†† | — | (522,752) | — | (522,752) | |||
| Futures†† | (205,716) | — | — | (205,716) | |||
| Swaps†† | — | (361,752) | — | (361,752) | |||
| † | See Statement of Investments for additional detailed categorizations. |
| †† | Amount shown represents unrealized appreciation (depreciation) at period end. |
| The Fund | 27 |
NOTES TO FINANCIAL STATEMENTS (continued)
In May 2011, FASB issued Accounting Standards Update (“ASU”) No. 2011-04 “Amendments to Achieve Common Fair Value Measurement and Disclosure Requirements in GAAP and International Financial Reporting Standards (“IFRS”)” (“ASU 2011-04”). ASU 2011-04 includes common requirements for measurement of and disclosure about fair value between GAAP and IFRS. ASU 2011-04 will require reporting entities to disclose the following information for fair value measurements categorized within Level 3 of the fair value hierarchy: quantitative information about the unobservable inputs used in the fair value measurement, the valuation processes used by the reporting entity and a narrative description of the sensitivity of the fair value measurement to changes in unobservable inputs and the interrelationships between those unobservable inputs. In addition, ASU 2011-04 will require reporting entities to make disclosures about amounts and reasons for all transfers in and out of Level 1 and Level 2 fair value measurements.The new and revised disclosures are effective for interim and annual reporting periods beginning after December 15, 2011. At this time, management is evaluating the implications of ASU 2011-04 and its impact on the financial statements.
(b) Foreign currency transactions: The fund does not isolate that portion of the results of operations resulting from changes in foreign exchange rates on investments from the fluctuations arising from changes in market prices of securities held. Such fluctuations are included with the net realized and unrealized gain or loss on investments.
Net realized foreign exchange gains or losses arise from sales of foreign currencies, currency gains or losses realized on securities transactions between trade and settlement date, and the difference between the amounts of dividends, interest and foreign withholding taxes recorded on the fund’s books and the U.S. dollar equivalent of the amounts actually received or paid. Net unrealized foreign exchange gains and losses arise from changes in the value of assets and liabilities other than investments resulting from changes in exchange rates. Foreign currency gains and losses on investments are included with net realized and unrealized gain or loss on investments.
28
(c) Securities transactions and investment income: Securities transactions are recorded on a trade date basis. Realized gains and losses from securities transactions are recorded on the identified cost basis. Dividend income is recognized on the ex-dividend date and interest income, including, where applicable, accretion of discount and amortization of premium on investments, is recognized on the accrual basis.
Investing in foreign markets may involve special risks and considerations not typically associated with investing in the U.S. These risks include revaluation of currencies, high rates of inflation, repatriation restrictions on income and capital, and adverse political and economic developments. Moreover, securities issued in these markets may be less liquid, subject to government ownership controls and delayed settlements, and their prices may be more volatile than those of comparable securities in the U.S.
Pursuant to a securities lending agreement withThe Bank of NewYork Mellon, the fund may lend securities to qualified institutions. It is the fund’s policy that, at origination, all loans are secured by collateral of at least 102% of the value of U.S. securities loaned and 105% of the value of foreign securities loaned. Collateral equivalent to at least 100% of the market value of securities on loan is maintained at all times. Collateral is either in the form of cash, which can be invested in certain money market mutual funds managed by the Manager, U.S. Government and Agency securities or letters of credit.The fund is entitled to receive all income on securities loaned, in addition to income earned as a result of the lending transaction.Although each security loaned is fully collateralized, the fund bears the risk of delay in recovery of, or loss of rights in, the securities loaned should a borrower fail to return the securities in a timely manner. During the period ended December 31, 2011,The Bank of NewYork Mellon earned $1,184 from lending portfolio securities, pursuant to the securities lending agreement.
(d) Affiliated issuers: Investments in other investment companies advised by Dreyfus are defined as “affiliated” in the Act.
| The Fund | 29 |
NOTES TO FINANCIAL STATEMENTS (continued)
The fund may invest in shares of certain affiliated investment companies also advised or managed by Dreyfus. Investments in affiliated investment companies for the period ended December 31, 2011 were as follows:
| Affiliated | |||||||
| Investment | Value | Value | Net | ||||
| Company | 12/31/2010 | ($) | Purchases ($) | Sales ($) | 12/31/2011 | ($) | Assets (%) |
| Dreyfus | |||||||
| Institutional | |||||||
| Preferred | |||||||
| Plus Money | |||||||
| Market | |||||||
| Fund | 2,877,501 | 98,839,537 | 95,612,831 | 6,104,207 | 6.7 | ||
| Dreyfus | |||||||
| Institutional | |||||||
| Cash | |||||||
| Advantage | |||||||
| Fund | 624,400 | 16,720,622 | 17,345,022 | — | — | ||
| Total | 3,501,901 | 115,560,159 | 112,957,853 | 6,104,207 | 6.7 |
(e) Concentration of Risk: The fund invests primarily in debt securities. Failure of an issuer of the debt securities to make timely interest or principal payments, or a decline or the perception of a decline in the credit quality of a debt security, can cause the debt security’s price to fall, potentially lowering the fund’s share price. In addition, the value of debt securities may decline due to general market conditions that are not specifically related to a particular issuer, such as real or perceived adverse economic conditions, changes in outlook for corporate earnings, changes in interest or currency rates or adverse investor sentiment.They may also decline because of factors that affect a particular industry or country.
(f) Dividends to shareholders: Dividends are recorded on the ex-dividend date. Dividends from investment income-net are declared and paid quarterly. Dividends from net realized capital gains, if any, are normally declared and paid annually, but the fund may make distributions on a more frequent basis to comply with the distribution requirements of the Internal Revenue Code of 1986, as amended (the “Code”).To the extent that net realized capital gains can be offset by capital loss carryovers, it is the policy of the fund not to distribute such gains.
30
Income and capital gain distributions are determined in accordance with income tax regulations, which may differ from GAAP.
(g) Federal income taxes: It is the policy of the fund to continue to qualify as a regulated investment company, if such qualification is in the best interests of its shareholders, by complying with the applicable provisions of the Code, and to make distributions of taxable income sufficient to relieve it from substantially all federal income and excise taxes.
As of and during the period ended December 31, 2011, the fund did not have any liabilities for any uncertain tax positions.The fund recognizes interest and penalties, if any, related to uncertain tax positions as income tax expense in the Statement of Operations. During the period, the fund did not incur any interest or penalties.
Each of the tax years in the four-year period ended December 31, 2011 remains subject to examination by the Internal Revenue Service and state taxing authorities.
At December 31, 2011, the components of accumulated earnings on a tax basis were as follows: undistributed ordinary income $2,317,274, accumulated capital losses $1,174,778 and unrealized appreciation $616,604.
Under the Regulated Investment Company Modernization Act of 2010 (the “2010 Act”), the fund will be permitted to carry forward capital losses incurred in taxable years beginning after December 22, 2010 (“post-enactment losses”) for an unlimited period. Furthermore, post-enactment capital loss carryovers will retain their character as either short-term or long-term capital losses rather than short-term as they were under previous statute. The 2010 Act requires post-enactment losses to be utilized before the utilization of losses incurred in taxable years prior to the effective date of the 2010 Act (“pre-enactment losses”). As a result of this ordering rule, pre-enactment losses may be more likely to expire unused.
| The Fund | 31 |
NOTES TO FINANCIAL STATEMENTS (continued)
The accumulated capital loss carryover is available for federal income tax purposes to be applied against future net securities profits, if any, realized subsequent to December 31, 2011. The fund has $979,791 of post-enactment short-term capital losses and $194,987 of post-enactment long-term capital losses that can be carried forward for an unlimited period.
The tax character of distributions paid to shareholders during the fiscal periods ended December 31, 2011 and December 31, 2010 were as follows: ordinary income $4,918,313 and $4,592,306 and long-term capital gains $425,546 and $0, respectively.
During the period ended December 31, 2011, as a result of permanent book to tax differences, primarily due to the tax treatment for paydowns gains and losses on mortgage-backed securities, foreign currency transactions, amortization of premiums, swap periodic payments and dividend reclassification, the fund increased accumulated undistributed investment income-net by $9,300 and decreased accumulated net realized gain (loss) on investments by the same amount. Net assets and net asset value per share were not affected by this reclassification.
(h) New Accounting Pronouncement: In April 2011, FASB issued ASU No. 2011-03“Transfers and Servicing (Topic 860) Reconsideration of Effective Control for Repurchase Agreements (“ASU 2011-03”) which relates to the accounting for repurchase agreements and similar agreements including mortgage dollar rolls, that both entitle and obligate a transferor to repurchase or redeem financial assets before their maturity. ASU 2011-03 modifies the criteria for determining effective control of transferred assets and as a result certain agreements may now be accounted for as secured borrowings.ASU 2011-03 is effective prospectively for new transfers and existing transactions that are modified in the first interim or annual period beginning on or after December 15, 2011. Management is currently evaluating the implications of this change and its impact on the financial statements.
32
NOTE 2—Bank Lines of Credit:
The fund participates with other Dreyfus-managed funds in a $225 million unsecured credit facility led by Citibank, N.A. and a $300 million unsecured credit facility provided by The Bank of New York Mellon (each, a “Facility”), each to be utilized primarily for temporary or emergency purposes, including the financing of redemptions. In connection therewith, the fund has agreed to pay its pro rata portion of commitment fees for each Facility. Interest is charged to the fund based on rates determined pursuant to the terms of the respective Facility at the time of borrowing.
The average amount of borrowings outstanding under the Facilities during the period ended December 31, 2011, was approximately $25,800 with a related weighted average annualized interest rate of 2.05%.
NOTE 3—Investment Advisory Fee and Other Transactions With Affiliates:
(a) Pursuant to an investment advisory agreement with the Manager, the investment advisory fee is computed at the annual rate of .40% of the value of the fund’s average daily net assets and is payable monthly.
From January 1, 2011 through April 30, 2011, the Trust had an agreement withThe Bank of NewYork Mellon, pursuant to whichThe Bank of New York Mellon provided administration and fund accounting services for the fund. For these services, the fund paidThe Bank of New York Mellon a fixed fee plus asset and transaction based fees, as well as out-of-pocket expenses. Pursuant to this agreement, the fund was charged $20,000 during the period January 1, 2011 through April 30, 2011 for administration and fund accounting services.
At Board Meetings of the Trust held on February 15-16, 2011, the Board ofTrustees of theTrust terminated the agreement withThe Bank
| The Fund | 33 |
NOTES TO FINANCIAL STATEMENTS (continued)
of New York Mellon and, on behalf of the Trust, entered into a Fund Accounting and Administration Agreement (the “Administration Agreement”) with Dreyfus, effective May 1, 2011, whereby Dreyfus performs administrative, accounting and recordkeeping services for the fund. The fund has agreed to compensate Dreyfus for providing accounting services, administration, compliance monitoring, regulatory and shareholder reporting, as well as related facilities, equipment and clerical help.The fee is based on the fund’s average daily net assets and computed at the following annual rates: .10% of the first $500 million, .065% of the next $500 million and .02% in excess of $1 billion.
In addition, after applying any expense limitations or fee waivers that reduce the fees paid to Dreyfus for this service, Dreyfus has contractually agreed in writing to waive any remaining fees for this service to the extent that they exceed both Dreyfus’ costs in providing these services and a reasonable allocation of the costs incurred by Dreyfus and its affiliates related to the support and oversight of these services. The fund also reimburses Dreyfus for the out-of-pocket expenses incurs in performing this service for the fund. Pursuant to the Administration Agreement, the fund was charged $66,640 during the period May 1, 2011 through December 31, 2011.
(b) The fund pays administrative service fees.These fees are paid to affiliated or unaffiliated retirement plans, omnibus accounts and platform administrators and other entities (“Plan Administrators”) that provide recordkeeping and/or other administrative support services to accounts, retirement plans and their participants.As compensation for such services, the fund pays each Plan Administrator an administrative service fee in an amount of up to .15% (on an annualized basis) of the fund’s average daily net assets attributable to fund shares that are held in accounts serviced by such Plan Administrator. During the period ended December 31, 2011, the fund was charged $1,831.The fund’s adviser or its affiliates may pay additional compensation from their own resources to Plan Administrators and other entities for administrative services, as well as in consideration of marketing or other distribution related services.These payments may
34
provide an incentive for these entities to actively promote the fund or cooperate with the distributor’s promotional efforts.
(c) The fund compensates Dreyfus Transfer, Inc., a wholly-owned subsidiary of the Manager, under a transfer agency agreement for providing personnel and facilities to perform transfer agency services for the fund. During the period ended December 31, 2011, the fund was charged $4,365 pursuant to the transfer agency agreement, which is included in Shareholder servicing costs in the Statement of Operations.
The fund has arrangements with the custodian and cash management bank whereby the fund may receive earnings credits when positive cash balances are maintained, which are used to offset custody and cash management fees. For financial reporting purposes, the fund includes net earnings credits as an expense offset in the Statement of Operations.
The fund compensates The Bank of New York Mellon under cash management agreements for performing cash management services related to fund subscriptions and redemptions. During the period ended December 31, 2011, the fund was charged $656 pursuant to the cash management agreements, which is included in Shareholder servicing costs in the Statement of Operations.These fees were partially offset by earnings credits of $18.
The fund also compensates The Bank of New York Mellon under a custody agreement for providing custodial services for the fund. During the period ended December 31, 2011, the fund was charged $59,385 pursuant to the custody agreement.
During the period ended December 31, 2011, the fund was charged $6,402 for services performed by the Chief Compliance Officer.
The components of “Due to The Dreyfus Corporation and affiliates” in the Statement of Assets and Liabilities consist of: investment advisory fees $30,253, custodian fees $14,704, chief compliance officer fees $5,295 and transfer agency per account fees $1,000.
| The Fund | 35 |
NOTES TO FINANCIAL STATEMENTS (continued)
(d) Prior to January 1, 2012, eachTrustee who is not an “interested person” of the Trust (as defined in the Act) received $60,000 per annum, plus $7,000 per joint Board meeting of the Trust,The Dreyfus/Laurel Funds, Inc.,The Dreyfus/Laurel Funds Trust,The Dreyfus/Laurel Tax-Free Municipal Funds and Dreyfus Funds, Inc. (collectively, the “Board Group Open-End Funds”) attended, $2,500 for separate in-person committee meetings attended which were not held in conjunction with a regularly scheduled Board meeting and $2,000 for Board meetings and separate committee meetings attended that were conducted by telephone. The Board Group Open-End Funds also reimbursed each Trustee who is not an “interested person” of theTrust (as defined in the Act) for travel and out-of-pocket expenses. With respect to Board meetings, the Chair of the Board received an additional 25% of such compensation (with the exception of reimbursable amounts). The Chair of each of the Board’s committees, unless the Chair also served as Chair of the Board, received $1,350 per applicable committee meeting. In the event that there was an in-person joint committee meeting or a joint telephone meeting of the Board Group Open-End Funds and Dreyfus High Yield Strategies Fund (“DHF”), $2,500 was allocated between the Board Group Open-End Funds and DHF.
Effective January 1, 2012, the Board Group Open-End Funds and DHF (collectively, the “Board Group Funds”) will pay each Trustee their respective allocated portions of an annual retainer of $85,000 and a fee of $10,000 for each regularly scheduled Board meeting attended ($75,000 and $8,000, respectively, in the aggregate, prior to January 1, 2012). With respect to the annual retainer and Board meetings of the Board Group Funds, the Chair of the Board will receive an additional 25% of such compensation (with the exception of reimbursable amounts). Each Trustee will receive $2,500 for any separate in-person committee meetings attended, which are not held in conjunction with a regularly scheduled Board meeting, such amount to be allocated among the Board Group Funds, as applicable. In the event that there is a joint telephone meeting of the Board Group Funds, a fee of $2,000 will be allocated among the applicable Board Group Funds, accordingly
36
(prior to January 1, 2012, the fee allocated was $2,500 if the meeting included DHF).The Chair of each of the Board’s committees, unless the Chair also serves as Chair of the Board, will receive $1,500 per applicable committee meeting. Each Emeritus Trustee is entitled to receive an annual retainer of one-half the amount paid as a retainer at the time the Trustee became Emeritus and a per meeting attended fee of one-half the amount paid to Trustees.The Board Group Funds also reimburse each IndependentTrustee and EmeritusTrustees for travel and out-of-pocket expenses. These fees and expenses are charged and allocated to each series based on net assets.
NOTE 4—Securities Transactions:
The aggregate amount of purchases and sales (including paydowns) of investment securities, excluding short-term securities, forward contracts, financial futures, options transactions and swap transactions, during the period ended December 31, 2011, amounted to $210,824,283 and $228,609,598, respectively.
The following tables show the fund’s exposure to different types of market risk as it relates to the Statement of Assets and Liabilities and the Statement of Operations, respectively.
Fair value of derivative instruments as of December 31, 2011 is shown below:
| Derivative | Derivative | |||
| Assets ($) | Liabilities ($) | |||
| Interest rate risk1,2 | 177,344 | Interest rate risk1,3 | (567,468) | |
| Foreign exchange risk4 | 157,579 | Foreign exchange risk5 | (522,752) | |
| Gross fair value of | ||||
| derivatives contracts | 334,923 | (1,090,220) | ||
Statement of Assets and Liabilities location:
| 1 | Includes cumulative appreciation (depreciation) on futures contracts as reported in the Statement of |
| Financial Futures, but only the unpaid variation margin is reported in the Statement of Assets | |
| and Liabilities. | |
| 2 | Unrealized appreciation on swap contracts. |
| 3 | Unrealized depreciation on swap contracts. |
| 4 | Unrealized appreciation on forward foreign currency exchange contracts. |
| 5 | Unrealized depreciation on forward foreign currency exchange contracts. |
| The Fund | 37 |
NOTES TO FINANCIAL STATEMENTS (continued)
The effect of derivative instruments in the Statement of Operations during the period ended December 31, 2011 is shown below:
| Amount of realized gain or (loss) on derivatives recognized in income ($) | ||||||||||
| Forward | ||||||||||
| Underlying risk | Futures6 | Options7 | Contracts8 | Swaps9 | Total | |||||
| Interest rate | (1,421,486) | — | — | (284,988) | (1,706,474) | |||||
| Foreign exchange | — | (96,066) | (641,027) | — | (737,093) | |||||
| Credit | — | — | — | (89,927) | (89,927) | |||||
| Total | (1,421,486) | (96,066) | (641,027) | (374,915) | (2,533,494) | |||||
| Change in unrealized appreciation or (depreciation) on derivatives recognized in income ($) | |||||||||
| Forward | |||||||||
| Underlying risk | Futures10 | Options11 | Contracts12 | Swaps13 | Total | ||||
| Interest rate | (87,522) | (80,583) | — | (361,759) | (529,864) | ||||
| Foreign exchange | — | 79,564 | 404,091 | — | 483,655 | ||||
| Credit | — | — | — | — | |||||
| Total | (87,522) | (1,019) | 404,091 | (361,759) | (46,209) | ||||
| Statement of Operations location: | |
| 6 | Net realized gain (loss) on financial futures. |
| 7 | Net realized gain (loss) on options transactions. |
| 8 | Net realized gain (loss) on forward foreign currency exchange contracts. |
| 9 | Net realized gain (loss) on swap transactions. |
| 10 Net unrealized appreciation (depreciation) on financial futures. | |
| 11 Net unrealized appreciation (depreciation) on options transactions. | |
| 12 Net unrealized appreciation (depreciation) on forward foreign currency exchange contracts. | |
| 13 Net unrealized appreciation (depreciation) on swap transactions. | |
Futures Contracts: In the normal course of pursuing its investment objective, the fund is exposed to market risk, including, interest rate risk, as a result of changes in value of underlying financial instruments.The fund invests in financial futures contracts in order to manage its exposure to or protect against changes in the market. A futures contract represents a commitment for the future purchase or a sale of an asset at a specified date. Upon entering into such contracts, these investments require initial margin deposits with a broker, which consist of cash or cash equivalents. The amount of these deposits is determined by the exchange or Board of Trade on which the contract is traded and is subject to change. Accordingly, variation margin payments are received or made to reflect daily unrealized gains or losses which are recorded in the Statement of Operations. Futures contracts are valued daily at the last
38
sales price established by the Board of Trade or exchange upon which they are traded. When the contracts are closed, the fund recognizes a realized gain or loss. There is minimal counterparty credit risk to the fund with futures since futures are exchange traded, and the exchange’s clearinghouse guarantees the futures against default. Contracts open at December 31, 2011 are set forth in the Statement of Financial Futures.
Options: The fund purchases and writes (sells) put and call options to hedge against changes in interest rates and foreign currencies, or as a substitute for an investment. The fund is subject to interest rate risk and currency risk in the course of pursuing its investment objectives through its investments in options contracts. A call option gives the purchaser of the option the right (but not the obligation) to buy, and obligates the writer to sell, the underlying security or securities at the exercise price at any time during the option period, or at a specified date. Conversely, a put option gives the purchaser of the option the right (but not the obligation) to sell, and obligates the writer to buy the underlying security or securities at the exercise price at any time during the option period, or at a specified date.
As a writer of call options, the fund receives a premium at the outset and then bears the market risk of unfavorable changes in the price of the financial instrument underlying the option. Generally, the fund realizes a gain, to the extent of the premium, if the price of the underlying financial instrument decreases between the date the option is written and the date on which the option is terminated. Generally, the fund incurs a loss, if the price of the financial instrument increases between those dates.
As a writer of put options, the fund receives a premium at the outset and then bears the market risk of unfavorable changes in the price of the financial instrument underlying the option. Generally, the fund realizes a gain, to the extent of the premium, if the price of the underlying financial instrument increases between the date the option is written and the date on which the option is terminated. Generally, the fund incurs a loss, if the price of the financial instrument decreases between those dates.
| The Fund | 39 |
NOTES TO FINANCIAL STATEMENTS (continued)
As a writer of an option, the fund has no control over whether the underlying securities may be sold (call) or purchased (put) and as a result bears the market risk of an unfavorable change in the price of the security underlying the written option.There is a risk of loss from a change in value of such options which may exceed the related premiums received. One risk of holding a put or a call option is that if the option is not sold or exercised prior to its expiration, it becomes worthless. However, this risk is limited to the premium paid by the fund. Upon the expiration or closing of the option transaction, a gain or loss is reported in the Statement of Operations.
The following summarizes the fund’s call/put options written during the period ended December 31, 2011:
| Face Amount | Options Terminated | |||
| Covered by | Premiums | Net Realized | ||
| Options Written: | Contracts ($) | Received ($) | Cost ($) | Gain ($) |
| Contracts outstanding | ||||
| December 31, 2010 | 3,220,000 | 48,300 | ||
| Contracts terminated; | ||||
| Contracts expired | 3,220,000 | 48,300 | — | 48,300 |
| Contracts Outstanding | ||||
| December 31, 2011 | — | — | ||
Forward Foreign Currency Exchange Contracts: The fund enters into forward contracts in order to hedge its exposure to changes in foreign currency exchange rates on its foreign portfolio holdings, to settle foreign currency transactions or as a part of its investment strategy. When executing forward contracts, the fund is obligated to buy or sell a foreign currency at a specified rate on a certain date in the future. With respect to sales of forward contracts, the fund incurs a loss if the value of the contract increases between the date the forward contract is opened and the date the forward contract is closed.The fund realizes a gain if the value of the contract decreases between those dates. With respect to purchases of forward contracts, the fund incurs a loss if the value of the contract decreases between the date the forward contract is opened and the date the forward contract is closed.The fund realizes a gain if the value of the contract increases between those dates. Any realized gain or loss which occurred during the period is reflected in
40
the Statement of Operations.The fund is exposed to foreign currency risk as a result of changes in value of underlying financial instruments. The fund is also exposed to credit risk associated with counterparty nonperformance on these forward contracts, which is typically limited to the unrealized gain on each open contract.The following summarizes open forward contracts at December 31, 2011:
| Forward Foreign | |||||||||
| Currency | Number | Foreign | Unrealized | ||||||
| Exchange | of | Currency | Appreciation | ||||||
| Contracts | Contracts | Amounts | Cost ($) | Value ($) (Depreciation) ($) | |||||
| Purchases: | |||||||||
| British Pound, | |||||||||
| Expiring | |||||||||
| 1/3/2012a | 1 | 237,273 | 365,685 | 368,482 | 2,797 | ||||
| Canadian Dollar, | |||||||||
| Expiring | |||||||||
| 1/3/2012b | 1 | 215,896 | 210,809 | 211,923 | 1,114 | ||||
| Euro, | |||||||||
| Expiring | |||||||||
| 1/3/2012a | 1 | 1,417,850 | 1,828,459 | 1,835,048 | 6,589 | ||||
| Japanese Yen, | |||||||||
| Expiring | |||||||||
| 1/4/2012c | 1 | 25,110,615 | 322,842 | 326,239 | 3,397 | ||||
| Mexican New Peso, | |||||||||
| Expiring | |||||||||
| 1/31/2012d | 1 | 29,170,000 | 2,086,552 | 2,084,339 | (2,213 | ) | |||
| Sales: | Proceeds ($) | ||||||||
| Australian Dollar, | |||||||||
| Expiring | |||||||||
| 1/31/2012b | 1 | 1,770,000 | 1,746,105 | 1,803,222 | (57,117 | ) | |||
| Brazilian Real, | |||||||||
| Expiring | |||||||||
| 1/31/2012e | 1 | 1,935,000 | 1,022,673 | 1,029,001 | (6,328 | ) | |||
| British Pound, | |||||||||
| Expiring: | |||||||||
| 1/31/2012f | 2 | 1,380,000 | 2,132,561 | 2,142,485 | (9,924 | ) | |||
| 1/31/2012b | 1 | 580,000 | 896,042 | 900,465 | (4,423 | ) | |||
| 1/31/2012c | 1 | 830,000 | 1,279,748 | 1,288,596 | (8,848 | ) | |||
| 1/31/2012a | 2 | 750,000 | 1,157,156 | 1,164,394 | (7,238 | ) | |||
| 1/31/2012g | 1 | 3,070,000 | 4,746,803 | 4,766,252 | (19,449 | ) | |||
| Canadian Dollar, | |||||||||
| Expiring | |||||||||
| 1/31/2012b | 2 | 290,000 | 281,931 | 284,452 | (2,521 | ) | |||
| Chilean Peso, | |||||||||
| Expiring | |||||||||
| 1/31/2012h | 1 | 595,890,000 | 1,137,607 | 1,141,518 | (3,911 | ) | |||
| The Fund | 41 |
NOTES TO FINANCIAL STATEMENTS (continued)
| Forward Foreign | ||||||||
| Currency | Number | Foreign | Unrealized | |||||
| Exchange | of | Currency | Appreciation | |||||
| Contracts | Contracts | Amounts | Proceeds ($) | Value ($) (Depreciation) ($) | ||||
| Sales (continued): | ||||||||
| Euro, | ||||||||
| Expiring: | ||||||||
| 1/31/2012b | 1 | 4,510,000 | 5,861,196 | 5,838,374 | 22,822 | |||
| 1/31/2012c | 2 | 310,000 | 403,831 | 401,307 | 2,524 | |||
| 1/31/2012a | 2 | 1,560,000 | 2,012,842 | 2,019,482 | (6,640) | |||
| 1/31/2012g | 1 | 6,305,000 | 8,201,323 | 8,162,073 | 39,250 | |||
| 1/31/2012i | 1 | 5,605,000 | 7,290,255 | 7,255,895 | 34,360 | |||
| 1/31/2012j | 1 | 1,955,000 | 2,544,120 | 2,530,825 | 13,295 | |||
| Hungarian Forint, | ||||||||
| Expiring | ||||||||
| 1/31/2012i | 1 | 202,800,000 | 862,025 | 830,594 | 31,431 | |||
| Japanese Yen, | ||||||||
| Expiring: | ||||||||
| 1/31/2012f | 2 | 89,670,000 | 1,150,621 | 1,165,586 | (14,965) | |||
| 1/31/2012b | 1 | 290,315,000 | 3,723,801 | 3,773,691 | (49,890) | |||
| 1/31/2012c | 2 | 40,290,000 | 517,557 | 523,714 | (6,157) | |||
| 1/31/2012a | 1 | 102,735,000 | 1,317,453 | 1,335,412 | (17,959) | |||
| 1/31/2012 | 1 | 568,115,000 | 7,285,954 | 7,384,705 | (98,751) | |||
| 1/31/2012j | 1 | 385,680,000 | 4,948,993 | 5,013,304 | (64,311) | |||
| Norwegian Krone, | ||||||||
| Expiring | ||||||||
| 1/31/2012e | 1 | 840,000 | 140,067 | 140,290 | (223) | |||
| South African Rand, | ||||||||
| Expiring | ||||||||
| 1/31/2012b | 1 | 4,070,000 | 480,242 | 501,339 | (21,097) | |||
| Swedish Krona, | ||||||||
| Expiring: | ||||||||
| 1/31/2012a | 1 | 23,130,000 | 3,292,199 | 3,355,120 | (62,921) | |||
| 1/31/2012e | 2 | 11,500,000 | 1,641,777 | 1,668,132 | (26,355) | |||
| Swiss Franc, | ||||||||
| Expiring | ||||||||
| 1/31/2012e | 2 | 2,570,000 | 2,706,174 | 2,737,685 | (31,511) | |||
| Gross Unrealized | ||||||||
| Appreciation | 157,579 | |||||||
| Gross Unrealized | ||||||||
| Depreciation | (522,752) | |||||||
| Counterparties: | |
| a | Deutsche Bank |
| b | Credit Suisse First Boston |
| c | Commonwealth Bank of Australia |
| d | JPMorgan Chase & Co. |
| e | Morgan Stanley |
| f | Barclays Capital |
| g | Goldman Sachs |
| h | Merrill Lynch |
| i | Royal Bank of Scotland |
| j | UBS |
42
Swaps: The fund enters into swap agreements to exchange the interest rate on, or return generated by, one nominal instrument for the return generated by another nominal instrument.The fund enters into these agreements to hedge certain market or interest rate risks, to manage the interest rate sensitivity (sometimes called duration) of fixed income securities, to provide a substitute for purchasing or selling particular securities or to increase potential returns.
The fund accrues for the interim payments on swap contracts on a daily basis, with the net amount recorded within unrealized appreciation (depreciation) on swap contracts in the Statement of Assets and Liabilities. Once the interim payments are settled in cash, the net amount is recorded as realized gain (loss) on swaps, in addition to realized gain (loss) recorded upon the termination of swaps contracts in the Statement of Operations. Upfront payments made and/or received by the fund, are recorded as an asset and/or liability in the Statement of Assets and Liabilities and are recorded as a realized gain or loss ratably over the contract’s term/event with the exception of forward starting interest rate swaps which are recorded as realized gains or losses on the termination date. Fluctuations in the value of swap contracts are recorded for financial statement purposes as unrealized appreciation or depreciation on swap transactions.
Interest Rate Swaps: Interest rate swaps involve the exchange of commitments to pay and receive interest based on a notional principal amount.The fund enters into these agreements for a variety of reasons, including to hedge certain market or interest rate risks, to manage the interest rate sensitivity (sometimes called duration) of fixed income securities, to provide a substitute for purchasing or selling particular securities or to increase potential returns.The fund may elect to pay a fixed rate and receive a floating rate, or receive a fixed rate and pay a floating rate on a notional principal amount.The net interest received or paid on interest rate swap agreements is included within unrealized appreciation (depreciation) on swap contracts in the Statement of Assets and Liabilities. Interest rate swaps are valued daily and the
| The Fund | 43 |
NOTES TO FINANCIAL STATEMENTS (continued)
change, if any, is recorded as an unrealized gain or loss in the Statement of Operations. When a swap contract is terminated early, the fund records a realized gain or loss equal to the difference between the current realized value and the expected cash flows.
The fund’s maximum risk of loss from counterparty credit risk is the discounted net value of the cash flows to be received from the coun-terparty over the contract’s remaining life, to the extent that the amount is positive. This risk is mitigated by having a master netting arrangement between the fund and the counterparty and by the posting of collateral by the counterparty to the fund to cover the fund’s exposure to the counterparty.The following summarizes open interest rate swaps entered into by the fund at December 31, 2011:
| Unrealized | |||||||
| Notional | Reference | (Pay) Receive | Appreciation | ||||
| Amount ($) | Entity/Currency | Counterparty | Fixed Rate (%) Expiration (Depreciation) ($) | ||||
| 2,410,000 | USD—6 Month | ||||||
| Libor | Citibank | (3.68 | ) | 5/5/2020 | (361,752) | ||
| 3,100,000 | EUR—1 Yr | ||||||
| Libor | JP Morgan | 1.91 | 11/4/2016 | 39,327 | |||
| Gross Unrealized | |||||||
| Appreciation | 39,327 | ||||||
| Gross Unrealized | |||||||
| Depreciation | (361,752) | ||||||
Credit Default Swaps: Credit default swaps involve commitments to pay a fixed interest rate in exchange for payment if a credit event affecting a third party (the referenced company, obligation or index) occurs. Credit events may include a failure to pay interest or principal, bankruptcy, or restructuring.The fund enters into these agreements to manage its exposure to the market or certain sectors of the market, to reduce its risk exposure to defaults of corporate and sovereign issuers, or to create exposure to corporate or sovereign issuers to which it is not otherwise exposed. For those credit default swaps in which the fund is paying a fixed rate, the fund is buying credit protection on the instrument. In the event of a credit event, the fund would receive the full notional amount for the reference obligation. For those credit default swaps in which the fund is receiving a fixed rate, the fund is
44
selling credit protection on the underlying instrument.The maximum payouts for these contracts are limited to the notional amount of each swap. Credit default swaps may involve greater risks than if the fund had invested in the reference obligation directly and are subject to general market risk, liquidity risk, counterparty risk and credit risk.At December 31, 2011, there were no credit default swap agreements outstanding.
The following summarizes the average market value of derivatives outstanding during the period ended December 31, 2011:
| Average Market Value ($) | |
| Interest rate futures contracts | 32,910,926 |
| Interest rate options contracts | 9,689 |
| Foreign currency options contracts | 9,801 |
| Forward contracts | 83,028,779 |
The following summarizes the average notional value of swap contracts outstanding during the period ended December 31, 2011:
| Average Notional Value ($) | |
| Interest rate swap contracts | 15,645,504 |
| Credit default swap contracts | 1,977,692 |
At December 31, 2011, the cost of investments for federal income tax purposes was $89,899,121; accordingly, accumulated net unrealized appreciation on investments was $3,419,756, consisting of $5,357,308 gross unrealized appreciation and $1,937,552 gross unrealized depreciation.
NOTE 5—Other Matters:
At the October 27, 2011 Board meeting, the Board of the Trust elected Ms. Bovich as a Trustee of the Trust, subject to shareholder approval. A proxy statement was mailed on December 1, 2011 to shareholders of record as of the close of business on November 1, 2011, asking shareholders to consider Ms. Bovich’s election at a special meeting of shareholders held on Wednesday, February 8, 2012. At this meeting, Ms. Bovich was elected by the shareholders to serve as a Trustee of the Trust.
| The Fund | 45 |
| REPORT OF INDEPENDENT REGISTERED |
| PUBLIC ACCOUNTING FIRM |
The Board of Trustees and Shareholders of Dreyfus/Standish International Fixed Income Fund
We have audited the accompanying statement of assets and liabilities of Dreyfus/Standish International Fixed Income Fund (the“Fund”), a series of Dreyfus Investment Funds, including the statements of investments and financial futures as of December 31, 2011, the related statement of operations for the year then ended, and the statement of changes in net assets for each of the years in the two-year period then ended and financial highlights for each of the years in the three-year period then ended. These financial statements and financial highlights are the responsibility of the Fund’s management. Our responsibility is to express an opinion on these financial statements and financial highlights based on our audits. The financial highlights for each of the years in the two-year period ended December 31, 2008 were audited by other independent registered public accountants whose report thereon, dated February 27, 2009, expressed an unqualified opinion on those financial highlights.
We conducted our audits in accordance with the standards of the Public Company Accounting Oversight Board (United States).Those standards require that we plan and perform the audit to obtain reasonable assurance about whether the financial statements and financial highlights are free of material misstatement. An audit includes examining, on a test basis, evidence supporting the amounts and disclosures in the financial statements. Our procedures included confirmation of securities owned as of December 31, 2011, by correspondence with the custodian and brokers or by other appropriate auditing procedures where replies from brokers were not received.An audit also includes assessing the accounting principles used and significant estimates made by management, as well as evaluating the overall financial statement presentation.We believe that our audits provide a reasonable basis for our opinion.
In our opinion, the financial statements and financial highlights referred to above present fairly, in all material respects, the financial position of Dreyfus/Standish International Fixed Income Fund as of December 31, 2011, the results of its operations for the year then ended, and the changes in its net assets for each of the years in the two-year period then ended and financial highlights for each of the years in the three-year period then ended, in conformity with U.S. generally accepted accounting principles.

New York, New York
February 24, 2012
46
IMPORTANT TAX INFORMATION (Unaudited)
For federal tax purposes, the fund reports the maximum amount allowable but not less than 17.01% as interest-related dividends in accordance with Sections 871(k)(1) and 881(e) of the Internal Revenue Code. Also, the fund reports the maximum amount allowable but not less than $.0798 per share as a capital gain dividend paid on March 31, 2011 in accordance with Section 852(b)(3)(C) of the Internal Revenue Code.
| The Fund | 47 |
BOARD MEMBERS INFORMATION (Unaudited)
| Joseph S. DiMartino (68) |
| Chairman of the Board (2008) |
| Principal Occupation During Past 5Years: |
| • Corporate Director and Trustee |
| Other Public Company Board Memberships During Past 5Years: |
| • CBIZ (formerly, Century Business Services, Inc.), a provider of outsourcing functions for small |
| and medium size companies, Director (1997-present) |
| • Sunair Services Corporation, a provider of certain outdoor-related services to homes and |
| businesses, Director (2005-2009) |
| • The Newark Group, a provider of a national market of paper recovery facilities, paperboard |
| mills and paperboard converting plants, Director (2000-2010) |
| No. of Portfolios for which Board Member Serves: 164 |
| ——————— |
| Francine J. Bovich (60)† |
| Board Member (2011) |
| Principal Occupation During Past 5Years: |
| • Trustee,The Bradley Trusts, private trust funds (2011-Present) |
| • Managing Director, Morgan Stanley Investment Management (1993-2010) |
| No. of Portfolios for which Board Member Serves: 13 |
| ——————— |
| James M. Fitzgibbons (77) |
| Board Member (2008) |
| Principal Occupation During Past 5Years: |
| • Corporate Director and Trustee |
| Other Public Company Board Memberships During Past 5Years: |
| • Bill Barrett Corporation, an oil and natural gas exploration company, Director (2004-present) |
| No. of Portfolios for which Board Member Serves: 31 |
| ——————— |
| Kenneth A. Himmel (65) |
| Board Member (2008) |
| Principal Occupation During Past 5Years: |
| • President and CEO, Related Urban Development, a real estate development company (1996-present) |
| • President and CEO, Himmel & Company, a real estate development company (1980-present) |
| • CEO,American Food Management, a restaurant company (1983-present) |
| No. of Portfolios for which Board Member Serves: 31 |
48
| Stephen J. Lockwood (64) |
| Board Member (2008) |
| Principal Occupation During Past 5Years: |
| • Chairman of the Board, Stephen J. Lockwood and Company LLC, a real estate investment |
| company (2000-present) |
| No. of Portfolios for which Board Member Serves: 31 |
| ——————— |
| Roslyn M. Watson (62) |
| Board Member (2008) |
| Principal Occupation During Past 5Years: |
| • Principal,Watson Ventures, Inc., a real estate investment company (1993-present) |
| No. of Portfolios for which Board Member Serves: 41 |
| ——————— |
| Benaree Pratt Wiley (65) |
| Board Member (2008) |
| Principal Occupation During Past 5Years: |
| • Principal,TheWiley Group, a firm specializing in strategy and business development (2005-present) |
| Other Public Company Board Memberships During Past 5Years: |
| • CBIZ (formerly, Century Business Services, Inc.), a provider of outsourcing functions for small |
| and medium size companies, Director (2008-present) |
| No. of Portfolios for which Board Member Serves: 66 |
| ——————— |
† Ms. Bovich was elected as a Trustee of the Trust, effective October 27, 2011. See Note 5.
Once elected all Board Members serve for an indefinite term, but achieve Emeritus status upon reaching age 80.The address of the Board Members and Officers is in c/o The Dreyfus Corporation, 200 Park Avenue, NewYork, NewYork 10166.Additional information about the Board Members is available in the fund’s Statement of Additional Information which can be obtained from Dreyfus free of charge by calling this toll free number: 1-800-DREYFUS.
| The Fund | 49 |
OFFICERS OF THE FUND (Unaudited)
BRADLEY J. SKAPYAK, President since January 2010.
Chief Operating Officer and a director of the Manager since June 2009. From April 2003 to June 2009, Mr. Skapyak was the head of the Investment Accounting and Support Department of the Manager. He is an officer of 75 investment companies (comprised of 163 portfolios) managed by the Manager. He is 53 years old and has been an employee of the Manager since February 1988.
JANETTE E. FARRAGHER, Vice President and Secretary since December 2011.
Assistant General Counsel of BNY Mellon, and an officer of 76 investment companies (comprised of 189 portfolios) managed by the Manager. She is 49 years old and has been an employee of the Manager since February 1984.
KIESHA ASTWOOD, Vice President and Assistant Secretary since January 2010.
Counsel of BNY Mellon, and an officer of 76 investment companies (comprised of 189 portfolios) managed by the Manager. She is 38 years old and has been an employee of the Manager since July 1995.
JAMES BITETTO, Vice President and Assistant Secretary since December 2008.
Senior Counsel of BNY Mellon and Secretary of the Manager, and an officer of 76 investment companies (comprised of 189 portfolios) managed by the Manager. He is 45 years old and has been an employee of the Manager since December 1996.
JONI LACKS CHARATAN, Vice President and Assistant Secretary since December 2008.
Senior Counsel of BNY Mellon, and an officer of 76 investment companies (comprised of 189 portfolios) managed by the Manager. She is 56 years old and has been an employee of the Manager since October 1988.
JOSEPH M. CHIOFFI, Vice President and Assistant Secretary since December 2008.
Senior Counsel of BNY Mellon, and an officer of 76 investment companies (comprised of 189 portfolios) managed by the Manager. He is 50 years old and has been an employee of the Manager since June 2000.
KATHLEEN DENICHOLAS, Vice President and Assistant Secretary since January 2010.
Managing Counsel of BNY Mellon, and an officer of 76 investment companies (comprised of 189 portfolios) managed by the Manager. She is 37 years old and has been an employee of the Manager since February 2001.
JOHN B. HAMMALIAN, Vice President and Assistant Secretary since December 2008.
Senior Managing Counsel of BNY Mellon, and an officer of 76 investment companies (comprised of 189 portfolios) managed by the Manager. He is 48 years old and has been an employee of the Manager since February 1991.
M. CRISTINA MEISER, Vice President and Assistant Secretary since January 2010.
Senior Counsel of BNY Mellon, and an officer of 76 investment companies (comprised of 189 portfolios) managed by the Manager. She is 41 years old and has been an employee of the Manager since August 2001.
ROBERT R. MULLERY, Vice President and Assistant Secretary since December 2008.
Managing Counsel of BNY Mellon, and an officer of 76 investment companies (comprised of 189 portfolios) managed by the Manager. He is 59 years old and has been an employee of the Manager since May 1986.
50
JEFF PRUSNOFSKY, Vice President and Assistant Secretary since December 2008.
Senior Managing Counsel of BNY Mellon, and an officer of 76 investment companies (comprised of 189 portfolios) managed by the Manager. He is 46 years old and has been an employee of the Manager since October 1990.
JAMES WINDELS, Treasurer since December 2008.
Director – Mutual Fund Accounting of the Manager, and an officer of 76 investment companies (comprised of 189 portfolios) managed by the Manager. He is 53 years old and has been an employee of the Manager since April 1985.
RICHARD CASSARO, Assistant Treasurer since December 2008.
Senior Accounting Manager – Money Market and Municipal Bond Funds of the Manager, and an officer of 76 investment companies (comprised of 189 portfolios) managed by the Manager. He is 52 years old and has been an employee of the Manager since September 1982.
GAVIN C. REILLY, Assistant Treasurer since December 2008.
Tax Manager of the Investment Accounting and Support Department of the Manager, and an officer of 76 investment companies (comprised of 189 portfolios) managed by the Manager. He is 43 years old and has been an employee of the Manager since April 1991.
ROBERT S. ROBOL, Assistant Treasurer since December 2008.
Senior Accounting Manager – Fixed Income Funds of the Manager, and an officer of 76 investment companies (comprised of 189 portfolios) managed by the Manager. He is 47 years old and has been an employee of the Manager since October 1988.
ROBERT SALVIOLO, Assistant Treasurer since December 2008.
Senior Accounting Manager – Equity Funds of the Manager, and an officer of 76 investment companies (comprised of 189 portfolios) managed by the Manager. He is 44 years old and has been an employee of the Manager since June 1989.
ROBERT SVAGNA, Assistant Treasurer since December 2008.
Senior Accounting Manager – Equity Funds of the Manager, and an officer of 76 investment companies (comprised of 189 portfolios) managed by the Manager. He is 44 years old and has been an employee of the Manager since November 1990.
JOSEPH W. CONNOLLY, Chief Compliance Officer since December 2008.
Chief Compliance Officer of the Manager and The Dreyfus Family of Funds (76 investment companies, comprised of 189 portfolios). From November 2001 through March 2004, Mr. Connolly was first Vice-President, Mutual Fund Servicing for Mellon Global Securities Services. In that capacity, Mr. Connolly was responsible for managing Mellon’s Custody, Fund Accounting and Fund Administration services to third-party mutual fund clients. He is 54 years old and has served in various capacities with the Manager since 1980, including manager of the firm’s Fund Accounting Department from 1997 through October 2001.
STEPHEN J. STOREN, Anti-Money Laundering Compliance Officer since May 2011.
Chief Compliance Officer of the Distributor, and the Anti-Money Laundering Compliance Officer of 72 investment companies (comprised of 185 portfolios) managed by the Manager. He is 57 years old and has been an employee of the Distributor since October 1999.
| The Fund | 51 |
NOTES
For More Information
| Telephone Call your Financial Representative or 1-800-DREYFUS |
| Mail The Dreyfus Family of Funds, 144 Glenn Curtiss Boulevard, Uniondale, NY 11556-0144 |
| E-mail Send your request to info@dreyfus.com |
| Internet Information can be viewed online or downloaded at: http://www.dreyfus.com |
The fund files its complete schedule of portfolio holdings with the Securities and Exchange Commission (“SEC”) for the first and third quarters of each fiscal year on Form N-Q. The fund’s Forms N-Q are available on the SEC’s website at http://www.sec.gov and may be reviewed and copied at the SEC’s Public Reference Room in Washington, DC. Information on the operation of the Public Reference Room may be obtained by calling 1-800-SEC-0330.
A description of the policies and procedures that the fund uses to determine how to vote proxies relating to portfolio securities, and information regarding how the fund voted these proxies for the most recent 12-month period ended June 30 is available at http://www.dreyfus.com and on the SEC’s website at http://www.sec.gov. The description of the policies and procedures is also available without charge, upon request, by calling 1-800-DREYFUS.

Item 2. Code of Ethics.
The Registrant has adopted a code of ethics that applies to the Registrant's principal executive officer, principal financial officer, principal accounting officer or controller, or persons performing similar functions. There have been no amendments to, or waivers in connection with, the Code of Ethics during the period covered by this Report.
Item 3. Audit Committee Financial Expert.
The Registrant's Board has determined that Joseph S. DiMartino, a member of the Audit Committee of the Board, is an audit committee financial expert as defined by the Securities and Exchange Commission (the "SEC"). Joseph S. DiMartino is "independent" as defined by the SEC for purposes of audit committee financial expert determinations.
Item 4. Principal Accountant Fees and Services.
(a) Audit Fees. The aggregate fees billed for each of the last two fiscal years (the "Reporting Periods") for professional services rendered by the Registrant's principal accountant (the "Auditor") for the audit of the Registrant's annual financial statements or services that are normally provided by the Auditor in connection with the statutory and regulatory filings or engagements for the Reporting Periods, were $101,100 in 2010 and $103,210 in 2011.
(b) Audit-Related Fees. The aggregate fees billed in the Reporting Periods for assurance and related services by the Auditor that are reasonably related to the performance of the audit of the Registrant's financial statements and are not reported under paragraph (a) of this Item 4 were $12,900 in 2010 and $13,170 in 2011. These services consisted of one or more of the following: (i) agreed upon procedures related to compliance with Internal Revenue Code section 817(h), (ii) security counts required by Rule 17f-2 under the Investment Company Act of 1940, as amended, (iii) advisory services as to the accounting or disclosure treatment of Registrant transactions or events and (iv) advisory services to the accounting or disclosure treatment of the actual or potential impact to the Registrant of final or proposed rules, standards or interpretations by the Securities and Exchange Commission, the Financial Accounting Standards Boards or other regulatory or standard-setting bodies.
The aggregate fees billed in the Reporting Periods for non-audit assurance and related services by the Auditor to the Registrant's investment adviser (not including any sub-investment adviser whose role is primarily portfolio management and is subcontracted with or overseen by another investment adviser), and any entity controlling, controlled by or under common control with the investment adviser that provides ongoing services to the Registrant ("Service Affiliates"), that were reasonably related to the performance of the annual audit of the Service Affiliate, which required pre-approval by the Audit Committee were $0 in 2010 and $0 in 2011.
(c) Tax Fees. The aggregate fees billed in the Reporting Periods for professional services rendered by the Auditor for tax compliance, tax advice, and tax planning ("Tax Services") were $7,500 in 2010 and $7,650 in 2011. These services consisted of review or preparation of U.S. federal, state, local and excise tax returns. The aggregate fees billed in the Reporting Periods for Tax Services by the Auditor to Service Affiliates, which required pre-approval by the Audit Committee were $0 in 2010 and $0 in 2011.
(d) All Other Fees. The aggregate fees billed in the Reporting Periods for products and services provided by the Auditor, other than the services reported in paragraphs (a) through (c) of this Item, were $0 in 2010 and $0 in 2011.
The aggregate fees billed in the Reporting Periods for Non-Audit Services by the Auditor to Service Affiliates, other than the services reported in paragraphs (b) through (c) of this Item, which required pre-approval by the Audit Committee, were $0 in 2010 and $0 in 2011.
(e)(1) Audit Committee Pre-Approval Policies and Procedures. The Registrant's Audit Committee has established policies and procedures (the "Policy") for pre-approval (within specified fee limits) of the Auditor's engagements for non-audit services to the Registrant and Service Affiliates without specific case-by-case consideration. The pre-approved services in the Policy can include pre-approved audit services, pre-approved audit-related services, pre-approved tax services and pre-approved all other services. Pre-approval considerations include whether the proposed services are compatible with maintaining the Auditor's independence. Pre-approvals pursuant to the Policy are considered annually.
(e)(2) Note: None of the services described in paragraphs (b) through (d) of this Item 4 were approved by the Audit Committee pursuant to paragraph (c)(7)(i)(C) of Rule 2-01 of Regulation S-X.
(f) None of the hours expended on the principal accountant's engagement to audit the registrant's financial statements for the most recent fiscal year were attributed to work performed by persons other than the principal account's full-time, permanent employees.
Non-Audit Fees. The aggregate non-audit fees billed by the Auditor for services rendered to the Registrant, and rendered to Service Affiliates, for the Reporting Periods were $3,693,000 in 2010 and $12,255,249 in 2011.
Auditor Independence. The Registrant's Audit Committee has considered whether the provision of non-audit services that were rendered to Service Affiliates, which were not pre-approved (not requiring pre-approval), is compatible with maintaining the Auditor's independence.
Item 5. Audit Committee of Listed Registrants.
Not applicable. [CLOSED-END FUNDS ONLY]
Item 6. Investments.
(a) Not applicable.
Item 7. Disclosure of Proxy Voting Policies and Procedures for Closed-End Management Investment Companies.
Not applicable. [CLOSED-END FUNDS ONLY]
Item 8. Portfolio Managers of Closed-End Management Investment Companies.
Not applicable. [CLOSED-END FUNDS ONLY, beginning with reports for periods ended on and after December 31, 2005]
Item 9. Purchases of Equity Securities by Closed-End Management Investment Companies and Affiliated Purchasers.
Not applicable. [CLOSED-END FUNDS ONLY]
Item 10. Submission of Matters to a Vote of Security Holders.
There have been no material changes to the procedures applicable to Item 10.
Item 11. Controls and Procedures.
(a) The Registrant's principal executive and principal financial officers have concluded, based on their evaluation of the Registrant's disclosure controls and procedures as of a date within 90 days of the filing date of this report, that the Registrant's disclosure controls and procedures are reasonably designed to ensure that information required to be disclosed by the Registrant on Form N-CSR is recorded, processed, summarized and reported within the required time periods and that information required to be disclosed by the Registrant in the reports that it files or submits on Form N-CSR is accumulated and communicated to the Registrant's management, including its principal executive and principal financial officers, as appropriate to allow timely decisions regarding required disclosure.
(b) There were no changes to the Registrant's internal control over financial reporting that occurred during the second fiscal quarter of the period covered by this report that have materially affected, or are reasonably likely to materially affect, the Registrant's internal control over financial reporting.
Item 12. Exhibits.
(a)(1) Code of ethics referred to in Item 2.
(a)(2) Certifications of principal executive and principal financial officers as required by Rule 30a-2(a) under the Investment Company Act of 1940.
(a)(3) Not applicable.
(b) Certification of principal executive and principal financial officers as required by Rule 30a-2(b) under the Investment Company Act of 1940.
SIGNATURES
Pursuant to the requirements of the Securities Exchange Act of 1934 and the Investment Company Act of 1940, the Registrant has duly caused this Report to be signed on its behalf by the undersigned, thereunto duly authorized.
Dreyfus Investment Funds
By: /s/Bradley J. Skapyak | |
Bradley J. Skapyak, President
| |
Date: | February 23, 2012 |
| |
Pursuant to the requirements of the Securities Exchange Act of 1934 and the Investment Company Act of 1940, this Report has been signed below by the following persons on behalf of the Registrant and in the capacities and on the dates indicated. | |
| |
By: /s/Bradley J. Skapyak | |
Bradley J. Skapyak, President
| |
Date: | February 23, 2012 |
| |
By: /s/ James Windels | |
James Windels, Treasurer
| |
Date: | February 23, 2012 |
| |
EXHIBIT INDEX
(a)(1) Code of ethics referred to in Item 2.
(a)(2) Certifications of principal executive and principal financial officers as required by Rule 30a-2(a) under the Investment Company Act of 1940. (EX-99.CERT)
(b) Certification of principal executive and principal financial officers as required by Rule 30a-2(b) under the Investment Company Act of 1940. (EX-99.906CERT)