UNITED STATES
SECURITIES AND EXCHANGE COMMISSION
Washington, D.C. 20549
FORM N-CSR
CERTIFIED SHAREHOLDER REPORT OF REGISTERED MANAGEMENT
INVESTMENT COMPANIES
Investment Company Act file number | 811- 04813 | |||||
|
| |||||
| Dreyfus Investment Funds |
| ||||
| (Exact name of Registrant as specified in charter) |
| ||||
|
|
| ||||
|
c/o The Dreyfus Corporation 200 Park Avenue New York, New York 10166 |
| ||||
| (Address of principal executive offices) (Zip code) |
| ||||
|
|
| ||||
| Michael A. Rosenberg, Esq. 200 Park Avenue New York, New York 10166 |
| ||||
| (Name and address of agent for service) |
| ||||
| ||||||
Registrant's telephone number, including area code: | (212) 922-6000 | |||||
|
| |||||
Date of fiscal year end:
| 9/30 |
| ||||
Date of reporting period: | 9/30/11 |
| ||||
The following N-CSR relates only to the Registrant’s series listed below and does not affect the other series of the Registrant, which have a different fiscal year end and, therefore, different N-CSR reporting requirements. Separate N-CSR Forms will be filed for those series, as appropriate.
Dreyfus/The Boston Company Emerging Markets Core Equity Fund
Dreyfus/The Boston Company Large Cap Core Fund
Dreyfus/The Boston Company Small Cap Growth Fund
Dreyfus/The Boston Company Small Cap Tax-Sensitive Equity Fund
Dreyfus/The Boston Company Small Cap Value Fund
Dreyfus/The Boston Company Small/Mid Growth Fund
Dreyfus/Standish Intermediate Tax Exempt Bond Fund
Dreyfus/Newton International Equity Fund
| Dreyfus/The Boston |
| Company Emerging |
| Markets Core Equity Fund |
ANNUAL REPORT September 30, 2011
Save time. Save paper. View your next shareholder report online as soon as it’s available. Log into www.dreyfus.com and sign up for Dreyfus eCommunications. It’s simple and only takes a few minutes.
The views expressed in this report reflect those of the portfolio manager only through the end of the period covered and do not necessarily represent the views of Dreyfus or any other person in the Dreyfus organization. Any such views are subject to change at any time based upon market or other conditions and Dreyfus disclaims any responsibility to update such views.These views may not be relied on as investment advice and, because investment decisions for a Dreyfus fund are based on numerous factors, may not be relied on as an indication of trading intent on behalf of any Dreyfus fund.
Not FDIC-Insured • Not Bank-Guaranteed • May Lose Value
Contents | |
THE FUND | |
| 2 | A Letter from the Chairman and CEO |
| 3 | Discussion of Fund Performance |
| 6 | Fund Performance |
| 8 | Understanding Your Fund’s Expenses |
| 8 | Comparing Your Fund’s Expenses With Those of Other Funds |
| 9 | Statement of Investments |
| 14 | Statement of Assets and Liabilities |
| 15 | Statement of Operations |
| 16 | Statement of Changes in Net Assets |
| 18 | Financial Highlights |
| 21 | Notes to Financial Statements |
| 36 | Report of Independent Registered Public Accounting Firm |
| 37 | Important Tax Information |
| 38 | Board Members Information |
| 40 | Officers of the Fund |
FOR MORE INFORMATION | |
Back Cover |
Dreyfus/The Boston
Company Emerging
Markets Core Equity Fund
The Fund

A LETTER FROM THE CHAIRMAN AND CEO
Dear Shareholder:
This annual report for Dreyfus/The Boston Company Emerging Markets Core Equity Fund covers the 12-month period from October 1, 2010, through September 30, 2011. For information about how the fund performed during the reporting period, as well as general market perspectives, we provide a Discussion of Fund Performance on the pages that follow.
Although stocks in some markets rallied strongly over the first half of the reporting period amid expectations of a more robust economic recovery, investor sentiment deteriorated sharply during the second half due to disappointing economic data, rising commodity prices, an escalating sovereign debt crisis in Europe and a contentious debate regarding taxes, spending and borrowing in the United States. Market volatility was particularly severe during August and September after a major credit rating agency downgraded U.S. long-term debt. Stocks proved sensitive to macroeconomic concerns in this challenging environment, often regardless of more promising company fundamentals, and most international equity market indices ended the reporting period with negative absolute returns.
The economic outlook currently is clouded by market turbulence and political infighting, but we believe that a continued subpar global expansion is more likely than a return to recession. Inflationary pressures appear to be waning in most countries as energy prices recently have retreated from their highs. In the United States, the Federal Reserve Board has signaled its intention to maintain an aggressively accommodative monetary policy, which may help offset the financial stresses caused by deleveraging in the private sector and fiscal consolidation by governments in the United States and Europe. To assess the potential impact of these and other developments on your investments, we encourage you, as always, to speak with your financial advisor.
Thank you for your continued confidence and support.

Jonathan R. Baum
Chairman and Chief Executive Officer
The Dreyfus Corporation
October 17, 2011
2

DISCUSSION OF FUND PERFORMANCE
For the period of October 1, 2010, through September 30, 2011, as provided by Sean P. Fitzgibbon and Jay Malikowski, Portfolio Managers
Fund and Market Performance Overview
For the 12-month period ended September 30, 2011, Dreyfus/The Boston Company Emerging Markets Core Equity Fund’s Class A shares produced a total return of –18.77%, Class C shares returned –19.43% and Class I shares returned –18.27%.1 In comparison, the fund’s benchmark, the Morgan Stanley Capital International Emerging Markets Index (the “MSCI EM Index”), produced a total return of –16.15% for the same period.2 Stocks in the emerging markets encountered heightened volatility throughout the reporting period, but turbulence was especially severe over the summer of 2011, more than erasing previous gains.The fund produced lower returns than its benchmark, mainly due to shortfalls in the consumer staples and basic materials sectors.
The Fund’s Investment Approach
The fund seeks long-term growth of capital. To pursue this goal, the fund normally invests at least 80% of its assets in equity securities of companies that are located in foreign countries represented in the MSCI EM Index. The fund may invest up to 20% of its net assets in fixed income securities and may invest in preferred stocks of any credit quality if common stocks of the relevant company are not available.The fund employs a “bottom-up” investment approach, which emphasizes individual stock selection.
Economic Developments Challenged Emerging Markets
Emerging stock markets proved volatile over the reporting period as country-specific issues and global macroeconomic developments fueled dramatic shifts in investor sentiment. During the fourth quarter of 2010, emerging markets stocks were dampened by corporate governance scandals in India and inflation fears in China, offsetting the benefits of encouraging economic data in other parts of the world.These worries ebbed over the opening months of 2011, when investors turned away from sluggish developed markets and toward faster-growing economies in the wake of political uprisings in the Middle East and natural and nuclear disasters in Japan.
| The Fund | 3 |
DISCUSSION OF FUND PERFORMANCE (continued)
Strong corporate earnings in the second quarter of 2011 helped support stock prices, particularly among companies reporting better-than-expected financial results. However, during the third quarter of the year, the resurgence of a sovereign debt crisis in Europe and an intensifying debate about government spending and borrowing in the United States sparked a renewed flight to quality in which investors fled riskier assets, including emerging markets equities.The potentially dampening impact of inflation-fighting measures in China also spooked investors at the time, and the MSCI EM Index finished the reporting period in solidly negative territory despite continued economic growth in many parts of Asia and Latin America.
Stock Selections Produced Mixed Results vs. the Benchmark
Companies that met near-term expectations tended to hold up well in this environment, but those that fell short were punished, often regardless of attractive valuations and longer-term fundamental strengths. For example, food producers in the consumer staples sector were hurt by higher input costs, adversely affecting China Agri-Industries Holdings and Shree Renuka Sugars. In the basic materials sector, ChinaVanadium Titano-Magnetite Mining suffered due to weakening commodity prices over the reporting period’s second half, and Indian pipeline builder Welspun encountered delays in a number of energy-related projects. From a country perspective, Indian budget airline SpiceJet declined amid higher fuel prices and competitive pressures, and our stock selections in Russia disappointed due to a sharp decline posted by Sberbank of Russia.
The fund achieved better results in South Korea, where strong stock selections included auto parts maker Hyundai Mobis, which benefited from a global expansion and market-share gains. Stocks in Taiwan also fared relatively well due to a heavy concentration of information technology companies in the forefront of new trends. For example, HTC Corp. prospered due to its position as a leading supplier of smartphones using the Android operating system. In India, technology services outsourcer Hexaware Technologies gained value as it captured market share and boosted earnings. The financials sector also was a relatively bright spot for the fund, as we effectively managed the risks associated with floundering lenders in China. Instead, we favored countries such as South Africa, where Nedbank Group and FirstRand benefited from a well-capitalized banking system.
4
Emerging Markets May Be Poised to Rally
Although we expect macroeconomic pressures to continue to dampen global growth and threaten corporate earnings over the near term, the emerging markets may be poised for longer-term gains. Inflationary pressures seem to be receding, and equity valuations have declined to reflect current headwinds, potentially setting the stage for a sustained rally. Our bottom-up investment process has identified a number of particularly attractive prospects in the telecommunications services sector, where high dividend yields and stable earnings may help attract investors’ attention.We have found fewer stocks meeting our criteria in the materials sector, where commodity prices could decline further, and in the financials sector, where Chinese banks remain under pressure.
October 17, 2011
| Please note, the position in any security highlighted with italicized typeface was sold during the | |
| reporting period. | |
| Equity funds are subject generally to market, market sector, market liquidity, issuer and investment | |
| style risks, among other factors, to varying degrees, all of which are more fully described in the | |
| fund’s prospectus. | |
| The fund’s performance will be influenced by political, social and economic factors affecting | |
| investments in foreign companies. These special risks include exposure to currency fluctuations, | |
| less liquidity, less developed or less efficient trading markets, lack of comprehensive company | |
| information, political instability and differing auditing and legal standards. Investments in | |
| foreign currencies are subject to the risk that those currencies will decline in value relative to the | |
| U. S. dollar, or, in the case of hedged positions, that the U. S. dollar will decline relative to the | |
| currency being hedged. | |
| Emerging markets tend to be more volatile than the markets of more mature economies, and | |
| generally have less diverse and less mature economic structures and less stable political systems | |
| than those of developed countries. | |
| 1 | Total return includes reinvestment of dividends and any capital gains paid, and does not take into |
| consideration the maximum initial sales charge in the case of Class A shares, or the applicable | |
| contingent deferred sales charges imposed on redemptions in the case of Class C shares. Had these | |
| charges been reflected, returns would have been lower. Past performance is no guarantee of future | |
| results. Share price and investment return fluctuate such that upon redemption, fund shares may be | |
| worth more or less than their original cost.The fund’s returns reflect the absorption of certain fund | |
| expenses by The Dreyfus Corporation pursuant to an agreement in effect through February 1, | |
| 2012, at which time it may be extended, terminated or modified. Had these expenses not been | |
| absorbed, the fund’s returns would have been lower. | |
| 2 | SOURCE: LIPPER INC. – Reflects reinvestment of net dividends and, where applicable, |
| capital gain distributions.The Morgan Stanley Capital International Emerging Markets Index is | |
| a free float-adjusted market capitalization weighted index that is designed to measure the equity | |
| performance in global emerging markets.The index consists of select designated MSCI emerging | |
| market national indices. MSCI Indices reflect investable opportunities for global investors by | |
| taking into account local market restrictions on share ownership by foreigners. Investors cannot | |
| invest directly in any index. |
| The Fund | 5 |
FUND PERFORMANCE
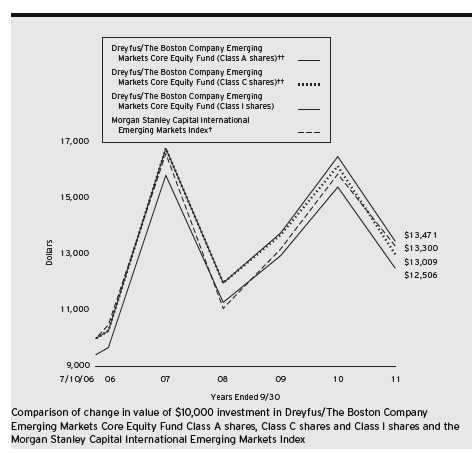
| † | Source: Lipper Inc. |
| †† | The total return figures presented for Class A shares and Class C shares of the fund reflect the performance of the |
| fund’s Class I shares for the period prior to March 31, 2009 (the inception date for Class A shares and Class C | |
| shares respectively), adjusted to reflect the applicable sales load for each share class. | |
| Past performance is not predictive of future performance. | |
| The above graph compares a $10,000 investment made in each of the Class A, Class C and Class I shares of | |
| Dreyfus/The Boston Company Emerging Markets Core Equity Fund on 7/10/06 (inception date) to a $10,000 | |
| investment made in the Morgan Stanley Capital International Emerging Markets Index (the “Index”) on that date.All | |
| dividends and capital gain distributions are reinvested. For comparative purposes, the value of the Index on 6/30/06 is | |
| used as the beginning value on 7/10/06. | |
| The fund’s performance shown in the line graph above takes into account the maximum initial sales charge on Class A | |
| shares and all other applicable fees and expenses on all classes. The Index is a free float-adjusted market capitalization | |
| weighted index that is designed to measure the equity performance in global emerging markets. Unlike a mutual fund, | |
| the Index is not subject to charges, fees and other expenses. Investors cannot invest directly in any index. These factors | |
| can contribute to the Index potentially outperforming the fund. Further information relating to fund performance, | |
| including expense reimbursements, if applicable, is contained in the Financial Highlights section of the prospectus and | |
| elsewhere in this report. | |
6
| Average Annual Total Returns as of 9/30/11 | |||||||
| Inception | From | ||||||
| Date | 1Year | 5 Years | Inception | ||||
| Class A shares | |||||||
| with maximum sales charge (5.75%) | 3/31/09 | –23.45% | 4.01%†† | 4.38%†† | |||
| without sales charge | 3/31/09 | –18.77% | 5.25%†† | 5.57%†† | |||
| Class C shares | |||||||
| with applicable redemption charge † | 3/31/09 | –20.24% | 4.83%†† | 5.17%†† | |||
| without redemption | 3/31/09 | –19.43% | 4.83%†† | 5.17%†† | |||
| Class I shares | 7/10/06 | –18.27% | 5.57% | 5.87% | |||
| Morgan Stanley Capital International | |||||||
| Emerging Markets Index | 6/30/06 | –16.15% | 4.87% | 5.58%††† | |||
Past performance is not predictive of future performance.The fund’s performance shown in the graph and table does not reflect the deduction of taxes that a shareholder would pay on fund distributions or the redemption of fund shares.
| † | The maximum contingent deferred sales charge for Class C shares is 1% for shares redeemed within one year of the |
| date of purchase. | |
| †† | The total return performance figures presented for Class A and Class C shares of the fund reflect the performance of |
| the fund’s Class I shares for the period prior to March 31, 2009 (the inception date for Class A and Class C shares | |
| respectively), adjusted to reflect the applicable sales load for each share class. | |
| ††† The Index date is based on the life of Class I shares. For comparative purposes, the value of the Index as of the | |
| month end 6/30/06 is used as the beginning value on 7/10/06 (the inception date for Class I shares). | |
| The Fund | 7 |
UNDERSTANDING YOUR FUND’S EXPENSES (Unaudited)
As a mutual fund investor, you pay ongoing expenses, such as management fees and other expenses. Using the information below, you can estimate how these expenses affect your investment and compare them with the expenses of other funds.You also may pay one-time transaction expenses, including sales charges (loads) and redemption fees, which are not shown in this section and would have resulted in higher total expenses. For more information, see your fund’s prospectus or talk to your financial adviser.
Review your fund’s expenses
The table below shows the expenses you would have paid on a $1,000 investment in Dreyfus/The Boston Company Emerging Markets Core Equity Fund from April 1, 2011 to September 30, 2011. It also shows how much a $1,000 investment would be worth at the close of the period, assuming actual returns and expenses.
Expenses and Value of a $1,000 Investment
assuming actual returns for the six months ended September 30, 2011
| Class A | Class C | Class I | ||||
| Expenses paid per $1,000† | $ | 9.82 | $ | 13.07 | $ | 6.55 |
| Ending value (after expenses) | $ | 740.50 | $ | 737.90 | $ | 743.10 |
COMPARING YOUR FUND’S EXPENSES
WITH THOSE OF OTHER FUNDS (Unaudited)
Using the SEC’s method to compare expenses
The Securities and Exchange Commission (SEC) has established guidelines to help investors assess fund expenses. Per these guidelines, the table below shows your fund’s expenses based on a $1,000 investment, assuming a hypothetical 5% annualized return. You can use this information to compare the ongoing expenses (but not transaction expenses or total cost) of investing in the fund with those of other funds.All mutual fund shareholder reports will provide this information to help you make this comparison. Please note that you cannot use this information to estimate your actual ending account balance and expenses paid during the period.
Expenses and Value of a $1,000 Investment
assuming a hypothetical 5% annualized return for the six months ended September 30, 2011
| Class A | Class C | Class I | ||||
| Expenses paid per $1,000† | $ | 11.36 | $ | 15.12 | $ | 7.59 |
| Ending value (after expenses) | $ | 1,013.79 | $ | 1,010.03 | $ | 1,017.55 |
| † Expenses are equal to the fund’s annualized expense ratio of 2.25% for Class A, 3.00% for Class C and 1.50% |
| for Class I, multiplied by the average account value over the period, multiplied by 183/365 (to reflect the one-half |
| year period). |
8
STATEMENT OF INVESTMENTS
September 30, 2011
| Common Stocks—89.3% | Shares | Value ($) | |
| Brazil—6.6% | |||
| Cia de Bebidas das Americas, ADR | 1,720 | 52,718 | |
| Embraer, ADR | 2,500 | 63,425 | |
| Fleury | 7,500 | 89,509 | |
| Obrascon Huarte Lain Brasil | 2,800 | 89,946 | |
| Rossi Residencial | 16,700 | 77,982 | |
| Tim Participacoes | 17,661 | 81,718 | |
| Tim Participacoes, ADR | 1,021 | 24,055 | |
| Vale, ADR | 3,470 | 79,116 | |
| 558,469 | |||
| Chile—2.3% | |||
| Cencosud | 13,040 | 69,886 | |
| ENTEL | 6,270 | 120,634 | |
| 190,520 | |||
| China—13.3% | |||
| Baidu, ADR | 690a | 73,768 | |
| Changyou.com, ADR | 2,630a | 66,539 | |
| China BlueChemical, Cl. H | 68,000 | 51,966 | |
| China Communications Construction, Cl. H | 158,000 | 100,673 | |
| China Construction Bank, Cl. H | 235,000 | 140,226 | |
| China Petroleum & Chemical, Cl. H | 158,000 | 152,169 | |
| China Vanadium Titano-Magnetite Mining | 171,000 | 26,168 | |
| Focus Media Holding, ADR | 2,710a | 45,501 | |
| Great Wall Motor, Cl. H | 68,250 | 76,392 | |
| Industrial & Commercial Bank of China, Cl. H | 186,000 | 89,907 | |
| Lonking Holdings | 160,000 | 50,578 | |
| Tencent Holdings | 5,600 | 114,870 | |
| WuXi PharmaTech, ADR | 5,240a | 60,994 | |
| Yingde Gases | 76,500 | 69,426 | |
| 1,119,177 | |||
| Hong Kong—5.8% | |||
| China Agri-Industries Holdings | 206,481 | 126,776 | |
| China Minsheng Banking, Cl. H | 62,500 | 37,500 | |
| China Mobile | 15,000 | 146,287 | |
| CNOOC | 28,000 | 44,985 | |
| The Fund | 9 |
STATEMENT OF INVESTMENTS (continued)
| Common Stocks (continued) | Shares | Value ($) | |
| Hong Kong (continued) | |||
| Guangdong Investment | 102,000 | 63,404 | |
| Lenovo Group | 98,000 | 65,527 | |
| 484,479 | |||
| Hungary—.9% | |||
| MOL Hungarian Oil and Gas | 1,160a | 78,188 | |
| India—7.1% | |||
| Apollo Tyres | 56,640 | 63,394 | |
| Hexaware Technologies | 69,460 | 117,170 | |
| Oil & Natural Gas | 11,210 | 60,719 | |
| Shree Renuka Sugars | 91,170 | 101,755 | |
| Sintex Industries | 54,280 | 140,101 | |
| Sterlite Industries India | 32,690 | 74,120 | |
| Welspun | 17,690 | 39,670 | |
| 596,929 | |||
| Indonesia—2.7% | |||
| Bank Mandiri | 86,000 | 60,058 | |
| Bank Rakyat Indonesia Persero | 136,500 | 89,560 | |
| Indofood Sukses Makmur | 137,500 | 77,558 | |
| 227,176 | |||
| Malaysia—2.9% | |||
| AMMB Holdings | 55,900 | 99,544 | |
| Genting | 27,800 | 78,685 | |
| Tenaga Nasional | 39,775 | 64,084 | |
| 242,313 | |||
| Mexico—2.3% | |||
| America Movil, ADR, Ser. L | 3,240 | 71,539 | |
| Fomento Economico Mexicano, ADR | 1,900 | 123,158 | |
| 194,697 | |||
| Peru—1.1% | |||
| Credicorp | 990 | 91,278 | |
| Russia—7.6% | |||
| Gazprom, ADR | 24,780 | 240,118 | |
| Lukoil, ADR | 4,510 | 229,334 | |
| MMC Norilsk Nickel, ADR | 1,092 | 23,729 | |
| Mobile Telesystems, ADR | 6,040 | 74,292 | |
10
| Common Stocks (continued) | Shares | Value ($) | |
| Russia (continued) | |||
| Sberbank of Russia, ADR | 7,920a | 69,954 | |
| 637,427 | |||
| South Africa—10.1% | |||
| ABSA Group | 5,380 | 89,249 | |
| Aveng | 13,110 | 55,853 | |
| Exxaro Resources | 4,800 | 100,677 | |
| FirstRand | 32,770 | 79,138 | |
| Growthpoint Properties | 42,882 | 94,122 | |
| MTN Group | 11,534 | 188,706 | |
| Nedbank Group | 5,710 | 96,511 | |
| Sasol | 3,590 | 146,722 | |
| 850,978 | |||
| South Korea—11.6% | |||
| BS Financial Group | 8,200a | 89,770 | |
| DGB Financial Group | 5,810a | 67,379 | |
| Hana Financial Group | 2,500 | 72,653 | |
| Hyundai Mobis | 550 | 156,202 | |
| KT&G | 1,215 | 75,786 | |
| Kukdo Chemical | 800 | 26,157 | |
| POSCO | 180 | 55,341 | |
| Samsung Electronics | 408 | 285,809 | |
| Woori Finance Holdings | 8,060 | 66,149 | |
| Youngone | 4,076 | 67,182 | |
| Youngone Holdings | 434 | 14,547 | |
| 976,975 | |||
| Taiwan—6.6% | |||
| Advanced Semiconductor Engineering | 57,084 | 48,674 | |
| Asia Cement | 36,931 | 38,011 | |
| CTCI | 38,000 | 45,566 | |
| E Ink Holdings | 38,000 | 78,805 | |
| Fubon Financial Holding | 83,400 | 86,313 | |
| Taishin Financial Holdings | 172,395 | 66,055 | |
| Taiwan Semiconductor | |||
| Manufacturing, ADR | 16,829 | 192,356 | |
| 555,780 | |||
| The Fund | 11 |
STATEMENT OF INVESTMENTS (continued)
| Common Stocks (continued) | Shares | Value ($) |
| Thailand—1.6% | ||
| Asian Property Development | 279,940 | 46,999 |
| PTT Chemical | 28,000 | 87,475 |
| 134,474 | ||
| Turkey—1.8% | ||
| Ford Otomotiv Sanayi | 6,050 | 42,176 |
| Turk Telekomunikasyon | 25,700 | 109,996 |
| 152,172 | ||
| United States—5.0% | ||
| iShares MSCI Emerging Markets Index Fund | 11,950 | 419,445 |
| Total Common Stocks | ||
| (cost $8,530,861) | 7,510,477 | |
| Preferred Stocks—9.9% | ||
| Brazil | ||
| Banco Bradesco | 9,275 | 136,689 |
| Banco do Estado do Rio Grande do Sul | 9,700 | 82,542 |
| Bradespar | 3,800 | 66,875 |
| Cia de Bebidas das Americas | 1,900 | 57,346 |
| Cia de Saneamento de Minas Gerais | 1,600 | 25,316 |
| Cia Paranaense de Energia, Cl. B | 8,000 | 144,236 |
| Petroleo Brasileiro | 9,700 | 98,535 |
| Randon Participacoes | 8,800 | 47,598 |
| Vale, Cl. A | 8,400 | 175,260 |
| Total Preferred Stocks | ||
| (cost $871,783) | 834,397 | |
12
| Other Investment—.2% | Shares | Value ($) | |
| Registered Investment Company; | |||
| Dreyfus Institutional Preferred | |||
| Plus Money Market Fund | |||
| (cost $13,098) | 13,098b | 13,098 | |
| Total Investments (cost $9,415,742) | 99.4% | 8,357,972 | |
| Cash and Receivables (Net) | .6% | 47,486 | |
| Net Assets | 100.0% | 8,405,458 | |
| ADR—American Depository Receipts | |
| a | Non-income producing security. |
| b | Investment in affiliated money market mutual fund. |
| Portfolio Summary (Unaudited)† | |||
| Value (%) | Value (%) | ||
| Financial | 20.8 | Consumer Discretionary | 7.4 |
| Energy | 12.5 | Exchange Traded Funds | 5.0 |
| Information Technology | 11.6 | Utilities | 3.5 |
| Materials | 10.9 | Health Care | 1.8 |
| Telecommunication Services | 9.7 | Money Market Investment | .2 |
| Consumer Staples | 8.1 | ||
| Industrial | 7.9 | 99.4 | |
| † Based on net assets. |
| See notes to financial statements. |
| The Fund | 13 |
| STATEMENT OF ASSETS AND LIABILITIES |
| September 30, 2011 |
| Cost | Value | |||
| Assets ($): | ||||
| Investments in securities—See Statement of Investments—Note 1(c): | ||||
| Unaffiliated issuers | 9,402,644 | 8,344,874 | ||
| Affiliated issuers | 13,098 | 13,098 | ||
| Cash denominated in foreign currencies | 222,597 | 213,318 | ||
| Receivable for investment securities sold | 67,474 | |||
| Dividends receivable | 5,629 | |||
| Unrealized appreciation on forward foreign | ||||
| currency exchange contracts—Note 4 | 1,259 | |||
| Prepaid expenses | 11,113 | |||
| 8,656,765 | ||||
| Liabilities ($): | ||||
| Due to The Dreyfus Corporation and affiliates—Note 3(c) | 36,635 | |||
| Payable for investment securities purchased | 185,944 | |||
| Unrealized depreciation on forward foreign | ||||
| currency exchange contracts—Note 4 | 102 | |||
| Accrued expenses | 28,626 | |||
| 251,307 | ||||
| Net Assets ($) | 8,405,458 | |||
| Composition of Net Assets ($): | ||||
| Paid-in capital | 9,065,040 | |||
| Accumulated undistributed investment income—net | 19,337 | |||
| Accumulated net realized gain (loss) on investments | 387,308 | |||
| Accumulated net unrealized appreciation (depreciation) | ||||
| on investments and foreign currency transactions | (1,066,227) | |||
| Net Assets ($) | 8,405,458 | |||
| Net Asset Value Per Share | ||||
| Class A | Class C | Class I | ||
| Net Assets ($) | 158,060 | 157,198 | 8,090,200 | |
| Shares Outstanding | 7,230 | 7,405 | 370,792 | |
| Net Asset Value Per Share ($) | 21.86 | 21.23 | 21.82 | |
| See notes to financial statements. | ||||
14
| STATEMENT OF OPERATIONS |
| Year Ended September 30, 2011 |
| Investment Income ($): | ||
| Income: | ||
| Cash dividends (net of $43,425 foreign taxes withheld at source): | ||
| Unaffiliated issuers | 357,937 | |
| Affiliated issuers | 51 | |
| Income from securities lending—Note 1(c) | 418 | |
| Total Income | 358,406 | |
| Expenses: | ||
| Investment advisory fee—Note 3(a) | 163,647 | |
| Custodian fees—Note 3(c) | 87,687 | |
| Auditing fees | 43,902 | |
| Registration fees | 36,341 | |
| Accounting and administrative fees—Note 3(a) | 26,250 | |
| Shareholder servicing costs—Note 3(c) | 19,475 | |
| Prospectus and shareholders’ reports | 11,739 | |
| Administration fees—Note 3(a) | 5,224 | |
| Legal fees | 3,246 | |
| Distribution fees—Note 3(b) | 1,767 | |
| Trustees’ fees and expenses—Note 3(d) | 1,039 | |
| Interest expense—Note 2 | 621 | |
| Loan commitment fees—Note 2 | 160 | |
| Miscellaneous | 23,693 | |
| Total Expenses | 424,791 | |
| Less—expense reimbursement from The Dreyfus | ||
| Corporation due to undertaking—Note 3(a) | (196,058) | |
| Less—reduction in fees due to earnings credits—Note 3(c) | (5) | |
| Net Expenses | 228,728 | |
| Investment Income—Net | 129,678 | |
| Realized and Unrealized Gain (Loss) on Investments—Note 4 ($): | ||
| Net realized gain (loss) on investments and foreign currency transactions | 3,310,942 | |
| Net realized gain (loss) on forward foreign currency exchange contracts | (2,715) | |
| Net Realized Gain (Loss) | 3,308,227 | |
| Net unrealized appreciation(depreciation) on | ||
| investments and foreign currency transactions | (5,002,270) | |
| Net unrealized appreciation(depreciation) on | ||
| forward foreign currency exchange contracts | 1,157 | |
| Net Unrealized Appreciation (Depreciation) | (5,001,113) | |
| Net Realized and Unrealized Gain (Loss) on Investments | (1,692,886) | |
| Net (Decrease) in Net Assets Resulting from Operations | (1,563,208) | |
See notes to financial statements.
| The Fund | 15 |
STATEMENT OF CHANGES IN NET ASSETS
| Year Ended September 30, | ||||
| 2011 | 2010 | |||
| Operations ($): | ||||
| Investment income—net | 129,678 | 117,960 | ||
| Net realized gain (loss) on investments | 3,308,227 | 2,659,677 | ||
| Net unrealized appreciation | ||||
| (depreciation) on investments | (5,001,113) | 103,765 | ||
| Net Increase (Decrease) in Net Assets | ||||
| Resulting from Operations | (1,563,208) | 2,881,402 | ||
| Dividends to Shareholders from ($): | ||||
| Investment income—net: | ||||
| Class A Shares | (603) | — | ||
| Class C Shares | — | (2,360) | ||
| Class I Shares | (62,615) | (218,041) | ||
| Total Dividends | (63,218) | (220,401) | ||
| Beneficial Interest Transactions ($): | ||||
| Net proceeds from shares sold: | ||||
| Class A Shares | 172,455 | 127,583 | ||
| Class C Shares | 11,090 | 53,392 | ||
| Class I Shares | 189,858 | 1,420,351 | ||
| Dividends reinvested: | ||||
| Class A Shares | 512 | — | ||
| Class C Shares | — | 2,139 | ||
| Class I Shares | 4,708 | 137,480 | ||
| Cost of shares redeemed: | ||||
| Class A Shares | (125,263) | (13,885) | ||
| Class C Shares | (73,795) | (8,496) | ||
| Class I Shares | (6,535,360) | (4,780,001) | ||
| Increase (Decrease) in Net Assets from | ||||
| Beneficial Interest Transactions | (6,355,795) | (3,061,437) | ||
| Total Increase (Decrease) in Net Assets | (7,982,221) | (400,436) | ||
| Net Assets ($): | ||||
| Beginning of Period | 16,387,679 | 16,788,115 | ||
| End of Period | 8,405,458 | 16,387,679 | ||
| Undistributed (distributions in excess of) | ||||
| investment income—net | 19,337 | (23,114) | ||
16
| Year Ended September 30, | ||||
| 2011 | 2010 | |||
| Capital Share Transactions: | ||||
| Class A | ||||
| Shares sold | 6,009 | 5,107 | ||
| Shares issued for dividends reinvested | 18 | — | ||
| Shares redeemed | (4,446) | (553) | ||
| Net Increase (Decrease) in Shares Outstanding | 1,581 | 4,554 | ||
| Class C | ||||
| Shares sold | 394 | 2,190 | ||
| Shares issued for dividends reinvested | — | 89 | ||
| Shares redeemed | (2,766) | (369) | ||
| Net Increase (Decrease) in Shares Outstanding | (2,372) | 1,910 | ||
| Class I | ||||
| Shares sold | 6,684 | 59,386 | ||
| Shares issued for dividends reinvested | 169 | 5,719 | ||
| Shares redeemed | (232,400) | (200,276) | ||
| Net Increase (Decrease) in Shares Outstanding | (225,547) | (135,171) | ||
| See notes to financial statements. | ||||
| The Fund | 17 |
FINANCIAL HIGHLIGHTS
The following tables describe the performance for each share class for the fiscal periods indicated.All information (except portfolio turnover rate) reflects financial results for a single fund share.Total return shows how much your investment in the fund would have increased (or decreased) during each period, assuming you had reinvested all dividends and distributions.These figures have been derived from the fund’s financial statements.
| Year Ended September 30, | |||||
| Class A Shares | 2011 | 2010 | 2009a | ||
| Per Share Data ($): | |||||
| Net asset value, beginning of period | 26.99 | 22.70 | 13.55 | ||
| Investment Operations: | |||||
| Investment income—netb | .09 | .17 | .14 | ||
| Net realized and unrealized | |||||
| gain (loss) on investments | (5.14) | 4.12 | 9.01 | ||
| Total from Investment Operations | (5.05) | 4.29 | 9.15 | ||
| Distributions: | |||||
| Dividends from investment income—net | (.08) | — | — | ||
| Net asset value, end of period | 21.86 | 26.99 | 22.70 | ||
| Total Return (%)c | (18.77) | 18.85 | 67.60d | ||
| Ratios/Supplemental Data (%): | |||||
| Ratio of total expenses to average net assets | 3.66 | 3.69 | 11.21e | ||
| Ratio of net expenses to average net assets | 2.25 | 2.25 | 2.00e | ||
| Ratio of net investment income | |||||
| to average net assets | .30 | .71 | 1.56e | ||
| Portfolio Turnover Rate | 75.59 | 102.30 | 157.45 | ||
| Net Assets, end of period ($ x 1,000) | 158 | 152 | 25 | ||
| a | From March 31, 2009 (commencement of initial offering) to September 30, 2009. |
| b | Based on average shares outstanding at each month end. |
| c | Exclusive of sales charge. |
| d | Not annualized. |
| e | Annualized. |
See notes to financial statements.
18
| Year Ended September 30, | ||||||
| Class C Shares | 2011 | 2010 | 2009a | |||
| Per Share Data ($): | ||||||
| Net asset value, beginning of period | 26.36 | 22.62 | 13.55 | |||
| Investment Operations: | ||||||
| Investment (loss)—netb | (.16) | (.13) | (.03) | |||
| Net realized and unrealized | ||||||
| gain (loss) on investments | (4.97) | 4.17 | 9.10 | |||
| Total from Investment Operations | (5.13) | 4.04 | 9.07 | |||
| Distributions: | ||||||
| Dividends from investment income—net | — | (.30) | — | |||
| Net asset value, end of period | 21.23 | 26.36 | 22.62 | |||
| Total Return (%)c | (19.43) | 17.95 | 66.94d | |||
| Ratios/Supplemental Data (%): | ||||||
| Ratio of total expenses to average net assets | 3.92 | 4.18 | 3.80e | |||
| Ratio of net expenses to average net assets | 3.00 | 3.00 | 2.75e | |||
| Ratio of net investment (loss) | ||||||
| to average net assets | (.58) | (.57) | (.35)e | |||
| Portfolio Turnover Rate | 75.59 | 102.30 | 157.45 | |||
| Net Assets, end of period ($ x 1,000) | 157 | 258 | 178 | |||
| a | From March 31, 2009 (commencement of initial offering) to September 30, 2009. |
| b | Based on average shares outstanding at each month end. |
| c | Exclusive of sales charge. |
| d | Not annualized. |
| e | Annualized. |
See notes to financial statements.
| The Fund | 19 |
FINANCIAL HIGHLIGHTS (continued)
| Year Ended September 30, | ||||||||||
| Class I Shares | 2011 | 2010 | 2009a | 2008 | 2007 | |||||
| Per Share Data ($): | ||||||||||
| Net asset value, beginning of period | 26.79 | 22.67 | 21.33 | 33.24 | 20.55 | |||||
| Investment Operations: | ||||||||||
| Investment income—netb | .25 | .18 | .24 | .35 | .31 | |||||
| Net realized and unrealized | ||||||||||
| gain (loss) on investments | (5.11) | 4.26 | 2.21 | (8.86) | 12.62 | |||||
| Total from Investment Operations | (4.86) | 4.44 | 2.45 | (8.51) | 12.93 | |||||
| Distributions: | ||||||||||
| Dividends from investment income—net | (.11) | (.32) | (.26) | (.26) | (.24) | |||||
| Dividends from net realized | ||||||||||
| gain on investments | — | — | (.85) | (3.14) | — | |||||
| Total Distributions | (.11) | (.32) | (1.11) | (3.40) | (.24) | |||||
| Net asset value, end of period | 21.82 | 26.79 | 22.67 | 21.33 | 33.24 | |||||
| Total Return (%) | (18.27) | 19.73 | 14.90 | (28.51) | 63.25 | |||||
| Ratios/Supplemental Data (%): | ||||||||||
| Ratio of total expenses | ||||||||||
| to average net assets | 2.83 | 3.07 | 3.50 | 2.74 | 3.18 | |||||
| Ratio of net expenses | ||||||||||
| to average net assets | 1.50 | 1.50 | 1.43 | 1.45 | 1.45 | |||||
| Ratio of net investment income | ||||||||||
| to average net assets | .90 | .75 | 1.43 | 1.21 | 1.15 | |||||
| Portfolio Turnover Rate | 75.59 | 102.30 | 157.45 | 128 | 76 | |||||
| Net Assets, end of period ($ x 1,000) | 8,090 | 15,978 | 16,585 | 15,328 | 13,671 | |||||
| a The fund commenced offering three classes of shares on March 31, 2009.The existing shares were redesignated as |
| Class I shares. |
| b Based on average shares outstanding at each month end. |
See notes to financial statements.
20
NOTES TO FINANCIAL STATEMENTS
NOTE 1—Significant Accounting Policies:
Dreyfus/The Boston Company Emerging Markets Core Equity Fund (the “fund”) is a separate diversified series of Dreyfus Investment Funds (the “Trust”), which is registered under the Investment Company Act of 1940, as amended (the “Act”), as an open-end management investment company and operates as a series company currently offering eleven series, including the fund.The fund’s investment objective is to seek long-term growth of capital. The Dreyfus Corporation (the “Manager” or “Dreyfus”), a wholly-owned subsidiary of The Bank of New York Mellon Corporation (“BNY Mellon”), serves as the fund’s investment adviser.
MBSC Securities Corporation (the “Distributor”), a wholly-owned subsidiary of the Manager, is the distributor of the fund’s shares.The fund is authorized to issue an unlimited number of $.001 par value shares of Beneficial Interest in each of the following classes of shares: Class A, Class C and Class I. Class A shares are subject to a sales charge imposed at the time of purchase. Class C shares are subject to a contingent deferred sales charge (“CDSC”) on Class C shares redeemed within one year of purchase. Class I shares are sold primarily to bank trust departments and other financial service providers (including The Bank of New York Mellon, a subsidiary of BNY Mellon and an affiliate of Dreyfus), acting on behalf of customers having a qualified trust or investment account or relationship at such institution, and bear no distribution or shareholder services fees. Class I shares are offered without a front-end sales charge or CDSC. Other differences between the classes include the services offered to, the expenses borne by each class, the allocation of certain transfer agency costs and certain voting
| The Fund | 21 |
NOTES TO FINANCIAL STATEMENTS (continued)
rights. Income, expenses (other than expenses attributable to a specific class), and realized and unrealized gains or losses on investments are allocated to each class of shares based on its relative net assets.
TheTrust accounts separately for the assets, liabilities and operations of each series. Expenses directly attributable to each series are charged to that series’ operations; expenses which are applicable to all series are allocated among them on a pro rata basis.
The Financial Accounting Standards Board (“FASB”) Accounting Standards Codification (“ASC”) is the exclusive reference of authoritative U.S. generally accepted accounting principles (“GAAP”) recognized by the FASB to be applied by nongovernmental entities. Rules and interpretive releases of the Securities and Exchange Commission (“SEC”) under authority of federal laws are also sources of authoritative GAAP for SEC registrants. The fund’s financial statements are prepared in accordance with GAAP, which may require the use of management estimates and assumptions.Actual results could differ from those estimates.
(a) Portfolio valuation: The fair value of a financial instrument is the amount that would be received to sell an asset or paid to transfer a liability in an orderly transaction between market participants at the measurement date (i.e. the exit price). GAAP establishes a fair value hierarchy that prioritizes the inputs of valuation techniques used to measure fair value.This hierarchy gives the highest priority to unadjusted quoted prices in active markets for identical assets or liabilities (Level 1 measurements) and the lowest priority to unobservable inputs (Level 3 measurements).
Additionally, GAAP provides guidance on determining whether the volume and activity in a market has decreased significantly and whether such a decrease in activity results in transactions that are not orderly. GAAP requires enhanced disclosures around valuation inputs and techniques used during annual and interim periods.
22
Various inputs are used in determining the value of the fund’s investments relating to fair value measurements.These inputs are summarized in the three broad levels listed below:
Level 1—unadjusted quoted prices in active markets for identical investments.
Level 2—other significant observable inputs (including quoted prices for similar investments, interest rates, prepayment speeds, credit risk, etc.).
Level 3—significant unobservable inputs (including the fund’s own assumptions in determining the fair value of investments).
The inputs or methodology used for valuing securities are not necessarily an indication of the risk associated with investing in those securities.
Changes in valuation techniques may result in transfers in or out of an assigned level within the disclosure hierarchy. Valuation techniques used to value the fund’s investments are as follows:
Investments in securities are valued at the last sales price on the securities exchange or national securities market on which such securities are primarily traded. Securities listed on the National Market System for which market quotations are available are valued at the official closing price or, if there is no official closing price that day, at the last sales price. Securities not listed on an exchange or the national securities market, or securities for which there were no transactions, are valued at the average of the most recent bid and asked prices, except for open short positions, where the asked price is used for valuation purposes. Bid price is used when no asked price is available. Registered investment companies that are not traded on an exchange are valued at their net asset value. All preceding securities are categorized within Level 1 of the fair value hierarchy.
| The Fund | 23 |
NOTES TO FINANCIAL STATEMENTS (continued)
Fair valuing of securities may be determined with the assistance of a pricing service using calculations based on indices of domestic securities and other appropriate indicators, such as prices of relevant ADRs and futures contracts. Utilizing these techniques may result in transfers between Level 1 and Level 2 of the fair value hierarchy.
When market quotations or official closing prices are not readily available, or are determined not to reflect accurately fair value, such as when the value of a security has been significantly affected by events after the close of the exchange or market on which the security is principally traded (for example, a foreign exchange or market), but before the fund calculates its net asset value, the fund may value these investments at fair value as determined in accordance with the procedures approved by the Board of Trustees. Certain factors may be considered when fair valuing investments such as: fundamental analytical data, the nature and duration of restrictions on disposition, an evaluation of the forces that influence the market in which the securities are purchased and sold, and public trading in similar securities of the issuer or comparable issuers.These securities are either categorized as Level 2 or 3 depending on the relevant inputs used.
For restricted securities where observable inputs are limited, assumptions about market activity and risk are used and are categorized within Level 3 of the fair value hierarchy.
Investments denominated in foreign currencies are translated to U.S. dollars at the prevailing rates of exchange. Forward foreign currency exchange contracts (“forward contracts”) are valued at the forward rate. These securities are generally categorized within Level 2 of the fair value hierarchy.
24
The following is a summary of the inputs used as of September 30, 2011 in valuing the fund’s investments:
| Level 2—Other | Level 3— | |||||
| Level 1— | Significant | Significant | ||||
| Unadjusted | Observable | Unobservable | ||||
| Quoted Prices | Inputs | Inputs | Total | |||
| Assets ($) | ||||||
| Investments in Securities: | ||||||
| Equity Securities— | ||||||
| Foreign† | 1,511,920 | 6,413,509 | †† | — | 7,925,429 | |
| Mutual Funds/Exchange | ||||||
| Traded Funds | 432,543 | — | — | 432,543 | ||
| Other Financial | ||||||
| Instruments: | ||||||
| Forward Foreign | ||||||
| Currency Exchange | ||||||
| Contracts††† | — | 1,259 | — | 1,259 | ||
| Liabilities ($) | ||||||
| Other Financial | ||||||
| Instruments: | ||||||
| Forward Foreign | ||||||
| Currency Exchange | ||||||
| Contracts††† | — | (102 | ) | — | (102 | ) |
| † | See Statement of Investments for additional detailed categorizations. |
| †† | Securities classified as Level 2 at period end as the values were determined pursuant to the fund's |
| fair valuation procedures. | |
| ††† Amount shown represents unrealized appreciation (depreciation) at period end. | |
In May 2011, FASB issued Accounting Standards Update (“ASU”) No. 2011-04 “Amendments to Achieve Common Fair Value Measurement and Disclosure Requirements in GAAP and International Financial Reporting Standards (“IFRS”)” (“ASU 2011-04”). ASU 2011-04 includes common requirements for measurement of and disclosure
| The Fund | 25 |
NOTES TO FINANCIAL STATEMENTS (continued)
about fair value between GAAP and IFRS. ASU 2011-04 will require reporting entities to disclose the following information for fair value measurements categorized within Level 3 of the fair value hierarchy: quantitative information about the unobservable inputs used in the fair value measurement, the valuation processes used by the reporting entity and a narrative description of the sensitivity of the fair value measurement to changes in unobservable inputs and the interrelationships between those unobservable inputs. In addition, ASU 2011-04 will require reporting entities to make disclosures about amounts and reasons for all transfers in and out of Level 1 and Level 2 fair value measurements. The new and revised disclosures are effective for interim and annual reporting periods beginning after December 15, 2011. At this time, management is evaluating the implications of ASU 2011-04 and its impact on the financial statements.
(b) Foreign currency transactions: The fund does not isolate that portion of the results of operations resulting from changes in foreign exchange rates on investments from the fluctuations arising from changes in market prices of securities held. Such fluctuations are included with the net realized and unrealized gain or loss on investments.
Net realized foreign exchange gains or losses arise from sales of foreign currencies, currency gains or losses realized on securities transactions between trade and settlement date and the difference between the amounts of dividends, interest, and foreign withholding taxes recorded on the fund’s books and the U.S. dollar equivalent of the amounts actually received or paid. Net unrealized foreign exchange gains and losses arise from changes in the value of assets and liabilities other than investments resulting from changes in exchange rates. Foreign currency gains and losses on investments are included with net realized and unrealized gain or loss on investments.
(c) Securities transactions and investment income: Securities transactions are recorded on a trade date basis. Realized gains and losses
26
from securities transactions are recorded on the identified cost basis. Dividend income is recognized on the ex-dividend date and interest income, including, where applicable, accretion of discount and amortization of premium on investments, is recognized on the accrual basis.
Pursuant to a securities lending agreement withThe Bank of NewYork Mellon, the fund may lend securities to qualified institutions. It is the fund’s policy that, at origination, all loans are secured by collateral of at least 102% of the value of U.S. securities loaned and 105% of the value of foreign securities loaned. Collateral equivalent to at least 100% of the market value of securities on loan is maintained at all times. Collateral is either in the form of cash, which can be invested in certain money market mutual funds managed by the Manager, U.S. Government and Agency securities or letters of credit.The fund is entitled to receive all income on securities loaned, in addition to income earned as a result of the lending transaction.Although each security loaned is fully collateralized, the fund bears the risk of delay in recovery of, or loss of rights in, the securities loaned should a borrower fail to return the securities in a timely manner. During the period ended September 30, 2011, the Bank of NewYork Mellon earned $225 from lending portfolio securities pursuant to the securities lending agreement.
Investing in foreign markets may involve special risks and considerations not typically associated with investing in the U.S. These risks include revaluation of currencies, high rates of inflation, repatriation restrictions on income and capital, and adverse political and economic developments. Moreover, securities issued in these markets may be less liquid, subject to government ownership controls and delayed settlements, and their prices may be more volatile than those of comparable securities in the U.S.
(d) Affiliated issuers: Investments in other investment companies advised by Dreyfus are defined as “affiliated” in the Act.
| The Fund | 27 |
NOTES TO FINANCIAL STATEMENTS (continued)
The fund may invest in shares of certain affiliated investment companies also advised or managed by Dreyfus. Investments in affiliated investment companies for the period ended September 30, 2011 were as follows:
| Affiliated | |||||||
| Investment | Value | Value | Net | ||||
| Company | 9/30/2010 | ($) | Purchases ($) | Sales ($) | 9/30/2011 | ($) | Assets (%) |
| Dreyfus | |||||||
| Institutional | |||||||
| Preferred | |||||||
| Plus Money | |||||||
| Market Fund | — | 3,514,749 | 3,501,651 | 13,098 | .2 | ||
| Dreyfus | |||||||
| Institutional | |||||||
| Cash | |||||||
| Advantage | |||||||
| Fund | 144,550 | 4,093,039 | 4,237,589 | — | — | ||
| Total | 144,550 | 7,607,788 | 7,739,240 | 13,098 | .2 |
(e) Dividends to shareholders: Dividends are recorded on the ex-dividend date. Dividends from investment income-net and dividends from net realized capital gains, if any, are normally declared and paid annually, but the fund may make distributions on a more frequent basis to comply with the distribution requirements of the Internal Revenue Code of 1986, as amended (the “Code”).To the extent that net realized capital gains can be offset by capital loss carryovers, it is the policy of the fund not to distribute such gains. Income and capital gain distributions are determined in accordance with income tax regulations, which may differ from GAAP.
(f) Federal income taxes: It is the policy of the fund to continue to qualify as a regulated investment company, if such qualification is in the best interests of its shareholders, by complying with the applicable provisions of the Code, and to make distributions of taxable income sufficient to relieve it from substantially all federal income and excise taxes.
As of and during the period ended September 30, 2011, the fund did not have any liabilities for any uncertain tax positions.The fund recognizes interest and penalties, if any, related to uncertain tax positions as income tax expense in the Statement of Operations. During the period, the fund did not incur any interest or penalties.
28
Each of the tax years in the four-year period ended September 30, 2011 remains subject to examination by the Internal Revenue Service and state taxing authorities.
At September 30, 2011, the components of accumulated earnings on tax basis were as follows: undistributed ordinary income $62,518, undistributed capital gains $866,741 and unrealized depreciation $1,569,971. In addition, the fund had $18,870 of passive foreign investment company losses realized after October 31, 2010, which were deferred for tax purposes to the first day of the following fiscal year.
The tax character of distributions paid to shareholders during the fiscal periods ended September 30, 2011 and September 30, 2010 were as follows: ordinary income $63,218 and $220,401, respectively.
During the period ended September 30, 2011, as a result of permanent book to tax differences, primarily due to the tax treatment for foreign currency gains and losses, passive foreign investment companies and Thailand capital gain taxes, the fund decreased accumulated undistributed investment income-net by $24,009 and increased accumulated net realized gain (loss) on investments by the same amount. Net assets and net asset value per share were not affected by this reclassification.
NOTE 2—Bank Lines of Credit:
The fund participates with other Dreyfus-managed funds in a $225 million unsecured credit facility led by Citibank, N.A. and a $300 million unsecured credit facility provided by The Bank of New York Mellon (each, a “Facility”), each to be utilized primarily for temporary or emergency purposes, including the financing of redemptions. In connection therewith, the fund has agreed to pay its pro rata portion of commitment fees for each Facility. Interest is charged to the fund based on rates determined pursuant to the terms of the respective Facility at the time of borrowing.
The average amount of borrowings outstanding under the Facilities during the period ended September 30, 2011 was approximately $45,800, with a related weighted average annualized interest rate of 1.36%
| The Fund | 29 |
NOTES TO FINANCIAL STATEMENTS (continued)
NOTE 3—Investment Advisory Fee and Other Transactions with Affiliates:
(a) Pursuant to an investment advisory agreement with the Manager, the investment advisory fee is computed at the annual rate of 1.10% of the value of the fund’s average daily net assets and is payable monthly. The Manager has agreed, until February 1, 2013, to waive receipt of its fees and/or assume the expenses of the fund so that the direct expenses of Class A, Class C and Class I shares (excluding Rule 12b-1 fees, shareholder services fees, taxes, interest, brokerage commissions, acquired fund fees and extraordinary expenses) do not exceed 2.00%, 2.00% and 1.50%, respectively, of the value of such class’ average daily net assets. The expense reimbursement, pursuant to the undertaking, amounted to $196,058 during the period ended September 30, 2011.
From October 1, 2010 through April 30, 2011, the Trust had an agreement with The Bank of New York Mellon, pursuant to which The Bank of NewYork Mellon provided administration and fund accounting services for the fund. For these services, the fund paid The Bank of New York Mellon a fixed fee plus asset and transaction based fees, as well as out-of-pocket expenses. Pursuant to this agreement, the fund was charged $26,250 during the period October 1, 2010 through April 30, 2011 for administration and fund accounting services.
At Board Meetings of the Trust held on February 15-16, 2011, the Board of Trustees of the Trust terminated the agreement with The Bank of New York Mellon and, on behalf of the Trust, entered into a Fund Accounting and Administration Agreement (the “Administration Agreement”) with Dreyfus, effective May 1, 2011, whereby Dreyfus performs administrative, accounting and recordkeeping services for the fund. The fund has agreed to compensate Dreyfus for providing accounting services, administration, compliance monitoring, regulatory and shareholder reporting, as well as related facilities, equipment and clerical help.The fee is based on the fund’s average daily net assets and computed at the following annual rates: .10% of the first $500 million, .065% of the next $500 million and .02% in excess of $1 billion.
30
In addition, after applying any expense limitations or fee waivers that reduce the fees paid to Dreyfus for this service, Dreyfus has contractually agreed in writing to waive any remaining fees for this service to the extent that they exceed both Dreyfus’ costs in providing these services and a reasonable allocation of the costs incurred by Dreyfus and its affiliates related to the support and oversight of these services.The fund also reimburses Dreyfus for the out-of-pocket expenses it incurs in performing this service for the fund. Pursuant to the Administration Agreement, the fund was charged $5,224 during the period May 1, 2011 through September 30, 2011.
During the period ended September 30, 2011, the Distributor retained $61 from commissions earned on sales of the fund’s Class A shares.
(b) Under the Distribution Plan (the “Plan”) adopted pursuant to Rule 12b-1 under the Act, Class C shares pay the Distributor for distributing its shares at an annual rate of .75% of the value of the average daily net assets of Class C shares. During the period ended September 30, 2011, Class C shares were charged $1,767 pursuant to the Plan.
(c) Under the Shareholder Services Plan, Class A and Class C shares pay the Distributor at the annual rate of .25% of the value of their average daily net assets for the provision of certain services.The services provided may include personal services relating to shareholder accounts, such as answering shareholder inquiries regarding the fund and providing reports and other information, and services related to the maintenance of shareholder accounts.The Distributor may make payments to Service Agents (a securities dealer, financial institution or other industry professional) in respect of these services.The Distributor determines the amounts to be paid to Service Agents. During the period ended September 30, 2011, Class A and Class C shares were charged $507 and $589, respectively, pursuant to the Shareholder Services Plan.
The fund compensates Dreyfus Transfer, Inc., a wholly-owned subsidiary of the Manager, under a transfer agency agreement for providing personnel and facilities to perform transfer agency services for the
| The Fund | 31 |
NOTES TO FINANCIAL STATEMENTS (continued)
fund. During the period ended September 30, 2011, the fund was charged $1,496 pursuant to the transfer agency agreement, which is included in Shareholder servicing costs in the Statement of Operations.
The fund has arrangements with the custodian and cash management bank whereby the fund may receive earnings credits when positive cash balances are maintained, which are used to offset custody and cash management fees. For financial reporting purposes, the fund includes net earnings credits as an expense offset in the Statement of Operations.
The fund compensates The Bank of New York Mellon under cash management agreements for performing cash management services related to fund subscriptions and redemptions. During the period ended September 30, 2011, the fund was charged $116 pursuant to the cash management agreements, which is included in Shareholder servicing costs in the Statement of Operations.These fees were partially offset by earnings credits of $5.
The fund also compensates The Bank of New York Mellon under a custody agreement for providing custodial services for the fund. During the period ended September 30, 2011, the fund was charged $87,687 pursuant to the custody agreement.
During the period ended September 30, 2011, the fund was charged $7,146 for services performed by the Chief Compliance Officer.
The components of “Due to The Dreyfus Corporation and affiliates” in the Statement of Assets and Liabilities consist of: investment advisory fees $8,590, administration fees $781, Rule 12b-1 distribution plan fees $108, shareholder services plan fees $72, custodian fees $29,466, chief compliance officer fees $3,750, Private Wealth sub-accounting fees $829 and transfer agency per account fees $283, which are offset against an expense reimbursement currently in effect in the amount of $7,244.
(d) Each Trustee who is not an “interested person” of the Trust (as defined in the Act) receives $60,000 per annum, plus $7,000 per joint Board meeting of the Trust, The Dreyfus/Laurel Funds, Inc., The Dreyfus/Laurel Funds Trust, The Dreyfus/Laurel Tax-Free Municipal
32
Funds and Dreyfus Funds, Inc. (collectively, the “Board Group Open-End Funds”) attended, $2,500 for separate in-person committee meetings attended which are not held in conjunction with a regularly scheduled Board meeting and $2,000 for Board meetings and separate committee meetings attended that are conducted by telephone. The Board Group Open-End Funds also reimburse eachTrustee who is not an “interested person” of the Trust (as defined in the Act) for travel and out-of-pocket expenses. With respect to Board meetings, the Chairman of the Board receives an additional 25% of such compensation (with the exception of reimbursable amounts).The Chair of each of the Board’s committees, unless the Chair also serves as Chair of the Board, receives $1,350 per applicable committee meeting. In the event that there is an in-person joint committee meeting or a joint telephone meeting of the Board Group Open-End Funds and Dreyfus HighYield Strategies Fund (“DHF”), a $2,500 fee is allocated between the Board Group Open-End Funds and DHF.
Effective January 1, 2012, the Board Group Open-End Funds and DHF (collectively, the “Board Group Funds”) will pay each Trustee their respective allocated portions of an annual retainer of $85,000 and a fee of $10,000 for each regularly scheduled Board meeting attended ($75,000 and $8,000, respectively, in the aggregate, prior to January 1, 2012).With respect to the annual retainer and Board meetings of the Board Group Funds, the Chair of the Board will receive an additional 25% of such compensation (with the exception of reimbursable amounts). Each Trustee will receive $2,500 for any separate in-person committee meetings attended, which are not held in conjunction with a regularly scheduled Board meeting, such amount to be allocated among the Board Group Funds, as applicable. In the event that there is a joint telephone meeting of the Board Group Funds, a fee of $2,000 will be allocated among the applicable Board Group Funds, accordingly (prior to January 1, 2012, the fee allocated was $2,500 if the meeting included DHF).The Chair of each of the Board’s committees, unless the Chair also serves as Chair of the Board, will receive $1,500
| The Fund | 33 |
NOTES TO FINANCIAL STATEMENTS (continued)
per applicable committee meeting. Each Emeritus Trustee is entitled to receive an annual retainer of one-half the amount paid as a retainer at the time the Trustee became Emeritus and a per meeting attended fee of one-half the amount paid to Trustees.The Board Group Funds also reimburse each Independent Trustee and Emeritus Trustees for travel and out-of-pocket expenses.
(e) A 2% redemption fee is charged and retained by the fund on certain shares redeemed within sixty days following the date of issuance, subject to exceptions, including redemptions made through the use of the fund’s exchange privilege. During the period ended September 30, 2011, redemption fees charged and retained by the fund amounted to $209.
NOTE 4—Securities Transactions:
The aggregate amount of purchases and sales of investment securities, excluding short-term securities and forward contracts, during the period ended September 30, 2011, amounted to $11,070,880 and $17,356,959, respectively.
Forward Foreign Currency Exchange Contracts: The fund enters into forward contracts in order to hedge its exposure to changes in foreign currency exchange rates on its foreign portfolio holdings, to settle foreign currency transactions or as a part of its investment strategy. When executing forward contracts, the fund is obligated to buy or sell a foreign currency at a specified rate on a certain date in the future. With respect to sales of forward contracts, the fund incurs a loss if the value of the contract increases between the date the forward contract is opened and the date the forward contract is closed.The fund realizes a gain if the value of the contract decreases between those dates. With respect to purchases of forward contracts, the fund incurs a loss if the value of the contract decreases between the date the forward contract is opened and the date the forward contract is closed.The fund realizes a gain if the value of the contract increases between those dates. Any realized gain or loss which occurred during the period is reflected in the Statement of Operations.The fund is exposed to foreign currency risk as a result of changes in value of underlying financial instruments.
34
The fund is also exposed to credit risk associated with counterparty nonperformance on these forward contracts, which is typically limited to the unrealized gain on each open contract.The following summarizes open forward contracts at September 30, 2011:
| Foreign | Unrealized | ||||
| Forward Foreign Currency | Currency | Appreciation | |||
| Exchange Contracts | Amounts | Cost ($) | Value ($) (Depreciation) ($) | ||
| Purchases: | |||||
| Indonesian Rupiah, | |||||
| Expiring 10/4/2011 | 315,155,902 | 34,595 | 35,854 | 1,259 | |
| Sales: | Proceeds ($) | ||||
| Hong Kong Dollar, | |||||
| Expiring 10/3/2011 | 35,496 | 4,555 | 4,558 | (3 | ) |
| Taiwan Dollar, | |||||
| Expiring 10/3/2011 | 530,000 | 17,292 | 17,391 | (99 | ) |
| Gross Unrealized | |||||
| Appreciation | 1,259 | ||||
| Gross Unrealized | |||||
| Depreciation | (102 | ) | |||
The following summarizes the average market value of derivatives outstanding during the period ended September 30, 2011:
| Average Market Value ($) | |
| Forward contracts | 28,884 |
At September 30, 2011, the cost of investments for federal income tax purposes was $9,919,486; accordingly, accumulated net unrealized depreciation on investments was $1,561,514 consisting of $628,683 gross unrealized appreciation and $2,190,197 gross unrealized depreciation.
NOTE 5—Subsequent Event:
Effective October 27, 2011, the Nominating Committee of the Board of Trustees nominated, and the Board of Trustees approved the election of, Francine J. Bovich as a Trustee of the Trust. A proxy statement will be mailed, on or about November 28, 2011, to Trust shareholders of record as of the close of business November 1, 2011, asking shareholders to consider Ms. Bovich’s election as a Board member of the Trust at a Special Joint Meeting of Shareholders to be held on Wednesday, February 8, 2012.
| The Fund | 35 |
| REPORT OF INDEPENDENT REGISTERED |
| PUBLIC ACCOUNTING FIRM |
To the Board of Trustees and Shareholders Dreyfus/The Boston Company Emerging Markets Core Equity Fund:
We have audited the accompanying statement of assets and liabilities of Dreyfus/The Boston Company Emerging Markets Core Equity Fund (the “Fund”), a series of Dreyfus Investment Funds, including the statement of investments as of September 30, 2011, the related statement of operations for the year then ended, and the statements of changes in net assets for each of the years in the two-year period then ended and the financial highlights for each of the years in the three-year period then ended.These financial statements and financial highlights are the responsibility of the Fund’s management. Our responsibility is to express an opinion on these financial statements and financial highlights based on our audits.The financial highlights for each of the years in the two-year period ended September 30, 2008 were audited by other independent registered public accountants whose report thereon, dated November 28, 2008, expressed an unqualified opinion on those financial highlights.
We conducted our audits in accordance with the standards of the Public Company Accounting Oversight Board (United States).Those standards require that we plan and perform the audit to obtain reasonable assurance about whether the financial statements and financial highlights are free of material misstatement.An audit includes examining, on a test basis, evidence supporting the amounts and disclosures in the financial statements. Our procedures included confirmation of securities owned as of September 30, 2011 by correspondence with the custodian and brokers or by other appropriate auditing procedures where replies from brokers were not received.An audit also includes assessing the accounting principles used and significant estimates made by management, as well as evaluating the overall financial statement presentation.We believe that our audits provide a reasonable basis for our opinion.
In our opinion, the financial statements and financial highlights referred to above present fairly, in all material respects, the financial position of Dreyfus/The Boston Company Emerging Markets Core Equity Fund as of September 30, 2011, the results of its operations for the year then ended, and the changes in its net assets for each of the years in the two-year period then ended and the financial highlights for each of the years in the three-year period then ended, in conformity with U.S. generally accepted accounting principles.

New York, New York
November 23, 2011
36
IMPORTANT TAX INFORMATION (Unaudited)
For federal tax purposes, the fund elects to provide each shareholder with their portion of the fund’s income sourced from foreign countries and taxes paid from foreign countries. The fund designates the maximum amount allowable but not less than $404,739 as income sourced from foreign countries for the fiscal year ended September 30, 2011 in accordance with Section 853(c)(2) of the Internal Revenue Code and also the fund designates the maximum amount allowable but not less than $58,977 as taxes paid from foreign countries for the fiscal year ended September 30, 2011 in accordance with Section 853(a) of the Internal Revenue Code.Where required by federal tax law rules, shareholders will receive notification of their proportionate share of foreign sourced income and foreign taxes paid for the 2011 calendar year with Form 1099-DIV which will be mailed in early 2012.Also, the fund designates $63,218 as ordinary income dividends paid during the fiscal year ended September 30, 2011 as qualified dividend income in accordance with Section 854(b)(1)(B) of the Internal Revenue Code.
| The Fund | 37 |
BOARD MEMBERS INFORMATION (Unaudited)
| Joseph S. DiMartino (67) |
| Chairman of the Board (2008) |
| Principal Occupation During Past 5Years: |
| • Corporate Director and Trustee |
| Other Public Company Board Memberships During Past 5Years: |
| • CBIZ (formerly, Century Business Services, Inc.), a provider of outsourcing functions for small |
| and medium size companies, Director (1997-present) |
| • Sunair Services Corporation, a provider of certain outdoor-related services to homes and |
| businesses, Director (2005-2009) |
| • The Newark Group, a provider of a national market of paper recovery facilities, paperboard |
| mills and paperboard converting plants, Director (2000-2010) |
| No. of Portfolios for which Board Member Serves: 167 |
| ——————— |
| Francine J. Bovich (60)† |
| Board Member (2011) |
| Principal Occupation During Past 5Years: |
| • Trustee,The Bradley Trusts, private trust funds (2011-present) |
| • Managing Director, Morgan Stanley Investment Management (1993-2010) |
| No. of Portfolios for which Board Member Serves: 14 |
| ——————— |
| James M. Fitzgibbons (77) |
| Board Member (2008) |
| Principal Occupation During Past 5Years: |
| • Corporate Director and Trustee |
| Other Public Company Board Memberships During Past 5Years: |
| • Bill Barrett Corporation, an oil and natural gas exploration company, Director (2004-present) |
| No. of Portfolios for which Board Member Serves: 33 |
| ——————— |
| Kenneth A. Himmel (65) |
| Board Member (2008) |
| Principal Occupation During Past 5Years: |
| • President and CEO, Related Urban Development, a real estate development company (1996-present) |
| • President and CEO, Himmel & Company, a real estate development company (1980-present) |
| • CEO,American Food Management, a restaurant company (1983-present) |
| No. of Portfolios for which Board Member Serves: 33 |
38
| Stephen J. Lockwood (64) |
| Board Member (2008) |
| Principal Occupation During Past 5Years: |
| • Chairman of the Board, Stephen J. Lockwood and Company LLC, a real estate investment |
| company (2000-present) |
| No. of Portfolios for which Board Member Serves: 33 |
| ——————— |
| Roslyn M. Watson (61) |
| Board Member (2008) |
| Principal Occupation During Past 5Years: |
| • Principal,Watson Ventures, Inc., a real estate investment company (1993-present) |
| No. of Portfolios for which Board Member Serves: 43 |
| ——————— |
| Benaree Pratt Wiley (65) |
| Board Member (2008) |
| Principal Occupation During Past 5Years: |
| • Principal,TheWiley Group, a firm specializing in strategy and business development (2005-present) |
| Other Public Company Board Memberships During Past 5Years: |
| • CBIZ (formerly, Century Business Services, Inc.), a provider of outsourcing functions for small |
| and medium size companies, Director (2008-present) |
| No. of Portfolios for which Board Member Serves: 68 |
| ——————— |
† Ms. Bovich was elected as a Board Member by the Board of Trustees, effective October 27, 2011. See Note 5.
Once elected all Board Members serve for an indefinite term, but achieve Emeritus status upon reaching age 80.The address of the Board Members and Officers is in c/o The Dreyfus Corporation, 200 Park Avenue, NewYork, NewYork 10166.Additional information about the Board Members is available in the fund’s Statement of Additional Information which can be obtained from Dreyfus free of charge by calling this toll free number: 1-800-DREYFUS.
| The Fund | 39 |
OFFICERS OF THE FUND (Unaudited)
BRADLEY J. SKAPYAK, President since January 2010.
Chief Operating Officer and a director of the Manager since June 2009. From April 2003 to June 2009, Mr. Skapyak was the head of the Investment Accounting and Support Department of the Manager. He is an officer of 75 investment companies (comprised of 167 portfolios) managed by the Manager. He is 52 years old and has been an employee of the Manager since February 1988.
MICHAEL A. ROSENBERG, Vice President and Secretary since December 2008.
Assistant General Counsel of BNY Mellon, and an officer of 76 investment companies (comprised of 192 portfolios) managed by the Manager. He is 51 years old and has been an employee of the Manager since October 1991.
KIESHA ASTWOOD, Vice President and Assistant Secretary since January 2010.
Counsel of BNY Mellon, and an officer of 76 investment companies (comprised of 192 portfolios) managed by the Manager. She is 38 years old and has been an employee of the Manager since July 1995.
JAMES BITETTO, Vice President and Assistant Secretary since December 2008.
Senior Counsel of BNY Mellon and Secretary of the Manager, and an officer of 76 investment companies (comprised of 192 portfolios) managed by the Manager. He is 45 years old and has been an employee of the Manager since December 1996.
JONI LACKS CHARATAN, Vice President and Assistant Secretary since December 2008.
Senior Counsel of BNY Mellon, and an officer of 76 investment companies (comprised of 192 portfolios) managed by the Manager. She is 55 years old and has been an employee of the Manager since October 1988.
JOSEPH M. CHIOFFI, Vice President and Assistant Secretary since December 2008.
Senior Counsel of BNY Mellon, and an officer of 76 investment companies (comprised of 192 portfolios) managed by the Manager. He is 49 years old and has been an employee of the Manager since June 2000.
KATHLEEN DENICHOLAS, Vice President and Assistant Secretary since January 2010.
Managing Counsel of BNY Mellon, and an officer of 76 investment companies (comprised of 192 portfolios) managed by the Manager. She is 36 years old and has been an employee of the Manager since February 2001.
JANETTE E. FARRAGHER, Vice President and Assistant Secretary since December 2008.
Assistant General Counsel of BNY Mellon, and an officer of 76 investment companies (comprised of 192 portfolios) managed by the Manager. She is 48 years old and has been an employee of the Manager since February 1984.
JOHN B. HAMMALIAN, Vice President and Assistant Secretary since December 2008.
Senior Managing Counsel of BNY Mellon, and an officer of 76 investment companies (comprised of 192 portfolios) managed by the Manager. He is 48 years old and has been an employee of the Manager since February 1991.
M. CRISTINA MEISER, Vice President and Assistant Secretary since January 2010.
Senior Counsel of BNY Mellon, and an officer of 76 investment companies (comprised of 192 portfolios) managed by the Manager. She is 41 years old and has been an employee of the Manager since August 2001.
40
ROBERT R. MULLERY, Vice President and Assistant Secretary since December 2008.
Managing Counsel of BNY Mellon, and an officer of 76 investment companies (comprised of 192 portfolios) managed by the Manager. He is 59 years old and has been an employee of the Manager since May 1986.
JEFF PRUSNOFSKY, Vice President and Assistant Secretary since December 2008.
Senior Managing Counsel of BNY Mellon, and an officer of 76 investment companies (comprised of 192 portfolios) managed by the Manager. He is 46 years old and has been an employee of the Manager since October 1990.
JAMES WINDELS, Treasurer since December 2008.
Director – Mutual Fund Accounting of the Manager, and an officer of 76 investment companies (comprised of 192 portfolios) managed by the Manager. He is 53 years old and has been an employee of the Manager since April 1985.
RICHARD CASSARO, Assistant Treasurer since December 2008.
Senior Accounting Manager – Money Market and Municipal Bond Funds of the Manager, and an officer of 76 investment companies (comprised of 192 portfolios) managed by the Manager. He is 52 years old and has been an employee of the Manager since September 1982.
GAVIN C. REILLY, Assistant Treasurer since December 2008.
Tax Manager of the Investment Accounting and Support Department of the Manager, and an officer of 76 investment companies (comprised of 192 portfolios) managed by the Manager. He is 43 years old and has been an employee of the Manager since April 1991.
ROBERT ROBOL, Assistant Treasurer since December 2008.
Senior Accounting Manager – Fixed Income Funds of the Manager, and an officer of 76 investment companies (comprised of 192 portfolios) managed by the Manager. He is 47 years old and has been an employee of the Manager since October 1988.
ROBERT SALVIOLO, Assistant Treasurer since December 2008.
Senior Accounting Manager – Equity Funds of the Manager, and an officer of 76 investment companies (comprised of 192 portfolios) managed by the Manager. He is 44 years old and has been an employee of the Manager since June 1989.
ROBERT SVAGNA, Assistant Treasurer since December 2008.
Senior Accounting Manager – Equity Funds of the Manager, and an officer of 76 investment companies (comprised of 192 portfolios) managed by the Manager. He is 44 years old and has been an employee of the Manager since November 1990.
| The Fund | 41 |
OFFICERS OF THE FUND (Unaudited) (continued)
JOSEPH W. CONNOLLY, Chief Compliance Officer since December 2008.
Chief Compliance Officer of the Manager and The Dreyfus Family of Funds (76 investment companies, comprised of 192 portfolios). From November 2001 through March 2004, Mr. Connolly was first Vice-President, Mutual Fund Servicing for Mellon Global Securities Services. In that capacity, Mr. Connolly was responsible for managing Mellon’s Custody, Fund Accounting and Fund Administration services to third-party mutual fund clients. He is 54 years old and has served in various capacities with the Manager since 1980, including manager of the firm’s Fund Accounting Department from 1997 through October 2001.
STEPHEN J. STOREN, Anti-Money Laundering Compliance Officer since May 2011.
Chief Compliance Officer of the Distributor, and the Anti-Money Laundering Compliance Officer of 72 investment companies (comprised of 188 portfolios) managed by the Manager. He is 57 years old and has been an employee of the Distributor since October 1999.
42
NOTES
For More Information
Telephone Call your financial representative or 1-800-DREYFUS
Mail The Dreyfus Family of Funds, 144 Glenn Curtiss Boulevard, Uniondale, NY 11556-0144
The fund files its complete schedule of portfolio holdings with the Securities and Exchange Commission (“SEC”) for the first and third quarters of each fiscal year on Form N-Q. The fund’s Forms N-Q are available on the SEC’s website at http://www.sec.gov and may be reviewed and copied at the SEC’s Public Reference Room in Washington, DC. Information on the operation of the Public Reference Room may be obtained by calling 1-800-SEC-0330.
A description of the policies and procedures that the fund uses to determine how to vote proxies relating to portfolio securities, and information regarding how the fund voted these proxies for the most recent 12-month period ended June 30 is available at http://www.dreyfus.com and on the SEC’s website at http://www.sec.gov. The description of the policies and procedures is also available without charge, upon request, by calling 1-800-DREYFUS.

| Dreyfus/The Boston |
| Company Large Cap |
| Core Fund |
ANNUAL REPORT September 30, 2011
Save time. Save paper. View your next shareholder report online as soon as it’s available. Log into www.dreyfus.com and sign up for Dreyfus eCommunications. It’s simple and only takes a few minutes.
The views expressed in this report reflect those of the portfolio manager only through the end of the period covered and do not necessarily represent the views of Dreyfus or any other person in the Dreyfus organization. Any such views are subject to change at any time based upon market or other conditions and Dreyfus disclaims any responsibility to update such views.These views may not be relied on as investment advice and, because investment decisions for a Dreyfus fund are based on numerous factors, may not be relied on as an indication of trading intent on behalf of any Dreyfus fund.
Not FDIC-Insured • Not Bank-Guaranteed • May Lose Value
Contents | |
THE FUND | |
| 2 | A Letter from the Chairman and CEO |
| 3 | Discussion of Fund Performance |
| 6 | Fund Performance |
| 8 | Understanding Your Fund’s Expenses |
| 8 | Comparing Your Fund’s Expenses With Those of Other Funds |
| 9 | Statement of Investments |
| 13 | Statement of Assets and Liabilities |
| 14 | Statement of Operations |
| 15 | Statement of Changes in Net Assets |
| 17 | Financial Highlights |
| 20 | Notes to Financial Statements |
| 32 | Report of Independent Registered Public Accounting Firm |
| 33 | Important Tax Information |
| 34 | Board Members Information |
| 36 | Officers of the Fund |
FOR MORE INFORMATION | |
Back Cover |
Dreyfus/The Boston
Company Large Cap
Core Fund
The Fund

A LETTER FROM THE CHAIRMAN AND CEO
Dear Shareholder:
This annual report for Dreyfus/The Boston Company Large Cap Core Fund covers the 12-month period from October 1, 2010, through September 30, 2011. For information about how the fund performed during the reporting period, as well as general market perspectives, we provide a Discussion of Fund Performance on the pages that follow.
Investors generally were encouraged by expectations of a more robust economic recovery over the first half of the reporting period, but investor sentiment deteriorated sharply during the second half due to disappointing economic data, rising commodity prices, an escalating sovereign debt crisis in Europe and a contentious debate regarding taxes, spending and borrowing in the United States. Market volatility was particularly severe during August and September after a major credit rating agency downgraded U.S. long-term debt. Stocks proved sensitive to macroeconomic concerns in this challenging environment, often regardless of more promising company fundamentals, and most U.S. equity market indices gave back their earlier gains.
The economic outlook currently is clouded by market turbulence and political infighting, but we believe that a continued subpar global expansion is more likely than a return to recession. Inflationary pressures appear to be waning in most countries as energy prices recently have retreated from their highs. In the United States, the Federal Reserve Board has signaled its intention to maintain an aggressively accommodative monetary policy, which may help offset the financial stresses caused by deleveraging in the private sector and fiscal consolidation by governments in the United States and Europe. To assess the potential impact of these and other developments on your investments, we encourage you, as always, to speak with your financial advisor.
Thank you for your continued confidence and support.

Jonathan R. Baum
Chairman and Chief Executive Officer
The Dreyfus Corporation
October 17, 2011
2

DISCUSSION OF FUND PERFORMANCE
For the period of October 1, 2010, through September 30, 2011, as provided by Sean P. Fitzgibbon and Jeffrey D. McGrew, Portfolio Managers
Market and Fund Performance Overview
For the 12-month period ended September 30, 2011, Dreyfus/The Boston Company Large Cap Core Fund’s Class A shares produced a total return of –4.83%, Class C shares returned –5.49% and Class I shares returned –4.56%.1 In comparison, the fund’s benchmark, the Standard & Poor’s 500 Composite Stock Price Index (“S&P 500 Index”), produced a total return of 1.13% for the same period.2 Stocks rallied through the first quarter of 2011 amid expectations of continued economic recovery, but several macroeconomic disappointments later erased the market’s gains.The fund produced lower returns than its benchmark, mainly due to a constructive investment posture when traditionally defensive stocks fared better.
The Fund’s Investment Approach
The fund seeks long-term growth of capital.The fund normally invests at least 80% of its assets in equity securities of large cap companies that appear to be undervalued relative to underlying business fundamentals. The fund currently considers large cap companies to be those with total market capitalizations, at the time of purchase, that are greater than the market capitalizations of companies in the bottom 5% of the capitalization range represented in the S&P 500 Index.The portfolio managers employ a core investment style that incorporates both growth and value criteria in managing the fund’s portfolio.The portfolio managers use a combination of quantitative and fundamental research to identify portfolio candidates.
Shifting Sentiment Sparked Heightened Volatility
Encouraging upturns in economic data and corporate earnings helped support rising stock prices into the first quarter of 2011.Although the rally was interrupted in February 2011 when political unrest in the Middle East led to sharply rising energy prices, and in March when devastating natural and nuclear disasters in Japan threatened the global industrial supply chain, stocks bounced back quickly from these unexpected setbacks.
| The Fund | 3 |
DISCUSSION OF FUND PERFORMANCE (continued)
In late April, investor sentiment began to deteriorate in earnest when Greece appeared headed for default on its sovereign debt, economic data proved disappointing and a contentious debate regarding U.S. government spending and borrowing intensified. In addition, inflation-fighting efforts in China threatened to derail one of the primary engines of global growth. Stocks suffered heightened volatility as newly risk-averse investors shifted their focus to industry groups that historically have held up well under uncertain economic conditions. Market turbulence proved particularly severe in August and September as investors disregarded underlying company fundamentals in favor of reacting to each new headline and release of economic data.
Constructive Posture Hindered Relative Results
Although the fund’s bias toward the more economically sensitive market sectors buoyed relative performance early in the reporting period, it undermined results for the reporting period overall. We took steps to reduce the fund’s risk profile as market conditions deteriorated by reducing holdings as they met price targets and trading out of companies when we became concerned our investment thesis could be threatened by a continued lull in economic activity.
Nonetheless, a number of holdings in the consumer discretionary sector undermined relative performance. Consumer products maker Newell Rubbermaid reduced earnings guidance in anticipation of sluggish consumer spending, cruise line operator Carnival suffered amid rising fuel costs, advertising conglomerate Omnicom Group declined on general economic concerns, and Hong Kong-based leisure and entertainment company Melco Crown Entertainment was hurt by fears of a slowdown in China. In the health care sector, biotechnology firms Amylin Pharmaceuticals, Human Genome Sciences and Dendreon were hurt by negative developments in their efforts to bring new drug therapies to market. The fund’s results in the financials sector were undermined by Bank of America and Citigroup, which continued to struggle with the consequences of past lending missteps. In addition, insurer Lincoln National was hurt by concerns regarding its investment portfolio under challenging market conditions. Our preference for exploration-and-production companies and service companies in the energy sector also weighed on relative performance when integrated oil-and-gas producers fared better.
4
The fund achieved better results among information technology companies, where a focus on emerging trends toward “cloud computing” and wireless devices proved beneficial. Electronics innovator Apple gained value on the popularity of its iPhone and iPad, International Business Machines produced solid results from global consulting services, and Electronic Arts was bolstered by a new product cycle centered on digital downloads of gaming software. In the materials sector, chemical companies such as CF Industries Holdings buoyed relative performance. Similarly, an emphasis on machinery producers—including Caterpillar and Textron—helped drive gains in the industrials sector. Other winners for the reporting period included PPL, NextEra Energy, and Unilever.
Seeing Encouraging Signs of Growth
Global economic turmoil and the recent slowdown in U.S. growth have given us cause for caution. Therefore, we have adopted a more defensive investment posture with an emphasis on risk management. Our cautious outlook is reflected in the fund’s current composition, including underweighted positions in the financials, industrials and materials sectors.We have found more opportunities in the information technology and health care sectors.
October 17, 2011
| Please note, the position in any security highlighted with italicized typeface was sold during the | |
| reporting period. | |
| Equity funds are subject generally to market, market sector, market liquidity, issuer and investment | |
| style risks, among other factors, to varying degrees, all of which are more fully described in the | |
| fund’s prospectus. | |
| 1 | Total return includes reinvestment of dividends and any capital gains paid, and does not take into |
| consideration the maximum initial sales charge in the case of Class A shares, or the applicable | |
| contingent deferred sales charge imposed on redemptions in the case of Class C shares. Had these | |
| charges been reflected, returns would have been lower. Past performance is no guarantee of future | |
| results. Share price and investment return fluctuate such that upon redemption, fund shares may be | |
| worth more or less than their original cost.The fund’s returns reflect the absorption of certain fund | |
| expenses by The Dreyfus Corporation pursuant to an agreement in effect through February 1, | |
| 2012, at which time it may be extended, terminated or modified. Had these expenses not been | |
| absorbed, the fund’s returns would have been lower. | |
| 2 | SOURCE: LIPPER INC. — Reflects the monthly reinvestment of dividends and, where |
| applicable, capital gain distributions. The Standard & Poor’s 500 Composite Stock Price Index | |
| is a widely accepted, unmanaged index of U. S. stock market performance. Index return does not | |
| reflect fees and expenses associated with operating a mutual fund. Investors cannot invest | |
| directly in any index. |
| The Fund | 5 |
FUND PERFORMANCE
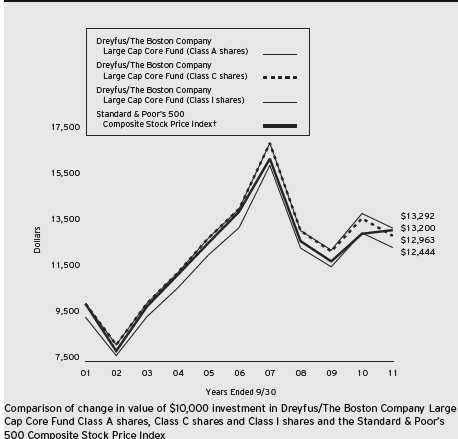
| † | Source: Lipper Inc. |
| †† | The total return figures presented for Class A shares and Class C shares of the fund reflect the performance of the |
| fund’s Class I shares for the period prior to March 31, 2009 (the inception date for Class A shares and Class C | |
| shares respectively), adjusted to reflect the applicable sales load for each share class. | |
| Past performance is not predictive of future performance. | |
| The above graph compares a $10,000 investment made in each of the Class A, Class C and Class I shares of | |
| Dreyfus/The Boston Company Large Cap Core Fund on 9/30/01 to a $10,000 investment made in the | |
| Standard & Poor’s 500 Composite Stock Price Index (the “Index”) on that date. All dividends and capital gain | |
| distributions are reinvested. | |
| The fund’s performance shown in the line graph above takes into account the maximum initial sales charge on Class A | |
| shares and all other applicable fees and expenses on all classes.The Index is a widely accepted, unmanaged Index of U.S. | |
| stock market performance. Unlike a mutual fund, the Index is not subject to charges, fees and other expenses. Investors | |
| cannot invest directly in any index.These factors can contribute to the Index potentially outperforming the fund. Further | |
| information relating to fund performance, including expense reimbursements, if applicable, is contained in the Financial | |
| Highlights section of the prospectus and elsewhere in this report. | |
6
| Average Annual Total Returns as of 9/30/11 | |||||||
| Inception | |||||||
| Date | 1Year | 5 Years | 10 Years | ||||
| Class A shares | |||||||
| with maximum sales charge (5.75%) | 3/31/09 | –10.30% | –2.50%†† | 2.21%†† | |||
| without sales charge | 3/31/09 | –4.83% | –1.34%†† | 2.82%†† | |||
| Class C shares | |||||||
| with applicable redemption charge † | 3/31/09 | –6.43% | –1.70%†† | 2.63%†† | |||
| without redemption | 3/31/09 | –5.49% | –1.70%†† | 2.63%†† | |||
| Class I shares | 1/31/91 | –4.56% | –1.20% | 2.89% | |||
| Standard & Poor’s 500 | |||||||
| Composite Stock Price Index | 1.13% | –1.18% | 2.82% | ||||
Past performance is not predictive of future performance.The fund’s performance shown in the graph and table does not reflect the deduction of taxes that a shareholder would pay on fund distributions or the redemption of fund shares.
| † | The maximum contingent deferred sales charge for Class C shares is 1% for shares redeemed within one year of the |
| date of purchase. | |
| †† | The total return performance figures presented for Class A and Class C shares of the fund reflect the performance of |
| the fund’s Class I shares for the period prior to March 31, 2009 (the inception date for Class A and Class C shares | |
| respectively), adjusted to reflect the applicable sales load for each share class. |
| The Fund | 7 |
UNDERSTANDING YOUR FUND’S EXPENSES (Unaudited)
As a mutual fund investor, you pay ongoing expenses, such as management fees and other expenses. Using the information below, you can estimate how these expenses affect your investment and compare them with the expenses of other funds.You also may pay one-time transaction expenses, including sales charges (loads) and redemption fees, which are not shown in this section and would have resulted in higher total expenses. For more information, see your fund’s prospectus or talk to your financial adviser.
Review your fund’s expenses
The table below shows the expenses you would have paid on a $1,000 investment in Dreyfus/The Boston Company Large Cap Core Fund from April 1, 2011 to September 30, 2011. It also shows how much a $1,000 investment would be worth at the close of the period, assuming actual returns and expenses.
Expenses and Value of a $1,000 Investment
assuming actual returns for the six months ended September 30, 2011
| Class A | Class C | Class I | ||||
| Expenses paid per $1,000† | $ | 5.22 | $ | 8.62 | $ | 4.09 |
| Ending value (after expenses) | $ | 812.00 | $ | 809.20 | $ | 813.20 |
COMPARING YOUR FUND’S EXPENSES
WITH THOSE OF OTHER FUNDS (Unaudited)
Using the SEC’s method to compare expenses
The Securities and Exchange Commission (SEC) has established guidelines to help investors assess fund expenses. Per these guidelines, the table below shows your fund’s expenses based on a $1,000 investment, assuming a hypothetical 5% annualized return. You can use this information to compare the ongoing expenses (but not transaction expenses or total cost) of investing in the fund with those of other funds.All mutual fund shareholder reports will provide this information to help you make this comparison. Please note that you cannot use this information to estimate your actual ending account balance and expenses paid during the period.
Expenses and Value of a $1,000 Investment
assuming a hypothetical 5% annualized return for the six months ended September 30, 2011
| Class A | Class C | Class I | ||||
| Expenses paid per $1,000† | $ | 5.82 | $ | 9.60 | $ | 4.56 |
| Ending value (after expenses) | $ | 1,019.30 | $ | 1,015.54 | $ | 1,020.56 |
| † Expenses are equal to the fund’s annualized expense ratio of 1.15% for Class A, 1.90% for Class C, and .90% |
| for Class I, multiplied by the average account value over the period, multiplied by 183/365 (to reflect the one-half |
| year period). |
8
| STATEMENT OF INVESTMENTS |
| September 30, 2011 |
| Common Stocks—99.2% | Shares | Value ($) | |
| Consumer Discretionary—9.9% | |||
| Carnival | 5,070 | 153,621 | |
| CBS, Cl. B | 11,710 | 238,650 | |
| Deckers Outdoor | 1,770a | 165,070 | |
| DIRECTV, Cl. A | 7,480a | 316,030 | |
| Macy’s | 12,250 | 322,420 | |
| McDonald’s | 4,150 | 364,453 | |
| Melco Crown Entertainment, ADR | 21,230a | 176,421 | |
| Omnicom Group | 10,140 | 373,558 | |
| PVH | 2,750 | 160,160 | |
| 2,270,383 | |||
| Consumer Staples—10.4% | |||
| Coca-Cola Enterprises | 9,990 | 248,551 | |
| ConAgra Foods | 11,360 | 275,139 | |
| Hansen Natural | 2,740a | 239,175 | |
| Kimberly-Clark | 5,130 | 364,281 | |
| Lorillard | 2,510 | 277,857 | |
| Ralcorp Holdings | 3,970a | 304,539 | |
| Unilever, ADR | 21,070 | 657,173 | |
| 2,366,715 | |||
| Energy—11.3% | |||
| Anadarko Petroleum | 4,190 | 264,180 | |
| Apache | 2,270 | 182,145 | |
| Chevron | 7,342 | 679,282 | |
| ENSCO, ADR | 5,380 | 217,513 | |
| Halliburton | 6,720 | 205,094 | |
| Hess | 4,750 | 249,185 | |
| National Oilwell Varco | 6,950 | 355,979 | |
| Occidental Petroleum | 2,740 | 195,910 | |
| TransCanada | 5,790 | 234,437 | |
| 2,583,725 | |||
| Exchange Traded Funds—2.1% | |||
| Standard & Poor’s Depository | |||
| Receipts S&P 500 ETF Trust | 4,270 | 483,151 | |
| The Fund | 9 |
STATEMENT OF INVESTMENTS (continued)
| Common Stocks (continued) | Shares | Value ($) | |
| Financial—11.7% | |||
| American Express | 6,380 | 286,462 | |
| Bank of America | 20,540 | 125,705 | |
| Capital One Financial | 5,380 | 213,209 | |
| Chubb | 2,720 | 163,173 | |
| Citigroup | 10,019 | 256,687 | |
| Discover Financial Services | 5,740 | 131,676 | |
| Hartford Financial Services Group | 10,780 | 173,989 | |
| IntercontinentalExchange | 1,950a | 230,607 | |
| JPMorgan Chase & Co. | 5,800 | 174,696 | |
| Lincoln National | 7,480 | 116,912 | |
| Nasdaq OMX Group | 10,000a | 231,400 | |
| Wells Fargo & Co. | 23,300 | 561,996 | |
| 2,666,512 | |||
| Health Care—15.0% | |||
| Baxter International | 9,800 | 550,172 | |
| CIGNA | 8,170 | 342,650 | |
| Covidien | 8,337 | 367,662 | |
| McKesson | 3,460 | 251,542 | |
| Pfizer | 30,930 | 546,842 | |
| Sanofi, ADR | 15,030 | 492,984 | |
| St. Jude Medical | 5,730 | 207,369 | |
| Warner Chilcott, Cl. A | 12,170a | 174,031 | |
| Watson Pharmaceuticals | 3,050a | 208,162 | |
| Zimmer Holdings | 5,400a | 288,900 | |
| 3,430,314 | |||
| Industrial—6.4% | |||
| Caterpillar | 1,440 | 106,330 | |
| Cummins | 2,410 | 196,801 | |
| Dover | 4,510 | 210,166 | |
| General Electric | 39,740 | 605,638 | |
| Owens Corning | 3,950a | 85,636 | |
| Thomas & Betts | 2,900a | 115,739 | |
10
| Common Stocks (continued) | Shares | Value ($) | |
| Industrial (continued) | |||
| Tyco International | 3,727 | 151,875 | |
| 1,472,185 | |||
| Materials—.5% | |||
| CF Industries Holdings | 930 | 114,753 | |
| Technology—23.3% | |||
| Alliance Data Systems | 1,350a | 125,145 | |
| Amazon.com | 1,810a | 391,376 | |
| Apple | 2,920a | 1,113,046 | |
| BMC Software | 1,880a | 72,493 | |
| Cognizant Technology Solutions, Cl. A | 4,400a | 275,880 | |
| Electronic Arts | 14,560a | 297,752 | |
| EMC | 15,110a | 317,159 | |
| F5 Networks | 2,040a | 144,942 | |
| Informatica | 3,670a | 150,286 | |
| International Business Machines | 2,150 | 376,314 | |
| Intuit | 5,040 | 239,098 | |
| NetApp | 13,810a | 468,711 | |
| Oracle | 13,260 | 381,092 | |
| QUALCOMM | 7,560 | 367,643 | |
| Riverbed Technology | 6,780a | 135,329 | |
| Teradata | 6,141a | 328,728 | |
| VMware, Cl. A | 1,570a | 126,197 | |
| 5,311,191 | |||
| Telecommunication Services—2.8% | |||
| AT&T | 22,070 | 629,436 | |
| Utilities—5.8% | |||
| Exelon | 6,250 | 266,312 | |
| NextEra Energy | 10,650 | 575,313 | |
| PPL | 16,620 | 474,335 | |
| 1,315,960 | |||
| Total Common Stocks | |||
| (cost $23,728,598) | 22,644,325 | ||
| The Fund | 11 |
STATEMENT OF INVESTMENTS (continued)
| Other Investment—1.9% | Shares | Value ($) | ||
| Registered Investment Company; | ||||
| Dreyfus Institutional Preferred | ||||
| Plus Money Market Fund | ||||
| (cost $430,248) | 430,248b | 430,248 | ||
| Total Investments (cost $24,158,846) | 101.1% | 23,074,573 | ||
| Liabilities, Less Cash and Receivables | (1.1%) | (240,785) | ||
| Net Assets | 100.0% | 22,833,788 | ||
| ADR—American Depository Receipts | |
| a | Non-income producing security. |
| b | Investment in affiliated money market mutual fund. |
| Portfolio Summary (Unaudited)† | |||
| Value (%) | Value (%) | ||
| Technology | 23.3 | Utilities | 5.8 |
| Health Care | 15.0 | Telecommunication Services | 2.8 |
| Financial | 11.7 | Exchange Traded Funds | 2.1 |
| Energy | 11.3 | Money Market Investment | 1.9 |
| Consumer Staples | 10.4 | Materials | .5 |
| Consumer Discretionary | 9.9 | ||
| Industrial | 6.4 | 101.1 | |
| † Based on net assets. |
| See notes to financial statements. |
12
| STATEMENT OF ASSETS AND LIABILITIES |
| September 30, 2011 |
| Cost | Value | |||
| Assets ($): | ||||
| Investments in securities—See Statement of Investments: | ||||
| Unaffiliated issuers | 23,728,598 | 22,644,325 | ||
| Affiliated issuers | 430,248 | 430,248 | ||
| Cash | 1,427 | |||
| Receivable for investment securities sold | 302,669 | |||
| Dividends receivable | 30,474 | |||
| Prepaid expenses | 11,546 | |||
| 23,420,689 | ||||
| Liabilities ($): | ||||
| Due to The Dreyfus Corporation and affiliates—Note 3(c) | 36,429 | |||
| Payable for investment securities purchased | 514,289 | |||
| Accrued expenses | 36,183 | |||
| 586,901 | ||||
| Net Assets ($) | 22,833,788 | |||
| Composition of Net Assets ($): | ||||
| Paid-in capital | 35,596,947 | |||
| Accumulated undistributed investment income—net | 229,952 | |||
| Accumulated net realized gain (loss) on investments | (11,908,838) | |||
| Accumulated net unrealized appreciation | ||||
| (depreciation) on investments | (1,084,273) | |||
| Net Assets ($) | 22,833,788 | |||
| Net Asset Value Per Share | ||||
| Class A | Class C | Class I | ||
| Net Assets ($) | 281,829 | 21,754 | 22,530,205 | |
| Shares Outstanding | 9,507 | 739 | 757,668 | |
| Net Asset Value Per Share ($) | 29.64 | 29.44 | 29.74 | |
| See notes to financial statements. | ||||
| The Fund | 13 |
| STATEMENT OF OPERATIONS |
| Year Ended September 30, 2011 |
| Investment Income ($): | ||
| Income: | ||
| Cash dividends (net of $4,079 foreign taxes withheld at source): | ||
| Unaffiliated issuers | 515,053 | |
| Affiliated issuers | 212 | |
| Total Income | 515,265 | |
| Expenses: | ||
| Investment advisory fee—Note 3(a) | 146,164 | |
| Auditing fees | 46,711 | |
| Shareholder servicing costs—Note 3(c) | 40,379 | |
| Accounting and administration fees—Note 3(a) | 33,250 | |
| Registration fees | 37,477 | |
| Custodian fees—Note 3(c) | 29,802 | |
| Administration fees—Note 3(a) | 6,632 | |
| Prospectus and shareholders’ reports | 2,536 | |
| Trustees’ fees and expenses—Note 3(d) | 1,723 | |
| Legal fees | 1,545 | |
| Interest expense—Note 2 | 433 | |
| Loan commitment fees—Note 2 | 361 | |
| Distribution fees—Note 3(b) | 186 | |
| Miscellaneous | 13,201 | |
| Total Expenses | 360,400 | |
| Less—reduction in investment advisory fee | ||
| due to undertaking—Note 3(a) | (96,177) | |
| Less—reduction in fees due to earnings credits—Note 3(c) | (6) | |
| Net Expenses | 264,217 | |
| Investment Income—Net | 251,048 | |
| Realized and Unrealized Gain (Loss) on Investments—Note 4 ($): | ||
| Net realized gain (loss) on investments | 4,372,021 | |
| Net unrealized appreciation (depreciation) on investments | (4,756,534) | |
| Net Realized and Unrealized Gain (Loss) on Investments | (384,513) | |
| Net (Decrease) in Net Assets Resulting from Operations | (133,465) | |
| See notes to financial statements. | ||
14
STATEMENT OF CHANGES IN NET ASSETS
| Year Ended September 30, | ||||
| 2011 | 2010 | |||
| Operations ($): | ||||
| Investment income—net | 251,048 | 257,087 | ||
| Net realized gain (loss) on investments | 4,372,021 | 3,595,387 | ||
| Net unrealized appreciation | ||||
| (depreciation) on investments | (4,756,534) | 200,923 | ||
| Net Increase (Decrease) in Net Assets | ||||
| Resulting from Operations | (133,465) | 4,053,397 | ||
| Dividends to Shareholders from ($): | ||||
| Investment income—net: | ||||
| Class A Shares | (447) | (50) | ||
| Class I Shares | (275,220) | (131,718) | ||
| Total Dividends | (275,667) | (131,768) | ||
| Beneficial Interest Transactions ($): | ||||
| Net proceeds from shares sold: | ||||
| Class A Shares | 318,243 | 30,030 | ||
| Class C Shares | 22,020 | — | ||
| Class I Shares | 4,188,092 | 3,840,994 | ||
| Dividends reinvested: | ||||
| Class A Shares | 339 | 8 | ||
| Class I Shares | 195,227 | 76,544 | ||
| Cost of shares redeemed: | ||||
| Class A Shares | (29,950) | — | ||
| Class C Shares | (13,242) | — | ||
| Class I Shares | (12,764,826) | (11,133,307) | ||
| Increase (Decrease) in Net Assets from | ||||
| Beneficial Interest Transactions | (8,084,097) | (7,185,731) | ||
| Total Increase (Decrease) in Net Assets | (8,493,229) | (3,264,102) | ||
| Net Assets ($): | ||||
| Beginning of Period | 31,327,017 | 34,591,119 | ||
| End of Period | 22,833,788 | 31,327,017 | ||
| Undistributed investment income—net | 229,952 | 254,992 | ||
| The Fund | 15 |
STATEMENT OF CHANGES IN NET ASSETS (continued)
| Year Ended September 30, | ||||
| 2011 | 2010 | |||
| Capital Share Transactions: | ||||
| Class A | ||||
| Shares sold | 8,911 | 994 | ||
| Shares issued for dividends reinvested | 10 | —a | ||
| Shares redeemed | (979) | — | ||
| Net Increase (Decrease) in Shares Outstanding | 7,942 | 994 | ||
| Class C | ||||
| Shares sold | 621 | — | ||
| Shares redeemed | (367) | — | ||
| Net Increase (Decrease) in Shares Outstanding | 254 | — | ||
| Class I | ||||
| Shares sold | 119,747 | 129,178 | ||
| Shares issued for dividends reinvested | 5,778 | 2,637 | ||
| Shares redeemed | (362,891) | (373,140) | ||
| Net Increase (Decrease) in Shares Outstanding | (237,366) | (241,325) | ||
| a Amount represents less than 1 share. | ||||
| See notes to financial statements. | ||||
16
FINANCIAL HIGHLIGHTS
The following tables describe the performance for each share class for the fiscal periods indicated.All information (except portfolio turnover rate) reflects financial results for a single fund share.Total return shows how much your investment in the fund would have increased (or decreased) during each period, assuming you had reinvested all dividends and distributions.These figures have been derived from the fund’s financial statements.
| Year Ended September 30, | ||||||
| Class A Shares | 2011 | 2010 | 2009a | |||
| Per Share Data ($): | ||||||
| Net asset value, beginning of period | 31.35 | 27.93 | 20.60 | |||
| Investment Operations: | ||||||
| Investment income—netb | .24 | .16 | .09 | |||
| Net realized and unrealized | ||||||
| gain (loss) on investments | (1.73) | 3.35 | 7.43 | |||
| Total from Investment Operations | (1.49) | 3.51 | 7.52 | |||
| Distributions: | ||||||
| Dividends from investment income—net | (.22) | (.09) | (.19) | |||
| Net asset value, end of period | 29.64 | 31.35 | 27.93 | |||
| Total Return (%)c | (4.83) | 12.58 | 36.67d | |||
| Ratios/Supplemental Data (%): | ||||||
| Ratio of total expenses to average net assets | 1.76 | 1.43 | 4.43e | |||
| Ratio of net expenses to average net assets | 1.15 | 1.15 | 1.15e | |||
| Ratio of net investment income | ||||||
| to average net assets | .67 | .53 | .74e | |||
| Portfolio Turnover Rate | 85.58 | 82.28 | 116.21 | |||
| Net Assets, end of period ($ x 1,000) | 282 | 49 | 16 | |||
| a | From March 31, 2009 (commencement of initial offering) to September 30, 2009. |
| b | Based on average shares outstanding at each month end. |
| c | Exclusive of sales charge. |
| d | Not annualized. |
| e | Annualized. |
See notes to financial statements.
| The Fund | 17 |
FINANCIAL HIGHLIGHTS (continued)
| Year Ended September 30, | ||||||
| Class C Shares | 2011 | 2010 | 2009a | |||
| Per Share Data ($): | ||||||
| Net asset value, beginning of period | 31.14 | 27.87 | 20.60 | |||
| Investment Operations: | ||||||
| Investment income (loss)—netb | (.05) | (.06) | .00c | |||
| Net realized and unrealized | ||||||
| gain (loss) on investments | (1.65) | 3.33 | 7.41 | |||
| Total from Investment Operations | (1.70) | 3.27 | 7.41 | |||
| Distributions: | ||||||
| Dividends from investment income—net | — | — | (.14) | |||
| Net asset value, end of period | 29.44 | 31.14 | 27.87 | |||
| Total Return (%)d | (5.49) | 11.73 | 36.16e | |||
| Ratios/Supplemental Data (%): | ||||||
| Ratio of total expenses to average net assets | 2.28 | 2.40 | 3.45f | |||
| Ratio of net expenses to average net assets | 1.90 | 1.90 | 1.90f | |||
| Ratio of net investment income | ||||||
| (loss) to average net assets | (.15) | (.19) | .01f | |||
| Portfolio Turnover Rate | 85.58 | 82.28 | 116.21 | |||
| Net Assets, end of period ($ x 1,000) | 22 | 15 | 14 | |||
| a | From March 31, 2009 (commencement of initial offering) to September 30, 2009. |
| b | Based on average shares outstanding at each month end. |
| c | Amount represents less than $.01 per share. |
| d | Exclusive of sales charge. |
| e | Not annualized. |
| f | Annualized. |
See notes to financial statements.
18
| Year Ended September 30, | ||||||||||
| Class I Shares | 2011 | 2010 | 2009a | 2008 | 2007 | |||||
| Per Share Data ($): | ||||||||||
| Net asset value, beginning of period | 31.42 | 27.95 | 30.39 | 43.28 | 37.58 | |||||
| Investment Operations: | ||||||||||
| Investment income—netb | .29 | .24 | .34 | .43 | .43 | |||||
| Net realized and unrealized | ||||||||||
| gain (loss) on investments | (1.69) | 3.35 | (2.38) | (9.32)c | 7.01c | |||||
| Total from Investment Operations | (1.40) | 3.59 | (2.04) | (8.89) | 7.44 | |||||
| Distributions: | ||||||||||
| Dividends from investment income—net | (.28) | (.12) | (.40) | (.53) | (.33) | |||||
| Dividends from net realized | ||||||||||
| gain on investments | — | — | — | (3.47) | (1.41) | |||||
| Total Distributions | (.28) | (.12) | (.40) | (4.00) | (1.74) | |||||
| Net asset value, end of period | 29.74 | 31.42 | 27.95 | 30.39 | 43.28 | |||||
| Total Return (%) | (4.56) | 12.87 | (6.43) | (22.41) | 20.27 | |||||
| Ratios/Supplemental Data (%): | ||||||||||
| Ratio of total expenses | ||||||||||
| to average net assets | 1.23 | 1.23 | 1.23 | .84 | .80d | |||||
| Ratio of net expenses | ||||||||||
| to average net assets | .90 | .90 | .91 | .84 | .80d | |||||
| Ratio of net investment income | ||||||||||
| to average net assets | .86 | .81 | 1.43 | 1.17 | 1.05 | |||||
| Portfolio Turnover Rate | 85.58 | 82.28 | 116.21 | 61 | 59e | |||||
| Net Assets, end of period ($ x 1,000) | 22,530 | 31,263 | 34,562 | 59,996 | 122,591 | |||||
| a The fund commenced offering three classes of shares on March 31, 2009.The existing shares were redesignated as |
| Class I shares. |
| b Based on average shares outstanding at each month end. |
| c Amounts include litigation proceeds received by the fund amounting to $.02 and $.04 per share for the year ended |
| September 30, 2008 and 2007, respectively. |
| d For the period October 1, 2006 to September 19, 2007, the ratio includes the fund’s share of the TBC Large Cap |
| Core Portfolio’s (the “Portfolio”) allocated expenses. |
| e On September 19, 2007 the fund, which owned 100% of the Portfolio on such date, withdrew entirely from the |
| Portfolio and received the Portfolio’s securities and cash in exchange for its interest in the Portfolio. Effective |
| September 20, 2007, the fund began investing directly in securities.Portfolio turnover represents combined investment |
| activity of the fund and the Portfolio for the year ended September 30, 2007. |
See notes to financial statements.
| The Fund | 19 |
NOTES TO FINANCIAL STATEMENTS
NOTE 1—Significant Accounting Policies:
Dreyfus/The Boston Company Large Cap Core Fund (the “fund”) is a separate diversified series of Dreyfus Investment Funds (the “Trust”), which is registered under the Investment Company Act of 1940, as amended (the “Act”), as an open-end management investment company and operates as a series company currently offering eleven series, including the fund.The fund’s investment objective is to seek long-term growth of capital. The Dreyfus Corporation (the “Manager” or “Dreyfus”), a wholly-owned subsidiary ofThe Bank of NewYork Mellon Corporation (“BNY Mellon”), serves as the fund’s investment adviser.
MBSC Securities Corporation (the “Distributor”), a wholly-owned subsidiary of the Manager, is the distributor of the fund’s shares. The fund is authorized to issue an unlimited number of $.001 par value shares of Beneficial Interest in each of the following classes of shares: Class A, Class C, and Class I. Class A shares are subject to a sales charge imposed at the time of purchase. Class C shares are subject to a contingent deferred sales charge (“CDSC”) imposed on Class C shares redeemed within one year of purchase. Class I shares are sold primarily to bank trust departments and other financial service providers (including The Bank of New York Mellon, a subsidiary of BNY Mellon and an affiliate of Dreyfus), acting on behalf of customers having a qualified trust or investment account or relationship at such institution, and bear no distribution or shareholder services fees. Class I shares are offered without a front-end sales charge or CDSC. Other differences between the classes include the services offered to, the expenses borne by each class, the allocation of certain transfer agency costs and certain voting rights. Income, expenses (other than expenses attributable to a specific class), and realized and unrealized gains or losses on investments are allocated to each class of shares based on its relative net assets.
20
As of September 30, 2011, MBC Investments Corp., an indirect subsidiary of BNY Mellon, held 485 Class A and 485 Class C shares of the fund.
TheTrust accounts separately for the assets, liabilities and operations of each series. Expenses directly attributable to each series are charged to that series’ operations; expenses which are applicable to all series are allocated among them on a pro rata basis.
The Financial Accounting Standards Board (“FASB”) Accounting Standards Codification (“ASC”) is the exclusive reference of authoritative U.S. generally accepted accounting principles (“GAAP”) recognized by the FASB to be applied by nongovernmental entities. Rules and interpretive releases of the Securities and Exchange Commission (“SEC”) under authority of federal laws are also sources of authoritative GAAP for SEC registrants. The fund’s financial statements are prepared in accordance with GAAP, which may require the use of management estimates and assumptions.Actual results could differ from those estimates.
(a) Portfolio valuation: The fair value of a financial instrument is the amount that would be received to sell an asset or paid to transfer a liability in an orderly transaction between market participants at the measurement date (i.e. the exit price). GAAP establishes a fair value hierarchy that prioritizes the inputs of valuation techniques used to measure fair value.This hierarchy gives the highest priority to unadjusted quoted prices in active markets for identical assets or liabilities (Level 1 measurements) and the lowest priority to unobservable inputs (Level 3 measurements).
Additionally, GAAP provides guidance on determining whether the volume and activity in a market has decreased significantly and whether such a decrease in activity results in transactions that are not
| The Fund | 21 |
NOTES TO FINANCIAL STATEMENTS (continued)
orderly. GAAP requires enhanced disclosures around valuation inputs and techniques used during annual and interim periods.
Various inputs are used in determining the value of the fund’s investments relating to fair value measurements.These inputs are summarized in the three broad levels listed below:
Level 1—unadjusted quoted prices in active markets for identical investments.
Level 2—other significant observable inputs (including quoted prices for similar investments, interest rates, prepayment speeds, credit risk, etc.).
Level 3—significant unobservable inputs (including the fund’s own assumptions in determining the fair value of investments).
The inputs or methodology used for valuing securities are not necessarily an indication of the risk associated with investing in those securities.
Changes in valuation techniques may result in transfers in or out of an assigned level within the disclosure hierarchy. Valuation techniques used to value the fund’s investments are as follows:
Investments in securities are valued at the last sales price on the securities exchange or national securities market on which such securities are primarily traded. Securities listed on the National Market System for which market quotations are available are valued at the official closing price or, if there is no official closing price that day, at the last sales price. Securities not listed on an exchange or the national securities market, or securities for which there were no transactions, are valued at the average of the most recent bid and asked prices, except for open short positions, where the asked price is used for valuation purposes. Bid price is used when no asked price is available. Registered investment companies that are not traded on an exchange are valued at their net asset value. All preceding securities are categorized within Level 1 of the fair value hierarchy.
Fair valuing of securities may be determined with the assistance of a pricing service using calculations based on indices of domestic securities and other appropriate indicators, such as prices of relevant ADRs
22
and futures contracts. Utilizing these techniques may result in transfers between Level 1 and Level 2 of the fair value hierarchy.
When market quotations or official closing prices are not readily available, or are determined not to reflect accurately fair value, such as when the value of a security has been significantly affected by events after the close of the exchange or market on which the security is principally traded (for example, a foreign exchange or market), but before the fund calculates its net asset value, the fund may value these investments at fair value as determined in accordance with the procedures approved by the Board of Trustees. Certain factors may be considered when fair valuing investments such as: fundamental analytical data, the nature and duration of restrictions on disposition, an evaluation of the forces that influence the market in which the securities are purchased and sold, and public trading in similar securities of the issuer or comparable issuers. These securities are either categorized as Level 2 or 3 depending on the relevant inputs used.
For restricted securities where observable inputs are limited, assumptions about market activity and risk are used and are categorized within Level 3 of the fair value hierarchy.
The following is a summary of the inputs used as of September 30, 2011 in valuing the fund’s investments:
| Level 2—Other | Level 3— | |||
| Level 1— | Significant | Significant | ||
| Unadjusted | Observable | Unobservable | ||
| Quoted Prices | Inputs | Inputs | Total | |
| Assets ($) | ||||
| Investments in Securities: | ||||
| Equity Securities— | ||||
| Domestic† | 20,382,646 | — | — | 20,382,646 |
| Equity Securities— | ||||
| Foreign† | 1,778,528 | — | — | 1,778,528 |
| Mutual Funds/ | ||||
| Exchange | ||||
| Traded Funds | 913,399 | — | — | 913,399 |
| † | See Statement of Investments for additional detailed categorizations. |
| The Fund | 23 |
NOTES TO FINANCIAL STATEMENTS (continued)
In May 2011, FASB issued Accounting Standards Update (“ASU”) No. 2011-04 “Amendments to Achieve Common Fair Value Measurement and Disclosure Requirements in GAAP and International Financial Reporting Standards (“IFRS”)” (“ASU 2011-04”). ASU 2011-04 includes common requirements for measurement of and disclosure about fair value between GAAP and IFRS. ASU 2011-04 will require reporting entities to disclose the following information for fair value measurements categorized within Level 3 of the fair value hierarchy: quantitative information about the unobservable inputs used in the fair value measurement, the valuation processes used by the reporting entity and a narrative description of the sensitivity of the fair value measurement to changes in unobservable inputs and the interrelationships between those unobservable inputs. In addition, ASU 2011-04 will require reporting entities to make disclosures about amounts and reasons for all transfers in and out of Level 1 and Level 2 fair value measurements.The new and revised disclosures are effective for interim and annual reporting periods beginning after December 15, 2011. At this time, management is evaluating the implications of ASU 2011-04 and its impact on the financial statements.
(b) Securities transactions and investment income: Securities transactions are recorded on a trade date basis. Realized gains and losses from securities transactions are recorded on the identified cost basis. Dividend income is recognized on the ex-dividend date and interest income, including, where applicable, accretion of discount and amortization of premium on investments, is recognized on the accrual basis.
Investing in foreign markets may involve special risks and considerations not typically associated with investing in the U.S. These risks include revaluation of currencies, high rates of inflation, repatriation restrictions on income and capital, and adverse political and economic developments. Moreover, securities issued in these markets may be less liquid, subject to government ownership controls and delayed settlements, and their prices may be more volatile than those of comparable securities in the U.S.
24
(c) Affiliated issuers: Investments in other investment companies advised by Dreyfus are defined as “affiliated” in the Act.
The fund may invest in shares of certain affiliated investment companies also advised or managed by Dreyfus. Investments in affiliated investment companies for the period ended September 30, 2011 were as follows:
| Affiliated | |||||||
| Investment | Value | Value | Net | ||||
| Company | 9/30/2010 | ($) | Purchases ($) | Sales ($) | 9/30/2011 | ($) | Assets (%) |
| Dreyfus | |||||||
| Institutional | |||||||
| Preferred | |||||||
| Plus Money | |||||||
| Market Fund | 55,809 | 8,362,443 | 7,988,004 | 430,248 | 1.9 |
(d) Dividends to shareholders: Dividends are recorded on the ex-dividend date. Dividends from investment income-net and dividends from net realized capital gains, if any, are normally declared and paid annually, but the fund may make distributions on a more frequent basis to comply with the distribution requirements of the Internal Revenue Code of 1986, as amended (the “Code”).To the extent that net realized capital gains can be offset by capital loss carryovers, it is the policy of the fund not to distribute such gains. Income and capital gain distributions are determined in accordance with income tax regulations, which may differ from GAAP.
(e) Federal income taxes: It is the policy of the fund to continue to qualify as a regulated investment company, if such qualification is in the best interests of its shareholders, by complying with the applicable provisions of the Code, and to make distributions of taxable income sufficient to relieve it from substantially all federal income and excise taxes.
As of and during the period ended September 30, 2011, the fund did not have any liabilities for any uncertain tax positions.The fund recognizes interest and penalties, if any, related to uncertain tax positions as income tax expense in the Statement of Operations. During the period, the fund did not incur any interest or penalties.
| The Fund | 25 |
NOTES TO FINANCIAL STATEMENTS (continued)
Each of the tax years in the four-year period ended September 30, 2011 remains subject to examination by the Internal Revenue Service and state taxing authorities.
At September 30, 2011, the components of accumulated earnings on a tax basis were as follows: undistributed ordinary income $229,952, accumulated capital losses $11,850,502 and unrealized depreciation $1,142,609.
The accumulated capital loss carryover is available for federal income tax purposes to be applied against future net securities profits, if any, realized subsequent to September 30, 2011. If not applied, $2,334,766 of the carryover expires in fiscal 2017 and $9,515,736 expires in fiscal 2018.
Under the recently enacted Regulated Investment Company Modernization Act of 2010 (the “2010 Act”), the fund will be permitted to carry forward capital losses incurred in taxable years beginning after December 22, 2010 (“post-enactment losses”) for an unlimited period. However, the 2010 Act requires post-enactment losses to be utilized before the utilization of losses incurred in taxable years prior to the effective date of the 2010 Act. As a result of this ordering rule, capital loss carryovers related to taxable years beginning prior to the effective date of the 2010 Act may be more likely to expire unused.
The tax character of distributions paid to shareholders during the fiscal periods ended September 30, 2011 and September 30, 2010 were as follows: ordinary income $275,667 and $131,768, respectively.
During the period ended September 30, 2011, as a result of permanent book to tax differences, primarily due to the tax treatment for a return of capital distribution, the fund decreased accumulated undistributed investment income-net by $421 and increased accumulated net realized gain (loss) on investments by the same amount. Net assets and net asset value per share were not affected by this reclassification.
NOTE 2—Bank Lines of Credit:
The fund participates with other Dreyfus-managed funds in a $225 million unsecured credit facility led by Citibank, N.A. and a $300 mil-
26
lion unsecured credit facility provided by The Bank of New York Mellon (each, a “Facility”), each to be utilized primarily for temporary or emergency purposes, including the financing of redemptions. In connection therewith, the fund has agreed to pay its pro rata portion of commitment fees for each Facility. Interest is charged to the fund based on rates determined pursuant to the terms of the respective Facility at the time of borrowing.
The average amount of borrowings outstanding under the Facilities during the period ended September 30, 2011 was approximately $30,400 with a related weighted average annualized interest rate of 1.43%.
NOTE 3—Investment Advisory Fee and Other Transactions with Affiliates:
(a) Pursuant to an investment advisory agreement with the Manager, the investment advisory fee is computed at the annual rate of .50% of the value of the fund’s average daily net assets and is payable monthly.
The Manager has agreed, until February 1, 2013, to waive receipt of its fees and/or assume the expenses of the fund so that the fund’s total operating expenses (excluding Rule 12b-1 fees, shareholder services fees, taxes, interest, brokerage commissions, acquired fund fees and extraordinary expenses) do not exceed .90% of the value of the fund’s average daily net assets.The reduction in investment advisory fee, pursuant to the undertaking, amounted to $96,177 during the period ended September 30, 2011.
From October 1, 2010 through April 30, 2011, the Trust had an agreement with The Bank of New York Mellon, pursuant to which The Bank of NewYork Mellon provided administration and fund accounting services for the fund. For these services, the fund paid The Bank of New York Mellon a fixed fee plus asset and transaction based fees, as well as out-of-pocket expenses. Pursuant to this agreement, the fund was charged $33,250 during the period October 1, 2010 through April 30, 2011 for administration and fund accounting services.
| The Fund | 27 |
NOTES TO FINANCIAL STATEMENTS (continued)
At Board Meetings of the Trust held on February 15-16, 2011, the Board of Trustees of the Trust terminated the agreement with The Bank of New York Mellon and, on behalf of the Trust, entered into a Fund Accounting and Administration Agreement (the “Administration Agreement”) with Dreyfus, effective May 1, 2011, whereby Dreyfus performs administrative, accounting and recordkeeping services for the fund. The fund has agreed to compensate Dreyfus for providing accounting services, administration, compliance monitoring, regulatory and shareholder reporting, as well as related facilities, equipment and clerical help.The fee is based on the fund’s average daily net assets and computed at the following annual rates: .06% of the first $500 million, .04% of the next $500 million and .02% in excess of $1 billion.
In addition, after applying any expense limitations or fee waivers that reduce the fees paid to Dreyfus for this service, Dreyfus has contractually agreed in writing to waive any remaining fees for this service to the extent that they exceed both Dreyfus’ costs in providing these services and a reasonable allocation of the costs incurred by Dreyfus and its affiliates related to the support and oversight of these services.The fund also reimburses Dreyfus for the out-of-pocket expenses Dreyfus incurs in performing this service for the fund. Pursuant to the Administration Agreement, the fund was charged $6,632 during the period May 1, 2011 through September 30, 2011.
During the period ended September 30, 2011, the Distributor retained $72 from commissions earned on sales of the fund’s Class A shares.
(b) Under the Distribution Plan (the “Plan”) adopted pursuant to Rule 12b-1 under the Act, Class C shares pay the Distributor for distributing its shares at an annual rate of .75% of the value of the average daily net assets of Class C shares. During the period ended September 30, 2011, Class C shares were charged $186 pursuant to the Plan.
(c) Under the Shareholder Services Plan, Class A and Class C shares pay the Distributor at the annual rate of .25% of the value of their average daily net assets for the provision of certain services. The services provided may include personal services relating to shareholder accounts,
28
such as answering shareholder inquiries regarding the fund and providing reports and other information, and services related to the maintenance of shareholder accounts.The Distributor may make payments to Service Agents (a securities dealer, financial institution or other industry professional) in respect of these services.The Distributor determines the amounts to be paid to Service Agents. During the period ended September 30, 2011, Class A and Class C shares were charged $580 and $62, respectively, pursuant to the Shareholder Services Plan.
The fund compensates Dreyfus Transfer, Inc., a wholly-owned subsidiary of the Manager, under a transfer agency agreement for providing personnel and facilities to perform transfer agency services for the fund. During the period ended September 30, 2011, the fund was charged $1,528 pursuant to the transfer agency agreement, which is included in Shareholder servicing costs in the Statement of Operations.
The fund has arrangements with the custodian and cash management bank whereby the fund may receive earnings credits when positive cash balances are maintained, which are used to offset custody and cash management fees. For financial reporting purposes, the fund includes net earnings credits as an expense offset in the Statement of Operations.
The fund compensates The Bank of New York Mellon under cash management agreements for performing cash management services related to fund subscriptions and redemptions. During the period ended September 30, 2011, the fund was charged $147 pursuant to the cash management agreements, which is included in Shareholder servicing costs in the Statement of Operations.These fees were partially offset by earnings credits which amounted to $6.
The fund also compensates The Bank of New York Mellon under a custody agreement for providing custodial services for the fund. During the period ended September 30, 2011, the fund was charged $29,802 pursuant to the custody agreement.
During the period ended September 30, 2011, the fund was charged $7,146 for services performed by the Chief Compliance Officer.
| The Fund | 29 |
NOTES TO FINANCIAL STATEMENTS (continued)
The components of “Due to The Dreyfus Corporation and affiliates” in the Statement of Assets and Liabilities consist of: investment advisory fees $15,841, administration fees $1,175, Rule 12b-1 distribution plan fees $14, shareholder services plan fees $65, custodian fees $11,593, chief compliance officer fees $3,750, Private Wealth sub-accounting fees $3,649 and transfer agency per account fees $342.
(d) Each Trustee who is not an “interested person” of the Trust (as defined in the Act) receives $60,000 per annum, plus $7,000 per joint Board meeting of the Trust, The Dreyfus/Laurel Funds, Inc., The Dreyfus/Laurel Funds Trust, The Dreyfus/Laurel Tax-Free Municipal Funds and Dreyfus Funds, Inc. (collectively, the “Board Group Open-End Funds”) attended, $2,500 for separate in-person committee meetings attended which are not held in conjunction with a regularly scheduled Board meeting and $2,000 for Board meetings and separate committee meetings attended that are conducted by telephone. The Board Group Open-End Funds also reimburse each Trustee who is not an “interested person” of the Trust (as defined in the Act) for travel and out-of-pocket expenses. With respect to Board meetings, the Chairman of the Board receives an additional 25% of such compensation (with the exception of reimbursable amounts). The Chair of each of the Board’s committees, unless the Chair also serves as Chair of the Board, receives $1,350 per applicable committee meeting. In the event that there is an in-person joint committee meeting or a joint telephone meeting of the Board Group Open-End Funds and Dreyfus HighYield Strategies Fund (“DHF”), a $2,500 fee is allocated between the Board Group Open-End Funds and DHF.
Effective January 1, 2012, the Board Group Open-End Funds and DHF (collectively, the “Board Group Funds”) will pay each Trustee their respective allocated portions of an annual retainer of $85,000 and a fee of $10,000 for each regularly scheduled Board meeting attended ($75,000 and $8,000, respectively, in the aggregate, prior to January 1, 2012). With respect to the annual retainer and Board meetings of the Board Group Funds, the Chair of the Board will receive an additional 25% of such compensation (with the exception of reimbursable amounts). Each Trustee will receive $2,500 for any separate in-person
30
committee meetings attended, which are not held in conjunction with a regularly scheduled Board meeting, such amount to be allocated among the Board Group Funds, as applicable. In the event that there is a joint telephone meeting of the Board Group Funds, a fee of $2,000 will be allocated among the applicable Board Group Funds, accordingly (prior to January 1, 2012, the fee allocated was $2,500 if the meeting included DHF).The Chair of each of the Board’s committees, unless the Chair also serves as Chair of the Board, will receive $1,500 per applicable committee meeting. Each Emeritus Trustee is entitled to receive an annual retainer of one-half the amount paid as a retainer at the time the Trustee became Emeritus and a per meeting attended fee of one-half the amount paid to Trustees.The Board Group Funds also reimburse each IndependentTrustee and EmeritusTrustees for travel and out-of-pocket expenses.
NOTE 4—Securities Transactions:
The aggregate amount of purchases and sales of investment securities, excluding short-term securities, during the period ended September 30, 2011, amounted to $24,865,394 and $33,062,400, respectively.
At September 30, 2011, the cost of investments for federal income tax purposes was $24,217,182; accordingly, accumulated net unrealized depreciation on investments was $1,142,609, consisting of $1,563,595 gross unrealized appreciation and $2,706,204 gross unrealized depreciation.
NOTE 5—Subsequent Event:
Effective October 27, 2011, the Nominating Committee of the Board of Trustees nominated, and the Board of Trustees approved the election of, Francine J. Bovich as a Trustee of the Trust. A proxy statement will be mailed, on or about November 28, 2011, to Trust shareholders of record as of the close of business November 1, 2011, asking shareholders to consider Ms. Bovich’s election as a Board member of the Trust at a Special Joint Meeting of Shareholders to be held on Wednesday, February 8, 2012.
| The Fund | 31 |
| REPORT OF INDEPENDENT REGISTERED |
| PUBLIC ACCOUNTING FIRM |
To the Board of Trustees and Shareholders of Dreyfus/The Boston Company Large Cap Core Fund:
We have audited the accompanying statement of assets and liabilities of Dreyfus/The Boston Company Large Cap Core Fund (the “Fund”), a series of Dreyfus Investment Funds, including the statement of investments as of September 30, 2011, and the related statement of operations for the year ended, the statements of changes in net assets for each of the years in the two-year period then ended and financial highlights for each of the years in the three-year period then ended.These financial statements and financial highlights are the responsibility of the Fund’s management. Our responsibility is to express an opinion on these financial statements and financial highlights based on our audits. The financial highlights for each of the years in the two-year period ended September 30, 2008 were audited by other independent registered public accountants whose report thereon, dated November 28, 2008, expressed an unqualified opinion on those financial highlights.
We conducted our audits in accordance with the standards of the Public Company Accounting Oversight Board (United States).Those standards require that we plan and perform the audit to obtain reasonable assurance about whether the financial statements and financial highlights are free of material misstatement.An audit also includes examining, on a test basis, evidence supporting the amounts and disclosures in the financial statements. Our procedures included confirmation of securities owned as of September 30, 2011 by correspondence with the custodian and brokers or by other appropriate auditing procedures where replies from brokers were not received.An audit also includes assessing the accounting principles used and significant estimates made by management, as well as evaluating the overall financial statement presentation.We believe that our audits provide a reasonable basis for our opinion.
In our opinion, the financial statements and financial highlights referred to above present fairly, in all material respects, the financial position of Dreyfus/The Boston Company Large Cap Core Fund as of September 30, 2011, and the results of its operations for the year ended, the changes in its net assets for each of the years in the two-year period then ended, and the financial highlights for each of the years in the three-year period then ended, in conformity with U.S. generally accepted accounting principles.

New York, New York
November 23, 2011
32
IMPORTANT TAX INFORMATION (Unaudited)
For federal tax purposes, the fund designates $275,667 as ordinary income dividends paid during the year ended September 30, 2011 as qualified dividend income in accordance with Section 854(b)(1)(B) of the Internal Revenue Code.Also, the fund designates 100% of ordinary income dividends paid during the year ended September 30, 2011 as eligible for the corporate dividends received deduction provided under Section 243 of the Internal Revenue Code in accordance with Section 854(b)(1)(A) of the Internal Revenue Code. Shareholders will receive notification in early 2012 of the percentage applicable to the preparation of their 2011 income tax returns.
| The Fund | 33 |
BOARD MEMBERS INFORMATION (Unaudited)
| Joseph S. DiMartino (67) |
| Chairman of the Board (2008) |
| Principal Occupation During Past 5Years: |
| • Corporate Director and Trustee |
| Other Public Company Board Memberships During Past 5Years: |
| • CBIZ (formerly, Century Business Services, Inc.), a provider of outsourcing functions for small |
| and medium size companies, Director (1997-present) |
| • Sunair Services Corporation, a provider of certain outdoor-related services to homes and |
| businesses, Director (2005-2009) |
| • The Newark Group, a provider of a national market of paper recovery facilities, paperboard |
| mills and paperboard converting plants, Director (2000-2010) |
| No. of Portfolios for which Board Member Serves: 167 |
| ——————— |
| Francine J. Bovich (60)† |
| Board Member (2011) |
| Principal Occupation During Past 5Years: |
| • Trustee,The Bradley Trusts, private trust funds (2011-Present) |
| • Managing Director, Morgan Stanley Investment Management (1993-2010) |
| No. of Portfolios for which Board Member Serves: 14 |
| ——————— |
| James M. Fitzgibbons (77) |
| Board Member (2008) |
| Principal Occupation During Past 5Years: |
| • Corporate Director and Trustee |
| Other Public Company Board Memberships During Past 5Years: |
| • Bill Barrett Corporation, an oil and natural gas exploration company, Director (2004-present) |
| No. of Portfolios for which Board Member Serves: 33 |
| ——————— |
| Kenneth A. Himmel (65) |
| Board Member (2008) |
| Principal Occupation During Past 5Years: |
| • President and CEO, Related Urban Development, a real estate development company (1996-present) |
| • President and CEO, Himmel & Company, a real estate development company (1980-present) |
| • CEO,American Food Management, a restaurant company (1983-present) |
| No. of Portfolios for which Board Member Serves: 33 |
34
| Stephen J. Lockwood (64) |
| Board Member (2008) |
| Principal Occupation During Past 5Years: |
| • Chairman of the Board, Stephen J. Lockwood and Company LLC, a real estate investment |
| company (2000-present) |
| No. of Portfolios for which Board Member Serves: 33 |
| ——————— |
| Roslyn M. Watson (61) |
| Board Member (2008) |
| Principal Occupation During Past 5Years: |
| • Principal,Watson Ventures, Inc., a real estate investment company (1993-present) |
| No. of Portfolios for which Board Member Serves: 43 |
| ——————— |
| Benaree Pratt Wiley (65) |
| Board Member (2008) |
| Principal Occupation During Past 5Years: |
| • Principal,TheWiley Group, a firm specializing in strategy and business development (2005-present) |
| Other Public Company Board Memberships During Past 5Years: |
| • CBIZ (formerly, Century Business Services, Inc.), a provider of outsourcing functions for small |
| and medium size companies, Director (2008-present) |
| No. of Portfolios for which Board Member Serves: 68 |
| ——————— |
† Ms. Bovich was elected as a Board Member by the Board of Trustees, effective October 27, 2011. See Note 5.
Once elected all Board Members serve for an indefinite term, but achieve Emeritus status upon reaching age 80.The address of the Board Members and Officers is in c/o The Dreyfus Corporation, 200 Park Avenue, NewYork, NewYork 10166.Additional information about the Board Members is available in the fund’s Statement of Additional Information which can be obtained from Dreyfus free of charge by calling this toll free number: 1-800-DREYFUS.
| The Fund | 35 |
OFFICERS OF THE FUND (Unaudited)
BRADLEY J. SKAPYAK, President since January 2010.
Chief Operating Officer and a director of the Manager since June 2009. From April 2003 to June 2009, Mr. Skapyak was the head of the Investment Accounting and Support Department of the Manager. He is an officer of 75 investment companies (comprised of 167 portfolios) managed by the Manager. He is 52 years old and has been an employee of the Manager since February 1988.
MICHAEL A. ROSENBERG, Vice President and Secretary since December 2008.
Assistant General Counsel of BNY Mellon, and an officer of 76 investment companies (comprised of 192 portfolios) managed by the Manager. He is 51 years old and has been an employee of the Manager since October 1991.
KIESHA ASTWOOD, Vice President and Assistant Secretary since January 2010.
Counsel of BNY Mellon, and an officer of 76 investment companies (comprised of 192 portfolios) managed by the Manager. She is 38 years old and has been an employee of the Manager since July 1995.
JAMES BITETTO, Vice President and Assistant Secretary since December 2008.
Senior Counsel of BNY Mellon and Secretary of the Manager, and an officer of 76 investment companies (comprised of 192 portfolios) managed by the Manager. He is 45 years old and has been an employee of the Manager since December 1996.
JONI LACKS CHARATAN, Vice President and Assistant Secretary since December 2008.
Senior Counsel of BNY Mellon, and an officer of 76 investment companies (comprised of 192 portfolios) managed by the Manager. She is 55 years old and has been an employee of the Manager since October 1988.
JOSEPH M. CHIOFFI, Vice President and Assistant Secretary since December 2008.
Senior Counsel of BNY Mellon, and an officer of 76 investment companies (comprised of 192 portfolios) managed by the Manager. He is 49 years old and has been an employee of the Manager since June 2000.
KATHLEEN DENICHOLAS, Vice President and Assistant Secretary since January 2010.
Managing Counsel of BNY Mellon, and an officer of 76 investment companies (comprised of 192 portfolios) managed by the Manager. She is 36 years old and has been an employee of the Manager since February 2001.
JANETTE E. FARRAGHER, Vice President and Assistant Secretary since December 2008.
Assistant General Counsel of BNY Mellon, and an officer of 76 investment companies (comprised of 192 portfolios) managed by the Manager. She is 48 years old and has been an employee of the Manager since February 1984.
JOHN B. HAMMALIAN, Vice President and Assistant Secretary since December 2008.
Senior Managing Counsel of BNY Mellon, and an officer of 76 investment companies (comprised of 192 portfolios) managed by the Manager. He is 48 years old and has been an employee of the Manager since February 1991.
M. CRISTINA MEISER, Vice President and Assistant Secretary since January 2010.
Senior Counsel of BNY Mellon, and an officer of 76 investment companies (comprised of 192 portfolios) managed by the Manager. She is 41 years old and has been an employee of the Manager since August 2001.
36
ROBERT R. MULLERY, Vice President and Assistant Secretary since December 2008.
Managing Counsel of BNY Mellon, and an officer of 76 investment companies (comprised of 192 portfolios) managed by the Manager. He is 59 years old and has been an employee of the Manager since May 1986.
JEFF PRUSNOFSKY, Vice President and Assistant Secretary since December 2008.
Senior Managing Counsel of BNY Mellon, and an officer of 76 investment companies (comprised of 192 portfolios) managed by the Manager. He is 46 years old and has been an employee of the Manager since October 1990.
JAMES WINDELS, Treasurer since December 2008.
Director – Mutual Fund Accounting of the Manager, and an officer of 76 investment companies (comprised of 192 portfolios) managed by the Manager. He is 53 years old and has been an employee of the Manager since April 1985.
RICHARD CASSARO, Assistant Treasurer since December 2008.
Senior Accounting Manager – Money Market and Municipal Bond Funds of the Manager, and an officer of 76 investment companies (comprised of 192 portfolios) managed by the Manager. He is 52 years old and has been an employee of the Manager since September 1982.
GAVIN C. REILLY, Assistant Treasurer since December 2008.
Tax Manager of the Investment Accounting and Support Department of the Manager, and an officer of 76 investment companies (comprised of 192 portfolios) managed by the Manager. He is 43 years old and has been an employee of the Manager since April 1991.
ROBERT ROBOL, Assistant Treasurer since December 2008.
Senior Accounting Manager – Fixed Income Funds of the Manager, and an officer of 76 investment companies (comprised of 192 portfolios) managed by the Manager. He is 47 years old and has been an employee of the Manager since October 1988.
ROBERT SALVIOLO, Assistant Treasurer since December 2008.
Senior Accounting Manager – Equity Funds of the Manager, and an officer of 76 investment companies (comprised of 192 portfolios) managed by the Manager. He is 44 years old and has been an employee of the Manager since June 1989.
ROBERT SVAGNA, Assistant Treasurer since December 2008.
Senior Accounting Manager – Equity Funds of the Manager, and an officer of 76 investment companies (comprised of 192 portfolios) managed by the Manager. He is 44 years old and has been an employee of the Manager since November 1990.
| The Fund | 37 |
OFFICERS OF THE FUND (Unaudited) (continued)
JOSEPH W. CONNOLLY, Chief Compliance Officer since December 2008.
Chief Compliance Officer of the Manager and The Dreyfus Family of Funds (76 investment companies, comprised of 192 portfolios). From November 2001 through March 2004, Mr. Connolly was first Vice-President, Mutual Fund Servicing for Mellon Global Securities Services. In that capacity, Mr. Connolly was responsible for managing Mellon’s Custody, Fund Accounting and Fund Administration services to third-party mutual fund clients. He is 54 years old and has served in various capacities with the Manager since 1980, including manager of the firm’s Fund Accounting Department from 1997 through October 2001.
STEPHEN J. STOREN, Anti-Money Laundering Compliance Officer since May 2011.
Chief Compliance Officer of the Distributor, and the Anti-Money Laundering Compliance Officer of 72 investment companies (comprised of 188 portfolios) managed by the Manager. He is 57 years old and has been an employee of the Distributor since October 1999.
38
NOTES
For More Information
Telephone Call your financial representative or 1-800-DREYFUS
Mail The Dreyfus Family of Funds, 144 Glenn Curtiss Boulevard, Uniondale, NY 11556-0144
The fund files its complete schedule of portfolio holdings with the Securities and Exchange Commission (“SEC”) for the first and third quarters of each fiscal year on Form N-Q. The fund’s Forms N-Q are available on the SEC’s website at http://www.sec.gov and may be reviewed and copied at the SEC’s Public Reference Room in Washington, DC. Information on the operation of the Public Reference Room may be obtained by calling 1-800-SEC-0330.
A description of the policies and procedures that the fund uses to determine how to vote proxies relating to portfolio securities, and information regarding how the fund voted these proxies for the most recent 12-month period ended June 30 is available at http://www.dreyfus.com and on the SEC’s website at http://www.sec.gov. The description of the policies and procedures is also available without charge, upon request, by calling 1-800-DREYFUS.

| Dreyfus/The Boston |
| Company Small Cap |
| Growth Fund |
ANNUAL REPORT September 30, 2011
Save time. Save paper. View your next shareholder report online as soon as it’s available. Log into www.dreyfus.com and sign up for Dreyfus eCommunications. It’s simple and only takes a few minutes.
The views expressed in this report reflect those of the portfolio manager only through the end of the period covered and do not necessarily represent the views of Dreyfus or any other person in the Dreyfus organization. Any such views are subject to change at any time based upon market or other conditions and Dreyfus disclaims any responsibility to update such views.These views may not be relied on as investment advice and, because investment decisions for a Dreyfus fund are based on numerous factors, may not be relied on as an indication of trading intent on behalf of any Dreyfus fund.
Not FDIC-Insured • Not Bank-Guaranteed • May Lose Value
Contents | |
THE FUND | |
| 2 | A Letter from the Chairman and CEO |
| 3 | Discussion of Fund Performance |
| 6 | Fund Performance |
| 7 | Understanding Your Fund’s Expenses |
| 7 | Comparing Your Fund’s Expenses With Those of Other Funds |
| 8 | Statement of Investments |
| 13 | Statement of Assets and Liabilities |
| 14 | Statement of Operations |
| 15 | Statement of Changes in Net Assets |
| 16 | Financial Highlights |
| 17 | Notes to Financial Statements |
| 28 | Report of Independent Registered Public Accounting Firm |
| 29 | Information About the Renewal of the Fund’s Investment Advisory Agreement |
| 34 | Board Members Information |
| 36 | Officers of the Fund |
FOR MORE INFORMATION | |
Back Cover |
Dreyfus/The Boston
Company Small Cap
Growth Fund
The Fund

A LETTER FROM THE CHAIRMAN AND CEO
Dear Shareholder:
This annual report for Dreyfus/The Boston Company Small Cap Growth Fund covers the 12-month period from October 1, 2010, through September 30, 2011. For information about how the fund performed during the reporting period, as well as general market perspectives, we provide a Discussion of Fund Performance on the pages that follow.
Investors generally were encouraged by expectations of a more robust economic recovery over the first half of the reporting period, but investor sentiment deteriorated sharply during the second half due to disappointing economic data, rising commodity prices, an escalating sovereign debt crisis in Europe and a contentious debate regarding taxes, spending and borrowing in the United States. Market volatility was particularly severe during August and September after a major credit rating agency downgraded U.S. long-term debt. Stocks proved sensitive to macroeconomic concerns in this challenging environment, often regardless of more promising company fundamentals, and most U.S. equity market indices gave back their earlier gains.
The economic outlook currently is clouded by market turbulence and political infighting, but we believe that a continued subpar global expansion is more likely than a return to recession. Inflationary pressures appear to be waning in most countries as energy prices recently have retreated from their highs. In the United States, the Federal Reserve Board has signaled its intention to maintain an aggressively accommodative monetary policy, which may help offset the financial stresses caused by deleveraging in the private sector and fiscal consolidation by governments in the United States and Europe. To assess the potential impact of these and other developments on your investments, we encourage you, as always, to speak with your financial advisor.
Thank you for your continued confidence and support.

Jonathan R. Baum
Chairman and Chief Executive Officer
The Dreyfus Corporation
October 17, 2011
2

DISCUSSION OF FUND PERFORMANCE
For the period from October 1, 2010, through September 30, 2011, as provided by B. Randall Watts and P. Hans Von Der Luft, Portfolio Managers
Fund and Market Performance Overview
For the 12-month period ended September 30, 2011, Dreyfus/The Boston Company Small Cap Growth Fund produced a total return of –0.99%.1 In comparison, the fund’s benchmark, the Russell 2000 Growth Index (the “Index”), produced a total return of –1.12% for the same period.2
Small-cap stocks rallied through the first quarter of 2011 amid expectations of continued economic recovery, but several macroeconomic disappointments later erased those gains. The fund produced a return that was roughly in line with its benchmark, as strong stock selections in the health care and energy sectors were balanced by disappointments in the information technology and consumer staples sectors.
The Fund’s Investment Approach
The fund seeks long-term growth of capital. To pursue its goal, the fund normally invests at least 80% of its assets in equity securities of small-cap U.S. companies with total market capitalizations, at the time of purchase, equal to or less than that of the largest company in the Index.When choosing stocks, we seek to identify high-quality, small-cap companies that are experiencing or are expected to experience rapid current or expected earnings or revenue growth.We employ fundamental research to identify companies with attractive characteristics, such as strong business and competitive positions, solid cash flows and balance sheets, high-quality management and high sustainable growth. We also may invest in companies that our research indicates will experience accelerating revenues and expanding operating margins.
Shifting Sentiment Sparked Heightened Volatility
Investors’ outlooks had improved markedly during the final months of 2010 after the Federal Reserve Board announced a second round of quantitative easing to jump-start the U.S. economy. Subsequent upturns
| The Fund | 3 |
DISCUSSION OF FUND PERFORMANCE (continued)
in economic data and corporate earnings supported rising stock prices into the first quarter of 2011 as investors looked forward to a more robust economic recovery.The rally was interrupted in February when political unrest in the Middle East led to sharply rising energy prices, and in March when devastating natural and nuclear disasters in Japan threatened the global industrial supply chain. Still, stocks generally recovered quickly from these unexpected shocks.
In late April, investor sentiment began to deteriorate in earnest when Greece appeared headed for default and other European countries struggled with a resurgent sovereign debt crisis. Closer to home, investors grew worried when U.S. economic data proved disappointing and a contentious debate in Congress regarding government spending and borrowing intensified. Stocks suffered bouts of heightened volatility as newly risk-averse investors shifted their focus to industry groups that historically have held up well under uncertain economic conditions. Market turbulence was particularly severe in August and September, driving the benchmark into negative territory for the reporting period overall.Within the small-cap market, growth stocks generally produced higher returns than value stocks over the reporting period.
Stock Selections Produced Mixed Results
In this challenging investment climate, our security selection strategy drove above-average returns in several market sectors.Among health care companies, biotechnology was among the strongest portfolio segments. For example, viral infections specialist Pharmasset expanded its trials of a new medicine for Hepatitis C, and Alexion Pharmaceuticals gained value in anticipation of new uses for its treatment for a chronic blood disease. Among health care service providers, pharmacy benefit management firm Catalyst Health Solutions achieved better-than-expected financial results despite prevailing economic headwinds. In the energy sector, relative performance was buoyed by exploration-and-production company Gulfport Energy, which increased its natural gas production capacity.
A handful of disappointments offset the positive impact of the fund’s winners on relative performance. In the information technology sector, economic concerns later in the reporting period sparked a pullback in video infrastructure systems provider Harmonic, which reduced its
4
earnings guidance. Digital optical networking specialist Infinera also reduced future earnings guidance, and technical and management consulting services provider Acxiom was hurt by the loss of a major outsourcing customer. Among consumer staples companies, bottled water purveyor Primo Water missed quarterly sales estimates due to delays in product roll-out shipments to two national retail chains.
Focusing on Underlying Fundamentals
We expect economic headwinds to persist and equity markets to stay volatile, suggesting that investors may continue to respond primarily to macroeconomic developments over the near term. Still, we remain committed to our fundamentals-based investment process, which we believe will remain effective over the longer term. Indeed, it is worth noting that, historically, companies that can grow faster than average have become scarcer, and therefore more valuable, during economic downturns. Our security selection process has identified a number of growing small-cap businesses in the health care sector, but we have found fewer opportunities meeting our investment criteria in the information technology sector.
October 17, 2011
| Please note, the position in any security highlighted in italicized typeface was sold during the | |
| reporting period. | |
| Equity funds are subject generally to market, market sector, market liquidity, issuer and investment | |
| style risks, among other factors, to varying degrees, all of which are more fully described in the | |
| fund’s prospectus. | |
| The prices of small company stocks tend to be more volatile than the prices of large company | |
| stocks, mainly because these companies have less established and more volatile earnings histories. | |
| They also tend to be less liquid than larger company stocks. | |
| 1 | Total return includes reinvestment of dividends and any capital gains paid. Past performance is no |
| guarantee of future results. Share price and investment return fluctuate such that upon redemption, | |
| fund shares may be worth more or less than their original cost.The return figure provided reflects the | |
| absorption of certain fund expenses by The Dreyfus Corporation and The Boston Company Asset | |
| Management, LLC. Had these expenses not been absorbed, the return would have been lower. | |
| 2 | SOURCE: LIPPER INC. — The Russell 2000 Growth Index is an unmanaged index, |
| which measures the performance of those Russell 2000 companies with higher price-to-book ratios | |
| and higher forecasted growth values.The total return figure cited for this index assumes change in | |
| security prices and reinvestment of dividends, but does not reflect the costs of managing a mutual | |
| fund. Investors cannot invest directly in any index. |
| The Fund | 5 |
FUND PERFORMANCE
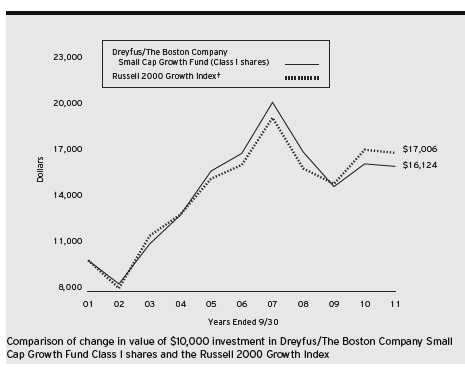
| Average Annual Total Returns as of 9/30/11 | ||||||
| 1Year | 5 Years | 10 Years | ||||
| Class I shares | –0.99% | –1.02% | 4.89% | |||
| Russell 2000 Growth Index | –1.12% | 0.96% | 5.45% | |||
| † Source: Lipper Inc. |
| Past performance is not predictive of future performance.The fund’s performance shown in the graph and table does not |
| reflect the deduction of taxes that a shareholder would pay on fund distributions or the redemption of fund shares. |
| The above graph compares a $10,000 investment made in Class I shares of Dreyfus/The Boston Company Small Cap |
| Growth Fund on 9/30/01 to a $10,000 investment made in the Russell 2000 Growth Index (the “Index”) on that |
| date.All dividends and capital gain distributions are reinvested. |
| The fund’s performance shown in the line graph above takes into account all applicable fees and expenses. The Index is |
| an unmanaged index that measures the performance of those Russell 2000 companies (the 2,000 smallest companies |
| in the Russell 3000 Index) with higher price-to-book ratios and higher forecasted growth values. Unlike a mutual fund, |
| the Index is not subject to charges, fees and other expenses. Investors cannot invest directly in any index. These factors |
| can contribute to the Index potentially outperforming the fund. Further information relating to fund performance, |
| including expense reimbursements, if applicable, is contained in the Financial Highlights section of the prospectus and |
| elsewhere in this report. |
6
UNDERSTANDING YOUR FUND’S EXPENSES (Unaudited)
As a mutual fund investor, you pay ongoing expenses, such as management fees and other expenses. Using the information below, you can estimate how these expenses affect your investment and compare them with the expenses of other funds.You also may pay one-time transaction expenses, including sales charges (loads) and redemption fees, which are not shown in this section and would have resulted in higher total expenses. For more information, see your fund’s prospectus or talk to your financial adviser.
Review your fund’s expenses
The table below shows the expenses you would have paid on a $1,000 investment in Dreyfus/The Boston Company Small Cap Growth Fund from April 1, 2011 to September 30, 2011. It also shows how much a $1,000 investment would be worth at the close of the period, assuming actual returns and expenses.
Expenses and Value of a $1,000 Investment
assuming actual returns for the six months ended September 30, 2011
| Expenses paid per $1,000† | $ | 4.35 |
| Ending value (after expenses) | $ | 788.30 |
COMPARING YOUR FUND’S EXPENSES
WITH THOSE OF OTHER FUNDS (Unaudited)
Using the SEC’s method to compare expenses
The Securities and Exchange Commission (SEC) has established guidelines to help investors assess fund expenses. Per these guidelines, the table below shows your fund’s expenses based on a $1,000 investment, assuming a hypothetical 5% annualized return. You can use this information to compare the ongoing expenses (but not transaction expenses or total cost) of investing in the fund with those of other funds.All mutual fund shareholder reports will provide this information to help you make this comparison. Please note that you cannot use this information to estimate your actual ending account balance and expenses paid during the period.
Expenses and Value of a $1,000 Investment
assuming a hypothetical 5% annualized return for the six months ended September 30, 2011
| Expenses paid per $1,000† | $ | 4.91 |
| Ending value (after expenses) | $ | 1,020.21 |
| † Expenses are equal to the fund’s annualized expense ratio of .97% for Class I, multiplied by the average account value |
| over the period, multiplied by 183/365 (to reflect the one-half year period). |
| The Fund | 7 |
| STATEMENT OF INVESTMENTS |
| September 30, 2011 |
| Common Stocks—98.2% | Shares | Value ($) | ||
| Consumer Discretionary—15.0% | ||||
| Aaron’s | 59,920 | a | 1,512,980 | |
| Body Central | 40,550 | 736,388 | ||
| Buffalo Wild Wings | 27,370 | a,b | 1,636,726 | |
| Caribou Coffee | 57,390 | b | 678,350 | |
| Cheesecake Factory | 46,180 | a,b | 1,138,337 | |
| Hibbett Sports | 43,940 | a,b | 1,489,127 | |
| Interface, Cl. A | 75,310 | a | 893,177 | |
| Jarden | 39,880 | a | 1,127,009 | |
| Lions Gate Entertainment | 284,760 | a,b | 1,964,844 | |
| Papa John’s International | 48,280 | b | 1,467,712 | |
| Pinnacle Entertainment | 185,060 | b | 1,680,345 | |
| Rent-A-Center | 15,230 | 418,063 | ||
| Select Comfort | 123,320 | b | 1,722,780 | |
| Skullcandy | 38,280 | a | 540,896 | |
| SodaStream International | 19,490 | a | 644,144 | |
| Tractor Supply | 15,360 | 960,768 | ||
| Ulta Salon, Cosmetics & Fragrance | 13,060 | a,b | 812,724 | |
| Vitamin Shoppe | 54,750 | a,b | 2,049,840 | |
| 21,474,210 | ||||
| Consumer Staples—6.9% | ||||
| Casey’s General Stores | 41,510 | a | 1,811,911 | |
| Chefs’ Warehouse Holdings | 46,180 | a | 543,077 | |
| Darling International | 79,210 | a,b | 997,254 | |
| Elizabeth Arden | 73,520 | b | 2,090,909 | |
| Inter Parfums | 87,720 | 1,355,274 | ||
| Primo Water | 96,140 | a | 542,230 | |
| Ruddick | 39,660 | a | 1,546,343 | |
| United Natural Foods | 28,200 | a,b | 1,044,528 | |
| 9,931,526 | ||||
| Energy—5.3% | ||||
| Bill Barrett | 40,390 | a,b | 1,463,734 | |
| Brigham Exploration | 27,940 | a,b | 705,764 | |
8
| Common Stocks (continued) | Shares | Value ($) | |
| Energy (continued) | |||
| Carrizo Oil & Gas | 31,386a,b | 676,368 | |
| Gulfport Energy | 97,030a,b | 2,346,185 | |
| Oil States International | 23,830a,b | 1,213,424 | |
| Tesco | 95,300b | 1,105,480 | |
| 7,510,955 | |||
| Exchange Traded Funds—4.7% | |||
| iShares Russell 2000 Growth Index Fund | 91,270a | 6,705,607 | |
| Financial—11.8% | |||
| American Campus Communities | 60,300a,c | 2,243,763 | |
| Education Realty Trust | 164,100c | 1,409,619 | |
| Encore Capital Group | 92,690b | 2,025,276 | |
| EZCORP, Cl. A | 56,145a,b | 1,602,378 | |
| First Cash Financial Services | 41,467b | 1,739,541 | |
| MarketAxess Holdings | 25,370a | 660,127 | |
| Mid-America Apartment Communities | 44,860a,c | 2,701,469 | |
| Potlatch | 65,800a,c | 2,074,016 | |
| Prosperity Bancshares | 31,840a | 1,040,531 | |
| Resolute Energy | 50,400a,b | 572,544 | |
| World Acceptance | 14,470a,b | 809,597 | |
| 16,878,861 | |||
| Health Care—24.4% | |||
| Air Methods | 13,330a,b | 848,721 | |
| Alexion Pharmaceuticals | 37,460b | 2,399,688 | |
| Allscripts Healthcare Solutions | 69,500a,b | 1,252,390 | |
| Amarin, ADR | 78,800b | 724,960 | |
| Analogic | 17,030 | 773,332 | |
| Catalyst Health Solutions | 33,390a,b | 1,926,269 | |
| Centene | 64,520a,b | 1,849,788 | |
| Cepheid | 59,730a,b | 2,319,316 | |
| Chemed | 13,760 | 756,250 | |
| Cooper | 40,540 | 3,208,741 | |
| Cubist Pharmaceuticals | 62,200a,b | 2,196,904 | |
| The Fund | 9 |
STATEMENT OF INVESTMENTS (continued)
| Common Stocks (continued) | Shares | Value ($) | |
| Health Care (continued) | |||
| Exact Sciences | 85,170a,b | 564,677 | |
| MAP Pharmaceuticals | 65,040a,b | 950,885 | |
| Masimo | 47,830a | 1,035,519 | |
| Medicis Pharmaceutical, Cl. A | 41,120 | 1,500,058 | |
| Merit Medical Systems | 89,970b | 1,182,206 | |
| NPS Pharmaceuticals | 102,080b | 664,541 | |
| Pharmasset | 25,940b | 2,136,678 | |
| Questcor Pharmaceuticals | 53,960a,b | 1,470,950 | |
| Salix Pharmaceuticals | 57,970a,b | 1,715,912 | |
| SXC Health Solutions | 39,630b | 2,207,391 | |
| Theravance | 52,100a,b | 1,049,294 | |
| ViroPharma | 72,300b | 1,306,461 | |
| Volcano | 27,353a,b | 810,469 | |
| 34,851,400 | |||
| Industrial—13.0% | |||
| Allegiant Travel | 15,350 | 723,445 | |
| Corporate Executive Board | 80,201 | 2,389,990 | |
| Crane | 36,900 | 1,316,961 | |
| EMCOR Group | 60,640a | 1,232,811 | |
| Exponent | 30,200a,b | 1,248,166 | |
| Forward Air | 42,260a | 1,075,517 | |
| Hexcel | 73,770a,b | 1,634,743 | |
| Interline Brands | 45,810b | 589,575 | |
| Landstar System | 18,900 | 747,684 | |
| Middleby | 16,450a,b | 1,159,067 | |
| Old Dominion Freight Line | 62,122b | 1,799,674 | |
| Robbins & Myers | 27,710 | 961,814 | |
| Taleo, Cl. A | 64,640a,b | 1,662,541 | |
| Teledyne Technologies | 27,885b | 1,362,461 | |
| Thomas & Betts | 18,560b | 740,730 | |
| 18,645,179 | |||
10
| Common Stocks (continued) | Shares | Value ($) | |
| Materials—2.8% | |||
| Intrepid Potash | 69,640a,b | 1,731,947 | |
| Kaiser Aluminum | 20,300a | 898,884 | |
| Titanium Metals | 96,430a | 1,444,521 | |
| 4,075,352 | |||
| Technology—14.3% | |||
| Bottomline Technologies | 71,740b | 1,444,844 | |
| BroadSoft | 26,690a,b | 810,041 | |
| Cirrus Logic | 47,470b | 699,708 | |
| Commvault Systems | 20,030b | 742,312 | |
| Exlservice Holdings | 49,440b | 1,087,680 | |
| Marchex, Cl. B | 61,300a | 521,050 | |
| MAXIMUS | 53,660 | 1,872,734 | |
| Mellanox Technologies | 51,580b | 1,610,328 | |
| Mentor Graphics | 113,210b | 1,089,080 | |
| Netgear | 44,840b | 1,160,908 | |
| NetLogic Microsystems | 80,540b | 3,874,779 | |
| Photronics | 70,410a,b | 350,642 | |
| Quality Systems | 10,230a | 992,310 | |
| Solarwinds | 63,241b | 1,392,567 | |
| Vocus | 83,860a,b | 1,405,494 | |
| Volterra Semiconductor | 59,660a,b | 1,147,262 | |
| Websense | 11,320a,b | 195,836 | |
| 20,397,575 | |||
| Total Common Stocks | |||
| (cost $141,766,364) | 140,470,665 | ||
| Other Investment—1.3% | |||
| Registered Investment Company; | |||
| Dreyfus Institutional Preferred | |||
| Plus Money Market Fund | |||
| (cost $1,826,345) | 1,826,345d | 1,826,345 | |
| The Fund | 11 |
STATEMENT OF INVESTMENTS (continued)
| Investment of Cash Collateral | ||||
| for Securities Loaned—20.9% | Shares | Value ($) | ||
| Registered Investment Company; | ||||
| Dreyfus Institutional Cash | ||||
| Advantage Fund | ||||
| (cost $29,798,675) | 29,798,675d | 29,798,675 | ||
| Total Investments (cost $173,391,384) | 120.4% | 172,095,685 | ||
| Liabilities, Less Cash and Receivables | (20.4%) | (29,189,627) | ||
| Net Assets | 100.0% | 142,906,058 | ||
ADR—American Depository Receipts
| a Security, or portion thereof, on loan.At September 30, 2011, the value of the fund’s securities on loan was |
| $27,656,622 and the value of the collateral held by the fund was $29,798,675. |
| b Non-income producing security. |
| c Investment in real estate investment trust. |
| d Investment in affiliated money market mutual fund. |
| Portfolio Summary (Unaudited)† | |||
| Value (%) | Value (%) | ||
| Health Care | 24.4 | Consumer Staples | 6.9 |
| Money Market Investments | 22.2 | Energy | 5.3 |
| Consumer Discretionary | 15.0 | Exchange Traded Funds | 4.7 |
| Technology | 14.3 | Materials | 2.8 |
| Industrial | 13.0 | ||
| Financial | 11.8 | 120.4 | |
| † Based on net assets. | |||
| See notes to financial statements. | |||
12
| STATEMENT OF ASSETS AND LIABILITIES |
| September 30, 2011 |
| Cost | Value | ||
| Assets ($): | |||
| Investments in securities—See Statement of Investments (including | |||
| securities on loan, valued at $27,656,622)—Note 1(b): | |||
| Unaffiliated issuers | 141,766,364 | 140,470,665 | |
| Affiliated issuers | 31,625,020 | 31,625,020 | |
| Receivable for investment securities sold | 3,890,124 | ||
| Dividends and securities lending income receivable | 35,615 | ||
| Prepaid expenses | 7,663 | ||
| 176,029,087 | |||
| Liabilities ($): | |||
| Due to The Dreyfus Corporation and affiliates—Note 3(b) | 147,339 | ||
| Cash overdraft due to Custodian | 306,247 | ||
| Liability for securities on loan—Note 1(b) | 29,798,675 | ||
| Payable for investment securities purchased | 2,786,680 | ||
| Payable for shares of Beneficial Interest redeemed | 23,156 | ||
| Interest payable—Note 2 | 1,452 | ||
| Accrued expenses | 59,480 | ||
| 33,123,029 | |||
| Net Assets ($) | 142,906,058 | ||
| Composition of Net Assets ($): | |||
| Paid-in capital | 143,996,232 | ||
| Accumulated undistributed Investment income—net | 19,145 | ||
| Accumulated net realized gain (loss) on investments | 186,380 | ||
| Accumulated net unrealized appreciation | |||
| (depreciation) on investments | (1,295,699) | ||
| Net Assets ($) | 142,906,058 | ||
| Class I Shares Outstanding | |||
| (unlimited number of $.001 par value shares of Beneficial Interest authorized) | 3,027,097 | ||
| Net Asset Value, offering and redemption price per share ($) | 47.21 | ||
| See notes to financial statements. | |||
| The Fund | 13 |
| STATEMENT OF OPERATIONS |
| Year Ended September 30, 2011 |
| Investment Income ($): | ||
| Income: | ||
| Cash dividends: | ||
| Unaffiliated issuers | 1,218,562 | |
| Affiliated issuers | 4,400 | |
| Income from securities lending—Note 1(b) | 107,582 | |
| Total Income | 1,330,544 | |
| Expenses: | ||
| Investment advisory fee—Note 3(a) | 1,675,524 | |
| Custodian fees—Note 3(b) | 103,744 | |
| Shareholder servicing costs—Note 3(b) | 69,403 | |
| Professional fees | 65,500 | |
| Administration fees—Note 3(a) | 45,205 | |
| Accounting and administration fees—Note 3(a) | 26,250 | |
| Registration fees | 10,558 | |
| Trustees’ fees and expenses—Note 3(c) | 10,543 | |
| Prospectus and shareholders’ reports | 9,718 | |
| Interest expense—Note 2 | 1,560 | |
| Loan commitment fees—Note 2 | 563 | |
| Miscellaneous | 15,896 | |
| Total Expenses | 2,034,464 | |
| Less—reduction in investment advisory fee due to undertaking—Note 3(a) | (21,934) | |
| Less—reduction in fees due to earnings credits—Note 3(b) | (87) | |
| Net Expenses | 2,012,443 | |
| Investment (Loss)—Net | (681,899) | |
| Realized and Unrealized Gain (Loss) on Investments—Note 4 ($): | ||
| Net realized gain (loss) on investments | 46,453,903 | |
| Net unrealized appreciation (depreciation) on investments | (36,617,778) | |
| Net Realized and Unrealized Gain (Loss) on Investments | 9,836,125 | |
| Net Increase in Net Assets Resulting from Operations | 9,154,226 | |
| See notes to financial statements. | ||
14
STATEMENT OF CHANGES IN NET ASSETS
| Year Ended September 30, | ||||
| 2011 | 2010 | |||
| Operations ($): | ||||
| Investment (loss)—net | (681,899) | (744,979) | ||
| Net realized gain (loss) on investments | 46,453,903 | 36,441,395 | ||
| Net unrealized appreciation | ||||
| (depreciation) on investments | (36,617,778) | (12,492,874) | ||
| Net Increase (Decrease) in Net Assets | ||||
| Resulting from Operations | 9,154,226 | 23,203,542 | ||
| Beneficial Interest Transactions ($): | ||||
| Net proceeds from shares sold | 12,522,209 | 14,174,094 | ||
| Cost of shares redeemed | (97,914,186) | (117,797,097) | ||
| Increase (Decrease) in Net Assets from | ||||
| Beneficial Interest Transactions | (85,391,977) | (103,623,003) | ||
| Total Increase (Decrease) in Net Assets | (76,237,751) | (80,419,461) | ||
| Net Assets ($): | ||||
| Beginning of Period | 219,143,809 | 299,563,270 | ||
| End of Period | 142,906,058 | 219,143,809 | ||
| Undistributed investment income—net | 19,145 | 9,860 | ||
| Capital Share Transactions (Shares): | ||||
| Shares sold | 226,697 | 316,382 | ||
| Shares redeemed | (1,795,374) | (2,629,565) | ||
| Net Increase (Decrease) in Shares Outstanding | (1,568,677) | (2,313,183) | ||
| See notes to financial statements. | ||||
| The Fund | 15 |
FINANCIAL HIGHLIGHTS
The following table describes the performance for the fiscal periods indicated. Total return shows how much your investment in the fund would have increased (or decreased) during each period, assuming you had reinvested all dividends and distributions.These figures have been derived from the fund’s financial statements.
| Year Ended September 30, | ||||||||||
| Class I Shares�� | 2011 | 2010 | 2009a | 2008 | 2007 | |||||
| Per Share Data ($): | ||||||||||
| Net asset value, beginning of period | 47.68 | 43.36 | 49.89 | 59.41 | 49.67 | |||||
| Investment Operations: | ||||||||||
| Investment (loss)—netb | (.18) | (.13) | (.12) | (.11) | (.11) | |||||
| Net realized and unrealized | ||||||||||
| gain (loss) on investments | (.29) | 4.45 | (6.41) | (9.41)c | 9.85c | |||||
| Total from Investment Operations | (.47) | 4.32 | (6.53) | (9.52) | 9.74 | |||||
| Net asset value, end of period | 47.21 | 47.68 | 43.36 | 49.89 | 59.41 | |||||
| Total Return (%) | (.99) | 9.96 | (13.14) | (16.02) | 19.61 | |||||
| Ratios/Supplemental Data (%): | ||||||||||
| Ratio of total expenses | ||||||||||
| to average net assets | .97 | .94 | 1.00 | 1.01 | 1.09d | |||||
| Ratio of net expenses | ||||||||||
| to average net assets | .96 | .94 | 1.00 | 1.01 | 1.09d | |||||
| Ratio of net investment (loss) | ||||||||||
| to average net assets | (.33) | (.29) | (.34) | (.20) | (.20) | |||||
| Portfolio Turnover Rate | 176.06 | 181.09 | 271 | 207 | 175e | |||||
| Net Assets, end of period ($ x 1,000) | 142,906 | 219,144 | 299,563 | 232,706 | 186,991 | |||||
| a Effective September 1, 2009, the fund’s shares were redesignated as Class I shares. |
| b Based on average shares outstanding at each month end. |
| c Amounts include litigation proceeds received by the fund of $.01 for the year ended September 30, 2008 and $.01 |
| for the year ended September 30, 2007. |
| d For the period October 1, 2006 to September 19, 2007, the ratio includes the fund’s share of the TBC Small Cap |
| Growth Portfolio’s (the “Portfolio”) allocated expenses. |
| e On September 19, 2007, the fund, which had owned 100% of the Portfolio on such date, withdrew entirely from |
| the Portfolio and received the Portfolio’s securities and cash in exchange for its interest in the Portfolio. Effective |
| September 20, 2007, the fund began investing directly in the securities in which the Portfolio had invested. Portfolio |
| turnover represents activity of both the fund and the Portfolio for 2007. |
See notes to financial statements.
16
NOTES TO FINANCIAL STATEMENTS
NOTE 1—Significant Accounting Policies:
Dreyfus/The Boston Company Small Cap Growth Fund (the “fund”) is a separate diversified series of Dreyfus Investment Funds (the “Trust”), which is registered under the Investment Company Act of 1940, as amended (the “Act”), as an open-end management investment company and operates as a series company currently offering eleven series, including the fund.The fund’s investment objective is to seek long-term growth of capital. The Dreyfus Corporation (the “Manager” or “Dreyfus”), a wholly-owned subsidiary of The Bank of NewYork Mellon Corporation (“BNY Mellon”), serves as the fund’s investment adviser. MBSC Securities Corporation (the “Distributor”), a wholly-owned subsidiary of the Manager, is the distributor of the fund’s shares, which are sold without a sales charge.
The Trust accounts separately for the assets, liabilities and operations of each series. Expenses directly attributable to each series are charged to that series’ operations; expenses which are applicable to all series are allocated among them on a pro rata basis.
The Financial Accounting Standards Board (“FASB”) Accounting Standards Codification (“ASC”) is the exclusive reference of authoritative U.S. generally accepted accounting principles (“GAAP”) recognized by the FASB to be applied by nongovernmental entities. Rules and interpretive releases of the Securities and Exchange Commission (“SEC”) under authority of federal laws are also sources of authoritative GAAP for SEC registrants. The fund’s financial statements are prepared in accordance with GAAP, which may require the use of management estimates and assumptions.Actual results could differ from those estimates.
(a) Portfolio valuation: The fair value of a financial instrument is the amount that would be received to sell an asset or paid to transfer a liability in an orderly transaction between market participants at the measurement date (i.e. the exit price). GAAP establishes a fair value hierarchy that pri-oritizes the inputs of valuation techniques used to measure fair value.This hierarchy gives the highest priority to unadjusted quoted prices in active
| The Fund | 17 |
NOTES TO FINANCIAL STATEMENTS (continued)
markets for identical assets or liabilities (Level 1 measurements) and the lowest priority to unobservable inputs (Level 3 measurements).
Additionally, GAAP provides guidance on determining whether the volume and activity in a market has decreased significantly and whether such a decrease in activity results in transactions that are not orderly. GAAP requires enhanced disclosures around valuation inputs and techniques used during annual and interim periods.
Various inputs are used in determining the value of the fund’s investments relating to fair value measurements.These inputs are summarized in the three broad levels listed below:
Level 1—unadjusted quoted prices in active markets for identical investments.
Level 2—other significant observable inputs (including quoted prices for similar investments, interest rates, prepayment speeds, credit risk, etc.).
Level 3—significant unobservable inputs (including the fund’s own assumptions in determining the fair value of investments).
The inputs or methodology used for valuing securities are not necessarily an indication of the risk associated with investing in those securities.
Changes in valuation techniques may result in transfers in or out of an assigned level within the disclosure hierarchy. Valuation techniques used to value the fund’s investments are as follows:
Investments in securities are valued at the last sales price on the securities exchange or national securities market on which such securities are primarily traded. Securities listed on the National Market System for which market quotations are available are valued at the official closing price or, if there is no official closing price that day, at the last sales price. Securities not listed on an exchange or the national securities
18
market, or securities for which there were no transactions, are valued at the average of the most recent bid and asked prices, except for open short positions, where the asked price is used for valuation purposes. Bid price is used when no asked price is available. Registered investment companies that are not traded on an exchange are valued at their net asset value.All preceding securities are categorized as Level 1 of the fair value hierarchy.
Fair valuing of securities may be determined with the assistance of a pricing service using calculations based on indices of domestic securities and other appropriate indicators, such as prices of relevant ADRs and futures contracts. Utilizing these techniques may result in transfers between Level 1 and Level 2 of the fair value hierarchy.
When market quotations or official closing prices are not readily available, or are determined not to reflect accurately fair value, such as when the value of a security has been significantly affected by events after the close of the exchange or market on which the security is principally traded (for example, a foreign exchange or market), but before the fund calculates its net asset value, the fund may value these investments at fair value as determined in accordance with the procedures approved by the Board of Trustees. Certain factors may be considered when fair valuing investments such as: fundamental analytical data, the nature and duration of restrictions on disposition, an evaluation of the forces that influence the market in which the securities are purchased and sold, and public trading in similar securities of the issuer or comparable issuers.These securities are either categorized as Level 2 or 3 depending on the relevant inputs used.
For restricted securities where observable inputs are limited, assumptions about market activity and risk are used and are categorized as Level 3 of the fair value hierarchy.
| The Fund | 19 |
NOTES TO FINANCIAL STATEMENTS (continued)
The following is a summary of the inputs used as of September 30, 2011 in valuing the fund’s investments:
| Level 2—Other | Level 3— | |||
| Level 1— | Significant | Significant | ||
| Unadjusted | Observable | Unobservable | ||
| Quoted Prices | Inputs | Inputs | Total | |
| Assets ($) | ||||
| Investments in Securities: | ||||
| Equity Securities— | ||||
| Domestic† | 132,395,954 | — | — | 132,395,954 |
| Equity Securities— | ||||
| Foreign† | 1,369,104 | — | — | 1,369,104 |
| Mutual Funds/ | ||||
| Exchange | ||||
| Traded Funds | 38,330,627 | — | — | 38,330,627 |
| † See Statement of Investments for additional detailed categorizations. | ||||
In May 2011, FASB issued Accounting Standards Update (“ASU”) No. 2011-04 “Amendments to Achieve Common FairValue Measurement and Disclosure Requirements in GAAP and International Financial Reporting Standards (“IFRS”)” (“ASU 2011-04”). ASU 2011-04 includes common requirements for measurement of and disclosure about fair value between GAAP and IFRS. ASU 2011-04 will require reporting entities to disclose the following information for fair value measurements categorized within Level 3 of the fair value hierarchy: quantitative information about the unobservable inputs used in the fair value measurement, the valuation processes used by the reporting entity and a narrative description of the sensitivity of the fair value measurement to changes in unobservable inputs and the interrelationships between those unobservable inputs. In addition, ASU 2011-04 will require reporting entities to make disclosures about amounts and reasons for all transfers in and out of Level 1 and Level 2 fair value mea-surements.The new and revised disclosures are effective for interim and
20
annual reporting periods beginning after December 15, 2011. At this time, management is evaluating the implications of ASU 2011-04 and its impact on the financial statements.
(b) Securities transactions and investment income: Securities transactions are recorded on a trade date basis. Realized gains and losses from securities transactions are recorded on the identified cost basis. Dividend income is recognized on the ex-dividend date and interest income, including, where applicable, accretion of discount and amortization of premium on investments, is recognized on the accrual basis.
Pursuant to a securities lending agreement with The Bank of New York Mellon, a subsidiary of BNY Mellon and an affiliate of Dreyfus, the fund may lend securities to qualified institutions. It is the fund’s policy that, at origination, all loans are secured by collateral of at least 102% of the value of U.S. securities loaned and 105% of the value of foreign securities loaned. Collateral equivalent to at least 100% of the market value of securities on loan is maintained at all times. Collateral is either in the form of cash, which can be invested in certain money market mutual funds managed by the Manager, U.S. Government and Agency securities or letters of credit.The fund is entitled to receive all income on securities loaned, in addition to income earned as a result of the lending transaction. Although each security loaned is fully collateralized, the fund bears the risk of delay in recovery of, or loss of rights in, the securities loaned should a borrower fail to return the securities in a timely manner. During the period ended September 30, 2011, The Bank of New York Mellon earned $35,861 from lending portfolio securities, pursuant to the securities lending agreement.
(c) Affiliated issuers: Investments in other investment companies advised by Dreyfus are defined as “affiliated” in the Act.
| The Fund | 21 |
NOTES TO FINANCIAL STATEMENTS (continued)
The fund may invest in shares of certain affiliated investment companies also advised or managed by Dreyfus. Investments in affiliated investment companies for the period ended September 30, 2011 were as follows:
| Affiliated | |||||||
| Investment | Value | Value | Net | ||||
| Company | 9/30/2010 | ($) | Purchases ($) | Sales ($) | 9/30/2011 | ($) | Assets (%) |
| Dreyfus | |||||||
| Institutional | |||||||
| Preferred | |||||||
| Plus Money | |||||||
| Market Fund | 3,074,283 | 95,675,082 | 96,923,020 | 1,826,345 | 1.3 | ||
| Dreyfus | |||||||
| Institutional | |||||||
| Cash | |||||||
| Advantage | |||||||
| Fund | 15,429,349 | 167,773,597 | 153,404,271 | 29,798,675 | 20.9 | ||
| Total | 18,503,632 | 263,448,679 | 250,327,291 | 31,625,020 | 22.2 |
(d) Dividends to shareholders: Dividends are recorded on the ex-dividend date. Dividends from investment income-net and dividends from net realized capital gains, if any, are normally declared and paid annually, but the fund may make distributions on a more frequent basis to comply with the distribution requirements of the Internal Revenue Code of 1986, as amended (the “Code”).To the extent that net realized capital gains can be offset by capital loss carryovers, it is the policy of the fund not to distribute such gains. Income and capital gain distributions are determined in accordance with income tax regulations, which may differ from GAAP.
(e) Federal income taxes: It is the policy of the fund to continue to qualify as a regulated investment company, if such qualification is in the best interests of its shareholders, by complying with the applicable pro visions of the Code, and to make distributions of taxable income sufficient to relieve it from substantially all federal income and excise taxes.
As of and during the period ended September 30, 2011, the fund did not have any liabilities for any uncertain tax positions.The fund recognizes interest and penalties, if any, related to uncertain tax positions
22
as income tax expense in the Statement of Operations. During the period, the fund did not incur any interest or penalties.
Each of the tax years in the four-year period ended September 30, 2011 remains subject to examination by the Internal Revenue Service and state taxing authorities.
At September 30, 2011, the components of accumulated earnings on a tax basis were as follows: undistributed capital gains $2,489,686 and unrealized depreciation $3,579,860.
During the period ended September 30, 2011, as a result of permanent book to tax differences, primarily due to the tax treatment for net operating losses, real estate investment trusts and passive foreign investment companies, the fund increased accumulated undistributed investment income-net by $691,184, increased accumulated net realized gain (loss) on investments by $107,635 and decreased paid-in capital by $798,819. Net assets and net asset value per share were not affected by this reclassification.
NOTE 2—Bank Lines of Credit:
The fund participates with other Dreyfus-managed funds in a $225 million unsecured credit facility led by Citibank, N.A. and a $300 million unsecured credit facility provided by The Bank of New York Mellon (each, a “Facility”), each to be utilized primarily for temporary or emergency purposes, including the financing of redemptions. In connection therewith, the fund has agreed to pay its pro rata portion of commitment fees for each Facility. Interest is charged to the fund based on rates determined pursuant to the terms of the respective Facility at the time of borrowing.
The average amount of borrowings outstanding under the Facilities during the period ended September 30, 2011 was approximately $112,300, with a related weighted average annualized interest rate of 1.39%.
| The Fund | 23 |
NOTES TO FINANCIAL STATEMENTS (continued)
NOTE 3—Investment Advisory Fee and Other Transactions with Affiliates:
(a) Pursuant to an investment advisory agreement with the Manager, the investment advisory fee is computed at the annual rate of .80% of the value of the fund’s average daily net assets and is payable monthly.
The Manager has undertaken, from August 1, 2011 until February 29, 2012, to waive receipt of its fees and/or assume the expenses of the fund’s Class I shares, so that direct annual fund operating expenses for Class I shares (excluding taxes, interest, brokerage commissions, commitment fees on borrowings and extraordinary expenses) do not exceed .95% of the value of the fund’s average daily net assets. The reduction in investment advisory fee, pursuant to the undertaking, amounted to $21,934 during the period ended September 30, 2011.
From October 1, 2010 through April 30, 2011, the Trust had an agreement withThe Bank of NewYork Mellon, pursuant to whichThe Bank of New York Mellon provided administration and fund accounting services for the fund. For these services, the fund paidThe Bank of New York Mellon a fixed fee plus asset and transaction based fees, as well as out-of-pocket expenses. Pursuant to this agreement, the fund was charged $26,250 during the period October 1, 2010 through April 30, 2011 for administration and fund accounting services.
At Board Meetings of the Trust held on February 15-16, 2011, the Board of Trustees of the Trust terminated the agreement with The Bank of New York Mellon and, on behalf of the Trust, entered into a Fund Accounting and Administration Agreement (the “Administration Agreement”) with Dreyfus, effective May 1, 2011, whereby Dreyfus performs administrative, accounting and recordkeeping services for the fund. The fund has agreed to compensate Dreyfus for providing accounting services, administration, compliance monitoring, regulatory and shareholder reporting, as well as related facilities, equipment and clerical help.The fee is based on the fund’s average daily net assets and computed at the following annual rates: .06% of the first $500 million, .04% of the next $500 million and .02% in excess of $1 billion.
24
In addition, after applying any expense limitations or fee waivers that reduce the fees paid to Dreyfus for this service, Dreyfus has contractually agreed in writing to waive any remaining fees for this service to the extent that they exceed both Dreyfus’ costs in providing these services and a reasonable allocation of the costs incurred by Dreyfus and its affiliates related to the support and oversight of these services.The fund also reimburses Dreyfus for the out-of-pocket expenses Dreyfus incurs in performing this service for the fund. Pursuant to the Administration Agreement, the fund was charged $45,205 during the period May 1, 2011 through September 30, 2011.
(b) The fund compensates Dreyfus Transfer, Inc., a wholly-owned subsidiary of the Manager, under a transfer agency agreement for providing personnel and facilities to perform transfer agency services for the fund. During the period ended September 30, 2011, the fund was charged $20,895 pursuant to the transfer agency agreement, which is included in Shareholder servicing costs in the Statement of Operations.
The fund has arrangements with the custodian and cash management bank whereby the fund may receive earnings credits when positive cash balances are maintained, which are used to offset custody and cash management fees. For financial reporting purposes, the fund includes net earnings credits as an expense offset in the Statement of Operations.
The fund compensates The Bank of New York Mellon under cash management agreements for performing cash management services related to fund subscriptions and redemptions. During the period ended September 30, 2011, the fund was charged $3,416 pursuant to the cash management agreements, which is included in Shareholder servicing costs in the Statement of Operations.These fees were partially offset by earnings credits of $87.
The fund also compensates The Bank of New York Mellon under a custody agreement for providing custodial services for the fund. During the period ended September 30, 2011, the fund was charged $103,744 pursuant to the custody agreement.
| The Fund | 25 |
NOTES TO FINANCIAL STATEMENTS (continued)
During the period ended September 30, 2011, the fund was charged $7,146 for services performed by the Chief Compliance Officer.
The components of “Due to The Dreyfus Corporation and affiliates” in the Statement of Assets and Liabilities consist of: investment advisory fees $100,075, custodian fees $37,938, chief compliance officer fees $3,750, Private Wealth sub-accounting fees $13 and transfer agency per account fees $5,563.
(c) Each Trustee who is not an “interested person” of the Trust (as defined in the Act) receives $60,000 per annum, plus $7,000 per joint Board meeting of the Trust, The Dreyfus/Laurel Funds, Inc., The Dreyfus/Laurel Funds Trust, The Dreyfus/Laurel Tax-Free Municipal Funds and Dreyfus Funds, Inc. (collectively, the “Board Group Open-End Funds”) attended, $2,500 for separate in-person committee meetings attended which are not held in conjunction with a regularly scheduled Board meeting and $2,000 for Board meetings and separate committee meetings attended that are conducted by telephone. The Board Group Open-End Funds also reimburse each Trustee who is not an “interested person” of the Trust (as defined in the Act) for travel and out-of-pocket expenses. With respect to Board meetings, the Chairman of the Board receives an additional 25% of such compensation (with the exception of reimbursable amounts). The Chair of each of the Board’s committees, unless the Chair also serves as Chair of the Board, receives $1,350 per applicable committee meeting. In the event that there is an in-person joint committee meeting or a joint telephone meeting of the Board Group Open-End Funds and Dreyfus High Yield Strategies Fund, a $2,500 fee is allocated between the Board Group Open-End Funds and DHF.
Effective January 1, 2012, the Board Group Open-End Funds and DHF (collectively, the “Board Group Funds”) will pay each Trustee their respective allocated portions of an annual retainer of $85,000 and a fee of $10,000 for each regularly scheduled Board meeting attended ($75,000 and $8,000, respectively, in the aggregate, prior to January 1, 2012).With respect to the annual retainer and Board meetings of the Board Group Funds, the Chair of the Board will receive an additional 25% of such compensation (with the exception of reimbursable
26
amounts). Each Trustee will receive $2,500 for any separate in-person committee meetings attended, which are not held in conjunction with a regularly scheduled Board meeting, such amount to be allocated among the Board Group Funds, as applicable. In the event that there is a joint telephone meeting of the Board Group Funds, a fee of $2,000 will be allocated among the applicable Board Group Funds, accordingly (prior to January 1, 2012, the fee allocated was $2,500 if the meeting included DHF). The Chair of each of the Board’s committees, unless the Chair also serves as Chair of the Board, will receive $1,500 per applicable committee meeting. Each Emeritus Trustee is entitled to receive an annual retainer of one-half the amount paid as a retainer at the time the Trustee became Emeritus and a per meeting attended fee of one-half the amount paid to Trustees.The Board Group Funds also reimburse each Independent Trustee and Emeritus Trustees for travel and out-of-pocket expenses.
NOTE 4—Securities Transactions:
The aggregate amount of purchases and sales of investment securities, excluding short-term securities, during the period ended September 30, 2011, amounted to $362,734,041 and $447,236,610, respectively.
At September 30, 2011, the cost of investments for federal income tax purposes was $175,675,545; accordingly, accumulated net unrealized depreciation on investments was $3,579,860, consisting of $14,475,651 gross unrealized appreciation and $18,055,511 gross unrealized depreciation.
NOTE 5—Subsequent Event:
Effective October 27, 2011, the Nominating Committee of the Board ofTrustees nominated, and the Board ofTrustees approved the election of, Francine J. Bovich as a Trustee of the Trust.A proxy statement will be mailed, on or about November 28, 2011, to Trust shareholders of record as of the close of business November 1, 2011, asking shareholders to consider Ms. Bovich’s election as a Board member of the Trust at a Special Joint Meeting of Shareholders to be held on Wednesday, February 8, 2012.
| The Fund | 27 |
| REPORT OF INDEPENDENT REGISTERED |
| PUBLIC ACCOUNTING FIRM |
To the Board of Trustees and Shareholders of Dreyfus/The Boston Company Small Cap Growth Fund:
We have audited the accompanying statement of assets and liabilities of Dreyfus/The Boston Company Small Cap Growth Fund (the “Fund”), a series of Dreyfus Investment Funds, including the statement of investments as of September 30, 2011, and the related statement of operations for the year then ended, the statements of changes in net assets for each of the years in the two-year period then ended and financial highlights for each of the years in the three-year period then ended.These financial statements and financial highlights are the responsibility of the Fund’s management. Our responsibility is to express an opinion on these financial statements and financial highlights based on our audits.The financial highlights for each of the years in the two-year period ended September 30, 2008 were audited by other independent registered public accountants whose report thereon, dated November 28, 2008, expressed an unqualified opinion on those financial highlights.
We conducted our audits in accordance with the standards of the Public Company Accounting Oversight Board (United States).Those standards require that we plan and perform the audit to obtain reasonable assurance about whether the financial statements and financial highlights are free of material misstatement.An audit also includes examining, on a test basis, evidence supporting the amounts and disclosures in the financial statements. Our procedures included confirmation of securities owned as of September 30, 2011 by correspondence with the custodian and brokers or by other appropriate auditing procedures where replies from brokers were not received.An audit also includes assessing the accounting principles used and significant estimates made by management, as well as evaluating the overall financial statement presentation.We believe that our audits provide a reasonable basis for our opinion.
In our opinion, the financial statements and financial highlights referred to above present fairly, in all material respects, the financial position of Dreyfus/The Boston Company Small Cap Growth Fund as of September 30, 2011, and the results of its operations for the year then ended, the changes in its net assets for each of the years in the two-year period then ended, and the financial highlights for each of the years in the three-year period then ended, in conformity with U.S. generally accepted accounting principles.

New York, New York
November 23, 2011
28
| INFORMATION ABOUT THE RENEWAL OF THE FUND’S |
| INVESTMENT ADVISORY AGREEMENT (Unaudited) |
At a meeting of the fund’s Board of Trustees held on July 28, 2011, the Board considered the renewal of the fund’s Investment Advisory Agreement pursuant to which Dreyfus provides the fund with investment advisory services (the “Agreement”).The Board members, none of whom are “interested persons” (as defined in the Investment Company Act of 1940, as amended) of the fund, were assisted in their review by independent legal counsel and met with counsel in executive session separate from representatives of Dreyfus. In considering the renewal of the Agreement, the Board considered all factors that it believed to be relevant, including those discussed below.The Board did not identify any one factor as dispositive, and each Board member may have attributed different weights to the factors considered.
Analysis of Nature, Extent, and Quality of Services Provided to the Fund.The Board members considered information previously provided to them in presentations from representatives of Dreyfus regarding the nature, extent, and quality of the services provided to funds in the Dreyfus fund complex, and representatives of Dreyfus confirmed that there had been no material changes in this information. Dreyfus provided the number of open accounts in the fund, the fund’s asset size and the allocation of fund assets among distribution channels. Dreyfus also had previously provided information regarding the diverse intermediary relationships and distribution channels of funds in the Dreyfus fund complex and Dreyfus’ corresponding need for broad, deep, and diverse resources to be able to provide ongoing shareholder services to each distribution channel, including the distribution channel(s) for the fund.
The Board members also considered research support available to, and portfolio management capabilities of, the fund’s portfolio management personnel.The Board members also considered Dreyfus’ extensive compliance infrastructure.The Board also considered portfolio management’s brokerage policies and practices (including policies and practices regarding soft dollars) and the standards applied in seeking best execution.
Comparative Analysis of the Fund’s Performance and Management Fee and Expense Ratio.The Board members reviewed reports prepared by Lipper, Inc. (“Lipper”), an independent provider of investment company
| The Fund | 29 |
| INFORMATION ABOUT THE RENEWAL OF THE FUND’S |
| INVESTMENT ADVISORY AGREEMENT (Unaudited) (continued) |
data, which included information comparing (1) the fund’s performance with the performance of a group of comparable funds (the “Performance Group”) and with a broader group of funds (the “Performance Universe”), all for various periods ended June 30, 2011, and (2) the fund’s actual and contractual management fees and total expenses with those of a group of comparable funds (the “Expense Group”) and with a broader group of funds (the “Expense Universe”), the information for which was derived in part from fund financial statements available to Lipper as of March 31, 2011. Dreyfus previously had furnished the Board with a description of the methodology Lipper used to select the Performance Group and Performance Universe and the Expense Group and Expense Universe.
Dreyfus representatives stated that the usefulness of performance comparisons may be affected by a number of factors, including different investment limitations that may be applicable to the fund and comparison funds.The Board members discussed the results of the comparisons and noted that the fund’s total return performance was below the Performance Group and Performance Universe medians for all periods. Dreyfus also provided a comparison of the fund’s calendar year total returns to the returns of the fund’s benchmark index, noting that the fund outperformed the benchmark index 6 of the last 10 calendar years. A representative of Dreyfus noted that although the fund underper-formed during the reporting periods ended June 30, 2011, as provided by Lipper, the fund did outperform the benchmark for the 3-month period ended July 26, 2011 and, for the two-month period ended July 26, 2011, the fund was in the 2nd quartile of the Performance Group. Despite the improved performance over the short-term, the Board expressed its concern with the fund’s longer-term performance and requested that Dreyfus take steps to improve it. Representatives of Dreyfus discussed with the Board members the investment style and strategy used by the fund’s portfolio managers to identify and select stocks and the role of fundamental analysis in selecting stocks. Dreyfus representatives informed the Board of steps being taken in an effort to improve fund performance and stated that Dreyfus would report back to the Board at the next regularly scheduled Board meeting.
30
The Board members also reviewed the range of actual and contractual management fees and total expenses of the Expense Group and Expense Universe funds and discussed the results of the comparisons. They noted that the fund’s contractual management fee was below the Expense Group median, the fund’s actual management fee was below the Expense Group median and above the Expense Universe median, and the fund’s total expenses were below the Expense Group and Expense Universe medians.
A representative of Dreyfus noted that Dreyfus has been voluntarily waiving receipt of its fees and/or assume the expenses of the fund’s Class I shares, so that the annual direct fund operating expenses for Class I shares (excluding taxes, interest, brokerage commissions, commitment fees on borrowings, acquired fund fees and extraordinary expenses) did not exceed 1.10% of the fund’s average daily net assets. It was noted that Dreyfus would contractually agree to waive receipt of its fees and/or assume the expenses of the fund’s Class I shares, until February 28, 2012, so that direct annual fund operating expenses for Class I shares (excluding taxes, interest, brokerage commissions, commitment fees on borrowings, acquired fund fees and extraordinary expenses) do not exceed 0.95% of the fund’s average daily net assets.
Representatives of Dreyfus reviewed with the Board members the management or investment advisory fees (1) paid by funds advised or administered by Dreyfus that are in the same Lipper category as the fund and (2) paid to Dreyfus or the Dreyfus-affiliated primary employer of the fund’s primary portfolio manager for advising any separate accounts and/or other types of client portfolios that are considered to have similar investment strategies and policies as the fund (the “Similar Clients”), and explained the nature of the Similar Clients.They discussed differences in fees paid and the relationship of the fees paid in light of any differences in the services provided and other relevant factors.The Board members considered the relevance of the fee information provided for the Similar Clients to evaluate the appropriateness and reasonableness of the fund’s management fee.
| The Fund | 31 |
| INFORMATION ABOUT THE RENEWAL OF THE FUND’S |
| INVESTMENT ADVISORY AGREEMENT (Unaudited) (continued) |
Analysis of Profitability and Economies of Scale. Dreyfus’ representatives reviewed the expenses allocated and profit received by Dreyfus and the resulting profitability percentage for managing the fund, and the method used to determine the expenses and profit. The Board concluded that the profitability results were not unreasonable, given the services rendered, or to be rendered, and service levels provided, or to be provided, by Dreyfus.The Board previously had been provided with information prepared by an independent consulting firm regarding Dreyfus’ approach to allocating costs to, and determining the profitability of, individual funds and the entire Dreyfus fund complex.The consulting firm also had analyzed where any economies of scale might emerge in connection with the management of a fund.
The Board’s counsel stated that the Board members should consider the profitability analysis (1) as part of their evaluation of whether the fees under the Agreements bear a reasonable relationship to the mix of services provided by Dreyfus, including the nature, extent and quality of such services, and (2) in light of the relevant circumstances for the fund and the extent to which economies of scale would be realized if the fund grows and whether fee levels reflect these economies of scale for the benefit of fund shareholders. Dreyfus representatives noted that a discussion of economies of scale is predicated on a fund having achieved a substantial size with increasing assets and that, if a fund’s assets had been stable or decreasing, the possibility that Dreyfus may have realized any economies of scale would be less.A Dreyfus representative also noted that the fund had been generally closed to new investors since July 6, 2007.They also noted that, as a result of shared and allocated costs among funds in the Dreyfus funds complex, the extent of economies of scale could depend substantially on the level of assets in the complex as a whole, so that increases and decreases in complex-wide assets can affect potential economies of scale in a manner that is disproportionate to, or even in the opposite direction from, changes in the fund’s asset level. The Board members also considered potential benefits to Dreyfus from acting as investment adviser and noted the soft dollar arrangements in effect for trading the fund’s investments.
32
At the conclusion of these discussions, the Board agreed that it had been furnished with sufficient information to make an informed business decision with respect to the renewal of the Agreement. Based on the discussions and considerations as described above, the Board concluded and determined as follows.
The Board concluded that the nature, extent and quality of the services provided by Dreyfus are adequate and appropriate.
The Board agreed to closely monitor performance and to renew the Agreement through April 4, 2012, in light of the considerations described above.
The Board concluded that the fees payable to Dreyfus were reasonable in light of the considerations described above.
The Board determined that the economies of scale which may accrue to Dreyfus and its affiliates in connection with the management of the fund had been adequately considered by Dreyfus in connection with the fee rate charged to the fund pursuant to the Agreement and that, to the extent in the future it were determined that material economies of scale had not been shared with the fund, the Board would seek to have those economies of scale shared with the fund.
The Board members considered these conclusions and determinations, along with information received on a routine and regular basis throughout the year. In addition, it should be noted that the Board’s consideration of the contractual fee arrangements for this fund had the benefit of a number of years of reviews of similar agreements during which lengthy discussions took place between the Board members and Dreyfus representatives. Certain aspects of the arrangements may receive greater scrutiny in some years than in others, and the Board members’ conclusions may be based, in part, on their consideration of the same or similar arrangements in prior years.The Board members determined that renewal of the Agreement was in the best interests of the fund and its shareholders.
| The Fund | 33 |
BOARD MEMBERS INFORMATION (Unaudited)
| Joseph S. DiMartino (67) |
| Chairman of the Board (2008) |
| Principal Occupation During Past 5Years: |
| • Corporate Director and Trustee |
| Other Public Company Board Memberships During Past 5Years: |
| • CBIZ (formerly, Century Business Services, Inc.), a provider of outsourcing functions for small |
| and medium size companies, Director (1997-present) |
| • Sunair Services Corporation, a provider of certain outdoor-related services to homes and |
| businesses, Director (2005-2009) |
| • The Newark Group, a provider of a national market of paper recovery facilities, paperboard |
| mills and paperboard converting plants, Director (2000-2010) |
| No. of Portfolios for which Board Member Serves: 167 |
| ——————— |
| Francine J. Bovich (60)† |
| Board Member (2011) |
| Principal Occupation During Past 5 years: |
| • Trustee,The Bradley Trusts, private trust funds (2011-Present) |
| • Managing Director, Morgan Stanley Investment Management (1993-2010) |
| No. of Portfolios for which Board Member Serves: 14 |
| ——————— |
| James M. Fitzgibbons (77) |
| Board Member (2008) |
| Principal Occupation During Past 5Years: |
| • Corporate Director and Trustee |
| Other Public Company Board Memberships During Past 5Years: |
| • Bill Barrett Corporation, an oil and natural gas exploration company, Director (2004-present) |
| No. of Portfolios for which Board Member Serves: 33 |
| ——————— |
| Kenneth A. Himmel (65) |
| Board Member (2008) |
| Principal Occupation During Past 5Years: |
| • President and CEO, Related Urban Development, a real estate development company (1996-present) |
| • President and CEO, Himmel & Company, a real estate development company (1980-present) |
| • CEO,American Food Management, a restaurant company (1983-present) |
| No. of Portfolios for which Board Member Serves: 33 |
34
| Stephen J. Lockwood (64) |
| Board Member (2008) |
| Principal Occupation During Past 5Years: |
| • Chairman of the Board, Stephen J. Lockwood and Company LLC, a real estate investment |
| company (2000-present) |
| No. of Portfolios for which Board Member Serves: 33 |
| ——————— |
| Roslyn M. Watson (61) |
| Board Member (2008) |
| Principal Occupation During Past 5Years: |
| • Principal,Watson Ventures, Inc., a real estate investment company (1993-present) |
| No. of Portfolios for which Board Member Serves: 43 |
| ——————— |
| Benaree Pratt Wiley (65) |
| Board Member (2008) |
| Principal Occupation During Past 5Years: |
| • Principal,TheWiley Group, a firm specializing in strategy and business development (2005-present) |
| Other Public Company Board Memberships During Past 5Years: |
| • CBIZ (formerly, Century Business Services, Inc.), a provider of outsourcing functions for small |
| and medium size companies, Director (2008-present) |
| No. of Portfolios for which Board Member Serves: 68 |
| ——————— |
† Ms. Bovich was elected as a Board Member by the Board of Trustees, effective October 27, 2011. See Note 5.
Once elected all Board Members serve for an indefinite term, but achieve Emeritus status upon reaching age 80.The address of the Board Members and Officers is in c/o The Dreyfus Corporation, 200 Park Avenue, NewYork, NewYork 10166.Additional information about the Board Members is available in the fund’s Statement of Additional Information which can be obtained from Dreyfus free of charge by calling this toll free number: 1-800-DREYFUS.
| The Fund | 35 |
OFFICERS OF THE FUND (Unaudited)
BRADLEY J. SKAPYAK, President since January 2010.
Chief Operating Officer and a director of the Manager since June 2009. From April 2003 to June 2009, Mr. Skapyak was the head of the Investment Accounting and Support Department of the Manager. He is an officer of 75 investment companies (comprised of 167 portfolios) managed by the Manager. He is 52 years old and has been an employee of the Manager since February 1988.
MICHAEL A. ROSENBERG, Vice President and Secretary since August 2005.
Assistant General Counsel of BNY Mellon, and an officer of 76 investment companies (comprised of 192 portfolios) managed by the Manager. He is 51 years old and has been an employee of the Manager since October 1991.
KIESHA ASTWOOD, Vice President and Assistant Secretary since January 2010.
Counsel of BNY Mellon, and an officer of 76 investment companies (comprised of 192 portfolios) managed by the Manager. She is 38 years old and has been an employee of the Manager since July 1995.
JAMES BITETTO, Vice President and Assistant Secretary since August 2005.
Senior Counsel of BNY Mellon and Secretary of the Manager, and an officer of 76 investment companies (comprised of 192 portfolios) managed by the Manager. He is 45 years old and has been an employee of the Manager since December 1996.
JONI LACKS CHARATAN, Vice President and Assistant Secretary since August 2005.
Senior Counsel of BNY Mellon, and an officer of 76 investment companies (comprised of 192 portfolios) managed by the Manager. She is 55 years old and has been an employee of the Manager since October 1988.
JOSEPH M. CHIOFFI, Vice President and Assistant Secretary since August 2005.
Senior Counsel of BNY Mellon, and an officer of 76 investment companies (comprised of 192 portfolios) managed by the Manager. He is 49 years old and has been an employee of the Manager since June 2000.
KATHLEEN DENICHOLAS, Vice President and Assistant Secretary since January 2010.
Managing Counsel of BNY Mellon, and an officer of 76 investment companies (comprised of 192 portfolios) managed by the Manager. She is 36 years old and has been an employee of the Manager since February 2001.
JANETTE E. FARRAGHER, Vice President and Assistant Secretary since August 2005.
Assistant General Counsel of BNY Mellon, and an officer of 76 investment companies (comprised of 192 portfolios) managed by the Manager. She is 48 years old and has been an employee of the Manager since February 1984.
JOHN B. HAMMALIAN, Vice President and Assistant Secretary since August 2005.
Senior Managing Counsel of BNY Mellon, and an officer of 76 investment companies (comprised of 192 portfolios) managed by the Manager. He is 48 years old and has been an employee of the Manager since February 1991.
M. CRISTINA MEISER, Vice President and Assistant Secretary since January 2010.
Senior Counsel of BNY Mellon, and an officer of 76 investment companies (comprised of 192 portfolios) managed by the Manager. She is 41 years old and has been an employee of the Manager since August 2001.
36
ROBERT R. MULLERY, Vice President and Assistant Secretary since August 2005.
Managing Counsel of BNY Mellon, and an officer of 76 investment companies (comprised of 192 portfolios) managed by the Manager. He is 59 years old and has been an employee of the Manager since May 1986.
JEFF PRUSNOFSKY, Vice President and Assistant Secretary since August 2005.
Senior Managing Counsel of BNY Mellon, and an officer of 76 investment companies (comprised of 192 portfolios) managed by the Manager. He is 46 years old and has been an employee of the Manager since October 1990.
JAMES WINDELS, Treasurer since November 2001.
Director – Mutual Fund Accounting of the Manager, and an officer of 76 investment companies (comprised of 192 portfolios) managed by the Manager. He is 53 years old and has been an employee of the Manager since April 1985.
RICHARD CASSARO, Assistant Treasurer since December 2008.
Senior Accounting Manager – Money Market and Municipal Bond Funds of the Manager, and an officer of 76 investment companies (comprised of 192 portfolios) managed by the Manager. He is 52 years old and has been an employee of the Manager since September 1982.
GAVIN C. REILLY, Assistant Treasurer since December 2008.
Tax Manager of the Investment Accounting and Support Department of the Manager, and an officer of 76 investment companies (comprised of 192 portfolios) managed by the Manager. He is 43 years old and has been an employee of the Manager since April 1991.
ROBERT ROBOL, Assistant Treasurer since December 2008.
Senior Accounting Manager – Fixed Income Funds of the Manager, and an officer of 76 investment companies (comprised of 192 portfolios) managed by the Manager. He is 47 years old and has been an employee of the Manager since October 1988.
ROBERT SALVIOLO, Assistant Treasurer since December 2008.
Senior Accounting Manager – Equity Funds of the Manager, and an officer of 76 investment companies (comprised of 192 portfolios) managed by the Manager. He is 44 years old and has been an employee of the Manager since June 1989.
ROBERT SVAGNA, Assistant Treasurer since December 2008.
Senior Accounting Manager – Equity Funds of the Manager, and an officer of 76 investment companies (comprised of 192 portfolios) managed by the Manager. He is 44 years old and has been an employee of the Manager since November 1990.
| The Fund | 37 |
OFFICERS OF THE FUND (Unaudited) (continued)
JOSEPH W. CONNOLLY, Chief Compliance Officer since December 2008.
Chief Compliance Officer of the Manager and The Dreyfus Family of Funds (76 investment companies, comprised of 192 portfolios). From November 2001 through March 2004, Mr. Connolly was first Vice-President, Mutual Fund Servicing for Mellon Global Securities Services. In that capacity, Mr. Connolly was responsible for managing Mellon’s Custody, Fund Accounting and Fund Administration services to third-party mutual fund clients.
He is 54 years old and has served in various capacities with the Manager since 1980, including manager of the firm’s Fund Accounting Department from 1997 through October 2001.
STEPHEN J. STOREN, Anti-Money Laundering Compliance Officer since May 2011.
Chief Compliance Officer of the Distributor, and the Anti-Money Laundering Compliance Officer of 72 investment companies (comprised of 188 portfolios) managed by the Manager. He is 57 years old and has been an employee of the Distributor since October 1999.
38
NOTES
For More Information
Ticker Symbol: SSETX
Telephone 1-800-DREYFUS
Mail The Dreyfus Family of Funds, 144 Glenn Curtiss Boulevard, Uniondale, NY 11556-0144 E-mail Send your request to info@dreyfus.com Internet Information can be viewed online or downloaded at: http://www.dreyfus.com
The fund files its complete schedule of portfolio holdings with the Securities and Exchange Commission (“SEC”) for the first and third quarters of each fiscal year on Form N-Q. The fund’s Forms N-Q are available on the SEC’s website at http://www.sec.gov and may be reviewed and copied at the SEC’s Public Reference Room in Washington, DC. Information on the operation of the Public Reference Room may be obtained by calling 1-800-SEC-0330.
A description of the policies and procedures that the fund uses to determine how to vote proxies relating to portfolio securities, and information regarding how the fund voted these proxies for the most recent 12-month period ended June 30 is available at http://www.dreyfus.com and on the SEC’s website at http://www.sec.gov.
The description of the policies and procedures is also available without charge, upon request, by calling 1-800-DREYFUS.

| Dreyfus/The Boston |
| Company Small Cap |
| Tax-Sensitive Equity Fund |
ANNUAL REPORT September 30, 2011
Save time. Save paper. View your next shareholder report online as soon as it’s available. Log into www.dreyfus.com and sign up for Dreyfus eCommunications. It’s simple and only takes a few minutes.
The views expressed in this report reflect those of the portfolio manager only through the end of the period covered and do not necessarily represent the views of Dreyfus or any other person in the Dreyfus organization. Any such views are subject to change at any time based upon market or other conditions and Dreyfus disclaims any responsibility to update such views.These views may not be relied on as investment advice and, because investment decisions for a Dreyfus fund are based on numerous factors, may not be relied on as an indication of trading intent on behalf of any Dreyfus fund.
Not FDIC-Insured • Not Bank-Guaranteed • May Lose Value
Contents | |
THE FUND | |
| 2 | A Letter from the Chairman and CEO |
| 3 | Discussion of Fund Performance |
| 6 | Fund Performance |
| 7 | Understanding Your Fund’s Expenses |
| 7 | Comparing Your Fund’s Expenses With Those of Other Funds |
| 8 | Statement of Investments |
| 13 | Statement of Assets and Liabilities |
| 14 | Statement of Operations |
| 15 | Statement of Changes in Net Assets |
| 16 | Financial Highlights |
| 17 | Notes to Financial Statements |
| 28 | Report of Independent Registered Public Accounting Firm |
| 29 | Information About the Renewal of the Fund’s Investment Advisory Agreement |
| 34 | Board Members Information |
| 36 | Officers of the Fund |
FOR MORE INFORMATION | |
Back Cover |
Dreyfus/The Boston
Company Small Cap
Tax-Sensitive Equity Fund
The Fund

A LETTER FROM THE CHAIRMAN AND CEO
Dear Shareholder:
This annual report for Dreyfus/The Boston Company Small Cap Tax-Sensitive Equity Fund covers the 12-month period from October 1, 2010, through September 30, 2011. For information about how the fund performed during the reporting period, as well as general market perspectives, we provide a Discussion of Fund Performance on the pages that follow.
Investors generally were encouraged by expectations of a more robust economic recovery over the first half of the reporting period, but investor sentiment deteriorated sharply during the second half due to disappointing economic data, rising commodity prices, an escalating sovereign debt crisis in Europe and a contentious debate regarding taxes, spending and borrowing in the United States. Market volatility was particularly severe during August and September after a major credit rating agency downgraded U.S. long-term debt. Stocks proved sensitive to macroeconomic concerns in this challenging environment, often regardless of more promising company fundamentals, and most U.S. equity market indices gave back their earlier gains.
The economic outlook currently is clouded by market turbulence and political infighting, but we believe that a continued subpar global expansion is more likely than a return to recession. Inflationary pressures appear to be waning in most countries as energy prices recently have retreated from their highs. In the United States, the Federal Reserve Board has signaled its intention to maintain an aggressively accommodative monetary policy, which may help offset the financial stresses caused by deleveraging in the private sector and fiscal consolidation by governments in the United States and Europe.To assess the potential impact of these and other developments on your investments, we encourage you, as always, to speak with your financial advisor.
Thank you for your continued confidence and support.

Jonathan R. Baum
Chairman and Chief Executive Officer
The Dreyfus Corporation
October 17, 2011
2

DISCUSSION OF FUND PERFORMANCE
For the period from October 1, 2010, through September 30, 2011, as provided by Todd Wakefield and B. Randall Watts, Jr., Portfolio Managers
Fund and Market Performance Overview
For the 12-month period ended September 30, 2011, Dreyfus/The Boston Company Small Cap Tax-Sensitive Equity Fund produced a total return of –1.16%.1 In comparison, the fund’s benchmark, the Russell 2000 Growth Index (the “Index”), produced a total return of –1.12%% for the same period.2
Small-cap stocks rallied through the first quarter of 2011 amid expectations of continued economic recovery, but several macroeconomic disappointments later erased those gains. The fund produced a return that was roughly in line with its benchmark, as strong stock selections in the health care and energy sectors were balanced by disappointments in the information technology and consumer staples sectors.
The Fund’s Investment Approach
The fund seeks to maximize after-tax total return, consisting of long-term growth of capital.To pursue its goal, the fund normally invests at least 80% of its assets in equity securities of small-cap U.S. companies with total market capitalizations, at the time of purchase, equal to or less than that of the largest company in the Index.When choosing stocks, we seek to identify small-cap companies which are experiencing or are expected to experience rapid growth.We use tax-sensitive strategies in seeking to reduce the impact of federal and state income taxes on the fund’s after-tax returns, including minimizing sales of securities that result in capital gains and selling underperforming securities to realize capital losses that can be offset against realized capital gains.
Shifting Sentiment Sparked Heightened Volatility
Investors’ outlooks had improved markedly during the final months of 2010 after the Federal Reserve Board announced a second round of quantitative easing to jump-start the U.S. economy. Subsequent upturns in economic data and corporate earnings supported rising stock prices
| The Fund | 3 |
DISCUSSION OF FUND PERFORMANCE (continued)
into the first quarter of 2011 as investors looked forward to a more robust economic recovery. However, the rally was interrupted in February when political unrest in the Middle East led to sharply rising energy prices, and in March when devastating natural and nuclear disasters in Japan threatened the global industrial supply chain. Still, stocks generally recovered quickly from these unexpected shocks.
In late April, investor sentiment began to deteriorate in earnest when Greece appeared headed for default and other European countries struggled with a resurgent sovereign debt crisis. Closer to home, investors grew worried when U.S. economic data proved disappointing and a contentious debate in Congress regarding government spending and borrowing intensified. Stocks suffered bouts of heightened volatility as newly risk-averse investors shifted their focus to industry groups that historically have held up well under uncertain economic conditions. Market turbulence was particularly severe in August and September, driving the benchmark into negative territory for the reporting period overall.Within the small-cap market, growth stocks generally produced higher returns than value stocks over the reporting period.
Stock Selections Produced Mixed Results
In this challenging investment climate, our security selection strategy drove above-average returns in several market sectors.Among health care companies, biotechnology was among the strongest portfolio segments. For example, viral infections specialist Pharmasset expanded its trials of a new medicine for Hepatitis C, and Alexion Pharmaceuticals gained value in anticipation of new uses for its treatment for a chronic blood disease. Among health care service providers, pharmacy benefit management firm Catalyst Health Solutions achieved better-than-expected financial results despite prevailing economic headwinds. In addition, investors responded positively when medical facilities operator Kindred Healthcare acquired a former rival. In the energy sector, relative performance was buoyed by exploration-and-production company Gulfport Energy, which increased its natural gas production capacity.
A handful of disappointments offset the positive impact of the fund’s winners on relative performance. In the information technology sector, economic concerns later in the reporting period sparked a pullback
4
in video infrastructure systems provider Harmonic, which reduced its earnings guidance. Digital optical networking specialist Infinera also reduced future earnings guidance, and technical and management consulting services provider Acxiom was hurt by the loss of a major outsourcing customer. Among consumer staples companies, bottled water purveyor Primo Water missed quarterly sales estimates due to delays in product roll-out at two national retail chains.
Focusing on Underlying Fundamentals
We expect economic headwinds to persist and equity markets to stay volatile, suggesting that investors may continue to respond primarily to macroeconomic developments over the near term. Still, we remain committed to our fundamentals-based investment process, which we believe will remain effective over the longer term. Indeed, it is worth noting that, historically, companies that can grow faster than average have become scarcer, and therefore more valuable, during economic downturns. Our security selection process has identified a number of growing small-cap businesses in the health care sector, but we have found fewer opportunities meeting our investment criteria in the information technology sector.
October 17, 2011
| Please note, the position in any security highlighted in italicized typeface was sold during the |
| reporting period. |
| Equity funds are subject generally to market, market sector, market liquidity, issuer and investment |
| style risks, among other factors, to varying degrees, all of which are more fully described in the |
| fund’s prospectus. |
| The prices of small company stocks tend to be more volatile than the prices of large company |
| stocks, mainly because these companies have less established and more volatile earnings histories. |
| They also tend to be less liquid than larger company stocks. |
| Total return includes reinvestment of dividends and any capital gains paid. Past performance is no |
| guarantee of future results. Share price and investment return fluctuate such that upon redemption, |
| fund shares may be worth more or less than their original cost. |
| SOURCE: LIPPER INC. — The Russell 2000 Growth Index is an unmanaged index, |
| which measures the performance of those Russell 2000 companies with higher price-to-book ratios |
| and higher forecasted growth values.The total return figure cited for this index assumes change in |
| security prices and reinvestment of dividends, but does not reflect the costs of managing a mutual |
| fund. Investors cannot invest directly in any index. |
| The Fund | 5 |
FUND PERFORMANCE
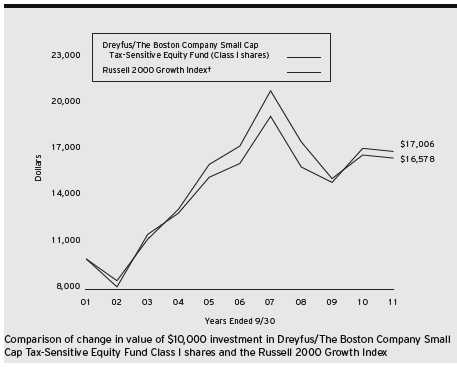
| Average Annual Total Returns as of 9/30/11 | ||||||
| 1Year | 5 Years | 10 Years | ||||
| Class I shares | –1.16% | –0.92% | 5.19% | |||
| Russell 2000 Growth Index | –1.12% | 0.96% | 5.45% | |||
| † Source: Lipper Inc. |
| Past performance is not predictive of future performance.The fund’s performance shown in the graph and table does not |
| reflect the deduction of taxes that a shareholder would pay on fund distributions or the redemption of fund shares. |
| The above graph compares a $10,000 investment made in Class I shares of Dreyfus/The Boston Company Small Cap |
| Tax-Sensitive Equity Fund on 9/30/01 to a $10,000 investment made in the Russell 2000 Growth Index (the |
| “Index”) on that date.All dividends and capital gain distributions are reinvested. |
| The fund’s performance shown in the line graph takes into account all applicable fees and expenses. The Index is an |
| unmanaged index that measures the performance of those Russell 2000 companies (the 2,000 smallest companies of |
| the Russell 3000 Index) with higher price-to-book ratios and higher forecasted growth values. Unlike a mutual fund, |
| the Index is not subject to charges, fees and other expenses. Investors cannot invest directly in any index. These factors |
| can contribute to the Index potentially outperforming the fund. Further information relating to fund performance, |
| including expense reimbursements, if applicable, is contained in the Financial Highlights section of the prospectus and |
| elsewhere in this report. |
6
UNDERSTANDING YOUR FUND’S EXPENSES (Unaudited)
As a mutual fund investor, you pay ongoing expenses, such as management fees and other expenses. Using the information below, you can estimate how these expenses affect your investment and compare them with the expenses of other funds.You also may pay one-time transaction expenses, including sales charges (loads) and redemption fees, which are not shown in this section and would have resulted in higher total expenses. For more information, see your fund’s prospectus or talk to your financial adviser.
Review your fund’s expenses
The table below shows the expenses you would have paid on a $1,000 investment in Dreyfus/The Boston Company Small Cap Tax-Sensitive Equity Fund from April 1, 2011 to September 30, 2011. It also shows how much a $1,000 investment would be worth at the close of the period, assuming actual returns and expenses.
Expenses and Value of a $1,000 Investment
assuming actual returns for the six months ended September 30, 2011
| Expenses paid per $1,000† | $ | 4.93 |
| Ending value (after expenses) | $ | 787.60 |
| COMPARING YOUR FUND’S EXPENSES |
| WITH THOSE OF OTHER FUNDS (Unaudited) |
Using the SEC’s method to compare expenses
The Securities and Exchange Commission (SEC) has established guidelines to help investors assess fund expenses. Per these guidelines, the table below shows your fund’s expenses based on a $1,000 investment, assuming a hypothetical 5% annualized return. You can use this information to compare the ongoing expenses (but not transaction expenses or total cost) of investing in the fund with those of other funds.All mutual fund shareholder reports will provide this information to help you make this comparison. Please note that you cannot use this information to estimate your actual ending account balance and expenses paid during the period.
Expenses and Value of a $1,000 Investment
assuming a hypothetical 5% annualized return for the six months ended September 30, 2011
| Expenses paid per $1,000† | $ | 5.57 |
| Ending value (after expenses) | $ | 1,019.55 |
| † Expenses are equal to the fund’s annualized expense ratio of 1.10% for Class I, multiplied by the average account |
| value over the period, multiplied by 183/365 (to reflect the one-half year period). |
| The Fund | 7 |
| STATEMENT OF INVESTMENTS |
| September 30, 2011 |
| Common Stocks—100.3% | Shares | Value ($) | ||
| Consumer Discretionary—16.1% | ||||
| Aaron’s | 34,630 | a | 874,407 | |
| Body Central | 23,550 | 427,668 | ||
| Buffalo Wild Wings | 14,650 | a,b | 876,070 | |
| Caribou Coffee | 31,020 | b | 366,656 | |
| Cheesecake Factory | 25,570 | a,b | 630,300 | |
| Hibbett Sports | 25,490 | a,b | 863,856 | |
| Interface, Cl. A | 40,461 | a | 479,867 | |
| Jarden | 21,800 | a | 616,068 | |
| Lions Gate Entertainment | 160,022 | a,b | 1,104,152 | |
| Papa John’s International | 25,470 | b | 774,288 | |
| Pinnacle Entertainment | 105,490 | a,b | 957,849 | |
| Rent-A-Center | 8,030 | 220,424 | ||
| Select Comfort | 68,080 | b | 951,078 | |
| Skullcandy | 21,140 | a | 298,708 | |
| SodaStream International | 10,760 | a | 355,618 | |
| Tractor Supply | 8,560 | 535,428 | ||
| Ulta Salon, Cosmetics & Fragrance | 7,450 | a,b | 463,613 | |
| Vitamin Shoppe | 30,760 | a,b | 1,151,654 | |
| 11,947,704 | ||||
| Consumer Staples—7.6% | ||||
| Casey’s General Stores | 23,270 | 1,015,736 | ||
| Chefs’ Warehouse Holdings | 25,270 | a | 297,175 | |
| Darling International | 44,730 | a,b | 563,151 | |
| Elizabeth Arden | 42,020 | b | 1,195,049 | |
| Inter Parfums | 48,050 | 742,373 | ||
| Primo Water | 54,610 | 308,000 | ||
| Ruddick | 23,040 | a | 898,330 | |
| United Natural Foods | 16,300 | a,b | 603,752 | |
| 5,623,566 | ||||
| Energy—5.6% | ||||
| Bill Barrett | 22,560 | b | 817,574 | |
| Brigham Exploration | 15,160 | b | 382,942 | |
8
| Common Stocks (continued) | Shares | Value ($) | |
| Energy (continued) | |||
| Carrizo Oil & Gas | 17,583a,b | 378,914 | |
| Gulfport Energy | 51,210b | 1,238,258 | |
| Oil States International | 13,370b | 680,800 | |
| Tesco | 54,430b | 631,388 | |
| 4,129,876 | |||
| Financial—12.9% | |||
| American Campus Communities | 33,100c | 1,231,651 | |
| Education Realty Trust | 90,590c | 778,168 | |
| Encore Capital Group | 51,550a,b | 1,126,368 | |
| EZCORP, Cl. A | 33,539b | 957,203 | |
| First Cash Financial Services | 23,820a,b | 999,249 | |
| MarketAxess Holdings | 14,380 | 374,168 | |
| Mid-America Apartment Communities | 24,760a,c | 1,491,047 | |
| Potlatch | 38,300c | 1,207,216 | |
| Prosperity Bancshares | 18,670a | 610,136 | |
| Resolute Energy | 29,140b | 331,030 | |
| World Acceptance | 8,000a,b | 447,600 | |
| 9,553,836 | |||
| Health Care—26.0% | |||
| Air Methods | 7,750a,b | 493,443 | |
| Alexion Pharmaceuticals | 19,950b | 1,277,997 | |
| Allscripts Healthcare Solutions | 37,830b | 681,697 | |
| Amarin, ADR | 44,300b | 407,560 | |
| Analogic | 9,340 | 424,129 | |
| Catalyst Health Solutions | 19,010b | 1,096,687 | |
| Centene | 35,020b | 1,004,023 | |
| Cepheid | 33,340a,b | 1,294,592 | |
| Chemed | 7,400 | 406,704 | |
| Cooper | 20,590 | 1,629,699 | |
| Cubist Pharmaceuticals | 36,340a,b | 1,283,529 | |
| Exact Sciences | 54,410b | 360,738 | |
| MAP Pharmaceuticals | 36,240a,b | 529,829 | |
| The Fund | 9 |
STATEMENT OF INVESTMENTS (continued)
| Common Stocks (continued) | Shares | Value ($) | |
| Health Care (continued) | |||
| Masimo | 28,000a | 606,200 | |
| Medicis Pharmaceutical, Cl. A | 22,230 | 810,950 | |
| Merit Medical Systems | 49,440b | 649,642 | |
| NPS Pharmaceuticals | 54,300b | 353,493 | |
| Pharmasset | 14,060b | 1,158,122 | |
| Questcor Pharmaceuticals | 31,450a,b | 857,327 | |
| Salix Pharmaceuticals | 31,590a,b | 935,064 | |
| SXC Health Solutions | 21,370b | 1,190,309 | |
| Theravance | 29,010a,b | 584,261 | |
| ViroPharma | 40,700b | 735,449 | |
| Volcano | 15,000a,b | 444,450 | |
| 19,215,894 | |||
| Industrial—14.0% | |||
| Allegiant Travel | 8,100b | 381,753 | |
| Corporate Executive Board | 43,413 | 1,293,707 | |
| Crane | 20,120 | 718,083 | |
| EMCOR Group | 33,640 | 683,901 | |
| Exponent | 16,400b | 677,812 | |
| Forward Air | 23,830 | 606,474 | |
| Hexcel | 42,370b | 938,919 | |
| Interline Brands | 28,430b | 365,894 | |
| Landstar System | 9,970 | 394,413 | |
| Middleby | 8,970b | 632,026 | |
| Old Dominion Freight Line | 33,372b | 966,787 | |
| Robbins & Myers | 16,080 | 558,137 | |
| Taleo, Cl. A | 37,540b | 965,529 | |
| Teledyne Technologies | 15,668b | 765,538 | |
| Thomas & Betts | 9,780b | 390,320 | |
| 10,339,293 | |||
| Materials—2.9% | |||
| Intrepid Potash | 37,470a,b | 931,879 | |
10
| Common Stocks (continued) | Shares | Value ($) | |
| Materials (continued) | |||
| Kaiser Aluminum | 10,700a | 473,796 | |
| Titanium Metals | 50,940a | 763,081 | |
| 2,168,756 | |||
| Technology—15.2% | |||
| Bottomline Technologies | 40,100b | 807,614 | |
| BroadSoft | 15,250a,b | 462,838 | |
| Cirrus Logic | 25,020b | 368,795 | |
| Commvault Systems | 10,570b | 391,724 | |
| Exlservice Holdings | 27,280b | 600,160 | |
| Marchex, Cl. B | 33,830a | 287,555 | |
| MAXIMUS | 28,810 | 1,005,469 | |
| Mellanox Technologies | 28,467b | 888,740 | |
| Mentor Graphics | 63,600b | 611,832 | |
| Netgear | 24,600a,b | 636,894 | |
| NetLogic Microsystems | 43,110b | 2,074,022 | |
| Photronics | 41,550b | 206,919 | |
| Quality Systems | 5,740a | 556,780 | |
| Solarwinds | 37,669b | 829,471 | |
| Vocus | 45,360b | 760,234 | |
| Volterra Semiconductor | 32,380a,b | 622,667 | |
| Websense | 6,120a,b | 105,876 | |
| 11,217,590 | |||
| Total Common Stocks | |||
| (cost $77,902,164) | 74,196,515 | ||
| Other Investment—.7% | |||
| Registered Investment Company; | |||
| Dreyfus Institutional Preferred | |||
| Plus Money Market Fund | |||
| (cost $526,397) | 526,397d | 526,397 | |
| The Fund | 11 |
STATEMENT OF INVESTMENTS (continued)
| Investment of Cash Collateral | ||||
| for Securities Loaned—22.2% | Shares | Value ($) | ||
| Registered Investment Company; | ||||
| Dreyfus Institutional Cash | ||||
| Advantage Fund | ||||
| (cost $16,444,135) | 16,444,135d | 16,444,135 | ||
| Total Investments (cost $94,872,696) | 123.2% | 91,167,047 | ||
| Liabilities, Less Cash and Receivables | (23.2%) | (17,186,683) | ||
| Net Assets | 100.0% | 73,980,364 | ||
ADR—American Depository Receipts
| a Security, or portion thereof, on loan.At September 30, 2011, the value of the fund’s securities on loan was |
| $15,146,627 and the value of the collateral held by the fund was $16,444,135. |
| b Non-income producing security. |
| c Investment in real estate investment trust. |
| d Investment in affiliated money market mutual fund. |
| Portfolio Summary (Unaudited)† | |||
| Value (%) | Value (%) | ||
| Health Care | 26.0 | Financial | 12.9 |
| Money Market Investments | 22.9 | Consumer Staples | 7.6 |
| Consumer Discretionary | 16.1 | Energy | 5.6 |
| Technology | 15.2 | Materials | 2.9 |
| Industrial | 14.0 | 123.2 | |
| † Based on net assets. | |||
| See notes to financial statements. | |||
12
| STATEMENT OF ASSETS AND LIABILITIES |
| September 30, 2011 |
| Cost | Value | ||
| Assets ($): | |||
| Investments in securities—See Statement of Investments (including | |||
| securities on loan, valued at $15,146,627)—Note 1(b): | |||
| Unaffiliated issuers | 77,902,164 | 74,196,515 | |
| Affiliated issuers | 16,970,532 | 16,970,532 | |
| Receivable for investment securities sold | 2,063,633 | ||
| Dividends and securities lending income receivable | 19,963 | ||
| Prepaid expenses | 7,028 | ||
| 93,257,671 | |||
| Liabilities ($): | |||
| Due to The Dreyfus Corporation and affiliates—Note 3(b) | 123,779 | ||
| Cash overdraft due to Custodian | 81,575 | ||
| Liability for securities on loan—Note 1(b) | 16,444,135 | ||
| Payable for investment securities purchased | 1,457,396 | ||
| Payable for shares of Beneficial Interest redeemed | 1,124,642 | ||
| Accrued expenses | 45,780 | ||
| 19,277,307 | |||
| Net Assets ($) | 73,980,364 | ||
| Composition of Net Assets ($): | |||
| Paid-in capital | 100,565,121 | ||
| Accumulated undistributed Investment income—net | 10,260 | ||
| Accumulated net realized gain (loss) on investments | (22,889,368) | ||
| Accumulated net unrealized appreciation | |||
| (depreciation) on investments | (3,705,649) | ||
| Net Assets ($) | 73,980,364 | ||
| Class I Shares Outstanding | |||
| (unlimited number of $.001 par value shares of Beneficial Interest authorized) | 2,339,842 | ||
| Net Asset Value, offering and redemption price per share ($) | 31.62 | ||
| See notes to financial statements. | |||
| The Fund | 13 |
| STATEMENT OF OPERATIONS |
| Year Ended September 30, 2011 |
| Investment Income ($): | ||
| Income: | ||
| Cash dividends: | ||
| Unaffiliated issuers | 915,356 | |
| Affiliated issuers | 2,802 | |
| Income from securities lending—Note 1(b) | 94,292 | |
| Total Income | 1,012,450 | |
| Expenses: | ||
| Management fee—Note 3(a) | 1,241,054 | |
| Custodian fees—Note 3(b) | 136,412 | |
| Shareholder servicing costs—Note 3(b) | 71,102 | |
| Professional fees | 60,165 | |
| Administration fees—Note 3(a) | 29,124 | |
| Accounting and administration fees—Note 3(a) | 26,250 | |
| Registration fees | 16,090 | |
| Trustees’ fees and expenses—Note 3(c) | 8,456 | |
| Prospectus and shareholders’ reports | 4,136 | |
| Interest expense—Note 2 | 2,664 | |
| Loan commitment fees—Note 2 | 1,103 | |
| Miscellaneous | 15,110 | |
| Total Expenses | 1,611,666 | |
| Less—reduction in fees due to earnings credits—Note 3(b) | (11) | |
| Net Expenses | 1,611,655 | |
| Investment (Loss)—Net | (599,205) | |
| Realized and Unrealized Gain (Loss) on Investments—Note 4 ($): | ||
| Net realized gain (loss) on investments | 44,112,136 | |
| Net unrealized appreciation (depreciation) on investments | (26,503,951) | |
| Net Realized and Unrealized Gain (Loss) on Investments | 17,608,185 | |
| Net Increase in Net Assets Resulting from Operations | 17,008,980 | |
| See notes to financial statements. | ||
14
STATEMENT OF CHANGES IN NET ASSETS
| Year Ended September 30, | ||||
| 2011 | 2010 | |||
| Operations ($): | ||||
| Investment (loss)—net | (599,205) | (623,171) | ||
| Net realized gain (loss) on investments | 44,112,136 | 32,428,299 | ||
| Net unrealized appreciation | ||||
| (depreciation) on investments | (26,503,951) | (13,558,978) | ||
| Net Increase (Decrease) in Net Assets | ||||
| Resulting from Operations | 17,008,980 | 18,246,150 | ||
| Beneficial Interest Transactions ($): | ||||
| Net proceeds from shares sold | 9,467,058 | 14,599,482 | ||
| Cost of shares redeemed | (136,293,105) | (52,853,254) | ||
| Increase (Decrease) in Net Assets from | ||||
| Beneficial Interest Transactions | (126,826,047) | (38,253,772) | ||
| Total Increase (Decrease) in Net Assets | (109,817,067) | (20,007,622) | ||
| Net Assets ($): | ||||
| Beginning of Period | 183,797,431 | 203,805,053 | ||
| End of Period | 73,980,364 | 183,797,431 | ||
| Undistributed investment income—net | 10,260 | 8,637 | ||
| Capital Share Transactions (Shares): | ||||
| Shares sold | 259,583 | 490,583 | ||
| Shares redeemed | (3,665,874) | (1,759,076) | ||
| Net Increase (Decrease) in Shares Outstanding | (3,406,291) | (1,268,493) | ||
| See notes to financial statements. | ||||
| The Fund | 15 |
FINANCIAL HIGHLIGHTS
The following table describes the performance for the fiscal periods indicated. Total return shows how much your investment in the fund would have increased (or decreased) during each period, assuming you had reinvested all dividends and distributions.These figures have been derived from the fund’s financial statements.
| Year Ended September 30, | ||||||||||
| Class I Shares | 2011 | 2010 | 2009a | 2008 | 2007 | |||||
| Per Share Data ($): | ||||||||||
| Net asset value, beginning of period | 31.99 | 29.05 | 33.59 | 43.15 | 42.27 | |||||
| Investment Operations: | ||||||||||
| Investment (loss)—netb | (.14) | (.10) | (.09) | (.07) | (.07) | |||||
| Net realized and unrealized | ||||||||||
| gain (loss) on investments | (.23) | 3.04c | (4.45) | (6.42)c | 8.07c | |||||
| Total from Investment Operations | (.37) | 2.94 | (4.54) | (6.49) | 8.00 | |||||
| Distributions: | ||||||||||
| Dividends from net realized | ||||||||||
| gain on investments | — | — | — | (3.07) | (7.12) | |||||
| Net asset value, end of period | 31.62 | 31.99 | 29.05 | 33.59 | 43.15 | |||||
| Total Return (%) | (1.16) | 10.12 | (13.54) | (15.99) | 20.79 | |||||
| Ratios/Supplemental Data (%): | ||||||||||
| Ratio of total expenses | ||||||||||
| to average net assets | 1.04 | .99 | 1.05 | .95 | .96 | |||||
| Ratio of net expenses | ||||||||||
| to average net assets | 1.04 | .99 | 1.05 | .95 | .96 | |||||
| Ratio of net investment (loss) | ||||||||||
| to average net assets | (.39) | (.33) | (.38) | (.19) | (.17) | |||||
| Portfolio Turnover Rate | 188.90 | 171.24 | 265.74 | 209 | 170 | |||||
| Net Assets, end of period ($ x 1,000) | 73,980 | 183,797 | 203,805 | 303,246 | 316,479 | |||||
| a Effective September 1, 2009, the fund’s shares were redesignated as Class I shares. |
| b Based on average shares outstanding at each month end. |
| c Amount includes litigation proceeds received by the fund amounting to $.02, $.01 and $.04, respectively, per share |
| for the years ended September 30, 2010, 2008 and 2007. |
See notes to financial statements.
16
NOTES TO FINANCIAL STATEMENTS
NOTE 1—Significant Accounting Policies:
Dreyfus/The Boston Company Small Cap Tax-Sensitive Equity Fund (the “fund”) is a separate diversified series of Dreyfus Investment Funds (the “Trust”), which is registered under the Investment Company Act of 1940, as amended (the “Act”), as an open-end management investment company and operates a series company currently offering eleven series, including the fund. The fund’s investment objective is to maximize after-tax total return, consisting of long-term growth of capital. The Dreyfus Corporation (the “Manager” or “Dreyfus”), a wholly-owned subsidiary of The Bank of New York Mellon Corporation (“BNY Mellon”), serves as the fund’s investment adviser. MBSC Securities Corporation (the “Distributor”), a wholly-owned subsidiary of the Manager, is the distributor of the fund’s shares, which are sold without a sales charge.
The Trust accounts separately for the assets, liabilities and operations of each series. Expenses directly attributable to each series are charged to that series’ operations; expenses which are applicable to all series are allocated among them on a pro rata basis.
The Financial Accounting Standards Board (“FASB”) Accounting Standards Codification (“ASC”) is the exclusive reference of authoritative U.S. generally accepted accounting principles (“GAAP”) recognized by the FASB to be applied by nongovernmental entities. Rules and interpretive releases of the Securities and Exchange Commission (“SEC”) under authority of federal laws are also sources of authoritative GAAP for SEC registrants. The fund’s financial statements are prepared in accordance with GAAP, which may require the use of management estimates and assumptions.Actual results could differ from those estimates.
(a) Portfolio valuation: The fair value of a financial instrument is the amount that would be received to sell an asset or paid to transfer a liability in an orderly transaction between market participants at the
| The Fund | 17 |
NOTES TO FINANCIAL STATEMENTS (continued)
measurement date (i.e. the exit price). GAAP establishes a fair value hierarchy that prioritizes the inputs of valuation techniques used to measure fair value.This hierarchy gives the highest priority to unadjusted quoted prices in active markets for identical assets or liabilities (Level 1 measurements) and the lowest priority to unobservable inputs (Level 3 measurements).
Additionally, GAAP provides guidance on determining whether the volume and activity in a market has decreased significantly and whether such a decrease in activity results in transactions that are not orderly. GAAP requires enhanced disclosures around valuation inputs and techniques used during annual and interim periods.
Various inputs are used in determining the value of the fund’s investments relating to fair value measurements.These inputs are summarized in the three broad levels listed below:
Level 1—unadjusted quoted prices in active markets for identical investments.
Level 2—other significant observable inputs (including quoted prices for similar investments, interest rates, prepayment speeds, credit risk, etc.).
Level 3—significant unobservable inputs (including the fund’s own assumptions in determining the fair value of investments).
The inputs or methodology used for valuing securities are not necessarily an indication of the risk associated with investing in those securities.
Changes in valuation techniques may result in transfers in or out of an assigned level within the disclosure hierarchy. Valuation techniques used to value the fund’s investments are as follows:
Investments in securities are valued at the last sales price on the securities exchange or national securities market on which such securities are primarily traded. Securities listed on the National Market System
18
for which market quotations are available are valued at the official closing price or, if there is no official closing price that day, at the last sales price. Securities not listed on an exchange or the national securities market, or securities for which there were no transactions, are valued at the average of the most recent bid and asked prices, except for open short positions, where the asked price is used for valuation purposes. Bid price is used when no asked price is available. Registered investment companies that are not traded on an exchange are valued at their net asset value.All preceding securities are categorized within Level 1 of the fair value hierarchy.
Fair valuing of securities may be determined with the assistance of a pricing service using calculations based on indices of domestic securities and other appropriate indicators, such as prices of relevant ADRs and futures contracts. Utilizing these techniques may result in transfers between Level 1 and Level 2 of the fair value hierarchy.
When market quotations or official closing prices are not readily available, or are determined not to reflect accurately fair value, such as when the value of a security has been significantly affected by events after the close of the exchange or market on which the security is principally traded (for example, a foreign exchange or market), but before the fund calculates its net asset value, the fund may value these investments at fair value as determined in accordance with the procedures approved by the Board of Trustees. Certain factors may be considered when fair valuing investments such as: fundamental analytical data, the nature and duration of restrictions on disposition, an evaluation of the forces that influence the market in which the securities are purchased and sold, and public trading in similar securities of the issuer or comparable issuers.These securities are either categorized as Level 2 or 3 depending on the relevant inputs used.
| The Fund | 19 |
NOTES TO FINANCIAL STATEMENTS (continued)
For restricted securities where observable inputs are limited, assumptions about market activity and risk are used and are categorized within Level 3 of the fair value hierarchy.
The following is a summary of the inputs used as of September 30, 2011 in valuing the fund’s investments:
| Level 2—Other | Level 3— | |||
| Level 1— | Significant | Significant | ||
| Unadjusted | Observable | Unobservable | ||
| Quoted Prices | Inputs | Inputs | Total | |
| Assets ($) | ||||
| Investments in Securities: | ||||
| Equity Securities— | ||||
| Domestic† | 73,433,337 | — | — | 73,433,337 |
| Equity Securities— | ||||
| Foreign† | 763,178 | — | — | 763,178 |
| Mutual Funds | 16,970,532 | — | — | 16,970,532 |
| † See Statement of Investments for additional detailed categorizations. | ||||
In May 2011, FASB issued Accounting Standards Update (“ASU”) No. 2011-04 “Amendments to Achieve Common Fair Value Measurement and Disclosure Requirements in GAAP and International Financial Reporting Standards (“IFRS”)” (“ASU 2011-04”). ASU 2011-04 includes common requirements for measurement of and disclosure about fair value between GAAP and IFRS. ASU 2011-04 will require reporting entities to disclose the following information for fair value measurements categorized within Level 3 of the fair value hierarchy: quantitative information about the unobservable inputs used in the fair value measurement, the valuation processes used by the reporting entity and a narrative description of the sensitivity of the fair value measurement to changes in unobservable inputs and the interrelationships between those unobservable inputs. In addition, ASU 2011-04 will require reporting entities to make disclosures about amounts and reasons for all transfers in and out of Level 1 and Level 2 fair value measure-
20
ments. The new and revised disclosures are effective for interim and annual reporting periods beginning after December 15, 2011. At this time, management is evaluating the implications of ASU 2011-04 and its impact on the financial statements.
(b) Securities transactions and investment income: Securities transactions are recorded on a trade date basis. Realized gains and losses from securities transactions are recorded on the identified cost basis. Dividend income is recognized on the ex-dividend date and interest income, including, where applicable, accretion of discount and amortization of premium on investments, is recognized on the accrual basis.
Pursuant to a securities lending agreement with The Bank of New York Mellon, a subsidiary of BNY Mellon and an affiliate of Dreyfus, the fund may lend securities to qualified institutions. It is the fund’s policy that, at origination, all loans are secured by collateral of at least 102% of the value of U.S. securities loaned and 105% of the value of foreign securities loaned. Collateral equivalent to at least 100% of the market value of securities on loan is maintained at all times. Collateral is either in the form of cash, which can be invested in certain money market mutual funds managed by the Manager, U.S. Government and Agency securities or letters of credit.The fund is entitled to receive all income on securities loaned, in addition to income earned as a result of the lending transaction. Although each security loaned is fully collateralized, the fund bears the risk of delay in recovery of, or loss of rights in, the securities loaned should a borrower fail to return the securities in a timely manner. During the period ended September 30, 2011, The Bank of New York Mellon earned $31,431 from lending portfolio securities, pursuant to the securities lending agreement.
(c) Affiliated issuers: Investments in other investment companies advised by Dreyfus are defined as “affiliated” in the Act.
| The Fund | 21 |
NOTES TO FINANCIAL STATEMENTS (continued)
The fund may invest in shares of certain affiliated investment companies also advised or managed by Dreyfus. Investments in affiliated investment companies for the period ended September 30, 2011 were as follows:
| Affiliated | ||||||
| Investment | Value | Value | Net | |||
| Company | 9/30/2010 ($) | Purchases ($) | Sales ($) | 9/30/2011 | ($) | Assets (%) |
| Dreyfus | ||||||
| Institutional | ||||||
| Preferred | ||||||
| Plus Money | ||||||
| Market | ||||||
| Fund | 3,587,659 | 75,241,367 | 78,302,629 | 526,397 | .7 | |
| Dreyfus | ||||||
| Institutional | ||||||
| Cash | ||||||
| Advantage | ||||||
| Fund | 22,398,298 | 207,449,700 | 213,403,863 | 16,444,135 | 22.2 | |
| Total | 25,985,957 | 282,691,067 | 291,706,492 | 16,970,532 | 22.9 |
(d) Dividends to shareholders: Dividends are recorded on the ex-dividend date. Dividends from investment income-net and dividends from net realized capital gains, if any, are normally declared and paid annually, but the fund may make distributions on a more frequent basis to comply with the distribution requirements of the Internal Revenue Code of 1986, as amended (the “Code”).To the extent that net realized capital gains can be offset by capital loss carryovers, it is the policy of the fund not to distribute such gains. Income and capital gain distributions are determined in accordance with income tax regulations, which may differ from GAAP.
(e) Federal income taxes: It is the policy of the fund to continue to qualify as a regulated investment company, if such qualification is in the best interests of its shareholders, by complying with the applicable provisions of the Code, and to make distributions of taxable income sufficient to relieve it from substantially all federal income and excise taxes.
As of and during the period ended September 30, 2011, the fund did not have any liabilities for any uncertain tax positions.The fund recognizes interest and penalties, if any, related to uncertain tax positions as income tax expense in the Statement of Operations. During the period, the fund did not incur any interest or penalties.
22
Each of the tax years in the four-year period ended September 30, 2011 remains subject to examination by the Internal Revenue Service and state taxing authorities.
At September 30, 2011, the components of accumulated earnings on a tax basis were as follows: accumulated capital losses $21,097,536 and unrealized depreciation $5,487,221.
The accumulated capital loss carryover is available for federal income tax purposes to be applied against future net securities profits, if any, realized subsequent to September 30, 2010. If not applied, the carryover expires in fiscal 2018.
Under the recently enacted Regulated Investment Company Modernization Act of 2010 (the “2010 Act”), the fund will be permitted to carry forward capital losses incurred in taxable years beginning after December 22, 2010 (“post-enactment losses”) for an unlimited period. However, the 2010 Act requires any post-enactment losses to be utilized before the utilization of losses incurred in taxable years prior to the effective date of the 2010 Act. As a result of this ordering rule, capital loss carryovers related to taxable years beginning prior to the effective date of the 2010 Act may be more likely to expire unused.
During the period ended September 30, 2011, as a result of permanent book to tax differences, primarily due to the tax treatment for net operating losses, real estate investment trusts and passive foreign investment companies, the fund increased accumulated undistributed investment income-net by $600,828, increased accumulated net realized gain (loss) on investments by $73,119 and decreased paid-in capital by $673,947. Net assets and net asset value per share were not affected by this reclassification.
NOTE 2—Bank Lines of Credit:
The fund participates with other Dreyfus-managed funds in a $225 million unsecured credit facility led by Citibank, N.A. and a $300 million unsecured credit facility provided by The Bank of New York Mellon (each, a “Facility”), each to be utilized primarily for temporary
| The Fund | 23 |
NOTES TO FINANCIAL STATEMENTS (continued)
or emergency purposes, including the financing of redemptions. In connection therewith, the fund has agreed to pay its pro rata portion of commitment fees for each Facility. Interest is charged to the fund based on rates determined pursuant to the terms of the respective Facility at the time of borrowing.
The average amount of borrowings outstanding under the Facilities during the period ended September 30, 2011 was approximately $192,600, with a related weighted average annualized interest rate of 1.38%.
NOTE 3—Investment Advisory Fee and Other Transactions With Affiliates:
(a) Pursuant to an investment advisory agreement with the Manager, the investment advisory fee is computed at the annual rate of .80% of the value of the fund’s average daily net assets and is payable monthly.
From October 1, 2010 through April 30, 2011, the Trust had an agreement with The Bank of New York Mellon, pursuant to which The Bank of NewYork Mellon provided administration and fund accounting services for the fund. For these services, the fund paid The Bank of New York Mellon a fixed fee plus asset and transaction based fees, as well as out-of-pocket expenses. Pursuant to this agreement, the fund was charged $26,250 during the period October 1, 2010 through April 30, 2011 for administration and fund accounting services.
At Board Meetings of the Trust held on February 15-16, 2011, the Board of Trustees of the Trust terminated the agreement with The Bank of New York Mellon and, on behalf of the Trust, entered into a Fund Accounting and Administration Agreement (the “Administration Agreement”) with Dreyfus, effective May 1, 2011, whereby Dreyfus performs administrative, accounting and recordkeeping services for the fund. The fund has agreed to compensate Dreyfus for providing accounting services, administration, compliance monitoring, regulatory and shareholder reporting, as well as related facilities, equipment and clerical help.The fee is based on the fund’s average daily net assets and computed at the following annual rates: .06% of the first $500 million, .04% of the next $500 million and .02% in excess of $1 billion.
24
In addition, after applying any expense limitations or fee waivers that reduce the fees paid to Dreyfus for this service, Dreyfus has contractually agreed in writing to waive any remaining fees for this service to the extent that they exceed both Dreyfus’ costs in providing these services and a reasonable allocation of the costs incurred by Dreyfus and its affiliates related to the support and oversight of these services.The fund also reimburses Dreyfus for the out-of-pocket expenses Dreyfus incurs in performing this service for the fund. Pursuant to the Administration Agreement, the fund was charged $29,124 during the period May 1, 2011 through September 30, 2011.
(b) The fund compensates Dreyfus Transfer, Inc., a wholly-owned subsidiary of the Manager, under a transfer agency agreement for providing personnel and facilities to perform transfer agency services for the fund. During the period ended September 30, 2011, the fund was charged $3,396 pursuant to the transfer agency agreement, which is included in Shareholder servicing costs in the Statement of Operations.
The fund has arrangements with the custodian and cash management bank whereby the fund may receive earnings credits when positive cash balances are maintained, which are used to offset custody and cash management fees. For financial reporting purposes, the fund includes net earnings credits as an expense offset in the Statement of Operations.
The fund compensates The Bank of New York Mellon under cash management agreements for performing cash management services related to fund subscriptions and redemptions. During the period ended September 30, 2011, the fund was charged $240 pursuant to the cash management agreements, which is included in Shareholder servicing costs in the Statement of Operations.These fees were partially offset by earnings credits of $11.
The fund also compensates The Bank of New York Mellon under a custody agreement for providing custodial services for the fund. During the period ended September 30, 2011, the fund was charged $136,412 pursuant to the custody agreement.
| The Fund | 25 |
NOTES TO FINANCIAL STATEMENTS (continued)
During the period ended September 30, 2011, the fund was charged $7,146 for services performed by the Chief Compliance Officer.
The components of “Due to The Dreyfus Corporation and affiliates” in the Statement of Assets and Liabilities consist of: investment advisory fees $54,437, administration fees $4,072, custodian fees $57,087, chief compliance officer fees $3,750, private wealth sub-accounting fees $4,033 and transfer agency per account fees $400.
(c) Each Trustee who is not an “interested person” of the Trust (as defined in the Act) receives $60,000 per annum, plus $7,000 per joint Board meeting of the Trust, The Dreyfus/Laurel Funds, Inc., The Dreyfus/Laurel Funds Trust, The Dreyfus/Laurel Tax-Free Municipal Funds and Dreyfus Funds, Inc. (collectively, the “Board Group Open-End Funds”) attended, $2,500 for separate in-person committee meetings attended which are not held in conjunction with a regularly scheduled Board meeting and $2,000 for Board meetings and separate committee meetings attended that are conducted by telephone. The Board Group Open-End Funds also reimburse eachTrustee who is not an “interested person” of theTrust (as defined in the Act) for travel and out-of-pocket expenses. With respect to Board meetings, the Chairman of the Board receives an additional 25% of such compensation (with the exception of reimbursable amounts).The Chair of each of the Board’s committees, unless the Chair also serves as Chair of the Board, receives $1,350 per applicable committee meeting. In the event that there is an in-person joint committee meeting or a joint telephone meeting of the Board Group Open-End Funds and Dreyfus HighYield Strategies Fund (“DHF”), a $2,500 fee is allocated between the Board Group Open-End Funds and DHF.
Effective January 1, 2012, the Board Group Open-End Funds and DHF (collectively, the “Board Group Funds”) will pay each Trustee their respective allocated portions of an annual retainer of $85,000 and a fee of $10,000 for each regularly scheduled Board meeting attended ($75,000 and $8,000, respectively, in the aggregate, prior to January 1, 2012).With respect to the annual retainer and Board meetings of the Board Group Funds, the Chair of the Board will receive an additional 25% of such compensation (with the exception of reimbursable
26
amounts). Each Trustee will receive $2,500 for any separate in-person committee meetings attended, which are not held in conjunction with a regularly scheduled Board meeting, such amount to be allocated among the Board Group Funds, as applicable. In the event that there is a joint telephone meeting of the Board Group Funds, a fee of $2,000 will be allocated among the applicable Board Group Funds, accordingly (prior to January 1, 2012, the fee allocated was $2,500 if the meeting included DHF). The Chair of each of the Board’s committees, unless the Chair also serves as Chair of the Board, will receive $1,500 per applicable committee meeting. Each Emeritus Trustee is entitled to receive an annual retainer of one-half the amount paid as a retainer at the time the Trustee became Emeritus and a per meeting attended fee of one-half the amount paid to Trustees.The Board Group Funds also reimburse each Independent Trustee and Emeritus Trustees for travel and out-of-pocket expenses.
NOTE 4—Securities Transactions:
The aggregate amount of purchases and sales of investment securities, excluding short-term securities, during the period ended September 30, 2011, amounted to $288,369,988 and $412,808,124, respectively.
At September 30, 2011, the cost of investments for federal income tax purposes was $96,654,268; accordingly, accumulated net unrealized depreciation on investments was $5,487,221, consisting of $5,736,583 gross unrealized appreciation and $11,223,804 gross unrealized depreciation.
NOTE 5—Subsequent Event:
Effective October 27, 2011, the Nominating Committee of the Board of Trustees nominated, and the Board of Trustees approved the election of, Francine J. Bovich as a Trustee of the Trust. A proxy statement will be mailed, on or about November 28, 2011, to Trust shareholders of record as of the close of business November 1, 2011, asking shareholders to consider Ms. Bovich’s election as a Board member of the Trust at a Special Joint Meeting of Shareholders to be held on Wednesday, February 8, 2012.
| The Fund | 27 |
| REPORT OF INDEPENDENT REGISTERED |
| PUBLIC ACCOUNTING FIRM |
To the Board of Trustees and Shareholders of Dreyfus/The Boston Company Small Cap Tax-Sensitive Equity Fund:
We have audited the accompanying statement of assets and liabilities of Dreyfus/The Boston Company Small Cap Tax-Sensitive Equity Fund (the “Fund”), a series of Dreyfus Investment Funds, including the statement of investments as of September 30, 2011, and the related statement of operations for the year then ended, the statements of changes in net assets for each of the years in the two-year period then ended and financial highlights for each of the years in the three-year period then ended. These financial statements and financial highlights are the responsibility of the Fund’s management. Our responsibility is to express an opinion on these financial statements and financial highlights based on our audits.The financial highlights for each of the years in the two-year period ended September 30, 2008 were audited by other independent registered public accountants whose report thereon, dated November 28, 2008, expressed an unqualified opinion on those financial highlights.
We conducted our audits in accordance with the standards of the Public Company Accounting Oversight Board (United States).Those standards require that we plan and perform the audit to obtain reasonable assurance about whether the financial statements and financial highlights are free of material misstatement.An audit also includes examining, on a test basis, evidence supporting the amounts and disclosures in the financial statements. Our procedures included confirmation of securities owned as of September 30, 2011 by correspondence with the custodian and brokers or by other appropriate auditing procedures where replies from brokers were not received.An audit also includes assessing the accounting principles used and significant estimates made by management, as well as evaluating the overall financial statement presentation.We believe that our audits provide a reasonable basis for our opinion.
In our opinion, the financial statements and financial highlights referred to above present fairly, in all material respects, the financial position of Dreyfus/The Boston Company Small CapTax-Sensitive Equity Fund as of September 30, 2011, and the results of its operations for the year then ended, the changes in its net assets for each of the years in the two-year period then ended, and the financial highlights for each of the years in the three-year period then ended, in conformity with U.S. generally accepted accounting principles.

New York, New York
November 23, 2011
28
| INFORMATION ABOUT THE RENEWAL OF THE FUND’S |
| INVESTMENT ADVISORY AGREEMENT (Unaudited) |
At a meeting of the fund’s Board of Trustees held on July 28, 2011, the Board considered the renewal of the fund’s Investment Advisory Agreement pursuant to which Dreyfus provides the fund with investment advisory services (the “Agreement”).The Board members, none of whom are “interested persons” (as defined in the Investment Company Act of 1940, as amended) of the fund, were assisted in their review by independent legal counsel and met with counsel in executive session separate from representatives of Dreyfus. In considering the renewal of the Agreement, the Board considered all factors that it believed to be relevant, including those discussed below.The Board did not identify any one factor as dispositive, and each Board member may have attributed different weights to the factors considered.
Analysis of Nature, Extent, and Quality of Services Provided to the Fund.The Board members considered information previously provided to them in presentations from representatives of Dreyfus regarding the nature, extent, and quality of the services provided to funds in the Dreyfus fund complex, and representatives of Dreyfus confirmed that there had been no material changes in this information. Dreyfus provided the number of open accounts in the fund, the fund’s asset size and the allocation of fund assets among distribution channels. Dreyfus also had previously provided information regarding the diverse intermediary relationships and distribution channels of funds in the Dreyfus fund complex and Dreyfus’ corresponding need for broad, deep, and diverse resources to be able to provide ongoing shareholder services to each distribution channel, including the distribution channel(s) for the fund.
The Board members also considered research support available to, and portfolio management capabilities of, the fund’s portfolio management personnel.The Board members also considered Dreyfus’ extensive compliance infrastructure.The Board also considered portfolio management’s brokerage policies and practices (including policies and practices regarding soft dollars) and the standards applied in seeking best execution.
| The Fund | 29 |
| INFORMATION ABOUT THE RENEWAL OF THE FUND’S |
| INVESTMENT ADVISORY AGREEMENT (Unaudited) (continued) |
Comparative Analysis of the Fund’s Performance and Management Fee and Expense Ratio. The Board members reviewed reports prepared by Lipper, Inc. (“Lipper”), an independent provider of investment company data, which included information comparing (1) the fund’s performance with the performance of a group of comparable funds (the “Performance Group”) and with a broader group of funds (the “Performance Universe”), all for various periods ended June 30, 2011, and (2) the fund’s actual and contractual management fees and total expenses with those of a group of comparable funds (the “Expense Group”) and with a broader group of funds (the “Expense Universe”), the information for which was derived in part from fund financial statements available to Lipper as of March 31, 2011. Dreyfus previously had furnished the Board with a description of the methodology Lipper used to select the Performance Group and Performance Universe and the Expense Group and Expense Universe.
Dreyfus representatives stated that the usefulness of performance comparisons may be affected by a number of factors, including different investment limitations that may be applicable to the fund and comparison funds.The Board members discussed the results of the comparisons and noted that the fund’s total return performance was variously above, at and below the Performance Group medians and below the Performance Universe medians for all periods. Dreyfus also provided a comparison of the fund’s calendar year total returns to the returns of the fund’s benchmark index, noting that the fund outperformed the benchmark index 6 of the last 10 calendar years. A representative of Dreyfus noted that, although the fund underperformed during most of the reporting periods ended June 30, 2011, as provided by Lipper, the fund did outperform the benchmark for the 3-month period ended July 26, 2011 and, for the two-month period ended July 26, 2011, the fund was in the 2nd quartile of the Performance Group. Despite the improved performance over the short-term, the Board expressed its concern with the fund’s longer-term performance and requested that Dreyfus take steps to improve it.
30
Representatives of Dreyfus discussed with the Board members the investment style and strategy used by the fund’s portfolio managers to identify and select stocks and the role of fundamental analysis in selecting stocks. Dreyfus representatives informed the Board of steps being taken in an effort to improve fund performance and stated that Dreyfus would report back to the Board at the next regularly scheduled Board meeting.
The Board members also reviewed the range of actual and contractual management fees and total expenses of the Expense Group and Expense Universe funds and discussed the results of the comparisons. They noted that the fund’s contractual management fee was below the Expense Group median, the fund’s actual management fee was below the Expense Group median and above the Expense Universe median, and the fund’s total expenses were below the Expense Group and Expense Universe medians.
Representatives of Dreyfus reviewed with the Board members the management or investment advisory fees (1) paid by funds advised or administered by Dreyfus that are in the same Lipper category as the fund and (2) paid to Dreyfus or the Dreyfus-affiliated primary employer of the fund’s primary portfolio manager for advising any separate accounts and/or other types of client portfolios that are considered to have similar investment strategies and policies as the fund (the “Similar Clients”), and explained the nature of the Similar Clients.They discussed differences in fees paid and the relationship of the fees paid in light of any differences in the services provided and other relevant factors.The Board members considered the relevance of the fee information provided for the Similar Clients to evaluate the appropriateness and reasonableness of the fund’s management fee.
Analysis of Profitability and Economies of Scale. Dreyfus’ representatives reviewed the expenses allocated and profit received by Dreyfus and the resulting profitability percentage for managing the fund, and the
| The Fund | 31 |
| INFORMATION ABOUT THE RENEWAL OF THE FUND’S |
| INVESTMENT ADVISORY AGREEMENT (Unaudited) (continued) |
method used to determine the expenses and profit. The Board concluded that the profitability results were not unreasonable, given the services rendered, or to be rendered, and service levels provided, or to be provided, by Dreyfus.The Board previously had been provided with information prepared by an independent consulting firm regarding Dreyfus’ approach to allocating costs to, and determining the profitability of, individual funds and the entire Dreyfus fund complex.The consulting firm also had analyzed where any economies of scale might emerge in connection with the management of a fund.
The Board’s counsel stated that the Board members should consider the profitability analysis (1) as part of their evaluation of whether the fees under the Agreements bear a reasonable relationship to the mix of services provided by Dreyfus, including the nature, extent and quality of such services, and (2) in light of the relevant circumstances for the fund and the extent to which economies of scale would be realized if the fund grows and whether fee levels reflect these economies of scale for the benefit of fund shareholders. Dreyfus representatives noted that a discussion of economies of scale is predicated on a fund having achieved a substantial size with increasing assets and that, if a fund’s assets had been stable or decreasing, the possibility that Dreyfus may have realized any economies of scale would be less. A Dreyfus representative also noted that the fund had been generally closed to new investors since July 6, 2007. They also noted that, as a result of shared and allocated costs among funds in the Dreyfus funds complex, the extent of economies of scale could depend substantially on the level of assets in the complex as a whole, so that increases and decreases in complex-wide assets can affect potential economies of scale in a manner that is disproportionate to, or even in the opposite direction from, changes in the fund’s asset level. The Board members also considered potential benefits to Dreyfus from acting as investment adviser and noted the soft dollar arrangements in effect for trading the fund’s investments.
At the conclusion of these discussions, the Board agreed that it had been furnished with sufficient information to make an informed business
32
decision with respect to the renewal of the Agreement. Based on the discussions and considerations as described above, the Board concluded and determined as follows.
The Board concluded that the nature, extent and quality of the services provided by Dreyfus are adequate and appropriate.
The Board agreed to closely monitor performance and to renew the Agreement through April 4, 2012, in light of the considerations described above.
The Board concluded that the fees payable to Dreyfus were reasonable in light of the considerations described above.
The Board determined that the economies of scale which may accrue to Dreyfus and its affiliates in connection with the management of the fund had been adequately considered by Dreyfus in connection with the fee rate charged to the fund pursuant to the Agreement and that, to the extent in the future it were determined that material economies of scale had not been shared with the fund, the Board would seek to have those economies of scale shared with the fund.
The Board members considered these conclusions and determinations, along with information received on a routine and regular basis throughout the year. In addition, it should be noted that the Board’s consideration of the contractual fee arrangements for this fund had the benefit of a number of years of reviews of similar agreements during which lengthy discussions took place between the Board members and Dreyfus representatives. Certain aspects of the arrangements may receive greater scrutiny in some years than in others, and the Board members’ conclusions may be based, in part, on their consideration of the same or similar arrangements in prior years.The Board members determined that renewal of the Agreement was in the best interests of the fund and its shareholders.
| The Fund | 33 |
BOARD MEMBERS INFORMATION (Unaudited)
| Joseph S. DiMartino (67) |
| Chairman of the Board (2008) |
| Principal Occupation During Past 5Years: |
| • Corporate Director and Trustee |
| Other Public Company Board Memberships During Past 5Years: |
| • CBIZ (formerly, Century Business Services, Inc.), a provider of outsourcing functions for small |
| and medium size companies, Director (1997-present) |
| • Sunair Services Corporation, a provider of certain outdoor-related services to homes and |
| businesses, Director (2005-2009) |
| • The Newark Group, a provider of a national market of paper recovery facilities, paperboard |
| mills and paperboard converting plants, Director (2000-2010) |
| No. of Portfolios for which Board Member Serves: 167 |
| ——————— |
| Francine J. Bovich (60)† |
| Board Member (2011) |
| Principal Occupation During Past 5Years: |
| • Trustee,The Bradley Trusts, private trust funds (2011-present) |
| • Managing Director, Morgan Stanley Investment Management (1993-2010) |
| No. of Portfolios for which Board Member Serves: 14 |
| ——————— |
| James M. Fitzgibbons (77) |
| Board Member (2008) |
| Principal Occupation During Past 5Years: |
| • Corporate Director and Trustee |
| Other Public Company Board Memberships During Past 5Years: |
| • Bill Barrett Corporation, an oil and natural gas exploration company, Director (2004-present) |
| No. of Portfolios for which Board Member Serves: 33 |
| ——————— |
| Kenneth A. Himmel (65) |
| Board Member (2008) |
| Principal Occupation During Past 5Years: |
| • President and CEO, Related Urban Development, a real estate development company |
| (1996-present) |
| • President and CEO, Himmel & Company, a real estate development company (1980-present) |
| • CEO,American Food Management, a restaurant company (1983-present) |
| No. of Portfolios for which Board Member Serves: 33 |
34
| Stephen J. Lockwood (64) |
| Board Member (2008) |
| Principal Occupation During Past 5Years: |
| • Chairman of the Board, Stephen J. Lockwood and Company LLC, a real estate investment |
| company (2000-present) |
| No. of Portfolios for which Board Member Serves: 33 |
| ——————— |
| Roslyn M. Watson (61) |
| Board Member (2008) |
| Principal Occupation During Past 5Years: |
| • Principal,Watson Ventures, Inc., a real estate investment company (1993-present) |
| No. of Portfolios for which Board Member Serves: 43 |
| ——————— |
| Benaree Pratt Wiley (65) |
| Board Member (2008) |
| Principal Occupation During Past 5Years: |
| • Principal,TheWiley Group, a firm specializing in strategy and business development (2005-present) |
| Other Public Company Board Memberships During Past 5Years: |
| • CBIZ (formerly, Century Business Services, Inc.), a provider of outsourcing functions for small |
| and medium size companies, Director (2008-present) |
| No. of Portfolios for which Board Member Serves: 68 |
| ——————— |
† Ms. Bovich was elected as a Board Member by the Board ofTrustees, effective October 27, 2011. See Note 5.
Once elected all Board Members serve for an indefinite term, but achieve Emeritus status upon reaching age 80.The address of the Board Members and Officers is in c/o The Dreyfus Corporation, 200 Park Avenue, NewYork, NewYork 10166.Additional information about the Board Members is available in the fund’s Statement of Additional Information which can be obtained from Dreyfus free of charge by calling this toll free number: 1-800-DREYFUS.
| The Fund | 35 |
OFFICERS OF THE FUND (Unaudited)
BRADLEY J. SKAPYAK, President since January 2010.
Chief Operating Officer and a director of the Manager since June 2009. From April 2003 to June 2009, Mr. Skapyak was the head of the Investment Accounting and Support Department of the Manager. He is an officer of 75 investment companies (comprised of 167 portfolios) managed by the Manager. He is 52 years old and has been an employee of the Manager since February 1988.
MICHAEL A. ROSENBERG, Vice President and Secretary since August 2005.
Assistant General Counsel of BNY Mellon, and an officer of 76 investment companies (comprised of 192 portfolios) managed by the Manager. He is 51 years old and has been an employee of the Manager since October 1991.
KIESHA ASTWOOD, Vice President and Assistant Secretary since January 2010.
Counsel of BNY Mellon, and an officer of 76 investment companies (comprised of 192 portfolios) managed by the Manager. She is 38 years old and has been an employee of the Manager since July 1995.
JAMES BITETTO, Vice President and Assistant Secretary since August 2005.
Senior Counsel of BNY Mellon and Secretary of the Manager, and an officer of 76 investment companies (comprised of 192 portfolios) managed by the Manager. He is 45 years old and has been an employee of the Manager since December 1996.
JONI LACKS CHARATAN, Vice President and Assistant Secretary since August 2005.
Senior Counsel of BNY Mellon, and an officer of 76 investment companies (comprised of 192 portfolios) managed by the Manager. She is 55 years old and has been an employee of the Manager since October 1988.
JOSEPH M. CHIOFFI, Vice President and Assistant Secretary since August 2005.
Senior Counsel of BNY Mellon, and an officer of 76 investment companies (comprised of 192 portfolios) managed by the Manager. He is 49 years old and has been an employee of the Manager since June 2000.
KATHLEEN DENICHOLAS, Vice President and Assistant Secretary since January 2010.
Managing Counsel of BNY Mellon, and an officer of 76 investment companies (comprised of 192 portfolios) managed by the Manager. She is 36 years old and has been an employee of the Manager since February 2001.
JANETTE E. FARRAGHER, Vice President and Assistant Secretary since August 2005.
Assistant General Counsel of BNY Mellon, and an officer of 76 investment companies (comprised of 192 portfolios) managed by the Manager. She is 48 years old and has been an employee of the Manager since February 1984.
JOHN B. HAMMALIAN, Vice President and Assistant Secretary since August 2005.
Senior Managing Counsel of BNY Mellon, and an officer of 76 investment companies (comprised of 192 portfolios) managed by the Manager. He is 48 years old and has been an employee of the Manager since February 1991.
M. CRISTINA MEISER, Vice President and Assistant Secretary since January 2010.
Senior Counsel of BNY Mellon, and an officer of 76 investment companies (comprised of 192 portfolios) managed by the Manager. She is 41 years old and has been an employee of the Manager since August 2001.
36
ROBERT R. MULLERY, Vice President and Assistant Secretary since August 2005.
Managing Counsel of BNY Mellon, and an officer of 76 investment companies (comprised of 192 portfolios) managed by the Manager. He is 59 years old and has been an employee of the Manager since May 1986.
JEFF PRUSNOFSKY, Vice President and Assistant Secretary since August 2005.
Senior Managing Counsel of BNY Mellon, and an officer of 76 investment companies (comprised of 192 portfolios) managed by the Manager. He is 46 years old and has been an employee of the Manager since October 1990.
JAMES WINDELS, Treasurer since November 2001.
Director – Mutual Fund Accounting of the Manager, and an officer of 76 investment companies (comprised of 192 portfolios) managed by the Manager. He is 53 years old and has been an employee of the Manager since April 1985.
RICHARD CASSARO, Assistant Treasurer since December 2008.
Senior Accounting Manager – Money Market and Municipal Bond Funds of the Manager, and an officer of 76 investment companies (comprised of 192 portfolios) managed by the Manager. He is 52 years old and has been an employee of the Manager since September 1982.
GAVIN C. REILLY, Assistant Treasurer since December 2008.
Tax Manager of the Investment Accounting and Support Department of the Manager, and an officer of 76 investment companies (comprised of 192 portfolios) managed by the Manager. He is 43 years old and has been an employee of the Manager since April 1991.
ROBERT ROBOL, Assistant Treasurer since December 2008.
Senior Accounting Manager – Fixed Income Funds of the Manager, and an officer of 76 investment companies (comprised of 192 portfolios) managed by the Manager. He is 47 years old and has been an employee of the Manager since October 1988.
ROBERT SALVIOLO, Assistant Treasurer since December 2008.
Senior Accounting Manager – Equity Funds of the Manager, and an officer of 76 investment companies (comprised of 192 portfolios) managed by the Manager. He is 44 years old and has been an employee of the Manager since June 1989.
ROBERT SVAGNA, Assistant Treasurer since December 2008.
Senior Accounting Manager – Equity Funds of the Manager, and an officer of 76 investment companies (comprised of 192 portfolios) managed by the Manager. He is 44 years old and has been an employee of the Manager since November 1990.
| The Fund | 37 |
OFFICERS OF THE FUND (Unaudited) (continued)
JOSEPH W. CONNOLLY, Chief Compliance Officer since December 2008.
Chief Compliance Officer of the Manager and The Dreyfus Family of Funds (76 investment companies, comprised of 192 portfolios). From November 2001 through March 2004, Mr. Connolly was first Vice-President, Mutual Fund Servicing for Mellon Global Securities Services. In that capacity, Mr. Connolly was responsible for managing Mellon’s Custody, Fund Accounting and Fund Administration services to third-party mutual fund clients.
He is 54 years old and has served in various capacities with the Manager since 1980, including manager of the firm’s Fund Accounting Department from 1997 through October 2001.
STEPHEN J. STOREN, Anti-Money Laundering Compliance Officer since May 2011.
Chief Compliance Officer of the Distributor, and the Anti-Money Laundering Compliance Officer of 72 investment companies (comprised of 188 portfolios) managed by the Manager. He is 57 years old and has been an employee of the Distributor since October 1999.
38
NOTES
For More Information
Ticker Symbol: SDCEX
Telephone 1-800-DREYFUS
Mail The Dreyfus Family of Funds, 144 Glenn Curtiss Boulevard, Uniondale, NY 11556-0144 E-mail Send your request to info@dreyfus.com Internet Information can be viewed online or downloaded at: http://www.dreyfus.com
The fund files its complete schedule of portfolio holdings with the Securities and Exchange Commission (“SEC”) for the first and third quarters of each fiscal year on Form N-Q. The fund’s Forms N-Q are available on the SEC’s website at http://www.sec.gov and may be reviewed and copied at the SEC’s Public Reference Room in Washington, DC. Information on the operation of the Public Reference Room may be obtained by calling 1-800-SEC-0330.
A description of the policies and procedures that the fund uses to determine how to vote proxies relating to portfolio securities, and information regarding how the fund voted these proxies for the most recent 12-month period ended June 30 is available at http://www.dreyfus.com and on the SEC’s website at http://www.sec.gov. The description of the policies and procedures is also available without charge, upon request, by calling 1-800-DREYFUS.

| Dreyfus/The Boston |
| Company Small Cap |
| Value Fund |
ANNUAL REPORT September 30, 2011
Save time. Save paper. View your next shareholder report online as soon as it’s available. Log into www.dreyfus.com and sign up for Dreyfus eCommunications. It’s simple and only takes a few minutes.
The views expressed in this report reflect those of the portfolio manager only through the end of the period covered and do not necessarily represent the views of Dreyfus or any other person in the Dreyfus organization. Any such views are subject to change at any time based upon market or other conditions and Dreyfus disclaims any responsibility to update such views.These views may not be relied on as investment advice and, because investment decisions for a Dreyfus fund are based on numerous factors, may not be relied on as an indication of trading intent on behalf of any Dreyfus fund.
Not FDIC-Insured • Not Bank-Guaranteed • May Lose Value
Contents | |
THE FUND | |
| 2 | A Letter from the Chairman and CEO |
| 3 | Discussion of Fund Performance |
| 6 | Fund Performance |
| 7 | Understanding Your Fund’s Expenses |
| 7 | Comparing Your Fund’s Expenses With Those of Other Funds |
| 8 | Statement of Investments |
| 14 | Statement of Assets and Liabilities |
| 15 | Statement of Operations |
| 16 | Statement of Changes in Net Assets |
| 17 | Financial Highlights |
| 18 | Notes to Financial Statements |
| 29 | Report of Independent Registered Public Accounting Firm |
| 30 | Important Tax Information |
| 31 | Board Members Information |
| 33 | Officers of the Fund |
FOR MORE INFORMATION | |
Back Cover |
Dreyfus/The Boston
Company Small Cap
Value Fund
The Fund

A LETTER FROM THE CHAIRMAN AND CEO
Dear Shareholder:
This annual report for Dreyfus/The Boston Company Small CapValue Fund covers the 12-month period from October 1, 2010, through September 30, 2011. For information about how the fund performed during the reporting period, as well as general market perspectives, we provide a Discussion of Fund Performance on the pages that follow.
Investors generally were encouraged by expectations of a more robust economic recovery over the first half of the reporting period, but investor sentiment deteriorated sharply during the second half due to disappointing economic data, rising commodity prices, an escalating sovereign debt crisis in Europe and a contentious debate regarding taxes, spending and borrowing in the United States. Market volatility was particularly severe during August and September after a major credit rating agency downgraded U.S. long-term debt. Stocks proved sensitive to macroeconomic concerns in this challenging environment, often regardless of more promising company fundamentals, and most U.S. equity market indices gave back their earlier gains.
The economic outlook currently is clouded by market turbulence and political infighting, but we believe that a continued subpar global expansion is more likely than a return to recession. Inflationary pressures appear to be waning in most countries as energy prices recently have retreated from their highs. In the United States, the Federal Reserve Board has signaled its intention to maintain an aggressively accommodative monetary policy, which may help offset the financial stresses caused by deleveraging in the private sector and fiscal consolidation by governments in the United States and Europe. To assess the potential impact of these and other developments on your investments, we encourage you, as always, to speak with your financial advisor.
Thank you for your continued confidence and support.

Jonathan R. Baum
Chairman and Chief Executive Officer
The Dreyfus Corporation
October 17, 2011
2

DISCUSSION OF FUND PERFORMANCE
For the period from October 1, 2010, through September 30, 2011, as provided by Joseph M. Corrado, CFA, and Stephanie K. Brandaleone, CFA, Portfolio Managers
Fund and Market Performance Overview
For the 12-month period ended September 30, 2011, Dreyfus/The Boston Company Small Cap Value Fund produced a total return of –8.14%.1 In comparison, the fund’s benchmark, the Russell 2000 Value Index (the “Index”), produced a total return of –5.99% for the same period.2
Small-cap stocks rallied through the first quarter of 2011 amid expectations of continued economic recovery, but several macroeconomic disappointments later erased those gains.The fund produced a return that was lower than its benchmark, primarily due to shortfalls in the financials and consumer discretionary sectors.
The Fund’s Investment Approach
The fund seeks long-term growth of capital.To pursue its goal, the fund normally invests at least 80% of its assets in equity securities of small-cap U.S. companies with market capitalizations, at the time of purchase, that are equal to or less than the total market capitalization of the largest company in the Index. We use fundamental research and qualitative analysis to select stocks and look for companies with strong competitive positions, high-quality management, and financial strength. We use a consistent three-step fundamental research process to evaluate the stocks, consisting of valuation, which is to identify small-cap companies that are considered to be attractively priced relative to their earnings potential; fundamentals, which is to verify the strength of the underlying business position; and catalyst, which is to identify a specific event that has the potential to cause the stocks to appreciate in value.
| The Fund | 3 |
DISCUSSION OF FUND PERFORMANCE (continued)
Shifting Sentiment Sparked Heightened Volatility
Investors’ outlooks had improved markedly during the final months of 2010 after the Federal Reserve Board announced a second round of quantitative easing to jump-start the U.S. economy, and subsequent upturns in economic data and corporate earnings supported rising stock prices into the first quarter of 2011. However, the rally was interrupted in February when political unrest in the Middle East led to sharply rising energy prices, and in March when devastating natural and nuclear disasters in Japan threatened the global industrial supply chain. Nonetheless, stocks generally recovered quickly from these unexpected shocks.
In late April, investor sentiment began to deteriorate in earnest when Greece appeared headed for default and other European countries struggled with a resurgent sovereign debt crisis. Closer to home, investors grew worried when U.S. economic data proved disappointing and a contentious debate in Congress regarding government spending and borrowing intensified. Stocks suffered bouts of heightened volatility as newly risk-averse investors shifted their focus to industry groups that historically have held up well under uncertain economic conditions. Market turbulence was particularly severe in August and September, driving the Index into negative territory for the reporting period overall as investors disregarded underlying company fundamentals in favor of reacting to each new headline and release of economic data.
Stock Selections Produced Mixed Results
In this challenging investment climate, investors generally ignored the valuations and growth catalysts considered by our investment approach. Instead, they focused on quarterly financial results, punishing companies that fell short of near-term expectations regardless of longer-term strengths.This change in investor sentiment proved particularly damaging to the fund’s holdings in the financials sector, where a number of commercial banks, thrifts and mortgage finance companies were caught in the downdraft despite what we regarded as attractive valuations and better capitalized balance sheets. In addition, Wilmington Trust hurt performance when the company was acquired as part of a bailout after reporting a significant loss that surprised investors, and mortgage
4
insurance provider MGIC Investment was hurt by persistently elevated levels of mortgage delinquencies. In the consumer discretionary sector, specialty retailers Talbots and OfficeMax were punished when sales disappointed, putting pressure on profit margins. Among homebuilders, Ryland Group was hurt by a weak housing market and rising uncertainty.
The fund achieved better results in the consumer staples sector, where chicken producer Sanderson Farms benefited from reduced industry capacity and greater pricing power. Bakery products maker Flowers Foods gained value after achieving higher sales and earnings, and warehouse club operator BJ’s Wholesale Club received a buyout offer from a private equity firm. In the industrials sector, hazardous materials disposal specialist Clean Harbors climbed on the strength of high asset utilization rates in the United States and Canada, as well as a robust backlog of orders.
Focusing on Underlying Fundamentals
We expect economic headwinds to persist and equity markets to stay volatile, suggesting that investors may continue to respond primarily to macroeconomic developments over the near term. Still, we remain committed to our valuation- and fundamentals-based investment process, which we believe will remain effective over the longer term.
October 17, 2011
| Please note, the position in any security highlighted in italicized typeface was sold during the | |
| reporting period. | |
| Equity funds are subject generally to market, market sector, market liquidity, issuer and investment | |
| style risks, among other factors, to varying degrees, all of which are more fully described in the | |
| fund’s prospectus. | |
| Small companies carry additional risks because their earnings and revenues tend to be less | |
| predictable, and their share prices more volatile than those of larger, more established companies. | |
| The shares of smaller companies tend to trade less frequently than those of larger, more established | |
| companies, which can adversely affect the pricing of these securities and the fund’s ability to sell | |
| these securities. | |
| 1 | Total return includes reinvestment of dividends and any capital gains paid. Past performance is no |
| guarantee of future results. Share price and investment return fluctuate such that upon redemption, | |
| fund shares may be worth more or less than their original cost. | |
| 2 | SOURCE: LIPPER INC. — Reflects the reinvestment of dividends and, where applicable, |
| capital gain distributions.The Russell 2000 Value Index is an unmanaged index, which measures | |
| the performance of those Russell 2000 companies with lower price-to-book ratios and lower | |
| forecasted growth values. |
| The Fund | 5 |
FUND PERFORMANCE
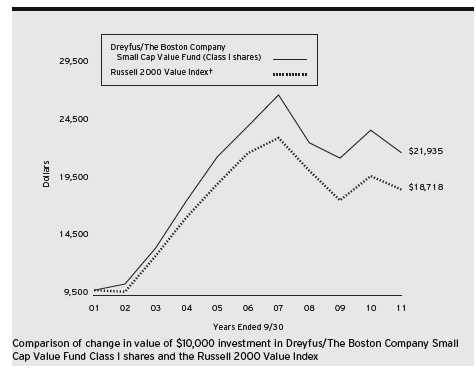
| Average Annual Total Returns as of 9/30/11 | ||||||
| 1Year | 5 Years | 10 Years | ||||
| Class I shares | –8.14% | –1.96% | 8.17% | |||
| Russell 2000 Value Index | –5.99% | –3.08% | 6.47% | |||
| † Source: Lipper Inc. |
| Past performance is not predictive of future performance.The fund’s performance shown in the graph and table does not |
| reflect the deduction of taxes that a shareholder would pay on fund distributions or the redemption of fund shares. |
| The above graph compares a $10,000 investment made in Class I shares of Dreyfus/The Boston Company Small Cap |
| Value Fund on 9/30/01 to a $10,000 investment made in the Russell 2000 Value Index (the “Index”) on that date. |
| All dividends and capital gain distributions are reinvested. |
| The fund’s performance shown in the line graph above takes into account all applicable fees and expenses.The Index is an |
| unmanaged index, which measures the performance of those Russell 2000 companies (the 2,000 smallest companies in the |
| Russell 3000 Index) with lower price-to-book ratios and lower forecasted growth values. Unlike a mutual fund, the Index |
| is not subject to charges, fees and other expenses. Investors cannot invest directly in any index.These factors can contribute |
| to the Index potentially outperforming the fund. Further information relating to fund performance, including expense |
| reimbursements, if applicable, is contained in the Financial Highlights section of the prospectus and elsewhere in this report. |
6
UNDERSTANDING YOUR FUND’S EXPENSES (Unaudited)
As a mutual fund investor, you pay ongoing expenses, such as management fees and other expenses. Using the information below, you can estimate how these expenses affect your investment and compare them with the expenses of other funds.You also may pay one-time transaction expenses, including sales charges (loads) and redemption fees, which are not shown in this section and would have resulted in higher total expenses. For more information, see your fund’s prospectus or talk to your financial adviser.
Review your fund’s expenses
The table below shows the expenses you would have paid on a $1,000 investment in Dreyfus/The Boston Company Small CapValue Fund from April 1, 2011 to September 30, 2011. It also shows how much a $1,000 investment would be worth at the close of the period, assuming actual returns and expenses.
Expenses and Value of a $1,000 Investment
assuming actual returns for the six months ended September 30, 2011
| Expenses paid per $1,000† | $ | 4.41 |
| Ending value (after expenses) | $ | 759.70 |
| COMPARING YOUR FUND’S EXPENSES |
| WITH THOSE OF OTHER FUNDS (Unaudited) |
Using the SEC’s method to compare expenses
The Securities and Exchange Commission (SEC) has established guidelines to help investors assess fund expenses. Per these guidelines, the table below shows your fund’s expenses based on a $1,000 investment, assuming a hypothetical 5% annualized return. You can use this information to compare the ongoing expenses (but not transaction expenses or total cost) of investing in the fund with those of other funds.All mutual fund shareholder reports will provide this information to help you make this comparison. Please note that you cannot use this information to estimate your actual ending account balance and expenses paid during the period.
Expenses and Value of a $1,000 Investment
assuming a hypothetical 5% annualized return for the six months ended September 30, 2011
| Expenses paid per $1,000† | $ | 5.06 |
| Ending value (after expenses) | $ | 1,020.05 |
| † Expenses are equal to the fund’s annualized expense ratio of 1.00% for Class I, multiplied by the average account |
| value over the period, multiplied by 183/365 (to reflect the one-half year period). |
| The Fund | 7 |
| STATEMENT OF INVESTMENTS |
| September 30, 2011 |
| Common Stocks—99.4% | Shares | Value ($) | ||
| Consumer Discretionary—13.2% | ||||
| 99 Cents Only Stores | 98,400 | a | 1,812,528 | |
| Big 5 Sporting Goods | 123,240 | b | 749,299 | |
| Cavco Industries | 36,032 | a,b | 1,240,942 | |
| Chico’s FAS | 342,800 | b | 3,918,204 | |
| Children’s Place Retail Stores | 71,800 a,b | 3,340,854 | ||
| Choice Hotels International | 65,480 b | 1,946,066 | ||
| Drew Industries | 54,540 | b | 1,089,709 | |
| Ethan Allen Interiors | 188,780 b | 2,569,296 | ||
| Express | 232,950 | b | 4,726,555 | |
| Jack in the Box | 216,230 | a,b | 4,307,302 | |
| Meredith | 178,370 | b | 4,038,297 | |
| Meritage Homes | 139,220 | a,b | 2,107,791 | |
| Papa John’s International | 81,060 a | 2,464,224 | ||
| Ryland Group | 233,390 | b | 2,485,604 | |
| Saks | 240,350 | a,b | 2,103,063 | |
| Skechers USA, Cl. A | 158,230 | a,b | 2,219,967 | |
| Take-Two Interactive Software | 127,830 a | 1,625,998 | ||
| Thor Industries | 164,230 | b | 3,637,695 | |
| Warnaco Group | 60,380 | a,b | 2,782,914 | |
| 49,166,308 | ||||
| Consumer Staples—8.2% | ||||
| BJ’s Wholesale Club | 92,830 a,b | 4,756,609 | ||
| Casey’s General Stores | 75,863 | b | 3,311,420 | |
| Flowers Foods | 196,880 | b | 3,831,285 | |
| Hain Celestial Group | 68,650 a,b | 2,097,257 | ||
| Lancaster Colony | 50,950 | b | 3,108,460 | |
| Sanderson Farms | 153,810 | b | 7,305,975 | |
| Snyders-Lance | 89,970 | b | 1,875,875 | |
| Spartan Stores | 190,680 | 2,951,726 | ||
| Winn-Dixie Stores | 227,120 a,b | 1,344,550 | ||
| 30,583,157 | ||||
| Energy—6.2% | ||||
| Berry Petroleum, Cl. A | 70,560 b | 2,496,413 | ||
| Cloud Peak Energy | 134,750 a,b | 2,284,012 | ||
| Comstock Resources | 118,050 | a,b | 1,825,053 | |
8
| Common Stocks (continued) | Shares | Value ($) | ||
| Energy (continued) | ||||
| Dawson Geophysical | 64,780 | a | 1,527,512 | |
| Global Industries | 451,920 | a | 3,579,206 | |
| Helix Energy Solutions Group | 97,860 | a | 1,281,966 | |
| Matrix Service | 256,310 | a | 2,181,198 | |
| Tesco | 128,250 | a | 1,487,700 | |
| Tidewater | 77,790 | b | 3,271,070 | |
| Unit | 89,090 | a | 3,289,203 | |
| 23,223,333 | ||||
| Exchange Traded Funds—.5% | ||||
| iShares Russell 2000 Value Index Fund | 31,350 | b | 1,787,890 | |
| Financial—23.7% | ||||
| Associated Estates Realty | 115,100 | 1,779,446 | ||
| BioMed Realty Trust | 300,230 | b,c | 4,974,811 | |
| Brookline Bancorp | 364,480 | b | 2,810,141 | |
| Cardinal Financial | 120,180 | 1,035,952 | ||
| CBL & Associates Properties | 180,400 | b,c | 2,049,344 | |
| City National | 83,197 | b | 3,141,519 | |
| CVB Financial | 437,760 | b | 3,366,374 | |
| DCT Industrial Trust | 693,680 | b,c | 3,045,255 | |
| DiamondRock Hospitality | 494,251 | b,c | 3,454,814 | |
| Entertainment Properties Trust | 87,550 | b,c | 3,412,699 | |
| First American Financial | 303,270 | b | 3,881,856 | |
| First Midwest Bancorp | 297,230 | b | 2,175,724 | |
| Hancock Holding | 151,167 | b | 4,048,252 | |
| Inland Real Estate | 340,740 | b,c | 2,487,402 | |
| Lakeland Financial | 53,480 | 1,104,897 | ||
| LaSalle Hotel Properties | 137,600 | c | 2,641,920 | |
| Lexington Realty Trust | 535,870 | b,c | 3,504,590 | |
| MB Financial | 150,140 | 2,210,061 | ||
| National Health Investors | 89,230 | b,c | 3,759,260 | |
| National Penn Bancshares | 409,220 | b | 2,868,632 | |
| Omega Healthcare Investors | 192,880 | b,c | 3,072,578 | |
| PacWest Bancorp | 161,660 | b | 2,253,540 | |
| Pebblebrook Hotel Trust | 136,470 | b,c | 2,135,756 | |
| Piper Jaffray | 73,330 | a | 1,314,807 | |
| The Fund | 9 |
STATEMENT OF INVESTMENTS (continued)
| Common Stocks (continued) | Shares | Value ($) | ||
| Financial (continued) | ||||
| ProAssurance | 45,790 | b | 3,297,796 | |
| Protective Life | 204,450 | 3,195,554 | ||
| Provident Financial Services | 219,150 | 2,355,863 | ||
| SVB Financial Group | 63,260 | a,b | 2,340,620 | |
| Urstadt Biddle Properties, Cl. A | 74,500 | c | 1,189,765 | |
| Viad | 96,490 | 1,638,400 | ||
| Washington Trust Bancorp | 41,690 | 824,628 | ||
| Webster Financial | 302,960 | 4,635,288 | ||
| Wintrust Financial | 77,490 | b | 2,000,017 | |
| 88,007,561 | ||||
| Health Care—10.0% | ||||
| AMERIGROUP | 54,630 | a,b | 2,131,116 | |
| Ensign Group | 41,690 | 963,456 | ||
| Haemonetics | 95,500 | a,b | 5,584,840 | |
| Healthsouth | 158,640 | a,b | 2,368,495 | |
| HealthSpring | 91,460 | a,b | 3,334,632 | |
| LifePoint Hospitals | 130,430 | a,b | 4,778,955 | |
| Medicis Pharmaceutical, Cl. A | 48,760 | 1,778,765 | ||
| Mednax | 61,803 | a | 3,871,340 | |
| Omnicell | 217,440 | a | 2,996,323 | |
| Parexel International | 175,600 | a,b | 3,324,108 | |
| Salix Pharmaceuticals | 70,020 | a,b | 2,072,592 | |
| STERIS | 135,050 | b | 3,952,914 | |
| 37,157,536 | ||||
| Industrial—16.3% | ||||
| Apogee Enterprises | 173,420 | 1,489,678 | ||
| Astec Industries | 105,890 | a,b | 3,100,459 | |
| Brink’s | 215,350 | 5,019,808 | ||
| Carlisle | 87,050 | 2,775,154 | ||
| Clean Harbors | 82,880 | a | 4,251,744 | |
| Columbus McKinnon | 121,100 | a | 1,327,256 | |
| Comfort Systems USA | 165,190 | 1,374,381 | ||
| Duff & Phelps, Cl. A | 158,940 | b | 1,694,300 | |
10
| Common Stocks (continued) | Shares | Value ($) | ||
| Industrial (continued) | ||||
| FreightCar America | 63,550 | a | 915,755 | |
| FTI Consulting | 119,780 | a,b | 4,409,102 | |
| Granite Construction | 181,634 | b | 3,409,270 | |
| Huron Consulting Group | 96,370 | a | 2,999,998 | |
| II-VI | 104,580 | a | 1,830,150 | |
| John Bean Technologies | 52,180 | 744,087 | ||
| Korn/Ferry International | 153,270 | a | 1,868,361 | |
| McGrath Rentcorp | 86,300 | 2,053,077 | ||
| Mueller Industries | 69,330 | b | 2,675,445 | |
| RSC Holdings | 363,510 | a | 2,591,826 | |
| Spirit Aerosystems Holdings, Cl. A | 242,370 | a | 3,865,802 | |
| Steelcase, Cl. A | 397,940 | b | 2,511,001 | |
| Team | 76,110 | a | 1,596,788 | |
| Tetra Tech | 198,370 | a,b | 3,717,454 | |
| Thomas & Betts | 87,560 | a | 3,494,520 | |
| Watts Water Technologies, Cl. A | 41,580 | b | 1,108,107 | |
| 60,823,523 | ||||
| Materials—5.0% | ||||
| AMCOL International | 68,280 | b | 1,638,037 | |
| Carpenter Technology | 81,500 | 3,658,535 | ||
| Coeur d’Alene Mines | 112,810 | a,b | 2,418,646 | |
| Cytec Industries | 51,340 | 1,804,088 | ||
| Kaiser Aluminum | 55,980 | b | 2,478,794 | |
| Louisiana-Pacific | 530,100 | a,b | 2,703,510 | |
| Packaging Corp. of America | 172,170 | 4,011,561 | ||
| 18,713,171 | ||||
| Technology—10.0% | ||||
| Aspen Technology | 211,028 | a | 3,222,398 | |
| Cadence Design Systems | 302,770 | a,b | 2,797,595 | |
| Cognex | 91,750 | b | 2,487,342 | |
| CoreLogic | 243,630 | a | 2,599,532 | |
| Cymer | 76,440 | a,b | 2,842,039 | |
| Diebold | 110,040 | b | 3,027,200 | |
| The Fund | 11 |
STATEMENT OF INVESTMENTS (continued)
| Common Stocks (continued) | Shares | Value ($) | ||
| Technology (continued) | ||||
| FEI | 74,740 | a,b | 2,239,210 | |
| Ixia | 221,050 | a | 1,695,453 | |
| JDA Software Group | 98,510 | a | 2,309,074 | |
| Netgear | 80,100 | a | 2,073,789 | |
| NetScout Systems | 181,280 | a,b | 2,070,218 | |
| Parametric Technology | 75,400 | a | 1,159,652 | |
| QLogic | 211,310 | a,b | 2,679,411 | |
| Semtech | 119,210 | a | 2,515,331 | |
| Triquint Semiconductor | 258,510 | a,b | 1,297,720 | |
| Websense | 121,160 | a,b | 2,096,068 | |
| 37,112,032 | ||||
| Telecommunication Services—.3% | ||||
| AboveNet | 20,730 | 1,111,128 | ||
| Utilities—6.0% | ||||
| El Paso Electric | 124,040 | 3,980,444 | ||
| Hawaiian Electric Industries | 196,430 | b | 4,769,320 | |
| NorthWestern | 151,830 | 4,849,450 | ||
| Portland General Electric | 192,610 | b | 4,562,931 | |
| WGL Holdings | 106,760 | b | 4,171,113 | |
| 22,333,258 | ||||
| Total Common Stocks | ||||
| (cost $406,330,450) | 370,018,897 | |||
| Other Investment—.9% | ||||
| Registered Investment Company; | ||||
| Dreyfus Institutional Preferred | ||||
| Plus Money Market Fund | ||||
| (cost $3,302,281) | 3,302,281 | d | 3,302,281 | |
12
| Investment of Cash Collateral | ||||
| for Securities Loaned—25.5% | Shares | Value ($) | ||
| Registered Investment Company; | ||||
| Dreyfus Institutional Cash Advantage Fund | ||||
| (cost $94,767,134) | 94,767,134d | 94,767,134 | ||
| Total Investments (cost $504,399,865) | 125.8% | 468,088,312 | ||
| Liabilities, Less Cash and Receivables | (25.8%) | (95,912,490) | ||
| Net Assets | 100.0% | 372,175,822 | ||
| a Non-income producing security. |
| b Security, or portion thereof, on loan.At September 30, 2011, the value of the fund’s securities on loan was |
| $89,848,659 and the value of the collateral held by the fund was $94,767,134. |
| c Investment in real estate investment trust. |
| d Investment in affiliated money market mutual fund. |
| Portfolio Summary (Unaudited)† | |||
| Value (%) | Value (%) | ||
| Money Market Investments | 26.4 | Energy | 6.2 |
| Financial | 23.7 | Utilities | 6.0 |
| Industrial | 16.3 | Materials | 5.0 |
| Consumer Discretionary | 13.2 | Exchange Traded Funds | .5 |
| Health Care | 10.0 | Telecommunication Services | .3 |
| Technology | 10.0 | ||
| Consumer Staples | 8.2 | 125.8 | |
| † Based on net assets. | |||
| See notes to financial statements. | |||
| The Fund | 13 |
| STATEMENT OF ASSETS AND LIABILITIES |
| September 30, 2011 |
| Cost | Value | ||
| Assets ($): | |||
| Investments in securities—See Statement of Investments (including | |||
| securities on loan, valued at $89,848,659)—Note 1(b): | |||
| Unaffiliated issuers | 406,330,450 | 370,018,897 | |
| Affiliated issuers | 98,069,415 | 98,069,415 | |
| Cash | 471,520 | ||
| Receivable for investment securities sold | 727,398 | ||
| Dividends and securities lending income receivable | 595,723 | ||
| Receivable for shares of Beneficial Interest subscribed | 395 | ||
| Prepaid expenses | 5,855 | ||
| 469,889,203 | |||
| Liabilities ($): | |||
| Due to The Dreyfus Corporation and affiliates—Note 3(b) | 319,878 | ||
| Liability for securities on loan—Note 1(b) | 94,767,134 | ||
| Payable for investment securities purchased | 2,391,894 | ||
| Payable for shares of Beneficial Interest redeemed | 107,203 | ||
| Accrued expenses | 127,272 | ||
| 97,713,381 | |||
| Net Assets ($) | 372,175,822 | ||
| Composition of Net Assets ($): | |||
| Paid-in capital | 455,516,617 | ||
| Accumulated undistributed investment income—net | 1,638,623 | ||
| Accumulated net realized gain (loss) on investments | (48,667,865) | ||
| Accumulated net unrealized appreciation | |||
| (depreciation) on investments | (36,311,553) | ||
| Net Assets ($) | 372,175,822 | ||
| Class I Shares Outstanding | |||
| (unlimited number of $.001 par value shares of Beneficial Interest authorized) | 19,781,392 | ||
| Net Asset Value, offering and redemption price per share ($) | 18.81 | ||
| See notes to financial statements. | |||
14
| STATEMENT OF OPERATIONS |
| Year Ended September 30, 2011 |
| Investment Income ($): | ||
| Income: | ||
| Cash dividends: | ||
| Unaffiliated issuers | 7,226,568 | |
| Affiliated issuers | 8,906 | |
| Income from securities lending—Note 1(b) | 124,038 | |
| Total Income | 7,359,512 | |
| Expenses: | ||
| Management fee—Note 3(a) | 3,856,968 | |
| Shareholder servicing costs—Note 3(b) | 396,708 | |
| Custodian fees—Note 3(b) | 118,204 | |
| Professional fees | 89,091 | |
| Administration fees—Note 3(b) | 46,388 | |
| Accounting and administration fees—Note 3(a) | 26,250 | |
| Trustees’ fees and expenses—Note 3(c) | 23,002 | |
| Registration fees | 18,907 | |
| Prospectus and shareholders’ reports | 7,659 | |
| Loan commitment fees—Note 2 | 3,848 | |
| Interest expense—Note 2 | 701 | |
| Miscellaneous | 17,976 | |
| Total Expenses | 4,605,702 | |
| Less—reduction in fees due to earnings credits—Note 3(b) | (76) | |
| Net Expenses | 4,605,626 | |
| Investment Income—Net | 2,753,886 | |
| Realized and Unrealized Gain (Loss) on Investments—Note 4 ($): | ||
| Net realized gain (loss) on investments | 36,131,352 | |
| Net unrealized appreciation (depreciation) on investments | (62,052,604) | |
| Net Realized and Unrealized Gain (Loss) on Investments | (25,921,252) | |
| Net (Decrease) in Net Assets Resulting from Operations | (23,167,366) | |
| See notes to financial statements. | ||
| The Fund | 15 |
STATEMENT OF CHANGES IN NET ASSETS
| Year Ended September 30, | ||||
| 2011 | 2010 | |||
| Operations ($): | ||||
| Investment income—net | 2,753,886 | 2,486,948 | ||
| Net realized gain (loss) on investments | 36,131,352 | 58,166,999 | ||
| Net unrealized appreciation | ||||
| (depreciation) on investments | (62,052,604) | (11,272,810) | ||
| Net Increase (Decrease) in Net Assets | ||||
| Resulting from Operations | (23,167,366) | 49,381,137 | ||
| Dividends to Shareholders from ($): | ||||
| Investment income—net | (2,299,813) | (1,329,932) | ||
| Beneficial Interest Transactions ($): | ||||
| Net proceeds from shares sold | 65,411,759 | 78,442,990 | ||
| Dividends reinvested | 1,902,141 | 1,044,363 | ||
| Cost of shares redeemed | (162,063,464)a | (93,644,622) | ||
| Increase (Decrease) in Net Assets from | ||||
| Beneficial Interest Transactions | (94,749,564) | (14,157,269) | ||
| Total Increase (Decrease) in Net Assets | (120,216,743) | 33,893,936 | ||
| Net Assets ($): | ||||
| Beginning of Period | 492,392,565 | 458,498,629 | ||
| End of Period | 372,175,822 | 492,392,565 | ||
| Undistributed investment income—net | 1,638,623 | 1,394,809 | ||
| Capital Share Transactions (Shares): | ||||
| Shares sold | 2,957,882 | 3,915,144 | ||
| Shares issued for dividends reinvested | 83,795 | 55,141 | ||
| Shares redeemed | (7,194,347) | (4,760,845) | ||
| Net Increase (Decrease) in Shares Outstanding | (4,152,670) | (790,560) | ||
| a Includes redemption-in-kind amounting to $25,413,113. | ||||
| See notes to financial statements. | ||||
16
FINANCIAL HIGHLIGHTS
The following table describes the performance for the fiscal periods indicated. Total return shows how much your investment in the fund would have increased (or decreased) during each period, assuming you had reinvested all dividends and distributions.These figures have been derived from the fund’s financial statements.
| Year Ended September 30, | ||||||||||
| Class I Shares | 2011 | 2010 | 2009a | 2008 | 2007 | |||||
| Per Share Data ($): | ||||||||||
| Net asset value, beginning of period | 20.57 | 18.54 | 19.85 | 25.26 | 23.70 | |||||
| Investment Operations: | ||||||||||
| Investment income—netb | .13 | .10 | .11 | .18 | .16 | |||||
| Net realized and unrealized | ||||||||||
| gain (loss) on investments | (1.79) | 1.99 | (1.31) | (3.95) | 2.48 | |||||
| Total from Investment Operations | (1.66) | 2.09 | (1.20) | (3.77) | 2.64 | |||||
| Distributions: | ||||||||||
| Dividends from investment income—net | (.10) | (.06) | (.11) | (.19) | (.09) | |||||
| Dividends from net realized | ||||||||||
| gain on investments | — | — | — | (1.45) | (.99) | |||||
| Total Distributions | (.10) | (.06) | (.11) | (1.64) | (1.08) | |||||
| Net asset value, end of period | 18.81 | 20.57 | 18.54 | 19.85 | 25.26 | |||||
| Total Return (%) | (8.14) | 11.27 | (5.83) | (15.38) | 11.18 | |||||
| Ratios/Supplemental Data (%): | ||||||||||
| Ratio of total expenses | ||||||||||
| to average net assets | .96 | .93 | .97 | .93 | .90c | |||||
| Ratio of net expenses | ||||||||||
| to average net assets | .96 | .93 | .97 | .93 | .90c | |||||
| Ratio of net investment income | ||||||||||
| to average net assets | .57 | .52 | .76 | .85 | .61 | |||||
| Portfolio Turnover Rate | 66.51 | 79.47 | 82.04 | 73 | 67d | |||||
| Net Assets, end of period ($ x 1,000) | 372,176 | 492,393 | 458,499 | 504,373 | 829,957 | |||||
| a Effective September 1, 2009, the fund’s shares were redesignated as Class I shares. |
| b Based on average shares outstanding at each month end. |
| c Includes the fund’s share of the The Boston Company Small Cap Value Portfolio’s (the “Portfolio”) allocated expenses. |
| d On September 19, 2007, the fund, which owned 100% of the Portfolio on such date, withdrew entirely from the |
| Portfolio and received the Portfolio’s securities and cash in exchange for its interest in the Portfolio. Effective |
| September 20, 2007, the fund began investing directly in the securities in which the Portfolio had invested. Portfolio |
| turnover represents activity of both the fund and the Portfolio for the year ended September 30, 2007. |
See notes to financial statements.
| The Fund | 17 |
NOTES TO FINANCIAL STATEMENTS
NOTE 1—Significant Accounting Policies:
Dreyfus/The Boston Company Small Cap Value Fund (the “fund”) is a separate diversified series of Dreyfus Investment Funds (the “Trust”), which is registered under the Investment Company Act of 1940, as amended (the “Act”), as an open-end management investment company and operates as a series company currently offering eleven series, including the fund. The fund’s investment objective is to seek long-term growth of capital.The Dreyfus Corporation (the “Manager” or “Dreyfus”), a wholly-owned subsidiary of The Bank of New York Mellon Corporation (“BNY Mellon”), serves as the fund’s investment adviser. MBSC Securities Corporation (the “Distributor”), a wholly-owned subsidiary of the Manager, is the distributor of the fund’s shares, which are sold to the public without a sales charge.
The Trust accounts separately for the assets, liabilities and operations of each series. Expenses directly attributable to each series are charged to that series’ operations; expenses which are applicable to all series are allocated among them on a pro rata basis.
The Financial Accounting Standards Board (“FASB”) Accounting Standards Codification (“ASC”) is the exclusive reference of authoritative U.S. generally accepted accounting principles (“GAAP”) recognized by the FASB to be applied by nongovernmental entities. Rules and interpretive releases of the Securities and Exchange Commission (“SEC”) under authority of federal laws are also sources of authoritative GAAP for SEC registrants. The fund’s financial statements are prepared in accordance with GAAP, which may require the use of management estimates and assumptions.Actual results could differ from those estimates.
(a) Portfolio valuation: The fair value of a financial instrument is the amount that would be received to sell an asset or paid to transfer a liability in an orderly transaction between market participants at the measurement date (i.e. the exit price). GAAP establishes a fair value hierarchy that pri-oritizes the inputs of valuation techniques used to measure fair value.This hierarchy gives the highest priority to unadjusted quoted prices in active markets for identical assets or liabilities (Level 1 measurements) and the lowest priority to unobservable inputs (Level 3 measurements).
18
Additionally, GAAP provides guidance on determining whether the volume and activity in a market has decreased significantly and whether such a decrease in activity results in transactions that are not orderly. GAAP requires enhanced disclosures around valuation inputs and techniques used during annual and interim periods.
Various inputs are used in determining the value of the fund’s investments relating to fair value measurements.These inputs are summarized in the three broad levels listed below:
Level 1—unadjusted quoted prices in active markets for identical investments.
Level 2—other significant observable inputs (including quoted prices for similar investments, interest rates, prepayment speeds, credit risk, etc.).
Level 3—significant unobservable inputs (including the fund’s own assumptions in determining the fair value of investments).
The inputs or methodology used for valuing securities are not necessarily an indication of the risk associated with investing in those securities.
Changes in valuation techniques may result in transfers in or out of an assigned level within the disclosure hierarchy. Valuation techniques used to value the fund’s investments are as follows:
Investments in securities are valued at the last sales price on the securities exchange or national securities market on which such securities are primarily traded. Securities listed on the National Market System for which market quotations are available are valued at the official closing price or, if there is no official closing price that day, at the last sales price. Securities not listed on an exchange or the national securities market, or securities for which there were no transactions, are valued at the average of the most recent bid and asked prices, except for open short positions, where the asked price is used for valuation purposes. Bid price is used when no asked price is available. Registered investment companies that are not traded on an exchange are valued at their net asset value.All preceding securities are categorized within Level 1 of the fair value hierarchy.
| The Fund | 19 |
NOTES TO FINANCIAL STATEMENTS (continued)
Fair valuing of securities may be determined with the assistance of a pricing service using calculations based on indices of domestic securities and other appropriate indicators, such as prices of relevant American Depository Receipts and futures contracts. Utilizing these techniques may result in transfers between Level 1 and Level 2 of the fair value hierarchy.
When market quotations or official closing prices are not readily available, or are determined not to reflect accurately fair value, such as when the value of a security has been significantly affected by events after the close of the exchange or market on which the security is principally traded (for example, a foreign exchange or market), but before the fund calculates its net asset value, the fund may value these investments at fair value as determined in accordance with the procedures approved by the Board of Trustees. Certain factors may be considered when fair valuing investments such as: fundamental analytical data, the nature and duration of restrictions on disposition, an evaluation of the forces that influence the market in which the securities are purchased and sold, and public trading in similar securities of the issuer or comparable issuers.These securities are either categorized as Level 2 or 3 depending on the relevant inputs used.
For restricted securities where observable inputs are limited, assumptions about market activity and risk are used and are categorized within Level 3 of the fair value hierarchy.
The following is a summary of the inputs used as of September 30, 2011 in valuing the fund’s investments:
| Level 2—Other | Level 3— | |||
| Level 1— | Significant | Significant | ||
| Unadjusted | Observable | Unobservable | ||
| Quoted Prices | Inputs | Inputs | Total | |
| Assets ($) | ||||
| Investments in Securities: | ||||
| Equity Securities— | ||||
| Domestic† | 368,231,007 | — | — | 368,231,007 |
| Mutual Funds/ | ||||
| Exchange | ||||
| Traded Funds | 99,857,305 | — | — | 99,857,305 |
| † | See Statement of Investments for additional detailed categorizations. |
20
In May 2011, FASB issued Accounting Standards Update (“ASU”) No. 2011-04 “Amendments to Achieve Common Fair Value Measurement and Disclosure Requirements in GAAP and International Financial Reporting Standards (“IFRS”)” (“ASU 2011-04”). ASU 2011-04 includes common requirements for measurement of and disclosure about fair value between GAAP and IFRS. ASU 2011-04 will require reporting entities to disclose the following information for fair value measurements categorized within Level 3 of the fair value hierarchy: quantitative information about the unobservable inputs used in the fair value measurement, the valuation processes used by the reporting entity and a narrative description of the sensitivity of the fair value measurement to changes in unobservable inputs and the interrelationships between those unobservable inputs. In addition, ASU 2011-04 will require reporting entities to make disclosures about amounts and reasons for all transfers in and out of Level 1 and Level 2 fair value measurements.The new and revised disclosures are effective for interim and annual reporting periods beginning after December 15, 2011. At this time, management is evaluating the implications of ASU 2011-04 and its impact on the financial statements.
(b) Securities transactions and investment income: Securities transactions are recorded on a trade date basis. Realized gains and losses from securities transactions are recorded on the identified cost basis. Dividend income is recognized on the ex-dividend date and interest income, including, where applicable, accretion of discount and amortization of premium on investments, is recognized on the accrual basis.
Pursuant to a securities lending agreement with The Bank of New York Mellon, a subsidiary of BNY Mellon and an affiliate of Dreyfus, the fund may lend securities to qualified institutions. It is the fund’s policy that, at origination, all loans are secured by collateral of at least 102% of the value of U.S. securities loaned and 105% of the value of foreign securities loaned. Collateral equivalent to at least 100% of the market value of securities on loan is maintained at all times. Collateral is either in the form of cash, which can be invested in certain money market mutual funds managed by the Manager, U.S. Government and
| The Fund | 21 |
NOTES TO FINANCIAL STATEMENTS (continued)
Agency securities or letters of credit.The fund is entitled to receive all income on securities loaned, in addition to income earned as a result of the lending transaction. Although each security loaned is fully collateralized, the fund bears the risk of delay in recovery of, or loss of rights in, the securities loaned should a borrower fail to return the securities in a timely manner. During the period ended September 30, 2011, The Bank of New York Mellon earned $41,316 from lending portfolio securities, pursuant to the securities lending agreement.
(c) Affiliated issuers: Investments in other investment companies advised by Dreyfus are defined as “affiliated” in the Act.
The fund may invest in shares of certain affiliated investment companies also advised or managed by Dreyfus. Investments in affiliated investment companies for the period ended September 30, 2011 were as follows:
| Affiliated | |||||||
| Investment | Value | Value | Net | ||||
| Company | 9/30/2010 | ($) | Purchases ($) | Sales ($) | 9/30/2011 | ($) | Assets (%) |
| Dreyfus | |||||||
| Institutional | |||||||
| Preferred | |||||||
| Plus Money | |||||||
| Market Fund | 8,248,138 | 162,819,918 | 167,765,775 | 3,302,281 | .9 | ||
| Dreyfus | |||||||
| Institutional | |||||||
| Cash | |||||||
| Advantage | |||||||
| Fund | 47,366,286 | 255,505,085 | 208,104,237 | 94,767,134 | 25.5 | ||
| Total | 55,614,424 | 418,325,003 | 375,870,012 | 98,069,415 | 26.4 |
(d) Dividends to shareholders: Dividends are recorded on the ex-dividend date. Dividends from investment income-net and dividends from net realized capital gains, if any, are normally declared and paid annually, but the fund may make distributions on a more frequent basis to comply with the distribution requirements of the Internal Revenue Code of 1986, as amended (the “Code”).To the extent that net realized capital gains can be offset by capital loss carryovers, it is the policy of the fund not to distribute such gains. Income and capital gain distributions are determined in accordance with income tax regulations, which may differ from GAAP.
22
(e) Federal income taxes: It is the policy of the fund to continue to qualify as a regulated investment company, if such qualification is in the best interests of its shareholders, by complying with the applicable provisions of the Code, and to make distributions of taxable income sufficient to relieve it from substantially all federal income and excise taxes.
As of and during the period ended September 30, 2011, the fund did not have any liabilities for any uncertain tax positions.The fund recognizes interest and penalties, if any, related to uncertain tax positions as income tax expense in the Statement of Operations. During the period, the fund did not incur any interest or penalties.
Each of the tax years in the four-year period ended September 30, 2011 remains subject to examination by the Internal Revenue Service and state taxing authorities.
At September 30, 2011, the components of accumulated earnings on a tax basis were as follows: undistributed ordinary income $830,420, accumulated capital losses $46,749,064 and unrealized depreciation $37,422,151.
The accumulated capital loss carryover is available for federal income tax purposes to be applied against future net securities profits, if any, realized subsequent to September 30, 2011. If not applied, $29,030,754 of the carryover expires in fiscal 2017 and $17,718,310 expires in fiscal 2018.
Under the recently enacted Regulated Investment Company Modernization Act of 2010 (the “2010 Act”), the fund will be permitted to carry forward capital losses incurred in taxable years beginning after December 22, 2010 (“post-enactment losses”) for an unlimited period. However, the 2010 Act requires any post-enactment losses to be utilized before the utilization of losses incurred in taxable years prior to the effective date of the 2010 Act.As a result of this ordering rule, capital loss carryovers related to taxable years beginning prior to the effective date of the 2010 Act may be more likely to expire unused.
| The Fund | 23 |
NOTES TO FINANCIAL STATEMENTS (continued)
The tax character of distributions paid to shareholders during the fiscal periods ended September 30, 2011 and September 30, 2010 were as follows: ordinary income $2,299,813 and $1,329,932, respectively.
During the period ended September 30, 2011, as a result of permanent book to tax differences, primarily due to the tax treatment for real estate investment trusts, limited partnerships, gains from redemption-in-kind and recognition of book to tax differences resulting from prior year fund restructure, the fund decreased accumulated undistributed investment income-net by $210,259, decreased accumulated net realized gain (loss) on investments by $2,171,974 and increased paid-in capital by $2,382,233. Net assets and net asset value per share were not affected by this reclassification.
NOTE 2—Bank Lines of Credit:
The fund participates with other Dreyfus-managed funds in a $225 million unsecured credit facility led by Citibank, N.A. and a $300 million unsecured credit facility provided by The Bank of New York Mellon (each, a “Facility”), each to be utilized primarily for temporary or emergency purposes, including the financing of redemptions. In connection therewith, the fund has agreed to pay its pro rata portion of commitment fees for each Facility. Interest is charged to the fund based on rates determined pursuant to the terms of the respective Facility at the time of borrowing.
The average amount of borrowings outstanding under the Facilities during the period ended September 30, 2011 was approximately $51,200, with a related weighted average annualized interest rate of 1.37%.
NOTE 3—Investment Advisory Fee and Other Transactions With Affiliates:
(a) Pursuant to an investment advisory agreement with the Manager, the investment advisory fee is computed at the annual rate of .80% of the fund’s average daily net assets and is payable monthly.
24
From October 1, 2010 through April 30, 2011, the Trust had an agreement with The Bank of New York Mellon, pursuant to which The Bank of NewYork Mellon provided administration and fund accounting services for the fund. For these services, the fund paid The Bank of New York Mellon a fixed fee plus asset and transaction based fees, as well as out-of-pocket expenses. Pursuant to this agreement, the fund was charged $26,250 during the period October 1, 2010 through April 30, 2011 for administration and fund accounting services.
At Board Meetings of the Trust held on February 15-16, 2011, the Board ofTrustees of theTrust terminated the agreement withThe Bank of New York Mellon and, on behalf of the Trust, entered into a Fund Accounting and Administration Agreement (the “Administration Agreement”) with Dreyfus, effective May 1, 2011, whereby Dreyfus performs administrative, accounting and recordkeeping services for the fund. The fund has agreed to compensate Dreyfus for providing accounting services, administration, compliance monitoring, regulatory and shareholder reporting, as well as related facilities, equipment and clerical help.The fee is based on the fund’s average daily net assets and computed at the following annual rates: .06% of the first $500 million, .04% of the next $500 million and .02% in excess of $1 billion.
In addition, after applying any expense limitations or fee waivers that reduce the fees paid to Dreyfus for this service, Dreyfus has contractually agreed in writing to waive any remaining fees for this service to the extent that they exceed both Dreyfus’ costs in providing these services and a reasonable allocation of the costs incurred by Dreyfus and its affiliates related to the support and oversight of these services.The fund also reimburses Dreyfus for the out-of-pocket expenses Dreyfus incurs in performing this service for the fund. Pursuant to the Administration Agreement, the fund was charged $46,388 during the period May 1, 2011 through September 30, 2011.
| The Fund | 25 |
NOTES TO FINANCIAL STATEMENTS (continued)
(b) The fund compensates Dreyfus Transfer, Inc., a wholly-owned subsidiary of the Manager, under a transfer agency agreement for providing personnel and facilities to perform transfer agency services for the fund. During the period ended September 30, 2011, the fund was charged $17,992 pursuant to the transfer agency agreement, which is included in Shareholder servicing costs in the Statement of Operations.
The fund has arrangements with the custodian and cash management bank whereby the fund may receive earnings credits when positive cash balances are maintained, which are used to offset custody and cash management fees. For financial reporting purposes, the fund includes net earnings credits as an expense offset in the Statement of Operations.
The fund compensates The Bank of New York Mellon under cash management agreements for performing cash management services related to fund subscriptions and redemptions. During the period ended September 30, 2011, the fund was charged $3,049 pursuant to the cash management agreements, which is included in Shareholder servicing costs in the Statement of Operations. These fees were partially offset by earnings credits of $76.
The fund also compensates The Bank of New York Mellon under a custody agreement for providing custodial services for the fund. During the period ended September 30, 2011, the fund was charged $118,204 pursuant to the custody agreement.
During the period ended September 30, 2011, the fund was charged $7,146 for services performed by the Chief Compliance Officer.
The components of “Due to The Dreyfus Corporation and affiliates” in the Statement of Assets and Liabilities consist of: investment advisory fees $255,539, administration fees $8,500, custodian fees $41,655, chief compliance officer fees $3,750, Private Wealth sub-accounting fees $5,474 and transfer agency per account fees $4,960.
(c) Each Trustee who is not an “interested person” of the Trust (as defined in the Act) receives $60,000 per annum, plus $7,000 per joint Board meeting of the Trust, The Dreyfus/Laurel Funds, Inc., The
26
Dreyfus/Laurel Funds Trust, The Dreyfus/Laurel Tax-Free Municipal Funds and Dreyfus Funds, Inc. (collectively, the “Board Group Open-End Funds”) attended, $2,500 for separate in-person committee meetings attended which are not held in conjunction with a regularly scheduled Board meeting and $2,000 for Board meetings and separate committee meetings attended that are conducted by telephone. The Board Group Open-End Funds also reimburse each Trustee who is not an “interested person” of the Trust (as defined in the Act) for travel and out-of-pocket expenses. With respect to Board meetings, the Chairman of the Board receives an additional 25% of such compensation (with the exception of reimbursable amounts). The Chair of each of the Board’s committees, unless the Chair also serves as Chair of the Board, receives $1,350 per applicable committee meeting. In the event that there is an in-person joint committee meeting or a joint telephone meeting of the Board Group Open-End Funds and Dreyfus HighYield Strategies Fund (“DHF”), a $2,500 fee is allocated between the Board Group Open-End Funds and DHF.
Effective January 1, 2012, the Board Group Open-End Funds and DHF (collectively, the “Board Group Funds”) will pay each Trustee their respective allocated portions of an annual retainer of $85,000 and a fee of $10,000 for each regularly scheduled Board meeting attended ($75,000 and $8,000, respectively, in the aggregate, prior to January 1, 2012).With respect to the annual retainer and Board meetings of the Board Group Funds, the Chair of the Board will receive an additional 25% of such compensation (with the exception of reimbursable amounts). Each Trustee will receive $2,500 for any separate in-person committee meetings attended, which are not held in conjunction with a regularly scheduled Board meeting, such amount to be allocated among the Board Group Funds, as applicable. In the event that there is a joint telephone meeting of the Board Group Funds, a fee of $2,000 will be allocated among the applicable Board Group Funds, accordingly (prior to January 1, 2012, the fee allocated was $2,500 if the meeting
| The Fund | 27 |
NOTES TO FINANCIAL STATEMENTS (continued)
included DHF). The Chair of each of the Board’s committees, unless the Chair also serves as Chair of the Board, will receive $1,500 per applicable committee meeting. Each Emeritus Trustee is entitled to receive an annual retainer of one-half the amount paid as a retainer at the time the Trustee became Emeritus and a per meeting attended fee of one-half the amount paid to Trustees.The Board Group Funds also reimburse each Independent Trustee and Emeritus Trustees for travel and out-of-pocket expenses.
NOTE 4—Securities Transactions:
The aggregate amount of purchases and sales of investment securities, excluding short-term securities, during the period ended September 30, 2011, amounted to $317,040,448 and $405,641,991, respectively.
At September 30, 2011, the cost of investments for federal income tax purposes was $505,510,463; accordingly, accumulated net unrealized depreciation on investments was $37,422,151, consisting of $21,237,996 gross unrealized appreciation and $58,660,147 gross unrealized depreciation.
NOTE 5—Subsequent Event:
Effective October 27, 2011, the Nominating Committee of the Board of Trustees nominated, and the Board of Trustees approved the election of, Francine J. Bovich as a Trustee of the Trust. A proxy statement will be mailed, on or about November 28, 2011, to Trust shareholders of record as of the close of business November 1, 2011, asking shareholders to consider Ms. Bovich’s election as a Board member of the Trust at a Special Joint Meeting of Shareholders to be held on Wednesday, February 8, 2012.
28
| REPORT OF INDEPENDENT REGISTERED |
| PUBLIC ACCOUNTING FIRM |
To the Board of Trustees and Shareholders of Dreyfus/The Boston Company Small Cap Value Fund:
We have audited the accompanying statement of assets and liabilities of Dreyfus/The Boston Company Small CapValue Fund (the “Fund”), a series of Dreyfus Investment Funds, including the statement of investments as of September 30, 2011, and the related statement of operations for the year then ended, the statements of changes in net assets for each of the years in the two-year period then ended and financial highlights for each of the years in the three-year period then ended. These financial statements and financial highlights are the responsibility of the Fund’s management. Our responsibility is to express an opinion on these financial statements and financial highlights based on our audits. The financial highlights for each of the years in the two-year period ended September 30, 2008 were audited by other independent registered public accountants whose report thereon, dated November 28, 2008, expressed an unqualified opinion on those financial highlights.
We conducted our audits in accordance with the standards of the Public Company Accounting Oversight Board (United States).Those standards require that we plan and perform the audit to obtain reasonable assurance about whether the financial statements and financial highlights are free of material misstatement.An audit also includes examining, on a test basis, evidence supporting the amounts and disclosures in the financial statements. Our procedures included confirmation of securities owned as of September 30, 2011 by correspondence with the custodian and brokers or by other appropriate auditing procedures where replies from brokers were not received.An audit also includes assessing the accounting principles used and significant estimates made by management, as well as evaluating the overall financial statement presentation.We believe that our audits provide a reasonable basis for our opinion.
In our opinion, the financial statements and financial highlights referred to above present fairly, in all material respects, the financial position of Dreyfus/The Boston Company Small CapValue Fund as of September 30, 2011, and the results of its operations for the year then ended, the changes in its net assets for each of the years in the two-year period then ended, and the financial highlights for each of the years in the three-year period then ended, in conformity with U.S. generally accepted accounting principles.
![]()
New York, New York
November 23, 2011
| The Fund | 29 |
IMPORTANT TAX INFORMATION (Unaudited)
For federal tax purposes, the fund designates $2,299,813 as ordinary income dividends paid during the year ended September 30, 2011 as qualified dividend income in accordance with Section 854(b)(1)(B) of the Internal Revenue Code.Also, the fund designates 100% of ordinary income dividends paid during the year ended September 30, 2011 as eligible for the corporate dividends received deduction provided under Section 243 of the Internal Revenue Code in accordance with Section 854(b)(1)(A) of the Internal Revenue Code. Shareholders will receive notification in early 2012 of the percentage applicable to the preparation of their 2011 income tax returns.
30
BOARD MEMBERS INFORMATION (Unaudited)
| Joseph S. DiMartino (67) |
| Chairman of the Board (2008) |
| Principal Occupation During Past 5Years: |
| • Corporate Director and Trustee |
| Other Public Company Board Memberships During Past 5Years: |
| • CBIZ (formerly, Century Business Services, Inc.), a provider of outsourcing functions for small |
| and medium size companies, Director (1997-present) |
| • Sunair Services Corporation, a provider of certain outdoor-related services to homes and |
| businesses, Director (2005-2009) |
| • The Newark Group, a provider of a national market of paper recovery facilities, paperboard |
| mills and paperboard converting plants, Director (2000-2010) |
| No. of Portfolios for which Board Member Serves: 167 |
| ——————— |
| Francine J. Bovich (60)† |
| Board Member (2011) |
| Principal Occupation During Past 5Years: |
| • Trustee,The Bradley Trusts, private trust funds (2011-Present) |
| • Managing Director, Morgan Stanley Investment Management (1993-2010) |
| No. of Portfolios for which Board Member Serves: 14 |
| ——————— |
| James M. Fitzgibbons (77) |
| Board Member (2008) |
| Principal Occupation During Past 5Years: |
| • Corporate Director and Trustee |
| Other Public Company Board Memberships During Past 5Years: |
| • Bill Barrett Corporation, an oil and natural gas exploration company, Director (2004-present) |
| No. of Portfolios for which Board Member Serves: 33 |
| ——————— |
| Kenneth A. Himmel (65) |
| Board Member (2008) |
| Principal Occupation During Past 5Years: |
| • President and CEO, Related Urban Development, a real estate development company (1996-present) |
| • President and CEO, Himmel & Company, a real estate development company (1980-present) |
| • CEO,American Food Management, a restaurant company (1983-present) |
| No. of Portfolios for which Board Member Serves: 33 |
| The Fund | 31 |
BOARD MEMBERS INFORMATION (Unaudited) (continued)
| Stephen J. Lockwood (64) |
| Board Member (2008) |
| Principal Occupation During Past 5Years: |
| • Chairman of the Board, Stephen J. Lockwood and Company LLC, a real estate investment |
| company (2000-present) |
| No. of Portfolios for which Board Member Serves: 33 |
| ——————— |
| Roslyn M. Watson (61) |
| Board Member (2008) |
| Principal Occupation During Past 5Years: |
| • Principal,Watson Ventures, Inc., a real estate investment company (1993-present) |
| No. of Portfolios for which Board Member Serves: 43 |
| ——————— |
| Benaree Pratt Wiley (65) |
| Board Member (2008) |
| Principal Occupation During Past 5Years: |
| • Principal,TheWiley Group, a firm specializing in strategy and business development (2005-present) |
| Other Public Company Board Memberships During Past 5Years: |
| • CBIZ (formerly, Century Business Services, Inc.), a provider of outsourcing functions for small |
| and medium size companies, Director (2008-present) |
| No. of Portfolios for which Board Member Serves: 68 |
| ——————— |
† Ms. Bovich was elected as a Board Member by the Board of Trustees, effective October 27, 2011. See Note 5.
Once elected all Board Members serve for an indefinite term, but achieve Emeritus status upon reaching age 80.The address of the Board Members and Officers is in c/o The Dreyfus Corporation, 200 Park Avenue, NewYork, NewYork 10166.Additional information about the Board Members is available in the fund’s Statement of Additional Information which can be obtained from Dreyfus free of charge by calling this toll free number: 1-800-DREYFUS.
32
OFFICERS OF THE FUND (Unaudited)
BRADLEY J. SKAPYAK, President since January 2010.
Chief Operating Officer and a director of the Manager since June 2009. From April 2003 to June 2009, Mr. Skapyak was the head of the Investment Accounting and Support Department of the Manager. He is an officer of 75 investment companies (comprised of 167 portfolios) managed by the Manager. He is 52 years old and has been an employee of the Manager since February 1988.
MICHAEL A. ROSENBERG, Vice President and Secretary since December 2008.
Assistant General Counsel of BNY Mellon, and an officer of 76 investment companies (comprised of 192 portfolios) managed by the Manager. He is 51 years old and has been an employee of the Manager since October 1991.
KIESHA ASTWOOD, Vice President and Assistant Secretary since January 2010.
Counsel of BNY Mellon, and an officer of 76 investment companies (comprised of 192 portfolios) managed by the Manager. She is 38 years old and has been an employee of the Manager since July 1995.
JAMES BITETTO, Vice President and Assistant Secretary since December 2008.
Senior Counsel of BNY Mellon and Secretary of the Manager, and an officer of 76 investment companies (comprised of 192 portfolios) managed by the Manager. He is 45 years old and has been an employee of the Manager since December 1996.
JONI LACKS CHARATAN, Vice President and Assistant Secretary since December 2008.
Senior Counsel of BNY Mellon, and an officer of 76 investment companies (comprised of 192 portfolios) managed by the Manager. She is 55 years old and has been an employee of the Manager since October 1988.
JOSEPH M. CHIOFFI, Vice President and Assistant Secretary since December 2008.
Senior Counsel of BNY Mellon, and an officer of 76 investment companies (comprised of 192 portfolios) managed by the Manager. He is 49 years old and has been an employee of the Manager since June 2000.
KATHLEEN DENICHOLAS, Vice President and Assistant Secretary since January 2010.
Managing Counsel of BNY Mellon, and an officer of 76 investment companies (comprised of 192 portfolios) managed by the Manager. She is 36 years old and has been an employee of the Manager since February 2001.
JANETTE E. FARRAGHER, Vice President and Assistant Secretary since December 2008.
Assistant General Counsel of BNY Mellon, and an officer of 76 investment companies (comprised of 192 portfolios) managed by the Manager. She is 48 years old and has been an employee of the Manager since February 1984.
JOHN B. HAMMALIAN, Vice President and Assistant Secretary since December 2008.
Senior Managing Counsel of BNY Mellon, and an officer of 76 investment companies (comprised of 192 portfolios) managed by the Manager. He is 48 years old and has been an employee of the Manager since February 1991.
M. CRISTINA MEISER, Vice President and Assistant Secretary since January 2010.
Senior Counsel of BNY Mellon, and an officer of 76 investment companies (comprised of 192 portfolios) managed by the Manager. She is 41 years old and has been an employee of the Manager since August 2001.
| The Fund | 33 |
OFFICERS OF THE FUND (Unaudited) (continued)
ROBERT R. MULLERY, Vice President and Assistant Secretary since December 2008.
Managing Counsel of BNY Mellon, and an officer of 76 investment companies (comprised of 192 portfolios) managed by the Manager. He is 59 years old and has been an employee of the Manager since May 1986.
JEFF PRUSNOFSKY, Vice President and Assistant Secretary since December 2008.
Senior Managing Counsel of BNY Mellon, and an officer of 76 investment companies (comprised of 192 portfolios) managed by the Manager. He is 46 years old and has been an employee of the Manager since October 1990.
JAMES WINDELS, Treasurer since December 2008.
Director – Mutual Fund Accounting of the Manager, and an officer of 76 investment companies (comprised of 192 portfolios) managed by the Manager. He is 53 years old and has been an employee of the Manager since April 1985.
RICHARD CASSARO, Assistant Treasurer since December 2008.
Senior Accounting Manager – Money Market and Municipal Bond Funds of the Manager, and an officer of 76 investment companies (comprised of 192 portfolios) managed by the Manager. He is 52 years old and has been an employee of the Manager since September 1982.
GAVIN C. REILLY, Assistant Treasurer since December 2008.
Tax Manager of the Investment Accounting and Support Department of the Manager, and an officer of 76 investment companies (comprised of 192 portfolios) managed by the Manager. He is 43 years old and has been an employee of the Manager since April 1991.
ROBERT ROBOL, Assistant Treasurer since December 2008.
Senior Accounting Manager – Fixed Income Funds of the Manager, and an officer of 76 investment companies (comprised of 192 portfolios) managed by the Manager. He is 47 years old and has been an employee of the Manager since October 1988.
ROBERT SALVIOLO, Assistant Treasurer since December 2008.
Senior Accounting Manager – Equity Funds of the Manager, and an officer of 76 investment companies (comprised of 192 portfolios) managed by the Manager. He is 44 years old and has been an employee of the Manager since June 1989.
ROBERT SVAGNA, Assistant Treasurer since December 2008.
Senior Accounting Manager – Equity Funds of the Manager, and an officer of 76 investment companies (comprised of 192 portfolios) managed by the Manager. He is 44 years old and has been an employee of the Manager since November 1990.
34
JOSEPH W. CONNOLLY, Chief Compliance Officer since December 2008.
Chief Compliance Officer of the Manager and The Dreyfus Family of Funds (76 investment companies, comprised of 192 portfolios). From November 2001 through March 2004, Mr. Connolly was first Vice-President, Mutual Fund Servicing for Mellon Global Securities Services. In that capacity, Mr. Connolly was responsible for managing Mellon’s Custody, Fund Accounting and Fund Administration services to third-party mutual fund clients. He is 54 years old and has served in various capacities with the Manager since 1980, including manager of the firm’s Fund Accounting Department from 1997 through October 2001.
STEPHEN J. STOREN, Anti-Money Laundering Compliance Officer since May 2011.
Chief Compliance Officer of the Distributor, and the Anti-Money Laundering Compliance Officer of 72 investment companies (comprised of 188 portfolios) managed by the Manager. He is 57 years old and has been an employee of the Distributor since October 1999.
| The Fund | 35 |
NOTES
For More Information

Ticker Symbol: STSVX
Telephone 1-800-DREYFUS
Mail The Dreyfus Family of Funds, 144 Glenn Curtiss Boulevard, Uniondale, NY 11556-0144 E-mail Send your request to info@dreyfus.com Internet Information can be viewed online or downloaded at: http://www.dreyfus.com
The fund files its complete schedule of portfolio holdings with the Securities and Exchange Commission (“SEC”) for the first and third quarters of each fiscal year on Form N-Q. The fund’s Forms N-Q are available on the SEC’s website at http://www.sec.gov and may be reviewed and copied at the SEC’s Public Reference Room in Washington, DC. Information on the operation of the Public Reference Room may be obtained by calling 1-800-SEC-0330.
A description of the policies and procedures that the fund uses to determine how to vote proxies relating to portfolio securities, and information regarding how the fund voted these proxies for the most recent 12-month period ended June 30 is available at http://www.dreyfus.com and on the SEC’s website at http://www.sec.gov. The description of the policies and procedures is also available without charge, upon request, by calling 1-800-DREYFUS.

| Dreyfus/The Boston |
| Company Small/Mid Cap |
| Growth Fund |
ANNUAL REPORT September 30, 2011
Save time. Save paper. View your next shareholder report online as soon as it’s available. Log into www.dreyfus.com and sign up for Dreyfus eCommunications. It’s simple and only takes a few minutes.
The views expressed in this report reflect those of the portfolio manager only through the end of the period covered and do not necessarily represent the views of Dreyfus or any other person in the Dreyfus organization. Any such views are subject to change at any time based upon market or other conditions and Dreyfus disclaims any responsibility to update such views.These views may not be relied on as investment advice and, because investment decisions for a Dreyfus fund are based on numerous factors, may not be relied on as an indication of trading intent on behalf of any Dreyfus fund.
Not FDIC-Insured • Not Bank-Guaranteed • May Lose Value
Contents | |
THE FUND | |
| 2 | A Letter from the Chairman and CEO |
| 3 | Discussion of Fund Performance |
| 6 | Fund Performance |
| 8 | Understanding Your Fund’s Expenses |
| 8 | Comparing Your Fund’s Expenses With Those of Other Funds |
| 9 | Statement of Investments |
| 13 | Statement of Assets and Liabilities |
| 14 | Statement of Operations |
| 15 | Statement of Changes in Net Assets |
| 17 | Financial Highlights |
| 20 | Notes to Financial Statements |
| 33 | Report of Independent Registered Public Accounting Firm |
| 34 | Board Members Information |
| 36 | Officers of the Fund |
FOR MORE INFORMATION | |
Back Cover |
Dreyfus/The Boston
Company Small/Mid Cap
Growth Fund
The Fund

A LETTER FROM THE CHAIRMAN AND CEO
Dear Shareholder:
This annual report for Dreyfus/The Boston Company Small/Mid Cap Growth Fund covers the 12-month period from October 1, 2010, through September 30, 2011. For information about how the fund performed during the reporting period, as well as general market perspectives, we provide a Discussion of Fund Performance on the pages that follow.
Investors generally were encouraged by expectations of a more robust economic recovery over the first half of the reporting period, but investor sentiment deteriorated sharply during the second half due to disappointing economic data, rising commodity prices, an escalating sovereign debt crisis in Europe and a contentious debate regarding taxes, spending and borrowing in the United States. Market volatility was particularly severe during August and September after a major credit rating agency downgraded U.S. long-term debt. Stocks proved sensitive to macroeconomic concerns in this challenging environment, often regardless of more promising company fundamentals, and most U.S. equity market indices gave back their earlier gains.
The economic outlook currently is clouded by market turbulence and political infighting, but we believe that a continued subpar global expansion is more likely than a return to recession. Inflationary pressures appear to be waning in most countries as energy prices recently have retreated from their highs. In the United States, the Federal Reserve Board has signaled its intention to maintain an aggressively accommodative monetary policy, which may help offset the financial stresses caused by deleveraging in the private sector and fiscal consolidation by governments in the United States and Europe. To assess the potential impact of these and other developments on your investments, we encourage you, as always, to speak with your financial advisor.
Thank you for your continued confidence and support.

Jonathan R. Baum
Chairman and Chief Executive Officer
The Dreyfus Corporation
October 17, 2011
2

DISCUSSION OF FUND PERFORMANCE
For the period from October 1, 2010, through September 30, 2011, as provided by Todd Wakefield and B. Randall Watts, Jr., Portfolio Managers
Fund and Market Performance Overview
For the 12-month period ended September 30, 2011, Dreyfus/The Boston Company Small/Mid Cap Growth Fund’s Class A shares produced a total return of 5.63%, Class C shares returned 4.73% and Class I shares returned 6.02%.1 In comparison, the fund’s benchmark, the Russell 2500 Growth Index (the “Index”), produced a total return of 0.59% for the same period.2
Small- and mid-cap stocks rallied through the first quarter of 2011 amid expectations of continued economic recovery, but several macroeconomic disappointments later erased those gains.The fund produced returns that were higher than its benchmark, primarily due to strong stock selections in the health care, consumer staples and energy sectors.
The Fund’s Investment Approach
The fund seeks long-term growth of capital.To pursue its goal, the fund normally invests at least 80% of its assets in equity securities of small-cap and mid-cap U.S. companies with market capitalizations, at the time of purchase, equal to or less than the total market capitalization of the largest company in the Index.When choosing stocks, we seek to identify high-quality small-cap and mid-cap companies with rapid current or expected earnings or revenue growth.We employ fundamental research to identify companies with attractive characteristics, such as strong business and competitive positions, solid cash flows and balance sheets, high-quality management and high sustainable growth.We also may invest in companies that our research indicates will experience accelerating revenues and expanding operating margins.
Shifting Sentiment Sparked Heightened Volatility
Investors’ outlooks had improved markedly during the final months of 2010 after the Federal Reserve Board announced a second round of quantitative easing to jump-start the U.S. economy, and subsequent
| The Fund | 3 |
DISCUSSION OF FUND PERFORMANCE (continued)
upturns in economic data and corporate earnings supported rising stock prices into the first quarter of 2011. However, the rally was interrupted in February when political unrest in the Middle East led to sharply rising energy prices, and in March when devastating natural and nuclear disasters in Japan threatened the global industrial supply chain. Nonetheless, stocks generally recovered quickly from these unexpected shocks.
In late April, investor sentiment began to deteriorate in earnest when Greece appeared headed for default and other European countries struggled with a resurgent sovereign debt crisis. Closer to home, investors grew worried when U.S. economic data proved disappointing and a contentious debate in Congress regarding government spending and borrowing intensified. Stocks suffered bouts of heightened volatility as newly risk-averse investors shifted their focus to industry groups that historically have held up well under uncertain economic conditions. Market turbulence was particularly severe in August and September, driving the benchmark into negative territory for the reporting period overall.Within the small- and mid-cap markets, growth stocks generally produced higher returns than value stocks over the reporting period.
Stock Selection Strategy Bolstered Relative Performance
In this challenging investment climate, our security selection strategy drove above-average returns in several market sectors.Among health care companies, biotechnology was the strongest area of the portfolio. For example, viral infections specialist Pharmasset expanded its trials of a new medicine for Hepatitis C, and Alexion Pharmaceuticals gained value in anticipation of new uses for its treatment for a chronic blood disease. Among health care service providers, pharmacy benefit management firm Catalyst Health Solutions achieved better-than-expected financial results despite prevailing economic headwinds.Among consumer staples companies, food producers and retailers generally fared well as investors became more defensive. The fund achieved particularly strong results from Green Mountain Coffee Roasters, which entered into a marketing agreement with Starbucks, andWhole Foods Market, which encountered strong demand from higher-end consumers. In the energy sector, relative performance was buoyed by exploration-and-production company Complete Production Services, which gained value due to increased production of natural gas in the United States.
4
Although disappointments proved relatively mild during the reporting period, results from the financials sector were undermined by commercial banks and consumer finance companies, including KeyCorp and Huntington Bancshares, as low interest rates put pressure on lending margins. In addition, prepaid debit card provider Green Dot was hurt by heightened regulatory scrutiny.
Focusing on Underlying Fundamentals
We expect economic headwinds to persist and equity markets to stay volatile, suggesting that investors may continue to respond primarily to macroeconomic developments over the near term. Still, we remain committed to our fundamentals-based investment process, which we believe will remain effective over the longer term. Indeed, it is worth noting that, historically, companies that can grow faster than average have become scarcer, and therefore more valuable, during economic downturns. Our security selection process has identified a number of growing small-cap businesses in the technology and biotechnology segments of the health care sector, but we have found fewer opportunities meeting our investment criteria in the materials sector.
October 17, 2011
| Please note, the position in any security highlighted in italicized typeface was sold during the | |
| reporting period. | |
| Equity funds are subject generally to market, market sector, market liquidity, issuer and investment | |
| style risks, among other factors, to varying degrees, all of which are more fully described in the | |
| fund’s prospectus. | |
| Small and midsize companies carry additional risks because their earnings and revenues tend to be | |
| less predictable, and their share prices more volatile, than those of larger more established | |
| companies. | |
| 1 | Total return includes reinvestment of dividends and any capital gains paid, and does not take into |
| consideration the maximum initial sales charge in the case of Class A shares, or the applicable | |
| contingent deferred sales charge imposed on redemptions in the case of Class C shares. Had these | |
| charges been reflected, returns would have been lower. Past performance is no guarantee of future | |
| results. Share price and investment return fluctuate such that upon redemption, fund shares may be | |
| worth more or less than their original cost. | |
| 2 | SOURCE: LIPPER INC. — The Russell 2500 Growth Index is an unmanaged index that |
| measures the performance of those Russell 2500 companies (the 2,500 smallest companies in the | |
| Russell 3000 Index, which is composed of the 3,000 largest U.S. companies based on total market | |
| capitalization) with higher price-to-book ratios and higher forecasted growth values.The total return | |
| figure cited for this index assumes change in security prices and reinvestment of dividends, but does | |
| not reflect the costs of managing a mutual fund. Investors cannot invest directly in any index. |
| The Fund | 5 |
FUND PERFORMANCE
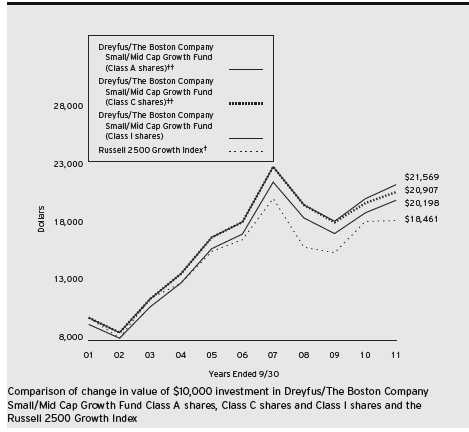
| † | Source: Lipper Inc. |
| †† | The total return figures presented for Class A shares and Class C shares of the fund reflect the performance of the |
| fund’s Class I shares for the period prior to March 31, 2009 (the inception date for Class A shares and Class C | |
| shares respectively), adjusted to reflect the applicable sales load for each share class. | |
| Past performance is not predictive of future performance. | |
| The above graph compares a $10,000 investment made in each of the Class A, Class C and Class I shares of | |
| Dreyfus/The Boston Company Small/Mid Cap Growth Fund on 9/30/01 to a $10,000 investment made in the | |
| Russell 2500 Growth Index (the “Index”) on that date.All dividends and capital gain distributions are reinvested. | |
| The fund’s performance shown in the line graph above takes into account the maximum initial sales charge on Class A | |
| shares and all other applicable fees and expenses on all classes.The Index is an unmanaged index that measures the | |
| performance of those Russell 2500 companies in the Russell 3000 Index with higher price-to-book ratios and higher | |
| forecasted growth values. Unlike a mutual fund, the Index is not subject to charges, fees and other expenses. Investors | |
| cannot invest directly in any index.These factors can contribute to the Index potentially outperforming the fund. Further | |
| information relating to fund performance, including expense reimbursements, if applicable, is contained in the Financial | |
| Highlights section of the prospectus and elsewhere in this report. | |
6
| Average Annual Total Returns as of 9/30/11 | |||||||
| Inception | |||||||
| Date | 1Year | 5 Years | 10 Years | ||||
| Class A shares | |||||||
| with maximum sales charge (5.75%) | 3/31/09 | –0.46% | 1.98%†† | 7.28%†† | |||
| without sales charge | 3/31/09 | 5.63% | 3.19%†† | 7.92%†† | |||
| Class C shares | |||||||
| with applicable redemption charge † | 3/31/09 | 3.73% | 2.68%†† | 7.65%†† | |||
| without redemption | 3/31/09 | 4.73% | 2.68%†† | 7.65%†† | |||
| Class I shares | 1/1/88 | 6.02% | 3.32% | 7.99% | |||
| Russell 2500 Growth Index | 0.59% | 1.91% | 6.32% | ||||
Past performance is not predictive of future performance.The fund’s performance shown in the graph and table does not reflect the deduction of taxes that a shareholder would pay on fund distributions or the redemption of fund shares.
| † | The maximum contingent deferred sales charge for Class C shares is 1% for shares redeemed within one year of the |
| date of purchase. | |
| †† | The total return performance figures presented for Class A and Class C shares of the fund reflect the performance of |
| the fund’s Class I shares for the period prior to March 31, 2009 (the inception date for Class A and Class C shares | |
| respectively), adjusted to reflect the applicable sales load for each share class. |
| The Fund | 7 |
UNDERSTANDING YOUR FUND’S EXPENSES (Unaudited)
As a mutual fund investor, you pay ongoing expenses, such as management fees and other expenses. Using the information below, you can estimate how these expenses affect your investment and compare them with the expenses of other funds.You also may pay one-time transaction expenses, including sales charges (loads) and redemption fees, which are not shown in this section and would have resulted in higher total expenses. For more information, see your fund’s prospectus or talk to your financial adviser.
Review your fund’s expenses
The table below shows the expenses you would have paid on a $1,000 investment in Dreyfus/The Boston Company Small/Mid Cap Growth Fund from April 1, 2011 to September 30, 2011. It also shows how much a $1,000 investment would be worth at the close of the period, assuming actual returns and expenses.
Expenses and Value of a $1,000 Investment
assuming actual returns for the six months ended September 30, 2011
| Class A | Class C | Class I | ||||
| Expenses paid per $1,000† | $ | 5.13 | $ | 9.23 | $ | 3.56 |
| Ending value (after expenses) | $ | 844.20 | $ | 840.90 | $ | 845.60 |
| COMPARING YOUR FUND’S EXPENSES |
| WITH THOSE OF OTHER FUNDS (Unaudited) |
Using the SEC’s method to compare expenses
The Securities and Exchange Commission (SEC) has established guidelines to help investors assess fund expenses. Per these guidelines, the table below shows your fund’s expenses based on a $1,000 investment, assuming a hypothetical 5% annualized return. You can use this information to compare the ongoing expenses (but not transaction expenses or total cost) of investing in the fund with those of other funds.All mutual fund shareholder reports will provide this information to help you make this comparison. Please note that you cannot use this information to estimate your actual ending account balance and expenses paid during the period.
Expenses and Value of a $1,000 Investment
assuming a hypothetical 5% annualized return for the six months ended September 30, 2011
| Class A | Class C | Class I | ||||
| Expenses paid per $1,000† | $ | 5.62 | $ | 10.10 | $ | 3.90 |
| Ending value (after expenses) | $ | 1,019.50 | $ | 1,015.04 | $ | 1,021.21 |
| † Expenses are equal to the fund’s annualized expense ratio of 1.11% for Class A, 2.00% for Class C and .77% |
| for Class I , multiplied by the average account value over the period, multiplied by 183/365 (to reflect the one-half |
| year period). |
8
| STATEMENT OF INVESTMENTS |
| September 30, 2011 |
| Common Stocks—98.1% | Shares | Value ($) | |
| Consumer Discretionary—14.4% | |||
| Buffalo Wild Wings | 83,010a,b | 4,963,998 | |
| Cheesecake Factory | 174,770a,b | 4,308,080 | |
| Deckers Outdoor | 63,370a,b | 5,909,886 | |
| Iconix Brand Group | 271,790a,b | 4,294,282 | |
| Jarden | 152,420 | 4,307,389 | |
| Lions Gate Entertainment | 818,678a,b | 5,648,878 | |
| LKQ | 192,990b | 4,662,638 | |
| PetSmart | 107,476 | 4,583,851 | |
| Rent-A-Center | 71,810 | 1,971,185 | |
| Sally Beauty Holdings | 166,600b | 2,765,560 | |
| Tractor Supply | 54,460 | 3,406,473 | |
| Ulta Salon, Cosmetics & Fragrance | 51,890b | 3,229,115 | |
| Vitamin Shoppe | 122,120a,b | 4,572,173 | |
| Williams-Sonoma | 215,010 | 6,620,158 | |
| Wolverine World Wide | 70,480 | 2,343,460 | |
| Zumiez | 79,380a,b | 1,389,944 | |
| 64,977,070 | |||
| Consumer Staples—5.2% | |||
| Casey’s General Stores | 124,480a | 5,433,552 | |
| Estee Lauder, Cl. A | 41,550 | 3,649,752 | |
| Green Mountain Coffee Roasters | 59,090a,b | 5,491,825 | |
| Hansen Natural | 52,030b | 4,541,699 | |
| Whole Foods Market | 68,690 | 4,486,144 | |
| 23,602,972 | |||
| Energy—4.8% | |||
| Brigham Exploration | 226,060b | 5,710,276 | |
| Cabot Oil & Gas | 51,790 | 3,206,319 | |
| Oil States International | 109,080a,b | 5,554,354 | |
| Patterson-UTI Energy | 176,251 | 3,056,192 | |
| Plains Exploration & Production | 174,186b | 3,955,764 | |
| 21,482,905 | |||
| Exchange Traded Funds—1.4% | |||
| iShares Russell 2000 Growth Index Fund | 87,730a | 6,445,523 | |
| Financial—6.2% | |||
| American Campus Communities | 245,720c | 9,143,241 | |
| First Cash Financial Services | 131,070b | 5,498,386 | |
| The Fund | 9 |
STATEMENT OF INVESTMENTS (continued)
| Common Stocks (continued) | Shares | Value ($) | |
| Financial (continued) | |||
| Mid-America | |||
| Apartment Communities | 137,500a,c | 8,280,250 | |
| Prosperity Bancshares | 153,400a | 5,013,112 | |
| 27,934,989 | |||
| Health Care—23.9% | |||
| Alexion Pharmaceuticals | 138,090b | 8,846,045 | |
| Allscripts Healthcare Solutions | 365,620b | 6,588,472 | |
| Amarin, ADR | 249,800b | 2,298,160 | |
| AmerisourceBergen | 90,630a | 3,377,780 | |
| Catalyst Health Solutions | 109,186b | 6,298,940 | |
| Centene | 192,040a,b | 5,505,787 | |
| Cepheid | 138,550a,b | 5,379,896 | |
| Cooper | 173,257 | 13,713,292 | |
| Coventry Health Care | 125,430b | 3,613,638 | |
| Cubist Pharmaceuticals | 189,370a,b | 6,688,548 | |
| Masimo | 145,590a | 3,152,024 | |
| Medicis Pharmaceutical, Cl. A | 127,150 | 4,638,432 | |
| Mednax | 72,990b | 4,572,094 | |
| Pharmasset | 79,810b | 6,573,950 | |
| Questcor Pharmaceuticals | 164,290b | 4,478,545 | |
| Salix Pharmaceuticals | 174,020a,b | 5,150,992 | |
| SXC Health Solutions | 123,230b | 6,863,911 | |
| Theravance | 101,100a,b | 2,036,154 | |
| ViroPharma | 200,390a,b | 3,621,047 | |
| Volcano | 129,964a,b | 3,850,833 | |
| 107,248,540 | |||
| Industrial—18.8% | |||
| AMETEK | 146,303 | 4,823,610 | |
| BE Aerospace | 171,853b | 5,690,053 | |
| Corporate Executive Board | 253,222 | 7,546,016 | |
| Crane | 114,330 | 4,080,438 | |
| EMCOR Group | 171,170 | 3,479,886 | |
| Hexcel | 229,240a,b | 5,079,958 | |
| IDEX | 123,290 | 3,841,716 | |
| Jacobs Engineering Group | 124,590b | 4,023,011 | |
| Landstar System | 88,540 | 3,502,642 | |
10
| Common Stocks (continued) | Shares | Value ($) | |
| Industrial (continued) | |||
| Middleby | 46,250a,b | 3,258,775 | |
| Old Dominion Freight Line | 151,014a,b | 4,374,876 | |
| Robbins & Myers | 68,560 | 2,379,718 | |
| Roper Industries | 59,565 | 4,104,624 | |
| Taleo, Cl. A | 195,500a,b | 5,028,260 | |
| Thomas & Betts | 90,150b | 3,597,887 | |
| Verisk Analytics, Cl. A | 334,580b | 11,633,347 | |
| Waste Connections | 235,803a | 7,974,857 | |
| 84,419,674 | |||
| Materials—3.7% | |||
| CF Industries Holdings | 28,360 | 3,499,340 | |
| Cytec Industries | 89,540 | 3,146,436 | |
| FMC | 79,750 | 5,515,510 | |
| Titanium Metals | 301,190a | 4,511,826 | |
| 16,673,112 | |||
| Technology—19.7% | |||
| Alliance Data Systems | 122,880a,b | 11,390,976 | |
| BroadSoft | 74,950a,b | 2,274,732 | |
| Commvault Systems | 93,870b | 3,478,822 | |
| Equinix | 104,130b | 9,249,868 | |
| Exlservice Holdings | 201,690b | 4,437,180 | |
| Genpact | 719,340b | 10,351,303 | |
| Linear Technology | 156,330 | 4,322,525 | |
| MAXIMUS | 143,560a | 5,010,244 | |
| Mellanox Technologies | 109,080b | 3,405,478 | |
| Mentor Graphics | 329,370b | 3,168,539 | |
| Netgear | 135,790a,b | 3,515,603 | |
| NetLogic Microsystems | 112,360b | 5,405,640 | |
| Polycom | 147,130b | 2,702,778 | |
| Quality Systems | 46,270a | 4,488,190 | |
| Rackspace Hosting | 191,270a,b | 6,529,958 | |
| Synopsys | 199,290b | 4,854,704 | |
| Teradata | 75,150b | 4,022,780 | |
| 88,609,320 | |||
| Total Common Stocks | |||
| (cost $431,753,962) | 441,394,105 | ||
| The Fund | 11 |
STATEMENT OF INVESTMENTS (continued)
| Other Investment—1.7% | Shares | Value ($) | ||
| Registered Investment Company; | ||||
| Dreyfus Institutional Preferred | ||||
| Plus Money Market Fund | ||||
| (cost $7,666,191) | 7,666,191 | d | 7,666,191 | |
| Investment of Cash Collateral | ||||
| for Securities Loaned—21.0% | ||||
| Registered Investment Company; | ||||
| Dreyfus Institutional Cash | ||||
| Advantage Fund | ||||
| (cost $94,607,097) | 94,607,097 | d | 94,607,097 | |
| Total Investments (cost $534,027,250) | 120.8 | % | 543,667,393 | |
| Liabilities, Less Cash and Receivables | (20.8 | %) | (93,441,721 | ) |
| Net Assets | 100.0 | % | 450,225,672 | |
ADR—American Depository Receipts
| a Security, or portion thereof, on loan.At September 30, 2011, the value of the fund’s securities on loan was |
| $90,328,207 and the value of the collateral held by the fund was $94,607,097. |
| b Non-income producing security. |
| c Investment in real estate investment trust. |
| d Investment in affiliated money market mutual fund. |
| Portfolio Summary (Unaudited)† | |||
| Value (%) | Value (%) | ||
| Health Care | 23.9 | Consumer Staples | 5.2 |
| Money Market Investments | 22.7 | Energy | 4.8 |
| Technology | 19.7 | Materials | 3.7 |
| Industrial | 18.8 | Exchange Traded Funds | 1.4 |
| Consumer Discretionary | 14.4 | ||
| Financial | 6.2 | 120.8 | |
| † Based on net assets. | |||
| See notes to financial statements. | |||
12
| STATEMENT OF ASSETS AND LIABILITIES |
| September 30, 2011 |
| Cost | Value | ||
| Assets ($): | |||
| Investments in securities—See Statement of Investments (including | |||
| securities on loan, valued at $90,328,207)—Note 1(b): | |||
| Unaffiliated issuers | 431,753,962 | 441,394,105 | |
| Affiliated issuers | 102,273,288 | 102,273,288 | |
| Cash | 286,968 | ||
| Receivable for investment securities sold | 10,281,028 | ||
| Dividends and securities lending income receivable | 105,135 | ||
| Receivable for shares of Beneficial Interest subscribed | 4,527 | ||
| Prepaid expenses | 20,518 | ||
| 554,365,569 | |||
| Liabilities ($): | |||
| Due to The Dreyfus Corporation and affiliates—Note 3(c) | 335,946 | ||
| Liability for securities on loan—Note 1(b) | 94,607,097 | ||
| Payable for investment securities purchased | 8,907,004 | ||
| Payable for shares of Beneficial Interest redeemed | 164,919 | ||
| Accrued expenses | 124,931 | ||
| 104,139,897 | |||
| Net Assets ($) | 450,225,672 | ||
| Composition of Net Assets ($): | |||
| Paid-in capital | 437,991,380 | ||
| Accumulated net realized gain (loss) on investments | 2,594,149 | ||
| Accumulated net unrealized appreciation | |||
| (depreciation) on investments | 9,640,143 | ||
| Net Assets ($) | 450,225,672 | ||
| Net Asset Value Per Share | |||
| Class A | Class C | Class I | |
| Net Assets ($) | 107,695,670 | 1,124,414 | 341,405,588 |
| Shares Outstanding | 8,314,854 | 89,001 | 26,192,614 |
| Net Asset Value Per Share ($) | 12.95 | 12.63 | 13.03 |
| See notes to financial statements. | |||
| The Fund | 13 |
| STATEMENT OF OPERATIONS |
| Year Ended September 30, 2011 |
| Investment Income ($): | ||
| Income: | ||
| Cash dividends: | ||
| Unaffiliated issuers | 2,884,653 | |
| Affiliated issuers | 13,389 | |
| Income from securities lending—Note 1(b) | 172,953 | |
| Total Income | 3,070,995 | |
| Expenses: | ||
| Investment advisory fee—Note 3(a) | 2,925,145 | |
| Shareholder servicing costs—Note 3(c) | 802,150 | |
| Custodian fees—Note 3(c) | 117,300 | |
| Professional fees | 75,650 | |
| Administration fees—Note 3(a) | 48,048 | |
| Prospectus and shareholders’ reports | 47,741 | |
| Trustees’ fees and expenses—Note 3(d) | 34,669 | |
| Registration fees | 33,591 | |
| Accounting and administration fees—Note 3(a) | 33,250 | |
| Distribution fees—Note 3(b) | 9,429 | |
| Loan commitment fees—Note 2 | 1,886 | |
| Miscellaneous | 23,194 | |
| Total Expenses | 4,152,053 | |
| Less—reduction in fees due to earnings credits—Note 3(c) | (783) | |
| Net Expenses | 4,151,270 | |
| Investment (Loss)—Net | (1,080,275) | |
| Realized and Unrealized Gain (Loss) on Investments—Note 4 ($): | ||
| Net realized gain (loss) on investments | 54,634,136 | |
| Net unrealized appreciation (depreciation) on investments | (32,974,637) | |
| Net Realized and Unrealized Gain (Loss) on Investments | 21,659,499 | |
| Net Increase in Net Assets Resulting from Operations | 20,579,224 | |
| See notes to financial statements. | ||
14
STATEMENT OF CHANGES IN NET ASSETS
| Year Ended September 30, | ||||
| 2011 | 2010 | |||
| Operations ($): | ||||
| Investment (loss)—net | (1,080,275) | (262,408) | ||
| Net realized gain (loss) on investments | 54,634,136 | 4,889,168 | ||
| Net unrealized appreciation | ||||
| (depreciation) on investments | (32,974,637) | 10,238,158 | ||
| Net Increase (Decrease) in Net Assets | ||||
| Resulting from Operations | 20,579,224 | 14,864,918 | ||
| Beneficial Interest Transactions ($): | ||||
| Net proceeds from shares sold: | ||||
| Class A Shares | 6,956,002 | 2,214,224 | ||
| Class C Shares | 102,958 | 13,675 | ||
| Class I Shares | 102,128,527 | 152,990,340 | ||
| Net assets received in connection | ||||
| with reorganization—Note 1 | — | 122,932,527 | ||
| Cost of shares redeemed: | ||||
| Class A Shares | (13,693,679) | (6,909,828) | ||
| Class C Shares | (125,270) | (96,540) | ||
| Class I Shares | (67,735,285) | (52,826,717) | ||
| Increase (Decrease) in Net Assets from | ||||
| Beneficial Interest Transactions | 27,633,253 | 218,317,681 | ||
| Total Increase (Decrease) in Net Assets | 48,212,477 | 233,182,599 | ||
| Net Assets ($): | ||||
| Beginning of Period | 402,013,195 | 168,830,596 | ||
| End of Period | 450,225,672 | 402,013,195 | ||
| The Fund | 15 |
STATEMENT OF CHANGES IN NET ASSETS (continued)
| Year Ended September 30, | ||||
| 2011 | 2010 | |||
| Capital Share Transactions: | ||||
| Class A | ||||
| Shares sold | 476,874 | 189,226 | ||
| Shares issued in connection | ||||
| with reorganization—Note 1 | — | 9,172,714 | ||
| Shares redeemed | (957,046) | (583,665) | ||
| Net Increase (Decrease) in Shares Outstanding | (480,172) | 8,778,275 | ||
| Class C | ||||
| Shares sold | 7,212 | 1,115 | ||
| Shares issued in connection | ||||
| with reorganization—Note 1 | — | 96,557 | ||
| Shares redeemed | (8,690) | (8,389) | ||
| Net Increase (Decrease) in Shares Outstanding | (1,478) | 89,283 | ||
| Class I | ||||
| Shares sold | 7,087,450 | 12,980,200 | ||
| Shares issued in connection | ||||
| with reorganization—Note 1 | — | 186,506 | ||
| Shares redeemed | (4,737,304) | (4,509,566) | ||
| Net Increase (Decrease) in Shares Outstanding | 2,350,146 | 8,657,140 | ||
| See notes to financial statements. | ||||
16
FINANCIAL HIGHLIGHTS
The following tables describe the performance for each share class for the fiscal periods indicated. All information (except portfolio turnover rate) reflects financial results for a single fund share.Total return shows how much your investment in the fund would have increased (or decreased) during each period, assuming you had reinvested all dividends and distributions.These figures have been derived from the fund’s financial statements.
| Year Ended September 30, | ||||||
| Class A Shares | 2011 | 2010 | 2009a | |||
| Per Share Data ($): | ||||||
| Net asset value, beginning of period | 12.26 | 11.10 | 8.36 | |||
| Investment Operations: | ||||||
| Investment (loss)—netb | (.06) | (.04) | (.02) | |||
| Net realized and unrealized | ||||||
| gain (loss) on investments | .75 | 1.20 | 2.76 | |||
| Total from Investment Operations | .69 | 1.16 | 2.74 | |||
| Net asset value, end of period | 12.95 | 12.26 | 11.10 | |||
| Total Return (%)c | 5.63 | 10.45 | 32.78 | |||
| Ratios/Supplemental Data (%): | ||||||
| Ratio of total expenses to average net assets | 1.09 | 1.12 | 1.26 | |||
| Ratio of net expenses to average net assets | 1.09 | 1.12 | 1.25 | |||
| Ratio of net investment (loss) to average net assets | (.45) | (.35) | (.37) | |||
| Portfolio Turnover Rate | 180.82 | 191.46 | 278.73d | |||
| Net Assets, end of period ($ x 1,000) | 107,696 | 107,796 | 186 | |||
| a | From March 31, 2009 (commencement of initial offering) to September 30, 2009. |
| b | Based on average shares outstanding at each month end. |
| c | Exclusive of sales charge. |
| d | Represents portfolio turnover for the fund for the year. |
See notes to financial statements.
| The Fund | 17 |
FINANCIAL HIGHLIGHTS (continued)
| Year Ended September 30, | ||||||
| Class C Shares | 2011 | 2010 | 2009a | |||
| Per Share Data ($): | ||||||
| Net asset value, beginning of period | 12.06 | 11.05 | 8.36 | |||
| Investment Operations: | ||||||
| Investment (loss)—netb | (.18) | (.13) | (.06) | |||
| Net realized and unrealized | ||||||
| gain (loss) on investments | .75 | 1.14 | 2.75 | |||
| Total from Investment Operations | .57 | 1.01 | 2.69 | |||
| Net asset value, end of period | 12.63 | 12.06 | 11.05 | |||
| Total Return (%)c | 4.73 | 9.14 | 32.18 | |||
| Ratios/Supplemental Data (%): | ||||||
| Ratio of total expenses to average net assets | 1.95 | 1.99 | 2.16 | |||
| Ratio of net expenses to average net assets | 1.95 | 1.99 | 2.00 | |||
| Ratio of net investment (loss) to average net assets | (1.31) | (1.21) | (1.20) | |||
| Portfolio Turnover Rate | 180.82 | 191.46 | 278.73d | |||
| Net Assets, end of period ($ x 1,000) | 1,124 | 1,091 | 13 | |||
| a | From March 31, 2009 (commencement of initial offering) to September 30, 2009. |
| b | Based on average shares outstanding at each month end. |
| c | Exclusive of sales charge. |
| d | Represents portfolio turnover for the fund for the year. |
See notes to financial statements.
18
| Year Ended September 30, | ||||||||||
| Class I Shares | 2011 | 2010 | 2009a | 2008 | 2007 | |||||
| Per Share Data ($): | ||||||||||
| Net asset value, beginning of period | 12.29 | 11.10 | 11.97 | 17.66 | 14.92 | |||||
| Investment Operations: | ||||||||||
| Investment income (loss)—netb | (.02) | (.01) | (.00)c | (.02) | .01 | |||||
| Net realized and unrealized gain | ||||||||||
| (loss) on investments | .76 | 1.20 | (.87) | (1.93)d | 3.74d | |||||
| Total from Investment Operations | .74 | 1.19 | (.87) | (1.95) | 3.75 | |||||
| Distributions: | ||||||||||
| Dividends from | ||||||||||
| investment income—net | — | — | — | (.01) | — | |||||
| Dividends from net realized | ||||||||||
| gain on investments | — | — | — | (3.73) | (1.01) | |||||
| Total Distributions | — | — | — | (3.74) | (1.01) | |||||
| Net asset value, end of period | 13.03 | 12.29 | 11.10 | 11.97 | 17.66 | |||||
| Total Return (%) | 6.02 | 10.72 | (7.27) | (14.32) | 26.31 | |||||
| Ratios/Supplemental Data (%): | ||||||||||
| Ratio of total expenses | ||||||||||
| to average net assets | .77 | .81 | .93 | 1.11 | 1.23 | |||||
| Ratio of net expenses | ||||||||||
| to average net assets | .77 | .81 | .93 | 1.00 | 1.00 | |||||
| Ratio of net investment income | ||||||||||
| (loss) to average net assets | (.14) | (.05) | (.01) | (.15) | .07 | |||||
| Portfolio Turnover Rate | 180.82 | 191.46 | 278.73 | 201 | 180 | |||||
| Net Assets, end of period ($ x 1,000) | 341,406 | 293,126 | 168,631 | 90,267 | 22,432 | |||||
| a The fund changed to a multiple class fund on March 31, 2009.The existing shares were redesignated as |
| Class I shares. |
| b Based on average shares outstanding at each month end. |
| c Amount represents less than $.01 per share. |
| d Amounts include litigation proceeds received by the fund of $.01 and $.19 per share for the years ended |
| September 30, 2008 and September 30, 2007, respectively. |
See notes to financial statements.
| The Fund | 19 |
NOTES TO FINANCIAL STATEMENTS
NOTE 1—Significant Accounting Policies:
Dreyfus/The Boston Company Small/Mid Cap Growth Fund (the “fund”) is a separate diversified series of Dreyfus Investment Funds (the “Trust”), which is registered under the Investment Company Act of 1940, as amended (the “Act”), as an open-end management investment company and operates as a series company currently offering eleven series, including the fund.The fund’s investment objective is to seek long-term growth of capital. The Dreyfus Corporation (the “Manager” or “Dreyfus”), a wholly-owned subsidiary of The Bank of New York Mellon Corporation (“BNY Mellon”), serves as the fund’s investment adviser.
As of the close of business on April 29, 2010, pursuant to an Agreement and Plan of Reorganization previously approved by the fund’s Board of Trustees, all of the assets, subject to the liabilities, of Dreyfus Discovery Fund (“Discovery Fund”), a series of Dreyfus Funds, Inc., were transferred to the fund in exchange for a corresponding class of shares of Beneficial Interest of the fund of equal value. Shareholders of Class A, Class B and Class F shares of Discovery Fund received Class A shares of the fund and shareholders of Class C and Class I shares of Discovery Fund received Class C and Class I shares of the fund, respectively, in each case in an amount equal to the aggregate net asset value of their investment in Discovery Fund at the time of the exchange.The exchange ratio for Class A, Class B, Class C, Class F and Class I shares are 2.10, 1.91, 1.95, 2.13 and 2.16, respectively.The net asset value of the fund’s shares on the close of business April 29, 2010, after the reorganization was $13.00 for Class A, $12.84 for Class C and $13.02 for Class I shares, and a total of 9,172,714 Class A shares, 96,557 Class C shares and 186,506 Class I shares were issued to shareholders of Discovery Fund in the exchange. The exchange was a tax-free event to the Discovery Fund shareholders. For financial reporting purposes, assets received and shares issued by the fund were recorded at fair value; however, the cost basis of investments received from Discovery Fund was carried forward to align ongoing reporting of the fund’s realized and unrealized gains and losses with amounts distributable to shareholders for tax purposes.
20
The net assets and net unrealized appreciation (depreciation) immediately before the acquisition were as follows:
| Unrealized | ||
| Appreciation | ||
| (Depreciation) ($) | Net Assets ($) | |
| Dreyfus Discovery Fund-Target Fund | 9,102,488 | 122,932,527 |
| Dreyfus/The Boston Company Small/Mid | ||
| Cap Growth Fund-Acquiring Fund | 36,200,644 | 226,305,289 |
| Total | 45,303,132 | 349,237,816 |
MBSC Securities Corporation (the “Distributor”), a wholly-owned subsidiary of the Manager, is the distributor of the fund’s shares.The fund is authorized to issue an unlimited number of $.001 par value shares of Beneficial Interest in each of the following classes of shares: Class A, Class C and Class I shares. Class A shares are subject to a sales charge imposed at the time of purchase. Class C shares are subject to a contingent deferred sales charge (“CDSC”) imposed on Class C shares redeemed within one year of purchase. Class I shares are sold primarily to bank trust departments and other financial service providers (includingThe Bank of New York Mellon, a subsidiary of BNY Mellon and an affiliate of Dreyfus), acting on behalf of customers having a qualified trust or an investment account or relationship at such institution, and bear no distribution or shareholder services fees. Class I shares are offered without a front-end sales charge or CDSC. Other differences between the classes include the services offered to and the expenses borne by each class, the allocation of certain transfer agency costs and certain voting rights. Income, expenses (other than expenses attributable to a specific class), and realized and unrealized gains or losses on investments are allocated to each class of shares based on its relative net assets.
TheTrust accounts separately for the assets, liabilities and operations of each series. Expenses directly attributable to each series are charged to that series’ operations; expenses which are applicable to all series are allocated among them on a pro rata basis.
The Financial Accounting Standards Board (“FASB”) Accounting Standards Codification (“ASC”) is the exclusive reference of authorita-
| The Fund | 21 |
NOTES TO FINANCIAL STATEMENTS (continued)
tive U.S. generally accepted accounting principles (“GAAP”) recognized by the FASB to be applied by nongovernmental entities. Rules and interpretive releases of the Securities and Exchange Commission (“SEC”) under authority of federal laws are also sources of authoritative GAAP for SEC registrants. The fund’s financial statements are prepared in accordance with GAAP, which may require the use of management estimates and assumptions.Actual results could differ from those estimates.
(a) Portfolio valuation: The fair value of a financial instrument is the amount that would be received to sell an asset or paid to transfer a liability in an orderly transaction between market participants at the measurement date (i.e. the exit price). GAAP establishes a fair value hierarchy that prioritizes the inputs of valuation techniques used to measure fair value.This hierarchy gives the highest priority to unadjusted quoted prices in active markets for identical assets or liabilities (Level 1 measurements) and the lowest priority to unobservable inputs (Level 3 measurements).
Additionally, GAAP provides guidance on determining whether the volume and activity in a market has decreased significantly and whether such a decrease in activity results in transactions that are not orderly. GAAP requires enhanced disclosures around valuation inputs and techniques used during annual and interim periods.
Various inputs are used in determining the value of the fund’s investments relating to fair value measurements.These inputs are summarized in the three broad levels listed below:
Level 1—unadjusted quoted prices in active markets for identical investments.
Level 2—other significant observable inputs (including quoted prices for similar investments, interest rates, prepayment speeds, credit risk, etc.).
Level 3—significant unobservable inputs (including the fund’s own assumptions in determining the fair value of investments).
The inputs or methodology used for valuing securities are not necessarily an indication of the risk associated with investing in those securities.
22
Changes in valuation techniques may result in transfers in or out of an assigned level within the disclosure hierarchy. Valuation techniques used to value the fund’s investments are as follows:
Investments in securities are valued at the last sales price on the securities exchange or national securities market on which such securities are primarily traded. Securities listed on the National Market System for which market quotations are available are valued at the official closing price or, if there is no official closing price that day, at the last sales price. Securities not listed on an exchange or the national securities market, or securities for which there were no transactions, are valued at the average of the most recent bid and asked prices, except for open short positions, where the asked price is used for valuation purposes. Bid price is used when no asked price is available. Registered investment companies that are not traded on an exchange are valued at their net asset value. All preceding securities are categorized within Level 1 of the fair value hierarchy.
Fair valuing of securities may be determined with the assistance of a pricing service using calculations based on indices of domestic securities and other appropriate indicators, such as prices of relevant ADRs and futures contracts. Utilizing these techniques may result in transfers between Level 1 and Level 2 of the fair value hierarchy.
When market quotations or official closing prices are not readily available, or are determined not to reflect accurately fair value, such as when the value of a security has been significantly affected by events after the close of the exchange or market on which the security is principally traded (for example, a foreign exchange or market), but before the fund calculates its net asset value, the fund may value these investments at fair value as determined in accordance with the procedures approved by the Board of Trustees. Certain factors may be considered when fair valuing investments such as: fundamental analytical data, the nature and duration of restrictions on disposition, an evaluation of the forces that influence the market in which the securities are purchased and sold,
| The Fund | 23 |
NOTES TO FINANCIAL STATEMENTS (continued)
and public trading in similar securities of the issuer or comparable issuers.These securities are either categorized as Level 2 or 3 depending on the relevant inputs used.
For restricted securities where observable inputs are limited, assumptions about market activity and risk are used and are categorized within Level 3 of the fair value hierarchy.
The following is a summary of the inputs used as of September 30, 2011 in valuing the fund’s investments:
| Level 1— | Level 2—Other | Level 3— | ||
| Unadjusted | Significant | Significant | ||
| Quoted | Observable | Unobservable | ||
| Prices | Inputs | Inputs | Total | |
| Assets ($) | ||||
| Investments in Securities: | ||||
| Equity Securities— | ||||
| Domestic† | 422,299,119 | — | — | 422,299,119 |
| Equity Securities— | ||||
| Foreign† | 12,649,463 | — | — | 12,649,463 |
| Mutual Funds/ | ||||
| Exchange | ||||
| Traded Funds | 108,718,811 | — | — | 108,718,811 |
| † See Statement of Investments for additional detailed categorizations. | ||||
In May 2011, FASB issued Accounting Standards Update (“ASU”) No. 2011-04“Amendments to Achieve Common FairValue Measurement and Disclosure Requirements in GAAP and International Financial Reporting Standards (“IFRS”)” (“ASU 2011-04”).ASU 2011-04 includes common requirements for measurement of and disclosure about fair value between GAAP and IFRS.ASU 2011-04 will require reporting entities to disclose the following information for fair value measurements categorized within Level 3 of the fair value hierarchy: quantitative information about the unobservable inputs used in the fair value measurement, the valuation processes used by the reporting entity and a narrative description of the sensitivity of the fair value measurement to changes in unobservable inputs and the interrelationships between those unobservable inputs. In addition,
24
ASU 2011-04 will require reporting entities to make disclosures about amounts and reasons for all transfers in and out of Level 1 and Level 2 fair value measurements. The new and revised disclosures are effective for interim and annual reporting periods beginning after December 15, 2011. At this time, management is evaluating the implications of ASU 2011-04 and its impact on the financial statements.
(b) Securities transactions and investment income: Securities transactions are recorded on a trade date basis. Realized gains and losses from securities transactions are recorded on the identified cost basis. Dividend income is recognized on the ex-dividend date and interest income, including, where applicable, accretion of discount and amortization of premium on investments, is recognized on the accrual basis.
Pursuant to a securities lending agreement with The Bank of New York Mellon, the fund may lend securities to qualified institutions. It is the fund’s policy that, at origination, all loans are secured by collateral of at least 102% of the value of U.S. securities loaned and 105% of the value of foreign securities loaned. Collateral equivalent to at least 100% of the market value of securities on loan is maintained at all times. Collateral is either in the form of cash, which can be invested in certain money market mutual funds managed by the Manager, U.S. Government and Agency securities or letters of credit. The fund is entitled to receive all income on securities loaned, in addition to income earned as a result of the lending transaction. Although each security loaned is fully collateralized, the fund bears the risk of delay in recovery of, or loss of rights in, the securities loaned should a borrower fail to return the securities in a timely manner. During the period ended September 30, 2011, The Bank of New York Mellon earned $57,651 from lending portfolio securities, pursuant to the securities lending agreement.
(c) Affiliated issuers: Investments in other investment companies advised by the Dreyfus are defined as “affiliated” in the Act.
| The Fund | 25 |
NOTES TO FINANCIAL STATEMENTS (continued)
The fund may invest in shares of certain affiliated investment companies also advised or managed by Dreyfus. Investments in affiliated investment companies for the period ended September 30, 2011 were as follows:
| Affiliated | ||||||
| Investment | Value | Value | Net | |||
| Company | 9/30/2010 ($) | Purchases ($) | Sales ($) | 9/30/2011 | ($) | Assets (%) |
| Dreyfus | ||||||
| Institutional | ||||||
| Preferred | ||||||
| Plus Money | ||||||
| Market | ||||||
| Fund | 4,598,849 | 200,561,060 | 197,493,718 | 7,666,191 | 1.7 | |
| Dreyfus | ||||||
| Institutional | ||||||
| Cash | ||||||
| Advantage | ||||||
| Fund | 24,017,181 | 627,336,592 | 556,746,676 | 94,607,097 | 21.0 | |
| Total | 28,616,030 | 827,897,652 | 754,240,394 | 102,273,288 | 22.7 | |
(d) Dividends to shareholders: Dividends are recorded on the ex-dividend date. Dividends from investment income-net and dividends from net realized capital gains, if any, are normally declared and paid annually, but the fund may make distributions on a more frequent basis to comply with the distribution requirements of the Internal Revenue Code of 1986, as amended (the “Code”).To the extent that net realized capital gains can be offset by capital loss carryovers, it is the policy of the fund not to distribute such gains. Income and capital gain distributions are determined in accordance with income tax regulations, which may differ from GAAP.
(e) Federal income taxes: It is the policy of the fund to continue to qualify as a regulated investment company, if such qualification is in the best interests of its shareholders, by complying with the applicable provisions of the Code, and to make distributions of taxable income sufficient to relieve it from substantially all federal income and excise taxes.
As of and during the period ended September 30, 2011, the fund did not have any liabilities for any uncertain tax positions.The fund recognizes interest and penalties, if any, related to uncertain tax positions
26
as income tax expense in the Statement of Operations. During the period, the fund did not incur any interest or penalties.
Each of the tax years in the four-year period ended September 30, 2011 remains subject to examination by the Internal Revenue Service and state taxing authorities.
At September 30, 2011, the components of accumulated earnings on a tax basis were as follows: undistributed capital gains $33,608,920, accumulated capital losses $26,861,162 and unrealized appreciation $5,486,534.
The accumulated capital loss carryover is available for federal income tax purposes to be applied against future net securities profits, if any, realized subsequent to September 30, 2011. As a result of the fund’s April 29, 2010 merger with Dreyfus Discovery Fund, capital losses of $26,861,162 are available to offset future gains, if any. Based on certain privisions in the Code, the amount of losses which can be utilized in subsequent years is subject to an annual limitation.This acquired capital loss will expire in fiscal 2016.
Under the recently enacted Regulated Investment Company Modernization Act of 2010 (the “2010 Act”), the fund will be permitted to carry forward capital losses incurred in taxable years beginning after December 22, 2010 (“post-enactment losses”) for an unlimited period. However, the 2010 Act requires post-enactment losses to be utilized before the utilization of losses incurred in taxable years prior to the effective date of the 2010 Act. As a result of this ordering rule, capital loss carryovers related to taxable years beginning prior to the effective date of the 2010 Act may be more likely to expire unused.
During the period ended September 30, 2011, as a result of permanent book to tax differences, primarily due to the tax treatment, for limited partnerships, a write-off of capital loss carryovers and net operating losses, the fund increased accumulated undistributed investment income-net by $1,080,275, increased accumulated net realized gain
| The Fund | 27 |
NOTES TO FINANCIAL STATEMENTS (continued)
(loss) on investments by $21,201,824 and decreased paid-in-capital by $22,282,099. Net assets and net asset value per share were not affected by this reclassification.
NOTE 2—Bank Lines of Credit:
The fund participates with other Dreyfus-managed funds in a $225 million unsecured credit facility led by Citibank, N.A. and a $300 million unsecured credit facility provided by The Bank of New York Mellon (each, a “Facility”), each to be utilized primarily for temporary or emergency purposes, including the financing of redemptions. In connection therewith, the fund has agreed to pay its pro rata portion of commitment fees for each Facility. Interest is charged to the fund based on rates determined pursuant to the terms of the respective Facility at the time of borrowing. During the period ended September 30, 2011, the fund did not borrow under the Facilities.
NOTE 3—Investment Advisory Fee and Other Transactions With Affiliates:
(a) Pursuant to an investment advisory agreement with the Manager, the investment advisory fee is computed at the annual rate of .60% of the value of the fund’s average daily net assets and is payable monthly.
From October 1, 2010 through April 30, 2011, the Trust had an agreement with The Bank of New York Mellon, pursuant to which The Bank of NewYork Mellon provided administration and fund accounting services for the fund. For these services, the fund paid The Bank of New York Mellon a fixed fee plus asset and transaction based fees, as well as out-of-pocket expenses. Pursuant to this agreement, the fund was charged $33,250 during the period October 1, 2010 through April 30, 2011 for administration and fund accounting services.
At Board Meetings of the Trust held on February 15-16, 2011, the Board of Trustees of the Trust terminated the agreement with The Bank of New York Mellon and, on behalf of the Trust, entered into a Fund Accounting and Administration Agreement (the “Administration Agreement”) with Dreyfus, effective May 1, 2011, whereby Dreyfus performs administrative, accounting and recordkeeping services for the
28
fund. The fund has agreed to compensate Dreyfus for providing accounting services, administration, compliance monitoring, regulatory and shareholder reporting, as well as related facilities, equipment and clerical help.The fee is based on the fund’s average daily net assets and computed at the following annual rates: .06% of the first $500 million, .04% of the next $500 million and .02% in excess of $1 billion.
In addition, after applying any expense limitations or fee waivers that reduce the fees paid to Dreyfus for this service, Dreyfus has contractually agreed in writing to waive any remaining fees for this service to the extent that they exceed both Dreyfus’ costs in providing these services and a reasonable allocation of the costs incurred by Dreyfus and its affiliates related to the support and oversight of these services.The fund also reimburses Dreyfus for the out-of-pocket expenses Dreyfus incurs in performing this service for the fund. Pursuant to the Administration Agreement, the fund was charged $48,048 during the period May 1, 2011 through September 30, 2011.
During the period ended September 30, 2011, the Distributor retained $1,019 from commissions earned on sales of the fund’s Class A shares and $50 from CDSCs on redemptions of the fund’s Class C shares.
(b) Under the Distribution Plan (the “Plan”) adopted pursuant to Rule 12b-1 under the Act, Class C shares pay the Distributor for distributing its shares at an annual rate of .75% of the value of the average daily net assets of Class C shares. During the period ended September 30, 2011, Class C shares were charged $9,429 pursuant to the Plan.
(c) Under the Shareholder Services Plan, Class A and Class C shares pay the Distributor at an annual rate of .25% of their average daily net assets for the provision of certain services.The services provided may include personal services relating to shareholder accounts, such as answering shareholder inquiries regarding the fund and providing reports and other information, and services related to the maintenance of shareholder accounts.The Distributor may make payments to Service Agents (a securities dealer, financial institution or other industry professional) in respect of these services. The Distributor determines the
| The Fund | 29 |
NOTES TO FINANCIAL STATEMENTS (continued)
amounts to be paid to Service Agents. During the period ended September 30, 2011, Class A and Class C shares were charged $303,440 and $3,143, respectively, pursuant to the Shareholder Services Plan.
The fund compensates DreyfusTransfer, Inc., a wholly-owned subsidiary of the Manager, under a transfer agency agreement for providing personnel and facilities to perform transfer agency services for the fund. During the period ended September 30, 2011, the fund was charged $148,059 pursuant to the transfer agency agreement, which is included in Shareholder servicing costs in the Statement of Operations.
The fund has arrangements with the custodian and cash management bank whereby the fund may receive earnings credits when positive cash balances are maintained, which are used to offset custody and cash management fees. For financial reporting purposes, the fund includes net earnings credits as an expense offset in the Statement of Operations.
The fund compensates The Bank of New York Mellon under cash management agreements for performing cash management services related to fund subscriptions and redemptions. During the period ended September 30, 2011, the fund was charged $18,209 pursuant to the cash management agreements, which is included in Shareholder servicing costs in the Statement of Operations. These fees were partially offset by earnings credits of $783.
The fund also compensates The Bank of New York Mellon under a custody agreement for providing custodial services for the fund. During the period ended September 30, 2011, the fund was charged $117,300 pursuant to the custody agreement.
During the period ended September 30, 2011, the fund was charged $7,146 for services performed by the Chief Compliance Officer.
The components of “Due to The Dreyfus Corporation and affiliates” in the Statement of Assets and Liabilities consist of: investment advisory fees $230,129, administration fees $8,730, Rule 12b-1 distribution plan fees $719, shareholder services plan fees $23,187, custodian fees $49,293, chief compliance officer fees $3,750, PrivateWealth Sub-accounting fees $383 and transfer agency per account fees $19,755.
30
(d) Each Trustee who is not an “interested person” of the Trust (as defined in the Act) receives $60,000 per annum, plus $7,000 per joint Board meeting of the Trust, The Dreyfus/Laurel Funds, Inc., The Dreyfus/Laurel Funds Trust, The Dreyfus/Laurel Tax-Free Municipal Funds and Dreyfus Funds, Inc. (collectively, the “Board Group Open-End Funds”) attended, $2,500 for separate in-person committee meetings attended which are not held in conjunction with a regularly scheduled Board meeting and $2,000 for Board meetings and separate committee meetings attended that are conducted by telephone. The Board Group Open-End Funds also reimburse each Trustee who is not an “interested person” of the Trust (as defined in the Act) for travel and out-of-pocket expenses.With respect to Board meetings, the Chairman of the Board receives an additional 25% of such compensation (with the exception of reimbursable amounts). The Chair of each of the Board’s committees, unless the Chair also serves as Chair of the Board, receives $1,350 per applicable committee meeting. In the event that there is an in-person joint committee meeting or a joint telephone meeting of the Board Group Open-End Funds and Dreyfus HighYield Strategies Fund (“DHF”), a $2,500 fee is allocated between the Board Group Open-End Funds and DHF.
Effective January 1, 2012, the Board Group Open-End Funds and DHF (collectively, the “Board Group Funds”) will pay each Trustee their respective allocated portions of an annual retainer of $85,000 and a fee of $10,000 for each regularly scheduled Board meeting attended ($75,000 and $8,000, respectively, in the aggregate, prior to January 1, 2012).With respect to the annual retainer and Board meetings of the Board Group Funds, the Chair of the Board will receive an additional 25% of such compensation (with the exception of reimbursable amounts). Each Trustee will receive $2,500 for any separate in-person committee meetings attended, which are not held in conjunction with a regularly scheduled Board meeting, such amount to be allocated among the Board Group Funds, as applicable. In the event that there is a joint telephone meeting of the Board Group Funds, a fee of $2,000 will be allocated among the applicable Board Group Funds, accord-
| The Fund | 31 |
NOTES TO FINANCIAL STATEMENTS (continued)
ingly (prior to January 1, 2012, the fee allocated was $2,500 if the meeting included DHF).The Chair of each of the Board’s committees, unless the Chair also serves as Chair of the Board, will receive $1,500 per applicable committee meeting. Each Emeritus Trustee is entitled to receive an annual retainer of one-half the amount paid as a retainer at the time the Trustee became Emeritus and a per meeting attended fee of one-half the amount paid to Trustees.The Board Group Funds also reimburse each Independent Trustee and Emeritus Trustees for travel and out-of-pocket expenses.
NOTE 4—Securities Transactions:
The aggregate amount of purchases and sales of investment securities, excluding short-term securities, during the period ended September 30, 2011, amounted to $884,024,666 and $864,378,544, respectively.
At September 30, 2011, the cost of investments for federal income tax purposes was $538,180,859; accordingly, accumulated net unrealized appreciation on investments was $5,486,534, consisting of $46,898,771 gross unrealized appreciation and $41,412,237 gross unrealized depreciation.
NOTE 5—Subsequent Event:
Effective October 27, 2011, the Nominating Committee of the Board of Trustees nominated, and the Board of Trustees approved the election of, Francine J. Bovich as a Trustee of the Trust. A proxy statement will be mailed, on or about November 28, 2011, to Trust shareholders of record as of the close of business November 1, 2011, asking shareholders to consider Ms. Bovich’s election as a Board member of the Trust at a Special Joint Meeting of Shareholders to be held on Wednesday, February 8, 2012.
32
REPORT OF INDEPENDENT REGISTERED
PUBLIC ACCOUNTING FIRM
To the Board of Trustees and Shareholders of Dreyfus/The Boston Company Small/Mid Cap Growth Fund:
We have audited the accompanying statement of assets and liabilities of Dreyfus/The Boston Company Small/Mid Cap Growth Fund (the “Fund”), a series of Dreyfus Investment Funds, including the statement of investments as of September 30, 2011, the related statement of operations for the year then ended, and the statements of changes in net assets for each of the years in the two-year period then ended and the financial highlights for each of the years in the three-year period then ended. These financial statements and financial highlights are the responsibility of the Fund’s management. Our responsibility is to express an opinion on these financial statements and financial highlights based on our audits. The financial highlights for each of the years in the two-year period ended September 30, 2008 were audited by other independent registered public accountants whose report thereon, dated November 28, 2008, expressed an unqualified opinion on those financial highlights.
We conducted our audits in accordance with the standards of the Public Company Accounting Oversight Board (United States).Those standards require that we plan and perform the audit to obtain reasonable assurance about whether the financial statements and financial highlights are free of material misstatement.An audit includes examining, on a test basis, evidence supporting the amounts and disclosures in the financial statements. Our procedures included confirmation of securities owned as of September 30, 2011 by correspondence with the custodian and brokers or by other appropriate auditing procedures where replies from brokers were not received.An audit also includes assessing the accounting principles used and significant estimates made by management, as well as evaluating the overall financial statement presentation.We believe that our audits provide a reasonable basis for our opinion.
In our opinion, the financial statements and financial highlights referred to above present fairly, in all material respects, the financial position of Dreyfus/The Boston Company Small/Mid Cap Growth Fund as of September 30, 2011, the results of its operations for the year then ended, the changes in its net assets for each of the years in the two-year period then ended and the financial highlights for each of the years in the three-year period then ended, in conformity with U.S. generally accepted accounting principles.

New York, New York
November 23, 2011
| The Fund | 33 |
BOARD MEMBERS INFORMATION (Unaudited)
| Joseph S. DiMartino (67) |
| Chairman of the Board (2008) |
| Principal Occupation During Past 5Years: |
| • Corporate Director and Trustee |
| Other Public Company Board Memberships During Past 5Years: |
| • CBIZ (formerly, Century Business Services, Inc.), a provider of outsourcing functions for small |
| and medium size companies, Director (1997-present) |
| • Sunair Services Corporation, a provider of certain outdoor-related services to homes and |
| businesses, Director (2005-2009) |
| • The Newark Group, a provider of a national market of paper recovery facilities, paperboard |
| mills and paperboard converting plants, Director (2000-2010) |
| No. of Portfolios for which Board Member Serves: 167 |
| ——————— |
| Francine J. Bovich (60)† |
| Board Member (2011) |
| Principal Occupation During Past 5Years: |
| • Trustee,The Bradley Trusts, private trust funds (2011-Present) |
| • Managing Director, Morgan Stanley Investment Management (1993-2010) |
| No. of Portfolios for which Board Member Serves: 14 |
| ——————— |
| James M. Fitzgibbons (77) |
| Board Member (2008) |
| Principal Occupation During Past 5Years: |
| • Corporate Director and Trustee |
| Other Public Company Board Memberships During Past 5Years: |
| • Bill Barrett Corporation, an oil and natural gas exploration company, Director (2004-present) |
| No. of Portfolios for which Board Member Serves: 33 |
| ——————— |
| Kenneth A. Himmel (65) |
| Board Member (2008) |
| Principal Occupation During Past 5Years: |
| • President and CEO, Related Urban Development, a real estate development company (1996-present) |
| • President and CEO, Himmel & Company, a real estate development company (1980-present) |
| • CEO,American Food Management, a restaurant company (1983-present) |
| No. of Portfolios for which Board Member Serves: 33 |
34
| Stephen J. Lockwood (64) |
| Board Member (2008) |
| Principal Occupation During Past 5Years: |
| • Chairman of the Board, Stephen J. Lockwood and Company LLC, a real estate investment |
| company (2000-present) |
| No. of Portfolios for which Board Member Serves: 33 |
| ——————— |
| Roslyn M. Watson (61) |
| Board Member (2008) |
| Principal Occupation During Past 5Years: |
| • Principal,Watson Ventures, Inc., a real estate investment company (1993-present) |
| No. of Portfolios for which Board Member Serves: 43 |
| ——————— |
| Benaree Pratt Wiley (65) |
| Board Member (2008) |
| Principal Occupation During Past 5Years: |
| • Principal,TheWiley Group, a firm specializing in strategy and business development (2005-present) |
| Other Public Company Board Memberships During Past 5Years: |
| • CBIZ (formerly, Century Business Services, Inc.), a provider of outsourcing functions for small |
| and medium size companies, Director (2008-present) |
| No. of Portfolios for which Board Member Serves: 68 |
| ——————— |
† Ms. Bovich was elected as a Board Member by the Board of Trustees, effective October 27, 2011. See Note 5.
Once elected all Board Members serve for an indefinite term, but achieve Emeritus status upon reaching age 80.The address of the Board Members and Officers is in c/o The Dreyfus Corporation, 200 Park Avenue, NewYork, NewYork 10166.Additional information about the Board Members is available in the fund’s Statement of Additional Information which can be obtained from Dreyfus free of charge by calling this toll free number: 1-800-DREYFUS.
| The Fund | 35 |
OFFICERS OF THE FUND (Unaudited)
BRADLEY J. SKAPYAK, President since January 2010.
Chief Operating Officer and a director of the Manager since June 2009. From April 2003 to June 2009, Mr. Skapyak was the head of the Investment Accounting and Support Department of the Manager. He is an officer of 75 investment companies (comprised of 167 portfolios) managed by the Manager. He is 52 years old and has been an employee of the Manager since February 1988.
MICHAEL A. ROSENBERG, Vice President and Secretary since August 2005.
Assistant General Counsel of BNY Mellon, and an officer of 76 investment companies (comprised of 192 portfolios) managed by the Manager. He is 51 years old and has been an employee of the Manager since October 1991.
KIESHA ASTWOOD, Vice President and Assistant Secretary since January 2010.
Counsel of BNY Mellon, and an officer of 76 investment companies (comprised of 192 portfolios) managed by the Manager. She is 38 years old and has been an employee of the Manager since July 1995.
JAMES BITETTO, Vice President and Assistant Secretary since August 2005.
Senior Counsel of BNY Mellon and Secretary of the Manager, and an officer of 76 investment companies (comprised of 192 portfolios) managed by the Manager. He is 45 years old and has been an employee of the Manager since December 1996.
JONI LACKS CHARATAN, Vice President and Assistant Secretary since August 2005.
Senior Counsel of BNY Mellon, and an officer of 76 investment companies (comprised of 192 portfolios) managed by the Manager. She is 55 years old and has been an employee of the Manager since October 1988.
JOSEPH M. CHIOFFI, Vice President and Assistant Secretary since August 2005.
Senior Counsel of BNY Mellon, and an officer of 76 investment companies (comprised of 192 portfolios) managed by the Manager. He is 49 years old and has been an employee of the Manager since June 2000.
KATHLEEN DENICHOLAS, Vice President and Assistant Secretary since January 2010.
Managing Counsel of BNY Mellon, and an officer of 76 investment companies (comprised of 192 portfolios) managed by the Manager. She is 36 years old and has been an employee of the Manager since February 2001.
JANETTE E. FARRAGHER, Vice President and Assistant Secretary since August 2005.
Assistant General Counsel of BNY Mellon, and an officer of 76 investment companies (comprised of 192 portfolios) managed by the Manager. She is 48 years old and has been an employee of the Manager since February 1984.
JOHN B. HAMMALIAN, Vice President and Assistant Secretary since August 2005.
Senior Managing Counsel of BNY Mellon, and an officer of 76 investment companies (comprised of 192 portfolios) managed by the Manager. He is 48 years old and has been an employee of the Manager since February 1991.
M. CRISTINA MEISER, Vice President and Assistant Secretary since January 2010.
Senior Counsel of BNY Mellon, and an officer of 76 investment companies (comprised of 192 portfolios) managed by the Manager. She is 41 years old and has been an employee of the Manager since August 2001.
36
ROBERT R. MULLERY, Vice President and Assistant Secretary since August 2005.
Managing Counsel of BNY Mellon, and an officer of 76 investment companies (comprised of 192 portfolios) managed by the Manager. He is 59 years old and has been an employee of the Manager since May 1986.
JEFF PRUSNOFSKY, Vice President and Assistant Secretary since August 2005.
Senior Managing Counsel of BNY Mellon, and an officer of 76 investment companies (comprised of 192 portfolios) managed by the Manager. He is 46 years old and has been an employee of the Manager since October 1990.
JAMES WINDELS, Treasurer since November 2001.
Director – Mutual Fund Accounting of the Manager, and an officer of 76 investment companies (comprised of 192 portfolios) managed by the Manager. He is 53 years old and has been an employee of the Manager since April 1985.
RICHARD CASSARO, Assistant Treasurer since December 2008.
Senior Accounting Manager – Money Market and Municipal Bond Funds of the Manager, and an officer of 76 investment companies (comprised of 192 portfolios) managed by the Manager. He is 52 years old and has been an employee of the Manager since September 1982.
GAVIN C. REILLY, Assistant Treasurer since December 2008.
Tax Manager of the Investment Accounting and Support Department of the Manager, and an officer of 76 investment companies (comprised of 192 portfolios) managed by the Manager. He is 43 years old and has been an employee of the Manager since April 1991.
ROBERT ROBOL, Assistant Treasurer since December 2008.
Senior Accounting Manager – Fixed Income Funds of the Manager, and an officer of 76 investment companies (comprised of 192 portfolios) managed by the Manager. He is 47 years old and has been an employee of the Manager since October 1988.
ROBERT SALVIOLO, Assistant Treasurer since December 2008.
Senior Accounting Manager – Equity Funds of the Manager, and an officer of 76 investment companies (comprised of 192 portfolios) managed by the Manager. He is 44 years old and has been an employee of the Manager since June 1989.
ROBERT SVAGNA, Assistant Treasurer since December 2008.
Senior Accounting Manager – Equity Funds of the Manager, and an officer of 76 investment companies (comprised of 192 portfolios) managed by the Manager. He is 44 years old and has been an employee of the Manager since November 1990.
| The Fund | 37 |
OFFICERS OF THE FUND (Unaudited) (continued)
JOSEPH W. CONNOLLY, Chief Compliance Officer since December 2008.
Chief Compliance Officer of the Manager and The Dreyfus Family of Funds (76 investment companies, comprised of 192 portfolios). From November 2001 through March 2004, Mr. Connolly was first Vice-President, Mutual Fund Servicing for Mellon Global Securities Services. In that capacity, Mr. Connolly was responsible for managing Mellon’s Custody, Fund Accounting and Fund Administration services to third-party mutual fund clients.
He is 54 years old and has served in various capacities with the Manager since 1980, including manager of the firm’s Fund Accounting Department from 1997 through October 2001.
STEPHEN J. STOREN, Anti-Money Laundering Compliance Officer since May 2011.
Chief Compliance Officer of the Distributor, and the Anti-Money Laundering Compliance Officer of 72 investment companies (comprised of 188 portfolios) managed by the Manager. He is 57 years old and has been an employee of the Distributor since October 1999.
38
NOTES
For More Information
Telephone Call your financial representative or 1-800-DREYFUS
Mail The Dreyfus Family of Funds, 144 Glenn Curtiss Boulevard, Uniondale, NY 11556-0144
The fund files its complete schedule of portfolio holdings with the Securities and Exchange Commission (“SEC”) for the first and third quarters of each fiscal year on Form N-Q. The fund’s Forms N-Q are available on the SEC’s website at http://www.sec.gov and may be reviewed and copied at the SEC’s Public Reference Room in Washington, DC. Information on the operation of the Public Reference Room may be obtained by calling 1-800-SEC-0330.
A description of the policies and procedures that the fund uses to determine how to vote proxies relating to portfolio securities, and information regarding how the fund voted these proxies for the most recent 12-month period ended June 30 is available at http://www.dreyfus.com and on the SEC’s website at http://www.sec.gov. The description of the policies and procedures is also available without charge, upon request, by calling 1-800-DREYFUS.

| Dreyfus/Standish |
| Intermediate Tax Exempt |
| Bond Fund |
ANNUAL REPORT September 30, 2011
The views expressed in this report reflect those of the portfolio manager only through the end of the period covered and do not necessarily represent the views of Dreyfus or any other person in the Dreyfus organization. Any such views are subject to change at any time based upon market or other conditions and Dreyfus disclaims any responsibility to update such views.These views may not be relied on as investment advice and, because investment decisions for a Dreyfus fund are based on numerous factors, may not be relied on as an indication of trading intent on behalf of any Dreyfus fund.
Not FDIC-Insured • Not Bank-Guaranteed • May Lose Value
Contents | |
THE FUND | |
| 2 | A Letter from the Chairman and CEO |
| 3 | Discussion of Fund Performance |
| 6 | Fund Performance |
| 8 | Understanding Your Fund’s Expenses |
| 8 | Comparing Your Fund’s Expenses With Those of Other Funds |
| 9 | Statement of Investments |
| 22 | Statement of Assets and Liabilities |
| 23 | Statement of Operations |
| 24 | Statement of Changes in Net Assets |
| 26 | Financial Highlights |
| 29 | Notes to Financial Statements |
| 41 | Report of Independent Registered Public Accounting Firm |
| 42 | Important Tax Information |
| 43 | Board Members Information |
| 45 | Officers of the Fund |
FOR MORE INFORMATION | |
Back Cover |
Dreyfus/Standish
Intermediate Tax Exempt
Bond Fund
The Fund

A LETTER FROM THE CHAIRMAN AND CEO
Dear Shareholder:
This annual report for Dreyfus/Standish IntermediateTax Exempt Bond Fund covers the 12-month period from October 1, 2010, through September 30, 2011. For information about how the fund performed during the reporting period, as well as general market perspectives, we provide a Discussion of Fund Performance on the pages that follow.
Investors generally were encouraged by expectations of a more robust economic recovery over the first half of the reporting period, but investor sentiment deteriorated sharply during the second half due to disappointing economic data, rising commodity prices, an escalating sovereign debt crisis in Europe and a contentious debate regarding taxes, spending and borrowing in the United States. Market volatility was particularly severe during August and September after a major credit rating agency downgraded U.S. long-term debt. While most fixed-income securities proved volatile in this tumultuous environment, municipal bonds held up relatively well due to robust demand for a limited supply of newly issued securities.
The economic outlook currently is clouded by heightened market turbulence and political infighting, but we believe that a continued subpar global expansion is more likely than a return to recession. Inflationary pressures appear to be waning in most countries as energy prices recently have retreated from their highs. In the United States, the Federal Reserve Board has signaled its intention to maintain an aggressively accommodative monetary policy, which may help offset the financial stresses caused by deleveraging in the private sector and fiscal consolidation by governments in the United States and Europe. To assess the potential impact of these and other developments on your investments, we encourage you, as always, to speak with your financial advisor.
Thank you for your continued confidence and support.

Jonathan R. Baum
Chairman and Chief Executive Officer
The Dreyfus Corporation
October 17, 2011
2

DISCUSSION OF FUND PERFORMANCE
For the period of October 1, 2010, through September 30, 2011, as provided by Christine Todd, CFA, Steven Harvey, and Thomas Casey, Portfolio Managers
Fund and Market Performance Overview
For the 12-month period ended September 30, 2011, Dreyfus/Standish Intermediate Tax Exempt Bond Fund’s Class A shares produced a total return of 3.38%, Class C shares returned 2.60% and Class I shares returned 3.79%.1 In comparison, the fund’s benchmark, the Barclays Capital 3-, 5-, 7-, 10-Year Municipal Bond Index (the “Index”), provided a total return of 3.91% for the same period.2
Despite intensifying economic uncertainty during the reporting period, municipal bonds fared relatively well as a reduced supply of newly issued securities was met by robust investor demand.The fund returns were lower than its benchmark, due mainly to relative weakness among bonds with shorter maturities.
The Fund’s Investment Approach
The fund seeks to provide a high level of interest income exempt from federal income tax, while seeking preservation of shareholders’ capital. To pursue this goal, the fund normally invests at least 80% of its assets in municipal bonds that provide income exempt from federal personal income tax.
The fund invests exclusively in fixed-income securities rated, at the time of purchase, investment grade or the unrated equivalent as determined by Dreyfus, with an emphasis on high grade securities.3 The dollar weighted average effective maturity of the fund’s portfolio generally will be between three and 10 years, but the fund may invest in individual securities of any maturity.We focus on identifying undervalued sectors and securities, and we minimize the use of interest rate forecasting.We select municipal bonds by using fundamental credit analysis to estimate the relative value and attractiveness of various sectors and securities and to exploit pricing inefficiencies in the municipal bond market. We actively trade among various sectors, such as pre-refunded, general obligation and revenue bonds, based on their apparent relative values.
| The Fund | 3 |
DISCUSSION OF FUND PERFORMANCE (continued)
Municipal Bonds Held Up Relatively Well Amid Uncertainty
Improved economic data and rising corporate earnings generally supported investor sentiment through the first quarter of 2011.While investor confidence was shaken in February due to political unrest in the Middle East, and again in March when natural and nuclear disasters struck Japan, most markets bounced back quickly from these unexpected shocks.
Economic sentiment began to deteriorate in earnest in late April when Greece appeared headed for default on its sovereign debt, U.S. economic data disappointed and a contentious debate regarding U.S. government spending and borrowing intensified. Riskier assets suffered bouts of volatility as investors shifted their focus to traditionally defensive invest-ments.Turbulence among stocks and lower-rated bonds was particularly severe in August and September after a major credit-rating agency downgraded its assessment of long-term U.S. debt securities.
After exhibiting pronounced weakness over the final weeks of 2010, municipal bonds held up relatively well in 2011 due to positive supply-and-demand forces. New issuance volumes fell sharply in 2011 after a flood of new issuance in late 2010 as issuers sought to lock in federal subsidies provided by the Build America Bonds program, which expired at the end of the year. Political pressure to reduce spending and borrowing also led to fewer capital projects requiring financing over the first nine months of 2011.Yet, demand remained robust throughout the reporting period from investors seeking competitive levels of tax-exempt income.
Revenue Bonds Supported Relative Performance
The fund’s results compared to its benchmark were constrained to a degree by municipal bonds with maturities of two years and less, where yields remained anchored at low levels by an unchanged federal funds rate. On the other hand, the fund achieved better relative results from tactical positions in certain general obligation bonds that, in our view, were punished too severely at the end of 2010. General obligation bonds from California, Illinois and New Jersey gained value as tax receipts increased and local credit conditions stabilized.We later sold these bonds at a profit, and we redeployed the proceeds to revenue bonds backed by essential-services facilities, such as waterworks and sewer projects. Such
4
securities generally have been less sensitive to economic concerns than their general obligation counterparts. Indeed, the fund received especially strong results during the reporting period from revenue bonds backed by hospitals and airports.
Adjusting to a Slower-Growth Environment
Ongoing market turbulence and general economic uncertainty convinced us to adopt a relatively cautious investment posture during the reporting period, including a bias toward higher-quality securities with good liquidity characteristics. In addition, the fund ended the reporting period with a modestly long average duration in order to capture incrementally higher yields from longer-term securities.We have identified particularly attractive values in the eight- to 12-year maturity range, where yield differences are relatively steep. In our view, municipal bonds with these characteristics are likely to be the focus of demand from individual investors seeking competitive levels of tax advantaged income as they grow more concerned about persistently low interest rates and potential tax increases.
October 17, 2011
| Bond funds are subject generally to interest rate, credit, liquidity and market risks, to varying | |
| degrees, all of which are more fully described in the fund’s prospectus. Generally, all other factors | |
| being equal, bond prices are inversely related to interest-rate changes, and rate increases can cause | |
| price declines. | |
| 1 | Total return includes reinvestment of dividends and any capital gains paid, and does not take into |
| consideration the maximum initial sales charge in the case of Class A shares or the applicable | |
| contingent deferred sales charge imposed on redemptions in the case of Class C shares. Had these | |
| charges been reflected, returns would have been lower. Class I shares are not subject to any initial | |
| or deferred sales charge. Past performance is no guarantee of future results. Share price, yield and | |
| investment return fluctuate such that upon redemption, fund shares may be worth more or less | |
| than their original cost. Income may be subject to state and local taxes, and some income may be | |
| subject to the federal alternative minimum tax (AMT) for certain investors. Capital gains, if any, | |
| are taxable. Return figures provided reflect the absorption of certain fund expenses by The Dreyfus | |
| Corporation, pursuant to an agreement in effect through February 1, 2012, at which time it may | |
| be extended, modified or terminated. Had these expenses not been absorbed, the fund’s returns | |
| would have been lower. | |
| 2 | Source: Lipper Inc. |
| 3 | The fund may continue to own investment-grade bonds (at the time of purchase), which are |
| subsequently downgraded to below investment grade. |
| The Fund | 5 |
FUND PERFORMANCE
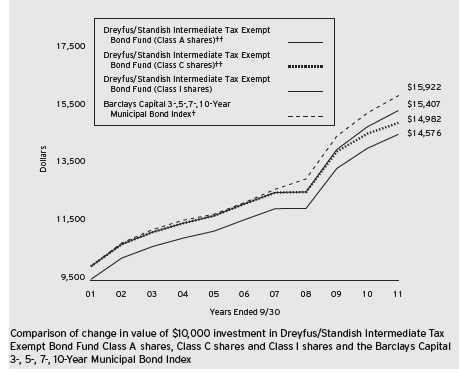
| † | Source: Lipper Inc. |
| †† | The total return figures presented for Class A and Class C shares of the fund reflect the performance of the fund’s |
| Class I shares for the period prior to March 31, 2009 (the inception date for Class A and Class C shares | |
| respectively), adjusted to reflect the applicable sales load for each share class. | |
| Past performance is not predictive of future performance. | |
| The above graph compares a $10,000 investment made in each of the Class A, Class C and Class I shares of | |
| Dreyfus/Standish Intermediate Tax Exempt Bond Fund on 9/30/01 to a $10,000 investment made in the Barclays | |
| Capital 3-, 5-, 7-, 10-Year Municipal Bond Index (the “Index”) on that date.All dividends and capital gain | |
| distributions are reinvested. | |
| The fund’s performance shown in the line graph above takes into account the maximum initial sales charge on Class A | |
| shares and all other applicable fees and expenses on all classes.The Index is an equal-weighted composite of the Barclays | |
| Capital 3-Year, 5-Year, 7-Year, and 10-Year Municipal Bond indices, each of which is a broad measure of the | |
| performance of investment grade, fixed-rate municipal bonds. Unlike a mutual fund, the Index is not subject to charges, | |
| fees and other expenses. Investors cannot invest directly in any index.These factors can contribute to the Index potentially | |
| outperforming the fund. Further information relating to fund performance, including expense reimbursements, if applicable, | |
| is contained in the Financial Highlights section of the prospectus and elsewhere in this report. | |
6
| Average Annual Total Returns as of 9/30/11 | |||||||
| Inception | |||||||
| Date | 1Year | 5 Years | 10 Years | ||||
| Class A shares | |||||||
| with maximum sales charge (4.5%) | 3/31/09 | –1.27% | 3.68%†† | 3.84%†† | |||
| without sales charge | 3/31/09 | 3.38% | 4.64%†† | 4.32%†† | |||
| Class C shares | |||||||
| with applicable redemption charge † | 3/31/09 | 1.60% | 4.25%†† | 4.13%†† | |||
| without redemption | 3/31/09 | 2.60% | 4.25%†† | 4.13%†† | |||
| Class I shares | 11/2/92 | 3.79% | 4.83% | 4.42% | |||
| Barclays Capital 3-, 5-, 7-, | |||||||
| 10-Year Municipal Bond Index | 3.91% | 5.44% | 4.76% | ||||
Past performance is not predictive of future performance.The fund’s performance shown in the graph and table does not reflect the deduction of taxes that a shareholder would pay on fund distributions or the redemption of fund shares.
| † | The maximum contingent deferred sales charge for Class C shares is 1% for shares redeemed within one year of the |
| date of purchase. | |
| †† | The total return performance figures presented for Class A and Class C shares of the fund reflect the performance of |
| the fund’s Class I shares for the period prior to March 31, 2009 (the inception date for Class A and Class C shares | |
| respectively), adjusted to reflect the applicable sales load for each share class. |
| The Fund | 7 |
UNDERSTANDING YOUR FUND’S EXPENSES (Unaudited)
As a mutual fund investor, you pay ongoing expenses, such as management fees and other expenses. Using the information below, you can estimate how these expenses affect your investment and compare them with the expenses of other funds.You also may pay one-time transaction expenses, including sales charges (loads) and redemption fees, which are not shown in this section and would have resulted in higher total expenses. For more information, see your fund’s prospectus or talk to your financial adviser.
Review your fund’s expenses
The table below shows the expenses you would have paid on a $1,000 investment in Dreyfus/Standish IntermediateTax Exempt Bond Fund from April 1, 2011 to September 30, 2011. It also shows how much a $1,000 investment would be worth at the close of the period, assuming actual returns and expenses.
Expenses and Value of a $1,000 Investment
assuming actual returns for the six months ended September 30, 2011
| Class A | Class C | Class I | ||||
| Expenses paid per $1,000† | $ | 4.12 | $ | 7.97 | $ | 2.32 |
| Ending value (after expenses) | $ | 1,055.70 | $ | 1,051.70 | $ | 1,058.00 |
COMPARING YOUR FUND’S EXPENSES
WITH THOSE OF OTHER FUNDS (Unaudited)
Using the SEC’s method to compare expenses
The Securities and Exchange Commission (SEC) has established guidelines to help investors assess fund expenses. Per these guidelines, the table below shows your fund’s expenses based on a $1,000 investment, assuming a hypothetical 5% annualized return. You can use this information to compare the ongoing expenses (but not transaction expenses or total cost) of investing in the fund with those of other funds.All mutual fund shareholder reports will provide this information to help you make this comparison. Please note that you cannot use this information to estimate your actual ending account balance and expenses paid during the period.
Expenses and Value of a $1,000 Investment
assuming a hypothetical 5% annualized return for the six months ended September 30, 2011
| Class A | Class C | Class I | ||||
| Expenses paid per $1,000† | $ | 4.05 | $ | 7.84 | $ | 2.28 |
| Ending value (after expenses) | $ | 1,021.06 | $ | 1,017.30 | $ | 1,022.81 |
| † Expenses are equal to the fund’s annualized expense ratio of .80% for Class A, 1.55% for Class C and .45% |
| for Class I, multiplied by the average account value over the period, multiplied by 183/365 (to reflect the one-half |
| year period). |
8
| STATEMENT OF INVESTMENTS |
| September 30, 2011 |
| Long-Term Municipal | Coupon | Maturity | Principal | |
| Investments—98.0% | Rate (%) | Date | Amount ($) | Value ($) |
| Alabama—1.7% | ||||
| Alabama Public School and | ||||
| College Authority, Capital | ||||
| Improvement Revenue | 5.00 | 5/1/13 | 1,000,000 | 1,071,250 |
| Birmingham Water Works Board, | ||||
| Water Revenue (Insured; Assured | ||||
| Guaranty Municipal Corp.) | 5.00 | 1/1/17 | 1,000,000 | 1,148,580 |
| Alaska—.8% | ||||
| Alaska Student Loan Corporation, | ||||
| Education Loan Revenue | 5.25 | 6/1/14 | 1,000,000 | 1,100,570 |
| Arizona—.5% | ||||
| Pima County Industrial Development | ||||
| Authority, Education Revenue | ||||
| (American Charter Schools | ||||
| Foundation Project) | 5.13 | 7/1/15 | 710,000 | 695,495 |
| California—15.5% | ||||
| California, | ||||
| Economic Recovery Bonds | 5.00 | 7/1/18 | 1,500,000 | 1,768,980 |
| California, | ||||
| GO | 5.00 | 10/1/11 | 70,000 | 70,009 |
| California, | ||||
| GO (Insured; AMBAC) | 6.00 | 4/1/16 | 1,000,000 | 1,192,100 |
| California, | ||||
| GO (Insured; AMBAC) | 6.00 | 2/1/17 | 1,000,000 | 1,208,560 |
| California, | ||||
| GO (Various Purpose) | 5.00 | 10/1/17 | 1,500,000 | 1,753,350 |
| California Department of Water | ||||
| Resources, Power Supply Revenue | 5.00 | 5/1/14 | 1,250,000 | 1,391,675 |
| California Department of Water | ||||
| Resources, Power Supply Revenue | 5.00 | 5/1/17 | 1,000,000 | 1,182,270 |
| California Housing Finance Agency, | ||||
| Home Mortgage Revenue | ||||
| (Insured; Assured Guaranty | ||||
| Municipal Corp.) | 5.13 | 8/1/18 | 1,250,000 | 1,264,362 |
| California State University | ||||
| Trustees, Systemwide Revenue | 5.00 | 11/1/22 | 1,000,000 | 1,166,290 |
| California Statewide Communities | ||||
| Development Authority, Revenue | ||||
| (Kaiser Permanente) | 5.00 | 4/1/14 | 1,000,000 | 1,099,540 |
| The Fund | 9 |
STATEMENT OF INVESTMENTS (continued)
| Long-Term Municipal | Coupon | Maturity | Principal | |
| Investments (continued) | Rate (%) | Date | Amount ($) | Value ($) |
| California (continued) | ||||
| Golden State Tobacco | ||||
| Securitization Corporation, | ||||
| Enhanced Tobacco Settlement | ||||
| Asset-Backed Bonds | ||||
| (Insured; AMBAC) | 5.00 | 6/1/20 | 500,000 | 500,210 |
| Golden State Tobacco | ||||
| Securitization Corporation, | ||||
| Enhanced Tobacco Settlement | ||||
| Asset-Backed Bonds | ||||
| (Insured; AMBAC) | 4.60 | 6/1/23 | 750,000 | 751,110 |
| Sacramento County, | ||||
| Airport System Senior Revenue | 5.00 | 7/1/22 | 1,275,000 | 1,377,128 |
| San Diego County Water Authority, | ||||
| Water Revenue | 5.00 | 5/1/21 | 1,000,000 | 1,204,810 |
| Southern California Public Power | ||||
| Authority, Revenue (Canyon | ||||
| Power Project) | 5.00 | 7/1/22 | 2,000,000 | 2,295,140 |
| Southern California Public Power | ||||
| Authority, Revenue (Windy | ||||
| Point/Windy Flats Project) | 5.00 | 7/1/23 | 1,000,000 | 1,137,640 |
| Tuolumne Wind Project Authority, | ||||
| Revenue (Tuolumne | ||||
| Company Project) | 5.00 | 1/1/18 | 1,000,000 | 1,151,030 |
| Colorado—1.1% | ||||
| Colorado Housing and Finance | ||||
| Authority, Single Family Program | ||||
| Senior and Subordinate Bonds | 6.80 | 2/1/31 | 895,000 | 955,591 |
| Colorado Housing and Finance | ||||
| Authority, Single Family | ||||
| Program Senior and Subordinate | ||||
| Bonds (Collateralized; FHA) | 6.60 | 8/1/32 | 535,000 | 578,656 |
| Florida—9.9% | ||||
| Broward County School Board, | ||||
| COP (Master Lease Purchase | ||||
| Agreement) (Insured; National | ||||
| Public Finance Guarantee Corp.) | 5.00 | 7/1/13 | 1,000,000 | 1,060,140 |
| Citizens Property Insurance | ||||
| Corporation, High-Risk | ||||
| Account Senior Secured | ||||
| Revenue (Insured; | ||||
| National Public Finance | ||||
| Guarantee Corp.) | 5.00 | 3/1/14 | 1,000,000 | 1,067,040 |
10
| Long-Term Municipal | Coupon | Maturity | Principal | |
| Investments (continued) | Rate (%) | Date | Amount ($) | Value ($) |
| Florida (continued) | ||||
| Citizens Property Insurance | ||||
| Corporation, High-Risk Account | ||||
| Senior Secured Revenue | ||||
| (Insured; National Public | ||||
| Finance Guarantee Corp.) | 5.00 | 3/1/15 | 2,000,000 | 2,155,160 |
| Hillsborough County, | ||||
| Capacity Assessment Special | ||||
| Assessment Revenue (Insured; | ||||
| National Public Finance | ||||
| Guarantee Corp.) | 5.00 | 3/1/13 | 1,000,000 | 1,045,940 |
| Lakeland, | ||||
| Energy System Revenue | ||||
| (Insured; Assured Guaranty | ||||
| Municipal Corp.) | 5.00 | 10/1/17 | 1,000,000 | 1,167,970 |
| Miami-Dade County, | ||||
| Aviation Revenue (Miami | ||||
| International Airport) | 5.25 | 10/1/23 | 1,000,000 | 1,096,100 |
| Miami-Dade County, | ||||
| Water and Sewer System Revenue | ||||
| (Insured; Assured Guaranty | ||||
| Municipal Corp.) | 5.25 | 10/1/19 | 2,000,000 | 2,386,280 |
| Orlando Utilities Commission, | ||||
| Utility System Revenue | 5.00 | 10/1/14 | 100,000 | 112,469 |
| Orlando-Orange County Expressway | ||||
| Authority, Revenue (Insured; | ||||
| Assured Guaranty Municipal Corp.) | 5.00 | 7/1/18 | 1,000,000 | 1,162,510 |
| South Miami Health Facilities | ||||
| Authority, HR (Baptist Health | ||||
| South Florida Obligated Group) | 5.00 | 8/15/18 | 750,000 | 860,355 |
| Tampa, | ||||
| Health System Revenue (BayCare | ||||
| Health System Issue) | 5.00 | 11/15/18 | 1,000,000 | 1,155,780 |
| Georgia—7.6% | ||||
| Atlanta, | ||||
| Airport General Revenue | 5.00 | 1/1/16 | 1,000,000 | 1,134,590 |
| Atlanta, | ||||
| Airport General Revenue | 5.00 | 1/1/22 | 1,000,000 | 1,085,910 |
| Atlanta, | ||||
| Water and Wastewater Revenue | 6.00 | 11/1/20 | 1,000,000 | 1,210,200 |
| Fulton County, | ||||
| Water and Sewerage Revenue | 5.00 | 1/1/17 | 1,000,000 | 1,170,890 |
| The Fund | 11 |
STATEMENT OF INVESTMENTS (continued)
| Long-Term Municipal | Coupon | Maturity | Principal | |
| Investments (continued) | Rate (%) | Date | Amount ($) | Value ($) |
| Georgia (continued) | ||||
| Georgia State Road and Tollway | ||||
| Authority, Guaranteed Revenue | 5.00 | 3/1/19 | 1,175,000 | 1,437,413 |
| Municipal Electric Authority of | ||||
| Georgia, GO (Project One | ||||
| Subordinated Bonds) | 5.00 | 1/1/21 | 1,000,000 | 1,162,700 |
| Private Colleges and Universities | ||||
| Authority, Revenue | ||||
| (Emory University) | 5.00 | 9/1/16 | 2,500,000 | 2,953,525 |
| Hawaii—1.6% | ||||
| Hawaii, | ||||
| Harbor System Revenue | ||||
| (Insured; Assured Guaranty | ||||
| Municipal Corp.) | 5.00 | 1/1/14 | 1,000,000 | 1,074,570 |
| Honolulu City and County Board of | ||||
| Water Supply, Water System | ||||
| Revenue (Insured; National | ||||
| Public Finance Guarantee Corp.) | 5.00 | 7/1/14 | 1,000,000 | 1,094,160 |
| Illinois—6.1% | ||||
| Chicago, | ||||
| GO (Insured; Assured Guaranty | ||||
| Municipal Corp.) | 5.50 | 1/1/19 | 2,000,000 | 2,311,640 |
| Cook County Community High School | ||||
| District Number 219, GO School | ||||
| Bonds (Insured; FGIC) | 7.88 | 12/1/14 | 100,000 | 123,114 |
| Cook County Community High School | ||||
| District Number 219, GO School | ||||
| Bonds (Insured; National | ||||
| Public Finance Guarantee Corp.) | 7.88 | 12/1/14 | 650,000 | 780,032 |
| Illinois, | ||||
| Sales Tax Revenue | 5.00 | 6/15/15 | 1,000,000 | 1,128,320 |
| Illinois Finance Authority, | ||||
| Revenue (DePaul University) | 5.00 | 10/1/16 | 1,000,000 | 1,109,360 |
| Northern Illinois University Board | ||||
| of Trustees, Auxiliary | ||||
| Facilities System Revenue | ||||
| (Insured; Assured Guaranty | ||||
| Municipal Corp.) | 5.00 | 4/1/17 | 1,500,000 | 1,669,635 |
| Railsplitter Tobacco Settlement | ||||
| Authority, Tobacco | ||||
| Settlement Revenue | 5.00 | 6/1/17 | 1,000,000 | 1,111,230 |
12
| Long-Term Municipal | Coupon | Maturity | Principal | ||
| Investments (continued) | Rate (%) | Date | Amount ($) | Value ($) | |
| Indiana—1.4% | |||||
| Indianapolis Local Public | |||||
| Improvement Bond Bank, Revenue | 5.00 | 6/1/17 | 1,625,000 | 1,824,290 | |
| Kansas—1.0% | |||||
| Kansas Development Finance | |||||
| Authority, Revolving Funds | |||||
| Revenue (Kansas Department of | |||||
| Health and Environment) | 5.00 | 3/1/21 | 1,150,000 | 1,390,327 | |
| Kentucky—.9% | |||||
| Louisville and Jefferson County | |||||
| Metropolitan Sewer District, Sewer | |||||
| and Drainage System Revenue | 5.00 | 5/15/23 | 1,000,000 | 1,160,790 | |
| Louisiana—1.2% | |||||
| Parish of Orleans Parishwide | |||||
| School District, GO (Insured; | |||||
| Assured Guaranty Municipal Corp.) | 4.00 | 9/1/14 | 1,500,000 | 1,607,250 | |
| Maryland—5.7% | |||||
| Anne Arundel County, | |||||
| GO (Consolidated General | |||||
| Improvements) | 5.00 | 4/1/17 | 500,000 | 598,025 | |
| Maryland, | |||||
| GO (State and Local | |||||
| Facilities Loan) | 5.00 | 8/1/16 | 1,500,000 | 1,784,355 | |
| Maryland Economic Development | |||||
| Corporation, EDR (Transportation | |||||
| Facilities Project) | 5.13 | 6/1/20 | 1,000,000 | 1,029,770 | |
| Montgomery County, | |||||
| GO (Consolidated Public | |||||
| Improvement) | 5.00 | 7/1/16 | 1,500,000 | 1,780,485 | |
| Prince George’s County, | |||||
| GO (Consolidated Public | |||||
| Improvement) | 5.00 | 9/15/17 | 2,000,000 | 2,420,760 | |
| Massachusetts—3.7% | |||||
| Massachusetts, | |||||
| GO (Consolidated Loan) | |||||
| (Insured; Assured Guaranty | |||||
| Municipal Corp.) (Prerefunded) | 5.00 | 3/1/15 | 1,000,000 | a | 1,151,340 |
| Massachusetts Bay Transportation | |||||
| Authority, Senior Sales | |||||
| Tax Revenue | 5.25 | 7/1/20 | 810,000 | 997,353 |
| The Fund | 13 |
STATEMENT OF INVESTMENTS (continued)
| Long-Term Municipal | Coupon | Maturity | Principal | |
| Investments (continued) | Rate (%) | Date | Amount ($) | Value ($) |
| Massachusetts (continued) | ||||
| Massachusetts Department of | ||||
| Transportation, Metropolitan | ||||
| Highway System Senior Revenue | 5.00 | 1/1/15 | 1,500,000 | 1,676,940 |
| Massachusetts Health and | ||||
| Educational Facilities | ||||
| Authority, Revenue (Lahey | ||||
| Clinic Medical Center Issue) | ||||
| (Insured; National Public | ||||
| Finance Guarantee Corp.) | 5.00 | 8/15/14 | 1,000,000 | 1,089,630 |
| Michigan—3.2% | ||||
| Detroit, | ||||
| Sewage Disposal System Second | ||||
| Lien Revenue (Insured; | ||||
| National Public Finance | ||||
| Guarantee Corp.) | 5.00 | 7/1/13 | 1,000,000 | 1,049,880 |
| Detroit, | ||||
| Sewage Disposal System Senior | ||||
| Lien Revenue (Insured; Assured | ||||
| Guaranty Municipal Corp.) | 5.25 | 7/1/19 | 1,000,000 | 1,123,290 |
| Detroit School District, | ||||
| School Building and Site | ||||
| Improvement Bonds (Insured; | ||||
| Assured Guaranty Municipal Corp.) | 5.00 | 5/1/14 | 1,000,000 | 1,076,860 |
| Wayne County Airport Authority, | ||||
| Airport Revenue (Detroit | ||||
| Metropolitan Wayne | ||||
| County Airport) | 5.00 | 12/1/16 | 1,000,000 | 1,088,970 |
| Nebraska—.8% | ||||
| Nebraska Public Power District, | ||||
| General Revenue | 5.00 | 1/1/15 | 1,000,000 | 1,129,580 |
| New Jersey—2.7% | ||||
| New Jersey Economic Development | ||||
| Authority, Water Facilities | ||||
| Revenue (New Jersey—American | ||||
| Water Company, Inc. Project) | 5.10 | 6/1/23 | 1,000,000 | 1,095,590 |
| New Jersey Educational Facilities | ||||
| Authority, Revenue (Rowan | ||||
| University Issue) | 5.00 | 7/1/18 | 1,225,000 | 1,394,565 |
14
| Long-Term Municipal | Coupon | Maturity | Principal | |
| Investments (continued) | Rate (%) | Date | Amount ($) | Value ($) |
| New Jersey (continued) | ||||
| New Jersey Transportation | ||||
| Trust Fund Authority | ||||
| (Transportation System) | 5.00 | 12/15/16 | 1,000,000 | 1,147,230 |
| New Mexico—1.1% | ||||
| Jicarilla, | ||||
| Apache Nation Revenue | 5.00 | 9/1/13 | 320,000 | 334,122 |
| New Mexico, | ||||
| Severance Tax Bonds | 5.00 | 7/1/15 | 1,000,000 | 1,157,170 |
| New York—5.9% | ||||
| Metropolitan Transportation | ||||
| Authority, Transportation Revenue | 5.25 | 11/15/14 | 1,000,000 | 1,122,690 |
| New York City, | ||||
| GO | 5.00 | 8/1/21 | 2,000,000 | 2,323,460 |
| New York City Health and | ||||
| Hospitals Corporation, | ||||
| Health System Revenue | 5.00 | 2/15/19 | 1,000,000 | 1,152,480 |
| New York City Industrial | ||||
| Development Agency, Special | ||||
| Facility Revenue (Terminal One | ||||
| Group Association, L.P. Project) | 5.50 | 1/1/14 | 1,000,000 | 1,065,620 |
| New York State Dormitory | ||||
| Authority, Revenue (New York | ||||
| State Department of Health) | 5.00 | 7/1/17 | 1,000,000 | 1,160,750 |
| Port Authority of New York and | ||||
| New Jersey (Consolidated Bonds, | ||||
| 139th Series) (Insured; | ||||
| National Public Finance | ||||
| Guarantee Corp.) | 5.00 | 10/1/13 | 1,000,000 | 1,076,320 |
| Ohio—1.1% | ||||
| Franklin County, | ||||
| Revenue (Trinity Health | ||||
| Credit Group) | 5.00 | 6/1/14 | 1,340,000 | 1,472,620 |
| Pennsylvania—1.7% | ||||
| Pennsylvania Intergovernmental | ||||
| Cooperation Authority, Special | ||||
| Tax Revenue (City of | ||||
| Philadelphia Funding Program) | 5.00 | 6/15/17 | 1,000,000 | 1,184,280 |
| The Fund | 15 |
STATEMENT OF INVESTMENTS (continued)
| Long-Term Municipal | Coupon | Maturity | Principal | |
| Investments (continued) | Rate (%) | Date | Amount ($) | Value ($) |
| Pennsylvania (continued) | ||||
| Philadelphia School District, | ||||
| GO | 5.00 | 9/1/14 | 1,000,000 | 1,098,150 |
| Rhode Island—.0% | ||||
| Rhode Island Housing and | ||||
| Mortgage Finance | ||||
| Corporation, Homeownership | ||||
| Opportunity Bonds | 4.95 | 10/1/16 | 65,000 | 65,144 |
| South Carolina—1.3% | ||||
| South Carolina Public Service | ||||
| Authority, Revenue Obligations | ||||
| (Santee Cooper) | 5.00 | 12/1/21 | 1,500,000 | 1,797,870 |
| South Dakota—2.1% | ||||
| South Dakota Conservancy District, | ||||
| Revenue (State Revolving | ||||
| Fund Program) | 5.00 | 8/1/17 | 2,370,000 | 2,833,714 |
| Texas—10.2% | ||||
| Dallas Independent School | ||||
| District, Unlimited Tax School | ||||
| Building Bonds (Permament | ||||
| School Fund Guarantee Program) | 5.25 | 2/15/16 | 1,000,000 | 1,180,910 |
| Fort Worth, | ||||
| Water and Sewer System | ||||
| Improvement Revenue | 5.00 | 2/15/17 | 1,500,000 | 1,776,750 |
| Harris County Health Facilities | ||||
| Development Corporation, HR | ||||
| (Memorial Hospital System | ||||
| Project) (Insured; National | ||||
| Public Finance Guarantee Corp.) | 6.00 | 6/1/13 | 1,000,000 | 1,071,540 |
| Houston, | ||||
| Combined Utility System First | ||||
| Lien Revenue | 5.00 | 11/15/18 | 1,355,000 | 1,628,751 |
| Houston Convention and | ||||
| Entertainment Facilities | ||||
| Department, Hotel Occupancy | ||||
| Tax and Special Revenue | 5.00 | 9/1/20 | 1,000,000 | 1,119,000 |
16
| Long-Term Municipal | Coupon | Maturity | Principal | ||
| Investments (continued) | Rate (%) | Date | Amount ($) | Value ($) | |
| Texas (continued) | |||||
| Midlothian Development Authority, | |||||
| Tax Increment Contract Revenue | |||||
| (Insured; Radian) | 5.00 | 11/15/13 | 530,000 | 550,537 | |
| Pasadena Independent School | |||||
| District, Unlimited Tax School | |||||
| Building Bonds (Permanent | |||||
| School Fund Guarantee Program) | 5.00 | 2/15/15 | 1,000,000 | 1,143,170 | |
| San Antonio, | |||||
| Airport System Revenue | |||||
| (Insured; Assured Guaranty | |||||
| Municipal Corp.) | 5.00 | 7/1/13 | 1,000,000 | 1,064,880 | |
| San Manuel Entertainment | |||||
| Authority, Public | |||||
| Improvement Revenue | 4.50 | 12/1/16 | 1,000,000 | 985,680 | |
| Stafford Economic Development | |||||
| Corporation, Sales Tax Revenue | |||||
| (Insured; National Public | |||||
| Finance Guarantee Corp.) | 6.00 | 9/1/15 | 525,000 | 612,019 | |
| Texas, | |||||
| GO (College Student Loan) | 5.00 | 8/1/17 | 1,000,000 | 1,168,350 | |
| Texas Municipal Power Agency, | |||||
| Revenue (Insured; National | |||||
| Public Finance Guarantee Corp.) | 0.00 | 9/1/16 | 10,000 | b | 9,435 |
| Texas Transportation Commission, | |||||
| State Highway Fund First | |||||
| Tier Revenue | 5.00 | 4/1/16 | 1,000,000 | 1,174,240 | |
| Utah—.0% | |||||
| Utah Housing Finance Agency, | |||||
| SMFR (Collateralized; FHA) | 5.40 | 7/1/20 | 35,000 | 35,037 | |
| Washington—3.9% | |||||
| Energy Northwest, | |||||
| Electric Revenue (Columbia | |||||
| Generating Station) | 5.50 | 7/1/15 | 1,000,000 | 1,170,370 | |
| Energy Northwest, | |||||
| Electric Revenue (Project Three) | 5.00 | 7/1/15 | 1,000,000 | 1,152,350 |
| The Fund | 17 |
STATEMENT OF INVESTMENTS (continued)
| Long-Term Municipal | Coupon | Maturity | Principal | |
| Investments (continued) | Rate (%) | Date | Amount ($) | Value ($) |
| Washington (continued) | ||||
| King County, | ||||
| Sewer Revenue | 5.00 | 1/1/17 | 1,500,000 | 1,769,610 |
| NJB Properties, | ||||
| LR (King County, | ||||
| Washington Project) | 5.00 | 12/1/14 | 1,000,000 | 1,130,330 |
| West Virginia—1.0% | ||||
| West Virginia University Board of | ||||
| Governors, University | ||||
| Improvement Revenue (West | ||||
| Virginia University Projects) | 5.00 | 10/1/17 | 1,135,000 | 1,332,660 |
| Wyoming—.8% | ||||
| Wyoming Community Development | ||||
| Authority, Housing Revenue | 5.50 | 12/1/17 | 1,000,000 | 1,082,820 |
| U.S. Related—3.5% | ||||
| Puerto Rico Electric Power | ||||
| Authority, Power Revenue | ||||
| (Insured; XLCA) | 5.50 | 7/1/16 | 500,000 | 558,955 |
| Puerto Rico Government Development | ||||
| Bank, Senior Notes | 5.25 | 1/1/15 | 600,000 | 635,298 |
| Puerto Rico Highways and | ||||
| Transportation Authority, | ||||
| Transportation Revenue | 5.00 | 7/1/13 | 1,750,000 | 1,853,215 |
| Puerto Rico Sales Tax Financing | ||||
| Corporation, Sales Tax Revenue | ||||
| (First Subordinate Series) | 5.50 | 8/1/22 | 1,500,000 | 1,693,005 |
| Total Long-Term Municipal Investments | ||||
| (cost $125,450,001) | 131,251,961 | |||
18
| Short-Term Municipal | Coupon | Maturity | Principal | ||||
| Investments—4.4% | Rate (%) | Date | Amount ($) | Value ($) | |||
| California—.7% | |||||||
| Irvine Assessment District Number | |||||||
| 05-21, Limited Obligation | |||||||
| Improvement Bonds (LOC: | |||||||
| California State Teachers | |||||||
| Retirement System and | |||||||
| U.S. Bank NA) | 0.20 | 10/1/11 | 1,000,000 | c | 1,000,000 | ||
| Florida—2.3% | |||||||
| Florida Municipal Power | |||||||
| Agency, Revenue, Refunding | |||||||
| (All-Requirements Power Supply | |||||||
| Project) (LOC; Bank of America) | 0.21 | 10/1/11 | 3,000,000 | c | 3,000,000 | ||
| New York—1.4% | |||||||
| New York City, | |||||||
| GO Notes (LOC; JPMorgan | |||||||
| Chase Bank) | 0.10 | 10/1/11 | 400,000 | c | 400,000 | ||
| New York City, | |||||||
| GO Notes (LOC; JPMorgan | |||||||
| Chase Bank) | 0.14 | 10/1/11 | 1,500,000 | c | 1,500,000 | ||
| Total Short-Term Municipal Investments | |||||||
| (cost $5,900,000) | 5,900,000 | ||||||
| Total Investments (cost $131,350,001) | 102.4 | % | 137,151,961 | ||||
| Liabilities, Less Cash and Receivables | (2.4 | %) | (3,275,166 | ) | |||
| Net Assets | 100.0 | % | 133,876,795 | ||||
| a This security is prerefunded; the date shown represents the prerefunded date. Bonds which are prerefunded are |
| collateralized by U.S. Government securities which are held in escrow and are used to pay principal and interest on |
| the municipal issue and to retire the bonds in full at the earliest refunding date. |
| b Security issued with a zero coupon. Income is recognized through the accretion of discount. |
| c Variable rate demand note—rate shown is the interest rate in effect at September 30, 2011. Maturity date represents |
| the next demand date, or the ultimate maturity date if earlier. |
| The Fund | 19 |
STATEMENT OF INVESTMENTS (continued)
| Summary of Abbreviations | |||
| ABAG | Association of Bay Area Governments | ACA | American Capital Access |
| AGC | ACE Guaranty Corporation | AGIC | Asset Guaranty Insurance Company |
| AMBAC | American Municipal Bond | ARRN | Adjustable Rate Receipt Notes |
| Assurance Corporation | |||
| BAN | Bond Anticipation Notes | BPA | Bond Purchase Agreement |
| CIFG | CDC Ixis Financial Guaranty | COP | Certificate of Participation |
| CP | Commercial Paper | EDR | Economic Development Revenue |
| EIR | Environmental Improvement Revenue | FGIC | Financial Guaranty Insurance |
| Company | |||
| FHA | Federal Housing Administration | FHLB | Federal Home Loan Bank |
| FHLMC | Federal Home Loan Mortgage | FNMA | Federal National |
| Corporation | Mortgage Association | ||
| GAN | Grant Anticipation Notes | GIC | Guaranteed Investment Contract |
| GNMA | Government National | GO | General Obligation |
| Mortgage Association | |||
| HR | Hospital Revenue | IDB | Industrial Development Board |
| IDC | Industrial Development Corporation | IDR | Industrial Development Revenue |
| LOC | Letter of Credit | LOR | Limited Obligation Revenue |
| LR | Lease Revenue | MFHR | Multi-Family Housing Revenue |
| MFMR | Multi-Family Mortgage Revenue | PCR | Pollution Control Revenue |
| PILOT | Payment in Lieu of Taxes | PUTTERS | Puttable Tax-Exempt Receipts |
| RAC | Revenue Anticipation Certificates | RAN | Revenue Anticipation Notes |
| RAW | Revenue Anticipation Warrants | RRR | Resources Recovery Revenue |
| SAAN | State Aid Anticipation Notes | SBPA | Standby Bond Purchase Agreement |
| SFHR | Single Family Housing Revenue | SFMR | Single Family Mortgage Revenue |
| SONYMA | State of New York Mortgage Agency | SWDR | Solid Waste Disposal Revenue |
| TAN | Tax Anticipation Notes | TAW | Tax Anticipation Warrants |
| TRAN | Tax and Revenue Anticipation Notes | XLCA | XL Capital Assurance |
20
| Summary of Combined Ratings (Unaudited) | |||||
| Fitch | or | Moody’s | or | Standard & Poor’s | Value (%)† |
| AAA | Aaa | AAA | 17.4 | ||
| AA | Aa | AA | 46.8 | ||
| A | A | A | 28.6 | ||
| BBB | Baa | BBB | 3.3 | ||
| F1 | MIG1/P1 | SP1/A1 | 3.2 | ||
| Not Ratedd | Not Ratedd | Not Ratedd | .7 | ||
| 100.0 | |||||
| † Based on total investments. |
| d Securities which, while not rated by Fitch, Moody’s and Standard & Poor’s, have been determined by the Manager to |
| be of comparable quality to those rated securities in which the fund may invest. |
See notes to financial statements.
| The Fund | 21 |
| STATEMENT OF ASSETS AND LIABILITIES |
| September 30, 2011 |
| Cost | Value | ||
| Assets ($): | |||
| Investments in securities—See Statement of Investments | 131,350,001 | 137,151,961 | |
| Cash | 72,779 | ||
| Interest receivable | 1,428,897 | ||
| Receivable for shares of Beneficial Interest subscribed | 285,265 | ||
| Prepaid expenses | 15,725 | ||
| 138,954,627 | |||
| Liabilities ($): | |||
| Due to The Dreyfus Corporation and affiliates—Note 3(c) | 54,932 | ||
| Payable for investment securities purchased | 4,955,147 | ||
| Payable for shares of Beneficial Interest redeemed | 33,179 | ||
| Accrued expenses | 34,574 | ||
| 5,077,832 | |||
| Net Assets ($) | 133,876,795 | ||
| Composition of Net Assets ($): | |||
| Paid-in capital | 126,665,114 | ||
| Accumulated net realized gain (loss) on investments | 1,409,721 | ||
| Accumulated net unrealized appreciation | |||
| (depreciation) on investments | 5,801,960 | ||
| Net Assets ($) | 133,876,795 | ||
| Net Asset Value Per Share | |||
| Class A | Class C | Class I | |
| Net Assets ($) | 4,759,743 | 718,598 | 128,398,454 |
| Shares Outstanding | 206,520 | 31,171 | 5,568,550 |
| Net Asset Value Per Share ($) | 23.05 | 23.05 | 23.06 |
| See notes to financial statements. | |||
22
| STATEMENT OF OPERATIONS |
| Year Ended September 30, 2011 |
| Investment Income ($): | ||
| Interest Income | 4,040,703 | |
| Expenses: | ||
| Management fee—Note 3(a) | 455,052 | |
| Registration fees | 47,177 | |
| Professional fees | 43,654 | |
| Custodian fees—Note 3(c) | 32,770 | |
| Shareholder servicing costs—Note 3(c) | 32,123 | |
| Accounting and administration fees—Note 3(a) | 31,250 | |
| Administration fees—Note 3(a) | 30,170 | |
| Prospectus and shareholders’ reports | 13,211 | |
| Trustees’ fees and expenses—Note 3(d) | 6,506 | |
| Distribution fees—Note 3(b) | 4,665 | |
| Loan commitment fees—Note 2 | 1,068 | |
| Interest expense—Note 2 | 47 | |
| Miscellaneous | 33,821 | |
| Total Expenses | 731,514 | |
| Less—reduction in investment advisory fee due to undertaking—Note 3(a) | (201,087) | |
| Less—reduction in fees due to earnings credits—Note 3(c) | (12) | |
| Net Expenses | 530,415 | |
| Investment Income—Net | 3,510,288 | |
| Realized and Unrealized Gain (Loss) on Investments—Note 4 ($): | ||
| Net realized gain (loss) on investments | 1,493,354 | |
| Net unrealized appreciation (depreciation) on investments | (740,895) | |
| Net Realized and Unrealized Gain (Loss) on Investments | 752,459 | |
| Net Increase in Net Assets Resulting from Operations | 4,262,747 | |
| See notes to financial statements. | ||
| The Fund | 23 |
STATEMENT OF CHANGES IN NET ASSETS
| Year Ended September 30, | ||||
| 2011 | 2010 | |||
| Operations ($): | ||||
| Investment income—net | 3,510,288 | 3,574,491 | ||
| Net realized gain (loss) on investments | 1,493,354 | 274,451 | ||
| Net unrealized appreciation | ||||
| (depreciation) on investments | (740,895) | 2,344,153 | ||
| Net Increase (Decrease) in Net Assets | ||||
| Resulting from Operations | 4,262,747 | 6,193,095 | ||
| Dividends to Shareholders from ($): | ||||
| Investment income—net: | ||||
| Class A Shares | (81,781) | (17,524) | ||
| Class C Shares | (12,350) | (2,018) | ||
| Class I Shares | (3,414,866) | (3,552,313) | ||
| Net realized gain on investments: | ||||
| Class A Shares | (3,630) | — | ||
| Class C Shares | (747) | — | ||
| Class I Shares | (134,715) | — | ||
| Total Dividends | (3,648,089) | (3,571,855) | ||
| Beneficial Interest Transactions ($): | ||||
| Net proceeds from shares sold: | ||||
| Class A Shares | 4,604,666 | 2,159,513 | ||
| Class C Shares | 567,251 | 460,579 | ||
| Class I Shares | 41,492,291 | 36,947,885 | ||
| Dividends reinvested: | ||||
| Class A Shares | 77,696 | 16,272 | ||
| Class C Shares | 11,545 | 1,650 | ||
| Class I Shares | 3,169,284 | 3,107,384 | ||
| Cost of shares redeemed: | ||||
| Class A Shares | (1,620,961) | (593,981) | ||
| Class C Shares | (348,252) | (2,639) | ||
| Class I Shares | (26,306,295) | (40,074,005) | ||
| Increase (Decrease) in Net Assets from | ||||
| Beneficial Interest Transactions | 21,647,225 | 2,022,658 | ||
| Total Increase (Decrease) in Net Assets | 22,261,883 | 4,643,898 | ||
| Net Assets ($): | ||||
| Beginning of Period | 111,614,912 | 106,971,014 | ||
| End of Period | 133,876,795 | 111,614,912 | ||
24
| Year Ended September 30, | ||||
| 2011 | 2010 | |||
| Capital Share Transactions: | ||||
| Class A | ||||
| Shares sold | 203,377 | 95,287 | ||
| Shares issued for dividends reinvested | 3,446 | 720 | ||
| Shares redeemed | (72,882) | (25,891) | ||
| Net Increase (Decrease) in Shares Outstanding | 133,941 | 70,116 | ||
| Class C | ||||
| Shares sold | 25,211 | 20,255 | ||
| Shares issued for dividends reinvested | 511 | 72 | ||
| Shares redeemed | (15,461) | (116) | ||
| Net Increase (Decrease) in Shares Outstanding | 10,261 | 20,211 | ||
| Class I | ||||
| Shares sold | 1,831,004 | 1,658,013 | ||
| Shares issued for dividends reinvested | 140,567 | 138,560 | ||
| Shares redeemed | (1,172,434) | (1,787,809) | ||
| Net Increase (Decrease) in Shares Outstanding | 799,137 | 8,764 | ||
| See notes to financial statements. | ||||
| The Fund | 25 |
FINANCIAL HIGHLIGHTS
The following tables describe the performance for each share class for the fiscal periods indicated.All information (except portfolio turnover rate) reflects financial results for a single fund share.Total return shows how much your investment in the fund would have increased (or decreased) during each period, assuming you had reinvested all dividends and distributions.These figures have been derived from the fund’s financial statements.
| Year Ended September 30, | ||||||
| Class A Shares | 2011 | 2010 | 2009a | |||
| Per Share Data ($): | ||||||
| Net asset value, beginning of period | 22.95 | 22.45 | 21.07 | |||
| Investment Operations: | ||||||
| Investment income—netb | .61 | .61 | .32 | |||
| Net realized and unrealized | ||||||
| gain (loss) on investments | .14 | .54 | 1.42 | |||
| Total from Investment Operations | .75 | 1.15 | 1.74 | |||
| Distributions: | ||||||
| Dividends from investment income—net | (.62) | (.65) | (.36) | |||
| Dividends from net realized gain on investments | (.03) | — | — | |||
| Total Distributions | (.65) | (.65) | (.36) | |||
| Net asset value, end of period | 23.05 | 22.95 | 22.45 | |||
| Total Return (%)c | 3.38 | 5.24 | 8.30d | |||
| Ratios/Supplemental Data (%): | ||||||
| Ratio of total expenses to average net assets | .98 | .96 | .96e | |||
| Ratio of net expenses to average net assets | .80 | .80 | .80e | |||
| Ratio of net investment income | ||||||
| to average net assets | 2.72 | 2.80 | 3.31e | |||
| Portfolio Turnover Rate | 27.67 | 32.07 | 22.49 | |||
| Net Assets, end of period ($ x 1,000) | 4,760 | 1,665 | 55 | |||
| a | From March 31, 2009 (commencement of initial offering) to September 30, 2009. |
| b | Based on average shares outstanding at each month end. |
| c | Exclusive of sales charge. |
| d | Not annualized. |
| e | Annualized. |
See notes to financial statements.
26
| Year Ended September 30, | ||||||
| Class C Shares | 2011 | 2010 | 2009a | |||
| Per Share Data ($): | ||||||
| Net asset value, beginning of period | 22.95 | 22.45 | 21.07 | |||
| Investment Operations: | ||||||
| Investment income—netb | .45 | .40 | .27 | |||
| Net realized and unrealized | ||||||
| gain (loss) on investments | .13 | .59 | 1.39 | |||
| Total from Investment Operations | .58 | .99 | 1.66 | |||
| Distributions: | ||||||
| Dividends from investment income—net | (.45) | (.49) | (.28) | |||
| Dividends from net realized gain on investments | (.03) | — | — | |||
| Total Distributions | (.48) | (.49) | (.28) | |||
| Net asset value, end of period | 23.05 | 22.95 | 22.45 | |||
| Total Return (%)c | 2.60 | 4.46 | 7.91d | |||
| Ratios/Supplemental Data (%): | ||||||
| Ratio of total expenses to average net assets | 1.73 | 1.74 | 1.72e | |||
| Ratio of net expenses to average net assets | 1.55 | 1.55 | 1.55e | |||
| Ratio of net investment income | ||||||
| to average net assets | 1.99 | 1.94 | 2.59e | |||
| Portfolio Turnover Rate | 27.67 | 32.07 | 22.49 | |||
| Net Assets, end of period ($ x 1,000) | 719 | 480 | 16 | |||
| a | From March 31, 2009 (commencement of initial offering) to September 30, 2009. |
| b | Based on average shares outstanding at each month end. |
| c | Exclusive of sales charge. |
| d | Not annualized. |
| e | Annualized. |
See notes to financial statements.
| The Fund | 27 |
FINANCIAL HIGHLIGHTS (continued)
| Year Ended September 30, | ||||||||||
| Class I Shares | 2011 | 2010 | 2009a | 2008 | 2007 | |||||
| Per Share Data ($): | ||||||||||
| Net asset value, beginning of period | 22.95 | 22.45 | 20.85 | 21.60 | 21.69 | |||||
| Investment Operations: | ||||||||||
| Investment income—netb | .70 | .73 | .79 | .79 | .78 | |||||
| Net realized and unrealized | ||||||||||
| gain (loss) on investments | .14 | .50 | 1.60 | (.75) | (.09) | |||||
| Total from Investment Operations | .84 | 1.23 | 2.39 | .04 | .69 | |||||
| Distributions: | ||||||||||
| Dividends from investment income—net | (.70) | (.73) | (.79) | (.79) | (.78) | |||||
| Dividends from net realized | ||||||||||
| gain on investments | (.03) | — | — | — | — | |||||
| Total Distributions | (.73) | (.73) | (.79) | (.79) | (.78) | |||||
| Net asset value, end of period | 23.06 | 22.95 | 22.45 | 20.85 | 21.60 | |||||
| Total Return (%) | 3.79 | 5.61 | 11.73 | .12 | 3.26 | |||||
| Ratios/Supplemental Data (%): | ||||||||||
| Ratio of total expenses | ||||||||||
| to average net assets | .63 | .64 | .67 | .60 | .59 | |||||
| Ratio of net expenses | ||||||||||
| to average net assets | .45 | .45 | .45 | .45 | .45 | |||||
| Ratio of net investment income | ||||||||||
| to average net assets | 3.10 | 3.26 | 3.74 | 3.63 | 3.63 | |||||
| Portfolio Turnover Rate | 27.67 | 32.07 | 22.49 | 34 | 10 | |||||
| Net Assets, end of period ($ x 1,000) | 128,398 | 109,470 | 106,900 | 141,949 | 201,480 | |||||
| a The fund commenced offering three classes of shares on March 31, 2009.The existing shares were redesignated as |
| Class I shares. |
| b Based on average shares outstanding at each month end. |
See notes to financial statements.
28
NOTES TO FINANCIAL STATEMENTS
NOTE 1—Significant Accounting Policies:
Dreyfus/Standish Intermediate Tax Exempt Bond Fund (the “fund”) is a separate diversified series of Dreyfus Investment Funds (the “Trust”), which is registered under the Investment Company Act of 1940, as amended (the “Act”), as an open-end management investment company and operates as a series company currently offering eleven series, including the fund.The fund’s investment objective is to seek a high level of interest income exempt from federal income tax, while seeking preservation of shareholders’ capital. The Dreyfus Corporation (the “Manager” or “Dreyfus”), a wholly-owned subsidiary of The Bank of New York Mellon Corporation (“BNY Mellon”), serves as the fund’s investment adviser.
MBSC Securities Corporation (the “Distributor”), a wholly-owned subsidiary of the Manager, is the distributor of the fund’s shares.The fund is authorized to issue an unlimited number of $.001 par value shares of Beneficial Interest in each of the following classes of shares: Class A, Class C and Class I. Class A shares are subject to a sales charge imposed at the time of purchase. Class C shares are subject to a contingent deferred sales charge (“CDSC”) imposed on Class C shares redeemed within one year of purchase and Class I shares are sold primarily to bank trust departments and other financial service providers (including The Bank of New York Mellon, a subsidiary of BNY Mellon and an affiliate of Dreyfus), acting on behalf of customers having a qualified trust or an investment account or relationship at such institution, and bear no distribution or shareholder services fees. Class I shares are offered without a front-end sales charge or CDSC. Other differences between the classes include the services offered to and the expenses borne by each class, the allocation of certain transfer agency costs and certain voting rights. Income, expenses (other than expenses attributable to a specific class), and realized and unrealized gains or losses on investments are allocated to each class of shares based on its relative net assets.
| The Fund | 29 |
NOTES TO FINANCIAL STATEMENTS (continued)
The Trust accounts separately for the assets, liabilities and operations of each series. Expenses directly attributable to each series are charged to that series’ operations; expenses which are applicable to all series are allocated among them on a pro rata basis.
The Financial Accounting Standards Board (“FASB”) Accounting Standards Codification (“ASC”) is the exclusive reference of authoritative U.S. generally accepted accounting principles (“GAAP”) recognized by the FASB to be applied by nongovernmental entities. Rules and interpretive releases of the Securities and Exchange Commission (“SEC”) under authority of federal laws are also sources of authoritative GAAP for SEC registrants. The fund’s financial statements are prepared in accordance with GAAP, which may require the use of management estimates and assumptions.Actual results could differ from those estimates.
(a) Portfolio valuation: The fair value of a financial instrument is the amount that would be received to sell an asset or paid to transfer a liability in an orderly transaction between market participants at the measurement date (i.e. the exit price). GAAP establishes a fair value hierarchy that prioritizes the inputs of valuation techniques used to measure fair value.This hierarchy gives the highest priority to unadjusted quoted prices in active markets for identical assets or liabilities (Level 1 measurements) and the lowest priority to unobservable inputs (Level 3 measurements).
Additionally, GAAP provides guidance on determining whether the volume and activity in a market has decreased significantly and whether such a decrease in activity results in transactions that are not orderly. GAAP requires enhanced disclosures around valuation inputs and techniques used during annual and interim periods.
30
Various inputs are used in determining the value of the fund’s investments relating to fair value measurements.These inputs are summarized in the three broad levels listed below:
Level 1—unadjusted quoted prices in active markets for identical investments.
Level 2—other significant observable inputs (including quoted prices for similar investments, interest rates, prepayment speeds, credit risk, etc.).
Level 3—significant unobservable inputs (including the fund’s own assumptions in determining the fair value of investments).
The inputs or methodology used for valuing securities are not necessarily an indication of the risk associated with investing in those securities.
Changes in valuation techniques may result in transfers in or out of an assigned level within the disclosure hierarchy. Valuation techniques used to value the fund’s investments are as follows:
Investments in securities are valued each business day by an independent pricing service (the “Service”) approved by the Board of Trustees. Investments for which quoted bid prices are readily available and are representative of the bid side of the market in the judgment of the Service are valued at the mean between the quoted bid prices (as obtained by the Service from dealers in such securities) and asked prices (as calculated by the Service based upon its evaluation of the market for such securities). Other investments (which constitute a majority of the portfolio securities) are carried at fair value as determined by the Service, based on methods which include consideration of: yields or prices of municipal securities of comparable quality, coupon, maturity
| The Fund | 31 |
NOTES TO FINANCIAL STATEMENTS (continued)
and type; indications as to values from dealers; and general market conditions. All preceding securities are categorized within Level 2 of the fair value hierarchy. These securities are generally categorized within level 2 of the fair value hierarchy.
When market quotations or official closing prices are not readily available, or are determined not to reflect accurately fair value, such as when the value of a security has been significantly affected by events after the close of the exchange or market on which the security is principally traded (for example, a foreign exchange or market), but before the fund calculates its net asset value, the fund may value these investments at fair value as determined in accordance with the procedures approved by the Board of Trustees. Certain factors may be considered when fair valuing investments such as: fundamental analytical data, the nature and duration of restrictions on disposition, an evaluation of the forces that influence the market in which the securities are purchased and sold, and public trading in similar securities of the issuer or comparable issuers.
For restricted securities where observable inputs are limited, assumptions about market activity and risk are used and are categorized within Level 3 of the fair value hierarchy.
The following is a summary of the inputs used as of September 30, 2011 in valuing the fund’s investments:
| Level 2—Other | Level 3— | |||
| Level 1— | Significant | Significant | ||
| Unadjusted | Observable | Unobservable | ||
| Quoted Prices | Inputs | Inputs | Total | |
| Assets ($) | ||||
| Investments in Securities: | ||||
| Municipal Bonds | — | 137,151,961 | — | 137,151,961 |
In May 2011, FASB issued Accounting Standards Update (“ASU”) No. 2011-04 “Amendments to Achieve Common Fair Value Measurement and Disclosure Requirements in GAAP and International Financial Reporting Standards (“IFRS”)” (“ASU 2011-04”). ASU 2011-04 includes common requirements for measurement of and disclosure
32
about fair value between GAAP and IFRS. ASU 2011-04 will require reporting entities to disclose the following information for fair value measurements categorized within Level 3 of the fair value hierarchy: quantitative information about the unobservable inputs used in the fair value measurement, the valuation processes used by the reporting entity and a narrative description of the sensitivity of the fair value measurement to changes in unobservable inputs and the interrelationships between those unobservable inputs. In addition, ASU 2011-04 will require reporting entities to make disclosures about amounts and reasons for all transfers in and out of Level 1 and Level 2 fair value measurements. The new and revised disclosures are effective for interim and annual reporting periods beginning after December 15, 2011. At this time, management is evaluating the implications of ASU 2011-04 and its impact on the financial statements.
(b) Securities transactions and investment income: Securities transactions are recorded on a trade date basis. Realized gains and losses from securities transactions are recorded on the identified cost basis. Interest income, adjusted for accretion of discount and amortization of premium on investments, is earned from settlement date and recognized on the accrual basis. Securities purchased or sold on a when-issued or delayed delivery basis may be settled a month or more after the trade date.
(c) Dividends to shareholders: It is the policy of the fund to declare dividends daily from investment income-net. Such dividends are paid monthly. Dividends from net realized capital gains, if any, are normally declared and paid annually, but the fund may make distributions on a more frequent basis to comply with the distribution requirements of the Internal Revenue Code of 1986, as amended (the “Code”).To the extent that net realized capital gains can be offset by capital loss carryovers, it is the policy of the fund not to distribute such gains. Income and capital gain distributions are determined in accordance with income tax regulations, which may differ from GAAP.
| The Fund | 33 |
NOTES TO FINANCIAL STATEMENTS (continued)
(d) Federal income taxes: It is the policy of the fund to continue to qualify as a regulated investment company, which can distribute tax-exempt dividends, by complying with the applicable provisions of the Code, and to make distributions of income and net realized capital gain sufficient to relieve it from substantially all federal income and excise taxes.
As of and during the period ended September 30, 2011, the fund did not have any liabilities for any uncertain tax positions.The fund recognizes interest and penalties, if any, related to uncertain tax positions as income tax expense in the Statement of Operations. During the period, the fund did not incur any interest or penalties.
Each of the tax years in the four-year period ended September 30, 2011 remains subject to examination by the Internal Revenue Service and state taxing authorities.
At September 30, 2011, the components of accumulated earnings on a tax basis were as follows: undistributed tax exempt income $5,089, undistributed ordinary income $342,069, undistributed capital gains $1,060,869 and unrealized appreciation $5,808,743.
The tax character of distributions paid to shareholders during the fiscal periods ended September 30, 2011 and September 30, 2010 were as follows: tax exempt income $3,508,997 and $3,571,855, ordinary income $3,323 and $0, and long-term capital gains $135,769 and $0, respectively.
During the period ended September 30, 2011, as a result of permanent book to tax differences, primarily due to the tax treatment for amortization adjustments, the fund decreased accumulated undistributed investment income-net by $1,291, increased accumulated net realized gain (loss) on investments $1,115 and increased paid-in capital by $176. Net assets and net asset value per share were not affected by this reclassification.
NOTE 2—Bank Lines of Credit:
The fund participates with other Dreyfus-managed funds in a $225 million unsecured credit facility led by Citibank, N.A. and a $300 mil-
34
lion unsecured credit facility provided by The Bank of New York Mellon, (each, a “Facility”), each to be utilized primarily for temporary or emergency purposes, including the financing of redemptions. In connection therewith, the fund has agreed to pay its pro rata portion of commitment fees for each Facility. Interest is charged to the fund based on rates determined pursuant to the terms of the respective Facility at the time of borrowing.
The average amount of borrowings outstanding under the Facilities during the period ended September 30, 2011, was approximately $3,300 with a related weighted average annualized interest rate of 1.43%.
NOTE 3—Investment Advisory Fee and Other Transactions with Affiliates:
(a) Pursuant to an investment advisory agreement with the Manager, the investment advisory fee is computed at the annual rate of .40% of the value of the funds average daily net assets and is payable monthly.
The Manager has agreed, until February 1, 2013, to waive receipt of its fees and/or assume the expenses of the fund so that the direct expenses of Class A, C and I shares (excluding Rule 12b-1 fees, shareholder services fees, taxes, interest, brokerage commissions, acquired fund fees and extraordinary expenses) do not exceed an annual rate of .55%, .55% and .45%, respectively, of the value such class’ average daily net assets.The reduction in investment advisory fee, pursuant to the undertaking, amounted to $201,087 during the year ended September 30, 2011.
From October 1, 2010 through April 30, 2011, the Trust had an agreement withThe Bank of NewYork Mellon pursuant to whichThe Bank of NewYork Mellon provided administration and fund accounting services for the fund. For these services, the fund paid The Bank of New York Mellon a fixed fee plus asset and transaction based fees, as well as out-of-pocket expenses. Pursuant to this agreement, the fund was charged $31,250 during the period ended October 1, 2010 through April 30, 2011 for administration and fund accounting services.
| The Fund | 35 |
NOTES TO FINANCIAL STATEMENTS (continued)
At Board Meetings of the Trust held on February 15-16, 2011, the Board of Trustees of the Trust terminated the agreement with The Bank of New York Mellon and, on behalf of the Trust, entered into a Fund Accounting and Administration Agreement (the “Administration Agreement”) with Dreyfus, effective May 1, 2011, whereby Dreyfus performs administrative, accounting and recordkeeping services for the fund. The fund has agreed to compensate Dreyfus for providing accounting services, administration, compliance monitoring, regulatory and shareholder reporting, as well as related facilities, equipment and clerical help.The fee is based on the fund’s average daily net assets and computed at the following annual rates: .06% of the first $500 million, .04% of the next $500 million and .02% in excess of $1 billion.
In addition, after applying any expense limitations or fee waivers that reduce the fees paid to Dreyfus for this service, Dreyfus has contractually agreed in writing to waive any remaining fees for this service to the extent that they exceed both Dreyfus’ costs in providing these services and a reasonable allocation of the costs incurred by Dreyfus and its affiliates related to the support and oversight of these services.The fund also reimburses Dreyfus for the out-of-pocket expenses Dreyfus incurs in performing this service for the fund. Pursuant to the Administration Agreement, the fund was charged $30,170 during the period May 1, 2011 through September 30, 2011.
During the period ended September 30, 2011, the Distributor retained $946 from commissions earned on sales of the fund’s Class A shares and $11 from CDSCs on redemptions of the fund’s Class C shares.
(b) Under the Distribution Plan (the “Plan”) adopted pursuant to Rule 12b-1 under the Act, Class C shares pay the Distributor for distributing its shares at an annual rate of .75% of the value of the average daily net assets of Class C shares. During the period ended September 30, 2011, Class C shares were charged $4,665 pursuant to the Plan.
(c) Under the Shareholder Services Plan, Class A and Class C shares pay the Distributor at the annual rate of .25% of the value of their average daily net assets for the provision of certain services. The ser-
36
vices provided may include personal services relating to shareholder accounts, such as answering shareholder inquiries regarding the fund and providing reports and other information, and services related to the maintenance of shareholder accounts. The Distributor may make payments to Service Agents (a securities dealer, financial institution or other industry professional) in respect of these services. The Distributor determines the amounts to be paid to Service Agents. During the period ended September 30, 2011, Class A and Class C shares were charged $7,518 and $1,555, respectively, pursuant to the Shareholder Services Plan.
The fund compensates Dreyfus Transfer, Inc., a wholly-owned subsidiary of the Manager, under a transfer agency agreement for providing personnel and facilities to perform transfer agency services for the fund. During the period ended September 30, 2011, the fund was charged $4,178 pursuant to the transfer agency agreement, which is included in Shareholder servicing costs in the Statement of Operations.
The fund has arrangements with the custodian and cash management bank whereby the fund may receive earnings credits when positive cash balances are maintained, which are used to offset custody and cash management fees. For financial reporting purposes, the fund includes net earnings credits as an expense offset in the Statement of Operations.
The fund compensates The Bank of New York Mellon under cash management agreements for performing cash management services related to fund subscriptions and redemptions. During the period ended September 30, 2011, the fund was charged $286 pursuant to the cash management agreements, which is included in Shareholder servicing costs in the Statement of Operations.These fees were partially offset by earnings credits of $12.
The fund also compensates The Bank of New York Mellon under a custody agreement for providing custodial services for the fund. During the period ended September 30, 2011, the fund was charged $32,770 pursuant to the custody agreement.
| The Fund | 37 |
NOTES TO FINANCIAL STATEMENTS (continued)
During the period ended September 30, 2011, the fund was charged $7,146 for services performed by the Chief Compliance Officer.
The components of “Due toThe Dreyfus Corporation and affiliates” in the Statement of Assets and Liabilities consist of: investment advisory fees $44,008, administration fees $6,601, Rule 12b-1 distribution plan fees $437, shareholder services plan fees $1,039, custodian fees $5,001, chief compliance officer fees $3,750, PrivateWealth sub-accounting fees $797 and transfer agency per account fees $854, which are offset against an expense reimbursement currently in effect in the amount of $7,555.
(d) Each Trustee who is not an “interested person” of the Trust (as defined in the Act) receives $60,000 per annum, plus $7,000 per joint Board meeting of the Trust, The Dreyfus/Laurel Funds, Inc., The Dreyfus/Laurel Funds Trust, The Dreyfus/Laurel Tax-Free Municipal Funds and Dreyfus Funds, Inc. (collectively, the “Board Group Open-end Funds”) attended, $2,500 for separate in-person committee meetings attended which are not held in conjunction with a regularly scheduled Board meeting and $2,000 for Board meetings and separate committee meetings attended that are conducted by telephone. The Board Group Open-end Funds also reimburse each Trustee who is not an “interested person” of the Trust (as defined in the Act) for travel and out-of-pocket expenses.With respect to Board meetings, the Chairman of the Board receives an additional 25% of such compensation (with the exception of reimbursable amounts).The Chair of each of the Board’s committees, unless the Chair also serves as Chair of the Board, receives $1,350 per applicable committee meeting. In the event that there is an in-person joint committee meeting or a joint telephone meeting of the Board Group Open-end Funds and Dreyfus HighYield Strategies Fund (“DHF”), a $2,500 fee is allocated between the Board Group Open-end Funds and DHF.
Effective January 1, 2012, the Board Group Open-End Funds and DHF (collectively, the “Board Group Funds”) will pay each Trustee
38
their respective allocated portions of an annual retainer of $85,000 and a fee of $10,000 for each regularly scheduled Board meeting attended ($75,000 and $8,000, respectively, in the aggregate, prior to January 1, 2012).With respect to the annual retainer and Board meetings of the Board Group Funds, the Chair of the Board will receive an additional 25% of such compensation (with the exception of reimbursable amounts). Each Trustee will receive $2,500 for any separate in-person committee meetings attended, which are not held in conjunction with a regularly scheduled Board meeting, such amount to be allocated among the Board Group Funds, as applicable. In the event that there is a joint telephone meeting of the Board Group Funds, a fee of $2,000 will be allocated among the applicable Board Group Funds, accordingly (prior to January 1, 2012, the fee allocated was $2,500 if the meeting included DHF).The Chair of each of the Board’s committees, unless the Chair also serves as Chair of the Board, will receive $1,500 per applicable committee meeting. Each EmeritusTrustee is entitled to receive an annual retainer of one-half the amount paid as a retainer at the time the Trustee became Emeritus and a per meeting attended fee of one-half the amount paid to Trustees.The Board Group Funds also reimburse each Independent Trustee and Emeritus Trustees for travel and out-of-pocket expenses.
NOTE 4—Securities Transactions:
The aggregate amount of purchases and sales of investment securities, excluding short-term securities, during the period ended September 30, 2011, amounted to $54,581,195 and $30,786,311, respectively.
At September 30, 2011, the cost of investments for federal income tax purposes was $131,343,218; accordingly, accumulated net unrealized appreciation on investments was $5,808,743, consisting of $5,969,721 gross unrealized appreciation and $160,978 gross unrealized depreciation.
| The Fund | 39 |
NOTES TO FINANCIAL STATEMENTS (continued)
NOTE 5—Subsequent Event:
Effective October 27, 2011, the Nominating Committee of the Board of Trustees nominated, and the Board of Trustees approved the election of, Francine J. Bovich as a Trustee of the Trust. A proxy statement will be mailed, on or about November 28, 2011, to Trust shareholders of record as of the close of business November 1, 2011, asking shareholders to consider Ms. Bovich’s election as a Board member of the Trust at a Special Joint Meeting of Shareholders to be held on Wednesday, February 8, 2012.
40
REPORT OF INDEPENDENT REGISTERED
PUBLIC ACCOUNTING FIRM
To the Board of Trustees and Shareholders of Dreyfus/Standish Intermediate Tax Exempt Bond Fund:
We have audited the accompanying statement of assets and liabilities of Dreyfus/ Standish Intermediate Tax Exempt Bond Fund (the “Fund”), a series of Dreyfus Investment Funds, including the statement of investments as of September 30, 2011, and the related statement of operations for the year then ended, the statements of changes in net assets for each of the years in the two-year period then ended and financial highlights for each of the years in the three-year period then ended. These financial statements and financial highlights are the responsibility of the Fund’s management. Our responsibility is to express an opinion on these financial statements and financial highlights based on our audits.The financial highlights for each of the years in the two-year period ended September 30, 2008 were audited by other independent registered public accountants whose report thereon, dated November 28, 2008, expressed an unqualified opinion on those financial highlights.
We conducted our audits in accordance with the standards of the Public Company Accounting Oversight Board (United States).Those standards require that we plan and perform the audit to obtain reasonable assurance about whether the financial statements and financial highlights are free of material misstatement. An audit also includes examining, on a test basis, evidence supporting the amounts and disclosures in the financial statements. Our procedures included confirmation of securities owned as of September 30, 2011 by correspondence with the custodian and brokers or by other appropriate auditing procedures where replies from brokers were not received.An audit also includes assessing the accounting principles used and significant estimates made by management, as well as evaluating the overall financial statement presentation.We believe that our audits provide a reasonable basis for our opinion.
In our opinion, the financial statements and financial highlights referred to above present fairly, in all material respects, the financial position of Dreyfus/Standish Intermediate Tax Exempt Bond Fund as of September 30, 2011, and the results of its operations for the year then ended, the changes in its net assets for each of the years in the two-year period then ended, and the financial highlights for each of the years in the three-year period then ended, in conformity with U.S. generally accepted accounting principles.

New York, New York
November 23, 2011
| The Fund | 41 |
IMPORTANT TAX INFORMATION (Unaudited)
In accordance with federal tax law, the fund hereby designates all the dividends paid from investment income-net during its fiscal year ended September 30, 2011 as “exempt-interest dividends” (not generally subject to regular federal income tax). The fund designates the maximum amount allowable but not less than $.0286 per share as a capital gain dividend in accordance with Section 852(b)(3)(C) of the Internal Revenue Code. The fund designates the maximum amount allowable but not less than $.0007 per share as a short-term capital gain dividend in accordance with Sections 871(k)(2) and 881(e) of the Internal Revenue Code. Where required by federal tax law rules, shareholders will receive notification of their portion of the fund’s taxable ordinary dividends (if any) and capital gains distributions (if any) paid for the 2011 calendar year on Form 1099-DIV and their portion of the fund’s tax-exempt dividends paid for the 2011 calendar year on Form 1099-INT, both of which will be mailed in early 2012.
42
BOARD MEMBERS INFORMATION (Unaudited)
| Joseph S. DiMartino (67) |
| Chairman of the Board (2008) |
| Principal Occupation During Past 5Years: |
| • Corporate Director and Trustee |
| Other Public Company Board Memberships During Past 5Years: |
| • CBIZ (formerly, Century Business Services, Inc.), a provider of outsourcing functions for small |
| and medium size companies, Director (1997-present) |
| • Sunair Services Corporation, a provider of certain outdoor-related services to homes and |
| businesses, Director (2005-2009) |
| • The Newark Group, a provider of a national market of paper recovery facilities, paperboard |
| mills and paperboard converting plants, Director (2000-2010) |
| No. of Portfolios for which Board Member Serves: 167 |
| ——————— |
| Francine J. Bovich (60)† |
| Board Member (2011) |
| Principal Occupation During Past 5Years: |
| • Trustee,The Bradley Trusts, private trust funds (2011-present) |
| • Managing Director, Morgan Stanley Investment Management (1993-2010) |
| No. of Portfolios for which Board Member Serves: 14 |
| ——————— |
| James M. Fitzgibbons (77) |
| Board Member (2008) |
| Principal Occupation During Past 5Years: |
| • Corporate Director and Trustee |
| Other Public Company Board Memberships During Past 5Years: |
| • Bill Barrett Corporation, an oil and natural gas exploration company, Director (2004-present) |
| No. of Portfolios for which Board Member Serves: 33 |
| ——————— |
| Kenneth A. Himmel (65) |
| Board Member (2008) |
| Principal Occupation During Past 5Years: |
| • President and CEO, Related Urban Development, a real estate development company (1996-present) |
| • President and CEO, Himmel & Company, a real estate development company (1980-present) |
| • CEO,American Food Management, a restaurant company (1983-present) |
| No. of Portfolios for which Board Member Serves: 33 |
| The Fund | 43 |
BOARD MEMBERS INFORMATION (Unaudited) (continued)
| Stephen J. Lockwood (64) |
| Board Member (2008) |
| Principal Occupation During Past 5Years: |
| • Chairman of the Board, Stephen J. Lockwood and Company LLC, a real estate investment |
| company (2000-present) |
| No. of Portfolios for which Board Member Serves: 33 |
| ——————— |
| Roslyn M. Watson (61) |
| Board Member (2008) |
| Principal Occupation During Past 5Years: |
| • Principal,Watson Ventures, Inc., a real estate investment company (1993-present) |
| No. of Portfolios for which Board Member Serves: 43 |
| ——————— |
| Benaree Pratt Wiley (65) |
| Board Member (2008) |
| Principal Occupation During Past 5Years: |
| • Principal,TheWiley Group, a firm specializing in strategy and business development (2005-present) |
| Other Public Company Board Memberships During Past 5Years: |
| • CBIZ (formerly, Century Business Services, Inc.), a provider of outsourcing functions for small |
| and medium size companies, Director (2008-present) |
| No. of Portfolios for which Board Member Serves: 68 |
| ——————— |
† Ms. Bovich was elected as a Board Member by the Board ofTrustees, effective October 27, 2011. See Note 5.
Once elected all Board Members serve for an indefinite term, but achieve Emeritus status upon reaching age 80.The address of the Board Members and Officers is in c/o The Dreyfus Corporation, 200 Park Avenue, NewYork, NewYork 10166.Additional information about the Board Members is available in the fund’s Statement of Additional Information which can be obtained from Dreyfus free of charge by calling this toll free number: 1-800-DREYFUS.
44
OFFICERS OF THE FUND (Unaudited)
BRADLEY J. SKAPYAK, President since January 2010.
Chief Operating Officer and a director of the Manager since June 2009. From April 2003 to June 2009, Mr. Skapyak was the head of the Investment Accounting and Support Department of the Manager. He is an officer of 75 investment companies (comprised of 167 portfolios) managed by the Manager. He is 52 years old and has been an employee of the Manager since February 1988.
MICHAEL A. ROSENBERG, Vice President and Secretary since December 2008.
Assistant General Counsel of BNY Mellon, and an officer of 76 investment companies (comprised of 192 portfolios) managed by the Manager. He is 51 years old and has been an employee of the Manager since October 1991.
KIESHA ASTWOOD, Vice President and Assistant Secretary since January 2010.
Counsel of BNY Mellon, and an officer of 76 investment companies (comprised of 192 portfolios) managed by the Manager. She is 38 years old and has been an employee of the Manager since July 1995.
JAMES BITETTO, Vice President and Assistant Secretary since December 2008.
Senior Counsel of BNY Mellon and Secretary of the Manager, and an officer of 76 investment companies (comprised of 192 portfolios) managed by the Manager. He is 45 years old and has been an employee of the Manager since December 1996.
JONI LACKS CHARATAN, Vice President and Assistant Secretary since December 2008.
Senior Counsel of BNY Mellon, and an officer of 76 investment companies (comprised of 192 portfolios) managed by the Manager. She is 55 years old and has been an employee of the Manager since October 1988.
JOSEPH M. CHIOFFI, Vice President and Assistant Secretary since December 2008.
Senior Counsel of BNY Mellon, and an officer of 76 investment companies (comprised of 192 portfolios) managed by the Manager. He is 49 years old and has been an employee of the Manager since June 2000.
KATHLEEN DENICHOLAS, Vice President and Assistant Secretary since January 2010.
Managing Counsel of BNY Mellon, and an officer of 76 investment companies (comprised of 192 portfolios) managed by the Manager. She is 36 years old and has been an employee of the Manager since February 2001.
JANETTE E. FARRAGHER, Vice President and Assistant Secretary since December 2008.
Assistant General Counsel of BNY Mellon, and an officer of 76 investment companies (comprised of 192 portfolios) managed by the Manager. She is 48 years old and has been an employee of the Manager since February 1984.
JOHN B. HAMMALIAN, Vice President and Assistant Secretary since December 2008.
Senior Managing Counsel of BNY Mellon, and an officer of 76 investment companies (comprised of 192 portfolios) managed by the Manager. He is 48 years old and has been an employee of the Manager since February 1991.
M. CRISTINA MEISER, Vice President and Assistant Secretary since January 2010.
Senior Counsel of BNY Mellon, and an officer of 76 investment companies (comprised of 192 portfolios) managed by the Manager. She is 41 years old and has been an employee of the Manager since August 2001.
| The Fund | 45 |
OFFICERS OF THE FUND (Unaudited) (continued)
ROBERT R. MULLERY, Vice President and Assistant Secretary since December 2008.
Managing Counsel of BNY Mellon, and an officer of 76 investment companies (comprised of 192 portfolios) managed by the Manager. He is 59 years old and has been an employee of the Manager since May 1986.
JEFF PRUSNOFSKY, Vice President and Assistant Secretary since December 2008.
Senior Managing Counsel of BNY Mellon, and an officer of 76 investment companies (comprised of 192 portfolios) managed by the Manager. He is 46 years old and has been an employee of the Manager since October 1990.
JAMES WINDELS, Treasurer since December 2008.
Director – Mutual Fund Accounting of the Manager, and an officer of 76 investment companies (comprised of 192 portfolios) managed by the Manager. He is 53 years old and has been an employee of the Manager since April 1985.
RICHARD CASSARO, Assistant Treasurer since December 2008.
Senior Accounting Manager – Money Market and Municipal Bond Funds of the Manager, and an officer of 76 investment companies (comprised of 192 portfolios) managed by the Manager. He is 52 years old and has been an employee of the Manager since September 1982.
GAVIN C. REILLY, Assistant Treasurer since December 2008.
Tax Manager of the Investment Accounting and Support Department of the Manager, and an officer of 76 investment companies (comprised of 192 portfolios) managed by the Manager. He is 43 years old and has been an employee of the Manager since April 1991.
ROBERT ROBOL, Assistant Treasurer since December 2008.
Senior Accounting Manager – Fixed Income Funds of the Manager, and an officer of 76 investment companies (comprised of 192 portfolios) managed by the Manager. He is 47 years old and has been an employee of the Manager since October 1988.
ROBERT SALVIOLO, Assistant Treasurer since December 2008.
Senior Accounting Manager – Equity Funds of the Manager, and an officer of 76 investment companies (comprised of 192 portfolios) managed by the Manager. He is 44 years old and has been an employee of the Manager since June 1989.
ROBERT SVAGNA, Assistant Treasurer since December 2008.
Senior Accounting Manager – Equity Funds of the Manager, and an officer of 76 investment companies (comprised of 192 portfolios) managed by the Manager. He is 44 years old and has been an employee of the Manager since November 1990.
46
JOSEPH W. CONNOLLY, Chief Compliance Officer since December 2008.
Chief Compliance Officer of the Manager and The Dreyfus Family of Funds (76 investment companies, comprised of 192 portfolios). From November 2001 through March 2004, Mr. Connolly was first Vice-President, Mutual Fund Servicing for Mellon Global Securities Services. In that capacity, Mr. Connolly was responsible for managing Mellon’s Custody, Fund Accounting and Fund Administration services to third-party mutual fund clients. He is 54 years old and has served in various capacities with the Manager since 1980, including manager of the firm’s Fund Accounting Department from 1997 through October 2001.
STEPHEN J. STOREN, Anti-Money Laundering Compliance Officer since May 2011.
Chief Compliance Officer of the Distributor, and the Anti-Money Laundering Compliance Officer of 72 investment companies (comprised of 188 portfolios) managed by the Manager. He is 57 years old and has been an employee of the Distributor since October 1999.
| The Fund | 47 |
NOTES
For More Information

Telephone Call your Financial Representative or 1-800-DREYFUS
Mail The Dreyfus Family of Funds, 144 Glenn Curtiss Boulevard, Uniondale, NY 11556-0144 E-mail Send your request to info@dreyfus.com Internet Information can be viewed online or downloaded at: http://www.dreyfus.com
The fund files its complete schedule of portfolio holdings with the Securities and Exchange Commission (“SEC”) for the first and third quarters of each fiscal year on Form N-Q. The fund’s Forms N-Q are available on the SEC’s website at http://www.sec.gov and may be reviewed and copied at the SEC’s Public Reference Room in Washington, DC. Information on the operation of the Public Reference Room may be obtained by calling 1-800-SEC-0330.
Information regarding how the fund voted proxies relating to portfolio securities for the most recent 12-month period ended June 30 is available on the SEC’s website at http://www.sec.gov and without charge, upon request, by calling 1-800-DREYFUS.

| Dreyfus/Newton |
| International Equity Fund |
ANNUAL REPORT September 30, 2011
Save time. Save paper. View your next shareholder report online as soon as it’s available. Log into www.dreyfus.com and sign up for Dreyfus eCommunications. It’s simple and only takes a few minutes.
The views expressed in this report reflect those of the portfolio manager only through the end of the period covered and do not necessarily represent the views of Dreyfus or any other person in the Dreyfus organization. Any such views are subject to change at any time based upon market or other conditions and Dreyfus disclaims any responsibility to update such views.These views may not be relied on as investment advice and, because investment decisions for a Dreyfus fund are based on numerous factors, may not be relied on as an indication of trading intent on behalf of any Dreyfus fund.
Not FDIC-Insured • Not Bank-Guaranteed • May Lose Value
Contents | |
THE FUND | |
| 2 | A Letter from the Chairman and CEO |
| 3 | Discussion of Fund Performance |
| 6 | Fund Performance |
| 8 | Understanding Your Fund’s Expenses |
| 8 | Comparing Your Fund’s Expenses With Those of Other Funds |
| 9 | Statement of Investments |
| 13 | Statement of Assets and Liabilities |
| 14 | Statement of Operations |
| 15 | Statement of Changes in Net Assets |
| 17 | Financial Highlights |
| 20 | Notes to Financial Statements |
| 35 | Report of Independent Registered Public Accounting Firm |
| 36 | Important Tax Information |
| 37 | Board Members Information |
| 39 | Officers of the Fund |
FOR MORE INFORMATION | |
Back Cover |
Dreyfus/Newton
International Equity Fund
The Fund

A LETTER FROM THE CHAIRMAN AND CEO
Dear Shareholder:
This annual report for Dreyfus/Newton International Equity Fund covers the 12-month period from October 1, 2010, through September 30, 2011. For information about how the fund performed during the reporting period, as well as general market perspectives, we provide a Discussion of Fund Performance on the pages that follow.
Although stocks in some markets rallied strongly over the first half of the reporting period amid expectations of a more robust economic recovery, investor sentiment deteriorated sharply during the second half due to disappointing economic data, rising commodity prices, an escalating sovereign debt crisis in Europe and a contentious debate regarding taxes, spending and borrowing in the United States. Market volatility was particularly severe during August and September after a major credit rating agency downgraded U.S. long-term debt. Stocks proved sensitive to macroeconomic concerns in this challenging environment, often regardless of more promising company fundamentals, and most international equity market indices ended the reporting period with negative absolute returns.
The economic outlook currently is clouded by market turbulence and political infighting, but we believe that a continued subpar global expansion is more likely than a return to recession. Inflationary pressures appear to be waning in most countries as energy prices recently have retreated from their highs. In the United States, the Federal Reserve Board has signaled its intention to maintain an aggressively accommodative monetary policy, which may help offset the financial stresses caused by deleveraging in the private sector and fiscal consolidation by governments in the United States and Europe. To assess the potential impact of these and other developments on your investments, we encourage you, as always, to speak with your financial advisor.
Thank you for your continued confidence and support.

Jonathan R. Baum
Chairman and Chief Executive Officer
The Dreyfus Corporation
October 17, 2011
2

DISCUSSION OF FUND PERFORMANCE
For the period of October 1, 2010, through September 30, 2011, as provided by Paul Markham, Lead Portfolio Manager of Newton Capital Management Limited, Sub-Investment Adviser
Fund and Market Performance Overview
For the 12-month period ended September 30, 2011, Dreyfus/Newton International Equity Fund’s Class A shares produced a total return of –10.10%, Class C shares returned –10.79% and Class I shares returned –9.90%.1 In comparison, the fund’s benchmark, the Morgan Stanley Capital International Europe,Australasia, Far East Index (“MSCI EAFE Index”), produced a total return of –9.36% for the same period.2
Strong corporate earnings buoyed international stocks over the reporting period’s first half, but a number of macroeconomic challenges later erased those gains.The fund produced lower returns than its benchmark, primarily due to weakness in emerging markets that are not represented in the MSCI EAFE Index.
The Fund’s Investment Approach
The fund normally invests at least 80% of its assets in common stocks or securities convertible into common stocks of foreign companies and depositary receipts evidencing ownership in such securities.The process of identifying investment ideas begins by identifying a core list of investment themes.These themes are based primarily on observable economic, industrial or social trends (typically global) that Newton believes will positively affect certain sectors or industries. For instance, Newton’s “deleverage” theme asserts that excessive debt is weighing on economic activity, and that the way in which deleveraging occurs is critical to the outlook for economics and financial markets. Elsewhere, Newton’s “networked world” theme focuses upon the opportunities and risks inherent in the growth of information technology networks around the world.
Macroeconomic Developments Challenged Global Markets
Expectations of continued global economic recovery prevailed through the first quarter of 2011, supporting international stock prices. While global markets continued to advance during the spring of 2011, investors grew more concerned about several economic challenges,
| The Fund | 3 |
DISCUSSION OF FUND PERFORMANCE (continued)
including a sovereign debt crisis in Europe, inflationary pressures in China and rising energy prices stemming from political unrest in the Middle East. In March, catastrophic natural and nuclear disasters struck Japan, disrupting the global industrial supply chain. However, most equity markets rebounded quickly, and the MSCI EAFE Index hit new highs for the reporting period in April.
By May, investor sentiment began to deteriorate in earnest. Global economic growth proved more sluggish than expected as businesses and individuals continued to deleverage and governments struggled with heavy debt burdens. In Europe, the debt problems facing Ireland, Portugal, Spain and Italy intensified, and Greece faced the possibility of default. Market volatility proved especially severe during September, driving the MSCI EAFE Index well into negative territory for the reporting period overall.
Stock Selections Produced Mixed Results
In this challenging investment climate, the fund’s investments in Brazil fared relatively poorly despite ongoing local economic growth. Infrastructure constraints and inflation fears weighed on the fund’s holdings in Brazil, including household goods purveyor Hypermarcas, which also struggled with intensifying competitive pressures from multinational corporations.The fund’s holdings in China suffered amid rising interest rates and other inflation-fighting measures. In addition, exporters such as Hong Kong-based furniture manufacturer Man Wah Holdings were hurt by a strengthening U.S. dollar. In more developed markets, Danish jewelry maker Pandora encountered higher costs for precious metals and inventory problems that reduced profit margins.
The fund achieved better results in other areas. Returns were especially robust in Thailand, where mobile operator Advance Info Service benefited from political developments and strong cash flows. Overweighted exposure to Japan also proved beneficial as the country bounced back from the earthquake and tsunami, helping to boost the market value of convenience store operator Lawson and discount chain Don Quijote. Meanwhile, JapanTobacco benefited from government divestment of its shares.
From an industry group perspective, the health care sector was buoyed by large pharmaceutical developers, including Switzerland’s Novartis
4
and Germany’s Roche Holding. The fund benefited from underweighted exposure to large banks in the financials sector, particularly in Europe. Instead, we focused on securities brokers, such as ICAP in the United Kingdom, and insurers, such as AMP in Australia.Among basic materials companies, the fund received favorable results from fertilizer maker Potash Corporation of Saskatchewan as agricultural demand intensified. Precious metals producers Barrick Gold and Yamana Gold also fared relatively well despite weakness in commodity prices later in the reporting period.
Finding Opportunities Amid Global Challenges
Although we expect global economic weakness and heightened market volatility to persist over the near term, we believe that stocks remain more attractive than most other financial assets. In our judgment, selectivity is likely to be key to success in global equity markets. As of the reporting period’s end, we have found a number of opportunities in the health care sector, particularly in Switzerland. We have found fewer stocks meeting our investment criteria in the remainder of Europe and in the telecommunications services sector.
October 17, 2011
| Please note, the position in any security highlighted with italicized typeface was sold during the | |
| reporting period. | |
| Equity funds are subject generally to market, market sector, market liquidity, issuer and investment | |
| style risks, among other factors, to varying degrees, all of which are more fully described in the | |
| fund’s prospectus. | |
| Investing internationally involves special risks, including changes in currency exchange rates, | |
| political, economic and social instability, a lack of comprehensive company information, differing | |
| auditing and legal standards and less market liquidity. | |
| 1 | Total return includes reinvestment of dividends and any capital gains paid, and does not take into |
| consideration the maximum initial sales charge in the case of Class A shares, or the applicable | |
| contingent deferred sales charge imposed on redemptions in the case of Class C shares. Had these | |
| charges been reflected, returns would have been lower. Past performance is no guarantee of future | |
| results. Share price, yield and investment return fluctuate such that upon redemption, fund shares | |
| may be worth more or less than their original cost. Investments in foreign securities involve special | |
| risks. Please read the prospectus for further discussion of these risks. | |
| 2 | SOURCE: LIPPER INC. — Reflects reinvestment of net dividends and, where applicable, |
| capital gain distributions.The Morgan Stanley Capital International Europe,Australasia, Far East | |
| (MSCI EAFE) Index is an unmanaged index composed of a sample of companies representative | |
| of the market structure of European and Pacific Basin countries.The Index does not take into | |
| account fees and expenses to which the fund is subject. Investors cannot invest directly in any index. |
| The Fund | 5 |
FUND PERFORMANCE
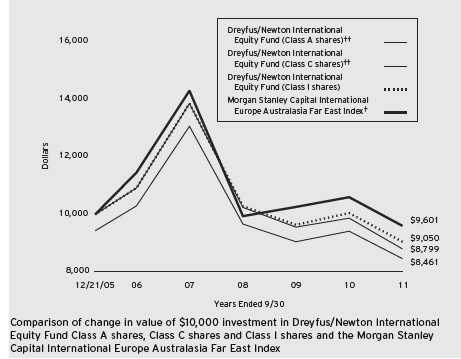
| † | Source: Lipper Inc. |
| †† | The total return figures presented for Class A and Class C shares of the fund reflect the performance of the fund’s |
| Class I shares for the period prior to March 31, 2008 (the inception date for Class A and Class C shares | |
| respectively), adjusted to reflect the applicable sales load for each share class. | |
| Past performance is not predictive of future performance. | |
| The above graph compares a $10,000 investment made in each of the Class A, Class C and Class I shares of | |
| Dreyfus/Newton International Equity Fund on 12/21/05 (inception date) to a $10,000 investment made in the | |
| Morgan Stanley Capital International Europe Australasia Far East Index (the “Index”) on that date.All dividends and | |
| capital gain distributions are reinvested. For comparative purposes, the value of the Index on 12/31/05 is used as the | |
| beginning value on 12/21/05. | |
| The fund’s performance shown in the line graph above takes into account the maximum initial sales charge on Class A | |
| shares and all other applicable fees and expenses on all classes.The Index is an unmanaged index composed of a sample of | |
| companies representative of the market structure of European and Pacific Basin countries. Unlike a mutual fund, the Index | |
| is not subject to charges, fees and other expenses. Investors cannot invest directly in any index.These factors can contribute | |
| to the Index potentially outperforming the fund. Further information relating to fund performance, including expense | |
| reimbursements, if applicable, is contained in the Financial Highlights section of the prospectus and elsewhere in this report. | |
6
| Average Annual Total Returns as of 9/30/11 | |||||||
| Inception | From | ||||||
| Date | 1Year | 5 Years | Inception | ||||
| Class A shares | |||||||
| with maximum sales charge (5.75%) | 3/31/08 | –15.24% | –4.96%†† | –2.85%†† | |||
| without sales charge | 3/31/08 | –10.10% | –3.83%†† | –1.85%†† | |||
| Class C shares | |||||||
| with applicable redemption charge † | 3/31/08 | –11.67% | –4.22%†† | –2.19%†† | |||
| without redemption | 3/31/08 | –10.79% | –4.22%†† | –2.19%†† | |||
| Class I shares | 12/21/05 | –9.90% | –3.68% | –1.71% | |||
| Morgan Stanley Capital International | |||||||
| Europe Australasia Far East Index | 12/31/05 | –9.36% | –3.46% | –0.71%††† | |||
| Past performance is not predictive of future performance.The fund’s performance shown in the graph and table does not | |
| reflect the deduction of taxes that a shareholder would pay on fund distributions or the redemption of fund shares. | |
| † | The maximum contingent deferred sales charge for Class C shares is 1% for shares redeemed within one year of the |
| date of purchase. | |
| †† | The total return performance figures presented for Class A and Class C shares of the fund reflect the performance of |
| the fund’s Class I shares for the period prior to March 31, 2008 (the inception date for Class A and Class C shares | |
| respectively), adjusted to reflect the applicable sales load for each share class. | |
| ††† The Index date is based on the life of Class I shares. For comparative purposes, the value of the Index as of the | |
| month end 12/31/05 is used as the beginning value on 12/21/05 (the inception date for Class I shares). | |
| The Fund | 7 |
UNDERSTANDING YOUR FUND’S EXPENSES (Unaudited)
As a mutual fund investor, you pay ongoing expenses, such as management fees and other expenses. Using the information below, you can estimate how these expenses affect your investment and compare them with the expenses of other funds.You also may pay one-time transaction expenses, including sales charges (loads) and redemption fees, which are not shown in this section and would have resulted in higher total expenses. For more information, see your fund’s prospectus or talk to your financial adviser.
Review your fund’s expenses
The table below shows the expenses you would have paid on a $1,000 investment in Dreyfus/Newton International Equity Fund from April 1, 2011 to September 30, 2011. It also shows how much a $1,000 investment would be worth at the close of the period, assuming actual returns and expenses.
Expenses and Value of a $1,000 Investment
assuming actual returns for the six months ended September 30, 2011
| Class A | Class C | Class I | ||||
| Expenses paid per $1,000† | $ | 6.12 | $ | 9.44 | $ | 4.80 |
| Ending value (after expenses) | $ | 822.10 | $ | 819.10 | $ | 823.30 |
COMPARING YOUR FUND’S EXPENSES
WITH THOSE OF OTHER FUNDS (Unaudited)
Using the SEC’s method to compare expenses
The Securities and Exchange Commission (SEC) has established guidelines to help investors assess fund expenses. Per these guidelines, the table below shows your fund’s expenses based on a $1,000 investment, assuming a hypothetical 5% annualized return. You can use this information to compare the ongoing expenses (but not transaction expenses or total cost) of investing in the fund with those of other funds.All mutual fund shareholder reports will provide this information to help you make this comparison. Please note that you cannot use this information to estimate your actual ending account balance and expenses paid during the period.
Expenses and Value of a $1,000 Investment
assuming a hypothetical 5% annualized return for the six months ended September 30, 2011
| Class A | Class C | Class I | ||||
| Expenses paid per $1,000† | $ | 6.78 | $ | 10.45 | $ | 5.32 |
| Ending value (after expenses) | $ | 1,018.35 | $ | 1,014.69 | $ | 1,019.80 |
| † Expenses are equal to the fund’s annualized expense ratio of 1.34% for Class A, 2.07% for Class C and 1.05% |
| for Class I, multiplied by the average account value over the period, multiplied by 183/365 (to reflect the one-half |
| year period). |
8
| STATEMENT OF INVESTMENTS |
| September 30, 2011 |
| Common Stocks—98.4% | Shares | Value ($) | |
| Australia—5.5% | |||
| AMP | 1,197,327 | 4,494,549 | |
| Newcrest Mining | 305,749 | 10,075,822 | |
| Santos | 548,160 | 5,927,663 | |
| White Energy | 1,617,139a | 2,268,706 | |
| WorleyParsons | 180,725 | 4,509,573 | |
| 27,276,313 | |||
| Belgium—1.3% | |||
| Anheuser-Busch InBev | 118,907 | 6,306,026 | |
| Brazil—2.4% | |||
| Arezzo Industria e Comercio | 334,297 | 3,378,084 | |
| Hypermarcas | 624,894 | 2,937,941 | |
| International Meal Co. Holdings | 283,100 | 1,799,253 | |
| Rossi Residencial | 429,178 | 2,004,086 | |
| Tele Norte Leste Participacoes, ADR | 190,678 | 1,817,161 | |
| 11,936,525 | |||
| Canada—3.9% | |||
| Barrick Gold | 141,639 | 6,637,934 | |
| Nexen | 154,136 | 2,397,573 | |
| Potash Corporation of Saskatchewan | 84,335 | 3,661,840 | |
| Yamana Gold | 480,693 | 6,596,398 | |
| 19,293,745 | |||
| China—2.1% | |||
| Biostime International Holdings | 2,546,000 | 4,236,785 | |
| Mindray Medical International, ADR | 110,947 | 2,619,459 | |
| Sands China | 1,573,600a | 3,619,255 | |
| 10,475,499 | |||
| France—5.5% | |||
| Air Liquide | 60,833 | 7,113,592 | |
| L’Oreal | 47,613 | 4,658,997 | |
| Nexans | 59,606 | 3,462,392 | |
| Thales | 158,532 | 4,954,014 | |
| Total | 156,106 | 6,882,800 | |
| 27,071,795 | |||
| Germany—3.4% | |||
| Bayer | 140,869 | 7,741,573 | |
| Fresenius Medical Care & Co. | 71,464 | 4,841,604 | |
| The Fund | 9 |
STATEMENT OF INVESTMENTS (continued)
| Common Stocks (continued) | Shares | Value ($) |
| Germany (continued) | ||
| Gerry Weber International | 148,257 | 4,225,855 |
| 16,809,032 | ||
| Hong Kong—5.7% | ||
| AIA Group | 1,757,000 | 4,972,982 |
| Belle International Holdings | 2,044,000 | 3,487,440 |
| China Mobile | 650,500 | 6,343,973 |
| GOME Electrical Appliances Holdings | 9,539,000 | 2,170,944 |
| Huabao International Holdings | 3,234,000 | 2,636,262 |
| Jardine Matheson Holdings | 155,600 | 7,033,095 |
| Man Wah Holdings | 3,631,200 | 1,413,430 |
| 28,058,126 | ||
| Japan—25.6% | ||
| Asahi Group Holdings | 311,000 | 6,585,902 |
| Dena | 81,435 | 3,406,848 |
| DON Quijote | 226,300 | 8,088,238 |
| FANUC | 30,300 | 4,171,666 |
| Hitachi Construction Machinery | 332,200 | 5,550,473 |
| INPEX | 657 | 4,048,701 |
| Japan Tobacco | 2,358 | 11,001,196 |
| Lawson | 104,500 | 5,906,411 |
| Mitsubishi | 304,000 | 6,190,862 |
| Mitsui Fudosan | 438,000 | 6,932,311 |
| Nomura Holdings | 1,536,200 | 5,597,774 |
| NTN | 868,000 | 4,068,918 |
| Otsuka Holdings | 144,200 | 3,943,602 |
| Shiseido | 267,000 | 5,171,149 |
| Softbank | 239,800 | 7,019,643 |
| Sumco | 417,829 | 3,904,461 |
| Sumitomo Mitsui Financial Group | 221,900 | 6,262,484 |
| Toshiba | 1,486,000 | 6,059,511 |
| Towa Pharmaceutical | 139,700 | 6,413,597 |
| Toyota Motor | 478,000 | 16,340,162 |
| 126,663,909 | ||
| Netherlands—.7% | ||
| SBM Offshore | 189,058 | 3,278,476 |
| Norway—1.4% | ||
| DnB NOR | 705,249 | 7,040,663 |
10
| Common Stocks (continued) | Shares | Value ($) | |
| Philippines—.7% | |||
| Energy Development | 28,407,500 | 3,651,063 | |
| Poland—1.0% | |||
| Telekomunikacja Polska | 972,767 | 5,067,531 | |
| Singapore—2.1% | |||
| Sakari Resources | 2,838,000 | 4,239,840 | |
| United Overseas Bank | 463,000 | 5,959,531 | |
| 10,199,371 | |||
| South Africa—.7% | |||
| MTN Group | 224,496 | 3,672,953 | |
| Spain—.9% | |||
| Amadeus IT Holding, Cl. A | 278,609 | 4,472,432 | |
| Switzerland—13.3% | |||
| ABB | 272,511a | 4,653,863 | |
| Actelion | 120,523a | 4,009,586 | |
| Bank Sarasin & Cie, Cl. B | 90,994 | 2,779,406 | |
| Lonza Group | 46,614a | 2,798,039 | |
| Nestle | 254,783 | 14,005,504 | |
| Novartis | 209,765 | 11,706,890 | |
| Roche Holding | 86,991 | 13,995,260 | |
| Syngenta | 25,002a | 6,477,001 | |
| Zurich Financial Services | 25,860a | 5,353,691 | |
| 65,779,240 | |||
| Taiwan—.7% | |||
| HTC | 151,000 | 3,317,326 | |
| Thailand—4.2% | |||
| Advanced Info Service | 1,274,500 | 4,933,681 | |
| Bangkok Bank | 1,145,800 | 5,220,132 | |
| Bangkok Dusit Medical Services | 3,073,132 | 6,117,063 | |
| Bank of Ayudhya | 2,690,500 | 1,627,030 | |
| Bank of Ayudhya, NVDR | 4,663,700 | 2,894,857 | |
| 20,792,763 | |||
| United Kingdom—17.3% | |||
| Associated British Foods | 281,033 | 4,820,012 | |
| Barclays | 3,287,568 | 8,070,433 | |
| BHP Billiton | 457,063 | 12,111,281 | |
| Bowleven | 1,250,540a | 1,817,889 | |
| British American Tobacco | 247,193 | 10,477,295 | |
| The Fund | 11 |
STATEMENT OF INVESTMENTS (continued)
| Common Stocks (continued) | Shares | Value ($) | |
| United Kingdom (continued) | |||
| British Sky Broadcasting Group | 376,909 | 3,869,623 | |
| Cable & Wireless Communications | 4,431,236 | 2,551,179 | |
| Cable & Wireless Worldwide | 621,907 | 297,521 | |
| Centrica | 1,026,046 | 4,716,685 | |
| GlaxoSmithKline | 420,905 | 8,690,234 | |
| ICAP | 1,033,291 | 6,567,993 | |
| Imagination Technologies Group | 803,715a | 5,197,538 | |
| Ophir Energy PLC | 924,693 | 3,888,198 | |
| Scottish & Southern Energy | 379,894 | 7,597,478 | |
| Standard Chartered | 252,290 | 5,035,569 | |
| 85,708,928 | |||
| Total Common Stocks | |||
| (cost $522,744,803) | 486,871,716 | ||
| Preferred Stocks—1.0% | |||
| Brazil | |||
| Petroleo Brasileiro | |||
| (cost $8,055,973) | 492,793 | 5,005,902 | |
| Total Investments (cost $530,800,776) | 99.4% | 491,877,618 | |
| Cash and Receivables (Net) | .6% | 3,161,355 | |
| Net Assets | 100.0% | 495,038,973 | |
| ADR—American Depository Receipts |
| NVDR—Non-Voting Depository Receipts |
| a Non-income producing security. |
| Portfolio Summary (Unaudited)† | |||
| Value (%) | Value (%) | ||
| Financial | 17.4 | Industrial | 6.7 |
| Consumer Staples | 15.4 | Telecommunication Services | 6.4 |
| Health Care | 14.7 | Information Technology | 5.3 |
| Materials | 11.6 | Utilities | 3.2 |
| Consumer Discretionary | 10.2 | ||
| Energy | 8.5 | 99.4 | |
| † Based on net assets. |
| See notes to financial statements. |
12
| STATEMENT OF ASSETS AND LIABILITIES |
| September 30, 2011 |
| Cost | Value | |||
| Assets ($): | ||||
| Investments in securities—See Statement of Investments | 530,800,776 | 491,877,618 | ||
| Cash | 344,095 | |||
| Cash denominated in foreign currencies | 769,363 | 766,273 | ||
| Receivable for investment securities sold | 7,749,220 | |||
| Dividends and interest receivable | 2,344,936 | |||
| Unrealized appreciation on forward foreign | ||||
| currency exchange contracts—Note 4 | 582,818 | |||
| Receivable for shares of Beneficial Interest subscribed | 75,568 | |||
| Prepaid expenses | 11,433 | |||
| 503,751,961 | ||||
| Liabilities ($): | ||||
| Due to The Dreyfus Corporation and affiliates—Note 3(c) | 705,662 | |||
| Bank loan payable—Note 2 | 4,900,000 | |||
| Payable for shares of Beneficial Interest redeemed | 1,641,123 | |||
| Payable for investment securities purchased | 1,111,154 | |||
| Unrealized depreciation on forward foreign | ||||
| currency exchange contracts—Note 4 | 293,339 | |||
| Interest payable—Note 2 | 726 | |||
| Accrued expenses | 60,984 | |||
| 8,712,988 | ||||
| Net Assets ($) | 495,038,973 | |||
| Composition of Net Assets ($): | ||||
| Paid-in capital | 523,641,382 | |||
| Accumulated undistributed investment income—net | 7,010,161 | |||
| Accumulated net realized gain (loss) on investments | 3,121,252 | |||
| Accumulated net unrealized appreciation (depreciation) | ||||
| on investments and foreign currency transactions | (38,733,822) | |||
| Net Assets ($) | 495,038,973 | |||
| Net Asset Value Per Share | ||||
| Class A | Class C | Class I | ||
| Net Assets ($) | 9,765,899 | 924,442 | 484,348,632 | |
| Shares Outstanding | 662,419 | 63,576 | 32,785,325 | |
| Net Asset Value Per Share ($) | 14.74 | 14.54 | 14.77 | |
| See notes to financial statements. | ||||
| The Fund | 13 |
| STATEMENT OF OPERATIONS |
| Year Ended September 30, 2011 |
| Investment Income ($): | ||
| Income: | ||
| Cash dividends (net of $1,241,616 foreign taxes withheld at source): | ||
| Unaffiliated issuers | 15,202,069 | |
| Affiliated issuers | 19,735 | |
| Income from securities lending—Note 1(c) | 27,532 | |
| Total Income | 15,249,336 | |
| Expenses: | ||
| Investment advisory fee—Note 3(a) | 4,839,114 | |
| Shareholder servicing costs—Note 3(c) | 843,359 | |
| Custodian fees—Note 3(c) | 383,283 | |
| Administration fees—Note 3(a) | 69,340 | |
| Professional fees | 68,146 | |
| Registration fees | 55,300 | |
| Accounting and administration fees—Note 3(a) | 42,000 | |
| Trustees’ fees and expenses—Note 3(d) | 30,679 | |
| Distribution fees—Note 3(b) | 9,798 | |
| Prospectus and shareholders’ reports | 8,724 | |
| Loan commitment fees—Note 2 | 4,496 | |
| Interest expense—Note 2 | 2,194 | |
| Miscellaneous | 38,563 | |
| Total Expenses | 6,394,996 | |
| Less—reduction in fees due to earnings credits—Note 3(c) | (12) | |
| Net Expenses | 6,394,984 | |
| Investment Income—Net | 8,854,352 | |
| Realized and Unrealized Gain (Loss) on Investments—Note 4 ($): | ||
| Net realized gain (loss) on investments and foreign currency transactions | 12,105,642 | |
| Net realized gain (loss) on forward foreign currency exchange contracts | (1,081,093) | |
| Net Realized Gain (Loss) | 11,024,549 | |
| Net unrealized appreciation (depreciation) | ||
| on investments and foreign currency transactions | (82,278,417) | |
| Net unrealized appreciation (depreciation) | ||
| on forward foreign currency exchange contracts | 1,557,819 | |
| Net Unrealized Appreciation (Depreciation) | (80,720,598) | |
| Net Realized and Unrealized Gain (Loss) on Investments | (69,696,049) | |
| Net (Decrease) in Net Assets Resulting from Operations | (60,841,697) | |
| See notes to financial statements. | ||
14
STATEMENT OF CHANGES IN NET ASSETS
| Year Ended September 30, | ||||
| 2011 | 2010 | |||
| Operations ($): | ||||
| Investment income—net | 8,854,352 | 6,698,573 | ||
| Net realized gain (loss) on investments | 11,024,549 | 10,965,846 | ||
| Net unrealized appreciation | ||||
| (depreciation) on investments | (80,720,598) | 3,229,954 | ||
| Net Increase (Decrease) in Net Assets | ||||
| Resulting from Operations | (60,841,697) | 20,894,373 | ||
| Dividends to Shareholders from ($): | ||||
| Investment income—net: | ||||
| Class A Shares | (186,610) | (131,070) | ||
| Class C Shares | (3,732) | (8,639) | ||
| Class I Shares | (6,484,341) | (2,885,834) | ||
| Net realized gain on investments: | ||||
| Class A Shares | (294,754) | — | ||
| Class C Shares | (21,745) | — | ||
| Class I Shares | (8,019,784) | — | ||
| Total Dividends | (15,010,966) | (3,025,543) | ||
| Beneficial Interest Transactions ($): | ||||
| Net proceeds from shares sold: | ||||
| Class A Shares | 5,731,984 | 9,676,967 | ||
| Class C Shares | 134,097 | 415,438 | ||
| Class I Shares | 183,824,565 | 194,598,875 | ||
| Dividends reinvested: | ||||
| Class A Shares | 477,012 | 130,729 | ||
| Class C Shares | 25,467 | 8,590 | ||
| Class I Shares | 7,750,756 | 940,851 | ||
| Cost of shares redeemed: | ||||
| Class A Shares | (13,959,839) | (8,184,510) | ||
| Class C Shares | (453,604) | (287,112) | ||
| Class I Shares | (133,695,220) | (44,153,805) | ||
| Increase (Decrease) in Net Assets from | ||||
| Beneficial Interest Transactions | 49,835,218 | 153,146,023 | ||
| Total Increase (Decrease) in Net Assets | (26,017,445) | 171,014,853 | ||
| Net Assets ($): | ||||
| Beginning of Period | 521,056,418 | 350,041,565 | ||
| End of Period | 495,038,973 | 521,056,418 | ||
| Undistributed investment income—net | 7,010,161 | 4,484,773 | ||
| The Fund | 15 |
STATEMENT OF CHANGES IN NET ASSETS (continued)
| Year Ended September 30, | ||||
| 2011 | 2010 | |||
| Capital Share Transactions: | ||||
| Class A | ||||
| Shares sold | 323,875 | 593,707 | ||
| Shares issued for dividends reinvested | 27,493 | 7,895 | ||
| Shares redeemed | (813,824) | (513,536) | ||
| Net Increase (Decrease) in Shares Outstanding | (462,456) | 88,066 | ||
| Class C | ||||
| Shares sold | 7,520 | 25,679 | ||
| Shares issued for dividends reinvested | 1,479 | 523 | ||
| Shares redeemed | (26,497) | (18,780) | ||
| Net Increase (Decrease) in Shares Outstanding | (17,498) | 7,422 | ||
| Class I | ||||
| Shares sold | 10,424,872 | 11,997,797 | ||
| Shares issued for dividends reinvested | 446,730 | 56,849 | ||
| Shares redeemed | (7,832,272) | (2,716,420) | ||
| Net Increase (Decrease) in Shares Outstanding | 3,039,330 | 9,338,226 | ||
| See notes to financial statements. | ||||
16
FINANCIAL HIGHLIGHTS
The following tables describe the performance for each share class for the fiscal periods indicated.All information (except portfolio turnover rate) reflects financial results for a single fund share.Total return shows how much your investment in the fund would have increased (or decreased) during each period, assuming you had reinvested all dividends and distributions.These figures have been derived from the fund’s financial statements.
| Year Ended September 30, | ||||||||
| Class A Shares | 2011 | 2010 | 2009 | 2008a | ||||
| Per Share Data ($): | ||||||||
| Net asset value, beginning of period | 16.80 | 16.27 | 18.18 | 23.37 | ||||
| Investment Operations: | ||||||||
| Investment income—netb | .19 | .21 | .29 | .14 | ||||
| Net realized and unrealized | ||||||||
| gain (loss) on investments | (1.82) | .44 | (1.57) | (5.20) | ||||
| Total from Investment Operations | (1.63) | .65 | (1.28) | (5.06) | ||||
| Distributions: | ||||||||
| Dividends from investment income—net | (.17) | (.12) | (.16) | (.13) | ||||
| Dividends from net realized | ||||||||
| gain on investments | (.26) | — | (.47) | — | ||||
| Total Distributions | (.43) | (.12) | (.63) | (.13) | ||||
| Net asset value, end of period | 14.74 | 16.80 | 16.27 | 18.18 | ||||
| Total Return (%)c | (10.10) | 3.99 | (6.33) | (21.78)d | ||||
| Ratios/Supplemental Data (%): | ||||||||
| Ratio of total expenses to average net assets | 1.32 | 1.32 | 1.52 | 2.35e | ||||
| Ratio of net expenses to average net assets | 1.32 | 1.32 | 1.26 | 1.40e | ||||
| Ratio of net investment income | ||||||||
| to average net assets | 1.06 | 1.29 | 2.27 | 1.61e | ||||
| Portfolio Turnover Rate | 63.28 | 64.45 | 115.69 | 105 | ||||
| Net Assets, end of period ($ x 1,000) | 9,766 | 18,901 | 16,864 | 4,412 | ||||
| a | From March 31, 2008 (commencement of operations) to September 30, 2008. |
| b | Based on average shares outstanding at each month end. |
| c | Exclusive of sales charge. |
| d | Not annualized. |
| e | Annualized. |
See notes to financial statements.
| The Fund | 17 |
FINANCIAL HIGHLIGHTS (continued)
| Year Ended September 30, | ||||||||
| Class C Shares | 2011 | 2010 | 2009 | 2008a | ||||
| Per Share Data ($): | ||||||||
| Net asset value, beginning of period | 16.59 | 16.17 | 18.14 | 23.37 | ||||
| Investment Operations: | ||||||||
| Investment income—netb | .05 | .08 | .26 | .05 | ||||
| Net realized and unrealized | ||||||||
| gain (loss) on investments | (1.79) | .45 | (1.59) | (5.15) | ||||
| Total from Investment Operations | (1.74) | .53 | (1.33) | (5.10) | ||||
| Distributions: | ||||||||
| Dividends from investment income—net | (.05) | (.11) | (.17) | (.13) | ||||
| Dividends from net realized | ||||||||
| gain on investments | (.26) | — | (.47) | — | ||||
| Total Distributions | (.31) | (.11) | (.64) | (.13) | ||||
| Net asset value, end of period | 14.54 | 16.59 | 16.17 | 18.14 | ||||
| Total Return (%)c | (10.79) | 3.20 | (6.67) | (21.95)d | ||||
| Ratios/Supplemental Data (%): | ||||||||
| Ratio of total expenses to average net assets | 2.07 | 2.11 | 1.83 | 6.42e | ||||
| Ratio of net expenses to average net assets | 2.07 | 2.11 | 1.42 | 2.15e | ||||
| Ratio of net investment income | ||||||||
| to average net assets | .31 | .52 | 2.07 | .49e | ||||
| Portfolio Turnover Rate | 63.28 | 64.45 | 115.69 | 105 | ||||
| Net Assets, end of period ($ x 1,000) | 924 | 1,345 | 1,191 | 399 | ||||
| a | From March 31, 2008 (commencement of operations) to September 30, 2008. |
| b | Based on average shares outstanding at each month end. |
| c | Exclusive of sales charge. |
| d | Not annualized. |
| e | Annualized. |
See notes to financial statements.
18
| Year Ended September 30, | ||||||||||
| Class I Shares | 2011 | 2010 | 2009 | 2008a | 2007 | |||||
| Per Share Data ($): | ||||||||||
| Net asset value, beginning of period | 16.84 | 16.27 | 18.21 | 26.94 | 21.51 | |||||
| Investment Operations: | ||||||||||
| Investment income—netb | .26 | .25 | .30 | .31 | .35 | |||||
| Net realized and unrealized | ||||||||||
| gain (loss) on investments | (1.86) | .45 | (1.59) | (6.64) | 5.41 | |||||
| Total from Investment Operations | (1.60) | .70 | (1.29) | (6.33) | 5.76 | |||||
| Distributions: | ||||||||||
| Dividends from investment income—net | (.21) | (.13) | (.18) | (.35) | (.20) | |||||
| Dividends from net realized | ||||||||||
| gain on investments | (.26) | — | (.47) | (2.05) | (.13) | |||||
| Total Distributions | (.47) | (.13) | (.65) | (2.40) | (.33) | |||||
| Net asset value, end of period | 14.77 | 16.84 | 16.27 | 18.21 | 26.94 | |||||
| Total Return (%) | (9.90) | 4.31 | (6.32) | (25.80) | 26.92 | |||||
| Ratios/Supplemental Data (%): | ||||||||||
| Ratio of total expenses | ||||||||||
| to average net assets | 1.05 | 1.07 | 1.16 | 1.59 | 1.36 | |||||
| Ratio of net expenses | ||||||||||
| to average net assets | 1.05 | 1.07 | 1.13 | 1.15 | 1.15 | |||||
| Ratio of net investment income | ||||||||||
| to average net assets | 1.48 | 1.57 | 2.41 | 1.33 | 1.45 | |||||
| Portfolio Turnover Rate | 63.28 | 64.45 | 115.69 | 105 | 87 | |||||
| Net Assets, end of period ($ x 1,000) | 484,349 | 500,811 | 331,986 | 61,779 | 49,134 | |||||
| a The fund commenced offering four classes of shares on March 31, 2008.The existing shares were redesignated Class I |
| and the fund added Class A, Class C and Class R shares.The fund terminated its offering of Class R shares on |
| December 3, 2008. |
| b Based on average shares outstanding at each month end. |
See notes to financial statements.
| The Fund | 19 |
NOTES TO FINANCIAL STATEMENTS
NOTE 1—Significant Accounting Policies:
Dreyfus/Newton International Equity Fund (the “fund”) is a separate diversified series of Dreyfus Investment Funds (the “Trust”), which is registered under the Investment Company Act of 1940, as amended (the “Act”), as an open-end management investment company and operates as a series company currently offering eleven series, including the fund.The fund’s investment objective is to seek long-term growth of capital. The Dreyfus Corporation (the“Manager” or“Dreyfus”), a wholly-owned subsidiary ofThe Bank of NewYork Mellon Corporation (“BNY Mellon”), serves as the fund’s investment adviser. Newton Capital Management Limited (“Newton”) serves as the fund’s sub-investment adviser.
MBSC Securities Corporation (the “Distributor”), a wholly-owned subsidiary of Dreyfus, is the distributor of the fund’s shares.The fund is authorized to issue an unlimited number of $.001 par value shares of Beneficial Interest in the following classes of shares: Class A, Class C and Class I. Class A shares are subject to a sales charge imposed at the time of purchase. Class C shares are subject to a contingent deferred sales charge (“CDSC”) imposed on Class C shares redeemed within one year of purchase. Class I shares are sold primarily to bank trust departments and other financial services providers (including The Bank of New York Mellon, a subsidiary of BNY Mellon and an affiliate of Dreyfus), acting on behalf of customers having a qualified trust or an investment account or relationship at such institution, and bear no distribution or shareholder services fees. Class I shares are offered without a front-end sales charge or CDSC. Other differences between the classes include the services offered to, the expenses borne by each class, the allocation of certain transfer agency costs and certain voting rights. Income, expenses (other than expenses attributable to a specific class), and realized and unrealized gains or losses on investments are allocated to each class of shares based on its relative net assets.
TheTrust accounts separately for the assets, liabilities and operations of each series. Expenses directly attributable to each series are charged to that series’ operations; expenses which are applicable to all series are allocated among them on a pro rata basis.
20
The Financial Accounting Standards Board (“FASB”) Accounting Standards Codification (“ASC”) is the exclusive reference of authoritative U.S. generally accepted accounting principles (“GAAP”) recognized by the FASB to be applied by nongovernmental entities. Rules and interpretive releases of the Securities and Exchange Commission (“SEC”) under authority of federal laws are also sources of authoritative GAAP for SEC registrants. The fund’s financial statements are prepared in accordance with GAAP, which may require the use of management estimates and assumptions.Actual results could differ from those estimates.
(a) Portfolio valuation: The fair value of a financial instrument is the amount that would be received to sell an asset or paid to transfer a liability in an orderly transaction between market participants at the measurement date (i.e. the exit price). GAAP establishes a fair value hierarchy that prioritizes the inputs of valuation techniques used to measure fair value.This hierarchy gives the highest priority to unadjusted quoted prices in active markets for identical assets or liabilities (Level 1 measurements) and the lowest priority to unobservable inputs (Level 3 measurements).
Additionally, GAAP provides guidance on determining whether the volume and activity in a market has decreased significantly and whether such a decrease in activity results in transactions that are not orderly. GAAP requires enhanced disclosures around valuation inputs and techniques used during annual and interim periods.
Various inputs are used in determining the value of the fund’s investments relating to fair value measurements.These inputs are summarized in the three broad levels listed below:
Level 1—unadjusted quoted prices in active markets for identical investments.
Level 2—other significant observable inputs (including quoted prices for similar investments, interest rates, prepayment speeds, credit risk, etc.).
Level 3—significant unobservable inputs (including the fund’s own assumptions in determining the fair value of investments).
| The Fund | 21 |
NOTES TO FINANCIAL STATEMENTS (continued)
The inputs or methodology used for valuing securities are not necessarily an indication of the risk associated with investing in those securities.
Changes in valuation techniques may result in transfers in or out of an assigned level within the disclosure hierarchy. Valuation techniques used to value the fund’s investments are as follows:
Investments in securities are valued at the last sales price on the securities exchange or national securities market on which such securities are primarily traded. Securities listed on the National Market System for which market quotations are available are valued at the official closing price or, if there is no official closing price that day, at the last sales price. Securities not listed on an exchange or the national securities market, or securities for which there were no transactions, are valued at the average of the most recent bid and asked prices, except for open short positions, where the asked price is used for valuation purposes. Bid price is used when no asked price is available. Registered investment companies that are not traded on an exchange are valued at their net asset value. All preceding securities are categorized within Level 1 of the fair value hierarchy.
Fair valuing of securities may be determined with the assistance of a pricing service using calculations based on indices of domestic securities and other appropriate indicators, such as prices of relevant ADRs and futures contracts. Utilizing these techniques may result in transfers between Level 1 and Level 2 of the fair value hierarchy.
When market quotations or official closing prices are not readily available, or are determined not to reflect accurately fair value, such as when the value of a security has been significantly affected by events after the close of the exchange or market on which the security is principally traded (for example, a foreign exchange or market), but before the fund calculates its net asset value, the fund may value these investments at fair value as determined in accordance with the procedures approved by the Board of Trustees. Certain factors may be considered when fair valuing investments such as: fundamental analytical data, the nature and duration of restrictions on disposition, an evaluation of the forces that influence
22
the market in which the securities are purchased and sold, and public trading in similar securities of the issuer or comparable issuers.These securities are either categorized as Level 2 or 3 depending on the relevant inputs used.
For restricted securities where observable inputs are limited, assumptions about market activity and risk are used and are categorized within Level 3 of the fair value hierarchy.
Investments denominated in foreign currencies are translated to U.S. dollars at the prevailing rates of exchange. Forward foreign currency exchange contracts (“forward contracts”) are valued at the forward rate. These securities are generally categorized within Level 2 of the fair value hierarchy.
The following is a summary of the inputs used as of September 30, 2011 in valuing the fund’s investments:
| Level 2—Other | Level 3— | |||||
| Level 1— | Significant | Significant | ||||
| Unadjusted | Observable | Unobservable | ||||
| Quoted Prices | Inputs | Inputs | Total | |||
| Assets ($) | ||||||
| Investments in Securities: | ||||||
| Equity Securities— | ||||||
| Foreign† | 4,436,620 | 487,440,998 | †† | — | 491,877,618 | |
| Other Financial | ||||||
| Instruments: | ||||||
| Forward Foreign | ||||||
| Currency Exchange | ||||||
| Contracts††† | — | 582,818 | — | 582,818 | ||
| Liabilities ($) | ||||||
| Other Financial | ||||||
| Instruments: | ||||||
| Forward Foreign | ||||||
| Currency Exchange | ||||||
| Contracts††† | — | (293,339 | ) | — | (293,339 | ) |
| † | See Statement of Investments for additional detailed categorizations. |
| †† | Securities classified as Level 2 at period end as the values were determined pursuant to the fund’s |
| fair valuation procedures. | |
| ††† Amount shown represents unrealized appreciation (depreciation) at period end. | |
| The Fund | 23 |
NOTES TO FINANCIAL STATEMENTS (continued)
In May 2011, FASB issued Accounting Standards Update (“ASU”) No. 2011-04 “Amendments to Achieve Common Fair Value Measurement and Disclosure Requirements in GAAP and International Financial Reporting Standards (“IFRS”)” (“ASU 2011-04”). ASU 2011-04 includes common requirements for measurement of and disclosure about fair value between GAAP and IFRS. ASU 2011-04 will require reporting entities to disclose the following information for fair value measurements categorized within Level 3 of the fair value hierarchy: quantitative information about the unobservable inputs used in the fair value measurement, the valuation processes used by the reporting entity and a narrative description of the sensitivity of the fair value measurement to changes in unobservable inputs and the interrelationships between those unobservable inputs. In addition, ASU 2011-04 will require reporting entities to make disclosures about amounts and reasons for all transfers in and out of Level 1 and Level 2 fair value mea-surements.The new and revised disclosures are effective for interim and annual reporting periods beginning after December 15, 2011. At this time, management is evaluating the implications of ASU 2011-04 and its impact on the financial statements.
(b) Foreign currency transactions: The fund does not isolate that portion of the results of operations resulting from changes in foreign exchange rates on investments from the fluctuations arising from changes in the market prices of securities held. Such fluctuations are included with the net realized and unrealized gain or loss on investments.
Net realized foreign exchange gains or losses arise from sales of foreign currencies, currency gains or losses realized on securities transactions between trade and settlement date and the difference between the amounts of dividends, interest and foreign withholding taxes recorded on the fund’s books and the U.S. dollar equivalent of the amounts actually received or paid. Net unrealized foreign exchange gains and losses arise from changes in the value of assets and liabilities other than investments resulting from changes in exchange rates. Foreign currency gains and losses on investments are included with net realized and unrealized gain or loss on investments.
24
(c) Securities transactions and investment income: Securities transactions are recorded on a trade date basis. Realized gains and losses from securities transactions are recorded on the identified cost basis. Dividend income is recognized on the ex-dividend date and interest income, including, where applicable, accretion of discount and amortization of premium on investments, is recognized on the accrual basis.
Investing in foreign markets may involve special risks and considerations not typically associated with investing in the U.S. These risks include revaluation of currencies, high rates of inflation, repatriation restrictions on income and capital, and adverse political and economic developments. Moreover, securities issued in these markets may be less liquid, subject to government ownership controls and delayed settlements, and their prices may be more volatile than those of comparable securities in the U.S.
Pursuant to a securities lending agreement withThe Bank of NewYork Mellon, the fund may lend securities to qualified institutions. It is the fund’s policy that, at origination, all loans are secured by collateral of at least 102% of the value of U.S. securities loaned and 105% of the value of foreign securities loaned. Collateral equivalent to at least 100% of the market value of securities on loan is maintained at all times. Collateral is either in the form of cash, which can be invested in certain money market mutual funds managed by Dreyfus, U.S Government and Agency securities or letters of credit.The fund is entitled to receive all income on securities loaned, in addition to income earned as a result of the lending transaction.Although each security loaned is fully collateralized, the fund bears the risk of delay in recovery of, or loss of rights in, the securities loaned should a borrower fail to return the securities in a timely manner. During the period ended September 30, 2011,The Bank of New York Mellon earned $14,825 from lending portfolio securities, pursuant to the securities lending agreement.
(d) Affiliated issuers: Investments in other investment companies advised by Dreyfus are defined as “affiliated” in the Act.
| The Fund | 25 |
NOTES TO FINANCIAL STATEMENTS (continued)
The fund may invest in shares of certain affiliated investment companies also advised or managed by Dreyfus. Investments in affiliated investment companies for the period ended September 30, 2011 were as follows:
| Affiliated | ||||||
| Investment | Value | Value | Net | |||
| Company | 9/30/2010 ($) | Purchases ($) | Sales ($) | 9/30/2011 ($) | Assets (%) | |
| Dreyfus | ||||||
| Institutional | ||||||
| Preferred | ||||||
| Plus Money | ||||||
| Market | ||||||
| Fund | 15,643,594 | 229,595,316 | 245,238,910 | — | — | |
| Dreyfus | ||||||
| Institutional | ||||||
| Cash | ||||||
| Advantage | ||||||
| Fund | — | 28,481,913 | 28,481,913 | — | — | |
| Total | 15,643,594 | 258,077,229 | 273,720,823 | — | — |
(e) Dividends to shareholders: Dividends are recorded on the ex-dividend date. Dividends from investment income-net and dividends from net realized capital gains, if any, are normally declared and paid annually, but the fund may make distributions on a more frequent basis to comply with the distribution requirements of the Internal Revenue Code of 1986, as amended (the “Code”).To the extent that net realized capital gains can be offset by capital loss carryovers, it is the policy of the fund not to distribute such gains. Income and capital gain distributions are determined in accordance with income tax regulations, which may differ from GAAP.
(f) Federal income taxes: It is the policy of the fund to continue to qualify as a regulated investment company, if such qualification is in the best interests of its shareholders, by complying with the applicable provisions of the Code, and to make distributions of taxable income sufficient to relieve it from substantially all federal income and excise taxes.
As of and during the period ended September 30, 2011, the fund did not have any liabilities for any uncertain tax positions.The fund recognizes interest and penalties, if any, related to uncertain tax positions as income tax expense in the Statement of Operations. During the period, the fund did not incur any interest or penalties.
26
Each of the tax years in the four-year period ended September 30, 2011 remains subject to examination by the Internal Revenue Service and state taxing authorities.
At September 30, 2011, the components of accumulated earnings on a tax basis were as follows: undistributed ordinary income $10,627,121, undistributed capital gains $7,137,268 and unrealized depreciation $43,628,269. In addition, the fund had $2,738,529 of passive foreign investment company losses realized after October 31, 2010, which were deferred for tax purposes to the first day of the following fiscal year.
The tax character of distributions paid to shareholders during the fiscal periods ended September 30, 2011 and September 30, 2010 were as follows: ordinary income $13,631,124 and $3,025,543 and long-term capital gains $1,379,842 and $0, respectively.
During the period ended September 30, 2011, as a result of permanent book to tax differences, primarily due to the tax treatment for foreign currency gains and losses, passive foreign investment companies and Thailand capital gain taxes, the fund increased accumulated undistributed investment income-net by $345,719 and decreased accumulated net realized gain (loss) on investments by the same amount. Net assets and net asset value per share were not affected by this reclassification.
NOTE 2—Bank Lines of Credit:
The fund participates with other Dreyfus-managed funds in a $225 million unsecured credit facility led by Citibank, N.A. and a $300 million unsecured credit facility provided by The Bank of New York Mellon (each, a “Facility”), each to be utilized primarily for temporary or emergency purposes, including the financing of redemptions. In connection therewith, the fund has agreed to pay its pro rata portion of commitment fees for each Facility. Interest is charged to the fund based on rates determined pursuant to the terms of the respective Facility at the time of borrowing.
| The Fund | 27 |
NOTES TO FINANCIAL STATEMENTS (continued)
The average amount of borrowings outstanding under the Facilities during the period ended September 30, 2011 was approximately $123,000, with a related weighted average annualized interest rate of 1.79%.
NOTE 3—Investment Advisory Fee, Sub-Investment Advisory Fee and Other Transactions With Affiliates:
(a) Pursuant to an investment advisory agreement with Dreyfus, the investment advisory fee is computed at the annual rate of .80% of the value of the fund’s average daily net assets and is payable monthly. Dreyfus had agreed, until February 1, 2011, to waive receipt of its fees and/or assume the expenses of the fund so that the direct expenses of none of the classes (excluding Rule 12b-1 fees, shareholder services fees, taxes, interest, brokerage commissions, acquired fund fees and extraordinary expenses) exceed 1.15% of the value of the fund’s average daily net assets.There was no reduction in the investment advisory fee, pursuant to the undertaking, during the period ended September 30, 2011.
Pursuant to a sub-investment advisory agreement between Dreyfus and Newton, Dreyfus pays Newton a monthly fee at an annual percentage rate of the value of the fund’s average daily net assets.
From October 1, 2010 through April 30, 2011, the Trust had an agreement with The Bank of New York Mellon, pursuant to which The Bank of NewYork Mellon provided administration and fund accounting services for the fund. For these services, the fund paid The Bank of New York Mellon a fixed fee plus asset and transaction based fees, as well as out-of-pocket expenses. Pursuant to this agreement, the fund was charged $42,000 during the period October 1, 2010 through April 30, 2011 for administration and fund accounting services.
At Board Meetings of the Trust held on February 15-16, 2011, the Board ofTrustees of theTrust terminated the agreement withThe Bank of New York Mellon and, on behalf of the Trust, entered into a Fund Accounting and Administration Agreement (the “Administration Agreement”) with Dreyfus, effective May 1, 2011, whereby Dreyfus performs administrative, accounting and recordkeeping services for the fund. The fund has agreed to compensate Dreyfus for providing
28
accounting services, administration, compliance monitoring, regulatory and shareholder reporting, as well as related facilities, equipment and clerical help.The fee is based on the fund’s average daily net assets and computed at the following annual rates: .10% of the first $500 million, .065% of the next $500 million and .02% in excess of $1 billion.
In addition, after applying any expense limitations or fee waivers that reduce the fees paid to Dreyfus for this service, Dreyfus has contractually agreed in writing to waive any remaining fees for this service to the extent that they exceed both Dreyfus’ costs in providing these services and a reasonable allocation of the costs incurred by Dreyfus and its affiliates related to the support and oversight of these services. The fund also reimburses Dreyfus for the out-of-pocket expenses Dreyfus incurs in performing this service for the fund. Pursuant to the Administration Agreement, the fund was charged $69,340 during the period May 1, 2011 through September 30, 2011.
During the period ended September 30, 2011, the Distributor retained $1,489 from commissions earned on sales of the fund’s Class A shares.
(b) Under the Distribution Plan (the “Plan”) adopted pursuant to Rule 12b-1 under the Act, Class C shares pay the Distributor for distributing its shares at an annual rate of .75% of the value of the average daily net assets of Class C shares. During the period ended September 30, 2011, Class C shares were charged $9,798 pursuant to the Plan.
(c) Under the Shareholder Services Plan, Class A and Class C shares pay the Distributor at an annual rate of .25% of the value of their average daily net assets for the provision of certain services.The services provided may include personal services relating to shareholder accounts, such as answering shareholder inquiries regarding the fund and providing reports and other information, and services related to the maintenance of shareholder accounts.The Distributor may make payments to Service Agents (a securities dealer, financial institution or other industry professional) in respect of these services.The Distributor determines the amounts to be paid to Service Agents. During the period ended September 30, 2011,
| The Fund | 29 |
NOTES TO FINANCIAL STATEMENTS (continued)
Class A and Class C shares were charged $47,357 and $3,266, respectively, pursuant to the Shareholder Services Plan.
The fund compensates Dreyfus Transfer, Inc., a wholly-owned subsidiary of Dreyfus, under a transfer agency agreement for providing personnel and facilities to perform transfer agency services for the fund. During the period ended September 30, 2011, the fund was charged $5,421 pursuant to the transfer agency agreement, which is included in Shareholder servicing costs in the Statement of Operations.
The fund has arrangements with the custodian and cash management bank whereby the fund may receive earnings credits when positive cash balances are maintained, which are used to offset custody and cash management fees. For financial reporting purposes, the fund includes net earnings credits as an expense offset in the Statement of Operations.
The fund compensatesThe Bank of NewYork Mellon under cash management agreements for performing cash management services related to fund subscriptions and redemptions. During the period ended September 30, 2011, the fund was charged $291 pursuant to the cash management agreements, which is included in Shareholder servicing costs in the Statement of Operations.These fees were partially offset by earnings credits of $12.
The fund also compensates The Bank of New York Mellon under a custody agreement for providing custodial services for the fund. During the period ended September 30, 2011, the fund was charged $383,283 pursuant to the custody agreement.
During the period ended September 30, 2011, the fund was charged $7,146 for services performed by the Chief Compliance Officer.
The components of “Due to The Dreyfus Corporation and affiliates” in the Statement of Assets and Liabilities consist of: investment advisory fees $353,549, administration fees $12,730 Rule 12b-1 distribution plan fees $621, shareholder services plan fees $2,368, custodian fees $145,165, chief compliance officer fees $3,750, private wealth sub-accounting fees $186,620 and transfer agency per account fees $859.
30
(d) Each Trustee who is not an “interested person” of the Trust (as defined in the Act) receives $60,000 per annum, plus $7,000 per joint Board meeting of the Trust, The Dreyfus/Laurel Funds, Inc., The Dreyfus/Laurel Funds Trust, The Dreyfus/Laurel Tax-Free Municipal Funds and Dreyfus Funds, Inc. (collectively, the “Board Group Open-End Funds”) attended, $2,500 for separate in-person committee meetings attended which are not held in conjunction with a regularly scheduled Board meeting and $2,000 for Board meetings and separate committee meetings attended that are conducted by telephone. The Board Group Open-End Funds also reimburse eachTrustee who is not an “interested person” of the Trust (as defined in the Act) for travel and out-of-pocket expenses. With respect to Board meetings, the Chairman of the Board receives an additional 25% of such compensation (with the exception of reimbursable amounts).The Chair of each of the Board’s committees, unless the Chair also serves as Chair of the Board, receives $1,350 per applicable committee meeting. In the event that there is an in-person joint committee meeting or a joint telephone meeting of the Board Group Open-End Funds and Dreyfus HighYield Strategies Fund (“DHF”), a $2,500 fee is allocated between the Board Group Open-End Funds and DHF.
Effective January 1, 2012, the Board Group Open-End Funds and DHF (collectively, the “Board Group Funds”) will pay each Trustee their respective allocated portions of an annual retainer of $85,000 and a fee of $10,000 for each regularly scheduled Board meeting attended ($75,000 and $8,000, respectively, in the aggregate, prior to January 1, 2012).With respect to the annual retainer and Board meetings of the Board Group Funds, the Chair of the Board will receive an additional 25% of such compensation (with the exception of reimbursable amounts). Each Trustee will receive $2,500 for any separate in-person committee meetings attended, which are not held in conjunction with a regularly scheduled Board meeting, such amount to be allocated among the Board Group Funds, as applicable. In the event that there is a joint telephone meeting of the Board Group Funds, a fee of $2,000
| The Fund | 31 |
NOTES TO FINANCIAL STATEMENTS (continued)
will be allocated among the applicable Board Group Funds, accordingly (prior to January 1, 2012, the fee allocated was $2,500 if the meeting included DHF). The Chair of each of the Board’s committees, unless the Chair also serves as Chair of the Board, will receive $1,500 per applicable committee meeting. Each Emeritus Trustee is entitled to receive an annual retainer of one-half the amount paid as a retainer at the time the Trustee became Emeritus and a per meeting attended fee of one-half the amount paid to Trustees.The Board Group Funds also reimburse each Independent Trustee and Emeritus Trustees for travel and out-of-pocket expenses.
(e) A 2% redemption fee was charged and retained by the fund on certain shares redeemed within sixty days following the date of issuance, subject to exceptions, including redemptions made through the use of the fund’s exchange privilege. During the period ended September 30, 2011, redemption fees charged and retained by the fund amounted to $1,713.
Effective December 15, 2010, the fund no longer charges a redemption fee on shares that are redeemed or exchanged before the end of the required holding period.The fund reserves the right to reimpose a redemption fee in the future.
NOTE 4—Securities Transactions:
The aggregate amount of purchases and sales of investment securities, excluding short-term securities and forward contracts, during the period ended September 30, 2011, amounted to $416,602,996 and $371,343,846, respectively.
Forward Foreign Currency Exchange Contracts: The fund enters into forward contracts in order to hedge its exposure to changes in foreign currency exchange rates on its foreign portfolio holdings, to settle foreign currency transactions or as a part of its investment strategy. When executing forward contracts, the fund is obligated to buy or sell a foreign currency at a specified rate on a certain date in the future. With respect to sales of forward contracts, the fund incurs a loss if the
32
value of the contract increases between the date the forward contract is opened and the date the forward contract is closed.The fund realizes a gain if the value of the contract decreases between those dates. With respect to purchases of forward contracts, the fund incurs a loss if the value of the contract decreases between the date the forward contract is opened and the date the forward contract is closed.The fund realizes a gain if the value of the contract increases between those dates. Any realized gain or loss which occurred during the period is reflected in the Statement of Operations.The fund is exposed to foreign currency risk as a result of changes in value of underlying financial instruments. The fund is also exposed to credit risk associated with counterparty nonperformance on these forward contracts, which is typically limited to the unrealized gain on each open contract.The following summarizes open forward contracts at September 30, 2011:
| Foreign | Unrealized | ||||
| Forward Foreign Currency | Currency | Appreciation | |||
| Exchange Contracts | Amounts | Cost ($) | Value ($) (Depreciation) ($) | ||
| Purchases: | |||||
| Japanese Yen, | |||||
| Expiring 10/3/2011 | 81,829,690 | 1,071,207 | 1,060,932 | (10,275 | ) |
| Japanese Yen, | |||||
| Expiring 3/15/2012 | 563,608,430 | 7,422,110 | 7,327,545 | (94,565 | ) |
| Sales: | Proceeds ($) | ||||
| Australian Dollar, | |||||
| Expiring 10/5/2011 | 90,363 | 89,201 | 87,444 | 1,757 | |
| Australian Dollar, | |||||
| Expiring 2/15/2012 | 5,412,000 | 5,545,725 | 5,155,776 | 389,949 | |
| Australian Dollar, | |||||
| Expiring 2/15/2012 | 2,624,000 | 2,541,108 | 2,499,770 | 41,338 | |
| Brazilian Real, | |||||
| Expiring 3/15/2012 | 14,770,000 | 7,422,111 | 7,610,610 | (188,499 | ) |
| British Pound, | |||||
| Expiring 10/3/2011 | 141,003 | 221,317 | 219,881 | 1,436 | |
| British Pound, | |||||
| Expiring 10/4/2011 | 27,925 | 43,593 | 43,546 | 47 | |
| British Pound, | |||||
| Expiring 1/13/2012 | 4,147,000 | 6,589,193 | 6,460,307 | 128,886 | |
| Euro, | |||||
| Expiring 10/4/2011 | 978,408 | 1,313,708 | 1,310,818 | 2,890 | |
| The Fund | 33 |
NOTES TO FINANCIAL STATEMENTS (continued)
| Foreign | Unrealized | ||||
| Forward Foreign Currency | Currency | Appreciation | |||
| Exchange Contracts | Amounts | Proceeds ($) | Value ($) (Depreciation) ($) | ||
| Sales (continued): | |||||
| Japanese Yen, | |||||
| Expiring 10/3/2011 | 128,753,324 | 1,678,289 | 1,669,303 | 8,986 | |
| Japanese Yen, | |||||
| Expiring 10/4/2011 | 149,725,969 | 1,948,745 | 1,941,216 | 7,529 | |
| Gross Unrealized | |||||
| Appreciation | 582,818 | ||||
| Gross Unrealized | |||||
| Depreciation | (293,339) | ||||
The following summarizes the average market value of derivatives outstanding during the period ended September 30, 2011:
| Average Market Value ($) | |
| Forward contracts | 16,417,441 |
At September 30, 2011, the cost of investments for federal income tax purposes was $535,416,358; accordingly, accumulated net unrealized depreciation on investments was $43,538,740, consisting of $38,130,143 gross unrealized appreciation and $81,668,883 gross unrealized depreciation.
NOTE 5—Subsequent Event:
Effective October 27, 2011, the Nominating Committee of the Board of Trustees nominated, and the Board of Trustees approved the election of, Francine J. Bovich as a Trustee of the Trust. A proxy statement will be mailed, on or about November 28, 2011, to Trust shareholders of record as of the close of business November 1, 2011, asking shareholders to consider Ms. Bovich’s election as a Board member of the Trust at a Special Joint Meeting of Shareholders to be held on Wednesday, February 8, 2012.
34
| REPORT OF INDEPENDENT REGISTERED |
| PUBLIC ACCOUNTING FIRM |
To the Board of Trustees and Shareholders of Dreyfus/Newton International Equity Fund:
We have audited the accompanying statement of assets and liabilities of Dreyfus/Newton International Equity Fund (the “Fund”), a series of Dreyfus Investment Funds, including the statement of investments as of September 30, 2011, and the related statement of operations for the year then ended, the statements of changes in net assets for each of the years in the two-year period then ended and financial highlights for each of the years in the three-year period then ended.These financial statements and financial highlights are the responsibility of the Fund’s management. Our responsibility is to express an opinion on these financial statements and financial highlights based on our audits.The financial highlights for each of the years in the two-year period ended September 30, 2008 were audited by other independent registered public accountants whose report thereon, dated November 28, 2008, expressed an unqualified opinion on those financial highlights.
We conducted our audit in accordance with the standards of the Public Company Accounting Oversight Board (United States).Those standards require that we plan and perform the audit to obtain reasonable assurance about whether the financial statements and financial highlights are free of material misstatement.An audit also includes examining, on a test basis, evidence supporting the amounts and disclosures in the financial statements. Our procedures included confirmation of securities owned as of September 30, 2011 by correspondence with the custodian and brokers or by other appropriate auditing procedures where replies from brokers were not received.An audit also includes assessing the accounting principles used and significant estimates made by management, as well as evaluating the overall financial statement presentation.We believe that our audits provide a reasonable basis for our opinion.
In our opinion, the financial statements and financial highlights referred to above present fairly, in all material respects, the financial position of Dreyfus/Newton International Equity Fund as of September 30, 2011, and the results of its operations for the year then ended, the changes in its net assets for each of the years in the two-year period then ended, and the financial highlights for each of the years in the three-year period then ended, in conformity with U.S. generally accepted accounting principles.

New York, New York
November 23, 2011
| The Fund | 35 |
IMPORTANT TAX INFORMATION (Unaudited)
For federal tax purposes, the fund elects to provide each shareholder with their portion of the fund’s income sourced from foreign countries and taxes paid from foreign countries. The fund designates the maximum amount allowable but not less than $16,443,878 as income sourced from foreign countries for the fiscal year ended September 30, 2011 in accordance with Section 853(c)(2) of the Internal Revenue Code and also the fund designates the maximum amount allowable but not less than $1,517,748 as taxes paid from foreign countries for the fiscal year ended September 30, 2011 in accordance with Section 853(a) of the Internal Revenue Code.Where required by federal tax law rules, shareholders will receive notification of their proportionate share of foreign sourced income and foreign taxes paid for the 2011 calendar year with Form 1099-DIV which will be mailed in early 2012. Also, the fund designates the maximum amount allowable, but not less than $12,059,497 as ordinary income dividends paid during the fiscal year ended September 30, 2011 as qualified dividend income in accordance with Section 854(b)(1)(B) of the Internal Revenue Code. The fund designates the maximum amount allowable but not less than $.0434 per share as a long-term capital gain dividend in accordance with Section 852(b)(3)(C) of the Internal Revenue Code. The fund designates the maximum amount allowable but not less than $.2188 per share as a short-term capital gain dividend in accordance with Sections 871(k)(2) and 881(e) of the Internal Revenue Code.
36
BOARD MEMBERS INFORMATION (Unaudited)
| Joseph S. DiMartino (67) |
| Chairman of the Board (2008) |
| Principal Occupation During Past 5Years: |
| • Corporate Director and Trustee |
| Other Public Company Board Memberships During Past 5Years: |
| • CBIZ (formerly, Century Business Services, Inc.), a provider of outsourcing functions for small |
| and medium size companies, Director (1997-present) |
| • Sunair Services Corporation, a provider of certain outdoor-related services to homes and |
| businesses, Director (2005-2009) |
| • The Newark Group, a provider of a national market of paper recovery facilities, paperboard |
| mills and paperboard converting plants, Director (2000-2010) |
| No. of Portfolios for which Board Member Serves: 167 |
| ——————— |
| Francine J. Bovich (60)† |
| Board Member (2011) |
| Principal Occupation During Past 5Years: |
| • Trustee,The Bradley Trusts, private trust funds (2011-present) |
| • Managing Director, Morgan Stanley Investment Management (1993-2010) |
| No. of Portfolios for which Board Member Serves: 14 |
| ——————— |
| James M. Fitzgibbons (77) |
| Board Member (2008) |
| Principal Occupation During Past 5Years: |
| • Corporate Director and Trustee |
| Other Public Company Board Memberships During Past 5Years: |
| • Bill Barrett Corporation, an oil and natural gas exploration company, Director (2004-present) |
| No. of Portfolios for which Board Member Serves: 33 |
| ——————— |
| Kenneth A. Himmel (65) |
| Board Member (2008) |
| Principal Occupation During Past 5Years: |
| • President and CEO, Related Urban Development, a real estate development company (1996-present) |
| • President and CEO, Himmel & Company, a real estate development company (1980-present) |
| • CEO,American Food Management, a restaurant company (1983-present) |
| No. of Portfolios for which Board Member Serves: 33 |
| The Fund | 37 |
BOARD MEMBERS INFORMATION (Unaudited) (continued)
| Stephen J. Lockwood (64) |
| Board Member (2008) |
| Principal Occupation During Past 5Years: |
| • Chairman of the Board, Stephen J. Lockwood and Company LLC, a real estate investment |
| company (2000-present) |
| No. of Portfolios for which Board Member Serves: 33 |
| ——————— |
| Roslyn M. Watson (61) |
| Board Member (2008) |
| Principal Occupation During Past 5Years: |
| • Principal,Watson Ventures, Inc., a real estate investment company (1993-present) |
| No. of Portfolios for which Board Member Serves: 43 |
| ——————— |
| Benaree Pratt Wiley (65) |
| Board Member (2008) |
| Principal Occupation During Past 5Years: |
| • Principal,TheWiley Group, a firm specializing in strategy and business development (2005-present) |
| Other Public Company Board Memberships During Past 5Years: |
| • CBIZ (formerly, Century Business Services, Inc.), a provider of outsourcing functions for small |
| and medium size companies, Director (2008-present) |
| No. of Portfolios for which Board Member Serves: 68 |
| ——————— |
† Ms. Bovich was elected as a Board Member by the Board of Trustees, effective October 27, 2011. See Note 5.
Once elected all Board Members serve for an indefinite term, but achieve Emeritus status upon reaching age 80.The address of the Board Members and Officers is in c/o The Dreyfus Corporation, 200 Park Avenue, NewYork, NewYork 10166.Additional information about the Board Members is available in the fund’s Statement of Additional Information which can be obtained from Dreyfus free of charge by calling this toll free number: 1-800-DREYFUS.
38
OFFICERS OF THE FUND (Unaudited)
BRADLEY J. SKAPYAK, President since January 2010.
Chief Operating Officer and a director of the Manager since June 2009. From April 2003 to June 2009, Mr. Skapyak was the head of the Investment Accounting and Support Department of the Manager. He is an officer of 75 investment companies (comprised of 167 portfolios) managed by the Manager. He is 52 years old and has been an employee of the Manager since February 1988.
MICHAEL A. ROSENBERG, Vice President and Secretary since December 2008.
Assistant General Counsel of BNY Mellon, and an officer of 76 investment companies (comprised of 192 portfolios) managed by the Manager. He is 51 years old and has been an employee of the Manager since October 1991.
KIESHA ASTWOOD, Vice President and Assistant Secretary since January 2010.
Counsel of BNY Mellon, and an officer of 76 investment companies (comprised of 192 portfolios) managed by the Manager. She is 38 years old and has been an employee of the Manager since July 1995.
JAMES BITETTO, Vice President and Assistant Secretary since December 2008.
Senior Counsel of BNY Mellon and Secretary of the Manager, and an officer of 76 investment companies (comprised of 192 portfolios) managed by the Manager. He is 45 years old and has been an employee of the Manager since December 1996.
JONI LACKS CHARATAN, Vice President and Assistant Secretary since December 2008.
Senior Counsel of BNY Mellon, and an officer of 76 investment companies (comprised of 192 portfolios) managed by the Manager. She is 55 years old and has been an employee of the Manager since October 1988.
JOSEPH M. CHIOFFI, Vice President and Assistant Secretary since December 2008.
Senior Counsel of BNY Mellon, and an officer of 76 investment companies (comprised of 192 portfolios) managed by the Manager. He is 49 years old and has been an employee of the Manager since June 2000.
KATHLEEN DENICHOLAS, Vice President and Assistant Secretary since January 2010.
Managing Counsel of BNY Mellon, and an officer of 76 investment companies (comprised of 192 portfolios) managed by the Manager. She is 36 years old and has been an employee of the Manager since February 2001.
JANETTE E. FARRAGHER, Vice President and Assistant Secretary since December 2008.
Assistant General Counsel of BNY Mellon, and an officer of 76 investment companies (comprised of 192 portfolios) managed by the Manager. She is 48 years old and has been an employee of the Manager since February 1984.
JOHN B. HAMMALIAN, Vice President and Assistant Secretary since December 2008.
Senior Managing Counsel of BNY Mellon, and an officer of 76 investment companies (comprised of 192 portfolios) managed by the Manager. He is 48 years old and has been an employee of the Manager since February 1991.
M. CRISTINA MEISER, Vice President and Assistant Secretary since January 2010.
Senior Counsel of BNY Mellon, and an officer of 76 investment companies (comprised of 192 portfolios) managed by the Manager. She is 41 years old and has been an employee of the Manager since August 2001.
| The Fund | 39 |
OFFICERS OF THE FUND (Unaudited) (continued)
ROBERT R. MULLERY, Vice President and Assistant Secretary since December 2008.
Managing Counsel of BNY Mellon, and an officer of 76 investment companies (comprised of 192 portfolios) managed by the Manager. He is 59 years old and has been an employee of the Manager since May 1986.
JEFF PRUSNOFSKY, Vice President and Assistant Secretary since December 2008.
Senior Managing Counsel of BNY Mellon, and an officer of 76 investment companies (comprised of 192 portfolios) managed by the Manager. He is 46 years old and has been an employee of the Manager since October 1990.
JAMES WINDELS, Treasurer since December 2008.
Director – Mutual Fund Accounting of the Manager, and an officer of 76 investment companies (comprised of 192 portfolios) managed by the Manager. He is 53 years old and has been an employee of the Manager since April 1985.
RICHARD CASSARO, Assistant Treasurer since December 2008.
Senior Accounting Manager – Money Market and Municipal Bond Funds of the Manager, and an officer of 76 investment companies (comprised of 192 portfolios) managed by the Manager. He is 52 years old and has been an employee of the Manager since September 1982.
GAVIN C. REILLY, Assistant Treasurer since December 2008.
Tax Manager of the Investment Accounting and Support Department of the Manager, and an officer of 76 investment companies (comprised of 192 portfolios) managed by the Manager. He is 43 years old and has been an employee of the Manager since April 1991.
ROBERT ROBOL, Assistant Treasurer since December 2008.
Senior Accounting Manager – Fixed Income Funds of the Manager, and an officer of 76 investment companies (comprised of 192 portfolios) managed by the Manager. He is 47 years old and has been an employee of the Manager since October 1988.
ROBERT SALVIOLO, Assistant Treasurer since December 2008.
Senior Accounting Manager – Equity Funds of the Manager, and an officer of 76 investment companies (comprised of 192 portfolios) managed by the Manager. He is 44 years old and has been an employee of the Manager since June 1989.
ROBERT SVAGNA, Assistant Treasurer since December 2008.
Senior Accounting Manager – Equity Funds of the Manager, and an officer of 76 investment companies (comprised of 192 portfolios) managed by the Manager. He is 44 years old and has been an employee of the Manager since November 1990.
40
JOSEPH W. CONNOLLY, Chief Compliance Officer since December 2008.
Chief Compliance Officer of the Manager and The Dreyfus Family of Funds (76 investment companies, comprised of 192 portfolios). From November 2001 through March 2004, Mr. Connolly was first Vice-President, Mutual Fund Servicing for Mellon Global Securities Services. In that capacity, Mr. Connolly was responsible for managing Mellon’s Custody, Fund Accounting and Fund Administration services to third-party mutual fund clients. He is 54 years old and has served in various capacities with the Manager since 1980, including manager of the firm’s Fund Accounting Department from 1997 through October 2001.
STEPHEN J. STOREN, Anti-Money Laundering Compliance Officer since May 2011.
Chief Compliance Officer of the Distributor, and the Anti-Money Laundering Compliance Officer of 72 investment companies (comprised of 188 portfolios) managed by the Manager. He is 57 years old and has been an employee of the Distributor since October 1999.
| The Fund | 41 |
For More Information
Telephone Call your financial representative or 1-800-DREYFUS
Mail The Dreyfus Family of Funds, 144 Glenn Curtiss Boulevard, Uniondale, NY 11556-0144
The fund files its complete schedule of portfolio holdings with the Securities and Exchange Commission (“SEC”) for the first and third quarters of each fiscal year on Form N-Q. The fund’s Forms N-Q are available on the SEC’s website at http://www.sec.gov and may be reviewed and copied at the SEC’s Public Reference Room in Washington, DC. Information on the operation of the Public Reference Room may be obtained by calling 1-800-SEC-0330.
A description of the policies and procedures that the fund uses to determine how to vote proxies relating to portfolio securities, and information regarding how the fund voted these proxies for the most recent 12-month period ended June 30 is available at http://www.dreyfus.com and on the SEC’s website at http://www.sec.gov. The description of the policies and procedures is also available without charge, upon request, by calling 1-800-DREYFUS.

Item 2. Code of Ethics.
The Registrant has adopted a code of ethics that applies to the Registrant's principal executive officer, principal financial officer, principal accounting officer or controller, or persons performing similar functions. There have been no amendments to, or waivers in connection with, the Code of Ethics during the period covered by this Report.
Item 3. Audit Committee Financial Expert.
The Registrant's Board has determined that Joseph S. DiMartino, a member of the Audit Committee of the Board, is an audit committee financial expert as defined by the Securities and Exchange Commission (the "SEC"). Joseph S. DiMartino is "independent" as defined by the SEC for purposes of audit committee financial expert determinations.
Item 4. Principal Accountant Fees and Services.
(a) Audit Fees. The aggregate fees billed for each of the last two fiscal years (the "Reporting Periods") for professional services rendered by the Registrant's principal accountant (the "Auditor") for the audit of the Registrant's annual financial statements or services that are normally provided by the Auditor in connection with the statutory and regulatory filings or engagements for the Reporting Periods, were $ 226,300 in 2010 and $198,460 in 2011.
(b) Audit-Related Fees. The aggregate fees billed in the Reporting Periods for assurance and related services by the Auditor that are reasonably related to the performance of the audit of the Registrant's financial statements and are not reported under paragraph (a) of this Item 4 were $38,700 in 2010 and $34,400 in 2011. These services consisted of one or more of the following: (i) agreed upon procedures related to compliance with Internal Revenue Code section 817(h), (ii) security counts required by Rule 17f-2 under the Investment Company Act of 1940, as amended, (iii) advisory services as to the accounting or disclosure treatment of Registrant transactions or events and (iv) advisory services to the accounting or disclosure treatment of the actual or potential impact to the Registrant of final or proposed rules, standards or interpretations by the Securities and Exchange Commission, the Financial Accounting Standards Boards or other regulatory or standard-setting bodies.
The aggregate fees billed in the Reporting Periods for non-audit assurance and related services by the Auditor to the Registrant's investment adviser (not including any sub-investment adviser whose role is primarily portfolio management and is subcontracted with or overseen by another investment adviser), and any entity controlling, controlled by or under common control with the investment adviser that provides ongoing services to the Registrant ("Service Affiliates"), that were reasonably related to the performance of the annual audit of the Service Affiliate, which required pre-approval by the Audit Committee were $0 in 2010 and $0 in 2011.
(c) Tax Fees. The aggregate fees billed in the Reporting Periods for professional services rendered by the Auditor for tax compliance, tax advice, and tax planning ("Tax Services") were $22,500 in 2010 and $20,000 in 2011. These services consisted of: (i) review or preparation of U.S. federal, state, local and excise tax returns. The aggregate fees billed in the Reporting Periods for Tax Services by the Auditor to Service Affiliates, which required pre-approval by the Audit Committee were $0 in 2010 and $0 in 2011.
(d) All Other Fees. The aggregate fees billed in the Reporting Periods for products and services provided by the Auditor, other than the services reported in paragraphs (a) through (c) of this Item, were $0 in 2010 and $0 in 2011.
The aggregate fees billed in the Reporting Periods for Non-Audit Services by the Auditor to Service Affiliates, other than the services reported in paragraphs (b) through (c) of this Item, which required pre-approval by the Audit Committee, were $0 in 2010 and $0 in 2011.
(e)(1) Audit Committee Pre-Approval Policies and Procedures. The Registrant's Audit Committee has established policies and procedures (the "Policy") for pre-approval (within specified fee limits) of the Auditor's engagements for non-audit services to the Registrant and Service Affiliates without specific case-by-case consideration. The pre-approved services in the Policy can include pre-approved audit services, pre-approved audit-related services, pre-approved tax services and pre-approved all other services. Pre-approval considerations include whether the proposed services are compatible with maintaining the Auditor's independence. Pre-approvals pursuant to the Policy are considered annually.
(e)(2) Note: None of the services described in paragraphs (b) through (d) of this Item 4 were approved by the Audit Committee pursuant to paragraph (c)(7)(i)(C) of Rule 2-01 of Regulation S-X.
(f) None of the hours expended on the principal accountant's engagement to audit the registrant's financial statements for the most recent fiscal year were attributed to work performed by persons other than the principal account's full-time, permanent employees.
Non-Audit Fees. The aggregate non-audit fees billed by the Auditor for services rendered to the Registrant, and rendered to Service Affiliates, for the Reporting Periods were $4,755,000 in 2010 and $7,022,311 in 2011.
Auditor Independence. The Registrant's Audit Committee has considered whether the provision of non-audit services that were rendered to Service Affiliates, which were not pre-approved (not requiring pre-approval), is compatible with maintaining the Auditor's independence.
Item 5. Audit Committee of Listed Registrants.
Not applicable.
Item 6. Investments.
(a) Not applicable.
Item 7. Disclosure of Proxy Voting Policies and Procedures for Closed-End Management Investment Companies.
Not applicable.
Item 8. Portfolio Managers of Closed-End Management Investment Companies.
Not applicable.
Item 9. Purchases of Equity Securities by Closed-End Management Investment Companies and Affiliated Purchasers.
Not applicable.
Item 10. Submission of Matters to a Vote of Security Holders.
There have been no material changes to the procedures applicable to Item 10.
Item 11. Controls and Procedures.
(a) The Registrant's principal executive and principal financial officers have concluded, based on their evaluation of the Registrant's disclosure controls and procedures as of a date within 90 days of the filing date of this report, that the Registrant's disclosure controls and procedures are reasonably designed to ensure that information required to be disclosed by the Registrant on Form N-CSR is recorded, processed, summarized and reported within the required time periods and that information required to be disclosed by the Registrant in the reports that it files or submits on Form N-CSR is accumulated and communicated to the Registrant's management, including its principal executive and principal financial officers, as appropriate to allow timely decisions regarding required disclosure.
(b) There were no changes to the Registrant's internal control over financial reporting that occurred during the second fiscal quarter of the period covered by this report that have materially affected, or are reasonably likely to materially affect, the Registrant's internal control over financial reporting.
Item 12. Exhibits.
(a)(1) Code of ethics referred to in Item 2.
(a)(2) Certifications of principal executive and principal financial officers as required by Rule 30a-2(a) under the Investment Company Act of 1940.
(a)(3) Not applicable.
(b) Certification of principal executive and principal financial officers as required by Rule 30a-2(b) under the Investment Company Act of 1940.
SIGNATURES
Pursuant to the requirements of the Securities Exchange Act of 1934 and the Investment Company Act of 1940, the Registrant has duly caused this Report to be signed on its behalf by the undersigned, thereunto duly authorized.
Dreyfus Investment Funds
By: /s/ Bradley J. Skapyak | |
Bradley J. Skapyak, President
| |
Date: | November 22, 2011 |
| |
Pursuant to the requirements of the Securities Exchange Act of 1934 and the Investment Company Act of 1940, this Report has been signed below by the following persons on behalf of the Registrant and in the capacities and on the dates indicated. | |
| |
By: /s/ Bradley J. Skapyak | |
Bradley J. Skapyak, President
| |
Date: | November 22, 2011 |
| |
By: /s/ James Windels | |
James Windels, Treasurer
| |
Date: | November 22, 2011 |
| |
EXHIBIT INDEX
(a)(1) Code of ethics referred to in Item 2.
(a)(2) Certifications of principal executive and principal financial officers as required by Rule 30a-2(a) under the Investment Company Act of 1940. (EX-99.CERT)
(b) Certification of principal executive and principal financial officers as required by Rule 30a-2(b) under the Investment Company Act of 1940. (EX-99.906CERT)