UNITED STATES
SECURITIES AND EXCHANGE COMMISSION
Washington, D.C. 20549
FORM N-CSR
CERTIFIED SHAREHOLDER REPORT OF REGISTERED MANAGEMENT
INVESTMENT COMPANIES
Investment Company Act file number | 811- 04813 | |||||
|
| |||||
| Dreyfus Investment Funds |
| ||||
| (Exact name of Registrant as specified in charter) |
| ||||
|
|
| ||||
|
c/o The Dreyfus Corporation 200 Park Avenue New York, New York 10166 |
| ||||
| (Address of principal executive offices) (Zip code) |
| ||||
|
|
| ||||
| Janette E. Farragher, Esq. 200 Park Avenue New York, New York 10166 |
| ||||
| (Name and address of agent for service) |
| ||||
| ||||||
Registrant's telephone number, including area code: | (212) 922-6000 | |||||
|
| |||||
Date of fiscal year end:
| 9/30 |
| ||||
Date of reporting period: | 9/30/12 |
| ||||
The following N-CSR relates only to the Registrant’s series listed below and does not affect the other series of the Registrant, which have a different fiscal year end and, therefore, different N-CSR reporting requirements. Separate N-CSR Forms will be filed for those series, as appropriate.
-Dreyfus/The Boston Company Emerging Markets Core Equity Fund
-Dreyfus/The Boston Company Large Cap Core Fund
-Dreyfus/The Boston Company Small Cap Growth Fund
-Dreyfus/The Boston Company Small Cap Tax-Sensitive Equity Fund
-Dreyfus/The Boston Company Small Cap Value Fund
-Dreyfus/The Boston Company Small/Mid Cap Growth Fund
-Dreyfus/Standish Intermediate Tax Exempt Bond Fund
-Dreyfus/Newton International Equity Fund
| Dreyfus/The Boston |
| Company Emerging |
| Markets Core Equity Fund |
ANNUAL REPORT September 30, 2012
Save time. Save paper. View your next shareholder report online as soon as it’s available. Log into www.dreyfus.com and sign up for Dreyfus eCommunications. It’s simple and only takes a few minutes.
The views expressed in this report reflect those of the portfolio manager only through the end of the period covered and do not necessarily represent the views of Dreyfus or any other person in the Dreyfus organization. Any such views are subject to change at any time based upon market or other conditions and Dreyfus disclaims any responsibility to update such views.These views may not be relied on as investment advice and, because investment decisions for a Dreyfus fund are based on numerous factors, may not be relied on as an indication of trading intent on behalf of any Dreyfus fund.
| Not FDIC-Insured • Not Bank-Guaranteed • May Lose Value |
Contents | |
THE FUND | |
| 2 | A Letter from the Chairman and CEO |
| 3 | Discussion of Fund Performance |
| 6 | Fund Performance |
| 8 | Understanding Your Fund’s Expenses |
| 8 | Comparing Your Fund’s Expenses With Those of Other Funds |
| 9 | Statement of Investments |
| 14 | Statement of Assets and Liabilities |
| 15 | Statement of Operations |
| 16 | Statement of Changes in Net Assets |
| 18 | Financial Highlights |
| 21 | Notes to Financial Statements |
| 35 | Report of Independent Registered Public Accounting Firm |
| 36 | Important Tax Information |
| 37 | Board Members Information |
| 39 | Officers of the Fund |
FOR MORE INFORMATION | |
Back Cover |
Dreyfus/The Boston
Company Emerging
Markets Core Equity Fund
The Fund
A LETTER FROM THE CHAIRMAN AND CEO

Dear Shareholder:
This annual report for Dreyfus/The Boston Company Emerging Markets Core Equity Fund covers the 12-month period from October 1, 2011, through September 30, 2012. For information about how the fund performed during the reporting period, as well as general market perspectives, we provide a Discussion of Fund Performance on the pages that follow.
U.S. equities proved unusually volatile over the past year, as prices rose and fell according to investors’ changing expectations of global and domestic economic conditions. And while the pace of U.S. economic growth has been relatively consistent, it has progressed at about half the average rate achieved in prior recoveries. Overseas, Europe has remained under severe economic pressure due to a persistent debt crisis and austerity-oriented fiscal policies adopted by many governments. In Japan, a strengthening currency dampened export activity and economic growth. The emerging markets have posted a slower rate of growth, reducing demand for industrial commodities and other goods and services.
The sustained-but-subpar U.S. expansion appears likely to continue over the foreseeable future.Across the international markets though, on one hand the global economy has responded to a variety of stimulative measures, most notably aggressively accommodative monetary policies in most major markets. On the other hand, headwinds emanating from Europe and China may continue to weigh on economic growth and investor sentiment. Indeed, the ability of governments and economic policymakers to address these issues could go a long way toward shaping the 2013 market environment. As always, we urge you to speak regularly with your financial advisor to discuss how changing global economic conditions may affect your investments.
Thank you for your continued confidence and support.

Jonathan R. Baum
Chairman and Chief Executive Officer
The Dreyfus Corporation
October 15, 2012
2
DISCUSSION OF FUND PERFORMANCE
For the period of October 1, 2011, through September 30, 2012, as provided by Sean P. Fitzgibbon and Jay Malikowski, Portfolio Managers
Fund and Market Performance Overview
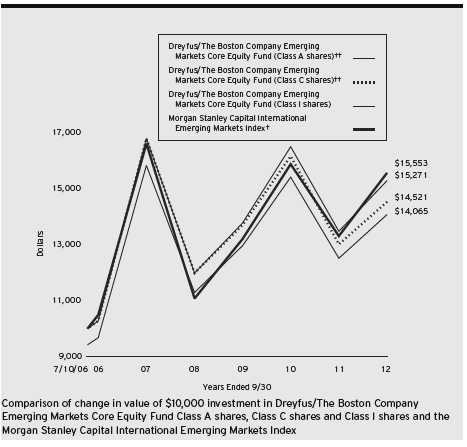
For the 12-month period ended September 30, 2012, Dreyfus/The Boston Company Emerging Markets Core Equity Fund’s Class A shares produced a total return of 12.48%, Class C shares returned 11.63% and Class I shares returned 13.36%.1 In comparison, the fund’s benchmark, the Morgan Stanley Capital International Emerging Markets Index (the “MSCI EM Index”), produced a total return of 16.93% for the same period.2
Despite heightened volatility throughout the reporting period, emerging market stocks posted respectable gains, on average, as macroeconomic conditions improved in China and other developing nations.The fund lagged its benchmark, mainly as a result of shortfalls among consumer staples and materials stocks.
The Fund’s Investment Approach
The fund seeks long-term growth of capital.To pursue this goal, the fund normally invests at least 80% of its assets in equity securities of companies that are located in foreign countries represented in the MSCI EM Index.The fund may invest up to 20% of its net assets in fixed income securities and may invest in preferred stocks of any credit quality if common stocks of the relevant company are not available.The fund employs a “bottom-up” investment approach, which emphasizes individual stock selection.
Markets Reacted Sharply to Economic Developments
The reporting period began in the immediate wake of severe stock market declines throughout the world. One credit-rating agency’s downgrade of long-term U.S. government debt, an intensifying European debt crisis and inflation-fighting programs in China had triggered a flight away from riskier assets in the third quarter of 2011. Better economic data in the fall largely arrested the declines, but heightened market volatility persisted through the end of the year.
| The Fund | 3 |
DISCUSSION OF FUND PERFORMANCE (continued)
Over the opening months of 2012, however, the emerging markets began to rally strongly, as investors were optimistic that less restrictive monetary and fiscal policies in China could tame inflationary pressures without triggering a recession. Meanwhile, the U.S. economy reported higher levels of manufacturing activity and improvements in labor markets, and European policymakers launched a quantitative easing program that seemed to forestall a more severe crisis in the region’s banking system.
The rally was interrupted in the spring, when U.S. employment gains moderated, proposed austerity programs in Europe encountered political resistance, and the Chinese economy was slow to respond to more accommodative policies.While better equity market performance over the summer erased many of those losses, emerging market stocks in general lost a modest amount of value over the reporting period’s second half, dampening results for the reporting period overall.
Valuation Metrics Proved Relatively Ineffective
In this tumultuous environment, investors tended to prefer better known markets and companies with positive earnings momentum. In contrast, valuation factors proved relatively ineffective over the reporting period.
A focus on valuations was especially damaging in the consumer staples sector, where Indian sugar processor Shree Renuka Sugars fell sharply due to lower commodity prices and operational problems in its Brazil facilities. Likewise, food producer China Agri-Industries Holdings moved lower amid fears of government pricing restrictions.The materials sector lagged all other market segments over the reporting period, and the fund’s results in the sector were further undermined by Brazilian metals-and-mining companyVale, which suffered from management turnover and deteriorating operational metrics. Other laggards during the reporting period included India’s plastics and textiles manufacturer Sintex Industries, where worries regarding cuts in government spending weighed on the company’s stock price. Indeed, India was the fund’s greatest laggard on a country basis over the reporting period.
The fund achieved better results in the information technology sector, where Samsung Electronics scored market share gains and achieved better-than-expected earnings stemming from the popularity of its smartphones. In the consumer discretionary sector, carmakers Hyundai Motor in Korea and Great Wall Motor in China advanced due to market share gains and strong sales, respectively. From a country perspective, the fund
4
participated in relatively robust gains in Thailand when a number of companies rebounded from depressed levels as the nation recovered from the 2011 floods.
Positioned for a More Balanced Market
We currently expect market volatility to remain elevated over the near term amid ongoing macroeconomic uncertainties. However, we remain optimistic over the longer term. China is widely expected to adopt more stimulative monetary and fiscal policies, and Europe appears to be making progress in engineering a recovery from its debt crisis. Meanwhile, personal incomes in the emerging markets are rising, potentially boosting spending and consumption.
We have continued to focus on identifying individual companies with attractive valuations and strong business momentum. Indeed, we believe that valuations in some countries and market sectors have become especially compelling, and the fund is well positioned to benefit when valuation factors return to favor among investors.
October 15, 2012
Please note, the position in any security highlighted with italicized typeface was sold during the reporting period. Equity funds are subject generally to market, market sector, market liquidity, issuer and investment style risks, among other factors, to varying degrees, all of which are more fully described in the fund’s prospectus.
The fund’s performance will be influenced by political, social and economic factors affecting investments in foreign companies.These special risks include exposure to currency fluctuations, less liquidity, less developed or less efficient trading markets, lack of comprehensive company information, political instability and differing auditing and legal standards. Investments in foreign currencies are subject to the risk that those currencies will decline in value relative to the U.S. dollar, or, in the case of hedged positions, that the U.S. dollar will decline relative to the currency being hedged. Emerging markets tend to be more volatile than the markets of more mature economies, and generally have less diverse and less mature economic structures and less stable political systems than those of developed countries.
| 1 Total return includes reinvestment of dividends and any capital gains paid, and does not take into consideration the |
| maximum initial sales charge in the case of Class A shares, or the applicable contingent deferred sales charge imposed |
| on redemptions in the case of Class C shares. Had these charges been reflected, returns would have been lower. Past |
| performance is no guarantee of future results. Share price and investment return fluctuate such that upon redemption, |
| fund shares may be worth more or less than their original cost. The fund’s returns reflect the absorption of certain |
| fund expenses by The Dreyfus Corporation pursuant to an agreement in effect through February 1, 2014, at which |
| time it may be extended, terminated or modified. Had these expenses not been absorbed, the fund’s returns would |
| have been lower. |
| 2 SOURCE: LIPPER INC. – Reflects reinvestment of net dividends and, where applicable, capital gain distributions. |
| The Morgan Stanley Capital International Emerging Markets Index is a free float-adjusted market capitalization |
| weighted index that is designed to measure the equity performance in global emerging markets.The index consists of |
| select designated MSCI emerging market national indices. MSCI Indices reflect investable opportunities for global |
| investors by taking into account local market restrictions on share ownership by foreigners. Investors cannot invest |
| directly in any index. |
| The Fund | 5 |
FUND PERFORMANCE
| † | Source: Lipper Inc. |
| †† | The total return figures presented for Class A and Class C shares of the fund reflect the performance of the fund’s |
| Class I shares for the period prior to 3/31/09 (the inception date for Class A and Class C shares), adjusted to | |
| reflect the applicable sales load for each share class. |
Past performance is not predictive of future performance.
The above graph compares a $10,000 investment made in each of the Class A, Class C and Class I shares of Dreyfus/The Boston Company Emerging Markets Core Equity Fund on 7/10/06 (inception date) to a $10,000 investment made in the Morgan Stanley Capital International Emerging Markets Index (the “Index”) on that date.All dividends and capital gain distributions are reinvested. For comparative purposes, the value of the Index on 6/30/06 is used as the beginning value on 7/10/06.
The fund’s performance shown in the line graph above takes into account the maximum initial sales charge on Class A shares and all other applicable fees and expenses on all classes.The Index is a free float-adjusted market capitalization weighted index that is designed to measure the equity performance in global emerging markets. Unlike a mutual fund, the Index is not subject to charges, fees and other expenses. Investors cannot invest directly in any index.These factors can contribute to the Index potentially outperforming the fund. Further information relating to fund performance, including expense reimbursements, if applicable, is contained in the Financial Highlights section of the prospectus and elsewhere in this report.
6
| Average Annual Total Returns as of 9/30/12 | |||||||
| Inception | From | ||||||
| Date | 1 Year | 5 Years | Inception | ||||
| Class A shares | |||||||
| with maximum sales charge (5.75%) | 3/31/09 | 6.02 | % | –3.47 | %†† | 5.64 | %†† |
| without sales charge | 3/31/09 | 12.48 | % | –2.32 | %†† | 6.65 | %†† |
| Class C shares | |||||||
| with applicable redemption charge † | 3/31/09 | 10.73 | % | –2.85 | %†† | 6.18 | %†† |
| without redemption | 3/31/09 | 11.63 | % | –2.85 | %†† | 6.18 | %†† |
| Class I shares | 7/10/06 | 13.36 | % | –1.87 | % | 7.04 | % |
| Morgan Stanley Capital International | |||||||
| Emerging Markets Index | 6/30/06 | 16.93 | % | –1.28 | % | 7.32 | %††† |
Past performance is not predictive of future performance.The fund’s performance shown in the graph and table does not reflect the deduction of taxes that a shareholder would pay on fund distributions or the redemption of fund shares.
| † | The maximum contingent deferred sales charge for Class C shares is 1% for shares redeemed within one year of the |
| date of purchase. | |
| †† | The total return performance figures presented for Class A and Class C shares of the fund reflect the performance of |
| the fund’s Class I shares for the period prior to 3/31/09 (the inception date for Class A and Class C shares), | |
| adjusted to reflect the applicable sales load for each share class. | |
| ††† The Index date is based on the life of Class I shares. For comparative purposes, the value of the Index as of the | |
| month end 6/30/06 is used as the beginning value on 7/10/06 (the inception date for Class I shares). | |
| The Fund | 7 |
UNDERSTANDING YOUR FUND’S EXPENSES (Unaudited)
As a mutual fund investor, you pay ongoing expenses, such as management fees and other expenses. Using the information below, you can estimate how these expenses affect your investment and compare them with the expenses of other funds.You also may pay one-time transaction expenses, including sales charges (loads) and redemption fees, which are not shown in this section and would have resulted in higher total expenses. For more information, see your fund’s prospectus or talk to your financial adviser.
Review your fund’s expenses
The table below shows the expenses you would have paid on a $1,000 investment in Dreyfus/The Boston Company Emerging Markets Core Equity Fund from April 1, 2012 to September 30, 2012. It also shows how much a $1,000 investment would be worth at the close of the period, assuming actual returns and expenses.
Expenses and Value of a $1,000 Investment
assuming actual returns for the six months ended September 30, 2012
| Class A | Class C | Class I | ||||
| Expenses paid per $1,000† | $ | 10.97 | $ | 14.61 | $ | 7.33 |
| Ending value (after expenses) | $ | 951.00 | $ | 947.60 | $ | 954.70 |
COMPARING YOUR FUND’S EXPENSES
WITH THOSE OF OTHER FUNDS (Unaudited)
Using the SEC’s method to compare expenses
The Securities and Exchange Commission (SEC) has established guidelines to help investors assess fund expenses. Per these guidelines, the table below shows your fund’s expenses based on a $1,000 investment, assuming a hypothetical 5% annualized return. You can use this information to compare the ongoing expenses (but not transaction expenses or total cost) of investing in the fund with those of other funds.All mutual fund shareholder reports will provide this information to help you make this comparison. Please note that you cannot use this information to estimate your actual ending account balance and expenses paid during the period.
Expenses and Value of a $1,000 Investment
assuming a hypothetical 5% annualized return for the six months ended September 30, 2012
| Class A | Class C | Class I | ||||
| Expenses paid per $1,000† | $ | 11.33 | $ | 15.08 | $ | 7.57 |
| Ending value (after expenses) | $ | 1,013.75 | $ | 1,010.00 | $ | 1,017.50 |
| † Expenses are equal to the fund’s annualized expense ratio of 2.25% for Class A, 3.00% for Class C and 1.50% |
| for Class I, multiplied by the average account value over the period, multiplied by 183/366 (to reflect the one-half |
| year period). |
8
| STATEMENT OF INVESTMENTS |
| September 30, 2012 |
| Common Stocks—96.0% | Shares | Value ($) | |
| Brazil—5.7% | |||
| Cia de Bebidas das Americas, ADR | 1,240 | 47,455 | |
| Cia de Saneamento Basico do Estado de Sao Paulo | 700 | 28,656 | |
| Cielo | 720 | 17,967 | |
| Embraer, ADR | 2,140 | 56,967 | |
| Fleury | 3,200 | 38,278 | |
| Obrascon Huarte Lain Brasil | 4,800 | 44,040 | |
| Rossi Residencial | 8,600 | 21,338 | |
| 254,701 | |||
| Chile—1.5% | |||
| ENTEL | 3,210 | 66,920 | |
| China—12.9% | |||
| AAC Technologies Holdings | 6,500 | 23,472 | |
| China BlueChemical, Cl. H | 58,000 | 34,333 | |
| China Communications Construction, Cl. H | 70,000 | 56,603 | |
| China Construction Bank, Cl. H | 61,000 | 42,324 | |
| China Petroleum & Chemical, Cl. H | 82,000 | 76,564 | |
| China Railway Construction, Cl. H | 78,500 | 70,259 | |
| China Vanadium Titano—Magnetite Mining | 43,000 | 6,655 | |
| Focus Media Holding, ADR | 2,450 | 57,330 | |
| Great Wall Motor, Cl. H | 35,250 | 92,966 | |
| Huaneng Power International, Cl. H | 44,000 | 33,479 | |
| WuXi PharmaTech, ADR | 2,700 | a | 40,311 |
| Yingde Gases | 22,500 | 19,935 | |
| Zhen Ding Technology Holding | 7,000 | 21,993 | |
| 576,224 | |||
| Hong Kong—5.2% | |||
| China Mobile | 9,000 | 99,761 | |
| China Overseas Land & Investment | 18,000 | 45,777 | |
| China Resources Power Holdings | 14,000 | 30,657 | |
| CNOOC | 29,000 | 59,466 | |
| 235,661 |
| The Fund | 9 |
STATEMENT OF INVESTMENTS (continued)
| Common Stocks (continued) | Shares | Value ($) |
| India—5.6% | ||
| Apollo Tyres | 15,220 | 26,735 |
| Hexaware Technologies | 14,960 | 34,546 |
| ICICI Bank | 2,660 | 53,397 |
| JSW Steel | 1,360 | 19,517 |
| NMDC | 3,910 | 14,374 |
| Oil & Natural Gas | 5,740 | 30,564 |
| Power Finance | 6,230 | 22,318 |
| Sterlite Industries India | 26,370 | 49,770 |
| 251,221 | ||
| Indonesia—1.5% | ||
| Indofood Sukses Makmur | 49,000 | 28,929 |
| Telekomunikasi | ||
| Indonesia Persero | 39,500 | 39,005 |
| 67,934 | ||
| Malaysia—1.9% | ||
| AMMB Holdings | 20,200 | 42,032 |
| Malayan Banking | 14,800 | 43,628 |
| 85,660 | ||
| Mexico—4.1% | ||
| Alfa, Cl. A | 27,000 | 50,259 |
| Fomento Economico | ||
| Mexicano, ADR | 490 | 45,070 |
| Grupo Financiero Banorte, Cl. O | 15,700 | 88,735 |
| 184,064 | ||
| Peru—.6% | ||
| Credicorp | 200 | 25,056 |
| Philippines—.7% | ||
| Metropolitan Bank & Trust | 15,040 | 33,350 |
| Russia—9.4% | ||
| Gazprom, ADR | 7,330 | 73,520 |
| Lukoil, ADR | 2,040 | 125,664 |
10
| Common Stocks (continued) | Shares | Value ($) | |
| Russia (continued) | |||
| Mobile Telesystems, ADR | 3,090 | 54,137 | |
| Sberbank of Russia, ADR | 2,600 | 30,290 | |
| Sberbank of Russia, ADR | 4,060 | 47,968 | |
| Surgutneftegas, ADR | 5,930 | 53,489 | |
| Uralkali, GDR | 850 | 35,164 | |
| 420,232 | |||
| South Africa—7.8% | |||
| AngloGold Ashanti | 1,020 | 35,837 | |
| Anglovaal Industries | 1,890 | 13,570 | |
| FirstRand | 7,630 | 25,568 | |
| Growthpoint Properties | 13,542 | 40,465 | |
| Imperial Holdings | 1,760 | 39,651 | |
| MTN Group | 4,104 | 78,998 | |
| Nedbank Group | 1,290 | 28,362 | |
| Sasol | 1,050 | 46,967 | |
| Tiger Brands | 1,280 | 42,003 | |
| 351,421 | |||
| South Korea—16.8% | |||
| BS Financial Group | 2,430 | 26,237 | |
| Daelim Industrial | 615 | 52,512 | |
| DGB Financial Group | 2,970 | 39,282 | |
| Hana Financial Group | 1,500 | 45,954 | |
| Hankook Tire | 630 | b | 23,580 |
| Hyundai Motor | 634 | 143,751 | |
| KT | 1,090 | 34,521 | |
| KT&G | 622 | 47,402 | |
| Kukdo Chemical | 400 | 17,491 | |
| Samsung Electronics | 208 | 251,900 | |
| Youngone | 2,096 | 69,306 | |
| 751,936 |
| The Fund | 11 |
STATEMENT OF INVESTMENTS (continued)
| Common Stocks (continued) | Shares | Value ($) |
| Taiwan—9.3% | ||
| Asia Cement | 147 | 186 |
| CTCI | 20,000 | 45,713 |
| E.Sun Financial Holding | 47,000 | 26,616 |
| Hon Hai Precision Industry | 37,400 | 117,379 |
| Mega Financial Holding | 73,080 | 56,343 |
| Taiwan Semiconductor Manufacturing, ADR | 10,839 | 171,473 |
| 417,710 | ||
| Thailand—7.2% | ||
| Airports of Thailand | 13,900 | 35,901 |
| Asian Property Development | 138,240 | 40,646 |
| Bangkok Bank | 7,900 | 51,589 |
| CP ALL | 20,500 | 23,644 |
| PTT | 4,700 | 50,237 |
| PTT Global Chemical | 28,643 | 58,626 |
| Siam Commercial Bank | 5,300 | 29,014 |
| Thanachart Capital | 29,000 | 35,567 |
| 325,224 | ||
| Turkey—4.5% | ||
| Aselsan Elektronik Sanayi Ve Ticaret | 4,040 | 14,611 |
| Kardemir Karabuk Demir Celik | ||
| Sanayi ve Ticaret, Cl. D | 32,470 | 21,138 |
| Koza Altin Isletmeleri | 1,110 | 23,840 |
| Turk Telekomunikasyon | 8,930 | 35,576 |
| Turkiye Garanti Bankasi | 8,090 | 33,760 |
| Turkiye Halk Bankasi | 3,560 | 27,731 |
| Turkiye Is Bankasi, Cl. C | 15,070 | 47,291 |
| 203,947 | ||
| United States—1.3% | ||
| iShares MSCI Emerging Markets Index Fund | 1,390 | 57,449 |
| Total Common Stocks | ||
| (cost $3,723,958) | 4,308,710 |
12
| Preferred Stocks—3.5% | Shares | Value ($) | |
| Brazil | |||
| Bradespar | 2,000 | 27,762 | |
| Cia de Bebidas das Americas | 900 | 34,490 | |
| Cia de Saneamento de Minas Gerais | 800 | 18,192 | |
| Vale | 4,400 | 76,551 | |
| Total Preferred Stocks | |||
| (cost $135,885) | 156,995 | ||
| Total Investments (cost $3,859,843) | 99.5 | % | 4,465,705 |
| Cash and Receivables (Net) | .5 | % | 24,451 |
| Net Assets | 100.0 | % | 4,490,156 |
ADR—American Depository Receipts
GDR—Global Depository Receipts
| a Non-income producing security. |
| b The valuation of this security has been determined in good faith by management under the direction of the Board of |
| Trustees.At September 30, 2012, the value of this security amounted to $23,580 or 0.5% of net assets. |
| Portfolio Summary (Unaudited)† | |||
| Value (%) | Value (%) | ||
| Financial | 22.9 | Telecommunication Services | 9.1 |
| Information Technology | 14.2 | Consumer Staples | 6.3 |
| Energy | 11.5 | Utilities | 2.5 |
| Consumer Discretionary | 10.6 | Health Care | 1.8 |
| Materials | 9.8 | Exchange-Traded Funds | 1.3 |
| Industrial | 9.5 | 99.5 | |
| † Based on net assets. | |||
| See notes to financial statements. | |||
| The Fund | 13 |
| STATEMENT OF ASSETS AND LIABILITIES |
| September 30, 2012 |
| Cost | Value | |||
| Assets ($): | ||||
| Investments in securities—See Statement of Investments | 3,859,843 | 4,465,705 | ||
| Cash denominated in foreign currencies | 17,187 | 17,234 | ||
| Receivable for investment securities sold | 60,727 | |||
| Dividends receivable | 4,549 | |||
| Unrealized appreciation on forward foreign | ||||
| currency exchange contracts—Note 4 | 5 | |||
| Prepaid expenses | 18,928 | |||
| 4,567,148 | ||||
| Liabilities ($): | ||||
| Due to The Dreyfus Corporation and affiliates—Note 3(c) | 12,829 | |||
| Due to Administrator—Note 3(a) | 365 | |||
| Cash overdraft due to Custodian | 19,964 | |||
| Payable for investment securities purchased | 18,029 | |||
| Unrealized depreciation on forward foreign | ||||
| currency exchange contracts—Note 4 | 5 | |||
| Accrued expenses | 25,800 | |||
| 76,992 | ||||
| Net Assets ($) | 4,490,156 | |||
| Composition of Net Assets ($): | ||||
| Paid-in capital | 5,088,046 | |||
| Accumulated distributions in excess of investment income—net | (11,818 | ) | ||
| Accumulated net realized gain (loss) on investments | (1,191,999 | ) | ||
| Accumulated net unrealized appreciation (depreciation) | ||||
| on investments and foreign currency transactions | 605,927 | |||
| Net Assets ($) | 4,490,156 | |||
| Net Asset Value Per Share | ||||
| Class A | Class C | Class I | ||
| Net Assets ($) | 107,470 | 91,220 | 4,291,466 | |
| Shares Outstanding | 5,434 | 4,806 | 218,971 | |
| Net Asset Value Per Share ($) | 19.78 | 18.98 | 19.60 | |
| See notes to financial statements. | ||||
14
| STATEMENT OF OPERATIONS | ||
| Year Ended September 30, 2012 | ||
| Investment Income ($): | ||
| Income: | ||
| Cash dividends (net of $14,832 foreign taxes withheld at source): | ||
| Unaffiliated issuers | 135,655 | |
| Affiliated issuers | 20 | |
| Total Income | 135,675 | |
| Expenses: | ||
| Investment advisory fee—Note 3(a) | 55,704 | |
| Custodian fees—Note 3(c) | 56,912 | |
| Registration fees | 38,468 | |
| Auditing fees | 36,126 | |
| Prospectus and shareholders’ reports | 12,635 | |
| Legal fees | 7,003 | |
| Administration fees—Note 3(a) | 5,064 | |
| Shareholder servicing costs—Note 3(c) | 4,685 | |
| Distribution fees—Note 3(b) | 826 | |
| Trustees’ fees and expenses—Note 3(d) | 706 | |
| Interest expense—Note 2 | 137 | |
| Loan commitment fees—Note 2 | 69 | |
| Miscellaneous | 19,895 | |
| Total Expenses | 238,230 | |
| Less—reduction in expenses due to undertaking—Note 3(a) | (159,546 | ) |
| Less—reduction in fees due to earnings credits—Note 3(c) | (3 | ) |
| Net Expenses | 78,681 | |
| Investment Income—Net | 56,994 | |
| Realized and Unrealized Gain (Loss) on Investments—Note 4 ($): | ||
| Net realized gain (loss) on investments and foreign currency transactions | (729,114 | ) |
| Net realized gain (loss) on forward foreign currency exchange contracts | (10,982 | ) |
| Net Realized Gain (Loss) | (740,096 | ) |
| Net unrealized appreciation (depreciation) on | ||
| investments and foreign currency transactions | 1,673,311 | |
| Net unrealized appreciation (depreciation) on | ||
| forward foreign currency exchange contracts | (1,157 | ) |
| Net Unrealized Appreciation (Depreciation) | 1,672,154 | |
| Net Realized and Unrealized Gain (Loss) on Investments | 932,058 | |
| Net Increase in Net Assets Resulting from Operations | 989,052 | |
| See notes to financial statements. | ||
| The Fund | 15 |
STATEMENT OF CHANGES IN NET ASSETS
| Year Ended September 30, | ||||
| 2012 | 2011 | |||
| Operations ($): | ||||
| Investment income—net | 56,994 | 129,678 | ||
| Net realized gain (loss) on investments | (740,096 | ) | 3,308,227 | |
| Net unrealized appreciation | ||||
| (depreciation) on investments | 1,672,154 | (5,001,113 | ) | |
| Net Increase (Decrease) in Net Assets | ||||
| Resulting from Operations | 989,052 | (1,563,208 | ) | |
| Dividends to Shareholders from ($): | ||||
| Investment income—net: | ||||
| Class A Shares | (517 | ) | (603 | ) |
| Class C Shares | (200 | ) | — | |
| Class I Shares | (64,392 | ) | (62,615 | ) |
| Net realized gain on investments: | ||||
| Class A Shares | (27,294 | ) | — | |
| Class C Shares | (33,777 | ) | — | |
| Class I Shares | (808,941 | ) | — | |
| Total Dividends | (935,121 | ) | (63,218 | ) |
| Beneficial Interest Transactions ($): | ||||
| Net proceeds from shares sold: | ||||
| Class A Shares | 25,691 | 172,455 | ||
| Class C Shares | 67,180 | 11,090 | ||
| Class I Shares | 298,380 | 189,858 | ||
| Dividends reinvested: | ||||
| Class A Shares | 27,811 | 512 | ||
| Class C Shares | 33,977 | — | ||
| Class I Shares | 442,938 | 4,708 | ||
| Cost of shares redeemed: | ||||
| Class A Shares | (90,543 | ) | (125,263 | ) |
| Class C Shares | (151,101 | ) | (73,795 | ) |
| Class I Shares | (4,623,566 | ) | (6,535,360 | ) |
| Increase (Decrease) in Net Assets from | ||||
| Beneficial Interest Transactions | (3,969,233 | ) | (6,355,795 | ) |
| Total Increase (Decrease) in Net Assets | (3,915,302 | ) | (7,982,221 | ) |
| Net Assets ($): | ||||
| Beginning of Period | 8,405,458 | 16,387,679 | ||
| End of Period | 4,490,156 | 8,405,458 | ||
| Undistributed (distributions in excess of) | ||||
| investment income—net | (11,818 | ) | 19,337 | |
16
| Year Ended September 30, | ||||
| 2012 | 2011 | |||
| Capital Share Transactions: | ||||
| Class A | ||||
| Shares sold | 1,195 | 6,009 | ||
| Shares issued for dividends reinvested | 1,572 | 18 | ||
| Shares redeemed | (4,563 | ) | (4,446 | ) |
| Net Increase (Decrease) in Shares Outstanding | (1,796 | ) | 1,581 | |
| Class C | ||||
| Shares sold | 3,206 | 394 | ||
| Shares issued for dividends reinvested | 1,989 | — | ||
| Shares redeemed | (7,794 | ) | (2,766 | ) |
| Net Increase (Decrease) in Shares Outstanding | (2,599 | ) | (2,372 | ) |
| Class I | ||||
| Shares sold | 15,131 | 6,684 | ||
| Shares issued for dividends reinvested | 25,412 | 169 | ||
| Shares redeemed | (192,364 | ) | (232,400 | ) |
| Net Increase (Decrease) in Shares Outstanding | (151,821 | ) | (225,547 | ) |
| See notes to financial statements. | ||||
| The Fund | 17 |
FINANCIAL HIGHLIGHTS
The following tables describe the performance for each share class for the fiscal periods indicated.All information (except portfolio turnover rate) reflects financial results for a single fund share.Total return shows how much your investment in the fund would have increased (or decreased) during each period, assuming you had reinvested all dividends and distributions.These figures have been derived from the fund’s financial statements.
| Year Ended September 30, | |||||||
| Class A Shares | 2012 | 2011 | 2010 | 2009 | a | ||
| Per Share Data ($): | |||||||
| Net asset value, beginning of period | 21.86 | 26.99 | 22.70 | 13.55 | |||
| Investment Operations: | |||||||
| Investment income—netb | .07 | .09 | .17 | .14 | |||
| Net realized and unrealized | |||||||
| gain (loss) on investments | 2.15 | (5.14 | ) | 4.12 | 9.01 | ||
| Total from Investment Operations | 2.22 | (5.05 | ) | 4.29 | 9.15 | ||
| Distributions: | |||||||
| Dividends from investment income—net | (.08 | ) | (.08 | ) | — | — | |
| Dividends from net realized | |||||||
| gain on investments | (4.22 | ) | — | — | — | ||
| Total Distributions | (4.30 | ) | (.08 | ) | — | — | |
| Net asset value, end of period | 19.78 | 21.86 | 26.99 | 22.70 | |||
| Total Return (%)c | 12.48 | (18.77 | ) | 18.85 | 67.60 | d | |
| Ratios/Supplemental Data (%): | |||||||
| Ratio of total expenses to average net assets | 5.55 | 3.66 | 3.69 | 11.21 | e | ||
| Ratio of net expenses to average net assets | 2.25 | 2.25 | 2.25 | 2.00 | e | ||
| Ratio of net investment income | |||||||
| to average net assets | .36 | .30 | .71 | 1.56 | e | ||
| Portfolio Turnover Rate | 70.79 | 75.59 | 102.30 | 157.45 | |||
| Net Assets, end of period ($ x 1,000) | 107 | 158 | 152 | 25 | |||
| a | From March 31, 2009 (commencement of initial offering) to September 30, 2009. |
| b | Based on average shares outstanding at each month end. |
| c | Exclusive of sales charge. |
| d | Not annualized. |
| e | Annualized. |
See notes to financial statements.
18
| Year Ended September 30, | ||||||||
| Class C Shares | 2012 | 2011 | 2010 | 2009 | a | |||
| Per Share Data ($): | ||||||||
| Net asset value, beginning of period | 21.23 | 26.36 | 22.62 | 13.55 | ||||
| Investment Operations: | ||||||||
| Investment (loss)—netb | (.14 | ) | (.16 | ) | (.13 | ) | (.03 | ) |
| Net realized and unrealized | ||||||||
| gain (loss) on investments | 2.14 | (4.97 | ) | 4.17 | 9.10 | |||
| Total from Investment Operations | 2.00 | (5.13 | ) | 4.04 | 9.07 | |||
| Distributions: | ||||||||
| Dividends from investment income—net | (.03 | ) | — | (.30 | ) | — | ||
| Dividends from net realized | ||||||||
| gain on investments | (4.22 | ) | — | — | — | |||
| Total Distributions | (4.25 | ) | — | (.30 | ) | — | ||
| Net asset value, end of period | 18.98 | 21.23 | 26.36 | 22.62 | ||||
| Total Return (%)c | 11.63 | (19.43 | ) | 17.95 | 66.94 | d | ||
| Ratios/Supplemental Data (%): | ||||||||
| Ratio of total expenses to average net assets | 5.79 | 3.92 | 4.18 | 3.80 | e | |||
| Ratio of net expenses to average net assets | 3.00 | 3.00 | 3.00 | 2.75 | e | |||
| Ratio of net investment (loss) | ||||||||
| to average net assets | (.69 | ) | (.58 | ) | (.57 | ) | (.35 | )e |
| Portfolio Turnover Rate | 70.79 | 75.59 | 102.30 | 157.45 | ||||
| Net Assets, end of period ($ x 1,000) | 91 | 157 | 258 | 178 | ||||
| a | From March 31, 2009 (commencement of initial offering) to September 30, 2009. |
| b | Based on average shares outstanding at each month end. |
| c | Exclusive of sales charge. |
| d | Not annualized. |
| e | Annualized. |
See notes to financial statements.
| The Fund | 19 |
FINANCIAL HIGHLIGHTS (continued)
| Year Ended September 30, | ||||||||||
| Class I Shares | 2012 | 2011 | 2010 | 2009 | a | 2008 | ||||
| Per Share Data ($): | ||||||||||
| Net asset value, beginning of period | 21.82 | 26.79 | 22.67 | 21.33 | 33.24 | |||||
| Investment Operations: | ||||||||||
| Investment income—netb | .24 | .25 | .18 | .24 | .35 | |||||
| Net realized and unrealized | ||||||||||
| gain (loss) on investments | 2.10 | (5.11 | ) | 4.26 | 2.21 | (8.86 | ) | |||
| Total from Investment Operations | 2.34 | (4.86 | ) | 4.44 | 2.45 | (8.51 | ) | |||
| Distributions: | ||||||||||
| Dividends from investment income—net | (.34 | ) | (.11 | ) | (.32 | ) | (.26 | ) | (.26 | ) |
| Dividends from net realized | ||||||||||
| gain on investments | (4.22 | ) | — | — | (.85 | ) | (3.14 | ) | ||
| Total Distributions | (4.56 | ) | (.11 | ) | (.32 | ) | (1.11 | ) | (3.40 | ) |
| Net asset value, end of period | 19.60 | 21.82 | 26.79 | 22.67 | 21.33 | |||||
| Total Return (%) | 13.36 | (18.27 | ) | 19.73 | 14.90 | (28.51 | ) | |||
| Ratios/Supplemental Data (%): | ||||||||||
| Ratio of total expenses | ||||||||||
| to average net assets | 4.66 | 2.83 | 3.07 | 3.50 | 2.74 | |||||
| Ratio of net expenses | ||||||||||
| to average net assets | 1.50 | 1.50 | 1.50 | 1.43 | 1.45 | |||||
| Ratio of net investment income | ||||||||||
| to average net assets | 1.19 | .90 | .75 | 1.43 | 1.21 | |||||
| Portfolio Turnover Rate | 70.79 | 75.59 | 102.30 | 157.45 | 128 | |||||
| Net Assets, end of period ($ x 1,000) | 4,291 | 8,090 | 15,978 | 16,585 | 15,328 | |||||
| a The fund commenced offering three classes of shares on March 31, 2009.The existing shares were redesignated as |
| Class I shares. |
| b Based on average shares outstanding at each month end. |
See notes to financial statements.
20
NOTES TO FINANCIAL STATEMENTS
NOTE 1—Significant Accounting Policies:
Dreyfus/The Boston Company Emerging Markets Core Equity Fund (the “fund”) is a separate diversified series of Dreyfus Investment Funds (the “Trust”), which is registered under the Investment Company Act of 1940, as amended (the “Act”), as an open-end management investment company and operates as a series company currently offering eleven series, including the fund.The fund’s investment objective is to seek long-term growth of capital. The Dreyfus Corporation (the “Manager” or “Dreyfus”), a wholly-owned subsidiary of The Bank of New York Mellon Corporation (“BNY Mellon”), serves as the fund’s investment adviser.
MBSC Securities Corporation (the “Distributor”), a wholly-owned subsidiary of the Manager, is the distributor of the fund’s shares.The fund is authorized to issue an unlimited number of $.001 par value shares of Beneficial Interest in each of the following classes of shares: Class A, Class C and Class I. Class A and Class C shares are sold primarily to retail investors through financial intermediaries and bear a distribution fee and/or shareholder services fee. Class A shares are subject to a sales charge imposed at the time of purchase. Class C shares are subject to a contingent deferred sales charge (“CDSC”) imposed on Class C shares redeemed within one year of purchase. Class I shares are sold primarily to bank trust departments and other financial service providers (including The Bank of New York Mellon, a subsidiary of BNY Mellon and an affiliate of Dreyfus, and its affiliates), acting on behalf of customers having a qualified trust or an investment account or relationship at such institution, and bear no Distribution or Shareholder Services Plan fees. Class I shares are offered without a front-end sales charge or CDSC. Other differences between the classes
| The Fund | 21 |
NOTES TO FINANCIAL STATEMENTS (continued)
include the services offered to and the expenses borne by each class, the allocation of certain transfer agency costs and certain voting rights. Income, expenses (other than expenses attributable to a specific class), and realized and unrealized gains or losses on investments are allocated to each class of shares based on its relative net assets.
The Trust accounts separately for the assets, liabilities and operations of each series. Expenses directly attributable to each series are charged to that series’ operations; expenses which are applicable to all series are allocated among them on a pro rata basis.
The Financial Accounting Standards Board (“FASB”) Accounting Standards Codification is the exclusive reference of authoritative U.S. generally accepted accounting principles (“GAAP”) recognized by the FASB to be applied by nongovernmental entities. Rules and interpretive releases of the Securities and Exchange Commission (“SEC”) under authority of federal laws are also sources of authoritative GAAP for SEC registrants. The fund’s financial statements are prepared in accordance with GAAP, which may require the use of management estimates and assumptions.Actual results could differ from those estimates.
(a) Portfolio valuation: The fair value of a financial instrument is the amount that would be received to sell an asset or paid to transfer a liability in an orderly transaction between market participants at the measurement date (i.e., the exit price). GAAP establishes a fair value hierarchy that prioritizes the inputs of valuation techniques used to measure fair value.This hierarchy gives the highest priority to unadjusted quoted prices in active markets for identical assets or liabilities (Level 1 measurements) and the lowest priority to unobservable inputs (Level 3 measurements).
Additionally, GAAP provides guidance on determining whether the volume and activity in a market has decreased significantly and whether such a decrease in activity results in transactions that are not orderly. GAAP requires enhanced disclosures around valuation inputs and techniques used during annual and interim periods.
22
Various inputs are used in determining the value of the fund’s investments relating to fair value measurements.These inputs are summarized in the three broad levels listed below:
Level 1—unadjusted quoted prices in active markets for identical investments.
Level 2—other significant observable inputs (including quoted prices for similar investments, interest rates, prepayment speeds, credit risk, etc.).
Level 3—significant unobservable inputs (including the fund’s own assumptions in determining the fair value of investments).
The inputs or methodology used for valuing securities are not necessarily an indication of the risk associated with investing in those securities.
Changes in valuation techniques may result in transfers in or out of an assigned level within the disclosure hierarchy. Valuation techniques used to value the fund’s investments are as follows:
Investments in securities are valued at the last sales price on the securities exchange or national securities market on which such securities are primarily traded. Securities listed on the National Market System for which market quotations are available are valued at the official closing price or, if there is no official closing price that day, at the last sales price. Securities not listed on an exchange or the national securities market, or securities for which there were no transactions, are valued at the average of the most recent bid and asked prices, except for open short positions, where the asked price is used for valuation purposes. Bid price is used when no asked price is available. Registered investment companies that are not traded on an exchange are valued at their net asset value. All of the preceding securities are categorized within Level 1 of the fair value hierarchy.
Fair valuing of securities may be determined with the assistance of a pricing service using calculations based on indices of domestic securities and other appropriate indicators, such as prices of relevant ADRs
| The Fund | 23 |
NOTES TO FINANCIAL STATEMENTS (continued)
and financial futures. Utilizing these techniques may result in transfers between Level 1 and Level 2 of the fair value hierarchy.
When market quotations or official closing prices are not readily available, or are determined not to reflect accurately fair value, such as when the value of a security has been significantly affected by events after the close of the exchange or market on which the security is principally traded (for example, a foreign exchange or market), but before the fund calculates its net asset value, the fund may value these investments at fair value as determined in accordance with the procedures approved by the Trust’s Board of Trustees (the “Board”). Certain factors may be considered when fair valuing investments such as: fundamental analytical data, the nature and duration of restrictions on disposition, an evaluation of the forces that influence the market in which the securities are purchased and sold, and public trading in similar securities of the issuer or comparable issuers.These securities are either categorized as Level 2 or 3 depending on the relevant inputs used.
For restricted securities where observable inputs are limited, assumptions about market activity and risk are used and are categorized within Level 3 of the fair value hierarchy.
Investments denominated in foreign currencies are translated to U.S. dollars at the prevailing rates of exchange.
Forward foreign currency exchange contracts (“forward contracts”) are valued at the forward rate. These securities are generally categorized within Level 2 of the fair value hierarchy.
The following is a summary of the inputs used as of September 30, 2012 in valuing the fund’s investments:
| Level 2—Other | Level 3— | ||||
| Level 1— | Significant | Significant | |||
| Unadjusted | Observable | Unobservable | |||
| Quoted Prices | Inputs | Inputs | Total | ||
| Assets ($) | |||||
| Investments in Securities: | |||||
| Equity Securities—Foreign | |||||
| Common Stocks† | 4,227,681 | 23,580 | †† | — | 4,251,261 |
| Preferred Stocks† | 156,995 | — | — | 156,995 | |
24
| Level 2—Other | Level 3— | |||||
| Level 1— | Significant | Significant | ||||
| Unadjusted | Observable | Unobservable | ||||
| Quoted Prices | Inputs | Inputs | Total | |||
| Exchange-Traded | ||||||
| Funds | 57,449 | — | — | 57,449 | ||
| Other Financial | ||||||
| Instruments: | ||||||
| Forward Foreign | ||||||
| Currency Exchange | ||||||
| Contracts††† | — | 5 | — | 5 | ||
| Liabilities ($) | ||||||
| Other Financial | ||||||
| Instruments: | ||||||
| Forward Foreign | ||||||
| Currency Exchange | ||||||
| Contracts††† | — | (5 | ) | — | (5 | ) |
| † | See Statement of Investments for additional detailed categorizations. |
| †† | Securities classified as Level 2 at period end as the values were determined pursuant to the fund’s |
| fair valuation procedures. | |
| ††† Amount shown represents unrealized appreciation (depreciation) at period end. | |
At September 30, 2011, $6,413,509 of exchange traded foreign equity securities were classified as Level 2 of the fair value hierarchy pursuant to the fund’s fair valuation procedures.
(b) Foreign currency transactions: The fund does not isolate that portion of the results of operations resulting from changes in foreign exchange rates on investments from the fluctuations arising from changes in the market prices of securities held. Such fluctuations are included with the net realized and unrealized gain or loss on investments.
Net realized foreign exchange gains or losses arise from sales of foreign currencies, currency gains or losses realized on securities transactions between trade and settlement date, and the difference between the amounts of dividends, interest and foreign withholding taxes recorded on the fund’s books and the U.S. dollar equivalent of the amounts actually received or paid. Net unrealized foreign exchange gains and losses arise from changes in the value of assets and liabilities other than investments
| The Fund | 25 |
NOTES TO FINANCIAL STATEMENTS (continued)
resulting from changes in exchange rates. Foreign currency gains and losses on investments are also included with net realized and unrealized gain or loss on investments.
(c) Securities transactions and investment income: Securities transactions are recorded on a trade date basis. Realized gains and losses from securities transactions are recorded on the identified cost basis. Dividend income is recognized on the ex-dividend date and interest income, including, where applicable, accretion of discount and amortization of premium on investments, is recognized on the accrual basis.
(d) Affiliated issuers: Investments in other investment companies advised by Dreyfus are defined as “affiliated” in the Act. Investments in affiliated investment companies for the period ended September 30, 2012 were as follows:
| Affiliated | |||||
| Investment | Value | Value | Net | ||
| Company | 9/30/2011 ($) | Purchases ($) | Sales ($) | 9/30/2012 ($) | Assets (%) |
| Dreyfus | |||||
| Institutional | |||||
| Preferred | |||||
| Plus Money | |||||
| Market Fund | 13,098 | 1,780,659 | 1,793,757 | — | — |
(e) Risk: Investing in foreign markets may involve special risks and considerations not typically associated with investing in the U.S.These risks include revaluation of currencies, high rates of inflation, repatriation restrictions on income and capital, and adverse political and economic developments. Moreover, securities issued in these markets may be less liquid, subject to government ownership controls and delayed settlements, and their prices may be more volatile than those of comparable securities in the U.S.
(f) Dividends to shareholders: Dividends are recorded on the ex-dividend date. Dividends from investment income-net and dividends from net realized capital gains, if any, are normally declared and paid annually, but the fund may make distributions on a more frequent basis to com-
26
ply with the distribution requirements of the Internal Revenue Code of 1986, as amended (the “Code”). To the extent that net realized capital gains can be offset by capital loss carryovers, it is the policy of the fund not to distribute such gains. Income and capital gain distributions are determined in accordance with income tax regulations, which may differ from GAAP.
(g) Federal income taxes: It is the policy of the fund to continue to qualify as a regulated investment company, if such qualification is in the best interests of its shareholders, by complying with the applicable provisions of the Code, and to make distributions of taxable income sufficient to relieve it from substantially all federal income and excise taxes.
As of and during the period ended September 30, 2012, the fund did not have any liabilities for any uncertain tax positions.The fund recognizes interest and penalties, if any, related to uncertain tax positions as income tax expense in the Statement of Operations. During the period, the fund did not incur any interest or penalties.
Each of the tax years in the four-year period ended September 30, 2012 remains subject to examination by the Internal Revenue Service and state taxing authorities.
At September 30, 2012, the components of accumulated earnings on a tax basis were as follows: accumulated capital losses $1,038,036 and unrealized appreciation $440,146.
Under the Regulated Investment Company Modernization Act of 2010 (the “2010 Act”), the fund is permitted to carry forward capital losses incurred in taxable years beginning after December 22, 2010 (“post-enactment losses”) for an unlimited period. Furthermore, post-enactment capital loss carryovers retain their character as either short-term or long-term capital losses rather than short-term as they were under previous statute.
| The Fund | 27 |
NOTES TO FINANCIAL STATEMENTS (continued)
The accumulated capital loss carryover is available for federal income tax purposes to be applied against future net realized capital gains, if any, realized subsequent to September 30, 2012.The fund has $699,710 of post-enactment short-term capital losses and $338,326 of post-enactment long-term capital losses which can be carried forward for an unlimited period.
The tax character of distributions paid to shareholders during the fiscal periods ended September 30, 2012 and September 30, 2011 were as follows: ordinary income $65,109 and $63,218 and long-term capital gains $870,012 and $0, respectively.
During the period ended September 30, 2012, as a result of permanent book to tax differences, primarily due to the tax treatment for foreign currency gains and losses, passive foreign investment companies, net operating losses and capital gain taxes, the fund decreased accumulated undistributed investment income-net by $23,040, increased accumulated net realized gain (loss) on investments by $30,801 and decreased paid-in capital by $7,761. Net assets and net asset value per share were not affected by this reclassification.
(h) New Accounting Pronouncement: In December 2011, FASB issued Accounting Standards Update No. 2011-11 “Disclosures about Offsetting Assets and Liabilities” (“ASU 2011-11”). These disclosure requirements are intended to help investors and other financial statement users to better assess the effect or potential effect of offsetting arrangements on a company’s financial position.They also improve transparency in the reporting of how companies mitigate credit risk, including disclosure of related collateral pledged or received. In addition,ASU 2011-11 facilitates comparison between those entities that prepare their financial statements on the basis of GAAP and those entities that prepare their financial statements on the basis of International Financial Reporting Standards (“IFRS”). ASU 2011-11 requires entities to: disclose both gross and net information about both instruments and transactions eligible for offset in the financial statements; and disclose instruments
28
and transactions subject to an agreement similar to a master netting agreement. ASU 2011-11 is effective for fiscal years beginning on or after January 1, 2013, and interim periods within those annual periods. At this time, management is evaluating the implications of ASU 2011-11 and its impact on the fund’s financial statement disclosures.
NOTE 2—Bank Lines of Credit:
The fund participates with other Dreyfus-managed funds in a $225 million unsecured credit facility led by Citibank, N.A. and a $300 million unsecured credit facility provided by The Bank of New York Mellon (each, a “Facility”), each to be utilized primarily for temporary or emergency purposes, including the financing of redemptions. In connection therewith, the fund has agreed to pay its pro rata portion of commitment fees for each Facility. Interest is charged to the fund based on rates determined pursuant to the terms of the respective Facility at the time of borrowing.
The average amount of borrowings outstanding under the Facilities during the period ended September 30, 2012 was approximately $11,500, with a related weighted average annualized interest rate of 1.20%.
NOTE 3—Investment Advisory Fee and Other Transactions with Affiliates:
(a) Pursuant to an investment advisory agreement with the Manager, the investment advisory fee is computed at the annual rate of 1.10% of the value of the fund’s average daily net assets and is payable monthly.The Manager had agreed, from October 1, 2011 through September 30, 2012, to waive receipt of its fees and/or assume the expenses of the fund, so that the direct expenses of Class A, Class C and Class I shares (excluding Rule 12b-1 Distribution Plan fees, Shareholder Services Plan fees, taxes, interest expense, brokerage commissions, commitment fees on borrowings, acquired fund fees and extraordinary expenses) did not exceed 2.00%, 2.00% and 1.50%, respectively, of the value of the
| The Fund | 29 |
NOTES TO FINANCIAL STATEMENTS (continued)
respective class’ average daily net assets.The manager has agreed from October 1, 2012 until February 1, 2014 to waive receipt of its fees and/or assume the expenses of the fund so that the direct expenses of the fund (exclusive of certain expenses as described above) do not exceed 1.35% of the fund’s average daily net assets.The reduction in expenses, pursuant to the undertaking, amounted to $159,546 during the period ended September 30, 2012.
The fund has an Accounting and Administration Agreement (the “Administration Agreement”) with Dreyfus, whereby Dreyfus performs administrative and accounting services for the fund. The fund has agreed to compensate Dreyfus for providing accounting services, administration, compliance monitoring, regulatory and shareholder reporting, as well as for related facilities and equipment.The fee is based on the fund’s average daily net assets and computed at the following annual rates: .10% of the first $500 million, .065% of the next $500 million and .02% in excess of $1 billion.
In addition, after applying any expense limitations or fee waivers that reduce the fees paid to Dreyfus for this service, Dreyfus has contractually agreed in writing to waive any remaining fees for this service to the extent that they exceed both Dreyfus’ costs in providing these services and a reasonable allocation of the costs incurred by Dreyfus and its affiliates related to the support and oversight of these services. The fund also reimburses Dreyfus for the out-of-pocket expenses incurred in performing this service for the fund. Pursuant to the Administration Agreement, the fund was charged $5,064 during the period ended September 30, 2012.
(b) Under the Distribution Plan adopted pursuant to Rule 12b-1 under the Act, Class C shares pay the Distributor for distributing its shares at an annual rate of .75% of the value of the average daily net assets of Class C shares. During the period ended September 30, 2012, Class C shares were charged $826 pursuant to the Distribution Plan.
30
(c) Under the Shareholder Services Plan, Class A and Class C shares pay the Distributor at the annual rate of .25% of the value of their average daily net assets for the provision of certain services.The services provided may include personal services relating to shareholder accounts, such as answering shareholder inquiries regarding the fund and providing reports and other information, and services related to the maintenance of shareholder accounts.The Distributor may make payments to Service Agents (securities dealers, financial institutions or other industry professionals) in respect of these services. The Distributor determines the amounts to be paid to Service Agents. During the period ended September 30, 2012, Class A and Class C shares were charged $331 and $275, respectively, pursuant to the Shareholder Services Plan.
Under its terms, the Distribution Plan and Shareholder Services Plan shall remain in effect from year to year, provided such continuance is approved annually by a vote of a majority of those Trustees who are not “interested persons” of the Trust and who have no direct or indirect financial interest in the operation of or in any agreement related to the Distribution Plan or Shareholder Services Plan.
The fund has arrangements with the transfer agent and the custodian whereby the fund may receive earnings credits when positive cash balances are maintained, which are used to offset transfer agency and custody fees. For financial reporting purposes, the fund includes net earnings credits as an expense offset in the Statement of Operations.
The fund compensates Dreyfus Transfer, Inc. (“DTI”), a wholly-owned subsidiary of the Manager, under a transfer agency agreement for providing transfer agency services for the fund and, since May 29, 2012, cash management services related to fund subscriptions and redemptions. During the period ended September 30, 2012, the fund was charged $1,059 for transfer agency services and $10 for cash management
| The Fund | 31 |
NOTES TO FINANCIAL STATEMENTS (continued)
services. Cash management fees were partially offset by earnings credits of $1. These fees are included in Shareholder servicing costs in the Statement of Operations.
The fund compensatesThe Bank of NewYork Mellon under a custody agreement for providing custodial services for the fund. During the period ended September 30, 2012 the fund was charged $56,912 pursuant to the custody agreement.
Prior to May 29, 2012, the fund compensated The Bank of NewYork Mellon under a cash management agreement for performing cash management services related to fund subscriptions and redemptions. During the period ended September 30, 2012, the fund was charged $61 pursuant to the cash management agreement, which is included in Shareholder servicing costs in the Statement of Operations.These fees were partially offset by earnings credits of $2.
During the period ended September 30, 2012, the fund was charged $8,384 for services performed by the Chief Compliance Officer and his staff.
The components of “Due toThe Dreyfus Corporation and affiliates” in the Statement of Assets and Liabilities consist of: investment advisory fees $4,017, Rule 12b-1 Distribution Plan fees $55, Shareholder Services Plan fees $41, custodian fees $11,532, Chief Compliance Officer fees $1,991 and transfer agency fees $718, which are offset against an expense reimbursement currently in effect in the amount of $5,525.
(d) Each Board member also serves as a Board member of other funds within the Dreyfus complex. Annual retainer fees and attendance fees are allocated to each fund based on net assets.
(e) A 2% redemption fee is charged and retained by the fund on certain shares redeemed within sixty days following the date of issuance subject to exceptions, including redemptions made through use of the fund’s
32
exchange privilege. During the period ended September 30, 2012, redemption fees charged and retained by the fund amounted to $153.
NOTE 4—Securities Transactions:
The aggregate amount of purchases and sales of investment securities, excluding short-term securities and forward contracts, during the period ended September 30, 2012, amounted to $3,661,717 and $8,510,477, respectively.
Derivatives: A derivative is a financial instrument whose performance is derived from the performance of another asset. Each type of derivative instrument that was held by the fund during the period ended September 30, 2012 is discussed below.
Forward Foreign Currency Exchange Contracts: The fund enters into forward contracts in order to hedge its exposure to changes in foreign currency exchange rates on its foreign portfolio holdings, to settle foreign currency transactions or as a part of its investment strategy. When executing forward contracts, the fund is obligated to buy or sell a foreign currency at a specified rate on a certain date in the future. With respect to sales of forward contracts, the fund incurs a loss if the value of the contract increases between the date the forward contract is opened and the date the forward contract is closed.The fund realizes a gain if the value of the contract decreases between those dates.With respect to purchases of forward contracts, the fund incurs a loss if the value of the contract decreases between the date the forward contract is opened and the date the forward contract is closed.The fund realizes a gain if the value of the contract increases between those dates. Any realized or unrealized gains or losses which occurred during the period are reflected in the Statement of Operations. The fund is exposed to foreign currency risk as a result of changes in value of underlying financial instruments.The fund is also exposed to credit risk associated
| The Fund | 33 |
NOTES TO FINANCIAL STATEMENTS (continued)
with counterparty nonperformance on these forward contracts, which is typically limited to the unrealized gain on each open contract.The following summarizes open forward contracts at September 30, 2012:
| Foreign | Unrealized | ||||
| Forward Foreign Currency | Currency | Appreciation | |||
| Exchange Contracts | Amounts | Proceeds ($) | Value ($) | (Depreciation) ($) | |
| Sales: | |||||
| Brazilian Real, | |||||
| Expiring | |||||
| 10/3/2012 a | 20,261 | 9,997 | 9,995 | 2 | |
| Mexican New Peso, | |||||
| Expiring: | |||||
| 10/1/2012 a | 113,490 | 8,819 | 8,817 | 2 | |
| 10/2/2012 a | 49,693 | 3,861 | 3,860 | 1 | |
| Thai Baht, | |||||
| Expiring: | |||||
| 10/1/2012 b | 3,564 | 115 | 116 | (1) | |
| 10/2/2012 a | 33,541 | 1,087 | 1,090 | (3) | |
| 10/3/2012 a | 11,593 | 376 | 377 | (1 | |
| Gross Unrealized | |||||
| Appreciation | 5 | ||||
| Gross Unrealized | |||||
| Depreciation | (5) |
| Counterparties: | |
| a | Citigroup |
| b | HSBC |
The following summarizes the average market value of derivatives outstanding during the period ended September 30, 2012:
| Average Market Value ($) | |
| Forward contracts | 23,365 |
At September 30, 2012, the cost of investments for federal income tax purposes was $4,025,622; accordingly, accumulated net unrealized appreciation on investments was $440,083, consisting of $788,696 gross unrealized appreciation and $348,613 gross unrealized depreciation.
34
| REPORT OF INDEPENDENT REGISTERED |
| PUBLIC ACCOUNTING FIRM |
To the Board of Trustees and Shareholders of Dreyfus/The Boston Company Emerging Markets Core Equity Fund:
We have audited the accompanying statement of assets and liabilities of Dreyfus/The Boston Company Emerging Markets Core Equity Fund (the “Fund”), a series of Dreyfus Investment Funds, including the statement of investments as of September 30, 2012, the related statement of operations for the year then ended, and the statements of changes in net assets for each of the years in the two-year period then ended and the financial highlights for each of the years in the four-year period then ended.These financial statements and financial highlights are the responsibility of the Fund’s management. Our responsibility is to express an opinion on these financial statements and financial highlights based on our audits. The financial highlights for the year ended September 30, 2008 were audited by other independent registered public accountants whose report thereon, dated November 28, 2008, expressed an unqualified opinion on those financial highlights.
We conducted our audits in accordance with the standards of the Public Company Accounting Oversight Board (United States).Those standards require that we plan and perform the audit to obtain reasonable assurance about whether the financial statements and financial highlights are free of material misstatement. An audit includes examining, on a test basis, evidence supporting the amounts and disclosures in the financial statements. Our procedures included confirmation of securities owned as of September 30, 2012 by correspondence with the custodian and brokers or by other appropriate auditing procedures where replies from brokers were not received.An audit also includes assessing the accounting principles used and significant estimates made by management, as well as evaluating the overall financial statement presentation.We believe that our audits provide a reasonable basis for our opinion.
In our opinion, the financial statements and financial highlights referred to above present fairly, in all material respects, the financial position of Dreyfus/The Boston Company Emerging Markets Core Equity Fund as of September 30, 2012, the results of its operations for the year then ended, and the changes in its net assets for each of the years in the two-year period then ended and the financial highlights for each of the years in the four-year period then ended, in conformity with U.S. generally accepted accounting principles.

New York, New York
November 28, 2012
| The Fund | 35 |
IMPORTANT TAX INFORMATION (Unaudited)
For federal tax purposes, the fund elects to provide each shareholder with their portion of the fund’s income sourced from foreign countries and taxes paid from foreign countries.The fund reports the maximum amount allowable but not less than $151,312 as income sourced from foreign countries for the fiscal year ended September 30, 2012 in accordance with Section 853(c)(2) of the Internal Revenue Code and also the fund reports the maximum amount allowable but not less than $13,494 as taxes paid from foreign countries for the fiscal year ended September 30, 2012 in accordance with Section 853(a) of the Internal Revenue Code. Where required by federal tax law rules, shareholders will receive notification of their proportionate share of foreign sourced income and foreign taxes paid for the 2012 calendar year with Form 1099-DIV which will be mailed in early 2013.Also, the fund reports the maximum amount allowable, but not less than $65,109 as ordinary income dividends paid during the fiscal year ended September 30, 2012 as qualified dividend income in accordance with Section 854(b)(1)(B) of the Internal Revenue Code. The fund reports the maximum amount allowable but not less than $4.2211 per share as a capital gain dividend in accordance with Section 852(b)(3)(C) of the Internal Revenue Code.
36
BOARD MEMBERS INFORMATION (Unaudited)
| Joseph S. DiMartino (68) |
| Chairman of the Board (2008) |
| Principal Occupation During Past 5Years: |
| • Corporate Director and Trustee |
| Other Public Company Board Memberships During Past 5Years: |
| • CBIZ (formerly, Century Business Services, Inc.), a provider of outsourcing functions for small |
| and medium size companies, Director (1997-present) |
| • Sunair Services Corporation, a provider of certain outdoor-related services to homes and |
| businesses, Director (2005-2009) |
| • The Newark Group, a provider of a national market of paper recovery facilities, paperboard |
| mills and paperboard converting plants, Director (2000-2010) |
| No. of Portfolios for which Board Member Serves: 157 |
| ——————— |
| Francine J. Bovich (61) |
| Board Member (2011) |
| Principal Occupation During Past 5Years: |
| • Trustee,The Bradley Trusts, private trust funds (2011-present) |
| • Managing Director, Morgan Stanley Investment Management (1993-2010) |
| No. of Portfolios for which Board Member Serves: 31 |
| ——————— |
| James M. Fitzgibbons (78) |
| Board Member (2008) |
| Principal Occupation During Past 5Years: |
| • Corporate Director and Trustee |
| Other Public Company Board Memberships During Past 5Years: |
| • Bill Barrett Corporation, an oil and natural gas exploration company, Director (2004-present) |
| No. of Portfolios for which Board Member Serves: 31 |
| ——————— |
| Kenneth A. Himmel (66) |
| Board Member (2008) |
| Principal Occupation During Past 5Years: |
| • President and CEO, Related Urban Development, a real estate development company (1996-present) |
| • President and CEO, Himmel & Company, a real estate development company (1980-present) |
| • CEO,American Food Management, a restaurant company (1983-present) |
| No. of Portfolios for which Board Member Serves: 31 |
| The Fund | 37 |
BOARD MEMBERS INFORMATION (Unaudited) (continued)
| Stephen J. Lockwood (65) |
| Board Member (2008) |
| Principal Occupation During Past 5Years: |
| • Chairman of the Board, Stephen J. Lockwood and Company LLC, a real estate investment |
| company (2000-present) |
| No. of Portfolios for which Board Member Serves: 31 |
| ——————— |
| Roslyn M. Watson (62) |
| Board Member (2008) |
| Principal Occupation During Past 5Years: |
| • Principal,Watson Ventures, Inc., a real estate investment company (1993-present) |
| No. of Portfolios for which Board Member Serves: 41 |
| ——————— |
| Benaree Pratt Wiley (66) |
| Board Member (2008) |
| Principal Occupation During Past 5Years: |
| • Principal,TheWiley Group, a firm specializing in strategy and business development (2005-present) |
| Other Public Company Board Memberships During Past 5Years: |
| • CBIZ (formerly, Century Business Services, Inc.), a provider of outsourcing functions for small |
| and medium size companies, Director (2008-present) |
| No. of Portfolios for which Board Member Serves: 64 |
| ——————— |
Once elected all Board Members serve for an indefinite term, but achieve Emeritus status upon reaching age 80.The address of the Board Members and Officers is c/o The Dreyfus Corporation, 200 Park Avenue, NewYork, NewYork 10166.Additional information about the Board Members is available in the fund’s Statement of Additional Information which can be obtained from Dreyfus free of charge by calling this toll free number: 1-800-DREYFUS.
38
OFFICERS OF THE FUND (Unaudited)
BRADLEY J. SKAPYAK, President since January 2010.
Chief Operating Officer and a director of the Manager since June 2009; from April 2003 to June 2009, Mr. Skapyak was the head of the Investment Accounting and Support Department of the Manager. He is an officer of 72 investment companies (comprised of 156 portfolios) managed by the Manager. He is 53 years old and has been an employee of the Manager since February 1988.
JANETTE E. FARRAGHER, Vice President and Secretary since December 2011.
Assistant General Counsel of BNY Mellon, and an officer of 73 investment companies (comprised of 183 portfolios) managed by the Manager. She is 49 years old and has been an employee of the Manager since February 1984.
KIESHA ASTWOOD, Vice President and Assistant Secretary since January 2010.
Counsel of BNY Mellon, and an officer of 73 investment companies (comprised of 183 portfolios) managed by the Manager. She is 39 years old and has been an employee of the Manager since July 1995.
JAMES BITETTO, Vice President and Assistant Secretary since December 2008.
Senior Counsel of BNY Mellon and Secretary of the Manager, and an officer of 73 investment companies (comprised of 183 portfolios) managed by the Manager. He is 46 years old and has been an employee of the Manager since December 1996.
JONI LACKS CHARATAN, Vice President and Assistant Secretary since December 2008.
Senior Counsel of BNY Mellon, and an officer of 73 investment companies (comprised of 183 portfolios) managed by the Manager. She is 56 years old and has been an employee of the Manager since October 1988.
JOSEPH M. CHIOFFI, Vice President and Assistant Secretary since December 2008.
Senior Counsel of BNY Mellon, and an officer of 73 investment companies (comprised of 183 portfolios) managed by the Manager. He is 50 years old and has been an employee of the Manager since June 2000.
JOHN B. HAMMALIAN, Vice President and Assistant Secretary since December 2008.
Senior Managing Counsel of BNY Mellon, and an officer of 73 investment companies (comprised of 183 portfolios) managed by the Manager. He is 49 years old and has been an employee of the Manager since February 1991.
ROBERT R. MULLERY, Vice President and Assistant Secretary since December 2008.
Managing Counsel of BNY Mellon, and an officer of 73 investment companies (comprised of 183 portfolios) managed by the Manager. He is 60 years old and has been an employee of the Manager since May 1986.
JEFF PRUSNOFSKY, Vice President and Assistant Secretary since December 2008.
Senior Managing Counsel of BNY Mellon, and an officer of 73 investment companies (comprised of 183 portfolios) managed by the Manager. He is 47 years old and has been an employee of the Manager since October 1990.
JAMES WINDELS, Treasurer since December 2008.
Director – Mutual Fund Accounting of the Manager, and an officer of 73 investment companies (comprised of 183 portfolios) managed by the Manager. He is 54 years old and has been an employee of the Manager since April 1985.
| The Fund | 39 |
OFFICERS OF THE FUND (Unaudited) (continued)
RICHARD CASSARO, Assistant Treasurer since December 2008.
Senior Accounting Manager – Money Market and Municipal Bond Funds of the Manager, and an officer of 73 investment companies (comprised of 183 portfolios) managed by the Manager. He is 53 years old and has been an employee of the Manager since September 1982.
GAVIN C. REILLY, Assistant Treasurer since December 2008.
Tax Manager of the Investment Accounting and Support Department of the Manager, and an officer of 73 investment companies (comprised of 183 portfolios) managed by the Manager. He is 44 years old and has been an employee of the Manager since April 1991.
ROBERT S. ROBOL, Assistant Treasurer since December 2008.
Senior Accounting Manager – Fixed Income Funds of the Manager, and an officer of 73 investment companies (comprised of 183 portfolios) managed by the Manager. He is 48 years old and has been an employee of the Manager since October 1988.
ROBERT SALVIOLO, Assistant Treasurer since December 2008.
Senior Accounting Manager – Equity Funds of the Manager, and an officer of 73 investment companies (comprised of 183 portfolios) managed by the Manager. He is 45 years old and has been an employee of the Manager since June 1989.
ROBERT SVAGNA, Assistant Treasurer since December 2008.
Senior Accounting Manager – Equity Funds of the Manager, and an officer of 73 investment companies (comprised of 183 portfolios) managed by the Manager. He is 45 years old and has been an employee of the Manager since November 1990.
JOSEPH W. CONNOLLY, Chief Compliance Officer since December 2008.
Chief Compliance Officer of the Manager and The Dreyfus Family of Funds (73 investment companies, comprised of 183 portfolios). He is 55 years old and has served in various capacities with the Manager since 1980, including manager of the firm’s Fund Accounting Department from 1997 through October 2001.
MATTHEW D. CONNOLLY, Anti-Money Laundering Compliance Officer since April 2012.
Anti-Money Laundering Compliance Officer of the Distributor since October 2011; from March 2010 to September 2011, Global Head, KYC Reviews and Director, UBS Investment Bank; until March 2010,AML Compliance Officer and Senior Vice President, Citi Global Wealth Management. He is an officer of 69 investment companies (comprised of 179 portfolios) managed by the Manager. He is 40 years old and has been an employee of the Distributor since October 2011.
40
For More Information
Telephone Call your financial representative or 1-800-DREYFUS
Mail The Dreyfus Family of Funds, 144 Glenn Curtiss Boulevard, Uniondale, NY 11556-0144
The fund files its complete schedule of portfolio holdings with the Securities and Exchange Commission (“SEC”) for the first and third quarters of each fiscal year on Form N-Q. The fund’s Forms N-Q are available on the SEC’s website at http://www.sec.gov and may be reviewed and copied at the SEC’s Public Reference Room in Washington, DC. Information on the operation of the Public Reference Room may be obtained by calling 1-800-SEC-0330.
A description of the policies and procedures that the fund uses to determine how to vote proxies relating to portfolio securities, and information regarding how the fund voted these proxies for the most recent 12-month period ended June 30 is available at http://www.dreyfus.com and on the SEC’s website at http://www.sec.gov. The description of the policies and procedures is also available without charge, upon request, by calling 1-800-DREYFUS.

| Dreyfus/The Boston |
| Company Large Cap |
| Core Fund |
ANNUAL REPORT September 30, 2012
Save time. Save paper. View your next shareholder report online as soon as it’s available. Log into www.dreyfus.com and sign up for Dreyfus eCommunications. It’s simple and only takes a few minutes.
The views expressed in this report reflect those of the portfolio manager only through the end of the period covered and do not necessarily represent the views of Dreyfus or any other person in the Dreyfus organization. Any such views are subject to change at any time based upon market or other conditions and Dreyfus disclaims any responsibility to update such views.These views may not be relied on as investment advice and, because investment decisions for a Dreyfus fund are based on numerous factors, may not be relied on as an indication of trading intent on behalf of any Dreyfus fund.
| Not FDIC-Insured • Not Bank-Guaranteed • May Lose Value |
Contents | |
THE FUND | |
| 2 | A Letter from the Chairman and CEO |
| 3 | Discussion of Fund Performance |
| 6 | Fund Performance |
| 8 | Understanding Your Fund’s Expenses |
| 8 | Comparing Your Fund’s Expenses With Those of Other Funds |
| 9 | Statement of Investments |
| 13 | Statement of Assets and Liabilities |
| 14 | Statement of Operations |
| 15 | Statement of Changes in Net Assets |
| 17 | Financial Highlights |
| 20 | Notes to Financial Statements |
| 31 | Report of Independent Registered Public Accounting Firm |
| 32 | Important Tax Information |
| 32 | Proxy Results |
| 33 | Board Members Information |
| 35 | Officers of the Fund |
FOR MORE INFORMATION | |
Back Cover |
Dreyfus/The Boston
Company Large Cap
Core Fund
The Fund
A LETTER FROM THE CHAIRMAN AND CEO

Dear Shareholder:
This annual report for Dreyfus/The Boston Company Large Cap Core Fund covers the 12-month period from October 1, 2011, through September 30, 2012. For information about how the fund performed during the reporting period, as well as general market perspectives, we provide a Discussion of Fund Performance on the pages that follow.
U.S. equities proved unusually volatile over the past year, as prices rose and fell according to investors’ changing expectations of global and domestic economic conditions.And while the pace of U.S. economic growth has been relatively consistent, it has progressed at about half the average rate achieved in prior recoveries. Overseas, Europe has remained under severe economic pressure due to a persistent debt crisis and austerity-oriented fiscal policies adopted by many governments. In Japan, a strengthening currency dampened export activity and economic growth. The emerging markets have posted a slower rate of growth, reducing demand for industrial commodities and other goods and services.
The sustained-but-subpar U.S. expansion appears likely to continue over the foreseeable future.Across the international markets though, on one hand the global economy has responded to a variety of stimulative measures, most notably aggressively accommodative monetary policies in most major markets. On the other hand, headwinds emanating from Europe and China may continue to weigh on economic growth and investor sentiment. Indeed, the ability of governments and economic policymakers to address these issues could go a long way toward shaping the 2013 market environment. As always, we urge you to speak regularly with your financial advisor to discuss how changing global economic conditions may affect your investments.
Thank you for your continued confidence and support.

Jonathan R. Baum
Chairman and Chief Executive Officer
The Dreyfus Corporation
October 15, 2012
2
DISCUSSION OF FUND PERFORMANCE
For the period of October 1, 2011, through September 30, 2012, as provided by Sean P. Fitzgibbon and Jeffrey D. McGrew, Portfolio Managers
Fund and Market Performance Overview
For the 12-month period ended September 30, 2012, Dreyfus/The Boston Company Large Cap Core Fund’s Class A shares produced a total return of 27.66%, Class C shares returned 26.70% and Class I shares returned 27.98%.1 In comparison, the fund’s benchmark, the Standard & Poor’s 500 Composite Stock Price Index (“S&P 500 Index”), produced a total return of 30.17% for the same period.2
Improving economic sentiment drove large-cap stocks higher during the reporting period.The fund produced lower returns than its benchmark, largely due to shortfalls early in the reporting period, when a long-term investment perspective proved relatively ineffective.
The Fund’s Investment Approach
The fund seeks long-term growth of capital.The fund normally invests at least 80% of its assets in equity securities of large cap companies that appear to be undervalued relative to underlying business fundamentals.The fund currently considers large cap companies to be those with total market capitalizations, at the time of purchase, that are greater than the market capitalizations of companies in the bottom 5% of the capitalization range represented in the S&P 500 Index.The portfolio managers employ a core investment style that incorporates both growth and value criteria in managing the fund’s portfolio. The portfolio managers use a combination of quantitative and fundamental research to identify portfolio candidates.
Markets Reacted to Shifting Macroeconomic Developments
The reporting period began in the immediate aftermath of a major stock market decline. One credit-rating agency’s downgrade of long-term U.S. government debt, an intensifying debt crisis in Europe and inflation-fighting programs in China had triggered a flight away from risky assets. Fortunately, better U.S. economic data and new remedial measures from European policymakers sparked a rebound in October 2011, and U.S. equity markets stabilized during the fall.
| The Fund | 3 |
DISCUSSION OF FUND PERFORMANCE (continued)
By the beginning of 2012, stocks were rallying amid domestic employment gains, a quantitative easing program in Europe and less restrictive monetary and fiscal policies in China. Investors grew more tolerant of risks, focusing more intently on company fundamentals. However, these positive influences were called into question during the spring, when U.S. employment gains slowed, measures designed to relieve fiscal pressures in Europe encountered resistance, and the Chinese economy remained sluggish. The summer saw the market rally resume amid more encouraging macroeconomic news, and the S&P 500 Index ended the reporting period with substantial gains.
Investors Favored Current Growth over Future Prospects
Although the fund participated substantially in the benchmark’s gains, relative performance was dampened by risk-averse market sentiment early in the reporting period, as investors focused on current earnings and largely disregarded factors suggesting robust future growth. Shortfalls were especially severe in the consumer staples sector, where Ralcorp Holdings encountered higher input costs. Unilever faltered due to economic weakness in Europe, as investors punished the stock despite the company’s robust presence in the emerging markets. Lorillard lost market share to larger tobacco producers.
In the information technology sector, a number of stocks succumbed to short-term selling pressure over the fall of 2011, and Amazon.com was hurt by elevated spending on capital improvements. In the health care sector, several holdings were punished by the market’s skepticism regarding rising procedure volumes, Baxter International suffered a setback in the approval of a new product, and Watson Pharmaceuticals was undermined by intensifying competitive pressures.
The fund achieved better results in the consumer discretionary sector. CBS enjoyed increased syndication and rebroadcast opportunities from highly rated programming. Michael Kors Holdings expanded its retail presence and reported better-than-expected earnings. Melco Crown Entertainment rebounded as concerns ebbed regarding its casino operations in China. Cabela’s took advantage of robust retail demand for sporting goods and apparel. In the industrials sector,Cooper Industries and Thomas & Betts received acquisition offers at premiums to their stock prices at the time. General Electric successfully streamlined its financial services division and posted strong results from traditional businesses. Cummins advanced as truck sales recovered.
4
Among materials producers, lack of exposure to metals-and-mining companies helped the fund avoid a weak industry group, while chemicals producers such as LyondellBasell Industries benefited from lower input costs. In other areas, Apple represented the fund’s top individual performer due to the popularity of its smart-phones and tablet computers, and National-Oilwell Varco proved well positioned to support energy producers as they resume and expand offshore drilling activity, as we help them comply with stricter safety regulations.
Maintaining a Constructive Investment Posture
Although macroeconomic uncertainties remain over the near term, we are optimistic about the longer term prospects for large-cap stocks. Low interest rates and accommodative monetary policies are expected to keep the U.S. and global economies growing, but at a relatively moderate pace. In this environment, our research intensive investment process has identified a number of opportunities among health care and information technology companies, but the fund held no positions in the utilities sector as of the reporting period’s end.
October 15, 2012
Please note, the position in any security highlighted with italicized typeface was sold during the reporting period. Equity funds are subject generally to market, market sector, market liquidity, issuer and investment style risks, among other factors, to varying degrees, all of which are more fully described in the fund’s prospectus.
| 1 Total return includes reinvestment of dividends and any capital gains paid, and does not take into consideration the |
| maximum initial sales charge in the case of Class A shares, or the applicable contingent deferred sales charge imposed |
| on redemptions in the case of Class C shares. Had these charges been reflected, returns would have been lower. Past |
| performance is no guarantee of future results. Share price and investment return fluctuate such that upon redemption, |
| fund shares may be worth more or less than their original cost.The fund’s returns reflect the absorption of certain fund |
| expenses by The Dreyfus Corporation pursuant to an agreement in effect through February 1, 2013, at which The |
| Dreyfus Corporation does not intend to continue this expense limitation. Had these expenses not been absorbed, the |
| fund’s returns would have been lower. |
| 2 SOURCE: LIPPER INC. — Reflects the monthly reinvestment of dividends and, where applicable, capital gain |
| distributions.The Standard & Poor’s 500 Composite Stock Price Index is a widely accepted, unmanaged index of |
| U.S. stock market performance. Index return does not reflect fees and expenses associated with operating a mutual |
| fund. Investors cannot invest directly in any index. |
| The Fund | 5 |
FUND PERFORMANCE
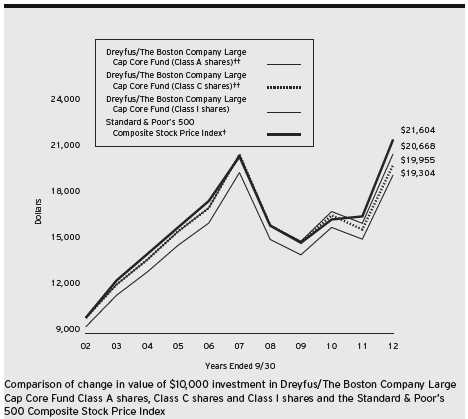
| † | Source: Lipper Inc. |
| †† | The total return figures presented for Class A and Class C shares of the fund reflect the performance of the fund’s |
| Class I shares for the period prior to 3/31/09 (the inception date for Class A and Class C shares), adjusted to | |
| reflect the applicable sales load for each share class. |
Past performance is not predictive of future performance.
The above graph compares a $10,000 investment made in each of the Class A, Class C and Class I shares of Dreyfus/The Boston Company Large Cap Core Fund on 9/30/02 to a $10,000 investment made in the Standard & Poor’s 500 Composite Stock Price Index (the “Index”) on that date. All dividends and capital gain distributions are reinvested.
The fund’s performance shown in the line graph above takes into account the maximum initial sales charge on Class A shares and all other applicable fees and expenses on all classes.The Index is a widely accepted, unmanaged Index of U.S. stock market performance. Unlike a mutual fund, the Index is not subject to charges, fees and other expenses. Investors cannot invest directly in any index.These factors can contribute to the Index potentially outperforming the fund. Further information relating to fund performance, including expense reimbursements, if applicable, is contained in the Financial Highlights section of the prospectus and elsewhere in this report.
6
| Average Annual Total Returns as of 9/30/12 | |||||||
| Inception | |||||||
| Date | 1 Year | 5 Years | 10 Years | ||||
| Class A shares | |||||||
| with maximum sales charge (5.75%) | 3/31/09 | 20.32 | % | –1.33 | %†† | 6.80 | %†† |
| without sales charge | 3/31/09 | 27.66 | % | –0.16 | %†† | 7.43 | %†† |
| Class C shares | |||||||
| with applicable redemption charge † | 3/31/09 | 25.70 | % | –0.67 | %†† | 7.15 | %†† |
| without redemption | 3/31/09 | 26.70 | % | –0.67 | %†† | 7.15 | %†† |
| Class I shares | 1/31/91 | 27.98 | % | 0.03 | % | 7.53 | % |
| Standard & Poor’s 500 | |||||||
| Composite Stock Price Index | 30.17 | % | 1.05 | % | 8.01 | % | |
Past performance is not predictive of future performance.The fund’s performance shown in the graph and table does not reflect the deduction of taxes that a shareholder would pay on fund distributions or the redemption of fund shares.
| † | The maximum contingent deferred sales charge for Class C shares is 1% for shares redeemed within one year of the |
| date of purchase. | |
| †† | The total return performance figures presented for Class A and Class C shares of the fund reflect the performance of |
| the fund’s Class I shares for the period prior to 3/31/09 (the inception date for Class A and Class C shares), | |
| adjusted to reflect the applicable sales load for each share class. |
| The Fund | 7 |
UNDERSTANDING YOUR FUND’S EXPENSES (Unaudited)
As a mutual fund investor, you pay ongoing expenses, such as management fees and other expenses. Using the information below, you can estimate how these expenses affect your investment and compare them with the expenses of other funds.You also may pay one-time transaction expenses, including sales charges (loads) and redemption fees, which are not shown in this section and would have resulted in higher total expenses. For more information, see your fund’s prospectus or talk to your financial adviser.
Review your fund’s expenses
The table below shows the expenses you would have paid on a $1,000 investment in Dreyfus/The Boston Company Large Cap Core Fund from April 1, 2012 to September 30, 2012. It also shows how much a $1,000 investment would be worth at the close of the period, assuming actual returns and expenses.
Expenses and Value of a $1,000 Investment
assuming actual returns for the six months ended September 30, 2012
| Class A | Class C | Class I | ||||
| Expenses paid per $1,000† | $ | 5.80 | $ | 9.57 | $ | 4.54 |
| Ending value (after expenses) | $ | 1,017.90 | $ | 1,013.90 | $ | 1,019.00 |
COMPARING YOUR FUND’S EXPENSES
WITH THOSE OF OTHER FUNDS (Unaudited)
Using the SEC’s method to compare expenses
The Securities and Exchange Commission (SEC) has established guidelines to help investors assess fund expenses. Per these guidelines, the table below shows your fund’s expenses based on a $1,000 investment, assuming a hypothetical 5% annualized return. You can use this information to compare the ongoing expenses (but not transaction expenses or total cost) of investing in the fund with those of other funds.All mutual fund shareholder reports will provide this information to help you make this comparison. Please note that you cannot use this information to estimate your actual ending account balance and expenses paid during the period.
Expenses and Value of a $1,000 Investment
assuming a hypothetical 5% annualized return for the six months ended September 30, 2012
| Class A | Class C | Class I | ||||
| Expenses paid per $1,000† | $ | 5.81 | $ | 9.57 | $ | 4.55 |
| Ending value (after expenses) | $ | 1,019.25 | $ | 1,015.50 | $ | 1,020.50 |
| † Expenses are equal to the fund’s annualized expense ratio of 1.15% for Class A, 1.90% for Class C, and .90% |
| for Class I, multiplied by the average account value over the period, multiplied by 183/366 (to reflect the one-half |
| year period). |
8
STATEMENT OF INVESTMENTS
September 30, 2012
| Common Stocks—100.0% | Shares | Value ($) | |
| Automobiles & Components—1.1% | |||
| Delphi Automotive | 5,620 | 174,220 | |
| Banks—2.7% | |||
| Wells Fargo & Co. | 12,750 | 440,258 | |
| Capital Goods—5.7% | |||
| Eaton | 3,930 | 185,732 | |
| General Electric | 26,590 | 603,859 | |
| Tyco International | 2,477 | 139,356 | |
| 928,947 | |||
| Commercial & Professional Services—.8% | |||
| Robert Half International | 4,620 | 123,031 | |
| Consumer Durables & Apparel—.9% | |||
| PVH | 1,640 | 153,701 | |
| Diversified Financials—10.2% | |||
| Affiliated Managers Group | 1,778 | a | 218,694 |
| American Express | 4,240 | 241,086 | |
| Ameriprise Financial | 3,790 | 214,855 | |
| Bank of America | 13,710 | 121,059 | |
| Capital One Financial | 2,950 | 168,179 | |
| Discover Financial Services | 3,850 | 152,961 | |
| IntercontinentalExchange | 1,300 | a | 173,433 |
| JPMorgan Chase & Co. | 2,230 | 90,270 | |
| Moody’s | 4,580 | 202,299 | |
| T. Rowe Price Group | 1,450 | 91,785 | |
| 1,674,621 | |||
| Energy—12.8% | |||
| Anadarko Petroleum | 2,820 | 197,174 | |
| Apache | 1,530 | 132,299 | |
| Chevron | 4,932 | 574,874 | |
| Ensco, Cl. A | 3,590 | 195,870 | |
| EOG Resources | 1,920 | 215,136 | |
| National Oilwell Varco | 5,610 | 449,417 | |
| Occidental Petroleum | 1,830 | 157,490 | |
| TransCanada | 3,880 | 176,540 | |
| 2,098,800 |
| The Fund | 9 |
STATEMENT OF INVESTMENTS (continued)
| Common Stocks (continued) | Shares | Value ($) | |
| Exchange-Traded Funds—.7% | |||
| Standard & Poor’s Depository | |||
| Receipts S&P 500 ETF Trust | 820 | 118,055 | |
| Food, Beverage & Tobacco—7.2% | |||
| Dean Foods | 3,940 | a | 64,419 |
| Dr. Pepper Snapple Group | 1,810 | 80,599 | |
| Philip Morris International | 5,710 | 513,557 | |
| Unilever, ADR | 14,180 | 517,854 | |
| 1,176,429 | |||
| Health Care Equipment & Services—4.9% | |||
| Cigna | 2,330 | 109,906 | |
| Covidien | 5,557 | 330,197 | |
| McKesson | 1,450 | 124,744 | |
| Zimmer Holdings | 3,400 | 229,908 | |
| 794,755 | |||
| Insurance—1.5% | |||
| American International Group | 3,480 | a | 114,109 |
| Chubb | 1,780 | 135,778 | |
| 249,887 | |||
| Materials—2.8% | |||
| LyondellBasell Industries, Cl. A | 3,900 | 201,474 | |
| Monsanto | 2,730 | 248,485 | |
| 449,959 | |||
| Media—2.9% | |||
| CBS, Cl. B | 3,430 | 124,612 | |
| Walt Disney | 6,810 | 356,027 | |
| 480,639 | |||
| Pharmaceuticals, Biotech & | |||
| Life Sciences—10.9% | |||
| Johnson & Johnson | 4,060 | 279,775 | |
| Merck & Co. | 10,340 | 466,334 |
10
| Common Stocks (continued) | Shares | Value ($) | |
| Pharmaceuticals, Biotech & | |||
| Life Sciences (continued) | |||
| Pfizer | 24,100 | 598,885 | |
| Sanofi, ADR | 10,050 | 432,753 | |
| 1,777,747 | |||
| Real Estate—1.8% | |||
| American Tower | 1,660 | 118,507 | |
| CBRE Group, Cl. A | 9,930 | a | 182,811 |
| 301,318 | |||
| Retailing—3.7% | |||
| Cabela’s | 2,520 | a | 137,794 |
| Dollar General | 4,340 | a | 223,684 |
| Foot Locker | 6,750 | 239,625 | |
| 601,103 | |||
| Semiconductors & Semiconductor | |||
| Equipment—1.6% | |||
| Skyworks Solutions | 10,900 | a | 256,859 |
| Software & Services—7.0% | |||
| Alliance Data Systems | 1,430 | a | 202,988 |
| Cognizant Technology Solutions, Cl. A | 2,890 | a | 202,069 |
| International Business Machines | 1,440 | 298,728 | |
| Oracle | 8,890 | 279,946 | |
| VMware, Cl. A | 1,580 | a | 152,849 |
| 1,136,580 | |||
| Technology Hardware & Equipment—13.7% | |||
| Apple | 1,980 | 1,321,175 | |
| Ciena | 11,950 | a | 162,520 |
| EMC | 9,540 | a | 260,156 |
| QUALCOMM | 6,140 | 383,689 | |
| Vishay Intertechnology | 10,780 | a | 105,967 |
| 2,233,507 |
| The Fund | 11 |
STATEMENT OF INVESTMENTS (continued)
| Common Stocks (continued) | Shares | Value ($) | |
| Telecommunication Services—3.4% | |||
| AT&T | 14,740 | 555,698 | |
| Transportation—3.7% | |||
| FedEx | 2,870 | 242,859 | |
| JB Hunt Transport Services | 2,650 | 137,906 | |
| Union Pacific | 1,900 | 225,530 | |
| 606,295 | |||
| Total Investments (cost $14,336,693) | 100.0 | % | 16,332,409 |
| Cash and Receivables (Net) | .0 | % | 4,143 |
| Net Assets | 100.0 | % | 16,336,552 |
| ADR—American Depository Receipts |
| a Non-income producing security. |
| Portfolio Summary (Unaudited)† | |||
| Value (%) | Value (%) | ||
| Technology Hardware & Equipment | 13.7 | Media | 2.9 |
| Energy | 12.8 | Materials | 2.8 |
| Pharmaceuticals, | Banks | 2.7 | |
| Biotech & Life Sciences | 10.9 | Real Estate | 1.8 |
| Diversified Financials | 10.2 | Semiconductors & | |
| Food, Beverage & Tobacco | 7.2 | Semiconductor Equipment | 1.6 |
| Software & Services | 7.0 | Insurance | 1.5 |
| Capital Goods | 5.7 | Automobiles & Components | 1.1 |
| Health Care Equipment & Services | 4.9 | Consumer Durables & Apparel | .9 |
| Retailing | 3.7 | Commercial & Professional Services | .8 |
| Transportation | 3.7 | Exchange-Traded Funds | .7 |
| Telecommunication Services | 3.4 | 100.0 | |
| † Based on net assets. |
| See notes to financial statements. |
12
| STATEMENT OF ASSETS AND LIABILITIES |
| September 30, 2012 |
| Cost | Value | |||
| Assets ($): | ||||
| Investments in securities—See Statement of Investments | 14,336,693 | 16,332,409 | ||
| Receivable for investment securities sold | 220,124 | |||
| Dividends receivable | 22,651 | |||
| Receivable for shares of Beneficial Interest subscribed | 968 | |||
| Prepaid expenses | 16,680 | |||
| 16,592,832 | ||||
| Liabilities ($): | ||||
| Due to The Dreyfus Corporation and affiliates—Note 3(c) | 8,058 | |||
| Due to Administrator—Note 3(a) | 817 | |||
| Cash overdraft due to Custodian | 111,296 | |||
| Payable for investment securities purchased | 80,328 | |||
| Payable for shares of Beneficial Interest redeemed | 15,000 | |||
| Accrued expenses | 40,781 | |||
| 256,280 | ||||
| Net Assets ($) | 16,336,552 | |||
| Composition of Net Assets ($): | ||||
| Paid-in capital | 23,874,969 | |||
| Accumulated undistributed investment income—net | 195,008 | |||
| Accumulated net realized gain (loss) on investments | (9,729,141 | ) | ||
| Accumulated net unrealized appreciation | ||||
| (depreciation) on investments | 1,995,716 | |||
| Net Assets ($) | 16,336,552 | |||
| Net Asset Value Per Share | ||||
| Class A | Class C | Class I | ||
| Net Assets ($) | 393,577 | 27,559 | 15,915,416 | |
| Shares Outstanding | 10,508 | 739 | 422,793 | |
| Net Asset Value Per Share ($) | 37.45 | 37.29 | 37.64 | |
| See notes to financial statements. | ||||
| The Fund | 13 |
| STATEMENT OF OPERATIONS | ||
| Year Ended September 30, 2012 | ||
| Investment Income ($): | ||
| Income: | ||
| Cash dividends (net of $4,599 foreign taxes withheld at source): | ||
| Unaffiliated issuers | 385,996 | |
| Affiliated issuers | 286 | |
| Total Income | 386,282 | |
| Expenses: | ||
| Investment advisory fee—Note 3(a) | 105,081 | |
| Registration fees | 38,586 | |
| Auditing fees | 33,217 | |
| Shareholder servicing costs—Note 3(c) | 21,020 | |
| Prospectus and shareholders’ reports | 12,900 | |
| Administration fee—Note 3(a) | 12,610 | |
| Legal fees | 9,370 | |
| Custodian fees—Note 3(c) | 2,920 | |
| Trustees’ fees and expenses—Note 3(d) | 2,511 | |
| Interest expense—Note 2 | 491 | |
| Distribution fees—Note 3(b) | 190 | |
| Loan commitment fees—Note 2 | 61 | |
| Miscellaneous | 18,845 | |
| Total Expenses | 257,802 | |
| Less—reduction in expenses due to undertaking—Note 3(a) | (67,036 | ) |
| Less—reduction in fees due to earnings credits—Note 3(c) | (4 | ) |
| Net Expenses | 190,762 | |
| Investment Income—Net | 195,520 | |
| Realized and Unrealized Gain (Loss) on Investments—Note 4 ($): | ||
| Net realized gain (loss) on investments | 2,179,697 | |
| Net unrealized appreciation (depreciation) on investments | 3,079,989 | |
| Net Realized and Unrealized Gain (Loss) on Investments | 5,259,686 | |
| Net Increase in Net Assets Resulting from Operations | 5,455,206 | |
| See notes to financial statements. | ||
14
STATEMENT OF CHANGES IN NET ASSETS
| Year Ended September 30, | ||||
| 2012 | 2011 | |||
| Operations ($): | ||||
| Investment income—net | 195,520 | 251,048 | ||
| Net realized gain (loss) on investments | 2,179,697 | 4,372,021 | ||
| Net unrealized appreciation | ||||
| (depreciation) on investments | 3,079,989 | (4,756,534 | ) | |
| Net Increase (Decrease) in Net Assets | ||||
| Resulting from Operations | 5,455,206 | (133,465 | ) | |
| Dividends to Shareholders from ($): | ||||
| Investment income—net: | ||||
| Class A Shares | (2,758 | ) | (447 | ) |
| Class I Shares | (227,706 | ) | (275,220 | ) |
| Total Dividends | (230,464 | ) | (275,667 | ) |
| Beneficial Interest Transactions ($): | ||||
| Net proceeds from shares sold: | ||||
| Class A Shares | 53,331 | 318,243 | ||
| Class C Shares | — | 22,020 | ||
| Class I Shares | 1,728,011 | 4,188,092 | ||
| Dividends reinvested: | ||||
| Class A Shares | 2,530 | 339 | ||
| Class I Shares | 183,602 | 195,227 | ||
| Cost of shares redeemed: | ||||
| Class A Shares | (16,721 | ) | (29,950 | ) |
| Class C Shares | — | (13,242 | ) | |
| Class I Shares | (13,672,731 | ) | (12,764,826 | ) |
| Increase (Decrease) in Net Assets from | ||||
| Beneficial Interest Transactions | (11,721,978 | ) | (8,084,097 | ) |
| Total Increase (Decrease) in Net Assets | (6,497,236 | ) | (8,493,229 | ) |
| Net Assets ($): | ||||
| Beginning of Period | 22,833,788 | 31,327,017 | ||
| End of Period | 16,336,552 | 22,833,788 | ||
| Undistributed investment income—net | 195,008 | 229,952 | ||
| The Fund | 15 |
STATEMENT OF CHANGES IN NET ASSETS (continued)
| Year Ended September 30, | ||||
| 2012 | 2011 | |||
| Capital Share Transactions: | ||||
| Class A | ||||
| Shares sold | 1,449 | 8,911 | ||
| Shares issued for dividends reinvested | 82 | 10 | ||
| Shares redeemed | (530 | ) | (979 | ) |
| Net Increase (Decrease) in Shares Outstanding | 1,001 | 7,942 | ||
| Class C | ||||
| Shares sold | — | 621 | ||
| Shares redeemed | — | (367 | ) | |
| Net Increase (Decrease) in Shares Outstanding | — | 254 | ||
| Class I | ||||
| Shares sold | 50,578 | 119,747 | ||
| Shares issued for dividends reinvested | 5,983 | 5,778 | ||
| Shares redeemed | (391,436 | ) | (362,891 | ) |
| Net Increase (Decrease) in Shares Outstanding | (334,875 | ) | (237,366 | ) |
| See notes to financial statements. | ||||
16
FINANCIAL HIGHLIGHTS
The following tables describe the performance for each share class for the fiscal periods indicated.All information (except portfolio turnover rate) reflects financial results for a single fund share.Total return shows how much your investment in the fund would have increased (or decreased) during each period, assuming you had reinvested all dividends and distributions.These figures have been derived from the fund’s financial statements.
| Year Ended September 30, | ||||||||
| Class A Shares | 2012 | 2011 | 2010 | 2009 | a | |||
| Per Share Data ($): | ||||||||
| Net asset value, beginning of period | 29.64 | 31.35 | 27.93 | 20.60 | ||||
| Investment Operations: | ||||||||
| Investment income—netb | .25 | .24 | .16 | .09 | ||||
| Net realized and unrealized | ||||||||
| gain (loss) on investments | 7.87 | (1.73 | ) | 3.35 | 7.43 | |||
| Total from Investment Operations | 8.12 | (1.49 | ) | 3.51 | 7.52 | |||
| Distributions: | ||||||||
| Dividends from investment income—net | (.31 | ) | (.22 | ) | (.09 | ) | (.19 | ) |
| Net asset value, end of period | 37.45 | 29.64 | 31.35 | 27.93 | ||||
| Total Return (%)c | 27.66 | (4.83 | ) | 12.58 | 36.67 | d | ||
| Ratios/Supplemental Data (%): | ||||||||
| Ratio of total expenses to average net assets | 1.47 | 1.76 | 1.43 | 4.43 | e | |||
| Ratio of net expenses to average net assets | 1.15 | 1.15 | 1.15 | 1.15 | e | |||
| Ratio of net investment income | ||||||||
| to average net assets | .72 | .67 | .53 | .74 | e | |||
| Portfolio Turnover Rate | 82.52 | 85.58 | 82.28 | 116.21 | ||||
| Net Assets, end of period ($ x 1,000) | 394 | 282 | 49 | 16 | ||||
| a | From March 31, 2009 (commencement of initial offering) to September 30, 2009. |
| b | Based on average shares outstanding at each month end. |
| c | Exclusive of sales charge. |
| d | Not annualized. |
| e | Annualized. |
See notes to financial statements.
| The Fund | 17 |
FINANCIAL HIGHLIGHTS (continued)
| Year Ended September 30, | ||||||||
| Class C Shares | 2012 | 2011 | 2010 | 2009 | a | |||
| Per Share Data ($): | ||||||||
| Net asset value, beginning of period | 29.44 | 31.14 | 27.87 | 20.60 | ||||
| Investment Operations: | ||||||||
| Investment income (loss)—netb | (.01 | ) | (.05 | ) | (.06 | ) | .00 | c |
| Net realized and unrealized | ||||||||
| gain (loss) on investments | 7.86 | (1.65 | ) | 3.33 | 7.41 | |||
| Total from Investment Operations | 7.85 | (1.70 | ) | 3.27 | 7.41 | |||
| Distributions: | ||||||||
| Dividends from investment income—net | — | — | — | (.14 | ) | |||
| Net asset value, end of period | 37.29 | 29.44 | 31.14 | 27.87 | ||||
| Total Return (%)d | 26.70 | (5.49 | ) | 11.73 | 36.16 | e | ||
| Ratios/Supplemental Data (%): | ||||||||
| Ratio of total expenses to average net assets | 2.79 | 2.28 | 2.40 | 3.45 | f | |||
| Ratio of net expenses to average net assets | 1.90 | 1.90 | 1.90 | 1.90 | f | |||
| Ratio of net investment income | ||||||||
| (loss) to average net assets | (.04 | ) | (.15 | ) | (.19 | ) | .01 | f |
| Portfolio Turnover Rate | 82.52 | 85.58 | 82.28 | 116.21 | ||||
| Net Assets, end of period ($ x 1,000) | 28 | 22 | 15 | 14 | ||||
| a | From March 31, 2009 (commencement of initial offering) to September 30, 2009. |
| b | Based on average shares outstanding at each month end. |
| c | Amount represents less than $.01 per share. |
| d | Exclusive of sales charge. |
| e | Not annualized. |
| f | Annualized. |
See notes to financial statements.
18
| Year Ended September 30, | ||||||||||
| Class I Shares | 2012 | 2011 | 2010 | 2009 | a | 2008 | ||||
| Per Share Data ($): | ||||||||||
| Net asset value, beginning of period | 29.74 | 31.42 | 27.95 | 30.39 | 43.28 | |||||
| Investment Operations: | ||||||||||
| Investment income—netb | .32 | .29 | .24 | .34 | .43 | |||||
| Net realized and unrealized | ||||||||||
| gain (loss) on investments | 7.92 | (1.69 | ) | 3.35 | (2.38 | ) | (9.32 | )c | ||
| Total from Investment Operations | 8.24 | (1.40 | ) | 3.59 | (2.04 | ) | (8.89 | ) | ||
| Distributions: | ||||||||||
| Dividends from investment income—net | (.34 | ) | (.28 | ) | (.12 | ) | (.40 | ) | (.53 | ) |
| Dividends from net realized | ||||||||||
| gain on investments | — | — | — | — | (3.47 | ) | ||||
| Total Distributions | (.34 | ) | (.28 | ) | (.12 | ) | (.40 | ) | (4.00 | ) |
| Net asset value, end of period | 37.64 | 29.74 | 31.42 | 27.95 | 30.39 | |||||
| Total Return (%) | 27.98 | (4.56 | ) | 12.87 | (6.43 | ) | (22.41 | ) | ||
| Ratios/Supplemental Data (%): | ||||||||||
| Ratio of total expenses | ||||||||||
| to average net assets | 1.22 | 1.23 | 1.23 | 1.23 | .84 | |||||
| Ratio of net expenses | ||||||||||
| to average net assets | .90 | .90 | .90 | .91 | .84 | |||||
| Ratio of net investment income | ||||||||||
| to average net assets | .93 | .86 | .81 | 1.43 | 1.17 | |||||
| Portfolio Turnover Rate | 82.52 | 85.58 | 82.28 | 116.21 | 61 | |||||
| Net Assets, end of period ($ x 1,000) | 15,915 | 22,530 | 31,263 | 34,562 | 59,996 | |||||
| a The fund commenced offering three classes of shares on March 31, 2009.The existing shares were redesignated as |
| Class I shares. |
| b Based on average shares outstanding at each month end. |
| c Amount included litigation proceeds received by the fund amounting to $.02 per share for the year ended |
| September 30, 2008. |
See notes to financial statements.
| The Fund | 19 |
NOTES TO FINANCIAL STATEMENTS
NOTE 1—Significant Accounting Policies:
Dreyfus/The Boston Company Large Cap Core Fund (the “fund”) is a separate diversified series of Dreyfus Investment Funds (the “Trust”), which is registered under the Investment Company Act of 1940, as amended (the “Act”), as an open-end management investment company and operates as a series company currently offering eleven series, including the fund.The fund’s investment objective is to seek long-term growth of capital. The Dreyfus Corporation (the “Manager” or “Dreyfus”), a wholly-owned subsidiary of The Bank of New York Mellon Corporation (“BNY Mellon”), serves as the fund’s investment adviser.
MBSC Securities Corporation (the “Distributor”), a wholly-owned subsidiary of the Manager, is the distributor of the fund’s shares. The fund is authorized to issue an unlimited number of $.001 par value shares of Beneficial Interest in each of the following classes of shares: Class A, Class C, and Class I. Class A and Class C shares are sold primarily to retail investors through intermediaries and bear a distribution fee and/or shareholder services fee. Class A shares are subject to a sales charge imposed at the time of purchase. Class C shares are subject to a contingent deferred sales charge (“CDSC”) imposed on Class C shares redeemed within one year of purchase. Class I shares are sold primarily to bank trust departments and other financial service providers (includingThe Bank of NewYork Mellon, a subsidiary of BNY Mellon and an affiliate of Dreyfus, and its affiliates), acting on behalf of customers having a qualified trust or investment account or relationship at such institution, and bear no Distribution or Shareholder Services Plan fees. Class I shares are offered without a front-end sales charge or CDSC. Other differences between the classes include the services offered to and the expenses borne by each class, the allocation of certain transfer agency costs and certain voting rights. Income, expenses (other than expenses attributable to a specific class), and realized and unrealized gains or losses on investments are allocated to each class of shares based on its relative net assets.
20
As of September 30, 2012, MBC Investments Corp., an indirect subsidiary of BNY Mellon, held 485 Class C shares of the fund.
The Trust accounts separately for the assets, liabilities and operations of each series. Expenses directly attributable to each series are charged to that series’ operations; expenses which are applicable to all series are allocated among them on a pro rata basis.
The Financial Accounting Standards Board (“FASB”) Accounting Standards Codification is the exclusive reference of authoritative U.S. generally accepted accounting principles (“GAAP”) recognized by the FASB to be applied by nongovernmental entities. Rules and interpretive releases of the Securities and Exchange Commission (“SEC”) under authority of federal laws are also sources of authoritative GAAP for SEC registrants. The fund’s financial statements are prepared in accordance with GAAP, which may require the use of management estimates and assumptions.Actual results could differ from those estimates.
(a) Portfolio valuation: The fair value of a financial instrument is the amount that would be received to sell an asset or paid to transfer a liability in an orderly transaction between market participants at the measurement date (i.e., the exit price). GAAP establishes a fair value hierarchy that prioritizes the inputs of valuation techniques used to measure fair value.This hierarchy gives the highest priority to unadjusted quoted prices in active markets for identical assets or liabilities (Level 1 measurements) and the lowest priority to unobservable inputs (Level 3 measurements).
Additionally, GAAP provides guidance on determining whether the volume and activity in a market has decreased significantly and whether such a decrease in activity results in transactions that are not orderly. GAAP requires enhanced disclosures around valuation inputs and techniques used during annual and interim periods.
| The Fund | 21 |
NOTES TO FINANCIAL STATEMENTS (continued)
Various inputs are used in determining the value of the fund’s investments relating to fair value measurements.These inputs are summarized in the three broad levels listed below:
Level 1—unadjusted quoted prices in active markets for identical investments.
Level 2—other significant observable inputs (including quoted prices for similar investments, interest rates, prepayment speeds, credit risk, etc.).
Level 3—significant unobservable inputs (including the fund’s own assumptions in determining the fair value of investments).
The inputs or methodology used for valuing securities are not necessarily an indication of the risk associated with investing in those securities.
Changes in valuation techniques may result in transfers in or out of an assigned level within the disclosure hierarchy. Valuation techniques used to value the fund’s investments are as follows:
Investments in securities are valued at the last sales price on the securities exchange or national securities market on which such securities are primarily traded. Securities listed on the National Market System for which market quotations are available are valued at the official closing price or, if there is no official closing price that day, at the last sales price. Securities not listed on an exchange or the national securities market, or securities for which there were no transactions, are valued at the average of the most recent bid and asked prices, except for open short positions, where the asked price is used for valuation purposes. Bid price is used when no asked price is available. Registered investment companies that are not traded on an exchange are valued at their net asset value. All of the preceding securities are categorized within Level 1 of the fair value hierarchy.
Fair valuing of securities may be determined with the assistance of a pricing service using calculations based on indices of domestic securities and other appropriate indicators, such as prices of relevant ADRs and financial futures. Utilizing these techniques may result in transfers between Level 1 and Level 2 of the fair value hierarchy.
22
When market quotations or official closing prices are not readily available, or are determined not to reflect accurately fair value, such as when the value of a security has been significantly affected by events after the close of the exchange or market on which the security is principally traded (for example, a foreign exchange or market), but before the fund calculates its net asset value, the fund may value these investments at fair value as determined in accordance with the procedures approved by the Trust’s Board of Trustees (the “Board”). Certain factors may be considered when fair valuing investments such as: fundamental analytical data, the nature and duration of restrictions on disposition, an evaluation of the forces that influence the market in which the securities are purchased and sold, and public trading in similar securities of the issuer or comparable issuers.These securities are either categorized as Level 2 or 3 depending on the relevant inputs used.
For restricted securities where observable inputs are limited, assumptions about market activity and risk are used and are categorized within Level 3 of the fair value hierarchy.
The following is a summary of the inputs used as of September 30, 2012 in valuing the fund’s investments:
| Level 2—Other | Level 3— | |||
| Level 1— | Significant | Significant | ||
| Unadjusted | Observable | Unobservable | ||
| Quoted Prices | Inputs | Inputs | Total | |
| Assets ($) | ||||
| Investments in Securities: | ||||
| Equity Securities—Domestic | ||||
| Common Stocks† | 14,891,337 | — | — | 14,891,337 |
| Equity Securities—Foreign | ||||
| Common Stocks† | 1,323,017 | — | — | 1,323,017 |
| Exchange-Traded Funds | 118,055 | — | — | 118,055 |
| † See Statement of Investments for additional detailed categorizations. | ||||
At September 30, 2012, there were no transfers between Level 1 and Level 2 of the fair value hierarchy.
| The Fund | 23 |
NOTES TO FINANCIAL STATEMENTS (continued)
(b) Securities transactions and investment income: Securities transactions are recorded on a trade date basis. Realized gains and losses from securities transactions are recorded on the identified cost basis. Dividend income is recognized on the ex-dividend date and interest income, including, where applicable, accretion of discount and amortization of premium on investments, is recognized on the accrual basis.
(c) Affiliated issuers: Investments in other investment companies advised by Dreyfus are defined as “affiliated” in the Act. Investments in affiliated investment companies for the period ended September 30, 2012 were as follows:
| Affiliated | |||||||
| Investment | Value | Value | Net | ||||
| Company | 9/30/2011 | ($) | Purchases ($) | Sales ($) | 9/30/2012 ($) | Assets (%) | |
| Dreyfus | |||||||
| Institutional | |||||||
| Preferred | |||||||
| Plus Money | |||||||
| Market Fund | 430,248 | 9,087,360 | 9,517,608 | — | — |
(d) Dividends to shareholders: Dividends are recorded on the ex-dividend date. Dividends from investment income-net and dividends from net realized capital gains, if any, are normally declared and paid annually, but the fund may make distributions on a more frequent basis to comply with the distribution requirements of the Internal Revenue Code of 1986, as amended (the “Code”).To the extent that net realized capital gains can be offset by capital loss carryovers, it is the policy of the fund not to distribute such gains. Income and capital gain distributions are determined in accordance with income tax regulations, which may differ from GAAP.
(e) Federal income taxes: It is the policy of the fund to continue to qualify as a regulated investment company, if such qualification is in the best interests of its shareholders, by complying with the applicable provisions of the Code, and to make distributions of taxable income sufficient to relieve it from substantially all federal income and excise taxes.
24
As of and during the period ended September 30, 2012, the fund did not have any liabilities for any uncertain tax positions.The fund recognizes interest and penalties, if any, related to uncertain tax positions as income tax expense in the Statement of Operations. During the period, the fund did not incur any interest or penalties.
Each of the tax years in the four-year period ended September 30, 2012 remains subject to examination by the Internal Revenue Service and state taxing authorities.
At September 30, 2012, the components of accumulated earnings on a tax basis were as follows: undistributed ordinary income $195,008, accumulated capital losses $9,717,509 and unrealized appreciation $1,984,084.
Under the Regulated Investment Company Modernization Act of 2010 (the “2010 Act”), the fund is permitted to carry forward capital losses incurred in taxable years beginning after December 22, 2010 (“post-enactment losses”) for an unlimited period. Furthermore, post-enactment capital loss carryovers retain their character as either short-term or long-term capital losses rather than short-term as they were under previous statute.The 2010 Act requires post-enactment losses to be utilized before the utilization of losses incurred in taxable years prior to the effective date of the 2010 Act (“pre-enactment losses”).As a result of this ordering rule, pre-enactment losses may be more likely to expire unused.
The accumulated capital loss carryover is available for federal income tax purposes to be applied against future net realized capital gains, if any, realized subsequent to September 30, 2012. If not applied, $201,772 of the carryover expires in fiscal year 2017 and $9,515,737 expires in fiscal year 2018.
The tax character of distributions paid to shareholders during the fiscal periods ended September 30, 2012 and September 30, 2011 were as follows: ordinary income $230,464 and $275,667, respectively.
| The Fund | 25 |
NOTES TO FINANCIAL STATEMENTS (continued)
NOTE 2—Bank Lines of Credit:
The fund participates with other Dreyfus-managed funds in a $225 million unsecured credit facility led by Citibank, N.A. and a $300 million unsecured credit facility provided by The Bank of New York Mellon (each, a “Facility”), each to be utilized primarily for temporary or emergency purposes, including the financing of redemptions. In connection therewith, the fund has agreed to pay its pro rata portion of commitment fees for each Facility. Interest is charged to the fund based on rates determined pursuant to the terms of the respective Facility at the time of borrowing.
The average amount of borrowings outstanding under the Facilities during the period ended September 30, 2012 was approximately $41,300 with a related weighted average annualized interest rate of 1.19%.
NOTE 3—Investment Advisory Fee and Other Transactions with Affiliates:
(a) Pursuant to an investment advisory agreement with the Manager, the investment advisory fee is computed at the annual rate of .50% of the value of the fund’s average daily net assets and is payable monthly.
The Manager had agreed, until the liquidation date, on or about January 25, 2013, to waive receipt of its fees and/or assume the expenses of the fund so that the fund’s total operating expenses (excluding Rule 12b-1 distribution plan fees, shareholder services fees, taxes, interest expense, brokerage commissions, acquired fund fees and extraordinary expenses) do not exceed .90% of the value of the fund’s average daily net assets. The reduction in expenses, pursuant to the undertaking, amounted to $67,036 during the period ended September 30, 2012.
The fund has an Accounting and Administration Agreement (the “Administration Agreement”) with Dreyfus, whereby Dreyfus performs administrative and accounting services for the fund.The fund has agreed
26
to compensate Dreyfus for providing accounting services, administration, compliance monitoring, regulatory and shareholder reporting, as well as for related facilities and equipment.The fee is based on the fund’s average daily net assets and computed at the following annual rates: .06% of the first $500 million, .04% of the next $500 million and .02% in excess of $1 billion.
In addition, after applying any expense limitations or fee waivers that reduce the fees paid to Dreyfus for this service, Dreyfus has contractually agreed in writing to waive any remaining fees for this service to the extent that they exceed both Dreyfus’ costs in providing these services and a reasonable allocation of the costs incurred by Dreyfus and its affiliates related to the support and oversight of these services.The fund also reimburses Dreyfus for the out-of-pocket expenses incurred in performing this service for the fund. Pursuant to the Administration Agreement, the fund was charged $12,610 during the period ended September 30, 2012.
During the period ended September 30, 2012, the Distributor retained $126 from commissions earned on sales of the fund’s Class A shares.
(b) Under the Distribution Plan adopted pursuant to Rule 12b-1 under the Act, Class C shares pay the Distributor for distributing its shares at an annual rate of .75% of the value of the average daily net assets of Class C shares. During the period ended September 30, 2012, Class C shares were charged $190 pursuant to the Distribution Plan.
(c) Under the Shareholder Services Plan, Class A and Class C shares pay the Distributor at the annual rate of .25% of the value of their average daily net assets for the provision of certain services.The services provided may include personal services relating to shareholder accounts, such as answering shareholder inquiries regarding the fund and providing reports and other information, and services related to the maintenance
| The Fund | 27 |
NOTES TO FINANCIAL STATEMENTS (continued)
of shareholder accounts.The Distributor may make payments to Service Agents (securities dealers, financial institutions or other industry professionals) in respect of these services. The Distributor determines the amounts to be paid to Service Agents. During the period ended September 30, 2012, Class A and Class C shares were charged $811 and $63, respectively, pursuant to the Shareholder Services Plan.
Under its terms, the Distribution Plan and Shareholder Services Plan shall remain in effect from year to year, provided such continuance is approved annually by a vote of a majority of thoseTrustees who are not “interested persons” of the Trust and who have no direct or indirect financial interest in the operation of or in any agreement related to the Distribution Plan or Shareholder Services Plan.
The fund has arrangements with the transfer agent and the custodian whereby the fund may receive earnings credits when positive cash balances are maintained, which are used to offset transfer agency and custody fees. For financial reporting purposes, the fund includes net earnings credits as an expense offset in the Statement of Operations.
The fund compensates DreyfusTransfer, Inc. (“DTI”), a wholly-owned subsidiary of the Manager, under a transfer agency agreement for providing transfer agency services for the fund and, since May 29, 2012, cash management services related to fund subscriptions and redemptions. During the period ended September 30, 2012, the fund was charged $1,163 for transfer agency services and $14 for cash management services. Cash management fees were partially offset by earnings credits of $2.These fees are included in Shareholder servicing costs in the Statement of Operations.
The fund compensates The Bank of New York Mellon under a custody agreement for providing custodial services for the fund. During the period ended September 30, 2012, the fund was charged $2,920 pursuant to the custody agreement.
28
Prior to May 29, 2012, the fund compensated The Bank of NewYork Mellon under a cash management agreement for performing cash management services related to fund subscriptions and redemptions. During the period ended September 30, 2012, the fund was charged $82 pursuant to the cash management agreement, which is included in Shareholder servicing costs in the Statement of Operations.These fees were partially offset by earnings credits of $2.
During the period ended September 30, 2012, the fund was charged $8,384 for services performed by the Chief Compliance Officer and his staff.
The components of “Due to The Dreyfus Corporation and affiliates” in the Statement of Assets and Liabilities consist of: investment advisory fees $6,812, Distribution Plan fees $17, Shareholder Services Plan fees $87, custodian fees $2,541, Chief Compliance Officer fees $1,991 and transfer agency fees $2,893, which are offset against an expense reimbursement currently in effect in the amount of $6,283.
(d) Each Board member also serves as a Board member of other funds within the Dreyfus complex. Annual retainer fees and attendance fees are allocated to each fund based on net assets.
NOTE 4—Securities Transactions:
The aggregate amount of purchases and sales of investment securities, excluding short-term securities, during the period ended September 30, 2012, amounted to $17,108,713 and $28,633,655, respectively.
At September 30, 2012, the cost of investments for federal income tax purposes was $14,348,325; accordingly, accumulated net unrealized appreciation on investments was $1,984,084, consisting of $2,320,061 gross unrealized appreciation and $335,977 gross unrealized depreciation.
| The Fund | 29 |
NOTES TO FINANCIAL STATEMENTS (continued)
NOTE 5—Plan of Liquidation:
On July 27, 2012, the Board approved a Plan of Liquidation (the “Plan”), which was approved by the fund’s shareholders on November 15, 2012. The Plan provides for the liquidation of the fund, the pro rata distribution of the assets of the fund to its shareholders and the closing of fund shareholder accounts (the “Liquidation”).The Liquidation of the fund will occur on or about January 25, 2013. Accordingly, effective August 9, 2012, the fund will be closed to any investments for new accounts.
30
| REPORT OF INDEPENDENT REGISTERED |
| PUBLIC ACCOUNTING FIRM |
To the Board of Trustees and Shareholders of Dreyfus/The Boston Company Large Cap Core Fund:
We have audited the accompanying statement of assets and liabilities of Dreyfus/The Boston Company Large Cap Core Fund (the “Fund”), a series of Dreyfus Investment Funds, including the statement of investments as of September 30, 2012, and the related statement of operations for the year ended, the statements of changes in net assets for each of the years in the two-year period then ended and financial highlights for each of the years in the four-year period then ended. These financial statements and financial highlights are the responsibility of the Fund’s management. Our responsibility is to express an opinion on these financial statements and financial highlights based on our audits. The financial highlights for the year ended September 30, 2008 were audited by other independent registered public accountants whose report thereon, dated November 28, 2008, expressed an unqualified opinion on those financial highlights.
We conducted our audits in accordance with the standards of the Public Company Accounting Oversight Board (United States).Those standards require that we plan and perform the audit to obtain reasonable assurance about whether the financial statements and financial highlights are free of material misstatement.An audit also includes examining, on a test basis, evidence supporting the amounts and disclosures in the financial statements. Our procedures included confirmation of securities owned as of September 30, 2012 by correspondence with the custodian and brokers or by other appropriate auditing procedures where replies from brokers were not received.An audit also includes assessing the accounting principles used and significant estimates made by management, as well as evaluating the overall financial statement presentation.We believe that our audits provide a reasonable basis for our opinion.
In our opinion, the financial statements and financial highlights referred to above present fairly, in all material respects, the financial position of Dreyfus/The Boston Company Large Cap Core Fund as of September 30, 2012, and the results of its operations for the year ended, the changes in its net assets for each of the years in the two-year period then ended, and the financial highlights for each of the years in the four-year period then ended, in conformity with U.S. generally accepted accounting principles.

New York, New York
November 28, 2012
| The Fund | 31 |
IMPORTANT TAX INFORMATION (Unaudited)
For federal tax purposes, the fund reports the maximum amount allowable, but not less than $230,464 as ordinary income dividends paid during the year ended September 30, 2012 as qualified dividend income in accordance with Section 854(b)(1)(B) of the Internal Revenue Code. Also, the fund reports the maximum amount allowable but not less than 100% of ordinary income dividends paid during the year ended September 30, 2012 as eligible for the corporate dividends received deduction provided under Section 243 of the Internal Revenue Code in accordance with Section 854(b)(1)(A) of the Internal Revenue Code. Shareholders will receive notification in early 2013 of the percentage applicable to the preparation of their 2012 income tax returns.
PROXY RESULTS (Unaudited)
The Trust held a special meeting of shareholders on November 15, 2012. The proposal considered at the meeting, and the results, are as follows:
| Shares | |||
| Votes For | Authority Withheld | Abstain | |
| To approve a plan of liquidation | |||
| pursuant to which the fund’s assets | |||
| will be liquidated, known liabilities | |||
| satisfied and remaining proceeds | |||
| distributed pro rata to fund shareholders. | 222,979 | 847 | 44,306 |
32
BOARD MEMBERS INFORMATION (Unaudited)
| Joseph S. DiMartino (68) |
| Chairman of the Board (2008) |
| Principal Occupation During Past 5Years: |
| • Corporate Director and Trustee |
| Other Public Company Board Memberships During Past 5Years: |
| • CBIZ (formerly, Century Business Services, Inc.), a provider of outsourcing functions for small |
| and medium size companies, Director (1997-present) |
| • Sunair Services Corporation, a provider of certain outdoor-related services to homes and |
| businesses, Director (2005-2009) |
| • The Newark Group, a provider of a national market of paper recovery facilities, paperboard |
| mills and paperboard converting plants, Director (2000-2010) |
| No. of Portfolios for which Board Member Serves: 157 |
| ——————— |
| Francine J. Bovich (61) |
| Board Member (2011) |
| Principal Occupation During Past 5Years: |
| • Trustee,The Bradley Trusts, private trust funds (2011-present) |
| • Managing Director, Morgan Stanley Investment Management (1993-2010) |
| No. of Portfolios for which Board Member Serves: 31 |
| ——————— |
| James M. Fitzgibbons (78) |
| Board Member (2008) |
| Principal Occupation During Past 5Years: |
| • Corporate Director and Trustee |
| Other Public Company Board Memberships During Past 5Years: |
| • Bill Barrett Corporation, an oil and natural gas exploration company, Director (2004-present) |
| No. of Portfolios for which Board Member Serves: 31 |
| ——————— |
| Kenneth A. Himmel (66) |
| Board Member (2008) |
| Principal Occupation During Past 5Years: |
| • President and CEO, Related Urban Development, a real estate development company (1996-present) |
| • President and CEO, Himmel & Company, a real estate development company (1980-present) |
| • CEO,American Food Management, a restaurant company (1983-present) |
| No. of Portfolios for which Board Member Serves: 31 |
| The Fund | 33 |
BOARD MEMBERS INFORMATION (Unaudited) (continued)
| Stephen J. Lockwood (65) |
| Board Member (2008) |
| Principal Occupation During Past 5Years: |
| • Chairman of the Board, Stephen J. Lockwood and Company LLC, a real estate investment |
| company (2000-present) |
| No. of Portfolios for which Board Member Serves: 31 |
| ——————— |
| Roslyn M. Watson (62) |
| Board Member (2008) |
| Principal Occupation During Past 5Years: |
| • Principal,Watson Ventures, Inc., a real estate investment company (1993-present) |
| No. of Portfolios for which Board Member Serves: 41 |
| ——————— |
| Benaree Pratt Wiley (66) |
| Board Member (2008) |
| Principal Occupation During Past 5Years: |
| • Principal,TheWiley Group, a firm specializing in strategy and business development (2005-present) |
| Other Public Company Board Memberships During Past 5Years: |
| • CBIZ (formerly, Century Business Services, Inc.), a provider of outsourcing functions |
| for small and medium size companies, Director (2008-present) |
| No. of Portfolios for which Board Member Serves: 64 |
| ——————— |
Once elected all Board Members serve for an indefinite term, but achieve Emeritus status upon reaching age 80.The address of the Board Members and Officers is c/o The Dreyfus Corporation, 200 Park Avenue, NewYork, NewYork 10166.Additional information about the Board Members is available in the fund’s Statement of Additional Information which can be obtained from Dreyfus free of charge by calling this toll free number: 1-800-DREYFUS.
34
OFFICERS OF THE FUND (Unaudited)
BRADLEY J. SKAPYAK, President since January 2010.
Chief Operating Officer and a director of the Manager since June 2009; from April 2003 to June 2009, Mr. Skapyak was the head of the Investment Accounting and Support Department of the Manager. He is an officer of 72 investment companies (comprised of 156 portfolios) managed by the Manager. He is 53 years old and has been an employee of the Manager since February 1988.
JANETTE E. FARRAGHER, Vice President and Secretary since December 2011.
Assistant General Counsel of BNY Mellon, and an officer of 73 investment companies (comprised of 183 portfolios) managed by the Manager. She is 49 years old and has been an employee of the Manager since February 1984.
KIESHA ASTWOOD, Vice President and Assistant Secretary since January 2010.
Counsel of BNY Mellon, and an officer of 73 investment companies (comprised of 183 portfolios) managed by the Manager. She is 39 years old and has been an employee of the Manager since July 1995.
JAMES BITETTO, Vice President and Assistant Secretary since December 2008.
Senior Counsel of BNY Mellon and Secretary of the Manager, and an officer of 73 investment companies (comprised of 183 portfolios) managed by the Manager. He is 46 years old and has been an employee of the Manager since December 1996.
JONI LACKS CHARATAN, Vice President and Assistant Secretary since December 2008.
Senior Counsel of BNY Mellon, and an officer of 73 investment companies (comprised of 183 portfolios) managed by the Manager. She is 56 years old and has been an employee of the Manager since October 1988.
JOSEPH M. CHIOFFI, Vice President and Assistant Secretary since December 2008.
Senior Counsel of BNY Mellon, and an officer of 73 investment companies (comprised of 183 portfolios) managed by the Manager. He is 50 years old and has been an employee of the Manager since June 2000.
JOHN B. HAMMALIAN, Vice President and Assistant Secretary since December 2008.
Senior Managing Counsel of BNY Mellon, and an officer of 73 investment companies (comprised of 183 portfolios) managed by the Manager. He is 49 years old and has been an employee of the Manager since February 1991.
ROBERT R. MULLERY, Vice President and Assistant Secretary since December 2008.
Managing Counsel of BNY Mellon, and an officer of 73 investment companies (comprised of 183 portfolios) managed by the Manager. He is 60 years old and has been an employee of the Manager since May 1986.
JEFF PRUSNOFSKY, Vice President and Assistant Secretary since December 2008.
Senior Managing Counsel of BNY Mellon, and an officer of 73 investment companies (comprised of 183 portfolios) managed by the Manager. He is 47 years old and has been an employee of the Manager since October 1990.
JAMES WINDELS, Treasurer since December 2008.
Director– Mutual Fund Accounting of the Manager, and an officer of 73 investment companies (comprised of 183 portfolios) managed by the Manager. He is 54 years old and has been an employee of the Manager since April 1985.
| The Fund | 35 |
OFFICERS OF THE FUND (Unaudited) (continued)
RICHARD CASSARO, Assistant Treasurer since December 2008.
Senior Accounting Manager – Money Market and Municipal Bond Funds of the Manager, and an officer of 73 investment companies (comprised of 183 portfolios) managed by the Manager. He is 53 years old and has been an employee of the Manager since September 1982.
GAVIN C. REILLY, Assistant Treasurer since December 2008.
Tax Manager of the Investment Accounting and Support Department of the Manager, and an officer of 73 investment companies (comprised of 183 portfolios) managed by the Manager. He is 44 years old and has been an employee of the Manager since April 1991.
ROBERT S. ROBOL, Assistant Treasurer since December 2008.
Senior Accounting Manager – Fixed Income Funds of the Manager, and an officer of 73 investment companies (comprised of 183 portfolios) managed by the Manager. He is 48 years old and has been an employee of the Manager since October 1988.
ROBERT SALVIOLO, Assistant Treasurer since December 2008.
Senior Accounting Manager – Equity Funds of the Manager, and an officer of 73 investment companies (comprised of 183 portfolios) managed by the Manager. He is 45 years old and has been an employee of the Manager since June 1989.
ROBERT SVAGNA, Assistant Treasurer since December 2008.
Senior Accounting Manager – Equity Funds of the Manager, and an officer of 73 investment companies (comprised of 183 portfolios) managed by the Manager. He is 45 years old and has been an employee of the Manager since November 1990.
JOSEPH W. CONNOLLY, Chief Compliance Officer since December 2008.
Chief Compliance Officer of the Manager and The Dreyfus Family of Funds (73 investment companies, comprised of 183 portfolios). He is 55 years old and has served in various capacities with the Manager since 1980, including manager of the firm’s Fund Accounting Department from 1997 through October 2001.
MATTHEW D. CONNOLLY, Anti-Money Laundering Compliance Officer since April 2012.
Anti-Money Laundering Compliance Officer of the Distributor since October 2011; from March 2010 to September 2011, Global Head, KYC Reviews and Director, UBS Investment Bank; until March 2010,AML Compliance Officer and Senior Vice President, Citi Global Wealth Management. He is an officer of 69 investment companies (comprised of 179 portfolios) managed by the Manager. He is 40 years old and has been an employee of the Distributor since October 2011.
36
For More Information
Telephone Call your financial representative or 1-800-DREYFUS
Mail The Dreyfus Family of Funds, 144 Glenn Curtiss Boulevard, Uniondale, NY 11556-0144
The fund files its complete schedule of portfolio holdings with the Securities and Exchange Commission (“SEC”) for the first and third quarters of each fiscal year on Form N-Q. The fund’s Forms N-Q are available on the SEC’s website at http://www.sec.gov and may be reviewed and copied at the SEC’s Public Reference Room in Washington, DC. Information on the operation of the Public Reference Room may be obtained by calling 1-800-SEC-0330.
A description of the policies and procedures that the fund uses to determine how to vote proxies relating to portfolio securities, and information regarding how the fund voted these proxies for the most recent 12-month period ended June 30 is available at http://www.dreyfus.com and on the SEC’s website at http://www.sec.gov. The description of the policies and procedures is also available without charge, upon request, by calling 1-800-DREYFUS.

| Dreyfus/The Boston |
| Company Small Cap |
| Growth Fund |
ANNUAL REPORT September 30, 2012
Save time. Save paper. View your next shareholder report online as soon as it’s available. Log into www.dreyfus.com and sign up for Dreyfus eCommunications. It’s simple and only takes a few minutes.
The views expressed in this report reflect those of the portfolio manager only through the end of the period covered and do not necessarily represent the views of Dreyfus or any other person in the Dreyfus organization. Any such views are subject to change at any time based upon market or other conditions and Dreyfus disclaims any responsibility to update such views.These views may not be relied on as investment advice and, because investment decisions for a Dreyfus fund are based on numerous factors, may not be relied on as an indication of trading intent on behalf of any Dreyfus fund.
| Not FDIC-Insured • Not Bank-Guaranteed • May Lose Value |
Contents | |
THE FUND | |
| 2 | A Letter from the Chairman and CEO |
| 3 | Discussion of Fund Performance |
| 6 | Fund Performance |
| 7 | Understanding Your Fund’s Expenses |
| 7 | Comparing Your Fund’s Expenses With Those of Other Funds |
| 8 | Statement of Investments |
| 14 | Statement of Assets and Liabilities |
| 15 | Statement of Operations |
| 16 | Statement of Changes in Net Assets |
| 17 | Financial Highlights |
| 18 | Notes to Financial Statements |
| 27 | Report of Independent Registered Public Accounting Firm |
| 28 | Important Tax Information |
| 29 | Board Members Information |
| 31 | Officers of the Fund |
FOR MORE INFORMATION | |
Back Cover |
Dreyfus/The Boston
Company Small Cap
Growth Fund
The Fund
A LETTER FROM THE CHAIRMAN AND CEO

Dear Shareholder:
This annual report for Dreyfus/The Boston Company Small Cap Growth Fund covers the 12-month period from October 1, 2011, through September 30, 2012. For information about how the fund performed during the reporting period, as well as general market perspectives, we provide a Discussion of Fund Performance on the pages that follow.
U.S. equities proved unusually volatile over the past year, as prices rose and fell according to investors’ changing expectations of global and domestic economic conditions.And while the pace of U.S. economic growth has been relatively consistent, it has progressed at about half the average rate achieved in prior recoveries. Overseas, Europe has remained under severe economic pressure due to a persistent debt crisis and austerity-oriented fiscal policies adopted by many governments. In Japan, a strengthening currency dampened export activity and economic growth. The emerging markets have posted a slower rate of growth, reducing demand for industrial commodities and other goods and services.
The sustained-but-subpar U.S. expansion appears likely to continue over the foreseeable future.Across the international markets though, on one hand the global economy has responded to a variety of stimulative measures, most notably aggressively accommodative monetary policies in most major markets. On the other hand, headwinds emanating from Europe and China may continue to weigh on economic growth and investor sentiment. Indeed, the ability of governments and economic policymakers to address these issues could go a long way toward shaping the 2013 market environment. As always, we urge you to speak regularly with your financial advisor to discuss how changing global economic conditions may affect your investments.
Thank you for your continued confidence and support.

Jonathan R. Baum
Chairman and Chief Executive Officer
The Dreyfus Corporation
October 15, 2012
2
DISCUSSION OF FUND PERFORMANCE
For the period of October 1, 2011, through September 30, 2012, as provided by B. Randall Watts and P. Hans Von Der Luft, Portfolio Managers
Fund and Market Performance Overview
For the 12-month period ended September 30, 2012, Dreyfus/The Boston Company Small Cap Growth Fund produced a total return of 30.86%.1 In comparison, the fund’s benchmark, the Russell 2000 Growth Index (the “Index”), produced a total return of 31.18% for the same period.2
Improving economic sentiment drove small-cap stocks higher as market declines during the spring of 2012 were more than offset by gains at other times of the reporting period. The fund produced a slightly lower return than its benchmark, largely due to relative underperformance within the Information Technology, Financials and Healthcare sectors.
The Fund’s Investment Approach
The fund seeks long-term growth of capital. To pursue its goal, the fund normally invests at least 80% of its net assets in equity securities of small-cap U.S. companies with total market capitalizations, at the time of purchase, equal to or less than that of the largest company in the Index.When choosing stocks, we seek to identify high-quality, small-cap companies that are experiencing or are expected to experience rapid current or expected earnings or revenue growth. We employ fundamental research to identify companies with attractive characteristics, such as strong business and competitive positions, solid cash flows and balance sheets, high-quality management and high sustainable growth.We also may invest in companies that our research indicates will experience accelerating revenues and expanding operating margins.
Markets Reacted to Shifting Macroeconomic Developments
The reporting period began in the immediate wake of a major stock market decline. One credit-rating agency’s downgrade of long-term U.S. government debt, an intensifying debt crisis in Europe and inflation-fighting programs in China had triggered a flight away from stocks and other risky assets. Fortunately, better U.S. economic data and new remedial measures from European and Chinese policymakers sparked a rebound in October 2011, and U.S. equity markets stabilized during the fall.
| The Fund | 3 |
DISCUSSION OF FUND PERFORMANCE (continued)
By the beginning of 2012, U.S. stocks were rallying amid domestic employment gains, a quantitative easing program in Europe and less restrictive monetary and fiscal policies in China. Investors grew more tolerant of risks, focusing more intently on company fundamentals and less on macroeconomic news. However, these positive influences were called into question during the spring, when U.S. employment gains slowed, measures designed to relieve fiscal pressures in Europe encountered resistance, and the Chinese economy remained sluggish.The summer saw the market rally resume amid more encouraging macroeconomic news, and the Russell 2000 Growth Index ended the reporting period with substantial gains.
Security Selection Strategies Enhanced Returns
The fund’s investment approach proved effective within the consumer discretionary sector, which generated especially attractive results as movie studio Lions Gate Entertainment broke box office records with its Hunger Games release. Apparel maker Oxford Industries expanded its branded stores to Asia, and a mild U.S. winter created a more positive backdrop for its warm weather brands. Mattress seller Select Comfort reported better-than-expected earnings stemming from improved marketing and merchandising initiatives, and the company raised the future guidance it provides to analysts.
In the consumer staples sector, beauty products purveyor Elizabeth Arden acquired licenses to market fragrances named for popular entertainers, and healthy foods distributor United Natural Foods achieved strong execution on a major contract in a fast-growing category of the grocery industry.Among energy companies, Gulfport Energy saw solid production growth from domestic natural gas drilling, while Oil States International encountered greater demand from projects in Canada and Australia. Finally, Brigham Exploration agreed to be acquired by a larger rival at a premium to its stock price at the time.
Disappointments during the reporting period included the information technology sector, as digital advertising specialist Marchex, Cl. B reported quarterly earnings that fell short of analysts’ expectations. Semiconductor manufacturer Vishay Intertechnology also missed earning targets, mainly due to weakening demand in Asia. Printed circuit boards provider TTM Technologies also struggled with headwinds emanating from Asia as well as higher facilities-related costs. In the financials sector, pawn broker First Cash Financial Services stumbled amid slowing growth in Mexico.
4
Results in the health care sector were undermined by eye care specialist The Cooper Companies, which was pressured by safety recalls affecting its products, and medical information systems provider Allscripts Healthcare Solutions, which struggled with legal issues and changes to a key contract.
Maintaining a Constructive Investment Posture
Although macroeconomic uncertainties remain over the near term, we are optimistic about the longer term prospects for small-cap stocks. Lower interest rates and reduced borrowing costs for businesses, consumers and homebuyers are expected to further stimulate economic growth; however this will likely occur at a more modest pace relative to the first two rounds of easing. Despite the Fed’s accommodative actions, we continue to face many of the same headwinds that have persisted throughout the year: weak employment trends, uncertainty surrounding the November elections, and future fiscal policy. Businesses appear to remain reluctant to spend in the face of these issues. The lack of confidence has contained additional hiring, capital expenditures, etc. while cash continues to build on company balance sheets.Although macro headline risks may continue to cause near-term market volatility, we continue to utilize a long-term view and remain focused on the strategy’s disciplined research-driven investment approach.
October 15, 2012
Please note, the position in any security highlighted with italicized typeface was sold during the reporting period. Equity funds are subject generally to market, market sector, market liquidity, issuer and investment style risks, among other factors, to varying degrees, all of which are more fully described in the fund’s prospectus.
The prices of small company stocks tend to be more volatile than the prices of large company stocks, mainly because these companies have less established and more volatile earnings histories.They also tend to be less liquid than larger company stocks.
| 1 Total return includes reinvestment of dividends and any capital gains paid. Past performance is no guarantee of future |
| results. Share price and investment return fluctuate such that upon redemption, fund shares may be worth more or less |
| than their original cost.The fund’s return reflects the absorption of certain fund expenses by The Dreyfus Corporation |
| pursuant to an agreement in effect through July 31, 2012. Had these expenses not been absorbed, the fund’s return |
| would have been lower. |
| 2 SOURCE: LIPPER INC. — The Russell 2000 Growth Index is an unmanaged index, which measures the |
| performance of those Russell 2000 companies with higher price-to-book ratios and higher forecasted growth values. |
| The total return figure cited for this index assumes change in security prices and reinvestment of dividends, but does |
| not reflect the costs of managing a mutual fund. Investors cannot invest directly in any index. |
| The Fund | 5 |
FUND PERFORMANCE
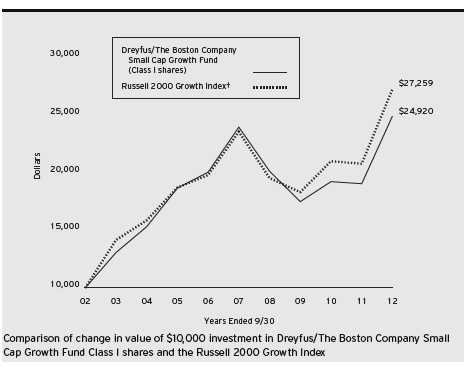
| Average Annual Total Returns as of 9/30/12 | ||||||
| 1 Year | 5 Years | 10 Years | ||||
| Class I shares | 30.86 | % | 0.78 | % | 9.56 | % |
| Russell 2000 Growth Index | 31.18 | % | 2.96 | % | 10.55 | % |
† Source: Lipper Inc.
Past performance is not predictive of future performance.The fund’s performance shown in the graph and table does not reflect the deduction of taxes that a shareholder would pay on fund distributions or the redemption of fund shares.
The above graph compares a $10,000 investment made in Class I shares of Dreyfus/The Boston Company Small Cap Growth Fund on 9/30/02 to a $10,000 investment made in the Russell 2000 Growth Index (the “Index”) on that date.All dividends and capital gain distributions are reinvested.
The fund’s performance shown in the line graph above takes into account all applicable fees and expenses.The Index is an unmanaged index that measures the performance of those Russell 2000 companies (the 2,000 smallest companies in the Russell 3000 Index) with higher price-to-book ratios and higher forecasted growth values. Unlike a mutual fund, the Index is not subject to charges, fees and other expenses. Investors cannot invest directly in any index.These factors can contribute to the Index potentially outperforming the fund. Further information relating to fund performance, including expense reimbursements, if applicable, is contained in the Financial Highlights section of the prospectus and elsewhere in this report.
6
UNDERSTANDING YOUR FUND’S EXPENSES (Unaudited)
As a mutual fund investor, you pay ongoing expenses, such as management fees and other expenses. Using the information below, you can estimate how these expenses affect your investment and compare them with the expenses of other funds.You also may pay one-time transaction expenses, including sales charges (loads) and redemption fees, which are not shown in this section and would have resulted in higher total expenses. For more information, see your fund’s prospectus or talk to your financial adviser.
Review your fund’s expenses
The table below shows the expenses you would have paid on a $1,000 investment in Dreyfus/The Boston Company Small Cap Growth Fund from April 1, 2012 to September 30, 2012. It also shows how much a $1,000 investment would be worth at the close of the period, assuming actual returns and expenses.
Expenses and Value of a $1,000 Investment
assuming actual returns for the six months ended September 30, 2012
| Expenses paid per $1,000† | $ | 4.93 |
| Ending value (after expenses) | $ | 1,031.30 |
COMPARING YOUR FUND’S EXPENSES
WITH THOSE OF OTHER FUNDS (Unaudited)
Using the SEC’s method to compare expenses
The Securities and Exchange Commission (SEC) has established guidelines to help investors assess fund expenses. Per these guidelines, the table below shows your fund’s expenses based on a $1,000 investment, assuming a hypothetical 5% annualized return. You can use this information to compare the ongoing expenses (but not transaction expenses or total cost) of investing in the fund with those of other funds.All mutual fund shareholder reports will provide this information to help you make this comparison. Please note that you cannot use this information to estimate your actual ending account balance and expenses paid during the period.
Expenses and Value of a $1,000 Investment
assuming a hypothetical 5% annualized return for the six months ended September 30, 2012
| Expenses paid per $1,000† | $ | 4.90 |
| Ending value (after expenses) | $ | 1,020.15 |
| † Expenses are equal to the fund’s annualized expense ratio of .97% for Class I, multiplied by the average account value |
| over the period, multiplied by 183/366 (to reflect the one-half year period). |
| The Fund | 7 |
STATEMENT OF INVESTMENTS
September 30, 2012
| Common Stocks—98.2% | Shares | Value ($) | |
| Automobiles & Components—1.1% | |||
| Drew Industries | 23,240 | a | 702,080 |
| Thor Industries | 20,730 | 752,914 | |
| 1,454,994 | |||
| Banks—1.2% | |||
| Oritani Financial | 45,240 | 680,862 | |
| Prosperity Bancshares | 21,920 | 934,230 | |
| 1,615,092 | |||
| Capital Goods—9.7% | |||
| Applied Industrial Technologies | 15,350 | 635,950 | |
| Beacon Roofing Supply | 45,760 | a | 1,304,160 |
| Crane | 26,980 | 1,077,311 | |
| EMCOR Group | 42,460 | 1,211,808 | |
| Foster Wheeler | 65,010 | a | 1,557,640 |
| Hexcel | 63,190 | a | 1,517,824 |
| Middleby | 8,320 | a | 962,125 |
| MRC Global | 72,350 | b | 1,779,086 |
| Teledyne Technologies | 25,355 | a | 1,607,253 |
| Triumph Group | 20,820 | 1,301,875 | |
| 12,955,032 | |||
| Commercial & Professional Services—3.2% | |||
| Corporate Executive Board | 27,371 | 1,467,907 | |
| Encore Capital Group | 20,710 | a | 585,265 |
| Exponent | 12,570 | a | 717,621 |
| InnerWorkings | 13,740 | a | 178,895 |
| RPX | 45,850 | a | 513,978 |
| TrueBlue | 48,380 | a | 760,534 |
| 4,224,200 | |||
| Consumer Durables & Apparel—4.2% | |||
| Jarden | 19,670 | 1,039,363 | |
| La-Z-Boy | 37,020 | a | 541,603 |
| Oxford Industries | 33,760 | 1,905,752 | |
| SodaStream International | 34,340 | a,b | 1,345,098 |
| Steven Madden | 18,200 | a | 795,704 |
| 5,627,520 |
8
| Common Stocks (continued) | Shares | Value ($) | |
| Consumer Services—5.6% | |||
| BJ’s Restaurants | 19,570 | a,b | 887,499 |
| Bloomin’ Brands | 64,480 | 1,060,696 | |
| Buffalo Wild Wings | 13,940 | a | 1,195,216 |
| Cheesecake Factory | 31,140 | 1,113,255 | |
| Papa John’s International | 15,190 | a | 811,298 |
| Shuffle Master | 43,880 | a | 693,743 |
| Six Flags Entertainment | 30,120 | 1,771,056 | |
| 7,532,763 | |||
| Energy—6.2% | |||
| Dril-Quip | 23,150 | a | 1,664,022 |
| Exterran Holdings | 13,500 | a | 273,780 |
| Gulfport Energy | 55,310 | a | 1,728,991 |
| Oasis Petroleum | 56,880 | a,b | 1,676,254 |
| Oil States International | 14,460 | a | 1,148,992 |
| OYO Geospace | 7,810 | a | 956,022 |
| PDC Energy | 25,690 | a | 812,575 |
| 8,260,636 | |||
| Exchange-Traded Funds—4.1% | |||
| iShares Russell 2000 Growth Index Fund | 57,140 | b | 5,463,155 |
| Food & Staples Retailing—3.5% | |||
| Casey’s General Stores | 27,420 | 1,566,779 | |
| Chefs’ Warehouse Holdings | 33,190 | a | 543,652 |
| Harris Teeter Supermarkets | 28,690 | 1,114,320 | |
| United Natural Foods | 24,320 | a | 1,421,504 |
| 4,646,255 | |||
| Food, Beverage & Tobacco—.6% | |||
| Smart Balance | 71,020 | a | 857,922 |
| Health Care Equipment & | |||
| Services—9.2% | |||
| ABIOMED | 49,210 | a,b | 1,032,918 |
| Acadia Healthcare | 46,030 | a | 1,097,815 |
| Accuray | 91,060 | a | 644,705 |
| Air Methods | 8,960 | a | 1,069,555 |
| Analogic | 12,590 | 984,160 |
| The Fund | 9 |
STATEMENT OF INVESTMENTS (continued)
| Common Stocks (continued) | Shares | Value ($) | |
| Health Care Equipment & | |||
| Services (continued) | |||
| Catamaran | 26,573 | a | 2,603,357 |
| Centene | 24,420 | a | 913,552 |
| HMS Holdings | 39,430 | a | 1,318,145 |
| Merit Medical Systems | 67,270 | a | 1,004,341 |
| Natus Medical | 60,060 | a | 784,984 |
| WellCare Health Plans | 15,510 | a | 877,091 |
| 12,330,623 | |||
| Household & Personal Products—2.5% | |||
| Elizabeth Arden | 34,270 | a | 1,618,915 |
| Inter Parfums | 96,710 | 1,769,793 | |
| 3,388,708 | |||
| Materials—2.6% | |||
| Allied Nevada Gold | 26,870 | a | 1,049,542 |
| Haynes International | 15,870 | 827,620 | |
| Innophos Holdings | 17,660 | 856,333 | |
| KapStone Paper and Packaging | 33,810 | a | 757,006 |
| 3,490,501 | |||
| Media—2.0% | |||
| DreamWorks Animation SKG, Cl. A | 66,720 | a,b | 1,283,026 |
| Lions Gate Entertainment | 94,170 | a,b | 1,437,976 |
| 2,721,002 | |||
| Pharmaceuticals, Biotech & Life Sciences—13.0% | |||
| Affymax | 37,750 | a | 795,015 |
| Alexion Pharmaceuticals | 18,630 | a | 2,131,272 |
| Alkermes | 70,510 | a | 1,463,082 |
| Alnylam Pharmaceuticals | 44,810 | a,b | 841,980 |
| ARIAD Pharmaceuticals | 54,840 | a | 1,328,499 |
| Charles River Laboratories International | 7,330 | a | 290,268 |
| Cubist Pharmaceuticals | 36,140 | a | 1,723,155 |
| Exact Sciences | 55,820 | a | 614,578 |
| Incyte | 26,340 | a,b | 475,437 |
| Jazz Pharmaceuticals | 20,840 | a | 1,188,088 |
| Nektar Therapeutics | 120,750 | a,b | 1,289,610 |
10
| Common Stocks (continued) | Shares | Value ($) | |
| Pharmaceuticals, Biotech & Life Sciences (continued) | |||
| NPS Pharmaceuticals | 68,110 | a | 630,017 |
| Onyx Pharmaceuticals | 21,240 | a | 1,794,780 |
| Pharmacyclics | 22,880 | a,b | 1,475,760 |
| Salix Pharmaceuticals | 13,080 | a | 553,807 |
| Vivus | 41,680 | a,b | 742,738 |
| 17,338,086 | |||
| Real Estate—2.9% | |||
| Hudson Pacific Properties | 56,000 | c | 1,036,000 |
| LaSalle Hotel Properties | 35,220 | c | 940,022 |
| Mid-America Apartment Communities | 18,150 | c | 1,185,377 |
| Zillow, Cl. A | 16,180 | a,b | 682,472 |
| 3,843,871 | |||
| Retailing—5.9% | |||
| Asbury Automotive Group | 30,770 | a | 860,021 |
| Finish Line, Cl. A | 58,820 | 1,337,567 | |
| Lumber Liquidators Holdings | 18,730 | a,b | 949,236 |
| Rent-A-Center | 55,590 | 1,950,097 | |
| Select Comfort | 46,710 | a | 1,473,700 |
| Tilly’s, Cl. A | 33,950 | 622,304 | |
| Tractor Supply | 6,580 | 650,696 | |
| 7,843,621 | |||
| Semiconductors & Semiconductor | |||
| Equipment—3.2% | |||
| ATMI | 58,660 | a | 1,089,316 |
| Entegris | 77,920 | a | 633,490 |
| Micrel | 66,380 | 691,680 | |
| PMC-Sierra | 109,100 | a | 615,324 |
| Silicon Image | 277,230 | a | 1,272,486 |
| 4,302,296 | |||
| Software & Services—8.8% | |||
| ExlService Holdings | 41,380 | a | 1,220,710 |
| Jive Software | 123,060 | b | 1,933,273 |
| LogMeIn | 32,010 | a | 717,984 |
| MAXIMUS | 30,050 | 1,794,586 |
| The Fund | 11 |
STATEMENT OF INVESTMENTS (continued)
| Common Stocks (continued) | Shares | Value ($) | |
| Software & Services (continued) | |||
| Mentor Graphics | 125,120 | a | 1,936,858 |
| Millennial Media | 67,350 | b | 966,472 |
| Qualys | 55,880 | a | 791,261 |
| Responsys | 143,690 | a | 1,469,949 |
| SolarWinds | 17,861 | a | 995,572 |
| 11,826,665 | |||
| Technology Hardware & Equipment—6.5% | |||
| Arris Group | 97,600 | a | 1,248,304 |
| Aruba Networks | 119,410 | a,b | 2,684,934 |
| NETGEAR | 50,700 | a | 1,933,698 |
| RADWARE | 28,870 | a | 1,039,897 |
| TTM Technologies | 72,670 | a | 685,278 |
| Vishay Intertechnology | 106,020 | a | 1,042,177 |
| 8,634,288 | |||
| Transportation—2.2% | |||
| Allegiant Travel | 10,290 | a | 651,974 |
| Con-way | 26,480 | 724,758 | |
| Forward Air | 32,420 | 985,892 | |
| Werner Enterprises | 28,770 | 614,815 | |
| 2,977,439 | |||
| Total Common Stocks | |||
| (cost $106,588,442) | 131,334,669 | ||
| Other Investment—2.0% | |||
| Registered Investment Company; | |||
| Dreyfus Institutional Preferred | |||
| Plus Money Market Fund | |||
| (cost $2,628,913) | 2,628,913 | d | 2,628,913 |
12
| Investment of Cash Collateral | ||||
| for Securities Loaned—17.7% | Shares | Value ($) | ||
| Registered Investment Company; | ||||
| Dreyfus Institutional Cash Advantage Fund | ||||
| (cost $23,648,554) | 23,648,554 | d | 23,648,554 | |
| Total Investments (cost $132,865,909) | 117.9 | % | 157,612,136 | |
| Liabilities, Less Cash and Receivables | (17.9 | %) | (23,920,361 | ) |
| Net Assets | 100.0 | % | 133,691,775 |
| a Non-income producing security. |
| b Security, or portion thereof, on loan.At September 30, 2012, the value of the fund’s securities on loan was |
| $22,861,671 and the value of the collateral held by the fund was $23,648,554. |
| c Investment in real estate investment trust. |
| d Investment in affiliated money market mutual fund. |
| Portfolio Summary (Unaudited)† | |||
| Value (%) | Value (%) | ||
| Money Market Investments | 19.7 | Commercial & Professional Services | 3.2 |
| Pharmaceuticals, Biotech & | Semiconductors & | ||
| Life Sciences | 13.0 | Semiconductor Equipment | 3.2 |
| Capital Goods | 9.7 | Real Estate | 2.9 |
| Health Care Equipment & Services | 9.2 | Materials | 2.6 |
| Software & Services | 8.8 | Household & Personal Products | 2.5 |
| Technology Hardware & Equipment | 6.5 | Transportation | 2.2 |
| Energy | 6.2 | Media | 2.0 |
| Retailing | 5.9 | Banks | 1.2 |
| Consumer Services | 5.6 | Automobiles & Components | 1.1 |
| Consumer Durables & Apparel | 4.2 | Food, Beverage & Tobacco | .6 |
| Exchange-Traded Funds | 4.1 | ||
| Food & Staples Retailing | 3.5 | 117.9 | |
| † Based on net assets. | |||
| See notes to financial statements. | |||
| The Fund | 13 |
| STATEMENT OF ASSETS AND LIABILITIES |
| September 30, 2012 |
| Cost | Value | |
| Assets ($): | ||
| Investments in securities—See Statement of Investments (including | ||
| securities on loan, valued at $22,861,671)—Note 1(b): | ||
| Unaffiliated issuers | 106,588,442 | 131,334,669 |
| Affiliated issuers | 26,277,467 | 26,277,467 |
| Cash | 16,343 | |
| Receivable for investment securities sold | 2,281,711 | |
| Dividends and securities lending income receivable | 63,296 | |
| Receivable for shares of Beneficial Interest subscribed | 44,610 | |
| Prepaid expenses | 11,962 | |
| 160,030,058 | ||
| Liabilities ($): | ||
| Due to The Dreyfus Corporation and affiliates—Note 3(b) | 106,818 | |
| Due to Adminstrator—Note 3(a) | 14,229 | |
| Liability for securities on loan—Note 1(b) | 23,648,554 | |
| Payable for investment securities purchased | 2,375,156 | |
| Payable for shares of Beneficial Interest redeemed | 134,824 | |
| Accrued expenses | 58,702 | |
| 26,338,283 | ||
| Net Assets ($) | 133,691,775 | |
| Composition of Net Assets ($): | ||
| Paid-in capital | 97,873,792 | |
| Accumulated undistributed investment income—net | 10,993 | |
| Accumulated net realized gain (loss) on investments | 11,060,763 | |
| Accumulated net unrealized appreciation | ||
| (depreciation) on investments | 24,746,227 | |
| Net Assets ($) | 133,691,775 | |
| Class I Shares Outstanding | ||
| (unlimited number of $.001 par value shares of Beneficial Interest authorized) | 2,207,269 | |
| Net Asset Value, offering and redemption price per share ($) | 60.57 | |
| See notes to financial statements. | ||
14
| STATEMENT OF OPERATIONS | ||
| Year Ended September 30, 2012 | ||
| Investment Income ($): | ||
| Income: | ||
| Cash dividends: | ||
| Unaffiliated issuers | 727,695 | |
| Affiliated issuers | 2,132 | |
| Income from securities lending—Note 1(b) | 229,933 | |
| Total Income | 959,760 | |
| Expenses: | ||
| Investment advisory fee—Note 3(a) | 1,152,114 | |
| Administration fees—Note 3(a) | 86,414 | |
| Shareholder servicing costs—Note 3(b) | 74,379 | |
| Professional fees | 58,650 | |
| Prospectus and shareholders’ reports | 27,602 | |
| Custodian fees—Note 3(b) | 21,137 | |
| Registration fees | 19,795 | |
| Trustees’ fees and expenses—Note 3(c) | 13,815 | |
| Loan commitment fees—Note 2 | 1,559 | |
| Miscellaneous | 18,629 | |
| Total Expenses | 1,474,094 | |
| Less—reduction in expenses due to undertaking—Note 3(a) | (90,949 | ) |
| Less—reduction in fees due to earnings credits—Note 3(b) | (144 | ) |
| Net Expenses | 1,383,001 | |
| Investment (Loss)—Net | (423,241 | ) |
| Realized and Unrealized Gain (Loss) on Investments—Note 4 ($): | ||
| Net realized gain (loss) on investments | 13,851,594 | |
| Net unrealized appreciation (depreciation) on investments | 26,041,926 | |
| Net Realized and Unrealized Gain (Loss) on Investments | 39,893,520 | |
| Net Increase in Net Assets Resulting from Operations | 39,470,279 | |
| See notes to financial statements. | ||
| The Fund | 15 |
STATEMENT OF CHANGES IN NET ASSETS
| Year Ended September 30, | ||||
| 2012 | 2011 | |||
| Operations ($): | ||||
| Investment (loss)—net | (423,241 | ) | (681,899 | ) |
| Net realized gain (loss) on investments | 13,851,594 | 46,453,903 | ||
| Net unrealized appreciation | ||||
| (depreciation) on investments | 26,041,926 | (36,617,778 | ) | |
| Net Increase (Decrease) in Net Assets | ||||
| Resulting from Operations | 39,470,279 | 9,154,226 | ||
| Dividends to Shareholders from ($): | ||||
| Net realized gain on investments | (2,982,294 | ) | — | |
| Beneficial Interest Transactions ($): | ||||
| Net proceeds from shares sold | 5,577,737 | 12,522,209 | ||
| Dividends reinvested | 1,603,362 | — | ||
| Cost of shares redeemed | (52,883,367 | ) | (97,914,186 | ) |
| Increase (Decrease) in Net Assets from | ||||
| Beneficial Interest Transactions | (45,702,268 | ) | (85,391,977 | ) |
| Total Increase (Decrease) in Net Assets | (9,214,283 | ) | (76,237,751 | ) |
| Net Assets ($): | ||||
| Beginning of Period | 142,906,058 | 219,143,809 | ||
| End of Period | 133,691,775 | 142,906,058 | ||
| Undistributed investment income—net | 10,993 | 19,145 | ||
| Capital Share Transactions (Shares): | ||||
| Shares sold | 100,290 | 226,697 | ||
| Shares issued for dividends reinvested | 30,471 | — | ||
| Shares redeemed | (950,589 | ) | (1,795,374 | ) |
| Net Increase (Decrease) in Shares Outstanding | (819,828 | ) | (1,568,677 | ) |
| See notes to financial statements. | ||||
16
FINANCIAL HIGHLIGHTS
The following table describes the performance for the fiscal periods indicated. Total return shows how much your investment in the fund would have increased (or decreased) during each period, assuming you had reinvested all dividends and distributions.These figures have been derived from the fund’s financial statements.
| Year Ended September 30, | ||||||||||
| Class I Shares | 2012 | 2011 | 2010 | 2009 | a | 2008 | ||||
| Per Share Data ($): | ||||||||||
| Net asset value, beginning of period | 47.21 | 47.68 | 43.36 | 49.89 | 59.41 | |||||
| Investment Operations: | ||||||||||
| Investment (loss)—netb | (.16 | ) | (.18 | ) | (.13 | ) | (.12 | ) | (.11 | ) |
| Net realized and unrealized | ||||||||||
| gain (loss) on investments | 14.57 | (.29 | ) | 4.45 | (6.41 | ) | (9.41 | )c | ||
| Total from Investment Operations | 14.41 | (.47 | ) | 4.32 | (6.53 | ) | (9.52 | ) | ||
| Distributions: | ||||||||||
| Dividends from net realized | ||||||||||
| gain on investments | (1.05 | ) | — | — | — | — | ||||
| Net asset value, end of period | 60.57 | 47.21 | 47.68 | 43.36 | 49.89 | |||||
| Total Return (%) | 30.86 | (.99 | ) | 9.96 | (13.14 | ) | (16.02 | ) | ||
| Ratios/Supplemental Data (%): | ||||||||||
| Ratio of total expenses | ||||||||||
| to average net assets | 1.02 | .97 | .94 | 1.00 | 1.01 | |||||
| Ratio of net expenses | ||||||||||
| to average net assets | .96 | .96 | .94 | 1.00 | 1.01 | |||||
| Ratio of net investment (loss) | ||||||||||
| to average net assets | (.29 | ) | (.33 | ) | (.29 | ) | (.34 | ) | (.20 | ) |
| Portfolio Turnover Rate | 154.49 | 176.06 | 181.09 | 271 | 207 | |||||
| Net Assets, end of period ($ x 1,000) | 133,692 | 142,906 | 219,144 | 299,563 | 232,706 | |||||
| a Effective September 1, 2009, the fund’s shares were redesignated as Class I shares. |
| b Based on average shares outstanding at each month end. |
| c Amounts include litigation proceeds received by the fund of $.01 for the year ended September 30, 2008. |
See notes to financial statements.
| The Fund | 17 |
NOTES TO FINANCIAL STATEMENTS
NOTE 1—Significant Accounting Policies:
Dreyfus/The Boston Company Small Cap Growth Fund (the “fund”) is a separate diversified series of Dreyfus Investment Funds (the “Trust”), which is registered under the Investment Company Act of 1940, as amended (the “Act”), as an open-end management investment company and operates as a series company currently offering eleven series, including the fund. The fund’s investment objective is to seek long-term growth of capital. The Dreyfus Corporation (the “Manager” or “Dreyfus”), a wholly-owned subsidiary of The Bank of New York Mellon Corporation (“BNY Mellon”), serves as the fund’s investment adviser. MBSC Securities Corporation (the “Distributor”), a wholly-owned subsidiary of the Manager, is the distributor of the fund’s shares.
Class I shares are sold primarily to bank trust departments and other financial service providers (including The Bank of NewYork Mellon, a subsidiary of BNY Mellon and an affiliate of Dreyfus, and its affiliates), acting on behalf of customers having a qualified trust or an investment account or relationship at such institution, and bear no Distribution or Shareholder Services Plan fees. Class I shares are offered without a front-end sales charge or a contingent deferred sales charge.
TheTrust accounts separately for the assets, liabilities and operations of each series. Expenses directly attributable to each series are charged to that series’ operations; expenses which are applicable to all series are allocated among them on a pro rata basis.
The Financial Accounting Standards Board (“FASB”) Accounting Standards Codification is the exclusive reference of authoritative U.S. generally accepted accounting principles (“GAAP”) recognized by the FASB to be applied by nongovernmental entities. Rules and interpretive releases of the Securities and Exchange Commission (“SEC”) under authority of federal laws are also sources of authoritative GAAP for SEC registrants. The fund’s financial statements are prepared in accordance with GAAP, which may require the use of management estimates and assumptions.Actual results could differ from those estimates.
18
(a) Portfolio valuation: The fair value of a financial instrument is the amount that would be received to sell an asset or paid to transfer a liability in an orderly transaction between market participants at the measurement date (i.e., the exit price). GAAP establishes a fair value hierarchy that prioritizes the inputs of valuation techniques used to measure fair value.This hierarchy gives the highest priority to unadjusted quoted prices in active markets for identical assets or liabilities (Level 1 measurements) and the lowest priority to unobservable inputs (Level 3 measurements).
Additionally, GAAP provides guidance on determining whether the volume and activity in a market has decreased significantly and whether such a decrease in activity results in transactions that are not orderly. GAAP requires enhanced disclosures around valuation inputs and techniques used during annual and interim periods.
Various inputs are used in determining the value of the fund’s investments relating to fair value measurements. These inputs are summarized in the three broad levels listed below:
Level 1—unadjusted quoted prices in active markets for identical investments.
Level 2—other significant observable inputs (including quoted prices for similar investments, interest rates, prepayment speeds, credit risk, etc.).
Level 3—significant unobservable inputs (including the fund’s own assumptions in determining the fair value of investments).
The inputs or methodology used for valuing securities are not necessarily an indication of the risk associated with investing in those securities.
Changes in valuation techniques may result in transfers in or out of an assigned level within the disclosure hierarchy. Valuation techniques used to value the fund’s investments are as follows:
Investments in securities are valued at the last sales price on the securities exchange or national securities market on which such securities are primarily traded. Securities listed on the National Market System
| The Fund | 19 |
NOTES TO FINANCIAL STATEMENTS (continued)
for which market quotations are available are valued at the official closing price or, if there is no official closing price that day, at the last sales price. Securities not listed on an exchange or the national securities market, or securities for which there were no transactions, are valued at the average of the most recent bid and asked prices, except for open short positions, where the asked price is used for valuation purposes. Bid price is used when no asked price is available. Registered investment companies that are not traded on an exchange are valued at their net asset value. All of the preceding securities are categorized within Level 1 of the fair value hierarchy.
Fair valuing of securities may be determined with the assistance of a pricing service using calculations based on indices of domestic securities and other appropriate indicators, such as prices of relevant American Depository Receipts and financial futures. Utilizing these techniques may result in transfers between Level 1 and Level 2 of the fair value hierarchy.
When market quotations or official closing prices are not readily available, or are determined not to reflect accurately fair value, such as when the value of a security has been significantly affected by events after the close of the exchange or market on which the security is principally traded (for example, a foreign exchange or market), but before the fund calculates its net asset value, the fund may value these investments at fair value as determined in accordance with the procedures approved by the Trust’s Board of Trustees (the “Board”). Certain factors may be considered when fair valuing investments such as: fundamental analytical data, the nature and duration of restrictions on disposition, an evaluation of the forces that influence the market in which the securities are purchased and sold, and public trading in similar securities of the issuer or comparable issuers.These securities are either categorized as Level 2 or 3 depending on the relevant inputs used.
For restricted securities where observable inputs are limited, assumptions about market activity and risk are used and are categorized within Level 3 of the fair value hierarchy.
20
The following is a summary of the inputs used as of September 30, 2012 in valuing the fund’s investments:
| Level 2—Other | Level 3— | |||
| Level 1— | Significant | Significant | ||
| Unadjusted | Observable | Unobservable | ||
| Quoted Prices | Inputs | Inputs | Total | |
| Assets ($) | ||||
| Investments in Securities: | ||||
| Equity Securities— | ||||
| Domestic | ||||
| Common Stocks† | 123,486,519 | — | — | 123,486,519 |
| Equity Securities— | ||||
| Foreign | ||||
| Common Stocks† | 2,384,995 | — | — | 2,384,995 |
| Exchange- | ||||
| Traded Funds | 5,463,155 | — | — | 5,463,155 |
| Mutual Funds | 26,277,467 | — | — | 26,277,467 |
| † See Statement of Investments for additional detailed categorizations. | ||||
At September 30, 2012, there were no transfers between Level 1 and Level 2 of the fair value hierarchy.
(b) Securities transactions and investment income: Securities transactions are recorded on a trade date basis. Realized gains and losses from securities transactions are recorded on the identified cost basis. Dividend income is recognized on the ex-dividend date and interest income, including, where applicable, accretion of discount and amortization of premium on investments, is recognized on the accrual basis.
Pursuant to a securities lending agreement with The Bank of New York Mellon, the fund may lend securities to qualified institutions. It is the fund’s policy that, at origination, all loans are secured by collateral of at least 102% of the value of U.S. securities loaned and 105% of the value of foreign securities loaned. Collateral equivalent to at least 100% of the market value of securities on loan is maintained at all times. Collateral is either in the form of cash, which can be invested in certain money market mutual funds managed by the Manager, U.S. Government and Agency securities or letters of credit. The fund is
| The Fund | 21 |
NOTES TO FINANCIAL STATEMENTS (continued)
entitled to receive all income on securities loaned, in addition to income earned as a result of the lending transaction. Although each security loaned is fully collateralized, the fund bears the risk of delay in recovery of, or loss of rights in, the securities loaned should a borrower fail to return the securities in a timely manner. During the period ended September 30, 2012, The Bank of New York Mellon earned $76,644 from lending portfolio securities, pursuant to the securities lending agreement.
(c) Affiliated issuers: Investments in other investment companies advised by Dreyfus are defined as “affiliated” in the Act. Investments in affiliated investment companies for the period ended September 30, 2012 were as follows:
| Affiliated | |||||||
| Investment | Value | Value | Net | ||||
| Company | 9/30/2011 | ($) | Purchases ($) | Sales ($) | 9/30/2012 | ($) | Assets (%) |
| Dreyfus | |||||||
| Institutional | |||||||
| Preferred | |||||||
| Plus Money | |||||||
| Market Fund | 1,826,345 | 66,909,089 | 66,106,521 | 2,628,913 | 2.0 | ||
| Dreyfus | |||||||
| Institutional | |||||||
| Cash | |||||||
| Advantage | |||||||
| Fund | 29,798,675 | 142,120,437 | 148,270,558 | 23,648,554 | 17.7 | ||
| Total | 31,625,020 | 209,029,526 | 214,377,079 | 26,277,467 | 19.7 |
(d) Dividends to shareholders: Dividends are recorded on the ex-dividend date. Dividends from investment income-net and dividends from net realized capital gains, if any, are normally declared and paid annually, but the fund may make distributions on a more frequent basis to comply with the distribution requirements of the Internal Revenue Code of 1986, as amended (the “Code”).To the extent that net realized capital gains can be offset by capital loss carryovers, it is the policy of the fund not to distribute such gains. Income and capital gain distribu-
22
tions are determined in accordance with income tax regulations, which may differ from GAAP.
(e) Federal income taxes: It is the policy of the fund to continue to qualify as a regulated investment company, if such qualification is in the best interests of its shareholders, by complying with the applicable pro visions of the Code, and to make distributions of taxable income sufficient to relieve it from substantially all federal income and excise taxes.
As of and during the period ended September 30, 2012, the fund did not have any liabilities for any uncertain tax positions.The fund recognizes interest and penalties, if any, related to uncertain tax positions as income tax expense in the Statement of Operations. During the period, the fund did not incur any interest or penalties.
Each of the tax years in the four-year period ended September 30, 2012 remains subject to examination by the Internal Revenue Service and state taxing authorities.
At September 30, 2012, the components of accumulated earnings on a tax basis were as follows: undistributed capital gains $12,237,402 and unrealized appreciation $23,580,581.
The tax character of distributions paid to shareholders during the fiscal periods ended September 30, 2012 and September 30, 2011 were as follows: long-term capital gains $2,982,294 and $0, respectively.
During the period ended September 30, 2012, as a result of permanent book to tax differences, primarily due to the tax treatment for net operating losses and real estate investment trusts, the fund increased accumulated undistributed investment income-net by $415,089, increased accumulated net realized gain (loss) on investments by $5,083 and decreased paid-in capital by $420,172. Net assets and net asset value per share were not affected by this reclassification.
| The Fund | 23 |
NOTES TO FINANCIAL STATEMENTS (continued)
NOTE 2—Bank Lines of Credit:
The fund participates with other Dreyfus-managed funds in a $225 million unsecured credit facility led by Citibank, N.A. and a $300 million unsecured credit facility provided by The Bank of New York Mellon (each, a “Facility”), each to be utilized primarily for temporary or emergency purposes, including the financing of redemptions. In connection therewith, the fund has agreed to pay its pro rata portion of commitment fees for each Facility. Interest is charged to the fund based on rates determined pursuant to the terms of the respective Facility at the time of borrowing. During the period ended on September 30, 2012, the fund did not borrow under the Facilities.
NOTE 3—Investment Advisory Fee and Other Transactions with Affiliates:
(a) Pursuant to an investment advisory agreement with the Manager, the investment advisory fee is computed at the annual rate of .80% of the value of the fund’s average daily net assets and is payable monthly. The Manager had undertaken until July 31, 2012, to waive receipt of its fees and/or assume the expenses of the fund’s Class I shares, so that direct annual fund operating expenses for Class I shares (excluding taxes, interest expense, brokerage commissions, commitment fees on borrowings and extraordinary expenses) did not exceed .95% of the value of the fund’s average daily net assets.The reduction in expenses, pursuant to the undertaking, amounted to $90,949 during the period ended September 30, 2012.
The fund has an Accounting and Administration Agreement (the “Administration Agreement”) with Dreyfus, whereby Dreyfus performs administrative and accounting services for the fund. The fund has agreed to compensate Dreyfus for providing accounting services, administration, compliance monitoring, regulatory and shareholder reporting, as well as for related facilities and equipment. The fee is based on the fund’s average daily net assets and computed at the following annual rates: .06% of the first $500 million, .04% of the next $500 million and .02% in excess of $1 billion.
24
In addition, after applying any expense limitations or fee waivers that reduce the fees paid to Dreyfus for this service, Dreyfus has contractually agreed in writing to waive any remaining fees for this service to the extent that they exceed both Dreyfus’ costs in providing these services and a reasonable allocation of the costs incurred by Dreyfus and its affiliates related to the support and oversight of these services. The fund also reimburses Dreyfus for the out-of-pocket expenses incurred in performing this service for the fund. Pursuant to the Administration Agreement, the fund was charged $86,414 during the period ended September 30, 2012.
(b) The fund has arrangements with the transfer agent and the custodian whereby the fund may receive earnings credits when positive cash balances are maintained, which are used to offset transfer agency and custody fees. For financial reporting purposes, the fund includes net earnings credits as an expense offset in the Statement of Operations.
The fund compensates Dreyfus Transfer, Inc. (“DTI”), a wholly-owned subsidiary of the Manager, under a transfer agency agreement for providing transfer agency services for the fund and, since May 29, 2012, cash management services related to fund subscriptions and redemptions. During the period ended September 30, 2012, the fund was charged $27,392 for transfer agency services and $478 for cash management services. Cash management fees were partially offset by earnings credits of $57.These fees are included in Shareholder servicing costs in the Statement of Operations.
The fund compensatesThe Bank of NewYork Mellon under a custody agreement for providing custodial services for the fund. During the period ended September 30, 2012, the fund was charged $21,137 pursuant to the custody agreement.
Prior to May 29, 2012, the fund compensated The Bank of New York Mellon under a cash management agreement for performing cash management services related to fund subscriptions and redemptions. During the period ended September 30, 2012, the fund was charged $2,906
| The Fund | 25 |
NOTES TO FINANCIAL STATEMENTS (continued)
pursuant to the cash management agreement, which is included in Shareholder servicing costs in the Statement of Operations.These fees were partially offset by earnings credits of $87.
During the period ended September 30, 2012, the fund was charged $8,384 for services performed by the Chief Compliance Officer and his staff.
The components of “Due to The Dreyfus Corporation and affiliates” in the Statement of Assets and Liabilities consist of: investment advisory fees $89,266, custodian fees $11,187, Chief Compliance Officer fees $1,991 and transfer agency fees $6,276, which are offset against an expense reimbursement currently in effect in the amount of $1,902.
(c) Each Board member also serves as a Board member of other funds within the Dreyfus complex. Annual retainer fees and attendance fees are allocated to each fund based on net assets.
NOTE 4—Securities Transactions:
The aggregate amount of purchases and sales of investment securities, excluding short-term securities, during the period ended September 30, 2012, amounted to $218,808,523 and $267,832,601, respectively.
At September 30, 2012, the cost of investments for federal income tax purposes was $134,031,555; accordingly, accumulated net unrealized appreciation on investments was $23,580,581, consisting of $28,734,163 gross unrealized appreciation and $5,153,582 gross unrealized depreciation.
26
| REPORT OF INDEPENDENT REGISTERED |
| PUBLIC ACCOUNTING FIRM |
To the Board of Trustees and Shareholders of Dreyfus/The Boston Company Small Cap Growth Fund:
We have audited the accompanying statement of assets and liabilities of Dreyfus/The Boston Company Small Cap Growth Fund (the “Fund”), a series of Dreyfus Investment Funds, including the statement of investments as of September 30, 2012, and the related statement of operations for the year then ended, the statements of changes in net assets for each of the years in the two-year period then ended and financial highlights for each of the years in the four-year period then ended.These financial statements and financial highlights are the responsibility of the Fund’s management. Our responsibility is to express an opinion on these financial statements and financial highlights based on our audits. The financial highlights for the year ended September 30, 2008 were audited by other independent registered public accountants whose report thereon, dated November 28, 2008, expressed an unqualified opinion on those financial highlights.
We conducted our audits in accordance with the standards of the Public Company Accounting Oversight Board (United States).Those standards require that we plan and perform the audit to obtain reasonable assurance about whether the financial statements and financial highlights are free of material misstatement.An audit also includes examining, on a test basis, evidence supporting the amounts and disclosures in the financial statements. Our procedures included confirmation of securities owned as of September 30, 2012 by correspondence with the custodian and brokers or by other appropriate auditing procedures where replies from brokers were not received.An audit also includes assessing the accounting principles used and significant estimates made by management, as well as evaluating the overall financial statement presentation.We believe that our audits provide a reasonable basis for our opinion.
In our opinion, the financial statements and financial highlights referred to above present fairly, in all material respects, the financial position of Dreyfus/The Boston Company Small Cap Growth Fund as of September 30, 2012, and the results of its operations for the year then ended, the changes in its net assets for each of the years in the two-year period then ended, and the financial highlights for each of the years in the four-year period then ended, in conformity with U.S. generally accepted accounting principles.

New York, New York
November 28, 2012
| The Fund | 27 |
IMPORTANT TAX INFORMATION (Unaudited)
The fund reports the maximum amount allowable but not less than $1.0470 per share as a capital gain dividend in accordance with Section 852(b)(3)(C) of the Internal Revenue Code.
28
BOARD MEMBERS INFORMATION (Unaudited)
| Joseph S. DiMartino (68) |
| Chairman of the Board (2008) |
| Principal Occupation During Past 5Years: |
| • Corporate Director and Trustee |
| Other Public Company Board Memberships During Past 5Years: |
| • CBIZ (formerly, Century Business Services, Inc.), a provider of outsourcing functions for small |
| and medium size companies, Director (1997-present) |
| • Sunair Services Corporation, a provider of certain outdoor-related services to homes and |
| businesses, Director (2005-2009) |
| • The Newark Group, a provider of a national market of paper recovery facilities, paperboard |
| mills and paperboard converting plants, Director (2000-2010) |
| No. of Portfolios for which Board Member Serves: 157 |
| ——————— |
| Francine J. Bovich (61) |
| Board Member (2011) |
| Principal Occupation During Past 5Years: |
| • Trustee,The Bradley Trusts, private trust funds (2011-present) |
| • Managing Director, Morgan Stanley Investment Management (1993-2010) |
| No. of Portfolios for which Board Member Serves: 31 |
| ——————— |
| James M. Fitzgibbons (78) |
| Board Member (2008) |
| Principal Occupation During Past 5Years: |
| • Corporate Director and Trustee |
| Other Public Company Board Memberships During Past 5Years: |
| • Bill Barrett Corporation, an oil and natural gas exploration company, Director (2004-present) |
| No. of Portfolios for which Board Member Serves: 31 |
| ——————— |
| Kenneth A. Himmel (66) |
| Board Member (2008) |
| Principal Occupation During Past 5Years: |
| • President and CEO, Related Urban Development, a real estate development company (1996-present) |
| • President and CEO, Himmel & Company, a real estate development company (1980-present) |
| • CEO,American Food Management, a restaurant company (1983-present) |
| No. of Portfolios for which Board Member Serves: 31 |
| The Fund | 29 |
BOARD MEMBERS INFORMATION (Unaudited) (continued)
| Stephen J. Lockwood (65) |
| Board Member (2008) |
| Principal Occupation During Past 5Years: |
| • Chairman of the Board, Stephen J. Lockwood and Company LLC, a real estate investment |
| company (2000-present) |
| No. of Portfolios for which Board Member Serves: 31 |
| ——————— |
| Roslyn M. Watson (62) |
| Board Member (2008) |
| Principal Occupation During Past 5Years: |
| • Principal,Watson Ventures, Inc., a real estate investment company (1993-present) |
| No. of Portfolios for which Board Member Serves: 41 |
| ——————— |
| Benaree Pratt Wiley (66) |
| Board Member (2008) |
| Principal Occupation During Past 5Years: |
| • Principal,The Wiley Group, a firm specializing in strategy and business development (2005-present) |
| Other Public Company Board Memberships During Past 5Years: |
| • CBIZ (formerly, Century Business Services, Inc.), a provider of outsourcing functions for small |
| and medium size companies, Director (2008-present) |
| No. of Portfolios for which Board Member Serves: 64 |
| ——————— |
Once elected all Board Members serve for an indefinite term, but achieve Emeritus status upon reaching age 80.The address of the Board Members and Officers is c/o The Dreyfus Corporation, 200 Park Avenue, NewYork, NewYork 10166.Additional information about the Board Members is available in the fund’s Statement of Additional Information which can be obtained from Dreyfus free of charge by calling this toll free number: 1-800-DREYFUS.
30
OFFICERS OF THE FUND (Unaudited)
BRADLEY J. SKAPYAK, President since January 2010.
Chief Operating Officer and a director of the Manager since June 2009; from April 2003 to June 2009, Mr. Skapyak was the head of the Investment Accounting and Support Department of the Manager. He is an officer of 72 investment companies (comprised of 156 portfolios) managed by the Manager. He is 53 years old and has been an employee of the Manager since February 1988.
JANETTE E. FARRAGHER, Vice President and Secretary since December 2011.
Assistant General Counsel of BNY Mellon, and an officer of 73 investment companies (comprised of 183 portfolios) managed by the Manager. She is 49 years old and has been an employee of the Manager since February 1984.
KIESHA ASTWOOD, Vice President and Assistant Secretary since January 2010.
Counsel of BNY Mellon, and an officer of 73 investment companies (comprised of 183 portfolios) managed by the Manager. She is 39 years old and has been an employee of the Manager since July 1995.
JAMES BITETTO, Vice President and Assistant Secretary since December 2008.
Senior Counsel of BNY Mellon and Secretary of the Manager, and an officer of 73 investment companies (comprised of 183 portfolios) managed by the Manager. He is 46 years old and has been an employee of the Manager since December 1996.
JONI LACKS CHARATAN, Vice President and Assistant Secretary since December 2008.
Senior Counsel of BNY Mellon, and an officer of 73 investment companies (comprised of 183 portfolios) managed by the Manager. She is 56 years old and has been an employee of the Manager since October 1988.
JOSEPH M. CHIOFFI, Vice President and Assistant Secretary since December 2008.
Senior Counsel of BNY Mellon, and an officer of 73 investment companies (comprised of 183 portfolios) managed by the Manager. He is 50 years old and has been an employee of the Manager since June 2000.
JOHN B. HAMMALIAN, Vice President and Assistant Secretary since December 2008.
Senior Managing Counsel of BNY Mellon, and an officer of 73 investment companies (comprised of 183 portfolios) managed by the Manager. He is 49 years old and has been an employee of the Manager since February 1991.
ROBERT R. MULLERY, Vice President and Assistant Secretary since December 2008.
Managing Counsel of BNY Mellon, and an officer of 73 investment companies (comprised of 183 portfolios) managed by the Manager. He is 60 years old and has been an employee of the Manager since May 1986.
JEFF PRUSNOFSKY, Vice President and Assistant Secretary since December 2008.
Senior Managing Counsel of BNY Mellon, and an officer of 73 investment companies (comprised of 183 portfolios) managed by the Manager. He is 47 years old and has been an employee of the Manager since October 1990.
JAMES WINDELS, Treasurer since December 2008.
Director – Mutual Fund Accounting of the Manager, and an officer of 73 investment companies (comprised of 183 portfolios) managed by the Manager. He is 54 years old and has been an employee of the Manager since April 1985.
| The Fund | 31 |
OFFICERS OF THE FUND (Unaudited) (continued)
RICHARD CASSARO, Assistant Treasurer since December 2008.
Senior Accounting Manager – Money Market and Municipal Bond Funds of the Manager, and an officer of 73 investment companies (comprised of 183 portfolios) managed by the Manager. He is 53 years old and has been an employee of the Manager since September 1982.
GAVIN C. REILLY, Assistant Treasurer since December 2008.
Tax Manager of the Investment Accounting and Support Department of the Manager, and an officer of 73 investment companies (comprised of 183 portfolios) managed by the Manager. He is 44 years old and has been an employee of the Manager since April 1991.
ROBERT S. ROBOL, Assistant Treasurer since December 2008.
Senior Accounting Manager – Fixed Income Funds of the Manager, and an officer of 73 investment companies (comprised of 183 portfolios) managed by the Manager. He is 48 years old and has been an employee of the Manager since October 1988.
ROBERT SALVIOLO, Assistant Treasurer since December 2008.
Senior Accounting Manager – Equity Funds of the Manager, and an officer of 73 investment companies (comprised of 183 portfolios) managed by the Manager. He is 45 years old and has been an employee of the Manager since June 1989.
ROBERT SVAGNA, Assistant Treasurer since December 2008.
Senior Accounting Manager – Equity Funds of the Manager, and an officer of 73 investment companies (comprised of 183 portfolios) managed by the Manager. He is 45 years old and has been an employee of the Manager since November 1990.
JOSEPH W. CONNOLLY, Chief Compliance Officer since December 2008.
Chief Compliance Officer of the Manager and The Dreyfus Family of Funds (73 investment companies, comprised of 183 portfolios). He is 55 years old and has served in various capacities with the Manager since 1980, including manager of the firm’s Fund Accounting Department from 1997 through October 2001.
MATTHEW D. CONNOLLY, Anti-Money Laundering Compliance Officer since April 2012.
Anti-Money Laundering Compliance Officer of the Distributor since October 2011; from March 2010 to September 2011, Global Head, KYC Reviews and Director, UBS Investment Bank; until March 2010,AML Compliance Officer and Senior Vice President, Citi Global Wealth Management. He is an officer of 69 investment companies (comprised of 179 portfolios) managed by the Manager. He is 40 years old and has been an employee of the Distributor since October 2011.
32
For More Information
Ticker Symbol: SSETX
Telephone 1-800-DREYFUS
Mail The Dreyfus Family of Funds, 144 Glenn Curtiss Boulevard, Uniondale, NY 11556-0144 E-mail Send your request to info@dreyfus.com Internet Information can be viewed online or downloaded at: http://www.dreyfus.com
The fund files its complete schedule of portfolio holdings with the Securities and Exchange Commission (“SEC”) for the first and third quarters of each fiscal year on Form N-Q. The fund’s Forms N-Q are available on the SEC’s website at http://www.sec.gov and may be reviewed and copied at the SEC’s Public Reference Room in Washington, DC. Information on the operation of the Public Reference Room may be obtained by calling 1-800-SEC-0330.
A description of the policies and procedures that the fund uses to determine how to vote proxies relating to portfolio securities, and information regarding how the fund voted these proxies for the most recent 12-month period ended June 30 is available at http://www.dreyfus.com and on the SEC’s website at http://www.sec.gov.
The description of the policies and procedures is also available without charge, upon request, by calling 1-800-DREYFUS.

| Dreyfus/The Boston |
| Company Small Cap |
| Tax-Sensitive Equity Fund |
ANNUAL REPORT September 30, 2012
Save time. Save paper. View your next shareholder report online as soon as it’s available. Log into www.dreyfus.com and sign up for Dreyfus eCommunications. It’s simple and only takes a few minutes.
The views expressed in this report reflect those of the portfolio manager only through the end of the period covered and do not necessarily represent the views of Dreyfus or any other person in the Dreyfus organization. Any such views are subject to change at any time based upon market or other conditions and Dreyfus disclaims any responsibility to update such views.These views may not be relied on as investment advice and, because investment decisions for a Dreyfus fund are based on numerous factors, may not be relied on as an indication of trading intent on behalf of any Dreyfus fund.
| Not FDIC-Insured • Not Bank-Guaranteed • May Lose Value |
Contents | |
THE FUND | |
| 2 | A Letter from the Chairman and CEO |
| 3 | Discussion of Fund Performance |
| 6 | Fund Performance |
| 7 | Understanding Your Fund’s Expenses |
| 7 | Comparing Your Fund’s Expenses With Those of Other Funds |
| 8 | Statement of Investments |
| 14 | Statement of Assets and Liabilities |
| 15 | Statement of Operations |
| 16 | Statement of Changes in Net Assets |
| 17 | Financial Highlights |
| 18 | Notes to Financial Statements |
| 29 | Report of Independent Registered Public Accounting Firm |
| 30 | Board Members Information |
| 32 | Officers of the Fund |
FOR MORE INFORMATION | |
Back Cover |
Dreyfus/The Boston
Company Small Cap
Tax-Sensitive Equity Fund
The Fund
A LETTER FROM THE CHAIRMAN AND CEO

Dear Shareholder:
This annual report for Dreyfus/The Boston Company Small Cap Tax-Sensitive Equity Fund covers the 12-month period from October 1, 2011, through September 30, 2012. For information about how the fund performed during the reporting period, as well as general market perspectives, we provide a Discussion of Fund Performance on the pages that follow.
U.S. equities proved unusually volatile over the past year, as prices rose and fell according to investors’ changing expectations of global and domestic economic conditions. And while the pace of U.S. economic growth has been relatively consistent, it has progressed at about half the average rate achieved in prior recoveries. Overseas, Europe has remained under severe economic pressure due to a persistent debt crisis and austerity-oriented fiscal policies adopted by many governments. In Japan, a strengthening currency dampened export activity and economic growth. The emerging markets have posted a slower rate of growth, reducing demand for industrial commodities and other goods and services.
The sustained-but-subpar U.S. expansion appears likely to continue over the foreseeable future.Across the international markets though, on one hand the global economy has responded to a variety of stimulative measures, most notably aggressively accommodative monetary policies in most major markets. On the other hand, headwinds emanating from Europe and China may continue to weigh on economic growth and investor sentiment. Indeed, the ability of governments and economic policymakers to address these issues could go a long way toward shaping the 2013 market environment. As always, we urge you to speak regularly with your financial advisor to discuss how changing global economic conditions may affect your investments.
Thank you for your continued confidence and support.

Jonathan R. Baum
Chairman and Chief Executive Officer
The Dreyfus Corporation
October 15, 2012
2
DISCUSSION OF FUND PERFORMANCE
For the period of October 1, 2011, through September 30, 2012, as provided by Todd Wakefield and B. Randall Watts, Jr., Portfolio Managers
Fund and Market Performance Overview
For the 12-month period ended September 30, 2012, Dreyfus/The Boston Company Small CapTax-Sensitive Equity Fund produced a total return of 30.58%.1 In comparison, the fund’s benchmark, the Russell 2000 Growth Index (the “Index”), produced a total return of 31.18% for the same period.2
Improving economic sentiment drove small-cap stocks higher as market declines during the spring of 2012 were more than offset by gains at other times of the reporting period. The fund produced a slightly lower return than its benchmark, largely due to relative underperformance within the Information Technology, Financials and Healthcare sectors.
The Fund’s Investment Approach
The fund seeks to maximize after-tax total return, consisting of long-term growth of capital.To pursue its goal, the fund normally invests at least 80% of its net assets in equity securities of small-cap U.S. companies with total market capitalizations, at the time of purchase, equal to or less than that of the largest company in the Index.When choosing stocks, we seek to identify small-cap companies which are experiencing or are expected to experience rapid growth. We use tax-sensitive strategies in seeking to reduce the impact of federal and state income taxes on the fund’s after-tax returns, including minimizing sales of securities that result in capital gains and selling underperforming securities to realize capital losses that can be offset against realized capital gains.
Markets Reacted to Shifting Macroeconomic Developments
The reporting period began in the immediate wake of a major stock market decline. One credit-rating agency’s downgrade of long-term U.S. government debt, an intensifying debt crisis in Europe and inflation-fighting programs in China had triggered a flight away from stocks and other risky assets. Fortunately, better U.S. economic data and new remedial measures from European and Chinese policymakers sparked a rebound in October 2011, and U.S. equity markets stabilized during the fall.
| The Fund | 3 |
DISCUSSION OF FUND PERFORMANCE (continued)
By the beginning of 2012, U.S. stocks were rallying amid domestic employment gains, a quantitative easing program in Europe and less restrictive monetary and fiscal policies in China. Investors grew more tolerant of risks, focusing more intently on company fundamentals and less on macroeconomic news. However, these positive influences were called into question during the spring, when U.S. employment gains slowed, measures designed to relieve fiscal pressures in Europe encountered resistance, and the Chinese economy remained sluggish. The summer saw the market rally resume amid more encouraging macroeconomic news, and the Russell 2000 Growth Index ended the reporting period with substantial gains.
Security Selection Strategies Enhanced Returns
The fund’s investment approach proved effective within the consumer discretionary sector, which generated especially attractive results as movie studio Lions Gate Entertainment broke box office records with its Hunger Games release. Apparel maker Oxford Industries expanded its branded stores to Asia, and a mild U.S. winter created a more positive backdrop for its warm weather brands. Mattress seller Select Comfort reported better-than-expected earnings stemming from improved marketing and merchandising initiatives, and the company raised the future guidance it provides to analysts.
In the consumer staples sector, beauty products purveyor Elizabeth Arden acquired licenses to market fragrances named for popular entertainers, and healthy foods distributor United Natural Foods achieved strong execution on a major contract in a fast-growing category of the grocery industry.Among energy companies, Gulfport Energy saw solid production growth from domestic natural gas drilling, while Oil States International encountered greater demand from projects in Canada and Australia. Finally, Brigham Exploration agreed to be acquired by a larger rival at a premium to its stock price at the time.
Disappointments during the reporting period included the information technology sector, as digital advertising specialist Marchex, Cl. B reported quarterly earnings that fell short of analysts’ expectations. Semiconductor manufacturer Vishay Intertechnology also missed earning targets, mainly due to weakening demand in Asia. Printed circuit boards providerTTMTechnologies also struggled with headwinds emanating from Asia as well as higher facilities-related costs. In the financials sector, pawn broker First Cash Financial Services stumbled amid slowing growth in Mexico. Results in the health care
4
sector were undermined by eye care specialist The Cooper Companies, which was pressured by safety recalls affecting its products, and medical information systems provider Allscripts Healthcare Solutions, which struggled with legal issues and changes to a key contract.
Maintaining a Constructive Investment Posture
Although macroeconomic uncertainties remain over the near term, we are optimistic about the longer term prospects for small-cap stocks. Lower interest rates and reduced borrowing costs for businesses, consumers and homebuyers are expected to further stimulate economic growth; however this will likely occur at a more modest pace relative to the first two rounds of easing. Despite the Fed’s accommodative actions, we continue to face many of the same headwinds that have persisted throughout the year: weak employment trends, uncertainty surrounding the November elections, and future fiscal policy. Businesses appear to remain reluctant to spend in the face of these issues. The lack of confidence has contained additional hiring, capital expenditures, etc. while cash continues to build on company balance sheets.Although macro headline risks may continue to cause near-term market volatility, we continue to utilize a long-term view and remain focused on the strategy’s disciplined research-driven investment approach.
October 15, 2012
Please note, the position in any security highlighted with italicized typeface was sold during the reporting period. Equity funds are subject generally to market, market sector, market liquidity, issuer and investment style risks, among other factors, to varying degrees, all of which are more fully described in the fund’s prospectus.
The prices of small company stocks tend to be more volatile than the prices of large company stocks, mainly because these companies have less established and more volatile earnings histories.They also tend to be less liquid than larger company stocks.
| 1 Total return includes reinvestment of dividends and any capital gains paid. Past performance is no guarantee of future |
| results. Share price and investment return fluctuate such that upon redemption, fund shares may be worth more or less |
| than their original cost.The fund’s return reflects the voluntary absorption of certain fund expenses by The Dreyfus |
| Corporation, which may be terminated at any time. Had these expenses not been absorbed, the return would have |
| been lower. |
| 2 SOURCE: LIPPER INC. — The Russell 2000 Growth Index is an unmanaged index, which measures the |
| performance of those Russell 2000 companies with higher price-to-book ratios and higher forecasted growth values.The |
| total return figure cited for this index assumes change in security prices and reinvestment of dividends, but does not |
| reflect the costs of managing a mutual fund. Investors cannot invest directly in any index. |
| The Fund | 5 |
FUND PERFORMANCE
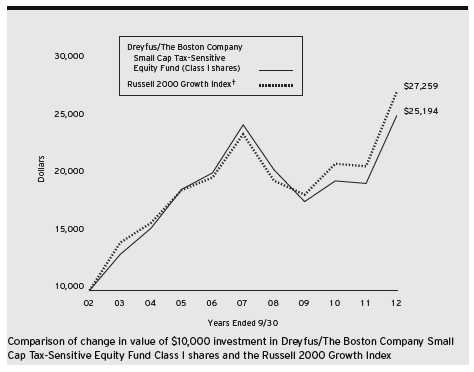
| Average Annual Total Returns as of 9/30/12 | ||||||
| 1 Year | 5 Years | 10 Years | ||||
| Class I shares | 30.58 | % | 0.65 | % | 9.68 | % |
| Russell 2000 Growth Index | 31.18 | % | 2.96 | % | 10.55 | % |
† Source: Lipper Inc.
Past performance is not predictive of future performance.The fund’s performance shown in the graph and table does not reflect the deduction of taxes that a shareholder would pay on fund distributions or the redemption of fund shares.
The above graph compares a $10,000 investment made in Class I shares of Dreyfus/The Boston Company Small Cap Tax-Sensitive Equity Fund on 9/30/02 to a $10,000 investment made in the Russell 2000 Growth Index (the “Index”) on that date.All dividends and capital gain distributions are reinvested.
The fund’s performance shown in the line graph above takes into account all applicable fees and expenses.The Index is an unmanaged index that measures the performance of those Russell 2000 companies (the 2,000 smallest companies of the Russell 3000 Index) with higher price-to-book ratios and higher forecasted growth values. Unlike a mutual fund, the Index is not subject to charges, fees and other expenses. Investors cannot invest directly in any index.These factors can contribute to the Index potentially outperforming the fund. Further information relating to fund performance, including expense reimbursements, if applicable, is contained in the Financial Highlights section of the prospectus and elsewhere in this report.
6
UNDERSTANDING YOUR FUND’S EXPENSES (Unaudited)
As a mutual fund investor, you pay ongoing expenses, such as management fees and other expenses. Using the information below, you can estimate how these expenses affect your investment and compare them with the expenses of other funds.You also may pay one-time transaction expenses, including sales charges (loads) and redemption fees, which are not shown in this section and would have resulted in higher total expenses. For more information, see your fund’s prospectus or talk to your financial adviser.
Review your fund’s expenses
The table below shows the expenses you would have paid on a $1,000 investment in Dreyfus/The Boston Company Small Cap Tax-Sensitive Equity Fund from April 1, 2012 to September 30, 2012. It also shows how much a $1,000 investment would be worth at the close of the period, assuming actual returns and expenses.
Expenses and Value of a $1,000 Investment
assuming actual returns for the six months ended September 30, 2012
| Expenses paid per $1,000† | $ | 5.84 |
| Ending value (after expenses) | $ | 1,030.20 |
COMPARING YOUR FUND’S EXPENSES
WITH THOSE OF OTHER FUNDS (Unaudited)
Using the SEC’s method to compare expenses
The Securities and Exchange Commission (SEC) has established guidelines to help investors assess fund expenses. Per these guidelines, the table below shows your fund’s expenses based on a $1,000 investment, assuming a hypothetical 5% annualized return. You can use this information to compare the ongoing expenses (but not transaction expenses or total cost) of investing in the fund with those of other funds.All mutual fund shareholder reports will provide this information to help you make this comparison. Please note that you cannot use this information to estimate your actual ending account balance and expenses paid during the period.
Expenses and Value of a $1,000 Investment
assuming a hypothetical 5% annualized return for the six months ended September 30, 2012
| Expenses paid per $1,000† | $ | 5.81 |
| Ending value (after expenses) | $ | 1,019.25 |
| † Expenses are equal to the fund’s annualized expense ratio of 1.15% for Class I, multiplied by the average account |
| value over the period, multiplied by 183/366 (to reflect the one-half year period). |
| The Fund | 7 |
STATEMENT OF INVESTMENTS
September 30, 2012
| Common Stocks—98.3% | Shares | Value ($) | |
| Automobiles & Components—1.2% | |||
| Drew Industries | 5,740 | a | 173,405 |
| Thor Industries | 5,760 | 209,203 | |
| 382,608 | |||
| Banks—1.2% | |||
| Oritani Financial | 11,110 | 167,205 | |
| Prosperity Bancshares | 5,380 | 229,296 | |
| 396,501 | |||
| Capital Goods—9.8% | |||
| Applied Industrial Technologies | 3,620 | 149,977 | |
| Beacon Roofing Supply | 10,910 | a | 310,935 |
| Crane | 6,990 | 279,111 | |
| EMCOR Group | 10,470 | 298,814 | |
| Foster Wheeler | 15,470 | a | 370,661 |
| Hexcel | 15,450 | a | 371,109 |
| Middleby | 1,960 | a | 226,654 |
| MRC Global | 18,150 | b | 446,309 |
| Teledyne Technologies | 6,068 | a | 384,651 |
| Triumph Group | 5,070 | 317,027 | |
| 3,155,248 | |||
| Commercial & Professional Services—3.2% | |||
| Corporate Executive Board | 6,573 | 352,510 | |
| Encore Capital Group | 5,070 | a | 143,278 |
| Exponent | 2,950 | a | 168,416 |
| InnerWorkings | 3,320 | a | 43,226 |
| RPX | 11,120 | a | 124,655 |
| TrueBlue | 11,750 | a | 184,710 |
| 1,016,795 | |||
| Consumer Durables & Apparel—4.2% | |||
| Jarden | 4,680 | 247,291 | |
| La-Z-Boy | 8,970 | a | 131,231 |
| Oxford Industries | 8,260 | 466,277 | |
| SodaStream International | 8,400 | a,b | 329,028 |
| Steven Madden | 4,370 | a | 191,056 |
| 1,364,883 |
8
| Common Stocks (continued) | Shares | Value ($) | |
| Consumer Services—5.8% | |||
| BJ’s Restaurants | 4,850 | a,b | 219,948 |
| Bloomin’ Brands | 15,450 | 254,153 | |
| Buffalo Wild Wings | 3,330 | a | 285,514 |
| Cheesecake Factory | 7,680 | 274,560 | |
| Papa John’s International | 3,720 | a | 198,685 |
| Shuffle Master | 12,190 | a | 192,724 |
| Six Flags Entertainment | 7,300 | 429,240 | |
| 1,854,824 | |||
| Energy—6.4% | |||
| Dril-Quip | 6,430 | a | 462,188 |
| Exterran Holdings | 3,250 | a | 65,910 |
| Gulfport Energy | 13,370 | a | 417,946 |
| Oasis Petroleum | 13,440 | a,b | 396,077 |
| Oil States International | 3,550 | a | 282,083 |
| OYO Geospace | 1,950 | a | 238,699 |
| PDC Energy | 6,110 | a | 193,259 |
| 2,056,162 | |||
| Exchange-Traded Funds—2.4% | |||
| iShares Russell 2000 Growth Index Fund | 8,010 | b | 765,836 |
| Food & Staples Retailing—3.5% | |||
| Casey’s General Stores | 6,560 | 374,838 | |
| Chefs’ Warehouse Holdings | 8,780 | a | 143,816 |
| Harris Teeter Supermarkets | 7,080 | 274,987 | |
| United Natural Foods | 5,970 | a | 348,947 |
| 1,142,588 | |||
| Food, Beverage & Tobacco—.6% | |||
| Smart Balance | 17,220 | a | 208,018 |
| Health Care Equipment & Services—9.5% | |||
| ABIOMED | 12,350 | a,b | 259,227 |
| Acadia Healthcare | 12,750 | a | 304,088 |
| Accuray | 22,450 | a | 158,946 |
| Air Methods | 2,210 | a | 263,808 |
| Analogic | 2,990 | 233,728 | |
| Catamaran | 6,426 | a | 629,555 |
| The Fund | 9 |
STATEMENT OF INVESTMENTS (continued)
| Common Stocks (continued) | Shares | Value ($) | |
| Health Care Equipment & Services (continued) | |||
| Centene | 5,990 | a | 224,086 |
| HMS Holdings | 10,170 | a | 339,983 |
| Merit Medical Systems | 16,210 | a | 242,015 |
| Natus Medical | 15,580 | a | 203,631 |
| WellCare Health Plans | 3,730 | a | 210,932 |
| 3,069,999 | |||
| Household & Personal Products—2.6% | |||
| Elizabeth Arden | 8,500 | a | 401,540 |
| Inter Parfums | 23,040 | 421,632 | |
| 823,172 | |||
| Materials—2.7% | |||
| Allied Nevada Gold | 6,710 | a | 262,093 |
| Haynes International | 3,840 | 200,256 | |
| Innophos Holdings | 4,270 | 207,052 | |
| KapStone Paper and Packaging | 9,000 | a | 201,510 |
| 870,911 | |||
| Media—2.1% | |||
| DreamWorks Animation SKG, Cl. A | 16,470 | a,b | 316,718 |
| Lions Gate Entertainment | 23,102 | a,b | 352,768 |
| 669,486 | |||
| Pharmaceuticals, Biotech & | |||
| Life Sciences—13.0% | |||
| Affymax | 8,970 | a | 188,908 |
| Alexion Pharmaceuticals | 4,390 | a | 502,216 |
| Alkermes | 16,870 | a | 350,053 |
| Alnylam Pharmaceuticals | 10,680 | a,b | 200,677 |
| ARIAD Pharmaceuticals | 13,070 | a,b | 316,621 |
| Charles River Laboratories International | 1,770 | a | 70,092 |
| Cubist Pharmaceuticals | 8,910 | a | 424,829 |
| Exact Sciences | 13,770 | a | 151,608 |
| Incyte | 6,440 | a,b | 116,242 |
| Jazz Pharmaceuticals | 4,920 | a | 280,489 |
10
| Common Stocks (continued) | Shares | Value ($) | |
| Pharmaceuticals, Biotech & | |||
| Life Sciences (continued) | |||
| Nektar Therapeutics | 30,090 | a,b | 321,361 |
| NPS Pharmaceuticals | 18,860 | a | 174,455 |
| Onyx Pharmaceuticals | 5,060 | a | 427,570 |
| Pharmacyclics | 5,500 | a,b | 354,750 |
| Salix Pharmaceuticals | 3,150 | a | 133,371 |
| Vivus | 9,900 | a,b | 176,418 |
| 4,189,660 | |||
| Real Estate—2.9% | |||
| Hudson Pacific Properties | 13,540 | c | 250,490 |
| LaSalle Hotel Properties | 8,840 | c | 235,940 |
| Mid-America | |||
| Apartment Communities | 4,420 | c | 288,670 |
| Zillow, Cl. A | 3,890 | a,b | 164,080 |
| 939,180 | |||
| Retailing—5.9% | |||
| Asbury Automotive Group | 7,330 | a | 204,874 |
| Finish Line, Cl. A | 14,420 | 327,911 | |
| Lumber Liquidators Holdings | 4,470 | a,b | 226,540 |
| Rent-A-Center | 13,420 | 470,774 | |
| Select Comfort | 11,380 | a | 359,039 |
| Tilly’s, Cl. A | 8,200 | 150,306 | |
| Tractor Supply | 1,610 | 159,213 | |
| 1,898,657 | |||
| Semiconductors & Semiconductor | |||
| Equipment—3.2% | |||
| ATMI | 14,000 | a | 259,980 |
| Entegris | 18,980 | a | 154,307 |
| Micrel | 16,390 | 170,784 | |
| PMC-Sierra | 26,030 | a | 146,809 |
| Silicon Image | 67,780 | a | 311,110 |
| 1,042,990 |
| The Fund | 11 |
STATEMENT OF INVESTMENTS (continued)
| Common Stocks (continued) | Shares | Value ($) | |
| Software & Services—9.2% | |||
| ExlService Holdings | 10,090 | a | 297,655 |
| Jive Software | 32,040 | b | 503,348 |
| LogMeIn | 9,940 | a | 222,954 |
| MAXIMUS | 7,220 | 431,178 | |
| Mentor Graphics | 32,030 | a | 495,824 |
| Millennial Media | 16,250 | b | 233,188 |
| Qualys | 13,480 | a | 190,877 |
| Responsys | 35,150 | a | 359,584 |
| SolarWinds | 4,409 | a | 245,758 |
| 2,980,366 | |||
| Technology Hardware & Equipment—6.6% | |||
| Arris Group | 23,870 | a | 305,297 |
| Aruba Networks | 29,970 | a,b | 673,875 |
| NETGEAR | 12,670 | a | 483,234 |
| RADWARE | 6,810 | a | 245,296 |
| TTM Technologies | 18,390 | a | 173,418 |
| Vishay Intertechnology | 26,630 | a | 261,773 |
| 2,142,893 | |||
| Transportation—2.3% | |||
| Allegiant Travel | 2,570 | a | 162,835 |
| Con-way | 6,310 | 172,705 | |
| Forward Air | 7,920 | 240,847 | |
| Werner Enterprises | 7,190 | 153,650 | |
| 730,037 | |||
| Total Common Stocks | |||
| (cost $28,297,474) | 31,700,814 | ||
| Other Investment—1.8% | |||
| Registered Investment Company; | |||
| Dreyfus Institutional Preferred | |||
| Plus Money Market Fund | |||
| (cost $592,896) | 592,896 | d | 592,896 |
12
| Investment of Cash Collateral | ||||
| for Securities Loaned—14.1% | Shares | Value ($) | ||
| Registered Investment Company; | ||||
| Dreyfus Institutional Cash Advantage Fund | ||||
| (cost $4,528,783) | 4,528,783 | d | 4,528,783 | |
| Total Investments (cost $33,419,153) | 114.2 | % | 36,822,493 | |
| Liabilities, Less Cash and Receivables | (14.2 | %) | (4,590,283 | ) |
| Net Assets | 100.0 | % | 32,232,210 |
| a Non-income producing security. |
| b Security, or portion thereof, on loan.At September 30, 2012, the value of the fund’s securities on loan was |
| $4,465,739 and the value of the collateral held by the fund was $4,528,783. |
| c Investment in real estate investment trust. |
| d Investment in affiliated money market mutual fund. |
| Portfolio Summary (Unaudited)† | |||
| Value (%) | Value (%) | ||
| Money Market Investments | 15.9 | Semiconductors & | |
| Pharmaceuticals, | Semiconductor Equipment | 3.2 | |
| Biotech & Life Sciences | 13.0 | Real Estate | 2.9 |
| Capital Goods | 9.8 | Materials | 2.7 |
| Health Care Equipment & Services | 9.5 | Household & Personal Products | 2.6 |
| Software & Services | 9.2 | Exchange-Traded Funds | 2.4 |
| Technology Hardware & Equipment | 6.6 | Transportation | 2.3 |
| Energy | 6.4 | Media | 2.1 |
| Retailing | 5.9 | Automobiles & Components | 1.2 |
| Consumer Services | 5.8 | Banks | 1.2 |
| Consumer Durables & Apparel | 4.2 | Food, Beverage & Tobacco | .6 |
| Food & Staples Retailing | 3.5 | ||
| Commercial & Professional Services | 3.2 | 114.2 | |
| † Based on net assets. | |||
| See notes to financial statements. | |||
| The Fund | 13 |
| STATEMENT OF ASSETS AND LIABILITIES |
| September 30, 2012 |
| Cost | Value | ||
| Assets ($): | |||
| Investments in securities—See Statement of Investments (including | |||
| securities on loan, valued at $4,465,739)—Note 1(b): | |||
| Unaffiliated issuers | 28,297,474 | 31,700,814 | |
| Affiliated issuers | 5,121,679 | 5,121,679 | |
| Cash | 429 | ||
| Receivable for investment securities sold | 618,537 | ||
| Dividends and securities lending income receivable | 16,468 | ||
| Prepaid expenses | 7,528 | ||
| 37,465,455 | |||
| Liabilities ($): | |||
| Due to The Dreyfus Corporation and affiliates—Note 3(b) | 48,227 | ||
| Due to Administrator—Note 3(a) | 1,857 | ||
| Liability for securities on loan—Note 1(b) | 4,528,783 | ||
| Payable for investment securities purchased | 577,328 | ||
| Payable for shares of Beneficial Interest redeemed | 32,520 | ||
| Interest payable—Note 2 | 482 | ||
| Accrued expenses | 44,048 | ||
| 5,233,245 | |||
| Net Assets ($) | 32,232,210 | ||
| Composition of Net Assets ($): | |||
| Paid-in capital | 40,541,970 | ||
| Accumulated undistributed investment income—net | 2,980 | ||
| Accumulated net realized gain (loss) on investments | (11,716,080 | ) | |
| Accumulated net unrealized appreciation | |||
| (depreciation) on investments | 3,403,340 | ||
| Net Assets ($) | 32,232,210 | ||
| Class I Shares Outstanding | |||
| (unlimited number of $.001 par value shares of Beneficial Interest authorized) | 780,643 | ||
| Net Asset Value, offering and redemption price per share ($) | 41.29 | ||
| See notes to financial statements. | |||
14
| STATEMENT OF OPERATIONS | ||
| Year Ended September 30, 2012 | ||
| Investment Income ($): | ||
| Income: | ||
| Cash dividends: | ||
| Unaffiliated issuers | 297,178 | |
| Affiliated issuers | 932 | |
| Income from securities lending—Note 1(b) | 98,583 | |
| Total Income | 396,693 | |
| Expenses: | ||
| Investment advisory fee—Note 3(a) | 508,134 | |
| Administration fees—Note 3(a) | 38,110 | |
| Auditing fees | 37,248 | |
| Shareholder servicing costs—Note 3(b) | 34,684 | |
| Custodian fees—Note 3(b) | 21,828 | |
| Registration fees | 20,570 | |
| Prospectus and shareholders’ reports | 19,424 | |
| Legal fees | 11,062 | |
| Trustees’ fees and expenses—Note 3(c) | 6,964 | |
| Interest expense—Note 2 | 1,136 | |
| Loan commitment fees—Note 2 | 750 | |
| Miscellaneous | 17,319 | |
| Total Expenses | 717,229 | |
| Less—reduction in expenses due to undertaking—Note 3(a) | (6,993 | ) |
| Less—reduction in fees due to earnings credits—Note 3(b) | (6 | ) |
| Net Expenses | 710,230 | |
| Investment (Loss)—Net | (313,537 | ) |
| Realized and Unrealized Gain (Loss) on Investments—Note 4 ($): | ||
| Net realized gain (loss) on investments | 11,065,361 | |
| Net realized gain (loss) on financial futures | 98,038 | |
| Net Realized Gain (Loss) | 11,163,399 | |
| Net unrealized appreciation (depreciation) on investments | 7,108,989 | |
| Net Realized and Unrealized Gain (Loss) on Investments | 18,272,388 | |
| Net Increase in Net Assets Resulting from Operations | 17,958,851 | |
| See notes to financial statements. | ||
| The Fund | 15 |
STATEMENT OF CHANGES IN NET ASSETS
| Year Ended September 30, | ||||
| 2012 | 2011 | |||
| Operations ($): | ||||
| Investment (loss)—net | (313,537 | ) | (599,205 | ) |
| Net realized gain (loss) on investments | 11,163,399 | 44,112,136 | ||
| Net unrealized appreciation | ||||
| (depreciation) on investments | 7,108,989 | (26,503,951 | ) | |
| Net Increase (Decrease) in Net Assets | ||||
| Resulting from Operations | 17,958,851 | 17,008,980 | ||
| Beneficial Interest Transactions ($): | ||||
| Net proceeds from shares sold | 1,896,854 | 9,467,058 | ||
| Cost of shares redeemed | (61,603,859 | ) | (136,293,105 | ) |
| Increase (Decrease) in Net Assets from | ||||
| Beneficial Interest Transactions | (59,707,005 | ) | (126,826,047 | ) |
| Total Increase (Decrease) in Net Assets | (41,748,154 | ) | (109,817,067 | ) |
| Net Assets ($): | ||||
| Beginning of Period | 73,980,364 | 183,797,431 | ||
| End of Period | 32,232,210 | 73,980,364 | ||
| Undistributed investment income—net | 2,980 | 10,260 | ||
| Capital Share Transactions (Shares): | ||||
| Shares sold | 51,815 | 259,583 | ||
| Shares redeemed | (1,611,014 | ) | (3,665,874 | ) |
| Net Increase (Decrease) in Shares Outstanding | (1,559,199 | ) | (3,406,291 | ) |
| See notes to financial statements. | ||||
16
FINANCIAL HIGHLIGHTS
The following table describes the performance for the fiscal periods indicated. Total return shows how much your investment in the fund would have increased (or decreased) during each period, assuming you had reinvested all dividends and distributions.These figures have been derived from the fund’s financial statements.
| Year Ended September 30, | ||||||||||
| Class I Shares | 2012 | 2011 | 2010 | 2009 | a | 2008 | ||||
| Per Share Data ($): | ||||||||||
| Net asset value, beginning of period | 31.62 | 31.99 | 29.05 | 33.59 | 43.15 | |||||
| Investment Operations: | ||||||||||
| Investment (loss)—netb | (.19 | ) | (.14 | ) | (.10 | ) | (.09 | ) | (.07 | ) |
| Net realized and unrealized | ||||||||||
| gain (loss) on investments | 9.86 | (.23 | ) | 3.04 | c | (4.45 | ) | (6.42 | )c | |
| Total from Investment Operations | 9.67 | (.37 | ) | 2.94 | (4.54 | ) | (6.49 | ) | ||
| Distributions: | ||||||||||
| Dividends from net realized | ||||||||||
| gain on investments | — | — | — | — | (3.07 | ) | ||||
| Net asset value, end of period | 41.29 | 31.62 | 31.99 | 29.05 | 33.59 | |||||
| Total Return (%) | 30.58 | (1.16 | ) | 10.12 | (13.54 | ) | (15.99 | ) | ||
| Ratios/Supplemental Data (%): | ||||||||||
| Ratio of total expenses | ||||||||||
| to average net assets | 1.13 | 1.04 | .99 | 1.05 | .95 | |||||
| Ratio of net expenses | ||||||||||
| to average net assets | 1.12 | 1.04 | .99 | 1.05 | .95 | |||||
| Ratio of net investment (loss) | ||||||||||
| to average net assets | (.49 | ) | (.39 | ) | (.33 | ) | (.38 | ) | (.19 | ) |
| Portfolio Turnover Rate | 175.97 | 188.90 | 171.24 | 265.74 | 209 | |||||
| Net Assets, end of period ($ x 1,000) | 32,232 | 73,980 | 183,797 | 203,805 | 303,246 | |||||
| a Effective September 1, 2009, the fund’s shares were redesignated as Class I shares. |
| b Based on average shares outstanding at each month end. |
| c Amount includes litigation proceeds received by the fund amounting to $.02 and $.01, respectively, per share for the |
| years ended September 30, 2010 and 2008. |
See notes to financial statements.
| The Fund | 17 |
NOTES TO FINANCIAL STATEMENTS
NOTE 1—Significant Accounting Policies:
Dreyfus/The Boston Company Small Cap Tax-Sensitive Equity Fund (the “fund”) is a separate diversified series of Dreyfus Investment Funds (the “Trust”), which is registered under the Investment Company Act of 1940, as amended (the “Act”), as an open-end management investment company and operates a series company currently offering eleven series, including the fund.The fund’s investment objective is to maximize after-tax total return, consisting of long-term growth of capital.The Dreyfus Corporation (the “Manager” or “Dreyfus”), a wholly-owned subsidiary ofThe Bank of NewYork Mellon Corporation (“BNY Mellon”), serves as the fund’s investment adviser. MBSC Securities Corporation (the “Distributor”), a wholly-owned subsidiary of the Manager, is the distributor of the fund’s shares.
Class I shares are sold primarily to bank trust departments and other financial service providers (including The Bank of New York Mellon, a subsidiary of BNY Mellon and affiliate of Dreyfus, and its affiliates), acting on behalf of customers having a qualified trust or an investment account or relationship at such institution and bear no Distribution or Shareholder Services Plan fees. Class I shares are offered without a front end sales charge or a contingent deferred sales charge.
The Trust accounts separately for the assets, liabilities and operations of each series. Expenses directly attributable to each series are charged to that series’ operations; expenses which are applicable to all series are allocated among them on a pro rata basis.
The Financial Accounting Standards Board (“FASB”) Accounting Standards Codification is the exclusive reference of authoritative U.S. generally accepted accounting principles (“GAAP”) recognized by the FASB to be applied by nongovernmental entities. Rules and interpretive releases of the Securities and Exchange Commission (“SEC”) under authority of federal laws are also sources of authoritative GAAP for SEC registrants. The fund’s financial statements are prepared in accordance with GAAP, which may require the use of management estimates and assumptions.Actual results could differ from those estimates.
18
(a) Portfolio valuation: The fair value of a financial instrument is the amount that would be received to sell an asset or paid to transfer a liability in an orderly transaction between market participants at the measurement date (i.e., the exit price). GAAP establishes a fair value hierarchy that prioritizes the inputs of valuation techniques used to measure fair value.This hierarchy gives the highest priority to unadjusted quoted prices in active markets for identical assets or liabilities (Level 1 measurements) and the lowest priority to unobservable inputs (Level 3 measurements).
Additionally, GAAP provides guidance on determining whether the volume and activity in a market has decreased significantly and whether such a decrease in activity results in transactions that are not orderly. GAAP requires enhanced disclosures around valuation inputs and techniques used during annual and interim periods.
Various inputs are used in determining the value of the fund’s investments relating to fair value measurements.These inputs are summarized in the three broad levels listed below:
Level 1—unadjusted quoted prices in active markets for identical investments.
Level 2—other significant observable inputs (including quoted prices for similar investments, interest rates, prepayment speeds, credit risk, etc.).
Level 3—significant unobservable inputs (including the fund’s own assumptions in determining the fair value of investments).
The inputs or methodology used for valuing securities are not necessarily an indication of the risk associated with investing in those securities.
Changes in valuation techniques may result in transfers in or out of an assigned level within the disclosure hierarchy. Valuation techniques used to value the fund’s investments are as follows:
Investments in securities are valued at the last sales price on the securities exchange or national securities market on which such securities are primarily traded. Securities listed on the National Market System
| The Fund | 19 |
NOTES TO FINANCIAL STATEMENTS (continued)
for which market quotations are available are valued at the official closing price or, if there is no official closing price that day, at the last sales price. Securities not listed on an exchange or the national securities market, or securities for which there were no transactions, are valued at the average of the most recent bid and asked prices, except for open short positions, where the asked price is used for valuation purposes. Bid price is used when no asked price is available. Registered investment companies that are not traded on an exchange are valued at their net asset value. All of the preceding securities are categorized within Level 1 of the fair value hierarchy.
Fair valuing of securities may be determined with the assistance of a pricing service using calculations based on indices of domestic securities and other appropriate indicators, such as prices of relevant American Depository Receipts and financial futures. Utilizing these techniques may result in transfers between Level 1 and Level 2 of the fair value hierarchy.
When market quotations or official closing prices are not readily available, or are determined not to reflect accurately fair value, such as when the value of a security has been significantly affected by events after the close of the exchange or market on which the security is principally traded (for example, a foreign exchange or market), but before the fund calculates its net asset value, the fund may value these investments at fair value as determined in accordance with the procedures approved by the Trust’s Board of Trustees (the “Board”). Certain factors may be considered when fair valuing investments such as: fundamental analytical data, the nature and duration of restrictions on disposition, an evaluation of the forces that influence the market in which the securities are purchased and sold, and public trading in similar securities of the issuer or comparable issuers.These securities are either categorized as Level 2 or 3 depending on the relevant inputs used.
For restricted securities where observable inputs are limited, assumptions about market activity and risk are used and are categorized within Level 3 of the fair value hierarchy.
20
Financial futures, which are traded on an exchange, are valued at the last sales price on the securities exchange on which such securities are primarily traded or at the last sales price on the national securities market on each business day.These securities are generally categorized within Level 1 of the fair value hierarchy.
The following is a summary of the inputs used as of September 30, 2012 in valuing the fund’s investments:
| Level 2—Other | Level 3— | |||
| Level 1— | Significant | Significant | ||
| Unadjusted | Observable | Unobservable | ||
| Quoted Prices | Inputs | Inputs | Total | |
| Assets ($) | ||||
| Investments in Securities: | ||||
| Equity Securities—Domestic | ||||
| Common Stocks† | 30,360,654 | — | — | 30,360,654 |
| Equity Securities—Foreign | ||||
| Common Stocks† | 574,324 | — | — | 574,324 |
| Exchange-Traded Funds | 765,836 | — | — | 765,836 |
| Mutual Funds | 5,121,679 | — | — | 5,121,679 |
| † See Statement of Investments for additional detailed categorizations. | ||||
At September 30, 2012, there were no transfers between Level 1 and Level 2 of the fair value hierarchy.
(b) Securities transactions and investment income: Securities transactions are recorded on a trade date basis. Realized gains and losses from securities transactions are recorded on the identified cost basis. Dividend income is recognized on the ex-dividend date and interest income, including, where applicable, accretion of discount and amortization of premium on investments, is recognized on the accrual basis.
Pursuant to a securities lending agreement with The Bank of New York Mellon, the fund may lend securities to qualified institutions. It is the fund’s policy that, at origination, all loans are secured by collateral of at least 102% of the value of U.S. securities loaned and 105% of the value of foreign securities loaned. Collateral equivalent to at least
| The Fund | 21 |
NOTES TO FINANCIAL STATEMENTS (continued)
100% of the market value of securities on loan is maintained at all times. Collateral is either in the form of cash, which can be invested in certain money market mutual funds managed by the Manager, U.S. Government and Agency securities or letters of credit. The fund is entitled to receive all income on securities loaned, in addition to income earned as a result of the lending transaction. Although each security loaned is fully collateralized, the fund bears the risk of delay in recovery of, or loss of rights in, the securities loaned should a borrower fail to return the securities in a timely manner. During the period ended September 30, 2012, The Bank of New York Mellon earned $32,861 from lending portfolio securities, pursuant to the securities lending agreement.
(c) Affiliated issuers: Investments in other investment companies advised by Dreyfus are defined as “affiliated” in the Act. Investments in affiliated investment companies for the period ended September 30, 2012 were as follows:
| Affiliated | |||||
| Investment | Value | Value | Net | ||
| Company | 9/30/2011 ($) | Purchases ($) | Sales ($) | 9/30/2012 ($) | Assets (%) |
| Dreyfus | |||||
| Institutional | |||||
| Preferred | |||||
| Plus Money | |||||
| Market Fund | 526,397 | 32,308,807 | 32,242,308 | 592,896 | 1.8 |
| Dreyfus | |||||
| Institutional | |||||
| Cash | |||||
| Advantage | |||||
| Fund | 16,444,135 | 73,533,327 | 85,448,679 | 4,528,783 | 14.1 |
| Total | 16,970,532 | 105,842,134 | 117,690,987 | 5,121,679 | 15.9 |
(d) Dividends to shareholders: Dividends are recorded on the ex-dividend date. Dividends from investment income-net and dividends from net realized capital gains, if any, are normally declared and paid annually, but the fund may make distributions on a more frequent basis to comply with the distribution requirements of the Internal Revenue Code of 1986, as amended (the “Code”).To the extent that net realized capital gains can be offset by capital loss carryovers, it is the policy
22
of the fund not to distribute such gains. Income and capital gain distributions are determined in accordance with income tax regulations, which may differ from GAAP.
(e) Federal income taxes: It is the policy of the fund to continue to qualify as a regulated investment company, if such qualification is in the best interests of its shareholders, by complying with the applicable provisions of the Code, and to make distributions of taxable income sufficient to relieve it from substantially all federal income and excise taxes.
As of and during the period ended September 30, 2012, the fund did not have any liabilities for any uncertain tax positions.The fund recognizes interest and penalties, if any, related to uncertain tax positions as income tax expense in the Statement of Operations. During the period, the fund did not incur any interest or penalties.
Each of the tax years in the four-year period ended September 30, 2012 remains subject to examination by the Internal Revenue Service and state taxing authorities.
At September 30, 2012, the components of accumulated earnings on a tax basis were as follows: accumulated capital losses $11,051,918 and unrealized appreciation $2,742,158.
Under the Regulated Investment Company Modernization Act of 2010 (the “2010 Act”), the fund is permitted to carry forward capital losses incurred in taxable years beginning after December 22, 2010 (“post-enactment losses”) for an unlimited period. Furthermore, post-enactment capital loss carryovers retain their character as either short-term or long-term capital losses rather than short-term as they were under previous statute. The 2010 Act requires post-enactment losses to be utilized before the utilization of losses incurred in taxable years prior to the effective date of the 2010 Act (“pre-enactment losses”).As a result of this ordering rule, pre-enactment losses may be more likely to expire unused.
| The Fund | 23 |
NOTES TO FINANCIAL STATEMENTS (continued)
The accumulated capital loss carryover is available for federal income tax purposes to be applied against future net realized capital gains, if any, realized subsequent to September 30, 2012. If not applied, the carryover expires in fiscal year 2018.
During the period ended September 30, 2012, as a result of permanent book to tax differences, primarily due to the tax treatment for net operating losses and real estate investment trusts, the fund increased accumulated undistributed investment income-net by $306,257, increased accumulated net realized gain (loss) on investments by $9,889 and decreased paid-in capital by $316,146. Net assets and net asset value per share were not affected by this reclassification.
(f) New Accounting Pronouncement: In December 2011, FASB issued Accounting Standards Update No. 2011-11 “Disclosures about Offsetting Assets and Liabilities” (“ASU 2011-11”). These disclosure requirements are intended to help investors and other financial statement users to better assess the effect or potential effect of offsetting arrangements on a company’s financial position.They also improve transparency in the reporting of how companies mitigate credit risk, including disclosure of related collateral pledged or received. In addition,ASU 2011-11 facilitates comparison between those entities that prepare their financial statements on the basis of GAAP and those entities that prepare their financial statements on the basis of International Financial Reporting Standards (“IFRS”). ASU 2011-11 requires entities to: disclose both gross and net information about both instruments and transactions eligible for offset in the financial statements; and disclose instruments and transactions subject to an agreement similar to a master netting agreement. ASU 2011-11 is effective for fiscal years beginning on or after January 1, 2013, and interim periods within those annual periods. At this time, management is evaluating the implications of ASU 2011-11 and its impact on the fund’s financial statement disclosures.
NOTE 2—Bank Lines of Credit:
The fund participates with other Dreyfus-managed funds in a $225 million unsecured credit facility led by Citibank, N.A. and a $300 mil-
24
lion unsecured credit facility provided by The Bank of New York Mellon (each, a “Facility”), each to be utilized primarily for temporary or emergency purposes, including the financing of redemptions. In connection therewith, the fund has agreed to pay its pro rata portion of commitment fees for each Facility. Interest is charged to the fund based on rates determined pursuant to the terms of the respective Facility at the time of borrowing.
The average amount of borrowings outstanding under the Facilities during the period ended September 30, 2012, was approximately $96,200 with a related weighted average annualized interest rate of 1.18%.
NOTE 3—Investment Advisory Fee and Other Transactions With Affiliates:
(a) Pursuant to an investment advisory agreement with the Manager, the investment advisory fee is computed at the annual rate of .80% of the value of the fund’s average daily net assets and is payable monthly. The Manager had agreed until July 31, 2012, to limit the fund’s operating expenses or assume all or part of the expenses of the fund, if the aggregate expenses of the fund (exclusive taxes, brokerage commissions, interest expense, commitment fees on borrowings and extraordinary expenses) exceeded 1.10% of the value of the fund’s average daily net assets on the fund shares.The reduction in expenses, pursuant to the undertaking, amounted to $6,993 during the period ended September 30, 2012.
The fund has an Accounting and Administration Agreement (the “Administration Agreement”) with Dreyfus, whereby Dreyfus performs administrative and accounting services for the fund. The fund has agreed to compensate Dreyfus for providing accounting services, administration, compliance monitoring, regulatory and shareholder reporting, as well as for related facilities and equipment. The fee is based on the fund’s average daily net assets and computed at the following annual rates: .06% of the first $500 million, .04% of the next $500 million and .02% in excess of $1 billion.
| The Fund | 25 |
NOTES TO FINANCIAL STATEMENTS (continued)
In addition, after applying any expense limitations or fee waivers that reduce the fees paid to Dreyfus for this service, Dreyfus has contractually agreed in writing to waive any remaining fees for this service to the extent that they exceed both Dreyfus’ costs in providing these services and a reasonable allocation of the costs incurred by Dreyfus and its affiliates related to the support and oversight of these services.The fund also reimburses Dreyfus for the out-of-pocket expenses incurred in performing this service for the fund. Pursuant to the Administration Agreement, the fund was charged $38,110 during the period ended September 30, 2012.
(b) The fund has arrangements with the transfer agent and the custodian whereby the fund may receive earnings credits when positive cash balances are maintained, which are used to offset transfer agency and custody fees. For financial reporting purposes, the fund includes net earnings credits as an expense offset in the Statement of Operations.
The fund compensates Dreyfus Transfer, Inc. (“DTI”), a wholly-owned subsidiary of the Manager, under a transfer agency agreement for providing transfer agency services for the fund and, since May 29, 2012, cash management services related to fund subscriptions and redemptions. During the period ended September 30, 2012, the fund was charged $1,551 for transfer agency services and $18 for cash management services. Cash management fees were partially offset by earnings credits of $2. These fees are included in Shareholder servicing costs in the Statement of Operations.
The fund compensates The Bank of New York Mellon under a custody agreement for providing custodial services for the fund. During the period ended September 30, 2012, the fund was charged $21,828 pursuant to the custody agreement.
Prior to May 29, 2012, the fund compensated The Bank of NewYork Mellon under a cash management agreement for performing cash management services related to fund subscriptions and redemptions. During the period ended September 30, 2012, the fund was charged
26
$113 pursuant to the cash management agreement, which is included in Shareholder servicing costs in the Statement of Operations. These fees were partially offset by earnings credits of $4.
During the period ended September 30, 2012, the fund was charged $8,384 for services performed by the Chief Compliance Officer and his staff.
The components of “Due to The Dreyfus Corporation and affiliates” in the Statement of Assets and Liabilities consist of: investment advisory fees $27,441, custodian fees $13,334, Chief Compliance Officer fees $1,991 and transfer agency fees $5,461.
(c) Each Board member also serves as a Board member of other funds within the Dreyfus complex. Annual retainer fees and attendance fees are allocated to each fund based on net assets.
NOTE 4—Securities Transactions:
The aggregate amount of purchases and sales of investment securities, excluding short-term securities and financial futures, during the period ended September 30, 2012, amounted to $109,719,929 and $170,369,440, respectively.
Derivatives: A derivative is a financial instrument whose performance is derived from the performance of another asset. Each type of derivative instrument that was held by the fund during the period ended September 30, 2012 is discussed below.
Financial Futures: In the normal course of pursuing its investment objective, the fund is exposed to market risk, including equity price risk as a result of changes in value of underlying financial instruments.The fund invests in financial futures in order to manage its exposure to or protect against changes in the market.A financial futures contract represents a commitment for the future purchase or a sale of an asset at a specified date. Upon entering into such contracts, these investments
| The Fund | 27 |
NOTES TO FINANCIAL STATEMENTS (continued)
require initial margin deposits with a counterparty, which consist of cash or cash equivalents.The amount of these deposits is determined by the exchange or Board of Trade on which the contract is traded and is subject to change.Accordingly, variation margin payments are received or made to reflect daily unrealized gains or losses which are recorded in the Statement of Operations.When the contracts are closed, the fund recognizes a realized gain or loss which is reflected in the Statement of Operations.There is minimal counterparty credit risk to the fund with financial futures since they are exchange traded, and the exchange’s clearinghouse guarantees the financial futures against default At September 30, 2012, there were no financial futures outstanding.
At September 30, 2012, the cost of investments for federal income tax purposes was $34,080,335; accordingly, accumulated net unrealized appreciation on investments was $2,742,158, consisting of $4,764,280 gross unrealized appreciation and $2,022,122 gross unrealized depreciation.
NOTE 5—Subsequent Event:
On October 24-25, 2012, the Board approved the liquidation of the fund, effective on or about January 8, 2013. Effective November 15, 2012, the fund generally will be closed to any investments for new accounts.
28
| REPORT OF INDEPENDENT REGISTERED |
| PUBLIC ACCOUNTING FIRM |
To the Board of Trustees and Shareholders of Dreyfus/The Boston Company Small Cap Tax-Sensitive Equity Fund:
We have audited the accompanying statement of assets and liabilities of Dreyfus/The Boston Company Small Cap Tax-Sensitive Equity Fund (the “Fund”), a series of Dreyfus Investment Funds, including the statement of investments as of September 30, 2012, and the related statement of operations for the year then ended, the statements of changes in net assets for each of the years in the two-year period then ended and financial highlights for each of the years in the four-year period then ended.These financial statements and financial highlights are the responsibility of the Fund’s management. Our responsibility is to express an opinion on these financial statements and financial highlights based on our audits.The financial highlights for the year ended September 30, 2008 were audited by other independent registered public accountants whose report thereon, dated November 28, 2008, expressed an unqualified opinion on those financial highlights.
We conducted our audits in accordance with the standards of the Public Company Accounting Oversight Board (United States).Those standards require that we plan and perform the audit to obtain reasonable assurance about whether the financial statements and financial highlights are free of material misstatement.An audit also includes examining, on a test basis, evidence supporting the amounts and disclosures in the financial statements. Our procedures included confirmation of securities owned as of September 30, 2012 by correspondence with the custodian and brokers or by other appropriate auditing procedures where replies from brokers were not received.An audit also includes assessing the accounting principles used and significant estimates made by management, as well as evaluating the overall financial statement presentation.We believe that our audits provide a reasonable basis for our opinion.
In our opinion, the financial statements and financial highlights referred to above present fairly, in all material respects, the financial position of Dreyfus/The Boston Company Small CapTax-Sensitive Equity Fund as of September 30, 2012, and the results of its operations for the year then ended, the changes in its net assets for each of the years in the two-year period then ended, and the financial highlights for each of the years in the four-year period then ended, in conformity with U.S. generally accepted accounting principles.
![]()
New York, New York
November 28, 2012
| The Fund | 29 |
BOARD MEMBERS INFORMATION (Unaudited)
| Joseph S. DiMartino (68) |
| Chairman of the Board (2008) |
| Principal Occupation During Past 5Years: |
| • Corporate Director and Trustee |
| Other Public Company Board Memberships During Past 5Years: |
| • CBIZ (formerly, Century Business Services, Inc.), a provider of outsourcing functions for small |
| and medium size companies, Director (1997-present) |
| • Sunair Services Corporation, a provider of certain outdoor-related services to homes and |
| businesses, Director (2005-2009) |
| • The Newark Group, a provider of a national market of paper recovery facilities, paperboard |
| mills and paperboard converting plants, Director (2000-2010) |
| No. of Portfolios for which Board Member Serves: 157 |
| ——————— |
| Francine J. Bovich (61) |
| Board Member (2011) |
| Principal Occupation During Past 5Years: |
| • Trustee,The Bradley Trusts, private trust funds (2011-present) |
| • Managing Director, Morgan Stanley Investment Management (1993-2010) |
| No. of Portfolios for which Board Member Serves: 31 |
| ——————— |
| James M. Fitzgibbons (78) |
| Board Member (2008) |
| Principal Occupation During Past 5Years: |
| • Corporate Director and Trustee |
| Other Public Company Board Memberships During Past 5Years: |
| • Bill Barrett Corporation, an oil and natural gas exploration company, Director (2004-present) |
| No. of Portfolios for which Board Member Serves: 31 |
| ——————— |
| Kenneth A. Himmel (66) |
| Board Member (2008) |
| Principal Occupation During Past 5Years: |
| • President and CEO, Related Urban Development, a real estate development company (1996-present) |
| • President and CEO, Himmel & Company, a real estate development company (1980-present) |
| • CEO,American Food Management, a restaurant company (1983-present) |
| No. of Portfolios for which Board Member Serves: 31 |
30
| Stephen J. Lockwood (65) |
| Board Member (2008) |
| Principal Occupation During Past 5Years: |
| • Chairman of the Board, Stephen J. Lockwood and Company LLC, a real estate investment |
| company (2000-present) |
| No. of Portfolios for which Board Member Serves: 31 |
| ——————— |
| Roslyn M. Watson (62) |
| Board Member (2008) |
| Principal Occupation During Past 5Years: |
| • Principal,Watson Ventures, Inc., a real estate investment company (1993-present) |
| No. of Portfolios for which Board Member Serves: 41 |
| ——————— |
| Benaree Pratt Wiley (66) |
| Board Member (2008) |
| Principal Occupation During Past 5Years: |
| • Principal,TheWiley Group, a firm specializing in strategy and business development (2005-present) |
| Other Public Company Board Memberships During Past 5Years: |
| • CBIZ (formerly, Century Business Services, Inc.), a provider of outsourcing functions for small |
| and medium size companies, Director (2008-present) |
| No. of Portfolios for which Board Member Serves: 64 |
| ——————— |
Once elected all Board Members serve for an indefinite term, but achieve Emeritus status upon reaching age 80.The address of the Board Members and Officers is c/o The Dreyfus Corporation, 200 Park Avenue, NewYork, NewYork 10166.Additional information about the Board Members is available in the fund’s Statement of Additional Information which can be obtained from Dreyfus free of charge by calling this toll free number: 1-800-DREYFUS.
| The Fund | 31 |
OFFICERS OF THE FUND (Unaudited)
BRADLEY J. SKAPYAK, President since January 2010.
Chief Operating Officer and a director of the Manager since June 2009; from April 2003 to June 2009, Mr. Skapyak was the head of the Investment Accounting and Support Department of the Manager. He is an officer of 72 investment companies (comprised of 156 portfolios) managed by the Manager. He is 53 years old and has been an employee of the Manager since February 1988.
JANETTE E. FARRAGHER, Vice President and Secretary since December 2011.
Assistant General Counsel of BNY Mellon, and an officer of 73 investment companies (comprised of 183 portfolios) managed by the Manager. She is 49 years old and has been an employee of the Manager since February 1984.
KIESHA ASTWOOD, Vice President and Assistant Secretary since January 2010.
Counsel of BNY Mellon, and an officer of 73 investment companies (comprised of 183 portfolios) managed by the Manager. She is 39 years old and has been an employee of the Manager since July 1995.
JAMES BITETTO, Vice President and Assistant Secretary since December 2008.
Senior Counsel of BNY Mellon and Secretary of the Manager, and an officer of 73 investment companies (comprised of 183 portfolios) managed by the Manager. He is 46 years old and has been an employee of the Manager since December 1996.
JONI LACKS CHARATAN, Vice President and Assistant Secretary since December 2008.
Senior Counsel of BNY Mellon, and an officer of 73 investment companies (comprised of 183 portfolios) managed by the Manager. She is 56 years old and has been an employee of the Manager since October 1988.
JOSEPH M. CHIOFFI, Vice President and Assistant Secretary since December 2008.
Senior Counsel of BNY Mellon, and an officer of 73 investment companies (comprised of 183 portfolios) managed by the Manager. He is 50 years old and has been an employee of the Manager since June 2000.
JOHN B. HAMMALIAN, Vice President and Assistant Secretary since December 2008.
Senior Managing Counsel of BNY Mellon, and an officer of 73 investment companies (comprised of 183 portfolios) managed by the Manager. He is 49 years old and has been an employee of the Manager since February 1991.
ROBERT R. MULLERY, Vice President and Assistant Secretary since December 2008.
Managing Counsel of BNY Mellon, and an officer of 73 investment companies (comprised of 183 portfolios) managed by the Manager. He is 60 years old and has been an employee of the Manager since May 1986.
JEFF PRUSNOFSKY, Vice President and Assistant Secretary since December 2008.
Senior Managing Counsel of BNY Mellon, and an officer of 73 investment companies (comprised of 183 portfolios) managed by the Manager. He is 47 years old and has been an employee of the Manager since October 1990.
JAMES WINDELS, Treasurer since December 2008.
Director – Mutual Fund Accounting of the Manager, and an officer of 73 investment companies (comprised of 183 portfolios) managed by the Manager. He is 54 years old and has been an employee of the Manager since April 1985.
32
RICHARD CASSARO, Assistant Treasurer since December 2008.
Senior Accounting Manager – Money Market and Municipal Bond Funds of the Manager, and an officer of 73 investment companies (comprised of 183 portfolios) managed by the Manager. He is 53 years old and has been an employee of the Manager since September 1982.
GAVIN C. REILLY, Assistant Treasurer since December 2008.
Tax Manager of the Investment Accounting and Support Department of the Manager, and an officer of 73 investment companies (comprised of 183 portfolios) managed by the Manager. He is 44 years old and has been an employee of the Manager since April 1991.
ROBERT S. ROBOL, Assistant Treasurer since December 2008.
Senior Accounting Manager – Fixed Income Funds of the Manager, and an officer of 73 investment companies (comprised of 183 portfolios) managed by the Manager. He is 48 years old and has been an employee of the Manager since October 1988.
ROBERT SALVIOLO, Assistant Treasurer since December 2008.
Senior Accounting Manager – Equity Funds of the Manager, and an officer of 73 investment companies (comprised of 183 portfolios) managed by the Manager. He is 45 years old and has been an employee of the Manager since June 1989.
ROBERT SVAGNA, Assistant Treasurer since December 2008.
Senior Accounting Manager – Equity Funds of the Manager, and an officer of 73 investment companies (comprised of 183 portfolios) managed by the Manager. He is 45 years old and has been an employee of the Manager since November 1990.
JOSEPH W. CONNOLLY, Chief Compliance Officer since December 2008.
Chief Compliance Officer of the Manager and The Dreyfus Family of Funds (73 investment companies, comprised of 183 portfolios). He is 55 years old and has served in various capacities with the Manager since 1980, including manager of the firm’s Fund Accounting Department from 1997 through October 2001.
MATTHEW D. CONNOLLY, Anti-Money Laundering Compliance Officer since April 2012.
Anti-Money Laundering Compliance Officer of the Distributor since October 2011; from March 2010 to September 2011, Global Head, KYC Reviews and Director, UBS Investment Bank; until March 2010,AML Compliance Officer and Senior Vice President, Citi Global Wealth Management. He is an officer of 69 investment companies (comprised of 179 portfolios) managed by the Manager. He is 40 years old and has been an employee of the Distributor since October 2011.
| The Fund | 33 |
For More Information
Ticker Symbol: SDCEX
Telephone 1-800-DREYFUS
Mail The Dreyfus Family of Funds, 144 Glenn Curtiss Boulevard, Uniondale, NY 11556-0144 E-mail Send your request to info@dreyfus.com Internet Information can be viewed online or downloaded at: http://www.dreyfus.com
The fund files its complete schedule of portfolio holdings with the Securities and Exchange Commission (“SEC”) for the first and third quarters of each fiscal year on Form N-Q. The fund’s Forms N-Q are available on the SEC’s website at http://www.sec.gov and may be reviewed and copied at the SEC’s Public Reference Room in Washington, DC. Information on the operation of the Public Reference Room may be obtained by calling 1-800-SEC-0330.
A description of the policies and procedures that the fund uses to determine how to vote proxies relating to portfolio securities, and information regarding how the fund voted these proxies for the most recent 12-month period ended June 30 is available at http://www.dreyfus.com and on the SEC’s website at http://www.sec.gov. The description of the policies and procedures is also available without charge, upon request, by calling 1-800-DREYFUS.

| Dreyfus/The Boston |
| Company Small Cap |
| Value Fund |
ANNUAL REPORT September 30, 2012
Save time. Save paper. View your next shareholder report online as soon as it’s available. Log into www.dreyfus.com and sign up for Dreyfus eCommunications. It’s simple and only takes a few minutes.
The views expressed in this report reflect those of the portfolio manager only through the end of the period covered and do not necessarily represent the views of Dreyfus or any other person in the Dreyfus organization. Any such views are subject to change at any time based upon market or other conditions and Dreyfus disclaims any responsibility to update such views.These views may not be relied on as investment advice and, because investment decisions for a Dreyfus fund are based on numerous factors, may not be relied on as an indication of trading intent on behalf of any Dreyfus fund.
| Not FDIC-Insured • Not Bank-Guaranteed • May Lose Value |
Contents | |
THE FUND | |
| 2 | A Letter from the Chairman and CEO |
| 3 | Discussion of Fund Performance |
| 6 | Fund Performance |
| 7 | Understanding Your Fund’s Expenses |
| 7 | Comparing Your Fund’s Expenses With Those of Other Funds |
| 8 | Statement of Investments |
| 14 | Statement of Assets and Liabilities |
| 15 | Statement of Operations |
| 16 | Statement of Changes in Net Assets |
| 17 | Financial Highlights |
| 18 | Notes to Financial Statements |
| 27 | Report of Independent Registered Public Accounting Firm |
| 28 | Important Tax Information |
| 29 | Board Members Information |
| 31 | Officers of the Fund |
FOR MORE INFORMATION | |
Back Cover |
Dreyfus/The Boston
Company Small Cap
Value Fund
The Fund
A LETTER FROM THE CHAIRMAN AND CEO

Dear Shareholder:
This annual report for Dreyfus/The Boston Company Small CapValue Fund covers the 12-month period from October 1, 2011, through September 30, 2012. For information about how the fund performed during the reporting period, as well as general market perspectives, we provide a Discussion of Fund Performance on the pages that follow.
U.S. equities proved unusually volatile over the past year, as prices rose and fell according to investors’ changing expectations of global and domestic economic conditions. And while the pace of U.S. economic growth has been relatively consistent, it has progressed at about half the average rate achieved in prior recoveries. Overseas, Europe has remained under severe economic pressure due to a persistent debt crisis and austerity-oriented fiscal policies adopted by many governments. In Japan, a strengthening currency dampened export activity and economic growth. The emerging markets have posted a slower rate of growth, reducing demand for industrial commodities and other goods and services.
The sustained-but-subpar U.S. expansion appears likely to continue over the foreseeable future.Across the international markets though, on one hand the global economy has responded to a variety of stimulative measures, most notably aggressively accommodative monetary policies in most major markets. On the other hand, headwinds emanating from Europe and China may continue to weigh on economic growth and investor sentiment. Indeed, the ability of governments and economic policymakers to address these issues could go a long way toward shaping the 2013 market environment. As always, we urge you to speak regularly with your financial advisor to discuss how changing global economic conditions may affect your investments.
Thank you for your continued confidence and support.

Jonathan R. Baum
Chairman and Chief Executive Officer
The Dreyfus Corporation
October 15, 2012
2
DISCUSSION OF FUND PERFORMANCE
For the period of October 1, 2011, through September 30, 2012, as provided by Joseph M. Corrado, CFA, and Stephanie K. Brandaleone, CFA, Portfolio Managers
Fund and Market Performance Overview
For the 12-month period ended September 30, 2012, Dreyfus/The Boston Company Small CapValue Fund produced a total return of 36.95%.1 In comparison, the fund’s benchmark, the Russell 2000 Value Index (the “Index”), produced a total return of 32.63% for the same period.2
Improving economic sentiment drove small-cap stocks higher as market declines during the spring of 2012 were more than offset by gains at other times of the reporting period.The fund produced a higher return than its benchmark, largely due to the success of our security selection strategy in eight of the 10 market sectors represented in the benchmark.
The Fund’s Investment Approach
The fund seeks long-term growth of capital. To pursue its goal, the fund normally invests at least 80% of its net assets in equity securities of small-cap U.S. companies with market capitalizations, at the time of purchase, that are equal to or less than the total market capitalization of the largest company in the Index.We use fundamental research and qualitative analysis to select stocks and look for companies with strong competitive positions, high-quality management, and financial strength. We use a consistent three-step fundamental research process to evaluate the stocks, consisting of valuation, which is to identify small-cap companies that are considered to be attractively priced relative to their earnings potential; fundamentals, which is to verify the strength of the underlying business position; and catalyst, which is to identify a specific event that has the potential to cause the stocks to appreciate in value.
Markets Reacted to Shifting Macroeconomic Developments
The reporting period began in the immediate aftermath of a major stock market decline. One credit-rating agency’s downgrade of long-term U.S. government debt, an intensifying debt crisis in Europe and inflation-fighting programs in China had triggered a flight away from stocks and other risky assets. Fortunately, better U.S. economic data and new remedial measures from European and Chinese policymakers helped to stabilize equity markets in the fall.
| The Fund | 3 |
DISCUSSION OF FUND PERFORMANCE (continued)
By the beginning of 2012, U.S. stocks were rallying amid U.S. employment gains, a quantitative easing program in Europe and less restrictive monetary and fiscal policies in China. Investors grew more tolerant of risks, focusing more intently on company fundamentals and less on macroeconomic news. However, these positive influences were called into question during the spring, when the U.S. labor market’s rebound slowed, measures designed to relieve fiscal pressures in Europe encountered resistance and the Chinese economy remained sluggish. The summer saw the market rally resume amid more encouraging macroeconomic news, and the Russell 2000 Value Index ended the reporting period with substantial gains. Value-oriented small-cap stocks produced slightly higher returns than their growth-oriented counterparts.
Security Selections Bolstered Relative Performance
The fund’s research-intensive stock selection process proved quite effective over the reporting period. Relative performance was especially strong in the information technology sector, where CoreLogic, a provider of consumer, financial, and property information and analytics, reported better-than-expected quarterly revenues and earnings; business processing outsourcer MAXIMUS advanced in anticipation of rising demand stemming from U.S. health care reform legislation; and Internet Protocol test systems provider Ixia benefited from accelerating trends pertaining to wireless connectivity.
In the industrials sector, winners during the reporting period included equipment rental company RSC Holdings and electrical components maker Thomas & Betts, which announced agreements to be acquired by former rivals at premiums to their stock prices at the time. In addition, aircraft parts producer Spirit AeroSystems Holdings participated in increased equipment upgrade activity among airlines. The materials sector also contained a number of strong performers. Building products company Louisiana-Pacific benefited from improving U.S. residential and commercial construction trends, while kraft paper producer KapStone Paper and Packaging saw profit margins rise along with containerboard prices.
Disappointments during the reporting period were concentrated primarily in the consumer staples and energy sectors.Among consumer staples companies, Sanderson Farms was impacted by concerns regarding potentially higher input costs in the aftermath of a severe U.S. drought over the summer of 2012, and Flowers Foods
4
encountered intensifying competitive pressures. In the energy sector, oil services provider Tetra Technologies missed quarterly revenue targets due to production disruptions caused by weather-related issues, and production equipment maker Tesco Corp. saw its order backlog decline.
Maintaining a Constructive Investment Posture
Although macroeconomic uncertainties remain over the near term, we are optimistic about the longer term prospects for small-cap value stocks. Lower interest rates and reduced borrowing costs for businesses, consumers and homebuyers are expected to further stimulate economic growth; however this will likely occur at a more modest pace relative to the first two rounds of easing. Despite the Fed’s accommodative actions, we continue to face many of the same headwinds that have persisted throughout the year: weak employment trends, uncertainty surrounding the November elections, and future fiscal policy. Businesses appear to remain reluctant to spend in the face of these issues.The lack of confidence has contained additional hiring, capital expenditures, etc. while cash continues to build on company balance sheets.Although macro headline risks may continue to cause near-term market volatility, we continue to utilize a long-term view and remain focused on the strategy’s disciplined research-driven investment approach.
October 15, 2012
Please note, the position in any security highlighted with italicized typeface was sold during the reporting period. Equity funds are subject generally to market, market sector, market liquidity, issuer and investment style risks, among other factors, to varying degrees, all of which are more fully described in the fund’s prospectus.
Small companies carry additional risks because their earnings and revenues tend to be less predictable, and their share prices more volatile than those of larger, more established companies.The shares of smaller companies tend to trade less frequently than those of larger, more established companies, which can adversely affect the pricing of these securities and the fund’s ability to sell these securities.
| 1 Total return includes reinvestment of dividends and any capital gains paid. Past performance is no guarantee of future |
| results. Share price and investment return fluctuate such that upon redemption, fund shares may be worth more or less |
| than their original cost. |
| 2 SOURCE: LIPPER INC. — Reflects the reinvestment of dividends and, where applicable, capital gain |
| distributions.The Russell 2000 Value Index is an unmanaged index, which measures the performance of those |
| Russell 2000 companies with lower price-to-book ratios and lower forecasted growth values. |
| The Fund | 5 |
FUND PERFORMANCE
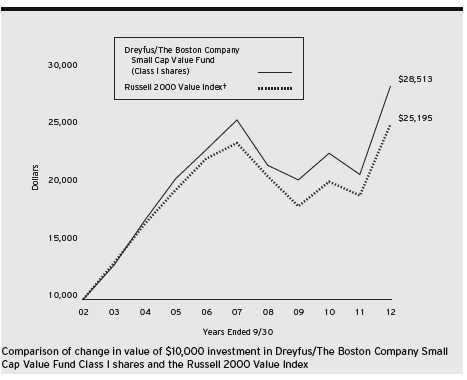
| Average Annual Total Returns as of 9/30/12 | ||||||
| 1 Year | 5 Years | 10 Years | ||||
| Class I shares | 36.95 | % | 2.20 | % | 11.05 | % |
| Russell 2000 Value Index | 32.63 | % | 1.35 | % | 9.68 | % |
† Source: Lipper Inc.
Past performance is not predictive of future performance.The fund’s performance shown in the graph and table does not reflect the deduction of taxes that a shareholder would pay on fund distributions or the redemption of fund shares.
The above graph compares a $10,000 investment made in Class I shares of Dreyfus/The Boston Company Small Cap Value Fund on 9/30/02 to a $10,000 investment made in the Russell 2000 Value Index (the “Index”) on that date. All dividends and capital gain distributions are reinvested.
The fund’s performance shown in the line graph above takes into account all applicable fees and expenses.The Index is an unmanaged index, which measures the performance of those Russell 2000 companies (the 2,000 smallest companies in the Russell 3000 Index) with lower price-to-book ratios and lower forecasted growth values. Unlike a mutual fund, the Index is not subject to charges, fees and other expenses. Investors cannot invest directly in any index.These factors can contribute to the Index potentially outperforming the fund. Further information relating to fund performance, including expense reimbursements, if applicable, is contained in the Financial Highlights section of the prospectus and elsewhere in this report.
6
UNDERSTANDING YOUR FUND’S EXPENSES (Unaudited)
As a mutual fund investor, you pay ongoing expenses, such as management fees and other expenses. Using the information below, you can estimate how these expenses affect your investment and compare them with the expenses of other funds.You also may pay one-time transaction expenses, including sales charges (loads) and redemption fees, which are not shown in this section and would have resulted in higher total expenses. For more information, see your fund’s prospectus or talk to your financial adviser.
Review your fund’s expenses
The table below shows the expenses you would have paid on a $1,000 investment in Dreyfus/The Boston Company Small CapValue Fund from April 1, 2012 to September 30, 2012. It also shows how much a $1,000 investment would be worth at the close of the period, assuming actual returns and expenses.
Expenses and Value of a $1,000 Investment
assuming actual returns for the six months ended September 30, 2012
| Expenses paid per $1,000† | $ | 4.94 |
| Ending value (after expenses) | $ | 1,015.40 |
COMPARING YOUR FUND’S EXPENSES
WITH THOSE OF OTHER FUNDS (Unaudited)
Using the SEC’s method to compare expenses
The Securities and Exchange Commission (SEC) has established guidelines to help investors assess fund expenses. Per these guidelines, the table below shows your fund’s expenses based on a $1,000 investment, assuming a hypothetical 5% annualized return. You can use this information to compare the ongoing expenses (but not transaction expenses or total cost) of investing in the fund with those of other funds.All mutual fund shareholder reports will provide this information to help you make this comparison. Please note that you cannot use this information to estimate your actual ending account balance and expenses paid during the period.
Expenses and Value of a $1,000 Investment
assuming a hypothetical 5% annualized return for the six months ended September 30, 2012
| Expenses paid per $1,000† | $ | 4.95 |
| Ending value (after expenses) | $ | 1,020.10 |
| † Expenses are equal to the fund’s annualized expense ratio of .98% for Class I, multiplied by the average account |
| value over the period, multiplied by 183/366 (to reflect the one-half year period). |
| The Fund | 7 |
| STATEMENT OF INVESTMENTS |
| September 30, 2012 |
| Common Stocks—99.5% | Shares | Value ($) | ||
| Automobiles & Components—2.5% | ||||
| Dana Holding | 360,590 | 4,435,257 | ||
| Drew Industries | 58,170 | a | 1,757,316 | |
| Thor Industries | 145,510 | 5,284,923 | ||
| 11,477,496 | ||||
| Banks—15.1% | ||||
| Associated Banc-Corp | 175,400 | 2,310,018 | ||
| BancorpSouth | 179,430 | b | 2,644,798 | |
| Brookline Bancorp | 339,080 | 2,990,686 | ||
| Cardinal Financial | 148,680 | 2,126,124 | ||
| City National | 85,727 | 4,415,798 | ||
| CVB Financial | 407,090 | b | 4,860,655 | |
| First Horizon National | 669,300 | 6,445,359 | ||
| First Midwest Bancorp | 416,430 | 5,226,196 | ||
| Hancock Holding | 119,137 | 3,687,290 | ||
| Lakeland Financial | 56,880 | 1,569,888 | ||
| MB Financial | 211,640 | 4,179,890 | ||
| National Penn Bancshares | 362,560 | 3,302,922 | ||
| PacWest Bancorp | 129,350 | 3,022,910 | ||
| Provident Financial Services | 194,140 | 3,065,471 | ||
| SCBT Financial | 23,370 | 941,344 | ||
| Susquehanna Bancshares | 319,510 | 3,342,075 | ||
| Washington Trust Bancorp | 36,930 | 970,151 | ||
| Webster Financial | 199,670 | 4,732,179 | ||
| Western Alliance Bancorp | 377,880 | a | 3,854,376 | |
| Wintrust Financial | 142,030 | 5,336,067 | ||
| 69,024,197 | ||||
| Capital Goods—5.5% | ||||
| Aerovironment | 141,770 | a | 3,327,342 | |
| Apogee Enterprises | 129,940 | 2,549,423 | ||
| Armstrong World Industries | 87,600 | 4,062,012 | ||
| Astec Industries | 93,810 | a | 2,965,334 | |
| Comfort Systems USA | 158,570 | 1,733,170 | ||
| FreightCar America | 67,240 | 1,196,200 | ||
| Granite Construction | 175,714 | 5,046,506 | ||
| II-VI | 154,240 | a | 2,933,645 | |
| John Bean Technologies | 69,770 | 1,139,344 | ||
| 24,952,976 | ||||
8
| Common Stocks (continued) | Shares | Value ($) | ||
| Commercial & Professional Services—5.8% | ||||
| Brink’s | 141,350 | 3,631,281 | ||
| Huron Consulting Group | 77,270 | a | 2,690,541 | |
| ICF International | 90,460 | a | 1,818,246 | |
| Interface | 279,470 | 3,691,799 | ||
| Korn/Ferry International | 258,770 | a | 3,966,944 | |
| McGrath Rentcorp | 98,550 | 2,571,170 | ||
| Steelcase, Cl. A | 427,550 | 4,211,368 | ||
| Tetra Tech | 143,630 | a | 3,771,724 | |
| 26,353,073 | ||||
| Consumer Durables & Apparel—6.5% | ||||
| Brunswick | 155,680 | 3,523,038 | ||
| Cavco Industries | 31,912 | a,b | 1,464,442 | |
| Ethan Allen Interiors | 129,670 | b | 2,842,366 | |
| KB Home | 478,130 | b | 6,861,165 | |
| M/I Homes | 131,600 | a | 2,545,144 | |
| Meritage Homes | 107,970 | a | 4,106,099 | |
| Skechers USA, Cl. A | 164,000 | a | 3,345,600 | |
| Tempur-Pedic International | 37,500 | a | 1,120,875 | |
| Warnaco Group | 71,440 | a | 3,707,736 | |
| 29,516,465 | ||||
| Consumer Services—2.2% | ||||
| Brinker International | 108,420 | 3,827,226 | ||
| Grand Canyon Education | 103,260 | a | 2,429,708 | |
| WMS Industries | 238,590 | a | 3,908,104 | |
| 10,165,038 | ||||
| Diversified Financials—2.9% | ||||
| Duff & Phelps, Cl. A | 110,310 | 1,501,319 | ||
| E*TRADE Financial | 648,990 | a | 5,717,602 | |
| KBW | 163,160 | b | 2,687,245 | |
| Piper Jaffray | 136,280 | a | 3,468,326 | |
| 13,374,492 | ||||
| Energy—6.3% | ||||
| Approach Resources | 122,550 | a,b | 3,692,431 | |
| Cloud Peak Energy | 194,180 | a | 3,514,658 | |
| Gulfport Energy | 155,280 | a | 4,854,053 | |
| Matrix Service | 96,750 | a | 1,022,647 | |
| McDermott International | 352,900 | a | 4,312,438 | |
| The Fund | 9 |
STATEMENT OF INVESTMENTS (continued)
| Common Stocks (continued) | Shares | Value ($) | |
| Energy (continued) | |||
| OYO Geospace | 30,120 | a | 3,686,989 |
| Tesco | 297,710 | a | 3,179,543 |
| Unit | 107,930 | a | 4,479,095 |
| 28,741,854 | |||
| Exchange-Traded Funds—.5% | |||
| iShares Russell 2000 Value Index Fund | 29,520 | 2,182,709 | |
| Food & Staples Retailing—2.2% | |||
| Casey’s General Stores | 67,193 | 3,839,408 | |
| Harris Teeter Supermarkets | 125,950 | 4,891,898 | |
| Spartan Stores | 98,870 | 1,513,700 | |
| 10,245,006 | |||
| Food, Beverage & Tobacco—1.9% | |||
| Dole Food | 99,490 | a,b | 1,395,845 |
| Flowers Foods | 140,090 | 2,827,016 | |
| Lancaster Colony | 27,690 | b | 2,028,292 |
| Sanderson Farms | 53,810 | b | 2,387,550 |
| 8,638,703 | |||
| Health Care Equipment & Services—5.9% | |||
| Haemonetics | 55,550 | a | 4,455,110 |
| Hanger | 161,410 | a | 4,605,027 |
| HealthSouth | 226,450 | a | 5,448,387 |
| ICU Medical | 52,960 | a | 3,203,021 |
| LifePoint Hospitals | 123,810 | a | 5,296,592 |
| Natus Medical | 58,760 | a | 767,993 |
| Omnicell | 225,600 | a | 3,135,840 |
| 26,911,970 | |||
| Insurance—3.3% | |||
| First American Financial | 268,660 | 5,821,862 | |
| ProAssurance | 34,600 | 3,129,224 | |
| Protective Life | 159,610 | 4,183,378 | |
| RLI | 27,950 | 1,863,147 | |
| 14,997,611 | |||
| Materials—7.1% | |||
| AMCOL International | 108,300 | b | 3,669,204 |
| Buckeye Technologies | 82,660 | 2,650,080 |
10
| Common Stocks (continued) | Shares | Value ($) | ||
| Materials (continued) | ||||
| Carpenter Technology | 107,040 | 5,600,333 | ||
| Coeur d’Alene Mines | 163,860 | a | 4,724,084 | |
| Cytec Industries | 95,330 | 6,246,022 | ||
| KapStone Paper and Packaging | 134,050 | a | 3,001,379 | |
| Louisiana-Pacific | 324,800 | a | 4,060,000 | |
| Packaging Corp. of America | 74,230 | 2,694,549 | ||
| 32,645,651 | ||||
| Media—2.1% | ||||
| DreamWorks Animation SKG, Cl. A | 176,760 | a,b | 3,399,095 | |
| Meredith | 103,630 | b | 3,627,050 | |
| Sinclair Broadcast Group, Cl. A | 210,620 | 2,361,050 | ||
| 9,387,195 | ||||
| Pharmaceuticals, | ||||
| Biotech & Life Sciences—.7% | ||||
| Salix Pharmaceuticals | 77,080 | a | 3,263,567 | |
| Real Estate—5.2% | ||||
| DCT Industrial Trust | 752,120 | c | 4,866,216 | |
| First Potomac Realty Trust | 244,690 | c | 3,151,607 | |
| Getty Realty | 103,140 | b,c | 1,851,363 | |
| LaSalle Hotel Properties | 157,140 | c | 4,194,067 | |
| National Health Investors | 87,960 | c | 4,524,662 | |
| Pebblebrook Hotel Trust | 164,560 | c | 3,849,058 | |
| Urstadt Biddle Properties, Cl. A | 66,000 | c | 1,335,180 | |
| 23,772,153 | ||||
| Retailing—5.6% | ||||
| Aeropostale | 219,560 | a | 2,970,647 | |
| Big 5 Sporting Goods | 75,620 | b | 752,419 | |
| Children’s Place Retail Stores | 68,840 | a | 4,130,400 | |
| Express | 206,370 | a | 3,058,403 | |
| Finish Line, Cl. A | 181,000 | 4,115,940 | ||
| GameStop, Cl. A | 126,290 | b | 2,652,090 | |
| OfficeMax | 184,440 | 1,440,476 | ||
| PEP Boys-Manny Moe & Jack | 275,280 | b | 2,802,350 | |
| Saks | 378,460 | a,b | 3,901,923 | |
| 25,824,648 | ||||
| The Fund | 11 |
STATEMENT OF INVESTMENTS (continued)
| Common Stocks (continued) | Shares | Value ($) | ||
| Semiconductors & Semiconductor | ||||
| Equipment—3.0% | ||||
| ATMI | 148,580 | a | 2,759,131 | |
| Kulicke & Soffa Industries | 223,470 | a | 2,324,088 | |
| MKS Instruments | 99,390 | 2,533,451 | ||
| Semtech | 127,940 | a | 3,217,691 | |
| Teradyne | 210,180 | a | 2,988,760 | |
| 13,823,121 | ||||
| Software & Services—4.6% | ||||
| CoreLogic | 245,780 | a | 6,520,543 | |
| MAXIMUS | 69,750 | 4,165,470 | ||
| Monotype Imaging Holdings | 238,990 | 3,725,854 | ||
| NetScout Systems | 61,550 | a | 1,570,141 | |
| Parametric Technology | 72,050 | a | 1,570,690 | |
| Take-Two Interactive Software | 349,280 | a | 3,642,990 | |
| 21,195,688 | ||||
| Technology Hardware & Equipment—5.4% | ||||
| Cognex | 73,440 | 2,539,555 | ||
| Extreme Networks | 577,440 | a | 1,928,650 | |
| FARO Technologies | 50,850 | a | 2,101,122 | |
| FEI | 48,200 | 2,578,700 | ||
| IPG Photonics | 22,080 | a,b | 1,265,184 | |
| Ixia | 269,580 | a | 4,332,151 | |
| NETGEAR | 94,940 | a | 3,621,012 | |
| Synaptics | 79,990 | a,b | 1,921,360 | |
| Vishay Intertechnology | 442,530 | a | 4,350,070 | |
| 24,637,804 | ||||
| Transportation—.9% | ||||
| Atlas Air Worldwide Holdings | 75,750 | a | 3,910,972 | |
| Utilities—4.3% | ||||
| El Paso Electric | 95,460 | 3,269,505 | ||
| Hawaiian Electric Industries | 162,340 | 4,271,165 | ||
| NorthWestern | 113,210 | 4,101,598 | ||
| Portland General Electric | 156,860 | 4,241,494 | ||
| WGL Holdings | 94,580 | 3,806,845 | ||
| 19,690,607 | ||||
| Total Common Stocks | ||||
| (cost $411,274,677) | 454,732,996 | |||
12
| Other Investment—.7% | Shares | Value ($) | ||
| Registered Investment Company; | ||||
| Dreyfus Institutional Preferred | ||||
| Plus Money Market Fund | ||||
| (cost $3,254,987) | 3,254,987 | d | 3,254,987 | |
| Investment of Cash Collateral | ||||
| for Securities Loaned—7.7% | ||||
| Registered Investment Company; | ||||
| Dreyfus Institutional Cash Advantage Fund | ||||
| (cost $35,302,764) | 35,302,764 | d | 35,302,764 | |
| Total Investments (cost $449,832,428) | 107.9 | % | 493,290,747 | |
| Liabilities, Less Cash and Receivables | (7.9 | %) | (36,110,438 | ) |
| Net Assets | 100.0 | % | 457,180,309 | |
| a Non-income producing security. |
| b Security, or portion thereof, on loan.At September 30, 2012, the value of the fund’s securities on loan was |
| $34,122,297 and the value of the collateral held by the fund was $35,302,764. |
| c Investment in real estate investment trust. |
| d Investment in affiliated money market mutual fund. |
| Portfolio Summary (Unaudited)† | |||
| Value (%) | Value (%) | ||
| Banks | 15.1 | Semiconductors & | |
| Money Market Investments | 8.4 | Semiconductor Equipment | 3.0 |
| Materials | 7.1 | Diversified Financials | 2.9 |
| Consumer Durables & Apparel | 6.5 | Automobiles & Components | 2.5 |
| Energy | 6.3 | Consumer Services | 2.2 |
| Health Care Equipment & Services | 5.9 | Food & Staples Retailing | 2.2 |
| Commercial & Professional Services | 5.8 | Media | 2.1 |
| Retailing | 5.6 | Food, Beverage & Tobacco | 1.9 |
| Capital Goods | 5.5 | Transportation | .9 |
| Technology Hardware & Equipment | 5.4 | Pharmaceuticals, | |
| Real Estate | 5.2 | Biotech & Life Sciences | .7 |
| Software & Services | 4.6 | Exchange-Traded Funds | .5 |
| Utilities | 4.3 | ||
| Insurance | 3.3 | 107.9 | |
| † Based on net assets. | |||
| See notes to financial statements. | |||
| The Fund | 13 |
| STATEMENT OF ASSETS AND LIABILITIES |
| September 30, 2012 |
| Cost | Value | |
| Assets ($): | ||
| Investments in securities—See Statement of Investments (including | ||
| securities on loan, valued at $34,122,297)—Note 1(b): | ||
| Unaffiliated issuers | 411,274,677 | 454,732,996 |
| Affiliated issuers | 38,557,751 | 38,557,751 |
| Cash | 363,343 | |
| Receivable for investment securities sold | 5,115,814 | |
| Dividends and securities lending income receivable | 429,929 | |
| Receivable for shares of Beneficial Interest subscribed | 1,194 | |
| Prepaid expenses | 12,040 | |
| 499,213,067 | ||
| Liabilities ($): | ||
| Due to The Dreyfus Corporation and affiliates—Note 3(b) | 330,459 | |
| Due to Administrator—Note 3(a) | 16,688 | |
| Liability for securities on loan—Note 1(b) | 35,302,764 | |
| Payable for investment securities purchased | 5,352,059 | |
| Payable for shares of Beneficial Interest redeemed | 871,648 | |
| Accrued expenses | 159,140 | |
| 42,032,758 | ||
| Net Assets ($) | 457,180,309 | |
| Composition of Net Assets ($): | ||
| Paid-in capital | 409,687,220 | |
| Accumulated undistributed investment income—net | 1,765,884 | |
| Accumulated net realized gain (loss) on investments | 2,268,886 | |
| Accumulated net unrealized appreciation | ||
| (depreciation) on investments | 43,458,319 | |
| Net Assets ($) | 457,180,309 | |
| Class I Shares Outstanding | ||
| (unlimited number of $.001 par value shares of Beneficial Interest authorized) | 17,822,913 | |
| Net Asset Value, offering and redemption price per share ($) | 25.65 | |
| See notes to financial statements. | ||
14
| STATEMENT OF OPERATIONS | ||
| Year Ended September 30, 2012 | ||
| Investment Income ($): | ||
| Income: | ||
| Cash dividends: | ||
| Unaffiliated issuers | 6,644,453 | |
| Affiliated issuers | 5,527 | |
| Income from securities lending—Note 1(b) | 305,680 | |
| Total Income | 6,955,660 | |
| Expenses: | ||
| Investment advisory fee—Note 3(a) | 3,557,869 | |
| Shareholder servicing costs—Note 3(b) | 410,061 | |
| Administation fees—Note 3(a) | 124,502 | |
| Professional fees | 87,153 | |
| Trustees’ fees and expenses—Note 3(c) | 42,206 | |
| Custodian fees—Note 3(b) | 41,831 | |
| Prospectus and shareholders’ reports | 26,988 | |
| Registration fees | 22,132 | |
| Loan commitment fees—Note 2 | 3,127 | |
| Interest expense—Note 2 | 1,806 | |
| Miscellaneous | 24,964 | |
| Total Expenses | 4,342,639 | |
| Less—reduction in fees due to earnings credits—Note 3(b) | (97 | ) |
| Net Expenses | 4,342,542 | |
| Investment Income—Net | 2,613,118 | |
| Realized and Unrealized Gain (Loss) on Investments—Note 4 ($): | ||
| Net realized gain (loss) on investments | 50,162,892 | |
| Net unrealized appreciation (depreciation) on investments | 79,769,872 | |
| Net Realized and Unrealized Gain (Loss) on Investments | 129,932,764 | |
| Net Increase in Net Assets Resulting from Operations | 132,545,882 | |
| See notes to financial statements. | ||
| The Fund | 15 |
STATEMENT OF CHANGES IN NET ASSETS
| Year Ended September 30, | ||||
| 2012 | 2011 | |||
| Operations ($): | ||||
| Investment income—net | 2,613,118 | 2,753,886 | ||
| Net realized gain (loss) on investments | 50,162,892 | 36,131,352 | ||
| Net unrealized appreciation | ||||
| (depreciation) on investments | 79,769,872 | (62,052,604 | ) | |
| Net Increase (Decrease) in Net Assets | ||||
| Resulting from Operations | 132,545,882 | (23,167,366 | ) | |
| Dividends to Shareholders from ($): | ||||
| Investment income—net | (1,739,010 | ) | (2,299,813 | ) |
| Beneficial Interest Transactions ($): | ||||
| Net proceeds from shares sold | 86,806,574 | 65,411,759 | ||
| Dividends reinvested | 1,557,770 | 1,902,141 | ||
| Cost of shares redeemed | (134,166,729 | ) | (162,063,464 | )a |
| Increase (Decrease) in Net Assets from | ||||
| Beneficial Interest Transactions | (45,802,385 | ) | (94,749,564 | ) |
| Total Increase (Decrease) in Net Assets | 85,004,487 | (120,216,743 | ) | |
| Net Assets ($): | ||||
| Beginning of Period | 372,175,822 | 492,392,565 | ||
| End of Period | 457,180,309 | 372,175,822 | ||
| Undistributed investment income—net | 1,765,884 | 1,638,623 | ||
| Capital Share Transactions (Shares): | ||||
| Shares sold | 3,618,290 | 2,957,882 | ||
| Shares issued for dividends reinvested | 72,964 | 83,795 | ||
| Shares redeemed | (5,649,733 | ) | (7,194,347 | ) |
| Net Increase (Decrease) in Shares Outstanding | (1,958,479 | ) | (4,152,670 | ) |
| a Includes redemption-in-kind amounting to $25,413,113. | ||||
| See notes to financial statements. | ||||
16
FINANCIAL HIGHLIGHTS
The following table describes the performance for the fiscal periods indicated. Total return shows how much your investment in the fund would have increased (or decreased) during each period, assuming you had reinvested all dividends and distributions.These figures have been derived from the fund’s financial statements.
| Year Ended September 30, | ||||||||||
| Class I Shares | 2012 | 2011 | 2010 | 2009 | a | 2008 | ||||
| Per Share Data ($): | ||||||||||
| Net asset value, beginning of period | 18.81 | 20.57 | 18.54 | 19.85 | 25.26 | |||||
| Investment Operations: | ||||||||||
| Investment income—netb | .14 | .13 | .10 | .11 | .18 | |||||
| Net realized and unrealized | ||||||||||
| gain (loss) on investments | 6.79 | (1.79 | ) | 1.99 | (1.31 | ) | (3.95 | ) | ||
| Total from Investment Operations | 6.93 | (1.66 | ) | 2.09 | (1.20 | ) | (3.77 | ) | ||
| Distributions: | ||||||||||
| Dividends from investment income—net | (.09 | ) | (.10 | ) | (.06 | ) | (.11 | ) | (.19 | ) |
| Dividends from net realized | ||||||||||
| gain on investments | — | — | — | — | (1.45 | ) | ||||
| Total Distributions | (.09 | ) | (.10 | ) | (.06 | ) | (.11 | ) | (1.64 | ) |
| Net asset value, end of period | 25.65 | 18.81 | 20.57 | 18.54 | 19.85 | |||||
| Total Return (%) | 36.95 | (8.14 | ) | 11.27 | (5.83 | ) | (15.38 | ) | ||
| Ratios/Supplemental Data (%): | ||||||||||
| Ratio of total expenses | ||||||||||
| to average net assets | .98 | .96 | .93 | .97 | .93 | |||||
| Ratio of net expenses | ||||||||||
| to average net assets | .98 | .96 | .93 | .97 | .93 | |||||
| Ratio of net investment income | ||||||||||
| to average net assets | .59 | .57 | .52 | .76 | .85 | |||||
| Portfolio Turnover Rate | 88.54 | 66.51 | 79.47 | 82.04 | 73 | |||||
| Net Assets, end of period ($ x 1,000) | 457,180 | 372,176 | 492,393 | 458,499 | 504,373 | |||||
| a Effective September 1, 2009, the fund’s shares were redesignated as Class I shares. |
| b Based on average shares outstanding at each month end. |
See notes to financial statements.
| The Fund | 17 |
NOTES TO FINANCIAL STATEMENTS
NOTE 1—Significant Accounting Policies:
Dreyfus/The Boston Company Small Cap Value Fund (the “fund”) is a separate diversified series of Dreyfus Investment Funds (the “Trust”), which is registered under the Investment Company Act of 1940, as amended (the “Act”), as an open-end management investment company and operates as a series company currently offering eleven series, including the fund. The fund’s investment objective is to seek long-term growth of capital.The Dreyfus Corporation (the “Manager” or “Dreyfus”), a wholly-owned subsidiary of The Bank of New York Mellon Corporation (“BNY Mellon”), serves as the fund’s investment adviser. MBSC Securities Corporation (the “Distributor”), a wholly-owned subsidiary of the Manager, is the distributor of the fund’s shares.
Class I shares are sold primarily to bank trust departments and other financial service providers (including The Bank of New York Mellon, a subsidiary of BNY Mellon and an affiliate of Dreyfus, and its affiliates), acting on behalf of customers having a qualified trust or an investment account or relationship at such institution, and bear no Distribution or Shareholder Service Plan fees. Class I shares are offered without a front-end sales charge or a contingent deferred sales charge.
The Trust accounts separately for the assets, liabilities and operations of each series. Expenses directly attributable to each series are charged to that series’ operations; expenses which are applicable to all series are allocated among them on a pro rata basis.
The Financial Accounting Standards Board (“FASB”) Accounting Standards Codification is the exclusive reference of authoritative U.S. generally accepted accounting principles (“GAAP”) recognized by the FASB to be applied by nongovernmental entities. Rules and interpretive releases of the Securities and Exchange Commission (“SEC”) under authority of federal laws are also sources of authoritative GAAP for SEC registrants. The fund’s financial statements are prepared in accordance with GAAP, which may require the use of management estimates and
18
assumptions.Actual results could differ from those estimates.
(a) Portfolio valuation: The fair value of a financial instrument is the amount that would be received to sell an asset or paid to transfer a liability in an orderly transaction between market participants at the measurement date (i.e., the exit price). GAAP establishes a fair value hierarchy that prioritizes the inputs of valuation techniques used to measure fair value.This hierarchy gives the highest priority to unadjusted quoted prices in active markets for identical assets or liabilities (Level 1 measurements) and the lowest priority to unobservable inputs (Level 3 measurements).
Additionally, GAAP provides guidance on determining whether the volume and activity in a market has decreased significantly and whether such a decrease in activity results in transactions that are not orderly. GAAP requires enhanced disclosures around valuation inputs and techniques used during annual and interim periods.
Various inputs are used in determining the value of the fund’s investments relating to fair value measurements.These inputs are summarized in the three broad levels listed below:
Level 1—unadjusted quoted prices in active markets for identical investments.
Level 2—other significant observable inputs (including quoted prices for similar investments, interest rates, prepayment speeds, credit risk, etc.).
Level 3—significant unobservable inputs (including the fund’s own assumptions in determining the fair value of investments).
The inputs or methodology used for valuing securities are not necessarily an indication of the risk associated with investing in those securities.
Changes in valuation techniques may result in transfers in or out of an assigned level within the disclosure hierarchy. Valuation techniques used to value the fund’s investments are as follows:
| The Fund | 19 |
NOTES TO FINANCIAL STATEMENTS (continued)
Investments in securities are valued at the last sales price on the securities exchange or national securities market on which such securities are primarily traded. Securities listed on the National Market System for which market quotations are available are valued at the official closing price or, if there is no official closing price that day, at the last sales price. Securities not listed on an exchange or the national securities market, or securities for which there were no transactions, are valued at the average of the most recent bid and asked prices, except for open short positions, where the asked price is used for valuation purposes. Bid price is used when no asked price is available. Registered investment companies that are not traded on an exchange are valued at their net asset value. All of the preceding securities are categorized within Level 1 of the fair value hierarchy.
Fair valuing of securities may be determined with the assistance of a pricing service using calculations based on indices of domestic securities and other appropriate indicators, such as prices of relevant American Depository Receipts and financial futures. Utilizing these techniques may result in transfers between Level 1 and Level 2 of the fair value hierarchy.
When market quotations or official closing prices are not readily available, or are determined not to reflect accurately fair value, such as when the value of a security has been significantly affected by events after the close of the exchange or market on which the security is principally traded (for example, a foreign exchange or market), but before the fund calculates its net asset value, the fund may value these investments at fair value as determined in accordance with the procedures approved by the Trust’s Board of Trustees (the “Board”). Certain factors may be considered when fair valuing investments such as: fundamental analytical data, the nature and duration of restrictions on disposition, an evaluation of the forces that influence the market in which the securities are purchased and sold, and public trading in similar securities of the issuer
20
or comparable issuers.These securities are either categorized as Level 2 or 3 depending on the relevant inputs used.
For restricted securities where observable inputs are limited, assumptions about market activity and risk are used and are categorized within Level 3 of the fair value hierarchy.
The following is a summary of the inputs used as of September 30, 2012 in valuing the fund’s investments:
| Level 2—Other | Level 3— | |||
| Level 1— | Significant | Significant | ||
| Unadjusted | Observable | Unobservable | ||
| Quoted Prices | Inputs | Inputs | Total | |
| Assets ($) | ||||
| Investments in Securities: | ||||
| Equity Securities— | ||||
| Domestic | ||||
| Common Stocks† | 452,550,287 | — | — | 452,550,287 |
| Exchange- | ||||
| Traded Funds | 2,182,709 | — | — | 2,182,709 |
| Mutual Funds | 38,557,751 | — | — | 38,557,751 |
| † See Statement of Investments for additional detailed categorizations. | ||||
At September 30, 2012, there were no transfers between Level 1 and Level 2 of the fair value hierarchy.
(b) Securities transactions and investment income: Securities transactions are recorded on a trade date basis. Realized gains and losses from securities transactions are recorded on the identified cost basis. Dividend income is recognized on the ex-dividend date and interest income, including, where applicable, accretion of discount and amortization of premium on investments, is recognized on the accrual basis.
Pursuant to a securities lending agreement with The Bank of New York Mellon, the fund may lend securities to qualified institutions. It is the fund’s policy that, at origination, all loans are secured by collat-
| The Fund | 21 |
NOTES TO FINANCIAL STATEMENTS (continued)
eral of at least 102% of the value of U.S. securities loaned and 105% of the value of foreign securities loaned. Collateral equivalent to at least 100% of the market value of securities on loan is maintained at all times. Collateral is either in the form of cash, which can be invested in certain money market mutual funds managed by the Manager, U.S. Government and Agency securities or letters of credit. The fund is entitled to receive all income on securities loaned, in addition to income earned as a result of the lending transaction. Although each security loaned is fully collateralized, the fund bears the risk of delay in recovery of, or loss of rights in, the securities loaned should a borrower fail to return the securities in a timely manner. During the period ended September 30, 2012, The Bank of New York Mellon earned $101,893 from lending portfolio securities, pursuant to the securities lending agreement.
(c) Affiliated issuers: Investments in other investment companies advised by Dreyfus are defined as “affiliated” in the Act. Investments in affiliated investment companies for the period ended September 30, 2012 were as follows:
| Affiliated | |||||||
| Investment | Value | Value | Net | ||||
| Company | 9/30/2011 | ($) | Purchases ($) | Sales ($) | 9/30/2012 | ($) | Assets (%) |
| Dreyfus | |||||||
| Institutional | |||||||
| Preferred | |||||||
| Plus Money | |||||||
| Market | |||||||
| Fund | 3,302,281 | 176,802,861 | 176,850,155 | 3,254,987 | .7 | ||
| Dreyfus | |||||||
| Institutional | |||||||
| Cash | |||||||
| Advantage | |||||||
| Fund | 94,767,134 | 214,243,386 | 273,707,756 | 35,302,764 | 7.7 | ||
| Total | 98,069,415 | 391,046,247 | 450,557,911 | 38,557,751 | 8.4 |
(d) Dividends to shareholders: Dividends are recorded on the ex-dividend date. Dividends from investment income-net and dividends from net realized capital gains, if any, are normally declared and paid annually,
22
but the fund may make distributions on a more frequent basis to comply with the distribution requirements of the Internal Revenue Code of 1986, as amended (the “Code”).To the extent that net realized capital gains can be offset by capital loss carryovers, it is the policy of the fund not to distribute such gains. Income and capital gain distributions are determined in accordance with income tax regulations, which may differ from GAAP.
(e) Federal income taxes: It is the policy of the fund to continue to qualify as a regulated investment company, if such qualification is in the best interests of its shareholders, by complying with the applicable pro visions of the Code, and to make distributions of taxable income sufficient to relieve it from substantially all federal income and excise taxes.
As of and during the period ended September 30, 2012, the fund did not have any liabilities for any uncertain tax positions.The fund recognizes interest and penalties, if any, related to uncertain tax positions as income tax expense in the Statement of Operations. During the period, the fund did not incur any interest or penalties.
Each of the tax years in the four-year period ended September 30, 2012 remains subject to examination by the Internal Revenue Service and state taxing authorities.
At September 30, 2012, the components of accumulated earnings on a tax basis were as follows: undistributed ordinary income $1,268,272, undistributed capital gains $3,126,257 and unrealized appreciation $43,098,560.
The tax character of distributions paid to shareholders during the fiscal periods ended September 30, 2012 and September 30, 2011 were as follows: ordinary income $1,739,010 and $2,299,813, respectively.
During the period ended September 30, 2012, as a result of permanent book to tax differences, primarily due to the tax treatment for real estate
| The Fund | 23 |
NOTES TO FINANCIAL STATEMENTS (continued)
investment trusts and recognition of book to tax differences resulting from prior year fund restructure, the fund decreased accumulated undistributed investment income-net by $746,847, increased accumulated net realized gain (loss) on investments by $773,859 and decreased paid-in capital by $27,012. Net assets and net asset value per share were not affected by this reclassification.
NOTE 2—Bank Lines of Credit:
The fund participates with other Dreyfus-managed funds in a $225 million unsecured credit facility led by Citibank, N.A. and a $300 million unsecured credit facility provided by The Bank of New York Mellon (each, a “Facility”), each to be utilized primarily for temporary or emergency purposes, including the financing of redemptions. In connection therewith, the fund has agreed to pay its pro rata portion of commitment fees for each Facility. Interest is charged to the fund based on rates determined pursuant to the terms of the respective Facility at the time of borrowing.
The average amount of borrowings outstanding under the Facilities during the period ended September 30, 2012, was approximately $153,000 with a related weighted average annualized interest rate of 1.18%.
NOTE 3—Investment Advisory Fee and Other Transactions With Affiliates:
(a) Pursuant to an investment advisory agreement with the Manager, the investment advisory fee is computed at the annual rate of .80% of the fund’s average daily net assets and is payable monthly.
The fund has an Accounting and Administration Agreement (the “Administration Agreement”) with Dreyfus, whereby Dreyfus performs administrative and accounting services for the fund.The fund has agreed to compensate Dreyfus for providing accounting services, administration, compliance monitoring, regulatory and shareholder reporting, as well as for related facilities and equipment. The fee is based on the fund’s average daily net assets and computed at the following annual rates: .06% of the first $500 million, .04% of the next $500 million and .02% in excess of $1 billion.
24
In addition, after applying any expense limitations or fee waivers that reduce the fees paid to Dreyfus for this service, Dreyfus has contractually agreed in writing to waive any remaining fees for this service to the extent that they exceed both Dreyfus’ costs in providing these services and a reasonable allocation of the costs incurred by Dreyfus and its affiliates related to the support and oversight of these services.The fund also reimburses Dreyfus for the out-of-pocket expenses expenses incurred in performing this service for the fund. Pursuant to the Administration Agreement, the fund was charged $124,502 during the period ended September 30, 2012.
(b) The fund has arrangements with the transfer agent and the custodian whereby the fund may receive earnings credits when positive cash balances are maintained, which are used to offset transfer agency and custody fees. For financial reporting purposes, the fund includes net earnings credits as an expense offset in the Statement of Operations.
The fund compensates Dreyfus Transfer, Inc. (“DTI”), a wholly-owned subsidiary of the Manager, under a transfer agency agreement for providing transfer agency services for the fund and, since May 29, 2012, cash management services related to fund subscriptions and redemptions. During the period ended September 30, 2012, the fund was charged $20,719 for transfer agency services and $300 for cash management services. Cash management fees were partially offset by earnings credits of $36. These fees are included in Shareholder servicing costs in the Statement of Operations.
The fund compensatesThe Bank of NewYork Mellon under a custody agreement for providing custodial services for the fund. During the period ended September 30, 2012, the fund was charged $41,831 pursuant to the custody agreement.
Prior to May 29, 2012, the fund compensated The Bank of New York Mellon under a cash management agreement for performing cash management services related to fund subscriptions and redemptions. During the period ended September 30, 2012, the fund was charged $2,105
| The Fund | 25 |
NOTES TO FINANCIAL STATEMENTS (continued)
pursuant to the cash management agreement, which is included in Shareholder servicing costs in the Statement of Operations.These fees were partially offset by earnings credits of $61.
During the period ended September 30, 2012, the fund was charged $8,384 for services performed by the Chief Compliance Officer and his staff.
The components of “Due to The Dreyfus Corporation and affiliates” in the Statement of Assets and Liabilities consist of: investment advisory fees $303,358, custodian fees $16,183, Chief Compliance Officer fees $1,991 and transfer agency fees $8,927.
(c) Each Board member also serves as a Board member of other funds within the Dreyfus complex. Annual retainer fees and attendance fees are allocated to each fund based on net assets.
NOTE 4—Securities Transactions:
The aggregate amount of purchases and sales of investment securities, excluding short-term securities, during the period ended September 30, 2012, amounted to $388,015,127 and $433,145,826, respectively.
At September 30, 2012, the cost of investments for federal income tax purposes was $450,192,187; accordingly, accumulated net unrealized appreciation on investments was $43,098,560, consisting of $59,503,371 gross unrealized appreciation and $16,404,811 gross unrealized depreciation.
26
| REPORT OF INDEPENDENT REGISTERED |
| PUBLIC ACCOUNTING FIRM |
To the Board of Trustees and Shareholders of Dreyfus/The Boston Company Small Cap Value Fund:
We have audited the accompanying statement of assets and liabilities of Dreyfus/The Boston Company Small CapValue Fund (the “Fund”), a series of Dreyfus Investment Funds, including the statement of investments as of September 30, 2012, and the related statement of operations for the year then ended, the statements of changes in net assets for each of the years in the two-year period then ended and financial highlights for each of the years in the four-year period then ended.These financial statements and financial highlights are the responsibility of the Fund’s management. Our responsibility is to express an opinion on these financial statements and financial highlights based on our audits. The financial highlights for the year ended September 30, 2008 were audited by other independent registered public accountants whose report thereon, dated November 28, 2008, expressed an unqualified opinion on those financial highlights.
We conducted our audits in accordance with the standards of the Public Company Accounting Oversight Board (United States).Those standards require that we plan and perform the audit to obtain reasonable assurance about whether the financial statements and financial highlights are free of material misstatement.An audit also includes examining, on a test basis, evidence supporting the amounts and disclosures in the financial statements. Our procedures included confirmation of securities owned as of September 30, 2012 by correspondence with the custodian and brokers or by other appropriate auditing procedures where replies from brokers were not received.An audit also includes assessing the accounting principles used and significant estimates made by management, as well as evaluating the overall financial statement presentation.We believe that our audits provide a reasonable basis for our opinion.
In our opinion, the financial statements and financial highlights referred to above present fairly, in all material respects, the financial position of Dreyfus/The Boston Company Small CapValue Fund as of September 30, 2012, and the results of its operations for the year then ended, the changes in its net assets for each of the years in the two-year period then ended, and the financial highlights for each of the years in the four-year period then ended, in conformity with U.S. generally accepted accounting principles.

New York, New York
November 28, 2012
| The Fund | 27 |
IMPORTANT TAX INFORMATION (Unaudited)
For federal tax purposes, the fund reports the maximum amount allowable, but not less than $1,739,010 as ordinary income dividends paid during the year ended September 30, 2012 as qualified dividend income in accordance with Section 854(b)(1)(B) of the Internal Revenue Code. Also, the fund reports the maximum amount allowable but not less than 100% of ordinary income dividends paid during the year ended September 30, 2012 as eligible for the corporate dividends received deduction provided under Section 243 of the Internal Revenue Code in accordance with Section 854(b)(1)(A) of the Internal Revenue Code. Shareholders will receive notification in early 2013 of the percentage applicable to the preparation of their 2012 income tax returns.
28
BOARD MEMBERS INFORMATION (Unaudited)
| Joseph S. DiMartino (68) |
| Chairman of the Board (2008) |
| Principal Occupation During Past 5Years: |
| • Corporate Director and Trustee |
| Other Public Company Board Memberships During Past 5Years: |
| • CBIZ (formerly, Century Business Services, Inc.), a provider of outsourcing functions for small |
| and medium size companies, Director (1997-present) |
| • Sunair Services Corporation, a provider of certain outdoor-related services to homes and |
| businesses, Director (2005-2009) |
| • The Newark Group, a provider of a national market of paper recovery facilities, paperboard |
| mills and paperboard converting plants, Director (2000-2010) |
| No. of Portfolios for which Board Member Serves: 157 |
| ——————— |
| Francine J. Bovich (61) |
| Board Member (2011) |
| Principal Occupation During Past 5Years: |
| • Trustee,The Bradley Trusts, private trust funds (2011-present) |
| • Managing Director, Morgan Stanley Investment Management (1993-2010) |
| No. of Portfolios for which Board Member Serves: 31 |
| ——————— |
| James M. Fitzgibbons (78) |
| Board Member (2008) |
| Principal Occupation During Past 5Years: |
| • Corporate Director and Trustee |
| Other Public Company Board Memberships During Past 5Years: |
| • Bill Barrett Corporation, an oil and natural gas exploration company, Director (2004-present) |
| No. of Portfolios for which Board Member Serves: 31 |
| ——————— |
| Kenneth A. Himmel (66) |
| Board Member (2008) |
| Principal Occupation During Past 5Years: |
| • President and CEO, Related Urban Development, a real estate development company (1996-present) |
| • President and CEO, Himmel & Company, a real estate development company (1980-present) |
| • CEO,American Food Management, a restaurant company (1983-present) |
| No. of Portfolios for which Board Member Serves: 31 |
| The Fund | 29 |
BOARD MEMBERS INFORMATION (Unaudited) (continued)
| Stephen J. Lockwood (65) |
| Board Member (2008) |
| Principal Occupation During Past 5Years: |
| • Chairman of the Board, Stephen J. Lockwood and Company LLC, a real estate investment |
| company (2000-present) |
| No. of Portfolios for which Board Member Serves: 31 |
| ——————— |
| Roslyn M. Watson (62) |
| Board Member (2008) |
| Principal Occupation During Past 5Years: |
| • Principal,Watson Ventures, Inc., a real estate investment company (1993-present) |
| No. of Portfolios for which Board Member Serves: 41 |
| ——————— |
| Benaree Pratt Wiley (66) |
| Board Member (2008) |
| Principal Occupation During Past 5Years: |
| • Principal,TheWiley Group, a firm specializing in strategy and business development (2005-present) |
| Other Public Company Board Memberships During Past 5Years: |
| • CBIZ (formerly, Century Business Services, Inc.), a provider of outsourcing functions for small |
| and medium size companies, Director (2008-present) |
| No. of Portfolios for which Board Member Serves: 64 |
| ——————— |
Once elected all Board Members serve for an indefinite term, but achieve Emeritus status upon reaching age 80.The address of the Board Members and Officers is c/o The Dreyfus Corporation, 200 Park Avenue, NewYork, NewYork 10166.Additional information about the Board Members is available in the fund’s Statement of Additional Information which can be obtained from Dreyfus free of charge by calling this toll free number: 1-800-DREYFUS.
30
OFFICERS OF THE FUND (Unaudited)
BRADLEY J. SKAPYAK, President since January 2010.
Chief Operating Officer and a director of the Manager since June 2009; from April 2003 to June 2009, Mr. Skapyak was the head of the Investment Accounting and Support Department of the Manager. He is an officer of 72 investment companies (comprised of 156 portfolios) managed by the Manager. He is 53 years old and has been an employee of the Manager since February 1988.
JANETTE E. FARRAGHER, Vice President and Secretary since December 2011.
Assistant General Counsel of BNY Mellon, and an officer of 73 investment companies (comprised of 183 portfolios) managed by the Manager. She is 49 years old and has been an employee of the Manager since February 1984.
KIESHA ASTWOOD, Vice President and Assistant Secretary since January 2010.
Counsel of BNY Mellon, and an officer of 73 investment companies (comprised of 183 portfolios) managed by the Manager. She is 39 years old and has been an employee of the Manager since July 1995.
JAMES BITETTO, Vice President and Assistant Secretary since December 2008.
Senior Counsel of BNY Mellon and Secretary of the Manager, and an officer of 73 investment companies (comprised of 183 portfolios) managed by the Manager. He is 46 years old and has been an employee of the Manager since December 1996.
JONI LACKS CHARATAN, Vice President and Assistant Secretary since December 2008.
Senior Counsel of BNY Mellon, and an officer of 73 investment companies (comprised of 183 portfolios) managed by the Manager. She is 56 years old and has been an employee of the Manager since October 1988.
JOSEPH M. CHIOFFI, Vice President and Assistant Secretary since December 2008.
Senior Counsel of BNY Mellon, and an officer of 73 investment companies (comprised of 183 portfolios) managed by the Manager. He is 50 years old and has been an employee of the Manager since June 2000.
JOHN B. HAMMALIAN, Vice President and Assistant Secretary since December 2008.
Senior Managing Counsel of BNY Mellon, and an officer of 73 investment companies (comprised of 183 portfolios) managed by the Manager. He is 49 years old and has been an employee of the Manager since February 1991.
ROBERT R. MULLERY, Vice President and Assistant Secretary since December 2008.
Managing Counsel of BNY Mellon, and an officer of 73 investment companies (comprised of 183 portfolios) managed by the Manager. He is 60 years old and has been an employee of the Manager since May 1986.
JEFF PRUSNOFSKY, Vice President and Assistant Secretary since December 2008.
Senior Managing Counsel of BNY Mellon, and an officer of 73 investment companies (comprised of 183 portfolios) managed by the Manager. He is 47 years old and has been an employee of the Manager since October 1990.
JAMES WINDELS, Treasurer since December 2008.
Director – Mutual Fund Accounting of the Manager, and an officer of 73 investment companies (comprised of 183 portfolios) managed by the Manager. He is 54 years old and has been an employee of the Manager since April 1985.
| The Fund | 31 |
OFFICERS OF THE FUND (Unaudited) (continued)
RICHARD CASSARO, Assistant Treasurer since December 2008.
Senior Accounting Manager – Money Market and Municipal Bond Funds of the Manager, and an officer of 73 investment companies (comprised of 183 portfolios) managed by the Manager. He is 53 years old and has been an employee of the Manager since September 1982.
GAVIN C. REILLY, Assistant Treasurer since December 2008.
Tax Manager of the Investment Accounting and Support Department of the Manager, and an officer of 73 investment companies (comprised of 183 portfolios) managed by the Manager. He is 44 years old and has been an employee of the Manager since April 1991.
ROBERT S. ROBOL, Assistant Treasurer since December 2008.
Senior Accounting Manager – Fixed Income Funds of the Manager, and an officer of 73 investment companies (comprised of 183 portfolios) managed by the Manager. He is 48 years old and has been an employee of the Manager since October 1988.
ROBERT SALVIOLO, Assistant Treasurer since December 2008.
Senior Accounting Manager – Equity Funds of the Manager, and an officer of 73 investment companies (comprised of 183 portfolios) managed by the Manager. He is 45 years old and has been an employee of the Manager since June 1989.
ROBERT SVAGNA, Assistant Treasurer since December 2008.
Senior Accounting Manager – Equity Funds of the Manager, and an officer of 73 investment companies (comprised of 183 portfolios) managed by the Manager. He is 45 years old and has been an employee of the Manager since November 1990.
JOSEPH W. CONNOLLY, Chief Compliance Officer since December 2008.
Chief Compliance Officer of the Manager and The Dreyfus Family of Funds (73 investment companies, comprised of 183 portfolios). He is 55 years old and has served in various capacities with the Manager since 1980, including manager of the firm’s Fund Accounting Department from 1997 through October 2001.
MATTHEW D. CONNOLLY, Anti-Money Laundering Compliance Officer since April 2012.
Anti-Money Laundering Compliance Officer of the Distributor since October 2011; from March 2010 to September 2011, Global Head, KYC Reviews and Director, UBS Investment Bank; until March 2010,AML Compliance Officer and Senior Vice President, Citi Global Wealth Management. He is an officer of 69 investment companies (comprised of 179 portfolios) managed by the Manager. He is 40 years old and has been an employee of the Distributor since October 2011.
32
For More Information

Ticker Symbol: STSVX
Telephone 1-800-DREYFUS
Mail The Dreyfus Family of Funds, 144 Glenn Curtiss Boulevard, Uniondale, NY 11556-0144 E-mail Send your request to info@dreyfus.com Internet Information can be viewed online or downloaded at: http://www.dreyfus.com
The fund files its complete schedule of portfolio holdings with the Securities and Exchange Commission (“SEC”) for the first and third quarters of each fiscal year on Form N-Q. The fund’s Forms N-Q are available on the SEC’s website at http://www.sec.gov and may be reviewed and copied at the SEC’s Public Reference Room in Washington, DC. Information on the operation of the Public Reference Room may be obtained by calling 1-800-SEC-0330.
A description of the policies and procedures that the fund uses to determine how to vote proxies relating to portfolio securities, and information regarding how the fund voted these proxies for the most recent 12-month period ended June 30 is available at http://www.dreyfus.com and on the SEC’s website at http://www.sec.gov. The description of the policies and procedures is also available without charge, upon request, by calling 1-800-DREYFUS.

| Dreyfus/The Boston |
| Company Small/Mid Cap |
| Growth Fund |
ANNUAL REPORT September 30, 2012
Save time. Save paper. View your next shareholder report online as soon as it’s available. Log into www.dreyfus.com and sign up for Dreyfus eCommunications. It’s simple and only takes a few minutes.
The views expressed in this report reflect those of the portfolio manager only through the end of the period covered and do not necessarily represent the views of Dreyfus or any other person in the Dreyfus organization. Any such views are subject to change at any time based upon market or other conditions and Dreyfus disclaims any responsibility to update such views.These views may not be relied on as investment advice and, because investment decisions for a Dreyfus fund are based on numerous factors, may not be relied on as an indication of trading intent on behalf of any Dreyfus fund.
| Not FDIC-Insured • Not Bank-Guaranteed • May Lose Value |
Contents | |
THE FUND | |
| 2 | A Letter from the Chairman and CEO |
| 3 | Discussion of Fund Performance |
| 6 | Fund Performance |
| 8 | Understanding Your Fund’s Expenses |
| 8 | Comparing Your Fund’s Expenses With Those of Other Funds |
| 9 | Statement of Investments |
| 14 | Statement of Assets and Liabilities |
| 15 | Statement of Operations |
| 16 | Statement of Changes in Net Assets |
| 18 | Financial Highlights |
| 21 | Notes to Financial Statements |
| 32 | Report of Independent Registered Public Accounting Firm |
| 33 | Important Tax Information |
| 34 | Board Members Information |
| 36 | Officers of the Fund |
FOR MORE INFORMATION | |
Back Cover |
Dreyfus/The Boston
Company Small/Mid Cap
Growth Fund
The Fund
A LETTER FROM THE CHAIRMAN AND CEO

Dear Shareholder:
This annual report for Dreyfus/The Boston Company Small/Mid Cap Growth Fund covers the 12-month period from October 1, 2011, through September 30, 2012. For information about how the fund performed during the reporting period, as well as general market perspectives, we provide a Discussion of Fund Performance on the pages that follow.
U.S. equities proved unusually volatile over the past year, as prices rose and fell according to investors’ changing expectations of global and domestic economic conditions.And while the pace of U.S. economic growth has been relatively consistent, it has progressed at about half the average rate achieved in prior recoveries. Overseas, Europe has remained under severe economic pressure due to a persistent debt crisis and austerity-oriented fiscal policies adopted by many governments. In Japan, a strengthening currency dampened export activity and economic growth. The emerging markets have posted a slower rate of growth, reducing demand for industrial commodities and other goods and services.
The sustained-but-subpar U.S. expansion appears likely to continue over the foreseeable future.Across the international markets though, on one hand the global economy has responded to a variety of stimulative measures, most notably aggressively accommodative monetary policies in most major markets. On the other hand, headwinds emanating from Europe and China may continue to weigh on economic growth and investor sentiment. Indeed, the ability of governments and economic policymakers to address these issues could go a long way toward shaping the 2013 market environment. As always, we urge you to speak regularly with your financial advisor to discuss how changing global economic conditions may affect your investments.
Thank you for your continued confidence and support.

Jonathan R. Baum
Chairman and Chief Executive Officer
The Dreyfus Corporation
October 15, 2012
2
DISCUSSION OF FUND PERFORMANCE
For the period of October 1, 2011, through September 30, 2012, as provided by Todd Wakefield and B. Randall Watts, Jr., Portfolio Managers
Fund and Market Performance Overview
For the 12-month period ended September 30, 2012, Dreyfus/The Boston Company Small/Mid Cap Growth Fund’s Class A shares produced a total return of 32.36%, Class C shares returned 31.21% and Class I shares returned 32.81%.1 In comparison, the fund’s benchmark, the Russell 2500 Growth Index (the “Index”), produced a total return of 29.52% for the same period.2
Improving economic sentiment drove small- and midcap stocks higher as market declines during the spring of 2012 were more than offset by gains at other times of the reporting period.The fund produced higher returns than its benchmark, largely due to the success of our security selection strategy in seven of the 10 market sectors represented in the benchmark.
The Fund’s Investment Approach
The fund seeks long-term growth of capital. To pursue its goal, the fund normally invests at least 80% of its net assets in equity securities of small-cap and midcap U.S. companies with market capitalizations, at the time of purchase, equal to or less than the total market capitalization of the largest company in the Index.When choosing stocks, we seek to identify high-quality small-cap and midcap companies with rapid current or expected earnings or revenue growth.We employ fundamental research to identify companies with attractive characteristics, such as strong business and competitive positions, solid cash flows and balance sheets, high-quality management and high sustainable growth.We also may invest in companies that our research indicates will experience accelerating revenues and expanding operating margins.
Markets Reacted to Shifting Macroeconomic Developments
The reporting period began in the immediate wake of a major stock market decline. One credit-rating agency’s downgrade of long-term U.S. government debt, an intensifying debt crisis in Europe and inflation-fighting programs in China had triggered a flight away from stocks and other risky assets. Fortunately, better U.S. economic data and new remedial measures from European and Chinese policymakers sparked a rebound in October 2011, and U.S. equity markets stabilized during the fall.
| The Fund | 3 |
DISCUSSION OF FUND PERFORMANCE (continued)
By the beginning of 2012, U.S. stocks were rallying amid domestic employment gains, a quantitative easing program in Europe and less restrictive monetary and fiscal policies in China. Investors grew more tolerant of risks, focusing more intently on company fundamentals and less on macroeconomic news. However, these positive influences were called into question during the spring, when U.S. employment gains slowed, measures designed to relieve fiscal pressures in Europe encountered resistance, and the Chinese economy remained sluggish. The summer saw the market rally resume amid more encouraging macroeconomic news, and the Russell 2500 Growth Index ended the reporting period with substantial gains.
Security Selection Strategies Enhanced Returns
The fund’s investment approach proved effective during the reporting period, producing above-average returns in seven of 10 market sectors in the benchmark. The consumer discretionary sector generated especially attractive results, as movie studio Lions Gate Entertainment broke box office records with its Hunger Games release. Fashion accessories seller Michael Kors Holdings achieved better-than-expected earnings due to robust sales of watches, which drove additional traffic to the brand. Apparel maker Under Armour, Cl. A improved its product mix, helping to boost earnings. Retailer Urban Outfitters gained value through a renewed focus on merchandising and e-commerce.
In the information technology sector, semiconductor manufacturer Mellanox Technologies benefited from positive trends pertaining to data center upgrades and cloud computing. Another semiconductor company, Skyworks Solutions, advanced along with the popularity of mobile technologies, including smartphones and tablet computers. Storage and networking specialist LSI Corp. gained market share and increased the future guidance it provides to analysts. Network solutions provider Aruba Networks reported strong bookings growth and higher profit margins.Among energy companies, Plains Exploration & Production reduced costs, strengthened its balance sheet and ramped up production. Brigham Exploration agreed to be acquired by a larger rival at a significant premium. Oil States International encountered greater demand from projects in Canada and Australia.
Disappointments during the reporting period included the health care sector, where eye care specialist The Cooper Companies was pressured by safety recalls affecting its
4
products, and medical information systems provider Allscripts Healthcare Solutions struggled with legal issues and changes to a key contract. In the financials sector, pawn broker First Cash Financial Services stumbled due to slowing growth in Mexico.
Maintaining a Constructive Investment Posture
Although macroeconomic uncertainties remain over the near term, we are optimistic about the longer term prospects for small- and midcap stocks. Lower interest rates and reduced borrowing costs for businesses, consumers and homebuyers are expected to further stimulate economic growth; however this will likely occur at a more modest pace relative to the first two rounds of easing. Despite the Fed’s accommodative actions, we continue to face many of the same headwinds that have persisted throughout the year: weak employment trends, uncertainty surrounding the November elections, and future fiscal policy. Businesses appear to remain reluctant to spend in the face of these issues.The lack of confidence has contained additional hiring, capital expenditures, etc. while cash continues to build on company balance sheets. Although macro headline risks may continue to cause near-term market volatility, we continue to utilize a long-term view and remain focused on the strategy’s disciplined research-driven investment approach.
October 15, 2012
Please note, the position in any security highlighted with italicized typeface was sold during the reporting period. Equity funds are subject generally to market, market sector, market liquidity, issuer and investment style risks, among other factors, to varying degrees, all of which are more fully described in the fund’s prospectus.
Small and midsize companies carry additional risks because their earnings and revenues tend to be less predictable, and their share prices more volatile, than those of larger more established companies.
| 1 Total return includes reinvestment of dividends and any capital gains paid, and does not take into consideration the |
| maximum initial sales charge in the case of Class A shares, or the applicable contingent deferred sales charge imposed |
| on redemptions in the case of Class C shares. Had these charges been reflected, returns would have been lower. Past |
| performance is no guarantee of future results. Share price and investment return fluctuate such that upon redemption, |
| fund shares may be worth more or less than their original cost. |
| 2 SOURCE: LIPPER INC. — The Russell 2500 Growth Index is an unmanaged index that measures the |
| performance of those Russell 2500 companies (the 2,500 smallest companies in the Russell 3000 Index, which |
| is composed of the 3,000 largest U. S. companies based on total market capitalization) with higher price-to-book |
| ratios and higher forecasted growth values. The total return figure cited for this index assumes change in security |
| prices and reinvestment of dividends, but does not reflect the costs of managing a mutual fund. Investors cannot |
| invest directly in any index. |
| The Fund | 5 |
FUND PERFORMANCE
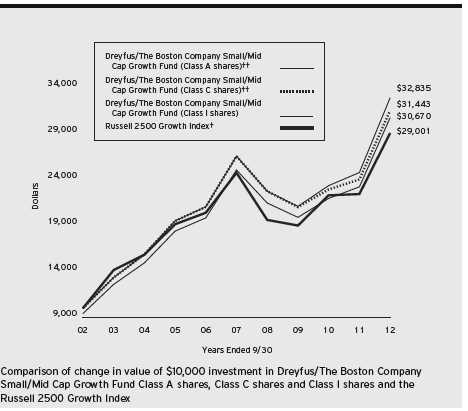
| † | Source: Lipper Inc. |
| †† | The total return figures presented for Class A and Class C shares of the fund reflect the performance of the fund’s |
| Class I shares for the period prior to 3/31/09 (the inception date for Class A and Class C shares), adjusted to | |
| reflect the applicable sales load for each share class. |
Past performance is not predictive of future performance.
The above graph compares a $10,000 investment made in each of the Class A, Class C and Class I shares of Dreyfus/The Boston Company Small/Mid Cap Growth Fund on 9/30/02 to a $10,000 investment made in the Russell 2500 Growth Index (the “Index”) on that date.All dividends and capital gain distributions are reinvested. The fund’s performance shown in the line graph above takes into account the maximum initial sales charge on Class A shares and all other applicable fees and expenses on all classes.The Index is an unmanaged index that measures the performance of those Russell 2500 companies in the Russell 3000 Index with higher price-to-book ratios and higher forecasted growth values. Unlike a mutual fund, the Index is not subject to charges, fees and other expenses. Investors cannot invest directly in any index.These factors can contribute to the Index potentially outperforming the fund. Further information relating to fund performance, including expense reimbursements, if applicable, is contained in the Financial Highlights section of the prospectus and elsewhere in this report.
6
| Average Annual Total Returns as of 9/30/12 | |||||||
| Inception | |||||||
| Date | 1 | Year | 5 Years | 10 Years | |||
| Class A shares | |||||||
| with maximum sales charge (5.75%) | 3/31/09 | 24.75 | % | 2.95 | %†† | 11.86 | %†† |
| without sales charge | 3/31/09 | 32.36 | % | 4.18 | %†† | 12.52 | %†† |
| Class C shares | |||||||
| with applicable redemption charge † | 3/31/09 | 30.21 | % | 3.47 | %†† | 12.14 | %†† |
| without redemption | 3/31/09 | 31.21 | % | 3.47 | %†† | 12.14 | %†† |
| Class I shares | 1/1/88 | 32.81 | % | 4.37 | % | 12.63 | % |
| Russell 2500 Growth Index | 29.52 | % | 3.26 | % | 11.24 | % | |
Past performance is not predictive of future performance.The fund’s performance shown in the graph and table does not reflect the deduction of taxes that a shareholder would pay on fund distributions or the redemption of fund shares.
| † | The maximum contingent deferred sales charge for Class C shares is 1% for shares redeemed within one year of the |
| date of purchase. | |
| †† | The total return performance figures presented for Class A and Class C shares of the fund reflect the performance of |
| the fund’s Class I shares for the period prior to 3/31/09 (the inception date for Class A and Class C shares), | |
| adjusted to reflect the applicable sales load for each share class. |
| The Fund | 7 |
UNDERSTANDING YOUR FUND’S EXPENSES (Unaudited)
As a mutual fund investor, you pay ongoing expenses, such as management fees and other expenses. Using the information below, you can estimate how these expenses affect your investment and compare them with the expenses of other funds.You also may pay one-time transaction expenses, including sales charges (loads) and redemption fees, which are not shown in this section and would have resulted in higher total expenses. For more information, see your fund’s prospectus or talk to your financial adviser.
Review your fund’s expenses
The table below shows the expenses you would have paid on a $1,000 investment in Dreyfus/The Boston Company Small/Mid Cap Growth Fund from April 1, 2012 to September 30, 2012. It also shows how much a $1,000 investment would be worth at the close of the period, assuming actual returns and expenses.
Expenses and Value of a $1,000 Investment
assuming actual returns for the six months ended September 30, 2012
| Class A | Class C | Class I | ||||
| Expenses paid per $1,000† | $ | 5.38 | $ | 9.68 | $ | 3.92 |
| Ending value (after expenses) | $ | 1,010.90 | $ | 1,006.60 | $ | 1,012.70 |
COMPARING YOUR FUND’S EXPENSES
WITH THOSE OF OTHER FUNDS (Unaudited)
Using the SEC’s method to compare expenses
The Securities and Exchange Commission (SEC) has established guidelines to help investors assess fund expenses. Per these guidelines, the table below shows your fund’s expenses based on a $1,000 investment, assuming a hypothetical 5% annualized return. You can use this information to compare the ongoing expenses (but not transaction expenses or total cost) of investing in the fund with those of other funds.All mutual fund shareholder reports will provide this information to help you make this comparison. Please note that you cannot use this information to estimate your actual ending account balance and expenses paid during the period.
Expenses and Value of a $1,000 Investment
assuming a hypothetical 5% annualized return for the six months ended September 30, 2012
| Class A | Class C | Class I | ||||
| Expenses paid per $1,000† | $ | 5.40 | $ | 9.72 | $ | 3.94 |
| Ending value (after expenses) | $ | 1,019.65 | $ | 1,015.35 | $ | 1,021.10 |
| † Expenses are equal to the fund’s annualized expense ratio of 1.07% for Class A, 1.93% for Class C and .78% |
| for Class I , multiplied by the average account value over the period, multiplied by 183/366 (to reflect the one-half |
| year period). |
8
STATEMENT OF INVESTMENTS
September 30, 2012
| Common Stocks—98.0% | Shares | Value ($) | |
| Banks—.7% | |||
| Prosperity Bancshares | 106,700 | 4,547,554 | |
| Capital Goods—11.6% | |||
| AMETEK | 230,624 | 8,175,621 | |
| B/E Aerospace | 137,423 | a | 5,785,508 |
| Crane | 116,270 | 4,642,661 | |
| EMCOR Group | 174,080 | 4,968,243 | |
| Fortune Brands Home & Security | 195,180 | a | 5,271,812 |
| Hexcel | 248,590 | a | 5,971,132 |
| IDEX | 147,600 | 6,165,252 | |
| Jacobs Engineering Group | 309,380 | a | 12,508,233 |
| Middleby | 40,580 | a | 4,692,671 |
| Roper Industries | 45,375 | 4,986,259 | |
| Teledyne Technologies | 99,140 | a | 6,284,485 |
| Triumph Group | 99,600 | 6,227,988 | |
| 75,679,865 | |||
| Commercial & Professional Services—2.1% | |||
| Corporate Executive Board | 131,802 | 7,068,541 | |
| RPX | 64,921 | a | 727,764 |
| Waste Connections | 187,443 | 5,670,151 | |
| 13,466,456 | |||
| Consumer Durables & Apparel—4.5% | |||
| Harman International Industries | 146,670 | 6,770,287 | |
| Jarden | 127,560 | 6,740,270 | |
| SodaStream International | 145,660 | a,b | 5,705,502 |
| Steven Madden | 133,050 | a | 5,816,946 |
| Under Armour, Cl. A | 82,310 | a,b | 4,595,367 |
| 29,628,372 | |||
| Consumer Services—4.5% | |||
| BJ’s Restaurants | 123,970 | a,b | 5,622,040 |
| Bloomin’ Brands | 313,865 | 5,163,079 | |
| Buffalo Wild Wings | 67,380 | a | 5,777,161 |
| Cheesecake Factory | 151,590 | 5,419,343 | |
| Six Flags Entertainment | 125,240 | 7,364,112 | |
| 29,345,735 |
| The Fund | 9 |
STATEMENT OF INVESTMENTS (continued)
| Common Stocks (continued) | Shares | Value ($) | |
| Diversified Financials—.7% | |||
| Affiliated Managers Group | 40,470 | a | 4,977,810 |
| Energy—5.5% | |||
| Dril-Quip | 112,650 | a | 8,097,282 |
| Exterran Holdings | 65,624 | a | 1,330,855 |
| Oil States International | 93,844 | a | 7,456,844 |
| Plains Exploration & Production | 135,216 | a | 5,066,544 |
| QEP Resources | 215,230 | 6,814,182 | |
| Whiting Petroleum | 145,300 | a | 6,884,314 |
| 35,650,021 | |||
| Exchange-Traded Funds—5.5% | |||
| iShares Russell 2000 Growth Index Fund | 320,020 | b | 30,597,112 |
| iShares Russell 2000 Index Fund | 62,280 | 5,196,643 | |
| 35,793,755 | |||
| Food & Staples Retailing—3.8% | |||
| Casey’s General Stores | 133,900 | 7,651,046 | |
| Harris Teeter Supermarkets | 110,770 | 4,302,307 | |
| United Natural Foods | 107,030 | a | 6,255,903 |
| Whole Foods Market | 69,860 | 6,804,364 | |
| 25,013,620 | |||
| Food, Beverage & Tobacco—.7% | |||
| Monster Beverage | 85,490 | a | 4,630,138 |
| Health Care Equipment & Services—8.3% | |||
| ABIOMED | 197,590 | a,b | 4,147,414 |
| AmerisourceBergen | 92,170 | 3,567,901 | |
| Catamaran | 105,547 | a | 10,340,440 |
| Centene | 155,700 | a | 5,824,737 |
| HMS Holdings | 193,660 | a | 6,474,054 |
| Hologic | 189,447 | a | 3,834,407 |
| MEDNAX | 94,540 | a | 7,038,503 |
| Universal Health Services, Cl. B | 185,990 | 8,505,323 | |
| WellCare Health Plans | 75,310 | a | 4,258,780 |
| 53,991,559 | |||
| Materials—2.8% | |||
| Agnico-Eagle Mines | 105,790 | 5,488,385 | |
| Cytec Industries | 107,090 | 7,016,537 | |
| Innophos Holdings | 115,120 | 5,582,169 | |
| 18,087,091 |
10
| Common Stocks (continued) | Shares | Value ($) | |
| Media—3.0% | |||
| DreamWorks Animation SKG, Cl. A | 299,390 | a,b | 5,757,270 |
| Interpublic Group of Cos | 558,850 | 6,214,412 | |
| Lions Gate Entertainment | 485,095 | a,b | 7,407,401 |
| 19,379,083 | |||
| Pharmaceuticals, Biotech & Life Sciences—10.2% | |||
| Alexion Pharmaceuticals | 88,460 | a | 10,119,824 |
| Alkermes | 344,330 | a | 7,144,848 |
| ARIAD Pharmaceuticals | 284,600 | a | 6,894,435 |
| Charles River Laboratories International | 53,350 | a | 2,112,660 |
| Cubist Pharmaceuticals | 157,870 | a | 7,527,242 |
| Incyte | 192,810 | a,b | 3,480,221 |
| Jazz Pharmaceuticals | 102,130 | a | 5,822,431 |
| Nektar Therapeutics | 88,510 | a,b | 945,287 |
| Onyx Pharmaceuticals | 111,670 | a | 9,436,115 |
| Pharmacyclics | 84,340 | a,b | 5,439,930 |
| Salix Pharmaceuticals | 91,240 | a | 3,863,102 |
| Vivus | 202,650 | a,b | 3,611,223 |
| 66,397,318 | |||
| Real Estate—1.8% | |||
| LaSalle Hotel Properties | 162,950 | c | 4,349,135 |
| Mid-America Apartment Communities | 110,740 | c | 7,232,429 |
| 11,581,564 | |||
| Retailing—7.4% | |||
| American Eagle Outfitters | 285,700 | 6,022,556 | |
| Dick’s Sporting Goods | 157,970 | 8,190,745 | |
| Groupon | 670,658 | b | 3,192,332 |
| LKQ | 263,840 | a | 4,881,040 |
| Netflix | 81,470 | a,b | 4,435,227 |
| Rent-A-Center | 217,850 | 7,642,178 | |
| Urban Outfitters | 376,120 | a | 14,127,067 |
| 48,491,145 | |||
| Semiconductors & Semiconductor | |||
| Equipment—2.8% | |||
| Entegris | 525,890 | a | 4,275,486 |
| PMC-Sierra | 795,830 | a | 4,488,481 |
| Skyworks Solutions | 401,300 | a | 9,456,634 |
| 18,220,601 |
| The Fund | 11 |
STATEMENT OF INVESTMENTS (continued)
| Common Stocks (continued) | Shares | Value ($) | |
| Software & Services—13.0% | |||
| Akamai Technologies | 330,180 | a | 12,632,687 |
| Electronic Arts | 234,721 | a | 2,978,609 |
| ExlService Holdings | 178,170 | a | 5,256,015 |
| Jive Software | 597,720 | b | 9,390,181 |
| MAXIMUS | 121,180 | 7,236,870 | |
| Mentor Graphics | 557,830 | a | 8,635,208 |
| Millennial Media | 326,620 | b | 4,686,997 |
| Nuance Communications | 341,280 | a | 8,494,459 |
| Synopsys | 321,660 | a | 10,621,213 |
| Total System Services | 194,480 | 4,609,176 | |
| Vantiv, Cl. A | 476,320 | 10,264,696 | |
| 84,806,111 | |||
| Technology Hardware & Equipment—7.9% | |||
| Arris Group | 476,150 | a | 6,089,959 |
| Aruba Networks | 519,650 | a,b | 11,684,330 |
| F5 Networks | 94,380 | a | 9,881,586 |
| NETGEAR | 236,670 | a | 9,026,594 |
| Riverbed Technology | 423,620 | a | 9,857,637 |
| Vishay Intertechnology | 486,970 | a | 4,786,915 |
| 51,327,021 | |||
| Transportation—1.2% | |||
| Con-way | 126,970 | 3,475,169 | |
| Werner Enterprises | 195,810 | 4,184,460 | |
| 7,659,629 | |||
| Total Common Stocks | |||
| (cost $539,182,037) | 638,674,448 | ||
| Other Investment—2.3% | |||
| Registered Investment Company; | |||
| Dreyfus Institutional Preferred | |||
| Plus Money Market Fund | |||
| (cost $14,704,904) | 14,704,904 | d | 14,704,904 |
12
| Investment of Cash Collateral | ||||
| for Securities Loaned—12.6% | Shares | Value ($) | ||
| Registered Investment Company; | ||||
| Dreyfus Institutional Cash Advantage Fund | ||||
| (cost $82,390,227) | 82,390,227 | d | 82,390,227 | |
| Total Investments (cost $636,277,168) | 112.9 | % | 735,769,579 | |
| Liabilities, Less Cash and Receivables | (12.9 | %) | (84,025,822 | ) |
| Net Assets | 100.0 | % | 651,743,757 |
| a Non-income producing security. |
| b Security, or portion thereof, on loan.At September 30, 2012, the value of the fund’s securities on loan was |
| $81,007,427 and the value of the collateral held by the fund was $82,596,658, consisting of cash collateral of |
| $82,390,227 and U.S Government & Agency securities valued at $206,431. |
| c Investment in real estate investment trust. |
| d Investment in affiliated money market mutual fund. |
| Portfolio Summary (Unaudited)† | |||
| Value (%) | Value (%) | ||
| Money Market Investments | 14.9 | Food & Staples Retailing | 3.8 |
| Software & Services | 13.0 | Media | 3.0 |
| Capital Goods | 11.6 | Materials | 2.8 |
| Pharmaceuticals, | Semiconductors & | ||
| Biotech & Life Sciences | 10.2 | Semiconductor Equipment | 2.8 |
| Health Care Equipment & Services | 8.3 | Commercial & Professional Services | 2.1 |
| Technology Hardware & Equipment | 7.9 | Real Estate | 1.8 |
| Retailing | 7.4 | Transportation | 1.2 |
| Energy | 5.5 | Banks | .7 |
| Exchange-Traded Funds | 5.5 | Diversified Financials | .7 |
| Consumer Durables & Apparel | 4.5 | Food, Beverage & Tobacco | .7 |
| Consumer Services | 4.5 | 112.9 | |
| † Based on net assets. | |||
| See notes to financial statements. | |||
| The Fund | 13 |
| STATEMENT OF ASSETS AND LIABILITIES |
| September 30, 2012 |
| Cost | Value | ||
| Assets ($): | |||
| Investments in securities—See Statement of Investments (including | |||
| securities on loan, valued at $81,007,427)—Note 1(b): | |||
| Unaffiliated issuers | 539,182,037 | 638,674,448 | |
| Affiliated issuers | 97,095,131 | 97,095,131 | |
| Cash | 348,904 | ||
| Receivable for investment securities sold | 9,067,007 | ||
| Dividends and securities lending income receivable | 663,466 | ||
| Receivable for shares of Beneficial Interest subscribed | 146,742 | ||
| Prepaid expenses | 31,016 | ||
| 746,026,714 | |||
| Liabilities ($): | |||
| Due to The Dreyfus Corporation and affiliates—Note 3(c) | 396,345 | ||
| Due to Administrator—Note 3(a) | 17,138 | ||
| Liability for securities on loan—Note 1(b) | 82,390,227 | ||
| Payable for investment securities purchased | 11,059,266 | ||
| Payable for shares of Beneficial Interest redeemed | 204,420 | ||
| Accrued expenses | 215,561 | ||
| 94,282,957 | |||
| Net Assets ($) | 651,743,757 | ||
| Composition of Net Assets ($): | |||
| Paid-in capital | 528,977,351 | ||
| Accumulated undistributed Investment income—net | 59,887 | ||
| Accumulated net realized gain (loss) on investments | 23,214,108 | ||
| Accumulated net unrealized appreciation | |||
| (depreciation) on investments | 99,492,411 | ||
| Net Assets ($) | 651,743,757 | ||
| Net Asset Value Per Share | |||
| Class A | Class C | Class I | |
| Net Assets ($) | 135,903,918 | 1,892,730 | 513,947,109 |
| Shares Outstanding | 8,590,725 | 124,036 | 32,169,280 |
| Net Asset Value Per Share ($) | 15.82 | 15.26 | 15.98 |
| See notes to financial statements. | |||
14
| STATEMENT OF OPERATIONS | ||
| Year Ended September 30, 2012 | ||
| Investment Income ($): | ||
| Income: | ||
| Cash dividends (net of $3,174 foreign taxes withheld at source): | ||
| Unaffiliated issuers | 3,638,076 | |
| Affiliated issuers | 11,836 | |
| Income from securities lending—Note 1(b) | 450,584 | |
| Total Income | 4,100,496 | |
| Expenses: | ||
| Investment advisory fee—Note 3(a) | 3,456,200 | |
| Shareholder servicing costs—Note 3(c) | 937,661 | |
| Administration fee—Note 3(a) | 124,502 | |
| Professional fees | 103,803 | |
| Prospectus and shareholders’ reports | 88,535 | |
| Registration fees | 62,822 | |
| Trustees’ fees and expenses—Note 3(d) | 49,970 | |
| Custodian fees—Note 3(c) | 29,498 | |
| Distribution fees—Note 3(b) | 10,754 | |
| Loan commitment fees—Note 2 | 4,917 | |
| Miscellaneous | 25,942 | |
| Total Expenses | 4,894,604 | |
| Less—reduction in fees due to earnings credits—Note 3(c) | (544 | ) |
| Net Expenses | 4,894,060 | |
| Investment (Loss)—Net | (793,564 | ) |
| Realized and Unrealized Gain (Loss) on Investments—Note 4 ($): | ||
| Net realized gain (loss) on investments | 61,828,019 | |
| Net unrealized appreciation (depreciation) on investments | 89,852,268 | |
| Net Realized and Unrealized Gain (Loss) on Investments | 151,680,287 | |
| Net Increase in Net Assets Resulting from Operations | 150,886,723 | |
| See notes to financial statements. | ||
| The Fund | 15 |
STATEMENT OF CHANGES IN NET ASSETS
| Year Ended September 30, | ||||
| 2012 | 2011 | |||
| Operations ($): | ||||
| Investment (loss)—net | (793,564 | ) | (1,080,275 | ) |
| Net realized gain (loss) on investments | 61,828,019 | 54,634,136 | ||
| Net unrealized appreciation | ||||
| (depreciation) on investments | 89,852,268 | (32,974,637 | ) | |
| Net Increase (Decrease) in Net Assets | ||||
| Resulting from Operations | 150,886,723 | 20,579,224 | ||
| Dividends to Shareholders from ($): | ||||
| Net realized gain on investments: | ||||
| Class A Shares | (9,565,986 | ) | — | |
| Class C Shares | (104,974 | ) | — | |
| Class I Shares | (30,683,649 | ) | — | |
| Total Dividends | (40,354,609 | ) | — | |
| Beneficial Interest Transactions ($): | ||||
| Net proceeds from shares sold: | ||||
| Class A Shares | 15,462,347 | 6,956,002 | ||
| Class C Shares | 698,964 | 102,958 | ||
| Class I Shares | 138,633,294 | 102,128,527 | ||
| Dividends reinvested: | ||||
| Class A Shares | 9,182,151 | — | ||
| Class C Shares | 82,604 | — | ||
| Class I Shares | 25,334,493 | — | ||
| Cost of shares redeemed: | ||||
| Class A Shares | (20,987,457 | ) | (13,693,679 | ) |
| Class C Shares | (271,011 | ) | (125,270 | ) |
| Class I Shares | (77,149,414 | ) | (67,735,285 | ) |
| Increase (Decrease) in Net Assets from | ||||
| Beneficial Interest Transactions | 90,985,971 | 27,633,253 | ||
| Total Increase (Decrease) in Net Assets | 201,518,085 | 48,212,477 | ||
| Net Assets ($): | ||||
| Beginning of Period | 450,225,672 | 402,013,195 | ||
| End of Period | 651,743,757 | 450,225,672 | ||
| Undistributed investment income—net | 59,887 | — | ||
16
| Year Ended September 30, | ||||
| 2012 | 2011 | |||
| Capital Share Transactions: | ||||
| Class A | ||||
| Shares sold | 1,025,580 | 476,874 | ||
| Shares issued for dividends reinvested | 664,423 | — | ||
| Shares redeemed | (1,414,132 | ) | (957,046 | ) |
| Net Increase (Decrease) in Shares Outstanding | 275,871 | (480,172 | ) | |
| Class C | ||||
| Shares sold | 47,416 | 7,212 | ||
| Shares issued for dividends reinvested | 6,151 | — | ||
| Shares redeemed | (18,532 | ) | (8,690 | ) |
| Net Increase (Decrease) in Shares Outstanding | 35,035 | (1,478 | ) | |
| Class I | ||||
| Shares sold | 9,282,049 | 7,087,450 | ||
| Shares issued for dividends reinvested | 1,820,007 | — | ||
| Shares redeemed | (5,125,390 | ) | (4,737,304 | ) |
| Net Increase (Decrease) in Shares Outstanding | 5,976,666 | 2,350,146 | ||
| See notes to financial statements. | ||||
| The Fund | 17 |
FINANCIAL HIGHLIGHTS
The following tables describe the performance for each share class for the fiscal periods indicated.All information (except portfolio turnover rate) reflects financial results for a single fund share.Total return shows how much your investment in the fund would have increased (or decreased) during each period, assuming you had reinvested all dividends and distributions.These figures have been derived from the fund’s financial statements.
| Year Ended September 30, | ||||||||
| Class A Shares | 2012 | 2011 | 2010 | 2009 | a | |||
| Per Share Data ($): | ||||||||
| Net asset value, beginning of period | 12.95 | 12.26 | 11.10 | 8.36 | ||||
| Investment Operations: | ||||||||
| Investment (loss)—netb | (.06 | ) | (.06 | ) | (.04 | ) | (.02 | ) |
| Net realized and unrealized | ||||||||
| gain (loss) on investments | 4.08 | .75 | 1.20 | 2.76 | ||||
| Total from Investment Operations | 4.02 | .69 | 1.16 | 2.74 | ||||
| Distributions: | ||||||||
| Dividends from net realized | ||||||||
| gain on investments | (1.15 | ) | — | — | — | |||
| Net asset value, end of period | 15.82 | 12.95 | 12.26 | 11.10 | ||||
| Total Return (%)c | 32.36 | 5.63 | 10.45 | 32.78 | ||||
| Ratios/Supplemental Data (%): | ||||||||
| Ratio of total expenses to average net assets | 1.08 | 1.09 | 1.12 | 1.26 | ||||
| Ratio of net expenses to average net assets | 1.08 | 1.09 | 1.12 | 1.25 | ||||
| Ratio of net investment (loss) | ||||||||
| to average net assets | (.37 | ) | (.45 | ) | (.35 | ) | (.37 | ) |
| Portfolio Turnover Rate | 153.75 | 180.82 | 191.46 | 278.73 | ||||
| Net Assets, end of period ($ x 1,000) | 135,904 | 107,696 | 107,796 | 186 | ||||
| a From March 31, 2009 (commencement of initial offering) to September 30, 2009. |
| b Based on average shares outstanding at each month end. |
| c Exclusive of sales charge. |
See notes to financial statements.
18
| Year Ended September 30, | ||||||||
| Class C Shares | 2012 | 2011 | 2010 | 2009 | a | |||
| Per Share Data ($): | ||||||||
| Net asset value, beginning of period | 12.63 | 12.06 | 11.05 | 8.36 | ||||
| Investment Operations: | ||||||||
| Investment (loss)—netb | (.18 | ) | (.18 | ) | (.13 | ) | (.06 | ) |
| Net realized and unrealized | ||||||||
| gain (loss) on investments | 3.96 | .75 | 1.14 | 2.75 | ||||
| Total from Investment Operations | 3.78 | .57 | 1.01 | 2.69 | ||||
| Distributions: | ||||||||
| Dividends from net realized | ||||||||
| gain on investments | (1.15 | ) | — | — | — | |||
| Net asset value, end of period | 15.26 | 12.63 | 12.06 | 11.05 | ||||
| Total Return (%)c | 31.21 | 4.73 | 9.14 | 32.18 | ||||
| Ratios/Supplemental Data (%): | ||||||||
| Ratio of total expenses to average net assets | 1.97 | 1.95 | 1.99 | 2.16 | ||||
| Ratio of net expenses to average net assets | 1.97 | 1.95 | 1.99 | 2.00 | ||||
| Ratio of net investment (loss) | ||||||||
| to average net assets | (1.24 | ) | (1.31 | ) | (1.21 | ) | (1.20 | ) |
| Portfolio Turnover Rate | 153.75 | 180.82 | 191.46 | 278.73 | ||||
| Net Assets, end of period ($ x 1,000) | 1,893 | 1,124 | 1,091 | 13 | ||||
| a From March 31, 2009 (commencement of initial offering) to September 30, 2009. |
| b Based on average shares outstanding at each month end. |
| c Exclusive of sales charge. |
See notes to financial statements.
| The Fund | 19 |
FINANCIAL HIGHLIGHTS (continued)
| Year Ended September 30, | ||||||||||
| Class I Shares | 2012 | 2011 | 2010 | 2009 | a | 2008 | ||||
| Per Share Data ($): | ||||||||||
| Net asset value, beginning of period | 13.03 | 12.29 | 11.10 | 11.97 | 17.66 | |||||
| Investment Operations: | ||||||||||
| Investment (loss)—netb | (.01 | ) | (.02 | ) | (.01 | ) | (.00 | )c | (.02 | ) |
| Net realized and unrealized | ||||||||||
| gain (loss) on investments | 4.11 | .76 | 1.20 | (.87 | ) | (1.93 | )d | |||
| Total from Investment Operations | 4.10 | .74 | 1.19 | (.87 | ) | (1.95 | ) | |||
| Distributions: | ||||||||||
| Dividends from investment income—net | — | — | — | — | (.01 | ) | ||||
| Dividends from net realized | ||||||||||
| gain on investments | (1.15 | ) | — | — | — | (3.73 | ) | |||
| Total Distributions | (1.15 | ) | — | — | — | (3.74 | ) | |||
| Net asset value, end of period | 15.98 | 13.03 | 12.29 | 11.10 | 11.97 | |||||
| Total Return (%) | 32.81 | 6.02 | 10.72 | (7.27 | ) | (14.32 | ) | |||
| Ratios/Supplemental Data (%): | ||||||||||
| Ratio of total expenses | ||||||||||
| to average net assets | .78 | .77 | .81 | .93 | 1.11 | |||||
| Ratio of net expenses | ||||||||||
| to average net assets | .78 | .77 | .81 | .93 | 1.00 | |||||
| Ratio of net investment (loss) | ||||||||||
| to average net assets | (.07 | ) | (.14 | ) | (.05 | ) | (.01 | ) | (.15 | ) |
| Portfolio Turnover Rate | 153.75 | 180.82 | 191.46 | 278.73 | 201.00 | |||||
| Net Assets, end of period ($ x 1,000) | 513,947 | 341,406 | 293,126 | 168,631 | 90,267 | |||||
| a The fund changed to a multiple class fund on March 31, 2009.The existing shares were redesignated as Class I shares. |
| b Based on average shares outstanding at each month end. |
| c Amount represents less than $.01 per share. |
| d Amount included litigation proceeds received by the fund of $.01 per share for the year ended September 30, 2008. |
See notes to financial statements.
20
NOTES TO FINANCIAL STATEMENTS
NOTE 1—Significant Accounting Policies:
Dreyfus/The Boston Company Small/Mid Cap Growth Fund (the “fund”) is a separate diversified series of Dreyfus Investment Funds (the “Trust”), which is registered under the Investment Company Act of 1940, as amended (the “Act”), as an open-end management investment company and operates as a series company currently offering eleven series, including the fund.The fund’s investment objective is to seek long-term growth of capital. The Dreyfus Corporation (the “Manager” or “Dreyfus”), a wholly-owned subsidiary of The Bank of New York Mellon Corporation (“BNY Mellon”), serves as the fund’s investment adviser.
MBSC Securities Corporation (the “Distributor”), a wholly-owned subsidiary of the Manager, is the distributor of the fund’s shares. The fund is authorized to issue an unlimited number of $.001 par value shares of Beneficial Interest in each of the following classes of shares: Class A, Class C and Class I shares. Class A and Class C shares are sold primarily to retail investors through intermediaries and bear a distribution fee and/or shareholder services fee. Class A shares are subject to a sales charge imposed at the time of purchase. Class C shares are subject to a contingent deferred sales charge (“CDSC”) imposed on Class C shares redeemed within one year of purchase. Class I shares are sold primarily to bank trust departments and other financial service providers (including The Bank of New York Mellon, a subsidiary of BNY Mellon and an affiliate of Dreyfus, and its affiliates), acting on behalf of customers having a qualified trust or an investment account or relationship at such institution, and bear no Distribution or Shareholder Services Plan fees. Class I shares are offered without a front-end sales charge or CDSC. Other differences between the classes include the services offered to and the expenses borne by each class, the
| The Fund | 21 |
NOTES TO FINANCIAL STATEMENTS (continued)
allocation of certain transfer agency costs and certain voting rights. Income, expenses (other than expenses attributable to a specific class), and realized and unrealized gains or losses on investments are allocated to each class of shares based on its relative net assets.
TheTrust accounts separately for the assets, liabilities and operations of each series. Expenses directly attributable to each series are charged to that series’ operations; expenses which are applicable to all series are allocated among them on a pro rata basis.
The Financial Accounting Standards Board (“FASB”) Accounting Standards Codification is the exclusive reference of authoritative U.S. generally accepted accounting principles (“GAAP”) recognized by the FASB to be applied by nongovernmental entities. Rules and interpretive releases of the Securities and Exchange Commission (“SEC”) under authority of federal laws are also sources of authoritative GAAP for SEC registrants. The fund’s financial statements are prepared in accordance with GAAP, which may require the use of management estimates and assumptions.Actual results could differ from those estimates.
(a) Portfolio valuation: The fair value of a financial instrument is the amount that would be received to sell an asset or paid to transfer a liability in an orderly transaction between market participants at the measurement date (i.e., the exit price). GAAP establishes a fair value hierarchy that prioritizes the inputs of valuation techniques used to measure fair value.This hierarchy gives the highest priority to unadjusted quoted prices in active markets for identical assets or liabilities (Level 1 measurements) and the lowest priority to unobservable inputs (Level 3 measurements).
Additionally, GAAP provides guidance on determining whether the volume and activity in a market has decreased significantly and whether such a decrease in activity results in transactions that are not orderly. GAAP requires enhanced disclosures around valuation inputs and techniques used during annual and interim periods.
22
Various inputs are used in determining the value of the fund’s investments relating to fair value measurements.These inputs are summarized in the three broad levels listed below:
Level 1—unadjusted quoted prices in active markets for identical investments.
Level 2—other significant observable inputs (including quoted prices for similar investments, interest rates, prepayment speeds, credit risk, etc.).
Level 3—significant unobservable inputs (including the fund’s own assumptions in determining the fair value of investments).
The inputs or methodology used for valuing securities are not necessarily an indication of the risk associated with investing in those securities.
Changes in valuation techniques may result in transfers in or out of an assigned level within the disclosure hierarchy. Valuation techniques used to value the fund’s investments are as follows:
Investments in securities are valued at the last sales price on the securities exchange or national securities market on which such securities are primarily traded. Securities listed on the National Market System for which market quotations are available are valued at the official closing price or, if there is no official closing price that day, at the last sales price. Securities not listed on an exchange or the national securities market, or securities for which there were no transactions, are valued at the average of the most recent bid and asked prices, except for open short positions, where the asked price is used for valuation purposes. Bid price is used when no asked price is available. Registered investment companies that are not traded on an exchange are valued at their net asset value. All of the preceding securities are categorized within Level 1 of the fair value hierarchy.
Fair valuing of securities may be determined with the assistance of a pricing service using calculations based on indices of domestic securi-
| The Fund | 23 |
NOTES TO FINANCIAL STATEMENTS (continued)
ties and other appropriate indicators, such as prices of relevant American Depository Receipts and financial futures. Utilizing these techniques may result in transfers between Level 1 and Level 2 of the fair value hierarchy.
When market quotations or official closing prices are not readily available, or are determined not to reflect accurately fair value, such as when the value of a security has been significantly affected by events after the close of the exchange or market on which the security is principally traded (for example, a foreign exchange or market), but before the fund calculates its net asset value, the fund may value these investments at fair value as determined in accordance with the procedures approved by the Company’s Board ofTrustees (the“Board”). Certain factors may be considered when fair valuing investments such as: fundamental analytical data, the nature and duration of restrictions on disposition, an evaluation of the forces that influence the market in which the securities are purchased and sold, and public trading in similar securities of the issuer or comparable issuers.These securities are either categorized as Level 2 or 3 depending on the relevant inputs used.
For restricted securities where observable inputs are limited, assumptions about market activity and risk are used and are categorized within Level 3 of the fair value hierarchy.
The following is a summary of the inputs used as of September 30, 2012 in valuing the fund’s investments:
| Level 2—Other | Level 3— | |||
| Level 1— | Significant | Significant | ||
| Unadjusted | Observable Unobservable | |||
| Quoted Prices | Inputs | Inputs | Total | |
| Assets ($) | ||||
| Investments in Securities: | ||||
| Equity Securities—Domestic | ||||
| Common Stocks† | 591,686,806 | — | — | 591,686,806 |
| Equity Securities—Foreign | ||||
| Common Stocks† | 11,193,887 | — | — | 11,193,887 |
| Exchange— | ||||
| Traded Funds | 35,793,755 | — | — | 35,793,755 |
| Mutual Funds | 97,095,131 | — | — | 97,095,131 |
| † | See Statement of Investments for additional detailed categorizations. |
24
At September 30, 2012, there were no transfers between Level 1 and Level 2 of the fair value hierarchy.
(b) Securities transactions and investment income: Securities transactions are recorded on a trade date basis. Realized gains and losses from securities transactions are recorded on the identified cost basis. Dividend income is recognized on the ex-dividend date and interest income, including, where applicable, accretion of discount and amortization of premium on investments, is recognized on the accrual basis.
Pursuant to a securities lending agreement withThe Bank of NewYork Mellon, the fund may lend securities to qualified institutions. It is the fund’s policy that, at origination, all loans are secured by collateral of at least 102% of the value of U.S. securities loaned and 105% of the value of foreign securities loaned. Collateral equivalent to at least 100% of the market value of securities on loan is maintained at all times. Collateral is either in the form of cash, which can be invested in certain money market mutual funds managed by the Manager, U.S. Government and Agency securities or letters of credit.The fund is entitled to receive all income on securities loaned, in addition to income earned as a result of the lending transaction.Although each security loaned is fully collateralized, the fund bears the risk of delay in recovery of, or loss of rights in, the securities loaned should a borrower fail to return the securities in a timely manner. During the period ended September 30, 2012,The Bank of New York Mellon earned $150,194 from lending portfolio securities, pursuant to the securities lending agreement.
(c) Affiliated issuers: Investments in other investment companies advised by Dreyfus are defined as “affiliated” in the Act. Investments in affiliated investment companies for the period ended September 30, 2012 were as follows:
| Affiliated | |||||
| Investment | Value | Value | Net | ||
| Company | 9/30/2011 ($) | Purchases ($) | Sales ($) | 9/30/2012 ($) | Assets (%) |
| Dreyfus | |||||
| Institutional | |||||
| Preferred | |||||
| Plus Money | |||||
| Market | |||||
| Fund | 7,666,191 | 252,012,982 | 244,974,269 | 14,704,904 | 2.3 |
| The Fund | 25 |
NOTES TO FINANCIAL STATEMENTS (continued)
| Affiliated | |||||
| Investment | Value | Value | Net | ||
| Company | 9/30/2011 ($) | Purchases ($) | Sales ($) | 9/30/2012 ($) | Assets (%) |
| Dreyfus | |||||
| Institutional | |||||
| Cash | |||||
| Advantage | |||||
| Fund | 94,607,097 | 472,818,627 | 485,035,497 | 82,390,227 | 12.6 |
| Total | 102,273,288 | 724,831,609 | 730,009,766 | 97,095,131 | 14.9 |
(d) Dividends to shareholders: Dividends are recorded on the ex-dividend date. Dividends from investment income-net and dividends from net realized capital gains, if any, are normally declared and paid annually, but the fund may make distributions on a more frequent basis to comply with the distribution requirements of the Internal Revenue Code of 1986, as amended (the “Code”).To the extent that net realized capital gains can be offset by capital loss carryovers, it is the policy of the fund not to distribute such gains. Income and capital gain distributions are determined in accordance with income tax regulations, which may differ from GAAP.
(e) Federal income taxes: It is the policy of the fund to continue to qualify as a regulated investment company, if such qualification is in the best interests of its shareholders, by complying with the applicable provisions of the Code, and to make distributions of taxable income sufficient to relieve it from substantially all federal income and excise taxes.
As of and during the period ended September 30, 2012, the fund did not have any liabilities for any uncertain tax positions.The fund recognizes interest and penalties, if any, related to uncertain tax positions as income tax expense in the Statement of Operations. During the period, the fund did not incur any interest or penalties.
Each of the tax years in the four-year period ended September 30, 2012 remains subject to examination by the Internal Revenue Service and state taxing authorities.
At September 30, 2012, the components of accumulated earnings on a tax basis were as follows: undistributed ordinary income $16,744,109,
26
undistributed capital gains $33,561,918, accumulated capital losses $21,906,981 and unrealized appreciation $94,367,360.
Under the Regulated Investment Company Modernization Act of 2010 (the “2010 Act”), the fund is permitted to carry forward capital losses incurred in taxable years beginning after December 22, 2010 (“post-enactment losses”) for an unlimited period. Furthermore, post-enactment capital loss carryovers retain their character as either short-term or long-term capital losses rather than short-term as they were under previous statute.The 2010 Act requires post-enactment losses to be utilized before the utilization of losses incurred in taxable years prior to the effective date of the 2010 Act (“pre-enactment losses”).As a result of this ordering rule, pre-enactment losses may be more likely to expire unused.
The accumulated capital loss carryover is available for federal income tax purposes to be applied against future net realized capital gains, if any, realized subsequent to September 30, 2012.As a result of the fund’s April 29, 2010 merger with Dreyfus Discovery Fund, capital losses of $21,906,981 are available to offset future gains, if any. Based on certain provisions in the Code, the amount of losses which can be utilized in subsequent years is subject to an annual limitation.This acquired capital loss will expire in fiscal 2016.
The tax character of distributions paid to shareholders during the fiscal periods ended September 30, 2012 and September 30, 2011 were as follows: ordinary income $1,503,681 and $0 and long-term capital gains $38,850,928 and $0, respectively.
During the period ended September 30, 2012, as a result of permanent book to tax differences, primarily due to the tax treatment for net operating losses, real estate investment trusts and limited partnerships, the fund increased accumulated undistributed investment income-net by $853,451 and decreased accumulated net realized gain (loss) on investments by the same amount. Net assets and net asset value per share were not affected by this reclassification.
| The Fund | 27 |
NOTES TO FINANCIAL STATEMENTS (continued)
NOTE 2—Bank Lines of Credit:
The fund participates with other Dreyfus-managed funds in a $225 million unsecured credit facility led by Citibank, N.A. and a $300 million unsecured credit facility provided by The Bank of New York Mellon (each, a “Facility”), each to be utilized primarily for temporary or emergency purposes, including the financing of redemptions. In connection therewith, the fund has agreed to pay its pro rata portion of commitment fees for each Facility. Interest is charged to the fund based on rates determined pursuant to the terms of the respective Facility at the time of borrowing. During the period ended September 30, 2012, the fund did not borrow under the Facilities.
NOTE 3—Investment Advisory Fee and Other Transactions With Affiliates:
(a) Pursuant to an investment advisory agreement with the Manager, the investment advisory fee is computed at the annual rate of .60% of the value of the fund’s average daily net assets and is payable monthly.
The fund has an Accounting and Administration Agreement (the “Administration Agreement”) with Dreyfus, whereby Dreyfus performs administrative and accounting services for the fund. The fund has agreed to compensate Dreyfus for providing accounting services, administration, compliance monitoring, regulatory and shareholder reporting, as well as for related facilities and equipment. The fee is based on the fund’s average daily net assets and computed at the following annual rates: .06% of the first $500 million, .04% of the next $500 million and .02% in excess of $1 billion.
In addition, after applying any expense limitations or fee waivers that reduce the fees paid to Dreyfus for this service, Dreyfus has contractually agreed in writing to waive any remaining fees for this service to the extent that they exceed both Dreyfus’ costs in providing these services and a reasonable allocation of the costs incurred by Dreyfus and its affiliates related to the support and oversight of these services.The
28
fund also reimburses Dreyfus for the out-of-pocket expenses incurred in performing this service for the fund. Pursuant to the Administration Agreement, the fund was charged $124,502 during the period ended September 30, 2012.
During the period ended September 30, 2012, the Distributor retained $5,420 from commissions earned on sales of the fund’s Class A shares and $733 from CDSCs on redemptions of the fund’s Class C shares.
(b) Under the Distribution Plan adopted pursuant to Rule 12b-1 under the Act, Class C shares pay the Distributor for distributing its shares at an annual rate of .75% of the value of the average daily net assets of Class C shares. During the period ended September 30, 2012, Class C shares were charged $10,754 pursuant to the Distribution Plan.
(c) Under the Shareholder Services Plan, Class A and Class C shares pay the Distributor at an annual rate of .25% of their average daily net assets for the provision of certain services.The services provided may include personal services relating to shareholder accounts, such as answering shareholder inquiries regarding the fund and providing reports and other information, and services related to the maintenance of shareholder accounts.The Distributor may make payments to Service Agents (securities dealers, financial institutions or other industry professionals) in respect of these services.The Distributor determines the amounts to be paid to Service Agents. During the period ended September 30, 2012, Class A and Class C shares were charged $322,353 and $3,585, respectively, pursuant to the Shareholder Services Plan.
Under its terms, the Distribution Plan and Shareholder Services Plan shall remain in effect from year to year, provided such continuance is approved annually by a vote of a majority of those Trustees who are not “interested persons” of the Trust and who have no direct or indirect financial interest in the operation of or in any agreement related to the Distribution Plan or Shareholder Services Plan.
| The Fund | 29 |
NOTES TO FINANCIAL STATEMENTS (continued)
The fund has arrangements with the transfer agent and the custodian whereby the fund may receive earnings credits when positive cash balances are maintained, which are used to offset transfer agency and custody fees. For financial reporting purposes, the fund includes net earnings credits as an expense offset in the Statement of Operations.
The fund compensates Dreyfus Transfer, Inc. (“DTI”), a wholly-owned subsidiary of the Manager, under a transfer agency agreement for providing transfer agency services for the fund and, since May 29, 2012, cash management services related to fund subscriptions and redemptions. During the period ended September 30, 2012, the fund was charged $99,677 for transfer agency services and $1,929 for cash management services. Cash management fees were partially offset by earnings credits of $230. These fees are included in Shareholder servicing costs in the Statement of Operations.
The fund compensatesThe Bank of NewYork Mellon under a custody agreement for providing custodial services for the fund. During the period ended September 30, 2012, the fund was charged $29,498 pursuant to the custody agreement.
Prior to May 29, 2012, the fund compensated The Bank of New York Mellon under a cash management agreement for performing cash management services related to fund subscriptions and redemptions. During the period ended September 30, 2012, the fund was charged $10,252 pursuant to the cash management agreement, which is included in Shareholder servicing costs in the Statement of Operations.These fees were partially offset by earnings credits of $314.
30
During the period ended September 30, 2012, the fund was charged $8,384 for services performed by the Chief Compliance Officer and his staff.
The components of “Due to The Dreyfus Corporation and affiliates” in the Statement of Assets and Liabilities consist of: investment advisory fees $320,850, Distribution Plan fees $1,085, Shareholder Services Plan fees $28,403, custodian fees $19,724, Chief Compliance Officer fees $1,991 and transfer agency fees $24,292.
(d) Each Board member also serves as a Board member of other funds within the Dreyfus complex. Annual retainer fees and attendance fees are allocated to each fund based on net assets.
NOTE 4—Securities Transactions:
The aggregate amount of purchases and sales of investment securities, excluding short-term securities, during the period ended September 30, 2012, amounted to $912,619,983 and $867,003,110, respectively.
At September 30, 2012, the cost of investments for federal income tax purposes was $641,402,219; accordingly, accumulated net unrealized appreciation on investments was $94,367,360, consisting of $111,088,713 gross unrealized appreciation and $16,721,353 gross unrealized depreciation.
| The Fund | 31 |
| REPORT OF INDEPENDENT REGISTERED |
| PUBLIC ACCOUNTING FIRM |
To the Board of Trustees and Shareholders of Dreyfus/The Boston Company Small/Mid Cap Growth Fund:
We have audited the accompanying statement of assets and liabilities of Dreyfus/The Boston Company Small/Mid Cap Growth Fund (the “Fund”), a series of Dreyfus Investment Funds, including the statement of investments as of September 30, 2012, the related statement of operations for the year then ended, and the statements of changes in net assets for each of the years in the two-year period then ended and the financial highlights for each of the years in the four-year period then ended. These financial statements and financial highlights are the responsibility of the Fund’s management. Our responsibility is to express an opinion on these financial statements and financial highlights based on our audits.The financial highlights for the year ended September 30, 2008 were audited by other independent registered public accountants whose report thereon, dated November 28, 2008, expressed an unqualified opinion on those financial highlights.
We conducted our audits in accordance with the standards of the Public Company Accounting Oversight Board (United States).Those standards require that we plan and perform the audit to obtain reasonable assurance about whether the financial statements and financial highlights are free of material misstatement. An audit includes examining, on a test basis, evidence supporting the amounts and disclosures in the financial statements. Our procedures included confirmation of securities owned as of September 30, 2012 by correspondence with the custodian and brokers or by other appropriate auditing procedures where replies from brokers were not received.An audit also includes assessing the accounting principles used and significant estimates made by management, as well as evaluating the overall financial statement presentation.We believe that our audits provide a reasonable basis for our opinion.
In our opinion, the financial statements and financial highlights referred to above present fairly, in all material respects, the financial position of Dreyfus/The Boston Company Small/Mid Cap Growth Fund as of September 30, 2012, the results of its operations for the year then ended, the changes in its net assets for each of the years in the two-year period then ended and the financial highlights for each of the years in the four-year period then ended, in conformity with U.S. generally accepted accounting principles.

New York, New York
November 28, 2012
32
IMPORTANT TAX INFORMATION (Unaudited)
For federal tax purposes, the fund reports the maximum amount allowable, but not less than $1,503,681 as ordinary income dividends paid during the year ended September 30, 2012 as qualified dividend income in accordance with Section 854(b)(1)(B) of the Internal Revenue Code.Also, the fund reports the maximum amount allowable but not less than 18.49% of ordinary income dividends paid during the year ended September 30, 2012 as eligible for the corporate dividends received deduction provided under Section 243 of the Internal Revenue Code in accordance with Section 854(b)(1)(A) of the Internal Revenue Code. Shareholders will receive notification in early 2013 of the percentage applicable to the preparation of their 2012 income tax returns.The fund reports the maximum amount allowable but not less than $1.1110 per share as a capital gain dividend in accordance with Section 852(b)(3)(C) of the Internal Revenue Code.The fund reports the maximum amount allowable but not less than $.0430 per share as a short-term capital gain dividend in accordance with Sections 871(k)(2) and 881(e) of the Internal Revenue Code.
| The Fund | 33 |
BOARD MEMBERS INFORMATION (Unaudited)
| Joseph S. DiMartino (68) |
| Chairman of the Board (2008) |
| Principal Occupation During Past 5Years: |
| • Corporate Director and Trustee |
| Other Public Company Board Memberships During Past 5Years: |
| • CBIZ (formerly, Century Business Services, Inc.), a provider of outsourcing functions for small |
| and medium size companies, Director (1997-present) |
| • Sunair Services Corporation, a provider of certain outdoor-related services to homes and |
| businesses, Director (2005-2009) |
| • The Newark Group, a provider of a national market of paper recovery facilities, paperboard |
| mills and paperboard converting plants, Director (2000-2010) |
| No. of Portfolios for which Board Member Serves: 157 |
| ——————— |
| Francine J. Bovich (61) |
| Board Member (2011) |
| Principal Occupation During Past 5Years: |
| • Trustee,The Bradley Trusts, private trust funds (2011-present) |
| • Managing Director, Morgan Stanley Investment Management (1993-2010) |
| No. of Portfolios for which Board Member Serves: 31 |
| ——————— |
| James M. Fitzgibbons (78) |
| Board Member (2008) |
| Principal Occupation During Past 5Years: |
| • Corporate Director and Trustee |
| Other Public Company Board Memberships During Past 5Years: |
| • Bill Barrett Corporation, an oil and natural gas exploration company, Director (2004-present) |
| No. of Portfolios for which Board Member Serves: 31 |
| ——————— |
| Kenneth A. Himmel (66) |
| Board Member (2008) |
| Principal Occupation During Past 5Years: |
| • President and CEO, Related Urban Development, a real estate development company (1996-present) |
| • President and CEO, Himmel & Company, a real estate development company (1980-present) |
| • CEO,American Food Management, a restaurant company (1983-present) |
| No. of Portfolios for which Board Member Serves: 31 |
34
| Stephen J. Lockwood (65) |
| Board Member (2008) |
| Principal Occupation During Past 5Years: |
| • Chairman of the Board, Stephen J. Lockwood and Company LLC, a real estate investment |
| company (2000-present) |
| No. of Portfolios for which Board Member Serves: 31 |
| ——————— |
| Roslyn M. Watson (62) |
| Board Member (2008) |
| Principal Occupation During Past 5Years: |
| • Principal,Watson Ventures, Inc., a real estate investment company (1993-present) |
| No. of Portfolios for which Board Member Serves: 41 |
| ——————— |
| Benaree Pratt Wiley (66) |
| Board Member (2008) |
| Principal Occupation During Past 5Years: |
| • Principal,TheWiley Group, a firm specializing in strategy and business development (2005-present) |
| Other Public Company Board Memberships During Past 5Years: |
| • CBIZ (formerly, Century Business Services, Inc.), a provider of outsourcing functions for small |
| and medium size companies, Director (2008-present) |
| No. of Portfolios for which Board Member Serves: 64 |
| ——————— |
Once elected all Board Members serve for an indefinite term, but achieve Emeritus status upon reaching age 80.The address of the Board Members and Officers is c/o The Dreyfus Corporation, 200 Park Avenue, NewYork, NewYork 10166.Additional information about the Board Members is available in the fund’s Statement of Additional Information which can be obtained from Dreyfus free of charge by calling this toll free number: 1-800-DREYFUS.
| The Fund | 35 |
OFFICERS OF THE FUND (Unaudited)
BRADLEY J. SKAPYAK, President since January 2010.
Chief Operating Officer and a director of the Manager since June 2009; from April 2003 to June 2009, Mr. Skapyak was the head of the Investment Accounting and Support Department of the Manager. He is an officer of 72 investment companies (comprised of 156 portfolios) managed by the Manager. He is 53 years old and has been an employee of the Manager since February 1988.
JANETTE E. FARRAGHER, Vice President and Secretary since December 2011.
Assistant General Counsel of BNY Mellon, and an officer of 73 investment companies (comprised of 183 portfolios) managed by the Manager. She is 49 years old and has been an employee of the Manager since February 1984.
KIESHA ASTWOOD, Vice President and Assistant Secretary since January 2010.
Counsel of BNY Mellon, and an officer of 73 investment companies (comprised of 183 portfolios) managed by the Manager. She is 39 years old and has been an employee of the Manager since July 1995.
JAMES BITETTO, Vice President and Assistant Secretary since December 2008.
Senior Counsel of BNY Mellon and Secretary of the Manager, and an officer of 73 investment companies (comprised of 183 portfolios) managed by the Manager. He is 46 years old and has been an employee of the Manager since December 1996.
JONI LACKS CHARATAN, Vice President and Assistant Secretary since December 2008.
Senior Counsel of BNY Mellon, and an officer of 73 investment companies (comprised of 183 portfolios) managed by the Manager. She is 56 years old and has been an employee of the Manager since October 1988.
JOSEPH M. CHIOFFI, Vice President and Assistant Secretary since December 2008.
Senior Counsel of BNY Mellon, and an officer of 73 investment companies (comprised of 183 portfolios) managed by the Manager. He is 50 years old and has been an employee of the Manager since June 2000.
JOHN B. HAMMALIAN, Vice President and Assistant Secretary since December 2008.
Senior Managing Counsel of BNY Mellon, and an officer of 73 investment companies (comprised of 183 portfolios) managed by the Manager. He is 49 years old and has been an employee of the Manager since February 1991.
ROBERT R. MULLERY, Vice President and Assistant Secretary since December 2008.
Managing Counsel of BNY Mellon, and an officer of 73 investment companies (comprised of 183 portfolios) managed by the Manager. He is 60 years old and has been an employee of the Manager since May 1986.
JEFF PRUSNOFSKY, Vice President and Assistant Secretary since December 2008.
Senior Managing Counsel of BNY Mellon, and an officer of 73 investment companies (comprised of 183 portfolios) managed by the Manager. He is 47 years old and has been an employee of the Manager since October 1990.
JAMES WINDELS, Treasurer since December 2008.
Director – Mutual Fund Accounting of the Manager, and an officer of 73 investment companies (comprised of 183 portfolios) managed by the Manager. He is 54 years old and has been an employee of the Manager since April 1985.
36
RICHARD CASSARO, Assistant Treasurer since December 2008.
Senior Accounting Manager – Money Market and Municipal Bond Funds of the Manager, and an officer of 73 investment companies (comprised of 183 portfolios) managed by the Manager. He is 53 years old and has been an employee of the Manager since September 1982.
GAVIN C. REILLY, Assistant Treasurer since December 2008.
Tax Manager of the Investment Accounting and Support Department of the Manager, and an officer of 73 investment companies (comprised of 183 portfolios) managed by the Manager. He is 44 years old and has been an employee of the Manager since April 1991.
ROBERT S. ROBOL, Assistant Treasurer since December 2008.
Senior Accounting Manager – Fixed Income Funds of the Manager, and an officer of 73 investment companies (comprised of 183 portfolios) managed by the Manager. He is 48 years old and has been an employee of the Manager since October 1988.
ROBERT SALVIOLO, Assistant Treasurer since December 2008.
Senior Accounting Manager – Equity Funds of the Manager, and an officer of 73 investment companies (comprised of 183 portfolios) managed by the Manager. He is 45 years old and has been an employee of the Manager since June 1989.
ROBERT SVAGNA, Assistant Treasurer since December 2008.
Senior Accounting Manager – Equity Funds of the Manager, and an officer of 73 investment companies (comprised of 183 portfolios) managed by the Manager. He is 45 years old and has been an employee of the Manager since November 1990.
JOSEPH W. CONNOLLY, Chief Compliance Officer since December 2008.
Chief Compliance Officer of the Manager and The Dreyfus Family of Funds (73 investment companies, comprised of 183 portfolios). He is 55 years old and has served in various capacities with the Manager since 1980, including manager of the firm’s Fund Accounting Department from 1997 through October 2001.
MATTHEW D. CONNOLLY, Anti-Money Laundering Compliance Officer since April 2012.
Anti-Money Laundering Compliance Officer of the Distributor since October 2011; from March 2010 to September 2011, Global Head, KYC Reviews and Director, UBS Investment Bank; until March 2010,AML Compliance Officer and Senior Vice President, Citi Global Wealth Management. He is an officer of 69 investment companies (comprised of 179 portfolios) managed by the Manager. He is 40 years old and has been an employee of the Distributor since October 2011.
| The Fund | 37 |
For More Information
Telephone Call your financial representative or 1-800-DREYFUS
Mail The Dreyfus Family of Funds, 144 Glenn Curtiss Boulevard, Uniondale, NY 11556-0144
The fund files its complete schedule of portfolio holdings with the Securities and Exchange Commission (“SEC”) for the first and third quarters of each fiscal year on Form N-Q. The fund’s Forms N-Q are available on the SEC’s website at http://www.sec.gov and may be reviewed and copied at the SEC’s Public Reference Room in Washington, DC. Information on the operation of the Public Reference Room may be obtained by calling 1-800-SEC-0330.
A description of the policies and procedures that the fund uses to determine how to vote proxies relating to portfolio securities, and information regarding how the fund voted these proxies for the most recent 12-month period ended June 30 is available at http://www.dreyfus.com and on the SEC’s website at http://www.sec.gov. The description of the policies and procedures is also available without charge, upon request, by calling 1-800-DREYFUS.

| Dreyfus/Standish |
| Intermediate Tax Exempt |
| Bond Fund |
ANNUAL REPORT September 30, 2012
The views expressed in this report reflect those of the portfolio manager only through the end of the period covered and do not necessarily represent the views of Dreyfus or any other person in the Dreyfus organization. Any such views are subject to change at any time based upon market or other conditions and Dreyfus disclaims any responsibility to update such views.These views may not be relied on as investment advice and, because investment decisions for a Dreyfus fund are based on numerous factors, may not be relied on as an indication of trading intent on behalf of any Dreyfus fund.
| Not FDIC-Insured • Not Bank-Guaranteed • May Lose Value |
Contents | |
THE FUND | |
| 2 | A Letter from the Chairman and CEO |
| 3 | Discussion of Fund Performance |
| 6 | Fund Performance |
| 8 | Understanding Your Fund’s Expenses |
| 8 | Comparing Your Fund’s Expenses With Those of Other Funds |
| 9 | Statement of Investments |
| 22 | Statement of Assets and Liabilities |
| 23 | Statement of Operations |
| 24 | Statement of Changes in Net Assets |
| 26 | Financial Highlights |
| 29 | Notes to Financial Statements |
| 41 | Report of Independent Registered Public Accounting Firm |
| 42 | Important Tax Information |
| 43 | Board Members Information |
| 45 | Officers of the Fund |
FOR MORE INFORMATION | |
Back Cover |
Dreyfus/Standish
Intermediate Tax Exempt
Bond Fund
The Fund
A LETTER FROM THE CHAIRMAN AND CEO

Dear Shareholder:
This annual report for Dreyfus/Standish Intermediate Tax Exempt Bond Fund covers the 12-month period from October 1, 2011, through September 30, 2012. For information about how the fund performed during the reporting period, as well as general market perspectives, we provide a Discussion of Fund Performance on the pages that follow.
The municipal bond market exhibited heightened volatility over the past year as prices rose and fell according to supply-and-demand factors and investors’ changing expectations of global and domestic economic conditions.While monthly variations in economic data have been pronounced, the longer-term pace of U.S. economic growth has been relatively consistent at about half the average rate achieved in prior recoveries. Even U.S. employment numbers, which have been volatile over short periods, averaged approximately 150,000 new jobs a month so far in 2012, roughly unchanged from the monthly average in 2011.
The sustained but subpar U.S. expansion appears likely to continue over the foreseeable future. On one hand, the economy has responded to a variety of stimulative measures, most notably an aggressively accommodative monetary policy. On the other hand, the prospect of automatic spending cuts and tax hikes scheduled for the end of 2012 has weighed on economic growth by contributing to a temporary postponement of spending decisions among consumers and businesses. Indeed, the ability of the U.S. political system to address both this “fiscal cliff” and long-term deficit reduction could go a long way toward shaping the 2013 market environment.As always, we urge you to speak regularly with your financial advisor to discuss how changing economic conditions may affect your investments.
Thank you for your continued confidence and support.

Jonathan R. Baum
Chairman and Chief Executive Officer
The Dreyfus Corporation
October 15, 2012
2
DISCUSSION OF FUND PERFORMANCE
For the period of October 1, 2011, through September 30, 2012, as provided by Christine Todd, CFA, Steven Harvey and Thomas Casey, Portfolio Managers
Fund and Market Performance Overview
For the 12-month period ended September 30, 2012, Dreyfus/Standish Intermediate Tax Exempt Bond Fund’s Class A shares produced a total return of 5.19%, Class C shares returned 4.39% and Class I shares returned 5.54%.1 In comparison, the fund’s benchmark, the Barclays 3-, 5-, 7-, 10-Year Municipal Bond Index (the “Index”), provided a total return of 5.43% for the same period.2
Falling long-term interest rates and favorable supply-and-demand dynamics supported municipal bond prices over the reporting period. The fund’s relative returns to the benchmark were mainly due to a focus on longer-term maturities and an emphasis on income-oriented revenue bonds.
The Fund’s Investment Approach
The fund seeks to provide a high level of interest income exempt from federal income tax, while seeking preservation of shareholders’ capital.To pursue this goal, the fund normally invests at least 80% of its assets in municipal bonds that provide income exempt from federal personal income tax.
The fund invests exclusively in fixed-income securities rated, at the time of purchase, investment grade or the unrated equivalent as determined by Dreyfus, with an emphasis on high grade securities.3 The dollar-weighted average effective maturity of the fund’s portfolio generally will be between three and 10 years, but the fund may invest in individual securities of any maturity. We focus on identifying undervalued sectors and securities, and we minimize the use of interest rate forecasting.We select municipal bonds by using fundamental credit analysis to estimate the relative value and attractiveness of various sectors and securities and to exploit pricing inefficiencies in the municipal bond market.We actively trade among various sectors, such as pre-refunded, general obligation and revenue bonds, based on their apparent relative values.
| The Fund | 3 |
DISCUSSION OF FUND PERFORMANCE (continued)
Supply-and-Demand Dynamics Supported Municipal Bonds
Although macroeconomic concerns in the fall of 2011 and the spring of 2012 sparked heightened volatility in most financial markets, municipal bonds generally remained strong during the reporting period, in part due to falling long-term interest rates stemming from quantitative easing and other stimulative measures by the Federal Reserve Board.
Municipal bond prices also responded positively to robust demand as investors sought competitive levels of after-tax income in a low interest-rate environment. Meanwhile, new issuance volumes remained relatively low when political pressure led to less borrowing for capital projects, and municipalities primarily issued new bonds to refinance older debt, resulting in a net decrease in the supply of tax-exempt securities. In this constructive environment, lower-rated and longer maturity municipal bonds that had been punished earlier in 2011 led the market higher, while highly rated and shorter-term securities generally lagged market averages.
From a credit-quality perspective, a number of state governments have taken the difficult steps necessary to reduce or eliminate budget deficits, and a few have achieved surpluses.
Revenue Bonds Buoyed Relative Performance
The fund benefited from overweighted exposure to higher yielding revenue-backed municipal bonds and a corresponding de-emphasis on lower yielding general obligation bonds.The fund received especially robust contributions to relative performance from overweighted exposure to bonds backed by revenues from hospitals, airports, industrial development projects, and the states’ settlement of litigation with U.S. tobacco companies.
The fund’s performance also was aided by a modestly long duration posture, as we favored municipal bonds toward the longer end of the market’s intermediate-maturity spectrum at a time when longer-term yields fell. As holdings neared their final maturities, we typically sold them and redeployed the proceeds into bonds with maturities of eight to 12 years. In addition, we made tactical investments in highly rated, relatively liquid municipal bonds when they declined to levels we considered undervalued. For example, we purchased Illinois general obligation bonds over the summer of 2012 and subsequently sold them at higher prices.
4
At times during the reporting period, we successfully employed interest rate swaps to take advantage of temporary dislocations in the yield relationship between municipal bonds and U.S.Treasury securities.
Disappointments during the reporting period were relatively limited, concentrated mainly among higher quality, lower yielding market segments, such as securities backed by revenues from essential municipal services. In addition, an underweighted position in callable bonds hindered relative results when such securities fared relatively well in the low interest-rate environment.
Adjusting to Richer Valuations
We have been encouraged by recently improved data, but the U.S. economy remains vulnerable to unexpected shocks and uncertainty regarding future fiscal policies. In addition, higher yielding and longer-maturity bonds have become more richly valued after recent rallies. Consequently, while we have continued to favor revenue-backed municipal bonds over their general obligation counterparts, we remain watchful for opportunities to capture better relative values, and we are prepared to adjust the fund’s strategies accordingly.
October 15, 2012
Bond funds are subject generally to interest rate, credit, liquidity and market risks, to varying degrees, all of which are more fully described in the fund’s prospectus. Generally, all other factors being equal, bond prices are inversely related to interest-rate changes, and rate increases can cause price declines.
The use of derivatives involves risks different from, or possibly greater than, the risks associated with investing directly in the underlying assets. Derivatives can be highly volatile, illiquid, and difficult to value and there is the risk that changes in the value of a derivative held by the fund will not correlate with the underlying instruments of the fund’s other investments.
| 1 Total return includes reinvestment of dividends and any capital gains paid, and does not take into consideration the |
| maximum initial sales charge in the case of Class A shares or the applicable contingent deferred sales charge imposed |
| on redemptions in the case of Class C shares. Had these charges been reflected, returns would have been lower. Class I |
| shares are not subject to any initial or deferred sales charge. Past performance is no guarantee of future results. Share |
| price, yield and investment return fluctuate such that upon redemption, fund shares may be worth more or less than |
| their original cost. Income may be subject to state and local taxes, and some income may be subject to the federal |
| alternative minimum tax (AMT) for certain investors. Capital gains, if any, are taxable. Return figures provided |
| reflect the absorption of certain fund expenses by The Dreyfus Corporation, pursuant to an agreement in effect through |
| February 1, 2014, at which time it may be extended, modified or terminated. Had these expenses not been absorbed, |
| the fund’s returns would have been lower. |
| 2 Source: Lipper Inc. |
| 3 The fund may continue to own investment-grade bonds (at the time of purchase), which are subsequently downgraded |
| to below investment grade. |
| The Fund | 5 |
FUND PERFORMANCE
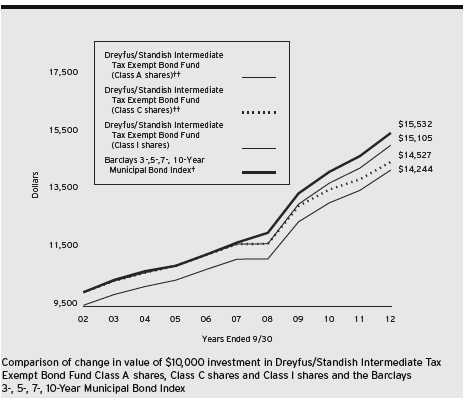
| † | Source: Lipper Inc. |
| †† | The total return figures presented for Class A and Class C shares of the fund reflect the performance of the fund’s |
| Class I shares for the period prior to 3/31/09 (the inception date for Class A and Class C shares), adjusted to | |
| reflect the applicable sales load for each share class. |
Past performance is not predictive of future performance.
The above graph compares a $10,000 investment made in each of the Class A, Class C and Class I shares of Dreyfus/Standish Intermediate Tax Exempt Bond Fund on 9/30/02 to a $10,000 investment made in the Barclays 3-, 5-, 7-, 10-Year Municipal Bond Index (the “Index”) on that date. All dividends and capital gain distributions are reinvested.
The fund’s performance shown in the line graph above takes into account the maximum initial sales charge on Class A shares and all other applicable fees and expenses on all classes.The Index is an equal-weighted composite of the Barclays 3-Year, 5-Year, 7-Year, and 10-Year Municipal Bond indices, each of which is a broad measure of the performance of investment grade, fixed-rate municipal bonds. Unlike a mutual fund, the Index is not subject to charges, fees and other expenses. Investors cannot invest directly in any index.These factors can contribute to the Index potentially outperforming the fund. Further information relating to fund performance, including expense reimbursements, if applicable, is contained in the Financial Highlights section of the prospectus and elsewhere in this report.
6
| Average Annual Total Returns as of 9/30/12 | |||||||
| Inception | |||||||
| Date | 1 Year | 5 Years | 10 Years | ||||
| Class A shares | |||||||
| with maximum sales charge (4.5%) | 3/31/09 | 0.43 | % | 4.06 | %†† | 3.60 | %†† |
| without sales charge | 3/31/09 | 5.19 | % | 5.03 | %†† | 4.08 | %†† |
| Class C shares | |||||||
| with applicable redemption charge † | 3/31/09 | 3.39 | % | 4.48 | %†† | 3.81 | %†† |
| without redemption | 3/31/09 | 4.39 | % | 4.48 | %†† | 3.81 | %†† |
| Class I shares | 11/2/92 | 5.54 | % | 5.30 | % | 4.21 | % |
| Barclays Capital 3-, 5-, 7-, | |||||||
| 10-Year Municipal Bond Index | 5.43 | % | 5.79 | % | 4.50 | % | |
Past performance is not predictive of future performance.The fund’s performance shown in the graph and table does not reflect the deduction of taxes that a shareholder would pay on fund distributions or the redemption of fund shares.
| † | The maximum contingent deferred sales charge for Class C shares is 1% for shares redeemed within one year of the |
| date of purchase. | |
| †† | The total return performance figures presented for Class A and Class C shares of the fund reflect the performance of |
| the fund’s Class I shares for the period prior to 3/31/09 (the inception date for Class A and Class C shares), | |
| adjusted to reflect the applicable sales load for each share class. |
| The Fund | 7 |
UNDERSTANDING YOUR FUND’S EXPENSES (Unaudited)
As a mutual fund investor, you pay ongoing expenses, such as management fees and other expenses. Using the information below, you can estimate how these expenses affect your investment and compare them with the expenses of other funds.You also may pay one-time transaction expenses, including sales charges (loads) and redemption fees, which are not shown in this section and would have resulted in higher total expenses. For more information, see your fund’s prospectus or talk to your financial adviser.
Review your fund’s expenses
The table below shows the expenses you would have paid on a $1,000 investment in Dreyfus/Standish IntermediateTax Exempt Bond Fund from April 1, 2012 to September 30, 2012. It also shows how much a $1,000 investment would be worth at the close of the period, assuming actual returns and expenses.
Expenses and Value of a $1,000 Investment
assuming actual returns for the six months ended September 30, 2012
| Class A | Class C | Class I | ||||
| Expenses paid per $1,000† | $ | 4.05 | $ | 7.84 | $ | 2.28 |
| Ending value (after expenses) | $ | 1,027.30 | $ | 1,023.10 | $ | 1,029.20 |
COMPARING YOUR FUND’S EXPENSES
WITH THOSE OF OTHER FUNDS (Unaudited)
Using the SEC’s method to compare expenses
The Securities and Exchange Commission (SEC) has established guidelines to help investors assess fund expenses. Per these guidelines, the table below shows your fund’s expenses based on a $1,000 investment, assuming a hypothetical 5% annualized return. You can use this information to compare the ongoing expenses (but not transaction expenses or total cost) of investing in the fund with those of other funds.All mutual fund shareholder reports will provide this information to help you make this comparison. Please note that you cannot use this information to estimate your actual ending account balance and expenses paid during the period.
Expenses and Value of a $1,000 Investment
assuming a hypothetical 5% annualized return for the six months ended September 30, 2012
| Class A | Class C | Class I | ||||
| Expenses paid per $1,000† | $ | 4.05 | $ | 7.82 | $ | 2.28 |
| Ending value (after expenses) | $ | 1,021.00 | $ | 1,017.25 | $ | 1,022.75 |
| † Expenses are equal to the fund’s annualized expense ratio of .80% for Class A, 1.55% for Class C and .45% |
| for Class I, multiplied by the average account value over the period, multiplied by 183/366 (to reflect the one-half |
| year period). |
8
| STATEMENT OF INVESTMENTS | ||||
| September 30, 2012 | ||||
| Long-Term Municipal | Coupon | Maturity | Principal | |
| Investments—97.7% | Rate (%) | Date | Amount ($) | Value ($) |
| Alabama—.8% | ||||
| Birmingham Water Works Board, | ||||
| Water Revenue (Insured; Assured | ||||
| Guaranty Municipal Corp.) | 5.00 | 1/1/17 | 1,000,000 | 1,161,110 |
| Alaska—.8% | ||||
| Alaska Student Loan Corporation, | ||||
| Education Loan Revenue | 5.25 | 6/1/14 | 1,000,000 | 1,072,000 |
| Arizona—.4% | ||||
| Pima County Industrial Development | ||||
| Authority, Education Revenue | ||||
| (American Charter Schools | ||||
| Foundation Project) | 5.13 | 7/1/15 | 545,000 | 550,254 |
| California—14.5% | ||||
| California, | ||||
| Economic Recovery Bonds | 5.00 | 7/1/18 | 1,500,000 | 1,839,150 |
| California, | ||||
| GO (Insured; AMBAC) | 6.00 | 4/1/16 | 1,000,000 | 1,182,400 |
| California, | ||||
| GO (Insured; AMBAC) | 6.00 | 2/1/17 | 1,000,000 | 1,215,520 |
| California, | ||||
| GO (Various Purpose) | 5.00 | 10/1/17 | 1,500,000 | 1,789,305 |
| California Health Facilities | ||||
| Financing Authority, Revenue | ||||
| (Sutter Health) | 5.00 | 8/15/18 | 1,030,000 | 1,236,669 |
| California Housing Finance Agency, | ||||
| Home Mortgage Revenue | ||||
| (Insured; Assured Guaranty | ||||
| Municipal Corp.) | 5.13 | 8/1/18 | 1,250,000 | 1,323,512 |
| California State Public Works | ||||
| Board, LR (Judicial Council of | ||||
| California) (Various Judicial | ||||
| Council Projects) | 5.00 | 12/1/17 | 1,015,000 | 1,194,665 |
| California State University | ||||
| Trustees, Systemwide Revenue | 5.00 | 11/1/22 | 1,000,000 | 1,249,180 |
| Golden State Tobacco | ||||
| Securitization Corporation, | ||||
| Enhanced Tobacco Settlement | ||||
| Asset-Backed Bonds | ||||
| (Insured; AMBAC) | 5.00 | 6/1/20 | 500,000 | 500,635 |
| The Fund | 9 |
STATEMENT OF INVESTMENTS (continued)
| Long-Term Municipal | Coupon | Maturity | Principal | |
| Investments (continued) | Rate (%) | Date | Amount ($) | Value ($) |
| California (continued) | ||||
| Golden State Tobacco | ||||
| Securitization Corporation, | ||||
| Enhanced Tobacco Settlement | ||||
| Asset-Backed Bonds | ||||
| (Insured; AMBAC) | 4.60 | 6/1/23 | 750,000 | 785,873 |
| Sacramento County, | ||||
| Airport System Senior Revenue | 5.00 | 7/1/22 | 1,275,000 | 1,458,893 |
| San Diego County Water Authority, | ||||
| Water Revenue | 5.00 | 5/1/21 | 1,000,000 | 1,259,550 |
| Southern California Public Power | ||||
| Authority, Revenue (Canyon | ||||
| Power Project) | 5.00 | 7/1/22 | 2,000,000 | 2,429,040 |
| Southern California Public Power | ||||
| Authority, Revenue (Windy | ||||
| Point/Windy Flats Project) | 5.00 | 7/1/23 | 1,000,000 | 1,217,780 |
| Tuolumne Wind Project Authority, | ||||
| Revenue (Tuolumne | ||||
| Company Project) | 5.00 | 1/1/18 | 1,000,000 | 1,189,410 |
| Colorado—.9% | ||||
| Colorado Housing and Finance | ||||
| Authority, Single Family | ||||
| Program Senior and | ||||
| Subordinate Bonds | 6.80 | 2/1/31 | 785,000 | 826,056 |
| Colorado Housing and Finance | ||||
| Authority, Single Family | ||||
| Program Senior and Subordinate | ||||
| Bonds (Collateralized; FHA) | 6.60 | 8/1/32 | 440,000 | 470,474 |
| Florida—10.1% | ||||
| Citizens Property Insurance | ||||
| Corporation, High-Risk Account | ||||
| Senior Secured Revenue | ||||
| (Insured; National Public | ||||
| Finance Guarantee Corp.) | 5.00 | 3/1/14 | 1,000,000 | 1,058,090 |
| Citizens Property Insurance | ||||
| Corporation, High-Risk Account | ||||
| Senior Secured Revenue | ||||
| (Insured; National Public | ||||
| Finance Guarantee Corp.) | 5.00 | 3/1/15 | 2,000,000 | 2,174,760 |
10
| Long-Term Municipal | Coupon | Maturity | Principal | |
| Investments (continued) | Rate (%) | Date | Amount ($) | Value ($) |
| Florida (continued) | ||||
| Citizens Property Insurance | ||||
| Corporation, Personal Lines | ||||
| Account/Commercial Lines | ||||
| Account Senior Secured Revenue | 5.00 | 6/1/20 | 1,500,000 | 1,744,545 |
| Lakeland, | ||||
| Energy System Revenue | ||||
| (Insured; Assured Guaranty | ||||
| Municipal Corp.) | 5.00 | 10/1/17 | 1,000,000 | 1,187,120 |
| Miami-Dade County, | ||||
| Aviation Revenue (Miami | ||||
| International Airport) | 5.25 | 10/1/23 | 1,000,000 | 1,195,020 |
| Miami-Dade County, | ||||
| Water and Sewer System Revenue | ||||
| (Insured; Assured Guaranty | ||||
| Municipal Corp.) | 5.25 | 10/1/19 | 2,000,000 | 2,491,140 |
| Orlando Utilities Commission, | ||||
| Utility System Revenue | 5.00 | 10/1/14 | 100,000 | 108,949 |
| Orlando-Orange County Expressway | ||||
| Authority, Revenue (Insured; | ||||
| Assured Guaranty Municipal Corp.) | 5.00 | 7/1/18 | 1,000,000 | 1,198,170 |
| South Miami Health Facilities | ||||
| Authority, HR (Baptist Health | ||||
| South Florida Obligated Group) | 5.00 | 8/15/18 | 750,000 | 873,848 |
| Tampa, | ||||
| Capital Improvement Cigarette | ||||
| Tax Allocation Revenue (H. Lee | ||||
| Moffitt Cancer Center Project) | 5.00 | 9/1/23 | 500,000 | 597,030 |
| Tampa, | ||||
| Health System Revenue (BayCare | ||||
| Health System Issue) | 5.00 | 11/15/18 | 1,000,000 | 1,194,550 |
| Georgia—6.7% | ||||
| Atlanta, | ||||
| Airport General Revenue | 5.00 | 1/1/16 | 1,000,000 | 1,135,670 |
| Atlanta, | ||||
| Airport General Revenue | 5.00 | 1/1/22 | 1,000,000 | 1,159,960 |
| Atlanta, | ||||
| Water and Wastewater Revenue | 6.00 | 11/1/20 | 1,000,000 | 1,291,990 |
| The Fund | 11 |
STATEMENT OF INVESTMENTS (continued)
| Long-Term Municipal | Coupon | Maturity | Principal | |
| Investments (continued) | Rate (%) | Date | Amount ($) | Value ($) |
| Georgia (continued) | ||||
| Georgia State Road and Tollway | ||||
| Authority, Guaranteed Revenue | 5.00 | 3/1/19 | 1,175,000 | 1,467,763 |
| Municipal Electric Authority of | ||||
| Georgia, GO (Project One | ||||
| Subordinated Bonds) | 5.00 | 1/1/21 | 1,000,000 | 1,216,680 |
| Private Colleges and Universities | ||||
| Authority, Revenue | ||||
| (Emory University) | 5.00 | 9/1/16 | 2,500,000 | 2,935,750 |
| Hawaii—.8% | ||||
| Honolulu City and County Board of | ||||
| Water Supply, Water System | ||||
| Revenue (Insured; National | ||||
| Public Finance Guarantee Corp.) | 5.00 | 7/1/14 | 1,000,000 | 1,078,030 |
| Illinois—7.4% | ||||
| Chicago, | ||||
| General Airport Third Lien | ||||
| Revenue (Chicago O’Hare | ||||
| International Airport) | ||||
| (Insured; Assured Guaranty | ||||
| Municipal Corp.) | 5.00 | 1/1/20 | 1,000,000 | 1,146,580 |
| Chicago, | ||||
| GO (Insured; Assured Guaranty | ||||
| Municipal Corp.) | 5.50 | 1/1/19 | 2,000,000 | 2,432,760 |
| Cook County Community High School | ||||
| District Number 219, GO School | ||||
| Bonds (Insured; FGIC) | 7.88 | 12/1/14 | 100,000 | 116,295 |
| Cook County Community High School | ||||
| District Number 219, GO School | ||||
| Bonds (Insured; National | ||||
| Public Finance Guarantee Corp.) | 7.88 | 12/1/14 | 650,000 | 749,580 |
| Illinois, | ||||
| GO | 5.00 | 8/1/22 | 500,000 | 579,250 |
| Illinois, | ||||
| Sales Tax Revenue | 5.00 | 6/15/15 | 1,000,000 | 1,121,080 |
| Illinois Finance Authority, | ||||
| Revenue (DePaul University) | 5.00 | 10/1/16 | 1,000,000 | 1,097,610 |
12
| Long-Term Municipal | Coupon | Maturity | Principal | |
| Investments (continued) | Rate (%) | Date | Amount ($) | Value ($) |
| Illinois (continued) | ||||
| Northern Illinois University | ||||
| Board of Trustees, Auxiliary | ||||
| Facilities System Revenue | ||||
| (Insured; Assured Guaranty | ||||
| Municipal Corp.) | 5.00 | 4/1/17 | 1,500,000 | 1,694,670 |
| Railsplitter Tobacco Settlement | ||||
| Authority, Tobacco | ||||
| Settlement Revenue | 5.00 | 6/1/17 | 1,000,000 | 1,138,310 |
| Indiana—2.5% | ||||
| Indianapolis Local Public | ||||
| Improvement Bond Bank, Revenue | 5.00 | 6/1/17 | 1,625,000 | 1,881,864 |
| Knox County, | ||||
| EDR (Good Samaritan | ||||
| Hospital Project) | 5.00 | 4/1/23 | 1,300,000 | 1,479,439 |
| Kansas—1.0% | ||||
| Kansas Development Finance | ||||
| Authority, Revolving Funds | ||||
| Revenue (Kansas Department of | ||||
| Health and Environment) | 5.00 | 3/1/21 | 1,150,000 | 1,423,516 |
| Kentucky—.9% | ||||
| Louisville and Jefferson County | ||||
| Metropolitan Sewer District, | ||||
| Sewer and Drainage | ||||
| System Revenue | 5.00 | 5/15/23 | 1,000,000 | 1,242,510 |
| Louisiana—1.2% | ||||
| Parish of Orleans Parishwide | ||||
| School District, GO (Insured; | ||||
| Assured Guaranty Municipal Corp.) | 4.00 | 9/1/14 | 1,500,000 | 1,584,840 |
| Maryland—2.1% | ||||
| Maryland, | ||||
| GO (State and Local | ||||
| Facilities Loan) | 5.00 | 8/1/16 | 1,500,000 | 1,762,470 |
| Maryland Economic Development | ||||
| Corporation, EDR (Transportation | ||||
| Facilities Project) | 5.13 | 6/1/20 | 1,000,000 | 1,109,700 |
| The Fund | 13 |
STATEMENT OF INVESTMENTS (continued)
| Long-Term Municipal | Coupon | Maturity | Principal | |
| Investments (continued) | Rate (%) | Date | Amount ($) | Value ($) |
| Massachusetts—5.3% | ||||
| Boston, | ||||
| GO | 5.00 | 4/1/22 | 2,500,000 | 3,232,425 |
| Massachusetts Department of | ||||
| Transportation, Metropolitan | ||||
| Highway System Senior Revenue | 5.00 | 1/1/15 | 1,500,000 | 1,643,715 |
| Massachusetts Health and | ||||
| Educational Facilities | ||||
| Authority, Revenue (Lahey | ||||
| Clinic Medical Center Issue) | ||||
| (Insured; National Public | ||||
| Finance Guarantee Corp.) | 5.00 | 8/15/14 | 1,000,000 | 1,071,700 |
| Massachusetts School Building | ||||
| Authority, Senior Dedicated | ||||
| Sales Tax Revenue | 5.00 | 8/15/24 | 1,000,000 | 1,261,600 |
| Michigan—4.5% | ||||
| Detroit, | ||||
| Sewage Disposal System Second | ||||
| Lien Revenue (Insured; | ||||
| National Public Finance | ||||
| Guarantee Corp.) | 5.00 | 7/1/13 | 1,000,000 | 1,022,740 |
| Detroit, | ||||
| Sewage Disposal System Senior | ||||
| Lien Revenue (Insured; Assured | ||||
| Guaranty Municipal Corp.) | 5.25 | 7/1/19 | 1,000,000 | 1,156,190 |
| Detroit School District, | ||||
| School Building and Site | ||||
| Improvement Bonds | ||||
| (Insured; Assured Guaranty | ||||
| Municipal Corp.) | 5.00 | 5/1/14 | 1,000,000 | 1,062,590 |
| Michigan Finance Authority, | ||||
| Unemployment Obligation | ||||
| Assessment Revenue | 5.00 | 7/1/21 | 1,500,000 | 1,802,775 |
| Wayne County Airport Authority, | ||||
| Airport Revenue (Detroit | ||||
| Metropolitan Wayne | ||||
| County Airport) | 5.00 | 12/1/16 | 1,000,000 | 1,136,330 |
| Nebraska—.8% | ||||
| Nebraska Public Power District, | ||||
| General Revenue | 5.00 | 1/1/15 | 1,000,000 | 1,102,470 |
14
| Long-Term Municipal | Coupon | Maturity | Principal | |
| Investments (continued) | Rate (%) | Date | Amount ($) | Value ($) |
| New Jersey—3.6% | ||||
| Higher Education Student | ||||
| Assistance Authority, Senior | ||||
| Student Loan Revenue | 5.00 | 12/1/18 | 1,000,000 | 1,136,490 |
| New Jersey Economic Development | ||||
| Authority, Water Facilities | ||||
| Revenue (New Jersey—American | ||||
| Water Company, Inc. Project) | 5.10 | 6/1/23 | 1,000,000 | 1,138,560 |
| New Jersey Educational Facilities | ||||
| Authority, Revenue (Rowan | ||||
| University Issue) | 5.00 | 7/1/18 | 1,225,000 | 1,441,041 |
| New Jersey Transportation | ||||
| Trust Fund Authority | ||||
| (Transportation System) | 5.00 | 12/15/16 | 1,000,000 | 1,169,060 |
| New Mexico—.9% | ||||
| Jicarilla, | ||||
| Apache Nation Revenue | 5.00 | 9/1/13 | 165,000 | 170,163 |
| New Mexico, | ||||
| Severance Tax Bonds | 5.00 | 7/1/15 | 1,000,000 | 1,127,380 |
| New York—5.1% | ||||
| Metropolitan Transportation | ||||
| Authority, Transportation | ||||
| Revenue | 5.25 | 11/15/14 | 1,000,000 | 1,100,780 |
| New York City, | ||||
| GO | 5.00 | 8/1/21 | 2,000,000 | 2,411,340 |
| New York City Health and | ||||
| Hospitals Corporation, | ||||
| Health System Revenue | 5.00 | 2/15/19 | 1,000,000 | 1,185,960 |
| New York City Industrial | ||||
| Development Agency, Special | ||||
| Facility Revenue (Terminal One | ||||
| Group Association, L.P. Project) | 5.50 | 1/1/14 | 1,000,000 | 1,044,140 |
| New York State Dormitory | ||||
| Authority, Revenue (New York | ||||
| State Department of Health) | 5.00 | 7/1/17 | 1,000,000 | 1,187,710 |
| Ohio—1.9% | ||||
| Franklin County, | ||||
| Revenue (Trinity Health | ||||
| Credit Group) | 5.00 | 6/1/14 | 1,340,000 | 1,434,912 |
| The Fund | 15 |
STATEMENT OF INVESTMENTS (continued)
| Long-Term Municipal | Coupon | Maturity | Principal | |
| Investments (continued) | Rate (%) | Date | Amount ($) | Value ($) |
| Ohio (continued) | ||||
| University of Toledo, | ||||
| General Receipts Bonds | 5.00 | 6/1/17 | 1,050,000 | 1,214,010 |
| Pennsylvania—1.7% | ||||
| Pennsylvania Intergovernmental | ||||
| Cooperation Authority, | ||||
| Special Tax Revenue (City of | ||||
| Philadelphia Funding Program) | 5.00 | 6/15/17 | 1,000,000 | 1,194,980 |
| Philadelphia School District, | ||||
| GO | 5.00 | 9/1/14 | 1,000,000 | 1,082,510 |
| South Carolina—1.4% | ||||
| South Carolina Public Service | ||||
| Authority, Revenue Obligations | ||||
| (Santee Cooper) | 5.00 | 12/1/21 | 1,500,000 | 1,885,770 |
| South Dakota—2.1% | ||||
| South Dakota Conservancy District, | ||||
| Revenue (State Revolving | ||||
| Fund Program) | 5.00 | 8/1/17 | 2,370,000 | 2,861,704 |
| Texas—10.6% | ||||
| Dallas Independent School | ||||
| District, Unlimited Tax | ||||
| School Building Bonds | ||||
| (Permament School Fund | ||||
| Guarantee Program) | 5.25 | 2/15/16 | 1,000,000 | 1,161,770 |
| Houston, | ||||
| Combined Utility System First | ||||
| Lien Revenue | 5.00 | 11/15/18 | 1,355,000 | 1,672,233 |
| Houston Convention and | ||||
| Entertainment Facilities | ||||
| Department, Hotel Occupancy | ||||
| Tax and Special Revenue | 5.00 | 9/1/20 | 1,000,000 | 1,181,150 |
| Love Field Airport Modernization | ||||
| Corporation, Special | ||||
| Facilities Revenue (Southwest | ||||
| Airlines Company—Love Field | ||||
| Modernization Program Project) | 5.00 | 11/1/15 | 1,000,000 | 1,086,820 |
| Midlothian Development Authority, | ||||
| Tax Increment Contract Revenue | ||||
| (Insured; Radian) | 5.00 | 11/15/13 | 530,000 | 546,949 |
16
| Long-Term Municipal | Coupon | Maturity | Principal | ||
| Investments (continued) | Rate (%) | Date | Amount ($) | Value ($) | |
| Texas (continued) | |||||
| Sam Rayburn Municipal Power | |||||
| Agency, Power Supply | |||||
| System Revenue | 5.00 | 10/1/20 | 1,210,000 | 1,443,506 | |
| San Manuel Entertainment | |||||
| Authority, Public | |||||
| Improvement Revenue | 4.50 | 12/1/16 | 1,000,000 | 1,007,590 | |
| Stafford Economic Development | |||||
| Corporation, Sales Tax Revenue | |||||
| (Insured; National Public | |||||
| Finance Guarantee Corp.) | 6.00 | 9/1/15 | 525,000 | 599,298 | |
| Tarrant Regional Water District, | |||||
| Water Transmission Facilities | |||||
| Contract Revenue (City of | |||||
| Dallas Project) | 5.00 | 9/1/18 | 1,000,000 | 1,231,620 | |
| Texas, | |||||
| GO (College Student Loan) | 5.00 | 8/1/17 | 1,000,000 | 1,183,330 | |
| Texas Municipal Power Agency, | |||||
| Revenue (Insured; National | |||||
| Public Finance Guarantee Corp.) | 0.00 | 9/1/16 | 10,000 | a | 9,709 |
| Texas Transportation Commission, | |||||
| State Highway Fund First | |||||
| Tier Revenue | 5.00 | 4/1/16 | 1,000,000 | 1,157,630 | |
| Texas Transportation Commission, | |||||
| State Highway Fund First | |||||
| Tier Revenue | 5.00 | 4/1/20 | 1,905,000 | 2,246,814 | |
| Utah—.0% | |||||
| Utah Housing Finance Agency, | |||||
| SMFR (Collateralized; FHA) | 5.40 | 7/1/20 | 20,000 | 20,040 | |
| Virginia—2.4% | |||||
| Virginia Beach, | |||||
| Public Improvement GO | 5.00 | 4/1/22 | 2,500,000 | 3,220,225 | |
| Washington—2.9% | |||||
| Energy Northwest, | |||||
| Electric Revenue (Columbia | |||||
| Generating Station) | 5.50 | 7/1/15 | 1,000,000 | 1,139,010 | |
| King County, | |||||
| Sewer Revenue | 5.00 | 1/1/17 | 1,500,000 | 1,767,705 |
| The Fund | 17 |
STATEMENT OF INVESTMENTS (continued)
| Long-Term Municipal | Coupon | Maturity | Principal | ||
| Investments (continued) | Rate (%) | Date | Amount ($) | Value ($) | |
| Washington (continued) | |||||
| NJB Properties, | |||||
| LR (King County, | |||||
| Washington Project) | 5.00 | 12/1/14 | 1,000,000 | 1,096,120 | |
| West Virginia—1.0% | |||||
| West Virginia University Board of | |||||
| Governors, University | |||||
| Improvement Revenue (West | |||||
| Virginia University Projects) | 5.00 | 10/1/17 | 1,135,000 | 1,359,004 | |
| Wyoming—.7% | |||||
| Wyoming Community Development | |||||
| Authority, Housing Revenue | 5.50 | 12/1/17 | 930,000 | 998,801 | |
| U.S. Related—2.7% | |||||
| Puerto Rico Electric Power | |||||
| Authority, Power Revenue | |||||
| (Insured; XLCA) | 5.50 | 7/1/16 | 500,000 | 558,805 | |
| Puerto Rico Highways and | |||||
| Transportation Authority, | |||||
| Transportation Revenue | 5.00 | 7/1/13 | 1,360,000 | 1,403,302 | |
| Puerto Rico Sales Tax Financing | |||||
| Corporation, Sales Tax Revenue | |||||
| (First Subordinate Series) | 5.50 | 8/1/22 | 1,500,000 | 1,721,835 | |
| Total Long-Term Municipal Investments | |||||
| (cost $124,958,953) | 133,713,326 | ||||
| Short-Term Municipal | |||||
| Investments—1.2% | |||||
| California—.9% | |||||
| California, | |||||
| GO Notes | |||||
| (Kindergarten-University) | |||||
| (LOC: California State | |||||
| Teachers Retirement | |||||
| System and Citibank NA) | 0.17 | 10/1/12 | 1,000,000 | b | 1,000,000 |
18
| Short-Term Municipal | Coupon | Maturity | Principal | ||
| Investments (continued) | Rate (%) | Date | Amount ($) | Value ($) | |
| California (continued) | |||||
| Irvine Assessment District Number | |||||
| 03-19, Limited Obligation | |||||
| Improvement Bonds (LOC: | |||||
| California State Teachers | |||||
| Retirement System and | |||||
| U.S. Bank NA) | 0.17 | 10/1/12 | 300,000 | b | 300,000 |
| New York—.3% | |||||
| New York City, | |||||
| GO Notes (LOC; JPMorgan | |||||
| Chase Bank) | 0.17 | 10/1/12 | 200,000 | b | 200,000 |
| New York City, | |||||
| GO Notes (LOC; JPMorgan | |||||
| Chase Bank) | 0.19 | 10/1/12 | 200,000 | b | 200,000 |
| Total Short-Term Municipal Investments | |||||
| (cost $1,700,000) | 1,700,000 | ||||
| Total Investments (cost $126,658,953) | 98.9 | % | 135,413,326 | ||
| Cash and Receivables (Net) | 1.1 | % | 1,487,838 | ||
| Net Assets | 100.0 | % | 136,901,164 | ||
| a Security issued with a zero coupon. Income is recognized through the accretion of discount. |
| b Variable rate demand note—rate shown is the interest rate in effect at September 30, 2012. Maturity date represents |
| the next demand date, or the ultimate maturity date if earlier. |
| The Fund | 19 |
STATEMENT OF INVESTMENTS (continued)
| Summary of Abbreviations | |||
| ABAG | Association of Bay Area | ACA | American Capital Access |
| Governments | |||
| AGC | ACE Guaranty Corporation | AGIC | Asset Guaranty Insurance Company |
| AMBAC | American Municipal Bond | ARRN | Adjustable Rate |
| Assurance Corporation | Receipt Notes | ||
| BAN | Bond Anticipation Notes | BPA | Bond Purchase Agreement |
| CIFG | CDC Ixis Financial Guaranty | COP | Certificate of Participation |
| CP | Commercial Paper | DRIVERS | Derivative Inverse |
| Tax-Exempt Receipts | |||
| EDR | Economic Development | EIR | Environmental Improvement |
| Revenue | Revenue | ||
| FGIC | Financial Guaranty | FHA | Federal Housing |
| Insurance Company | Administration | ||
| FHLB | Federal Home | FHLMC | Federal Home Loan Mortgage |
| Loan Bank | Corporation | ||
| FNMA | Federal National | GAN | Grant Anticipation Notes |
| Mortgage Association | |||
| GIC | Guaranteed Investment | GNMA | Government National Mortgage |
| Contract | Association | ||
| GO | General Obligation | HR | Hospital Revenue |
| IDB | Industrial Development Board | IDC | Industrial Development Corporation |
| IDR | Industrial Development | LIFERS | Long Inverse Floating |
| Revenue | Exempt Receipts | ||
| LOC | Letter of Credit | LOR | Limited Obligation Revenue |
| LR | Lease Revenue | MERLOTS | Municipal Exempt Receipt |
| Liquidity Option Tender | |||
| MFHR | Multi-Family Housing Revenue | MFMR | Multi-Family Mortgage Revenue |
| PCR | Pollution Control Revenue | PILOT | Payment in Lieu of Taxes |
| P-FLOATS | Puttable Floating Option | PUTTERS | Puttable Tax-Exempt Receipts |
| Tax-Exempt Receipts | |||
| RAC | Revenue Anticipation Certificates | RAN | Revenue Anticipation Notes |
| RAW | Revenue Anticipation Warrants | ROCS | Reset Options Certificates |
| RRR | Resources Recovery Revenue | SAAN | State Aid Anticipation Notes |
| SBPA | Standby Bond Purchase Agreement | SFHR | Single Family Housing Revenue |
| SFMR | Single Family Mortgage Revenue | SONYMA | State of New York Mortgage Agency |
| SPEARS | Short Puttable Exempt | SWDR | Solid Waste Disposal Revenue |
| Adjustable Receipts | |||
| TAN | Tax Anticipation Notes | TAW | Tax Anticipation Warrants |
| TRAN | Tax and Revenue Anticipation Notes | XLCA | XL Capital Assurance |
20
| Summary of Combined Ratings (Unaudited) | |||||
| Fitch | or | Moody’s | or | Standard & Poor’s | Value (%)† |
| AAA | Aaa | AAA | 19.8 | ||
| AA | Aa | AA | 41.7 | ||
| A | A | A | 31.7 | ||
| BBB | Baa | BBB | 5.3 | ||
| F1 | MIG1/P1 | SP1/A1 | 1.0 | ||
| Not Ratedc | Not Ratedc | Not Ratedc | .5 | ||
| 100.0 | |||||
| † Based on total investments. |
| c Securities which, while not rated by Fitch, Moody’s and Standard & Poor’s, have been determined by the Manager to |
| be of comparable quality to those rated securities in which the fund may invest. |
See notes to financial statements.
| The Fund | 21 |
| STATEMENT OF ASSETS AND LIABILITIES |
| September 30, 2012 |
| Cost | Value | ||
| Assets ($): | |||
| Investments in securities—See Statement of Investments | 126,658,953 | 135,413,326 | |
| Interest receivable | 1,640,249 | ||
| Receivable for shares of Beneficial Interest subscribed | 1,091 | ||
| Prepaid expenses | 21,353 | ||
| 137,076,019 | |||
| Liabilities ($): | |||
| Due to The Dreyfus Corporation and affiliates—Note 3(c) | 36,336 | ||
| Due to Administrator—Note 3(a) | 6,688 | ||
| Cash overdraft due to Custodian | 28,640 | ||
| Payable for shares of Beneficial Interest redeemed | 54,533 | ||
| Accrued expenses | 48,658 | ||
| 174,855 | |||
| Net Assets ($) | 136,901,164 | ||
| Composition of Net Assets ($): | |||
| Paid-in capital | 127,406,958 | ||
| Accumulated undistributed investment income—net | 18,752 | ||
| Accumulated net realized gain (loss) on investments | 721,081 | ||
| Accumulated net unrealized appreciation | |||
| (depreciation) on investments | 8,754,373 | ||
| Net Assets ($) | 136,901,164 | ||
| Net Asset Value Per Share | |||
| Class A | Class C | Class I | |
| Net Assets ($) | 6,639,520 | 2,044,756 | 128,216,888 |
| Shares Outstanding | 283,219 | 87,203 | 5,466,924 |
| Net Asset Value Per Share ($) | 23.44 | 23.45 | 23.45 |
| See notes to financial statements. | |||
22
| STATEMENT OF OPERATIONS | ||
| Year Ended September 30, 2012 | ||
| Investment Income ($): | ||
| Interest Income | 4,143,515 | |
| Expenses: | ||
| Investment advisory fee—Note 3(a) | 541,260 | |
| Administration fee—Note 3(a) | 81,189 | |
| Professional fees | 55,496 | |
| Registration fees | 48,085 | |
| Shareholder servicing costs—Note 3(c) | 46,299 | |
| Prospectus and shareholders’ reports | 18,190 | |
| Distribution fees—Note 3(b) | 11,766 | |
| Custodian fees—Note 3(c) | 10,621 | |
| Trustees’ fees and expenses—Note 3(d) | 9,817 | |
| Loan commitment fees—Note 2 | 1,009 | |
| Miscellaneous | 36,550 | |
| Total Expenses | 860,282 | |
| Less—reduction in expenses due to undertaking—Note 3(a) | (210,043 | ) |
| Less—reduction in fees due to earnings credits—Note 3(c) | (14 | ) |
| Net Expenses | 650,225 | |
| Investment Income—Net | 3,493,290 | |
| Realized and Unrealized Gain (Loss) on Investments—Note 4 ($): | ||
| Net realized gain (loss) on investments | 787,451 | |
| Net realized gain (loss) on swap transactions | 29,510 | |
| Net Realized Gain (Loss) | 816,961 | |
| Net unrealized appreciation (depreciation) on investments | 2,952,413 | |
| Net Realized and Unrealized Gain (Loss) on Investments | 3,769,374 | |
| Net Increase in Net Assets Resulting from Operations | 7,262,664 | |
| See notes to financial statements. | ||
| The Fund | 23 |
STATEMENT OF CHANGES IN NET ASSETS
| Year Ended September 30, | ||||
| 2012 | 2011 | |||
| Operations ($): | ||||
| Investment income—net | 3,493,290 | 3,510,288 | ||
| Net realized gain (loss) on investments | 816,961 | 1,493,354 | ||
| Net unrealized appreciation | ||||
| (depreciation) on investments | 2,952,413 | (740,895 | ) | |
| Net Increase (Decrease) in Net Assets | ||||
| Resulting from Operations | 7,262,664 | 4,262,747 | ||
| Dividends to Shareholders from ($): | ||||
| Investment income—net: | ||||
| Class A Shares | (146,942 | ) | (81,781 | ) |
| Class C Shares | (23,008 | ) | (12,350 | ) |
| Class I Shares | (3,303,258 | ) | (3,414,866 | ) |
| Net realized gain on investments: | ||||
| Class A Shares | (53,767 | ) | (3,630 | ) |
| Class C Shares | (10,843 | ) | (747 | ) |
| Class I Shares | (1,442,321 | ) | (134,715 | ) |
| Total Dividends | (4,980,139 | ) | (3,648,089 | ) |
| Beneficial Interest Transactions ($): | ||||
| Net proceeds from shares sold: | ||||
| Class A Shares | 5,704,291 | 4,604,666 | ||
| Class C Shares | 1,331,400 | 567,251 | ||
| Class I Shares | 23,367,976 | 41,492,291 | ||
| Dividends reinvested: | ||||
| Class A Shares | 185,889 | 77,696 | ||
| Class C Shares | 33,302 | 11,545 | ||
| Class I Shares | 4,333,470 | 3,169,284 | ||
| Cost of shares redeemed: | ||||
| Class A Shares | (4,123,686 | ) | (1,620,961 | ) |
| Class C Shares | (65,374 | ) | (348,252 | ) |
| Class I Shares | (30,025,424 | ) | (26,306,295 | ) |
| Increase (Decrease) in Net Assets | ||||
| from Beneficial Interest Transactions | 741,844 | 21,647,225 | ||
| Total Increase (Decrease) in Net Assets | 3,024,369 | 22,261,883 | ||
| Net Assets ($): | ||||
| Beginning of Period | 133,876,795 | 111,614,912 | ||
| End of Period | 136,901,164 | 133,876,795 | ||
| Undistributed investment income—net | 18,752 | — | ||
24
| Year Ended September 30, | ||||
| 2012 | 2011 | |||
| Capital Share Transactions: | ||||
| Class A | ||||
| Shares sold | 246,966 | 203,377 | ||
| Shares issued for dividends reinvested | 8,026 | 3,446 | ||
| Shares redeemed | (178,293 | ) | (72,882 | ) |
| Net Increase (Decrease) in Shares Outstanding | 76,699 | 133,941 | ||
| Class C | ||||
| Shares sold | 57,408 | 25,211 | ||
| Shares issued for dividends reinvested | 1,438 | 511 | ||
| Shares redeemed | (2,814 | ) | (15,461 | ) |
| Net Increase (Decrease) in Shares Outstanding | 56,032 | 10,261 | ||
| Class I | ||||
| Shares sold | 1,004,977 | 1,831,004 | ||
| Shares issued for dividends reinvested | 187,236 | 140,567 | ||
| Shares redeemed | (1,293,839 | ) | (1,172,434 | ) |
| Net Increase (Decrease) in Shares Outstanding | (101,626 | ) | 799,137 | |
| See notes to financial statements. | ||||
| The Fund | 25 |
FINANCIAL HIGHLIGHTS
The following tables describe the performance for each share class for the fiscal periods indicated.All information (except portfolio turnover rate) reflects financial results for a single fund share.Total return shows how much your investment in the fund would have increased (or decreased) during each period, assuming you had reinvested all dividends and distributions.These figures have been derived from the fund’s financial statements.
| Year Ended September 30, | ||||||||
| Class A Shares | 2012 | 2011 | 2010 | 2009 | a | |||
| Per Share Data ($): | ||||||||
| Net asset value, beginning of period | 23.05 | 22.95 | 22.45 | 21.07 | ||||
| Investment Operations: | ||||||||
| Investment income—netb | .53 | .61 | .61 | .32 | ||||
| Net realized and unrealized | ||||||||
| gain (loss) on investments | .64 | .14 | .54 | 1.42 | ||||
| Total from Investment Operations | 1.17 | .75 | 1.15 | 1.74 | ||||
| Distributions: | ||||||||
| Dividends from investment income—net | (.52 | ) | (.62 | ) | (.65 | ) | (.36 | ) |
| Dividends from net realized | ||||||||
| gain on investments | (.26 | ) | (.03 | ) | — | — | ||
| Total Distributions | (.78 | ) | (.65 | ) | (.65 | ) | (.36 | ) |
| Net asset value, end of period | 23.44 | 23.05 | 22.95 | 22.45 | ||||
| Total Return (%)c | 5.19 | 3.38 | 5.24 | 8.30 | d | |||
| Ratios/Supplemental Data (%): | ||||||||
| Ratio of total expenses to average net assets | .90 | .98 | .96 | .96 | e | |||
| Ratio of net expenses to average net assets | .80 | .80 | .80 | .80 | e | |||
| Ratio of net investment income | ||||||||
| to average net assets | 2.25 | 2.72 | 2.80 | 3.31 | e | |||
| Portfolio Turnover Rate | 21.97 | 27.67 | 32.07 | 22.49 | ||||
| Net Assets, end of period ($ x 1,000) | 6,639 | 4,760 | 1,665 | 55 | ||||
| a | From March 31, 2009 (commencement of initial offering) to September 30, 2009. |
| b | Based on average shares outstanding at each month end. |
| c | Exclusive of sales charge. |
| d | Not annualized. |
| e | Annualized. |
See notes to financial statements.
26
| Year Ended September 30, | ||||||||
| Class C Shares | 2012 | 2011 | 2010 | 2009 | a | |||
| Per Share Data ($): | ||||||||
| Net asset value, beginning of period | 23.05 | 22.95 | 22.45 | 21.07 | ||||
| Investment Operations: | ||||||||
| Investment income-netb | .35 | .45 | .40 | .27 | ||||
| Net realized and unrealized | ||||||||
| gain (loss) on investments | .66 | .13 | .59 | 1.39 | ||||
| Total from Investment Operations | 1.01 | .58 | .99 | 1.66 | ||||
| Distributions: | ||||||||
| Dividends from investment income—net | (.35 | ) | (.45 | ) | (.49 | ) | (.28 | ) |
| Dividends from net realized | ||||||||
| gain on investments | (.26 | ) | (.03 | ) | — | — | ||
| Total Distributions | (.61 | ) | (.48 | ) | (.49 | ) | (.28 | ) |
| Net asset value, end of period | 23.45 | 23.05 | 22.95 | 22.45 | ||||
| Total Return (%)c | 4.39 | 2.60 | 4.46 | 7.91 | d | |||
| Ratios/Supplemental Data (%): | ||||||||
| Ratio of total expenses to average net assets | 1.67 | 1.73 | 1.74 | 1.72 | e | |||
| Ratio of net expenses to average net assets | 1.55 | 1.55 | 1.55 | 1.55 | e | |||
| Ratio of net investment income | ||||||||
| to average net assets | 1.48 | 1.99 | 1.94 | 2.59 | e | |||
| Portfolio Turnover Rate | 21.97 | 27.67 | 32.07 | 22.49 | ||||
| Net Assets, end of period ($ x 1,000) | 2,045 | 719 | 480 | 16 | ||||
| a | From March 31, 2009 (commencement of initial offering) to September 30, 2009. |
| b | Based on average shares outstanding at each month end. |
| c | Exclusive of sales charge. |
| d | Not annualized. |
| e | Annualized. |
See notes to financial statements.
| The Fund | 27 |
FINANCIAL HIGHLIGHTS (continued)
| Year Ended September 30, | ||||||||||
| Class I Shares | 2012 | 2011 | 2010 | 2009 | a | 2008 | ||||
| Per Share Data ($): | ||||||||||
| Net asset value, beginning of period | 23.06 | 22.95 | 22.45 | 20.85 | 21.60 | |||||
| Investment Operations: | ||||||||||
| Investment income—netb | .60 | .70 | .73 | .79 | .79 | |||||
| Net realized and unrealized | ||||||||||
| gain (loss) on investments | .65 | .14 | .50 | 1.60 | (.75 | ) | ||||
| Total from Investment Operations | 1.25 | .84 | 1.23 | 2.39 | .04 | |||||
| Distributions: | ||||||||||
| Dividends from investment income—net | (.60 | ) | (.70 | ) | (.73 | ) | (.79 | ) | (.79 | ) |
| Dividends from net realized | ||||||||||
| gain on investments | (.26 | ) | (.03 | ) | — | — | — | |||
| Total Distributions | (.86 | ) | (.73 | ) | (.73 | ) | (.79 | ) | (.79 | ) |
| Net asset value, end of period | 23.45 | 23.06 | 22.95 | 22.45 | 20.85 | |||||
| Total Return (%) | 5.54 | 3.79 | 5.61 | 11.73 | .12 | |||||
| Ratios/Supplemental Data (%): | ||||||||||
| Ratio of total expenses | ||||||||||
| to average net assets | .61 | .63 | .64 | .67 | .60 | |||||
| Ratio of net expenses | ||||||||||
| to average net assets | .45 | .45 | .45 | .45 | .45 | |||||
| Ratio of net investment income | ||||||||||
| to average net assets | 2.61 | 3.10 | 3.26 | 3.74 | 3.63 | |||||
| Portfolio Turnover Rate | 21.97 | 27.67 | 32.07 | 22.49 | 34 | |||||
| Net Assets, end of period ($ x 1,000) | 128,217 | 128,398 | 109,470 | 106,900 | 141,949 | |||||
| a The fund commenced offering three classes of shares on March 31, 2009.The existing shares were redesignated as |
| Class I shares. |
| b Based on average shares outstanding at each month end. |
See notes to financial statements.
28
NOTES TO FINANCIAL STATEMENTS
NOTE 1—Significant Accounting Policies:
Dreyfus/Standish IntermediateTax Exempt Bond Fund (the “fund”) is a separate diversified series of Dreyfus Investment Funds (the “Trust”), which is registered under the Investment Company Act of 1940, as amended (the “Act”), as an open-end management investment company and operates as a series company currently offering eleven series, including the fund.The fund’s investment objective is to seek a high level of interest income exempt from federal income tax, while seeking preservation of shareholders’ capital. The Dreyfus Corporation (the “Manager” or “Dreyfus”), a wholly-owned subsidiary of The Bank of New York Mellon Corporation (“BNY Mellon”), serves as the fund’s investment adviser.
MBSC Securities Corporation (the “Distributor”), a wholly-owned subsidiary of the Manager, is the distributor of the fund’s shares. The fund is authorized to issue an unlimited number of $.001 par value shares of Beneficial Interest in each of the following classes of shares: Class A, Class C and Class I. Class A shares are subject to a sales charge imposed at the time of purchase. Class C shares are subject to a contingent deferred sales charge (“CDSC”) imposed on Class C shares redeemed within one year of purchase and Class I shares are sold primarily to bank trust departments and other financial service providers (includingThe Bank of NewYork Mellon, a subsidiary of BNY Mellon and an affiliate of Dreyfus, and its affiliates), acting on behalf of customers having a qualified trust or an investment account or relationship at such institution, and bear no Distribution or Shareholder Services Plan fees. Class I shares are offered without a front-end sales charge or CDSC. Other differences between the classes include the services offered to, the expenses borne by each class, the allocation of certain transfer agency costs and certain voting rights. Income, expenses (other
| The Fund | 29 |
NOTES TO FINANCIAL STATEMENTS (continued)
than expenses attributable to a specific class), and realized and unrealized gains or losses on investments are allocated to each class of shares based on its relative net assets.
TheTrust accounts separately for the assets, liabilities and operations of each series. Expenses directly attributable to each series are charged to that series’ operations; expenses which are applicable to all series are allocated among them on a pro rata basis.
The Financial Accounting Standards Board (“FASB”) Accounting Standards Codification is the exclusive reference of authoritative U.S. generally accepted accounting principles (“GAAP”) recognized by the FASB to be applied by nongovernmental entities. Rules and interpretive releases of the Securities and Exchange Commission (“SEC”) under authority of federal laws are also sources of authoritative GAAP for SEC registrants. The fund’s financial statements are prepared in accordance with GAAP, which may require the use of management estimates and assumptions.Actual results could differ from those estimates.
(a) Portfolio valuation: The fair value of a financial instrument is the amount that would be received to sell an asset or paid to transfer a liability in an orderly transaction between market participants at the measurement date (i.e., the exit price). GAAP establishes a fair value hierarchy that prioritizes the inputs of valuation techniques used to measure fair value.This hierarchy gives the highest priority to unadjusted quoted prices in active markets for identical assets or liabilities (Level 1 measurements) and the lowest priority to unobservable inputs (Level 3 measurements).
Additionally, GAAP provides guidance on determining whether the volume and activity in a market has decreased significantly and whether such a decrease in activity results in transactions that are not orderly. GAAP requires enhanced disclosures around valuation inputs and techniques used during annual and interim periods.
30
Various inputs are used in determining the value of the fund’s investments relating to fair value measurements.These inputs are summarized in the three broad levels listed below:
Level 1—unadjusted quoted prices in active markets for identical investments.
Level 2—other significant observable inputs (including quoted prices for similar investments, interest rates, prepayment speeds, credit risk, etc.).
Level 3—significant unobservable inputs (including the fund’s own assumptions in determining the fair value of investments).
The inputs or methodology used for valuing securities are not necessarily an indication of the risk associated with investing in those securities.
Changes in valuation techniques may result in transfers in or out of an assigned level within the disclosure hierarchy. Valuation techniques used to value the fund’s investments are as follows:
Investments in securities are valued each business day by an independent pricing service (the “Service”) approved by the Trust’s Board of Trustees (the “Board”). Investments for which quoted bid prices are readily available and are representative of the bid side of the market in the judgment of the Service are valued at the mean between the quoted bid prices (as obtained by the Service from dealers in such securities) and asked prices (as calculated by the Service based upon its evaluation of the market for such securities). Other investments (which constitute a majority of the portfolio securities) are carried at fair value as determined by the Service, based on methods which include consideration of the following: yields or prices of municipal securities of comparable quality, coupon, maturity and type; indications as to values from dealers; and general market conditions.All of the preceding securities are categorized within Level 2 of the fair value hierarchy. Investments in swap transac-
| The Fund | 31 |
NOTES TO FINANCIAL STATEMENTS (continued)
tions are valued each business day by the Service. Swaps are valued by the Service by using a swap pricing model which incorporates among other factors, default probabilities, recovery rates, credit curves of the underlying issuer and swap spreads on interest rates.These securities are generally categorized within Level 2 of the fair value hierarchy.
The Service’s procedures are reviewed by Dreyfus under the general supervision of the Board.
When market quotations or official closing prices are not readily available, or are determined not to reflect accurately fair value, such as when the value of a security has been significantly affected by events after the close of the exchange or market on which the security is principally traded, but before the fund calculates its net asset value, the fund may value these investments at fair value as determined in accordance with the procedures approved by the Board. Certain factors may be considered when fair valuing investments such as: fundamental analytical data, the nature and duration of restrictions on disposition, an evaluation of the forces that influence the market in which the securities are purchased and sold, and public trading in similar securities of the issuer or comparable issuers.These securities are either categorized as Level 2 or 3 depending on the relevant inputs used.
For restricted securities where observable inputs are limited, assumptions about market activity and risk are used and are categorized within Level 3 of the fair value hierarchy.
The following is a summary of the inputs used as of September 30, 2012 in valuing the fund’s investments:
| Level 2—Other | Level 3— | |||
| Level 1— | Significant | Significant | ||
| Unadjusted | Observable | Unobservable | ||
| Quoted Prices | Inputs | Inputs | Total | |
| Assets ($) | ||||
| Investments in Securities: | ||||
| Municipal Bonds | — | 135,413,326 | — | 135,413,326 |
32
At September 30, 2012, there were no transfers between Level 1 and Level 2 of the fair value hierarchy.
(b) Securities transactions and investment income: Securities transactions are recorded on a trade date basis. Realized gains and losses from securities transactions are recorded on the identified cost basis. Interest income, adjusted for accretion of discount and amortization of premium on investments, is earned from settlement date and recognized on the accrual basis. Securities purchased or sold on a when issued or delayed delivery basis may be settled a month or more after the trade date.
(c) Dividends to shareholders: It is the policy of the fund to declare dividends daily from investment income-net. Such dividends are paid monthly. Dividends from net realized capital gains, if any, are normally declared and paid annually, but the fund may make distributions on a more frequent basis to comply with the distribution requirements of the Internal Revenue Code of 1986, as amended (the “Code”).To the extent that net realized capital gains can be offset by capital loss carryovers, it is the policy of the fund not to distribute such gains. Income and capital gain distributions are determined in accordance with income tax regulations, which may differ from GAAP.
(d) Federal income taxes: It is the policy of the fund to continue to qualify as a regulated investment company, which can distribute tax-exempt dividends, by complying with the applicable provisions of the Code, and to make distributions of income and net realized capital gain sufficient to relieve it from substantially all federal income and excise taxes.
As of and during the period ended September 30, 2012, the fund did not have any liabilities for any uncertain tax positions.The fund recognizes interest and penalties, if any, related to uncertain tax positions as income tax expense in the Statement of Operations. During the period, the fund did not incur any interest or penalties.
| The Fund | 33 |
NOTES TO FINANCIAL STATEMENTS (continued)
Each of the tax years in the four-year period ended September 30, 2012 remains subject to examination by the Internal Revenue Service and state taxing authorities.
At September 30, 2012, the components of accumulated earnings on a tax basis were as follows: undistributed tax-exempt income $23,841, undistributed ordinary income $208,428, undistributed capital gains $504,539 and unrealized appreciation $8,762,487.
The tax character of distributions paid to shareholders during the fiscal periods ended September 30, 2012 and September 30, 2011 were as follows: tax-exempt income $3,473,208 and $3,508,997, ordinary income $342,590 and $3,323 and long-term capital gains $1,164,341 and $135,769, respectively.
During the period ended September 30, 2012, as a result of permanent book to tax differences, primarily due to the tax treatment for amortization adjustments, the fund decreased accumulated undistributed investment income-net by $1,331 and increased accumulated net realized gain (loss) on investments by the same amount. Net assets and net asset value per share were not affected by this reclassification.
(e) New Accounting Pronouncement: In December 2011, FASB issued Accounting Standards Update No. 2011-11 “Disclosures about Offsetting Assets and Liabilities” (“ASU 2011-11”). These disclosure requirements are intended to help investors and other financial statement users to better assess the effect or potential effect of offsetting arrangements on a company’s financial position.They also improve transparency in the reporting of how companies mitigate credit risk, including disclosure of related collateral pledged or received. In addition,ASU 2011-11 facilitates comparison between those entities that prepare their financial statements on the basis of GAAP and those entities that prepare their financial statements on the basis of International Financial Reporting Standards (“IFRS”).ASU 2011-11 requires entities to: disclose both gross and net information about both instruments and transactions eligible for offset in the financial statements; and disclose instruments and transac-
34
tions subject to an agreement similar to a master netting agreement.ASU 2011-11 is effective for fiscal years beginning on or after January 1, 2013, and interim periods within those annual periods. At this time, management is evaluating the implications of ASU 2011-11 and its impact on the funds’ financial statement disclosures.
NOTE 2—Bank Lines of Credit:
The fund participates with other Dreyfus-managed funds in a $225 million unsecured credit facility led by Citibank, N.A. and a $300 million unsecured credit facility provided by The Bank of New York Mellon, (each, a “Facility”), each to be utilized primarily for temporary or emergency purposes, including the financing of redemptions. In connection therewith, the fund has agreed to pay its pro rata portion of commitment fees for each Facility. Interest is charged to the fund based on rates determined pursuant to the terms of the respective Facility at the time of borrowing. During the period ended on September 30, 2012, the fund did not borrow under the Facilities.
NOTE 3—Investment Advisory Fee and Other Transactions with Affiliates:
(a) Pursuant to an investment advisory agreement with the Manager, the investment advisory fee is computed at the annual rate of .40% of the value of the funds average daily net assets and is payable monthly.The Manager had agreed, from October 1, 2011, through September 30, 2012, to waive receipt of its fees and/or assume the expenses of the fund so that the direct expenses of Class A, C and I shares (excluding Rule 12b-1 Distribution Plan fees, Shareholder Services Plan fees, taxes, interest expense, brokerage commissions, commitment fees on borrowings and extraordinary expenses) did not exceed an annual rate of .55%, .55% and .45%, respectively, of the value such class’ average daily net assets.The Manager has agreed to waive receipt of its fees and assume the expenses of the fund from October 1, 2012 until February 1, 2014 so that the direct expenses of the fund (exclusive of certain expenses as described
| The Fund | 35 |
NOTES TO FINANCIAL STATEMENTS (continued)
above) do not exceed .45% of the value of the fund’s average daily net assets.The reduction in expenses, pursuant to the undertaking, amounted to $210,043 during the year ended September 30, 2012.
The fund has an Accounting and Administration Agreement (the “Administration Agreement”) with Dreyfus, whereby Dreyfus performs administrative and accounting services for the fund. The fund has agreed to compensate Dreyfus for providing accounting services, administration, compliance monitoring, regulatory and shareholder reporting, as well as for related facilities and equipment. The fee is based on the fund’s average daily net assets and computed at the following annual rates: .06% of the first $500 million, .04% of the next $500 million and .02% in excess of $1 billion.
In addition, after applying any expense limitations or fee waivers that reduce the fees paid to Dreyfus for this service, Dreyfus has contractually agreed in writing to waive any remaining fees for this service to the extent that they exceed both Dreyfus’ costs in providing these services and a reasonable allocation of the costs incurred by Dreyfus and its affiliates related to the support and oversight of these services.The fund also reimburses Dreyfus for the out-of-pocket expenses incurred in performing this service for the fund. Pursuant to the Administration Agreement, the fund was charged $81,189 during the period September 30, 2012.
During the period ended September 30, 2012, the Distributor retained $1,824 from commissions earned on sales of the Class A shares.
(b) Under the Distribution Plan adopted pursuant to Rule 12b-1 under the Act, Class C shares pay the Distributor for distributing its shares at an annual rate of .75% of the value of the average daily net assets of Class C shares. During the period ended September 30, 2012, Class C shares were charged $11,766 pursuant to the Plan.
36
(c) Under the Shareholder Services Plan, Class A and Class C shares pay the Distributor at the annual rate of .25% of the value of their average daily net assets for the provision of certain services. The services provided may include personal services relating to shareholder accounts, such as answering shareholder inquiries regarding the fund and providing reports and other information, and services related to the maintenance of shareholder accounts. The Distributor may make payments to Service Agents Agents (securities dealers, financial institutions or other industry professionals) in respect of these services.The Distributor determines the amounts to be paid to Service Agents. During the period ended September 30, 2012, Class A and Class C shares were charged $16,458 and $3,922, respectively, pursuant to the Shareholder Services Plan.
Under its terms, the Distribution Plan and Shareholder Services Plan shall remain in effect from year to year, provided such continuance is approved annually by a vote of a majority of those Trustees who are not “interested persons” of the Trust and who have no direct or indirect financial interest in the operation of or in any agreement related to the Distribution Plan or Shareholder Services Plan.
The fund has arrangements with the transfer agent and the custodian whereby the fund may receive earnings credits when positive cash balances are maintained, which are used to offset transfer agency and custody fees. For financial reporting purposes, the fund includes net earnings credits as an expense offset in the Statement of Operations.
The fund compensates Dreyfus Transfer, Inc. (“DTI”), a wholly-owned subsidiary of the Manager, under a transfer agency agreement for providing transfer agency services for the fund and, since May 29, 2012, cash
| The Fund | 37 |
NOTES TO FINANCIAL STATEMENTS (continued)
management services related to fund subscriptions and redemptions. During the period ended September 30, 2012, the fund was charged $4,578 for transfer agency services and $48 for cash management services. Cash management fees were partially offset by earnings credits of $6. These fees are included in Shareholder servicing costs in the Statement of Operations.
The fund compensatesThe Bank of NewYork Mellon under a custody agreement for providing custodial services for the fund. During the period ended September 30, 2012, the fund was charged $10,621 pursuant to the custody agreement.
Prior to May 29, 2012, the fund compensated The Bank of NewYork Mellon under a cash management agreement for performing cash management services related to fund subscriptions and redemptions. During the period ended September 30, 2012, the fund was charged $247 pursuant to the cash management agreement, which is included in Shareholder servicing costs in the Statement of Operations. These fees were partially offset by earnings credits of $8.
During the period ended September 30, 2012, the fund was charged $8,384 for services performed by the Chief Compliance Officer and his staff.
The components of “Due to The Dreyfus Corporation and affiliates” in the Statement of Assets and Liabilities consist of: investment advisory fees $44,587, Distribution Plan fees $1,255, Shareholder Services Plan fees $1,801, custodian fees $3,870, Chief Compliance Officer fees $1,991 and transfer agency fees $1,468, which are offset against an expense reimbursement currently in effect in the amount of $18,636.
(d) Each Board member also serves as a Board member of other funds within the Dreyfus complex. Annual retainer fees and attendance fees are allocated to each fund based on net assets.
38
NOTE 4—Securities Transactions:
The aggregate amount of purchases and sales of investment securities, excluding short-term securities and swap transactions, during the period ended September 30, 2012, amounted to $29,673,049 and $29,218,236, respectively.
Derivatives: A derivative is a financial instrument whose performance is derived from the performance of another asset. Each type of derivative instrument that was held by the fund during the period ended September 30, 2012 is discussed below.
Swap Transactions:The fund enters into swap agreements to exchange the interest rate on, or return generated by, one nominal instrument for the return generated by another nominal instrument.The fund enters into these agreements to hedge certain market or interest rate risks, to manage the interest rate sensitivity (sometimes called duration) of fixed income securities, to provide a substitute for purchasing or selling particular securities or to increase potential returns.
The fund accrues for the interim payments on swap contracts on a daily basis, with the net amount recorded within unrealized appreciation (depreciation) on swap contracts in the Statement of Assets and Liabilities. Once the interim payments are settled in cash, the net amount is recorded as a realized gain (loss) on swaps, in addition to realized gain (loss) recorded upon the termination of swap contracts in the Statement of Operations. Upfront payments made and/or received by the fund, are recorded as an asset and/or liability in the Statement of Assets and Liabilities and are recorded as a realized gain or loss ratably over the contract’s term/event with the exception of forward starting interest rate swaps which are recorded as realized gains or losses on the termination date. Fluctuations in the value of swap contracts are
| The Fund | 39 |
NOTES TO FINANCIAL STATEMENTS (continued)
recorded for financial statement purposes as unrealized appreciation or depreciation on swap transactions.
Interest Rate Swaps: Interest rate swaps involve the exchange of commitments to pay and receive interest based on a notional principal amount.The fund may elect to pay a fixed rate and receive a floating rate, or receive a fixed rate and pay a floating rate on a notional principal amount. The net interest received or paid on interest rate swap agreements is included within unrealized appreciation (depreciation) on swap contracts in the Statement of Assets and Liabilities. Interest rate swaps are valued daily and the change, if any, is recorded as an unrealized gain or loss in the Statement of Operations.When a swap contract is terminated early, the fund records a realized gain or loss equal to the difference between the current realized value and the expected cash flows. For financial reporting purposes, forward rate agreements are classified as interest rate swaps.At September 30, 2012, there were no interest rate swap agreements outstanding.
The following summarizes the average notional value of swap contracts outstanding during the period ended September 30, 2012:
| Average Notional Value ($) | |
| Interest rate swap contracts | 246,154 |
At September 30, 2012, the cost of investments for federal income tax purposes was $126,650,839; accordingly, accumulated net unrealized appreciation on investments was $8,762,487, consisting of $8,762,487 gross unrealized appreciation.
40
| REPORT OF INDEPENDENT REGISTERED |
| PUBLIC ACCOUNTING FIRM |
To the Board of Trustees and Shareholders of Dreyfus/Standish Intermediate Tax Exempt Bond Fund:
We have audited the accompanying statement of assets and liabilities of Dreyfus/ Standish Intermediate Tax Exempt Bond Fund (the “Fund”), a series of Dreyfus Investment Funds, including the statement of investments as of September 30, 2012, and the related statement of operations for the year then ended, the statements of changes in net assets for each of the years in the two-year period then ended and financial highlights for each of the years in the four-year period then ended.These financial statements and financial highlights are the responsibility of the Fund’s management. Our responsibility is to express an opinion on these financial statements and financial highlights based on our audits. The financial highlights for the year ended September 30, 2008 were audited by other independent registered public accountants whose report thereon, dated November 28, 2008, expressed an unqualified opinion on those financial highlights.
We conducted our audits in accordance with the standards of the Public Company Accounting Oversight Board (United States).Those standards require that we plan and perform the audit to obtain reasonable assurance about whether the financial statements and financial highlights are free of material misstatement.An audit also includes examining, on a test basis, evidence supporting the amounts and disclosures in the financial statements. Our procedures included confirmation of securities owned as of September 30, 2012 by correspondence with the custodian and brokers or by other appropriate auditing procedures where replies from brokers were not received.An audit also includes assessing the accounting principles used and significant estimates made by management, as well as evaluating the overall financial statement presentation.We believe that our audits provide a reasonable basis for our opinion.
In our opinion, the financial statements and financial highlights referred to above present fairly, in all material respects, the financial position of Dreyfus/Standish Intermediate Tax Exempt Bond Fund as of September 30, 2012, and the results of its operations for the year then ended, the changes in its net assets for each of the years in the two-year period then ended, and the financial highlights for each of the years in the four-year period then ended, in conformity with U.S. generally accepted accounting principles.

New York, New York
November 28, 2012
| The Fund | 41 |
IMPORTANT TAX INFORMATION (Unaudited)
In accordance with federal tax law, the fund hereby reports all the dividends paid from investment income-net during its fiscal year ended September 30, 2012 as “exempt-interest dividends” (not generally subject to regular federal income tax).The fund reports the maximum amount allowable but not less than $.2012 per share as a capital gain dividend in accordance with Section 852(b)(3)(C) of the Internal Revenue Code. The fund reports the maximum amount allowable but not less than $.0592 per share as a short-term capital gain dividend in accordance with Sections 871(k)(2) and 881(e) of the Internal Revenue Code. Where required by federal tax law rules, shareholders will receive notification of their portion of the fund’s taxable ordinary dividends (if any), capital gains distributions (if any) and tax-exempt dividends paid for the 2012 calendar year on Form 1099-DIV, which will be mailed in early 2013.
42
BOARD MEMBERS INFORMATION (Unaudited)
| Joseph S. DiMartino (68) |
| Chairman of the Board (2008) |
| Principal Occupation During Past 5Years: |
| • Corporate Director and Trustee |
| Other Public Company Board Memberships During Past 5Years: |
| • CBIZ (formerly, Century Business Services, Inc.), a provider of outsourcing functions for small |
| and medium size companies, Director (1997-present) |
| • Sunair Services Corporation, a provider of certain outdoor-related services to homes and busi- |
| nesses, Director (2005-2009) |
| • The Newark Group, a provider of a national market of paper recovery facilities, paperboard |
| mills and paperboard converting plants, Director (2000-2010) |
| No. of Portfolios for which Board Member Serves: 157 |
| ——————— |
| Francine J. Bovich (61) |
| Board Member (2011) |
| Principal Occupation During Past 5Years: |
| • Trustee,The Bradley Trusts, private trust funds (2011-present) |
| • Managing Director, Morgan Stanley Investment Management (1993-2010) |
| No. of Portfolios for which Board Member Serves: 31 |
| ——————— |
| James M. Fitzgibbons (78) |
| Board Member (2008) |
| Principal Occupation During Past 5Years: |
| • Corporate Director and Trustee |
| Other Public Company Board Memberships During Past 5Years: |
| • Bill Barrett Corporation, an oil and natural gas exploration company, Director (2004-present) |
| No. of Portfolios for which Board Member Serves: 31 |
| ——————— |
| Kenneth A. Himmel (66) |
| Board Member (2008) |
| Principal Occupation During Past 5Years: |
| • President and CEO, Related Urban Development, a real estate development company (1996-present) |
| • President and CEO, Himmel & Company, a real estate development company (1980-present) |
| • CEO,American Food Management, a restaurant company (1983-present) |
| No. of Portfolios for which Board Member Serves: 31 |
| The Fund | 43 |
BOARD MEMBERS INFORMATION (Unaudited) (continued)
| Stephen J. Lockwood (65) |
| Board Member (2008) |
| Principal Occupation During Past 5Years: |
| • Chairman of the Board, Stephen J. Lockwood and Company LLC, a real estate investment |
| company (2000-present) |
| No. of Portfolios for which Board Member Serves: 31 |
| ——————— |
| Roslyn M. Watson (62) |
| Board Member (2008) |
| Principal Occupation During Past 5Years: |
| • Principal,Watson Ventures, Inc., a real estate investment company (1993-present) |
| No. of Portfolios for which Board Member Serves: 41 |
| ——————— |
| Benaree Pratt Wiley (66) |
| Board Member (2008) |
| Principal Occupation During Past 5Years: |
| • Principal,TheWiley Group, a firm specializing in strategy and business development (2005-present) |
| Other Public Company Board Memberships During Past 5Years: |
| • CBIZ (formerly, Century Business Services, Inc.), a provider of outsourcing functions for small |
| and medium size companies, Director (2008-present) |
| No. of Portfolios for which Board Member Serves: 64 |
| ——————— |
Once elected all Board Members serve for an indefinite term, but achieve Emeritus status upon reaching age 80.The address of the Board Members and Officers is c/o The Dreyfus Corporation, 200 Park Avenue, NewYork, NewYork 10166.Additional information about the Board Members is available in the fund’s Statement of Additional Information which can be obtained from Dreyfus free of charge by calling this toll free number: 1-800-DREYFUS.
44
OFFICERS OF THE FUND (Unaudited)
BRADLEY J. SKAPYAK, President since January 2010.
Chief Operating Officer and a director of the Manager since June 2009; from April 2003 to June 2009, Mr. Skapyak was the head of the Investment Accounting and Support Department of the Manager. He is an officer of 72 investment companies (comprised of 156 portfolios) managed by the Manager. He is 53 years old and has been an employee of the Manager since February 1988.
JANETTE E. FARRAGHER, Vice President and Secretary since December 2011.
Assistant General Counsel of BNY Mellon, and an officer of 73 investment companies (comprised of 183 portfolios) managed by the Manager. She is 49 years old and has been an employee of the Manager since February 1984.
KIESHA ASTWOOD, Vice President and Assistant Secretary since January 2010.
Counsel of BNY Mellon, and an officer of 73 investment companies (comprised of 183 portfolios) managed by the Manager. She is 39 years old and has been an employee of the Manager since July 1995.
JAMES BITETTO, Vice President and Assistant Secretary since December 2008.
Senior Counsel of BNY Mellon and Secretary of the Manager, and an officer of 73 investment companies (comprised of 183 portfolios) managed by the Manager. He is 46 years old and has been an employee of the Manager since December 1996.
JONI LACKS CHARATAN, Vice President and Assistant Secretary since December 2008.
Senior Counsel of BNY Mellon, and an officer of 73 investment companies (comprised of 183 portfolios) managed by the Manager. She is 56 years old and has been an employee of the Manager since October 1988.
JOSEPH M. CHIOFFI, Vice President and Assistant Secretary since December 2008.
Senior Counsel of BNY Mellon, and an officer of 73 investment companies (comprised of 183 portfolios) managed by the Manager. He is 50 years old and has been an employee of the Manager since June 2000.
JOHN B. HAMMALIAN, Vice President and Assistant Secretary since December 2008.
Senior Managing Counsel of BNY Mellon, and an officer of 73 investment companies (comprised of 183 portfolios) managed by the Manager. He is 49 years old and has been an employee of the Manager since February 1991.
ROBERT R. MULLERY, Vice President and Assistant Secretary since December 2008.
Managing Counsel of BNY Mellon, and an officer of 73 investment companies (comprised of 183 portfolios) managed by the Manager. He is 60 years old and has been an employee of the Manager since May 1986.
JEFF PRUSNOFSKY, Vice President and Assistant Secretary since December 2008.
Senior Managing Counsel of BNY Mellon, and an officer of 73 investment companies (comprised of 183 portfolios) managed by the Manager. He is 47 years old and has been an employee of the Manager since October 1990.
JAMES WINDELS, Treasurer since December 2008.
Director – Mutual Fund Accounting of the Manager, and an officer of 73 investment companies (comprised of 183 portfolios) managed by the Manager. He is 54 years old and has been an employee of the Manager since April 1985.
| The Fund | 45 |
OFFICERS OF THE FUND (Unaudited) (continued)
RICHARD CASSARO, Assistant Treasurer since December 2008.
Senior Accounting Manager – Money Market and Municipal Bond Funds of the Manager, and an officer of 73 investment companies (comprised of 183 portfolios) managed by the Manager. He is 53 years old and has been an employee of the Manager since September 1982.
GAVIN C. REILLY, Assistant Treasurer since December 2008.
Tax Manager of the Investment Accounting and Support Department of the Manager, and an officer of 73 investment companies (comprised of 183 portfolios) managed by the Manager. He is 44 years old and has been an employee of the Manager since April 1991.
ROBERT S. ROBOL, Assistant Treasurer since December 2008.
Senior Accounting Manager – Fixed Income Funds of the Manager, and an officer of 73 investment companies (comprised of 183 portfolios) managed by the Manager. He is 48 years old and has been an employee of the Manager since October 1988.
ROBERT SALVIOLO, Assistant Treasurer since December 2008.
Senior Accounting Manager – Equity Funds of the Manager, and an officer of 73 investment companies (comprised of 183 portfolios) managed by the Manager. He is 45 years old and has been an employee of the Manager since June 1989.
ROBERT SVAGNA, Assistant Treasurer since December 2008.
Senior Accounting Manager – Equity Funds of the Manager, and an officer of 73 investment companies (comprised of 183 portfolios) managed by the Manager. He is 45 years old and has been an employee of the Manager since November 1990.
JOSEPH W. CONNOLLY, Chief Compliance Officer since December 2008.
Chief Compliance Officer of the Manager and The Dreyfus Family of Funds (73 investment companies, comprised of 183 portfolios). He is 55 years old and has served in various capacities with the Manager since 1980, including manager of the firm’s Fund Accounting Department from 1997 through October 2001.
MATTHEW D. CONNOLLY, Anti-Money Laundering Compliance Officer since April 2012.
Anti-Money Laundering Compliance Officer of the Distributor since October 2011; from March 2010 to September 2011, Global Head, KYC Reviews and Director, UBS Investment Bank; until March 2010,AML Compliance Officer and Senior Vice President, Citi Global Wealth Management. He is an officer of 69 investment companies (comprised of 179 portfolios) managed by the Manager. He is 40 years old and has been an employee of the Distributor since October 2011.
46
NOTES
For More Information

Telephone Call your Financial Representative or 1-800-DREYFUS
Mail The Dreyfus Family of Funds, 144 Glenn Curtiss Boulevard, Uniondale, NY 11556-0144 E-mail Send your request to info@dreyfus.com Internet Information can be viewed online or downloaded at: http://www.dreyfus.com
The fund files its complete schedule of portfolio holdings with the Securities and Exchange Commission (“SEC”) for the first and third quarters of each fiscal year on Form N-Q. The fund’s Forms N-Q are available on the SEC’s website at http://www.sec.gov and may be reviewed and copied at the SEC’s Public Reference Room in Washington, DC. Information on the operation of the Public Reference Room may be obtained by calling 1-800-SEC-0330.
Information regarding how the fund voted proxies relating to portfolio securities for the most recent 12-month period ended June 30 is available on the SEC’s website at http://www.sec.gov and without charge, upon request, by calling 1-800-DREYFUS.

| Dreyfus/Newton |
| International Equity Fund |
ANNUAL REPORT September 30, 2012
Save time. Save paper. View your next shareholder report online as soon as it’s available. Log into www.dreyfus.com and sign up for Dreyfus eCommunications. It’s simple and only takes a few minutes.
The views expressed in this report reflect those of the portfolio manager only through the end of the period covered and do not necessarily represent the views of Dreyfus or any other person in the Dreyfus organization. Any such views are subject to change at any time based upon market or other conditions and Dreyfus disclaims any responsibility to update such views.These views may not be relied on as investment advice and, because investment decisions for a Dreyfus fund are based on numerous factors, may not be relied on as an indication of trading intent on behalf of any Dreyfus fund.
| Not FDIC-Insured • Not Bank-Guaranteed • May Lose Value |
Contents | |
THE FUND | |
| 2 | A Letter from the Chairman and CEO |
| 3 | Discussion of Fund Performance |
| 6 | Fund Performance |
| 8 | Understanding Your Fund’s Expenses |
| 8 | Comparing Your Fund’s Expenses With Those of Other Funds |
| 9 | Statement of Investments |
| 13 | Statement of Assets and Liabilities |
| 14 | Statement of Operations |
| 15 | Statement of Changes in Net Assets |
| 17 | Financial Highlights |
| 20 | Notes to Financial Statements |
| 34 | Report of Independent Registered Public Accounting Firm |
| 35 | Important Tax Information |
| 36 | Information About the Renewal of the Fund’s Investment Advisory Agreement |
| 42 | Board Members Information |
| 44 | Officers of the Fund |
FOR MORE INFORMATION | |
Back Cover |
Dreyfus/Newton
International Equity Fund
The Fund
A LETTER FROM THE CHAIRMAN AND CEO

Dear Shareholder:
This annual report for Dreyfus/Newton International Equity Fund covers the 12-month period from October 1, 2011, through September 30, 2012. For information about how the fund performed during the reporting period, as well as general market perspectives, we provide a Discussion of Fund Performance on the pages that follow.
U.S. equities proved unusually volatile over the past year, as prices rose and fell according to investors’ changing expectations of global and domestic economic conditions.And while the pace of U.S. economic growth has been relatively consistent, it has progressed at about half the average rate achieved in prior recoveries. Overseas, Europe has remained under severe economic pressure due to a persistent debt crisis and austerity-oriented fiscal policies adopted by many governments. In Japan, a strengthening currency dampened export activity and economic growth.The emerging markets have posted a slower rate of growth, reducing demand for industrial commodities and other goods and services.
The sustained-but-subpar U.S. expansion appears likely to continue over the foreseeable future.Across the international markets though, on one hand the global economy has responded to a variety of stimulative measures, most notably aggressively accommodative monetary policies in most major markets. On the other hand, headwinds emanating from Europe and China may continue to weigh on economic growth and investor sentiment. Indeed, the ability of governments and economic policymakers to address these issues could go a long way toward shaping the 2013 market environment. As always, we urge you to speak regularly with your financial advisor to discuss how changing global economic conditions may affect your investments.
Thank you for your continued confidence and support.
Jonathan R. Baum
Chairman and Chief Executive Officer
The Dreyfus Corporation
October 15, 2012
2
DISCUSSION OF FUND PERFORMANCE
For the period of October 1, 2011, through September 30, 2012, as provided by Paul Markham, Lead Portfolio Manager of Newton Capital Management Limited, Sub-Investment Adviser
Fund and Market Performance Overview
For the 12-month period ended September 30, 2012, Dreyfus/Newton International Equity Fund’s Class A shares produced a total return of 18.92%, Class C shares returned 17.92%, and Class I shares returned 19.27%.1 In comparison, the fund’s benchmark, the Morgan Stanley Capital International Europe, Australasia, Far East Index (the “MSCI EAFE Index”), produced a total return of 13.75% for the same period.2
Despite heightened market volatility throughout the reporting period, a more stable macroeconomic environment helped drive international stocks higher. The fund produced more robust returns than its benchmark, primarily due to the success of our security selection strategy in the consumer staples and health care sectors.
The Fund’s Investment Approach
The fund normally invests at least 80% of its assets in common stocks, securities convertible into common stocks of foreign companies and in depositary receipts evidencing ownership in such securities.The process of selecting investments begins with Newton’s core list of global investment themes. These themes are based on observable economic, industrial or social trends (typically global) that Newton believes will positively affect certain sectors or industries.The list of themes is discussed and updated on a regular basis. For instance, Newton’s deleverage theme asserts that excessive debt is weighing on economic activity, and that the way in which deleveraging occurs is critical to the outlook for economics and financial markets. Elsewhere, Newton’s networked world theme focuses upon the opportunities and risks inherent in the growth of information technology networks around the world.
Markets Reacted Sharply to Macroeconomic News
The reporting period began in the immediate aftermath of major stock market declines throughout the world. One credit-rating agency’s downgrade of long-term U.S. government debt, an intensifying European debt crisis and inflationary pressures
| The Fund | 3 |
DISCUSSION OF FUND PERFORMANCE (continued)
in China had triggered a flight away from stocks and other risky assets. Fortunately, better U.S. economic data and remedial measures from European policymakers helped to stabilize global equity markets.
By the start of 2012, international stocks were rallying amid U.S. employment gains, quantitative easing in Europe and looser monetary and fiscal policies in China. Consequently, investors focused more intently on company fundamentals and less on macroeconomic developments. They returned to a risk-averse posture during the spring when austerity programs in a number of peripheral European countries encountered resistance, but more encouraging economic data over the summer enabled the MSCI EAFE Index to end the reporting period with double-digit gains.
In this tumultuous environment, international investors tended to prefer large-cap, dividend-paying companies with positive earnings momentum. In contrast, value-oriented companies generally fell out of favor.
Security Selection Strategy Drove Strong Performance
Our theme-based global investment process proved quite effective over the reporting period. Results compared to the benchmark were especially robust in Japan and, from an industry group standpoint, the consumer staples and health care sectors. Emphasis on these areas reflected a relatively defensive positioning, which rendered the fund more resilient than market averages during downturns while enabling it also to participe substantially in rallies.
Among consumer staples stocks, the fund scored success with global brewer Anheuser-Busch InBev, which benefited from robust growth in Brazil and strong sales in the United States. In addition, the company’s acquisition of a Mexican brewer was well received by investors. Japanese food producer CALBEE also fared well, gaining share in its domestic market while leveraging PepsiCo’s U.S. distribution channel for a larger North American presence. In the health care sector,Thai hospitals operator Bangkok Dusit Medical Services was the fund’s top individual performer for the reporting period as hospital use increased among a growing middle class of consumers. The fund also received strong results from some energy stocks, as U.K.-based exploration-and-production company Ophir Energy roughly doubled its reserves, and Canada’s Nexen was acquired by a major Chinese oil-and-gas producer.
Disappointments during the reporting period were primarily concentrated in the materials sector. For example, gold producer Newcrest Mining suffered poor pro-
4
duction volumes that damaged the credibility of its management team. In other areas, Japanese online gaming company DeNA was hurt when regulators outlawed a popular game format, electronic hardware makerToshiba stumbled amid a general oversupply of electronics, and Hong Kong-based tobacco flavors and fragrances specialist Huabao International Holdings suffered on account of negative rumors that later proved to be unfounded.
The fund employed foreign-exchange forward contracts to manage currency-related risks during the reporting period.
Maintaining a Defensive Posture
Although we have been encouraged by recent positive macroeconomic news, we remain concerned about uncertainty stemming from the peripheral European sovereign debt crisis, upcoming automatic tax hikes and spending reductions in the United States, and a leadership change in China. Consequently, we have retained the fund’s generally defensive stance. We have identified a number of opportunities meeting our investment criteria in the health care and consumer staples sectors, but relatively few in the financials, industrials and energy sectors.
October 15, 2012
Please note, the position in any security highlighted with italicized typeface was sold during the reporting period. Equity funds are subject generally to market, market sector, market liquidity, issuer and investment style risks, among other factors, to varying degrees, all of which are more fully described in the fund’s prospectus.
Investing internationally involves special risks, including changes in currency exchange rates, political, economic and social instability, a lack of comprehensive company information, differing auditing and legal standards and less market liquidity. The use of derivatives involves risks different from, or possibly greater than, the risks associated with investing directly in the underlying assets. Derivatives can be highly volatile, illiquid, and difficult to value and there is the risk that changes in the value of a derivative held by the fund will not correlate with the underlying instruments or the fund’s other investments.
| 1 Total return includes reinvestment of dividends and any capital gains paid, and does not take into consideration the |
| maximum initial sales charge in the case of Class A shares, or the applicable contingent deferred sales charge imposed |
| on redemptions in the case of Class C shares. Had these charges been reflected, returns would have been lower. Past |
| performance is no guarantee of future results. Share price, yield and investment return fluctuate such that upon |
| redemption, fund shares may be worth more or less than their original cost. |
| 2 SOURCE: LIPPER INC. — Reflects reinvestment of net dividends and, where applicable, capital gain |
| distributions.The Morgan Stanley Capital International Europe,Australasia, Far East (MSCI EAFE) Index is an |
| unmanaged index composed of a sample of companies representative of the market structure of European and Pacific |
| Basin countries.The Index does not take into account fees and expenses to which the fund is subject. Investors cannot |
| invest directly in any index. |
| The Fund | 5 |
FUND PERFORMANCE
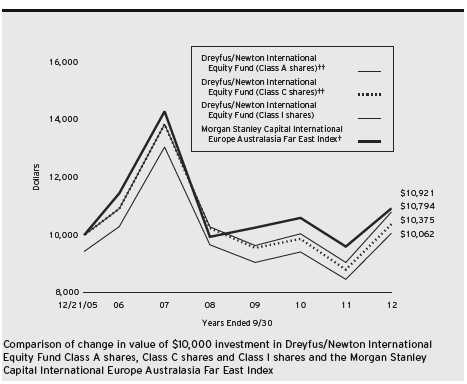
| † | Source: Lipper Inc. |
| †† | The total return figures presented for Class A and Class C shares of the fund reflect the performance of the fund’s |
| Class I shares for the period prior to 3/31/08 (the inception date for Class A and Class C shares), adjusted to | |
| reflect the applicable sales load for each share class. |
Past performance is not predictive of future performance.
The above graph compares a $10,000 investment made in each of the Class A, Class C and Class I shares of Dreyfus/Newton International Equity Fund on 12/21/05 (inception date) to a $10,000 investment made in the Morgan Stanley Capital International Europe Australasia Far East Index (the “Index”) on that date.All dividends and capital gain distributions are reinvested. For comparative purposes, the value of the Index on 12/31/05 is used as the beginning value on 12/21/05.
The fund’s performance shown in the line graph above takes into account the maximum initial sales charge on Class A shares and all other applicable fees and expenses on all classes.The Index is an unmanaged index composed of a sample of companies representative of the market structure of European and Pacific Basin countries. Unlike a mutual fund, the Index is not subject to charges, fees and other expenses. Investors cannot invest directly in any index.These factors can contribute to the Index potentially outperforming the fund. Further information relating to fund performance, including expense reimbursements, if applicable, is contained in the Financial Highlights section of the prospectus and elsewhere in this report.
6
| Average Annual Total Returns as of 9/30/12 | |||||||
| Inception | From | ||||||
| Date | 1 Year | 5 Years | Inception | ||||
| Class A shares | |||||||
| with maximum sales charge (5.75%) | 3/31/08 | 12.08 | % | –6.19 | %†† | 0.09 | %†† |
| without sales charge | 3/31/08 | 18.92 | % | –5.07 | %†† | 0.97 | %†† |
| Class C shares | |||||||
| with applicable redemption charge † | 3/31/08 | 16.92 | % | –5.61 | %†† | 0.55 | %†† |
| without redemption | 3/31/08 | 17.92 | % | –5.61 | %†† | 0.55 | %†† |
| Class I shares | 12/21/05 | 19.27 | % | –4.86 | % | 1.13 | % |
| Morgan Stanley Capital International | |||||||
| Europe Australasia Far East Index | 12/31/05 | 13.75 | % | –5.24 | % | 1.31 | %††† |
Past performance is not predictive of future performance.The fund’s performance shown in the graph and table does not reflect the deduction of taxes that a shareholder would pay on fund distributions or the redemption of fund shares.
| † | The maximum contingent deferred sales charge for Class C shares is 1% for shares redeemed within one year of the |
| date of purchase. | |
| †† | The total return performance figures presented for Class A and Class C shares of the fund reflect the performance of |
| the fund’s Class I shares for the period prior to 3/31/08 (the inception date for Class A and Class C shares), | |
| adjusted to reflect the applicable sales load for each share class. | |
| ††† The Index date is based on the life of Class I shares. For comparative purposes, the value of the Index as of the | |
| month end 12/31/05 is used as the beginning value on 12/21/05 (the inception date for Class I shares). | |
| The Fund | 7 |
UNDERSTANDING YOUR FUND’S EXPENSES (Unaudited)
As a mutual fund investor, you pay ongoing expenses, such as management fees and other expenses. Using the information below, you can estimate how these expenses affect your investment and compare them with the expenses of other funds.You also may pay one-time transaction expenses, including sales charges (loads) and redemption fees, which are not shown in this section and would have resulted in higher total expenses. For more information, see your fund’s prospectus or talk to your financial adviser.
Review your fund’s expenses
The table below shows the expenses you would have paid on a $1,000 investment in Dreyfus/Newton International Equity Fund from April 1, 2012 to September 30, 2012. It also shows how much a $1,000 investment would be worth at the close of the period, assuming actual returns and expenses.
Expenses and Value of a $1,000 Investment
assuming actual returns for the six months ended September 30, 2012
| Class A | Class C | Class I | ||||
| Expenses paid per $1,000† | $ | 6.95 | $ | 11.04 | $ | 5.28 |
| Ending value (after expenses) | $ | 1,030.40 | $ | 1,025.80 | $ | 1,031.70 |
COMPARING YOUR FUND’S EXPENSES
WITH THOSE OF OTHER FUNDS (Unaudited)
Using the SEC’s method to compare expenses
The Securities and Exchange Commission (SEC) has established guidelines to help investors assess fund expenses. Per these guidelines, the table below shows your fund’s expenses based on a $1,000 investment, assuming a hypothetical 5% annualized return. You can use this information to compare the ongoing expenses (but not transaction expenses or total cost) of investing in the fund with those of other funds.All mutual fund shareholder reports will provide this information to help you make this comparison. Please note that you cannot use this information to estimate your actual ending account balance and expenses paid during the period.
Expenses and Value of a $1,000 Investment
assuming a hypothetical 5% annualized return for the six months ended September 30, 2012
| Class A | Class C | Class I | ||||
| Expenses paid per $1,000† | $ | 6.91 | $ | 10.98 | $ | 5.25 |
| Ending value (after expenses) | $ | 1,018.15 | $ | 1,014.10 | $ | 1,019.80 |
| † Expenses are equal to the fund’s annualized expense ratio of 1.37% for Class A, 2.18% for Class C and 1.04% |
| for Class I, multiplied by the average account value over the period, multiplied by 183/366 (to reflect the one-half |
| year period). |
8
| STATEMENT OF INVESTMENTS |
| September 30, 2012 |
| Common Stocks—97.5% | Shares | Value ($) |
| Australia—3.4% | ||
| Newcrest Mining | 195,235 | 5,901,361 |
| Santos | 403,907 | 4,759,536 |
| WorleyParsons | 139,731 | 4,100,442 |
| 14,761,339 | ||
| Belgium—2.5% | ||
| Anheuser-Busch InBev | 128,432 | 10,920,796 |
| Brazil—2.0% | ||
| CCR | 276,600 | 2,503,692 |
| International Meal Co. Holdings | 251,146 | 2,353,816 |
| Vale, ADR | 219,053 | 3,921,049 |
| 8,778,557 | ||
| Canada—1.8% | ||
| Barrick Gold | 116,126 | 4,852,463 |
| Nexen | 120,480 | 3,051,523 |
| 7,903,986 | ||
| China—1.5% | ||
| Biostime International Holdings | 1,486,504 | 3,811,131 |
| Mindray Medical International, ADR | 85,782 | 2,883,133 |
| 6,694,264 | ||
| France—3.9% | ||
| Air Liquide | 59,964 | 7,432,121 |
| L’Oreal | 33,623 | 4,159,128 |
| Total | 114,729 | 5,690,893 |
| 17,282,142 | ||
| Germany—5.1% | ||
| Bayer | 104,919 | 9,010,430 |
| Brenntag | 27,886 | 3,569,156 |
| Fresenius Medical Care & Co. | 81,276 | 5,959,558 |
| Gerry Weber International | 92,778 | 3,834,255 |
| 22,373,399 | ||
| Hong Kong—6.4% | ||
| AIA Group | 1,824,512 | 6,800,110 |
| Belle International Holdings | 2,345,255 | 4,246,475 |
| China Mobile | 628,365 | 6,965,131 |
| Jardine Matheson Holdings | 128,000 | 7,283,200 |
| The Fund | 9 |
STATEMENT OF INVESTMENTS (continued)
| Common Stocks (continued) | Shares | Value ($) | |
| Hong Kong (continued) | |||
| Man Wah Holdings | 5,355,200 | 2,921,376 | |
| 28,216,292 | |||
| Italy—1.5% | |||
| Intesa Sanpaolo | 1,745,103 | 2,652,930 | |
| Saipem | 84,249 | 4,045,831 | |
| 6,698,761 | |||
| Japan—24.7% | |||
| Asahi Group Holdings | 225,900 | 5,569,344 | |
| CALBEE | 44,700 | 3,917,837 | |
| Daiichi Sankyo | 177,273 | 2,930,320 | |
| Don Quijote | 219,800 | 8,463,596 | |
| FANUC | 32,000 | 5,158,380 | |
| INPEX | 606 | 3,614,723 | |
| Japan Airlines | 67,193 | 3,142,676 | |
| Japan Tobacco | 417,700 | 12,535,282 | |
| Lawson | 59,000 | 4,536,135 | |
| Makita | 117,500 | 4,562,084 | |
| Mitsubishi Estate | 378,000 | 7,236,443 | |
| NGK Spark Plug | 306,000 | 3,219,195 | |
| Nissan Motor | 617,000 | 5,257,624 | |
| Nomura Holdings | 1,267,900 | 4,532,856 | |
| Shiseido | 216,700 | 2,973,933 | |
| Sugi Holdings | 157,800 | 5,542,412 | |
| Toshiba | 1,470,000 | 4,709,123 | |
| Towa Pharmaceutical | 81,000 | 5,417,991 | |
| Toyota Motor | 368,200 | 14,343,004 | |
| 107,662,958 | |||
| Mexico—.7% | |||
| Grupo Finance Santander, Cl. B, ADR | 232,610 | a | 3,186,757 |
| Norway—1.9% | |||
| DNB | 667,874 | 8,189,731 | |
| Philippines—.7% | |||
| Energy Development | 20,243,800 | 2,950,553 | |
| Poland—.8% | |||
| Telekomunikacja Polska | 663,807 | 3,408,495 | |
| Singapore—1.1% | |||
| United Overseas Bank | 313,000 | 5,011,775 |
10
| Common Stocks (continued) | Shares | Value ($) | |
| South Africa—.9% | |||
| MTN Group | 201,489 | 3,878,476 | |
| Sweden—1.1% | |||
| TeliaSonera | 681,794 | 4,907,322 | |
| Switzerland—13.1% | |||
| Actelion | 58,324 | a | 2,919,611 |
| Bank Sarasin & Cie, Cl. B | 90,768 | a | 2,596,129 |
| Nestle | 224,049 | 14,126,641 | |
| Novartis | 152,697 | 9,343,660 | |
| Roche Holding | 78,672 | 14,697,151 | |
| Syngenta | 23,489 | 8,778,717 | |
| Zurich Insurance Group | 19,992 | a | 4,978,337 |
| 57,440,246 | |||
| Thailand—3.2% | |||
| Bangkok Bank | 1,309,700 | 8,552,622 | |
| Bangkok Dusit Medical Services | 1,570,183 | 5,483,907 | |
| 14,036,529 | |||
| United Kingdom—21.2% | |||
| Aberdeen Asset Management | 984,990 | 4,948,252 | |
| Associated British Foods | 268,677 | 5,592,466 | |
| BG Group | 210,896 | 4,256,948 | |
| BHP Billiton | 356,737 | 11,089,165 | |
| Bowleven | 2,027,757 | a | 2,521,312 |
| British American Tobacco | 162,379 | 8,336,978 | |
| Centrica | 1,640,336 | 8,682,838 | |
| Compass Group | 405,105 | 4,471,220 | |
| GlaxoSmithKline | 342,900 | 7,904,303 | |
| Imagination | |||
| Technologies Group | 390,914 | a | 2,998,436 |
| Ophir Energy | 457,084 | a | 4,487,656 |
| Prudential | 347,079 | 4,492,125 | |
| Royal Bank of Scotland Group | 1,894,712 | a | 7,863,145 |
| Severn Trent | 179,063 | 4,854,858 | |
| SSE | 242,367 | 5,447,944 | |
| Wolseley | 114,607 | 4,889,494 | |
| 92,837,140 | |||
| Total Common Stocks | |||
| cost $353,059,752) | 427,139,518 |
| The Fund | 11 |
STATEMENT OF INVESTMENTS (continued)
| Preferred Stocks—1.0% | Shares | Value ($) | |
| Brazil | |||
| Petroleo Brasileiro | |||
| (cost $5,489,720) | 400,304 | 4,417,216 | |
| Other Investment—1.0% | |||
| Registered Investment Company; | |||
| Dreyfus Institutional Preferred | |||
| Plus Money Market Fund | |||
| (cost $4,533,107) | 4,533,107 | b | 4,533,107 |
| Total Investments (cost $363,082,579) | 99.5 | % | 436,089,841 |
| Cash and Receivables (Net) | .5 | % | 2,228,340 |
| Net Assets | 100.0 | % | 438,318,181 |
| ADR—American Depository Receipts | |
| a | Non-income producing security. |
| b | Investment in affiliated money market mutual fund. |
| Portfolio Summary (Unaudited)† | |||
| Value (%) | Value (%) | ||
| Consumer Staples | 18.7 | Industrial | 5.4 |
| Financial | 17.9 | Utilities | 5.0 |
| Health Care | 15.2 | Telecommunication Services | 4.4 |
| Consumer Discretionary | 11.2 | Information Technology | 1.8 |
| Materials | 9.6 | Money Market Investment | 1.0 |
| Energy | 9.3 | 99.5 | |
| † Based on net assets. |
| See notes to financial statements. |
12
| STATEMENT OF ASSETS AND LIABILITIES |
| September 30, 2012 |
| Cost | Value | |||
| Assets ($): | ||||
| Investments in securities—See Statement of Investments: | ||||
| Unaffiliated issuers | 358,549,472 | 431,556,734 | ||
| Affiliated issuers | 4,533,107 | 4,533,107 | ||
| Cash | 175,344 | |||
| Cash denominated in foreign currencies | 3,740,413 | 3,762,977 | ||
| Dividends receivable | 2,109,442 | |||
| Receivable for shares of Beneficial Interest subscribed | 159,461 | |||
| Unrealized appreciation on forward foreign | ||||
| currency exchange contracts—Note 4 | 1,372 | |||
| Prepaid expenses | 17,503 | |||
| 442,315,940 | ||||
| Liabilities ($): | ||||
| Due to The Dreyfus Corporation and affiliates—Note 3(c) | 471,671 | |||
| Due to Administrator—Note 3(a) | 5,966 | |||
| Payable for investment securities purchased | 2,886,152 | |||
| Payable for shares of Beneficial Interest redeemed | 572,935 | |||
| Interest payable—Note 2 | 2,179 | |||
| Unrealized depreciation on forward foreign | ||||
| currency exchange contracts—Note 4 | 2 | |||
| Accrued expenses | 58,854 | |||
| 3,997,759 | ||||
| Net Assets ($) | 438,318,181 | |||
| Composition of Net Assets ($): | ||||
| Paid-in capital | 403,194,819 | |||
| Accumulated undistributed investment income—net | 3,975,425 | |||
| Accumulated net realized gain (loss) on investments | (41,850,600 | ) | ||
| Accumulated net unrealized appreciation (depreciation) | ||||
| on investments and foreign currency transactions | 72,998,537 | |||
| Net Assets ($) | 438,318,181 | |||
| Net Asset Value Per Share | ||||
| Class A | Class C | Class I | ||
| Net Assets ($) | 7,299,893 | 721,671 | 430,296,617 | |
| Shares Outstanding | 430,502 | 43,217 | 25,431,908 | |
| Net Asset Value Per Share ($) | 16.96 | 16.70 | 16.92 | |
See notes to financial statements.
| The Fund | 13 |
| STATEMENT OF OPERATIONS | ||
| Year Ended September 30, 2012 | ||
| Investment Income ($): | ||
| Income: | ||
| Cash dividends (net of $1,005,853 foreign taxes withheld at source): | ||
| Unaffiliated issuers | 11,845,192 | |
| Affiliated issuers | 5,417 | |
| Total Income | 11,850,609 | |
| Expenses: | ||
| Investment advisory fee—Note 3(a) | 3,680,636 | |
| Shareholder servicing costs—Note 3(c) | 540,822 | |
| Administration fees—Note 3(a) | 161,623 | |
| Custodian fees—Note 3(c) | 158,005 | |
| Professional fees | 98,706 | |
| Registration fees | 41,568 | |
| Trustees’ fees and expenses—Note 3(d) | 38,222 | |
| Prospectus and shareholders’ reports | 22,126 | |
| Interest expense—Note 2 | 9,153 | |
| Distribution fees—Note 3(b) | 6,336 | |
| Loan commitment fees—Note 2 | 5,255 | |
| Miscellaneous | 44,221 | |
| Total Expenses | 4,806,673 | |
| Less—reduction in fees due to earnings credits—Note 3(c) | (7 | ) |
| Net Expenses | 4,806,666 | |
| Investment Income—Net | 7,043,943 | |
| Realized and Unrealized Gain (Loss) on Investments—Note 4 ($): | ||
| Net realized gain (loss) on investments and foreign currency transactions | (36,377,263 | ) |
| Net realized gain (loss) on forward foreign currency exchange contracts | (889,728 | ) |
| Net Realized Gain (Loss) | (37,266,991 | ) |
| Net unrealized appreciation (depreciation) on | ||
| investments and foreign currency transactions | 112,020,468 | |
| Net unrealized appreciation (depreciation) on | ||
| forward foreign currency exchange contracts | (288,109 | ) |
| Net Unrealized Appreciation (Depreciation) | 111,732,359 | |
| Net Realized and Unrealized Gain (Loss) on Investments | 74,465,368 | |
| Net Increase in Net Assets Resulting from Operations | 81,509,311 | |
| See notes to financial statements. | ||
14
STATEMENT OF CHANGES IN NET ASSETS
| Year Ended September 30, | ||||
| 2012 | 2011 | |||
| Operations ($): | ||||
| Investment income—net | 7,043,943 | 8,854,352 | ||
| Net realized gain (loss) on investments | (37,266,991 | ) | 11,024,549 | |
| Net unrealized appreciation | ||||
| (depreciation) on investments | 111,732,359 | (80,720,598 | ) | |
| Net Increase (Decrease) in Net Assets | ||||
| Resulting from Operations | 81,509,311 | (60,841,697 | ) | |
| Dividends to Shareholders from ($): | ||||
| Investment income—net: | ||||
| Class A Shares | (129,603 | ) | (186,610 | ) |
| Class C Shares | (8,405 | ) | (3,732 | ) |
| Class I Shares | (10,097,256 | ) | (6,484,341 | ) |
| Net realized gain on investments: | ||||
| Class A Shares | (138,111 | ) | (294,754 | ) |
| Class C Shares | (15,969 | ) | (21,745 | ) |
| Class I Shares | (7,394,196 | ) | (8,019,784 | ) |
| Total Dividends | (17,783,540 | ) | (15,010,966 | ) |
| Beneficial Interest Transactions ($): | ||||
| Net proceeds from shares sold: | ||||
| Class A Shares | 1,527,854 | 5,731,984 | ||
| Class C Shares | 116,417 | 134,097 | ||
| Class I Shares | 114,043,269 | 183,824,565 | ||
| Dividends reinvested: | ||||
| Class A Shares | 267,564 | 477,012 | ||
| Class C Shares | 24,374 | 25,467 | ||
| Class I Shares | 8,847,087 | 7,750,756 | ||
| Cost of shares redeemed: | ||||
| Class A Shares | (5,413,378 | ) | (13,959,839 | ) |
| Class C Shares | (458,150 | ) | (453,604 | ) |
| Class I Shares | (239,401,600 | ) | (133,695,220 | ) |
| Increase (Decrease) in Net Assets from | ||||
| Beneficial Interest Transactions | (120,446,563 | ) | 49,835,218 | |
| Total Increase (Decrease) in Net Assets | (56,720,792 | ) | (26,017,445 | ) |
| Net Assets ($): | ||||
| Beginning of Period | 495,038,973 | 521,056,418 | ||
| End of Period | 438,318,181 | 495,038,973 | ||
| Undistributed investment income—net | 3,975,425 | 7,010,161 | ||
| The Fund | 15 |
STATEMENT OF CHANGES IN NET ASSETS (continued)
| Year Ended September 30, | ||||
| 2012 | 2011 | |||
| Capital Share Transactions: | ||||
| Class A | ||||
| Shares sold | 97,788 | 323,875 | ||
| Shares issued for dividends reinvested | 18,883 | 27,493 | ||
| Shares redeemed | (348,588 | ) | (813,824 | ) |
| Net Increase (Decrease) in Shares Outstanding | (231,917 | ) | (462,456 | ) |
| Class C | ||||
| Shares sold | 7,805 | 7,520 | ||
| Shares issued for dividends reinvested | 1,736 | 1,479 | ||
| Shares redeemed | (29,900 | ) | (26,497 | ) |
| Net Increase (Decrease) in Shares Outstanding | (20,359 | ) | (17,498 | ) |
| Class I | ||||
| Shares sold | 7,442,539 | 10,424,872 | ||
| Shares issued for dividends reinvested | 627,898 | 446,730 | ||
| Shares redeemed | (15,423,854 | ) | (7,832,272 | ) |
| Net Increase (Decrease) in Shares Outstanding | (7,353,417 | ) | 3,039,330 | |
| See notes to financial statements. | ||||
16
FINANCIAL HIGHLIGHTS
The following tables describe the performance for each share class for the fiscal periods indicated.All information (except portfolio turnover rate) reflects financial results for a single fund share.Total return shows how much your investment in the fund would have increased (or decreased) during each period, assuming you had reinvested all dividends and distributions.These figures have been derived from the fund’s financial statements.
| Year Ended September 30, | ||||||||||
| Class A Shares | 2012 | 2011 | 2010 | 2009 | 2008 | a | ||||
| Per Share Data ($): | ||||||||||
| Net asset value, beginning of period | 14.74 | 16.80 | 16.27 | 18.18 | 23.37 | |||||
| Investment Operations: | ||||||||||
| Investment income—netb | .18 | .19 | .21 | .29 | .14 | |||||
| Net realized and unrealized | ||||||||||
| gain (loss) on investments | 2.52 | (1.82 | ) | .44 | (1.57 | ) | (5.20 | ) | ||
| Total from Investment Operations | 2.70 | (1.63 | ) | .65 | (1.28 | ) | (5.06 | ) | ||
| Distributions: | ||||||||||
| Dividends from investment income—net | (.23 | ) | (.17 | ) | (.12 | ) | (.16 | ) | (.13 | ) |
| Dividends from net realized | ||||||||||
| gain on investments | (.25 | ) | (.26 | ) | — | (.47 | ) | — | ||
| Total Distributions | (.48 | ) | (.43 | ) | (.12 | ) | (.63 | ) | (.13 | ) |
| Net asset value, end of period | 16.96 | 14.74 | 16.80 | 16.27 | 18.18 | |||||
| Total Return (%)c | 18.92 | (10.10 | ) | 3.99 | (6.33 | ) | (21.78 | )d | ||
| Ratios/Supplemental Data (%): | ||||||||||
| Ratio of total expenses | ||||||||||
| to average net assets | 1.32 | 1.32 | 1.32 | 1.52 | 2.35 | e | ||||
| Ratio of net expenses | ||||||||||
| to average net assets | 1.32 | 1.32 | 1.32 | 1.26 | 1.40 | e | ||||
| Ratio of net investment income | ||||||||||
| to average net assets | 1.14 | 1.06 | 1.29 | 2.27 | 1.61 | e | ||||
| Portfolio Turnover Rate | 57.88 | 63.28 | 64.45 | 115.69 | 105 | |||||
| Net Assets, end of period ($ x 1,000) | 7,300 | 9,766 | 18,901 | 16,864 | 4,412 | |||||
| a | From March 31, 2008 (commencement of initial offering) to September 30, 2008. |
| b | Based on average shares outstanding at each month end. |
| c | Exclusive of sales charge. |
| d | Not annualized. |
| e | Annualized. |
See notes to financial statements.
| The Fund | 17 |
FINANCIAL HIGHLIGHTS (continued)
| Year Ended September 30, | ||||||||||
| Class C Shares | 2012 | 2011 | 2010 | 2009 | 2008 | a | ||||
| Per Share Data ($): | ||||||||||
| Net asset value, beginning of period | 14.54 | 16.59 | 16.17 | 18.14 | 23.37 | |||||
| Investment Operations: | ||||||||||
| Investment income—netb | .07 | .05 | .08 | .26 | .05 | |||||
| Net realized and unrealized | ||||||||||
| gain (loss) on investments | 2.47 | (1.79 | ) | .45 | (1.59 | ) | (5.15 | ) | ||
| Total from Investment Operations | 2.54 | (1.74 | ) | .53 | (1.33 | ) | (5.10 | ) | ||
| Distributions: | ||||||||||
| Dividends from investment income—net | (.13 | ) | (.05 | ) | (.11 | ) | (.17 | ) | (.13 | ) |
| Dividends from net realized | ||||||||||
| gain on investments | (.25 | ) | (.26 | ) | — | (.47 | ) | — | ||
| Total Distributions | (.38 | ) | (.31 | ) | (.11 | ) | (.64 | ) | (.13 | ) |
| Net asset value, end of period | 16.70 | 14.54 | 16.59 | 16.17 | 18.14 | |||||
| Total Return (%)c | 17.92 | (10.79 | ) | 3.20 | (6.67 | ) | (21.95 | )d | ||
| Ratios/Supplemental Data (%): | ||||||||||
| Ratio of total expenses | ||||||||||
| to average net assets | 2.16 | 2.07 | 2.11 | 1.83 | 6.42 | e | ||||
| Ratio of net expenses | ||||||||||
| to average net assets | 2.16 | 2.07 | 2.11 | 1.42 | 2.15 | e | ||||
| Ratio of net investment income | ||||||||||
| to average net assets | .42 | .31 | .52 | 2.07 | .49 | e | ||||
| Portfolio Turnover Rate | 57.88 | 63.28 | 64.45 | 115.69 | 105 | |||||
| Net Assets, end of period ($ x 1,000) | 722 | 924 | 1,345 | 1,191 | 399 | |||||
| a | From March 31, 2008 (commencement of initial offering) to September 30, 2008. |
| b | Based on average shares outstanding at each month end. |
| c | Exclusive of sales charge. |
| d | Not annualized. |
| e | Annualized. |
See notes to financial statements.
18
| Year Ended September 30, | ||||||||||
| Class I Shares | 2012 | 2011 | 2010 | 2009 | 2008 | a | ||||
| Per Share Data ($): | ||||||||||
| Net asset value, beginning of period | 14.77 | 16.84 | 16.27 | 18.21 | 26.94 | |||||
| Investment Operations: | ||||||||||
| Investment income—netb | .24 | .26 | .25 | .30 | .31 | |||||
| Net realized and unrealized | ||||||||||
| gain (loss) on investments | 2.49 | (1.86 | ) | .45 | (1.59 | ) | (6.64 | ) | ||
| Total from Investment Operations | 2.73 | (1.60 | ) | .70 | (1.29 | ) | (6.33 | ) | ||
| Distributions: | ||||||||||
| Dividends from investment income—net | (.33 | ) | (.21 | ) | (.13 | ) | (.18 | ) | (.35 | ) |
| Dividends from net realized | ||||||||||
| gain on investments | (.25 | ) | (.26 | ) | — | (.47 | ) | (2.05 | ) | |
| Total Distributions | (.58 | ) | (.47 | ) | (.13 | ) | (.65 | ) | (2.40 | ) |
| Net asset value, end of period | 16.92 | 14.77 | 16.84 | 16.27 | 18.21 | |||||
| Total Return (%) | 19.27 | (9.90 | ) | 4.31 | (6.32 | ) | (25.80 | ) | ||
| Ratios/Supplemental Data (%): | ||||||||||
| Ratio of total expenses | ||||||||||
| to average net assets | 1.04 | 1.05 | 1.07 | 1.16 | 1.59 | |||||
| Ratio of net expenses | ||||||||||
| to average net assets | 1.04 | 1.05 | 1.07 | 1.13 | 1.15 | |||||
| Ratio of net investment income | ||||||||||
| to average net assets | 1.54 | 1.48 | 1.57 | 2.41 | 1.33 | |||||
| Portfolio Turnover Rate | 57.88 | 63.28 | 64.45 | 115.69 | 105 | |||||
| Net Assets, end of period ($ x 1,000) | 430,297 | 484,349 | 500,811 | 331,986 | 61,779 | |||||
| a The fund commenced offering four classes of shares on March 31, 2008.The existing shares were redesignated Class |
| I and the fund added Class A, Class C and Class R shares.The fund terminated its offering of Class R shares on |
| December 3, 2008. |
| b Based on average shares outstanding at each month end. |
See notes to financial statements.
| The Fund | 19 |
NOTES TO FINANCIAL STATEMENTS
NOTE 1—Significant Accounting Policies:
Dreyfus/Newton International Equity Fund (the “fund”) is a separate diversified series of Dreyfus Investment Funds (the “Trust”), which is registered under the Investment Company Act of 1940, as amended (the “Act”), as an open-end management investment company and operates as a series company currently offering eleven series, including the fund.The fund’s investment objective is to seek long-term growth of capital.The Dreyfus Corporation (the “Manager” or “Dreyfus”), a wholly-owned subsidiary of The Bank of New York Mellon Corporation (“BNY Mellon”), serves as the fund’s investment adviser. Newton Capital Management Limited (“Newton”) serves as the fund’s sub-investment adviser.
MBSC Securities Corporation (the “Distributor”), a wholly-owned subsidiary of Dreyfus, is the distributor of the fund’s shares.The fund is authorized to issue an unlimited number of $.001 par value shares of Beneficial Interest in the following classes of shares: Class A, Class C and Class I. Class A and Class C shares are sold primarily to retail investors through financial intermediaries and bear a distribution fee and/or shareholder services fee. Class A shares are subject to a sales charge imposed at the time of purchase. Class C shares are subject to a contingent deferred sales charge (“CDSC”) imposed on Class C shares redeemed within one year of purchase. Class I shares are sold primarily to bank trust departments and other financial services providers (includingThe Bank of NewYork Mellon, a subsidiary of BNY Mellon and an affiliate of Dreyfus, and its affiliates), acting on behalf of customers having a qualified trust or an investment account or relationship at such institution, and bear no Distribution or Shareholder Services Plan fees. Class I shares are offered without a front-end sales charge or CDSC. Other differences between the classes include the services offered to and the expenses borne by each class, the allocation of certain transfer agency costs and certain voting rights. Income, expenses (other
20
than expenses attributable to a specific class), and realized and unrealized gains or losses on investments are allocated to each class of shares based on its relative net assets.
The Trust accounts separately for the assets, liabilities and operations of each series. Expenses directly attributable to each series are charged to that series’ operations; expenses which are applicable to all series are allocated among them on a pro rata basis.
The Financial Accounting Standards Board (“FASB”) Accounting Standards Codification is the exclusive reference of authoritative U.S. generally accepted accounting principles (“GAAP”) recognized by the FASB to be applied by nongovernmental entities. Rules and interpretive releases of the Securities and Exchange Commission (“SEC”) under authority of federal laws are also sources of authoritative GAAP for SEC registrants. The fund’s financial statements are prepared in accordance with GAAP, which may require the use of management estimates and assumptions.Actual results could differ from those estimates.
(a) Portfolio valuation: The fair value of a financial instrument is the amount that would be received to sell an asset or paid to transfer a liability in an orderly transaction between market participants at the measurement date (i.e., the exit price). GAAP establishes a fair value hierarchy that prioritizes the inputs of valuation techniques used to measure fair value.This hierarchy gives the highest priority to unadjusted quoted prices in active markets for identical assets or liabilities (Level 1 measurements) and the lowest priority to unobservable inputs (Level 3 measurements).
Additionally, GAAP provides guidance on determining whether the volume and activity in a market has decreased significantly and whether such a decrease in activity results in transactions that are not orderly. GAAP requires enhanced disclosures around valuation inputs and techniques used during annual and interim periods.
| The Fund | 21 |
NOTES TO FINANCIAL STATEMENTS (continued)
Various inputs are used in determining the value of the fund’s investments relating to fair value measurements.These inputs are summarized in the three broad levels listed below:
Level 1—unadjusted quoted prices in active markets for identical investments.
Level 2—other significant observable inputs (including quoted prices for similar investments, interest rates, prepayment speeds, credit risk, etc.).
Level 3—significant unobservable inputs (including the fund’s own assumptions in determining the fair value of investments).
The inputs or methodology used for valuing securities are not necessarily an indication of the risk associated with investing in those securities.
Changes in valuation techniques may result in transfers in or out of an assigned level within the disclosure hierarchy. Valuation techniques used to value the fund’s investments are as follows:
Investments in securities are valued at the last sales price on the securities exchange or national securities market on which such securities are primarily traded. Securities listed on the National Market System for which market quotations are available are valued at the official closing price or, if there is no official closing price that day, at the last sales price. Securities not listed on an exchange or the national securities market, or securities for which there were no transactions, are valued at the average of the most recent bid and asked prices, except for open short positions, where the asked price is used for valuation purposes. Bid price is used when no asked price is available. Registered investment companies that are not traded on an exchange are valued at their net asset value. All of the preceding securities are categorized within Level 1 of the fair value hierarchy.
22
Fair valuing of securities may be determined with the assistance of a pricing service using calculations based on indices of domestic securities and other appropriate indicators, such as prices of relevant ADRs and financial futures. Utilizing these techniques may result in transfers between Level 1 and Level 2 of the fair value hierarchy.
When market quotations or official closing prices are not readily available, or are determined not to reflect accurately fair value, such as when the value of a security has been significantly affected by events after the close of the exchange or market on which the security is principally traded (for example, a foreign exchange or market), but before the fund calculates its net asset value, the fund may value these investments at fair value as determined in accordance with the procedures approved by the Trust’s Board of Trustees (the “Board”). Certain factors may be considered when fair valuing investments such as: fundamental analytical data, the nature and duration of restrictions on disposition, an evaluation of the forces that influence the market in which the securities are purchased and sold, and public trading in similar securities of the issuer or comparable issuers.These securities are either categorized as Level 2 or 3 depending on the relevant inputs used.
For restricted securities where observable inputs are limited, assumptions about market activity and risk are used and are categorized within Level 3 of the fair value hierarchy.
Investments denominated in foreign currencies are translated to U.S. dollars at the prevailing rates of exchange.
Forward foreign currency exchange contracts (“forward contracts”) are valued at the forward rate. These securities are generally categorized within Level 2 of the fair value hierarchy.
| The Fund | 23 |
NOTES TO FINANCIAL STATEMENTS (continued)
The following is a summary of the inputs used as of September 30, 2012 in valuing the fund’s investments:
| Level 2—Other | Level 3— | |||
| Level 1— | Significant | Significant | ||
| Unadjusted | Observable | Unobservable | ||
| Quoted Prices | Inputs | Inputs | Total | |
| Assets ($) | ||||
| Investments in Securities: | ||||
| Equity Securities—Foreign | ||||
| Common Stocks† | 427,139,518 | — | — | 427,139,518 |
| Preferred Stocks† | 4,417,216 | — | — | 4,417,216 |
| Mutual Funds | 4,533,107 | — | — | 4,533,107 |
| Other Financial | ||||
| Instruments: | ||||
| Forward Foreign | ||||
| Currency Exchange | ||||
| Contracts†† | — | 1,372 | — | 1,372 |
| Liabilities ($) | ||||
| Other Financial | ||||
| Instruments: | ||||
| Forward Foreign | ||||
| Currency Exchange | ||||
| Contracts†† | — | (2) | — | (2) |
| † | See Statement of Investments for additional detailed categorizations. |
| †† | Amount shown represents unrealized appreciation (depreciation) at period end. |
At September 30, 2011, $487,440,998 of exchange traded foreign equity securities were classified as Level 2 of the fair value hierarchy pursuant to the fund’s fair valuation procedures.
(b) Foreign currency transactions: The fund does not isolate that portion of the results of operations resulting from changes in foreign exchange rates on investments from the fluctuations arising from changes in the market prices of securities held. Such fluctuations are included with the net realized and unrealized gain or loss on investments.
Net realized foreign exchange gains or losses arise from sales of foreign currencies, currency gains or losses realized on securities transactions between trade and settlement date, and the difference between the amounts of dividends, interest and foreign withholding taxes recorded on the fund’s books and the U.S. dollar equivalent of the amounts actu-
24
ally received or paid. Net unrealized foreign exchange gains and losses arise from changes in the value of assets and liabilities other than investments resulting from changes in exchange rates. Foreign currency gains and losses on investments are also included with net realized and unrealized gain or loss on investments.
(c) Securities transactions and investment income: Securities transactions are recorded on a trade date basis. Realized gains and losses from securities transactions are recorded on the identified cost basis. Dividend income is recognized on the ex-dividend date and interest income, including, where applicable, accretion of discount and amortization of premium on investments, is recognized on the accrual basis.
(d) Affiliated issuers: Investments in other investment companies advised by Dreyfus are defined as “affiliated” in the Act. Investments in affiliated investment companies for the period ended September 30, 2012 were as follows:
| Affiliated | |||||
| Investment | Value | Value | Net | ||
| Company | 9/30/2011 ($) | Purchases ($) | Sales ($) | 9/30/2012 ($) | Assets (%) |
| Dreyfus | |||||
| Institutional | |||||
| Preferred | |||||
| Plus Money | |||||
| Market Fund | — | 212,125,030 | 207,591,923 | 4,533,107 | 1.0 |
Certain affiliated investment companies also advised or managed by Dreyfus may also invest in the fund. At September 30, 2012, Dreyfus Diversified International Fund held approximately 29% of the outstanding Class I shares of the fund.
(e) Risk: Investing in foreign markets may involve special risks and considerations not typically associated with investing in the U.S.These risks include revaluation of currencies, high rates of inflation, repatriation restrictions on income and capital, and adverse political and economic developments. Moreover, securities issued in these markets may be less liquid, subject to government ownership controls and delayed settlements, and their prices may be more volatile than those of comparable securities in the U.S.
| The Fund | 25 |
NOTES TO FINANCIAL STATEMENTS (continued)
(f) Dividends to shareholders: Dividends are recorded on the ex-dividend date. Dividends from investment income-net and dividends from net realized capital gains, if any, are normally declared and paid annually, but the fund may make distributions on a more frequent basis to comply with the distribution requirements of the Internal Revenue Code of 1986, as amended (the “Code”).To the extent that net realized capital gains can be offset by capital loss carryovers, it is the policy of the fund not to distribute such gains. Income and capital gain distributions are determined in accordance with income tax regulations, which may differ from GAAP.
(g) Federal income taxes: It is the policy of the fund to continue to qualify as a regulated investment company, if such qualification is in the best interests of its shareholders, by complying with the applicable provisions of the Code, and to make distributions of taxable income sufficient to relieve it from substantially all federal income and excise taxes.
As of and during the period ended September 30, 2012, the fund did not have any liabilities for any uncertain tax positions.The fund recognizes interest and penalties, if any, related to uncertain tax positions as income tax expense in the Statement of Operations. During the period, the fund did not incur any interest or penalties.
Each of the tax years in the four-year period ended September 30, 2012 remains subject to examination by the Internal Revenue Service and state taxing authorities.
At September 30, 2012, the components of accumulated earnings on a tax basis were as follows: undistributed ordinary income $6,593,759, accumulated capital losses $33,273,210 and unrealized appreciation $61,802,813.
Under the Regulated Investment Company Modernization Act of 2010 (the “2010 Act”), the fund is permitted to carry forward capital losses incurred in taxable years beginning after December 22, 2010 (“post-enactment losses”) for an unlimited period. Furthermore, post-
26
enactment capital loss carryovers retain their character as either short-term or long-term capital losses rather than short-term as they were under previous statute.
The accumulated capital loss carryover is available for federal income tax purposes to be applied against future net realized capital gains, if any, realized subsequent to September 30, 2012.The fund has $15,379,466 of post-enactment short-term capital losses and $17,893,744 of post enactment long-term capital losses which can be carried forward for an unlimited period.
The tax character of distributions paid to shareholders during the fiscal periods ended September 30, 2012 and September 30, 2011 were as follows: ordinary income $10,646,272 and $13,631,124 and long-term capital gains $7,137,268 and $1,379,842, respectively.
During the period ended September 30, 2012, as a result of permanent book to tax differences, primarily due to tax treatment for foreign currency gains and losses, passive foreign investment companies, dividend reclassification and Thailand capital gain taxes, the fund increased accumulated undistributed investment income-net by $156,585 and decreased accumulated net realized gain (loss) on investments by the same amount. Net assets and net asset value per share were not affected by this reclassification.
(h) New Accounting Pronouncement: In December 2011, FASB issued Accounting Standards Update No. 2011-11 “Disclosures about Offsetting Assets and Liabilities” (“ASU 2011-11”). These disclosure requirements are intended to help investors and other financial statement users to better assess the effect or potential effect of offsetting arrangements on a company’s financial position.They also improve transparency in the reporting of how companies mitigate credit risk, including disclosure of related collateral pledged or received. In addition,ASU 2011-11 facilitates comparison between those entities that prepare their financial
| The Fund | 27 |
NOTES TO FINANCIAL STATEMENTS (continued)
statements on the basis of GAAP and those entities that prepare their financial statements on the basis of International Financial Reporting Standards (“IFRS”). ASU 2011-11 requires entities to: disclose both gross and net information about both instruments and transactions eligible for offset in the financial statements; and disclose instruments and transactions subject to an agreement similar to a master netting agreement. ASU 2011-11 is effective for fiscal years beginning on or after January 1, 2013, and interim periods within those annual periods.At this time, management is evaluating the implications of ASU 2011-11 and its impact on the fund’s financial statement disclosures.
NOTE 2—Bank Lines of Credit:
The fund participates with other Dreyfus-managed funds in a $225 million unsecured credit facility led by Citibank, N.A. and a $300 million unsecured credit facility provided by The Bank of New York Mellon (each, a “Facility”), each to be utilized primarily for temporary or emergency purposes, including the financing of redemptions. In connection therewith, the fund has agreed to pay its pro rata portion of commitment fees for each Facility. Interest is charged to the fund based on rates determined pursuant to the terms of the respective Facility at the time of borrowing.
The average amount of borrowings outstanding under the Facilities during the period ended September 30, 2012, was approximately $792,600 with a related weighted average annualized interest rate of 1.15%.
NOTE 3—Investment Advisory Fee, Sub-Investment Advisory Fee and Other Transactions With Affiliates:
(a) Pursuant to an investment advisory agreement with Dreyfus, the investment advisory fee is computed at the annual rate of .80% of the value of the fund’s average daily net assets and is payable monthly.
Pursuant to a sub-investment advisory agreement between Dreyfus and Newton, Dreyfus pays Newton a monthly fee at an annual percentage rate of the value of the fund’s average daily net assets.
28
The fund has an Accounting and Administration Agreement (the “Administration Agreement”) with Dreyfus, whereby Dreyfus performs administrative and accounting services for the fund. The fund has agreed to compensate Dreyfus for providing accounting services, administration, compliance monitoring, regulatory and shareholder reporting, as well as for related facilities and equipment.The fee is based on the fund’s average daily net assets and computed at the following annual rates: .10% of the first $500 million, .065% of the next $500 million and .02% in excess of $1 billion.
In addition, after applying any expense limitations or fee waivers that reduce the fees paid to Dreyfus for this service, Dreyfus has contractually agreed in writing to waive any remaining fees for this service to the extent that they exceed both Dreyfus’ costs in providing these services and a reasonable allocation of the costs incurred by Dreyfus and its affiliates related to the support and oversight of these services. The fund also reimburses Dreyfus for the out-of-pocket expenses incurred in performing this service for the fund. Pursuant to the Administration Agreement, the fund was charged $161,623 during the period ended September 30, 2012.
(b) Under the Distribution Plan adopted pursuant to Rule 12b-1 under the Act, Class C shares pay the Distributor for distributing its shares at an annual rate of .75% of the value of the average daily net assets of Class C shares. During the period ended September 30, 2012, Class C shares were charged $6,336 pursuant to the Distribution Plan.
(c) Under the Shareholder Services Plan, Class A and Class C shares pay the Distributor at an annual rate of .25% of the value of their average daily net assets for the provision of certain services.The services provided may include personal services relating to shareholder accounts, such as answering shareholder inquiries regarding the fund and providing reports and other information, and services related to the maintenance of shareholder accounts.The Distributor may make payments to Service Agents (securities dealers, financial institutions or other industry
| The Fund | 29 |
NOTES TO FINANCIAL STATEMENTS (continued)
professionals) in respect of these services.The Distributor determines the amounts to be paid to Service Agents. During the period ended September 30, 2012, Class A and Class C shares were charged $19,662 and $2,112, respectively, pursuant to the Shareholder Services Plan.
Under its terms, the Distribution Plan and Shareholder Services Plan shall remain in effect from year to year, provided such continuance is approved annually by a vote of a majority of thoseTrustees who are not “interested persons” of the Trust and who have no direct or indirect financial interest in the operation of or in any agreement related to the Distribution Plan or Shareholder Services Plan.
The fund has arrangements with the transfer agent and the custodian whereby the fund may receive earnings credits when positive cash balances are maintained, which are used to offset transfer agency and custody fees. For financial reporting purposes, the fund includes net earnings credits as an expense offset in the Statement of Operations.
The fund compensates DreyfusTransfer, Inc. (“DTI”), a wholly-owned subsidiary of Dreyfus, under a transfer agency agreement for providing transfer agency services for the fund and, since May 29, 2012, cash management services related to fund subscriptions and redemptions. During the period ended September 30, 2012, the fund was charged $3,267 for transfer agency services and $22 for cash management services. Cash management fees were partially offset by earnings credits of $3. These fees are included in Shareholder servicing costs in the Statement of Operations.
The fund compensatesThe Bank of NewYork Mellon under a custody agreement for providing custodial services for the fund. During the period ended September 30, 2012, the fund was charged $158,005 pursuant to the custody agreement.
Prior to May 29, 2012, the fund compensated The Bank of NewYork Mellon under a cash management agreement for performing cash management services related to fund subscriptions and redemptions.
30
During the period ended September 30, 2012, the fund was charged $150 pursuant to the cash management agreement, which is included in Shareholder servicing costs in the Statement of Operations. These fees were partially offset by earnings credits of $4.
During the period ended September 30, 2012, the fund was charged $8,384 for services performed by the Chief Compliance Officer and his staff.
The components of “Due to The Dreyfus Corporation and affiliates” in the Statement of Assets and Liabilities consist of: investment advisory fees $288,244, Distribution Plan fees $442, Shareholder Services Plan fees $1,629, custodian fees $64,189, Chief Compliance Officer fees $1,991 and transfer agency fees $115,176.
(d) Each Board member also serves as a Board member of other funds within the Dreyfus complex. Annual retainer fees and attendance fees are allocated to each fund based on net assets.
NOTE 4—Securities Transactions:
The aggregate amount of purchases and sales of investment securities, excluding short-term securities and forward contracts, during the period ended September 30, 2012, amounted to $261,901,125 and $397,542,166, respectively.
Derivatives: A derivative is a financial instrument whose performance is derived from the performance of another asset. Each type of derivative instrument that was held by the fund during the period ended September 30, 2012 is discussed below.
Forward Foreign Currency Exchange Contracts: The fund enters into forward contracts in order to hedge its exposure to changes in foreign currency exchange rates on its foreign portfolio holdings, to settle foreign currency transactions or as a part of its investment strategy. When executing forward contracts, the fund is obligated to buy or sell
| The Fund | 31 |
NOTES TO FINANCIAL STATEMENTS (continued)
a foreign currency at a specified rate on a certain date in the future. With respect to sales of forward contracts, the fund incurs a loss if the value of the contract increases between the date the forward contract is opened and the date the forward contract is closed.The fund realizes a gain if the value of the contract decreases between those dates.With respect to purchases of forward contracts, the fund incurs a loss if the value of the contract decreases between the date the forward contract is opened and the date the forward contract is closed.The fund realizes a gain if the value of the contract increases between those dates. Any realized or unrealized gains or losses which occurred during the period are reflected in the Statement of Operations. The fund is exposed to foreign currency risk as a result of changes in value of underlying financial instruments.The fund is also exposed to credit risk associated with counterparty nonperformance on these forward contracts, which is typically limited to the unrealized gain on each open contract.The following summarizes open forward contracts at September 30, 2012:
| Foreign | Unrealized | |||
| Forward Foreign Currency | Currency | Appreciation | ||
| Exchange Contracts | Amounts | Proceeds ($) | Value ($) | (Depreciation) ($) |
| Sales: | ||||
| British Pound, | ||||
| Expiring: | ||||
| 10/1/2012 a | 70,038 | 116,629 | 116,328 | 301 |
| 10/2/2012 a | 30,650 | 49,728 | 49,493 | 235 |
| Euro, | ||||
| Expiring | ||||
| 10/1/2012 b | 55,586 | 72,011 | 71,431 | 580 |
| Hong Kong Dollar, | ||||
| Expiring | ||||
| 10/4/2012 c | 948,493 | 122,320 | 122,322 | (2) |
| Japanese Yen, | ||||
| Expiring | ||||
| 10/2/2012 a | 4,495,806 | 57,865 | 57,609 | 256 |
| Gross Unrealized | ||||
| Appreciation | 1,372 | |||
| Gross Unrealized | ||||
| Depreciation | (2) |
| Counterparties: | |
| a | Royal Bank of Scotland |
| b | JPMorgan Chase & Co. |
| c | Barclay Bank |
32
The following summarizes the average market value of derivatives outstanding during the period ended September 30, 2012:
| Average Market Value ($) | |
| Forward contracts | 24,011,746 |
At September 30, 2012, the cost of investments for federal income tax purposes was $374,278,047; accordingly, accumulated net unrealized appreciation on investments was $61,811,794, consisting of $82,162,976 gross unrealized appreciation and $20,351,182 gross unrealized depreciation.
| The Fund | 33 |
REPORT OF INDEPENDENT REGISTERED
PUBLIC ACCOUNTING FIRM
To the Board of Trustees and Shareholders of Dreyfus/Newton International Equity Fund:
We have audited the accompanying statement of assets and liabilities of Dreyfus/Newton International Equity Fund (the “Fund”), a series of Dreyfus Investment Funds, including the statement of investments as of September 30, 2012, and the related statement of operations for the year then ended, the statements of changes in net assets for each of the years in the two-year period then ended and financial highlights for each of the years in the four-year period then ended.These financial statements and financial highlights are the responsibility of the Fund’s management. Our responsibility is to express an opinion on these financial statements and financial highlights based on our audits.The financial highlights for the year ended September 30, 2008 were audited by other independent registered public accountants whose report thereon, dated November 28, 2008, expressed an unqualified opinion on those financial highlights.
We conducted our audit in accordance with the standards of the Public Company Accounting Oversight Board (United States).Those standards require that we plan and perform the audit to obtain reasonable assurance about whether the financial statements and financial highlights are free of material misstatement.An audit also includes examining, on a test basis, evidence supporting the amounts and disclosures in the financial statements. Our procedures included confirmation of securities owned as of September 30, 2012 by correspondence with the custodian and brokers or by other appropriate auditing procedures where replies from brokers were not received.An audit also includes assessing the accounting principles used and significant estimates made by management, as well as evaluating the overall financial statement presentation.We believe that our audits provide a reasonable basis for our opinion.
In our opinion, the financial statements and financial highlights referred to above present fairly, in all material respects, the financial position of Dreyfus/Newton International Equity Fund as of September 30, 2012, and the results of its operations for the year then ended, the changes in its net assets for each of the years in the two-year period then ended, and the financial highlights for each of the years in the four-year period then ended, in conformity with U.S. generally accepted accounting principles.

New York, New York
November 28, 2012
34
IMPORTANT TAX INFORMATION (Unaudited)
For federal tax purposes, the fund elects to provide each shareholder with their portion of the fund’s income sourced from foreign countries and taxes paid from foreign countries.The fund reports the maximum amount allowable but not less than $12,854,725 as income sourced from foreign countries for the fiscal year ended September 30, 2012 in accordance with Section 853(c)(2) of the Internal Revenue Code. Also, the fund reports the maximum amount allowable but not less than $1,142,262 as taxes paid from foreign countries for the fiscal year ended September 30, 2012 in accordance with Section 853(a) of the Internal Revenue Code. Where required by federal tax rules, shareholders will receive notification of their proportionate share of foreign sourced income and foreign taxes paid for the 2012 calendar year with Form 1099-DIV which will be mailed in early 2013.Also, the fund reports the maximum amount allowable, but not less than $10,646,272 as ordinary income dividends paid during the fiscal year ended September 30, 2012 as qualified dividend income in accordance with Section 854(b)(1)(B) of the Internal Revenue Code. The fund reports the maximum amount allowable but not less than $.2319 per share as a capital gain dividend in accordance with Section 852(b)(3)(C) of the Internal Revenue Code. The fund reports the maximum amount allowable but not less than $.0132 per share as a short-term capital gain dividend in accordance with Sections 871(k)(2) and 881(e) of the Internal Revenue Code.
| The Fund | 35 |
| INFORMATION ABOUT THE RENEWAL OF THE FUND’S |
| INVESTMENT ADVISORY AGREEMENT (Unaudited) |
At a meeting of the fund’s Board ofTrustees held on July 25-26, 2012, the Board considered the renewal of the fund’s Investment Advisory Agreement, pursuant to which Dreyfus provides the fund with investment advisory services, and the Sub-Investment Advisory Agreement (together, the “Agreements”), pursuant to which Newton Capital Management Limited (the “Sub-Adviser”) provides day-to-day management of the fund’s investments.The Board members, none of whom are “interested persons” (as defined in the Investment CompanyAct of 1940, as amended) of the fund, were assisted in their review by independent legal counsel and met with counsel in executive session separate from representatives of Dreyfus and the Sub-Adviser. In considering the renewal of the Agreements, the Board considered all factors that it believed to be relevant, including those discussed below.The Board did not identify any one factor as dispositive, and each Board member may have attributed different weights to the factors considered.
Analysis of Nature, Extent, and Quality of Services Provided to the Fund. The Board considered information previously provided to them in presentations from Dreyfus representatives regarding the nature, extent, and quality of the services provided to funds in the Dreyfus fund complex, and Dreyfus representatives confirmed that there had been no material changes in this information. Dreyfus provided the number of open accounts in the fund, the fund’s asset size and the allocation of fund assets among distribution channels. Dreyfus also had previously provided information regarding the diverse intermediary relationships and distribution channels of funds in the Dreyfus fund complex (such as retail direct or intermediary, in which intermediaries typically are paid by the fund and/or Dreyfus) and Dreyfus’ corresponding need for broad, deep, and diverse resources to be able to provide ongoing shareholder services to each intermediary or distribution channel, as applicable to the fund.
The Board also considered research support available to, and portfolio management capabilities of, the fund’s portfolio management personnel. The Board also considered Dreyfus’ extensive compliance infrastructures, as well as Dreyfus’ supervisory activities over the Sub-Adviser.The
36
Board also considered portfolio management’s brokerage policies and practices (including policies and practices regarding soft dollars) and the standards applied in seeking best execution.
Comparative Analysis of the Fund’s Performance and Management Fee and Expense Ratio.The Board reviewed reports prepared by Lipper, Inc. (“Lipper”), an independent provider of investment company data, which included information comparing (1) the fund’s performance with the performance of a group of comparable funds (the “Performance Group”) and with a broader group of funds (the “Performance Universe”), all for various periods ended June 30, 2012, and (2) the fund’s actual and contractual management fees and total expenses with those of a group of comparable funds (the “Expense Group”) and with a broader group of funds (the “Expense Universe”), the information for which was derived in part from fund financial statements available to Lipper as of the date of its analysis. Dreyfus previously had furnished the Board with a description of the methodology Lipper used to select the Performance Group and Performance Universe and the Expense Group and Expense Universe.
Dreyfus representatives stated that the usefulness of performance comparisons may be affected by a number of factors, including different investment limitations that may be applicable to the fund and comparison funds.The Board discussed the results of the comparisons and noted that the fund’s total return performance was below the Performance Group and Performance Universe medians for the various periods, except for the one-year period when the fund’s performance was above the Performance Group and Performance Universe medians. Dreyfus representatives reminded the Board of personnel and process changes at the Sub-Adviser early in 2012, noting that the fund ranked in the first quartile of the Lipper International Multi-Cap Growth category and the Morningstar Foreign Large Blend category for the three- and six-month periods ended June 30, 2012. Dreyfus also provided a comparison of the fund’s calendar year total returns to the returns of the fund’s benchmark index and noted that the fund had performed better than the index in three of the six periods shown.
| The Fund | 37 |
| INFORMATION ABOUT THE RENEWAL OF THE FUND’S |
| INVESTMENT ADVISORY AGREEMENT (Unaudited) (continued) |
The Board also reviewed the range of actual and contractual management fees and total expenses of the Expense Group and Expense Universe funds and discussed the results of the comparisons.The Board noted that the fund’s contractual management fee was below the Expense Group median, the fund’s actual management fee was below the Expense Group median and above the Expense Universe median and the fund’s total expense ratio was below the Expense Group and Expense Universe medians.
Dreyfus representatives reviewed with the Board the management or investment advisory fees (1) paid by funds advised or administered by Dreyfus that are in the same Lipper category as the fund and (2) paid to Dreyfus or the Sub-Adviser or its affiliates for advising any separate accounts and/or other types of client portfolios that are considered to have similar investment strategies and policies as the fund (the “Similar Clients”), and explained the nature of the Similar Clients.They discussed differences in fees paid and the relationship of the fees paid in light of any differences in the services provided and other relevant factors.The Board considered the relevance of the fee information provided for the Similar Clients to evaluate the appropriateness and reasonableness of the fund’s management fee.
The Board considered the fee to the Sub-Adviser in relation to the fee paid to Dreyfus by the fund and the respective services provided by the Sub-Adviser and Dreyfus.The Board also noted the Sub-Adviser’s fee is paid by Dreyfus (out of its fee from the fund) and not the fund.
Analysis of Profitability and Economies of Scale. Dreyfus representatives reviewed the expenses allocated and profit received by Dreyfus and the resulting profitability percentage for managing the fund, and the method used to determine the expenses and profit. The Board concluded that the profitability results were not unreasonable, given the services rendered and service levels provided by Dreyfus.The Board previously had
38
been provided with information prepared by an independent consulting firm regarding Dreyfus’ approach to allocating costs to, and determining the profitability of, individual funds and the entire Dreyfus fund complex. The consulting firm also had analyzed where any economies of scale might emerge in connection with the management of a fund.
The Board’s counsel stated that the Board should consider the profitability analysis (1) as part of the evaluation of whether the fees under the Agreements bear a reasonable relationship to the mix of services provided by Dreyfus and the Sub-Adviser, including the nature, extent and quality of such services, and (2) in light of the relevant circumstances for the fund and the extent to which economies of scale would be realized if the fund grows and whether fee levels reflect these economies of scale for the benefit of fund shareholders. Since Dreyfus, and not the fund, pays the Sub-Adviser pursuant to the Sub-Investment Advisory Agreement, the Board did not consider the Sub-Adviser’s profitability to be relevant to its deliberations. Dreyfus representatives noted that a discussion of economies of scale is predicated on a fund having achieved a substantial size with increasing assets and that, if a fund’s assets had been stable or decreasing, the possibility that Dreyfus may have realized any economies of scale would be less. Dreyfus representatives also noted that, as a result of shared and allocated costs among funds in the Dreyfus fund complex, the extent of economies of scale could depend substantially on the level of assets in the complex as a whole, so that increases and decreases in complex-wide assets can affect potential economies of scale in a manner that is disproportionate to, or even in the opposite direction from, changes in the fund’s asset level.The Board also considered potential benefits to Dreyfus and the Sub-Adviser from acting as investment adviser and sub-investment adviser, respectively, and noted the soft dollar arrangements in effect for trading the fund’s investments.
| The Fund | 39 |
| INFORMATION ABOUT THE RENEWAL OF THE FUND’S |
| INVESTMENT ADVISORY AGREEMENT (Unaudited) (continued) |
At the conclusion of these discussions, the Board agreed that it had been furnished with sufficient information to make an informed business decision with respect to the renewal of the Agreements. Based on the discussions and considerations as described above, the Board concluded and determined as follows.
The Board concluded that the nature, extent and quality of the services provided by Dreyfus and the Sub-Adviser are adequate and appropriate.
The Board noted the fund’s improved short-term performance and determined to continue to closely monitor performance given the relatively unfavorable long-term performance.
The Board concluded that the fees paid to Dreyfus and the Sub- Adviser were reasonable in light of the considerations described above.
The Board determined that the economies of scale which may accrue to Dreyfus and its affiliates in connection with the management of the fund had been adequately considered by Dreyfus in connection with the fee rate charged to the fund pursuant to the Investment Agreement and that, to the extent in the future it were determined that material economies of scale had not been shared with the fund, the Board would seek to have those economies of scale shared with the fund.
In evaluating the Agreements, the Board considered these conclusions and determinations and also relied on its previous knowledge, gained through meetings and other interactions with Dreyfus and its affiliates and the Sub-Adviser, of the fund and the services provided to the fund by Dreyfus and the Sub-Adviser.The Board also relied on information received on a routine and regular basis throughout the year relating to the operations of the fund and the investment management services provided under the Agreements, including information on the investment
40
performance of the fund in comparison to similar mutual funds and benchmark performance indices; general market outlook as applicable to the fund; and compliance reports. In addition, it should be noted that the Board’s consideration of the contractual fee arrangements for this fund had the benefit of a number of years of reviews of prior or similar agreements during which lengthy discussions took place between the Board and Dreyfus representatives. Certain aspects of the arrangements may receive greater scrutiny in some years than in others, and the Board’s conclusions may be based, in part, on their consideration of the same or similar arrangements in prior years.The Board determined that renewal of the Agreements through April 4, 2013 was in the best interests of the fund and its shareholders.
| The Fund | 41 |
BOARD MEMBERS INFORMATION (Unaudited)
| Joseph S. DiMartino (68) |
| Chairman of the Board (2008) |
| Principal Occupation During Past 5Years: |
| • Corporate Director and Trustee |
| Other Public Company Board Memberships During Past 5Years: |
| • CBIZ (formerly, Century Business Services, Inc.), a provider of outsourcing functions for small |
| and medium size companies, Director (1997-present) |
| • Sunair Services Corporation, a provider of certain outdoor-related services to homes and |
| businesses, Director (2005-2009) |
| • The Newark Group, a provider of a national market of paper recovery facilities, paperboard |
| mills and paperboard converting plants, Director (2000-2010) |
| No. of Portfolios for which Board Member Serves: 157 |
| ——————— |
| Francine J. Bovich (61) |
| Board Member (2011) |
| Principal Occupation During Past 5Years: |
| • Trustee,The Bradley Trusts, private trust funds (2011-present) |
| • Managing Director, Morgan Stanley Investment Management (1993-2010) |
| No. of Portfolios for which Board Member Serves: 31 |
| ——————— |
| James M. Fitzgibbons (78) |
| Board Member (2008) |
| Principal Occupation During Past 5Years: |
| • Corporate Director and Trustee |
| Other Public Company Board Memberships During Past 5Years: |
| • Bill Barrett Corporation, an oil and natural gas exploration company, Director (2004-present) |
| No. of Portfolios for which Board Member Serves: 31 |
| ——————— |
| Kenneth A. Himmel (66) |
| Board Member (2008) |
| Principal Occupation During Past 5Years: |
| • President and CEO, Related Urban Development, a real estate development company (1996-present) |
| • President and CEO, Himmel & Company, a real estate development company (1980-present) |
| • CEO,American Food Management, a restaurant company (1983-present) |
| No. of Portfolios for which Board Member Serves: 31 |
42
| Stephen J. Lockwood (65) |
| Board Member (2008) |
| Principal Occupation During Past 5Years: |
| • Chairman of the Board, Stephen J. Lockwood and Company LLC, a real estate investment |
| company (2000-present) |
| No. of Portfolios for which Board Member Serves: 31 |
| ——————— |
| Roslyn M. Watson (62) |
| Board Member (2008) |
| Principal Occupation During Past 5Years: |
| • Principal,Watson Ventures, Inc., a real estate investment company (1993-present) |
| No. of Portfolios for which Board Member Serves: 41 |
| ——————— |
| Benaree Pratt Wiley (66) |
| Board Member (2008) |
| Principal Occupation During Past 5Years: |
| • Principal,TheWiley Group, a firm specializing in strategy and business development (2005-present) |
| Other Public Company Board Memberships During Past 5Years: |
| • CBIZ (formerly, Century Business Services, Inc.), a provider of outsourcing functions for small |
| and medium size companies, Director (2008-present) |
| No. of Portfolios for which Board Member Serves: 64 |
| ——————— |
Once elected all Board Members serve for an indefinite term, but achieve Emeritus status upon reaching age 80.The address of the Board Members and Officers is c/o The Dreyfus Corporation, 200 Park Avenue, NewYork, NewYork 10166.Additional information about the Board Members is available in the fund’s Statement of Additional Information which can be obtained from Dreyfus free of charge by calling this toll free number: 1-800-DREYFUS.
| The Fund | 43 |
OFFICERS OF THE FUND (Unaudited)
BRADLEY J. SKAPYAK, President since January 2010.
Chief Operating Officer and a director of the Manager since June 2009; from April 2003 to June 2009, Mr. Skapyak was the head of the Investment Accounting and Support Department of the Manager. He is an officer of 72 investment companies (comprised of 156 portfolios) managed by the Manager. He is 53 years old and has been an employee of the Manager since February 1988.
JANETTE E. FARRAGHER, Vice President and Secretary since December 2011.
Assistant General Counsel of BNY Mellon, and an officer of 73 investment companies (comprised of 183 portfolios) managed by the Manager. She is 49 years old and has been an employee of the Manager since February 1984.
KIESHA ASTWOOD, Vice President and Assistant Secretary since January 2010.
Counsel of BNY Mellon, and an officer of 73 investment companies (comprised of 183 portfolios) managed by the Manager. She is 39 years old and has been an employee of the Manager since July 1995.
JAMES BITETTO, Vice President and Assistant Secretary since December 2008.
Senior Counsel of BNY Mellon and Secretary of the Manager, and an officer of 73 investment companies (comprised of 183 portfolios) managed by the Manager. He is 46 years old and has been an employee of the Manager since December 1996.
JONI LACKS CHARATAN, Vice President and Assistant Secretary since December 2008.
Senior Counsel of BNY Mellon, and an officer of 73 investment companies (comprised of 183 portfolios) managed by the Manager. She is 56 years old and has been an employee of the Manager since October 1988.
JOSEPH M. CHIOFFI, Vice President and Assistant Secretary since December 2008.
Senior Counsel of BNY Mellon, and an officer of 73 investment companies (comprised of 183 portfolios) managed by the Manager. He is 50 years old and has been an employee of the Manager since June 2000.
JOHN B. HAMMALIAN, Vice President and Assistant Secretary since December 2008.
Senior Managing Counsel of BNY Mellon, and an officer of 73 investment companies (comprised of 183 portfolios) managed by the Manager. He is 49 years old and has been an employee of the Manager since February 1991.
ROBERT R. MULLERY, Vice President and Assistant Secretary since December 2008.
Managing Counsel of BNY Mellon, and an officer of 73 investment companies (comprised of 183 portfolios) managed by the Manager. He is 60 years old and has been an employee of the Manager since May 1986.
JEFF PRUSNOFSKY, Vice President and Assistant Secretary since December 2008.
Senior Managing Counsel of BNY Mellon, and an officer of 73 investment companies (comprised of 183 portfolios) managed by the Manager. He is 47 years old and has been an employee of the Manager since October 1990.
JAMES WINDELS, Treasurer since December 2008.
Director – Mutual Fund Accounting of the Manager, and an officer of 73 investment companies (comprised of 183 portfolios) managed by the Manager. He is 54 years old and has been an employee of the Manager since April 1985.
44
RICHARD CASSARO, Assistant Treasurer since December 2008.
Senior Accounting Manager – Money Market and Municipal Bond Funds of the Manager, and an officer of 73 investment companies (comprised of 183 portfolios) managed by the Manager. He is 53 years old and has been an employee of the Manager since September 1982.
GAVIN C. REILLY, Assistant Treasurer since December 2008.
Tax Manager of the Investment Accounting and Support Department of the Manager, and an officer of 73 investment companies (comprised of 183 portfolios) managed by the Manager. He is 44 years old and has been an employee of the Manager since April 1991.
ROBERT S. ROBOL, Assistant Treasurer since December 2008.
Senior Accounting Manager – Fixed Income Funds of the Manager, and an officer of 73 investment companies (comprised of 183 portfolios) managed by the Manager. He is 48 years old and has been an employee of the Manager since October 1988.
ROBERT SALVIOLO, Assistant Treasurer since December 2008.
Senior Accounting Manager – Equity Funds of the Manager, and an officer of 73 investment companies (comprised of 183 portfolios) managed by the Manager. He is 45 years old and has been an employee of the Manager since June 1989.
ROBERT SVAGNA, Assistant Treasurer since December 2008.
Senior Accounting Manager – Equity Funds of the Manager, and an officer of 73 investment companies (comprised of 183 portfolios) managed by the Manager. He is 45 years old and has been an employee of the Manager since November 1990.
JOSEPH W. CONNOLLY, Chief Compliance Officer since December 2008.
Chief Compliance Officer of the Manager and The Dreyfus Family of Funds (73 investment companies, comprised of 183 portfolios). He is 55 years old and has served in various capacities with the Manager since 1980, including manager of the firm’s Fund Accounting Department from 1997 through October 2001.
MATTHEW D. CONNOLLY, Anti-Money Laundering Compliance Officer since April 2012.
Anti-Money Laundering Compliance Officer of the Distributor since October 2011; from March 2010 to September 2011, Global Head, KYC Reviews and Director, UBS Investment Bank; until March 2010,AML Compliance Officer and Senior Vice President, Citi Global Wealth Management. He is an officer of 69 investment companies (comprised of 179 portfolios) managed by the Manager. He is 40 years old and has been an employee of the Distributor since October 2011.
| The Fund | 45 |
For More Information
Telephone Call your financial representative or 1-800-DREYFUS
Mail The Dreyfus Family of Funds, 144 Glenn Curtiss Boulevard, Uniondale, NY 11556-0144
The fund files its complete schedule of portfolio holdings with the Securities and Exchange Commission (“SEC”) for the first and third quarters of each fiscal year on Form N-Q. The fund’s Forms N-Q are available on the SEC’s website at http://www.sec.gov and may be reviewed and copied at the SEC’s Public Reference Room in Washington, DC. Information on the operation of the Public Reference Room may be obtained by calling 1-800-SEC-0330.
A description of the policies and procedures that the fund uses to determine how to vote proxies relating to portfolio securities, and information regarding how the fund voted these proxies for the most recent 12-month period ended June 30 is available at http://www.dreyfus.com and on the SEC’s website at http://www.sec.gov. The description of the policies and procedures is also available without charge, upon request, by calling 1-800-DREYFUS.

Item 2. Code of Ethics.
The Registrant has adopted a code of ethics that applies to the Registrant's principal executive officer, principal financial officer, principal accounting officer or controller, or persons performing similar functions. There have been no amendments to, or waivers in connection with, the Code of Ethics during the period covered by this Report.
Item 3. Audit Committee Financial Expert.
The Registrant's Board has determined that Joseph S. DiMartino, a member of the Audit Committee of the Board, is an audit committee financial expert as defined by the Securities and Exchange Commission (the "SEC"). Mr. DiMartino is "independent" as defined by the SEC for purposes of audit committee financial expert determinations.
Item 4. Principal Accountant Fees and Services.
(a) Audit Fees. The aggregate fees billed for each of the last two fiscal years (the "Reporting Periods") for professional services rendered by the Registrant's principal accountant (the "Auditor") for the audit of the Registrant's annual financial statements or services that are normally provided by the Auditor in connection with the statutory and regulatory filings or engagements for the Reporting Periods, were $198,460 in 2011 and $208,030 in 2012.
(b) Audit-Related Fees. The aggregate fees billed in the Reporting Periods for assurance and related services by the Auditor that are reasonably related to the performance of the audit of the Registrant's financial statements and are not reported under paragraph (a) of this Item 4 were $34,400 in 2011 and $35,120 in 2012. These services consisted of one or more of the following: (i) agreed upon procedures related to compliance with Internal Revenue Code section 817(h), (ii) security counts required by Rule 17f-2 under the Investment Company Act of 1940, as amended, (iii) advisory services as to the accounting or disclosure treatment of Registrant transactions or events and (iv) advisory services to the accounting or disclosure treatment of the actual or potential impact to the Registrant of final or proposed rules, standards or interpretations by the Securities and Exchange Commission, the Financial Accounting Standards Boards or other regulatory or standard-setting bodies.
The aggregate fees billed in the Reporting Periods for non-audit assurance and related services by the Auditor to the Registrant's investment adviser (not including any sub-investment adviser whose role is primarily portfolio management and is subcontracted with or overseen by another investment adviser), and any entity controlling, controlled by or under common control with the investment adviser that provides ongoing services to the Registrant ("Service Affiliates"), that were reasonably related to the performance of the annual audit of the Service Affiliate, which required pre-approval by the Audit Committee were $0 in 2011 and $0 in 2012.
(c) Tax Fees. The aggregate fees billed in the Reporting Periods for professional services rendered by the Auditor for tax compliance, tax advice, and tax planning ("Tax Services") were $20,000 in 2011 and $20,400 in 2012. These services consisted of the review or preparation of U.S. federal, state, local and excise tax returns. The aggregate fees billed in the Reporting Periods for Tax Services by the Auditor to Service Affiliates, which required pre-approval by the Audit Committee were $0 in 2011 and $0 in 2012.
(d) All Other Fees. The aggregate fees billed in the Reporting Periods for products and services provided by the Auditor, other than the services reported in paragraphs (a) through (c) of this Item, were $0 in 2011 and $0 in 2012.
The aggregate fees billed in the Reporting Periods for Non-Audit Services by the Auditor to Service Affiliates, other than the services reported in paragraphs (b) through (c) of this Item, which required pre-approval by the Audit Committee, were $0 in 2011 and $0 in 2012.
(e)(1) Audit Committee Pre-Approval Policies and Procedures. The Registrant's Audit Committee has established policies and procedures (the "Policy") for pre-approval (within specified fee limits) of the Auditor's engagements for non-audit services to the Registrant and Service Affiliates without specific case-by-case consideration. The pre-approved services in the Policy can include pre-approved audit services, pre-approved audit-related services, pre-approved tax services and pre-approved all other services. Pre-approval considerations include whether the proposed services are compatible with maintaining the Auditor's independence. Pre-approvals pursuant to the Policy are considered annually.
(e)(2) Note: None of the services described in paragraphs (b) through (d) of this Item 4 were approved by the Audit Committee pursuant to paragraph (c)(7)(i)(C) of Rule 2-01 of Regulation S-X.
(f) None of the hours expended on the principal accountant's engagement to audit the registrant's financial statements for the most recent fiscal year were attributed to work performed by persons other than the principal account's full-time, permanent employees.
Non-Audit Fees. The aggregate non-audit fees billed by the Auditor for services rendered to the Registrant, and rendered to Service Affiliates, for the Reporting Periods were $7,022,311 in 2011 and $11,233,025 in 2012.
Auditor Independence. The Registrant's Audit Committee has considered whether the provision of non-audit services that were rendered to Service Affiliates, which were not pre-approved (not requiring pre-approval), is compatible with maintaining the Auditor's independence.
Item 5. Audit Committee of Listed Registrants.
Not applicable.
Item 6. Investments.
(a) Not applicable.
Item 7. Disclosure of Proxy Voting Policies and Procedures for Closed-End Management Investment Companies.
Not applicable.
Item 8. Portfolio Managers of Closed-End Management Investment Companies.
Not applicable.
Item 9. Purchases of Equity Securities by Closed-End Management Investment Companies and Affiliated Purchasers.
Not applicable.
Item 10. Submission of Matters to a Vote of Security Holders.
There have been no material changes to the procedures applicable to Item 10.
Item 11. Controls and Procedures.
(a) The Registrant's principal executive and principal financial officers have concluded, based on their evaluation of the Registrant's disclosure controls and procedures as of a date within 90 days of the filing date of this report, that the Registrant's disclosure controls and procedures are reasonably designed to ensure that information required to be disclosed by the Registrant on Form N-CSR is recorded, processed, summarized and reported within the required time periods and that information required to be disclosed by the Registrant in the reports that it files or submits on Form N-CSR is accumulated and communicated to the Registrant's management, including its principal executive and principal financial officers, as appropriate to allow timely decisions regarding required disclosure.
(b) There were no changes to the Registrant's internal control over financial reporting that occurred during the second fiscal quarter of the period covered by this report that have materially affected, or are reasonably likely to materially affect, the Registrant's internal control over financial reporting.
Item 12. Exhibits.
(a)(1) Code of ethics referred to in Item 2.
(a)(2) Certifications of principal executive and principal financial officers as required by Rule 30a-2(a) under the Investment Company Act of 1940.
(a)(3) Not applicable.
(b) Certification of principal executive and principal financial officers as required by Rule 30a-2(b) under the Investment Company Act of 1940.
SIGNATURES
Pursuant to the requirements of the Securities Exchange Act of 1934 and the Investment Company Act of 1940, the Registrant has duly caused this Report to be signed on its behalf by the undersigned, thereunto duly authorized.
Dreyfus Investment Funds
By: /s/ Bradley J. Skapyak | |
Bradley J. Skapyak, President
| |
Date: | November 20, 2012 |
| |
Pursuant to the requirements of the Securities Exchange Act of 1934 and the Investment Company Act of 1940, this Report has been signed below by the following persons on behalf of the Registrant and in the capacities and on the dates indicated. | |
| |
By: /s/ Bradley J. Skapyak | |
Bradley J. Skapyak, President
| |
Date: | November 20, 2012 |
| |
By: /s/ James Windels | |
James Windels, Treasurer
| |
Date: | November 20, 2012 |
| |
EXHIBIT INDEX
(a)(1) Code of ethics referred to in Item 2.
(a)(2) Certifications of principal executive and principal financial officers as required by Rule 30a-2(a) under the Investment Company Act of 1940. (EX-99.CERT)
(b) Certification of principal executive and principal financial officers as required by Rule 30a-2(b) under the Investment Company Act of 1940. (EX-99.906CERT)