UNITED STATES
SECURITIES AND EXCHANGE COMMISSION
Washington, D.C. 20549
FORM N-CSR
CERTIFIED SHAREHOLDER REPORT OF REGISTERED MANAGEMENT
INVESTMENT COMPANIES
Investment Company Act file number | 811- 04813 | |||||
|
| |||||
| Dreyfus Investment Funds |
| ||||
| (Exact name of Registrant as specified in charter) |
| ||||
|
|
| ||||
|
c/o The Dreyfus Corporation 200 Park Avenue New York, New York 10166 |
| ||||
| (Address of principal executive offices) (Zip code) |
| ||||
|
|
| ||||
| John Pak, Esq. 200 Park Avenue New York, New York 10166 |
| ||||
| (Name and address of agent for service) |
| ||||
| ||||||
Registrant's telephone number, including area code: | (212) 922-6000 | |||||
|
| |||||
Date of fiscal year end:
| 12/31 |
| ||||
Date of reporting period: | 12/31/13 |
| ||||
The following N-CSR relates only to Dreyfus/Standish Global Fixed Income Fund and does not affect the other series of the Registrant, which have a different fiscal year end and, therefore, different N-CSR reporting requirements. Separate N-CSR Forms will be filed for those series, as appropriate.
The views expressed in this report reflect those of the portfolio manager only through the end of the period covered and do not necessarily represent the views of Dreyfus or any other person in the Dreyfus organization. Any such views are subject to change at any time based upon market or other conditions and Dreyfus disclaims any responsibility to update such views.These views may not be relied on as investment advice and, because investment decisions for a Dreyfus fund are based on numerous factors, may not be relied on as an indication of trading intent on behalf of any Dreyfus fund.
Contents | |
THE FUND | |
| 2 | A Letter from the President |
| 3 | Discussion of Fund Performance |
| 6 | Fund Performance |
| 8 | Understanding Your Fund’s Expenses |
| 8 | Comparing Your Fund’s Expenses With Those of Other Funds |
| 9 | Statement of Investments |
| 25 | Statement of Financial Futures |
| 25 | Statement of Options Written |
| 26 | Statement of Assets and Liabilities |
| 27 | Statement of Operations |
| 28 | Statement of Changes in Net Assets |
| 30 | Financial Highlights |
| 34 | Notes to Financial Statements |
| 62 | Report of Independent Registered Public Accounting Firm |
| 63 | Important Tax Information |
| 64 | Information About the Renewal of the Fund’s Sub-Investment Advisory Agreement |
| 68 | Board Members Information |
| 70 | Officers of the Fund |
FOR MORE INFORMATION | |
Back Cover |
Dreyfus/Standish
Global Fixed
Income Fund
The Fund
A LETTER FROM THE PRESIDENT
Dear Shareholder:
We are pleased to present this annual report for Dreyfus/Standish Global Fixed Income Fund, covering the 12-month period from January 1, 2013, through December 31, 2013. For information about how the fund performed during the reporting period, as well as general market perspectives, we provide a Discussion of Fund Performance on the pages that follow.
The year 2013 proved to be challenging for the U.S. bond market. Accelerating economic growth and anticipation of a more moderately accommodative monetary policy took their toll on bond prices even as stocks climbed to new record highs. As a result, intermediate- and long-term U.S. government securities value over the past year, pushing the yield on 10-year U.S. Treasury securities above 3% for the first time in more than two years. Corporate-backed bonds generally fared better, as they tended to respond more to their issuers’ underlying credit quality than to changing interest rates.
We remain somewhat cautious regarding the U.S. bond market’s prospects in 2014. We expect the domestic economy to continue to strengthen over the next year, particularly if U.S. fiscal policy is less restrictive and short-term interest rates remain near historical lows, which could push long-term interest rates higher. However, our fixed-income investment teams have continued to identify pockets of perceived opportunity in the bond market, which suggests that a highly selective approach could produce more favorable results for income-oriented investors in the months ahead. As always, we urge you to speak with your financial adviser to identify the investment strategies that are right for you.
Thank you for your continued confidence and support.
Sincerely,

J. Charles Cardona
President
The Dreyfus Corporation
January 15, 2014
2
DISCUSSION OF FUND PERFORMANCE
For the period of January 1, 2013, through December 31, 2013, as provided by David Leduc, CFA, Raman Srivastava, CFA, and Brendan Murphy, CFA, Portfolio Managers
Fund and Market Performance Overview
For the 12-month period ended December 31, 2013, Dreyfus/Standish Global Fixed Income Fund’s Class A shares achieved a total return of –0.18%, Class C shares returned –0.94%, Class I shares returned 0.11%, and ClassY shares returned 1.60%.1 In comparison, the Barclays Global Aggregate Index (Hedged) (the “Index”), the fund’s benchmark, produced a total return of –0.14% for the same period.2
U.S. and international bond markets encountered heightened volatility during 2013 in response to sustained economic recoveries and rising long-term interest rates in developed nations.
The Fund’s Investment Approach
The fund seeks to maximize total return while realizing a market level of income, consistent with preserving principal and liquidity, by normally investing at least 80% of its net assets in fixed income securities.The fund also normally invests at least 65% of its assets in non-U.S. dollar-denominated fixed-income securities of governments and companies located in various countries, including emerging markets. The fund generally invests in eight or more countries, but always invests in at least three countries, one of which may be the United States.The fund’s investments may include bonds, notes, mortgage-related securities, asset-backed securities, convertible securities, eurodollar and Yankee dollar instruments, preferred stock, and money market instruments.To protect the U.S. dollar value of the fund’s assets, we hedge most, but not necessarily all, of the portfolio’s foreign currency exposure.
The portfolio managers focus on identifying undervalued government bond markets, currencies, sectors, and securities and de-emphasize the use of interest rate forecasting. The portfolio managers look for fixed income securities with the most potential for added value, such as those involving the potential for credit upgrades, unique structural characteristics, or innovative features.The portfolio managers select securities for the fund’s portfolio by using fundamental economic research and quantitative analysis and focusing on sectors and individual securities that appear to be relatively undervalued and actively trading among sectors.
The Fund 3
DISCUSSION OF FUND PERFORMANCE (continued)
Rising Long-Term Rates Roiled Global Bond Markets
The year 2013 began amid heightened bond market volatility as investors responded nervously to improving economic conditions in most developed markets. Employment gains, rebounding housing markets, and a massive quantitative easing program enabled the United States to lead the global recovery. The worst of Europe’s financial crisis seemed to be over, and Japan’s economic outlook was lifted by stimulative fiscal and monetary policies from a new government seeking an end to years of economic stagnation.These factors generally helped drive bond yields higher and prices lower in the United States and Europe, while Japanese sovereign bonds gained a degree of value. In contrast, most emerging markets struggled with economic slowdowns, resulting in outflows of investment capital and falling bond prices.
The global bond markets’ worries about rising interest rates intensified in late May, when remarks by Federal Reserve Board (the “Fed”) Chairman Ben Bernanke were interpreted as a signal that the central bank would soon back away from quantitative easing. Consequently, most bond markets fell sharply in June before stabilizing over the summer. Global bonds rallied in September and October when the Fed refrained from tapering its quantitative easing program, but additional evidence of economic strength subsequently erased those gains, and the Index ended the year in modestly negative territory.
Security Selections Buoyed Relative Results
Results during the year were especially favorable from security selections in individual markets, particularly Slovakia, Italy, and Spain. Our sector allocation strategy also produced positive results due to overweighted exposure to investment-grade and high yield corporate-backed securities, which fared well as underlying credit conditions improved.The fund further benefited from a relatively short average duration in the rising interest-rate environment.
Disappointments during 2013 stemmed mainly from our country allocation strategy, as an underweighted position in Japan prevented the fund from participating more fully in the local market’s gains, while overweighted exposure to Brazilian bonds magnified the effects of local market declines.A position in inflation-linked bonds also detracted from relative performance, as did an underweight to agency mortgage-backed secu-rities.The fund’s currency strategies had relatively little impact on performance during the year.
4
We employed currency forward contracts, interest-rate options, and interest-rate futures contracts to establish some of the fund’s positions.
Finding Opportunities in a Rising Rate Environment
We currently expect the global economic recovery to persist. However, additional economic gains appear already to be reflected in global bond prices, suggesting that 2014 could produce positive results for fixed-income investors who can identify pockets of value in individual markets. For example, as of year-end, we have found value-oriented opportunities in some emerging markets that may have been punished too severely during the downturn. Conversely, we have identified relatively few opportunities among more richly valued bonds in Japan.
January 15, 2014
| Bond funds are subject generally to interest rate, credit, liquidity and market risks, to varying degrees, all of which are |
| more fully described in the fund’s prospectus. Generally, all other factors being equal, bond prices are inversely related |
| to interest-rate changes, and rate increases can cause price declines. |
| Foreign bonds are subject to special risks including exposure to currency fluctuations, changing political and economic |
| conditions, and potentially less liquidity.The fixed income securities of issuers located in emerging markets can be more |
| volatile and less liquid than those of issuers in more mature economies. |
| Investments in foreign currencies are subject to the risk that those currencies will decline in value relative to the U.S. |
| dollar, or, in the case of hedged positions, that the U.S. dollar will decline relative to the currency being hedged. |
| Currency rates in foreign countries may fluctuate significantly over short periods of time.A decline in the value of |
| foreign currencies relative to the U.S. dollar will reduce the value of securities held by the fund and denominated in |
| those currencies. |
| High yield bonds are subject to increased credit risk and are considered speculative in terms of the issuer’s perceived |
| ability to continue making interest payments on a timely basis and to repay principal upon maturity. |
| The fund may use derivative instruments, such as options, futures and options on futures, forward contracts, swaps |
| (including credit default swaps on corporate bonds and asset-backed securities), options on swaps and other credit |
| derivatives.A small investment in derivatives could have a potentially large impact on the fund’s performance.The use |
| of derivatives involves risks different from, or possibly greater than, the risks associated with investing directly in the |
| underlying assets. |
| 1 Total return includes reinvestment of dividends and any capital gains paid and does not take into consideration the |
| maximum initial sales charge in the case of Class A shares or the applicable contingent deferred sales charge imposed |
| on redemptions in the case of Class C shares. Had these charges been reflected, returns would have been lower. Class I |
| and ClassY shares are not subject to any initial or deferred sales charge. Past performance is no guarantee of future |
| results. Share price and investment return fluctuate such that upon redemption, fund shares may be worth more or less |
| than their original cost. ClassY shares returns are since inception 7/1/13. |
| 2 SOURCE: FACTSET — Reflects reinvestment of dividends and, where applicable, capital gain distributions.The |
| Barclays Global Aggregate (Hedged) Index provides a broad-based measure of the global investment-grade fixed |
| income markets.The three major components of this index are the U.S.Aggregate, the Pan-European Aggregate, and |
| the Asian-Pacific Aggregate Indices.The index also includes Eurodollar and Euro-Yen corporate bonds, Canadian |
| Government securities, and USD investment-grade 144A securities. Index returns do not reflect fees and expenses |
| associated with operating a mutual fund. Investors cannot invest directly in any index. |
The Fund 5
FUND PERFORMANCE
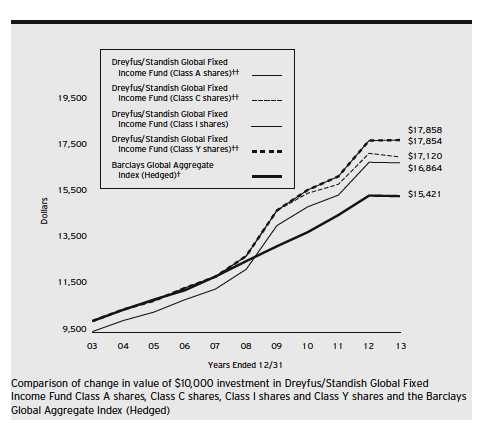
| † | Source: FactSet |
| †† | The total return figures presented for Class A and Class C shares of the fund reflect the performance of the fund’s |
| Class I shares for the period prior to 12/2/09 (the inception date for Class A and Class C shares), adjusted to | |
| reflect the applicable sales load for Class A shares. | |
| The total return figures presented for ClassY shares of the fund reflect the performance of the fund’s Class I shares for | |
| the period prior to 7/1/13 (the inception date for ClassY shares). | |
| Past performance is not predictive of future performance. | |
| The above graph compares a $10,000 investment made in each of the Class A, Class C, Class I and ClassY shares of | |
| Dreyfus/Standish Global Fixed Income Fund on 12/31/03 to a $10,000 investment made in the Barclays Global | |
| Aggregate Index (Hedged) (the “Index”) on that date.All dividends and capital gain distributions are reinvested. | |
| On April 24, 2013, the Board authorized the fund to offer ClassY shares, as a new class of shares, to certain investors, | |
| including certain institutional investors. On July 1, 2013, ClassY shares were offered at net asset value and are not | |
| subject to certain fees, including Distribution Plan and Shareholder Services Plan fees. | |
| The fund’s performance shown in the line graph above takes into account the maximum initial sales charge on Class A | |
| shares and all other applicable fees and expenses on all classes.The Index provides a broad-based measure of the global | |
| investment-grade fixed income markets.The three major components of this index are the U.S.Aggregate, the Pan- | |
| European Aggregate, and the Asian-Pacific Aggregate Indices.The Index also includes Eurodollar and Euro-Yen corporate | |
| bonds, Canadian government securities, and USD investment grade 144A securities. Unlike a mutual fund, the Index is | |
| not subject to charges, fees and other expenses. Investors cannot invest directly in any index.These factors can contribute to | |
| the Index potentially outperforming the fund. Further information relating to fund performance, including expense | |
| reimbursements, if applicable, is contained in the Financial Highlights section of the prospectus and elsewhere in this report. | |
6
| Average Annual Total Returns as of 12/31/13 | |||||||
| Inception Date | 1 Year | 5 Years | 10 Years | ||||
| Class A shares | |||||||
| with maximum sales charge (4.5%) | 12/2/09 | –4.68 | % | 5.64 | %†† | 5.37 | %†† |
| without sales charge | 12/2/09 | –0.18 | % | 6.61 | %†† | 5.85 | %†† |
| Class C shares | |||||||
| with applicable redemption charge † | 12/2/09 | –1.91 | % | 5.96 | %†† | 5.52 | %†† |
| without redemption | 12/2/09 | –0.94 | % | 5.96 | %†† | 5.52 | %†† |
| Class I shares | 1/1/94 | 0.11 | % | 6.85 | % | 5.97 | % |
| Class Y shares | 7/1/13 | 0.14 | %†† | 6.86 | %†† | 5.97 | %†† |
| Barclays Global | |||||||
| Aggregate Index (Hedged) | –0.14 | % | 4.11 | % | 4.43 | % | |
| Past performance is not predictive of future performance.The fund’s performance shown in the graph and table does not | |
| reflect the deduction of taxes that a shareholder would pay on fund distributions or the redemption of fund shares. | |
| † | The maximum contingent deferred sales charge for Class C shares is 1% for shares redeemed within one year of the |
| date of purchase. | |
| †† | The total return performance figures presented for Class A and Class C shares of the fund reflect the performance of |
| the fund’s Class I shares for the period prior to 12/2/09 (the inception date for Class A and Class C shares), | |
| adjusted to reflect the applicable sales load for Class A shares. | |
| The total return performance figures presented for ClassY shares of the fund reflect the performance of the fund’s | |
| Class I shares for the period prior to 7/1/13 (the inception date for ClassY shares). | |
The Fund 7
UNDERSTANDING YOUR FUND’S EXPENSES (Unaudited)
As a mutual fund investor, you pay ongoing expenses, such as management fees and other expenses. Using the information below, you can estimate how these expenses affect your investment and compare them with the expenses of other funds.You also may pay one-time transaction expenses, including sales charges (loads) and redemption fees, which are not shown in this section and would have resulted in higher total expenses. For more information, see your fund’s prospectus or talk to your financial adviser.
Review your fund’s expenses
The table below shows the expenses you would have paid on a $1,000 investment in Dreyfus/Standish Global Fixed Income Fund from July 1, 2013 to December 31, 2013. It also shows how much a $1,000 investment would be worth at the close of the period, assuming actual returns and expenses.
| Expenses and Value of a $1,000 Investment | ||||||||
| assuming actual returns for the six months ended December 31, 2013† | ||||||||
| Class A | Class C | Class I | Class Y | |||||
| Expenses paid per $1,000†† | $ | 4.37 | $ | 8.16 | $ | 2.90 | $ | 2.78 |
| Ending value (after expenses) | $ | 1,014.80 | $ | 1,010.40 | $ | 1,016.30 | $ | 1,016.00 |
COMPARING YOUR FUND’S EXPENSES
WITH THOSE OF OTHER FUNDS (Unaudited)
Using the SEC’s method to compare expenses
The Securities and Exchange Commission (SEC) has established guidelines to help investors assess fund expenses. Per these guidelines, the table below shows your fund’s expenses based on a $1,000 investment, assuming a hypothetical 5% annualized return. You can use this information to compare the ongoing expenses (but not transaction expenses or total cost) of investing in the fund with those of other funds.All mutual fund shareholder reports will provide this information to help you make this comparison. Please note that you cannot use this information to estimate your actual ending account balance and expenses paid during the period.
| Expenses and Value of a $1,000 Investment | ||||||||
| assuming a hypothetical 5% annualized return for the six months ended December 31, 2013††† | ||||||||
| Class A | Class C | Class I | Class Y | |||||
| Expenses paid per $1,000†††† | $ | 4.38 | $ | 8.19 | $ | 2.91 | $ | 2.80 |
| Ending value (after expenses) | $ | 1,020.87 | $ | 1,017.09 | $ | 1,022.33 | $ | 1,022.43 |
| † | From the close of business on July 1, 2013 (commencement of initial offering) to December 31, 2013 for ClassY shares. |
| †† | Expenses are equal to the fund's annualized expense ratio of .86% for Class A, 1.61% for Class C and .57% |
| for Class I, multiplied by the average account value over the period, multiplied by 184/365 (to reflect the one-half | |
| year period). Expenses are equal to the fund’s annualized expense ratio of .55% for ClassY, multiplied by the | |
| average account value over the period, multiplied by 183/365 (to reflect the actual days in the period). | |
| ††† | Please note that while ClassY shares commenced operations on July 1, 2013, the hypothetical expenses paid during |
| the period reflect projected activity for the full six month period for purposes of comparability.This projection | |
| assumes that annualized expense ratios were in effect during the period July 1, 2013 to December 31, 2013. | |
| †††† | Expenses are equal to the fund’s annualized expense ratio of .86% for Class A, 1.61% for Class C, .57% for |
| Class I and .55% for ClassY, multiplied by the average account value over the period, multiplied by 184/365 (to | |
| reflect the one-half year period). |
8
STATEMENT OF INVESTMENTS
December 31, 2013
| Coupon | Maturity | Principal | ||||
| Bonds and Notes—97.2% | Rate (%) | Date | Amount ($)a | Value ($) | ||
| Australia—1.6% | ||||||
| Australian Government, | ||||||
| Sr. Unscd. Bonds, | ||||||
| Ser. 35CI | AUD | 2.00 | 8/21/35 | 5,780,000 | b | 5,145,591 |
| CNOOC Curtis | ||||||
| Funding No. 1 Pty, | ||||||
| Gtd. Notes | 4.50 | 10/3/23 | 1,115,000 | c | 1,108,777 | |
| 6,254,368 | ||||||
| Belgium—1.1% | ||||||
| Anheuser-Busch InBev, | ||||||
| Gtd. Notes | GBP | 9.75 | 7/30/24 | 130,000 | 322,847 | |
| Belgium Government, | ||||||
| Unscd. Bonds, Ser. 60 | EUR | 4.25 | 3/28/41 | 2,650,000 | c | 4,167,270 |
| 4,490,117 | ||||||
| Brazil—5.2% | ||||||
| Banco Nacional de | ||||||
| Desenvolvimento | ||||||
| Economico e Social, | ||||||
| Sr. Unscd. Notes | 3.38 | 9/26/16 | 1,550,000 | c,d | 1,569,375 | |
| Brazil Notas do | ||||||
| Tesouro Nacional, | ||||||
| Notes, Ser. F | BRL | 10.00 | 1/1/23 | 12,700,000 | 4,559,974 | |
| Brazil Notas do | ||||||
| Tesouro Nacional, | ||||||
| Sr. Notes, Ser. F | BRL | 10.00 | 1/1/17 | 28,500,000 | 11,449,758 | |
| Caixa Economica Federal, | ||||||
| Sr. Unscd. Notes | 4.50 | 10/3/18 | 2,580,000 | c | 2,569,680 | |
| Odebrecht Finance, | ||||||
| Gtd. Notes | BRL | 8.25 | 4/25/18 | 1,370,000 | c | 483,427 |
| 20,632,214 | ||||||
| Canada—4.7% | ||||||
| Bombardier, | ||||||
| Sr. Unscd. Notes | EUR | 6.13 | 5/15/21 | 595,000 | c | 890,167 |
| Canadian Capital Auto | ||||||
| Receivables Asset Trust, | ||||||
| Ser. 2012-1A, Cl. A2 | CAD | 2.03 | 8/17/15 | 255,741 | c | 241,269 |
| Canadian Capital Auto | ||||||
| Receivables Asset Trust, | ||||||
| Ser. 2012-1A, Cl. A3 | CAD | 2.38 | 4/17/17 | 2,345,000 | c | 2,230,934 |
The Fund 9
STATEMENT OF INVESTMENTS (continued)
| Coupon | Maturity | Principal | ||||
| Bonds and Notes (continued) | Rate (%) | Date | Amount ($)a | Value ($) | ||
| Canada (continued) | ||||||
| CIT Canada Equipment | ||||||
| Receivables Trust, | ||||||
| Ser. 2012-1A, Cl. A2 | CAD | 2.11 | 12/20/16 | 1,172,352 | c | 1,108,341 |
| CNH Capital Canada | ||||||
| Receivables Trust, | ||||||
| Ser. 2011-1A, Cl. A2 | CAD | 2.34 | 7/17/17 | 1,276,580 | c | 1,211,000 |
| Ford Auto | ||||||
| Securitization Trust, | ||||||
| Ser. 2011-R3A, Cl. A2 | CAD | 1.96 | 7/15/15 | 310,852 | c | 293,020 |
| Ford Auto | ||||||
| Securitization Trust, | ||||||
| Ser. 2012-R1, Cl. A2 | CAD | 2.02 | 3/15/16 | 1,165,430 | 1,105,779 | |
| Ford Auto | ||||||
| Securitization Trust, | ||||||
| Ser. 2010-R3A, Cl. A3 | CAD | 2.71 | 9/15/15 | 293,338 | c | 277,846 |
| MEG Energy, | ||||||
| Gtd. Notes | 6.38 | 1/30/23 | 860,000 | c | 869,675 | |
| Province of Alberta, | ||||||
| Unscd. Bonds | CAD | 3.40 | 12/1/23 | 7,480,000 | 7,025,672 | |
| Province of British Columbia, | ||||||
| Sr. Unscd. Bonds | CAD | 2.70 | 12/18/22 | 1,100,000 | 990,720 | |
| Province of Ontario, | ||||||
| Bonds | CAD | 4.40 | 3/8/16 | 1,200,000 | 1,204,564 | |
| Valeant Pharmaceuticals | ||||||
| International, | ||||||
| Gtd. Notes | 5.63 | 12/1/21 | 250,000 | c | 251,875 | |
| Videotron, | ||||||
| Gtd. Notes | 5.00 | 7/15/22 | 865,000 | 849,863 | ||
| 18,550,725 | ||||||
| Chile—1.8% | ||||||
| Banco Santander Chile, | ||||||
| Sr. Unscd. Notes | 3.88 | 9/20/22 | 640,000 | c | 606,829 | |
| Chilean Government, | ||||||
| Sr. Unscd. Notes | CLP | 5.50 | 8/5/20 | 1,485,000,000 | 2,892,846 | |
| Codelco, | ||||||
| Sr. Unscd. Notes | 5.63 | 10/18/43 | 1,885,000 | c | 1,866,898 | |
| Embotelladora Andina, | ||||||
| Sr. Unscd. Notes | 5.00 | 10/1/23 | 1,015,000 | c | 1,020,897 | |
10
| Coupon | Maturity | Principal | ||||
| Bonds and Notes (continued) | Rate (%) | Date | Amount ($)a | Value ($) | ||
| Chile (continued) | ||||||
| Telefonica Chile, | ||||||
| Sr. Unscd. Notes | 3.88 | 10/12/22 | 820,000 | c | 753,383 | |
| 7,140,853 | ||||||
| Denmark—1.9% | ||||||
| Danish Government, | ||||||
| Bonds | DKK | 0.10 | 11/15/23 | 40,455,000 | e | 7,389,905 |
| France—2.6% | ||||||
| AXA, | ||||||
| Jr. Sub. Notes | EUR | 5.78 | 7/29/49 | 1,500,000 | f | 2,156,882 |
| AXA, | ||||||
| Jr. Sub. Notes | EUR | 6.21 | 10/29/49 | 310,000 | f | 458,081 |
| Electricite de France, | ||||||
| Sub. Notes | EUR | 5.38 | 1/29/49 | 500,000 | f | 736,979 |
| Pernod-Ricard, | ||||||
| Sr. Unscd. Notes | 5.50 | 1/15/42 | 2,080,000 | c | 2,134,215 | |
| Societe Generale, | ||||||
| Bank Gtd. Notes | 2.75 | 10/12/17 | 3,760,000 | d | 3,878,902 | |
| Veolia Environnement, | ||||||
| Jr. Sub. Notes | EUR | 4.45 | 1/29/49 | 600,000 | d,f | 821,378 |
| 10,186,437 | ||||||
| Germany—1.7% | ||||||
| Allianz, | ||||||
| Sub. Notes | EUR | 5.63 | 10/17/42 | 1,400,000 | f | 2,141,856 |
| German Government, | ||||||
| Bonds | EUR | 3.25 | 7/4/42 | 1,515,000 | 2,289,255 | |
| Globaldrive Auto Receivables, | ||||||
| Ser. 2011-AA, Cl. A | EUR | 1.00 | 4/20/19 | 439,664 | c,f | 607,112 |
| KFW, | ||||||
| Govt Gtd. Bonds | 3.50 | 3/10/14 | 125,000 | 125,730 | ||
| Techem, | ||||||
| Sr. Scd. Notes | EUR | 6.13 | 10/1/19 | 500,000 | c | 752,855 |
| Unitymedia Hessen, | ||||||
| Sr. Scd. Notes | EUR | 7.50 | 3/15/19 | 555,000 | c | 834,187 |
| 6,750,995 | ||||||
| Hungary—1.0% | ||||||
| Hungarian Development Bank, | ||||||
| Govt Gtd. Notes | 6.25 | 10/21/20 | 525,000 | c | 542,719 | |
The Fund 11
STATEMENT OF INVESTMENTS (continued)
| Coupon | Maturity | Principal | ||||
| Bonds and Notes (continued) | Rate (%) | Date | Amount ($)a | Value ($) | ||
| Hungary (continued) | ||||||
| Hungarian Government, | ||||||
| Sr. Unscd. Notes | 5.75 | 11/22/23 | 3,500,000 | 3,535,000 | ||
| 4,077,719 | ||||||
| Iceland—1.5% | ||||||
| Icelandic Government, | ||||||
| Unscd. Notes | 4.88 | 6/16/16 | 350,000 | c | 364,091 | |
| Icelandic Government, | ||||||
| Unscd. Notes | 4.88 | 6/16/16 | 5,185,000 | 5,393,743 | ||
| 5,757,834 | ||||||
| Ireland—1.6% | ||||||
| Ardagh Packaging Finance, | ||||||
| Sr. Scd. Notes | 4.88 | 11/15/22 | 200,000 | c | 199,000 | |
| Ardagh Packaging Finance, | ||||||
| Sr. Scd. Notes | EUR | 7.38 | 10/15/17 | 355,000 | 524,417 | |
| Bank of Ireland, | ||||||
| Govt Gtd. Notes | EUR | 4.00 | 1/28/15 | 3,060,000 | 4,374,255 | |
| Smurfit Kappa Acquisitions, | ||||||
| Sr. Scd. Notes | EUR | 5.13 | 9/15/18 | 360,000 | c | 539,827 |
| Smurfit Kappa Acquistions, | ||||||
| Sr. Scd. Notes | EUR | 7.75 | 11/15/19 | 555,000 | c | 836,050 |
| 6,473,549 | ||||||
| Italy—11.9% | ||||||
| Enel, | ||||||
| Sr. Unscd. Bonds | EUR | 4.88 | 2/20/18 | 915,000 | 1,380,452 | |
| Enel, | ||||||
| Sub. Bonds | 8.75 | 9/24/73 | 915,000 | c,f | 998,372 | |
| Enel Finance International, | ||||||
| Gtd. Notes | 5.13 | 10/7/19 | 155,000 | c | 165,693 | |
| Intesa Sanpaolo, | ||||||
| Sr. Unscd. Notes | 3.88 | 1/16/18 | 3,035,000 | 3,110,675 | ||
| Intesa Sanpaolo, | ||||||
| Sr. Unscd. Notes | EUR | 3.00 | 1/28/19 | 850,000 | 1,177,707 | |
| Italian Government, | ||||||
| Bonds | EUR | 2.10 | 9/15/16 | 1,550,000 | g | 2,348,892 |
| Italian Government, | ||||||
| Treasury Bonds | EUR | 2.75 | 11/15/16 | 4,690,000 | 6,630,456 | |
| Italian Government, | ||||||
| Treasury Bonds | EUR | 3.50 | 6/1/18 | 6,515,000 | 9,332,314 | |
12
| Coupon | Maturity | Principal | ||||
| Bonds and Notes (continued) | Rate (%) | Date | Amount ($)a | Value ($) | ||
| Italy (continued) | ||||||
| Italian Government, | ||||||
| Treasury Bonds | EUR | 4.75 | 6/1/17 | 11,885,000 | 17,725,981 | |
| Telecom Italia, | ||||||
| Sr. Unscd. Notes | EUR | 4.00 | 1/21/20 | 895,000 | d | 1,224,312 |
| Telecom Italia, | ||||||
| Sr. Unscd. Notes | GBP | 7.38 | 12/15/17 | 1,100,000 | 2,010,440 | |
| Wind Acquisition Finance, | ||||||
| Sr. Scd. Notes | 6.50 | 4/30/20 | 925,000 | c | 989,750 | |
| 47,095,044 | ||||||
| Japan—3.6% | ||||||
| Development Bank of Japan, | ||||||
| Govt Gtd. Bonds | JPY | 1.70 | 9/20/22 | 263,000,000 | 2,709,482 | |
| Development Bank of Japan, | ||||||
| Govt Gtd. Notes | JPY | 1.05 | 6/20/23 | 38,000,000 | 371,316 | |
| Japanese Government, | ||||||
| Sr. Unscd. Bonds, Ser. 8 | JPY | 1.00 | 6/10/16 | 223,000,000 | h | 2,308,788 |
| Japanese Government, | ||||||
| Sr. Unscd. Bonds, Ser. 39 | JPY | 1.90 | 6/20/43 | 890,000,000 | 8,792,306 | |
| 14,181,892 | ||||||
| Kazakhstan—.5% | ||||||
| Development | ||||||
| Bank of Kazakhstan, | ||||||
| Sr. Unscd. Notes | 4.13 | 12/10/22 | 2,125,000 | 1,909,738 | ||
| Mexico—1.3% | ||||||
| Comision Federal de | ||||||
| Electricidad, | ||||||
| Sr. Unscd. Notes | 4.88 | 1/15/24 | 350,000 | c | 348,250 | |
| Mexican Government, | ||||||
| Bonds, Ser. M | MXN | 8.00 | 12/7/23 | 57,155,000 | 4,877,644 | |
| 5,225,894 | ||||||
| Netherlands—4.4% | ||||||
| ABN AMRO Bank, | ||||||
| Sr. Unscd. Notes | 4.25 | 2/2/17 | 1,600,000 | c,d | 1,718,755 | |
| Deutsche | ||||||
| Annington Finance, | ||||||
| Gtd. Notes | 3.20 | 10/2/17 | 1,475,000 | c | 1,496,153 | |
| ELM, | ||||||
| Jr. Sub. Notes | EUR | 5.25 | 5/29/49 | 1,500,000 | f | 2,166,414 |
The Fund 13
STATEMENT OF INVESTMENTS (continued)
| Coupon | Maturity | Principal | ||||
| Bonds and Notes (continued) | Rate (%) | Date | Amount ($)a | Value ($) | ||
| Netherlands (continued) | ||||||
| Iberdrola International, | ||||||
| Gtd. Notes | EUR | 4.50 | 9/21/17 | 1,000,000 | 1,516,789 | |
| Iberdrola International, | ||||||
| Gtd. Notes | EUR | 5.75 | 2/27/49 | 800,000 | d,f | 1,167,493 |
| ING Bank, | ||||||
| Covered Notes | EUR | 3.63 | 8/31/21 | 475,000 | 728,354 | |
| LyondellBasell Industries, | ||||||
| Sr. Unscd. Notes | 5.00 | 4/15/19 | 625,000 | 694,951 | ||
| Rabobank Nederland, | ||||||
| Bank Gtd. Notes | 3.38 | 1/19/17 | 2,115,000 | 2,228,478 | ||
| Rabobank Nederland, | ||||||
| Sr. Unscd. Notes | EUR | 3.88 | 4/20/16 | 1,125,000 | 1,651,105 | |
| Repsol International Finance, | ||||||
| Gtd. Notes | EUR | 4.38 | 2/20/18 | 700,000 | 1,053,937 | |
| Repsol International Finance, | ||||||
| Gtd. Notes | EUR | 4.88 | 2/19/19 | 700,000 | 1,077,237 | |
| UPCB Finance VI, | ||||||
| Sr. Scd. Notes | 6.88 | 1/15/22 | 830,000 | c | 886,025 | |
| Ziggo Bond, | ||||||
| Gtd. Notes | EUR | 8.00 | 5/15/18 | 570,000 | c | 833,350 |
| 17,219,041 | ||||||
| Norway—.9% | ||||||
| DNB Boligkreditt, | ||||||
| Covered Bonds | 2.10 | 10/14/16 | 795,000 | c,d | 815,670 | |
| DNB Boligkreditt, | ||||||
| Covered Bonds | EUR | 3.38 | 1/20/17 | 590,000 | 875,307 | |
| Norwegian Government, | ||||||
| Bonds, Ser. 474 | NOK | 3.75 | 5/25/21 | 5,200,000 | 914,949 | |
| Statoil, | ||||||
| Gtd. Notes | 4.25 | 11/23/41 | 1,090,000 | 1,003,057 | ||
| 3,608,983 | ||||||
| Peru—.0% | ||||||
| BBVA Banco Continental, | ||||||
| Sr. Unscd. Notes | 5.00 | 8/26/22 | 130,000 | c,d | 130,325 | |
| Poland—.3% | ||||||
| Polish Government, | ||||||
| Sr. Unscd. Notes | 5.00 | 3/23/22 | 1,015,000 | 1,087,319 | ||
| Portugal—1.6% | ||||||
| Portuguese Government, | ||||||
| Sr. Unscd. Bonds | EUR | 5.65 | 2/15/24 | 4,650,000 | c | 6,184,148 |
14
| Coupon | Maturity | Principal | ||||
| Bonds and Notes (continued) | Rate (%) | Date | Amount ($)a | Value ($) | ||
| Russia—1.4% | ||||||
| Gazprom, | ||||||
| Sr. Unscd. Bonds | 6.00 | 11/27/23 | 1,775,000 | c | 1,810,500 | |
| Russian Government, | ||||||
| Sr. Unscd. Bonds | 4.88 | 9/16/23 | 1,600,000 | c | 1,620,000 | |
| Vnesheconombank, | ||||||
| Sr. Unscd. Notes | 5.94 | 11/21/23 | 2,025,000 | c | 2,030,063 | |
| 5,460,563 | ||||||
| Slovakia—5.2% | ||||||
| Slovakian Government, | ||||||
| Sr. Unscd. Notes | 4.38 | 5/21/22 | 16,545,000 | c | 17,155,841 | |
| Slovakian Government, | ||||||
| Bonds, Ser. 225 | EUR | 3.00 | 2/28/23 | 1,795,000 | 2,569,154 | |
| Slovakian Government, | ||||||
| Sr. Unscd. Notes, | ||||||
| Ser. 216 | EUR | 4.35 | 10/14/25 | 600,000 | 929,591 | |
| 20,654,586 | ||||||
| Spain—7.6% | ||||||
| Banco Bilbao | ||||||
| Vizcaya Argentaria, | ||||||
| Covered Notes | EUR | 3.88 | 1/30/23 | 500,000 | d | 742,314 |
| Banco Santander, | ||||||
| Covered Bonds | EUR | 4.63 | 1/20/16 | 2,300,000 | 3,383,025 | |
| BBVA US Senior, | ||||||
| Bank Gtd. Notes | 4.66 | 10/9/15 | 875,000 | 920,260 | ||
| Gestamp Funding, | ||||||
| Sr. Scd. Notes | EUR | 5.88 | 5/31/20 | 575,000 | c | 838,492 |
| Santander | ||||||
| International Debt, | ||||||
| Bank Gtd. Notes | EUR | 4.00 | 3/27/17 | 2,300,000 | 3,387,834 | |
| Spanish Government, | ||||||
| Bonds | EUR | 3.75 | 10/31/18 | 5,920,000 | 8,527,211 | |
| Spanish Government, | ||||||
| Bonds | EUR | 5.15 | 10/31/44 | 1,650,000 | c | 2,323,937 |
| Spanish | ||||||
| Government, | ||||||
| Sr. Unscd. Bonds | EUR | 5.40 | 1/31/23 | 3,365,000 | c | 5,089,395 |
| Telefonica Emisiones, | ||||||
| Gtd. Notes | EUR | 3.96 | 3/26/21 | 500,000 | d | 728,602 |
| Telefonica Emisiones, | ||||||
| Gtd. Notes | 5.46 | 2/16/21 | 910,000 | 962,455 | ||
The Fund 15
STATEMENT OF INVESTMENTS (continued)
| Coupon | Maturity | Principal | ||||
| Bonds and Notes (continued) | Rate (%) | Date | Amount ($)a | Value ($) | ||
| Spain (continued) | ||||||
| Telefonica Emisiones, | ||||||
| Gtd. Notes | GBP | 5.38 | 2/2/18 | 1,840,000 | 3,284,717 | |
| 30,188,242 | ||||||
| Supranational—1.2% | ||||||
| Corporacion | ||||||
| Andina de Fomento, | ||||||
| Sr. Unscd. Notes | 3.75 | 1/15/16 | 920,000 | 961,122 | ||
| Eurasian Development Bank, | ||||||
| Sr. Unscd. Notes | 5.00 | 9/26/20 | 800,000 | c | 818,000 | |
| European Investment Bank, | ||||||
| Sr. Unscd. Notes | JPY | 1.90 | 1/26/26 | 58,000,000 | 607,115 | |
| International Bank for | ||||||
| Reconstruction & | ||||||
| Development, | ||||||
| Sr. Unscd. Notes | AUD | 3.50 | 1/24/18 | 2,800,000 | 2,485,386 | |
| 4,871,623 | ||||||
| Switzerland—.7% | ||||||
| Credit Suisse, | ||||||
| Sub. Notes | 6.50 | 8/8/23 | 690,000 | c | 735,712 | |
| Credit Suisse, | ||||||
| Covered Notes | EUR | 2.13 | 1/18/17 | 1,300,000 | 1,863,602 | |
| 2,599,314 | ||||||
| United Kingdom—7.2% | ||||||
| Abbey National | ||||||
| Treasury Services, | ||||||
| Covered Bonds | EUR | 3.63 | 9/8/17 | 1,150,000 | 1,705,292 | |
| Barclays Bank, | ||||||
| Covered Notes | EUR | 2.13 | 9/8/15 | 790,000 | 1,100,114 | |
| BP Capital Markets, | �� | |||||
| Gtd. Notes | 2.25 | 11/1/16 | 375,000 | 388,339 | ||
| CNOOC Finance (2012), | ||||||
| Gtd. Notes | 3.88 | 5/2/22 | 350,000 | c | 337,739 | |
| E-Carat, | ||||||
| Ser. 2012-1, Cl. A | GBP | 1.30 | 6/18/20 | 448,854 | 743,662 | |
| Gracechurch Card Funding, | ||||||
| Ser. 2012-1A, Cl. A2 | EUR | 1.02 | 2/15/17 | 1,720,000 | c,f | 2,378,891 |
| HSBC Bank, | ||||||
| Sr. Unscd. Notes | EUR | 3.88 | 10/24/18 | 1,000,000 | 1,523,156 | |
| HSBC Holdings, | ||||||
| Sub. Notes | EUR | 6.25 | 3/19/18 | 650,000 | 1,041,198 | |
16
| Coupon | Maturity | Principal | ||||
| Bonds and Notes (continued) | Rate (%) | Date | Amount ($)a | Value ($) | ||
| United Kingdom (continued) | ||||||
| INEOS Finance, | ||||||
| Sr. Scd. Notes | 7.50 | 5/1/20 | 650,000 | c | 715,813 | |
| Lloyds Bank, | ||||||
| Bank Gtd. Notes | 6.50 | 9/14/20 | 1,115,000 | c | 1,269,212 | |
| Lloyds Bank, | ||||||
| Covered Bonds | EUR | 4.00 | 9/29/21 | 400,000 | 629,060 | |
| Lloyds Bank, | ||||||
| Covered Notes | EUR | 3.38 | 3/17/16 | 900,000 | 1,282,810 | |
| Lloyds Bank, | ||||||
| Sr. Unscd. Notes | EUR | 4.63 | 2/2/17 | 1,650,000 | 2,504,482 | |
| Lloyds Bank, | ||||||
| Sr. Unscd. Notes | EUR | 5.38 | 9/3/19 | 450,000 | d | 734,536 |
| Lloyds Bank, | ||||||
| Sub. Notes | EUR | 6.50 | 3/24/20 | 575,000 | d | 918,594 |
| Paragon Mortgages, | ||||||
| Ser. 14A, Cl. A2C | 0.44 | 9/15/39 | 1,753,450 | c,f | 1,560,568 | |
| Royal Bank of Scotland, | ||||||
| Bank Gtd. Notes | 5.63 | 8/24/20 | 405,000 | 454,042 | ||
| Royal Bank of Scotland, | ||||||
| Covered Notes | EUR | 3.00 | 9/8/16 | 545,000 | 781,901 | |
| Royal Bank of Scotland, | ||||||
| Covered Notes | EUR | 3.88 | 10/19/21 | 1,000,000 | 1,560,052 | |
| Royal Bank of Scotland, | ||||||
| Sub. Notes | 9.50 | 3/16/22 | 410,000 | f | 481,150 | |
| Royal Bank of | ||||||
| Scotland Group, | ||||||
| Sub. Notes | 6.00 | 12/19/23 | 1,745,000 | 1,759,606 | ||
| Sinopec Group Overseas | ||||||
| Development (2013), | ||||||
| Gtd. Notes | 4.38 | 10/17/23 | 1,600,000 | c | 1,579,072 | |
| United Kingdom Gilt, | ||||||
| Bonds | GBP | 4.25 | 12/7/40 | 1,620,000 | 2,962,380 | |
| 28,411,669 | ||||||
| United States—24.7% | ||||||
| 21st Century Fox America, | ||||||
| Gtd. Notes | 5.40 | 10/1/43 | 1,055,000 | c | 1,072,220 | |
| A10 Securitization, | ||||||
| Ser. 2013-2, Cl. A | 2.62 | 11/15/27 | 2,250,000 | c | 2,244,288 | |
| Ally Financial, | ||||||
| Gtd. Notes | 4.50 | 2/11/14 | 270,000 | 271,519 | ||
The Fund 17
STATEMENT OF INVESTMENTS (continued)
| Coupon | Maturity | Principal | |||
| Bonds and Notes (continued) | Rate (%) | Date | Amount ($)a | Value ($) | |
| United States (continued) | |||||
| Ally Financial, | |||||
| Gtd. Notes | 5.50 | 2/15/17 | 1,200,000 | 1,305,000 | |
| American Home | |||||
| Mortgage Investment Trust, | |||||
| Ser. 2004-4, Cl. 6A1 | 5.29 | 2/25/45 | 2,011,945 | f | 2,042,210 |
| American International Group, | |||||
| Sr. Unscd. Notes | 4.88 | 6/1/22 | 825,000 | 888,266 | |
| Americredit Automobile | |||||
| Receivables Trust, | |||||
| Ser. 2013-4, Cl. C | 2.72 | 9/9/19 | 1,065,000 | 1,078,400 | |
| Anadarko Petroleum, | |||||
| Sr. Unscd. Notes | 6.20 | 3/15/40 | 1,255,000 | 1,392,904 | |
| ARL First, | |||||
| Ser. 2012-1A, Cl. A1 | 1.92 | 12/15/42 | 870,917 | c,f | 880,846 |
| Aventura Mall Trust, | |||||
| Ser. 2013-AVM, Cl. A | 3.74 | 12/5/32 | 1,805,000 | c,f | 1,856,174 |
| Barclays Commercial | |||||
| Mortgage Securities, | |||||
| Ser. 2013-TYSN, Cl. A2 | 3.76 | 9/5/32 | 1,245,000 | c | 1,286,037 |
| Bear Stearns Alt-A Trust, | |||||
| Ser. 2005-4, Cl. 24A1 | 2.71 | 5/25/35 | 2,156,604 | f | 2,079,958 |
| Boston Scientific, | |||||
| Sr. Unscd. Notes | 2.65 | 10/1/18 | 1,105,000 | 1,113,753 | |
| Calpine, | |||||
| Sr. Scd. Notes | 6.00 | 1/15/22 | 180,000 | c | 185,400 |
| Capital Auto Receivables | |||||
| Asset Trust, | |||||
| Ser. 2013-1, Cl. D | 2.19 | 9/20/21 | 415,000 | 407,090 | |
| Capital Auto Receivables | |||||
| Asset Trust, | |||||
| Ser. 2013-3, Cl. D | 3.69 | 2/20/19 | 710,000 | 721,350 | |
| Carrington Mortgage Loan Trust, | |||||
| Ser. 2006-RFC1, Cl. A3 | 0.31 | 5/25/36 | 908,441 | f | 843,243 |
| Centurylink, | |||||
| Sr. Unscd. Notes, Ser. W | 6.75 | 12/1/23 | 600,000 | 610,500 | |
| CIT Group, | |||||
| Sr. Unscd. Notes | 5.00 | 5/15/17 | 755,000 | 809,737 | |
| CIT Group, | |||||
| Sr. Unscd. Notes | 4.25 | 8/15/17 | 665,000 | 694,925 | |
| Citigroup, | |||||
| Sub. Notes | 4.05 | 7/30/22 | 1,165,000 | 1,154,085 |
18
| Coupon | Maturity | Principal | |||
| Bonds and Notes (continued) | Rate (%) | Date | Amount ($)a | Value ($) | |
| United States (continued) | |||||
| Citigroup Commercial | |||||
| Mortgage Trust, | |||||
| Ser. 2013-375P, Cl. E | 3.52 | 5/10/35 | 1,215,000 | c,f | 1,030,643 |
| Comcast, | |||||
| Gtd. Notes | 5.90 | 3/15/16 | 200,000 | 220,993 | |
| Commercial Mortgage | |||||
| Pass Through Certificates, | |||||
| Ser. 2013-CR6, Cl. B | 3.40 | 3/10/46 | 530,000 | c | 487,155 |
| Commercial Mortgage | |||||
| Pass Through Certificates, | |||||
| Ser. 2013-WWP, Cl. B | 3.73 | 3/10/31 | 1,225,000 | c | 1,167,116 |
| Commercial Mortgage | |||||
| Pass Through Certificates, | |||||
| Ser. 2013-CR6, Cl. C | 3.78 | 3/10/46 | 370,000 | c,f | 337,535 |
| Commercial Mortgage Trust, | |||||
| Ser. 2013-CR10, Cl. A4 | 4.21 | 8/10/46 | 1,250,000 | f | 1,290,956 |
| Commercial Mortgage Trust, | |||||
| Ser. 2013-LC13, Cl. B | 5.01 | 8/10/46 | 890,000 | c,f | 915,255 |
| Commercial Mortgage Trust, | |||||
| Ser. 2013-LC13, Cl. C | 5.05 | 8/10/46 | 325,000 | c,f | 328,600 |
| Commercial Mortgage Trust, | |||||
| Ser. 2013-CR11, Cl. C | 5.17 | 10/10/46 | 725,000 | c,f | 722,755 |
| Countrywide | |||||
| Alternative Loan Trust, | |||||
| Ser. 2004-18, Cl. 4A1 | 5.50 | 9/25/34 | 1,203,122 | 1,223,617 | |
| DaVita HealthCare Partners, | |||||
| Gtd. Notes | 5.75 | 8/15/22 | 170,000 | 172,975 | |
| EQT, | |||||
| Sr. Unscd. Notes | 8.13 | 6/1/19 | 135,000 | 163,963 | |
| Exelon Generation, | |||||
| Sr. Unscd. Notes | 4.25 | 6/15/22 | 2,500,000 | 2,400,182 | |
| Express Scripts Holding, | |||||
| Gtd. Notes | 2.10 | 2/12/15 | 785,000 | 796,595 | |
| Extended Stay America Trust, | |||||
| Ser. 2013-ESH7, Cl. D7 | 5.05 | 12/5/31 | 1,000,000 | c,f | 1,009,182 |
| Ford Motor Credit, | |||||
| Sr. Unscd. Notes | 3.00 | 6/12/17 | 1,620,000 | 1,685,072 | |
| Freeport-McMoRan Copper & Gold, | |||||
| Gtd. Notes | 5.45 | 3/15/43 | 1,465,000 | 1,407,053 | |
| Freeport-McMoRan Copper & Gold, | |||||
| Sr. Unscd. Notes | 3.55 | 3/1/22 | 425,000 | 404,625 |
The Fund 19
STATEMENT OF INVESTMENTS (continued)
| Coupon | Maturity | Principal | ||||
| Bonds and Notes (continued) | Rate (%) | Date | Amount ($)a | Value ($) | ||
| United States (continued) | ||||||
| General Electric Capital, | ||||||
| Sub. Notes | 5.30 | 2/11/21 | 450,000 | 504,133 | ||
| General Motor Financial, | ||||||
| Gtd. Notes | 2.75 | 5/15/16 | 795,000 | c | 806,925 | |
| General Motor Financial, | ||||||
| Gtd. Notes | 3.25 | 5/15/18 | 190,000 | c | 190,475 | |
| Genworth Holdings, | ||||||
| Gtd. Notes | 4.90 | 8/15/23 | 1,595,000 | 1,597,239 | ||
| Goldman Sachs Group, | ||||||
| Sub. Notes | 6.75 | 10/1/37 | 1,100,000 | 1,227,594 | ||
| Hilton USA Trust, | ||||||
| Ser. 2013-HLT, Cl. DFX | 4.41 | 11/5/30 | 915,000 | c | 919,621 | |
| Holcim US Finance Sarl & Cie, | ||||||
| Gtd. Notes | 6.00 | 12/30/19 | 975,000 | c | 1,103,407 | |
| Holcim US Finance Sarl & Cie, | ||||||
| Gtd. Notes | 5.15 | 9/12/23 | 1,395,000 | c | 1,435,077 | |
| JPMorgan Chase & Co., | ||||||
| Sr. Unscd. Notes | 4.50 | 1/24/22 | 650,000 | 688,689 | ||
| JPMorgan Chase Bank, | ||||||
| Sub. Notes | EUR | 4.38 | 11/30/21 | 1,350,000 | f | 1,943,109 |
| JP Morgan Chase Commercial | ||||||
| Mortgage Securities Trust, | ||||||
| Ser. 2013-LC11, Cl. AS | 3.22 | 4/15/46 | 930,000 | 874,450 | ||
| JP Morgan Chase Commercial | ||||||
| Mortgage Securities Trust, | ||||||
| Ser. 2013-LC11, Cl. B | 3.50 | 4/15/46 | 1,775,000 | 1,646,902 | ||
| JP Morgan Chase Commercial | ||||||
| Mortgage Securities Trust, | ||||||
| Ser. 2006-CB17, Cl. AM | 5.46 | 12/12/43 | 760,000 | 787,928 | ||
| Keycorp Student Loan Trust, | ||||||
| Ser. 1999-B, Cl. CTFS | 0.96 | 11/25/36 | 710,000 | f | 637,161 | |
| Lamar Media, | ||||||
| Gtd. Notes | 5.88 | 2/1/22 | 505,000 | 520,150 | ||
| Long Beach Mortgage Loan Trust, | ||||||
| Ser. 2004-1, Cl. M2 | 0.99 | 2/25/34 | 603,826 | f | 589,271 | |
| Merrill Lynch & Co., | ||||||
| Sub. Notes | 7.75 | 5/14/38 | 1,300,000 | 1,683,611 | ||
| Metropolitan Life Global Funding I, | ||||||
| Scd. Notes | 1.50 | 1/10/18 | 1,160,000 | c | 1,129,313 | |
| Metropolitan Life Global Funding I, | ||||||
| Sr. Scd. Notes | 2.00 | 1/9/15 | 265,000 | c | 269,355 | |
20
| Coupon | Maturity | Principal | |||
| Bonds and Notes (continued) | Rate (%) | Date | Amount ($)a | Value ($) | |
| United States (continued) | |||||
| MGM Resorts International, | |||||
| Gtd. Notes | 7.75 | 3/15/22 | 785,000 | 881,162 | |
| Morgan Stanley, | |||||
| Sub. Notes | 4.10 | 5/22/23 | 1,240,000 | 1,202,318 | |
| Morgan Stanley Bank of | |||||
| America Merrill Lynch Trust, | |||||
| Ser. 2013-C8, Cl. B | 3.68 | 12/15/48 | 460,000 | f | 432,526 |
| Morgan Stanley Bank of | |||||
| America Merrill Lynch Trust, | |||||
| Ser. 2013-C7, Cl. B | 3.77 | 2/15/46 | 505,000 | 476,733 | |
| Morgan Stanley Bank of | |||||
| America Merrill Lynch Trust, | |||||
| Ser. 2013-C8, Cl. C | 4.17 | 12/15/48 | 390,000 | f | 368,097 |
| Mosaic, | |||||
| Sr. Unscd. Notes | 5.63 | 11/15/43 | 750,000 | 763,627 | |
| Mylan, | |||||
| Sr. Unscd. Notes | 4.20 | 11/29/23 | 900,000 | 887,008 | |
| Pemex Project Funding | |||||
| Master Trust, | |||||
| Gtd. Bonds | 6.63 | 6/15/35 | 1,840,000 | 1,945,800 | |
| Philip Morris International, | |||||
| Sr. Unscd. Notes | 5.65 | 5/16/18 | 125,000 | 143,706 | |
| Philip Morris International, | |||||
| Sr. Unscd. Notes | 6.88 | 3/17/14 | 135,000 | 136,805 | |
| Popular ABS Mortgage | |||||
| Pass-Through Trust, | |||||
| Ser. 2006-D, Cl. A2 | 0.32 | 11/25/46 | 477,013 | f | 458,165 |
| Prudential Financial, | |||||
| Sr. Unscd. Notes | 5.38 | 6/21/20 | 300,000 | 339,503 | |
| Puget Energy, | |||||
| Sr. Scd. Notes | 6.00 | 9/1/21 | 270,000 | 302,408 | |
| Santander Drive | |||||
| Auto Receivables Trust, | |||||
| Ser. 2013-3, Cl. D | 2.42 | 4/15/19 | 2,900,000 | 2,869,995 | |
| Santander Drive | |||||
| Auto Receivables Trust, | |||||
| Ser. 2012-1, Cl. B | 2.72 | 5/16/16 | 535,000 | 541,015 | |
| Sealed Air, | |||||
| Gtd. Notes | 6.50 | 12/1/20 | 350,000 | c | 378,000 |
| SLM, | |||||
| Sr. Unscd. Notes | 5.50 | 1/15/19 | 1,000,000 | 1,038,888 |
The Fund 21
STATEMENT OF INVESTMENTS (continued)
| Coupon | Maturity | Principal | ||||
| Bonds and Notes (continued) | Rate (%) | Date | Amount ($)a | Value ($) | ||
| United States (continued) | ||||||
| SLM, | ||||||
| Sr. Unscd. Notes | 7.25 | 1/25/22 | 1,060,000 | 1,126,250 | ||
| SLM Private Education Loan Trust, | ||||||
| Ser. 2011-B, Cl. A1 | 1.02 | 12/16/24 | 572,132 | c,f | 573,213 | |
| Springleaf Funding Trust, | ||||||
| Ser. 2013-AA, Cl. A | 2.58 | 9/15/21 | 2,015,000 | c | 2,013,601 | |
| Staples, | ||||||
| Sr. Unscd. Notes | 4.38 | 1/12/23 | 2,105,000 | d | 2,042,955 | |
| Structured Asset Securities | ||||||
| Corp. Mortgage Loan | ||||||
| Trust, Ser. 2006-AM1, Cl. A4 | 0.32 | 4/25/36 | 974,340 | f | 907,700 | |
| Structured Asset Securities | ||||||
| Corp. Mortgage Pass-Through | ||||||
| Certificates, Ser. 2004-11XS, | ||||||
| Cl. 1A5A | 5.84 | 6/25/34 | 895,000 | f | 887,557 | |
| T-Mobile USA, | ||||||
| Gtd. Notes | 6.13 | 1/15/22 | 495,000 | 504,900 | ||
| Tenet Healthcare, | ||||||
| Sr. Scd. Notes | 6.00 | 10/1/20 | 1,455,000 | c | 1,521,384 | |
| U.S. Treasury Notes | 1.25 | 10/31/18 | 3,300,000 | d | 3,235,676 | |
| UBS-Barclays Commercial | ||||||
| Mortgage Trust, | ||||||
| Ser. 2013-C5, Cl. B | 3.65 | 3/10/46 | 475,000 | c,f | 444,848 | |
| UBS-Barclays Commercial | ||||||
| Mortgage Trust, | ||||||
| Ser. 2013-C5, Cl. C | 4.09 | 3/10/46 | 370,000 | c,f | 348,406 | |
| Unit, | ||||||
| Gtd. Notes | 6.63 | 5/15/21 | 860,000 | 911,600 | ||
| Ventas Realty, | ||||||
| Gtd. Notes | 4.25 | 3/1/22 | 355,000 | 357,829 | ||
| Verizon Communications, | ||||||
| Sr. Unscd. Notes | 6.55 | 9/15/43 | 2,150,000 | 2,524,360 | ||
| Virgin Media Secured Finance, | ||||||
| Sr. Scd. Notes | GBP | 6.00 | 4/15/21 | 1,175,000 | c | 2,008,988 |
| Wachovia Bank Commercial | ||||||
| Mortgage Trust, | �� | |||||
| Ser. 2006-C29, Cl. AJ | 5.37 | 11/15/48 | 1,060,000 | f | 987,685 | |
| Wells Fargo & Co. | ||||||
| Sr. Unscd. Notes | 2.63 | 12/15/16 | 1,330,000 | 1,393,877 | ||
| Wells Fargo & Co. | ||||||
| Sub. Notes | 5.38 | 11/2/43 | 1,260,000 | 1,295,086 | ||
22
The Fund 23
STATEMENT OF INVESTMENTS (continued)
| Investment of Cash Collateral | ||||
| for Securities Loaned—3.3% | Shares | Value ($) | ||
| Registered Investment Company; | ||||
| Dreyfus Institutional Cash Advantage Fund | ||||
| (cost $12,916,958) | 12,916,958 | j | 12,916,958 | |
| Total Investments (cost $396,978,818) | 102.2 | % | 403,899,002 | |
| Liabilities, Less Cash and Receivables | (2.2 | %) | (8,854,112 | ) |
| Net Assets | 100.0 | % | 395,044,890 |
| BBA—British Bankers Association |
| LIBOR—London Interbank Offered Rate |
| USD—U.S. Dollar |
| a Principal amount stated in U.S. Dollars unless otherwise noted. |
| AUD—Australian Dollar |
| BRL—Brazilian Real |
| CAD—Canadian Dollar |
| CLP—Chilean Peso |
| DKK—Danish Krone |
| EUR—Euro |
| GBP—British Pound |
| JPY—JapaneseYen |
| MXN—Mexican New Peso |
| NOK—Norwegian Krone |
| b Principal amount for accrual purposes is periodically adjusted based on changes in the Australian Consumer Price Index. |
| c Securities exempt from registration pursuant to Rule 144A under the Securities Act of 1933.These securities may be |
| resold in transactions exempt from registration, normally to qualified institutional buyers.At December 31, 2013, |
| these securities were valued at $110,896,264 or 28.1% of net assets. |
| d Security, or portion thereof, on loan.At December 31, 2013, the value of funds securities on loan was $15,832,283 |
| and the value of the collateral held by the fund was $16,462,620, consisting of cash collateral of $12,916,958 and |
| U.S. Government & Agency securities valued at $3,545,662. |
| e Principal amount for accrual purposes is periodically adjusted based on changes in the Danish Consumer Price Index. |
| f Variable rate security—interest rate subject to periodic change. |
| g Principal amount for accrual purposes is periodically adjusted based on changes in the Italian Consumer Price Index. |
| h Principal amount for accrual purposes is periodically adjusted based on changes in the Japanese Consumer Price Index. |
| i Held by or on behalf of a counterparty for open financial futures contracts. |
| j Investment in affiliated money market mutual fund. |
| Portfolio Summary (Unaudited)† | |||
| Value (%) | Value (%) | ||
| Foreign/Governmental | 45.9 | Residential Mortgage-Backed | 2.3 |
| Corporate Bonds | 37.2 | U.S. Government | .8 |
| Asset-Backed | 5.8 | Options Purchased | .0 |
| Commercial Mortgage-Backed | 5.2 | ||
| Short-Term/Money Market Investments | 5.0 | 102.2 | |
| † Based on net assets. |
| See notes to financial statements. |
24
STATEMENT OF FINANCIAL FUTURES
December 31, 2013
| Unrealized | ||||||
| Market Value | Appreciation | |||||
| Covered by | (Depreciation) | |||||
| Contracts | Contracts ($) | Expiration | at 12/31/2013 | ($) | ||
| Financial Futures Long | ||||||
| Euro-Bobl | 73 | 12,496,065 | March 2014 | (68,737 | ) | |
| Long Gilt | 78 | 13,763,794 | March 2014 | (236,462 | ) | |
| U.S. Treasury 5 Year Notes | 294 | 35,077,875 | March 2014 | (217,314 | ) | |
| U.S. Treasury Ultra Long Bonds | 30 | 4,087,500 | March 2014 | (16,689 | ) | |
| Financial Futures Short | ||||||
| Euro-Bund | 60 | (11,487,412 | ) | March 2014 | 103,941 | |
| Euro-Schatz | 68 | (10,318,338 | ) | March 2014 | 16,768 | |
| Japanese 10 Year Bonds | 24 | (32,662,425 | ) | March 2014 | 186,747 | |
| U.S. Treasury 2 Year Notes | 143 | (31,433,188 | ) | March 2014 | 19,881 | |
| U.S. Treasury 10 Year Notes | 544 | (66,937,500 | ) | March 2014 | 760,091 | |
| U.S. Treasury Long Bonds | 58 | (7,442,125 | ) | March 2014 | 111,806 | |
| Gross Unrealized Appreciation | 1,199,234 | |||||
| Gross Unrealized Depreciation | (539,202 | ) |
| See notes to financial statements. |
STATEMENT OF OPTIONS WRITTEN
December 31, 2013
| Face Amount | |||
| Covered by | |||
| Contracts ($) | Value ($) | ||
| Call Options: | |||
| Brazilian Real, | |||
| January 2014 @ $2.43 | |||
| (premiums received $63,832) | 7,900,000 | (14,947 | ) |
| See notes to financial statements. |
The Fund 25
STATEMENT OF ASSETS AND LIABILITIES
December 31, 2013
| Cost | Value | ||
| Assets ($): | |||
| Investments in securities—See Statement of Investments (including | |||
| securities on loan, valued at $15,832,283)—Note 1(c): | |||
| Unaffiliated issuers | 383,563,513 | 390,483,697 | |
| Affiliated issuers | 13,415,305 | 13,415,305 | |
| Cash | 227,285 | ||
| Cash denominated in foreign currencies | 1,682,420 | 1,676,724 | |
| Dividends, interest and securities lending income receivable | 4,928,244 | ||
| Unrealized appreciation on forward foreign | |||
| currency exchange contracts—Note 4 | 1,871,374 | ||
| Receivable for shares of Beneficial Interest subscribed | 1,486,174 | ||
| Unrealized appreciation on swap agreements—Note 4 | 1,123,126 | ||
| Receivable for investment securities sold | 552,378 | ||
| Swaps premium paid—Note 4 | 111,322 | ||
| Receivable for futures variation margin—Note 4 | 71,800 | ||
| Prepaid expenses | 43,437 | ||
| 415,990,866 | |||
| Liabilities ($): | |||
| Due to The Dreyfus Corporation and affiliates—Note 3(d) | 219,992 | ||
| Due to Administrator—Note 3(a) | 13,161 | ||
| Liability for securities on loan—Note 1(c) | 12,916,958 | ||
| Unrealized depreciation on forward foreign | |||
| currency exchange contracts—Note 4 | 2,770,667 | ||
| Payable for investment securities purchased | 2,607,318 | ||
| Payable for shares of Beneficial Interest redeemed | 2,189,697 | ||
| Unrealized depreciation on swap agreements—Note 4 | 125,813 | ||
| Outstanding options written, at value (premiums received | |||
| $63,832)—See Statement of Options Written—Note 4 | 14,947 | ||
| Dividend payable | 272 | ||
| Accrued expenses | 87,151 | ||
| 20,945,976 | |||
| Net Assets ($) | 395,044,890 | ||
| Composition of Net Assets ($): | |||
| Paid-in capital | 393,974,906 | ||
| Accumulated undistributed investment income—net | 1,179,508 | ||
| Accumulated net realized gain (loss) on investments | (7,874,414 | ) | |
| Accumulated net unrealized appreciation (depreciation) on investments, | |||
| options transactions, swap transactions and foreign currency transactions | |||
| (including $660,032 net unrealized appreciation on financial futures) | 7,764,890 | ||
| Net Assets ($) | 395,044,890 | ||
| Net Asset Value Per Share | ||||
| Class A | Class C | Class I | Class Y | |
| Net Assets ($) | 104,430,923 | 19,481,347 | 271,131,623 | 997 |
| Shares Outstanding | 4,940,250 | 924,874 | 12,807,678 | 47.10 |
| Net Asset Value Per Share ($) | 21.14 | 21.06 | 21.17 | 21.17 |
| See notes to financial statements. |
26
STATEMENT OF OPERATIONS
Year Ended December 31, 2013
| Investment Income ($): | ||
| Income: | ||
| Interest | 13,392,424 | |
| Income from securities lending—Note 1(c) | 101,598 | |
| Dividends; | ||
| Affiliated issuers | 7,298 | |
| Total Income | 13,501,320 | |
| Expenses: | ||
| Investment advisory fee—Note 3(a) | 1,685,671 | |
| Shareholder servicing costs—Note 3(d) | 509,926 | |
| Administration fee—Note 3(a) | 188,292 | |
| Distribution fees—Note 3(c) | 149,933 | |
| Custodian fees—Note 3(d) | 94,298 | |
| Professional fees | 73,468 | |
| Registration fees | 66,774 | |
| Prospectus and shareholders’ reports | 43,230 | |
| Trustees’ fees and expenses—Note 3(e) | 26,017 | |
| Administrative service fees—Note 3(b) | 12,907 | |
| Loan commitment fees—Note 2 | 3,524 | |
| Miscellaneous | 72,801 | |
| Total Expenses | 2,926,841 | |
| Less—reduction in fees due to earnings credits—Note 3(d) | (89 | ) |
| Net Expenses | 2,926,752 | |
| Investment Income—Net | 10,574,568 | |
| Realized and Unrealized Gain (Loss) on Investments—Note 4 ($): | ||
| Net realized gain (loss) on investments and foreign currency transactions | (5,328,180 | ) |
| Net realized gain (loss) on options transactions | (1,557,352 | ) |
| Net realized gain (loss) on financial futures | (994,784 | ) |
| Net realized gain (loss) on swap transactions | (574,633 | ) |
| Net realized gain (loss) on forward foreign currency exchange contracts | 5,129,392 | |
| Net Realized Gain (Loss) | (3,325,557 | ) |
| Net unrealized appreciation (depreciation) on | ||
| investments and foreign currency transactions | (9,763,314 | ) |
| Net unrealized appreciation (depreciation) on options transactions | (96,832 | ) |
| Net unrealized appreciation (depreciation) on financial futures | 865,100 | |
| Net unrealized appreciation (depreciation) on swap transactions | 628,276 | |
| Net unrealized appreciation (depreciation) on | ||
| forward foreign currency exchange contracts | (1,771,117 | ) |
| Net Unrealized Appreciation (Depreciation) | (10,137,887 | ) |
| Net Realized and Unrealized Gain (Loss) on Investments | (13,463,444 | ) |
| Net (Decrease) in Net Assets Resulting from Operations | (2,888,876 | ) |
| See notes to financial statements. |
The Fund 27
STATEMENT OF CHANGES IN NET ASSETS
| Year Ended December 31, | ||||
| 2013 | a | 2012 | ||
| Operations ($): | ||||
| Investment income—net | 10,574,568 | 5,259,283 | ||
| Net realized gain (loss) on investments | (3,325,557 | ) | 8,961,235 | |
| Net unrealized appreciation | ||||
| (depreciation) on investments | (10,137,887 | ) | 7,826,210 | |
| Net Increase (Decrease) in Net Assets | ||||
| Resulting from Operations | (2,888,876 | ) | 22,046,728 | |
| Dividends to Shareholders from ($): | ||||
| Investment income—net: | ||||
| Class A | (2,893,524 | ) | (1,184,277 | ) |
| Class C | (424,225 | ) | (158,879 | ) |
| Class I | (9,338,992 | ) | (3,623,174 | ) |
| Class Y | (19 | ) | — | |
| Net realized gain on investments: | ||||
| Class A | (97,509 | ) | (1,561,860 | ) |
| Class C | (20,733 | ) | (343,963 | ) |
| Class I | (370,468 | ) | (4,134,508 | ) |
| Total Dividends | (13,145,470 | ) | (11,006,661 | ) |
| Beneficial Interest Transactions ($): | ||||
| Net proceeds from shares sold: | ||||
| Class A | 76,830,419 | 40,020,503 | ||
| Class C | 10,745,241 | 6,674,327 | ||
| Class I | 168,076,669 | 76,140,895 | ||
| Class Y | 1,000 | — | ||
| Net assets received in connection | ||||
| with reorganization—Note 1 | 101,889,154 | — | ||
| Dividends reinvested: | ||||
| Class A | 2,959,849 | 2,722,931 | ||
| Class C | 444,958 | 496,249 | ||
| Class I | 9,423,957 | 7,235,059 | ||
| Cost of shares redeemed: | ||||
| Class A | (47,757,927 | ) | (18,231,493 | ) |
| Class C | (7,610,523 | ) | (1,926,424 | ) |
| Class I | (197,063,881 | ) | (30,846,236 | ) |
| Increase (Decrease) in Net Assets from | ||||
| Beneficial Interest Transactions | 117,938,916 | 82,285,811 | ||
| Total Increase (Decrease) in Net Assets | 101,904,570 | 93,325,878 | ||
| Net Assets ($): | ||||
| Beginning of Period | 293,140,320 | 199,814,442 | ||
| End of Period | 395,044,890 | 293,140,320 | ||
| Undistributed (distributions in excess of) | ||||
| investment Income—net | 1,179,508 | (1,688,095 | ) | |
28
| Year Ended December 31, | ||||
| 2013 | a | 2012 | ||
| Capital Share Transactions: | ||||
| Class Ab | ||||
| Shares sold | 3,548,435 | 1,856,321 | ||
| Shares issued for dividends reinvested | 139,033 | 124,983 | ||
| Shares redeemed | (2,222,674 | ) | (844,462 | ) |
| Net Increase (Decrease) in Shares Outstanding | 1,464,794 | 1,136,842 | ||
| Class Cb | ||||
| Shares sold | 495,713 | 309,946 | ||
| Shares issued for dividends reinvested | 21,004 | 22,815 | ||
| Shares redeemed | (355,910 | ) | (89,826 | ) |
| Net Increase (Decrease) in Shares Outstanding | 160,807 | 242,935 | ||
| Class I | ||||
| Shares sold | 7,742,892 | 3,509,137 | ||
| Shares issued in connection | ||||
| with reorganization—Note 1 | 4,652,940 | — | ||
| Shares issued for dividends reinvested | 441,216 | 331,676 | ||
| Shares redeemed | (9,213,690 | ) | (1,422,591 | ) |
| Net Increase (Decrease) in Shares Outstanding | 3,623,358 | 2,418,222 | ||
| Class Y | ||||
| Shares sold | 47.10 | — | ||
| a | Effective July 1, 2013, the fund commenced offering ClassY shares. |
| b | During the period ended December 31, 2013, 17,876 Class C shares representing $394,170 were exchanged for |
| 17,804 Class A shares. | |
| See notes to financial statements. | |
The Fund 29
FINANCIAL HIGHLIGHTS
The following tables describe the performance for each share class for the fiscal periods indicated. All information (except portfolio turnover rate) reflects financial results for a single fund share.Total return shows how much your investment in the fund would have increased (or decreased) during each period, assuming you had reinvested all dividends and distributions.These figures have been derived from the fund’s financial statements.
| Year Ended December 31, | ||||||||||
| Class A Shares | 2013 | 2012 | 2011 | 2010 | 2009 | a | ||||
| Per Share Data ($): | ||||||||||
| Net asset value, beginning of period | 21.82 | 20.74 | 20.84 | 20.73 | 20.92 | |||||
| Investment Operations: | ||||||||||
| Investment income—netb | .51 | .43 | .48 | .59 | .08 | |||||
| Net realized and unrealized | ||||||||||
| gain (loss) on investments | (.55 | ) | 1.48 | .21 | .60 | (.07 | ) | |||
| Total from Investment Operations | (.04 | ) | 1.91 | .69 | 1.19 | .01 | ||||
| Distributions: | ||||||||||
| Dividends from investment income—net | (.62 | ) | (.37 | ) | (.79 | ) | (1.08 | ) | (.20 | ) |
| Dividends from net realized | ||||||||||
| gain on investments | (.02 | ) | (.46 | ) | (.00 | )c | — | — | ||
| Total Distributions | (.64 | ) | (.83 | ) | (.79 | ) | (1.08 | ) | (.20 | ) |
| Net asset value, end of period | 21.14 | 21.82 | 20.74 | 20.84 | 20.73 | |||||
| Total Return (%)d | (.18 | ) | 9.26 | 3.36 | 5.77 | .03 | e | |||
| Ratios/Supplemental Data (%): | ||||||||||
| Ratio of total expenses | ||||||||||
| to average net assets | .88 | .93 | 1.00 | 1.08 | .98 | f | ||||
| Ratio of net expenses | ||||||||||
| to average net assets | .88 | .93 | .98 | .90 | .90 | f | ||||
| Ratio of net investment income | ||||||||||
| to average net assets | 2.35 | 1.99 | 2.26 | 2.86 | 4.40 | f | ||||
| Portfolio Turnover Rate | 189.93 | 245.46g 267.08g 210.75g 131.97g | ||||||||
| Net Assets, end of period ($ x 1,000) | 104,431 | 75,834 | 48,509 | 29,900 | 10 | |||||
| a | From December 2, 2009 (commencement of initial offering) to December 31, 2009. |
| b | Based on average shares outstanding at each month end. |
| c | Amount represents less than $.01 per share. |
| d | Exclusive of sales charge. |
| e | Not annualized. |
| f | Annualized. |
| g | The portfolio turnover rates excluding mortgage dollar roll transactions for the periods ended December 31, 2012, |
| 2011, 2010 and 2009 were 197.97%, 247.48%, 206.04% and 111.36%, respectively. | |
| See notes to financial statements. | |
30
| Year Ended December 31, | ||||||||||
| Class C Shares | 2013 | 2012 | 2011 | 2010 | 2009 | a | ||||
| Per Share Data ($): | ||||||||||
| Net asset value, beginning of period | 21.74 | 20.68 | 20.79 | 20.73 | 20.92 | |||||
| Investment Operations: | ||||||||||
| Investment income—netb | .34 | .27 | .31 | .42 | .06 | |||||
| Net realized and unrealized | ||||||||||
| gain (loss) on investments | (.55 | ) | 1.47 | .23 | .60 | (.07 | ) | |||
| Total from Investment Operations | (.21 | ) | 1.74 | .54 | 1.02 | (.01 | ) | |||
| Distributions: | ||||||||||
| Dividends from investment income—net | (.45 | ) | (.22 | ) | (.65 | ) | (.96 | ) | (.18 | ) |
| Dividends from net realized | ||||||||||
| gain on investments | (.02 | ) | (.46 | ) | (.00 | )c | — | — | ||
| Total Distributions | (.47 | ) | (.68 | ) | (.65 | ) | (.96 | ) | (.18 | ) |
| Net asset value, end of period | 21.06 | 21.74 | 20.68 | 20.79 | 20.73 | |||||
| Total Return (%)d | (.94 | ) | 8.42 | 2.56 | 5.01 | (.03 | )e | |||
| Ratios/Supplemental Data (%): | ||||||||||
| Ratio of total expenses | ||||||||||
| to average net assets | 1.63 | 1.68 | 1.76 | 1.87 | 1.73 | f | ||||
| Ratio of net expenses | ||||||||||
| to average net assets | 1.63 | 1.68 | 1.73 | 1.65 | 1.65 | f | ||||
| Ratio of net investment income | ||||||||||
| to average net assets | 1.58 | 1.24 | 1.47 | 2.12 | 3.65 | f | ||||
| Portfolio Turnover Rate | 189.93 | 245.46g 267.08g 210.75g 131.97g | ||||||||
| Net Assets, end of period ($ x 1,000) | 19,481 | 16,613 | 10,778 | 5,181 | 10 | |||||
| a | From December 2, 2009 (commencement of initial offering) to December 31, 2009. |
| b | Based on average shares outstanding at each month end. |
| c | Amount represents less than $.01 per share. |
| d | Exclusive of sales charge. |
| e | Not annualized. |
| f | Annualized. |
| g | The portfolio turnover rates excluding mortgage dollar roll transactions for the periods ended December 31, 2012, |
| 2011, 2010 and 2009 were 197.97%, 247.48%, 206.04% and 111.36%, respectively. | |
| See notes to financial statements. | |
The Fund 31
FINANCIAL HIGHLIGHTS (continued)
| Year Ended December 31, | ||||||||||
| Class I Shares | 2013 | 2012 | 2011 | 2010 | 2009 | a | ||||
| Per Share Data ($): | ||||||||||
| Net asset value, beginning of period | 21.85 | 20.77 | 20.86 | 20.72 | 18.53 | |||||
| Investment Operations: | ||||||||||
| Investment income—netb | .57 | .50 | .54 | .75 | .91 | |||||
| Net realized and unrealized | ||||||||||
| gain (loss) on investments | (.55 | ) | 1.47 | .23 | .49 | 1.90 | ||||
| Total from Investment Operations | .02 | 1.97 | .77 | 1.24 | 2.81 | |||||
| Distributions: | ||||||||||
| Dividends from investment income—net | (.68 | ) | (.43 | ) | (.86 | ) | (1.10 | ) | (.62 | ) |
| Dividends from net realized | ||||||||||
| gain on investments | (.02 | ) | (.46 | ) | (.00 | )c | — | — | ||
| Total Distributions | (.70 | ) | (.89 | ) | (.86 | ) | (1.10 | ) | (.62 | ) |
| Net asset value, end of period | 21.17 | 21.85 | 20.77 | 20.86 | 20.72 | |||||
| Total Return (%) | .11 | 9.55 | 3.72 | 6.02 | 15.48 | |||||
| Ratios/Supplemental Data (%): | ||||||||||
| Ratio of total expenses | ||||||||||
| to average net assets | .57 | .63 | .67 | .78 | .92 | |||||
| Ratio of net expenses | ||||||||||
| to average net assets | .57 | .63 | .66 | .65 | .65 | |||||
| Ratio of net investment income | ||||||||||
| to average net assets | 2.62 | 2.29 | 2.58 | 3.50 | 4.62 | |||||
| Portfolio Turnover Rate | 189.93 | 245.46d 267.08d 210.75d 131.97d | ||||||||
| Net Assets, end of period ($ x 1,000) | 271,132 | 200,694 | 140,527 | 95,681 | 72,910 | |||||
| a | The fund commenced offering three classes of shares on December 2, 2009. Effective September 1, 2009, the existing |
| shares were redesignated as Class I shares. | |
| b | Based on average shares outstanding at each month end. |
| c | Amount represents less than $.01 per share. |
| d | The portfolio turnover rates excluding mortgage dollar roll transactions for the periods ended December 31, 2012, |
| 2011, 2010 and 2009 were 197.97%, 247.48%, 206.04% and 111.36%, respectively. | |
| See notes to financial statements. | |
32
| Period Ended | ||
| Class Y Shares | December 31, 2013a | |
| Per Share Data ($): | ||
| Net asset value, beginning of period | 21.23 | |
| Investment Operations: | ||
| Investment income—netb | .30 | |
| Net realized and unrealized | ||
| gain (loss) on investments | .04 | |
| Total from Investment Operations | .34 | |
| Distributions: | ||
| Dividends from investment income—net | (.40 | ) |
| Net asset value, end of period | 21.17 | |
| Total Return (%)c | 1.60 | |
| Ratios/Supplemental Data (%): | ||
| Ratio of total expenses to average net assetsd | .55 | |
| Ratio of net expenses to average net assetsd | .55 | |
| Ratio of net investment income | ||
| to average net assetsd | 2.84 | |
| Portfolio Turnover Rate | 189.93 | |
| Net Assets, end of period ($ x 1,000) | 1 |
| a | From the close of business on July 1, 2013 (commencement of initial offering) to December 31, 2013. |
| b | Based on average shares outstanding at each month end. |
| c | Not annualized. |
| d | Annualized. |
| See notes to financial statements. | |
The Fund 33
NOTES TO FINANCIAL STATEMENTS
NOTE 1—Significant Accounting Policies:
Dreyfus/Standish Global Fixed Income Fund (the “fund”) is a separate non-diversified series of Dreyfus Investment Funds (the “Trust”), which is registered under the Investment Company Act of 1940, as amended (the “Act”), as an open-end management investment company and operates as a series company offering seven series, including the fund. The fund’s investment objective seeks to maximize total return while realizing a market level of income, consistent with preserving principal and liquidity.The Dreyfus Corporation (the “Manager” or “Dreyfus”), a wholly-owned subsidiary of The Bank of New York Mellon Corporation (“BNY Mellon”), serves as the fund’s investment adviser.
As of the close of business on January 25, 2013, pursuant to an Agreement and Plan of Reorganization previously approved by the Trust’s Board of Trustees (the “Board”), all of the assets, subject to the liabilities, of Dreyfus Investment Funds–Dreyfus/Standish International Fixed Income Fund (“International Fixed Income”) were transferred to the fund in exchange for shares of Beneficial Interest of the fund’s Class I shares of equal value. The purpose of the transaction was to combine two funds with comparable investment objectives and strategies. Shareholders of International Fixed Income received Class I shares of the fund in an amount equal to the aggregate net asset value of their investment in International Fixed Income at the time of the exchange.The exchange ratio was as follows for Class I–.9224 to 1. The net asset value of the fund’s Class I shares on the close of business January 25, 2013, after the reorganization was $21.90 and a total of 4,652,940 Class I shares were issued to shareholders of International Fixed Income in the exchange.
The net unrealized appreciation on investments and net assets prior to the acquisition as of the merger date for International Fixed Income and the fund, were as follows:
| Unrealized | ||
| Appreciation ($) | Net Assets ($) | |
| International Fixed Income | 6,249,038 | 101,889,154 |
| Dreyfus/Standish Global | ||
| Fixed Income Fund | 7,718,358 | 308,236,927 |
| Total | 13,967,396 | 410,126,081 |
34
Assuming the merger had been completed on January 1, 2013, the fund’s pro forma results in the Statement of Operations during the period ended December 31, 2013 were as follows:
| Net investment income | $10,794,8911 | ||
| Net realized and unrealized | |||
| gain (loss) on investments | ($13,338,312 | )2 | |
| Net (decrease) in net assets | |||
| resulting from operations | ($2,543,421 | ) | |
| 1 | $10,574,568 as reported in the Statement of Operations plus $220,323 International Fixed |
| Income pre-merger. | |
| 2 | ($13,463,444) as reported in the Statement of Operations plus $125,132 International Fixed |
| Income pre-merger. |
Because the combined funds have been managed as a single integrated fund since the merger was completed, it is not practicable to separate the amounts of revenue and earnings of International Fixed Income that have been included in the fund’s Statement of Operations since January 1, 2013.
At a meeting held on April 24-25, 2013, the Board approved, effective July 1, 2013, for the fund to offer Class Y shares.
MBSC Securities Corporation (the “Distributor”), a wholly-owned subsidiary of the Manager, is the distributor of the fund’s shares. The fund is authorized to issue an unlimited number of $.001 par value shares of Beneficial Interest in each of the following classes of shares: Class A, Class C, Class I and ClassY. Class A and Class C shares are sold primarily to retail investors through financial intermediaries and bear Distribution and/or Shareholder Services Plan fees. Class A shares generally are subject to a sale charge imposed at the time of purchase. Class C shares are subject to a contingent deferred sales charge (“CDSC”) imposed on Class C shares redeemed within one year of purchase. Class I shares are sold primarily to bank trust departments and other financial service providers (including The Bank of New York Mellon, a subsidiary of BNY Mellon and an affiliate of Dreyfus, and its affiliates), acting on behalf of customers having a qualified trust or an investment account or relationship at such institution, and bear no
The Fund 35
NOTES TO FINANCIAL STATEMENTS (continued)
Distribution or Shareholder Services Plan fees. Class I shares are offered without a front-end sales charge or CDSC. Class Y shares are offered at net asset value generally to institutional investors. Other differences between the classes include the services offered to and the expenses borne by each class, the allocation of certain transfer agency costs, and certain voting rights. Income, expenses (other than expenses attributable to a specific class), and realized and unrealized gains or losses on investments are allocated to each class of shares based on its relative net assets.
As of December 31, 2013, MBC Investments Corp., an indirect subsidiary of BNY Mellon, held all of the outstanding Class Y shares of the fund.
The Trust accounts separately for the assets, liabilities and operations of each series. Expenses directly attributable to each series are charged to that series’ operations; expenses which are applicable to all series are allocated among them on a pro rata basis.
The Financial Accounting Standards Board (“FASB”) Accounting Standards Codification is the exclusive reference of authoritative U.S. generally accepted accounting principles (“GAAP”) recognized by the FASB to be applied by nongovernmental entities. Rules and interpretive releases of the Securities and Exchange Commission (“SEC”) under authority of federal laws are also sources of authoritative GAAP for SEC registrants. The fund’s financial statements are prepared in accordance with GAAP, which may require the use of management estimates and assumptions.Actual results could differ from those estimates.
(a) Portfolio valuation: The fair value of a financial instrument is the amount that would be received to sell an asset or paid to transfer a liability in an orderly transaction between market participants at the measurement date (i.e., the exit price). GAAP establishes a fair value hierarchy that prioritizes the inputs of valuation techniques used to measure fair value. This hierarchy gives the highest priority to unadjusted quoted prices in active markets for identical assets or liabilities (Level 1 measurements) and the lowest priority to unobservable inputs (Level 3 measurements).
36
Additionally, GAAP provides guidance on determining whether the volume and activity in a market has decreased significantly and whether such a decrease in activity results in transactions that are not orderly. GAAP requires enhanced disclosures around valuation inputs and techniques used during annual and interim periods.
Various inputs are used in determining the value of the fund’s investments relating to fair value measurements.These inputs are summarized in the three broad levels listed below:
Level 1—unadjusted quoted prices in active markets for identical investments.
Level 2—other significant observable inputs (including quoted prices for similar investments, interest rates, prepayment speeds, credit risk, etc.).
Level 3—significant unobservable inputs (including the fund’s own assumptions in determining the fair value of investments).
The inputs or methodology used for valuing securities are not necessarily an indication of the risk associated with investing in those securities.
Changes in valuation techniques may result in transfers in or out of an assigned level within the disclosure hierarchy. Valuation techniques used to value the fund’s investments are as follows:
Registered investment companies that are not traded on an exchange are valued at their net asset value and are categorized within Level 1 of the fair value hierarchy.
Investments in securities, excluding short-term investments (other than U.S. Treasury Bills), financial futures, options and forward foreign currency exchange contracts (“forward contracts”) are valued each business day by an independent pricing service (the “Service”) approved by the Board. Investments for which quoted bid prices are readily available and are representative of the bid side of the market in the judgment of the Service are valued at the mean between the quoted bid prices (as obtained by the Service from dealers in such securities) and asked prices (as calculated by the Service based upon its evaluation of the market for
The Fund 37
NOTES TO FINANCIAL STATEMENTS (continued)
such securities). Other investments (which constitute a majority of the portfolio securities) are valued as determined by the Service, based on methods which include consideration of the following: yields or prices of securities of comparable quality, coupon, maturity and type; indications as to values from dealers; and general market conditions.These securities are generally categorized within Level 2 of the fair value hierarchy.
U.S. Treasury Bills are valued at the mean price between quoted bid prices and asked prices by the Service. These securities are generally categorized within Level 2 of the fair value hierarchy.
The Service’s procedures are reviewed by Dreyfus under the general supervision of the Board.
When market quotations or official closing prices are not readily available, or are determined not to reflect accurately fair value, such as when the value of a security has been significantly affected by events after the close of the exchange or market on which the security is principally traded (for example, a foreign exchange or market), but before the fund calculates its net asset value, the fund may value these investments at fair value as determined in accordance with the procedures approved by the Board. Certain factors may be considered when fair valuing investments such as: fundamental analytical data, the nature and duration of restrictions on disposition, an evaluation of the forces that influence the market in which the securities are purchased and sold, and public trading in similar securities of the issuer or comparable issuers. These securities are either categorized within Level 2 or 3 of the fair value hierarchy depending on the relevant inputs used.
For restricted securities where observable inputs are limited, assumptions about market activity and risk are used and are categorized within Level 3 of the fair value hierarchy.
Investments denominated in foreign currencies are translated to U.S. dollars at the prevailing rates of exchange.
Financial futures and options, which are traded on an exchange, are valued at the last sales price on the securities exchange on which such
38
securities are primarily traded or at the last sales price on the national securities market on each business day and are generally categorized within Level 1 of the fair value hierarchy. Options traded over-the-counter (“OTC”) are valued at the mean between the bid and asked price and are generally categorized within Level 2 of the fair value hierarchy. Investments in swap transactions are valued each business day by the Service. Swaps are valued by the Service by using a swap pricing model which incorporates among other factors, default probabilities, recovery rates, credit curves of the underlying issuer and swap spreads on interest rates and are generally categorized within Level 2 of the fair value hierarchy. Forward contracts are valued at the forward rate and are generally categorized within Level 2 of the fair value hierarchy.
The following is a summary of the inputs used as of December 31, 2013 in valuing the fund’s investments:
| Level 2—Other | Level 3— | |||
| Level 1— | Significant | Significant | ||
| Unadjusted | Observable | Unobservable | ||
| Quoted Prices | Inputs | Inputs | Total | |
| Assets ($) | ||||
| Investments in Securities: | ||||
| Asset-Backed | — | 22,718,904 | — | 22,718,904 |
| Commercial | ||||
| Mortgage-Backed | — | 20,711,530 | — | 20,711,530 |
| Corporate Bonds† | — | 146,938,344 | — | 146,938,344 |
| Foreign Government | — | 181,201,918 | — | 181,201,918 |
| Mutual Funds | 13,415,305 | — | — | 13,415,305 |
| Residential | ||||
| Mortgage-Backed | — | 9,087,977 | — | 9,087,977 |
| U.S. Treasury | — | 9,819,983 | — | 9,819,983 |
| Other Financial | ||||
| Instruments: | ||||
| Financial Futures†† | 1,199,234 | — | — | 1,199,234 |
| Forward Foreign | ||||
| Currency Exchange | ||||
| Contracts†† | — | 1,871,374 | — | 1,871,374 |
| Options Purchased | 5,041 | — | — | 5,041 |
| Swaps†† | 1,123,126 | — | — | 1,123,126 |
The Fund 39
NOTES TO FINANCIAL STATEMENTS (continued)
| Level 2—Other | Level 3— | ||||||
| Level 1— | Significant | Significant | |||||
| Unadjusted | Observable | Unobservable | |||||
| Quoted Prices | Inputs | Inputs | Total | ||||
| Liabilities ($) | |||||||
| Other Financial | |||||||
| Instruments: | |||||||
| Financial Futures†† | (539,202 | ) | — | — | (539,202 | ) | |
| Forward Foreign | |||||||
| Currency Exchange | |||||||
| Contracts†† | — | (2,770,667 | ) | — | (2,770,667 | ) | |
| Options Written | — | (14,947 | ) | — | (14,947 | ) | |
| Swaps†† | (125,813 | ) | — | — | (125,813 | ) |
| † | See Statement of Investments for additional detailed categorizations. |
| †† | Amount shown represents unrealized appreciation (depreciation) at period end. |
At December 31, 2013, there were no transfers between Level 1 and Level 2 of the fair value hierarchy.
(b) Foreign currency transactions: The fund does not isolate that portion of the results of operations resulting from changes in foreign exchange rates on investments from the fluctuations arising from changes in the market prices of securities held. Such fluctuations are included with the net realized and unrealized gain or loss on investments.
Net realized foreign exchange gains or losses arise from sales of foreign currencies, currency gains or losses realized on securities transactions between trade and settlement date, and the difference between the amounts of dividends, interest and foreign withholding taxes recorded on the fund’s books and the U.S. dollar equivalent of the amounts actually received or paid. Net unrealized foreign exchange gains and losses arise from changes in the value of assets and liabilities other than investments resulting from changes in exchange rates. Foreign currency gains and losses on foreign currency transactions are also included with net realized and unrealized gain or loss on investments.
(c) Securities transactions and investment income: Securities transactions are recorded on a trade date basis. Realized gains and losses from securities transactions are recorded on the identified cost basis.
40
Dividend income is recognized on the ex-dividend date and interest income, including, where applicable, accretion of discount and amortization of premium on investments, is recognized on the accrual basis.
Pursuant to a securities lending agreement with The Bank of New York Mellon, the fund may lend securities to qualified institutions. It is the fund’s policy that, at origination, all loans are secured by collateral of at least 102% of the value of U.S. securities loaned and 105% of the value of foreign securities loaned. Collateral equivalent to at least 100% of the market value of securities on loan is maintained at all times. Collateral is either in the form of cash, which can be invested in certain money market mutual funds managed by the Manager or U.S. Government and Agency securities.The fund is entitled to receive all dividends, interest and distributions on securities loaned, in addition to income earned as a result of the lending transaction. Should a borrower fail to return the securities in a timely manner, The Bank of New York Mellon is required to replace the securities for the benefit of the fund or credit the fund with the market value of the unreturned securities and is subrogated to the fund’s rights against the borrower and the collateral. During the period ended December 31, 2013,The Bank of New York Mellon earned $22,276 from lending portfolio securities, pursuant to the securities lending agreement.
(d) Affiliated issuers: Investments in other investment companies advised by Dreyfus are defined as “affiliated” under the Act. Investments in affiliated investment companies during the period ended December 31, 2013 were as follows:
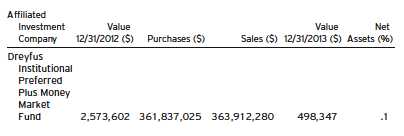
The Fund 41
NOTES TO FINANCIAL STATEMENTS (continued)
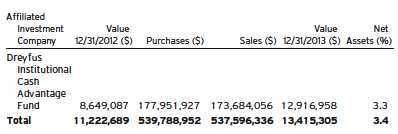
(e) Risk: The fund invests primarily in debt securities. Failure of an issuer of the debt securities to make timely interest or principal payments, or a decline or the perception of a decline in the credit quality of a debt security, can cause the debt security’s price to fall, potentially lowering the fund’s share price. In addition, the value of debt securities may decline due to general market conditions that are not specifically related to a particular issuer, such as real or perceived adverse economic conditions, changes in outlook for corporate earnings, changes in interest or currency rates or adverse investor sentiment.They may also decline because of factors that affect a particular industry or country.
Investing in foreign markets may involve special risks and considerations not typically associated with investing in the U.S. These risks include revaluation of currencies, high rates of inflation, repatriation restrictions on income and capital, and adverse political and economic developments. Moreover, securities issued in these markets may be less liquid, subject to government ownership controls and delayed settlements, and their prices may be more volatile than those of comparable securities in the U.S.
(f) Dividends to shareholders: Dividends are recorded on the ex-dividend date. Dividends from investment income-net are normally declared and paid quarterly. Dividends from net realized capital gains, if any, are normally declared and paid annually, but the fund may make distributions on a more frequent basis to comply with the distribution requirements of the Internal Revenue Code of 1986, as amended (the “Code”).To the extent that net realized capital gains can be offset by
42
capital loss carryovers, it is the policy of the fund not to distribute such gains. Income and capital gain distributions are determined in accordance with income tax regulations, which may differ from GAAP.
(g) Federal income taxes: It is the policy of the fund to continue to qualify as a regulated investment company, if such qualification is in the best interests of its shareholders, by complying with the applicable provisions of the Code, and to make distributions of taxable income sufficient to relieve it from substantially all federal income and excise taxes.
As of and during the period ended December 31, 2013, the fund did not have any liabilities for any uncertain tax positions.The fund recognizes interest and penalties, if any, related to uncertain tax positions as income tax expense in the Statement of Operations. During the period ended December 31, 2013, the fund did not incur any interest or penalties.
At December 31, 2013, the components of accumulated earnings on a tax basis were as follows: undistributed ordinary income $2,478,228, accumulated capital losses $9,355,993 and unrealized appreciation $7,947,749.
Under the Regulated Investment Company Modernization Act of 2010 (the “2010 Act”), the fund is permitted to carry forward capital losses incurred in taxable years beginning after December 22, 2010 (“post-enactment losses”) for an unlimited period. Furthermore, post-enactment capital loss carryovers retain their character as either short-term or long-term capital losses rather than short-term as they were under previous statute.
The accumulated capital loss carryover is available for federal income tax purposes to be applied against future net realized capital gains, if any, realized subsequent to December 31, 2013.The fund has $7,861,169 of post-enactment short-term capital losses and $1,494,824 of post-enactment long-term capital losses which can be carried forward for an unlimited period.
The Fund 43
NOTES TO FINANCIAL STATEMENTS (continued)
The tax character of distributions paid to shareholders during the fiscal periods ended December 31, 2013 and December 31, 2012 were as follows: ordinary income $13,145,470 and $10,547,494, and long-term capital gains $0 and $459,167, respectively.
During the period ended December 31, 2013, as a result of permanent book to tax differences, primarily due to the tax treatment for paydown gains and losses on mortgage-backed securities, foreign currency transactions, amortization of premiums, swap periodic payments and dividend reclassification, the fund increased accumulated undistributed investment income-net by $4,949,795 and decreased accumulated net realized gain (loss) on investments by the same amount. Net assets and net asset value per share were not affected by this reclassification.
NOTE 2—Bank Lines of Credit:
The fund participates with other Dreyfus-managed funds in a $265 million unsecured credit facility led by Citibank, N.A. and a $300 million unsecured credit facility provided by The Bank of New York Mellon (each, a “Facility”), each to be utilized primarily for temporary or emergency purposes, including the financing of redemptions. Prior to October 9, 2013, the unsecured credit facility with Citibank, N.A. was $210 million. In connection therewith, the fund has agreed to pay its pro rata portion of commitment fees for each Facility. Interest is charged to the fund based on rates determined pursuant to the terms of the respective Facility at the time of borrowing. During the period ended December 31, 2013, the fund did not borrow under the Facilities.
NOTE 3—Investment Advisory Fee and Other Transactions With Affiliates:
(a) Pursuant to an investment advisory agreement with the Manager, the investment advisory fee is computed at the annual rate of .40% of the value of the fund’s average daily net assets and is payable monthly.
The fund has an Accounting and Administration Agreement (the “Administration Agreement”) with Dreyfus, whereby Dreyfus performs administrative and accounting services for the fund. The fund
44
has agreed to compensate Dreyfus for providing accounting services, administration, compliance monitoring, regulatory and shareholder reporting, as well as related facilities and equipment. The fee is based on the fund’s average daily net assets and computed at the following annual rates: .10% of the first $500 million, .065% of the next $500 million and .02% in excess of $1 billion.
In addition, after applying any expense limitations or fee waivers that reduce the fees paid to Dreyfus for this service, Dreyfus has contractually agreed in writing to waive any remaining fees for this service to the extent that they exceed both Dreyfus’ costs in providing these services and a reasonable allocation of the costs incurred by Dreyfus and its affiliates related to the support and oversight of these services.The fund also reimburses Dreyfus for the out-of-pocket expenses incurred in performing this service for the fund. Pursuant to the Administration Agreement, the fund was charged $188,292 during the period ended December 31, 2013.
During the period ended December 31, 2013, the Distributor retained $5,210 from commissions earned on sales of the fund’s Class A shares and $2,905 from CDSCs on redemptions of the fund’s Class C shares.
(b) The fund pays administrative service fees for Class I shares.These fees are paid to affiliated or unaffiliated retirement plans, omnibus accounts and platform administrators and other entities (“Plan Administrators”) that provide record keeping and/or other administrative support services to accounts, retirement plans and their participants.As compensation for such services, Class I shares pay each Plan Administrator an administrative service fee in an amount of up to .15% (on an annualized basis) of the average daily net assets attributable to Class I shares that are held in accounts serviced by such Plan Administrators. During the period ended December 31, 2013, Class I shares were charged $12,907 for administrative service fees. The fund’s adviser or its affiliates may pay additional compensation from their own resources to Plan Administrators and other entities for administrative services, as well as for marketing or other
The Fund 45
NOTES TO FINANCIAL STATEMENTS (continued)
distribution-related services. These payments may provide an incentive for these entities to actively promote the fund or cooperate with the Distributor’s promotional efforts.
(c) Under the Distribution Plan adopted pursuant to Rule 12b-1 under the Act, Class C shares pay the Distributor for distributing its shares at an annual rate of .75% of the value of its average daily net assets. During the period ended December 31, 2013, Class C shares were charged $149,933 pursuant to the Distribution Plan.
(d) Under the Shareholder Services Plan, Class A and Class C shares pay the Distributor at an annual rate of .25% of the value of their average daily net assets for the provision of certain services.The services provided may include personal services relating to shareholder accounts, such as answering shareholder inquiries regarding the fund and providing reports and other information, and services related to the maintenance of shareholder accounts. The Distributor may make payments to Service Agents (securities dealers, financial institutions or other industry professionals) with respect to these services.The Distributor determines the amounts to be paid to Service Agents. During the period ended December 31, 2013, Class A and Class C shares were charged $241,988 and $49,978, respectively, pursuant to the Shareholder Services Plan.
Under its terms, the Distribution Plan and Shareholder Services Plan shall remain in effect from year to year, provided such continuance is approved annually by a vote of a majority of those Trustees who are not “interested persons” of the Trust and who have no direct or indirect financial interest in the operation of or in any agreement related to the Distribution Plan or Shareholder Services Plan.
The fund has arrangements with the transfer agent and the custodian whereby the fund may receive earnings credits when positive cash balances are maintained, which are used to offset transfer agency and custody fees. For financial reporting purposes, the fund includes net earnings credits as an expense offset in the Statement of Operations.
46
The fund compensates DreyfusTransfer, Inc., a wholly-owned subsidiary of the Manager, under a transfer agency agreement for providing transfer agency and cash management services for the fund. The majority of transfer agency fees are comprised of amounts paid on a per account basis, while cash management fees are related to fund subscriptions and redemptions. During the period ended December 31, 2013, the fund was charged $15,878 for transfer agency services and $763 for cash management services.These fees are included in Shareholder servicing costs in the Statement of Operations. Cash management fees were partially offset by earnings credits of $89.
The fund compensates The Bank of NewYork Mellon under a custody agreement for providing custodial services for the fund.These fees are determined based on net assets, geographic region and transaction activity. During the period ended December 31, 2013, the fund was charged $94,298 pursuant to the custody agreement.
The fund compensated The Bank of New York Mellon under a cash management agreement that was in effect until September 30, 2013 for performing certain cash management services related to fund subscriptions and redemptions. During the period ended December 31, 2013, the fund was charged $315 pursuant to the cash management agreement, which is included in Shareholder servicing costs in the Statement of Operations.
During the period ended December 31, 2013, the fund was charged $9,093 for services performed by the Chief Compliance Officer and his staff.
The components of “Due to The Dreyfus Corporation and affiliates” in the Statement of Assets and Liabilities consist of: investment advisory fees $134,607, Distribution Plan fees $12,290, Shareholder Services Plan fees $26,108, custodian fees $42,000, Chief Compliance Officer fees $2,299 and transfer agency fees $2,688.
The Fund 47
NOTES TO FINANCIAL STATEMENTS (continued)
(e) Each Board member also serves as a Board member of other funds within the Dreyfus complex. Annual retainer fees and attendance fees are allocated to each fund based on net assets.
NOTE 4—Securities Transactions:
The aggregate amount of purchases and sales (including paydowns) of investment securities, excluding short-term securities, financial futures, forward contracts, options transactions and swap transactions, during the period ended December 31, 2013, amounted to $872,283,022 and $752,014,950, respectively.
Derivatives: A derivative is a financial instrument whose performance is derived from the performance of another asset. Each type of derivative instrument that was held by the fund during the period ended December 31, 2013 is discussed below.
Financial Futures: In the normal course of pursuing its investment objective, the fund is exposed to market risk, including interest rate risk, as a result of changes in value of underlying financial instruments.The fund invests in financial futures in order to manage its exposure to or protect against changes in the market. A financial futures contract represents a commitment for the future purchase or a sale of an asset at a specified date. Upon entering into such contracts, these investments require initial margin deposits with a counterparty, which consist of cash or cash equivalents.The amount of these deposits is determined by the exchange or Board of Trade on which the contract is traded and is subject to change.Accordingly, variation margin payments are received or made to reflect daily unrealized gains or losses which are recorded in the Statement of Operations.When the contracts are closed, the fund recognizes a realized gain or loss which is reflected in the Statement of Operations.There is minimal counterparty credit risk to the fund with financial futures since they are exchange traded, and the exchange guarantees the financial futures against default. Financial futures open at December 31, 2013 are set forth in the Statement of Financial Futures.
Options Transactions: The fund purchases and writes (sells) put and call options to hedge against changes in interest rates and foreign currencies
48
or as a substitute for an investment.The fund is subject to market risk, interest rate risk and currency risk in the course of pursuing its investment objectives through its investments in options contracts. A call option gives the purchaser of the option the right (but not the obligation) to buy, and obligates the writer to sell, the underlying security or securities at the exercise price at any time during the option period, or at a specified date. Conversely, a put option gives the purchaser of the option the right (but not the obligation) to sell, and obligates the writer to buy the underlying security or securities at the exercise price at any time during the option period, or at a specified date.
As a writer of call options, the fund receives a premium at the outset and then bears the market risk of unfavorable changes in the price of the financial instrument underlying the option. Generally, the fund realizes a gain, to the extent of the premium, if the price of the underlying financial instrument decreases between the date the option is written and the date on which the option is terminated. Generally, the fund incurs a loss if the price of the financial instrument increases between those dates.
As a writer of put options, the fund receives a premium at the outset and then bears the market risk of unfavorable changes in the price of the financial instrument underlying the option. Generally, the fund realizes a gain, to the extent of the premium, if the price of the underlying financial instrument increases between the date the option is written and the date on which the option is terminated. Generally, the fund incurs a loss if the price of the financial instrument decreases between those dates.
As a writer of an option, the fund has no control over whether the underlying securities may be sold (call) or purchased (put) and as a result bears the market risk of an unfavorable change in the price of the security underlying the written option.There is a risk of loss from a change in value of such options which may exceed the related premiums received. The Statement of Operations reflects the following:
The Fund 49
NOTES TO FINANCIAL STATEMENTS (continued)
any unrealized gains or losses which occurred during the period as well as any realized gains or losses which occurred upon the expiration or closing of the option transaction.
The following summarizes the fund’s call/put options written during the period ended December 31, 2013:
| Face Amount | Options Terminated | ||||
| Covered by | Premiums | Net Realized | |||
| Options Written: | Contracts ($) | Received ($) | Cost ($) | (Loss) ($) | |
| Contracts outstanding | |||||
| December 31, 2012 | — | — | |||
| Contracts written | 50,830,000 | 967,315 | |||
| Contracts terminated; | |||||
| Contracts closed | 42,930,000 | 903,483 | 1,603,082 | (699,599 | ) |
| Contracts outstanding | |||||
| December 31, 2013 | 7,900,000 | 63,832 | |||
Forward Foreign Currency Exchange Contracts: The fund enters into forward contracts in order to hedge its exposure to changes in foreign currency exchange rates on its foreign portfolio holdings, to settle foreign currency transactions or as a part of its investment strategy. When executing forward contracts, the fund is obligated to buy or sell a foreign currency at a specified rate on a certain date in the future. With respect to sales of forward contracts, the fund incurs a loss if the value of the contract increases between the date the forward contract is opened and the date the forward contract is closed.The fund realizes a gain if the value of the contract decreases between those dates.With respect to purchases of forward contracts, the fund incurs a loss if the value of the contract decreases between the date the forward contract is opened and the date the forward contract is closed.The fund realizes a gain if the value of the contract increases between those dates. Any realized or unrealized gains or losses which occurred during the period are reflected in the Statement of Operations. The fund is exposed to foreign currency risk as a result of changes in value of underlying financial instruments.The fund is also exposed to credit risk associated with counterparty nonperformance on these forward contracts, which
50
is generally limited to the unrealized gain on each open contract.The following summarizes open forward contracts at December 31, 2013:
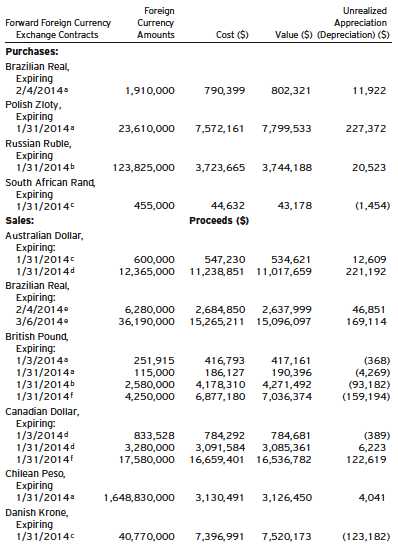
The Fund 51
NOTES TO FINANCIAL STATEMENTS (continued)
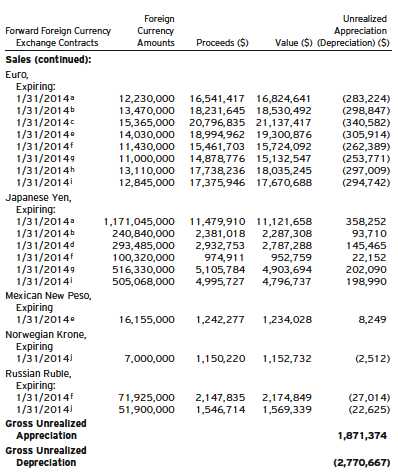
| Counterparties: | |
| a | Barclays Bank |
| b | Deutsche Bank |
| c | Goldman Sachs International |
| d | Bank of America |
| e | Morgan Stanley Capital Services |
| f | Credit Suisse |
| g | Commonwealth Bank of Australia |
| h | Royal Bank of Scotland |
| i | UBS |
| j | JP Morgan Chase Bank |
52
Swap Transactions: The fund enters into swap agreements to exchange the interest rate on, or return generated by, one nominal instrument for the return generated by another nominal instrument. Swap agreements are privately negotiated in the OTC market or centrally cleared. The fund enters into these agreements to hedge certain market or interest rate risks, to manage the interest rate sensitivity (sometimes called duration) of fixed income securities, to provide a substitute for purchasing or selling particular securities or to increase potential returns.
For OTC swaps, the fund accrues for the interim payments on a daily basis, with the net amount recorded within unrealized appreciation (depreciation) on swap agreements in the Statement of Assets and Liabilities. Once the interim payments are settled in cash, the net amount is recorded as a realized gain (loss) on swaps, in addition to realized gain (loss) recorded upon the termination of swap transactions in the Statement of Operations. Upfront payments made and/or received by the fund, are recorded as an asset and/or liability in the Statement of Assets and Liabilities and are recorded as a realized gain or loss ratably over the agreement’s term/event with the exception of forward starting interest rate swaps which are recorded as realized gains or losses on the termination date.
Fluctuations in the value of swap agreements are recorded for financial statement purposes as unrealized appreciation or depreciation on swap transactions.
Interest Rate Swaps: Interest rate swaps involve the exchange of commitments to pay and receive interest based on a notional principal amount.The fund may elect to pay a fixed rate and receive a floating rate, or receive a fixed rate and pay a floating rate on a notional principal amount. The net interest received or paid on interest rate swap agreements is included within realized gain (loss) on swap transactions in the Statement of Operations. Interest rate swap agreements are subject to general market risk, liquidity risk, counterparty risk and interest rate risk.
The Fund 53
NOTES TO FINANCIAL STATEMENTS (continued)
For OTC swaps, the fund’s maximum risk of loss from counterparty risk is the discounted value of the cash flows to be received from the coun-terparty over the agreement’s remaining life, to the extent that the amount is positive.This risk is mitigated by master netting arrangements (“MNA”) between the fund and the counterparty and the posting of collateral by the counterparty to the fund to cover the fund’s exposure to the counterparty.The following summarizes open interest rate swaps entered into by the fund at December 31, 2013:
| OTC—Interest Rate Swaps | ||||||
| Notional | Currency/ | (Pay) Receive | Unrealized | |||
| Amount ($) | Floating Rate | Counterparty | Fixed Rate (%) | Expiration | Appreciation ($) | |
| 5,900,000 | USD—6 Month | JP Morgan | ||||
| Libor | Chase Bank | (1.76 | ) | 11/8/2022 | 519,591 | |
| 16,100,000 | EUR—1 Year | |||||
| Libor | Citibank | (.84 | ) | 11/8/2022 | 250,237 | |
| 36,200,000 | USD—6 Month | |||||
| Libor | Citibank | .65 | 6/7/2016 | 26,301 | ||
| 6,500,000 | EUR—1 Year | JP Morgan | ||||
| Libor | Chase Bank | 1.91 | 11/4/2016 | 326,997 | ||
| Gross Unrealized | ||||||
| Appreciation | 1,123,126 | |||||
| EUR—Euro |
| LIBOR—London Interbank Offered Rate |
| USD—U.S. Dollar |
Credit Default Swaps: Credit default swaps involve commitments to pay a fixed interest rate in exchange for payment if a credit event affecting a third party (the referenced company, obligation or index) occurs. Credit events may include a failure to pay interest or principal, bankruptcy, or restructuring.The fund enters into these agreements to manage its exposure to the market or certain sectors of the market, to reduce its risk exposure to defaults of corporate and sovereign issuers, or to create exposure to corporate or sovereign issuers to which it is not otherwise exposed. For those credit default swaps in which the fund is paying a fixed rate, the fund is buying credit protection on the instrument. In the event of a credit event, the fund would receive the full notional amount for the reference obligation. For those credit
54
default swaps in which the fund is receiving a fixed rate, the fund is selling credit protection on the underlying instrument.The maximum payouts for these agreements are limited to the notional amount of each swap. Credit default swaps may involve greater risks than if the fund had invested in the reference obligation directly and are subject to general market risk, liquidity risk, counterparty risk and credit risk. This risk is mitigated by MNA between the fund and the counterparty and the posting of collateral by the counterparty to the fund to cover the fund’s exposure to the counterparty.
The maximum potential amount of future payments (undiscounted) that a fund as a seller of protection could be required to make under a credit default swap agreement would be an amount equal to the notional amount of the agreement which may exceed the amount of unrealized appreciation or depreciation reflected in the Statement of Assets and Liabilities. Notional amounts of all credit default swap agreements are disclosed in the following chart, which summarizes open credit default swaps on index issues entered into by the fund. These potential amounts would be partially offset by any recovery values of the respective referenced obligations, underlying securities comprising the referenced index, upfront payments received upon entering into the agreement, or net amounts received from the settlement of buy protection credit default swap agreements entered into by the fund for the same referenced entity or entities.The following summarizes open credit default swaps entered into by the fund at December 31, 2013:
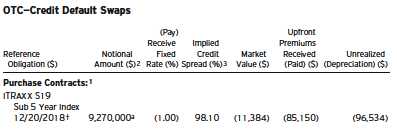
The Fund 55
NOTES TO FINANCIAL STATEMENTS (continued)
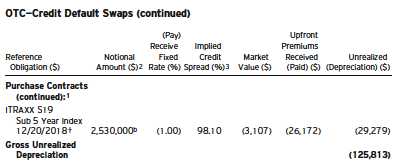
| † | Expiration Date |
| Counterparties: | |
| a | Deutsche Bank |
| b | JP Morgan Chase Bank |
| 1 | If the fund is a buyer of protection and a credit event occurs, as defined under the terms of the |
| swap agreement, the fund will either (i) receive from the seller of protection an amount equal to the | |
| notional amount of the swap and deliver the reference obligation or (ii) receive a net settlement | |
| amount in the form of cash or securities equal to the notional amount of the swap less the recovery | |
| value of the reference obligation. | |
| 2 | The maximum potential amount the fund could be required to pay as a seller of credit protection |
| or receive as a buyer of credit protection if a credit event occurs as defined under the terms of the | |
| swap agreement. | |
| 3 | Implied credit spreads, represented in absolute terms, utilized in determining the market value as of |
| the period end serve as an indicator of the current status of the payment/performance risk and | |
| represent the likelihood of risk of default for the credit derivative.The credit spread of a particular | |
| referenced entity reflects the cost of buying/selling protection and may include upfront payments | |
| required to be made to enter into the agreement.Wider credit spreads represent a deterioration of | |
| the referenced entity's credit soundness and a greater likelihood of risk of default or other credit | |
| event occurring as defined under the terms of the agreement.A credit spread identified as | |
| “Defaulted” indicates a credit event has occurred for the referenced entity. | |
GAAP requires disclosure for (i) the nature and terms of the credit derivative, reasons for entering into the credit derivative, the events or circumstances that would require the seller to perform under the credit derivative, and the current status of the payment/performance risk of the credit derivative, (ii) the maximum potential amount of future payments (undiscounted) the seller could be required to make under the credit derivative, (iii) the fair value of the credit derivative, and (iv) the nature of any recourse provisions and assets held either as collateral or by third parties.All required disclosures have been made and are incor-
56
porated within the current period as part of the Notes to the Statement of Investments and disclosures within this Note.
The following tables show the fund’s exposure to different types of market risk as it relates to the Statement of Assets and Liabilities and the Statement of Operations, respectively.
Fair value of derivative instruments as of December 31, 2013 is shown below:
| Derivative | Derivative | ||||
| Assets ($) | Liabilities ($) | ||||
| Interest rate risk1,2,4 | 2,327,401 | Interest rate risk1 | (539,202 | ) | |
| Foreign exchange risk6 | 1,871,374 | Foreign exchange risk3,7 | (2,785,614 | ) | |
| Credit risk5 | (125,813 | ) | |||
| Gross fair value of | |||||
| derivatives contracts | 4,198,775 | (3,450,629 | ) |
| Statement of Assets and Liabilities location: | |
| 1 | Includes cumulative appreciation (depreciation) on financial futures as reported in the Statement of |
| Financial Futures, but only the unpaid variation margin is reported in the Statement of Assets | |
| and Liabilities. | |
| 2 | Options purchased are included in Investments in securities—Unaffiliated issuers, at value. |
| 3 | Outstanding options written, at value. |
| 4 | Unrealized appreciation on swap agreement. |
| 5 | Unrealized depreciation on swap agreement. |
| 6 | Unrealized appreciation on forward foreign currency exchange contracts. |
| 7 | Unrealized depreciation on forward foreign currency exchange contracts. |
The effect of derivative instruments in the Statement of Operations during the period ended December 31, 2013 is shown below:
| Amount of realized gain (loss) on derivatives recognized in income ($) | |||||||||
| Financial | Options | Forward | Swap | ||||||
| Underlying risk | Futures8 | Transactions9 | Contracts10 Transactions11 | Total | |||||
| Interest rate | (994,784 | ) | (785,323 | ) | — | (292,348 | ) | (2,072,455 | ) |
| Foreign | |||||||||
| exchange | — | (772,029 | ) | 5,129,392 | — | 4,357,363 | |||
| Credit | — | — | — | (282,285 | ) | (282,285 | ) | ||
| Total | (994,784 | ) | (1,557,352 | ) | 5,129,392 | (574,633 | ) | 2,002,623 | |
The Fund 57
NOTES TO FINANCIAL STATEMENTS (continued)
| Change in unrealized appreciation (depreciation) on derivatives recognized in income ($) | ||||||||||
| Financial | Options | Forward | Swap | |||||||
| Underlying risk | Futures12 | Transactions13 | Contracts14 | Transactions15 | Total | |||||
| Interest rate | 865,100 | (207,537 | ) | — | 713,217 | 1,370,780 | ||||
| Foreign | ||||||||||
| exchange | — | 110,705 | (1,771,117 | ) | — | (1,660,412 | ) | |||
| Credit | — | — | — | (84,941 | ) | (84,941 | ) | |||
| Total | 865,100 | (96,832 | ) | (1,771,117 | ) | 628,276 | (374,573 | ) | ||
| Statement of Operations location: | |
| 8Net realized gain (loss) on financial futures. | |
| 9Net realized gain (loss) on options transactions. | |
| 10Net realized gain (loss) on forward foreign currency exchange contracts. | |
| 11Net realized gain (loss) on swap transactions. | |
| 12Net unrealized appreciation (depreciation) on financial futures. | |
| 13Net unrealized appreciation (depreciation) on options transactions. | |
| 14Net unrealized appreciation (depreciation) on forward foreign currency exchange contracts. | |
| 15Net unrealized appreciation (depreciation) on swap transactions. | |
In December 2011, with clarification in January 2013, FASB issued guidance that expands disclosure requirements with respect to the offsetting of certain assets and liabilities.The fund adopted these disclosure provisions during the current reporting period.These disclosures are required for certain investments, including derivative financial instruments subject to MNA or similar agreements which are eligible for offsetting in the Statement of Assets and Liabilities and require the fund to disclose both gross and net information with respect to such investments. For financial reporting purposes, the fund does not offset derivative assets and derivative liabilities that are subject to MNA in the Statement of Assets and Liabilities.
At December 31, 2013, derivative assets and liabilities (by type) on a gross basis are as follows:
| Derivative Financial Instruments: | Assets ($) | Liabilities ($) | |
| Options | — | (14,947 | ) |
| Forward contracts | 1,871,374 | (2,770,667 | ) |
| Swaps | 1,123,126 | (125,813 | ) |
| Total gross amount of derivative | |||
| assets and liabilities in the | |||
| Statement of Assets and Liabilities | 2,994,500 | (2,911,427 | ) |
| Derivatives not subject to | |||
| MNA or similar agreements | 144,771 | (448,597 | ) |
| Total gross amount of assets and | |||
| liabilities subject to MNA or | |||
| similar agreements | 2,849,729 | (2,462,830 | ) |
58
The following tables present derivative assets and liabilities net of amounts available for offsetting under MNA and net of related collateral received or pledged as of December 31, 2013:
| Gross Amounts Not Offset in the Statement of Assets and Liabilities and Subject to MNA† | ||||||||||
| Financial | ||||||||||
| Instruments | ||||||||||
| and | ||||||||||
| Derivatives | Securities | Cash | ||||||||
| Gross Amount | Available | Collateral | Collateral | Net Amount | ||||||
| Counterparty | of Assets ($)1 | for Offset ($) | Received ($)2 Received ($)2 | of Assets ($) | ||||||
| Bank of America | 372,880 | (389 | ) | — | — | 372,491 | ||||
| Barclays Bank | 601,587 | (302,808 | ) | (263,000 | ) | — | 35,779 | |||
| Citibank | 276,538 | — | (256,000 | ) | — | 20,538 | ||||
| Commonwealth | ||||||||||
| Bank of | ||||||||||
| Australia | 202,090 | (202,090 | ) | — | — | — | ||||
| Credit Suisse | 144,771 | — | — | — | 144,771 | |||||
| Deutsche Bank | 114,233 | (114,233 | ) | — | — | — | ||||
| Goldman Sachs | ||||||||||
| International | 12,609 | (12,609 | ) | — | — | — | ||||
| JP Morgan | ||||||||||
| Chase Bank | 846,588 | (54,416 | ) | — | (610,000 | ) | 182,172 | |||
| Morgan Stanley | ||||||||||
| Capital Services | 224,214 | (224,214 | ) | — | — | — | ||||
| UBS | 198,990 | (198,990 | ) | — | — | — | ||||
| Total | 2,994,500 | (1,109,749 | ) | (519,000 | ) | (610,000 | ) | 755,751 | ||
| Financial | ||||||||||
| Instruments | ||||||||||
| and | ||||||||||
| Derivatives | Securities | Cash | ||||||||
| Gross Amount of | Available | Collateral | Collateral | Net Amount | ||||||
| Counterparty | Liabilities ($)1 | for Offset ($) | Pledged ($)2 | Pledged ($)2 of Liabilities ($) | ||||||
| Bank of America | (389 | ) | 389 | — | — | — | ||||
| Barclays Bank | (302,808 | ) | 302,808 | — | — | — | ||||
| Commonwealth | ||||||||||
| Bank of | ||||||||||
| Australia | (253,771 | ) | 202,090 | — | — | (51,681 | ) | |||
| Credit Suisse | (448,597 | ) | — | 280,000 | — | (168,597 | ) | |||
| Deutsche Bank | (488,563 | ) | 114,233 | 120,000 | — | (254,330 | ) | |||
| Goldman Sachs | ||||||||||
| International | (465,218 | ) | 12,609 | 452,609 | — | — | ||||
| JP Morgan | ||||||||||
| Chase Bank | (54,416 | ) | 54,416 | — | — | — | ||||
| Morgan Stanley | ||||||||||
| Capital Services | (305,914 | ) | 224,214 | — | — | (81,700 | ) | |||
| Royal Bank of | ||||||||||
| Scotland | (297,009 | ) | — | — | — | (297,009 | ) | |||
The Fund 59
NOTES TO FINANCIAL STATEMENTS (continued)
| Financial | ||||||||||
| Instruments | ||||||||||
| and | ||||||||||
| Derivatives | Securities | Cash | ||||||||
| Gross Amount of | Available | Collateral | Collateral | Net Amount | ||||||
| Counterparty | Liabilities ($)1 | for Offset ($) | Pledged ($)2 | Pledged ($)2 | of Liabilities ($) | |||||
| UBS | (294,742 | ) | 198,990 | 280,000 | — | 184,248 | ||||
| Total | (2,911,427 | ) | 1,109,749 | 1,132,609 | — | (669,069 | ) | |||
| 1 | Absent a default event or early termination, OTC derivative assets and liabilities are presented at |
| gross amounts and are not offset in the Statement of Assets and Liabilities. | |
| 2 | In some instances, the actual collateral received and/or pledged may be more than the amount |
| shown due to overcollateralization. | |
| † | See Statement of Investments for detailed information regarding collateral held for open financial |
| futures contracts. |
The following summarizes the average market value of derivatives outstanding during the period ended December 31, 2013:
| Average Market Value ($) | |
| Interest rate financial futures | 145,749,518 |
| Interest rate options contracts | 915,924 |
| Forward currency options contracts | 293,341 |
| Forward contracts | 294,942,357 |
The following summarizes the average notional value of swap agreements outstanding during the period ended December 31, 2013:
| Average Notional Value ($) | |
| Interest rate swap agreements | 100,386,034 |
| Credit default swap agreements | 6,153,846 |
At December 31, 2013, the cost of investments for federal income tax purposes was $397,100,820; accordingly, accumulated net unrealized appreciation on investments was $6,798,182, consisting of $13,380,983 gross unrealized appreciation and $6,582,801 gross unrealized depreciation.
60
NOTE 5—Subsequent Event:
At a Board meeting held on October 30-31, 2013, the fund’s Board approved, subject to shareholder approval, Standish Mellon Asset Management Company LLC (“Standish”), an affiliate of Dreyfus, to serve as the fund’s sub-adviser. In addition, the fund’s board approved, subject to shareholder approval, the implementation of a “manager of managers” arrangement to enable Dreyfus to hire and replace sub-advisers in the future that are either unaffiliated with Dreyfus or are wholly-owned subsidiaries (as defined in the Act ) of Dreyfus’ ultimate parent company, which is BNY Mellon, without shareholder approval.
Shareholders of the fund as of December 6, 2013 (the “Record Date”) voted at a special meeting of shareholders, held on February 13, 2014, on the engagement of Standish as a sub-adviser to manage the fund’s assets and the implementation of the “manager of managers” arrangement. A proxy statement with respect to these proposals, and others, was mailed prior to the meeting to fund shareholders as of the Record Date. At the meeting, shareholders of the fund approved each of the proposals, which will become effective on or about February 21, 2014.
The Fund 61
REPORT OF INDEPENDENT REGISTERED
PUBLIC ACCOUNTING FIRM
The Board of Trustees and Shareholders of Dreyfus Investment Funds
We have audited the accompanying statement of assets and liabilities of Dreyfus/Standish Global Fixed Income Fund (the “Fund”), a series of Dreyfus Investment Funds, including the statements of investments and financial futures as of December 31, 2013, and the related statement of operations for the year then ended, the statements of changes in net assets for each of the years in the two-year period then ended, and the financial highlights for each of the years or periods in the five-year period then ended.These financial statements and financial highlights are the responsibility of the Fund’s management. Our responsibility is to express an opinion on these financial statements and financial highlights based on our audits.
We conducted our audits in accordance with the standards of the Public Company Accounting Oversight Board (United States).Those standards require that we plan and perform the audit to obtain reasonable assurance about whether the financial statements and financial highlights are free of material misstatement.An audit includes examining, on a test basis, evidence supporting the amounts and disclosures in the financial statements. Our procedures included confirmation of securities owned as of December 31, 2013, by correspondence with the custodian and brokers or by other appropriate auditing procedures. An audit also includes assessing the accounting principles used and significant estimates made by management, as well as evaluating the overall financial statement presentation.We believe that our audits provide a reasonable basis for our opinion.
In our opinion, the financial statements and financial highlights referred to above present fairly, in all material respects, the financial position of Dreyfus/Standish Global Fixed Income Fund as of December 31, 2013, the results of its operations for the year then ended, the changes in its net assets for each of the years in the two-year period then ended, and the financial highlights for each of the years or periods in the five-year period then ended, in conformity with U.S. generally accepted accounting principles.

New York, New York
February 21, 2014
62
IMPORTANT TAX INFORMATION (Unaudited)
For federal tax purposes, the fund reports the maximum amount allowable but not less than 23.48% as interest-related dividends in accordance with Sections 871(k)(1) and 881(e) of the Internal Revenue Code. Also, the fund reports the maximum amount allowable but not less than $.0232 as a short-term capital gain dividend paid on March 28, 2013 in accordance with Sections 871(k)(2) and 881(e) of the Internal Revenue Code.
The Fund 63
INFORMATION ABOUT THE RENEWAL OF THE FUND’S
SUB-INVESTMENT ADVISORY AGREEMENT (Unaudited)
At a meeting of the Board of Trustees of the fund held on October 30-31, 2013 (the “Board Meeting”), Dreyfus recommended the appointment of Standish Mellon Asset Management Company LLC (“Standish”) to serve as a sub-adviser for the fund.The recommendation of Standish was based on, among other information, Dreyfus’ review and due diligence report relating to Standish and its investment advisory services. The Board members also noted that investment personnel of Standish currently serve as dual employees of Dreyfus and Standish in managing (as Dreyfus employees) the fund and certain other funds in the Dreyfus Family of Funds for which they serve as Board members and that Standish currently serves as sub-adviser to another fund in the Dreyfus Family of Funds for which they serve as Board members.
At the Board Meeting, the Board, all of whose members are Independent Trustees, considered and approved the Sub-Investment Advisory Agreement between Dreyfus and Standish (the “Standish Sub-Advisory Agreement”) for the fund. In determining whether to approve the Standish Sub-Advisory Agreement, the Board considered the due diligence materials prepared by Dreyfus and other information received in advance of the Board Meeting, which was comprised of: (i) a copy of the Standish Sub-Advisory Agreement between Dreyfus and Standish; (ii) information regarding the process by which Dreyfus selected and recommended Standish for Board approval; (iii) information regarding the nature, extent and quality of the services Standish would provide to the fund; (iv) information regarding Standish’s investment process, reputation, investment management business, personnel and operations; (v) information regarding Standish’s brokerage and trading policies and practices; (vi) information regarding the level of sub-investment advisory fee to be charged by Standish; (vii) information regarding Standish’s compliance program; (viii) information regarding historical performance returns of the Fund, with such performance compared to relevant indices; and (ix) information regarding Standish’s financial condition. The Board also considered the substance of discussions with representatives of Dreyfus at
64
the Board Meeting. Additionally, the Board reviewed materials supplied by counsel that were prepared for use by the Board in fulfilling its duties under the Investment Company Act of 1940, as amended.
Nature, Extent and Quality of Services to be Provided by Standish. In examining the nature, extent and quality of the services to be provided by Standish to the fund, the Board considered (i) Standish’s organization, history, reputation, qualification and background, as well as the qualifications of its personnel; (ii) its expertise in providing portfolio management services to other similar investment portfolios; (iii) its investment strategy for the fund; (iv) its long- and short-term performance relative to unmanaged indices; and (v) its compliance program.The Board specifically took into account Standish’s investment process and research resources and capabilities. The Board also discussed the acceptability of the terms of the Standish Sub-Advisory Agreement.The Board also considered the review process undertaken by Dreyfus, and Dreyfus’ favorable assessment of the nature and quality of the sub-investment advisory services expected to be provided to the fund by Standish.The Board concluded that the fund will benefit from the quality and experience of Standish’s investment professionals. Based on their consideration and review of the foregoing information, the Board concluded that the nature, extent and quality of the sub-investment advisory services to be provided by Standish were adequate and appropriate in light of Standish’s experience in managing fixed-income assets, Standish’s portfolio management and research resources to be applied in managing the fund’s portfolio, and Dreyfus’ recommendation to engage Standish, and supported a decision to approve the Standish Sub-Advisory Agreement.
Investment Performance of Standish. The Board considered the investment performance of the fund, which is managed by dual employees of Dreyfus and Standish, as a factor in evaluating the Standish Sub-Advisory Agreement during the Board Meeting. The Board also discussed with representatives of Dreyfus the investment strategies to be employed by
The Fund 65
INFORMATION ABOUT THE RENEWAL OF THE FUND’S
SUB-INVESTMENT ADVISORY AGREEMENT (Unaudited) (continued)
Standish in the management of the fund’s assets. The Board noted Standish’s reputation and experience with respect to fixed-income investing, each portfolio manager’s experience, and Dreyfus’ experience in selecting, evaluating, and overseeing investment managers. Based on these factors, the Board supported a decision to approve the Standish Sub-Advisory Agreement.
Costs of Services to be Provided. The Board considered the proposed fees payable under the Standish Sub-Advisory Agreement, noting that the proposed fee would be paid by Dreyfus, and not the fund, and, thus, would not impact the fee paid by the fund.The Board concluded that the proposed fees payable to Standish by Dreyfus in its capacity as sub-adviser were reasonable and appropriate.
Profitability and Economies of Scale to be Realized. The Board recognized that, because Standish’s fees would be paid by Dreyfus, and not the fund, an analysis of profitability and economies of scale was more appropriate in the context of the Board’s consideration of the Investment Advisory Agreement. Accordingly, considerations of profitability and economies of scale with respect to Standish were not relevant to the Board’s determination to approve the Standish Sub-Advisory Agreement.
The Board also considered whether there were any ancillary benefits that may accrue to Standish and its affiliates as a result of Standish’s relationship with the fund. The Board recognized that, because Standish is a subsidiary of BNY Mellon, BNY Mellon will benefit from the sub-investment advisory fees paid by Dreyfus to Standish.The Board concluded that the benefits that were expected to accrue to Standish and its affiliates by virtue of its relationship with the fund were reasonable.
66
In considering the materials and information described above, the Independent Trustees received assistance from, and met separately with, their independent legal counsel, and were provided with a written description of their statutory responsibilities and the legal standards that are applicable to the approval of investment advisory and sub-investment advisory agreements.
After full consideration of the factors discussed above, with no single factor identified as being of paramount importance, the Board, all of whose members are Independent Trustees, with the assistance of independent legal counsel, concluded that the initial approval of the Standish Sub-Advisory Agreement was in the best interests of the fund and approved the Standish Sub-Advisory Agreement.
The Fund 67
BOARD MEMBERS INFORMATION (Unaudited)
INDEPENDENT BOARD MEMBERS
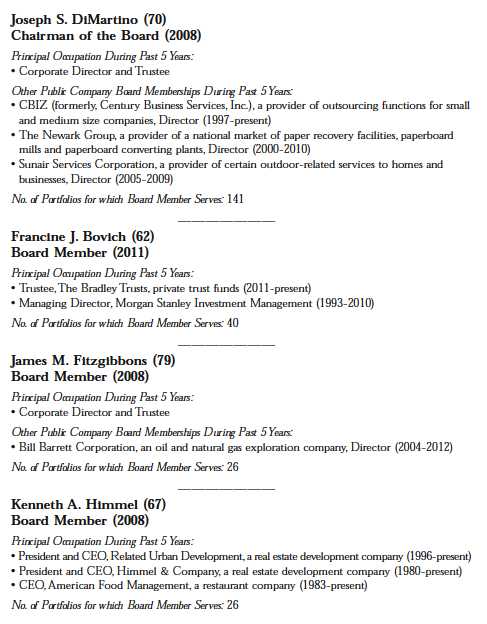
68
The Fund 69
OFFICERS OF THE FUND (Unaudited)
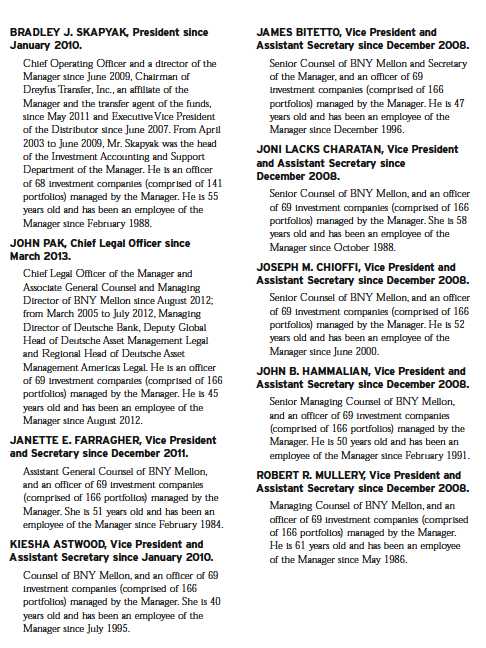
70
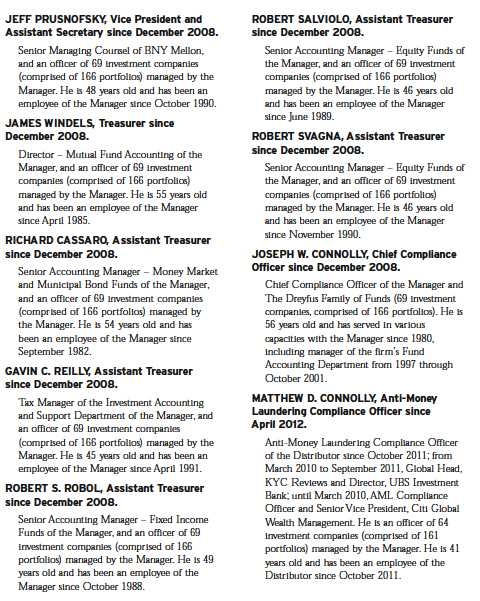
The Fund 71
NOTES
Item 2. Code of Ethics.
The Registrant has adopted a code of ethics that applies to the Registrant's principal executive officer, principal financial officer, principal accounting officer or controller, or persons performing similar functions. There have been no amendments to, or waivers in connection with, the Code of Ethics during the period covered by this Report.
Item 3. Audit Committee Financial Expert.
The Registrant's Board has determined that Joseph S. DiMartino, a member of the Audit Committee of the Board, is an audit committee financial expert as defined by the Securities and Exchange Commission (the "SEC"). Mr. DiMartino is "independent" as defined by the SEC for purposes of audit committee financial expert determinations.
Item 4. Principal Accountant Fees and Services.
(a) Audit Fees. The aggregate fees billed for each of the last two fiscal years (the "Reporting Periods") for professional services rendered by the Registrant's principal accountant (the "Auditor") for the audit of the Registrant's annual financial statements or services that are normally provided by the Auditor in connection with the statutory and regulatory filings or engagements for the Reporting Periods, were $106,300 in 2012 and $45,950 in 2013.
(b) Audit-Related Fees. The aggregate fees billed in the Reporting Periods for assurance and related services by the Auditor that are reasonably related to the performance of the audit of the Registrant's financial statements and are not reported under paragraph (a) of this Item 4 were $13,560 in 2012 and $4,790 in 2013. These services consisted of one or more of the following: (i) agreed upon procedures related to compliance with Internal Revenue Code section 817(h), (ii) security counts required by Rule 17f-2 under the Investment Company Act of 1940, as amended, (iii) advisory services as to the accounting or disclosure treatment of Registrant transactions or events and (iv) advisory services to the accounting or disclosure treatment of the actual or potential impact to the Registrant of final or proposed rules, standards or interpretations by the Securities and Exchange Commission, the Financial Accounting Standards Boards or other regulatory or standard-setting bodies.
The aggregate fees billed in the Reporting Periods for non-audit assurance and related services by the Auditor to the Registrant's investment adviser (not including any sub-investment adviser whose role is primarily portfolio management and is subcontracted with or overseen by another investment adviser), and any entity controlling, controlled by or under common control with the investment adviser that provides ongoing services to the Registrant ("Service Affiliates"), that were reasonably related to the performance of the annual audit of the Service Affiliate, which required pre-approval by the Audit Committee were $0 in 2012 and $0 in 2013.
(c) Tax Fees. The aggregate fees billed in the Reporting Periods for professional services rendered by the Auditor for tax compliance, tax advice, and tax planning ("Tax Services") were $7,890 in 2012 and $2,680 in 2013. These services consisted of the review or preparation of U.S. federal, state, local and excise tax returns. The aggregate fees billed in the Reporting Periods for Tax Services by the Auditor to Service Affiliates, which required pre-approval by the Audit Committee were $0 in 2012 and $0 in 2013.
(d) All Other Fees. The aggregate fees billed in the Reporting Periods for products and services provided by the Auditor, other than the services reported in paragraphs (a) through (c) of this Item, were $0 in 2012 and $0 in 2013.
The aggregate fees billed in the Reporting Periods for Non-Audit Services by the Auditor to Service Affiliates, other than the services reported in paragraphs (b) through (c) of this Item, which required pre-approval by the Audit Committee, were $0 in 2012 and $0 in 2013.
(e)(1) Audit Committee Pre-Approval Policies and Procedures. The Registrant's Audit Committee has established policies and procedures (the "Policy") for pre-approval (within specified fee limits) of the Auditor's engagements for non-audit services to the Registrant and Service Affiliates without specific case-by-case consideration. The pre-approved services in the Policy can include pre-approved audit services, pre-approved audit-related services, pre-approved tax services and pre-approved all other services. Pre-approval considerations include whether the proposed services are compatible with maintaining the Auditor's independence. Pre-approvals pursuant to the Policy are considered annually.
(e)(2) Note: None of the services described in paragraphs (b) through (d) of this Item 4 were approved by the Audit Committee pursuant to paragraph (c)(7)(i)(C) of Rule 2-01 of Regulation S-X.
(f) None of the hours expended on the principal accountant's engagement to audit the registrant's financial statements for the most recent fiscal year were attributed to work performed by persons other than the principal account's full-time, permanent employees.
Non-Audit Fees. The aggregate non-audit fees billed by the Auditor for services rendered to the Registrant, and rendered to Service Affiliates, for the Reporting Periods were $12,372,510 in 2012 and $13,916,529 in 2013.
Auditor Independence. The Registrant's Audit Committee has considered whether the provision of non-audit services that were rendered to Service Affiliates, which were not pre-approved (not requiring pre-approval), is compatible with maintaining the Auditor's independence.
Item 5. Audit Committee of Listed Registrants.
Not applicable.
Item 6. Investments.
(a) Not applicable.
Item 7. Disclosure of Proxy Voting Policies and Procedures for Closed-End Management Investment Companies.
Not applicable.
Item 8. Portfolio Managers of Closed-End Management Investment Companies.
Not applicable.
Item 9. Purchases of Equity Securities by Closed-End Management Investment Companies and Affiliated Purchasers.
Not applicable.
Item 10. Submission of Matters to a Vote of Security Holders.
There have been no material changes to the procedures applicable to Item 10.
Item 11. Controls and Procedures.
(a) The Registrant's principal executive and principal financial officers have concluded, based on their evaluation of the Registrant's disclosure controls and procedures as of a date within 90 days of the filing date of this report, that the Registrant's disclosure controls and procedures are reasonably designed to ensure that information required to be disclosed by the Registrant on Form N-CSR is recorded, processed, summarized and reported within the required time periods and that information required to be disclosed by the Registrant in the reports that it files or submits on Form N-CSR is accumulated and communicated to the Registrant's management, including its principal executive and principal financial officers, as appropriate to allow timely decisions regarding required disclosure.
(b) There were no changes to the Registrant's internal control over financial reporting that occurred during the second fiscal quarter of the period covered by this report that have materially affected, or are reasonably likely to materially affect, the Registrant's internal control over financial reporting.
Item 12. Exhibits.
(a)(1) Code of ethics referred to in Item 2.
(a)(2) Certifications of principal executive and principal financial officers as required by Rule 30a-2(a) under the Investment Company Act of 1940.
(a)(3) Not applicable.
(b) Certification of principal executive and principal financial officers as required by Rule 30a-2(b) under the Investment Company Act of 1940.
SIGNATURES
Pursuant to the requirements of the Securities Exchange Act of 1934 and the Investment Company Act of 1940, the Registrant has duly caused this Report to be signed on its behalf by the undersigned, thereunto duly authorized.
Dreyfus Investment Funds
By: /s/ Bradley J. Skapyak | |
Bradley J. Skapyak President
| |
Date: | February 21, 2014 |
| |
Pursuant to the requirements of the Securities Exchange Act of 1934 and the Investment Company Act of 1940, this Report has been signed below by the following persons on behalf of the Registrant and in the capacities and on the dates indicated. | |
| |
By: /s/ Bradley J. Skapyak | |
Bradley J. Skapyak President
| |
Date: | February 21, 2014 |
| |
By: /s/ James Windels | |
James Windels Treasurer
| |
Date: | February 21, 2014 |
| |
EXHIBIT INDEX
(a)(1) Code of ethics referred to in Item 2.
(a)(2) Certifications of principal executive and principal financial officers as required by Rule 30a-2(a) under the Investment Company Act of 1940. (EX-99.CERT)
(b) Certification of principal executive and principal financial officers as required by Rule 30a-2(b) under the Investment Company Act of 1940. (EX-99.906CERT)